Filed Pursuant to Rule 433
Registration No. 333-277211
January 14, 2025
FREE WRITING PROSPECTUS
(To Prospectus dated February 21, 2024,
Prospectus Supplement dated February 21, 2024 and
Equity Index Underlying Supplement dated February 21, 2024)

Linked to the HSBC 3D Edge Index (the “Reference Asset”)
| ► | At least 6.60x exposure to any positive return of the Reference Asset (to be determined on the Trade Date) |
| ► | Return of principal at maturity if the Reference Return is less than or equal to zero. |
| ► | All payments on the Notes are subject to the credit risk of HSBC USA Inc. |
| ► | Due February 2, 2032 |
The Accelerated Market Participation Securities (each a “Note” and collectively the “Notes") offered hereunder will not be listed on any securities exchange or automated quotation system. The Notes will not bear interest.
Neither the U.S. Securities and Exchange Commission (the “SEC”) nor any state securities commission has approved or disapproved of the Notes or passed upon the accuracy or the adequacy of this document, the accompanying prospectus, prospectus supplement or Equity Index Underlying Supplement. Any representation to the contrary is a criminal offense.
We have appointed HSBC Securities (USA) Inc., an affiliate of ours, as the agent for the sale of the Notes. HSBC Securities (USA) Inc. will purchase the Notes from us for distribution to other registered broker-dealers or will offer the Notes directly to investors. In addition, HSBC Securities (USA) Inc. or another of its affiliates or agents may use the pricing supplement to which this document relates in market-making transactions in any Notes after their initial sale. Unless we or our agent inform you otherwise in the confirmation of sale, the pricing supplement to which this document relates is being used in a market-making transaction. See “Supplemental Plan of Distribution (Conflicts of Interest)” on page FWP-22 of this document.
Investment in the Notes involves certain risks. You should refer to “Risk Factors” beginning on page FWP-7 of this document, page S-1 of the accompanying prospectus supplement and page S-1 of the accompanying Equity Index Underlying Supplement.
The Estimated Initial Value of the Notes on the Trade Date is expected to be between $850.00 and $950.00 per Note, which will be less than the price to public. The market value of the Notes at any time will reflect many factors and cannot be predicted with accuracy. See “Estimated Initial Value” on page FWP-4 and “Risk Factors” beginning on page FWP-7 of this document for additional information.
| Price to Public | Underwriting Discount1 | Proceeds to Issuer | |
| Per Note | $1,000 | ||
| Total |
1HSBC USA Inc. or one of our affiliates may pay varying underwriting discounts of up to 5.00% per $1,000 Principal Amount in connection with the distribution of the Notes to other registered broker-dealers. See “Supplemental Plan of Distribution (Conflicts of Interest)” on page FWP-22 of this document.
The Notes:
| Are Not FDIC Insured | Are Not Bank Guaranteed | May Lose Value |

| Indicative Terms1 | |
| Principal Amount | $1,000 per Note |
| Reference Asset | The HSBC 3D Edge Index (the “HSIE3EDG Index” or the “Index”) |
| Upside Participation Rate | At least 660.00% (6.60x) exposure to any positive Reference Return of the Reference Asset (to be determined on the Trade Date) |
| Maximum Cap | None |
| Reference Return | Final Value – Initial Value Initial Value |
Payment at Maturity per Note | ■ If the Reference Return is greater than zero, you will receive: $1,000 + ($1,000 × Reference Return × Upside Participation Rate) ■ If the Reference Return is less than or equal to zero: $1,000 (a zero return) |
| Initial Value | The Official Closing Level of the Reference Asset on the Pricing Date. |
| Final Value | The Official Closing Level of the Reference Asset on the Final Valuation Date. |
| Pricing Date | January 28, 2025 |
| Trade Date | January 28, 2025 |
| Original Issue Date | January 31, 2025 |
| Final Valuation Date(2) | January 28, 2032 |
| Maturity Date(2) | February 2, 2032 |
| CUSIP/ISIN | 40447BXS6/US40447BXS68 |
The Notes
The Notes are designed for investors who believe the Reference Asset will appreciate moderately over the term of the Notes.
The Reference Return is positive, you will realize a return equal to at least 660.00% (6.60x) (to be determined on the Trade Date) of the appreciation of the Reference Asset.
If the Reference Return is less than or equal to zero, you will receive your principal at maturity (a zero return).

(1)As more fully described on page FWP-4.
(2)Subject to adjustment as described under “Additional Terms of the Notes” in the accompanying Equity Index Underlying Supplement.
| FWP-2 |
Payoff Example
The table at right shows the hypothetical payout profile of an investment in the Notes assuming an Upside Participation Rate of 660.00% (to be determined on the Trade Date). | 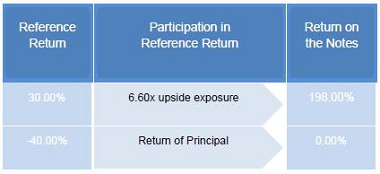 |
Information about the Reference Asset
The HSIE3EDG Index is based on the HSBC 3D Edge Base Index, which is comprised of two sub-index components designed to provide broad based exposure to US Large Cap Equity Futures and US 10Yr Treasury Bond Futures The directional exposure to each index component will default to long, but can dynamically shift to short on any day in order to react to changing market conditions. | 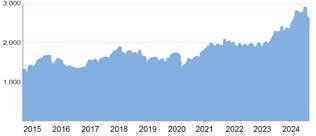 |
The hypothetical back-tested Index data only reflects the application of that methodology in hindsight, since the Index, the Base Index and the Sub-Indices were not actually calculated and published prior to December 24, 2024. The hypothetical back-tested Index data cannot completely account for the impact of financial risk in actual trading. There are numerous factors related to the equities markets in general that cannot be, and have not been, accounted for in the hypothetical back-tested Index data, all of which can affect actual performance. Consequently, you should not rely on that data as a reflection of what the actual Index performance would have been had the Index been in existence or in forecasting future Index performance. The graph above also reflects the actual Index performance from December 24, 2024 to January [ ], 2025 based on information that we obtained from Bloomberg L.P. Any hypothetical or actual historical upward or downward trend in the level of the Index during any period shown is not an indication that the level of the Index is more or less likely to increase or decrease at any time during the term of the Notes. For more information about the historical levels of the Index, see “Annex A: Description of the Index—Historical Performance of the Index” herein.
| FWP-3 |
HSBC USA Inc.
Accelerated Market Participation Securities
Linked to the HSBC 3D Edge Index
This document relates to a single offering of Accelerated Market Participation Securities. The Notes will have the terms described in this document and the accompanying prospectus, prospectus supplement and Equity Index Underlying Supplement. If the terms of the Notes offered hereby are inconsistent with those described in the accompanying prospectus, prospectus supplement, or Equity Index Underlying Supplement, the terms described in this document shall control.
This document relates to an offering of Notes linked to the performance of the Reference Asset. The purchaser of a Note will acquire a senior unsecured debt security of HSBC USA Inc. linked to the Reference Asset as described below. The following key terms relate to the offering of the Notes:
| Issuer: | HSBC USA Inc. |
| Principal Amount: | $1,000 per Note |
| Reference Asset: | The HSBC 3D Edge Index (the “HSIE3EDG Index” or the “Index”) |
| Trade Date: | January 28, 2025 |
| Pricing Date: | January 28, 2025 |
| Original Issue Date: | January 31, 2025 |
| Final Valuation Date: | January 28, 2032, subject to adjustment as described under “Additional Terms of the Notes—Valuation Dates” in the accompanying Equity Index Underlying Supplement. |
| Maturity Date: | 3 business days after the Final Valuation Date, which is expected to be February 2, 2032. The Maturity Date is subject to adjustment as described under “Additional Terms of the Notes—Coupon Payment Dates, Call Payment Dates and Maturity Date” in the accompanying Equity Index Underlying Supplement. |
| Maximum Cap: | None. |
| Upside Participation Rate: | At least 660.00% (6.60x) (to be determined on the Trade Date) |
| Payment at Maturity: | On the Maturity Date, for each Note, we will pay you the Final Settlement Value. |
| Final Settlement Value: | For each $1,000 Principal Amount, you will receive a cash payment on the Maturity Date, calculated as follows: ■ If the Reference Return is greater than zero, you will receive a cash payment on the Maturity Date, per $1,000 Principal Amount, equal to: $1,000 + ($1,000 × Reference Return × Upside Participation Rate) ■ If the Reference Return is less than or equal to zero: $1,000 per $1,000 Principal Amount (a zero return). |
| Reference Return: | The quotient, expressed as a percentage, calculated as follows: |
Final Value – Initial Value Initial Value | |
| Initial Value: | The Official Closing Level of the Reference Asset on the Pricing Date. |
| Final Value: | The Official Closing Level of the Reference Asset on the Final Valuation Date. |
| Form of Notes: | Book-Entry |
| Listing: | The Notes will not be listed on any securities exchange or quotation system. |
| CUSIP/ISIN: | 40447BXS6/US40447BXS68 |
| Estimated Initial Value: | The Estimated Initial Value of the Notes is expected to be less than the price you pay to purchase the Notes. The Estimated Initial Value does not represent a minimum price at which we or any of our affiliates would be willing to purchase your Notes in the secondary market, if any, at any time. The Estimated Initial Value will be calculated on the Trade Date and will be set forth in the pricing supplement to which this free writing prospectus relates. See “Risk Factors — The Estimated Initial Value of the Notes, which will be determined by us on the Trade Date, is expected to be less than the price to public and may differ from the market value of the Notes in the secondary market, if any.” |
| The Trade Date, the Pricing Date and the other dates set forth above are subject to change, and will be set forth in the pricing supplement relating to the Notes. | |
| FWP-4 |
GENERAL
This document relates to an offering of Notes linked to the Reference Asset. The purchaser of a Note will acquire a senior unsecured debt security of HSBC USA Inc. We reserve the right to withdraw, cancel or modify this offering and to reject orders in whole or in part. Although the offering of Notes relates to the Reference Asset, you should not construe that fact as a recommendation as to the merits of acquiring an investment linked to the Reference Asset or any security included in the Reference Asset or as to the suitability of an investment in the Notes.
You should read this document together with the prospectus dated February 21, 2024, the prospectus supplement dated February 21, 2024 and the Equity Index Underlying Supplement dated February 21, 2024. If the terms of the Notes offered hereby are inconsistent with those described in the accompanying prospectus, prospectus supplement or Equity Index Underlying Supplement, the terms described in this document shall control. You should carefully consider, among other things, the matters set forth in “Risk Factors” beginning on page FWP-5 of this document, page S-1 of the prospectus supplement and page S-1 of the Equity Index Underlying Supplement, as the Notes involve risks not associated with conventional debt securities. We urge you to consult your investment, legal, tax, accounting and other advisors before you invest in the Notes. As used herein, references to the “Issuer”, “HSBC”, “we”, “us” and “our” are to HSBC USA Inc.
HSBC has filed a registration statement (including a prospectus, prospectus supplement and Equity Index Underlying Supplement) with the SEC for the offering to which this document relates. Before you invest, you should read the prospectus, prospectus supplement and Equity Index Underlying Supplement in that registration statement and other documents HSBC has filed with the SEC for more complete information about HSBC and this offering. You may get these documents for free by visiting EDGAR on the SEC’s web site at www.sec.gov. Alternatively, HSBC Securities (USA) Inc. or any dealer participating in this offering will arrange to send you the prospectus, prospectus supplement and Equity Index Underlying Supplement if you request them by calling toll-free 1-866-811-8049.
You may also obtain:
| 🞂 | The Equity Index Underlying Supplement at: https://www.sec.gov/Archives/edgar/data/83246/000110465924025885/tm244959d3_424b2.htm |
| 🞂 | The prospectus supplement at: https://www.sec.gov/Archives/edgar/data/83246/000110465924025878/tm244959d1_424b2.htm |
| 🞂 | The prospectus at: https://www.sec.gov/Archives/edgar/data/83246/000110465924025864/tm244959d13_424b3.htm |
We are using this document to solicit from you an offer to purchase the Notes. You may revoke your offer to purchase the Notes at any time prior to the time at which we accept your offer by notifying HSBC Securities (USA) Inc. We reserve the right to change the terms of, or reject any offer to purchase, the Notes prior to their issuance. In the event of any material changes to the terms of the Notes, we will notify you.
PAYMENT AT MATURITY
On the Maturity Date, for each Note you hold, we will pay you the Final Settlement Value, which is an amount in cash, as described below:
If the Reference Return is greater than zero, you will receive a cash payment on the Maturity Date, per $1,000 Principal Amount, equal to:
$1,000 + ($1,000 × Reference Return × Upside Participation Rate)
If the Reference Return is less than or equal to zero, you will receive:
$1,000 per $1,000 Principal Amount (zero return).
Interest
The Notes will not pay interest.
Calculation Agent
We or one of our affiliates will act as calculation agent with respect to the Notes.
Reference Sponsor
The reference sponsor of the HSIE3EDG Index is HSBC Bank plc.
| FWP-5 |
INVESTOR SUITABILITY
The Notes may be suitable for you if:
| ► | You seek an investment with a return linked to the potential positive performance of the Reference Asset and that will provide a full return of principal. |
| ► | You are willing to accept the risk and return profile of the Notes versus a conventional debt security with a comparable maturity issued by HSBC or another issuer with a similar credit rating. |
| ► | You are willing to forgo dividends or other distributions paid on the stocks included in the Reference Asset. |
| ► | You do not seek current income from your investment. |
| ► | You do not seek an investment for which there is an active secondary market. |
| ► | You are willing to hold the Notes to maturity. |
| ► | You are comfortable with the creditworthiness of HSBC, as Issuer of the Notes. |
The Notes may not be suitable for you if:
| ► | You believe the Reference Return will not be sufficiently positive to provide you with your desired return. |
| ► | You prefer the lower risk, and therefore accept the potentially lower returns, of conventional debt securities with comparable maturities issued by HSBC or another issuer with a similar credit rating. |
| ► | You prefer to receive the dividends or other distributions paid on the stocks included in the Reference Asset. |
| ► | You seek current income from your investment. |
| ► | You seek an investment for which there will be an active secondary market. |
| ► | You are unable or unwilling to hold the Notes to maturity. |
| ► | You are not willing or are unable to assume the credit risk associated with HSBC, as Issuer of the Notes. |
| FWP-6 |
RISK FACTORS
We urge you to read the section “Risk Factors” beginning on page S-1 of the accompanying prospectus supplement and on page S-1 of the accompanying Equity Index Underlying Supplement. You should understand the risks of investing in the Notes and should reach an investment decision only after careful consideration, with your advisors, of the suitability of the Notes in light of your particular financial circumstances and the information set forth in this document and the accompanying, prospectus, prospectus supplement and Equity Index Underlying Supplement.
In addition to the risks discussed below, you should review “Risk Factors” in the accompanying prospectus supplement and Equity Index Underlying Supplement including the explanation of risks relating to the Notes described in the following sections:
| ► | “— Risks Relating to All Note Issuances” in the prospectus supplement; and |
| ► | “— General Risks Related to Indices” in the Equity Index Underlying Supplement. |
You will be subject to significant risks not associated with conventional fixed-rate or floating-rate debt securities.
Risks Relating to the Structure or Features of the Notes
The amount payable on the Notes is not linked to the value of the Reference Asset at any time other than on the Final Valuation Date.
The Final Value of the Reference Asset will be based on its Official Closing Level on the Final Valuation Date, subject to postponement for non-trading days and certain Market Disruption Events. Even if the value of the Reference Asset appreciates during the term of the Notes other than on the Final Valuation Date but then decreases on the Final Valuation Date to a value that reflects a Reference Return that is less than or equal to zero, the Payment at Maturity may be less than it would have been had the Payment at Maturity been linked to the value of the Reference Asset prior to such decrease. Although the actual value of the Reference Asset on the Maturity Date or at other times during the term of the Notes may be higher than the Final Value, the Payment at Maturity will be based solely on the Official Closing Level of the Reference Asset on the Final Valuation Date.
The Notes will not bear interest.
As a holder of the Notes, you will not receive interest payments.
Risks Relating to the Reference Asset
The strategy tracked by the HSIE3EDG Index and the views implicit in the HSIE3EDG Index are not guaranteed to succeed.
The strategy tracked by the HSIE3EDG Index is not guaranteed to be successful. It is impossible to predict whether and the extent to which the HSBC 3D Edge Base Index (the “Base Index”) or its constituents will yield positive or negative results. You should seek your own advice as necessary to assess the HSIE3EDG Index and its strategy.
The HSIE3EDG Index aims to provide a hypothetical exposure to the performance of the Base Index with a rules-based volatility control mechanism that aims to control the volatility of the HSIE3EDG Index by ensuring that it does not exceed a pre-defined target maximum level. By seeking to ensure that volatility does not exceed a predetermined maximum level, the HSIE3EDG Index may underperform an alternative strategy that seeks to maintain a higher or lower volatility or an alternative strategy that does not seek to maintain a level volatility. The volatility control mechanism includes an aggregate limit on exposure to the Base Index. These provisions may limit the ability of the HSIE3EDG Index to adjust to market conditions or to participate in favorable Base Index performance and may cause the HSIE3EDG Index to underperform another strategy that is not subject to these or similar conditions.
It is impossible to predict and list all factors and events that may impact the HSIE3EDG Index, positively or negatively. Conditions in particular markets, as well as overall market and macroeconomic conditions and other events and circumstances, may affect the HSIE3EDG Index in different ways. Moreover, market or other conditions or events may cause the HSIE3EDG Index to act in unanticipated ways, which could adversely affect the HSIE3EDG Index performance and, therefore, your return on the Notes. Certain disruption or extraordinary events may also require the Index Sponsor (which is us) to adjust or terminate the HSIE3EDG Index or the Base Index (of which we are also the index sponsor), which could adversely affect the HSIE3EDG Index performance and the return on the Notes.
No assurance can be given that the investment strategy on which the HSIE3EDG Index is based will be successful or that the HSIE3EDG Index will outperform any alternative strategy that might be employed in respect of the Base Index. Similarly, no assurance can be given that the investment strategy on which the Base Index is based will be successful or that the Base Index will outperform any alternative strategy that might be employed in respect of its components.
| FWP-7 |
The HSIE3EDG Index may underperform the Base Index.
The HSIE3EDG Index is intended to provide volatility-adjusted exposure to the Base Index. The HSIE3EDG Index temporarily decreases exposure to the Base Index when the volatility is higher than the maximum target level. The underlying investment thesis, which may or may not prove to be accurate, is that decreasing exposure to the Base Index during periods of increased volatility will limit the HSIE3EDG Index’s participation in rapid downturns in the Base Index. However, decreasing exposure to the Base Index during periods of increased volatility will also limit the HSIE3EDG Index’s participation in rapid growth of the Base Index. There can be no assurance that the HSIE3EDG Index’s investment thesis will prove correct or that the HSIE3EDG Index will effectively implement its investment thesis. Additionally, because there are embedded fees and costs and the decrement feature, the HSIE3EDG Index will underperform the Base Index unless its strategy performs sufficiently well to overcome the negative effect of the embedded fees and costs and decrement on the level of the HSIE3EDG Index.
The decrement will reduce the performance of the HSIE3EDG Index.
The HSIE3EDG Index includes a decrement feature, whereby 0.75% per annum of the HSIE3EDG Index level is deducted daily from the performance of the Base Index as part of the calculation of the HSIE3EDG Index level. The level of the Base Index must increase by an amount sufficient to offset the decrement in order for the HSIE3EDG Index to display a positive return. Accordingly, the level of the HSIE3EDG Index may decline even if the constituents of the Base Index appreciate. The decrement will adversely affect the performance of the HSIE3EDG Index in all cases, whether the Base Index appreciates or depreciates.
The level of the HSIE3EDG Index will be reduced based on embedded fees and costs.
The level of the HSIE3EDG Index is adjusted to reflect embedded fees and costs. Additionally, the Base Index and the indices referenced in the calculation of the Base Index, including sub-indices of the indices referenced in the calculation of the Base Index, (each, an “Underlying Index”) are also adjusted to reflect embedded fees and costs.
Because reductions are made from both the HSIE3EDG Index, Base Index and Underlying Indices, the deductions will have a compounding effect on the performance of the HSIE3EDG Index.
These fees will offset, in whole or in part, any positive performance and increase any negative performance of the Base Index and Underlying Indices. The level of the Underlying Indices must, as a result, increase by an amount sufficient to offset the fees and costs in order for the HSIE3EDG Index to display a positive return. There can be no assurance that such an increase will occur.
The total amount of embedded fees in the HSIE3EDG Index and Underlying Indices are not predictable at the issuance of the Notes and will depend on a number of factors, including the performance of the HSIE3EDG Index and Underlying Indices among other matters. As a result, it is not possible to predict at the time of issuance of the Notes the amount of the increase in the Underlying Indices (before taking into account such embedded fees and costs) that would be necessary to offset such fees and costs and to result in a positive return on your investment.
Daily adjustments will increase the embedded costs.
Daily adjustments of the HSIE3EDG Index’s exposure to the Base Index increase the embedded costs which are based, in part, on hypothetical transaction activity corresponding to the daily calculation of the HSIE3EDG Index’s exposure to the Base Index. Similarly, monthly rebalancing of the Base Index and daily adjustments to Underlying Indices will increase the embedded costs in the Underlying Indices which are also based, in part, on hypothetical transaction activity. The embedded fees may also exceed than the costs incurred as a result of actual transaction activity. The daily rebalancing of the HSIE3EDG Index and Underlying Indices will adversely affect the performance of the HSIE3EDG Index and the value of the Notes.
The HSIE3EDG Index may not approximate the target maximum volatility.
The HSIE3EDG Index is designed to ensure that volatility does not exceed the maximum level of 5% by dynamically adjusting its exposure to the Base Index on a daily basis, subject to a maximum exposure of 100%. Similarly, the HSBC Dynamic US Equity 15% VC Index (the “Equity Sub-Index”) also is designed to ensure that volatility does not exceed the maximum level of 15% by dynamically adjusting its exposure to its underlying index. These adjustments are made based on historic volatility, and there is no guarantee that trends exhibited by any such measures will continue in the future. The volatility of a portfolio on any day may change quickly and unexpectedly. There can be no assurance that the volatility control mechanism employed by the HSIE3EDG Index will be the most effective way to accurately assess volatility or to predict patterns of volatility. There can also be no assurance that maximum volatility of the HSIE3EDG Index will not exceed the maximum level of 5%.
| FWP-8 |
Historical volatility may be a poor indicator of future volatility.
The HSIE3EDG Index seeks to take on a defined and limited degree of expected risk by allocating exposure to the Base Index to ensure that volatility of the HSIE3EDG Index does not exceed the maximum level of 5%. Similarly, the Equity Sub-Index also seeks to limit the degree of expected risk by allocating exposure to its underlying index with aim to ensure that volatility of the Equity Sub-Index does not exceed the maximum level of 15%. Each of Index and Equity Sub-Index measures the expected risk of its portfolio based on historical volatility. There can be no assurance that the historical volatility of a portfolio will be indicative of future volatility. In addition, other potential measures of volatility, such as implied volatility, may be more predictive of future volatility than historical volatility. As a result, the measure of expected risk used by the HSIE3EDG Index and Equity Sub-Index may be less accurate than other measures that could have been used.
The volatility control mechanism may negatively impact the performance of the HSIE3EDG Index.
The HSIE3EDG Index and Equity Sub-Index each employ a rules-based volatility control mechanism that aims to control the maximum level of volatility. By seeking to ensure that volatility does not exceed a predetermined maximum, the HSIE3EDG Index and Equity Sub-Index may each underperform an alternative strategy that seeks to maintain a higher or lower volatility or an alternative strategy that does not seek to maintain a level volatility. The volatility control mechanisms also include aggregate limits on exposure. These provisions may limit the ability to adjust to market conditions or to participate in favorable performance of constituents and, accordingly, may cause the HSIE3EDG Index to underperform another strategy that is not subject to these or similar conditions.
The Signals employed by the Underlying Indices may be less accurate or result in less favorable performance that other alternatives.
The Underlying Indices use momentum, volatility and carry indicators (“Signals”) to determine “exposure direction” (i.e., whether the applicable Underlying Index will take a long or short position). The investment thesis for the Signals assumes that these momentum, volatility and carry indicators are useful to predict the direction of exposure. However, these momentum, volatility and carry indicators may not be reliable predictors of the direction of exposure to the Underlying Indices.
There can be no guarantee that the method by which volatility is determined will be effective; exponentially weighted moving averages place greater emphasis on more recent levels.
Certain volatility measures referenced in the calculation of the Underlying Indices are determined based on exponentially weighted moving average levels of reference measures. The exponentially weighted moving average is a type of moving average in which greater emphasis is given to more recent history by weighting each input according to the relevant decay factor with more recent values receiving a higher weighting than more distant values. Moving average itself is a concept in which an average value is obtained for a value observed at a specific frequency during a particular period, and this average “moves” every day to record the average daily return for the specified period. An exponentially weighted moving average will react more quickly to recent changes than a simple moving average.
There can be no guarantee that the method by which volatility is determined for purposes of calculating the Underlying Indices (including whether determined using an exponentially weighted moving average, simple average or otherwise) will be effective or achieve the intended results. Alternative methods of calculating volatility could produce more effective results.
The weighting between the Equity Sub-Index and the Treasury Sub-Index may not be suitable for all market conditions or objectives; the weighting may diverge significantly between rebalancings.
The Base Index assigns a weight of 40% to the Equity Sub-Index and a weight of 60% to the HSBC Dynamic US 10Y Treasury Index (the “Treasury Sub-Index”) as of each monthly rebalancing. The choice of weights may not be appropriate for all market conditions or objectives. For example, it is possible that a different choice of weights may lead to a better investment outcome for the investor under different market conditions. Additionally, if one Sub-Index outperforms the other Sub-Index between the monthly rebalancing days, the respective weighting of the Sub-Indices within the Base Index may diverge significantly from the 40% and 60% target levels.
The lower performance of one Sub-Index may offset increases in the other Sub-Index.
At a time when the value of one Sub-Index increases, the value of the other Sub-Index may not increase as much or may even decline. This may offset the potentially positive effect of the performance of the former Sub-Index on the performance of the Base Index and, therefore, the HSIE3EDG Index. Because the Underlying Indices are not equally weighted, changes in the lower weighted Sub-Index may be offset by smaller changes in the more heavily weighted Sub-Index.
| FWP-9 |
Accordingly, it is possible that the level of the Base Index may decline even if the value of one Sub-Index rises, because of the offsetting effect of a decline in the other Sub-Index.
No ownership rights in any bonds or component stocks or any rights in any bond futures contracts or equity index futures contracts.
As an owner of the Notes, you will not have rights that holders of the bond futures contracts or equity index futures contracts tracked by the Underlying Indices or holders of any related sovereign bonds or component stocks. The Notes will be paid in cash, and you will have no right to receive any payment or delivery in respect of any bond futures contracts or equity index futures contracts tracked by the Underlying Indices or any sovereign bonds or component stocks.
The Notes do not offer direct exposure to the performance of U.S. equities or U.S. Treasury bonds.
The Sub-Indices track the performance of rolling futures indices. These indices do not track the spot prices of any component stocks or U.S. Treasury bonds and, instead, track the prices of futures contracts. The price of futures contract reflects the expected level of the underlying asset in the future rather than its current level. A variety of factors can lead to a disparity between the expected future price of an underlying asset and the spot price at a given point in time, such as interest charges incurred to finance the purchase of the underlying asset, expectations concerning supply and demand for the underlying asset, and the volatility of the underlying asset. The price movements of a futures contract are typically correlated with the movements of the spot price of the underlying asset, but the correlation is generally imperfect and price movements in the spot market may not be reflected in the futures market (and vice versa). Accordingly, the Notes may underperform a similar investment that is linked to U.S. equities and U.S. treasuries rather than futures contracts on U.S. equities and U.S. treasuries.
Higher futures prices of the futures contracts underlying the indices tracked by the Sub-Indices relative to the current prices of those contracts may affect the level of the indices and, therefore, the value of the Sub-Indices, Base Index and the HSIE3EDG Index and the value of the Notes.
As the futures contracts that compose an index tracked by a Sub-Index approach expiration, they are replaced by contracts that have a later expiration. Thus, for example, a contract purchased and held in August may specify an October expiration. As time passes, the contract expiring in October is replaced with a contract for delivery in November. This process is referred to as “rolling.” If the market for these contracts is (putting aside other considerations) in “contango,” where the prices are higher in the distant delivery months than in the nearer delivery months, the purchase of the November contract would take place at a price that is higher than the price of the October contract, thereby creating a negative “roll yield.” Contango markets could adversely affect the level of the applicable index and thus the value of the Sub-Indices, Base Index and the HSIE3EDG Index and the value of any structured product investment linked to the HSIE3EDG Index.
The Underlying Indices are excess return indices, not total return indices.
The Underlying Indices are excess return indices not total return indices. With respect to an index comprised of futures contracts, an “excess return” index reflects the “price yield” generated by a change in the price of the futures contract comprising the index and the “roll yield” that is generated when the first expiring futures contract is rolled into the second expiring futures contract, but it does not include interest earned on collateral that a hypothetical investor must provide to secure its performance under the futures contract. By contrast, a “total return” index, reflects interest earned on a hypothetical fully collateralized contract position, in addition to the price yield and the roll yield. Similarly, the calculation of the Underlying Indices only considers the change in the level of any component index and does not consider any interest earned on any “uninvested” funds or other synthetic cash flows.
Suspension or disruptions of market trading in futures contracts may adversely affect the value of the Notes.
Futures markets are subject to temporary distortions or other disruptions due to various factors, including the lack of liquidity in the markets, the participation of speculators, and government regulation and intervention. In addition, futures markets typically have regulations that limit the amount of fluctuation in some futures contract prices that may occur during a single business day. These limits are generally referred to as “daily price fluctuation limits,” and the maximum or minimum price of a contract on any given day as a result of these limits is referred to as a “limit price.” Once the limit price has been reached in a particular contract, no trades may be made at a price beyond the limit, or trading may be limited for a specified period of time. Limit prices have the effect of precluding trading in a particular contract or forcing the liquidation of contracts at potentially disadvantageous times or prices. These circumstances could affect the levels of the Underlying Indices and, therefore, could adversely affect the performance of the HSIE3EDG Index.
| FWP-10 |
HSBC may adjust the HSIE3EDG Index or the Base Index in ways that adversely affect holder’s interests in the Notes.
HSBC is the index sponsor for the HSIE3EDG Index and the Base Index. As the index sponsor, HSBC will make determinations with respect to the HSIE3EDG Index and the Base Index, including whether a disruption event has occurred and whether to use an alternate method of calculation if a disruption event has occurred, and have the discretion to modify the methodology for the HSIE3EDG Index and/or the Base Index or to suspend or cancel the HSIE3EDG Index and/or the Base Index. HSBC has no obligation to consider the interests of any holders of the Notes in making any determinations as index sponsor. There can be no assurance that any determination made by HSBC in its capacity as index sponsor will not have an adverse effect on the level of the HSIE3EDG Index and, therefore, the return on your Notes.
The HSIE3EDG Index, the Base Index and the Sub- Indices were recently launched and have limited operating history.
Each of the HSIE3EDG Index, the Base Index and each Sub-Index was launched on December 24, 2024 and therefore has limited historical performance. As a result, limited actual historical performance information is available for you to consider in making an independent investigation of the HSIE3EDG Index, which may make it more difficult for you to evaluate the historical performance of the HSIE3EDG Index and make an informed investment decision than would be the case if each of the HSIE3EDG Index, the Base Index and each Sub-Index had a longer trading history.
Hypothetical back-tested performance prior to the launch of the HSIE3EDG Index, the Base Index and each Sub-Index provided in this document refers to simulated performance data created by applying each index’s respective calculation methodology to historical or simulated levels of the Underlying Indices (which themselves may be based on applying the applicable Underlying Index’s calculation methodology to historical or simulated levels of its constituents). Such simulated performance data has been produced by the retroactive application of a back-tested methodology in hindsight, that is, with the benefit of being able to evaluate how the HSIE3EDG Index methodology would have caused the HSIE3EDG Index to perform had it existed during the hypothetical back-test period. It is impossible to predict whether the HSIE3EDG Index will rise or fall. Accordingly, the actual performance of the HSIE3EDG Index may differ significantly from the back-tested information, and if the HSIE3EDG Index is shown to have generally appreciated over the hypothetical back-test period, that may not therefore be an accurate or reliable indication of any fundamental aspect of the HSIE3EDG Index methodology. Hypothetical back-tested results are neither an indicator nor a guarantor of future results.
The hypothetical back-tested performance of the HSIE3EDG Index, the Base Index and each Sub-Index prior to December 24, 2024 cannot fully reflect the actual results that would have occurred had each of the HSIE3EDG Index, the Base Index and each Sub-Index actually been calculated during that period, and should not be relied upon as an indication of the HSIE3EDG Index’s future performance. A longer history of actual performance could be helpful in providing more reliable information on which to assess the HSIE3EDG Index.
MerQube administers, calculates and publishes the HSIE3EDG Index and the Base Index and sponsors, administers, calculates and publishes the Sub-Indices.
MerQube Inc., MerQube UK Limited and any subsidiaries and affiliates (“MerQube”) have the authority to determine whether certain events affecting the HSIE3EDG Index, the Base Index or the Sub-Indices have occurred including, but not limited to, events affecting the measures referenced in the calculation of the indices.
Potential investors in any financial instrument of which the HSIE3EDG Index is an underlying need to be aware that any determination or calculation made by MerQube may affect the level of the HSIE3EDG Index, the Base Index or the Sub-Indices, as applicable, and, as appropriate, the performance of any instruments linked to the performance of the HSIE3EDG Index. MerQube has no obligation to consider the interest of investors in any such instruments when making any determination or calculation. Such discretion in the decisions taken by MerQube (in the absence of manifest or proven error) are binding on all investors and holders of such instruments.
General Risk Factors
The Notes are subject to the credit risk of HSBC USA Inc.
The Notes are senior unsecured debt obligations of the Issuer, HSBC, and are not, either directly or indirectly, an obligation of any third party. As further described in the accompanying prospectus supplement and prospectus, the Notes will rank on par with all of the other unsecured and unsubordinated debt obligations of HSBC, except such obligations as may be preferred by operation of law. Any payment to be made on the Notes, including any return of principal at maturity, depends on the ability of HSBC to satisfy its obligations as they come due. As a result, the actual and perceived creditworthiness of HSBC may affect the market value of the Notes and, in the event HSBC were to default on its obligations, you may not receive the amounts owed to you under the terms of the Notes.
| FWP-11 |
The Notes are not insured or guaranteed by any governmental agency of the United States or any other jurisdiction.
The Notes are not deposit liabilities or other obligations of a bank and are not insured or guaranteed by the Federal Deposit Insurance Corporation or any other governmental agency or program of the United States or any other jurisdiction. An investment in the Notes is subject to the credit risk of HSBC, and in the event that HSBC is unable to pay its obligations as they become due, you may not receive the full payments due on the Notes.
The Estimated Initial Value of the Notes, which will be determined by us on the Trade Date, is expected to be less than the price to public and may differ from the market value of the Notes in the secondary market, if any.
The Estimated Initial Value of the Notes will be calculated by us on the Trade Date and is expected to be less than the price to public. The Estimated Initial Value will reflect our and our affiliates’ internal funding rate, which is the borrowing rate paid to issue market-linked securities, as well as the mid-market value of the embedded derivatives in the Notes. This internal funding rate is typically lower than the rate we would use when we issue conventional fixed or floating rate debt securities. As a result of the difference between our internal funding rate and the rate we would use when we issue conventional fixed or floating rate debt securities, the Estimated Initial Value of the Notes may be lower if it were based on the prices at which our fixed or floating rate debt securities trade in the secondary market. In addition, if we were to use the rate we use for our conventional fixed or floating rate debt issuances, we would expect the economic terms of the Notes to be more favorable to you. We will determine the value of the embedded derivatives in the Notes by reference to our or our affiliates’ internal pricing models. These pricing models consider certain assumptions and variables, which can include volatility and interest rates. Different pricing models and assumptions could provide valuations for the Notes that are different from our Estimated Initial Value. These pricing models rely in part on certain forecasts about future events, which may prove to be incorrect. The Estimated Initial Value does not represent a minimum price at which we or any of our affiliates would be willing to purchase your Notes in the secondary market (if any exists) at any time.
The price of your Notes in the secondary market, if any, immediately after the Trade Date is expected to be less than the price to public.
The price to public takes into account certain costs. These costs include our affiliates’ projected hedging profits (which may or may not be realized) for assuming risks inherent in hedging our obligations under the Notes, the underwriting discount and the costs associated with structuring and hedging our obligations under the Notes. These costs will be used or retained by us or one of our affiliates, except for underwriting discounts paid to unaffiliated distributors. If you were to sell your Notes in the secondary market, if any, the price you would receive for your Notes may be less than the price you paid for them because secondary market prices will not take into account these costs. The price of your Notes in the secondary market, if any, at any time after issuance will vary based on many factors, including the value of the Reference Asset and changes in market conditions, and cannot be predicted with accuracy. The Notes are not designed to be short-term trading instruments, and you should, therefore, be able and willing to hold the Notes to maturity. Any sale of the Notes prior to maturity could result in a loss to you.
If we were to repurchase your Notes immediately after the Original Issue Date, the price you receive may be higher than the Estimated Initial Value of the Notes.
Assuming that all relevant factors remain constant after the Original Issue Date, the price at which HSBC Securities (USA) Inc. may initially buy or sell the Notes in the secondary market, if any, and the value that may initially be used for customer account statements, if any, may exceed the Estimated Initial Value on the Trade Date for a temporary period expected to be approximately 6 months after the Original Issue Date. This temporary price difference may exist because, in our discretion, we may elect to effectively reimburse to investors a portion of the estimated cost of hedging our obligations under the Notes and other costs in connection with the Notes that we will no longer expect to incur over the term of the Notes. We will make such discretionary election and determine this temporary reimbursement period on the basis of a number of factors, including the tenor of the Notes and any agreement we may have with the distributors of the Notes. The amount of our estimated costs which we effectively reimburse to investors in this way may not be allocated ratably throughout the reimbursement period, and we may discontinue such reimbursement at any time or revise the duration of the reimbursement period after the Original Issue Date of the Notes based on changes in market conditions and other factors that cannot be predicted.
You will not have any ownership interest in the stocks included in the Reference Asset.
As a holder of the Notes, you will not have any ownership interest in the stocks included in the Reference Asset, such as rights to vote, dividend payments or other distributions. Because the return on the Notes will not reflect any dividends on those stocks, the Notes may underperform an investment in the stocks included in the Reference Asset.
| FWP-12 |
The Notes lack liquidity.
The Notes will not be listed on any securities exchange or automated quotation system. HSBC Securities (USA) Inc. is not required to offer to purchase the Notes in the secondary market, if any exists. Even if there is a secondary market, it may not provide enough liquidity to allow you to trade or sell the Notes easily. Because other dealers are not likely to make a secondary market for the Notes, the price at which you may be able to trade your Notes is likely to depend on the price, if any, at which HSBC Securities (USA) Inc. is willing to buy the Notes.
Potential conflicts of interest may exist.
An affiliate of HSBC has a minority equity interest in the owner of an electronic platform, through which we may make available certain structured investments offering materials. HSBC and its affiliates play a variety of roles in connection with the issuance of the Notes, including acting as calculation agent and hedging our obligations under the Notes. In performing these duties, the economic interests of the calculation agent and other affiliates of ours are potentially adverse to your interests as an investor in the Notes. We will not have any obligation to consider your interests as a holder of the Notes in taking any action that might affect the value of your Notes.
Uncertain tax treatment.
We intend to treat the Notes as contingent payment debt instruments for U.S. federal income tax purposes. Pursuant to the terms of the Notes, you agree to treat the Notes as contingent payment debt instruments for all U.S. federal income tax purposes. Assuming the Notes are treated as contingent payment debt instruments, a U.S. holder will be required to include original issue discount in gross income each year, even though no payments will be made on the Notes until maturity.
For a discussion of the U.S. federal income tax consequences of your investment in a Note, please see the discussion under “U.S. Federal Income Tax Considerations” herein and the discussion under “U.S. Federal Income Tax Considerations” in the accompanying prospectus supplement.
| FWP-13 |
ILLUSTRATIVE EXAMPLES
The following table and examples are provided for illustrative purposes only and are hypothetical. They do not purport to be representative of every possible scenario concerning increases or decreases in the value of the Reference Asset relative to the Initial Value. We cannot predict the Final Value of the Reference Asset. The assumptions we have made in connection with the illustrations set forth below may not reflect actual events, and the hypothetical Initial Value used in the table and examples below is not expected to be the actual Initial Value of the Reference Asset. You should not take this illustration or these examples as an indication or assurance of the expected performance of the Reference Asset or the return on your Notes. The Final Settlement Value may be less than the amount that you would have received from a conventional debt security with the same stated maturity, including such a security issued by HSBC. The numbers appearing in the table below and following examples have been rounded for ease of analysis.
The table below illustrates the Payment at Maturity on a $1,000 investment in the Notes for a hypothetical range of Reference Returns of the Reference Asset from -100% to +100%. The following results are based solely on the assumptions outlined below. The “Hypothetical Return on the Notes” as used below is the number, expressed as a percentage, that results from comparing the Final Settlement Value per $1,000 Principal Amount to $1,000. The potential returns described here assume that your Notes are held to maturity. You should consider carefully whether the Notes are suitable to your investment goals. The following table and examples assume the following:
| 🞂 | Principal Amount: | $1,000 |
| 🞂 | Hypothetical Initial Value: | 100.00 |
| 🞂 | Maximum Cap: | None |
| 🞂 | Hypothetical Upside Participation Rate: | 660.00%* |
The hypothetical Initial Value of 100.00 used in the examples below has been chosen for illustrative purposes only and does not represent the actual Initial Value of the Reference Asset. The actual Initial Value of the Reference Asset will be determined on the Pricing Date.
*To be determined on the Trade Date and will be at least 660.00%*
| Hypothetical Final Value | Hypothetical Reference Return | Hypothetical Payment at Maturity | Hypothetical Return on the Notes |
| 200.00 | 100.00% | $7,600.00 | 660.00% |
| 180.00 | 80.00% | $6,280.00 | 528.00% |
| 160.00 | 60.00% | $4,960.00 | 396.00% |
| 140.00 | 40.00% | $3,640.00 | 264.00% |
| 130.00 | 30.00% | $2,980.00 | 198.00% |
| 120.00 | 20.00% | $2,320.00 | 132.00% |
| 115.00 | 15.00% | $1,990.00 | 99.00% |
| 110.00 | 10.00% | $1,660.00 | 66.00% |
| 105.00 | 5.00% | $1,330.00 | 33.00% |
| 102.00 | 2.00% | $1,132.00 | 13.20% |
| 101.00 | 1.00% | $1,066.00 | 6.60% |
| 100.00 | 0.00% | $1,000.00 | 0.00% |
| 990.00 | -1.00% | $1,000.00 | 0.00% |
| 980.00 | -2.00% | $1,000.00 | 0.00% |
| 950.00 | -5.00% | $1,000.00 | 0.00% |
| 850.00 | -15.00% | $1,000.00 | 0.00% |
| 800.00 | -20.00% | $1,000.00 | 0.00% |
| 700.00 | -30.00% | $1,000.00 | 0.00% |
| 600.00 | -40.00% | $1,000.00 | 0.00% |
| 500.00 | -50.00% | $1,000.00 | 0.00% |
| 400.00 | -60.00% | $1,000.00 | 0.00% |
| 50.00 | -95.00% | $1,000.00 | 0.00% |
| 0.00 | -100.00% | $1,000.00 | 0.00% |
| FWP-14 |
The following examples indicate how the Final Settlement Value would be calculated with respect to a hypothetical $1,000 investment in the Notes.
Example 1: The value of the Reference Asset increases from the Initial Value of 100.00 to a Final Value of 130.00.
| Reference Return: | 30.00% |
| Final Settlement Value: | 130.00 |
Because the Reference Return is positive, the Final Settlement Value would be $2,980.00 per $1,000 Principal Amount, calculated as follows:
$1,000 + ($1,000 × Reference Return × Upside Participation Rate)
= $1,000 + ($1,000 × 30.00% × 660.00%)
= $2,980.00
Example 1 shows that you will receive the return of your principal investment plus a return equal to the Reference Return multiplied by the Upside Participation Rate when the Reference Asset appreciates.
Example 2: The value of the Reference Asset decreases from the Initial Value of 100.00 to a Final Value of 600.00.
| Reference Return: | -40.00% |
| Final Settlement Value: | $1,000.00 |
Because the Reference Return is less than or equal to zero, the Final Settlement Value would be $1,000.00 per $1,000 Principal Amount (a zero return).
Example 2 shows that you will receive only your principal amount if the Reference Return is negative.
| FWP-15 |
DESCRIPTION OF THE REFERENCE ASSET
General
The HSBC 3D Edge Index
The HSBC 3D Edge Index (the “HSIE3EDG”) tracks a synthetic investment in the HSBC 3D Edge Base Index (the “Base Index”), net of embedded fees and costs. The exposure of the HSIE3EDG to the Base Index will be adjusted on a daily basis based on the volatility of the Base Index, subject to a maximum exposure of 100%. During periods where the volatility of the Base Index exceeds 5%, the HSIE3EDG will be partially “uninvested” in the Base Index. The embedded fees and costs include a deduction of 0.75% per annum (accruing daily) of the HSIE3EDG index level (the “HSIE3EDG Adjustment Factor”) and a daily deduction that is meant to represent simulated transaction costs of 0.02% based on the change in the level of exposure of the HSIE3EDG to the Base Index (the “HSIE3EDG Transaction Cost”).
The Index is sponsored by HSBC Bank Plc (in such capacity, the “Index Sponsor”), is administered by MerQube UK Limited (the “Index Administrator”), and calculated by MerQube, Inc. (the “Index Calculation Agent”). The HSIE3EDG was first calculated on December 24, 2024, and is calculated based on a base value of 1,000.00 as of the base date of February 4, 2005. The HSIE3EDG is calculated on each Index Business Day and is published on Bloomberg under the ticker HSIE3EDG.
The Base Index tracks a basket of the HSBC Dynamic US Equity 15% VC Index (the “Equity Sub-Index”) and the HSBC Dynamic US 10Y Treasury Index (the “Treasury Sub-Index” and, together with the Equity Sub-Index, the “Sub-Indices” and each a “Sub-Index”), net of embedded fees. As of each monthly rebalancing date, the weight of the basket will reflect a 40% weight for the Equity Sub-Index and a 60% weight for the Treasury-Sub Index. On each rebalancing date, the level of the Base Index will be reduced based on a “Sub-Index Transaction Cost” for each Sub-Index represented by transaction costs of 0.02% based on the change in the level of exposure of the Base Index to such Sub-Index.
The Equity Sub-Index tracks dynamic long and short positions in the MerQube US Large Cap Rolling Futures Index (TWAP) (the “MQFTUSE1”), net of certain embedded fees and costs. The embedded fees and costs include the “MQFTUSE1 Replication Cost”, which is a deduction from the level of the Equity Sub-Index that is designed to represent the cost of 0.20% applied to the level of MQFTUSE1 that is required to replicate the position in the MQFTUSE1 that is synthetically represented in the Equity Sub-Index, and the “MQFTUSE1 Transaction Cost” which is a deduction from the level of the Equity Sub-Index that is designed to represent the cost of purchasing additional “units” or divesting “units” of the MQFTUSE1 based on a transaction cost rate of 0.02%. The MQFTUSE1 seeks to measure the performance of an investment strategy with exposure to return of E-mini futures contracts on the S&P 500® Index currently listed for trading on the Chicago Mercantile Exchange. The S&P 500® Index includes a representative sample of 500 companies in leading industries of the U.S. economy and is intended to provide a performance benchmark for the large-cap U.S. equity markets.
The Treasury Sub-Index tracks dynamic long and short positions in the MerQube 10-Year US T-Note Intraday Rolling Futures Index (TWAP) (the “MQFIUSTY”), net of certain embedded fees and costs. The embedded fees and costs include the “MQFIUSTY Replication Cost”, which is a deduction from the level of the Treasury Sub-Index that is designed to represent the cost of 0.20% applied to the level of MQFIUSTY that is required to replicate the position in the MQFIUSTY that is synthetically represented in the Treasury Sub-Index, and the “MQFIUSTY Transaction Cost” which is a deduction from the level of the Treasury Sub-Index that is designed to represent the cost of purchasing additional “units” or divesting “units” of the MQFIUSTY based on a transaction cost rate of 0.02%. The MQFIUSTY seeks to measure the performance of an investment strategy with exposure to the return of 10-Year U.S. Treasury Notes futures contracts currently listed on the Chicago Board of Trade, part of the CME Group and traded via CME Globex. Calculation of the Level of the HSIE3EDG.
The Index Calculation Agent will calculate the level of the HSIE3EDG on each Index Business Day based on the daily performance of the Base Index, net of certain embedded fees. Specifically, on any Index Business Day, the level of the HSIE3EDG will equal the result of (i) the level of the HSIE3EDG on the immediately preceding Index Business Day plus (ii) a performance factor based on the performance of the Base Index (the “Performance Factor”) minus (iii) the HSIE3EDG Adjustment Factor and HSIE3EDG Transaction Cost. The Performance factor will equal the product of the “Leverage Factor” determined based on the volatility of the Base Index and the daily change in the level of the Base Index (calculated as the difference between the level of the Base Index on such Index Business Day minus the level of the Base Index on the immediately preceding Index Business Day). Expressed as formulas:

Where:
 | = | the level of the HSIE3EDG in respect of Index Business Day t; |
 | = | the HSIE3EDG Performance Factor in respect of Index Business Day t (calculated as described in greater detail below); |
| FWP-16 |
 | = | the HSIE3EDG Adjustment Factor in respect of Index Business Day t (calculated as described in greater detail below); and |
 | = | the HSIE3EDG Transaction Cost in respect of the Index Business Day immediately preceding Index Business Day t (calculated as described in greater detail below). |
| = | the HSIE3EDG Performance Factor in respect of Index Business Day t; |
 | = | the Leverage Factor in respect of the Index Business Day immediately preceding Index Business Day t (calculated as described in greater detail below); |
 | = | the level of the Base Index in respect of Index Business Day t; and |
 | = | the level of the Base Index in respect of the Index Business Day immediately preceding Index Business Day t. |
The Leverage Factor is designed to represent the number of “units” of the Base Index that are represented in the level of the HSIE3EDG and is calculated as the product of a weighting factor multiplied by the ratio of the HSIE3EDG level and the Base Index level (each as of the immediately preceding Index Business Day). The weighting factor seeks to ensure that the volatility of HSIE3EDG does not exceed 5% based on the historic performance of the Base Index and is subject to a cap of 100%. During periods of high volatility, the weighting factor will cause the HSIE3EDG to be significantly “uninvested” in the Base Index. As a result, the HSIE3EDG may underperform the Base Index during periods where the level Base Index is performing positively or the level of the Base Index is increasing rapidly. The weighting factor on any Index Business Day will equal the lesser of (i) the cap of 100% and (ii) the quotient of the 5% divided by the volatility of Base Index (calculated as described in greater detail below). Expressed as a formula:
Where:
 | = | the number of units of the Base Index in respect of Index Business Day t; |
 | = | the weighting factor in respect of the Index Business Day immediately preceding Index Business Day t, which is equal the lesser of (i) the cap of 100% and (ii) the quotient of the 5% divided by the volatility of Base Index in respect of Index Business Day t (calculated as described in greater detail below); |
 | = | the level of the HSIE3EDG in respect of the Index Business Day immediately preceding Index Business Day t; and |
 | = | the level of the Base Index in respect of the Index Business Day immediately preceding Index Business Day t. |
The volatility of the Base Index will equal the greater of the short term volatility (based on an exponentially weighted moving average variance calculated with a decay factor of 0.94) and the long term volatility (based on an exponentially weighted moving average variance with a decay factor of 0.97). In each case, the volatility will equal the square root of the annualized variance (achieved by multiplying the variance by 252 which represents the number of trading days in one year) and the applicable variance will equal the sum of (i) relevant decay factor multiplied by the variance on the immediately preceding Index Business Day and (ii) the result of (a) one minus the decay factor multiplied by (b) the square of the natural logarithm of a fraction, the numerator of which is the level of the Base Index on the applicable Index Business Day and the denominator of which is equal to the level of the Base Index on the immediately preceding Index Business Day. Expressed as formulas:

Where:
 | = | the applicable volatility (short term or long term) of the Base Index in respect of Index Business Day t; and |
 | = | the applicable variance (short term or long term) of the Base Index in respect of Index Business Day t. |
| FWP-17 |
Where:
| = | the applicable variance (short term or long term) of the Base Index in respect of Index Business Day t; |
 | = | the applicable variance (short term or long term) of the Base Index in respect of the Index Business Day immediately preceding Index Business Day t; |
| DF | = | the applicable decay factor (0.94 with respect to short term variance or 0.97 with respect to long term variance); and |
 | = | the natural logarithm of the quotient of the level of the Base Index in respect of Index Business Day t divided by the level of the Base Index on the Index Business Day immediately preceding Index Business Day t. |
An exponentially weighted moving average is a type of moving average in which greater emphasis is given to more recent history with more recent values receiving a higher weighting than more distant values. Moving average itself is a concept in which an average value is obtained for a value observed at a specific frequency during a particular period, and this average “moves” every day to record the average daily return for the specified period.. There can be no guarantee that the method by which the variance and volatility are determined will be effective or achieve the intended results. Alternative methods of calculating the variance and volatility could produce more effective results.
HSIE3EDG Embedded Fees and Costs
The HSIE3EDG Adjustment Factor is a fixed decrement of 0.75% per annum (accruing daily) that is deducted on a daily basis during the calculation of the HSIE3EDG level. Accordingly, on any Index Business Day the HSIE3EDG Adjustment Factor will equal the product of (i) 0.75%, (ii) the level of the HSIE3EDG on the immediately preceding Index Business Day and (ii) a day count fraction (calculated on an Actual/360 basis) representing each calendar day elapsed between the current Index Business Day and the immediately preceding Index Business Day. Expressed as a formula:
Where:
 | = | the HSIE3EDG Adjustment Factor in respect of Index Business Day t; |
 | = | the level of the HSIE3EDG in respect of the Index Business Day immediately preceding Index Business Day t; and |
 | = | the number of calendar days from, and including, the Index Business Day immediately preceding Index Business Day t to, and excluding, Index Business Day t. |
The HSIE3EDG Transaction Cost is a deduction from the level of the HSIE3EDG that is designed to represent the cost of purchasing additional “units” or divesting “units” of the Base Index. Accordingly, on any Index Business Day the HSIE3EDG Transaction Cost will equal the product of (i) the daily change in the level of the Leverage Factor (represented by the absolute value of the difference between the Leverage Factor on such Index Business Day minus the Leverage Factor on the immediately preceding Index Business Day), (ii) the level of the Base Index and (iii) the transaction cost rate of 0.02%. Expressed as a formula:

Where:
 | = | the HSIE3EDG Transaction Cost in respect of Index Business Day t; and |
 | = | the absolute value of the difference of the number of units of the Base Index reflected in the HSIE3EDG in respect of Index Business Day t minus the number of units of the Base Index reflected in the HSIE3EDG in respect of the Index Business Day immediately preceding Index Business Day t; |
 | = | the level of the Base Index in respect of Index Business Day t; and |
 | = | the transaction cost rate of 0.02%. |
| FWP-18 |
The HSIE3EDG Adjustment Factor and HSIE3EDG Transaction Cost will adversely affect the performance of the HSIE3EDG. In order for the level of the HSIE3EDG to increase, the level of the Base Index will need to increase sufficiently to overcome the negative effect of the HSIE3EDG Adjustment Factor and the HSIE3EDG Transaction Cost.
The HSBC 3D Edge Base Index
The Base Index is sponsored by HSBC Bank Plc, an affiliate of the issuer, is administered by MerQube UK Limited and calculated by MerQube, Inc. The Base Index is calculated on each Index Business Day and is published on Bloomberg under the ticker HSIE3EDB. The Base Index was launched on December 24, 2024 and is calculated based on a base level of 1,000 as of the base date of January 7, 2025.
The Base Index tracks a basket of the Equity Sub-Index and the Treasury Sub-Index, net of embedded fees. As of each monthly rebalancing date, the weight of the basket will reflect a 40% weight for the Equity Sub-Index and a 60% weight for the Treasury-Sub Index.
Calculating the Level of the Base Index
The level of the Base Index on each Index Business Day will equal the level of the Base Index on the immediately preceding Index Business Day plus a basket performance factor which represents the sum of the daily performance of each Sub-Index. The daily performance of each Sub-Index is calculated as the level of such Sub-Index on the Index Business Day minus the level of the Sub-Index on the immediately preceding Index Business Day multiplied by the applicable number of “units” (corresponding to the level of “investment” of the Base Index in such Sub-Index) net of the Sub-Index Transaction Cost. Expressed as formulas:

Where:
 | = | the level of the Base Index in respect of Index Business Day t; |
| = | the level of the Base Index in respect of the Index Business Day immediately preceding Index Business Day t; and |
 | = | the performance factor with respect to Index Business Day t based on the performance of the Sub-Indices which is calculated as described below. |

Where:
| = | the performance factor with respect to Index Business Day t based on the performance of the Sub-Indices; |
 | = | the units of the Equity Sub-Index represented in the Base Index in respect of the Index Business Day immediately preceding Index Business Day t; |
 | = | the level of the Equity Sub-Index in respect of the Index Business Day t; |
 | = | the level of the Equity Sub-Index in respect of the Index Business Day immediately preceding Index Business Day t; |
 | = | the Sub-Index Transaction Cost rate for the Equity Sub-Index in respect of the Index Business Day immediately preceding Index Business Day t; |
 | = | the units of the Treasury Sub-Index represented in the Base Index in respect of the Index Business Day immediately preceding Index Business Day t; |
 | = | the level of the Treasury Sub-Index in respect of the Index Business Day t; |
 | = | the level of the Treasury Sub-Index in respect of the Index Business Day immediately preceding Index Business Day t; and |
 | = | the Sub-Index Transaction Cost rate for the Treasury Sub-Index in respect of the Index Business Day immediately preceding Index Business Day t. |
| FWP-19 |
The number of “units” of each Sub-Index that will be included in the calculation of the Base Index is set each month on the last Index Business Day of each month (the “Base Index Rebalancing Date”) and will be used in the calculation of the Base Index until the next Base Index Rebalancing Date. As of each Base Index Rebalancing Date, the number of “units” for a Sub-Index will equal the Sub-Index weight (40% with respect to the Equity Sub-Index and 60% with respect to the Treasury Sub-Index) multiplied by quotient of the Base Index Level on such date divided by the applicable Sub-Index Level on such date. Expressed as a formula:
Where:
 | = | The number of units of the applicable Sub-Index in respect of the Index Business Day immediately preceding for Index Business Day t; |
 | = | the weight of the applicable Sub-Index (40% with respect to the Equity Sub-Index and 60% with respect to the Treasury Sub-Index); |
| = | the level of the Base Index in respect of the Index Business Day immediately preceding Index Business Day t; and |
 | = | the level of the applicable Sub-Index in respect of the Index Business Day immediately preceding Index Business Day t. |
The Sub-Index Transaction Cost is a deduction from the level of the Base Index that is designed to represent the cost of purchasing additional “units” or divesting “units” of a Sub-Index. Accordingly, on any day on which the “units” of the Sub-Indices represented in the Base Index are adjusted (i.e., any Base Index Rebalancing Date) the Sub-Index Transaction Cost will be deducted from the level of the Base Index. On any such day, the Sub-Index Transaction Cost will equal the product of (i) the change in the number of “units” (represented by the absolute value of the difference between the “units” on such Index Business Day minus the number of “units” on immediately preceding Index Business Day), (ii) the level of the Sub-Index and (iii) the transaction cost rate of 0.02%. Expressed as a formula:

Where:
| = | the Sub-Index Transaction Cost for the applicable Sub-Index in respect of Index Business Day t; |
| = | the absolute value of the difference of the number of units of the applicable Sub-Index reflected in the Base Index in respect of Index Business Day t minus the number of units of the applicable Sub-Index reflected in the Base Index in respect of the Index Business Day immediately preceding Index Business Day t; |
 | = | the level of the applicable Sub-Index in respect of Index Business Day t; and |
| = | the transaction cost rate of 0.02%. |
The Sub-Index Transaction Cost will adversely affect the performance of the Base Index and, therefore, the performance of the HSIE3EDG.
The HSBC Dynamic US Equity 15% VC Index
The Equity Sub-Index is sponsored by HSBC Bank Plc, an affiliate of the issuer, is administered by MerQube UK Limited and calculated by MerQube, Inc. The Equity Sub-Index is calculated on each Index Business Day and is published on Bloomberg under the ticker HSIEDU15. The Equity Sub-Index was launched on December 24, 2024 and is calculated based on a base level of 1,000 as of the base date of January 7, 2025.
The Equity Sub-Index tracks dynamic long and short positions in the MQFTUSE1, net of certain embedded fees and costs and adjusted with the aim of ensuring that the volatility of the index does not exceed 15% based on the historic performance of MQFTUSE1. The MQFTUSE1 seeks to measure the performance of an investment strategy with exposure to the return of E-mini futures contracts on the S&P 500® Index currently listed for trading on the Chicago Mercantile Exchange. The S&P 500® Index includes a representative sample
| FWP-20 |
of 500 companies in leading industries of the U.S. economy and is intended to provide a performance benchmark for the large-cap U.S. equity markets.
Calculating the Level of the Equity Sub-Index
The level of the Equity Sub-Index on each Index Business Day will equal the level of the Equity Sub-Index on the immediately preceding Index Business Day plus a performance factor which represents the daily performance of the MQFTUSE1 (equal to the level of MQFTUSE1 on the Index Business Day minus the level of the MQFTUSE1 on the immediately preceding Index Business Day) multiplied by the applicable number of “units” (corresponding to the level of long or short “investment” in the Equity Sub-Index in the MQFTUSE1) net of the MQFTUSE1 Replication Cost and MQFTUSE1 Transaction Cost. Expressed as formulas:

Where:
| = | the level of the Equity Sub-Index in respect of Index Business Day t; |
| = | the level of the Equity Sub-Index in respect of the Index Business Day immediately preceding Index Business Day t; |
| = | the performance factor which represents the daily performance of the MQFTUSE1 in respect of Index Business Day t (calculated as described in greater detail below); |
 | = | the MQFTUSE1 Replication Cost in respect of Index Business Day t (calculated as described in greater detail below); and |
 | = | the MQFTUSE1 Transaction Cost in respect of the Index Business Day immediately preceding Index Business Day i (calculated as described in greater detail below). |

 | = | the performance factor which represents the daily performance of the MQFTUSE1 in respect of Index Business Day t; |
 | = | the number of “units” of the MQFTUSE1 represented in the Equity Sub-Index in respect of the Index Business Day immediately preceding Index Business Day t (calculated as described in greater detail below); |
| = | the level of the MQFTUSE1 in respect of Index Business Day t; and |
| = | the level of the MQFTUSE1 in respect of the Index Business Day immediately preceding Index Business Day t. |
The applicable “units” on any Index Business Day will equal the product of the weighting factor as of the immediately preceding Index Business Day and a fraction, the numerator of which is the level of the Equity Sub-Index on the immediately preceding Index Business Day and the denominator of which is the level of the MQFTUSE1 on the immediately preceding Index Business Day. The weighting factor, in turn, is equal to the product of Direction and Exposure (each as defined below).
“Exposure” is a multiplier that seeks to ensure that the volatility of the Equity Sub-Index does not exceed 15% based on the historic performance of the MQFTUSE1and is subject to a cap of 100%. Specifically, Exposure will equal the lesser of (i) 100% and (ii) the quotient of 15% divided by the volatility of the MQFTUSE1 (calculated as described below). During periods of volatility exceeding 15%, the Exposure will decrease in an effort to prevent the volatility of the Equity Sub-Index from exceeding 15% based on the historic performance of MQFTUSE1. Accordingly, the Exposure will determine the magnitude of the Equity Sub-Index’s investment in the MQFTUSE1.
The volatility of the MQFTUSE1 will equal the greater of the short term volatility (based on an exponentially weighted moving average variance calculated with decay factor of 0.94) and the long term volatility (based on an exponentially weighted moving average variance with decay factor of 0.97). In each case, the volatility will equal the square root of the annualized variance (achieved by multiplying the variance by 252 which represents the number of trading days in one year) and the applicable variance will equal the sum of (i) relevant decay factor multiplied by the variance on the immediately preceding Index Business Day and (ii) the result of (a) one minus the decay factor multiplied by (b) the square of the natural logarithm of a fraction, the numerator of which is the level of the MQFTUSE1on the applicable Index Business Day and the denominator of which is equal to the level of the MQFTUSE1 on the immediately preceding Index Business Day. Expressed as formulas:
| FWP-21 |

Where:
| = | the applicable volatility (short term or long term) of the Reference Underlying (as defined below) in respect of Index Business Day t; and |
| = | the applicable variance (short term or long term) of the Reference Underlying (as defined below) in respect of Index Business Day t. |
Where:
| = | the applicable variance (short term or long term) of the Reference Underlying in respect of Index Business Day t; |
| = | the applicable variance (short term or long term) of the Reference Underlying in respect of the Index Business Day immediately preceding Index Business Day t; |
| DF | = | the applicable decay factor (0.94 with respect to short term variance or 0.97 with respect to long term variance); and |
| = | the natural logarithm of the quotient of the level of the MQFTUSE1in respect of Index Business Day t divided by the level of the MQFTUSE1 on the Index Business Day immediately preceding Index Business Day t. |
“Direction” is a multiplier equal to either 1 or -1. While Exposure will determine the magnitude of the Equity Sub-Index’s position in MQFTUSE1, the Direction will determine whether the Equity Sub-Index will take a long position (meaning that the level of the Equity Sub-Index will increase as the level of the MQFTUSE1 increases and decrease as the level of the MQFTUSE1 decreases) or a short-position (meaning that the level of the Equity Sub-Index will increase as the level of the MQFTUSE1 decreases and decrease as the level of the MQFTUSE1 increases) in the MQFTUSE1. The Direction will equal -1 (representing a short position) if both the Momentum Signal and Volatility Signal (each as defined below) on such Index Business Day are negative. Otherwise, the Direction will equal 1 (representing a long position). Accordingly, the Direction will only equal -1 and the Equity Sub-Index will reflect a short position in the MQFTUSE1 only where market conditions reflect increased volatility and falling prices for the relevant reference measures.
The “Momentum Signal” is an indicator, equal to either 1 or -1 with respect to each Index Business Day, determined based on whether recent average levels of the Reference Underlying exceed longer term average levels of the Reference Underlying as described herein. The “Reference Underlying” is the “SPY US Equity Total Return Series” (as described in greater detail below). Specifically, the Index Calculation Agent will calculate a simple moving average of the levels of the Reference Underlying over 5 historical periods and determine the differences between the moving average for a shorter period of 5 days and each moving average for longer periods of 20 days, 60 days, 126 days and 252 days. For each such difference, when the moving average for the longer period (the 20-day, 60-day, 126-day and 252-day periods) exceeds the moving average for shorter 5 day period, a value of -1 is assigned. If a -1 value is assigned to at least 3 of the 4 periods, the Momentum Signal will be equal to -1. If a -1 value is assigned to less than 3 of the 4 periods (including if a -1 value is not assigned to any of the 4 periods), the Momentum Signal will equal 1. Accordingly, the Momentum Signal will be negative when recent moving average levels of the Reference Underlying are lower than historical moving average levels of the Reference Underlying.
The “SPY US Equity Total Return Series” is a total return calculation of the performance of the SPDR® S&P 500® ETF Trust performed by the Index Calculation Agent. On each Index Business Day, the level of the SPY US Equity Total Return Series is equal to the product of the level of the SPY US Equity Total Return Series on the immediately preceding Index Business Day multiplied by a fraction, the numerator of which is equal to the sum of the closing level of the SPDR® S&P 500® ETF Trust on such Index Business Day and the gross dividends paid in respect of the SPDR® S&P 500® ETF Trust, as determined by the Index Administrator, and the denominator of which is the closing level of the SPDR® S&P 500® ETF Trust on the immediately preceding Index Business Day.
The “Volatility Signal” is an indicator, equal to either 1 or -1 with respect to each Index Business Day, determined based on whether recent realized volatility of the Reference Underlying exceeds longer term average realized volatility of the Reference Underlying as described herein. Specifically, the Index Calculation Agent determines the 5-day realized volatility of the Reference Underlying (expressed as an annualized figure), a simple average of the 5-day realized volatility of the Reference Underlying on each of the prior 20 days and the standard deviation of the 5-day realized volatility of the Reference Underlying. If the 5-day realized volatility of the Reference Underlying
| FWP-22 |
exceeds the sum of the simple average of the 5-day realized volatility of the Reference Underlying on each of the prior 20 days and the standard deviation of the 5-day realized volatility of the Reference Underlying, the Volatility Signal will equal -1. Otherwise, the Volatility signal will equal 1.
The MQFTUSE1 Replication Cost is a deduction from the level of the Equity Sub-Index that is designed to represent the cost of replicating the position in the MQFTUSE1 that is synthetically represented in the Equity Sub-Index. Accordingly, on any Index Business Day the MQFTUSE1 Replication Cost will equal the product of (i) an absolute value of the number of “units” of the MQFTUSE1 represented in the Equity Sub-Index as of the immediately preceding Index Business Day (ii) the level of the MQFTUSE1 on the immediately preceding Index Business Day, (iii) the replication cost rate of 0.20% and (iv) a day count fraction (calculated on an Actual/360 basis) representing each calendar day elapsed between the current Index Business Day and the immediately preceding Index Business Day. Expressed as a formula:
Where:
 | = | the absolute value of the number of “units” (representing a long or short position) of the MQFTUSE1 represented in the Equity Sub-Index on the Index Business Day immediately preceding Index Business Day t; |
| = | the level of the MQFTUSE1 on the Index Business Day immediately preceding Index Business Day t; |
 | = | 0.20%; and |
 | = | the number of calendar days from, and including, Index Business Day t to, and excluding, the Index Business Day immediately preceding Index Business Day t. |
The MQFTUSE1 Transaction Cost is a deduction from the level of the Equity Sub-Index that is designed to represent the cost of purchasing additional “units” or divesting “units” of the MQFTUSE1. Accordingly, on any Index Business Day the MQFTUSE1 Transaction Cost will equal the product of (i) the daily change in the number of “units” (represented by the absolute value of the difference between the “units” on such Index Business Day minus the number of “units” on immediately preceding Index Business Day), (ii) the level of the MQFTUSE1 on that Index Business Day and (iii) the transaction cost rate of 0.02%. Expressed as a formula:
Where:
| = | the absolute value of the difference of the number of units of the MQFTUSE1 reflected in the Equity Sub-Index in respect of Index Business Day t minus the number of units of the MQFTUSE1 reflected in the Equity Sub-Index in respect of the Index Business Day immediately preceding Index Business Day t; |
| = | the level of the MQFTUSE1 in respect of Index Business Day t; and |
| = | the transaction cost rate of 0.02%. |
The MQFTUSE1 Transaction Cost and MQFTUSE1 Replication Cost will adversely affect the performance of the Equity Sub-Index and, therefore, the performance of the Base Index and HSIE3EDG.
The MerQube US Large Cap Rolling Futures Index (TWAP)
All disclosures contained herein regarding the Underlier, including, without limitation, its make-up, method of calculation, and changes in composition, have been derived from publicly available sources. The information reflects the policies of, and is subject to change by, the index sponsor, MerQube UK Limited. The index sponsor has no obligation to continue to publish, and may discontinue publication of, the MQFTUSE1. Neither we nor any of our affiliates accept any responsibility for the calculation, maintenance or publication of the MQFTUSE1 or any successor index.
| FWP-23 |
The MQFTUSE1 replicates a hypothetical portfolio of a series of long positions in the E-mini S&P 500 futures contracts. Over time, the MQFTUSE1 will “roll” its exposure from a nearby futures contract to a similar contract with a later expiry. The level of the MQFTUSE1 is calculated based on the 10-minute time-weighted average price from 3:50 to 4:00 p.m. Eastern time.
The E-mini S&P 500 futures contracts are U.S. dollar-denominated futures contracts, based on the S&P 500® Index, traded on the Chicago Mercantile Exchange (“CME”), representing a contract unit of $50 multiplied by the S&P 500® Index, measured in cents per index point. The E-mini S&P 500 futures contracts listed for the nearest nine quarters, for each March, June, September and December, and the nearest three Decembers are available for trading. Trading of the E-mini S&P 500 futures contracts terminates at 9:30 A.M. Eastern time on the third Friday of the contract month. The daily settlement prices of the E-mini S&P 500 futures contracts are based on trading activity in the relevant contract (and in the case of a lead month also being the expiry month, together with trading activity on lead month-second month spread contracts) on the CME during a specified settlement period. The final settlement price of E-mini S&P 500 futures contracts is based on the opening prices of the component stocks in the S&P 500® Index, determined on the third Friday of the contract month.
The MQFTUSE1 was launched on January 3, 2022, and the level of the MQFTUSE1 is published daily on Bloomberg under the ticker symbol “MQFTUSE1”.
The HSBC Dynamic US 10Y Treasury Index
The Treasury Sub-Index is sponsored by HSBC Bank Plc, an affiliate of the issuer, is administered by MerQube UK Limited and calculated by MerQube, Inc. The Treasury Sub-Index is calculated on each Index Business Day and is published on Bloomberg under the ticker HSIEDT10. The Treasury Sub-Index was launched on December 24, 2024 and is calculated based on a base level of 1,000 as of the base date of December 29, 2000.
The Treasury Sub-Index tracks dynamic long and short positions in the MQFIUSTY, net of certain embedded fees and costs. The MQFIUSTY seeks to measure the performance of an investment strategy with exposure to the return of 10-Year U.S. Treasury Notes futures contracts currently listed on the Chicago Board of Trade, part of the CME Group and traded via CME Globex.
Calculating the Level of the Treasury Sub-Index
The level of the Treasury Sub-Index on each Index Business Day will equal the level of the Treasury Sub-Index on the immediately preceding Index Business Day plus a performance factor which represents the daily performance of the MQFIUSTY (equal to the level of MQFIUSTY on the Index Business Day minus the level of the MQFIUSTY on the immediately preceding Index Business Day) multiplied by the applicable number of “units” (corresponding to the level of long or short “investment” in the Treasury Sub-Index in the MQFIUSTY) net of the MQFIUSTY Replication Cost and MQFIUSTY Transaction Cost. Expressed as a formula:

Where:
| = | the level of the Treasury Sub-Index in respect of Index Business Day t; |
| = | the level of the Treasury Sub-Index in respect of the Index Business Day immediately preceding Index Business Day t; |
| Units t–1 | = | the number of “units” of the MQFIUSTY represented in the Treasury Sub-Index in respect of the Index Business Day immediately preceding Index Business Day t; |
| = | the level of the MQFIUSTY on Index Business Day t; |
| = | the level of the MQFIUSTY on the Index Business Day immediately preceding Index Business Day t; |
| = | the MQFIUSTY Replication Cost in respect of Index Business Day t (calculated as described in greater detail below); and |
| = | the MQFIUSTY Transaction Cost in respect of the Index Business Day immediately preceding Index Business Day t (calculated as described in greater detail below). |
The applicable “units” on any Index Business Day will equal the product of the Direction (as described below) as of the immediately preceding Index Business Day and a fraction, the numerator of which is the level of the Treasury Sub-Index on the immediately preceding Index Business Day and the denominator of which is the level of the MQFIUSTY on the immediately preceding Index Business Day.
| FWP-24 |
“Direction” is a multiplier equal to either 1 or -1, and the Direction will determine whether the Treasury Sub-Index will take a long position (meaning that the level of the Treasury Sub-Index will increase as the level of the MQFIUSTY increases and decrease as the level of the MQFIUSTY decreases) or a short-position (meaning that the level of the Treasury Sub-Index will increase as the level of the MQFIUSTY decreases and decrease as the level of the MQFIUSTY increases) in the MQFIUSTY. The Direction will equal -1 (representing a short position) if the Yield Momentum Signal is positive and Adjusted Carry Signal is negative (each as defined below) on such Index Business Day. Otherwise, the Direction will equal 1 (representing a long position).
The “Yield Momentum Signal” is an indicator, equal to either 1 or -1 with respect to each Index Business Day, determined based on whether recent levels of the DGS10 exceed longer term average levels of the DGS10 as described herein. The “DGS10” is the market yield on U.S. Treasury securities at 10-year constant maturity. Specifically, the Index Calculation Agent will calculate a simple moving average of the levels of the DGS10 over 5 historical periods and determine the differences between the moving average for a shorter period of 5 days, and each moving average for longer periods of 20 days, 60 days, 126 days and 252 days. For each such difference when the moving average for the shorter 5 day period exceeds the moving average for the longer period (the 20-day, 60-day, 126-day and 252-day periods), a value of 1 is assigned. If a 1 value is assigned to at least 3 of the 4 periods, the Yield Momentum Signal will be equal to 1. If a 1 value is assigned to less than 3 of the 4 periods (including if a 1 value is not assigned to any of the 4 periods), the Yield Momentum Signal will equal -1. Accordingly, the Yield Momentum Signal will be positive when recent moving average levels of the DGS10 are higher than historical moving average levels of the DGS10.
Carry is a measure which aims to represent the profits (or losses) of investing in bonds with borrowed money and is based on the difference in the amount of interest received and funding costs. The carry used in the calculation of the Treasury Sub-Index includes a roll-down return based on the DGS10 and the market yield U.S. Treasury securities at 5-year constant maturity (“DGS5”). Both DGS10 and DGS5 are published by the Federal Reserve Bank of St. Louis. “Adjusted Carry” will equal the carry (calculated as set forth below) based on the DGS10 minus the greater of (i) 0 and (ii) the amount by which the year-over-year percentage change of the Consumer Price Index (All Urban Consumers) exceeds the selected risk free rate. The applicable risk free rate was the federal funds rate (the rate financial institutions pay one another to loan money overnight) prior to January 3, 2023. On and after January 3, 2023, the applicable risk free rate is SOFR (the secured overnight funding rate published by the Federal Reserve Bank of New York) which is a measure of the cost of borrowing cash overnight collateralized by Treasury securities. The Consumer Price Index is a measure of the average change in consumer prices over time for a fixed market basket of goods and services, including food and beverages, housing, apparel, transportation, medical care, recreation, and education and communication, and other goods and services. In calculating the Consumer Price Index, price changes for the various items are averaged together with weights that represent their importance in the spending of urban households in the United States. The contents of the market basket of goods and services and the weights assigned to the various items are updated periodically by the U.S. Department of Labor to take into account changes in consumer expenditure patterns.
The Carry will be calculated as set forth in the following formulas:

Where:
 | = | Carry in respect of Index Business Day t; |
 | = | the market yield on U.S. Treasury securities at 10-year constant maturity; |
| RFRt-1 | = | the risk free rate in respect of the Index Business Day immediately preceding Index Business Day t; and |
 | = | the roll down with respect to Index Business Day t. |

Where:
| = | the roll down with respect to Index Business Day t; |
 | = | the duration with respect to Index Business Day t; |
| = | the market yield on U.S. Treasury securities at 10-year constant maturity; and |
 | = | the market yield on U.S. Treasury securities at 5-year constant maturity. |
| FWP-25 |

Where:
| = | the duration with respect to Index Business Day t; and |
| = | the market yield on U.S. Treasury securities at 10-year constant maturity. |
The MQFIUSTY Replication Cost is a deduction from the level of the Treasury Sub-Index that is designed to represent the cost of replicating the position in the MQFIUSTY that is synthetically represented in the Treasury Sub-Index. Accordingly, on any Index Business Day the MQFIUSTY Replication Cost will equal the product of (i) an absolute value of the number of “units” of the MQFIUSTY represented in the Treasury Sub-Index as of the immediately preceding Index Business Day (ii) the level of the MQFIUSTY on the immediately preceding Index Business Day, (iii) the transaction cost rate of 0.20% and (iv) a day count fraction (calculated on an Actual/360 basis) representing each calendar day elapsed between the current Index Business Day and the immediately preceding Index Business Day. Expressed as a formula:
Where:
| = | the absolute value of the number of “units” (representing a long or short position) of the MQFIUSTY represented in the Treasury Sub-Index on the Index Business Day immediately preceding Index Business Day t; |
| = | the level of the MQFIUSTY on the Index Business Day immediately preceding Index Business Day t; |
| = | 0.20%; and |
| = | the number of calendar days from, and including, Index Business Day t to, and excluding, the Index Business Day immediately preceding Index Business Day t. |
The MQFIUSTY Transaction Cost is a deduction from the level of the Treasury Sub-Index that is designed to represent the cost of purchasing additional “units” or divesting “units” of the MQFIUSTY. Accordingly, on any Index Business Day the MQFIUSTY Transaction Cost will equal the product of (i) the daily change in the number of “units” (represented by the absolute value of the difference between the “units” on such Index Business Day minus the number of “units” on immediately preceding Index Business Day), (ii) the level of the MQFIUSTY on that Index Business Day and (iii) the transaction cost rate of 0.02%. Expressed as a formula:
Where:
| = | the absolute value of the difference of the number of units of the MQFIUSTY reflected in the Treasury Sub-Index in respect of Index Business Day t minus the number of units of the MQFIUSTY reflected in the Treasury Sub-Index in respect of the Index Business Day immediately preceding Index Business Day t; |
| = | the level of the MQFIUSTY in respect of Index Business Day t; and |
| = | the transaction cost rate of 0.02%. |
The MQFIUSTY Transaction Cost and MQFIUSTY Replication Cost will adversely affect the performance of the Treasury Sub-Index and, therefore, the performance of the Base Index and HSIE3EDG.
The MerQube 10-Year US T-Note Intraday Rolling Futures Index (TWAP) All disclosures contained herein regarding the Underlier, including, without limitation, its make-up, method of calculation, and changes in composition, have been derived from publicly available sources. The information reflects the policies of, and is subject to change by, the index sponsor, MerQube UK Limited. The index sponsor has no obligation to continue to publish, and may discontinue publication of, the MQFIUSTY. Neither we nor any of our affiliates accept any responsibility for the calculation, maintenance or publication of the MQFIUSTY or any successor index.
| FWP-26 |
The MQFIUSTY seeks to measure the performance of an investment strategy with exposure to the return of 10-Year U.S. Treasury Notes futures contracts currently listed on the Chicago Board of Trade, part of the CME Group and traded via CME Globex. Over time, the MQFIUSTY will “roll” its exposure from a nearby futures contract to a similar contract with a later expiry. The level of the MQFIUSTY is calculated based on the time-weighted average price of the traded prices between 8:20 a.m. and 3:00 p.m. Eastern Time.
The MQFIUSTY was launched on January 20, 2023, and the level of the MQFIUSTY is published daily on Bloomberg under the ticker symbol “MQFIUSTY”.
Index Governance
The HSIE3EDG (and each constituent index which MerQube UK Limited administers) is overseen by an index committee that is made up of MerQube UK Limited staff. The index committee will meet periodically, as well as when any scenarios that require an index committee decision arise.
In the case of any scenario occurring that is not explicitly covered in the relevant index methodology, the index committee will use its discretion to determine the action to be taken. Any such determination will be announced to the index stakeholders as soon as practical.
Adjustments to the HSIE3EDG
If certain events occur with respect to any measure used in calculating the level of HSIE3EDG, including but not limited to changes in the method by which such measure is calculated, MerQube UK Limited may make such determinations and/or adjustments that it considers necessary as a result of the relevant events and market developments. Similarly, if the level of any such measure becomes unavailable, including if such disruption is only temporary, MerQube UK Limited may make such determinations and/or adjustments that it considers necessary with respect to the calculation of the index.
License Agreements
We have entered into a license agreement with MerQube UK Limited (together with its affiliates, “MerQube”) that provides, in exchange for a fee, of the right to use the indices described herein which are owned and published by MerQube. We and/or our affiliates worked with MerQube in developing the guidelines and policies governing the composition and calculation of some or all of the indices. The policies and judgments for which we or one or more of our affiliates was responsible could have an impact, positive or negative, on the level of the relevant index and the value of your investment. We had no obligation and have no obligation to consider your interests as an investor in our role in developing the guidelines and policies governing any index or making judgments that may affect the level of any index. Investment suitability must be determined individually for each investor, and investments linked to the Base Index may not be suitable for all investors.
MerQube is not the issuer or producer of any investment linked to the Base Index referenced herein and MerQube has no duties, responsibilities, or obligations to investors in such investment. The Base Index is a product of MerQube and has been licensed for use by the issuer and its affiliates (“Licensee”). Such index is calculated using, among other things, market data or other information (“Input Data”) from one or more sources (each a “Data Provider”). MerQube is a registered trademark of MerQube. These trademarks have been licensed for certain purposes by Licensee, including in its capacity as the issuer of investments linked to the Base Index. Such investments are not sponsored, endorsed, sold or promoted by MerQube, any Data Provider, or any other third party, and none of such parties make any representation regarding the advisability of investing in such product(s) nor do they have any liability for any errors, omissions, or interruptions of the Input Data, Base Index or any associated data.
Hypothetical and Historical Performance of the HSIE3EDG
The following graph sets forth the hypothetical and historical performance of the HSIE3EDG based on the daily historical closing values from January 10, 2015 through January 10, 2025. We obtained the closing values below from the Bloomberg Professional® service. We have not undertaken any independent review of, or made any due diligence inquiry with respect to, the information obtained from the Bloomberg Professional® service.
| FWP-27 |

Hypothetical and historical levels of the Index should not be taken as an indication of its future performance. The hypothetical back-tested Index data only reflects the application of that methodology in hindsight, since the Index, the Base Index and the Sub-Indices were not actually calculated and published prior to December 24, 2024. The hypothetical back-tested Index data cannot completely account for the impact of financial risk in actual trading. There are numerous factors related to the equities markets in general that cannot be, and have not been, accounted for in the hypothetical back-tested Index data, all of which can affect actual performance. Consequently, you should not rely on that data as a reflection of what the actual Index performance would have been had the Index been in existence or in forecasting future Index performance. The graph above also reflects the actual Index performance from December 24, 2024 to January 10, 2025 based on information that we obtained from Bloomberg L.P. Any hypothetical or actual historical upward or downward trend in the level of the Index during any period shown is not an indication that the level of the Index is more or less likely to increase or decrease at any time during the term of the Notes.
EVENTS OF DEFAULT AND ACCELERATION
If the Notes have become immediately due and payable following an Event of Default (as defined in the accompanying prospectus) with respect to the Notes, the calculation agent will determine the accelerated payment due and payable in the same general manner as described in this document except that in such a case, the scheduled trading day immediately preceding the date of acceleration will be used as the Final Valuation Date for purposes of determining the Reference Return of the Reference Asset, and the accelerated Maturity Date will be three business days after the accelerated Final Valuation Date. If a Market Disruption Event exists with respect to the Reference Asset on that scheduled trading day, then the accelerated Final Valuation Date for the Reference Asset will be postponed for up to five scheduled trading days (in the same manner used for postponing the originally scheduled Final Valuation Date). The accelerated Maturity Date will also be postponed by an equal number of business days.
If the Notes have become immediately due and payable following an Event of Default, you will not be entitled to any additional payments with respect to the Notes. For more information, see “Description of Debt Securities — Senior Debt Securities — Events of Default” in the accompanying prospectus.
SUPPLEMENTAL PLAN OF DISTRIBUTION (CONFLICTS OF INTEREST)
We have appointed HSBC Securities (USA) Inc., an affiliate of HSBC, as the agent for the sale of the Notes. Pursuant to the terms of a distribution agreement, HSBC Securities (USA) Inc. will purchase the Notes from HSBC at the price to public less the underwriting discount set forth on the cover page of the pricing supplement to which this document relates, for distribution to other registered broker-dealers, or will offer the Notes directly to investors. HSBC Securities (USA) Inc. proposes to offer the Notes at the price to public set forth on the cover page of this document. HSBC USA Inc. or one of our affiliates may pay varying underwriting discounts of up to 5.00% per $1,000 Principal Amount in connection with the distribution of the Notes to other registered broker-dealers.
An affiliate of HSBC has paid or may pay in the future an amount to broker-dealers in connection with the costs of the continuing implementation of systems to support the Notes. We or one of our affiliates may pay a fee to one or more broker dealers for providing certain services with respect to this offering, which may reduce the economic terms of the notes to you.
In addition, HSBC Securities (USA) Inc. or another of its affiliates or agents may use the pricing supplement to which this document relates in market-making transactions after the initial sale of the Notes, but is under no obligation to make a market in the Notes and may discontinue any market-making activities at any time without notice.
| FWP-28 |
See “Supplemental Plan of Distribution (Conflicts of Interest)” on page S-87 in the prospectus supplement.
We expect that delivery of the Notes will be made against payment for the Notes on or about the Original Issue Date set forth on the inside cover page of this document, which is more than one business day following the Trade Date. Under Rule 15c6-1 under the Securities Exchange Act of 1934, trades in the secondary market generally are required to settle in one business day unless the parties to that trade expressly agree otherwise. Accordingly, purchasers who wish to trade the Notes more than one business day prior to the Original Issue Date will be required to specify an alternate settlement cycle at the time of any such trade to prevent a failed settlement, and should consult their own advisors.
U.S. FEDERAL INCOME TAX CONSIDERATIONS
You should carefully consider the matters set forth in “U.S. Federal Income Tax Considerations” in the accompanying prospectus supplement. The following discussion summarizes the U.S. federal income tax consequences of the purchase, beneficial ownership, and disposition of the Notes. This summary supplements the section “U.S. Federal Income Tax Considerations” in the accompanying prospectus supplement and supersedes it to the extent inconsistent therewith.
There are no statutory provisions, regulations, published rulings or judicial decisions addressing the characterization for U.S. federal income tax purposes of securities with terms that are substantially the same as those of the Notes. We intend to treat the Notes as contingent payment debt instruments for U.S. federal income tax purposes. Pursuant to the terms of the Notes, you agree to treat the Notes as contingent payment debt instruments for all U.S. federal income tax purposes and, in the opinion of Mayer Brown LLP, special U.S. tax counsel to us, it is reasonable to treat the Notes as contingent payment debt instruments. Assuming the Notes are treated as contingent payment debt instruments, a U.S. holder will be required to include original issue discount (“OID”) in gross income each year, even though no payments will be made on the Notes until maturity.
Based on the factors described in the section, “U.S. Federal Income Tax Considerations — Tax Treatment of U.S. Holders — U.S. Federal Income Tax Treatment of the Notes as Indebtedness for U.S. Federal Income Tax Purposes — Contingent Notes,” we have determined that the comparable yield of the Notes, solely for U.S. federal income tax purposes, will be [•]% per annum (compounded annually). Further, based upon the method described in the section, “U.S. Federal Income Tax Considerations —Tax Treatment of U.S. Holders — U.S. Federal Income Tax Treatment of the Notes as Indebtedness for U.S. Federal Income Tax Purposes — Contingent Notes” and based upon the comparable yield, we have determined that the projected payment schedule for Notes that have a Principal Amount of $1,000 and an issue price of $1,000 consists of a single payment of $[•] at maturity (the “Projected Payment”).
Based upon the comparable yield, a U.S. holder that pays taxes on a calendar year basis, buys a Note for $1,000, and holds the Note until maturity will be required to pay taxes on the following amounts of ordinary income in respect of the Notes in each year:
| Year | OID |
| 2025 | $[•] |
| 2026 | $[•] |
| 2027 | $[•] |
| 2008 | $[•] |
| 2029 | $[•] |
| 2030 | $[•] |
| 2031 | $[•] |
| 2032 | $[•] |
However, the ordinary income reported in the taxable year the Notes mature will be adjusted to reflect the actual payment received at maturity. U.S. holders may obtain the actual comparable yield and projected payment schedule as determined by us by submitting a written request to: Structured Equity Derivatives – Structuring HSBC Bank USA, National Association, 452 Fifth Avenue, 9th Floor, New York, NY 10018. A U.S. holder is generally bound by the comparable yield and the projected payment schedule established by us for the Notes. However, if a U.S. holder believes that the projected payment schedule is unreasonable, a U.S. holder must determine its own projected payment schedule and explicitly disclose the use of such schedule and the reason the holder believes the projected payment schedule provided herein is unreasonable on its timely filed U.S. federal income tax return for the taxable year in which it acquires the Notes.
| FWP-29 |
The comparable yield and projected payment schedule are not provided for any purpose other than the determination of a U.S. holder’s interest accruals for U.S. federal income tax purposes and do not constitute a projection or representation by us regarding the actual yield on a Note. We do not make any representation as to what such actual yield will be.
Upon a sale, exchange, or retirement of a Note prior to maturity, a U.S. holder generally will recognize taxable gain or loss equal to the difference between the amount realized on the sale, exchange, or retirement and the holder’s tax basis in the Note. A U.S. holder generally will treat any gain as ordinary interest income, and any loss as ordinary loss up to the amount of previously accrued OID and then as capital loss. At maturity, (i) if the actual Payment at Maturity exceeds the Projected Payment, a U.S. holder must include such excess as interest income, or (ii) if the Projected Payment exceeds the actual Payment at Maturity, a U.S. holder will generally treat such excess first as an offset to previously accrued OID for the taxable year, then as an ordinary loss to the extent of all prior OID inclusions, and thereafter as a capital loss.
Because there are no statutory provisions, regulations, published rulings or judicial decisions addressing the characterization for U.S. federal income tax purposes of securities with terms that are substantially the same as those of the Notes, other characterizations and treatments are possible. As a result, the timing and character of income in respect of the Notes might differ from the treatment described above. You should carefully consider the discussion of all potential tax consequences as set forth in “U.S. Federal Income Tax Considerations” in the accompanying prospectus supplement.
We will not attempt to ascertain whether any of the entities whose stock is included in the Reference Asset would be treated as a passive foreign investment company (“PFIC”) or United States real property holding corporation (“USRPHC”), both as defined for U.S. federal income tax purposes. If one or more of the entities whose stock is included in the Reference Asset were so treated, certain adverse U.S. federal income tax consequences might apply. You should refer to information filed with the SEC and other authorities by the entities whose stock is included in the Reference Asset and consult your tax advisor regarding the possible consequences to you if one or more of the entities whose stock is included in the Reference Asset is or becomes a PFIC or a USRPHC.
A “dividend equivalent” payment is treated as a dividend from sources within the United States and such payments generally would be subject to a 30% U.S. withholding tax if paid to a non-U.S. holder. Under U.S. Treasury Department regulations, payments (including deemed payments) with respect to equity-linked instruments (“ELIs”) that are “specified ELIs” may be treated as dividend equivalents if such specified ELIs reference an interest in an “underlying security,” which is generally any interest in an entity taxable as a corporation for U.S. federal income tax purposes if a payment with respect to such interest could give rise to a U.S. source dividend. However, Internal Revenue Service guidance provides that withholding on dividend equivalent payments will not apply to specified ELIs that are not delta-one instruments and that are issued before January 1, 2027. Based on the Issuer’s determination that the Notes are not “delta-one” instruments, non-U.S. holders should not be subject to withholding on dividend equivalent payments, if any, under the Notes. However, it is possible that the Notes could be treated as deemed reissued for U.S. federal income tax purposes upon the occurrence of certain events affecting the Reference Asset or the Notes, and following such occurrence the Notes could be treated as subject to withholding on dividend equivalent payments. Non-U.S. holders that enter, or have entered, into other transactions in respect of the Reference Asset or the Notes should consult their tax advisors as to the application of the dividend equivalent withholding tax in the context of the Notes and their other transactions. If any payments are treated as dividend equivalents subject to withholding, we (or the applicable paying agent) would be entitled to withhold taxes without being required to pay any additional amounts with respect to amounts so withheld.
PROSPECTIVE PURCHASERS OF NOTES SHOULD CONSULT THEIR TAX ADVISORS AS TO THE FEDERAL, STATE, LOCAL, AND OTHER TAX CONSEQUENCES TO THEM OF THE PURCHASE, OWNERSHIP AND DISPOSITION OF NOTES.
| FWP-30 |
| TABLE OF CONTENTS |
You should only rely on the information contained in this document, the accompanying Equity Index Underlying Supplement, prospectus supplement and prospectus. We have not authorized anyone to provide you with information or to make any representation to you that is not contained in this document, the accompanying Equity Index Underlying Supplement, prospectus supplement and prospectus. If anyone provides you with different or inconsistent information, you should not rely on it. This document, the accompanying Equity Index Underlying Supplement, prospectus supplement and prospectus are not an offer to sell these Notes, and these documents are not soliciting an offer to buy these Notes, in any jurisdiction where the offer or sale is not permitted. You should not, under any circumstances, assume that the information in this document, the accompanying Equity Index Underlying Supplement, prospectus supplement and prospectus is correct on any date after their respective dates.
HSBC USA Inc.
$ Securities Linked to the HSBC 3D Edge Index
January 14, 2025
Free Writing Prospectus | ||
| Free Writing Prospectus | |||
| General | FWP-5 | ||
| Payment at Maturity | FWP-5 | ||
| Investor Suitability | FWP-6 | ||
| Risk Factors | FWP-7 | ||
| Illustrative Examples | FWP-14 | ||
| Description of the Reference Asset | FWP-16 | ||
| Events of Default and Acceleration | FWP-28 | ||
| Supplemental Plan of Distribution (Conflicts of Interest) | FWP-28 | ||
| U.S. Federal Income Tax Considerations | FWP-29 | ||
| Equity Index Underlying Supplement | |||
| Disclaimer | ii | ||
| Risk Factors | S-1 | ||
| The DAX® Index | S-8 | ||
| The Dow Jones Industrial Average® | S-10 | ||
| The EURO STOXX 50® Index | S-12 | ||
| The EURO STOXX® Banks Index | S-14 | ||
| The FTSE® 100 Index | S-16 | ||
| The Hang Seng® Index | S-17 | ||
| The Hang Seng China Enterprises Index | S-19 | ||
| The KOSPI 200 Index | S-21 | ||
| The MSCI Indices | S-23 | ||
| The NASDAQ 100 Index® | S-30 | ||
| The Nikkei Stock Average | S-33 | ||
| The NYSE® FANG+™ Index | S-35 | ||
| The PHLX Housing Sector Index | S-40 | ||
| The Russell 2000® Index | S-44 | ||
| The S&P 100® Index | S-47 | ||
| The S&P 500® Index | S-54 | ||
| The S&P 500® Low Volatility Index | S-61 | ||
| The S&P BRIC 40 Index | S-64 | ||
| The S&P MidCap 400® Index | S-67 | ||
| The S&P/ASX 200 Index | S-74 | ||
| The S&P 500® ESG Index | S-77 | ||
| The TOPIX® Index | S-82 | ||
| The Swiss Market Index | S-84 | ||
| Additional Terms of the Notes | S-86 | ||
| Prospectus Supplement | |||
| Risk Factors | S-1 | ||
| Pricing Supplement | S-12 | ||
| Description of Notes | S-14 | ||
| Use of Proceeds and Hedging | S-58 | ||
| Certain ERISA and Related Considerations | S-59 | ||
| U.S. Federal Income Tax Considerations | S-61 | ||
| Supplemental Plan of Distribution (Conflicts of Interest) | S-87 | ||
| Prospectus | |||
| About this Prospectus | 1 | ||
| Risk Factors | 2 | ||
| Where You Can Find More Information | 3 | ||
| Special Note Regarding Forward-Looking Statements | 4 | ||
| HSBC USA Inc. | 6 | ||
| Use of Proceeds | 7 | ||
| Description of Debt Securities | 8 | ||
| Description of Preferred Stock | 19 | ||
| Description of Warrants | 24 | ||
| Description of Purchase Contracts | 29 | ||
| Description of Units | 32 | ||
| Book-Entry Procedures | 35 | ||
| Limitations on Issuances in Bearer Form | 39 | ||
| U.S. Federal Income Tax Considerations Relating to Debt Securities | 40 | ||
| Certain European Union Tax Considerations Relating to Debt Securities | 48 | ||
| Plan of Distribution (Conflicts of Interest) | 49 | ||
| Notice to Canadian Investors | 52 | ||
| Notice to EEA Investors | 53 | ||
| Notice to U.K. Investors | 54 | ||
| U.K. Financial Promotion | 54 | ||
| Certain ERISA and Related Matters | 55 | ||
| Legal Opinions | 57 | ||
| Experts | 58 |