UNITED STATES
SECURITIES AND EXCHANGE COMMISSION
Washington, D.C. 20549
FORM 10-K
(Mark One)
[X] ANNUAL REPORT PURSUANT TO SECTION 13 OR 15(D)
OF THE SECURITIES EXCHANGE ACT OF 1934
For the fiscal year ended December 31, 2004
or
[ ] TRANSITION REPORT PURSUANT TO SECTION 13 OR 15(D)
OF THE SECURITIES EXCHANGE ACT OF 1934
For the transition period from _____________ to ______________
Commission File Number 0-16867
UNITED TRUST GROUP, INC.
(Exact name of registrant as specified in its charter)
ILLINOIS 37-1172848
(State or other jurisdiction of (I.R.S. Employer
incorporation or organization) Identification No.)
5250 South Sixth Street, Springfield, IL 62703
(Address of principal executive offices) (Zip code)
Registrant's telephone number, including area code: (217) 241-6300
Securities registered pursuant to Section 12(b) of the Act:
Name of each exchange
Title of each class on which registered
None None
Securities registered pursuant to Section 12(g) of the Act:
Title of each class
Common Stock, stated value $ .02 per share
Indicate by check mark whether the registrant (1) has filed all reports required
to be filed by Section 13 or 15(d) of the Securities Exchange Act of 1934 during
the preceding 12 months (or for such shorter period that the registrant was
required to file such reports), and (2) has been subject to such filing
requirements for the past 90 days. Yes [X] No [ ]
Indicate by check mark if disclosure of delinquent filers pursuant to Item 405
of Regulation S-K (229.405 of this chapter) is not contained herein, and will
not be contained, to the best of registrant's knowledge, in definitive proxy or
information statements incorporated by reference in Part III of this Form 10-K
or any amendment to this Form 10- K. [ ]
Indicate by check mark whether the registrant is an accelerated filer (as
defined by Rule 12b-2 of the Act). Yes [ ] No [X]
As of June 30, 2004, shares of the Registrant's common stock held by
non-affiliates (based upon the price of the last sale of $ 5.50 per share), had
an aggregate market value of approximately $ 7,256,893.
At March 22, 2005 the Registrant had 3,955,355 outstanding shares of Common
Stock, stated value $ .02 per share.
DOCUMENTS INCORPORATED BY REFERENCE: None
UNITED TRUST GROUP, INC.
FORM 10-K
YEAR ENDED DECEMBER 31, 2004
TABLE OF CONTENTS
PART I.........................................................................3
ITEM 1. BUSINESS..........................................................3
ITEM 2. PROPERTIES.......................................................15
ITEM 3. LEGAL PROCEEDINGS................................................15
ITEM 4. SUBMISSION OF MATTERS TO A VOTE OF SECURITY HOLDERS..............15
PART II.......................................................................16
ITEM 5. MARKET FOR COMPANY'S COMMON EQUITY AND RELATED
SHAREHOLDER MATTERS..........................................16
ITEM 6. SELECTED FINANCIAL DATA..........................................17
ITEM 7. MANAGEMENT'S DISCUSSION AND ANALYSIS OF FINANCIAL CONDITION
AND RESULTS OF OPERATIONS....................................18
ITEM 7A. QUANTITATIVE AND QUALITATIVE DISCLOSURES ABOUT MARKET RISK .....28
ITEM 8. FINANCIAL STATEMENTS AND SUPPLEMENTARY DATA......................30
ITEM 9. DISAGREEMENTS WITH ACCOUNTANTS ON ACCOUNTING AND
FINANCIAL DISCLOSURE.........................................61
ITEM 9A. CONTROLS AND PROCEDURES..........................................61
PART III......................................................................63
ITEM 10. DIRECTORS AND EXECUTIVE OFFICERS OF UTG..........................63
ITEM 11. EXECUTIVE COMPENSATION...........................................65
ITEM 12. SECURITY OWNERSHIP OF CERTAIN BENEFICIAL OWNERS AND MANAGEMENT...68
ITEM 13. CERTAIN RELATIONSHIPS AND RELATED TRANSACTIONS...................71
ITEM 14. PRINCIPAL ACCOUNTING FEES AND SERVICES...........................72
PART IV.......................................................................73
ITEM 15. EXHIBITS, FINANCIAL STATEMENT SCHEDULES AND REPORTS ON FORM 8-K..74
PART I
ITEM 1. BUSINESS
FORWARD-LOOKING INFORMATION
Any forward-looking statement contained herein or in any other oral or written
statement by the Company or any of its officers, directors or employees is
qualified by the fact that actual results of the Company may differ materially
from those projected in forward-looking statements. Additional information
concerning factors that could cause actual results to differ from those in the
forward-looking statements is contained in "Management's Discussion and Analysis
of Financial Condition and Results of Operations."
OVERVIEW
United Trust Group, Inc. (the "Registrant") was incorporated in 1984, under the
laws of the State of Illinois to serve as an insurance holding company. The
Registrant and its subsidiaries (the "Company") have only one significant
industry segment - insurance. The Company's dominant business is individual life
insurance, which includes the servicing of existing insurance business in force,
the solicitation of new individual life insurance, the acquisition of other
companies in the insurance business, and the administration processing of life
insurance business for other entities.
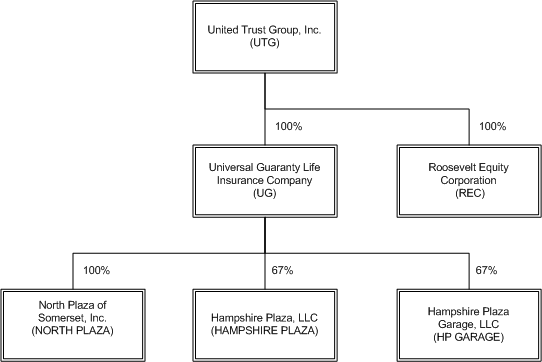
At December 31, 2004, significant majority-owned subsidiaries of the Registrant
were as depicted on the following organizational chart:
This document at times will refer to the Registrant's largest shareholder, Mr.
Jesse T. Correll and certain companies controlled by Mr. Correll. Mr. Correll
holds a majority ownership of First Southern Funding LLC, a Kentucky
corporation, (FSF) and First Southern Bancorp, Inc. (FSBI), a financial services
holding company. FSBI operates through four 100% owned subsidiary banks
including First Southern National Bank (FSNB). Banking activities are conducted
through multiple locations within 10 counties in the state of Kentucky. Mr.
Correll is Chief Executive Officer and Chairman of the Board of Directors of UTG
and is currently UTG's largest shareholder through his ownership control of FSF,
FSBI and affiliates. At December 31, 2004, Mr. Correll owns or controls directly
and indirectly approximately 66% of UTG's outstanding stock.
UTG is a life insurance holding company. The focus of UTG is the acquisition of
other companies in similar lines of business and management of the insurance
subsidiary. UTG has no activities outside the life insurance focus. The UTG
companies became members of the same affiliated group through a history of
acquisitions in which life insurance companies were involved.
UG is a wholly owned life insurance subsidiary of UTG, which operates in the
individual life insurance business. The primary focus of the insurance company
has been the servicing of existing insurance business in force and the
solicitation of new insurance business. In addition, UG provides insurance
administrative services for other non-related entities.
REC is a wholly owned subsidiary of UTG, which was incorporated under the laws
of the State of Delaware on June 1, 1971, for the purpose of dealing and
brokering in securities. REC acts as an agent for its customers by placing
orders of mutual funds and variable annuity contracts which are placed in the
customers' names, the mutual fund shares and variable annuity accumulation units
are held by the respective custodians, and the only financial involvement of REC
is through receipt of commission (load). REC functions at a minimum
broker-dealer level. It does not maintain any of its customer accounts nor
receives customer funds directly. Operating activity of REC accounts for less
than $ 28,000 of earnings annually.
NORTH PLAZA is a wholly owned subsidiary of UG, which owns for investment
purposes, a shopping center in Somerset, Kentucky, approximately 14,000 acres of
timberland in Kentucky, and a 50% partnership interest in an additional 11,000
acres of Kentucky timberland. Operating activity of North Plaza accounts for
less than $ 100,000 of earnings annually. The timberland is harvested and in
various stages of maturity. The property is carried at approximately
$ 7,400,000.
HAMPSHIRE PLAZA is a 67% owned subsidiary of UG, which owns for investment
purposes, a property consisting of a 254,228 square foot office tower, and
72,382 square foot attached retail plaza totaling 326,610 square feet along with
an attached 349 space parking garage, in New Hampshire. In 2004, the Company
obtained new lease agreements whereby approximately 58% of the building is now
leased. At December 31, 2004, the property was carried at approximately
$ 13,400,000. Operating activity of Hampshire Plaza accounted for approximately
$ 547,000 of income in the current year.
HP GARAGE is a 67% owned subsidiary of UG, which owns for investment purposes, a
property consisting of a 578 space parking garage, in New Hampshire. Operating
activity of HP Garage accounted for approximately $ 68,000 of earnings in the
current year.
HISTORY
UTG was incorporated December 14, 1984, as an Illinois corporation. The original
name was United Trust, Inc. (UTI). The name was changed in 1999 following a
merger with United Income Inc. (UII). During its first two and one-half years,
UTG was engaged in an intrastate public offering of its securities, raising over
$ 12,000,000 net of offering costs. In 1986, UTG formed a life insurance
subsidiary and by 1987 began selling life insurance products. Over the next
several years, UTG acquired several additional holding and life insurance
companies. UTG has taken several steps to streamline and simplify the corporate
structure following the acquisitions, including dissolution of intermediate
holding companies and mergers of several life insurance companies.
In March 2005, UTG's Board of Directors adopted a proposal to change the state
of incorporation of UTG from Illinois to Delaware by merging UTG with and into a
wholly-owned Delaware subsidiary (the "reincorporation merger"). The Board of
Directors and management of UTG believe that reincorporation in Delaware would
be beneficial to the Company because Delaware corporate law is more
comprehensive, widely used and extensively interpreted than other state
corporate laws, including Illinois corporate law. The reincorporation merger
would effect only a change in UTG's legal domicile and certain other changes of
a legal nature. It would not result in any change in UTG's business, management,
fiscal year, assets or liabilities or location of its principal facilities. The
Board of Directors intends to submit the reincorporation proposal to its
shareholders for approval at the 2005 annual meeting of shareholders to be held
on June 15, 2005. If approved by shareholders, UTG expects that the
reincorporation merger would be effected as soon as reasonably practicable
following the annual meeting.
PRODUCTS
UG's current product portfolio consists of a limited number of life insurance
product offerings, with a goal of enough variety to provide for the needs of the
general public and existing policyholders. The products are designed to be
competitive in the marketplace.
Historically, UG's primary universal life insurance product was referred to as
the "UL90A". It was issued for ages 0 - 65 and had a minimum face amount of
$ 25,000. The administrative load is based on the issue age, sex and rating
class of the policy. Policy fees vary from $ 1 per month in the first year to
$ 4 per month in the second and third years and $ 3 per month each year
thereafter. The UL90A currently credits 4.5% interest with a 4.5% guaranteed
interest rate. Partial withdrawals, subject to a remaining minimum $ 500 cash
surrender value and a $ 25 fee, are allowed once a year after the first
duration. Policy loans are available at 7.4% interest in advance. The policy's
accumulated fund will be credited the guaranteed interest rate in relation to
the amount of the policy loan. Surrender charges are based on a percentage of
target premiums starting at 120% for years 1-5 then grading downward to zero in
year 15. This policy contains a guaranteed interest credit bonus for the
long-term policyholder. From years 10 through 20, additional interest bonuses
can be earned if certain criteria are met, primarily relating to the total
amount of premiums paid and amount of accumulated value, with a total in the
twentieth year of 1.375%. The bonus is credited from the policy issue date and
is contractually guaranteed.
In 2003 UG replaced its "Century 2000" product with a new universal life
contract; the "Legacy" product. This product was designed for use with several
distribution channels including the Company's own internal agents, bank
agent/employees and through personally producing general agents "PPGA". Similar
to the UL90A, this policy is issued for ages 0 - 65, in face amounts with a
minimum of $ 25,000. But unlike the Century 2000 this product was designed with
level commissions. The Legacy product has a current declared interest rate of
4.0%, which is equal to its guaranteed rate. After five years the guaranteed
rate drops to 3.0%. During the first five years the policy fee will be $ 6.00
per month on face amounts less than $ 50,000 and $ 5.00 per month for larger
amounts. After the first five years the Company may increase this rate but not
more than $ 8.00 per month. The policy has other loads that vary based upon
issue age and risk classification. Partial withdrawals, subject to a remaining
minimum $ 500 cash surrender value and a $ 25 fee, are allowed once a year after
the first duration. Policy loans are available at 7.4% interest in advance. The
policy's accumulated fund will be credited the guaranteed interest rate in
relation to the amount of the policy loan. Surrender charges are based on a
percentage of target premiums starting at 100% for years 1 and 2 then grading
downward to zero in year 5.
Also available are a number of traditional whole life policies. The Company's
Ten Pay Whole Life Insurance product has a level face amount. The level premium
is payable for the first ten policy years. This policy is available for issue
ages 0-65, and has a minimum face amount of $10,000. This policy can be used in
conversion situations, where it is available up to age 75 and at a minimum face
amount of $5,000. There is no policy fee.
The Preferred Whole Life Insurance product also has a level face amount and
level premium, although the premiums are payable for life on this product. Issue
ages are 0-65 and the minimum face amount is $25,000. There is no policy fee.
Unlike the Ten Pay, this product has several optional riders available:
Accidental Death rider, Children's Term Insurance rider, Terminal Illness rider
and/or Waiver of Premium rider.
The Tradition is a fixed premium whole life insurance policy. Premiums are level
and payable for life. Issue ages are 0-80. The minimum face amount is the
greater of $10,000 or the amount of coverage provided by a $100 annual premium.
There is a $30 policy fee. This product has the same optional riders as the
Preferred Whole Life, listed above.
Our newest product is called Kid Kare. This is a single premium level term
policy to age 21. A face amount of $5,000 can be purchased for a single premium
of $250, and a $10,000 face amount requires a premium of $500. The policy is
issued from ages 0-15 and has conversion privileges at age 21. There is no
policy fee.
The Horizon Annuity completes our product portfolio. This product is issued to
ages 0-80. The minimum annual premium in the first year is $2,000, with premiums
being optional in all other years. There is a maintenance fee of $18 beginning
in the second policy year. This fee is waived if the annuity value is at least
$2,000. This policy has a decreasing surrender charge for the first five years
of the contract.
Products currently in development include a decreasing term policy and a level
term policy. The decreasing term policy will be convertible to age 65 or the
policy anniversary prior to expiry. Terms of 10, 15, 20 25 and 30 years will be
available. Each term period has it's own issue age criteria. The level term
policy will be renewable to age 70 and convertible to age 65. Issue ages for the
level term policy will be 18-60.
The Company's actual experience for earned interest, persistency and mortality
varies from the assumptions applied to pricing and for determining premiums.
Accordingly, differences between the Company's actual experience and those
assumptions applied may impact the profitability of the Company. The Company
monitors investment yields, and when necessary adjusts credited interest rates
on its insurance products to preserve targeted interest spreads. Credited rates
are reviewed and established by the Board of Directors of UG. Currently, all
crediting rates have been reduced to the respective product guaranteed interest
rate.
The Company has a variety of policies in force different from those being
marketed. Interest sensitive products, including universal life and excess
interest whole life ("fixed premium UL"), account for 59% of the insurance in
force. Approximately 20% of the insurance in force is participating business,
which represents policies under which the policyowner shares in the insurance
company's statutory divisible surplus. The Company's average persistency rate
for its policies in force for 2004 and 2003 has been 94.6% and 94.9%,
respectively.
Interest sensitive life insurance products have characteristics similar to
annuities with respect to the crediting of a current rate of interest at or
above a guaranteed minimum rate and the use of surrender charges to discourage
premature withdrawal of cash values. Universal life insurance policies also
involve variable premium charges against the policyholder's account balance for
the cost of insurance and administrative expenses. Interest-sensitive whole-life
products generally have fixed premiums. Interest-sensitive life insurance
products are designed with a combination of front-end loads, periodic variable
charges, and back-end loads or surrender charges.
Traditional life insurance products have premiums and benefits predetermined at
issue; the premiums are set at levels that are designed to exceed expected
policyholder benefits and insurance company expenses. Participating business is
traditional life insurance with the added feature that the policyholder may
share in the divisible surplus of the insurance company through policyholder
dividend. This dividend is set annually by the Board of Directors of UG and is
completely discretionary.
MARKETING
The Company has not actively marketed life products in the past several years.
Management currently places little emphasis on new business production,
believing resources could be better utilized in other ways. Current sales
primarily represent sales to existing customers through additional insurance
needs or conservation efforts. In 2001, the Company increased its emphasis on
policy retention in an attempt to improve current persistency levels. In this
regard, several of the home office staff have become licensed insurance agents
enabling them broader abilities when dealing with the customer in regard to
his/her existing policies and possible alternatives. The conservation efforts
described above have been generally positive. Management will continue to
monitor these efforts and make adjustments as seen appropriate to enhance the
future success of the program.
At year-end 2004, the Company retired its universal life product commonly
referred to as the UL90A. This product had been offered since 1990. Sales of
this product have been extremely low in recent periods. Management concluded the
product had run its life cycle and discontinued its offering. The Company has
introduced new and updated products in recent periods including the Horizon
Annuity, the Legacy and Kid Kare. The company is currently working on
development of a level term and decreasing term product. Management has no
current plans to increase marketing efforts. New product development is
anticipated to be utilized in conservation efforts and sales to existing
customers. Such sales are not expected to be material.
Excluding licensed home office personnel, UG has 15 general agents. UG primarily
markets its products in the Midwest region with most sales in the states of
Ohio, Illinois and West Virginia. UG is licensed to sell life insurance in
Alabama, Arizona, Arkansas, Colorado, Delaware, Florida, Georgia, Idaho,
Illinois, Indiana, Iowa, Kansas, Kentucky, Louisiana, Massachusetts, Minnesota,
Mississippi, Missouri, Montana, Nebraska, Nevada, New Mexico, North Carolina,
North Dakota, Ohio, Oklahoma, Oregon, Pennsylvania, Rhode Island, South
Carolina, South Dakota, Tennessee, Texas, Utah, Virginia, Washington, West
Virginia and Wisconsin.
In 2004, $ 17,161,576 of total direct premium was collected by the insurance
subsidiary. Ohio accounted for 27%, Illinois accounted for 19%, and West
Virginia accounted for 11% of total direct premiums collected. No other state
accounted for more than 5% of direct premiums collected.
UNDERWRITING
The underwriting procedures of the insurance subsidiary are established by
management. Insurance policies are issued by the Company based upon underwriting
practices established for each market in which the Company operates. Most
policies are individually underwritten. Applications for insurance are reviewed
to determine additional information required to make an underwriting decision,
which depends on the amount of insurance applied for and the applicant's age and
medical history. Additional information may include inspection reports, medical
examinations, and statements from doctors who have treated the applicant in the
past and, where indicated, special medical tests. After reviewing the
information collected, the Company either issues the policy as applied for, with
an extra premium charge because of unfavorable factors, or rejects the
application. Substandard risks may be referred to reinsurers for full or partial
reinsurance of the substandard risk.
The Company requires blood samples to be drawn with individual insurance
applications for coverage over $ 45,000 (age 46 and above) or $ 95,000 (ages
16-45). Blood samples are tested for a wide range of chemical values and are
screened for antibodies to the HIV virus. Applications also contain questions
permitted by law regarding the HIV virus, which must be answered by the proposed
insureds.
RESERVES
The applicable insurance laws under which the insurance subsidiary operates
require that the insurance company report policy reserves as liabilities to meet
future obligations on the policies in force. These reserves are the amounts
which, with the additional premiums to be received and interest thereon
compounded annually at certain assumed rates, are calculated in accordance with
applicable law to be sufficient to meet the various policy and contract
obligations as they mature. These laws specify that the reserves shall not be
less than reserves calculated using certain mortality tables and interest rates.
The liabilities for traditional life insurance and accident and health insurance
policy benefits are computed using a net level method. These liabilities include
assumptions as to investment yields, mortality, withdrawals, and other
assumptions based on the life insurance subsidiary's experience adjusted to
reflect anticipated trends and to include provisions for possible unfavorable
deviations. The Company makes these assumptions at the time the contract is
issued or, in the case of contracts acquired by purchase, at the purchase date.
Future policy benefits for individual life insurance and annuity policies are
computed using interest rates ranging from 2% to 6% for life insurance and 3.0%
to 9.25% for annuities. Benefit reserves for traditional life insurance policies
include certain deferred profits on limited-payment policies that are being
recognized in income over the policy term. Policy benefit claims are charged to
expense in the period that the claims are incurred. Current mortality rate
assumptions are based on 1975-80 select and ultimate tables. Withdrawal rate
assumptions are based upon Linton B or Linton C, which are industry standard
actuarial tables for forecasting assumed policy lapse rates.
Benefit reserves for universal life insurance and interest sensitive life
insurance products are computed under a retrospective deposit method and
represent policy account balances before applicable surrender charges. Policy
benefits and claims that are charged to expense include benefit claims in excess
of related policy account balances. Interest crediting rates for universal life
and interest sensitive products range from 4.0% to 5.5% for the years ended
December 31, 2004, 2003 and 2002.
REINSURANCE
As is customary in the insurance industry, the insurance subsidiary of the
Company cedes insurance to, and assumes insurance from, other insurance
companies under reinsurance agreements. Reinsurance agreements are intended to
limit a life insurer's maximum loss on a large or unusually hazardous risk or to
obtain a greater diversification of risk. The ceding insurance company remains
primarily liable with respect to ceded insurance should any reinsurer be unable
to meet the obligations assumed by it. However, it is the practice of insurers
to reduce their exposure to loss to the extent that they have been reinsured
with other insurance companies. The Company sets a limit on the amount of
insurance retained on the life of any one person. The Company will not retain
more than $ 125,000, including accidental death benefits, on any one life. At
December 31, 2004, the Company had gross insurance in force of $ 3.141 billion
of which approximately $ 531 million was ceded to reinsurers.
The Company's reinsured business is ceded to numerous reinsurers. The Company
monitors the solvency of its reinsurers in seeking to minimize the risk of loss
in the event of a failure by one of the parties. The primary reinsurers of the
Company are large, well capitalized entities.
Currently, the Company is utilizing reinsurance agreements with Generali USA
Life Reassurance Company, (Generali) and Swiss Re Life and Health America
Incorporated (SWISS RE). Generali and SWISS RE currenty hold an "A" (Excellent),
and "A+" (Superior) rating, respectively, from A.M. Best, an industry rating
company. The reinsurance agreements were effective December 1, 1993, and covered
most new business of the Company. The agreements are a yearly renewable term
(YRT) treaty where the Company cedes amounts above its retention limit of
$ 100,000 with a minimum cession of $ 25,000.
In addition to the above reinsurance agreements, the Company entered into
reinsurance agreements with Optimum Re Insurance Company (Optimum) during 2004
to provide reinsurance on new products released for sale in 2004. The agreements
are yearly renewable term (YRT) treaties where the Company cedes amounts above
its retention limit of $100,000 with a minimum cession of $25,000 as has been a
Company practice for the last several years with its reinsurers. Also, effective
January 1, 2005, Optimum became the reinsurer of 100% of the accidental death
benefits (ADB) in force of the Company. Previously, Generali provided this
coverage. This coverage is renewable annually at the Company's option. Optimum
specializes in reinsurance agreements with small to mid-size carriers such as
the Company. Optimum currently holds an "A" (Excellent) rating from A.M. Best.
UG entered a coinsurance agreement with Park Avenue Life Insurance Company
(PALIC) as of September 30, 1996. Under the terms of the agreement, UG ceded to
PALIC substantially all of its paid-up life insurance policies. Paid-up life
insurance generally refers to non-premium paying life insurance policies. PALIC
and its ultimate parent The Guardian Life Insurance Company of America
(Guardian), currently hold an "A" (Excellent), and "A+" (Superior) rating,
respectively, from A.M. Best, an industry rating company. The PALIC agreement
accounts for approximately 68% of the reinsurance reserve credit, as of
December 31, 2004.
On September 30, 1998, UG entered into a coinsurance agreement with The
Independent Order of Vikings, an Illinois fraternal benefit society (IOV). Under
the terms of the agreement, UG agreed to assume, on a coinsurance basis, 25% of
the reserves and liabilities arising from all in-force insurance contracts
issued by the IOV to its members. At December 31, 2004, the IOV insurance
in-force was approximately $ 1,686,000, with reserves being held on that amount
of approximately $ 393,000.
On June 1, 2000, UG assumed an already existing coinsurance agreement, dated
January 1, 1992, between Lancaster Life Reinsurance Company, an Arizona
corporation (LLRC) and Investors Heritage Life Insurance Company, a corporation
organized under the laws of the Commonwealth of Kentucky (IHL). Under the terms
of the agreement, LLRC agreed to assume from IHL a 90% quota share of new issues
of credit life and accident and health policies that have been written on or
after January 1, 1992 through various branches of the First Southern National
Bank. The maximum amount of credit life insurance that can be assumed on any one
individual's life is $ 15,000. UG assumed all the rights and obligations
formerly held by LLRC as the reinsurer in the agreement. LLRC liquidated its
charter immediately following the transfer. At December 31, 2004, IHL has
insurance in-force of approximately $ 2,295,000, with reserves being held on
that amount of approximately $ 33,000.
The Company does not have any short-duration reinsurance contracts. The effect
of the Company's long-duration reinsurance contracts
on premiums earned in 2004, 2003 and 2002 was as follows:
Shown in thousands
---------------------------------------------------------
2004 2003 2002
Premiums Premiums Premiums
Earned Earned Earned
---------------- ---------------- ----------------
Direct $ 17,238 $ 18,087 $ 18,597
Assumed 38 34 96
Ceded (3,036) (2,896) (2,701)
---------------- ---------------- ----------------
Net premiums $ 14,240 $ 15,225 $ 15,992
================ ================ ================
INVESTMENTS
Investment income represents a significant portion of the Company's total
income. Investments are subject to applicable state insurance laws and
regulations, which limit the concentration of investments in any one category or
class and further limit the investment in any one issuer. Generally, these
limitations are imposed as a percentage of statutory assets or percentage of
statutory capital and surplus of each company.
The following table reflects net investment income by type of investment.
December 31,
----------------------------------------------------------
2004 2003 2002
--------------- ---------------- ----------------
Fixed maturities and fixed maturities
held for sale $ 7,060,761 $ 8,418,969 $ 10,302,735
Equity securities 657,609 456,361 131,778
Mortgage loans 1,209,358 1,522,700 1,749,935
Real estate 5,335,530 2,832,171 3,261,043
Policy loans 918,562 949,770 965,227
Short-term investments 80,241 11,161 26,522
Cash 111,986 137,478 211,293
--------------- ---------------- ----------------
Total consolidated investment income 15,374,047 14,328,610 16,648,533
Investment expenses (4,953,161) (4,058,110) (3,133,731)
---------------- ---------------- ----------------
Consolidated net investment income $ 10,420,886 $ 10,270,500 $ 13,514,802
=============== ================ ================
At December 31, 2004, the Company had a total of $ 805,787 in investment real
estate, which did not produce income during 2004.
The following table summarizes the Company's fixed maturities distribution at
December 31, 2004 and 2003 by ratings category as issued by Standard and Poor's,
a leading ratings analyst.
Fixed Maturities
Rating % of Portfolio
----------------------
2004 2003
---------- ----------
Investment Grade
AAA 82% 82%
AA 1% 1%
A 13% 12%
BBB 4% 4%
Below investment grade 0% 1%
---------- ----------
100% 100%
========== ==========
The following table summarizes the Company's fixed maturities and fixed
maturities held for sale by major classification.
Carrying Value
--------------------------------------------------
2004 2003
-------------------- --------------------
U.S. government and government agencies $ 49,434,111 $ 42,023,692
States, municipalities and political subdivisions 2,625,737 6,520,332
Collateralized mortgage obligations 79,701,893 89,195,177
Public utilities 0 5,397,880
Corporate 28,405,561 22,977,808
-------------------- --------------------
$ 160,167,302 $ 166,114,889
==================== ====================
The following table shows the composition, average maturity and yield of the
Company's investment portfolio at December 31, 2004.
Average
Carrying Average Average
Investments Value Maturity Yield
----------------------------------- ---------------- ------------------ ------------
Fixed maturities and fixed
maturities held for sale $ 163,141,096 5 years 4.33%
Equity securities 20,880,669 Not applicable 3.15%
Mortgage Loans 23,719,192 5 years 5.10%
Investment real estate 26,458,953 Not applicable 20.17%
Policy loans 13,035,574 Not applicable 7.05%
Short-term investments 37,083 Not applicable 8.25%
Cash and cash equivalents 10,304,600 On demand 1.84%
----------------
Total Investments and Cash
and cash equivalents $ 257,577,167 4.05%
================
At December 31, 2004, fixed maturities and fixed maturities held for sale have a
combined market value of $ 160,291,675. Fixed maturities held to maturity are
carried at amortized cost. Management has the ability and intent to hold these
securities until maturity. Fixed maturities held for sale are carried at market.
The Company holds $ 39,489 in short-term investments. Management monitors its
investment maturities, which in their opinion is sufficient to meet the
Company's cash requirements. Fixed maturities of $ 9,016,462 mature in one year
and $ 55,006,074 mature in two to five years.
The Company holds $ 20,722,415 in mortgage loans, which represents approximately
7% of the total assets. All mortgage loans are first position loans. Before a
new loan is issued, the applicant is subject to certain criteria set forth by
Company management to ensure quality control. These criteria include, but are
not limited to, a credit report, personal financial information such as
outstanding debt, sources of income, and personal equity. Loans issued are
limited to no more than 80% of the appraised value of the property and must be
first position against the collateral.
The Company has one mortgage loan in the process of foreclosure, with a balance
due of $ 1,401,345 at December 31, 2004. The Company has no loans under a
repayment plan or restructuring. Letters are sent to each mortgagee when the
loan becomes 30 days or more delinquent. Loans 90 days or more delinquent are
placed on a non-performing status and classified as delinquent loans. Reserves
for loan losses are established based on management's analysis of the loan
balances compared to the expected realizable value should foreclosure take
place. Loans are placed on a non-accrual status based on a quarterly analysis of
the likelihood of repayment. All delinquent and troubled loans held by the
Company are loans, which were held in portfolios by acquired companies at the
time of acquisition. Management believes the current internal controls
surrounding the mortgage loan selection process provide a quality portfolio with
minimal risk of foreclosure and/or negative financial impact.
The Company has in place a monitoring system to provide management with
information regarding potential troubled loans. Management is provided with a
monthly listing of loans that are 30 days or more past due along with a brief
description of what steps are being taken to resolve the delinquency. Quarterly,
coinciding with external financial reporting, the Company determines how each
delinquent loan should be classified. All loans 90 days or more past due are
classified as delinquent. Each delinquent loan is reviewed to determine the
classification and status the loan should be given. Interest accruals are
analyzed based on the likelihood of repayment. In no event will interest
continue to accrue when accrued interest along with the outstanding principal
exceeds the net realizable value of the property. The Company does not utilize a
specified number of days delinquent to cause an automatic non-accrual status.
In the past few years the Company has invested more of its funds in mortgage
loans. This is the result of increased mortgage opportunities available through
FSNB, an affiliate of Mr. Jesse T. Correll. Mr. Correll is the CEO and Chairman
of the Board of Directors of UTG and is, directly and through his affiliates,
its largest shareholder. FSNB has been able to provide the Company with
expertise and experience in underwriting commercial and residential mortgage
loans, which provide more attractive yields than the traditional bond market.
During 2004, 2003 and 2002 the Company issued approximately $ 2,627,000,
$ 11,405,000 and $ 6,920,000 in new mortgage loans, respectively. These new
loans were originated through FSNB and funded by the Company through
participation agreements with FSNB. FSNB services all the mortgage loans of the
Company. The Company pays FSNB a .25% servicing fee on these loans and a
one-time fee at loan origination of .50% of the original loan amount to cover
costs incurred by FSNB relating to the processing and establishment of the loan.
UG paid $ 45,468, $ 63,214 and $ 70,140 in servicing fees and $ 0, $ 13,821 and
$ 35,127 in origination fees to FSNB during 2004, 2003 and 2002, respectively.
A mortgage loan reserve is established and adjusted based on management's
quarterly analysis of the portfolio and any deterioration in value of the
underlying property which would reduce the net realizable value of the property
below its current carrying value.
In addition, the Company also attempts to ensure that current and adequate
insurance on the properties underlying the mortgages is being maintained. The
Company requires proof of insurance on each loan and further requires to be
shown as a lien holder on the policy so that any change in coverage status is
reported to the Company. Proof of payment of real estate taxes is another
monitoring technique utilized by the Company. Management believes a change in
insurance status or non-payments of real estate taxes are indicators that a loan
is potentially troubled. Correspondence with the mortgagee is performed to
determine the reasons for either of these events occurring.
The following table shows a distribution of the Company's mortgage loans by type.
Mortgage Loans Amount % of Total
- ------------------------------------------------------ ---------------- -------------
Commercial - insured or guaranteed $ 3,832,838 19%
Commercial - all other 16,807,574 81%
Residential - insured or guaranteed 53,210 0%
Residential - all other 28,793 0%
The following table shows a geographic distribution of the Company's mortgage
loan portfolio and investment real estate.
Mortgage Real
Loans Estate
------------ ----------
Alabama 15% 0%
Colorado 15% 0%
Illinois 7% 3%
Indiana 3% 0%
Kentucky 40% 36%
New Hampshire 0% 61%
Texas 20% 0%
Virginia 0% 0%
------------ ----------
Total 100% 100%
============ ==========
The following table summarizes delinquent mortgage loan holdings of the Company.
Delinquent
90 days or more 2004 2003 2002
- ----------------------------------- ------------- ------------- -------------
Non-accrual status $ 167,148 $ 179,204 $ 171,300
Other 0 0 0
Reserve on delinquent
Loans (120,000) (120,000) (120,000)
------------- ------------- -------------
Total delinquent $ 47,148 $ 59,204 $ 51,300
============= ============= =============
Interest income past due
(delinquent loans) $ 0 $ 0 $ 0
============= ============= =============
In process of restructuring $ 0 $ 0 $ 0
Restructuring on other
than market terms 0 0 0
Other potential problem
Loans 0 0 1,709
------------- ------------- -------------
Total problem loans $ 0 $ 0 $ 1,709
============= ============= =============
Interest income foregone
(restructured loans) $ 0 $ 0 $ 0
============= ============= =============
In process of foreclosure $ 1,401,345 $ 1,423,804 $ 0
------------- ------------- -------------
Total foreclosed loans $ 1,401,345 $ 1,423,804 $ 0
============= ============= =============
Interest income foregone
(restructured loans) $ 0 $ 0 $ 0
============= ============= =============
See Item 2, Properties, for description of real estate holdings.
COMPETITION
The insurance business is a highly competitive industry and there are a number
of other companies, both stock and mutual, doing business in areas where the
Company operates. Many of these competing insurers are larger, have more
diversified and established lines of insurance coverage, have substantially
greater financial resources and brand recognition, as well as a greater number
of agents. Other significant competitive factors in the insurance industry
include policyholder benefits, service to policyholders, and premium rates.
The Company has not placed an emphasis on new business production. Costs
associated with supporting new business can be significant. In recent years, the
insurance industry as a whole has experienced a decline in the total number of
agents who sell insurance products; therefore competition has intensified for
top producing sales agents. The relatively small size of the Company, and the
resulting limitations, has made it challenging to compete in this area. The
number of agents marketing the Company's products has reduced to a negligible
number.
The Company performs administrative work as a third party administrator (TPA)
for unaffiliated life insurance companies. During the year ended 2004, the
Company obtained an additional contract for these services, which should provide
approximately $ 360,000 additional annual revenues. These TPA revenue fees are
included in the line item "other income" on the Company's consolidated
statements of operations. The Company intends to continue to pursue other TPA
arrangements through its alliance with Fiserv Life Insurance Solutions (Fiserv).
Through this alliance, the Company provides TPA services to insurance companies
seeking business process outsourcing solutions. Fiserv is responsible for the
marketing and sales function for the alliance, as well as providing the
datacenter operations. UTG staffs the administration effort. Management believes
this alliance with Fiserv positions the Company to generate additional revenues
by utilizing the Company's current excess capacity and administrative services.
Fiserv is a unit of Fiserv, Inc. (Nasdaq: FISV) which is an independent,
full-service provider of integrated data processing and information management
systems to the financial industry, headquartered in Brookfield, Wisconsin.
The Company has considered the feasibility of a marketing opportunity with First
Southern National Bank (FSNB) an affiliate of UTG's largest shareholder.
Management has considered various products including annuity type products,
mortgage protection products and existing insurance products, as a possibility
to market to all banking customers. This marketing opportunity has potential and
is believed to be a viable niche. The Company has recently designed the
"Horizon" annuity product as well as the "Legacy" life product, which are both
to be used in marketing efforts by FSNB. The introduction of these new products
is currently not expected to produce significant premium writings.
GOVERNMENT REGULATION
Insurance companies are subject to regulation and supervision in all the states
where they do business. Generally the state supervisory agencies have broad
administrative powers relating to granting and revoking licenses to transact
business , license agents, approving forms of policies used, regulating trade
practices and market conduct, the form and content of required financial
statements, reserve requirements, permitted investments, approval of dividends
and in general, the conduct of all insurance activities. Insurance regulation is
concerned primarily with the protection of policyholders. The Company cannot
predict the impact of any future proposals, regulations or market conduct
investigations. UG is domiciled in the state of Ohio.
Insurance companies must also file detailed annual reports on a statutory
accounting basis with the state supervisory agencies where each does business;
(see Note 6 to the consolidated financial statements) regarding statutory equity
and income from operations. These agencies may examine the business and accounts
at any time. Under the rules of the National Association of Insurance
Commissioners (NAIC) and state laws, the supervisory agencies of one or more
states examine a company periodically, usually at three to five year intervals.
Most states also have insurance holding company statutes, which require
registration and periodic reporting by insurance companies controlled by other
corporations licensed to transact business within their respective
jurisdictions. The insurance subsidiary is subject to such legislation and
registered as controlled insurers in those jurisdictions in which such
registration is required. Statutes vary from state to state but typically
require periodic disclosure, concerning the corporation that controls the
registered insurers and all subsidiaries of such corporation. In addition, prior
notice to, or approval by, the state insurance commission of material
transactions with affiliates, including transfers of assets, reinsurance
agreements, management agreements (see Note 9 to the consolidated financial
statements), and payment of dividends (see Note 2 to the consolidated financial
statements) in excess of specified amounts by the insurance subsidiary, within
the holding company system, are required.
Risk-based capital requirements and state guaranty fund laws are discussed in
Item 7, "Management's Discussion and Analysis of Financial Condition and Results
of Operations".
EMPLOYEES
At December 31, 2004, UTG and its subsidiaries had 52 full-time equivalent
employees. UTG's operations are headquartered in Springfield, Illinois.
ITEM 2. PROPERTIES
The following table shows a breakout of property, net of accumulated
depreciation, owned and occupied by the Company and the distribution of real
estate by type.
Property owned Amount % of Total
Home Office $ 1,758,587 6%
Investment real estate
Commercial 27,386,294 91%
Residential development 805,787 3%
28,192,081 94%
Grand total $ 29,950,668 100%
Total investment real estate holdings represent approximately 9% of the total
assets of the Company net of accumulated depreciation of $ 2,872,199 and
$ 1,729,001 at year-end 2004 and 2003 respectively. The Company owns an office
complex in Springfield, Illinois, which houses the primary insurance operations.
The office buildings in this complex contain 57,000 square feet of office and
warehouse space, and are carried at $ 1,758,587. Currently, the facilities
occupied by the Company are adequate relative to the Company's present
operations.
Commercial property mainly consists of North Plaza, Hampshire Plaza and
Hampshire Plaza Garage. See Item 1, "Business" for additional information
regarding descriptions and operating results of these properties.
Residential development property is primarily located in Springfield, Illinois,
and consists of two parcels. The Company has no current plans to further develop
these parcels. The properties are located in a growing area of the community and
are currently being marketed for sale.
ITEM 3. LEGAL PROCEEDINGS
In the normal course of business the Company is involved from time to time in
various legal actions and other state and federal proceedings. There were no
proceedings pending as of December 31, 2004.
ITEM 4. SUBMISSION OF MATTERS TO A VOTE OF SECURITY HOLDERS
There were no matters submitted to a vote of UTG's shareholders during the
fourth quarter of 2004.
PART II
ITEM 5. MARKET FOR COMPANY'S COMMON EQUITY AND RELATED SHAREHOLDER MATTERS
The Registrant is a public company whose common stock is traded in the
over-the-counter market. Over-the-counter quotations can be obtained with the
UTGI.OB stock symbol.
The following table shows the high and low bid quotations for each quarterly
period during the past two years, without retail mark-up, mark-down or
commission and may not necessarily represent actual transactions. The quotations
below were acquired from the NASDAQ web site, which also provides quotes for
over-the-counter traded securities such as UTG.
2004 2003
PERIOD High Low High Low
First quarter 6.250 5.550 7.000 6.800
Second quarter 6.250 5.500 8.000 6.850
Third quarter 5.600 5.100 7.150 6.700
Fourth quarter 6.000 5.100 7.490 5.800
UTG has not declared or paid any dividends on its common stock in the past two
fiscal years, and has no current plans to pay dividends on its common stock as
it intends to retain all earnings for investment in and growth of the Company's
business. See Note 2 in the accompanying consolidated financial statements for
information regarding dividend restrictions, including applicable restrictions
on the ability of the Company's life insurance subsidiary to pay dividends up to
the Registrant.
As of March 22, 2005 there were 9,306 record holders of UTG common stock.
The following table reflects the Company's Employee and Director Stock Purchase
Plan Information:
- --------------------------------- ------------------------------ ------------------------------- ------------------------------
Plan category Number of securities to be Weighted-average exercise Number of securities
issued upon exercise of price of outstanding options, remaining available for
outstanding options, warrants and rights future issuance under
warrants and rights employee and director stock
purchase plans (excluding
securities reflected in
column (a))
(a) (b) (c)
- --------------------------------- ------------------------------ ------------------------------- ------------------------------
Employee and Director Stock
Purchase plans approved by
security holders
310,123
0 0
- --------------------------------- ------------------------------ ------------------------------- ------------------------------
Employee and Director Stock
Purchase plans not approved by
security holders
0 0 0
- --------------------------------- ------------------------------ ------------------------------- ------------------------------
Total 0 0 310,123
- --------------------------------- ------------------------------ ------------------------------- ------------------------------
On March 26, 2002, the Board of Directors of UTG adopted, and on June 11, 2002,
the shareholders of UTG approved the United Trust Group, Inc. Employee and
Director Stock Purchase Plan. The Plan allows for the issuance of up to 400,000
shares of UTG common stock. The plan's purpose is to encourage ownership of UTG
stock by eligible directors and employees of UTG and its subsidiary by providing
them with an opportunity to invest in shares of UTG common stock. The plan is
administered by the Board of Directors of UTG.
A total of 400,000 shares of common stock may be purchased under the plan,
subject to appropriate adjustment for stock dividends, stock splits or similar
recapitalizations resulting in a change in shares of UTG. The plan is not
intended to qualify as an "employee stock purchase plan" under Section 423 of
the Internal Revenue Code. During 2004 and 2003, the Board of Directors of UTG
approved offerings under the plan to qualified individuals. For the years ended
December 31, 2004 and 2003, four individuals purchased 14,440 and eight
individuals purchased 58,891 shares of UTG common stock, respectively. Each
participant under the plan executed a "stock restriction and buy-sell
agreement", which among other things provides UTG with a right of first refusal
on any future sales of the shares acquired by the participant under this plan.
The purchase price of shares repurchased under the stock restriction and
buy-sell agreement shall be computed, on a per share basis, equal to the sum of
(i) the original purchase price paid to acquire such shares from UTG and (ii)
the consolidated statutory net earnings (loss) per share of such shares during
the period from the end of the month next preceding the month in which such
shares were acquired pursuant to the plan, to the end of the month next
preceding the month in which the sale of such shares to UTG occurs. At
December 31, 2004, UTG had 89,877 shares outstanding that were issued under this
program with a value of $ 11.63 per share pursuant to the above formula.
The Company has no other stock plans.
ITEM 6. SELECTED FINANCIAL DATA
The following selected historical consolidated financial data should be read in
conjunction with "Item 7 - Management's Discussion and Analysis of Financial
Condition and Results of Operations," "Item 8 - Financial Statements and
Supplementary Data" and other financial information included elsewhere in this
Form 10-K.
FINANCIAL HIGHLIGHTS
(000's omitted, except per share data)
2004 2003 2002 2001 2000
------------- ----------- ----------- ------------ ------------
Premium income
net of reinsurance $ 14,140 $ 15,023 $ 15,832 $ 17,141 $ 19,490
Total revenues $ 25,467 $ 26,488 $ 30,177 $ 33,313 $ 35,747
Net income (loss)* $ (276) $ (6,396) $ 1,339 $ 2,308 $ (696)
Basic income (loss) per share $ (0.07) $ (1.67) $ 0.38 $ 0.62 $ (0.17)
Total assets $ 317,868 $ 311,557 $ 320,494 $ 328,939 $ 333,035
Total long-term debt $ 0 $ 2,290 $ 2,995 $ 4,401 $ 1,817
Dividends paid per share NONE NONE NONE NONE NONE
* Includes equity earnings of investees.
ITEM 7. MANAGEMENT'S DISCUSSION AND ANALYSIS OF FINANCIAL CONDITION AND
RESULTS OF OPERATIONS
The purpose of this section is to discuss and analyze the Company's consolidated
results of operations, financial condition and liquidity and capital resources
for the three years ended December 31, 2004. This analysis should be read in
conjunction with the consolidated financial statements and related notes, which
appear elsewhere in this Form 10-K. The Company reports financial results on a
consolidated basis. The consolidated financial statements include the accounts
of UTG and its subsidiaries at December 31, 2004.
Cautionary Statement Regarding Forward-Looking Statements
Any forward-looking statement contained herein or in any other oral or written
statement by the Company or any of its officers, directors or employees is
qualified by the fact that actual results of the Company may differ materially
from any such statement due to the following important factors, among other
risks and uncertainties inherent in the Company's business:
1. Prevailing interest rate levels, which may affect the ability of the
Company to sell its products, the market value of the Company's investments
and the lapse ratio of the Company's policies, notwithstanding product
design features intended to enhance persistency of the Company's products.
2. Changes in the federal income tax laws and regulations which may affect the
relative tax advantages of the Company's products.
3. Changes in the regulation of financial services, including bank sales and
underwriting of insurance products, which may affect the competitive
environment for the Company's products.
4. Other factors affecting the performance of the Company, including, but not
limited to, market conduct claims, insurance industry insolvencies,
insurance regulatory initiatives and developments, stock market
performance, an unfavorable outcome in pending litigation, and investment
performance.
Critical Accounting Policies
General
We have identified the accounting policies below as critical to the
understanding of our results of operations and our financial position. The
application of these critical accounting policies in preparing our financial
statement requires management to use significant judgments and estimates
concerning future results or other developments including the likelihood, timing
or amount of one or more future transactions or amounts. Actual results may
differ from these estimates under different assumptions or conditions. On an
on-going basis, we evaluate our estimates, assumptions and judgments based upon
historical experience and various other information that we believe to be
reasonable under the circumstances. For a detailed discussion of other
significant accounting policies, see Note 1 to the consolidated financial
statements.
DAC and Cost of Insurance Acquired
Deferred acquisition costs (DAC) and cost ofinsurance acquired reflect our
expectations about the future experience of the existing business in-force. The
primary assumptions regarding future experience that can affect the carrying
value of DAC and cost of insurance acquired balances include mortality, interest
spreads and policy lapse rates. Significant changes in these assumptions can
impact amortization of DAC and cost of insurance acquired in both the current
and future periods, which is reflected in earnings.
Investments
We regularly monitor our investment portfolio to ensure that investments that
may be other than temporarily impaired are identified in a timely manner and
properly valued, and that any impairments are charged against earnings in the
proper period.
Valuing our investment portfolio involves a variety of assumptions and
estimates, particularly for investments that are not actively traded. We rely on
external pricing sources for highly liquid publicly traded securities. Many
judgments are involved in timely identifying and valuing securities, including
potentially impaired securities. Inherently, there are risks and uncertainties
involved in making these judgments. Changes in circumstances and critical
assumptions such as a continued weak economy, a more pronounced economic
downturn or unforeseen events which affect one or more companies, industry
sectors or countries could result in write downs in future periods for
impairments that are deemed other than temporary.
Results of Operations
(a) Revenues
Premiums and policy fee revenues, net of reinsurance premiums and policy fees,
decreased 6% when comparing 2004 to 2003 and 5% from 2003 to 2002. The Company
continues to write very little new business, as Management places modest
emphasis on new business production. Unless the Company acquires a block of
in-force business, management expects premium revenue to continue to decline at
a rate consistent with prior experience. The Company's average persistency rate
for all policies in force for 2004, 2003 and 2002 was approximately 94.6%,
94.9%, and 93.6%, respectively. Persistency is a measure of insurance in force
retained in relation to the previous year.
The Company's primary source of new business production comes from the
conservation effort implemented several years ago. This effort was an attempt to
improve the persistency rate of insurance company's policies. Several of the
customer service representatives of the Company are also licensed insurance
agents, allowing them to offer other products within the Company's portfolio to
existing customers. Additionally, stronger efforts have been made in policy
retention through more personal contact with the customer including telephone
calls to discuss alternatives and reasons for a customer's request to surrender
their policy. Previously, the Company's agency force was primarily responsible
for conservation efforts. With the decline in the number of agents, their
ability to reach these customers diminished, making conservation efforts
difficult. The conservation efforts described above have been generally
positive. Management will continue to monitor these efforts and make adjustments
as seen appropriate to enhance the future success of the program. In 2003, the
Company replaced its original universal life product with a new universal life
contract referred to as "the Legacy". This product was designed for use with
several distribution channels including the Company's own internal agents, bank
agent/employees and through personally producing general agents "PPGA". In
addition, the Company has introduced other new and updated products in recent
periods including the Horizon Annuity and Kid Kare (as single premium, child
term policy). The company is currently working on development of a level term
and decreasing term product. Management has no current plans to increase
marketing efforts. New product development is anticipated to be utilized in
conservation efforts and sales to existing customers. Such sales are not
expected to be material.
The Company has considered the feasibility of a marketing opportunity with First
Southern National Bank (FSNB) an affiliate of UTG's largest shareholder,
Chairman and CEO, Mr. Jesse T. Correll. Management has considered various
products including annuity type products, mortgage protection products and
existing insurance products, as potential products that could be marketed to
banking customers. This marketing opportunity has potential and is believed to
be a viable niche. This potential is in the very early states of consideration.
Management will proceed cautiously and may even determine not to proceed. The
introduction of new products is not expected to produce significant premium
writings. The Company is currently looking at other types of products to
compliment the existing offerings.
Net investment income increased 1% when comparing 2004 to 2003 and decreased 24%
when comparing 2003 to 2002. The overall gross investment yields for 2004, 2003
and 2002, are 6.06%, 5.73% and 6.66%, respectively. The decline in investment
yield during 2003 was directly affected by the decline in the national prime
rate, which was 4.00% at December 31, 2003. The national prime rate increased to
5.25% at December 31, 2004; however, the lower yield in recent years has
resulted in reduced earnings on short-term funds as well as on longer-term
investments acquired during the reporting period. Through this period,
Management shortened the length of the Company's portfolio and maintained a
conservative investment philosophy. As such, following an analysis of current
holdings during the first half of 2004, the Company liquidated approximately
$ 39,000,000 of its collateralized mortgage obligation and mortgage backed bond
portfolio in order to limit its interest rate and extension risk. In addition,
there were $ 48,000,000 in bonds that matured or were called during 2004. The
result of these transactions caused an excess of cash invested in short-term
money market funds during parts of 2004. The Company began reinvesting this cash
during the second quarter primarily in governmental and agency bonds at current
lower yields. Although this hurts investment earnings in the short run, the
Company has not had to write off any investment losses due to excessive risk.
Many insurance companies have suffered significant losses in their investment
portfolios as a result of corporate defaults and bankruptcies in the last few
years; however, because of the Company's conservative investment philosophy the
Company has so far avoided such significant losses. The Company's corporate
holdings are relatively small compared to the insurance industry. Recent periods
investments acquired include a very limited amount in corporate securities.
In addition to the changing interest rate environment, the Company benefited
from improved earnings on its real estate investment in Hampshire Plaza. New
tenant leases during the year resulted in an increase in earnings on this
investment, with 2004 being the first year of ownership to show positive
results. The property is expected to continue showing positive results in future
periods. This parcel was acquired two years ago with an original projection of
two years of unprofitable results. Actual results have been better than
originally projected as a result of leasing vacant space quicker. This property
reflected an increase in investment income of approximately $992,000 in 2004 as
compared to 2003.
The Company's investments are generally managed to match related insurance and
policyholder liabilities. The comparison of investment return with insurance or
investment product crediting rates establishes an interest spread. The Company
monitors investment yields, and when necessary adjusts credited interest rates
on its insurance products to preserve targeted interest spreads, ranging from 1%
to 2%. In previous years, the Board of Directors lowered crediting rates to
their guaranteed minimum rates, and as such, cannot lower them any further.
These adjustments were in response to the continued declines in interest rates
in the marketplace described above. Policy interest crediting rate changes and
expense load changes become effective on an individual policy basis on the next
policy anniversary. Therefore, it takes a full year from the time the change was
determined for the full impact of such change to be realized. If interest rates
decline in the future, the Company won't be able to lower rates and both net
investment income and net income will be impacted negatively.
Realized investment gains, net of realized losses, were $ (20,648), $ 485,436
and $ 13,634 in 2004, 2003 and 2002, respectively. As previously discussed, the
Company sold several of its collateralized mortgage obligation bonds during 2004
and realized a nominal net loss on these securities. The primary source for the
2003 gain is from the sale of two investments. The Company sold one common stock
holding, realizing a gain of $ 165,262 and one real estate holding, realizing a
gain of $ 211,352. During 2002, the modest realized gain consisted primarily of
real estate sales on residential development property the Company owned in
Springfield, Illinois.
The Company performs administrative work as a third party administrator (TPA)
for unaffiliated life insurance companies. The Company receives monthly fees
based on policy in force counts and certain other activity indicators, such as
number of premium collections performed, or services performed. The Company
entered into a new contract mid-year 2004, which should provide approximately
$ 360,000 additional annual revenues. For the years ended 2004, 2003 and 2002,
the Company received $ 719,053, $ 571,298, and $ 521,782 for this work,
respectively. These TPA revenue fees are included in the line item "other
income" on the Company's consolidated statements of operations. The Company
intends to continue to pursue other TPA arrangements, through an alliance with
Fiserv (Fiserv) to insurance companies seeking business process outsourcing
solutions. Fiserv will be responsible for the marketing and sales function for
the alliance, as well as providing the datacenter operations. UTG will staff the
administration effort. Management believes this alliance with Fiserv positions
the Company to generate additional revenues by utilizing the Company's current
excess capacity and administrative services. Fiserv is a unit of Fiserv, Inc.
(Nasdaq: FISV) which is an independent, full-service provider of integrated data
processing and information management systems to the financial industry,
headquartered in Brookfield, Wisconsin. Management believes this area is a
growing market and the Company is well positioned to serve this market.
(b) Expenses
Benefits, claims and settlement expenses net of reinsurance benefits and claims,
decreased $ 2,307,898 from 2003 to 2004 and increased $ 1,631,372 from 2002 to
2003. The significant fluctuations between the three years relates primarily to
changes in the Company's policyholder reserves, or future policy benefits.
Reserves are calculated on an individual policy basis and generally increase
over the life of the policy as a result of additional premium payments and
acknowledgement of increased risk as the insured continues to age. Fluctuations
in death claim experience from year to year also typically have a significant
impact on variances in this line item. Death claims were approximately $240,000
less in 2004 as compared to 2003. Direct (prior to reinsurance) death claims
were approximately $ 1,024,000 less in 2004 than in 2003. There is no single
event that caused the mortality variances. Policy claims vary from year to year
and therefore, fluctuations in mortality are to be expected and are not
considered unusual by management. Policy surrender benefits decreased
approximately $ 546,000 during the year 2004 compared to the same period in 2003
and $ 980,000 during the year 2003 compared to the same period in 2002. As
discussed above, stronger efforts have been made in policy retention through
more personal contact with customers including telephone calls to discuss
alternatives and reasons for a request to surrender their policy. The short-term
impact of such fewer policy surrenders is negligible since a reserve for future
policy benefits payable is held which is, at a minimum, equal to and generally
greater than the cash surrender value of a policy. Therefore, a decline in
current period surrenders results in an overall increase in the policy benefits
number in the current period. The benefit of fewer policy surrenders is
primarily received over a longer time period through the retention of the
Company's asset base.
Commissions and amortization of deferred policy acquisition costs decreased 1%
in 2004 compared to 2003 and decreased 60% in 2003 compared to 2002. The most
significant factor in the continuing decrease is attributable to the Company
paying fewer commissions, since the Company writes very little new business and
renewal premiums on existing business continue to decline. Another factor of the
decrease is attributable to normal amortization of the deferred policy
acquisition costs asset. The Company reviews the recoverability of the asset
based on current trends and known events compared to the assumptions used in the
establishment of the original asset. No impairments were recorded in any of the
three periods reported.
Net amortization of cost of insurance acquired increased 10% in 2004 compared to
2003 and decreased 12% in 2003 compared to 2002. Cost of insurance acquired is
established when an insurance company is acquired. The Company assigns a portion
of its cost to the right to receive future cash flows from insurance contracts
existing at the date of the acquisition. The cost of policies purchased
represents the actuarially determined present value of the projected future cash
flows from the acquired policies. Cost of insurance acquired is comprised of
individual life insurance products including whole life, interest sensitive
whole life and universal life insurance products. Cost of insurance acquired is
amortized with interest in relation to expected future profits, including direct
charge-offs for any excess of the unamortized asset over the projected future
profits. The interest rates utilized in the amortization calculation are 9% on
approximately 25% of the balance and 15% on the remaining balance. The interest
rates vary due to risk analysis performed at the time of acquisition on the
business acquired. The amortization is adjusted retrospectively when estimates
of current or future gross profits to be realized from a group of products are
revised. Amortization of cost of insurance acquired is particularly sensitive to
changes in interest rate spreads and persistency of certain blocks of insurance
in-force. Persistency is a measure of insurance in force retained in relation to
the previous year. The Company's average persistency rate for all policies in
force for 2004, 2003 and 2002 has been approximately 94.6%, 94.9% and 93.6%,
respectively. Based on the projected future profits of the insurance in-force
during 2003, the Company wrote off an additional $ 5,000,000 of cost of
insurance acquired. This write-off is primarily the result of continued
tightening of interest rate spreads of the Company. The Company continues to
analyze these projections to determine the adequacy of present values assigned
to future cash flows.
Operating expenses decreased 30% in 2004 compared to 2003 and increased 29% in
2003 compared to 2002. During 2003, the Company paid $ 1,950,000 in settlement
of a lawsuit. In addition, the Company maintained a $ 75,000 accrual during 2004
to cover expected future costs regarding this matter. Additional expense
reductions have been made in the normal course of business, as the Company
continually monitors expenditures looking for savings opportunities. These
expense reductions have been partially offset by increased operating costs of
approximately $ 285,000 attributable to the Company's conversion of its existing
business and TPA clients to "ID3", a software system owned by Fiserv and
utilized by the Company. Conversion costs to date include fees for initial
licensing, consultation, and training.
Interest expense declined 52% comparing 2004 to 2003 and 38% comparing 2003 to
2002. The Company repaid $ 2,289,776, $ 705,499 and $ 1,405,395 in outside debt
in 2004, 2003 and 2002 respectively, through operating cash flows and dividends
received from its subsidiary UG. At December 31, 2004, UTG had no debt
outstanding for the first time since 1992.
Deferred taxes are established to recognize future tax effects attributable to
temporary differences between the financial statements and the tax return. As
these differences are realized in the financial statement or tax return, the
deferred income tax established on the difference is recognized in the financial
statements as an income tax expense or credit.
(c) Net income (loss)
The Company had a net income (loss) of $ (275,617), $ (6,396,490), and
$ 1,338,795 in 2004, 2003 and 2002 respectively. Significant one-time charges
and accruals to operating expenses, combined with an additional write-off of
cost of insurance acquired and lower interest rates during 2003 as previously
described, were the primary differences in the 2004 to 2003 results. The Company
continues to monitor and adjust those items within its control.
Financial Condition
(a) Assets
Investments are the largest asset group of the Company. The Company's insurance
subsidiary is regulated by insurance statutes and regulations as to the type of
investments it is permitted to make, and the amount of funds that may be used
for any one type of investment. In light of these statutes and regulations, and
the Company's business and investment strategy, the Company generally seeks to
invest in United States government and government agency securities and other
high quality low risk investments. Many insurance companies have suffered
significant losses in their investment portfolios in the last couple of years;
however, because of the Company's conservative investment philosophy the Company
has so far largely avoided such significant losses. The Company has not written
off any investment losses in these turbulent economic times.
At December 31, 2004, the carrying value of fixed maturity securities in default
as to principal or interest was immaterial in the context of consolidated assets
or shareholders' equity. The Company has identified securities it may sell and
classified them as "investments held for sale". Investments held for sale are
carried at market, with changes in market value charged directly to
shareholders' equity. To provide additional flexibility and liquidity, the
Company has categorized almost all fixed maturity investments acquired in recent
periods as available for sale.
The following table summarizes the Company's fixed maturities distribution at
December 31, 2004 and 2003 by ratings category as issued by Standard and Poor's,
a leading ratings analyst.
Fixed Maturities
Rating % of Portfolio
----------------------
2004 2003
---------- ----------
Investment Grade
AAA 82% 82%
AA 1% 1%
A 13% 12%
BBB 4% 4%
Below investment grade 0% 1%
---------- ----------
100% 100%
========== ==========
In previous years the Company has invested more of its funds in mortgage loans.
This is the result of increased mortgage opportunities available through FSNB,
an affiliate of Mr. Jesse T. Correll. Mr. Correll is the CEO and Chairman of the
Board of Directors of UTG, and directly and indirectly through affiliates, its
largest shareholder. FSNB has been able to provide the Company with additional
expertise and experience in underwriting commercial and residential mortgage
loans, which provide more attractive yields than the traditional bond market.
During 2004, 2003 and 2002 the Company issued approximately $ 2,627,000,
$ 11,405,000 and $ 6,920,000 respectively, in new mortgage loans. These new
loans were originated through FSNB and funded by the Company through
participation agreements with FSNB. FSNB services the loans covered by these
participation agreements. The Company pays FSNB a .25% servicing fee on these
loans and a one-time fee at loan origination of .50% of the original loan amount
to cover costs incurred by FSNB relating to the processing and establishment of
the loan. UG paid $ 45,468, $ 63,214 and $ 70,140 in servicing fees and $ 0,
$ 13,821 and $ 35,127 in origination fees to FSNB during 2004, 2003 and 2002,
respectively. The Company anticipates these opportunities to continue to be
available and will pursue those investments that provide attractive yields.
Total investment real estate holdings represent approximately 9% and 8% of the
total assets of the Company, net of accumulated depreciation, at year-end 2004
and 2003 respectively. Total investment real estate is separated into commercial
and residential categories.
Policy loans remained consistent for the periods presented. Industry experience
for policy loans indicates that few policy loans are ever repaid by the
policyholder, other than through termination of the policy. Policy loans are
systematically reviewed to ensure that no individual policy loan exceeds the
underlying cash value of the policy.
Deferred policy acquisition costs decreased 21% in 2004 compared to 2003.
Deferred policy acquisition costs, which vary with, and are primarily related to
producing new business, are referred to as DAC. DAC consists primarily of
commissions and certain costs of policy issuance and underwriting, net of fees
charged to the policy in excess of ultimate fees charged. To the extent these
costs are recoverable from future profits, the Company defers these costs and
amortizes them with interest in relation to the present value of expected gross
profits from the contracts, discounted using the interest rate credited by the
policy. The Company had $ 5,000 in policy acquisition costs deferred, $ 10,000
in interest accretion and $ 447,380 in amortization in 2004, and had $ 61,000 in
policy acquisition costs deferred, $ 17,000 in interest accretion and $ 417,844
in amortization in 2003.
Cost of insurance acquired decreased 13% in 2004 compared to 2003. When an
insurance company is acquired, the Company assigns a portion of its cost to the
right to receive future cash flows from insurance contracts existing at the date
of the acquisition. The cost of policies purchased represents the actuarially
determined present value of the projected future cash flows from the acquired
policies. Cost of insurance acquired is amortized with interest in relation to
expected future profits, including direct charge-offs for any excess of the
unamortized asset over the projected future profits. In 2004 and 2003
amortization decreased the asset by $ 1,869,135 and $ 1,695,328, respectively.
In 2003, the balance was reduced by an additional $ 5,000,000 as a direct
charge-off of unamortized asset over the projected future profits. Also, the
balance was reduced $ 8,409,722 in 2002 as a result of the valuation adjustment
attributable to the acquisition of the minority positions of FCC through its
merger with and into UTG.
(b) Liabilities
Total liabilities increased less than 1% in 2004 compared to 2003. Policy
liabilities and accruals, which represented 94% and 95% of total liabilities at
year end 2004 and 2003, respectively, decreased slightly during the current
year. The decrease is attributable to a decrease in the outstanding policy
benefit claims at the end of the year.
The Company had $ 0 and $ 2,289,776 in outstanding notes payable as of December
31, 2004 and 2003, respectively. The Company has two lines of credit available
for operating liquidity or acquisitions of additional lines of business. The
Company's long-term debt is discussed in more detail in Note 11 to the
consolidated financial statements, which is incorporated herein by this
reference.
(c) Shareholders' Equity
Total shareholders' equity increased 12% in 2004 compared to 2003. This is
primarily due to significant increases in the unrealized gains on the Company's
equity investments. Unrealized gains increased by $ 5,112,145 during 2004. This
increase in unrealized gains is partially offset by the net loss from operations
during the year of $ (275,617). Other factors that impacted shareholders' equity
included issuance of shares from an employee and director stock purchase plan
which was approved and implemented in 2002 of $ 167,360 and treasury shares
purchased and retirements totaling $ (299,057).
The Company's current and merged insurance subsidiaries are assessed
contributions by life and health guaranty associations in almost all states to
indemnify policyholders of failed companies. In several states the company may
reduce premium taxes paid to recover a portion of assessments paid to the
states' guaranty fund association. This right of "offset" may come under review
by the various states, and the company cannot predict whether and to what extent
legislative initiatives may affect this right to offset. In addition, some state
guaranty associations have adjusted the basis by which they assess the cost of
insolvencies to individual companies. The Company believes that its reserve for
future guaranty fund assessments is sufficient to provide for assessments
related to known insolvencies. This reserve is based upon management's current
expectation of the availability of this right of offset, known insolvencies and
state guaranty fund assessment bases. However, changes in the basis whereby
assessments are charged to individual companies and changes in the availability
of the right to offset assessments against premium tax payments could materially
affect the Company's results.
Each year, the NAIC calculates financial ratio results (commonly referred to as
IRIS ratios) for each insurance company. These ratios compare key financial data
pertaining to the statutory balance sheet and income statement. The results are
then compared to pre-established normal ranges determined by the NAIC. Results
outside the range typically require explanation to the domiciliary insurance
department. At year-end 2004, UG had four ratios outside the normal range. These
ratios are discussed in more detail in the Regulatory Environment discussion
included in this Item 7.
Liquidity and Capital Resources
The Company has two principal needs for cash - the insurance companies'
contractual obligations to policyholders and the payment of operating expenses.
Cash and cash equivalents as a percentage of total assets were 4% and 3% as of
December 31, 2004 and 2003, respectively. Fixed maturities as a percentage of
total invested assets were 50% and 68% as of December 31, 2004 and 2003,
respectively.
The Company's investments are predominantly in fixed maturity investments such
as bonds and mortgage loans, which provide sufficient return to cover future
obligations. The Company carries certain of its fixed maturity holdings as held
to maturity which are reported in the financial statements at their amortized
cost.
Many of the Company's products contain surrender charges and other features
which reward persistency and penalize the early withdrawal of funds. With
respect to such products, surrender charges are generally sufficient to cover
the Company's unamortized deferred policy acquisition costs with respect to the
policy being surrendered.
Cash provided by (used in) operating activities was $ (45,950), $ (933,048) and
$ 467,034 in 2004, 2003 and 2002, respectively. Reporting regulations require
cash inflows and outflows from universal life insurance products to be shown as
financing activities when reporting on cash flows. The net cash provided by
operating activities plus policyholder contract deposits less policyholder
contract withdrawals equaled $ 1,754,504 in 2004, $ 1,504,703 in 2003 and
$ 2,798,799 in 2002. Management utilizes this measurement of cash flows as an
indicator of the performance of the Company's insurance operations.
Cash provided by (used in) investing activities was $ 3,776,714, $ (15,846,714)
and $ 7,833,788 for 2004, 2003 and 2002, respectively. The most significant
aspect of cash provided by (used in) investing activities is the fixed maturity
transactions. Fixed maturities account for 82%, 82% and 78% of the total cost of
investments acquired in 2004, 2003 and 2002, respectively.
Net cash provided by (used in) financing activities was $ (621,019), $ 1,487,041
and $ (473,692) for 2004, 2003 and 2002, respectively. The Company paid off the
remaining balance of its outstanding debt in 2004. Such payments are included
within this category. In addition, in 2001 the Board of Directors of the Company
authorized a repurchase program of UTG's common stock and the purchase of stock
is still pursued as it becomes available. In addition, in 2002 this category
includes payments made to former FCC shareholders for shares they owned prior to
the merger of FCC into UTG.
Policyholder contract deposits decreased 5% in 2004 compared to 2003 and 8% in
2003 compared to 2002. The decrease in policyholder contract deposits relates to
the declining in force business of the Company. New premium production of
interest sensitive type policies has been negligible in recent periods.
Management anticipates continued moderate declines in contract deposits.
Policyholder contract withdrawals have increased 2% in 2004 compared to 2003 and
decreased 11% in 2003 compared to 2002. The change in policyholder contract
withdrawals is not attributable to any one significant event. Factors that
influence policyholder contract withdrawals are fluctuation of interest rates,
competition and other economic factors.
During 2004, the Company paid in full the remaining debt owed to two former
officers and directors of the Company and their respective families as a result
of an April 2001 stock purchase transaction. These notes were paid from a draw
on a line of credit, which was also repaid in 2004. As of December 31, 2004, the
Company has no outstanding notes payable.
The Company has two lines of credit available for future use. The Company has a
$ 3,300,000 line of credit (LOC) available from the First National Bank of the
Cumberlands (FNBC) located in Livingston, Tennessee. The interest rate on the
LOC is variable and indexed to be the lowest of the U.S. prime rates as
published in the Wall Street Journal, with any interest rate adjustments to be
made monthly. At December 31, 2004, the Company had no outstanding borrowings
attributable to this LOC. During 2004 and 2003, the Company had no borrowings
against this LOC. During 2002 the Company had total borrowings of $ 1,600,000 on
this LOC, which were all repaid during the year.
The second LOC available to the Company is a $ 5,000,000 line of credit (LOC)
extended from Southwest Bank of St. Louis. As collateral for any draws under the
line of credit, the Company pledged 100% of the common stock of its insurance
subsidiary UG. Borrowings under the LOC bear interest at the rate of 0.25% in
excess of Southwest Bank of St. Louis' prime rate. At December 31, 2004, the
Company had no outstanding borrowings attributable to this LOC. During 2004, the
Company had total borrowings of $ 2,275,000, which were repaid during the year.
In addition, during 2002 the Company had total borrowings of $ 400,000 on this
LOC which were all repaid during the year.
During 2002, UTG and Fiserv formed an alliance between their respective
organizations to provide third party administration (TPA) services to insurance
companies seeking business process outsourcing solutions. Fiserv will be
responsible for the marketing and sales function for the alliance, as well as
providing the operations processing service for the Company. The Company will
staff the administration effort. To facilitate the alliance, the Company has
converted part of its existing business and all TPA clients to "ID3", a software
system owned by Fiserv to administer an array of life, health and annuity
products in the insurance industry. Fiserv is a unit of Fiserv, Inc. (Nasdaq:
FISV) which is an independent, full-service provider of integrated data
processing and information management systems to the financial industry,
headquartered in Brookfield, Wisconsin. In addition, the Company entered into a
five-year contract with Fiserv for services related to their purchase of the
"ID3" software system. Under the contract, the Company is required to pay
$ 12,000 per month in software maintenance costs and a monthly fee for offsite
data center costs, based on the number and type of policies being administered
the ID3 software system for a five-year period from the date of the signing.
On November 20, 1998, FSF and affiliates acquired 929,904 shares of common stock
of UTG from UTG and certain UTG shareholders. As consideration for the shares,
FSF paid UTG $ 10,999,995 and certain shareholders of UTG $ 999,990 in cash.
Included in the stock acquisition agreement was an earnings covenant whereby UTG
warrants UTG and its subsidiaries and affiliates would have future earnings of
at least $ 30,000,000 for a five-year period beginning January 1, 1998. Such
earnings were computed based on statutory results excluding inter-company
activities such as inter-company dividends plus realized and unrealized gains
and losses on real estate, mortgage loans and unaffiliated common stocks. At the
end of the covenant period, an adjustment was to be made equal to the difference
between the then market value and statutory carrying value of real estate still
owned that existed at the beginning of the covenant period. If UTG did not meet
the covenant requirements, any shortfall would first be reduced by the actual
average tax rate for UTG for the period, and then will be further reduced by
one-half of the percentage, if any, representing UTG's ownership percentage of
the insurance company subsidiaries. This result would then be reduced by
$ 250,000. The remaining amount would be paid by UTG in the form of UTG common
stock valued at $ 15.00 per share with a maximum number of shares to be issued
of 500,000. However, there was to be no limit to the number of shares
transferred to the extent that there are legal fees, settlements, damage
payments or other losses as a result of certain legal action taken. The price
and number of shares was adjusted for any applicable stock splits, stock
dividends or other recapitalizations. For the five-year period starting
January 1, 1998 and ending December 31, 2003, the Company had total earnings of
$ 17,011,307 applicable to this covenant. Therefore, UTG did not meet the
earnings requirements stipulated, and during 2003, UTG was required to issue
500,000 additional shares to FSF or its assigns.
UTG is a holding company that has no day-to-day operations of its own. Funds
required to meet its expenses, generally costs associated with maintaining the
Company in good standing with states in which it does business, are primarily
provided by its subsidiaries. On a parent only basis, UTG's cash flow is
dependent on management fees received from its insurance subsidiary and earnings
received on cash balances. On December 31, 2004, substantially all of the
consolidated shareholders equity represents net assets of its subsidiary. The
Company's insurance subsidiary has maintained adequate statutory capital and
surplus and has not used surplus relief or financial reinsurance, which have
come under scrutiny by many state insurance departments. The payment of cash
dividends to shareholders is not legally restricted. However, the state
insurance department regulates insurance company dividend payments where the
company is domiciled.
UG is an Ohio domiciled insurance company, which requires five days prior
notification to the insurance commissioner for the payment of an ordinary
dividend. Ordinary dividends are defined as the greater of: a) prior year
statutory earnings or b) 10% of statutory capital and surplus. At December 31,
2004 UG statutory shareholders' equity was $ 21,860,401. At December 31, 2004,
UG statutory loss from operations was $ (762,152). Extraordinary dividends
(amounts in excess of ordinary dividend limitations) require prior approval of
the insurance commissioner and are not restricted to a specific calculation. UG
paid a dividend of $ 2,275,000 to UTG in 2004, of which $ 974,180 was considered
to be an extraordinary dividend.
Management believes the overall sources of liquidity available will be
sufficient to satisfy its financial obligations.
REGULATORY ENVIRONMENT
In March 2005, UTG's Board of Directors adopted a proposal to change the state
of incorporation of UTG from Illinois to Delaware by merging UTG with and into a
wholly-owned Delaware subsidiary (the "reincorporation merger"). The Board of
Directors and management of UTG believe that reincorporation in Delaware would
be beneficial to the Company because Delaware corporate law is more
comprehensive, widely used and extensively interpreted than other state
corporate laws, including Illinois corporate law. The reincorporation merger
would effect only a change in UTG's legal domicile and certain other changes of
a legal nature. It would not result in any change in UTG's business, management,
fiscal year, assets or liabilities or location of its principal facilities. The
Board of Directors intends to submit the reincorporation proposal to its
shareholders for approval at the 2005 annual meeting of shareholders to be held
on June 15, 2005. If approved by shareholders, UTG expects that the
reincorporation merger would be effected as soon as reasonably practicable
following the annual meeting.
The Company's current and merged insurance subsidiaries are assessed
contributions by life and health guaranty associations in almost all states to
indemnify policyholders of failed companies. In several states the company may
reduce premium taxes paid to recover a portion of assessments paid to the
states' guaranty fund association. This right of "offset" may come under review
by the various states, and the company cannot predict whether and to what extent
legislative initiatives may affect this right to offset. In addition, some state
guaranty associations have adjusted the basis by which they assess the cost of
insolvencies to individual companies. The Company believes that its reserve for
future guaranty fund assessments is sufficient to provide for assessments
related to known insolvencies. This reserve is based upon management's current
expectation of the availability of this right of offset, known insolvencies and
state guaranty fund assessment bases. However, changes in the basis whereby
assessments are charged to individual companies and changes in the availability
of the right to offset assessments against premium tax payments could materially
affect the company's results.
Currently, UG, the insurance subsidiary, is subject to government regulation in
each of the states in which it conducts business. Such regulation is vested in
state agencies having broad administrative power dealing with all aspects of the
insurance business, including the power to: (i) grant and revoke licenses to
transact business; (ii) regulate and supervise trade practices and market
conduct; (iii) establish guaranty associations; (iv) license agents; (v) approve
policy forms; (vi) approve premium rates for some lines of business; (vii)
establish reserve requirements; (viii) prescribe the form and content of
required financial statements and reports; (ix) determine the reasonableness and
adequacy of statutory capital and surplus; and (x) regulate the type and amount
of permitted investments. Insurance regulation is concerned primarily with the
protection of policyholders. The Company cannot predict the impact of any future
proposals, regulations or market conduct investigations. UG is domiciled in the
state of Ohio.
The insurance regulatory framework continues to be scrutinized by various
states, the federal government and the National Association of Insurance
Commissioners (NAIC). The NAIC is an association whose membership consists of
the insurance commissioners or their designees of the various states. The NAIC
has no direct regulatory authority over insurance companies. However, its
primary purpose is to provide a more consistent method of regulation and
reporting from state to state. This is accomplished through the issuance of
model regulations, which can be adopted by individual states unmodified,
modified to meet the state's own needs or requirements, or dismissed entirely.
Most states also have insurance holding company statutes, which require
registration and periodic reporting by insurance companies controlled by other
corporations licensed to transact business within their respective
jurisdictions. The insurance subsidiary is subject to such legislation and
registered as controlled insurers in those jurisdictions in which such
registration is required. Statutes vary from state to state but typically
require periodic disclosure, concerning the corporation that controls the
registered insurers and all subsidiaries of such corporation. In addition, prior
notice to, or approval by, the state insurance commission of material
intercorporate transfers of assets, reinsurance agreements, management
agreements (see Note 9 to the consolidated financial statements), and payment of
dividends (see Note 2 to the consolidated financial statements) in excess of
specified amounts by the insurance subsidiary, within the holding company
system, are required.
Each year, the NAIC calculates financial ratio results (commonly referred to as
IRIS ratios) for each company. These ratios compare various financial
information, pertaining to the statutory balance sheet and income statement. The
results are then compared to pre-established normal ranges determined by the
NAIC. Results outside the range typically require explanation to the domiciliary
insurance department.
At year-end 2004, UG had four ratios outside the normal range. Each of the
ratios outside the normal range was anticipated by Management, based upon the
operating results of the Company. The first ratio addresses significant
variations in capital of the life company. The variance from normal was the
result of the contribution of capital, North Plaza of Somerset, to the insurance
company from its parent. The second ratio compares net income with total income,
including realized capital gains and losses. Any ratio that results in a
negative value will be considered outside the normal range. As expected with the
current year loss by the insurance subsidiary, this ratio was outside the normal
range. The third ratio was slightly outside the normal range, as it relates to
net investment income. As discussed in previous sections of this report,
investment income has been hindered by declining interest rates in recent years
and the average life of the investment portfolio. The fourth ratio outside the
normal range relates to the current year change in premium. As previously
discussed, premium revenues have declined in recent periods. In addition to this
factor, the Company paid additional reinsurance premiums during the current year
that were due in previous periods.
The NAIC's risk-based capital requirements require insurance companies to
calculate and report information under a risk-based capital formula. The
risk-based capital (RBC) formula measures the adequacy of statutory capital and
surplus in relation to investment and insurance risks such as asset quality,
mortality and morbidity, asset and liability matching and other business
factors. The RBC formula is used by state insurance regulators as an early
warning tool to identify, for the purpose of initiating regulatory action,
insurance companies that potentially are inadequately capitalized. In addition,
the formula defines new minimum capital standards that will supplement the
current system of low fixed minimum capital and surplus requirements on a
state-by-state basis. Regulatory compliance is determined by a ratio of the
insurance company's regulatory total adjusted capital, as defined by the NAIC,
to its authorized control level RBC, as defined by the NAIC. Insurance companies
below specific trigger points or ratios are classified within certain levels,
each of which requires specific corrective action. The levels and ratios are as
follows:
Ratio of Total Adjusted Capital to
Authorized Control Level RBC
Regulatory Event (Less Than or Equal to)
Company action level 2*
Regulatory action level 1.5
Authorized control level 1
Mandatory control level 0.7
* Or, 2.5 with negative trend.
At December 31, 2004, the insurance subsidiary has a ratio that is in excess of
4, which is 400% of the authorized control level; accordingly, the insurance
subsidiary meets the RBC requirements.
On July 30, 2002, President Bush signed into law the "SARBANES-OXLEY" Act of
2002 ("the Act"). This Law, enacted in response to several high-profile business
failures, was developed to provide meaningful reforms that protect the public
interest and restore confidence in the reporting practices of publicly traded
companies. The implications of the Act to public companies, (which includes UTG)
are vast, widespread, and evolving. Many of the new requirements will not take
effect or full effect until after calendar-year-end companies have completed
their 2004 annual reports. The Company has implemented requirements affecting
the current reporting period, and is continually monitoring, evaluating, and
planning implementation of requirements that will need to be taken into account
in future reporting periods.
ACCOUNTING AND LEGAL DEVELOPMENTS
The Financial Accounting Standards Board ("FASB") has issued Statement No. 132
(revised 2003), Employers' Disclosures about Pensions and Other Postretirement
Benefits (an amendment of FASB Statements 87, 88 and 106). Statement No. 132 was
developed to address concerns of users of financial statements regarding their
need for more information about pension plan assets, obligations, benefit
payment, contributions and net benefit costs. This statement was effective at
the beginning of the first interim period beginning after December 15, 2003. The
adoption of Statement 132 (revised 2003) did not affect the Company's financial
position or results of operations, since the Company has no such plans that meet
the provisions of this statement.
The Financial Accounting Standards Board ("FASB") has issued Statement No. 151,
Inventory Costs--an amendment of ARB No. 43, Chapter 4. This Statement amends the
guidance in ARB No. 43, Chapter 4, "Inventory Pricing," to clarify the
accounting for abnormal amounts of idle facility expense, freight, handling
costs, and wasted material (spoilage). This Statement requires that those items
be recognized as current-period charges regardless of whether they meet the
criterion of "so abnormal." In addition, this Statement requires that allocation
of fixed production overheads to the costs of conversion be based on the normal
capacity of the production facilities. This statement is effective for financial
statements for fiscal years beginning after June 15, 2005. The adoption of
Statement 151 does not currently affect the Company's financial position or
results of operations, since the Company has no inventory costs that meet the
provisions of this statement.
The Financial Accounting Standards Board ("FASB") has issued Statement No. 152,
Accounting for Real Estate Time-Sharing Transactions. Statement No. 152 amends
FASB Statement No. 66, Accounting for Sales of Real Estate, to reference the
financial accounting and reporting guidance for real estate time-sharing
transactions that is provided in AICPA Statement of Position (SOP) 04-2,
Accounting for Real Estate Time-Sharing Transactions. Statement No. 152 also
amends FASB Statement No. 67, Accounting for Costs and Initial Rental Operations
of Real Estate Projects, to state that the guidance for (a) incidental
operations and (b) costs incurred to sell real estate projects does not apply to
real estate time-sharing transactions. This statement is effective for financial
statements for fiscal years beginning after June 15, 2005. The adoption of
Statement 152 does not currently affect the Company's financial position or
results of operations, since the Company has no real estate interests that meet
the provisions of this statement.
The Financial Accounting Standards Board ("FASB") has issued Statement No. 153,
Exchanges of Nonmonetary Assets. Statement No. 153 amends APB Opinion No. 29,
Accounting for Nonmonetary Transactions, to eliminate the exception for
nonmonetary exchanges of similar productive assets and replaces it with a
general exception for exchanges of nonmonetary assets that do not have
commercial substance. This statement is effective for financial statements for
nonmonetary asset exchanges occurring in fiscal periods beginning after June 15,
2005. The Company's will account for all future nonmonetary asset exchanges in
accordance with the requirements of Statement No. 153.
The Financial Accounting Standards Board ("FASB") has issued Statement No. 123
(revised 2004), Share Based Payment. Statement No. 123 establishes standards for
the accounting for transactions in which an entity exchanges its equity
instruments for goods or services. It also addresses transactions in which an
entity incurs liabilities in exchange for goods or services that are based on
the fair value of the entity's equity instruments or that may be settled by the
issuance of those equity instruments. This statement is effective as of the
beginning of the first interim or annual reporting period that begins after
June 15, 2005. The Company's will account for all future share based payments in
accordance with the requirements of Statement No. 123.
ITEM 7A. QUANTITATIVE AND QUALITATIVE DISCLOSURES ABOUT MARKET RISK
Market risk relates, broadly, to changes in the value of financial instruments
that arise from adverse movements in interest rates, equity prices and foreign
exchange rates. The Company is exposed principally to changes in interest rates
which affect the market prices of its fixed maturities available for sale. The
Company's exposure to equity prices and foreign currency exchange rates is
immaterial. The information is presented in U.S. Dollars, the Company's
reporting currency.
Interest rate risk
The Company could experience economic losses if it were required to liquidate
fixed income securities available for sale during periods of rising and/or
volatile interest rates. The Company attempts to mitigate its exposure to
adverse interest rate movements through staggering the maturities of its fixed
maturity investments and through maintaining cash and other short term
investments to assure sufficient liquidity to meet its obligations and to
address reinvestment risk considerations.
Tabular presentation
The Company does not have long-term debt that is sensitive to changes in
interest rates or derivative financial instruments or interest rate swap
contracts.
ITEM 8. FINANCIAL STATEMENTS AND SUPPLEMENTARY DATA
Listed below are the financial statements included in this Part of the Annual
Report on SEC Form 10-K:
Page No.
UNITED TRUST GROUP, INC. AND CONSOLIDATED SUBSIDIARIES
Independent Auditors' Report for the
years ended December 31, 2004, 2003, 2002.................................31
Consolidated Balance Sheets..................................................32
Consolidated Statements of Operations........................................33
Consolidated Statements of Shareholders' Equity..............................34
Consolidated Statements of Cash Flows........................................35
Notes to Consolidated Financial Statements............................... 36-60
Independent Auditors' Report
Board of Directors and Shareholders
UNITED TRUST GROUP, INC.
We have audited the accompanying consolidated balance sheets of UNITED
TRUST GROUP, INC. (an Illinois corporation) and subsidiaries as of December 31,
2004 and 2003, and the related consolidated statements of operations,
shareholders' equity, and cash flows for each of the three years in the period
ended December 31, 2004. These financial statements are the responsibility of
the Company's management. Our responsibility is to express an opinion on these
financial statements based on our audits.
We conducted our audits in accordance with the standards of the Public
Company Accounting Oversight Board (United States). Those standards require that
we plan and perform the audit to obtain reasonable assurance about whether the
financial statements are free of material misstatement. An audit includes
examining, on a test basis, evidence supporting the amounts and disclosures in
the financial statements. An audit also includes assessing the accounting
principles used and significant estimates made by management, as well as
evaluating the overall financial statement presentation. We believe that our
audits provide a reasonable basis for our opinion.
In our opinion, the financial statements referred to above present fairly,
in all material respects, the consolidated financial position of UNITED TRUST
GROUP, INC. and subsidiaries as of December 31, 2004 and 2003, and the
consolidated results of their operations and their consolidated cash flows for
each of the three years in the period ended December 31, 2004, in conformity
with accounting principles generally accepted in the United States of America.
We have also audited Schedule I as of December 31, 2004, and Schedules II,
IV and V as of December 31, 2004 and 2003, of UNITED TRUST GROUP, INC. and
subsidiaries and Schedules II, IV and V for each of the three years in the
period then ended. In our opinion, these schedules present fairly, in all
material respects, the information required to be set forth therein.
KERBER, ECK & BRAECKEL LLP
Springfield, Illinois
March 11, 2005
UNITED TRUST GROUP, INC.
CONSOLIDATED BALANCE SHEETS
As of December 31, 2004 and 2003
ASSETS
2004 2003
--------------- ---------------
Investments:
Fixed maturities held to maturity, at amortized cost
(market $12,097,708 and $27,440,277) $ 11,973,415 $ 26,724,507
Investments held for sale:
Fixed maturities, at market (cost $147,217,453 and $139,248,547) 148,193,887 139,390,382
Equity securities, at market (cost $15,216,214 and $7,209,443) 24,399,172 9,362,165
Mortgage loans on real estate at amortized cost 20,722,415 26,715,968
Investment real estate, at cost, net of accumulated depreciation 28,192,081 24,725,824
Policy loans 12,844,748 13,226,399
Short-term investments 39,489 34,677
--------------- ---------------
246,365,207 240,179,922
Cash and cash equivalents 11,859,472 8,749,727
Securities of affiliate 4,000,000 4,000,000
Accrued investment income 1,678,393 1,961,552
Reinsurance receivables:
Future policy benefits 32,422,529 32,789,725
Policy claims and other benefits 3,959,569 4,120,299
Cost of insurance acquired 12,747,532 14,616,667
Deferred policy acquisition costs 1,685,263 2,122,643
Property and equipment, net of accumulated depreciation 2,172,636 2,450,109
Income taxes receivable, current 181,683 212,197
Other assets 795,800 354,292
--------------- ---------------
Total assets $ 317,868,084 $ 311,557,133
=============== ===============
LIABILITIES AND SHAREHOLDERS' EQUITY
Policy liabilities and accruals:
Future policy benefits $ 235,592,973 $ 236,192,132
Policy claims and benefits payable 1,879,566 2,541,735
Other policyholder funds 1,323,668 1,038,063
Dividend and endowment accumulations 12,526,390 12,626,515
Deferred income taxes 8,561,010 6,763,648
Notes payable 0 2,289,776
Other liabilities 7,405,434 5,557,215
--------------- ---------------
Total liabilities 267,289,041 267,009,084
Minority interests in consolidated subsidiaries 6,127,938 4,851,410
Shareholders' equity:
Common stock - no par value, stated value $.02 per share.
Authorized 7,000,000 shares - 3,965,533 and 4,004,666 shares issued
and outstanding after deducting treasury shares of 227,709 and 174,136 79,315 80,008
Additional paid-in capital 42,590,820 42,672,189
Accumulated deficit (4,897,572) (4,621,955)
Accumulated other comprehensive income 6,678,542 1,566,397
--------------- ---------------
Total shareholders' equity 44,451,105 39,696,639
--------------- ---------------
Total liabilities and shareholders' equity $ 317,868,084 $ 311,557,133
=============== ===============
See accompanying notes.
UNITED TRUST GROUP, INC.
CONSOLIDATED STATEMENTS OF OPERATIONS
Three Years Ended December 31, 2004
2004 2003 2002
--------------- ---------------- ----------------
Revenues:
Premiums and policy fees $ 17,275,708 $ 18,121,018 $ 18,693,022
Reinsurance premiums and policy fees (3,135,279) (3,097,980) (2,861,445)
Net investment income 10,420,886 10,270,500 13,514,802
Realized investment gains (losses), net (20,648) 485,436 13,634
Other income 926,212 709,384 817,186
--------------- ---------------- ----------------
25,466,879 26,488,358 30,177,199
Benefits and other expenses:
Benefits, claims and settlement expenses:
Life 18,942,272 22,175,842 20,393,044
Reinsurance benefits and claims (2,268,869) (3,194,541) (3,043,115)
Annuity 1,111,998 1,122,707 1,151,973
Dividends to policyholders 980,306 966,668 984,346
Commissions and amortization of deferred
policy acquisition costs 309,776 311,939 785,861
Amortization of cost of insurance acquired 1,869,135 6,695,328 1,515,450
Operating expenses 5,312,747 7,566,780 5,876,456
Interest expense 77,453 162,179 263,441
--------------- ---------------- ----------------
26,334,818 35,806,902 27,927,456
--------------- ---------------- ----------------
Income (loss) before income taxes
and minority interest (867,939) (9,318,544) 2,249,743
Income tax benefit (expense) 797,716 2,699,493 (479,355)
Minority interest in (income) loss
of consolidated subsidiaries (205,394) 222,561 (431,593)
--------------- ---------------- ----------------
Net income (loss) $ (275,617) $ (6,396,490)$ 1,338,795
=============== ================ ================
Basic income (loss) per share from continuing
operations and net income (loss) $ (0.07) $ (1.67)$ 0.38
=============== ================ ================
Diluted income (loss) per share from continuing
operations and net income (loss) $ (0.07) $ (1.67)$ 0.33
=============== ================ ================
Basic weighted average shares outstanding 3,986,731 3,839,947 3,505,424
=============== ================ ================
Diluted weighted average shares outstanding 3,986,731 3,839,947 4,005,424
=============== ================ ================
See accompanying notes.
UNITED TRUST GROUP, INC.
CONSOLIDATED STATEMENTS OF SHAREHOLDERS' EQUITY
Three Years Ended December 31, 2004
2004 2003 2002
-------------------------- ------------------------- ------------
Common stock
Balance, beginning of year $ 80,008 $ 70,726 $ 70,996
Issued during year 289 10,331 1,177
Treasury shares acquired (1,066) (532) (1,447)
Reclassification under FAS 150 84 0 0
Retired during year 0 (433) 0
Cumulative change in accounting principal 0 (84) 0
------------ ----------- -----------
Balance, end of year $ 79,315 $ 80,008 $ 70,726
============ =========== ===========
Additional paid-in capital
Balance, beginning of year $ 42,672,189 $ 42,976,344 $ 42,789,636
Issued during year 167,071 185,574 705,514
Treasury shares acquired (297,991) (181,817) (518,806)
Reclassification under FAS 150 49,551 0 0
Retired during year 0 (258,361) 0
Cumulative change in accounting principal 0 (49,551) 0
------------ ----------- -----------
Balance, end of year $ 42,590,820 $ 42,672,189 $ 42,976,344
============ =========== ===========
Retained earnings (accumulated deficit)
Balance, beginning of year $ (4,621,955) $ 1,774,535 $ 435,740
Net income (loss) (275,617) $ (275,617) (6,396,490) $ (6,396,490) 1,338,795 $ 1,338,795
------------ ----------- -----------
Balance, end of year $ (4,897,572) $ (4,621,955) $ 1,774,535
============ =========== ===========
Accumulated other comprehensive income
Balance, beginning of year $ 1,566,397 $ 2,771,941 $ 908,744
Other comprehensive income (loss)
Unrealized holding gain (loss) on securities
net of minority interest and
reclassification adjustment and taxes 5,112,145 5,112,145 (1,205,544) (1,205,544) 1,863,197 1,863,197
------------ ----------- ----------- ------------ ----------- -----------
Comprehensive income (loss) $ 4,836,528 $ (7,602,034) $ 3,201,992
=========== ============ ===========
Balance, end of year $ 6,678,542 $ 1,566,397 $ 2,771,941
============ =========== ===========
Total shareholders' equity, end of year $ 44,451,105 $ 39,696,639 $ 47,593,546
============ =========== ===========
See accompanying notes.
UNITED TRUST GROUP, INC.
CONSOLIDATED STATEMENTS OF CASH FLOWS
Three Years Ended December 31, 2004
2004 2003 2002
--------------- --------------- --------------
Increase (decrease) in cash and cash equivalents
Cash flows from operating activities:
Net income (loss) $ (275,617) $ (6,396,490) $ 1,338,795
Adjustments to reconcile net income (loss) to net cash provided by
(used in) operating activities net of changes in assets and liabilities
resulting from the sales and purchases of subsidiaries:
Amortization/accretion of fixed maturities 604,608 978,307 513,308
Realized investment (gains) losses, net 20,648 (485,436) (13,634)
Amortization of deferred policy acquisition costs 442,380 400,844 714,432
Amortization of cost of insurance acquired 1,869,135 6,695,328 1,515,450
Depreciation 1,617,116 1,052,964 835,538
Minority interest 205,394 (222,561) 431,593
Charges for mortality and administration
of universal life and annuity products (9,281,555) (9,083,778) (8,660,548)
Interest credited to account balances 5,332,145 5,478,488 5,468,318
Policy acquisition costs deferred (5,000) (61,000) (69,000)
Change in accrued investment income 283,159 491,288 550,020
Change in reinsurance receivables 527,926 (100,703) 1,010,146
Change in policy liabilities and accruals 1,073,108 3,163,696 (2,279,449)
Change in income taxes payable (924,815) (2,877,425) 413,476
Change in other assets and liabilities, net (1,534,582) 33,430 (1,301,411)
--------------- --------------- --------------
Net cash provided by (used in) operating activities (45,950) (933,048) 467,034
--------------- --------------- --------------
Cash flows from investing activities:
Proceeds from investments sold and matured:
Fixed maturities held for sale 70,893,152 73,314,066 29,748,521
Fixed maturities matured 16,098,477 36,065,715 19,957,888
Equity securities 25,569 167,734 0
Mortgage loans 8,620,093 8,494,201 6,472,013
Real estate 314,157 1,096,759 1,179,931
Policy loans 2,757,989 2,619,463 3,112,687
Short-term 350,000 350,000 203,706
--------------- --------------- --------------
Total proceeds from investments sold and matured 99,059,437 122,107,938 60,674,746
Cost of investments acquired:
Fixed maturities held for sale (76,377,916) (108,410,675) (37,341,428)
Fixed maturities (1,513,700) (4,283,413) (3,973,623)
Equity securities (8,033,052) (7,089,857) (185,075)
Mortgage loans (2,626,540) (11,405,342) (6,889,945)
Real estate (3,981,568) (3,722,406) (1,575,713)
Policy loans (2,376,338) (2,499,358) (2,850,735)
Short-term (353,061) (7,001) 0
--------------- --------------- --------------
Total cost of investments acquired (95,262,175) (137,418,052) (52,816,519)
Purchase of property and equipment (20,548) (536,600) (24,439)
--------------- --------------- --------------
Net cash provided by (used in) investing activities 3,776,714 (15,846,714) 7,833,788
--------------- --------------- --------------
Cash flows from financing activities:
Policyholder contract deposits 9,015,637 9,505,436 10,291,519
Policyholder contract withdrawals (7,215,183) (7,067,658) (7,959,754)
Payments of principal on notes payable (4,564,776) (705,499) (3,405,395)
Proceeds from line of credit 2,275,000 0 2,000,000
Payments from FCC merger 0 0 (1,586,500)
Issuance of common stock 167,360 195,906 706,691
Purchase of treasury stock (299,057) (441,144) (520,253)
--------------- --------------- --------------
Net cash provided by (used in) financing activities (621,019) 1,487,041 (473,692)
--------------- --------------- --------------
Net increase (decrease) in cash and cash equivalents 3,109,745 (15,292,721) 7,827,130
Cash and cash equivalents at beginning of year 8,749,727 24,042,448 16,215,318
--------------- --------------- --------------
Cash and cash equivalents at end of year $ 11,859,472 $ 8,749,727 $ 24,042,448
=============== =============== ==============
See accompanying notes.
UNITED TRUST GROUP, INC.
NOTES TO CONSOLIDATED FINANCIAL STATEMENTS
1. ORGANIZATION AND SUMMARY OF SIGNIFICANT ACCOUNTING POLICIES
A. ORGANIZATION - At December 31, 2004, the significant majority-owned
subsidiaries of UNITED TRUST GROUP, INC., were as depicted on the
following organizational chart.
The Company's significant accounting policies, consistently applied in the
preparation of the accompanying consolidated financial statements, are
summarized as follows.
B. NATURE OF OPERATIONS - United Trust Group, Inc., is an insurance
holding company, which sells individual life insurance products
through its subsidiary. The Company's principal market is the
Midwestern United States. The Company's dominant business is
individual life insurance which includes the servicing of existing
insurance business in force, the solicitation of new individual life
insurance and the acquisition of other companies in the insurance
business.
C. BUSINESS SEGMENTS - The Company has only one significant business
segment - insurance.
D. BASIS OF PRESENTATION - The financial statements of United Trust
Group, Inc., and its subsidiaries have been prepared in accordance
with accounting principles generally accepted in the United States of
America which differ from statutory accounting practices permitted by
insurance regulatory authorities.
E. PRINCIPLES OF CONSOLIDATION - The consolidated financial statements
include the accounts of the Registrant and its majority-owned
subsidiaries. All significant intercompany accounts and transactions
have been eliminated.
F. INVESTMENTS - Investments are shown on the following bases:
Fixed maturities held to maturity - at cost, adjusted for amortization
of premium or discount and other-than-temporary market value declines.
The amortized cost of such investments differs from their market
values; however, the Company has the ability and intent to hold these
investments to maturity, at which time the full face value is expected
to be realized.
Investments held for sale - at current market value, unrealized
appreciation or depreciation is charged directly to shareholders'
equity.
Mortgage loans on real estate - at unpaid balances, adjusted for
amortization of premium or discount, less allowance for possible
losses.
Real estate - investment real estate at cost less allowance for
depreciation and, as appropriate, provisions for possible losses.
Accumulated depreciation on investment real estate was $ 2,491,205 and
$ 1,200,454 as of December 31, 2004 and 2003, respectively.
Policy loans - at unpaid balances including accumulated interest but
not in excess of the cash surrender value.
Short-term investments - at cost, which approximates current market
value.
Realized gains and losses on sales of investments are recognized in
net income on the specific identification basis.
Unrealized gains and losses on investments carried at market value are
recognized in other comprehensive income on the specific
identification basis.
G. CASH EQUIVALENTS - The Company considers certificates of deposit and
other short-term instruments with an original purchased maturity of
three months or less cash equivalents.
H. REINSURANCE - In the normal course of business, the Company seeks to
limit its exposure to loss on any single insured and to recover a
portion of benefits paid by ceding reinsurance to other insurance
enterprises or reinsurers under excess coverage and coinsurance
contracts. The Company retains a maximum of $ 125,000 of coverage per
individual life.
Amounts paid, or deemed to have been paid, for reinsurance contracts
are recorded as reinsurance receivables. Reinsurance receivables are
recognized in a manner consistent with the liabilities relating to the
underlying reinsured contracts. The cost of reinsurance related to
long-duration contracts is accounted for over the life of the
underlying reinsured policies using assumptions consistent with those
used to account for the underlying policies.
I. FUTURE POLICY BENEFITS AND EXPENSES - The liabilities for traditional
life insurance and accident and health insurance policy benefits are
computed using a net level method. These liabilities include
assumptions as to investment yields, mortality, withdrawals, and other
assumptions based on the life insurance subsidiary's experience
adjusted to reflect anticipated trends and to include provisions for
possible unfavorable deviations. The Company makes these assumptions
at the time the contract is issued or, in the case of contracts
acquired by purchase, at the purchase date. Future policy benefits for
individual life insurance and annuity policies are computed using
interest rates ranging from 2% to 6% for life insurance and 3.0% to
9.25% for annuities. Benefit reserves for traditional life insurance
policies include certain deferred profits on limited-payment policies
that are being recognized in income over the policy term. Policy
benefit claims are charged to expense in the period that the claims
are incurred. Current mortality rate assumptions are based on 1975-80
select and ultimate tables. Withdrawal rate assumptions are based upon
Linton B or Linton C, which are industry standard actuarial tables for
forecasting assumed policy lapse rates.
Benefit reserves for universal life insurance and interest sensitive
life insurance products are computed under a retrospective deposit
method and represent policy account balances before applicable
surrender charges. Policy benefits and claims that are charged to
expense include benefit claims in excess of related policy account
balances. Interest crediting rates for universal life and interest
sensitive products range from 4.0% to 5.5% for the years ended
December 31, 2004, 2003 and 2002, respectively.
J. POLICY AND CONTRACT CLAIMS - Policy and contract claims include
provisions for reported claims in process of settlement, valued in
accordance with the terms of the policies and contracts, as well as
provisions for claims incurred and unreported based on prior
experience of the Company. Incurred but not reported claims were
$ 899,126 and $ 920,656 as of December 31, 2004 and 2003,
respectively.
K. COST OF INSURANCE ACQUIRED - When an insurance company is acquired,
the Company assigns a portion of its cost to the right to receive
future cash flows from insurance contracts existing at the date of the
acquisition. The cost of policies purchased represents the actuarially
determined present value of the projected future cash flows from the
acquired policies. The Company utilized 9% discount rate on
approximately 25% of the business and 15% discount rate on
approximately 75% of the business. Cost of insurance acquired is
amortized with interest in relation to expected future profits,
including direct charge-offs for any excess of the unamortized asset
over the projected future profits. The interest rates utilized in the
amortization calculation are 9% on approximately 25% of the balance
and 15% on the remaining balance. The interest rates vary due to
differences in the blocks of business. The amortization is adjusted
retrospectively when estimates of current or future gross profits to
be realized from a group of products are revised.
2004 2003 2002
---------------- ----------------- ----------------
Cost of insurance acquired,
beginning of year $ 14,616,667 $ 21,311,995 $ 31,237,167
Interest accretion 4,002,245 4,370,526 4,570,678
Amortization (5,871,380) (6,065,854) (6,086,128)
---------------- ----------------- ----------------
Net amortization (1,869,135) (1,695,328) (1,515,450)
Impairment loss 0 (5,000,000) 0
Revaluation adjustment from
UTG/FCC merger 0 0 (8,409,722)
---------------- ----------------- ----------------
Cost of insurance acquired,
end of year $ 12,747,532 $ 14,616,667 $ 21,311,995
================ ================= ================
Cost of insurance acquired was tested for impairment as part of the
regular reporting process. Due to a decline in projected future cash
flows from the business and lower current investment yields, a
revision of the estimated fair value of the cost of insurance acquired
was considered necessary in 2003. This revision resulted in a
$ 5,000,000 impairment loss. The fair value of the cost of insurance
acquired was estimated using the expected present value of future cash
flows. The impairment loss is included in the consolidated statements
of operations under the caption of amortization of cost of insurance
acquired.
Estimated net amortization expense of cost of insurance acquired for
the next five years is as follows:
Interest Net
Accretion Amortization Amortization
2005 $ 3,875,000 $ 6,084,000 $ 2,209,000
2006 3,560,000 6,422,000 2,862,000
2007 3,145,000 5,994,000 2,849,000
2008 2,730,000 5,256,000 2,526,000
2009 2,360,000 4,482,000 2,122,000
L. DEFERRED POLICY ACQUISITION COSTS - Commissions and other costs
(salaries of certain employees involved in the underwriting and policy
issue functions and medical and inspection fees) of acquiring life
insurance products that vary with and are primarily related to the
production of new business have been deferred. Traditional life
insurance acquisition costs are being amortized over the
premium-paying period of the related policies using assumptions
consistent with those used in computing policy benefit reserves.
For universal life insurance and interest sensitive life insurance
products, acquisition costs are being amortized generally in
proportion to the present value of expected gross profits from
surrender charges and investment, mortality, and expense margins.
Under SFAS No. 97, "Accounting and Reporting by Insurance Enterprises
for Certain Long-Duration Contracts and for Realized Gains and Losses
from the Sale of Investments," the Company makes certain assumptions
regarding the mortality, persistency, expenses, and interest rates it
expects to experience in future periods. These assumptions are to be
best estimates and are to be periodically updated whenever actual
experience and/or expectations for the future change from initial
assumptions. The amortization is adjusted retrospectively when
estimates of current or future gross profits to be realized from a
group of products are revised.
The following table summarizes deferred policy acquisition costs and
related data for the years shown.
2004 2003 2002
---------------- ----------------- ----------------
Deferred, beginning of year $ 2,122,643 $ 2,462,487 $ 3,107,919
Acquisition costs deferred:
Commissions 0 56,000 49,000
Other expenses 5,000 5,000 20,000
---------------- ----------------- ----------------
Total
Interest accretion 10,000 17,000 55,000
Amortization charged to income (452,380) (417,844) (769,432)
---------------- ----------------- ----------------
Net amortization
---------------- ----------------- ----------------
Change for the year (437,380) (339,844) (645,432)
---------------- ----------------- ----------------
Deferred, end of year $ 1,685,263 $ 2,122,643 $ 2,462,487
================ ================= ================
Estimated net amortization expense of deferred policy acquisition
costs for the next five years is as follows:
Interest Net
Accretion Amortization Amortization
-------------- --------------- ----------------
2005 12,000 280,000 268,000
2006 10,000 245,000 235,000
2007 9,000 219,000 210,000
2008 7,000 207,000 200,000
2009 6,000 180,000 174,000
M. PROPERTY AND EQUIPMENT - Company-occupied property, data processing
equipment and furniture and office equipment are stated at cost less
accumulated depreciation of $ 6,336,241 and $ 6,038,220 at
December 31, 2004 and 2003, respectively. Depreciation is computed on
a straight-line basis for financial reporting purposes using estimated
useful lives of three to thirty years. Depreciation expense was
$ 298,021, $ 149,664, and $ 280,148 for the years ended December 31,
2004, 2003, and 2002, respectively.
N. INCOME TAXES - Income taxes are reported under Statement of Financial
Accounting Standards Number 109. Deferred income taxes are recorded to
reflect the tax consequences on future periods of differences between
the tax bases of assets and liabilities and their financial reporting
amounts at the end of each such period.
O. EARNINGS PER SHARE - Earnings per share (EPS) are reported under
Statement of Financial Accounting Standards Number 128. The objective
of both basic EPS and diluted EPS is to measure the performance of an
entity over the reporting period. Basic EPS is computed by dividing
income available to common stockholders (the numerator) by the
weighted-average number of common shares outstanding (the denominator)
during the period. Diluted EPS is similar to the computation of basic
EPS except that the denominator is increased to include the number of
additional common shares that would have been outstanding if the
dilutive potential common shares had been issued. In addition, the
numerator also is adjusted for any changes in income or loss that
would result from the assumed conversion of those potential common
shares.
P. TREASURY SHARES - The Company holds 227,709 and 174,136 shares of
common stock as treasury shares with a cost basis of $ 1,675,097 and
$ 1,376,039 at December 31, 2004 and 2003, respectively.
Q. RECOGNITION OF REVENUES AND RELATED EXPENSES - Premiums for
traditional life insurance products, which include those products with
fixed and guaranteed premiums and benefits, consist principally of
whole life insurance policies, and certain annuities with life
contingencies are recognized as revenues when due. Limited payment
life insurance policies defer gross premiums received in excess of net
premiums, which is then recognized in income in a constant
relationship with insurance in force. Accident and health insurance
premiums are recognized as revenue pro rata over the terms of the
policies. Benefits and related expenses associated with the premiums
earned are charged to expense proportionately over the lives of the
policies through a provision for future policy benefit liabilities and
through deferral and amortization of deferred policy acquisition
costs. For universal life and investment products, generally there is
no requirement for payment of premium other than to maintain account
values at a level sufficient to pay mortality and expense charges.
Consequently, premiums for universal life policies and investment
products are not reported as revenue, but as deposits. Policy fee
revenue for universal life policies and investment products consists
of charges for the cost of insurance and policy administration fees
assessed during the period. Expenses include interest credited to
policy account balances and benefit claims incurred in excess of
policy account balances.
R. PARTICIPATING INSURANCE - Participating business represents 20% of the
ordinary life insurance in force at December 31, 2004 and 2003,
respectively. Premium income from participating business represents
22%, 23%, and 25% of total premiums for the years ended December 31,
2004, 2003 and 2002, respectively. The amount of dividends to be paid
is determined annually by the respective insurance subsidiary's Board
of Directors. Earnings allocable to participating policyholders are
based on legal requirements that vary by state.
S. RECLASSIFICATIONS - Certain prior year amounts have been reclassified
to conform to the 2004 presentation. Such reclassifications had no
effect on previously reported net income or shareholders' equity.
T. USE OF ESTIMATES - In preparing financial statements in conformity
with accounting principles generally accepted in the United States of
America, management is required to make estimates and assumptions that
affect the reported amounts of assets and liabilities, the disclosure
of contingent assets and liabilities at the date of the financial
statements, and the reported amounts of revenues and expenses during
the reporting period. Actual results could differ from those
estimates.
2. SHAREHOLDER DIVIDEND RESTRICTION
At December 31, 2004, substantially all of consolidated shareholders' equity
represents net assets of UTG's subsidiaries. The payment of cash dividends to
shareholders by UTG is not legally restricted. However, the state insurance
department regulates insurance company dividend payments where the company is
domiciled. UG's dividend limitations are described below.
Ohio domiciled insurance companies require five days prior notification to the
insurance commissioner for the payment of an ordinary dividend. Ordinary
dividends are defined as the greater of: a) prior year statutory earnings or b)
10% of statutory capital and surplus. For the year ended December 31, 2004, UG
had a statutory loss from operations of $ 762,152. At December 31, 2004, UG's
statutory capital and surplus amounted to $ 21,860,401. Extraordinary dividends
(amounts in excess of ordinary dividend limitations) require prior approval of
the insurance commissioner and are not restricted to a specific calculation. UG
paid a dividend of $ 2,275,000 to UTG in 2004, of which $ 974,180 was considered
to be an extraordinary dividend.
3. INCOME TAXES
Until 1984, the insurance company was taxed under the provisions of the Life
Insurance Company Income Tax Act of 1959 as amended by the Tax Equity and Fiscal
Responsibility Act of 1982. These laws were superseded by the Deficit Reduction
Act of 1984. All of these laws are based primarily upon statutory results with
certain special deductions and other items available only to life insurance
companies. Under the provision of the pre-1984 life insurance company income tax
regulations, a portion of "gain from operations" of a life insurance company was
not subject to current taxation but was accumulated, for tax purposes, in a
special tax memorandum account designated as "policyholders' surplus account".
Federal income taxes will become payable on this account at the then current tax
rate when and if distributions to shareholders, other than stock dividends and
other limited exceptions, are made in excess of the accumulated previously taxed
income maintained in the "shareholders surplus account". At December 31, 2004,
the balances of the shareholders' surplus account and the untaxed balance for UG
were $ 27,099,356 and $ 4,363,821, respectively.
The payment of taxes on this income is not anticipated; and, accordingly, no
deferred taxes have been established.
The life insurance company and the non-insurance companies of the group file
separate federal income tax returns.
Life insurance company taxation is based primarily upon statutory results with
certain special deductions and other items available only to life insurance
companies. Income tax expense (benefit) consists of the following components:
2004 2003 2002
--------------- ---------------- ---------------
Current tax expense $ 147,358 $ 197,732 $ 7,893
Deferred tax (benefit) expense (945,074) (2,897,225) 471,462
---------------- ----------------- ----------------
$ (797,716) $ (2,699,493) $ 479,355
================ ================= ================
The Company's life insurance subsidiary has net operating loss carryforwards for
federal income tax purposes expiring as follows:
UG
-------------
2014 965,080
2016 1,806
2017 5,078
2018 2,992,288
2019 2,101,569
-------------
TOTAL $ 6,065,821
=============
The Company has established a deferred tax asset of $ 2,123,037 for its
operating loss carryforwards and has established no allowance in the current or
prior years.
UG has a net operating loss carryforward of $ 6,065,821 at December 31, 2004. UG
must average taxable income of approximately $ 404,388 over the next 15 years to
fully realize its net operating loss carryforward. Management believes future
earnings of UG will be sufficient to fully utilize the net operating loss
carryforwards. Therefore, management has established no allowance for potential
uncollectibility of its loss carryforwards in the current year.
The following table shows the reconciliation of net income to taxable income of
UTG:
2004 2003 2002
--------------- --------------- ----------------
Net income (loss) $ (275,617)$ (6,396,490)$ 1,338,795
Federal income tax provision 105,098 263,992 327,472
Loss (gain) of subsidiaries 803,662 6,723,981 (700,226)
--------------- --------------- ----------------
Taxable income $ 633,143 $ 591,483 $ 966,041
=============== =============== ================
The expense or (credit) for income differed from the amounts computed by
applying the applicable United States statutory rate of 35% before income taxes
as a result of the following differences:
2004 2003 2002
--------------- --------------- ----------------
Tax computed at statutory rate $ (303,779) $ (3,183,594) $ 728,618
Changes in taxes due to:
Current year expense previously deducted 0 175,000 0
Tax reserve adjustment (202,225) 150,831 123,512
Benefit of prior losses 0 0 (309,710)
Dividend received deduction (161,114) 0 0
Tax deferred acquisition costs (134,324) 0 0
Other 3,726 158,270 (63,065)
--------------- --------------- ----------------
Income tax expense (benefit) $ (797,716) $ (2,699,493) $ 479,355
=============== =============== ================
The following table summarizes the major components that comprise the deferred
tax liability as reflected in the balance sheets:
2004 2003
---------------- ---------------
Investments $ 5,289,610 $ 2,514,031
Cost of insurance acquired 4,461,636 5,115,833
Deferred policy acquisition costs 589,842 742,925
Management/consulting fees (289,877) (304,038)
Future policy benefits (646,374) (1,145,126)
Gain on sale of subsidiary 2,312,483 2,312,483
Net operating loss carryforward (2,123,037) (1,304,864)
Federal tax DAC (1,033,272) (1,167,596)
---------------- ---------------
Deferred tax liability $ 8,561,010 $ 6,763,648
================ ===============
4. ANALYSIS OF INVESTMENTS, INVESTMENT INCOME AND INVESTMENT GAIN
A. NET INVESTMENT INCOME - The following table reflects net investment income
by type of investment:
December 31,
----------------------------------------------------------
2004 2003 2002
--------------- ---------------- ----------------
Fixed maturities and fixed maturities
held for sale $ 7,060,761 $ 8,418,969 $ 10,302,735
Equity securities 657,609 456,361 131,778
Mortgage loans 1,209,358 1,522,700 1,749,935
Real estate 5,335,530 2,832,171 3,261,043
Policy loans 918,562 949,770 965,227
Short-term investments 80,241 11,161 26,522
Cash 111,986 137,478 211,293
--------------- ---------------- ----------------
Total consolidated investment income 15,374,047 14,328,610 16,648,533
Investment expenses (4,953,161) (4,058,110) (3,133,731)
---------------- ---------------- ----------------
Consolidated net investment income $ 10,420,886 $ 10,270,500 $ 13,514,802
=============== ================ ================
At December 31, 2004, the Company had a total of $ 805,787 in investment real
estate, which did not produce income during 2004.
The following table summarizes the Company's fixed maturity holdings and
investments held for sale by major classifications:
Carrying Value
----------------------------------------
2004 2003
--------------- --------------
Investments held for sale:
Fixed maturities
U.S. Government, government agencies and authorities $ 41,632,843 $ 31,347,586
State, municipalities and political subdivisions 177,444 177,963
Collateralized mortgage obligations 79,643,440 89,117,375
All other corporate bonds 26,740,160 18,747,458
--------------- --------------
$ 148,193,887 $ 139,390,382
=============== ==============
Equity securities
Banks, trust and insurance companies $ 19,706,511 $ 1,517,159
Industrial and miscellaneous 4,692,661 7,845,006
--------------- --------------
$ 24,399,172 $ 9,362,165
=============== ==============
Carrying Value
----------------------------------------
2004 2003
--------------- --------------
Fixed maturities held to maturity:
U.S. Government, government agencies and authorities $ 7,801,268 $ 10,676,106
State, municipalities and political subdivisions 2,448,293 6,342,369
Collateralized mortgage obligations 58,453 77,802
Public utilities 0 5,397,880
All other corporate bonds 1,665,401 4,230,350
--------------- --------------
$ 11,973,415 $ 26,724,507
=============== ==============
Securities of affiliate $ 4,000,000 $ 4,000,000
=============== ==============
By insurance statute, the majority of the Company's investment portfolio is
invested in investment grade securities to provide ample protection for
policyholders.
Below investment grade debt securities generally provide higher yields and
involve greater risks than investment grade debt securities because their
issuers typically are more highly leveraged and more vulnerable to adverse
economic conditions than investment grade issuers. In addition, the trading
market for these securities is usually more limited than for investment grade
debt securities. Debt securities classified as below-investment grade are those
that receive a Standard & Poor's rating of BB or below.
The following table summarizes securities held, at amortized cost, that are
below investment grade by major classification:
Below Investment
Grade Investments 2004 2003
----------------------------- -------------- ------------
Public Utilities $ 0 $ 1,001,673
CMO 15,764 24,984
Corporate 2,123,028 1,818,673
------------- ------------
Total $ 2,138,792 $ 2,845,330
============= ============
B. INVESTMENT SECURITIES
The amortized cost and estimated market values of investments in securities
including investments held for sale are as follows:
Cost or Gross Gross Estimated
Amortized Unrealized Unrealized Market
2004 Cost Gains Losses Value
- ------------------------------------ -------------- ------------- --------------- --------------
Investments held for sale:
Fixed maturities
U.S. Government and govt.
agencies and authorities $ 41,377,077 $ 384,193 $ (128,427) $ 41,632,843
States, municipalities and
political subdivisions 162,025 15,419 0 177,444
Collateralized mortgage
obligations 79,634,753 459,508 (450,821) 79,643,440
Public utilities 0 0 0 0
All other corporate bonds 26,043,598 792,693 (96,131) 26,740,160
-------------- ------------- --------------- --------------
147,217,453 1,651,813 (675,379) 148,193,887
Equity securities 15,216,214 10,214,201 (1,031,243) 24,399,172
-------------- ------------- --------------- --------------
Total $ 162,433,667 $ 11,866,014 $ (1,706,622) $ 172,593,059
============== ============= =============== ==============
Fixed maturities held to maturity:
U.S. Government and govt.
agencies and authorities $ 7,801,268 $ 43,237 $ (40,910) $ 7,803,595
States, municipalities and
political subdivisions 2,448,293 116,815 0 2,565,108
Collateralized mortgage
obligations 58,453 661 (1,343) 57,771
Public utilities 0 0 0 0
All other corporate bonds 1,665,401 26,833 (20,920) 1,671,314
-------------- ------------- --------------- --------------
Total $ 11,973,415 $ 187,546 $ (63,173) $ 12,097,788
============== ============= =============== ==============
Securities of affiliate $ 4,000,000 $ 0 $ 0 $ 4,000,000
============== ============= =============== ==============
Cost or Gross Gross Estimated
Amortized Unrealized Unrealized Market
2003 Cost Gains Losses Value
- ------------------------------------ -------------- ------------- --------------- --------------
Investments held for sale:
Fixed maturities
U.S. Government and govt.
agencies and authorities $ 30,850,682 $ 642,756 $ (145,852) $ 31,347,586
States, municipalities and
political subdivisions 160,271 17,692 0 177,963
Collateralized mortgage
obligations 90,353,657 429,542 (1,665,824) 89,117,375
Public utilities 0 0 0 0
All other corporate bonds 17,883,937 886,396 (22,875) 18,747,458
-------------- ------------- --------------- --------------
139,248,547 1,976,386 (1,834,551) 139,390,382
Equity securities 7,209,443 2,152,722 0 9,362,165
-------------- ------------- --------------- --------------
Total $ 146,457,990 $ 4,129,708 $ (1,834,551) $ 148,752,757
============== ============= =============== ==============
Fixed maturities held to maturity:
U.S. Government and govt.
agencies and authorities $ 10,676,106 $ 229,788 $ 0 $ 10,905,894
States, municipalities and
political subdivisions 6,342,369 231,132 (12,919) 6,560,582
Collateralized mortgage
obligations 77,802 875 (444) 78,233
Public utilities 5,397,880 100,056 0 5,497,936
All other corporate bonds 4,230,350 188,071 (20,789) 4,397,632
-------------- ------------- --------------- --------------
Total $ 26,724,507 $ 749,922 $ (34,152) $ 27,440,277
============== ============= =============== ==============
Securities of affiliate $ 4,000,000 $ 0 $ 0 $ 4,000,000
============== ============= =============== ==============
The amortized cost and estimated market value of debt securities at December 31,
2004, by contractual maturity, is shown below. Expected maturities will differ
from contractual maturities because borrowers may have the right to call or
prepay obligations with or without call or prepayment penalties.
Fixed Maturities Held for Sale Estimated
Amortized Market
December 31, 2004 Cost Value
- --------------------------------------------- -------------- --------------
Due in one year or less $ 3,974,952 $ 4,016,732
Due after one year through five years 49,501,280 50,431,776
Due after five years through ten years 7,018,679 7,085,760
Due after ten years 7,087,789 7,016,180
Collateralized mortgage obligations 79,634,753 79,643,439
-------------- --------------
Total $ 147,217,453 $ 148,193,887
============== ==============
Estimated
Fixed Maturities Held to Maturity Amortized Market
December 31, 2004 Cost Value
- --------------------------------------------- -------------- --------------
Due in one year or less $ 5,041,510 $ 5,075,216
Due after one year through five years 5,504,794 5,534,706
Due after five years through ten years 751,410 771,845
Due after ten years 617,248 658,250
Collateralized mortgage obligations 58,453 57,771
-------------- --------------
Total $ 11,973,415 $ 12,097,788
============== ==============
An analysis of sales, maturities and principal repayments of the Company's fixed
maturities portfolio for the years ended December 31, 2004, 2003 and 2002 is as
follows:
Cost or Gross Gross Proceeds
Amortized Realized Realized From
Year ended December 31, 2004 Cost Gains Losses Sale
- ------------------------------------- --------------- ------------- --------------- ---------------
Scheduled principal repayments,
Calls and tenders:
Held for sale $ 25,119,862 $ 8,062 $ (2,098) $ 25,125,826
Held to maturity 16,099,278 0 (801) 16,098,477
Sales:
Held for sale 45,840,981 278,896 (352,551) 45,767,326
Held to maturity 0 0 0 0
--------------- ------------- --------------- ---------------
Total $ 87,060,121 $ 286,958 $ (355,450) $ 86,991,629
=============== ============= =============== ===============
Cost or Gross Gross Proceeds
Amortized Realized Realized From
Year ended December 31, 2003 Cost Gains Losses Sale
- ------------------------------------- --------------- ------------- --------------- ---------------
Scheduled principal repayments,
Calls and tenders:
Held for sale $ 60,702,967 $ 2,283 $ (13,872) $ 60,691,378
Held to maturity 30,923,388 0 (227) 30,923,161
Sales:
Held for sale 12,863,340 0 (240,652) 12,622,688
Held to maturity 4,825,213 319,980 (2,639) 5,142,554
--------------- ------------- --------------- ---------------
Total $ 109,314,908 $ 322,263 $ (257,390) $ 109,379,781
=============== ============= =============== ===============
Cost or Gross Gross Proceeds
Amortized Realized Realized From
Year ended December 31, 2002 Cost Gains Losses Sale
- ------------------------------------- --------------- ------------- --------------- ---------------
Scheduled principal repayments,
Calls and tenders:
Held for sale $ 29,746,832 $ 1,689 $ 0 $ 29,748,521
Held to maturity 20,071,850 7,782 (6,744) 20,072,888
Sales:
Held for sale 0 0 0 0
Held to maturity 0 0 0 0
--------------- ------------- --------------- ---------------
Total $ 49,818,682 $ 9,471 $ (6,744) $ 49,821,409
=============== ============= =============== ===============
Annually, the Company completes an analysis of sales of securities held to
maturity to further assess the issuer's creditworthiness of fixed maturity
holdings. Based on this analysis, certain issues were sold that had been
classified as held to maturity. The Company considers these transactions
rare and non recurring.
C. INVESTMENTS ON DEPOSIT - At December 31, 2004, investments carried at
approximately $ 5,939,498 were on deposit with various state insurance
departments.
5. DISCLOSURES ABOUT FAIR VALUES OF FINANCIAL INSTRUMENTS
The financial statements include various estimated fair value information at
December 31, 2004 and 2003, as required by Statement of Financial Accounting
Standards 107, Disclosure about Fair Value of Financial Instruments (SFAS 107).
Such information, which pertains to the Company's financial instruments, is
based on the requirements set forth in that Statement and does not purport to
represent the aggregate net fair value of the Company.
The following methods and assumptions were used to estimate the fair value of
each class of financial instrument required to be valued by SFAS 107 for which
it is practicable to estimate that value:
(a) Cash and Cash equivalents
The carrying amount in the financial statements approximates fair value because
of the relatively short period of time between the origination of the
instruments and their expected realization.
(b) Fixed maturities and investments held for sale
Quoted market prices, if available, are used to determine the fair value. If
quoted market prices are not available, management estimates the fair value
based on the quoted market price of a financial instrument with similar
characteristics.
(c) Mortgage loans on real estate
The fair values of mortgage loans are estimated using discounted cash flow
analyses and interest rates being offered for similar loans to borrowers with
similar credit ratings.
(d) Policy loans
It is not practical to estimate the fair value of policy loans as they have no
stated maturity and their rates are set at a fixed spread to related policy
liability rates. Policy loans are carried at the aggregate unpaid principal
balances in the consolidated balance sheets, and earn interest at rates ranging
from 4% to 8%. Individual policy liabilities in all cases equal or exceed
outstanding policy loan balances.
(e) Short-term investments
For short-term instruments, the carrying amount is a reasonable estimate of fair
value. Short-term instruments represent collateral loans and certificates of
deposit with various banks that are protected under FDIC.
(f) Notes payable
For borrowings subject to floating rates of interest, carrying value is a
reasonable estimate of fair value. For fixed rate borrowings fair value was
determined based on the borrowing rates currently available to the Company for
loans with similar terms and average maturities.
The estimated fair values of the Company's financial instruments required to be
valued by SFAS 107 are as follows as of December 31:
2004 2003
-------------------------------------------------------------------------
Estimated Estimated
Carrying Fair Carrying Fair
Assets Amount Value Amount Value
-------------- -------------- --------------- ---------------
Fixed maturities $ 11,973,415 $ 12,097,788 $ 26,724,507 $ 27,440,277
Fixed maturities held for sale 148,193,887 148,193,887 139,390,382 139,390,382
Equity securities 20,399,172 20,399,172 9,362,165 9,362,165
Securities of affiliate 4,000,000 4,000,000 4,000,000 4,000,000
Mortgage loans on real estate 20,722,415 20,816,955 26,715,968 26,853,183
Investment in real estate 28,192,081 28,192,081 24,725,824 24,725,824
Policy loans 12,844,748 12,844,748 13,226,399 13,226,399
Short-term investments 39,489 39,489 34,677 34,677
Liabilities
Notes payable 0 0 2,289,776 2,390,810
6. STATUTORY EQUITY AND INCOME FROM OPERATIONS
The Company's insurance subsidiary is domiciled in Ohio and prepares its
statutory-based financial statements in accordance with accounting practices
prescribed or permitted by the Ohio insurance department. These principles
differ significantly from accounting principles generally accepted in the United
States of America. "Prescribed" statutory accounting practices include state
laws, regulations, and general administrative rules, as well as a variety of
publications of the National Association of Insurance Commissioners (NAIC).
"Permitted" statutory accounting practices encompass all accounting practices
that are not prescribed; such practices may differ from state to state, from
company to company within a state, and may change in the future. UG's total
statutory shareholders' equity was $ 21,860,401 and $ 13,008,198 at December 31,
2004 and 2003, respectively. The Company's life insurance subsidiary reported a
statutory operating income (loss) before taxes (exclusive of intercompany
dividends) of approximately $ (762,000), $ (1,461,000) and $ 2,700,000 for 2004,
2003 and 2002, respectively.
7. REINSURANCE
As is customary in the insurance industry, the insurance subsidiary of the
Company cedes insurance to, and assumes insurance from, other insurance
companies under reinsurance agreements. Reinsurance agreements are intended to
limit a life insurer's maximum loss on a large or unusually hazardous risk or to
obtain a greater diversification of risk. The ceding insurance company remains
primarily liable with respect to ceded insurance should any reinsurer be unable
to meet the obligations assumed by it. However, it is the practice of insurers
to reduce their exposure to loss to the extent that they have been reinsured
with other insurance companies. The Company sets a limit on the amount of
insurance retained on the life of any one person. The Company will not retain
more than $ 125,000, including accidental death benefits, on any one life. At
December 31, 2004, the Company had gross insurance in force of $ 3.141 billion
of which approximately $ 531 million was ceded to reinsurers.
The Company's reinsured business is ceded to numerous reinsurers. The Company
monitors the solvency of its reinsurers in seeking to minimize the risk of loss
in the event of a failure by one of the parties. The primary reinsurers of the
Company are large, well capitalized entities.
Currently, the Company is utilizing reinsurance agreements with Generali USA
Life Reassurance Company, (Generali) and Swiss Re Life and Health America
Incorporated (SWISS RE). Generali and SWISS RE currenty hold an "A" (Excellent),
and "A+" (Superior) rating, respectively, from A.M. Best, an industry rating
company. The reinsurance agreements were effective December 1, 1993, and cover
most new business of the Company. The agreements are a yearly renewable term
(YRT) treaty where the Company cedes amounts above its retention limit of
$ 100,000 with a minimum cession of $ 25,000.
In addition to the above reinsurance agreements, the Company entered into
reinsurance agreements with Optimum Re Insurance Company (Optimum) during 2004
to provide reinsurance on new products released for sale in 2004. The agreements
are yearly renewable term (YRT) treaties where the Company cedes amounts above
its retention limit of $100,000 with a minimum cession of $25,000 as has been a
Company practice for the last several years with its reinsurers. Also, effective
January 1, 2005, Optimum became the reinsurer of 100% of the accidental death
benefits (ADB) in force of the Company. Previously, Generali provided this
coverage. This coverage is renewable annually at the Company's option. Optimum
specializes in reinsurance agreements with small to mid-size carriers such as
the Company. Optimum currently holds an "A-" (Excellent) rating from A.M. Best.
UG entered a coinsurance agreement with Park Avenue Life Insurance Company
(PALIC) as of September 30, 1996. Under the terms of the agreement, UG ceded to
PALIC substantially all of its paid-up life insurance policies. Paid-up life
insurance generally refers to non-premium paying life insurance policies. PALIC
and its ultimate parent The Guardian Life Insurance Company of America
(Guardian), currently hold an "A" (Excellent), and "A+" (Superior) rating,
respectively, from A.M. Best, an industry rating company. The PALIC agreement
accounts for approximately 68% of the reinsurance reserve credit, as of
December 31, 2004.
On September 30, 1998, UG entered into a coinsurance agreement with The
Independent Order of Vikings, an Illinois fraternal benefit society (IOV). Under
the terms of the agreement, UG agreed to assume, on a coinsurance basis, 25% of
the reserves and liabilities arising from all in-force insurance contracts
issued by the IOV to its members. At December 31, 2004, the IOV insurance
in-force was approximately $ 1,686,000, with reserves being held on that amount
of approximately $ 393,000.
On June 1, 2000, UG assumed an already existing coinsurance agreement, dated
January 1, 1992, between Lancaster Life Reinsurance Company (LLRC), an Arizona
corporation and Investors Heritage Life Insurance Company (IHL), a corporation
organized under the laws of the Commonwealth of Kentucky. Under the terms of the
agreement, LLRC agreed to assume from IHL a 90% quota share of new issues of
credit life and accident and health policies that have been written on or after
January 1, 1992 through various branches of the First Southern National Bank.
The maximum amount of credit life insurance that can be assumed on any one
individual's life is $ 15,000. UG assumed all the rights and obligations
formerly held by LLRC as the reinsurer in the agreement. LLRC liquidated its
charter immediately following the transfer. At December 31, 2004, IHL has
insurance in-force of approximately $ 2,295,000, with reserves being held on
that amount of approximately $ 33,000.
The Company does not have any short-duration reinsurance contracts. The effect
of the Company's long-duration reinsurance contracts on premiums earned in 2004,
2003 and 2002 was as follows:
Shown in thousands
-----------------------------------------------------
2004 2003 2002
Premiums Premiums Premiums
Earned Earned Earned
---------------- ---------------- ----------------
Direct $ 17,238 $ 18,087 $ 18,597
Assumed 38 34 96
Ceded (3,036) (2,896) (2,701)
---------------- ---------------- ----------------
Net premiums $ 14,240 $ 15,225 $ 15,992
================ ================ ================
8. COMMITMENTS AND CONTINGENCIES
The insurance industry has experienced a number of civil jury verdicts which
have been returned against life and health insurers in the jurisdictions in
which the Company does business involving the insurers' sales practices, alleged
agent misconduct, failure to properly supervise agents, and other matters. Some
of the lawsuits have resulted in the award of substantial judgments against the
insurer, including material amounts of punitive damages. In some states, juries
have substantial discretion in awarding punitive damages in these circumstances.
Under the insurance guaranty fund laws in most states, insurance companies doing
business in a participating state can be assessed up to prescribed limits for
policyholder losses incurred by insolvent or failed insurance companies.
Although the Company cannot predict the amount of any future assessments, most
insurance guaranty fund laws currently provide that an assessment may be excused
or deferred if it would threaten an insurer's financial strength. Mandatory
assessments may be partially recovered through a reduction in future premium tax
in some states. The Company does not believe such assessments will be materially
different from amounts already provided for in the financial statements, though
the Company has no control over such assessments.
On June 10, 2002 UTG and Fiserv formed an alliance between their respective
organizations to provide third party administration (TPA) services to insurance
companies seeking business process outsourcing solutions. Fiserv will be
responsible for the marketing and sales function for the alliance, as well as
providing the operations processing service for the Company. The Company will
staff the administration effort. To facilitate the alliance, the Company plans
to convert its existing business and TPA clients to "ID3", a software system
owned by Fiserv to administer an array of life, health and annuity products in
the insurance industry. Fiserv is a unit of Fiserv, Inc. (Nasdaq: FISV) which is
an independent, full-service provider of integrated data processing and
information management systems to the financial industry, headquartered in
Brookfield, Wisconsin.
In June 2002, the Company entered into a five-year contract with Fiserv for
services related to its purchase of the "ID3" software system. Under the
contract, the Company is required to pay $ 12,000 per month in software
maintenance costs and $ 5,000 per month in offsite data center costs for a
five-year period from the date of the signing.
On April 25, 2003 the Company entered into an agreement with Fiserv for the
conversion of the two TPA client companies to the "ID3" system. The conversion
was successfully completed in December 2003 utilizing Company personnel with
onsite training and guidance provided by Fiserv. During 2004, the Company began
the conversion of the remaining insurance business to the "ID3" software system
and successfully completed the first phase of this project. The remaining blocks
of business will be completed during 2005.
In the normal course of business the Company is involved from time to time in
various legal actions and other state and federal proceedings. There were no
proceedings pending or threatened as of December 31, 2004.
9. RELATED PARTY TRANSACTIONS
On September 1, 2004, UTG contributed the common stock of its wholly-owned
subsidiary, North Plaza, to its life insurance subsidiary, UG. The contribution,
which received prior approval by the regulatory authorities, increased the
capital of the life insurance subsidiary by $ 7,857,794.
On February 20, 2003, UG purchased $ 4,000,000 of a trust preferred security
offering issued by FSBI. The security has a mandatory redemption after 30 years
with a call provision after 5 years. The security pays a quarterly dividend at a
fixed rate of 6.515%. The Company received $ 264,842 and $ 226,104 of dividends
in 2004 and 2003, respectively.
On June 18, 2003, UG entered into a lease agreement with Bandyco, LLC, an
affiliated entity, for a one-sixth interest in an aircraft. Bandyco, LLC is
affiliated with Ward F. Correll, who is a director of the Company. The lease
term is for a period of five years at a total cost of $ 523,831 per year. The
Company is responsible for its share of annual non-operational costs, in
addition to the operational costs as are billable for specific use.
On November 6, 2003, UG purchased real estate at a cost of $ 2,220,256 from an
outside third party through the formation of an LLC in which UG is a two-thirds
owner. The other one-third partner is Millard V. Oakley, who is a former
Director of UTG. Hampshire Plaza Garage is a 578 space parking garage located in
New Hampshire.
On March 26, 2002, the Board of Directors of UTG adopted, and on June 11, 2002,
the shareholders of UTG approved, the United Trust Group, Inc. Employee and
Director Stock Purchase Plan (See Note 10.A. to the consolidated financial
statements).
On November 20, 1998, FSF and affiliates acquired 929,904 shares of common stock
of UTG from UTG and certain UTG shareholders. As consideration for the shares,
FSF paid UTG $ 10,999,995 and certain shareholders of UTG $ 999,990 in cash.
Included in the stock acquisition agreement is an earnings covenant whereby UTG
warrants UTG and its subsidiaries and affiliates will have future earnings of at
least $ 30,000,000 for a five-year period beginning January 1, 1998 (See Note
10.C. to the consolidated financial statements).
At the March 2003 Board of Directors meeting, the Appalachian Life Insurance
Company (APPL) and UG Boards reaffirmed the merger of APPL with and into UG and
approved the final merger documents. Upon receiving the necessary regulatory
approvals, the merger of Abraham Lincoln Insurance Company (ABE) and APPL with
and into UG was consummated effective July 1, 2003. ABE and APPL were each 100%
owned subsidiaries of UG prior to the merger. Management of the Company believes
the completion of the mergers will provide the Company with additional cost
savings. These cost savings result from streamlining the Company's operations
and organizational structure from three life insurance subsidiaries to one life
insurance subsidiary, UG. Thus, the Company will further improve administrative
efficiency.
On January 1, 1993, UTG entered an agreement with UG pursuant to which UTG
provided management services necessary for UG to carry on its business. UG paid
$ 5,625,451, $ 5,906,406 and $ 3,025,194 to UTG in 2004, 2003 and 2002,
respectively, under this arrangement.
ABE paid fees to FCC pursuant to a cost sharing and management fee agreement.
FCC provided management services for ABE to carry on its business. The agreement
required ABE to pay a percentage of the actual expenses incurred by FCC based on
certain activity indicators of ABE business to the business of all the insurance
company subsidiaries plus a management fee based on a percentage of the actual
expenses allocated to ABE. ABE paid fees of $ 188,494 in 2002 under this
agreement. ABE paid fees of $ 165,269 and $ 170,729 in 2003 and 2002,
respectively, to UTG under this agreement.
APPL had a management fee agreement with FCC whereby FCC provided certain
administrative duties, primarily data processing and investment advice. APPL
paid fees of $ 222,000 during 2002 to FCC under this agreement. APPL paid fees
of $ 222,000 and $ 222,000 to UTG during 2003 and 2002, respectively, under this
agreement.
Respective domiciliary insurance departments have approved the agreements of the
insurance companies and it is Management's opinion that where applicable, costs
have been allocated fairly and such allocations are based upon accounting
principles generally accepted in the United States of America.
Since the Company's affiliation with FSF, UG has acquired mortgage loans through
participation agreements with FSNB. FSNB services the loans covered by these
participation agreements. UG pays a .25% servicing fee on these loans and a
one-time fee at loan origination of .50% of the original loan amount to cover
costs incurred by FSNB relating to the processing and establishment of the loan.
UG paid $ 45,468, $ 63,214 and $ 70,140 in servicing fees and $ 0, $ 13,821 and
$ 35,127 in origination fees to FSNB during 2004, 2003 and 2002, respectively.
The Company reimbursed expenses incurred by Mr. Jesse T. Correll and Mr. Randall
L. Attkisson relating to travel and other costs incurred on behalf of or
relating to the Company. The Company paid $ 50,098, $ 20,238 and $ 74,621 in
2004, 2003 and 2002, respectively to First Southern Bancorp, Inc. in
reimbursement of such costs. In addition, beginning in 2001, the Company began
reimbursing FSBI a portion of salaries and pension costs for Mr. Correll and Mr.
Attkisson. The reimbursement was approved by the UTG Board of Directors and
totaled $ 160,440, $ 151,440 and $ 169,651 in 2004, 2003 and 2002, respectively,
which included salaries and other benefits.
10. CAPITAL STOCK TRANSACTIONS
A. EMPLOYEE AND DIRECTOR STOCK PURCHASE PROGRAM
On March 26, 2002, the Board of Directors of UTG adopted, and on June 11, 2002,
the shareholders of UTG approved, the United Trust Group, Inc. Employee and
Director Stock Purchase Plan. The plan's purpose is to encourage ownership of
UTG stock by eligible directors and employees of UTG and its subsidiaries by
providing them with an opportunity to invest in shares of UTG common stock. The
plan is administered by the Board of Directors of UTG. A total of 400,000 shares
of common stock may be purchased under the plan, subject to appropriate
adjustment for stock dividends, stock splits or similar recapitalizations
resulting in a change in shares of UTG. The plan is not intended to qualify as
an "employee stock purchase plan" under Section 423 of the Internal Revenue
Code.
During 2004 and 2003, the Board of Directors of UTG approved offerings under the
plan to qualified individuals. For the years ended December 31, 2004 and 2003,
four individuals purchased 14,440 and eight individuals purchased 58,891 shares
of UTG common stock, respectively. Each participant under the plan executed a
"stock restriction and buy-sell agreement", which among other things provides
UTG with a right of first refusal on any future sales of the shares acquired by
the participant under this plan.
The purchase price of shares repurchased under the stock restriction and
buy-sell agreement shall be computed, on a per share basis, equal to the sum of
(i) the original purchase price paid to acquire such shares from UTG and (ii)
the consolidated statutory net earnings (loss) per share of such shares during
the period from the end of the month next preceding the month in which such
shares were acquired pursuant to the plan, to the end of the month next
preceding the month in which the sale of such shares to UTG occurs. At
December 31, 2004, UTG had 89,877 shares outstanding that were issued under this
program with a value of $ 11.63 per share pursuant to the above formula.
B. STOCK REPURCHASE PROGRAM
On June 5, 2001, the Board of Directors of UTG authorized the repurchase in the
open market or in privately negotiated transactions of up to $ 1 million of
UTG's common stock. On June 16, 2004, an additional $ 1 million was authorized
for repurchasing shares. Repurchased shares are available for future issuance
for general corporate purposes. Through February 24, 2005, UTG has spent
$ 1,181,691 in the acquisition of 181,316 shares under this program.
C. SHARES ACQUIRED BY FSF AND AFFILIATES WITH OPTIONS GRANTED
On November 20, 1998, FSF and affiliates acquired 929,904 shares of common stock
of UTG from UTG and certain UTG shareholders. As consideration for the shares,
FSF paid UTG $ 10,999,995 and certain shareholders of UTG $ 999,990 in cash.
Included in the stock acquisition agreement was an earnings covenant whereby UTG
warranted UTG and its subsidiaries and affiliates would have future earnings of
at least $ 30,000,000 for a five-year period beginning January 1, 1998. Such
earnings were computed based on statutory results excluding inter-company
activities such as inter-company dividends plus realized and unrealized gains
and losses on real estate, mortgage loans and unaffiliated common stocks. At the
end of the covenant period, an adjustment was to be made equal to the difference
between the then market value and statutory carrying value of real estate still
owned that existed at the beginning of the covenant period. If UTG did not meet
the covenant requirements, any shortfall would first be reduced by the actual
average tax rate for UTG for the period, and then would be further reduced by
one-half of the percentage, if any, representing UTG's ownership percentage of
the insurance company subsidiaries. This result would then be reduced by
$ 250,000. The remaining amount would be paid by UTG in the form of UTG common
stock valued at $ 15.00 per share with a maximum number of shares to be issued
of 500,000. However, there was to be no limit to the number of shares
transferred to the extent that there were legal fees, settlements, damage
payments or other losses as a result of certain legal action taken. The price
and number of shares was adjusted for any applicable stock splits, stock
dividends or other recapitalizations. For the five-year period starting
January 1, 1998 and ending December 31, 2003, the Company had total earnings of
$ 17,011,307 applicable to this covenant. Therefore, UTG did not meet the
earnings requirements stipulated, and during 2003, UTG was required to issue
500,000 additional shares to FSF or its assigns.
D. EARNINGS PER SHARE CALCULATIONS
The following is a reconciliation of the numerators and denominators of the
basic and diluted EPS computations as presented on the income statement.
For the year ended December 31, 2004
---------------- ----- ------------------ ---- -----------------
Income(Loss) Shares Per-Share
(Numerator) (Denominator) Amount
---------------- ------------------ -----------------
Basic EPS
Income available to common shareholders $ (275,619) 3,986,731 $ (.07)
=================
Effect of Dilutive Securities
Options 0 0
---------------- ------------------
Diluted EPS
Income available to common shareholders and $
assumed conversions (275,619) 3,986,731 $ (0.07)
================ ================== =================
For the year ended December 31, 2003
------------------ --- ------------------ ---- -----------------
Income (Loss) Shares Per-Share
(Numerator) (Denominator) Amount
------------------ ------------------ -----------------
Basic EPS
Income available to common shareholders $ (6,396,490) 3,839,947 $ (1.67)
=================
Effect of Dilutive Securities
Options 0 0
------------------ ------------------
Diluted EPS
Income available to common shareholders and $
assumed conversions (6,396,490) 3,839,947 $ (1.67)
================== ================== =================
For the year ended December 31, 2002
--------------- ------ ------------------ ---- -----------------
Income Shares Per-Share
(Numerator) (Denominator) Amount
--------------- ------------------ -----------------
Basic EPS
Income available to common shareholders $ 1,338,795 3,505,424 $ 0.38
=================
Effect of Dilutive Securities
Earnings covenant 0 500,000
Options 0 0
--------------- ------------------
Diluted EPS
Income available to common shareholders and $
assumed conversions 1,338,795 4,005,424 $ 0.33
=============== ================== =================
In accordance with Statement of Financial Accounting Standards No. 128, the
computation of diluted earnings per share is the same as basic earnings per
share for the years ending December 31, 2004 and 2003, since the Company had a
loss from continuing operation for the year presented, and any assumed
conversion, exercise, or contingent issuance of securities would have an
antidilutive effect on earnings per share. At December 31, 2002, UTG had an
obligation to issue to FSF or its assigns 500,000 shares of UTG common stock, as
the result of a failed earnings covenant (See note 10.C. to the consolidated
financial statements). As such, the computation of diluted earnings per share
differs from basic earnings per share for the year ending December 31, 2002.
11. NOTES PAYABLE
At December 31, 2004, the Company had no long-term debt outstanding. At December
31, 2003, the Company had $ 2,289,776 in long-term debt outstanding.
The notes payable were incurred in April 2001 to facilitate the repurchase of
common stock owned primarily by two former Officers and Directors of UTG, and
members of their respective families. These notes bore interest at the fixed
rate of 7% per annum (paid quarterly) with payments of principal to be made in
five equal installments. UTG has paid the entire principal balance on these
notes.
During 2001, UTG was extended a $ 3,300,000 line of credit (LOC) from the First
National Bank of the Cumberlands (FNBC) located in Livingston, Tennessee. The
LOC was for a one-year term from the date of issue. Upon maturity the Company
has renewed the LOC for an additional one-year term. The interest rate on the
LOC is variable and indexed to be the lowest of the U.S. prime rates as
published in the Wall Street Journal, with any interest rate adjustments to be
made monthly. No borrowings were incurred during 2004 and 2003.
During 2002, UTG was extended a $ 5,000,000 line of credit (LOC) from Southwest
Bank of St. Louis. The LOC expired one year from the date of issue and has been
renewed for an additional term. As collateral for any draws under the line of
credit, UTG pledged 100% of the common stock of its insurance subsidiary, UG.
Borrowings under the LOC will bear interest at the rate of 0.25% in excess of
Southwest Bank of St. Louis' prime rate. At December 31, 2004 and 2003, the
Company had no outstanding borrowings attributable to this LOC. During 2004, UTG
drew $ 2,275,000 on this LOC to repay the outstanding principal balances on the
notes payable describe above. The entire draw was repaid during 2004.
12. OTHER CASH FLOW DISCLOSURES
On a cash basis, the Company paid $ 77,453, $ 162,179, and $ 263,441 in interest
expense for the years 2004, 2003 and 2002, respectively. The Company paid
$ 110,000, $ 175,000, and $ 60,290 in federal income tax for 2004, 2003 and
2002, respectively.
As of December 31, 2004, the Company has $ 450,250 that has not been disbursed
to former minority shareholders of FCC in connection with FCC's merger with and
into UTG. The total consideration to be paid by the Company to the former
minority shareholders as a result of the merger is $ 2,480,000 (See Note 15 to
the consolidated financial statements).
At December 31, 2004, the Company acquired $ 2,990,928 in fixed maturity
investments for which the cash had not yet been paid. The payable for these
securities is included in the line item "Other liabilities" on the consolidated
balance sheet.
13. CONCENTRATION OF CREDIT RISK
The Company maintains cash balances in financial institutions that at times may
exceed federally insured limits. The Company maintains its primary operating
cash accounts with First Southern National Bank, an affiliate of the largest
shareholder of UTG, Mr. Jesse T. Correll, the Company's CEO and Chairman. In
aggregate at December 31, 2004 these accounts have no balances for which there
are no pledges or guarantees outside FDIC insurance limits. The Company has not
experienced any losses in such accounts and believes it is not exposed to any
significant credit risk on cash and cash equivalents.
14. NEW ACCOUNTING STANDARDS
The Financial Accounting Standards Board ("FASB") has issued Statement No. 132
(revised 2003), Employers' Disclosures about Pensions and Other Postretirement
Benefits (an amendment of FASB Statements 87, 88 and 106). Statement No. 132 was
developed to address concerns of users of financial statements regarding their
need for more information about pension plan assets, obligations, benefit
payment, contributions and net benefit costs. This statement was effective at
the beginning of the first interim period beginning after December 15, 2003. The
adoption of Statement 132 (revised 2003) did not affect the Company's financial
position or results of operations, since the Company has no such plans that meet
the provisions of this statement.
The Financial Accounting Standards Board ("FASB") has issued Statement No. 151,
Inventory Costs--an amendment of ARB No. 43, Chapter 4. This Statement amends the
guidance in ARB No. 43, Chapter 4, "Inventory Pricing," to clarify the
accounting for abnormal amounts of idle facility expense, freight, handling
costs, and wasted material (spoilage). This Statement requires that those items
be recognized as current-period charges regardless of whether they meet the
criterion of "so abnormal." In addition, this Statement requires that allocation
of fixed production overheads to the costs of conversion be based on the normal
capacity of the production facilities. This statement is effective for financial
statements for fiscal years beginning after June 15, 2005. The adoption of
Statement 151 does not currently affect the Company's financial position or
results of operations, since the Company has no inventory costs that meet the
provisions of this statement.
The Financial Accounting Standards Board ("FASB") has issued Statement No. 152,
Accounting for Real Estate Time-Sharing Transactions. Statement No. 152 amends
FASB Statement No. 66, Accounting for Sales of Real Estate, to reference the
financial accounting and reporting guidance for real estate time-sharing
transactions that is provided in AICPA Statement of Position (SOP) 04-2,
Accounting for Real Estate Time-Sharing Transactions. Statement No. 152 also
amends FASB Statement No. 67, Accounting for Costs and Initial Rental Operations
of Real Estate Projects, to state that the guidance for (a) incidental
operations and (b) costs incurred to sell real estate projects does not apply to
real estate time-sharing transactions. This statement is effective for financial
statements for fiscal years beginning after June 15, 2005. The adoption of
Statement 152 does not currently affect the Company's financial position or
results of operations, since the Company has no real estate interests that meet
the provisions of this statement.
The Financial Accounting Standards Board ("FASB") has issued Statement No. 153,
Exchanges of Nonmonetary Assets. Statement No. 153 amends APB Opinion No. 29,
Accounting for Nonmonetary Transactions, to eliminate the exception for
nonmonetary exchanges of similar productive assets and replaces it with a
general exception for exchanges of nonmonetary assets that do not have
commercial substance. This statement is effective for financial statements for
nonmonetary asset exchanges occurring in fiscal periods beginning after June 15,
2005. The Company will account for all future nonmonetary asset exchanges in
accordance with the requirements of Statement No. 153.
The Financial Accounting Standards Board ("FASB") has issued Statement No. 123
(revised 2004), Share Based Payment. Statement No. 123 establishes standards for
the accounting for transactions in which an entity exchanges its equity
instruments for goods or services. It also addresses transactions in which an
entity incurs liabilities in exchange for goods or services that are based on
the fair value of the entity's equity instruments or that may be settled by the
issuance of those equity instruments. This statement is effective as of the
beginning of the first interim or annual reporting period that begins after
June 15, 2005. The Company will account for all future share based payments in
accordance with the requirements of Statement No. 123.
15. MERGER OF UNITED TRUST GROUP, INC. AND FIRST COMMONWEALTH CORPORATION
On May 21, 2002, at a special meeting of shareholders, the shareholders of FCC,
then an 82% owned subsidiary of UTG, voted on and approved that certain
Agreement and Plan of Reorganization and related Plan of Merger, each dated as
of June 5, 2001, between UTG, and FCC (collectively, the "Merger Agreement"),
and the merger contemplated thereby in which FCC would be merged with and into
UTG, with UTG being the surviving corporation of the merger. The merger became
effective on June 12, 2002. Pursuant to the terms and conditions of the Merger
Agreement, each share of FCC stock outstanding at the effective time of the
merger (other than shares held by UTG or shares held in treasury by FCC or by
any of its subsidiaries) was at such time automatically converted into the right
to receive $ 250 in cash per share. This allowed UTG to acquire the remaining
common shares (approximately 18%) of FCC that UTG did not own prior to the
effective time of the merger.
The following table summarizes certain unaudited operating results of UTG as
though the merger transaction had taken place at the beginning of the reporting
periods ending on December 31, 2002.
December 31,
2002
--------------------
Total revenues $ 30,064,644
Total benefits and other expenses $ 27,927,456
Operating income $ 2,137,188
Net Income $ 1,394,218
Basic earnings per share $ 0.40
Diluted earnings per share $ 0.35
16. COMPREHENSIVE INCOME
Tax
Before-Tax (Expense) Net of Tax
2004 Amount or Benefit Amount
------------------------------------------ ---------------- ------------------- ---------------
Unrealized holding gains during
period $ 7,896,605 $ (2,763,812) $ 5,132,793
Less: reclassification adjustment
for gains realized in net income (31,766) (11,118) (20,648)
---------------- ------------------- ---------------
Net unrealized gains 7,864,838 (2,752,693) 5,112,145
---------------- ------------------- ---------------
Other comprehensive income $ 7,864,838 $ (2,752,693) $ 5,112,145
================ =================== ===============
Tax
Before-Tax (Expense) Net of Tax
2003 Amount or Benefit Amount
------------------------------------------ ---------------- ------------------- ---------------
Unrealized holding losses during
period $ (1,941,662) $ 679,582 $ (1,262,080)
Less: reclassification adjustment
for losses realized in net income 86,979 (30,443) 56,536
---------------- ------------------- ---------------
Net unrealized losses (1,854,683) 649,139 (1,205,544)
---------------- ------------------- ---------------
Other comprehensive deficit $ (1,854,683) $ 649,139 $ (1,205,544)
================ =================== ===============
Tax
Before-Tax (Expense) Net of Tax
2002 Amount or Benefit Amount
------------------------------------------ ---------------- ------------------- ---------------
Unrealized holding gains during
period $ 2,868,146 $ (1,003,851) $ 1,864,295
Less: reclassification adjustment
for gains realized in net income (1,689) 591 (1,098)
---------------- ------------------- ---------------
Net unrealized gains 2,866,457 (1,003,260) 1,863,197
---------------- ------------------- ---------------
Other comprehensive income $ 2,866,457 $ (1,003,260) $ 1,863,197
================ =================== ===============
In 2004, 2003 and 2002, the Company established a deferred tax liability of
$ 3,555,787, $ 803,095 and $ 1,170,197, respectively, for the unrealized gains
based on the applicable United States statutory rate of 35%.
17. SELECTED QUARTERLY FINANCIAL DATA (UNAUDITED)
2004
-------------------- --------------------- --------------------- --------------------
1st 2nd 3rd 4th
--------------- --------------- --------------- ---------------
Premiums and policy fees, net $ 3,874,145 $ 3,671,667 $ 3,389,672 $ 3,204,945
Net investment income 1,831,077 2,734,854 2,865,198 2,989,757
Total revenues 5,833,347 6,607,203 6,429,302 6,597,027
Policy benefits including
dividends 5,172,042 4,923,292 4,467,013 4,203,360
Commissions and
amortization of DAC and COI 493,284 505,872 544,678 635,077
Operating expenses 1,397,448 1,432,013 1,319,472 1,163,814
Operating income (1,255,061) (278,683) 71,029 594,776
Net income (874,195) 66,841 141,264 390,473
Basic earnings per share (0.22) 0.02 0.04 0.09
Diluted earnings per
share (0.22) 0.02 0.04 0.09
2003
-------------------- --------------------- --------------------- --------------------
1st 2nd 3rd 4th
--------------- --------------- --------------- ---------------
Premiums and policy fees, net $ 3,883,003 $ 4,093,239 $ 3,686,584 $ 3,360,212
Net investment income 2,888,444 3,231,542 2,462,813 1,687,701
Total revenues 7,185,509 7,811,693 6,498,785 4,992,371
Policy benefits including
dividends 5,520,920 4,931,443 5,516,224 5,102,089
Commissions and
amortization of DAC and COI 544,139 441,914 513,488 5,507,726
Operating expenses 1,169,139 3,500,807 1,451,973 1,444,861
Operating income (loss) (90,406) (1,102,433) (1,023,300) (7,102,405)
Net income (loss) (494,124) (669,492) (464,142) (4,768,732)
Basic earnings (loss) per share 0.14) (0.17) (0.12) (1.24)
Diluted earnings (loss) per
share (0.12) (0.17) (0.12) (1.24)
2002
-------------------- --------------------- --------------------- --------------------
1st 2nd 3rd 4th
--------------- --------------- --------------- ---------------
Premiums and policy fees, net $ 4,276,861 $ 4,388,284 $ 3,725,823 $ 3,440,609
Net investment income 3,396,613 3,383,548 3,294,038 3,440,603
Total revenues 7,882,176 7,994,915 7,211,394 7,088,714
Policy benefits including
dividends 4,835,106 4,609,999 5,110,590 4,930,553
Commissions and
amortization of DAC and COI 688,618 578,688 501,283 532,722
Operating expenses 1,530,433 1,649,134 1,441,502 1,255,387
Operating income 755,809 1,095,700 86,789 311,445
Net income (loss) 477,034 722,679 327,499 (188,417)
Basic earnings (loss) per share 0.14 0.21 0.08 (0.05)
Diluted earnings (loss) per
share 0.12 0.18 0.08 (0.05)
ITEM 9. DISAGREEMENTS WITH ACCOUNTANTS ON ACCOUNTING AND FINANCIAL DISCLOSURE
NONE
ITEM 9A. CONTROLS AND PROCEDURES
Within the 90 days prior to the filing date of this quarterly report, an
evaluation was performed under the supervision and with the participation of the
Company's management, including the President and Chief Executive Officer (the
"CEO") and the Chief Financial Officer (the "CFO"), of the effectiveness of the
design and operation of the Company's disclosure controls and procedures. Based
on that evaluation, the Company's management, including the CEO and CFO,
concluded that the Company's disclosure controls and procedures were effective
in alerting them on a timely basis to material information relating to the
Company required to be included in the Company's periodic reports filed or
submitted under the Securities Exchange Act of 1934, as amended. There have been
no significant changes in the Company's internal controls or in other factors
that could significantly affect internal controls subsequent to the date of the
evaluation.
PART III
ITEM 10. DIRECTORS AND EXECUTIVE OFFICERS OF UTG
The Board Of Directors
In accordance with the laws of Illinois and the Certificate of Incorporation and
Bylaws of UTG, as amended, UTG is managed by its executive officers under the
direction of the Board of Directors. The Board elects executive officers,
evaluates their performance, works with management in establishing business
objectives and considers other fundamental corporate matters, such as the
issuance of stock or other securities, the purchase or sale of a business and
other significant corporate business transactions. In the fiscal year ended
December 31, 2004, the Board met 4 times. All directors attended at least 75% of
all meetings of the board, except Mr. John Albin and Mr. Ward Correll.
The Board of Directors has an Audit Committee consisting of Messrs. Perry,
Albin, and Brinck. The Audit Committee performs such duties as outlined in the
Company's Audit Committee Charter. The Audit Committee reviews and acts or
reports to the Board with respect to various auditing and accounting matters,
the scope of the audit procedures and the results thereof, internal accounting
and control systems of UTG, the nature of services performed for UTG and the
fees to be paid to the independent auditors, the performance of UTG's
independent and internal auditors and the accounting practices of UTG. The Audit
Committee also recommends to the full Board of Directors the auditors to be
appointed by the Board. The Audit Committee met twice in 2004.
The Board has reviewed the qualifications of each member of the audit committee
and determined no member of the committee meets the definition of a "financial
expert". The Board concluded however, that each member of the committee has a
proven track record as a successful businessman, each operating their own
company and their experience as businessmen provide a knowledge base and
experience adequate for participation as a member of the committee.
The compensation of UTG's executive officers is determined by the full Board of
Directors (see report on Executive Compensation).
Under UTG's By-Laws, the Board of Directors should be comprised of at least six
and no more than eleven directors. At December 31, 2004. the Board consisted of
eight directors. Shareholders elect Directors to serve for a period of one year
at UTG's Annual Shareholders' meeting.
Directors and officers of UTG file periodic reports regarding ownership of
Company securities with the Securities and Exchange Commission pursuant to
Section 16(a) of the Securities Exchange Act of 1934 as amended, and the rules
promulgated thereunder. During 2004, UTG was aware of the following individual
who filed a late Form 4, statement of changes in beneficial ownership of
securities, with the Securities and Exchange Commission; Thomas F Darden, II,
director. This individual reported a purchase of 4,315 shares of UTG stock.
Audit Committee Report To Shareholders
In connection with the December 31, 2004 financial statements, the audit
committee: (1) reviewed and discussed the audited financial statements with
management; (2) discussed with the auditors the matters required by Statement on
Auditing Standards No. 61; and (3) received and discussed with the auditors the
matters required by Independence Standards Board Statement No.1. Based upon
these reviews and discussions, the audit committee recommended to the Board of
Directors that the audited financial statements be included in the Annual Report
on Form 10-K filed with the SEC.
William W. Perry - Committee Chairman
John S. Albin
Joseph A. Brinck, II
The following information with respect to business experience of the Board of
Directors has been furnished by the respective directors or obtained from the
records of UTG.
Directors
Name, Age Position with the Company, Business Experience and Other Directorships
John S. Albin, 76
Director of UTG since 1984; farmer in Douglas and Edgar
counties, Illinois, since 1951; Chairman of the Board of
Longview State Bank from 1978 to 2005; President of the
Longview Capitol Corporation, a bank holding company, since
1978; Chairman of First National Bank of Ogden, Illinois,
from 1987 to 2005; Chairman of the State Bank of Chrisman
from 1988 to 2005; Chairman of First National Bank in
Georgetown from 1994 to 2005; Director and Secretary of
Illini Community Development Corporation since 1990;
Commissioner of Illinois Student Assistance Commission from
1996 to 2002.
Randall L. Attkisson, 59
Director of UTG since 1999; President and Chief Operating
Officer of UTG since 2001; Chief Financial Officer,
Treasurer, Director of First Southern Bancorp, Inc, a bank
holding company, since 1986; Treasurer, Director of First
Southern Funding, LLC since 1992; Director of Kentucky
Christian Foundation since 2002; Director of The River
Foundation, Inc. since 1990; President of Randall L.
Attkisson & Associates from 1982 to 1986; Commissioner of
Kentucky Department of Banking & Securities from 1980 to
1982; Self-employed Banking Consultant in Miami, FL from
1978 to 1980.
Joseph A. Brinck, II, 49
Director of UTG since 2003; CEO of Stelter & Brinck, LTD, a
full service combustion engineering and manufacturing
company from 1979 to present; President of Superior Thermal,
LTD from 1990 to present. Currently holds Professional
Engineering Licenses in Ohio, Kentucky, Indiana and
Illinois.
Jesse T. Correll, 48
Chairman and CEO of UTG since 2000; Director of UTG since
1999; Chairman, President, Director of First Southern
Bancorp, Inc. since 1983; President, Director of First
Southern Funding, LLC since 1992; President, Director of The
River Foundation since 1990; Director of Thomas Nelson,
Inc., a premier publisher of Bibles and Christian Books
since 2001; Director of Computer Services, Inc., provider of
bank technology products and services since 2001; Director
of Global Focus since 2001; Young Life Dominican Republic
Committee Member since 2000. Jesse Correll is the son of
Ward Correll.
Ward F. Correll, 76
Director of UTG since 2000; President, Director of Tradeway,
Inc. of Somerset, KY since 1973; President, Director of
Cumberland Lake Shell, Inc. of Somerset, KY since 1971;
President, Director of Tradewind Shopping Center, Inc. of
Somerset, KY since 1966; Director of First Southern Bancorp
since 1988; Director of First Southern Funding, LLC since
1991; Director of The River Foundation since 1990; and
Director First Southern Insurance Agency since 1987. Ward
Correll is the father of Jesse Correll.
Thomas F. Darden, 50
Mr. Darden is the Chief Executive Officer of Cherokee
Investment Partners, a private equity fund with over $1
billion of capital for investing in brownfields. Cherokee
has offices in North Carolina, Colorado, New Jersey, London,
Toronto and Montreal. Beginning in 1984, he served for 16
years as the Chairman of Cherokee Sanford Group, the largest
privately-held brick manufacturing company in the United
States and previously the Southeast's largest soil
remediation company. From 1981 to 1983, Mr. Darden was a
consultant with Bain & Company in Boston. From 1977 to 1978,
he worked as an environmental planner for the Korea
Institute of Science and Technology in Seoul, where he was a
Henry Luce Foundation Scholar. Mr. Darden is on the Boards
of Shaw University and the University of North Carolina's
environmental department. He is on the Board of Directors of
the National Brownfield Association and on the Board of
Trustees of North Carolina Environmental Defense. He was
Chairman of the Research Triangle Transit Authority and
served two terms on the N.C. Board of Transportation through
appointments by the Governor and the Speaker of the House.
Mr. Darden is a director of Winston Hotels, Inc. (NYSE) and
serves on the Board of Governors of Research Triangle
Institute in Research Triangle Park, NC. Mr. Darden earned a
Masters in Regional Planning from the University of North
Carolina at Chapel Hill, a JD from Yale Law School and a BA
from the University of North Carolina at Chapel Hill, where
he was a Morehead Scholar. His 1976 undergraduate thesis
analyzed the environmental impact of third world development
and his 1981 Yale thesis addressed interstate acid rain air
pollution. Mr. Darden and his wife Jody have three children,
ages 16 to 25.
William W. Perry, 48
Director of UTG since 2001; Owner of SES Investments, Ltd.,
an oil and gas investments company since 1991; President of
EGL Resources, Inc., an oil and gas operations company based
in Texas and New Mexico since 1992; President of a real
estate investment company; Chairman of Perry & Perry, Inc.,
a Texas oil and gas consulting company since 1977; Director
of Young Life Foundation and involved with Young Life in
various capacities; Director of Abel-Hangar Foundation,
Director of University of Oklahoma Associates; Midland,
Texas city council member since 2002
James P. Rousey, 46
Executive Vice President, Chief Administrative Officer and
Director of UTG since September 2001; Regional CEO and
Director of First Southern National Bank from 1988 to 2001.
Board Member with the Illinois Fellowship of Christian
Athletes since 2001.
Executive Officers Of UTG
More detailed information on the following executive officers of UTG appears
under "Directors":
Jesse T. Correll Chairman of the Board and Chief Executive Officer
Randall L. Attkisson President and Chief Operating Officer
James P. Rousey Executive Vice President and Chief Administrative Officer
Other executive officers of UTG are set forth below:
Name, Age Position with UTG and Business Experience
Theodore C. Miller, 42
Corporate Secretary since December 2000, Senior Vice
President and Chief Financial Officer since July 1997; Vice
President since October 1992 and Treasurer from October 1992
to December 2003; Vice President and Controller of certain
affiliated companies from 1984 to 1992. Vice President and
Treasurer of certain affiliated companies from 1992 to 1997;
Senior Vice President and Chief Financial Officer of
subsidiary companies since 1997; Corporate Secretary of
subsidiary companies since 2000.
Code Of Ethics
We have adopted a Code of Business Conduct and Ethics for our directors,
officers (including our principal executive officer, principal financial
officer, principal accounting officer or controller, and persons performing
similar functions) and employees. Our Code of Business Conduct and Ethics is
available to our stockholders by requesting a free copy of the Code of Business
Conduct and Ethics by writing to us at United Trust Group, 5250 South Sixth St,
Springfield, Illinois 62703.
ITEM 11. EXECUTIVE COMPENSATION
Executive Compensation Table
The following table sets forth certain information regarding compensation paid
to or earned by UTG's Chief Executive Officer and President, and each of the
executive officers of UTG whose salary plus bonus exceeded $100,000 during UTG's
last fiscal year:
SUMMARY COMPENSATION TABLE
Name and Annual Compensation Other Annual All Other (1)
Principal Position Year Salary ($) Bonus ($) Compensation ($) Compensation ($)
Jesse T. Correll (2) 2004 75,720 - - 4,500
Chairman of the Board 2003 75,720 - - 4,500
Chief Executive Officer 2002 75,000 - - 4,500
Randall L. Attkisson 2004 75,720 - - 4,500
President 2003 75,720 - - 4,500
2002 75,000 - - 4,500
Theodore C. Miller 2004 100,000 - - 3,000
Corporate Secretary 2003 100,000 3,000 - 3,000
Senior Vice President 2002 100,000 - - 3,000
Chief Financial Officer
James P. Rousey 2004 135,000 - - 1,519
Executive Vice President 2003 135,000 - - 2,025
Chief Administrative Officer 2002 135,000 10,000 - 2,025
Member of the Board
Douglas A. Dockter (3) 2004 100,000 1,000 - 2,700
Vice President 2003 100,000 4,000 - 2,689
2002 95,000 - - 2,316
(1) All Other Compensation consists of matching contributions to a Employee
Savings Trust 401(k) Plan.
(2) On March 27, 2000, Mr. Jesse T. Correll assumed the position as Chairman of
the Board and Chief Executive Officer of UTG and each of its affiliates. In
March 2001, the Board of Directors approved an annual salary for Mr.
Correll of $75,000, with payments to begin on April 1, 2001.
(3) Mr. Douglas A. Dockter is not considered an executive officer of UTG, but
is included in this table pursuant to compensation disclosure requirements.
Option/SAR Grants/Aggregated Option/SAR Exercises in Last Fiscal Year and FY-End
Option/SAR Values
At December 31, 2004 there were no shares of the common stock of UTG subject to
unexercised options held by the named executive officers. There were no options
or stock appreciation rights granted to the named executive officers for the
past three fiscal years.
Compensation of Directors
UTG's standard arrangement for the compensation of directors provides that each
director shall receive an annual retainer of $2,400, plus $300 for each meeting
attended and reimbursement for reasonable travel expenses. UTG's director
compensation policy also provides that directors who are employees of UTG or its
affiliates do not receive any compensation for their services as directors
except for reimbursement for reasonable travel expenses for attending each
meeting.
Employment Contracts
There are no employment agreements in effect with any executive officers of the
Company.
Compensation Committee Interlocks and Insider Participation
UTG does not have a compensation committee and decisions regarding executive
officer compensation are made by the full Board of Directors of UTG. The
following persons served as directors of UTG during 2004 and were officers or
employees of UTG or its affiliates during 2004: Jesse T. Correll, Randall L.
Attkisson and James P. Rousey. Accordingly, these individuals have participated
in decisions related to compensation of executive officers of UTG and its
subsidiaries.
During 2004, Jesse T. Correll and Randall L. Attkisson, executive officers of
UTG and UG, were also members of the Board of Directors of UG.
Jesse T. Correll and Randall L. Attkisson are each directors and executive
officers of FSBI and participate in compensation decisions of FSBI. FSBI owns or
controls directly and indirectly approximately 46.5% of the outstanding common
stock of UTG.
Performance Graph
The following graph compares the cumulative total shareholder return on UTG's
Common Stock during the five fiscal years ended December 31, 2004 with the
cumulative total return on the NASDAQ Composite Index Performance and the NASDAQ
Insurance Index (1). The graph assumes that $ 100 was invested on December 31,
1999 in each of the Company's common stock, the NASDAQ Composite Index, and the
NASDAQ Insurance Stock Index, and that any dividends were reinvested.

(1) The Company selected the NASDAQ Composite Index Performance as an
appropriate comparison since during the time period reflected, the
Company's Common Stock was traded on the NASDAQ Small Cap exchange under
the sign "UTGI" until December 31, 2001. Furthermore, the Company selected
the NASDAQ Insurance Stock Index as the second comparison because there is
no similar single "peer company" in the NASDAQ system with which to compare
stock performance and the closest additional line-of-business index which
could be found was the NASDAQ Insurance Stock Index. Trading activity in
the Company's Common Stock is limited, which may be due in part as a result
of the Company's low profile. The Return Chart is not intended to forecast
or be indicative of possible future performance of the Company's Common
Stock.
ITEM 12. SECURITY OWNERSHIP OF CERTAIN BENEFICIAL OWNERS AND MANAGEMENT.
Principal Holders Of Securities
The following tabulation sets forth the name and address of the entity known to
be the beneficial owners of more than 5% of UTG's Common Stock and shows: (i)
the total number of shares of common Stock beneficially owned by such person as
of March 22, 2005 and the nature of such ownership; and (ii) the percent of the
issued and outstanding shares of common stock so owned as of the same date.
Title Amount Percent
of Name and Address and Nature of of
Class of Beneficial Owner(2) Beneficial Ownership Class (1)
Common Jesse T. Correll 185,454 (3) 4.7%
Stock, no First Southern Bancorp, Inc. 1,739,072 (3)(4) 44.0%
par value First Southern Funding, LLC 335,453 (3)(4) 8.5%
First Southern Holdings, LLC 1,483,791 (3)(4) 37.5%
First Southern Capital Corp., LLC 237,333 (3)(4) 6.0%
First Southern Investments, LLC 24,086 0.6%
Ward F. Correll 98,523 (5) 2.5%
WCorrell, Limited Partnership 72,750 (3) 1.8%
Cumberland Lake Shell, Inc. 98,523 (5) 2.5%
Total(6) 2,619,921 66.2%
(1) The percentage of outstanding shares is based on 3,955,355 shares of Common
Stock outstanding as of March 22, 2005.
(2) The address for each of Jesse Correll, First Southern Bancorp, Inc.
("FSBI"), First Southern Funding, LLC ("FSF"), First Southern Holdings, LLC
("FSH"), First Southern Capital Corp., LLC ("FSC"), First Southern
Investments, LLC ("FSI"), and WCorrell, Limited Partnership ("WCorrell
LP"), is P.O. Box 328, 99 Lancaster Street, Stanford, Kentucky 40484. The
address for each of Ward Correll and Cumberland Lake Shell, Inc. ("CLS") is
P.O. Box 430, 150 Railroad Drive, Somerset, Kentucky 42502.
(3) The share ownership of Jesse Correll listed includes 112,704 shares of
Common Stock owned by him individually. The share ownership of Mr. Correll
also includes 72,750 shares of Common Stock held by WCorrell, Limited
Partnership, a limited partnership in which Jesse Correll serves as
managing general partner and, as such, has sole voting and dispositive
power over the shares held by it.
In addition, by virtue of his ownership of voting securities of FSF and
FSBI, and in turn, their ownership of 100% of the outstanding membership
interests of FSH, Jesse Correll may be deemed to beneficially own the total
number of shares of Common Stock owned by FSH (as well as the shares owned
by FSBI directly), and may be deemed to share with FSH (as well as FSBI)
the right to vote and to dispose of such shares. Mr. Correll owns
approximately 79% of the outstanding membership interests of FSF; he owns
directly approximately 50%, companies he controls own approximately 14%,
and he has the power to vote but does not own an additional 3% of the
outstanding voting stock of FSBI. FSBI and FSF in turn own 99% and 1%,
respectively, of the outstanding membership interests of FSH. Mr. Correll
is also a manager of FSC and thereby may also be deemed to beneficially own
the total number of shares of Common Stock owned by FSC, and may be deemed
to share with it the right to vote and to dispose of such shares. The
aggregate number of shares of Common Stock held by these other entities, as
shown in the above table, is 1,976,405 shares.
(4) The share ownership of FSBI consists of 255,281 shares of Common Stock held
by FSBI directly (which FSBI acquired by virtue of its merger with Dyscim,
LLC) and 1,483,791 shares of Common Stock held by FSH of which FSBI is a
99% member and FSF is a 1% member, as further described below. As a result,
FSBI may be deemed to share the voting and dispositive power over the
shares held by FSH.
(5) Represents the shares of Common Stock held by CLS, all of the outstanding
voting shares of which are owned by Ward F. Correll and his wife. As a
result, Ward F. Correll may be deemed to share the voting and dispositive
power over these shares.
(6) According to the most recent Schedule 13D, as amended, filed jointly by
each of the entities and persons listed above, Jesse Correll, FSBI, FSF,
FSH, FSC, and FSI, have agreed in principle to act together for the purpose
of acquiring or holding equity securities of UTG. In addition, the Schedule
13D indicates that because of their relationships with Jesse Correll and
these other entities, Ward Correll, CLS, and WCorrell, Limited Partnership
may also be deemed to be members of this group. Because the Schedule 13D
indicates that for its purposes, each of these entities and persons may be
deemed to have acquired beneficial ownership of the equity securities of
UTG beneficially owned by the other entities and persons, each has been
identified and listed in the above tabulation.
Security Ownership Of Management Of UTG
The following tabulation shows with respect to each of the directors of UTG,
with respect to UTG's chief executive officer and President, and each of UTG's
executive officers whose salary plus bonus exceeded $100,000 for fiscal 2004,
and with respect to all executive officers and directors of UTG as a group: (i)
the total number of shares of all classes of stock of UTG or any of its parents
or subsidiaries, beneficially owned as of March 1, 2005 and the nature of such
ownership; and (ii) the percent of the issued and outstanding shares of stock so
owned, and granted stock options available as of the same date.
Title Directors, Named Executive Amount Percent
of Officers, & All Directors & and Nature of of
Class Executive Officers as a Group Ownership Class (1)
UTG's John S. Albin 10,503 (4) *
Common Randall L. Attkisson 0 (2) *
Stock, no Joseph A. Brinck, II 0 *
par value Jesse T. Correll 2,497,312 (3) 63.1%
Ward F. Correll 98,523 (5) 2.4%
Thomas F. Darden 21,095 (6) *
Theodore C. Miller 10,000 (6) *
William W. Perry 30,000 (6) *
James P. Rousey 0 *
All directors and executive officers
as a group (ten in number) 2,667,433 67.4%
(1) The percentage of outstanding shares for UTG is based on 3,955,355 shares
of Common Stock outstanding as of March 22, 2005.
(2) Randall L. Attkisson is an associate and business partner of Mr. Jesse T.
Correll and holds minority ownership positions in certain of the companies
listed as owning UTG Common Stock including First Southern Bancorp, Inc.
Ownership of these shares is reflected in the ownership of Jesse T.
Correll.
(3) The share ownership of Mr. Correll includes 112,704 shares of United Trust
Group common stock owned by him individually, 255,281 shares of United
Trust Group common stock held by First Southern Bancorp, Inc. and 335,453
shares of United Trust Group common stock owned by First Southern Funding,
LLC. The share ownership of Mr. Correll also includes 72,750 shares of
United Trust Group common stock held by WCorrell, Limited Partnership, a
limited partnership in which Mr. Correll serves as managing general partner
and, as such, has sole voting and dispositive power over the shares held by
it. In addition, by virtue of his ownership of voting securities of First
Southern Funding, LLC and First Southern Bancorp, Inc., and in turn, their
ownership of 100% of the outstanding membership interests of First Southern
Holdings, LLC (the holder of 1,483,791 shares of United Trust Group common
stock), Mr. Correll may be deemed to beneficially own the total number of
shares of United Trust Group common stock owned by First Southern Holdings,
and may be deemed to share with First Southern Holdings the right to vote
and to dispose of such shares. Mr. Correll owns approximately 79% of the
outstanding membership interests of First Southern Funding; he owns
directly approximately 50%, companies he controls own approximately 14%,
and he has the power to vote but does not own an additional 3% of the
outstanding voting stock of First Southern Bancorp. First Southern Bancorp
and First Southern Funding in turn own 99% and 1%, respectively, of the
outstanding membership interests of First Southern Holdings. Mr. Correll is
also a manager of First Southern Capital Corp., LLC, and thereby may also
be deemed to beneficially own the 237,333 shares of United Trust Group
common stock held by First Southern Capital, and may be deemed to share
with it the right to vote and to dispose of such shares. Share ownership of
Mr. Correll in United Trust Group common stock does not include 24,086
shares of United Trust Group common stock held by First Southern
Investments, LLC.
(4) Includes 392 shares owned directly by Mr. Albin's spouse.
(5) Cumberland Lake Shell, Inc. owns 98,523 shares of UTG Common Stock, all of
the outstanding voting shares of which are owned by Ward F. Correll and his
wife. As a result Ward F. Correll may be deemed to share the voting and
dispositive power over these shares. Ward F. Correll is the father of Jesse
T. Correll. There are 72,750 shares of UTG Common Stock owned by WCorrell
Limited Partnership in which Jesse T. Correll serves as managing general
partner and, as such, has sole voting and dispositive power over the shares
of Common Stock held by it. The aforementioned 72,750 shares are deemed to
be beneficially owned by and listed under Jesse T. Correll in this section.
(6) Shares subject to UTG Employee and Director Stock Purchase Plan.
* Less than 1%.
Except as indicated above, the foregoing persons hold sole voting and investment
power.
The following table reflects the Company's Employee and Director Stock Purchase
Plan Information:
- --------------------------------- ------------------------------ ------------------------------- ------------------------------
Plan category Number of securities to be Weighted-average exercise Number of securities
issued upon exercise of price of outstanding options, remaining available for
outstanding options, warrants and rights future issuance under
warrants and rights employee and director stock
purchase plans (excluding
securities reflected in
column (a))
(a) (b) (c)
- --------------------------------- ------------------------------ ------------------------------- ------------------------------
Employee and director stock
purchase plans approved by
security holders
310,123
0 0
- --------------------------------- ------------------------------ ------------------------------- ------------------------------
Employee and director stock
purchase plans not approved by
security holders
0 0 0
- --------------------------------- ------------------------------ ------------------------------- ------------------------------
Total 0 0 310,123
- --------------------------------- ------------------------------ ------------------------------- ------------------------------
On March 26, 2002, the Board of Directors of UTG adopted, and on June 11, 2002,
the shareholders of UTG approved the United Trust Group, Inc. Employee and
Director Stock Purchase Plan. The Plan allows for the issuance of up to 400,000
shares of UTG common stock. The plan's purpose is to encourage ownership of UTG
stock by eligible directors and employees of UTG and its subsidiary by providing
them with an opportunity to invest in shares of UTG common stock. The plan is
administered by the Board of Directors of UTG.
A total of 400,000 shares of common stock may be purchased under the plan,
subject to appropriate adjustment for stock dividends, stock splits or similar
recapitalizations resulting in a change in shares of UTG. The plan is not
intended to qualify as an "employee stock purchase plan" under Section 423 of
the Internal Revenue Code. During 2004 and 2003, the Board of Directors of UTG
approved offerings under the plan to qualified individuals. For the years ended
December 31, 2004 and 2003, four individuals purchased 14,440 and eight
individuals purchased 58,891 shares of UTG common stock, respectively. Each
participant under the plan executed a "stock restriction and buy-sell
agreement", which among other things provides UTG with a right of first refusal
on any future sales of the shares acquired by the participant under this plan.
The purchase price of shares repurchased under the stock restriction and
buy-sell agreement shall be computed, on a per share basis, equal to the sum of
(i) the original purchase price paid to acquire such shares from UTG and (ii)
the consolidated statutory net earnings (loss) per share of such shares during
the period from the end of the month next preceding the month in which such
shares were acquired pursuant to the plan, to the end of the month next
preceding the month in which the sale of such shares to UTG occurs. At
December 31, 2004, UTG had 89,877 shares outstanding that were issued under this
program with a value of $ 11.63 per share pursuant to the above formula.
ITEM 13. CERTAIN RELATIONSHIPS AND RELATED TRANSACTIONS
On September 1, 2004, UTG contributed the common stock of its wholly-owned
subsidiary, North Plaza, to its life insurance subsidiary, UG. The contribution,
which received prior approval by the regulatory authorities, increased the
capital of the life insurance subsidiary by $ 7,857,794.
On February 20, 2003, UG purchased $ 4,000,000 of a trust preferred security
offering issued by FSBI. The security has a mandatory redemption after 30 years
with a call provision after 5 years. The security pays a quarterly dividend at a
fixed rate of 6.515%. The Company received $ 264,841 and $ 226,104 of dividends
in 2004 and 2003, respectively.
On June 18, 2003, UG entered into a lease agreement with Bandyco, LLC, an
affiliated entity, for a one-sixth interest in an aircraft. Bandyco, LLC is
affiliated with Ward F. Correll, who is a director of the Company. The lease
term is for a period of five years at a cost of $ 523,831. The Company is
responsible for its share of annual non-operational costs, in addition to the
operational costs as are billable for specific use.
On November 6, 2003, UG purchased real estate at a cost of $ 2,220,256 from an
outside third party through the formation of an LLC in which UG is a two-thirds
owner. The other one-third partner is Millard V. Oakley, who is a former
Director of UTG. Hampshire Plaza Garage is a 578 space parking garage located in
New Hampshire.
On March 26, 2002, the Board of Directors of UTG adopted, and on June 11, 2002,
the shareholders of UTG approved, the United Trust Group, Inc. Employee and
Director Stock Purchase Plan (See Note 10.A. to the consolidated financial
statements).
On November 20, 1998, FSF and affiliates acquired 929,904 shares of common stock
of UTG from UTG and certain UTG shareholders. As consideration for the shares,
FSF paid UTG $ 10,999,995 and certain shareholders of UTG $ 999,990 in cash.
Included in the stock acquisition agreement is an earnings covenant whereby UTG
warrants UTG and its subsidiaries and affiliates will have future earnings of at
least $ 30,000,000 for a five-year period beginning January 1, 1998 (See Note
10.C. to the consolidated financial statements).
At the March 2003 Board of Directors meeting, the Appalachian Life Insurance
Company (APPL) and UG Boards reaffirmed the merger of APPL with and into UG and
approved the final merger documents. Upon receiving the necessary regulatory
approvals, the merger of Abraham Lincoln Insurance Company (ABE) and APPL with
and into UG was consummated effective July 1, 2003. ABE and APPL were each 100%
owned subsidiaries of UG prior to the merger. Management of the Company believes
the completion of the mergers will provide the Company with additional cost
savings. These cost savings result from streamlining the Company's operations
and organizational structure from three life insurance subsidiaries to one life
insurance subsidiary, UG. Thus, the Company will further improve administrative
efficiency.
On January 1, 1993, UTG entered an agreement with UG pursuant to which UTG
provided management services necessary for UG to carry on its business. UG paid
$ 5,625,451, $ 5,906,406 and $ 3,025,194 to UTG in 2004, 2003 and 2002,
respectively, under this arrangement.
ABE paid fees to FCC pursuant to a cost sharing and management fee agreement.
FCC provided management services for ABE to carry on its business. The agreement
required ABE to pay a percentage of the actual expenses incurred by FCC based on
certain activity indicators of ABE business to the business of all the insurance
company subsidiaries plus a management fee based on a percentage of the actual
expenses allocated to ABE. ABE paid fees of $ 188,494 in 2002 under this
agreement. ABE paid fees of $ 165,269 and $ 170,729 in 2003 and 2002,
respectively, to UTG under this agreement.
APPL had a management fee agreement with FCC whereby FCC provided certain
administrative duties, primarily data processing and investment advice. APPL
paid fees of $ 222,000 during 2002 under this agreement. APPL paid fees of
$ 222,000 and $ 222,000 to UTG during 2003 and 2002, respectively, under this
agreement.
Respective domiciliary insurance departments have approved the agreements of the
insurance companies and it is Management's opinion that where applicable, costs
have been allocated fairly and such allocations are based upon accounting
principles generally accepted in the United States of America.
Since the Company's affiliation with FSF, UG has acquired mortgage loans through
participation agreements with FSNB. FSNB services the loans covered by these
participation agreements. UG pays a .25% servicing fee on these loans and a
one-time fee at loan origination of .50% of the original loan amount to cover
costs incurred by FSNB relating to the processing and establishment of the loan.
UG paid $ 45,468, $ 63,214 and $ 70,140 in servicing fees and $ 0, $ 13,821 and
$ 35,127 in origination fees to FSNB during 2004, 2003 and 2002, respectively.
The Company reimbursed expenses incurred by Mr. Jesse T. Correll and Mr. Randall
L. Attkisson relating to travel and other costs incurred on behalf of or
relating to the Company. The Company paid $ 50,098, $ 20,238 and $ 74,621 in
2004, 2003 and 2002, respectively to First Southern Bancorp, Inc. in
reimbursement of such costs. In addition, beginning in 2001, the Company began
reimbursing FSBI a portion of salaries and pension costs for Mr. Correll and Mr.
Attkisson. The reimbursement was approved by the UTG Board of Directors and
totaled $ 160,960, $ 151,440 and $ 169,651 in 2004, 2003 and 2002, respectively,
which included salaries and other benefits.
ITEM 14. PRINCIPAL ACCOUNTING FEES AND SERVICES
Kerber, Eck and Braeckel LLP ("KEB") served as UTG's independent certified
public accounting firm for the fiscal year ended December 31, 2004 and for
fiscal year ended December 31, 2003. In serving its primary function as outside
auditor for UTG, KEB performed the following audit services: examination of
annual consolidated financial statements; assistance and consultation on reports
filed with the Securities and Exchange Commission; and assistance and
consultation on separate financial reports filed with the State insurance
regulatory authorities pursuant to certain statutory requirements.
Audit Fees. Audit fees billed for these audit services in the fiscal year ended
December 31, 2004 and December 31, 2003 totaled $ 99,970 and $ 115,000,
respectively and audit fees billed for quarterly reviews of the Company's
financial statements totaled $ 12,014 and $ 13,909 for the year 2004 and 2003,
respectively.
Audit Related Fees. No audit related fees were incurred by the Company from KEB
for the fiscal years ended December 31, 2004 and December 31, 2003.
Tax Fees. KEB did not render any services related to tax compliance, tax advice
or tax planning for the fiscal years ended December 31, 2004 and December 31,
2003.
All Other Fees. No other services besides the audit services described above
were performed by, and therefore no other fees were billed by, KEB for services
in the fiscal years ended December 31, 2004 and December 31, 2003.
The audit committee of the Company appoints the independent certified public
accounting firm, with the appointment approved by the entire Board of Directors.
Non-audit related services to be performed by the firm are to be approved by the
audit committee prior to engagement. The Company had no non-audit related
services performed by KEB for the fiscal years ended December 31, 2004 and
December 31, 2003.
PART IV
ITEM 15. EXHIBITS AND FINANCIAL STATEMENT SCHEDULES
(a) The following documents are filed as a part of the report:
(1) Financial Statements:
See Item 8, Index to Financial Statements
(2) Financial Statement Schedules
Schedule I - Summary of Investments - other than invested in related parties.
Schedule II - Condensed financial information of registrant
Schedule IV - Reinsurance
Schedule V - Valuation and qualifying accounts
NOTE: Schedules other than those listed above are omitted because
they are not required or the information is disclosed in the
financial statements or footnotes.
(B) Exhibits:
Index to Exhibits incorporated herein by this reference (See pages 73 and 74).
INDEX TO EXHIBITS
Exhibit
Number
2(a) (4) Articles of Merger of First Commonwealth Corporation, A Virginia
Corporation with and into United Trust Group, Inc., An Illinois Corporation
dated as of May 30, 2002, including exhibits thereto.
3(a) (5) Articles of Incorporation of the Registrant and all amendments thereto.
3(b) (5) By-Laws for the Registrant and all amendments thereto.
4(a) (4) UTG's Agreement pursuant to Item 601(b)(4)(iii)(A) of Regulation S-K
with respect to long-term debt instruments.
10(a)(2) Coinsurance Agreement dated September 30, 1996 between Universal
Guaranty Life Insurance Company and First International Life Insurance
Company, including assumption reinsurance agreement exhibit and amendments.
10(b)(1) Management and Consultant Agreement dated as of January 1, 1993
between First Commonwealth Corporation and Universal Guaranty Life
Insurance Company.
10(c)(1) Management Agreement dated December 20, 1981 between Commonwealth
Industries Corporation, and Abraham Lincoln Insurance Company.
10(d)(1) Reinsurance Agreement dated January 1, 1991 between Universal Guaranty
Life Insurance Company and Republic Vanguard Life Insurance Company.
10(e)(1) Reinsurance Agreement dated July 1, 1992 between United Security
Assurance Company and Life Reassurance Corporation of America.
10(f)(1) Agreement dated June 16, 1992 between John K. Cantrell and First
Commonwealth Corporation.
10(g)(1) Stock Purchase Agreement dated February 20, 1992 between United Trust
Group, Inc. and Sellers.
10(h)(1) Amendment No. One dated April 20, 1992 to the Stock Purchase Agreement
between the Sellers and United Trust Group, Inc.
10(i)(1) Security Agreement dated June 16, 1992 between United Trust Group,
Inc. and the Sellers.
10(j)(1) Stock Purchase Agreement dated June 16, 1992 between United Trust
Group, Inc. and First Commonwealth Corporation
10(k)(3) Universal note and security agreement dated November 15, 2001, between
United Trust Group, Inc. and First National Bank of the Cumberlands.
INDEX TO EXHIBITS
Exhibit
Number
10(l)(3) Line of credit agreement dated November 15, 2001, between United Trust
Group, Inc. and First National Bank of the Cumberlands.
10(m)(4) United Trust Group, Inc. Employee and Director Stock Purchase Plan and
form of related Stock Restriction and Buy-Sell Agreement.
21(a) (5) List of Subsidiaries of the Registrant.
31.1 Certificate of Chief Executive Officer pursuant to Rule
13a-14(a)/15d-14(a).
31.2 Certificate of Chief Financial Officer pursuant to Rule
13a-14(a)/15d-14(a).
32.1 Certificate of Jesse T. Correll, Chief Executive Officer and Chairman of
the Board of UTG, as required pursuant to 18 U.S.C. Section 1350.
32.2 Certificate of Theodore C. Miller, Chief Financial Officer, Senior Vice
President and Corporate Secretary of UTG, as required pursuant to 18 U.S.C.
Section 1350.
99(a) (3) Audit Committee Charter.
Footnote:
(1) Incorporated by reference from the Company's Annual Report on Form
10-K, File No. 0-5392, as of December 31, 1993.
(2) Incorporated by reference from the Company's Annual Report on Form
10-K, File No. 0-5392, as of December 31, 1996.
(3) Incorporated by reference from the Company's Annual Report on Form
10-K, File No. 0-5392, as of December 31, 2001.
(4) Incorporated by reference from the Company's Annual Report on Form
10-K, File No. 0-5392, as of December 31, 2002.
(5) Incorporated by reference from the Company's Annual Report on Form
10-K, File No. 0-5392, as of December 31, 2003.
UNITED TRUST GROUP, INC.
SUMMARY OF INVESTMENTS - OTHER THAN
INVESTMENTS IN RELATED PARTIES
As of December 31, 2004
Schedule I
Column A Column B Column C Column D
- -------------------------------------------------------------------------- ---------------- ----------------
Amount at
Which Shown
in Balance
Cost Value Sheet
--------------- ---------------- ----------------
Fixed maturities:
Bonds:
United States Government and
government agencies and authorities $ 7,801,268 $ 7,803,595 $ 7,801,268
State, municipalities, and political
subdivisions 2,448,293 2,565,108 2,448,293
Collateralized mortgage obligations 58,453 57,771 58,453
Public utilities 0 0 0
All other corporate bonds 1,665,401 1,671,314 1,665,401
--------------- ---------------- ----------------
Total fixed maturities 11,973,415 $ 12,097,788 11,973,415
================
Investments held for sale:
Fixed maturities:
United States Government and
government agencies and authorities 41,377,077 $ 41,632,843 41,632,843
State, municipalities, and political
subdivisions 162,025 177,444 177,444
Collateralized mortgage obligations 79,634,753 79,643,440 79,643,440
Public utilities 0 0 0
All other corporate bonds 26,043,598 26,740,160 26,740,160
--------------- ---------------- ----------------
147,217,453 $ 148,193,887 148,193,887
================
Equity securities:
Banks, trusts and insurance companies 4,501,676 $ 4,692,661 4,692,661
All other corporate securities 10,714,538 19,706,511 19,706,511
--------------- ---------------- ----------------
15,216,214 $ 24,399,172 24,399,172
================
Mortgage loans on real estate 20,722,415 20,722,415
Investment real estate 28,192,081 28,192,081
Real estate acquired in satisfaction of debt 0 0
Policy loans 12,844,748 12,844,748
Other long-term investments 0 0
Short-term investments 39,489 39,489
--------------- ----------------
Total investments $ 236,205,815 $ 246,365,207
=============== ================
UNITED TRUST GROUP, INC.
CONDENSED FINANCIAL INFORMATION OF REGISTRANT Schedule II
NOTES TO CONDENSED FINANCIAL INFORMATION
(a) The condensed financial information should be read in conjunction with the
consolidated financial statements and notes of United Trust Group, Inc. and
Consolidated Subsidiaries.
UNITED TRUST GROUP, INC.
CONDENSED FINANCIAL INFORMATION OF REGISTRANT
PARENT ONLY BALANCE SHEETS
As of December 31, 2004 and 2003
Schedule II
2004 2003
---------------- ---------------
ASSETS
Investment in affiliates $ 46,758,363 $ 44,724,882
Cash and cash equivalents 502,375 439,734
FIT recoverable 10,051 988
Accrued interest income 26,751 26,058
Receivable from affiliates, net 391,694 18,477
Other assets 366,682 471,448
---------------- ---------------
Total assets $ 48,055,916 $ 45,681,587
================ ===============
LIABILITIES AND SHAREHOLDERS' EQUITY
Liabilities:
Notes payable $ 0 $ 2,289,776
Deferred income taxes 2,022,606 2,008,445
Other liabilities 1,582,205 1,686,727
---------------- ---------------
Total liabilities 3,604,811 5,984,948
Shareholders' equity:
Common stock, net of treasury shares 79,315 80,008
Additional paid-in capital, net of treasury 42,590,820 42,672,189
Accumulated other comprehensive
income of affiliates 6,678,542 1,566,397
Accumulated deficit (4,897,572) (4,621,955)
---------------- ---------------
Total shareholders' equity 44,451,105 39,696,639
---------------- ---------------
Total liabilities and shareholders' equity $ 48,055,916 $ 45,681,587
================ ===============
UNITED TRUST GROUP, INC.
CONDENSED FINANCIAL INFORMATION OF REGISTRANT
PARENT ONLY STATEMENTS OF OPERATIONS
Three Years Ended December 31, 2004
Schedule II
2004 2003 2002
--------------- ---------------- ----------------
Revenues:
Management fees from affiliates $ 5,790,843 $ 6,031,472 $ 6,510,753
Other income from affiliates 0 0 0
Interest income from affiliates 0 0 324,467
Interest income 4,933 7,904 11,215
Other income 0 50,137 52,163
--------------- ---------------- ----------------
5,795,776 6,089,513 6,898,598
Expenses:
Interest expense 77,453 162,179 263,441
Operating expenses 5,085,180 5,335,851 5,669,116
--------------- ---------------- ----------------
5,162,633 5,498,030 5,932,557
--------------- ---------------- ----------------
Operating income 633,143 591,483 966,041
Income tax expense (105,098) (263,992) (327,472)
Equity in income (loss) of subsidiaries (803,662) (6,723,981) 700,226
--------------- ---------------- ----------------
Net income (loss) $ (275,617) $ (6,396,490)$ 1,338,795
=============== ================ ================
Basic income (loss) per share from continuing
operations and net income (loss) $ (0.07) $ (1.67)$ 0.38
=============== ================ ================
Diluted income (loss) per share from continuing
operations and net income (loss) $ (0.07) $ (1.67)$ 0.33
=============== ================ ================
Basic weighted average shares outstanding 3,986,731 3,839,947 3,505,424
=============== ================ ================
Diluted weighted average shares outstanding 3,986,731 3,839,947 4,005,424
=============== ================ ================
UNITED TRUST GROUP, INC.
CONDENSED FINANCIAL INFORMATION OF REGISTRANT
PARENT ONLY STATEMENTS OF CASH FLOWS
Three Years Ended December 31, 2004
Schedule II
2004 2003 2002
---------------- --------------- ----------------
Increase (decrease) in cash and cash equivalents
Cash flows from operating activities:
Net income (loss) $ (275,617) $ (6,396,490) $ 1,338,795
Adjustments to reconcile net income (loss) to
net cash provided by (used in) operating activities:
Equity in (income) loss of subsidiaries 803,662 6,723,981 (700,226)
Depreciation 104,766 52,383 0
Change in FIT recoverable (9,063) 9,981 22,817
Change in accrued interest income (693) (26,058) 64,331
Change in indebtedness (to) from affiliates, net (373,217) 4,787 674,524
Change in deferred income taxes 14,161 79,011 327,472
Change in other assets and liabilities (54,885) (1,000,625) (226,075)
---------------- --------------- ----------------
Net cash provided by (used in) operating activities 209,114 (553,030) 1,501,638
---------------- --------------- ----------------
Cash flows from investing activities:
Payments received on notes receivable from affiliates 0 0 800,000
---------------- --------------- ----------------
Net cash provided by investing activities 0 0 800,000
---------------- --------------- ----------------
Cash flows from financing activities:
Purchase of treasury stock (299,057) (441,143) (520,253)
Issuance of common stock 167,360 195,905 706,691
Payments on notes payable (4,564,776) (705,499) (3,405,395)
Proceeds from line of credit 2,275,000 0 2,000,000
Dividend received from subsidiary 2,275,000 600,000 1,400,000
Cash received in FCC merger 0 0 69,187
Payments made from FCC merger 0 0 (1,586,500)
---------------- --------------- ----------------
Net cash used in financing activities (146,473) (350,737) (1,336,270)
---------------- --------------- ----------------
Net increase (decrease) in cash and cash equivalents 62,641 (903,767) 965,368
Cash and cash equivalents at beginning of year 439,734 1,343,501 378,133
---------------- --------------- ----------------
Cash and cash equivalents at end of year $ 502,375 $ 439,734 $ 1,343,501
================ =============== ================
UNITED TRUST GROUP, INC.
REINSURANCE
As of December 31, 2004 and the year ended December 31, 2004
Schedule IV
- ----------------------------------------------------------------------------------------------------------------------------
Column A Column B Column C Column D Column E Column F
---------------- ---------------- --------------- --------------- -------------
Percentage
Ceded to Assumed of amount
other from other assumed to
Gross amount companies companies Net amount net
- ----------------------------------------------------------------------------------------------------------------------------
Life insurance
in force $ 2,145,096,000 $ 531,146,000 $ 995,939,000 $ 2,609,889,000 38.2%
================ ================ =============== ===============
Premiums and policy fees:
Life insurance $ 17,161,525 $ 3,111,559 $ 26,273 $ 14,076,239 0.2%
Accident and health
insurance 76,595 23,720 11,315 64,190 17.6%
---------------- ---------------- --------------- ---------------
$ 17,238,120 $ 3,135,279 $ 37,588 $ 14,140,429 0.3%
================ ================ =============== ===============
UNITED TRUST GROUP, INC.
REINSURANCE
As of December 31, 2003 and the year ended December 31, 2003
Schedule IV
- ----------------------------------------------------------------------------------------------------------------------------
Column A Column B Column C Column D Column E Column F
---------------- ---------------- --------------- --------------- -------------
Percentage
Ceded to Assumed of amount
other from other assumed to
Gross amount companies companies Net amount net
- ----------------------------------------------------------------------------------------------------------------------------
Life insurance
in force $ 2,289,738,000 $ 580,145,000 $ 1,273,735,000 $ 2,983,328,000 42.7%
================ ================ =============== ===============
Premiums and policy fees:
Life insurance $ 18,000,036 $ 3,062,361 $ 25,026 $ 14,962,701 0.2%
Accident and health
insurance 86,856 35,619 9,100 60,337 15.1%
---------------- ---------------- --------------- ---------------
$ 18,086,892 $ 3,097,980 $ 34,126 $ 15,023,038 0.2%
================ ================ =============== ===============
UNITED TRUST GROUP, INC.
REINSURANCE
As of December 31, 2002 and the year ended December 31, 2002
Schedule IV
- --------------------------------------------------------------------------------------------------------------------
Column A Column B Column C Column D Column E Column F
--------------- --------------- --------------- --------------- ------------
Percentage
Ceded to Assumed of amount
other from other assumed to
Gross amount companies companies Net amount net
- --------------------------------------------------------------------------------------------------------------------
Life insurance
in force $ 2,440,716,000 $ 560,356,000 $ 1,553,748,000 $ 3,434,108,000 45.2%
=============== =============== =============== ===============
Premiums and policy fees:
Life insurance $ 18,454,030 $ 2,829,619 $ 73,979 $ 15,698,390 0.5%
Accident and health
insurance 130,905 31,826 22,135 121,214 18.3%
--------------- --------------- --------------- ---------------
$ 18,584,935 $ 2,861,445 $ 96,114 $ 15,819,604 0.6%
=============== =============== =============== ===============
UNITED TRUST GROUP, INC.
VALUATION AND QUALIFYING ACCOUNTS
As of and for the years ended December 31, 2004, 2003, and 2002
Schedule V
Balance at Additions
Beginning Charges Balances at
Description Of Period and Expenses Deductions End of Period
- ---------------------------------------------------------------------------------------------------------------------------
December 31, 2004
..
Allowance for doubtful accounts -
mortgage loans $ 120,000 $ 0 $ 0 $ 120,000
December 31, 2003
Allowance for doubtful accounts -
mortgage loans $ 120,000 $ 0 $ 0 $ 120,000
December 31, 2002
Allowance for doubtful accounts -
mortgage loans $ 120,000 $ 0 $ 0 $ 120,000
SIGNATURES
Pursuant to the requirements of the Securities Exchange Act of 1934, this
report has been signed below by the following persons on behalf of the
registrant and in the capacities and on the dates indicated.
UNITED TRUST GROUP, INC.
(Registrant)
/s/ John S. Albin March 24, 2005
John S. Albin, Director
/s/ Randall L. Attkisson March 24, 2005
Randall L. Attkisson, President, Chief
Operating Officer and Director
/s/ Joseph A. Brinck March 24, 2005
Joseph A. Brinck, Director
/s/ Jesse T. Correll March 24, 2005
Jesse T. Correll, Chairman of the Board,
Chief Executive Officer and Director
/s/ Ward F. Correll March 24, 2005
Ward F. Correll, Director
March 24, 2005
Thomas F. Darden, Director
s/ William W. Perry March 24, 2005
William W. Perry, Director
/s/ James P. Rousey March 24, 2005
James P. Rousey, Chief Administrative
Officer and Director
/s/ Theodore C. Miller March 24, 2005
Theodore C. Miller, Corporate Secretary
and Chief Financial Officer