UNITED STATES
SECURITIES AND EXCHANGE COMMISSION
Washington, D.C. 20549
FORM N-CSR
CERTIFIED SHAREHOLDER REPORT
OF
REGISTERED MANAGEMENT INVESTMENT COMPANIES
Investment Company Act file number: 811-05547
The Laudus Trust
(Exact name of registrant as specified in charter)
101 Montgomery Street, San Francisco, California 94104
(Address of principal executive offices) (Zip code)
Randall W. Merk
The Laudus Trust
101 Montgomery Street, San Francisco, California 94104
(Name and address of agent for service)
Registrant’s telephone number, including area code: (415) 627-7000
Date of fiscal year end: March 31
Date of reporting period: March 31, 2008
Item 1: Report(s) to Shareholders.
Annual Report
March 31, 2008
U.S. Equity Funds
Laudus Rosenberg U.S. Large Capitalization Fund
Laudus Rosenberg U.S. Large Capitalization Growth Fund
Laudus Rosenberg U.S. Large Capitalization Value Fund
Laudus Rosenberg U.S. Discovery Fund (closed to new investors)
Laudus Rosenberg U.S. Small Capitalization Fund (closed to new investors)
Long/Short Equity Funds
Laudus Rosenberg Long/Short Equity Fund
(formerly Laudus Rosenberg Value Long/Short Equity Fund)
Each of the Funds is a series of Laudus Trust, which is an open-end management investment company offering diversified portfolios with different investment objectives and strategies.
Charles Schwab Investment Management, Inc. is the Adviser to the Funds and AXA Rosenberg Investment Management LLC is the Sub-adviser.
Table of Contents
| | | |
1 | | President’s Message |
| |
2 | | Management’s Discussion |
| |
9 | | Performance and Fund Facts |
| |
16 | | Fund Expenses |
| |
18 | | Portfolio Holdings |
| |
54 | | Financial Statements and Notes |
| |
74 | | Report of Independent Registered Public Accounting Firm |
| |
76 | | Trustees and Officers of Laudus Trust |
| |
79 | | Definitions, Terms and Other Information |
Nothing in this report represents a recommendation of a security by the investmentadviser. Portfolio Manager views and portfolio holdings may have changed since the report date.
Notice About Duplicate Mailings
In order to reduce expenses of the Laudus Trust incurred in connection with the mailing of prospectuses, prospectus supplements, semi-annual reports and annual reports to multiple shareholders at the same address, Laudus Trust may deliver one copy of a prospectus, prospectus supplement, semi-annual report or annual report to a single investor sharing a street address or post office box with other investors, provided that all such investors have the same last name or are believed to be members of the same family. This process, called “householding,” will continue indefinitely unless you instruct us otherwise. If you share an address with another investor and wish to receive your own prospectus, prospectus supplements, semi-annual reports and annual reports, please call the Trust toll-free at 800.447.3332.
Each of the Funds is a series of the Laudus Trust (the “Trust”), an open-end management investment company offering multiple portfolios with different investment objectives and strategies. Except as explicitly described otherwise, the investment objective and policies of each of the Funds may be changed without shareholder approval. The Funds are advised by Charles Schwab Investment Management, Inc. (“CSIM”). AXA Rosenberg Investment Management LLC (“AXA Rosenberg”) acts as Sub-adviser to the Funds. The Funds are distributed by ALPS Distributors, Inc. Charles Schwab & Co. and ALPS Distributors, Inc. are unaffiliated entities.
President’s Message
Randall W. Merk is President and CEO of Charles Schwab Investment Management, Inc. and the funds during the period of this report. He joined the firm in 2002 and has held a variety of executive positions at Schwab.
Jeffrey Mortimer is President, CEO, and CIO of Laudus Funds and SVP of Charles Schwab Investment Management, Inc. He joined the firm in 1997 and has held a variety of executive positions at Schwab.
Dear Shareholder,
I am pleased to present the annual report for the Laudus Rosenberg Funds for the year ended March 31, 2008. At this time, I would also like to introduce Jeffrey Mortimer, who will be assuming the position of President and CEO of the Laudus Rosenberg Funds. As the current Chief Investment Officer (CIO) of both Laudus Funds and Schwab Equity Funds, Jeffrey is an exceptionally capable portfolio manager and strategist, bringing over 20 years of industry knowledge and experience to the role.
The Laudus Rosenberg Funds are sub-advised by AXA Rosenberg, one of the world’s premier equity specialists and institutional money managers. Through the Laudus Rosenberg Funds offering, this distinctive approach to investment management is easily accessible to independent advisors and individual investors.
Since our initial offering, we have continued to evaluate investment opportunities and adjust our products to better support our clients by leveraging the Laudus Rosenberg investment process. Our most recently launched fund, the Laudus Rosenberg International Discovery Fund, has reached $261 million in assets, representing an increase of over 250% in the past year. The fund utilizes the same investment discipline used in all of the Laudus Rosenberg Funds and provides international small/mid-cap exposure in developing and emerging markets.
In closing, I would like to thank you for investing with us.
Sincerely,
Investors should consider carefully information contained in the prospectus, including investment objectives, risks, charges and expenses. You can request a prospectus by calling 1-800-447-3332. Please read the prospectus carefully before investing.
Laudus U.S. Equity Funds 1
Management’s Discussion for the year ended March 31, 2008
Global Market Overview
The past four quarters were a period of increasing volatility in capital markets around the globe. The period began with fairly strong positive returns, with many equity indexes gaining over 6% in the second quarter of 2007. In the third quarter, however, small-cap stocks around the world began to pull back, posting generally negative returns, particularly more value-oriented stocks. Large-cap indexes, especially those with a growth-style orientation, continued upward. During the final two quarters of the period, the damage spread across all equity areas — many indexes lost well over 10%, as investors became increasingly concerned about slowing global economic growth and problems in the credit markets. As a result, global equity markets ultimately generated mostly negative returns for the full period, with U.S. small-cap stocks the worst performing area. The most notable exception was emerging markets stocks, which finished the period up over 20%.
Three specific months stand out as significant contributors to the relatively weak returns over the period: July and November of 2007, and January of 2008. In July, investors around the globe sold equity positions in reaction to problems in the credit markets. Continued deterioration in the U.S. housing market and weakness in the sub-prime lending business led to significant financing problems among major investment banks. Over the past several years, many of the loans made to U.S. homeowners were packaged into securitized, bond-like products and placed in fixed income portfolios around the globe. As some borrowers across the U.S. housing markets began to default on their loans, the quality of the securities created by packaging them began to deteriorate. For example, Bear Stearns, a venerated U.S. investment bank, ran into trouble with two of their hedge funds during the summer of 2007, as the values of the underlying assets became increasingly difficult to determine. As these funds were highly leveraged, declines in asset values led to significant losses for the funds. These funds — and others like them — needed to sell their more liquid and highly valued assets to raise cash, causing some unusually strong global volatility in the middle of August 2007. While in its initial stages these effects were felt most strongly in the U.S. fixed income markets, equity investors were concerned about the financial status of the U.S. consumer, and thus the continued growth of the U.S. economy.
After the U.S. Federal Reserve’s (the “Fed”) Open Market Committee acted to provide additional liquidity to the credit markets in mid-August, and followed that up with a cut in interest rates in mid-September, the markets responded positively. The Fed probably had the Financial sector in mind when it took considerable action during August and September. This group of companies comprises about 20% of most major U.S. indexes, so their valuations and future earnings are very important to stock market investors. In August, the Fed lowered the discount rate, which makes it easier for banks to borrow directly from the Fed. They even persuaded some major banks to step up to the discount window, in a public display of pumping liquidity into the financial system. Then, in September, they lowered the Fed funds rate, the rate banks charge each other, which has much broader application. That caused an immediate decline in the prime rate, lowering borrowing costs throughout the economy. The equity markets generally cheered these moves, but the concerns over the housing market continued the pressure on Financial stocks, keeping the pressure on the markets overall.
By November 2007, it became increasingly clear that the U.S. economy was slowing down. Banks, mortgage firms and homebuilders began to write down assets on their balance sheets in response to the declines in asset values in securities tied to the U.S. mortgage markets. These firms also reported lower earnings and reduced their expectations of future earnings in their reports and updates to investors. Economists around the world spoke of a recession — or at best flat economic growth — in the U.S. and possibly around the world. By January 2008, investors saw evidence of the slowdown in higher unemployment figures and lower manufacturing production. The final figure for U.S. GDP growth in the fourth quarter of 2007 was an annual rate of 0.6% — growth, but just barely. Investors continued to sell stocks across the globe, and equities in general continued their decline.
Also in January, the Fed and some of their global counterparts took some unusual steps designed to restore liquidity to the credit markets. These central banks created pools of credit facilities and lowered the interest rates they charged to borrowers. The Fed again lowered their main interest rate, the Fed funds rate, numerous times in the early part of 2008, thus reducing borrowing costs across the entire economy. While other central banks around the world were not quite as accommodat-
2 Laudus U.S. Equity Funds
Management’s Discussion continued
ing, they too injected liquidity into their markets. And in one of the most unusual moves in recent financial history, the Fed also engineered a purchase of Bear Stearns by JP Morgan. The Fed believed that Bear Stearns’ potential bankruptcy — an event no one thought likely just days before — would very negatively affect both the equity and credit markets, partially due to the firm’s size and presence as a prime broker. But all of these moves, while helpful in calming the markets, also lowered the value of the U.S. dollar versus other currencies, leading to higher commodity and energy prices and increasing fears of inflation.
Investors’ concerns were heightened by reports of inflation. The U.S. Consumer Price Index climbed during the period, with a reported gain of 4.1% during the calendar year 2007. The decline in the value of the U.S. dollar versus other major currencies was a factor in the U.S. inflation rate, as that decline increased the price of imports, especially energy-related products such as crude oil and gasoline. Further evidence of inflation fears showed in the fixed income markets, as the return on U.S. Treasury Inflation Protected Series (“TIPS”) bonds was strongly positive over the period, returning over 14%. Major commodity indexes also were up strongly, many over 30% during the period. Inflation is generally viewed by investors as negative for equities, due to the difficulty of passing along higher costs to consumers and thus increasing the likelihood of lower earnings.
The U.S. dollar’s decline and the gains in some commodity markets did generate some positive news for U.S. investors with assets in non-U.S. stocks, however. The MSCI EAFE Index, while negative for the period at - -2.27%, lost less than its U.S. counterpart, the Russell 1000 Index, which was down 5.40%. The dollar’s decline explains much of the difference, but also important was that financial firms in the U.S. index were down significantly more than their foreign counterparts, as a result of their greater direct exposure to problems stemming from the U.S. housing markets. Also important was the higher return to foreign firms in the Materials Sector. Generally, commodity-oriented firms were of greater importance in non-U.S. economies, and their increased weight in the non-U.S. indexes, plus their overall higher returns, helped push these stocks to higher returns versus U.S. equities. This trend was especially true for the emerging markets area, where the Materials and Energy Sectors combined to contribute nearly 11% of the total 21.6% return to the MSCI Emerging Markets Index over the period.
U.S. Equity Funds Performance
Total returns are for the year ended 3/31/08. For performance details, see pages 9 through 15.
| | | | | |
| Laudus Rosenberg U.S. Large Capitalization Fund(1,2) |
| |
| AXLIX | | AXLVX | | Russell |
| Institutional shares | | Investor shares | | 1000 Index |
| -6.30% | | -6.61% | | -5.40% |
| |
Laudus Rosenberg U.S. Large Capitalization Growth Fund(1) |
| �� |
| REDIX | | REFIX | | Russell 1000 |
| Institutional shares | | Investor shares | | Growth Index |
| -0.78% | | -1.25% | | -0.75% |
| |
Laudus Rosenberg U.S. Large Capitalization Value Fund(1,2) |
| |
| LLCVX | | LCVJX | | Russell 1000 |
| Institutional shares | | Investor shares | | Value Index |
| -5.29% | | -5.50% | | -9.99% |
| |
Laudus Rosenberg U.S. Discovery Fund(1,3)
(Closed to new investors) |
| |
| RDISX | | RDIVX | | Russell 2500 |
| Institutional shares | | Investor shares | | Index |
| -10.98% | | -11.36% | | -11.27% |
| | | | | | | |
| Laudus Rosenberg U.S. Small Capitalization Fund(1,3) |
| (Closed to new investors) |
| |
| USCIX | | LIFUX | | BRSCX | | Russell 2000 |
| Institutional shares | | Adviser | | Investor shares | | Index |
| -13.34% | | shares | | -13.57% | | -13.00% |
| | | -13.50% | | | | |
| | | | | |
| Laudus Rosenberg Long/Short Equity Fund(1,2,4) |
| |
| BMNIX | | BRMIX | | 90-Day T-Bills |
| Institutional shares | | Investor shares | | |
| -0.51% | | -0.82% | | 3.57% |
Past performance does not guarantee future results. The performance data quoted represents past performance, and current returns may be lower or higher. The performance information does not reflect the deduction of taxes that a shareholder would pay on fund distributions or the redemption of fund shares. The investment return and principal value will fluctuate so that an investor’s shares, when redeemed, may be worth more or less than the original cost. To obtain performance information current to the most recent month end, visit www.laudus.com.
Performance data quoted does not reflect the non-recurring redemption fee of 2% that may be charged if shares are sold or exchanged within 30 days of the purchase date. If these fees were reflected, the performance data quoted would be lower.
Total returns include change in share price and reinvestment of distributions. Total returns reflect the waiver of a portion of a Fund’s advisory or administrative fees for certain periods since the inception date. In such instances, and without the waiver of fees, total return would have been lower.
Laudus U.S. Equity Funds 3
Management’s Discussion continued
Investments in long/short funds are more volatile and risky than some other forms of investments. Since they have both long and short portfolios, an investment will involve risks associated with twice the number of investment decisions made for a typical stock fund. These types of funds typically have a high portfolio turnover that could increase transaction costs and cause short-term capital gains to be realized. While it may be the intent of the Manager to take long positions in stocks that outperform the market and short positions in stocks that underperform the market, there is no assurance that the Manager will be successful.
The Fund may sell a security short by borrowing it from a third party and selling it at the then-current market price. The Fund is obligated to buy the security on a later date so it can return the security to the lender. Short sales involve the risk that the Fund will incur a loss by subsequently buying a security at a higher price than the price at which the Fund previously sold the security short. Moreover, because the Fund’s loss on a short sale arises from increases in the value of the security sold short, the extent of such loss is theoretically unlimited.
Since risk in long/short funds relates specifically to the Manager’s stock selection techniques and not to any systematic or economy-wide factors, the proper benchmark is an asset that also has the least exposure to systematic influences. 90-day T-bills are such an asset. The full faith and credit of the U.S. government back an investment in 90-day T-bills. T-bills have a fixed rate of return, and investors do not bear the risk of losing their investment. The income received from T-bills is free from state income tax.
Investors cannot invest directly in any index.
| |
| (1) | Equity securities (stocks) are more volatile and carry more risk than other forms of investments, including investments in high- grade fixed income securities. The net asset value per share of this Fund will fluctuate as the value of the securities in the portfolio changes. Common stocks, and funds investing in common stocks, generally provide greater return potential when compared with other types of investments. |
| |
| (2) | Value-based investments are subject to the risk that the broad market may not recognize their value. |
| |
| (3) | Small capitalization funds typically carry additional risks since smaller companies generally have experienced a greater degree of market volatility. |
| |
| (4) | Small- and mid-capitalization funds typically carry additional risk since small- and mid-capitalization companies generally have a higher risk of failure. |
Laudus Rosenberg U.S. Large Capitalization Fund For its fiscal year ended 3/31/08, the Fund posted a negative return and underperformed its benchmark, the Russell 1000® Index: The Fund’s Investor Shares lost 6.61% versus the benchmark’s loss of 5.40%. The Fund’s underperformance can be attributed primarily to stock selection. The Fund’s allocations across sectors and valuations contributed positively, but not enough to overcome the negative impacts from stock selection.
Among sectors, the strongest contributor to performance was from the Fund’s stock selection in the Information Technology sector. The Fund’s overweight of Energy stocks as compared to the benchmark also contributed nicely as the sector performed strongly for the fiscal year. Despite the extremely weak performance of the Financials sector for the period — by far the benchmark’s worst-performing sector for the period — the Fund posted a positive contribution due to a combination of its underweighting to the benchmark and stock selection with the sector; the Fund was able to avoid the most damaging fallout resulting from the expanding credit crisis over the period. However, dragging on Fund performance was stock selection in the Consumer Discretionary, Utilities, Consumer Staples and Health Care sectors, in combination with an underweight in Consumer Staples and Health Care, both of which held up relatively well for the period.
Across market capitalization, no clear pattern emerged. The strongest contribution came from stock selection among the smallest companies, along with an underweight of those stocks — among the weakest performers for the reporting period. An underweight of mid-caps, also weak performers, contributed somewhat. Those underweights logically led to an overweight of stocks in the mid- to large-cap range, however, which hurt the Fund, as did stock selection among mega-cap stocks (those with market caps above $150 billion).
From a valuation standpoint, the Fund’s value orientation dragged on performance for the reporting period as growth-oriented stocks generally outperformed value by a substantial margin. From a Price/ Earnings (“P/E”) perspective, the largest drag came from weak selection among stocks with mid-range P/Es, followed by a combination of stock selection and a substantial overweight of the most deeply undervalued stocks. Those negatives were somewhat mitigated by a substantial underweight of stocks with negative P/Es (those with no earnings), which as a group performed poorly for the period. A combination of stock selection and an underweight of high-P/E stocks also added value, consistent with the Fund’s value orientation as compared to the benchmark.
From a Price/ Book (“P/B”) perspective, stock selection among the most richly valued stocks — those with the highest P/B ratios — provided the greatest contribution, followed by selection among stocks at the low end of the P/B range. However, those contributions were overshadowed by the Fund’s overweight of low- to mid-range
4 Laudus U.S. Equity Funds
Management’s Discussion continued
P/B stocks, which were the worst performers for the period and dragged on performance, compounded by weak selection among those stocks.
The Fund is managed for long-term performance and seeks to outperform its benchmark as a result of effective stock picking. Consistent with the Fund’s underlying model, it seeks to capitalize on stocks with both superior long-term earnings and those with accelerating near-term earnings growth.
Laudus Rosenberg U.S. Large Capitalization Growth Fund For its fiscal year ended 3/31/08, the Fund posted a negative return and modestly underperformed its benchmark, the Russell 1000® Growth Index: The Fund’s Investor Shares lost 1.25% versus the benchmark’s loss of 0.75%. While allocations across sectors and some valuation measures added value, they were overshadowed by the negative impact of stock selection across those categories.
Among sectors, the strongest contribution came from a substantial overweight in Energy stocks as compared to the benchmark; Energy was the benchmark’s strongest-performing sector for the fiscal year. Stock-picking, however, detracted somewhat from that contribution. An overweight in the Materials sector also contributed notably, boosted by positive stock picking as well; although moderating recently, commodities posted a strong return for the period, and the Fund’s long-standing overweight to Basic Minerals and Metals added notable value. A combination of a slight underweight to Consumer Discretionary stocks in concert with positive stock selection also contributed. On the other hand, the Fund’s performance was negatively impacted by a combined underweighting to the Health Care sector plus stock selection among those stocks, weak stock selection among Financials, and an underweight to Consumer Staples — which performed relatively well; as consumer confidence fell with increasingly dire economic reports, investors flocked to more defensive stocks such as Consumer Staples.
Across market capitalizations, the Fund’s allocation contributed only modestly, and despite the positive effect of stock picking across several market-cap ranges, stock selection overall dragged on Fund performance. Stock selection contributed most notably among the small- to mid-caps but detracted among the large-cap and mega-cap ranges. Market-cap allocation had the greatest contribution across mega-cap companies, where the Fund was slightly underweight as compared to the benchmark, and across mid-cap companies where the Fund was also underweighted. The greatest drag came from the Fund’s slight underweight in very large-cap stocks — the benchmark’s strongest performers for the period.
From a valuation standpoint, allocation across P/Es contributed somewhat but was overshadowed by the negative impact of stock selection. Across several P/E ranges, stock selection did contribute positively, primarily among mid-range P/Es and the highest P/Es (those with more growth-like characteristics). But detracting from performance was the Fund’s stock selection among the highest P/E ranges. In terms of allocation, a substantial underweight to stocks with negative P/Es (those with no earnings) worked in the Fund’s favor, as those stocks were snubbed by the market in favor of reliable earnings. An overweight of low-P/E stocks also contributed — the strongest performers in the benchmark for the period, albeit by only a small margin. As far as P/B measures, however, the contributors were a bit different: The Fund was helped by stock selection among stocks in the mid-range of P/B value, but dragged by its allocations, particularly from an overweight of low-P/B stocks and an overweight of stocks with extremely high P/B valuation. Such results are reflective of the market’s preference of growth characteristics over value for the period; and the Fund’s slight underperformance is not surprising given its overall value orientation.
The Fund is managed for long-term performance and seeks to outperform its benchmark as a result of effective stock picking. Consistent with the Fund’s underlying model, it seeks to capitalize on stocks with both superior long-term earnings and those with accelerating near-term earnings growth.
Laudus Rosenberg U.S. Large Capitalization Value Fund For its fiscal year ended 3/31/08, the Fund posted a negative return but outperformed its benchmark, the Russell 1000® Value Index: The Fund’s Investor Shares lost 5.50% versus the benchmark’s loss of 9.99%. The Fund’s outperformance can be attributed to both stock selection and its allocation across multiple measures.
Across sectors, the Fund’s greatest contribution came from a combination of solid stock selection and a notable underweight to the Financial sector — the benchmark’s weakest-performing sector for the fiscal year — as the Fund was able to avoid much of the fallout resulting from the subprime lending issues and the subsequent
Laudus U.S. Equity Funds 5
Management’s Discussion continued
credit crisis. A combination of an overweight of the Materials sector along with strong stock selection among those stocks also contributed notably. In the Energy sector — by far the benchmark’s strongest-performing sector for the period — the Fund’s substantial overweight contributed nicely. Strong stock-picking coupled with an overweight in Industrials — another strong performer — also added value.
From a market-capitalization standpoint, stock selection added value almost across the board, with the exception among mega-cap stocks — those with market caps above $150 billion. Selection among large-cap stocks provided the greatest contribution, although among small-caps was also notable. As far as allocation, the Fund’s overweight of the smallest of the benchmark’s large-cap spectrum and its underweight of the largest together provided the most notable contribution.
Across valuation measures, the Fund’s outperformance was again dominated by stock selection, with only a modest contribution from its allocations. From a P/E perspective, strong stock selection was particularly notable among the lower-end of the P/E range, although it was also in evidence among the highest P/E stocks (those with P/Es above 35). The most notable contribution from allocation across P/Es was the Fund’s substantial underweighting among stocks with negative P/Es — those with no earnings — which the market shunned in favor of stocks with reliable earnings. From a P/B perspective, the Fund’s stock selection among the most undervalued stocks was particular notable. Stock selection, combined with a modest overweighting of stocks with the highest P/B valuations also contributed nicely.
The Fund is managed for long-term performance and seeks to outperform its benchmark as a result of effective stock picking. Consistent with the Fund’s underlying model, it seeks to capitalize on stocks with both superior long-term earnings and those with accelerating near-term earnings growth.
Laudus Rosenberg U.S. Discovery Fund For its fiscal year ended 3/31/08, the Fund posted a negative return and slightly underperformed its benchmark, the Russell 2500tm Index: The Fund’s Investor Shares lost 11.36% for the period versus the benchmark’s loss of 11.27%. The Fund’s underperformance was generally attributable to stock selection, with allocations contributing modestly.
Among sectors, the Fund’s most notable contribution came from extremely strong stock picking in the Materials sector, which performed well for the reporting period, albeit moderating in recent months from earlier highs. While allocation played some role — the Fund was overweight the benchmark — it was the Fund’s holdings in the Materials sector that had the most impact. The Fund’s overweight of the Energy sector — by far the benchmark’s strongest-performing sector of the reporting period — also added substantial value, although it was dampened a bit by weak stock selection within the sector. And stock selection among Financials also contributed to performance, as the Fund managed to avoid the most heavily hit holdings in the rapidly expanding credit-crisis fallout; an underweight to the sector also helped. Detracting from performance, however, was stock selection in the Information Technology sector, compounded somewhat by an overweight to the weakly performing sector, and weak stock selection in the Consumer Staples and Utilities sectors.
Across market capitalizations, while the Fund added value from strong stock selection within some ranges, others worked against it, resulting in only a modestly positive effect from stock picking. Allocation detracted somewhat. The Fund’s stock selection among the mid-range of market caps added the most value, whereas it detracted at the upper and lower ends of the range. The Fund’s substantial overweight of the smallest companies and its underweight of the largest also detracted from performance.
Across valuations, no clear pattern emerged. From a P/E perspective, strong stock picking among the most undervalued stocks added value, but it was overshadowed by a combination of weak performance of the Fund’s most richly valued stocks, along with a substantial underweighting of those stocks. A significant underweight among stocks with negative P/Es (those with no earnings) added value as the market shunned such stocks in favor of reliable earnings and anticipated earnings growth.
From a P/B perspective, the Fund suffered from its allocations across nearly all P/B levels, most notably its underweighting among stocks with the highest valuations, as the market favored those stocks and their growth orientation. Weak performance among the Fund’s stocks in that arena magnified the drag on performance. Stock selection contributed, however, among the middle ranges of P/Bs. Overall, the Fund’s value orientation as com-
6 Laudus U.S. Equity Funds
Management’s Discussion continued
pared to the benchmark did not bode well for it over the reporting period, as growth continued to outperform.
The Fund is managed for long-term performance and seeks to outperform its benchmark as a result of effective stock picking. Consistent with the Fund’s underlying model, it seeks to capitalize on stocks with both superior long-term earnings and those with accelerating near-term earnings growth.
Laudus Rosenberg U.S. Small Capitalization Fund For its fiscal year ended 3/31/08, the Fund posted a negative return and slightly underperformed its benchmark, the Russell 2000® Index: The Fund’s Investor Shares lost 13.57% versus the benchmark’s loss of 13.00%. The Fund’s underperformance was generally attributable to stock selection, although some allocations also detracted.
Among sectors, the Fund’s greatest contribution came from the benchmark’s worst-performing industry for the reporting period, Consumer Discretionary, in which weakness was a reflection of the soft economy and a growing lack of consumer confidence during the period. A combination of the Fund’s underweighting of the sector and stock selection within the sector contributed notably to the Fund’s performance. Also contributing were overweights to Materials and Energy — the benchmark’s strongest performers for the period — coupled with solid stock selection in both sectors. And stock selection among Health Care companies also added value, albeit dampened somewhat by the negative impact of an underweighting to the sector. Detracting from performance, however, was the impact of weak stock selection among Industrials, Information Technology, Financials and, to a lesser extent, Utilities.
Across market capitalizations, the Fund’s allocations dragged on performance, with stock selection adding some value but unable to overcome the negatives. Evident of its value orientation, the Fund’s substantial underweight to the smallest companies worked against it for the fiscal year, compounded by weak selection among those companies. This was offset somewhat, however, by strong overall performance of the Fund’s small/mid-cap holdings, which outperformed those in the benchmark.
From a valuation standpoint, the effect of allocations and stock picking across P/E and P/B ratios yielded mixed effects. From a P/E perspective, the Fund’s allocations contributed, but were overshadowed by the drag from stock selection across multiple P/E ranges. For example, the Fund’s substantial underweighting of stocks with negative P/Es contributed notably to performance, but the stocks that the Fund held in that range underperformed those of the benchmark. The Fund’s substantial overweight of the lowest-P/E stocks contributed. However, although stock selection among stocks in the mid-range of P/E ratios provided a modest positive contribution, it was overshadowed by weak stock selection among the most overvalued stocks — those with stronger growth characteristics that the market rewarded for the period.
Across the valuation measure of P/B, stock selection overall provided the greatest contribution, but it was reduced by the drag from weak allocation. As with P/E measures, stock selection among the most richly valued stocks dragged notably on Fund performance — compounded by the Fund’s substantial underweighting of those stocks (the Fund held less than half of the benchmark’s weighting). And the Fund’s overweighting of low P/B stocks also dragged on performance, along with weak stock selection among the very low P/B range. The bright spot among P/B measures was stock selection among stocks in the mid-range of valuations.
The Fund is managed for long-term performance and seeks to outperform its benchmark as a result of effective stock picking. Consistent with the Fund’s underlying model, it seeks to capitalize on stocks with both superior long-term earnings and those with accelerating near-term earnings growth.
Laudus Rosenberg Long/Short Equity Fund For its fiscal year ended 3/31/08, the Fund posted a negative return and underperformed its benchmark, 90-day T-bills: The Fund’s Investor Shares lost 0.82% versus the benchmark’s gain of 3.57%. Although the Fund’s short positions contributed nicely, they were overshadowed by the negative impact of weak performance of many of the Fund’s long positions.
From a sector standpoint, the largest drag came from the Fund’s net long exposure to Information Technology; the Fund’s long positions underperformed, and while its short positions added value, the net effect was negative. The Fund’s net long exposure to Energy also detracted: While the Fund’s net long positions added value, they were more than overshadowed by strong performance among the Fund’s short positions, which dragged on the Fund. A net long exposure to Telecommunication Services also hurt the Fund for the period, as its long
Laudus U.S. Equity Funds 7
Management’s Discussion continued
positions were weak performers and its shorts were strong. And a net short exposure to Financials hurt: Although the Fund’s short positions added value due to the general decline of Financial stocks over the period, the Fund’s long positions underperformed, resulting in a net drag for the period. The Materials sector, where the Fund was net long, was the notable bright spot on a sector basis: The Fund’s long positions performed well, and its shorts fell — both adding value nicely for the period.
From a market-capitalization perspective, the Fund was generally net long among the smallest and largest stocks, and net short in between. That net long exposure to the smallest stocks — which performed weakly for the period, reflective of the general strength of larger-caps over the period — was the greatest detraction from Fund performance on a market-cap basis. Weak performance among the Fund’s net short positions among the smallest stocks added value — but not quite enough to overcome the negative impact of the longs.
From a valuation standpoint, in a market environment that favored growth over value, the Fund’s value orientation hurt. From a P/E perspective, value was added primarily among the lower-P/E ranges, where the Fund held a net long exposure (although the contribution came primarily from weak performance among the Fund’s short positions). At the mid-range of P/Es, the Fund’s weak performance of its longs as well as positive performance of its shorts netted a drag, as did weak performance among the Fund’s long positions with the highest valuations (P/Es above 35).
From a P/B perspective, a similar pattern emerged. Generally speaking, among the low-P/B stocks, the Fund’s short positions added value, while its longs lost value due to weak performance, resulting in a net loss. Only the Fund’s shorts among stocks with the highest P/B values detracted from Fund performance, as the market favored growth characteristics over value for the period.
8 Laudus U.S. Equity Funds
Performance and Fund Facts
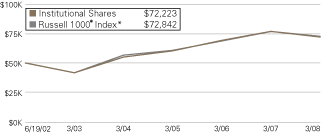
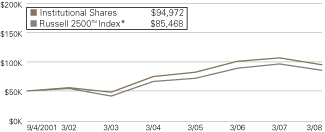
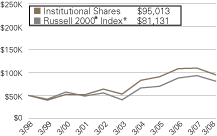
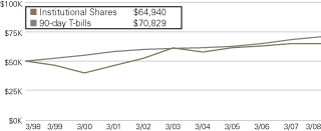
Laudus Rosenberg U.S. Large Capitalization Fund as of 3/31/08
Performance of a Hypothetical
$50,000 Investment in Institutional Shares1
Performance of a Hypothetical
$10,000 Investment in Investor Shares1
Average Annual Total Returns1
| | | | | | | | | | | | | | | | | |
| | | | | | | Since Inception | | Since Inception |
| Class and Inception Date | | 1 year | | 5 year | | Institutional | | Investor |
| Institutional (6/19/02) | | | -6.30% | | | | 11.66% | | | | 6.57% | | | | n/a | |
| Investor (7/31/02) | | | -6.61% | | | | 11.28% | | | | n/a | | | | 8.60% | |
Russell 1000® Index* | | | -5.40% | | | | 11.86% | | | | 6.71% | | | | 9.23% | |
Past performance does not guarantee future results. The performance data quoted represents past performance, and current returns may be lower or higher. The performance information does not reflect the deduction of taxes that a shareholder would pay on fund distributions or the redemption of fund shares. The investment return and principal value will fluctuate so that an investor’s shares, when redeemed, may be worth more or less than the original cost. To obtain performance information current to the most recent month end, visit www.laudusfunds.com.
Performance data quoted does not reflect the non-recurring redemption fee of 2% that may be charged if shares are sold or exchanged within 30 days of the purchase date. If these fees were reflected, the performance data quoted would be lower.
Investors cannot invest directly in any index.
| |
| * | The Russell 1000® Index measures the performance of the 1,000 largest companies in the Russell 3000® Index, and represents approximately 92% of the total market capitalization of the Russell 3000® Index. |
| |
| 1 | Total returns include change in share price and reinvestment of distributions. Total returns may reflect the waiver of a portion of a Fund’s advisory fees for certain periods since the inception date. In such instances, and without the waiver of fees, total returns would have been lower. |
| | | | | | | | | |
| | | Institutional | | Investor |
| Fund Overview2 | | Shares | | Shares |
| |
| Initial Investment | | | $50,000 | | | | $100 | |
| Inception Date | | | 6/19/02 | | | | 7/31/02 | |
| Total Net Assets ($ x 1,000) | | | $83,783 | | | | $9,017 | |
| Ticker Symbol | | | AXLIX | | | | AXLVX | |
| Cusip | | | 51855Q101 | | | | 51855Q853 | |
| NAV | | | $10.38 | | | | $10.38 | |
Net Expense Ratio3 | | | 0.84% | | | | 1.14% | |
Gross Expense Ratio4 | | | 1.00% | | | | 1.37% | |
| | | | | |
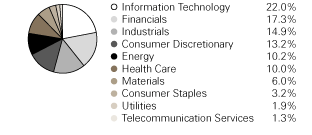
| Fund Characteristics2 | | |
| |
| Number of Securities | | | 186 | |
Avg. Market Capitalization
($Wtd. x 1,000,000) | | | 77,522 | |
| Portfolio Turnover (One year trailing) | | | 166 | % |
| Price to Earnings (P/E) | | | 14.06 | |
| Price to Book (P/B) | | | 2.17 | |
| Price to Cash Flow | | | 9.41 | |
| Beta | | | 1.04 | |
| Return on Equity | | | 17.39 | % |
| Five-Year Earnings Growth | | | 22.80 | % |
| | | | | |
| Top Equity Holdings2 % of Net Assets | | |
| |
| Exxon Mobil Corp. | | | 4.5 | % |
| Chevron Corp. | | | 3.2 | % |
| International Business Machines Corp. | | | 3.2 | % |
| Verizon Communications, Inc. | | | 2.9 | % |
| Pfizer, Inc. | | | 2.9 | % |
| ConocoPhillips | | | 2.8 | % |
| Occidental Petroleum Corp. | | | 2.4 | % |
| Apple, Inc. | | | 2.2 | % |
| The Coca-Cola Co. | | | 2.0 | % |
| Time Warner, Inc. | | | 2.0 | % |
Total | | | 28.1 | % |
| | | | | |
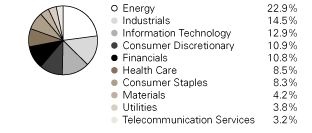
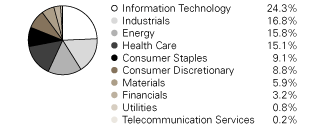
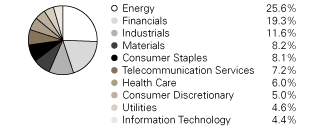
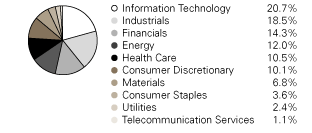
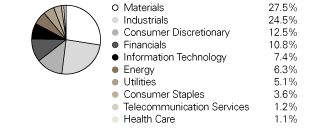
| Portfolio Composition2 % of Investments |
| |
| Sector Weightings |
| |
| 2 | Portfolio holdings are subject to change and may not represent current or future holdings. |
| |
| 3 | Reflects expenses expected to be charged to shareholders through at least 7/30/10. Adviser expects to hold expenses at this level by waiving its management fees and/or bearing other expenses. Please see the prospectus for more information. |
| |
| 4 | Reflects the total annual fund operating expenses without the effect of contractual fee waivers. Please see the prospectus for more information. For actual ratios during the period, refer to the financial highlights section of the financial statements. |
Laudus U.S. Equity Funds 9
Performance and Fund Facts
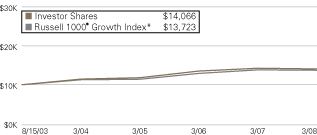
Laudus Rosenberg U.S. Large Capitalization Growth Fund as of 3/31/08
Performance of a Hypothetical
$50,000 Investment in Institutional Shares1
Performance of a Hypothetical
$10,000 Investment in Investor Shares1
Average Annual Total Returns1
| | | | | | | | | | | | | | | | | |
| | | | | | | Since Inception | | Since Inception |
| Class and Inception Date | | 1 year | | 5 year | | Institutional | | Investor |
| Institutional (6/7/00) | | | -0.78% | | | | 10.58% | | | | 0.06% | | | | n/a | |
| Investor (8/15/03) | | | -1.25% | | | | n/a | | | | n/a | | | | 7.65% | |
Russell 1000® Growth Index* | | | -0.75% | | | | 9.96% | | | | -3.93% | | | | 7.08% | |
Past performance does not guarantee future results. The performance data quoted represents past performance, and current returns may be lower or higher. The performance information does not reflect the deduction of taxes that a shareholder would pay on fund distributions or the redemption of fund shares. The investment return and principal value will fluctuate so that an investor’s shares, when redeemed, may be worth more or less than the original cost. To obtain performance information current to the most recent month end, visit www.laudusfunds.com.
Performance data quoted does not reflect the non-recurring redemption fee of 2% that may be charged if shares are sold or exchanged within 30 days of the purchase date. If these fees were reflected, the performance data quoted would be lower.
Investors cannot invest directly in any index.
| |
| * | The Russell 1000® Growth Index measures the performance of those Russell 1000® companies with higher price-to-book ratios and higher forecasted growth values. |
| |
| 1 | Total returns include change in share price and reinvestment of distributions. Total returns may reflect the waiver of a portion of a Fund’s advisory fees for certain periods since the inception date. In such instances, and without the waiver of fees, total returns would have been lower. |
| | | | | | | | | |
| | | Institutional | | Investor |
| Fund Overview2 | | Shares | | Shares |
| |
| Initial Investment | | | $50,000 | | | | $100 | |
| Inception Date | | | 6/7/00 | | | | 8/15/03 | |
| Total Net Assets ($ x 1,000) | | | $52,681 | | | | $2,804 | |
| Ticker Symbol | | | REDIX | | | | REFIX | |
| Cusip | | | 51855Q200 | | | | 51855Q846 | |
| NAV | | | $9.14 | | | | $9.18 | |
Net Expense Ratio3 | | | 0.84% | | | | 1.14% | |
Gross Expense Ratio4 | | | 1.05% | | | | 1.43% | |
| | | | | |
| Fund Characteristics2 | | |
| |
| Number of Securities | | | 302 | |
| Avg. Market Capitalization ($Wtd. x 1,000,000) | | | 65,532 | |
| Portfolio Turnover (One year trailing) | | | 85 | % |
| Price to Earnings (P/E) | | | 16.98 | |
| Price to Book (P/B) | | | 3.53 | |
| Price to Cash Flow | | | 13.69 | |
| Beta | | | 1.10 | |
| Return on Equity | | | 24.94 | % |
| Five-Year Earnings Growth | | | 26.61 | % |
| | | | | |
| Top Equity Holdings2 % of Net Assets | | |
| |
| Microsoft Corp. | | | 2.9 | % |
| Apple, Inc. | | | 2.7 | % |
| Schlumberger Ltd. | | | 2.3 | % |
| International Business Machines Corp. | | | 2.1 | % |
| Hewlett-Packard Co. | | | 1.9 | % |
| Cisco Systems, Inc. | | | 1.6 | % |
| The Coca-Cola Co. | | | 1.6 | % |
| Exxon Mobil Corp. | | | 1.5 | % |
| Intel Corp. | | | 1.4 | % |
| Transocean, Inc. | | | 1.4 | % |
Total | | | 19.4 | % |
| | | | | |
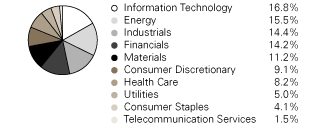
| Portfolio Composition2 % of Investments |
| |
| Sector Weightings |
| |
| 2 | Portfolio holdings are subject to change and may not represent current or future holdings. |
| |
| 3 | Reflects expenses expected to be charged to shareholders through at least 7/30/10. Adviser expects to hold expenses at this level by waiving its management fees and/or bearing other expenses. Please see the prospectus for more information. |
| |
| 4 | Reflects the total annual fund operating expenses without the effect of contractual fee waivers. Please see the prospectus for more information. For actual ratios during the period, refer to the financial highlights section of the financial statements. |
10 Laudus U.S. Equity Funds
Performance and Fund Facts
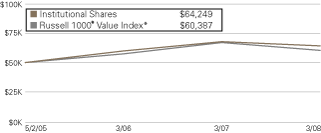
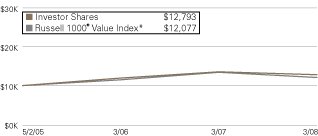
Laudus Rosenberg U.S. Large Capitalization Value Fund as of 3/31/08
Performance of a Hypothetical
$50,000 Investment in Institutional Shares1
Performance of a Hypothetical
$10,000 Investment in Investor Shares1
Average Annual Total Returns1
| | | | | | | | | | | | | |
| | | | | Since Inception | | Since Inception |
| Class and Inception Date | | 1 year | | Institutional | | Investor |
| Institutional (5/02/05) | | | -5.29% | | | | 9.05% | | | | n/a | |
| Investor (5/02/05) | | | -5.50% | | | | n/a | | | | 8.74% | |
Russell 1000® Value Index* | | | -9.99% | | | | 6.68% | | | | 6.68% | |
Past performance does not guarantee future results. The performance data quoted represents past performance, and current returns may be lower or higher. The performance information does not reflect the deduction of taxes that a shareholder would pay on fund distributions or the redemption of fund shares. The investment return and principal value will fluctuate so that an investor’s shares, when redeemed, may be worth more or less than the original cost. To obtain performance information current to the most recent month end, visit www.laudusfunds.com.
Performance data quoted does not reflect the non-recurring redemption fee of 2% that may be charged if shares are sold or exchanged within 30 days of the purchase date. If these fees were reflected, the performance data quoted would be lower.
Value-based investments are subject to the risk that the broad market may not recognize their value.
Investors cannot invest directly in any index.
| |
| * | The Russell 1000® Value Index measures the performance of those Russell 1000® companies with lower valuation ratios such as price-to-book and price-to-earnings ratios. |
| |
| 1 | Total returns include change in share price and reinvestment of distributions. Total returns may reflect the waiver of a portion of a Fund’s advisory fees for certain periods since the inception date. In such instances, and without the waiver of fees, total returns would have been lower. |
| | | | | | | | | |
| | | Institutional | | Investor |
| Fund Overview2 | | Shares | | Shares |
| |
| Initial Investment | | | $50,000 | | | | $100 | |
| Inception Date | | | 5/2/05 | | | | 5/2/05 | |
| |
| Total Net Assets ($ x 1,000) | | | $5,765 | | | | $454 | |
| Ticker Symbol | | | LLCVX | | | | LCVJX | |
| Cusip | | | 51855Q713 | | | | 51855Q721 | |
| NAV | | | $10.47 | | | | $10.45 | |
Net Expense Ratio3 | | | 0.84% | | | | 1.14% | |
Gross Expense Ratio4 | | | 2.37% | | | | 2.75% | |
| | | | | |
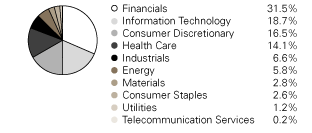
| Fund Characteristics2 | | |
| |
| Number of Securities | | | 151 | |
| Avg. Market Capitalization ($Wtd. x 1,000,000) | | | 100,320 | |
| Portfolio Turnover (One year trailing) | | | 61 | % |
| Price to Earnings (P/E) | | | 11.99 | |
| Price to Book (P/B) | | | 1.77 | |
| Price to Cash Flow | | | 7.59 | |
| Beta | | | 0.99 | |
| Return on Equity | | | 16.44 | % |
| Five-Year Earnings Growth | | | 18.25 | % |
| | | | | |
| Top Equity Holdings2 % of Net Assets | | |
| |
| Chevron Corp. | | | 4.5 | % |
| Exxon Mobil Corp. | | | 4.3 | % |
| General Electric Co. | | | 3.9 | % |
| ConocoPhillips | | | 3.7 | % |
| AT&T, Inc. | | | 3.6 | % |
| Pfizer, Inc. | | | 3.6 | % |
| JPMorgan Chase & Co. | | | 3.3 | % |
| Verizon Communications, Inc. | | | 3.0 | % |
| Bank of America Corp. | | | 2.9 | % |
| Apache Corp. | | | 2.3 | % |
Total | | | 35.1 | % |
Portfolio Composition2 % of Investments
Sector Weightings
| |
| 2 | Portfolio holdings are subject to change and may not represent current or future holdings. |
| |
| 3 | Reflects expenses expected to be charged to shareholders through at least 7/30/10. Adviser expects to hold expenses at this level by waiving its management fees and/or bearing other expenses. Please see the prospectus for more information. |
| |
| 4 | Reflects the total annual fund operating expenses without the effect of contractual fee waivers. Please see the prospectus for more information. For actual ratios during the period, refer to the financial highlights section of the financial statements. |
Laudus U.S. Equity Funds 11
Performance and Fund Facts
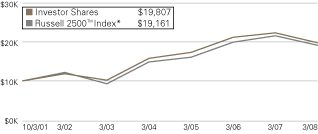
Laudus Rosenberg U.S. Discovery Fund as of 3/31/08
Performance of a Hypothetical
$50,000 Investment in Institutional Shares1
Performance of a Hypothetical
$10,000 Investment in Investor Shares1
Average Annual Total Returns1
| | | | | | | | | | | | | | | | | |
| | | | | | | Since Inception | | Since Inception |
| Class and Inception Date | | 1 year | | 5 year | | Institutional | | Investor |
| Institutional (9/4/01) | | | -10.98% | | | | 14.65% | | | | 10.25% | | | | n/a | |
| Investor (10/3/01) | | | -11.36% | | | | 14.24% | | | | n/a | | | | 11.10% | |
Russell 2500tm Index* | | | -11.27% | | | | 15.67% | | | | 8.50% | | | | 10.53% | |
Past performance does not guarantee future results. The performance data quoted represents past performance, and current returns may be lower or higher. The performance information does not reflect the deduction of taxes that a shareholder would pay on fund distributions or the redemption of fund shares. The investment return and principal value will fluctuate so that an investor’s shares, when redeemed, may be worth more or less than the original cost. To obtain performance information current to the most recent month end, visit www.laudusfunds.com.
Performance data quoted does not reflect the non-recurring redemption fee of 2% that may be charged if shares are sold or exchanged within 30 days of the purchase date. If these fees were reflected, the performance data quoted would be lower.
Small and mid-capitalization funds typically carry additional risks since smaller companies generally have experienced a greater degree of market volatility.
Investors cannot invest directly in any index.
| |
| * | The Russell 2500tm Index measures the performance of the 2,500 smallest companies in the Russell 3000® Index, and represents approximately 16% of the total market capitalization of the Russell 3000® Index. |
| |
| 1 | Total returns include change in share price and reinvestment of distributions. Total returns may reflect the waiver of a portion of a Fund’s advisory fees for certain periods since the inception date. In such instances, and without the waiver of fees, total returns would have been lower. |
| | | | | | | | | |
| | | Institutional | | Investor |
| Fund Overview2 | | Shares | | Shares |
| |
| Initial Investment | | | $50,000 | | | | $100 | |
| Inception Date | | | 9/4/01 | | | | 10/3/01 | |
| Total Net Assets ($ x 1,000) | | | $566,055 | | | | $169,670 | |
| Ticker Symbol | | | RDISX | | | | RDIVX | |
| Cusip | | | 51855Q309 | | | | 51855Q838 | |
| NAV | | | $16.23 | | | | $15.97 | |
Fund Expense Ratio3 | | | 0.97% | | | | 1.35% | |
| | | | | |
| Fund Characteristics2 | | |
| |
| Number of Securities | | | 765 | |
| Avg. Market Capitalization ($Wtd. x 1,000,000) | | | $2,449 | |
| Portfolio Turnover (One year trailing) | | | 74 | % |
| Price to Earnings (P/ E) | | | 14.34 | |
| Price to Book (P/ B) | | | 1.66 | |
| Price to Cash Flow | | | 9.16 | |
| Beta | | | 1.26 | |
| Return on Equity | | | 12.84 | % |
| Five-Year Earnings Growth | | | 24.31 | % |
| | | | | |
| Top Equity Holdings2 % of Net Assets | | |
| |
| CF Industries Holdings, Inc. | | | 2.0% | |
| FMC Corp. | | | 1.9% | |
| Avnet, Inc. | | | 1.9% | |
| SPX Corp. | | | 1.8% | |
| Tidewater, Inc. | | | 1.4% | |
| Helmerich & Payne, Inc. | | | 1.3% | |
| MDU Resources Group, Inc. | | | 1.3% | |
| Rowan Cos., Inc. | | | 1.2% | |
| Terra Industries, Inc. | | | 1.2% | |
| PartnerRe Ltd. | | | 1.1% | |
Total | | | 15.1% | |
Portfolio Composition2 % of Investments
Sector Weightings
| |
| 2 | Portfolio holdings are subject to change and may not represent current or future holdings. |
| |
| 3 | Reflects the total annual fund operating expenses. Please see the prospectus for more information. For actual ratios during the period, refer to the financial highlights section of the financial statements. |
12 Laudus U.S. Equity Funds
Performance and Fund Facts
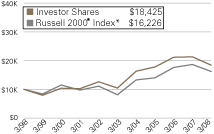
Laudus Rosenberg U.S. Small Capitalization Fund as of 3/31/08
Performance of a Hypothetical
$50,000 Investment in Institutional Shares1
Performance of a Hypothetical
$100,000 Investment in Adviser Shares1
Performance of a Hypothetical
$10,000 Investment in Investor Shares1
Average Annual Total Returns1
| | | | | | | | | | | | | |
| Class and Inception Date | | 1 year | | 5 year | | 10 year |
| Institutional (2/22/89) | | | -13.34% | | | | 12.41% | | | | 6.63% | |
| Adviser (1/21/97) | | | -13.50% | | | | 12.16% | | | | 6.39% | |
| Investor (10/22/96) | | | -13.57% | | | | 12.05% | | | | 6.30% | |
Russell 2000® Index* | | | -13.00% | | | | 14.90% | | | | 4.96% | |
Past performance does not guarantee future results. The performance data quoted represents past performance, and current returns may be lower or higher. The performance information does not reflect the deduction of taxes that a shareholder would pay on fund distributions or the redemption of fund shares. The investment return and principal value will fluctuate so that an investor’s shares, when redeemed, may be worth more or less than the original cost. To obtain performance information current to the most recent month end, visit www.laudusfunds.com.
Performance data quoted does not reflect the non-recurring redemption fee of 2% that may be charged if shares are sold or exchanged within 30 days of the purchase date. If these fees were reflected, the performance data quoted would be lower.
Small capitalization funds typically carry additional risks since smaller companies generally have experienced a greater degree of market volatility.
Investors cannot invest directly in any index.
| |
| * | The Russell 2000® Index measures the performance of the 2,000 smallest companies in the Russell 3000® Index, and represents approximately 8% of the total market capitalization of the Russell 3000® Index. |
| |
| 1 | Total returns include change in share price and reinvestment of distributions. Total returns may reflect the waiver of a portion of a Fund’s advisory fees for certain periods since the inception date. In such instances, and without the waiver of fees, total returns would have been lower. |
| | | | | | | | | | | | | |
| | | Institutional | | Adviser | | Investor |
| Fund Overview2 | | Shares | | Shares | | Shares |
| |
| Initial Investment | | | $50,000 | | | | $100,000 | | | | $100 | |
| Inception Date | | | 2/22/89 | | | | 1/21/97 | | | | 10/22/96 | |
| Total Net Assets ($ x 1,000) | | | $393,939 | | | | $34,799 | | | | $183,980 | |
| Ticker Symbol | | | USCIX | | | | LIFUX | | | | BRSCX | |
| Cusip | | | 51855Q408 | | | | 51855Q739 | | | | 51855Q820 | |
| NAV | | | $9.03 | | | | $8.82 | | | | $8.70 | |
Fund Expense Ratio3 | | | 0.95% | | | | 1.20% | | | | 1.30% | |
| | | | | |
| Fund Characteristics2 | | |
| |
| Number of Securities | | | 561 | |
| |
| Avg. Market Capitalization ($Wtd. x 1,000,000) | | | 1,082 | |
| Portfolio Turnover (One year trailing) | | | 68 | % |
| Price to Earnings (P/E) | | | 16.10 | |
| Price to Book (P/B) | | | 1.53 | |
| Price to Cash Flow | | | 9.90 | |
| Beta | | | 1.32 | |
| Return on Equity | | | 10.28 | % |
| Five-Year Earnings Growth | | | 22.42 | % |
| | | | | |
| Top Equity Holdings2 % of Net Assets | | |
| |
| Woodward Governor Co. | | | 1.9% | |
| Mariner Energy, Inc. | | | 1.7% | |
| Perot Systems Corp., Class A | | | 1.7% | |
| Atwood Oceanics, Inc. | | | 1.7% | |
| Sybase, Inc. | | | 1.6% | |
| Terra Industries, Inc. | | | 1.5% | |
| MPS Group, Inc. | | | 1.4% | |
| Regal-Beloit Corp. | | | 1.4% | |
| Schnitzer Steel Industries, Inc., Class A | | | 1.3% | |
| Longs Drug Stores Corp. | | | 1.2% | |
Total | | | 15.4% | |
Portfolio Composition2 % of Investments
Sector Weightings
| |
| 2 | Portfolio holdings are subject to change and may not represent current or future holdings. |
| |
| 3 | Reflects the total annual fund operating expenses. Please see the prospectus for more information. For actual ratios during the period, refer to the financial highlights section of the financial statements. |
Laudus U.S. Equity Funds 13
Performance and Fund Facts
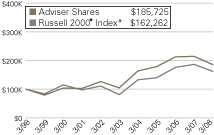
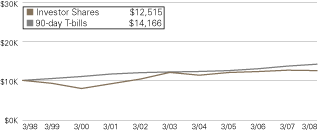
Laudus Rosenberg Long/Short Equity Fund as of 3/31/08
Performance of a Hypothetical
$50,000 Investment in Institutional Shares1
Performance of a Hypothetical
$10,000 Investment in Investor Shares1
Average Annual Total Returns1
| | | | | | | | | | | | | |
| Class and Inception Date | | 1 year | | 5 year | | 10 year |
| Institutional (12/16/97) | | | -0.51% | | | | 1.06% | | | | 2.60% | |
| Investor (12/18/97) | | | -0.82% | | | | 0.76% | | | | 2.27% | |
| 90 day T-bills | | | 3.57% | | | | 3.03% | | | | 3.47% | |
Past performance does not guarantee future results. The performance data quoted represents past performance, and current returns may be lower or higher. The performance information does not reflect the deduction of taxes that a shareholder would pay on fund distributions or the redemption of fund shares. The investment return and principal value will fluctuate so that an investor’s shares, when redeemed, may be worth more or less than the original cost. To obtain performance information current to the most recent month end, visit www.laudusfunds.com.
Performance data quoted does not reflect the non-recurring redemption fee of 2% that may be charged if shares are sold or exchanged within 30 days of the purchase date. If these fees were reflected, the performance data quoted would be lower.
Investments in long/short funds are more volatile and risky than some other forms of investments. Since they have both long and short portfolios, an investment will involve risks associated with twice the number of investment decisions made for a typical stock fund. These types of Funds typically have a high portfolio turnover that could increase transaction costs and cause short-term capital gains to be realized. While it may be the intent of the Manager to take long positions in stocks that outperform the market and short positions in stocks that underperform the market, there is no assurance that the Manager will be successful.
The Fund uses the return that an investor could achieve through an investment in 3-month U.S. Treasury Bills as a benchmark against which to measure the Fund’s performance. AXA Rosenberg attempts to achieve returns for the Fund’s shareholders which exceed the benchmark. An investment in the Fund is different from an investment in 3-month U.S. Treasury Bills because, among other differences, U.S. Treasury Bills are backed by the full faith and credit of the U.S. Government, U.S. Treasury Bills have a fixed rate of return, investors in U.S. Treasury Bills do not risk losing their investment, and an investment in the Fund is more volatile than an investment in U.S. Treasury Bills.
Small- and mid-capitalization funds typically carry additional risk since small-and mid-capitalization companies generally have a higher risk of failure.
Value-based investments are subject to the risk that the broad market may not recognize their value.
| |
| 1 | Total returns include change in share price and reinvestment of distributions. Total returns may reflect the waiver of a portion of a Fund’s advisory fees for certain periods since the inception date. In such instances, and without the waiver of fees, total returns would have been lower. |
| | | | | | | | | |
| | | Institutional | | Investor |
| Fund Overview2 | | Shares | | Shares |
| |
| Initial Investment | | | $50,000 | | | | $100 | |
| Inception Date | | | 12/16/97 | | | | 12/18/97 | |
| Total Net Assets ($ x 1,000) | | | $182,817 | | | | $14,714 | |
| Ticker Symbol | | | BMNIX | | | | BRMIX | |
| Cusip | | | 51855Q861 | | | | 51855Q762 | |
| NAV | | | $10.37 | | | | $10.30 | |
Gross Expense Ratio3 | | | 1.66% | | | | 1.99% | |
Gross Expense Ratio4
(paid by shareholders) | | |
2.99% | | | | 3.32% | |
| | | | | | | | | |
| Fund Characteristics2 | | Long | | Short |
| |
| Number of Securities | | | 584 | | | | 386 | |
| Avg. Market Capitalization ($Wtd. x 1,000,000) | | | 3,017 | | | | 3,059 | |
| Portfolio Turnover (One year trailing) | | | 129 | % | | | 124 | % |
| Price to Earnings (P/E) | | | 13.87 | | | | -97.68 | |
| Price to Book (P/B) | | | 1.57 | | | | 1.90 | |
| Price to Cash Flow | | | 9.50 | | | | 11.74 | |
| Beta | | | 1.37 | | | | 1.40 | |
| Return on Equity | | | 12.52 | % | | | -1.85 | % |
| Five-Year Earnings Growth | | | 23.99 | % | | | 5.13 | % |
| |
| 2 | Portfolio holdings are subject to change and may not represent current or future holdings. |
| |
| 3 | Reflects expenses expected to be charged to shareholders through at least 7/30/10. Adviser expects to hold expenses at this level by waiving its management fees and/or bearing other expenses. Please see the prospectus for more information. |
| |
| 4 | Reflects the total annual fund operating expenses without the effect of contractual fee waivers. Also, includes dividend expense on securities sold short. Please see the prospectus for more information. For actual ratios during the period, refer to the financial highlights section of the financial statements. |
14 Laudus U.S. Equity Funds
Performance and Fund Facts continued
Laudus Rosenberg Long/Short Equity Fund as of 3/31/08
| | | | | |
| Top Equity Holdings1 % of Net Assets | | Long |
| |
| ENSCO International, Inc. | | | 1.4% | |
| Avnet, Inc. | | | 1.3% | |
| Axis Capital Holdings, Inc. | | | 1.1% | |
| AGCO Corp. | | | 1.1% | |
| FMC Corp. | | | 1.1% | |
| Perrigo Co. | | | 1.0% | |
| Sybase, Inc. | | | 1.0% | |
| MDU Resources Group, Inc. | | | 1.0% | |
| Electronic Data Systems Corp. | | | 1.0% | |
| Gannett Co., Inc. | | | 1.0% | |
Total | | | 11.0% | |
| | | | | |
| Top Equity Holdings1 % of Net Assets | | Short |
| |
| Ventas, Inc. | | | 1.2% | |
| Boston Properties, Inc. | | | 1.2% | |
| Regency Centers Corp. | | | 1.2% | |
| Developers Diversified Realty Corp. | | | 1.2% | |
| Microchip Technology, Inc. | | | 1.1% | |
| The Macerich Co. | | | 1.1% | |
| CB Richard Ellis Group, Inc., Class A | | | 1.1% | |
| Plum Creek Timber Co., Inc. | | | 1.1% | |
| Camden Property Trust | | | 1.0% | |
| The Hershey Co. | | | 1.0% | |
Total | | | 11.2% | |
Portfolio Composition1 % of Investments
Sector Weightings—Long Holdings
Portfolio Composition1 % of Short Positions
Sector Weightings—Short Positions
| |
| 1 | Portfolio holdings are subject to change and may not represent current or future holdings. |
Laudus U.S. Equity Funds 15
Disclosure of Fund Expenses (Unaudited)
Examples for a $1,000 Investment
As a fund shareholder, you incur two types of costs: transaction costs, such as redemption fees; and, ongoing costs, such as management fees, transfer agent and shareholder services fees, and other fund expenses.
The expense examples below are intended to help you understand your ongoing cost (in dollars) of investing in a fund and to compare this cost with the ongoing cost of investing in other mutual funds. These examples are based on an investment of $1,000 invested for the period beginning October 1, 2007 and held through March 31, 2008, unless otherwise noted.
Actual Return lines in the table below provide information about actual account values and actual expenses. You may use this information, together with the amount you invested, to estimate the expenses that you paid over the period. To do so, simply divide your account value by $1,000 (for example, an $8,600 account value ÷ $1,000 = 8.6), then multiply the result by the number given for your fund or share class under the heading entitled “Expenses Paid During Period.”
Hypothetical Return lines in the table below provide information about hypothetical account values and hypothetical expenses based on a fund’s share classes’ actual expense ratios and an assumed return of 5% per year before expenses. Because the return used is not an actual return, it may not be used to estimate the actual ending account value or expenses you paid for the period.
You may use this information to compare the ongoing costs of investing in the fund and other funds. To do so, compare this 5% hypothetical example with the 5% hypothetical examples that appear in the shareholder reports of the other funds.
Please note that the expenses shown in the table are meant to highlight your ongoing costs only, and do not reflect any transactional costs, such as redemption fees. If these transactional costs were included, your costs would have been higher.
| | | | | | | | | | | | | | | | | | |
| | | | | | | Ending | | |
| | | | | Beginning | | Account Value | | Expenses |
| | | Expense Ratio1 | | Account Value | | (Net of Expenses) | | Paid During Period2 |
| | | (Annualized) | | at 10/1/07 | | at 3/31/08 | | 10/1/07 - 3/31/08 |
| |
Laudus Rosenberg U.S. Large Capitalization Fund | | | | | | | | | | | | | | | | |
Institutional Shares | | | 0.98 | % | | | | | | | | | | | | |
| | Actual Return | | | | | | $ | 1,000 | | | $ | 860.20 | | | $ | 4.56 | |
| | Hypothetical 5% Return | | | | | | $ | 1,000 | | | $ | 1,020.10 | | | $ | 4.95 | |
Investor Shares | | | 1.30 | % | | | | | | | | | | | | |
| | Actual Return | | | | | | $ | 1,000 | | | $ | 857.90 | | | $ | 6.04 | |
| | Hypothetical 5% Return | | | | | | $ | 1,000 | | | $ | 1,018.50 | | | $ | 6.56 | |
| |
| Laudus Rosenberg U.S. Large Capitalization Growth Fund | | | | | | | | |
Institutional Shares | | | 1.00 | % | | | | | | | | | | | | |
| | Actual Return | | | | | | $ | 1,000 | | | $ | 866.00 | | | $ | 4.72 | |
| | Hypothetical 5% Return | | | | | | $ | 1,000 | | | $ | 1,020.00 | | | $ | 5.05 | |
Investor Shares | | | 1.30 | % | | | | | | | | | | | | |
| | Actual Return | | | | | | $ | 1,000 | | | $ | 884.10 | | | $ | 6.12 | |
| | Hypothetical 5% Return | | | | | | $ | 1,000 | | | $ | 1,018.50 | | | $ | 6.56 | |
| |
| Laudus Rosenberg U.S. Large Capitalization Value Fund | | | | | | | | |
Institutional Shares | | | 0.99 | % | | | | | | | | | | | | |
| | Actual Return | | | | | | $ | 1,000 | | | $ | 892.40 | | | $ | 4.68 | |
| | Hypothetical 5% Return | | | | | | $ | 1,000 | | | $ | 1,020.05 | | | $ | 5.00 | |
Investor Shares | | | 1.29 | % | | | | | | | | | | | | |
| | Actual Return | | | | | | $ | 1,000 | | | $ | 891.60 | | | $ | 6.10 | |
| | Hypothetical 5% Return | | | | | | $ | 1,000 | | | $ | 1,018.55 | | | $ | 6.51 | |
| |
| |
| 1 | Based on the most recent six-month expense ratio; may differ from the expense ratio provided in Financial Highlights. |
| 2 | Expenses for each fund or share class are equal to that fund’s or share class’ annualized expense ratio (net of any expenses waived or reimbursed), multiplied by the average account value for the hypothetical account over the period, multiplied by 183 days of the period, and divided by 366 days of the fiscal year. |
16 Laudus U.S. Equity Funds
| | | | | | | | | | | | | | | | | | |
| | | | | | | Ending | | |
| | | | | Beginning | | Account Value | | Expenses |
| | | Expense Ratio1 | | Account Value | | (Net of Expenses) | | Paid During Period2 |
| | | (Annualized) | | at 10/1/07 | | at 3/31/08 | | 10/1/07 - 3/31/08 |
| |
| Laudus Rosenberg U.S. Discovery Fund | | | | | | | | |
Institutional Shares | | | 0.95 | % | | | | | | | | | | | | |
| | Actual Return | | | | | | $ | 1,000 | | | $ | 876.45 | | | $ | 4.46 | |
| | Hypothetical 5% Return | | | | | | $ | 1,000 | | | $ | 1,020.25 | | | $ | 4.80 | |
Investor Shares | | | 1.31 | % | | | | | | | | | | | | |
| | Actual Return | | | | | | $ | 1,000 | | | $ | 875.20 | | | $ | 6.14 | |
| | Hypothetical 5% Return | | | | | | $ | 1,000 | | | $ | 1,018.45 | | | $ | 6.61 | |
| |
| Laudus Rosenberg U.S. Small Capitalization Fund | | | | | | | | |
Institutional Shares | | | 0.96 | % | | | | | | | | | | | | |
| | Actual Return | | | | | | $ | 1,000 | | | $ | 864.50 | | | $ | 4.47 | |
| | Hypothetical 5% Return | | | | | | $ | 1,000 | | | $ | 1,020.20 | | | $ | 4.85 | |
Adviser Shares | | | 1.19 | % | | | | | | | | | | | | |
| | Actual Return | | | | | | $ | 1,000 | | | $ | 864.30 | | | $ | 5.55 | |
| | Hypothetical 5% Return | | | | | | $ | 1,000 | | | $ | 1,019.05 | | | $ | 6.01 | |
Investor Shares | | | 1.29 | % | | | | | | | | | | | | |
| | Actual Return | | | | | | $ | 1,000 | | | $ | 862.80 | | | $ | 6.01 | |
| | Hypothetical 5% Return | | | | | | $ | 1,000 | | | $ | 1,018.55 | | | $ | 6.51 | |
| |
| Laudus Rosenberg Long/ Short Equity Fund | | | | | | | | |
Institutional Shares | | | 3.45 | % | | | | | | | | | | | | |
| | Actual Return | | | | | | $ | 1,000 | | | $ | 1,010.90 | | | $ | 17.34 | |
| | Hypothetical 5% Return | | | | | | $ | 1,000 | | | $ | 1,007.75 | | | $ | 17.32 | |
Investor Shares | | | 3.69 | % | | | | | | | | | | | | |
| | Actual Return | | | | | | $ | 1,000 | | | $ | 1,009.80 | | | $ | 18.54 | |
| | Hypothetical 5% Return | | | | | | $ | 1,000 | | | $ | 1,006.55 | | | $ | 18.51 | |
| |
| |
| 1 | Based on the most recent six-month expense ratio; may differ from the expense ratio provided in Financial Highlights. |
| 2 | Expenses for each fund or share class are equal to that fund’s or share class’ annualized expense ratio (net of any expenses waived or reimbursed), multiplied by the average account value for the hypothetical account over the period, multiplied by 183 days of the period, and divided by 366 days of the fiscal year. |
Laudus U.S. Equity Funds 17
Laudus Rosenberg U.S. Large Capitalization Fund
Portfolio Holdings as of March 31, 2008
| | | | | | | | | | | | | |
| | | Cost | | Value |
| Holdings by Category | | ($) | | ($) |
| |
| | 99.3 | % | | Common Stock | | | 91,038,135 | | | | 92,120,930 | |
| | 1.9 | % | | Short-Term Investment | | | 1,798,000 | | | | 1,798,000 | |
| |
| | 101.2 | % | | Total Investments | | | 92,836,135 | | | | 93,918,930 | |
| | (1.2 | )% | | Other Assets and
Liabilities | | | | | | | (1,118,639 | ) |
| |
| | 100.0 | % | | Net Assets | | | | | | | 92,800,291 | |
| | | | | | | | | | | |
| | | Number of | | Value | | |
| Security | | Shares | | ($) | | |
| Common Stock 99.3% of net assets |
Automobiles & Components 0.2% |
| |
| Johnson Controls, Inc. | | | 4,020 | | | | 135,876 | | | |
| TRW Automotive Holdings Corp. * | | | 3,600 | | | | 84,132 | | | |
| | | | | | | |
| | | | | | | | 220,008 | | | |
Banks 2.8% |
| |
| Fifth Third Bancorp | | | 35,430 | | | | 741,195 | | | |
| Hudson City Bancorp, Inc. | | | 6,200 | | | | 109,616 | | | |
| Regions Financial Corp. | | | 44,612 | | | | 881,087 | | | |
| U.S. Bancorp | | | 11,755 | | | | 380,392 | | | |
| Wells Fargo & Co. | | | 15,420 | | | | 448,722 | | | |
| | | | | | | |
| | | | | | | | 2,561,012 | | | |
Capital Goods 12.8% |
| |
| 3M Co. | | | 19,700 | | | | 1,559,255 | | | |
| Aecom Technology Corp. * | | | 2,700 | | | | 70,227 | | | |
| AGCO Corp. * | | | 6,069 | | | | 363,412 | | | |
| Caterpillar, Inc. | | | 2,840 | | | | 222,344 | | | |
| Crane Co. | | | 910 | | | | 36,719 | | | |
| Cummins, Inc. | | | 15,612 | | | | 730,954 | | | |
| Deere & Co. | | | 13,094 | | | | 1,053,281 | | | |
| Dover Corp. | | | 12,950 | | | | 541,051 | | | |
| Emerson Electric Co. | | | 1,730 | | | | 89,026 | | | |
| First Solar, Inc. * | | | 1,900 | | | | 439,166 | | | |
| Fluor Corp. | | | 1,000 | | | | 141,160 | | | |
| General Electric Co. | | | 34,100 | | | | 1,262,041 | | | |
| Goodrich Corp. | | | 100 | | | | 5,751 | | | |
| Honeywell International, Inc. | | | 1,070 | | | | 60,369 | | | |
| Ingersoll-Rand Co., Ltd., Class A | | | 14,527 | | | | 647,614 | | | |
| Kennametal, Inc. | | | 5,600 | | | | 164,808 | | | |
| L-3 Communications Holdings, Inc. | | | 5,383 | | | | 588,577 | | | |
| Lockheed Martin Corp. | | | 8,890 | | | | 882,777 | | | |
| Precision Castparts Corp. | | | 378 | | | | 38,586 | | | |
| Rockwell Collins, Inc. | | | 6,700 | | | | 382,905 | | | |
| SPX Corp. | | | 4,770 | | | | 500,373 | | | |
| Teleflex, Inc. | | | 2,800 | | | | 133,588 | | | |
| Terex Corp. * | | | 100 | | | | 6,250 | | | |
| The Manitowoc Co., Inc. | | | 9,000 | | | | 367,200 | | | |
| The Shaw Group, Inc. * | | | 5,800 | | | | 273,412 | | | |
| The Timken Co. | | | 6,799 | | | | 202,066 | | | |
| United Technologies Corp. | | | 9,395 | | | | 646,564 | | | |
| W.W. Grainger, Inc. | | | 5,700 | | | | 435,423 | | | |
| | | | | | | |
| | | | | | | | 11,844,899 | | | |
Commercial Services & Supplies 0.0% |
| |
| Republic Services, Inc. | | | 500 | | | | 14,620 | | | |
| Steelcase, Inc., Class A | | | 510 | | | | 5,641 | | | |
| | | | | | | |
| | | | | | | | 20,261 | | | |
Consumer Durables & Apparel 1.0% |
| |
| Hasbro, Inc. | | | 7,500 | | | | 209,250 | | | |
| Mattel, Inc. | | | 15,522 | | | | 308,888 | | | |
| Whirlpool Corp. | | | 5,216 | | | | 452,644 | | | |
| | | | | | | |
| | | | | | | | 970,782 | | | |
Consumer Services 1.6% |
| |
| Darden Restaurants, Inc. | | | 5,400 | | | | 175,770 | | | |
| McDonald’s Corp. | | | 3,995 | | | | 222,801 | | | |
| Yum! Brands, Inc. | | | 29,100 | | | | 1,082,811 | | | |
| | | | | | | |
| | | | | | | | 1,481,382 | | | |
Diversified Financials 2.2% |
| |
| Bank of America Corp. | | | 30,903 | | | | 1,171,533 | | | |
| Bank of New York Mellon Corp. | | | 8,204 | | | | 342,353 | | | |
| JPMorgan Chase & Co. | | | 8,330 | | | | 357,773 | | | |
| State Street Corp. | | | 2,380 | | | | 188,020 | | | |
| | | | | | | |
| | | | | | | | 2,059,679 | | | |
Energy 22.7% |
| |
| Apache Corp. | | | 2,800 | | | | 338,296 | | | |
| Atwood Oceanics, Inc. * | | | 1,700 | | | | 155,924 | | | |
| Berry Petroleum Co., Class A | | | 340 | | | | 15,807 | | | |
| Bill Barrett Corp. * | | | 2,000 | | | | 94,500 | | | |
| Cameron International Corp. * | | | 7,800 | | | | 324,792 | | | |
| Chevron Corp. | | | 34,884 | | | | 2,977,698 | | | |
| Cimarex Energy Co. | | | 5,400 | | | | 295,596 | | | |
| ConocoPhillips | | | 33,760 | | | | 2,572,850 | | | |
| Devon Energy Corp. | | | 8,268 | | | | 862,600 | | | |
| Diamond Offshore Drilling, Inc. | | | 5,200 | | | | 605,280 | | | |
| El Paso Corp. | | | 28,764 | | | | 478,633 | | | |
| Encore Acquisition Co. * | | | 790 | | | | 31,821 | | | |
| ENSCO International, Inc. | | | 12,300 | | | | 770,226 | | | |
| EXCO Resources, Inc. * | | | 2,077 | | | | 38,424 | | | |
| Exxon Mobil Corp. | | | 48,800 | | | | 4,127,504 | | | |
| Forest Oil Corp. * | | | 380 | | | | 18,605 | | | |
| Foundation Coal Holdings, Inc. | | | 3,017 | | | | 151,846 | | | |
| Helix Energy Solutions Group, Inc. * | | | 1,024 | | | | 32,256 | | | |
| Helmerich & Payne, Inc. | | | 7,096 | | | | 332,589 | | | |
| Mariner Energy, Inc. * | | | 5,300 | | | | 143,153 | | | |
| Massey Energy Co. | | | 1,310 | | | | 47,815 | | | |
| Noble Corp. | | | 17,516 | | | | 870,020 | | | |
| Occidental Petroleum Corp. | | | 29,915 | | | | 2,188,880 | | | |
| Oil States International, Inc. * | | | 1,980 | | | | 88,724 | | | |
| Petrohawk Energy Corp. * | | | 10,500 | | | | 211,785 | | | |
| Pioneer Natural Resources Co. | | | 8,055 | | | | 395,662 | | | |
| Plains Exploration & Production Co. * | | | 6,173 | | | | 328,033 | | | |
| Pride International, Inc. * | | | 13,499 | | | | 471,790 | | | |
| Rowan Cos., Inc. | | | 7,170 | | | | 295,261 | | | |
| Schlumberger Ltd. | | | 10,494 | | | | 912,978 | | | |
| SEACOR Holdings, Inc. * | | | 1,580 | | | | 134,869 | | | |
| St. Mary Land & Exploration Co. | | | 4,500 | | | | 173,250 | | | |
| Superior Energy Services, Inc. * | | | 2,652 | | | | 105,072 | | | |
| Tidewater, Inc. | | | 3,800 | | | | 209,418 | | | |
| Transocean, Inc. * | | | 356 | | | | 48,131 | | | |
| Unit Corp. * | | | 1,200 | | | | 67,980 | | | |
| Whiting Petroleum Corp. * | | | 2,700 | | | | 174,555 | | | |
| | | | | | | |
| | | | | | | | 21,092,623 | | | |
See financial notes.
18 Laudus U.S. Equity Funds
Laudus Rosenberg U.S. Large Capitalization Fund
| | | | | | | | | | | |
| | | Number of | | Value | | |
| Security | | Shares | | ($) | | |
Food & Staples Retailing 0.3% |
| |
| CVS Caremark Corp. | | | 7,700 | | | | 311,927 | | | |
| Sysco Corp. | | | 480 | | | | 13,930 | | | |
| | | | | | | |
| | | | | | | | 325,857 | | | |
Food, Beverage & Tobacco 5.7% |
| |
| Altria Group, Inc. | | | 12,740 | | | | 282,828 | | | |
| Corn Products International, Inc. | | | 5,960 | | | | 221,355 | | | |
| General Mills, Inc. | | | 16,173 | | | | 968,439 | | | |
| Molson Coors Brewing Co., Class B | | | 6,355 | | | | 334,082 | | | |
| Philip Morris International, Inc. * | | | 12,740 | | | | 644,389 | | | |
| Sara Lee Corp. | | | 45,790 | | | | 640,144 | | | |
| The Coca-Cola Co. | | | 30,900 | | | | 1,880,883 | | | |
| UST, Inc. | | | 5,424 | | | | 295,717 | | | |
| | | | | | | |
| | | | | | | | 5,267,837 | | | |
Health Care Equipment & Services 1.0% |
| |
| Express Scripts, Inc. * | | | 1,100 | | | | 70,752 | | | |
| Health Net, Inc. * | | | 7,900 | | | | 243,320 | | | |
| Humana, Inc. * | | | 10,950 | | | | 491,217 | | | |
| UnitedHealth Group, Inc. | | | 2,748 | | | | 94,421 | | | |
| | | | | | | |
| | | | | | | | 899,710 | | | |
Household & Personal Products 2.2% |
| |
| Avon Products, Inc. | | | 1,740 | | | | 68,800 | | | |
| Colgate-Palmolive Co. | | | 15,350 | | | | 1,195,918 | | | |
| Energizer Holdings, Inc. * | | | 3,010 | | | | 272,345 | | | |
| The Estee Lauder Cos., Inc., Class A | | | 8,100 | | | | 371,385 | | | |
| The Procter & Gamble Co. | | | 1,920 | | | | 134,534 | | | |
| | | | | | | |
| | | | | | | | 2,042,982 | | | |
Insurance 5.7% |
| |
| ACE Ltd. | | | 18,400 | | | | 1,013,104 | | | |
| Alleghany Corp. * | | | 322 | | | | 110,072 | | | |
| Aspen Insurance Holdings Ltd. | | | 475 | | | | 12,531 | | | |
| CNA Financial Corp. | | | 4,490 | | | | 115,797 | | | |
| Hanover Insurance Group, Inc. | | | 51 | | | | 2,098 | | | |
| Loews Corp. | | | 32,140 | | | | 1,292,671 | | | |
| Marsh & McLennan Cos., Inc. | | | 978 | | | | 23,814 | | | |
| Prudential Financial, Inc. | | | 22,526 | | | | 1,762,659 | | | |
| The Hartford Financial Services Group, Inc. | | | 5,471 | | | | 414,538 | | | |
| Unum Group | | | 24,500 | | | | 539,245 | | | |
| | | | | | | |
| | | | | | | | 5,286,529 | | | |
Materials 4.2% |
| |
| AK Steel Holding Corp. | | | 1,450 | | | | 78,909 | | | |
| Celanese Corp., Series A | | | 9,000 | | | | 351,450 | | | |
| Century Aluminum Co. * | | | 240 | | | | 15,898 | | | |
| CF Industries Holdings, Inc. | | | 3,490 | | | | 361,634 | | | |
| Eastman Chemical Co. | | | 2,800 | | | | 174,860 | | | |
| FMC Corp. | | | 1,937 | | | | 107,484 | | | |
| Freeport-McMoRan Copper & Gold, Inc. | | | 9,318 | | | | 896,578 | | | |
| Monsanto Co. | | | 2,960 | | | | 330,040 | | | |
| Nalco Holding Co. | | | 2,170 | | | | 45,896 | | | |
| Owens-Illinois, Inc. * | | | 6,388 | | | | 360,475 | | | |
| PPG Industries, Inc. | | | 5,900 | | | | 357,009 | | | |
| RPM International, Inc. | | | 5,560 | | | | 116,426 | | | |
| Southern Copper Corp. | | | 3,650 | | | | 378,979 | | | |
| Terra Industries, Inc. * | | | 5,662 | | | | 201,171 | | | |
| The Scotts Miracle-Gro Co., Class A | | | 3,120 | | | | 101,150 | | | |
| | | | | | | |
| | | | | | | | 3,877,959 | | | |
Media 5.1% |
| |
| CBS Corp., Class B | | | 55,900 | | | | 1,234,272 | | | |
| DISH Network Corp., Class A * | | | 7,078 | | | | 203,351 | | | |
| Gannett Co., Inc. | | | 15,500 | | | | 450,275 | | | |
| The DIRECTV Group, Inc. * | | | 39,859 | | | | 988,105 | | | |
| Time Warner, Inc. | | | 132,912 | | | | 1,863,426 | | | |
| | | | | | | |
| | | | | | | | 4,739,429 | | | |
Pharmaceuticals & Biotechnology 7.5% |
| |
| Applied Biosystems Group-Applera Corp. | | | 5,310 | | | | 174,487 | | | |
| Biogen Idec, Inc. * | | | 3,759 | | | | 231,893 | | | |
| Bristol-Myers Squibb Co. | | | 10,480 | | | | 223,224 | | | |
| Gilead Sciences, Inc. * | | | 12,783 | | | | 658,708 | | | |
| Illumina, Inc. * | | | 2,220 | | | | 168,498 | | | |
| Invitrogen Corp. * | | | 2,040 | | | | 174,359 | | | |
| Millennium Pharmaceuticals, Inc. * | | | 5,550 | | | | 85,803 | | | |
| Mylan, Inc. | | | 21,500 | | | | 249,400 | | | |
| PerkinElmer, Inc. | | | 7,890 | | | | 191,332 | | | |
| Pfizer, Inc. | | | 127,431 | | | | 2,667,131 | | | |
| Pharmaceutical Product Development, Inc. | | | 2,982 | | | | 124,946 | | | |
| Waters Corp. * | | | 6,820 | | | | 379,874 | | | |
| Wyeth | | | 37,960 | | | | 1,585,209 | | | |
| | | | | | | |
| | | | | | | | 6,914,864 | | | |
Retailing 2.9% |
| |
| Abercrombie & Fitch Co., Class A | | | 6,200 | | | | 453,468 | | | |
| Amazon.com, Inc. * | | | 16,182 | | | | 1,153,777 | | | |
| Autozone, Inc. * | | | 3,028 | | | | 344,677 | | | |
| IAC/ InterActive Corp. * | | | 14,500 | | | | 301,020 | | | |
| The Sherwin-Williams Co. | | | 7,790 | | | | 397,602 | | | |
| The TJX Cos., Inc. | | | 420 | | | | 13,889 | | | |
| | | | | | | |
| | | | | | | | 2,664,433 | | | |
Semiconductors & Semiconductor Equipment 1.1% |
| |
| MEMC Electronic Materials, Inc. * | | | 14,010 | | | | 993,309 | | | |
| Micron Technology, Inc. * | | | 2,010 | | | | 12,000 | | | |
| | | | | | | |
| | | | | | | | 1,005,309 | | | |
Software & Services 3.9% |
| |
| Accenture Ltd., Class A | | | 5,670 | | | | 199,414 | | | |
| BMC Software, Inc. * | | | 510 | | | | 16,585 | | | |
| Cadence Design Systems, Inc. * | | | 18,270 | | | | 195,124 | | | |
| Computer Sciences Corp. * | | | 12,100 | | | | 493,559 | | | |
| Electronic Data Systems Corp. | | | 33,260 | | | | 553,779 | | | |
| Hewitt Associates, Inc., Class A * | | | 830 | | | | 33,009 | | | |
| Microsoft Corp. | | | 10,826 | | | | 307,242 | | | |
| Novell, Inc. * | | | 22,479 | | | | 141,393 | | | |
| Oracle Corp. * | | | 84,409 | | | | 1,651,040 | | | |
| | | | | | | |
| | | | | | | | 3,591,145 | | | |
Technology Hardware & Equipment 7.9% |
| |
| Apple, Inc. * | | | 14,190 | | | | 2,036,265 | | | |
| Avnet, Inc. * | | | 9,848 | | | | 322,325 | | | |
| AVX Corp. | | | 1,520 | | | | 19,471 | | | |
| EchoStar Corp., Class A * | | | 1,126 | | | | 33,262 | | | |
See financial notes.
Laudus U.S. Equity Funds 19
Laudus Rosenberg U.S. Large Capitalization Fund
Portfolio Holdings continued
| | | | | | | | | | | |
| | | Number of | | Value | | |
| Security | | Shares | | ($) | | |
| Harris Corp. | | | 7,210 | | | | 349,901 | | | |
| Hewlett-Packard Co. | | | 27,022 | | | | 1,233,825 | | | |
| International Business Machines Corp. | | | 25,410 | | | | 2,925,707 | | | |
| Western Digital Corp. * | | | 14,446 | | | | 390,620 | | | |
| | | | | | | |
| | | | | | | | 7,311,376 | | | |
Telecommunication Services 3.1% |
| |
| AT&T, Inc. | | | 6,086 | | | | 233,094 | | | |
| CenturyTel, Inc. | | | 100 | | | | 3,324 | | | |
| Verizon Communications, Inc. | | | 73,365 | | | | 2,674,154 | | | |
| | | | | | | |
| | | | | | | | 2,910,572 | | | |
Transportation 1.6% |
| |
| Union Pacific Corp. | | | 12,040 | | | | 1,509,575 | | | |
| | | | | | | |
Utilities 3.8% |
| |
| Alliant Energy Corp. | | | 100 | | | | 3,501 | | | |
| DTE Energy Co. | | | 10,810 | | | | 420,401 | | | |
| Great Plains Energy, Inc. | | | 1,390 | | | | 34,264 | | | |
| MDU Resources Group, Inc. | | | 12,500 | | | | 306,875 | | | |
| NRG Energy, Inc. * | | | 501 | | | | 19,534 | | | |
| ONEOK, Inc. | | | 3,620 | | | | 161,561 | | | |
| Pepco Holdings, Inc. | | | 12,838 | | | | 317,355 | | | |
| PG&E Corp. | | | 26,100 | | | | 961,002 | | | |
| Reliant Energy, Inc. * | | | 22,080 | | | | 522,192 | | | |
| The AES Corp. * | | | 15,532 | | | | 258,918 | | | |
| Xcel Energy, Inc. | | | 25,920 | | | | 517,104 | | | |
| | | | | | | |
| | | | | | | | 3,522,707 | | | |
| | | | | | | |
Total Common Stock (Cost $91,038,135) | | | 92,120,930 | | | |
| | | | | | | |
| | | | | | | | | | | |
| Security | | Face Amount | | Value | | |
| Rate, Maturity Date | | ($) | | ($) | | |
| Short-Term Investment 1.9% of net assets |
Repurchase Agreement 1.9% |
| |
| Fixed Income Clearing Corp. dated 03/31/08, due 04/01/08 at 2.0%, with a maturity value of $1,798,100 (fully collateralized by Federal National Mortgage Association with a value of $1,834,451.) | | | 1,798,000 | | | | 1,798,000 | | | |
| | | | | | | |
Total Short-Term Investment
(Cost $1,798,000) | | | 1,798,000 | | | |
| | | | | | | |
| |
End of Investments. |
At 3/31/08, the tax basis cost of the fund’s investments was $93,066,331 and the unrealized appreciation and depreciation were $7,169,479 and ($6,316,880), respectively, with a net unrealized appreciation of $852,599.
| |
| * | Non-income producing security. |
See financial notes.
20 Laudus U.S. Equity Funds
Laudus Rosenberg U.S. Large Capitalization Growth Fund
Portfolio Holdings as of March 31, 2008
| | | | | | | | | | | | | |
| | | Cost | | Value |
| Holdings by Category | | ($) | | ($) |
| |
| | 97.7 | % | | Common Stock | | | 48,142,221 | | | | 54,201,935 | |
| | 1.4 | % | | Short-Term Investment | | | 780,000 | | | | 780,000 | |
| |
| | 99.1 | % | | Total Investments | | | 48,922,221 | | | | 54,981,935 | |
| | 17.3 | % | | Collateral for Securities on Loan | | | 9,625,633 | | | | 9,625,633 | |
| | (16.4 | )% | | Other Assets and
Liabilities | | | | | | | (9,122,078 | ) |
| |
| | 100.0 | % | | Net Assets | | | | | | | 55,485,490 | |
| | | | | | | | | | | |
| | | Number of | | Value | | |
| Security | | Shares | | ($) | | |
| Common Stock 97.7% of net assets |
Automobiles & Components 0.5% |
| |
| Johnson Controls, Inc. (a) | | | 7,500 | | | | 253,500 | | | |
| The Goodyear Tire & Rubber Co. * | | | 198 | | | | 5,108 | | | |
| Thor Industries, Inc. (a) | | | 810 | | | | 24,114 | | | |
| | | | | | | |
| | | | | | | | 282,722 | | | |
Capital Goods 13.7% |
| |
| 3M Co. | | | 6,140 | | | | 485,981 | | | |
| AGCO Corp. (a)* | | | 2,510 | | | | 150,299 | | | |
| Alliant Techsystems, Inc. (a)* | | | 1,030 | | | | 106,636 | | | |
| AMETEK, Inc. (a) | | | 3,300 | | | | 144,903 | | | |
| Caterpillar, Inc. | | | 6,420 | | | | 502,622 | | | |
| Cummins, Inc. | | | 4,600 | | | | 215,372 | | | |
| Danaher Corp. (a) | | | 1,300 | | | | 98,839 | | | |
| Deere & Co. (a) | | | 870 | | | | 69,983 | | | |
| Donaldson Co., Inc. (a) | | | 2,100 | | | | 84,588 | | | |
| Dover Corp. | | | 1,900 | | | | 79,382 | | | |
| Emerson Electric Co. | | | 8,200 | | | | 421,972 | | | |
| First Solar, Inc. * | | | 629 | | | | 145,387 | | | |
| Flowserve Corp. | | | 1,080 | | | | 112,730 | | | |
| Fluor Corp. | | | 1,500 | | | | 211,740 | | | |
| Foster Wheeler Ltd. * | | | 400 | | | | 22,648 | | | |
| Gardner Denver, Inc. * | | | 1,900 | | | | 70,490 | | | |
| General Dynamics Corp. | | | 235 | | | | 19,592 | | | |
| General Electric Co. | | | 6,210 | | | | 229,832 | | | |
| Goodrich Corp. (a) | | | 2,600 | | | | 149,526 | | | |
| Honeywell International, Inc. | | | 8,000 | | | | 451,360 | | | |
| Hubbell, Inc., Class B (a) | | | 900 | | | | 39,321 | | | |
| Illinois Tool Works, Inc. (a) | | | 2,100 | | | | 101,283 | | | |
| Ingersoll-Rand Co., Ltd., Class A | | | 1,300 | | | | 57,954 | | | |
| Jacobs Engineering Group, Inc. (a)* | | | 1,900 | | | | 139,821 | | | |
| Joy Global, Inc. | | | 1,800 | | | | 117,288 | | | |
| Kennametal, Inc. | | | 1,800 | | | | 52,974 | | | |
| L-3 Communications Holdings, Inc. | | | 860 | | | | 94,032 | | | |
| Lennox International, Inc. (a) | | | 200 | | | | 7,194 | | | |
| Lincoln Electric Holdings, Inc. (a) | | | 1,590 | | | | 102,539 | | | |
| Lockheed Martin Corp. | | | 5,950 | | | | 590,835 | | | |
| McDermott International, Inc. * | | | 4,600 | | | | 252,172 | | | |
| Northrop Grumman Corp. | | | 747 | | | | 58,124 | | | |
| PACCAR, Inc. | | | 2,340 | | | | 105,300 | | | |
| Parker Hannifin Corp. (a) | | | 2,250 | | | | 155,858 | | | |
| Precision Castparts Corp. | | | 800 | | | | 81,664 | | | |
| Raytheon Co. | | | 3,700 | | | | 239,057 | | | |
| Rockwell Collins, Inc. | | | 3,400 | | | | 194,310 | | | |
| Terex Corp. * | | | 1,700 | | | | 106,250 | | | |
| Textron, Inc. | | | 1,300 | | | | 72,046 | | | |
| The Boeing Co. | | | 4,600 | | | | 342,102 | | | |
| The Manitowoc Co., Inc. (a) | | | 4,000 | | | | 163,200 | | | |
| The Shaw Group, Inc. * | | | 1,580 | | | | 74,481 | | | |
| The Timken Co. | | | 107 | | | | 3,180 | | | |
| The Toro Co. (a) | | | 1,700 | | | | 70,363 | | | |
| United Technologies Corp. | | | 7,100 | | | | 488,622 | | | |
| W.W. Grainger, Inc. (a) | | | 1,500 | | | | 114,585 | | | |
| | | | | | | |
| | | | | | | | 7,598,437 | | | |
Commercial Services & Supplies 0.5% |
| |
| Allied Waste Industries, Inc. (a)* | | | 1,500 | | | | 16,215 | | | |
| Copart, Inc. (a)* | | | 2,000 | | | | 77,520 | | | |
| Republic Services, Inc. | | | 2,900 | | | | 84,796 | | | |
| Steelcase, Inc., Class A (a) | | | 2,490 | | | | 27,539 | | | |
| The Brink’s Co. (a) | | | 1,300 | | | | 87,334 | | | |
| | | | | | | |
| | | | | | | | 293,404 | | | |
Consumer Durables & Apparel 0.9% |
| |
| Hasbro, Inc. | | | 1,600 | | | | 44,640 | | | |
| Mattel, Inc. | | | 1,340 | | | | 26,666 | | | |
| NIKE, Inc., Class B | | | 4,800 | | | | 326,400 | | | |
| Whirlpool Corp. (a) | | | 1,060 | | | | 91,987 | | | |
| | | | | | | |
| | | | | | | | 489,693 | | | |
Consumer Services 1.4% |
| |
| Burger King Holdings, Inc. (a) | | | 80 | | | | 2,213 | | | |
| CBRL Group, Inc. (a) | | | 800 | | | | 28,616 | | | |
| Darden Restaurants, Inc. (a) | | | 2,700 | | | | 87,885 | | | |
| International Game Technology (a) | | | 1,350 | | | | 54,284 | | | |
| McDonald’s Corp. (a) | | | 3,894 | | | | 217,168 | | | |
| Yum! Brands, Inc. (a) | | | 10,600 | | | | 394,426 | | | |
| | | | | | | |
| | | | | | | | 784,592 | | | |
Diversified Financials 2.1% |
| |
| American Express Co. | | | 5,700 | | | | 249,204 | | | |
| Bank of New York Mellon Corp. | | | 2,100 | | | | 87,633 | | | |
| CME Group, Inc. | | | 300 | | | | 140,730 | | | |
| Franklin Resources, Inc. (a) | | | 800 | | | | 77,592 | | | |
| NYSE Euronext (a) | | | 1,500 | | | | 92,565 | | | |
| State Street Corp. (a) | | | 4,390 | | | | 346,810 | | | |
| The Goldman Sachs Group, Inc. | | | 900 | | | | 148,851 | | | |
| | | | | | | |
| | | | | | | | 1,143,385 | | | |
Energy 15.4% |
| |
| Arch Coal, Inc. | | | 2,130 | | | | 92,655 | | | |
| Baker Hughes, Inc. | | | 1,900 | | | | 130,150 | | | |
| BJ Services Co. | | | 2,400 | | | | 68,424 | | | |
| Cabot Oil & Gas Corp. (a) | | | 1,200 | | | | 61,008 | | | |
| Cameron International Corp. * | | | 4,800 | | | | 199,872 | | | |
| Chesapeake Energy Corp. | | | 4,570 | | | | 210,905 | | | |
| CONSOL Energy, Inc. | | | 2,800 | | | | 193,732 | | | |
| Continental Resources, Inc. * | | | 1,800 | | | | 57,402 | | | |
| Denbury Resources, Inc. * | | | 4,000 | | | | 114,200 | | | |
| Diamond Offshore Drilling, Inc. (a) | | | 1,650 | | | | 192,060 | | | |
| Dresser-Rand Group, Inc. * | | | 3,100 | | | | 95,325 | | | |
| ENSCO International, Inc. (a) | | | 3,220 | | | | 201,636 | | | |
| Exxon Mobil Corp. | | | 10,130 | | | | 856,795 | | | |
| FMC Technologies, Inc. (a)* | | | 2,200 | | | | 125,158 | | | |
| Foundation Coal Holdings, Inc. (a) | | | 1,310 | | | | 65,932 | | | |
| Global Industries Ltd. * | | | 3,200 | | | | 51,488 | | | |
| Grant Prideco, Inc. * | | | 2,900 | | | | 142,738 | | | |
See financial notes.
Laudus U.S. Equity Funds 21
Laudus Rosenberg U.S. Large Capitalization Growth Fund
Portfolio Holdings continued
| | | | | | | | | | | |
| | | Number of | | Value | | |
| Security | | Shares | | ($) | | |
| Halliburton Co. (a) | | | 11,600 | | | | 456,228 | | | |
| Helix Energy Solutions Group, Inc. (a)* | | | 2,300 | | | | 72,450 | | | |
| Helmerich & Payne, Inc. (a) | | | 3,500 | | | | 164,045 | | | |
| Massey Energy Co. (a) | | | 2,310 | | | | 84,315 | | | |
| National-Oilwell Varco, Inc. (a)* | | | 7,000 | | | | 408,660 | | | |
| Noble Corp. | | | 5,380 | | | | 267,225 | | | |
| Noble Energy | | | 800 | | | | 58,240 | | | |
| Oceaneering International, Inc. * | | | 2,200 | | | | 138,600 | | | |
| Peabody Energy Corp. | | | 700 | | | | 35,700 | | | |
| Pride International, Inc. * | | | 3,530 | | | | 123,373 | | | |
| Quicksilver Resources, Inc. * | | | 2,500 | | | | 91,325 | | | |
| Range Resources Corp. | | | 2,400 | | | | 152,280 | | | |
| Rowan Cos., Inc. (a) | | | 2,720 | | | | 112,010 | | | |
| Schlumberger Ltd. | | | 14,800 | | | | 1,287,600 | | | |
| Smith International, Inc. | | | 4,700 | | | | 301,881 | | | |
| Southwestern Energy Co. (a)* | | | 5,800 | | | | 195,402 | | | |
| Superior Energy Services, Inc. * | | | 2,246 | | | | 88,987 | | | |
| The Williams Cos., Inc. | | | 3,300 | | | | 108,834 | | | |
| Tidewater, Inc. (a) | | | 1,460 | | | | 80,461 | | | |
| Transocean, Inc. (a)* | | | 5,543 | | | | 749,414 | | | |
| Unit Corp. * | | | 1,120 | | | | 63,448 | | | |
| Valero Energy Corp. (a) | | | 2,400 | | | | 117,864 | | | |
| W&T Offshore, Inc. (a) | | | 470 | | | | 16,032 | | | |
| Weatherford International Ltd. * | | | 4,700 | | | | 340,609 | | | |
| XTO Energy, Inc. | | | 2,625 | | | | 162,382 | | | |
| | | | | | | |
| | | | | | | | 8,536,845 | | | |
Food & Staples Retailing 2.0% |
| |
| Costco Wholesale Corp. (a) | | | 1,700 | | | | 110,449 | | | |
| CVS Caremark Corp. | | | 4,920 | | | | 199,309 | | | |
| Sysco Corp. | | | 3,400 | | | | 98,668 | | | |
| Wal-Mart Stores, Inc. | | | 9,950 | | | | 524,166 | | | |
| Walgreen Co. (a) | | | 5,300 | | | | 201,877 | | | |
| | | | | | | |
| | | | | | | | 1,134,469 | | | |
Food, Beverage & Tobacco 4.5% |
| |
| Altria Group, Inc. | | | 7,700 | | | | 170,940 | | | |
| Anheuser-Busch Cos., Inc. | | | 2,700 | | | | 128,115 | | | |
| General Mills, Inc. | | | 1,095 | | | | 65,568 | | | |
| PepsiCo, Inc. | | | 9,900 | | | | 714,780 | | | |
| Philip Morris International, Inc. * | | | 7,700 | | | | 389,466 | | | |
| Sara Lee Corp. | | | 2,460 | | | | 34,391 | | | |
| The Coca-Cola Co. | | | 14,300 | | | | 870,441 | | | |
| The Pepsi Bottling Group, Inc. | | | 1,700 | | | | 57,647 | | | |
| UST, Inc. | | | 1,600 | | | | 87,232 | | | |
| | | | | | | |
| | | | | | | | 2,518,580 | | | |
Health Care Equipment & Services 6.8% |
| |
| Aetna, Inc. | | | 6,000 | | | | 252,540 | | | |
| Baxter International, Inc. | | | 8,000 | | | | 462,560 | | | |
| Beckman Coulter, Inc. | | | 1,260 | | | | 81,333 | | | |
| Becton, Dickinson & Co. | | | 1,400 | | | | 120,190 | | | |
| Cardinal Health, Inc. (a) | | | 3,128 | | | | 164,251 | | | |
| CIGNA Corp. | | | 5,700 | | | | 231,249 | | | |
| Edwards Lifesciences Corp. (a)* | | | 1,700 | | | | 75,735 | | | |
| Express Scripts, Inc. * | | | 4,400 | | | | 283,008 | | | |
| Health Net, Inc. * | | | 1,830 | | | | 56,364 | | | |
| Hillenbrand Industries, Inc. (a) | | | 400 | | | | 19,120 | | | |
| Humana, Inc. * | | | 3,400 | | | | 152,524 | | | |
| IDEXX Laboratories, Inc. (a)* | | | 1,700 | | | | 83,742 | | | |
| Intuitive Surgical, Inc. (a)* | | | 900 | | | | 291,915 | | | |
| Kinetic Concepts, Inc. * | | | 1,300 | | | | 60,099 | | | |
| McKesson Corp. | | | 1,700 | | | | 89,029 | | | |
| Medco Health Solutions, Inc. (a)* | | | 5,300 | | | | 232,087 | | | |
| Medtronic, Inc. | | | 6,300 | | | | 304,731 | | | |
| Pediatrix Medical Group, Inc. * | | | 1,800 | | | | 121,320 | | | |
| St. Jude Medical, Inc. (a)* | | | 1,800 | | | | 77,742 | | | |
| Stryker Corp. (a) | | | 1,700 | | | | 110,585 | | | |
| UnitedHealth Group, Inc. | | | 10,200 | | | | 350,472 | | | |
| WellPoint, Inc. * | | | 1,500 | | | | 66,195 | | | |
| Zimmer Holdings, Inc. * | | | 1,300 | | | | 101,218 | | | |
| | | | | | | |
| | | | | | | | 3,788,009 | | | |
Household & Personal Products 2.3% |
| |
| Avon Products, Inc. | | | 6,130 | | | | 242,380 | | | |
| Church & Dwight Co., Inc. (a) | | | 1,600 | | | | 86,784 | | | |
| Colgate-Palmolive Co. | | | 3,500 | | | | 272,685 | | | |
| Energizer Holdings, Inc. * | | | 400 | | | | 36,192 | | | |
| Herbalife Ltd. (a) | | | 1,530 | | | | 72,675 | | | |
| The Estee Lauder Cos., Inc., Class A (a) | | | 2,000 | | | | 91,700 | | | |
| The Procter & Gamble Co. | | | 6,960 | | | | 487,687 | | | |
| | | | | | | |
| | | | | | | | 1,290,103 | | | |
Insurance 1.1% |
| |
| ACE Ltd. | | | 1,400 | | | | 77,084 | | | |
| Aflac, Inc. (a) | | | 2,700 | | | | 175,365 | | | |
| Arthur J. Gallagher & Co. (a) | | | 200 | | | | 4,724 | | | |
| CNA Financial Corp. (a) | | | 1,800 | | | | 46,422 | | | |
| Hanover Insurance Group, Inc. | | | 200 | | | | 8,228 | | | |
| PartnerRe Ltd. | | | 480 | | | | 36,624 | | | |
| Prudential Financial, Inc. | | | 2,333 | | | | 182,558 | | | |
| Transatlantic Holdings, Inc. (a) | | | 375 | | | | 24,881 | | | |
| W. R. Berkley Corp. | | | 1,600 | | | | 44,304 | | | |
| | | | | | | |
| | | | | | | | 600,190 | | | |
Materials 5.8% |
| |
| Airgas, Inc. (a) | | | 2,320 | | | | 105,490 | | | |
| AK Steel Holding Corp. | | | 3,200 | | | | 174,144 | | | |
| Carpenter Technology Corp. | | | 1,000 | | | | 55,970 | | | |
| Celanese Corp., Series A | | | 2,200 | | | | 85,910 | | | |
| Chemtura Corp. | | | 200 | | | | 1,468 | | | |
| Cleveland-Cliffs, Inc. (a) | | | 1,400 | | | | 167,748 | | | |
| Crown Holdings, Inc. * | | | 3,600 | | | | 90,576 | | | |
| Domtar Corp. (a)* | | | 790 | | | | 5,396 | | | |
| E.I. du Pont de Nemours & Co. (a) | | | 2,400 | | | | 112,224 | | | |
| Freeport-McMoRan Copper & Gold, Inc. | | | 4,100 | | | | 394,502 | | | |
| International Flavors & Fragrances, Inc. | | | 510 | | | | 22,466 | | | |
| Monsanto Co. | | | 6,500 | | | | 724,750 | | | |
| Nalco Holding Co. (a) | | | 3,290 | | | | 69,583 | | | |
| Owens-Illinois, Inc. * | | | 2,300 | | | | 129,789 | | | |
| Packaging Corp. of America (a) | | | 3,600 | | | | 80,388 | | | |
| Praxair, Inc. | | | 4,500 | | | | 379,035 | | | |
| Reliance Steel & Aluminum Co. | | | 200 | | | | 11,972 | | | |
| Rohm & Haas Co. (a) | | | 1,700 | | | | 91,936 | | | |
| RPM International, Inc. (a) | | | 4,300 | | | | 90,042 | | | |
| Southern Copper Corp. (a) | | | 1,600 | | | | 166,128 | | | |
| Steel Dynamics, Inc. (a) | | | 2,630 | | | | 86,895 | | | |
| The Lubrizol Corp. (a) | | | 800 | | | | 44,408 | | | |
| The Mosaic Co. * | | | 1,100 | | | | 112,860 | | | |
See financial notes.
22 Laudus U.S. Equity Funds
Laudus Rosenberg U.S. Large Capitalization Growth Fund
| | | | | | | | | | | |
| | | Number of | | Value | | |
| Security | | Shares | | ($) | | |
| The Scotts Miracle-Gro Co., Class A (a) | | | 200 | | | | 6,484 | | | |
| The Valspar Corp. | | | 100 | | | | 1,984 | | | |
| | | | | | | |
| | | | | | | | 3,212,148 | | | |
Media 2.2% |
| |
| Comcast Corp., Class A (a) | | | 9,400 | | | | 181,796 | | | |
| CTC Media, Inc. * | | | 1,800 | | | | 49,950 | | | |
| DISH Network Corp., Class A (a)* | | | 3,595 | | | | 103,284 | | | |
| News Corp., Class A | | | 7,600 | | | | 142,500 | | | |
| Omnicom Group, Inc. (a) | | | 1,800 | | | | 79,524 | | | |
| The DIRECTV Group, Inc. * | | | 10,553 | | | | 261,609 | | | |
| The Walt Disney Co. (a) | | | 4,400 | | | | 138,072 | | | |
| Time Warner, Inc. (a) | | | 8,800 | | | | 123,376 | | | |
| Viacom, Inc., Class B * | | | 3,400 | | | | 134,708 | | | |
| | | | | | | |
| | | | | | | | 1,214,819 | | | |
Pharmaceuticals & Biotechnology 7.9% |
| |
| Abbott Laboratories | | | 8,800 | | | | 485,320 | | | |
| Allergan, Inc. | | | 1,800 | | | | 101,502 | | | |
| Amgen, Inc. * | | | 4,100 | | | | 171,298 | | | |
| Applied Biosystems Group-Applera Corp. (a) | | | 320 | | | | 10,515 | | | |
| Biogen Idec, Inc. * | | | 1,297 | | | | 80,012 | | | |
| Bristol-Myers Squibb Co. | | | 22,300 | | | | 474,990 | | | |
| Celgene Corp. (a)* | | | 2,300 | | | | 140,967 | | | |
| Cephalon, Inc. * | | | 1,400 | | | | 90,160 | | | |
| Charles River Laboratories International, Inc. (a)* | | | 800 | | | | 47,152 | | | |
| Eli Lilly & Co. | | | 2,900 | | | | 149,611 | | | |
| Genentech, Inc. * | | | 2,400 | | | | 194,832 | | | |
| Genzyme Corp. * | | | 4,000 | | | | 298,160 | | | |
| Gilead Sciences, Inc. * | | | 9,735 | | | | 501,645 | | | |
| ImClone Systems, Inc. (a)* | | | 400 | | | | 16,968 | | | |
| Invitrogen Corp. (a)* | | | 740 | | | | 63,248 | | | |
| Johnson & Johnson | | | 6,200 | | | | 402,194 | | | |
| Merck & Co., Inc. | | | 10,910 | | | | 414,034 | | | |
| Millennium Pharmaceuticals, Inc. (a)* | | | 5,100 | | | | 78,846 | | | |
| PerkinElmer, Inc. | | | 1,240 | | | | 30,070 | | | |
| Pharmaceutical Product Development, Inc. | | | 1,700 | | | | 71,230 | | | |
| Schering-Plough Corp. | | | 9,160 | | | | 131,996 | | | |
| Watson Pharmaceuticals, Inc. (a)* | | | 1,910 | | | | 56,001 | | | |
| Wyeth | | | 8,962 | | | | 374,253 | | | |
| | | | | | | |
| | | | | | | | 4,385,004 | | | |
Real Estate 0.0% |
| |
| ProLogis | | | 280 | | | | 16,481 | | | |
Retailing 3.6% |
| |
| Abercrombie & Fitch Co., Class A | | | 1,480 | | | | 108,247 | | | |
| Amazon.com, Inc. * | | | 6,000 | | | | 427,800 | | | |
| AutoZone, Inc. (a)* | | | 800 | | | | 91,064 | | | |
| Best Buy Co., Inc. (a) | | | 2,200 | | | | 91,212 | | | |
| Big Lots, Inc. * | | | 3,100 | | | | 69,130 | | | |
| Dollar Tree, Inc. * | | | 363 | | | | 10,015 | | | |
| GameStop Corp., Class A (a)* | | | 1,400 | | | | 72,394 | | | |
| IAC/ InterActiveCorp (a)* | | | 2,700 | | | | 56,052 | | | |
| Kohl’s Corp. (a)* | | | 1,700 | | | | 72,913 | | | |
| Lowe’s Cos., Inc. | | | 7,900 | | | | 181,226 | | | |
| RadioShack Corp. (a) | | | 2,470 | | | | 40,138 | | | |
| Staples, Inc. | | | 3,700 | | | | 81,807 | | | |
| Target Corp. | | | 4,800 | | | | 243,264 | | | |
| The Home Depot, Inc. | | | 5,000 | | | | 139,850 | | | |
| The Sherwin-Williams Co. (a) | | | 1,900 | | | | 96,976 | | | |
| The TJX Cos., Inc. (a) | | | 7,300 | | | | 241,411 | | | |
| | | | | | | |
| | | | | | | | 2,023,499 | | | |
Semiconductors & Semiconductor Equipment 2.9% |
| |
| Applied Materials, Inc. (a) | | | 8,400 | | | | 163,884 | | | |
| Fairchild Semiconductor International, Inc. * | | | 1,700 | | | | 20,264 | | | |
| Intel Corp. | | | 35,400 | | | | 749,772 | | | |
| Intersil Corp., Class A | | | 2,300 | | | | 59,041 | | | |
| MEMC Electronic Materials, Inc. * | | | 4,600 | | | | 326,140 | | | |
| Texas Instruments, Inc. | | | 7,800 | | | | 220,506 | | | |
| Varian Semiconductor Equipment Associates, Inc. (a)* | | | 2,700 | | | | 76,005 | | | |
| | | | | | | |
| | | | | | | | 1,615,612 | | | |
Software & Services 8.9% |
| |
| Accenture Ltd., Class A (a) | | | 8,900 | | | | 313,013 | | | |
| Activision, Inc. * | | | 4,700 | | | | 128,357 | | | |
| Adobe Systems, Inc. (a)* | | | 3,200 | | | | 113,888 | | | |
| Automatic Data Processing, Inc. (a) | | | 3,000 | | | | 127,170 | | | |
| BMC Software, Inc. (a)* | | | 3,400 | | | | 110,568 | | | |
| Cadence Design Systems, Inc. (a)* | | | 3,100 | | | | 33,108 | | | |
| eBay, Inc. (a)* | | | 6,000 | | | | 179,040 | | | |
| Electronic Arts, Inc. * | | | 1,700 | | | | 84,864 | | | |
| Electronic Data Systems Corp. (a) | | | 6,088 | | | | 101,365 | | | |
| Google, Inc., Class A * | | | 1,380 | | | | 607,849 | | | |
| Hewitt Associates, Inc., Class A * | | | 2,260 | | | | 89,880 | | | |
| MasterCard, Inc., Class A | | | 1,300 | | | | 289,887 | | | |
| Microsoft Corp. | | | 57,210 | | | | 1,623,620 | | | |
| Novell, Inc. (a)* | | | 400 | | | | 2,516 | | | |
| Oracle Corp. * | | | 36,097 | | | | 706,057 | | | |
| Synopsys, Inc. (a)* | | | 4,510 | | | | 102,422 | | | |
| Western Union Co. (a) | | | 4,000 | | | | 85,080 | | | |
| Yahoo!, Inc. * | | | 7,300 | | | | 211,189 | | | |
| | | | | | | |
| | | | | | | | 4,909,873 | | | |
Technology Hardware & Equipment 12.0% |
| |
| Apple, Inc. * | | | 10,570 | | | | 1,516,795 | | | |
| Arrow Electronics, Inc. (a)* | | | 2,400 | | | | 80,760 | | | |
| Avnet, Inc. (a)* | | | 3,000 | | | | 98,190 | | | |
| Avocent Corp. (a)* | | | 15 | | | | 254 | | | |
| AVX Corp. (a) | | | 300 | | | | 3,843 | | | |
| Brocade Communications Systems, Inc. (a)* | | | 9,950 | | | | 72,635 | | | |
| Cisco Systems, Inc. * | | | 37,700 | | | | 908,193 | | | |
| CommScope, Inc. (a)* | | | 1,800 | | | | 62,694 | | | |
| Corning, Inc. | | | 19,300 | | | | 463,972 | | | |
| Dell, Inc. * | | | 12,500 | | | | 249,000 | | | |
| EchoStar Corp., Class A (a)* | | | 719 | | | | 21,239 | | | |
| EMC Corp. (a)* | | | 11,200 | | | | 160,608 | | | |
| Harris Corp. (a) | | | 2,810 | | | | 136,369 | | | |
| Hewlett-Packard Co. | | | 23,340 | | | | 1,065,705 | | | |
| International Business Machines Corp. | | | 9,900 | | | | 1,139,886 | | | |
| Mettler-Toledo International, Inc. * | | | 1,400 | | | | 135,968 | | | |
| NCR Corp. (a)* | | | 800 | | | | 18,264 | | | |
| QUALCOMM, Inc. | | | 9,800 | | | | 401,800 | | | |
| Teradata Corp. * | | | 1,500 | | | | 33,090 | | | |
See financial notes.
Laudus U.S. Equity Funds 23
Laudus Rosenberg U.S. Large Capitalization Growth Fund
Portfolio Holdings continued
| | | | | | | | | | | |
| | | Number of | | Value | | |
| Security | | Shares | | ($) | | |
| Vishay Intertechnology, Inc. * | | | 300 | | | | 2,718 | | | |
| Western Digital Corp. * | | | 2,700 | | | | 73,008 | | | |
| | | | | | | |
| | | | | | | | 6,644,991 | | | |
Telecommunication Services 0.2% |
| |
| American Tower Corp., Class A * | | | 2,300 | | | | 90,183 | | | |
Transportation 2.2% |
| |
| Burlington Northern Santa Fe Corp. (a) | | | 2,000 | | | | 184,440 | | | |
| C.H. Robinson Worldwide, Inc. (a) | | | 1,500 | | | | 81,600 | | | |
| FedEx Corp. | | | 1,400 | | | | 129,738 | | | |
| Kansas City Southern (a)* | | | 1,500 | | | | 60,165 | | | |
| Kirby Corp. (a)* | | | 1,600 | | | | 91,200 | | | |
| Northwest Airlines Corp. * | | | 4,300 | | | | 38,657 | | | |
| UAL Corp. | | | 2,200 | | | | 47,366 | | | |
| Union Pacific Corp. (a) | | | 2,452 | | | | 307,432 | | | |
| United Parcel Service, Inc., Class B (a) | | | 3,600 | | | | 262,872 | | | |
| | | | | | | |
| | | | | | | | 1,203,470 | | | |
Utilities 0.8% |
| |
| CenterPoint Energy, Inc. (a) | | | 5,640 | | | | 80,483 | | | |
| Exelon Corp. | | | 1,800 | | | | 146,286 | | | |
| NRG Energy, Inc. * | | | 3,200 | | | | 124,768 | | | |
| PPL Corp. (a) | | | 1,600 | | | | 73,472 | | | |
| The AES Corp. * | | | 25 | | | | 417 | | | |
| | | | | | | |
| | | | | | | | 425,426 | | | |
| | | | | | | |
Total Common Stock (Cost $48,142,221) | | | 54,201,935 | | | |
| | | | | | | |
| | | | | | | | | | | |
| Security | | Face Amount | | Value | | |
| Rate, Maturity Date | | ($) | | ($) | | |
| Short-Term Investment 1.4% of net assets |
Repurchase Agreements 1.4% |
| |
| Fixed Income Clearing Corp. dated 03/31/08, due 04/01/08 at 2.00%, with a maturity value of $780,043 (fully collateralized by Federal National Mortgage Association with a value of $796,273.) | | | 780,000 | | | | 780,000 | | | |
| | | | | | | |
Total Short-Term Investment
(Cost $780,000) | | | 780,000 | | | |
| | | | | | | |
| |
End of Investments. |
| | | | | | | | | | | |
| | | Number of | | Value | | |
| Security | | Shares | | ($) | | |
| Collateral Invested for Securities on Loan 17.3% of net assets |
| State Street Navigator Security Lending Prime Portfolio | | | 9,625,633 | | | | 9,625,633 | | | |
| |
End of collateral invested for securities on loan. |
At 03/31/08 the tax basis cost of the fund’s investments was $49,280,916 and the unrealized appreciation and depreciation were $7,496,557 and ($1,795,538), respectively, with a net unrealized appreciation of $5,701,019.
| |
| * | Non-income producing security. |
(a) All or a portion of this security is on loan.
See financial notes.
24 Laudus U.S. Equity Funds
Laudus Rosenberg U.S. Large Capitalization Value Fund
Portfolio Holdings as of March 31, 2008
| | | | | | | | | | | | | |
| | | Cost | | Value |
| Holdings by Category | | ($) | | ($) |
| |
| | 100.5 | % | | Common Stock | | | 5,899,094 | | | | 6,246,814 | |
| | 0.9 | % | | Short-Term Investment | | | 58,000 | | | | 58,000 | |
| |
| | 101.4 | % | | Total Investments | | | 5,957,094 | | | | 6,304,814 | |
| | (1.4 | )% | | Other Assets and
Liabilities | | | | | | | (86,337 | ) |
| |
| | 100.0 | % | | Net Assets | | | | | | | 6,218,477 | |
| | | | | | | | | | | |
| | | Number of | | Value | | |
| Security | | Shares | | ($) | | |
| Common Stock 100.5% of net assets |
Automobiles & Components 0.4% |
| |
| Johnson Controls, Inc. | | | 600 | | | | 20,280 | | | |
TRW Automotive Holdings Corp. * | | | 300 | | | | 7,011 | | | |
| | | | | | | |
| | | | | | | | 27,291 | | | |
Banks 2.5% |
| |
| Hudson City Bancorp, Inc. | | | 320 | | | | 5,658 | | | |
| U.S. Bancorp | | | 1,510 | | | | 48,863 | | | |
| Wells Fargo & Co. | | | 3,400 | | | | 98,940 | | | |
| | | | | | | |
| | | | | | | | 153,461 | | | |
Capital Goods 10.3% |
| |
AGCO Corp. * | | | 154 | | | | 9,221 | | | |
| Armstrong World Industries, Inc. | | | 50 | | | | 1,783 | | | |
| Crane Co. | | | 300 | | | | 12,105 | | | |
| Cummins, Inc. | | | 752 | | | | 35,209 | | | |
| Deere & Co. | | | 700 | | | | 56,308 | | | |
| General Electric Co. | | | 6,500 | | | | 240,565 | | | |
| Goodrich Corp. | | | 200 | | | | 11,502 | | | |
| Honeywell International, Inc. | | | 400 | | | | 22,568 | | | |
| Ingersoll-Rand Co., Ltd., Class A | | | 1,000 | | | | 44,580 | | | |
| Kennametal, Inc. | | | 140 | | | | 4,120 | | | |
| L-3 Communications Holdings, Inc. | | | 300 | | | | 32,802 | | | |
| Lennox International, Inc. | | | 300 | | | | 10,791 | | | |
| Northrop Grumman Corp. | | | 700 | | | | 54,467 | | | |
| SPX Corp. | | | 270 | | | | 28,323 | | | |
| Teleflex, Inc. | | | 230 | | | | 10,973 | | | |
Terex Corp. * | | | 400 | | | | 25,000 | | | |
The Shaw Group, Inc. * | | | 390 | | | | 18,385 | | | |
| The Timken Co. | | | 300 | | | | 8,916 | | | |
| Tyco International Ltd. | | | 62 | | | | 2,731 | | | |
United Rentals, Inc. * | | | 400 | | | | 7,536 | | | |
| | | | | | | |
| | | | | | | | 637,885 | | | |
Commercial Services & Supplies 0.4% |
| |
Allied Waste Industries, Inc. * | | | 1,000 | | | | 10,810 | | | |
| Manpower, Inc. | | | 300 | | | | 16,878 | | | |
| | | | | | | |
| | | | | | | | 27,688 | | | |
Consumer Durables & Apparel 0.4% |
| |
| Hasbro, Inc. | | | 100 | | | | 2,790 | | | |
Mohawk Industries, Inc. * | | | 60 | | | | 4,297 | | | |
| Whirlpool Corp. | | | 200 | | | | 17,356 | | | |
| | | | | | | |
| | | | | | | | 24,443 | | | |
Consumer Services 1.3% |
| |
| CBRL Group, Inc. | | | 4 | | | | 143 | | | |
| McDonald’s Corp. | | | 1,500 | | | | 83,655 | | | |
| | | | | | | |
| | | | | | | | 83,798 | | | |
Diversified Financials 8.8% |
| |
| Bank of America Corp. | | | 4,700 | | | | 178,177 | | | |
| Bank of New York Mellon Corp. | | | 640 | | | | 26,707 | | | |
| Citigroup, Inc. | | | 3,700 | | | | 79,254 | | | |
| JPMorgan Chase & Co. | | | 4,810 | | | | 206,590 | | | |
| State Street Corp. | | | 60 | | | | 4,740 | | | |
| The Goldman Sachs Group, Inc. | | | 300 | | | | 49,617 | | | |
| | | | | | | |
| | | | | | | | 545,085 | | | |
Energy 25.7% |
| |
| Anadarko Petroleum Corp. | | | 900 | | | | 56,727 | | | |
| Apache Corp. | | | 1,200 | | | | 144,984 | | | |
| Chesapeake Energy Corp. | | | 1,400 | | | | 64,610 | | | |
| Chevron Corp. | | | 3,300 | | | | 281,688 | | | |
| Cimarex Energy Co. | | | 329 | | | | 18,010 | | | |
| ConocoPhillips | | | 3,000 | | | | 228,630 | | | |
| Devon Energy Corp. | | | 600 | | | | 62,598 | | | |
| El Paso Corp. | | | 2,300 | | | | 38,272 | | | |
| ENSCO International, Inc. | | | 200 | | | | 12,524 | | | |
| Exxon Mobil Corp. | | | 3,180 | | | | 268,964 | | | |
| Helix Energy Solutions Group, Inc. * | | | 200 | | | | 6,300 | | | |
| Helmerich & Payne, Inc. | | | 400 | | | | 18,748 | | | |
| Hess Corp. | | | 1,000 | | | | 88,180 | | | |
| Marathon Oil Corp. | | | 2,400 | | | | 109,440 | | | |
Nabors Industries Ltd. * | | | 300 | | | | 10,131 | | | |
| Occidental Petroleum Corp. | | | 1,190 | | | | 87,072 | | | |
| Overseas Shipholding Group, Inc. | | | 200 | | | | 14,008 | | | |
Pride International, Inc. * | | | 300 | | | | 10,485 | | | |
| Rowan Cos., Inc. | | | 300 | | | | 12,354 | | | |
SEACOR Holdings, Inc. * | | | 120 | | | | 10,243 | | | |
| Tidewater, Inc. | | | 300 | | | | 16,533 | | | |
Unit Corp. * | | | 200 | | | | 11,330 | | | |
| Valero Energy Corp. | | | 600 | | | | 29,466 | | | |
| | | | | | | |
| | | | | | | | 1,601,297 | | | |
Food & Staples Retailing 2.2% |
| |
| Safeway, Inc. | | | 1,600 | | | | 46,960 | | | |
| Supervalu, Inc. | | | 800 | | | | 23,984 | | | |
| Wal-Mart Stores, Inc. | | | 1,300 | | | | 68,484 | | | |
| | | | | | | |
| | | | | | | | 139,428 | | | |
Food, Beverage & Tobacco 4.3% |
| |
| Altria Group, Inc. | | | 900 | | | | 19,980 | | | |
| Bunge Ltd. | | | 110 | | | | 9,557 | | | |
| Coca-Cola Enterprises, Inc. | | | 1,200 | | | | 29,040 | | | |
| Corn Products International, Inc. | | | 230 | | | | 8,542 | | | |
| General Mills, Inc. | | | 933 | | | | 55,868 | | | |
| Kellogg Co. | | | 300 | | | | 15,768 | | | |
| Loews Corp. — Carolina Group | | | 400 | | | | 29,020 | | | |
Philip Morris International, Inc. * | | | 900 | | | | 45,522 | | | |
| Sara Lee Corp. | | | 1,300 | | | | 18,174 | | | |
| The Pepsi Bottling Group, Inc. | | | 500 | | | | 16,955 | | | |
| UST, Inc. | | | 300 | | | | 16,356 | | | |
| | | | | | | |
| | | | | | | | 264,782 | | | |
See financial notes.
Laudus U.S. Equity Funds 25
Laudus Rosenberg U.S. Large Capitalization Value Fund
Portfolio Holdings continued
| | | | | | | | | | | |
| | | Number of | | Value | | |
| Security | | Shares | | ($) | | |
Health Care Equipment & Services 0.1% |
| |
Kinetic Concepts, Inc. * | | | 200 | | | | 9,246 | | | |
Household & Personal Products 1.7% |
| |
| Avon Products, Inc. | | | 300 | | | | 11,862 | | | |
| The Procter & Gamble Co. | | | 1,300 | | | | 91,091 | | | |
| | | | | | | |
| | | | | | | | 102,953 | | | |
Insurance 7.8% |
| |
| ACE Ltd. | | | 1,000 | | | | 55,060 | | | |
| Allied World Assurance Co. Holdings Ltd. | | | 180 | | | | 7,146 | | | |
| American Financial Group, Inc. | | | 400 | | | | 10,224 | | | |
| American International Group, Inc. | | | 1,400 | | | | 60,550 | | | |
| CNA Financial Corp. | | | 240 | | | | 6,190 | | | |
| Endurance Specialty Holdings Ltd. | | | 300 | | | | 10,980 | | | |
| Everest Re Group Ltd. | | | 200 | | | | 17,906 | | | |
| Loews Corp. | | | 1,800 | | | | 72,396 | | | |
| PartnerRe Ltd. | | | 260 | | | | 19,838 | | | |
| The Allstate Corp. | | | 1,900 | | | | 91,314 | | | |
| The Travelers Cos., Inc. | | | 2,100 | | | | 100,485 | | | |
| Unum Group | | | 1,400 | | | | 30,814 | | | |
| | | | | | | |
| | | | | | | | 482,903 | | | |
Materials 8.2% |
| |
| Alcoa, Inc. | | | 2,080 | | | | 75,005 | | | |
| Celanese Corp., Series A | | | 280 | | | | 10,934 | | | |
| Commercial Metals Co. | | | 150 | | | | 4,495 | | | |
| FMC Corp. | | | 432 | | | | 23,972 | | | |
| Freeport-McMoRan Copper & Gold, Inc. | | | 290 | | | | 27,904 | | | |
| International Paper Co. | | | 1,690 | | | | 45,968 | | | |
Owens-Illinois, Inc. * | | | 300 | | | | 16,929 | | | |
| PPG Industries, Inc. | | | 300 | | | | 18,153 | | | |
| Reliance Steel & Aluminum Co. | | | 300 | | | | 17,958 | | | |
| Steel Dynamics, Inc. | | | 1,200 | | | | 39,648 | | | |
| The Dow Chemical Co. | | | 1,800 | | | | 66,330 | | | |
The Mosaic Co. * | | | 800 | | | | 82,080 | | | |
| The Scotts Miracle-Gro Co., Class A | | | 120 | | | | 3,890 | | | |
| United States Steel Corp. | | | 600 | | | | 76,122 | | | |
| | | | | | | |
| | | | | | | | 509,388 | | | |
Media 2.8% |
| |
| CBS Corp., Class B | | | 2,500 | | | | 55,200 | | | |
| Gannett Co., Inc. | | | 1,000 | | | | 29,050 | | | |
| Time Warner, Inc. | | | 6,200 | | | | 86,924 | | | |
| | | | | | | |
| | | | | | | | 171,174 | | | |
Pharmaceuticals & Biotechnology 5.9% |
| |
Amgen, Inc. * | | | 500 | | | | 20,890 | | | |
Invitrogen Corp. * | | | 200 | | | | 17,094 | | | |
| Johnson & Johnson | | | 1,200 | | | | 77,844 | | | |
King Pharmaceuticals, Inc. * | | | 1,100 | | | | 9,570 | | | |
Millennium Pharmaceuticals, Inc. * | | | 600 | | | | 9,276 | | | |
| PerkinElmer, Inc. | | | 380 | | | | 9,215 | | | |
| Pfizer, Inc. | | | 10,600 | | | | 221,858 | | | |
| | | | | | | |
| | | | | | | | 365,747 | | | |
Real Estate 0.4% |
| |
| Hospitality Properties Trust | | | 400 | | | | 13,608 | | | |
| iStar Financial, Inc. | | | 600 | | | | 8,418 | | | |
| | | | | | | |
| | | | | | | | 22,026 | | | |
Retailing 0.1% |
| |
| RadioShack Corp. | | | 300 | | | | 4,875 | | | |
Semiconductors & Semiconductor Equipment 0.1% |
| |
Fairchild Semiconductor International, Inc. * | | | 300 | | | | 3,576 | | | |
Software & Services 1.7% |
| |
Cadence Design Systems, Inc. * | | | 730 | | | | 7,796 | | | |
Computer Sciences Corp. * | | | 690 | | | | 28,145 | | | |
| Electronic Data Systems Corp. | | | 1,500 | | | | 24,975 | | | |
Hewitt Associates, Inc., Class A * | | | 130 | | | | 5,170 | | | |
Novell, Inc. * | | | 2 | | | | 13 | | | |
Symantec Corp. * | | | 2,500 | | | | 41,550 | | | |
| | | | | | | |
| | | | | | | | 107,649 | | | |
Technology Hardware & Equipment 2.7% |
| |
Arrow Electronics, Inc. * | | | 550 | | | | 18,507 | | | |
Avnet, Inc. * | | | 400 | | | | 13,092 | | | |
| International Business Machines Corp. | | | 800 | | | | 92,112 | | | |
Sun Microsystems, Inc. * | | | 1,205 | | | | 18,714 | | | |
Vishay Intertechnology, Inc. * | | | 700 | | | | 6,342 | | | |
Western Digital Corp. * | | | 600 | | | | 16,224 | | | |
| | | | | | | |
| | | | | | | | 164,991 | | | |
Telecommunication Services 7.2% |
| |
| AT&T, Inc. | | | 5,840 | | | | 223,672 | | | |
| CenturyTel, Inc. | | | 390 | | | | 12,964 | | | |
| Embarq Corp. | | | 700 | | | | 28,070 | | | |
| Verizon Communications, Inc. | | | 5,100 | | | | 185,895 | | | |
| | | | | | | |
| | | | | | | | 450,601 | | | |
Transportation 0.9% |
| |
| CSX Corp. | | | 100 | | | | 5,607 | | | |
| Norfolk Southern Corp. | | | 100 | | | | 5,432 | | | |
Northwest Airlines Corp. * | | | 310 | | | | 2,787 | | | |
| Ryder System, Inc. | | | 300 | | | | 18,273 | | | |
| Union Pacific Corp. | | | 190 | | | | 23,822 | | | |
US Airways Group, Inc. * | | | 300 | | | | 2,673 | | | |
| | | | | | | |
| | | | | | | | 58,594 | | | |
Utilities 4.6% |
| |
| Alliant Energy Corp. | | | 500 | | | | 17,505 | | | |
| American Electric Power Co., Inc. | | | 1,400 | | | | 58,282 | | | |
| DTE Energy Co. | | | 590 | | | | 22,945 | | | |
| Edison International | | | 1,100 | | | | 53,922 | | | |
| MDU Resources Group, Inc. | | | 660 | | | | 16,203 | | | |
Mirant Corp. * | | | 160 | | | | 5,822 | | | |
NRG Energy, Inc. * | | | 300 | | | | 11,697 | | | |
| Pepco Holdings, Inc. | | | 800 | | | | 19,776 | | | |
| PG&E Corp. | | | 1,300 | | | | 47,866 | | | |
| Xcel Energy, Inc. | | | 1,700 | | | | 33,915 | | | |
| | | | | | | |
| | | | | | | | 287,933 | | | |
| | | | | | | |
Total Common Stock (Cost $5,899,094) | | | 6,246,814 | | | |
| | | | | | | |
See financial notes.
26 Laudus U.S. Equity Funds
Laudus Rosenberg U.S. Large Capitalization Value Fund
| | | | | | | | | | | |
| Security | | Face Amount | | Value | | |
| Rate, Maturity Date | | ($) | | ($) | | |
| Short-Term Investment 0.9% of net assets |
Repurchase Agreement 0.9% |
| |
| Fixed Income Clearing Corp. dated 03/31/08, due 04/01/08 at 2.00%, with a maturity value of $58,003 (fully collateralized by Federal National Mortgage Association with a value of $60,625) | | | 58,000 | | | | 58,000 | | | |
| | | | | | | |
Total Short-Term Investment
(Cost $58,000) | | | 58,000 | | | |
| | | | | | | |
| |
End of Investments. |
At 03/31/08 the tax basis cost of the fund’s investments was $5,980,549 and the unrealized appreciation and depreciation were $831,697 and ($507,432), respectively, with a net unrealized appreciation of $324,265.
| |
| * | Non-income producing security. |
See financial notes.
Laudus U.S. Equity Funds 27
Laudus Rosenberg U.S. Discovery Fund
Portfolio Holdings as of March 31, 2008
| | | | | | | | | | | | | |
| | | Cost | | Value |
| Holdings by Category | | ($) | | ($) |
| |
| | 99.7 | % | | Common Stock | | | 698,254,356 | | | | 733,707,665 | |
| | — | % | | Foreign Common Stock | | | 82,705 | | | | 80,621 | |
| | 1.5 | % | | Short-Term Investment | | | 10,796,000 | | | | 10,796,000 | |
| |
| | 101.2 | % | | Total Investments | | | 709,133,061 | | | | 744,584,286 | |
| | 34.0 | % | | Collateral Invested for Securities on Loan | | | 250,095,950 | | | | 250,095,950 | |
| | (35.2 | )% | | Other Assets and Liabilities | | | | | | | (258,955,541 | ) |
| |
| | 100.0 | % | | Net Assets | | | | | | | 735,724,695 | |
| | | | | | | | | | | |
| | | Number of | | Value | | |
| Security | | Shares | | ($) | | |
| Common Stock 99.7% of net assets |
Automobiles & Components 1.3% |
| |
| Aftermarket Technology Corp. (a)* | | | 9,396 | | | | 182,658 | | | |
| American Axle & Manufacturing Holdings, Inc. (a) | | | 2 | | | | 41 | | | |
| Autoliv, Inc. (a) | | | 81,713 | | | | 4,101,993 | | | |
| Cooper Tire & Rubber Co. (a) | | | 31,442 | | | | 470,687 | | | |
| Exide Technologies (a)* | | | 68,197 | | | | 893,381 | | | |
| Standard Motor Products, Inc. | | | 27,524 | | | | 168,447 | | | |
| Strattec Security Corp. (a) | | | 371 | | | | 15,704 | | | |
| Superior Industries International, Inc. (a) | | | 13,860 | | | | 287,595 | | | |
| TRW Automotive Holdings Corp. * | | | 130,720 | | | | 3,054,926 | | | |
| | | | | | | |
| | | | | | | | 9,175,432 | | | |
Banks 2.4% |
| |
| 1st Independence Financial Group, Inc. | | | 98 | | | | 1,751 | | | |
| Alliance Financial Corp. (a) | | | 5,510 | | | | 137,750 | | | |
| American National Bankshares, Inc. | | | 300 | | | | 6,429 | | | |
| Annapolis Bancorp, Inc. * | | | 1,902 | | | | 13,980 | | | |
| Associated Banc-Corp. (a) | | | 39,749 | | | | 1,058,516 | | | |
| BancFirst Corp. (a) | | | 4,300 | | | | 196,854 | | | |
| Banco Latinoamericano de Exportaciones, S.A., Class E (a) | | | 73,670 | | | | 1,134,518 | | | |
| Bank of Hawaii Corp. (a) | | | 14,900 | | | | 738,444 | | | |
| Bar Harbor Bankshares | | | 657 | | | | 20,268 | | | |
| Berkshire Hills Bancorp, Inc. (a) | | | 3,556 | | | | 89,576 | | | |
| Beverly Hills Bancorp, Inc. | | | 44,368 | | | | 112,251 | | | |
| BOK Financial Corp. (a) | | | 7,699 | | | | 402,119 | | | |
| Bridge Capital Holdings * | | | 909 | | | | 19,271 | | | |
| Britton & Koontz Capital Corp. | | | 946 | | | | 15,079 | | | |
| Camco Financial Corp. | | | 930 | | | | 10,235 | | | |
| Capital Bank Corp. | | | 4,693 | | | | 48,103 | | | |
| Carolina Bank Holdings, Inc. * | | | 1,750 | | | | 18,856 | | | |
| Carver Bancorp, Inc. | | | 4,970 | | | | 58,050 | | | |
| Cascade Financial Corp. | | | 7,760 | | | | 94,672 | | | |
| Central Bancorp, Inc. (a) | | | 1,000 | | | | 18,435 | | | |
| Centrue Financial Corp. | | | 4,300 | | | | 83,850 | | | |
| CFS Bancorp, Inc. (a) | | | 15,042 | | | | 216,154 | | | |
| Citizens Holdings Co. (a) | | | 311 | | | | 6,220 | | | |
| Citizens South Banking Corp. | | | 650 | | | | 6,175 | | | |
| Codorus Valley Bancorp, Inc. | | | 220 | | | | 3,573 | | | |
| Commerce Bancshares, Inc. (a) | | | 22,300 | | | | 937,269 | | | |
| Community Bank Shares of Indiana, Inc. | | | 4,527 | | | | 88,842 | | | |
| Community Bankshares, Inc. | | | 400 | | | | 4,796 | | | |
| Community Capital Corp. | | | 4,020 | | | | 63,074 | | | |
| Community Financial Corp. | | | 1,920 | | | | 15,360 | | | |
| Cullen/Frost Bankers, Inc. (a) | | | 14,440 | | | | 765,898 | | | |
| Farmers Capital Bank Corp. | | | 520 | | | | 12,340 | | | |
| Fidelity Southern Corp. (a) | | | 24,400 | | | | 205,204 | | | |
| First Bancorp of Indiana, Inc. | | | 1,455 | | | | 17,315 | | | |
| First Bancshares, Inc. * | | | 1,310 | | | | 21,654 | | | |
| First BancTrust Corp. | | | 6,300 | | | | 57,519 | | | |
| First Capital, Inc. | | | 990 | | | | 16,434 | | | |
| First Community Corp. | | | 1,710 | | | | 25,308 | | | |
| First Defiance Financial Corp. | | | 6,790 | | | | 124,596 | | | |
| First Federal Bancshares of Arkansas, Inc. (a) | | | 7,300 | | | | 100,594 | | | |
| First Federal Bankshares, Inc. | | | 2,400 | | | | 33,120 | | | |
| First Financial Service Corp. | | | 440 | | | | 10,494 | | | |
| First Franklin Corp. (a) | | | 3,600 | | | | 28,800 | | | |
| First M&F Corp. | | | 6,200 | | | | 89,900 | | | |
| First Merchants Corp. (a) | | | 6,926 | | | | 197,668 | | | |
| First Niagara Financial Group, Inc. (a) | | | 32,709 | | | | 444,515 | | | |
| First PacTrust Bancorp, Inc. | | | 100 | | | | 1,659 | | | |
| First Place Financial Corp. (a) | | | 27,571 | | | | 358,423 | | | |
| First United Corp. | | | 9,295 | | | | 184,227 | | | |
| First West Virginia Bancorp, Inc. | | | 3,300 | | | | 51,975 | | | |
| FirstMerit Corp. (a) | | | 27,632 | | | | 570,877 | | | |
| FNB Corp. of North Carolina | | | 7,098 | | | | 74,529 | | | |
| Franklin Bank Corp. (a)* | | | 6 | | | | 18 | | | |
| Gateway Financial Holdings, Inc. | | | 16,792 | | | | 177,995 | | | |
| Glen Burnie Bancorp (a) | | | 240 | | | | 2,874 | | | |
| Great Pee Dee Bancorp, Inc. | | | 397 | | | | 9,135 | | | |
| GS Financial Corp. | | | 1,850 | | | | 30,756 | | | |
| Guaranty Federal Bancshares, Inc. (a) | | | 3,352 | | | | 87,655 | | | |
| Habersham Bancorp | | | 7,400 | | | | 103,008 | | | |
| Hawthorn Bancshares, Inc. | | | 8,042 | | | | 221,155 | | | |
| Heritage Financial Corp. | | | 2,641 | | | | 45,953 | | | |
| HF Financial Corp. | | | 6,987 | | | | 111,792 | | | |
| HMN Financial, Inc. | | | 10,097 | | | | 233,039 | | | |
| Home Federal Bancorp | | | 1,618 | | | | 35,596 | | | |
| Horizon Bancorp | | | 3,681 | | | | 84,258 | | | |
| Imperial Capital Bancorp, Inc. | | | 1 | | | | 22 | | | |
| International Bancshares Corp. (a) | | | 10,428 | | | | 235,464 | | | |
| Liberty Bancorp, Inc. | | | 2,240 | | | | 22,613 | | | |
| LSB Financial Corp. | | | 4,725 | | | | 86,467 | | | |
| MASSBANK Corp. | | | 9,855 | | | | 381,684 | | | |
| MFB Corp. | | | 2,000 | | | | 66,570 | | | |
| Monarch Community Bancorp, Inc. | | | 4,130 | | | | 41,713 | | | |
| Monroe Bancorp (a) | | | 113 | | | | 1,695 | | | |
| MutualFirst Financial, Inc. (a) | | | 164 | | | | 2,160 | | | |
| New Hampshire Thrift Bancshares, Inc. | | | 3,660 | | | | 45,018 | | | |
| New York Community Bancorp, Inc. (a) | | | 29,570 | | | | 538,765 | | | |
| NewBridge Bancorp (a) | | | 6,302 | | | | 55,206 | | | |
| Northeast Bancorp | | | 890 | | | | 13,128 | | | |
| Northrim BanCorp, Inc. | | | 1,906 | | | | 34,651 | | | |
| Norwood Financial Corp. | | | 160 | | | | 4,779 | | | |
| Park Bancorp, Inc. | | | 1,095 | | | | 22,727 | | | |
See financial notes.
28 Laudus U.S. Equity Funds
Laudus Rosenberg U.S. Discovery Fund
| | | | | | | | | | | |
| | | Number of | | Value | | |
| Security | | Shares | | ($) | | |
| Parkvale Financial Corp. | | | 9,812 | | | | 263,354 | | | |
| People’s United Financial, Inc. (a) | | | 37,400 | | | | 647,394 | | | |
| Peoples Bancorp of North Carolina | | | 15,363 | | | | 207,400 | | | |
| Peoples Bancorp, Inc. (a) | | | 9,373 | | | | 225,983 | | | |
| Peoples Community Bancorp, Inc. | | | 835 | | | | 3,332 | | | |
| Premier Financial Bancorp, Inc. | | | 200 | | | | 2,310 | | | |
| Provident Financial Holdings, Inc. (a) | | | 9,690 | | | | 155,428 | | | |
| Republic First Bancorp, Inc. * | | | 20,435 | | | | 100,745 | | | |
| Security National Financial Corp., Class A (a)* | | | 2,997 | | | | 11,538 | | | |
| Simmons First National Corp., Class A (a) | | | 9,048 | | | | 268,997 | | | |
| Southern Connecticut Bancorp, Inc. (a)* | | | 100 | | | | 700 | | | |
| Southern Missouri Bancorp, Inc. | | | 100 | | | | 1,475 | | | |
| Southwest Bancorp, Inc. (a) | | | 39,571 | | | | 692,888 | | | |
| StellarOne Corp. (a) | | | 8,869 | | | | 149,975 | | | |
| Sun Bancorp, Inc. (a)* | | | 3,970 | | | | 52,285 | | | |
| SVB Financial Group (a)* | | | 1,580 | | | | 68,951 | | | |
| TCF Financial Corp. (a) | | | 17,086 | | | | 306,181 | | | |
| Team Financial, Inc. | | | 2,330 | | | | 30,290 | | | |
| Teche Holding Co. | | | 900 | | | | 29,700 | | | |
| TF Financial Corp. | | | 6,010 | | | | 145,742 | | | |
| UMB Financial Corp. (a) | | | 8,010 | | | | 330,012 | | | |
| United Bancshares, Inc. | | | 1,140 | | | | 15,960 | | | |
| United Community Financial Corp. (a) | | | 39,175 | | | | 242,885 | | | |
| United Western Bancorp, Inc. | | | 8,845 | | | | 158,325 | | | |
| Wainwright Bank & Trust Co. | | | 5,269 | | | | 64,967 | | | |
| Washington Federal, Inc. (a) | | | 26,980 | | | | 616,223 | | | |
| Wayne Savings Bancshares, Inc. | | | 941 | | | | 9,104 | | | |
| Willow Financial Bancorp, Inc. | | | 324 | | | | 2,394 | | | |
| WSFS Financial Corp. (a) | | | 15,751 | | | | 776,209 | | | |
| WVS Financial Corp. | | | 1,900 | | | | 30,400 | | | |
| Yadkin Valley Financial Corp. | | | 195 | | | | 2,467 | | | |
| | | | | | | |
| | | | | | | | 17,323,029 | | | |
Capital Goods 10.9% |
| |
| 3D Systems Corp. * | | | 420 | | | | 6,170 | | | |
| Acuity Brands, Inc. (a) | | | 56,600 | | | | 2,430,970 | | | |
| Aecom Technology Corp. (a)* | | | 75,361 | | | | 1,960,140 | | | |
| Alamo Group, Inc. (a) | | | 4,180 | | | | 88,909 | | | |
| Alliant Techsystems, Inc. (a)* | | | 9,800 | | | | 1,014,594 | | | |
| Ameron International Corp. (a) | | | 4,430 | | | | 414,338 | | | |
| Applied Industrial Technologies, Inc. (a) | | | 71,827 | | | | 2,146,909 | | | |
| Astec Industries, Inc. * | | | 21,161 | | | | 820,200 | | | |
| Baldwin Technology Co., Inc., Class A * | | | 36,953 | | | | 94,969 | | | |
| Barnes Group, Inc. (a) | | | 18,394 | | | | 422,142 | | | |
| Chase Corp. (a) | | | 2,280 | | | | 41,291 | | | |
| Chicago Rivet & Machine Co. | | | 1,490 | | | | 33,376 | | | |
| CIRCOR International, Inc. (a) | | | 11,510 | | | | 532,338 | | | |
| Columbus Mckinnon Corp. (a)* | | | 1,957 | | | | 60,628 | | | |
| Crane Co. (a) | | | 117,718 | | | | 4,749,921 | | | |
| Cubic Corp. (a) | | | 6,824 | | | | 194,006 | | | |
| Ducommun, Inc. * | | | 21,672 | | | | 599,664 | | | |
| Eastern Co. | | | 13,940 | | | | 218,161 | | | |
| Edac Technologies Corp. * | | | 9,834 | | | | 62,938 | | | |
| EnPro Industries, Inc. (a)* | | | 8,551 | | | | 266,706 | | | |
| Espey Manufacturing & Electronics Corp. | | | 4,240 | | | | 84,800 | | | |
| Esterline Technologies Corp. (a)* | | | 7,530 | | | | 379,286 | | | |
| First Solar, Inc. (a)* | | | 3,446 | | | | 796,508 | | | |
| Flowserve Corp. (a) | | | 6,780 | | | | 707,696 | | | |
| Furmanite Corp. (a)* | | | 17,910 | | | | 152,235 | | | |
| Gardner Denver, Inc. (a)* | | | 40,940 | | | | 1,518,874 | | | |
| Hardinge, Inc. (a) | | | 30,691 | | | | 422,308 | | | |
| Harsco Corp. (a) | | | 25,902 | | | | 1,434,453 | | | |
| Herley Industries, Inc. (a)* | | | 36,650 | | | | 378,961 | | | |
| Hurco Cos., Inc. (a)* | | | 15,062 | | | | 704,600 | | | |
| II-VI, Inc. (a)* | | | 13,561 | | | | 515,047 | | | |
| Industrial Distribution Group, Inc. * | | | 4,032 | | | | 40,481 | | | |
| Insteel Industries, Inc. | | | 2,748 | | | | 31,959 | | | |
| K-Tron International, Inc. * | | | 6,005 | | | | 721,261 | | | |
| Kadant, Inc. (a)* | | | 50,900 | | | | 1,495,442 | | | |
| Kaman Corp. (a) | | | 35,184 | | | | 995,355 | | | |
| Kennametal, Inc. | | | 102,102 | | | | 3,004,862 | | | |
| Key Technology, Inc. (a)* | | | 5,056 | | | | 150,618 | | | |
| Lawson Products, Inc. (a) | | | 6,926 | | | | 190,811 | | | |
| Lennox International, Inc. (a) | | | 2,520 | | | | 90,644 | | | |
| Lincoln Electric Holdings, Inc. (a) | | | 16,908 | | | | 1,090,397 | | | |
| Lydall, Inc. (a)* | | | 41,980 | | | | 480,671 | | | |
| Meadow Valley Corp. * | | | 10,889 | | | | 89,290 | | | |
| Michael Baker Corp. (a)* | | | 17,100 | | | | 384,066 | | | |
| Mueller Industries, Inc. | | | 720 | | | | 20,772 | | | |
| NACCO Industries, Inc., Class A (a) | | | 15,810 | | | | 1,279,661 | | | |
| Nortech Systems, Inc. * | | | 3,328 | | | | 20,218 | | | |
| Northwest Pipe Co. (a)* | | | 21,052 | | | | 894,499 | | | |
| Orbital Sciences Corp. (a)* | | | 135,662 | | | | 3,269,454 | | | |
| Patrick Industries, Inc. * | | | 3,540 | | | | 25,435 | | | |
| Perini Corp. (a)* | | | 36,650 | | | | 1,327,829 | | | |
| Powell Industries, Inc. (a)* | | | 8,942 | | | | 352,047 | | | |
| PowerSecure International, Inc. (a)* | | | 180 | | | | 2,119 | | | |
| Preformed Line Products Co. (a) | | | 5,820 | | | | 283,318 | | | |
| Regal-Beloit Corp. (a) | | | 76,330 | | | | 2,795,968 | | | |
| Robbins & Myers, Inc. (a) | | | 78,960 | | | | 2,578,044 | | | |
| Rush Enterprises, Inc., Class A (a)* | | | 61,804 | | | | 978,975 | | | |
| Rush Enterprises, Inc., Class B * | | | 48,745 | | | | 715,577 | | | |
| Servotronics, Inc. | | | 980 | | | | 19,796 | | | |
| SL Industries, Inc. * | | | 12,970 | | | | 258,103 | | | |
| SPX Corp. (a) | | | 126,707 | | | | 13,291,564 | | | |
| Standex International Corp. (a) | | | 26,975 | | | | 602,622 | | | |
| Stanley, Inc. (a)* | | | 14,490 | | | | 426,875 | | | |
| Taylor Devices, Inc. (a)* | | | 4,848 | | | | 24,192 | | | |
| Tech/ Ops Sevcon, Inc. | | | 6,860 | | | | 48,020 | | | |
| Teledyne Technologies, Inc. (a)* | | | 47,791 | | | | 2,246,177 | | | |
| Teleflex, Inc. (a) | | | 128,880 | | | | 6,148,865 | | | |
| Tennant Co. (a) | | | 16,390 | | | | 652,486 | | | |
| The L.S. Starrett Co., Class A | | | 16,050 | | | | 308,802 | | | |
| The Manitowoc Co., Inc. (a) | | | 30,765 | | | | 1,255,212 | | | |
| The Middleby Corp. (a)* | | | 22,538 | | | | 1,406,146 | | | |
| The Shaw Group, Inc. (a)* | | | 7,444 | | | | 350,910 | | | |
| The Timken Co. (a) | | | 58,639 | | | | 1,742,751 | | | |
| The Toro Co. | | | 130 | | | | 5,381 | | | |
| Tredegar Corp. (a) | | | 6,674 | | | | 121,534 | | | |
| Triumph Group, Inc. (a) | | | 47,712 | | | | 2,716,244 | | | |
| Twin Disc, Inc. (a) | | | 6,720 | | | | 106,310 | | | |
See financial notes.
Laudus U.S. Equity Funds 29
Laudus Rosenberg U.S. Discovery Fund
Portfolio Holdings continued
| | | | | | | | | | | |
| | | Number of | | Value | | |
| Security | | Shares | | ($) | | |
| Veri-Tek International Corp. * | | | 2,610 | | | | 12,137 | | | |
| Watts Water Technologies, Inc., Class A | | | 2,170 | | | | 60,825 | | | �� |
| Willis Lease Finance Corp. (a)* | | | 21,670 | | | | 272,392 | | | |
| Woodward Governor Co. (a) | | | 53,220 | | | | 1,422,038 | | | |
| | | | | | | |
| | | | | | | | 80,062,293 | | | |
Commercial Services & Supplies 2.3% |
| |
| A.T. Cross Co., Class A (a)* | | | 33,849 | | | | 231,866 | | | |
| Avalon Holdings Corp., Class A * | | | 6,220 | | | | 37,320 | | | |
| CDI Corp. (a) | | | 38,539 | | | | 965,402 | | | |
| Champion Industries, Inc. (a) | | | 11,919 | | | | 62,217 | | | |
| Clean Harbors, Inc. (a)* | | | 1,126 | | | | 73,190 | | | |
| Comfort Systems USA, Inc. (a) | | | 118,521 | | | | 1,541,958 | | | |
| CompX International, Inc. (a) | | | 3,724 | | | | 34,261 | | | |
| Deluxe Corp. (a) | | | 45,631 | | | | 876,571 | | | |
| Ecology & Environment, Inc., Class A | | | 4,252 | | | | 50,811 | | | |
| Exponent, Inc. (a)* | | | 49,520 | | | | 1,626,237 | | | |
| GeoEye, Inc. (a)* | | | 50,266 | | | | 1,306,413 | | | |
| GP Strategies Corp. (a)* | | | 38,690 | | | | 367,555 | | | |
| IKON Office Solutions, Inc. (a) | | | 21,562 | | | | 163,871 | | | |
| Interface, Inc., Class A (a) | | | 108,634 | | | | 1,526,308 | | | |
| Kelly Services, Inc., Class A (a) | | | 69,460 | | | | 1,428,098 | | | |
| Layne Christensen Co. (a)* | | | 27,725 | | | | 970,929 | | | |
| LECG Corp. (a)* | | | 65,001 | | | | 608,409 | | | |
| Nashua Corp. (a)* | | | 7,734 | | | | 84,997 | | | |
| National Technical Systems, Inc. * | | | 15,323 | | | | 91,172 | | | |
| North American Galvanizing & Coatings, Inc. * | | | 16,156 | | | | 88,858 | | | |
| RCM Technologies, Inc. * | | | 28,827 | | | | 111,272 | | | |
| Spherion Corp. (a)* | | | 157,600 | | | | 964,512 | | | |
| Steelcase, Inc., Class A (a) | | | 235,887 | | | | 2,608,910 | | | |
| Tufco Technologies, Inc. * | | | 2,242 | | | | 13,878 | | | |
| Virco Manufacturing Corp. (a) | | | 15,455 | | | | 80,830 | | | |
| VSE Corp. | | | 10,801 | | | | 304,912 | | | |
| Waste Industries USA, Inc. (a) | | | 20,997 | | | | 759,042 | | | |
| Westaff, Inc. (a)* | | | 38,492 | | | | 83,143 | | | |
| | | | | | | |
| | | | | | | | 17,062,942 | | | |
Consumer Durables & Apparel 3.1% |
| |
| Aldila, Inc. | | | 12,396 | | | | 141,314 | | | |
| American Biltrite, Inc. * | | | 1,265 | | | | 9,045 | | | |
| American Greetings Corp., Class A (a) | | | 129,392 | | | | 2,400,222 | | | |
| Avatar Holdings, Inc. (a)* | | | 6,419 | | | | 279,804 | | | |
| Blyth, Inc. (a) | | | 69,830 | | | | 1,377,048 | | | |
| Callaway Golf Co. (a) | | | 112,500 | | | | 1,651,500 | | | |
| CSS Industries, Inc. (a) | | | 18,090 | | | | 632,426 | | | |
| Culp, Inc. * | | | 25,460 | | | | 191,459 | | | |
| Deckers Outdoor Corp. (a)* | | | 23,878 | | | | 2,574,526 | | | |
| Decorator Industries, Inc. | | | 3,640 | | | | 13,359 | | | |
| Ethan Allen Interiors, Inc. (a) | | | 37,861 | | | | 1,076,388 | | | |
| Flexsteel Industries, Inc. | | | 17,600 | | | | 237,248 | | | |
| Fossil, Inc. (a)* | | | 85,764 | | | | 2,619,233 | | | |
| G-III Apparel Group Ltd. (a)* | | | 3,009 | | | | 40,381 | | | |
| GameTech International, Inc. (a)* | | | 26,056 | | | | 153,991 | | | |
| Hooker Furniture Corp. (a) | | | 160 | | | | 3,574 | | | |
| Jaclyn, Inc. * | | | 520 | | | | 4,462 | | | |
| JAKKS Pacific, Inc. (a)* | | | 85,500 | | | | 2,357,235 | | | |
| LaCrosse Footwear, Inc. (a) | | | 2,350 | | | | 37,295 | | | |
| Liz Claiborne, Inc. | | | 17,660 | | | | 320,529 | | | |
| Man Sang Holdings, Inc. (a)* | | | 9,800 | | | | 65,366 | | | |
| Movado Group, Inc. (a) | | | 51,933 | | | | 1,012,174 | | | |
| National Presto Industries, Inc. (a) | | | 13,510 | | | | 707,924 | | | |
| P & F Industries, Inc., Class A (a)* | | | 5,120 | | | | 32,768 | | | |
| Q.E.P. Co., Inc. * | | | 8,900 | | | | 67,195 | | | |
| Russ Berrie & Co., Inc. (a)* | | | 3,740 | | | | 52,584 | | | |
| The Warnaco Group, Inc. (a)* | | | 77,196 | | | | 3,044,610 | | | |
| Universal Electronics, Inc. (a)* | | | 12,051 | | | | 291,755 | | | |
| Weyco Group, Inc. (a) | | | 12,684 | | | | 376,334 | | | |
| Wolverine World Wide, Inc. (a) | | | 44,540 | | | | 1,292,105 | | | |
| | | | | | | |
| | | | | | | | 23,063,854 | | | |
Consumer Services 3.3% |
| |
| Ark Restaurants Corp. | | | 250 | | | | 7,250 | | | |
| Bally Technologies, Inc. (a)* | | | 109,061 | | | | 3,745,155 | | | |
| Bob Evans Farms, Inc. (a) | | | 56,051 | | | | 1,546,447 | | | |
| Burger King Holdings, Inc. (a) | | | 111,350 | | | | 3,079,941 | | | |
| Canterbury Park Holding Corp. | | | 40 | | | | 378 | | | |
| CBRL Group, Inc. (a) | | | 8,856 | | | | 316,779 | | | |
| Churchill Downs, Inc. (a) | | | 3,929 | | | | 185,606 | | | |
| Darden Restaurants, Inc. (a) | | | 67,755 | | | | 2,205,425 | | | |
| DeVry, Inc. (a) | | | 50,432 | | | | 2,110,075 | | | |
| Dover Motorsports, Inc. (a) | | | 31,230 | | | | 192,064 | | | |
| Flanigan’s Enterprises, Inc. * | | | 1,831 | | | | 14,785 | | | |
| Frisch’s Restaurants, Inc. | | | 4,660 | | | | 107,180 | | | |
| ILX Resorts, Inc. | | | 8,290 | | | | 42,279 | | | |
| INVESTools, Inc. (a)* | | | 87,610 | | | | 962,834 | | | |
| J. Alexander’s Corp. (a) | | | 11,170 | | | | 92,488 | | | |
| Lodgian, Inc. (a)* | | | 2,036 | | | | 22,701 | | | |
| Nathan’s Famous, Inc. (a)* | | | 4,614 | | | | 64,596 | | | |
| Nobel Learning Communities, Inc. * | | | 15,620 | | | | 208,996 | | | |
| Red Lion Hotels Corp. * | | | 47,660 | | | | 407,970 | | | |
| Rubio’s Restaurants, Inc. (a)* | | | 8,220 | | | | 47,018 | | | |
| Service Corp. International (a) | | | 412,390 | | | | 4,181,634 | | | |
| Silverleaf Resorts, Inc. (a)* | | | 94,977 | | | | 215,598 | | | |
| Speedway Motorsports, Inc. (a) | | | 35,510 | | | | 890,236 | | | |
| Star Buffet, Inc. | | | 2,037 | | | | 14,605 | | | |
| Stewart Enterprises, Inc., Class A (a) | | | 88,115 | | | | 565,698 | | | |
| The Marcus Corp. (a) | | | 1,589 | | | | 30,509 | | | |
| Vail Resorts, Inc. (a)* | | | 9 | | | | 435 | | | |
| WMS Industries, Inc. (a)* | | | 93,408 | | | | 3,359,886 | | | |
| | | | | | | |
| | | | | | | | 24,618,568 | | | |
Diversified Financials 1.4% |
| |
| American Physicians Service Group, Inc. | | | 16,095 | | | | 315,140 | | | |
| California First National Bancorp | | | 8,190 | | | | 83,374 | | | |
| Federated Investors, Inc., Class B (a) | | | 29,649 | | | | 1,161,055 | | | |
| GAMCO Investors, Inc., Class A (a) | | | 6,760 | | | | 340,434 | | | |
| Greenhill & Co., Inc. (a) | | | 27,700 | | | | 1,926,812 | | | |
| Knight Capital Group, Inc., Class A (a)* | | | 316,775 | | | | 5,144,426 | | | |
| MicroFinancial, Inc. | | | 33,200 | | | | 173,636 | | | |
| Paulson Capital Corp. * | | | 900 | | | | 4,635 | | | |
| PICO Holdings, Inc. (a)* | | | 4,109 | | | | 124,215 | | | |
| Stifel Financial Corp. (a)* | | | 24,985 | | | | 1,121,826 | | | |
| | | | | | | |
| | | | | | | | 10,395,553 | | | |
See financial notes.
30 Laudus U.S. Equity Funds
Laudus Rosenberg U.S. Discovery Fund
| | | | | | | | | | | |
| | | Number of | | Value | | |
| Security | | Shares | | ($) | | |
Energy 15.5% |
| |
| Adams Resources & Energy, Inc. | | | 4,753 | | | | 132,133 | | | |
| Alpha Natural Resources, Inc. (a)* | | | 12,079 | | | | 524,712 | | | |
| Atlas America, Inc. (a) | | | 8,774 | | | | 530,301 | | | |
| ATP Oil & Gas Corp. * | | | 59,340 | | | | 1,941,605 | | | |
| Atwood Oceanics, Inc. * | | | 84,700 | | | | 7,768,684 | | | |
| Berry Petroleum Co., Class A (a) | | | 9,612 | | | | 446,862 | | | |
| Bill Barrett Corp. (a)* | | | 14,032 | | | | 663,012 | | | |
| Bois d’Arc Energy, Inc. (a)* | | | 28,090 | | | | 603,654 | | | |
| Cimarex Energy Co. (a) | | | 126,522 | | | | 6,925,814 | | | |
| Complete Production Services, Inc. (a)* | | | 19,887 | | | | 456,208 | | | |
| Comstock Resources, Inc. (a)* | | | 38,961 | | | | 1,570,128 | | | |
| Contango Oil & Gas Co. (a)* | | | 340 | | | | 21,967 | | | |
| Crosstex Energy, Inc. (a) | | | 39,892 | | | | 1,354,333 | | | |
| Dawson Geophysical Co. (a)* | | | 300 | | | | 20,250 | | | |
| Encore Acquisition Co. * | | | 13,681 | | | | 551,071 | | | |
| EXCO Resources, Inc. (a)* | | | 89,950 | | | | 1,664,075 | | | |
| FMC Technologies, Inc. (a)* | | | 20 | | | | 1,138 | | | |
| Forest Oil Corp. (a)* | | | 15,294 | | | | 748,794 | | | |
| Foundation Coal Holdings, Inc. (a) | | | 96,251 | | | | 4,844,313 | | | |
| Global Industries Ltd. (a)* | | | 17,748 | | | | 285,565 | | | |
| Gulf Island Fabrication, Inc. | | | 1,450 | | | | 41,644 | | | |
| GulfMark Offshore, Inc. (a)* | | | 57,354 | | | | 3,138,411 | | | |
| Harvest Natural Resources, Inc. (a)* | | | 6,014 | | | | 72,529 | | | |
| Helix Energy Solutions Group, Inc. (a)* | | | 4,610 | | | | 145,215 | | | |
| Helmerich & Payne, Inc. (a) | | | 202,738 | | | | 9,502,330 | | | |
| Hornbeck Offshore Services, Inc. (a)* | | | 61,305 | | | | 2,799,799 | | | |
| International Coal Group, Inc. (a)* | | | 1,810 | | | | 11,494 | | | |
| ION Geophysical Corp. (a)* | | | 174,571 | | | | 2,409,080 | | | |
| Lufkin Industries, Inc. (a) | | | 29,340 | | | | 1,872,479 | | | |
| Mariner Energy, Inc. (a)* | | | 232,340 | | | | 6,275,503 | | | |
| Massey Energy Co. (a) | | | 12,830 | | | | 468,295 | | | |
| McMoRan Exploration Co. (a)* | | | 3,500 | | | | 60,515 | | | |
| Oil States International, Inc. (a)* | | | 93,915 | | | | 4,208,331 | | | |
| Penn Virginia Corp. | | | 102,408 | | | | 4,515,169 | | | |
| Petrohawk Energy Corp. (a)* | | | 13,410 | | | | 270,480 | | | |
| PetroQuest Energy, Inc. (a)* | | | 9,697 | | | | 168,146 | | | |
| Plains Exploration & Production Co. (a)* | | | 33,074 | | | | 1,757,552 | | | |
| Pride International, Inc. (a)* | | | 89,216 | | | | 3,118,099 | | | |
| Rosetta Resources, Inc. (a)* | | | 134,772 | | | | 2,650,965 | | | |
| Rowan Cos., Inc. (a) | | | 220,279 | | | | 9,071,089 | | | |
| SEACOR Holdings, Inc. (a)* | | | 62,428 | | | | 5,328,854 | | | |
| St. Mary Land & Exploration Co. (a) | | | 19,962 | | | | 768,537 | | | |
| Stone Energy Corp. (a)* | | | 300 | | | | 15,693 | | | |
| Superior Energy Services, Inc. (a)* | | | 141,250 | | | | 5,596,325 | | | |
| Swift Energy Co. (a)* | | | 74,175 | | | | 3,337,133 | | | |
| T-3 Energy Services, Inc. (a)* | | | 16,089 | | | | 684,748 | | | |
| Tidewater, Inc. (a) | | | 181,780 | | | | 10,017,896 | | | |
| Trico Marine Services, Inc. (a)* | | | 31,144 | | | | 1,213,682 | | | |
| Union Drilling, Inc. (a)* | | | 33,732 | | | | 589,973 | | | |
| Unit Corp. (a)* | | | 20,943 | | | | 1,186,421 | | | |
| W&T Offshore, Inc. (a) | | | 1,300 | | | | 44,343 | | | |
| W-H Energy Services, Inc. (a)* | | | 570 | | | | 39,245 | | | |
| Warren Resources, Inc. * | | | 2,860 | | | | 33,948 | | | |
| Whiting Petroleum Corp. (a)* | | | 23,437 | | | | 1,515,202 | | | |
| Willbros Group, Inc. (a)* | | | 4,180 | | | | 127,908 | | | |
| | | | | | | |
| | | | | | | | 114,111,652 | | | |
Food & Staples Retailing 1.3% |
| |
| Arden Group, Inc., Class A (a) | | | 220 | | | | 31,460 | | | |
| Casey’s General Stores, Inc. (a) | | | 19,127 | | | | 432,270 | | | |
| Ingles Markets, Inc., Class A (a) | | | 27,765 | | | | 682,741 | | | |
| Longs Drug Stores Corp. (a) | | | 105,930 | | | | 4,497,788 | | | |
| Nash Finch Co. (a) | | | 34,633 | | | | 1,176,829 | | | |
| Ruddick Corp. (a) | | | 1,380 | | | | 50,867 | | | |
| Spartan Stores, Inc. (a) | | | 3,087 | | | | 64,364 | | | |
| Susser Holdings Corp. * | | | 12,170 | | | | 228,431 | | | |
| The Great Atlantic & Pacific Tea Co., Inc. (a)* | | | 57,602 | | | | 1,510,324 | | | |
| Village Super Market, Inc., Class A (a) | | | 4,268 | | | | 219,802 | | | |
| Weis Markets, Inc. (a) | | | 28,680 | | | | 988,600 | | | |
| | | | | | | |
| | | | | | | | 9,883,476 | | | |
Food, Beverage & Tobacco 2.0% |
| |
| Cal-Maine Foods, Inc. (a) | | | 36,900 | | | | 1,231,722 | | | |
| Chiquita Brands International, Inc. * | | | 8,850 | | | | 204,523 | | | |
| Corn Products International, Inc. (a) | | | 102,783 | | | | 3,817,361 | | | |
| Darling International, Inc. (a)* | | | 35,327 | | | | 457,485 | | | |
| Diamond Foods, Inc. (a) | | | 37,260 | | | | 675,896 | | | |
| Flowers Foods, Inc. (a) | | | 184,492 | | | | 4,566,177 | | | |
| Fresh Del Monte Produce, Inc. (a)* | | | 42,760 | | | | 1,556,464 | | | |
| Griffin Land & Nurseries, Inc. (a) | | | 3,320 | | | | 114,507 | | | |
| J & J Snack Foods Corp. (a) | | | 6,059 | | | | 166,441 | | | |
| Omega Protein Corp. * | | | 17,730 | | | | 242,014 | | | |
| Seaboard Corp. (a) | | | 1,171 | | | | 1,832,615 | | | |
| Seneca Foods Corp., Class B * | | | 1,000 | | | | 20,850 | | | |
| Tasty Baking Co. | | | 22,514 | | | | 128,330 | | | |
| Zapata Corp. * | | | 2,990 | | | | 20,810 | | | |
| | | | | | | |
| | | | | | | | 15,035,195 | | | |
Health Care Equipment & Services 2.9% |
| |
| Allied Healthcare Products, Inc. * | | | 19,700 | | | | 121,746 | | | |
| Amedisys, Inc. (a)* | | | 2,231 | | | | 87,768 | | | |
| American Shared Hospital Services | | | 5,642 | | | | 13,541 | | | |
| Angeion Corp. (a)* | | | 10,614 | | | | 76,951 | | | |
| AngioDynamics, Inc. (a)* | | | 13,195 | | | | 152,534 | | | |
| Atrion Corp. | | | 1,596 | | | | 159,504 | | | |
| BioScrip, Inc. (a)* | | | 9,865 | | | | 66,687 | | | |
| Cardiac Science Corp. * | | | 59,815 | | | | 499,455 | | | |
| CONMED Corp. (a)* | | | 28,955 | | | | 742,406 | | | |
| Cynosure, Inc., Class A (a)* | | | 19,880 | | | | 423,444 | | | |
| Datascope Corp. (a) | | | 33,805 | | | | 1,400,541 | | | |
| Gentiva Health Services, Inc. (a)* | | | 75,234 | | | | 1,637,092 | | | |
| Greatbatch, Inc. (a)* | | | 1,960 | | | | 36,084 | | | |
| Hanger Orthopedic Group, Inc. * | | | 54,190 | | | | 584,168 | | | |
| HMS Holdings Corp. (a)* | | | 13,760 | | | | 392,848 | | | |
| IntegraMed America, Inc. (a)* | | | 17,125 | | | | 167,654 | | | |
| Invacare Corp. (a) | | | 15,786 | | | | 351,712 | | | |
| Kewaunee Scientific Corp. | | | 4,537 | | | | 68,055 | | | |
| Kindred Healthcare, Inc. * | | | 74,536 | | | | 1,630,102 | | | |
| MedCath Corp. (a)* | | | 28,981 | | | | 527,454 | | | |
See financial notes.
Laudus U.S. Equity Funds 31
Laudus Rosenberg U.S. Discovery Fund
Portfolio Holdings continued
| | | | | | | | | | | |
| | | Number of | | Value | | |
| Security | | Shares | | ($) | | |
| MTS Medication Technologies (a)* | | | 13,395 | | | | 163,419 | | | |
| National Dentex Corp. * | | | 2,940 | | | | 37,897 | | | |
| National Healthcare Corp. (a) | | | 19,244 | | | | 937,183 | | | |
| Natus Medical, Inc. (a)* | | | 18,081 | | | | 328,170 | | | |
| Neogen Corp. (a)* | | | 292 | | | | 7,329 | | | |
| Orthofix International N.V. (a)* | | | 46,100 | | | | 1,833,397 | | | |
| Osteotech, Inc. (a)* | | | 13,670 | | | | 64,932 | | | |
| Pediatrix Medical Group, Inc. (a)* | | | 9,400 | | | | 633,560 | | | |
| Radnet, Inc. (a)* | | | 48,365 | | | | 340,490 | | | |
| RehabCare Group, Inc. (a)* | | | 51,698 | | | | 775,470 | | | |
| Res-Care, Inc. * | | | 67,585 | | | | 1,159,083 | | | |
| Skilled Healthcare Group, Inc., Class A (a)* | | | 55,227 | | | | 606,392 | | | |
| Span-America Medical Systems, Inc. (a) | | | 7,600 | | | | 89,680 | | | |
| SRI/ Surgical Express, Inc. * | | | 8,659 | | | | 37,234 | | | |
| STERIS Corp. (a) | | | 130,985 | | | | 3,514,328 | | | |
| Theragenics Corp. (a)* | | | 75,290 | | | | 296,643 | | | |
| Young Innovations, Inc. | | | 1,780 | | | | 30,830 | | | |
| Zoll Medical Corp. (a)* | | | 60,998 | | | | 1,621,937 | | | |
| | | | | | | |
| | | | | | | | 21,617,720 | | | |
Household & Personal Products 0.7% |
| |
| Chattem, Inc. (a)* | | | 2,248 | | | | 149,132 | | | |
| Elizabeth Arden, Inc. (a)* | | | 14,042 | | | | 280,138 | | | |
| Energizer Holdings, Inc. (a)* | | | 31,783 | | | | 2,875,726 | | | |
| Inter Parfums, Inc. (a) | | | 13,802 | | | | 304,748 | | | |
| Natural Alternative International, Inc. (a)* | | | 16,941 | | | | 152,469 | | | |
| Nutraceutical International Corp. * | | | 10,470 | | | | 136,110 | | | |
| Oil-Dri Corp. of America | | | 18,400 | | | | 329,176 | | | |
| Physicians Formula Holdings, Inc. (a)* | | | 505 | | | | 4,505 | | | |
| Schiff Nutrition International, Inc. | | | 16,960 | | | | 101,590 | | | |
| The Estee Lauder Cos., Inc., Class A (a) | | | 21,070 | | | | 966,060 | | | |
| | | | | | | |
| | | | | | | | 5,299,654 | | | |
Insurance 7.9% |
| |
| 21st Century Holding Co. | | | 520 | | | | 6,661 | | | |
| Affirmative Insurance Holdings, Inc. (a) | | | 5,370 | | | | 42,853 | | | |
| Alleghany Corp. (a)* | | | 10,478 | | | | 3,578,264 | | | |
| Allied World Assurance Co. Holdings Ltd. (a) | | | 94,397 | | | | 3,747,561 | | | |
| American Financial Group, Inc. (a) | | | 256,669 | | | | 6,560,460 | | | |
| American National Insurance Co. (a) | | | 15,033 | | | | 1,604,021 | | | |
| American Safety Insurance Holdings Ltd. * | | | 19,180 | | | | 327,978 | | | |
| Arch Capital Group Ltd. (a)* | | | 2,708 | | | | 185,958 | | | |
| Aspen Insurance Holdings Ltd. | | | 214,319 | | | | 5,653,735 | | | |
| Baldwin & Lyons, Inc., Class B (a) | | | 4,275 | | | | 109,782 | | | |
| Delphi Financial Group, Inc., Class A (a) | | | 14,509 | | | | 424,098 | | | |
| Endurance Specialty Holdings Ltd. (a) | | | 168,400 | | | | 6,163,440 | | | |
| Flagstone Reinsurance Holdings Ltd. (a) | | | 23,823 | | | | 288,258 | | | |
| Hanover Insurance Group, Inc. (a) | | | 58,028 | | | | 2,387,272 | | | |
| Harleysville Group, Inc. (a) | | | 3,780 | | | | 136,420 | | | |
| HCC Insurance Holdings, Inc. (a) | | | 32,380 | | | | 734,702 | | | |
| Hilltop Holdings, Inc. (a)* | | | 13,020 | | | | 135,408 | | | |
| Horace Mann Educators Corp. (a) | | | 95,300 | | | | 1,665,844 | | | |
| IPC Holdings Ltd. (a) | | | 114,058 | | | | 3,193,624 | | | |
| Kansas City Life Insurance Co. | | | 9,691 | | | | 465,750 | | | |
| Max Capital Group Ltd. (a) | | | 6,311 | | | | 165,285 | | | |
| National Western Life Insurance Co., Class A (a) | | | 3,418 | | | | 740,988 | | | |
| NYMAGIC, Inc. (a) | | | 6,510 | | | | 147,842 | | | |
| Odyssey Re Holdings Corp. (a) | | | 2,260 | | | | 83,055 | | | |
| PartnerRe Ltd. (a) | | | 114,670 | | | | 8,749,321 | | | |
| Platinum Underwriters Holdings Ltd. (a) | | | 119,419 | | | | 3,876,341 | | | |
| Presidential Life Corp. (a) | | | 33,821 | | | | 589,838 | | | |
| RenaissanceRe Holdings Ltd. (a) | | | 101,076 | | | | 5,246,855 | | | |
| The National Security Group, Inc. | | | 510 | | | | 8,548 | | | |
| Unico American Corp. * | | | 11,830 | | | | 111,202 | | | |
| United America Indemnity Ltd., Class A (a)* | | | 26,483 | | | | 510,063 | | | |
| Universal Insurance Holdings, Inc. (a) | | | 65,987 | | | | 249,431 | | | |
| Wesco Financial Corp. (a) | | | 338 | | | | 136,552 | | | |
| | | | | | | |
| | | | | | | | 58,027,410 | | | |
Materials 11.2% |
| |
| A.M. Castle & Co. (a) | | | 13,700 | | | | 369,900 | | | |
| AK Steel Holding Corp. (a) | | | 69,820 | | | | 3,799,604 | | | |
| American Pacific Corp. (a)* | | | 10,759 | | | | 171,821 | | | |
| Arch Chemicals, Inc. (a) | | | 13,036 | | | | 485,721 | | | |
| Celanese Corp., Series A | | | 139,291 | | | | 5,439,314 | | | |
| Century Aluminum Co. (a)* | | | 8,889 | | | | 588,807 | | | |
| CF Industries Holdings, Inc. (a) | | | 140,746 | | | | 14,584,101 | | | |
| Chemtura Corp. (a) | | | 10,684 | | | | 78,421 | | | |
| Coeur d’Alene Mines Corp. (a)* | | | 78,216 | | | | 315,993 | | | |
| Commercial Metals Co. | | | 520 | | | | 15,584 | | | |
| Compass Minerals International, Inc. (a) | | | 8,180 | | | | 482,456 | | | |
| Constar International, Inc. (a)* | | | 25,990 | | | | 68,094 | | | |
| Continental Materials Corp. (a)* | | | 300 | | | | 7,065 | | | |
| Cytec Industries, Inc. | | | 18,436 | | | | 992,779 | | | |
| FMC Corp. (a) | | | 254,304 | | | | 14,111,329 | | | |
| Friedman Industries, Inc. | | | 15,410 | | | | 79,361 | | | |
| Glatfelter (a) | | | 29,105 | | | | 439,777 | | | |
| Great Northern Iron Ore Properties | | | 846 | | | | 112,349 | | | |
| Greif, Inc., Class A (a) | | | 37,807 | | | | 2,568,229 | | | |
| Hecla Mining Co. * | | | 7,680 | | | | 85,709 | | | |
| Hercules, Inc. | | | 18,263 | | | | 334,030 | | | |
| Innophos Holdings, Inc. (a) | | | 15,040 | | | | 241,994 | | | |
| Innospec, Inc. (a) | | | 16,319 | | | | 345,963 | | | |
| International Flavors & Fragrances, Inc. | | | 2,070 | | | | 91,183 | | | |
| Kaiser Aluminum Corp. (a) | | | 14,236 | | | | 986,555 | | | |
| LSB Industries, Inc. (a)* | | | 28,860 | | | | 425,396 | | | |
| Material Sciences Corp. (a)* | | | 9,583 | | | | 74,364 | | | |
| Nalco Holding Co. (a) | | | 11,049 | | | | 233,686 | | | |
| NN, Inc. (a) | | | 11,261 | | | | 109,570 | | | |
| Olin Corp. (a) | | | 14,163 | | | | 279,861 | | | |
| Olympic Steel, Inc. (a) | | | 20,819 | | | | 938,937 | | | |
| Owens-Illinois, Inc. (a)* | | | 24,054 | | | | 1,357,367 | | | |
| Packaging Corp. of America (a) | | | 184,671 | | | | 4,123,703 | | | |
| Penford Corp. | | | 19,895 | | | | 432,318 | | | |
| PolyOne Corp. * | | | 1,086 | | | | 6,918 | | | |
See financial notes.
32 Laudus U.S. Equity Funds
Laudus Rosenberg U.S. Discovery Fund
| | | | | | | | | | | |
| | | Number of | | Value | | |
| Security | | Shares | | ($) | | |
| Reliance Steel & Aluminum Co. (a) | | | 106,940 | | | | 6,401,428 | | | |
| Rock of Ages Corp. * | | | 17,157 | | | | 67,942 | | | |
| Rockwood Holdings, Inc. (a)* | | | 22,678 | | | | 743,158 | | | |
| RPM International, Inc. (a) | | | 10,634 | | | | 222,676 | | | |
| Schnitzer Steel Industries, Inc., Class A (a) | | | 62,201 | | | | 4,417,515 | | | |
| Schweitzer-Mauduit International, Inc. (a) | | | 33,593 | | | | 777,342 | | | |
| Steel Dynamics, Inc. (a) | | | 3,914 | | | | 129,319 | | | |
| Stepan Co. (a) | | | 20,720 | | | | 792,126 | | | |
| Stillwater Mining Co. (a)* | | | 9,802 | | | | 151,637 | | | |
| Terra Industries, Inc. (a)* | | | 255,041 | | | | 9,061,607 | | | |
| The Scotts Miracle-Gro Co., Class A (a) | | | 117,274 | | | | 3,802,023 | | | |
| UFP Technologies, Inc. * | | | 2,270 | | | | 17,592 | | | |
| United States Lime & Minerals, Inc. (a)* | | | 5,054 | | | | 146,819 | | | |
| Worthington Industries, Inc. (a) | | | 61,219 | | | | 1,032,765 | | | |
| | | | | | | |
| | | | | | | | 82,542,208 | | | |
Media 0.4% |
| |
| Alloy, Inc. * | | | 35,700 | | | | 262,395 | | | |
| Mediacom Communications Corp., Class A * | | | 5,501 | | | | 23,819 | | | |
| Scholastic Corp. (a)* | | | 82,877 | | | | 2,508,687 | | | |
| | | | | | | |
| | | | | | | | 2,794,901 | | | |
Pharmaceuticals & Biotechnology 5.2% |
| |
| Accelrys, Inc. (a)* | | | 17,798 | | | | 96,287 | | | |
| Albany Molecular Research, Inc. (a)* | | | 4,330 | | | | 52,566 | | | |
| Bio-Rad Laboratories, Inc., Class A (a)* | | | 11,950 | | | | 1,062,952 | | | |
| Bioanalytical Systems, Inc. * | | | 3,360 | | | | 19,656 | | | |
| Bruker BioSciences Corp. (a)* | | | 108,817 | | | | 1,674,694 | | | |
| Emergent Biosolutions, Inc. (a)* | | | 15,500 | | | | 138,260 | | | |
| Harvard Bioscience, Inc. (a)* | | | 79,450 | | | | 397,250 | | | |
| Illumina, Inc. (a)* | | | 44,574 | | | | 3,383,167 | | | |
| Invitrogen Corp. (a)* | | | 102,334 | | | | 8,746,487 | | | |
| Kendle International, Inc. * | | | 37,621 | | | | 1,689,935 | | | |
| Millennium Pharmaceuticals, Inc. (a)* | | | 1,150 | | | | 17,779 | | | |
| Mylan, Inc. (a) | | | 10,440 | | | | 121,104 | | | |
| NPS Pharmaceuticals, Inc. (a)* | | | 74,482 | | | | 290,480 | | | |
| Par Pharmaceutical Cos, Inc. (a)* | | | 740 | | | | 12,869 | | | |
| PAREXEL International Corp. (a)* | | | 162,487 | | | | 4,240,911 | | | |
| PerkinElmer, Inc. (a) | | | 288,214 | | | | 6,989,189 | | | |
| Perrigo Co. (a) | | | 126,254 | | | | 4,763,563 | | | |
| Pharmanet Development Group, Inc. (a)* | | | 21,619 | | | | 545,447 | | | |
| Replidyne, Inc. (a)* | | | 62,280 | | | | 87,815 | | | |
| Sciele Pharma, Inc. (a)* | | | 60,007 | | | | 1,170,136 | | | |
| Varian, Inc. * | | | 35,430 | | | | 2,052,106 | | | |
| Waters Corp. (a)* | | | 701 | | | | 39,046 | | | |
| Watson Pharmaceuticals, Inc. (a)* | | | 26,509 | | | | 777,244 | | | |
| | | | | | | |
| | | | | | | | 38,368,943 | | | |
Real Estate 2.5% |
| |
| Ashford Hospitality Trust (a) | | | 176,644 | | | | 1,003,338 | | | |
| Cedar Shopping Centers, Inc. (a) | | | 7,100 | | | | 82,928 | | | |
| DiamondRock Hospitality Co. (a) | | | 116,971 | | | | 1,482,023 | | | |
| Douglas Emmett, Inc. (a) | | | 15,013 | | | | 331,187 | | | |
| Extra Space Storage, Inc. (a) | | | 187,131 | | | | 3,029,651 | | | |
| Gladstone Commercial Corp. (a) | | | 1,483 | | | | 23,061 | | | |
| Hersha Hospitality Trust (a) | | | 111,821 | | | | 1,009,744 | | | |
| Investors Real Estate Trust (a) | | | 3,237 | | | | 31,658 | | | |
| J.W. Mays, Inc. * | | | 500 | | | | 9,975 | | | |
| LTC Properties, Inc. (a) | | | 60,403 | | | | 1,552,961 | | | |
| Medical Properties Trust, Inc. (a) | | | 136,010 | | | | 1,539,633 | | | |
| MHI Hospitality Corp. | | | 2,190 | | | | 13,709 | | | |
| Mission West Properties, Inc. (a) | | | 44,097 | | | | 416,717 | | | |
| Monmouth Real Estate Investment Corp., Class A | | | 58,385 | | | | 467,080 | | | |
| National Retail Properties, Inc. | | | 49,601 | | | | 1,093,702 | | | |
| One Liberty Properties, Inc. | | | 26,650 | | | | 428,798 | | | |
| Ramco-Gershenson Properties Trust (a) | | | 39,167 | | | | 826,815 | | | |
| Strategic Hotels & Resorts, Inc. (a) | | | 204,986 | | | | 2,691,466 | | | |
| Sunstone Hotel Investors, Inc. (a) | | | 64,628 | | | | 1,034,694 | | | |
| Supertel Hospitality, Inc. (a) | | | 51,000 | | | | 270,300 | | | |
| United Capital Corp. (a)* | | | 8,880 | | | | 193,140 | | | |
| Urstadt Biddle Properties, Inc., Class A (a) | | | 2,910 | | | | 45,774 | | | |
| Winthrop Realty Trust | | | 145,531 | | | | 599,588 | | | |
| ZipRealty, Inc. (a)* | | | 46,654 | | | | 244,467 | | | |
| | | | | | | |
| | | | | | | | 18,422,409 | | | |
Retailing 1.0% |
| |
| 1-800-FLOWERS.COM, Inc., Class A (a)* | | | 80,900 | | | | 688,459 | | | |
| AMCON Distributing Co. * | | | 1,300 | | | | 40,118 | | | |
| Big Lots, Inc. (a)* | | | 40,670 | | | | 906,941 | | | |
| Books-A-Million, Inc. (a) | | | 37,920 | | | | 331,421 | | | |
| Build-A-Bear Workshop, Inc. (a)* | | | 6,040 | | | | 54,904 | | | |
| Educational Development Corp. | | | 764 | | | | 4,424 | | | |
| Franklin Covey Co. * | | | 52,790 | | | | 395,925 | | | |
| Gaiam, Inc., Class A (a)* | | | 11,802 | | | | 204,411 | | | |
| GSI Commerce, Inc. (a)* | | | 19,369 | | | | 254,702 | | | |
| Hastings Entertainment, Inc. (a)* | | | 26,860 | | | | 211,120 | | | |
| IAC/ InterActiveCorp * | | | 1,470 | | | | 30,517 | | | |
| Jennifer Convertibles, Inc. * | | | 1,290 | | | | 2,954 | | | |
| Jo-Ann Stores, Inc. (a)* | | | 1,590 | | | | 23,421 | | | |
| Monro Muffler Brake, Inc. (a) | | | 9,139 | | | | 154,449 | | | |
| Netflix, Inc. (a)* | | | 50 | | | | 1,732 | | | |
| Priceline.com, Inc. (a)* | | | 16,720 | | | | 2,020,779 | | | |
| REX Stores Corp. * | | | 25,070 | | | | 493,127 | | | |
| Sport Supply Group, Inc. (a) | | | 23,790 | | | | 284,290 | | | |
| Stage Stores, Inc. | | | 8,605 | | | | 139,401 | | | |
| Systemax, Inc. (a) | | | 28,607 | | | | 345,000 | | | |
| The Aristotle Corp. * | | | 450 | | | | 4,698 | | | |
| The Bon-Ton Stores, Inc. (a) | | | 6,730 | | | | 36,813 | | | |
| The Buckle, Inc. (a) | | | 6,430 | | | | 287,614 | | | |
| The Finish Line, Inc., Class A | | | 715 | | | | 3,403 | | | |
| Trans World Entertainment Corp. (a)* | | | 30,055 | | | | 113,007 | | | |
| | | | | | | |
| | | | | | | | 7,033,630 | | | |
Semiconductors & Semiconductor Equipment 1.8% |
| |
| Applied Micro Circuits Corp. * | | | 790 | | | | 5,672 | | | |
| Aviza Technology, Inc. (a)* | | | 11,328 | | | | 6,132 | | | |
| CEVA, Inc. (a)* | | | 50,470 | | | | 386,095 | | | |
| Cirrus Logic, Inc. (a)* | | | 106,662 | | | | 716,769 | | | |
See financial notes.
Laudus U.S. Equity Funds 33
Laudus Rosenberg U.S. Discovery Fund
Portfolio Holdings continued
| | | | | | | | | | | |
| | | Number of | | Value | | |
| Security | | Shares | | ($) | | |
| DSP Group, Inc. * | | | 10,420 | | | | 132,751 | | | |
| Fairchild Semiconductor International, Inc. (a)* | | | 30,546 | | | | 364,108 | | | |
| FEI Co. (a)* | | | 90,663 | | | | 1,979,173 | | | |
| Microtune, Inc. (a)* | | | 13,502 | | | | 49,417 | | | |
| MKS Instruments, Inc. (a)* | | | 4,772 | | | | 102,121 | | | |
| Monolithic Power Systems (a)* | | | 23,817 | | | | 419,894 | | | |
| OmniVision Technologies, Inc. (a)* | | | 13,423 | | | | 225,775 | | | |
| Pericom Semiconductor Corp. (a)* | | | 72,840 | | | | 1,069,291 | | | |
| Skyworks Solutions, Inc. (a)* | | | 454,433 | | | | 3,308,272 | | | |
| Standard Microsystems Corp. (a)* | | | 34,173 | | | | 997,168 | | | |
| Trio-Tech International | | | 5,030 | | | | 31,941 | | | |
| TriQuint Semiconductor, Inc. (a)* | | | 197,479 | | | | 999,244 | | | |
| Varian Semiconductor Equipment Associates, Inc. (a)* | | | 26,580 | | | | 748,227 | | | |
| Veeco Instruments, Inc. * | | | 760 | | | | 12,639 | | | |
| Zoran Corp. (a)* | | | 136,910 | | | | 1,870,191 | | | |
| | | | | | | |
| | | | | | | | 13,424,880 | | | |
Software & Services 7.0% |
| |
| American Software, Inc., Class A (a) | | | 17,050 | | | | 106,733 | | | |
| AsiaInfo Holdings, Inc. (a)* | | | 56,811 | | | | 616,967 | | | |
| Astea International, Inc. * | | | 8,570 | | | | 33,509 | | | |
| Bankrate, Inc. (a)* | | | 1,148 | | | | 57,274 | | | |
| BMC Software, Inc. (a)* | | | 7 | | | | 228 | | | |
| Cadence Design Systems, Inc. (a)* | | | 150,462 | | | | 1,606,934 | | | |
| Chordiant Software, Inc. (a)* | | | 48,048 | | | | 289,729 | | | |
| CIBER, Inc. (a)* | | | 163,269 | | | | 800,018 | | | |
| Computer Task Group, Inc. * | | | 27,930 | | | | 115,072 | | | |
| Convergys Corp. (a)* | | | 37,350 | | | | 562,491 | | | |
| CSG Systems International, Inc. (a)* | | | 10,429 | | | | 118,578 | | | |
| CSP, Inc. (a)* | | | 9,451 | | | | 56,989 | | | |
| Dynamics Research Corp. (a)* | | | 17,804 | | | | 179,998 | | | |
| EarthLink, Inc. (a)* | | | 8,740 | | | | 65,987 | | | |
| Edgewater Technology, Inc. (a)* | | | 33,993 | | | | 179,143 | | | |
| EPIQ Systems, Inc. (a)* | | | 51,618 | | | | 801,111 | | | |
| Gevity HR, Inc. (a) | | | 36,410 | | | | 315,311 | | | |
| Hackett Group, Inc. * | | | 45,797 | | | | 179,066 | | | |
| Hewitt Associates, Inc., Class A (a)* | | | 3,208 | | | | 127,582 | | | |
| iGATE Corp. (a)* | | | 1,381 | | | | 9,833 | | | |
| Integral Systems, Inc. (a) | | | 17,607 | | | | 514,653 | | | |
| Interwoven, Inc. * | | | 113,500 | | | | 1,212,180 | | | |
| JDA Software Group, Inc. (a)* | | | 75,752 | | | | 1,382,474 | | | |
| Keynote Systems, Inc. (a)* | | | 29,014 | | | | 342,075 | | | |
| Lawson Software, Inc. * | | | 378,901 | | | | 2,853,124 | | | |
| Manhattan Associates, Inc. (a)* | | | 220 | | | | 5,045 | | | |
| MAXIMUS, Inc. | | | 54,634 | | | | 2,005,614 | | | |
| Mentor Graphics Corp. (a)* | | | 1,520 | | | | 13,422 | | | |
| Moldflow Corp. * | | | 22,947 | | | | 400,196 | | | |
| MPS Group, Inc. (a)* | | | 191,574 | | | | 2,264,405 | | | |
| Ness Technologies, Inc. (a)* | | | 10,789 | | | | 102,388 | | | |
| NetScout Systems, Inc. (a)* | | | 72,145 | | | | 670,948 | | | |
| Novell, Inc. (a)* | | | 234,240 | | | | 1,473,370 | | | |
| Online Resources Corp * | | | 1,820 | | | | 17,508 | | | |
| Perot Systems Corp., Class A (a)* | | | 227,578 | | | | 3,422,773 | | | |
| Phoenix Technologies Ltd. (a)* | | | 18,448 | | | | 288,896 | | | |
| Progress Software Corp. (a)* | | | 12,022 | | | | 359,698 | | | |
| QAD, Inc. (a) | | | 39,060 | | | | 328,495 | | | |
| Quest Software, Inc. (a)* | | | 67,260 | | | | 879,088 | | | |
| Radiant Systems, Inc. (a)* | | | 58,546 | | | | 817,888 | | | |
| Retalix Ltd. (a)* | | | 3,772 | | | | 53,525 | | | |
| S1 Corp. (a)* | | | 100,821 | | | | 716,837 | | | |
| Sapient Corp. (a)* | | | 60,907 | | | | 423,913 | | | |
| Servidyne, Inc. | | | 1,490 | | | | 9,238 | | | |
| Solera Holdings, Inc. (a)* | | | 19,764 | | | | 481,451 | | | |
| SonicWALL, Inc. (a)* | | | 202,447 | | | | 1,653,992 | | | |
| SPSS, Inc. (a)* | | | 51,700 | | | | 2,004,926 | | | |
| SumTotal Systems, Inc. (a)* | | | 17,521 | | | | 73,062 | | | |
| Sybase, Inc. (a)* | | | 256,161 | | | | 6,737,034 | | | |
| Synopsys, Inc. (a)* | | | 350,865 | | | | 7,968,144 | | | |
| TechTeam Global, Inc. * | | | 26,600 | | | | 240,730 | | | |
| TIBCO Software, Inc. (a)* | | | 163,479 | | | | 1,167,240 | | | |
| TNS, Inc. (a)* | | | 56,358 | | | | 1,163,229 | | | |
| TSR, Inc. | | | 4,099 | | | | 17,216 | | | |
| Unisys Corp. * | | | 11,035 | | | | 48,885 | | | |
| United Online, Inc. (a) | | | 178,593 | | | | 1,885,942 | | | |
| Vignette Corp. (a)* | | | 76,256 | | | | 1,007,342 | | | |
| | | | | | | |
| | | | | | | | 51,229,499 | | | |
Technology Hardware & Equipment 7.9% |
| |
| ADDvantage Technologies Group, Inc. (a)* | | | 4,170 | | | | 14,428 | | | |
| Aetrium, Inc. * | | | 7,101 | | | | 27,907 | | | |
| Allied Motion Technologies, Inc. * | | | 15,522 | | | | 73,574 | | | |
| Arrow Electronics, Inc. (a)* | | | 255,517 | | | | 8,598,147 | | | |
| Astro-Med, Inc. | | | 15,610 | | | | 139,709 | | | |
| Avnet, Inc. (a)* | | | 417,340 | | | | 13,659,538 | | | |
| AVX Corp. (a) | | | 98,800 | | | | 1,265,628 | | | |
| Black Box Corp. (a) | | | 47,851 | | | | 1,476,203 | | | |
| Bonso Electronic International, Inc. * | | | 3,393 | | | | 7,024 | | | |
| Brocade Communications Systems, Inc. (a)* | | | 226,569 | | | | 1,653,954 | | | |
| Coherent, Inc. (a)* | | | 50,588 | | | | 1,410,899 | | | |
| CommScope, Inc. (a)* | | | 3,660 | | | | 127,478 | | | |
| Communications Systems, Inc. | | | 21,480 | | | | 231,340 | | | |
| CTS Corp. (a) | | | 100,155 | | | | 1,071,658 | | | |
| Data I/ O Corp. (a)* | | | 8,734 | | | | 37,993 | | | |
| Ddi Corp. (a)* | | | 37,086 | | | | 172,079 | | | |
| Digi International, Inc. (a)* | | | 69,546 | | | | 802,561 | | | |
| Electro Scientific Industries, Inc. (a)* | | | 82,765 | | | | 1,363,967 | | | |
| Electronics for Imaging, Inc. (a)* | | | 9,426 | | | | 140,636 | | | |
| EMS Technologies, Inc. (a)* | | | 28,902 | | | | 784,400 | | | |
| Emulex Corp. (a)* | | | 210,890 | | | | 3,424,854 | | | |
| FLIR Systems, Inc. (a)* | | | 39,216 | | | | 1,180,009 | | | |
| Gerber Scientific, Inc. (a)* | | | 10,166 | | | | 90,376 | | | |
| Globecomm Systems, Inc. (a)* | | | 4,255 | | | | 37,018 | | | |
| Harmonic, Inc. * | | | 202,815 | | | | 1,541,394 | | | |
| Insight Enterprises, Inc. * | | | 100,053 | | | | 1,750,927 | | | |
| Interphase Corp. (a)* | | | 1,160 | | | | 5,243 | | | |
| IntriCon Corp. * | | | 11,040 | | | | 88,210 | | | |
| Itron, Inc. (a)* | | | 1,224 | | | | 110,442 | | | |
| Keithley Instruments, Inc. (a) | | | 650 | | | | 6,305 | | | |
| KEMET Corp. (a)* | | | 37,976 | | | | 153,423 | | | |
| Key Tronic Corp. * | | | 509 | | | | 1,318 | | | |
| Loral Space & Communications, Inc. (a)* | | | 28,709 | | | | 684,423 | | | |
| Measurement Specialties, Inc. (a)* | | | 38,491 | | | | 672,438 | | | |
See financial notes.
34 Laudus U.S. Equity Funds
Laudus Rosenberg U.S. Discovery Fund
| | | | | | | | | | | |
| | | Number of | | Value | | |
| Security | | Shares | | ($) | | |
| Mesa Laboratories, Inc. | | | 2,568 | | | | 57,523 | | | |
| Methode Electronics, Inc. (a) | | | 23,098 | | | | 270,016 | | | |
| Mettler-Toledo International, Inc. * | | | 6,864 | | | | 666,632 | | | |
| MOCON, Inc. (a) | | | 3,253 | | | | 36,694 | | | |
| NETGEAR, Inc. (a)* | | | 1,387 | | | | 27,671 | | | |
| Network Equipment Technologies, Inc. (a)* | | | 63,494 | | | | 417,156 | | | |
| O.I. Corp. | | | 4,685 | | | | 55,283 | | | |
| Oplink Communications, Inc. (a)* | | | 40,339 | | | | 357,807 | | | |
| Optical Cable Corp. * | | | 7,491 | | | | 37,455 | | | |
| OSI Systems, Inc. (a)* | | | 40,800 | | | | 939,216 | | | |
| PC Connection, Inc. (a)* | | | 200 | | | | 1,584 | | | |
| Perceptron, Inc. * | | | 18,668 | | | | 236,524 | | | |
| Rofin-Sinar Technologies, Inc. (a)* | | | 1,440 | | | | 64,656 | | | |
| Schmitt Industries, Inc. * | | | 1,892 | | | | 11,257 | | | |
| SeaChange International, Inc. (a)* | | | 1,970 | | | | 13,849 | | | |
| Sigmatron International, Inc. (a)* | | | 690 | | | | 4,271 | | | |
| Soapstone Networks, Inc. (a) | | | 28,535 | | | | 204,311 | | | |
| Spectrum Control, Inc. (a)* | | | 35,600 | | | | 301,176 | | | |
| Super Micro Computer, Inc. (a)* | | | 24,900 | | | | 207,915 | | | |
| Sutron Corp. * | | | 80 | | | | 560 | | | |
| Technitrol, Inc. (a) | | | 152,370 | | | | 3,524,318 | | | |
| TESSCO Technologies, Inc. (a)* | | | 9,026 | | | | 135,390 | | | |
| Tollgrade Communications, Inc. * | | | 30,331 | | | | 158,934 | | | |
| TTM Technologies, Inc. (a)* | | | 3,330 | | | | 37,696 | | | |
| Vicon Industries, Inc. (a)* | | | 9,260 | | | | 46,300 | | | |
| Vishay Intertechnology, Inc. * | | | 467,946 | | | | 4,239,591 | | | |
| Western Digital Corp. (a)* | | | 106,306 | | | | 2,874,514 | | | |
| Zones, Inc. (a)* | | | 5,640 | | | | 46,304 | | | |
| Zygo Corp. (a)* | | | 51,155 | | | | 636,368 | | | |
| | | | | | | |
| | | | | | | | 58,416,474 | | | |
Telecommunication Services 1.5% |
| |
| Atlantic Tele-Network, Inc. (a) | | | 1,105 | | | | 37,382 | | | |
| CenturyTel, Inc. (a) | | | 231,768 | | | | 7,703,968 | | | |
| D&E Communications, Inc. | | | 38,728 | | | | 344,679 | | | |
| Gilat Satellite Networks Ltd. * | | | 93,765 | | | | 1,015,475 | | | |
| HickoryTech Corp. | | | 4,874 | | | | 39,821 | | | |
| Hungarian Telephone & Cable Corp. (a)* | | | 490 | | | | 8,502 | | | |
| Premiere Global Services, Inc. (a)* | | | 94,195 | | | | 1,350,756 | | | |
| USA Mobility, Inc. (a)* | | | 41,371 | | | | 295,389 | | | |
| | | | | | | |
| | | | | | | | 10,795,972 | | | |
Transportation 1.2% |
| |
| Air T., Inc. | | | 970 | | | | 9,331 | | | |
| B & H Ocean Carriers Ltd. * | | | 7,460 | | | | 77,771 | | | |
| Dynamex, Inc. (a)* | | | 27,778 | | | | 702,784 | | | |
| Genco Shipping & Trading Ltd. (a) | | | 12,290 | | | | 693,525 | | | |
| International Shipholding Corp. * | | | 2,100 | | | | 40,278 | | | |
| Park-Ohio Holdings Corp. (a)* | | | 6,420 | | | | 100,858 | | | |
| Republic Airways Holdings, Inc. (a)* | | | 55,564 | | | | 1,203,516 | | | |
| Ryder System, Inc. | | | 33,590 | | | | 2,045,967 | | | |
| SkyWest, Inc. (a) | | | 174,628 | | | | 3,688,143 | | | |
| | | | | | | |
| | | | | | | | 8,562,173 | | | |
Utilities 5.0% |
| |
| Alliant Energy Corp. (a) | | | 211,023 | | | | 7,387,915 | | | |
| Artesian Resources Corp., Class A | | | 10,340 | | | | 191,600 | | | |
| CenterPoint Energy, Inc. (a) | | | 547,637 | | | | 7,814,780 | | | |
| CH Energy Group, Inc. (a) | | | 8,582 | | | | 333,840 | | | |
| Delta Natural Gas Co., Inc. | | | 6,413 | | | | 158,337 | | | |
| Energy West, Inc. | | | 1,905 | | | | 16,669 | | | |
| Florida Public Utilities Co. | | | 10,870 | | | | 121,201 | | | |
| Maine & Maritimes Corp. * | | | 3,843 | | | | 106,835 | | | |
| MDU Resources Group, Inc. (a) | | | 373,607 | | | | 9,172,052 | | | |
| Northeast Utilities (a) | | | 138 | | | | 3,387 | | | |
| NorthWestern Corp. | | | 20,020 | | | | 487,887 | | | |
| ONEOK, Inc. | | | 310 | | | | 13,835 | | | |
| Pennichuck Corp. (a) | | | 2,764 | | | | 63,848 | | | |
| Pepco Holdings, Inc. (a) | | | 136,912 | | | | 3,384,465 | | | |
| Portland General Electric Co. (a) | | | 10,529 | | | | 237,429 | | | |
| RGC Resources, Inc. | | | 3,037 | | | | 84,611 | | | |
| Southern Union Co. | | | 680 | | | | 15,824 | | | |
| The Laclede Group, Inc. (a) | | | 2,420 | | | | 86,225 | | | |
| UIL Holdings Corp. (a) | | | 1,880 | | | | 56,644 | | | |
| Unisource Energy Corp. | | | 48,690 | | | | 1,083,839 | | | |
| Unitil Corp. | | | 2,890 | | | | 77,886 | | | |
| Westar Energy, Inc. (a) | | | 216,933 | | | | 4,939,564 | | | |
| WGL Holdings, Inc. (a) | | | 18,750 | | | | 601,125 | | | |
| | | | | | | |
| | | | | | | | 36,439,798 | | | |
| | | | | | | |
Total Common Stock (Cost $698,254,356) | | | 733,707,665 | | | |
| | | | | | | |
| |
| Foreign Common Stock 0.0% of net assets |
Bermuda 0.0% |
| |
| Telecommunication Services 0.0% | | | | �� | | |
| Global Crossing Ltd. (a)* | | | 5,318 | | | | 80,621 | | | |
| | | | | | | |
Total Foreign Common Stock
(Cost $82,705) | | | 80,621 | | | |
| | | | | | | |
| | | | | | | | | | | |
| Security | | Face Amount | | Value | | |
| Rate, Maturity Date | | ($) | | ($) | | |
| Short-Term Investment 1.5% of net assets |
Repurchase Agreement 1.5% |
| |
| Fixed Income Clearing Corp. dated 03/31/08, due 04/01/08 at 2.00%, with a maturity value of $10,796,600 (fully collateralized by Federal National Mortgage Association with a value of $11,016,784.) | | | 10,796,000 | | | | 10,796,000 | | | |
| | | | | | | |
Total Short-Term Investment
(Cost $10,796,000) | | | 10,796,000 | | | |
| | | | | | | |
| |
End of Investments. |
See financial notes.
Laudus U.S. Equity Funds 35
Laudus Rosenberg U.S. Discovery Fund
Portfolio Holdings continued
| | | | | | | | | | | |
| | | Number of | | Value | | |
| Security | | Shares | | ($) | | |
| Collateral Invested for Securities on Loan 34.0% of net assets |
| State Street Navigator Security Lending Prime Portfolio | | | 250,095,950 | | | | 250,095,950 | | | |
| |
End of collateral invested for securities on loan. |
| |
| At 03/31/08, the tax basis cost of the fund’s investments was $709,831,489 and the unrealized appreciation and depreciation were $94,094,685 and ($59,341,888), respectively, with a net unrealized appreciation of $34,752,797. |
| |
| * | Non-income producing security. |
| |
| (a) | All or a portion of this security is on loan. |
See financial notes.
36 Laudus U.S. Equity Funds
Laudus Rosenberg U.S. Small Capitalization Fund
Portfolio Holdings as of March 31, 2007
| | | | | | | | | | | | | |
| | | Cost | | Value |
| Holdings by Category | | ($) | | ($) |
| |
| | 98.7 | % | | Common Stock | | | 552,025,608 | | | | 604,735,597 | |
| | — | % | | Foreign Common Stock | | | 245,080 | | | | 237,042 | |
| |
| | 98.7 | % | | Total Investments | | | 552,270,688 | | | | 604,972,639 | |
| | 41.0 | % | | Collateral Invested for Securities on Loan | | | 251,007,699 | | | | 251,007,699 | |
| | (39.7 | )% | | Other Assets and Liabilities | | | | | | | (243,261,712 | ) |
| |
| | 100.0 | % | | Net Assets | | | | | | | 612,718,626 | |
| | | | | | | | | | | |
| | | Number of | | Value | | |
| Security | | Shares | | ($) | | |
| Common Stock 98.7% of net assets |
Automobiles & Components 1.2% |
| |
| Aftermarket Technology Corp. (a)* | | | 56,640 | | | | 1,101,082 | | | |
| Cooper Tire & Rubber Co. (a) | | | 88,176 | | | | 1,319,995 | | | |
| Exide Technologies (a)* | | | 80,186 | | | | 1,050,437 | | | |
| Standard Motor Products, Inc. | | | 6,660 | | | | 40,759 | | | |
| Strattec Security Corp. (a) | | | 200 | | | | 8,466 | | | |
| Superior Industries International, Inc. (a) | | | 22,754 | | | | 472,145 | | | |
| TRW Automotive Holdings Corp. (a)* | | | 137,358 | | | | 3,210,056 | | | |
| | | | | | | |
| | | | | | | | 7,202,940 | | | |
Banks 3.5% |
| |
| Alliance Financial Corp. | | | 830 | | | | 20,750 | | | |
| American National Bankshares, Inc. | | | 100 | | | | 2,143 | | | |
| BancFirst Corp. (a) | | | 27,663 | | | | 1,266,412 | | | |
| Banco Latinoamericano de Exportaciones, S.A., Class E (a) | | | 136,565 | | | | 2,103,101 | | | |
| Berkshire Bancorp, Inc. | | | 970 | | | | 13,968 | | | |
| Beverly Hills Bancorp, Inc. (a) | | | 132,360 | | | | 334,871 | | | |
| Britton & Koontz Capital Corp. | | | 5,933 | | | | 94,572 | | | |
| Camco Financial Corp. | | | 530 | | | | 5,833 | | | |
| Carrollton Bancorp | | | 560 | | | | 7,560 | | | |
| Carver Bancorp, Inc. (a) | | | 21,720 | | | | 253,690 | | | |
| Cascade Financial Corp. | | | 270 | | | | 3,294 | | | |
| Central Bancorp, Inc. (a) | | | 110 | | | | 2,028 | | | |
| Centrue Financial Corp. | | | 8,242 | | | | 160,719 | | | |
| CFS Bancorp, Inc. (a) | | | 24,002 | | | | 344,909 | | | |
| Codorus Valley Bancorp, Inc. | | | 2,165 | | | | 35,160 | | | |
| Community Bank Shares of Indiana, Inc. | | | 1,190 | | | | 23,354 | | | |
| Community Bankshares, Inc. | | | 720 | | | | 8,633 | | | |
| Community Capital Corp. | | | 3,966 | | | | 62,227 | | | |
| Community Financial Corp. | | | 4,180 | | | | 33,440 | | | |
| Community Shores Bank Corp. * | | | 180 | | | | 936 | | | |
| Crescent Banking Co. | | | 324 | | | | 3,564 | | | |
| Elmira Savings Bank, FSB (a) | | | 5,026 | | | | 93,534 | | | |
| Farmers Capital Bank Corp. | | | 1,755 | | | | 41,646 | | | |
| Fidelity Bancorp, Inc. | | | 60 | | | | 849 | | | |
| Fidelity Southern Corp. | | | 6,159 | | | | 51,797 | | | |
| First Bancorp of Indiana, Inc. (a) | | | 4,691 | | | | 55,823 | | | |
| First Bancshares, Inc. * | | | 11,651 | | | | 192,591 | | | |
| First BancTrust Corp. | | | 12,250 | | | | 111,842 | | | |
| First Capital, Inc. | | | 100 | | | | 1,660 | | | |
| First Citizens BancShares, Inc., Class A (a) | | | 8,044 | | | | 1,120,931 | | | |
| First Community Corp. | | | 630 | | | | 9,324 | | | |
| First Defiance Financial Corp. | | | 24,036 | | | | 441,061 | | | |
| First Federal Bancshares of Arkansas, Inc. (a) | | | 14,014 | | | | 193,113 | | | |
| First Federal Bankshares, Inc. (a) | | | 8,373 | | | | 115,547 | | | |
| First Financial Service Corp. | | | 119 | | | | 2,838 | | | |
| First M&F Corp. | | | 5,900 | | | | 85,550 | | | |
| First Niagara Financial Group, Inc. (a) | | | 49,400 | | | | 671,346 | | | |
| First West Virginia Bancorp, Inc. | | | 320 | | | | 5,040 | | | |
| FirstMerit Corp. (a) | | | 47,136 | | | | 973,830 | | | |
| FNB Corp. of North Carolina | | | 11,864 | | | | 124,572 | | | |
| Franklin Bank Corp. (a)* | | | 5,561 | | | | 16,850 | | | |
| Gateway Financial Holdings, Inc. (a) | | | 10,996 | | | | 116,558 | | | |
| Glen Burnie Bancorp | | | 420 | | | | 5,030 | | | |
| Great Pee Dee Bancorp, Inc. | | | 1,500 | | | | 34,515 | | | |
| GS Financial Corp. | | | 8,330 | | | | 138,486 | | | |
| Guaranty Federal Bancshares, Inc. (a) | | | 7,644 | | | | 199,891 | | | |
| Habersham Bancorp (a) | | | 24,098 | | | | 335,444 | | | |
| Harrington West Financial Group, Inc. (a) | | | 660 | | | | 5,392 | | | |
| Hawthorn Bancshares, Inc. | | | 3,930 | | | | 108,075 | | | |
| Heritage Financial Corp. | | | 1,730 | | | | 30,102 | | | |
| HF Financial Corp. (a) | | | 24,416 | | | | 390,656 | | | |
| Hingham Institution for Savings (a) | | | 8,940 | | | | 256,801 | | | |
| HMN Financial, Inc. | | | 19,380 | | | | 447,290 | | | |
| Horizon Bancorp | | | 5,893 | | | | 134,891 | | | |
| International Bancshares Corp. (a) | | | 27,130 | | | | 612,595 | | | |
| Lincoln Bancorp (a) | | | 2,400 | | | | 29,232 | | | |
| LSB Financial Corp. | | | 3,926 | | | | 71,846 | | | |
| MASSBANK Corp. | | | 11,662 | | | | 451,669 | | | |
| MFB Corp. (a) | | | 3,280 | | | | 109,175 | | | |
| Monarch Community Bancorp, Inc. | | | 5,808 | | | | 58,661 | | | |
| NB&T Financial Group, Inc. | | | 100 | | | | 1,907 | | | |
| New Hampshire Thrift Bancshares, Inc. (a) | | | 10,020 | | | | 123,246 | | | |
| North Central Bancshares, Inc. (a) | | | 300 | | | | 8,867 | | | |
| Northeast Bancorp (a) | | | 100 | | | | 1,475 | | | |
| Pacific Premier Bancorp, Inc. (a)* | | | 2,540 | | | | 17,780 | | | |
| Park Bancorp, Inc. | | | 12,118 | | | | 251,509 | | | |
| Parkvale Financial Corp. | | | 28,120 | | | | 754,741 | | | |
| Peoples Bancorp | | | 414 | | | | 6,469 | | | |
| Peoples Bancorp of North Carolina | | | 2,708 | | | | 36,558 | | | |
| Peoples Community Bancorp, Inc. | | | 2,004 | | | | 7,996 | | | |
| Premier Financial Bancorp, Inc. (a) | | | 2,220 | | | | 25,641 | | | |
| Prosperity Bancshares, Inc. (a) | | | 5,547 | | | | 158,977 | | | |
| Provident Community Bancshares, Inc. (a) | | | 372 | | | | 6,603 | | | |
| Provident Financial Holdings, Inc. (a) | | | 32,769 | | | | 525,615 | | | |
| QCR Holdings, Inc. (a) | | | 761 | | | | 11,339 | | | |
| Republic First Bancorp, Inc. * | | | 34,116 | | | | 168,192 | | | |
| River Valley Bancorp | | | 199 | | | | 2,744 | | | |
| Rurban Financial Corp. | | | 7,696 | | | | 78,730 | | | |
| Security National Financial Corp., Class A * | | | 39,754 | | | | 153,053 | | | |
| Simmons First National Corp., Class A (a) | | | 2,510 | | | | 74,622 | | | |
| Southern First Bancshares, Inc. * | | | 3,860 | | | | 57,784 | | | |
| Southern Missouri Bancorp, Inc. | | | 12,058 | | | | 177,855 | | | |
See financial notes.
Laudus U.S. Equity Funds 37
Laudus Rosenberg U.S. Small Capitalization Fund
Portfolio Holdings continued
| | | | | | | | | | | |
| | | Number of | | Value | | |
| Security | | Shares | | ($) | | |
| Southwest Bancorp, Inc. (a) | | | 76,787 | | | | 1,344,540 | | | |
| StellarOne Corp. (a) | | | 1,077 | | | | 18,212 | | | |
| Sun Bancorp, Inc. (a)* | | | 8,796 | | | | 115,843 | | | |
| SVB Financial Group (a)* | | | 20,500 | | | | 894,620 | | | |
| Team Financial, Inc. | | | 15,648 | | | | 203,424 | | | |
| Teche Holding Co. (a) | | | 3,760 | | | | 124,080 | | | |
| TF Financial Corp. (a) | | | 10,476 | | | | 254,043 | | | |
| UMB Financial Corp. (a) | | | 14,900 | | | | 613,880 | | | |
| United Bancshares, Inc. | | | 10,998 | | | | 153,972 | | | |
| United Community Financial Corp. (a) | | | 34,360 | | | | 213,032 | | | |
| United Western Bancorp, Inc. (a) | | | 2,100 | | | | 37,590 | | | |
| VIST Financial Corp. | | | 1,489 | | | | 26,742 | | | |
| Wainwright Bank & Trust Co. (a) | | | 52,749 | | | | 650,395 | | | |
| Willow Financial Bancorp, Inc. | | | 1,262 | | | | 9,326 | | | |
| WSB Holdings, Inc. | | | 12,350 | | | | 67,678 | | | |
| WSFS Financial Corp. (a) | | | 25,661 | | | | 1,264,574 | | | |
| WVS Financial Corp. | | | 151 | | | | 2,416 | | | |
| | | | | | | |
| | | | | | | | 21,273,287 | | | |
Capital Goods 13.3% |
| |
| Aecom Technology Corp. (a)* | | | 59,985 | | | | 1,560,210 | | | |
| Alamo Group, Inc. (a) | | | 320 | | | | 6,806 | | | |
| Ameron International Corp. (a) | | | 29,105 | | | | 2,722,191 | | | |
| Applied Industrial Technologies, Inc. (a) | | | 15,935 | | | | 476,297 | | | |
| Badger Meter, Inc. (a) | | | 5,436 | | | | 234,835 | | | |
| Barnes Group, Inc. (a) | | | 120,439 | | | | 2,764,075 | | | |
| Chase Corp. (a) | | | 16,720 | | | | 302,799 | | | |
| Chicago Rivet & Machine Co. | | | 4,920 | | | | 110,208 | | | |
| Columbus Mckinnon Corp. (a)* | | | 300 | | | | 9,294 | | | |
| Cubic Corp. (a) | | | 21,135 | | | | 600,868 | | | |
| Curtiss-Wright Corp. (a) | | | 1,080 | | | | 44,798 | | | |
| Ducommun, Inc. * | | | 11,350 | | | | 314,055 | | | |
| Eastern Co. (a) | | | 25,630 | | | | 401,110 | | | |
| Edac Technologies Corp. * | | | 19,163 | | | | 122,643 | | | |
| EnPro Industries, Inc. (a)* | | | 19,005 | | | | 592,766 | | | |
| Espey Manufacturing & Electronics Corp. | | | 20,760 | | | | 415,200 | | | |
| Esterline Technologies Corp. (a)* | | | 3,910 | | | | 196,947 | | | |
| EXX, Inc., Class A (a)* | | | 2,120 | | | | 6,699 | | | |
| GrafTech International Ltd. (a)* | | | 28,649 | | | | 464,400 | | | |
| Hardinge, Inc. (a) | | | 81,732 | | | | 1,124,632 | | | |
| Herley Industries, Inc. (a)* | | | 35,277 | | | | 364,764 | | | |
| Hurco Cos., Inc. (a)* | | | 9,198 | | | | 430,282 | | | |
| II-VI, Inc. (a)* | | | 59,257 | | | | 2,250,581 | | | |
| Industrial Distribution Group, Inc. * | | | 48,803 | | | | 489,982 | | | |
| K-Tron International, Inc. * | | | 21,580 | | | | 2,591,974 | | | |
| Kadant, Inc. (a)* | | | 55,200 | | | | 1,621,776 | | | |
| Key Technology, Inc. (a)* | | | 2,380 | | | | 70,900 | | | |
| L.B. Foster Co., Class A (a)* | | | 28,831 | | | | 1,241,463 | | | |
| Lawson Products, Inc. (a) | | | 7,117 | | | | 196,073 | | | |
| Lydall, Inc. (a)* | | | 81,080 | | | | 928,366 | | | |
| Meadow Valley Corp. * | | | 20,931 | | | | 171,634 | | | |
| Mueller Industries, Inc. (a) | | | 172,750 | | | | 4,983,838 | | | |
| NACCO Industries, Inc., Class A (a) | | | 35,357 | | | | 2,861,796 | | | |
| Nortech Systems, Inc. * | | | 938 | | | | 5,698 | | | |
| Northwest Pipe Co. (a)* | | | 43,123 | | | | 1,832,296 | | | |
| Orbital Sciences Corp. (a)* | | | 154,050 | | | | 3,712,605 | | | |
| Patrick Industries, Inc. * | | | 300 | | | | 2,156 | | | |
| Perini Corp. (a)* | | | 2,805 | | | | 101,625 | | | |
| Powell Industries, Inc. * | | | 4,850 | | | | 190,945 | | | |
| PowerSecure International, Inc. (a)* | | | 10,244 | | | | 120,572 | | | |
| Preformed Line Products Co. (a) | | | 5,514 | | | | 268,422 | | | |
| Regal-Beloit Corp. (a) | | | 230,460 | | | | 8,441,750 | | | |
| Robbins & Myers, Inc. (a) | | | 167,840 | | | | 5,479,976 | | | |
| Rush Enterprises, Inc., Class A (a)* | | | 137,306 | | | | 2,174,927 | | | |
| Rush Enterprises, Inc., Class B (a)* | | | 17,440 | | | | 256,019 | | | |
| SL Industries, Inc. * | | | 34,560 | | | | 687,744 | | | |
| Standex International Corp. (a) | | | 84,680 | | | | 1,891,751 | | | |
| Tech/ Ops Sevcon, Inc. | | | 7,056 | | | | 49,392 | | | |
| Teledyne Technologies, Inc. (a)* | | | 19,330 | | | | 908,510 | | | |
| The L.S. Starrett Co., Class A (a) | | | 25,886 | | | | 498,047 | | | |
| The Middleby Corp. (a)* | | | 78,850 | | | | 4,919,452 | | | |
| Tredegar Corp. (a) | | | 9,888 | | | | 180,060 | | | |
| Triumph Group, Inc. (a) | | | 88,588 | | | | 5,043,315 | | | |
| Twin Disc, Inc. (a) | | | 120,820 | | | | 1,911,372 | | | |
| Valmont Industries, Inc. (a) | | | 2,070 | | | | 181,932 | | | |
| Willis Lease Finance Corp. * | | | 72,568 | | | | 912,180 | | | |
| Woodward Governor Co. (a) | | | 423,275 | | | | 11,309,908 | | | |
| | | | | | | |
| | | | | | | | 81,754,916 | | | |
Commercial Services & Supplies 4.3% |
| |
| A.T. Cross Co., Class A (a)* | | | 35,330 | | | | 242,011 | | | |
| ABM Industries, Inc. (a) | | | 480 | | | | 10,771 | | | |
| Avalon Holdings Corp., Class A * | | | 9,680 | | | | 58,080 | | | |
| CDI Corp. (a) | | | 112,090 | | | | 2,807,854 | | | |
| Champion Industries, Inc. (a) | | | 20,740 | | | | 108,263 | | | |
| Comfort Systems USA, Inc. (a) | | | 217,469 | | | | 2,829,272 | | | |
| CompX International, Inc. (a) | | | 5,660 | | | | 52,072 | | | |
| Deluxe Corp. (a) | | | 78,461 | | | | 1,507,236 | | | |
| Ecology & Environment, Inc., Class A (a) | | | 25,430 | | | | 303,888 | | | |
| Exponent, Inc. (a)* | | | 99,554 | | | | 3,269,353 | | | |
| GeoEye, Inc. (a)* | | | 94,995 | | | | 2,468,920 | | | |
| GP Strategies Corp. * | | | 22,050 | | | | 209,475 | | | |
| Interface, Inc., Class A (a) | | | 935 | | | | 13,137 | | | |
| Kelly Services, Inc., Class A (a) | | | 196,775 | | | | 4,045,694 | | | |
| Layne Christensen Co. (a)* | | | 61,538 | | | | 2,155,061 | | | |
| LECG Corp. (a)* | | | 87,492 | | | | 818,925 | | | |
| Nashua Corp. * | | | 20,530 | | | | 225,625 | | | |
| National Technical Systems, Inc. * | | | 10,376 | | | | 61,737 | | | |
| North American Galvanizing & Coatings, Inc. * | | | 40,636 | | | | 223,498 | | | |
| RCM Technologies, Inc. (a)* | | | 98,583 | | | | 380,530 | | | |
| Spherion Corp. (a)* | | | 417,013 | | | | 2,552,120 | | | |
| Steelcase, Inc., Class A (a) | | | 3,900 | | | | 43,134 | | | |
| Tufco Technologies, Inc. * | | | 17,215 | | | | 106,561 | | | |
| Virco Manufacturing Corp. (a) | | | 22,650 | | | | 118,460 | | | |
| VSE Corp. | | | 16,602 | | | | 468,674 | | | |
| Waste Industries USA, Inc. (a) | | | 33,295 | | | | 1,203,614 | | | |
| Westaff, Inc. (a)* | | | 74,331 | | | | 160,555 | | | |
| | | | | | | |
| | | | | | | | 26,444,520 | | | |
Consumer Durables & Apparel 4.0% |
| |
| Aldila, Inc. | | | 21,474 | | | | 244,804 | | | |
| American Biltrite, Inc. * | | | 18,550 | | | | 132,632 | | | |
| American Greetings Corp., Class A (a) | | | 65,420 | | | | 1,213,541 | | | |
| Blyth, Inc. (a) | | | 124,288 | | | | 2,450,959 | | | |
| Callaway Golf Co. (a) | | | 125,248 | | | | 1,838,641 | | | |
| CSS Industries, Inc. (a) | | | 15,150 | | | | 529,644 | | | |
| Culp, Inc. (a)* | | | 54,440 | | | | 409,389 | | | |
See financial notes.
38 Laudus U.S. Equity Funds
Laudus Rosenberg U.S. Small Capitalization Fund
| | | | | | | | | | | |
| | | Number of | | Value | | |
| Security | | Shares | | ($) | | |
| Deckers Outdoor Corp. (a)* | | | 30,224 | | | | 3,258,752 | | | |
| Decorator Industries, Inc. (a) | | | 690 | | | | 2,532 | | | |
| Delta Apparel, Inc. (a) | | | 11,171 | | | | 67,473 | | | |
| Flexsteel Industries, Inc. (a) | | | 21,910 | | | | 295,347 | | | |
| Hooker Furniture Corp. (a) | | | 22,349 | | | | 499,277 | | | |
| Jaclyn, Inc. (a)* | | | 470 | | | | 4,033 | | | |
| JAKKS Pacific, Inc. (a)* | | | 216,860 | | | | 5,978,830 | | | |
| LaCrosse Footwear, Inc. (a) | | | 1,158 | | | | 18,377 | | | |
| Man Sang Holdings, Inc. (a)* | | | 200 | | | | 1,334 | | | |
| Movado Group, Inc. (a) | | | 128,541 | | | | 2,505,264 | | | |
| National Presto Industries, Inc. (a) | | | 13,830 | | | | 724,692 | | | |
| P & F Industries, Inc., Class A * | | | 16,530 | | | | 105,792 | | | |
| Q.E.P. Co., Inc. * | | | 7,548 | | | | 56,987 | | | |
| UniFirst Corp. (a) | | | 46,960 | | | | 1,741,746 | | | |
| Universal Electronics, Inc. (a)* | | | 86,957 | | | | 2,105,229 | | | |
| Weyco Group, Inc. (a) | | | 1,979 | | | | 58,717 | | | |
| | | | | | | |
| | | | | | | | 24,243,992 | | | |
Consumer Services 2.4% |
| |
| Ark Restaurants Corp. (a) | | | 24,752 | | | | 717,808 | | | |
| Bally Technologies, Inc. (a)* | | | 4 | | | | 137 | | | |
| Bob Evans Farms, Inc. (a) | | | 152,716 | | | | 4,213,434 | | | |
| CBRL Group, Inc. (a) | | | 1,986 | | | | 71,039 | | | |
| Churchill Downs, Inc. (a) | | | 3,700 | | | | 174,788 | | | |
| Frisch’s Restaurants, Inc. | | | 26,420 | | | | 607,660 | | | |
| ILX Resorts, Inc. | | | 18,950 | | | | 96,645 | | | |
| INVESTools, Inc. (a)* | | | 10,075 | | | | 110,724 | | | |
| J. Alexander’s Corp. | | | 29,420 | | | | 243,598 | | | |
| Nathan’s Famous, Inc. (a)* | | | 3,065 | | | | 42,910 | | | |
| Nobel Learning Communities, Inc. * | | | 4,790 | | | | 64,090 | | | |
| Red Lion Hotels Corp. (a)* | | | 81,011 | | | | 693,454 | | | |
| Silverleaf Resorts, Inc. (a)* | | | 152,095 | | | | 345,256 | | | |
| Speedway Motorsports, Inc. (a) | | | 3,580 | | | | 89,751 | | | |
| Star Buffet, Inc. (a) | | | 7,383 | | | | 52,936 | | | |
| WMS Industries, Inc. (a)* | | | 192,651 | | | | 6,929,657 | | | |
| | | | | | | |
| | | | | | | | 14,453,887 | | | |
Diversified Financials 1.0% |
| |
| American Physicians Service Group, Inc. | | | 29,398 | | | | 575,613 | | | |
| California First National Bancorp | | | 35,001 | | | | 356,310 | | | |
| GAMCO Investors, Inc., Class A (a) | | | 14,870 | | | | 748,853 | | | |
| Greenhill & Co., Inc. (a) | | | 8,163 | | | | 567,818 | | | |
| Knight Capital Group, Inc., Class A (a)* | | | 146,503 | | | | 2,379,209 | | | |
| MicroFinancial, Inc. (a) | | | 48,620 | | | | 254,283 | | | |
| Stifel Financial Corp. (a)* | | | 25,421 | | | | 1,141,403 | | | |
| | | | | | | |
| | | | | | | | 6,023,489 | | | |
Energy 11.9% |
| |
| Adams Resources & Energy, Inc. (a) | | | 30,350 | | | | 843,730 | | | |
| Alpha Natural Resources, Inc. (a)* | | | 13,487 | | | | 585,875 | | | |
| Atlas America, Inc. (a) | | | 313 | | | | 18,918 | | | |
| ATP Oil & Gas Corp. * | | | 6,578 | | | | 215,232 | | | |
| Atwood Oceanics, Inc. (a)* | | | 110,880 | | | | 10,169,914 | | | |
| Berry Petroleum Co., Class A | | | 3,120 | | | | 145,049 | | | |
| Bill Barrett Corp. (a)* | | | 13,293 | | | | 628,094 | | | |
| Complete Production Services, Inc. (a)* | | | 20,234 | | | | 464,168 | | | |
| Comstock Resources, Inc. (a)* | | | 23,340 | | | | 940,602 | | | |
| Contango Oil & Gas Co. (a)* | | | 940 | | | | 60,733 | | | |
| Crosstex Energy, Inc. (a) | | | 13,085 | | | | 444,236 | | | |
| Dawson Geophysical Co. (a)* | | | 52,798 | | | | 3,563,865 | | | |
| Dril-Quip, Inc. (a)* | | | 11,098 | | | | 515,724 | | | |
| Encore Acquisition Co. * | | | 18,289 | | | | 736,681 | | | |
| EXCO Resources, Inc. (a)* | | | 124,920 | | | | 2,311,020 | | | |
| Gulf Island Fabrication, Inc. | | | 190 | | | | 5,457 | | | |
| GulfMark Offshore, Inc. (a)* | | | 62,111 | | | | 3,398,714 | | | |
| Harvest Natural Resources, Inc. (a)* | | | 1,478 | | | | 17,825 | | | |
| Hornbeck Offshore Services, Inc. (a)* | | | 99,311 | | | | 4,535,533 | | | |
| International Coal Group, Inc. (a)* | | | 4,672 | | | | 29,667 | | | |
| ION Geophysical Corp. (a)* | | | 232,019 | | | | 3,201,862 | | | |
| Lufkin Industries, Inc. (a) | | | 64,811 | | | | 4,136,238 | | | |
| Mariner Energy, Inc. (a)* | | | 389,331 | | | | 10,515,830 | | | |
| McMoRan Exploration Co. (a)* | | | 5,200 | | | | 89,908 | | | |
| Oil States International, Inc. (a)* | | | 156,395 | | | | 7,008,060 | | | |
| Penn Virginia Corp. | | | 157,358 | | | | 6,937,914 | | | |
| Petrohawk Energy Corp. (a)* | | | 14,360 | | | | 289,641 | | | |
| Rosetta Resources, Inc. (a)* | | | 125,520 | | | | 2,468,979 | | | |
| Stone Energy Corp. (a)* | | | 770 | | | | 40,279 | | | |
| Swift Energy Co. (a)* | | | 87,851 | | | | 3,952,417 | | | |
| T-3 Energy Services, Inc. (a)* | | | 29,813 | | | | 1,268,841 | | | |
| Trico Marine Services, Inc. (a)* | | | 60,144 | | | | 2,343,812 | | | |
| Union Drilling, Inc. (a)* | | | 42,088 | | | | 736,119 | | | |
| Venoco, Inc. (a)* | | | 5,610 | | | | 65,188 | | | |
| W&T Offshore, Inc. (a) | | | 1,120 | | | | 38,203 | | | |
| Whiting Petroleum Corp. (a)* | | | 220 | | | | 14,223 | | | |
| | | | | | | |
| | | | | | | | 72,738,551 | | | |
Food & Staples Retailing 2.0% |
| |
| Arden Group, Inc., Class A (a) | | | 302 | | | | 43,186 | | | |
| Casey’s General Stores, Inc. (a) | | | 18,814 | | | | 425,196 | | | |
| Ingles Markets, Inc., Class A (a) | | | 1,720 | | | | 42,295 | | | |
| Longs Drug Stores Corp. (a) | | | 166,653 | | | | 7,076,086 | | | |
| Nash Finch Co. (a) | | | 63,792 | | | | 2,167,652 | | | |
| Ruddick Corp. (a) | | | 1,360 | | | | 50,130 | | | |
| Susser Holdings Corp. * | | | 7,460 | | | | 140,024 | | | |
| Village Super Market, Inc., Class A (a) | | | 32,834 | | | | 1,690,951 | | | |
| Weis Markets, Inc. (a) | | | 26,618 | | | | 917,523 | | | |
| | | | | | | |
| | | | | | | | 12,553,043 | | | |
Food, Beverage & Tobacco 1.2% |
| |
| Cal-Maine Foods, Inc. (a) | | | 64,375 | | | | 2,148,837 | | | |
| Chiquita Brands International, Inc. * | | | 59,160 | | | | 1,367,188 | | | |
| Darling International, Inc. (a)* | | | 970 | | | | 12,561 | | | |
| Flowers Foods, Inc. (a) | | | 2,380 | | | | 58,905 | | | |
| Fresh Del Monte Produce, Inc. (a)* | | | 92,000 | | | | 3,348,800 | | | |
| Omega Protein Corp. (a)* | | | 25,962 | | | | 354,381 | | | |
| Seneca Foods Corp., Class B * | | | 390 | | | | 8,132 | | | |
| Tasty Baking Co. (a) | | | 33,007 | | | | 188,140 | | | |
| | | | | | | |
| | | | | | | | 7,486,944 | | | |
Health Care Equipment & Services 6.1% |
| |
| Allied Healthcare Products, Inc. * | | | 75,542 | | | | 466,849 | | | |
| American Shared Hospital Services (a) | | | 28,138 | | | | 67,531 | | | |
| Analogic Corp. (a) | | | 3 | | | | 200 | | | |
| AngioDynamics, Inc. (a)* | | | 22,580 | | | | 261,025 | | | |
| Atrion Corp. | | | 12,270 | | | | 1,226,264 | | | |
| Cardiac Science Corp. (a)* | | | 109,630 | | | | 915,410 | | | |
See financial notes.
Laudus U.S. Equity Funds 39
Laudus Rosenberg U.S. Small Capitalization Fund
Portfolio Holdings continued
| | | | | | | | | | | |
| | | Number of | | Value | | |
| Security | | Shares | | ($) | | |
| CONMED Corp. (a)* | | | 53,230 | | | | 1,364,817 | | | |
| Cynosure, Inc., Class A (a)* | | | 29,680 | | | | 632,184 | | | |
| Datascope Corp. (a) | | | 134,134 | | | | 5,557,172 | | | |
| Gentiva Health Services, Inc. (a)* | | | 33,891 | | | | 737,468 | | | |
| Greatbatch, Inc. (a)* | | | 2,340 | | | | 43,079 | | | |
| Hanger Orthopedic Group, Inc. (a)* | | | 55,483 | | | | 598,107 | | | |
| HMS Holdings Corp. (a)* | | | 89,312 | | | | 2,549,858 | | | |
| Integra LifeSciences Holdings (a)* | | | 71,365 | | | | 3,102,236 | | | |
| IntegraMed America, Inc. * | | | 33,034 | | | | 323,403 | | | |
| Invacare Corp. (a) | | | 39,233 | | | | 874,111 | | | |
| Kewaunee Scientific Corp. (a) | | | 24,858 | | | | 372,870 | | | |
| Kindred Healthcare, Inc. (a)* | | | 141,673 | | | | 3,098,388 | | | |
| MedCath Corp. (a)* | | | 63,164 | | | | 1,149,585 | | | |
| MTS Medication Technologies (a)* | | | 4,380 | | | | 53,436 | | | |
| National Dentex Corp. * | | | 47,550 | | | | 612,919 | | | |
| National Healthcare Corp. (a) | | | 45,687 | | | | 2,224,957 | | | |
| Orthofix International N.V. (a)* | | | 62,184 | | | | 2,473,058 | | | |
| Radnet, Inc. * | | | 1,667 | | | | 11,736 | | | |
| RehabCare Group, Inc. (a)* | | | 22,710 | | | | 340,650 | | | |
| Res-Care, Inc. (a)* | | | 175,407 | | | | 3,008,230 | | | |
| Skilled Healthcare Group, Inc., Class A (a)* | | | 111,911 | | | | 1,228,783 | | | |
| SonoSite, Inc. (a)* | | | 13,146 | | | | 373,741 | | | |
| Span-America Medical Systems, Inc. (a) | | | 26,220 | | | | 309,396 | | | |
| SRI/ Surgical Express, Inc. (a)* | | | 3,202 | | | | 13,769 | | | |
| Theragenics Corp. (a)* | | | 141,295 | | | | 556,702 | | | |
| Zoll Medical Corp. (a)* | | | 117,088 | | | | 3,113,370 | | | |
| | | | | | | |
| | | | | | | | 37,661,304 | | | |
Household & Personal Products 0.3% |
| |
| Cascade International, Inc. (a)(b)(c)(d)* | | | 37,660 | | | | — | | | |
| Geopharma, Inc. (a)* | | | 13,958 | | | | 36,151 | | | |
| Inter Parfums, Inc. (a) | | | 8,232 | | | | 181,763 | | | |
| Natural Alternative International, Inc. * | | | 34,822 | | | | 313,398 | | | |
| Nutraceutical International Corp. (a)* | | | 22,913 | | | | 297,869 | | | |
| Oil-Dri Corp. of America | | | 13,959 | | | | 249,726 | | | |
| Schiff Nutrition International, Inc. | | | 128,840 | | | | 771,752 | | | |
| | | | | | | |
| | | | | | | | 1,850,659 | | | |
Insurance 6.3% |
| |
| Alleghany Corp. (a)* | | | 8 | | | | 2,786 | | | |
| American National Insurance Co. (a) | | | 375 | | | | 40,012 | | | |
| American Safety Insurance Holdings Ltd. * | | | 56,270 | | | | 962,217 | | | |
| Aspen Insurance Holdings Ltd. (a) | | | 245,300 | | | | 6,471,014 | | | |
| Delphi Financial Group, Inc., Class A (a) | | | 199,896 | | | | 5,842,960 | | | |
| Flagstone Reinsurance Holdings Ltd. (a) | | | 18,479 | | | | 223,596 | | | |
| FPIC Insurance Group, Inc. (a)* | | | 71,127 | | | | 3,352,927 | | | |
| Hallmark Financial Services, Inc. (a)* | | | 6,312 | | | | 70,442 | | | |
| Harleysville Group, Inc. (a) | | | 12,576 | | | | 453,868 | | | |
| Horace Mann Educators Corp. (a) | | | 386,481 | | | | 6,755,688 | | | |
| IPC Holdings Ltd. (a) | | | 24,661 | | | | 690,508 | | | |
| Kansas City Life Insurance Co. (a) | | | 37,181 | | | | 1,786,919 | | | |
| Mercer Insurance Group, Inc. | | | 5,089 | | | | 88,498 | | | |
| National Western Life Insurance Co., Class A (a) | | | 23,320 | | | | 5,055,543 | | | |
| Presidential Life Corp. (a) | | | 84,114 | | | | 1,466,948 | | | |
| Seabright Insurance Holdings (a)* | | | 12,505 | | | | 184,199 | | | |
| Unico American Corp. * | | | 48,686 | | | | 457,648 | | | |
| United America Indemnity Ltd., Class A (a)* | | | 213,400 | | | | 4,110,084 | | | |
| Universal Insurance Holdings, Inc. (a) | | | 157,800 | | | | 596,484 | | | |
| | | | | | | |
| | | | | | | | 38,612,341 | | | |
Materials 6.7% |
| |
| A. Schulman, Inc. (a) | | | 229,173 | | | | 4,704,922 | | | |
| A.M. Castle & Co. (a) | | | 14,723 | | | | 397,521 | | | |
| American Pacific Corp. (a)* | | | 14,245 | | | | 227,493 | | | |
| Arch Chemicals, Inc. (a) | | | 26,564 | | | | 989,775 | | | |
| Century Aluminum Co. (a)* | | | 8,903 | | | | 589,735 | | | |
| Coeur d’Alene Mines Corp. (a)* | | | 11,350 | | | | 45,854 | | | |
| Compass Minerals International, Inc. (a) | | | 12,978 | | | | 765,442 | | | |
| Constar International, Inc. (a)* | | | 10,588 | | | | 27,740 | | | |
| Continental Materials Corp. (a)* | | | 6,350 | | | | 149,542 | | | |
| Friedman Industries, Inc. | | | 21,890 | | | | 112,733 | | | |
| Glatfelter (a) | | | 22,210 | | | | 335,593 | | | |
| Hercules, Inc. | | | 20,909 | | | | 382,426 | | | |
| Innophos Holdings, Inc. (a) | | | 2,780 | | | | 44,730 | | | |
| Innospec, Inc. (a) | | | 36,486 | | | | 773,503 | | | |
| Kaiser Aluminum Corp. (a) | | | 35,964 | | | | 2,492,305 | | | |
| LSB Industries, Inc. (a)* | | | 8,540 | | | | 125,880 | | | |
| Minerals Technologies, Inc. (a) | | | 5,320 | | | | 334,096 | | | |
| Olin Corp. (a) | | | 65,035 | | | | 1,285,092 | | | |
| Olympic Steel, Inc. (a) | | | 24,648 | | | | 1,111,625 | | | |
| OM Group, Inc. * | | | 1,500 | | | | 81,810 | | | |
| Penford Corp. (a) | | | 14,011 | | | | 304,459 | | | |
| PolyOne Corp. (a)* | | | 61,525 | | | | 391,914 | | | |
| Rock of Ages Corp. * | | | 5,960 | | | | 23,602 | | | |
| Rockwood Holdings, Inc. (a)* | | | 180 | | | | 5,899 | | | |
| Schnitzer Steel Industries, Inc., Class A (a) | | | 112,321 | | | | 7,977,037 | | | |
| Schweitzer-Mauduit International, Inc. (a) | | | 61,800 | | | | 1,430,052 | | | |
| Stepan Co. (a) | | | 37,660 | | | | 1,439,742 | | | |
| Stillwater Mining Co. (a)* | | | 8,110 | | | | 125,462 | | | |
| Terra Industries, Inc. (a)* | | | 251,206 | | | | 8,925,349 | | | |
| The Scotts Miracle-Gro Co., Class A (a) | | | 99,746 | | | | 3,233,765 | | | |
| U.S. Energy Corp. (a) | | | 1,750 | | | | 5,862 | | | |
| UFP Technologies, Inc. * | | | 2,460 | | | | 19,065 | | | |
| Worthington Industries, Inc. (a) | | | 142,094 | | | | 2,397,126 | | | |
| | | | | | | |
| | | | | | | | 41,257,151 | | | |
Media 0.9% |
| |
| Alloy, Inc. (a)* | | | 65,314 | | | | 480,058 | | | |
| DG Fastchannel, Inc. (a)* | | | 1,567 | | | | 30,055 | | | |
| New Frontier Media, Inc. | | | 3,020 | | | | 13,469 | | | |
| Scholastic Corp. (a)* | | | 158,060 | | | | 4,784,476 | | | |
| Triple Crown Media, Inc. * | | | 10,084 | | | | 28,135 | | | |
| | | | | | | |
| | | | | | | | 5,336,193 | | | |
See financial notes.
40 Laudus U.S. Equity Funds
Laudus Rosenberg U.S. Small Capitalization Fund
| | | | | | | | | | | |
| | | Number of | | Value | | |
| Security | | Shares | | ($) | | |
Pharmaceuticals & Biotechnology 4.2% |
| |
| Albany Molecular Research, Inc. (a)* | | | 3,694 | | | | 44,845 | | | |
| Bioanalytical Systems, Inc. * | | | 580 | | | | 3,393 | | | |
| Bruker BioSciences Corp. (a)* | | | 237,059 | | | | 3,648,338 | | | |
| Cambrex Corp. (a) | | | 2,670 | | | | 18,503 | | | |
| Emergent Biosolutions, Inc. (a)* | | | 28,197 | | | | 251,517 | | | |
| Harvard Bioscience, Inc. (a)* | | | 103,862 | | | | 519,310 | | | |
| Illumina, Inc. (a)* | | | 45,782 | | | | 3,474,854 | | | |
| Kendle International, Inc. (a)* | | | 69,260 | | | | 3,111,159 | | | |
| Medicis Pharmaceutical Corp., Class A | | | 197,975 | | | | 3,898,128 | | | |
| Noven Pharmaceuticals, Inc. * | | | 890 | | | | 7,992 | | | |
| PAREXEL International Corp. (a)* | | | 242,998 | | | | 6,342,248 | | | |
| Pharmanet Development Group, Inc. (a)* | | | 6,313 | | | | 159,277 | | | |
| Sciele Pharma, Inc. (a)* | | | 78,327 | | | | 1,527,377 | | | |
| Varian, Inc. (a)* | | | 46,949 | | | | 2,719,286 | | | |
| | | | | | | |
| | | | | | | | 25,726,227 | | | |
Real Estate 3.3% |
| |
| Ashford Hospitality Trust (a) | | | 72,478 | | | | 411,675 | | | |
| Extra Space Storage, Inc. (a) | | | 87,893 | | | | 1,422,988 | | | |
| Gladstone Commercial Corp. (a) | | | 1,170 | | | | 18,193 | | | |
| Hersha Hospitality Trust (a) | | | 200,313 | | | | 1,808,826 | | | |
| J.W. Mays, Inc. * | | | 16,430 | | | | 327,778 | | | |
| LTC Properties, Inc. (a) | | | 135,283 | | | | 3,478,126 | | | |
| Medical Properties Trust, Inc. (a) | | | 248,860 | | | | 2,817,095 | | | |
| MHI Hospitality Corp. (a) | | | 510 | | | | 3,193 | | | |
| Mission West Properties, Inc. (a) | | | 86,808 | | | | 820,336 | | | |
| Monmouth Real Estate Investment Corp., Class A | | | 27,609 | | | | 220,872 | | | |
| National Retail Properties, Inc. | | | 53,390 | | | | 1,177,249 | | | |
| One Liberty Properties, Inc. | | | 38,130 | | | | 613,512 | | | |
| Ramco-Gershenson Properties Trust (a) | | | 29,355 | | | | 619,684 | | | |
| Reis, Inc. (a)* | | | 20,168 | | | | 107,899 | | | |
| Strategic Hotel & Resorts, Inc. (a) | | | 362,412 | | | | 4,758,470 | | | |
| Supertel Hospitality, Inc. (a) | | | 58,649 | | | | 310,840 | | | |
| United Capital Corp. * | | | 7,450 | | | | 162,037 | | | |
| Winthrop Realty Trust | | | 297,190 | | | | 1,224,423 | | | |
| | | | | | | |
| | | | | | | | 20,303,196 | | | |
Retailing 1.6% |
| |
| 1-800-FLOWERS.COM, Inc., Class A (a)* | | | 189,744 | | | | 1,614,722 | | | |
| AMCON Distributing Co. (a)* | | | 2,400 | | | | 74,064 | | | |
| Appliance Recycling Centers of America, Inc. * | | | 100 | | | | 491 | | | |
| Big Lots, Inc. (a)* | | | 20,580 | | | | 458,934 | | | |
| Coast Distribution System, Inc. | | | 17,137 | | | | 87,399 | | | |
| Duckwall-ALCO Stores, Inc. (a)* | | | 1,568 | | | | 17,875 | | | |
| Educational Development Corp. | | | 2,503 | | | | 14,492 | | | |
| Franklin Covey Co. * | | | 119,148 | | | | 893,610 | | | |
| Gaiam, Inc., Class A (a)* | | | 34,335 | | | | 594,682 | | | |
| GSI Commerce, Inc. (a)* | | | 25,745 | | | | 338,547 | | | |
| Hastings Entertainment, Inc. * | | | 78,370 | | | | 615,988 | | | |
| Jennifer Convertibles, Inc. * | | | 120 | | | | 275 | | | |
| Jo-Ann Stores, Inc. (a)* | | | 8,620 | | | | 126,973 | | | |
| Monro Muffler Brake, Inc. (a) | | | 45,446 | | | | 768,037 | | | |
| REX Stores Corp. (a)* | | | 52,199 | | | | 1,026,754 | | | |
| Sport Chalet, Inc., Class B (a)* | | | 2,931 | | | | 15,227 | | | |
| Sport Supply Group, Inc. (a) | | | 38,581 | | | | 461,043 | | | |
| Stage Stores, Inc. (a) | | | 115,149 | | | | 1,865,414 | | | |
| Systemax, Inc. (a) | | | 56,518 | | | | 681,607 | | | |
| The Aristotle Corp. * | | | 430 | | | | 4,489 | | | |
| The Bon-Ton Stores, Inc. (a) | | | 12,170 | | | | 66,570 | | | |
| Trans World Entertainment Corp. (a)* | | | 42,344 | | | | 159,213 | | | |
| | | | | | | |
| | | | | | | | 9,886,406 | | | |
Semiconductors & Semiconductor Equipment 3.4% |
| |
| CEVA, Inc. (a)* | | | 95,904 | | | | 733,665 | | | |
| Cirrus Logic, Inc. (a)* | | | 35,299 | | | | 237,209 | | | |
| FEI Co. (a)* | | | 131,912 | | | | 2,879,639 | | | |
| hi/fn, Inc. * | | | 890 | | | | 4,539 | | | |
| Monolithic Power Systems (a)* | | | 2,008 | | | | 35,401 | | | |
| Pericom Semiconductor Corp. (a)* | | | 128,354 | | | | 1,884,237 | | | |
| Skyworks Solutions, Inc. (a)* | | | 886,572 | | | | 6,454,244 | | | |
| Standard Microsystems Corp. (a)* | | | 143,265 | | | | 4,180,473 | | | |
| TriQuint Semiconductor, Inc. (a)* | | | 226,778 | | | | 1,147,497 | | | |
| Zoran Corp. (a)* | | | 233,902 | | | | 3,195,101 | | | |
| | | | | | | |
| | | | | | | | 20,752,005 | | | |
Software & Services 11.1% |
| |
| AsiaInfo Holdings, Inc. (a)* | | | 4,014 | | | | 43,592 | | | |
| Astea International, Inc. * | | | 17,870 | | | | 69,872 | | | |
| Chordiant Software, Inc. (a)* | | | 89,300 | | | | 538,479 | | | |
| CIBER, Inc. (a)* | | | 272,306 | | | | 1,334,299 | | | |
| Computer Task Group, Inc. * | | | 68,846 | | | | 283,645 | | | |
| CSP, Inc. (a)* | | | 19,112 | | | | 115,245 | | | |
| EarthLink, Inc. (a)* | | | 162,063 | | | | 1,223,576 | | | |
| Edgewater Technology, Inc. (a)* | | | 106,794 | | | | 562,804 | | | |
| EPIQ Systems, Inc. (a)* | | | 9,638 | | | | 149,582 | | | |
| Fair Isaac Corp. | | | 15,650 | | | | 336,788 | | | |
| Hackett Group, Inc. * | | | 31,964 | | | | 124,979 | | | |
| Interwoven, Inc. (a)* | | | 140,648 | | | | 1,502,121 | | | |
| JDA Software Group, Inc. (a)* | | | 136,075 | | | | 2,483,369 | | | |
| Lawson Software, Inc. * | | | 553,543 | | | | 4,168,179 | | | |
| MAXIMUS, Inc. (a) | | | 79,096 | | | | 2,903,614 | | | |
| Mentor Graphics Corp. (a)* | | | 170,747 | | | | 1,507,696 | | | |
| MPS Group, Inc. (a)* | | | 721,648 | | | | 8,529,879 | | | |
| Ness Technologies, Inc. (a)* | | | 28,442 | | | | 269,915 | | | |
| NetScout Systems, Inc. (a)* | | | 89,309 | | | | 830,574 | | | |
| Perot Systems Corp., Class A (a)* | | | 686,770 | | | | 10,329,021 | | | |
| Phoenix Technologies Ltd. * | | | 10,260 | | | | 160,672 | | | |
| QAD, Inc. (a) | | | 8,271 | | | | 69,559 | | | |
| Radiant Systems, Inc. (a)* | | | 19,250 | | | | 268,922 | | | |
| S1 Corp. (a)* | | | 59,335 | | | | 421,872 | | | |
| Sapient Corp. (a)* | | | 190,995 | | | | 1,329,325 | | | |
| Solera Holdings, Inc. (a)* | | | 7,575 | | | | 184,527 | | | |
| SonicWALL, Inc. (a)* | | | 317,623 | | | | 2,594,980 | | | |
| SPSS, Inc. (a)* | | | 123,837 | | | | 4,802,399 | | | |
| SumTotal Systems, Inc. (a)* | | | 32,388 | | | | 135,058 | | | |
| Sybase, Inc. (a)* | | | 362,186 | | | | 9,525,492 | | | |
| TechTeam Global, Inc. (a)* | | | 53,045 | | | | 480,057 | | | |
| TIBCO Software, Inc. * | | | 8,870 | | | | 63,332 | | | |
| TNS, Inc. (a)* | | | 125,442 | | | | 2,589,123 | | | |
| TSR, Inc. | | | 49,080 | | | | 206,136 | | | |
| Unisys Corp. (a)* | | | 403,378 | | | | 1,786,964 | | | |
| United Online, Inc. (a) | | | 496,585 | | | | 5,243,938 | | | |
| Vignette Corp. (a)* | | | 69,495 | | | | 918,029 | | | |
| | | | | | | |
| | | | | | | | 68,087,614 | | | |
See financial notes.
Laudus U.S. Equity Funds 41
Laudus Rosenberg U.S. Small Capitalization Fund
Portfolio Holdings continued
| | | | | | | | | | | |
| | | Number of | | Value | | |
| Security | | Shares | | ($) | | |
Technology Hardware & Equipment 5.9% |
| |
| Aetrium, Inc. (a)* | | | 2,020 | | | | 7,939 | | | |
| Allied Motion Technologies, Inc. * | | | 43,156 | | | | 204,559 | | | |
| Astro-Med, Inc. (a) | | | 25,734 | | | | 230,319 | | | |
| Black Box Corp. (a) | | | 161,880 | | | | 4,993,998 | | | |
| Bonso Electronic International, Inc. * | | | 25,562 | | | | 52,913 | | | |
| Coherent, Inc. (a)* | | | 2,363 | | | | 65,904 | | | |
| Communications Systems, Inc. | | | 57,540 | | | | 619,706 | | | |
| CTS Corp. (a) | | | 86,286 | | | | 923,260 | | | |
| Data I/O Corp. (a)* | | | 1,936 | | | | 8,422 | | | |
| Digi International, Inc. (a)* | | | 141,451 | | | | 1,632,345 | | | |
| Electro Scientific Industries, Inc. (a)* | | | 44,295 | | | | 729,982 | | | |
| EMS Technologies, Inc. (a)* | | | 40,442 | | | | 1,097,596 | | | |
| Emulex Corp. (a)* | | | 232,525 | | | | 3,776,206 | | | |
| FLIR Systems, Inc. (a)* | | | 76,444 | | | | 2,300,200 | | | |
| Gerber Scientific, Inc. (a)* | | | 49,677 | | | | 441,629 | | | |
| Globecomm Systems, Inc. (a)* | | | 14,841 | | | | 129,117 | | | |
| Harmonic, Inc. (a)* | | | 82,480 | | | | 626,848 | | | |
| Insight Enterprises, Inc. (a)* | | | 246,729 | | | | 4,317,757 | | | |
| IntriCon Corp. (a)* | | | 20,400 | | | | 162,996 | | | |
| Keithley Instruments, Inc. (a) | | | 385 | | | | 3,734 | | | |
| Key Tronic Corp. (a)* | | | 2,420 | | | | 6,268 | | | |
| Loral Space & Communications, Inc. (a)* | | | 54,377 | | | | 1,296,348 | | | |
| Measurement Specialties, Inc. (a)* | | | 4,380 | | | | 76,519 | | | |
| Mesa Laboratories, Inc. | | | 1,640 | | | | 36,736 | | | |
| Methode Electronics, Inc. (a) | | | 64,718 | | | | 756,553 | | | |
| Network Equipment Technologies, Inc. (a)* | | | 22,950 | | | | 150,781 | | | |
| O.I. Corp. (a) | | | 28,114 | | | | 331,745 | | | |
| Oplink Communications, Inc. (a)* | | | 84,175 | | | | 746,632 | | | |
| Optical Cable Corp. (a)* | | | 1,140 | | | | 5,700 | | | |
| OSI Systems, Inc. (a)* | | | 27,307 | | | | 628,607 | | | |
| Perceptron, Inc. * | | | 30,655 | | | | 388,399 | | | |
| Rofin-Sinar Technologies, Inc. (a)* | | | 10,964 | | | | 492,284 | | | |
| Schmitt Industries, Inc. * | | | 8,703 | | | | 51,783 | | | |
| SeaChange International, Inc. (a)* | | | 3,740 | | | | 26,292 | | | |
| Soapstone Networks, Inc. (a) | | | 8 | | | | 57 | | | |
| Spectrum Control, Inc. * | | | 91,736 | | | | 776,087 | | | |
| Sutron Corp. * | | | 800 | | | | 5,600 | | | |
| Technitrol, Inc. (a) | | | 295,810 | | | | 6,842,085 | | | |
| Tekelec * | | | 4,469 | | | | 55,639 | | | |
| TESSCO Technologies, Inc. (a)* | | | 8,716 | | | | 130,740 | | | |
| Tollgrade Communications, Inc. * | | | 10,442 | | | | 54,716 | | | |
| Vicon Industries, Inc. (a)* | | | 33,740 | | | | 168,700 | | | |
| Zones, Inc. (a)* | | | 6,970 | | | | 57,224 | | | |
| Zygo Corp. (a)* | | | 83,273 | | | | 1,035,916 | | | |
| | | | | | | |
| | | | | | | | 36,446,841 | | | |
Telecommunication Services 1.1% |
| |
| Atlantic Tele-Network, Inc. (a) | | | 63,300 | | | | 2,141,439 | | | |
| D&E Communications, Inc. | | | 53,724 | | | | 478,144 | | | |
| Gilat Satellite Networks Ltd. (a)* | | | 220,120 | | | | 2,383,900 | | | |
| HickoryTech Corp. | | | 2,830 | | | | 23,121 | | | |
| Hungarian Telephone & Cable Corp. (a)* | | | 6,900 | | | | 119,715 | | | |
| Premiere Global Services, Inc. (a)* | | | 68,048 | | | | 975,808 | | | |
| USA Mobility, Inc. (a)* | | | 78,403 | | | | 559,797 | | | |
| | | | | | | |
| | | | | | | | 6,681,924 | | | |
Transportation 0.6% |
| |
| Air T., Inc. | | | 575 | | | | 5,531 | | | |
| B & H Ocean Carriers Ltd. * | | | 17,030 | | | | 177,538 | | | |
| Dynamex, Inc. (a)* | | | 53,552 | | | | 1,354,866 | | | |
| Genco Shipping & Trading Ltd. (a) | | | 11,278 | | | | 636,418 | | | |
| International Shipholding Corp. * | | | 12,810 | | | | 245,696 | | | |
| Park-Ohio Holdings Corp. (a)* | | | 7,090 | | | | 111,384 | | | |
| Pinnacle Airlines Corp. (a)* | | | 7,065 | | | | 61,677 | | | |
| SkyWest, Inc. (a) | | | 44,659 | | | | 943,198 | | | |
| | | | | | | |
| | | | | | | | 3,536,308 | | | |
Utilities 2.4% |
| |
| Artesian Resources Corp., Class A (a) | | | 14,445 | | | | 267,666 | | | |
| CH Energy Group, Inc. (a) | | | 140,455 | | | | 5,463,699 | | | |
| Delta Natural Gas Co., Inc. (a) | | | 6,456 | | | | 159,399 | | | |
| El Paso Electric Co. (a)* | | | 1,000 | | | | 21,370 | | | |
| Energy West, Inc. | | | 4,995 | | | | 43,706 | | | |
| Florida Public Utilities Co. | | | 6,490 | | | | 72,363 | | | |
| Maine & Maritimes Corp. * | | | 7,077 | | | | 196,741 | | | |
| NorthWestern Corp. (a) | | | 156,794 | | | | 3,821,070 | | | |
| Portland General Electric Co. (a) | | | 22,221 | | | | 501,083 | | | |
| RGC Resources, Inc. | | | 3,210 | | | | 89,431 | | | |
| The Empire District Electric Co. (a) | | | 2,981 | | | | 60,365 | | | |
| UIL Holdings Corp. (a) | | | 1,320 | | | | 39,772 | | | |
| Unisource Energy Corp. (a) | | | 160,033 | | | | 3,562,334 | | | |
| Unitil Corp. | | | 300 | | | | 8,085 | | | |
| WGL Holdings, Inc. (a) | | | 3,580 | | | | 114,775 | | | |
| | | | | | | |
| | | | | | | | 14,421,859 | | | |
| | | | | | | |
Total Common Stock
(Cost $552,025,608) | | | 604,735,597 | | | |
| | | | | | | |
| Foreign Common Stock 0.0% of net assets |
Bermuda 0.0% |
| |
| Telecommunication Services 0.0% |
| Global Crossing Ltd. (a)* | | | 15,636 | | | | 237,042 | | | |
| | | | | | | |
Total Foreign Common Stock
(Cost $245,080) | | | 237,042 | | | |
| | | | | | | |
| |
End of Investments. |
| |
| Collateral Invested for Securities on Loan 41.0% of net assets |
| State Street Navigator Security Lending Prime Portfolio | | | 251,007,699 | | | | 251,007,699 | | | |
| |
End of collateral invested for securities on loan. |
At 03/31/2008, the tax basis cost of the fund’s investments was $552,628,230 and the unrealized appreciation and depreciation were $99,330,008 and ($46,985,599), respectively, with a net unrealized appreciation of $52,344,409.
| |
| * | Non-income producing security. |
| |
| (a) | All or a portion of this security is on loan. |
| (b) | Fair-valued by management. |
| (c) | Bankrupt security/delisted. |
| (d) | Illiquid security. At the period end, the value of these amounted to $0 or 0.0% of net assets. |
See financial notes.
42 Laudus U.S. Equity Funds
Laudus Rosenberg Long/Short Equity Fund
Portfolio Holdings as of March 31, 2008
| | | | | | | | | | | | | |
| | | Cost | | Value |
| Holdings by Category | | ($) | | ($) |
| |
| | 96.4 | % | | Common Stock | | | 185,348,950 | | | | 190,396,715 | |
| | 2.8 | % | | Short-Term Investment | | | 5,461,514 | | | | 5,461,514 | |
| |
| | 99.2 | % | | Total Investments | | | 190,810,464 | | | | 195,858,229 | |
| | (93.6 | )% | | Short Sales | | | (235,881,827 | ) | | | (184,841,365 | ) |
| | — | % | | Rights | | | — | | | | (47 | ) |
| | 93.1 | % | | Deposits with broker and custodian bank for securities sold short | | | 183,925,872 | | | | 183,925,872 | |
| | 1.3 | % | | Other Assets and Liabilities | | | | | | | 2,588,751 | |
| |
| | 100.0 | % | | Net Assets | | | | | | | 197,531,440 | |
| | | | | | | | | | | |
| | | Number of | | Value | | |
| Security | | Shares | | ($) | | |
| Common Stock (a) 96.4% of net assets |
Automobiles & Components 0.5% |
| |
| Cooper Tire & Rubber Co. | | | 3,510 | | | | 52,545 | | | |
| Standard Motor Products, Inc. | | | 2,750 | | | | 16,830 | | | |
| Superior Industries International, Inc. | | | 3,500 | | | | 72,625 | | | |
| Thor Industries, Inc. | | | 8,004 | | | | 238,279 | | | |
| TRW Automotive Holdings Corp. * | | | 29,130 | | | | 680,768 | | | |
| | | | | | | |
| | | | | | | | 1,061,047 | | | |
Banks 3.2% |
| |
| 1st Independence Financial Group, Inc. | | | 1,380 | | | | 24,661 | | | |
| AMCORE Financial, Inc. | | | 9,384 | | | | 190,964 | | | |
| Ameriana Bancorp | | | 300 | | | | 2,619 | | | |
| American National Bankshares, Inc. | | | 4,800 | | | | 102,864 | | | |
| Anchor BanCorp Wisconsin, Inc. | | | 2,771 | | | | 52,566 | | | |
| Annapolis Bancorp, Inc. * | | | 800 | | | | 5,880 | | | |
| BancFirst Corp. | | | 2,600 | | | | 119,028 | | | |
| Banco Latinoamericano de Exportaciones, S.A., Class E | | | 18,240 | | | | 280,896 | | | |
| Berkshire Hills Bancorp, Inc. | | | 9,400 | | | | 236,786 | | | |
| Beverly Hills Bancorp, Inc. | | | 7,400 | | | | 18,722 | | | |
| Boston Private Financial Holdings, Inc. | | | 1,760 | | | | 18,638 | | | |
| C&F Financial Corp. | | | 30 | | | | 805 | | | |
| Camco Financial Corp. | | | 650 | | | | 7,153 | | | |
| Capital Bank Corp. | | | 200 | | | | 2,050 | | | |
| Cardinal Financial Corp. | | | 9,300 | | | | 82,491 | | | |
| Carver Bancorp, Inc. | | | 1,610 | | | | 18,805 | | | |
| CCF Holding Co. | | | 100 | | | | 602 | | | |
| Central Bancorp, Inc. | | | 100 | | | | 1,844 | | | |
| Central Virginia Bankshares, Inc. | | | 460 | | | | 8,096 | | | |
| Centrue Financial Corp. | | | 1,050 | | | | 20,475 | | | |
| CFS Bancorp, Inc. | | | 12,000 | | | | 172,440 | | | |
| Citizens South Banking Corp. | | | 300 | | | | 2,850 | | | |
| Codorus Valley Bancorp, Inc. | | | 2,786 | | | | 45,245 | | | |
| Community Bank Shares of Indiana, Inc. | | | 2,209 | | | | 43,352 | | | |
| Community Bankshares, Inc. | | | 1,840 | | | | 22,062 | | | |
| Community Capital Corp. | | | 2,752 | | | | 43,179 | | | |
| Community Financial Corp. | | | 3,600 | | | | 28,800 | | | |
| Crescent Banking Co. | | | 4,300 | | | | 47,300 | | | |
| Epic Bancorp | | | 700 | | | | 8,239 | | | |
| Farmers Capital Bank Corp. | | | 8,300 | | | | 196,959 | | | |
| Federal Agricultural Mortgage Corp., Class C | | | 7,850 | | | | 204,885 | | | |
| Fidelity Southern Corp. | | | 710 | | | | 5,971 | | | |
| First Bancorp of Indiana, Inc. | | | 300 | | | | 3,570 | | | |
| First Bancshares, Inc. * | | | 200 | | | | 3,306 | | | |
| First BancTrust Corp. | | | 400 | | | | 3,652 | | | |
| First Capital, Inc. | | | 1,632 | | | | 27,091 | | | |
| First Citizens BancShares, Inc., Class A | | | 380 | | | | 52,953 | | | |
| First Defiance Financial Corp. | | | 5,900 | | | | 108,265 | | | |
| First Federal Bancshares of Arkansas, Inc. | | | 1,954 | | | | 26,926 | | | |
| First Federal Bankshares, Inc. | | | 2,185 | | | | 30,153 | | | |
| First Financial Service Corp. | | | 121 | | | | 2,886 | | | |
| First M&F Corp. | | | 802 | | | | 11,629 | | | |
| First Merchants Corp. | | | 13,060 | | | | 372,732 | | | |
| First Niagara Financial Group, Inc. | | | 9,700 | | | | 131,823 | | | |
| First Niles Financial, Inc. | | | 99 | | | | 1,134 | | | |
| First PacTrust Bancorp, Inc. | | | 200 | | | | 3,317 | | | |
| First United Corp. | | | 4,188 | | | | 83,006 | | | |
| First West Virginia Bancorp, Inc. | | | 10 | | | | 158 | | | |
| FNB Corp. of North Carolina | | | 5,020 | | | | 52,710 | | | |
| Gateway Financial Holdings, Inc. | | | 11,100 | | | | 117,660 | | | |
| Great Pee Dee Bancorp, Inc. | | | 201 | | | | 4,625 | | | |
| Great Southern Bancorp, Inc. | | | 200 | | | | 3,122 | | | |
| Greene Bancshares, Inc. | | | 9,500 | | | | 168,055 | | | |
| GS Financial Corp. | | | 1,090 | | | | 18,121 | | | |
| Guaranty Federal Bancshares, Inc. | | | 2,700 | | | | 70,605 | | | |
| Habersham Bancorp | | | 1,410 | | | | 19,627 | | | |
| Harrington West Financial Group, Inc. | | | 460 | | | | 3,758 | | | |
| Hawthorn Bancshares, Inc. | | | 420 | | | | 11,550 | | | |
| HF Financial Corp. | | | 1,060 | | | | 16,960 | | | |
| HMN Financial, Inc. | | | 4,400 | | | | 101,552 | | | |
| Hopfed Bancorp, Inc. | | | 60 | | | | 797 | | | |
| Horizon Bancorp | | | 2,800 | | | | 64,092 | | | |
| IBERIABANK Corp. | | | 400 | | | | 17,700 | | | |
| LSB Financial Corp. | | | 800 | | | | 14,640 | | | |
| MASSBANK Corp. | | | 400 | | | | 15,492 | | | |
| MFB Corp. | | | 600 | | | | 19,971 | | | |
| Monarch Community Bancorp, Inc. | | | 2,800 | | | | 28,280 | | | |
| MutualFirst Financial, Inc. | | | 3,210 | | | | 42,276 | | | |
| National Bankshares, Inc. | | | 999 | | | | 17,792 | | | |
| NBT Bancorp, Inc. | | | 5,230 | | | | 116,106 | | | |
| New Hampshire Thrift Bancshares, Inc. | | | 4,381 | | | | 53,886 | | | |
| NewBridge Bancorp | | | 200 | | | | 1,752 | | | |
| North Central Bancshares, Inc. | | | 1,367 | | | | 40,402 | | | |
| Northrim BanCorp, Inc. | | | 2,022 | | | | 36,760 | | | |
| OceanFirst Financial Corp. | | | 9,607 | | | | 168,026 | | | |
| Pacific Premier Bancorp, Inc. * | | | 5,750 | | | | 40,250 | | | |
| Parkvale Financial Corp. | | | 1,810 | | | | 48,580 | | | |
| Peoples Bancorp of North Carolina | | | 833 | | | | 11,246 | | | |
| Premier Financial Bancorp, Inc. | | | 1,300 | | | | 15,015 | | | |
| Provident Community Bancshares, Inc. | | | 890 | | | | 15,798 | | | |
| Provident Financial Holdings, Inc. | | | 820 | | | | 13,153 | | | |
| QCR Holdings, Inc. | | | 620 | | | | 9,238 | | | |
See financial notes.
Laudus U.S. Equity Funds 43
Laudus Rosenberg Long/ Short Equity Fund
Portfolio Holdings continued
| | | | | | | | | | | |
| | | Number of | | Value | | |
| Security | | Shares | | ($) | | |
| Republic First Bancorp, Inc. * | | | 1,635 | | | | 8,061 | | | |
| River Valley Bancorp | | | 393 | | | | 5,419 | | | |
| Rurban Financial Corp. | | | 1,810 | | | | 18,516 | | | |
| Security National Financial Corp., Class A * | | | 105 | | | | 404 | | | |
| Severn Bancorp, Inc. | | | 9,283 | | | | 81,690 | | | |
| Simmons First National Corp., Class A | | | 13,800 | | | | 410,274 | | | |
| Southern First Bancshares, Inc. * | | | 1,490 | | | | 22,305 | | | |
| Southern Missouri Bancorp, Inc. | | | 1,800 | | | | 26,550 | | | |
| Southwest Bancorp, Inc. | | | 12,401 | | | | 217,142 | | | |
| StellarOne Corp. | | | 158 | | | | 2,672 | | | |
| Summit Financial Group, Inc. | | | 6,700 | | | | 95,140 | | | |
| Sun Bancorp, Inc. * | | | 12,293 | | | | 161,899 | | | |
| Superior Bancorp * | | | 24,053 | | | | 119,543 | | | |
| TF Financial Corp. | | | 3,100 | | | | 75,175 | | | |
| The Bank Holdings * | | | 460 | | | | 4,393 | | | |
| Tower Financial Corp. | | | 446 | | | | 4,861 | | | |
| United Bancshares, Inc. | | | 572 | | | | 8,008 | | | |
| United Community Financial Corp. | | | 3,800 | | | | 23,560 | | | |
| United Western Bancorp, Inc. | | | 5,860 | | | | 104,894 | | | |
| VIST Financial Corp. | | | 4,450 | | | | 79,922 | | | |
| Wainwright Bank & Trust Co. | | | 5,083 | | | | 62,673 | | | |
| Wayne Savings Bancshares, Inc. | | | 700 | | | | 6,773 | | | |
| Willow Financial Bancorp, Inc. | | | 13,700 | | | | 101,243 | | | |
| Wintrust Financial Corp. | | | 1,890 | | | | 66,056 | | | |
| WSB Holdings, Inc. | | | 800 | | | | 4,384 | | | |
| WSFS Financial Corp. | | | 5,980 | | | | 294,694 | | | |
| | | | | | | |
| | | | | | | | 6,265,676 | | | |
Capital Goods 9.7% |
| |
| Acuity Brands, Inc. | | | 29,330 | | | | 1,259,723 | | | |
| Aecom Technology Corp. * | | | 9,380 | | | | 243,974 | | | |
| AGCO Corp. * | | | 37,110 | | | | 2,222,147 | | | |
| Alliant Techsystems, Inc. * | | | 1,100 | | | | 113,883 | | | |
| Applied Industrial Technologies, Inc. | | | 4,940 | | | | 147,657 | | | |
| Chase Corp. | | | 3,200 | | | | 57,952 | | | |
| Chicago Rivet & Machine Co. | | | 600 | | | | 13,440 | | | |
| Crane Co. | | | 15,598 | | | | 629,379 | | | |
| Ducommun, Inc. * | | | 5,410 | | | | 149,695 | | | |
| EnPro Industries, Inc. * | | | 14,900 | | | | 464,731 | | | |
| Espey Manufacturing & Electronics Corp. | | | 1,200 | | | | 24,000 | | | |
| Esterline Technologies Corp. * | | | 3,080 | | | | 155,140 | | | |
| Hardinge, Inc. | | | 3,900 | | | | 53,664 | | | |
| Harsco Corp. | | | 31,700 | | | | 1,755,546 | | | |
| Herley Industries, Inc. * | | | 600 | | | | 6,204 | | | |
| Hurco Cos., Inc. * | | | 4,300 | | | | 201,154 | | | |
| II-VI, Inc. * | | | 18,703 | | | | 710,340 | | | |
| Jacobs Engineering Group, Inc. * | | | 14,500 | | | | 1,067,055 | | | |
| K-Tron International, Inc. * | | | 2,300 | | | | 276,253 | | | |
| Kadant, Inc. * | | | 9,200 | | | | 270,296 | | | |
| Kennametal, Inc. | | | 39,520 | | | | 1,163,073 | | | |
| Lawson Products, Inc. | | | 800 | | | | 22,040 | | | |
| Lennox International, Inc. | | | 1,500 | | | | 53,955 | | | |
| Lincoln Electric Holdings, Inc. | | | 1,600 | | | | 103,184 | | | |
| Lydall, Inc. * | | | 14,960 | | | | 171,292 | | | |
| Meadow Valley Corp. * | | | 4,599 | | | | 37,712 | | | |
| Michael Baker Corp. * | | | 150 | | | | 3,369 | | | |
| Orbital Sciences Corp. * | | | 54,400 | | | | 1,311,040 | | | |
| Perini Corp. * | | | 19,370 | | | | 701,775 | | | |
| PowerSecure International, Inc. * | | | 13,000 | | | | 153,010 | | | |
| Preformed Line Products Co. | | | 500 | | | | 24,340 | | | |
| Regal-Beloit Corp. | | | 15,820 | | | | 579,487 | | | |
| Robbins & Myers, Inc. | | | 12,580 | | | | 410,737 | | | |
| SPX Corp. | | | 12,930 | | | | 1,356,357 | | | |
| Standex International Corp. | | | 6,700 | | | | 149,678 | | | |
| Supreme Industries, Inc., Class A | | | 10,850 | | | | 61,845 | | | |
| Sypris Solutions, Inc. | | | 4,203 | | | | 17,358 | | | |
| Teledyne Technologies, Inc. * | | | 2,880 | | | | 135,360 | | | |
| Teleflex, Inc. | | | 8,062 | | | | 384,638 | | | |
| Tennant Co. | | | 6,400 | | | | 254,784 | | | |
| The L.S. Starrett Co., Class A | | | 5,817 | | | | 111,919 | | | |
| The Shaw Group, Inc. * | | | 500 | | | | 23,570 | | | |
| Triumph Group, Inc. | | | 3,240 | | | | 184,453 | | | |
| Twin Disc, Inc. | | | 5,190 | | | | 82,106 | | | |
| W.W. Grainger, Inc. | | | 23,600 | | | | 1,802,804 | | | |
| Willis Lease Finance Corp. * | | | 6,930 | | | | 87,110 | | | |
| | | | | | | |
| | | | | | | | 19,209,229 | | | |
Commercial Services & Supplies 2.1% |
| |
| A.T. Cross Co., Class A * | | | 300 | | | | 2,055 | | | |
| Avalon Holdings Corp., Class A * | | | 700 | | | | 4,200 | | | |
| CDI Corp. | | | 12,579 | | | | 315,104 | | | |
| Champion Industries, Inc. | | | 2,720 | | | | 14,198 | | | |
| Comfort Systems USA, Inc. | | | 39,250 | | | | 510,642 | | | |
| CompX International, Inc. | | | 400 | | | | 3,680 | | | |
| Deluxe Corp. | | | 13,450 | | | | 258,374 | | | |
| Ecology & Environment, Inc., Class A | | | 3,181 | | | | 38,013 | | | |
| Exponent, Inc. * | | | 10,200 | | | | 334,968 | | | |
| First Advantage Corp., Class A * | | | 100 | | | | 2,119 | | | |
| GeoEye, Inc. * | | | 10,400 | | | | 270,296 | | | |
| GP Strategies Corp. * | | | 12,690 | | | | 120,555 | | | |
| Industrial Services of America, Inc. | | | 3,400 | | | | 33,932 | | | |
| Interface, Inc., Class A | | | 4,000 | | | | 56,200 | | | |
| Kelly Services, Inc., Class A | | | 19,274 | | | | 396,273 | | | |
| Kforce, Inc. * | | | 27,931 | | | | 246,910 | | | |
| LECG Corp. * | | | 20,200 | | | | 189,072 | | | |
| Nashua Corp. * | | | 220 | | | | 2,418 | | | |
| National Technical Systems, Inc. * | | | 2,370 | | | | 14,102 | | | |
| RCM Technologies, Inc. * | | | 12,100 | | | | 46,706 | | | |
| Spherion Corp. * | | | 47,730 | | | | 292,108 | | | |
| Steelcase, Inc., Class A | | | 74,100 | | | | 819,546 | | | |
| United Stationers, Inc. * | | | 200 | | | | 9,540 | | | |
| VSE Corp. | | | 4,790 | | | | 135,222 | | | |
| Westaff, Inc. * | | | 11,700 | | | | 25,272 | | | |
| | | | | | | |
| | | | | | | | 4,141,505 | | | |
Consumer Durables & Apparel 2.6% |
| |
| Acme United Corp. | | | 360 | | | | 4,752 | | | |
| Aldila, Inc. | | | 5,000 | | | | 57,000 | | | |
| American Biltrite, Inc. * | | | 2,040 | | | | 14,586 | | | |
| American Greetings Corp., Class A | | | 46,070 | | | | 854,598 | | | |
| Blyth, Inc. | | | 18,400 | | | | 362,848 | | | |
| Callaway Golf Co. | | | 48,200 | | | | 707,576 | | | |
| Cavco Industries, Inc. * | | | 1,695 | | | | 59,393 | | | |
| CSS Industries, Inc. | | | 6,880 | | | | 240,525 | | | |
| Culp, Inc. * | | | 12,300 | | | | 92,496 | | | |
| Deckers Outdoor Corp. * | | | 7,824 | | | | 843,584 | | | |
| G-III Apparel Group Ltd. * | | | 10,200 | | | | 136,884 | | | |
See financial notes.
44 Laudus U.S. Equity Funds
Laudus Rosenberg Long/Short Equity Fund
| | | | | | | | | | | |
| | | Number of | | Value | | |
| Security | | Shares | | ($) | | |
| Hooker Furniture Corp. | | | 3,279 | | | | 73,253 | | | |
| Jaclyn, Inc. * | | | 1,000 | | | | 8,580 | | | |
| JAKKS Pacific, Inc. * | | | 20,491 | | | | 564,937 | | | |
| LaCrosse Footwear, Inc. | | | 2,884 | | | | 45,769 | | | |
| Lifetime Brands, Inc. | | | 3,950 | | | | 35,313 | | | |
| Man Sang Holdings, Inc. * | | | 1,120 | | | | 7,470 | | | |
| National Presto Industries, Inc. | | | 1,320 | | | | 69,168 | | | |
| P & F Industries, Inc., Class A * | | | 700 | | | | 4,480 | | | |
| Polaris Industries, Inc. | | | 611 | | | | 25,057 | | | |
| Q.E.P. Co., Inc. * | | | 2,240 | | | | 16,912 | | | |
| Russ Berrie & Co., Inc. * | | | 5,000 | | | | 70,300 | | | |
| The Dixie Group, Inc. * | | | 770 | | | | 6,453 | | | |
| The Warnaco Group, Inc. * | | | 7,599 | | | | 299,704 | | | |
| Tupperware Brands Corp. | | | 2,976 | | | | 115,112 | | | |
| Universal Electronics, Inc. * | | | 5,509 | | | | 133,373 | | | |
| Weyco Group, Inc. | | | 2,673 | | | | 79,308 | | | |
| Whirlpool Corp. | | | 2,700 | | | | 234,306 | | | |
| | | | | | | |
| | | | | | | | 5,163,737 | | | |
Consumer Services 3.7% |
| |
| Ark Restaurants Corp. | | | 3,305 | | | | 95,845 | | | |
| Bally Technologies, Inc. * | | | 32,000 | | | | 1,098,880 | | | |
| Bob Evans Farms, Inc. | | | 23,313 | | | | 643,206 | | | |
| Burger King Holdings, Inc. | | | 47,140 | | | | 1,303,892 | | | |
| Canterbury Park Holding Corp. | | | 3,900 | | | | 36,855 | | | |
| CBRL Group, Inc. | | | 480 | | | | 17,170 | | | |
| Chipotle Mexican Grill, Inc., Class A * | | | 3,310 | | | | 375,453 | | | |
| Churchill Downs, Inc. | | | 3,000 | | | | 141,720 | | | |
| Darden Restaurants, Inc. | | | 20,472 | | | | 666,363 | | | |
| DeVry, Inc. | | | 870 | | | | 36,401 | | | |
| Einstein Noah Restaurant Group, Inc. * | | | 100 | | | | 856 | | | |
| Frisch’s Restaurants, Inc. | | | 4,500 | | | | 103,500 | | | |
| Nathan’s Famous, Inc. * | | | 450 | | | | 6,300 | | | |
| Red Lion Hotels Corp. * | | | 19,080 | | | | 163,325 | | | |
| Rubio’s Restaurants, Inc. * | | | 7,725 | | | | 44,187 | | | |
| Service Corp. International | | | 129,229 | | | | 1,310,382 | | | |
| Silverleaf Resorts, Inc. * | | | 37,600 | | | | 85,352 | | | |
| Speedway Motorsports, Inc. | | | 2,250 | | | | 56,407 | | | |
| WMS Industries, Inc. * | | | 30,811 | | | | 1,108,272 | | | |
| | | | | | | |
| | | | | | | | 7,294,366 | | | |
Diversified Financials 2.2% |
| |
| American Physicians Service Group, Inc. | | | 3,670 | | | | 71,859 | | | |
| California First National Bancorp | | | 3,243 | | | | 33,014 | | | |
| Federated Investors, Inc., Class B | | | 32,995 | | | | 1,292,084 | | | |
| Greenhill & Co., Inc. | | | 13,491 | | | | 938,434 | | | |
| International Assets Holding Corp. * | | | 1,100 | | | | 27,456 | | | |
| Knight Capital Group, Inc., Class A * | | | 72,000 | | | | 1,169,280 | | | |
| Paulson Capital Corp. * | | | 5,500 | | | | 28,325 | | | |
| QC Holdings, Inc. | | | 5,645 | | | | 51,087 | | | |
| Stifel Financial Corp. * | | | 10,500 | | | | 471,450 | | | |
| SWS Group, Inc. | | | 300 | | | | 3,669 | | | |
| Waddell & Reed Financial, Inc., Class A | | | 9,900 | | | | 318,087 | | | |
| | | | | | | |
| | | | | | | | 4,404,745 | | | |
Energy 9.8% |
| |
| Adams Resources & Energy, Inc. | | | 190 | | | | 5,282 | | | |
| Atlas America, Inc. | | | 90 | | | | 5,440 | | | |
| Atwood Oceanics, Inc. * | | | 12,098 | | | | 1,109,629 | | | |
| Cimarex Energy Co. | | | 7,426 | | | | 406,499 | | | |
| Dawson Geophysical Co. * | | | 1,570 | | | | 105,975 | | | |
| Diamond Offshore Drilling, Inc. | | | 720 | | | | 83,808 | | | |
| Edge Petroleum Corp. * | | | 18,700 | | | | 75,361 | | | |
| ENSCO International, Inc. | | | 44,921 | | | | 2,812,953 | | | |
| Forest Oil Corp. * | | | 7,830 | | | | 383,357 | | | |
| GulfMark Offshore, Inc. * | | | 16,175 | | | | 885,096 | | | |
| Helmerich & Payne, Inc. | | | 10,865 | | | | 509,243 | | | |
| Hornbeck Offshore Services, Inc. * | | | 17,820 | | | | 813,839 | | | |
| Mariner Energy, Inc. * | | | 61,570 | | | | 1,663,006 | | | |
| Massey Energy Co. | | | 18,280 | | | | 667,220 | | | |
| Oil States International, Inc. * | | | 19,490 | | | | 873,347 | | | |
| Penn Virginia Corp. | | | 29,200 | | | | 1,287,428 | | | |
| Pride International, Inc. * | | | 30,370 | | | | 1,061,431 | | | |
| Rosetta Resources, Inc. * | | | 6,431 | | | | 126,498 | | | |
| Rowan Cos., Inc. | | | 27,503 | | | | 1,132,573 | | | |
| SEACOR Holdings, Inc. * | | | 18,590 | | | | 1,586,842 | | | |
| Swift Energy Co. * | | | 3,274 | | | | 147,297 | | | |
| T-3 Energy Services, Inc. * | | | 900 | | | | 38,304 | | | |
| Tidewater, Inc. | | | 30,700 | | | | 1,691,877 | | | |
| Trico Marine Services, Inc. * | | | 8,579 | | | | 334,324 | | | |
| Whiting Petroleum Corp. * | | | 19,051 | | | | 1,231,647 | | | |
| Willbros Group, Inc. * | | | 10,200 | | | | 312,120 | | | |
| | | | | | | |
| | | | | | | | 19,350,396 | | | |
Food & Staples Retailing 1.0% |
| |
| Arden Group, Inc., Class A | | | 772 | | | | 110,396 | | | |
| BJ’s Wholesale Club, Inc. * | | | 16,980 | | | | 606,016 | | | |
| Casey’s General Stores, Inc. | | | 455 | | | | 10,283 | | | |
| Longs Drug Stores Corp. | | | 18,610 | | | | 790,181 | | | |
| Nash Finch Co. | | | 9,765 | | | | 331,815 | | | |
| Village Super Market, Inc., Class A | | | 3,000 | | | | 154,500 | | | |
| | | | | | | |
| | | | | | | | 2,003,191 | | | |
Food, Beverage & Tobacco 1.8% |
| |
| Cal-Maine Foods, Inc. | | | 10,106 | | | | 337,338 | | | |
| Corn Products International, Inc. | | | 45,318 | | | | 1,683,110 | | | |
| Darling International, Inc. * | | | 19,280 | | | | 249,676 | | | |
| Flowers Foods, Inc. | | | 15,964 | | | | 395,109 | | | |
| Fresh Del Monte Produce, Inc. * | | | 4,460 | | | | 162,344 | | | |
| Griffin Land & Nurseries, Inc. | | | 197 | | | | 6,795 | | | |
| Seaboard Corp. | | | 237 | | | | 370,905 | | | |
| Seneca Foods Corp., Class A * | | | 700 | | | | 14,700 | | | |
| Seneca Foods Corp., Class B * | | | 3,200 | | | | 66,720 | | | |
| Tasty Baking Co. | | | 8,210 | | | | 46,797 | | | |
| TreeHouse Foods, Inc. * | | | 6,870 | | | | 157,048 | | | |
| UST, Inc. | | | 1,159 | | | | 63,189 | | | |
| | | | | | | |
| | | | | | | | 3,553,731 | | | |
Health Care Equipment & Services 3.9% |
| |
| Air Methods Corp. * | | | 6,585 | | | | 318,517 | | | |
| Allied Healthcare Products, Inc. * | | | 1,942 | | | | 12,002 | | | |
| Amedisys, Inc. * | | | 16,600 | | | | 653,044 | | | |
| America Service Group, Inc. * | | | 7,300 | | | | 44,238 | | | |
| AngioDynamics, Inc. * | | | 17,300 | | | | 199,988 | | | |
| Arrhythmia Research Technology, Inc. * | | | 2,700 | | | | 16,308 | | | |
See financial notes.
Laudus U.S. Equity Funds 45
Laudus Rosenberg Long/ Short Equity Fund
Portfolio Holdings continued
| | | | | | | | | | | |
| | | Number of | | Value | | |
| Security | | Shares | | ($) | | |
| Atrion Corp. | | | 280 | | | | 27,983 | | | |
| Cardiac Science Corp. * | | | 5,030 | | | | 42,001 | | | |
| CONMED Corp. * | | | 6,267 | | | | 160,686 | | | |
| Cynosure, Inc., Class A * | | | 6,450 | | | | 137,385 | | | |
| Datascope Corp. | | | 9,504 | | | | 393,751 | | | |
| Gentiva Health Services, Inc. * | | | 9,809 | | | | 213,444 | | | |
| Hanger Orthopedic Group, Inc. * | | | 18,400 | | | | 198,352 | | | |
| Health Net, Inc. * | | | 52,054 | | | | 1,603,263 | | | |
| Humana, Inc. * | | | 29,400 | | | | 1,318,884 | | | |
| Integra LifeSciences Holdings * | | | 324 | | | | 14,084 | | | |
| IntegraMed America, Inc. * | | | 5,957 | | | | 58,319 | | | |
| Kewaunee Scientific Corp. | | | 2,580 | | | | 38,700 | | | |
| Kindred Healthcare, Inc. * | | | 21,000 | | | | 459,270 | | | |
| MedCath Corp. * | | | 9,967 | | | | 181,399 | | | |
| National Dentex Corp. * | | | 6,019 | | | | 77,585 | | | |
| Orthofix International N.V. * | | | 2,642 | | | | 105,072 | | | |
| Pediatrix Medical Group, Inc. * | | | 90 | | | | 6,066 | | | |
| RehabCare Group, Inc. * | | | 16,500 | | | | 247,500 | | | |
| Res-Care, Inc. * | | | 20,359 | | | | 349,157 | | | |
| Skilled Healthcare Group, Inc., Class A * | | | 9,410 | | | | 103,322 | | | |
| Sonic Innovations, Inc. * | | | 20,410 | | | | 98,580 | | | |
| Span-America Medical Systems, Inc. | | | 2,600 | | | | 30,680 | | | |
| SunLink Health Systems, Inc. * | | | 5,570 | | | | 35,091 | | | |
| Theragenics Corp. * | | | 29,377 | | | | 115,745 | | | |
| Universal American Financial Corp. * | | | 34,064 | | | | 361,078 | | | |
| Zoll Medical Corp. * | | | 5,426 | | | | 144,277 | | | |
| | | | | | | |
| | | | | | | | 7,765,771 | | | |
Household & Personal Products 0.3% |
| |
| Geopharma, Inc. * | | | 900 | | | | 2,331 | | | |
| Inter Parfums, Inc. | | | 4,500 | | | | 99,360 | | | |
| Natural Alternative International, Inc. * | | | 4,114 | | | | 37,026 | | | |
| Nu Skin Enterprises, Inc., Class A | | | 4,100 | | | | 73,882 | | | |
| Nutraceutical International Corp. * | | | 9,600 | | | | 124,800 | | | |
| Oil-Dri Corp. of America | | | 2,050 | | | | 36,675 | | | |
| Schiff Nutrition International, Inc. | | | 8,650 | | | | 51,813 | | | |
| The Estee Lauder Cos., Inc., Class A | | | 3,000 | | | | 137,550 | | | |
| | | | | | | |
| | | | | | | | 563,437 | | | |
Insurance 7.3% |
| |
| 21st Century Holding Co. | | | 500 | | | | 6,405 | | | |
| Affirmative Insurance Holdings, Inc. | | | 1,233 | | | | 9,839 | | | |
| Alleghany Corp. * | | | 838 | | | | 286,177 | | | |
| Allied World Assurance Co. Holdings Ltd. | | | 18,288 | | | | 726,034 | | | |
| American Financial Group, Inc. | | | 18,370 | | | | 469,537 | | | |
| American National Insurance Co. | | | 3,411 | | | | 363,954 | | | |
| American Safety Insurance Holdings Ltd. * | | | 5,000 | | | | 85,500 | | | |
| Aspen Insurance Holdings Ltd. | | | 20,490 | | | | 540,526 | | | |
| Axis Capital Holdings Ltd. | | | 65,963 | | | | 2,241,423 | | | |
| CNA Financial Corp. | | | 450 | | | | 11,606 | | | |
| Flagstone Reinsurance Holdings Ltd. | | | 11,700 | | | | 141,570 | | | |
| FPIC Insurance Group, Inc. * | | | 9,000 | | | | 424,260 | | | |
| Hallmark Financial Services, Inc. * | | | 880 | | | | 9,821 | | | |
| Hanover Insurance Group, Inc. | | | 32,950 | | | | 1,355,563 | | | |
| HCC Insurance Holdings, Inc. | | | 16,992 | | | | 385,548 | | | |
| Horace Mann Educators Corp. | | | 18,830 | | | | 329,148 | | | |
| IPC Holdings Ltd. | | | 41,700 | | | | 1,167,600 | | | |
| Kansas City Life Insurance Co. | | | 310 | | | | 14,899 | | | |
| Max Capital Group Ltd. | | | 2,427 | | | | 63,563 | | | |
| Mercer Insurance Group, Inc. | | | 310 | | | | 5,391 | | | |
| National Western Life Insurance Co., Class A | | | 950 | | | | 205,951 | | | |
| PartnerRe Ltd. | | | 18,521 | | | | 1,413,152 | | | |
| Platinum Underwriters Holdings Ltd. | | | 46,590 | | | | 1,512,311 | | | |
| Presidential Life Corp. | | | 15,343 | | | | 267,582 | | | |
| RenaissanceRe Holdings Ltd. | | | 35,546 | | | | 1,845,193 | | | |
| Unico American Corp. * | | | 2,900 | | | | 27,260 | | | |
| United America Indemnity Ltd., Class A * | | | 17,055 | | | | 328,479 | | | |
| Universal Insurance Holdings, Inc. | | | 23,064 | | | | 87,182 | | | |
| Unum Group | | | 7,000 | | | | 154,070 | | | |
| | | | | | | |
| | | | | | | | 14,479,544 | | | |
Materials 5.8% |
| |
| AK Steel Holding Corp. | | | 21,357 | | | | 1,162,248 | | | |
| Buckeye Technologies, Inc. * | | | 5,600 | | | | 62,496 | | | |
| CF Industries Holdings, Inc. | | | 8,050 | | | | 834,141 | | | |
| Continental Materials Corp. * | | | 800 | | | | 18,840 | | | |
| Domtar Corp. * | | | 104,634 | | | | 714,650 | | | |
| FMC Corp. | | | 36,900 | | | | 2,047,581 | | | |
| Friedman Industries, Inc. | | | 2,180 | | | | 11,227 | | | |
| Glatfelter | | | 20,107 | | | | 303,817 | | | |
| Greif, Inc., Class A | | | 28,200 | | | | 1,915,626 | | | |
| Innospec, Inc. | | | 20,800 | | | | 440,960 | | | |
| Owens-Illinois, Inc. * | | | 1,160 | | | | 65,459 | | | |
| Packaging Corp. of America | | | 65,655 | | | | 1,466,076 | | | |
| Penford Corp. | | | 396 | | | | 8,605 | | | |
| Rock of Ages Corp. * | | | 2,430 | | | | 9,623 | | | |
| Schnitzer Steel Industries, Inc., Class A | | | 5,685 | | | | 403,749 | | | |
| Schweitzer-Mauduit International, Inc. | | | 460 | | | | 10,644 | | | |
| Southern Copper Corp. | | | 15,970 | | | | 1,658,165 | | | |
| Steel Dynamics, Inc. | | | 760 | | | | 25,110 | | | |
| Stepan Co. | | | 2,720 | | | | 103,986 | | | |
| The Scotts Miracle-Gro Co., Class A | | | 2,864 | | | | 92,851 | | | |
| U.S. Energy Corp. | | | 190 | | | | 636 | | | |
| United States Lime & Minerals, Inc. * | | | 100 | | | | 2,905 | | | |
| | | | | | | |
| | | | | | | | 11,359,395 | | | |
Media 1.6% |
| |
| Alloy, Inc. * | | | 13,650 | | | | 100,327 | | | |
| DG Fastchannel, Inc. * | | | 3,638 | | | | 69,777 | | | |
| DISH Network Corp., Class A * | | | 5,839 | | | | 167,754 | | | |
| Fisher Communications, Inc. * | | | 2,700 | | | | 84,132 | | | |
| Gannett Co., Inc. | | | 67,200 | | | | 1,952,160 | | | |
| New Frontier Media, Inc. | | | 2,300 | | | | 10,258 | | | |
| Saga Communications, Inc., Class A * | | | 17,300 | | | | 96,880 | | | |
| Scholastic Corp. * | | | 20,539 | | | | 621,716 | | | |
| Value Line, Inc. | | | 300 | | | | 13,770 | | | |
| | | | | | | |
| | | | | | | | 3,116,774 | | | |
See financial notes.
46 Laudus U.S. Equity Funds
Laudus Rosenberg Long/Short Equity Fund
| | | | | | | | | | | |
| | | Number of | | Value | | |
| Security | | Shares | | ($) | | |
Pharmaceuticals & Biotechnology 5.7% |
| |
| Albany Molecular Research, Inc. * | | | 23,350 | | | | 283,469 | | | |
| Bioanalytical Systems, Inc. * | | | 1,250 | | | | 7,313 | | | |
| Cambrex Corp. | | | 4,600 | | | | 31,878 | | | |
| Caraco Pharmaceutical Laboratories Ltd. * | | | 6,830 | | | | 122,598 | | | |
| Emergent Biosolutions, Inc. * | | | 5,500 | | | | 49,060 | | | |
| Harvard Bioscience, Inc. * | | | 30,270 | | | | 151,350 | | | |
| Invitrogen Corp. * | | | 21,866 | | | | 1,868,887 | | | |
| Kendle International, Inc. * | | | 10,812 | | | | 485,675 | | | |
| Medicis Pharmaceutical Corp., Class A | | | 29,279 | | | | 576,504 | | | |
| Pain Therapeutics, Inc. * | | | 16,683 | | | | 140,971 | | | |
| Par Pharmaceutical Cos, Inc. * | | | 15,550 | | | | 270,414 | | | |
| PAREXEL International Corp. * | | | 47,400 | | | | 1,237,140 | | | |
| PerkinElmer, Inc. | | | 65,000 | | | | 1,576,250 | | | |
| Perrigo Co. | | | 53,300 | | | | 2,011,009 | | | |
| Pharmanet Development Group, Inc. * | | | 12,530 | | | | 316,132 | | | |
| Sciele Pharma, Inc. * | | | 29,000 | | | | 565,500 | | | |
| Watson Pharmaceuticals, Inc. * | | | 55,900 | | | | 1,638,988 | | | |
| | | | | | | |
| | | | | | | | 11,333,138 | | | |
Real Estate 3.9% |
| |
| American Campus Communities, Inc. | | | 1,050 | | | | 28,728 | | | |
| Ashford Hospitality Trust | | | 10,630 | | | | 60,378 | | | |
| Cedar Shopping Centers, Inc. | | | 2,350 | | | | 27,448 | | | |
| DiamondRock Hospitality Co. | | | 66,781 | | | | 846,115 | | | |
| Extra Space Storage, Inc. | | | 46,670 | | | | 755,587 | | | |
| FelCor Lodging Trust, Inc. | | | 1,385 | | | | 16,662 | | | |
| Gladstone Commercial Corp. | | | 4,187 | | | | 65,108 | | | |
| Hersha Hospitality Trust | | | 24,400 | | | | 220,332 | | | |
| Income Opportunity Realty Investors * | | | 590 | | | | 3,443 | | | |
| J.W. Mays, Inc. * | | | 2,600 | | | | 51,870 | | | |
| Lexington Realty Trust | | | 9,451 | | | | 136,189 | | | |
| LTC Properties, Inc. | | | 16,797 | | | | 431,851 | | | |
| Medical Properties Trust, Inc. | | | 36,120 | | | | 408,878 | | | |
| MHI Hospitality Corp. | | | 6,510 | | | | 40,753 | | | |
| Mission West Properties, Inc. | | | 16,368 | | | | 154,678 | | | |
| Monmouth Real Estate Investment Corp., Class A | | | 20,697 | | | | 165,576 | | | |
| National Retail Properties, Inc. | | | 45,900 | | | | 1,012,095 | | | |
| Nationwide Health Properties, Inc. | | | 47,236 | | | | 1,594,215 | | | |
| One Liberty Properties, Inc. | | | 9,150 | | | | 147,224 | | | |
| Ramco-Gershenson Properties Trust | | | 8,592 | | | | 181,377 | | | |
| Strategic Hotel & Resorts, Inc. | | | 50,603 | | | | 664,417 | | | |
| Sunstone Hotel Investors, Inc. | | | 28,745 | | | | 460,207 | | | |
| Supertel Hospitality, Inc. | | | 16,100 | | | | 85,330 | | | |
| The Intergroup Corp. * | | | 130 | | | | 2,340 | | | |
| United Capital Corp. * | | | 720 | | | | 15,660 | | | |
| Winthrop Realty Trust | | | 22,570 | | | | 92,988 | | | |
| | | | | | | |
| | | | | | | | 7,669,449 | | | |
Retailing 4.3% |
| |
| 1-800-FLOWERS.COM, Inc., Class A * | | | 25,266 | | | | 215,014 | | | |
| Abercrombie & Fitch Co., Class A | | | 13,730 | | | | 1,004,212 | | | |
| Aeropostale, Inc. * | | | 44,900 | | | | 1,217,239 | | | |
| AMCON Distributing Co. * | | | 550 | | | | 16,973 | | | |
| AutoZone, Inc. * | | | 150 | | | | 17,074 | | | |
| Books-A-Million, Inc. | | | 8,700 | | | | 76,038 | | | |
| Duckwall-ALCO Stores, Inc. * | | | 320 | | | | 3,648 | | | |
| Educational Development Corp. | | | 3,920 | | | | 22,697 | | | |
| Franklin Covey Co. * | | | 21,300 | | | | 159,750 | | | |
| GameStop Corp., Class A * | | | 300 | | | | 15,513 | | | |
| GSI Commerce, Inc. * | | | 14,838 | | | | 195,120 | | | |
| Hastings Entertainment, Inc. * | | | 3,743 | | | | 29,420 | | | |
| IAC/ InterActiveCorp * | | | 88,901 | | | | 1,845,585 | | | |
| Jo-Ann Stores, Inc. * | | | 18,600 | | | | 273,978 | | | |
| Monro Muffler Brake, Inc. | | | 6,710 | | | | 113,399 | | | |
| Netflix, Inc. * | | | 30,400 | | | | 1,053,360 | | | |
| Priceline.com, Inc. * | | | 14,600 | | | | 1,764,556 | | | |
| REX Stores Corp. * | | | 8,610 | | | | 169,359 | | | |
| Sport Supply Group, Inc. | | | 11,000 | | | | 131,450 | | | |
| Systemax, Inc. | | | 9,282 | | | | 111,941 | | | |
| The Bon-Ton Stores, Inc. | | | 5,707 | | | | 31,217 | | | |
| The Buckle, Inc. | | | 1,300 | | | | 58,149 | | | |
| West Marine, Inc. * | | | 3,600 | | | | 25,092 | | | |
| | | | | | | |
| | | | | | | | 8,550,784 | | | |
Semiconductors & Semiconductor Equipment 4.9% |
| |
| CEVA, Inc. * | | | 2,040 | | | | 15,606 | | | |
| Cirrus Logic, Inc. * | | | 65,726 | | | | 441,679 | | | |
| Fairchild Semiconductor International, Inc. * | | | 85,300 | | | | 1,016,776 | | | |
| Integrated Device Technology, Inc. * | | | 38,586 | | | | 344,573 | | | |
| International Rectifier Corp. * | | | 25,780 | | | | 554,270 | | | |
| Intersil Corp., Class A | | | 56,119 | | | | 1,440,575 | | | |
| IXYS Corp. * | | | 1,200 | | | | 8,196 | | | |
| Mattson Technology, Inc. * | | | 7,276 | | | | 44,311 | | | |
| MEMC Electronic Materials, Inc. * | | | 23,700 | | | | 1,680,330 | | | |
| Microsemi Corp. * | | | 51,100 | | | | 1,165,080 | | | |
| Microtune, Inc. * | | | 5,563 | | | | 20,361 | | | |
| OmniVision Technologies, Inc. * | | | 40,070 | | | | 673,977 | | | |
| Pericom Semiconductor Corp. * | | | 17,600 | | | | 258,368 | | | |
| Skyworks Solutions, Inc. * | | | 128,308 | | | | 934,082 | | | |
| Standard Microsystems Corp. * | | | 18,500 | | | | 539,830 | | | |
| Trio-Tech International | | | 3,150 | | | | 20,002 | | | |
| TriQuint Semiconductor, Inc. * | | | 6,338 | | | | 32,070 | | | |
| Zoran Corp. * | | | 34,103 | | | | 465,847 | | | |
| | | | | | | |
| | | | | | | | 9,655,933 | | | |
Software & Services 8.7% |
| |
| Astea International, Inc. * | | | 1,900 | | | | 7,429 | | | |
| Bankrate, Inc. * | | | 3,437 | | | | 171,472 | | | |
| Cadence Design Systems, Inc. * | | | 152,400 | | | | 1,627,632 | | | |
| Chordiant Software, Inc. * | | | 802 | | | | 4,836 | | | |
| CIBER, Inc. * | | | 47,484 | | | | 232,672 | | | |
| Computer Task Group, Inc. * | | | 16,815 | | | | 69,278 | | | |
| Convergys Corp. * | | | 87,996 | | | | 1,325,220 | | | |
| CSP, Inc. * | | | 3,604 | | | | 21,732 | | | |
| Dynamics Research Corp. * | | | 7,190 | | | | 72,691 | | | |
| Edgewater Technology, Inc. * | | | 11,360 | | | | 59,867 | | | |
| Electronic Data Systems Corp. | | | 117,500 | | | | 1,956,375 | | | |
| Gevity HR, Inc. | | | 6,650 | | | | 57,589 | | | |
| Hewitt Associates, Inc., Class A * | | | 6,628 | | | | 263,595 | | | |
| Interwoven, Inc. * | | | 29,361 | | | | 313,575 | | | |
| JDA Software Group, Inc. * | | | 18,100 | | | | 330,325 | | | |
| Lawson Software, Inc. * | | | 105,403 | | | | 793,684 | | | |
| MAXIMUS, Inc. | | | 16,070 | | | | 589,930 | | | |
See financial notes.
Laudus U.S. Equity Funds 47
Laudus Rosenberg Long/ Short Equity Fund
Portfolio Holdings continued
| | | | | | | | | | | |
| | | Number of | | Value | | |
| Security | | Shares | | ($) | | |
| Mentor Graphics Corp. * | | | 58,320 | | | | 514,966 | | | |
| MPS Group, Inc. * | | | 71,900 | | | | 849,858 | | | |
| Ness Technologies, Inc. * | | | 26,132 | | | | 247,993 | | | |
| NetScout Systems, Inc. * | | | 8,320 | | | | 77,376 | | | |
| Perot Systems Corp., Class A * | | | 18,068 | | | | 271,743 | | | |
| Quest Software, Inc. * | | | 15,160 | | | | 198,141 | | | |
| Sapient Corp. * | | | 29,506 | | | | 205,362 | | | |
| SonicWALL, Inc. * | | | 57,264 | | | | 467,847 | | | |
| SPSS, Inc. * | | | 17,074 | | | | 662,130 | | | |
| StarTek, Inc. * | | | 300 | | | | 2,763 | | | |
| SumTotal Systems, Inc. * | | | 200 | | | | 834 | | | |
| Sybase, Inc. * | | | 75,340 | | | | 1,981,442 | | | |
| Synopsys, Inc. * | | | 77,842 | | | | 1,767,792 | | | |
| TechTeam Global, Inc. * | | | 4,670 | | | | 42,263 | | | |
| TIBCO Software, Inc. * | | | 134,490 | | | | 960,258 | | | |
| TSR, Inc. | | | 3,200 | | | | 13,440 | | | |
| United Online, Inc. | | | 57,106 | | | | 603,039 | | | |
| Vignette Corp. * | | | 24,460 | | | | 323,117 | | | |
| | | | | | | |
| | | | | | | | 17,088,266 | | | |
Technology Hardware & Equipment 7.7% |
| |
| Aetrium, Inc. * | | | 1,160 | | | | 4,559 | | | |
| Allied Motion Technologies, Inc. * | | | 4,871 | | | | 23,088 | | | |
| Arrow Electronics, Inc. * | | | 53,106 | | | | 1,787,017 | | | |
| Astro-Med, Inc. | | | 3,420 | | | | 30,609 | | | |
| Avnet, Inc. * | | | 74,700 | | | | 2,444,931 | | | |
| AVX Corp. | | | 45,095 | | | | 577,667 | | | |
| Black Box Corp. | | | 13,172 | | | | 406,356 | | | |
| Brocade Communications Systems, Inc. * | | | 207,592 | | | | 1,515,422 | | | |
| Coherent, Inc. * | | | 591 | | | | 16,483 | | | |
| Communications Systems, Inc. | | | 7,690 | | | | 82,821 | | | |
| CTS Corp. | | | 28,380 | | | | 303,666 | | | |
| Digi International, Inc. * | | | 24,077 | | | | 277,849 | | | |
| Electro Scientific Industries, Inc. * | | | 25,000 | | | | 412,000 | | | |
| Electronics for Imaging, Inc. * | | | 5,501 | | | | 82,075 | | | |
| Emulex Corp. * | | | 63,230 | | | | 1,026,855 | | | |
| Gerber Scientific, Inc. * | | | 18,149 | | | | 161,345 | | | |
| Harmonic, Inc. * | | | 70,200 | | | | 533,520 | | | |
| Harris Corp. | | | 1,035 | | | | 50,229 | | | |
| Hauppauge Digital, Inc. * | | | 4,772 | | | | 16,034 | | | |
| Insight Enterprises, Inc. * | | | 33,402 | | | | 584,535 | | | |
| IntriCon Corp. * | | | 4,000 | | | | 31,960 | | | |
| Itron, Inc. * | | | 8,343 | | | | 752,789 | | | |
| Key Tronic Corp. * | | | 700 | | | | 1,813 | | | |
| Measurement Specialties, Inc. * | | | 4,801 | | | | 83,873 | | | |
| Mesa Laboratories, Inc. | | | 100 | | | | 2,240 | | | |
| MOCON, Inc. | | | 4,900 | | | | 55,272 | | | |
| MTS Systems Corp. | | | 2,640 | | | | 85,166 | | | |
| NETGEAR, Inc. * | | | 3,500 | | | | 69,825 | | | |
| Network Equipment Technologies, Inc. * | | | 22,100 | | | | 145,197 | | | |
| O.I. Corp. | | | 1,200 | | | | 14,160 | | | |
| Oplink Communications, Inc. * | | | 8,400 | | | | 74,508 | | | |
| Optical Cable Corp. * | | | 200 | | | | 1,000 | | | |
| OSI Systems, Inc. * | | | 14,500 | | | | 333,790 | | | |
| PC Connection, Inc. * | | | 2,500 | | | | 19,800 | | | |
| PC-Tel, Inc. * | | | 7,473 | | | | 50,816 | | | |
| Schmitt Industries, Inc. * | | | 769 | | | | 4,576 | | | |
| Soapstone Networks, Inc. | | | 6,960 | | | | 49,834 | | | |
| Spectrum Control, Inc. * | | | 11,800 | | | | 99,828 | | | |
| SYNNEX Corp. * | | | 3,700 | | | | 78,514 | | | |
| Technitrol, Inc. | | | 25,790 | | | | 596,523 | | | |
| TTM Technologies, Inc. * | | | 29,960 | | | | 339,147 | | | |
| ViaSat, Inc. * | | | 3,944 | | | | 85,664 | | | |
| Vicon Industries, Inc. * | | | 3,700 | | | | 18,500 | | | |
| Vishay Intertechnology, Inc. * | | | 122,400 | | | | 1,108,944 | | | |
| Western Digital Corp. * | | | 17,650 | | | | 477,256 | | | |
| Zones, Inc. * | | | 9,526 | | | | 78,208 | | | |
| Zygo Corp. * | | | 17,250 | | | | 214,590 | | | |
| | | | | | | |
| | | | | | | | 15,210,854 | | | |
Telecommunication Services 1.3% |
| |
| Atlantic Tele-Network, Inc. | | | 7,150 | | | | 241,884 | | | |
| CenturyTel, Inc. | | | 52,090 | | | | 1,731,472 | | | |
| D&E Communications, Inc. | | | 13,595 | | | | 120,996 | | | |
| Gilat Satellite Networks Ltd. * | | | 32,999 | | | | 357,379 | | | |
| HickoryTech Corp. | | | 1,740 | | | | 14,216 | | | |
| Premiere Global Services, Inc. * | | | 4,260 | | | | 61,088 | | | |
| USA Mobility, Inc. * | | | 212 | | | | 1,514 | | | |
| | | | | | | |
| | | | | | | | 2,528,549 | | | |
Transportation 2.5% |
| |
| Air T., Inc. | | | 2,900 | | | | 27,898 | | | |
| B & H Ocean Carriers Ltd. * | | | 1,430 | | | | 14,908 | | | |
| C.H. Robinson Worldwide, Inc. | | | 26,745 | | | | 1,454,928 | | | |
| Genco Shipping & Trading Ltd. | | | 3,570 | | | | 201,455 | | | |
| Kansas City Southern * | | | 4,641 | | | | 186,151 | | | |
| Northwest Airlines Corp. * | | | 660 | | | | 5,933 | | | |
| Park-Ohio Holdings Corp. * | | | 4,200 | | | | 65,982 | | | |
| Pinnacle Airlines Corp. * | | | 15,200 | | | | 132,696 | | | |
| Republic Airways Holdings, Inc. * | | | 21,328 | | | | 461,964 | | | |
| SkyWest, Inc. | | | 49,547 | | | | 1,046,433 | | | |
| UAL Corp. | | | 63,900 | | | | 1,375,767 | | | |
| | | | | | | |
| | | | | | | | 4,974,115 | | | |
Utilities 1.9% |
| |
| ALLETE, Inc. | | | 15,620 | | | | 603,244 | | | |
| Artesian Resources Corp., Class A | | | 645 | | | | 11,952 | | | |
| Florida Public Utilities Co. | | | 1,800 | | | | 20,070 | | | |
| Great Plains Energy, Inc. | | | 9,480 | | | | 233,682 | | | |
| MDU Resources Group, Inc. | | | 79,868 | | | | 1,960,759 | | | |
| Middlesex Water Co. | | | 590 | | | | 10,714 | | | |
| NorthWestern Corp. | | | 9,800 | | | | 238,826 | | | |
| Reliant Energy, Inc. * | | | 11,017 | | | | 260,552 | | | |
| Southern Union Co. | | | 1,730 | | | | 40,257 | | | |
| The Laclede Group, Inc. | | | 1,850 | | | | 65,916 | | | |
| Unisource Energy Corp. | | | 1,160 | | | | 25,822 | | | |
| Unitil Corp. | | | 1,100 | | | | 29,645 | | | |
| WGL Holdings, Inc. | | | 4,730 | | | | 151,644 | | | |
| | | | | | | |
| | | | | | | | 3,653,083 | | | |
| | | | | | | |
Total Common Stock
(Cost $185,348,950) | | | 190,396,715 | | | |
| | | | | | | |
See financial notes.
48 Laudus U.S. Equity Funds
Laudus Rosenberg Long/Short Equity Fund
| | | | | | | | | | | |
| Security | | Face Amount | | Value | | |
| Rate, Maturity Date | | ($) | | ($) | | |
| Short-Term Investment 2.8% of net assets |
Repurchase Agreement 2.8% |
| |
| Custodian Trust Company, dated 03/31/08, due 04/01/08 at 1.70% with a maturity value of $5,461,772 (fully collateralized by U.S. Treasury Bond with a value of $5,621,591) | | | 5,461,514 | | | | 5,461,514 | | | |
| | | | | | | |
Total Short-Term Investment
(Cost $5,461,514) | | | 5,461,514 | | | |
| | | | | | | |
| |
End of Investments. |
At 03/31/08, the tax basis cost of the fund’s investments was $192,150,604 and the unrealized appreciation and depreciation were $21,775,360 and ($18,067,735), respectively, with a net unrealized appreciation of $3,707,625.
| |
| * | Non-income producing security. |
| (a) | All or a portion of these securities are pledged as collateral for securities sold short. The market value of these pledged securities is $125,686,897. |
| | | | | | | | | | | |
| | | Number of | | Value | | |
| Security | | Shares | | ($) | | |
| Short Sales 93.6% of net assets |
Automobiles & Components 0.2% |
| |
| ArvinMeritor, Inc. | | | 14,960 | | | | 187,150 | | | |
| Coachmen Industries, Inc. | | | 2,980 | | | | 8,880 | | | |
| Modine Manufacturing Co. | | | 16,976 | | | | 245,982 | | | |
| | | | | | | |
| | | | | | | | 442,012 | | | |
Banks 4.0% |
| |
| BNCCORP, Inc. * | | | 800 | | | | 10,160 | | | |
| Central Pacific Financial Corp. | | | 19,700 | | | | 371,345 | | | |
| First Midwest Bancorp, Inc. | | | 34,000 | | | | 944,180 | | | |
| Flagstar Bancorp, Inc. | | | 33,981 | | | | 245,343 | | | |
| Kearny Financial Corp. | | | 17,186 | | | | 188,187 | | | |
| New York Community Bancorp, Inc. | | | 116,841 | | | | 2,128,843 | | | |
| Popular, Inc. | | | 140,521 | | | | 1,638,475 | | | |
| Provident Bankshares Corp. | | | 24,400 | | | | 262,056 | | | |
| Taylor Capital Group, Inc. | | | 370 | | | | 6,075 | | | |
| TCF Financial Corp. | | | 83,100 | | | | 1,489,152 | | | |
| TIB Financial Corp. | | | 2,010 | | | | 16,080 | | | |
| Wauwatosa Holdings, Inc. * | | | 10,179 | | | | 121,130 | | | |
| Zions Bancorp | | | 12,322 | | | | 561,267 | | | |
| | | | | | | |
| | | | | | | | 7,982,293 | | | |
Capital Goods 2.3% |
| |
| Accuride Corp. * | | | 19,290 | | | | 157,792 | | | |
| Blount International, Inc. * | | | 28,000 | | | | 346,360 | | | |
| Builders FirstSource, Inc. * | | | 4,880 | | | | 35,429 | | | |
| Commercial Vehicle Group, Inc. * | | | 20,825 | | | | 206,376 | | | |
| DynCorp International, Inc., Class A * | | | 224 | | | | 3,736 | | | |
| Energy Focus, Inc. * | | | 12,600 | | | | 31,374 | | | |
| ESCO Technologies, Inc. * | | | 8,661 | | | | 344,015 | | | |
| Flanders Corp. * | | | 22,600 | | | | 137,634 | | | |
| FreightCar America, Inc. | | | 9,100 | | | | 312,130 | | | |
| GenCorp, Inc. * | | | 34,200 | | | | 351,918 | | | |
| Graco, Inc. | | | 19,867 | | | | 720,378 | | | |
| H&E Equipment Services, Inc. * | | | 1,616 | | | | 20,313 | | | |
| Masco Corp. | | | 13,500 | | | | 267,705 | | | |
| Omega Flex, Inc. | | | 8,018 | | | | 134,622 | | | |
| Plug Power, Inc. * | | | 36,700 | | | | 114,137 | | | |
| Power-One, Inc. * | | | 68,360 | | | | 219,436 | | | |
| Sparton Corp. * | | | 9,960 | | | | 41,035 | | | |
| The Allied Defense Group, Inc. * | | | 6,840 | | | | 40,493 | | | |
| WESCO International, Inc. * | | | 27,860 | | | | 1,016,611 | | | |
| | | | | | | |
| | | | | | | | 4,501,494 | | | |
Commercial Services & Supplies 1.3% |
| |
| Acco Brands Corp. * | | | 10,290 | | | | 139,635 | | | |
| American Reprographics Co. * | | | 22,000 | | | | 326,480 | | | |
| Cenveo, Inc. * | | | 37,575 | | | | 393,035 | | | |
| Mac-Gray Corp. * | | | 10,310 | | | | 117,740 | | | |
| TeleTech Holdings, Inc. * | | | 9,496 | | | | 213,280 | | | |
| The Corporate Executive Board Co. | | | 31,900 | | | | 1,291,312 | | | |
| TRC Cos., Inc. * | | | 16,800 | | | | 73,416 | | | |
| WCA Waste Corp. * | | | 4,960 | | | | 30,157 | | | |
| | | | | | | |
| | | | | | | | 2,585,055 | | | |
Consumer Durables & Apparel 7.3% |
| |
| Arctic Cat, Inc. | | | 10,518 | | | | 76,676 | | | |
| Ashworth, Inc. * | | | 14,702 | | | | 42,048 | | | |
| Brunswick Corp. | | | 72,500 | | | | 1,157,825 | | | |
| California Coastal Communities, Inc. * | | | 8,810 | | | | 42,640 | | | |
| Centex Corp. | | | 63,794 | | | | 1,544,453 | | | |
| Chromcraft Revington, Inc. * | | | 5,600 | | | | 24,640 | | | |
| D.R. Horton, Inc. | | | 4,843 | | | | 76,277 | | | |
| Furniture Brands International, Inc. | | | 27,890 | | | | 326,313 | | | |
| K-Swiss, Inc., Class A | | | 24,100 | | | | 381,262 | | | |
| KB Home | | | 53,500 | | | | 1,323,055 | | | |
| Lennar Corp., Class A | | | 22,000 | | | | 413,820 | | | |
| M.D.C. Holdings, Inc. | | | 31,810 | | | | 1,392,960 | | | |
| MarineMax, Inc. * | | | 12,750 | | | | 158,865 | | | |
| Newell Rubbermaid, Inc. | | | 86,477 | | | | 1,977,729 | | | |
| Pulte Homes, Inc. | | | 122,519 | | | | 1,782,652 | | | |
| R. G. Barry Corp. * | | | 8,080 | | | | 63,994 | | | |
| Tandy Brands Accessories, Inc. | | | 4,101 | | | | 19,849 | | | |
| The Black & Decker Corp. | | | 28,610 | | | | 1,891,121 | | | |
| The Ryland Group, Inc. | | | 33,070 | | | | 1,087,672 | | | |
| Toll Brothers, Inc. * | | | 23,480 | | | | 551,310 | | | |
| | | | | | | |
| | | | | | | | 14,335,161 | | | |
Consumer Services 3.1% |
| |
| Ambassadors Groups, Inc. | | | 7,891 | | | | 149,061 | | | |
| Century Casinos, Inc. * | | | 200 | | | | 648 | | | |
| Choice Hotels International, Inc. | | | 23,100 | | | | 787,941 | | | |
| Domino’s Pizza, Inc. | | | 16,260 | | | | 219,347 | | | |
| Gaylord Entertainment Co. * | | | 5,590 | | | | 169,321 | | | |
| INVESTools, Inc. * | | | 31,830 | | | | 349,812 | | | |
| Las Vegas Sands Corp. * | | | 720 | | | | 53,021 | | | |
| McCormick & Schmick’s Seafood Restaurants, Inc. * | | | 10,420 | | | | 121,393 | | | |
| Papa John’s International, Inc. * | | | 3,906 | | | | 94,564 | | | |
| Pinnacle Entertainment, Inc. * | | | 29,100 | | | | 372,480 | | | |
| Ruby Tuesday, Inc. | | | 36,620 | | | | 274,650 | | | |
| Ruth’s Chris Steak House, Inc. * | | | 5,900 | | | | 40,769 | | | |
See financial notes.
Laudus U.S. Equity Funds 49
Laudus Rosenberg Long/ Short Equity Fund
Portfolio Holdings continued
| | | | | | | | | | | |
| | | Number of | | Value | | |
| Security | | Shares | | ($) | | |
| Scientific Games Corp., Class A * | | | 41,038 | | | | 866,312 | | | |
| Star Buffet, Inc. | | | 1,300 | | | | 9,321 | | | |
| Texas Roadhouse, Inc., Class A * | | | 8,174 | | | | 80,105 | | | |
| The Cheesecake Factory, Inc. * | | | 49,200 | | | | 1,072,068 | | | |
| The Steak n Shake Co. * | | | 8,970 | | | | 70,594 | | | |
| Universal Technical Institute, Inc. * | | | 3,865 | | | | 45,337 | | | |
| Wendy’s International, Inc. | | | 56,391 | | | | 1,300,377 | | | |
| | | | | | | |
| | | | | | | | 6,077,121 | | | |
Diversified Financials 2.3% |
| |
| Asset Acceptance Capital Corp. | | | 6,808 | | | | 65,561 | | | |
| Cash Systems, Inc. * | | | 13,890 | | | | 7,220 | | | |
| Cohen & Steers, Inc. | | | 12,500 | | | | 331,125 | | | |
| E*TRADE Financial Corp. * | | | 152,331 | | | | 587,998 | | | |
| Jefferies Group, Inc. | | | 78,517 | | | | 1,266,479 | | | |
| LaBranche & Co., Inc. * | | | 39,246 | | | | 170,720 | | | |
| Moody’s Corp. | | | 56,500 | | | | 1,967,895 | | | |
| NewStar Financial, Inc. * | | | 440 | | | | 2,279 | | | |
| Resource America, Inc., Class A | | | 9,560 | | | | 90,342 | | | |
| Thomas Weisel Partners Group, Inc. * | | | 4,903 | | | | 32,458 | | | |
| World Acceptance Corp. * | | | 2,653 | | | | 84,498 | | | |
| | | | | | | |
| | | | | | | | 4,606,575 | | | |
Energy 5.4% |
| |
| Alon USA Energy, Inc. | | | 10,140 | | | | 154,229 | | | |
| BJ Services Co. | | | 65,483 | | | | 1,866,920 | | | |
| CREDO Petroleum Corp. * | | | 3,250 | | | | 32,370 | | | |
| Delek US Holdings, Inc. | | | 500 | | | | 6,335 | | | |
| Energy Partners Ltd. * | | | 21,500 | | | | 203,605 | | | |
| Frontier Oil Corp. | | | 24,437 | | | | 666,153 | | | |
| Grey Wolf, Inc. * | | | 109,500 | | | | 742,410 | | | |
| Hercules Offshore, Inc. * | | | 54,281 | | | | 1,363,539 | | | |
| Holly Corp. | | | 14,160 | | | | 614,685 | | | |
| Nabors Industries Ltd. * | | | 6,640 | | | | 224,233 | | | |
| Parallel Petroleum Corp. * | | | 32,900 | | | | 643,853 | | | |
| Patterson-UTI Energy, Inc. | | | 55,137 | | | | 1,443,487 | | | |
| RPC, Inc. | | | 9,757 | | | | 148,209 | | | |
| Tesoro Corp. | | | 51,934 | | | | 1,558,020 | | | |
| TETRA Technologies, Inc. * | | | 49,660 | | | | 786,614 | | | |
| Venoco, Inc. * | | | 300 | | | | 3,486 | | | |
| Western Refining, Inc. | | | 19,100 | | | | 257,277 | | | |
| | | | | | | |
| | | | | | | | 10,715,425 | | | |
Food & Staples Retailing 0.8% |
| |
| The Pantry, Inc. * | | | 21,700 | | | | 457,436 | | | |
| Whole Foods Market, Inc. | | | 35,080 | | | | 1,156,588 | | | |
| | | | | | | |
| | | | | | | | 1,614,024 | | | |
Food, Beverage & Tobacco 1.4% |
| |
| Cuisine Solutions, Inc. * | | | 6,950 | | | | 20,641 | | | |
| Dean Foods Co. * | | | 25,542 | | | | 513,139 | | | |
| The Hershey Co. | | | 56,600 | | | | 2,132,122 | | | |
| | | | | | | |
| | | | | | | | 2,665,902 | | | |
Health Care Equipment & Services 6.0% |
| |
| Accuray, Inc. * | | | 13,500 | | | | 105,435 | | | |
| Advanced Medical Optics, Inc. * | | | 51,600 | | | | 1,047,480 | | | |
| Advocat, Inc. * | | | 1,100 | | | | 11,968 | | | |
| Align Technology, Inc. * | | | 37,178 | | | | 413,048 | | | |
| Allscripts Healthcare Solutions, Inc. * | | | 38,600 | | | | 398,352 | | | |
| Bovie Medical Corp. * | | | 6,470 | | | | 41,408 | | | |
| Brookdale Senior Living, Inc. | | | 100 | | | | 2,390 | | | |
| CAS Medical Systems, Inc. * | | | 800 | | | | 3,440 | | | |
| Clinical Data, Inc. * | | | 14,986 | | | | 277,091 | | | |
| Community Health Systems, Inc. * | | | 49,700 | | | | 1,668,429 | | | |
| Computer Programs & Systems, Inc. | | | 9,100 | | | | 190,190 | | | |
| Conceptus, Inc. * | | | 3,200 | | | | 59,392 | | | |
| Emeritus Corp. * | | | 9,940 | | | | 207,348 | | | |
| Endologix, Inc. * | | | 28,030 | | | | 83,810 | | | |
| ev3, Inc. * | | | 33,600 | | | | 273,504 | | | |
| Gen-Probe, Inc. * | | | 14,680 | | | | 707,576 | | | |
| Health Management Associates, Inc., Class A * | | | 89,322 | | | | 472,513 | | | |
| Immucor, Inc. * | | | 1,010 | | | | 21,554 | | | |
| LHC Group, Inc. * | | | 5,321 | | | | 89,393 | | | |
| Micrus Endovascular Corp. * | | | 1,991 | | | | 24,609 | | | |
| NMT Medical, Inc. * | | | 8,660 | | | | 33,601 | | | |
| NxStage Medical, Inc. * | | | 14,835 | | | | 64,087 | | | |
| Omnicare, Inc. | | | 24,968 | | | | 453,419 | | | |
| Palomar Medical Technologies, Inc. * | | | 14,732 | | | | 222,453 | | | |
| Patterson Cos., Inc. * | | | 13,984 | | | | 507,619 | | | |
| PDI, Inc. * | | | 3,567 | | | | 30,034 | | | |
| ResMed, Inc. * | | | 9,310 | | | | 392,696 | | | |
| Rockwell Medical Technologies, Inc. * | | | 9,130 | | | | 55,876 | | | |
| STAAR Surgical Co. * | | | 8,486 | | | | 21,809 | | | |
| Stereotaxis, Inc. * | | | 1,000 | | | | 5,920 | | | |
| Sunrise Senior Living, Inc. * | | | 17,480 | | | | 389,454 | | | |
| Tenet Healthcare Corp. * | | | 288,400 | | | | 1,632,344 | | | |
| The Spectranetics Corp. * | | | 22,180 | | | | 185,425 | | | |
| VCA Antech, Inc. * | | | 49,481 | | | | 1,353,305 | | | |
| Vital Images, Inc. * | | | 13,600 | | | | 201,552 | | | |
| Volcano Corp. * | | | 20,480 | | | | 256,000 | | | |
| | | | | | | |
| | | | | | | | 11,904,524 | | | |
Household & Personal Products 0.3% |
| |
| Central Garden & Pet Co. * | | | 88 | | | | 406 | | | |
| NBTY, Inc. * | | | 14,807 | | | | 443,469 | | | |
| Reliv’ International, Inc. | | | 13,000 | | | | 86,450 | | | |
| | | | | | | |
| | | | | | | | 530,325 | | | |
Insurance 5.6% |
| |
| American Equity Investment Life Holding Co. | | | 40,364 | | | | 374,578 | | | |
| Argo Group International Holdings Ltd. * | | | 19,700 | | | | 699,744 | | | |
| Assured Guaranty Ltd. | | | 42,166 | | | | 1,001,021 | | | |
| Brown & Brown, Inc. | | | 91,300 | | | | 1,586,794 | | | |
| Conseco, Inc. * | | | 119,892 | | | | 1,222,899 | | | |
| eHealth, Inc. * | | | 5,380 | | | | 118,737 | | | |
| Employers Holdings, Inc. | | | 22,530 | | | | 417,706 | | | |
| Independence Holding Co. | | | 2,900 | | | | 34,568 | | | |
| LandAmerica Financial Group, Inc. | | | 12,200 | | | | 481,534 | | | |
| Markel Corp. * | | | 3,756 | | | | 1,652,527 | | | |
| Old Republic International Corp. | | | 125,800 | | | | 1,624,078 | | | |
| Philadelphia Consolidated Holding Corp. * | | | 22,221 | | | | 715,516 | | | |
See financial notes.
50 Laudus U.S. Equity Funds
Laudus Rosenberg Long/Short Equity Fund
| | | | | | | | | | | |
| | | Number of | | Value | | |
| Security | | Shares | | ($) | | |
| SAFECO Corp. | | | 4,074 | | | | 178,767 | | | |
| Stewart Information Services Corp. | | | 12,800 | | | | 358,272 | | | |
| Willis Group Holdings Ltd. | | | 15,230 | | | | 511,880 | | | |
| | | | | | | |
| | | | | | | | 10,978,621 | | | |
Materials 2.6% |
| |
| ADA-ES, Inc. * | | | 5,400 | | | | 45,198 | | | |
| Apex Silver Mines Ltd. * | | | 2,938 | | | | 35,609 | | | |
| Deltic Timber Corp. | | | 7,555 | | | | 420,813 | | | |
| Headwaters, Inc. * | | | 3,191 | | | | 42,089 | | | |
| Kronos Worldwide, Inc. | | | 2,170 | | | | 52,405 | | | |
| Louisiana-Pacific Corp. | | | 94,620 | | | | 868,612 | | | |
| Mod-Pac Corp. * | | | 300 | | | | 1,515 | | | |
| Nanophase Technologies Corp. * | | | 7,600 | | | | 24,624 | | | |
| Pactiv Corp. * | | | 66,470 | | | | 1,742,179 | | | |
| Smurfit-Stone Container Corp. * | | | 154,780 | | | | 1,191,806 | | | |
| Symyx Technologies, Inc. * | | | 880 | | | | 6,600 | | | |
| Titanium Metals Corp. | | | 47,000 | | | | 707,350 | | | |
| | | | | | | |
| | | | | | | | 5,138,800 | | | |
Media 1.7% |
| |
| 4Kids Entertainment, Inc. * | | | 11,240 | | | | 109,815 | | | |
| Arbitron, Inc. | | | 10,250 | | | | 442,390 | | | |
| Beasley Broadcast Group, Inc., Class A | | | 8,862 | | | | 31,549 | | | |
| Cinemark Holdings, Inc. | | | 12,460 | | | | 159,364 | | | |
| CKX, Inc. * | | | 4,364 | | | | 41,545 | | | |
| Clear Channel Outdoor Holdings, Inc., Class A * | | | 12,030 | | | | 228,690 | | | |
| Lamar Advertising Co., Class A * | | | 43,013 | | | | 1,545,457 | | | |
| LodgeNet Interactive Corp. * | | | 16,580 | | | | 100,972 | | | |
| R.H. Donnelley Corp. * | | | 29,188 | | | | 147,691 | | | |
| RCN Corp. * | | | 13,060 | | | | 146,011 | | | |
| Rentrak Corp. * | | | 3,902 | | | | 47,136 | | | |
| The E.W. Scripps Co., Class A | | | 7,220 | | | | 303,312 | | | |
| The Interpublic Group of Cos., Inc. * | | | 200 | | | | 1,682 | | | |
| Virgin Media, Inc. | | | 1,009 | | | | 14,197 | | | |
| | | | | | | |
| | | | | | | | 3,319,811 | | | |
Pharmaceuticals & Biotechnology 7.1% |
| |
| Acadia Pharmaceuticals, Inc. * | | | 23,010 | | | | 208,471 | | | |
| Affymetrix, Inc. * | | | 14,893 | | | | 259,287 | | | |
| Altus Pharmaceuticals, Inc. * | | | 22,260 | | | | 101,283 | | | |
| AMAG Pharmaceuticals, Inc. * | | | 10,779 | | | | 435,795 | | | |
| Amylin Pharmaceuticals, Inc. * | | | 66,068 | | | | 1,929,846 | | | |
| Arena Pharmaceuticals, Inc. * | | | 58,700 | | | | 401,508 | | | |
| ARIAD Pharmaceuticals, Inc. * | | | 42,200 | | | | 142,214 | | | |
| ArQule, Inc. * | | | 23,819 | | | | 101,945 | | | |
| Array BioPharma, Inc. * | | | 42,506 | | | | 297,967 | | | |
| Barr Pharmaceuticals, Inc. * | | | 2,050 | | | | 99,035 | | | |
| BioCryst Pharmaceuticals, Inc. * | | | 1,220 | | | | 5,624 | | | |
| BioSphere Medical, Inc. * | | | 19,597 | | | | 89,950 | | | |
| Caliper Life Sciences, Inc. * | | | 2,700 | | | | 10,125 | | | |
| Cepheid, Inc. * | | | 19,200 | | | | 468,288 | | | |
| CombiMatrix Corp. * | | | 5,300 | | | | 50,403 | | | |
| CV Therapeutics, Inc. * | | | 42,450 | | | | 302,668 | | | |
| Cypress Bioscience, Inc. * | | | 18,300 | | | | 131,028 | | | |
| Dyax Corp. * | | | 7,141 | | | | 33,634 | | | |
| Enzo Biochem, Inc. * | | | 23,600 | | | | 214,524 | | | |
| Exelixis, Inc. * | | | 83,970 | | | | 583,592 | | | |
| Geron Corp. * | | | 44,596 | | | | 217,628 | | | |
| Human Genome Sciences, Inc. * | | | 117,350 | | | | 691,192 | | | |
| Incyte Corp. * | | | 18,700 | | | | 196,537 | | | |
| InterMune, Inc. * | | | 21,270 | | | | 310,117 | | | |
| Keryx Biopharmaceuticals, Inc. * | | | 36,770 | | | | 22,062 | | | |
| Maxygen, Inc. * | | | 19,300 | | | | 124,678 | | | |
| Medarex, Inc. * | | | 85,752 | | | | 758,905 | | | |
| Metabolix, Inc. * | | | 10,510 | | | | 115,084 | | | |
| Momenta Pharmaceuticals, Inc. * | | | 3,027 | | | | 33,085 | | | |
| Nektar Therapeutics * | | | 4,618 | | | | 32,049 | | | |
| Neurocrine Biosciences, Inc. * | | | 35,400 | | | | 191,160 | | | |
| Omrix Biopharmaceuticals, Inc. * | | | 9,670 | | | | 135,380 | | | |
| PDL BioPharma, Inc. * | | | 78,180 | | | | 827,926 | | | |
| Penwest Pharmaceuticals Co. * | | | 16,735 | | | | 43,511 | | | |
| Pharmacopeia, Inc. * | | | 1,420 | | | | 5,226 | | | |
| Progenics Pharmaceuticals, Inc. * | | | 20,054 | | | | 130,953 | | | |
| Regeneron Pharmaceuticals, Inc. * | | | 21,831 | | | | 418,937 | | | |
| Senomyx, Inc. * | | | 25,580 | | | | 150,922 | | | |
| Sepracor, Inc. * | | | 34,304 | | | | 669,614 | | | |
| The Medicines Co. * | | | 24,569 | | | | 496,294 | | | |
| Valeant Pharmaceuticals International * | | | 3,760 | | | | 48,241 | | | |
| Vertex Pharmaceuticals, Inc. * | | | 84,535 | | | | 2,019,541 | | | |
| XenoPort, Inc. * | | | 6,210 | | | | 251,319 | | | |
| ZymoGenetics, Inc. * | | | 31,927 | | | | 312,885 | | | |
| | | | | | | |
| | | | | | | | 14,070,433 | | | |
Real Estate 17.6% |
| |
| Alexandria Real Estate Equities, Inc. | | | 200 | | | | 18,544 | | | |
| Apartment Investment & Management Co., Class A | | | 58,595 | | | | 2,098,287 | | | |
| AvalonBay Communities, Inc. | | | 20,880 | | | | 2,015,338 | | | |
| Boston Properties, Inc. | | | 24,740 | | | | 2,277,812 | | | |
| Brandywine Realty Trust | | | 14,909 | | | | 252,857 | | | |
| BRE Properties, Inc. | | | 39,709 | | | | 1,809,142 | | | |
| Camden Property Trust | | | 42,800 | | | | 2,148,560 | | | |
| CB Richard Ellis Group, Inc., Class A * | | | 99,720 | | | | 2,157,941 | | | |
| Corporate Office Properties Trust | | | 26,870 | | | | 903,101 | | | |
| Developers Diversified Realty Corp. | | | 54,200 | | | | 2,269,896 | | | |
| Duke Realty Corp. | | | 5,527 | | | | 126,071 | | | |
| EastGroup Properties, Inc. | | | 4,960 | | | | 230,442 | | | |
| Essex Property Trust, Inc. | | | 18,700 | | | | 2,131,426 | | | |
| Forest City Enterprises, Inc., Class A | | | 11,780 | | | | 433,504 | | | |
| General Growth Properties, Inc. | | | 10 | | | | 382 | | | |
| Grubb & Ellis Co. | | | 25,420 | | | | 174,635 | | | |
| Healthcare Realty Trust, Inc. | | | 25,757 | | | | 673,545 | | | |
| Jones Lang LaSalle, Inc. | | | 4,883 | | | | 377,651 | | | |
| Kilroy Realty Corp. | | | 28,200 | | | | 1,384,902 | | | |
| Liberty Property Trust | | | 49,000 | | | | 1,524,390 | | | |
| Mack-Cali Realty Corp. | | | 36,656 | | | | 1,308,986 | | | |
| Plum Creek Timber Co., Inc. | | | 52,920 | | | | 2,153,844 | | | |
| PS Business Parks, Inc. | | | 10,800 | | | | 560,520 | | | |
| Public Storage | | | 2,900 | | | | 256,998 | | | |
| Regency Centers Corp. | | | 35,170 | | | | 2,277,609 | | | |
| Sun Communities, Inc. | | | 603 | | | | 12,361 | | | |
| Tejon Ranch Co. * | | | 4,980 | | | | 185,854 | | | |
| The Macerich Co. | | | 30,860 | | | | 2,168,532 | | | |
See financial notes.
Laudus U.S. Equity Funds 51
Laudus Rosenberg Long/ Short Equity Fund
Portfolio Holdings continued
| | | | | | | | | | | |
| | | Number of | | Value | | |
| Security | | Shares | | ($) | | |
| Thomas Properties Group, Inc. | | | 14,907 | | | | 130,883 | | | |
| Ventas, Inc. | | | 52,351 | | | | 2,351,083 | | | |
| Washington Real Estate Investment Trust | | | 10,101 | | | | 337,575 | | | |
| | | | | | | |
| | | | | | | | 34,752,671 | | | |
Retailing 3.2% |
| |
| American Eagle Outfitters, Inc. | | | 1,500 | | | | 26,265 | | | |
| Borders Group, Inc. | | | 56,400 | | | | 331,068 | | | |
| Casual Male Retail Group, Inc. * | | | 13,828 | | | | 58,078 | | | |
| Charming Shoppes, Inc. * | | | 35,700 | | | | 172,431 | | | |
| Chico’s FAS, Inc. * | | | 82,683 | | | | 587,876 | | | |
| Coldwater Creek, Inc. * | | | 40,800 | | | | 206,040 | | | |
| Collective Brands, Inc. * | | | 15,433 | | | | 187,048 | | | |
| Core-Mark Holding Co., Inc. * | | | 5,820 | | | | 167,267 | | | |
| Dillard’s, Inc., Class A | | | 40,100 | | | | 690,121 | | | |
| Eddie Bauer Holdings, Inc. * | | | 4,171 | | | | 16,225 | | | |
| Hibbett Sports, Inc. * | | | 21,700 | | | | 335,048 | | | |
| Limited Brands, Inc. | | | 11,500 | | | | 196,650 | | | |
| Office Depot, Inc. * | | | 57,359 | | | | 633,817 | | | |
| Pacific Sunwear of California, Inc. * | | | 49,807 | | | | 628,066 | | | |
| Pier 1 Imports, Inc. * | | | 73,700 | | | | 462,836 | | | |
| Pomeroy IT Solutions, Inc. * | | | 9,511 | | | | 52,596 | | | |
| Ross Stores, Inc. | | | 9,970 | | | | 298,701 | | | |
| Saks, Inc. * | | | 50,282 | | | | 627,016 | | | |
| Stein Mart, Inc. | | | 22,700 | | | | 127,574 | | | |
| The Cato Corp., Class A | | | 600 | | | | 8,964 | | | |
| The Children’s Place Retail Stores, Inc. * | | | 15,119 | | | | 371,323 | | | |
| The Dress Barn, Inc. * | | | 6,600 | | | | 85,404 | | | |
| The Pep Boys — Manny, Moe & Jack | | | 1,360 | | | | 13,546 | | | |
| | | | | | | |
| | | | | | | | 6,283,960 | | | |
Semiconductors & Semiconductor Equipment 6.8% |
| |
| Advanced Micro Devices, Inc. * | | | 285,740 | | | | 1,683,009 | | | |
| Altera Corp. | | | 86,500 | | | | 1,594,195 | | | |
| Cypress Semiconductor Corp. * | | | 87,728 | | | | 2,071,258 | | | |
| FormFactor, Inc. * | | | 32,400 | | | | 618,840 | | | |
| Ikanos Communications, Inc. * | | | 28,800 | | | | 131,616 | | | |
| Microchip Technology, Inc. | | | 69,100 | | | | 2,261,643 | | | |
| National Semiconductor Corp. | | | 52,120 | | | | 954,838 | | | |
| ON Semiconductor Corp. * | | | 107,552 | | | | 610,895 | | | |
| Photronics, Inc. * | | | 28,447 | | | | 271,669 | | | |
| Rambus, Inc. * | | | 81,915 | | | | 1,909,439 | | | |
| Rudolph Technologies, Inc. * | | | 11,400 | | | | 111,378 | | | |
| Silicon Laboratories, Inc. * | | | 35,089 | | | | 1,106,707 | | | |
| Tessera Technologies, Inc. * | | | 2,118 | | | | 44,054 | | | |
| | | | | | | |
| | | | | | | | 13,369,541 | | | |
Software & Services 7.5% |
| |
| Ansoft Corp. * | | | 6,630 | | | | 202,348 | | | |
| Bitstream, Inc., Class A * | | | 9,800 | | | | 54,684 | | | |
| Blackboard, Inc. * | | | 8,600 | | | | 286,638 | | | |
| Callidus Software, Inc. * | | | 12,048 | | | | 57,951 | | | |
| Citrix Systems, Inc. * | | | 60,840 | | | | 1,784,437 | | | |
| CNET Networks, Inc. * | | | 101,800 | | | | 722,780 | | | |
| Cognizant Technology Solutions Corp., Class A * | | | 20,133 | | | | 580,434 | | | |
| DealerTrack Holdings, Inc. * | | | 25,000 | | | | 505,500 | | | |
| Digital River, Inc. * | | | 23,237 | | | | 719,650 | | | |
| eLoyalty Corp. * | | | 2,740 | | | | 22,249 | | | |
| Equinix, Inc. * | | | 21,700 | | | | 1,442,833 | | | |
| Euronet Worldwide, Inc. * | | | 1,200 | | | | 23,112 | | | |
| Fidelity National Information Services, Inc. | | | 540 | | | | 20,595 | | | |
| Global Cash Access Holdings, Inc. * | | | 32,660 | | | | 191,388 | | | |
| Global Payments, Inc. | | | 700 | | | | 28,952 | | | |
| Interactive Intelligence, Inc. * | | | 10,264 | | | | 120,807 | | | |
| Internet Capital Group, Inc. * | | | 25,900 | | | | 271,173 | | | |
| Iron Mountain, Inc. * | | | 60,405 | | | | 1,597,108 | | | |
| j2 Global Communications, Inc. * | | | 300 | | | | 6,696 | | | |
| Liquidity Services, Inc. * | | | 10,900 | | | | 87,200 | | | |
| LoopNet, Inc. * | | | 6,000 | | | | 76,200 | | | |
| MicroStrategy, Inc., Class A * | | | 3,200 | | | | 236,768 | | | |
| MSC.Software Corp. * | | | 32,385 | | | | 420,681 | | | |
| Parametric Technology Corp. * | | | 76,100 | | | | 1,216,078 | | | |
| Rainmaker Systems, Inc. * | | | 3,050 | | | | 9,912 | | | |
| RealNetworks, Inc. * | | | 64,742 | | | | 370,972 | | | |
| Red Hat, Inc. * | | | 93,430 | | | | 1,718,178 | | | |
| SAVVIS, Inc. * | | | 19,399 | | | | 315,622 | | | |
| Sonic Solutions * | | | 10,312 | | | | 99,511 | | | |
| SupportSoft, Inc. * | | | 12,600 | | | | 41,580 | | | |
| TheStreet.com, Inc. | | | 9,279 | | | | 74,974 | | | |
| THQ, Inc. * | | | 45,400 | | | | 989,720 | | | |
| Websense, Inc. * | | | 29,564 | | | | 554,325 | | | |
| | | | | | | |
| | | | | | | | 14,851,056 | | | |
Technology Hardware & Equipment 3.2% |
| |
| Acacia Research-Acacia Technologies * | | | 24,500 | | | | 140,875 | | | |
| Acme Packet, Inc. * | | | 11,270 | | | | 90,047 | | | |
| ADTRAN, Inc. | | | 5,010 | | | | 92,685 | | | |
| Brightpoint, Inc. * | | | 43,600 | | | | 364,496 | | | |
| Ciprico, Inc. * | | | 1,420 | | | | 2,130 | | | |
| Cogent, Inc. * | | | 34,380 | | | | 324,203 | | | |
| Comarco, Inc. | | | 7,730 | | | | 28,833 | | | |
| Comtech Group, Inc. * | | | 7,300 | | | | 78,767 | | | |
| Daktronics, Inc. | | | 6,740 | | | | 120,713 | | | |
| F5 Networks, Inc. * | | | 29,684 | | | | 539,358 | | | |
| InterDigital, Inc. * | | | 25,355 | | | | 502,283 | | | |
| Intevac, Inc. * | | | 15,858 | | | | 205,361 | | | |
| Lexmark International, Inc., Class A * | | | 49,790 | | | | 1,529,549 | | | |
| LoJack Corp. * | | | 14,840 | | | | 187,578 | | | |
| Merix Corp. * | | | 20,000 | | | | 40,800 | | | |
| Metalink Ltd. * | | | 1,900 | | | | 3,458 | | | |
| Nam Tai Electronics, Inc. | | | 31,800 | | | | 305,280 | | | |
| Napco Security Systems, Inc. * | | | 12,570 | | | | 61,844 | | | |
| NumereX Corp., Class A * | | | 12,975 | | | | 90,825 | | | |
| Occam Networks, Inc. * | | | 12,961 | | | | 70,508 | | | |
| Photon Dynamics, Inc. * | | | 9,320 | | | | 98,792 | | | |
| Planar Systems, Inc. * | | | 19,000 | | | | 76,190 | | | |
| Powerwave Technologies, Inc. * | | | 105,670 | | | | 269,459 | | | |
| Riverbed Technology, Inc. * | | | 2,560 | | | | 38,042 | | | |
| Tellabs, Inc. * | | | 165,363 | | | | 901,228 | | | |
| Vyyo, Inc. * | | | 1,428 | | | | 585 | | | |
| X-Rite, Inc. * | | | 23,300 | | | | 139,101 | | | |
| Zebra Technologies Corp., Class A * | | | 2,668 | | | | 88,898 | | | |
| | | | | | | |
| | | | | | | | 6,391,888 | | | |
See financial notes.
52 Laudus U.S. Equity Funds
Laudus Rosenberg Long/Short Equity Fund
| | | | | | | | | | | |
| | | Number of | | Value | | |
| Security | | Shares | | ($) | | |
Telecommunication Services 0.2% |
| |
| Cbeyond, Inc. * | | | 7,420 | | | | 139,422 | | | |
| Citizens Communications Co. | | | 21,520 | | | | 225,745 | | | |
| GoAmerica, Inc. * | | | 495 | | | | 3,217 | | | |
| Metropcs Communications, Inc. * | | | 4,190 | | | | 71,230 | | | |
| | | | | | | |
| | | | | | | | 439,614 | | | |
Transportation 2.6% |
| |
| AirTran Holdings, Inc. * | | | 58,300 | | | | 384,780 | | | |
| AMR Corp. * | | | 117,600 | | | | 1,060,752 | | | |
| Celadon Group, Inc. * | | | 20,181 | | | | 195,352 | | | |
| Expeditors International of Washington, Inc. | | | 33,141 | | | | 1,497,310 | | | |
| Frozen Food Express Industries, Inc. | | | 16,410 | | | | 130,296 | | | |
| Hertz Global Holdings, Inc. * | | | 39,862 | | | | 480,736 | | | |
| JetBlue Airways Corp. * | | | 98,400 | | | | 570,720 | | | |
| P.A.M. Transportation Services, Inc. * | | | 3,573 | | | | 55,596 | | | |
| YRC Worldwide, Inc. * | | | 51,402 | | | | 674,394 | | | |
| | | | | | | |
| | | | | | | | 5,049,936 | | | |
Utilities 1.1% |
| |
| Allegheny Energy, Inc. | | | 3,130 | | | | 158,065 | | | |
| CMS Energy Corp. | | | 120,500 | | | | 1,631,570 | | | |
| Environmental Power Corp. * | | | 10,120 | | | | 41,998 | | | |
| PNM Resources, Inc. | | | 31,870 | | | | 397,419 | | | |
| Pure Cycle Corp. * | | | 1,090 | | | | 6,071 | | | |
| | | | | | | |
| | | | | | | | 2,235,123 | | | |
| | | | | | | |
Total Short Sales
(Proceeds $235,881,827) | | | 184,841,365 | | | |
| | | | | | | |
| Rights 0.0% of net assets |
Real Estate 0.0% |
| |
| FX Real Estate & Entertainment, Inc. * | | | 585 | | | | 47 | | | |
| | | | | | | |
Total Rights (Proceed $—) | | | 47 | | | |
| | | | | | | |
| |
End of short sale positions. |
| |
| * | Non-income producing security |
See financial notes.
Laudus U.S. Equity Funds 53
Financial Statements
Statement of Assets and Liabilities as of 3/31/08
| | | | | | | | | | | | | | | |
| | | Laudus Rosenberg | | Laudus Rosenberg | | Laudus Rosenberg |
| | | U.S. Large | | U.S. Large | | U.S. Large |
| | | Capitalization | | Capitalization | | Capitalization |
| | | Fund | | Growth Fund | | Value Fund |
| | | | | | | |
Assets: | | | | | | | | | | | | |
| Total investments, at cost | | $ | 92,836,135 | | | $ | 48,922,221 | | | $ | 5,957,094 | |
| | | | | | | | | | | | | |
Investments, at value1 | | $ | 92,120,930 | | | $ | 54,201,935 | | | $ | 6,246,814 | |
| Repurchase agreements, at amortized cost | | | 1,798,000 | | | | 780,000 | | | | 58,000 | |
| | | | | | | | | | | | | |
| | | Total Investments | | | 93,918,930 | | | | 54,981,935 | | | | 6,304,814 | |
| | | | | | | | | | | | | |
| Deposits with broker and custodian bank for securities sold short | | | — | | | | — | | | | — | |
| Collateral invested for securities on loan | | | — | | | | 9,625,633 | | | | — | |
| Cash | | | 795 | | | | 704 | | | | 1,179 | |
| Dividends and interest receivable | | | 124,995 | | | | 46,562 | | | | 9,697 | |
| Receivable for fund shares sold | | | 55,294 | | | | 454,588 | | | | 829 | |
| Receivable for securities sold short | | | — | | | | — | | | | — | |
| Receivable for investments sold | | | 1,269,275 | | | | 427,460 | | | | — | |
| Receivable from Manager | | | 2,958 | | | | — | | | | — | |
| Prepaid expenses | | | 877 | | | | 639 | | | | 115 | |
| | | | | | | | | | | | | |
| | | Total Assets | | | 95,373,124 | | | | 65,537,521 | | | | 6,316,634 | |
| | | | | | | | | | | | | |
Liabilities: | | | | | | | | | | | | |
| Securities sold short, proceeds | | $ | — | | | $ | — | | | $ | — | |
| | | | | | | | | | | | | |
| Securities sold short at value | | | — | | | | — | | | | — | |
| Payable to custodian | | | | | | | — | | | | — | |
| Payable for fund shares repurchased | | | 21,745 | | | | 484 | | | | — | |
| Payable for cover securities sold short | | | — | | | | — | | | | — | |
| Payable for investments purchased | | | 2,492,108 | | | | 378,504 | | | | 58,587 | |
| Collateral held for securities on loan | | | — | | | | 9,625,633 | | | | — | |
| Accrued expenses and other liabilities: | | | | | | | | | | | | |
| | Trustees’ retirement plan | | | 4,631 | | | | 1,180 | | | | 152 | |
| | Dividend payable on securities sold short | | | — | | | | — | | | | — | |
| | Manager fees | | | — | | | | — | | | | — | |
| | Transfer agent fees | | | 3,221 | | | | 2,786 | | | | 2,493 | |
| | Distribution and shareholder service fees | | | 3,141 | | | | 751 | | | | 100 | |
| | Administration and fund accounting fee | | | 3,346 | | | | 3,588 | | | | 3,120 | |
| | Other accrued expenses | | | 44,641 | | | | 39,105 | | | | 33,705 | |
| | | | | | | | | | | | | |
| | | Total Liabilities | | | 2,572,833 | | | | 10,052,031 | | | | 98,157 | |
| | | | | | | | | | | | | |
Net Assets | | $ | 92,800,291 | | | $ | 55,485,490 | | | $ | 6,218,477 | |
| | | | | | | | | | | | | |
Net Assets Consist of: | | | | | | | | | | | | |
| Capital | | $ | 95,385,195 | | | $ | 49,406,533 | | | $ | 5,883,767 | |
| Undistributed net investment income/Distributions in excess of net investment income | | | 224,733 | | | | 37,074 | | | | 22,576 | |
| Accumulated net realized gains/(losses) on investments | | | (3,892,432 | ) | | | (17,831 | ) | | | (35,586 | ) |
| Net unrealized appreciation on investments | | | 1,082,795 | | | | 6,059,714 | | | | 347,720 | |
| | | | | | | | | | | | | |
Net Assets | | $ | 92,800,291 | | | $ | 55,485,490 | | | $ | 6,218,477 | |
| | | | | | | | | | | | | |
Institutional Shares: | | | | | | | | | | | | |
| Net Assets | | $ | 83,783,339 | | | $ | 52,681,257 | | | $ | 5,764,570 | |
| Shares Outstanding | | | 8,073,585 | | | | 5,766,064 | | | | 550,547 | |
| Net Asset Value, Offering Price and Redemption Price per Share | | $ | 10.38 | | | $ | 9.14 | | | $ | 10.47 | |
| | | | | | | | | | | | | |
Adviser Shares: | | | | | | | | | | | | |
| Net Assets | | $ | — | | | $ | — | | | $ | — | |
| Shares Outstanding | | | — | | | | — | | | | — | |
| Net Asset Value, Offering Price and Redemption Price per Share | | $ | — | | | $ | — | | | $ | — | |
| | | | | | | | | | | | | |
Investor Shares: | | | | | | | | | | | | |
| Net Assets | | $ | 9,016,952 | | | $ | 2,804,233 | | | $ | 453,907 | |
| Shares Outstanding | | | 868,322 | | | | 305,402 | | | | 43,448 | |
| Net Asset Value, Offering Price and Redemption Price per Share | | $ | 10.38 | | | $ | 9.18 | | | $ | 10.45 | |
| | | | | | | | | | | | | |
| |
| 1 | Includes securities on loan for Laudus Rosenberg U.S. Large Capitalization Growth Fund, Laudus Rosenberg U.S. Discovery Fund, and Laudus Rosenberg U.S. Small Capitalization Fund of $9,410,133, $243,929,093, and $244,590,493 respectively. |
See the accompanying notes to the financial statements.
54 Laudus U.S. Equity Funds
Financial Statements—Statement of Assets and Liabilities continued
| | | | | | | | | | | | | |
| | | | | Laudus Rosenberg | | Laudus |
| | | Laudus Rosenberg | | U.S. Small | | Rosenberg |
| | | U.S. Discovery | | Capitalization | | Long/Short |
| | | Fund | | Fund | | Equity Fund |
| | | | | | | |
| | | $ | 709,133,061 | | | $ | 552,270,688 | | | $ | 190,810,464 | |
| | | | | | | | | | | | | |
| | | $ | 733,788,286 | | | $ | 604,972,639 | | | $ | 190,396,715 | |
| | | | 10,796,000 | | | | — | | | | 5,461,514 | |
| | | | | | | | | | | | | |
| | | | 744,584,286 | | | | 604,972,639 | | | | 195,858,229 | |
| | | | | | | | | | | | | |
| | | | — | | | | — | | | | 183,925,872 | |
| | | | 250,095,950 | | | | 251,007,699 | | | | — | |
| | | | | | | | — | | | | — | |
| | | | 741,442 | | | | 620,473 | | | | 392,567 | |
| | | | 1,224,928 | | | | 686,343 | | | | 662,396 | |
| | | | — | | | | — | | | | 4,873,834 | |
| | | | 11,578,405 | | | | 43,465,198 | | | | 2,349,007 | |
| | | | — | | | | — | | | | — | |
| | | | 11,329 | | | | 16,135 | | | | 3,339 | |
| | | | | | | | | | | | | |
| | | | 1,008,236,340 | | | | 900,768,487 | | | | 388,065,244 | |
| | | | | | | | | | | | | |
| | | $ | — | | | $ | — | | | $ | 235,881,827 | |
| | | | | | | | | | | | | |
| | | | — | | | | — | | | | 184,841,412 | |
| | | | 1,201,386 | | | | 20,307,613 | | | | 3,362 | |
| | | | 8,677,558 | | | | 1,206,322 | | | | 175,039 | |
| | | | — | | | | — | | | | 4,663,593 | |
| | | | 12,199,119 | | | | 15,069,461 | | | | 430,764 | |
| | | | 250,095,950 | | | | 251,007,699 | | | | — | |
| | | | 37,982 | | | | 116,814 | | | | 14,469 | |
| | | | — | | | | — | | | | 277,861 | |
| | | | 55,103 | | | | 47,076 | | | | 23,549 | |
| | | | 12,713 | | | | 20,536 | | | | 10,407 | |
| | | | 113,998 | | | | 156,289 | | | | 14,624 | |
| | | | 7,433 | | | | 7,215 | | | | 5,695 | |
| | | | 110,403 | | | | 110,836 | | | | 73,029 | |
| | | | | | | | | | | | | |
| | | | 272,511,645 | | | | 288,049,861 | | | | 190,533,804 | |
| | | | | | | | | | | | | |
| | | $ | 735,724,695 | | | $ | 612,718,626 | | | $ | 197,531,440 | |
| | | | | | | | | | | | | |
| | | $ | 708,797,654 | | | $ | 563,160,074 | | | $ | 208,574,360 | |
| | | | 778,433 | | | | 65,175 | | | | 257,125 | |
| | | | (9,302,617 | ) | | | (3,208,574 | ) | | | (67,388,225 | ) |
| | | | 35,451,225 | | | | 52,701,951 | | | | 56,088,180 | |
| | | | | | | | | | | | | |
| | | $ | 735,724,695 | | | $ | 612,718,626 | | | $ | 197,531,440 | |
| | | | | | | | | | | | | |
| | | $ | 566,054,934 | | | $ | 393,939,141 | | | $ | 182,817,211 | |
| | | | 34,878,978 | | | | 43,612,300 | | | | 17,636,497 | |
| | | $ | 16.23 | | | $ | 9.03 | | | $ | 10.37 | |
| | | | | | | | | | | | | |
| | | $ | — | | | $ | 34,799,073 | | | $ | — | |
| | | | — | | | | 3,947,313 | | | | — | |
| | | $ | — | | | $ | 8.82 | | | $ | — | |
| | | | | | | | | | | | | |
| | | $ | 169,669,761 | | | $ | 183,980,412 | | | $ | 14,714,229 | |
| | | | 10,624,133 | | | | 21,145,360 | | | | 1,429,131 | |
| | | $ | 15.97 | | | $ | 8.70 | | | $ | 10.30 | |
| | | | | | | | | | | | | |
See the accompanying notes to the financial statements.
Laudus U.S. Equity Funds 55
Financial Statements
Statement of Operations for the year ended 3/31/08
| | | | | | | | | | | | | | | |
| | | Laudus Rosenberg | | Laudus Rosenberg | | Laudus Rosenberg |
| | | U.S. Large | | U.S. Large | | U.S. Large |
| | | Capitalization | | Capitalization | | Capitalization |
| | | Fund | | Growth Fund | | Value Fund |
| | | | | | | |
Investment Income: | | | | | | | | | | | | |
| | Dividends1 | | $ | 1,814,048 | | | $ | 724,352 | | | $ | 153,941 | |
| | Interest | | | 43,686 | | | | 25,604 | | | | 1,912 | |
| | Securities lending | | | — | | | | 21,135 | | | | — | |
| | | | | | | | | | | | | |
| | Total investment income | | | 1,857,734 | | | | 771,091 | | | | 155,853 | |
| | | | | | | | | | | | | |
Expenses: | | | | | | | | | | | | |
| | Manager fees | | | 786,790 | | | | 523,784 | | | | 50,238 | |
| | Distribution and shareholder service fees (Investor Shares) | | | 24,914 | | | | 6,816 | | | | 1,319 | |
| | Service fees (Adviser Shares) | | | — | | | | — | | | | — | |
| | Professional fees | | | 41,488 | | | | 37,557 | | | | 50,080 | |
| | Custodian fees | | | 16,843 | | | | 12,855 | | | | 3,490 | |
| | Overdraft charges | | | 23,181 | | | | 8,050 | | | | 1,443 | |
| | Fund accounting fees and administration fees | | | 42,534 | | | | 46,303 | | | | 39,106 | |
| | Registration and filing fees | | | 33,091 | | | | 29,056 | | | | 21,573 | |
| | Sub-accounting fees (Investor Shares) | | | 13,425 | | | | 3,362 | | | | 820 | |
| | Shareholder report fee | | | 9,261 | | | | 5,146 | | | | 485 | |
| | Transfer agent fees | | | 21,523 | | | | 19,072 | | | | 17,386 | |
| | Trustees’ fees | | | 9,470 | | | | 9,119 | | | | 7,719 | |
| | Recouped by manager | | | 59,654 | | | | 3,572 | | | | — | |
| | Dividend expense for securities sold short | | | — | | | | — | | | | — | |
| | Other expenses | | | 6,624 | | | | 4,978 | | | | 1,219 | |
| | | | | | | | | | | | | |
| | | Total expenses before custody credits and waivers/reimbursements | | | 1,088,798 | | | | 709,670 | | | | 194,878 | |
| | | Less custody credits | | | (227 | ) | | | (137 | ) | | | (28 | ) |
| | | Less expenses waived/reimbursed by the Manager2 | | | (7,331 | ) | | | (2,046 | ) | | | (125,556 | ) |
| | | | | | | | | | | | | |
| | | Net expenses | | | 1,081,240 | | | | 707,487 | | | | 69,294 | |
| | | | | | | | | | | | | |
| | Net investment income/(loss) | | | 776,494 | | | | 63,604 | | | | 86,559 | |
| | | | | | | | | | | | | |
Realized and Unrealized Gains/(Losses) on Investments | | | | | | | | | | | | |
| | Net realized gains/(losses) on securities and foreign currency transactions | | | 5,283,353 | | | | 5,183,102 | | | | 223,229 | |
| | Net realized gains/(losses) on securities sold short | | | — | | | | — | | | | — | |
| | Change in unrealized appreciation/(depreciation) on investments | | | (11,039,541 | ) | | | (1,983,838 | ) | | | (653,994 | ) |
| | | | | | | | | | | | | |
| | Net realized and unrealized gains/(losses) on investments | | | (5,756,188 | ) | | | 3,199,264 | | | | (430,765 | ) |
| | | | | | | | | | | | | |
Change in Net Assets Resulting from Operations | | $ | (4,979,694 | ) | | $ | 3,262,868 | | | $ | (344,206 | ) |
| | | | | | | | | | | | | |
| |
| 1 | Net of foreign withholding tax for Laudus Rosenberg U.S. Discovery Fund, Laudus Rosenberg U.S. Small Capitalization Fund, and Laudus Rosenberg Long/ Short Equity Fund which was $73, $36 and $154, respectively. |
| |
| 2 | Includes reimbursement of sub-accounting fees on Investor Shares. |
See the accompanying notes to the financial statements.
56 Laudus U.S. Equity Funds
Financial Statements—Statement of Operations continued
| | | | | | | | | | | | | |
| | | | | Laudus Rosenberg | | |
| | | Laudus Rosenberg | | U.S. Small | | Laudus Rosenberg |
| | | U.S. Discovery | | Capitalization | | Long/Short |
| | | Fund | | Fund | | Equity Fund |
| | | | | | | |
| | | $ | 9,445,933 | | | $ | 8,930,245 | | | $ | 2,846,105 | |
| | | | 238,656 | | | | 187,991 | | | | 11,509,288 | |
| | | | 405,988 | | | | 383,635 | | | | — | |
| | | | | | | | | | | | | |
| | | | 10,090,577 | | | | 9,501,871 | | | | 14,355,393 | |
| | | | | | | | | | | | | |
| | | | 7,999,076 | | | | 7,860,015 | | | | 4,096,280 | |
| | | | 506,558 | | | | 593,285 | | | | 98,223 | |
| | | | — | | | | 107,475 | | | | — | |
| | | | 61,554 | | | | 61,811 | | | | 51,572 | |
| | | | 68,759 | | | | 54,010 | | | | 77,509 | |
| | | | 40,931 | | | | 64,142 | | | | — | |
| | | | 82,927 | | | | 77,967 | | | | 72,231 | |
| | | | 35,776 | | | | 34,287 | | | | 25,951 | |
| | | | 237,080 | | | | 240,293 | | | | 36,260 | |
| | | | 71,308 | | | | — | | | | 37,728 | |
| | | | 73,769 | | | | 119,057 | | | | 60,824 | |
| | | | 25,044 | | | | 24,138 | | | | 12,787 | |
| | | | 28,690 | | | | — | | | | 3,362 | |
| | | | — | | | | — | | | | 3,925,008 | |
| | | | 56,655 | | | | 120,404 | | | | 18,863 | |
| | | | | | | | | | | | | |
| | | | 9,288,127 | | | | 9,356,884 | | | | 8,516,598 | |
| | | | (2,014 | ) | | | (7,183 | ) | | | — | |
| | | | — | | | | (30,174 | ) | | | — | |
| | | | | | | | | | | | | |
| | | | 9,286,113 | | | | 9,319,527 | | | | 8,516,598 | |
| | | | | | | | | | | | | |
| | | | 804,464 | | | | 182,344 | | | | 5,838,795 | |
| | | | | | | | | | | | | |
| | | | 37,108,290 | | | | 82,186,761 | | | | 14,628,632 | |
| | | | — | | | | — | | | | (23,241,906 | ) |
| | | | (131,953,681 | ) | | | (190,015,225 | ) | | | 14,263 | |
| | | | | | | | | | | | | |
| | | | (94,845,391 | ) | | | (107,828,464 | ) | | | (8,599,011 | ) |
| | | | | | | | | | | | | |
| | | $ | (94,040,927 | ) | | $ | (107,646,120 | ) | | $ | (2,760,216 | ) |
| | | | | | | | | | | | | |
See the accompanying notes to the financial statements.
Laudus U.S. Equity Funds 57
Financial Statements
Statement of Changes in Net Assets
| | | | | | | | | | | | | | | | | | | |
| | | Laudus Rosenberg | | Laudus Rosenberg |
| | | U.S. Large | | U.S. Large |
| | | Capitalization Fund | | Capitalization Growth Fund |
| | | | | |
| | | Year Ended | | Year Ended | | Year Ended | | Year Ended |
| | | March 31, | | March 31, | | March 31, | | March 31, |
| | | 2008 | | 2007 | | 2008 | | 2007 |
| | | | | | | | | |
Operations: | | | | | | | | | | | | | | | | |
| | Net investment income | | $ | 776,494 | | | $ | 751,307 | | | $ | 63,604 | | | $ | 167,446 | |
| | Net realized gains/(losses) from investments | | | 5,283,353 | | | | 6,522,821 | | | | 5,183,102 | | | | (1,019,951 | ) |
| | Change in unrealized appreciation/(depreciation) from investments | | | (11,039,541 | ) | | | 3,731,397 | | | | (1,983,838 | ) | | | 4,581,034 | |
| | | | | | | | | | | | | | | | | |
| | | Change in net assets resulting from operations | | | (4,979,694 | ) | | | 11,005,525 | | | | 3,262,868 | | | | 3,728,529 | |
| | | | | | | | | | | | | | | | | |
Distributions to Shareholders from: | | | | | | | | | | | | | | | | |
| | Net investment income | | | | | | | | | | | | | | | | |
| | | Institutional Shares | | | (668,782 | ) | | | (668,604 | ) | | | (87,957 | ) | | | (135,787 | ) |
| | | Adviser Shares | | | — | | | | — | | | | — | | | | — | |
| | | Investor Shares | | | (45,709 | ) | | | (40,997 | ) | | | — | | | | — | |
| | | | | | | | | | | | | | | | | |
| | | | (714,491 | ) | | | (709,601 | ) | | | (87,957 | ) | | | (135,787 | ) |
| | | | | | | | | | | | | | | | | |
| | Net realized gains on investments | | | | | | | | | | | | | | | | |
| | | Institutional Shares | | | (13,458,529 | ) | | | (3,045,475 | ) | | | (2,948,584 | ) | | | — | |
| | | Adviser Shares | | | — | | | | — | | | | — | | | | — | |
| | | Investor Shares | | | (1,538,942 | ) | | | (320,576 | ) | | | (159,976 | ) | | | — | |
| | | | | | | | | | | | | | | | | |
| | | | (14,997,471 | ) | | | (3,366,051 | ) | | | (3,108,560 | ) | | | — | |
| | | | | | | | | | | | | | | | | |
| | | Change in net assets resulting from distributions | | | (15,711,962 | ) | | | (4,075,652 | ) | | | (3,196,517 | ) | | | (135,787 | ) |
| | | | | | | | | | | | | | | | | |
Capital Transactions: | | | | | | | | | | | | | | | | |
| | Proceeds from shares issued | | | | | | | | | | | | | | | | |
| | | Institutional Shares | | | 48,736,304 | | | | 58,578,093 | | | | 25,766,635 | | | | 36,913,996 | |
| | | Adviser Shares | | | — | | | | — | | | | — | | | | — | |
| | | Investor Shares | | | 2,518,064 | | | | 2,449,618 | | | | 1,466,020 | | | | 1,064,127 | |
| | | | | | | | | | | | | | | | | |
| | | | 51,254,368 | | | | 61,027,711 | | | | 27,232,655 | | | | 37,978,123 | |
| | | | | | | | | | | | | | | | | |
| | Distributions reinvested | | | | | | | | | | | | | | | | |
| | | Institutional Shares | | | 13,078,824 | | | | 2,813,571 | | | | 2,457,436 | | | | 54,198 | |
| | | Adviser Shares | | | — | | | | — | | | | — | | | | — | |
| | | Investor Shares | | | 1,511,650 | | | | 344,240 | | | | 152,686 | | | | — | |
| | | | | | | | | | | | | | | | | |
| | | | 14,590,474 | | | | 3,157,811 | | | | 2,610,122 | | | | 54,198 | |
| | | | | | | | | | | | | | | | | |
| | Value of shares redeemed | | | | | | | | | | | | | | | | |
| | | Institutional Shares1 | | | (54,462,466 | ) | | | (27,058,789 | ) | | | (51,349,953 | ) | | | (9,389,918 | ) |
| | | Adviser Shares | | | — | | | | — | | | | — | | | | — | |
| | | Investor Shares | | | (2,884,976 | ) | | | (3,384,025 | ) | | | (796,543 | ) | | | (747,706 | ) |
| | | | | | | | | | | | | | | | | |
| | | | (57,347,442 | ) | | | (30,442,814 | ) | | | (52,146,496 | ) | | | (10,137,624 | ) |
| | | | | | | | | | | | | | | | | |
| | | Change in net assets from capital transactions | | | 8,497,400 | | | | 33,742,708 | | | | (22,303,719 | ) | | | 27,894,697 | |
| | | | | | | | | | | | | | | | | |
| Change in net assets | | | (12,194,256 | ) | | | 40,672,581 | | | | (22,237,368 | ) | | | 31,487,439 | |
Net Assets: | | | | | | | | | | | | | | | | |
| | Beginning of period | | $ | 104,994,547 | | | $ | 64,321,966 | | | $ | 77,722,858 | | | $ | 46,235,419 | |
| | | | | | | | | | | | | | | | | |
| | End of period | | $ | 92,800,291 | | | $ | 104,994,547 | | | $ | 55,485,490 | | | $ | 77,722,858 | |
| | | | | | | | | | | | | | | | | |
| Undistributed net investment income/Distributions in excess of net investment income | | $ | 224,733 | | | $ | 163,419 | | | $ | 37,074 | | | $ | 61,427 | |
| | | | | | | | | | | | | | | | | |
| |
| 1 | Amounts for the Institutional Shares of the Laudus Rosenberg U.S. Small Capitalization Fund included $33,136,950 for shares redeemed in-kind during the period ended March 31, 2008. |
See the accompanying notes to the financial statements.
58 Laudus U.S. Equity Funds
Financial Statements—Statement of Changes in Net Assets continued
| | | | | | | | | | | | | | | | | | | | | | | | | | | | | | | | | |
| | | Laudus Rosenberg | | | | | | |
| | | U.S. Large | | Laudus Rosenberg | | Laudus Rosenberg | | Laudus Rosenberg |
| | | Capitalization Value Fund | | U.S. Discovery Fund | | U.S. Small Capitalization Fund | | Long/Short Equity Fund |
| | | | | | | | | |
| | | Year Ended | | Year Ended | | Year Ended | | Year Ended | | Year Ended | | Year Ended | | Year Ended | | Year Ended |
| | | March 31, | | March 31, | | March 31, | | March 31, | | March 31, | | March 31, | | March 31, | | March 31, |
| | | 2008 | | 2007 | | 2008 | | 2007 | | 2008 | | 2007 | | 2008 | | 2007 |
| | | | | | | | | | | | | | | | | |
| | | $ | 86,559 | | | $ | 90,120 | | | $ | 804,464 | | | $ | 614,851 | | | $ | 182,344 | | | $ | 52,119 | | | $ | 5,838,795 | | | $ | 7,595,741 | |
| | | | 223,229 | | | | 667,997 | | | | 37,108,290 | | | | 42,825,956 | | | | 82,186,761 | | | | 150,336,455 | | | | (8,613,274 | ) | | | (20,334,104 | ) |
| | | | (653,994 | ) | | | 206,286 | | | | (131,953,681 | ) | | | 4,928,724 | | | | (190,015,225 | ) | | | (145,392,179 | ) | | | 14,263 | | | | 22,006,563 | |
| | | | | | | | | | | | | | | | | | | | | | | | | | | | | | | | | |
| | | | (344,206 | ) | | | 964,403 | | | | (94,040,927 | ) | | | 48,369,531 | | | | (107,646,120 | ) | | | 4,996,395 | | | | (2,760,216 | ) | | | 9,268,200 | |
| | | | | | | | | | | | | | | | | | | | | | | | | | | | | | | | | |
| | | | (79,412 | ) | | | (148,373 | ) | | | — | | | | (1,053,017 | ) | | | (52,220 | ) | | | — | | | | (6,504,002 | ) | | | (5,816,661 | ) |
| | | | — | | | | — | | | | — | | | | — | | | | — | | | | — | | | | — | | | | — | |
| | | | (4,658 | ) | | | (10,519 | ) | | | — | | | | — | | | | — | | | | — | | | | (560,827 | ) | | | (1,317,915 | ) |
| | | | | | | | | | | | | | | | | | | | | | | | | | | | | | | | | |
| | | | (84,070 | ) | | | (158,892 | ) | | | — | | | | (1,053,017 | ) | | | (52,220 | ) | | | — | | | | (7,064,829 | ) | | | (7,134,576 | ) |
| | | | | | | | | | | | | | | | | | | | | | | | | | | | | | | | | |
| | | | (721,640 | ) | | | (276,428 | ) | | | (49,870,890 | ) | | | (17,334,529 | ) | | | (86,858,222 | ) | | | (95,202,915 | ) | | | — | | | | — | |
| | | | — | | | | — | | | | — | | | | — | | | | (6,733,105 | ) | | | (5,940,043 | ) | | | — | | | | — | |
| | | | (57,870 | ) | | | (21,234 | ) | | | (15,189,189 | ) | | | (5,813,751 | ) | | | (37,650,467 | ) | | | (33,618,626 | ) | | | — | | | | — | |
| | | | | | | | | | | | | | | | | | | | | | | | | | | | | | | | | |
| | | | (779,510 | ) | | | (297,662 | ) | | | (65,060,079 | ) | | | (23,148,280 | ) | | | (131,241,794 | ) | | | (134,761,584 | ) | | | — | | | | — | |
| | | | | | | | | | | | | | | | | | | | | | | | | | | | | | | | | |
| | | | (863,580 | ) | | | (456,554 | ) | | | (65,060,079 | ) | | | (24,201,297 | ) | | | (131,294,014 | ) | | | (134,761,584 | ) | | | (7,064,829 | ) | | | (7,134,576 | ) |
| | | | | | | | | | | | | | | | | | | | | | | | | | | | | | | | | |
| | | | 320,163 | | | | 321,271 | | | | 148,548,635 | | | | 168,801,668 | | | | 71,884,130 | | | | 118,380,094 | | | | 76,300,683 | | | | 145,201,890 | |
| | | | — | | | | — | | | | — | | | | — | | | | 9,727,022 | | | | 14,915,237 | | | | — | | | | — | |
| | | | 243,213 | | | | 702,787 | | | | 43,513,918 | | | | 71,671,762 | | | | 34,760,049 | | | | 59,760,279 | | | | 15,207,733 | | | | 29,892,979 | |
| | | | | | | | | | | | | | | | | | | | | | | | | | | | | | | | | |
| | | | 563,376 | | | | 1,024,058 | | | | 192,062,553 | | | | 240,473,430 | | | | 116,371,201 | | | | 193,055,610 | | | | 91,508,416 | | | | 175,094,869 | |
| | | | | | | | | | | | | | | | | | | | | | | | | | | | | | | | | |
| | | | 790,081 | | | | 419,345 | | | | 48,369,515 | | | | 17,849,454 | | | | 79,563,111 | | | | 88,113,447 | | | | 5,834,792 | | | | 5,200,711 | |
| | | | — | | | | — | | | | — | | | | — | | | | 5,022,981 | | | | 4,445,580 | | | | — | | | | — | |
| | | | 59,887 | | | | 28,972 | | | | 14,899,234 | | | | 5,684,793 | | | | 30,996,893 | | | | 27,639,151 | | | | 390,128 | | | | 1,166,200 | |
| | | | | | | | | | | | | | | | | | | | | | | | | | | | | | | | | |
| | | | 849,968 | | | | 448,317 | | | | 63,268,749 | | | | 23,534,247 | | | | 115,582,985 | | | | 120,198,178 | | | | 6,224,920 | | | | 6,366,911 | |
| | | | | | | | | | | | | | | | | | | | | | | | | | | | | | | | | |
| | | | (285,264 | ) | | | (1,857,508 | ) | | | (226,995,283 | ) | | | (164,345,008 | ) | | | (299,178,447 | ) | | | (334,677,200 | ) | | | (151,274,145 | ) | | | (80,914,601 | ) |
| | | | — | | | | — | | | | — | | | | — | | | | (16,603,866 | ) | | | (14,904,487 | ) | | | — | | | | — | |
| | | | (300,566 | ) | | | (363,352 | ) | | | (68,740,227 | ) | | | (146,485,470 | ) | | | (82,542,754 | ) | | | (96,464,540 | ) | | | (64,097,820 | ) | | | (29,975,740 | ) |
| | | | | | | | | | | | | | | | | | | | | | | | | | | | | | | | | |
| | | | (585,830 | ) | | | (2,220,860 | ) | | | (295,735,510 | ) | | | (310,830,478 | ) | | | (398,325,067 | ) | | | (446,046,227 | ) | | | (215,371,965 | ) | | | (110,890,341 | ) |
| | | | | | | | | | | | | | | | | | | | | | | | | | | | | | | | | |
| | | | 827,514 | | | | (748,485 | ) | | | (40,404,208 | ) | | | (46,822,801 | ) | | | (166,370,881 | ) | | | (132,792,439 | ) | | | (117,638,629 | ) | | | 70,571,439 | |
| | | | | | | | | | | | | | | | | | | | | | | | | | | | | | | | | |
| | | | (380,272 | ) | | | (240,636 | ) | | | (199,505,214 | ) | | | (22,654,567 | ) | | | (405,311,015 | ) | | | (262,557,628 | ) | | | (127,463,674 | ) | | | 72,705,063 | |
| | | $ | 6,598,749 | | | $ | 6,839,385 | | | $ | 935,229,909 | | | $ | 957,884,476 | | | $ | 1,018,029,641 | | | $ | 1,280,587,269 | | | $ | 324,995,114 | | | $ | 252,290,051 | |
| | | | | | | | | | | | | | | | | | | | | | | | | | | | | | | | | |
| | | $ | 6,218,477 | | | $ | 6,598,749 | | | $ | 735,724,695 | | | $ | 935,229,909 | | | $ | 612,718,626 | | | $ | 1,018,029,641 | | | $ | 197,531,440 | | | $ | 324,995,114 | |
| | | | | | | | | | | | | | | | | | | | | | | | | | | | | | | | | |
| | | $ | 22,576 | | | $ | 20,127 | | | $ | 778,433 | | | $ | (24,032 | ) | | $ | 65,175 | | | $ | (57,016 | ) | | $ | 257,125 | | | $ | 1,212,644 | |
| | | | | | | | | | | | | | | | | | | | | | | | | | | | | | | | | |
See the accompanying notes to the financial statements.
Laudus U.S. Equity Funds 59
Financial Statements
Statement of Changes in Net Assets continued
| | | | | | | | | | | | | | | | | | | | | | | | | | |
| | | Laudus Rosenberg | | Laudus Rosenberg | | Laudus Rosenberg |
| | | U.S. Large | | U.S. Large Capitalization | | U.S. Large Capitalization |
| | | Capitalization Fund | | Growth Fund | | Value Fund |
| | | | | | | |
| | | Year Ended | | Year Ended | | Year Ended | | Year Ended | | Year Ended | | Year Ended |
| | | March 31, | | March 31, | | March 31, | | March 31, | | March 31, | | March 31, |
| | | 2008 | | 2007 | | 2008 | | 2007 | | 2008 | | 2007 |
| | | | | | | | | | | | | |
Shares sold: | | | | | | | | | | | | | | | | | | | | | | | | |
| | Institutional | | | 3,800,104 | | | | 4,683,826 | | | | 2,592,386 | | | | 3,933,323 | | | | 25,907 | | | | 26,453 | |
| | Adviser | | | — | | | | — | | | | — | | | | — | | | | — | | | | — | |
| | Investor | | | 203,845 | | | | 196,259 | | | | 140,477 | | | | 114,333 | | | | 18,847 | | | | 56,943 | |
| | | | | | | | | | | | | | | | | | | | | | | | | |
| | | | 4,003,949 | | | | 4,880,085 | | | | 2,732,863 | | | | 4,047,656 | | | | 44,754 | | | | 83,396 | |
| | | | | | | | | | | | | | | | | | | | | | | | | |
Issued upon reinvestment of distributions: | | | | | | | | | | | | | | | | | | | | | | | | |
| | Institutional | | | 1,136,301 | | | | 214,123 | | | | 243,552 | | | | 5,570 | | | | 70,923 | | | | 33,361 | |
| | Adviser | | | — | | | | — | | | | — | | | | — | | | | — | | | | — | |
| | Investor | | | 131,106 | | | | 26,158 | | | | 15,043 | | | | — | | | | 5,381 | | | | 2,311 | |
| | | | | | | | | | | | | | | | | | | | | | | | | |
| | | | 1,267,407 | | | | 240,281 | | | | 258,595 | | | | 5,570 | | | | 76,304 | | | | 35,672 | |
| | | | | | | | | | | | | | | | | | | | | | | | | |
Shares redeemed: | | | | | | | | | | | | | | | | | | | | | | | | |
| | Institutional1 | | | (4,050,690 | ) | | | (2,106,330 | ) | | | (4,799,827 | ) | | | (1,005,648 | ) | | | (21,717 | ) | | | (147,151 | ) |
| | Adviser | | | — | | | | — | | | | — | | | | — | | | | — | | | | — | |
| | Investor | | | (228,959 | ) | | | (271,271 | ) | | | (78,208 | ) | | | (80,219 | ) | | | (23,337 | ) | | | (28,940 | ) |
| | | | | | | | | | | | | | | | | | | | | | | | | |
| | | | (4,279,649 | ) | | | (2,377,601 | ) | | | (4,878,035 | ) | | | (1,085,867 | ) | | | (45,054 | ) | | | (176,091 | ) |
| | | | | | | | | | | | | | | | | | | | | | | | | |
Change in shares: | | | | | | | | | | | | | | | | | | | | | | | | |
| | Institutional | | | 885,715 | | | | 2,791,619 | | | | (1,963,889 | ) | | | 2,933,245 | | | | 75,113 | | | | (87,337 | ) |
| | Adviser | | | — | | | | — | | | | — | | | | — | | | | — | | | | — | |
| | Investor | | | 105,992 | | | | (48,854 | ) | | | 77,312 | | | | 34,114 | | | | 891 | | | | 30,314 | |
| | | | | | | | | | | | | | | | | | | | | | | | | |
| | | | 991,707 | | | | 2,742,765 | | | | (1,886,577 | ) | | | 2,967,359 | | | | 76,004 | | | | (57,023 | ) |
| | | | | | | | | | | | | | | | | | | | | | | | | |
| |
| 1 | Amounts for the Institutional Shares of the Laudus Rosenberg U.S. Small Capitalization Fund included 2,754,526 for shares redeemed in-kind during the period ended March 31, 2008. |
See the accompanying notes to the financial statements.
60 Laudus U.S. Equity Funds
Financial Statements—Statement of Changes in Net Assets continued
| | | | | | | | | | | | | | | | | | | | | | | | | |
| | | Laudus Rosenberg | | Laudus Rosenberg | | Laudus Rosenberg |
| | | U.S. Discovery Fund | | U.S. Small Capitalization Fund | | Long/Short Equity Fund |
| | | | | | | |
| | | Year Ended | | Year Ended | | Year Ended | | Year Ended | | Year Ended | | Year Ended |
| | | March 31, | | March 31, | | March 31, | | March 31, | | March 31, | | March 31, |
| | | 2008 | | 2007 | | 2008 | | 2007 | | 2008 | | 2007 |
| | | | | | | | | | | | | |
| | | | 8,079,718 | | | | 8,954,963 | | | | 6,132,943 | | | | 9,025,809 | | | | 7,165,760 | | | | 13,615,380 | |
| | | | — | | | | — | | | | 923,717 | | | | 1,173,536 | | | | — | | | | — | |
| | | | 2,337,924 | | | | 3,821,131 | | | | 3,180,317 | | | | 4,688,425 | | | | 1,441,013 | | | | 2,806,789 | |
| | | | | | | | | | | | | | | | | | | | | | | | | |
| | | | 10,417,642 | | | | 12,776,094 | | | | 10,236,977 | | | | 14,887,770 | | | | 8,606,773 | | | | 16,422,169 | |
| | | | | | | | | | | | | | | | | | | | | | | | | |
| | | | 2,802,405 | | | | 931,114 | | | | 8,219,330 | | | | 7,100,197 | | | | 555,166 | | | | 497,676 | |
| | | | — | | | | — | | | | 531,532 | | | | 364,392 | | | | — | | | | — | |
| | | | 876,426 | | | | 299,515 | | | | 3,322,282 | | | | 2,288,009 | | | | 37,333 | | | | 112,676 | |
| | | | | | | | | | | | | | | | | | | | | | | | | |
| | | | 3,678,831 | | | | 1,230,629 | | | | 12,073,144 | | | | 9,752,598 | | | | 592,499 | | | | 610,352 | |
| | | | | | | | | | | | | | | | | | | | | | | | | |
| | | | (12,267,874 | ) | | | (8,657,298 | ) | | | (26,429,861 | ) | | | (25,741,760 | ) | | | (14,332,185 | ) | | | (7,619,121 | ) |
| | | | — | | | | — | | | | (1,470,741 | ) | | | (1,172,771 | ) | | | — | | | | — | |
| | | | (3,672,199 | ) | | | (7,948,553 | ) | | | (7,377,747 | ) | | | (7,593,651 | ) | | | (6,108,994 | ) | | | (2,836,891 | ) |
| | | | | | | | | | | | | | | | | | | | | | | | | |
| | | | (15,940,073 | ) | | | (16,605,851 | ) | | | (35,278,349 | ) | | | (34,508,182 | ) | | | (20,441,179 | ) | | | (10,456,012 | ) |
| | | | | | | | | | | | | | | | | | | | | | | | | |
| | | | (1,385,751 | ) | | | 1,228,779 | | | | (12,077,588 | ) | | | (9,615,754 | ) | | | (6,611,259 | ) | | | 6,493,935 | |
| | | | — | | | | — | | | | (15,492 | ) | | | 365,157 | | | | — | | | | — | |
| | | | (457,849 | ) | | | (3,827,907 | ) | | | (875,148 | ) | | | (617,217 | ) | | | (4,630,648 | ) | | | 82,574 | |
| | | | | | | | | | | | | | | | | | | | | | | | | |
| | | | (1,843,600 | ) | | | (2,599,128 | ) | | | (12,968,228 | ) | | | (9,867,814 | ) | | | (11,241,907 | ) | | | 6,576,509 | |
| | | | | | | | | | | | | | | | | | | | | | | | | |
See the accompanying notes to the financial statements.
Laudus U.S. Equity Funds 61
Financial Statements
Financial Highlights as of 3/31/08
| | | | | | | | | | | | | | | | | | | | | | | | | | | | | | | | | |
| | | | | Investment Activities | | Less Dividends From | | | | |
| | | | | | | | | | | |
| | | Net Asset | | | | Net Realized | | Total | | | | Net | | | | |
| | | Value, | | Net | | and Unrealized | | from | | Net | | Realized | | | | |
| | | Beginning | | Investment | | Gains (Losses) | | Investment | | Investment | | Gains on | | Return of | | Total |
| | | of Period | | Income/(Loss) | | on Investments | | Activities | | Income | | Investments | | Capital | | Dividends |
| | | | | | | | | | | | | | | | | |
| Institutional Shares | | | | | | | | | | | | | | | | | | | | | | | | | | | | | | | | |
| U.S. Large Capitalization Fund |
| For the year ended March 31, 2008 | | $ | 13.21 | | | $ | 0.10 | (6) | | $ | (0.71 | ) | | $ | (0.61 | ) | | $ | (0.11 | ) | | $ | (2.11 | ) | | $ | — | | | $ | (2.22 | ) |
| For the year ended March 31, 2007 | | | 12.35 | | | | 0.10 | (6) | | | 1.27 | | | | 1.37 | | | | (0.09 | ) | | | (0.42 | ) | | | — | | | | (0.51 | ) |
| For the year ended March 31, 2006 | | | 11.79 | | | | 0.10 | (6) | | | 1.62 | | | | 1.72 | | | | (0.09 | ) | | | (1.07 | ) | | | — | | | | (1.16 | ) |
| For the year ended March 31, 2005 | | | 10.92 | | | | 0.11 | (6) | | | 0.94 | | | | 1.05 | | | | (0.09 | ) | | | (0.09 | ) | | | — | | | | (0.18 | ) |
| For the year ended March 31, 2004 | | | 8.28 | | | | 0.06 | (6) | | | 2.62 | | | | 2.68 | | | | (0.04 | ) | | | — | | | | — | | | | (0.04 | ) |
| U.S. Large Capitalization Growth Fund |
| For the year ended March 31, 2008 | | | 9.76 | | | | 0.01 | (6) | | | (0.03 | ) | | | (0.02 | ) | | | (0.02 | ) | | | (0.58 | ) | | | — | | | | (0.60 | ) |
| For the year ended March 31, 2007 | | | 9.26 | | | | 0.03 | (6) | | | 0.49 | | | | 0.52 | | | | (0.02 | ) | | | — | | | | — | | | | (0.02 | ) |
| For the year ended March 31, 2006 | | | 8.07 | | | | 0.02 | (6) | | | 1.18 | | | | 1.20 | | | | (0.01 | ) | | | — | | | | — | | | | (0.01 | ) |
| For the year ended March 31, 2005 | | | 7.84 | | | | 0.04 | (6) | | | 0.23 | | | | 0.27 | | | | (0.04 | ) | | | — | | | | — | | | | (0.04 | ) |
| For the year ended March 31, 2004 | | | 5.95 | | | | 0.06 | (6) | | | 1.89 | | | | 1.95 | | | | (0.06 | ) | | | — | | | | — | | | | (0.06 | ) |
| U.S. Large Capitalization Value Fund |
| For the year ended March 31, 2008 | | | 12.74 | | | | 0.16 | (6) | | | (0.73 | ) | | | (0.57 | ) | | | (0.17 | ) | | | (1.53 | ) | | | — | | | | (1.70 | ) |
| For the year ended March 31, 2007 | | | 11.89 | | | | 0.15 | (6) | | | 1.45 | | | | 1.60 | | | | (0.26 | ) | | | (0.49 | ) | | | — | | | | (0.75 | ) |
| May 2, 2005 to March 31, 2006(1) | | | 10.00 | | | | 0.18 | (6) | | | 1.79 | | | | 1.97 | | | | (0.02 | ) | | | (0.06 | ) | | | — | | | | (0.08 | ) |
| U.S. Discovery Fund |
| For the year ended March 31, 2008 | | | 19.80 | | | | 0.04 | | | | (2.13 | ) | | | (2.09 | ) | | | — | (7) | | | (1.48 | ) | | | — | | | | (1.48 | ) |
| For the year ended March 31, 2007 | | | 19.23 | | | | 0.03 | | | | 1.05 | | | | 1.08 | | | | (0.03 | ) | | | (0.48 | ) | | | — | | | | (0.51 | ) |
| For the year ended March 31, 2006 | | | 15.96 | | | | 0.02 | | | | 3.58 | | | | 3.60 | | | | — | | | | (0.16 | ) | | | (0.17 | ) | | | (0.33 | ) |
| For the year ended March 31, 2005 | | | 14.71 | | | | 0.03 | (6) | | | 1.44 | | | | 1.47 | | | | (0.04 | ) | | | (0.18 | ) | | | — | | | | (0.22 | ) |
| For the year ended March 31, 2004 | | | 9.55 | | | | 0.06 | (6) | | | 5.26 | | | | 5.32 | | | | (0.04 | ) | | | (0.12 | ) | | | — | | | | (0.16 | ) |
| U.S. Small Capitalization Fund |
| For the year ended March 31, 2008 | | | 12.57 | | | | 0.03 | | | | (1.57 | ) | | | (1.54 | ) | | | — | | | | (2.00 | ) | | | — | | | | (2.00 | ) |
| For the year ended March 31, 2007 | | | 14.07 | | | | 0.02 | | | | 0.11 | | | | 0.13 | | | | — | | | | (1.63 | ) | | | — | | | | (1.63 | ) |
| For the year ended March 31, 2006 | | | 13.50 | | | | — | (7) | | | 2.43 | | | | 2.43 | | | | — | | | | (1.86 | ) | | | — | | | | (1.86 | ) |
| For the year ended March 31, 2005 | | | 13.82 | | | | 0.03 | (6) | | | 1.27 | | | | 1.30 | | | | (0.03 | ) | | | (1.59 | ) | | | — | | | | (1.62 | ) |
| For the year ended March 31, 2004 | | | 8.98 | | | | 0.05 | | | | 5.03 | | | | 5.08 | | | | (0.04 | ) | | | (0.20 | ) | | | — | | | | (0.24 | ) |
| Long/ Short Equity Fund |
| For the year ended March 31, 2008 | | | 10.75 | | | | 0.26 | | | | (0.31 | ) | | | (0.05 | ) | | | (0.33 | ) | | | — | | | | — | | | | (0.33 | ) |
| For the year ended March 31, 2007 | | | 10.66 | | | | 0.24 | | | | 0.09 | | | | 0.33 | | | | (0.24 | ) | | | — | | | | — | | | | (0.24 | ) |
| For the year ended March 31, 2006 | | | 10.51 | | | | 0.16 | (6) | | | 0.09 | | | | 0.25 | | | | (0.10 | ) | | | — | | | | — | | | | (0.10 | ) |
| For the year ended March 31, 2005 | | | 9.87 | | | | (0.03 | )(6) | | | 0.67 | | | | 0.64 | | | | — | | | | — | | | | — | | | | — | |
| For the year ended March 31, 2004 | | | 10.48 | | | | (0.05 | )(6) | | | (0.56 | ) | | | (0.61 | ) | | | — | | | | — | | | | — | | | | — | |
| |
| (1) | Commencement of operations. |
| (2) | Not annualized for periods less than one year. |
| (3) | Annualized for periods less than one year. |
| (4) | Includes interest expense and dividend expense on securities sold short. |
| (5) | Portfolio turnover is calculated on the basis of the Fund as a whole without distinguishing between the classes of shares issued. |
| (6) | Calculated based on the average shares outstanding during the period. |
| (7) | Amount less than $0.005. |
| (8) | Exclusive of nonrecurring account fees, extraordinary expenses, interest expense, and dividends on securities sold short. |
| (9) | The ratio of net operating expenses for Laudus U.S. Large Capitalization Fund, Laudus U.S. Large Capitalization Growth Fund, and Laudus U.S. Large Capitalization Value Fund would have been .99%, .99% and .99% respectively, if overdraft expenses had not been included. |
See the accompanying notes to the financial statements.
62 Laudus U.S. Equity Funds
Financial Statements—Financial Highlights continued
| | | | | | | | | | | | | | | | | | | | | | | | | | | | | | | | | | | | | |
| | | | | | | | | Ratios/Supplemental Data |
| | | | | | | | | |
| | | | | Net Asset | | | | Net Assets, | | Net Investment | | |
| | | | | Value, | | | | End of | | Income/(Loss) Net | | Expenses | | Expenses | | Expenses | | Portfolio |
| | | Redemption | | End of | | Total | | Period | | of Waivers/ | | before Waivers/ | | Net of Waivers/ | | Net of Waivers/ | | Turnover |
| | | Fees | | Period | | Return(2) | | (000’s) | | Reimbursements(3) | | Reimbursements(3),(4) | | Reimbursements(3),(4) | | Reimbursements(3),(8) | | Rate(5) |
| | | | | | | | | | | | | | | | | | | |
| | | $ | — | (7) | | $ | 10.38 | | | | (6.30 | )% | | $ | 83,783 | | | | 0.77 | % | | | 1.01 | % | | | 1.00 | % | | | 1.00 | %(9) | | | 165.80 | % |
| | | | — | (7) | | | 13.21 | | | | 11.10 | | | | 94,921 | | | | 0.81 | | | | 1.01 | | | | 1.00 | | | | 1.00 | (9) | | | 144.21 | |
| | | | — | | | | 12.35 | | | | 14.90 | | | | 54,296 | | | | 0.80 | | | | 1.14 | | | | 1.01 | | | | 0.99 | | | | 144.32 | |
| | | | — | | | | 11.79 | | | | 9.66 | | | | 44,559 | | | | 0.96 | | | | 1.23 | | | | 0.99 | | | | 0.99 | | | | 127.89 | |
| | | | — | (7) | | | 10.92 | | | | 32.33 | | | | 44,301 | | | | 0.62 | | | | 1.47 | | | | 1.00 | | | | 1.00 | | | | 141.50 | |
| | | | — | (7) | | | 9.14 | | | | (0.78 | ) | | | 52,681 | | | | 0.10 | | | | 1.02 | | | | 1.00 | | | | 1.00 | (9) | | | 85.18 | |
| | | | — | (7) | | | 9.76 | | | | 5.62 | | | | 75,481 | | | | 0.30 | | | | 1.05 | | | | 0.99 | | | | 0.99 | | | | 70.73 | |
| | | | — | | | | 9.26 | | | | 14.85 | | | | 44,426 | | | | 0.27 | | | | 1.34 | | | | 0.99 | | | | 0.99 | | | | 78.70 | |
| | | | — | (7) | | | 8.07 | | | | 3.42 | | | | 5,056 | | | | 0.53 | | | | 2.34 | | | | 0.99 | | | | 0.99 | | | | 77.81 | |
| | | | — | (7) | | | 7.84 | | | | 32.84 | | | | 5,006 | | | | 0.80 | | | | 2.59 | | | | 0.80 | | | | 0.80 | | | | 177.43 | |
| | | | — | (7) | | | 10.47 | | | | (5.29 | ) | | | 5,765 | | | | 1.32 | | | | 2.88 | | | | 1.01 | | | | 1.01 | (9) | | | 60.84 | |
| | | | — | (7) | | | 12.74 | | | | 13.55 | | | | 6,058 | | | | 1.22 | | | | 2.37 | | | | 0.99 | | | | 0.99 | | | | 107.77 | |
| | | | — | | | | 11.89 | | | | 19.83 | | | | 6,694 | | | | 1.82 | | | | 2.41 | | | | 0.49 | | | | 0.49 | | | | 81.30 | |
| | | | — | (7) | | | 16.23 | | | | (10.98 | ) | | | 566,055 | | | | 0.18 | | | | 0.96 | | | | 0.96 | | | | 0.96 | | | | 73.60 | |
| | | | — | (7) | | | 19.80 | | | | 5.71 | | | | 718,185 | | | | 0.17 | | | | 0.97 | | | | 0.97 | | | | 0.97 | | | | 85.69 | |
| | | | — | | | | 19.23 | | | | 22.80 | | | | 673,599 | | | | 0.15 | | | | 1.09 | | | | 1.09 | | | | 1.09 | | | | 88.63 | |
| | | | — | (7) | | | 15.96 | | | | 9.98 | | | | 256,444 | | | | 0.23 | | | | 1.20 | | | | 1.14 | | | | 1.14 | | | | 62.60 | |
| | | | — | (7) | | | 14.71 | | | | 55.90 | | | | 98,077 | | | | 0.49 | | | | 1.46 | | | | 1.14 | | | | 1.14 | | | | 93.08 | |
| | | | — | (7) | | | 9.03 | | | | (13.34 | ) | | | 393,939 | | | | 0.13 | | | | 0.96 | | | | 0.96 | | | | 0.96 | | | | 68.00 | |
| | | | — | (7) | | | 12.57 | | | | 1.11 | | | | 699,921 | | | | 0.10 | | | | 0.95 | | | | 0.95 | | | | 0.95 | | | | 76.00 | |
| | | | — | | | | 14.07 | | | | 19.46 | | | | 918,813 | | | | 0.02 | | | | 1.04 | | | | 1.04 | | | | 1.04 | | | | 69.26 | |
| | | | — | (7) | | | 13.50 | | | | 9.36 | | | | 948,225 | | | | 0.20 | | | | 1.09 | | | | 1.09 | | | | 1.09 | | | | 68.09 | |
| | | | — | (7) | | | 13.82 | | | | 56.83 | | | | 954,275 | | | | 0.45 | | | | 1.13 | | | | 1.13 | | | | 1.13 | | | | 75.65 | |
| | | | — | (7) | | | 10.37 | | | | (0.51 | ) | | | 182,817 | | | | 2.14 | | | | 3.09 | | | | 3.09 | | | | 1.63 | | | | 129.36 | |
| | | | — | (7) | | | 10.75 | | | | 3.19 | | | | 260,596 | | | | 2.70 | | | | 2.99 | | | | 2.99 | | | | 1.66 | | | | 139.74 | |
| | | | — | | | | 10.66 | | | | 2.41 | | | | 189,254 | | | | 1.51 | | | | 2.89 | | | | 2.89 | | | | 1.74 | | | | 121.80 | |
| | | | — | (7) | | | 10.51 | | | | 6.48 | | | | 102,974 | | | | (0.28 | ) | | | 3.04 | | | | 2.98 | | | | 1.74 | | | | 111.19 | |
| | | | — | (7) | | | 9.87 | | | | (5.82 | ) | | | 95,541 | | | | (0.46 | ) | | | 2.88 | | | | 2.77 | | | | 1.75 | | | | 76.36 | |
See the accompanying notes to the financial statements.
Laudus U.S. Equity Funds 63
Financial Statements
Financial Highlights as of 3/31/08
| | | | | | | | | | | | | | | | | | | | | | | | | | | | | | | | | |
| | | | | Investment Activities | | Less Dividends From | | | | |
| | | | | | | | | | | |
| | | Net Asset | | | | Net Realized | | Total | | | | Net | | | | |
| | | Value, | | Net | | and Unrealized | | from | | Net | | Realized | | | | |
| | | Beginning | | Investment | | Gains (Losses) | | Investment | | Investment | | Gains on | | Return of | | Total |
| | | of Period | | Income/(Loss) | | on Investments | | Activities | | Income | | Investments | | Capital | | Dividends |
| | | | | | | | | | | | | | | | | |
| Adviser Shares | | | | | | | | | | | | | | | | | | | | | | | | | | | | | | | | |
| U.S. Small Capitalization Fund |
| For the year ended March 31, 2008 | | $ | 12.35 | | | $ | (0.01 | ) | | $ | (1.52 | ) | | $ | (1.53 | ) | | $ | — | | | $ | (2.00 | ) | | $ | — | | | $ | (2.00 | ) |
| For the year ended March 31, 2007 | | | 13.88 | | | | (0.02 | ) | | | 0.12 | | | | 0.10 | | | | — | | | | (1.63 | ) | | | — | | | | (1.63 | ) |
| For the year ended March 31, 2006 | | | 13.38 | | | | (0.02 | ) | | | 2.38 | | | | 2.36 | | | | — | | | | (1.86 | ) | | | — | | | | (1.86 | ) |
| For the year ended March 31, 2005 | | | 13.71 | | | | — | (6),(7) | | | 1.26 | | | | 1.26 | | | | — | | | | (1.59 | ) | | | — | | | | (1.59 | ) |
| For the year ended March 31, 2004 | | | 8.91 | | | | 0.02 | | | | 5.00 | | | | 5.02 | | | | (0.02 | ) | | | (0.20 | ) | | | — | | | | (0.22 | ) |
| Investor Shares | | | | | | | | | | | | | | | | | | | | | | | | | | | | | | | | |
| U.S. Large Capitalization Fund |
| For the year ended March 31, 2008 | | | 13.21 | | | | 0.06 | (6) | | | (0.72 | ) | | | (0.66 | ) | | | (0.06 | ) | | | (2.11 | ) | | | — | | | | (2.17 | ) |
| For the year ended March 31, 2007 | | | 12.36 | | | | 0.07 | (6) | | | 1.25 | | | | 1.32 | | | | (0.05 | ) | | | (0.42 | ) | | | — | | | | (0.47 | ) |
| For the year ended March 31, 2006 | | | 11.81 | | | | 0.06 | (6) | | | 1.63 | | | | 1.69 | | | | (0.07 | ) | | | (1.07 | ) | | | — | | | | (1.14 | ) |
| For the year ended March 31, 2005 | | | 10.96 | | | | 0.08 | (6) | | | 0.93 | | | | 1.01 | | | | (0.07 | ) | | | (0.09 | ) | | | — | | | | (0.16 | ) |
| For the year ended March 31, 2004 | | | 8.31 | | | | 0.02 | (6) | | | 2.63 | | | | 2.65 | | | | — | | | | — | | | | — | | | | — | |
| U.S. Large Capitalization Growth Fund |
| For the year ended March 31, 2008 | | | 9.83 | | | | (0.02 | )(6) | | | (0.05 | ) | | | (0.07 | ) | | | — | | | | (0.58 | ) | | | — | | | | (0.58 | ) |
| For the year ended March 31, 2007 | | | 9.33 | | | | — | (6),(7) | | | 0.50 | | | | 0.50 | | | | — | | | | — | | | | — | | | | — | |
| For the year ended March 31, 2006 | | | 8.15 | | | | (0.01 | )(6) | | | 1.19 | | | | 1.18 | | | | — | | | | — | | | | — | | | | — | |
| For the year ended March 31, 2005 | | | 7.92 | | | | 0.02 | (6) | | | 0.23 | | | | 0.25 | | | | (0.02 | ) | | | — | | | | — | | | | (0.02 | ) |
| August 15, 2003 to March 31, 2004(1) | | | 6.95 | | | | 0.09 | (6) | | | 0.92 | | | | 1.01 | | | | (0.04 | ) | | | — | | | | — | | | | (0.04 | ) |
| U.S. Large Capitalization Value Fund |
| For the year ended March 31, 2008 | | | 12.70 | | | | 0.13 | (6) | | | (0.73 | ) | | | (0.60 | ) | | | (0.12 | ) | | | (1.53 | ) | | | — | | | | (1.65 | ) |
| For the year ended March 31, 2007 | | | 11.87 | | | | 0.11 | (6) | | | 1.45 | | | | 1.56 | | | | (0.24 | ) | | | (0.49 | ) | | | — | | | | (0.73 | ) |
| May 2, 2005 to March 31, 2006(1) | | | 10.00 | | | | 0.13 | (6) | | | 1.80 | | | | 1.93 | | | | — | | | | (0.06 | ) | | | — | | | | (0.06 | ) |
| U.S. Discovery Fund |
| For the year ended March 31, 2008 | | | 19.59 | | | | (0.04 | ) | | | (2.10 | ) | | | (2.14 | ) | | | — | | | | (1.48 | ) | | | — | | | | (1.48 | ) |
| For the year ended March 31, 2007 | | | 19.07 | | | | (0.06 | ) | | | 1.06 | | | | 1.00 | | | | — | | | | (0.48 | ) | | | — | | | | 0.48 | |
| For the year ended March 31, 2006 | | | 15.88 | | | | (0.03 | ) | | | 3.55 | | | | 3.52 | | | | — | | | | (0.16 | ) | | | (0.17 | ) | | | (0.33 | ) |
| For the year ended March 31, 2005 | | | 14.66 | | | | (0.05 | )(6) | | | 1.47 | | | | 1.42 | | | | (0.02 | ) | | | (0.18 | ) | | | — | | | | (0.20 | ) |
| For the year ended March 31, 2004 | | | 9.53 | | | | 0.01 | (6) | | | 5.24 | | | | 5.25 | | | | — | | | | (0.12 | ) | | | — | | | | (0.12 | ) |
| U.S. Small Capitalization Fund |
| For the year ended March 31, 2008 | | | 12.22 | | | | (0.03 | ) | | | (1.49 | ) | | | (1.52 | ) | | | — | | | | (2.00 | ) | | | — | | | | (2.00 | ) |
| For the year ended March 31, 2007 | | | 13.77 | | | | (0.03 | ) | | | 0.11 | | | | 0.08 | | | | — | | | | (1.63 | ) | | | — | | | | (1.63 | ) |
| For the year ended March 31, 2006 | | | 13.30 | | | | (0.04 | ) | | | 2.37 | | | | 2.33 | | | | — | | | | (1.86 | ) | | | — | | | | (1.86 | ) |
| For the year ended March 31, 2005 | | | 13.65 | | | | (0.02 | )(6) | | | 1.26 | | | | 1.24 | | | | — | | | | (1.59 | ) | | | — | | | | (1.59 | ) |
| For the year ended March 31, 2004 | | | 8.88 | | | | 0.01 | | | | 4.98 | | | | 4.99 | | | | (0.02 | ) | | | (0.20 | ) | | | — | | | | (0.22 | ) |
| Long/ Short Equity Fund |
| For the year ended March 31, 2008 | | | 10.63 | | | | 0.62 | | | | (0.70 | ) | | | (0.08 | ) | | | (0.25 | ) | | | — | | | | — | | | | (0.25 | ) |
| For the year ended March 31, 2007 | | | 10.55 | | | | 0.26 | | | | 0.03 | | | | 0.29 | | | | (0.21 | ) | | | — | | | | — | | | | (0.21 | ) |
| For the year ended March 31, 2006 | | | 10.41 | | | | 0.12 | (6) | | | 0.10 | | | | 0.22 | | | | (0.08 | ) | | | — | | | | — | | | | (0.08 | ) |
| For the year ended March 31, 2005 | | | 9.81 | | | | (0.06 | )(6) | | | 0.66 | | | | 0.60 | | | | — | | | | — | | | | — | | | | — | |
| For the year ended March 31, 2004 | | | 10.43 | | | | (0.09 | )(6) | | | (0.53 | ) | | | (0.62 | ) | | | — | | | | — | | | | — | | | | — | |
| |
| (1) | Commencement of operations. |
| (2) | Not annualized for periods less than one year. |
| (3) | Annualized for periods less than one year. |
| (4) | Includes interest expense and dividend expense on securities sold short. |
| (5) | Portfolio turnover is calculated on the basis of the Fund as a whole without distinguishing between the classes of shares issued. |
| (6) | Calculated based on the average shares outstanding during the period. |
| (7) | Amount less than $0.005. |
| (8) | Exclusive of nonrecurring account fees, extraordinary expenses, interest expense, and dividends on securities sold short. |
| (9) | The ratio of net operating expenses for Laudus U.S. Large Capitalization Fund, Laudus U.S. Large Capitalization Growth Fund, and Laudus U.S. Large Capitalization Value Fund would have been 1.29%, 1.29% and 1.29% respectively, if overdraft expenses had not been included. |
See the accompanying notes to the financial statements.
64 Laudus U.S. Equity Funds
Financial Statements—Financial Highlights continued
| | | | | | | | | | | | | | | | | | | | | | | | | | | | | | | | | | | | | |
| | | | | | | | | Ratios/Supplemental Data |
| | | | | | | | | |
| | | | | Net Asset | | | | Net Assets, | | Net Investment | | |
| | | | | Value, | | | | End of | | Income/(Loss) Net | | Expenses | | Expenses | | Expenses | | Portfolio |
| | | Redemption | | End of | | Total | | Period | | of Waivers/ | | before Waivers/ | | Net of Waivers/ | | Net of Waivers/ | | Turnover |
| | | Fees | | Period | | Return(2) | | (000’s) | | Reimbursements(3) | | Reimbursements(3),(4) | | Reimbursements(3),(4) | | Reimbursements(3),(8) | | Rate(5) |
| | | | | | | | | | | | | | | | | | | |
| | | $ | — | (7) | | $ | 8.82 | | | | (13.50 | )% | | $ | 34,799 | | | | (0.12 | )% | | | 1.21 | % | | | 1.20 | % | | | 1.20 | % | | | 68.00 | % |
| | | | — | (7) | | | 12.35 | | | | 0.90 | | | | 48,923 | | | | (0.14 | ) | | | 1.20 | | | | 1.20 | | | | 1.20 | | | | 76.00 | |
| | | | — | | | | 13.88 | | | | 19.09 | | | | 49,952 | | | | (0.24 | ) | | | 1.32 | | | | 1.32 | | | | 1.32 | | | | 69.26 | |
| | | | — | (7) | | | 13.38 | | | | 9.12 | | | | 41,104 | | | | (0.01 | ) | | | 1.31 | | | | 1.31 | | | | 1.31 | | | | 68.09 | |
| | | | — | (7) | | | 13.71 | | | | 56.53 | | | | 44,059 | | | | 0.19 | | | | 1.40 | | | | 1.40 | | | | 1.40 | | | | 75.65 | |
| | | | — | (7) | | | 10.38 | | | | (6.61 | ) | | | 9,017 | | | | 0.45 | | | | 1.40 | | | | 1.31 | | | | 1.31 | (9) | | | 165.80 | |
| | | | — | (7) | | | 13.21 | | | | 10.69 | | | | 10,074 | | | | 0.52 | | | | 1.38 | | | | 1.30 | | | | 1.30 | (9) | | | 144.21 | |
| | | | — | | | | 12.36 | | | | 14.57 | | | | 10,026 | | | | 0.50 | | | | 1.52 | | | | 1.34 | | | | 1.33 | | | | 144.32 | |
| | | | — | | | | 11.81 | | | | 9.22 | | | | 2,786 | | | | 0.69 | | | | 1.58 | | | | 1.35 | | | | 1.35 | | | | 127.89 | |
| | | | — | (7) | | | 10.96 | | | | 31.89 | | | | 590 | | | | 0.24 | | | | 1.51 | | | | 1.25 | | | | 1.25 | | | | 141.50 | |
| | | | — | (7) | | | 9.18 | | | | (1.25 | ) | | | 2,804 | | | | (0.17 | ) | | | 1.40 | | | | 1.30 | | | | 1.30 | (9) | | | 85.18 | |
| | | | — | (7) | | | 9.83 | | | | 5.36 | | | | 2,242 | | | | (0.01 | ) | | | 1.43 | | | | 1.29 | | | | 1.29 | | | | 70.73 | |
| | | | — | | | | 9.33 | | | | 14.48 | | | | 1,810 | | | | (0.12 | ) | | | 1.91 | | | | 1.33 | | | | 1.33 | | | | 78.70 | |
| | | | — | (7) | | | 8.15 | | | | 3.14 | | | | 1,894 | | | | 0.21 | | | | 2.68 | | | | 1.32 | | | | 1.32 | | | | 77.81 | |
| | | | — | (7) | | | 7.92 | | | | 14.50 | | | | 1,479 | | | | 1.12 | | | | 2.72 | | | | 1.11 | | | | 1.39 | | | | 177.43 | |
| | | | — | (7) | | | 10.45 | | | | (5.50 | ) | | | 454 | | | | 1.01 | | | | 3.28 | | | | 1.31 | | | | 1.31 | (9) | | | 60.84 | |
| | | | — | | | | 12.70 | | | | 13.22 | | | | 540 | | | | 0.90 | | | | 2.75 | | | | 1.29 | | | | 1.29 | | | | 107.77 | |
| | | | — | | | | 11.87 | | | | 19.33 | | | | 145 | | | | 1.31 | | | | 2.78 | | | | 0.96 | | | | 0.96 | | | | 81.30 | |
| | | | — | (7) | | | 15.97 | | | | (11.36 | ) | | | 169,670 | | | | (0.20 | ) | | | 1.34 | | | | 1.34 | | | | 1.34 | | | | 73.60 | |
| | | | — | (7) | | | 19.59 | | | | 5.34 | | | | 217,045 | | | | (0.21 | ) | | | 1.35 | | | | 1.34 | | | | 1.34 | | | | 85.69 | |
| | | | — | | | | 19.07 | | | | 22.40 | | | | 284,285 | | | | (0.20 | ) | | | 1.43 | | | | 1.43 | | | | 1.43 | | | | 88.63 | |
| | | | — | (7) | | | 15.88 | | | | 9.70 | | | | 58,284 | | | | (0.30 | ) | | | 1.55 | | | | 1.49 | | | | 1.49 | | | | 62.60 | |
| | | | — | (7) | | | 14.66 | | | | 55.22 | | | | 2,581 | | | | 0.04 | | | | 1.63 | | | | 1.40 | | | | 1.40 | | | | 93.08 | |
| | | | — | (7) | | | 8.70 | | | | (13.57 | ) | | | 183,980 | | | | (0.22 | ) | | | 1.32 | | | | 1.30 | | | | 1.30 | | | | 68.00 | |
| | | | — | (7) | | | 12.22 | | | | 0.75 | | | | 269,185 | | | | (0.25 | ) | | | 1.30 | | | | 1.30 | | | | 1.30 | | | | 76.00 | |
| | | | — | | | | 13.77 | | | | 18.98 | | | | 311,822 | | | | (0.33 | ) | | | 1.39 | | | | 1.39 | | | | 1.39 | | | | 69.26 | |
| | | | — | (7) | | | 13.30 | | | | 9.00 | | | | 297,927 | | | | (0.15 | ) | | | 1.43 | | | | 1.43 | | | | 1.43 | | | | 68.09 | |
| | | | — | (7) | | | 13.65 | | | | 56.40 | | | | 272,481 | | | | 0.11 | | | | 1.47 | | | | 1.47 | | | | 1.47 | | | | 75.65 | |
| | | | — | (7) | | | 10.30 | | | | (0.82 | ) | | | 14,714 | | | | 2.11 | | | | 3.30 | | | | 3.29 | | | | 1.97 | | | | 129.36 | |
| | | | — | (7) | | | 10.63 | | | | 2.81 | | | | 64,400 | | | | 2.41 | | | | 3.28 | | | | 3.28 | | | | 1.99 | | | | 139.74 | |
| | | | — | | | | 10.55 | | | | 2.08 | | | | 63,036 | | | | 1.17 | | | | 3.22 | | | | 3.22 | | | | 2.06 | | | | 121.80 | |
| | | | — | (7) | | | 10.41 | | | | 6.12 | | | | 34,930 | | | | (0.55 | ) | | | 3.37 | | | | 3.30 | | | | 2.06 | | | | 111.19 | |
| | | | — | (7) | | | 9.81 | | | | (5.94 | ) | | | 34,081 | | | | (0.90 | ) | | | 3.18 | | | | 3.06 | | | | 2.05 | | | | 76.36 | |
See the accompanying notes to the financial statements.
Laudus U.S. Equity Funds 65
Financial Statements
Notes to Financial Statements as of 3/31/08
1. Organization.
Laudus Trust, (the “Trust”) was established as a Massachusetts business trust under the laws of Massachusetts on April 1, 1988. The Trust is an open-end diversified management investment company consisting of eleven portfolios as of March 31, 2008.
The list below shows all the funds in the Trust including the funds discussed in this report, which are highlighted (individually each such highlighted portfolio, a “Fund” and collectively, the “Funds”):
Laudus Rosenberg U.S. Large Capitalization Fund,
Laudus Rosenberg U.S. Large Capitalization Growth
Fund,
Laudus Rosenberg U.S. Large Capitalization Value
Fund,
Laudus Rosenberg U.S. Discovery Fund,
Laudus Rosenberg U.S. Small Capitalization Fund,
Laudus Rosenberg International Equity Fund,
Laudus Rosenberg International Discovery Fund,
Laudus Rosenberg International Small Capitalization
Fund,
Laudus Rosenberg Long/Short Equity Fund (formerly the Laudus Rosenberg Value Long/Short Equity Fund),
Laudus Mondrian Emerging Markets Fund (commenced operations on November 2, 2007)
Laudus Mondrian International Fixed Income Fund (commenced operations on November 2, 2007)
As of October 15, 2004 and May 1, 2006 the Laudus Rosenberg U.S. Small Capitalization Fund and the Laudus Rosenberg U.S. Discovery Fund, respectively, were closed to new investors.
Each Fund is authorized to issue an unlimited number of Institutional Shares and Investor Shares of no par value, and the Laudus Rosenberg U.S. Small Capitalization Fund is also authorized to issue an unlimited number of Adviser Shares of no par value. Each class of shares generally has identical rights and preferences, except that each class is subject to different eligibility conditions, bear different distribution and sub-transfer agent expenses, and has separate voting rights on matters pertaining solely to that class of shares.
Under the Trust’s organizational documents, its officers and trustees are indemnified against certain liabilities arising out of the performance of their duties to the Funds. In addition, in the normal course of business, the Funds enter into contracts with their vendors and others that provide for general indemnifications. The Funds’ maximum exposure under these arrangements is unknown, as this would involve future claims that may be made against the Funds. However, based on experience, the Funds expect that risk of loss to be remote.
2. Significant Accounting Policies.
The accounting policies adopted by the Funds are in conformity with accounting principles generally accepted in the United States of America, which require management to make estimates and assumptions that affect the reported amounts and disclosures in the financial statements. Actual amounts could differ from those estimates. The following is a summary of significant accounting policies followed by the Trust in the preparation of its financial statements.
Security Valuation
Each Fund uses approved pricing services to provide values for its portfolio securities. Current market values are generally determined by the approved pricing services as follows: securities traded on stock exchanges are valued at the last-quoted sales price on the exchange on which such securities are primarily traded (closing values), or, lacking any sales, at the mean between the bid and ask prices; securities traded in the over-the-counter market are valued at the last sales price that day, or, if there are no sales that day, at the mean between the bid and ask prices. Securities may be fair valued pursuant to procedures approved by the Funds’ Board of Trustees when approved pricing services do not provide a value for a security, a furnished price appears manifestly incorrect or events occur prior to the close of the New York Stock Exchange that materially affect the furnished price.
Short-term debt securities that mature in 60 days or less are valued at amortized cost, which approximates market value.
Other investment companies are valued at their respective net asset values as determined by those funds, in accordance with the Investment Company Act of 1940 for a given day.
Security Transactions and Related Investment Income
Changes in holdings of portfolio securities are reflected no later than on the first business day following the trade
66 Laudus U.S. Equity Funds
Financial Statements—Notes to Financial Statements as of 3/31/08 continued
date. However, for financial reporting purposes, portfolio security transactions are reported on trade date. Net realized gains or losses from sales of securities are determined on the specific identification cost method. Interest income and expenses are recognized on the accrual basis. Dividend income, less foreign taxes withheld, (if any) and dividend expenses on securities sold short are recorded on the ex-dividend date. Interest income is recorded as earned.
Foreign Currency Transactions
The accounting records of the Funds are maintained in U.S. dollars. All monetary items denominated in foreign currencies are translated to U.S. dollars based upon the prevailing exchange rate at the close of each business day.
Net realized gains and losses on foreign currency transactions represent net gains and losses from currency gains and losses realized between the trade and settlement dates on securities transactions, and the difference between the amount of net investment income accrued and the U.S. dollar amount actually received. Further, the effects of changes in foreign currency exchange rates on investments in securities are not segregated in the financial statements from the effects of changes in market prices of those securities, but are included with the net realized gain or loss and unrealized appreciation or depreciation on investments.
Real Estate Investment Trusts
Several Funds may own shares of real estate investment trusts (“REITs”) which report information on the source of their distributions annually. Certain distributions received from REITs during the year, which are known to be a return of capital, are recorded as a reduction to the cost of the individual REIT.
Repurchase Agreements
In a repurchase agreement, a Fund buys a security from another party (usually a financial institution) with the agreement that the security will be sold back in the future. The date, price and other conditions are all specified when the agreement is created.
The Funds’ repurchase agreements are currently fully collateralized by U.S. government securities or by U.S. government agency securities. All collateral is held by the Funds’ Custodian (or, with tri-party agreements, the agent’s bank) and is monitored daily to ensure that its market value is at least equal to the repurchase price under the agreement.
Short Sales
The Laudus Rosenberg Long/ Short Equity Fund is authorized to engage in Short sales. Short sales are transactions in which a Fund sells a security it does not own, in anticipation of a decline in the market value of that security. To complete such a transaction, the Fund must borrow the security to deliver to the buyer upon the short sale; the Fund is then obligated to replace the security borrowed by purchasing the security at current market value sometime in the future. The Fund will incur a loss if the price of the security increases between the date of the short sale and the date on which the Fund replaces the borrowed security. The Fund will realize a gain if the price of the security declines between those dates. The potential for losses associated with short positions is much greater than the original value of the securities sold short and may exceed the market value of securities sold short recorded in the Statement of Assets and Liabilities. Until the Fund replaces the borrowed security, the Fund will maintain a segregated account at the Custodian Bank with cash, U.S. Government Securities and/or securities held long by the portfolio to sufficiently cover its short position on a daily basis. The collateral for the securities sold short includes the Deposits with Broker and Custodian Bank, as shown in the Statement of Assets and Liabilities, and the securities held long as shown in the Statement of Portfolio Holdings. Interest accrued or dividends paid on securities sold short are recorded as an expense on the Fund’s records.
Securities Lending
Under the Securities Lending Program, securities held by the Laudus Rosenberg U.S. Large Capitalization Growth Fund, the Laudus Rosenberg U.S. Discovery Fund and the Laudus Rosenberg U.S. Small Capitalization Fund are loaned by State Street Corporation, as agent, to certain brokers (the “Borrowers”). The Borrowers provide cash or U.S. Government securities as collateral against loans in an amount at least equal to 100% of the market value of the loaned securities.
The cash collateral of securities loaned is invested in high quality, short-term investments such as money market funds and U.S. government securities. The investments of collateral are marked-to-market daily and the value of the
Laudus U.S. Equity Funds 67
Financial Statements—Notes to Financial Statements as of 3/31/08 continued
collateral must be at least 100% of the market value of the loaned securities each day.
At March 31, 2008, the following Funds had collateral and loans outstanding of:
| | | | | | | | | |
| | | | | Value of |
| | | Value of | | Loaned |
| | | Collateral | | Securities |
| |
| Laudus Rosenberg U.S. Large Capitalization Growth Fund | | $ | 9,625,633 | | | $ | 9,410,133 | |
| Laudus Rosenberg U.S. Discovery Fund | | | 250,095,950 | | | | 243,929,093 | |
| Laudus Rosenberg U.S. Small Capitalization Fund | | | 251,007,699 | | | | 244,590,493 | |
Expense, Investment Income and Gain/Loss Allocation
Expenses directly attributable to a Fund are charged to that Fund; expenses not directly attributable to a Fund are allocated proportionately among each Fund within the Trust in relation to the net assets of each Fund or on another reasonable basis. Expenses specific to a class are charged to that class. Expenses other than class specific expenses are allocated daily to each class based upon the proportion of relative net assets or another reasonable basis. The investment income and expenses of the Fund (other than class specific expenses charged to a class) and realized and unrealized gains are allocated to each class of shares based upon relative net assets on the date income is earned, or expenses and realized/unrealized losses are incurred.
Distributions
Distributions to shareholders are recorded on the ex-dividend date. Distributions are made annually on a tax basis, which may differ from distribution amounts determined under accounting principles generally accepted in the United States of America. These differences are primarily due to differing treatments for REITs and wash sales for book and tax purposes.
Federal Income Taxes
It is each Fund’s policy to comply with the requirements of the Internal Revenue Code applicable to regulated investments companies, and to distribute substantially all of their taxable income, including any net realized gain on investments, to their shareholders. Therefore, no provisions are made for federal income taxes.
Custody Credit
Each Fund has an arrangement with its custodian bank under which the Fund receives a credit for its uninvested cash balance to offset its custody fees and accounting fees. The credit amounts are disclosed in the Statement of Operations as a reduction to the Funds’ operating expenses.
New Accounting Standards
Financial Accounting Standards Board Interpretation (FIN) No. 48 — Accounting for Uncertainty in Income Taxes — an Interpretation of SFAS No. 109, was issued in July 2006 and is effective for fiscal years beginning after December 15, 2006. This Interpretation provides new requirements for the recognition, measurement, and disclosure in the financial statements of a tax position taken or expected to be taken in a tax return when there is uncertainty about whether that tax position will ultimately be sustained. As of March 31, 2008, management has reviewed the tax positions for open tax years (March 31, 2004 through March 31, 2007), and determined that no provision for income tax is required in the Funds’ financial statements.
In September 2006, the Financial Accounting Standards Board (FASB) issued Statement of Financial Accounting Standards No. 157, “Fair Value Measurements” (SFAS No. 157). SFAS No. 157 defines fair value, establishes a framework for measuring fair value in accordance with generally accepted accounting principles and expands disclosure about fair value measurements. SFAS No. 157 is effective for fiscal years beginning after November 15, 2007. As of March 31, 2008, management does not believe the adoption of SFAS No. 157 will impact the financial statements; however, additional disclosures may be required about the inputs used to develop the measurements and the effects of certain of the measurements on changes in net assets for the period.
In March 2008, the Financial Accounting Standards board (“FASB”) issued Statement of Financial Accounting Standards No. 161, “Disclosures about Derivative Instruments and Hedging Activities” (“SFAS 161”). SFAS 161 is effective for fiscal years and interim periods beginning after November 15, 2008. SFAS 161 requires enhanced disclosures about Funds’ derivative and hedging activities. Management is currently evaluating the impact of the adoption of SFAS 161 on the Funds’ financial statement disclosures.
68 Laudus U.S. Equity Funds
Financial Statements—Notes to Financial Statements as of 3/31/08 continued
| |
| 3. | Management, Administration, Fund Accounting, Distribution, Shareholder Service Agreements, and Trustee Expense. |
The Trust’s Board of Trustees oversees the general conduct of the Trust and the Funds.
Charles Schwab Investment Management, Inc. (“CSIM” or the “Manager”) is the investment adviser of the Funds and manages the Funds’ business, subject to the supervision of the Board of Trustees. AXA Rosenberg Investment Management LLC (“AXA Rosenberg”), the Funds’ sub-adviser, provides day-to-day portfolio management services to the Funds, subject to the supervision of CSIM.
The Funds pay CSIM an advisory fee for these services on a monthly basis. CSIM — and not the Funds — pays a portion of the advisory fees it receives to AXA Rosenberg in return for its services.
The table below sets forth the advisory fee payable to CSIM by each Fund.
| | | |
| | | Agreement Rate* |
| |
| Laudus Rosenberg U.S. Large Capitalization Fund | | 1st $1 billion-0.75%
$1 billion to $2 billion-0.70%
Over $2 billion-0.675% |
| Laudus Rosenberg U.S. Large Capitalization Growth Fund | | 1st $1 billion-0.75%
$1 billion to $2 billion-0.70%
Over $2 billion-0.675% |
| Laudus Rosenberg U.S. Large Capitalization Value Fund | | 1st $1 billion-0.75%
$1 billion to $2 billion-0.70%
Over $2 billion-0.675% |
| Laudus Rosenberg U.S. Discovery Fund | | 1st $1 billion-0.90%
Over $1 billion-0.85% |
| Laudus Rosenberg U.S. Small Capitalization Fund | | 0.90% |
| Laudus Rosenberg Long/ Short Equity Fund | | 1st $500 million-1.50%
Over $500 million-1.45% |
| |
| * | The advisory fee payable to CSIM varies based on fund assets. |
The Funds may, from time to time, execute portfolio trades with affiliated brokers/dealers. For the year ended March 31, 2008, the Funds paid no brokerage fees on the execution of portfolio trades with affiliated brokers/dealers.
CSIM has contractually agreed, until at least July 30, 2010, to waive a portion of its management fee and bear certain expenses of each Fund. As such, CSIM further agrees to reimburse the Funds to limit the annual expenses, exclusive of nonrecurring account fees, fees on securities transactions such as exchange fees, dividends and interest on securities sold short, service fees, interest (overdraft charges), taxes, brokerage commissions, other expenditures which are capitalized in accordance with generally accepted accounting principles, and other extraordinary expenses not incurred in the ordinary course of the Funds’ business as follows:
| | | | | | | | | |
| | | Institutional | | Investor |
| | | Shares | | Shares |
| |
| Laudus Rosenberg U.S. Large Capitalization Fund | | | 0.99% | | | | 1.29% | |
| Laudus Rosenberg U.S. Large Capitalization Growth Fund | | | 0.99% | | | | 1.29% | |
| Laudus Rosenberg U.S. Large Capitalization Value Fund | | | 0.99% | | | | 1.29% | |
| Laudus Rosenberg U.S. Discovery Fund | | | 1.14% | | | | 1.44% | |
| Laudus Rosenberg U.S. Small Capitalization Fund * | | | 1.14% | | | | 1.44% | |
| Laudus Rosenberg Long/ Short Equity Fund | | | 1.74% | | | | 2.04% | |
| |
| * | There is no Expense Limit for Adviser Shares of the Laudus Rosenberg U.S. Small Capitalization Fund. However, effective November 1, 2007 through October 31, 2008 the Manager has agreed to voluntarily waive 0.03% of the Adviser Shares expenses. In addition, effective November 1, 2007 through October 31, 2008 the Manager has agreed to voluntarily waive 0.03% of the Investor Shares expenses. |
Effective April 15, 2008, the expense limitations will be reduced for the Laudus Rosenberg U.S. Large Capitalization Fund, Laudus Rosenberg U.S. Large Capitalization Growth Fund, and Laudus Rosenberg U.S. Large Capitalization Value Fund as follows:
| | | | | | | | | |
| | | Institutional | | Investor |
| | | Shares | | Shares |
| |
| Laudus Rosenberg U.S. Large Capitalization Fund | | | 0.84% | | | | 1.14% | |
| Laudus Rosenberg U.S. Large Capitalization Growth Fund | | | 0.84% | | | | 1.14% | |
| Laudus Rosenberg U.S. Large Capitalization Value Fund | | | 0.84% | | | | 1.14% | |
Any amounts waived or reimbursed in a particular fiscal year will be subject to repayment through the next two fiscal years, to the extent that the repayment will not cause the Funds’ net expenses to exceed the current limit (as stated in CSIM’s contractual undertaking) during the
Laudus U.S. Equity Funds 69
Financial Statements—Notes to Financial Statements as of 3/31/08 continued
respective year. As of March 31, 2008, the balance of recoupable expenses is as follows:
| | | | | | | | | |
| | | Expires | | Expires |
| | | 3/31/09 | | 3/31/10 |
| |
| Laudus Rosenberg U.S. Large Capitalization Fund | | $ | 7,039 | | | $ | — | |
| Laudus Rosenberg U.S. Large Capitalization Growth Fund | | | 36,418 | | | | — | |
| Laudus Rosenberg U.S. Large Capitalization Value Fund | | | 103,539 | | | | 125,556 | |
| Laudus Rosenberg U.S. Discovery Fund | | | — | | | | — | |
| Laudus Rosenberg U.S. Small Capitalization Fund | | | — | | | | — | |
| Laudus Rosenberg Long/ Short Equity Fund | | | 2,450 | | | | — | |
The Trust has a Distribution and Shareholder Service Plan with respect to its Investor Shares pursuant to Rule 12b-1 under the 1940 Act. The Investor Shares of the Funds are sold on a continuous basis by the Trust’s distributor — ALPS Distributors, Inc. Under the Distribution and Shareholder Services Plan, the Funds pay distribution and shareholder servicing fees in connection with the sale and servicing of the Investor Shares. The annual Distribution and Shareholder Service Fee consists of up to 0.25% of the respective average daily net assets of the Investor Shares. In addition, the Trustees have authorized each Fund to pay up to 0.15% of its average daily net assets attributable to Investor Shares for sub-transfer agent and sub-accounting services in connection with such shares.
Various service organizations act as servicing agents of the Adviser Shares of the Laudus Rosenberg U.S. Small Capitalization Fund. Such shares are subject to an annual Service Fee of up to 0.25% of the average daily net assets attributable to such shares in accordance with a Service Plan adopted by the Trust. In addition, the Trustees have authorized the Fund to pay up to 0.05% of its average daily net assets attributable to Adviser Shares for the transfer agent and sub-accounting services in connection with such shares.
The Board of Trustees may include people who are officers and/or directors of other fund families affiliated to the investment adviser. Federal securities law limits the percentage of the “interested persons” who may serve on a trust’s board, and the Laudus Funds are in compliance with these limitations. The Funds did not pay any of the interested persons for their services as trustees, but did pay non-interested persons Independent Trustees, as noted in each Fund’s Statement of Operations.
A Retirement Plan was instituted for certain Independent Trustees of the Trust. In September 2006, the Trustees voted to close the Retirement Plan to new participants as of June 26, 2006 and to discontinue making contributions to the Retirement Plan after the plan year ending March 31, 2007. All other terms of the Retirement Plan, including without limitation provisions relating to vesting and payment upon termination of service, remain in effect. Under the terms of the Retirement Plan, upon retirement or other termination from service from the Trust (other than termination for cause), a retiring Independent Trustee who has served as Independent Trustee for at least five years shall be paid a lump sum cash payment (the “Retirement Payment”). The Retirement Payment shall be equal to $10,000 for each year that the Trustee has served as an Independent Trustee of the Trust, including years of service prior to the adoption of the Retirement Plan and including a final one-half year credit for service during the plan year ending March 31, 2007. Beginning April 1, 2005, each Independent Trustee was permitted to make a one-time election to have the $10,000 attributable to service for the coming year and previously accrued benefits adjusted up or down at the end of each subsequent year based on the unweighted average performance of Institutional Shares of each Fund of the Trust. After the closure of the Retirement Plan, the previously accrued benefits that an Independent Trustee had elected to have adjusted by the performance of the Funds would continue to be adjusted for performance as provided under the Retirement Plan. As a result, the amount of the Retirement Payment payable to any Independent Trustee may increase or decrease based upon performance of the Funds. The portion of the total Retirement Payment owed to an Independent Trustee upon his or her retirement that is payable by any Fund will be determined based on the relative net assets of the Funds of the Trust. The Trust did not pay any pension or retirement benefits for its Trustees.
4. Redemption Fee.
Certain Fund shares purchased that were redeemed or exchanged in less than 30 days, are assessed a fee of 2% of the current net asset value of the shares. The fee, which is applied to shares redeemed or exchanged in the order in which they are purchased, is retained by the Fund and is intended to limit short-term trading in the Funds, or to the extent short-term trading persists, to
70 Laudus U.S. Equity Funds
Financial Statements—Notes to Financial Statements as of 3/31/08 continued
impose the costs of that activity on the shareholders who engage in it. Such amounts are net of the value of shares redeemed on the Statement of Changes in Net Assets. For the current and prior period, redemption fees assessed were as follows:
| | | | | | | | | |
| | | Current Period | | Prior Period |
| | | (4/1/07-3/31/08) | | (4/1/06-3/31/07) |
| |
| Laudus Rosenberg U.S. Large Capitalization Fund | | $ | 22,951 | | | $ | 2,002 | |
| Laudus Rosenberg U.S. Large Capitalization Growth Fund | | | 14,887 | | | | 1,118 | |
| Laudus Rosenberg U.S. Large Capitalization Value Fund | | | 378 | | | | 358 | |
| Laudus Rosenberg U.S. Discovery Fund | | | 10,158 | | | | 60,262 | |
| Laudus Rosenberg U.S. Small Capitalization Fund | | | 16,091 | | | | 30,427 | |
| Laudus Rosenberg Long/ Short Equity Fund | | | 26,432 | | | | 36,207 | |
5. Redemption-in-kind.
In certain circumstances, the Funds may distribute portfolio securities rather than cash as payment for redemption of Fund shares (redemption-in-kind). For financial reporting purposes, the Fund will recognize a gain on the in-kind redemptions to the extent the value of the distributed securities on the date of redemption exceeds the cost of those securities, the Fund will recognize a loss if the cost exceeds value. The net amount of $9,310,921 in gains and losses realized on the redemptions in-kind are not recognized for tax purposes, and are reclassified from realized gain (loss) to paid-in capital in excess of par value.
The Laudus Rosenberg U.S. Small Capitalization Fund — Institutional Shares had a redemption-in-kind in the amount of $33,136,950 during the year ended March 31, 2008.
6. Security Purchases and Sales.
For the period ended March 31, 2008, purchases and sales of securities (excluding short-term securities) were as follows:
| | | | | | | | | |
| | | Purchases | | Sales |
| |
| Laudus Rosenberg U.S. Large Capitalization Fund | | $ | 172,123,007 | | | $ | 178,075,673 | |
| Laudus Rosenberg U.S. Large Capitalization Growth Fund | | | 59,063,717 | | | | 84,909,269 | |
| Laudus Rosenberg U.S. Large Capitalization Value Fund | | | 4,169,415 | | | | 4,065,326 | |
| Laudus Rosenberg U.S. Discovery Fund | | | 649,285,400 | | | | 748,159,133 | |
| Laudus Rosenberg U.S. Small Capitalization Fund | | | 587,914,221 | | | | 884,355,242 | |
| Laudus Rosenberg Long/ Short Equity Fund | | | 334,225,956 | | | | 411,261,421 | |
7. Borrowings from Banks
The custodian has established a loan agreement for a maximum amount of 10% of total net assets for the Laudus Rosenberg Long/ Short Equity Fund for temporary borrowing purposes. In addition, the Laudus Rosenberg U.S. Large Capitalization Fund, Laudus Rosenberg U.S. Large Capitalization Growth Fund, Laudus Rosenberg U.S. Large Capitalization Value Fund, Laudus Rosenberg U.S. Discovery Fund and Laudus Rosenberg U.S. Small Capitalization Fund has access to custodian overdraft facilities and to an uncommitted line of credit up to a maximum of $100,000,000, as established by State Street Corporation. Interest is calculated based on the market rates at the time of borrowing. There were no borrowings from the line of credit for the period ended March 31, 2008.
8. Federal Income Taxes.
The tax character of distributions paid during the fiscal year ended March 31, 2008 was as follows:
| | | | | | | | | | | | | |
| | | Ordinary | | Long-Term | | Total |
| | | Income | | Capital Gains | | Distributions Paid |
| |
| Laudus Rosenberg U.S. Large Capitalization Fund | | $ | 5,920,126 | | | $ | 9,791,836 | | | $ | 15,711,962 | |
| Laudus Rosenberg U.S. Large Capitalization Growth Fund | | | 87,957 | | | | 3,108,560 | | | | 3,196,517 | |
| Laudus Rosenberg U.S. Large Capitalization Value Fund | | | 205,381 | | | | 658,199 | | | | 863,580 | |
| Laudus Rosenberg U.S. Discovery Fund | | | — | | | | 65,060,079 | | | | 65,060,079 | |
| Laudus Rosenberg U.S. Small Capitalization Fund | | | 57,252 | | | | 131,236,762 | | | | 131,294,014 | |
| Laudus Rosenberg Long/ Short Equity Fund | | | 7,064,829 | | | | — | | | | 7,064,829 | |
Laudus U.S. Equity Funds 71
Financial Statements—Notes to Financial Statements as of 3/31/08 continued
The tax character of distributions paid during the fiscal year ended March 31, 2007 was as follows:
| | | | | | | | | | | | | |
| | | Ordinary | | Long-Term | | Total |
| | | Income | | Capital Gains | | Distributions Paid |
| |
| Laudus Rosenberg U.S. Large Capitalization Fund | | $ | 1,126,178 | | | $ | 2,949,474 | | | $ | 4,075,652 | |
| Laudus Rosenberg U.S. Large Capitalization Growth Fund | | | 135,787 | | | | — | | | | 135,787 | |
| Laudus Rosenberg U.S. Large Capitalization Value Fund | | | 318,229 | | | | 138,325 | | | | 456,554 | |
| Laudus Rosenberg U.S. Discovery Fund | | | 606,878 | | | | 23,594,419 | | | | 24,201,297 | |
| Laudus Rosenberg U.S. Small Capitalization Fund | | | — | | | | 134,761,584 | | | | 134,761,584 | |
| Laudus Rosenberg Long/ Short Equity Fund | | | 7,134,576 | | | | — | | | | 7,134,576 | |
As of March 31, 2008, the Laudus Rosenberg Long/Short Equity Fund was the only fund with net capital loss carry forward, which is available to offset future realized gains:
| | | | | |
| Expire | | |
| |
| 2009 | | $ | 11,040,106 | |
| 2010 | | | — | |
| 2011 | | | — | |
| 2012 | | | 20,890,232 | |
| 2013 | | | — | |
| 2014 | | | — | |
| 2015 | | | 13,099,020 | |
| 2016 | | | 21,018,727 | |
| Total | | $ | 66,048,085 | |
Net capital losses incurred after October 31 and within the taxable year are deemed to arise on the first business day of the Funds’ next taxable year. For the year ended March 31, 2008, the Funds deferred to April 1, 2008 post October capital losses of:
| | | | | |
| | | Capital Losses |
| |
| Laudus Rosenberg U.S. Large Capitalization Fund | | $ | 3,662,236 | |
| Laudus Rosenberg U.S. Large Capitalization Growth Fund | | | — | |
| Laudus Rosenberg U.S. Large Capitalization Value Fund | | | 12,132 | |
| Laudus Rosenberg U.S. Discovery Fund | | | 8,642,506 | |
| Laudus Rosenberg U.S. Small Capitalization Fund | | | 2,851,031 | |
| Laudus Rosenberg Long/ Short Equity Fund | | | — | |
The Funds utilized capital loss carryforward during the year end March 31, 2008 in the amount of:
| | | | | | | | | |
| | | Capital Losses | | Capital Losses |
| | | Utilized | | Expired |
| |
| Laudus Rosenberg U.S. Large Capitalization Fund | | $ | — | | | | — | |
| Laudus Rosenberg U.S. Large Capitalization Growth Fund | | | 1,674,486 | | | | — | |
| Laudus Rosenberg U.S. Large Capitalization Value Fund | | | — | | | | — | |
| Laudus Rosenberg U.S. Discovery Fund | | | — | | | | — | |
| Laudus Rosenberg U.S. Small Capitalization Fund | | | — | | | | — | |
| Laudus Rosenberg Long/Short Equity Fund | | | | | | | 26,836,920 | |
72 Laudus U.S. Equity Funds
Financial Statements—Notes to Financial Statements as of 3/31/08 continued
As of March 31, 2008, the components of distributable earnings/accumulated(losses) on a tax basis were as follows:
| | | | | | | | | | | | | | | | | |
| | | | | Undistributed | | | | |
| | | Undistributed | | Long-Term | | Accumulated | | |
| | | Ordinary | | Capital | | Capital and | | Unrealized |
| | | Income | | Gains | | Other Losses | | Appreciation |
| |
| Laudus Rosenberg U.S. Large Capitalization Fund | | $ | 229,364 | | | $ | — | | | $ | (3,666,867 | ) | | $ | 852,599 | |
| Laudus Rosenberg U.S. Large Capitalization Growth Fund | | | 38,254 | | | | 340,864 | | | | (1,180 | ) | | | 5,701,019 | |
| Laudus Rosenberg U.S. Large Capitalization Value Fund | | | 22,728 | | | | — | | | | (12,284 | ) | | | 324,266 | |
| Laudus Rosenberg U.S. Discovery Fund | | | 816,416 | | | | 38,317 | | | | (8,680,489 | ) | | | 34,752,797 | |
| Laudus Rosenberg U.S. Small Capitalization Fund | | | 181,989 | | | | — | | | | (2,967,846 | ) | | | 52,344,409 | |
| Laudus Rosenberg Long/ Short Equity Fund | | | 271,594 | | | | — | | | | (66,062,554 | ) | | | 54,748,040 | |
The difference between book basis and tax basis unrealized appreciation/(depreciation) is attributable primarily to: tax deferral of losses on wash sales, the realization for tax purposes of unrealized gains/(losses) on certain derivative instruments, and unrealized gains/(losses) on investments in passive foreign investment companies.
The permanent book and tax basis differences may result in reclassifications between capital accounts such and other accounts as required. The adjustments will have no impact on net assets or the results of operations. As of March 31, 2008, the funds made the following reclassifications:
| | | | | | | | | | | | | |
| | | | | Accumulated | | |
| | | | | Net Realized | | |
| | | | | Gains/(Losses) | | |
| | | Accumulated | | on Investments | | |
| | | Net Investment | | and Securities | | Paid in |
| | | Income/(Loss) | | Sold Short | | Capital |
| |
| Laudus Rosenberg U.S. Large Capitalization Fund | | $ | (689 | ) | | $ | 689 | | | $ | — | |
| Laudus Rosenberg U.S. Large Capitalization Growth Fund | | | — | | | | — | | | | — | |
| Laudus Rosenberg U.S. Large Capitalization Value Fund | | | (40 | ) | | | 40 | | | | — | |
| Laudus Rosenberg U.S. Discovery Fund | | | (1,999 | ) | | | 1,999 | | | | — | |
| Laudus Rosenberg U.S. Small Capitalization Fund | | | (7,933 | ) | | | (9,230,555 | ) | | | 9,238,488 | |
| Laudus Rosenberg Long/ Short Equity Fund | | | 270,515 | | | | 26,566,405 | | | | (26,836,920 | ) |
Laudus U.S. Equity Funds 73
Report of Independent Registered Public Accounting Firm
To the Board of Trustees and Shareholders of Laudus Trust
In our opinion, the accompanying statements of assets and liabilities, including the portfolio holdings and the related statements of operations and of changes in net assets and the financial highlights present fairly, in all material respects, the financial position of Laudus Rosenberg U.S. Large Capitalization Fund, Laudus Rosenberg U.S. Large Capitalization Growth Fund, Laudus Rosenberg U.S. Large Capitalization Value Fund, Laudus Rosenberg U.S. Discovery Fund, Laudus Rosenberg U.S. Small Capitalization Fund, and Laudus Rosenberg Long/ Short Equity Fund (formerly Laudus Rosenberg Value Long/ Short Equity Fund) (the “Funds”) at March 31, 2008, the results of each of their operations for the year then ended, and the changes in each of their net assets and the financial highlights for each of the periods presented, in conformity with accounting principles generally accepted in the United States of America. These financial statements and financial highlights (hereafter referred to as “financial statements”) are the responsibility of the Funds’ management; our responsibility is to express an opinion on these financial statements based on our audits. We conducted our audits of these financial statements in accordance with the standards of the Public Company Accounting Oversight Board (United States). Those standards require that we plan and perform the audits to obtain reasonable assurance about whether the financial statements are free of material misstatement. An audit includes examining, on a test basis, evidence supporting the amounts and disclosures in the financial statements, assessing the accounting principles used and significant estimates made by management, and evaluating the overall financial statement presentation. We believe that our audits, which included confirmation of securities at March 31, 2008 by correspondence with the custodian and brokers, provide a reasonable basis for our opinion.
PricewaterhouseCoopers LLP
San Francisco, California
May 14, 2008
74 Laudus U.S. Equity Funds
Other Tax Information (unaudited)
For corporate shareholders, the following percentage of the total ordinary income dividends paid during the fiscal year ended March 31, 2008, qualify for the corporate dividends received deduction for the following Funds:
| | | | | |
| | | Dividends |
| | | Received Deduction |
| |
| Laudus Rosenberg U.S. Large Capitalization Fund | | | 49.04 | % |
| Laudus Rosenberg U.S. Large Capitalization Growth Fund | | | 100 | % |
| Laudus Rosenberg U.S. Large Capitalization Value Fund | | | 84.15 | % |
| Laudus Rosenberg U.S. Discovery Fund | | | 0.00 | % |
| Laudus Rosenberg U.S. Small Capitalization Fund | | | 100 | % |
| Laudus Rosenberg Long/ Short Equity Fund | | | 29.36 | % |
For the fiscal year March 31, 2008, certain dividends paid by the Funds may be subject to maximum tax rate of 15% as provided by the Jobs and Growth Tax Relief Reconciliation Act of 2003. The Funds intend to designate the maximum allowable as taxed at a maximum rate of 15%. Complete information will be reported in conjunction with your 2008 Form 1099-DIV.
For the year ended March 31, 2008, the Funds designate the following amounts of qualified dividend income:
| | | | | |
| | | Qualified |
| | | Dividend Income |
| |
| Laudus Rosenberg U.S. Large Capitalization Fund | | $ | 1,751,357 | |
| Laudus Rosenberg U.S. Large Capitalization Growth Fund | | | 87,957 | |
| Laudus Rosenberg U.S. Large Capitalization Value Fund | | | 149,286 | |
| Laudus Rosenberg U.S. Discovery Fund | | | — | |
| Laudus Rosenberg U.S. Small Capitalization Fund | | | 52,220 | |
| Laudus Rosenberg Long/ Short Equity Fund | | | 2,246,039 | |
Laudus U.S. Equity Funds 75
Trustees and Officers
The tables below provide information about the trustees and officers for the Laudus Trust, which includes the funds covered in this report. The “Fund Complex” includes The Charles Schwab Family of Funds, Schwab Investments, Schwab Capital Trust, Schwab Annuity Portfolios, Laudus Trust, and Laudus Institutional Trust. As of March 31, 2008, the Fund Complex included 79 funds.
At a meeting of the Board held on September 28-29, 2006, the Trustees voted to adopt a retirement policy for all independent trustees that requires an independent trustee to retire no later than December 31st of the year in which he or she reaches age seventy-two.
The address for all trustees and officers is 101 Montgomery Street, San Francisco, CA 94104. You can find more information about the trustees and officers in the Statement of Additional Information, which is available free by calling 1-866-452-8387.
| | | | | | | |
| Independent Trustees |
| |
| Name, Address1 and | | Number of | | |
| Year of Birth; | | Portfolios in | | |
| (Term of Office and | | Principal Occupation(s) | | Fund Complex | | Other Directorships |
| Length of Time Served2) | | During Past Five Years | | Overseen | | Held by Trustee |
| |
Mariann Byerwalter3
1960
(1/04-present) | | Chairman of JDN Corporate Advisory LLC. | | 79 | | Board 1 – Director, Redwood Trust, Inc. (mortgage finance).
Board 2 – Director, PMI Group, Inc. (mortgage insurance). |
| |
William A. Hasler3
1941
(1/04-present) | | Retired. Dean Emeritus of the Haas School of Business at the University of California, Berkeley. Until February 2004, Co-Chief Executive Officer, Aphton Corporation (bio- pharmaceuticals). | | 79 | | Board 1 – Director, Mission West Properties (commercial real estate).
Board 2 – Director, TOUSA (home building).
Board 3 – Director, Harris-Stratex Networks (a network equipment corporation).
Board 4 – Director, Genitope Corp. (bio-pharmaceuticals).
Board 5 – Director, Ditech Networks (voice communications technology)
Board 6 – Rubicon Limited (manufacturing) |
| |
Nils H. Hakansson3
1937
(3/90-present) | | Sylvan C. Coleman Professor of Finance and Accounting, Emeritus, Haas School of Business, University of California, Berkeley (since 2003). Mr. Hakansson was also a Professor of Finance and Accounting, Haas School of Business, University of California, Berkeley (July 1969 to January 2003). | | 11 | | None |
| |
76 Laudus U.S. Equity Funds
Trustees and Officers continued
| | | | | | | |
| Independent Trustees |
| |
| Name, Address1 and | | Number of | | |
| Year of Birth; | | Portfolios in | | |
| (Term of Office and | | Principal Occupation(s) | | Fund Complex | | Other Directorships |
| Length of Time Served2) | | During Past Five Years | | Overseen | | Held by Trustee |
| |
Randall W. Merk
1954
(6/06-present) | | Executive Vice President and President, Investment Management Services, Charles Schwab & Co., Inc.; Executive Vice President, Charles Schwab & Co., Inc. (2002- present); President and Chief Executive Officer, Charles Schwab Investment Management, Inc. (2007-present); Director, Charles Schwab Asset Management (Ireland) Limited and Charles Schwab Worldwide Funds PLC. From September 2002 to July 2004, Chief Executive Officer and President, Charles Schwab Investment Management, Inc. and Executive Vice President, Charles Schwab & Co., Inc. | | 11 | | None |
| |
| |
| 1 | The mailing address of each of the Trustees is c/o Laudus Trust, 101 Montgomery Street, San Francisco, CA 94104. |
| |
| 2 | Each Trustee shall hold office until the election and qualification of his or her successor, or until he or she dies, resigns or is removed. |
| |
| 3 | Member of the Audit Committee. |
Laudus U.S. Equity Funds 77
Trustees and Officers continued
| | | | | |
| Officers |
| |
| Name, Address4 |
| and Year of Birth; |
| (Term of Office5 and |
| Length of Time Served) | | Position with the Trust | | Principal Occupation During Past Five Years |
| |
Jeffrey Mortimer
1963
(3/08-present, President and CEO)
(6/04-present, CIO) | | President, Chief Executive Officer, and Chief Investment Officer | | Senior Vice President and Chief Investment Officer – Equities, Charles Schwab Investment Management, Inc., and Schwab Funds. Prior to May 2004, Vice President and Sr. Portfolio Manager, Charles Schwab Investment Management, Inc. |
| |
George Pereira
1964
(6/06-present) | | Treasurer and Chief Financial Officer | | Senior Vice President and Chief Financial Officer, Charles Schwab Investment Management, Inc.; Treasurer and Principal Financial Officer, Schwab Funds; Director, Charles Schwab Worldwide Funds, PLC and Charles Schwab Asset Management (Ireland) Ltd. Through June 2007, Chief Financial Officer, Mutual Fund Division, UST Advisers, Inc., and Treasurer, Chief Financial Officer and Chief Accounting Officer, Excelsior Funds, Inc., Excelsior Tax-Exempt Funds, Inc., and Excelsior Trust Inc.; From 12/99 to 11/04: Senior Vice President, Financial Reporting, Charles Schwab & Co., Inc. |
| |
Catherine MacGregor
1964
(12/05-present) | | Chief Legal Officer, Vice President and Clerk | | Vice President, Charles Schwab & Co., Inc. and Charles Schwab Investment Management, Inc.; Vice President, Schwab Funds; until July 2005, Senior Associate, Paul Hastings Janofsky & Walker LLP. |
| |
Randall Fillmore
1960
(9/04-present) | | Chief Compliance Officer | | Senior Vice President, Chief Compliance Officer, Charles Schwab Investment Management, Inc.; Senior Vice President, Charles Schwab & Co., Inc.; Chief Compliance Officer, Schwab Funds. From June 2006 to June 2007, Chief Compliance Officer, Excelsior Funds. From 2002 to 2003, Vice President, Charles Schwab & Co., Inc. and Charles Schwab Investment Management, Inc. From 2000 to 2002, Vice President, Internal Audit, Charles Schwab & Co., Inc. |
| |
Daniel Kern
1961
(3/05-present) | | Vice President | | Vice President, Investment Management Services. Until September 2005, Assistant Treasurer, Laudus Trust and Laudus Variable Insurance Trust. Until December 2004, Vice President, Internal Audit, Charles Schwab Corporation. |
| |
Michael Haydel
1972
(6/05-present) | | Vice President | | Vice President, Asset Management Client Services, Charles Schwab & Co., Inc. Until March 2004, Director, Charles Schwab & Co., Inc. |
| |
Cathy Sabo
1964
(12/05-present) | | Vice President | | Vice President, Compliance, Charles Schwab Investment, Management, Inc.; Vice President, Schwab Funds; until September 2004, Vice President, Client, Sales & Services Controls, Charles Schwab & Co., Inc. |
| |
| |
| 4 | The mailing address of each of the officers is c/o Laudus Trust, 101 Montgomery Street, San Francisco, CA 94104. |
| |
| 5 | There is no stated term of office for the officers of the Trust. |
78 Laudus U.S. Equity Funds
Definitions, Terms and Other Information
90 Day T-bill is a short-term discounted, government debt instrument of 90 days or less, issued in $10,000 denominations that pay its face value at maturity. The government issues Treasury bills weekly.
Alpha is a measure of a fund’s risk-adjusted return. Alpha can be used to directly measure the value added or subtracted by a fund’s manager. It is calculated by measuring the difference between a fund’s actual returns and its expected performance given its level of market risk as measured by beta.
Beta is a measure of the volatility of a stock relative to the overall market. A beta of less than one indicates lower historical risk than the market; a beta of more than one indicates higher historical risk than the market.
GDP, or Gross Domestic Product, is the market value of the goods and services produced by labor and property in the United States.
The MSCI Emerging Markets Index (Net) is a free float-adjusted market capitalization index that is designed to measure equity market performance in the global emerging markets. This series approximates the minimum possible dividend reinvestment.
The S&P/Citigroup Global ex US Broad Market Index (BMI) $2-$10 Billion Cap Range is an absolute size benchmark that divides the investable region into capitalization bands of between $2 billion and $10 billion. It is a subset of the Broad Market Index (BMI), which includes companies in approximately 52 developed and emerging markets with more than $100 million of free float capitalization.
The S&P/Citigroup World ex US Extended Market Index (EMI) is a float-adjusted index which measures the performance of small companies (approximately the bottom 20% by market capitalization) in 25 developed equity markets.
The Standard & Poor’s 500® (S&P 500) Index is an unmanaged index measuring large-cap U.S. stock market performance, and includes a representative sample of leading companies in leading industries.
The Russell 1000® Index measures the performance of the 1,000 largest companies in the Russell 3000® Index, and represents approximately 92% of the total market capitalization of the Russell 3000® Index.
The Russell 1000® Growth Index measures the performance of those Russell 1000 companies with higher price-to-book ratios and higher forecasted growth values.
The Russell 1000® Value Index measures the performance of those Russell 1000 companies with lower valuation ratios such as price-to-book and price-to-earnings ratios.
The Russell 2000® Index measures the performance of the 2,000 smallest companies in the Russell 3000® Index, and represents approximately 8% of the total market capitalization of the Russell 3000® Index.
The Russell 2500tm Index measures the performance of the 2,500 smallest companies in the Russell 3000® Index, and represents approximately 16% of the total market capitalization of the Russell 3000® Index.
The Russell 3000® Growth Index measures the performance of those Russell 3000 Index companies with higher price-to-book ratios and higher forecasted growth values. The stocks in this index are also members of either the Russell 1000 Growth or the Russell 2000 Growth indexes.
The Russell 3000® Value Index measures the performance of those Russell 3000 Index companies with lower price-to-book ratios and lower forecasted growth values. The stocks in this index are also members of either the Russell 1000 Value or the Russell 2000 Value indexes.
Price to earnings ratio is the price of a stock divided by its historical earnings per share.
Price to book ratio compares the stock’s market value to the value of the total assets less the total liabilities.
Price to cash flow ratio is the price of a stock dividend by its reported cash flow per share.
Relative strength is the rate that a stock falls relative to other stocks in a falling market or rises relative to other stocks in a rising market.
Return on equity represents the amount earned on a company’s common stock investment for a given period, calculated by dividing common stock equity into net income for the period after preferred stock dividends but before common stock dividends.
Trading Activity is one of several risk factors commonly used to attribute a portfolio’s return relative to its benchmark. Specifically, trading activity measures a stock’s trailing 12 month trading volume relative to its total shares outstanding. It measures how actively traded a stock has been in the last 12 months.
Proxy Voting
A description of the policies and procedures that the Fund uses to determine how to vote proxies relating to portfolio securities is available without charge, upon request by visiting www.laudus.com, the Securities and Exchange Commission’s website at www.sec.gov, or by contacting Laudus Funds at 866.452.8387.
Information regarding how the Fund voted proxies relating to portfolio securities during the most recent 12-month period ended June 30 is available without charge, upon request by visiting www.laudus.com, or the Securities and Exchange Commission’s website at www.sec.gov.
Quarterly Disclosure of Portfolio Holdings
The Fund files its complete schedule of portfolio holdings with the SEC for the first and third quarters of each fiscal year on Form N-Q. The Fund’s Forms N-Q are available on the SEC’s website at www.sec.gov and may be reviewed and copied at the SEC’s Public Reference Room in Washington, DC. Call 1-800-SEC-0330 for information on the operation of the Public Reference Room. The information filed on a fund’s most recent Form N-Q is also available at www.laudus.com.
Laudus U.S. Equity Funds 79
(This page intentionally left blank)
Manager
Charles Schwab Investment Management, Inc.
101 Montgomery Street
San Francisco, California 94104
Shareholder Services
1.866.452.8387 Investment Professionals
1.800.447.3332 Individual Investors
www.laudus.com
This report is for the information of the shareholders of the Laudus Trust.
Its use in connection with any offering of the Trust’s shares is authorized only in case of concurrent or prior
delivery of the current prospectus.
MFR 34765-05
Annual Report
March 31, 2008
International Equity Funds
Laudus Rosenberg International Equity Fund
Laudus Rosenberg International Discovery Fund
Laudus Rosenberg International Small Capitalization Fund (closed to investors)
Each of the Funds is a series of Laudus Trust, which is an open-end management investment company offering diversified portfolios with different investment objectives and strategies.
Charles Schwab Investment Management, Inc. is the Adviser to the Funds and AXA Rosenberg Investment Management LLC is the Sub-adviser.
Table of Contents
| | | |
1 | | President’s Message |
| |
2 | | Management’s Discussion |
| |
7 | | Performance and Fund Facts |
| |
13 | | Fund Expenses |
| |
14 | | Portfolio Holdings |
| |
48 | | Financial Statements and Notes |
| |
60 | | Report of Independent Registered Public Accounting Firm |
| |
62 | | Trustees and Officers of Laudus Trust |
| |
65 | | Definitions, Terms and Other Information |
Nothing in this report represents a recommendation of a security by the investmentadviser. Portfolio Manager views and portfolio holdings may have changed since the report date.
Notice About Duplicate Mailings
In order to reduce expenses of the Laudus Trust incurred in connection with the mailing of prospectuses, prospectus supplements, semi-annual reports and annual reports to multiple shareholders at the same address, Laudus Trust may deliver one copy of a prospectus, prospectus supplement, semi-annual report or annual report to a single investor sharing a street address or post office box with other investors, provided that all such investors have the same last name or are believed to be members of the same family. This process, called “householding,” will continue indefinitely unless you instruct us otherwise. If you share an address with another investor and wish to receive your own prospectus, prospectus supplements, semi-annual reports and annual reports, please call the Trust toll-free at 800.447.3332.
Each of the Funds is a series of the Laudus Trust (the “Trust”), an open-end management investment company offering multiple portfolios with different investment objectives and strategies. Except as explicitly described otherwise, the investment objective and policies of each of the Funds may be changed without shareholder approval. The Funds are advised by Charles Schwab Investment Management, Inc. (“CSIM”). AXA Rosenberg Investment Management LLC (“AXA Rosenberg”) acts as Sub-adviser to the Funds. The Funds are distributed by ALPS Distributors, Inc. Charles Schwab & Co. and ALPS Distributors, Inc. are unaffiliated entities.
President’s Message
Randall W. Merk is President and CEO of Charles Schwab Investment Management, Inc. and the funds during the period of this report. He joined the firm in 2002 and has held a variety of executive positions at Schwab.
Jeffrey Mortimer, is President, CEO, and CIO of Laudus Funds and SVP of Charles Schwab Investment Management, Inc. He joined the firm in 1997 and has held a variety of executive positions at Schwab.
Dear Shareholder,
I am pleased to present the annual report for the Laudus Rosenberg Funds for the year ended March 31, 2008. At this time, I would also like to introduce Jeffrey Mortimer, who will be assuming the position of President and CEO of the Laudus Rosenberg Funds. As the current Chief Investment Officer (CIO) of both Laudus Funds and Schwab Equity Funds, Jeffrey is an exceptionally capable portfolio manager and strategist, bringing over 20 years of industry knowledge and experience to the role.
The Laudus Rosenberg Funds are sub-advised by AXA Rosenberg, one of the world’s premier equity specialists and institutional money managers. Through the Laudus Rosenberg Funds offering, this distinctive approach to investment management is easily accessible to independent advisors and individual investors.
Since our initial offering, we have continued to evaluate investment opportunities and adjust our products to better support our clients by leveraging the Laudus Rosenberg investment process. Our most recently launched fund, the Laudus Rosenberg International Discovery Fund, has reached $261 million in assets, representing an increase of over 250% in the past year. The fund utilizes the same investment discipline used in all of the Laudus Rosenberg Funds and provides international small/mid-cap exposure in developing and emerging markets.
In closing, I would like to thank you for investing with us.
Sincerely,
Investors should consider carefully information contained in the prospectus, including investment objectives, risks, charges and expenses. You can request a prospectus by calling 1-800-447-3332. Please read the prospectus carefully before investing.
Laudus International Equity Funds 1
Management’s Discussion for the year ended March 31, 2008
Global Market Overview
The past four quarters were a period of increasing volatility in capital markets around the globe. The period began with fairly strong positive returns, with many equity indexes gaining over 6% in the second quarter of 2007. In the third quarter, however, small-cap stocks around the world began to pull back, posting generally negative returns, particularly more value-oriented stocks. Large-cap indexes, especially those with a growth-style orientation, continued upward. During the final two quarters of the period, the damage spread across all equity areas — many indexes lost well over 10%, as investors became increasingly concerned about slowing global economic growth and problems in the credit markets. As a result, global equity markets ultimately generated mostly negative returns for the full period, with U.S. small-cap stocks the worst performing area. The most notable exception was emerging markets stocks, which finished the period up over 20%.
Three specific months stand out as significant contributors to the relatively weak returns over the period: July and November of 2007, and January of 2008. In July, investors around the globe sold equity positions in reaction to problems in the credit markets. Continued deterioration in the U.S. housing market and weakness in the sub-prime lending business led to significant financing problems among major investment banks. Over the past several years, many of the loans made to U.S. homeowners were packaged into securitized, bond-like products and placed in fixed income portfolios around the globe. As some borrowers across the U.S. housing markets began to default on their loans, the quality of the securities created by packaging them began to deteriorate. For example, Bear Stearns, a venerated U.S. investment bank, ran into trouble with two of their hedge funds during the summer of 2007, as the values of the underlying assets became increasingly difficult to determine. As these funds were highly leveraged, declines in asset values led to significant losses for the funds. These funds — and others like them — needed to sell their more liquid and highly valued assets to raise cash, causing some unusually strong global volatility in the middle of August 2007. While in its initial stages these effects were felt most strongly in the U.S. fixed income markets, equity investors were concerned about the financial status of the U.S. consumer, and thus the continued growth of the U.S. economy.
After the U.S. Federal Reserve’s (the “Fed”) Open Market Committee acted to provide additional liquidity to the credit markets in mid-August, and followed that up with a cut in interest rates in mid-September, the markets responded positively. The Federal Reserve probably had the Financial sector in mind when it took considerable action during August and September. This group of companies comprises about 20% of most major U.S. indexes, so their valuations and future earnings are very important to stock market investors. In August, the Fed lowered the discount rate, which makes it easier for banks to borrow directly from the Fed. They even persuaded some major banks to step up to the discount window, in a public display of pumping liquidity into the financial system. Then, in September, they lowered the Fed funds rate, the rate banks charge each other, which has much broader application. That caused an immediate decline in the prime rate, lowering borrowing costs throughout the economy. The equity markets generally cheered these moves, but the concerns over the housing market continued the pressure on Financial stocks, keeping the pressure on the markets overall.
By November 2007, it became increasingly clear that the U.S. economy was slowing down. Banks, mortgage firms and homebuilders began to write down assets on their balance sheets in response to the declines in asset values in securities tied to the U.S. mortgage markets. These firms also reported lower earnings and reduced their expectations of future earnings in their reports and updates to investors. Economists around the world spoke of a recession — or at best flat economic growth — in the U.S. and possibly around the world. By January 2008, investors saw evidence of the slowdown in higher unemployment figures and lower manufacturing production. The final figure for U.S. GDP growth in the fourth quarter of 2007 was an annual rate of 0.6% — growth, but just barely. Investors continued to sell stocks across the globe, and equities in general continued their decline.
Also in January, the Fed and some of their global counterparts took some unusual steps designed to restore liquidity to the credit markets. These central banks created pools of credit facilities and lowered the interest rates they charged to borrowers. The Fed again lowered their main interest rate, the Fed funds rate, numerous times in the early part of 2008, thus reducing borrowing costs across the entire economy. While other central banks around the world were not quite as accommodat-
2 Laudus International Equity Funds
Management’s Discussion continued
ing, they too injected liquidity into their markets. And in one of the most unusual moves in recent financial history, the Fed also engineered a purchase of Bear Stearns by JP Morgan. The Fed believed that Bear Stearns’ potential bankruptcy — an event no one thought likely just days before — would very negatively affect both the equity and credit markets, partially due to the firm’s size and presence as a prime broker. But all of these moves, while helpful in calming the markets, also lowered the value of the U.S. dollar versus other currencies, leading to higher commodity and energy prices and increasing fears of inflation.
Investors’ concerns were heightened by reports of inflation. The U.S. Consumer Price Index climbed during the period, with a reported gain of 4.1% during the calendar year 2007. The decline in the value of the U.S. dollar versus other major currencies was a factor in the U.S. inflation rate, as that decline increased the price of imports, especially energy-related products such as crude oil and gasoline. Further evidence of inflation fears showed in the fixed income markets, as the return on U.S. Treasury Inflation Protected Series (“TIPS”) bonds was strongly positive over the period, returning over 14%. Major commodity indexes also were up strongly, many over 30% during the period. Inflation is generally viewed by investors as negative for equities, due to the difficulty of passing along higher costs to consumers and thus increasing the likelihood of lower earnings.
The U.S. dollar’s decline and the gains in some commodity markets did generate some positive news for U.S. investors with assets in non-U.S. stocks, however. The MSCI EAFE Index, while negative for the period at -2.27%, lost less than its U.S. counterpart, the Russell 1000 Index, which was down 5.40%. The dollar’s decline explains much of the difference, but also important was that financial firms in the U.S. index were down significantly more than their foreign counterparts, as a result of their greater direct exposure to problems stemming from the U.S. housing markets. Also important was the higher return to foreign firms in the Materials Sector. Generally, commodity-oriented firms were of greater importance in non-U.S. economies, and their increased weight in the non-U.S. indexes, plus their overall higher returns, helped push these stocks to higher returns versus U.S. equities. This trend was especially true for the emerging markets area, where the Materials and Energy Sectors combined to contribute nearly 11% of the total 21.6% return to the MSCI Emerging Markets Index over the period.
International Equity Funds Performance
Total returns are for the year ended 3/31/08. For performance details, see pages 7 through 12.
| | | | | |
| Laudus Rosenberg International Equity Fund(1) |
| |
| REQIX | | RIEIX | | MSCI-EAFE |
| Institutional shares | | Investor shares | | Index |
| -5.91% | | -6.21% | | -2.27% |
| | | | | |
| Laudus Rosenberg International Discovery Fund(1,2) |
| |
| | | | | S&P/Citigroup
Global ex US Broad Market Index (BMI) |
| LIDSX | | LIDIX | | $2-$10 Billion |
| Institutional shares | | Investor shares | | Cap Range |
| -0.16%* | | -0.51% | | 1.04% |
| | | | | |
| Laudus Rosenberg International Small Capitalization Fund(1,2) |
| (Closed) |
| |
| | | | | S&P/Citigroup World ex US Extended |
| ICSIX | | RISIX | | Market Index |
| Institutional shares | | Investor shares | | (EMI) |
| -9.97% | | -10.27% | | -6.39% |
Past performance does not guarantee future results. The performance data quoted represents past performance, and current returns may be lower or higher. The performance information does not reflect the deduction of taxes that a shareholder would pay on fund distributions or the redemption of fund shares. The investment return and principal value will fluctuate so that an investor’s shares, when redeemed, may be worth more or less than the original cost. To obtain performance information current to the most recent month end, visit www.laudus.com.
Performance data quoted does not reflect the non-recurring redemption fee of 2% that may be charged if shares are sold or exchanged within 30 days of the purchase date. If these fees were reflected, the performance data quoted would be lower.
Total returns include change in share price and reinvestment of distributions. Total returns reflect the waiver of a portion of a Fund’s advisory or administrative fees for certain periods since the inception date. In such instances, and without the waiver of fees, total return would have been lower.
Investors cannot invest directly in any index.
| |
| * | Return for the period presented in the table differs from the return in the Financial Highlights. This is a result of the calculation of Financial Highlights return adhering to GAAP presentation. |
| |
| (1) | There are risks associated with investing in foreign companies, such as erratic market conditions, economic and political instability and fluctuations in currency exchange rates. Investing in emerging markets accentuates these risks. |
| |
| (2) | Small capitalization funds typically carry additional risks since smaller companies generally have experienced a greater degree of market volatility. |
Laudus International Equity Funds 3
Management’s Discussion continued
Laudus Rosenberg International Equity Fund For its fiscal year ended 3/31/08, the Fund posted a negative return and underperformed its benchmark, the MSCI EAFE® Index: The Fund’s Investor Shares lost 6.21% versus the benchmark’s loss of 2.27%. Generally speaking, allocation decisions made modest positive contributions but were overshadowed by weak stock selection across most measures. The Fund, with its emphasis on valuation as well as earnings growth, clearly struggled against the benchmark in a period in which investors generally flocked to growth stocks — often without regard to cost.
On a sector basis, stock selection provided the greatest drag on performance; allocation across sectors added some value, but not enough to overcome the negatives. The largest sector detractor was from the Materials sector. Although the Fund’s substantial overweight to the strongly performing sector added value, it was overshadowed by underperformance of the Fund’s holdings in the sector as compared to those of the benchmark. An overweight to the Telecommunication Services sector also added value, as that industry held up relatively well over the reporting period. Stock selection, however, across multiple sectors detracted, most damaging in Information Technology, Industrials and Financials. The Fund’s underweight of Consumer Staples and overweight of Consumer Discretionary also worked against it, as international investors — following those in the U.S. — moved to more defensive holdings as the period wore on. The Fund’s stock selection within Consumer Discretionary, however, was able to mitigate the sector’s negative allocation impact.
Across market capitalizations, it was primarily the Fund’s stock selections that detracted from performance; in nearly all market-cap ranges the Fund’s holdings underperformed those of the benchmark. While overall allocation contributed slightly — most notably due to the Fund’s overweight to very large-cap stocks — the Fund’s modest overweight of the smallest stocks hurt, compounded by weak stock selection among them.
From a Price/Earnings (“P/E”) perspective, stock selection dragged on Fund performance for the period across nearly all valuation ranges as the Fund’s holdings failed to outperform those of the benchmark. The one exception was an overweight of stocks with the lowest P/Es that worked in the Fund’s favor, boosted by positive stock selection among those companies; in all other ranges, the Fund’s holdings underperformed those of its benchmark.
From a Price/Book (“P/B”) perspective, however, it was the Fund’s allocations that were the most damaging; in fact, stock picking in several valuation ranges contributed positively, most notably in the lower range of P/B values. Most damaging was a substantial overweight of stocks at the low end of the P/B range, not surprising in an environment in which growth notably outperformed value. At higher ranges, however, stock picking hurt. And among the stocks with the highest P/B valuations, both an underweight and weak stock selection detracted from performance.
As is typical for this Fund, regional allocation had little net effect. However, the Fund’s holdings within Europe — representing nearly two-thirds of the Fund’s portfolio — underperformed those of the benchmark, dragging on Fund performance for the period.
The Fund is managed for long-term performance and seeks to outperform its benchmark as a result of effective stock picking. Consistent with the Fund’s underlying model, it seeks to capitalize on stocks with both superior long-term earnings and those with accelerating near-term earnings growth.
Laudus Rosenberg International Discovery Fund For its fiscal year ended 3/31/08, the Fund posted a negative return and underperformed its benchmark, the S&P/Citigroup Global ex U.S. Broad Market Index, $2-10 Billion Cap Range: The Fund’s Investor Shares lost 0.51% versus the benchmark’s gain of 1.04%. The Fund’s underperformance was primarily a result of its stock selection decisions; allocations added value across some measures but detracted in others.
Among sectors, the Fund’s allocation decisions generally added value, but in most cases they were overshadowed by weak stock performance. The greatest sector contribution for the period came from Financials, where a combination of a substantial underweighting and strong stock selection among them added value. Most other sectors detracted — the largest of which was the Telecommunication Services sector where, despite an overweight that worked in the Fund’s favor, the Fund’s holdings significantly underperformed those in the benchmark. Other sectors that hurt performance for the period were Industrials, due to both an underweight and weak stock selection, and weak stock selection in the Consumer Discretionary and Materials sectors. A substantial overweight to Materials as compared to the benchmark did
4 Laudus International Equity Funds
Management’s Discussion continued
add value as the sector showed notable strength for the reporting period.
On a market-capitalization basis, while allocation added some value, it was more than offset by weak stock selection across market caps. The largest drag on performance came from the smallest stocks, where those held by the Fund substantially underperformed those of the benchmark. An overweight in this arena tempered the drag to some degree, but not nearly enough to overcome the stock-picking impact. The effect of weak stock selection was consistent across most capitalization ranges with the exception of the largest of the small-caps, where the Fund’s holdings outperformed those of the benchmark.
On a valuation basis, generally speaking, the Fund’s value orientation worked against it for the period, with overweights to both lower-valuation stocks and to more richly valued stocks — measured both by P/E and P/B values — working against the Fund for the fiscal year. However, strong performance of the Fund’s lower-P/E stocks contributed sufficiently to overcome the negative impact of allocation. Weak performance among the Fund’s stocks with mid-range P/Es also detracted from performance.
From a P/B perspective, the bright spot was that the Fund’s substantial overweight to stocks with low P/B values added some value. However, it was overshadowed the by effect of weak stock performance among the Fund’s holdings in that range.
Although typically, regional allocation has little net effect on Fund performance, for this period it added modest value as a result of the Fund’s overweight of Latin America compared to the benchmark. However, the Fund’s stocks in Latin America underperformed those of the benchmark, overshadowing the benefit of the Fund’s allocation there. Stock selection in North America, Europe and Asia & the Pacific Basin also detracted from Fund performance.
The Fund is managed for long-term performance and seeks to outperform its benchmark as a result of effective stock picking. Consistent with the Fund’s underlying model, it seeks to capitalize on stocks with both superior long-term earnings and those with accelerating near-term earnings growth.
Laudus Rosenberg International Small Capitalization Fund For its fiscal year ended 3/31/08, the Fund posted a negative return and underperformed its benchmark, the S&P/Citigroup World ex U.S. Extended Market Index: The Fund’s Investor Shares lost 10.27% versus the benchmark’s loss of 6.39%. The Fund’s underperformance was primarily a result of its stock selection decisions, although in some cases, allocations also dragged on performance.
Among sectors, the Fund’s stock selection generally detracted from performance, and allocation across sectors contributed only modestly. Although a substantial overweight to the Materials sector contributed to performance, the negative impact of stock selection within the sector nearly overshadowed that contribution. Stock selection among Information Technology, Telecommunications Services and Utilities added some value, but it was overshadowed by weak stock performance among the Fund’s holdings in Industrials and Financials and, to a lesser extent, Consumer Discretionary and Health Care. The Fund’s underweight of Energy — the benchmark’s strongest-performing sector — and Health Care sectors also detracted, as did its overweight of Industrials.
Across market capitalizations, the Fund’s stock picking generally detracted; allocations added little net contribution. The positive contribution of the Fund’s stock picking fit a clear pattern: its holdings among the smaller companies outperformed those of the benchmark, while its larger holdings underperformed. But because those smaller holdings represented roughly 30% of the portfolio versus 70% for the larger holdings, the net effect was a drag on Fund performance for the period.
On a valuation basis, results were inconsistent when examined on a P/E vs. a P/B basis for the period. From a P/E perspective, the Fund’s allocations had little net effect; it was primarily stock selection that dragged on returns, particularly among the Fund’s mid-range valuations. However, the Fund did exhibit strong stock picking among the lowest and highest valuations. From a P/B perspective, however, it was the Fund’s allocations that dragged most on performance; while this was the case across all P/B ranges, the impact was greatest among the Fund’s stocks with the highest and lowest valuations. The Fund’s stock selection did compensate somewhat, however, particularly among those stocks with the lowest and highest valuations. Generally speaking, the market rewarded more highly valued stocks over the period, which worked against the Fund’s value orientation.
Laudus International Equity Funds 5
Management’s Discussion continued
As is typical for this Fund, regional allocation had little net effect on Fund performance, although for this period it detracted modestly due to an underweight to North America and an overweight (albeit modest) to Africa & the Middle East. From a regional perspective, it was weak stock selection, particularly among European stocks — which represent more than 60% of the portfolio — that dragged most notably on performance. The Fund’s stock selection in Asia and the Pacific Basin compensated somewhat, but not enough to overcome the negatives.
The Fund is managed for long-term performance and seeks to outperform its benchmark as a result of effective stock picking. Consistent with the Fund’s underlying model, it seeks to capitalize on stocks with both superior long-term earnings and those with accelerating near-term earnings growth.
6 Laudus International Equity Funds
Performance and Fund Facts
Laudus Rosenberg International Equity Fund as of 3/31/08
Performance of a Hypothetical
$50,000 Investment in Institutional Shares1
Performance of a Hypothetical
$10,000 Investment in Investor Shares1
Average Annual Total Returns1
| | | | | | | | | | | | | | | | | |
| | | | | | | Since Inception | | Since Inception |
| Class and Inception Date | | 1 year | | 5 year | | Institutional | | Investor |
| Institutional (6/7/00) | | | -5.91% | | | | 19.40% | | | | 4.75% | | | | n/a | |
| Investor (12/5/00) | | | -6.21% | | | | 19.03% | | | | n/a | | | | 6.29% | |
| MSCI EAFE Index* | | | -2.27% | | | | 21.65% | | | | 4.88% | | | | 7.10% | |
Past performance does not guarantee future results. The performance data quoted represents past performance, and current returns may be lower or higher. The performance information does not reflect the deduction of taxes that a shareholder would pay on fund distributions or the redemption of fund shares. The investment return and principal value will fluctuate so that an investor’s shares, when redeemed, may be worth more or less than the original cost. To obtain performance information current to the most recent month end, visit www.laudusfunds.com.
Performance data quoted does not reflect the non-recurring redemption fee of 2% that may be charged if shares are sold or exchanged within 30 days of the purchase date. If these fees were reflected, the performance data quoted would be lower.
There are risks associated with investing in foreign companies, such as erratic market conditions, economic and political instability and fluctuations in currency exchange rates.
Investors cannot invest directly in any index.
| |
| * | The Morgan Stanley Capital International Europe, Australasia, Far East (MSCI-EAFE® Index) Index is a free float-adjusted market capitalization index that is designed to measure market equity performance in 21 developed market countries, excluding the U.S. and Canada. |
| |
| 1 | Total returns include change in share price and reinvestment of distributions. Total returns may reflect the waiver of a portion of a Fund’s advisory fees for certain periods since the inception date. In such instances, and without the waiver of fees, total returns would have been lower. |
| | | | | | | | | |
| | | Institutional | | Investor |
| Fund Overview2 | | Shares | | Shares |
| |
| Initial Investment | | | $50,000 | | | | $100 | |
| Inception Date | | | 6/7/00 | | | | 12/5/00 | |
| Total Net Assets ($ x 1,000) | | | $97,701 | | | | $19,570 | |
| Ticker Symbol | | | REQIX | | | | RIEIX | |
| Cusip | | | 51855Q507 | | | | 51855Q812 | |
| NAV | | | $11.59 | | | | $11.60 | |
Net Expense Ratio3 | | | 1.34% | | | | 1.64% | |
Gross Expense Ratio4 | | | 1.34% | | | | 1.71% | |
| | | | | |
| Fund Characteristics2 | | |
| |
| Number of Securities | | | 432 | |
| |
Avg. Market Capitalization
($Wtd. x 1,000,000) | | | 58,649 | |
| |
Portfolio Turnover
(One year trailing) | | | 83 | % |
| |
| Price to Earnings (P/E) | | | 10.69 | |
| |
| Price to Book (P/B) | | | 1.53 | |
| |
| Price to Cash Flow | | | 6.61 | |
| |
| Beta | | | 1.03 | |
| |
| Return on Equity | | | 15.75 | % |
| |
| Five-Year Earnings Growth | | | 21.53 | % |
| | | | | |
| Top Equity Holdings2 % of Net Assets | | |
| |
| Vodafone Group plc | | | 2.6 | % |
| |
| Royal Dutch Shell plc, Class A | | | 2.0 | % |
| |
| Total S.A. | | | 1.9 | % |
| |
| Daimler AG | | | 1.7 | % |
| |
| Zurich Financial Services AG — Reg’d | | | 1.7 | % |
| |
| Eni S.p.A. | | | 1.7 | % |
| |
| BASF SE | | | 1.6 | % |
| |
| Nestle S.A. — Reg’d | | | 1.6 | % |
| |
| Royal Dutch Shell plc, Class B | | | 1.5 | % |
| |
| Anglo American plc | | | 1.4 | % |
| |
Total | | | 17.7 | % |
| |
| 2 | Portfolio holdings are subject to change and may not represent current or future holdings. |
| |
| 3 | Reflects expenses expected to be charged to shareholders through at least 7/30/10. Adviser expects to hold expenses at this level by waiving its management fees and/or bearing other expenses. Please see the prospectus for more information. |
| |
| 4 | Reflects the total annual fund operating expenses without the effect of contractual fee waivers. Please see the prospectus for more information. For actual ratios during the period, refer to the financial highlights section of the financial statements. |
Laudus International Equity Funds 7
Performance and Fund Facts continued
Laudus Rosenberg International Equity Fund as of 3/31/08
Portfolio Composition1 % of Investments
Sector Weightings
Portfolio Composition1 % of Investments
Country Weightings
| |
| 1 | Portfolio holdings are subject to change and may not represent current or future holdings. |
8 Laudus International Equity Funds
Performance and Fund Facts
Laudus Rosenberg International Discovery Fund as of 3/31/08
Performance of a Hypothetical
$50,000 Investment in Institutional Shares1
Performance of a Hypothetical
$10,000 Investment in Investor Shares1
Average Annual Total Returns1
| | | | | | | | | | | | | |
| | | | | Since Inception | | Since Inception |
| Class and Inception Date | | 1 year | | Institutional | | Investor |
| Institutional (5/31/06) | | | -0.16%** | | | | 11.30% | | | | n/a | |
| |
| Investor (5/31/06) | | | -0.51% | | | | n/a | | | | 10.94% | |
| |
| S&P/ Citigroup Global ex US BMI $2-10 Bil Cap Range* | | | 1.04% | | | | 12.45% | | | | 12.45% | |
Past performance does not guarantee future results. The performance data quoted represents past performance, and current returns may be lower or higher. The performance information does not reflect the deduction of taxes that a shareholder would pay on fund distributions or the redemption of fund shares. The investment return and principal value will fluctuate so that an investor’s shares, when redeemed, may be worth more or less than the original cost. To obtain performance information current to the most recent month end, visit www.laudusfunds.com.
Performance data quoted does not reflect the non-recurring redemption fee of 2% that may be charged if shares are sold or exchanged within 30 days of the purchase date. If these fees were reflected, the performance data quoted would be lower.
There are risks associated with investing in foreign companies, such as erratic market conditions, economic and political instability and fluctuations in currency exchange rates. Investing in emerging markets accentuates these risks.
Small capitalization funds typically carry additional risks since smaller companies generally have experienced a greater degree of market volatility.
Investors cannot invest directly in any index.
| |
| * | The S&P/Citigroup Global ex US Broad Market Index (BMI) $2 - $10 Bill Cap Range includes companies in approximately 52 developed and emerging markets with more than $100 million of free float capitalization. |
| |
| ** | Return for the period presented in the table differs from the return in the Financial Highlights. This is a result of the calculation of Financial Highlights return adhering to GAAP presentation. |
| |
| 1 | Total returns include change in share price and reinvestment of distributions. Total returns may reflect the waiver of a portion of a Fund’s advisory fees for certain periods since the inception date. In such instances, and without the waiver of fees, total returns would have been lower. |
| | | | | | | | | |
| | | Institutional | | Investor |
| Fund Overview2 | | Shares | | Shares |
| |
| Initial Investment | | | $50,000 | | | | $100 | |
| Inception Date | | | 5/31/06 | | | | 5/31/06 | |
| Total Net Assets ($ x 1,000) | | | $139,643 | | | | $121,930 | |
| Ticker Symbol | | | LIDSX | | | | LIDIX | |
| Cusip | | | 51855Q689 | | | | 51855Q697 | |
| NAV | | | $11.45 | | | | $11.43 | |
Net Expense Ratio3 | | | 1.35% | | | | 1.65% | |
Gross Expense Ratio4 | | | 1.64% | | | | 2.03% | |
| | | | | |
| Fund Characteristics2 | | |
| |
| Number of Securities | | | 600 | |
Avg. Market Capitalization
($Wtd. x 1,000,000) | | | 5,601 | |
Portfolio Turnover
(One year trailing) | | | 147 | % |
| Price to Earnings (P/ E) | | | 12.26 | |
| Price to Book (P/ B) | | | 1.49 | |
| Price to Cash Flow | | | 6.99 | |
| Beta | | | 1.03 | |
| Return on Equity | | | 13.27 | % |
| Five-Year Earnings Growth | | | 20.99 | % |
| | | | | |
| Top Equity Holdings2 % of Net Assets | | |
| |
| Mapfre S.A. | | | 0.8% | |
| D/ S Norden A/ S | | | 0.8% | |
| Danisco A/ S | | | 0.7% | |
| IMI plc | | | 0.7% | |
| Fondiaria — Sai S.p.A. | | | 0.7% | |
| Petrofac Ltd. | | | 0.7% | |
| Kinross Gold Corp. | | | 0.7% | |
| Arkema | | | 0.6% | |
| Atos Origin S.A. | | | 0.6% | |
| Asahi Breweries Ltd. | | | 0.6% | |
Total | | | 6.9% | |
| |
| 2 | Portfolio holdings are subject to change and may not represent current or future holdings. |
| |
| 3 | Reflects expenses expected to be charged to shareholders through at least 7/30/10. Adviser expects to hold expenses at this level by waiving its management fees and/or bearing other expenses. Please see the prospectus for more information. |
| |
| 4 | Reflects the total annual fund operating expenses without the effect of contractual fee waivers. Please see the prospectus for more information. For actual ratios during the period, refer to the financial highlights section of the financial statements. |
Laudus International Equity Funds 9
Performance and Fund Facts continued
Laudus Rosenberg International Discovery Fund as of 3/31/08
Portfolio Composition1 % of Investments
Sector Weightings
Portfolio Composition1 % of Investments
Country Weightings
| |
| 1 | Portfolio holdings are subject to change and may not represent current or future holdings. |
10 Laudus International Equity Funds
Performance and Fund Facts
Laudus Rosenberg International Small Capitalization Fund as of 3/31/08
Performance of a Hypothetical
$50,000 Investment in Institutional Shares1
Performance of a Hypothetical
$10,000 Investment in Investor Shares1
Average Annual Total Returns1
| | | | | | | | | | | | | |
| Class and Inception Date | | 1 year | | 5 year | | 10 years |
| Institutional (9/23/96) | | | -9.97% | | | | 26.15% | | | | 11.95% | |
| |
| Investor (10/29/96) | | | -10.27% | | | | 25.75% | | | | 11.59% | |
| |
| S&P/ Citigroup World ex US EMI* | | | -6.39% | | | | 26.77% | | | | 9.98% | |
Past performance does not guarantee future results. The performance data quoted represents past performance, and current returns may be lower or higher. The performance information does not reflect the deduction of taxes that a shareholder would pay on fund distributions or the redemption of fund shares. The investment return and principal value will fluctuate so that an investor’s shares, when redeemed, may be worth more or less than the original cost. To obtain performance information current to the most recent month end, visit www.laudusfunds.com.
Performance data quoted does not reflect the non-recurring redemption fee of 2% that may be charged if shares are sold or exchanged within 30 days of the purchase date. If these fees were reflected, the performance data quoted would be lower.
There are risks associated with investing in foreign companies, such as erratic market conditions, economic and political instability and fluctuations in currency exchange rates.
Small capitalization funds typically carry additional risks since smaller companies generally have experienced a greater degree of market volatility.
Investors cannot invest directly in any index.
| |
| * | S&P/Citigroup World ex US Extended Market Index (EMI) is a float-adjusted index which measures the performance of small companies (approximately the bottom 20% by market capitalization) in 25 developed equity markets. |
| |
| 1 | Total returns include change in share price and reinvestment of distributions. Total returns may reflect the waiver of a portion of a Fund’s advisory fees for certain periods since the inception date. In such instances, and without the waiver of fees, total returns would have been lower. |
| | | | | | | | | |
| | | Institutional | | Investor |
| Fund Overview2 | | Shares | | Shares |
| |
| Initial Investment | | | $50,000 | | | | $100 | |
| |
| Inception Date | | | 9/23/96 | | | | 10/29/96 | |
| |
| Total Net Assets ($ x 1,000) | | | $612,703 | | | | $523,709 | |
| Ticker Symbol | | | ICSIX | | | | RISIX | |
| Cusip | | | 51855Q606 | | | | 51855Q796 | |
| NAV | | | $16.97 | | | | $16.74 | |
Fund Expense Ratio3 | | | 1.10% | | | | 1.47% | |
| | | | | |
| Fund Characteristics2 | | |
| |
| Number of Securities | | | 830 | |
| |
Avg. Market Capitalization
($Wtd. x 1,000,000) | | | 4,394 | |
Portfolio Turnover
(One year trailing) | | | 105 | % |
| Price to Earnings (P/ E) | | | 11.62 | |
| Price to Book (P/ B) | | | 1.18 | |
| Price to Cash Flow | | | 6.52 | |
| Beta | | | 1.06 | |
| Return on Equity | | | 10.92 | % |
| Five-Year Earnings Growth | | | 22.03 | % |
| | | | | |
| Top Equity Holdings2 % of Net Assets | | |
| |
| British Energy Group plc | | | 2.0% | |
| |
| Eramet | | | 1.8% | |
| |
| Compagnie Generale des Etablissements Michelin, class B | | | 1.8% | |
| |
| Salzgitter AG | | | 1.8% | |
| |
| Koninklijke DSM N.V. | | | 1.4% | |
| |
| K&S AG | | | 1.4% | |
| |
| Swiss Life Holding — Reg’d | | | 1.3% | |
| |
| Baloise Holding AG — Reg’d | | | 1.3% | |
| |
| Natixis | | | 1.3% | |
| |
| PSA Peugeot Citroen | | | 1.2% | |
| |
Total | | | 15.3% | |
| |
| 2 | Portfolio holdings are subject to change and may not represent current or future holdings. |
| |
| 3 | Reflects the total annual fund operating expenses. Please see the prospectus for more information. For actual ratios during the period, refer to the financial highlights section of the financial statements. |
Laudus International Equity Funds 11
Performance and Fund Facts continued
Laudus Rosenberg International Small Capitalization Fund as of 3/31/08
Portfolio Composition1 % of Investments
Sector Weightings
Portfolio Composition1 % of Investments
Country Weightings
1 Portfolio holdings are subject to change and may not represent current or future holdings.
12 Laudus International Equity Funds
Disclosure of Fund Expenses (Unaudited)
Examples for a $1,000 Investment
As a fund shareholder, you incur two types of costs: transaction costs, such as redemption fees; and, ongoing costs, such as management fees, transfer agent and shareholder services fees, and other fund expenses.
The expense examples below are intended to help you understand your ongoing cost (in dollars) of investing in a fund and to compare this cost with the ongoing cost of investing in other mutual funds. These examples are based on an investment of $1,000 invested for the period beginning October 1, 2007 and held through March 31, 2008, unless otherwise noted.
Actual Return lines in the table below provide information about actual account values and actual expenses. You may use this information, together with the amount you invested, to estimate the expenses that you paid over the period. To do so, simply divide your account value by $1,000 (for example, an $8,600 account value ÷ $1,000 = 8.6), then multiply the result by the number given for your fund or share class under the heading entitled “Expenses Paid During Period.”
Hypothetical Return lines in the table below provide information about hypothetical account values and hypothetical expenses based on a fund’s share classes’ actual expense ratios and an assumed return of 5% per year before expenses. Because the return used is not an actual return, it may not be used to estimate the actual ending account value or expenses you paid for the period.
You may use this information to compare the ongoing costs of investing in the fund and other funds. To do so, compare this 5% hypothetical example with the 5% hypothetical examples that appear in the shareholder reports of the other funds.
Please note that the expenses shown in the table are meant to highlight your ongoing costs only, and do not reflect any transactional costs, such as redemption fees. If these transactional costs were included, your costs would have been higher.
| | | | | | | | | | | | | | | | | | |
| | | | | | | Ending | | |
| | | | | Beginning | | Account Value | | Expenses |
| | | Expense Ratio1 | | Account Value | | (Net of Expenses) | | Paid During Period2 |
| | | (Annualized) | | at 10/1/07 | | at 3/31/08 | | 10/1/07 - 3/31/08 |
| |
Laudus Rosenberg International Equity Fund | | | | | | | | | | | | | | | | |
Institutional Shares | | | 1.12 | % | | | | | | | | | | | | |
| | Actual Return | | | | | | $ | 1,000 | | | $ | 883.60 | | | $ | 5.27 | |
| | Hypothetical 5% Return | | | | | | $ | 1,000 | | | $ | 1,019.40 | | | $ | 5.65 | |
Investor Shares | | | 1.53 | % | | | | | | | | | | | | |
| | Actual Return | | | | | | $ | 1,000 | | | $ | 882.50 | | | $ | 7.20 | |
| | Hypothetical 5% Return | | | | | | $ | 1,000 | | | $ | 1,017.35 | | | $ | 7.72 | |
| |
Laudus Rosenberg International Discovery Fund | | | | | | | | | | | | | | | | |
Institutional Shares | | | 1.35 | % | | | | | | | | | | | | |
| | Actual Return | | | | | | $ | 1,000 | | | $ | 900.40 | | | $ | 6.41 | |
| | Hypothetical 5% Return | | | | | | $ | 1,000 | | | $ | 1,018.25 | | | $ | 6.81 | |
Investor Shares | | | 1.65 | % | | | | | | | | | | | | |
| | Actual Return | | | | | | $ | 1,000 | | | $ | 900.00 | | | $ | 7.84 | |
| | Hypothetical 5% Return | | | | | | $ | 1,000 | | | $ | 1,016.75 | | | $ | 8.32 | |
| |
Laudus Rosenberg International Small Capitalization Fund | | | | | | | | | | | | | | | | |
Institutional Shares | | | 1.11 | % | | | | | | | | | | | | |
| | Actual Return | | | | | | $ | 1,000 | | | $ | 870.40 | | | $ | 5.19 | |
| | Hypothetical 5% Return | | | | | | $ | 1,000 | | | $ | 1,019.45 | | | $ | 5.60 | |
Investor Shares | | | 1.50 | % | | | | | | | | | | | | |
| | Actual Return | | | | | | $ | 1,000 | | | $ | 868.90 | | | $ | 7.01 | |
| | Hypothetical 5% Return | | | | | | $ | 1,000 | | | $ | 1,017.50 | | | $ | 7.57 | |
| |
| |
| 1 | Based on the most recent six-month expense ratio; may differ from the expense ratio provided in Financial Highlights. |
| 2 | Expenses for each fund or share class are equal to that fund’s or share class’ annualized expense ratio (net of any expenses waived or reimbursed), multiplied by the average account value for the hypothetical account over the period, multiplied by 183 days of the period, and divided by 366 days of the fiscal year. |
Laudus International Equity Funds 13
Laudus Rosenberg International Equity Fund
Portfolio Holdings as of March 31, 2008
| | | | | | | | | | | | | |
| | | Cost | | Value |
| Holdings by Category | | ($) | | ($) |
| |
| | 98.2 | % | | Common Stock | | | 108,493,630 | | | | 115,186,869 | |
| | 0.5 | % | | Short-Term | | | 597,000 | | | | 597,000 | |
| | | | | Investment | | | | | | | | |
| |
| | 98.7 | % | | Total Investments | | | 109,090,630 | | | | 115,783,869 | |
| | 1.3 | % | | Other Assets and | | | | | | | | |
| | | | | Liabilities | | | | | | | 1,487,356 | |
| |
| | 100.0 | % | | Net Assets | | | | | | | 117,271,225 | |
| | | | | | | | | | | |
| | | Number of | | Value | | |
| Security | | Shares | | ($) | | |
| Common Stock 98.2% of net assets |
Australia 5.6% |
| |
Banks 0.3% |
| Australia & New Zealand Banking Group Ltd. | | | 2,400 | | | | 49,801 | | | |
| Commonwealth Bank of Australia | | | 3,600 | | | | 138,336 | | | |
| National Australia Bank Ltd. | | | 3,100 | | | | 85,732 | | | |
| Westpac Banking Corp. | | | 2,600 | | | | 56,746 | | | |
| | | | | | | |
| | | | | | | | 330,615 | | | |
Capital Goods 0.0% |
| Leighton Holdings Ltd. | | | 600 | | | | 23,610 | | | |
Energy 0.9% |
| Origin Energy Ltd. | | | 33,800 | | | | 283,147 | | | |
| Santos Ltd. | | | 23,400 | | | | 311,188 | | | |
| Woodside Petroleum Ltd. | | | 8,600 | | | | 427,376 | | | |
| WorleyParsons Ltd. | | | 900 | | | | 27,584 | | | |
| | | | | | | |
| | | | | | | | 1,049,295 | | | |
Food, Beverage & Tobacco 0.5% |
| Coca-Cola Amatil Ltd. | | | 27,200 | | | | 211,694 | | | |
| Foster’s Group Ltd. | | | 69,800 | | | | 327,169 | | | |
| Goodman Fielder Ltd. | | | 5,600 | | | | 9,250 | | | |
| | | | | | | |
| | | | | | | | 548,113 | | | |
Materials 3.0% |
| Amcor Ltd. | | | 5,600 | | | | 36,643 | | | |
| BHP Billiton Ltd. | | | 41,000 | | | | 1,347,301 | | | |
| BlueScope Steel Ltd. | | | 29,500 | | | | 267,542 | | | |
| Dominion Mining Ltd. | | | 2,500 | | | | 7,713 | | | |
| Equigold NL | | | 1,300 | | | | 5,523 | | | |
| Fortescue Metals Group Ltd. * | | | 46,000 | | | | 274,679 | | | |
| Incitec Pivot Ltd. | | | 1,000 | | | | 129,293 | | | |
| Independence Group NL | | | 1,000 | | | | 7,335 | | | |
| Macarthur Coal Ltd. | | | 7,900 | | | | 94,547 | | | |
| Mincor Resources NL | | | 9,700 | | | | 27,155 | | | |
| Mount Gibson Iron Ltd. * | | | 12,600 | | | | 33,053 | | | |
| Nufarm Ltd. | | | 1,000 | | | | 15,709 | | | |
| OneSteel Ltd. | | | 18,785 | | | | 109,986 | | | |
| Orica Ltd. | | | 8,700 | | | | 232,407 | | | |
| Portman Ltd. * | | | 9,962 | | | | 113,519 | | | |
| Rio Tinto Ltd. | | | 5,800 | | | | 651,547 | | | |
| Sims Group Ltd. | | | 5,500 | | | | 149,676 | | | |
| | | | | | | |
| | | | | | | | 3,503,628 | | | |
Media 0.1% |
| Amalgamated Holdings Ltd. | | | 1,575 | | | | 7,776 | | | |
| Seven Network Ltd. | | | 14,400 | | | | 125,841 | | | |
| | | | | | | |
| | | | | | | | 133,617 | | | |
Pharmaceuticals & Biotechnology 0.1% |
| CSL Ltd. | | | 3,600 | | | | 122,034 | | | |
Real Estate 0.2% |
| Westfield Group | | | 16,400 | | | | 268,605 | | | |
Telecommunication Services 0.4% |
| Telstra Corp., Ltd. | | | 104,800 | | | | 422,496 | | | |
Transportation 0.1% |
| Toll Holdings Ltd. | | | 15,200 | | | | 139,904 | | | |
| | | | | | | |
| | | | | | | | 6,541,917 | | | |
Austria 0.9% |
| |
Energy 0.5% |
| OMV AG | | | 9,077 | | | | 599,937 | | | |
Materials 0.4% |
| Voestalpine AG | | | 5,785 | | | | 402,299 | | | |
Real Estate 0.0% |
| Meinl European Land Ltd. * | | | 780 | | | | 8,870 | | | |
| | | | | | | |
| | | | | | | | 1,011,106 | | | |
Belgium 1.1% |
| |
Food & Staples Retailing 0.4% |
| Delhaize Group | | | 6,021 | | | | 474,860 | | | |
Materials 0.7% |
| Solvay S.A. | | | 4,000 | | | | 510,002 | | | |
| Umicore | | | 6,340 | | | | 329,538 | | | |
| | | | | | | |
| | | | | | | | 839,540 | | | |
| | | | | | | |
| | | | | | | | 1,314,400 | | | |
Bermuda 0.8% |
| |
Diversified Financials 0.3% |
| Guoco Group Ltd. | | | 14,000 | | | | 137,375 | | | |
| Jardine Strategic Holdings Ltd. | | | 9,000 | | | | 151,996 | | | |
| | | | | | | |
| | | | | | | | 289,371 | | | |
Energy 0.3% |
| Seadrill Ltd. | | | 14,000 | | | | 377,130 | | | |
Insurance 0.0% |
| Hiscox Ltd. | | | 7,084 | | | | 33,645 | | | |
Real Estate 0.1% |
| Great Eagle Holdings Ltd. | | | 6,000 | | | | 16,536 | | | |
| Pacific Century Premium Developments Ltd. | | | 189,000 | | | | 68,634 | | | |
| Sinolink Worldwide Holdings Ltd. | | | 288,000 | | | | 44,018 | | | |
| | | | | | | |
| | | | | | | | 129,188 | | | |
Transportation 0.1% |
| Orient Overseas International Ltd. | | | 16,000 | | | | 94,361 | | | |
| Transport International Holdings Ltd. | | | 2,800 | | | | 13,891 | | | |
| | | | | | | |
| | | | | | | | 108,252 | | | |
| | | | | | | |
| | | | | | | | 937,586 | | | |
See financial notes.
14 Laudus International Equity Funds
Laudus Rosenberg International Equity Fund
| | | | | | | | | | | |
| | | Number of | | Value | | |
| Security | | Shares | | ($) | | |
Denmark 1.5% |
| |
Food, Beverage & Tobacco 0.5% |
| Carlsberg A/ S, Class B | | | 2,349 | | | | 301,276 | | | |
| Danisco A/ S | | | 3,600 | | | | 263,599 | | | |
| | | | | | | |
| | | | | | | | 564,875 | | | |
Transportation 1.0% |
| AP Moller – Maersk A/ S, Series A | | | 92 | | | | 1,023,510 | | | |
| D/ S Norden A/ S | | | 2,000 | | | | 224,063 | | | |
| | | | | | | |
| | | | | | | | 1,247,573 | | | |
| | | | | | | |
| | | | | | | | 1,812,448 | | | |
Finland 1.3% |
| |
Capital Goods 0.3% |
| Metso Corp. Oyj | | | 7,200 | | | | 388,926 | | | |
Materials 0.6% |
| Rautaruukki Oyj | | | 4,636 | | | | 224,105 | | | |
| UPM-Kymmene Oyj | | | 23,950 | | | | 426,067 | | | |
| | | | | | | |
| | | | | | | | 650,172 | | | |
Technology Hardware & Equipment 0.4% |
| Nokia Oyj | | | 14,800 | | | | 467,242 | | | |
| | | | | | | |
| | | | | | | | 1,506,340 | | | |
France 8.6% |
| |
Automobiles & Components 1.9% |
| Compagnie Generale des Etablissements Michelin, Class B | | | 7,489 | | | | 784,288 | | | |
| PSA Peugeot Citroen | | | 9,600 | | | | 745,046 | | | |
| Renault S.A. | | | 4,600 | | | | 509,175 | | | |
| Valeo S.A. | | | 3,782 | | | | 150,115 | | | |
| | | | | | | |
| | | | | | | | 2,188,624 | | | |
Banks 0.4% |
| BNP Paribas | | | 2,600 | | | | 262,163 | | | |
| Natixis | | | 13,858 | | | | 222,254 | | | |
| | | | | | | |
| | | | | | | | 484,417 | | | |
Capital Goods 1.8% |
| Compagnie de Saint-Gobain | | | 11,400 | | | | 931,695 | | | |
| Nexans S.A. | | | 1,105 | | | | 130,409 | | | |
| Schneider Electric S.A. | | | 5,700 | | | | 736,335 | | | |
| Thales S.A. | | | 4,538 | | | | 293,719 | | | |
| | | | | | | |
| | | | | | | | 2,092,158 | | | |
Consumer Durables & Apparel 0.4% |
| Beneteau | | | 4,200 | | | | 113,016 | | | |
| Christian Dior S.A. | | | 1,800 | | | | 199,513 | | | |
| Thomson | | | 16,610 | | | | 115,747 | | | |
| | | | | | | |
| | | | | | | | 428,276 | | | |
Energy 1.9% |
| Compagnie Generale de Geophysique-Veritas (CGG-Veritas) * | | | 334 | | | | 83,081 | | | |
| Total S.A. | | | 29,502 | | | | 2,185,622 | | | |
| | | | | | | |
| | | | | | | | 2,268,703 | | | |
Food, Beverage & Tobacco 0.1% |
| Vilmorin & Cie | | | 361 | | | | 62,706 | | | |
Materials 0.9% |
| Arkema * | | | 3,000 | | | | 168,152 | | | |
| Ciments Francais S.A. | | | 2,080 | | | | 346,534 | | | |
| Eramet | | | 690 | | | | 556,033 | | | |
| | | | | | | |
| | | | | | | | 1,070,719 | | | |
Media 0.0% |
| Vivendi | | | 1,058 | | | | 41,385 | | | |
Pharmaceuticals & Biotechnology 0.2% |
| Sanofi-Aventis | | | 3,000 | | | | 225,008 | | | |
Software & Services 0.5% |
| Atos Origin S.A. * | | | 2,217 | | | | 123,437 | | | |
| Cap Gemini S.A. | | | 8,400 | | | | 478,293 | | | |
| | | | | | | |
| | | | | | | | 601,730 | | | |
Telecommunication Services 0.4% |
| France Telecom S.A. | | | 12,595 | | | | 423,134 | | | |
Utilities 0.1% |
| Suez S.A. | | | 2,446 | | | | 160,328 | | | |
| | | | | | | |
| | | | | | | | 10,047,188 | | | |
Germany 8.9% |
| |
Automobiles & Components 1.9% |
| Bayerische Motoren Werke (BMW) AG | | | 1,863 | | | | 102,710 | | | |
| Daimler AG | | | 23,400 | | | | 2,000,150 | | | |
| Volkswagen AG | | | 528 | | | | 152,964 | | | |
| | | | | | | |
| | | | | | | | 2,255,824 | | | |
Capital Goods 0.9% |
| Bilfinger Berger AG | | | 200 | | | | 17,194 | | | |
| KSB AG | | | 41 | | | | 27,764 | | | |
| Siemens AG | | | 9,413 | | | | 1,020,847 | | | |
| | | | | | | |
| | | | | | | | 1,065,805 | | | |
Household & Personal Products 0.5% |
| Henkel KGaA | | | 14,964 | | | | 635,743 | | | |
Insurance 0.4% |
| Allianz SE – Reg’d | | | 1,497 | | | | 296,009 | | | |
| Muenchener Rueckversicherungs-Gesellschaft AG – Reg’d | | | 691 | | | | 135,406 | | | |
| | | | | | | |
| | | | | | | | 431,415 | | | |
Materials 3.1% |
| Altana AG | | | 2,853 | | | | 60,064 | | | |
| BASF SE | | | 14,300 | | | | 1,923,470 | | | |
| Lanxess | | | 4,500 | | | | 180,871 | | | |
| Salzgitter AG | | | 2,160 | | | | 376,270 | | | |
| ThyssenKrupp AG | | | 19,500 | | | | 1,119,495 | | | |
| | | | | | | |
| | | | | | | | 3,660,170 | | | |
Telecommunication Services 0.1% |
| Deutsche Telekom AG – Reg’d | | | 9,900 | | | | 164,483 | | | |
Transportation 0.7% |
| Deutsche Post AG – Reg’d | | | 26,627 | | | | 813,205 | | | |
Utilities 1.3% |
| E.ON AG | | | 2,223 | | | | 411,313 | | | |
| RWE AG | | | 8,698 | | | | 1,069,154 | | | |
| | | | | | | |
| | | | | | | | 1,480,467 | | | |
| | | | | | | |
| | | | | | | | 10,507,112 | | | |
See financial notes.
Laudus International Equity Funds 15
Laudus Rosenberg International Equity Fund
Portfolio Holdings continued
| | | | | | | | | | | |
| | | Number of | | Value | | |
| Security | | Shares | | ($) | | |
Greece 0.5% |
| |
Banks 0.0% |
| Agricultural Bank of Greece | | | 2,267 | | | | 10,349 | | | |
Food, Beverage & Tobacco 0.3% |
| Coca-Cola Hellenic Bottling Co., S.A. | | | 7,355 | | | | 343,535 | | | |
Telecommunication Services 0.1% |
| Hellenic Telecommunications Organization S.A. (OTE) | | | 4,500 | | | | 127,585 | | | |
Utilities 0.1% |
| Public Power Corp. S.A. (PPC) | | | 2,707 | | | | 118,423 | | | |
| | | | | | | |
| | | | | | | | 599,892 | | | |
Hong Kong 2.1% |
| |
Banks 0.7% |
| BOC Hong Kong (Holdings) Ltd. | | | 142,000 | | | | 345,032 | | | |
| Hang Seng Bank Ltd. | | | 22,800 | | | | 415,693 | | | |
| Wing Hang Bank Ltd. | | | 3,000 | | | | 45,747 | | | |
| | | | | | | |
| | | | | | | | 806,472 | | | |
Real Estate 0.6% |
| Cheung Kong (Holdings) Ltd. | | | 32,000 | | | | 460,699 | | | |
| Kowloon Development Co., Ltd. | | | 3,000 | | | | 5,827 | | | |
| New World Development Co., Ltd. | | | 88,000 | | | | 216,462 | | | |
| Wheelock Properties Ltd. | | | 5,000 | | | | 4,006 | | | |
| | | | | | | |
| | | | | | | | 686,994 | | | |
Retailing 0.0% |
| Wing On Co. International Ltd. | | | 24,000 | | | | 40,235 | | | |
Transportation 0.1% |
| Hopewell Holdings Ltd. | | | 44,000 | | | | 168,086 | | | |
Utilities 0.7% |
| CLP Holdings Ltd. | | | 54,500 | | | | 450,978 | | | |
| Hongkong Electric Holdings Ltd. | | | 49,500 | | | | 314,142 | | | |
| | | | | | | |
| | | | | | | | 765,120 | | | |
| | | | | | | |
| | | | | | | | 2,466,907 | | | |
Ireland 0.3% |
| |
Banks 0.2% |
| Anglo Irish Bank Corp. plc | | | 20,000 | | | | 267,223 | | | |
Energy 0.1% |
| Dragon Oil a plc * | | | 11,418 | | | | 101,453 | | | |
| | | | | | | |
| | | | | | | | 368,676 | | | |
Italy 5.4% |
| |
Automobiles & Components 0.7% |
| Fiat S.p.A. | | | 37,000 | | | | 857,329 | | | |
Banks 0.6% |
| Intesa Sanpaolo S.p.A. | | | 72,997 | | | | 515,001 | | | |
| UniCredit S.p.A. | | | 38,000 | | | | 254,608 | | | |
| | | | | | | |
| | | | | | | | 769,609 | | | |
Capital Goods 0.1% |
| C.I.R. S.p.A. – Compagnie Industriali Riunite | | | 3,549 | | | | 9,510 | | | |
| Danieli S.p.A. – Officine Meccaniche Danieli & Co. | | | 3,600 | | | | 130,168 | | | |
| | | | | | | |
| | | | | | | | 139,678 | | | |
Diversified Financials 0.1% |
| IFIL Investments S.p.A. | | | 12,000 | | | | 96,891 | | | |
Energy 1.7% |
| Eni S.p.A. | | | 57,600 | | | | 1,960,661 | | | |
Insurance 0.1% |
| Fondiaria – Sai S.p.A. | | | 1,600 | | | | 66,331 | | | |
Materials 0.2% |
| Buzzi Unicem S.p.A. | | | 4,800 | | | | 119,736 | | | |
| Italcementi S.p.A. | | | 7,000 | | | | 142,177 | | | |
| | | | | | | |
| | | | | | | | 261,913 | | | |
Telecommunication Services 0.7% |
| Telecom Italia S.p.A. | | | 369,197 | | | | 769,603 | | | |
Utilities 1.2% |
| Enel S.p.A. | | | 128,000 | | | | 1,359,304 | | | |
| Iride S.p.A. | | | 15,770 | | | | 50,001 | | | |
| | | | | | | |
| | | | | | | | 1,409,305 | | | |
| | | | | | | |
| | | | | | | | 6,331,320 | | | |
Japan 19.8% |
| |
Automobiles & Components 2.7% |
| Bosch Corp. | | | 8,000 | | | | 32,641 | | | |
| Bridgestone Corp. | | | 21,600 | | | | 372,697 | | | |
| Fuji Heavy Industries Ltd. | | | 26,000 | | | | 110,052 | | | |
| HI-LEX Corp. | | | 700 | | | | 9,805 | | | |
| Honda Motor Co., Ltd. | | | 30,100 | | | | 869,429 | | | |
| Mazda Motor Corp. | | | 54,000 | | | | 193,359 | | | |
| Mitsuba Corp. | | | 3,000 | | | | 12,996 | | | |
| NGK Spark Plug Co., Ltd. | | | 4,000 | | | | 52,351 | | | |
| Nippon Seiki Co., Ltd. | | | 1,000 | | | | 13,647 | | | |
| Nissan Motors Co., Ltd. | | | 1,400 | | | | 11,737 | | | |
| Showa Corp. | | | 3,100 | | | | 27,779 | | | |
| Sumitomo Rubber Industries Ltd. | | | 9,500 | | | | 73,150 | | | |
| Takata Corp. | | | 2,300 | | | | 51,237 | | | |
| The Yokohama Rubber Co., Ltd. | | | 10,000 | | | | 48,412 | | | |
| Topre Corp. | | | 1,800 | | | | 16,223 | | | |
| Toyota Motor Corp. | | | 20,600 | | | | 1,040,873 | | | |
| Yamaha Motor Co., Ltd. | | | 10,100 | | | | 187,709 | | | |
| | | | | | | |
| | | | | | | | 3,124,097 | | | |
Banks 0.8% |
| Chuo Mitsui Trust Holdings, Inc. | | | 19,000 | | | | 115,808 | | | |
| Mitsubishi UFJ Financial Group, Inc. | | | 44,500 | | | | 389,278 | | | |
| Shinsei Bank Ltd. | | | 12,000 | | | | 39,631 | | | |
| Sumitomo Mitsui Financial Group, Inc. | | | 11 | | | | 73,071 | | | |
| The Aichi Bank Ltd. | | | 400 | | | | 29,399 | | | |
| The Bank of Nagoya Ltd. | | | 4,000 | | | | 24,572 | | | |
| The Daishi Bank Ltd. | | | 10,000 | | | | 39,006 | | | |
| The Eighteenth Bank Ltd. | | | 7,000 | | | | 25,852 | | | |
| The Higashi-Nippon Bank Ltd. | | | 5,000 | | | | 17,347 | | | |
| The Hyakugo Bank Ltd. | | | 10,000 | | | | 59,657 | | | |
See financial notes.
16 Laudus International Equity Funds
Laudus Rosenberg International Equity Fund
| | | | | | | | | | | |
| | | Number of | | Value | | |
| Security | | Shares | | ($) | | |
| The Hyakujushi Bank Ltd. | | | 2,000 | | | | 10,675 | | | |
| The Kagawa Bank Ltd. | | | 2,000 | | | | 12,606 | | | |
| The San-in Godo Bank Ltd. | | | 2,000 | | | | 16,059 | | | |
| The Yachiyo Bank Ltd. | | | 5 | | | | 21,287 | | | |
| Yamaguchi Financial Group, Inc. | | | 1,000 | | | | 11,374 | | | |
| | | | | | | |
| | | | | | | | 885,622 | | | |
Capital Goods 3.8% |
| Aichi Corp. | | | 2,300 | | | | 17,240 | | | |
| Aida Engineering Ltd. | | | 1,000 | | | | 6,306 | | | |
| Amada Co., Ltd. | | | 14,000 | | | | 107,182 | | | |
| Asahi Glass Co., Ltd. | | | 18,000 | | | | 199,712 | | | |
| Chudenko Corp. | | | 500 | | | | 7,871 | | | |
| CKD Corp. | | | 1,900 | | | | 12,740 | | | |
| Daihen Corp. | | | 3,000 | | | | 10,802 | | | |
| Fuji Electric Holdings Co., Ltd. | | | 39,000 | | | | 159,518 | | | |
| Fuji Machine Manufacturing Co., Ltd. | | | 2,100 | | | | 44,005 | | | |
| Futaba Corp. | | | 1,700 | | | | 29,407 | | | |
| Itochu Corp. | | | 46,000 | | | | 460,057 | | | |
| JS Group Corp. | | | 3,600 | | | | 54,528 | | | |
| Kamei Corp. | | | 2,000 | | | | 8,567 | | | |
| Kawasaki Heavy Industries Ltd. | | | 32,000 | | | | 71,899 | | | |
| Maeda Road Construction Co., Ltd. | | | 4,000 | | | | 33,090 | | | |
| Marubeni Corp. | | | 46,000 | | | | 338,473 | | | |
| Mitsubishi Corp. | | | 27,000 | | | | 826,092 | | | |
| Mitsubishi Heavy Industries Ltd. | | | 97,000 | | | | 418,829 | | | |
| Mitsui & Co., Ltd. | | | 38,000 | | | | 779,783 | | | |
| Mori Seiki Co., Ltd. | | | 1,700 | | | | 30,865 | | | |
| Nippo Corp. | | | 3,000 | | | | 16,969 | | | |
| Nippon Thompson Co., Ltd. | | | 3,000 | | | | 18,491 | | | |
| Nishimatsu Construction Co., Ltd. | | | 7,000 | | | | 15,037 | | | |
| Nitto Kogyo Corp. | | | 1,800 | | | | 22,742 | | | |
| Okaya & Co., Ltd. | | | 500 | | | | 5,383 | | | |
| Sintokogio Ltd. | | | 1,600 | | | | 13,301 | | | |
| Sojitz Corp. | | | 54,700 | | | | 183,085 | | | |
| Sumitomo Corp. | | | 33,800 | | | | 450,515 | | | |
| Sumitomo Electric Industries Ltd. | | | 3,100 | | | | 39,628 | | | |
| Takeuchi Mfg. Co., Ltd. | | | 500 | | | | 10,315 | | | |
| Toyota Tsusho Corp. | | | 3,500 | | | | 75,170 | | | |
| Trusco Nakayama Corp. | | | 300 | | | | 4,626 | | | |
| | | | | | | |
| | | | | | | | 4,472,228 | | | |
Consumer Durables & Apparel 1.0% |
| Heiwa Corp. | | | 5,900 | | | | 56,368 | | | |
| Hitachi Koki Co., Ltd. | | | 3,100 | | | | 39,900 | | | |
| Kurabo Industries Ltd. | | | 9,000 | | | | 20,342 | | | |
| Matsushita Electric Industrial Co., Ltd. | | | 40,000 | | | | 869,480 | | | |
| Nikon Corp. | | | 3,000 | | | | 80,294 | | | |
| Roland Corp. | | | 800 | | | | 15,669 | | | |
| Sega Sammy Holdings, Inc. | | | 4,200 | | | | 44,755 | | | |
| Sony Corp. | | | 900 | | | | 36,199 | | | |
| Tokyo Style Co., Ltd. | | | 1,000 | | | | 10,013 | | | |
| | | | | | | |
| | | | | | | | 1,173,020 | | | |
Consumer Services 0.0% |
| Plenus Co., Ltd. | | | 1,200 | | | | 15,526 | | | |
| Royal Holdings Co., Ltd. | | | 800 | | | | 8,413 | | | |
| Saizeriya Co., Ltd. | | | 1,500 | | | | 14,444 | | | |
| | | | | | | |
| | | | | | | | 38,383 | | | |
Energy 0.9% |
| AOC Holdings, Inc. | | | 500 | | | | 4,555 | | | |
| Cosmo Oil Co., Ltd. | | | 24,000 | | | | 76,053 | | | |
| Idemitsu Kosan Co., Ltd. | | | 300 | | | | 23,403 | | | |
| Inpex Holdings, Inc. | | | 46 | | | | 519,955 | | | |
| Japan Petroleum Exploration Co., Ltd. | | | 1,200 | | | | 80,133 | | | |
| Nippon Mining Holdings, Inc. | | | 43,000 | | | | 231,098 | | | |
| Nippon Oil Corp. | | | 19,000 | | | | 119,831 | | | |
| | | | | | | |
| | | | | | | | 1,055,028 | | | |
Food & Staples Retailing 0.3% |
| Aeon Co., Ltd. | | | 19,300 | | | | 232,541 | | | |
| Cawachi Ltd. | | | 800 | | | | 20,776 | | | |
| Okuwa Co., Ltd. | | | 1,000 | | | | 14,126 | | | |
| Uny Co., Ltd. | | | 11,000 | | | | 105,586 | | | |
| | | | | | | |
| | | | | | | | 373,029 | | | |
Food, Beverage & Tobacco 1.0% |
| Asahi Breweries Ltd. | | | 18,000 | | | | 371,689 | | | |
| Japan Tobacco, Inc. | | | 37 | | | | 185,092 | | | |
| Kirin Holdings Co., Ltd. | | | 28,000 | | | | 533,738 | | | |
| Mikuni Coca-Cola Bottling Co., Ltd. | | | 1,700 | | | | 19,597 | | | |
| Q.P. Corp. | | | 200 | | | | 2,076 | | | |
| The Nisshin Oillio Group Ltd. | | | 1,000 | | | | 3,868 | | | |
| | | | | | | |
| | | | | | | | 1,116,060 | | | |
Health Care Equipment & Services 0.0% |
| Hitachi Medical Corp. | | | 2,000 | | | | 13,711 | | | |
Household & Personal Products 0.0% |
| Aderans Hodings Co., Ltd. | | | 400 | | | | 7,408 | | | |
| Kose Corp. | | | 400 | | | | 8,699 | | | |
| | | | | | | |
| | | | | | | | 16,107 | | | |
Insurance 1.2% |
| Aioi Insurance Co., Ltd. | | | 30,000 | | | | 168,126 | | | |
| Millea Holdings, Inc. | | | 19,500 | | | | 725,572 | | | |
| Mitsui Sumitomo Insurance Co., Ltd. | | | 1,000 | | | | 10,129 | | | |
| Nissay Dowa General Insurance Co., Ltd. | | | 1,000 | | | | 5,182 | | | |
| Sompo Japan Insurance, Inc. | | | 15,000 | | | | 133,737 | | | |
| T&D Holdings, Inc. | | | 7,150 | | | | 379,187 | | | |
| The Fuji Fire & Marine Insurance Co., Ltd. | | | 4,000 | | | | 10,715 | | | |
| | | | | | | |
| | | | | | | | 1,432,648 | | | |
Materials 3.1% |
| Asahi Kasei Corp. | | | 42,000 | | | | 220,870 | | | |
| Denki Kagaku Kogyo Kabushiki Kaisha | | | 20,000 | | | | 63,619 | | | |
| DIC Corp. | | | 37,000 | | | | 117,050 | | | |
| JFE Holdings, Inc. | | | 1,600 | | | | 71,569 | | | |
| Kaneka Corp. | | | 16,000 | | | | 101,138 | | | |
| Kobe Steel Ltd. | | | 117,000 | | | | 337,321 | | | |
| Kuraray Co., Ltd. | | | 12,000 | | | | 144,223 | | | |
| Mitsubishi Chemical Corp. | | | 38,500 | | | | 256,425 | | | |
| Mitsubishi Gas Chemical Co., Inc. | | | 17,000 | | | | 121,405 | | | |
| Mitsubishi Rayon Co., Ltd. | | | 22,000 | | | | 71,019 | | | |
| Mitsui Chemicals, Inc. | | | 26,000 | | | | 174,319 | | | |
| Nippon Shokubai Co., Ltd. | | | 7,000 | | | | 46,610 | | | |
| Nippon Soda Co., Ltd. | | | 5,000 | | | | 16,304 | | | |
See financial notes.
Laudus International Equity Funds 17
Laudus Rosenberg International Equity Fund
Portfolio Holdings continued
| | | | | | | | | | | |
| | | Number of | | Value | | |
| Security | | Shares | | ($) | | |
| Nippon Steel Corp. | | | 118,000 | | | | 603,312 | | | |
| Nisshin Steel Co., Ltd. | | | 43,000 | | | | 150,265 | | | |
| Osaka Steel Co., Ltd. | | | 1,700 | | | | 22,055 | | | |
| Sakai Chemical Industry Co., Ltd. | | | 3,000 | | | | 10,734 | | | |
| Shin-Etsu Polymer Co., Ltd. | | | 400 | | | | 2,418 | | | |
| Showa Denko K.K. | | | 9,000 | | | | 30,390 | | | |
| Sumitomo Chemical Co., Ltd. | | | 48,000 | | | | 309,832 | | | |
| Sumitomo Metal Mining Co., Ltd. | | | 10,000 | | | | 188,781 | | | |
| Teijin Ltd. | | | 51,000 | | | | 216,226 | | | |
| Toagosei Co., Ltd. | | | 10,000 | | | | 41,335 | | | |
| Tokuyama Corp. | | | 11,000 | | | | 80,783 | | | |
| Tosoh Corp. | | | 28,000 | | | | 97,301 | | | |
| Toyo Seikan Kaisha Ltd. | | | 3,000 | | | | 57,432 | | | |
| Yodogawa Steel Works Ltd. | | | 7,000 | | | | 34,206 | | | |
| Zeon Corp. | | | 9,000 | | | | 40,609 | | | |
| | | | | | | |
| | | | | | | | 3,627,551 | | | |
Media 0.1% |
| Daiichikosho Co., Ltd. | | | 100 | | | | 976 | | | |
| Fuji Television Network, Inc. | | | 29 | | | | 43,038 | | | |
| Hakuhodo Dy Holdings, Inc. | | | 380 | | | | 22,889 | | | |
| Sky Perfect JSAT Corp. | | | 66 | | | | 26,746 | | | |
| TV Asahi Corp. | | | 6 | | | | 8,536 | | | |
| | | | | | | |
| | | | | | | | 102,185 | | | |
Pharmaceuticals & Biotechnology 0.5% |
| Dainippon Sumitomo Pharma Co., Ltd. | | | 11,000 | | | | 101,613 | | | |
| Eisai Co., Ltd. | | | 1,600 | | | | 55,089 | | | |
| Mitsubishi Tanabe Pharma Corp. | | | 5,000 | | | | 58,236 | | | |
| Nippon Shinyaku Co., Ltd. | | | 3,000 | | | | 31,194 | | | |
| Taisho Pharmaceutical Co., Ltd. | | | 7,000 | | | | 139,300 | | | |
| Takeda Pharmaceutical Co., Ltd. | | | 4,300 | | | | 215,869 | | | |
| Torii Pharmaceutical Co., Ltd. | | | 1,200 | | | | 17,031 | | | |
| | | | | | | |
| | | | | | | | 618,332 | | | |
Retailing 0.1% |
| Aoyama Trading Co., Ltd. | | | 2,500 | | | | 54,135 | | | |
| AT-Group Co., Ltd. | | | 2,000 | | | | 25,357 | | | |
| Belluna Co., Ltd. | | | 1,550 | | | | 13,038 | | | |
| DCM Japan Holdings Co., Ltd. | | | 1,100 | | | | 5,536 | | | |
| Fields Corp. | | | 2 | | | | 2,776 | | | |
| Fujitsu Business Systems Ltd. | | | 200 | | | | 2,324 | | | |
| Nafco Co., Ltd. | | | 300 | | | | 4,223 | | | |
| Sazaby League, Ltd. | | | 100 | | | | 1,840 | | | |
| Senshukai Co., Ltd. | | | 1,700 | | | | 13,900 | | | |
| | | | | | | |
| | | | | | | | 123,129 | | | |
Software & Services 0.1% |
| Nintendo Co., Ltd. | | | 300 | | | | 156,961 | | | |
Technology Hardware & Equipment 2.7% |
| Dainippon Screen Mfg. Co., Ltd. | | | 8,000 | | | | 33,840 | | | |
| Eizo Nanao Corp. | | | 500 | | | | 9,735 | | | |
| Fujifilm Holdings Corp. | | | 15,800 | | | | 564,736 | | | |
| Fujitsu Ltd. | | | 63,000 | | | | 416,647 | | | |
| Furuno Electric Co., Ltd. | | | 900 | | | | 8,851 | | | |
| Hitachi Ltd. | | | 84,000 | | | | 501,545 | | | |
| Hitachi Maxell Ltd. | | | 3,200 | | | | 33,278 | | | |
| Japan Aviation Electronics Industry Ltd. | | | 2,000 | | | | 14,728 | | | |
| Japan Digital Laboratory Co., Ltd. | | | 1,400 | | | | 19,546 | | | |
| Mabuchi Motor Co., Ltd. | | | 900 | | | | 43,786 | | | |
| NEC Corp. | | | 81,000 | | | | 313,664 | | | |
| Nichicon Corp. | | | 2,000 | | | | 15,761 | | | |
| Omron Corp. | | | 10,000 | | | | 207,216 | | | |
| Riso Kagaku Corp. | | | 1,200 | | | | 14,737 | | | |
| Seiko Epson Corp. | | | 6,800 | | | | 183,248 | | | |
| Toshiba Corp. | | | 94,000 | | | | 631,747 | | | |
| Toshiba Tec Corp. | | | 7,000 | | | | 42,962 | | | |
| Yokogawa Electric Corp. | | | 8,900 | | | | 90,412 | | | |
| | | | | | | |
| | | | | | | | 3,146,439 | | | |
Telecommunication Services 0.6% |
| Nippon Telegraph & Telephone Corp. | | | 155 | | | | 671,398 | | | |
| Okinawa Cellular Telephone Co. | | | 1 | | | | 1,918 | | | |
| | | | | | | |
| | | | | | | | 673,316 | | | |
Transportation 0.6% |
| Central Japan Railway Co. | | | 7 | | | | 72,729 | | | |
| Kawasaki Kisen Kaisha Ltd. | | | 21,000 | | | | 206,131 | | | |
| Keisei Electric Railway Co., Ltd. | | | 14,000 | | | | 75,700 | | | |
| Nippon Yusen Kabushiki Kaisha | | | 8,000 | | | | 75,854 | | | |
| West Japan Railway Co. | | | 54 | | | | 239,125 | | | |
| | | | | | | |
| | | | | | | | 669,539 | | | |
Utilities 0.3% |
| Hokkaido Electric Power Co., Inc. | | | 9,300 | | | | 216,860 | | | |
| The Kansai Electric Power Co., Inc. | | | 5,500 | | | | 137,608 | | | |
| The Okinawa Electric Power Co., Inc. | | | 600 | | | | 23,674 | | | |
| | | | | | | |
| | | | | | | | 378,142 | | | |
| | | | | | | |
| | | | | | | | 23,195,527 | | | |
Luxembourg 1.4% |
| |
Household & Personal Products 0.1% |
| Oriflame Cosmetics S.A. | | | 982 | | | | 65,280 | | | |
Materials 1.3% |
| ArcelorMittal | | | 2,550 | | | | 208,859 | | | |
| ArcelorMittal N.V. | | | 16,994 | | | | 1,389,926 | | | |
| | | | | | | |
| | | | | | | | 1,598,785 | | | |
| | | | | | | |
| | | | | | | | 1,664,065 | | | |
Netherlands 2.8% |
| |
Capital Goods 0.2% |
| Koninklijke BAM Groep N.V. | | | 1,840 | | | | 43,546 | | | |
| Koninklijke Boskalis Westminster N.V., C.V.A. | | | 2,717 | | | | 156,981 | | | |
| | | | | | | |
| | | | | | | | 200,527 | | | |
Consumer Durables & Apparel 0.1% |
| TomTom N.V. * | | | 3,300 | | | | 136,461 | | | |
Diversified Financials 0.2% |
| ING Groep N.V. C.V.A. | | | 5,874 | | | | 219,602 | | | |
| SNS Reaal | | | 3,413 | | | | 69,165 | | | |
| | | | | | | |
| | | | | | | | 288,767 | | | |
Food, Beverage & Tobacco 0.7% |
| CSM | | | 315 | | | | 10,758 | | | |
| Heineken N.V. | | | 10,921 | | | | 634,284 | | | |
| Nutreco Holding N.V. | | | 1,600 | | | | 122,909 | | | |
| | | | | | | |
| | | | | | | | 767,951 | | | |
See financial notes.
18 Laudus International Equity Funds
Laudus Rosenberg International Equity Fund
| | | | | | | | | | | |
| | | Number of | | Value | | |
| Security | | Shares | | ($) | | |
Materials 1.3% |
| Akzo Nobel N.V. | | | 13,289 | | | | 1,066,251 | | | |
| Koninklijke DSM N.V. | | | 9,133 | | | | 440,398 | | | |
| | | | | | | |
| | | | | | | | 1,506,649 | | | |
Semiconductors & Semiconductor Equipment 0.2% |
| STMicroelectronics N.V. | | | 21,212 | | | | 225,234 | | | |
Transportation 0.1% |
| TNT N.V. | | | 4,859 | | | | 180,245 | | | |
| | | | | | | |
| | | | | | | | 3,305,834 | | | |
New Zealand 0.1% |
| |
Materials 0.0% |
| Fletcher Building Ltd. | | | 1,100 | | | | 7,256 | | | |
Retailing 0.0% |
| The Warehouse Group Ltd. | | | 4,700 | | | | 21,650 | | | |
Transportation 0.1% |
| Air New Zealand Ltd. | | | 76,400 | | | | 77,484 | | | |
| | | | | | | |
| | | | | | | | 106,390 | | | |
Norway 0.9% |
| |
Energy 0.7% |
| Aker Solutions A.S.A. * | | | 8,371 | | | | 191,745 | | | |
| Fred. Olsen Energy A.S.A. | | | 333 | | | | 18,967 | | | |
| Petroleum Geo-Services A.S.A. | | | 8,000 | | | | 198,610 | | | |
| StatoilHydro A.S.A. | | | 16,100 | | | | 483,015 | | | |
| | | | | | | |
| | | | | | | | 892,337 | | | |
Materials 0.2% |
| Yara International A.S.A. | | | 3,437 | | | | 199,887 | | | |
| | | | | | | |
| | | | | | | | 1,092,224 | | | |
Portugal 0.6% |
| |
Utilities 0.6% |
| EDP – Energias de Portugal S.A. | | | 118,638 | | | | 720,228 | | | |
Singapore 1.3% |
| |
Banks 0.4% |
| DBS Group Holdings Ltd. | | | 22,000 | | | | 289,703 | | | |
| United Overseas Bank Ltd. | | | 12,000 | | | | 167,914 | | | |
| | | | | | | |
| | | | | | | | 457,617 | | | |
Capital Goods 0.4% |
| Fraser & Neave Ltd. | | | 1,000 | | | | 3,561 | | | |
| Keppel Corp., Ltd. | | | 37,000 | | | | 269,344 | | | |
| SembCorp Industries Ltd. | | | 13,000 | | | | 38,758 | | | |
| Singapore Technologies Engineering Ltd. | | | 81,000 | | | | 200,361 | | | |
| | | | | | | |
| | | | | | | | 512,024 | | | |
Diversified Financials 0.1% |
| UOB-Kay Hian Holdings Ltd. | | | 40,000 | | | | 57,251 | | | |
Materials 0.0% |
| NatSteel Group Ltd. | | | 15,000 | | | | 16,620 | | | |
Real Estate 0.1% |
| Ho Bee Investment Ltd. | | | 45,000 | | | | 30,505 | | | |
| Singapore Land Ltd. | | | 2,000 | | | | 9,953 | | | |
| United Industrial Corp., Ltd. | | | 9,000 | | | | 18,091 | | | |
| | | | | | | |
| | | | | | | | 58,549 | | | |
Retailing 0.1% |
| Jardine Cycle & Carriage Ltd. | | | 11,000 | | | | 157,479 | | | |
Transportation 0.2% |
| Neptune Orient Lines Ltd. | | | 9,000 | | | | 21,476 | | | |
| Singapore Airlines Ltd. | | | 20,540 | | | | 233,705 | | | |
| | | | | | | |
| | | | | | | | 255,181 | | | |
| | | | | | | |
| | | | | | | | 1,514,721 | | | |
Spain 3.4% |
| |
Banks 0.6% |
| Banco Bilbao Vizcaya Argentaria S.A. | | | 12,456 | | | | 273,910 | | | |
| Banco Santander S.A. | | | 22,400 | | | | 446,252 | | | |
| | | | | | | |
| | | | | | | | 720,162 | | | |
Capital Goods 0.2% |
| Fomento de Construcciones y Contratas S.A. (FCC) | | | 2,700 | | | | 177,909 | | | |
| Obrascon Huarte Lain S.A. | | | 479 | | | | 17,770 | | | |
| | | | | | | |
| | | | | | | | 195,679 | | | |
Consumer Services 0.1% |
| Sol Melia S.A. | | | 9,000 | | | | 126,701 | | | |
Energy 1.2% |
| Repsol YPF S.A. | | | 38,869 | | | | 1,339,078 | | | |
Insurance 0.1% |
| Mapfre S.A. | | | 32,000 | | | | 160,678 | | | |
Materials 0.1% |
| Cementos Portland Valderrivas S.A. | | | 1,572 | | | | 152,709 | | | |
Telecommunication Services 0.6% |
| Telefonica S.A. | | | 23,524 | | | | 675,891 | | | |
Transportation 0.1% |
| Iberia Lineas Aereas de Espana S.A. | | | 28,660 | | | | 124,801 | | | |
Utilities 0.4% |
| Union Fenosa S.A. | | | 7,200 | | | | 484,020 | | | |
| | | | | | | |
| | | | | | | | 3,979,719 | | | |
Sweden 2.4% |
| |
Banks 0.2% |
| Swedbank AB, Class A | | | 9,889 | | | | 277,351 | | | |
Capital Goods 1.1% |
| AB SKF, Class B | | | 4,750 | | | | 95,634 | | | |
| Hexagon AB, Class B | | | 3,591 | | | | 73,151 | | | |
| NCC AB, Class B | | | 4,000 | | | | 116,438 | | | |
| Volvo AB, Class B | | | 67,500 | | | | 1,022,717 | | | |
| | | | | | | |
| | | | | | | | 1,307,940 | | | |
Food, Beverage & Tobacco 0.3% |
| Swedish Match AB | | | 13,819 | | | | 301,793 | | | |
Materials 0.4% |
| Boliden AB | | | 12,229 | | | | 130,535 | | | |
| SSAB Svenskt Stal AB, Class A | | | 7,437 | | | | 209,457 | | | |
| SSAB Svenskt Stal AB, Class B | | | 4,072 | | | | 104,771 | | | |
| Svenska Cellulosa AB (SCA), Class B | | | 3,031 | | | | 55,264 | | | |
| | | | | | | |
| | | | | | | | 500,027 | | | |
See financial notes.
Laudus International Equity Funds 19
Laudus Rosenberg International Equity Fund
Portfolio Holdings continued
| | | | | | | | | | | |
| | | Number of | | Value | | |
| Security | | Shares | | ($) | | |
Telecommunication Services 0.4% |
| Tele2 AB, Class B | | | 22,000 | | | | 416,168 | | | |
| | | | | | | |
| | | | | | | | 2,803,279 | | | |
Switzerland 8.3% |
| |
Capital Goods 0.5% |
| ABB Ltd. – Reg’d | | | 14,387 | | | | 387,761 | | | |
| Bucher Industries AG – Reg’d | | | 614 | | | | 166,709 | | | |
| Georg Fischer AG – Reg’d * | | | 171 | | | | 84,501 | | | |
| | | | | | | |
| | | | | | | | 638,971 | | | |
Commercial Services & Supplies 0.4% |
| Adecco S.A. – Reg’d | | | 8,700 | | | | 502,566 | | | |
Diversified Financials 0.2% |
| UBS AG – Reg’d | | | 6,800 | | | | 198,003 | | | |
Food, Beverage & Tobacco 1.6% |
| Nestle S.A. – Reg’d | | | 3,737 | | | | 1,867,911 | | | |
Insurance 2.5% |
| Baloise Holding AG – Reg’d | | | 1,914 | | | | 190,318 | | | |
| Helvetia Holding AG | | | 152 | | | | 57,292 | | | |
| Schweizerische Naional-Versicherungs-Gesellschaft – Reg’d | | | 107 | | | | 87,914 | | | |
| Swiss Life Holding – Reg’d * | | | 2,133 | | | | 593,228 | | | |
| Zurich Financial Services AG – Reg’d | | | 6,300 | | | | 1,985,812 | | | |
| | | | | | | |
| | | | | | | | 2,914,564 | | | |
Materials 2.3% |
| Ciba Holding AG | | | 4,500 | | | | 164,108 | | | |
| Clariant AG – Reg’d * | | | 12,302 | | | | 104,883 | | | |
| Holcim Ltd. – Reg’d | | | 8,600 | | | | 903,290 | | | |
| Schmolz & Bickenbach AG – Reg’d | | | 232 | | | | 19,248 | | | |
| Syngenta AG – Reg’d | | | 5,040 | | | | 1,472,409 | | | |
| | | | | | | |
| | | | | | | | 2,663,938 | | | |
Pharmaceuticals & Biotechnology 0.8% |
| Novartis AG – Reg’d | | | 8,364 | | | | 429,191 | | | |
| Roche Holding AG | | | 2,500 | | | | 471,174 | | | |
| | | | | | | |
| | | | | | | | 900,365 | | | |
Transportation 0.0% |
| Swissair Group (a)(b)(c)* | | | 30 | | | | — | | | |
Utilities 0.0% |
| Elektrizitaets-Gesellschaft Laufenburg AG | | | 18 | | | | 23,526 | | | |
| | | | | | | |
| | | | | | | | 9,709,844 | | | |
United Kingdom 20.2% |
| |
Banks 0.9% |
| Barclays plc | | | 3,680 | | | | 33,200 | | | |
| HSBC Holdings plc | | | 51,800 | | | | 853,349 | | | |
| Royal Bank of Scotland Group plc | | | 29,255 | | | | 195,985 | | | |
| | | | | | | |
| | | | | | | | 1,082,534 | | | |
Capital Goods 1.8% |
| AMEC plc | | | 15,965 | | | | 229,306 | | | |
| BAE Systems plc | | | 158,251 | | | | 1,525,997 | | | |
| Charter plc * | | | 2,427 | | | | 40,947 | | | |
| Cookson Group plc | | | 6,300 | | | | 83,121 | | | |
| IMI plc | | | 20,000 | | | | 180,256 | | | |
| Qinetiq plc | | | 16,928 | | | | 64,890 | | | |
| | | | | | | |
| | | | | | | | 2,124,517 | | | |
Commercial Services & Supplies 0.1% |
| WS Atkins plc | | | 5,763 | | | | 120,323 | | | |
Energy 4.8% |
| BG Group plc | | | 32,263 | | | | 747,578 | | | |
| BP plc | | | 82,000 | | | | 830,798 | | | |
| Dana Petroleum plc * | | | 1,974 | | | | 49,386 | | | |
| Royal Dutch Shell plc, Class A | | | 67,976 | | | | 2,344,435 | | | |
| Royal Dutch Shell plc, Class B | | | 50,387 | | | | 1,697,363 | | | |
| | | | | | | |
| | | | | | | | 5,669,560 | | | |
Food & Staples Retailing 0.2% |
| Tesco plc | | | 21,990 | | | | 165,730 | | | |
Food, Beverage & Tobacco 0.9% |
| Diageo plc | | | 14,000 | | | | 283,315 | | | |
| Imperial Tobacco Group plc | | | 16,146 | | | | 743,502 | | | |
| | | | | | | |
| | | | | | | | 1,026,817 | | | |
Insurance 2.4% |
| Aviva plc | | | 82,600 | | | | 1,012,794 | | | |
| Friends Provident plc | | | 22,637 | | | | 55,557 | | | |
| Old Mutual plc | | | 287,729 | | | | 631,457 | | | |
| Prudential plc | | | 83,448 | | | | 1,101,794 | | | |
| Standard Life plc | | | 3,926 | | | | 19,192 | | | |
| | | | | | | |
| | | | | | | | 2,820,794 | | | |
Materials 4.3% |
| Anglo American plc | | | 26,754 | | | | 1,603,673 | | | |
| Antofagasta plc | | | 10,690 | | | | 148,833 | | | |
| BHP Billiton plc | | | 49,022 | | | | 1,443,888 | | | |
| Kazakhmys plc | | | 6,500 | | | | 206,119 | | | |
| Rexam plc | | | 13,000 | | | | 110,092 | | | |
| Rio Tinto plc | | | 3,532 | | | | 367,068 | | | |
| Vedanta Resources plc | | | 3,900 | | | | 162,525 | | | |
| Xstrata plc | | | 14,080 | | | | 986,179 | | | |
| | | | | | | |
| | | | | | | | 5,028,377 | | | |
Pharmaceuticals & Biotechnology 0.4% |
| AstraZeneca plc | | | 1,841 | | | | 69,056 | | | |
| GlaxoSmithKline plc | | | 19,500 | | | | 412,468 | | | |
| | | | | | | |
| | | | | | | | 481,524 | | | |
Retailing 0.3% |
| Home Retail Group plc | | | 64,000 | | | | 332,204 | | | |
Software & Services 0.1% |
| LogicaCMG plc | | | 78,000 | | | | 163,959 | | | |
Telecommunication Services 2.6% |
| Vodafone Group plc | | | 1,004,600 | | | | 2,986,096 | | | |
Utilities 1.4% |
| British Energy Group plc | | | 40,252 | | | | 521,561 | | | |
| Centrica plc | | | 107,333 | | | | 635,930 | | | |
| United Utilities plc | | | 35,742 | | | | 490,220 | | | |
| | | | | | | |
| | | | | | | | 1,647,711 | | | |
| | | | | | | |
| | | | | | | | 23,650,145 | | | |
| | | | | | | |
Total Common Stock (Cost $108,493,630) | | | 115,186,869 | | | |
| | | | | | | |
See financial notes.
20 Laudus International Equity Funds
Laudus Rosenberg International Equity Fund
| | | | | | | | | | | |
| Security | | Face Amount | | Value | | |
| Rate, Maturity Date | | ($) | | ($) | | |
| Short-Term Investment 0.5% of net assets |
Repurchase Agreement 0.5% |
| |
Fixed Income Clearing Corp.
dated 03/31/08, due 04/01/08 at 2.00%, with a maturity value of $597,033 (fully collateralized by Federal Home Loan Mortgage Corp. with a value of $613,196.) | | | 597,000 | | | | 597,000 | | | |
| | | | | | | |
Total Short-Term Investment
(Cost $597,000) | | | 597,000 | | | |
| |
End of Investments. |
At 03/31/08, the tax basis cost of the fund’s investments was $109,717,096 and the unrealized appreciation and depreciation were $12,440,733 and ($6,373,960), respectively, with a net unrealized appreciation of $6,066,773.
At 03/31/08, the prices of certain foreign securities held by the fund aggregating $114,892,348 were adjusted from their closing market prices following the guidelines adopted by the fund’s Board of Trustees.
| |
| * | Non-income producing security. |
| (a) | Bankrupt security/delisted. |
| (b) | Fair-valued by Management. |
| (c) | Illiquid security. At the period end, the value of these amounted to $0 or 0.0% of net assets. |
CVA – Dutch Certificate
See financial notes.
Laudus International Equity Funds 21
Laudus Rosenberg International Discovery Fund
Portfolio Holdings as of March 31, 2008
| | | | | | | | | | | | | |
| | | Cost | | Value |
| Holdings by Category | | ($) | | ($) |
| |
| | 96.2 | % | | Common Stock | | | 258,411,648 | | | | 251,580,050 | |
| | 1.8 | % | | Preferred Stock | | | 4,285,865 | | | | 4,813,281 | |
| | — | % | | Rights | | | — | | | | 18,861 | |
| | 2.4 | % | | Short-Term Investment | | | 6,290,000 | | | | 6,290,000 | |
| |
| | 100.4 | % | | Total Investments | | | 268,987,513 | | | | 262,702,192 | |
| | (0.4 | )% | | Other Assets and Liabilities | | | | | | | (1,128,999 | ) |
| |
| | 100.0 | % | | Net Assets | | | | | | | 261,573,193 | |
| | | | | | | | | | | |
| | | Number of | | Value | | |
| Security | | Shares | | ($) | | |
| Common Stock 96.2% of net assets |
Argentina 0.4% |
| |
| Energy 0.2% |
| Petrobras Energia Participaciones S.A. ADR | | | 39,100 | | | | 443,785 | | | |
Telecommunication Services 0.2% |
| Telecom Argentina S.A. ADR * | | | 22,100 | | | | 468,078 | | | |
| | | | | | | |
| | | | | | | | 911,863 | | | |
Australia 5.2% |
| |
| Capital Goods 0.1% |
| Leighton Holdings Ltd. | | | 2,400 | | | | 94,440 | | | |
| Macmahon Holdings Ltd. | | | 44,700 | | | | 60,857 | | | |
| | | | | | | |
| | | | | | | | 155,297 | | | |
Commercial Services & Supplies 0.0% |
| Downer EDI Ltd. | | | 9,600 | | | | 55,023 | | | |
Consumer Services 0.0% |
| Flight Centre Ltd. | | | 4,500 | | | | 87,518 | | | |
Energy 1.2% |
| Aquila Resources Ltd. * | | | 19,000 | | | | 174,550 | | | |
| Centennial Coal Co., Ltd. | | | 82,700 | | | | 309,318 | | | |
| Felix Resources Ltd. | | | 16,900 | | | | 192,123 | | | |
| New Hope Corp., Ltd. | | | 75,000 | | | | 182,347 | | | |
| Origin Energy Ltd. | | | 124,100 | | | | 1,039,601 | | | |
| Queensland Gas Co. Ltd. * | | | 62,700 | | | | 212,241 | | | |
| Santos Ltd. | | | 78,600 | | | | 1,045,273 | | | |
| | | | | | | |
| | | | | | | | 3,155,453 | | | |
Food, Beverage & Tobacco 0.6% |
| Coca-Cola Amatil Ltd. | | | 73,600 | | | | 572,820 | | | |
| Foster’s Group Ltd. | | | 159,900 | | | | 749,488 | | | |
| Lion Nathan Ltd. | | | 45,500 | | | | 364,606 | | | |
| | | | | | | |
| | | | | | | | 1,686,914 | | | |
Materials 3.0% |
| Amcor Ltd. | | | 42,659 | | | | 279,135 | | | |
| BlueScope Steel Ltd. | | | 97,200 | | | | 881,528 | | | |
| Dominion Mining Ltd. | | | 39,500 | | | | 121,860 | | | |
| Fortescue Metals Group Ltd. * | | | 208,200 | | | | 1,243,224 | | | |
| Incitec Pivot Ltd. | | | 7,700 | | | | 995,558 | | | |
| Macarthur Coal Ltd. | | | 18,000 | | | | 215,423 | | | |
| Mount Gibson Iron Ltd. * | | | 75,400 | | | | 197,792 | | | |
| Newcrest Mining Ltd. | | | 44,900 | | | | 1,362,648 | | | |
| Nufarm Ltd. | | | 14,500 | | | | 227,777 | | | |
| OneSteel Ltd. | | | 126,900 | | | | 743,001 | | | |
| Orica Ltd. | | | 33,100 | | | | 884,215 | | | |
| Portman Ltd. * | | | 18,800 | | | | 214,230 | | | |
| Sally Malay Mining Ltd. | | | 15,700 | | | | 75,761 | | | |
| Sims Group Ltd. | | | 17,000 | | | | 462,635 | | | |
| | | | | | | |
| | | | | | | | 7,904,787 | | | |
Media 0.1% |
| Seven Network Ltd. | | | 21,800 | | | | 190,509 | | | |
Transportation 0.2% |
| Toll Holdings Ltd. | | | 49,400 | | | | 454,687 | | | |
| | | | | | | |
| | | | | | | | 13,690,188 | | | |
Austria 0.7% |
| |
| Capital Goods 0.2% |
| Andritz AG | | | 8,400 | | | | 460,721 | | | |
Energy 0.1% |
| OMV AG | | | 6,200 | | | | 409,784 | | | |
Materials 0.1% |
| Voestalpine AG | | | 5,600 | | | | 389,433 | | | |
Utilities 0.3% |
| EVN AG | | | 5,280 | | | | 671,831 | | | |
| | | | | | | |
| | | | | | | | 1,931,769 | | | |
Belgium 1.3% |
| |
| Food & Staples Retailing 0.4% |
| Delhaize Group | | | 14,400 | | | | 1,135,689 | | | |
Materials 0.8% |
| Solvay S.A. | | | 3,800 | | | | 484,502 | | | |
| Tessenderlo Chemie N.V. | | | 2,835 | | | | 128,761 | | | |
| Umicore | | | 25,500 | | | | 1,325,426 | | | |
| | | | | | | |
| | | | | | | | 1,938,689 | | | |
| Pharmaceuticals & Biotechnology 0.1% |
| UCB S.A. | | | 9,800 | | | | 340,412 | | | |
Retailing 0.0% |
| S.A. D’Ieteren N.V. | | | 164 | | | | 58,291 | | | |
| | | | | | | |
| | | | | | | | 3,473,081 | | | |
Bermuda 1.7% |
| |
| Capital Goods 0.2% |
| Chen Hsong Holdings Ltd. | | | 310,000 | | | | 149,550 | | | |
| Emperor International Holdings Ltd. | | | 615,000 | | | | 244,576 | | | |
| NWS Holdings Ltd. | | | 14,000 | | | | 47,587 | | | |
| | | | | | | |
| | | | | | | | 441,713 | | | |
Consumer Durables & Apparel 0.1% |
| Yue Yuen Industrial (Holdings) Ltd. | | | 102,500 | | | | 323,214 | | | |
Consumer Services 0.0% |
| Star Cruises Ltd. * | | | 189,000 | | | | 39,101 | | | |
Diversified Financials 0.5% |
| Guoco Group Ltd. | | | 30,000 | | | | 294,376 | | | |
| Jardine Matheson Holdings Ltd. | | | 19,600 | | | | 621,573 | | | |
| Jardine Strategic Holdings Ltd. | | | 16,000 | | | | 270,214 | | | |
| | | | | | | |
| | | | | | | | 1,186,163 | | | |
Energy 0.1% |
| CNPC Hong Kong Ltd. | | | 660,000 | | | | 306,447 | | | |
Food & Staples Retailing 0.0% |
| Dairy Farm International Holdings Ltd. | | | 27,900 | | | | 123,910 | | | |
See financial notes.
22 Laudus U.S. Equity Funds
Laudus Rosenberg International Discovery Fund
| | | | | | | | | | | |
| | | Number of | | Value | | |
| Security | | Shares | | ($) | | |
Food, Beverage & Tobacco 0.0% |
| People’s Food Holdings Ltd. | | | 7,000 | | | | 5,341 | | | |
Insurance 0.2% |
| Hiscox Ltd. | | | 126,558 | | | | 601,072 | | | |
Real Estate 0.3% |
| Great Eagle Holdings Ltd. | | | 117,000 | | | | 322,439 | | | |
| SEA Holdings Ltd. | | | 36,000 | | | | 24,087 | | | |
| Sinolink Worldwide Holdings Ltd. | | | 1,086,000 | | | | 165,986 | | | |
| SRE Group Ltd. | | | 982,000 | | | | 173,988 | | | |
| | | | | | | |
| | | | | | | | 686,500 | | | |
Retailing 0.2% |
| Chow Sang Sang Holdings International Ltd. | | | 48,000 | | | | 49,801 | | | |
| Esprit Holdings Ltd. | | | 30,500 | | | | 370,097 | | | |
| Wing On Co. International Ltd. | | | 29,000 | | | | 48,618 | | | |
| | | | | | | |
| | | | | | | | 468,516 | | | |
Technology Hardware & Equipment 0.0% |
| Digital China Holdings Ltd. | | | 75,000 | | | | 49,347 | | | |
| TPV Technology Ltd. | | | 100,000 | | | | 59,391 | | | |
| | | | | | | |
| | | | | | | | 108,738 | | | |
Transportation 0.1% |
| Transport International Holdings Ltd. | | | 56,000 | | | | 277,816 | | | |
Utilities 0.0% |
| Cheung Kong Infrastructure Holdings Ltd. | | | 1,000 | | | | 4,037 | | | |
| | | | | | | |
| | | | | | | | 4,572,568 | | | |
Brazil 0.8% |
| |
| Banks 0.1% |
| Banco Nossa Caixa S.A. | | | 17,100 | | | | 207,282 | | | |
Diversified Financials 0.0% |
| Bradespar S.A. | | | 2,900 | | | | 76,900 | | | |
Food, Beverage & Tobacco 0.2% |
| Souza Cruz S.A. | | | 15,900 | | | | 412,202 | | | |
Household & Personal Products 0.1% |
| Natura Cosmeticos S.A. | | | 31,800 | | | | 324,397 | | | |
Insurance 0.0% |
| Porto Seguro S.A. | | | 2,400 | | | | 24,346 | | | |
Materials 0.1% |
| Acos Villares S.A. | | | 519,000 | | | | 257,326 | | | |
Utilities 0.3% |
Companhia de Saneamento Basico do Estado de Sao Paulo –
SABESP * | | | 23,000 | | | | 506,087 | | | |
| EDP – Energias do Brasil S.A. | | | 15,000 | | | | 223,970 | | | |
| | | | | | | |
| | | | | | | | 730,057 | | | |
| | | | | | | |
| | | | | | | | 2,032,510 | | | |
Canada 6.6% |
| |
| Automobiles & Components 0.1% |
| Linamar Corp. | | | 14,100 | | | | 188,742 | | | |
| Magna International, Inc., Class A | | | 300 | | | | 21,815 | | | |
| | | | | | | |
| | | | | | | | 210,557 | | | |
Capital Goods 0.2% |
| Bombardier, Inc., Class B * | | | 87,800 | | | | 467,890 | | | |
Diversified Financials 0.1% |
| Dundee Corp., Class A * | | | 10,450 | | | | 134,487 | | | |
Energy 1.3% |
| Addax Petroleum Corp. | | | 25,800 | | | | 1,024,258 | | | |
| AltaGas Income Trust | | | 11,200 | | | | 265,365 | | | |
| Freehold Royalty Trust | | | 10,200 | | | | 179,266 | | | |
| Keyera Facilities Income Fund | | | 13,600 | | | | 278,241 | | | |
| Nexen, Inc. | | | 15,700 | | | | 465,899 | | | |
| Penn West Energy Trust | | | 22,200 | | | | 622,885 | | | |
| Provident Energy Trust | | | 53,400 | | | | 569,663 | | | |
| | | | | | | |
| | | | | | | | 3,405,577 | | | |
Food & Staples Retailing 0.3% |
| George Weston Ltd. | | | 16,200 | | | | 745,252 | | | |
Food, Beverage & Tobacco 0.1% |
| Rothmans, Inc. | | | 15,100 | | | | 384,396 | | | |
Insurance 0.4% |
| Industrial Alliance Insurance & Financial Services, Inc. | | | 22,600 | | | | 834,028 | | | |
| Power Corp. of Canada | | | 4,500 | | | | 149,057 | | | |
| | | | | | | |
| | | | | | | | 983,085 | | | |
Materials 3.3% |
| Agnico-Eagle Mines Ltd. | | | 1,400 | | | | 94,956 | | | |
| Agrium, Inc. | | | 22,780 | | | | 1,415,025 | | | |
| European Goldfields Ltd. * | | | 440 | | | | 2,298 | | | |
| First Quantum Minerals Ltd. | | | 9,820 | | | | 796,353 | | | |
| Fording Canadian Coal Trust | | | 9,500 | | | | 497,374 | | | |
| Gerdau Ameristeel Corp. | | | 6,100 | | | | 86,943 | | | |
| IAMGOLD Corp. | | | 84,000 | | | | 622,768 | | | |
| Inmet Mining Corp. | | | 10,500 | | | | 767,207 | | | |
| Kinross Gold Corp. | | | 76,100 | | | | 1,697,784 | | | |
| Major Drilling Group International, Inc. * | | | 2,670 | | | | 139,164 | | | |
| Methanex Corp. | | | 28,300 | | | | 744,410 | | | |
| Northgate Minerals Corp. * | | | 52,200 | | | | 166,296 | | | |
| Potash Corp. of Saskatchewan, Inc. | | | 4,700 | | | | 730,333 | | | |
| Sherritt International Corp. | | | 53,000 | | | | 749,730 | | | |
| Teck Cominco Ltd., Class B | | | 3,100 | | | | 127,117 | | | |
| Yamana Gold, Inc. | | | 11,800 | | | | 173,129 | | | |
| | | | | | | |
| | | | | | | | 8,810,887 | | | |
Software & Services 0.0% |
| CGI Group, Inc., Class A * | | | 1,700 | | | | 18,053 | | | |
Utilities 0.8% |
| ATCO Ltd., Class I | | | 100 | | | | 4,639 | | | |
| Fortis, Inc. | | | 35,100 | | | | 998,852 | | | |
| TransAlta Corp. | | | 33,300 | | | | 1,035,870 | | | |
| | | | | | | |
| | | | | | | | 2,039,361 | | | |
| | | | | | | |
| | | | | | | | 17,199,545 | | | |
Cayman Islands 0.4% |
| |
| Capital Goods 0.1% |
| China State Construction International Holdings Ltd. | | | 142,000 | | | | 233,542 | | | |
Consumer Durables & Apparel 0.1% |
| Shenzhou International Group | | | 516,000 | | | | 145,952 | | | |
Food, Beverage & Tobacco 0.1% |
| Chaoda Modern Agriculture (Holdings) Ltd. | | | 178,200 | | | | 203,554 | | | |
See financial notes.
Laudus International Equity Funds 23
Laudus Rosenberg International Discovery Fund
Portfolio Holdings continued
| | | | | | | | | | | |
| | | Number of | | Value | | |
| Security | | Shares | | ($) | | |
Real Estate 0.1% |
| Greentown China Holdings Ltd. | | | 225,000 | | | | 212,087 | | | |
| New World China Land Ltd. | | | 449,200 | | | | 286,434 | | | |
| | | | | | | |
| | | | | | | | 498,521 | | | |
Transportation 0.0% |
| Hopewell Highway Infrastructure Ltd. | | | 57,500 | | | | 44,237 | | | |
| | | | | | | |
| | | | | | | | 1,125,806 | | | |
Chile 0.4% |
| |
| Banks 0.0% |
| Corpbanca S.A. ADR | | | 700 | | | | 24,360 | | | |
Diversified Financials 0.0% |
| Administradora de Fondos de Pensiones Provida S.A. ADR | | | 266 | | | | 9,853 | | | |
Food, Beverage & Tobacco 0.2% |
| Compania Cervecerias Unidas S.A. ADR | | | 11,000 | | | | 388,740 | | | |
| Embotelladora Andina S.A. Series A ADR | | | 1,817 | | | | 34,977 | | | |
| Embotelladora Andina S.A. Series B ADR | | | 2,000 | | | | 42,000 | | | |
| | | | | | | |
| | | | | | | | 465,717 | | | |
Transportation 0.2% |
| Lan Airlines S.A. ADR | | | 39,600 | | | | 559,152 | | | |
| | | | | | | |
| | | | | | | | 1,059,082 | | | |
China 1.9% |
| |
| Automobiles & Components 0.2% |
| Chongqing Changan Automobile Co. Ltd., Class B * | | | 264,000 | | | | 173,819 | | | |
| Dongfeng Motor Group Co., Ltd., Class H | | | 530,000 | | | | 240,797 | | | |
| Jiangling Motors Corp., Ltd. | | | 64,700 | | | | 67,263 | | | |
| Zhejiang Glass Co., Ltd., Class H * | | | 55,000 | | | | 38,527 | | | |
| | | | | | | |
| | | | | | | | 520,406 | | | |
Capital Goods 0.5% |
| China International Marine Containers (Group) Co., Ltd., Class B | | | 171,800 | | | | 294,236 | | | |
| First Tractor Co., Ltd., Class H * | | | 304,000 | | | | 167,393 | | | |
| Harbin Power Equipment Co., Ltd., Class H | | | 118,000 | | | | 212,463 | | | |
| Jingwei Textile Machinery Co., Ltd., Class H | | | 96,000 | | | | 27,825 | | | |
| Shanghai Electric Group Co., Ltd., Class H | | | 412,000 | | | | 254,205 | | | |
| Shanghai Mechanical & Electrical Industry Co. Ltd., Class B | | | 110,341 | | | | 171,602 | | | |
| Weichai Power Co., Ltd., Class H | | | 51,000 | | | | 191,580 | | | |
| | | | | | | |
| | | | | | | | 1,319,304 | | | |
Consumer Durables & Apparel 0.0% |
| Weiqiao Textile Co., Ltd., Class H | | | 45,000 | | | | 58,267 | | | |
Energy 0.2% |
| China Oilfield Services Ltd., Class H | | | 34,000 | | | | 56,545 | | | |
| Yanzhou Coal Mining Co., Ltd., Class H | | | 346,000 | | | | 491,979 | | | |
| | | | | | | |
| | | | | | | | 548,524 | | | |
Materials 0.2% |
| Bengang Steel Plates Co., Ltd. | | | 260,200 | | | | 237,039 | | | |
| Jiangxi Copper Co., Ltd., Class H | | | 103,000 | | | | 197,757 | | | |
| Maanshan Iron & Steel Co., Ltd., Class H | | | 226,000 | | | | 120,036 | | | |
| | | | | | | |
| | | | | | | | 554,832 | | | |
Pharmaceuticals & Biotechnology 0.1% |
| Livzon Pharmaceutical Group, Inc., Class B * | | | 97,400 | | | | 164,953 | | | |
Transportation 0.5% |
| China Shipping Container Lines Co., Ltd., Class H | | | 908,750 | | | | 348,964 | | | |
| China Shipping Development Co. Ltd., Class H | | | 102,000 | | | | 325,574 | | | |
| Guangshen Railway Co., Ltd., Class H | | | 342,000 | | | | 179,484 | | | |
| Sinotrans Ltd., Class H | | | 343,000 | | | | 100,073 | | | |
| Zhejiang Expressway Co., Ltd., Class H | | | 394,000 | | | | 345,780 | | | |
| | | | | | | |
| | | | | | | | 1,299,875 | | | |
Utilities 0.2% |
| Datang International Power Generation Co., Ltd., Class H | | | 90,000 | | | | 48,366 | | | |
| Guangdong Electric Power Development Co. Ltd., Class B | | | 186,100 | | | | 104,571 | | | |
| Huadian Power International Corp., Ltd., Class H | | | 32,000 | | | | 8,060 | | | |
| Huaneng Power International, Inc., Class H | | | 274,000 | | | | 209,579 | | | |
| Zhejiang Southeast Electric Power Co. Ltd., Class B | | | 69,400 | | | | 63,963 | | | |
| | | | | | | |
| | | | | | | | 434,539 | | | |
| | | | | | | |
| | | | | | | | 4,900,700 | | | |
Columbia 0.2% |
| |
| Banks 0.2% |
| Bancolombia S.A. ADR | | | 15,400 | | | | 546,084 | | | |
Denmark 1.9% |
| |
| Food, Beverage & Tobacco 1.1% |
| Carlsberg A/S, Class B | | | 7,600 | | | | 974,755 | | | |
| Danisco A/S | | | 26,400 | | | | 1,933,060 | | | |
| | | | | | | |
| | | | | | | | 2,907,815 | | | |
Transportation 0.8% |
| D/S Norden A/S | | | 18,400 | | | | 2,061,377 | | | |
| | | | | | | |
| | | | | | | | 4,969,192 | | | |
See financial notes.
24 Laudus International Equity Funds
Laudus Rosenberg International Discovery Fund
| | | | | | | | | | | |
| | | Number of | | Value | | |
| Security | | Shares | | ($) | | |
Egypt 0.8% |
| |
| Materials 0.3% |
| El Ezz Steel Rebars S.A.E. | | | 52,000 | | | | 879,506 | | | |
Telecommunication Services 0.5% |
| Egyptian Company for Mobile Services (MobiNil) | | | 18,200 | | | | 658,283 | | | |
| Telecom Egypt | | | 180,000 | | | | 665,506 | | | |
| | | | | | | |
| | | | | | | | 1,323,789 | | | |
| | | | | | | |
| | | | | | | | 2,203,295 | | | |
Finland 1.9% |
| |
| Automobiles & Components 0.2% |
| Nokian Renkaat Oyj | | | 10,800 | | | | 462,641 | | | |
Capital Goods 1.3% |
| Cargotec Corp., B Shares | | | 4,800 | | | | 236,400 | | | |
| Kone Oyj, B Shares | | | 21,600 | | | | 887,402 | | | |
| Metso Corp. Oyj | | | 21,600 | | | | 1,166,778 | | | |
| Wartsila Corp. Oyj | | | 15,400 | | | | 1,039,885 | | | |
| | | | | | | |
| | | | | | | | 3,330,465 | | | |
Materials 0.4% |
| Rautaruukki Oyj | | | 24,400 | | | | 1,179,502 | | | |
| | | | | | | |
| | | | | | | | 4,972,608 | | | |
France 3.3% |
| |
| Automobiles & Components 0.8% |
| Compagnie Generale des Etablissements Michelin, Class B | | | 8,600 | | | | 900,639 | | | |
| PSA Peugeot Citroen | | | 5,400 | | | | 419,088 | | | |
| Valeo S.A. | | | 19,500 | | | | 773,991 | | | |
| | | | | | | |
| | | | | | | | 2,093,718 | | | |
Banks 0.0% |
| Natixis | | | 7,700 | | | | 123,492 | | | |
Capital Goods 0.2% |
| Nexans S.A. | | | 1,000 | | | | 118,017 | | | |
| Thales S.A. | | | 6,000 | | | | 388,347 | | | |
| | | | | | | |
| | | | | | | | 506,364 | | | |
Consumer Durables & Apparel 0.2% |
| Christian Dior S.A. | | | 2,333 | | | | 258,591 | | | |
| Thomson | | | 39,000 | | | | 271,771 | | | |
| | | | | | | |
| | | | | | | | 530,362 | | | |
Energy 0.1% |
| Compagnie Generale de Geophysique-Veritas (CGG-Veritas) * | | | 560 | | | | 139,297 | | | |
Materials 1.4% |
| Arkema * | | | 28,800 | | | | 1,614,258 | | | |
| Ciments Francais S.A. | | | 3,800 | | | | 633,091 | | | |
| Eramet | | | 1,120 | | | | 902,546 | | | |
| Sequana Capital | | | 17,500 | | | | 459,804 | | | |
| | | | | | | |
| | | | | | | | 3,609,699 | | | |
Software & Services 0.6% |
| Atos Origin S.A. * | | | 28,500 | | | | 1,586,802 | | | |
| | | | | | | |
| | | | | | | | 8,589,734 | | | |
Germany 2.6% |
| |
| Capital Goods 1.2% |
| GEA Group AG * | | | 36,500 | | | | 1,229,102 | | | |
| Krones AG | | | 800 | | | | 65,871 | | | |
| Rheinmetall AG | | | 11,678 | | | | 824,351 | | | |
| SGL Carbon AG * | | | 13,788 | | | | 871,159 | | | |
| | | | | | | |
| | | | | | | | 2,990,483 | | | |
Consumer Services 0.4% |
| TUI AG * | | | 34,800 | | | | 893,337 | | | |
Food, Beverage & Tobacco 0.0% |
| Suedzucker AG | | | 2,174 | | | | 48,195 | | | |
Insurance 0.4% |
| Hannover Rueckversicherung AG – Reg’d | | | 21,221 | | | | 1,106,349 | | | |
Materials 0.6% |
| Altana AG | | | 11,900 | | | | 250,530 | | | |
| Lanxess | | | 16,200 | | | | 651,137 | | | |
| Norddeutsche Affinerie AG | | | 13,600 | | | | 537,898 | | | |
| ThyssenKrupp AG | | | 3,200 | | | | 183,712 | | | |
| | | | | | | |
| | | | | | | | 1,623,277 | | | |
Utilities 0.0% |
| MVV Energie AG | | | 551 | | | | 27,060 | | | |
| | | | | | | |
| | | | | | | | 6,688,701 | | | |
Greece 0.6% |
| |
| Banks 0.1% |
| Agricultural Bank of Greece | | | 25,554 | | | | 116,659 | | | |
Energy 0.2% |
| Hellenic Petroleum S.A. | | | 42,000 | | | | 553,256 | | | |
Utilities 0.3% |
| Public Power Corp. S.A. (PPC) | | | 18,900 | | | | 826,819 | | | |
| | | | | | | |
| | | | | | | | 1,496,734 | | | |
Hong Kong 2.1% |
| |
| Banks 0.4% |
| CITIC International Financial Holdings Ltd. | | | 404,000 | | | | 207,862 | | | |
| Industrial and Commercial Bank of China (Asia) Ltd. | | | 164,000 | | | | 409,531 | | | |
| Wing Hang Bank Ltd. | | | 24,000 | | | | 365,976 | | | |
| | | | | | | |
| | | | | | | | 983,369 | | | |
Capital Goods 0.2% |
| Citic Pacific Ltd. | | | 44,000 | | | | 188,355 | | | |
| Shanghai Industrial Holdings Ltd. | | | 88,000 | | | | 334,933 | | | |
| | | | | | | |
| | | | | | | | 523,288 | | | |
Diversified Financials 0.0% |
| Allied Properties (H.K.) Ltd. | | | 148,000 | | | | 30,116 | | | |
| Sun Hung Kai & Co., Ltd. | | | 13,000 | | | | 12,349 | | | |
| | | | | | | |
| | | | | | | | 42,465 | | | |
Materials 0.0% |
| Shougang Concord International Enterprises Co., Ltd. | | | 196,000 | | | | 46,633 | | | |
Media 0.1% |
| Television Broadcasts Ltd. | | | 66,000 | | | | 355,294 | | | |
See financial notes.
Laudus International Equity Funds 25
Laudus Rosenberg International Discovery Fund
Portfolio Holdings continued
| | | | | | | | | | | |
| | | Number of | | Value | | |
| Security | | Shares | | ($) | | |
Pharmaceuticals & Biotechnology 0.1% |
| China Pharmaceutical Group Ltd. * | | | 606,000 | | | | 183,009 | | | |
Real Estate 0.5% |
| Kowloon Development Co., Ltd. | | | 171,000 | | | | 332,111 | | | |
| New World Development Co., Ltd. | | | 212,000 | | | | 521,478 | | | |
| Shenzhen Investment Ltd. | | | 528,000 | | | | 225,642 | | | |
| Wheelock & Co., Ltd. | | | 124,000 | | | | 349,348 | | | |
| | | | | | | |
| | | | | | | | 1,428,579 | | | |
Technology Hardware & Equipment 0.2% |
| Lenovo Group Ltd. | | | 646,000 | | | | 421,727 | | | |
Transportation 0.3% |
| Cathay Pacific Airways Ltd. | | | 132,000 | | | | 260,473 | | | |
| Hopewell Holdings Ltd. | | | 118,000 | | | | 450,775 | | | |
| | | | | | | |
| | | | | | | | 711,248 | | | |
Utilities 0.3% |
| Guangdong Investment Ltd. | | | 786,000 | | | | 393,817 | | | |
| Hongkong Electric Holdings Ltd. | | | 74,500 | | | | 472,800 | | | |
| | | | | | | |
| | | | | | | | 866,617 | | | |
| | | | | | | |
| | | | | | | | 5,562,229 | | | |
Hungary 0.3% |
| |
| Telecommunication Services 0.3% |
| Magyar Telekom Nyrt. | | | 170,000 | | | | 836,071 | | | |
India 2.4% |
| |
| Automobiles & Components 0.2% |
| Hero Honda Motors Ltd. | | | 1,700 | | | | 29,272 | | | |
| Mahindra & Mahindra Ltd. | | | 18,680 | | | | 319,906 | | | |
| Maruti Udyog Ltd. | | | 4,580 | | | | 93,289 | | | |
| | | | | | | |
| | | | | | | | 442,467 | | | |
Banks 0.4% |
| Bank of India | | | 44,920 | | | | 284,490 | | | |
| Bank Of Maharashtra Ltd. | | | 160,000 | | | | 201,020 | | | |
| Dena Bank Ltd. | | | 89,169 | | | | 113,208 | | | |
| Indian Bank | | | 40,230 | | | | 165,219 | | | |
| Syndicate Bank | | | 139,150 | | | | 261,797 | | | |
| | | | | | | |
| | | | | | | | 1,025,734 | | | |
Capital Goods 0.2% |
| Bharat Electronics Ltd. | | | 7,110 | | | | 188,943 | | | |
| Bharat Heavy Electricals Ltd. | | | 4,240 | | | | 215,266 | | | |
| SKF India Ltd. | | | 9,280 | | | | 68,705 | | | |
| Tata Motors Ltd. | | | 7,490 | | | | 115,414 | | | |
| | | | | | | |
| | | | | | | | 588,328 | | | |
Consumer Services 0.1% |
| Indian Hotels Co., Ltd. | | | 81,280 | | | | 227,944 | | | |
Diversified Financials 0.1% |
| IFCI Ltd. * | | | 45,780 | | | | 50,410 | | | |
| JM Financial Ltd. | | | 7,675 | | | | 259,404 | | | |
| | | | | | | |
| | | | | | | | 309,814 | | | |
Energy 0.1% |
| Bongaigaon Refinery & Petrochemicals Ltd. (BRP) | | | 48,220 | | | | 59,263 | | | |
| The Great Eastern Shipping Co., Ltd. | | | 13,490 | | | | 127,538 | | | |
| | | | | | | |
| | | | | | | | 186,801 | | | |
Materials 0.9% |
| ACC Ltd. | | | 3,070 | | | | 63,548 | | | |
| Birla Corp., Ltd. | | | 32,390 | | | | 156,789 | | | |
| Grasim Industries Ltd. | | | 2,050 | | | | 132,447 | | | |
| Gujarat Alkalies & Chemicals Ltd. | | | 33,880 | | | | 125,083 | | | |
| Gujarat Narmada Valley Fertilizers Co., Ltd. | | | 57,606 | | | | 192,720 | | | |
| Gujarat State Fertilizers & Chemicals Ltd. | | | 6,840 | | | | 29,150 | | | |
| Hindalco Industries Ltd. * | | | 57,510 | | | | 238,621 | | | |
| Hindustan Zinc Ltd. | | | 12,710 | | | | 168,886 | | | |
| Jindal Steel & Power Ltd. | | | 750 | | | | 38,610 | | | |
| National Aluminium Co., Ltd. | | | 6,740 | | | | 76,228 | | | |
| Pidilite Industries Ltd. | | | 23,650 | | | | 78,821 | | | |
| Steel Authority of India Ltd. | | | 39,790 | | | | 182,510 | | | |
| Sterlite Industries (India) Ltd. * | | | 17,150 | | | | 305,797 | | | |
| Tata Chemicals Ltd. | | | 17,930 | | | | 126,249 | | | |
| Tata Steel Ltd. | | | 8,172 | | | | 140,860 | | | |
| Ultra Tech Cement Ltd. | | | 14,940 | | | | 295,485 | | | |
| | | | | | | |
| | | | | | | | 2,351,804 | | | |
Pharmaceuticals & Biotechnology 0.1% |
| Ipca Laboratories Ltd. | | | 6,340 | | | | 96,776 | | | |
| Sun Pharmaceutical Industries Ltd. | | | 2,090 | | | | 63,905 | | | |
| Wockhardt Ltd. | | | 4,170 | | | | 27,675 | | | |
| | | | | | | |
| | | | | | | | 188,356 | | | |
Software & Services 0.3% |
| HCL Technologies Ltd. | | | 51,400 | | | | 327,609 | | | |
| Satyam Computer Services Ltd. | | | 44,674 | | | | 439,159 | | | |
| | | | | | | |
| | | | | | | | 766,768 | | | |
Transportation 0.0% |
| Container Corp. of India Ltd. | | | 1,650 | | | | 71,250 | | | |
Utilities 0.0% |
| Gail India Ltd. | | | 2,580 | | | | 27,689 | | | |
| | | | | | | |
| | | | | | | | 6,186,955 | | | |
Indonesia 0.4% |
| |
| Automobiles & Components 0.1% |
| PT Astra International Tbk | | | 82,000 | | | | 217,699 | | | |
Banks 0.1% |
| PT Bank Negara Indonesia (Persero) Tbk | | | 374,000 | | | | 56,860 | | | |
| PT Lippo Bank Tbk * | | | 475,000 | | | | 96,576 | | | |
| | | | | | | |
| | | | | | | | 153,436 | | | |
Capital Goods 0.1% |
| PT United Tractors Tbk | | | 140,000 | | | | 192,085 | | | |
Energy 0.0% |
| PT Apexindo Pratama Duta Tbk | | | 227,000 | | | | 42,479 | | | |
Food, Beverage & Tobacco 0.1% |
| PT Astra Agro Lestari Tbk | | | 71,000 | | | | 201,113 | | | |
| PT Hanjaya Mandala Sampoerna Tbk | | | 23,000 | | | | 32,655 | | | |
| | | | | | | |
| | | | | | | | 233,768 | | | |
Materials 0.1% |
| PT International Nickel Indonesia Tbk (INCO) | | | 270,000 | | | | 206,754 | | | |
| | | | | | | |
| | | | | | | | 1,046,221 | | | |
See financial notes.
26 Laudus International Equity Funds
Laudus Rosenberg International Discovery Fund
| | | | | | | | | | | |
| | | Number of | | Value | | |
| Security | | Shares | | ($) | | |
Ireland 1.0% |
| |
| Banks 0.2% |
| Anglo Irish Bank Corp. plc | | | 38,000 | | | | 507,725 | | | |
| |
Energy 0.5% |
| Dragon Oil plc * | | | 50,000 | | | | 444,268 | | | |
| Dragon Oil plc * | | | 84,206 | | | | 753,257 | | | |
| | | | | | | |
| | | | | | | | 1,197,525 | | | |
Food, Beverage & Tobacco 0.2% |
| Kerry Group plc, Class A | | | 18,900 | | | | 591,652 | | | |
| |
Materials 0.1% |
| CRH plc | | | 10,800 | | | | 409,400 | | | |
| | | | | | | |
| | | | | | | | 2,706,302 | | | |
Israel 0.6% |
| |
| Banks 0.5% |
| Bank Hapoalim B.M. | | | 220,000 | | | | 854,712 | | | |
| Bank Leumi Le-Israel | | | 25,000 | | | | 107,680 | | | |
| First International Bank of Israel Ltd. (FIBI) * | | | 17,919 | | | | 229,115 | | | |
| | | | | | | |
| | | | | | | | 1,191,507 | | | |
Capital Goods 0.1% |
| Delek Group Ltd. | | | 2,500 | | | | 379,239 | | | |
| | | | | | | |
| | | | | | | | 1,570,746 | | | |
Italy 2.6% |
| |
| Automobiles & Components 0.1% |
| Fiat S.p.A. | | | 6,666 | | | | 154,458 | | | |
| |
Banks 0.0% |
| Credito Bergamasco S.p.A. | | | 426 | | | | 19,647 | | | |
| |
Capital Goods 0.2% |
| C.I.R. S.p.A. – Compagnie Industriali Riunite | | | 185,000 | | | | 495,730 | | | |
| |
Consumer Services 0.1% |
| Autogrill S.p.A. | | | 12,273 | | | | 183,350 | | | |
| |
Insurance 1.0% |
| Fondiaria – Sai S.p.A. | | | 45,000 | | | | 1,865,562 | | | |
| Unipol Gruppo Finanziario S.p.A. | | | 225,555 | | | | 701,317 | | | |
| | | | | | | |
| | | | | | | | 2,566,879 | | | |
Materials 0.8% |
| Buzzi Unicem S.p.A. | | | 32,800 | | | | 818,193 | | | |
| Cementir S.p.A. Cementerie del Tirreno | | | 45,918 | | | | 427,084 | | | |
| Italcementi S.p.A. | | | 41,000 | | | | 832,751 | | | |
| Italmobiliare S.p.A. | | | 200 | | | | 20,798 | | | |
| | | | | | | |
| | | | | | | | 2,098,826 | | | |
Utilities 0.4% |
| ACEA S.p.A. | | | 36,000 | | | | 705,634 | | | |
| Iride S.p.A. | | | 162,000 | | | | 513,641 | | | |
| | | | | | | |
| | | | | | | | 1,219,275 | | | |
| | | | | | | |
| | | | | | | | 6,738,165 | | | |
Japan 18.8% |
| |
| Automobiles & Components 1.9% |
| Bosch Corp. | | | 139,000 | | | | 567,131 | | | |
| Fuji Heavy Industries Ltd. | | | 258,000 | | | | 1,092,056 | | | |
| Mazda Motor Corp. | | | 274,000 | | | | 981,120 | | | |
| NGK Spark Plug Co., Ltd. | | | 47,000 | | | | 615,127 | | | |
| Sumitomo Rubber Industries Ltd. | | | 83,300 | | | | 641,408 | | | |
| Yamaha Motor Co., Ltd. | | | 63,200 | | | | 1,174,572 | | | |
| | | | | | | |
| | | | | | | | 5,071,414 | | | |
Banks 0.1% |
| Shinsei Bank Ltd. | | | 54,000 | | | | 178,341 | | | |
| |
Capital Goods 3.4% |
| Amada Co., Ltd. | | | 147,000 | | | | 1,125,410 | | | |
| Fuji Electric Holdings Co., Ltd. | | | 85,000 | | | | 347,667 | | | |
| Hitachi Cable Ltd. | | | 114,000 | | | | 429,299 | | | |
| Hitachi Construction Machinery Co., Ltd. | | | 30,100 | | | | 763,311 | | | |
| IHI Corp. | | | 67,000 | | | | 129,808 | | | |
| JS Group Corp. | | | 80,200 | | | | 1,214,764 | | | |
| Kawasaki Heavy Industries Ltd. | | | 496,000 | | | | 1,114,436 | | | |
| Kubota Corp. | | | 146,000 | | | | 910,170 | | | |
| SMC Corp. | | | 4,800 | | | | 509,932 | | | |
| Sojitz Corp. | | | 343,700 | | | | 1,150,391 | | | |
| Toyota Tsusho Corp. | | | 57,800 | | | | 1,241,374 | | | |
| | | | | | | |
| | | | | | | | 8,936,562 | | | |
Consumer Durables & Apparel 0.6% |
| Makita Corp. | | | 40,500 | | | | 1,278,069 | | | |
| Sega Sammy Holdings, Inc. | | | 20,500 | | | | 218,446 | | | |
| | | | | | | |
| | | | | | | | 1,496,515 | | | |
Energy 1.3% |
| Cosmo Oil Co., Ltd. | | | 249,000 | | | | 789,046 | | | |
| Idemitsu Kosan Co., Ltd. | | | 2,300 | | | | 179,423 | | | |
| Japan Petroleum Exploration Co., Ltd. | | | 14,700 | | | | 981,632 | | | |
| Nippon Mining Holdings, Inc. | | | 217,000 | | | | 1,166,240 | | | |
| Nippon Oil Corp. | | | 35,000 | | | | 220,741 | | | |
| | | | | | | |
| | | | | | | | 3,337,082 | | | |
Food & Staples Retailing 0.0% |
| Aeon Co., Ltd. | | | 9,700 | | | | 116,873 | | | |
| |
Food, Beverage & Tobacco 0.9% |
| Asahi Breweries Ltd. | | | 75,400 | | | | 1,556,965 | | | |
| Nippon Meat Packers, Inc. | | | 50,000 | | | | 742,217 | | | |
| | | | | | | |
| | | | | | | | 2,299,182 | | | |
Insurance 1.0% |
| Aioi Insurance Co., Ltd. | | | 241,000 | | | | 1,350,609 | | | |
| Nissay Dowa General Insurance Co., Ltd. | | | 85,000 | | | | 440,475 | | | |
| Sompo Japan Insurance, Inc. | | | 100,000 | | | | 891,582 | | | |
| The Fuji Fire & Marine Insurance Co., Ltd. | | | 7,000 | | | | 18,752 | | | |
| | | | | | | |
| | | | | | | | 2,701,418 | | | |
Materials 5.7% |
| Asahi Kasei Corp. | | | 184,000 | | | | 967,621 | | | |
| Denki Kagaku Kogyo Kabushiki Kaisha | | | 173,000 | | | | 550,305 | | | |
| DIC Corp. | | | 263,000 | | | | 832,003 | | | |
| Hitachi Chemical Co., Ltd. | | | 18,500 | | | | 351,525 | | | |
| Kaneka Corp. | | | 139,000 | | | | 878,636 | | | |
| Kobe Steel Ltd. | | | 295,000 | | | | 850,511 | | | |
| Kuraray Co., Ltd. | | | 108,000 | | | | 1,298,010 | | | |
| Mitsubishi Chemical Corp. | | | 143,500 | | | | 955,767 | | | |
| Mitsubishi Gas Chemical Co., Inc. | | | 148,000 | | | | 1,056,936 | | | |
See financial notes.
Laudus International Equity Funds 27
Laudus Rosenberg International Discovery Fund
Portfolio Holdings continued
| | | | | | | | | | | |
| | | Number of | | Value | | |
| Security | | Shares | | ($) | | |
| Mitsubishi Rayon Co., Ltd. | | | 267,000 | | | | 861,914 | | | |
| Mitsui Chemicals, Inc. | | | 183,000 | | | | 1,226,937 | | | |
| Nisshin Steel Co., Ltd. | | | 206,000 | | | | 719,872 | | | |
| Oji Paper Co., Ltd. | | | 45,000 | | | | 204,292 | | | |
| Pacific Metals Co., Ltd. | | | 22,000 | | | | 216,217 | | | |
| Showa Denko K.K. | | | 262,000 | | | | 884,699 | | | |
| Tosoh Corp. | | | 254,000 | | | | 882,661 | | | |
| Toyo Seikan Kaisha Ltd. | | | 65,800 | | | | 1,259,681 | | | |
| Yamato Kogyo Co., Ltd. | | | 19,800 | | | | 806,811 | | | |
| | | | | | | |
| | | | | | | | 14,804,398 | | | |
Media 0.2% |
| Fuji Television Network, Inc. | | | 4 | | | | 5,936 | | | |
| Hakuhodo Dy Holdings, Inc. | | | 7,170 | | | | 431,874 | | | |
| Nippon Television Network Corp. | | | 730 | | | | 99,808 | | | |
| | | | | | | |
| | | | | | | | 537,618 | | | |
Pharmaceuticals & Biotechnology 0.5% |
| Dainippon Sumitomo Pharma Co., Ltd. | | | 123,000 | | | | 1,136,212 | | | |
| Mitsubishi Tanabe Pharma Corp. | | | 19,000 | | | | 221,298 | | | |
| | | | | | | |
| | | | | | | | 1,357,510 | | | |
Retailing 0.1% |
| Aoyama Trading Co., Ltd. | | | 8,400 | | | | 181,892 | | | |
| |
Technology Hardware & Equipment 1.6% |
| Alps Electric Co., Ltd. | | | 40,100 | | | | 401,490 | | | |
| NEC Corp. | | | 256,000 | | | | 991,334 | | | |
| Omron Corp. | | | 56,400 | | | | 1,168,701 | | | |
| Seiko Epson Corp. | | | 43,200 | | | | 1,164,165 | | | |
| Yokogawa Electric Corp. | | | 52,900 | | | | 537,392 | | | |
| | | | | | | |
| | | | | | | | 4,263,082 | | | |
Transportation 1.1% |
| Japan Airlines Corp. * | | | 26,000 | | | | 67,799 | | | |
| Kawasaki Kisen Kaisha Ltd. | | | 124,000 | | | | 1,217,156 | | | |
| Keisei Electric Railway Co., Ltd. | | | 22,000 | | | | 118,957 | | | |
| West Japan Railway Co. | | | 319 | | | | 1,412,606 | | | |
| | | | | | | |
| | | | | | | | 2,816,518 | | | |
| Utilities 0.4% |
| Hokkaido Electric Power Co., Inc. | | | 50,500 | | | | 1,177,571 | | | |
| | | | | | | |
| | | | | | | | 49,275,976 | | | |
Luxembourg 0.8% |
| |
| Household & Personal Products 0.3% |
| Oriflame Cosmetics S.A. | | | 12,400 | | | | 824,313 | | | |
| |
Telecommunication Services 0.3% |
| COLT Telecom Group S.A. * | | | 246,000 | | | | 817,271 | | | |
| |
Transportation 0.2% |
| Stolt-Nielsen S.A. | | | 22,500 | | | | 470,562 | | | |
| | | | | | | |
| | | | | | | | 2,112,146 | | | |
Malaysia 0.8% |
| |
| Automobiles & Components 0.0% |
| UMW Holdings Berhad | | | 24,000 | | | | 45,486 | | | |
| |
Banks 0.0% |
| Hong Leong Bank Berhad | | | 63,000 | | | | 114,635 | | | |
| |
Capital Goods 0.1% |
| Ranhill Berhard | | | 280,000 | | | | 142,051 | | | |
Consumer Services 0.2% |
| Genting Berhad | | | 124,000 | | | | 255,591 | | | |
| KFC Holdings (Malaysia) Berhad | | | 25,000 | | | | 48,552 | | | |
| Resorts World Berhad | | | 261,000 | | | | 282,078 | | | |
| | | | | | | |
| | | | | | | | 586,221 | | | |
Diversified Financials 0.1% |
| AMMB Holdings Berhad | | | 300,000 | | | | 324,215 | | | |
| |
Energy 0.1% |
| Petronas Dagangan Berhad | | | 99,000 | | | | 248,417 | | | |
| |
Food, Beverage & Tobacco 0.1% |
| Asiatic Development Berhard | | | 67,000 | | | | 177,035 | | | |
| Fraser & Neave Holdings Berhad | | | 5,000 | | | | 12,288 | | | |
| | | | | | | |
| | | | | | | | 189,323 | | | |
Materials 0.1% |
| Lion Industries Corp. Berhard | | | 233,000 | | | | 132,151 | | | |
| |
Transportation 0.1% |
| Malaysian Airline System Berhad * | | | 144,000 | | | | 159,375 | | | |
Utilities 0.0% |
| Tenaga Nasional Berhad | | | 24,000 | | | | 55,390 | | | |
| | | | | | | |
| | | | | | | | 1,997,264 | | | |
Mauritius 0.2% |
| |
| Food, Beverage & Tobacco 0.2% |
| Golden Agri-Resources Ltd. | | | 534,000 | | | | 391,367 | | | |
| |
Mexico 1.4% |
| |
| Banks 0.0% |
| Grupo Financiero Banorte S.A.B. de C.V., Class O | | | 14,000 | | | | 60,642 | | | |
| |
Capital Goods 0.4% |
| Alfa S.A.B., Class A | | | 70,900 | | | | 474,321 | | | |
| Grupo Carso S.A. de C.V., Series A1 | | | 135,900 | | | | 574,617 | | | |
| | | | | | | |
| | | | | | | | 1,048,938 | | | |
Food & Staples Retailing 0.1% |
| Controladora Comercial Mexicana S.A. de C.V. | | | 71,700 | | | | 202,109 | | | |
| Grupo Gigante S.A. de C.V., Class B * | | | 71,800 | | | | 136,682 | | | |
| | | | | | | |
| | | | | | | | 338,791 | | | |
Food, Beverage & Tobacco 0.3% |
| Coca-Cola Femsa S.A.B. de C.V. (Femsa), Series L | | | 35,600 | | | | 202,707 | | | |
| Gruma S.A.B., Class B | | | 35,300 | | | | 83,617 | | | |
| Grupo Bimbo S.A.B. de C.V., Series A | | | 24,100 | | | | 144,925 | | | |
| Grupo Continental, S.A.B. * | | | 72,900 | | | | 174,805 | | | |
| Industrias Bachoco S.A., Class B | | | 18,200 | | | | 44,684 | | | |
| | | | | | | |
| | | | | | | | 650,738 | | | |
Materials 0.6% |
| Grupo Mexico S.A.B. de C.V., Series B | | | 58,100 | | | | 385,687 | | | |
| Grupo Simec S.A. de C.V., Series B * | | | 81,900 | | | | 307,815 | | | |
| Grupo Simec S.A. de C.V.A. ADR * | | | 100 | | | | 1,113 | | | |
See financial notes.
28 Laudus International Equity Funds
Laudus Rosenberg International Discovery Fund
| | | | | | | | | | | |
| | | Number of | | Value | | |
| Security | | Shares | | ($) | | |
| Industrias CH S.A., Series B * | | | 75,700 | | | | 300,517 | | | |
| Industrias Penoles S.A. de C.V. | | | 19,700 | | | | 590,477 | | | |
| | | | | | | |
| | | | | | | | 1,585,609 | | | |
| | | | | | | |
| | | | | | | | 3,684,718 | | | |
Netherlands 2.1% |
| |
| Capital Goods 0.3% |
| Koninklijke BAM Groep N.V. | | | 31,800 | | | | 752,582 | | | |
| Koninklijke Boskalis Westminster N.V., C.V.A. | | | 481 | | | | 27,791 | | | |
| | | | | | | |
| | | | | | | | 780,373 | | | |
Commercial Services & Supplies 0.2% |
| USG People N.V. | | | 25,509 | | | | 605,064 | | | |
| |
Consumer Durables & Apparel 0.3% |
| TomTom N.V. * | | | 17,700 | | | | 731,928 | | | |
| |
Energy 0.2% |
| Fugro N.V., C.V.A. | | | 6,400 | | | | 497,412 | | | |
| |
Food, Beverage & Tobacco 0.5% |
| CSM | | | 41,000 | | | | 1,400,180 | | | |
| |
Materials 0.2% |
| Koninklijke DSM N.V. | | | 8,784 | | | | 423,569 | | | |
| |
Technology Hardware & Equipment 0.2% |
| Gemalto N.V. * | | | 14,581 | | | | 424,602 | | | |
| |
Transportation 0.2% |
| Smit Internationale N.V. | | | 6,000 | | | | 611,487 | | | |
| | | | | | | |
| | | | | | | | 5,474,615 | | | |
New Zealand 0.3% |
| |
| Materials 0.2% |
| Fletcher Building Ltd. | | | 74,200 | | | | 489,451 | | | |
| |
Retailing 0.0% |
| The Warehouse Group Ltd. | | | 1,200 | | | | 5,528 | | | |
| |
Transportation 0.0% |
| Air New Zealand Ltd. | | | 111,100 | | | | 112,676 | | | |
| |
Utilities 0.1% |
| Contact Energy Ltd. | | | 26,500 | | | | 166,297 | | | |
| | | | | | | |
| | | | | | | | 773,952 | | | |
Norway 0.8% |
| |
| Energy 0.8% |
| Aker Solutions A.S.A. * | | | 49,000 | | | | 1,122,384 | | | |
| Petroleum Geo-Services A.S.A. | | | 35,000 | | | | 868,920 | | | |
| TGS Nopec Geophysical Co., A.S.A. * | | | 7,063 | | | | 102,895 | | | |
| | | | | | | |
| | | | | | | | 2,094,199 | | | |
| | | | | | | |
| | | | | | | | 2,094,199 | | | |
Papua New Guinea 0.5% |
| |
| Energy 0.2% |
| Oil Search Ltd. | | | 133,400 | | | | 589,624 | | | |
| |
Materials 0.3% |
| Lihir Gold Ltd. * | | | 211,300 | | | | 674,244 | | | |
| | | | | | | |
| | | | | | | | 1,263,868 | | | |
Peru 0.2% |
| |
| Materials 0.2% |
| Compania de Minas Buenaventura S.A. ADR | | | 8,700 | | | | 595,950 | | | |
| |
Philippines 0.4% |
| |
| Banks 0.0% |
| Union Bank of the Philippines | | | 6,600 | | | | 5,538 | | | |
| |
Energy 0.1% |
| Petron Corp. | | | 1,878,000 | | | | 256,863 | | | |
| |
Food, Beverage & Tobacco 0.0% |
| San Miguel Corp. | | | 62,000 | | | | 71,414 | | | |
| |
Materials 0.0% |
| Philex Mining Corp. | | | 345,800 | | | | 55,513 | | | |
| |
Telecommunication Services 0.3% |
| Globe Telecom, Inc. | | | 10,000 | | | | 361,506 | | | |
| Philippine Long Distance Telephone Co. | | | 2,000 | | | | 133,735 | | | |
| Pilipino Telephone Corp. * | | | 1,030,000 | | | | 172,828 | | | |
| | | | | | | |
| | | | | | | | 668,069 | | | |
| | | | | | | |
| | | | | | | | 1,057,397 | | | |
Poland 1.4% |
| |
| Banks 0.2% |
| ING Bank Slaski S.A. | | | 2,500 | | | | 595,771 | | | |
| |
Energy 0.6% |
| Grupa Lotos S.A. * | | | 26,000 | | | | 410,962 | | | |
| Polski Koncern Naftowy Orlen S.A. * | | | 62,000 | | | | 1,108,197 | | | |
| | | | | | | |
| | | | | | | | 1,519,159 | | | |
| Materials 0.4% |
| KGHM Polska Miedz S.A. | | | 21,700 | | | | 1,002,809 | | | |
| |
Telecommunication Services 0.2% |
| Telekomunikacja Polska S.A. * | | | 63,000 | | | | 627,830 | | | |
| | | | | | | |
| | | | | | | | 3,745,569 | | | |
Portugal 0.1% |
| |
| Materials 0.1% |
| Semapa – Sociedade de Investimento e Gestao, SGPS, S.A. | | | 13,879 | | | | 177,803 | | | |
| |
Republic of Korea 3.8% |
| |
| Automobiles & Components 0.3% |
| Hankook Tire Co., Ltd. | | | 11,430 | | | | 181,840 | | | |
| Hyundai Mobis | | | 5,800 | | | | 453,714 | | | |
| Korea Kumho Petrochemical Co., Ltd. (KKPC) | | | 5,000 | | | | 290,131 | | | |
| | | | | | | |
| | | | | | | | 925,685 | | | |
Capital Goods 1.3% |
| Daelim Industrial Co., Ltd. | | | 4,200 | | | | 540,119 | | | |
| Doosan Corp. * | | | 2,400 | | | | 465,561 | | | |
| Doosan Infracore Co., Ltd. | | | 5,740 | | | | 192,302 | | | |
| GS Engineering & Construction Corp. | | | 1,600 | | | | 236,114 | | | |
| Hyundai Mipo Dockyard Co., Ltd. | | | 540 | | | | 121,694 | | | |
| LG Corp. | | | 11,250 | | | | 849,870 | | | |
| LS Cable Ltd. | | | 3,320 | | | | 302,071 | | | |
| Samho International Co., Ltd. | | | 6,560 | | | | 92,234 | | | |
See financial notes.
Laudus International Equity Funds 29
Laudus Rosenberg International Discovery Fund
Portfolio Holdings continued
| | | | | | | | | | | |
| | | Number of | | Value | | |
| Security | | Shares | | ($) | | |
| Samsung Heavy Industries Co., Ltd. | | | 15,010 | | | | 481,751 | | | |
| SK Holdings Co., Ltd. | | | 1,090 | | | | 157,242 | | | |
| | | | | | | |
| | | | | | | | 3,438,958 | | | |
Consumer Durables & Apparel 0.2% |
| LG Electronics, Inc. | | | 3,570 | | | | 458,808 | | | |
| Youngone Corp. | | | 15,880 | | | | 129,797 | | | |
| | | | | | | |
| | | | | | | | 588,605 | | | |
Energy 0.3% |
| GS Holdings Corp. | | | 8,590 | | | | 335,486 | | | |
| SK Energy Co., Ltd. | | | 2,669 | | | | 276,306 | | | |
| SK Gas Co., Ltd. | | | 1,653 | | | | 114,351 | | | |
| | | | | | | |
| | | | | | | | 726,143 | | | |
Food, Beverage & Tobacco 0.1% |
| KT&G Corp. | | | 4,760 | | | | 373,858 | | | |
| |
Household & Personal Products 0.1% |
| LG Household & Health Care Ltd. | | | 30 | | | | 5,182 | | | |
| Pacific Corp. | | | 2,220 | | | | 269,874 | | | |
| | | | | | | |
| | | | | | | | 275,056 | | | |
Insurance 0.1% |
| Dongbu Insurance Co., Ltd. | | | 9,240 | | | | 356,705 | | | |
| |
Materials 0.7% |
| Hanwha Chemical Corp. | | | 20,540 | | | | 348,884 | | | |
| Hanwha Corp. | | | 1,590 | | | | 84,253 | | | |
| Hyosung Corp. | | | 4,350 | | | | 295,468 | | | |
| Korea Petrochemical Industrial Co., Ltd. | | | 3,510 | | | | 132,605 | | | |
| Korea Zinc Co., Ltd. | | | 2,330 | | | | 282,873 | | | |
| LG Chem Ltd. | | | 7,830 | | | | 587,262 | | | |
| | | | | | | |
| | | | | | | | 1,731,345 | | | |
Retailing 0.2% |
| GS Home Shopping, Inc. | | | 980 | | | | 62,547 | | | |
| Hyundai Department Store Co., Ltd. | | | 4,110 | | | | 396,628 | | | |
| | | | | | | |
| | | | | | | | 459,175 | | | |
Software & Services 0.1% |
| Daou Technology, Inc. | | | 16,170 | | | | 139,558 | | | |
| |
Telecommunication Services 0.4% |
| KT Corp. | | | 9,730 | | | | 462,567 | | | |
| KT Freetel Co., Ltd. * | | | 5,030 | | | | 147,307 | | | |
| LG Telecom Ltd. | | | 45,150 | | | | 357,002 | | | |
| | | | | | | |
| | | | | | | | 966,876 | | | |
| | | | | | | |
| | | | | | | | 9,981,964 | | | |
Russia 0.3% |
| |
| Energy 0.2% |
| Tatneft GDR | | | 4,800 | | | | 624,000 | | | |
| |
Materials 0.1% |
| Mechel ADR | | | 2,000 | | | | 227,580 | | | |
| | | | | | | |
| | | | | | | | 851,580 | | | |
Singapore 1.7% |
| |
| Capital Goods 0.7% |
| Fraser & Neave Ltd. | | | 184,000 | | | | 655,215 | | | |
| Haw Par Corp., Ltd. | | | 8,000 | | | | 40,253 | | | |
| Keppel Corp., Ltd. | | | 62,000 | | | | 451,333 | | | |
| SembCorp Industries Ltd. | | | 21,000 | | | | 62,608 | | | |
| Singapore Technologies Engineering Ltd. (ST Engg) | | | 187,000 | | | | 462,563 | | | |
| The Straits Trading Co., Ltd. | | | 6,000 | | | | 29,249 | | | |
| | | | | | | |
| | | | | | | | 1,701,221 | | | |
Consumer Services 0.0% |
| Hotel Plaza Ltd. | | | 35,000 | | | | 48,165 | | | |
| |
Diversified Financials 0.2% |
| Kim Eng Holdings Ltd. | | | 154,000 | | | | 229,445 | | | |
| UOB-Kay Hian Holdings Ltd. | | | 192,000 | | | | 274,806 | | | |
| | | | | | | |
| | | | | | | | 504,251 | | | |
Energy 0.1% |
| Singapore Petroleum Co., Ltd. | | | 57,000 | | | | 281,960 | | | |
| Straits Asia Resources Ltd. | | | 13,000 | | | | 31,013 | | | |
| | | | | | | |
| | | | | | | | 312,973 | | | |
Food, Beverage & Tobacco 0.0% |
| Asia Food & Properties Ltd. * | | | 69,000 | | | | 34,727 | | | |
| |
Real Estate 0.1% |
| Allgreen Properties Ltd. | | | 23,000 | | | | 20,732 | | | |
| Ho Bee Investment Ltd. | | | 202,000 | | | | 136,932 | | | |
| Singapore Land Ltd. | | | 7,000 | | | | 34,837 | | | |
| United Industrial Corp., Ltd. | | | 23,000 | | | | 46,232 | | | |
| Wheelock Properties (S) Ltd. | | | 32,000 | | | | 46,325 | | | |
| | | | | | | |
| | | | | | | | 285,058 | | | |
Retailing 0.2% |
| Jardine Cycle & Carriage Ltd. | | | 27,000 | | | | 386,539 | | | |
| Metro Holdings Ltd. | | | 221,000 | | | | 113,127 | | | |
| | | | | | | |
| | | | | | | | 499,666 | | | |
Semiconductors & Semiconductor Equipment 0.0% |
| STATS ChipPAC Ltd. * | | | 147,000 | | | | 120,169 | | | |
| |
Technology Hardware & Equipment 0.1% |
| Venture Corp., Ltd. | | | 46,000 | | | | 355,151 | | | |
| |
Transportation 0.3% |
| ComfortDelGro Corp., Ltd. | | | 302,000 | | | | 402,294 | | | |
| Neptune Orient Lines Ltd. | | | 43,000 | | | | 102,607 | | | |
| SIA Engineering Co., Ltd. | | | 11,000 | | | | 31,646 | | | |
| Singapore Airlines Ltd. | | | 11,200 | | | | 127,434 | | | |
| | | | | | | |
| | | | | | | | 663,981 | | | |
| | | | | | | |
| | | | | | | | 4,525,362 | | | |
South Africa 1.0% |
| |
| Insurance 0.4% |
| Liberty Group Ltd. | | | 60,000 | | | | 543,855 | | | |
| Liberty Holdings Ltd. | | | 14,530 | | | | 340,213 | | | |
| | | | | | | |
| | | | | | | | 884,068 | | | |
Materials 0.6% |
| African Rainbow Minerals Ltd. | | | 22,000 | | | | 609,860 | | | |
| AngloGold Ashanti Ltd. | | | 1,500 | | | | 50,519 | | | |
| ArcelorMittal South Africa Ltd., Series L | | | 33,000 | | | | 800,793 | | | |
| Harmony Gold Mining Co., Ltd. * | | | 16,000 | | | | 190,807 | | | |
| | | | | | | |
| | | | | | | | 1,651,979 | | | |
| | | | | | | |
| | | | | | | | 2,536,047 | | | |
See financial notes.
30 Laudus International Equity Funds
Laudus Rosenberg International Discovery Fund
| | | | | | | | | | | |
| | | Number of | | Value | | |
| Security | | Shares | | ($) | | |
Spain 2.0% |
| |
| Capital Goods 0.3% |
| Obrascon Huarte Lain S.A. | | | 20,500 | | | | 760,491 | | | |
| |
Consumer Services 0.2% |
| Sol Melia S.A. | | | 36,000 | | | | 506,803 | | | |
| |
Food, Beverage & Tobacco 0.1% |
| Ebro Puleva S.A. | | | 11,200 | | | | 229,497 | | | |
| |
Insurance 0.8% |
| Mapfre S.A. | | | 420,000 | | | | 2,108,901 | | | |
| |
Materials 0.2% |
| Cementos Portland Valderrivas S.A. | | | 4,800 | | | | 466,286 | | | |
| |
Software & Services 0.3% |
| Indra Sistemas S.A. | | | 32,200 | | | | 927,337 | | | |
| |
Transportation 0.1% |
| Iberia Lineas Aereas de Espana S.A. | | | 77,976 | | | | 339,551 | | | |
| | | | | | | |
| | | | | | | | 5,338,866 | | | |
Sweden 2.3% |
| |
| Capital Goods 1.4% |
| AB SKF, Class B | | | 54,000 | | | | 1,087,211 | | | |
| Alfa Laval AB | | | 15,238 | | | | 927,268 | | | |
| Skanska AB, B Shares | | | 67,000 | | | | 1,343,455 | | | |
| Trelleborg AB, B Shares | | | 9,000 | | | | 179,672 | | | |
| | | | | | | |
| | | | | | | | 3,537,606 | | | |
Food, Beverage & Tobacco 0.3% |
| Swedish Match AB | | | 34,243 | | | | 747,833 | | | |
| |
Materials 0.2% |
| Svenska Cellulosa AB (SCA), Class B | | | 30,000 | | | | 546,989 | | | |
| |
Telecommunication Services 0.4% |
| Tele2 AB, Class B | | | 56,000 | | | | 1,059,337 | | | |
| | | | | | | |
| | | | | | | | 5,891,765 | | | |
Switzerland 4.2% |
| |
| Automobiles & Components 0.3% |
| Rieter Holding AG – Reg’d | | | 1,900 | | | | 727,461 | | | |
| |
Capital Goods 1.6% |
| Bobst Group AG – Reg’d | | | 7,500 | | | | 582,352 | | | |
| Bucher Industries AG – Reg’d | | | 5,680 | | | | 1,542,194 | | | |
| Georg Fischer AG – Reg’d * | | | 160 | | | | 79,066 | | | |
| Schindler Holding AG – Reg’d | | | 12,300 | | | | 910,811 | | | |
| Sulzer AG – Reg’d | | | 700 | | | | 925,441 | | | |
| | | | | | | |
| | | | | | | | 4,039,864 | | | |
Consumer Durables & Apparel 0.2% |
| Forbo Holding AG – Reg’d * | | | 900 | | | | 476,949 | | | |
| |
Consumer Services 0.2% |
| Kuoni Reisen Holding AG – Reg’d | | | 1,120 | | | | 622,693 | | | |
| |
Insurance 1.1% |
| Baloise Holding AG – Reg’d | | | 11,600 | | | | 1,153,442 | | | |
| Helvetia Holding AG | | | 1,600 | | | | 603,072 | | | |
| Swiss Life Holding – Reg’d * | | | 4,027 | | | | 1,119,987 | | | |
| | | | | | | |
| | | | | | | | 2,876,501 | | | |
Materials 0.5% |
| Ciba Holding AG | | | 9,559 | | | | 348,602 | | | |
| Clariant AG – Reg’d * | | | 92,000 | | | | 784,363 | | | |
| Schmolz & Bickenbach AG – Reg’d | | | 2,400 | | | | 199,120 | | | |
| | | | | | | |
| | | | | | | | 1,332,085 | | | |
Utilities 0.3% |
| Elektrizitaets-Gesellschaft Laufenburg AG | | | 640 | | | | 836,492 | | | |
| | | | | | | |
| | | | | | | | 10,912,045 | | | |
Taiwan 4.1% |
| |
| Banks 0.5% |
| Chang Hwa Commercial Bank | | | 220,000 | | | | 166,778 | | | |
| China Development Financial Holding Corp. | | | 1,473,340 | | | | 681,540 | | | |
| Taiwan Cooperative Bank | | | 543,720 | | | | 536,971 | | | |
| | | | | | | |
| | | | | | | | 1,385,289 | | | |
Capital Goods 0.2% |
| CTCI Corp. | | | 53,000 | | | | 44,725 | | | |
| Far Eastern Textile Ltd. | | | 90 | | | | 152 | | | |
| Teco Electric & Machinery Co., Ltd. | | | 449,000 | | | | 278,001 | | | |
| Walsin Lihwa Corp. | | | 273,000 | | | | 135,439 | | | |
| | | | | | | |
| | | | | | | | 458,317 | | | |
Consumer Durables & Apparel 0.0% |
| POU Chen Corp. | | | 68,000 | | | | 66,359 | | | |
| |
Materials 0.5% |
| China Steel Corp. | | | 432,130 | | | | 687,434 | | | |
| Formosa Chemicals & Fibre Corp. | | | 109,730 | | | | 285,712 | | | |
| Formosa Plastics Corp. | | | 155,000 | | | | 470,807 | | | |
| | | | | | | |
| | | | | | | | 1,443,953 | | | |
Real Estate 0.1% |
| Farglory Land Development Co., Ltd. | | | 66,000 | | | | 242,451 | | | |
| |
Semiconductors & Semiconductor Equipment 0.4% |
| Advanced Semiconductor Engineering, Inc. | | | 664,000 | | | | 650,981 | | | |
| Macronix International Co., Ltd. | | | 662,161 | | | | 302,936 | | | |
| | | | | | | |
| | | | | | | | 953,917 | | | |
Technology Hardware & Equipment 2.0% |
| Acer, Inc. | | | 154,071 | | | | 277,775 | | | |
| Asustek Computer, Inc. | | | 119,000 | | | | 350,539 | | | |
| AU Optronics Corp. | | | 332,537 | | | | 574,247 | | | |
| Chi Mei Optoelectronics Corp. | | | 451,400 | | | | 597,399 | | | |
| Chunghwa Picture Tubes, Ltd. * | | | 1,176,000 | | | | 361,254 | | | |
| Compal Electronics, Inc. | | | 613,281 | | | | 589,709 | | | |
| Delta Electronics, Inc. | | | 22,050 | | | | 65,309 | | | |
| HannStar Display Corp. * | | | 480,000 | | | | 207,178 | | | |
| Inventec Co., Ltd. | | | 207,100 | | | | 127,456 | | | |
| Lite-On Technology Corp. | | | 291,938 | | | | 340,749 | | | |
| Mitac International Corp. | | | 118,565 | | | | 107,914 | | | |
| Quanta Computer, Inc. | | | 421,181 | | | | 584,061 | | | |
| Tatung Co., Ltd. * | | | 744,000 | | | | 482,289 | | | |
| Walsin Technology Corp. | | | 8,000 | | | | 5,905 | | | |
| Wistron Corp. | | | 151,276 | | | | 241,704 | | | |
| Yageo Corp. | | | 897,000 | | | | 330,754 | | | |
| | | | | | | |
| | | | | | | | 5,244,242 | | | |
See financial notes.
Laudus International Equity Funds 31
Laudus Rosenberg International Discovery Fund
Portfolio Holdings continued
| | | | | | | | | | | |
| | | Number of | | Value | | |
| Security | | Shares | | ($) | | |
Telecommunication Services 0.2% |
| Far EasTone Telecommunications Co., Ltd. | | | 258,544 | | | | 442,545 | | | |
| |
Transportation 0.2% |
| U-Ming Marine Transport Corp. | | | 151,000 | | | | 459,105 | | | |
| | | | | | | |
| | | | | | | | 10,696,178 | | | |
Thailand 0.6% |
| |
| Banks 0.2% |
| Bangkok Bank Public Co., Ltd. NVDR | | | 86,000 | | | | 370,361 | | | |
| Krung Thai Bank Public Co., Ltd. NVDR | | | 486,000 | | | | 155,903 | | | |
| | | | | | | |
| | | | | | | | 526,264 | | | |
Diversified Financials 0.1% |
| Thanachart Capital Public Co., Ltd. NVDR | | | 504,000 | | | | 249,030 | | | |
| |
Energy 0.1% |
| Banpu Public Co., Ltd. | | | 7,000 | | | | 95,825 | | | |
| PTT Exploration & Production Public Co., Ltd. | | | 36,000 | | | | 172,654 | | | |
| PTT Exploration & Production Public Co., Ltd. NVDR | | | 11,000 | | | | 53,050 | | | |
| | | | | | | |
| | | | | | | | 321,529 | | | |
Materials 0.1% |
| Thai Rayon Public Co., Ltd. | | | 46,000 | | | | 103,001 | | | |
| |
Telecommunication Services 0.1% |
| Total Access Communication Public Co., Ltd. * | | | 226,000 | | | | 279,171 | | | |
| | | | | | | |
| | | | | | | | 1,478,995 | | | |
Turkey 1.4% |
| |
| Banks 0.2% |
| Sekerbank TAS * | | | 240,000 | | | | 456,656 | | | |
| |
Capital Goods 0.3% |
| Koc Holding A/ S * | | | 280,000 | | | | 782,312 | | | |
| |
Energy 0.4% |
| Petrol Ofisi A/ S * | | | 265,000 | | | | 1,084,237 | | | |
| |
Food, Beverage & Tobacco 0.1% |
| Anadolu Efes Biracilik ve Malt Sanayii A/ S | | | 30,000 | | | | 266,158 | | | |
| |
Materials 0.4% |
| Eregli Demir ve Celik Fabrikalari T.A.S. (Erdemir) | | | 136,000 | | | | 956,150 | | | |
| | | | | | | |
| | | | | | | | 3,545,513 | | | |
United Kingdom 6.9% |
| |
| Capital Goods 1.1% |
| Bodycote International plc | | | 111,000 | | | | 411,343 | | | |
| IMI plc | | | 208,000 | | | | 1,874,660 | | | |
| Qinetiq plc | | | 189,000 | | | | 724,499 | | | |
| | | | | | | |
| | | | | | | | 3,010,502 | | | |
Commercial Services & Supplies 0.3% |
| WS Atkins plc | | | 34,500 | | | | 720,309 | | | |
| |
Energy 1.6% |
| Dana Petroleum plc * | | | 2,709 | | | | 67,775 | | | |
| JKX Oil & Gas plc | | | 20,752 | | | | 181,385 | | | |
| John Wood Group plc | | | 106,000 | | | | 851,966 | | | |
| Petrofac Ltd. | | | 160,665 | | | | 1,791,964 | | | |
| Premier Oil plc * | | | 20,800 | | | | 573,142 | | | |
| Venture Production plc | | | 54,084 | | | | 669,580 | | | |
| | | | | | | |
| | | | | | | | 4,135,812 | | | |
Food, Beverage & Tobacco 0.2% |
| Britvic plc | | | 79,851 | | | | 504,809 | | | |
| |
Household & Personal Products 0.2% |
| PZ Cussons plc | | | 141,035 | | | | 518,059 | | | |
| |
Insurance 0.3% |
| Friends Provident plc | | | 135,629 | | | | 332,867 | | | |
| Old Mutual plc | | | 210,000 | | | | 460,871 | | | |
| | | | | | | |
| | | | | | | | 793,738 | | | |
Materials 1.2% |
| Antofagasta plc | | | 36,000 | | | | 501,216 | | | |
| Croda International plc | | | 4,853 | | | | 63,803 | | | |
| DS Smith plc | | | 36,500 | | | | 113,531 | | | |
| Hochschild Mining plc | | | 20,924 | | | | 182,208 | | | |
| Johnson Matthey plc | | | 29,700 | | | | 1,182,990 | | | |
| Kazakhmys plc | | | 19,600 | | | | 621,527 | | | |
| Vedanta Resources plc | | | 10,600 | | | | 441,733 | | | |
| | | | | | | |
| | | | | | | | 3,107,008 | | | |
Real Estate 0.2% |
| Meinl European Land Ltd. * | | | 55,195 | | | | 627,658 | | | |
| |
Retailing 0.5% |
| Home Retail Group plc | | | 180,000 | | | | 934,322 | | | |
| WH Smith plc | | | 65,189 | | | | 479,967 | | | |
| | | | | | | |
| | | | | | | | 1,414,289 | | | |
Software & Services 0.3% |
| Dimension Data Holdings plc | | | 506,000 | | | | 487,485 | | | |
| LogicaCMG plc | | | 191,967 | | | | 403,522 | | | |
| | | | | | | |
| | | | | | | | 891,007 | | | |
Transportation 0.7% |
| Arriva plc | | | 53,600 | | | | 730,067 | | | |
| FirstGroup plc | | | 91,800 | | | | 1,027,565 | | | |
| | | | | | | |
| | | | | | | | 1,757,632 | | | |
Utilities 0.3% |
| British Energy Group plc | | | 52,938 | | | | 685,939 | | | |
| | | | | | | |
| | | | | | | | 18,166,762 | | | |
| | | | | | | |
Total Common Stock (Cost $258,411,648) | | | 251,580,050 | | | |
| | | | | | | |
| Preferred Stock 1.8% of net assets |
| |
Brazil 1.8% |
| |
| Acesita S.A. | | | 4,900 | | | | 263,612 | | | |
| AES Tiete S.A. | | | 8,344,000 | | | | 277,705 | | | |
| Brasil Telecom Participacoes S.A. | | | 43,000 | | | | 575,392 | | | |
| Brasil Telecom S.A. | | | 37,700 | | | | 414,663 | | | |
| Braskem S.A., Class A | | | 58,000 | | | | 492,506 | | | |
| Centrais Eletricas de Santa Catarina S.A., Class B | | | 7,200 | | | | 177,261 | | | |
| Companhia de Gas de Sao Paulo – Comgas, Class A | | | 7,000 | | | | 175,928 | | | |
| Companhia de Transmissao de Energia Eletrica Eletrica Paulista | | | 11,000 | | | | 256,084 | | | |
See financial notes.
32 Laudus International Equity Funds
Laudus Rosenberg International Discovery Fund
| | | | | | | | | | | |
| | | Number of | | Value | | |
| Security | | Shares | | ($) | | |
| Companhia Energetica de Minas Gerais – CEMIG | | | 6,495 | | | | 116,597 | | | |
| Companhia Paranaense de Energia-Copel, Class B | | | 32,000 | | | | 523,212 | | | |
| Compania Brasileira de Distribuicao Grupo Pao de Acucar | | | 16,100 | | | | 330,313 | | | |
| Eletropaulo Metropolitana S.A., Class B | | | 1,116,679 | | | | 87,822 | | | |
| Sadia S.A. | | | 79,000 | | | | 468,228 | | | |
| Tele Norte Leste Participacoes S.A. | | | 10,300 | | | | 273,540 | | | |
| Telemar Norte Leste S.A., Class A | | | 700 | | | | 36,302 | | | |
| Ultrapar Participacoes S.A. | | | 2,475 | | | | 87,028 | | | |
| Uniao de Industrias Petroquimicas S.A. (Unipar), Class B | | | 73,900 | | | | 65,279 | | | |
| Vivo Participacoes S.A. | | | 32,900 | | | | 191,809 | | | |
| | | | | | | |
| | | | | | | | 4,813,281 | | | |
| | | | | | | |
Total Preferred Stock (Cost $4,285,865) | | | 4,813,281 | | | |
| | | | | | | |
| Rights 0.0% of net assets |
| |
India 0.0% |
| |
| Indian Hotels Co., Ltd. * | | | 16,256 | | | | 18,659 | | | |
| Indian Hotels Co., Ltd. * | | | 8,128 | | | | 202 | | | |
| | | | | | | |
| | | | | | | | 18,861 | | | |
Malaysia 0.0% |
| |
| Genting Berhad (a)* | | | 40,400 | | | | — | | | |
| | | | | | | |
Total Rights (Cost $ — ) | | | 18,861 | | | |
| | | | | | | |
| | | | | | | | | | | |
| Security | | Face Amount | | Value | | |
| Rate, Maturity Date | | ($) | | ($) | | |
| Short-Term Investment 2.4% of net assets |
| |
Repurchase Agreement 2.4% |
| |
Fixed Income Clearing Corp.
dated 03/31/08, due 04/01/08 at 2.00%, with a maturity value of $6,290,349 (fully collateralized by Federal National Mortgage Assn. with a value of $6,420,694.) | | | 6,290,000 | | | | 6,290,000 | | | |
| | | | | | | |
Total Short-Term Investment
(Cost $6,290,000) | | | 6,290,000 | | | |
| |
End of Investments. |
At 03/31/08, the tax basis cost of the fund’s investments was $270,867,593 and the unrealized appreciation and depreciation were $16,630,745 and ($24,796,146), respectively, with a net unrealized depreciation of ($8,165,401).
At 03/31/08, the prices of certain foreign securities held by the fund aggregating $221,660,514 were adjusted from their closing market prices following the guidelines adopted by the fund’s board of trustees.
| |
| * | Non-income producing security. |
| (a) | Fair-valued by Management. |
ADR – American Depositary Receipt
CVA – Dutch Certificate
GDR – Global Depositary Receipt
NVDR – Non-Voting Depositary Receipt
See financial notes.
Laudus International Equity Funds 33
Laudus Rosenberg International Small Capitalization Fund
Portfolio Holdings as of March 31, 2008
| | | | | | | | | | | | | |
| | | Cost | | Value |
| Holdings by Category | | ($) | | ($) |
| |
| | 95.8 | % | | Common Stock | | | 1,043,840,883 | | | | 1,088,713,385 | |
| | 0.3 | % | | Preferred Stock | | | 3,369,493 | | | | 3,530,234 | |
| | — | % | | Rights | | | — | | | | — | |
| | — | % | | Warrants | | | — | | | | — | |
| | 1.4 | % | | Short-Term Investment | | | 15,581,000 | | | | 15,581,000 | |
| |
| | 97.5 | % | | Total Investments | | | 1,062,791,376 | | | | 1,107,824,619 | |
| | 7.0 | % | | Collateral Invested for Securities on Loan | | | 79,431,797 | | | | 79,431,797 | |
| | (4.5 | )% | | Other Assets and Liabilities | | | | | | | (50,844,067 | ) |
| |
| | 100.0 | % | | Net Assets | | | | | | | 1,136,412,349 | |
| | | | | | | | | | | |
| | | Number of | | Value | | |
| Security | | Shares | | ($) | | |
| Common Stock 95.8% of net assets |
| |
Australia 4.9% |
| |
Capital Goods 0.2% |
| AJ Lucas Group Ltd. | | | 21,662 | | | | 75,666 | | | |
| Austal Ltd. | | | 44,000 | | | | 104,036 | | | |
| Crane Group Ltd. | | | 19,700 | | | | 276,435 | | | |
| Macmahon Holdings Ltd. | | | 1,335,200 | | | | 1,817,805 | | | |
| | | | | | | |
| | | | | | | | 2,273,942 | | | |
Consumer Services 0.1% |
| Flight Centre Ltd. | | | 67,316 | | | | 1,309,195 | | | |
| |
Energy 1.4% |
| Aquila Resources Ltd. * | | | 22,800 | | | | 209,460 | | | |
| Australian Worldwide Exploration Ltd * | | | 786,300 | | | | 2,541,845 | | | |
| Beach Petroleum Ltd. | | | 954,214 | | | | 1,100,450 | | | |
| Centennial Coal Co., Ltd. | | | 871,100 | | | | 3,258,131 | | | |
| Cooper Energy Ltd. * | | | 99,658 | | | | 67,964 | | | |
| Felix Resources Ltd. | | | 273,109 | | | | 3,104,762 | | | |
| New Hope Corp., Ltd. | | | 701,411 | | | | 1,705,332 | | | |
| Santos Ltd. | | | 265,400 | | | | 3,529,459 | | | |
| | | | | | | |
| | | | | | | | 15,517,403 | | | |
Food, Beverage & Tobacco 0.1% |
| Lion Nathan Ltd. | | | 111,700 | | | | 895,089 | | | |
| Ridley Corp., Ltd. | | | 426,419 | | | | 437,718 | | | |
| | | | | | | |
| | | | | | | | 1,332,807 | | | |
Materials 2.9% |
| Ausdrill Ltd. | | | 556,300 | | | | 1,029,195 | | | |
| BlueScope Steel Ltd. | | | 25,300 | | | | 229,451 | | | |
| Coal of Africa Ltd. * | | | 24,633 | | | | 50,940 | | | |
| Dominion Mining Ltd. | | | 191,634 | | | | 591,205 | | | |
| Equigold NL | | | 108,024 | | | | 458,929 | | | |
| Great Southern Ltd. | | | 301,000 | | | | 463,977 | | | |
| Incitec Pivot Ltd. | | | 47,400 | | | | 6,128,500 | | | |
| Independence Group NL | | | 362,364 | | | | 2,657,878 | | | |
| Macarthur Coal Ltd. | | | 251,544 | | | | 3,010,466 | | | |
| Mincor Resources NL | | | 571,000 | | | | 1,598,530 | | | |
| Mount Gibson Iron Ltd. * | | | 717,500 | | | | 1,882,173 | | | |
| National Can Industries Ltd. | | | 7,925 | | | | 12,278 | | | |
| Nufarm Ltd. | | | 11,200 | | | | 175,938 | | | |
| OneSteel Ltd. | | | 815,823 | | | | 4,776,655 | | | |
| Platinum Australia Ltd. * | | | 163,647 | | | | 382,210 | | | |
| Portman Ltd. * | | | 116,500 | | | | 1,327,539 | | | |
| Sally Malay Mining Ltd. | | | 669,900 | | | | 3,232,642 | | | |
| Sims Group Ltd. | | | 123,500 | | | | 3,360,908 | | | |
| TFS Corp., Ltd. | | | 1,390,771 | | | | 1,122,208 | | | |
| | | | | | | |
| | | | | | | | 32,491,622 | | | |
Media 0.1% |
| Amalgamated Holdings Ltd. | | | 118,887 | | | | 586,997 | | | |
| Seven Network Ltd. | | | 135,700 | | | | 1,185,875 | | | |
| | | | | | | |
| | | | | | | | 1,772,872 | | | |
Software & Services 0.0% |
| Data#3 Ltd. | | | 43,028 | | | | 229,334 | | | |
| |
Telecommunication Services 0.1% |
| iiNET Ltd. | | | 435,275 | | | | 795,633 | | | |
| | | | | | | |
| | | | | | | | 55,722,808 | | | |
Austria 1.0% |
| |
Consumer Durables & Apparel 0.0% |
| Linz Textile Holding AG | | | 158 | | | | 46,870 | | | |
| |
Materials 1.0% |
| Voestalpine AG | | | 168,200 | | | | 11,696,903 | | | |
| |
Software & Services 0.0% |
| S&T System Integration & Technology Distribution AG * | | | 4,341 | | | | 274,230 | | | |
| | | | | | | |
| | | | | | | | 12,018,003 | | | |
Belgium 1.1% |
| |
Capital Goods 0.0% |
| Moury Construct S.A. | | | 224 | | | | 31,933 | | | |
| Societe Anonyme Belge de Constructions Aeronautques (SABCA) | | | 681 | | | | 26,932 | | | |
| | | | | | | |
| | | | | | | | 58,865 | | | |
Consumer Durables & Apparel 0.0% |
| Jensen Group N.V. | | | 12,000 | | | | 172,562 | | | |
| |
Diversified Financials 0.0% |
| Auximines S.A. -Compagnie Auxiliaire des Mines | | | 17 | | | | 20,679 | | | |
| |
Food & Staples Retailing 0.5% |
| Delhaize Group | | | 69,956 | | | | 5,517,241 | | | |
| |
Materials 0.3% |
| Solvay S.A. | | | 4,258 | | | | 542,898 | | | |
| Tessenderlo Chemie N.V. | | | 66,754 | | | | 3,031,857 | | | |
| | | | | | | |
| | | | | | | | 3,574,755 | | | |
Real Estate 0.0% |
| Immobel | | | 2,752 | | | | 173,571 | | | |
| |
Retailing 0.3% |
| S.A. D’Ieteren N.V. | | | 7,336 | | | | 2,607,432 | | | |
| | | | | | | |
| | | | | | | | 12,125,105 | | | |
Bermuda 1.8% |
| |
Banks 0.0% |
| Hongkong Chinese Ltd. | | | 180,000 | | | | 27,930 | | | |
See financial notes.
34 Laudus International Equity Funds
Laudus Rosenberg International Small Capitalization Fund
| | | | | | | | | | | |
| | | Number of | | Value | | |
| Security | | Shares | | ($) | | |
Capital Goods 0.3% |
| Chen Hsong Holdings Ltd. | | | 426,000 | | | | 205,511 | | | |
| Chevalier International Holdings Ltd. | | | 356,000 | | | | 281,267 | | | |
| Noble Group Ltd. (a) | | | 1,844,000 | | | | 2,975,161 | | | |
| | | | | | | |
| | | | | | | | 3,461,939 | | | |
Consumer Durables & Apparel 0.1% |
| High Fashion International Ltd. | | | 60,000 | | | | 20,952 | | | |
| The Grande Holdings Ltd. | | | 14,000 | | | | 3,611 | | | |
| USI Holdings Ltd. | | | 722,727 | | | | 438,361 | | | |
| | | | | | | |
| | | | | | | | 462,924 | | | |
Consumer Services 0.0% |
| Mandarin Oriental International Ltd. | | | 152,000 | | | | 289,432 | | | |
| Star Cruises Ltd. * | | | 41,000 | | | | 8,482 | | | |
| | | | | | | |
| | | | | | | | 297,914 | | | |
Diversified Financials 0.3% |
| Asia Financial Holdings Ltd. | | | 506,000 | | | | 248,597 | | | |
| COL Capital Ltd. | | | 1,407,000 | | | | 653,576 | | | |
| Guoco Group Ltd. | | | 263,000 | | | | 2,580,698 | | | |
| | | | | | | |
| | | | | | | | 3,482,871 | | | |
Food, Beverage & Tobacco 0.1% |
| People’s Food Holdings Ltd. | | | 911,000 | | | | 695,082 | | | |
Insurance 0.1% |
| Hardy Underwriting Bermuda Ltd. | | | 90,767 | | | | 509,726 | | | |
Materials 0.0% |
| Kingboard Copper Foil Holdings Ltd. | | | 359,000 | | | | 91,515 | | | |
Real Estate 0.2% |
| Great Eagle Holdings Ltd. | | | 5,000 | | | | 13,779 | | | |
| Pacific Century Premium Developments Ltd. | | | 4,308,000 | | | | 1,564,425 | | | |
| Soundwill Holdings Ltd. | | | 554,000 | | | | 350,975 | | | |
| Tai Cheung Holdings Ltd. | | | 1,423,520 | | | | 759,974 | | | |
| | | | | | | |
| | | | | | | | 2,689,153 | | | |
Retailing 0.1% |
| Chow Sang Sang Holdings International Ltd. | | | 126,000 | | | | 130,727 | | | |
| Tan Chong International Ltd. | | | 1,236,000 | | | | 390,611 | | | |
| Wing On Co. International Ltd. | | | 276,500 | | | | 463,547 | | | |
| | | | | | | |
| | | | | | | | 984,885 | | | |
Technology Hardware & Equipment 0.2% |
| Champion Technology Holdings Ltd. | | | 4,363,582 | | | | 745,729 | | | |
| Digital China Holdings Ltd. | | | 119,000 | | | | 78,297 | | | |
| J.I.C. Technology Co., Ltd. | | | 37,000 | | | | 6,505 | | | |
| Lafe Technology Ltd. | | | 19,600 | | | | 1,924 | | | |
| Proview International Holdings Ltd. | | | 1,436,000 | | | | 98,532 | | | |
| VTech Holdings Ltd. | | | 344,000 | | | | 1,680,639 | | | |
| | | | | | | |
| | | | | | | | 2,611,626 | | | |
Telecommunication Services 0.1% |
| Asia Satellite Telecommunications Holdings Ltd. | | | 522,000 | | | | 990,648 | | | |
| SmarTone Telecommunications Holdings Ltd. | | | 497,000 | | | | 523,479 | | | |
| | | | | | | |
| | | | | | | | 1,514,127 | | | |
Transportation 0.3% |
| Transport International Holdings Ltd. | | | 705,200 | | | | 3,498,501 | | | |
| | | | | | | |
| | | | | | | | 20,328,193 | | | |
Canada 6.7% |
| |
Automobiles & Components 0.3% |
| Linamar Corp. | | | 175,300 | | | | 2,346,556 | | | |
| Martinrea International, Inc. * | | | 193,400 | | | | 1,426,312 | | | |
| | | | | | | |
| | | | | | | | 3,772,868 | | | |
Banks 0.2% |
| Laurentian Bank of Canada | | | 70,598 | | | | 2,926,538 | | | |
Capital Goods 0.0% |
| CAE, Inc. | | | 33,500 | | | | 379,566 | | | |
Diversified Financials 0.2% |
| Dundee Corp., Class A * | | | 199,460 | | | | 2,566,970 | | | |
Energy 1.5% |
| Addax Petroleum Corp. | | | 32,580 | | | | 1,293,424 | | | |
| AltaGas Income Trust | | | 106,600 | | | | 2,525,707 | | | |
| Flint Energy Services Ltd. * | | | 121,400 | | | | 2,245,980 | | | |
| Freehold Royalty Trust | | | 157,810 | | | | 2,773,532 | | | |
| Keyera Facilities Income Fund | | | 137,960 | | | | 2,822,505 | | | |
| Mullen Group Income Fund | | | 12,370 | | | | 227,166 | | | |
| Pembina Pipeline Income Fund | | | 44,350 | | | | 704,277 | | | |
| Penn West Energy Trust | | | 53,477 | | | | 1,500,451 | | | |
| Progress Energy Trust | | | 1,100 | | | | 13,717 | | | |
| Provident Energy Trust | | | 127,925 | | | | 1,364,683 | | | |
| Royal Utilities Income Fund | | | 29,070 | | | | 335,603 | | | |
| Vermilion Energy Trust | | | 26,850 | | | | 952,155 | | | |
| | | | | | | |
| | | | | | | | 16,759,200 | | | |
Food & Staples Retailing 0.1% |
| George Weston Ltd. | | | 20,900 | | | | 961,467 | | | |
Food, Beverage & Tobacco 0.3% |
| Rothmans, Inc. | | | 120,400 | | | | 3,064,983 | | | |
Insurance 0.4% |
| Industrial Alliance Insurance & Financial Services, Inc. | | | 77,300 | | | | 2,852,671 | | | |
| Northbridge Financial Corp. | | | 42,800 | | | | 1,367,665 | | | |
| | | | | | | |
| | | | | | | | 4,220,336 | | | |
Materials 2.4% |
| Agrium, Inc. | | | 21,742 | | | | 1,350,548 | | | |
| Cascades, Inc. | | | 210,660 | | | | 1,613,121 | | | |
| European Goldfields Ltd. * | | | 102,060 | | | | 532,945 | | | |
| First Quantum Minerals Ltd. | | | 10,200 | | | | 827,169 | | | |
| IAMGOLD Corp. | | | 371,700 | | | | 2,755,748 | | | |
| Inmet Mining Corp. | | | 45,500 | | | | 3,324,565 | | | |
| Kinross Gold Corp. | | | 48,800 | | | | 1,088,723 | | | |
| Major Drilling Group International, Inc. * | | | 53,400 | | | | 2,783,282 | | | |
See financial notes.
Laudus International Equity Funds 35
Laudus Rosenberg International Small Capitalization Fund
Portfolio Holdings continued
| | | | | | | | | | | |
| | | Number of | | Value | | |
| Security | | Shares | | ($) | | |
| Methanex Corp. | | | 56,090 | | | | 1,475,406 | | | |
| PAN American Silver Corp. * | | | 87,200 | | | | 3,371,784 | | | |
| Sherritt International Corp. | | | 225,320 | | | | 3,187,341 | | | |
| Sino-Forest Corp. * | | | 49,090 | | | | 765,200 | | | |
| Taseko Mines Ltd. * | | | 344,395 | | | | 1,748,062 | | | |
| Yamana Gold, Inc. | | | 154,500 | | | | 2,266,813 | | | |
| | | | | | | |
| | | | | | | | 27,090,707 | | | |
Media 0.1% |
| Cogeco Cable, Inc. | | | 1,320 | | | | 46,283 | | | |
| Cogeco, Inc. | | | 2,200 | | | | 65,371 | | | |
| Quebecor, Inc., Class B | | | 52,410 | | | | 1,314,271 | | | |
| | | | | | | |
| | | | | | | | 1,425,925 | | | |
Real Estate 0.0% |
| Extendicare Real Estate Investment Trust | | | 190 | | | | 2,166 | | | |
Retailing 0.0% |
| Leon’s Furniture Ltd. | | | 7,330 | | | | 84,979 | | | |
Software & Services 0.4% |
| CGI Group, Inc., Class A * | | | 91,450 | | | | 971,119 | | | |
| Open Text Corp. * | | | 98,000 | | | | 3,101,018 | | | |
| | | | | | | |
| | | | | | | | 4,072,137 | | | |
Technology Hardware & Equipment 0.1% |
| Celestica, Inc. * | | | 87,690 | | | | 594,595 | | | |
Utilities 0.7% |
| ATCO Ltd., Class I | | | 54,690 | | | | 2,537,228 | | | |
| Emera, Inc. | | | 71,960 | | | | 1,475,024 | | | |
| Fortis, Inc. | | | 125,700 | | | | 3,577,083 | | | |
| TransAlta Corp. | | | 18,090 | | | | 562,730 | | | |
| | | | | | | |
| | | | | | | | 8,152,065 | | | |
| | | | | | | |
| | | | | | | | 76,074,502 | | | |
Cayman Islands 0.1% |
| |
Consumer Durables & Apparel 0.1% |
| Truly International Holdings Ltd. | | | 626,000 | | | | 726,967 | | | |
Pharmaceuticals & Biotechnology 0.0% |
| China Shineway Pharmaceutical Group Ltd. | | | 18,000 | | | | 12,648 | | | |
Software & Services 0.0% |
| SUNeVision Holdings Ltd. | | | 1,050,280 | | | | 127,616 | | | |
Technology Hardware & Equipment 0.0% |
| CCT Telecom Holdings Ltd. | | | 404,000 | | | | 64,211 | | | |
Transportation 0.0% |
| Hopewell Highway Infrastructure Ltd. | | | 182,500 | | | | 140,403 | | | |
| | | | | | | |
| | | | | | | | 1,071,845 | | | |
China 0.4% |
| |
Consumer Durables & Apparel 0.1% |
| Weiqiao Textile Co., Ltd., Class H | | | 927,000 | | | | 1,200,298 | | | |
Technology Hardware & Equipment 0.1% |
| Great Wall Technology Co., Ltd., Class H * | | | 2,072,000 | | | | 477,857 | | | |
Transportation 0.2% |
| Sichuan Expressway Co., Ltd., Class H | | | 6,015,000 | | | | 2,186,163 | | | |
Utilities 0.0% |
| Huadian Power International Corp., Ltd., Class H | | | 880,000 | | | | 221,645 | | | |
| | | | | | | |
| | | | | | | | 4,085,963 | | | |
Denmark 0.3% |
| |
Banks 0.0% |
| Ostjydsk Bank A/S | | | 658 | | | | 119,236 | | | |
Capital Goods 0.2% |
| Monberg & Thorsen A/S, Class B | | | 4,661 | | | | 401,488 | | | |
| Ove Arkil Holding A/S, Class B | | | 899 | | | | 201,998 | | | |
| Per Aarsleff A/S, Class B | | | 7,416 | | | | 1,091,364 | | | |
| Renewagy A/S | | | 4,900 | | | | 10,893 | | | |
| | | | | | | |
| | | | | | | | 1,705,743 | | | |
Real Estate 0.0% |
| Tower Group A/S * | | | 15,902 | | | | 428,792 | | | |
Transportation 0.1% |
| DFDS A/S | | | 5,770 | | | | 898,574 | | | |
| | | | | | | |
| | | | | | | | 3,152,345 | | | |
Finland 0.4% |
| |
Capital Goods 0.0% |
| Larox Oyj | | | 24,816 | | | | 429,200 | | | |
Materials 0.4% |
| Kemira Oyj (a) | | | 266,797 | | | | 4,084,778 | | | |
Semiconductors & Semiconductor Equipment 0.0% |
| Okmetic Oyj * | | | 60,000 | | | | 235,002 | | | |
Software & Services 0.0% |
| Digia plc | | | 71,799 | | | | 340,176 | | | |
Technology Hardware & Equipment 0.0% |
| Elektrobit Corp. | | | 16,782 | | | | 37,887 | | | |
| | | | | | | |
| | | | | | | | 5,127,043 | | | |
France 11.0% |
| |
Automobiles & Components 3.9% |
| Compagnie Generale des Etablissements Michelin, Class B (a) | | | 198,658 | | | | 20,804,538 | | | |
| PSA Peugeot Citroen (a) | | | 169,930 | | | | 13,188,089 | | | |
| Societe Fonciere, Financiere et de Participations (FFP) | | | 38,167 | | | | 4,475,324 | | | |
| Valeo S.A. (a) | | | 155,202 | | | | 6,160,252 | | | |
| | | | | | | |
| | | | | | | | 44,628,203 | | | |
Banks 1.3% |
| Natixis (a) | | | 916,078 | | | | 14,691,997 | | | |
Capital Goods 0.4% |
| Compagnie Industrielle et Financiere d’ Entreprises | | | 598 | | | | 208,729 | | | |
| Ginger (Groupe Ingenierie Europe) | | | 8,835 | | | | 177,879 | | | |
| Haulotte Group (a) | | | 96,032 | | | | 2,187,961 | | | |
See financial notes.
36 Laudus International Equity Funds
Laudus Rosenberg International Small Capitalization Fund
| | | | | | | | | | | |
| | | Number of | | Value | | |
| Security | | Shares | | ($) | | |
| Securidev S.A. | | | 356 | | | | 14,484 | | | |
| Thales S.A. (a) | | | 28,488 | | | | 1,843,869 | | | |
| | | | | | | |
| | | | | | | | 4,432,922 | | | |
Commercial Services & Supplies 0.0% |
| A Novo * | | | 73,104 | | | | 30,004 | | | |
| Constructions Industrielles de la Mediterranee S.A. | | | 71 | | | | 8,074 | | | |
| | | | | | | |
| | | | | | | | 38,078 | | | |
Consumer Durables & Apparel 0.4% |
| Thomson | | | 641,860 | | | | 4,472,797 | | | |
Consumer Services 0.1% |
| Compagnie des Alpes | | | 4,130 | | | | 192,347 | | | |
| Pierre & Vacances (a) | | | 3,129 | | | | 376,691 | | | |
| | | | | | | |
| | | | | | | | 569,038 | | | |
Food, Beverage & Tobacco 0.0% |
| Laurent-Perrier | | | 100 | | | | 15,763 | | | |
| Sucriere de Pithiviers Le Vieil | | | 266 | | | | 214,393 | | | |
| | | | | | | |
| | | | | | | | 230,156 | | | |
Materials 2.8% |
| Ciments Francais S.A. | | | 39,280 | | | | 6,544,163 | | | |
| Eramet | | | 25,960 | | | | 20,919,727 | | | |
| Gevelot | | | 3,516 | | | | 296,616 | | | |
| Guillin Emballages | | | 60 | | | | 4,448 | | | |
| Rougier S.A. | | | 2,620 | | | | 267,068 | | | |
| Sequana Capital | | | 150,169 | | | | 3,945,618 | | | |
| Societe Anonyme d’Explosifs et de Produits Chimiques | | | 450 | | | | 266,508 | | | |
| | | | | | | |
| | | | | | | | 32,244,148 | | | |
Real Estate 0.0% |
| Acanthe Developpement S.A. | | | 34,947 | | | | 130,893 | | | |
Software & Services 2.0% |
| Atos Origin S.A. * | | | 138,685 | | | | 7,721,601 | | | |
| Cap Gemini S.A. (a) | | | 208,500 | | | | 11,871,919 | | | |
| ESI Group * | | | 9,000 | | | | 81,104 | | | |
| GFI Informatique | | | 37,935 | | | | 243,538 | | | |
| Groupe Steria S.C.A. (a) | | | 84,021 | | | | 2,765,251 | | | |
| Jet Multimedia | | | 15,000 | | | | 132,974 | | | |
| Tessi S.A. | | | 3,864 | | | | 174,534 | | | |
| | | | | | | |
| | | | | | | | 22,990,921 | | | |
Transportation 0.1% |
| Touax | | | 8,674 | | | | 473,781 | | | |
| | | | | | | |
| | | | | | | | 124,902,934 | | | |
Germany 9.2% |
| |
Automobiles & Components 0.0% |
| Bertrandt AG | | | 251 | | | | 9,431 | | | |
| Ruecker AG | | | 25,855 | | | | 297,976 | | | |
| | | | | | | |
| | | | | | | | 307,407 | | | |
Capital Goods 2.6% |
| Bilfinger Berger AG | | | 14,486 | | | | 1,245,314 | | | |
| Deutsche Steinzeug Cremer & Breuer AG * | | | 38,000 | | | | 70,191 | | | |
| Deutz AG (a)* | | | 304,707 | | | | 3,509,881 | | | |
| Duerr AG * | | | 51,356 | | | | 2,157,071 | | | |
| Gesco AG | | | 8,232 | | | | 625,883 | | | |
| Gildemeister AG | | | 170,000 | | | | 4,290,166 | | | |
| Indus Holding AG | | | 1,990 | | | | 69,711 | | | |
| Krones AG | | | 65,000 | | | | 5,351,983 | | | |
| KSB AG | | | 1,360 | | | | 920,947 | | | |
| KUKA AG (a)* | | | 98,602 | | | | 3,401,439 | | | |
| Muehlbauer Holding AG & Co. | | | 5,460 | | | | 189,779 | | | |
| Rheinmetall AG (a) | | | 111,000 | | | | 7,835,502 | | | |
| Westag & Getalit AG | | | 2,631 | | | | 66,874 | | | |
| | | | | | | |
| | | | | | | | 29,734,741 | | | |
Commercial Services & Supplies 0.0% |
| D. Logistics AG * | | | 150,322 | | | | 352,211 | | | |
Consumer Services 0.1% |
| IFA Hotel & Touristik AG * | | | 5,170 | | | | 65,751 | | | |
| TUI AG (a)* | | | 44,952 | | | | 1,153,945 | | | |
| | | | | | | |
| | | | | | | | 1,219,696 | | | |
Diversified Financials 0.0% |
| ADCapital AG | | | 498 | | | | 8,634 | | | |
Food & Staples Retailing 0.0% |
| WASGAU Produktions & Handels AG | | | 1,500 | | | | 13,593 | | | |
Food, Beverage & Tobacco 0.0% |
| Frosta AG | | | 4,880 | | | | 138,460 | | | |
| Sektkellerei Schloss Wachenheim AG | | | 21,039 | | | | 239,483 | | | |
| | | | | | | |
| | | | | | | | 377,943 | | | |
Health Care Equipment & Services 0.2% |
| Fresenius SE | | | 32,365 | | | | 2,742,695 | | | |
Materials 5.0% |
| Altana AG | | | 203,669 | | | | 4,287,826 | | | |
| K&S AG | | | 48,032 | | | | 15,624,770 | | | |
| Lanxess | | | 298,200 | | | | 11,985,752 | | | |
| Norddeutsche Affinerie AG (a) | | | 93,225 | | | | 3,687,174 | | | |
| Salzgitter AG | | | 119,000 | | | | 20,729,692 | | | |
| | | | | | | |
| | | | | | | | 56,315,214 | | | |
Retailing 0.1% |
| ComputerLinks AG | | | 16,576 | | | | 307,695 | | | |
| Essanelle Hair Group * | | | 11,162 | | | | 146,129 | | | |
| Hornbach Baumarkt Aktiengesellschaft | | | 2,700 | | | | 166,242 | | | |
| | | | | | | |
| | | | | | | | 620,066 | | | |
Semiconductors & Semiconductor Equipment 0.0% |
| ELMOS Semiconductor AG * | | | 33,286 | | | | 247,163 | | | |
Software & Services 0.2% |
| Bechtle AG | | | 15,839 | | | | 498,931 | | | |
| Cancom IT Systeme AG * | | | 36,078 | | | | 201,359 | | | |
| Integralis AG * | | | 33,677 | | | | 268,874 | | | |
| PC-Ware AG | | | 16,089 | | | | 302,045 | | | |
| REALTECH AG | | | 13,166 | | | | 251,653 | | | |
| syzygy AG * | | | 50,974 | | | | 253,700 | | | |
| USU Software AG | | | 24,000 | | | | 138,126 | | | |
| | | | | | | |
| | | | | | | | 1,914,688 | | | |
Technology Hardware & Equipment 0.7% |
| Augusta Technologie AG * | | | 21,207 | | | | 495,779 | | | |
| Epcos AG | | | 318,661 | | | | 4,847,353 | | | |
| Euromicron AG | | | 19,901 | | | | 433,578 | | | |
See financial notes.
Laudus International Equity Funds 37
Laudus Rosenberg International Small Capitalization Fund
Portfolio Holdings continued
| | | | | | | | | | | |
| | | Number of | | Value | | |
| Security | | Shares | | ($) | | |
| Funkwerk AG | | | 16,891 | | | | 269,979 | | | |
| Hyrican Informationssystems AG | | | 6,000 | | | | 115,085 | | | |
| Roth & Rau AG * | | | 5,787 | | | | 1,203,784 | | | |
| | | | | | | |
| | | | | | | | 7,365,558 | | | |
Utilities 0.3% |
| MVV Energie AG (a) | | | 78,000 | | | | 3,830,667 | | | |
| | | | | | | |
| | | | | | | | 105,050,276 | | | |
Hong Kong 0.7% |
| |
Banks 0.3% |
| Industrial and Commercial Bank of China (Asia) Ltd. | | | 1,179,000 | | | | 2,944,126 | | | |
Consumer Services 0.0% |
| Associated International Hotels Ltd. * | | | 4,000 | | | | 8,004 | | | |
Diversified Financials 0.1% |
| Allied Group Ltd. | | | 207,600 | | | | 781,537 | | | |
| Allied Properties (H.K.) Ltd. | | | 924,000 | | | | 188,020 | | | |
| Lippo Ltd. | | | 112,000 | | | | 86,639 | | | |
| | | | | | | |
| | | | | | | | 1,056,196 | | | |
Media 0.0% |
| I-Cable Communications Ltd. | | | 53,000 | | | | 7,909 | | | |
Real Estate 0.2% |
| China Motor Bus Co., Ltd. | | | 4,000 | | | | 31,671 | | | |
| Hong Kong Ferry (Holdings) Co., Ltd. | | | 258,280 | | | | 248,441 | | | |
| Keck Seng Investments (Hong Kong) Ltd. | | | 94,000 | | | | 48,702 | | | |
| Melbourne Enterprises Ltd. | | | 2,000 | | | | 15,110 | | | |
| Miramar Hotel & Investment Co., Ltd. | | | 326,000 | | | | 475,445 | | | |
| TAI Sang Land Developement Ltd. | | | 101,000 | | | | 50,407 | | | |
| Wheelock Properties Ltd. | | | 1,639,000 | | | | 1,313,094 | | | |
| | | | | | | |
| | | | | | | | 2,182,870 | | | |
Retailing 0.0% |
| Goldlion Holdings Ltd. | | | 300,000 | | | | 91,279 | | | |
Transportation 0.1% |
| Hopewell Holdings Ltd. | | | 368,000 | | | | 1,405,807 | | | |
| Safety Godown Co., Ltd. | | | 8,000 | | | | 5,297 | | | |
| | | | | | | |
| | | | | | | | 1,411,104 | | | |
| | | | | | | |
| | | | | | | | 7,701,488 | | | |
Ireland 0.8% |
| |
Capital Goods 0.6% |
| DCC plc | | | 251,302 | | | | 5,937,118 | | | |
Consumer Durables & Apparel 0.0% |
| Abbey plc | | | 15,931 | | | | 146,395 | | | |
Energy 0.2% |
| Dragon Oil a plc (a)* | | | 278,869 | | | | 2,477,852 | | | |
Software & Services 0.0% |
| Horizon Technology Group plc * | | | 77,652 | | | | 122,043 | | | |
| IONA Technologies plc * | | | 29,206 | | | | 110,538 | | | |
| | | | | | | |
| | | | | | | | 232,581 | | | |
| | | | | | | |
| | | | | | | | 8,793,946 | | | |
Italy 4.6% |
| |
Banks 0.0% |
| Banco di Sardegna S.p.A. | | | 1,034 | | | | 22,917 | | | |
Capital Goods 1.4% |
| Astaldi S.p.A. | | | 315,378 | | | | 2,429,968 | | | |
| Biesse S.p.A. | | | 33,417 | | | | 716,417 | | | |
| C.I.R. S.p.A. – Compagnie Industriali Riunite (a) | | | 1,758,000 | | | | 4,710,772 | | | |
| Cofide S.p.A. – Compagnia Finanziaria de Benedetti | | | 769,882 | | | | 886,957 | | | |
| Danieli S.p.A. – Officine Meccaniche Danieli & Co. | | | 143,186 | | | | 5,177,274 | | | |
| Vianini Lavori S.p.A. | | | 118,000 | | | | 1,663,175 | | | |
| | | | | | | |
| | | | | | | | 15,584,563 | | | |
Consumer Durables & Apparel 0.2% |
| Safilo Group S.p.A. (a) | | | 707,096 | | | | 2,253,217 | | | |
Diversified Financials 1.0% |
| IFIL Investments S.p.A. (a) | | | 1,349,456 | | | | 10,895,841 | | | |
| Intek S.p.A. | | | 185,475 | | | | 180,042 | | | |
| | | | | | | |
| | | | | | | | 11,075,883 | | | |
Food, Beverage & Tobacco 0.0% |
| Centrale del Latte di Torino & C S.p.A. | | | 3,956 | | | | 14,164 | | | |
| La Doria S.p.A. * | | | 32,445 | | | | 66,630 | | | |
| | | | | | | |
| | | | | | | | 80,794 | | | |
Household & Personal Products 0.1% |
| Mirato S.p.A. | | | 51,665 | | | | 667,917 | | | |
Materials 1.6% |
| Buzzi Unicem S.p.A. (a) | | | 272,048 | | | | 6,786,210 | | | |
| Cementir S.p.A. Cementerie del Tirreno | | | 408,944 | | | | 3,803,598 | | | |
| Italcementi S.p.A. (a) | | | 340,800 | | | | 6,921,991 | | | |
| KME Group * | | | 402,068 | | | | 653,457 | | | |
| | | | | | | |
| | | | | | | | 18,165,256 | | | |
Retailing 0.0% |
| BasicNet S.p.A. * | | | 39,408 | | | | 115,031 | | | |
Software & Services 0.1% |
| Engineering Ingegneria Informatica S.p.A. | | | 29,038 | | | | 1,089,381 | | | |
Technology Hardware & Equipment 0.0% |
| Gefran S.p.A. | | | 39,000 | | | | 289,004 | | | |
Transportation 0.0% |
| Autostrade Meridionali S.p.A. | | | 216 | | | | 5,465 | | | |
Utilities 0.2% |
| Iride S.p.A. (a) | | | 795,689 | | | | 2,522,828 | | | |
| | | | | | | |
| | | | | | | | 51,872,256 | | | |
See financial notes.
38 Laudus International Equity Funds
Laudus Rosenberg International Small Capitalization Fund
| | | | | | | | | | | |
| | | Number of | | Value | | |
| Security | | Shares | | ($) | | |
Japan 16.0% |
| |
Automobiles & Components 1.1% |
| Ahresty Corp. | | | 5,100 | | | | 68,809 | | | |
| Aichi Machine Industry Co., Ltd. | | | 331,000 | | | | 615,389 | | | |
| Aisan Industry Co., Ltd. | | | 40,300 | | | | 417,445 | | | |
| Ashimori Industry Co., Ltd. | | | 133,000 | | | | 223,623 | | | |
| Bosch Corp. | | | 264,000 | | | | 1,077,141 | | | |
| F.C.C. Co., Ltd. | | | 16,600 | | | | 206,145 | | | |
| Fuji Heavy Industries Ltd. (a) | | | 533,000 | | | | 2,256,070 | | | |
| HI-LEX Corp. | | | 38,300 | | | | 536,462 | | | |
| Ichishin Co., Ltd. | | | 35,500 | | | | 116,557 | | | |
| Mikuni Corp. | | | 28,000 | | | | 82,693 | | | |
| Murakami Corp. | | | 2,000 | | | | 15,353 | | | |
| Nihon Plast Co., Ltd. | | | 9,400 | | | | 49,686 | | | |
| Nippon Seiki Co., Ltd. | | | 1,000 | | | | 13,647 | | | |
| Nittan Valve Co., Ltd. | | | 5,100 | | | | 27,303 | | | |
| Piolax, Inc. | | | 100 | | | | 2,183 | | | |
| Showa Corp. (a) | | | 122,100 | | | | 1,094,128 | | | |
| SOFT99 Corp. | | | 29,500 | | | | 188,514 | | | |
| Sumitomo Rubber Industries Ltd. | | | 327,400 | | | | 2,520,972 | | | |
| Suncall Corp. | | | 26,000 | | | | 123,881 | | | |
| Takata Corp. | | | 57,600 | | | | 1,283,152 | | | |
| Topre Corp. | | | 129,200 | | | | 1,164,480 | | | |
| Univance Corp. | | | 8,500 | | | | 39,622 | | | |
| | | | | | | |
| | | | | | | | 12,123,255 | | | |
Banks 1.0% |
| Shinsei Bank Ltd. (a) | | | 77,000 | | | | 254,301 | | | |
| The Aichi Bank Ltd. | | | 29,700 | | | | 2,182,859 | | | |
| The Biwako Bank Ltd. | | | 3,000 | | | | 4,806 | | | |
| The Chiba Kogyo Bank Ltd. * | | | 1,800 | | | | 24,789 | | | |
| The Daishi Bank Ltd. | | | 11,000 | | | | 42,906 | | | |
| The Eighteenth Bank Ltd. | | | 403,000 | | | | 1,488,314 | | | |
| The Higashi-Nippon Bank Ltd. | | | 98,000 | | | | 339,996 | | | |
| The Higo Bank Ltd. | | | 47,000 | | | | 272,744 | | | |
| The Hyakugo Bank Ltd. | | | 343,000 | | | | 2,046,231 | | | |
| The Hyakujushi Bank Ltd. | | | 9,000 | | | | 48,036 | | | |
| The Kita-Nippon Bank Ltd. | | | 5,100 | | | | 189,243 | | | |
| The Nishi-Nippon City Bank Ltd. | | | 2,000 | | | | 5,296 | | | |
| The San-in Godo Bank Ltd. | | | 210,000 | | | | 1,686,244 | | | |
| The Taiko Bank Ltd. | | | 60,000 | | | | 168,810 | | | |
| The Tochigi Bank Ltd. | | | 2,000 | | | | 12,293 | | | |
| The Yachiyo Bank Ltd. | | | 126 | | | | 536,441 | | | |
| The Yamanashi Chuo Bank Ltd. | | | 136,000 | | | | 828,437 | | | |
| Yamaguchi Financial Group, Inc. | | | 74,000 | | | | 841,698 | | | |
| | | | | | | |
| | | | | | | | 10,973,444 | | | |
Capital Goods 3.6% |
| Aichi Corp. | | | 74,300 | | | | 556,940 | | | |
| Aichi Electric Co., Ltd. | | | 2,000 | | | | 4,716 | | | |
| Aida Engineering Ltd. | | | 269,000 | | | | 1,696,416 | | | |
| Amada Co., Ltd. | | | 274,000 | | | | 2,097,704 | | | |
| Aoki Marine Co., Ltd. | | | 15,000 | | | | 45,217 | | | |
| C-Cube Corp. | | | 96,600 | | | | 296,080 | | | |
| Chodai Co., Ltd. | | | 23,000 | | | | 78,328 | | | |
| Chudenko Corp. | | | 22,100 | | | | 347,893 | | | |
| CKD Corp. | | | 17,400 | | | | 116,675 | | | |
| CTI Engineering Co., Ltd. | | | 47,900 | | | | 275,581 | | | |
| Daiichi Kensetu Corp. | | | 10,000 | | | | 75,394 | | | |
| Denkyosha Co., Ltd. | | | 20,000 | | | | 121,915 | | | |
| Ebara Corp. (a) | | | 769,000 | | | | 2,364,395 | | | |
| Fuji Electric Holdings Co., Ltd. | | | 592,000 | | | | 2,421,396 | | | |
| Fuji Machine Manufacturing Co., Ltd. | | | 121,600 | | | | 2,548,093 | | | |
| Furusato Industries Ltd. | | | 24,000 | | | | 242,677 | | | |
| Futaba Corp. (a) | | | 122,600 | | | | 2,120,735 | | | |
| Hitachi Cable Ltd. | | | 426,000 | | | | 1,604,224 | | | |
| Inabata & Co., Ltd. | | | 18,900 | | | | 101,969 | | | |
| Ishikawajima Transportation Machinery Co., Ltd. | | | 43,000 | | | | 190,218 | | | |
| Japan Pulp & Paper Co., Ltd. | | | 248,000 | | | | 878,591 | | | |
| Kamei Corp. | | | 93,000 | | | | 398,353 | | | |
| Kanaden Corp. | | | 106,000 | | | | 593,695 | | | |
| Kioritz Corp. | | | 247,000 | | | | 553,962 | | | |
| Koatsu Kogyo Co., Ltd. | | | 28,000 | | | | 102,247 | | | |
| Komori Corp. | | | 110,800 | | | | 2,324,625 | | | |
| Kowa Spinning Co., Ltd. | | | 12,000 | | | | 36,587 | | | |
| Maeda Corp. (a) | | | 140,000 | | | | 411,201 | | | |
| Maeda Road Construction Co., Ltd. | | | 93,000 | | | | 769,334 | | | |
| Marufuji Sheet Piling Co., Ltd. | | | 29,000 | | | | 62,613 | | | |
| Mitani Corp. | | | 28,100 | | | | 211,425 | | | |
| Miyachi Corp. (a) | | | 41,100 | | | | 383,602 | | | |
| Mori Seiki Co., Ltd. | | | 11,100 | | | | 201,533 | | | |
| Musashi Co., Ltd. | | | 500 | | | | 7,052 | | | |
| Nagase & Co., Ltd. | | | 11,000 | | | | 113,212 | | | |
| Nakano Refrigerators Co., Ltd. | | | 1,800 | | | | 14,774 | | | |
| Nichireki Co., Ltd. | | | 11,000 | | | | 28,957 | | | |
| Nihon Decoluxe Co., Ltd. | | | 2,000 | | | | 11,346 | | | |
| Nippo Corp. | | | 354,000 | | | | 2,002,297 | | | |
| Nippon Road Co., Ltd. | | | 271,000 | | | | 370,716 | | | |
| Nippon Thompson Co., Ltd. | | | 208,000 | | | | 1,282,036 | | | |
| Nishimatsu Construction Co., Ltd. (a) | | | 753,000 | | | | 1,617,550 | | | |
| Nissei Plastic Industrial Co., Ltd. | | | 82,400 | | | | 400,572 | | | |
| Nitto Kogyo Corp. (a) | | | 114,200 | | | | 1,442,829 | | | |
| Ohmoto Gumi Co., Ltd. | | | 34,000 | | | | 103,068 | | | |
| Okaya & Co., Ltd. | | | 1,000 | | | | 10,766 | | | |
| Oki Wintech Co., Ltd. | | | 45,000 | | | | 230,900 | | | |
| Original Engineering Consultants Co., Ltd. | | | 13,000 | | | | 28,040 | | | |
| Rheon Automatic Machinery Co., Ltd. | | | 2,000 | | | | 6,773 | | | |
| Sankyo Rikagaku Co., Ltd. | | | 19,000 | | | | 237,481 | | | |
| Sanso Electric Co., Ltd. | | | 30,000 | | | | 86,413 | | | |
| Sanwa Holdings Corp. (a) | | | 522,000 | | | | 2,284,078 | | | |
| Seibu Electric Industry Co., Ltd. | | | 78,000 | | | | 348,179 | | | |
| ShinMaywa Industries Ltd. (a) | | | 378,000 | | | | 1,170,236 | | | |
| Sintokogio Ltd. | | | 46,200 | | | | 384,080 | | | |
| Sojitz Corp. | | | 53,400 | | | | 178,734 | | | |
| Sugimoto & Co., Ltd. | | | 3,100 | | | | 38,952 | | | |
| Taisei Oncho Co., Ltd. | | | 49,000 | | | | 183,439 | | | |
| Taisei Rotec Corp. | | | 308,000 | | | | 399,130 | | | |
| Takeuchi Mfg. Co., Ltd. (a) | | | 43,900 | | | | 905,710 | | | |
| Tigers Polymer Corp. | | | 8,300 | | | | 42,549 | | | |
| Totech Corp. | | | 42,000 | | | | 160,745 | | | |
| Trusco Nakayama Corp. (a) | | | 117,100 | | | | 1,805,737 | | | |
See financial notes.
Laudus International Equity Funds 39
Laudus Rosenberg International Small Capitalization Fund
Portfolio Holdings continued
| | | | | | | | | | | |
| | | Number of | | Value | | |
| Security | | Shares | | ($) | | |
| Tsurumi Manufacturing Co., Ltd. | | | 14,000 | | | | 91,642 | | | |
| Tsuzuki Denki Co., Ltd. | | | 5,000 | | | | 16,003 | | | |
| Uehara Sei Shoji Co., Ltd. | | | 51,000 | | | | 200,023 | | | |
| Wakita & Co., Ltd. | | | 49,000 | | | | 290,892 | | | |
| Yondenko Corp. | | | 124,000 | | | | 665,622 | | | |
| | | | | | | |
| | | | | | | | 41,394,867 | | | |
Commercial Services & Supplies 0.0% |
| Kawanishi Warehouse Co., Ltd. | | | 7,000 | | | | 48,877 | | | |
| Kimura Unity Co., Ltd. | | | 2,500 | | | | 19,808 | | | |
| Wesco, Inc. | | | 56,800 | | | | 112,081 | | | |
| | | | | | | |
| | | | | | | | 180,766 | | | |
Consumer Durables & Apparel 0.7% |
| Corona Corp. | | | 49,800 | | | | 544,818 | | | |
| Fuji Corp. | | | 18,000 | | | | 141,302 | | | |
| Fujishoji Co., Ltd. | | | 170 | | | | 122,745 | | | |
| Fujix Ltd. | | | 12,000 | | | | 51,623 | | | |
| Heiwa Corp. (a) | | | 99,800 | | | | 953,488 | | | |
| Hitachi Koki Co., Ltd. | | | 94,100 | | | | 1,211,171 | | | |
| Ichikawa Co., Ltd. | | | 79,000 | | | | 277,759 | | | |
| Jichodo Co., Ltd. | | | 16,000 | | | | 138,370 | | | |
| Kurabo Industries Ltd. | | | 790,000 | | | | 1,785,578 | | | |
| Maruzen Co., Ltd. | | | 3,000 | | | | 12,255 | | | |
| Miyuki Holdings Co., Ltd. | | | 27,000 | | | | 76,013 | | | |
| Pioneer Corp. (a) | | | 25,300 | | | | 254,058 | | | |
| Roland Corp. | | | 66,400 | | | | 1,300,533 | | | |
| Sega Sammy Holdings, Inc. | | | 20,400 | | | | 217,380 | | | |
| SRI Sports Ltd. | | | 64 | | | | 85,862 | | | |
| Tachikawa Corp. | | | 60,300 | | | | 300,306 | | | |
| Ten Arrows Co., Ltd. | | | 3,600 | | | | 18,784 | | | |
| Tokyo Style Co., Ltd. | | | 83,000 | | | | 831,069 | | | |
| Toso Co., Ltd. | | | 42,000 | | | | 82,584 | | | |
| | | | | | | |
| | | | | | | | 8,405,698 | | | |
Consumer Services 0.4% |
| Daisyo Corp. (a) | | | 33,300 | | | | 362,637 | | | |
| Eikoh, Inc. | | | 33,000 | | | | 128,336 | | | |
| Johnan Academic Preparatory Institute, Inc. | | | 32,000 | | | | 41,412 | | | |
| Nissin Healthcare Food Service Co., Ltd. | | | 3,700 | | | | 41,009 | | | |
| Plenus Co., Ltd. (a) | | | 98,400 | | | | 1,273,149 | | | |
| Royal Holdings Co., Ltd. | | | 10,900 | | | | 114,617 | | | |
| Saizeriya Co., Ltd. (a) | | | 134,400 | | | | 1,294,195 | | | |
| Shidax Corp. | | | 1,201 | | | | 614,435 | | | |
| Shingakukai Co., Ltd. | | | 44,600 | | | | 219,259 | | | |
| | | | | | | |
| | | | | | | | 4,089,049 | | | |
Diversified Financials 0.0% |
| Daiko Clearing Services Corp. | | | 41,300 | | | | 236,328 | | | |
| Hitachi Capital Corp. | | | 700 | | | | 8,421 | | | |
| Takagi Securities Co., Ltd. | | | 67,000 | | | | 148,491 | | | |
| | | | | | | |
| | | | | | | | 393,240 | | | |
Energy 0.4% |
| Cosmo Oil Co., Ltd. | | | 598,000 | | | | 1,894,979 | | | |
| Japan Petroleum Exploration Co., Ltd. | | | 36,400 | | | | 2,430,707 | | | |
| Kanto Natural Gas Development Co., Ltd. | | | 3,000 | | | | 18,142 | | | |
| Sinanen Co., Ltd. | | | 29,000 | | | | 119,514 | | | |
| | | | | | | |
| | | | | | | | 4,463,342 | | | |
Food & Staples Retailing 0.3% |
| Cawachi Ltd. | | | 69,700 | | | | 1,810,098 | | | |
| Cowboy Co., Ltd. * | | | 67,000 | | | | 106,445 | | | |
| Itochu-Shokuhin Co., Ltd. | | | 2,100 | | | | 64,514 | | | |
| Kasumi Co., Ltd. (a) | | | 62,000 | | | | 322,706 | | | |
| Marukyo Corp. | | | 8,000 | | | | 48,022 | | | |
| Okuwa Co., Ltd. | | | 42,000 | | | | 593,311 | | | |
| Poplar Co., Ltd. | | | 1,900 | | | | 13,225 | | | |
| San-A Co., Ltd. | | | 900 | | | | 27,831 | | | |
| Tokan Co., Ltd. | | | 1,000 | | | | 14,095 | | | |
| Universe Co., Ltd. | | | 5,000 | | | | 53,156 | | | |
| Uny Co., Ltd. (a) | | | 8,000 | | | | 76,790 | | | |
| | | | | | | |
| | | | | | | | 3,130,193 | | | |
Food, Beverage & Tobacco 0.8% |
| Coca-Cola Central Japan Co., Ltd. | | | 205 | | | | 1,765,069 | | | |
| EJ Holdings, Inc. * | | | 110 | | | | 18,760 | | | |
| Mercian Corp. (a) | | | 222,000 | | | | 456,676 | | | |
| Mikuni Coca-Cola Bottling Co., Ltd. | | | 130,100 | | | | 1,499,721 | | | |
| Morinaga Milk Industry Co., Ltd. | | | 50,000 | | | | 153,474 | | | |
| Nichiwa Sangyo Co., Ltd. | | | 57,000 | | | | 182,652 | | | |
| Nippon Beet Sugar Manufacturing Co., Ltd. (a) | | | 325,000 | | | | 713,402 | | | |
| Nissin Sugar Manufacturing Co., Ltd. | | | 115,000 | | | | 251,845 | | | |
| Q.P. Corp. | | | 77,100 | | | | 800,352 | | | |
| Sonton Food Industry Co., Ltd. | | | 31,000 | | | | 248,225 | | | |
| The Nisshin Oillio Group Ltd. (a) | | | 545,000 | | | | 2,107,878 | | | |
| Tokatsu Foods Co., Ltd. | | | 63,000 | | | | 314,117 | | | |
| Yonekyu Corp. | | | 111,000 | | | | 915,075 | | | |
| | | | | | | |
| | | | | | | | 9,427,246 | | | |
Health Care Equipment & Services 0.1% |
| Create Medic Co., Ltd. | | | 6,000 | | | | 52,583 | | | |
| Fukuda Denshi Co., Ltd. | | | 12,700 | | | | 311,619 | | | |
| Hitachi Medical Corp. | | | 102,000 | | | | 699,241 | | | |
| JMS Co., Ltd. | | | 20,000 | | | | 47,025 | | | |
| N.I.C. Corp. | | | 50,400 | | | | 240,893 | | | |
| Nissui Pharmaceutical Co., Ltd. | | | 3,700 | | | | 23,060 | | | |
| Tokiwa Yakuhin Co., Ltd. | | | 11,000 | | | | 47,263 | | | |
| | | | | | | |
| | | | | | | | 1,421,684 | | | |
Household & Personal Products 0.1% |
| Kose Corp. | | | 46,800 | | | | 1,017,835 | | | |
Insurance 0.3% |
| Aioi Insurance Co., Ltd. | | | 505,000 | | | | 2,830,114 | | | |
Materials 3.8% |
| Arakawa Chemical Industriial Ltd. | | | 17,500 | | | | 205,225 | | | |
| Asahi Industries Co., Ltd. | | | 205 | | | | 256,382 | | | |
| Atomix Co., Ltd. | | | 3,000 | | | | 7,073 | | | |
| Chubu Steel Plate Co., Ltd. | | | 112,300 | | | | 1,016,389 | | | |
See financial notes.
40 Laudus International Equity Funds
Laudus Rosenberg International Small Capitalization Fund
| | | | | | | | | | | |
| | | Number of | | Value | | |
| Security | | Shares | | ($) | | |
| Denki Kagaku Kogyo Kabushiki Kaisha | | | 693,000 | | | | 2,204,401 | | | |
| DIC Corp. | | | 475,000 | | | | 1,502,668 | | | |
| Hitachi Chemical Co., Ltd. | | | 73,000 | | | | 1,387,099 | | | |
| Kaneka Corp. | | | 217,000 | | | | 1,371,684 | | | |
| Kuraray Co., Ltd. | | | 136,500 | | | | 1,640,540 | | | |
| Kyoei Steel Ltd. | | | 97,800 | | | | 2,658,027 | | | |
| Mitsubishi Gas Chemical Co., Inc. | | | 278,000 | | | | 1,985,326 | | | |
| Mitsubishi Rayon Co., Ltd. (a) | | | 401,000 | | | | 1,294,486 | | | |
| Mitsui Mining & Smelting Co., Ltd. | | | 428,000 | | | | 1,358,403 | | | |
| Mory Industries, Inc. | | | 120,000 | | | | 404,186 | | | |
| N.E. Chemcat Corp. | | | 41,000 | | | | 749,612 | | | |
| Nichia Steel Works Ltd. (a) | | | 126,000 | | | | 472,349 | | | |
| Nihon Yamamura Glaaa Co., Ltd. | | | 235,000 | | | | 481,095 | | | |
| Nippon Chemical Industrial Co., Ltd. | | | 28,000 | | | | 66,815 | | | |
| Nippon Light Metal Co., Ltd. | | | 1,334,000 | | | | 2,027,410 | | | |
| Nippon Paper Group, Inc. | | | 322 | | | | 771,688 | | | |
| Nippon Shokubai Co., Ltd. | | | 74,000 | | | | 492,737 | | | |
| Nippon Soda Co., Ltd. | | | 422,000 | | | | 1,376,041 | | | |
| Nisshin Steel Co., Ltd. (a) | | | 758,000 | | | | 2,648,851 | | | |
| Nitto FC Co., Ltd. | | | 4,000 | | | | 17,392 | | | |
| Osaka Steel Co., Ltd. | | | 127,400 | | | | 1,652,849 | | | |
| Sakai Chemical Industry Co., Ltd. | | | 369,000 | | | | 1,320,212 | | | |
| Sumitomo Seika Chemicals Co., Ltd. | | | 174,000 | | | | 813,711 | | | |
| Toagosei Co., Ltd. | | | 573,000 | | | | 2,368,475 | | | |
| Tokuyama Corp. | | | 217,000 | | | | 1,593,621 | | | |
| Tokyo Ohka Kogyo Co., Ltd. | | | 28,700 | | | | 633,982 | | | |
| Tokyo Tekko Co., Ltd. (a) | | | 174,000 | | | | 722,992 | | | |
| Topy Industries Ltd. (a) | | | 753,000 | | | | 2,141,384 | | | |
| Tosoh Corp. (a) | | | 674,000 | | | | 2,342,179 | | | |
| Toyo Ink Mfg. Co., Ltd. | | | 321,000 | | | | 1,115,688 | | | |
| Toyo Kohan Co., Ltd. | | | 16,000 | | | | 83,913 | | | |
| Toyo Seikan Kaisha Ltd. | | | 12,000 | | | | 229,729 | | | |
| Yodogawa Steel Works Ltd. | | | 460,000 | | | | 2,247,803 | | | |
| | | | | | | |
| | | | | | | | 43,662,417 | | | |
Media 0.1% |
| Chubu-Nippon Broadcasting Co., Ltd. | | | 800 | | | | 6,679 | | | |
| Daiichikosho Co., Ltd. | | | 1,100 | | | | 10,739 | | | |
| Hakuhodo Dy Holdings, Inc. | | | 70 | | | | 4,216 | | | |
| RKB Mainichi Broadcasting Corp. | | | 37,000 | | | | 265,545 | | | |
| Sky Perfect JSAT Corp. (a) | | | 2,552 | | | | 1,034,175 | | | |
| | | | | | | |
| | | | | | | | 1,321,354 | | | |
Pharmaceuticals & Biotechnology 0.4% |
| Dainippon Sumitomo Pharma Co., Ltd. (a) | | | 49,000 | | | | 452,637 | | | |
| Mitsubishi Tanabe Pharma Corp. | | | 4,000 | | | | 46,589 | | | |
| Nippon Shinyaku Co., Ltd. | | | 174,000 | | | | 1,809,254 | | | |
| Seikagaku Corp. | | | 39,400 | | | | 447,057 | | | |
| Torii Pharmaceutical Co., Ltd. | | | 91,600 | | | | 1,299,996 | | | |
| | | | | | | |
| | | | | | | | 4,055,533 | | | |
Real Estate 0.1% |
| Hosoda Corp. | | | 57,000 | | | | 219,638 | | | |
| Nisshin Fudosan Co., Ltd. (a) | | | 68,700 | | | | 448,921 | | | |
| Sankyo Frontier Co., Ltd. | | | 64,000 | | | | 181,060 | | | |
| Yuraku Real Estate Co., Ltd. | | | 117,000 | | | | 297,337 | | | |
| | | | | | | |
| | | | | | | | 1,146,956 | | | |
Retailing 0.7% |
| Aoyama Trading Co., Ltd. | | | 117,600 | | | | 2,546,490 | | | |
| AT-Group Co., Ltd. | | | 20,000 | | | | 253,568 | | | |
| Belluna Co., Ltd. (a) | | | 120,300 | | | | 1,011,929 | | | |
| Daiwa Co., Ltd. | | | 96,000 | | | | 144,860 | | | |
| DCM Japan Holdings Co., Ltd. (a) | | | 190,000 | | | | 956,177 | | | |
| Fujitsu Business Systems Ltd. (a) | | | 76,900 | | | | 893,709 | | | |
| Haruyama Trading Co., Ltd. (a) | | | 21,900 | | | | 139,995 | | | |
| Hikari Furniture Co., Ltd. | | | 1,000 | | | | 5,232 | | | |
| Kato Sangyo Co., Ltd. | | | 1,000 | | | | 10,751 | | | |
| King Co., Ltd. | | | 64,000 | | | | 175,735 | | | |
| Kitamura Co Ltd | | | 2,100 | | | | 13,590 | | | |
| Ku Co., Ltd. | | | 60,700 | | | | 285,801 | | | |
| Mac House Co., Ltd. | | | 8,400 | | | | 57,802 | | | |
| Nafco Co., Ltd. | | | 25,900 | | | | 364,624 | | | |
| Nagahori Corp. | | | 57,000 | | | | 182,985 | | | |
| Sazaby League, Ltd. | | | 30,800 | | | | 566,816 | | | |
| Senshukai Co., Ltd. (a) | | | 45,900 | | | | 375,286 | | | |
| Shichie Co., Ltd. | | | 24,000 | | | | 162,609 | | | |
| The Daiei, Inc. (a)* | | | 37,600 | | | | 223,894 | | | |
| | | | | | | |
| | | | | | | | 8,371,853 | | | |
Semiconductors & Semiconductor Equipment 0.1% |
| Mitsui High-tec, Inc. (a) | | | 143,800 | | | | 1,110,631 | | | |
| Shindengen Electric Manufacturing Co., Ltd. | | | 250,000 | | | | 495,864 | | | |
| | | | | | | |
| | | | | | | | 1,606,495 | | | |
Software & Services 0.3% |
| Acca Networks Co., Ltd. | | | 42 | | | | 58,146 | | | |
| Aeria, Inc. | | | 12 | | | | 16,902 | | | |
| Atlus Co., Ltd. * | | | 4,100 | | | | 24,709 | | | |
| Computer Engineering & Consulting Ltd. | | | 1,000 | | | | 9,006 | | | |
| Hitachi Information System Ltd. | | | 3,500 | | | | 75,652 | | | |
| Hitachi System & Services Ltd. | | | 60,000 | | | | 1,323,222 | | | |
| Japan Process Development Co., Ltd. | | | 16,700 | | | | 133,328 | | | |
| NEC Fielding Ltd. | | | 102,900 | | | | 1,248,472 | | | |
| | | | | | | |
| | | | | | | | 2,889,437 | | | |
Technology Hardware & Equipment 1.1% |
| Dainippon Screen Mfg. Co., Ltd. (a) | | | 9,000 | | | | 38,070 | | | |
| Daishinku Corp. | | | 67,000 | | | | 280,658 | | | |
| Eizo Nanao Corp. (a) | | | 7,600 | | | | 147,967 | | | |
| Fujitsu Frontech Ltd. | | | 200 | | | | 1,477 | | | |
| Furuno Electric Co., Ltd. | | | 42,200 | | | | 415,035 | | | |
| Hakuto Co., Ltd. | | | 64,300 | | | | 589,523 | | | |
| Hitachi Maxell Ltd. | | | 171,000 | | | | 1,778,319 | | | |
| Japan Aviation Electronics Industry Ltd. | | | 81,000 | | | | 596,471 | | | |
| Japan Digital Laboratory Co., Ltd. | | | 119,000 | | | | 1,661,399 | | | |
See financial notes.
Laudus International Equity Funds 41
Laudus Rosenberg International Small Capitalization Fund
Portfolio Holdings continued
| | | | | | | | | | | |
| | | Number of | | Value | | |
| Security | | Shares | | ($) | | |
| Katsuragawa Electric Co., Ltd. | | | 3,000 | | | | 17,816 | | | |
| Kitagawa Industries Co., Ltd. | | | 9,700 | | | | 144,144 | | | |
| Macnica, Inc. | | | 16,200 | | | | 181,563 | | | |
| Nichicon Corp. (a) | | | 200,000 | | | | 1,576,100 | | | |
| Riso Kagaku Corp. | | | 51,600 | | | | 633,672 | | | |
| Roland DG Corp. | | | 12,800 | | | | 315,754 | | | |
| Ryoden Trading Co., Ltd. | | | 40,000 | | | | 252,884 | | | |
| Ryoyo Electro Corp. | | | 85,400 | | | | 840,018 | | | |
| Tachibana Eletech Co., Ltd. | | | 1,100 | | | | 9,249 | | | |
| Teikoku Tsushin Kogyo Co., Ltd. | | | 3,000 | | | | 9,139 | | | |
| Toshiba Tec Corp. | | | 92,000 | | | | 564,649 | | | |
| Tsuzuki Densan Co., Ltd. | | | 35,700 | | | | 128,556 | | | |
| Yokogawa Electric Corp. | | | 167,300 | | | | 1,699,540 | | | |
| | | | | | | |
| | | | | | | | 11,882,003 | | | |
Telecommunication Services 0.0% |
| Okinawa Cellular Telephone Co. | | | 17 | | | | 32,607 | | | |
Transportation 0.6% |
| Alps Logistics Co., Ltd. | | | 5,700 | | | | 58,780 | | | |
| Fukuyama Transporting Co., Ltd. (a) | | | 175,000 | | | | 645,422 | | | |
| i-Logistics Corp. | | | 2,000 | | | | 4,838 | | | |
| Isewan Terminal Service Co., Ltd. | | | 99,000 | | | | 612,867 | | | |
| Kamigumi Co., Ltd. | | | 138,000 | | | | 1,103,004 | | | |
| Kawasaki Kinkai Kisen Kaisha Ltd. | | | 5,000 | | | | 18,262 | | | |
| Keisei Electric Railway Co., Ltd. | | | 362,000 | | | | 1,957,379 | | | |
| Meiko Trans Co., Ltd. | | | 25,000 | | | | 282,165 | | | |
| Seino Holdings Co., Ltd. (a) | | | 237,000 | | | | 1,550,372 | | | |
| Yusen Air & Sea Service Co., Ltd. (a) | | | 3,300 | | | | 44,905 | | | |
| | | | | | | |
| | | | | | | | 6,277,994 | | | |
Utilities 0.0% |
| Hokuriku Gas Co., Ltd. | | | 2,000 | | | | 6,071 | | | |
| Keiyo Gas Co., Ltd. | | | 49,000 | | | | 258,412 | | | |
| Otaki Gas Co., Ltd. | | | 16,000 | | | | 111,982 | | | |
| The Okinawa Electric Power Co., Inc. | | | 400 | | | | 15,783 | | | |
| | | | | | | |
| | | | | | | | 392,248 | | | |
| | | | | | | |
| | | | | | | | 181,489,630 | | | |
Liechtenstein 0.1% |
| |
Diversified Financials 0.1% |
| Verwaltungs-und Privat-Bank AG | | | 2,707 | | | | 597,987 | | | |
Luxembourg 0.1% |
| |
Household & Personal Products 0.1% |
| Oriflame Cosmetics S.A. (a) | | | 9,241 | | | | 614,313 | | | |
Transportation 0.0% |
| Stolt-Nielsen S.A. (a) | | | 9,147 | | | | 191,299 | | | |
| | | | | | | |
| | | | | | | | 805,612 | | | |
Malaysia 0.0% |
| |
Real Estate 0.0% |
| Rekapacific Berhad (b)(c)(d) | | | 24,000 | | | | — | | | |
Netherlands 3.1% |
| |
Capital Goods 0.8% |
| Draka Holdings N.V. | | | 3,500 | | | | 112,994 | | | |
| Koninklijke BAM Groep N.V. | | | 372,676 | | | | 8,819,791 | | | |
| | | | | | | |
| | | | | | | | 8,932,785 | | | |
Commercial Services & Supplies 0.2% |
| USG People N.V. (a) | | | 94,734 | | | | 2,247,054 | | | |
Consumer Durables & Apparel 0.5% |
| TomTom N.V. (a)* | | | 130,500 | | | | 5,396,421 | | | |
Diversified Financials 0.1% |
| Van der Moolen Holding N.V. (a)* | | | 86,141 | | | | 363,501 | | | |
Food, Beverage & Tobacco 0.1% |
| CSM (a) | | | 36,440 | | | | 1,244,453 | | | |
Materials 1.4% |
| Crown Van Gelder N.V. CVA | | | 6,100 | | | | 141,973 | | | |
| Koninklijke DSM N.V. (a) | | | 333,748 | | | | 16,093,512 | | | |
| | | | | | | |
| | | | | | | | 16,235,485 | | | |
Media 0.0% |
| DOCdata N.V. | | | 26,000 | | | | 268,843 | | | |
Semiconductors & Semiconductor Equipment 0.0% |
| BE Semiconductor Industries N.V. (a)* | | | 70,783 | | | | 355,868 | | | |
Software & Services 0.0% |
| ICT Automatisering N.V. | | | 14,362 | | | | 199,004 | | | |
| | | | | | | |
| | | | | | | | 35,243,414 | | | |
New Zealand 0.3% |
| |
Consumer Services 0.1% |
| Millennium & Capthorne Hotels New Zealand Ltd. | | | 1,147,522 | | | | 654,732 | | | |
Energy 0.0% |
| New Zealand Oil & Gas Ltd. * | | | 11,942 | | | | 12,699 | | | |
| The New Zealand Refining Co., Ltd. | | | 15,972 | | | | 87,413 | | | |
| | | | | | | |
| | | | | | | | 100,112 | | | |
Retailing 0.0% |
| Hallenstein Glasson Holdings Ltd. | | | 52,084 | | | | 153,389 | | | |
| The Warehouse Group Ltd. | | | 16,100 | | | | 74,163 | | | |
| | | | | | | |
| | | | | | | | 227,552 | | | |
Transportation 0.2% |
| Air New Zealand Ltd. (a) | | | 1,616,305 | | | | 1,639,234 | | | |
| Tourism Holdings Ltd. | | | 217,789 | | | | 300,232 | | | |
| | | | | | | |
| | | | | | | | 1,939,466 | | | |
Utilities��0.0% |
| Vector Ltd. | | | 44,700 | | | | 60,492 | | | |
| | | | | | | |
| | | | | | | | 2,982,354 | | | |
Norway 0.3% |
| |
Capital Goods 0.3% |
| Aker Yards A/S (a)* | | | 278,280 | | | | 3,700,954 | | | |
See financial notes.
42 Laudus International Equity Funds
Laudus Rosenberg International Small Capitalization Fund
| | | | | | | | | | | |
| | | Number of | | Value | | |
| Security | | Shares | | ($) | | |
Transportation 0.0% |
| Fosen Trafikklag A.S.A. | | | 187 | | | | 25,338 | | | |
| | | | | | | |
| | | | | | | | 3,726,292 | | | |
Papua New Guinea 0.0% |
| |
Energy 0.0% |
| Oil Search Ltd. | | | 86,500 | | | | 382,328 | | | |
Portugal 0.8% |
| |
Capital Goods 0.3% |
| Grupo Soares da Costa, SGPS S.A. * | | | 647,330 | | | | 1,606,991 | | | |
| Teixeira Duarte – Engenharia e Construcoes S.A. | | | 513,134 | | | | 1,223,115 | | | |
| | | | | | | |
| | | | | | | | 2,830,106 | | | |
Consumer Services 0.0% |
| Ibersol SGPS S.A. | | | 24,228 | | | | 245,123 | | | |
Materials 0.5% |
| Corticeira Amorim S.A. | | | 3,256 | | | | 8,276 | | | |
| Semapa – Sociedade de Investimento e Gestao, SGPS, S.A. | | | 249,825 | | | | 3,200,498 | | | |
| Sonae Industria-SGPS S.A. * | | | 330,000 | | | | 2,293,131 | | | |
| | | | | | | |
| | | | | | | | 5,501,905 | | | |
Software & Services 0.0% |
| Novabase SGPS S.A. * | | | 25,210 | | | | 125,936 | | | |
| Reditus-SGPS S.A. * | | | 15,393 | | | | 205,853 | | | |
| | | | | | | |
| | | | | | | | 331,789 | | | |
| | | | | | | |
| | | | | | | | 8,908,923 | | | |
Republic of Korea 3.5% |
| |
Automobiles & Components 0.0% |
| Dong-Il Corp. | | | 3,446 | | | | 264,448 | | | |
| Motonic Corp. | | | 420 | | | | 35,581 | | | |
| | | | | | | |
| | | | | | | | 300,029 | | | |
Banks 0.1% |
| Cheju Bank Ltd. * | | | 4,240 | | | | 33,666 | | | |
| Jinheung Mutual Savings Bank Co., Ltd. | | | 148,070 | | | | 798,082 | | | |
| Korea Mutual Savings Bank | | | 1,780 | | | | 41,938 | | | |
| | | | | | | |
| | | | | | | | 873,686 | | | |
Capital Goods 0.9% |
| Daesang Holdings Co., Ltd. | | | 5,000 | | | | 22,281 | | | |
| Doosan Corp. * | | | 19,770 | | | | 3,835,059 | | | |
| Hanil Construction Industry Co. | | | 39,483 | | | | 533,729 | | | |
| Hanshin Construction Co., Ltd. | | | 5,850 | | | | 147,340 | | | |
| KCC Engineering & Construction Co., Ltd. | | | 23,792 | | | | 1,270,576 | | | |
| Kyeryong Construction Industrial Co., Ltd. | | | 39,750 | | | | 1,359,326 | | | |
| Sambu Construction Co., Ltd. | | | 26,711 | | | | 1,221,153 | | | |
| Samho International Co., Ltd. | | | 45,330 | | | | 637,342 | | | |
| Samwhan Corp. | | | 34,370 | | | | 745,821 | | | |
| Shinsegae Engineering & Construction Co., Ltd. | | | 7,650 | | | | 238,706 | | | |
| | | | | | | |
| | | | | | | | 10,011,333 | | | |
Consumer Durables & Apparel 0.3% |
| Cheil Industries, Inc. | | | 53,910 | | | | 2,627,683 | | | |
| Shinwon Corp. | | | 14,810 | | | | 299,263 | | | |
| Youngone Corp. | | | 114,450 | | | | 935,468 | | | |
| | | | | | | |
| | | | | | | | 3,862,414 | | | |
Diversified Financials 0.0% |
| Shinyoung Securities Co., Ltd. * | | | 7,370 | | | | 380,900 | | | |
Energy 0.1% |
| GS Holdings Corp. | | | 3,440 | | | | 134,351 | | | |
| SK Gas Co., Ltd. | | | 15,656 | | | | 1,083,052 | | | |
| | | | | | | |
| | | | | | | | 1,217,403 | | | |
Food, Beverage & Tobacco 0.2% |
| Dongwon F&B Co., Ltd. | | | 8,173 | | | | 300,526 | | | |
| Muhak Co., Ltd. | | | 177 | | | | 872 | | | |
| Namyang Dairy Products Co., Ltd. | | | 1,804 | | | | 1,415,366 | | | |
| Nong Shim Holdings Co., Ltd. | | | 790 | | | | 57,925 | | | |
| Samyang Corp. | | | 1,201 | | | | 52,802 | | | |
| Samyang Genex Co., Ltd. | | | 8,040 | | | | 450,800 | | | |
| TS Corp. | | | 7,400 | | | | 466,354 | | | |
| | | | | | | |
| | | | | | | | 2,744,645 | | | |
Household & Personal Products 0.1% |
| Pacific Corp. | | | 9,690 | | | | 1,177,963 | | | |
Materials 0.8% |
| Asia Cement Co., Ltd. | | | 19,010 | | | | 1,119,082 | | | |
| Hanwha Chemical Corp. | | | 59,740 | | | | 1,014,719 | | | |
| Hanwha Corp. | | | 20,172 | | | | 1,068,896 | | | |
| Honam Petrochemical Corp. | | | 4,780 | | | | 391,094 | | | |
| Hyosung Corp. | | | 18,270 | | | | 1,240,967 | | | |
| Hyundai Cement Co., Ltd. | | | 4,443 | | | | 163,750 | | | |
| Korea Iron & Steel Co., Ltd. | | | 17,020 | | | | 1,262,792 | | | |
| Korea Petrochemical Industrial Co., Ltd. | | | 13,010 | | | | 491,507 | | | |
| Korea Zinc Co., Ltd. | | | 16,510 | | | | 2,004,393 | | | |
| Taekwang Industrial Co., Ltd. | | | 106 | | | | 96,269 | | | |
| | | | | | | |
| | | | | | | | 8,853,469 | | | |
Pharmaceuticals & Biotechnology 0.3% |
| Choongwae Holdings Co., Ltd. * | | | 3,739 | | | | 47,223 | | | |
| Daewoong Co., Ltd. * | | | 40,310 | | | | 1,613,130 | | | |
| Green Cross Holdings Corp. | | | 584 | | | | 53,072 | | | |
| Il Dong Pharmaceutical Co., Ltd. * | | | 31,993 | | | | 1,347,108 | | | |
| Jeil Pharmaceutical Co. | | | 1,250 | | | | 13,821 | | | |
| Samil Pharmaceutical Co., Ltd. | | | 16,060 | | | | 183,325 | | | |
| Shin Poong Pharmaceutical Co., Ltd. | | | 1,860 | | | | 36,370 | | | |
| | | | | | | |
| | | | | | | | 3,294,049 | | | |
Retailing 0.2% |
| GS Home Shopping, Inc. | | | 15,100 | | | | 963,737 | | | |
| Taegu Department Store Co., Ltd. * | | | 54,180 | | | | 788,162 | | | |
| | | | | | | |
| | | | | | | | 1,751,899 | | | |
Software & Services 0.1% |
| Daou Technology, Inc. | | | 115,270 | | | | 994,859 | | | |
See financial notes.
Laudus International Equity Funds 43
Laudus Rosenberg International Small Capitalization Fund
Portfolio Holdings continued
| | | | | | | | | | | |
| | | Number of | | Value | | |
| Security | | Shares | | ($) | | |
Technology Hardware & Equipment 0.2% |
| People & Telecommunication | | | 24,708 | | | | 210,898 | | | |
| SFA Engineering Corp. | | | 29,719 | | | | 1,968,792 | | | |
| | | | | | | |
| | | | | | | | 2,179,690 | | | |
Telecommunication Services 0.0% |
| LG Telecom Ltd. | | | 52,220 | | | | 412,904 | | | |
Utilities 0.2% |
| KyungDong City Gas Co., Ltd. | | | 410 | | | | 23,572 | | | |
| Samchully Co., Ltd. | | | 7,900 | | | | 1,254,227 | | | |
| Seoul City Gas Co., Ltd. | | | 8,359 | | | | 717,917 | | | |
| YESCO Co., Ltd. | | | 7,350 | | | | 269,281 | | | |
| | | | | | | |
| | | | | | | | 2,264,997 | | | |
| | | | | | | |
| | | | | | | | 40,320,240 | | | |
Singapore 1.1% |
| |
Capital Goods 0.1% |
| Haw Par Corp., Ltd. | | | 319,000 | | | | 1,605,073 | | | |
| The Straits Trading Co., Ltd. | | | 7,000 | | | | 34,124 | | | |
| XP Power Ltd. | | | 30,792 | | | | 138,302 | | | |
| | | | | | | |
| | | | | | | | 1,777,499 | | | |
Consumer Services 0.1% |
| Hotel Grand Central Ltd. | | | 3,000 | | | | 2,082 | | | |
| Hotel Plaza Ltd. | | | 746,000 | | | | 1,026,606 | | | |
| Overseas Union Enterprise Ltd. | | | 6,000 | | | | 52,570 | | | |
| | | | | | | |
| | | | | | | | 1,081,258 | | | |
Diversified Financials 0.4% |
| G.K. Goh Holdings Ltd. | | | 509,083 | | | | 370,680 | | | |
| K1 Ventures Ltd. | | | 3,930,000 | | | | 557,903 | | | |
| Kim Eng Holdings Ltd. (a) | | | 1,121,513 | | | | 1,670,947 | | | |
| UOB-Kay Hian Holdings Ltd. | | | 1,505,850 | | | | 2,155,294 | | | |
| | | | | | | |
| | | | | | | | 4,754,824 | | | |
Energy 0.1% |
| Singapore Petroleum Co., Ltd. | | | 123,000 | | | | 608,439 | | | |
Food, Beverage & Tobacco 0.0% |
| Cerebos Pacific Ltd. | | | 32,000 | | | | 88,281 | | | |
| QAF Ltd. | | | 54,000 | | | | 15,927 | | | |
| | | | | | | |
| | | | | | | | 104,208 | | | |
Real Estate 0.0% |
| Ho Bee Investment Ltd. | | | 571,000 | | | | 387,070 | | | |
| MCL Land Ltd. | | | 24,000 | | | | 32,345 | | | |
| | | | | | | |
| | | | | | | | 419,415 | | | |
Retailing 0.2% |
| Jardine Cycle & Carriage Ltd. (a) | | | 58,000 | | | | 830,342 | | | |
| Metro Holdings Ltd. | | | 2,098,000 | | | | 1,073,939 | | | |
| | | | | | | |
| | | | | | | | 1,904,281 | | | |
Software & Services 0.0% |
| Singapore Computer Systems Ltd. | | | 21,000 | | | | 12,688 | | | |
Technology Hardware & Equipment 0.0% |
| Elec & Eltek International Co., Ltd. | | | 37,000 | | | | 64,128 | | | |
Transportation 0.2% |
| Neptune Orient Lines Ltd. (a) | | | 868,000 | | | | 2,071,236 | | | |
| | | | | | | |
| | | | | | | | 12,797,976 | | | |
Spain 3.1% |
| |
Capital Goods 1.0% |
| Construcciones y Auxiliar de Ferrocarriles S.A. | | | 9,692 | | | | 4,291,030 | | | |
| Obrascon Huarte Lain S.A. (a) | | | 193,226 | | | | 7,168,126 | | | |
| | | | | | | |
| | | | | | | | 11,459,156 | | | |
Commercial Services & Supplies 0.1% |
| Befesa Medio Ambiente S.A. (a)* | | | 29,309 | | | | 976,520 | | | |
Consumer Durables & Apparel 0.0% |
| Tavex Algodonera S.A. * | | | 94,146 | | | | 230,726 | | | |
Food, Beverage & Tobacco 0.1% |
| Pescanova S.A. | | | 17,100 | | | | 846,012 | | | |
Materials 0.6% |
| Cementos Portland Valderrivas S.A. (a) | | | 71,515 | | | | 6,947,178 | | | |
Transportation 0.5% |
| Iberia Lineas Aereas de Espana S.A. | | | 1,214,051 | | | | 5,286,649 | | | |
Utilities 0.8% |
| Union Fenosa S.A. (a) | | | 140,009 | | | | 9,412,106 | | | |
| | | | | | | |
| | | | | | | | 35,158,347 | | | |
Sweden 1.5% |
| |
Capital Goods 0.3% |
| AddTech AB, B Shares | | | 19,445 | | | | 418,893 | | | |
| OEM International AB, B Shares | | | 17,531 | | | | 122,598 | | | |
| Trelleborg AB, B Shares (a) | | | 133,524 | | | | 2,665,615 | | | |
| | | | | | | |
| | | | | | | | 3,207,106 | | | |
Commercial Services & Supplies 0.0% |
| Cision AB (a)* | | | 14,464 | | | | 40,172 | | | |
Diversified Financials 0.0% |
| AB Traction, B Shares | | | 10,017 | | | | 107,773 | | | |
| Geveko AB – B Shares | | | 44 | | | | 696 | | | |
| Havsfrun Investment AB | | | 2,029 | | | | 10,523 | | | |
| | | | | | | |
| | | | | | | | 118,992 | | | |
Energy 0.3% |
| PA Resources AB * | | | 385,845 | | | | 3,170,325 | | | |
Materials 0.0% |
| ProfilGruppen AB, B Shares | | | 3,615 | | | | 46,254 | | | |
Pharmaceuticals & Biotechnology 0.0% |
| Biotage AB * | | | 17,650 | | | | 26,744 | | | |
Software & Services 0.0% |
| Addnode AB | | | 34,730 | | | | 153,103 | | | |
| IBS AB, B Shares * | | | 4,816 | | | | 11,689 | | | |
| ProAct IT Group AB | | | 5,000 | | | | 30,548 | | | |
| Sigma AB, B Shares | | | 226,000 | | | | 274,097 | | | |
| | | | | | | |
| | | | | | | | 469,437 | | | |
See financial notes.
44 Laudus International Equity Funds
Laudus Rosenberg International Small Capitalization Fund
| | | | | | | | | | | |
| | | Number of | | Value | | |
| Security | | Shares | | ($) | | |
Technology Hardware & Equipment 0.0% |
| PartnerTech AB | | | 192 | | | | 1,224 | | | |
Telecommunication Services 0.9% |
| Tele2 AB, Class B | | | 510,000 | | | | 9,647,536 | | | |
Transportation 0.0% |
| Rederi AB Transatlantic | | | 65,778 | | | | 486,002 | | | |
| | | | | | | |
| | | | | | | | 17,213,792 | | | |
Switzerland 10.4% |
| |
Automobiles & Components 0.3% |
| Rieter Holding AG – Reg’d | | | 10,153 | | | | 3,887,324 | | | |
Banks 0.2% |
| Banque Cantonale de Geneve | | | 8,832 | | | | 2,161,567 | | | |
| Graubunder Kantonalbank | | | 672 | | | | 680,140 | | | |
| | | | | | | |
| | | | | | | | 2,841,707 | | | |
Capital Goods 2.3% |
| Bobst Group AG – Reg’d | | | 60,400 | | | | 4,689,873 | | | |
| Bucher Industries AG – Reg’d | | | 27,848 | | | | 7,561,097 | | | |
| Carlo Gavazzi Holding AG | | | 1,170 | | | | 224,115 | | | |
| Conzzeta Holding AG | | | 1,075 | | | | 2,655,297 | | | |
| Daetwyler Holding AG | | | 44,500 | | | | 3,473,378 | | | |
| Feintool International Holding AG – Reg’d | | | 1,932 | | | | 645,839 | | | |
| Georg Fischer AG – Reg’d * | | | 10,590 | | | | 5,233,154 | | | |
| Harwanne Compagnie de participations industielles et financieres S.A. (a) | | | 1,710 | | | | 507,094 | | | |
| Tornos S.A. – Reg’d * | | | 51,473 | | | | 832,346 | | | |
| WMH Walter Meier AG, Class A – Reg’d | | | 4,831 | | | | 929,980 | | | |
| | | | | | | |
| | | | | | | | 26,752,173 | | | |
Commercial Services & Supplies 1.2% |
| Adecco S.A. – Reg’d (a) | | | 228,071 | | | | 13,174,793 | | | |
Consumer Durables & Apparel 0.3% |
| Forbo Holding AG – Reg’d * | | | 7,335 | | | | 3,887,135 | | | |
Consumer Services 0.6% |
| Kuoni Reisen Holding AG – Reg’d | | | 11,100 | | | | 6,171,327 | | | |
| MCH Messe Schweiz Holding AG – Reg’d | | | 270 | | | | 191,362 | | | |
| | | | | | | |
| | | | | | | | 6,362,689 | | | |
Diversified Financials 0.1% |
| Valartis Group AG | | | 11,876 | | | | 669,935 | | | |
Food, Beverage & Tobacco 0.2% |
| Eichhof Holding AG – Reg’d | | | 193 | | | | 377,706 | | | |
| Emmi AG – Reg’d | | | 13,172 | | | | 1,903,416 | | | |
| | | | | | | |
| | | | | | | | 2,281,122 | | | |
Insurance 2.9% |
| Baloise Holding AG – Reg’d | | | 149,200 | | | | 14,835,651 | | | |
| Schweizerische Naional-Versicherungs-Gesellschaft – Reg’d | | | 3,206 | | | | 2,634,130 | | | |
| Swiss Life Holding – Reg’d * | | | 54,055 | | | | 15,033,744 | | | |
| | | | | | | |
| | | | | | | | 32,503,525 | | | |
Materials 1.2% |
| Ciba Holding AG (a) | | | 133,899 | | | | 4,883,093 | | | |
| Clariant AG – Reg’d * | | | 518,000 | | | | 4,416,300 | | | |
| CPH Chemie & Papier Holding AG – Reg’d | | | 102 | | | | 232,447 | | | |
| Industrieholding Cham AG – Reg’d * | | | 2,117 | | | | 720,350 | | | |
| Siegfried Holding AG – Reg’d | | | 9,738 | | | | 1,485,295 | | | |
| Swissmetal, UMS Schweizerische Metallwerke Holding AG * | | | 18,631 | | | | 394,341 | | | |
| Vetropack Holding AG | | | 546 | | | | 1,238,344 | | | |
| | | | | | | |
| | | | | | | | 13,370,170 | | | |
Real Estate 0.1% |
| LO Holding Lausanne-Ouchy S.A. | | | 77 | | | | 92,266 | | | |
| Pax-Anlage AG – Reg’d | | | 60 | | | | 49,658 | | | |
| Zueblin Immobilien Holding AG – Reg’d * | | | 71,646 | | | | 728,578 | | | |
| | | | | | | |
| | | | | | | | 870,502 | | | |
Retailing 0.0% |
| Metraux Services Holding AG – Reg’d | | | 1,633 | | | | 282,321 | | | |
Technology Hardware & Equipment 0.3% |
| Also Holding – Reg’d | | | 15,459 | | | | 901,295 | | | |
| Inficon Holding AG – Reg’d | | | 8,287 | | | | 1,322,784 | | | |
| Phoenix Mecano AG | | | 3,672 | | | | 1,845,189 | | | |
| | | | | | | |
| | | | | | | | 4,069,268 | | | |
Transportation 0.1% |
| The Jungfraubahn Holding AG – Reg’d | | | 21,324 | | | | 1,139,098 | | | |
Utilities 0.6% |
| Elektrizitaets-Gesellschaft Laufenburg AG | | | 2,680 | | | | 3,502,809 | | | |
| Energiedienst Holding AG – Reg’d * | | | 4,956 | | | | 3,197,797 | | | |
| | | | | | | |
| | | | | | | | 6,700,606 | | | |
| | | | | | | |
| | | | | | | | 118,792,368 | | | |
United Kingdom 12.5% |
| |
Automobiles & Components 0.0% |
| Avon Rubber plc | | | 126,000 | | | | 230,558 | | | |
Capital Goods 2.6% |
| AMEC plc | | | 73,227 | | | | 1,051,762 | | | |
| Carr’s Milling Industries plc | | | 27,358 | | | | 282,776 | | | |
| Castings plc | | | 97,863 | | | | 553,063 | | | |
| Chemring Group plc | | | 128,723 | | | | 6,285,598 | | | |
| Cookson Group plc | | | 213,545 | | | | 2,817,459 | | | |
| Hampson Industries plc | | | 28,899 | | | | 68,794 | | | |
| IMI plc | | | 972,000 | | | | 8,760,431 | | | |
| J. Smart & Co. (Contractors) plc | | | 17,591 | | | | 192,016 | | | |
| Keller Group plc | | | 169,787 | | | | 2,273,839 | | | |
| Molins plc | | | 5,909 | | | | 14,571 | | | |
| MS International plc | | | 19,986 | | | | 65,518 | | | |
| Qinetiq plc | | | 1,598,309 | | | | 6,126,844 | | | |
See financial notes.
Laudus International Equity Funds�� 45
Laudus Rosenberg International Small Capitalization Fund
Portfolio Holdings continued
| | | | | | | | | | | |
| | | Number of | | Value | | |
| Security | | Shares | | ($) | | |
| Renold plc * | | | 5,392 | | | | 8,449 | | | |
| Trifast plc | | | 275,125 | | | | 313,972 | | | |
| UMECO plc | | | 19,236 | | | | 200,394 | | | |
| Waterman Group plc | | | 81,607 | | | | 230,117 | | | |
| | | | | | | |
| | | | | | | | 29,245,603 | | | |
Commercial Services & Supplies 0.8% |
| Carter & Carter Group plc (b)(c)(d) | | | 173,983 | | | | 142,434 | | | |
| Communisis plc | | | 397,462 | | | | 500,385 | | | |
| Harvey Nash Group plc | | | 189,717 | | | | 141,263 | | | |
| Management Consulting Group plc | | | 517,552 | | | | 379,661 | | | |
| Office2office plc | | | 158,525 | | | | 475,071 | | | |
| OPD Group plc | | | 16,101 | | | | 56,367 | | | |
| Tribal Group plc | | | 169,542 | | | | 448,728 | | | |
| WS Atkins plc | | | 315,417 | | | | 6,585,445 | | | |
| | | | | | | |
| | | | | | | | 8,729,354 | | | |
Consumer Durables & Apparel 0.1% |
| Pace Micro Technology plc (b)(d)* | | | 350,566 | | | | 634,873 | | | |
Consumer Services 0.0% |
| Sportech plc * | | | 177,613 | | | | 266,091 | | | |
Energy 2.1% |
| Anglo Pacific Group plc | | | 18,001 | | | | 56,067 | | | |
| Dana Petroleum plc * | | | 171,997 | | | | 4,303,091 | | | |
| John Wood Group plc | | | 1,010,197 | | | | 8,119,374 | | | |
| Petrofac Ltd. | | | 656,784 | | | | 7,325,386 | | | |
| Premier Oil plc * | | | 164,836 | | | | 4,542,042 | | | |
| | | | | | | |
| | | | | | | | 24,345,960 | | | |
Food, Beverage & Tobacco 0.2% |
| Britvic plc | | | 284,902 | | | | 1,801,118 | | | |
Household & Personal Products 0.1% |
| McBride plc | | | 311,749 | | | | 652,475 | | | |
| PZ Cussons plc | | | 294,070 | | | | 1,080,197 | | | |
| | | | | | | |
| | | | | | | | 1,732,672 | | | |
Insurance 0.8% |
| Old Mutual plc | | | 4,101,000 | | | | 9,000,148 | | | |
Materials 1.8% |
| Antofagasta plc | | | 3,829 | | | | 53,310 | | | |
| Carclo plc | | | 136,704 | | | | 224,819 | | | |
| Croda International plc | | | 47,627 | | | | 626,158 | | | |
| Delta plc | | | 131,334 | | | | 244,861 | | | |
| DS Smith plc | | | 366,234 | | | | 1,139,150 | | | |
| Elementis plc | | | 372,704 | | | | 490,251 | | | |
| Hochschild Mining plc | | | 63,053 | | | | 549,069 | | | |
| Johnson Matthey plc | | | 150,000 | | | | 5,974,698 | | | |
| Randgold Resources Ltd. | | | 205,286 | | | | 9,601,700 | | | |
| Vedanta Resources plc | | | 26,565 | | | | 1,107,042 | | | |
| Yule Catto & Co. plc | | | 56,015 | | | | 174,034 | | | |
| | | | | | | |
| | | | | | | | 20,185,092 | | | |
Media 0.0% |
| Chime Communications plc | | | 98,233 | | | | 56,463 | | | |
| Creston plc | | | 155,944 | | | | 179,289 | | | |
| MICE Group plc (b)(d)* | | | 648,992 | | | | 19,321 | | | |
| Next Fifteen Communications plc | | | 156,902 | | | | 179,386 | | | |
| | | | | | | |
| | | | | | | | 434,459 | | | |
Retailing 0.1% |
| John David Group plc | | | 106,888 | | | | 709,319 | | | |
| Land of Leather Holdings plc | | | 252,000 | | | | 270,018 | | | |
| Moss Bros Group plc | | | 15,415 | | | | 14,307 | | | |
| | | | | | | |
| | | | | | | | 993,644 | | | |
Software & Services 0.6% |
| Computacenter plc | | | 436,666 | | | | 1,487,353 | | | |
| Dimension Data Holdings plc (a) | | | 3,306,056 | | | | 3,185,084 | | | |
| Intec Telecom Systems plc * | | | 1,008,849 | | | | 851,827 | | | |
| Kewill Systems plc | | | 98,961 | | | | 161,739 | | | |
| LogicaCMG plc | | | 151,368 | | | | 318,182 | | | |
| Microgen plc | | | 230,560 | | | | 217,656 | | | |
| Morse plc | | | 425,406 | | | | 531,898 | | | |
| nCipher plc * | | | 76,000 | | | | 193,140 | | | |
| | | | | | | |
| | | | | | | | 6,946,879 | | | |
Technology Hardware & Equipment 0.6% |
| Acal plc | | | 82,250 | | | | 266,868 | | | |
| E2V Technologies plc | | | 307,330 | | | | 1,081,237 | | | |
| Filtronic plc * | | | 93,535 | | | | 320,326 | | | |
| Oxford Instruments plc | | | 69,597 | | | | 255,738 | | | |
| Psion plc | | | 37,934 | | | | 75,189 | | | |
| Spectris plc | | | 224,534 | | | | 3,318,847 | | | |
| TT electronics plc | | | 480,007 | | | | 925,839 | | | |
| Vislink plc | | | 263,135 | | | | 147,801 | | | |
| | | | | | | |
| | | | | | | | 6,391,845 | | | |
Telecommunication Services 0.0% |
| Vanco plc (a)* | | | 119,897 | | | | 166,396 | | | |
Transportation 0.8% |
| Accident Exchange Group plc | | | 65,052 | | | | 45,208 | | | |
| Arriva plc | | | 48,679 | | | | 663,040 | | | |
| Braemar Shipping Services plc | | | 64,440 | | | | 564,836 | | | |
| Clarkson plc | | | 14,765 | | | | 225,855 | | | |
| FirstGroup plc | | | 665,483 | | | | 7,449,094 | | | |
| | | | | | | |
| | | | | | | | 8,948,033 | | | |
Utilities 1.9% |
| British Energy Group plc | | | 1,714,441 | | | | 22,214,690 | | | |
| | | | | | | |
| | | | | | | | 142,267,415 | | | |
| | | | | | | |
Total Common Stock (Cost $1,043,840,883) | | | 1,088,713,385 | | | |
| | | | | | | |
| Preferred Stock 0.3% of net assets |
| |
Austria 0.0% |
| |
| MIBA AG | | | 700 | | | | 135,930 | | | |
Canada 0.0% |
| |
| FirstService Corp. * | | | 15,595 | | | | 292,406 | | | |
See financial notes.
46 Laudus International Equity Funds
Laudus Rosenberg International Small Capitalization Fund
| | | | | | | | | | | |
| | | Number of | | Value | | |
| Security | | Shares | | ($) | | |
Germany 0.3% |
| |
| Draegerwerk AG | | | 11,938 | | | | 702,639 | | | |
| Hans Einhell AG | | | 4,600 | | | | 227,194 | | | |
| Jungheinrich AG | | | 47,379 | | | | 1,720,677 | | | |
| Sanacorp Pharmaholding AG | | | 884 | | | | 35,239 | | | |
| Sto AG | | | 4,603 | | | | 344,198 | | | |
| Villeroy & Boch AG (a) | | | 5,115 | | | | 71,951 | | | |
| | | | | | | |
| | | | | | | | 3,101,898 | | | |
| | | | | | | |
Total Preferred Stock (Cost $3,369,493) | | | 3,530,234 | | | |
| | | | | | | |
| Rights 0.0% of net assets |
| |
Belgium 0.0% |
| |
| Carrieres Unies Porphyre (b)(d)* | | | 11 | | | | — | | | |
| | | | | | | |
Total Rights (Cost $—) | | | | | | | — | | | |
| | | | | | | |
| Warrants 0.0% of net assets |
Bermuda 0.0% |
| |
| Champion Technology Holdings Ltd. (b)(d)* | | | 889,944 | | | | — | | | |
| | | | | | | |
Total Warrants (Cost $ — ) | | | | | | | — | | | |
| | | | | | | |
| | | | | | | | | | | |
| | | Number of | | Value | | |
| Security | | Shares | | ($) | | |
| Short-Term Investment 1.4% of net assets |
Repurchase Agreement 1.4% |
| |
| Fixed Income Clearing Corp. dated 03/31/08, due 04/01/08 at 2.00%, with a maturity value of $15,581,866 (fully collateralized by Federal Home Loan Mortgage Corp. with a value of $15,892,722.) | | | 15,581,000 | | | | 15,581,000 | | | |
| | | | | | | |
Total Short-Term Investment (Cost $15,581,000) | | | 15,581,000 | | | |
| |
End of Investments. |
| | | | | | | | | | | |
| | | Number of | | Value | | |
| Security | | Shares | | ($) | | |
| Collateral Invested for Securities on Loan 7.0% of net assets |
| |
| State Street Navigator Security Lending Prime Portfolio | | | 79,431,797 | | | | 79,431,797 | | | |
| |
End of collateral invested for securities on loan. |
At 03/31/08, the tax basis cost of the fund’s investments was $1,070,824,804 and the unrealized appreciation and depreciation were $172,075,616 and ($135,075,801), respectively, with a net unrealized appreciation of $36,999,815.
At 03/31/08, the prices of certain foreign securities held by the fund aggregating $997,626,259 were adjusted from their closing market prices following the guidelines adopted by the fund’s board of trustees.
| |
| * | Non-income producing security. |
| (a) | All or a portion of this security is on loan. |
| (b) | Fair-valued by Management. |
| (c) | Bankrupt security/delisted. |
| (d) | Illiquid security. At the period end, the value of these amounted to $796,628 or .0.1% of net assets. |
| | | | | | | | | | | |
| | | | | Amount | | | | | | |
| | | | | of | | | | Amount of | | Unrealized |
| | | Currency | | Currency | | Currency | | Currency to | | Gains/ |
| Expiration | | to be | | to be | | to be | | be | | Losses |
| Date | | Received | | Received | | Delivered | | Delivered | | ($) |
| Forward Foreign Currency Contract |
| 04/03/2008 | | USD | | 3,567,561 | | JPY | | 355,546,000 | | 7,346 |
| | | | | | | | | | | |
| Net unrealized gains on Forward Foreign Currency Contracts | | 7,346 |
| | | |
See financial notes.
Laudus International Equity Funds 47
Financial Statements
Statement of Assets and Liabilities as of 3/31/08
| | | | | | | | | | | | | | | |
| | | | | | | Laudus Rosenberg |
| | | | | | | International |
| | | Laudus Rosenberg | | Laudus Rosenberg | | Small |
| | | International | | International | | Capitalization |
| | | Equity Fund | | Discovery Fund | | Fund |
| | | | | | | |
Assets: | | | | | | | | | | | | |
| Total investments, at cost | | $ | 109,090,630 | | | $ | 268,987,513 | | | $ | 1,062,791,376 | |
| | | | | | | | | | | | | |
Investments, at value1 | | $ | 115,186,869 | | | $ | 256,412,192 | | | $ | 1,092,243,619 | |
| Repurchase agreements, at amortized cost | | | 597,000 | | | | 6,290,000 | | | | 15,581,000 | |
| | | | | | | | | | | | | |
| | | Total Investments | | | 115,783,869 | | | | 262,702,192 | | | | 1,107,824,619 | |
| | | | | | | | | | | | | |
| Collateral invested for securities on loan | | | — | | | | — | | | | 79,431,797 | |
| Cash | | | 561 | | | | 894 | | | | 5,966 | |
Foreign currency, at value2 | | | 564,073 | | | | 1,796,085 | | | | 9,254,942 | |
| Unrealized gain on foreign currency contracts | | | — | | | | — | | | | 7,346 | |
| Dividends and interest receivable | | | 427,668 | | | | 1,012,752 | | | | 4,376,888 | |
| Receivable for fund shares sold | | | 104,636 | | | | 1,054,769 | | | | 759,755 | |
| Receivable for investments sold | | | 1,825,805 | | | | 4,015,996 | | | | 19,204,183 | |
| Reclaims receivable | | | 24,914 | | | | 25,361 | | | | 300,854 | |
| Prepaid expenses | | | 1,445 | | | | 175 | | | | 11,435 | |
| | | | | | | | | | | | | |
| | | Total Assets | | | 118,732,971 | | | | 270,608,224 | | | | 1,221,177,785 | |
| | | | | | | | | | | | | |
Liabilities: | | | | | | | | | | | | |
| Payable for fund shares repurchased | | | 102,762 | | | | 292,284 | | | | 1,966,122 | |
| Payable for investments purchased | | | 1,272,623 | | | | 8,575,119 | | | | 2,475,224 | |
| Collateral held for securities on loan | | | — | | | | — | | | | 79,431,797 | |
| Accrued expenses and other liabilities: | | | | | | | | | | | | |
| | Trustees’ retirement plan | | | 3,078 | | | | 82 | | | | 68,113 | |
| | Manager fees | | | 7,893 | | | | 4,498 | | | | 89,731 | |
| | Transfer agent fees | | | 3,605 | | | | 53,884 | | | | 43,469 | |
| | Distribution and shareholder service fees | | | 3,581 | | | | 18,047 | | | | 309,338 | |
| | Administration and fund accounting fee | | | 9,476 | | | | 11,799 | | | | 19,788 | |
| | Other accrued expenses | | | 58,728 | | | | 79,318 | | | | 361,854 | |
| | | | | | | | | | | | | |
| | | Total Liabilities | | | 1,461,746 | | | | 9,035,031 | | | | 84,765,436 | |
| | | | | | | | | | | | | |
Net Assets | | $ | 117,271,225 | | | $ | 261,573,193 | | | $ | 1,136,412,349 | |
| | | | | | | | | | | | | |
Net Assets Consist of: | | | | | | | | | | | | |
| Capital | | $ | 112,301,552 | | | $ | 276,076,903 | | | $ | 1,174,055,651 | |
| Undistributed net investment income/Distributions in excess of net investment income | | | 75,602 | | | | 358,822 | | | | (4,769,775 | ) |
| Accumulated net realized gains/(losses) on investments | | | (1,802,731 | ) | | | (8,590,658 | ) | | | (77,902,302 | ) |
| Net unrealized appreciation/depreciation on investments | | | 6,696,802 | | | | (6,271,874 | ) | | | 45,028,775 | |
| | | | | | | | | | | | | |
Net Assets | | $ | 117,271,225 | | | $ | 261,573,193 | | | $ | 1,136,412,349 | |
| | | | | | | | | | | | | |
Institutional Shares: | | | | | | | | | | | | |
| Net Assets | | $ | 97,701,295 | | | $ | 139,642,717 | | | $ | 612,703,443 | |
| Shares Outstanding | | | 8,427,447 | | | | 12,191,249 | | | | 36,104,047 | |
| Net Asset Value, Offering Price and Redemption Price per Share | | $ | 11.59 | | | $ | 11.45 | | | $ | 16.97 | |
| | | | | | | | | | | | | |
Investor Shares: | | | | | | | | | | | | |
| Net Assets | | $ | 19,569,930 | | | $ | 121,930,476 | | | $ | 523,708,906 | |
| Shares Outstanding | | | 1,687,031 | | | | 10,670,699 | | | | 31,291,404 | |
| Net Asset Value, Offering Price and Redemption Price per Share | | $ | 11.60 | | | $ | 11.43 | | | $ | 16.74 | |
| | | | | | | | | | | | | |
| |
| 1 | Includes securities on loan for Laudus Rosenberg International Small Capitalization Fund of $75,372,794. |
| |
| 2 | Foreign currency at cost for Laudus Rosenberg International Equity Fund, Laudus Rosenberg International Discovery Fund and Laudus Rosenberg International Small Capitalization Fund was $562,936, $1,796,023, and $9,265,792, respectively. |
See the accompanying notes to the financial statements.
48 Laudus International Equity Funds
Financial Statements
Statement of Operations for the year ended 3/31/08
| | | | | | | | | | | | | | | |
| | | | | | | Laudus Rosenberg |
| | | | | | | International |
| | | Laudus Rosenberg | | Laudus Rosenberg | | Small |
| | | International | | International | | Capitalization |
| | | Equity Fund | | Discovery Fund | | Fund |
| | | | | | | |
Investment Income: | | | | | | | | | | | | |
| | Dividends1 | | $ | 3,891,455 | | | $ | 4,159,004 | | | $ | 52,075,484 | |
| | Interest | | | 51,868 | | | | 275,330 | | | | 698,062 | |
| | Securities lending | | | — | | | | — | | | | 2,144,300 | |
| | | | | | | | | | | | | |
| | Total investment income | | | 3,943,323 | | | | 4,434,334 | | | | 54,917,846 | |
| | | | | | | | | | | | | |
Expenses: | | | | | | | | | | | | |
| | Manager fees | | | 1,139,805 | | | | 1,756,110 | | | | 17,806,108 | |
| | Distribution and shareholder service fees (Investor Shares) | | | 96,769 | | | | 278,187 | | | | 1,996,369 | |
| | Professional fees | | | 48,737 | | | | 37,334 | | | | 101,846 | |
| | Custodian fees | | | 122,150 | | | | 327,795 | | | | 1,127,635 | |
| | Overdraft charges | | | 7,218 | | | | 4,902 | | | | 197,310 | |
| | Fund accounting fees and administration fees | | | 86,480 | | | | 101,411 | | | | 180,968 | |
| | Registration and filing fees | | | 21,090 | | | | 28,816 | | | | 38,022 | |
| | Sub-accounting fees (Investor Shares) | | | 50,015 | | | | 109,536 | | | | 931,957 | |
| | Shareholder report fee | | | 12,052 | | | | 27,012 | | | | 160,792 | |
| | Transfer agent fees | | | 23,069 | | | | 207,272 | | | | 280,493 | |
| | Trustees’ fees | | | 10,224 | | | | 11,190 | | | | 43,487 | |
| | Recouped by manager | | | 182,083 | | | | — | | | | — | |
| | Other expenses | | | 7,852 | | | | 15,219 | | | | 112,450 | |
| | | | | | | | | | | | | |
| | | Total expenses before custody credits and waivers/reimbursements | | | 1,807,544 | | | | 2,904,784 | | | | 22,977,437 | |
| | | Less custody credits | | | (161 | ) | | | (2,243 | ) | | | (2,778 | ) |
| | | Less expenses waived/reimbursed by the Manager2 | | | (16,061 | ) | | | (196,269 | ) | | | — | |
| | | | | | | | | | | | | |
| | | Net expenses | | | 1,791,322 | | | | 2,706,272 | | | | 22,974,659 | |
| | | | | | | | | | | | | |
| | Net investment income/(loss) | | | 2,152,001 | | | | 1,728,062 | | | | 31,943,187 | |
| | | | | | | | | | | | | |
Realized and Unrealized Gains/(Losses) on Investments | | | | | | | | | | | | |
| | Net realized gains/(losses) on securities and foreign currency transactions | | | 3,091,259 | | | | (2,339,694 | ) | | | 54,346,298 | |
| | Change in unrealized appreciation/(depreciation) on investments | | | (12,929,808 | ) | | | (14,507,335 | ) | | | (298,240,524 | ) |
| | | | | | | | | | | | | |
| | Net realized and unrealized gains/(losses) on investments | | | (9,838,549 | ) | | | (16,847,029 | ) | | | (243,894,226 | ) |
| | | | | | | | | | | | | |
Change in Net Assets Resulting from Operations | | $ | (7,686,548 | ) | | $ | (15,118,967 | ) | | $ | (211,951,039 | ) |
| | | | | | | | | | | | | |
| |
| 1 | Net of foreign withholding tax for Laudus Rosenberg International Equity Fund, Laudus Rosenberg International Discovery Fund, and Laudus Rosenberg International Small Capitalization Fund, was $372,348, $392,028, and $5,269,156 respectively. |
| |
| 2 | Includes reimbursement of sub-accounting fees on Investor Shares. |
See the accompanying notes to the financial statements.
Laudus International Equity Funds 49
Financial Statements
Statement of Changes in Net Assets
| | | | | | | | | | | | | | | | | | | | | | | | | | | |
| | | Laudus Rosenberg | | Laudus Rosenberg | | Laudus Rosenberg |
| | | International | | International | | International |
| | | Equity Fund | | Discovery Fund | | Small Capitalization Fund |
| | | | | | | |
| | | Year Ended | | Year Ended | | Year Ended | | Year Ended | | Year Ended | | Year Ended |
| | | March 31, | | March 31, | | March 31, | | March 31, | | March 31, | | March 31, |
| | | 2008 | | 2007 | | 2008 | | 2007* | | 2008 | | 2007 |
| | | | | | | | | | | | | |
Operations: | | | | | | | | | | | | | | | | | | | | | | | | |
| | Net investment income/(loss) | | $ | 2,152,001 | | | $ | 1,147,989 | | | $ | 1,728,062 | | | $ | 392,230 | | | $ | 31,943,187 | | | $ | 16,791,687 | |
| | Net realized gains/(losses) from investments | | | 3,091,259 | | | | 6,877,363 | | | | (2,339,694 | ) | | | 2,870,405 | | | | 54,346,298 | | | | 208,560,905 | |
| | Change in unrealized appreciation/(depreciation) from investments | | | (12,929,808 | ) | | | 11,549,757 | | | | (14,507,335 | ) | | | 8,235,461 | | | | (298,240,524 | ) | | | 82,283,173 | |
| | | | | | | | | | | | | | | | | | | | | | | | | |
| | | Change in net assets resulting from operations | | | (7,686,548 | ) | | | 19,575,109 | | | | (15,118,967 | ) | | | 11,498,096 | | | | (211,951,039 | ) | | | 307,635,765 | |
| | | | | | | | | | | | | | | | | | | | | | | | | |
Distributions to Shareholders from: | | | | | | | | | | | | | | | | | | | | | | | | |
| | Net investment income | | | | | | | | | | | | | | | | | | | | | | | | |
| | | Institutional Shares | | | (2,381,553 | ) | | | (627,740 | ) | | | (720,949 | ) | | | (109,953 | ) | | | (34,839,457 | ) | | | (14,345,867 | ) |
| | | Investor Shares | | | (361,620 | ) | | | (408,740 | ) | | | (1,224,195 | ) | | | (233,195 | ) | | | (21,597,431 | ) | | | (10,736,773 | ) |
| | | | | | | | | | | | | | | | | | | | | | | | | |
| | | | (2,743,173 | ) | | | (1,036,480 | ) | | | (1,945,144 | ) | | | (343,148 | ) | | | (56,436,888 | ) | | | (25,082,640 | ) |
| | | | | | | | | | | | | | | | | | | | | | | | | |
| | Net realized gains on investments | | | | | | | | | | | | | | | | | | | | | | | | |
| | | Institutional Shares | | | (7,587,962 | ) | | | (1,295,067 | ) | | | (2,753,798 | ) | | | (30,335 | ) | | | (131,923,248 | ) | | | (79,486,024 | ) |
| | | Investor Shares | | | (1,666,605 | ) | | | (1,092,235 | ) | | | (5,727,789 | ) | | | (82,625 | ) | | | (94,400,404 | ) | | | (74,164,191 | ) |
| | | | | | | | | | | | | | | | | | | | | | | | | |
| | | | (9,254,567 | ) | | | (2,387,302 | ) | | | (8,481,587 | ) | | | (112,960 | ) | | | (226,323,652 | ) | | | (153,650,215 | ) |
| | | | | | | | | | | | | | | | | | | | | | | | | |
| | | Change in net assets resulting from distributions | | | (11,997,740 | ) | | | (3,423,782 | ) | | | (10,426,731 | ) | | | (456,108 | ) | | | (282,760,540 | ) | | | (178,732,855 | ) |
| | | | | | | | | | | | | | | | | | | | | | | | | |
Capital Transactions: | | | | | | | | | | | | | | | | | | | | | | | | |
| | Proceeds from shares issued | | | | | | | | | | | | | | | | | | | | | | | | |
| | | Institutional Shares | | | 55,041,800 | | | | 48,370,879 | | | | 145,518,579 | | | | 18,758,287 | | | | 300,629,366 | | | | 430,184,421 | |
| | | Investor Shares | | | 6,229,865 | | | | 48,191,782 | | | | 144,113,465 | | | | 53,586,133 | | | | 92,413,634 | | | | 215,540,881 | |
| | | | | | | | | | | | | | | | | | | | | | | | | |
| | | | 61,271,665 | | | | 96,562,661 | | | | 289,632,044 | | | | 72,344,420 | | | | 393,043,000 | | | | 645,725,302 | |
| | | | | | | | | | | | | | | | | | | | | | | | | |
| | Distributions reinvested | | | | | | | | | | | | | | | | | | | | | | | | |
| | | Institutional Shares | | | 5,789,629 | | | | 746,719 | | | | 2,373,494 | | | | 118,690 | | | | 144,495,987 | | | | 77,822,309 | |
| | | Investor Shares | | | 1,834,295 | | | | 1,436,598 | | | | 6,361,968 | | | | 281,821 | | | | 97,508,406 | | | | 72,673,365 | |
| | | | | | | | | | | | | | | | | | | | | | | | | |
| | | | 7,623,924 | | | | 2,183,317 | | | | 8,735,462 | | | | 400,511 | | | | 242,004,393 | | | | 150,495,674 | |
| | | | | | | | | | | | | | | | | | | | | | | | | |
| | Value of shares redeemed | | | | | | | | | | | | | | | | | | | | | | | | |
| | | Institutional Shares | | | (16,666,965 | ) | | | (11,984,261 | ) | | | (17,223,557 | ) | | | (2,722,783 | ) | | | (585,177,294 | ) | | | (226,039,438 | ) |
| | | Investor Shares | | | (45,082,165 | ) | | | (13,615,518 | ) | | | (64,769,656 | ) | | | (10,319,538 | ) | | | (349,737,839 | ) | | | (270,496,667 | ) |
| | | | | | | | | | | | | | | | | | | | | | | | | |
| | | | (61,749,130 | ) | | | (25,599,779 | ) | | | (81,993,213 | ) | | | (13,042,321 | ) | | | (934,915,133 | ) | | | (496,536,105 | ) |
| | | | | | | | | | | | | | | | | | | | | | | | | |
| | | Change in net assets from capital transactions | | | 7,146,459 | | | | 73,146,199 | | | | 216,374,293 | | | | 59,702,610 | | | | (299,867,740 | ) | | | 299,684,871 | |
| | | | | | | | | | | | | | | | | | | | | | | | | |
| Change in net assets | | | (12,537,829 | ) | | | 89,297,526 | | | | 190,828,595 | | | | 70,744,598 | | | | (794,579,319 | ) | | | 428,587,781 | |
Net Assets: | | | | | | | | | | | | | | | | | | | | | | | | |
| | Beginning of period | | | 129,809,054 | | | | 40,511,528 | | | | 70,744,598 | | | | — | | | | 1,930,991,668 | | | | 1,502,403,887 | |
| | | | | | | | | | | | | | | | | | | | | | | | | |
| | End of period | | $ | 117,271,225 | | | $ | 129,809,054 | | | $ | 261,573,193 | | | $ | 70,744,598 | | | $ | 1,136,412,349 | | | $ | 1,930,991,668 | |
| | | | | | | | | | | | | | | | | | | | | | | | | |
| Undistributed net investment income/Distributions in excess of net investment income | | $ | 75,602 | | | $ | 327,367 | | | $ | 358,822 | | | $ | 245,660 | | | $ | (4,769,775 | ) | | $ | 9,402,286 | |
| | | | | | | | | | | | | | | | | | | | | | | | | |
| |
| * | For the period May 31, 2006 (commencement of operations) through March 31, 2007. |
See the accompanying notes to the financial statements.
50 Laudus International Equity Funds
Financial Statements—Statement of Changes in Net Assets continued
| | | | | | | | | | | | | | | | | | | | | | | | | | |
| | | Laudus Rosenberg | | Laudus Rosenberg | | Laudus Rosenberg |
| | | International | | International | | International |
| | | Equity Fund | | Discovery Fund | | Small Capitalization Fund |
| | | | | | | |
| | | Year Ended | | Year Ended | | Year Ended | | Period Ended | | Year Ended | | Year Ended |
| | | March 31, | | March 31, | | March 31, | | March 31, | | March 31, | | March 31, |
| | | 2008 | | 2007 | | 2008 | | 2007* | | 2008 | | 2007 |
| | | | | | | | | | | | | |
Shares sold: | | | | | | | | | | | | | | | | | | | | | | | | |
| | Institutional | | | 4,161,569 | | | | 4,057,376 | | | | 11,862,466 | | | | 1,838,230 | | | | 13,114,742 | | | | 20,193,658 | |
| | Investor | | | 449,393 | | | | 3,942,327 | | | | 11,324,623 | | | | 5,240,229 | | | | 3,984,585 | | | | 10,203,670 | |
| | | | | | | | | | | | | | | | | | | | | | | | | |
| | | | 4,610,962 | | | | 7,999,703 | | | | 23,187,089 | | | | 7,078,459 | | | | 17,099,327 | | | | 30,397,328 | |
| | | | | | | | | | | | | | | | | | | | | | | | | |
Issued upon reinvestment of distributions: | | | | | | | | | | | | | | | | | | | | | | | | |
| | Institutional | | | 474,171 | | | | 57,930 | | | | 203,036 | | | | 10,560 | | | | 8,381,438 | | | | 3,719,996 | |
| | Investor | | | 149,983 | | | | 111,624 | | | | 545,156 | | | | 25,073 | | | | 5,729,048 | | | | 3,514,186 | |
| | | | | | | | | | | | | | | | | | | | | | | | | |
| | | | 624,154 | | | | 169,554 | | | | 748,192 | | | | 35,633 | | | | 14,110,486 | | | | 7,234,182 | |
| | | | | | | | | | | | | | | | | | | | | | | | | |
Shares redeemed: | | | | | | | | | | | | | | | | | | | | | | | | |
| | Institutional | | | (1,244,671 | ) | | | (917,509 | ) | | | (1,465,877 | ) | | | (257,166 | ) | | | (31,657,552 | ) | | | (10,934,748 | ) |
| | Investor | | | (3,447,172 | ) | | | (1,117,813 | ) | | | (5,484,170 | ) | | | (980,212 | ) | | | (17,838,760 | ) | | | (13,086,640 | ) |
| | | | | | | | | | | | | | | | | | | | | | | | | |
| | | | (4,691,843 | ) | | | (2,035,322 | ) | | | (6,950,047 | ) | | | (1,237,378 | ) | | | (49,496,312 | ) | | | (24,021,388 | ) |
| | | | | | | | | | | | | | | | | | | | | | | | | |
Change in shares: | | | | | | | | | | | | | | | | | | | | | | | | |
| | Institutional | | | 3,391,069 | | | | 3,197,797 | | | | 10,599,625 | | | | 1,591,624 | | | | (10,161,372 | ) | | | 12,978,906 | |
| | Investor | | | (2,847,796 | ) | | | 2,936,138 | | | | 6,385,609 | | | | 4,285,090 | | | | (8,125,127 | ) | | | 631,216 | |
| | | | | | | | | | | | | | | | | | | | | | | | | |
| | | | 543,273 | | | | 6,133,935 | | | | 16,985,234 | | | | 5,876,714 | | | | (18,286,499 | ) | | | 13,610,122 | |
| | | | | | | | | | | | | | | | | | | | | | | | | |
See the accompanying notes to the financial statements.
Laudus International Equity Funds 51
Financial Statements
Financial Highlights as of 3/31/08
| | | | | | | | | | | | | | | | | | | | | | | | | | | | | |
| | | | | Investment Activities | | Less Dividends From | | |
| | | | | | | | | |
| | | Net Asset | | | | Net Realized | | Total | | | | Net | | |
| | | Value, | | Net | | and Unrealized | | from | | Net | | Realized | | |
| | | Beginning | | Investment | | Gains (Losses) | | Investment | | Investment | | Gains on | | Total |
| | | of Period | | Income/(Loss) | | on Investments | | Activities | | Income | | Investments | | Dividends |
| | | | | | | | | | | | | | | |
Institutional Shares | | | | | | | | | | | | | | | | | | | | | | | | | | | | |
| International Equity Fund |
| For the year ended March 31, 2008 | | $ | 13.58 | | | $ | 0.18 | | | $ | (0.92 | ) | | $ | (0.74 | ) | | $ | (0.30 | ) | | $ | (0.95 | ) | | $ | (1.25 | ) |
| For the year ended March 31, 2007 | | | 11.80 | | | | 0.07 | | | | 2.08 | | | | 2.15 | | | | (0.12 | ) | | | (0.25 | ) | | | (0.37 | ) |
| For the year ended March 31, 2006 | | | 9.63 | | | | 0.14 | | | | 2.15 | | | | 2.29 | | | | (0.12 | ) | | | — | | | | (0.12 | ) |
| For the year ended March 31, 2005 | | | 8.46 | | | | 0.09 | (5) | | | 1.12 | | | | 1.21 | | | | (0.04 | ) | | | — | | | | (0.04 | ) |
| For the year ended March 31, 2004 | | | 5.56 | | | | 0.08 | (5) | | | 2.90 | | | | 2.98 | | | | (0.08 | ) | | | — | | | | (0.08 | ) |
| International Discovery Fund |
| For the year ended March 31, 2008 | | | 12.05 | | | | 0.14 | (5) | | | (0.16 | ) | | | (0.02 | ) | | | (0.12 | ) | | | (0.46 | ) | | | (0.58 | ) |
| May 31, 2006 to March 31, 2007 (1) | | | 10.00 | | | | 0.09 | (5) | | | 2.06 | | | | 2.15 | | | | (0.08 | ) | | | (0.02 | ) | | | (0.10 | ) |
| International Small Capitalization Fund |
| For the year ended March 31, 2008 | | | 22.67 | | | | 0.34 | | | | (2.55 | ) | | | (2.21 | ) | | | (0.73 | ) | | | (2.76 | ) | | | (3.49 | ) |
| For the year ended March 31, 2007 | | | 20.97 | | | | 0.26 | | | | 3.90 | | | | 4.16 | | | | (0.38 | ) | | | (2.08 | ) | | | (2.46 | ) |
| For the year ended March 31, 2006 | | | 16.89 | | | | 0.13 | | | | 4.95 | | | | 5.08 | | | | (0.08 | ) | | | (0.92 | ) | | | (1.00 | ) |
| For the year ended March 31, 2005 | | | 13.94 | | | | 0.08 | (5) | | | 3.53 | | | | 3.61 | | | | (0.04 | ) | | | (0.62 | ) | | | (0.66 | ) |
| For the year ended March 31, 2004 | | | 7.92 | | | | 0.07 | (5) | | | 6.04 | | | | 6.11 | | | | (0.09 | ) | | | — | | | | (0.09 | ) |
| Investor Shares | | | | | | | | | | | | | | | | | | | | | | | | | | | | |
| International Equity Fund |
| For the year ended March 31, 2008 | | | 13.54 | | | | 0.55 | | | | (1.33 | ) | | | (0.78 | ) | | | (0.21 | ) | | | (0.95 | ) | | | (1.16 | ) |
| For the year ended March 31, 2007 | | | 11.77 | | | | 0.14 | | | | 1.97 | | | | 2.11 | | | | (0.09 | ) | | | (0.25 | ) | | | (0.34 | ) |
| For the year ended March 31, 2006 | | | 9.61 | | | | 0.10 | | | | 2.14 | | | | 2.24 | | | | (0.08 | ) | | | — | | | | (0.08 | ) |
| For the year ended March 31, 2005 | | | 8.47 | | | | 0.06 | (5) | | | 1.11 | | | | 1.17 | | | | (0.03 | ) | | | — | | | | (0.03 | ) |
| For the year ended March 31, 2004 | | | 5.57 | | | | 0.03 | (5) | | | 2.93 | | | | 2.96 | | | | (0.08 | ) | | | — | | | | (0.08 | ) |
| International Discovery Fund |
| For the year ended March 31, 2008 | | | 12.04 | | | | 0.11 | (5) | | | (0.16 | ) | | | (0.05 | ) | | | (0.10 | ) | | | (0.46 | ) | | | (0.56 | ) |
| May 31, 2006 to March 31, 2007 (1) | | | 10.00 | | | | 0.06 | (5) | | | 2.06 | | | | 2.12 | | | | (0.06 | ) | | | (0.02 | ) | | | (0.08 | ) |
| International Small Capitalization Fund |
| For the year ended March 31, 2008 | | | 22.38 | | | | 0.36 | | | | (2.60 | ) | | | (2.24 | ) | | | (0.63 | ) | | | (2.77 | ) | | | (3.40 | ) |
| For the year ended March 31, 2007 | | | 20.74 | | | | 0.20 | | | | 3.82 | | | | 4.02 | | | | (0.30 | ) | | | (2.08 | ) | | | (2.38 | ) |
| For the year ended March 31, 2006 | | | 16.73 | | | | 0.08 | | | | 4.89 | | | | 4.97 | | | | (0.04 | ) | | | (0.92 | ) | | | (0.96 | ) |
| For the year ended March 31, 2005 | | | 13.83 | | | | 0.03 | (5) | | | 3.51 | | | | 3.54 | | | | (0.02 | ) | | | (0.62 | ) | | | (0.64 | ) |
| For the year ended March 31, 2004 | | | 7.87 | | | | 0.03 | (5) | | | 6.01 | | | | 6.04 | | | | (0.08 | ) | | | — | | | | (0.08 | ) |
| |
| (1) | From the commencement of operations. |
| (2) | Not annualized for periods less than one year. |
| (3) | Annualized for periods less than one year. |
| (4) | Portfolio turnover is calculated on the basis of the Fund as a whole without distinguishing between the classes of shares issued. |
| (5) | Calculated based on the average shares outstanding during the period. |
| (6) | Amount less than $0.005. |
See the accompanying notes to the financial statements.
52 Laudus International Equity Funds
Financial Statements—Financial Highlights continued
| | | | | | | | | | | | | | | | | | | | | | | | | | | | | | | | | |
| | | | | | | | | Ratios/Supplemental Data |
| | | | | | | | | |
| | | | | Net Asset | | | | Net Assets, | | Net Investment | | |
| | | | | Value, | | | | End of | | Income/(Loss) Net | | Expenses | | Expenses | | Portfolio |
| | | Redemption | | End of | | Total | | Period | | of Waivers/ | | before Waivers/ | | Net of Waivers/ | | Turnover |
| | | Fees | | Period | | Return(2) | | (000’s) | | Reimbursements(3) | | Reimbursements(3) | | Reimbursements(3) | | Rate(4) |
| | | | | | | | | | | | | | | | | |
| | | $ | — | (6) | | $ | 11.59 | | | | (5.91 | )% | | $ | 97,701 | | | | 1.46 | % | | | 1.23 | % | | | 1.22 | % | | | 82.89 | % |
| | | | — | (6) | | | 13.58 | | | | 18.37 | | | | 68,398 | | | | 1.09 | | | | 1.34 | | | | 1.34 | | | | 64.19 | |
| | | | — | | | | 11.80 | | | | 23.86 | | | | 21,688 | | | | 1.34 | | | | 1.96 | | | | 1.34 | | | | 59.40 | |
| | | | — | (6) | | | 9.63 | | | | 14.36 | | | | 16,094 | | | | 0.96 | | | | 2.69 | | | | 1.34 | | | | 52.06 | |
| | | | 0.01 | | | | 8.46 | | | | 53.81 | | | | 9,914 | | | | 1.12 | | | | 4.32 | | | | 1.35 | | | | 107.02 | |
| | | | — | (6) | | | 11.45 | | | | (0.24 | ) | | | 139,643 | | | | 1.14 | | | | 1.54 | | | | 1.35 | | | | 146.60 | |
| | | | — | (6) | | | 12.05 | | | | 21.90 | | | | 19,173 | | | | 1.06 | | | | 1.64 | | | | 1.34 | | | | 105.81 | |
| | | | — | (6) | | | 16.97 | | | | (9.97 | ) | | | 612,703 | | | | 1.87 | | | | 1.09 | | | | 1.09 | | | | 104.58 | |
| | | | — | (6) | | | 22.67 | | | | 20.82 | | | | 1,048,829 | | | | 1.21 | | | | 1.10 | | | | 1.10 | | | | 91.82 | |
| | | | — | | | | 20.97 | | | | 30.90 | | | | 698,064 | | | | 0.85 | | | | 1.25 | | | | 1.25 | | | | 101.86 | |
| | | | — | (6) | | | 16.89 | | | | 26.52 | | | | 270,646 | | | | 0.50 | | | | 1.55 | | | | 1.49 | | | | 59.70 | |
| | | | — | (6) | | | 13.94 | | | | 77.37 | | | | 70,382 | | | | 0.65 | | | | 1.94 | | | | 1.47 | | | | 102.50 | |
| | | | — | (6) | | | 11.60 | | | | (6.21 | ) | | | 19,570 | | | | 1.97 | | | | 1.69 | | | | 1.61 | | | | 82.89 | |
| | | | — | (6) | | | 13.54 | | | | 18.08 | | | | 61,411 | | | | 1.17 | | | | 1.71 | | | | 1.64 | | | | 64.19 | |
| | | | — | | | | 11.77 | | | | 23.41 | | | | 18,824 | | | | 1.02 | | | | 2.33 | | | | 1.72 | | | | 59.40 | |
| | | | — | (6) | | | 9.61 | | | | 13.79 | | | | 12,491 | | | | 0.65 | | | | 2.96 | | | | 1.72 | | | | 52.06 | |
| | | | 0.02 | | | | 8.47 | | | | 53.61 | | | | 2,881 | | | | 0.45 | | | | 4.46 | | | | 1.59 | | | | 107.02 | |
| | | | — | (6) | | | 11.43 | | | | (0.51 | ) | | | 121,930 | | | | 0.89 | | | | 1.81 | | | | 1.65 | | | | 146.60 | |
| | | | — | (6) | | | 12.04 | | | | 21.62 | | | | 51,572 | | | | 0.75 | | | | 2.03 | | | | 1.64 | | | | 105.81 | |
| | | | — | (6) | | | 16.74 | | | | (10.27 | ) | | | 523,709 | | | | 1.55 | | | | 1.45 | | | | 1.45 | | | | 104.58 | |
| | | | — | (6) | | | 22.38 | | | | 20.35 | | | | 882,163 | | | | 0.87 | | | | 1.47 | | | | 1.47 | | | | 91.82 | |
| | | | — | | | | 20.74 | | | | 30.48 | | | | 804,340 | | | | 0.42 | | | | 1.60 | | | | 1.60 | | | | 101.86 | |
| | | | — | (6) | | | 16.73 | | | | 26.16 | | | | 355,766 | | | | 0.20 | | | | 1.88 | | | | 1.83 | | | | 59.70 | |
| | | | — | (6) | | | 13.83 | | | | 76.91 | | | | 82,780 | | | | 0.28 | | | | 2.18 | | | | 1.75 | | | | 102.50 | |
See the accompanying notes to the financial statements.
Laudus International Equity Funds 53
Financial Statements
Notes to Financial Statements as of 3/31/08
Laudus Trust, (the “Trust”) was established as a Massachusetts business trust under the laws of Massachusetts on April 1, 1988. The Trust is an open-end diversified management investment company consisting of eleven portfolios, as of March 31, 2008.
The list below shows all the funds in the Trust including the funds discussed in this report, which are highlighted (individually each such highlighted portfolio, a “Fund” and collectively, the “Funds”):
Laudus Rosenberg U.S. Large Capitalization Fund,
Laudus Rosenberg U.S. Large Capitalization Growth
Fund,
Laudus Rosenberg U.S. Large Capitalization Value
Fund,
Laudus Rosenberg U.S. Discovery Fund,
Laudus Rosenberg U.S. Small Capitalization Fund,
Laudus Rosenberg International Equity Fund,
Laudus Rosenberg International Discovery Fund,
Laudus Rosenberg International Small Capitalization
Fund,
Laudus Rosenberg Long/ Short Equity Fund (formerly the
Laudus Rosenberg Value Long/Short Equity Fund),
Laudus Mondrian Emerging Markets Fund
(commenced operations on November 2, 2007),
Laudus Mondrian International Fixed Income Fund
(commenced operations on November 2, 2007)
As of May 31, 2007, the Laudus Rosenberg International Small Capitalization Fund closed to all investors, except the Fund will continue to offer shares to certain qualified retirement plans and through reinvestment of dividends and capital gains.
Each Fund is authorized to issue an unlimited number of Institutional Shares and Investor Shares of no par value. Each class of shares generally has identical rights and preferences, except that each class is subject to different eligibility conditions, bears different distribution and sub-transfer agent expenses, and has separate voting rights on matters pertaining solely to that class of shares.
Under the Trust’s organizational documents, its officers and trustees are indemnified against certain liabilities arising out of the performance of their duties to the Funds. In addition, in the normal course of business, the Funds enter into contracts with their vendors and others that provide for general indemnifications. The Funds’ maximum exposure under these arrangements is unknown, as this would involve future claims that may be made against the Funds. However, based on experience, the Funds expect that risk of loss to be remote.
2. Significant Accounting Policies.
The accounting policies adopted by the Funds are in conformity with accounting principles generally accepted in the United States of America, which require management to make estimates and assumptions that affect the reported amounts and disclosures in the financial statements. Actual amounts could differ from those estimates. The following is a summary of significant accounting policies followed by the Trust in the preparation of its financial statements.
Security Valuation
Each Fund uses approved pricing services to provide values for its portfolio securities. Current market values are generally determined by the approved pricing services as follows: securities traded on stock exchanges are valued at the last-quoted sales price on the exchange on which such securities are primarily traded (closing values), or, lacking any sales, at the mean between the bid and ask prices; securities traded in the over-the-counter market are valued at the last sales price that day, or, if there are no sales that day, at the mean between the bid and ask prices. In addition, securities that are primarily traded on foreign exchanges are generally valued at the preceding closing values of such securities on their respective exchanges with these values then translated into U.S. dollars at the current exchange rate. Securities may be fair valued pursuant to procedures approved by the Funds’ Board of Trustees when approved pricing services do not provide a value for a security, a furnished price appears manifestly incorrect or events occur prior to the close of the New York Stock Exchange that materially affect the furnished price.
Short-term debt securities that mature in 60 days or less are valued at amortized cost, which approximates market value.
Other investment companies are valued at their respective net asset values as determined by those funds, in accordance with the Investment Company Act of 1940 for a given day.
54 Laudus International Equity Funds
Financial Statements—Notes to Financial Statements as of 3/31/08 continued
Security Transactions and Related Investment Income
Changes in holdings of portfolio securities are reflected no later than on the first business day following the trade date. However, for financial reporting purposes, portfolio security transactions are reported on trade date. Net realized gains or losses from sales of securities are determined on the specific identification cost method. Interest income and expenses are recognized on the accrual basis. Dividend income, less foreign taxes withheld, (if any) and dividend expenses on securities sold short are recorded on the ex-dividend date. Interest income is recorded as earned.
Foreign Currency Transactions
The accounting records of the Funds are maintained in U.S. dollars. All monetary items denominated in foreign currencies are translated to U.S. dollars based upon the prevailing exchange rate at the close of each business day. Net realized gains and losses on foreign currency transactions represent net gains and losses from currency gains and losses realized between the trade and settlement dates on securities transactions, and the difference between the amount of net investment income accrued and the U.S. dollar amount actually received. Further, the effects of changes in foreign currency exchange rates on investments in securities are not segregated in the financial statements from the effects of changes in market prices of those securities, but are included with the net realized gain or loss and unrealized appreciation or depreciation on investments.
Forward Foreign Currency Contracts
Forward foreign currency contracts are valued at the daily exchange rate of the underlying currency. The forward foreign currency contracts are adjusted by the daily exchange rate of the underlying currency and any gains or losses are recorded for financial statement purposes as unrealized appreciation or depreciation until the contractual settlement date. Gains or losses from the purchase or sale of forward foreign currency contracts are recorded as realized on the settlement date.
Foreign Securities
The Funds pursue their respective objectives by investing in foreign securities. Investments in securities of foreign issuers involve certain risks that are less significant for investments in securities of U.S. issuers. These include risks of adverse changes in foreign economic, political, regulatory and other conditions, changes in currency exchange rates or exchange control regulations (including currency blockage). The Funds may be unable to obtain and enforce judgments against foreign entities, and issuers of foreign securities are subject to different, and often less comprehensive, accounting, reporting and disclosure requirements than domestic issuers. Also, the securities of some foreign companies may be less liquid and at times more volatile than securities of comparable U.S. companies.
Real Estate Investment Trusts
Certain Funds may own shares of real estate investment trusts (“REITs”) which report information on the source of their distributions annually. Certain distributions received from REITs during the year, which are known to be a return of capital, are recorded as a reduction to the cost of the individual REIT.
Repurchase Agreements
In a repurchase agreement, a Fund buys a security from another party (usually a financial institution) with the agreement that the security will be sold back in the future. The date, price and other conditions are all specified when the agreement is created.
The Funds’ repurchase agreements are currently fully collateralized by U.S. government securities or by U.S. government agency securities. All collateral is held by the Funds’ Custodian (or, with tri-party agreements, the agent’s bank) and is monitored daily to ensure that its market value is at least equal to the repurchase price under the agreement.
Securities Lending
Under the Securities Lending Program, securities held by the Laudus Rosenberg International Small Capitalization Fund are loaned by State Street Corporation, as agent, to certain brokers (the “Borrowers”). The Borrowers provide cash or U.S. Government securities as collateral against loans in an amount at least equal to 100% of the market value of the loaned securities.
The cash collateral of securities loaned is invested in high quality, short-term investments such as money market funds and U.S. government securities. The investments of collateral are marked-to-market daily and the value of the collateral must be at least 100% of the market value of the loaned securities each day.
Laudus International Equity Funds 55
Financial Statements—Notes to Financial Statements as of 3/31/08 continued
At March 31, 2008, the Fund had collateral and loans outstanding of:
| | | | | | | | | |
| | | | | Value of |
| | | Value of | | Loaned |
| | | Collateral | | Securities |
| |
| Laudus Rosenberg International Small Capitalization Fund | | $ | 79,431,797 | | | $ | 75,372,794 | |
Expense, Investment Income and Gain/ Loss Allocation
Expenses directly attributable to a Fund are charged to that Fund; expenses not directly attributable to a Fund are allocated proportionately among each Fund within the Trust in relation to the net assets of each Fund or on another reasonable basis. Expenses specific to a class are charged to that class. Expenses other than class specific expenses are allocated daily to each class based upon the proportion of relative net assets or another reasonable basis. The investment income and expenses of the Fund (other than class specific expenses charged to a class) and realized and unrealized gains and losses are allocated to each class of shares based upon relative net assets on the date income is earned, or expenses and realized/unrealized gains and losses are incurred.
Distributions
Distributions to shareholders are recorded on the ex-dividend date. Distributions are made annually on a tax basis, which may differ from distribution amounts determined under accounting principles generally accepted in the United States of America. These differences are primarily due to differing treatments for foreign currency transactions, REITs, and wash sales for book and tax purposes.
Federal Income Taxes
It is the Funds’ policy to comply with the requirements of the Internal Revenue Code applicable to regulated investments companies, and to distribute substantially all of its taxable income, including any net realized gain on investments, to its shareholders. Therefore, no provisions are made for federal income taxes.
Custody Credit
Each Fund has an arrangement with its custodian bank under which the Fund receives a credit for its uninvested cash balance to offset its custody fees and accounting fees. The credit amounts are disclosed in the Statement of Operations as a reduction to the Funds’ operating expenses.
New Accounting Standards
Financial Accounting Standards Board Interpretation (FIN) No. 48 — Accounting for Uncertainty in Income Taxes — an Interpretation of SFAS No. 109, was issued in July 2006 and is effective for fiscal years beginning after December 15, 2006. This Interpretation provides new requirements for the recognition, measurement, and disclosure in the financial statements of a tax position taken or expected to be taken in a tax return when there is uncertainty about whether that tax position will ultimately be sustained. As of March 31, 2008, management has reviewed the tax positions for open tax years (March 31, 2004 through March 31, 2007), and determined that no provision for income tax is required in the Fund’s financial statements.
In September 2006, the Financial Accounting Standards Board (FASB) issued Statement of Financial Accounting Standards No. 157, “Fair Value Measurements” (SFAS No. 157). SFAS No. 157 defines fair value, establishes a framework for measuring fair value in accordance with generally accepted accounting principles and expands disclosure about fair value measurements. SFAS No. 157 is effective for fiscal years beginning after November 15, 2007. As of March 31, 2008 management does not believe the adoption of SFAS No. 157 will impact the financial statements; however, additional disclosures may be required about the inputs used to develop the measurements and the effects of certain of the measurements on changes in net assets for the period.
In March 2008, the Financial Accounting Standards board (“FASB”) issued Statement of Financial Accounting Standards No. 161, “Disclosures about Derivative Instruments and Hedging Activities” (“SFAS 161”). SFAS 161 is effective for fiscal years and interim periods beginning after November 15, 2008. SFAS 161 requires enhanced disclosures about Funds’ derivative and hedging activities. Management is currently evaluating the impact of the adoption of SFAS 161 on the Funds’ financial statement disclosures.
| |
| 3. | Management, Administration, Fund Accounting, Distribution, Shareholder Service Agreements, and Trustee Expenses |
The Trust’s Board of Trustees oversees the general conduct of the Trust and the Funds.
56 Laudus International Equity Funds
Financial Statements—Notes to Financial Statements as of 3/31/08 continued
Charles Schwab Investment Management, Inc. (“CSIM” or the “Manager”) is the investment adviser of the Funds and manages the Funds’ business, subject to the supervision of the Board of Trustees. AXA Rosenberg Investment Management LLC (“AXA Rosenberg”), the Funds’ sub-adviser, provides day-to-day portfolio management services to the Funds, subject to the supervision of CSIM.
The Funds pay CSIM an advisory fee for these services on a monthly basis. CSIM — and not the Funds — pays a portion of the advisory fees it receives to AXA Rosenberg in return for its services.
The table below sets forth the advisory fee payable to CSIM by each Fund.
| | | |
| | | Agreement Rate* |
| |
| Laudus Rosenberg International Equity Fund | | 1st $1 billion-0.85%
$1 billion to $2 billion-0.80%
Over $2 billion-0.775% |
| Laudus Rosenberg International Discovery Fund | | 1st $1billion-1.00%
Over $1 billion-0.95% |
| Laudus Rosenberg International Small Capitalization Fund | | 1st $500 million-1.00%
Over $500 million-0.95% |
| |
| * | The advisory fee payable to CSIM varies based on fund assets. |
The Funds may, from time to time, execute portfolio trades with affiliated brokers/dealers. For the period ended March 31, 2008, the Funds paid no brokerage fees on the execution of portfolio trades with affiliated brokers/dealers.
CSIM has contractually agreed, until at least July 30, 2010, to waive a portion of its management fee and bear certain expenses of each Fund. As such, CSIM further agrees to reimburse the Funds to limit the annual expenses, exclusive of nonrecurring account fees, fees on securities transactions such as exchange fees, dividends and interest on securities sold short, service fees, interest (overdraft charges), taxes, brokerage commissions, other expenditures which are capitalized in accordance with generally accepted accounting principles, and other extraordinary expenses not incurred in the ordinary course of the Funds’ business as follows:
| | | | | | | | | |
| | | Institutional | | Investor |
| | | Shares | | Shares |
| |
| Laudus Rosenberg International Equity Fund* | | | 1.12% | | | | 1.40% | |
| Laudus Rosenberg International Discovery Fund | | | 1.35% | | | | 1.65% | |
| Laudus Rosenberg International Small Capitalization Fund | | | 1.49% | | | | 1.79% | |
| |
| * | Prior to January 1, 2008, the expense limitation for the Institutional shares and Investor shares were 1.34% and 1.64%, respectively. |
Any amounts waived or reimbursed in a particular fiscal year will be subject to repayment through the next two fiscal years, to the extent that the repayment will not cause the Funds’ net expenses to exceed the current limit (as stated in CSIM’s contractual undertaking) during the respective year. As of March 31, 2008, the balance of recoupable expenses is as follows:
| | | | | | | | | |
| | | Expires | | Expires |
| | | 3/31/09 | | 3/31/10 |
| |
| Laudus Rosenberg International Equity Fund | | $ | 31,150 | | | $ | — | |
| Laudus Rosenberg International Discovery Fund | | | 167,471 | | | | 196,269 | |
| Laudus Rosenberg International Small Capitalization Fund | | | — | | | | — | |
The Trust has a Distribution and Shareholder Service Plan with respect to its Investor Shares pursuant to Rule 12b-1 under the 1940 Act. The Investor Shares of the Funds are sold on a continuous basis by the Trust’s distributor — ALPS Distributors, Inc. Under the Distribution and Shareholder Services Plan, the Funds pay distribution and shareholder servicing fees in connection with the sale and servicing of the Investor Shares. The annual Distribution and Shareholder Service Fee consists of up to 0.25% of the respective average daily net assets of the Investor Shares. In addition, the Trustees have authorized each Fund to pay up to 0.15% of its average daily net assets attributable to Investor Shares for sub-transfer agent and sub-accounting services in connection with such shares.
The Board of Trustees may include people who are officers and/or directors of other fund families affiliated to the investment adviser. Federal securities law limits the percentage of the “interested persons” who may serve on a trust’s board, and the Laudus Funds are in compliance with these limitations. The Funds did not pay any of the
Laudus International Equity Funds 57
Financial Statements—Notes to Financial Statements as of 3/31/08 continued
interested persons for their services as trustees, but did pay non-interested persons (Independent Trustees), as noted in each Fund’s Statement of Operations.
A Retirement Plan was instituted for certain Independent Trustees of the Trust. In September 2006, the Trustees voted to close the Retirement Plan to new participants as of June 26, 2006 and to discontinue making contributions to the Retirement Plan after the plan year ending March 31, 2007. All other terms of the Retirement Plan, including without limitation provisions relating to vesting and payment upon termination of service, remain in effect. Under the terms of the Retirement Plan, upon retirement or other termination from service from the Trust (other than termination for cause), a retiring Independent Trustee who has served as Independent Trustee for at least five years shall be paid a lump sum cash payment (the “Retirement Payment”). The Retirement Payment shall be equal to $10,000 for each year that the Trustee has served as an Independent Trustee of the Trust, including years of service prior to the adoption of the Retirement Plan and including a final one-half year credit for service during the plan year ending March 31, 2007. Beginning April 1, 2005, each Independent Trustee was permitted to make a one-time election to have the $10,000 attributable to service for the coming year and previously accrued benefits adjusted up or down at the end of each subsequent year based on the unweighted average performance of Institutional Shares of each Fund of the Trust. After the closure of the Retirement Plan, the previously accrued benefits that an Independent Trustee had elected to have adjusted by the performance of the Funds would continue to be adjusted for performance as provided under the Retirement Plan. As a result, the amount of the Retirement Payment payable to any Independent Trustee may increase or decrease based upon performance of the Funds. The portion of the total Retirement Payment owed to an Independent Trustee upon his or her retirement that is payable by any Fund will be determined based on the relative net assets of the Funds of the Trust. The Trust did not pay any pension or retirement benefits for its Trustees.
4. Redemption Fee.
Certain Fund shares purchased that were redeemed or exchanged in less than 30 days, are assessed a fee of 2% of the current net asset value of the shares. The fee, which is applied to shares redeemed or exchanged in the order in which they are purchased, is retained by the Fund and is intended to limit short-term trading in the Funds, or to the extent short-term trading persists, to impose the costs of that activity on the shareholders who engage in it. Such amounts are net of the value of shares redeemed on the Statement of Changes in Net Assets. For the current and prior period, redemption fees assessed were as follows:
| | | | | | | | | |
| | | Current | | Prior |
| | | Period | | Period |
| | | (4/1/07- | | (4/1/06- |
| | | 3/31/08) | | 3/31/07) |
| |
| Laudus Rosenberg International Equity Fund | | $ | 1,697 | | | $ | 20,146 | |
| Laudus Rosenberg International Discovery Fund | | | 66,859 | | | | 20,436 | |
| Laudus Rosenberg International Small Capitalization Fund | | | 32,882 | | | | 102,195 | |
| |
| 5. | Security Purchases and Sales. |
For the period ended March 31, 2008, purchases and sales of securities (excluding short-term securities) were as follows:
| | | | | | | | | |
| | | Purchases | | Sales |
| |
| Laudus Rosenberg International Equity Fund | | $ | 109,430,483 | | | $ | 111,413,371 | |
| Laudus Rosenberg International Discovery Fund | | | 456,907,616 | | | | 252,448,463 | |
| Laudus Rosenberg International Small Capitalization Fund | | | 1,883,956,112 | | | | 2,419,367,082 | |
The Laudus Rosenberg International Equity Fund, Laudus Rosenberg International Discovery Fund and Laudus Rosenberg International Small Capitalization Fund has access to custodian overdraft facilities and to an uncommitted line of credit up to a maximum of $100,000,000, as established by State Street Corporation. Interest is calculated based on the market rates at the time of borrowing. There were no borrowings from the line of credit for the period ended March 31, 2008.
58 Laudus International Equity Funds
Financial Statements—Notes to Financial Statements as of 3/31/08 continued
7. Federal Income Taxes.
The tax character of distributions paid during the fiscal year ended March 31, 2008 was as follows:
| | | | | | | | | | | | | |
| | | Ordinary | | Long-Term | | Total |
| | | Income | | Capital Gains | | Distributions Paid |
| |
| Laudus Rosenberg International Equity Fund | | $ | 6,985,862 | | | $ | 5,011,878 | | | $ | 11,997,740 | |
| Laudus Rosenberg International Discovery Fund | | | 9,290,498 | | | | 1,136,233 | | | | 10,426,731 | |
| Laudus Rosenberg International Small Capitalization Fund | | | 121,519,374 | | | | 161,241,166 | | | | 282,760,540 | |
The tax character of distributions paid during the fiscal year ended March 31, 2007 was as follows:
| | | | | | | | | | | | | |
| | | Ordinary | | Long-Term | | Total |
| | | Income | | Capital Gains | | Distributions Paid |
| |
| Laudus Rosenberg International Equity Fund | | $ | 1,036,481 | | | $ | 2,387,301 | | | $ | 3,423,782 | |
| Laudus Rosenberg International Discovery Fund | | | 456,108 | | | | — | | | | 456,108 | |
| Laudus Rosenberg International Small Capitalization Fund | | | 94,586,998 | | | | 84,145,857 | | | | 178,732,855 | |
Net capital losses incurred after October 31 and within the taxable year are deemed to arise on the first business day of the Funds’ next taxable year. For the year ended March 31, 2008, the Funds deferred to April 1, 2008 post October capital losses of:
| | | | | |
| | | Capital Losses |
| |
| Laudus Rosenberg International Equity Fund | | $ | 1,443,588 | |
| Laudus Rosenberg International Discovery Fund | | | 7,099,349 | |
| Laudus Rosenberg International Small Capitalization Fund | | | 75,298,406 | |
As of March 31, 2008, the components of distributable earnings/accumulated(losses) on a tax basis were as follows:
| | | | | | | | | | | | | | | | | |
| | | Undistributed | | Undistributed | | Accumulated | | Unrealized |
| | | Ordinary | | Long-Term | | Capital and | | Appreciation/ |
| | | Income | | Capital Gains | | Other Losses | | Depreciation |
| |
| Laudus Rosenberg International Equity Fund | | $ | 336,608 | | | $ | 9,394 | | | $ | (1,446,665 | ) | | $ | 6,070,336 | |
| Laudus Rosenberg International Discovery Fund | | | 771,470 | | | | — | | | | (7,123,219 | ) | | | (8,151,961 | ) |
| Laudus Rosenberg International Small Capitalization Fund | | | 736,530 | | | | — | | | | (75,375,179 | ) | | | 36,995,347 | |
The difference between book basis and tax basis unrealized appreciation/(depreciation) is attributable primarily to: tax deferral of losses on wash sales, the realization for tax purposes of unrealized gains/(losses) on certain derivative instruments, and unrealized gains/(losses) on investments in passive foreign investment companies.
The permanent book and tax basis differences may result in reclassifications between capital accounts and other accounts as required. The adjustments have no impact on net assets or the results of operations. As of March 31, 2008, the Funds made the following reclassifications:
| | | | | | | | | | | | | |
| | | | | Accumulated | | |
| | | Accumulated | | Net Realized | | |
| | | Net Investment | | Gains/(Losses) | | Paid In |
| | | Income/(Loss) | | on Investments | | Capital |
| |
| Laudus Rosenberg International Equity Fund | | $ | 339,407 | | | $ | (339,407 | ) | | $ | — | |
| Laudus Rosenberg International Discovery Fund | | | 330,244 | | | | (330,244 | ) | | | — | |
| Laudus Rosenberg International Small Capitalization Fund | | | 10,321,640 | | | | (10,321,640 | ) | | | — | |
Laudus International Equity Funds 59
Report of Independent Registered Public Accounting Firm
To the Board of Trustees and Shareholders of Laudus Trust
In our opinion, the accompanying statements of assets and liabilities, including the portfolio holdings, and the related statements of operations and of changes in net assets and the financial highlights present fairly, in all material respects, the financial position of Laudus Rosenberg International Equity Fund, Laudus Rosenberg International Discovery Fund, and Laudus Rosenberg International Small Capitalization Fund (the “Funds”) at March 31, 2008, the results of each of their operations for the year then ended, and the changes in each of their net assets and the financial highlights for each of the periods presented, in conformity with accounting principles generally accepted in the United States of America. These financial statements and financial highlights (hereafter referred to as “financial statements”) are the responsibility of the Funds’ management; our responsibility is to express an opinion on these financial statements based on our audits. We conducted our audits of these financial statements in accordance with the standards of the Public Company Accounting Oversight Board (United States). Those standards require that we plan and perform the audits to obtain reasonable assurance about whether the financial statements are free of material misstatement. An audit includes examining, on a test basis, evidence supporting the amounts and disclosures in the financial statements, assessing the accounting principles used and significant estimates made by management, and evaluating the overall financial statement presentation. We believe that our audits, which included confirmation of securities at March 31, 2008 by correspondence with the custodian and brokers, provide a reasonable basis for our opinion.
PricewaterhouseCoopers LLP
San Francisco, California
May 14, 2008
60 Laudus International Equity Funds
Other Tax Information (unaudited)
The Funds may elect to pass on the benefits of the foreign tax credit to its shareholders for the year ended March 31, 2008.
| | | | | |
| | | Foreign Tax |
| | | Credit |
| |
| Laudus Rosenberg International Equity Fund | | $ | 364,694 | |
| Laudus Rosenberg International Discovery Fund | | | 370,588 | |
| Laudus Rosenberg International Small Capitalization Fund | | | 5,058,257 | |
For the fiscal year March 31, 2008, certain dividends paid by the Funds may be subject to maximum tax rate of 15% as provided by the Jobs and Growth Tax Relief Reconciliation Act of 2003. The Funds intend to designate the maximum allowable as taxed at a maximum rate of 15%. Complete information will be reported in conjunction with your 2008 Form 1099-DIV.
For the year ended March 31, 2008, the Funds designate the following amounts of qualified dividend income:
| | | | | |
| | | Qualified |
| | | Dividend Income |
| |
| Laudus Rosenberg International Equity Fund | | $ | 3,986,816 | |
| Laudus Rosenberg International Discovery Fund | | | 3,373,856 | |
| Laudus Rosenberg International Small Capitalization Fund | | | 35,431,312 | |
Laudus International Equity Funds 61
Trustees and Officers
The tables below provide information about the trustees and officers for the Laudus Trust, which includes the funds covered in this report. The “Fund Complex” includes The Charles Schwab Family of Funds, Schwab Investments, Schwab Capital Trust, Schwab Annuity Portfolios, Laudus Trust, and Laudus Institutional Trust. As of March 31, 2008, the Fund Complex included 79 funds.
At a meeting of the Board held on September 28-29, 2006, the Trustees voted to adopt a retirement policy for all independent trustees that requires an independent trustee to retire no later than December 31st of the year in which he or she reaches age seventy-two.
The address for all trustees and officers is 101 Montgomery Street, San Francisco, CA 94104. You can find more information about the trustees and officers in the Statement of Additional Information, which is available free by calling 1-866-452-8387.
| | | | | | | |
| Independent Trustees |
| |
| Name, Address1 and | | Number of | | |
| Year of Birth; | | Portfolios in | | |
| (Term of Office and | | Principal Occupation(s) | | Fund Complex | | Other Directorships |
| Length of Time Served2) | | During Past Five Years | | Overseen | | Held by Trustee |
| |
Mariann Byerwalter3
1960
(1/04-present) | | Chairman of JDN Corporate Advisory LLC. | | 79 | | Board 1 – Director, Redwood Trust, Inc. (mortgage finance).
Board 2 – Director, PMI Group, Inc. (mortgage insurance). |
| |
William A. Hasler3
1941
(1/04-present) | | Retired. Dean Emeritus of the Haas School of Business at the University of California, Berkeley. Until February 2004, Co-Chief Executive Officer, Aphton Corporation (bio- pharmaceuticals). | | 79 | | Board 1 – Director, Mission West Properties (commercial real estate).
Board 2 – Director, TOUSA (home building).
Board 3 – Director, Harris-Stratex Networks (a network equipment corporation).
Board 4 – Director, Genitope Corp. (bio-pharmaceuticals).
Board 5 – Director, Ditech Networks (voice communications technology)
Board 6 – Rubicon Limited (manufacturing) |
| |
Nils H. Hakansson3
1937
(3/90-present) | | Sylvan C. Coleman Professor of Finance and Accounting, Emeritus, Haas School of Business, University of California, Berkeley (since 2003). Mr. Hakansson was also a Professor of Finance and Accounting, Haas School of Business, University of California, Berkeley (July 1969 to January 2003). | | 11 | | None |
| |
62 Laudus International Equity Funds
Trustees and Officers continued
| | | | | | | |
| Independent Trustees |
| |
| Name, Address1 and | | Number of | | |
| Year of Birth; | | Portfolios in | | |
| (Term of Office and | | Principal Occupation(s) | | Fund Complex | | Other Directorships |
| Length of Time Served2) | | During Past Five Years | | Overseen | | Held by Trustee |
| |
Randall W. Merk
1954
(6/06-present) | | Executive Vice President and President, Investment Management Services, Charles Schwab & Co., Inc.; Executive Vice President, Charles Schwab & Co., Inc. (2002- present); President and Chief Executive Officer, Charles Schwab Investment Management, Inc. (2007-present); Director, Charles Schwab Asset Management (Ireland) Limited and Charles Schwab Worldwide Funds PLC. From September 2002 to July 2004, Chief Executive Officer and President, Charles Schwab Investment Management, Inc. and Executive Vice President, Charles Schwab & Co., Inc. | | 11 | | None |
| |
| |
| 1 | The mailing address of each of the Trustees is c/o Laudus Trust, 101 Montgomery Street, San Francisco, CA 94104. |
| |
| 2 | Each Trustee shall hold office until the election and qualification of his or her successor, or until he or she dies, resigns or is removed. |
| |
| 3 | Member of the Audit Committee. |
Laudus International Equity Funds 63
Trustees and Officers continued
| | | | | |
| Officers |
| |
| Name, Address4 |
| and Year of Birth; |
| (Term of Office5 and |
| Length of Time Served) | | Position with the Trust | | Principal Occupation During Past Five Years |
| |
Jeffrey Mortimer
1963
(3/08-present, President and CEO)
(6/04-present, CIO) | | President, Chief Executive Officer, and Chief Investment Officer | | Senior Vice President and Chief Investment Officer – Equities, Charles Schwab Investment Management, Inc., and Schwab Funds. Prior to May 2004, Vice President and Sr. Portfolio Manager, Charles Schwab Investment Management, Inc. |
| |
George Pereira
1964
(6/06-present) | | Treasurer and Chief Financial Officer | | Senior Vice President and Chief Financial Officer, Charles Schwab Investment Management, Inc.; Treasurer and Principal Financial Officer, Schwab Funds; Director, Charles Schwab Worldwide Funds, PLC and Charles Schwab Asset Management (Ireland) Ltd. Through June 2007, Chief Financial Officer, Mutual Fund Division, UST Advisers, Inc., and Treasurer, Chief Financial Officer and Chief Accounting Officer, Excelsior Funds, Inc., Excelsior Tax-Exempt Funds, Inc., and Excelsior Trust Inc.; From 12/99 to 11/04: Senior Vice President, Financial Reporting, Charles Schwab & Co., Inc. |
| |
Catherine MacGregor
1964
(12/05-present) | | Chief Legal Officer, Vice President and Clerk | | Vice President, Charles Schwab & Co., Inc. and Charles Schwab Investment Management, Inc.; Vice President, Schwab Funds; until July 2005, Senior Associate, Paul Hastings Janofsky & Walker LLP. |
| |
Randall Fillmore
1960
(9/04-present) | | Chief Compliance Officer | | Senior Vice President, Chief Compliance Officer, Charles Schwab Investment Management, Inc.; Senior Vice President, Charles Schwab & Co., Inc.; Chief Compliance Officer, Schwab Funds. From June 2006 to June 2007, Chief Compliance Officer, Excelsior Funds. From 2002 to 2003, Vice President, Charles Schwab & Co., Inc. and Charles Schwab Investment Management, Inc. From 2000 to 2002, Vice President, Internal Audit, Charles Schwab & Co., Inc. |
| |
Daniel Kern
1961
(3/05-present) | | Vice President | | Vice President, Investment Management Services. Until September 2005, Assistant Treasurer, Laudus Trust and Laudus Variable Insurance Trust. Until December 2004, Vice President, Internal Audit, Charles Schwab Corporation. |
| |
Michael Haydel
1972
(6/05-present) | | Vice President | | Vice President, Asset Management Client Services, Charles Schwab & Co., Inc. Until March 2004, Director, Charles Schwab & Co., Inc. |
| |
Cathy Sabo
1964
(12/05-present) | | Vice President | | Vice President, Compliance, Charles Schwab Investment, Management, Inc.; Vice President, Schwab Funds; until September 2004, Vice President, Client, Sales & Services Controls, Charles Schwab & Co., Inc. |
| |
| |
| 4 | The mailing address of each of the officers is c/o Laudus Trust, 101 Montgomery Street, San Francisco, CA 94104. |
| |
| 5 | There is no stated term of office for the officers of the Trust. |
64 Laudus International Equity Funds
Definitions, Terms and Other Information
90 Day T-bill is a short-term discounted, government debt instrument of 90 days or less, issued in $10,000 denominations that pay its face value at maturity. The government issues Treasury bills weekly.
Alpha is a measure of a fund’s risk-adjusted return. Alpha can be used to directly measure the value added or subtracted by a fund’s manager. It is calculated by measuring the difference between a fund’s actual returns and its expected performance given its level of market risk as measured by beta.
Beta is a measure of the volatility of a stock relative to the overall market. A beta of less than one indicates lower historical risk than the market; a beta of more than one indicates higher historical risk than the market.
GDP, or Gross Domestic Product, is the market value of the goods and services produced by labor and property in the United States.
The MSCI Emerging Markets Index (Net) is a free float-adjusted market capitalization index that is designed to measure equity market performance in the global emerging markets. This series approximates the minimum possible dividend reinvestment.
The S&P/Citigroup Global ex US Broad Market Index (BMI) $2-$10 Billion Cap Range is an absolute size benchmark that divides the investable region into capitalization bands of between $2 billion and $10 billion. It is a subset of the Broad Market Index (BMI), which includes companies in approximately 52 developed and emerging markets with more than $100 million of free float capitalization.
The S&P/Citigroup World ex US Extended Market Index (EMI) is a float-adjusted index which measures the performance of small companies (approximately the bottom 20% by market capitalization) in 25 developed equity markets.
The Standard & Poor’s 500® (S&P 500) Index is an unmanaged index measuring large-cap U.S. stock market performance, and includes a representative sample of leading companies in leading industries.
The Russell 1000® Index measures the performance of the 1,000 largest companies in the Russell 3000® Index, and represents approximately 92% of the total market capitalization of the Russell 3000® Index.
The Russell 1000® Growth Index measures the performance of those Russell 1000 companies with higher price-to-book ratios and higher forecasted growth values.
The Russell 1000® Value Index measures the performance of those Russell 1000 companies with lower valuation ratios such as price-to-book and price-to-earnings ratios.
The Russell 2000® Index measures the performance of the 2,000 smallest companies in the Russell 3000® Index, and represents approximately 8% of the total market capitalization of the Russell 3000® Index.
The Russell 2500tm Index measures the performance of the 2,500 smallest companies in the Russell 3000® Index, and represents approximately 16% of the total market capitalization of the Russell 3000® Index.
The Russell 3000® Growth Index measures the performance of those Russell 3000 Index companies with higher price-to-book ratios and higher forecasted growth values. The stocks in this index are also members of either the Russell 1000 Growth or the Russell 2000 Growth indexes.
The Russell 3000® Value Index measures the performance of those Russell 3000 Index companies with lower price-to-book ratios and lower forecasted growth values. The stocks in this index are also members of either the Russell 1000 Value or the Russell 2000 Value indexes.
Price to earnings ratio is the price of a stock divided by its historical earnings per share.
Price to book ratio compares the stock’s market value to the value of the total assets less the total liabilities.
Price to cash flow ratio is the price of a stock dividend by its reported cash flow per share.
Relative strength is the rate that a stock falls relative to other stocks in a falling market or rises relative to other stocks in a rising market.
Return on equity represents the amount earned on a company’s common stock investment for a given period, calculated by dividing common stock equity into net income for the period after preferred stock dividends but before common stock dividends.
Trading Activity is one of several risk factors commonly used to attribute a portfolio’s return relative to its benchmark. Specifically, trading activity measures a stock’s trailing 12 month trading volume relative to its total shares outstanding. It measures how actively traded a stock has been in the last 12 months.
Proxy Voting
A description of the policies and procedures that the Fund uses to determine how to vote proxies relating to portfolio securities is available without charge, upon request by visiting www.laudus.com, the Securities and Exchange Commission’s website at www.sec.gov, or by contacting Laudus Funds at 866.452.8387.
Information regarding how the Fund voted proxies relating to portfolio securities during the most recent 12-month period ended June 30 is available without charge, upon request by visiting www.laudus.com, or the Securities and Exchange Commission’s website at www.sec.gov.
Quarterly Disclosure of Portfolio Holdings
The Fund files its complete schedule of portfolio holdings with the SEC for the first and third quarters of each fiscal year on Form N-Q. The Fund’s Forms N-Q are available on the SEC’s website at www.sec.gov and may be reviewed and copied at the SEC’s Public Reference Room in Washington, DC. Call 1-800-SEC-0330 for information on the operation of the Public Reference Room. The information filed on a fund’s most recent Form N-Q is also available at www.laudus.com.
Laudus International Equity Funds 65
(This page intentionally left blank)
(This page intentionally left blank)
(This page intentionally left blank)
Manager
Charles Schwab Investment Management, Inc.
101 Montgomery Street
San Francisco, California 94104
Shareholder Services
1.866.452.8387 Investment Professionals
1.800.447.3332 Individual Investors
www.laudus.com
This report is for the information of the shareholders of the Laudus Trust.
Its use in connection with any offering of the Trust’s shares is authorized only in case of concurrent or prior
delivery of the current prospectus.
MFR 41683
| | | |
Annual Report
March 31, 2008 | |  |
COMMAND PERFORMANCETM
Laudus Mondrian Fundstm
Laudus Mondrian Emerging Markets Fund
Laudus Mondrian International Fixed Income Fund
Adviser
Charles Schwab Investment Management, Inc.
Subadviser
Mondrian Investment Partners Limited
| | | |
| In This Report | | |
| Performance at a Glance | | 2 |
| From the President | | 3 |
| The Investment Environment | | 4 |
| Laudus Mondrian Emerging Markets Fund | | 6 |
| Laudus Mondrian International Fixed Income Fund | | 8 |
| Fund Expenses | | 10 |
| Financial Statements | | 11 |
| Financial Notes | | 26 |
| Report of Independent Registered Public Accounting Firm | | 33 |
| Trustees and Officers | | 37 |
| Glossary | | 40 |
| EXHIBIT 99.CERT |
| EXHIBIT 99.906CERT |
| EXHIBIT 99.CODE ETH |
Fund investment adviser: Charles Schwab Investment Management, Inc. (CSIM).
Distributor: ALPS Distributors, Inc.
The industry/sector classification of the funds’ portfolio holdings uses the Global Industry Classification Standard (GICS) which was developed by and is the exclusive property of Morgan Stanley Capital International Inc. and Standard & Poor’s. GICS is a service mark of MSCI and S&P and has been licensed for use by CSIM and certain affiliates. Charles Schwab & Co. and ALPS Distributors, Inc. are unaffiliated entities.
Performance at a Glance
The performance data quoted represents past performance. Past performance does not guarantee future results. Investment returns and principal value will fluctuate so that an investor’s shares may be worth more or less than their original cost. Current performance may be lower or higher than performance data quoted. To obtain performance information current to the most recent month end, please visit www.laudusfunds.com.
| | | |
| Total Return for the Report Period 11/2/07 (inception) to 3/31/08 |
|
| |
| Laudus Mondrian Emerging Markets Fund | | |
|
| Investor Shares (Ticker Symbol: LEMIX) | | -6.98% |
Select Shares® (Ticker Symbol: LEMSX) | | -6.75% |
| Institutional Shares (Ticker Symbol: LEMNX) | | -6.94% |
| Benchmark: MSCI Emerging Markets Index | | -15.27% |
|
| Performance Details | | pages 6-7 |
|
| |
|
| Laudus Mondrian International Fixed Income Fund | | |
|
| Investor Shares (Ticker Symbol: LIFIX) | | 13.27% |
Select Shares® (Ticker Symbol:LIFSX) | | 13.42% |
| Institutional Shares (Ticker Symbol: LIFNX) | | 13.42% |
| Benchmark: Citigroup non-U.S. Dollar World Government Bond Index | | 12.57% |
|
| Performance Details | | pages 8-9 |
|
| |
|
| Minimum Initial Investment1 | | |
|
| Investor Shares | | $ 100 |
| Select Shares | | $ 50,000 |
| Institutional Shares | | $500,000 |
|
All fund and index figures on this page assume dividends and distributions were reinvested. Index figures do not include trading and management costs, which would lower performance. Indices are unmanaged, and you cannot invest in them directly. Performance results less than one year are not annualized. Redemption fees charged on shares sold or exchanged 30 days or less after purchasing them may effect share level returns.
Fund expenses may have been partially waived or absorbed by CSIM. Without these reductions, the fund’s returns would have been lower. These returns do not reflect the deduction of taxes that a shareholder would pay on fund distributions or the redemption of fund shares.
Foreign securities can involve risks such as political and economic instability and currency risk. These risks may be greater in emerging markets. Bond funds are subject to increased risk of loss of principal during periods of rising interest rates.
| |
| 1 | Please see prospectus for further detail and eligibility requirements. |
2 Laudus Mondrian Funds
From the President
Randall W. Merk is President and CEO of Charles Schwab Investment Management, Inc. and the funds during the period of this report. He joined the firm in 2002 and has held a variety of executive positions at Schwab.
Jeffrey Mortimer is President, CEO, and CIO of Laudus Funds and SVP of Charles Schwab Investment Management, Inc. He joined the firm in 1997 and has held a variety of executive positions at Schwab.
Dear Shareholder,
I am pleased to present the annual report for the Laudus Mondrian Funds for the year ended March 31, 2008. At this time, I would also like to introduce Jeffrey Mortimer, who will be assuming the position of President and CEO of the Laudus Mondrian Funds. As the current Chief Investment Officer (CIO) of both Laudus Funds and Schwab Equity Funds, Jeffrey is an exceptionally capable portfolio manager and strategist, bringing over 20 years of industry knowledge and experience to the role.
Launched on November 2, 2007, the Laudus Mondrian Funds have reached over $100 million in assets as of the report date. Our two initial offerings, the Laudus Mondrian Emerging Markets Fund and the Laudus Mondrian International Fixed Income Fund, both provide independent advisors and individual investors with access to proven institutional investment management in international bond and emerging markets.
The Laudus Mondrian Funds are sub-advised by Mondrian Investment Partners, Limited, a London-based institutional investment manager. Founded in 1990, Mondrian is renowned for its international expertise and its adherence to a common and consistent value-oriented investment philosophy. Mondrian manages more than $60 billion in assets for some of the world’s largest companies and public retirement plans.
In closing, I would like to thank you for investing with us.
Sincerely,
Laudus Mondrian Funds 3
The Investment Environment
Global Market Overview
The following commentary covers the twelve-month period ending March 31, 2008. During the five-month period since the inception of the Laudus Mondrian Emerging Markets and International Fixed Income Funds in early November 2007 through March 31, 2008, the emerging markets area suffered through a significant decline, finishing the period down more than 15%, as shown in the performance table on page 7. However, the international fixed income area performed very well, gaining nearly 13% over the five-month period, as shown in the performance table on page 9.
The past four quarters were a period of increasing volatility in capital markets around the globe. The period began with fairly strong positive returns, with many equity indexes gaining over 6% in the second quarter of 2007. In the third quarter, however, small-cap stocks around the world began to pull back, posting generally negative returns, particularly more value-oriented stocks. Large-cap indexes, especially those with a growth-style orientation, continued upward. During the final two quarters of the period, the damage spread across all equity areas – many indexes lost well over 10%, as investors became increasingly concerned about slowing global economic growth and problems in the credit markets. As a result, global equity markets ultimately generated mostly negative returns for the full period, with U.S. small-cap stocks the worst performing area. The most notable exception was emerging markets stocks, which finished the period up over 20%.
Three specific months stand out as significant contributors to the relatively weak returns over the period: July and November of 2007, and January of 2008. In July, investors around the globe sold equity positions in reaction to problems in the credit markets. Continued deterioration in the U.S. housing market and weakness in the sub-prime lending business led to significant financing problems among major investment banks. Over the past several years, many of the loans made to U.S. homeowners were packaged into securitized, bond-like products and placed in fixed income portfolios around the globe. As some borrowers across the U.S. housing markets began to default on their loans, the quality of the securities created by packaging them began to deteriorate. For example, Bear Stearns, a venerated U.S. investment bank, ran into trouble with two of their hedge funds during the summer of 2007, as the values of the underlying assets became increasingly difficult to determine. As these funds were highly leveraged, declines in asset values led to significant losses for the funds. These funds – and others like them – needed to sell their more liquid and highly valued assets to raise cash, causing some unusually strong global volatility in the middle of August 2007. While in its initial stages these effects were felt most strongly in the U.S. fixed income markets, equity investors were concerned about the financial status of the U.S. consumer, and thus the continued growth of the U.S. economy.
After the U.S. Federal Reserve’s (the “Fed”) Open Market Committee acted to provide additional liquidity to the credit markets in mid-August, and followed that up with a cut in interest rates in mid-September, the markets responded positively. The Fed probably had the Financial sector in mind when it took considerable action during August and September. This group of companies comprises about 20% of most major U.S. indexes, so their valuations and future earnings are very important to stock market investors. In August, the Fed lowered the discount rate, which makes it easier for banks to borrow directly from the Fed. They even persuaded some major banks to step up to the discount window, in a public display of pumping liquidity into the financial system. Then, in September, they lowered the Fed funds rate, the rate banks charge each other, which has much broader application. That caused an immediate decline in the prime rate, lowering borrowing costs throughout the economy. The equity markets generally cheered these moves, but the concerns over the housing market continued the pressure on Financial stocks, keeping the pressure on the markets overall.
By November 2007, it became increasingly clear that the U.S. economy was slowing down. Banks, mortgage firms and homebuilders began to write down assets on their balance sheets in response to the declines in asset values in securities tied to the U.S. mortgage markets. These firms also reported lower earnings and reduced their expectations of future earnings in their reports and updates to investors. Economists around the world spoke of a recession – or at best flat economic growth – in the U.S. and possibly around the world. By January 2008, investors saw evidence of the slowdown in higher unemployment figures and lower manufacturing production. The final figure for U.S. GDP growth in the fourth quarter of 2007 was an annual rate of 0.6% - growth, but just barely. Investors continued to sell stocks across the globe, and equities in general continued their decline.
Also in January, the Fed and some of their global counterparts took some unusual steps designed to restore liquidity to the credit markets. These central banks created pools of credit facilities and lowered the interest rates they charged to borrowers. The Fed again lowered their main interest rate, the fed funds rate, numerous times in the early part of 2008, thus reducing borrowing costs across the entire economy. While other central banks around the world were not quite as accommodating, they too injected liquidity into their markets. And in one of the most unusual moves in recent financial history, the Fed also engineered a
4 Laudus Mondrian Funds
The Investment Environment continued
purchase of Bear Stearns by JP Morgan. The Fed believed that Bear Stearns’ potential bankruptcy – an event no one thought likely just days before – would very negatively affect both the equity and credit markets, partially due to the firm’s size and presence as a prime broker. But all of these moves, while helpful in calming the markets, also lowered the value of the U.S. dollar versus other currencies, leading to higher commodity and energy prices and increasing fears of inflation.
Investors’ concerns were heightened by reports of inflation. The U.S. Consumer Price Index climbed during the period, with a reported gain of 4.1% during the calendar year 2007. The decline in the value of the U.S. dollar versus other major currencies was a factor in the U.S. inflation rate, as that decline increased the price of imports, especially energy-related products such as crude oil and gasoline. Further evidence of inflation fears showed in the fixed income markets, as the return on U.S. Treasury Inflation Protected Series (“TIPS”) bonds was strongly positive over the period, returning over 14%. Major commodity indexes also were up strongly, many over 30% during the period. Inflation is generally viewed by investors as negative for equities, due to the difficulty of passing along higher costs to consumers and thus increasing the likelihood of lower earnings.
The U.S. dollar’s decline and the gains in some commodity markets did generate some positive news for U.S. investors with assets in non-U.S. stocks, however. The MSCI EAFE Index, while negative for the period at -2.27%, lost less than its U.S. counterpart, the Russell 1000 Index, which was down 5.40%. The dollar’s decline explains much of the difference, but also important was that financial firms in the U.S. index were down significantly more than their foreign counterparts, as a result of their greater direct exposure to problems stemming from the U.S. housing markets. Also important was the higher return to foreign firms in the Materials Sector. Generally, commodity-oriented firms were of greater importance in non-U.S. economies, and their increased weight in the non-U.S. indexes, plus their overall higher returns, helped push these stocks to higher returns versus U.S. equities. This trend was especially true for the emerging markets area, where the Materials and Energy Sectors combined to contribute nearly 11% of the total 21.6% return to the MSCI Emerging Markets Index over the period.
Nothing in this report represents a recommendation of a security by the investment adviser.
Manager views and portfolio holdings may have changed since the report date.
Laudus Mondrian Funds 5
Laudus Mondrian Emerging Markets Fund
Laudus Mondrian Emerging Markets Fund Investor Shares declined 6.98% since inception through the end of the period, significantly outperforming the benchmark MSCI Emerging Markets Index (Net), which declined 15.27%. In general, the fund maintained an underweight exposure to China and India, where valuations were unappealing. Also, the fund maintained an overweight exposure to select Asian markets, such as Taiwan and Thailand. From an industry group standpoint, the fund was overweight to the Telecom Sector, where strong free cash flows supported high dividend yields.
Emerging markets experienced a high degree of volatility during the fourth quarter of 2007, and marked weakness in the first quarter of 2008. During this period of market turbulence, the portfolio maintained its defensive characteristics, which primarily accounted for outperformance relative to the benchmark. Good positioning in China, Taiwan and India, as well as stock selection in Brazil and Russia, were the key factors contributing to performance. In addition, the fund’s strong value stock orientation helped returns during a period in which global growth slowed.
In terms of risk, the commodity boom in recent years has reduced macroeconomic risk, as countries such as Brazil and Russia have been able to pay down debt and build up healthy foreign currency reserves. Furthermore, progressive economic reforms, a greater focus on infrastructure development and growing domestic demand within emerging market countries has resulted in more balanced economies. However, political risk continued to be greater for emerging markets than for developed markets. Changes in government can lead to unpredictable and unstable economic outcomes.
As of 3/31/08:
Statistics
Weighted Average
Market Cap
| |
| Price/Earnings Ratio (P/E) | 13.45 |
| |
| Price/Book Ratio (P/B) | 1.92 |
| |
| Portfolio Turnover Rate1 | 49% |
Sector Weightings % of Investments
| |
| Telecommunication Services | 22.0% |
| |
| Information Technology | 13.9% |
| |
| Consumer Discretionary | 2.1% |
Top Holdings % of Net Assets2
Companhia Vale do Rio Doce
Taiwan Semiconductor Manufacturing
| |
| Chunghwa Telecom Co., Ltd. ADR | 3.2% |
| |
| Itausa-Investimentos Itau S.A. | 2.9% |
Manager views and portfolio holdings may have changed since the report date.
| |
| 1 | Not annualized. |
| |
| 2 | This list is not a recommendation of any security by the investment adviser. Holdings subject to change. |
6 Laudus Mondrian Funds
Laudus Mondrian Emerging Markets Fund
Performance Summary as of 3/31/08
The performance data quoted represents past performance. Past performance does not guarantee future results. Investment returns and principal value will fluctuate so that an investor’s shares may be worth more or less than their original cost. Current performance may be lower or higher than performance data quoted. To obtain performance information current to the most recent month end, please visit www.laudusfunds.com.
Performance of a Hypothetical
$10,000 Investment in Investor Shares1
Performance of a Hypothetical
$50,000 Investment in Select Shares1
Performance of a Hypothetical
$500,000 Investment in Institutional Shares1
Average Annual Total Returns1
| | | | | |
| Fund Class and Inception Date | | Since Inception |
|
| |
| Investor Shares (11/2/07) | | | -6.98% | |
| Select Shares (11/2/07) | | | -6.75% | |
| Institutional Shares (11/2/07) | | | -6.94% | |
| Benchmark: MSCI Emerging Markets Index (Net) | | | -15.27% | |
Fund Expense Ratios2,3: Investor Shares: Net 1.80%; Gross 1.93% / Select Shares: Net 1.52%; Gross 1.68% /
Institutional: Net 1.45%; Gross 1.53
All figures on this page assume dividends and distributions were reinvested. Index figures do not include trading and management costs, which would lower performance. Indices are unmanaged, and you cannot invest in them directly. Performance results less than one year are not annualized. Redemption fees charged on shares sold or exchanged 30 days or less after purchasing them may effect share level returns.
| |
| 1 | Fund expenses may have been partially absorbed by CSIM. Without these reductions, the fund’s returns would have been lower. These returns do not reflect the deduction of taxes that a shareholder would pay on fund distributions or the redemption of fund shares. |
| 2 | Reflects expenses expected to be charged to shareholders through at least 7/30/10. Adviser expects to hold expenses at this level by waiving its management fees and/or bearing other expenses. Please see the prospectus for more information. |
| 3 | Reflects the total annual fund operating expenses without the effect of contractual fee waivers. Please see the prospectus for more information. For actual ratios during the period, refer to the financial highlights section of the financial statements. |
Laudus Mondrian Funds 7
Laudus Mondrian International Fixed Income Fund
Laudus Mondrian International Fixed Income Fund Investor Shares returned 13.27% since inception, while the benchmark Citigroup non-U.S. Dollar World Government Bond Index returned 12.57%. Over the period, the fund outperformed mainly due to an overweight position to Japan. The fund was underweight the U.K., Canada, and Europe, with exposure to the Eurozone on a partial currency hedged basis. An overweight to the well-performing Mexican local bond market helped relative returns. Overall, the fund was defensively shorter than the benchmark index duration.
The relative weakness of the dollar versus many major foreign currency and positive international bond market returns drove the fund’s strong absolute return. Although the dollar has been declining for several years, it experienced significant declines during the period. As a result, exposure to strong foreign currencies, particularly the Japanese Yen, contributed to performance, as did an underweight to the Canadian Dollar and British Pound.
As of 3/31/08:
Country Weightings % of Investments
Statistics
| |
| Portfolio Turnover Rate1 | 1% |
Sector Weightings % of Investments
| |
| Government Agency Obligations | 9.4% |
Top Holdings % of Net Assets2
Japan Government Ten Year
Netherlands Government Bond,
Bundesrepublik Deutschland,
Belgium Government Bond, 5.50%,
Japan Government Ten Year
Japan Government Ten Year
Japan Government Ten Year
Japan Government Five Year
Japan Government Ten Year
Japan Government Ten Year
| |
| Bond, 1.30%, 12/20/14 | 3.9% |
Manager views and portfolio holdings may have changed since the report date.
8 Laudus Mondrian Funds
Laudus Mondrian International Fixed Income Fund
Performance Summary as of 3/31/08
The performance data quoted represents past performance. Past performance does not guarantee future results. Investment returns and principal value will fluctuate so that an investor’s shares may be worth more or less than their original cost. Current performance may be lower or higher than performance data quoted. To obtain performance information current to the most recent month end, please visit www.laudusfunds.com.
Performance of a Hypothetical
$10,000 Investment in Investor Shares1
Performance of a Hypothetical
$50,000 Investment in Select Shares1
Performance of a Hypothetical
$500,000 Investment in Institutional Shares1
Average Annual Total Returns1
| | | | | |
| Fund Class and Inception Date | | Since Inception |
|
| |
| Investor Shares (11/2/07) | | | 13.27% | |
| Select Shares (11/2/07) | | | 13.42% | |
| Institutional Shares (11/2/07) | | | 13.42% | |
| Benchmark: Citigroup non-U.S. Dollar World Government Bond Index | | | 12.57% | |
Fund Expense Ratios2,3: Investor Shares: Net 1.10% ; Gross 1.23%/ Select Shares: Net 0.82%; Gross 0.98% /
Institutional Shares: Net 0.75%; Gross 0.83%
All figures on this page assume dividends and distributions were reinvested. Index figures do not include trading and management costs, which would lower performance. Indices are unmanaged, and you cannot invest in them directly. Performance results less than one year are not annualized.
| |
| 1 | Fund expenses may have been partially absorbed by CSIM. Without these reductions, the fund’s returns would have been lower. These returns do not reflect the deduction of taxes that a shareholder would pay on fund distributions or the redemption of fund shares. |
| 2 | Reflects expenses expected to be charged to shareholders through at least 7/30/10. Adviser expects to hold expenses at this level by waiving its management fees and/or bearing other expenses. Please see the prospectus for more information. |
| 3 | Reflects the total annual fund operating expenses without the effect of contractual fee waivers. Please see the prospectus for more information. For actual ratios during the period, refer to the financial highlights section of the financial statements. |
Laudus Mondrian Funds 9
Fund Expenses (Unaudited)
Examples for a $1,000 Investment
As a fund shareholder, you incur two types of costs: transaction costs, such as redemption fees; and, ongoing costs, such as management fees, transfer agent and shareholder services fees, and other fund expenses.
The expense examples below are intended to help you understand your ongoing cost (in dollars) of investing in a fund and to compare this cost with the ongoing cost of investing in other mutual funds. These examples are based on an investment of $1,000 invested for the period beginning November 2, 2007 and held through March 31, 2008.
Actual Return lines in the table below provide information about actual account values and actual expenses. You may use this information, together with the amount you invested, to estimate the expenses that you paid over the period. To do so, simply divide your account value by $1,000 (for example, an $8,600 account value ¸ $1,000 = 8.6), then multiply the result by the number given for your fund or share class under the heading entitled “Expenses Paid During Period”.
Hypothetical Return lines in the table below provide information about hypothetical account values and hypothetical expenses based on a fund’s or share class’ actual expense ratio and an assumed return of 5% per year before expenses. Because the return used is not an actual return, it may not be used to estimate the actual ending account value or expenses you paid for the period.
You may use this information to compare the ongoing costs of investing in the fund and other funds. To do so, compare this 5% hypothetical example with the 5% hypothetical examples that appear in the shareholder reports of the other funds.
Please note that the expenses shown in the table are meant to highlight your ongoing costs only, and do not reflect any transactional costs, such as redemption fees. If these transactional costs were included, your costs would have been higher.
| | | | | | | | | | | | | | | | | |
| | | | | | | Ending
| | |
| | | | | Beginning
| | Account Value
| | Expenses Paid
|
| | | Expense Ratio
| | Account Value
| | (Net of Expenses)
| | During Period1
|
| | | (Annualized) | | at 11/2/07 | | at 3/31/08 | | 11/2/07 - 3/31/08 |
| |
| |
|
| Laudus Mondrian Emerging Markets Fund | | | | | | | | | | | | | | | | |
| Investor Shares | | | | | | | | | | | | | | | | |
| Actual Return | | | 1.82% | | | $ | 1,000 | | | $ | 930.20 | | | $ | 7.10 | |
| Hypothetical 5% Return | | | 1.82% | | | $ | 1,000 | | | $ | 1,012.86 | | | $ | 7.41 | |
| Select Shares | | | | | | | | | | | | | | | | |
| Actual Return | | | 1.54% | | | $ | 1,000 | | | $ | 932.50 | | | $ | 6.02 | |
| Hypothetical 5% Return | | | 1.54% | | | $ | 1,000 | | | $ | 1,013.99 | | | $ | 6.27 | |
| Institutional Shares | | | | | | | | | | | | | | | | |
| Actual Return | | | 1.47% | | | $ | 1,000 | | | $ | 930.60 | | | $ | 5.74 | |
| Hypothetical 5% Return | | | 1.47% | | | $ | 1,000 | | | $ | 1,014.27 | | | $ | 5.99 | |
| |
|
| Laudus Mondrian International Fixed Income Fund | | | | | | | | | | | | | | | | |
| Investor Shares | | | | | | | | | | | | | | | | |
| Actual Return | | | 1.10% | | | $ | 1,000 | | | $ | 1,132.70 | | | $ | 4.74 | |
| Hypothetical 5% Return | | | 1.10% | | | $ | 1,000 | | | $ | 1,015.77 | | | $ | 4.48 | |
| Select Shares | | | | | | | | | | | | | | | | |
| Actual Return | | | 0.82% | | | $ | 1,000 | | | $ | 1,134.20 | | | $ | 3.54 | |
| Hypothetical 5% Return | | | 0.82% | | | $ | 1,000 | | | $ | 1,016.90 | | | $ | 3.34 | |
| Institutional Shares | | | | | | | | | | | | | | | | |
| Actual Return | | | 0.75% | | | $ | 1,000 | | | $ | 1,134.20 | | | $ | 3.24 | |
| Hypothetical 5% Return | | | 0.75% | | | $ | 1,000 | | | $ | 1,017.19 | | | $ | 3.06 | |
| |
| 1 | Expenses for each fund or share class are equal to its annualized expense ratio, multiplied by the average account value over the period, multiplied by 148 days of the period, and divided by 366 days of the fiscal year. |
10 Laudus Mondrian Funds
Laudus Mondrian Emerging Markets Fund
Financial Statements
Financial Highlights
| | | | | |
| | | 11/02/071-
|
| Investor Shares | | 3/31/08 |
| |
| | | | | |
Per-Share Data ($) | | | | |
|
| Net asset value at beginning of period | | | 10.00 | |
| | | | | |
| Income (loss) from investment operations: | | | | |
| Net investment income (loss) | | | 0.02 | |
| Net realized and unrealized gains (losses) | | | (0.72 | ) |
| | | | | |
| Total from investment operations | | | (0.70 | ) |
| Less distributions: | | | | |
| Dividends from net investment income | | | (0.01 | ) |
| | | | | |
| Net asset value at end of period | | | 9.29 | |
| | | | | |
| Total return (%) | | | (6.98 | )2 |
| | | | | |
Ratios/Supplemental Data (%) | | | | |
|
| Ratios to average net assets: | | | | |
| Net operating expenses | | | 1.82 | 3,4 |
| Gross operating expenses | | | 2.79 | 3 |
| Net investment income (loss) | | | 0.89 | 3 |
| Portfolio turnover rate | | | 49 | 2 |
| Net assets, end of period ($ x 1,000) | | | 1,937 | |
| | | | | |
| | | 11/02/071-
|
| Select Shares | | 3/31/08 |
| |
| | | | | |
Per-Share Data ($) | | | | |
|
| Net asset value at beginning of period | | | 10.00 | |
| | | | | |
| Income (loss) from investment operations: | | | | |
| Net investment income (loss) | | | 0.02 | |
| Net realized and unrealized gains (losses) | | | (0.70 | ) |
| | | | | |
| Total from investment operations | | | (0.68 | ) |
| Less distributions: | | | | |
| Dividends from net investment income | | | (0.01 | ) |
| | | | | |
| Net asset value at end of period | | | 9.31 | |
| | | | | |
| Total return (%) | | | (6.75 | )2 |
| | | | | |
Ratios/Supplemental Data (%) | | | | |
|
| Ratios to average net assets: | | | | |
| Net operating expenses | | | 1.54 | 3,5 |
| Gross operating expenses | | | 2.74 | 3 |
| Net investment income (loss) | | | 0.69 | 3 |
| Portfolio turnover rate | | | 49 | 2 |
| Net assets, end of period ($ x 1,000) | | | 760 | |
1 Commencement of operations.
2 Not annualized.
3 Annualized.
4 The ratio of net operating expenses would have been 1.80% if interest expense had not been included.
5 The ratio of net operating expenses would have been 1.52% if interest expense had not been included.
See financial notes 11
Laudus Mondrian Emerging Markets Fund
Financial Highlights continued
| | | | | |
| | | 11/02/071-
|
| Institutional Shares | | 3/31/08 |
| |
| | | | | |
Per-Share Data ($) | | | | |
|
| Net asset value at beginning of period | | | 10.00 | |
| | | | | |
| Income (loss) from investment operations: | | | | |
| Net investment income (loss) | | | 0.02 | |
| Net realized and unrealized gains (losses) | | | (0.71 | ) |
| | | | | |
| Total from investment operations | | | (0.69 | ) |
| Less distributions: | | | | |
| Dividends from net investment income | | | (0.02 | ) |
| | | | | |
| Net asset value at end of period | | | 9.29 | |
| | | | | |
| Total return (%) | | | (6.94 | )2 |
| | | | | |
Ratios/Supplemental Data (%) | | | | |
|
| Ratios to average net assets: | | | | |
| Net operating expenses | | | 1.47 | 3,4 |
| Gross operating expenses | | | 2.62 | 3 |
| Net investment income (loss) | | | 0.59 | 3 |
| Portfolio turnover rate | | | 49 | 2 |
| Net assets, end of period ($ x 1,000) | | | 19,414 | |
1 Commencement of operations.
2 Not annualized.
3 Annualized.
4 The ratio of net operating expenses would have been 1.45% if interest expense had not been included.
12 See financial notes
Laudus Mondrian Emerging Markets Fund
Portfolio Holdings as of March 31, 2008
This section shows all the securities in the fund’s portfolio and their value as of the report date.
The fund files its complete schedule of portfolio holdings with the SEC for the first and third quarters of each fiscal year on Form N-Q. The fund’s Form N-Q is available on the SEC’s website at http://www.sec.gov and may be viewed and copied at the SEC’s Public Reference Room in Washington, D.C. Call 1-800-SEC-0330 for information on the operation of the Public Reference Room. The schedule of portfolio holdings filed on a fund’s most recent Form N-Q is also available by visiting the Fund’s website at www.laudusfunds.com.
| | | | | | | | | | | | | |
| | | Cost
| | Value
|
| Holdings by Category | | ($) | | ($) |
|
| |
| | 79 | .4% | | Common Stock | | | 17,662,919 | | | | 17,564,600 | |
| | 10 | .5% | | Preferred Stock | | | 2,348,766 | | | | 2,309,751 | |
| | 3 | .4% | | Short-Term Investment | | | 755,000 | | | | 755,000 | |
|
| | 93 | .3% | | Total Investments | | | 20,766,685 | | | | 20,629,351 | |
| | 6 | .7% | | Other Assets and Liabilities | | | | | | | 1,480,816 | |
|
| | 100 | .0% | | Net Assets | | | | | | | 22,110,167 | |
| | | | | | | | | |
| | | Number
| | Value
|
| Security | | of Shares | | ($) |
| |
| | | | | | | | | |
| | | | | | | | | |
| | | | | | | | | |
| |
Common Stock 79.4% of net assets |
| | | | | | | | | |
| |
Bermuda 3.0%
|
| | | | | | | | | |
| |
| Transportation 3.0% |
| Cosco Pacific Ltd. | | | 338,000 | | | | 665,105 | |
| | | | | | | | | |
| |
Brazil 7.6%
|
| | | | | | | | | |
| |
| Energy 2.5% |
| Petroleo Brasileiro S.A. ADR | | | 6,700 | | | | 567,423 | |
| | | | | | | | | |
| |
| Software & Services 2.9% |
| Redecard S.A. | | | 38,200 | | | | 635,469 | |
| | | | | | | | | |
| |
| Utilities 2.2% |
| CPFL Energia S.A. ADR | | | 8,000 | | | | 487,840 | |
| | | | | | | | | |
| | | | | | | | 1,690,732 | |
| | | | | | | | | |
| |
Canada 0.1%
|
| | | | | | | | | |
| |
| Energy 0.1% |
| Uranium One, Inc. * | | | 7,200 | | | | 23,709 | |
| | | | | | | | | |
| |
China 2.1%
|
| | | | | | | | | |
| |
| Transportation 2.1% |
| China Shipping Development Co. Ltd., Class H | | | 144,000 | | | | 459,635 | |
| | | | | | | | | |
| |
Columbia 2.1%
|
| | | | | | | | | |
| |
| Banks 2.1% |
| Bancolombia S.A. ADR | | | 13,300 | | | | 471,618 | |
| | | | | | | | | |
| |
Czech Republic 1.9%
|
| | | | | | | | | |
| |
| Banks 1.9% |
| Komercni Banka A/S | | | 1,775 | | | | 423,878 | |
| | | | | | | | | |
| |
Egypt 3.8%
|
| | | | | | | | | |
| |
| Telecommunication Services 3.8% |
| Orascom Telecom Holding S.A.E. -Reg’d GDR | | | 5,850 | | | | 397,528 | |
| Telecom Egypt | | | 121,289 | | | | 448,436 | |
| | | | | | | | | |
| | | | | | | | 845,964 | |
| | | | | | | | | |
| |
Hong Kong 3.1%
|
| | | | | | | | | |
| |
| Telecommunication Services 3.1% |
| China Mobile Ltd. | | | 45,000 | | | | 676,112 | |
| | | | | | | | | |
| |
India 2.0%
|
| | | | | | | | | |
| |
| Telecommunication Services 2.0% |
| Bharti Airtel Ltd. * | | | 21,515 | | | | 440,042 | |
| | | | | | | | | |
| |
Luxembourg 5.0%
|
| | | | | | | | | |
| |
| Energy 2.9% |
| Tenaris S.A. ADR | | | 12,769 | | | | 636,535 | |
| | | | | | | | | |
| |
| Materials 2.1% |
| Evraz Group S.A. -Reg’d GDR | | | 5,350 | | | | 461,705 | |
| | | | | | | | | |
| | | | | | | | 1,098,240 | |
| | | | | | | | | |
| |
Malaysia 3.5%
|
| | | | | | | | | |
| |
| Banks 1.6% |
| Public Bank Berhad | | | 103,900 | | | | 355,337 | |
| | | | | | | | | |
| |
| Transportation 1.9% |
| MISC Berhad | | | 142,800 | | | | 411,390 | |
| | | | | | | | | |
| | | | | | | | 766,727 | |
| | | | | | | | | |
| |
Mexico 6.6%
|
| | | | | | | | | |
| |
| Food, Beverage & Tobacco 2.3% |
| Grupo Modelo, S.A. de C.V., Series C | | | 114,900 | | | | 503,097 | |
| | | | | | | | | |
| |
| Materials 2.0% |
| Cemex SAB de C.V. ADR * | | | 16,900 | | | | 441,428 | |
| | | | | | | | | |
| |
| Telecommunication Services 2.3% |
| America Movil SAB de C.V., Series L ADR | | | 8,200 | | | | 522,258 | |
| | | | | | | | | |
| | | | | | | | 1,466,783 | |
| | | | | | | | | |
| |
Philippines 2.2%
|
| | | | | | | | | |
| |
| Telecommunication Services 2.2% |
| Philippine Long Distance Telephone Co. ADR | | | 7,400 | | | | 491,804 | |
See financial notes 13
Laudus Mondrian Emerging Markets Fund
Portfolio Holdings continued
| | | | | | | | | |
| | | Number
| | Value
|
| Security | | of Shares | | ($) |
| |
| | | | | | | | | |
| |
Republic of Korea 3.6%
|
| | | | | | | | | |
| |
| Banks 3.6% |
| Hana Financial Group, Inc. | | | 9,570 | | | | 392,246 | |
| Kookmin Bank | | | 4,818 | | | | 270,422 | |
| Kookmin Bank ADR | | | 2,400 | | | | 134,520 | |
| | | | | | | | | |
| | | | | | | | 797,188 | |
| | | | | | | | | |
| |
Russia 7.1%
|
| | | | | | | | | |
| |
| Energy 5.1% |
| Gazprom - Reg’d ADR | | | 7,600 | | | | 387,600 | |
| LUKOIL ADR | | | 8,600 | | | | 737,880 | |
| | | | | | | | | |
| | | | | | | | 1,125,480 | |
| | | | | | | | | |
| |
| Telecommunication Services 2.0% |
| Mobile TeleSystems ADR | | | 5,800 | | | | 439,930 | |
| | | | | | | | | |
| | | | | | | | 1,565,410 | |
| | | | | | | | | |
| |
South Africa 6.1%
|
| | | | | | | | | |
| |
| Energy 3.0% |
| Sasol | | | 13,931 | | | | 670,927 | |
| | | | | | | | | |
| |
| Materials 1.9% |
| Impala Platinum Holdings Ltd. | | | 10,917 | | | | 422,078 | |
| | | | | | | | | |
| |
| Telecommunication Services 1.2% |
| Telkom South Africa Ltd. | | | 16,093 | | | | 260,595 | |
| | | | | | | | | |
| | | | | | | | 1,353,600 | |
| | | | | | | | | |
| |
Taiwan 14.9%
|
| | | | | | | | | |
| |
| Banks 4.2% |
| Chinatrust Financial Holding Co., Ltd. * | | | 378,000 | | | | 367,731 | |
| Mega Financial Holding Co., Ltd. | | | 726,000 | | | | 572,784 | |
| | | | | | | | | |
| | | | | | | | 940,515 | |
| | | | | | | | | |
| |
| Semiconductors & Semiconductor Equipment 5.6% |
| MediaTek, Inc. | | | 32,000 | | | | 425,055 | |
| Taiwan Semiconductor Manufacturing Co., Ltd. | | | 32,000 | | | | 66,223 | |
| Taiwan Semiconductor Manufacturing Co., Ltd. ADR | | | 72,200 | | | | 741,494 | |
| | | | | | | | | |
| | | | | | | | 1,232,772 | |
| | | | | | | | | |
| |
| Technology Hardware & Equipment 1.9% |
| Asustek Computer, Inc. | | | 143,000 | | | | 421,236 | |
| | | | | | | | | |
| |
| Telecommunication Services 3.2% |
| Chunghwa Telecom Co., Ltd. ADR | | | 27,063 | | | | 704,179 | |
| | | | | | | | | |
| | | | | | | | 3,298,702 | |
| | | | | | | | | |
| |
Thailand 4.7%
|
| | | | | | | | | |
| |
| Energy 1.9% |
| PTT Public Co., Ltd. | | | 42,400 | | | | 425,549 | |
| | | | | | | | | |
| |
| Materials 2.8% |
| The Siam Cement Public Co., Ltd. NVDR | | | 88,500 | | | | 603,802 | |
| | | | | | | | | |
| | | | | | | | 1,029,351 | |
| | | | | | | | | |
Total Common Stock
(Cost $17,662,919) | | | 17,564,600 | |
| | | | | |
| | | | | | | | | |
| | | | | | | | | |
| |
Preferred Stock 10.5% of net assets |
| | | | | | | | | |
| |
Brazil 6.5%
|
| | | | | | | | | |
| |
| Banks 3.0% |
| Itausa - Investimentos Itau S.A. | | | 109,900 | | | | 645,108 | |
| | | | | | | | | |
| |
| Materials 3.5% |
| Companhia Vale do Rio Doce ADR (Vale) | | | 26,600 | | | | 775,390 | |
| | | | | | | | | |
| | | | | | | | 1,420,498 | |
| | | | | | | | | |
| |
Republic of Korea 4.0%
|
| | | | | | | | | |
| |
| Automobiles & Components 1.9% |
| Hyundai Motor Co. | | | 12,530 | | | | 413,908 | |
| | | | | | | | | |
| |
| Semiconductors & Semiconductor Equipment 2.1% |
| Samsung Electronics Co., Ltd. | | | 1,049 | | | | 475,345 | |
| | | | | | | | | |
| | | | | | | | 889,253 | |
| | | | | | | | | |
Total Preferred Stock
(Cost $2,348,766) | | | 2,309,751 | |
| | | | | |
| | | | | | | | | |
| | | | | | | | | |
Security
| | Face Amount
| | Value
|
| Rate, Maturity Date | | ($) | | ($) |
| |
| |
Short-Term Investment 3.4% of net assets |
| | | | | | | | | |
| |
Repurchase Agreement 3.4%
|
| Fixed Income Clearing Corp. dated 03/31/08, due 04/01/08 at 2.00%, with a maturity value of $755,042 (fully collateralized by Federal Home Loan Mortgage Corp. with a value of $774,035.) | | | 755,000 | | | | 755,000 | |
| | | | | | | | | |
Total Short-Term Investment
(Cost $755,000) | | | 755,000 | |
| | | | | |
| |
End of Investments. |
14 See financial notes
Laudus Mondrian Emerging Markets Fund
Portfolio Holdings continued
| | | | | | | | | |
| |
| At 03/31/08, the tax basis cost of the fund’s investments was $21,207,264 and the unrealized appreciation and depreciation were $779,904 and ($1,357,817), respectively, with a net unrealized depreciation of ($577,913). |
| |
| At 03/31/08, the prices of certain foreign securities held by the fund aggregating $9,639,815 were adjusted from their closing market prices following the guidelines adopted by the fund’s Board of Trustees. |
| | |
| * | | Non-income producing security. |
ADR — American Depositary Receipt
GDR — Global Depositary Receipt
NVDR — Non-Voting Depositary Receipt
Laudus Mondrian Emerging Markets Fund
Statement of
Assets and Liabilities
As of March 31, 2008.
| | | | | | | |
| | | | | | | |
| |
Assets
|
| Investments, at value (cost $20,766,685) | | | | | $20,629,351 | |
| Cash | | | | | 371 | |
| Foreign currency (cost $85,648) | | | | | 84,675 | |
| Receivables: | | | | | | |
| Investments sold | | | | | 278,758 | |
| Fund shares sold | | | | | 2,566,631 | |
| Interest | | | | | 46 | |
| Dividends | | + | | | 73,892 | |
| | | |
| | | |
Total assets | | | | | 23,633,724 | |
| | | | | | | |
| |
Liabilities
|
| Payables: | | | | | | |
| Investments bought | | | | | 1,485,470 | |
| Investment adviser | | | | | 1,853 | |
| Transfer agent | | | | | 3,710 | |
| Fund shares redeemed | | | | | 594 | |
| Distribution and shareholder services fees | | | | | 343 | |
| Accrued expenses | | + | | | 31,587 | |
| | | |
| | | |
Total liabilities | | | | | 1,523,557 | |
| | | | | | | |
| |
Net Assets
|
Total assets | | | | | 23,633,724 | |
Total liabilities | | − | | | 1,523,557 | |
| | | |
| | | |
Net assets | | | | | $22,110,167 | |
Net Assets by Source | | | | | | |
| Capital received from investors | | | | | 23,023,623 | |
| Distribution in excess of net investment income | | | | | (2,902 | ) |
| Net realized capital losses | | | | | (770,888 | ) |
| Net unrealized capital losses | | | | | (139,666 | ) |
Net Asset Value (NAV) by Shares Class
| | | | | | | | | | | | |
| | | | | | | Shares
| | | | |
| Share Class | | Net Assets | | ¸ | | Outstanding | | = | | NAV |
| |
| Investor Shares | | $1,936,794 | | | | 208,517 | | | | | $9.29 |
| Select Shares | | $759,572 | | | | 81,613 | | | | | $9.31 |
| Institutional Shares | | $19,413,801 | | | | 2,088,825 | | | | | $9.29 |
16 See financial notes
Laudus Mondrian Emerging Markets Fund
Statement of
Operations
For November 2, 2007* through March 31, 2008.
| | | | | | | |
| | | | | | | |
| |
Investment Income
|
| Dividends (net of foreign withholding taxes of $16,471) | | | | | $132,810 | |
| Interest | | + | | | 14,496 | |
| | | |
| | | |
Total Investment Income | | | | | 147,306 | |
| | | | | | | |
| |
Net Realized Gains and Losses
|
| Net realized losses on investments | | | | | (770,888 | ) |
| Net realized losses on foreign currency transactions | | + | | | (15,594 | ) |
| | | |
| | | |
Net realized losses | | | | | (786,482 | ) |
| | | | | | | |
| |
Net Unrealized Gains and Losses
|
| Net unrealized losses on investments | | | | | (137,334 | ) |
| Net unrealized losses on foreign currency transactions | | + | | | (2,332 | ) |
| | | |
| | | |
Net unrealized losses | | | | | (139,666 | ) |
| | | | | | | |
| |
Expenses
|
| Investment adviser fees | | | | | 84,187 | |
| Transfer agent fees | | | | | 22,465 | |
| Professional fees | | | | | 22,367 | |
| Custodian fees | | | | | 20,361 | |
| Registration fees | | | | | 14,934 | |
| Shareholder reports | | | | | 9,058 | |
| Trustees’ fees | | | | | 3,934 | |
| Accounting and administration fees | | | | | 2,888 | |
| Interest expense | | | | | 1,803 | |
| Distribution and shareholder services fees (Investor Shares) | | | | | 848 | |
| Sub-Accounting fees | | | | | | |
| Investor Shares | | | | | 354 | |
| Select Shares | | | | | 345 | |
| Other expenses | | + | | | 1,383 | |
| | | |
| | | |
| Total expenses | | | | | 184,927 | |
| Expense reduction by adviser | | − | | | 80,048 | |
| Custody credits | | − | | | 278 | |
| | | |
| | | |
Net expenses | | | | | 104,601 | |
| | | | | | | |
| |
Increase (Decrease) in Net Assets from Operations
|
Total investment income | | | | | 147,306 | |
Net expenses | | − | | | 104,601 | |
| | | |
| | | |
Net investment income | | | | | 42,705 | |
Net realized losses | | | | | (786,482 | ) |
Net unrealized losses | | + | | | (139,666 | ) |
| | | |
| | | |
Decrease in net assets from operations | | | | | ($883,443 | ) |
| |
| * | Commencement of operations. |
See financial notes 17
Laudus Mondrian Emerging Markets Fund
Statements of
Changes in Net Assets
For the current report period only. Because the fund commenced operations on November 2, 2007, it has no prior report period.
| | | | | | | |
| | | | | 11/02/07*-03/31/08 | |
| Net investment income | | | | | $42,705 | |
| Net realized losses | | | | | (786,482 | ) |
| Net unrealized losses | | + | | | (139,666 | ) |
| | | |
| | | |
Decrease in net assets from operations | | | | | (883,443 | ) |
| | | | | | | |
| |
Distributions to Shareholders
|
Distributions from net investment income | | | | | | |
| Investor Shares | | | | | 595 | |
| Select Shares | | | | | 1,121 | |
| Institutional Shares | | + | | | 28,590 | |
| | | |
| | | |
Total distributions from net investment income | | | | | $30,306 | |
| | | | | | | | | | | |
| | | | | | | | | | | |
| |
Transactions in Fund Shares
|
| | | | | | | | | | | |
| | | | | 11/2/07*-03/31/08 | |
| | | | | SHARES | | | VALUE | |
| | | | | | | | | | | |
| | | | | | | | | | | |
| Shares Sold |
| Investor Shares | | | | | 221,053 | | | | $2,073,502 | |
| Select Shares | | | | | 97,917 | | | | 934,439 | |
| Institutional Shares | | + | | | 2,608,232 | | | | 25,103,782 | |
| | | |
| | | |
Total shares sold | | | | | 2,927,202 | | | | $28,111,723 | |
| | | | | | | | | | | |
| | | | | | | | | | | |
| Shares Reinvested |
| Investor Shares | | | | | 62 | | | | $571 | |
| Select Shares | | | | | 122 | | | | 1,121 | |
| Institutional Shares | | + | | | 3,100 | | | | 28,584 | |
| | | |
| | | |
Total shares reinvested | | | | | 3,284 | | | | $30,276 | |
| | | | | | | | | | | |
| | | | | | | | | | | |
| Shares Redeemed |
| Investor Shares | | | | | (12,598 | ) | | | ($113,103 | ) |
| Select Shares | | | | | (16,426 | ) | | | (152,547 | ) |
| Institutional Shares | | + | | | (522,507 | ) | | | (4,852,433 | ) |
| | | |
| | | |
Total shares redeemed | | | | | (551,531 | ) | | | ($5,118,083 | ) |
| | | | | | | | | | | |
Net transactions in fund shares | | | | | 2,378,955 | | | | $23,023,916 | |
| | | | | | | | | | | |
| |
Shares Outstanding and Net Assets
|
| | | | | 11/2/07*-03/31/08 | |
| | | | | SHARES | | | NET ASSETS | |
| Beginning of period | | | | | — | | | | $- | |
| Total increase | | + | | | 2,378,955 | | | | 22,110,167 | |
| | | |
| | | |
End of period | | | | | 2,378,955 | | | | $22,110,167 | |
| | | |
| | | |
Distribution in excess of net investment income | | | | | | | | | ($2,902 | ) |
| |
| * | Commencement of operations. |
18 See financial notes
Laudus Mondrian International Fixed Income Fund
Financial Statements
Financial Highlights
| | | | | |
| | | 11/2/071-
|
| Investor Shares | | 3/31/08 |
| |
| | | | | |
Per-Share Data ($) | | | | |
|
| Net asset value at beginning of period | | | 10.00 | |
| | | | | |
| Income (loss) from investment operations: | | | | |
| Net investment income (loss) | | | 0.05 | |
| Net realized and unrealized gains (losses) | | | 1.27 | |
| | | | | |
| Total from investment operations | | | 1.32 | |
| Less distributions: | | | | |
| Distributions from net investment income | | | (0.04 | ) |
| | | | | |
| Net asset value at end of period | | | 11.28 | |
| | | | | |
| Total return (%) | | | 13.27 | 2 |
| | | | | |
Ratios/Supplemental Data (%) | | | | |
|
| Ratios to average net assets: | | | | |
| Net operating expenses | | | 1.10 | 3 |
| Gross operating expenses | | | 1.57 | 3 |
| Net investment income (loss) | | | 1.61 | 3 |
| Portfolio turnover rate | | | 1 | 2 |
| Net assets, end of period ($ x 1,000,000) | | | 16 | |
| | | | | |
| | | 11/2/071-
|
| Select Shares | | 3/31/08 |
| |
| | | | | |
Per-Share Data ($) | | | | |
|
| Net asset value at beginning of period | | | 10.00 | |
| | | | | |
| Income (loss) from investment operations: | | | | |
| Net investment income (loss) | | | 0.06 | |
| Net realized and unrealized gains (losses) | | | 1.28 | |
| | | | | |
| Total from investment operations | | | 1.34 | |
| Less distributions: | | | | |
| Distributions from net investment income | | | (0.05 | ) |
| | | | | |
| Net asset value at end of period | | | 11.29 | |
| | | | | |
| Total return (%) | | | 13.42 | 2 |
| | | | | |
Ratios/Supplemental Data (%) | | | | |
|
| Ratios to average net assets: | | | | |
| Net operating expenses | | | 0.82 | 3 |
| Gross operating expenses | | | 1.31 | 3 |
| Net investment income (loss) | | | 1.89 | 3 |
| Portfolio turnover rate | | | 1 | 2 |
| Net assets, end of period ($ x 1,000,000) | �� | | 20 | |
1 Commencement of operations.
2 Not annualized.
3 Annualized.
See financial notes 19
Laudus Mondrian International Fixed Income Fund
Financial Highlights continued
| | | | | |
| | | 11/2/071-
|
| Institutional Shares | | 3/31/08 |
| |
| | | | | |
Per-Share Data ($) | | | | |
|
| Net asset value at beginning of period | | | 10.00 | |
| | | | | |
| Income (loss) from investment operations: | | | | |
| Net investment income (loss) | | | 0.07 | |
| Net realized and unrealized gains (losses) | | | 1.27 | |
| | | | | |
| Total from investment operations | | | 1.34 | |
| Less distributions: | | | | |
| Distributions from net investment income | | | (0.05 | ) |
| | | | | |
| Net asset value at end of period | | | 11.29 | |
| | | | | |
| Total return (%) | | | 13.42 | 2 |
| | | | | |
Ratios/Supplemental Data (%) | | | | |
|
| Ratios to average net assets: | | | | |
| Net operating expenses | | | 0.75 | 3 |
| Gross operating expenses | | | 1.23 | 3 |
| Net investment income (loss) | | | 1.98 | 3 |
| Portfolio turnover rate | | | 1 | 2 |
| Net assets, end of period ($ x 1,000,000) | | | 52 | |
1 Commencement of operations.
2 Not annualized.
3 Annualized.
20 See financial notes
Laudus Mondrian International Fixed Income Fund
Portfolio Holdings as of March 31, 2008
This section shows all the securities in the fund’s portfolio and their value as of the report date.
The fund files its complete schedule of portfolio holdings with the SEC for the first and third quarters of each fiscal year on Form N-Q. The fund’s Form N-Q is available on the SEC’s website at http://www.sec.gov and may be viewed and copied at the SEC’s Public Reference Room in Washington, D.C. Call 1-800-SEC-0330 for information on the operation of the Public Reference Room. The schedule of portfolio holdings filed on a fund’s most recent Form N-Q is also available by visiting the Fund’s website at www.laudusfunds.com.
For fixed rate obligations, the rate shown is the interest rate (the rate established when the obligation was issued) and the maturity date shown is the stated legal maturity.
| | | | | | | | | | | | | |
| | | Cost
| | Value
|
| Holdings by Category | | ($) | | ($) |
|
| |
| | 84 | .8% | | Government Bonds | | | 70,251,607 | | | | 74,978,631 | |
| | 9 | .3% | | Government Agency Obligations | | | 7,088,416 | | | | 8,189,704 | |
| | 1 | .2% | | Corporate Bond | | | 950,829 | | | | 1,104,608 | |
| | 3 | .5% | | Short-Term Investment | | | 3,106,000 | | | | 3,106,000 | |
|
| | 98 | .8% | | Total Investments | | | 81,396,852 | | | | 87,378,943 | |
| | 1 | .2% | | Other Assets and Liabilities | | | | | | | 1,060,810 | |
|
| | 100 | .0% | | Net Assets | | | | | | | 88,439,753 | |
| | | | | | | | | |
Security
| | Face Amount
| | Value
|
| Rate, Maturity Date | | (local currency) | | ($) |
| |
| | | | | | | | | |
| | | | | | | | | |
| | | | | | | | | |
| |
Government Bonds 84.8% of net assets |
| | | | | | | | | |
| |
Austria 3.2%
|
| Austria Government Bond |
| 3.50%, 07/15/15 | | | 1,860,000 | | | | 2,861,760 | |
| | | | | | | | | |
| |
Belgium 8.5%
|
| Belgium Government Bond |
| 3.75%, 09/28/15 | | | 2,170,000 | | | | 3,367,422 | |
| 5.50%, 09/28/17 | | | 2,380,000 | | | | 4,130,527 | |
| | | | | | | | | |
| | | | | | | | 7,497,949 | |
| | | | | | | | | |
| |
France 8.5%
|
| France Government Bond OAT |
| 4.00%, 10/25/09 | | | 530,000 | | | | 840,489 | |
| 4.00%, 04/25/13 | | | 860,000 | | | | 1,370,185 | |
| 4.00%, 04/25/14 | | | 1,180,000 | | | | 1,879,498 | |
| 5.00%, 10/25/16 | | | 1,600,000 | | | | 2,702,217 | |
| 5.75%, 10/25/32 | | | 400,000 | | | | 730,848 | |
| | | | | | | | | |
| | | | | | | | 7,523,237 | |
| | | | | | | | | |
| |
Germany 14.5%
|
| Bundesrepublik Deutschland |
| 5.00%, 07/04/11 | | | 290,000 | | | | 477,385 | |
| 4.50%, 01/04/13 | | | 1,160,000 | | | | 1,903,084 | |
| 3.75%, 01/04/15 | | | 1,400,000 | | | | 2,210,087 | |
| 3.25%, 07/04/15 | | | 1,666,000 | | | | 2,537,442 | |
| 3.50%, 01/04/16 | | | 2,700,000 | | | | 4,164,773 | |
| 6.25%, 01/04/24 | | | 700,000 | | | | 1,336,632 | |
| 4.75%, 07/04/34 | | | 120,000 | | | | 194,834 | |
| | | | | | | | | |
| | | | | | | | 12,824,237 | |
| | | | | | | | | |
| |
Italy 3.3%
|
| Italy Government International Bond |
| 0.65%, 03/20/09 | | | 120,000,000 | | | | 1,202,183 | |
| 4.50%, 06/08/15 | | | 140,000,000 | | | | 1,706,768 | |
| | | | | | | | | |
| | | | | | | | 2,908,951 | |
| | | | | | | | | |
| |
Japan 33.5%
|
| Japan Government Five Year Bond |
| 0.50%, 06/20/10 | | | 390,000,000 | | | | 3,908,721 | |
| Japan Government Ten Year Bond |
| 1.40%, 09/20/11 | | | 430,000,000 | | | | 4,420,334 | |
| 1.10%, 09/20/12 | | | 400,000,000 | | | | 4,079,647 | |
| 1.20%, 09/20/12 | | | 350,000,000 | | | | 3,585,081 | |
| 0.50%, 06/20/13 | | | 400,000,000 | | | | 3,962,315 | |
| 0.90%, 06/20/13 | | | 390,000,000 | | | | 3,943,112 | |
| 1.30%, 12/20/14 | | | 331,000,000 | | | | 3,413,959 | |
| 1.50%, 03/20/15 | | | 225,000,000 | | | | 2,351,918 | |
| | | | | | | | | |
| | | | | | | | 29,665,087 | |
| | | | | | | | | |
| |
Mexico 3.9%
|
| Mexican Bonos |
| 9.00%, 12/20/12 | | | 16,600,000 | | | | 1,661,910 | |
| 8.00%, 12/07/23 | | | 17,800,000 | | | | 1,744,585 | |
| | | | | | | | | |
| | | | | | | | 3,406,495 | |
| | | | | | | | | |
| |
Netherlands 9.4%
|
| Netherlands Government Bond |
| 5.50%, 07/15/10 | | | 440,000 | | | | 722,735 | |
| 4.25%, 07/15/13 | | | 2,000,000 | | | | 3,234,414 | |
| 3.75%, 07/15/14 | | | 2,750,000 | | | | 4,333,766 | |
| | | | | | | | | |
| | | | | | | | 8,290,915 | |
| | | | | | | | | |
Total Government Bonds
(Cost $70,251,607) | | | 74,978,631 | |
| | | | | |
| | | | | | | | | |
| | | | | | | | | |
| |
Government Agency Obligations 9.3% of net assets |
| | | | | | | | | |
| |
Germany 1.4%
|
| Kreditanstalt fuer Wiederraufbau |
| 2.05%, 09/21/09 | | | 120,000,000 | | | | 1,225,772 | |
| | | | | | | | | |
| |
Japan 5.6%
|
| Development Bank of Japan |
| 1.40%, 06/20/12 | | | 170,000,000 | | | | 1,747,449 | |
| Japan Finance Corp. for Municipal Enterprises |
| 1.55%, 02/21/12 | | | 150,000,000 | | | | 1,553,976 | |
| 1.35%, 11/26/13 | | | 160,000,000 | | | | 1,656,540 | |
| | | | | | | | | |
| | | | | | | | 4,957,965 | |
See financial notes 21
Laudus Mondrian International Fixed Income Fund
Portfolio Holdings continued
| | | | | | | | | |
Security
| | Face Amount
| | Value
|
| Rate, Maturity Date | | (local currency) | | ($) |
| |
| | | | | | | | | |
| |
Netherlands 2.3%
|
| Bank Nederlandse Gemeenten |
| 0.80%, 09/22/08 | | | 200,000,000 | | | | 2,005,967 | |
| | | | | | | | | |
Total Government Agency Obligations
(Cost $7,088,416) | | | 8,189,704 | |
| | | | | |
| | | | | | | | | |
| | | | | | | | | |
| |
Corporate Bond 1.2% of net assets |
| | | | | | | | | |
| |
Ireland 1.2%
|
| Depfa ACS Bank |
| 1.65%, 12/20/16 | | | 110,000,000 | | | | 1,104,608 | |
| | | | | | | | | |
Total Corporate Bonds
(Cost $950,829) | | | 1,104,608 | |
| | | | | |
| | | | | | | | | |
| | | | | | | | | |
| |
Short-Term Investment 3.5% of net assets |
| | | | | | | | | |
| |
Repurchase Agreement 3.5%
|
| Fixed Income Clearing Corp. dated 03/31/08, due 04/01/08 at 2.00%, with a maturity value of $3,106,173 (fully collateralized by Federal Home Loan Mortgage Corp. with a value of $3,171,532.) | | | 3,106,000 | | | | 3,106,000 | |
| | | | | | | | | |
Total Short-Term Investment
(Cost $3,106,000) | | | 3,106,000 | |
| | | | | |
| |
End of Investments. |
| |
| At 03/31/08 the tax basis cost of the fund’s investments was $81,396,852, and the unrealized appreciation and depreciation were $5,982,091 and ($0), respectively, with a net appreciation of $5,982,091. |
In addition to the above, the fund held the following at 03/31/08.
| | | | | | | | | | | | | | | | | | | | | |
| | | Currency
| | Amount of
| | Currency
| | Amount of
| | |
Expiration
| | to be
| | Currency to be
| | to be
| | Currency to be
| | Unrealized
|
| Date | | Received | | Received | | Delivered | | Delivered | | Gains / Losses |
| |
| |
Forward Foreign Currency Contract |
| | | | | | | | | | | | | | | | | | | | | |
| 04/30/2008 | | | USD | | | | 5,959,181 | | | | EUR | | | | 3,778,500 | | | | (70,081 | ) |
Net unrealized loss on Forward Foreign Currency Contracts | | | | | | | | | | | | | | | | | | | (70,081 | ) |
Laudus Mondrian International Fixed Income Fund
Statement of
Assets and Liabilities
As of March 31, 2008.
| | | | | | | |
| | | | | | | |
| |
Assets
|
| Investments, at value (cost $81,396,852) | | | | | $87,378,943 | |
| Cash | | | | | 72 | |
| Foreign currency, at value (cost $264,276) | | | | | 265,518 | |
| Receivables: | | | | | | |
| Fund shares sold | | | | | 4,737,154 | |
| Interest | | | | | 1,071,848 | |
| Due from manager | | + | | | 8,863 | |
| | | |
| | | |
Total assets | | | | | 93,462,398 | |
| | | | | | | |
| |
Liabilities
|
| Payables: | | | | | | |
| Investments bought | | | | | 4,899,551 | |
| Transfer agent fees | | | | | 3,743 | |
| Distributions to shareholders | | | | | 13,429 | |
| Fund shares redeemed | | | | | 3,497 | |
| Distribution and shareholder services fees | | | | | 2,286 | |
| Unrealized loss on forward foreign currency contracts | | | | | 70,081 | |
| Accrued expenses | | + | | | 30,058 | |
| | | |
| | | |
Total liabilities | | | | | 5,022,645 | |
| | | | | | | |
| |
Net Assets
|
Total assets | | | | | 93,462,398 | |
Total liabilities | | − | | | 5,022,645 | |
| | | |
| | | |
Net assets | | | | | $88,439,753 | |
Net Assets by Source | | | | | | |
| Capital received from investors | | | | | 82,455,128 | |
| Net investment income not yet distributed | | | | | 36,096 | |
| Net unrealized capital gains | | | | | 5,948,529 | |
Net Asset Value (NAV) by Shares Class
| | | | | | | | | | | | |
| | | | | | | Shares
| | | | |
| Share Class | | Net Assets | | ¸ | | Outstanding | | = | | NAV |
| |
| Investor Shares | | $16,147,993 | | | | 1,431,530 | | | | | $11.28 |
| Select Shares | | $20,078,185 | | | | 1,778,743 | | | | | $11.29 |
| Institutional Shares | | $52,213,575 | | | | 4,625,743 | | | | | $11.29 |
See financial notes 23
Laudus Mondrian International Fixed Income Fund
Statement of
Operations
For November 2, 2007* through March 31, 2008.
| | | | | | | |
| | | | | | | |
| |
Investment Income
|
Interest | | | | | $482,248 | |
| | | | | | | |
| |
Net Realized Gains and Losses
|
| Net realized gains on investments | | | | | 23,697 | |
| Net realized losses on foreign currency transactions | | + | | | (101,678 | ) |
| | | |
| | | |
Net realized losses | | | | | (77,981 | ) |
| | | | | | | |
| |
Net Unrealized Gains and Losses
|
| Net unrealized gains on investments | | | | | 5,982,091 | |
| Net unrealized losses on foreign currency translations | | + | | | (33,562 | ) |
| | | |
| | | |
Net unrealized gains | | | | | 5,948,529 | |
| | | | | | | |
| |
Expenses
|
| Investment adviser fees | | | | | 106,185 | |
| Transfer agent fees | | | | | 22,803 | |
| Registration fees | | | | | 24,516 | |
| Professional fees | | | | | 22,840 | |
| Shareholder reports | | | | | 21,644 | |
| Custodian fees | | | | | 8,526 | |
| Sub-accounting fees | | | | | | |
| Investor Shares | | | | | 2,859 | |
| Select Shares | | | | | 4,653 | |
| Distribution and shareholder services fees (Investor Shares) | | | | | 6,100 | |
| Trustees’ fees | | | | | 4,173 | |
| Accounting and administrator fees | | | | | 2,630 | |
| Other expenses | | + | | | 1,416 | |
| | | |
| | | |
| Total expenses | | | | | 228,345 | |
| Expense reduction by adviser | | − | | | 84,455 | |
| Custody credits | | − | | | 5 | |
| | | |
| | | |
Net expenses | | | | | 143,885 | |
| | | | | | | |
| |
Increase (Decrease) in Net Assets from Operations
|
Total investment income | | | | | 482,248 | |
Net expenses | | − | | | 143,885 | |
| | | |
| | | |
Net investment income | | | | | 338,363 | |
Net realized losses | | | | | (77,981 | ) |
Net unrealized gains | | + | | | 5,948,529 | |
| | | |
| | | |
Increase in net assets from operations | | | | | $6,208,911 | |
24 See financial notes
Laudus Mondrian International Fixed Income Fund
Statements of
Changes in Net Assets
For the current period only. Because the fund commenced operations on November 2, 2007, it has no prior report period.
| | | | | | | |
| | | | | 11/2/07*-3/31/08 | |
| Net investment income | | | | | $338,363 | |
| Net realized losses | | | | | (77,981 | ) |
| Net unrealized gains | | + | | | 5,948,529 | |
| | | |
| | | |
Increase in net assets from operations | | | | | 6,208,911 | |
| | | | | | | |
| |
Distributions to Shareholders
|
Distributions from net investment income | | | | | | |
| Investor Shares | | | | | 33,714 | |
| Select Shares | | | | | 50,639 | |
| Institutional Shares | | + | | | 142,251 | |
| | | |
| | | |
Total distributions from net investment income | | | | | $226,604 | |
| | | | | | | | | | | |
| | | | | | | | | | | |
| |
Transactions in Fund Shares
|
| | | | | | | | | | | |
| | | | | 11/2/07*-3/31/08 | |
| | | | | SHARES | | | VALUE | |
| | | | | | | | | | | |
| | | | | | | | | | | |
| Shares Sold |
| Investor Shares | | | | | 1,546,672 | | | | $16,580,538 | |
| Select Shares | | | | | 1,854,202 | | | | 19,621,852 | |
| Institutional Shares | | + | | | 4,705,565 | | | | 49,150,016 | |
| | | |
| | | |
Total shares sold | | | | | 8,106,439 | | | | $85,352,406 | |
| | | | | | | | | | | |
| | | | | | | | | | | |
| Shares Reinvested |
| Investor Shares | | | | | 2,878 | | | | $31,299 | |
| Select Shares | | | | | 3,845 | | | | 41,629 | |
| Institutional Shares | | + | | | 12,658 | | | | 136,064 | |
| | | |
| | | |
Total shares reinvested | | | | | 19,381 | | | | $208,992 | |
| | | | | | | | | | | |
| | | | | | | | | | | |
| Shares Redeemed |
| Investor Shares | | | | | (118,020 | ) | | | ($1,271,229 | ) |
| Select Shares | | + | | | (79,304 | ) | | | (837,623 | ) |
| Institutional Shares | | + | | | (92,480 | ) | | | (995,100 | ) |
| | | |
| | | |
Total shares redeemed | | | | | (289,804 | ) | | | ($3,103,952 | ) |
| | | | | | | | | | | |
Net transactions in fund shares | | | | | 7,836,016 | | | | $82,457,446 | |
| | | | | | | | | | | |
| |
Shares Outstanding and Net Assets
|
| | | | | 11/2/07*-3/31/08 | |
| | | | | SHARES | | | NET ASSETS | |
| Beginning of period | | | | | — | | | | $- | |
| Total increase | | + | | | 7,836,016 | | | | 88,439,753 | |
| | | |
| | | |
End of period | | | | | 7,836,016 | | | | $88,439,753 | |
| | | |
| | | |
Net investment income not yet distributed | | | | | | | | | $36,096 | |
| |
| * | Commencement of operations. |
See financial notes 25
Laudus Mondrian Funds
Financial Notes
1. Business Structure of the Funds:
Each of the Laudus Mondrian Funds in this report is a series of Laudus Trust (the ”Trust”), an open-end management investment company. The Trust was organized as a Massachusetts business trust and is registered under the Investment Company Act of 1940 (the “1940 Act”), as amended. The list below shows all the funds in the Trust including the funds discussed in this report, which are highlighted:
| | | |
| |
Laudus Rosenberg U.S. Large Capitalization Fund
Laudus Rosenberg U.S. Large Capitalization Growth Fund
Laudus Rosenberg U.S. Large Capitalization Value Fund
Laudus Rosenberg U.S. Discovery Fund
Laudus Rosenberg U.S. Small Capitalization Fund
Laudus Rosenberg International Equity Fund
Laudus Rosenberg International Discovery Fund | | Laudus Rosenberg International Small Capitalization Fund
Laudus Rosenberg Long/Short Equity Fund (formerly the Laudus Rosenberg Value Long/Short Equity Fund)
Laudus Mondrian Emerging Markets Fund
Laudus Mondrian International Fixed Income Fund
|
| | | |
Both the Laudus Mondrian Emerging Markets Fund and the Laudus Mondrian International Fixed Income Fund (each a “Fund,” and collectively, the “Funds”) commenced operations on November 2, 2007 and each Fund offers three share classes: Investor Shares, Select Shares and Institutional Shares. Shares of each class represent interest in the same portfolio, but each class has different expenses and investment minimums. Shares are bought and sold at net asset value, or NAV, which is the price for all outstanding shares. Each Fund is authorized to issue an unlimited number of Institutional Shares, Investor Shares and Select Shares of no par value. Each class of shares generally has identical rights and preferences, except that each class is subject to different eligibility conditions, bears different distribution and sub-transfer agent expenses, and has separate voting rights on matters pertaining solely to that class of shares.
2. Significant Accounting Policies:
The following is a summary of the significant accounting policies the Funds use in the preparation of financial statements. The accounting policies are in conformity with accounting principles generally accepted in the United States of America.
(a) Security Valuation:
The Funds value the securities in their portfolios every business day. The Funds use the following policies to value various types of securities:
| | |
| | • | Securities traded on an exchange or over-the-counter: valued at the closing value for the day, or, on days when no closing value has been reported, halfway between the most recent bid and asked quotes. Securities that are primarily traded on foreign exchanges are valued at the closing values of such securities on their respective exchanges with these values then translated into U.S. dollars at the current exchange rate. The Funds do not isolate the portion of the fluctuation on investments resulting from changes in foreign currency exchange rates from the fluctuations in market prices of investments held. Such fluctuations are included with the net realized and unrealized gain or loss from investments. |
| |
| | • | Securities for which no quoted value is available or when a significant event has occurred between the time of the security’s last close and the time the Funds calculate net asset value: valued at fair value, as determined in good faith by the Funds’ investment adviser using guidelines adopted by the Funds’ Board of Trustees and the Pricing Committee. Some of the more common reasons that may necessitate that a security be valued at fair value include: the security’s trading has been halted or suspended; the security has been de-listed from a national exchange; the security’s primary trading market is temporarily closed at a time when under normal conditions it would be open; the security’s primary pricing source is not able or willing to provide a price, or certain foreign securities’ closing market prices adjusted for changes in value that may occur between the close of foreign exchange and the time at which Fund shares are priced. The Board of Trustees regularly reviews fair value determinations, made by the Funds, pursuant to the procedures. |
| |
| | • | Bonds and notes: valued at halfway between the most recent bid and asked quotes or, if such quotes are unavailable, at prices for securities of comparable maturity, credit quality and type. Valuations for bonds and notes are provided by an independent bond-pricing service. |
26
Laudus Mondrian Funds
Financial Notes (continued)
2. Significant Accounting Policies (continued):
| | |
| | • | Futures and forwards currency contracts: valued at their settlement prices as of the close of their exchanges (for futures) or at a market value based on that day’s exchange rates (for forwards). When a Fund closes out a futures or forwards position, it calculates the difference between the value of the position at the beginning and at the end of the contract, and records a realized gain or loss accordingly. |
| |
| | • | Short-term securities (60 days or less to maturity): valued at amortized cost (which approximates market value). |
| |
| | • | Mutual funds: valued at their respective net asset values as determined by those Funds in accordance with the 1940 Act for a given day. |
(b) Portfolio Investments:
Delayed-Delivery: The Funds may buy securities on a delayed-delivery basis. In these transactions, the Funds agree to buy a security for a stated price, with settlement generally occurring within two weeks. If the security’s value falls before settlement occurs, the Funds could end up paying more for the security than its market value at the time of settlement. The Funds have set aside sufficient securities as collateral for those securities bought on a delayed-delivery basis.
Futures Contract: The Funds may invest in futures contracts. Futures contracts involve certain risks because they can be very sensitive to market movements.
One risk is that the price of a futures contract may not move in perfect correlation with the price of the underlying securities. Another risk is that, at certain times, it may be impossible for a Fund to close out a position in a futures contract, due to a difference in trading hours or to market conditions that may reduce the liquidity for a futures contract or its underlying securities. The potential for losses associated with futures contracts may exceed amounts recorded in the Statement of Assets and Liabilities.
Because futures carry inherent risks, a Fund must give the broker a deposit of cash and/or securities (the “initial margin”) whenever it enters into the futures contract. The amount of the deposit may vary from one contract to another, but it is generally a percentage of the contract amount.
Futures are traded publicly on exchanges, and their market value changes daily. A Fund records the change daily in market value of futures, and also the change in the amount of margin deposit required (“due to/from broker”).
Forward Currency Contract: The Funds may invest in forward currency contracts in connection with the purchase and sale of portfolio securities to minimize the uncertainty of changes in future foreign currency exchange rates. “Forwards”, as they are known, are contracts to buy and sell a currency at a set price on a future date. Forwards are similar to futures except that they are not publicly traded, but are agreements directly between two parties.
As with futures, forwards involve certain risks that are not fully reflected in the Funds’ financial statements. If counter-parties to the contracts or if the value of the foreign currency changes unfavorably, the Funds could sustain a loss.
Repurchase Agreement: The Funds may enter into repurchase agreements. In a repurchase agreement, a Fund buys a security from another party (usually a financial institution) with the agreement that it be sold back in the future. The date, price and other conditions are all specified when the agreement is created.
The Funds’ repurchase agreements will be fully collateralized by U.S. government securities or U.S. Government Agency securities. All collateral is held by the Funds’ custodian (or, with tri-party agreements, the agent’s bank) and is monitored daily to ensure that its market value is at least equal to the repurchase price under the agreement.
(c) Security Transactions:
Security transactions are recorded as of the date the order to buy or sell the security is executed. Realized gains and losses from security transactions are based on the identified costs of the securities involved.
Assets and liabilities denominated in foreign currencies are reported in U.S. dollars. For assets and liabilities held on a given date, the dollar value is based on market exchange rates in effect on that date. Transactions involving foreign currencies,
27
Laudus Mondrian Funds
Financial Notes (continued)
2. Significant Accounting Policies (continued):
including purchases, sales, income receipts and expense payments, are calculated using exchange rates in effect on the transaction date.
(d) Investment Income:
Interest income is recorded as it accrues. Dividends and distributions from portfolio securities and underlying mutual funds are recorded on the date they are effective (the ex-dividend date), although the Funds record certain foreign security dividends on the day they learn of the ex-dividend date.
(e) Expenses:
Expenses that are specific to a Fund or a class within the trust are charged directly to that Fund or class. Expenses that are common to all Funds within the trust generally are allocated among the Funds in proportion to their average daily net assets.
For Funds offering multiple share classes, the net investment income, other than class specific expenses, and the realized and unrealized gains or losses, are allocated daily to each class in proportion to its net assets.
(f) Distributions to Shareholders:
The Funds make distributions from net investment income and net realized capital gains once a year with the exception of Laudus Mondrian International Fixed Income Fund which pays quarterly dividends.
(g) Custody Credit:
Each Fund has an arrangement with its custodian bank under which the Fund receives a credit for its uninvested cash balance to offset its custody fees and accounting fees. The credit amounts (if any) are disclosed in the Statement of Operations as a reduction to the Fund’s operating expenses.
(h) Accounting Estimates:
The accounting policies described in this report conform with accounting principles generally accepted in the United States of America. Notwithstanding this, shareholders should understand that in order to follow these principles, fund management has to make estimates and assumptions that affect the information reported in the financial statements. It’s possible that once the results are known, they may turn out to be different from these estimates.
(i) Federal Income Taxes:
The Funds intend to meet federal income and excise tax requirements for regulated investment companies. Accordingly, the Funds distribute substantially all of their net investment income and realized net capital gains (if any) to their respective shareholders each year. As long as a Fund meets the tax requirements, it is not required to pay federal income tax.
Each Fund maintains its own account for purposes of holding assets and accounting, and is considered a separate entity for tax purposes. Within its account, each Fund also keeps certain assets in segregated accounts, as may be required by securities law.
(j) Indemnification:
Under the Funds’ organizational documents, the officers and trustees are indemnified against certain liabilities arising out of the performance of their duties to the Funds. In addition, in the normal course of business the Funds enter into contracts with their vendors and others that provide general indemnifications. The Funds’ maximum exposure under these arrangements is unknown as this would involve future claims that may be made against the Funds. However, based on experience, the Funds expect the risk of loss to be remote.
(k) New Accounting Standards:
Financial Accounting Standards Board Interpretation (FIN) No. 48—Accounting for Uncertainty in Income Taxes—an Interpretation of SFAS No. 109, was issued in July 2006 and is effective for fiscal years beginning after December 15, 2006. This Interpretation provides new requirements for the recognition, measurement, and disclosure in the financial statements of a tax
28
Laudus Mondrian Funds
Financial Notes (continued)
2. Significant Accounting Policies (continued):
position taken or expected to be taken in a tax return when there is uncertainty about whether that tax position will ultimately be sustained. As of March 31, 2008, management has reviewed the tax positions for the current tax year (November 2, 2007 through March 31, 2008), and determined that no provision for income tax is required in the Funds’ financial statements.
In September 2006, the Financial Accounting Standards Board (FASB) issued Statement of Financial Accounting Standards No. 157, “Fair Value Measurements” (SFAS No. 157). SFAS No. 157 defines fair value, establishes a framework for measuring fair value in accordance with generally accepted accounting principles and expands disclosure about fair value measurements. SFAS No. 157 is effective for fiscal years beginning after November 15, 2007. As of March 31, 2008, management does not believe the adoption of SFAS No. 157 will impact the financial statement; however, additional disclosures may be required about the inputs used to develop the measurements and the effect of certain of the measurements on changes in net assets for the period.
In March 2008, the Financial Accounting Standards board (“FASB”) issued Statement of Financial Accounting Standards No. 161, “Disclosures about Derivative Instruments and Hedging Activities” (“SFAS 161”). SFAS 161 is effective for fiscal years and interim periods beginning after November 15, 2008. SFAS 161 requires enhanced disclosures about Funds’ derivative and hedging activities. Management is currently evaluating the impact of the adoption of SFAS 161 on the Funds’ financial statement disclosures.
3. Affiliates and Affiliated Transactions:
The Trust’s Board of Trustees oversees the general conduct of the Trust and the Funds.
Charles Schwab Investment Management, Inc. (”CSIM” or the “Investment Adviser”), a wholly owned subsidiary of The Charles Schwab Corporation, serves as the Funds’ investment adviser pursuant to Management Contracts (“Advisory Agreement”) between it and the Trust. Mondrian Investment Partners Limited (”Mondrian”), the Funds’ sub-adviser, provides day-to-day portfolio management services to the Funds, subject to the supervision of CSIM.
For its advisory services to each Fund, the Investment Adviser is entitled to receive an annual fee payable monthly base on the Funds’ average daily net assets described as follows.
| | | |
| | | Agreement Rate* |
| |
| Laudus Mondrian Emerging Markets Fund | | 1st $1 billion - 1.20% |
| Laudus Mondrian International Fixed Income Fund | | Over $1 billion - 1.15%
0.60% |
CSIM (not the Funds) pays a portion of the management fees it receives to Mondrian in return for its services.
CSIM has contractually agreed, until at least July 30, 2010, to waive a portion of its management fee and bear certain expenses of each Fund. As such, CSIM further agrees to reimburse the Funds to limit the annual expenses, exclusive of nonrecurring account fees, fees on securities transactions such as exchange fees, dividends and interest on securities sold short, service fees, interest (overdraft charges), taxes, brokerage commissions, other expenditures which are capitalized in accordance with generally accepted accounting principles, and other extraordinary expenses not incurred in the ordinary course of the Funds’ business as follows:
| | | | | | | | | |
| | | Laudus Mondrian
| | Laudus Mondrian
|
| | | Emerging Markets Fund | | International Fixed Income Fund |
| |
| Investor Shares | | | 1.80% | | | | 1.10% | |
| Select Shares | | | 1.52% | | | | 0.82% | |
| Institutional Shares | | | 1.45% | | | | 0.75% | |
29
Laudus Mondrian Funds
Financial Notes (continued)
3. Affiliates and Affiliated Transactions (continued):
Any amounts waived or reimbursed in a particular fiscal year will be subject to repayment through the next two fiscal years, to the extent that the repayment will not cause the Funds’ net expenses to exceed the current limit (as stated in CSIM’s contractual undertaking) during the respective year. As of March 31, 2008, the balances of recoupable expenses are as follows:
| | | | | | | | | |
| | | Laudus Mondrian
| | Laudus Mondrian
|
Expires | | Emerging Markets Fund | | International Fixed Income Fund |
| |
| March 31, 2010 | | | $80,048 | | | | $84,455 | |
| |
| 4. | Other Shareholders Services |
The Trust has a Distribution and Shareholder Service Plan with respect to its Investor Shares pursuant to Rule 12b-1 under the 1940 Act. The Investor Shares of the Funds are sold on a continuous basis by the Trust’s Distributor ALPS Distributors, Inc. serves as the Distributor. Under the Distribution and Shareholder Services Plan, the Funds pay distribution and shareholder servicing fees in connection with the sale and servicing of the Investor Shares. The annual Distribution and Shareholder Service Fee consists of up to 0.25% of the respective average daily net assets of the Investor Shares. In addition, the Trustees have authorized each Fund to reimburse, out of the Investor and Select Class assets of the Funds, financial intermediaries that provide sub-accounting and sub-transfer agency services in connection with Investor or Select Class shares of the Funds an amount up to 0.15% of the average daily net assets of that class on an annual basis.
Trustees may include people who are officers and/or directors of other fund families managed by the Investment Adviser. Federal securities law limits the percentage of the “interested persons” who may serve on a trust’s board, and the Laudus Funds are in compliance with these limitations. The Funds did not pay any of these persons for their service as trustees, but did pay non-interested persons (Independent Trustees), as noted in each Fund’s Statement of Operations.
A Retirement Plan was instituted for certain Independent Trustees of the Trust. In September 2006 the Trustees voted to close the Retirement Plan to new participants as of June 26, 2006 and to discontinue making contributions to the Retirement Plan after the plan year ending March 31, 2007. All other terms of the Retirement Plan, including without limitation provisions relating to vesting and payment upon termination of service, remain in effect. Under the terms of the Retirement Plan, upon retirement or other termination from service from the Trust (other than termination for cause), a retiring Independent Trustee who has served as Independent Trustee for at least five years shall be paid a lump sum cash payment (the “Retirement Payment”). The Retirement Payment shall be equal to $10,000 for each year that the Trustee has served as an Independent Trustee of the Trust, including years of service prior to the adoption of the Retirement Plan and including a final one-half year credit for service during the plan year ending March 31, 2007. Beginning April 1, 2005, each Independent Trustee was permitted to make a one-time election to have the $10,000 attributable to service for the coming year and previously accrued benefits adjusted up or down at the end of each subsequent year based on the unweighted average performance of Institutional Shares of each Fund of the Trust. After the closure of the Retirement Plan, the previously accrued benefits that an Independent Trustee had elected to have adjusted by the performance of the Funds would continue to be adjusted for performance as provided under the Retirement Plan. As a result, the amount of the Retirement Payment payable to any Independent Trustee may increase or decrease based upon performance of the Funds. The portion of the total Retirement Payment owed to an Independent Trustee upon his or her retirement that is payable by any Fund will be determined based on the relative net assets of the Funds of the Trust. The Trust did not pay any pension or retirement benefits for its Trustees.
The Laudus Mondrian Emerging Markets Fund and Laudus Mondrian International Fixed Income Fund has access to an uncommitted line of credit up to a maximum of $100,000,000, as established by State Street Corporation. Interest is calculated based on the market rates at the time of borrowing. There were no borrowings from the line of credit for the period ended March 31, 2008.
30
Laudus Mondrian Funds
Financial Notes (continued)
| |
| 7. | Purchases and Sales of Investment Securities: |
For the period ended March 31, 2008, purchases and sales of securities (excluding short-term obligations) were as follows:
| | | | | | | | | |
| | | Purchases | | Sales |
| |
| Laudus Mondrian Emerging Markets Fund | | | $29,540,106 | | | | $8,757,526 | |
| Laudus Mondrian International Fixed Income Fund | | | $79,013,347 | | | | $716,132 | |
The Funds charge a redemption fee of 2.00% on shares sold or exchanged 30 days or less after purchasing them. Such amounts are net of the redemption proceeds on the Statement of Changes in Net Assets. The redemption fees charged during the current report period were:
| | | | | |
| | | Current Period
|
| | | (11/02/07-3/31/08) |
| |
| Laudus Mondrian Emerging Markets Fund | | | | |
| Investor shares | | | $284 | |
| Select shares | | | 946 | |
| Institutional shares | | | 222 | |
| Laudus Mondrian International Fixed Income Fund | | | | |
| Investor shares | | | $314 | |
| Select shares | | | 341 | |
| Institutional shares | | | 182 | |
As of March 31, 2008, the components of distributable earnings on a tax-basis were as follows:
| | | | | | | | | |
| | | Laudus Mondrian
| | Laudus Mondrian
|
| | | Emerging Markets Fund | | International Fixed Income Fund |
| |
| Undistributed Ordinary Income | | | $— | | | | $— | |
| Undistributed Long-Term Capital Gains | | | — | | | | — | |
| Accumulated Capital and Other Losses | | | (333,211 | ) | | | 36,096 | |
| | | | | | | | | |
| Unrealized Appreciation/Depreciation on investments | | | (577,913 | ) | | | 5,982,091 | |
| Other unrealized appreciation/(depreciation) | | | (2,332 | ) | | | (33,562 | ) |
| | | | | | | | | |
| Net unrealized appreciation/(depreciation) | | | (580,245 | ) | | | 5,948,529 | |
Capital loss carry forwards may be used to offset future realized capital gains for federal income tax purposes. As of March 31, 2008, the Funds had no capital loss carry forwards.
For tax purposes, realized net losses occurring after October 31 may be deferred and treated as occurring on the first day of the following fiscal year. As of March 31, 2008, the Funds had aggregate deferred realized net losses as follows:
| | | | | | | | | |
| | | Laudus Mondrian
| | Laudus Mondrian
|
| | | Emerging Markets Fund | | International Fixed Income Fund |
| |
| Capital Losses Deferred | | | $330,309 | | | | $— | |
| Currency Losses Deferred | | | 2,902 | | | | 41,426 | |
| Capital Losses Utilized | | | — | | | | — | |
31
Laudus Mondrian Funds
Financial Notes (continued)
9. Federal Income Taxes (continued):
The tax-basis components of distributions paid during the current fiscal years were:
| | | | | | | | | |
| | | Laudus Mondrian
| | Laudus Mondrian
|
| | | Emerging Markets Fund | | International Fixed Income Fund |
| |
| Ordinary Income | | | $30,306 | | | | $226,604 | |
| Long-Term Capital Gains | | | — | | | | — | |
| | | | | | | | | |
| Total Distributions Paid | | | 30,306 | | | | 226,604 | |
Distributions paid to shareholders are based on net investment income and net realized gains determined on a tax basis, which may differ from net investment income and net realized gains for financial reporting purposes. These differences are due primarily to differing treatment for items such as non-U.S. currency gains and losses, short-term capital gains and losses; capital losses related to wash sales, unrealized appreciation of certain investments in non-U.S. securities; paydowns on fixed-income securities; investments in passive foreign investment companies and income on certain investments. The fiscal year in which amounts are distributed may differ from the year in which the net investment income and net realized gains are recorded by each Fund for financial reporting purposes. Each Fund may also designate a portion of the amount paid to redeeming shareholders as a distribution for tax purposes.
The permanent book and tax basis differences may result in reclassifications between capital account and other accounts as required. The adjustments have no impact on net assets or the results of operations. As of March 31, 2008, the Funds made the following reclassifications:
| | | | | | | | | |
| | | Laudus Mondrian
| | Laudus Mondrian
|
| | | Emerging Markets Fund | | International Fixed Income Fund |
| |
| Capital Shares | | | $(293 | ) | | | $(2,318 | ) |
| Undistributed Net Investment Income | | | (15,301 | ) | | | (75,663 | ) |
| Net Realized Capital Gains/Losses | | | 15,594 | | | | 77,981 | |
32
Report of Independent Registered Public Accounting Firm
To the Board of Trustees and Shareholders of:
Laudus Mondrian Emerging Markets Fund
Laudus Mondrian International Fixed Income Fund
In our opinion, the accompanying statements of assets and liabilities, including portfolio holdings, and the related statements of operations and of changes in net assets and the financial highlights present fairly, in all material respects, the financial position of Laudus Mondrian Emerging Markets Fund and Laudus Mondrian International Fixed Income Fund (the “Funds”) at March 31, 2008, and the results of each of their operations, the changes in each of their net assets and the financial highlights for the period November 2, 2007 (commencement of operations) through March 31, 2008, in conformity with accounting principles generally accepted in the United States of America. These financial statements and financial highlights (hereafter referred to as “financial statements”) are the responsibility of the Funds’ management; our responsibility is to express an opinion on these financial statements based on our audits. We conducted our audits of these financial statements in accordance with the standards of the Public Company Accounting Oversight Board (United States). Those standards require that we plan and perform the audits to obtain reasonable assurance about whether the financial statements are free of material misstatement. An audit includes examining, on a test basis, evidence supporting the amounts and disclosures in the financial statements, assessing the accounting principles used and significant estimates made by management, and evaluating the overall financial statement presentation. We believe that our audits, which included confirmation of securities at March 31, 2008 by correspondence with the custodian and brokers, provide a reasonable basis for our opinion.
PricewaterhouseCoopers LLP
San Francisco, California
May 14, 2008
Other Federal Tax Information (unaudited)
The Laudus Mondrian Emerging Markets Fund may elect to pass on the benefits of the foreign tax credit $12,233, to its shareholders for the year ended March 31, 2008.
For the fiscal year ended March 31, 2008, the Funds designate the following amounts of the dividend distributions as qualified dividends for the purpose of the maximum rate under section 1(h)(ii) of the Internal Revenue Code. Shareholders will be notified in January 2009 via IRS form 1099 of the amounts for use in preparing their 2008 income tax return.
| | | | | |
| Laudus Mondrian Emerging Markets Fund | | | $30,306 | |
| Laudus Mondrian International Fixed Income Fund | | | — | |
| | | | | |
34
Investment Advisory Agreement Approval
The Investment Company Act of 1940 (the “1940 Act”) requires that initial approval of, as well as the continuation of, a fund’s investment advisory agreements must be specifically approved (1) by the vote of the trustees or by a vote of the shareholders of the fund, and (2) by the vote of a majority of the trustees who are not parties to the investment advisory agreement or “interested persons” of any party (the “Independent Trustees”), cast in person at a meeting called for the purpose of voting on such approval. In connection with such approvals, the fund’s trustees must request and evaluate, and the investment adviser is required to furnish, such information as may be reasonably necessary to evaluate the terms of the advisory agreements. In addition, the Securities and Exchange Commission takes the position that, as part of their fiduciary duties with respect to fund fees, fund boards are required to evaluate the material factors applicable to a decision to approve an investment advisory agreement.
Consistent with these responsibilities, the Board of Trustees (the “Board”) called and held a meeting on September 28, 2007, in part, for the purpose of considering whether to approve the investment advisory agreements between Laudus Trust (the “Trust”) and Charles Schwab Investment Management, Inc. (“CSIM”), and the sub-advisory agreements between CSIM and Mondrian Investment Partners Limited (“Mondrian”) (such investment advisory and sub-advisory agreement, collectively, the “Agreements”) with respect to Laudus Mondrian Emerging Markets Fund and Laudus Mondrian International Fixed Income Fund. In preparation for the meeting, the Board requested and reviewed a variety of materials provided by CSIM and Mondrian with respect to the services to be provided to the funds under the Agreements, including information about their affiliates, personnel and operations. In recognition of the fact that the funds had not yet commenced operations, the Board also considered information provided by CSIM in connection with the Board’s consideration of approval or renewal of the investment advisory agreements with respect to the other funds within the Trust. The Board also took into account the detailed information about other funds within the Trust that the Board reviews during the course of the year, including information that relates to operations and performance of these other funds. The trustees also received a memorandum from fund counsel regarding the responsibilities of trustees for the approval of investment advisory contracts. In addition, the Independent Trustees received advice from independent counsel to the Independent Trustees, met in executive session outside the presence of fund management and participated in question and answer sessions with representatives of CSIM and Mondrian, as appropriate.
The Board, including a majority of the Independent Trustees approved the Agreements with respect to the funds for a two year term. The Board’s approval of the Agreements was based on consideration and evaluation of a variety of specific factors discussed at the meeting, and at prior meetings, including:
| |
| 1. | the nature, extent and quality of the services to be provided to the funds under the Agreements, including the resources of CSIM and its affiliates and Mondrian, dedicated to the funds; |
| |
| 2. | Mondrian’s investment performance in managing other funds and/or accounts having relevant investment objectives and strategies; |
| |
| 3. | the funds’ estimated expenses and how those expenses compared to those of certain other comparable mutual funds; |
| |
| 4. | the profitability of CSIM and its affiliates, including Charles Schwab & Co., Inc. (“Schwab”), with respect to other funds, including both direct and indirect benefits accruing to CSIM and its affiliates, as well as the profitability of Mondrian; and |
| |
| 5. | the extent to which economies of scale may be realized as the funds grow, and whether fee levels in the Agreements relating to the funds reflect those economies of scale for the benefit of fund investors. |
Nature, Extent and Quality of Services. The Board considered the nature, extent and quality of the services to be provided by CSIM to the funds and the resources of CSIM and its affiliates will dedicate to the funds. In this regard, the trustees evaluated, among other things, CSIM’s personnel, experience, track record and compliance program. The trustees have also considered Schwab’s excellent reputation in connection with the OneSource mutual fund offering and its overall financial condition, and how this affects the success of such funds. The Board has also considered the nature, extent and quality of the sub-advisory services provided by Mondrian to such funds and the resources it dedicates to such funds. Following such evaluation, the Board concluded, within the context of its full deliberations, that the nature, extent and quality of services provided by CSIM and Mondrian to the funds and the resources of CSIM and its affiliates dedicated to the funds supported approval of the Agreements with respect to the funds.
Fund Performance. With regard to fund performance, since the funds had not commenced operations and therefore did
35
not have any performance of their own, the Board considered performance of other funds and/or accounts having comparable investment objectives and strategies in determining whether to approve the Agreements. For example, the Board considered Mondrian’s performance in managing other similar funds and/or accounts. The trustees also considered both risk and shareholder risk expectations for the funds and the appropriateness of the benchmark that would be used to compare the performance of the funds. Following such evaluation, the Board concluded, within the context of its full deliberations, that the performance of CSIM and Mondrian supported approval of the Agreements with respect to the funds.
Fund Expenses. With respect to the funds’ expenses, the trustees considered the rate of compensation with respect to the funds called for by the Agreements, and the funds’ net operating expense ratio in comparison to those of other comparable mutual funds. The trustees also considered information about average expense ratios of comparable mutual funds in the funds’ expected peer group. Finally, the trustees considered the effects of CSIM’s waiver of management fees to prevent total fund expenses from exceeding a specified cap. Following such evaluation, the Board concluded, within the context of its full deliberations, that the expenses of the funds are reasonable and supported approval of the Agreements with respect to the funds.
Profitability. With regard to profitability, the trustees considered the compensation flowing to CSIM and its affiliates, directly or indirectly. In this connection, the trustees considered information that was previously provided by CSIM with respect to other funds it manages regarding profitability and how this information might reasonably be expected to be predictive of profitability to CSIM under the Agreements with respect to the funds. The trustees also considered any other benefits derived by CSIM from its relationship with the funds, such as whether, by virtue of its management of the funds, CSIM obtains investment information or other research resources that aid it in providing advisory services to other clients. With respect to CSIM and Mondrian, and their respective affiliates, the trustees considered whether the varied levels of compensation and profitability under the Agreements and other service agreements were reasonable and justified in light of the quality of all services rendered to each fund. The Board also considered the profitability of Mondrian with respect to the sub-advisory services it provides to the funds, although it also considered that Mondrian is compensated by CSIM, and not by such funds directly, and such compensation reflects arms-length negotiation between the parties. Based on this evaluation, the Board concluded, within the context of its full deliberations, that the expected profitability of CSIM and Mondrian, albeit uncertain, is reasonable and supported approval of the Agreements with respect to the funds.
Economies of Scale. Recognizing that the funds had not yet commenced operations and had no assets, the trustees considered the possible development of any economies of scale and whether those could be expected to be passed along to the funds’ shareholders through a graduated investment advisory fee schedule or other means, including any fee waivers by CSIM and its affiliates. In this regard, and consistent with their consideration of fund expenses, the trustees considered that CSIM has committed resources to minimize the effects on shareholders of diseconomies of scale during periods when fund assets are relatively small through their contractual expense waivers that may only be amended or terminated with the approval of the Board. For example, such diseconomies of scale typically affect new funds, but shareholders may benefit from the continued availability of such funds at subsidized expense levels. The trustees also considered CSIM’s agreement to contractual investment advisory fee schedules that includes lower fees at higher graduated asset levels. Based on this evaluation, and in consideration of the commitments made by CSIM as discussed above, the Board concluded, within the context of its full deliberations, that the funds may be expected to obtain reasonable benefit from economies of scale if such economies develop.
In the course of their deliberations, the trustees did not identify any particular information or factor that was all-important or controlling. Based on the trustees’ deliberation and their evaluation of the information described above, the Board, including all of the Independent Trustees, unanimously approved the Agreements as they relate to the funds and concluded that the compensation with respect to the funds under the Agreements is fair and reasonable in light of such services and expenses and such other matters as the trustees have considered to be relevant in the exercise of their reasonable judgment.
36
Trustees and Officers
The tables below provide information about the trustees and officers for the Laudus Trust, which includes the funds covered in this report. The “Fund Complex” includes The Charles Schwab Family of Funds, Schwab Investments, Schwab Capital Trust, Schwab Annuity Portfolios, Laudus Trust, and Laudus Institutional Trust. As of March 31, 2008, the Fund Complex included 79 funds.
At a meeting of the Board held on September 28-29, 2006, the Trustees voted to adopt a retirement policy for all independent trustees that requires an independent trustee to retire no later than December 31st of the year in which he or she reaches age seventy-two.
The address for all trustees and officers is 101 Montgomery Street, San Francisco, CA 94104. You can find more information about the trustees and officers in the Statement of Additional Information, which is available free by calling 1-866-452-8387.
| | | | | | | | | |
| Independent Trustees |
Name, Address1
| | | | | | |
and Year of Birth;
| | | | Number of
| | |
(Term of Office
| | | | Portfolios in
| | |
and Length of
| | Principal Occupation(s)
| | Fund Complex
| | Other Directorships
|
| Time Served2) | | During Past Five Years | | Overseen | | Held by Trustee |
|
| |
Mariann Byerwalter3
1960
(1/04-present) | | Chairman of JDN Corporate Advisory LLC. | | | 79 | | | Board 1—Director, Redwood Trust, Inc. (mortgage finance).
Board 2—Director, PMI Group, Inc. (mortgage insurance). |
| |
|
William A. Hasler3
1941
(1/04-present) | | Retired. Dean Emeritus of the Haas School of Business at the University of California, Berkeley. Until February 2004, Co-Chief Executive Officer, Aphton Corporation (bio-pharmaceuticals). | | | 79 | | | Board 1—Director, Mission West Properties (commercial real estate).
Board 2—Director, TOUSA (home building).
Board 3—Director, Harris-Stratex Networks (a network equipment corporation).
Board 4—Director, Genitope Corp. (bio-pharmaceuticals).
Board 5—Director, Ditech Networks (voice communications technology)
Board 6—Rubicon Limited (manufacturing) |
| |
|
Nils H. Hakansson3
1937
(3/90-present) | | Sylvan C. Coleman Professor of Finance and Accounting, Emeritus, Haas School of Business, University of California, Berkeley (since 2003). Mr. Hakansson was also a Professor of Finance and Accounting, Haas School of Business, University of California, Berkeley (July 1969 to January 2003). | | | 11 | | | None |
| |
|
37
| | | | | | | | | |
| Interested Trustees |
Name, Address1
| | | | | | |
and Year of Birth;
| | | | Number of
| | |
(Term of Office
| | | | Portfolios in
| | |
and Length of
| | Principal Occupation(s)
| | Fund Complex
| | Other Directorships
|
| Time Served2) | | During Past Five Years | | Overseen | | Held by Trustee |
|
| |
Randall W. Merk
1954
(6/06-present) | | Executive Vice President and President, Investment Management Services, Charles Schwab & Co., Inc.; Executive Vice President, Charles Schwab & Co., Inc. (2002-present); President and Chief Executive Officer, Charles Schwab Investment Management, Inc. (2007-present); Director, Charles Schwab Asset Management (Ireland) Limited and Charles Schwab Worldwide Funds PLC. From September 2002 to July 2004, Chief Executive Officer and President, Charles Schwab Investment Management, Inc. and Executive Vice President, Charles Schwab & Co., Inc. | | | 11 | | | None |
| |
|
| |
| 1 | The mailing address of each of the Trustees is c/o Laudus Trust, 101 Montgomery Street, San Francisco, CA 94104. |
| |
| 2 | Each Trustee shall hold office until the election and qualification of his or her successor, or until he or she dies, resigns or is removed. |
| |
| 3 | Member of the Audit Committee. |
38
| | | | | |
| Officers |
Name, Address4
| | | | |
and Year of Birth;
| | | | |
(Term of Office5
| | | | |
and Length of
| | | | |
| Time Served) | | Position with the Trust | | Principal Occupation During Past Five Years |
|
| |
Jeffrey Mortimer
1963
(3/08-present,
President and CEO)
(6/04-present, CIO) | | President, Chief Executive Officer, and Chief Investment Officer | | Senior Vice President and Chief Investment Officer—Equities, Charles Schwab Investment Management, Inc., and Schwab Funds. Prior to May 2004, Vice President and Sr. Portfolio Manager, Charles Schwab Investment Management, Inc. |
| |
|
George Pereira
1964
(6/06-present) | | Treasurer and Chief Financial Officer | | Senior Vice President and Chief Financial Officer, Charles Schwab Investment Management, Inc.; Treasurer and Principal Financial Officer, Schwab Funds; Director, Charles Schwab Worldwide Funds, PLC and Charles Schwab Asset Management (Ireland) Ltd. Through June 2007, Chief Financial Officer, Mutual Fund Division, UST Advisers, Inc., and Treasurer, Chief Financial Officer and Chief Accounting Officer, Excelsior Funds, Inc., Excelsior Tax-Exempt Funds, Inc., and Excelsior Trust Inc.; From 12/99 to 11/04: Senior Vice President, Financial Reporting, Charles Schwab & Co., Inc. |
| |
|
Catherine MacGregor
1964
(12/05-present) | | Chief Legal Officer, Vice President and Clerk | | Vice President, Charles Schwab & Co., Inc. and Charles Schwab Investment Management, Inc.; Vice President, Schwab Funds; until July 2005, Senior Associate, Paul Hastings Janofsky & Walker LLP. |
| |
|
Randall Fillmore
1960
(9/04-present) | | Chief Compliance Officer | | Senior Vice President, Chief Compliance Officer, Charles Schwab Investment Management, Inc.; Senior Vice President, Charles Schwab & Co., Inc.; Chief Compliance Officer, Schwab Funds. From June 2006 to June 2007, Chief Compliance Officer, Excelsior Funds. From 2002 to 2003, Vice President, Charles Schwab & Co., Inc. and Charles Schwab Investment Management, Inc. From 2000 to 2002, Vice President, Internal Audit, Charles Schwab & Co., Inc. |
| |
|
Daniel Kern
1961
(3/05-present) | | Vice President | | Vice President, Investment Management Services. Until September 2005, Assistant Treasurer, Laudus Trust and Laudus Variable Insurance Trust. Until December 2004, Vice President, Internal Audit, Charles Schwab Corporation. |
| |
|
Michael Haydel
1972
(6/05-present) | | Vice President | | Vice President, Asset Management Client Services, Charles Schwab & Co., Inc. Until March 2004, Director, Charles Schwab & Co., Inc. |
| |
|
Cathy Sabo
1964
(12/05-present) | | Vice President | | Vice President, Compliance, Charles Schwab Investment, Management, Inc.; Vice President, Schwab Funds; until September 2004, Vice President, Client, Sales & Services Controls, Charles Schwab & Co., Inc. |
| |
|
| |
| 4 | The mailing address of each of the officers is c/o Laudus Trust, 101 Montgomery Street, San Francisco, CA 94104. |
| |
| 5 | There is no stated term of office for the officers of the Trust. |
39
Definitions, Terms and Other Information
90 Day T-bill is a short-term discounted, government debt instrument of 90 days or less, issued in $10,000 denominations that pay its face value at maturity. The government issues Treasury bills weekly.
Alpha is a measure of a fund’s risk-adjusted return. Alpha can be used to directly measure the value added or subtracted by a fund’s manager. It is calculated by measuring the difference between a fund’s actual returns and its expected performance given its level of market risk as measured by beta.
Beta is a measure of the volatility of a stock relative to the overall market. A beta of less than one indicates lower historical risk than the market; a beta of more than one indicates higher historical risk than the market.
GDP, or Gross Domestic Product, is the market value of the goods and services produced by labor and property in the United States.
Modified Duration expresses the measurable change in the value of a security in response to a change in interest rates. The formula calculates the effect that a 1% change in interest rates will have on the price of a bond.
The MSCI Emerging Markets Index (Net) is a free float-adjusted market capitalization index that is designed to measure equity market performance in the global emerging markets. This series approximates the minimum possible dividend reinvestment.
The S&P/Citigroup Global ex US Broad Market Index (BMI) $2-$10 Billion Cap Range is an absolute size benchmark that divides the investable region into capitalization bands of between $2 billion and $10 billion. It is a subset of the Broad Market Index (BMI), which includes companies in approximately 52 developed and emerging markets with more than $100 million of free float capitalization.
The S&P/Citigroup World ex US Extended Market Index (EMI) is a float-adjusted index which measures the performance of small companies (approximately the bottom 20% by market capitalization) in 25 developed equity markets.
The Standard & Poor’s 500® (S&P 500) Index is an unmanaged index measuring large-cap U.S. stock market performance, and includes a representative sample of leading companies in leading industries.
The Russell 1000® Index measures the performance of the 1,000 largest companies in the Russell 3000® Index, and represents approximately 92% of the total market capitalization of the Russell 3000® Index.
The Russell 1000® Growth Index measures the performance of those Russell 1000 companies with higher price-to-book ratios and higher forecasted growth values.
The Russell 1000® Value Index measures the performance of those Russell 1000 companies with lower valuation ratios such as price-to-book and price-to-earnings ratios.
The Russell 2000® Index measures the performance of the 2,000 smallest companies in the Russell 3000® Index, and represents approximately 8% of the total market capitalization of the Russell 3000® Index.
The Russell 2500tm Index measures the performance of the 2,500 smallest companies in the Russell 3000® Index, and represents approximately 16% of the total market capitalization of the Russell 3000® Index.
The Russell 3000® Growth Index measures the performance of those Russell 3000 Index companies with higher price-to-book ratios and higher forecasted growth values. The stocks in this index are also members of either the Russell 1000 Growth or the Russell 2000 Growth indexes.
The Russell 3000® Value Index measures the performance of those Russell 3000 Index companies with lower price-to-book ratios and lower forecasted growth values. The stocks in this index are also members of either the Russell 1000 Value or the Russell 2000 Value indexes.
Price to earnings ratio is the price of a stock divided by its historical earnings per share.
Price to book ratio compares the stock’s market value to the value of the total assets less the total liabilities.
Price to cash flow ratio is the price of a stock dividend by its reported cash flow per share.
Relative strength is the rate that a stock falls relative to other stocks in a falling market or rises relative to other stocks in a rising market.
Return on equity represents the amount earned on a company’s common stock investment for a given period, calculated by dividing common stock equity into net income for the period after preferred stock dividends but before common stock dividends.
Trading Activity is one of several risk factors commonly used to attribute a portfolio’s return relative to its benchmark. Specifically, trading activity measures a stock’s trailing 12 month trading volume relative to its total shares outstanding. It measures how actively traded a stock has been in the last 12 months.
Proxy Voting
A description of the policies and procedures that the Fund uses to determine how to vote proxies relating to portfolio securities is available without charge, upon request by visiting www.laudus.com, the Securities and Exchange Commission’s website at www.sec.gov, or by contacting Laudus Funds at 866.452.8387.
Information regarding how the Fund voted proxies relating to portfolio securities during the most recent 12-month period ended June 30 is available without charge, upon request by visiting www.laudus.com, or the Securities and Exchange Commission’s website at www.sec.gov.
Quarterly Disclosure of Portfolio Holdings
The Fund files its complete schedule of portfolio holdings with the SEC for the first and third quarters of each fiscal year on Form N-Q. The Fund’s Forms N-Q are available on the SEC’s website at www.sec.gov and may be reviewed and copied at the SEC’s Public Reference Room in Washington, DC. Call 1-800-SEC-0330 for information on the operation of the Public Reference Room. The information filed on a fund’s most recent Form N-Q is also available at www.laudus.com.
40
(This page intentionally left blank)
For More Information about the Funds:
Investment Adviser
Charles Schwab Investment Management, Inc.
101 Montgomery Street, San Francisco, CA 94104
Funds
Laudus Mondrian Funds
P.O. Box 3812, Englewood, CO 80155–3812
This report is not authorized for distribution to prospective investors unless preceded or accompanied by a current prospectus.
Item 2: Code of Ethics.
| | | |
| (a) | | Registrant has adopted a code of ethics that applies to its principal executive officer, principal financial officer, and any other persons who perform a similar function, regardless of whether these individuals are employed by Registrant or a third party. |
| | | |
| (c) | | During the period covered by the report, no amendments were made to the provisions of this code of ethics. |
| | | |
| (d) | | During the period covered by the report, Registrant did not grant any waivers, including implicit waivers, from the provisions of this code of ethics. |
| | | |
| (f)(1) | | Registrant has filed this code of ethics as an exhibit pursuant to Item 11(a)(1) of Form N-CSR. |
Item 3: Audit Committee Financial Expert.
(a) (1) Disclose that the registrant’s board of directors has determined that the registrant either:
(i) Has at least one audit committee financial expert serving on its audit committee; or
(ii) Does not have an audit committee financial expert serving on its audit committee.
(2) If the registrant provides the disclosure required by paragraph (a)(1)(i) of this Item, it must disclose the name of the audit committee financial expert and whether that person is “independent.” In order to be considered “independent” for purposes of this Item, a member of an audit committee may not, other than in his or her capacity as a member of the audit committee, the board of directors, or any other board committee:
(i) Accept directly or indirectly any consulting, advisory, or other compensatory fee from the issuer; or
(ii) Be an “interested person” of the investment company as defined in Section 2(a)(19) of the Act (15 U.S.C. 80a-2(a)(19)).
(3) If the registrant provides the disclosure required by paragraph (a)(1)(ii) of this Item, it must explain why it does not have an audit committee financial expert.
3(a)(1) THE REGISTRANT’S BOARD OF DIRECTORS HAS DETERMINED THAT THE REGISTRANT HAS AT LEAST ONE AUDIT COMMITTEE FINANCIAL EXPERT SERVING ON ITS AUDIT COMMITTEE.
3(a)(2) THE AUDIT COMMITTEE FINANCIAL EXPERT IS NILS H. HAKANSSON, WHO IS “INDEPENDENT” FOR PURPOSES OF THIS ITEM 3 OF FORM N-CSR.
Item 4: Principal Accountant Fees and Services.
(a) Below are the aggregate fees billed for each of the last two fiscal years for professional services rendered by the principal accountant for the audit of Registrant’s annual financial statements or services that are normally provided by the accountant in connection with statutory and regulatory filings or engagements.
Audit Fees
2008: $283,520 2007: $294,785
(b) Below are the aggregate fees billed in each of the last two fiscal years for assurance and related services by the principal accountant that are reasonably related to the performance of the audit of Registrant’s financial statements and are not reported under paragraph (a) above.
Audit-Related Fees
For services rendered to Registrant:
2007: $43,205 2007: NONE
Nature of these services: Agreed upon services in regards to service provider conversion.
In each of the last two fiscal years there were no “Audit-Related Fees” required to be approved pursuant to paragraph (c)(7)(ii) of Rule 2-01 of Regulation S-X.
(c) Below are the aggregate fees billed in each of the last two fiscal years for professional services rendered by the principal accountant for tax compliance, tax advice, and tax planning.
Tax Fees
For services rendered to Registrant:
2008: $86,410 2007: $82,845
Nature of these services: preparation and review of tax returns.
In each of the last two fiscal years there were no “Tax Fees” required to be approved pursuant to paragraph (c)(7)(ii) of Rule 2-01 of Regulation S-X.
(d) Below are the aggregate fees billed in each of the last two fiscal years for products and services provided by the principal accountant, other than the services reported in paragraphs (a) through (c) above.
All Other Fees
For services rendered to Registrant:
2008: NONE 2007: $20,000
| | |
| Nature of these services: | | non-audit services related to the requirements of Section 15(c) of the Investment Company Act of 1940, such as evaluation of the Profitability Analysis System. |
In each of the last two fiscal years there were no “All Other Fees” required to be approved pursuant to paragraph (c)(7)(ii) of Rule 2-01 of Regulation S-X.
(e)(1) Registrant’s audit committee does not have pre-approval policies and procedures as described in paragraph (c)(7) of Rule 2-01 of Regulation S-X.
(2) There were no services described in each of paragraphs (b) through (d) above (including services required to be approved by Registrant’s audit committee pursuant to paragraph (c)(7)(ii) of Rule 2-01 of Regulation S-X) that were approved by Registrant’s audit committee pursuant to paragraph (c)(7)(i)(C) of Rule 2-01 of Regulation S-X.
(f) Not applicable.
(g) Below are the aggregate non-audit fees billed in each of the last two fiscal years by Registrant’s principal accountant for services rendered to Registrant, to Registrant’s investment adviser, and to any entity controlling, controlled by, or under common control with Registrant’s investment adviser that provides ongoing services to Registrant.
2008: $175,918 2007: $169,975
Although not required to be included in the amounts disclosed under this paragraph (g) or any other paragraph of this Item 4, below are the aggregate fees billed in each of the last two fiscal years by Registrant’s principal accountant for tax compliance services rendered to U.S. Trust, an entity under common control with Registrant’s investment adviser that does not provide services to Registrant.
2008: $1,014,998 2007: $4,221,564
(h) During the past fiscal year, all non-audit services provided by Registrant’s principal accountant to either Registrant’s investment adviser or to any entity controlling, controlled by, or under common control with Registrant’s investment adviser that provides ongoing services to Registrant were pre-approved. Included in the audit committee’s pre-approval was the review and consideration as to whether the provision of these non-audit services is compatible with maintaining the principal accountant’s independence.
Item 5: Audit Committee of Listed Registrants.
Not applicable.
Item 6: Schedule of Investments.
The schedules of investments are included as part of the report to shareholders filed under Item 1 of this Form.
Item 7: Disclosure of Proxy Voting Policies and Procedures for Closed-End Management Investment Companies.
Not applicable.
Item 8: Portfolio Managers of Closed-End Management Investment Companies.
Not applicable.
Item 9: Purchases of Equity Securities by Closed-End Management Investment Company and Affiliated Purchasers.
Not applicable.
Item 10: Submission of Matters to a Vote of Security Holders.
Not applicable.
Item 11: Controls and Procedures.
(a) Based on their evaluation of Registrant’s disclosure controls and procedures, as of a date within 90 days of the filing date, Registrant’s Chief Executive Officer, Evelyn Dilsaver and Registrant’s Principal Financial Officer, George Pereira, have concluded that Registrant’s disclosure controls and procedures are: (i) reasonably designed to ensure that information required to be disclosed in this report is appropriately communicated to Registrant’s officers to allow timely decisions regarding disclosures required in this
report; (ii) reasonably designed to ensure that information required to be disclosed in this report is recorded, processed, summarized and reported in a timely manner; and (iii) are effective in achieving the goals described in (i) and (ii) above.
| (b) | | During the second fiscal quarter of the period covered by this report, there have been no changes in Registrant’s internal control over financial reporting that the above officers believe to have materially affected, or to be reasonably likely to materially affect, Registrant’s internal control over financial reporting. |
Item 12: Exhibits.
| (a) | (1) | | Registrant’s code of ethics (that is the subject of the disclosure required by Item 2(a)) is attached. |
| |
| | (2) | | Separate certifications for Registrant’s principal executive officer and principal financial officer, as required by Rule 30a-2(a) under the 1940 Act, are attached. |
| |
| | (3) | | Not applicable. |
| (b) | | A certification for Registrant’s principal executive officer and principal financial officer, as required by Rule 30a-2(b) under the 1940 Act, is attached. This certification is being furnished to the Securities and Exchange Commission solely pursuant to 18 U.S.C. section 1350 and is not being filed as part of the Form N-CSR with the Commission. |
Pursuant to the requirements of the Securities Exchange Act of 1934 and the Investment Company Act of 1940, the registrant has duly caused this report to be signed on its behalf by the undersigned, thereunto duly authorized.
(Registrant) The Laudus Trust
| | | | | |
| By: | | /s/ Randall W. Merk | | |
| | | | | |
| | | Randall W. Merk | | |
| | | President and Chief Executive Officer | | |
| | | | | |
| Date: | | 5/14/08 | | |
Pursuant to the requirements of the Securities Exchange Act of 1934 and the Investment Company Act of 1940, this report has been signed below by the following persons on behalf of the registrant and in the capacities and on the dates indicated.
| | | | | |
| By: | | /s/ Randall W. Merk | | |
| | | | | |
| | | Randall W. Merk | | |
| | | President and Chief Executive Officer | | |
| | | | | |
| Date: | | 5/14/08 | | |
| | | | | |
| By: | | /s/ George Pereira | | |
| | | | | |
| | | George Pereira | | |
| | | Principal Financial Officer | | |
| | | | | |
| Date: | | 5/14/08 | | |