UNITED STATES
SECURITIES AND EXCHANGE COMMISSION
Washington, D.C. 20549
FORM N-CSRS
CERTIFIED SHAREHOLDER REPORT OF REGISTERED
MANAGEMENT INVESTMENT COMPANIES
Investment Company Act file number: 811-05547
Laudus Trust
(Exact name of registrant as specified in charter)
211 Main Street, San Francisco, California 94105
(Address of principal executive offices) (Zip code)
Marie Chandoha
211 Main Street, San Francisco, California 94105
(Name and address of agent for service)
Registrant’s telephone number, including area code: (415) 636-7000
Date of fiscal year end: March 31
Date of reporting period: September 30, 2017
Item 1: Report(s) to Shareholders.
Semiannual Report | September 30, 2017
Laudus Mondrian Funds™
Laudus Mondrian International Equity Fund
Laudus Mondrian Emerging Markets Fund
Laudus Mondrian International Government Fixed Income Fund
Adviser
Charles Schwab Investment Management, Inc.
Subadviser
Mondrian Investment Partners Limited
This page is intentionally left blank.
Fund investment adviser: Charles Schwab Investment Management, Inc. (CSIM).
Distributor: ALPS Distributors, Inc.
The industry/sector classification of certain funds’ portfolio holdings uses the Global Industry Classification Standard (GICS) which was developed by and is the exclusive property of MSCI Inc. (MSCI) and Standard & Poor’s (S&P). GICS is a service mark of MSCI and S&P and has been licensed for use by CSIM and certain affiliates. Charles Schwab & Co, Inc. and ALPS Distributors, Inc. are unaffiliated entities.
Laudus Mondrian Funds | Semiannual Report
The performance data quoted represents past performance. Past performance does not guarantee future results. Investment returns and principal value of an investment will fluctuate so that an investor’s shares may be worth more or less than their original cost. Current performance may be lower or higher than performance data quoted. To obtain performance information current to the most recent month end, please visit www.schwabfunds.com/laudusfunds_prospectus.
| Total Return for the 6 Months Ended September 30, 2017 |
| Laudus Mondrian International Equity Fund1,2 (Ticker Symbol: LIEIX) | 8.99% |
| MSCI EAFE Index® (Net)3 | 11.86% |
| MSCI EAFE® Value Index (Net)3 | 10.93% |
| Performance Details | pages 6-7 |
| |
| Laudus Mondrian Emerging Markets Fund1,2 (Ticker Symbol: LEMNX) | 7.91% |
| MSCI Emerging Markets Index (Net)3 | 14.66% |
| Performance Details | pages 8-9 |
| |
| Laudus Mondrian International Government Fixed Income Fund (Ticker Symbol: LIFNX) | 6.44% |
| Citigroup Non-U.S. Dollar World Government Bond Index | 6.48% |
| Performance Details | pages 10-11 |
| |
| Minimum Initial Investment4 | $ 100 |
All fund and index figures on this page assume dividends and distributions were reinvested. Index figures do not include trading and management costs, which would lower performance. Indices are unmanaged and cannot be invested in directly. Performance results less than one year are not annualized.
The first index listed for each fund is the fund’s primary benchmark, as shown in the prospectus. Additional indices shown are provided for comparative purposes.
For index definitions, please see the Glossary.
Fund expenses may have been partially absorbed by CSIM. Without these reductions, the funds’ returns would have been lower. These returns do not reflect the deduction of taxes that a shareholder would pay on fund distributions or the redemption of fund shares.
There are risks associated with investing in securities of foreign issuers, such as erratic market conditions, economic and political instability, fluctuations in currency and exchange rates, and an increased risk of price volatility associated with less uniformity in accounting and reporting requirements. Investing in emerging markets accentuates these risks. Investments in emerging markets may be more likely to experience political turmoil or rapid changes in market or economic conditions than more developed countries.
Bond funds are subject to increased risk of loss of principal during periods of volatile interest rates. When interest rates rise, bond prices fall which may impact the value of a bond fund’s shares.
| 1 | The fund’s performance relative to the indices may be affected by fair-value pricing, see financial note 2 for more information. |
| 2 | On July 25, 2017, the Investor Share class, Select Share class and Institutional Share class of the fund were combined into a single class of shares of the fund. The performance and financial history of the fund is that of the fund’s former Institutional Shares. Accordingly, the past performance shown is that of the fund’s former Institutional Shares. |
| 3 | The net version of the index reflects reinvested dividends net of withholding taxes, but reflects no deductions for expenses or other taxes. |
| 4 | Please see prospectus for further detail and eligibility requirements. There is no minimum initial investment for Laudus Mondrian International Equity Fund and Laudus Mondrian Emerging Markets Fund. |
Laudus Mondrian Funds | Semiannual Report
Marie Chandoha
President and CEO of
Charles Schwab Investment
Management, Inc. and the
funds covered in this report.
Dear Shareholder,
At Charles Schwab Investment Management, we understand that every investor thinks about risk differently. That’s why we seek to provide a set of products that suit a range of risk appetites, whether we manage the products directly or not.
We partnered with Mondrian Investment Partners Limited, the funds’ subadviser, to help meet the needs of investors who want to diversify their portfolios with investments in international markets. International markets offer an array of growth opportunities for investors, and these opportunities may lead to outperformance compared to U.S.-focused assets.
But investing in international stocks and bonds also entails a different set of risks than those faced by investors in U.S.-focused securities. As recent years have shown, these risks can and often do include geopolitical instability, regime change, currency fluctuations, changes in local laws and regulations, and even military conflict. Mondrian rigorously addresses these risks, using a discounted cash flow-based process that generally tends to cause the funds’ portfolios to underweight more volatile stocks.
The teams that manage the Laudus Mondrian Funds seek to capture the growth potential that international markets offer, but not at the expense of downside protection. They seek to provide this protection by searching for compelling values in the markets in which they invest. For the fixed income fund, Mondrian seeks to provide the U.S. investor with a high prospective “real” (inflation-adjusted) yield (PRY), and uses this approach as the main tool for finding value in bond markets. For the equity funds, Mondrian applies a proprietary discount methodology in seeking to unearth discounts not only in individual securities, but also in the regional markets where Mondrian is focused.
This value-oriented approach has historically helped limit the downside when those markets come under pressure, but it can also generate relative underperformance when security prices are broadly rising. This relative underperformance was evident in the six-month period ended September 30, 2017. International stocks generated an extremely strong performance during the period, led by emerging markets. The MSCI EAFE® Index and the MSCI Emerging Markets Index generated gains of 11.9% and 14.7%, respectively. By comparison, the Laudus Mondrian International Equity Fund returned 9.0%, and the Laudus Mondrian Emerging Markets Fund returned 7.9%. Though the two equity funds underperformed their benchmarks, they still generated
Laudus Mondrian Funds | Semiannual Report
From the President (continued)
“ The teams that manage the Laudus Mondrian Funds seek to capture the growth potential that international markets offer, but not at the expense of downside protection.”
positive absolute returns for their shareholders. Meanwhile, the 6.4% return of the bond fund, the Laudus Mondrian International Government Fixed Income Fund, was in line with its benchmark.
Thank you for investing with Charles Schwab Investment Management, and for trusting us to help you achieve your financial goals. For more information about the Laudus Mondrian Funds, please continue reading this report. In addition, you can find further details about these funds by visiting our website at www.schwabfunds.com. We are also happy to hear from you at 1-877-824-5615.
Sincerely,
All total returns assume dividends and distributions were reinvested. Index figures do not include trading and management costs, which would lower performance. Indices are unmanaged and you cannot invest in them directly. Performance results less than one year are not annualized. Remember that past performance is not a guarantee of future results.
Management views may have changes since the report date.
Charles Schwab Investment Management, Inc., Mondrian Investment Partners Limited, and ALPs Distributors, Inc. are unaffiliated entities.
Laudus Mondrian Funds | Semiannual Report
The Investment Environment
Over the six-month reporting period ended September 30, 2017, both global equity and fixed income markets generated positive returns. Generally accommodative monetary policies supported a positive global economic outlook, as did the stabilization of commodity prices. Escalating tensions in North Korea and elections in Europe, including in France, Germany, and the Netherlands, contributed to some spikes in volatility over the reporting period, though overall market volatility remained subdued. Throughout the reporting period, low inflation in Japan and the eurozone continued to contribute to historically low yields on many international government-backed securities. Meanwhile, the U.S. dollar generally depreciated against a basket of international currencies, enhancing returns on overseas investments in U.S. dollar terms and providing a tailwind to emerging market stocks, in particular. In this environment, the MSCI EAFE Index (Net), a broad measure of developed international equity performance, returned 11.86% for the six-month reporting period, while the MSCI Emerging Markets Index (Net) returned 14.66%. In global fixed income securities, the Citigroup Non-U.S. Dollar World Government Bond Index returned 6.48% over the same period.
Global economic growth improved over the six-month reporting period, with the world’s major economies growing together for the first time in 10 years.1 In the U.S., a tight labor market and increased consumer spending contributed to a 3% rise in second quarter gross domestic product (GDP), a broad measure of goods produced and services provided. Political risks and concerns diminished in the eurozone, and the region’s recovery accelerated over the reporting period, hitting an annualized pace of 2.3% in the second quarter of 2017. However, while the United Kingdom (U.K.) economy initially performed better than expected in the year following the Brexit referendum, U.K. economic growth showed signs of slowing toward the end of the reporting period. In Asia, strong corporate profits and solid imports and exports contributed to a more positive outlook in Japan, even with a downward revision to second quarter GDP. Chinese economic growth began to stabilize after concerns about decelerating GDP plagued the country last year, and according to the International Monetary Fund, the country has the potential to sustain strong growth over the medium term. U.S. sanctions weighed on Russia’s economy, though steadying oil prices provided some support toward the end of the reporting period. Meanwhile, after contracting every year between 2012 and 2016, Brazil emerged from its worst recession on record in the second quarter of 2017.
During the six-month reporting period, monetary policies remained generally accommodative, though some central banks took steps toward or prepared for more normalized policy environments. In the U.S., the Federal Reserve (Fed) raised the federal funds rate in June to a target range of 1.00% to 1.25%—the fourth short-term interest rate increase since the Fed began tightening policy in December 2015. The Fed also announced it would begin unwinding its $4.5 trillion balance sheet in October 2017 by allowing securities to mature without reinvesting the proceeds. Outside the U.S., the European Central Bank and the Bank of England maintained interest rates at or near historic lows, though both banks signaled that policy normalization was on the horizon. In Asia, the Bank of Japan maintained negative interest rates and continued to utilize yield curve management as a policy tool, while emphasizing that Japan’s policy stance would not change until inflation moved above the 2% target. Meanwhile, the People’s Bank of China continued to implement “prudent and neutral” monetary policy after taking tightening steps in early 2017.
Over the six-month reporting period, the U.S. Treasury yield curve generally flattened. Short-term yields rose in response to the Fed’s interest rate hike in June and peaked toward the end of July, then remained relatively stable through September. Longer-term yields, by comparison, are largely tied to economic growth and inflation expectations, and fell slightly over the reporting period. In this environment, the yield on the benchmark 10-year Treasury note began the reporting period at 2.35% and finished at 2.33%. Meanwhile, bond yields outside the U.S., including the yields on 10-year government bonds in Germany and the U.K., generally rose though remained comparatively low over the reporting period.
Index figures assume dividends and distributions were reinvested. Index figures do not include trading and management costs, which would lower performance. Indices are unmanaged and cannot be invested in directly. Performance results less than one year are not annualized. Past performance is not an indication of future results.
For index definitions, please see the Glossary.
Nothing in this report represents a recommendation of a security by the investment adviser.
Management views may have changed since the report date.
| 1 | As of August 2017, Organization for Economic Cooperation and Development. |
Laudus Mondrian Funds | Semiannual Report
Laudus Mondrian International Equity Fund
Past performance does not guarantee future results. The performance data quoted represents past performance, and current returns may be lower or higher. The performance information does not reflect the deduction of taxes that a shareholder would pay on fund distributions or the redemption of fund shares. The investment return and principal value of an investment will fluctuate so that an investor’s shares, when redeemed, may be worth more or less than the original cost. To obtain performance information current to the most recent month end, visit www.schwabfunds.com/laudusfunds_prospectus.
Average Annual Total Returns1,2
| Fund and Inception Date | 6 Months | 1 Year | 5 Years | Since Inception |
| Laudus Mondrian International Equity Fund (6/16/08) | 8.99% | 15.26% | 8.17% | 1.81% |
| MSCI EAFE Index® (Net)3 | 11.86% | 19.10% | 8.38% | 2.55% |
| MSCI EAFE® Value Index (Net)3 | 10.93% | 22.55% | 7.80% | 2.05% |
| Fund Expense Ratios4: Net 0.90%; Gross 0.96% |
| Fund Characteristics | |
| Number of Companies5 | 37 |
| Weighted Average Market Cap (millions) | $78,749 |
| Price/Earnings Ratio (P/E) | 17.13 |
| Price/Book Ratio (P/B) | 1.50 |
Portfolio Turnover
(One year trailing) | 23% |
| Fund Overview | |
| | Fund |
| Inception Date | 6/16/2008 |
| Ticker Symbol | LIEIX |
| Cusip | 51855Q580 |
| NAV | $6.67 |
All total returns on this page assume dividends and distributions were reinvested. Index figures do not include trading and management costs, which would lower performance. Indices are unmanaged and cannot be invested in directly. Performance results less than one year are not annualized.
The first index listed for the fund is the fund’s primary benchmark, as shown in the prospectus. Additional indices shown are provided for comparative purposes.
For index definitions, please see the Glossary.
Portfolio holdings may have changed since the report date.
| 1 | Fund expenses may have been partially absorbed by CSIM. Without these reductions, the fund’s returns would have been lower. These returns do not reflect the deduction of taxes that a shareholder would pay on fund distributions or the redemption of fund shares. |
| 2 | On July 25, 2017, the Investor Share class, Select Share class and Institutional Share class of the fund were combined into a single class of shares of the fund. The performance and financial history of the fund is that of the fund’s former Institutional Shares. Accordingly, the past performance shown is that of the fund’s former Institutional Shares. |
| 3 | The net version of the index reflects reinvested dividends net of withholding taxes, but reflects no deductions for expenses or other taxes. |
| 4 | As stated in the prospectus. Net Expenses: The adviser has agreed to limit the total annual fund operating expenses (excluding interest, taxes and certain non-routine expenses) of the fund to 0.90% until at least July 30, 2019. Gross Expenses: Reflects the total annual fund operating expenses without the effect of contractual fee waivers. For actual rates during the period, refer to the Financial Highlights section of the Financial Statements. |
| 5 | Short-term investments are not included. |
Laudus Mondrian Funds | Semiannual Report
Laudus Mondrian International Equity Fund
Performance and Fund Facts as of September 30, 2017
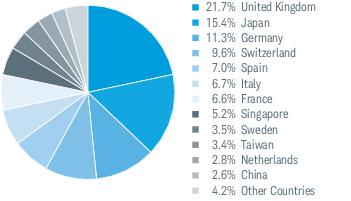
Country Weightings % of Investments1
Sector Weightings % of Equities
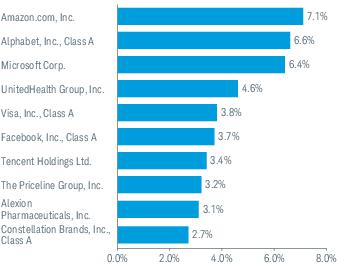
Top Equity Holdings % of Net Assets2
There are risks associated with investing in foreign companies, such as erratic market conditions, economic and political instability, fluctuations in currency and exchange rates, and an increased risk of price volatility associated with less uniformity in accounting and reporting requirements.
Portfolio holdings may have changed since the report date.
| 1 | The percentage may differ from the Portfolio Holdings because the above calculation is based on a percentage of total investments, whereas the calculation in the Portfolio Holdings is based on a percentage of net assets. |
| 2 | This list is not a recommendation of any security by the investment adviser or subadviser. |
Laudus Mondrian Funds | Semiannual Report
Laudus Mondrian Emerging Markets Fund
Past performance does not guarantee future results. The performance data quoted represents past performance, and current returns may be lower or higher. The performance information does not reflect the deduction of taxes that a shareholder would pay on fund distributions or the redemption of fund shares. The investment return and principal value of an investment will fluctuate so that an investor’s shares, when redeemed, may be worth more or less than the original cost. To obtain performance information current to the most recent month end, visit www.schwabfunds.com/laudusfunds_prospectus.
Average Annual Total Returns1,2
| Fund and Inception Date | 6 Months | 1 Year | 5 Years | Since Inception |
| Laudus Mondrian Emerging Markets Fund (11/2/07) | 7.91% | 13.87% | -0.11% | -0.06% |
| MSCI Emerging Markets Index (Net)3 | 14.66% | 22.46% | 3.99% | 0.46% |
| Fund Expense Ratios4: Net 1.20%; Gross 1.22% |
| Fund Characteristics | |
| Number of Companies5 | 56 |
| Weighted Average Market Cap (millions) | $52,821 |
| Price/Earnings Ratio (P/E) | 10.98 |
| Price/Book Ratio (P/B) | 1.28 |
Portfolio Turnover
(One year trailing) | 35% |
| Fund Overview | |
| | Fund |
| Inception Date | 11/2/2007 |
| Ticker Symbol | LEMNX |
| Cusip | 51855Q622 |
| NAV | $8.32 |
All total returns on this page assume dividends and distributions were reinvested. Index figures do not include trading and management costs, which would lower performance. Indices are unmanaged and cannot be invested in directly. Performance results less than one year are not annualized.
For index definitions, please see the Glossary.
Portfolio holdings may have changed since the report date.
| 1 | Fund expenses may have been partially absorbed by CSIM. Without these reductions, the fund’s returns would have been lower. These returns do not reflect the deduction of taxes that a shareholder would pay on fund distributions or the redemption of fund shares. |
| 2 | On July 25, 2017, the Investor Share class, Select Share class and Institutional Share class of the fund were combined into a single class of shares of the fund. The performance and financial history of the fund is that of the fund’s former Institutional Shares. Accordingly, the past performance shown is that of the fund’s former Institutional Shares. |
| 3 | The net version of the index reflects reinvested dividends net of withholding taxes, but reflects no deductions for expenses or other taxes. |
| 4 | As stated in the prospectus. Net Expenses: The adviser has agreed to limit the total annual fund operating expenses (excluding interest, taxes and certain non-routine expenses) of the fund to 1.20% until at least July 30, 2019. Gross Expenses: Reflects the total annual fund operating expenses without the effect of contractual fee waivers. For actual rates during the period, refer to the Financial Highlights section of the Financial Statements. |
| 5 | Short-term investments are not included. |
Laudus Mondrian Funds | Semiannual Report
Laudus Mondrian Emerging Markets Fund
Performance and Fund Facts as of September 30, 2017
Country Weightings % of Investments1
Sector Weightings % of Equities
Top Equity Holdings % of Net Assets2
There are risks associated with investing in foreign companies, such as erratic market conditions, economic and political instability, fluctuations in currency and exchange rates, and an increased risk of price volatility associated with less uniformity in accounting and reporting requirements. Investing in emerging markets accentuates these risks. Investments in emerging markets may be more likely to experience political turmoil or rapid changes in market or economic conditions than more developed countries.
Portfolio holdings may have changed since the report date.
| 1 | The percentage may differ from the Portfolio Holdings because the above calculation is based on a percentage of total investments, whereas the calculation in the Portfolio Holdings is based on a percentage of net assets. |
| 2 | This list is not a recommendation of any security by the investment adviser or subadviser. |
Laudus Mondrian Funds | Semiannual Report
Laudus Mondrian International Government Fixed Income Fund
Past performance does not guarantee future results. The performance data quoted represents past performance, and current returns may be lower or higher. The performance information does not reflect the deduction of taxes that a shareholder would pay on fund distributions or the redemption of fund shares. The investment return and principal value of an investment will fluctuate so that an investor’s shares, when redeemed, may be worth more or less than the original cost. To obtain performance information current to the most recent month end, visit www.schwabfunds.com/laudusfunds_prospectus.
Average Annual Total Returns1,2
| Fund and Inception Date | 6 Months | 1 Year | 5 Years | Since Inception |
| Laudus Mondrian International Government Fixed Income Fund (11/2/07) | 6.44% | -2.63% | -2.24% | 2.35% |
| Citigroup Non-U.S. Dollar World Government Bond Index | 6.48% | -3.14% | -1.07% | 2.45% |
| Fund Expense Ratios3: Net 0.75%; Gross 0.79% |
| Fund Characteristics4 | |
| Number of Issues5 | 48 |
| Weighted Average Maturity6 | 9.3 Yrs |
| Weighted Average Duration6 | 8.1 Yrs |
Portfolio Turnover
(One year trailing) | 71% |
| Fund Overview | |
| | Fund |
| Inception Date | 11/2/2007 |
| Ticker Symbol | LIFNX |
| Cusip | 51855Q655 |
| NAV | $9.92 |
All total returns on this page assume dividends and distributions were reinvested. Index figures do not include trading and management costs, which would lower performance. Indices are unmanaged and cannot be invested in directly. Performance results less than one year are not annualized.
For index definitions, please see the Glossary.
Portfolio holdings may have changed since the report date.
| 1 | Fund expenses may have been partially absorbed by CSIM. Without these reductions, the fund’s returns would have been lower. These returns do not reflect the deduction of taxes that a shareholder would pay on fund distributions or the redemption of fund shares. |
| 2 | On July 27, 2009, the Investor Share class, Select Share class and Institutional Share class of the fund were combined into a single class of shares of the fund. The performance and financial history of the fund is that of the fund’s former Institutional Shares. Accordingly, the past performance shown is that of the fund’s former Institutional Shares. |
| 3 | As stated in the prospectus. Net Expenses: The adviser has agreed to limit the total annual fund operating expenses (excluding interest, taxes and certain non-routine expenses) of the fund to 0.75% until at least July 30, 2019. Gross Expenses: Reflects the total annual fund operating expenses without the effect of contractual fee waivers. For actual rates during the period, refer to the Financial Highlights section of the Financial Statements. |
| 4 | Excludes derivatives. |
| 5 | Short-term investments are not included. |
| 6 | See Glossary for definitions of maturity and duration. |
Laudus Mondrian Funds | Semiannual Report
Laudus Mondrian International Government Fixed Income Fund
Performance and Fund Facts as of September 30, 2017
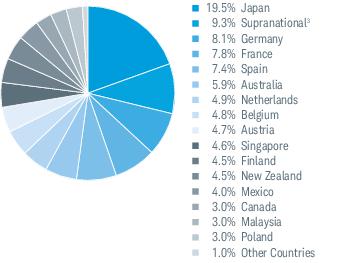
Country Weightings % of Investments1,2
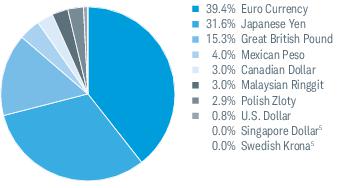
Currency Weightings % of Investments4
Sector Weightings % of Investments6
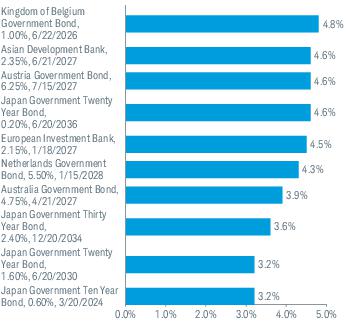
Top Holdings % of Net Assets7
There are risks associated with investing in foreign companies, such as erratic market conditions, economic and political instability, fluctuations in currency and exchange rates, and an increased risk of price volatility associated with less uniformity in accounting and reporting requirements.
Portfolio holdings may have changed since the report date.
| 1 | The percentage may differ from the Portfolio Holdings because the above calculation is based on a percentage of total investments, excluding derivatives, whereas the calculation in the Portfolio Holdings is based on a percentage of net assets. |
| 2 | Country weights may include issues via Samurai bonds issued in Japanese yen by non-Japanese entities and/or Yankee bonds issued in U.S. dollars by non-U.S. entities. |
| 3 | Supranational bonds represent the debt of international organizations or institutions such as the World Bank, the International Monetary Fund, regional multilateral development banks and others. Bonds are issued and held in Japanese yen and euro. |
| 4 | Includes forward foreign currency exchange contracts exposure, which may results in negative exposure to a particular currency. |
| 5 | Amount is less than 0.05% |
| 6 | Excludes derivatives. |
| 7 | This list is not a recommendation of any security by the investment adviser or subadviser. |
Laudus Mondrian Funds | Semiannual Report
Fund Expenses (Unaudited)
Examples for a $1,000 Investment
As a fund shareholder, you may incur two types of costs: (1) transaction costs; and (2) ongoing costs, including management fees, transfer agent and shareholder services fees, and other fund expenses.
The expense examples below are intended to help you understand your ongoing cost (in dollars) of investing in a fund and to compare this cost with the ongoing cost of investing in other mutual funds. These examples are based on an investment of $1,000 invested for the period beginning April 1, 2017 and held through September 30, 2017.
Actual Return lines in the table below provide information about actual account values and actual expenses. You may use this information, together with the amount you invested, to estimate the expenses that you paid over the period. To do so, simply divide your account value by $1,000 (for example, an $8,600 account value ÷ $1,000 = 8.6), then multiply the result by the number given for your fund or share class under the heading entitled “Expenses Paid During Period.”
Hypothetical Return lines in the table below provide information about hypothetical account values and hypothetical expenses based on a fund’s or share class’ actual expense ratio and an assumed return of 5% per year before expenses. Because the return used is not an actual return, it may not be used to estimate the actual ending account value or expenses you paid for the period.
You may use this information to compare the ongoing costs of investing in a fund and other funds. To do so, compare this 5% hypothetical example with the 5% hypothetical examples that appear in the shareholder reports of the other funds.
Please note that the expenses shown in the table are meant to highlight your ongoing costs only, and do not reflect any transactional costs, or any non-routine expenses, such as custody out-of-pocket fee reimbursement. Therefore, the hypothetical return lines of the table are useful in comparing ongoing costs only, and will not help you determine the relative total costs of owning different funds. In addition, if these transactional costs or non-routine expenses were included, your costs would have been higher.
| | Expense Ratio
(Annualized)1 | Beginning
Account Value
at 4/1/17 | Ending
Account Value
(Net of Expenses)
at 9/30/17 | Expenses Paid
During Period
4/1/17-9/30/172 |
| Laudus Mondrian International Equity Fund3 | | | | |
| Actual Return | 0.90% | $1,000.00 | $1,089.90 | $4.72 |
| Hypothetical 5% Return | 0.90% | $1,000.00 | $1,020.59 | $4.56 |
| Laudus Mondrian Emerging Markets Fund | | | | |
| Actual Return | 1.21% | $1,000.00 | $1,079.10 | $6.31 |
| Hypothetical 5% Return | 1.21% | $1,000.00 | $1,019.03 | $6.12 |
| Laudus Mondrian International Government Fixed Income Fund | | | | |
| Actual Return | 0.75% | $1,000.00 | $1,064.40 | $3.88 |
| Hypothetical 5% Return | 0.75% | $1,000.00 | $1,021.34 | $3.80 |
| 1 | Based on the most recent six-month expense ratio; may differ from the expense ratio provided in the Financial Highlights. This ratio does not include certain non-routine expenses, such as custody out-of-pocket fee reimbursement. |
| 2 | Expenses for each fund are equal to its annualized expense ratio, multiplied by the average account value over the period, multiplied by the 183 days of the period, and divided by the 365 days of the fiscal year. |
| 3 | Effective July 25, 2017, the Investor Share class, the Select Share class, and the Institutional share class were combined into a single class of shares of the fund. The actual return and hypothetical 5% return shown is that of the former Institutional share class (see financial note 1). |
Laudus Mondrian Funds | Semiannual Report
Laudus Mondrian International Equity Fund
Financial Statements
Financial Highlights
| | 4/1/17–
9/30/17*,1 | 4/1/16–
3/31/17 | 4/1/15–
3/31/16 | 4/1/14–
3/31/15 | 4/1/13–
3/31/14 | 4/1/12–
3/31/13 |
| Per-Share Data |
| Net asset value at beginning of period | $6.12 | $5.68 | $6.50 | $8.81 | $7.46 | $7.22 |
| Income (loss) from investment operations: | | | | | | |
| Net investment income (loss)2 | 0.13 | 0.18 | 0.16 | 0.27 | 0.35 | 0.23 |
| Net realized and unrealized gains (losses) | 0.42 | 0.42 | (0.61) | (0.41) | 1.22 | 0.27 |
| Total from investment operations | 0.55 | 0.60 | (0.45) | (0.14) | 1.57 | 0.50 |
| Less distributions: | | | | | | |
| Distributions from net investment income | — | (0.16) | (0.15) | (0.89) | (0.22) | (0.25) |
| Distributions from net realized gains | — | — | (0.22) | (1.28) | — | (0.01) |
| Total distributions | — | (0.16) | (0.37) | (2.17) | (0.22) | (0.26) |
| Net asset value at end of period | $6.67 | $6.12 | $5.68 | $6.50 | $8.81 | $7.46 |
| Total return | 8.99% 3 | 10.78% | (6.88%) | 0.11% | 21.31% | 7.10% |
| Ratios/Supplemental Data |
| Ratios to average net assets: | | | | | | |
| Net operating expenses | 0.89% 4,5 | 0.90% | 0.91% 6 | 1.01% 7 | 1.05% | 1.05% |
| Gross operating expenses | 0.99% 4,5 | 0.96% | 1.06% | 1.07% | 1.07% | 1.11% |
| Net investment income (loss) | 3.92% 4,5 | 3.10% | 2.53% | 3.28% | 4.24% | 3.22% |
| Portfolio turnover rate | 11% 3 | 34% | 29% | 36% 8 | 25% | 29% |
| Net assets, end of period (x 1,000) | $115,064 | $92,312 | $110,873 | $91,981 | $162,366 | $127,709 |
| |
1
Effective July 25, 2017, the Investor Share class, the Select Share class, and the Institutional Share class were combined into a single class of shares of the fund. The financial history as shown in the financial highlights is that of the former Institutional Shares (see financial note 1).
2
Calculated based on the average shares outstanding during the period.
3
Not annualized.
4
Annualized (except for custody out-of-pocket fee reimbursement).
5
The ratio of net operating expenses and gross operating expenses would have been 0.90% and 1.00%, respectively, and the ratio of net investment income would have been 3.91%, if the custody out-of-pocket fee reimbursement had not been included (see financial note 12).
6
The ratio of net operating expenses would have been 0.90%, if certain non-routine expenses had not been incurred.
7
Effective October 1, 2014, the annual operating expense was reduced. The ratio presented for period ended 3/31/15 is a blended ratio.
8
Portfolio turnover excludes the impact of investment activity from a merger with another fund.
Laudus Mondrian Funds | Semiannual Report
Laudus Mondrian International Equity Fund
Portfolio Holdings as of September 30, 2017 (Unaudited)
This section shows all the securities in the fund’s portfolio and their values as of the report date.
The fund files its complete schedule of portfolio holdings with the SEC for the first and third quarters of each fiscal year on Form N-Q. The fund’s Form N-Q is available on the SEC’s website at www.sec.gov and may be viewed and copied at the SEC’s Public Reference Room in Washington, D.C. Call 1-800-SEC-0330 for information on the operation of the Public Reference Room. The fund also makes available its complete schedule of portfolio holdings 15-20 days after calendar quarters on the fund’s website at www.schwabfunds.com/laudusfunds_prospectus.
| Security | Number
of Shares | Value ($) |
| Common Stock 98.9% of net assets |
| |
| Australia 1.8% |
| QBE Insurance Group Ltd. | 263,454 | 2,076,956 |
| |
| China 2.6% |
| China Mobile Ltd. | 290,500 | 2,949,142 |
| |
| France 6.5% |
| Compagnie de Saint-Gobain | 54,578 | 3,251,759 |
| Sanofi | 42,862 | 4,266,768 |
| | | 7,518,527 |
| |
| Germany 11.3% |
| Allianz SE | 13,630 | 3,061,119 |
| Daimler AG | 48,033 | 3,834,236 |
| Deutsche Telekom AG | 120,904 | 2,257,797 |
| SAP SE | 34,545 | 3,787,694 |
| | | 12,940,846 |
| |
| Hong Kong 2.0% |
| CK Hutchison Holdings Ltd. | 130,000 | 1,665,077 |
| WH Group Ltd. | 566,000 | 602,791 |
| | | 2,267,868 |
| |
| Italy 6.7% |
| Enel S.p.A. | 640,507 | 3,858,613 |
| Eni S.p.A. | 232,001 | 3,842,330 |
| | | 7,700,943 |
| |
| Japan 15.3% |
| Canon, Inc. | 83,400 | 2,854,028 |
| Honda Motor Co., Ltd. | 144,200 | 4,259,742 |
| Isuzu Motors, Ltd. | 51,800 | 686,809 |
| Mitsubishi Electric Corp. | 145,100 | 2,269,850 |
| Takeda Pharmaceutical Co., Ltd. | 79,200 | 4,379,436 |
| Tokio Marine Holdings, Inc. | 81,800 | 3,201,440 |
| | | 17,651,305 |
| |
| Netherlands 2.8% |
| Koninklijke Ahold Delhaize N.V. | 169,579 | 3,168,521 |
| |
| Singapore 5.1% |
| Singapore Telecommunications Ltd. | 862,000 | 2,343,282 |
| United Overseas Bank Ltd. | 205,522 | 3,569,043 |
| | | 5,912,325 |
| |
| Security | Number
of Shares | Value ($) |
| Spain 6.9% |
| Banco Santander S.A. | 236,467 | 1,654,050 |
| Iberdrola S.A. | 462,854 | 3,598,981 |
| Telefonica S.A. | 247,990 | 2,694,925 |
| | | 7,947,956 |
| |
| Sweden 3.5% |
| Telia Co. AB | 858,461 | 4,048,019 |
| |
| Switzerland 9.5% |
| ABB Ltd. | 138,649 | 3,428,509 |
| Nestle S.A. | 9,957 | 835,803 |
| Novartis AG | 37,274 | 3,197,175 |
| Zurich Insurance Group AG | 11,462 | 3,502,551 |
| | | 10,964,038 |
| |
| Taiwan 3.4% |
| Taiwan Semiconductor Manufacturing Co., Ltd. | 537,154 | 3,847,342 |
| |
| United Kingdom 21.5% |
| BP plc | 597,708 | 3,828,912 |
| GlaxoSmithKline plc | 168,086 | 3,360,142 |
| Kingfisher plc | 838,448 | 3,356,878 |
| Lloyds Banking Group plc | 4,562,650 | 4,146,339 |
| National Grid plc | 165,475 | 2,049,498 |
| Royal Dutch Shell plc, A Shares (a) | 7,085 | 214,587 |
| Royal Dutch Shell plc, A Shares (a) | 7,942 | 240,022 |
| Royal Dutch Shell plc, B Shares | 119,267 | 3,671,766 |
| Tesco plc * | 1,558,990 | 3,909,557 |
| | | 24,777,701 |
| Total Common Stock |
| (Cost $91,102,727) | | 113,771,489 |
|
| Other Investment Company 0.4% of net assets |
| |
| United States 0.4% |
| State Street Institutional U.S. Government Money Market Fund, Premier Class 0.92% (b) | 482,916 | 482,916 |
| Total Other Investment Company |
| (Cost $482,916) | | 482,916 |
At 09/30/17, the values of certain foreign securities held by the fund aggregating $113,771,489 were adjusted from their closing market values in accordance with international fair valuation procedures approved by the fund’s Board of Trustees. (See financial note 2(a) for additional information).
| * | Non-income producing security. |
| (a) | Securities are traded on separate exchanges for the same entity. |
| (b) | The rate shown is the 7-day yield. |
Laudus Mondrian Funds | Semiannual Report
Laudus Mondrian International Equity Fund
Portfolio Holdings as of September 30, 2017 (Unaudited) (continued)
The following is a summary of the inputs used to value the fund’s investments as of September 30, 2017 (see financial note 2(a) for additional information):
| Description | Quoted Prices in
Active Markets for
Identical Assets
(Level 1) | Other Significant
Observable Inputs
(Level 2) | Significant
Unobservable Inputs
(Level 3) | Total | |
| Assets | | | | | |
| Common Stock1 | $— | $113,771,489 | $— | $113,771,489 | |
| Other Investment Company1 | 482,916 | — | — | 482,916 | |
| Total | $482,916 | $113,771,489 | $— | $114,254,405 | |
| 1 | As categorized in Portfolio Holdings. |
The fund’s policy is to recognize transfers between Level 1, Level 2 and Level 3 as of the beginning of the fiscal year. There were no transfers between Level 1, Level 2 and Level 3 for the period ended September 30, 2017. Fund investments in underlying mutual funds are classified as Level 1, without consideration to the classification level of the investments held by the underlying mutual funds, which could be Level 1, Level 2 or Level 3.
Laudus Mondrian Funds | Semiannual Report
Laudus Mondrian International Equity Fund
Statement of Assets and Liabilities
As of September 30, 2017; unaudited
| Assets |
| Investments in unaffiliated issuers, at value (cost $91,585,643) | | $114,254,405 |
| Foreign currency, at value (cost $314,457) | | 314,217 |
| Receivables: | | |
| Foreign tax reclaims | | 277,275 |
| Dividends | | 197,090 |
| Fund shares sold | | 112,507 |
| Prepaid expenses | + | 30,137 |
| Total assets | | 115,185,631 |
| Liabilities |
| Payables: | | |
| Investment adviser fees | | 62,434 |
| Fund shares redeemed | | 1,242 |
| Accrued expenses | + | 58,255 |
| Total liabilities | | 121,931 |
| Net Assets |
| Total assets | | 115,185,631 |
| Total liabilities | – | 121,931 |
| Net assets | | $115,063,700 |
| Net Assets by Source | | |
| Capital received from investors | | 91,748,588 |
| Net investment income not yet distributed | | 2,831,472 |
| Net realized capital losses | | (2,189,908) |
| Net unrealized capital appreciation | | 22,673,548 |
| Net Asset Value (NAV) |
| Net Assets | ÷ | Shares
Outstanding | = | NAV |
| $115,063,700 | | 17,247,370 | | $6.67 |
| | | | | |
Laudus Mondrian Funds | Semiannual Report
Laudus Mondrian International Equity Fund
Statement of Operations
For the period April 1, 2017 through September 30, 2017; unaudited
| Investment Income |
| Dividends (net of foreign withholding tax of $260,860) | | $2,705,952 |
| Expenses |
| Investment adviser fees | | 416,278 |
| Custodian fees | | 34,806 |
| Registration fees | | 27,207 |
| Transfer agent fees | | 23,063 |
| Professional fees | | 21,105 |
| Accounting and administration fees | | 14,299 |
| Independent trustees’ fees | | 6,972 |
| Distribution and shareholder services fees (Investor Shares)1 | | 5,441 |
| Interest expense | | 4,008 |
| Shareholder reports | | 3,223 |
| Sub-accounting and sub-transfer agent fees: | | |
| Investor Shares1 | | 2,395 |
| Select Shares1 | | 2,460 |
| Custody out-of-pocket fee reimbursement | | (13,207)* |
| Other expenses | + | 5,212 |
| Total expenses | | 553,262 |
| Expense reduction by adviser | – | 53,008 |
| Net expenses | – | 500,254 |
| Net investment income | | 2,205,698 |
| Realized and Unrealized Gains (Losses) |
| Net realized gains on investments | | 3,209,546 |
| Net realized losses on foreign currency transactions | + | (6,481) |
| Net realized gains | | 3,203,065 |
| Net change in unrealized appreciation (depreciation) on investments | | 4,117,090 |
| Net change in unrealized appreciation (depreciation) on foreign currency translations | + | 24,115 |
| Net change in unrealized appreciation (depreciation) | + | 4,141,205 |
| Net realized and unrealized gains | | 7,344,270 |
| Increase in net assets resulting from operations | | $9,549,968 |
| * | See financial note 12 for additional information. |
| 1 | Effective July 25, 2017, all outstanding Investor Shares and Select Shares combined with Institutional Shares, resulting in a single class of shares of the fund (see financial note 1). |
Laudus Mondrian Funds | Semiannual Report
Laudus Mondrian International Equity Fund
Statement of Changes in Net Assets
For the current and prior report periods
Figures for the current period are unaudited
| Operations | |
| | 4/1/17-9/30/17 | 4/1/16-3/31/17 |
| Net investment income | | $2,205,698 | $4,214,846 |
| Net realized gains (losses) | | 3,203,065 | (1,314,651) |
| Net change in unrealized appreciation (depreciation) | + | 4,141,205 | 10,791,204 |
| Increase in net assets from operations | | 9,549,968 | 13,691,399 |
| Distributions to Shareholders1 | |
| Distributions from net investment income | | | |
| Investor Shares | | — | (174,166) |
| Select Shares | | — | (168,191) |
| Institutional Shares | + | — | (3,635,958) |
| Total distributions from net investment income | | — | (3,978,315) |
| Transactions in Fund Shares1 | | | |
| | | 4/1/17-9/30/17 | 4/1/16-3/31/17 |
| | | SHARES | VALUE | SHARES | VALUE |
| Shares Sold | | | | | |
| Investor Shares | | 62,863 | $392,981 | 754,099 | $4,346,911 |
| Select Shares | | 111,157 | 699,654 | 894,507 | 5,229,138 |
| Institutional Shares | + | 4,122,159 | 26,567,354 | 7,135,778 | 41,577,906 |
| Total shares sold | | 4,296,179 | $27,659,989 | 8,784,384 | $51,153,955 |
| Shares Reinvested | | | | | |
| Investor Shares | | — | $— | 26,886 | $151,100 |
| Select Shares | | — | — | 24,300 | 137,291 |
| Institutional Shares | + | — | — | 325,293 | 1,844,411 |
| Total shares reinvested | | — | $— | 376,479 | $2,132,802 |
| Shares Redeemed | | | | | |
| Investor Shares | | (1,259,304) | ($8,016,406) | (505,190) | ($2,904,993) |
| Select Shares | | (1,110,179) | (7,119,869) | (707,653) | (4,070,851) |
| Institutional Shares | + | (1,964,520) | (12,664,273) | (11,874,216) | (70,894,657) |
| Total shares redeemed | | (4,334,003) | ($27,800,548) | (13,087,059) | ($77,870,501) |
| Net transactions in fund shares | | (37,824) | ($140,559) | (3,926,196) | ($24,583,744) |
| Shares Outstanding and Net Assets | | | |
| | | 4/1/17-9/30/17 | 4/1/16-3/31/17 |
| | | SHARES | NET ASSETS | SHARES | NET ASSETS |
| Beginning of period | | 17,285,194 | $105,654,291 | 21,211,390 | $120,524,951 |
| Total increase or decrease | + | (37,824) | 9,409,409 | (3,926,196) | (14,870,660) |
| End of period | | 17,247,370 | $115,063,700 | 17,285,194 | $105,654,291 |
| Net investment income not yet distributed | | | $2,831,472 | | $625,774 |
| 1 | Effective July 25, 2017, all outstanding Investor Shares (758,820 shares valued at $4,844,685) and Select Shares (993,528 shares valued at $6,386,298) combined with Institutional Shares, resulting in a single class of shares of the fund (see financial note 1). |
Laudus Mondrian Funds | Semiannual Report
Laudus Mondrian Emerging Markets Fund
Financial Statements
Financial Highlights
| | 4/1/17–
9/30/17*,1 | 4/1/16–
3/31/17 | 4/1/15–
3/31/16 | 4/1/14–
3/31/15 | 4/1/13–
3/31/14 | 4/1/12–
3/31/13 |
| Per-Share Data |
| Net asset value at beginning of period | $7.71 | $7.03 | $8.18 | $8.69 | $9.85 | $9.49 |
| Income (loss) from investment operations: | | | | | | |
| Net investment income (loss)2 | 0.15 | 0.14 | 0.14 | 0.12 | 0.14 | 0.16 |
| Net realized and unrealized gains (losses) | 0.46 | 0.72 | (1.20) | (0.39) | (1.19) | 0.42 |
| Total from investment operations | 0.61 | 0.86 | (1.06) | (0.27) | (1.05) | 0.58 |
| Less distributions: | | | | | | |
| Distributions from net investment income | — | (0.18) | (0.09) | (0.24) | (0.11) | (0.22) |
| Distributions from net realized gains | — | — | — | — | (0.00) 3 | — |
| Total distributions | — | (0.18) | (0.09) | (0.24) | (0.11) | (0.22) |
| Net asset value at end of period | $8.32 | $7.71 | $7.03 | $8.18 | $8.69 | $9.85 |
| Total return | 7.91% 4 | 12.57% | (12.87%) | (3.03%) | (10.62%) | 6.21% |
| Ratios/Supplemental Data |
| Ratios to average net assets: | | | | | | |
| Net operating expenses | 1.20% 5,6 | 1.20% | 1.20% | 1.29% 7 | 1.45% | 1.45% |
| Gross operating expenses | 1.24% 5,6 | 1.22% | 1.21% | 1.31% | 1.52% | 1.49% |
| Net investment income (loss) | 3.59% 5,6 | 1.92% | 1.87% | 1.42% | 1.55% | 1.70% |
| Portfolio turnover rate | 19% 4 | 32% | 28% | 30% 8 | 69% | 59% |
| Net assets, end of period (x 1,000) | $305,974 | $336,896 | $406,462 | $559,347 | $121,795 | $141,536 |
| |
1
Effective July 25, 2017, the Investor Share class, the Select Share class, and the Institutional Share class were combined into a single class of shares of the fund. The financial history as shown in the financial highlights is that of the former Institutional Shares (see financial note 1).
2
Calculated based on the average shares outstanding during the period.
3
Per-share amount was less than $0.005.
4
Not annualized.
5
Annualized (except for custody out-of-pocket fee reimbursement).
6
The ratio of net operating expenses and gross operating expenses would have been 1.21% and 1.25%, respectively, and the ratio of net investment income would have been 3.58%, if the custody out-of-pocket fee reimbursement had not been included (see financial note 12).
7
Effective October 1, 2014, the annual operating expense was reduced. The ratio presented for period ended 3/31/15 is a blended ratio.
8
Portfolio turnover excludes the impact of investment activity from a merger with another fund.
Laudus Mondrian Funds | Semiannual Report
Laudus Mondrian Emerging Markets Fund
Portfolio Holdings as of September 30, 2017 (Unaudited)
This section shows all the securities in the fund’s portfolio and their values as of the report date.
The fund files its complete schedule of portfolio holdings with the SEC for the first and third quarters of each fiscal year on Form N-Q. The fund’s Form N-Q is available on the SEC’s website at www.sec.gov and may be viewed and copied at the SEC’s Public Reference Room in Washington, D.C. Call 1-800-SEC-0330 for information on the operation of the Public Reference Room. The fund also makes available its complete schedule of portfolio holdings 15-20 days after calendar quarters on the fund’s website at www.schwabfunds.com/laudusfunds_prospectus.
| Security | Number
of Shares | Value ($) |
| Common Stock 94.7% of net assets |
| |
| Brazil 8.5% |
| Ambev S.A. ADR | 490,057 | 3,229,476 |
| CCR S.A. | 1,055,881 | 5,904,252 |
| Cielo S.A. | 837,136 | 5,809,718 |
| Embraer S.A. ADR | 215,920 | 4,881,951 |
| Itau Unibanco Holding S.A. ADR | 459,300 | 6,292,410 |
| | | 26,117,807 |
| |
| China 15.6% |
| China Construction Bank Corp., Class H | 12,120,000 | 10,125,675 |
| China Mobile Ltd. | 971,500 | 9,862,622 |
| China Resources Power Holdings Co., Ltd. | 4,247,291 | 7,692,552 |
| CSPC Pharmaceutical Group Ltd. | 1,314,000 | 2,208,306 |
| Dongfeng Motor Group Co., Ltd., Class H | 5,644,000 | 7,489,597 |
| WH Group Ltd. | 9,811,000 | 10,448,738 |
| | | 47,827,490 |
| |
| Hong Kong 2.5% |
| Sands China Ltd. | 1,454,400 | 7,606,657 |
| |
| India 13.0% |
| Bajaj Auto Ltd. | 177,473 | 8,452,252 |
| HCL Technologies Ltd. | 432,949 | 5,802,022 |
| Housing Development Finance Corp., Ltd. | 215,345 | 5,748,211 |
| Infosys Ltd. | 172,474 | 2,381,294 |
| Infosys Ltd. ADR | 130,624 | 1,905,804 |
| Larsen & Toubro Ltd. | 201,285 | 3,524,605 |
| Reliance Industries Ltd. | 243,167 | 2,910,981 |
| Vedanta Ltd. | 1,884,664 | 9,095,776 |
| | | 39,820,945 |
| |
| Indonesia 1.6% |
| PT Bank Rakyat Indonesia (Persero) Tbk | 4,310,700 | 4,894,017 |
| |
| Kazakhstan 0.9% |
| KazMunaiGas Exploration Production JSC GDR | 265,082 | 2,624,312 |
| |
| Malaysia 4.9% |
| AMMB Holdings Berhad | 6,037,900 | 6,242,445 |
| Genting Malaysia Berhad | 3,892,500 | 4,961,179 |
| Tenaga Nasional Berhad | 1,103,600 | 3,744,879 |
| | | 14,948,503 |
| |
| Mexico 3.8% |
| Fibra Uno Administracion S.A. de C.V. | 5,403,338 | 9,115,351 |
| Grupo Financiero Santander Mexico S.A.B. de C.V., Class B ADR | 253,717 | 2,560,005 |
| | | 11,675,356 |
| |
| Security | Number
of Shares | Value ($) |
| Peru 1.3% |
| Credicorp Ltd. | 19,547 | 4,007,526 |
| |
| Philippines 1.3% |
| PLDT, Inc. ADR | 127,091 | 4,056,745 |
| |
| Qatar 1.4% |
| Qatar National Bank SAQ | 124,463 | 4,171,157 |
| |
| Republic of Korea 12.5% |
| Hyundai Mobis Co., Ltd. | 11,525 | 2,419,764 |
| Korea Electric Power Corp. | 127,035 | 4,316,053 |
| Korea Zinc Co., Ltd. | 3,879 | 1,680,689 |
| Samsung Electronics Co., Ltd. | 6,003 | 13,508,083 |
| Samsung SDI Co., Ltd. | 20,087 | 3,494,924 |
| Shinhan Financial Group Co., Ltd. | 158,575 | 7,008,739 |
| SK Telecom Co., Ltd. | 26,760 | 5,970,925 |
| | | 38,399,177 |
| |
| Russia 4.0% |
| Gazprom PJSC ADR | 2,083,568 | 8,730,150 |
| Lukoil PJSC ADR | 63,998 | 3,393,814 |
| | | 12,123,964 |
| |
| South Africa 5.8% |
| Barclays Africa Group Ltd. | 393,744 | 4,041,369 |
| Growthpoint Properties Ltd. | 1,735,154 | 3,116,244 |
| Sasol Ltd. | 152,385 | 4,169,979 |
| Woolworths Holdings Ltd. | 1,466,213 | 6,492,204 |
| | | 17,819,796 |
| |
| Taiwan 10.6% |
| Asustek Computer, Inc. | 613,000 | 5,051,614 |
| MediaTek, Inc. | 272,000 | 2,559,490 |
| Mega Financial Holding Co., Ltd. | 9,028,153 | 7,066,733 |
| Taiwan Mobile Co., Ltd. | 994,000 | 3,542,779 |
| Taiwan Semiconductor Manufacturing Co., Ltd. | 1,979,719 | 14,179,650 |
| | | 32,400,266 |
| |
| Thailand 1.9% |
| Kasikornbank PCL NVDR | 926,000 | 5,758,748 |
| |
| Turkey 3.7% |
| Eregli Demir ve Celik Fabrikalari TAS | 1,606,247 | 3,485,506 |
| Turk Telekomunikasyon A/S * | 892,209 | 1,701,610 |
| Turkiye Garanti Bankasi A/S | 1,313,468 | 3,568,745 |
| Turkiye Halk Bankasi A/S | 746,411 | 2,538,583 |
| | | 11,294,444 |
| |
Laudus Mondrian Funds | Semiannual Report
Laudus Mondrian Emerging Markets Fund
Portfolio Holdings as of September 30, 2017 (Unaudited) (continued)
| Security | Number
of Shares | Value ($) |
| United Arab Emirates 1.4% |
| Emaar Malls PJSC | 6,652,693 | 4,220,654 |
| Total Common Stock |
| (Cost $258,254,140) | | 289,767,564 |
|
| Preferred Stock 2.8% of net assets |
| |
| Brazil 2.3% |
| Suzano Papel e Celulose S.A. | 1,238,700 | 7,161,200 |
| |
| India 0.5% |
| Vedanta Ltd. * | 8,985,240 | 1,409,962 |
| Total Preferred Stock |
| (Cost $5,259,272) | | 8,571,162 |
|
| Other Investment Company 1.9% of net assets |
| |
| United States 1.9% |
| State Street Institutional U.S. Government Money Market Fund, Premier Class 0.92% (a) | 5,666,455 | 5,666,455 |
| Total Other Investment Company |
| (Cost $5,666,455) | | 5,666,455 |
At 09/30/17, the values of certain foreign securities held by the fund aggregating $223,035,396 were adjusted from their closing market values in accordance with international fair valuation procedures approved by the fund’s Board of Trustees. (See financial note 2(a) for additional information).
| * | Non-income producing security. |
| (a) | The rate shown is the 7-day yield. |
| | |
| ADR — | American Depositary Receipt |
| GDR — | Global Depositary Receipt |
| NVDR — | Non-Voting Depositary Receipt |
The following is a summary of the inputs used to value the fund’s investments as of September 30, 2017 (see financial note 2(a) for additional information):
| Description | Quoted Prices in
Active Markets for
Identical Assets
(Level 1) | Other Significant
Observable Inputs
(Level 2) | Significant
Unobservable Inputs
(Level 3) | Total | |
| Assets | | | | | |
| Common Stock1 | $— | $185,120,255 | $— | $185,120,255 | |
| Brazil | 26,117,807 | — | — | 26,117,807 | |
| India | 1,905,804 | 37,915,141 | — | 39,820,945 | |
| Kazakhstan | 2,624,312 | — | — | 2,624,312 | |
| Mexico | 11,675,356 | — | — | 11,675,356 | |
| Peru | 4,007,526 | — | — | 4,007,526 | |
| Philippines | 4,056,745 | — | — | 4,056,745 | |
| Russia | 12,123,964 | — | — | 12,123,964 | |
| United Arab Emirates | 4,220,654 | — | — | 4,220,654 | |
| Preferred Stock1 | 8,571,162 | — | — | 8,571,162 | |
| Other Investment Company1 | 5,666,455 | — | — | 5,666,455 | |
| Total | $80,969,785 | $223,035,396 | $— | $304,005,181 | |
| 1 | As categorized in Portfolio Holdings. |
The funds policy is to recognize transfers between Level 1, Level 2 and Level 3 as of the beginning of the fiscal year. There were security transfers in the amount of $6,612,158 and $6,409,799 from Level 1 to Level 2 and from Level 2 to Level 1, respectively, for the period ended September 30, 2017. The transfers between Level 1 and Level 2 were primarily due to the use of international fair valuation by the fund. There were no transfers in or out of Level 3 during the period. Fund investments in underlying mutual funds are classified as Level 1, without consideration to the classification level of the investments held by the underlying mutual funds, which could be Level 1, Level 2 or Level 3.
Laudus Mondrian Funds | Semiannual Report
Laudus Mondrian Emerging Markets Fund
Statement of Assets and Liabilities
As of September 30, 2017; unaudited
| Assets |
| Investments in unaffiliated issuers, at value (cost $269,179,867) | | $304,005,181 |
| Foreign currency, at value (cost $1,180,293) | | 1,179,330 |
| Receivables: | | |
| Investments sold | | 895,133 |
| Fund shares sold | | 555,451 |
| Dividends | | 200,132 |
| Foreign tax reclaims | | 36,354 |
| Prepaid expenses | + | 28,172 |
| Total assets | | 306,899,753 |
| Liabilities |
| Payables: | | |
| Investments bought | | 80,391 |
| Foreign capital gains tax | | 424,125 |
| Investment adviser fees | | 243,086 |
| Accrued expenses | + | 178,357 |
| Total liabilities | | 925,959 |
| Net Assets |
| Total assets | | 306,899,753 |
| Total liabilities | – | 925,959 |
| Net assets | | $305,973,794 |
| Net Assets by Source | | |
| Capital received from investors | | 389,578,195 |
| Net investment income not yet distributed | | 4,755,879 |
| Net realized capital losses | | (122,761,814) |
| Net unrealized capital appreciation | | 34,401,534 |
| Net Asset Value (NAV) |
| Net Assets | ÷ | Shares
Outstanding | = | NAV |
| $305,973,794 | | 36,770,264 | | $8.32 |
| | | | | |
Laudus Mondrian Funds | Semiannual Report
Laudus Mondrian Emerging Markets Fund
Statement of Operations
For the period April 1, 2017 through September 30, 2017; unaudited
| Investment Income |
| Dividends (net of foreign withholding tax of $870,022) | | $7,938,774 |
| Expenses |
| Investment adviser fees | | 1,657,896 |
| Custodian fees | | 277,251 |
| Accounting and administration fees | | 31,915 |
| Registration fees | | 25,971 |
| Professional fees | | 23,149 |
| Transfer agent fees | | 19,252 |
| Independent trustees’ fees | | 9,627 |
| Interest expense | | 9,332 |
| Shareholder reports | | 3,158 |
| Distribution and shareholder services fees (Investor Shares)1 | | 2,311 |
| Sub-accounting and sub-transfer agent fees: | | |
| Investor Shares1 | | 1,403 |
| Select Shares1 | | 1,389 |
| Custody out-of-pocket fee reimbursement | | (29,611)* |
| Other expenses | + | 14,063 |
| Total expenses | | 2,047,106 |
| Expense reduction by adviser | – | 73,028 |
| Net expenses | – | 1,974,078 |
| Net investment income | | 5,964,696 |
| Realized and Unrealized Gains (Losses) |
| Net realized losses on investments | | (1,494,706) |
| Net realized losses on foreign currency transactions | | (107,232) |
| Net realized gains on forward foreign currency exchange contracts | + | 43,735 |
| Net realized losses | | (1,558,203) |
| Net change in unrealized appreciation (depreciation) on investments (net of change in foreign capital gains tax of $363,812) | | 21,557,274 |
| Net change in unrealized appreciation (depreciation) on foreign currency translations | + | (24,523) |
| Net change in unrealized appreciation (depreciation) | + | 21,532,751 |
| Net realized and unrealized gains | | 19,974,548 |
| Increase in net assets resulting from operations | | $25,939,244 |
| * | See financial note 12 for additional information. |
| 1 | Effective July 25, 2017, all outstanding Investor Shares and Select Shares combined with Institutional Shares, resulting in a single class of shares of the fund (see financial note 1). |
Laudus Mondrian Funds | Semiannual Report
Laudus Mondrian Emerging Markets Fund
Statement of Changes in Net Assets
For the current and prior report periods
Figures for the current period are unaudited
| Operations | |
| | 4/1/17-9/30/17 | 4/1/16-3/31/17 |
| Net investment income | | $5,964,696 | $7,459,147 |
| Net realized losses | | (1,558,203) | (27,940,771) |
| Net change in unrealized appreciation (depreciation) | + | 21,532,751 | 62,217,878 |
| Increase in net assets from operations | | 25,939,244 | 41,736,254 |
| Distributions to Shareholders1 | |
| Distributions from net investment income | | | |
| Investor Shares | | — | (66,046) |
| Select Shares | | — | (112,696) |
| Institutional Shares | + | — | (9,365,136) |
| Total distributions from net investment income | | $— | ($9,543,878) |
| Transactions in Fund Shares1 | | | |
| | | 4/1/17-9/30/17 | 4/1/16-3/31/17 |
| | | SHARES | VALUE | SHARES | VALUE |
| Shares Sold | | | | | |
| Investor Shares | | 20,821 | $165,883 | 46,601 | $338,038 |
| Select Shares | | 6,912 | 55,245 | 36,751 | 267,197 |
| Institutional Shares | + | 3,538,894 | 28,930,333 | 6,004,591 | 43,359,379 |
| Total shares sold | | 3,566,627 | $29,151,461 | 6,087,943 | $43,964,614 |
| Shares Reinvested | | | | | |
| Investor Shares | | — | $— | 9,047 | $62,870 |
| Select Shares | | — | — | 15,230 | 105,697 |
| Institutional Shares | + | — | — | 1,291,515 | 8,950,205 |
| Total shares reinvested | | — | $— | 1,315,792 | $9,118,772 |
| Shares Redeemed | | | | | |
| Investor Shares | | (394,224) | ($3,271,281) | (150,769) | ($1,086,698) |
| Select Shares | | (608,480) | (5,038,003) | (286,761) | (2,091,380) |
| Institutional Shares | + | (10,471,403) | (85,232,037) | (21,407,200) | (153,322,505) |
| Total shares redeemed | | (11,474,107) | ($93,541,321) | (21,844,730) | ($156,500,583) |
| Net transactions in fund shares | | (7,907,480) | ($64,389,860) | (14,440,995) | ($103,417,197) |
| Shares Outstanding and Net Assets | | | |
| | | 4/1/17-9/30/17 | 4/1/16-3/31/17 |
| | | SHARES | NET ASSETS | SHARES | NET ASSETS |
| Beginning of period | | 44,677,744 | $344,424,410 | 59,118,739 | $415,649,231 |
| Total decrease | + | (7,907,480) | (38,450,616) | (14,440,995) | (71,224,821) |
| End of period | | 36,770,264 | $305,973,794 | 44,677,744 | $344,424,410 |
| Net investment income not yet distributed/Distributions in excess of net investment income | | | $4,755,879 | | ($1,208,817) |
| 1 | Effective July 25, 2017, all outstanding Investor Shares (350,481 shares valued at $2,921,115) and Select Shares (490,116 shares valued at $4,088,249) combined with Institutional Shares, resulting in a single class of shares of the fund (see financial note 1). |
Laudus Mondrian Funds | Semiannual Report
Laudus Mondrian International Government Fixed Income Fund
Financial Statements
Financial Highlights
| | 4/1/17–
9/30/17* | 4/1/16–
3/31/17 | 4/1/15–
3/31/16 | 4/1/14–
3/31/15 | 4/1/13–
3/31/14 | 4/1/12–
3/31/13 |
| Per-Share Data |
| Net asset value at beginning of period | $9.32 | $9.93 | $9.45 | $10.89 | $11.01 | $11.61 |
| Income (loss) from investment operations: | | | | | | |
| Net investment income (loss) | 0.04 1 | 0.09 1 | 0.11 1 | 0.15 1 | 0.16 1 | 0.15 |
| Net realized and unrealized gains (losses) | 0.56 | (0.64) | 0.56 | (1.14) | (0.21) | (0.53) |
| Total from investment operations | 0.60 | (0.55) | 0.67 | (0.99) | (0.05) | (0.38) |
| Less distributions: | | | | | | |
| Distributions from net investment income | — | (0.00) 2 | — | — | — | (0.15) |
| Distributions from net realized gains | — | (0.06) | (0.19) | (0.45) | (0.07) | (0.07) |
| Total distributions | — | (0.06) | (0.19) | (0.45) | (0.07) | (0.22) |
| Net asset value at end of period | $9.92 | $9.32 | $9.93 | $9.45 | $10.89 | $11.01 |
| Total return | 6.44% 3 | (5.48%) | 7.27% | (9.37%) | (0.49%) | (3.41%) |
| Ratios/Supplemental Data |
| Ratios to average net assets: | | | | | | |
| Net operating expenses | 0.74% 4,5 | 0.75% | 0.75% | 0.74% | 0.69% | 0.69% |
| Gross operating expenses | 0.80% 4,5 | 0.79% | 0.81% | 0.76% | 0.69% | 0.69% |
| Net investment income (loss) | 0.87% 4,5 | 0.87% | 1.21% | 1.39% | 1.48% | 1.27% |
| Portfolio turnover rate | 38% 3 | 98% | 31% | 50% | 52% | 44% |
| Net assets, end of period (x 1,000) | $88,761 | $95,565 | $119,938 | $187,388 | $652,647 | $741,235 |
| |
1
Calculated based on the average shares outstanding during the period.
2
Per-share amount was less than $0.005.
3
Not annualized.
4
Annualized (except for custody out-of-pocket fee reimbursement).
5
The ratio of net operating expenses and gross operating expenses would have been 0.75% and 0.81%, respectively, and the ratio of net investment income would have been 0.86%, if the custody out-of-pocket fee reimbursement had not been included (See financial note 12).
Laudus Mondrian Funds | Semiannual Report
Laudus Mondrian International Government Fixed Income Fund
Portfolio Holdings as of September 30, 2017 (Unaudited)
This section shows all the securities in the fund’s portfolio and their values as of the report date.
The fund files its complete schedule of portfolio holdings with the SEC for the first and third quarters of each fiscal year on Form N-Q. The fund’s Form N-Q is available on the SEC’s website at www.sec.gov and may be viewed and copied at the SEC’s Public Reference Room in Washington, D.C. Call 1-800-SEC-0330 for information on the operation of the Public Reference Room. The fund also makes available its complete schedule of portfolio holdings 15-20 days after calendar quarters on the fund’s website at www.schwabfunds.com/laudusfunds_prospectus.
For fixed-rate obligations, the rate shown is the interest rate (the rate established when the obligation was issued). For variable-rate obligations, the rate shown is the rate as of the report date; the reference rate and spread used is shown parenthetically in the security description, if available, if not, the reference rate is described in a footnote. The maturity date shown for all the securities is the final legal maturity.
Security
Rate, Maturity Date | Face Amount
(local currency) | Value ($) |
| Government Bonds 88.6% of net assets |
| |
| Australia 5.8% |
| Australia Government Bond |
| 5.75%, 05/15/21 (AUD) | 610,000 | 537,284 |
| 3.25%, 04/21/25 (AUD) | 1,386,000 | 1,129,604 |
| 4.75%, 04/21/27 (AUD) | 3,800,000 | 3,468,285 |
| | | 5,135,173 |
| |
| Austria 4.6% |
| Austria Government Bond |
| 6.25%, 07/15/27 (EUR) | 2,248,000 | 4,116,760 |
| |
| Belgium 4.8% |
| Kingdom of Belgium Government Bond |
| 1.00%, 06/22/26 (EUR) | 3,450,000 | 4,233,425 |
| |
| Canada 3.0% |
| Canadian Government Bond |
| 0.75%, 09/01/21 (CAD) | 1,500,000 | 1,160,882 |
| 1.50%, 06/01/26 (CAD) | 1,400,000 | 1,070,721 |
| 5.00%, 06/01/37 (CAD) | 350,000 | 392,000 |
| | | 2,623,603 |
| |
| Finland 4.5% |
| Finland Government Bond |
| 1.63%, 09/15/22 (EUR) | 2,000,000 | 2,573,874 |
| 0.50%, 09/15/27 (EUR) | 1,200,000 | 1,401,877 |
| | | 3,975,751 |
| |
| France 7.7% |
| France Government Bond OAT |
| 0.00%, 05/25/20 (EUR) (a) | 1,745,000 | 2,088,473 |
| 0.50%, 05/25/25 (EUR) | 1,000,000 | 1,193,221 |
| 5.75%, 10/25/32 (EUR) | 775,000 | 1,497,047 |
| 1.25%, 05/25/36 (EUR) | 850,000 | 971,221 |
| 3.25%, 05/25/45 (EUR) | 710,000 | 1,118,519 |
| | | 6,868,481 |
| |
| Germany 7.9% |
| Bundesobligation |
| 0.00%, 10/08/21 (EUR) (a) | 1,000,000 | 1,203,321 |
| Bundesrepublik Deutschland |
| 0.00%, 08/15/26 (EUR) (a) | 1,500,000 | 1,725,838 |
| 0.50%, 08/15/27 (EUR) | 500,000 | 593,062 |
| Bundesschatzanweisungen |
| 0.00%, 06/14/19 (EUR) (a) | 934,000 | 1,117,934 |
Security
Rate, Maturity Date | Face Amount
(local currency) | Value ($) |
| Kreditanstalt fuer Wiederaufbau |
| 2.05%, 02/16/26 (JPY) | 230,000,000 | 2,416,436 |
| | | 7,056,591 |
| |
| Japan 19.3% |
| Japan Government Five Year Bond |
| 0.10%, 09/20/19 (JPY) | 100,000,000 | 892,716 |
| 0.10%, 06/20/21 (JPY) | 150,000,000 | 1,342,657 |
| Japan Government Ten Year Bond |
| 0.60%, 03/20/24 (JPY) | 306,000,000 | 2,834,021 |
| 0.10%, 06/20/26 (JPY) | 212,000,000 | 1,897,604 |
| Japan Government Thirty Year Bond |
| 2.40%, 12/20/34 (JPY) | 275,000,000 | 3,235,723 |
| Japan Government Twenty Year Bond |
| 1.60%, 06/20/30 (JPY) | 274,000,000 | 2,865,832 |
| 0.20%, 06/20/36 (JPY) | 483,700,000 | 4,058,326 |
| | | 17,126,879 |
| |
| Malaysia 3.0% |
| Malaysia Government Bond |
| 4.05%, 09/30/21 (MYR) | 2,420,000 | 583,150 |
| 4.18%, 07/15/24 (MYR) | 7,850,000 | 1,892,208 |
| 4.25%, 05/31/35 (MYR) | 670,000 | 155,096 |
| | | 2,630,454 |
| |
| Mexico 3.9% |
| Mexico Government Bond |
| 6.50%, 06/10/21 (MXN) | 26,000,000 | 1,420,348 |
| 7.50%, 06/03/27 (MXN) | 9,600,000 | 550,664 |
| 7.75%, 11/23/34 (MXN) | 26,280,000 | 1,532,985 |
| | | 3,503,997 |
| |
| Netherlands 4.8% |
| Netherlands Government Bond |
| 0.00%, 01/15/22 (EUR) (a) | 388,000 | 464,854 |
| 5.50%, 01/15/28 (EUR) | 2,138,490 | 3,785,997 |
| | | 4,250,851 |
| |
| New Zealand 4.5% |
| New Zealand Government Bond |
| 5.00%, 03/15/19 (NZD) | 200,000 | 150,801 |
| 5.50%, 04/15/23 (NZD) | 1,605,000 | 1,335,684 |
| 4.50%, 04/15/27 (NZD) | 3,039,000 | 2,473,067 |
| | | 3,959,552 |
| |
Laudus Mondrian Funds | Semiannual Report
Laudus Mondrian International Government Fixed Income Fund
Portfolio Holdings as of September 30, 2017 (Unaudited) (continued)
Security
Rate, Maturity Date | Face Amount
(local currency) | Value ($) |
| Poland 2.9% |
| Poland Government Bond |
| 2.50%, 07/25/26 (PLN) | 3,750,000 | 967,303 |
| 5.75%, 04/25/29 (PLN) | 4,850,000 | 1,648,242 |
| | | 2,615,545 |
| |
| Singapore 4.6% |
| Singapore Government Bond |
| 2.00%, 07/01/20 (SGD) | 2,010,000 | 1,504,481 |
| 2.38%, 06/01/25 (SGD) | 2,350,000 | 1,776,641 |
| 2.88%, 09/01/30 (SGD) | 1,000,000 | 782,558 |
| | | 4,063,680 |
| |
| Spain 7.3% |
| Spain Government Bond |
| 1.40%, 01/31/20 (EUR) | 2,200,000 | 2,696,981 |
| 1.60%, 04/30/25 (EUR) | 2,050,000 | 2,521,660 |
| 4.20%, 01/31/37 (EUR) | 813,000 | 1,227,915 |
| | | 6,446,556 |
| Total Government Bonds |
| (Cost $74,722,551) | | 78,607,298 |
|
| Supranational* 9.2% of net assets |
| Asian Development Bank |
| 2.35%, 06/21/27 (JPY) | 380,000,000 | 4,127,187 |
| European Investment Bank |
| 2.15%, 01/18/27 (JPY) | 375,000,000 | 4,012,905 |
| Total Supranational |
| (Cost $8,323,187) | | 8,140,092 |
| Security | Number
of Shares | Value ($) |
| Other Investment Company 1.0% of net assets |
| |
| United States 1.0% |
| State Street Institutional U.S. Government Money Market Fund, Premier Class 0.92% (b) | 904,570 | 904,570 |
| Total Other Investment Company |
| (Cost $904,570) | | 904,570 |
| * | Supranational bonds represent the debt of international organizations or institutions such as the World Bank, the International Monetary Fund, regional multilateral development banks and others. |
| (a) | Zero Coupon Bond. |
| (b) | The rate shown is the 7-day yield. |
| | |
| AUD — | Australian dollar |
| CAD — | Canadian dollar |
| EUR — | euro currency |
| GBP — | Great British pound |
| JPY — | Japanese yen |
| MXN — | Mexican peso |
| MYR — | Malaysian ringgit |
| NZD — | New Zealand dollar |
| PLN — | Polish zloty |
| SEK — | Swedish Krona |
| SGD — | Singapore dollar |
| USD — | U.S. dollar |
In addition to the above, the fund held the following at 09/30/17:
| Expiration Date | Counterparty | Currency
to be
Received | Amount of
Currency
to be
Received | Currency
to be
Delivered | Amount of
Currency
to be
Delivered | Unrealized
Appreciation
(Depreciation)
($) |
| Forward Foreign Currency Exchange Contracts | | | | | | |
| 10/26/2017 | State Street Bank & Trust Co. | AUD | 69,500 | USD | 54,506 | (4) |
| 10/26/2017 | State Street Bank & Trust Co. | AUD | 215,000 | USD | 169,952 | (1,350) |
| 10/26/2017 | State Street Bank & Trust Co. | GBP | 144,000 | USD | 186,050 | 7,054 |
| 10/26/2017 | State Street Bank & Trust Co. | GBP | 872,000 | USD | 1,140,886 | 28,471 |
| 10/26/2017 | State Street Bank & Trust Co. | GBP | 9,831,500 | USD | 12,868,598 | 315,501 |
| 10/26/2017 | State Street Bank & Trust Co. | NZD | 62,500 | USD | 45,644 | (522) |
| 10/26/2017 | State Street Bank & Trust Co. | NZD | 64,000 | USD | 46,553 | (347) |
| 10/26/2017 | State Street Bank & Trust Co. | SEK | 13,221,500 | USD | 1,616,814 | 8,535 |
| 10/26/2017 | State Street Bank & Trust Co. | SGD | 27,500 | USD | 20,236 | 43 |
| 10/26/2017 | State Street Bank & Trust Co. | SGD | 29,000 | USD | 21,601 | (216) |
| 10/26/2017 | State Street Bank & Trust Co. | SGD | 160,500 | USD | 117,805 | 551 |
| 10/26/2017 | State Street Bank & Trust Co. | USD | 5,426,421 | AUD | 6,868,000 | 40,565 |
| 10/26/2017 | State Street Bank & Trust Co. | USD | 248,913 | GBP | 183,500 | 2,838 |
| 10/26/2017 | State Street Bank & Trust Co. | USD | 329,159 | GBP | 242,000 | 4,636 |
| 10/26/2017 | State Street Bank & Trust Co. | USD | 348,075 | GBP | 262,000 | (3,269) |
| 10/26/2017 | State Street Bank & Trust Co. | USD | 219,792 | GBP | 170,500 | (8,850) |
| 10/26/2017 | State Street Bank & Trust Co. | USD | 4,169,314 | NZD | 5,623,000 | 109,695 |
| 10/26/2017 | State Street Bank & Trust Co. | USD | 1,628,765 | SEK | 13,221,500 | 3,416 |
| 10/26/2017 | State Street Bank & Trust Co. | USD | 22,321 | SGD | 30,000 | 199 |
| 10/26/2017 | State Street Bank & Trust Co. | USD | 4,184,344 | SGD | 5,690,000 | (11,574) |
| Net Unrealized Appreciation on Forward Foreign Currency Exchange Contracts | 495,372 |
Laudus Mondrian Funds | Semiannual Report
Laudus Mondrian International Government Fixed Income Fund
Portfolio Holdings as of September 30, 2017 (Unaudited) (continued)
The following is a summary of the inputs used to value the fund’s investments as of September 30, 2017 (see financial note 2(a) for additional information):
| Description | Quoted Prices in
Active Markets for
Identical Assets
(Level 1) | Other Significant
Observable Inputs
(Level 2) | Significant
Unobservable Inputs
(Level 3) | Total | |
| Assets | | | | | |
| Government Bonds1 | $— | $78,607,298 | $— | $78,607,298 | |
| Supranational | — | 8,140,092 | — | 8,140,092 | |
| Other Investment Company1 | 904,570 | — | — | 904,570 | |
| Forward Foreign Currency Exchange Contracts2 | — | 521,504 | — | 521,504 | |
| Liabilities | | | | | |
| Forward Foreign Currency Exchange Contracts2 | — | (26,132) | — | (26,132) | |
| Total | $904,570 | $87,242,762 | $— | $88,147,332 | |
| 1 | As categorized in Portfolio Holdings. |
| 2 | Forward foreign currency exchange contracts are valued at unrealized appreciation or depreciation. |
The fund’s policy is to recognize transfers between Level 1, Level 2 and Level 3 as of the beginning of the fiscal year. There were no transfers between Level 1, Level 2 and Level 3 for the period ended September 30, 2017. Fund investments in underlying mutual funds are classified as Level 1, without consideration to the classification level of the investments held by the underlying mutual funds, which could be Level 1, Level 2 or Level 3.
Laudus Mondrian Funds | Semiannual Report
Laudus Mondrian International Government Fixed Income Fund
Statement of Assets and Liabilities
As of September 30, 2017; unaudited
| Assets |
| Investments in unaffiliated issuers, at value (cost $83,950,308) | | $87,651,960 |
| Receivables: | | |
| Interest | | 694,932 |
| Fund shares sold | | 21,501 |
| Dividends | | 608 |
| Unrealized appreciation on forward foreign currency exchange contracts | | 521,504 |
| Prepaid expenses | + | 15,787 |
| Total assets | | 88,906,292 |
| Liabilities |
| Payables: | | |
| Investment adviser fees | | 42,590 |
| Fund shares redeemed | | 3,287 |
| Unrealized depreciation on forward foreign currency exchange contracts | | 26,132 |
| Accrued expenses | + | 73,190 |
| Total liabilities | | 145,199 |
| Net Assets |
| Total assets | | 88,906,292 |
| Total liabilities | – | 145,199 |
| Net assets | | $88,761,093 |
| Net Assets by Source | | |
| Capital received from investors | | 90,895,700 |
| Net investment loss | | (4,421,056) |
| Net realized capital losses | | (1,924,131) |
| Net unrealized capital appreciation | | 4,210,580 |
| Net Asset Value (NAV) |
| Net Assets | ÷ | Shares
Outstanding | = | NAV |
| $88,761,093 | | 8,948,223 | | $9.92 |
| | | | | |
Laudus Mondrian Funds | Semiannual Report
Laudus Mondrian International Government Fixed Income Fund
Statement of Operations
For the period April 1, 2017 through September 30, 2017; unaudited
| Investment Income |
| Dividends | | $4,320 |
| Interest | + | 752,488 |
| Total investment income | | 756,808 |
| Expenses |
| Investment adviser fees | | 282,480 |
| Professional fees | | 26,060 |
| Custodian fees | | 22,203 |
| Transfer agent fees | | 16,092 |
| Accounting and administration fees | | 10,967 |
| Registration fees | | 10,152 |
| Shareholder reports | | 6,715 |
| Independent trustees’ fees | | 6,688 |
| Interest expense | | 462 |
| Custody out-of-pocket fee reimbursement | | (11,487)* |
| Other expenses | + | 2,523 |
| Total expenses | | 372,855 |
| Expense reduction by adviser | – | 30,780 |
| Net expenses | – | 342,075 |
| Net investment income | | 414,733 |
| Realized and Unrealized Gains (Losses) |
| Net realized losses on investments | | (1,678,261) |
| Net realized losses on foreign currency transactions | | (93,825) |
| Net realized gains on forward foreign currency exchange contracts | + | 252,889 |
| Net realized losses | | (1,519,197) |
| Net change in unrealized appreciation (depreciation) on investments | | 6,615,725 |
| Net change in unrealized appreciation (depreciation) on foreign currency translations | | 4,989 |
| Net change in unrealized appreciation (depreciation) on forward foreign currency exchange contracts | + | 363,137 |
| Net change in unrealized appreciation (depreciation) | + | 6,983,851 |
| Net realized and unrealized gains | | 5,464,654 |
| Increase in net assets resulting from operations | | $5,879,387 |
| * | See financial note 12 for additional information. |
Laudus Mondrian Funds | Semiannual Report
Laudus Mondrian International Government Fixed Income Fund
Statement of Changes in Net Assets
For the current and prior report periods
Figures for the current period are unaudited
| Operations | |
| | 4/1/17-9/30/17 | 4/1/16-3/31/17 |
| Net investment income | | $414,733 | $1,129,081 |
| Net realized losses | | (1,519,197) | (4,813,012) |
| Net change in unrealized appreciation (depreciation) | + | 6,983,851 | (3,925,465) |
| Increase (decrease) in net assets from operations | | 5,879,387 | (7,609,396) |
| Distributions to Shareholders | |
| Distributions from net investment income | | — | (14,676) |
| Distributions from net realized gains | + | — | (761,942) |
| Total distributions | | $— | ($776,618) |
| Transactions in Fund Shares | | | |
| | | 4/1/17-9/30/17 | 4/1/16-3/31/17 |
| | | SHARES | VALUE | SHARES | VALUE |
| Shares sold | | 346,004 | $3,359,649 | 8,151,717 | $81,286,242 |
| Shares reinvested | | — | — | 56,636 | 506,323 |
| Shares redeemed | + | (1,646,274) | (16,043,367) | (10,038,045) | (97,779,218) |
| Net transactions in fund shares | | (1,300,270) | ($12,683,718) | (1,829,692) | ($15,986,653) |
| Shares Outstanding and Net Assets | | | |
| | | 4/1/17-9/30/17 | 4/1/16-3/31/17 |
| | | SHARES | NET ASSETS | SHARES | NET ASSETS |
| Beginning of period | | 10,248,493 | $95,565,424 | 12,078,185 | $119,938,091 |
| Total decrease | + | (1,300,270) | (6,804,331) | (1,829,692) | (24,372,667) |
| End of period | | 8,948,223 | $88,761,093 | 10,248,493 | $95,565,424 |
| Net investment loss | | | ($4,421,056) | | ($4,835,789) |
Laudus Mondrian Funds | Semiannual Report
Financial Notes, unaudited
1. Business Structure of the Funds:
Each of the funds in this report is a series of Laudus Trust (the trust), a no-load, open-end management investment company. The trust is organized as a Massachusetts business trust and is registered under the Investment Company Act of 1940, as amended (the 1940 Act). The list below shows all the funds in the trust as of the end of the period, including the funds discussed in this report, which are highlighted:
| LAUDUS TRUST (ORGANIZED APRIL 1, 1988) |
| Laudus Mondrian International Equity Fund | |
| Laudus Mondrian Emerging Markets Fund | |
| Laudus Mondrian International Government Fixed Income Fund | |
| Laudus U.S. Large Cap Growth Fund | |
Prior to July 25, 2017, Laudus Mondrian International Equity Fund and Laudus Mondrian Emerging Markets Fund each offered three share classes: Investor Shares, Select Shares and Institutional Shares.
Effective July 25, 2017, all outstanding Investor Shares and Select Shares of Laudus Mondrian International Equity Fund and Laudus Mondrian Emerging Markets Fund were consolidated into the Institutional Shares of each respective fund and each fund in this report no longer offers separate share classes.
Shares are bought and sold at closing net asset value per share (NAV), which is the price for all outstanding shares of a fund.
Each fund maintains its own account for purposes of holding assets and accounting, and is considered a separate entity for tax purposes. Within its account, each fund may also keep certain assets in segregated accounts, as required by securities law.
2. Significant Accounting Policies:
The following is a summary of the significant accounting policies the funds use in their preparation of financial statements. The funds follow the investment company accounting and reporting guidance of the Financial Accounting Standards Board (FASB) Accounting Standard Codification Topic 946 Financial Services — Investment Companies. The accounting policies are in conformity with accounting principles generally accepted in the United States of America (GAAP).
The funds invest in certain other investment companies (underlying funds). For more information about the underlying funds’ operations and policies, please refer to those funds’ semiannual and annual reports, which are filed with the U.S. Securities and Exchange Commission (SEC).
Effective August 1, 2017, the funds adopted disclosure requirement changes for SEC Regulation S-X. The adopted changes are reflected throughout this report.
(a) Security Valuation:
Under procedures approved by the funds’ Board of Trustees (the Board), the investment adviser has formed a Pricing Committee to administer the pricing and valuation of portfolio securities and other assets and to ensure that prices used for internal purposes or provided by third parties reasonably reflect fair market value. Among other things, these procedures allow the funds to utilize independent pricing services, quotations from securities and financial instrument dealers and other market sources to determine fair value.
The funds value the securities in their portfolios every business day. The funds use the following policies to value various types of securities:
• Securities traded on an exchange or over-the-counter: Traded securities are valued at the closing value for the day, or, on days when no closing value has been reported, at the mean of the most recent bid and ask quotes. Securities that are primarily traded on foreign exchanges are valued at the official closing price or the last sales price on the exchange where the securities are principally traded with these values then translated into U.S. dollars at the current exchange rate, unless these securities are fair valued as discussed below.
• Securities for which no quoted value is available: The Board has adopted procedures to fair value each fund’s securities when market prices are not “readily available” or are unreliable. For example, a fund may fair value a security when it is de-listed or its trading is halted or suspended; when a security’s primary pricing source is unable or unwilling to provide a price; or when a security’s primary trading market is closed during regular market hours. Each fund makes fair value determinations in good faith in accordance with the fund’s valuation procedures. The Pricing Committee considers a number of factors, including unobservable market inputs when arriving at fair value. The Pricing Committee may employ techniques
Laudus Mondrian Funds | Semiannual Report
Financial Notes, unaudited (continued)
2. Significant Accounting Policies (continued):
such as the review of related or comparable assets or liabilities, related market activities, recent transactions, market multiples, book values, transactional back-testing, disposition analysis and other relevant information. The Pricing Committee regularly reviews these inputs and assumptions to calibrate the valuations. Due to the subjective and variable nature of fair value pricing, there can be no assurance that a fund could obtain the fair value assigned to the security upon the sale of such security. The Board convenes on a regular basis to review fair value determinations made by the funds pursuant to the valuation procedures.
• Bonds and notes: Fixed income investments are generally valued using an evaluated price at the mid-point of the bid/ask spread provided by an approved, independent pricing service (mid-price). To determine the evaluated mid-price, a pricing service may use a variety of techniques and inputs. Techniques may include, but are not limited to, spread models that calculate an investment-specific price relative to a benchmark or yield curve models that establish a price based on yields of comparable bonds along a range of maturities. Inputs differ by valuation approach and technique, as appropriate, and examples of inputs may include, but are not limited to, interest rates, market conditions, comparable bonds, market trades, projected cash flows, credit reviews and issuer news.
• Foreign equity security fair valuation: The Board has adopted procedures to fair value foreign equity securities that are traded in markets that close prior to the funds valuing their holdings. By fair valuing securities whose prices may have been affected by events occurring after the close of trading, each fund seeks to establish prices that investors might expect to realize upon the current sales of these securities. This methodology is designed to deter “arbitrage” market timers, who seek to exploit delays between the change in the value of a fund’s portfolio holdings and the NAV of the fund’s shares, and seeks to help ensure that the prices at which the fund’s shares are purchased and redeemed are fair and do not result in dilution of shareholder interest or other harm to shareholders. When fair value pricing is used at the open or close of a reporting period, it may cause a temporary divergence between the return of a fund and that of its comparative index or benchmark. The Board regularly reviews fair value determinations made by the funds pursuant to these procedures.
• Forward foreign currency exchange contracts (forwards): Forwards are valued based on that day’s forward exchange rates or by using an interpolated forward exchange rate for contracts with interim settlement dates.
• Underlying funds: Mutual funds are valued at their respective NAVs.
In accordance with the authoritative guidance on fair value measurements and disclosures under GAAP, the funds disclose the fair value of their investments in a hierarchy that prioritizes the significant inputs to valuation techniques used to measure the fair value. The hierarchy gives the highest priority to valuations based upon unadjusted quoted prices in active markets for identical assets or liabilities (Level 1 measurements) and the lowest priority to valuations based upon unobservable inputs that are significant to the valuation (Level 3 measurements). If inputs used to measure the financial instruments fall within different levels of the hierarchy, the categorization is based on the lowest level input that is significant to the valuation. If the funds determine that either the volume and/or level of activity for an asset or liability has significantly decreased (from normal conditions for that asset or liability) or price quotations or observable inputs are not associated with orderly transactions, increased analysis and management judgment will be required to estimate fair value.
The three levels of the fair value hierarchy are as follows:
• Level 1—quoted prices in active markets for identical securities—Investments whose values are based on quoted market prices in active markets, and whose values are therefore classified as Level 1 prices, include active listed equities. Investments in mutual funds are valued daily at their NAVs, which are classified as Level 1 prices, without consideration to the classification level of the specific investments held by an underlying fund.
• Level 2—other significant observable inputs (including quoted prices for similar securities, interest rates, prepayment speeds, credit risk, etc.)—Investments that trade in markets that are not considered to be active, but whose values are based on quoted market prices, dealer quotations or valuations provided by alternative pricing sources supported by observable inputs are classified as Level 2 prices. These generally include U.S. government and sovereign obligations, most government agency securities, investment-grade corporate bonds, certain mortgage products, less liquid listed equities, and state, municipal and provincial obligations. In addition, international securities whose markets close hours before the funds value their holdings may require fair valuations due to significant movement in the U.S. markets occurring after the daily close of the foreign markets. The Board has approved a vendor that calculates fair valuations of international equity securities based on a number of factors that appear to correlate to the movements in the U.S. markets.
Laudus Mondrian Funds | Semiannual Report
Financial Notes, unaudited (continued)
2. Significant Accounting Policies (continued):
• Level 3—significant unobservable inputs (including the funds’ own assumptions in determining the fair value of investments)—Investments whose values are classified as Level 3 prices have significant unobservable inputs, as they may trade infrequently or not at all. When observable prices are not available for these securities, the funds use one or more valuation techniques for which sufficient and reliable data is available. The inputs used by the funds in estimating the value of Level 3 prices may include the original transaction price, quoted prices for similar securities or assets in active markets, completed or pending third-party transactions in the underlying investment or comparable issuers, and changes in financial ratios or cash flows. Level 3 prices may also be adjusted to reflect illiquidity and/or non-transferability, with the amount of such discount estimated by the funds in the absence of market information. Assumptions used by the funds due to the lack of observable inputs may significantly impact the resulting fair value and therefore the funds’ results of operations.
The inputs or methodology used for valuing securities are not necessarily an indication of the risk associated with investing in those securities.
The levels associated with valuing the funds’ investments as of September 30, 2017 are disclosed in the Portfolio Holdings.
(b) Accounting Policies for certain Portfolio Investments (if held):
Forward Foreign Currency Exchange Contracts: Forwards are contracts to buy and sell a currency at a set price on a future date. The value of the forwards is accounted for as unrealized appreciation or depreciation until the contracts settle, at which time the gains or losses are realized.
(c) Security Transactions:
Security transactions are recorded as of the date the order to buy or sell the security is executed. Realized gains and losses from security transactions are based on the identified costs of the securities involved.
Assets and liabilities denominated in foreign currencies are reported in U.S. dollars. For assets and liabilities held on a given date, the dollar value is based on market exchange rates in effect on that date. Transactions involving foreign currencies, including purchases, sales, income receipts and expense payments, are calculated using exchange rates in effect on the transaction date. Realized foreign exchange gains or losses arise from sales of foreign currencies, currency gains or losses realized between the trade and settlement dates on securities transactions and the differences between the recorded amounts of dividends, interest, and foreign withholding taxes and the U.S. dollar equivalent of the amounts actually received or paid. Net unrealized foreign exchange appreciation or depreciation arises from changes in foreign exchange rates on foreign denominated assets and liabilities other than investments in securities held at the end of the reporting period. These realized and unrealized foreign exchange gains or losses are reported in foreign currency transactions or translations on the Statement of Operations. The funds do not isolate the portion of the fluctuations on investments resulting from changes in foreign currency exchange rates from the fluctuations in market prices of investments held. Such fluctuations are included with the net realized and unrealized gain or loss from investments.
Gains realized by the funds on the sale of securities in certain foreign countries may be subject to non-U.S. taxes. In those instances, the funds record a liability based on unrealized appreciation to provide for potential non-U.S. taxes payable upon the sale of these securities.
When a fund closes out a forwards position, it calculates the difference between the value of the position at the beginning and at the end of the contract, and records a realized gain or loss accordingly.
(d) Investment Income:
Interest income is recorded as it accrues. If a fund buys a debt security at a discount (less than face value) or a premium (more than face value), it amortizes premiums and accretes discounts from the purchase settlement date up to maturity. The fund then increases (in the case of discounts) or reduces (in the case of premiums) the income it records from the security. Certain securities may be callable (meaning that the issuer has the option to pay it off before its maturity date). The fund amortizes the premium and accretes the discount on each callable security to the security’s maturity date, except when the purchase price is higher than the call price at the security’s call date (in which case the premium is amortized to the call date). Dividends and distributions from portfolio securities and underlying funds are recorded on the date they are effective (the ex-dividend date), although the funds record certain foreign security dividends on the day they learn of the ex-dividend date. Any distributions from underlying funds are recorded in accordance with the character of the distributions as designated by the underlying funds.
Laudus Mondrian Funds | Semiannual Report
Financial Notes, unaudited (continued)
2. Significant Accounting Policies (continued):
Income received from foreign sources may result in withholding tax. Withholding taxes are accrued at the same time as the related income if the tax rate is fixed and known, unless a tax withheld is reclaimable from the local tax authorities in which case it is recorded as a receivable. If the tax rate is not known or estimable, such expense or reclaim receivable is recorded when the net proceeds are received.
In 2016, the Laudus International Equity Fund filed claims to recover taxes previously withheld in certain European Union countries on the basis that those countries had purportedly violated certain provisions in the Treaty on the Functioning of the European Union. These filings are subject to various administrative and judicial proceedings within these countries, and all professional fees associated with these filings have been paid by CSIM.
(e) Expenses:
Expenses that are specific to a fund are charged directly to the fund. Expenses that are common to all funds within the trust generally are allocated among the funds in proportion to their average daily net assets.
Prior to July 25, 2017, for the funds that offered multiple share classes, the net investment income, other than class specific expenses, and the realized and unrealized gains or losses, were allocated daily to each class in proportion to their average daily net assets.
(f) Distributions to Shareholders:
The funds make distributions from net realized gains, if any, once a year. The Laudus Mondrian International Equity Fund and Laudus Mondrian Emerging Markets Fund make distributions from net investment income, if any, once a year, while the Laudus Mondrian International Government Fixed Income Fund makes distributions from net investment income, if any, quarterly.
(g) Custody Credit:
The funds have an arrangement with their custodian bank, State Street Bank and Trust Company (State Street), under which the funds may receive a credit for their uninvested cash balance to offset their custody fees and accounting fees. The credit amounts, if any, are disclosed in the Statement of Operations as a reduction to the funds’ operating expenses.
(h) Accounting Estimates:
The accounting policies described in this report conform to GAAP. Notwithstanding this, shareholders should understand that in order to follow these principles, fund management has to make estimates and assumptions that affect the information reported in the financial statements. It’s possible that once the results are known, they may turn out to be different from these estimates and these differences may be material.
(i) Federal Income Taxes:
The funds intend to meet federal income and excise tax requirements for regulated investment companies under subchapter M of the Internal Revenue Code, as amended. Accordingly, the funds distribute substantially all of their net investment income and net realized capital gains, if any, to their respective shareholders each year. As long as a fund meets the tax requirements, it is not required to pay federal income tax.
(j) Foreign Taxes:
The funds may be subject to foreign taxes (a portion of which may be reclaimable) on income, corporate events, foreign currency exchanges and capital gains on investments. All foreign taxes are recorded in accordance with the applicable foreign tax regulations and rates that exist in foreign markets in which the funds invest. These foreign taxes, if any, are paid by the funds and are disclosed in the Statement of Operations. Foreign taxes payable as of September 30, 2017, if any, are reflected in each fund’s Statement of Assets and Liabilities.
(k) Indemnification:
Under the funds’ organizational documents, the officers and trustees are indemnified against certain liabilities arising out of the performance of their duties to the funds. In addition, in the normal course of business the funds enter into contracts with their vendors and others that provide general indemnifications. The funds’ maximum exposure under these arrangements is unknown as this would involve future claims that may be made against the funds. However, based on experience, the funds expect the risk of loss attributable to these arrangements to be remote.
Laudus Mondrian Funds | Semiannual Report
Financial Notes, unaudited (continued)
2. Significant Accounting Policies (continued):
(l) Recent Accounting Standards:
In March 2017, the Financial Accounting Standards Board issued Accounting Standards Update “Premium Amortization on Purchased Callable Debt Securities” which amends the amortization period for a callable debt security held at a premium from the maturity date to the earliest call date. The guidance is effective for annual periods beginning after December 15, 2018, and interim periods within those annual periods. At this time, management is evaluating the implications of these changes on the funds.
3. Risk Factors:
Investing in the funds may involve certain risks, as discussed in the funds’ prospectus, including, but not limited to, those described below. Any of these risks could cause an investor to lose money.
• Market Risk. Financial markets rise and fall in response to a variety of factors, sometimes rapidly and unpredictably. As with any investment whose performance is tied to these markets, the value of an investment in the fund will fluctuate, which means that an investor could lose money over short or long periods.
• Management risk. As with all actively managed funds, a fund is subject to the risk that its sub-adviser will select investments or allocate assets in a manner that could cause the fund to underperform or otherwise not meet its objective. Poor stock or bond selection or a focus on securities in a particular sector or region may cause a fund to underperform its benchmark or other funds with a similar investment objective.
• Equity Risk. The prices of equity securities rise and fall daily. These price movements may result from factors affecting individual companies, industries or the securities market as a whole. In addition, equity markets tend to move in cycles, which may cause stock prices to fall over short or extended periods of time.
• Market Capitalization Risk. Securities issued by companies of different market capitalizations tend to go in and out of favor based on market and economic conditions. During a period when securities of a particular market capitalization fall behind other types of investments, a fund’s performance could be impacted.
• Large-Cap Company Risk. Large-cap companies are generally more mature and the securities issued by these companies may not be able to reach the same levels of growth as the securities issued by small- or mid-cap companies.
• Foreign Investment Risk. A fund’s investments in securities of foreign issuers involve certain risks that may be greater than those associated with investments in securities of U.S. issuers. These include risks of adverse changes in foreign economic, political, regulatory and other conditions; changes in currency exchange rates or exchange control regulations (including limitations on currency movements and exchanges); the imposition of economic sanctions or other government restrictions; differing accounting, auditing, financial reporting and legal standards and practices; differing securities market structures; and higher transaction costs. These risks may negatively impact the value or liquidity of a fund’s investments, and could impair a fund’s ability to meet its investment objective or invest in accordance with its investment strategy. There is a risk that investments in securities denominated in, and/or receiving revenues in, foreign currencies will decline in value relative to the U.S. dollar or, in the case of hedging positions, that the U.S. dollar will decline in value relative to the currency hedged, resulting in the dollar value of the fund’s investment being adversely affected. Foreign securities also include American Depositary receipts (ADRs), Global Depositary receipts (GDRs) and European Depositary receipts (EDRs) which may be less liquid than the underlying shares in their primary trading market and GDRs, many of which are issued by companies in emerging markets, may be more volatile. These risks may be heightened in connection with investments in emerging markets or securities of issuers that conduct their business in emerging markets.
• Emerging Markets Risk. Emerging market countries may be more likely to experience political turmoil or rapid changes in market or economic conditions than more developed countries. Emerging market countries often have less uniformity in accounting and reporting requirements and greater risk associated with the custody of securities. In addition, the financial stability of issuers (including governments) in emerging market countries may be more precarious than in developed countries. As a result, there may be an increased risk of illiquidity and price volatility associated with the fund’s investments in emerging market countries, which may be magnified by currency fluctuations relative to the U.S. dollar, and, at times, it may be difficult to value such investments.
• Currency risk. A fund’s investments in securities denominated in, and/or receiving revenues in, foreign currencies, will subject the fund to the risk that those currencies will decline in value relative to the U.S. dollar, or, in the case of hedging positions, that the U.S. dollar will decline in value relative to the currency hedged. In either event, the dollar value of an investment in the
Laudus Mondrian Funds | Semiannual Report
Financial Notes, unaudited (continued)
3. Risk Factors (continued):
fund would be adversely affected. Forward contracts on foreign currencies are not traded on exchanges; rather, a bank or dealer will act as agent or as principal in order to make or take future delivery of a specified lot of a particular currency or the fund’s account. The fund is subject to the risk of a counterparty’s failure, inability or refusal to perform with respect to such contracts.
• Derivatives Risk. A fund’s use of derivative instruments involves risks different from, or possibly greater than, the risks associated with investing directly in securities and other traditional investments. A fund’s use of derivatives could reduce the fund’s performance, increase the fund’s volatility, and could cause the fund to lose more than the initial amount invested. In addition, investments in derivatives may involve leverage, which means a small percentage of assets invested in derivatives can have a disproportionately large impact on a fund.
• Fixed Income Risk. Interest rates rise and fall over time, which will affect a fund’s yield and share price. A change in a central bank’s monetary policy or improving economic conditions may result in an increase in interest rates. A sharp rise in interest rates could cause the fund to lose value. The credit quality of a portfolio investment could also cause the fund’s share price to fall. A fund could lose money if the issuer or guarantor of a portfolio investment or the counterparty to a derivatives contract fails to make timely principal or interest payments or otherwise honor its obligations. Fixed income securities may be paid off earlier or later than expected. Either situation could cause the fund to hold securities paying lower than market rates of interest, which could hurt the fund’s yield or share price. Below investment-grade bonds (junk bonds) involve greater risks than investment-grade securities.
• Leverage risk. Certain fund transactions, such as derivatives, may give rise to a form of leverage and may expose a fund to greater risk. Leverage tends to magnify the effect of any increase or decrease in the value of a fund’s portfolio securities, which means even a small amount of leverage can have a disproportionately large impact on the fund.
• Liquidity risk. The fund may be unable to sell certain securities, such as illiquid securities, readily at a favorable time or price, or the fund may have to sell them at a loss.
Please refer to the funds’ prospectus for a more complete description of the principal risks of investing in the funds.
4. Affiliates and Affiliated Transactions:
Investment Adviser
Charles Schwab Investment Management, Inc. (CSIM or the investment adviser), a wholly owned subsidiary of The Charles Schwab Corporation, serves as each fund’s investment adviser pursuant to an Investment Advisory Agreement (Advisory Agreement) between CSIM and the trust. Mondrian Investment Partners Limited (Mondrian), the funds’ sub-adviser, provides day-to-day portfolio management services to the funds, subject to the supervision of CSIM.
For its advisory services to the following funds, CSIM is entitled to receive an annual fee, payable monthly, based on a percentage of each fund’s average daily net assets described as follows:
| Laudus Mondrian International Equity Fund | 0.75% |
| Laudus Mondrian Emerging Markets Fund | 1.00% |
| Laudus Mondrian International Government Fixed Income Fund | 0.60% |
CSIM (not the funds) pays a portion of the advisory fees it receives to Mondrian in return for its services.
Expense Limitation
CSIM has contractually agreed, until at least July 30, 2019, to limit the total annual fund operating expenses charged, excluding interest, taxes and certain non-routine expenses as follows:
| Laudus Mondrian International Equity Fund | 0.90% |
| Laudus Mondrian Emerging Markets Fund | 1.20% |
| Laudus Mondrian International Government Fixed Income Fund | 0.75% |
Laudus Mondrian Funds | Semiannual Report
Financial Notes, unaudited (continued)
4. Affiliates and Affiliated Transactions (continued):
Prior to July 25, 2017, the expense limitations for funds that offered multiple share classes were:
| | Laudus Mondrian
International
Equity Fund | Laudus Mondrian
Emerging
Markets Fund |
| Investor Shares | 1.30% | 1.60% |
| Select Shares | 1.05% | 1.35% |
| Institutional Shares | 0.90% | 1.20% |
Any amounts waived or reimbursed in a particular fiscal year will be subject to repayment through the next two fiscal years, to the extent that the repayment will not cause the funds’ net expenses to exceed the limit (as stated in CSIM’s contractual undertaking) during the respective year. For the period ended September 30, 2017, the funds did not make any repayments of prior years’ waived amounts.
As of September 30, 2017, the balance of recoupable waivers and the respective years of expiration are as follows:
| Expiration Date | Laudus Mondrian
International
Equity Fund | | Laudus Mondrian
Emerging
Markets Fund | | Laudus Mondrian
International
Government Fixed
Income Fund |
| March 31, 2018 | $146,935 | | $52,987 | | $78,310 |
| March 31, 2019 | 70,113 | | 72,219 | | 52,325 |
| March 31, 2020 | 48,646 | | 72,064 | | 30,780 |
| Total | $265,694 | | $197,270 | | $161,415 |
Investments from Affiliates
Certain Schwab funds may own shares of other Schwab funds. The table below reflects the percentages of shares of each fund in this report that are owned by other Schwab funds as of September 30, 2017, as applicable:
| | Underlying Funds |
| | Laudus Mondrian
Mondrian
Emerging
Markets Fund | Laudus Mondrian
International
Government Fixed
Income Fund |
| Schwab Target 2010 Fund | —% | 0.5% |
| Schwab Target 2015 Fund | —% | 0.9% |
| Schwab Target 2020 Fund | 0.5% | 8.0% |
| Schwab Target 2025 Fund | 1.4% | 7.0% |
| Schwab Target 2030 Fund | 4.2% | 12.1% |
| Schwab Target 2035 Fund | 2.8% | 4.6% |
| Schwab Target 2040 Fund | 8.1% | 6.0% |
| Schwab Target 2045 Fund | 1.1% | 0.6% |
| Schwab Target 2050 Fund | 1.1% | 0.5% |
| Schwab Target 2055 Fund | 0.7% | 0.1% |
| Schwab Target 2060 Fund | 0.1% | 0.0%* |
Other Affiliated Transactions
The professional fees related to foreign withholding tax claims discussed in financial note 2 were non-routine expenses. However, the investment adviser agreed to pay these professional fees for this reporting period, subject to reimbursement by the Laudus International Equity Fund to the extent the fund is able to successfully recover taxes withheld in the future. As of September 30, 2017, the balance of professional fees related to foreign withholding tax subject to future reimbursement by the fund to the investment adviser was $8,945 for Laudus Mondrian International Equity Fund.
Laudus Mondrian Funds | Semiannual Report
Financial Notes, unaudited (continued)
4. Affiliates and Affiliated Transactions (continued):
No other amounts for additional tax reclaims are reflected in the financial statements due to the uncertainty surrounding the ultimate resolution of proceedings, the likelihood of receipt of these claims, and the potential timing of payment.
5. Distribution and Shareholder Services:
Effective July 25, 2017, none of the funds in this report are subject to a distribution and shareholder service fee.
Prior to July 25, 2017, the trust had a Distribution and Shareholder Service Plan with respect to its Investor Shares pursuant to Rule 12b-1 under the 1940 Act. The Investor Shares of the funds were sold on a continuous basis by the trust’s distributor, ALPS Distributors, Inc. Under the Distribution and Shareholder Services Plan, the funds paid distribution and shareholder servicing fees in connection with the sale and servicing of the Investor Shares. The annual Distribution and Shareholder Service Fee consisted of up to 0.25% of the respective average daily net assets of the Investor Shares. In addition, the trustees had authorized the Laudus Mondrian International Equity Fund and Laudus Mondrian Emerging Markets Fund to reimburse, out of the Investor and Select Shares assets of the funds, financial intermediaries that provide sub-accounting and sub-transfer agency services in connection with Investor or Select Shares an amount of up to 0.15% of the average daily net assets of that class on an annual basis.
6. Board of Trustees:
The trust’s Board of Trustees oversees the general conduct of the trust and the funds.
The Board may include people who are officers and/or directors of CSIM or its affiliates. Federal securities law limits the percentage of such “interested persons” who may serve on a trust’s board, and the trust was in compliance with these limitations throughout the report period. The trust did not pay any of these interested persons for their services as trustees, but it did pay non-interested persons (independent trustees), as noted in each fund’s Statement of Operations. For information regarding the trustees, please refer to Trustees and Officers table at the end of this report.
7. Borrowing from Banks:
During the period, the funds were participants with other U.S. registered investment companies managed by CSIM in a joint, syndicated, committed $555 million line of credit (the Credit Facility). Under the terms of the Credit Facility, in addition to the interest charged on any borrowings by a fund, each fund paid a commitment fee of 0.15% per annum on its proportionate share of the unused portion of the Credit Facility. There were no borrowings from any of the lines of credit during the period.
The funds also have access to custodian overdraft facilities. A fund may have utilized the overdraft facility and incurred an interest expense, which is disclosed on the fund’s Statement of Operations, if any. The interest expense is determined based on a negotiated rate above the current Federal Funds Rate.
8. Purchases and Sales/Maturities of Investment Securities:
For the period ended September 30, 2017, purchases and sales/maturities of securities (excluding short-term obligations) were as follows:
| | Purchases
of Securities | Sales/Maturities
of Securities |
| Laudus Mondrian International Equity Fund | $13,935,731 | $11,917,659 |
| Laudus Mondrian Emerging Markets Fund | 60,649,973 | 118,522,713 |
| Laudus Mondrian International Government Fixed Income Fund | 34,749,564 | 50,997,502 |
Laudus Mondrian Funds | Semiannual Report
Financial Notes, unaudited (continued)
9. Derivatives:
The funds invested in forwards during the report period to hedge part of the funds’ exposure to certain currencies. Refer to financial note 2(b) for the funds’ accounting policies with respect to forwards and financial note 3 for disclosures concerning the risks of investing in forwards. During the period ended September 30, 2017, the month-end average forward foreign currency notional amount and the month-end average unrealized appreciation (depreciation) were as follows:
| | Forward Foreign Currency
Exchange Contract
Notional Amount | Net Unrealized
Appreciation (Depreciation) |
| Laudus Mondrian International Equity Fund | $— | $— |
| Laudus Mondrian Emerging Markets Fund | 171,075 | 87 |
| Laudus Mondrian International Government Fixed Income Fund | 28,720,480 | 91,915 |
The fair value of forwards held by the funds is presented as unrealized appreciation (depreciation) on forward foreign currency exchange contracts on the Statement of Assets and Liabilities as follows:
| | Laudus Mondrian
International
Equity Fund | Laudus Mondrian
Emerging
Markets Fund | Laudus Mondrian
International
Government Fixed
Income Fund |
| Asset Derivatives | Fair Value | | | |
| Forward Foreign Currency Exchange Contracts1 | $— | $— | $521,504 |
| Liability Derivatives | Fair Value | | | |
| Forward Foreign Currency Exchange Contracts2 | $— | $— | ($26,132) |
| 1 | Statement of Assets and Liabilities location: Unrealized appreciation on forward foreign currency exchange contracts. |
| 2 | Statement of Assets and Liabilities location: Unrealized depreciation on forward foreign currency exchange contracts. |
The effects of the forwards held by the funds in the Statement of Operations for the period ended September 30, 2017 were:
| | Forward Foreign Currency Exchange Contracts |
| | Laudus Mondrian
International
Equity Fund | Laudus Mondrian
Emerging
Markets Fund | Laudus Mondrian
International
Government Fixed
Income Fund | |
| Realized Gains (Losses) | $— | $43,735 | $252,889 | |
| Change in Unrealized Appreciation (Depreciation) | — | — | 363,137 | |
The funds’ forwards are entered into pursuant to International Swaps and Derivatives Association, Inc. (ISDA) agreements which govern certain terms of derivative transactions. ISDA agreements typically contain, among other things, master netting provisions in the event of a default or other termination event. Master netting provisions allow the funds and the counterparty, in the event of a default or other termination event, to offset payable and receivable amounts for each party related to derivative contracts to one net amount payable by either the funds or the counterparty. The funds’ forwards which are reported gross in the Statement of Assets and Liabilities, are presented in the tables below. The following tables present the funds’ forwards, net of amounts available for offset under a master netting agreement and net of any related collateral received by the funds for assets and pledged by the funds for liabilities as of September 30, 2017.
Laudus Mondrian Funds | Semiannual Report
Financial Notes, unaudited (continued)
9. Derivatives (continued):
Laudus Mondrian International Government Fixed Income Fund
| | | | Gross Amounts Not Offset in the
Statement of Assets & Liabilities |
| Counterparty | Net Amounts of Assets
Presented in the
Statement of Assets and Liabilities | | Financial
Instruments | | Cash Collateral
Received | | Net
Amounts(a) |
| State Street Bank & Trust Co. | $521,504 | | ($26,132) | | $— | | $495,372 |
| Total | $521,504 | | ($26,132) | | $— | | $495,372 |
| Counterparty | Net Amounts of Liabilities
Presented in the
Statement of Assets and Liabilities | | Financial
Instruments | | Cash Collateral
Pledged | | Net
Amounts(b) |
| State Street Bank & Trust Co. | ($26,132) | | $26,132 | | $— | | $— |
| Total | ($26,132) | | $26,132 | | $— | | $— |
| a | Represents the net amount due from the counterparty in the event of default. |
| b | Represents the net amount due to the counterparty in the event of default. |
10. Redemption Fee:
Prior to February 28, 2017, the funds charged a 2.00% redemption fee on shares sold or exchanged within 30 days of the original purchase date. Such amounts are netted against redemption proceeds on the Statement of Changes in Net Assets. Effective February 28, 2017, the funds no longer charge redemption fees. The redemption fees charged during the prior period were as follows:
| | Prior Period
(4/1/16-3/31/17) |
| Laudus Mondrian International Equity Fund | $5,510 |
| Laudus Mondrian Emerging Markets Fund | 262 |
| Laudus Mondrian International Government Fixed Income Fund | 6,652 |
11. Federal Income Taxes:
As of September 30, 2017, the tax basis cost of the funds’ investments and gross unrealized appreciation and depreciation were as follows:
| | Laudus Mondrian
International
Equity Fund | | Laudus Mondrian
Emerging
Markets Fund | | Laudus Mondrian
International
Government Fixed
Income Fund |
| Tax cost | $94,663,210 | | $282,682,102 | | $85,029,344 |
| Gross unrealized appreciation | $20,079,093 | | $39,511,713 | | $3,826,718 |
| Gross unrealized depreciation | (487,898) | | (18,188,634) | | (708,730) |
| Net unrealized appreciation (depreciation) | $19,591,195 | | $21,323,079 | | $3,117,988 |
Capital loss carryforwards may be used to offset future realized capital gains for federal income tax purposes. As of March 31, 2017, the funds had capital loss carryforwards available to offset future net capital gains as follows:
| Expiration Date | Laudus Mondrian
International
Equity Fund | Laudus Mondrian
Emerging
Markets Fund | Laudus Mondrian
International
Government Fixed
Income Fund |
| No expiration | $2,240,408 | $105,528,240 | $— |
Laudus Mondrian Funds | Semiannual Report
Financial Notes, unaudited (continued)
11. Federal Income Taxes (continued):
As of March 31, 2017, management has reviewed the tax positions for open periods (for federal purposes, three years from the date of filing and for state purposes, four years from the date of filing) as applicable to the funds, and has determined that no provision for income tax is required in the funds’ financial statements. The funds recognize interest and penalties, if any, related to unrecognized tax benefits as income tax expense in the Statement of Operations. During the period ended March 31, 2017, the funds did not incur any interest or penalties.
12. Custody Out-of-Pocket Fee Reimbursement:
In December 2015, State Street, the funds’ custodian, identified inconsistencies in the way in which clients were invoiced for categories of expenses, particularly those deemed out-of-pocket costs, during an 18-year period going back to 1998. The issue was the result of inaccurate billing rates that were not subsequently reviewed or adjusted. The amount of the difference in what was charged and what should have been charged, plus interest, was paid to the funds during the period ended October 2017 as a reimbursement. The amounts applied to each fund were recognized as a change in accounting estimate. This resulted in a decrease in Net expenses and an overall increase in Net assets. This payment is presented in the fund’s Statement of Operations as Custody out-of-pocket fee reimbursement.
13. Subsequent Events:
Management has determined there are no subsequent events or transactions through the date the financial statements were issued that would have materially impacted the financial statements as presented.
Laudus Mondrian Funds | Semiannual Report
Approval of Renewal of Investment Advisory and Sub-Advisory Agreements
The Investment Company Act of 1940 (the 1940 Act) requires that initial approval of, as well as the continuation of, a fund’s investment advisory agreements be specifically approved (1) by the vote of the trustees or by a vote of the shareholders of the fund, and (2) by the vote of a majority of the trustees who are not parties to the investment advisory agreements or “interested persons” of any party (the Independent Trustees), cast in person at a meeting called for the purpose of voting on such approval. In connection with such approvals, the fund’s trustees must request and evaluate, and the investment adviser is required to furnish, such information as may be reasonably necessary to evaluate the terms of the investment advisory agreements.
The Board of Trustees (the Board or the Trustees, as appropriate) calls and holds one or more meetings each year that are dedicated, in part, to considering whether to renew the investment advisory agreements between Laudus Trust (the Trust) and Charles Schwab Investment Management, Inc. (CSIM), and the subadvisory agreements between CSIM and Mondrian Investment Partners Limited (Mondrian) (such investment advisory and subadvisory agreements, collectively, the Agreements) with respect to Laudus Mondrian International Equity Fund, Laudus Mondrian Emerging Markets Fund, and Laudus Mondrian International Government Fixed Income Fund (collectively, the Funds). In preparation for the meeting(s), the Board requests and reviews a wide variety of materials provided by CSIM and Mondrian, including information about their affiliates, personnel, business goals and priorities, profitability, third-party oversight, corporate structure and operations. The Board also receives extensive data provided by an independent provider of investment company data and an independent accounting firm. This information is in addition to the detailed information about the Funds that the Board reviews during the course of each year, including information that relates to fund operations and fund performance. The Independent Trustees receive advice from independent counsel to the Independent Trustees, including a memorandum regarding the responsibilities of trustees for the approval of investment advisory agreements. In addition, the Independent Trustees meet in executive session outside the presence of fund management and participate in question and answer sessions with representatives of CSIM and Mondrian, as appropriate.
As part of the renewal process and ongoing oversight of the advisory and sub-advisory relationships, Independent Trustees’ legal counsel sends an information request letter to CSIM and CSIM sends an information request letter to Mondrian seeking certain relevant information. The responses by CSIM and Mondrian are provided to the Trustees for their review prior to their meeting, and the Trustees are provided with the opportunity to request any additional materials.
The Board, including a majority of the Independent Trustees, considered information relating to its consideration of the continuance of the Agreements at meetings held on April 19, 2017, and June 6, 2017, and approved the renewal of the Agreements for an additional one-year term at the meeting held on June 6, 2017. The Board’s approval of the Agreements was based on consideration and evaluation of a variety of specific factors discussed at these meetings and at prior meetings, including:
| 1. | the nature, extent and quality of the services provided to the Funds under the Agreements, including the resources of CSIM and its affiliates, and Mondrian, dedicated to the Funds; |
| 2. | each Fund’s investment performance and how it compared to that of certain other comparable mutual funds; |
| 3. | each Fund’s expenses and how those expenses compared to those of certain other comparable mutual funds; |
| 4. | the profitability of CSIM and its affiliates, including Charles Schwab & Co., Inc. (Schwab), with respect to each Fund, including both direct and indirect benefits accruing to CSIM and its affiliates, as well as the profitability of Mondrian; and |
| 5. | the extent to which economies of scale would be realized as the Funds grow, and whether fee levels in the Agreements reflect those economies of scale for the benefit of Fund investors. |
Nature, Extent and Quality of Services. The Board considered the nature, extent and quality of the services provided by CSIM to the Funds and the resources of CSIM and its affiliates dedicated to the Funds. In this regard, the Trustees evaluated, among other things, CSIM’s personnel, experience, track record, compliance program, resources dedicated to hiring and retaining qualified personnel, and information security resources. The Trustees also considered information provided by CSIM relating to the Funds’ portfolio management team, portfolio strategy and risk oversight structure, and internal investment guidelines. The Trustees also considered investments in CSIM’s mutual fund infrastructure. The Trustees also considered Schwab’s reputation in connection with the OneSource mutual fund offering and its overall financial condition. The Board also considered the nature, extent and quality of the sub-advisory services provided by Mondrian to the Funds and the resources it dedicates to the Funds. Following such evaluation, the Board concluded, within the context of its full deliberations, that the nature, extent and quality of services provided by CSIM and Mondrian to the Funds and the resources of CSIM and its affiliates and the resources of Mondrian dedicated to the Funds supported renewal of the Agreements.
Laudus Mondrian Funds | Semiannual Report
Fund Performance. The Board considered Fund performance in determining whether to renew the Agreements with respect to the Funds. Specifically, the Trustees considered each Fund’s performance relative to a peer category of other mutual funds and appropriate indices/benchmarks, in light of total return, yield, if applicable, and market trends. As part of this review, the Trustees considered the composition of the peer category, selection criteria and the reputation of the third party who prepared the peer category analysis. In evaluating the performance of each Fund, the Trustees considered both risk and shareholder risk expectations for such Fund and the appropriateness of the benchmark used to compare the performance of each Fund. The Trustees further considered the level of Fund performance in the context of their review of Fund expenses and adviser profitability discussed below and also noted that performance is reviewed throughout the year by a designated committee of the Board and by the Board. Although each of Laudus Mondrian International Government Fixed Income Fund and Laudus Mondrian Emerging Markets Fund had performance that lagged that of a relevant peer group for certain (although not all) periods considered, the Board concluded that other factors relevant to performance supported renewal of the Agreements, including that the underperformance was attributable, to a significant extent, to investment decisions by Mondrian that were reasonable and consistent with Mondrian’s investment style and the investment objective and policies of each Fund. Following such evaluation, the Board concluded, within the context of its full deliberations, that the performance of the Funds supported renewal of the Agreements.
Fund Expenses. With respect to the Funds’ expenses, the Trustees considered the rate of compensation called for by the Agreements, and each Fund’s net operating expense ratio, in each case, in comparison to those of other comparable mutual funds, such peer categories and comparisons having been selected and calculated by an independent provider of investment company data. The Trustees considered the effects of CSIM’s contractual waivers of management and other fees to prevent total Fund expenses from exceeding a specified cap. The Trustees also considered fees charged by CSIM and Mondrian to other mutual funds and to other types of accounts, such as exchange-traded funds and separately managed accounts, but, with respect to such other types of accounts, accorded less weight to such comparisons due to the different legal, regulatory, compliance and operating features of mutual funds as compared to these other types of accounts and any differences in the nature and scope of the services CSIM provides to these other accounts, as well as differences in the market for these types of accounts. Following such evaluation, the Board concluded, within the context of its full deliberations, that the expenses of the Funds are reasonable and supported renewal of the Agreements.
Profitability. With regard to profitability, the Trustees considered the compensation flowing to CSIM and its affiliates, directly or indirectly and the compensation flowing to Mondrian, directly or indirectly. In this connection, with respect to the profitability of CSIM and its affiliates, the Trustees reviewed management’s profitability analyses. The Trustees also reviewed profitability of CSIM relating to the Schwab fund complex as a whole, noting the benefit to Fund shareholders of being part of the Schwab fund complex, including the allocations of certain fixed costs across the funds in the complex. The Trustees also considered any other benefits derived by CSIM and Mondrian from their relationships with the Funds, such as whether, by virtue of their management of the Funds, CSIM or Mondrian obtains investment information or other research resources that aid it in providing advisory services to other clients. With respect to CSIM and Mondrian, and their respective affiliates, the Trustees considered whether the varied levels of compensation and profitability under the Agreements and other service agreements were reasonable and justified in light of the quality of all services rendered to each Fund by CSIM and Mondrian, and their respective affiliates. With respect to the profitability of Mondrian, the Board also considered that Mondrian is compensated by CSIM, and not by the Funds directly, and such compensation reflects an arms-length negotiation between the parties. Based on this evaluation, the Board concluded, within the context of its full deliberations, that the profitability of CSIM and Mondrian is reasonable and supported renewal of the Agreements.
Economies of Scale. The Trustees considered the existence of any economies of scale and whether those are passed along to a Fund’s shareholders through a graduated investment advisory fee schedule or other means, including any fee waivers and expense caps by CSIM and its affiliates. In this regard, and consistent with their consideration of Fund expenses, the Trustees considered that CSIM has committed resources to minimize the effects on shareholders of diseconomies of scale during periods when Fund assets are relatively small through contractual expense waivers. Based on this evaluation, the Board concluded, within the context of its full deliberations, that the Funds obtain reasonable benefit from economies of scale.
In the course of their deliberations, the Trustees did not identify any particular information or factor that was all important or controlling. Based on the Trustees’ deliberation and their evaluation of the information described above, the Board, including all of the Independent Trustees, approved the continuation of the Agreements and concluded that the compensation under the Agreements is fair and reasonable in light of such services and expenses and such other matters as the Trustees have considered to be relevant in the exercise of their reasonable judgment.
Laudus Mondrian Funds | Semiannual Report
Trustees and Officers
The tables below give information about the trustees and officers of Laudus Trust, which includes the funds covered in this report. The “Fund Complex” includes The Charles Schwab Family of Funds, Schwab Capital Trust, Schwab Investments, Schwab Annuity Portfolios, Schwab Strategic Trust and Laudus Trust. The Fund Complex includes 105 funds.
The address for all trustees and officers is 211 Main Street, San Francisco, CA 94105. You can find more information about the trustees and officers in the funds’ Statement of Additional Information, which is available free by calling 1-877-824-5615.
| Independent Trustees |
Name, Year of Birth, and
Position(s) with the trust
(Terms of office, and
length of Time Served1) | Principal Occupations
During the Past Five Years | Number of
Portfolios in
Fund Complex
Overseen by
the Trustee | Other Directorships |
Robert W. Burns
1959
Trustee
(Trustee of Schwab Strategic Trust since 2009; The Charles Schwab Family of Funds, Schwab Investments, Schwab Capital Trust, Schwab Annuity Portfolios and Laudus Trust since 2016) | Retired/Private Investor (Jan. 2009 – present). Formerly, Managing Director, Pacific Investment Management Company, LLC (PIMCO) (investment management firm) and President, PIMCO Funds. | 105 | Director, PS Business Parks, Inc. (2005 – 2012) |
John F. Cogan
1947
Trustee
(Trustee of The Charles Schwab Family of Funds, Schwab Investments, Schwab Capital Trust and Schwab Annuity Portfolios since 2008; Laudus Trust since 2010; Schwab Strategic Trust since 2016) | Senior Fellow, The Hoover Institution at Stanford University (public policy think tank) (Oct. 1979 – present); Senior Fellow, Stanford Institute for Economic Policy Research (2000 – present); Professor of Public Policy, Stanford University (1994 – 2015). | 105 | Director, Gilead Sciences, Inc. (2005 – present) |
Stephen Timothy Kochis
1946
Trustee
(Trustee of Schwab Strategic Trust since 2012; The Charles Schwab Family of Funds, Schwab Investments, Schwab Capital Trust, Schwab Annuity Portfolios and Laudus Trust since 2016) | CEO and Owner, Kochis Global (wealth management consulting) (May 2012 – present); Chairman and CEO, Aspiriant, LLC (wealth management) (Jan. 2008 – Apr. 2012). | 105 | None |
David L. Mahoney
1954
Trustee
(Trustee of The Charles Schwab Family of Funds, Schwab Investments, Schwab Capital Trust, Schwab Annuity Portfolios and Laudus Trust since 2011; Schwab Strategic Trust since 2016) | Private Investor. | 105 | Director, Symantec Corporation (2003 – present)
Director, Corcept Therapeutics Incorporated (2004 – present)
Director, Adamas Pharmaceuticals, Inc. (2009 – present) |
Laudus Mondrian Funds | Semiannual Report
| Independent Trustees (continued) |
Name, Year of Birth, and
Position(s) with the trust
(Terms of office, and
length of Time Served1) | Principal Occupations
During the Past Five Years | Number of
Portfolios in
Fund Complex
Overseen by
the Trustee | Other Directorships |
Kiran M. Patel
1948
Trustee
(Trustee of The Charles Schwab Family of Funds, Schwab Investments, Schwab Capital Trust, Schwab Annuity Portfolios and Laudus Trust since 2011; Schwab Strategic Trust since 2016) | Retired. Executive Vice President and General Manager of Small Business Group, Intuit, Inc. (financial software and services firm for consumers and small businesses) (Dec. 2008 – Sept. 2013). | 105 | Director, KLA-Tencor Corporation (2008 – present) |
Kimberly S. Patmore
1956
Trustee
(Trustee of The Charles Schwab Family of Funds, Schwab Investments, Schwab Capital Trust, Schwab Annuity Portfolios, Schwab Strategic Trust and Laudus Trust since 2016) | Consultant, Patmore Management Consulting (management consulting) (2008 – present). | 105 | None |
Charles A. Ruffel
1956
Trustee
(Trustee of Schwab Strategic Trust since 2009; The Charles Schwab Family of Funds, Schwab Investments, Schwab Capital Trust, Schwab Annuity Portfolios and Laudus Trust since 2015) | Co-Chief Executive Officer, Kudu Investment Management, LLC (financial services) (Jan. 2015 – present); Partner, Kudu Advisors, LLC (financial services) (June 2008 – Jan. 2015); Advisor, Asset International, Inc. (publisher of financial services information) (Aug. 2008 – Jan. 2015). | 105 | None |
Gerald B. Smith
1950
Trustee
(Trustee of The Charles Schwab Family of Funds, Schwab Investments, Schwab Capital Trust and Schwab Annuity Portfolios since 2000; Laudus Trust since 2010; Schwab Strategic Trust since 2016) | Chairman, Chief Executive Officer and Founder of Smith Graham & Co. (investment advisors) (Mar. 1990 – present). | 105 | Director, Eaton (2012 – present)
Director and Chairman of the Audit Committee, Oneok Partners LP (2003 – 2013)
Director, Oneok, Inc. (2009 – 2013)
Lead Independent Director, Board of Cooper Industries (2002 – 2012) |
Joseph H. Wender
1944
Trustee
(Trustee of The Charles Schwab Family of Funds, Schwab Investments, Schwab Capital Trust and Schwab Annuity Portfolios since 2008; Laudus Trust since 2010; Schwab Strategic Trust since 2016) | Senior Consultant, Goldman Sachs & Co., Inc. (investment banking and securities firm) (Jan. 2008 – present); Partner, Colgin Partners, LLC (vineyards) (Feb. 1998 – present). | 105 | Board Member and Chairman of the Audit Committee, Ionis Pharmaceuticals (1994 – present)
Lead Independent Director and Chair of Audit Committee, OUTFRONT Media Inc. (2014 – present) |
Laudus Mondrian Funds | Semiannual Report
| Interested Trustees |
Name, Year of Birth, and
Position(s) with the trust
(Terms of office, and
length of Time Served1) | Principal Occupations
During the Past Five Years | Number of
Portfolios in
Fund Complex
Overseen by
the Trustee | Other Directorships |
Walter W. Bettinger II2
1960
Chairman and Trustee
(Trustee of The Charles Schwab Family of Funds, Schwab Investments, Schwab Capital Trust and Schwab Annuity Portfolios since 2008; Schwab Strategic Trust since 2009; Laudus Trust since 2010) | Director, President and Chief Executive Officer, The Charles Schwab Corporation (Oct. 2008 – present); President and Chief Executive Officer (Oct. 2008 – present), Director (May 2008 – present), Charles Schwab & Co., Inc.; Director, Charles Schwab Bank (Apr. 2006 – present); Director, Schwab Holdings, Inc. (May 2008 – present); and Director, Charles Schwab Investment Management, Inc. (July 2016 – present). | 105 | Director, The Charles Schwab Corporation (2008 – present) |
Marie A. Chandoha2
1961
Trustee
(Trustee of The Charles Schwab Family of Funds, Schwab Investments, Schwab Capital Trust, Schwab Annuity Portfolios, Schwab Strategic Trust and Laudus Trust since 2016) | Director, President and Chief Executive Officer (Dec. 2010 – present), Chief Investment Officer (Sept. 2010 – Oct. 2011), Charles Schwab Investment Management, Inc.; Trustee (Jan. 2016 – present), President, Chief Executive Officer (Dec. 2010 – present), and Chief Investment Officer (Sept. 2010 – Oct. 2011), Schwab Funds, Laudus Funds and Schwab ETFs; Director, Charles Schwab Worldwide Funds plc and Charles Schwab Asset Management (Ireland) Limited (Jan. 2011 – present); Global Head of Fixed Income Business Division, BlackRock, Inc. (formerly Barclays Global Investors) (investment management firm) (Mar. 2007 – Aug. 2010). | 105 | None |
Joseph R. Martinetto2
1962
Trustee
(Trustee of The Charles Schwab Family of Funds, Schwab Investments, Schwab Capital Trust, Schwab Annuity Portfolios, Schwab Strategic Trust and Laudus Trust since 2016) | Senior Executive Vice President (July 2015 – present), Chief Financial Officer (July 2015 – May 2017), Executive Vice President and Chief Financial Officer (May 2007 – July 2015), The Charles Schwab Corporation and Charles Schwab & Co., Inc.; Director, Charles Schwab & Co., Inc. (May 2007 – present); Director (Apr. 2010 – present) and Chief Executive Officer (July 2013 – Apr. 2015), Charles Schwab Bank; Director (May 2007 – present), Chief Financial Officer (May 2007 – May 2017), Senior Executive Vice President (Feb. 2016 – present), and Executive Vice President (May 2007 – Feb. 2016), Schwab Holdings, Inc. | 105 | None |
| Officers of the Trust |
Name, Year of Birth, and Position(s) with the trust
(Terms of office, and length of Time Served3) | Principal Occupations During the Past Five Years |
Marie A. Chandoha
1961
President and Chief Executive Officer
(Officer of The Charles Schwab Family of Funds, Schwab Investments, Schwab Capital Trust, Schwab Annuity Portfolios, Schwab Strategic Trust and Laudus Trust since 2010) | Director, President and Chief Executive Officer (Dec. 2010 – present), Chief Investment Officer (Sept. 2010 – Oct. 2011), Charles Schwab Investment Management, Inc.; Trustee (Jan. 2016 – present), President, Chief Executive Officer (Dec. 2010 – present), and Chief Investment Officer (Sept. 2010 – Oct. 2011), Schwab Funds, Laudus Funds and Schwab ETFs; Director, Charles Schwab Worldwide Funds plc and Charles Schwab Asset Management (Ireland) Limited (Jan. 2011 – present); Global Head of Fixed Income Business Division, BlackRock, Inc. (formerly Barclays Global Investors) (investment management firm) (Mar. 2007 – Aug. 2010). |
Mark Fischer
1970
Treasurer and Chief Financial Officer
(Officer of The Charles Schwab Family of Funds, Schwab Investments, Schwab Capital Trust, Schwab Annuity Portfolios, Schwab Strategic Trust and Laudus Trust since 2013) | Treasurer and Chief Financial Officer, Schwab Funds, Laudus Funds and Schwab ETFs (Jan. 2016 – present); Assistant Treasurer, Schwab Funds and Laudus Funds (Dec. 2013 – Dec. 2015), Schwab ETFs (Nov. 2013 – Dec. 2015); Vice President, Charles Schwab Investment Management, Inc. (Oct. 2013 – present); Executive Director, J.P. Morgan Investor Services (Apr. 2011 – Sept. 2013); Assistant Treasurer, Massachusetts Financial Service Investment Management (May 2005 – Mar. 2011). |
Laudus Mondrian Funds | Semiannual Report
| Officers of the Trust (continued) |
Name, Year of Birth, and Position(s) with the trust
(Terms of office, and length of Time Served3) | Principal Occupations During the Past Five Years |
George Pereira
1964
Senior Vice President and Chief Operating Officer
(Officer of The Charles Schwab Family of Funds, Schwab Investments, Schwab Capital Trust and Schwab Annuity Portfolios since 2004; Laudus Trust since 2006; Schwab Strategic Trust since 2009) | Senior Vice President and Chief Financial Officer (Nov. 2004 – present), Chief Operating Officer (Jan. 2011 – present), Charles Schwab Investment Management, Inc.; Senior Vice President and Chief Operating Officer (Jan. 2016 – present), Treasurer and Chief Financial Officer, Laudus Funds (June 2006 – Dec. 2015); Treasurer and Principal Financial Officer, Schwab Funds (Nov. 2004 – Dec. 2015) and Schwab ETFs (Oct. 2009 – Dec. 2015); Director, Charles Schwab Worldwide Funds plc and Charles Schwab Asset Management (Ireland) Limited (Apr. 2005 – present). |
Omar Aguilar
1970
Senior Vice President and Chief Investment Officer – Equities and Multi-Asset Strategies
(Officer of The Charles Schwab Family of Funds, Schwab Investments, Schwab Capital Trust, Schwab Annuity Portfolios, Schwab Strategic Trust and Laudus Trust since 2011) | Senior Vice President and Chief Investment Officer – Equities and Multi-Asset Strategies, Charles Schwab Investment Management, Inc. (Apr. 2011 – present); Senior Vice President and Chief Investment Officer – Equities, Schwab Funds, Laudus Funds and Schwab ETFs (June 2011 – present); Head of the Portfolio Management Group and Vice President of Portfolio Management, Financial Engines, Inc. (investment management firm) (May 2009 – Apr. 2011); Head of Quantitative Equity, ING Investment Management (July 2004 – Jan. 2009). |
Brett Wander
1961
Senior Vice President and Chief Investment Officer – Fixed Income
(Officer of The Charles Schwab Family of Funds, Schwab Investments, Schwab Capital Trust, Schwab Annuity Portfolios, Schwab Strategic Trust and Laudus Trust since 2011) | Senior Vice President and Chief Investment Officer – Fixed Income, Charles Schwab Investment Management, Inc. (Apr. 2011 – present); Senior Vice President and Chief Investment Officer – Fixed Income, Schwab Funds, Laudus Funds and Schwab ETFs (June 2011 – present); Senior Managing Director, Global Head of Active Fixed-Income Strategies, State Street Global Advisors (Jan. 2008 – Oct. 2010); Director of Alpha Strategies Loomis, Sayles & Company (investment management firm) (Apr. 2006 – Jan. 2008). |
David Lekich
1964
Chief Legal Officer and Secretary, Schwab Funds and Schwab ETFs
Vice President and Assistant Clerk, Laudus Funds
(Officer of The Charles Schwab Family of Funds, Schwab Investments, Schwab Capital Trust, Schwab Annuity Portfolios, Schwab Strategic Trust and Laudus Trust since 2011) | Senior Vice President (Sept. 2011 – present), Vice President (Mar. 2004 – Sept. 2011), Charles Schwab & Co., Inc.; Senior Vice President and Chief Counsel (Sept. 2011 – present), Vice President (Jan. 2011 – Sept. 2011), Charles Schwab Investment Management, Inc.; Secretary (Apr. 2011 – present) and Chief Legal Officer (Dec. 2011 – present), Schwab Funds; Vice President and Assistant Clerk, Laudus Funds (Apr. 2011 – present); Secretary (May 2011 – present) and Chief Legal Officer (Nov. 2011 – present), Schwab ETFs. |
Catherine MacGregor
1964
Vice President and Assistant Secretary, Schwab Funds and Schwab ETFs
Chief Legal Officer, Vice President and Clerk, Laudus Funds
(Officer of The Charles Schwab Family of Funds, Schwab Investments, Schwab Capital Trust, Schwab Annuity Portfolios and Laudus Trust since 2005; Schwab Strategic Trust since 2009) | Vice President, Charles Schwab & Co., Inc., Charles Schwab Investment Management, Inc. (July 2005 – present); Vice President (Dec. 2005 – present), Chief Legal Officer and Clerk (Mar. 2007 – present), Laudus Funds; Vice President (Nov. 2005 – present) and Assistant Secretary (June 2007 – present), Schwab Funds; Vice President and Assistant Secretary, Schwab ETFs (Oct. 2009 – present). |
| 1 | Each Trustee shall hold office until the election and qualification of his or her successor, or until he or she dies, resigns or is removed. The retirement policy requires that each independent trustee retire by December 31 of the year in which the Trustee turns 74 or the Trustee’s twentieth year of service as an independent trustee on any trust in the Fund Complex, whichever occurs first. |
| 2 | Mr. Bettinger, Ms. Chandoha and Mr. Martinetto are Interested Trustees. Mr. Bettinger is an Interested Trustee because he owns stock of The Charles Schwab Corporation (CSC), the parent company of Charles Schwab Investment Management, Inc. (CSIM), the investment adviser for the trusts in the Fund Complex, is an employee and director of Charles Schwab & Co., Inc. (CS&Co), the principal underwriter for The Charles Schwab Family of Funds, Schwab Investments, Schwab Capital Trust and Schwab Annuity Portfolios, and is a director of the investment adviser for the trusts in the Fund Complex. Ms. Chandoha is an Interested Trustee because she owns stock of CSC and is an employee and director of CSIM. Mr. Martinetto is an Interested Trustee because he owns stock of CSC and is an employee and director of CS&Co. |
| 3 | The President, Treasurer and Secretary/Clerk hold office until their respective successors are chosen and qualified or until he or she sooner dies, resigns, is removed or becomes disqualified. Each of the other officers serves at the pleasure of the Board. |
Laudus Mondrian Funds | Semiannual Report
Bond is a security representing a loan from the investor to the issuer. A bond typically pays interest at a fixed rate (the coupon rate) until a specified date (the maturity date), at which time the issuer returns the money borrowed (principal or face value) to the bondholder. Because of their structure, bonds are sometimes called “fixed income securities” or “debt securities.”
An individual bond is subject to the credit risk of the issuer. Bond credit ratings are measured on a scale that generally ranges from AAA (highest) to D (lowest). Changes in interest rates can affect a bond’s market value prior to call or maturity. There is no guarantee that a bond’s yield to call or maturity will provide a positive return over the rate of inflation.
Citigroup Non-U.S. Dollar World Government Bond Index A market capitalization index that measures the total rate of return performance for the government bonds of 22 countries, excluding the U.S., with a remaining maturity of at least 1 year.
Dividend yield is an expression of a stock’s market value in relationship to its dividend amount as a percentage. It is calculated by dividing the stock’s annual dividends by the market price of the stock.
Duration A measure of an individual bond’s sensitivity to interest rates. Calculations of duration generally take into account the bond’s yield, interest payments, maturity date and call features.
Weighted Average Duration A measure of the duration of all bonds in a fund’s portfolio, based on the market value weighted average duration of each bond in the portfolio.
Maturity The maturity of a bond will generally be determined using a portfolio security’s final maturity date (date on which the final principal payment of a bond is scheduled to be paid); however, for securitized products, such as mortgage-backed securities and certain other asset-backed securities, maturity will be determined on an average life basis (weighted average time to receipt of all principal payments) by the investment adviser. Because pre-payment rates of individual mortgage pools vary widely, the average life of a particular pool cannot be predicted precisely. For securities with embedded demand features, such as puts or calls, either the demand date or the final maturity date will be used depending on interest rates, yields and other market conditions. The weighted average maturity (WAM) of a fund is dollar-weighted based upon the market value of a fund’s securities at the time of the calculation.
MSCI EAFE Index (Net) A free float-adjusted market capitalization index that is designed to measure the equity market performance of developed markets in Europe, Australasia, and the Far East. The Net version of the index reflects reinvested dividends net of withholding taxes, but reflects no deductions for expenses or other taxes; returns are calculated applying dividend withholding rates applicable to non-resident persons who do not benefit from double taxation treaties.
MSCI EAFE Value Index (Net) A free float-adjusted market capitalization index that is designed to measure large- and mid-cap securities exhibiting overall value style characteristics across developed markets countries around the world, excluding the U.S. and Canada. The value investment style characteristics for index construction are defined using three variables: book value to price, 12-month forward earnings to price and dividend yield. This series approximates the minimum possible dividend reinvestment. The returns are calculated applying dividend withholding rates applicable to non-resident persons who do not benefit from double taxation treaties.
MSCI Emerging Markets Index (Net) A free float-adjusted market capitalization weighted index that is designed to measure equity market performance in the global emerging markets. This series approximates the minimum possible dividend reinvestment. The returns are calculated applying dividend withholding rates applicable to non-resident persons who do not benefit from double taxation treaties.
Price to earnings ratio is the price of a stock divided by its historical earnings per share.
Price to book ratio compares the stock’s market value to the value of the total assets less the total liabilities.
Sovereign debt refers to debt issued by a national government within a given country and denominated in a foreign currency.
Trading Activity is one of several risk factors commonly used to attribute a portfolio’s return relative to its benchmark. Specifically, trading activity measures a stock’s trailing 12 month trading volume relative to its total shares outstanding. It measures how actively traded a stock has been in the last 12 months.
Weighted Average Market Cap A measure of the size of the companies in which a fund invests, based upon the market value of a fund’s securities each weighted according to its percent of the portfolio.
Laudus Mondrian Funds | Semiannual Report
Laudus Funds®
Laudus Funds offer investors access to some of the world’s leading investment managers. With a rigorous manager selection process and ongoing oversight by Charles Schwab Investment Management, Laudus Funds offer single and multi-manager strategies as a complement to other funds managed by Charles Schwab Investment Management. The list below shows all currently available Laudus Funds.
An investor should consider a fund’s investment objectives, risks, charges and expenses carefully before investing or sending money. This and other important information can be found in the fund’s prospectus or, if available, the summary prospectus. Please call 1-877-824-5615 for a prospectus and brochure for any Laudus Fund. Please read the prospectus carefully before you invest. This report must be preceded or accompanied by a current prospectus.
Proxy Voting Policies, Procedures and Results
A description of the proxy voting policies and procedures used to determine how to vote proxies on behalf of the funds is available without charge, upon request, by visiting the Laudus Funds’ website at www.schwabfunds.com/laudusfunds_prospectus, the SEC’s website at www.sec.gov, or by contacting Laudus Funds at 1-877-824-5615.
Information regarding how a fund voted proxies relating to portfolio securities during the most recent twelve-month period ended June 30 is available, without charge, by visiting the fund’s website at www.schwabfunds.com/laudusfunds_prospectus or the SEC’s website at www.sec.gov.
Laudus U.S. Large Cap Growth
Laudus U.S. Large Cap Growth Fund
Laudus MarketMasters Funds®
Laudus International MarketMasters Fund™
Laudus Small-Cap MarketMasters Fund™
Laudus Mondrian Funds™
Laudus Mondrian International Equity Fund
Laudus Mondrian Emerging Markets Fund
Laudus Mondrian International Government Fixed Income Fund
Investment Adviser
Charles Schwab Investment Management, Inc.
211 Main Street, San Francisco, CA 94105
Funds
Laudus Funds
1-877-824-5615
Printed on recycled paper.
Charles Schwab Investment Management, Inc. (CSIM) is the investment adviser for Laudus Funds. The Laudus Group of Funds includes the Laudus Mondrian Funds and Laudus U.S. Large Cap Growth Fund, which are part of the Laudus Trust and distributed by ALPS Distributors, Inc. (ALPS); and the Laudus MarketMasters Funds, which are part of the Schwab Capital Trust and distributed by Charles Schwab & Co., Inc. (Schwab), Member SIPC. Schwab and CSIM, affiliates and subsidiaries of The Charles Schwab Corporation, are not affiliated with ALPS.
This page is intentionally left blank.
Semiannual Report | September 30, 2017
Laudus U.S. Large Cap Growth Fund
Adviser
Charles Schwab Investment Management, Inc.
Subadviser
BlackRock Investment Management, LLC
Fund investment adviser: Charles Schwab Investment Management, Inc. (CSIM).
Distributor: ALPS Distributors, Inc.
The industry/sector classification of the fund’s portfolio holdings uses the Global Industry Classification Standard (GICS) which was developed by and is the exclusive property of MSCI Inc. (MSCI) and Standard & Poor’s (S&P). GICS is a service mark of MSCI and S&P and has been licensed for use by CSIM and certain affiliates. Charles Schwab & Co, Inc. and ALPS Distributors, Inc. are unaffiliated entities. The Industry classifications used in the schedules of Portfolio Holdings are sub-categories of Sector classifications.
Laudus U.S. Large Cap Growth Fund | Semiannual Report
Laudus U.S. Large Cap Growth Fund
The performance data quoted represents past performance. Past performance does not guarantee future results. Investment returns and principal value of an investment will fluctuate so that an investor’s shares may be worth more or less than their original cost. Current performance may be lower or higher than performance data quoted. To obtain performance information current to the most recent month end, please visit www.schwabfunds.com/laudusfunds_prospectus.
| Total Return for the 6 Months Ended September 30, 2017 |
| Laudus U.S. Large Cap Growth Fund (Ticker Symbol: LGILX) | 12.86% |
| Russell 1000® Growth Index | 10.84% |
| Performance Details | page 5 |
| |
| Minimum Initial Investment1 | $ 100 |
All fund and index figures on this page assume dividends and distributions were reinvested. Index figures do not include trading and management costs, which would lower performance. Indices are unmanaged and cannot be invested in directly. Performance results less than one year are not annualized.
For index definitions, please see the Glossary.
Fund expenses may have been partially absorbed by CSIM. Without these reductions, the fund’s return would have been lower. This return does not reflect the deduction of taxes that a shareholder would pay on fund distributions or the redemption of fund shares.
| 1 | Please see prospectus for further detail and eligibility requirements. |
Laudus U.S. Large Cap Growth Fund | Semiannual Report
Laudus U.S. Large Cap Growth Fund
Marie Chandoha
President and CEO of
Charles Schwab Investment
Management, Inc. and the
fund covered in this report.
Dear Shareholder,
Our straightforward approach sets us apart. For more than 25 years, Charles Schwab Investment Management has put investor needs first. We’re driven to give investors what they want and need—without confusion. One of our goals has been to reduce the complexity of investing. Through the funds we manage, we or the funds’ subadvisers take on the responsibility of researching and selecting individual securities, a process which can be time-consuming, costly, and complicated.
The Laudus U.S. Large Cap Growth Fund is actively managed and offers investors a disciplined approach to investing in U.S. large-cap stocks. Blackrock Investment Management, the fund’s subadviser, identifies business models that have the potential for high returns on invested capital, high free cash flow conversion of net income, and the opportunity to replicate their success globally. The fund management team consistently searches for U.S. companies that meet its requirements, whether it’s a dominant market position, technological edge, or some other unique competitive advantage. Then they assemble a mix of companies that reflect different sources of growth, and invest in different types of business models with diverse valuations.
Our commitment to reducing complexity on behalf of investors continues to earn us recognition. Earlier this year, we were named one of Morningstar’s “9 Partners for the Next Decade”1 reflecting our differentiation, low costs, and repeatable investment strategies. While we’re proud of this achievement, most importantly, we’re honored to serve our investors. We’re committed to putting investors first by reducing complexity—a commitment that will continue to inform how we operate and the decisions that we make.
Thank you for investing with Charles Schwab Investment Management, and for trusting us to help you achieve your financial goals. We are pleased to report that for the six-month reporting period, the Laudus U.S. Large Cap Growth Fund outperformed its benchmark. For further information about this fund, please continue reading this report, or you can find additional details by visiting our website at www.schwabfunds.com. We are also happy to hear from you at 1-877-824-5615.
Sincerely,
“ We are pleased to report that for the six-month reporting period, the Laudus U.S. Large Cap Growth Fund outperformed its benchmark.”
Management views may have changes since the report date.
Charles Schwab Investment Management, Inc., BlackRock Investment Management, LLC, and ALPS Distributors, Inc. are unaffiliated entities.
| 1 | Morningstar, “9 Partners for the Next Decade.” Laura Pavlenko Lutton and Greggory Warren, CFA: April 27, 2017. Morningstar looked collectively across four traits (differentiation, low costs, repeatable investment processes, and adaptable business models) to identify firms that they believe are representative of these trends. |
Laudus U.S. Large Cap Growth Fund | Semiannual Report
Laudus U.S. Large Cap Growth Fund
The Investment Environment
Over the six-month reporting period ended September 30, 2017, U.S. equities generated positive returns. Several indices reached record highs over the reporting period, driven by strong corporate earnings and the outperformance of companies in growth sectors. Growth stocks notably outperformed value stocks, largely due to the strong showing by the FANG stocks (Facebook, Inc., Amazon.com, Inc., Netflix, Inc., and Alphabet, Inc., formerly known as Google, Inc.) and weakness in the Energy sector. Meanwhile, the U.S. economy continued its slow and steady expansion and growth outside the U.S. began to improve. Despite several setbacks in Washington, expectations for reflationary policies from the Trump administration continued to support stock markets. The Federal Reserve (Fed) raised the federal funds rate in June for the second time this year, and announced plans to begin unwinding its balance sheet in late 2017. In this environment, the S&P 500® Index, a bellwether for the overall U.S. stock market, returned 7.71%, while the Russell 1000® Growth Index and the Russell 1000® Value Index returned 10.84% and 4.50% respectively.
The U.S. economy generally strengthened over the reporting period, entering its ninth year of expansion in a slow but stable fashion. Nonfarm payrolls came in at or near expectations each month, while unemployment remained at lows not seen since before the financial crisis. After a slow start to 2017, gross domestic product (GDP) picked up in the second quarter to 3.1% — the fastest pace in more than two years. Consumer confidence, as measured by the Conference Board’s Consumer Confidence Index®1, dropped slightly toward the end of the reporting period amid escalating geopolitical tensions and Hurricanes Harvey, Irma, and Maria, though remained favorable overall. Meanwhile, despite a tight labor market and a growing economy, both inflation and wage growth remained subdued. Outside the U.S., the eurozone’s recovery accelerated over the reporting period, hitting an annualized pace of 2.3% in the second quarter of 2017. Strong corporate profits and solid imports and exports contributed to a more positive outlook in Japan, even with a downward revision to second quarter GDP. Chinese economic growth began to stabilize after concerns about decelerating GDP plagued the country last year, and according to the International Monetary Fund, the country has the potential to sustain strong growth over the medium term.
During the reporting period, the Fed continued on its path toward more normalized monetary policy. In June, the Fed raised the federal funds rate to a target range of 1.00% to 1.25%, and also announced plans to begin shrinking its portfolio of bonds and other assets in late 2017. The Fed began purchasing these assets after the financial crisis in an effort to push down long-term interest rates, and after several years, began reducing the size of these purchases. More recently, the Fed stopped buying additional holdings altogether, but continued to reinvest the proceeds of maturing bonds. The Fed’s plan to slowly unwind its balance sheet will be achieved by stopping the reinvestment of those proceeds after securities mature. Both the short-term interest rate increase and announcement of balance sheet unwinding signaled the Fed’s continued confidence in the overall U.S. economy, as well as in progress toward its goals of full employment and price stability.
U.S. equity markets performed well over the reporting period. Expectations for policy changes from the Trump administration, including tax reform and financial deregulation, continued to support stocks in spite of delays in Washington, as did generally positive economic data. Most markets remained relatively calm over the reporting period, outside of a few spikes in volatility tied to political uncertainty and escalating tensions in North Korea, with the CBOE Volatility Index® (or VIX®), a gauge of equity market volatility, falling to its lowest recorded level in July. From a sector standpoint, most sectors generated positive returns over the reporting period. The Information Technology sector was the top contributor to performance in the Russell 1000® Growth Index, with many companies in this sector benefitting from strong balance sheets and high consumer confidence. In contrast, the Consumer Staples sector was the biggest detractor from the performance of the Russell 1000® Growth Index, as low market volatility weighed on this traditionally defensive sector.
Index figures assume dividends and distributions were reinvested. Index figures do not include trading and management costs, which would lower performance. Indices are unmanaged and cannot be invested in directly. Performance results less than one year are not annualized. Past performance is not an indication of future results.
For index definitions, please see the Glossary.
Nothing in this report represents a recommendation of a security by the investment adviser.
Management views may have changed since the report date.
| 1 | The Conference Board is a global, independent business membership and research association working in the public interest. The Consumer Confidence Index® is based on the Consumer Confidence Survey® which reflects prevailing business conditions and likely developments for the months ahead. This monthly report details consumer attitudes and buying intentions, with data available by age, income, and region. |
Laudus U.S. Large Cap Growth Fund | Semiannual Report
Laudus U.S. Large Cap Growth Fund as of September 30, 2017
Past performance does not guarantee future results. The performance data quoted represents past performance, and current returns may be lower or higher. The performance information does not reflect the deduction of taxes that a shareholder would pay on fund distributions or the redemption of fund shares. The investment return and principal value of an investment will fluctuate so that an investor’s shares, when redeemed, may be worth more or less than the original cost. To obtain performance information current to the most recent month end, visit www.schwabfunds.com/laudusfunds_prospectus.
Average Annual Total Returns
| Fund and Inception Date | 6 Months | 1 Year | 5 Years | 10 Years |
| Laudus U.S. Large Cap Growth Fund (10/14/97)1 | 12.86% | 20.97% | 14.61% | 9.77% |
| Russell 1000® Growth Index | 10.84% | 21.94% | 15.26% | 9.08% |
| Fund Expense Ratio2: 0.76% |
| Fund Characteristics | |
| Number of Securities3 | 54 |
| Weighted Average Market Cap (millions) | $226,816 |
| Price/Earnings Ratio (P/E) | 35.12 |
| Price/Book Ratio (P/B) | 5.45 |
Portfolio Turnover
(One year trailing) | 64% |
| Fund Overview | |
| | Fund |
| Inception Date | 10/14/1997 * |
| Ticker Symbol | LGILX |
| Cusip | 51855Q549 |
| NAV | $20.45 |
Sector Weightings % of Equities
Top Equity Holdings % of Net Assets4
Total returns include change in share price and reinvestment of distributions. Total returns may reflect the waiver of a portion of the fund’s advisory fees for certain periods since the inception date. In such instances, and without the waiver of fees, total returns would have been lower. Performance results less than one year are not annualized.
For index definitions, please see the Glossary.
Portfolio holdings may have changed since the report date.
| * | Inception date is that of the fund’s predecessor fund, the Y Class of the UBS U.S. Large Cap Growth Fund. |
| 1 | The Laudus U.S. Large Cap Growth Fund was launched on 7/13/09. The fund was formerly known as UBS U.S. Large Cap Growth Fund. The performance and returns prior to 7/13/09 reflect the returns of UBS U.S. Large Cap Growth Fund, Class Y Shares. |
| 2 | As stated in the prospectus. Please see the prospectus for more information. For actual rates during the period, refer to the Financial Highlights section of the Financial Statements. |
| 3 | Short-term investments are not included. |
| 4 | This list is not a recommendation of any security by the investment adviser or subadviser. |
Laudus U.S. Large Cap Growth Fund | Semiannual Report
Laudus U.S. Large Cap Growth Fund
Fund Expenses (Unaudited)
Examples for a $1,000 Investment
As a fund shareholder, you may incur two types of costs: (1) transaction costs; and (2) ongoing costs, including management fees, transfer agent and shareholder services fees, and other fund expenses.
The expense examples below are intended to help you understand your ongoing cost (in dollars) of investing in the fund and to compare this cost with the ongoing cost of investing in other mutual funds. These examples are based on an investment of $1,000 invested for the period beginning April 1, 2017 and held through September 30, 2017.
Actual Return lines in the table below provide information about actual account values and actual expenses. You may use this information, together with the amount you invested, to estimate the expenses that you paid over the period. To do so, simply divide your account value by $1,000 (for example, an $8,600 account value ÷ $1,000 = 8.6), then multiply the result by the number given for your fund under the heading entitled “Expenses Paid During Period.”
Hypothetical Return lines in the table below provide information about hypothetical account values and hypothetical expenses based on the fund’s actual expense ratio and an assumed return of 5% per year before expenses. Because the return used is not an actual return, it may not be used to estimate the actual ending account value or expenses you paid for the period.
You may use this information to compare the ongoing costs of investing in the fund and other funds. To do so, compare this 5% hypothetical example with the 5% hypothetical examples that appear in the shareholder reports of the other funds.
Please note that the expenses shown in the table are meant to highlight your ongoing costs only, and do not reflect any transactional costs, or any non-routine expenses, such as custody out-of-pocket fee reimbursement. Therefore, the hypothetical return lines of the table are useful in comparing ongoing costs only, and will not help you determine the relative total costs of owning different funds. In addition, if these transactional costs or non-routine expenses were included, your costs would have been higher.
| | Expense Ratio
(Annualized)1 | Beginning
Account Value
at 4/1/17 | Ending
Account Value
(Net of Expenses)
at 9/30/17 | Expenses Paid
During Period
4/1/17-9/30/172 |
| Laudus U.S. Large Cap Growth Fund | | | | |
| Actual Return | 0.77% | $1,000.00 | $1,128.60 | $4.11 |
| Hypothetical 5% Return | 0.77% | $1,000.00 | $1,021.24 | $3.90 |
| 1 | Based on the most recent six-month expense ratio; may differ from the expense ratio provided in the Financial Highlights. This ratio does not include certain non-routine expenses, such as custody out-of-pocket fee reimbursement. |
| 2 | Expenses for the fund are equal to its annualized expense ratio, multiplied by the average account value over the period, multiplied by the 183 days of the period, and divided by the 365 days of the fiscal year. |
Laudus U.S. Large Cap Growth Fund | Semiannual Report
Laudus U.S. Large Cap Growth Fund
Financial Statements
Financial Highlights
| | 4/1/17–
9/30/17* | 4/1/16–
3/31/17 | 4/1/15–
3/31/16 | 4/1/14–
3/31/15 | 4/1/13–
3/31/14 | 4/1/12–
3/31/13 |
| Per-Share Data |
| Net asset value at beginning of period | $18.12 | $15.76 | $17.22 | $18.19 | $15.58 | $14.83 |
| Income (loss) from investment operations: | | | | | | |
| Net investment income (loss)1 | 0.01 | 0.00 2 | (0.01) | (0.01) | (0.02) | 0.02 |
| Net realized and unrealized gains (losses) | 2.32 | 2.63 | (0.37) | 2.44 | 3.85 | 1.01 |
| Total from investment operations | 2.33 | 2.63 | (0.38) | 2.43 | 3.83 | 1.03 |
| Less distributions: | | | | | | |
| Distributions from net investment income | — | — | — | — | — | (0.02) |
| Distributions from net realized gains | — | (0.27) | (1.08) | (3.40) | (1.22) | (0.26) |
| Total distributions | — | (0.27) | (1.08) | (3.40) | (1.22) | (0.28) |
| Net asset value at end of period | $20.45 | $18.12 | $15.76 | $17.22 | $18.19 | $15.58 |
| Total return | 12.86% 3 | 16.85% | (2.50%) | 14.99% | 24.81% | 7.09% |
| Ratios/Supplemental Data |
| Ratios to average net assets: | | | | | | |
| Net operating expenses | 0.76% 4,5 | 0.76% | 0.75% | 0.77% | 0.78% 6 | 0.78% |
| Gross operating expenses | 0.76% 4,5 | 0.76% | 0.75% | 0.77% | 0.78% | 0.82% |
| Net investment income (loss) | 0.09% 4,5 | 0.03% | (0.04%) | (0.06%) | (0.12%) | 0.13% |
| Portfolio turnover rate | 23% 3 | 73% | 82% | 102% | 124% | 76% |
| Net assets, end of period (x 1,000) | $1,741,711 | $1,667,059 | $1,969,169 | $2,171,783 | $2,122,365 | $1,695,291 |
| |
1
Calculated based on the average shares outstanding during the period.
2
Per-share amount was less than $0.005.
3
Not annualized.
4
Annualized (except for custody out-of-pocket fee reimbursement).
5
The ratio of net operating expenses and gross operating expenses would have been 0.77% and 0.77%, respectively, and the ratio of net investment income would have been 0.08%, if the custody out-of-pocket fee reimbursement had not been included (see financial note 11).
6
The ratio of net operating expenses would have been 0.77%, if certain non-routine expenses had not been incurred.
Laudus U.S. Large Cap Growth Fund | Semiannual Report
Laudus U.S. Large Cap Growth Fund
Portfolio Holdings as of September 30, 2017 (Unaudited)
This section shows all the securities in the fund’s portfolio and their values as of the report date.
The fund files its complete schedule of portfolio holdings with the SEC for the first and third quarters of each fiscal year on Form N-Q. The fund’s Form N-Q is available on the SEC’s website at www.sec.gov and may be viewed and copied at the SEC’s Public Reference Room in Washington, D.C. Call 1-800-SEC-0330 for information on the operation of the Public Reference Room. The fund also makes available its complete schedule of portfolio holdings 30 days after calendar quarters on the fund’s website at www.schwabfunds.com/laudusfunds_prospectus.
| Security | Number
of Shares | Value ($) |
| Common Stock 98.4% of net assets |
| |
| Banks 5.0% |
| Bank of America Corp. | 1,861,882 | 47,180,090 |
| First Republic Bank | 278,031 | 29,043,118 |
| Wells Fargo & Co. | 198,460 | 10,945,069 |
| | | 87,168,277 |
| |
| Capital Goods 3.6% |
| Acuity Brands, Inc. | 154,091 | 26,392,707 |
| Roper Technologies, Inc. | 72,391 | 17,619,969 |
| TransDigm Group, Inc. | 71,215 | 18,206,115 |
| | | 62,218,791 |
| |
| Commercial & Professional Services 1.6% |
| Equifax, Inc. | 267,096 | 28,309,505 |
| |
| Consumer Durables & Apparel 1.3% |
| NIKE, Inc., Class B | 429,575 | 22,273,464 |
| |
| Consumer Services 1.4% |
| Domino’s Pizza, Inc. | 124,460 | 24,711,533 |
| |
| Diversified Financials 2.1% |
| Berkshire Hathaway, Inc., Class B * | 134,115 | 24,585,962 |
| S&P Global, Inc. | 79,215 | 12,382,096 |
| | | 36,968,058 |
| |
| Energy 1.8% |
| Halliburton Co. | 454,489 | 20,920,128 |
| Pioneer Natural Resources Co. | 71,457 | 10,542,766 |
| | | 31,462,894 |
| |
| Food, Beverage & Tobacco 3.4% |
| Constellation Brands, Inc., Class A | 241,596 | 48,186,322 |
| Dr Pepper Snapple Group, Inc. | 133,775 | 11,835,074 |
| | | 60,021,396 |
| |
| Health Care Equipment & Services 7.8% |
| Becton, Dickinson & Co. | 142,717 | 27,965,396 |
| Boston Scientific Corp. * | 965,527 | 28,164,422 |
| UnitedHealth Group, Inc. | 408,195 | 79,944,991 |
| | | 136,074,809 |
| |
| Materials 2.7% |
| Monsanto Co. | 134,718 | 16,141,911 |
| The Sherwin-Williams Co. | 63,550 | 22,753,442 |
| Vulcan Materials Co. | 72,001 | 8,611,319 |
| | | 47,506,672 |
| |
| Security | Number
of Shares | Value ($) |
| Pharmaceuticals, Biotechnology & Life Sciences 8.8% |
| Alexion Pharmaceuticals, Inc. * | 382,371 | 53,642,828 |
| Biogen, Inc. * | 65,717 | 20,577,307 |
| Celgene Corp. * | 150,552 | 21,953,493 |
| Illumina, Inc. * | 110,006 | 21,913,195 |
| Vertex Pharmaceuticals, Inc. * | 127,797 | 19,430,256 |
| Zoetis, Inc. | 237,670 | 15,153,839 |
| | | 152,670,918 |
| |
| Real Estate 1.5% |
| Equinix, Inc. | 39,450 | 17,606,535 |
| SBA Communications Corp. * | 59,652 | 8,592,871 |
| | | 26,199,406 |
| |
| Retailing 16.5% |
| Amazon.com, Inc. * | 128,338 | 123,377,737 |
| Netflix, Inc. * | 241,249 | 43,750,506 |
| The Home Depot, Inc. | 221,088 | 36,161,153 |
| The Priceline Group, Inc. * | 30,488 | 55,818,040 |
| Ulta Salon, Cosmetics & Fragrance, Inc. * | 126,731 | 28,648,810 |
| | | 287,756,246 |
| |
| Semiconductors & Semiconductor Equipment 5.2% |
| ASML Holding N.V. | 159,176 | 27,250,931 |
| Broadcom Ltd. | 117,231 | 28,433,207 |
| NVIDIA Corp. | 126,363 | 22,589,913 |
| Teradyne, Inc. | 319,230 | 11,904,087 |
| | | 90,178,138 |
| |
| Software & Services 33.6% |
| Activision Blizzard, Inc. | 283,984 | 18,319,808 |
| Adobe Systems, Inc. * | 224,099 | 33,431,089 |
| Alibaba Group Holding Ltd. ADR * | 80,594 | 13,919,390 |
| Alphabet, Inc., Class A * | 118,745 | 115,624,381 |
| Autodesk, Inc. * | 331,529 | 37,217,446 |
| Electronic Arts, Inc. * | 73,306 | 8,654,506 |
| Facebook, Inc., Class A * | 379,490 | 64,843,456 |
| Global Payments, Inc. | 174,978 | 16,628,159 |
| MercadoLibre, Inc. | 52,934 | 13,706,201 |
| Microsoft Corp. | 1,490,688 | 111,041,349 |
| PayPal Holdings, Inc. * | 269,455 | 17,253,204 |
| Tencent Holdings Ltd. | 1,354,100 | 59,202,167 |
| Visa, Inc., Class A | 624,533 | 65,725,853 |
| Zendesk, Inc. * | 343,704 | 10,005,224 |
| | | 585,572,233 |
| |
| Technology Hardware & Equipment 1.6% |
| Apple, Inc. | 179,182 | 27,615,530 |
| |
Laudus U.S. Large Cap Growth Fund | Semiannual Report
Laudus U.S. Large Cap Growth Fund
Portfolio Holdings as of September 30, 2017 (Unaudited) (continued)
| Security | Number
of Shares | Value ($) |
| Telecommunication Services 0.5% |
| Zayo Group Holdings, Inc. * | 235,924 | 8,120,504 |
| Total Common Stock |
| (Cost $1,217,868,155) | | 1,714,828,374 |
|
| Other Investment Company 2.5% of net assets |
| |
| Money Market Fund 2.5% |
| State Street Institutional U.S. Government Money Market Fund, Premier Class 0.92% (a) | 43,339,226 | 43,339,226 |
| Total Other Investment Company |
| (Cost $43,339,226) | | 43,339,226 |
At 09/30/17, the value of a foreign security held by the fund totaling $59,202,167 was adjusted from its closing market value in accordance with international fair valuation procedures approved by the fund’s Board of Trustees. (See financial note 2(a) for additional information).
| * | Non-income producing security. |
| (a) | The rate shown is the 7-day yield. |
| | |
| ADR — | American Depositary Receipt |
The following is a summary of the inputs used to value the fund’s investments as of September 30, 2017 (see financial note 2(a) for additional information):
| Description | Quoted Prices in
Active Markets for
Identical Assets
(Level 1) | Other Significant
Observable Inputs
(Level 2) | Significant
Unobservable Inputs
(Level 3) | Total | |
| Assets | | | | | |
| Common Stock1 | $1,129,256,141 | $— | $— | $1,129,256,141 | |
| Software & Services | 526,370,066 | 59,202,167 | — | 585,572,233 | |
| Other Investment Company1 | 43,339,226 | — | — | 43,339,226 | |
| Total | $1,698,965,433 | $59,202,167 | $— | $1,758,167,600 | |
| 1 | As categorized in Portfolio Holdings. |
The fund’s policy is to recognize transfers between Level 1, Level 2 and Level 3 as of the beginning of the fiscal year. There were no transfers between Level 1, Level 2 and Level 3 for the period ended September 30, 2017. Fund investments in underlying mutual funds are classified as Level 1, without consideration to the classification level of the investments held by the underlying mutual funds, which could be Level 1, Level 2 or Level 3.
Laudus U.S. Large Cap Growth Fund | Semiannual Report
Laudus U.S. Large Cap Growth Fund
Statement of Assets and Liabilities
As of September 30, 2017; unaudited
| Assets |
| Investments in unaffiliated issuers, at value (cost $1,261,207,381) | | $1,758,167,600 |
| Foreign currency, at value (cost $62) | | 62 |
| Receivables: | | |
| Fund shares sold | | 3,612,823 |
| Dividends | | 179,871 |
| Prepaid expenses | + | 42,337 |
| Total assets | | 1,762,002,693 |
| Liabilities |
| Payables: | | |
| Investments bought | | 17,849,519 |
| Fund shares redeemed | | 1,219,341 |
| Investment adviser fees | | 912,586 |
| Accrued expenses | + | 310,446 |
| Total liabilities | | 20,291,892 |
| Net Assets |
| Total assets | | 1,762,002,693 |
| Total liabilities | – | 20,291,892 |
| Net assets | | $1,741,710,801 |
| Net Assets by Source | | |
| Capital received from investors | | 1,024,193,076 |
| Net investment income not yet distributed | | 826,731 |
| Net realized capital gains | | 219,730,775 |
| Net unrealized capital appreciation | | 496,960,219 |
| Net Asset Value (NAV) |
| Net Assets | ÷ | Shares
Outstanding | = | NAV |
| $1,741,710,801 | | 85,175,254 | | $20.45 |
| | | | | |
Laudus U.S. Large Cap Growth Fund | Semiannual Report
Laudus U.S. Large Cap Growth Fund
Statement of Operations
For the period April 1, 2017 through September 30, 2017; unaudited
| Investment Income |
| Dividends (net of foreign withholding tax of $46,038) | | $7,330,522 |
| Expenses |
| Investment adviser fees | | 5,525,613 |
| Sub-accounting and sub-transfer agent fees | | 735,352 |
| Transfer agent fees | | 154,188 |
| Accounting and administration fees | | 38,202 |
| Registration fees | | 35,039 |
| Shareholder reports | | 31,330 |
| Custodian fees | | 30,456 |
| Professional fees | | 26,918 |
| Independent trustees’ fees | | 25,824 |
| Interest expense | | 369 |
| Custody out-of-pocket fee reimbursement | | (126,477)* |
| Other expenses | + | 15,503 |
| Total expenses | – | 6,492,317 |
| Net investment income | | 838,205 |
| Realized and Unrealized Gains (Losses) |
| Net realized gains on investments | | 90,638,159 |
| Net realized losses on foreign currency transactions | + | (917) |
| Net realized gains | | 90,637,242 |
| Net change in unrealized appreciation (depreciation) on investments | + | 114,429,558 |
| Net realized and unrealized gains | | 205,066,800 |
| Increase in net assets resulting from operations | | $205,905,005 |
| * | See financial note 11 for additional information. |
Laudus U.S. Large Cap Growth Fund | Semiannual Report
Laudus U.S. Large Cap Growth Fund
Statement of Changes in Net Assets
For the current and prior report periods
Figures for the current period are unaudited
| Operations | |
| | 4/1/17-9/30/17 | 4/1/16-3/31/17 |
| Net investment income | | $838,205 | $535,085 |
| Net realized gains | | 90,637,242 | 167,376,920 |
| Net change in unrealized appreciation (depreciation) | + | 114,429,558 | 108,507,795 |
| Increase in net assets from operations | | 205,905,005 | 276,419,800 |
| Distributions to Shareholders | |
| Distributions from net realized gains | | $— | ($28,536,521) |
| Transactions in Fund Shares | | | |
| | | 4/1/17-9/30/17 | 4/1/16-3/31/17 |
| | | SHARES | VALUE | SHARES | VALUE |
| Shares sold | | 7,420,083 | $145,530,764 | 12,060,635 | $201,863,903 |
| Shares reinvested | | — | — | 1,481,964 | 24,659,880 |
| Shares redeemed | + | (14,256,806) | (276,784,304) | (46,461,188) | (776,516,242) |
| Net transactions in fund shares | | (6,836,723) | ($131,253,540) | (32,918,589) | ($549,992,459) |
| Shares Outstanding and Net Assets | | | |
| | | 4/1/17-9/30/17 | 4/1/16-3/31/17 |
| | | SHARES | NET ASSETS | SHARES | NET ASSETS |
| Beginning of period | | 92,011,977 | $1,667,059,336 | 124,930,566 | $1,969,168,516 |
| Total increase or decrease | + | (6,836,723) | 74,651,465 | (32,918,589) | (302,109,180) |
| End of period | | 85,175,254 | $1,741,710,801 | 92,011,977 | $1,667,059,336 |
| Net investment income not yet distributed/Net investment loss | | | $826,731 | | ($11,474) |
Laudus U.S. Large Cap Growth Fund | Semiannual Report
Laudus U.S. Large Cap Growth Fund
Financial Notes, unaudited
1. Business Structure of the Funds:
Laudus U.S. Large Cap Growth Fund is a series of Laudus Trust (the trust), a no-load, open-end management investment company. The trust is organized as a Massachusetts business trust and is registered under the Investment Company Act of 1940, as amended (the 1940 Act). The list below shows all the funds in the trust as of the end of the period, including the fund discussed in this report, which is highlighted:
| LAUDUS TRUST (ORGANIZED APRIL 1, 1988) |
| Laudus U.S. Large Cap Growth Fund | |
| Laudus Mondrian International Equity Fund | |
| Laudus Mondrian Emerging Markets Fund | |
| Laudus Mondrian International Government Fixed Income Fund | |
The Laudus U.S. Large Cap Growth Fund offers one share class. Shares are bought and sold at closing net asset value per share (NAV), which is the price for all outstanding shares of the fund.
The fund maintains its own account for purposes of holding assets and accounting, and is considered a separate entity for tax purposes. Within its account, the fund may also keep certain assets in segregated accounts, as required by securities law.
2. Significant Accounting Policies:
The following is a summary of the significant accounting policies the fund uses in its preparation of financial statements. The fund follows the investment company accounting and reporting guidance of the Financial Accounting Standards Board (FASB) Accounting Standard Codification Topic 946 Financial Services — Investment Companies. The accounting policies are in conformity with accounting principles generally accepted in the United States of America (GAAP).
The fund invests in certain other investment companies (underlying funds). For more information about the underlying funds’ operations and policies, please refer to those funds’ semiannual and annual reports, which are filed with the U.S. Securities and Exchange Commission (SEC).
Effective August 1, 2017, the fund adopted disclosure requirement changes for SEC Regulation S-X. The adopted changes are reflected throughout this report.
(a) Security Valuation:
Under procedures approved by the fund’s Board of Trustees (the Board), the investment adviser has formed a Pricing Committee to administer the pricing and valuation of portfolio securities and other assets and to ensure that prices used for internal purposes or provided by third parties reasonably reflect fair market value. Among other things, these procedures allow the fund to utilize independent pricing services, quotations from securities and financial instrument dealers and other market sources to determine fair value.
The fund values the securities in its portfolio every business day. The fund uses the following policies to value various types of securities:
• Securities traded on an exchange or over-the-counter: Traded securities are valued at the closing value for the day, or, on days when no closing value has been reported, at the mean of the most recent bid and ask quotes. Securities that are primarily traded on foreign exchanges are valued at the official closing price or the last sales price on the exchange where the securities are principally traded with these values then translated into U.S. dollars at the current exchange rate, unless these securities are fair valued as discussed below.
• Securities for which no quoted value is available: The Board has adopted procedures to fair value the fund’s securities when market prices are not “readily available” or are unreliable. For example, the fund may fair value a security when it is de-listed or its trading is halted or suspended; when a security’s primary pricing source is unable or unwilling to provide a price; or when a security’s primary trading market is closed during regular market hours. The fund makes fair value determinations in good faith in accordance with the fund’s valuation procedures. The Pricing Committee considers a number of factors, including unobservable market inputs when arriving at fair value. The Pricing Committee may employ techniques such as the review of related or comparable assets or liabilities, related market activities, recent transactions, market multiples, book values, transactional back-testing, disposition analysis and other relevant information. The Pricing Committee regularly reviews these inputs and assumptions to calibrate the valuations. Due to the subjective and variable nature of fair value pricing, there can be no assurance that the fund could obtain the fair value assigned to the security upon the sale of such security. The Board convenes on a regular basis to review fair value determinations made by the fund pursuant to the valuation procedures.
Laudus U.S. Large Cap Growth Fund | Semiannual Report
Laudus U.S. Large Cap Growth Fund
Financial Notes, unaudited (continued)
2. Significant Accounting Policies (continued):
• Foreign equity security fair valuation: The Board has adopted procedures to fair value foreign equity securities that are traded in markets that close prior to the fund valuing its holdings. By fair valuing securities whose prices may have been affected by events occurring after the close of trading, the fund seeks to establish prices that investors might expect to realize upon the current sales of these securities. This methodology is designed to deter “arbitrage” market timers, who seek to exploit delays between the change in the value of the fund’s portfolio holdings and the NAV of the fund’s shares, and seeks to help ensure that the prices at which the fund’s shares are purchased and redeemed are fair and do not result in dilution of shareholder interest or other harm to shareholders. When fair value pricing is used at the open or close of a reporting period, it may cause a temporary divergence between the return of the fund and that of its comparative index or benchmark. The Board regularly reviews fair value determinations made by the fund pursuant to these procedures.
• Underlying funds: Mutual funds are valued at their respective NAVs.
In accordance with the authoritative guidance on fair value measurements and disclosures under GAAP, the fund discloses the fair value of its investments in a hierarchy that prioritizes the significant inputs to valuation techniques used to measure the fair value. The hierarchy gives the highest priority to valuations based upon unadjusted quoted prices in active markets for identical assets or liabilities (Level 1 measurements) and the lowest priority to valuations based upon unobservable inputs that are significant to the valuation (Level 3 measurements). If inputs used to measure the financial instruments fall within different levels of the hierarchy, the categorization is based on the lowest level input that is significant to the valuation. If the fund determines that either the volume and/or level of activity for an asset or liability has significantly decreased (from normal conditions for that asset or liability) or price quotations or observable inputs are not associated with orderly transactions, increased analysis and management judgment will be required to estimate fair value.
The three levels of the fair value hierarchy are as follows:
• Level 1—quoted prices in active markets for identical securities—Investments whose values are based on quoted market prices in active markets, and whose values are therefore classified as Level 1 prices, include active listed equities. Investments in mutual funds are valued daily at their NAVs, which are classified as Level 1 prices, without consideration to the classification level of the specific investments held by an underlying fund.
• Level 2—other significant observable inputs (including quoted prices for similar securities, interest rates, prepayment speeds, credit risk, etc.)—Investments that trade in markets that are not considered to be active, but whose values are based on quoted market prices, dealer quotations or valuations provided by alternative pricing sources supported by observable inputs are classified as Level 2 prices. These generally include U.S. government and sovereign obligations, most government agency securities, investment-grade corporate bonds, certain mortgage products, less liquid listed equities, and state, municipal and provincial obligations. In addition, international securities whose markets close hours before the fund values its holdings may require fair valuations due to significant movement in the U.S. markets occurring after the daily close of the foreign markets. The Board has approved a vendor that calculates fair valuations of international equity securities based on a number of factors that appear to correlate to the movements in the U.S. markets.
• Level 3—significant unobservable inputs (including the fund’s own assumptions in determining the fair value of investments)—Investments whose values are classified as Level 3 prices have significant unobservable inputs, as they may trade infrequently or not at all. When observable prices are not available for these securities, the fund uses one or more valuation techniques for which sufficient and reliable data is available. The inputs used by the fund in estimating the value of Level 3 prices may include the original transaction price, quoted prices for similar securities or assets in active markets, completed or pending third-party transactions in the underlying investment or comparable issuers, and changes in financial ratios or cash flows. Level 3 prices may also be adjusted to reflect illiquidity and/or non-transferability, with the amount of such discount estimated by the fund in the absence of market information. Assumptions used by the fund due to the lack of observable inputs may significantly impact the resulting fair value and therefore the fund’s results of operations.
The inputs or methodology used for valuing securities are not necessarily an indication of the risk associated with investing in those securities.
The levels associated with valuing the fund’s investments as of September 30, 2017 are disclosed in the Portfolio Holdings.
(b) Security Transactions:
Security transactions are recorded as of the date the order to buy or sell the security is executed. Realized gains and losses from security transactions are based on the identified costs of the securities involved.
Laudus U.S. Large Cap Growth Fund | Semiannual Report
Laudus U.S. Large Cap Growth Fund
Financial Notes, unaudited (continued)
2. Significant Accounting Policies (continued):
Assets and liabilities denominated in foreign currencies are reported in U.S. dollars. For assets and liabilities held on a given date, the dollar value is based on market exchange rates in effect on that date. Transactions involving foreign currencies, including purchases, sales, income receipts and expense payments, are calculated using exchange rates in effect on the transaction date. Realized foreign exchange gains or losses arise from sales of foreign currencies, currency gains or losses realized between the trade and settlement dates on securities transactions and the differences between the recorded amounts of dividends, interest, and foreign withholding taxes and the U.S. dollar equivalent of the amounts actually received or paid. Net unrealized foreign exchange appreciation or depreciation arises from changes in foreign exchange rates on foreign denominated assets and liabilities other than investments in securities held at the end of the reporting period. These realized and unrealized foreign exchange gains or losses are reported in foreign currency transactions or translations on the Statement of Operations. The fund does not isolate the portion of the fluctuations on investments resulting from changes in foreign currency exchange rates from the fluctuations in market prices of investments held. Such fluctuations are included with the net realized and unrealized gain or loss from investments.
Gains realized by the fund on the sale of securities in certain foreign countries may be subject to non-U.S. taxes. In those instances, the fund records a liability based on unrealized appreciation to provide for potential non-U.S. taxes payable upon the sale of these securities.
(c) Investment Income:
Interest income is recorded as it accrues. Dividends and distributions from portfolio securities and underlying funds are recorded on the date they are effective (the ex-dividend date), although the fund records certain foreign security dividends on the day it learns of the ex-dividend date. Any distributions from underlying funds are recorded in accordance with the character of the distributions as designated by the underlying funds.
Income received from foreign sources may result in withholding tax. Withholding taxes are accrued at the same time as the related income if the tax rate is fixed and known, unless a tax withheld is reclaimable from the local tax authorities in which case it is recorded as receivable. If the tax rate is not known or estimable, such expense or reclaim receivable is recorded when the net proceeds are received.
(d) Expenses:
Expenses that are specific to the fund are charged directly to the fund. Expenses that are common to all funds within the trust generally are allocated among the funds in proportion to their average daily net assets.
(e) Distributions to Shareholders:
The fund makes distributions from net investment income and net realized capital gains, if any, once a year.
(f) Custody Credit:
The fund has an arrangement with its custodian bank, State Street Bank and Trust Company (State Street), under which the fund may receive a credit for its uninvested cash balance to offset its custody fees and accounting fees. The credit amounts, if any, are disclosed in the Statement of Operations as a reduction to the fund’s operating expenses.
(g) Accounting Estimates:
The accounting policies described in this report conform to GAAP. Notwithstanding this, shareholders should understand that in order to follow these principles, fund management has to make estimates and assumptions that affect the information reported in the financial statements. It’s possible that once the results are known, they may turn out to be different from these estimates and these differences may be material.
(h) Federal Income Taxes:
The fund intends to meet federal income and excise tax requirements for regulated investment companies under subchapter M of the Internal Revenue Code, as amended. Accordingly, the fund distributes substantially all of its net investment income and net realized capital gains, if any, to its respective shareholders each year. As long as the fund meets the tax requirements, it is not required to pay federal income tax.
Laudus U.S. Large Cap Growth Fund | Semiannual Report
Laudus U.S. Large Cap Growth Fund
Financial Notes, unaudited (continued)
2. Significant Accounting Policies (continued):
(i) Foreign Taxes:
The fund may be subject to foreign taxes (a portion of which may be reclaimable) on income, corporate events, foreign currency exchanges and capital gains on investments. All foreign taxes are recorded in accordance with the applicable foreign tax regulations and rates that exist in foreign markets in which the fund invests. These foreign taxes, if any, are paid by the fund and are disclosed in the Statement of Operations. Foreign taxes payable as of September 30, 2017, if any, are reflected in the fund’s Statement of Assets and Liabilities.
(j) Indemnification:
Under the fund’s organizational documents, the officers and trustees are indemnified against certain liabilities arising out of the performance of their duties to the fund. In addition, in the normal course of business the fund enters into contracts with its vendors and others that provide general indemnifications. The fund’s maximum exposure under these arrangements is unknown as this would involve future claims that may be made against the fund. However, based on experience, the fund expects the risk of loss attributable to these arrangements to be remote.
3. Risk Factors:
Investing in the fund may involve certain risks, as described in the fund’s prospectus, including, but not limited to, those described below. Any of these risks could cause an investor to lose money.
• Market Risk. Financial markets rise and fall in response to a variety of factors, sometimes rapidly and unpredictably. As with any investment whose performance is tied to these markets, the value of an investment in the fund will fluctuate, which means that an investor could lose money over short or long periods.
• Management risk. As with all actively managed funds, the fund is subject to the risk that its subadviser will select investments or allocate assets in a manner that could cause the fund to underperform or otherwise not meet its objective. The fund’s subadviser applies its own investment techniques and risk analyses in making investment decisions for the fund, but there can be no guarantee that they will produce the desired results.
• Equity Risk. The prices of equity securities rise and fall daily. These price movements may result from factors affecting individual companies, industries or the securities market as a whole. In addition, equity markets tend to move in cycles, which may cause stock prices to fall over short or extended periods of time.
• Market Capitalization Risk. Securities issued by companies of different market capitalizations tend to go in and out of favor based on market and economic conditions. During a period when securities of a particular market capitalization fall behind other types of investments, the fund’s performance could be impacted.
• Large-Cap Company Risk. Large-cap companies are generally more mature and the securities issued by these companies may not be able to reach the same levels of growth as the securities issued by small- or mid-cap companies.
• Growth Investing Risk. Growth stocks can be volatile. Growth companies usually invest a high portion of earnings in their businesses and may lack the dividends of value stocks that can cushion stock prices in a falling market. The prices of growth stocks are based largely on projections of the issuer’s future earnings and revenues. If a company’s earnings or revenues fall short of expectations, its stock price may fall dramatically. Growth stocks may also be more expensive relative to their earnings or assets compared to value or other stocks.
• Foreign investment risk. The fund’s investments in securities of foreign issuers involve certain risks that may be greater than those associated with investments in securities of U.S. issuers. These include risks of adverse changes in foreign economic, political, regulatory and other conditions; changes in currency exchange rates or exchange control regulations (including limitations on currency movements and exchanges); the imposition of economic sanctions or other government restrictions; differing accounting, auditing, financial reporting and legal standards and practices; differing securities market structures; and higher transaction costs. These risks may negatively impact the value or liquidity of the fund’s investments, and could impair the fund’s ability to meet its investment objective or invest in accordance with its investment strategy. There is a risk that investments in securities denominated in, and/or receiving revenues in, foreign currencies will decline in value relative to the U.S. dollar or, in the case of hedging positions, that the U.S. dollar will decline in value relative to the currency hedged, resulting in the dollar value of the fund’s investment being adversely affected. Foreign securities also include American Depositary receipts (ADRs), Global Depositary receipts (GDRs) and European Depositary receipts (EDRs) which may be less
Laudus U.S. Large Cap Growth Fund | Semiannual Report
Laudus U.S. Large Cap Growth Fund
Financial Notes, unaudited (continued)
3. Risk Factors (continued):
liquid than the underlying shares in their primary trading market and GDRs, many of which are issued by companies in emerging markets, may be more volatile. These risks may be heightened in connection with investments in emerging markets or securities of issuers that conduct their business in emerging markets.
• Derivatives Risk. The fund’s use of derivative instruments involves risks different from, or possibly greater than, the risks associated with investing directly in securities and other traditional investments. The fund’s use of derivatives could reduce the fund’s performance, increase the fund’s volatility, and could cause the fund to lose more than the initial amount invested. In addition, investments in derivatives may involve leverage, which means a small percentage of assets invested in derivatives can have a disproportionately large impact on the fund.
• Leverage risk. Certain fund transactions, such as derivatives, may give rise to a form of leverage and may expose the fund to greater risk. Leverage tends to magnify the effect of any increase or decrease in the value of the fund’s portfolio securities, which means even a small amount of leverage can have a disproportionately large impact on the fund.
• Liquidity risk. The fund may be unable to sell certain securities, such as illiquid securities, readily at a favorable time or price, or the fund may have to sell them at a loss.
Please refer to the fund’s prospectus for a more complete description of the principal risks of investing in the fund.
4. Affiliates and Affiliated Transactions:
Investment Adviser
Charles Schwab Investment Management, Inc. (CSIM or the investment adviser), a wholly owned subsidiary of The Charles Schwab Corporation, serves as the fund’s investment adviser pursuant to an Investment Advisory Agreement (Advisory Agreement) between CSIM and the trust. BlackRock Investment Management, LLC (BlackRock), the fund’s subadviser, provides day-to-day portfolio management services to the fund, subject to the supervision of CSIM.
For its advisory services to the fund, CSIM is entitled to receive an annual fee, payable monthly, based on a percentage of the fund’s average daily net assets described as follows:
| Average daily net assets | |
| First $500 million | 0.700% |
| $500 million to $1 billion | 0.650% |
| $1 billion to $1.5 billion | 0.600% |
| $1.5 billion to $2 billion | 0.575% |
| Over $2 billion | 0.550% |
For the period ended September 30, 2017, the aggregate net advisory fee paid to CSIM was 0.64% for the fund, as a percentage of the fund’s average daily net assets.
CSIM (not the fund) pays a portion of the advisory fees it receives to BlackRock in return for its services.
Expense Limitation
CSIM has contractually agreed, until at least July 30, 2019, to limit the total annual fund operating expenses charged, excluding interest, taxes and certain non-routine expenses of the fund to 0.77%.
Laudus U.S. Large Cap Growth Fund | Semiannual Report
Laudus U.S. Large Cap Growth Fund
Financial Notes, unaudited (continued)
4. Affiliates and Affiliated Transactions (continued):
Investments from Affiliates
Certain Schwab funds may own shares of other Schwab funds. The table below reflects the percentage of shares of the fund that are owned by other Schwab funds as of September 30, 2017:
| Schwab Target 2020 Fund | 0.2% |
| Schwab Target 2025 Fund | 0.5% |
| Schwab Target 2030 Fund | 1.7% |
| Schwab Target 2035 Fund | 1.1% |
| Schwab Target 2040 Fund | 3.3% |
| Schwab Target 2045 Fund | 0.5% |
| Schwab Target 2050 Fund | 0.4% |
| Schwab Target 2055 Fund | 0.3% |
| Schwab Target 2060 Fund | 0.0%* |
| Schwab Balanced Fund | 3.2% |
5. Shareholders Services:
The trustees have authorized the fund to reimburse, out of the assets of the fund, financial intermediaries that provide sub-accounting and sub-transfer agency services in connection with the fund’s shares in an amount of up to 0.10% of the average daily net assets of the fund on an annual basis.
6. Board of Trustees:
The trust’s Board oversees the general conduct of the trust and the fund.
The Board may include people who are officers and/or directors of CSIM or its affiliates. Federal securities law limits the percentage of such “interested persons” who may serve on a trust’s board, and the trust was in compliance with these limitations throughout the report period. The trust did not pay any of these interested persons for their services as trustees, but it did pay non-interested persons (independent trustees), as noted in the fund’s Statement of Operations. For information regarding the trustees, please refer to Trustees and Officers table at the end of this report.
7. Borrowing from Banks:
During the period, the fund was a participant with other U.S. registered investment companies managed by CSIM in a joint, syndicated, committed $555 million line of credit (the Credit Facility). Under the terms of the Credit Facility, in addition to the interest charged on any borrowings by the fund, the fund paid a commitment fee of 0.15% per annum on its proportionate share of the unused portion of the Credit Facility. There were no borrowings from the line of credit during the period.
The fund also has access to custodian overdraft facilities. The fund may have utilized the overdraft facility and incurred an interest expense, which is disclosed on the fund’s Statement of Operations, if any. The interest expense is determined based on a negotiated rate above the current Federal Funds Rate.
8. Purchases and Sales/Maturities of Investment Securities:
For the period ended September 30, 2017, purchases and sales/maturities of securities (excluding short-term obligations) were as follows:
Purchases
of Securities | Sales/Maturities
of Securities |
| $385,639,770 | $537,257,398 |
Laudus U.S. Large Cap Growth Fund | Semiannual Report
Laudus U.S. Large Cap Growth Fund
Financial Notes, unaudited (continued)
9. Redemption Fee:
Prior to February 28, 2017, the fund charged a 2.00% redemption fee on shares sold or exchanged within 30 days of the original purchase date. Such amounts are netted against redemption proceeds on the Statement of Changes in Net Assets. Effective February 28, 2017, the fund no longer charges redemption fees. The redemption fees charged during the prior period were $25,896.
10. Federal Income Taxes:
As of September 30, 2017, the tax basis cost of the fund’s investments and gross unrealized appreciation and depreciation were as follows:
| Tax cost | $1,264,676,236 |
| Gross unrealized appreciation | $505,799,830 |
| Gross unrealized depreciation | (12,308,466) |
| Net unrealized appreciation (depreciation) | $493,491,364 |
Capital loss carryforwards may be used to offset future realized capital gains for federal income tax purposes. As of March 31, 2017, the fund had no capital loss carryforwards.
As of March 31, 2017, management has reviewed the tax positions for open periods (for federal purposes, three years from the date of filing and for state purposes, four years from the date of filing) as applicable to the fund, and has determined that no provision for income tax is required in the fund’s financial statements. The fund recognizes interest and penalties, if any, related to unrecognized tax benefits as income tax expense in the Statement of Operations. During the period ended March 31, 2017, the fund did not incur any interest or penalties.
11. Custody Out-of-Pocket Fee Reimbursement:
In December 2015, State Street, the fund’s custodian, identified inconsistencies in the way in which clients were invoiced for categories of expenses, particularly those deemed out-of-pocket costs, during an 18-year period going back to 1998. The issue was the result of inaccurate billing rates that were not subsequently reviewed or adjusted. The amount of the difference in what was charged and what should have been charged, plus interest, was paid to the fund during the period ended October 2017 as a reimbursement. The amount applied to the fund was recognized as a change in accounting estimate. This resulted in a decrease in Net expenses and an overall increase in Net assets. This payment is presented in the fund’s Statement of Operations as Custody out-of-pocket fee reimbursement.
12. Subsequent Events:
Management has determined there are no subsequent events or transactions through the date the financial statements were issued that would have materially impacted the financial statements as presented.
Laudus U.S. Large Cap Growth Fund | Semiannual Report
Laudus U.S. Large Cap Growth Fund
Approval of Renewal of Investment Advisory and Sub-Advisory Agreements
The Investment Company Act of 1940 (the 1940 Act) requires that initial approval of, as well as the continuation of, a fund’s investment advisory agreements be specifically approved (1) by the vote of the trustees or by a vote of the shareholders of the fund, and (2) by the vote of a majority of the trustees who are not parties to the investment advisory agreements or “interested persons” of any party (the Independent Trustees), cast in person at a meeting called for the purpose of voting on such approval. In connection with such approvals, the fund’s trustees must request and evaluate, and the investment adviser is required to furnish, such information as may be reasonably necessary to evaluate the terms of the investment advisory agreements.
The Board of Trustees (the Board or the Trustees, as appropriate) calls and holds one or more meetings each year that are dedicated, in part, to considering whether to renew the investment advisory agreement between Laudus Trust (the Trust) and Charles Schwab Investment Management, Inc. (CSIM), and the subadvisory agreement between CSIM and BlackRock Investment Management LLC (BlackRock) (such investment advisory and sub-advisory agreements, collectively, the Agreements) with respect to Laudus U.S. Large Cap Growth Fund (the Fund). In preparation for the meeting(s), the Board requests and reviews a wide variety of materials provided by CSIM and BlackRock, including information about their affiliates, personnel, business goals and priorities, profitability, third-party oversight, corporate structure and operations. The Board also receives data provided by an independent provider of investment company data. This information is in addition to the detailed information about the Fund that the Board reviews during the course of each year, including information that relates to fund operations and fund performance. The Independent Trustees receive advice from independent counsel to the Independent Trustees, including a memorandum regarding the responsibilities of trustees for the approval of investment advisory agreements. In addition, the Independent Trustees meet in executive session outside the presence of fund management and participate in question and answer sessions with representatives of CSIM and BlackRock, as appropriate.
As part of the renewal process and ongoing oversight of the advisory and sub-advisory relationships, Independent Trustees’ legal counsel sends an information request letter to CSIM and CSIM sends an information request letter to BlackRock seeking certain relevant information. The responses by CSIM and BlackRock are provided to the Trustees for their review prior to their meeting, and the Trustees are provided with the opportunity to request any additional materials.
The Board, including a majority of the Independent Trustees, considered information relating to its consideration of the continuance of the Agreements at meetings held on April 19, 2017, and June 6, 2017, and approved the renewal of the Agreements for an additional one-year term at the meeting held on June 6, 2017. The Board’s approval of the Agreements was based on consideration and evaluation of a variety of specific factors discussed at these meetings and at prior meetings, including:
| 1. | the nature, extent and quality of the services provided to the Fund under the Agreements, including the resources of CSIM and its affiliates, and BlackRock, dedicated to the Fund; |
| 2. | the Fund’s investment performance and how it compared to that of certain other comparable mutual funds; |
| 3. | the Fund’s expenses and how those expenses compared to those of certain other comparable mutual funds; |
| 4. | the profitability of CSIM and its affiliates, including Charles Schwab & Co., Inc. (Schwab), with respect to the Fund, including both direct and indirect benefits accruing to CSIM and its affiliates, as well as the profitability of BlackRock; and |
| 5. | the extent to which economies of scale would be realized as the Fund grows, and whether fee levels in the Agreements reflect those economies of scale for the benefit of Fund investors. |
Nature, Extent and Quality of Services. The Board considered the nature, extent and quality of the services provided by CSIM to the Fund and the resources of CSIM and its affiliates dedicated to the Fund. In this regard, the Trustees evaluated, among other things, CSIM’s personnel, experience, track record, compliance program, resources dedicated to hiring and retaining qualified personnel, and information security resources. The Trustees also considered information provided by CSIM relating to the Fund’s portfolio management team, portfolio strategy and risk oversight structure, and internal investment guidelines. The Trustees also considered investments in CSIM’s mutual fund infrastructure. The Trustees also considered Schwab’s reputation in connection with the OneSource mutual fund offering and its overall financial condition. The Board also considered the nature, extent and quality of the sub-advisory services provided by BlackRock to the Fund and the resources it dedicates to the Fund. Following such evaluation, the Board concluded, within the context of its full deliberations, that the nature, extent and quality of services provided by CSIM and BlackRock to the Fund and the resources of CSIM and its affiliates and the resources of BlackRock dedicated to the Fund supported renewal of the Agreements.
Laudus U.S. Large Cap Growth Fund | Semiannual Report
Laudus U.S. Large Cap Growth Fund
Fund Performance. The Board considered Fund performance in determining whether to renew the Agreements with respect to the Fund. Specifically, the Trustees considered the Fund’s performance relative to a peer category of other mutual funds and an appropriate index/benchmark, in light of total return and market trends. As part of this review, the Trustees considered the composition of the peer category, selection criteria and the reputation of the third party who prepared the peer category analysis. In evaluating the performance of the Fund, the Trustees considered both risk and shareholder risk expectations for the Fund and the appropriateness of the benchmark used to compare the performance of the Fund. The Trustees further considered the level of Fund performance in the context of their review of Fund expenses and adviser profitability discussed below and also noted that performance is reviewed throughout the year by a designated committee of the Board and by the Board. Following such evaluation, the Board concluded, within the context of its full deliberations, that the performance of the Fund supported renewal of the Agreements.
Fund Expenses. With respect to the Fund’s expenses, the Trustees considered the rate of compensation called for by the Agreements, and the Fund’s net operating expense ratio, in each case, in comparison to those of other comparable mutual funds, such peer category and comparison having been selected and calculated by an independent provider of investment company data. The Trustees considered the effects of CSIM’s contractual waivers of management and other fees to prevent total Fund expenses from exceeding a specified cap. The Trustees also considered fees charged by CSIM and BlackRock to other mutual funds and to other types of accounts, such as exchange-traded funds and separately managed accounts, but, with respect to such other types of accounts, accorded less weight to such comparisons due to the different legal, regulatory, compliance and operating features of mutual funds as compared to these other types of accounts and any differences in the nature and scope of the services CSIM provides to these other accounts, as well as differences in the market for these types of accounts. Following such evaluation, the Board concluded, within the context of its full deliberations, that the expenses of the Fund are reasonable and supported renewal of the Agreements.
Profitability. With regard to profitability, the Trustees considered the compensation flowing to CSIM and its affiliates, directly or indirectly and the compensation flowing to BlackRock, directly or indirectly. In this connection, the Trustees reviewed management’s profitability analyses. The Trustees also reviewed profitability of CSIM relating to the
Schwab fund complex as a whole, noting the benefit to Fund shareholders of being part of the Schwab fund complex, including the allocations of certain fixed costs across the funds in the complex. The Trustees also considered any other benefits derived by CSIM and BlackRock from their relationship with the Fund, such as whether, by virtue of their management of the Fund, CSIM or BlackRock obtains investment information or other research resources that aid it in providing advisory services to other clients. With respect to CSIM and BlackRock, and their respective affiliates, the Trustees considered whether the varied levels of compensation and profitability under the Agreements and other service agreements were reasonable and justified in light of the quality of all services rendered to the Fund by CSIM and BlackRock and their respective affiliates. With respect to the profitability of BlackRock, the Board also considered that BlackRock is compensated by CSIM and not by the Funds directly, and such compensation reflects an arms-length negotiation between the parties. Based on this evaluation, the Board concluded, within the context of its full deliberations, that the profitability of CSIM and BlackRock is reasonable and supported renewal of the Agreements.
Economies of Scale. The Trustees considered the existence of any economies of scale and whether those are passed along to the Fund’s shareholders through a graduated investment advisory fee schedule or other means, including any fee waivers or expense caps by CSIM and its affiliates. In this regard, and consistent with their consideration of Fund expenses, the Trustees considered that CSIM has committed resources to minimize the effects on shareholders of diseconomies of scale during periods when Fund assets are relatively small through contractual expense waivers. The Trustees also considered the existing contractual investment advisory fee schedule for the Fund that includes lower fees at higher graduated asset levels. Based on this evaluation, the Board concluded, within the context of its full deliberations, that the Fund obtains reasonable benefit from economies of scale.
In the course of their deliberations, the Trustees did not identify any particular information or factor that was all important or controlling. Based on the Trustees’ deliberation and their evaluation of the information described above, the Board, including all of the Independent Trustees, approved the continuation of the Agreements and concluded that the compensation under the Agreements is fair and reasonable in light of such services and expenses and such other matters as the Trustees have considered to be relevant in the exercise of their reasonable judgment.
Laudus U.S. Large Cap Growth Fund | Semiannual Report
Laudus U.S. Large Cap Growth Fund
Trustees and Officers
The tables below give information about the trustees and officers of Laudus Trust, which includes the fund covered in this report. The “Fund Complex” includes The Charles Schwab Family of Funds, Schwab Capital Trust, Schwab Investments, Schwab Annuity Portfolios, Schwab Strategic Trust and Laudus Trust. The Fund Complex includes 105 funds.
The address for all trustees and officers is 211 Main Street, San Francisco, CA 94105. You can find more information about the trustees and officers in the Statement of Additional Information, which is available free by calling 1-877-824-5615.
| Independent Trustees |
Name, Year of Birth, and
Position(s) with the trust
(Terms of office, and
length of Time Served1) | Principal Occupations
During the Past Five Years | Number of
Portfolios in
Fund Complex
Overseen by
the Trustee | Other Directorships |
Robert W. Burns
1959
Trustee
(Trustee of Schwab Strategic Trust since 2009; The Charles Schwab Family of Funds, Schwab Investments, Schwab Capital Trust, Schwab Annuity Portfolios and Laudus Trust since 2016) | Retired/Private Investor (Jan. 2009 – present). Formerly, Managing Director, Pacific Investment Management Company, LLC (PIMCO) (investment management firm) and President, PIMCO Funds. | 105 | Director, PS Business Parks, Inc. (2005 – 2012) |
John F. Cogan
1947
Trustee
(Trustee of The Charles Schwab Family of Funds, Schwab Investments, Schwab Capital Trust and Schwab Annuity Portfolios since 2008; Laudus Trust since 2010; Schwab Strategic Trust since 2016) | Senior Fellow, The Hoover Institution at Stanford University (public policy think tank) (Oct. 1979 – present); Senior Fellow, Stanford Institute for Economic Policy Research (2000 – present); Professor of Public Policy, Stanford University (1994 – 2015). | 105 | Director, Gilead Sciences, Inc. (2005 – present) |
Stephen Timothy Kochis
1946
Trustee
(Trustee of Schwab Strategic Trust since 2012; The Charles Schwab Family of Funds, Schwab Investments, Schwab Capital Trust, Schwab Annuity Portfolios and Laudus Trust since 2016) | CEO and Owner, Kochis Global (wealth management consulting) (May 2012 – present); Chairman and CEO, Aspiriant, LLC (wealth management) (Jan. 2008 – Apr. 2012). | 105 | None |
David L. Mahoney
1954
Trustee
(Trustee of The Charles Schwab Family of Funds, Schwab Investments, Schwab Capital Trust, Schwab Annuity Portfolios and Laudus Trust since 2011; Schwab Strategic Trust since 2016) | Private Investor. | 105 | Director, Symantec Corporation (2003 – present)
Director, Corcept Therapeutics Incorporated (2004 – present)
Director, Adamas Pharmaceuticals, Inc. (2009 – present) |
Laudus U.S. Large Cap Growth Fund | Semiannual Report
Laudus U.S. Large Cap Growth Fund
| Independent Trustees (continued) |
Name, Year of Birth, and
Position(s) with the trust
(Terms of office, and
length of Time Served1) | Principal Occupations
During the Past Five Years | Number of
Portfolios in
Fund Complex
Overseen by
the Trustee | Other Directorships |
Kiran M. Patel
1948
Trustee
(Trustee of The Charles Schwab Family of Funds, Schwab Investments, Schwab Capital Trust, Schwab Annuity Portfolios and Laudus Trust since 2011; Schwab Strategic Trust since 2016) | Retired. Executive Vice President and General Manager of Small Business Group, Intuit, Inc. (financial software and services firm for consumers and small businesses) (Dec. 2008 – Sept. 2013). | 105 | Director, KLA-Tencor Corporation (2008 – present) |
Kimberly S. Patmore
1956
Trustee
(Trustee of The Charles Schwab Family of Funds, Schwab Investments, Schwab Capital Trust, Schwab Annuity Portfolios, Schwab Strategic Trust and Laudus Trust since 2016) | Consultant, Patmore Management Consulting (management consulting) (2008 – present). | 105 | None |
Charles A. Ruffel
1956
Trustee
(Trustee of Schwab Strategic Trust since 2009; The Charles Schwab Family of Funds, Schwab Investments, Schwab Capital Trust, Schwab Annuity Portfolios and Laudus Trust since 2015) | Co-Chief Executive Officer, Kudu Investment Management, LLC (financial services) (Jan. 2015 – present); Partner, Kudu Advisors, LLC (financial services) (June 2008 – Jan. 2015); Advisor, Asset International, Inc. (publisher of financial services information) (Aug. 2008 – Jan. 2015). | 105 | None |
Gerald B. Smith
1950
Trustee
(Trustee of The Charles Schwab Family of Funds, Schwab Investments, Schwab Capital Trust and Schwab Annuity Portfolios since 2000; Laudus Trust since 2010; Schwab Strategic Trust since 2016) | Chairman, Chief Executive Officer and Founder of Smith Graham & Co. (investment advisors) (Mar. 1990 – present). | 105 | Director, Eaton (2012 – present)
Director and Chairman of the Audit Committee, Oneok Partners LP (2003 – 2013)
Director, Oneok, Inc. (2009 – 2013)
Lead Independent Director, Board of Cooper Industries (2002 – 2012) |
Joseph H. Wender
1944
Trustee
(Trustee of The Charles Schwab Family of Funds, Schwab Investments, Schwab Capital Trust and Schwab Annuity Portfolios since 2008; Laudus Trust since 2010; Schwab Strategic Trust since 2016) | Senior Consultant, Goldman Sachs & Co., Inc. (investment banking and securities firm) (Jan. 2008 – present); Partner, Colgin Partners, LLC (vineyards) (Feb. 1998 – present). | 105 | Board Member and Chairman of the Audit Committee, Ionis Pharmaceuticals (1994 – present)
Lead Independent Director and Chair of Audit Committee, OUTFRONT Media Inc. (2014 – present) |
Laudus U.S. Large Cap Growth Fund | Semiannual Report
Laudus U.S. Large Cap Growth Fund
| Interested Trustees |
Name, Year of Birth, and
Position(s) with the trust
(Terms of office, and
length of Time Served1) | Principal Occupations
During the Past Five Years | Number of
Portfolios in
Fund Complex
Overseen by
the Trustee | Other Directorships |
Walter W. Bettinger II2
1960
Chairman and Trustee
(Trustee of The Charles Schwab Family of Funds, Schwab Investments, Schwab Capital Trust and Schwab Annuity Portfolios since 2008; Schwab Strategic Trust since 2009; Laudus Trust since 2010) | Director, President and Chief Executive Officer, The Charles Schwab Corporation (Oct. 2008 – present); President and Chief Executive Officer (Oct. 2008 – present), Director (May 2008 – present), Charles Schwab & Co., Inc.; Director, Charles Schwab Bank (Apr. 2006 – present); Director, Schwab Holdings, Inc. (May 2008 – present); and Director, Charles Schwab Investment Management, Inc. (July 2016 – present). | 105 | Director, The Charles Schwab Corporation (2008 – present) |
Marie A. Chandoha2
1961
Trustee
(Trustee of The Charles Schwab Family of Funds, Schwab Investments, Schwab Capital Trust, Schwab Annuity Portfolios, Schwab Strategic Trust and Laudus Trust since 2016) | Director, President and Chief Executive Officer (Dec. 2010 – present), Chief Investment Officer (Sept. 2010 – Oct. 2011), Charles Schwab Investment Management, Inc.; Trustee (Jan. 2016 – present), President, Chief Executive Officer (Dec. 2010 – present), and Chief Investment Officer (Sept. 2010 – Oct. 2011), Schwab Funds, Laudus Funds and Schwab ETFs; Director, Charles Schwab Worldwide Funds plc and Charles Schwab Asset Management (Ireland) Limited (Jan. 2011 – present); Global Head of Fixed Income Business Division, BlackRock, Inc. (formerly Barclays Global Investors) (investment management firm) (Mar. 2007 – Aug. 2010). | 105 | None |
Joseph R. Martinetto2
1962
Trustee
(Trustee of The Charles Schwab Family of Funds, Schwab Investments, Schwab Capital Trust, Schwab Annuity Portfolios, Schwab Strategic Trust and Laudus Trust since 2016) | Senior Executive Vice President (July 2015 – present), Chief Financial Officer (July 2015 – May 2017), Executive Vice President and Chief Financial Officer (May 2007 – July 2015), The Charles Schwab Corporation and Charles Schwab & Co., Inc.; Director, Charles Schwab & Co., Inc. (May 2007 – present); Director (Apr. 2010 – present) and Chief Executive Officer (July 2013 – Apr. 2015), Charles Schwab Bank; Director (May 2007 – present), Chief Financial Officer (May 2007 – May 2017), Senior Executive Vice President (Feb. 2016 – present), and Executive Vice President (May 2007 – Feb. 2016), Schwab Holdings, Inc. | 105 | None |
| Officers of the Trust |
Name, Year of Birth, and Position(s) with the trust
(Terms of office, and length of Time Served3) | Principal Occupations During the Past Five Years |
Marie A. Chandoha
1961
President and Chief Executive Officer
(Officer of The Charles Schwab Family of Funds, Schwab Investments, Schwab Capital Trust, Schwab Annuity Portfolios, Schwab Strategic Trust and Laudus Trust since 2010) | Director, President and Chief Executive Officer (Dec. 2010 �� present), Chief Investment Officer (Sept. 2010 – Oct. 2011), Charles Schwab Investment Management, Inc.; Trustee (Jan. 2016 – present), President, Chief Executive Officer (Dec. 2010 – present), and Chief Investment Officer (Sept. 2010 – Oct. 2011), Schwab Funds, Laudus Funds and Schwab ETFs; Director, Charles Schwab Worldwide Funds plc and Charles Schwab Asset Management (Ireland) Limited (Jan. 2011 – present); Global Head of Fixed Income Business Division, BlackRock, Inc. (formerly Barclays Global Investors) (investment management firm) (Mar. 2007 – Aug. 2010). |
Mark Fischer
1970
Treasurer and Chief Financial Officer
(Officer of The Charles Schwab Family of Funds, Schwab Investments, Schwab Capital Trust, Schwab Annuity Portfolios, Schwab Strategic Trust and Laudus Trust since 2013) | Treasurer and Chief Financial Officer, Schwab Funds, Laudus Funds and Schwab ETFs (Jan. 2016 – present); Assistant Treasurer, Schwab Funds and Laudus Funds (Dec. 2013 – Dec. 2015), Schwab ETFs (Nov. 2013 – Dec. 2015); Vice President, Charles Schwab Investment Management, Inc. (Oct. 2013 – present); Executive Director, J.P. Morgan Investor Services (Apr. 2011 – Sept. 2013); Assistant Treasurer, Massachusetts Financial Service Investment Management (May 2005 – Mar. 2011). |
Laudus U.S. Large Cap Growth Fund | Semiannual Report
Laudus U.S. Large Cap Growth Fund
| Officers of the Trust (continued) |
Name, Year of Birth, and Position(s) with the trust
(Terms of office, and length of Time Served3) | Principal Occupations During the Past Five Years |
George Pereira
1964
Senior Vice President and Chief Operating Officer
(Officer of The Charles Schwab Family of Funds, Schwab Investments, Schwab Capital Trust and Schwab Annuity Portfolios since 2004; Laudus Trust since 2006; Schwab Strategic Trust since 2009) | Senior Vice President and Chief Financial Officer (Nov. 2004 – present), Chief Operating Officer (Jan. 2011 – present), Charles Schwab Investment Management, Inc.; Senior Vice President and Chief Operating Officer (Jan. 2016 – present), Treasurer and Chief Financial Officer, Laudus Funds (June 2006 – Dec. 2015); Treasurer and Principal Financial Officer, Schwab Funds (Nov. 2004 – Dec. 2015) and Schwab ETFs (Oct. 2009 – Dec. 2015); Director, Charles Schwab Worldwide Funds plc and Charles Schwab Asset Management (Ireland) Limited (Apr. 2005 – present). |
Omar Aguilar
1970
Senior Vice President and Chief Investment Officer – Equities and Multi-Asset Strategies
(Officer of The Charles Schwab Family of Funds, Schwab Investments, Schwab Capital Trust, Schwab Annuity Portfolios, Schwab Strategic Trust and Laudus Trust since 2011) | Senior Vice President and Chief Investment Officer – Equities and Multi-Asset Strategies, Charles Schwab Investment Management, Inc. (Apr. 2011 – present); Senior Vice President and Chief Investment Officer – Equities, Schwab Funds, Laudus Funds and Schwab ETFs (June 2011 – present); Head of the Portfolio Management Group and Vice President of Portfolio Management, Financial Engines, Inc. (investment management firm) (May 2009 – Apr. 2011); Head of Quantitative Equity, ING Investment Management (July 2004 – Jan. 2009). |
Brett Wander
1961
Senior Vice President and Chief Investment Officer – Fixed Income
(Officer of The Charles Schwab Family of Funds, Schwab Investments, Schwab Capital Trust, Schwab Annuity Portfolios, Schwab Strategic Trust and Laudus Trust since 2011) | Senior Vice President and Chief Investment Officer – Fixed Income, Charles Schwab Investment Management, Inc. (Apr. 2011 – present); Senior Vice President and Chief Investment Officer – Fixed Income, Schwab Funds, Laudus Funds and Schwab ETFs (June 2011 – present); Senior Managing Director, Global Head of Active Fixed-Income Strategies, State Street Global Advisors (Jan. 2008 – Oct. 2010); Director of Alpha Strategies Loomis, Sayles & Company (investment management firm) (Apr. 2006 – Jan. 2008). |
David Lekich
1964
Chief Legal Officer and Secretary, Schwab Funds and Schwab ETFs
Vice President and Assistant Clerk, Laudus Funds
(Officer of The Charles Schwab Family of Funds, Schwab Investments, Schwab Capital Trust, Schwab Annuity Portfolios, Schwab Strategic Trust and Laudus Trust since 2011) | Senior Vice President (Sept. 2011 – present), Vice President (Mar. 2004 – Sept. 2011), Charles Schwab & Co., Inc.; Senior Vice President and Chief Counsel (Sept. 2011 – present), Vice President (Jan. 2011 – Sept. 2011), Charles Schwab Investment Management, Inc.; Secretary (Apr. 2011 – present) and Chief Legal Officer (Dec. 2011 – present), Schwab Funds; Vice President and Assistant Clerk, Laudus Funds (Apr. 2011 – present); Secretary (May 2011 – present) and Chief Legal Officer (Nov. 2011 – present), Schwab ETFs. |
Catherine MacGregor
1964
Vice President and Assistant Secretary, Schwab Funds and Schwab ETFs
Chief Legal Officer, Vice President and Clerk, Laudus Funds
(Officer of The Charles Schwab Family of Funds, Schwab Investments, Schwab Capital Trust, Schwab Annuity Portfolios and Laudus Trust since 2005; Schwab Strategic Trust since 2009) | Vice President, Charles Schwab & Co., Inc., Charles Schwab Investment Management, Inc. (July 2005 – present); Vice President (Dec. 2005 – present), Chief Legal Officer and Clerk (Mar. 2007 – present), Laudus Funds; Vice President (Nov. 2005 – present) and Assistant Secretary (June 2007 – present), Schwab Funds; Vice President and Assistant Secretary, Schwab ETFs (Oct. 2009 – present). |
| 1 | Each Trustee shall hold office until the election and qualification of his or her successor, or until he or she dies, resigns or is removed. The retirement policy requires that each independent trustee retire by December 31 of the year in which the Trustee turns 74 or the Trustee’s twentieth year of service as an independent trustee on any trust in the Fund Complex, whichever occurs first. |
| 2 | Mr. Bettinger, Ms. Chandoha and Mr. Martinetto are Interested Trustees. Mr. Bettinger is an Interested Trustee because he owns stock of The Charles Schwab Corporation (CSC), the parent company of Charles Schwab Investment Management, Inc. (CSIM), the investment adviser for the trusts in the Fund Complex, is an employee and director of Charles Schwab & Co., Inc. (CS&Co), the principal underwriter for The Charles Schwab Family of Funds, Schwab Investments, Schwab Capital Trust and Schwab Annuity Portfolios, and is a director of the investment adviser for the trusts in the Fund Complex. Ms. Chandoha is an Interested Trustee because she owns stock of CSC and is an employee and director of CSIM. Mr. Martinetto is an Interested Trustee because he owns stock of CSC and is an employee and director of CS&Co. |
| 3 | The President, Treasurer and Secretary/Clerk hold office until their respective successors are chosen and qualified or until he or she sooner dies, resigns, is removed or becomes disqualified. Each of the other officers serves at the pleasure of the Board. |
Laudus U.S. Large Cap Growth Fund | Semiannual Report
Laudus U.S. Large Cap Growth Fund
Dividend yield is an expression of a stock’s market value in relationship to its dividend amount as a percentage. It is calculated by dividing the stock’s annual dividends by the market price of the stock.
Price to earnings ratio is the price of a stock divided by its historical earnings per share.
Price to book ratio compares the stock’s market value to the value of the total assets less the total liabilities.
Russell 1000 Growth Index An index that measures the performance of those Russell 1000 companies with higher price-to-book ratios and higher forecasted growth values.
Russell 1000 Value Index An index that measures the performance of the large-cap value segment of the U.S. equity universe. It includes those Russell 1000 Index companies with lower price-to-book ratios and lower expected growth values.
S&P 500 Index An index that is designed to measure the performance of 500 leading publicly traded companies from a broad range of industries.
Sovereign debt refers to debt issued by a national government within a given country and denominated in a foreign currency.
Trading Activity is one of several risk factors commonly used to attribute a portfolio’s return relative to its benchmark. Specifically, trading activity measures a stock’s trailing 12 month trading volume relative to its total shares outstanding. It measures how actively traded a stock has been in the last 12 months.
Weighted Average Market Cap A measure of the size of the companies in which a fund invests, based upon the market value of a fund’s securities each weighted according to its percent of the portfolio.
Laudus U.S. Large Cap Growth Fund | Semiannual Report
Laudus U.S. Large Cap Growth Fund
Laudus Funds®
Laudus Funds offer investors access to some of the world’s leading investment managers. With a rigorous manager selection process and ongoing oversight by Charles Schwab Investment Management, Laudus Funds offer single and multi-manager strategies as a complement to other funds managed by Charles Schwab Investment Management. The list below shows all currently available Laudus Funds.
An investor should consider a fund’s investment objectives, risks, charges and expenses carefully before investing or sending money. This and other important information can be found in the fund’s prospectus or, if available, the summary prospectus. Please call 1-877-824-5615 for a prospectus and brochure for any Laudus Fund. Please read the prospectus carefully before you invest. This report must be preceded or accompanied by a current prospectus.
Proxy Voting Policies, Procedures and Results
A description of the proxy voting policies and procedures used to determine how to vote proxies on behalf of the funds is available without charge, upon request, by visiting the Laudus Funds’ website at www.schwabfunds.com/laudusfunds_prospectus, the SEC’s website at www.sec.gov, or by contacting Laudus Funds at 1-877-824-5615.
Information regarding how a fund voted proxies relating to portfolio securities during the most recent twelve-month period ended June 30 is available, without charge, by visiting the fund’s website at www.schwabfunds.com/laudusfunds_prospectus or the SEC’s website at www.sec.gov.
Laudus U.S. Large Cap Growth
Laudus U.S. Large Cap Growth Fund
Laudus MarketMasters Funds®
Laudus International MarketMasters Fund™
Laudus Small-Cap MarketMasters Fund™
Laudus Mondrian Funds™
Laudus Mondrian International Equity Fund
Laudus Mondrian Emerging Markets Fund
Laudus Mondrian International Government Fixed Income Fund
Investment Adviser
Charles Schwab Investment Management, Inc.
211 Main Street, San Francisco, CA 94105
Funds
Laudus Funds
1-877-824-5615
Printed on recycled paper.
Charles Schwab Investment Management, Inc. (CSIM) is the investment adviser for Laudus Funds. The Laudus Group of Funds includes the Laudus Mondrian Funds and Laudus U.S. Large Cap Growth Fund, which are part of the Laudus Trust and distributed by ALPS Distributors, Inc. (ALPS); and the Laudus MarketMasters Funds, which are part of the Schwab Capital Trust and distributed by Charles Schwab & Co., Inc. (Schwab), Member SIPC. Schwab and CSIM, affiliates and subsidiaries of The Charles Schwab Corporation, are not affiliated with ALPS.
This page is intentionally left blank.
Item 2: Code of Ethics.
Not applicable to this semi-annual report.
Item 3: Audit Committee Financial Expert.
Not applicable to this semi-annual report.
Item 4: Principal Accountant Fees and Services.
Not applicable to this semi-annual report.
Item 5: Audit Committee of Listed Registrants.
Not applicable.
Item 6: Schedule of Investments.
The schedules of investments are included as part of the report to shareholders filed under Item 1 of this Form.
Item 7: Disclosure of Proxy Voting Policies and Procedures for Closed-End Management Investment Companies.
Not applicable.
Item 8: Portfolio Managers of Closed-End Management Investment Companies.
Not applicable.
Item 9: Purchases of Equity Securities by Closed-End Management Investment Company and Affiliated Purchasers.
Not applicable.
Item 10: Submission of Matters to a Vote of Security Holders.
Not applicable.
Item 11: Controls and Procedures.
| (a) | Based on their evaluation of Registrant’s disclosure controls and procedures, as of a date within 90 days of the filing date, Registrant’s Chief Executive Officer, Marie Chandoha and Registrant’s Chief Financial Officer, Mark Fischer, have concluded that Registrant’s disclosure controls and procedures are: (i) reasonably designed to ensure that information required to be disclosed in this report is appropriately communicated to Registrant’s officers to allow timely decisions regarding disclosures required in this report; (ii) reasonably designed to ensure that information required to be disclosed in this report is recorded, processed, summarized and reported in a timely manner; and (iii) are effective in achieving the goals described in (i) and (ii) above. |
| (b) | During the second fiscal quarter of the period covered by this report, there have been no changes in Registrant’s internal control over financial reporting that the above officers believe to have materially affected, or to be reasonably likely to materially affect, Registrant’s internal control over financial reporting. |
Item 12: Exhibits.
| | | | |
| (a) | | (1) | | Code of ethics – not applicable to this semi-annual report. |
| | |
| | (2) | | Separate certifications for Registrant’s principal executive officer and principal financial officer, as required by Rule 30a-2(a) under the 1940 Act, are attached. |
| | |
| | (3) | | Not applicable. |
| (b) | A certification for Registrant’s principal executive officer and principal financial officer, as required by Rule 30a-2(b) under the 1940 Act, is attached. This certification is being furnished to the Securities and Exchange Commission solely pursuant to 18 U.S.C. section 1350 and is not being filed as part of the Form N-CSRS with the Commission. |
Pursuant to the requirements of the Securities Exchange Act of 1934 and the Investment Company Act of 1940, the registrant has duly caused this report to be signed on its behalf by the undersigned, thereunto duly authorized.
(Registrant) Laudus Trust
| | |
| By: | | /s/ Marie Chandoha |
| | Marie Chandoha |
| | Chief Executive Officer |
| |
| Date: | | November 15, 2017 |
Pursuant to the requirements of the Securities Exchange Act of 1934 and the Investment Company Act of 1940, this report has been signed below by the following persons on behalf of the registrant and in the capacities and on the dates indicated.
| | |
| By: | | /s/ Marie Chandoha |
| | Marie Chandoha |
| | Chief Executive Officer |
| |
| Date: | | November 15, 2017 |
| |
| By: | | /s/ Mark Fischer |
| | Mark Fischer |
| | Chief Financial Officer |
| |
| Date: | | November 15, 2017 |