UNITED STATES
SECURITIES AND EXCHANGE COMMISSION
Washington, D.C. 20549
FORM N-CSR
CERTIFIED SHAREHOLDER REPORT OF REGISTERED MANAGEMENT INVESTMENT COMPANIES
Investment Company Act file number
(Exact name of registrant as specified in charter)
100 Pearl Street, New York, New York 10004
Registrant's telephone number, including area code:
Date of reporting period:
Item 1. Report to Stockholders.
(a) The registrant’s semi-annual report transmitted to shareholders pursuant to Rule 30e-1 under the Investment Company Act of 1940 is as follows:
Alger Capital Appreciation Portfolio
Class I-2 / ALVOX
Semi-Annual SHAREHOLDER REPORT | June 30, 2024
This semi-annual shareholder report contains important information about the Alger Capital Appreciation Portfolio (“Fund”) for the period of January 1, 2024 to June 30, 2024. You can find additional information about the Fund at https://connect.rightprospectus.com/Alger. You can also request a copy of the semi-annual report by contacting us at (800) 992-3863.
This report describes changes to the Fund that occurred during the reporting period.
What were the Fund costs for the last six months?
(Based on a hypothetical $10,000 investment)
| Fund (Class/Ticker) | Costs of a $10,000 investment | Costs paid as a percentage of a $10,000 investment |
Alger Capital Appreciation Portfolio
(Class I-2 / ALVOX) | $53 | 0.93% |
Management's Discussion of Fund Performance
What impacted Fund performance over the reporting period?
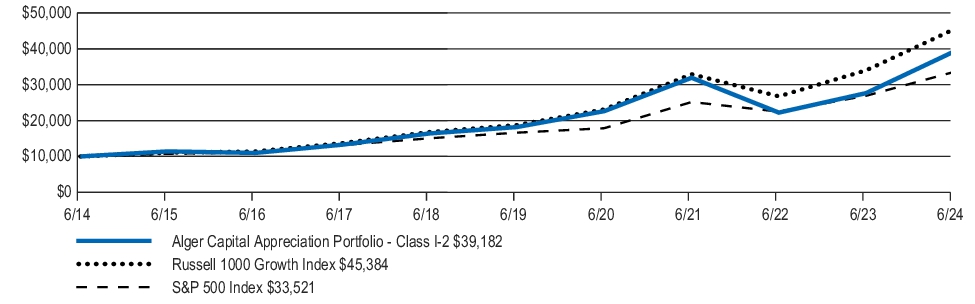
The Alger Capital Appreciation Portfolio Class I-2 returned 28.08% for the fiscal six-month period ended June 30, 2024, compared to the 20.70% return of the Russell 1000 Growth Index. During the reporting period, the largest sector weightings were Information Technology and Communication Services. The largest sector overweight was Communication Services and the largest sector underweight was Consumer Staples.
Contributors to Performance
The Information Technology and Industrials sectors provided the largest contributions to relative performance. Regarding individual positions, NVIDIA Corp.; Microsoft Corp.; Meta Platforms Inc; Amazon.com, Inc.; and Natera, Inc. were the top contributors to absolute performance.
Detractors from Performance
The Consumer Staples and Financials sectors were the largest detractors from relative performance. Regarding individual positions, Tesla, Inc.; Snowflake, Inc.; Humana Inc.; MongoDB, Inc.; and Adobe Inc. were the top five detractors from absolute performance.
| U.S. FACTOR | IMPACT | SUMMARY |
| Soft-landing Narrative | Positive | During the period, the soft-landing scenario—an economic slowdown without a recession—drove equity markets higher as U.S. GDP for the fourth quarter of 2023 grew 3.4%, exceeding the initial 2.0% consensus, driven by robust consumer spending. |
| AI Enthusiasm | Positive | Continued anticipation about artificial intelligence drove strong gains for related companies, supported by robust operating results and upward earnings revisions. |
| Elevated Inflation | Negative | Inflation concerns resurfaced during the first quarter of 2024, with Consumer Price Index (CPI) and Personal Consumption Expenditure Price Index (PCE) readings coming in higher-than-expected. |
| Revised Federal Reserve Rate Cut Expectations | Negative | Elevated inflation readings during the first quarter of 2024 led to the Federal Reserve postponing an anticipated March rate cut. The revision of the market’s rate cut expectations, initially from a projected six cuts at the beginning of the period down to just one for the year, led to some market volatility in April. |
Fund Performance
The following graph and chart compares the initial and subsequent account values at the end of each of the most recently completed semi-annual periods of Class I-2 shares of the Fund. The graph assumes a $10,000 initial investment at the beginning of the first semi-annual period in an appropriate, broad-based securities market index and a more narrowly based index that reflects the market sector in which the Fund invests for the same period.
INITIAL INVESTMENT OF $10,000
39181.80 15588.40 10000.01 22222.21 23517.68 32906.77 10945.39 18947.03 10921.23 11841.97 16803.61 23621.89 11653 27652.91 12174.67 11055.56 16631.55 15338.74 20673.48 27009.73 17951.70 11615 32931.69 15063.51 21412.24 12305.71 11405.92 31933.78 10851 18506.04 10711.13 23110.4 10000.00 12771 12537.03 10026.19 26749.25 32902.82 12821 25381.56 45384 12472.75 18745.76 19991.41 14120.60 13715.94 11389.78 13283.50 10000.02 12912.37 21424.67 28211.66 17393.15 38175.07 27240.4 9280.74 14984.49 14279.60 15199.57 19534.71 10000 16632.74 17881.04 17254.54 22502.89 10000 10742.28 23149.01 22058.99 9645.43 16238.21 19184.23 10000.00 11002.06 9880.50 16930.41 16414.56 23689.66 10806 11385 10000 10000 16857.29 26912.11 11731.77 27177.51 10000.03 17507.68 18081.36 15125.06 10169 31349.74 10747.42 21758.74 10000 14859.11 15651.19 21997.32 11305 10532.53 11234.03 25175.46 18692.47 23175.13 22279.08 18193.16 10909.38 32248.43 14267.32 10713.42 15478.55 18707.01 10981.21 10738 13122.00 10922.55 11171.19 13177.37 33520.67 15677.80 20400.33 10000.00 25870.58 11375.01 15770.01 11254.50 22638.66 34000.12 10000.00 13170.39 17466.98 30850.98
| Average Annual Total Returns (As of June 30, 2024) | 1 Year | 5 Years | 10 Years |
| Alger Capital Appreciation Portfolio Class I-2 | 41.69% | 16.58% | 14.63% |
| Russell 1000 Growth Index | 33.48% | 19.34% | 16.33% |
| S&P 500 Index | 24.56% | 15.05% | 12.86% |
Keep in mind that the Fund’s past performance is not a good predictor of how the Fund will perform in the future.
Visit https://www.alger.com/Pages/StrategyFinder.aspx?vehicle=mf for the most recent performance information. The graph and table do not reflect the deduction of taxes that a shareholder would pay on Fund distributions or redemption of Fund shares. All performance figures assume reinvestment of distributions.
Key Fund Statistics
The following table outlines key fund statistics as of the reporting date.
| Fund net assets | $603,172,776% |
| Total number of portfolio holdings1 | $75% |
| Portfolio turnover rate as of the end of the reporting period | $32.21% |
1 | Excludes Money Market Funds. |
| Communication Services | 15.4% |
| Consumer Discretionary | 10.5% |
| Consumer Staples | 0.4% |
| Energy | 0.3% |
| Financials | 3.9% |
| Healthcare | 11.7% |
| Industrials | 7.0% |
| Information Technology | 47.4% |
| Materials | 1.0% |
| Real Estate | 0.8% |
| Utilities | 1.4% |
| Short-Term Investments and Other Net Assets | 0.2% |
| 100.0% |
† | Based on net assets of the Fund. |
Material and Other Fund Changes
On May 23, 2023, the Board of Trustees of the Fund (the “Board”) approved the transition of the Fund’s custodian, and administrator from Brown Brothers Harriman & Company to The Bank of New York. This change was implemented on March 18, 2024.
On August 16, 2024, at a joint special meeting of shareholders, shareholders of the Fund elected three new trustees and one current trustee to the Board.
This is a summary of certain changes to the Fund since January 1, 2024. For more complete information, you may review the Fund's next prospectus, which we expect to be available by May 1, 2025 at https://connect.rightprospectus.com/Alger or upon request at (800) 992-3863.
Availability of Additional Information
You can find additional information about the Fund such as the prospectus, financial information and fund holdings at https://connect.rightprospectus.com/Alger. Fund proxy voting information is available at https://www.alger.com/ProxyVoting. You can also request this information by contacting us at (800) 992-3863.
For additional information, please scan the QR code at left to navigate to additional hosted material at www.alger.com.
Householding
To reduce expenses, only one copy of the most recent financial reports and prospectus may be mailed to households, even if more than one person in a household holds shares of a Fund. Call an Alger Funds Representative at (800) 992-3863 if you need additional copies of financial reports or prospectuses, or download them at https://connect.rightprospectus.com/Alger. If you do not want the mailing of these documents to be combined with those for other members of your household, contact your broker-dealer or other financial intermediary or the Alger Funds in writing at Alger Family of Funds, c/o UMB Fund Services, Inc. 235 W. Galena Street Milwaukee, WI 53212.
Alger Capital Appreciation Portfolio
Class S
Semi-Annual SHAREHOLDER REPORT | June 30, 2024
This semi-annual shareholder report contains important information about the Alger Capital Appreciation Portfolio (“Fund”) for the period of January 1, 2024 to June 30, 2024. You can find additional information about the Fund at https://connect.rightprospectus.com/Alger. You can also request a copy of the semi-annual report by contacting us at (800) 992-3863.
This report describes changes to the Fund that occurred during the reporting period.
What were the Fund costs for the last six months?
(Based on a hypothetical $10,000 investment)
| Fund (Class/Ticker) | Costs of a $10,000 investment | Costs paid as a percentage of a $10,000 investment |
Alger Capital Appreciation Portfolio
(Class S) | $67 | 1.18% |
Management's Discussion of Fund Performance
What impacted Fund performance over the reporting period?
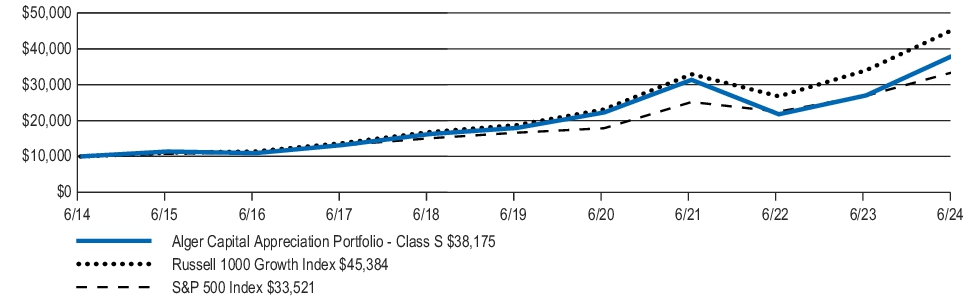
The Alger Capital Appreciation Portfolio Class S returned 27.92% for the fiscal six-month period ended June 30, 2024, compared to the 20.70% return of the Russell 1000 Growth Index. During the reporting period, the largest sector weightings were Information Technology and Communication Services. The largest sector overweight was Communication Services and the largest sector underweight was Consumer Staples.
Contributors to Performance
The Information Technology and Industrials sectors provided the largest contributions to relative performance. Regarding individual positions, NVIDIA Corp.; Microsoft Corp.; Meta Platforms Inc; Amazon.com, Inc.; and Natera, Inc. were the top contributors to absolute performance.
Detractors from Performance
The Consumer Staples and Financials sectors were the largest detractors from relative performance. Regarding individual positions, Tesla, Inc.; Snowflake, Inc.; Humana Inc.; MongoDB, Inc.; and Adobe Inc. were the top five detractors from absolute performance.
| U.S. FACTOR | IMPACT | SUMMARY |
| Soft-landing Narrative | Positive | During the period, the soft-landing scenario—an economic slowdown without a recession—drove equity markets higher as U.S. GDP for the fourth quarter of 2023 grew 3.4%, exceeding the initial 2.0% consensus, driven by robust consumer spending. |
| AI Enthusiasm | Positive | Continued anticipation about artificial intelligence drove strong gains for related companies, supported by robust operating results and upward earnings revisions. |
| Elevated Inflation | Negative | Inflation concerns resurfaced during the first quarter of 2024, with Consumer Price Index (CPI) and Personal Consumption Expenditure Price Index (PCE) readings coming in higher-than-expected. |
| Revised Federal Reserve Rate Cut Expectations | Negative | Elevated inflation readings during the first quarter of 2024 led to the Federal Reserve postponing an anticipated March rate cut. The revision of the market’s rate cut expectations, initially from a projected six cuts at the beginning of the period down to just one for the year, led to some market volatility in April. |
Fund Performance
The following graph and chart compares the initial and subsequent account values at the end of each of the most recently completed semi-annual periods of Class S shares of the Fund. The graph assumes a $10,000 initial investment at the beginning of the first semi-annual period in an appropriate, broad-based securities market index and a more narrowly based index that reflects the market sector in which the Fund invests for the same period.
INITIAL INVESTMENT OF $10,000
| Average Annual Total Returns (As of June 30, 2024) | 1 Year | 5 Years | 10 Years |
| Alger Capital Appreciation Portfolio Class S | 41.34% | 16.29% | 14.33% |
| Russell 1000 Growth Index | 33.48% | 19.34% | 16.33% |
| S&P 500 Index | 24.56% | 15.05% | 12.86% |
Keep in mind that the Fund’s past performance is not a good predictor of how the Fund will perform in the future.
Visit https://www.alger.com/Pages/StrategyFinder.aspx?vehicle=mf for the most recent performance information. The graph and table do not reflect the deduction of taxes that a shareholder would pay on Fund distributions or redemption of Fund shares. All performance figures assume reinvestment of distributions.
Key Fund Statistics
The following table outlines key fund statistics as of the reporting date.
| Fund net assets | $603,172,776% |
| Total number of portfolio holdings1 | $75% |
| Portfolio turnover rate as of the end of the reporting period | $32.21% |
1 | Excludes Money Market Funds. |
| Communication Services | 15.4% |
| Consumer Discretionary | 10.5% |
| Consumer Staples | 0.4% |
| Energy | 0.3% |
| Financials | 3.9% |
| Healthcare | 11.7% |
| Industrials | 7.0% |
| Information Technology | 47.4% |
| Materials | 1.0% |
| Real Estate | 0.8% |
| Utilities | 1.4% |
| Short-Term Investments and Other Net Assets | 0.2% |
| 100.0% |
† | Based on net assets of the Fund. |
Material and Other Fund Changes
On May 23, 2023, the Board of Trustees of the Fund (the “Board”) approved the transition of the Fund’s custodian, and administrator from Brown Brothers Harriman & Company to The Bank of New York. This change was implemented on March 18, 2024.
On August 16, 2024, at a joint special meeting of shareholders, shareholders of the Fund elected three new trustees and one current trustee to the Board.
This is a summary of certain changes to the Fund since January 1, 2024. For more complete information, you may review the Fund's next prospectus, which we expect to be available by May 1, 2025 at https://connect.rightprospectus.com/Alger or upon request at (800) 992-3863.
Availability of Additional Information
You can find additional information about the Fund such as the prospectus, financial information and fund holdings at https://connect.rightprospectus.com/Alger. Fund proxy voting information is available at https://www.alger.com/ProxyVoting. You can also request this information by contacting us at (800) 992-3863.
For additional information, please scan the QR code at left to navigate to additional hosted material at www.alger.com.
Householding
To reduce expenses, only one copy of the most recent financial reports and prospectus may be mailed to households, even if more than one person in a household holds shares of a Fund. Call an Alger Funds Representative at (800) 992-3863 if you need additional copies of financial reports or prospectuses, or download them at https://connect.rightprospectus.com/Alger. If you do not want the mailing of these documents to be combined with those for other members of your household, contact your broker-dealer or other financial intermediary or the Alger Funds in writing at Alger Family of Funds, c/o UMB Fund Services, Inc. 235 W. Galena Street Milwaukee, WI 53212.
Alger Large Cap Growth Portfolio
Class I-2 / AAGOX
Semi-Annual SHAREHOLDER REPORT | June 30, 2024
This semi-annual shareholder report contains important information about the Alger Large Cap Growth Portfolio (“Fund”) for the period of January 1, 2024 to June 30, 2024. You can find additional information about the Fund at https://connect.rightprospectus.com/Alger. You can also request a copy of the semi-annual report by contacting us at (800) 992-3863.
This report describes changes to the Fund that occurred during the reporting period.
What were the Fund costs for the last six months?
(Based on a hypothetical $10,000 investment)
| Fund (Class/Ticker) | Costs of a $10,000 investment | Costs paid as a percentage of a $10,000 investment |
Alger Large Cap Growth Portfolio
(Class I-2 / AAGOX) | $46 | 0.82% |
Management's Discussion of Fund Performance
What impacted Fund performance over the reporting period?
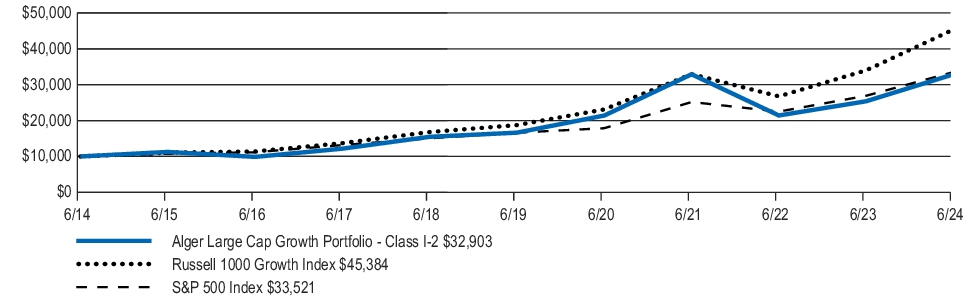
The Fund returned 23.28% for the fiscal six-month period ended June 30, 2024, compared to the 20.70% return of the Russell 1000 Growth Index. During the reporting period, the largest sector weightings were Information Technology and Communication Services. The largest sector overweight was Industrials and the largest sector underweight was Information Technology.
Contributors to Performance
The Industrials and Consumer Discretionary sectors provided the largest contributions to relative performance. Regarding individual positions, NVIDIA Corporation; Natera, Inc.; Microsoft Corporation; Amazon.com, Inc.; and Meta Platforms Inc. were the top five contributors to absolute performance.
Detractors from Performance
The Information Technology and Consumer Staples sectors were the largest detractors from relative performance. Regarding individual positions, Tesla, Inc.; Shopify, Inc.; Adobe Inc.; MarketAxess Holdings Inc.; and SLB were the top five detractors from absolute performance.
| U.S. FACTOR | IMPACT | SUMMARY |
| Soft-landing Narrative | Positive | During the period, the soft-landing scenario—an economic slowdown without a recession—drove equity markets higher as U.S. GDP for the fourth quarter of 2023 grew 3.4%, exceeding the initial 2.0% consensus, driven by robust consumer spending. |
| AI Enthusiasm | Positive | Continued anticipation about artificial intelligence drove strong gains for related companies, supported by robust operating results and upward earnings revisions. |
| Elevated Inflation | Negative | Inflation concerns resurfaced during the first quarter of 2024, with Consumer Price Index (CPI) and Personal Consumption Expenditure Price Index (PCE) readings coming in higher-than-expected. |
| Revised Federal Reserve Rate Cut Expectations | Negative | Elevated inflation readings during the first quarter of 2024 led to the Federal Reserve postponing an anticipated March rate cut. The revision of the market’s rate cut expectations, initially from a projected six cuts at the beginning of the period down to just one for the year, led to some market volatility in April. |
Fund Performance
The following graph and chart compares the initial and subsequent account values at the end of each of the most recently completed semi-annual periods of Class I-2 shares of the Fund. The graph assumes a $10,000 initial investment at the beginning of the first semi-annual period in an appropriate, broad-based securities market index and a more narrowly based index that reflects the market sector in which the Fund invests for the same period.
INITIAL INVESTMENT OF $10,000
| Average Annual Total Returns (As of June 30, 2024) | 1 Year | 5 Years | 10 Years |
| Alger Large Cap Growth Portfolio Class I-2 | 29.63% | 14.62% | 12.65% |
| Russell 1000 Growth Index | 33.48% | 19.34% | 16.33% |
| S&P 500 Index | 24.56% | 15.05% | 12.86% |
Keep in mind that the Fund’s past performance is not a good predictor of how the Fund will perform in the future.
Visit https://www.alger.com/Pages/StrategyFinder.aspx?vehicle=mf for the most recent performance information. The graph and table do not reflect the deduction of taxes that a shareholder would pay on Fund distributions or redemption of Fund shares. All performance figures assume reinvestment of distributions.
Key Fund Statistics
The following table outlines key fund statistics as of the reporting date.
| Fund net assets | $339,526,818% |
| Total number of portfolio holdings1 | $53% |
| Portfolio turnover rate as of the end of the reporting period | $36.22% |
1 | Excludes Money Market Funds. |
| Communication Services | 15.0% |
| Consumer Discretionary | 12.9% |
| Energy | 0.9% |
| Exchange Traded Fund | 2.3% |
| Financials | 1.5% |
| Healthcare | 11.0% |
| Industrials | 13.0% |
| Information Technology | 37.0% |
| Mutual Fund | 2.4% |
| Short-Term Investments and Other Net Assets | 4.0% |
| 100.0% |
| † | Based on net assets of the Fund. |
Material and Other Fund Changes
On May 23, 2023, the Board of Trustees of the Fund (the “Board”) approved the transition of the Fund’s custodian, and administrator from Brown Brothers Harriman & Company to The Bank of New York. This change was implemented on March 18, 2024.
On August 16, 2024, at a joint special meeting of shareholders, shareholders of the Fund elected three new trustees and one current trustee to the Board.
This is a summary of certain changes to the Fund since January 1, 2024. For more complete information, you may review the Fund's next prospectus, which we expect to be available by May 1, 2025 at https://connect.rightprospectus.com/Alger or upon request at (800) 992-3863.
Availability of Additional Information
You can find additional information about the Fund such as the prospectus, financial information and fund holdings at https://connect.rightprospectus.com/Alger. Fund proxy voting information is available at https://www.alger.com/ProxyVoting. You can also request this information by contacting us at (800) 992-3863.
For additional information, please scan the QR code at left to navigate to additional hosted material at www.alger.com.
Householding
To reduce expenses, only one copy of the most recent financial reports and prospectus may be mailed to households, even if more than one person in a household holds shares of a Fund. Call an Alger Funds Representative at (800) 992-3863 if you need additional copies of financial reports or prospectuses, or download them at https://connect.rightprospectus.com/Alger. If you do not want the mailing of these documents to be combined with those for other members of your household, contact your broker-dealer or other financial intermediary or the Alger Funds in writing at Alger Family of Funds, c/o UMB Fund Services, Inc. 235 W. Galena Street Milwaukee, WI 53212.
Alger Growth & Income Portfolio
Class I-2 / AIGOX
Semi-Annual SHAREHOLDER REPORT | June 30, 2024
This semi-annual shareholder report contains important information about the Alger Growth & Income Portfolio (“Fund”) for the period of January 1, 2024 to June 30, 2024. You can find additional information about the Fund at https://connect.rightprospectus.com/Alger. You can also request a copy of the semi-annual report by contacting us at (800) 992-3863.
This report describes changes to the Fund that occurred during the reporting period.
What were the Fund costs for the last six months?
(Based on a hypothetical $10,000 investment)
| Fund (Class/Ticker) | Costs of a $10,000 investment | Costs paid as a percentage of a $10,000 investment |
Alger Growth & Income Portfolio
(Class I-2 / AIGOX) | $51 | 0.95% |
Management's Discussion of Fund Performance
What impacted Fund performance over the reporting period?
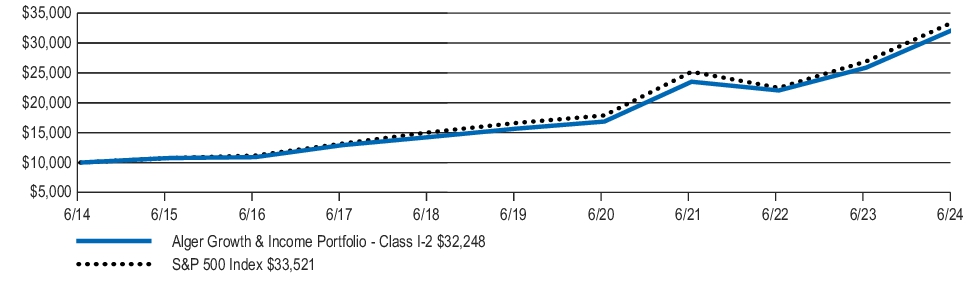
The Fund returned 14.74% for the fiscal six-month period ended June 30, 2024, compared to the 15.29% return of the S&P 500 Index. During the reporting period, the largest sector weightings were Information Technology and Financials. The largest sector overweight was Information Technology and the largest sector underweight was Consumer Discretionary.
Contributors to Performance
The Industrials and Real Estate sectors provided the largest contributions to relative performance. Regarding individual positions, Microsoft Corporation; Broadcom Inc.; KLA Corporation; Alphabet Inc.; and Eli Lilly and Company were the top five contributors to absolute performance.
Detractors from Performance
The Information Technology and Financials sectors were the largest detractors from relative performance. Regarding individual positions, Starbucks Corporation; Adobe Inc.; McDonald's Corporation; Comcast Corporation; and Crown Castle Inc. were the top five detractors from absolute performance.
| U.S. FACTOR | IMPACT | SUMMARY |
| Soft-landing Narrative | Positive | During the period, the soft-landing scenario—an economic slowdown without a recession—drove equity markets higher as U.S. GDP for the fourth quarter of 2023 grew 3.4%, exceeding the initial 2.0% consensus, driven by robust consumer spending. |
| AI Enthusiasm | Positive | Continued anticipation about artificial intelligence drove strong gains for related companies, supported by robust operating results and upward earnings revisions. |
| Elevated Inflation | Negative | Inflation concerns resurfaced during the first quarter of 2024, with Consumer Price Index (CPI) and Personal Consumption Expenditure Price Index (PCE) readings coming in higher-than-expected. |
| Revised Federal Reserve Rate Cut Expectations | Negative | Elevated inflation readings during the first quarter of 2024 led to the Federal Reserve postponing an anticipated March rate cut. The revision of the market’s rate cut expectations, initially from a projected six cuts at the beginning of the period down to just one for the year, led to some market volatility in April. |
Fund Performance
The following graph and chart compares the initial and subsequent account values at the end of each of the most recently completed semi-annual periods of Class I-2 shares of the Fund. The graph assumes a $10,000 initial investment at the beginning of the first semi-annual period in an appropriate, broad-based securities market index for the same period.
INITIAL INVESTMENT OF $10,000
| Average Annual Total Returns (As of June 30, 2024) | 1 Year | 5 Years | 10 Years |
| Alger Growth & Income Portfolio Class I-2 | 24.65% | 15.52% | 12.42% |
| S&P 500 Index | 24.56% | 15.05% | 12.86% |
Keep in mind that the Fund’s past performance is not a good predictor of how the Fund will perform in the future.
Visit https://www.alger.com/Pages/StrategyFinder.aspx?vehicle=mf for the most recent performance information. The graph and table do not reflect the deduction of taxes that a shareholder would pay on Fund distributions or redemption of Fund shares. All performance figures assume reinvestment of distributions.
Key Fund Statistics
The following table outlines key fund statistics as of the reporting date.
| Fund net assets | $41,762,047% |
| Total number of portfolio holdings1 | $78% |
| Portfolio turnover rate as of the end of the reporting period | $1.67% |
1 | Excludes Money Market Funds. |
| Communication Services | 10.3)% |
| Consumer Discretionary | 8.0)% |
| Consumer Staples | 6.2)% |
| Energy | 4.9)% |
| Financials | 12.8)% |
| Healthcare | 12.3)% |
| Industrials | 6.5)% |
| Information Technology | 33.8)% |
| Materials | 1.8)% |
| Real Estate | 2.1)% |
| Utilities | 1.6)% |
| Short-Term Investments and Other Net Assets | (0.3)% |
| 100.0)% |
† | Based on net assets of the Fund. |
Material and Other Fund Changes
On May 23, 2023, the Board of Trustees of the Fund (the “Board”) approved the transition of the Fund’s custodian, and administrator from Brown Brothers Harriman & Company to The Bank of New York. This change was implemented on March 18, 2024.
On August 16, 2024, at a joint special meeting of shareholders, shareholders of the Fund elected three new trustees and one current trustee to the Board.
This is a summary of certain changes to the Fund since January 1, 2024. For more complete information, you may review the Fund's next prospectus, which we expect to be available by May 1, 2025 at https://connect.rightprospectus.com/Alger or upon request at (800) 992-3863.
Availability of Additional Information
You can find additional information about the Fund such as the prospectus, financial information and fund holdings at https://connect.rightprospectus.com/Alger. Fund proxy voting information is available at https://www.alger.com/ProxyVoting. You can also request this information by contacting us at (800) 992-3863.
For additional information, please scan the QR code at left to navigate to additional hosted material at www.alger.com.
Householding
To reduce expenses, only one copy of the most recent financial reports and prospectus may be mailed to households, even if more than one person in a household holds shares of a Fund. Call an Alger Funds Representative at (800) 992-3863 if you need additional copies of financial reports or prospectuses, or download them at https://connect.rightprospectus.com/Alger. If you do not want the mailing of these documents to be combined with those for other members of your household, contact your broker-dealer or other financial intermediary or the Alger Funds in writing at Alger Family of Funds, c/o UMB Fund Services, Inc. 235 W. Galena Street Milwaukee, WI 53212.
Alger Mid Cap Growth Portfolio
Class I-2 / AMGOX
Semi-Annual SHAREHOLDER REPORT | June 30, 2024
This semi-annual shareholder report contains important information about the Alger Mid Cap Growth Portfolio (“Fund”) for the period of January 1, 2024 to June 30, 2024. You can find additional information about the Fund at https://connect.rightprospectus.com/Alger. You can also request a copy of the semi-annual report by contacting us at (800) 992-3863.
This report describes changes to the Fund that occurred during the reporting period.
What were the Fund costs for the last six months?
(Based on a hypothetical $10,000 investment)
| Fund (Class/Ticker) | Costs of a $10,000 investment | Costs paid as a percentage of a $10,000 investment |
Alger Mid Cap Growth Portfolio
(Class I-2 / AMGOX) | $50 | 0.96% |
Management's Discussion of Fund Performance
What impacted Fund performance over the reporting period?
The Fund returned 8.31% for the fiscal six-month period ended June 30, 2024, compared to the 5.98% return of the Russell Midcap Growth Index. During the reporting period, the largest sector weightings were Information Technology and Industrials. The largest sector overweight was Information Technology and the largest sector underweight was Financials.
Contributors to Performance
The Industrials and Communication Services sectors provided the largest contributions to relative performance. Regarding individual positions, Vertiv Holdings Co.; Natera, Inc.; Spotify Technology SA; Diamondback Energy, Inc.; and Amphenol Corporation were the top five contributors to absolute performance.
Detractors from Performance
The Financials and Information Technology sectors were the largest detractors from relative performance. Regarding individual positions, Repligen Corporation; MongoDB, Inc.; Globant SA; Five Below, Inc.; and Lattice Semiconductor Corporation were the top five detractors from absolute performance.
| U.S. FACTOR | IMPACT | SUMMARY |
| Soft-landing Narrative | Positive | During the period, the soft-landing scenario—an economic slowdown without a recession—drove equity markets higher as U.S. GDP for the fourth quarter of 2023 grew 3.4%, exceeding the initial 2.0% consensus, driven by robust consumer spending. |
| AI Enthusiasm | Positive | Continued anticipation about artificial intelligence drove strong gains for related companies, supported by robust operating results and upward earnings revisions. |
| Elevated Inflation | Negative | Inflation concerns resurfaced during the first quarter of 2024, with Consumer Price Index (CPI) and Personal Consumption Expenditure Price Index (PCE) readings coming in higher-than-expected. |
| Revised Federal Reserve Rate Cut Expectations | Negative | Elevated inflation readings during the first quarter of 2024 led to the Federal Reserve postponing an anticipated March rate cut. The revision of the market’s rate cut expectations, initially from a projected six cuts at the beginning of the period down to just one for the year, led to some market volatility in April. |
Fund Performance
The following graph and chart compares the initial and subsequent account values at the end of each of the most recently completed semi-annual periods of Class I-2 shares of the Fund. The graph assumes a $10,000 initial investment at the beginning of the first semi-annual period in an appropriate, broad-based securities market index and a more narrowly based index that reflects the market sector in which the Fund invests for the same period.
INITIAL INVESTMENT OF $10,000
| Average Annual Total Returns (As of June 30, 2024) | 1 Year | 5 Years | 10 Years |
| Alger Mid Cap Growth Portfolio Class I-2 | 12.10% | 8.25% | 8.77% |
| Russell Midcap Growth Index | 15.05% | 9.93% | 10.51% |
| S&P 500 Index | 24.56% | 15.05% | 12.86% |
Keep in mind that the Fund’s past performance is not a good predictor of how the Fund will perform in the future.
Visit https://www.alger.com/Pages/StrategyFinder.aspx?vehicle=mf for the most recent performance information. The graph and table do not reflect the deduction of taxes that a shareholder would pay on Fund distributions or redemption of Fund shares. All performance figures assume reinvestment of distributions.
Key Fund Statistics
The following table outlines key fund statistics as of the reporting date.
| Fund net assets | $137,368,384% |
| Total number of portfolio holdings1 | $64% |
| Portfolio turnover rate as of the end of the reporting period | $29.09% |
1 | Excludes Money Market Funds. |
| Communication Services | 8.1% |
| Consumer Discretionary | 11.2% |
| Consumer Staples | 1.2% |
| Energy | 2.7% |
| Exchange Traded Fund | 3.4% |
| Financials | 6.8% |
| Healthcare | 12.3% |
| Industrials | 18.9% |
| Information Technology | 29.3% |
| Materials | 1.7% |
| Real Estate | 4.1% |
| Short-Term Investments and Other Net Assets | 0.3% |
| 100.0% |
† | Based on net assets of the Fund. |
Material and Other Fund Changes
On May 23, 2023, the Board of Trustees of the Fund (the “Board”) approved the transition of the Fund’s custodian, and administrator from Brown Brothers Harriman & Company to The Bank of New York. This change was implemented on March 18, 2024.
On August 16, 2024, at a joint special meeting of shareholders, shareholders of the Fund elected three new trustees and one current trustee to the Board.
This is a summary of certain changes to the Fund since January 1, 2024. For more complete information, you may review the Fund's next prospectus, which we expect to be available by May 1, 2025 at https://connect.rightprospectus.com/Alger or upon request at (800) 992-3863.
Availability of Additional Information
You can find additional information about the Fund such as the prospectus, financial information and fund holdings at https://connect.rightprospectus.com/Alger. Fund proxy voting information is available at https://www.alger.com/ProxyVoting. You can also request this information by contacting us at (800) 992-3863.
For additional information, please scan the QR code at left to navigate to additional hosted material at www.alger.com.
Householding
To reduce expenses, only one copy of the most recent financial reports and prospectus may be mailed to households, even if more than one person in a household holds shares of a Fund. Call an Alger Funds Representative at (800) 992-3863 if you need additional copies of financial reports or prospectuses, or download them at https://connect.rightprospectus.com/Alger. If you do not want the mailing of these documents to be combined with those for other members of your household, contact your broker-dealer or other financial intermediary or the Alger Funds in writing at Alger Family of Funds, c/o UMB Fund Services, Inc. 235 W. Galena Street Milwaukee, WI 53212.
Alger Small Cap Growth Portfolio
Class I-2 / AASOX
Semi-Annual SHAREHOLDER REPORT | June 30, 2024
This semi-annual shareholder report contains important information about the Alger Small Cap Growth Portfolio (“Fund”) for the period of January 1, 2024 to June 30, 2024. You can find additional information about the Fund at https://connect.rightprospectus.com/Alger. You can also request a copy of the semi-annual report by contacting us at (800) 992-3863.
This report describes changes to the Fund that occurred during the reporting period.
What were the Fund costs for the last six months?
(Based on a hypothetical $10,000 investment)
| Fund (Class/Ticker) | Costs of a $10,000 investment | Costs paid as a percentage of a $10,000 investment |
Alger Small Cap Growth Portfolio
(Class I-2 / AASOX) | $53 | 1.05% |
Management's Discussion of Fund Performance
What impacted Fund performance over the reporting period?
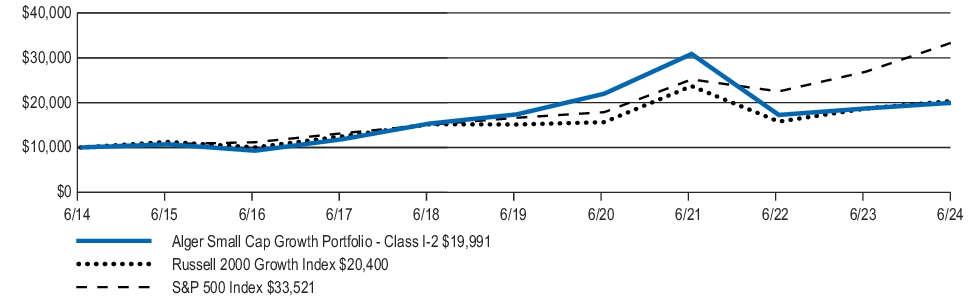
The Fund returned 1.69% for the fiscal six-month period ended June 30, 2024, compared to the 4.44% return of the Russell 2000 Growth Index. During the reporting period, the largest sector weightings were Information Technology and Health Care. The largest sector overweight was Health Care and the largest sector underweight was Industrials.
Contributors to Performance
The Consumer Discretionary and Materials sectors provided the largest contributions to relative performance. Regarding individual positions, Wingstop, Inc.; MicroStrategy Incorporated; Viking Therapeutics, Inc.; Manhattan Associates, Inc.; and Q2 Holdings, Inc. were the top five contributors to absolute performance.
Detractors from Performance
The Health Care and Industrials sectors were the largest detractors from relative performance. Regarding individual positions, Cabaletta Bio, Inc.; 908 Devices Inc.; Sprout Social, Inc.; Xometry, Inc.; and DLocal Limited were the top five detractors from absolute performance.
| U.S. FACTOR | IMPACT | SUMMARY |
| Soft-landing Narrative | Positive | During the period, the soft-landing scenario—an economic slowdown without a recession—drove equity markets higher as U.S. GDP for the fourth quarter of 2023 grew 3.4%, exceeding the initial 2.0% consensus, driven by robust consumer spending. |
| AI Enthusiasm | Positive | Continued anticipation about artificial intelligence drove strong gains for related companies, supported by robust operating results and upward earnings revisions. |
| Elevated Inflation | Negative | Inflation concerns resurfaced during the first quarter of 2024, with Consumer Price Index (CPI) and Personal Consumption Expenditure Price Index (PCE) readings coming in higher-than-expected. |
| Revised Federal Reserve Rate Cut Expectations | Negative | Elevated inflation readings during the first quarter of 2024 led to the Federal Reserve postponing an anticipated March rate cut. The revision of the market’s rate cut expectations, initially from a projected six cuts at the beginning of the period down to just one for the year, led to some market volatility in April. |
Fund Performance
The following graph and chart compares the initial and subsequent account values at the end of each of the most recently completed semi-annual periods of Class I-2 shares of the Fund. The graph assumes a $10,000 initial investment at the beginning of the first semi-annual period in an appropriate, broad-based securities market index and a more narrowly based index that reflects the market sector in which the Fund invests for the same period.
INITIAL INVESTMENT OF $10,000
| Average Annual Total Returns (As of June 30, 2024) | 1 Year | 5 Years | 10 Years |
| Alger Small Cap Growth Portfolio Class I-2 | 6.87% | 2.82% | 7.17% |
| Russell 2000 Growth Index | 9.14% | 6.17% | 7.39% |
| S&P 500 Index | 24.56% | 15.05% | 12.86% |
Keep in mind that the Fund’s past performance is not a good predictor of how the Fund will perform in the future.
Visit https://www.alger.com/Pages/StrategyFinder.aspx?vehicle=mf for the most recent performance information. The graph and table do not reflect the deduction of taxes that a shareholder would pay on Fund distributions or redemption of Fund shares. All performance figures assume reinvestment of distributions.
Key Fund Statistics
The following table outlines key fund statistics as of the reporting date.
| Fund net assets | $148,201,951% |
| Total number of portfolio holdings1 | $105% |
| Portfolio turnover rate as of the end of the reporting period | $17.97% |
1 | Excludes Money Market Funds. |
| Communication Services | 3.1% |
| Consumer Discretionary | 16.8% |
| Consumer Staples | 3.6% |
| Energy | 4.7% |
| Financials | 2.0% |
| Healthcare | 25.1% |
| Industrials | 8.4% |
| Information Technology | 29.7% |
| Materials | 0.7% |
| Short-Term Investments and Other Net Assets | 5.9% |
| 100.0% |
† | Based on net assets of the Fund. |
Material and Other Fund Changes
On May 23, 2023, the Board of Trustees of the Fund (the “Board”) approved the transition of the Fund’s custodian, and administrator from Brown Brothers Harriman & Company to The Bank of New York. This change was implemented on March 18, 2024.
On August 16, 2024, at a joint special meeting of shareholders, shareholders of the Fund elected three new trustees and one current trustee to the Board.
This is a summary of certain changes to the Fund since January 1, 2024. For more complete information, you may review the Fund's next prospectus, which we expect to be available by May 1, 2025 at https://connect.rightprospectus.com/Alger or upon request at (800) 992-3863.
Availability of Additional Information
You can find additional information about the Fund such as the prospectus, financial information and fund holdings at https://connect.rightprospectus.com/Alger. Fund proxy voting information is available at https://www.alger.com/ProxyVoting. You can also request this information by contacting us at (800) 992-3863.
For additional information, please scan the QR code at left to navigate to additional hosted material at www.alger.com.
Householding
To reduce expenses, only one copy of the most recent financial reports and prospectus may be mailed to households, even if more than one person in a household holds shares of a Fund. Call an Alger Funds Representative at (800) 992-3863 if you need additional copies of financial reports or prospectuses, or download them at https://connect.rightprospectus.com/Alger. If you do not want the mailing of these documents to be combined with those for other members of your household, contact your broker-dealer or other financial intermediary or the Alger Funds in writing at Alger Family of Funds, c/o UMB Fund Services, Inc. 235 W. Galena Street Milwaukee, WI 53212.
Alger Balanced Portfolio
Class I-2 / ABLOX
Semi-Annual SHAREHOLDER REPORT | June 30, 2024
This semi-annual shareholder report contains important information about the Alger Balanced Portfolio (“Fund”) for the period of January 1, 2024 to June 30, 2024. You can find additional information about the Fund at https://connect.rightprospectus.com/Alger. You can also request a copy of the semi-annual report by contacting us at (800) 992-3863.
This report describes changes to the Fund that occurred during the reporting period.
What were the Fund costs for the last six months?
(Based on a hypothetical $10,000 investment)
| Fund (Class/Ticker) | Costs of a $10,000 investment | Costs paid as a percentage of a $10,000 investment |
Alger Balanced Portfolio
(Class I-2 / ABLOX) | $57 | 1.09% |
Management's Discussion of Fund Performance
What impacted Fund performance over the reporting period?
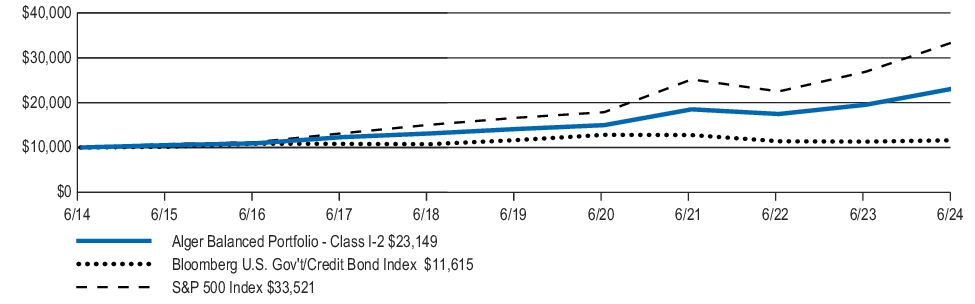
The Fund returned 10.88% during the fiscal six-month period ended June 30, 2024. The equity portion of the Fund underperformed the 15.29% return of the S&P 500 Index and the fixed income portion of the Fund underperformed the -0.68% return of the Bloomberg U.S. Government/Credit Bond Index. Regarding the equity portion of the Fund, the largest sector weightings were Information Technology and Financials. The largest sector overweight was Financials and the largest sector underweight was Information Technology.
Contributors to Performance
The Industrials and Financials sectors provided the largest contributions to relative performance. Regarding individual positions, Microsoft Corporation; Broadcom Inc.; KLA Corporation; Alphabet Inc.; and Eli Lilly and Company were the top five contributors to absolute performance.
Detractors from Performance
The Information Technology and Communication Services sectors were the largest detractors from relative performance. Regarding individual positions, Starbucks Corporation; Adobe Inc.; McDonald's Corporation; Comcast Corporation; and Crown Castle Inc. were the top five detractors from absolute performance.
| U.S. FACTOR | IMPACT | SUMMARY |
| Soft-landing Narrative | Positive | During the period, the soft-landing scenario—an economic slowdown without a recession—drove equity markets higher as U.S. GDP for the fourth quarter of 2023 grew 3.4%, exceeding the initial 2.0% consensus, driven by robust consumer spending. |
| AI Enthusiasm | Positive | Continued anticipation about artificial intelligence drove strong gains for related companies, supported by robust operating results and upward earnings revisions. |
| Tighter Credit Spread | Positive for Fixed Income | Credit spreads narrowed during the period due to strong economic data. |
| Elevated Inflation | Negative | Inflation concerns resurfaced during the first quarter of 2024, with Consumer Price Index (CPI) and Personal Consumption Expenditure Price Index (PCE) readings coming in higher-than-expected. |
| Revised Federal Reserve Rate Cut Expectations | Negative | Elevated inflation readings during the first quarter of 2024 led to the Federal Reserve postponing an anticipated March rate cut. The revision of the market’s rate cut expectations, initially from a projected six cuts at the beginning of the period down to just one for the year, led to some market volatility in April. |
| Rising U.S. Government Bond Yields | Negative for Fixed Income | U.S. Government Bond yields rose during the period due to persistent inflation and strong economic data. |
Fund Performance
The following graph and chart compares the initial and subsequent account values at the end of each of the most recently completed semi-annual periods of Class I-2 shares of the Fund. The graph assumes a $10,000 initial investment at the beginning of the first semi-annual period in an appropriate, broad-based securities market index and a more narrowly based index that reflects the market sector in which the Fund invests for the same period.
INITIAL INVESTMENT OF $10,000
| Average Annual Total Returns (As of June 30, 2024) | 1 Year | 5 Years | 10 Years |
| Alger Balanced Portfolio Class I-2 | 18.50% | 10.39)% | 8.76% |
| Bloomberg U.S. Gov't/Credit Bond Index | 2.74% | (0.07)% | 1.51% |
| S&P 500 Index | 24.56% | 15.05)% | 12.86% |
Keep in mind that the Fund’s past performance is not a good predictor of how the Fund will perform in the future.
Visit https://www.alger.com/Pages/StrategyFinder.aspx?vehicle=mf for the most recent performance information. The graph and table do not reflect the deduction of taxes that a shareholder would pay on Fund distributions or redemption of Fund shares. All performance figures assume reinvestment of distributions.
Key Fund Statistics
The following table outlines key fund statistics as of the reporting date.
| Fund net assets | $60,143,166% |
| Total number of portfolio holdings1 | $101% |
| Portfolio turnover rate as of the end of the reporting period | $2.99% |
1 | Excludes Money Market Funds. |
| Communication Services | 7.6% |
| Consumer Discretionary | 5.9% |
| Consumer Staples | 4.5% |
| Energy | 3.7% |
| Financials | 9.6% |
| Healthcare | 9.2% |
| Industrials | 4.8% |
| Information Technology | 25.1% |
| Materials | 1.4% |
| Real Estate | 1.5% |
| Utilities | 1.1% |
| Total Equities | 74.4% |
| Corporate Bonds | 25.4% |
| Short-Term Investments and Other Net Assets | 0.2% |
| 100.0% |
† | Based on net assets of the Fund. |
Material and Other Fund Changes
On May 23, 2023, the Board of Trustees of the Fund (the “Board”) approved the transition of the Fund’s custodian, and administrator from Brown Brothers Harriman & Company to The Bank of New York. This change was implemented on March 18, 2024.
On August 16, 2024, at a joint special meeting of shareholders, shareholders of the Fund elected three new trustees and one current trustee to the Board.
This is a summary of certain changes to the Fund since January 1, 2024. For more complete information, you may review the Fund's next prospectus, which we expect to be available by May 1, 2025 at https://connect.rightprospectus.com/Alger or upon request at (800) 992-3863.
Availability of Additional Information
You can find additional information about the Fund such as the prospectus, financial information and fund holdings at https://connect.rightprospectus.com/Alger. Fund proxy voting information is available at https://www.alger.com/ProxyVoting. You can also request this information by contacting us at (800) 992-3863.
For additional information, please scan the QR code at left to navigate to additional hosted material at www.alger.com.
Householding
To reduce expenses, only one copy of the most recent financial reports and prospectus may be mailed to households, even if more than one person in a household holds shares of a Fund. Call an Alger Funds Representative at (800) 992-3863 if you need additional copies of financial reports or prospectuses, or download them at https://connect.rightprospectus.com/Alger. If you do not want the mailing of these documents to be combined with those for other members of your household, contact your broker-dealer or other financial intermediary or the Alger Funds in writing at Alger Family of Funds, c/o UMB Fund Services, Inc. 235 W. Galena Street Milwaukee, WI 53212.
| (b) | Include a copy of each notice transmitted to stockholders in reliance on Rule 30e-3 under the Act (17 CFR 270.30e-3) that contains disclosures specified by paragraph (c)(3) of that rule. |
Not applicable.
ITEM 2. CODE OF ETHICS.
Not applicable to this semi-annual report.
ITEM 3. AUDIT COMMITTEE FINANCIAL EXPERT.
Not applicable to this semi-annual report.
ITEM 4. PRINCIPAL ACCOUNTANT FEES AND SERVICES.
Not applicable to this semi-annual report.
ITEM 5. AUDIT COMMITTEE OF LISTED REGISTRANTS.
Not applicable to this semi-annual report.
ITEM 6. INVESTMENTS.
(a) A Schedule of Investments in securities of unaffiliated issuers as of the close of the Reporting Period is included as part of the report to shareholders filed under Item 7 of this Form N-CSR.
(b) Not applicable.
ITEM 7. FINANCIAL STATEMENTS AND FINANCIAL HIGHLIGHTS FOR OPEN_END MANAGEMENT INVESTMENT COMPANIES.
Alger Capital Appreciation Portfolio |
SEMI-ANNUAL FINANCIAL STATEMENTS AND OTHER INFORMATION
June 30, 2024 (UNAUDITED)
Table of Contents
ALGER CAPITAL APPRECIATION PORTFOLIO
ALGER CAPITAL APPRECIATION PORTFOLIOSchedule of Investments June 30, 2024 (Unaudited)
| | |
|
|
The Trade Desk, Inc., Cl. A* | | |
|
| | |
| | |
| | |
|
|
| | |
|
| | |
APPLICATION SOFTWARE—4.9% |
| | |
| | |
Cadence Design Systems, Inc.* | | |
| | |
| | |
| | |
|
|
| | |
AUTOMOBILE MANUFACTURERS—0.2% |
| | |
|
| | |
| | |
Madrigal Pharmaceuticals, Inc.* | | |
| | |
| | |
Sarepta Therapeutics, Inc.* | | |
| | |
Vertex Pharmaceuticals, Inc.* | | |
|
|
| | |
|
| | |
| | |
|
|
| | |
CARGO GROUND TRANSPORTATION—0.3% |
Old Dominion Freight Line, Inc. | | |
|
| | |
Flutter Entertainment PLC* | | |
|
|
| | |
COAL & CONSUMABLE FUELS—0.2% |
| | |
See Notes to Financial Statements.
ALGER CAPITAL APPRECIATION PORTFOLIOSchedule of Investments June 30, 2024 (Unaudited) (Continued)
| | |
COMMON STOCKS—98.9% (CONT.) |
CONSTRUCTION & ENGINEERING—0.5% |
| | |
CONSTRUCTION MACHINERY & HEAVY TRANSPORTATION EQUIPMENT—0.5% |
| | |
CONSTRUCTION MATERIALS—0.7% |
Martin Marietta Materials, Inc. | | |
CONSUMER STAPLES MERCHANDISE RETAIL—0.4% |
| | |
|
| | |
|
| | |
|
Constellation Energy Corp. | | |
| | |
| | |
|
|
| | |
ELECTRICAL COMPONENTS & EQUIPMENT—1.5% |
| | |
Vertiv Holdings Co., Cl. A | | |
|
|
| | |
ENVIRONMENTAL & FACILITIES SERVICES—1.3% |
| | |
FINANCIAL EXCHANGES & DATA—1.3% |
| | |
|
| | |
HEALTHCARE DISTRIBUTORS—0.9% |
| | |
HEALTHCARE EQUIPMENT—3.8% |
| | |
| | |
Edwards Lifesciences Corp.* | | |
Intuitive Surgical, Inc.* | | |
| | |
|
|
| | |
HOMEFURNISHING RETAIL—0.0% |
| | |
INTERACTIVE HOME ENTERTAINMENT—0.1% |
Take-Two Interactive Software, Inc.* | | |
See Notes to Financial Statements.
ALGER CAPITAL APPRECIATION PORTFOLIOSchedule of Investments June 30, 2024 (Unaudited) (Continued)
| | |
COMMON STOCKS—98.9% (CONT.) |
INTERACTIVE MEDIA & SERVICES—11.4% |
| | |
Meta Platforms, Inc., Cl. A | | |
| | |
|
|
| | |
INTERNET SERVICES & INFRASTRUCTURE—0.3% |
| | |
LIFE SCIENCES TOOLS & SERVICES—0.6% |
| | |
|
| | |
MOVIES & ENTERTAINMENT—3.5% |
Liberty Media Corp. Series C Liberty Formula One * | | |
| | |
| | |
|
|
| | |
OIL & GAS EXPLORATION & PRODUCTION—0.2% |
| | |
PASSENGER GROUND TRANSPORTATION—0.4% |
| | |
|
| | |
|
Advanced Micro Devices, Inc.* | | |
| | |
| | |
| | |
| | |
| | |
Taiwan Semiconductor Manufacturing Co., Ltd. ADR | | |
|
|
| | |
|
| | |
| | |
|
|
| | |
TECHNOLOGY HARDWARE STORAGE & PERIPHERALS—6.2% |
| | |
Dell Technologies, Inc., Cl. C | | |
|
|
| | |
See Notes to Financial Statements.
ALGER CAPITAL APPRECIATION PORTFOLIOSchedule of Investments June 30, 2024 (Unaudited) (Continued)
| | |
COMMON STOCKS—98.9% (CONT.) |
TRANSACTION & PAYMENT PROCESSING SERVICES—2.0% |
| | |
TOTAL COMMON STOCKS
(Cost $326,163,285) | | |
|
DIVERSIFIED FINANCIAL SERVICES—0.0% |
Chime Financial, Inc.,Series G(a),*,@ | | |
| | |
REAL ESTATE INVESTMENT TRUST—0.8% |
|
| | |
| | |
SPECIAL PURPOSE VEHICLE—0.1% |
DATA PROCESSING & OUTSOURCED SERVICES—0.1% |
Crosslink Ventures C, LLC, Cl. A(a),(b),*,@ | | |
| | |
TOTAL SPECIAL PURPOSE VEHICLE
(Cost $475,000) | | |
SHORT-TERM SECURITIES—0.4% |
|
Dreyfus Treasury Obligations Cash Management Fund,
Institutional Shares, 5.18%(c) | | |
| | |
|
|
Total Investments
(Cost $334,818,784) | | |
Affiliated Securities (Cost $475,000) | | |
Unaffiliated Securities (Cost $334,343,784) | | |
Liabilities in Excess of Other Assets | | |
| | |
| American Depositary Receipts |
| Security is valued in good faith at fair value determined using significant unobservable inputs pursuant to procedures approved by the Board of Trustees. |
| Deemed an affiliate of the Portfolio in accordance with Section 2(a)(3) of the Investment Company Act of 1940. See Note 10 - Affiliated Securities. |
| Rate shown reflects 7-day effective yield as of June 30, 2024. |
| Non-income producing security. |
| Restricted security - Investment in security not registered under the Securities Act of 1933. Sales or transfers of the investment may be restricted only to qualified buyers. |
See Notes to Financial Statements.
ALGER CAPITAL APPRECIATION PORTFOLIOSchedule of Investments June 30, 2024 (Unaudited) (Continued)
| | | | % of net assets
as of
6/30/2024 |
Chime Financial, Inc.,Series G | | | | |
Crosslink Ventures C, LLC, Cl. A | | | | |
| | | | |
See Notes to Financial Statements.
ALGER CAPITAL APPRECIATION PORTFOLIOStatement of Assets and Liabilities June 30, 2024 (Unaudited)
| Alger Capital Appreciation Portfolio |
|
Investments in unaffiliated securities, at value (Identified cost below)* see accompanying schedule of investments | |
Investments in affiliated securities, at value (Identified cost below)** see accompanying schedule of investments | |
Cash and cash equivalents | |
Receivable for investment securities sold | |
Receivable for shares of beneficial interest sold | |
Dividends and interest receivable | |
| |
| |
|
Payable for shares of beneficial interest redeemed | |
Payable for investment securities purchased | |
Accrued investment advisory fees | |
Accrued fund accounting fees | |
Accrued professional fees | |
| |
Accrued administrative fees | |
Accrued distribution fees | |
Accrued transfer agent fees | |
| |
Accrued shareholder administrative fees | |
| |
| |
| |
| |
|
Paid in capital (par value of $.001 per share) | |
| |
| |
| |
| |
| |
See Notes to Financial Statements.
ALGER CAPITAL APPRECIATION PORTFOLIOStatement of Assets and Liabilities June 30, 2024 (Unaudited) (Continued)
| Alger Capital Appreciation Portfolio |
|
| |
| |
SHARES OF BENEFICIAL INTEREST OUTSTANDING — Note 6: |
| |
| |
NET ASSET VALUE PER SHARE: |
| |
| |
| At June 30, 2024, the net unrealized appreciation on investments, based on cost for federal income tax purposes of $335,270,252, amounted to $268,904,185, which consisted of aggregate gross unrealized appreciation of $270,036,091, and aggregate gross unrealized depreciation of $1,131,906. |
See Notes to Financial Statements.
ALGER CAPITAL APPRECIATION PORTFOLIOStatement of Operations for the six months ended June 30, 2024 (Unaudited)
| Alger Capital Appreciation Portfolio |
|
Dividends (net of foreign withholding taxes*) | |
| |
| |
|
Investment advisory fees — Note 3 | |
Administration fees — Note 3 | |
Distribution fees — Note 3 | |
| |
| |
| |
| |
Shareholder administrative fees — Note 3 | |
| |
Transfer agent fees — Note 3 | |
| |
| |
| |
| |
| |
| |
REALIZED AND UNREALIZED GAIN (LOSS) ON INVESTMENTS AND FOREIGN CURRENCY: |
Net realized gain on unaffiliated investments | |
Net realized (loss) on foreign currency transactions | |
| |
Net change in unrealized appreciation on unaffiliated investments | |
Net change in unrealized (depreciation) on affiliated investments | |
Net change in unrealized (depreciation) on foreign currency | |
Total change in unrealized appreciation | |
Net realized and unrealized gain on investments and foreign currency | |
NET INCREASE IN NET ASSETS RESULTING FROM OPERATIONS | |
* Foreign withholding taxes | |
See Notes to Financial Statements.
ALGER CAPITAL APPRECIATION PORTFOLIOStatements of Changes in Net Assets (Unaudited)
| Alger Capital Appreciation Portfolio |
| For the
Six Months Ended
June 30, 2024 | For the
Year Ended
December 31, 2023 |
| | |
| | |
Net change in unrealized appreciation | | |
Net increase in net assets resulting from operations | | |
Dividends and distributions to shareholders: |
| | |
| | |
Increase (decrease) from shares of beneficial interest transactions: |
| | |
| | |
Net increase (decrease) from shares of beneficial interest transactions — Note 6 | | |
| | |
|
| | |
| | |
See Notes to Financial Statements.
THE ALGER PORTFOLIOSFinancial Highlights for a share outstanding throughout the period (Unaudited)
Alger Capital Appreciation Portfolio | |
| | | | | | |
Net asset value, beginning of period | | | | | | |
INCOME FROM INVESTMENT OPERATIONS: |
| | | | | | |
Net realized and unrealized gain (loss) on investments | | | | | | |
Total from investment operations | | | | | | |
Distributions from net realized gains | | | | | | |
Net asset value, end of period | | | | | | |
| | | | | | |
RATIOS/SUPPLEMENTAL DATA: |
Net assets, end of period (000's omitted) | | | | | | |
Ratio of net expenses to average net assets | | | | | | |
Ratio of net investment loss to average net assets | | | | | | |
| | | | | | |
| Ratios have been annualized; total return and portfolio turnover rate have not been annualized. |
| Amount was computed based on average shares outstanding during the period. |
See Notes to Financial Statements.
ALGER CAPITAL APPRECIATION PORTFOLIONOTES TO FINANCIAL STATEMENTS (Unaudited)
NOTE 1 — General:
The Alger Portfolios (the “Fund”) is an open-end registered investment company organized as a business trust under the laws of the Commonwealth of Massachusetts. The Fund qualifies as an investment company as defined in Financial Accounting Standards Board (“FASB”) Accounting Standards Codification 946 – Financial Services – Investment Companies. The Fund operates as a series company currently offering six series of shares of beneficial interest: Alger Capital Appreciation Portfolio, Alger Large Cap Growth Portfolio, Alger Growth & Income Portfolio, Alger Mid Cap Growth Portfolio, Alger Small Cap Growth Portfolio and Alger Balanced Portfolio (collectively, the “Portfolios”). These financial statements include only the Alger Capital Appreciation Portfolio (the “Portfolio”). The Portfolio invests primarily in equity securities and has an investment objective of long-term capital appreciation. Shares of the Portfolio are available to investment vehicles for variable annuity contracts and variable life insurance policies offered by separate accounts of life insurance companies, as well as qualified pension and retirement plans.
The Portfolio offers Class I-2 shares and Class S shares. Each class has identical rights to assets and earnings except that only Class S shares have a plan of distribution and bear the related expenses. Effective April 30, 2021, the Board of Trustees of the Fund (the “Board”) authorized a partial closing of the Portfolio’s Class S shares. Existing investors that hold Class S shares who had an open account with the Portfolio on April 30, 2021 may continue to invest in additional Class S shares of the Portfolio through exchanges, dividend reinvestment and additional purchases as provided in the Portfolio’s prospectus.
On May 23, 2023, the Board approved the transition of the Fund's custodian and administrator from Brown Brothers Harriman & Company to The Bank of New York (collectively, the “Custodian”). This change became effective on March 18, 2024.
NOTE 2 — Significant Accounting Policies:
(a) Investment Valuation: The Portfolio values its financial instruments at fair value using independent dealers or pricing services under policies approved by the Board. Investments held by the Portfolio are valued on each day the New York Stock Exchange (the “NYSE”) is open, as of the close of the NYSE (normally 4:00 p.m. Eastern Time).
The Board has designated, pursuant to Rule 2a-5 under the Investment Company Act of 1940, as amended (the “1940 Act”), the Portfolio's investment adviser, Fred Alger Management, LLC (“Alger Management” or the “Investment Manager”) as its valuation designee (the “Valuation Designee”) to make fair value determinations subject to the Board’s review and oversight. The Valuation Designee has established a Valuation Committee (“Committee”) comprised of
ALGER CAPITAL APPRECIATION PORTFOLIONOTES TO FINANCIAL STATEMENTS (Unaudited) (Continued)
representatives of the Investment Manager and officers of the Portfolio to assist in performing the duties and responsibilities of the Valuation Designee.
The Valuation Designee has established valuation processes including but not limited to: (i) making fair value determinations when market quotations for financial instruments are not readily available in accordance with valuation policies and procedures adopted by the Board; (ii) assessing and managing material risks associated with fair valuation determinations; (iii) selecting, applying and testing fair valuation methodologies; and (iv) overseeing and evaluating pricing services used by the Portfolio. The Valuation Designee regularly reports its fair valuation determinations and related valuation information to the Board. The Committee generally meets quarterly and on an as-needed basis to review and evaluate the effectiveness of the valuation policies and procedures in accordance with the requirements of Rule 2a-5.
Investments in short-term securities held by the Portfolio having a remaining maturity of sixty days or less are valued at amortized cost which approximates market value. Investments in other open-end investment companies registered under the 1940 Act are valued at such investment companies' net asset value per share.
Equity securities, including traded rights, warrants and option contracts for which valuation information is readily available, are valued at the last quoted sales price or official closing price on the primary market or exchange on which they are traded as reported by an independent pricing service. In the absence of quoted sales, such securities are generally valued at the bid price or, in the absence of a recent bid price, the equivalent as obtained from one or more of the major market makers for the securities to be valued.
Securities in which the Portfolio invests may be traded in foreign markets that close before the close of the NYSE. Developments that occur between the close of the foreign markets and the close of the NYSE may result in adjustments to the closing foreign prices to reflect what the Valuation Designee, through its Committee, believes to be the fair value of these securities as of the close of the NYSE. The Portfolio may also fair value securities in other situations, for example, when a particular foreign market is closed but the NYSE is open.
FASB Accounting Standards Codification 820 – Fair Value Measurements and Disclosures (“ASC 820”) defines fair value as the price that the Portfolio would receive upon selling an investment in a timely transaction to an independent buyer in the principal or most advantageous market of the investment. ASC 820 established a three-tier hierarchy to maximize the use of observable market data and minimize the use of unobservable inputs and to establish classification of fair value measurements for disclosure purposes. Inputs refer broadly to the assumptions that market participants would use in pricing the asset or liability and may be observable or unobservable. Observable inputs are based on market
ALGER CAPITAL APPRECIATION PORTFOLIONOTES TO FINANCIAL STATEMENTS (Unaudited) (Continued)
data obtained from sources independent of the Portfolio. Unobservable inputs are inputs that reflect the Portfolio's own assumptions based on the best information available in the circumstances. The three-tier hierarchy of inputs is summarized in the three broad Levels listed below.
• Level 1 – quoted prices in active markets for identical investments
• Level 2 – significant other observable inputs (including quoted prices for similar investments, amortized cost, interest rates, prepayment speeds, credit risk, etc.)
• Level 3 – significant unobservable inputs (including the Portfolio's own assumptions in determining the fair value of investments)
The Portfolio's valuation techniques are generally consistent with either the market or the income approach to fair value. The market approach considers prices and other relevant information generated by market transactions involving identical or comparable assets to measure fair value. The income approach converts future amounts to a current, or discounted, single amount. These fair value measurements are determined on the basis of the value indicated by current market expectations about such future events. Inputs for Level 1 include exchange-listed prices and broker quotes in an active market. Inputs for Level 2 include the last trade price in the case of a halted security, an exchange-listed price which has been adjusted for fair value factors, and prices of closely related securities. Additional Level 2 inputs include an evaluated price which is based upon a compilation of observable market information such as spreads for fixed income and preferred securities. Inputs for Level 3 include, but are not limited to, revenue multiples, earnings before interest, taxes, depreciation and amortization (“EBITDA”) multiples, discount rates, time to exit and the probabilities of success of certain outcomes. Such unobservable market information may be obtained from a company’s financial statements and from industry studies, market data, and market indicators such as benchmarks and indexes. Because of the inherent uncertainty and often limited markets for restricted securities, the valuations assigned to such securities by the Portfolio may significantly differ from the valuations that would have been assigned by the Portfolio had there been an active market for such securities.
(b) Cash and Cash Equivalents: Cash and cash equivalents include U.S. dollars and foreign cash.
(c) Securities Transactions and Investment Income: Securities transactions are recorded on a trade date basis. Realized gains and losses from securities transactions are recorded on the identified cost basis. Dividend income is recognized on the ex-dividend date and interest income is recognized on the accrual basis.
ALGER CAPITAL APPRECIATION PORTFOLIONOTES TO FINANCIAL STATEMENTS (Unaudited) (Continued)
Premiums and discounts on debt securities purchased are amortized or accreted over the lives of the respective securities.
(d) Foreign Currency Transactions: The books and records of the Portfolio are maintained in U.S. dollars. Foreign currencies, investments and other assets and liabilities are translated into U.S. dollars at the prevailing rates of exchange on the valuation date. Purchases and sales of investment securities and income and expenses are translated into U.S. dollars at the prevailing exchange rates on the respective dates of such transactions.
Net realized gains and losses on foreign currency transactions represent net gains and losses from the disposition of foreign currencies, currency gains and losses realized between the trade dates and settlement dates of security transactions, and the difference between the amount of net investment income accrued and the U.S. dollar amount actually received. The effects of changes in foreign currency exchange rates on investments in securities are included in realized and unrealized gain or loss on investments in the accompanying Statement of Operations.
(e) Lending of Fund Securities: The Portfolio may lend its securities to financial institutions (other than to the Investment Manager or its affiliates), provided that the market value of the securities loaned will not at any time exceed one third of the Portfolio’s total assets including borrowings, as defined in its prospectus. The Portfolio can earn fees on the securities loaned, which are included in income from securities lending in the accompanying Statement of Operations. In order to protect against the risk of failure by the borrower to return the securities loaned or any delay in the delivery of such securities, the loan is collateralized by cash or securities that are maintained with the Custodian, in an amount equal to at least 102% of the current market value of U.S. loaned securities or 105% for non-U.S. loaned securities. The market value of the loaned securities is determined at the close of each business day of the Portfolio. Any required additional collateral is delivered to the Custodian each day and any excess collateral is returned to the borrower on the next business day. In the event the borrower fails to return the loaned securities when due, the Portfolio may take the collateral to replace the securities. If the value of the collateral is less than the purchase cost of replacement securities, the Custodian shall be responsible for any shortfall, but only to the extent that the shortfall is not due to any diminution in collateral value, as defined in the securities lending agreement. The Portfolio is required to maintain the collateral in a segregated account and determine its value each day until the loaned securities are returned. Cash collateral may be invested as determined by the Portfolio. Collateral is returned to the borrower upon settlement of the loan. There were no securities loaned as of June 30, 2024.
(f) Dividends to Shareholders: Dividends and distributions payable to shareholders are recorded by the Portfolio on the ex-dividend date. The Portfolio
ALGER CAPITAL APPRECIATION PORTFOLIONOTES TO FINANCIAL STATEMENTS (Unaudited) (Continued)
declares and pays dividends from net investment income, if available, annually. Dividends from net realized gains, offset by any loss carryforward, are declared and paid annually. Each share class is treated separately in determining the amount of dividends from net investment income payable to holders of its shares.
The characterization of distributions to shareholders for financial reporting purposes is determined in accordance with federal income tax rules. Therefore, the source of the Portfolio’s distributions may be shown in the accompanying financial statements as either from, or in excess of, net investment income, net realized gain on investment transactions, or return of capital, depending on the type of book/tax differences that may exist. Capital accounts within the financial statements are adjusted for permanent book/tax differences. Reclassifications result primarily from the differences in tax treatment of net operating losses and foreign currency transactions. The reclassifications are done annually at year-end and have no impact on the net asset value of the Portfolio and are designed to present the Portfolio’s capital accounts on a tax basis.
(g) Federal Income Taxes: It is the Portfolio’s policy to comply with the requirements of the Internal Revenue Code Subchapter M applicable to regulated investment companies and to distribute all of its taxable income to its shareholders. Provided that the Portfolio maintains such compliance, no federal income tax provision is required.
FASB Accounting Standards Codification 740 – Income Taxes (“ASC 740”) requires the Portfolio to measure and recognize in its financial statements the benefit of a tax position taken (or expected to be taken) on an income tax return if such position will more likely than not be sustained upon examination based on the technical merits of the position. No tax years are currently under investigation. The Portfolio files income tax returns in the U.S. Federal jurisdiction, as well as the New York State and New York City jurisdictions. The statute of limitations on the Portfolio's tax returns remains open for the tax years 2020-2023. Management does not believe there are any uncertain tax positions that require recognition of a tax liability.
(h) Allocation Methods: The Fund accounts separately for the assets, liabilities and operations of the Portfolio. Expenses directly attributable to the Portfolio are charged to the Portfolio’s operations; expenses which are applicable to all Portfolios are allocated among them based on net assets. Income, realized and unrealized gains and losses, and expenses of the Portfolio are allocated among the Portfolio’s classes based on relative net assets, with the exception of distribution fees, transfer agency fees, and shareholder servicing and related fees.
(i) Estimates: These financial statements have been prepared in accordance with accounting principles generally accepted in the United States of America,
ALGER CAPITAL APPRECIATION PORTFOLIONOTES TO FINANCIAL STATEMENTS (Unaudited) (Continued)
which require using estimates and assumptions that affect the reported amounts therein. This unaudited Semi-Annual Report reflects all adjustments that are, in the opinion of management, necessary to present a fair statement of results of the semi-annual period. Actual results may differ from those estimates. All such estimates are of a normal recurring nature.
NOTE 3 — Investment Advisory Fees and Other Transactions with Affiliates:
(a) Investment Advisory Fees: Fees incurred by the Portfolio, pursuant to the provisions of the Fund's Investment Advisory Agreement with the Investment Manager, are payable monthly and computed based on the following annual rates. The actual rate paid as a percentage of average daily net assets, for the six months ended June 30, 2024, is set forth below under the heading “Actual Rate”:
| | | | | | |
Alger Capital Appreciation | | | | | | |
| Tier 1 rate is paid on assets up to $2 billion, Tier 2 rate is paid on assets between $2 billion and $3 billion, Tier 3 rate is paid on assets between $3 billion and $4 billion, Tier 4 rate is paid on assets between $4 billion and $5 billion, and Tier 5 rate is paid on assets in excess of $5 billion. |
(b) Administration Fees: Fees incurred by the Portfolio, pursuant to the provisions of the Fund's Fund Administration Agreement with Alger Management, are payable monthly and computed based on the average daily net assets of the Portfolio at the annual rate of 0.0275%.
(c) Distribution Fees: The Fund adopted a Distribution Plan pursuant to which Class S shares of the Portfolio pay Fred Alger & Company, LLC, the Fund’s distributor and an affiliate of Alger Management (the “Distributor” or “Alger LLC”), a fee at the annual rate of 0.25% of the average daily net assets of the Class S shares of the Portfolio to compensate the Distributor for its activities and expenses incurred in distributing the Class S shares and/or shareholder servicing. Fees paid may be more or less than the expenses incurred by Alger LLC.
(d) Brokerage Commissions: During the six months ended June 30, 2024, the Portfolio paid Alger LLC $9,251 in connection with securities transactions.
(e) Interfund Loans: The Portfolio, along with other funds in the Alger Fund Complex (as defined below), may borrow money from and lend money to each other for temporary or emergency purposes. To the extent permitted under its investment restrictions, the Portfolio may lend uninvested cash in an amount up to 15% of its net assets to other funds in the Alger Fund Complex. If the Portfolio has borrowed from other funds in the Alger Fund Complex and has aggregate borrowings from all sources that exceed 10% of the Portfolio's total assets, the
ALGER CAPITAL APPRECIATION PORTFOLIONOTES TO FINANCIAL STATEMENTS (Unaudited) (Continued)
Portfolio will secure all of its loans from other funds in the Alger Fund Complex. The interest rate charged on interfund loans is equal to the average of the overnight time deposit rate and bank loan rate available to the Portfolio. There were no interfund loans outstanding as of June 30, 2024.
During the six months ended June 30, 2024, the Portfolio earned interfund loan interest income of $5,275 and incurred interest expenses of $11,865, which are included as interest income and interest expenses, respectively, in the accompanying Statement of Operations.
(f) Shareholder Administrative Fees: The Fund has entered into a Shareholder Administrative Services Agreement with Alger Management to compensate Alger Management for providing administrative oversight of the Fund’s transfer agent, and for other related services. The Portfolio compensates Alger Management at the annual rate of 0.01% of the average daily net assets for these services.
(g) Trustee Fees: Each trustee who is not an “interested person” of the Fund, as defined in the 1940 Act (“Independent Trustee”), receives a fee of $165,400 per annum, paid pro rata based on net assets by each fund in the Alger Fund Complex, plus travel expenses incurred for attending board meetings. The term “Alger Fund Complex” refers to the Fund, The Alger Institutional Funds, The Alger Funds II, The Alger Funds, Alger Global Focus Fund and The Alger ETF Trust, each of which is a registered investment company managed by Alger Management. The Independent Trustee appointed as Chair of the Board receives additional compensation of $22,000 per annum paid pro rata based on net assets by each fund in the Alger Fund Complex. Additionally, each member of the Audit Committee receives a fee of $13,000 per annum, paid pro rata based on net assets by each fund in the Alger Fund Complex. The Board has adopted a policy requiring Trustees to receive a minimum of 10% of their annual compensation in shares of one or more of the funds in the Alger Fund Complex.
(h) Interfund Trades: The Portfolio may engage in purchase and sale transactions with other funds advised by Alger Management or sub-advised by Weatherbie Capital LLC or Redwood Investments, LLC, affiliates of Alger Management. For the six months ended June 30, 2024, there were no interfund trades.
(i) Other Transactions with Affiliates: Certain officers and one Trustee of the Fund are directors and/or officers of Alger Management, the Distributor, or their affiliates. No shares of the Portfolio were held by Alger Management and its affiliated entities as of June 30, 2024.
ALGER CAPITAL APPRECIATION PORTFOLIONOTES TO FINANCIAL STATEMENTS (Unaudited) (Continued)
NOTE 4 — Securities Transactions:
The following summarizes the securities transactions by the Portfolio, other than U.S. Government securities, in-kind transactions, and short-term securities, for the six months ended June 30, 2024:
| | |
Alger Capital Appreciation Portfolio | | |
The Portfolio may borrow from the Custodian on an uncommitted basis. The Portfolio pays the Custodian a market rate of interest, generally based upon a rate of return with respect to each respective currency borrowed, taking into consideration relevant overnight and short-term reference rates and the range of distribution between and among the interest rates paid on deposits to other institutions, less applicable commissions, if any. Borrowings from the Custodian are included in Bank overdrafts in the Statement of Assets and Liabilities. The Portfolio may also borrow from other funds in the Alger Fund Complex, as discussed in Note 3(e). For the six months ended June 30, 2024, the Portfolio had the following borrowings from the Custodian and other funds in the Alger Fund Complex:
| | WEIGHTED AVERAGE
INTEREST RATE |
Alger Capital Appreciation Portfolio | | |
The highest amount borrowed by the Portfolio from the Custodian and other funds in the Alger Fund Complex during the six months ended June 30, 2024 was as follows:
| |
Alger Capital Appreciation Portfolio | |
ALGER CAPITAL APPRECIATION PORTFOLIONOTES TO FINANCIAL STATEMENTS (Unaudited) (Continued)
NOTE 6 — Share Capital:
The Portfolio has an unlimited number of authorized shares of beneficial interest of $.001 par value. During the six months ended June 30, 2024, and the year ended December 31, 2023, transactions of shares of beneficial interest were as follows:
| FOR THE SIX MONTHS ENDED
June 30, 2024 | FOR THE YEAR ENDED
December 31, 2023 |
| | | | |
Alger Capital Appreciation Portfolio |
| | | | |
| | | | |
| | | | |
| | | | |
| | | | |
| | | | |
| | | | |
| | | | |
| | | | |
| | | | |
| | | | |
| Certain shareholders of the Portfolio subscribed for shares in-kind. |
Subscriptions In-Kind: The Portfolio may receive payment for Fund shares purchased wholly or in part by receiving portfolio securities from shareholders. For the period ended June 30, 2024, the Portfolio had subscriptions in-kind in the amount of $84,370,859.
NOTE 7 — Income Tax Information:
At December 31, 2023, the Portfolio, for federal income tax purposes, had capital loss carryforwards of $21,137,808. This amount will not be subject to expiration under the Regulated Investment Company Modernization Act of 2010, and this amount may be applied against future net realized gains until its utilization.
The difference between book-basis and tax-basis unrealized appreciation (depreciation) is determined annually and is attributable primarily to the tax deferral of losses on wash sales.
The Portfolio accrues tax on unrealized gains in foreign jurisdictions that impose a foreign capital tax, if applicable.
NOTE 8 — Fair Value Measurements:
The following is a summary of the inputs used as of June 30, 2024 in valuing the Portfolio's investments carried at fair value on a recurring basis. Based upon the
ALGER CAPITAL APPRECIATION PORTFOLIONOTES TO FINANCIAL STATEMENTS (Unaudited) (Continued)
nature, characteristics, and risks associated with its investments, the Portfolio has determined that presenting them by security type and sector is appropriate.
Alger Capital Appreciation Portfolio | | | | |
| | | | |
| | | | |
| | | | |
| | | | |
| | | | |
| | | | |
| | | | |
| | | | |
| | | | |
| | | | |
| | | | |
| | | | |
| | | | |
| | | | |
REAL ESTATE INVESTMENT TRUST | | | | |
| | | | |
| | | | |
| | | | |
| | | | |
| | | | |
TOTAL INVESTMENTS IN SECURITIES | | | | |
| FAIR VALUE MEASUREMENTS USING SIGNIFICANT UNOBSERVABLE INPUTS (LEVEL 3) |
Alger Capital Appreciation Portfolio | |
Opening balance at January 1, 2024 | |
| |
| |
| |
Included in net realized gain (loss) on investments | |
Included in net change in unrealized appreciation (depreciation) on investments | |
| |
| |
| |
Closing balance at June 30, 2024 | |
Net change in unrealized appreciation (depreciation) attributable to investments
still held at June 30, 2024 * | |
ALGER CAPITAL APPRECIATION PORTFOLIONOTES TO FINANCIAL STATEMENTS (Unaudited) (Continued)
| FAIR VALUE MEASUREMENTS USING SIGNIFICANT UNOBSERVABLE INPUTS (LEVEL 3) |
Alger Capital Appreciation Portfolio | |
Opening balance at January 1, 2024 | |
| |
| |
| |
Included in net realized gain (loss) on investments | |
Included in net change in unrealized appreciation (depreciation) on investments | |
| |
| |
| |
Closing balance at June 30, 2024 | |
Net change in unrealized appreciation (depreciation) attributable to investments
still held at June 30, 2024 * | |
| Net change in unrealized appreciation (depreciation) is included in the net change in unrealized appreciation
(depreciation) on investments in the accompanying Statement of Operations. |
The following table provides quantitative information about the Portfolio Level 3 fair value measurements of its investments as of June 30, 2024. The table below is not intended to be all-inclusive, but rather provides information on the Level 3 inputs as they relate to the Portfolio fair value measurements.
| | | | | |
Alger Capital Appreciation Portfolio |
| | | | | |
| | | | | |
The significant unobservable inputs used in the fair value measurement of the Portfolio's securities are revenue and EBITDA multiples, discount rates, and the probability of success of certain outcomes. Significant increases and decreases in these inputs in isolation and interrelationships between these inputs would have resulted in significantly higher or lower fair value measurements than those noted in the table above. Generally, all other things being equal, increases in revenue and EBITDA multiples, decreases in discount rates, and increases in the probability of success result in higher fair value measurements, whereas decreases in revenues and EBITDA multiples, increases in discount rates, and decreases in the probability of success result in lower fair value measurements.
ALGER CAPITAL APPRECIATION PORTFOLIONOTES TO FINANCIAL STATEMENTS (Unaudited) (Continued)
For the period ended June 30, 2024, there were no changes in valuation methodology on Level 3 investments.
Certain of the Portfolio's assets and liabilities are held at carrying amount or face value, which approximates fair value for financial reporting purposes. As of June 30, 2024, such assets were categorized within the ASC 820 disclosure hierarchy as follows:
NOTE 9 — Principal Risks:
Investing in the stock market involves risks, including the potential loss of principal. The value of the securities owned by the Portfolio, like other investments, may move up or down, sometimes rapidly and unpredictably. Your Portfolio shares at any point in time may be worth less than what you invested, even after taking into account the reinvestment of Portfolio dividends and distributions. Local, regional or global events such as environmental or natural disasters, war, terrorism, pandemics, outbreaks of infectious diseases and similar public health threats, recessions, or other events could have a significant impact on investments. Growth stocks may be more volatile than other stocks as their prices tend to be higher in relation to their companies’ earnings and may be more sensitive to market, political, and economic developments. A significant portion of assets may be invested in securities of companies in related sectors, and may be similarly affected by economic, political, or market events and conditions and may be more vulnerable to unfavorable sector developments. Foreign securities involve special risks including currency fluctuations, inefficient trading, political and economic instability, and increased volatility. At times, the Portfolio may hold a large cash position, which may underperform relative to equity securities.
NOTE 10 — Affiliated Securities:
During the six months ended June 30, 2024, as disclosed in the following table, the Portfolio held 5% or more of the outstanding voting securities of the issuers listed below. As such, these issuers were “affiliated persons” of the Portfolio for purposes of the 1940 Act. Transactions during the six months ended June 30, 2024 with such affiliated persons are summarized below. During this period, other Portfolios in the Fund may also have held voting shares of the issuers at levels below 5%.
ALGER CAPITAL APPRECIATION PORTFOLIONOTES TO FINANCIAL STATEMENTS (Unaudited) (Continued)
| Shares
Held at
December 31,
2023 | | | Shares
Held at
June 30,
2024 | | | Net Change
in
Unrealized
App(Dep) | |
Alger Capital Appreciation Portfolio |
|
| | | | | | | | |
| | | | | | | | |
| The Alger Fund Complex and other entities managed by Alger Management fully own Crosslink Ventures C, LLC, Class A and Crosslink Ventures C, LLC, Class B. There were no capital increases or decreases for the period ended June 30, 2024. |
NOTE 11 — Subsequent Events:
Management of the Portfolio has evaluated events that have occurred subsequent to June 30, 2024, through the issuance date of the Financial Statements. On August 16, 2024, shareholders of the Portfolio elected Jean Brownhill, Susan L. Moffet, Jay C. Nadel, and one current trustee, David Rosenberg, to the Board. No other events have been identified which require recognition and/or disclosure.
THE ALGER PORTFOLIOSOTHER INFORMATION (Unaudited)
Proxy Voting Policies
A description of the policies and procedures the Portfolio uses to determine how to vote proxies relating to portfolio securities and the proxy voting record is available, without charge, by calling (800) 992-3863 or online on the Portfolio's website at http://www.alger.com or on the SEC’s website at http://www.sec.gov.
The Board has adopted policies and procedures relating to disclosure of the Porfolio's securities. These policies and procedures recognize that there may be legitimate business reasons for holdings to be disclosed and seek to balance those interests to protect the proprietary nature of the trading strategies and implementation thereof by the Portfolio.
Generally, the policies prohibit the release of information concerning portfolio holdings, which have not previously been made public, to individual investors, institutional investors, intermediaries that distribute the Portfolio's shares and other parties which are not employed by the Investment Manager or its affiliates except when the legitimate business purposes for selective disclosure and other conditions (designed to protect the Portfolio) are acceptable.
The Portfolio files its complete schedule of portfolio holdings with the SEC semi-annually in shareholder reports on Form N-CSR and after the first and third fiscal quarters as an exhibit to its reports on Form N-PORT. The Portfolio's Forms N-CSR and N-PORT are available online on the SEC’s website at www.sec.gov.
In addition, the Portfolio makes publicly available its month-end top 10 holdings with a 10 day lag and its month-end full portfolio with a 60 day lag on its website www.alger.com and through other marketing communications (including printed advertising/sales literature and/or shareholder telephone customer service centers). No compensation or other consideration is received for the non-public disclosure of portfolio holdings information.
In accordance with the foregoing, the Portfolio provides portfolio holdings information to third parties including financial intermediaries and service providers who need access to this information in the performance of their services and are subject to duties of confidentiality (1) imposed by law, including a duty not to trade on non-public information, and/or (2) pursuant to an agreement that confidential information is not to be disclosed or used (including trading on such information) other than as required by law. From time to time, the Portfolio will communicate with these third parties to confirm that they understand the Portfolio's policies and procedures regarding such disclosure. These agreements must be approved by the Portfolio's Chief Compliance Officer.
The Board periodically reviews a report disclosing the third parties to whom the Portfolio's holdings information has been disclosed and the purpose for such
THE ALGER PORTFOLIOSOTHER INFORMATION (Unaudited) (Continued)
disclosure, and it considers whether or not the release of information to such third parties is in the best interest of the Portfolio and its shareholders.
In addition to material the Portfolio routinely provides to shareholders, the Investment Manager may make additional statistical information available regarding the Alger Family of Funds.
Such information may include, but not be limited to, relative weightings and characteristics of the Portfolio versus an index (such as P/E ratio, alpha, beta, capture ratio, maximum drawdown, standard deviation, EPS forecasts, Sharpe ratio, information ratio, R-squared, and market cap analysis), security specific impact on overall portfolio performance, month-end top ten contributors to and detractors from performance, portfolio turnover, and other similar information. Shareholders should visit www.alger.com or may also contact the Portfolio at (800) 992-3863 to obtain such information.
THE ALGER PORTFOLIOS
100 Pearl Street, 27th Floor
New York, NY 10004
(800) 992-3863
www.alger.com
Fred Alger Management, LLC
100 Pearl Street, 27th Floor
New York, NY 10004
Fred Alger & Company, LLC
100 Pearl Street, 27th Floor
New York, NY 10004
Transfer Agent and Dividend Disbursing Agent
UMB Fund Services, Inc.
235 W. Galena Street
Milwaukee, WI 53212
The Bank of New York
240 Greenwich Street
New York, NY 10286
Independent Registered Public Accounting Firm
Deloitte & Touche LLP
30 Rockefeller Plaza
New York, NY 10112
This report is submitted for the general information of the shareholders of the Alger Capital Appreciation Portfolio. It is not authorized for distribution to prospective investors unless accompanied by an effective Prospectus for the Portfolio, which contains information concerning the Portfolio’s investment policies, fees and expenses as well as other pertinent information.
Inspired by Change, Driven by Growth.
Item 8. Changes in and Disagreements with Accountants for Open-End Management Investment Companies
Item 9. Proxy Disclosures for Open-End Management Investment Companies
Item 10. Remuneration Paid to Directors,Officers, and Others of Open-End Management Investment Companies
Remuneration paid to directors, officers and others is included in the Statement of Operations under the line items “Trustee fees” and “Investment advisory fees” as part of the financial statements filed under Item 7 of this Form N-CSR.
Item 11. Statement Regarding Basis for Approval of Investment Advisory Contract
ITEM 7. FINANCIAL STATEMENTS AND FINANCIAL HIGHLIGHTS FOR OPEN_END MANAGEMENT INVESTMENT COMPANIES.
Alger Large Cap Growth Portfolio |
SEMI-ANNUAL FINANCIAL STATEMENTS AND OTHER INFORMATION
June 30, 2024 (UNAUDITED)
Table of Contents
ALGER LARGE CAP GROWTH PORTFOLIO
ALGER LARGE CAP GROWTH PORTFOLIOSchedule of Investments June 30, 2024 (Unaudited)
| | |
|
|
| | |
| | |
|
|
| | |
APPLICATION SOFTWARE—1.5% |
| | |
AUTOMOBILE MANUFACTURERS—1.0% |
| | |
|
| | |
| | |
Regeneron Pharmaceuticals, Inc.* | | |
Vertex Pharmaceuticals, Inc.* | | |
Viking Therapeutics, Inc.* | | |
|
|
| | |
|
| | |
| | |
|
|
| | |
CARGO GROUND TRANSPORTATION—0.5% |
Old Dominion Freight Line, Inc. | | |
|
| | |
CONSTRUCTION MACHINERY & HEAVY TRANSPORTATION EQUIPMENT—0.7% |
| | |
ELECTRICAL COMPONENTS & EQUIPMENT—2.9% |
Vertiv Holdings Co., Cl. A | | |
ENVIRONMENTAL & FACILITIES SERVICES—0.9% |
| | |
| | |
|
|
| | |
HEALTHCARE DISTRIBUTORS—0.3% |
| | |
HEALTHCARE EQUIPMENT—1.1% |
| | |
Intuitive Surgical, Inc.* | | |
|
|
| | |
HEALTHCARE FACILITIES—0.5% |
Universal Health Services, Inc., Cl. B | | |
HEALTHCARE TECHNOLOGY—1.2% |
Veeva Systems, Inc., Cl. A* | | |
See Notes to Financial Statements.
ALGER LARGE CAP GROWTH PORTFOLIOSchedule of Investments June 30, 2024 (Unaudited) (Continued)
| | |
COMMON STOCKS—90.8% (CONT.) |
HOTELS RESORTS & CRUISE LINES—1.0% |
| | |
HUMAN RESOURCE & EMPLOYMENT SERVICES—0.7% |
| | |
INTERACTIVE HOME ENTERTAINMENT—1.1% |
| | |
INTERACTIVE MEDIA & SERVICES—10.0% |
| | |
Meta Platforms, Inc., Cl. A | | |
| | |
|
|
| | |
LIFE SCIENCES TOOLS & SERVICES—0.6% |
| | |
| | |
|
|
| | |
|
| | |
MOVIES & ENTERTAINMENT—3.8% |
Live Nation Entertainment, Inc.* | | |
| | |
|
|
| | |
OIL & GAS EXPLORATION & PRODUCTION—0.8% |
| | |
PASSENGER GROUND TRANSPORTATION—3.3% |
| | |
|
| | |
| | |
| | |
| | |
|
|
| | |
SEMICONDUCTOR MATERIALS & EQUIPMENT—1.3% |
| | |
|
Advanced Micro Devices, Inc.* | | |
| | |
| | |
| | |
Taiwan Semiconductor Manufacturing Co., Ltd. ADR | | |
|
|
| | |
See Notes to Financial Statements.
ALGER LARGE CAP GROWTH PORTFOLIOSchedule of Investments June 30, 2024 (Unaudited) (Continued)
| | |
COMMON STOCKS—90.8% (CONT.) |
|
Crowdstrike Holdings, Inc., Cl. A* | | |
| | |
| | |
|
|
| | |
TECHNOLOGY HARDWARE STORAGE & PERIPHERALS—5.0% |
| | |
TRANSACTION & PAYMENT PROCESSING SERVICES—1.5% |
| | |
TOTAL COMMON STOCKS
(Cost $181,492,609) | | |
EXCHANGE TRADED FUNDS—2.3% |
| | |
| | |
|
Alger 35 Fund, Cl. Z(a),* | | |
| | |
SPECIAL PURPOSE VEHICLE—0.5% |
DATA PROCESSING & OUTSOURCED SERVICES—0.5% |
Crosslink Ventures C, LLC, Cl. A(a),(b),*,@ | | |
| | |
TOTAL SPECIAL PURPOSE VEHICLE
(Cost $1,900,000) | | |
SHORT-TERM SECURITIES—4.1% |
|
Dreyfus Treasury Obligations Cash Management Fund,
Institutional Shares, 5.18%(c) | | |
| | |
|
|
Total Investments
(Cost $211,810,419) | | |
Affiliated Securities (Cost $16,297,074) | | |
Unaffiliated Securities (Cost $195,513,345) | | |
Liabilities in Excess of Other Assets | | |
| | |
| American Depositary Receipts |
| |
| Deemed an affiliate of the Portfolio in accordance with Section 2(a)(3) of the Investment Company Act of 1940. See Note 10 - Affiliated Securities. |
| Security is valued in good faith at fair value determined using significant unobservable inputs pursuant to procedures approved by the Board of Trustees. |
| Rate shown reflects 7-day effective yield as of June 30, 2024. |
See Notes to Financial Statements.
ALGER LARGE CAP GROWTH PORTFOLIOSchedule of Investments June 30, 2024 (Unaudited) (Continued)
| Non-income producing security. |
| Restricted security - Investment in security not registered under the Securities Act of 1933. Sales or transfers of the investment may be restricted only to qualified buyers. |
| | | | % of net assets
as of
6/30/2024 |
Crosslink Ventures C, LLC, Cl. A | | | | |
| | | | |
See Notes to Financial Statements.
ALGER LARGE CAP GROWTH PORTFOLIOStatement of Assets and Liabilities June 30, 2024 (Unaudited)
| Alger Large Cap Growth Portfolio |
|
Investments in unaffiliated securities, at value (Identified cost below)* see accompanying schedule of investments | |
Investments in affiliated securities, at value (Identified cost below)** see accompanying schedule of investments | |
Receivable for shares of beneficial interest sold | |
Dividends and interest receivable | |
Receivable from Investment Manager | |
| |
| |
|
Payable for shares of beneficial interest redeemed | |
Accrued investment advisory fees | |
Accrued fund accounting fees | |
| |
Accrued professional fees | |
Accrued administrative fees | |
| |
Accrued shareholder administrative fees | |
| |
Accrued transfer agent fees | |
| |
| |
| |
|
Paid in capital (par value of $.001 per share) | |
| |
| |
| |
| |
| |
See Notes to Financial Statements.
ALGER LARGE CAP GROWTH PORTFOLIOStatement of Assets and Liabilities June 30, 2024 (Unaudited) (Continued)
| Alger Large Cap Growth Portfolio |
|
| |
SHARES OF BENEFICIAL INTEREST OUTSTANDING — Note 6: |
| |
NET ASSET VALUE PER SHARE: |
| |
| At June 30, 2024, the net unrealized appreciation on investments, based on cost for federal income tax purposes of $213,449,997, amounted to $126,406,743, which consisted of aggregate gross unrealized appreciation of $129,013,682, and aggregate gross unrealized depreciation of $2,606,939. |
See Notes to Financial Statements.
ALGER LARGE CAP GROWTH PORTFOLIOStatement of Operations for the six months ended June 30, 2024 (Unaudited)
| Alger Large Cap Growth Portfolio |
|
Dividends (net of foreign withholding taxes*) | |
| |
| |
|
Investment advisory fees — Note 3 | |
Administration fees — Note 3 | |
| |
| |
| |
| |
Shareholder administrative fees — Note 3 | |
Transfer agent fees — Note 3 | |
| |
| |
| |
| |
| |
Less, expense reimbursements/waivers — Note 3 | |
| |
| |
REALIZED AND UNREALIZED GAIN (LOSS) ON INVESTMENTS AND FOREIGN CURRENCY: |
Net realized gain on unaffiliated investments | |
Net realized (loss) on affiliated investments | |
| |
Net change in unrealized appreciation on unaffiliated investments | |
Net change in unrealized appreciation on affiliated investments | |
Net change in unrealized (depreciation) on foreign currency | |
Total change in unrealized appreciation | |
Net realized and unrealized gain on investments and foreign currency | |
NET INCREASE IN NET ASSETS RESULTING FROM OPERATIONS | |
* Foreign withholding taxes | |
See Notes to Financial Statements.
ALGER LARGE CAP GROWTH PORTFOLIOStatements of Changes in Net Assets (Unaudited)
| Alger Large Cap Growth Portfolio |
| For the
Six Months Ended
June 30, 2024 | For the
Year Ended
December 31, 2023 |
| | |
| | |
Net change in unrealized appreciation | | |
Net increase in net assets resulting from operations | | |
Dividends and distributions to shareholders: |
| | |
Decrease from shares of beneficial interest transactions: |
| | |
Net decrease from shares of beneficial interest transactions — Note 6 | | |
| | |
|
| | |
| | |
See Notes to Financial Statements.
THE ALGER PORTFOLIOSFinancial Highlights for a share outstanding throughout the period (Unaudited)
Alger Large Cap Growth Portfolio | |
| | | | | | |
Net asset value, beginning of period | | | | | | |
INCOME FROM INVESTMENT OPERATIONS: |
| | | | | | |
Net realized and unrealized gain (loss) on investments | | | | | | |
Total from investment operations | | | | | | |
Dividends from net investment income | | | | | | |
Distributions from net realized gains | | | | | | |
Net asset value, end of period | | | | | | |
| | | | | | |
RATIOS/SUPPLEMENTAL DATA: |
Net assets, end of period (000's omitted) | | | | | | |
Ratio of gross expenses to average net assets | | | | | | |
Ratio of expense reimbursements to average net assets | | | | | | |
Ratio of net expenses to average net assets | | | | | | |
Ratio of net investment loss to average net assets | | | | | | |
| | | | | | |
| Ratios have been annualized; total return and portfolio turnover rate have not been annualized. |
| Class S Shares were converted into Class I-2 Shares after the close of business on June 3, 2022. |
| Amount was computed based on average shares outstanding during the period. |
See Notes to Financial Statements.
ALGER LARGE CAP GROWTH PORTFOLIONOTES TO FINANCIAL STATEMENTS (Unaudited)
NOTE 1 — General:
The Alger Portfolios (the “Fund”) is an open-end registered investment company organized as a business trust under the laws of the Commonwealth of Massachusetts. The Fund qualifies as an investment company as defined in Financial Accounting Standards Board (“FASB”) Accounting Standards Codification 946 – Financial Services – Investment Companies. The Fund operates as a series company currently offering six series of shares of beneficial interest: Alger Capital Appreciation Portfolio, Alger Large Cap Growth Portfolio, Alger Growth & Income Portfolio, Alger Mid Cap Growth Portfolio, Alger Small Cap Growth Portfolio and Alger Balanced Portfolio (collectively, the “Portfolios”). These financial statements include only the Alger Large Cap Growth Portfolio (the “Portfolio”). The Portfolio invests primarily in equity securities and has an investment objective of long-term capital appreciation. Shares of the Portfolio are available to investment vehicles for variable annuity contracts and variable life insurance policies offered by separate accounts of life insurance companies, as well as qualified pension and retirement plans.
The Portfolio only offers Class I-2 shares. After the close of business on June 3, 2022, Class S shares of the Portfolio were converted into Class I-2 shares with the same relative aggregate net asset value as the Class S shares held immediately prior to the conversion. Upon completion of the conversion, Class S shares of the Portfolio were no longer offered.
On May 23, 2023, the Board of Trustees of the Fund (the “Board”) approved the transition of the Fund’s custodian and administrator from Brown Brothers Harriman & Company to The Bank of New York (collectively, the "Custodian"). This change became effective on March 18, 2024.
NOTE 2 — Significant Accounting Policies:
(a) Investment Valuation: The Portfolio values its financial instruments at fair value using independent dealers or pricing services under policies approved by the Board. Investments held by the Portfolio are valued on each day the New York Stock Exchange (the “NYSE”) is open, as of the close of the NYSE (normally 4:00 p.m. Eastern Time).
The Board has designated, pursuant to Rule 2a-5 under the Investment Company Act of 1940, as amended (the “1940 Act”), the Portfolio's investment adviser, Fred Alger Management, LLC (“Alger Management” or the “Investment Manager”) as its valuation designee (the “Valuation Designee”) to make fair value determinations subject to the Board’s review and oversight. The Valuation Designee has established a Valuation Committee (“Committee”) comprised of representatives of the Investment Manager and officers of the Portfolio to assist in performing the duties and responsibilities of the Valuation Designee.
ALGER LARGE CAP GROWTH PORTFOLIONOTES TO FINANCIAL STATEMENTS (Unaudited) (Continued)
The Valuation Designee has established valuation processes including but not limited to: (i) making fair value determinations when market quotations for financial instruments are not readily available in accordance with valuation policies and procedures adopted by the Board; (ii) assessing and managing material risks associated with fair valuation determinations; (iii) selecting, applying and testing fair valuation methodologies; and (iv) overseeing and evaluating pricing services used by the Portfolio. The Valuation Designee regularly reports its fair valuation determinations and related valuation information to the Board. The Committee generally meets quarterly and on an as-needed basis to review and evaluate the effectiveness of the valuation policies and procedures in accordance with the requirements of Rule 2a-5.
Investments in short-term securities held by the Portfolio having a remaining maturity of sixty days or less are valued at amortized cost which approximates market value. Investments in other open-end investment companies registered under the 1940 Act are valued at such investment companies' net asset value per share.
Equity securities, including traded rights, warrants and option contracts for which valuation information is readily available, are valued at the last quoted sales price or official closing price on the primary market or exchange on which they are traded as reported by an independent pricing service. In the absence of quoted sales, such securities are generally valued at the bid price or, in the absence of a recent bid price, the equivalent as obtained from one or more of the major market makers for the securities to be valued.
Securities in which the Portfolio invests may be traded in foreign markets that close before the close of the NYSE. Developments that occur between the close of the foreign markets and the close of the NYSE may result in adjustments to the closing foreign prices to reflect what the Valuation Designee, through its Committee, believes to be the fair value of these securities as of the close of the NYSE. The Portfolio may also fair value securities in other situations, for example, when a particular foreign market is closed but the NYSE is open.
FASB Accounting Standards Codification 820 – Fair Value Measurements and Disclosures (“ASC 820”) defines fair value as the price that the Portfolio would receive upon selling an investment in a timely transaction to an independent buyer in the principal or most advantageous market of the investment. ASC 820 established a three-tier hierarchy to maximize the use of observable market data and minimize the use of unobservable inputs and to establish classification of fair value measurements for disclosure purposes. Inputs refer broadly to the assumptions that market participants would use in pricing the asset or liability and may be observable or unobservable. Observable inputs are based on market data obtained from sources independent of the Portfolio. Unobservable inputs are inputs that reflect the Portfolio's own assumptions based on the best
ALGER LARGE CAP GROWTH PORTFOLIONOTES TO FINANCIAL STATEMENTS (Unaudited) (Continued)
information available in the circumstances. The three-tier hierarchy of inputs is summarized in the three broad Levels listed below.
• Level 1 – quoted prices in active markets for identical investments
• Level 2 – significant other observable inputs (including quoted prices for similar investments, amortized cost, interest rates, prepayment speeds, credit risk, etc.)
• Level 3 – significant unobservable inputs (including the Portfolio's own assumptions in determining the fair value of investments)
The Portfolio's valuation techniques are generally consistent with either the market or the income approach to fair value. The market approach considers prices and other relevant information generated by market transactions involving identical or comparable assets to measure fair value. The income approach converts future amounts to a current, or discounted, single amount. These fair value measurements are determined on the basis of the value indicated by current market expectations about such future events. Inputs for Level 1 include exchange-listed prices and broker quotes in an active market. Inputs for Level 2 include the last trade price in the case of a halted security, an exchange-listed price which has been adjusted for fair value factors, and prices of closely related securities. Additional Level 2 inputs include an evaluated price which is based upon a compilation of observable market information such as spreads for fixed income and preferred securities. Inputs for Level 3 include, but are not limited to, revenue multiples, earnings before interest, taxes, depreciation and amortization (“EBITDA”) multiples, discount rates, time to exit and the probabilities of success of certain outcomes. Such unobservable market information may be obtained from a company’s financial statements and from industry studies, market data, and market indicators such as benchmarks and indexes. Because of the inherent uncertainty and often limited markets for restricted securities, the valuations assigned to such securities by the Portfolio may significantly differ from the valuations that would have been assigned by the Portfolio had there been an active market for such securities.
(b) Cash and Cash Equivalents: Cash and cash equivalents include U.S. dollars and foreign cash.
(c) Securities Transactions and Investment Income: Securities transactions are recorded on a trade date basis. Realized gains and losses from securities transactions are recorded on the identified cost basis. Dividend income is recognized on the ex-dividend date and interest income is recognized on the accrual basis.
Premiums and discounts on debt securities purchased are amortized or accreted over the lives of the respective securities.
ALGER LARGE CAP GROWTH PORTFOLIONOTES TO FINANCIAL STATEMENTS (Unaudited) (Continued)
(d) Foreign Currency Transactions: The books and records of the Portfolio are maintained in U.S. dollars. Foreign currencies, investments and other assets and liabilities are translated into U.S. dollars at the prevailing rates of exchange on the valuation date. Purchases and sales of investment securities and income and expenses are translated into U.S. dollars at the prevailing exchange rates on the respective dates of such transactions.
Net realized gains and losses on foreign currency transactions represent net gains and losses from the disposition of foreign currencies, currency gains and losses realized between the trade dates and settlement dates of security transactions, and the difference between the amount of net investment income accrued and the U.S. dollar amount actually received. The effects of changes in foreign currency exchange rates on investments in securities are included in realized and unrealized gain or loss on investments in the accompanying Statement of Operations.
(e) Lending of Fund Securities: The Portfolio may lend its securities to financial institutions (other than to the Investment Manager or its affiliates), provided that the market value of the securities loaned will not at any time exceed one third of the Portfolio’s total assets including borrowings, as defined in its prospectus. The Portfolio can earn fees on the securities loaned, which are included in income from securities lending in the accompanying Statement of Operations. In order to protect against the risk of failure by the borrower to return the securities loaned or any delay in the delivery of such securities, the loan is collateralized by cash or securities that are maintained with the Custodian, in an amount equal to at least 102% of the current market value of U.S. loaned securities or 105% for non-U.S. loaned securities. The market value of the loaned securities is determined at the close of each business day of the Portfolio. Any required additional collateral is delivered to the Custodian each day and any excess collateral is returned to the borrower on the next business day. In the event the borrower fails to return the loaned securities when due, the Portfolio may take the collateral to replace the securities. If the value of the collateral is less than the purchase cost of replacement securities, the Custodian shall be responsible for any shortfall, but only to the extent that the shortfall is not due to any diminution in collateral value, as defined in the securities lending agreement. The Portfolio is required to maintain the collateral in a segregated account and determine its value each day until the loaned securities are returned. Cash collateral may be invested as determined by the Portfolio. Collateral is returned to the borrower upon settlement of the loan. There were no securities loaned as of June 30, 2024.
(f) Dividends to Shareholders: Dividends and distributions payable to shareholders are recorded by the Portfolio on the ex-dividend date. The Portfolio
ALGER LARGE CAP GROWTH PORTFOLIONOTES TO FINANCIAL STATEMENTS (Unaudited) (Continued)
declares and pays dividends from net investment income, if available, annually. Dividends from net realized gains, offset by any loss carryforward, are declared and paid annually.
The characterization of distributions to shareholders for financial reporting purposes is determined in accordance with federal income tax rules. Therefore, the source of the Portfolio’s distributions may be shown in the accompanying financial statements as either from, or in excess of, net investment income, net realized gain on investment transactions, or return of capital, depending on the type of book/tax differences that may exist. Capital accounts within the financial statements are adjusted for permanent book/tax differences. Reclassifications result primarily from the differences in tax treatment of net operating losses. The reclassifications are done annually at year-end and have no impact on the net asset value of the Portfolio and are designed to present the Portfolio’s capital accounts on a tax basis.
(g) Federal Income Taxes: It is the Portfolio’s policy to comply with the requirements of the Internal Revenue Code Subchapter M applicable to regulated investment companies and to distribute all of its taxable income to its shareholders. Provided that the Portfolio maintains such compliance, no federal income tax provision is required.
FASB Accounting Standards Codification 740 – Income Taxes (“ASC 740”) requires the Portfolio to measure and recognize in its financial statements the benefit of a tax position taken (or expected to be taken) on an income tax return if such position will more likely than not be sustained upon examination based on the technical merits of the position. No tax years are currently under investigation. The Portfolio files income tax returns in the U.S. Federal jurisdiction, as well as the New York State and New York City jurisdictions. The statute of limitations on the Portfolio's tax returns remains open for the tax years 2020-2023. Management does not believe there are any uncertain tax positions that require recognition of a tax liability.
(h) Allocation Methods: The Fund accounts separately for the assets, liabilities and operations of the Portfolio. Expenses directly attributable to the Portfolio are charged to the Portfolio’s operations; expenses which are applicable to all Portfolios are allocated among them based on net assets.
(i) Estimates: These financial statements have been prepared in accordance with accounting principles generally accepted in the United States of America, which require using estimates and assumptions that affect the reported amounts therein. This unaudited Semi-Annual Report reflects all adjustments that are, in the opinion of management, necessary to present a fair statement of results of the semi-annual period. Actual results may differ from those estimates. All such estimates are of a normal recurring nature.
ALGER LARGE CAP GROWTH PORTFOLIONOTES TO FINANCIAL STATEMENTS (Unaudited) (Continued)
NOTE 3 — Investment Advisory Fees and Other Transactions with Affiliates:
(a) Investment Advisory Fees: Fees incurred by the Portfolio, pursuant to the provisions of the Fund's Investment Advisory Agreement with the Investment Manager, are payable monthly and computed based on the following annual rates. The actual rate paid as a percentage of average daily net assets, for the six months ended June 30, 2024, is set forth below under the heading “Actual Rate”:
| Alger Management has agreed to waive fees owed to it by, or to reimburse expenses of, the Portfolio in an amount corresponding to the management fee borne by the Portfolio as an investor in any underlying Alger Management- sponsored fund. This agreement will remain in effect for the life of any investment by the Portfolio in any Alger Management- sponsored fund. For the six months ended June 30, 2024, the Portfolio waived $51,444 of such advisory fees. The “Actual Rate” shown above includes the impact of such waiver. |
| Tier 1 rate is paid on assets up to $1 billion and Tier 2 rate is paid on assets in excess of $1 billion. |
(b) Administration Fees: Fees incurred by the Portfolio, pursuant to the provisions of the Fund's Fund Administration Agreement with Alger Management, are payable monthly and computed based on the average daily net assets of the Portfolio at the annual rate of 0.0275%.
(c) Brokerage Commissions: During the six months ended June 30, 2024, the Portfolio paid Fred Alger & Company, LLC, the Fund's distributor and affiliate of Alger Management (the "Distributor" or "Alger LLC"), $15,679 in connection with securities transactions.
(d) Interfund Loans: The Portfolio, along with other funds in the Alger Fund Complex (as defined below), may borrow money from and lend money to each other for temporary or emergency purposes. To the extent permitted under its investment restrictions, the Portfolio may lend uninvested cash in an amount up to 15% of its net assets to other funds in the Alger Fund Complex. If the Portfolio has borrowed from other funds in the Alger Fund Complex and has aggregate borrowings from all sources that exceed 10% of the Portfolio's total assets, the Portfolio will secure all of its loans from other funds in the Alger Fund Complex. The interest rate charged on interfund loans is equal to the average of the overnight time deposit rate and bank loan rate available to the Portfolio. There were no interfund loans outstanding as of June 30, 2024.
During the six months ended June 30, 2024, the Portfolio incurred interfund loan interest income of $776 and interest expenses of $8,432, which are included as interest income and interest expenses, respectively, in the accompanying Statement of Operations.
(e) Shareholder Administrative Fees: The Fund has entered into a Shareholder Administrative Services Agreement with Alger Management to compensate Alger
ALGER LARGE CAP GROWTH PORTFOLIONOTES TO FINANCIAL STATEMENTS (Unaudited) (Continued)
Management for providing administrative oversight of the Fund’s transfer agent, and for other related services. The Portfolio compensates Alger Management at the annual rate of 0.01% of the average daily net assets for these services.
(f) Trustee Fees: Each trustee who is not an “interested person” of the Fund, as defined in the 1940 Act (“Independent Trustee”), receives a fee of $165,400 per annum, paid pro rata based on net assets by each fund in the Alger Fund Complex, plus travel expenses incurred for attending board meetings. The term “Alger Fund Complex” refers to the Fund, The Alger Institutional Funds, The Alger Funds II, The Alger Funds, Alger Global Focus Fund and The Alger ETF Trust, each of which is a registered investment company managed by Alger Management. The Independent Trustee appointed as Chair of the Board receives additional compensation of $22,000 per annum paid pro rata based on net assets by each fund in the Alger Fund Complex. Additionally, each member of the Audit Committee receives a fee of $13,000 per annum, paid pro rata based on net assets by each fund in the Alger Fund Complex. The Board has adopted a policy requiring Trustees to receive a minimum of 10% of their annual compensation in shares of one or more of the funds in the Alger Fund Complex.
(g) Interfund Trades: The Portfolio may engage in purchase and sale transactions with other funds advised by Alger Management or sub-advised by Weatherbie Capital LLC or Redwood Investments, LLC, affiliates of Alger Management. For the six months ended June 30, 2024, there were no interfund trades.
(h) Other Transactions with Affiliates: Certain officers and one Trustee of the Fund are directors and/or officers of Alger Management, the Distributor, or their affiliates. No shares of the Portfolio were held by Alger Management and its affiliated entities as of June 30, 2024.
NOTE 4 — Securities Transactions:
The following summarizes the securities transactions by the Portfolio, other than U.S. Government securities, and short-term securities, for the six months ended June 30, 2024:
| | |
Alger Large Cap Growth Portfolio | | |
The Portfolio may borrow from the Custodian on an uncommitted basis. The Portfolio pays the Custodian a market rate of interest, generally based upon a rate of return with respect to each respective currency borrowed, taking into consideration relevant overnight and short-term reference rates and the range of distribution between and among the interest rates paid on deposits to other institutions, less applicable commissions, if any. Borrowings from the Custodian
ALGER LARGE CAP GROWTH PORTFOLIONOTES TO FINANCIAL STATEMENTS (Unaudited) (Continued)
are included in Bank overdrafts in the Statement of Assets and Liabilities. The Portfolio may also borrow from other funds in the Alger Fund Complex, as discussed in Note 3(e). For the six months ended June 30, 2024, the Portfolio had the following borrowings from the Custodian and other funds in the Alger Fund Complex:
| | WEIGHTED AVERAGE
INTEREST RATE |
Alger Large Cap Growth Portfolio | | |
The highest amount borrowed by the Portfolio from the Custodian and other funds in the Alger Fund Complex during the six months ended June 30, 2024 was as follows:
| |
Alger Large Cap Growth Portfolio | |
The Portfolio has an unlimited number of authorized shares of beneficial interest of $.001 par value. During the six months ended June 30, 2024, and the year ended December 31, 2023, transactions of shares of beneficial interest were as follows:
| FOR THE SIX MONTHS ENDED
June 30, 2024 | FOR THE YEAR ENDED
December 31, 2023 |
| | | | |
Alger Large Cap Growth Portfolio |
| | | | |
| | | | |
| | | | |
| | | | |
| | | | |
NOTE 7 — Income Tax Information:
At December 31, 2023, the Portfolio, for federal income tax purposes, had capital loss carryforwards of $36,968,283. This amount will not be subject to expiration under the Regulated Investment Company Modernization Act of 2010, and this amount may be applied against future net realized gains until its utilization.
The difference between book-basis and tax-basis unrealized appreciation (depreciation) is determined annually and is attributable primarily to the tax deferral of losses on wash sales.
The Portfolio accrues tax on unrealized gains in foreign jurisdictions that impose a foreign capital tax, if applicable.
ALGER LARGE CAP GROWTH PORTFOLIONOTES TO FINANCIAL STATEMENTS (Unaudited) (Continued)
NOTE 8 — Fair Value Measurements:
The following is a summary of the inputs used as of June 30, 2024 in valuing the Portfolio's investments carried at fair value on a recurring basis. Based upon the nature, characteristics, and risks associated with its investments, the Portfolio has determined that presenting them by security type and sector is appropriate.
Alger Large Cap Growth Portfolio | | | | |
| | | | |
| | | | |
| | | | |
| | | | |
| | | | |
| | | | |
| | | | |
| | | | |
| | | | |
| | | | |
| | | | |
| | | | |
| | | | |
| | | | |
| | | | |
TOTAL INVESTMENTS IN SECURITIES | | | | |
| FAIR VALUE MEASUREMENTS USING SIGNIFICANT UNOBSERVABLE INPUTS (LEVEL 3) |
Alger Large Cap Growth Portfolio | |
Opening balance at January 1, 2024 | |
| |
| |
| |
Included in net realized gain (loss) on investments | |
Included in net change in unrealized appreciation (depreciation) on investments | |
| |
| |
| |
Closing balance at June 30, 2024 | |
Net change in unrealized appreciation (depreciation) attributable to investments
still held at June 30, 2024 * | |
| Net change in unrealized appreciation (depreciation) is included in net change in unrealized appreciation (depreciation) on investments in the accompanying Statement of Operations. |
ALGER LARGE CAP GROWTH PORTFOLIONOTES TO FINANCIAL STATEMENTS (Unaudited) (Continued)
The following table provides quantitative information about the Portfolio Level 3 fair value measurements of its investments as of June 30, 2024. The table below is not intended to be all-inclusive, but rather provides information on the Level 3 inputs as they relate to the Portfolio fair value measurements.
| | | | | |
Alger Large Cap Growth Portfolio |
| | | | | |
The significant unobservable inputs used in the fair value measurement of the Portfolio's securities are revenue and EBITDA multiples, discount rates, and the probability of success of certain outcomes. Significant increases and decreases in these inputs in isolation and interrelationships between these inputs would have resulted in significantly higher or lower fair value measurements than those noted in the table above. Generally, all other things being equal, increases in revenue and EBITDA multiples, decreases in discount rates, and increases in the probability of success result in higher fair value measurements, whereas decreases in revenues and EBITDA multiples, increases in discount rates, and decreases in the probability of success result in lower fair value measurements. For the period ended June 30, 2024, there were no changes in valuation methodology on Level 3 investments.
Certain of the Portfolio's assets and liabilities are held at carrying amount or face value, which approximates fair value for financial reporting purposes. As of June 30, 2024, there were no assets held at carrying amount or face value.
NOTE 9 — Principal Risks:
Investing in the stock market involves risks, including the potential loss of principal. The value of the securities owned by the Portfolio, like other investments, may move up or down, sometimes rapidly and unpredictably. Your Portfolio shares at any point in time may be worth less than what you invested, even after taking into account the reinvestment of Portfolio dividends and distributions. Local, regional or global events such as environmental or natural disasters, war, terrorism, pandemics, outbreaks of infectious diseases and similar public health threats, recessions, or other events could have a significant impact on investments. Growth stocks may be more volatile than other stocks as their prices tend to be higher in relation to their companies' earnings and may be more sensitive to market, political, and economic developments. A significant portion of assets may be invested in securities of companies in related sectors, and may be similarly affected by economic, political, or market events and conditions and may be more vulnerable to unfavorable sector developments. Foreign securities involve special risks including currency fluctuations, inefficient
ALGER LARGE CAP GROWTH PORTFOLIONOTES TO FINANCIAL STATEMENTS (Unaudited) (Continued)
trading, political and economic instability, and increased volatility. Active trading may increase transaction costs, brokerage commissions, and taxes, which can lower the return on investment. At times, the Portfolio may hold a large cash position, which may underperform relative to equity securities.
NOTE 10 — Affiliated Securities:
During the six months ended June 30, 2024, as disclosed in the following table, the Portfolio held 5% or more of the outstanding voting securities of the issuers listed below. As such, these issuers were “affiliated persons” of the Portfolio for purposes of the 1940 Act. Transactions during the six months ended June 30, 2024 with such affiliated persons are summarized below. During this period, other Portfolios in the Fund may also have held voting shares of the issuers at levels below 5%.
| Shares
Held at
December 31,
2023 | | | Shares
Held at
June 30,
2024 | | | Net Change
in
Unrealized
App(Dep) | |
Alger Large Cap Growth Portfolio |
|
| | | | | | | | |
|
| | | | | | | | |
|
Crosslink Ventures C, LLC, | | | | | | | | |
| | | | | | | | |
| The Alger Fund Complex and other entities managed by Alger Management fully own Crosslink Ventures C, LLC, Class A and Crosslink Ventures C, LLC, Class B. There were no capital increases or decreases for the period ended June 30, 2024. |
NOTE 11 — Subsequent Events:
Management of the Portfolio has evaluated events that have occurred subsequent to June 30, 2024, through the issuance date of the Financial Statements. On August 16, 2024, shareholders of the Portfolio elected Jean Brownhill, Susan L. Moffet, Jay C. Nadel, and one current trustee, David Rosenberg, to the Board. No other events have been identified which require recognition and/or disclosure.
THE ALGER PORTFOLIOSOTHER INFORMATION (Unaudited)
Proxy Voting Policies
A description of the policies and procedures the Portfolio uses to determine how to vote proxies relating to portfolio securities and the proxy voting record is available, without charge, by calling (800) 992-3863 or online on the Portfolio's website at http://www.alger.com or on the SEC’s website at http://www.sec.gov.
The Board has adopted policies and procedures relating to disclosure of the Porfolio's securities. These policies and procedures recognize that there may be legitimate business reasons for holdings to be disclosed and seek to balance those interests to protect the proprietary nature of the trading strategies and implementation thereof by the Portfolio.
Generally, the policies prohibit the release of information concerning portfolio holdings, which have not previously been made public, to individual investors, institutional investors, intermediaries that distribute the Portfolio's shares and other parties which are not employed by the Investment Manager or its affiliates except when the legitimate business purposes for selective disclosure and other conditions (designed to protect the Portfolio) are acceptable.
The Portfolio files its complete schedule of portfolio holdings with the SEC semi-annually in shareholder reports on Form N-CSR and after the first and third fiscal quarters as an exhibit to its reports on Form N-PORT. The Portfolio's Forms N-CSR and N-PORT are available online on the SEC’s website at www.sec.gov.
In addition, the Portfolio makes publicly available its month-end top 10 holdings with a 10 day lag and its month-end full portfolio with a 60 day lag on its website www.alger.com and through other marketing communications (including printed advertising/sales literature and/or shareholder telephone customer service centers). No compensation or other consideration is received for the non-public disclosure of portfolio holdings information.
In accordance with the foregoing, the Portfolio provides portfolio holdings information to third parties including financial intermediaries and service providers who need access to this information in the performance of their services and are subject to duties of confidentiality (1) imposed by law, including a duty not to trade on non-public information, and/or (2) pursuant to an agreement that confidential information is not to be disclosed or used (including trading on such information) other than as required by law. From time to time, the Portfolio will communicate with these third parties to confirm that they understand the Portfolio's policies and procedures regarding such disclosure. These agreements must be approved by the Portfolio's Chief Compliance Officer.
The Board periodically reviews a report disclosing the third parties to whom the Portfolio's holdings information has been disclosed and the purpose for such
THE ALGER PORTFOLIOSOTHER INFORMATION (Unaudited) (Continued)
disclosure, and it considers whether or not the release of information to such third parties is in the best interest of the Portfolio and its shareholders.
In addition to material the Portfolio routinely provides to shareholders, the Investment Manager may make additional statistical information available regarding the Alger Family of Funds.
Such information may include, but not be limited to, relative weightings and characteristics of the Portfolio versus an index (such as P/E ratio, alpha, beta, capture ratio, maximum drawdown, standard deviation, EPS forecasts, Sharpe ratio, information ratio, R-squared, and market cap analysis), security specific impact on overall portfolio performance, month-end top ten contributors to and detractors from performance, portfolio turnover, and other similar information. Shareholders should visit www.alger.com or may also contact the Portfolio at (800) 992-3863 to obtain such information.
THE ALGER PORTFOLIOS
100 Pearl Street, 27th Floor
New York, NY 10004
(800) 992-3863
www.alger.com
Fred Alger Management, LLC
100 Pearl Street, 27th Floor
New York, NY 10004
Fred Alger & Company, LLC
100 Pearl Street, 27th Floor
New York, NY 10004
Transfer Agent and Dividend Disbursing Agent
UMB Fund Services, Inc.
235 W. Galena Street
Milwaukee, WI 53212
The Bank of New York
240 Greenwich Street
New York, NY 10286
Independent Registered Public Accounting Firm
Deloitte & Touche LLP
30 Rockefeller Plaza
New York, NY 10112
This report is submitted for the general information of the shareholders of the Alger Large Cap Growth Portfolio. It is not authorized for distribution to prospective investors unless accompanied by an effective Prospectus for the Portfolio, which contains information concerning the Portfolio’s investment policies, fees and expenses as well as other pertinent information.
Inspired by Change, Driven by Growth.
Item 8. Changes in and Disagreements with Accountants for Open-End Management Investment Companies
Item 9. Proxy Disclosures for Open-End Management Investment Companies
Item 10. Remuneration Paid to Directors,Officers, and Others of Open-End Management Investment Companies
Remuneration paid to directors, officers and others is included in the Statement of Operations under the line items “Trustee fees” and “Investment advisory fees” as part of the financial statements filed under Item 7 of this Form N-CSR.
Item 11. Statement Regarding Basis for Approval of Investment Advisory Contract
ITEM 7. FINANCIAL STATEMENTS AND FINANCIAL HIGHLIGHTS FOR OPEN_END MANAGEMENT INVESTMENT COMPANIES.
Alger Mid Cap Growth Portfolio |
SEMI-ANNUAL FINANCIAL STATEMENTS AND OTHER INFORMATION
June 30, 2024 (UNAUDITED)
Table of Contents
ALGER MID CAP GROWTH PORTFOLIO
ALGER MID CAP GROWTH PORTFOLIOSchedule of Investments June 30, 2024 (Unaudited)
| | |
|
|
The Trade Desk, Inc., Cl. A* | | |
|
| | |
| | |
|
|
| | |
APPLICATION SOFTWARE—15.1% |
Cadence Design Systems, Inc.* | | |
Clearwater Analytics Holdings, Inc., Cl. A* | | |
Constellation Software, Inc. | | |
| | |
Guidewire Software, Inc.* | | |
Manhattan Associates, Inc.* | | |
Procore Technologies, Inc.* | | |
The Descartes Systems Group, Inc.* | | |
|
|
| | |
ASSET MANAGEMENT & CUSTODY BANKS—4.0% |
Ares Management Corp., Cl. A | | |
Blue Owl Capital, Inc., Cl. A | | |
|
|
| | |
AUTOMOTIVE PARTS & EQUIPMENT—0.3% |
Mobileye Global, Inc., Cl. A* | | |
|
| | |
|
| | |
| | |
|
|
| | |
|
| | |
CARGO GROUND TRANSPORTATION—2.1% |
Old Dominion Freight Line, Inc. | | |
CONSTRUCTION & ENGINEERING—0.7% |
WillScot Mobile Mini Holdings Corp.* | | |
CONSTRUCTION MATERIALS—1.7% |
Martin Marietta Materials, Inc. | | |
ELECTRICAL COMPONENTS & EQUIPMENT—3.3% |
Vertiv Holdings Co., Cl. A | | |
ELECTRONIC COMPONENTS—2.4% |
| | |
See Notes to Financial Statements.
ALGER MID CAP GROWTH PORTFOLIOSchedule of Investments June 30, 2024 (Unaudited) (Continued)
| | |
COMMON STOCKS—95.3% (CONT.) |
ENVIRONMENTAL & FACILITIES SERVICES—3.6% |
| | |
FINANCIAL EXCHANGES & DATA—1.1% |
| | |
HEALTHCARE EQUIPMENT—3.4% |
| | |
IDEXX Laboratories, Inc.* | | |
|
|
| | |
HEALTHCARE TECHNOLOGY—1.5% |
Veeva Systems, Inc., Cl. A* | | |
HOME IMPROVEMENT RETAIL—0.9% |
Floor & Decor Holdings, Inc., Cl. A* | | |
|
| | |
HOMEFURNISHING RETAIL—1.0% |
| | |
HOTELS RESORTS & CRUISE LINES—2.0% |
Hilton Worldwide Holdings, Inc. | | |
HUMAN RESOURCE & EMPLOYMENT SERVICES—0.6% |
| | |
|
Ryan Specialty Holdings, Inc., Cl. A | | |
INTERACTIVE MEDIA & SERVICES—3.2% |
| | |
INTERNET SERVICES & INFRASTRUCTURE—2.0% |
| | |
| | |
|
|
| | |
IT CONSULTING & OTHER SERVICES—1.6% |
| | |
LIFE SCIENCES TOOLS & SERVICES—4.3% |
Mettler-Toledo International, Inc.* | | |
| | |
West Pharmaceutical Services, Inc. | | |
|
|
| | |
MOVIES & ENTERTAINMENT—3.2% |
Liberty Media Corp. Series C Liberty Formula One * | | |
| | |
|
|
| | |
OIL & GAS EXPLORATION & PRODUCTION—2.6% |
| | |
See Notes to Financial Statements.
ALGER MID CAP GROWTH PORTFOLIOSchedule of Investments June 30, 2024 (Unaudited) (Continued)
| | |
COMMON STOCKS—95.3% (CONT.) |
PROPERTY & CASUALTY INSURANCE—1.1% |
| | |
REAL ESTATE SERVICES—4.1% |
| | |
| | |
|
|
| | |
RESEARCH & CONSULTING SERVICES—1.6% |
| | |
| | |
|
|
| | |
|
Chipotle Mexican Grill, Inc.* | | |
| | |
|
|
| | |
SEMICONDUCTOR MATERIALS & EQUIPMENT—0.3% |
| | |
|
Lattice Semiconductor Corp.* | | |
| | |
Monolithic Power Systems, Inc. | | |
|
|
| | |
SOFT DRINKS & NON-ALCOHOLIC BEVERAGES—1.2% |
| | |
TECHNOLOGY HARDWARE STORAGE & PERIPHERALS—0.9% |
Super Micro Computer, Inc.* | | |
TRADING COMPANIES & DISTRIBUTORS—2.7% |
| | |
TOTAL COMMON STOCKS
(Cost $102,658,725) | | |
EXCHANGE TRADED FUNDS—3.4% |
Alger Mid Cap 40 ETF(a),* | | |
| | |
|
|
Prosetta Biosciences, Inc., Series D(a),(b),*,@ | | |
| | |
|
|
| | |
| | |
See Notes to Financial Statements.
ALGER MID CAP GROWTH PORTFOLIOSchedule of Investments June 30, 2024 (Unaudited) (Continued)
| | |
SPECIAL PURPOSE VEHICLE—0.8% |
DATA PROCESSING & OUTSOURCED SERVICES—0.8% |
Crosslink Ventures C, LLC, Cl. A(a),(b),*,@ | | |
Crosslink Ventures C, LLC, Cl. B(a),(b),*,@ | | |
|
|
| | |
TOTAL SPECIAL PURPOSE VEHICLE
(Cost $1,200,000) | | |
|
APPLICATION SOFTWARE—0.0% |
Constellation Software, Inc., 3/31/40(b),* | | |
| | |
SHORT-TERM SECURITIES—0.7% |
|
Dreyfus Treasury Obligations Cash Management Fund,
Institutional Shares, 5.18%(c) | | |
| | |
|
|
Total Investments
(Cost $111,745,540) | | |
Affiliated Securities (Cost $7,847,915) | | |
Unaffiliated Securities (Cost $103,897,625) | | |
Liabilities in Excess of Other Assets | | |
| | |
| Contingent Deferred Rights |
| |
| Deemed an affiliate of the Portfolio in accordance with Section 2(a)(3) of the Investment Company Act of 1940. See Note 10 - Affiliated Securities. |
| Security is valued in good faith at fair value determined using significant unobservable inputs pursuant to procedures approved by the Board of Trustees. |
| Rate shown reflects 7-day effective yield as of June 30, 2024. |
| Non-income producing security. |
| Restricted security - Investment in security not registered under the Securities Act of 1933. Sales or transfers of the investment may be restricted only to qualified buyers. |
| | | | % of net assets
as of
6/30/2024 |
Crosslink Ventures C, LLC, Cl. A | | | | |
Crosslink Ventures C, LLC, Cl. B | | | | |
Prosetta Biosciences, Inc., Series D | | | | |
| | | | |
| | | | |
See Notes to Financial Statements.
ALGER MID CAP GROWTH PORTFOLIOStatement of Assets and Liabilities June 30, 2024 (Unaudited)
| Alger Mid Cap Growth Portfolio |
|
Investments in unaffiliated securities, at value (Identified cost below)* see accompanying schedule of investments | |
Investments in affiliated securities, at value (Identified cost below)** see accompanying schedule of investments | |
| |
Receivable for investment securities sold | |
Receivable for shares of beneficial interest sold | |
Dividends and interest receivable | |
Receivable from Investment Manager | |
| |
| |
|
Payable for shares of beneficial interest redeemed | |
Payable for investment securities purchased | |
Accrued investment advisory fees | |
| |
Accrued professional fees | |
Accrued fund accounting fees | |
Accrued administrative fees | |
| |
| |
Accrued shareholder administrative fees | |
| |
Accrued transfer agent fees | |
| |
| |
|
Paid in capital (par value of $.001 per share) | |
| |
| |
| |
| |
| |
| |
See Notes to Financial Statements.
ALGER MID CAP GROWTH PORTFOLIOStatement of Assets and Liabilities June 30, 2024 (Unaudited) (Continued)
| Alger Mid Cap Growth Portfolio |
|
| |
SHARES OF BENEFICIAL INTEREST OUTSTANDING — Note 6: |
| |
NET ASSET VALUE PER SHARE: |
| |
| At June 30, 2024, the net unrealized appreciation on investments, based on cost for federal income tax purposes of $113,166,036, amounted to $24,719,935, which consisted of aggregate gross unrealized appreciation of $28,903,888, and aggregate gross unrealized depreciation of $4,183,953. |
See Notes to Financial Statements.
ALGER MID CAP GROWTH PORTFOLIOStatement of Operations for the six months ended June 30, 2024 (Unaudited)
| Alger Mid Cap Growth Portfolio |
|
Dividends (net of foreign withholding taxes*) | |
| |
| |
|
Investment advisory fees — Note 3 | |
Administration fees — Note 3 | |
| |
| |
| |
| |
| |
Shareholder administrative fees — Note 3 | |
Transfer agent fees — Note 3 | |
| |
| |
| |
| |
Less, expense reimbursements/waivers — Note 3 | |
| |
| |
REALIZED AND UNREALIZED GAIN (LOSS) ON INVESTMENTS AND FOREIGN CURRENCY: |
Net realized gain on unaffiliated investments | |
Net realized (loss) on affiliated investments | |
Net realized (loss) on foreign currency transactions | |
| |
Net change in unrealized appreciation on unaffiliated investments | |
Net change in unrealized appreciation on affiliated investments | |
Net change in unrealized (depreciation) on foreign currency | |
Total change in unrealized appreciation | |
Net realized and unrealized gain on investments and foreign currency | |
NET INCREASE IN NET ASSETS RESULTING FROM OPERATIONS | |
* Foreign withholding taxes | |
See Notes to Financial Statements.
ALGER MID CAP GROWTH PORTFOLIOStatements of Changes in Net Assets (Unaudited)
| Alger Mid Cap Growth Portfolio |
| For the
Six Months Ended
June 30, 2024 | For the
Year Ended
December 31, 2023 |
| | |
| | |
Net change in unrealized appreciation | | |
Net increase in net assets resulting from operations | | |
Dividends and distributions to shareholders: |
| | |
Decrease from shares of beneficial interest transactions: |
| | |
Net decrease from shares of beneficial interest transactions — Note 6 | | |
| | |
|
| | |
| | |
See Notes to Financial Statements.
THE ALGER PORTFOLIOSFinancial Highlights for a share outstanding throughout the period (Unaudited)
Alger Mid Cap Growth Portfolio | |
| | | | | | |
Net asset value, beginning of period | | | | | | |
INCOME FROM INVESTMENT OPERATIONS: |
| | | | | | |
Net realized and unrealized gain (loss) on investments | | | | | | |
Total from investment operations | | | | | | |
Distributions from net realized gains | | | | | | |
Net asset value, end of period | | | | | | |
| | | | | | |
RATIOS/SUPPLEMENTAL DATA: |
Net assets, end of period (000's omitted) | | | | | | |
Ratio of gross expenses to average net assets | | | | | | |
Ratio of expense reimbursements to average net assets | | | | | | |
Ratio of net expenses to average net assets | | | | | | |
Ratio of net investment loss to average net assets | | | | | | |
| | | | | | |
| Ratios have been annualized; total return and portfolio turnover rate have not been annualized. |
| Class S Shares were converted into Class I-2 Shares after the close of business on June 3, 2022. |
| Amount was computed based on average shares outstanding during the period. |
See Notes to Financial Statements.
ALGER MID CAP GROWTH PORTFOLIONOTES TO FINANCIAL STATEMENTS (Unaudited)
NOTE 1 — General:
The Alger Portfolios (the “Fund”) is an open-end registered investment company organized as a business trust under the laws of the Commonwealth of Massachusetts. The Fund qualifies as an investment company as defined in Financial Accounting Standards Board (“FASB”) Accounting Standards Codification 946 – Financial Services – Investment Companies. The Fund operates as a series company currently offering six series of shares of beneficial interest: Alger Capital Appreciation Portfolio, Alger Large Cap Growth Portfolio, Alger Growth & Income Portfolio, Alger Mid Cap Growth Portfolio, Alger Small Cap Growth Portfolio and Alger Balanced Portfolio (collectively, the “Portfolios”). These financial statements include only the Alger Mid Cap Growth Portfolio (the “Portfolio”). The Portfolio invests primarily in equity securities and has an investment objective of long-term capital appreciation. Shares of the Portfolio are available to investment vehicles for variable annuity contracts and variable life insurance policies offered by separate accounts of life insurance companies, as well as qualified pension and retirement plans.
The Portfolio only offers Class I-2 shares. After the close of business on June 3, 2022, Class S shares of the Portfolio were converted into Class I-2 shares with the same relative aggregate net asset value as the Class S shares held immediately prior to the conversion. Upon completion of the conversion, Class S shares of the Portfolio were no longer offered.
On May 23, 2023, the Board of Trustees of the Fund (the “Board”) approved the transition of the Fund’s custodian and administrator from Brown Brothers Harriman & Company to The Bank of New York (collectively, the "Custodian"). This change became effective on March 18, 2024.
NOTE 2 — Significant Accounting Policies:
(a) Investment Valuation: The Portfolio values its financial instruments at fair value using independent dealers or pricing services under policies approved by the Board. Investments held by the Portfolio are valued on each day the New York Stock Exchange (the “NYSE”) is open, as of the close of the NYSE (normally 4:00 p.m. Eastern Time).
The Board has designated, pursuant to Rule 2a-5 under the Investment Company Act of 1940, as amended (the “1940 Act”), the Portfolio's investment adviser, Fred Alger Management, LLC (“Alger Management” or the “Investment Manager”) as its valuation designee (the “Valuation Designee”) to make fair value determinations subject to the Board’s review and oversight. The Valuation Designee has established a Valuation Committee (“Committee”) comprised of representatives of the Investment Manager and officers of the Portfolio to assist in performing the duties and responsibilities of the Valuation Designee.
ALGER MID CAP GROWTH PORTFOLIONOTES TO FINANCIAL STATEMENTS (Unaudited) (Continued)
The Valuation Designee has established valuation processes including but not limited to: (i) making fair value determinations when market quotations for financial instruments are not readily available in accordance with valuation policies and procedures adopted by the Board; (ii) assessing and managing material risks associated with fair valuation determinations; (iii) selecting, applying and testing fair valuation methodologies; and (iv) overseeing and evaluating pricing services used by the Portfolio. The Valuation Designee regularly reports its fair valuation determinations and related valuation information to the Board. The Committee generally meets quarterly and on an as-needed basis to review and evaluate the effectiveness of the valuation policies and procedures in accordance with the requirements of Rule 2a-5.
Investments in short-term securities held by the Portfolio having a remaining maturity of sixty days or less are valued at amortized cost which approximates market value. Investments in other open-end investment companies registered under the 1940 Act are valued at such investment companies' net asset value per share.
Equity securities, including traded rights, warrants and option contracts for which valuation information is readily available, are valued at the last quoted sales price or official closing price on the primary market or exchange on which they are traded as reported by an independent pricing service. In the absence of quoted sales, such securities are generally valued at the bid price or, in the absence of a recent bid price, the equivalent as obtained from one or more of the major market makers for the securities to be valued.
Securities in which the Portfolio invests may be traded in foreign markets that close before the close of the NYSE. Developments that occur between the close of the foreign markets and the close of the NYSE may result in adjustments to the closing foreign prices to reflect what the Valuation Designee, through its Committee, believes to be the fair value of these securities as of the close of the NYSE. The Portfolio may also fair value securities in other situations, for example, when a particular foreign market is closed but the NYSE is open.
FASB Accounting Standards Codification 820 – Fair Value Measurements and Disclosures (“ASC 820”) defines fair value as the price that the Portfolio would receive upon selling an investment in a timely transaction to an independent buyer in the principal or most advantageous market of the investment. ASC 820 established a three-tier hierarchy to maximize the use of observable market data and minimize the use of unobservable inputs and to establish classification of fair value measurements for disclosure purposes. Inputs refer broadly to the assumptions that market participants would use in pricing the asset or liability and may be observable or unobservable. Observable inputs are based on market data obtained from sources independent of the Portfolio. Unobservable inputs are inputs that reflect the Portfolio's own assumptions based on the best
ALGER MID CAP GROWTH PORTFOLIONOTES TO FINANCIAL STATEMENTS (Unaudited) (Continued)
information available in the circumstances. The three-tier hierarchy of inputs is summarized in the three broad Levels listed below.
• Level 1 – quoted prices in active markets for identical investments
• Level 2 – significant other observable inputs (including quoted prices for similar investments, amortized cost, interest rates, prepayment speeds, credit risk, etc.)
• Level 3 – significant unobservable inputs (including the Portfolio's own assumptions in determining the fair value of investments)
The Portfolio's valuation techniques are generally consistent with either the market or the income approach to fair value. The market approach considers prices and other relevant information generated by market transactions involving identical or comparable assets to measure fair value. The income approach converts future amounts to a current, or discounted, single amount. These fair value measurements are determined on the basis of the value indicated by current market expectations about such future events. Inputs for Level 1 include exchange-listed prices and broker quotes in an active market. Inputs for Level 2 include the last trade price in the case of a halted security, an exchange-listed price which has been adjusted for fair value factors, and prices of closely related securities. Additional Level 2 inputs include an evaluated price which is based upon a compilation of observable market information such as spreads for fixed income and preferred securities. Inputs for Level 3 include, but are not limited to, revenue multiples, earnings before interest, taxes, depreciation and amortization (“EBITDA”) multiples, discount rates, time to exit and the probabilities of success of certain outcomes. Such unobservable market information may be obtained from a company’s financial statements and from industry studies, market data, and market indicators such as benchmarks and indexes. Because of the inherent uncertainty and often limited markets for restricted securities, the valuations assigned to such securities by the Portfolio may significantly differ from the valuations that would have been assigned by the Portfolio had there been an active market for such securities.
(b) Cash and Cash Equivalents: Cash and cash equivalents include U.S. dollars and foreign cash.
(c) Securities Transactions and Investment Income: Securities transactions are recorded on a trade date basis. Realized gains and losses from securities transactions are recorded on the identified cost basis. Dividend income is recognized on the ex-dividend date and interest income is recognized on the accrual basis.
Premiums and discounts on debt securities purchased are amortized or accreted over the lives of the respective securities.
ALGER MID CAP GROWTH PORTFOLIONOTES TO FINANCIAL STATEMENTS (Unaudited) (Continued)
(d) Foreign Currency Transactions: The books and records of the Portfolio are maintained in U.S. dollars. Foreign currencies, investments and other assets and liabilities are translated into U.S. dollars at the prevailing rates of exchange on the valuation date. Purchases and sales of investment securities and income and expenses are translated into U.S. dollars at the prevailing exchange rates on the respective dates of such transactions.
Net realized gains and losses on foreign currency transactions represent net gains and losses from the disposition of foreign currencies, currency gains and losses realized between the trade dates and settlement dates of security transactions, and the difference between the amount of net investment income accrued and the U.S. dollar amount actually received. The effects of changes in foreign currency exchange rates on investments in securities are included in realized and unrealized gain or loss on investments in the accompanying Statement of Operations.
(e) Lending of Fund Securities: The Portfolio may lend its securities to financial institutions (other than to the Investment Manager or its affiliates), provided that the market value of the securities loaned will not at any time exceed one third of the Portfolio’s total assets including borrowings, as defined in its prospectus. The Portfolio can earn fees on the securities loaned, which are included in income from securities lending in the accompanying Statement of Operations. In order to protect against the risk of failure by the borrower to return the securities loaned or any delay in the delivery of such securities, the loan is collateralized by cash or securities that are maintained with the Custodian, in an amount equal to at least 102% of the current market value of U.S. loaned securities or 105% for non-U.S. loaned securities. The market value of the loaned securities is determined at the close of each business day of the Portfolio. Any required additional collateral is delivered to the Custodian each day and any excess collateral is returned to the borrower on the next business day. In the event the borrower fails to return the loaned securities when due, the Portfolio may take the collateral to replace the securities. If the value of the collateral is less than the purchase cost of replacement securities, the Custodian shall be responsible for any shortfall, but only to the extent that the shortfall is not due to any diminution in collateral value, as defined in the securities lending agreement. The Portfolio is required to maintain the collateral in a segregated account and determine its value each day until the loaned securities are returned. Cash collateral may be invested as determined by the Portfolio. Collateral is returned to the borrower upon settlement of the loan. There were no securities loaned as of June 30, 2024.
(f) Dividends to Shareholders: Dividends and distributions payable to shareholders are recorded by the Portfolio on the ex-dividend date. The Portfolio
ALGER MID CAP GROWTH PORTFOLIONOTES TO FINANCIAL STATEMENTS (Unaudited) (Continued)
declares and pays dividends from net investment income, if available, annually. Dividends from net realized gains, offset by any loss carryforward, are declared and paid annually.
The characterization of distributions to shareholders for financial reporting purposes is determined in accordance with federal income tax rules. Therefore, the source of the Portfolio’s distributions may be shown in the accompanying financial statements as either from, or in excess of, net investment income, net realized gain on investment transactions, or return of capital, depending on the type of book/tax differences that may exist. Capital accounts within the financial statements are adjusted for permanent book/tax differences. Reclassifications result primarily from the differences in tax treatment of net operating losses. The reclassifications are done annually at year-end and have no impact on the net asset value of the Portfolio and are designed to present the Portfolio’s capital accounts on a tax basis.
(g) Federal Income Taxes: It is the Portfolio’s policy to comply with the requirements of the Internal Revenue Code Subchapter M applicable to regulated investment companies and to distribute all of its taxable income to its shareholders. Provided that the Portfolio maintains such compliance, no federal income tax provision is required.
FASB Accounting Standards Codification 740 – Income Taxes (“ASC 740”) requires the Portfolio to measure and recognize in its financial statements the benefit of a tax position taken (or expected to be taken) on an income tax return if such position will more likely than not be sustained upon examination based on the technical merits of the position. No tax years are currently under investigation. The Portfolio files income tax returns in the U.S. Federal jurisdiction, as well as the New York State and New York City jurisdictions. The statute of limitations on the Portfolio's tax returns remains open for the tax years 2020-2023. Management does not believe there are any uncertain tax positions that require recognition of a tax liability.
(h) Allocation Methods: The Fund accounts separately for the assets, liabilities and operations of the Portfolio. Expenses directly attributable to the Portfolio are charged to the Portfolio’s operations; expenses which are applicable to all Portfolios are allocated among them based on net assets.
(i) Estimates: These financial statements have been prepared in accordance with accounting principles generally accepted in the United States of America, which require using estimates and assumptions that affect the reported amounts therein. This unaudited Semi-Annual Report reflects all adjustments that are, in the opinion of management, necessary to present a fair statement of results of the semi-annual period. Actual results may differ from those estimates. All such estimates are of a normal recurring nature.
ALGER MID CAP GROWTH PORTFOLIONOTES TO FINANCIAL STATEMENTS (Unaudited) (Continued)
NOTE 3 — Investment Advisory Fees and Other Transactions with Affiliates:
(a) Investment Advisory Fees: Fees incurred by the Portfolio, pursuant to the provisions of the Fund's Investment Advisory Agreement with the Investment Manager, are payable monthly and computed based on the following annual rates. The actual rate paid as a percentage of average daily net assets, for the six months ended June 30, 2024, is set forth below under the heading “Actual Rate”:
| Alger Management has agreed to waive fees owed to it by, or to reimburse expenses of, the Portfolio in an amount corresponding management fee borne by the Portfolio as an investor in any underlying Alger Management-sponsored fund. This agreement will in effect for the life of any investment by the Portfolio in any Alger Management-sponsored fund. For the six months ended June 30, 2024, the Portfolio waived $17,503 of such advisory fees. The "Actual Rate" shown above includes the impact of such waiver. |
| Tier 1 rate is paid on assets up to $1 billion and Tier 2 rate is paid on assets in excess of $1 billion. |
(b) Administration Fees: Fees incurred by the Portfolio, pursuant to the provisions of the Fund's Fund Administration Agreement with Alger Management, are payable monthly and computed based on the average daily net assets of the Portfolio at the annual rate of 0.0275%.
(c) Brokerage Commissions: During the six months ended June 30, 2024, the Portfolio paid Fred Alger & Company, LLC, the Fund's distributor and affiliate of Alger Management (the "Distributor" or "Alger LLC"), $10,900 in connection with securities transactions.
(d) Interfund Loans: The Portfolio, along with other funds in the Alger Fund Complex (as defined below), may borrow money from and lend money to each other for temporary or emergency purposes. To the extent permitted under its investment restrictions, the Portfolio may lend uninvested cash in an amount up to 15% of its net assets to other funds in the Alger Fund Complex. If the Portfolio has borrowed from other funds in the Alger Fund Complex and has aggregate borrowings from all sources that exceed 10% of the Portfolio's total assets, the Portfolio will secure all of its loans from other funds in the Alger Fund Complex. The interest rate charged on interfund loans is equal to the average of the overnight time deposit rate and bank loan rate available to the Portfolio. There were no interfund loans outstanding as of June 30, 2024.
During the six months ended June 30, 2024, the Portfolio incurred interfund loan interest expenses of $265, which are included as interest expenses in the accompanying Statement of Operations.
(e) Shareholder Administrative Fees: The Fund has entered into a Shareholder Administrative Services Agreement with Alger Management to compensate Alger Management for providing administrative oversight of the Fund’s transfer agent,
ALGER MID CAP GROWTH PORTFOLIONOTES TO FINANCIAL STATEMENTS (Unaudited) (Continued)
and for other related services. The Portfolio compensates Alger Management at the annual rate of 0.01% of the average daily net assets for these services.
(f) Trustee Fees: Each trustee who is not an “interested person” of the Fund, as defined in the 1940 Act (“Independent Trustee”), receives a fee of $165,400 per annum, paid pro rata based on net assets by each fund in the Alger Fund Complex, plus travel expenses incurred for attending board meetings. The term “Alger Fund Complex” refers to the Fund, The Alger Institutional Funds, The Alger Funds II, The Alger Funds, Alger Global Focus Fund and The Alger ETF Trust, each of which is a registered investment company managed by Alger Management. The Independent Trustee appointed as Chair of the Board receives additional compensation of $22,000 per annum paid pro rata based on net assets by each fund in the Alger Fund Complex. Additionally, each member of the Audit Committee receives a fee of $13,000 per annum, paid pro rata based on net assets by each fund in the Alger Fund Complex. The Board has adopted a policy requiring Trustees to receive a minimum of 10% of their annual compensation in shares of one or more of the funds in the Alger Fund Complex.
(g) Interfund Trades: The Portfolio may engage in purchase and sale transactions with other funds advised by Alger Management or sub-advised by Weatherbie Capital LLC or Redwood Investments, LLC, affiliates of Alger Management. For the six months ended June 30, 2024, there were no interfund trades.
(h) Other Transactions with Affiliates: Certain officers and one Trustee of the Fund are directors and/or officers of Alger Management, the Distributor, or their affiliates. No shares of the Portfolio were held by Alger Management and its affiliated entities as of June 30, 2024.
NOTE 4 — Securities Transactions:
The following summarizes the securities transactions by the Portfolio, other than U.S. Government securities, and short-term securities, for the six months ended June 30, 2024:
| | |
Alger Mid Cap Growth Portfolio | | |
The Portfolio may borrow from the Custodian on an uncommitted basis. The Portfolio pays the Custodian a market rate of interest, generally based upon a rate of return with respect to each respective currency borrowed, taking into consideration relevant overnight and short-term reference rates and the range of distribution between and among the interest rates paid on deposits to other institutions, less applicable commissions, if any. Borrowings from the Custodian are included in Bank overdrafts in the Statement of Assets and Liabilities. The
ALGER MID CAP GROWTH PORTFOLIONOTES TO FINANCIAL STATEMENTS (Unaudited) (Continued)
Portfolio may also borrow from other funds in the Alger Fund Complex, as discussed in Note 3(e). For the six months ended June 30, 2024, the Portfolio had the following borrowings from the Custodian and other funds in the Alger Fund Complex:
| | WEIGHTED AVERAGE
INTEREST RATE |
Alger Mid Cap Growth Portfolio | | |
The highest amount borrowed by the Portfolio from the Custodian and other funds in the Alger Fund Complex during the six months ended June 30, 2024 was as follows:
| |
Alger Mid Cap Growth Portfolio | |
The Portfolio has an unlimited number of authorized shares of beneficial interest of $.001 par value. During the six months ended June 30, 2024, and the year ended December 31, 2023, transactions of shares of beneficial interest were as follows:
| FOR THE SIX MONTHS ENDED
June 30, 2024 | FOR THE YEAR ENDED
December 31, 2023 |
| | | | |
Alger Mid Cap Growth Portfolio |
| | | | |
| | | | |
| | | | |
| | | | |
| | | | |
NOTE 7 — Income Tax Information:
At December 31, 2023, the Portfolio, for federal income tax purposes, had capital loss carryforwards of $45,787,551. This amount will not be subject to expiration under the Regulated Investment Company Modernization Act of 2010, and this amount may be applied against future net realized gains until its utilization.
The difference between book-basis and tax-basis unrealized appreciation (depreciation) is determined annually and is attributable primarily to the tax deferral of losses on wash sales.
The Portfolio accrues tax on unrealized gains in foreign jurisdictions that impose a foreign capital tax, if applicable.
ALGER MID CAP GROWTH PORTFOLIONOTES TO FINANCIAL STATEMENTS (Unaudited) (Continued)
NOTE 8 — Fair Value Measurements:
The following is a summary of the inputs used as of June 30, 2024 in valuing the Portfolio's investments carried at fair value on a recurring basis. Based upon the nature, characteristics, and risks associated with its investments, the Portfolio has determined that presenting them by security type and sector is appropriate.
Alger Mid Cap Growth Portfolio | | | | |
| | | | |
| | | | |
| | | | |
| | | | |
| | | | |
| | | | |
| | | | |
| | | | |
| | | | |
| | | | |
| | | | |
| | | | |
| | | | |
| | | | |
| | | | |
| | | | |
| | | | |
| | | | |
| | | | |
| | | | |
| | | | |
| | | | |
| | | | |
TOTAL INVESTMENTS IN SECURITIES | | | | |
| Alger Mid Cap Growth Portfolio's holdings of Prosetta Biosciences, Inc., Series D shares are classified as a Level 3 investment and are fair valued at zero as of June 30, 2024. |
| Alger Mid Cap Growth Portfolio's holdings of Constellation Software, Inc. warrants expiring March 31, 2040, are classified as a Level 2 investment and are fair valued at zero as of June 30, 2024. |
ALGER MID CAP GROWTH PORTFOLIONOTES TO FINANCIAL STATEMENTS (Unaudited) (Continued)
| FAIR VALUE MEASUREMENTS USING SIGNIFICANT UNOBSERVABLE INPUTS (LEVEL 3) |
Alger Mid Cap Growth Portfolio | |
Opening balance at January 1, 2024 | |
| |
| |
| |
Included in net realized gain (loss) on investments | |
Included in net change in unrealized appreciation (depreciation) on investments | |
| |
| |
| |
Closing balance at June 30, 2024 | |
Net change in unrealized appreciation (depreciation) attributable to investments
still held at June 30, 2024 ** | |
ALGER MID CAP GROWTH PORTFOLIONOTES TO FINANCIAL STATEMENTS (Unaudited) (Continued)
| FAIR VALUE MEASUREMENTS USING SIGNIFICANT UNOBSERVABLE INPUTS (LEVEL 3) |
Alger Mid Cap Growth Portfolio | |
Opening balance at January 1, 2024 | |
| |
| |
| |
Included in net realized gain (loss) on investments | |
Included in net change in unrealized appreciation (depreciation) on investments | |
| |
| |
| |
Closing balance at June 30, 2024 | |
Net change in unrealized appreciation (depreciation) attributable to investments
still held at June 30, 2024 ** | |
| Prosetta Biosciences, Inc., Series D shares are classified as a Level 3 investment and are fair valued at zero as of June 30, 2024. |
| Net change in unrealized appreciation (depreciation) is included in net change in unrealized appreciation (depreciation) on investments in the accompanying Statement of Operations. |
The following table provides quantitative information about the Portfolio Level 3 fair value measurements of its investments as of June 30, 2024. The table below is not intended to be all-inclusive, but rather provides information on the Level 3 inputs as they relate to the Portfolio fair value measurements.
| | | | | |
Alger Mid Cap Growth Portfolio |
| | | | | |
| | | Discount Rate
Probability of Success | | |
| | | | | |
| Prosetta Biosciences, Inc., Series D shares are classified as a Level 3 investment and are fair valued at zero as of June 30, 2024. |
The significant unobservable inputs used in the fair value measurement of the Portfolio's securities are revenue and EBITDA multiples, discount rates, and the probability of success of certain outcomes. Significant increases and decreases in these inputs in isolation and interrelationships between these inputs would
ALGER MID CAP GROWTH PORTFOLIONOTES TO FINANCIAL STATEMENTS (Unaudited) (Continued)
have resulted in significantly higher or lower fair value measurements than those noted in the table above. Generally, all other things being equal, increases in revenue and EBITDA multiples, decreases in discount rates, and increases in the probability of success result in higher fair value measurements, whereas decreases in revenues and EBITDA multiples, increases in discount rates, and decreases in the probability of success result in lower fair value measurements. For the period ended June 30, 2024, there were no changes in valuation methodology on Level 3 investments.
Certain of the Portfolio's assets and liabilities are held at carrying amount or face value, which approximates fair value for financial reporting purposes. As of June 30, 2024, such assets were categorized within the ASC 820 disclosure hierarchy as follows:
NOTE 9 — Principal Risks:
Investing in the stock market involves risks, including the potential loss of principal. The value of the securities owned by the Portfolio, like other investments, may move up or down, sometimes rapidly and unpredictably. Your Portfolio shares at any point in time may be worth less than what you invested, even after taking into account the reinvestment of Portfolio dividends and distributions. Local, regional or global events such as environmental or natural disasters, war, terrorism, pandemics, outbreaks of infectious diseases and similar public health threats, recessions, or other events could have a significant impact on investments. Growth stocks may be more volatile than other stocks as their prices tend to be higher in relation to their companies' earnings and may be more sensitive to market, political, and economic developments. A significant portion of assets may be invested in securities of companies in related sectors, and may be similarly affected by economic, political, or market events and conditions and may be more vulnerable to unfavorable sector developments. Investing in companies of medium capitalizations involves the risk that such issuers may have limited product lines or financial resources, lack management depth, or have limited liquidity. Foreign securities involve special risks including currency fluctuations, inefficient trading, political and economic instability, and increased volatility. Active trading may increase transaction costs, brokerage commissions, and taxes, which can lower the return on investment. At times, the Portfolio may hold a large cash position, which may underperform relative to equity securities.
NOTE 10 — Affiliated Securities:
During the six months ended June 30, 2024, as disclosed in the following table, the Portfolio held 5% or more of the outstanding voting securities of the issuers
ALGER MID CAP GROWTH PORTFOLIONOTES TO FINANCIAL STATEMENTS (Unaudited) (Continued)
listed below. As such, these issuers were “affiliated persons” of the Portfolio for purposes of the 1940 Act. Transactions during the six months ended June 30, 2024 with such affiliated persons are summarized below. During this period, other Portfolios in the Fund may also have held voting shares of the issuers at levels below 5%.
| Shares
Held at
December 31,
2023 | | | Shares
Held at
June 30,
2024 | | | Net Change
in
Unrealized
App(Dep) | |
Alger Mid Cap Growth Portfolio |
|
| | | | | | | | |
|
Prosetta Biosciences, Inc., | | | | | | | | |
|
Crosslink Ventures C, LLC, | | | | | | | | |
Crosslink Ventures C, LLC, | | | | | | | | |
| | | | | | | | |
| Prosetta Biosciences, Inc., Series D is deemed to be an affiliate of the Fund because the Fund and Prosetta Biosciences, Inc., Series D are under common control. |
| Prosetta Biosciences, Inc., Series D shares are classified as a Level 3 investment and are fair valued at zero as of June 30, 2024. |
| The Alger Fund Complex and other entities managed by Alger Management fully own Crosslink Ventures C, LLC, Class A and Crosslink Ventures C, LLC, Class B. There were no capital increases or decreases for the period ended June 30, 2024. |
NOTE 11 — Subsequent Events:
Management of the Portfolio has evaluated events that have occurred subsequent to June 30, 2024, through the issuance date of the Financial Statements. On August 16, 2024, shareholders of the Portfolio elected Jean Brownhill, Susan L. Moffet, Jay C. Nadel, and one current trustee, David Rosenberg, to the Board. No other events have been identified which require recognition and/or disclosure.
THE ALGER PORTFOLIOSOTHER INFORMATION (Unaudited)
Proxy Voting Policies
A description of the policies and procedures the Portfolio uses to determine how to vote proxies relating to portfolio securities and the proxy voting record is available, without charge, by calling (800) 992-3863 or online on the Portfolio's website at http://www.alger.com or on the SEC’s website at http://www.sec.gov.
The Board has adopted policies and procedures relating to disclosure of the Porfolio's securities. These policies and procedures recognize that there may be legitimate business reasons for holdings to be disclosed and seek to balance those interests to protect the proprietary nature of the trading strategies and implementation thereof by the Portfolio.
Generally, the policies prohibit the release of information concerning portfolio holdings, which have not previously been made public, to individual investors, institutional investors, intermediaries that distribute the Portfolio's shares and other parties which are not employed by the Investment Manager or its affiliates except when the legitimate business purposes for selective disclosure and other conditions (designed to protect the Portfolio) are acceptable.
The Portfolio files its complete schedule of portfolio holdings with the SEC semi-annually in shareholder reports on Form N-CSR and after the first and third fiscal quarters as an exhibit to its reports on Form N-PORT. The Portfolio's Forms N-CSR and N-PORT are available online on the SEC’s website at www.sec.gov.
In addition, the Portfolio makes publicly available its month-end top 10 holdings with a 10 day lag and its month-end full portfolio with a 60 day lag on its website www.alger.com and through other marketing communications (including printed advertising/sales literature and/or shareholder telephone customer service centers). No compensation or other consideration is received for the non-public disclosure of portfolio holdings information.
In accordance with the foregoing, the Portfolio provides portfolio holdings information to third parties including financial intermediaries and service providers who need access to this information in the performance of their services and are subject to duties of confidentiality (1) imposed by law, including a duty not to trade on non-public information, and/or (2) pursuant to an agreement that confidential information is not to be disclosed or used (including trading on such information) other than as required by law. From time to time, the Portfolio will communicate with these third parties to confirm that they understand the Portfolio's policies and procedures regarding such disclosure. These agreements must be approved by the Portfolio's Chief Compliance Officer.
The Board periodically reviews a report disclosing the third parties to whom the Portfolio's holdings information has been disclosed and the purpose for such
THE ALGER PORTFOLIOSOTHER INFORMATION (Unaudited) (Continued)
disclosure, and it considers whether or not the release of information to such third parties is in the best interest of the Portfolio and its shareholders.
In addition to material the Portfolio routinely provides to shareholders, the Investment Manager may make additional statistical information available regarding the Alger Family of Funds.
Such information may include, but not be limited to, relative weightings and characteristics of the Portfolio versus an index (such as P/E ratio, alpha, beta, capture ratio, maximum drawdown, standard deviation, EPS forecasts, Sharpe ratio, information ratio, R-squared, and market cap analysis), security specific impact on overall portfolio performance, month-end top ten contributors to and detractors from performance, portfolio turnover, and other similar information. Shareholders should visit www.alger.com or may also contact the Portfolio at (800) 992-3863 to obtain such information.
THE ALGER PORTFOLIOS
100 Pearl Street, 27th Floor
New York, NY 10004
(800) 992-3863
www.alger.com
Fred Alger Management, LLC
100 Pearl Street, 27th Floor
New York, NY 10004
Fred Alger & Company, LLC
100 Pearl Street, 27th Floor
New York, NY 10004
Transfer Agent and Dividend Disbursing Agent
UMB Fund Services, Inc.
235 W. Galena Street
Milwaukee, WI 53212
The Bank of New York
240 Greenwich Street
New York, NY 10286
Independent Registered Public Accounting Firm
Deloitte & Touche LLP
30 Rockefeller Plaza
New York, NY 10112
This report is submitted for the general information of the shareholders of the Alger Mid Cap Growth Portfolio. It is not authorized for distribution to prospective investors unless accompanied by an effective Prospectus for the Portfolio, which contains information concerning the Portfolio’s investment policies, fees and expenses as well as other pertinent information.
Inspired by Change, Driven by Growth.
Item 8. Changes in and Disagreements with Accountants for Open-End Management Investment Companies
Item 9. Proxy Disclosures for Open-End Management Investment Companies
Item 10. Remuneration Paid to Directors,Officers, and Others of Open-End Management Investment Companies
Remuneration paid to directors, officers and others is included in the Statement of Operations under the line items “Trustee fees” and “Investment advisory fees” as part of the financial statements filed under Item 7 of this Form N-CSR.
Item 11. Statement Regarding Basis for Approval of Investment Advisory Contract
ITEM 7. FINANCIAL STATEMENTS AND FINANCIAL HIGHLIGHTS FOR OPEN_END MANAGEMENT INVESTMENT COMPANIES.
Alger Small Cap Growth Portfolio |
SEMI-ANNUAL FINANCIAL STATEMENTS AND OTHER INFORMATION
June 30, 2024 (UNAUDITED)
Table of Contents
ALGER SMALL CAP GROWTH PORTFOLIO
ALGER SMALL CAP GROWTH PORTFOLIOSchedule of Investments June 30, 2024 (Unaudited)
| | |
|
|
| | |
| | |
|
|
| | |
APPAREL ACCESSORIES & LUXURY GOODS—0.8% |
| | |
|
| | |
| | |
|
|
| | |
APPLICATION SOFTWARE—22.9% |
| | |
| | |
| | |
| | |
| | |
Guidewire Software, Inc.* | | |
| | |
| | |
Manhattan Associates, Inc.* | | |
| | |
| | |
Sprout Social, Inc., Cl. A* | | |
| | |
| | |
|
|
| | |
ASSET MANAGEMENT & CUSTODY BANKS—0.4% |
Affiliated Managers Group, Inc. | | |
|
| | |
Akero Therapeutics, Inc.* | | |
Blueprint Medicines Corp.* | | |
| | |
| | |
| | |
| | |
Keros Therapeutics, Inc.* | | |
Larimar Therapeutics, Inc.* | | |
| | |
MoonLake Immunotherapeutics* | | |
| | |
| | |
ORIC Pharmaceuticals, Inc.* | | |
| | |
See Notes to Financial Statements.
ALGER SMALL CAP GROWTH PORTFOLIOSchedule of Investments June 30, 2024 (Unaudited) (Continued)
| | |
COMMON STOCKS—93.0% (CONT.) |
BIOTECHNOLOGY—11.6% (CONT.) |
| | |
Viking Therapeutics, Inc.* | | |
|
|
| | |
|
Ollie's Bargain Outlet Holdings, Inc.* | | |
|
| | |
The AZEK Co., Inc., Cl. A* | | |
|
|
| | |
CONSUMER STAPLES MERCHANDISE RETAIL—1.6% |
BJ's Wholesale Club Holdings, Inc.* | | |
ELECTRONIC EQUIPMENT & INSTRUMENTS—0.8% |
| | |
| | |
|
|
| | |
ELECTRONIC MANUFACTURING SERVICES—0.9% |
| | |
ENVIRONMENTAL & FACILITIES SERVICES—0.0% |
Casella Waste Systems, Inc., Cl. A* | | |
|
| | |
HEALTHCARE DISTRIBUTORS—0.4% |
| | |
HEALTHCARE EQUIPMENT—2.3% |
| | |
Impulse Dynamics PLC, Series A(a),*,@ | | |
Impulse Dynamics PLC, Series F-1(a),*,@ | | |
| | |
Tandem Diabetes Care, Inc.* | | |
|
|
| | |
|
| | |
|
| | |
HEALTHCARE TECHNOLOGY—0.2% |
| | |
HOMEFURNISHING RETAIL—0.6% |
| | |
HOTELS RESORTS & CRUISE LINES—0.8% |
| | |
See Notes to Financial Statements.
ALGER SMALL CAP GROWTH PORTFOLIOSchedule of Investments June 30, 2024 (Unaudited) (Continued)
| | |
COMMON STOCKS—93.0% (CONT.) |
INDUSTRIAL MACHINERY & SUPPLIES & COMPONENTS—4.4% |
Gates Industrial Corp. PLC* | | |
| | |
| | |
|
|
| | |
INTERACTIVE HOME ENTERTAINMENT—1.4% |
Take-Two Interactive Software, Inc.* | | |
INTERACTIVE MEDIA & SERVICES—0.2% |
| | |
|
Planet Fitness, Inc., Cl. A* | | |
LIFE SCIENCES TOOLS & SERVICES—6.4% |
10X Genomics, Inc., Cl. A* | | |
| | |
| | |
| | |
| | |
| | |
| | |
| | |
| | |
|
|
| | |
|
| | |
MOVIES & ENTERTAINMENT—1.5% |
Live Nation Entertainment, Inc.* | | |
OIL & GAS EQUIPMENT & SERVICES—0.8% |
| | |
OIL & GAS EXPLORATION & PRODUCTION—3.9% |
Magnolia Oil & Gas Corp., Cl. A | | |
PERSONAL CARE PRODUCTS—1.6% |
| | |
Oddity Tech, Ltd., Cl. A* | | |
|
|
| | |
|
| | |
Structure Therapeutics, Inc. ADR* | | |
|
|
| | |
|
| | |
Kura Sushi USA, Inc., Cl. A* | | |
Shake Shack, Inc., Cl. A* | | |
See Notes to Financial Statements.
ALGER SMALL CAP GROWTH PORTFOLIOSchedule of Investments June 30, 2024 (Unaudited) (Continued)
| | |
COMMON STOCKS—93.0% (CONT.) |
RESTAURANTS—10.9% (CONT.) |
| | |
|
|
| | |
|
| | |
| | |
| | |
| | |
|
|
| | |
SOFT DRINKS & NON-ALCOHOLIC BEVERAGES—0.5% |
| | |
SPECIALIZED CONSUMER SERVICES—0.4% |
European Wax Center, Inc., Cl. A* | | |
|
| | |
|
| | |
| | |
| | |
|
|
| | |
TRADING COMPANIES & DISTRIBUTORS—0.4% |
SiteOne Landscape Supply, Inc.* | | |
| | |
|
|
| | |
TRANSACTION & PAYMENT PROCESSING SERVICES—1.6% |
| | |
| | |
Shift4 Payments, Inc., Cl. A* | | |
|
|
| | |
TOTAL COMMON STOCKS
(Cost $98,778,993) | | |
|
|
Prosetta Biosciences, Inc., Series D(a),(b),*,@ | | |
| | |
|
|
Fusion Pharmaceuticals, Inc. CVR(a),*,@ | | |
Mirati Therapeutics, Inc. CVR*,@ | | |
See Notes to Financial Statements.
ALGER SMALL CAP GROWTH PORTFOLIOSchedule of Investments June 30, 2024 (Unaudited) (Continued)
| | |
|
BIOTECHNOLOGY—0.1% (CONT.) |
| | |
|
|
| | |
TOTAL RIGHTS
(Cost $155,594) | | |
SPECIAL PURPOSE VEHICLE—1.0% |
DATA PROCESSING & OUTSOURCED SERVICES—1.0% |
Crosslink Ventures C, LLC, Cl. A(a),(b),*,@ | | |
Crosslink Ventures C, LLC, Cl. B(a),(b),*,@ | | |
|
|
| | |
TOTAL SPECIAL PURPOSE VEHICLE
(Cost $1,700,000) | | |
SHORT-TERM SECURITIES—4.8% |
|
Dreyfus Treasury Obligations Cash Management Fund,
Institutional Shares, 5.18%(c) | | |
| | |
|
|
Total Investments
(Cost $108,163,230) | | |
Affiliated Securities (Cost $2,086,992) | | |
Unaffiliated Securities (Cost $106,076,238) | | |
Other Assets in Excess of Liabilities | | |
| | |
| American Depositary Receipts |
| Contingent Deferred Rights |
| |
| Security is valued in good faith at fair value determined using significant unobservable inputs pursuant to procedures approved by the Board of Trustees. |
| Deemed an affiliate of the Portfolio in accordance with Section 2(a)(3) of the Investment Company Act of 1940. See Note 10 - Affiliated Securities. |
| Rate shown reflects 7-day effective yield as of June 30, 2024. |
| Non-income producing security. |
| Restricted security - Investment in security not registered under the Securities Act of 1933. Sales or transfers of the investment may be restricted only to qualified buyers. |
See Notes to Financial Statements.
ALGER SMALL CAP GROWTH PORTFOLIOSchedule of Investments June 30, 2024 (Unaudited) (Continued)
| | | | % of net assets
as of
6/30/2024 |
Crosslink Ventures C, LLC, Cl. A | | | | |
Crosslink Ventures C, LLC, Cl. B | | | | |
Fusion Pharmaceuticals, Inc. CVR | | | | |
Impulse Dynamics PLC, Series A | | | | |
Impulse Dynamics PLC, Series F-1 | | | | |
Mirati Therapeutics, Inc. CVR | | | | |
Prosetta Biosciences, Inc., Series D | | | | |
| | | | |
| | | | |
See Notes to Financial Statements.
ALGER SMALL CAP GROWTH PORTFOLIOStatement of Assets and Liabilities June 30, 2024 (Unaudited)
| Alger Small Cap Growth Portfolio |
|
Investments in unaffiliated securities, at value (Identified cost below)* see accompanying schedule of investments | |
Investments in affiliated securities, at value (Identified cost below)** see accompanying schedule of investments | |
Receivable for investment securities sold | |
Receivable for shares of beneficial interest sold | |
Dividends and interest receivable | |
| |
| |
|
Payable for shares of beneficial interest redeemed | |
Accrued investment advisory fees | |
| |
Accrued fund accounting fees | |
Accrued professional fees | |
Accrued administrative fees | |
| |
| |
| |
Accrued shareholder administrative fees | |
| |
Accrued transfer agent fees | |
| |
| |
|
Paid in capital (par value of $.001 per share) | |
| |
| |
| |
| |
| |
See Notes to Financial Statements.
ALGER SMALL CAP GROWTH PORTFOLIOStatement of Assets and Liabilities June 30, 2024 (Unaudited) (Continued)
| Alger Small Cap Growth Portfolio |
|
| |
SHARES OF BENEFICIAL INTEREST OUTSTANDING — Note 6: |
| |
NET ASSET VALUE PER SHARE: |
| |
| At June 30, 2024, the net unrealized appreciation on investments, based on cost for federal income tax purposes of $108,304,856, amounted to $38,228,556, which consisted of aggregate gross unrealized appreciation of $52,969,781, and aggregate gross unrealized depreciation of $14,741,225. |
See Notes to Financial Statements.
ALGER SMALL CAP GROWTH PORTFOLIOStatement of Operations for the six months ended June 30, 2024 (Unaudited)
| Alger Small Cap Growth Portfolio |
|
Dividends (net of foreign withholding taxes*) | |
| |
| |
|
Investment advisory fees — Note 3 | |
Administration fees — Note 3 | |
| |
| |
| |
| |
| |
Transfer agent fees — Note 3 | |
Shareholder administrative fees — Note 3 | |
| |
| |
| |
| |
| |
REALIZED AND UNREALIZED GAIN (LOSS) ON INVESTMENTS AND FOREIGN CURRENCY: |
Net realized gain on unaffiliated investments | |
Net realized (loss) on foreign currency transactions | |
| |
Net change in unrealized (depreciation) on unaffiliated investments | |
Net change in unrealized (depreciation) on affiliated investments | |
Total change in unrealized appreciation | |
Net realized and unrealized gain on investments and foreign currency | |
NET INCREASE IN NET ASSETS RESULTING FROM OPERATIONS | |
See Notes to Financial Statements.
ALGER SMALL CAP GROWTH PORTFOLIOStatements of Changes in Net Assets (Unaudited)
| Alger Small Cap Growth Portfolio |
| For the
Six Months Ended
June 30, 2024 | For the
Year Ended
December 31, 2023 |
| | |
| | |
Net change in unrealized appreciation (depreciation) | | |
Net increase in net assets resulting from operations | | |
Dividends and distributions to shareholders: |
| | |
Decrease from shares of beneficial interest transactions: |
| | |
Net decrease from shares of beneficial interest transactions — Note 6 | | |
Total increase (decrease) | | |
|
| | |
| | |
See Notes to Financial Statements.
THE ALGER PORTFOLIOSFinancial Highlights for a share outstanding throughout the period (Unaudited)
Alger Small Cap Growth Portfolio | |
| | | | | | |
Net asset value, beginning of period | | | | | | |
INCOME FROM INVESTMENT OPERATIONS: |
| | | | | | |
Net realized and unrealized gain (loss) on investments | | | | | | |
Total from investment operations | | | | | | |
Dividends from net investment income | | | | | | |
Distributions from net realized gains | | | | | | |
Net asset value, end of period | | | | | | |
| | | | | | |
RATIOS/SUPPLEMENTAL DATA: |
Net assets, end of period (000's omitted) | | | | | | |
Ratio of net expenses to average net assets | | | | | | |
Ratio of net investment loss to average net assets | | | | | | |
| | | | | | |
| Ratios have been annualized; total return and portfolio turnover rate have not been annualized. |
| Amount was computed based on average shares outstanding during the period. |
| Does not reflect the effect of sales charges, if applicable. |
See Notes to Financial Statements.
ALGER SMALL CAP GROWTH PORTFOLIONOTES TO FINANCIAL STATEMENTS (Unaudited)
NOTE 1 — General:
The Alger Portfolios (the “Fund”) is an open-end registered investment company organized as a business trust under the laws of the Commonwealth of Massachusetts. The Fund qualifies as an investment company as defined in Financial Accounting Standards Board (“FASB”) Accounting Standards Codification 946 – Financial Services – Investment Companies. The Fund operates as a series company currently offering six series of shares of beneficial interest: Alger Capital Appreciation Portfolio, Alger Large Cap Growth Portfolio, Alger Growth & Income Portfolio, Alger Mid Cap Growth Portfolio, Alger Small Cap Growth Portfolio and Alger Balanced Portfolio (collectively, the “Portfolios”). These financial statements include only the Alger Small Cap Growth Portfolio (the “Portfolio”). The Portfolio invests primarily in equity securities and has an investment objective of long-term capital appreciation. Shares of the Portfolio are available to investment vehicles for variable annuity contracts and variable life insurance policies offered by separate accounts of life insurance companies, as well as qualified pension and retirement plans.
On May 23, 2023, the Board of Trustees of the Fund (the “Board”) approved the transition of the Fund’s custodian and administrator from Brown Brothers Harriman & Company to The Bank of New York (collectively, the "Custodian"). This change became effective on March 18, 2024.
On May 23, 2023, the Board approved a Plan of Reorganization (the “Plan”), adopted with respect to Alger Weatherbie Specialized Growth Portfolio and the Portfolio. The Plan provided for the transfer of Alger Weatherbie Specialized Growth Portfolio’s assets to the Portfolio in a tax-free exchange for shares of the Portfolio and the assumption by the Portfolio of Alger Weatherbie Specialized Growth Portfolio’s stated liabilities, the distribution of such shares of the Portfolio to Alger Weatherbie Specialized Growth Portfolio shareholders and the subsequent termination of Alger Weatherbie Specialized Growth Portfolio (the “Reorganization”). Because the Reorganization satisfied the requisite conditions of Rule 17a-8 under the Investment Company Act of 1940, as amended (the “1940 Act”), in accordance with the Fund’s Amended and Restated Agreement and Declaration of Trust, and applicable Massachusetts state and U.S. federal law (including Rule 17a-8), the Reorganization was effected without the approval of shareholders of either Portfolio. The Reorganization became effective after the close of business on September 29, 2023.
After the close of business on September 29, 2023, the Portfolio acquired substantially all of the assets and liabilities of the Alger Weatherbie Specialized Growth Portfolio in exchange for Class I-2 shares of the Portfolio, which were distributed to the Alger Weatherbie Specialized Growth Portfolio’s shareholders. The investment portfolio of the Alger Weatherbie Specialized Growth Portfolio, with a fair value of $402,789 and identified cost of $397,988 as of the date of the Reorganization, was the principal asset acquired by the Portfolio. The acquisition
ALGER SMALL CAP GROWTH PORTFOLIONOTES TO FINANCIAL STATEMENTS (Unaudited) (Continued)
was accomplished by a tax-free exchange of 924,562 shares of the Alger Weatherbie Specialized Growth Portfolio, valued at $1,174,350 for 79,217 shares of the Portfolio. The net assets of the Alger Weatherbie Specialized Growth Portfolio and the Portfolio immediately before the acquisition were $1,174,350 (including $4,801 of net unrealized appreciation) and $144,564,758, respectively. The combined net assets of the Portfolio immediately following the acquisition were $145,739,108. For financial reporting purposes, assets received, and shares issued by the Portfolio were recorded at fair value; however the cost basis of the investments received from the Alger Weatherbie Specialized Growth Portfolio was carried forward to align ongoing reporting of Portfolio’s realized and unrealized gains and losses with amounts distributable to shareholders for tax purposes.
Fred Alger Management, LLC (“Alger Management” or the “Investment Manager”) and/ or its affiliates paid the expenses directly relating to the Reorganization. Assuming the Reorganization had been completed on January 1, 2023, the Portfolio’s pro-forma results of operations for the year ended December 31, 2023, were as follows:
| | |
| | |
Net realized and unrealized gain on investments in securities and foreign currency | | |
Net increase in net assets resulting from operations | | |
Undistributed net investment loss | | |
Because the combined investment portfolios have been managed as a single integrated portfolio since the Reorganization was completed, it is not practicable to separate the amounts of changes in revenue and earnings attributable to the Alger Weatherbie Specialized Growth Portfolio that have been included in the Alger Small Cap Growth Portfolio’s Statement of Operations since September 29, 2023.
NOTE 2 — Significant Accounting Policies:
(a) Investment Valuation: The Portfolio values its financial instruments at fair value using independent dealers or pricing services under policies approved by the Board. Investments held by the Portfolio are valued on each day the New York Stock Exchange (the “NYSE”) is open, as of the close of the NYSE (normally 4:00 p.m. Eastern Time).
The Board has designated, pursuant to Rule 2a-5 under the 1940 Act, the Portfolio's investment adviser, Alger Management, as its valuation designee (the “Valuation Designee”) to make fair value determinations subject to the Board’s review and oversight. The Valuation Designee has established a Valuation Committee (“Committee”) comprised of representatives of the Investment
ALGER SMALL CAP GROWTH PORTFOLIONOTES TO FINANCIAL STATEMENTS (Unaudited) (Continued)
Manager and officers of the Portfolio to assist in performing the duties and responsibilities of the Valuation Designee.
The Valuation Designee has established valuation processes including but not limited to: (i) making fair value determinations when market quotations for financial instruments are not readily available in accordance with valuation policies and procedures adopted by the Board; (ii) assessing and managing material risks associated with fair valuation determinations; (iii) selecting, applying and testing fair valuation methodologies; and (iv) overseeing and evaluating pricing services used by the Portfolio. The Valuation Designee regularly reports its fair valuation determinations and related valuation information to the Board. The Committee generally meets quarterly and on an as-needed basis to review and evaluate the effectiveness of the valuation policies and procedures in accordance with the requirements of Rule 2a-5.
Investments in short-term securities held by the Portfolio having a remaining maturity of sixty days or less are valued at amortized cost which approximates market value. Investments in other open-end investment companies registered under the 1940 Act are valued at such investment companies' net asset value per share.
Equity securities, including traded rights, warrants and option contracts for which valuation information is readily available, are valued at the last quoted sales price or official closing price on the primary market or exchange on which they are traded as reported by an independent pricing service. In the absence of quoted sales, such securities are generally valued at the bid price or, in the absence of a recent bid price, the equivalent as obtained from one or more of the major market makers for the securities to be valued.
Securities in which the Portfolio invests may be traded in foreign markets that close before the close of the NYSE. Developments that occur between the close of the foreign markets and the close of the NYSE may result in adjustments to the closing foreign prices to reflect what the Valuation Designee, through its Committee, believes to be the fair value of these securities as of the close of the NYSE. The Portfolio may also fair value securities in other situations, for example, when a particular foreign market is closed but the NYSE is open.
FASB Accounting Standards Codification 820 – Fair Value Measurements and Disclosures (“ASC 820”) defines fair value as the price that the Portfolio would receive upon selling an investment in a timely transaction to an independent buyer in the principal or most advantageous market of the investment. ASC 820 established a three-tier hierarchy to maximize the use of observable market data and minimize the use of unobservable inputs and to establish classification of fair value measurements for disclosure purposes. Inputs refer broadly to the assumptions that market participants would use in pricing the asset or liability and may be observable or unobservable. Observable inputs are based on market
ALGER SMALL CAP GROWTH PORTFOLIONOTES TO FINANCIAL STATEMENTS (Unaudited) (Continued)
data obtained from sources independent of the Portfolio. Unobservable inputs are inputs that reflect the Portfolio's own assumptions based on the best information available in the circumstances. The three-tier hierarchy of inputs is summarized in the three broad Levels listed below.
• Level 1 – quoted prices in active markets for identical investments
• Level 2 – significant other observable inputs (including quoted prices for similar investments, amortized cost, interest rates, prepayment speeds, credit risk, etc.)
• Level 3 – significant unobservable inputs (including the Portfolio's own assumptions in determining the fair value of investments)
The Portfolio's valuation techniques are generally consistent with either the market or the income approach to fair value. The market approach considers prices and other relevant information generated by market transactions involving identical or comparable assets to measure fair value. The income approach converts future amounts to a current, or discounted, single amount. These fair value measurements are determined on the basis of the value indicated by current market expectations about such future events. Inputs for Level 1 include exchange-listed prices and broker quotes in an active market. Inputs for Level 2 include the last trade price in the case of a halted security, an exchange-listed price which has been adjusted for fair value factors, and prices of closely related securities. Additional Level 2 inputs include an evaluated price which is based upon a compilation of observable market information such as spreads for fixed income and preferred securities. Inputs for Level 3 include, but are not limited to, revenue multiples, earnings before interest, taxes, depreciation and amortization (“EBITDA”) multiples, discount rates, time to exit and the probabilities of success of certain outcomes. Such unobservable market information may be obtained from a company’s financial statements and from industry studies, market data, and market indicators such as benchmarks and indexes. Because of the inherent uncertainty and often limited markets for restricted securities, the valuations assigned to such securities by the Portfolio may significantly differ from the valuations that would have been assigned by the Portfolio had there been an active market for such securities.
(b) Cash and Cash Equivalents: Cash and cash equivalents include U.S. dollars and foreign cash.
(c) Securities Transactions and Investment Income: Securities transactions are recorded on a trade date basis. Realized gains and losses from securities transactions are recorded on the identified cost basis. Dividend income is recognized on the ex-dividend date and interest income is recognized on the accrual basis.
ALGER SMALL CAP GROWTH PORTFOLIONOTES TO FINANCIAL STATEMENTS (Unaudited) (Continued)
Premiums and discounts on debt securities purchased are amortized or accreted over the lives of the respective securities.
(d) Foreign Currency Transactions: The books and records of the Portfolio are maintained in U.S. dollars. Foreign currencies, investments and other assets and liabilities are translated into U.S. dollars at the prevailing rates of exchange on the valuation date. Purchases and sales of investment securities and income and expenses are translated into U.S. dollars at the prevailing exchange rates on the respective dates of such transactions.
Net realized gains and losses on foreign currency transactions represent net gains and losses from the disposition of foreign currencies, currency gains and losses realized between the trade dates and settlement dates of security transactions, and the difference between the amount of net investment income accrued and the U.S. dollar amount actually received. The effects of changes in foreign currency exchange rates on investments in securities are included in realized and unrealized gain or loss on investments in the accompanying Statement of Operations.
(e) Lending of Fund Securities: The Portfolio may lend its securities to financial institutions (other than to the Investment Manager or its affiliates), provided that the market value of the securities loaned will not at any time exceed one third of the Portfolio’s total assets including borrowings, as defined in its prospectus. The Portfolio can earn fees on the securities loaned, which are included in income from securities lending in the accompanying Statement of Operations. In order to protect against the risk of failure by the borrower to return the securities loaned or any delay in the delivery of such securities, the loan is collateralized by cash or securities that are maintained with the Custodian, in an amount equal to at least 102% of the current market value of U.S. loaned securities or 105% for non-U.S. loaned securities. The market value of the loaned securities is determined at the close of each business day of the Portfolio. Any required additional collateral is delivered to the Custodian each day and any excess collateral is returned to the borrower on the next business day. In the event the borrower fails to return the loaned securities when due, the Portfolio may take the collateral to replace the securities. If the value of the collateral is less than the purchase cost of replacement securities, the Custodian shall be responsible for any shortfall, but only to the extent that the shortfall is not due to any diminution in collateral value, as defined in the securities lending agreement. The Portfolio is required to maintain the collateral in a segregated account and determine its value each day until the loaned securities are returned. Cash collateral may be invested as determined by the Portfolio. Collateral is returned to the borrower upon settlement of the loan. There were no securities loaned as of June 30, 2024.
(f) Dividends to Shareholders: Dividends and distributions payable to shareholders are recorded by the Portfolio on the ex-dividend date. The Portfolio
ALGER SMALL CAP GROWTH PORTFOLIONOTES TO FINANCIAL STATEMENTS (Unaudited) (Continued)
declares and pays dividends from net investment income, if available, annually. Dividends from net realized gains, offset by any loss carryforward, are declared and paid annually.
The characterization of distributions to shareholders for financial reporting purposes is determined in accordance with federal income tax rules. Therefore, the source of the Portfolio’s distributions may be shown in the accompanying financial statements as either from, or in excess of, net investment income, net realized gain on investment transactions, or return of capital, depending on the type of book/tax differences that may exist. Capital accounts within the financial statements are adjusted for permanent book/tax differences. Reclassifications result primarily due to the merger with Alger Weatherbie Specialized Growth Portfolio. The reclassifications are done annually at year-end and have no impact on the net asset value of the Portfolio and are designed to present the Portfolio’s capital accounts on a tax basis.
(g) Federal Income Taxes: It is the Portfolio’s policy to comply with the requirements of the Internal Revenue Code Subchapter M applicable to regulated investment companies and to distribute all of its taxable income to its shareholders. Provided that the Portfolio maintains such compliance, no federal income tax provision is required.
FASB Accounting Standards Codification 740 – Income Taxes (“ASC 740”) requires the Portfolio to measure and recognize in its financial statements the benefit of a tax position taken (or expected to be taken) on an income tax return if such position will more likely than not be sustained upon examination based on the technical merits of the position. No tax years are currently under investigation. The Portfolio files income tax returns in the U.S. Federal jurisdiction, as well as the New York State and New York City jurisdictions. The statute of limitations on the Portfolio's tax returns remains open for the tax years 2020-2023. Management does not believe there are any uncertain tax positions that require recognition of a tax liability.
(h) Allocation Methods: The Fund accounts separately for the assets, liabilities and operations of the Portfolio. Expenses directly attributable to the Portfolio are charged to the Portfolio’s operations; expenses which are applicable to all Portfolios are allocated among them based on net assets.
(i) Estimates: These financial statements have been prepared in accordance with accounting principles generally accepted in the United States of America, which require using estimates and assumptions that affect the reported amounts therein. This unaudited Semi-Annual Report reflects all adjustments that are, in the opinion of management, necessary to present a fair statement of results of the semi-annual period. Actual results may differ from those estimates. All such estimates are of a normal recurring nature.
ALGER SMALL CAP GROWTH PORTFOLIONOTES TO FINANCIAL STATEMENTS (Unaudited) (Continued)
NOTE 3 — Investment Advisory Fees and Other Transactions with Affiliates:
(a) Investment Advisory Fees: Fees incurred by the Portfolio, pursuant to the provisions of the Fund's Investment Advisory Agreement with the Investment Manager, are payable monthly and computed based on the following annual rates. The actual rate paid as a percentage of average daily net assets, for the six months ended June 30, 2024, is set forth below under the heading “Actual Rate”:
| Tier 1 rate is paid on assets up to $1 billion and Tier 2 rate is paid on assets in excess of $1 billion. |
(b) Administration Fees: Fees incurred by the Portfolio, pursuant to the provisions of the Fund's Fund Administration Agreement with Alger Management, are payable monthly and computed based on the average daily net assets of the Portfolio at the annual rate of 0.0275%.
(c) Brokerage Commissions: During the six months ended June 30, 2024, the Portfolio paid Fred Alger & Company, LLC, the Fund's distributor and affiliate of Alger Management (the "Distributor" or "Alger LLC"), $7,201 in connection with securities transactions.
(d) Interfund Loans: The Portfolio, along with other funds in the Alger Fund Complex (as defined below), may borrow money from and lend money to each other for temporary or emergency purposes. To the extent permitted under its investment restrictions, the Portfolio may lend uninvested cash in an amount up to 15% of its net assets to other funds in the Alger Fund Complex. If the Portfolio has borrowed from other funds in the Alger Fund Complex and has aggregate borrowings from all sources that exceed 10% of the Portfolio's total assets, the Portfolio will secure all of its loans from other funds in the Alger Fund Complex. The interest rate charged on interfund loans is equal to the average of the overnight time deposit rate and bank loan rate available to the Portfolio. There were no interfund loans outstanding as of June 30, 2024.
During the six months ended June 30, 2024, the Portfolio earned interfund loan interest income of $367, which is included as interest income in the accompanying Statement of Operations.
(e) Shareholder Administrative Fees: The Fund has entered into a Shareholder Administrative Services Agreement with Alger Management to compensate Alger Management for providing administrative oversight of the Fund’s transfer agent, and for other related services. The Portfolio compensates Alger Management at the annual rate of 0.01% of the average daily net assets for these services.
ALGER SMALL CAP GROWTH PORTFOLIONOTES TO FINANCIAL STATEMENTS (Unaudited) (Continued)
(f) Trustee Fees: Each trustee who is not an “interested person” of the Fund, as defined in the 1940 Act (“Independent Trustee”), receives a fee of $165,400 per annum, paid pro rata based on net assets by each fund in the Alger Fund Complex, plus travel expenses incurred for attending board meetings. The term “Alger Fund Complex” refers to the Fund, The Alger Institutional Funds, The Alger Funds II, The Alger Funds, Alger Global Focus Fund and The Alger ETF Trust, each of which is a registered investment company managed by Alger Management. The Independent Trustee appointed as Chair of the Board receives additional compensation of $22,000 per annum paid pro rata based on net assets by each fund in the Alger Fund Complex. Additionally, each member of the Audit Committee receives a fee of $13,000 per annum, paid pro rata based on net assets by each fund in the Alger Fund Complex. The Board has adopted a policy requiring Trustees to receive a minimum of 10% of their annual compensation in shares of one or more of the funds in the Alger Fund Complex.
(g) Interfund Trades: The Portfolio may engage in purchase and sale transactions with other funds advised by Alger Management or sub-advised by Weatherbie Capital LLC or Redwood Investments, LLC, affiliates of Alger Management. For the six months ended June 30, 2024, there were no interfund trades.
(h) Other Transactions with Affiliates: Certain officers and one Trustee of the Fund are directors and/or officers of Alger Management, the Distributor, or their affiliates. No shares of the Portfolio were held by Alger Management and its affiliated entities as of June 30, 2024.
NOTE 4 — Securities Transactions:
The following summarizes the securities transactions by the Portfolio, other than U.S. Government securities, and short-term securities, for the six months ended June 30, 2024:
| | |
Alger Small Cap Growth Portfolio | | |
The Portfolio may borrow from the Custodian on an uncommitted basis. The Portfolio pays the Custodian a market rate of interest, generally based upon a rate of return with respect to each respective currency borrowed, taking into consideration relevant overnight and short-term reference rates and the range of distribution between and among the interest rates paid on deposits to other institutions, less applicable commissions, if any. Borrowings from the Custodian are included in Bank overdrafts in the Statement of Assets and Liabilities. The Portfolio may also borrow from other funds in the Alger Fund Complex, as
ALGER SMALL CAP GROWTH PORTFOLIONOTES TO FINANCIAL STATEMENTS (Unaudited) (Continued)
discussed in Note 3(d). For the six months ended June 30, 2024, the Portfolio had the following borrowings from the Custodian and other funds in the Alger Fund Complex:
| | WEIGHTED AVERAGE
INTEREST RATE |
Alger Small Cap Growth Portfolio | | |
The highest amount borrowed by the Portfolio from the Custodian and other funds in the Alger Fund Complex during the six months ended June 30, 2024 was as follows:
| |
Alger Small Cap Growth Portfolio | |
The Portfolio has an unlimited number of authorized shares of beneficial interest of $.001 par value. During the six months ended June 30, 2024, and the year ended December 31, 2023, transactions of shares of beneficial interest were as follows:
| FOR THE SIX MONTHS ENDED
June 30, 2024 | FOR THE YEAR ENDED
December 31, 2023 |
| | | | |
Alger Small Cap Growth Portfolio |
| | | | |
| | | | |
Shares from Reorganization1 | | | | |
| | | | |
| | | | |
| | | | |
| Includes shares and amounts from the Reorganization. See Note 1 - General. |
NOTE 7 — Income Tax Information:
At December 31, 2023, the Portfolio had $17,777,608 capital loss carryforwards for federal income tax purposes. This amount will not be subject to expiration under the Regulated Investment Company Modernization Act of 2010, and this amount may be applied against future net realized gains until its utilization. Of this amount, $1,186,962 is subject to limitation due to the September 29, 2023 merger with Alger Weatherbie Specialized Growth Portfolio.
The difference between book-basis and tax-basis unrealized appreciation (depreciation) is determined annually and is attributable primarily to the tax deferral of losses on wash sales and PFICs.
ALGER SMALL CAP GROWTH PORTFOLIONOTES TO FINANCIAL STATEMENTS (Unaudited) (Continued)
The Portfolio accrues tax on unrealized gains in foreign jurisdictions that impose a foreign capital tax, if applicable.
NOTE 8 — Fair Value Measurements:
The following is a summary of the inputs used as of June 30, 2024 in valuing the Portfolio's investments carried at fair value on a recurring basis. Based upon the nature, characteristics, and risks associated with its investments, the Portfolio has determined that presenting them by security type and sector is appropriate.
Alger Small Cap Growth Portfolio | | | | |
| | | | |
| | | | |
| | | | |
| | | | |
| | | | |
| | | | |
| | | | |
| | | | |
| | | | |
| | | | |
| | | | |
| | | | |
| | | | |
| | | | |
| | | | |
| | | | |
| | | | |
| | | | |
| | | | |
TOTAL INVESTMENTS IN SECURITIES | | | | |
| Alger Small Cap Growth Portfolio's holdings of Prosetta Biosciences, Inc., Series D shares are classified as a Level 3 investment and are fair valued at zero as of June 30, 2024. |
ALGER SMALL CAP GROWTH PORTFOLIONOTES TO FINANCIAL STATEMENTS (Unaudited) (Continued)
| FAIR VALUE MEASUREMENTS USING SIGNIFICANT UNOBSERVABLE INPUTS (LEVEL 3) |
Alger Small Cap Growth Portfolio | |
Opening balance at January 1, 2024 | |
| |
| |
| |
Included in net realized gain (loss) on investments | |
Included in net change in unrealized appreciation (depreciation) on investments | |
| |
| |
| |
Closing balance at June 30, 2024 | |
Net change in unrealized appreciation (depreciation) attributable to investments
still held at June 30, 2024 * | |
| Net change in unrealized appreciation (depreciation) is included in net change in unrealized appreciation (depreciation) on
investments in the accompanying Statement of Operations. |
| Prosetta Biosciences, Inc., Series D shares are classified as a Level 3 investment and are fair valued at zero as of
June 30, 2024. |
The following table provides quantitative information about the Portfolio Level 3 fair value measurements of its investments as of June 30, 2024. The table below is not intended to be all-inclusive, but rather provides information on the Level 3 inputs as they relate to the Portfolio fair value measurements.
ALGER SMALL CAP GROWTH PORTFOLIONOTES TO FINANCIAL STATEMENTS (Unaudited) (Continued)
| | | | | |
Alger Small Cap Growth Portfolio |
| | | | | |
| | | | | |
| | | Discount Rate
Probability of Success | | |
| | | Discount Rate
Probability of Success | | |
| | | Discount Rate
Probability of Success | | |
| | | | | |
| Mirati Therapeutics, Inc. CVR |
| |
| Fusion Pharmaceuticals, Inc. CVR |
| Prosetta Biosciences, Inc., Series D shares are classified as a Level 3 investment and are fair valued at zero as of June 30, 2024. |
Certain of the Portfolio's assets and liabilities are held at carrying amount or face value, which approximates fair value for financial reporting purposes. As of June 30, 2024, such assets were categorized within the ASC 820 disclosure hierarchy as follows:
NOTE 9 — Principal Risks:
Investing in the stock market involves risks, including the potential loss of principal. The value of the securities owned by the Portfolio, like other investments, may move up or down, sometimes rapidly and unpredictably. Your Portfolio shares at any point in time may be worth less than what you invested, even after taking into account the reinvestment of Portfolio dividends and distributions. Local, regional or global events such as environmental or natural disasters, war, terrorism, pandemics, outbreaks of infectious diseases and similar public health threats, recessions, or other events could have a significant impact on investments. Growth stocks may be more volatile than other stocks as their prices tend to be higher in relation to their companies’ earnings and may be more sensitive to market, political, and economic developments. A significant portion of assets may be invested in securities of companies in related sectors, and may be similarly affected by economic, political, or market events and conditions and may be more vulnerable to unfavorable sector developments.
ALGER SMALL CAP GROWTH PORTFOLIONOTES TO FINANCIAL STATEMENTS (Unaudited) (Continued)
Investing in companies of small capitalizations involves the risk that such issuers may have limited product lines or financial resources, lack management depth, or have limited liquidity. Foreign securities involve special risks including currency fluctuations, inefficient trading, political and economic instability, and increased volatility. At times, the Portfolio may hold a large cash position, which may underperform relative to equity securities.
NOTE 10 — Affiliated Securities:
During the six months ended June 30, 2024, as disclosed in the following table, the Portfolio held 5% or more of the outstanding voting securities of the issuers listed below. As such, these issuers were “affiliated persons” of the Portfolio for purposes of the 1940 Act. Transactions during the six months ended June 30, 2024 with such affiliated persons are summarized below. During this period, other Portfolios in the Fund may also have held voting shares of the issuers at levels below 5%.
| Shares
Held at
December 31,
2023 | | | Shares
Held at
June 30,
2024 | | | Net Change
in
Unrealized
App(Dep) | |
Alger Small Cap Growth Portfolio |
|
Prosetta Biosciences, Inc., | | | | | | | | |
|
Crosslink Ventures C, LLC, | | | | | | | | |
Crosslink Ventures C, LLC, | | | | | | | | |
| | | | | | | | |
| Prosetta Biosciences, Inc., Series D is deemed to be an affiliate of the Fund because the Fund and Prosetta Biosciences, Inc., Series D are under common control. |
| Prosetta Biosciences, Inc., Series D shares are classified as a Level 3 investment and are fair valued at zero as of June 30, 2024. |
| The Alger Fund Complex and other entities managed by Alger Management fully own Crosslink Ventures C, LLC, Class A and Crosslink Ventures C, LLC, Class B. There were no capital increases or decreases for the period ended June 30, 2024. |
NOTE 11 — Subsequent Events:
Management of the Portfolio has evaluated events that have occurred subsequent to June 30, 2024, through the issuance date of the Financial Statements. On August 16, 2024, shareholders of the Portfolio elected Jean Brownhill, Susan L. Moffet, Jay C. Nadel, and one current trustee, David Rosenberg, to the Board. No other events have been identified which require recognition and/or disclosure.
THE ALGER PORTFOLIOSOTHER INFORMATION (Unaudited)
Proxy Voting Policies
A description of the policies and procedures the Portfolio uses to determine how to vote proxies relating to portfolio securities and the proxy voting record is available, without charge, by calling (800) 992-3863 or online on the Portfolio's website at http://www.alger.com or on the SEC’s website at http://www.sec.gov.
The Board has adopted policies and procedures relating to disclosure of the Porfolio's securities. These policies and procedures recognize that there may be legitimate business reasons for holdings to be disclosed and seek to balance those interests to protect the proprietary nature of the trading strategies and implementation thereof by the Portfolio.
Generally, the policies prohibit the release of information concerning portfolio holdings, which have not previously been made public, to individual investors, institutional investors, intermediaries that distribute the Portfolio's shares and other parties which are not employed by the Investment Manager or its affiliates except when the legitimate business purposes for selective disclosure and other conditions (designed to protect the Portfolio) are acceptable.
The Portfolio files its complete schedule of portfolio holdings with the SEC semi-annually in shareholder reports on Form N-CSR and after the first and third fiscal quarters as an exhibit to its reports on Form N-PORT. The Portfolio's Forms N-CSR and N-PORT are available online on the SEC’s website at www.sec.gov.
In addition, the Portfolio makes publicly available its month-end top 10 holdings with a 10 day lag and its month-end full portfolio with a 60 day lag on its website www.alger.com and through other marketing communications (including printed advertising/sales literature and/or shareholder telephone customer service centers). No compensation or other consideration is received for the non-public disclosure of portfolio holdings information.
In accordance with the foregoing, the Portfolio provides portfolio holdings information to third parties including financial intermediaries and service providers who need access to this information in the performance of their services and are subject to duties of confidentiality (1) imposed by law, including a duty not to trade on non-public information, and/or (2) pursuant to an agreement that confidential information is not to be disclosed or used (including trading on such information) other than as required by law. From time to time, the Portfolio will communicate with these third parties to confirm that they understand the Portfolio's policies and procedures regarding such disclosure. These agreements must be approved by the Portfolio's Chief Compliance Officer.
The Board periodically reviews a report disclosing the third parties to whom the Portfolio's holdings information has been disclosed and the purpose for such
THE ALGER PORTFOLIOSOTHER INFORMATION (Unaudited) (Continued)
disclosure, and it considers whether or not the release of information to such third parties is in the best interest of the Portfolio and its shareholders.
In addition to material the Portfolio routinely provides to shareholders, the Investment Manager may make additional statistical information available regarding the Alger Family of Funds.
Such information may include, but not be limited to, relative weightings and characteristics of the Portfolio versus an index (such as P/E ratio, alpha, beta, capture ratio, maximum drawdown, standard deviation, EPS forecasts, Sharpe ratio, information ratio, R-squared, and market cap analysis), security specific impact on overall portfolio performance, month-end top ten contributors to and detractors from performance, portfolio turnover, and other similar information. Shareholders should visit www.alger.com or may also contact the Portfolio at (800) 992-3863 to obtain such information.
THE ALGER PORTFOLIOS
100 Pearl Street, 27th Floor
New York, NY 10004
(800) 992-3863
www.alger.com
Fred Alger Management, LLC
100 Pearl Street, 27th Floor
New York, NY 10004
Fred Alger & Company, LLC
100 Pearl Street, 27th Floor
New York, NY 10004
Transfer Agent and Dividend Disbursing Agent
UMB Fund Services, Inc.
235 W. Galena Street
Milwaukee, WI 53212
The Bank of New York
240 Greenwich Street
New York, NY 10286
Independent Registered Public Accounting Firm
Deloitte & Touche LLP
30 Rockefeller Plaza
New York, NY 10112
This report is submitted for the general information of the shareholders of the Alger Small Cap Growth Portfolio. It is not authorized for distribution to prospective investors unless accompanied by an effective Prospectus for the Portfolio, which contains information concerning the Portfolio’s investment policies, fees and expenses as well as other pertinent information.
Inspired by Change, Driven by Growth.
Item 8. Changes in and Disagreements with Accountants for Open-End Management Investment Companies
Item 9. Proxy Disclosures for Open-End Management Investment Companies
Item 10. Remuneration Paid to Directors,Officers, and Others of Open-End Management Investment Companies
Remuneration paid to directors, officers and others is included in the Statement of Operations under the line items “Trustee fees” and “Investment advisory fees” as part of the financial statements filed under Item 7 of this Form N-CSR.
Item 11. Statement Regarding Basis for Approval of Investment Advisory Contract
ITEM 7. FINANCIAL STATEMENTS AND FINANCIAL HIGHLIGHTS FOR OPEN_END MANAGEMENT INVESTMENT COMPANIES.
Alger Growth & Income Portfolio |
SEMI-ANNUAL FINANCIAL STATEMENTS AND OTHER INFORMATION
June 30, 2024 (UNAUDITED)
Table of Contents
ALGER GROWTH & INCOME PORTFOLIO
ALGER GROWTH & INCOME PORTFOLIOSchedule of Investments June 30, 2024 (Unaudited)
| | |
|
|
| | |
| | |
|
|
| | |
APPLICATION SOFTWARE—0.9% |
| | |
ASSET MANAGEMENT & CUSTODY BANKS—3.2% |
| | |
| | |
Blue Owl Capital, Inc., Cl. A | | |
| | |
|
|
| | |
|
| | |
| | |
| | |
|
|
| | |
|
| | |
|
Johnson Controls International PLC | | |
|
| | |
|
| | |
COMMUNICATIONS EQUIPMENT—0.7% |
| | |
COMPUTER & ELECTRONICS RETAIL—0.4% |
| | |
CONSUMER ELECTRONICS—0.6% |
| | |
CONSUMER STAPLES MERCHANDISE RETAIL—0.9% |
| | |
|
| | |
|
| | |
| | |
| | |
|
|
| | |
See Notes to Financial Statements.
ALGER GROWTH & INCOME PORTFOLIOSchedule of Investments June 30, 2024 (Unaudited) (Continued)
| | |
COMMON STOCKS—97.0% (CONT.) |
|
| | |
ELECTRICAL COMPONENTS & EQUIPMENT—2.1% |
| | |
FINANCIAL EXCHANGES & DATA—0.9% |
| | |
|
| | |
HEALTHCARE DISTRIBUTORS—0.5% |
| | |
HEALTHCARE EQUIPMENT—0.5% |
| | |
HOME IMPROVEMENT RETAIL—1.9% |
| | |
|
| | |
INDUSTRIAL CONGLOMERATES—1.4% |
Honeywell International, Inc. | | |
|
Air Products & Chemicals, Inc. | | |
INTEGRATED OIL & GAS—3.9% |
| | |
| | |
| | |
|
|
| | |
INTEGRATED TELECOMMUNICATION SERVICES—0.8% |
Verizon Communications, Inc. | | |
INTERACTIVE MEDIA & SERVICES—8.5% |
| | |
| | |
Meta Platforms, Inc., Cl. A | | |
|
|
| | |
INVESTMENT BANKING & BROKERAGE—2.0% |
| | |
IT CONSULTING & OTHER SERVICES—0.3% |
International Business Machines Corp. | | |
|
| | |
|
| | |
See Notes to Financial Statements.
ALGER GROWTH & INCOME PORTFOLIOSchedule of Investments June 30, 2024 (Unaudited) (Continued)
| | |
COMMON STOCKS—97.0% (CONT.) |
|
Consolidated Edison, Inc. | | |
| | |
|
|
| | |
OIL & GAS STORAGE & TRANSPORTATION—0.5% |
| | |
|
| | |
| | |
| | |
| | |
| | |
| | |
| | |
| | |
|
|
| | |
PROPERTY & CASUALTY INSURANCE—0.6% |
The Hartford Financial Services Group, Inc. | | |
|
| | |
|
| | |
| | |
|
|
| | |
SEMICONDUCTOR MATERIALS & EQUIPMENT—4.3% |
| | |
|
| | |
| | |
Taiwan Semiconductor Manufacturing Co., Ltd. ADR | | |
|
|
| | |
SOFT DRINKS & NON-ALCOHOLIC BEVERAGES—2.3% |
| | |
| | |
|
|
| | |
|
| | |
| | |
|
|
| | |
TECHNOLOGY HARDWARE STORAGE & PERIPHERALS—8.1% |
| | |
See Notes to Financial Statements.
ALGER GROWTH & INCOME PORTFOLIOSchedule of Investments June 30, 2024 (Unaudited) (Continued)
| | |
COMMON STOCKS—97.0% (CONT.) |
TECHNOLOGY HARDWARE STORAGE & PERIPHERALS—8.1% (CONT.) |
Dell Technologies, Inc., Cl. C | | |
|
|
| | |
|
| | |
Philip Morris International, Inc. | | |
|
|
| | |
TRADING COMPANIES & DISTRIBUTORS—0.6% |
| | |
TRANSACTION & PAYMENT PROCESSING SERVICES—1.5% |
| | |
TOTAL COMMON STOCKS
(Cost $12,607,374) | | |
MASTER LIMITED PARTNERSHIP—0.5% |
OIL & GAS STORAGE & TRANSPORTATION—0.5% |
Cheniere Energy Partners LP | | |
| | |
REAL ESTATE INVESTMENT TRUST—2.8% |
|
| | |
|
| | |
|
Simon Property Group, Inc. | | |
|
Lamar Advertising Co., Cl. A | | |
|
| | |
TOTAL REAL ESTATE INVESTMENT TRUST
(Cost $798,755) | | |
See Notes to Financial Statements.
ALGER GROWTH & INCOME PORTFOLIOSchedule of Investments June 30, 2024 (Unaudited) (Continued)
| | |
SHORT-TERM SECURITIES—0.0% |
|
Dreyfus Treasury Obligations Cash Management Fund,
Institutional Shares, 5.18%(a) | | |
| | |
|
|
Total Investments
(Cost $13,565,950) | | |
Unaffiliated Securities (Cost $13,565,950) | | |
Liabilities in Excess of Other Assets | | |
| | |
| American Depositary Receipts |
| Rate shown reflects 7-day effective yield as of June 30, 2024. |
| Non-income producing security. |
See Notes to Financial Statements.
ALGER GROWTH & INCOME PORTFOLIOStatement of Assets and Liabilities June 30, 2024 (Unaudited)
| Alger Growth & Income Portfolio |
|
Investments in unaffiliated securities, at value (Identified cost below)* see accompanying schedule of investments | |
Receivable for shares of beneficial interest sold | |
Dividends and interest receivable | |
| |
| |
|
Payable for shares of beneficial interest redeemed | |
Accrued professional fees | |
Accrued fund accounting fees | |
Accrued investment advisory fees | |
| |
Accrued administrative fees | |
| |
| |
| |
Accrued shareholder administrative fees | |
Accrued transfer agent fees | |
| |
| |
|
Paid in capital (par value of $.001 per share) | |
| |
| |
| |
| |
See Notes to Financial Statements.
ALGER GROWTH & INCOME PORTFOLIOStatement of Assets and Liabilities June 30, 2024 (Unaudited) (Continued)
| Alger Growth & Income Portfolio |
|
| |
SHARES OF BENEFICIAL INTEREST OUTSTANDING — Note 6: |
| |
NET ASSET VALUE PER SHARE: |
| |
| At June 30, 2024, the net unrealized appreciation on investments, based on cost for federal income tax purposes of $13,584,044, amounted to $28,319,826, which consisted of aggregate gross unrealized appreciation of $28,612,625, and aggregate gross unrealized depreciation of $292,799. |
See Notes to Financial Statements.
ALGER GROWTH & INCOME PORTFOLIOStatement of Operations for the six months ended June 30, 2024 (Unaudited)
| Alger Growth & Income Portfolio |
|
Dividends (net of foreign withholding taxes*) | |
| |
Income from securities lending | |
| |
|
Investment advisory fees — Note 3 | |
Administration fees — Note 3 | |
| |
| |
| |
| |
| |
Transfer agent fees — Note 3 | |
Shareholder administrative fees — Note 3 | |
| |
| |
| |
| |
| |
REALIZED AND UNREALIZED GAIN (LOSS) ON INVESTMENTS AND FOREIGN CURRENCY: |
Net realized gain on unaffiliated investments | |
| |
Net change in unrealized appreciation on unaffiliated investments | |
Total change in unrealized appreciation | |
Net realized and unrealized gain on investments and foreign currency | |
NET INCREASE IN NET ASSETS RESULTING FROM OPERATIONS | |
* Foreign withholding taxes | |
See Notes to Financial Statements.
ALGER GROWTH & INCOME PORTFOLIOStatements of Changes in Net Assets (Unaudited)
| Alger Growth & Income Portfolio |
| For the
Six Months Ended
June 30, 2024 | For the
Year Ended
December 31, 2023 |
| | |
| | |
Net change in unrealized appreciation | | |
Net increase in net assets resulting from operations | | |
Dividends and distributions to shareholders: |
| | |
Total dividends and distributions to shareholders | | |
Decrease from shares of beneficial interest transactions: |
| | |
Net decrease from shares of beneficial interest transactions — Note 6 | | |
| | |
|
| | |
| | |
See Notes to Financial Statements.
THE ALGER PORTFOLIOSFinancial Highlights for a share outstanding throughout the period (Unaudited)
Alger Growth & Income Portfolio | |
| | | | | | |
Net asset value, beginning of period | | | | | | |
INCOME FROM INVESTMENT OPERATIONS: |
| | | | | | |
Net realized and unrealized gain (loss) on investments | | | | | | |
Total from investment operations | | | | | | |
Dividends from net investment income | | | | | | |
Distributions from net realized gains | | | | | | |
Net asset value, end of period | | | | | | |
| | | | | | |
RATIOS/SUPPLEMENTAL DATA: |
Net assets, end of period (000's omitted) | | | | | | |
Ratio of net expenses to average net assets | | | | | | |
Ratio of net investment income to average net assets | | | | | | |
| | | | | | |
| Ratios have been annualized; total return and portfolio turnover rate have not been annualized. |
| Amount was computed based on average shares outstanding during the period. |
See Notes to Financial Statements.
ALGER GROWTH & INCOME PORTFOLIONOTES TO FINANCIAL STATEMENTS (Unaudited)
NOTE 1 — General:
The Alger Portfolios (the “Fund”) is an open-end registered investment company organized as a business trust under the laws of the Commonwealth of Massachusetts. The Fund qualifies as an investment company as defined in Financial Accounting Standards Board (“FASB”) Accounting Standards Codification 946 – Financial Services – Investment Companies. The Fund operates as a series company currently offering six series of shares of beneficial interest: Alger Capital Appreciation Portfolio, Alger Large Cap Growth Portfolio, Alger Growth & Income Portfolio, Alger Mid Cap Growth Portfolio, Alger Small Cap Growth Portfolio and Alger Balanced Portfolio (collectively, the “Portfolios”). These financial statements include only the Alger Growth & Income Portfolio (the “Portfolio”). The Portfolio’s investment objective is capital appreciation and current income; it invests primarily in equity securities. Shares of the Portfolio are available to investment vehicles for variable annuity contracts and variable life insurance policies offered by separate accounts of life insurance companies, as well as qualified pension and retirement plans.
On May 23, 2023, the Board of Trustees of the Fund (the “Board”) approved the transition of the Fund’s custodian, administrator and securities lending agent from Brown Brothers Harriman & Company to The Bank of New York (collectively, the "Custodian"). This change became effective on March 18, 2024.
NOTE 2 — Significant Accounting Policies:
(a) Investment Valuation: The Portfolio values its financial instruments at fair value using independent dealers or pricing services under policies approved by the Board. Investments held by the Portfolio are valued on each day the New York Stock Exchange (the “NYSE”) is open, as of the close of the NYSE (normally 4:00 p.m. Eastern Time).
The Board has designated, pursuant to Rule 2a-5 under the Investment Company Act of 1940, as amended (the “1940 Act”), the Portfolio's investment adviser, Fred Alger Management, LLC (“Alger Management” or the “Investment Manager”) as its valuation designee (the “Valuation Designee”) to make fair value determinations subject to the Board’s review and oversight. The Valuation Designee has established a Valuation Committee (“Committee”) comprised of representatives of the Investment Manager and officers of the Portfolio to assist in performing the duties and responsibilities of the Valuation Designee.
The Valuation Designee has established valuation processes including but not limited to: (i) making fair value determinations when market quotations for financial instruments are not readily available in accordance with valuation policies and procedures adopted by the Board; (ii) assessing and managing material risks associated with fair valuation determinations; (iii) selecting, applying and testing fair valuation methodologies; and (iv) overseeing and evaluating pricing services used by the Portfolio. The Valuation Designee
ALGER GROWTH & INCOME PORTFOLIONOTES TO FINANCIAL STATEMENTS (Unaudited) (Continued)
regularly reports its fair valuation determinations and related valuation information to the Board. The Committee generally meets quarterly and on an as-needed basis to review and evaluate the effectiveness of the valuation policies and procedures in accordance with the requirements of Rule 2a-5.
Investments in short-term securities held by the Portfolio having a remaining maturity of sixty days or less are valued at amortized cost which approximates market value. Investments in other open-end investment companies registered under the 1940 Act are valued at such investment companies' net asset value per share.
Equity securities, including traded rights, warrants and option contracts for which valuation information is readily available, are valued at the last quoted sales price or official closing price on the primary market or exchange on which they are traded as reported by an independent pricing service. In the absence of quoted sales, such securities are generally valued at the bid price or, in the absence of a recent bid price, the equivalent as obtained from one or more of the major market makers for the securities to be valued.
Securities in which the Portfolio invests may be traded in foreign markets that close before the close of the NYSE. Developments that occur between the close of the foreign markets and the close of the NYSE may result in adjustments to the closing foreign prices to reflect what the Valuation Designee, through its Committee, believes to be the fair value of these securities as of the close of the NYSE. The Portfolio may also fair value securities in other situations, for example, when a particular foreign market is closed but the NYSE is open.
FASB Accounting Standards Codification 820 – Fair Value Measurements and Disclosures (“ASC 820”) defines fair value as the price that the Portfolio would receive upon selling an investment in a timely transaction to an independent buyer in the principal or most advantageous market of the investment. ASC 820 established a three-tier hierarchy to maximize the use of observable market data and minimize the use of unobservable inputs and to establish classification of fair value measurements for disclosure purposes. Inputs refer broadly to the assumptions that market participants would use in pricing the asset or liability and may be observable or unobservable. Observable inputs are based on market data obtained from sources independent of the Portfolio. Unobservable inputs are inputs that reflect the Portfolio's own assumptions based on the best information available in the circumstances. The three-tier hierarchy of inputs is summarized in the three broad Levels listed below.
• Level 1 – quoted prices in active markets for identical investments
• Level 2 – significant other observable inputs (including quoted prices for similar investments, amortized cost, interest rates, prepayment speeds, credit risk, etc.)
ALGER GROWTH & INCOME PORTFOLIONOTES TO FINANCIAL STATEMENTS (Unaudited) (Continued)
• Level 3 – significant unobservable inputs (including the Portfolio's own assumptions in determining the fair value of investments)
The Portfolio's valuation techniques are generally consistent with either the market or the income approach to fair value. The market approach considers prices and other relevant information generated by market transactions involving identical or comparable assets to measure fair value. The income approach converts future amounts to a current, or discounted, single amount. These fair value measurements are determined on the basis of the value indicated by current market expectations about such future events. Inputs for Level 1 include exchange-listed prices and broker quotes in an active market. Inputs for Level 2 include the last trade price in the case of a halted security, an exchange-listed price which has been adjusted for fair value factors, and prices of closely related securities. Additional Level 2 inputs include an evaluated price which is based upon a compilation of observable market information such as spreads for fixed income and preferred securities. Inputs for Level 3 include, but are not limited to, revenue multiples, earnings before interest, taxes, depreciation and amortization (“EBITDA”) multiples, discount rates, time to exit and the probabilities of success of certain outcomes. Such unobservable market information may be obtained from a company’s financial statements and from industry studies, market data, and market indicators such as benchmarks and indexes. Because of the inherent uncertainty and often limited markets for restricted securities, the valuations assigned to such securities by the Portfolio may significantly differ from the valuations that would have been assigned by the Portfolio had there been an active market for such securities.
(b) Cash and Cash Equivalents: Cash and cash equivalents include U.S. dollars and foreign cash.
(c) Securities Transactions and Investment Income: Securities transactions are recorded on a trade date basis. Realized gains and losses from securities transactions are recorded on the identified cost basis. Dividend income is recognized on the ex-dividend date and interest income is recognized on the accrual basis.
Premiums and discounts on debt securities purchased are amortized or accreted over the lives of the respective securities.
(d) Foreign Currency Transactions: The books and records of the Portfolio are maintained in U.S. dollars. Foreign currencies, investments and other assets and liabilities are translated into U.S. dollars at the prevailing rates of exchange on the valuation date. Purchases and sales of investment securities and income and expenses are translated into U.S. dollars at the prevailing exchange rates on the respective dates of such transactions.
Net realized gains and losses on foreign currency transactions represent net gains and losses from the disposition of foreign currencies, currency gains and
ALGER GROWTH & INCOME PORTFOLIONOTES TO FINANCIAL STATEMENTS (Unaudited) (Continued)
losses realized between the trade dates and settlement dates of security transactions, and the difference between the amount of net investment income accrued and the U.S. dollar amount actually received. The effects of changes in foreign currency exchange rates on investments in securities are included in realized and unrealized gain or loss on investments in the accompanying Statement of Operations.
(e) Lending of Fund Securities: The Portfolio may lend its securities to financial institutions (other than to the Investment Manager or its affiliates), provided that the market value of the securities loaned will not at any time exceed one third of the Portfolio’s total assets including borrowings, as defined in its prospectus. The Portfolio can earn fees on the securities loaned, which are included in income from securities lending in the accompanying Statement of Operations. In order to protect against the risk of failure by the borrower to return the securities loaned or any delay in the delivery of such securities, the loan is collateralized by cash or securities that are maintained with the Custodian, in an amount equal to at least 102% of the current market value of U.S. loaned securities or 105% for non-U.S. loaned securities. The market value of the loaned securities is determined at the close of each business day of the Portfolio. Any required additional collateral is delivered to the Custodian each day and any excess collateral is returned to the borrower on the next business day. In the event the borrower fails to return the loaned securities when due, the Portfolio may take the collateral to replace the securities. If the value of the collateral is less than the purchase cost of replacement securities, the Custodian shall be responsible for any shortfall, but only to the extent that the shortfall is not due to any diminution in collateral value, as defined in the securities lending agreement. The Portfolio is required to maintain the collateral in a segregated account and determine its value each day until the loaned securities are returned. Cash collateral may be invested as determined by the Portfolio. Collateral is returned to the borrower upon settlement of the loan. There were no securities loaned as of June 30, 2024.
(f) Dividends to Shareholders: Dividends and distributions payable to shareholders are recorded by the Portfolio on the ex-dividend date. The Portfolio declares and pays dividends from net investment income, if available, quarterly. Dividends from net realized gains, offset by any loss carryforward, are declared and paid annually.
The characterization of distributions to shareholders for financial reporting purposes is determined in accordance with federal income tax rules. Therefore, the source of the Portfolio’s distributions may be shown in the accompanying financial statements as either from, or in excess of, net investment income, net realized gain on investment transactions, or return of capital, depending on the type of book/tax differences that may exist. Capital accounts within the financial statements are adjusted for permanent book/tax differences. The
ALGER GROWTH & INCOME PORTFOLIONOTES TO FINANCIAL STATEMENTS (Unaudited) (Continued)
reclassifications are done annually at year-end and have no impact on the net asset value of the Portfolio and are designed to present the Portfolio’s capital accounts on a tax basis.
(g) Federal Income Taxes: It is the Portfolio’s policy to comply with the requirements of the Internal Revenue Code Subchapter M applicable to regulated investment companies and to distribute all of its taxable income to its shareholders. Provided that the Portfolio maintains such compliance, no federal income tax provision is required.
FASB Accounting Standards Codification 740 – Income Taxes (“ASC 740”) requires the Portfolio to measure and recognize in its financial statements the benefit of a tax position taken (or expected to be taken) on an income tax return if such position will more likely than not be sustained upon examination based on the technical merits of the position. No tax years are currently under investigation. The Portfolio files income tax returns in the U.S. Federal jurisdiction, as well as the New York State and New York City jurisdictions. The statute of limitations on the Portfolio's tax returns remains open for the tax years 2020-2023. Management does not believe there are any uncertain tax positions that require recognition of a tax liability.
(h) Allocation Methods: The Fund accounts separately for the assets, liabilities and operations of the Portfolio. Expenses directly attributable to the Portfolio are charged to the Portfolio’s operations; expenses which are applicable to all Portfolios are allocated among them based on net assets.
(i) Estimates: These financial statements have been prepared in accordance with accounting principles generally accepted in the United States of America, which require using estimates and assumptions that affect the reported amounts therein. This unaudited Semi-Annual Report reflects all adjustments that are, in the opinion of management, necessary to present a fair statement of results of the semi-annual period. Actual results may differ from those estimates. All such estimates are of a normal recurring nature.
NOTE 3 — Investment Advisory Fees and Other Transactions with Affiliates:
(a) Investment Advisory Fees: Fees incurred by the Portfolio, pursuant to the provisions of the Fund's Investment Advisory Agreement with the Investment Manager, are payable monthly and computed based on the following annual rate. The rate paid as a percentage of average daily net assets, for the six months ended June 30, 2024, is set forth below under the heading “Rate”:
| |
Alger Growth & Income Portfolio | |
ALGER GROWTH & INCOME PORTFOLIONOTES TO FINANCIAL STATEMENTS (Unaudited) (Continued)
(b) Administration Fees: Fees incurred by the Portfolio, pursuant to the provisions of the Fund's Fund Administration Agreement with Alger Management, are payable monthly and computed based on the average daily net assets of the Portfolio at the annual rate of 0.0275%.
(c) Brokerage Commissions: During the six months ended June 30, 2024, the Portfolio did not pay Fred Alger & Company, LLC, the Fund's distributor and affiliate of Alger Management (the "Distributor"), in connection with securities transactions.
(d) Interfund Loans: The Portfolio, along with other funds in the Alger Fund Complex (as defined below), may borrow money from and lend money to each other for temporary or emergency purposes. To the extent permitted under its investment restrictions, the Portfolio may lend uninvested cash in an amount up to 15% of its net assets to other funds in the Alger Fund Complex. If the Portfolio has borrowed from other funds in the Alger Fund Complex and has aggregate borrowings from all sources that exceed 10% of the Portfolio's total assets, the Portfolio will secure all of its loans from other funds in the Alger Fund Complex. The interest rate charged on interfund loans is equal to the average of the overnight time deposit rate and bank loan rate available to the Portfolio. There were no interfund loans outstanding as of June 30, 2024.
During the six months ended June 30, 2024, the Portfolio incurred interfund loan interest expenses of $183, which are included as interest expenses in the accompanying Statement of Operations.
(e) Shareholder Administrative Fees: The Fund has entered into a Shareholder Administrative Services Agreement with Alger Management to compensate Alger Management for providing administrative oversight of the Fund’s transfer agent, and for other related services. The Portfolio compensates Alger Management at the annual rate of 0.01% of the average daily net assets for these services.
(f) Trustee Fees: Each trustee who is not an “interested person” of the Fund, as defined in the 1940 Act (“Independent Trustee”), receives a fee of $165,400 per annum, paid pro rata based on net assets by each fund in the Alger Fund Complex, plus travel expenses incurred for attending board meetings. The term “Alger Fund Complex” refers to the Fund, The Alger Institutional Funds, The Alger Funds II, The Alger Funds, Alger Global Focus Fund and The Alger ETF Trust, each of which is a registered investment company managed by Alger Management. The Independent Trustee appointed as Chair of the Board receives additional compensation of $22,000 per annum paid pro rata based on net assets by each fund in the Alger Fund Complex. Additionally, each member of the Audit Committee receives a fee of $13,000 per annum, paid pro rata based on net assets by each fund in the Alger Fund Complex. The Board has adopted a policy requiring Trustees to receive a minimum of 10% of their annual compensation in shares of one or more of the funds in the Alger Fund Complex.
ALGER GROWTH & INCOME PORTFOLIONOTES TO FINANCIAL STATEMENTS (Unaudited) (Continued)
(g) Interfund Trades: The Portfolio may engage in purchase and sale transactions with other funds advised by Alger Management or sub-advised by Weatherbie Capital LLC or Redwood Investments, LLC, affiliates of Alger Management. For the six months ended June 30, 2024, there were no interfund trades.
(h) Other Transactions with Affiliates: Certain officers and one Trustee of the Fund are directors and/or officers of Alger Management, the Distributor, or their affiliates. No shares of the Portfolio were held by Alger Management and its affiliated entities as of June 30, 2024.
NOTE 4 — Securities Transactions:
The following summarizes the securities transactions by the Portfolio, other than U.S. Government securities, and short-term securities, for the six months ended June 30, 2024:
| | |
Alger Growth & Income Portfolio | | |
The Portfolio may borrow from the Custodian on an uncommitted basis. The Portfolio pays the Custodian a market rate of interest, generally based upon a rate of return with respect to each respective currency borrowed, taking into consideration relevant overnight and short-term reference rates and the range of distribution between and among the interest rates paid on deposits to other institutions, less applicable commissions, if any. Borrowings from the Custodian are included in Bank overdrafts in the Statement of Assets and Liabilities. The Portfolio may also borrow from other funds in the Alger Fund Complex, as discussed in Note 3(d). For the six months ended June 30, 2024, the Portfolio had the following borrowings from the Custodian and other funds in the Alger Fund Complex:
| | WEIGHTED AVERAGE
INTEREST RATE |
Alger Growth & Income Portfolio | | |
The highest amount borrowed by the Portfolio from the Custodian and other funds in the Alger Fund Complex during the six months ended June 30, 2024 was as follows:
| |
Alger Growth & Income Portfolio | |
ALGER GROWTH & INCOME PORTFOLIONOTES TO FINANCIAL STATEMENTS (Unaudited) (Continued)
NOTE 6 — Share Capital:
The Portfolio has an unlimited number of authorized shares of beneficial interest of $.001 par value. During the six months ended June 30, 2024, and the year ended December 31, 2023, transactions of shares of beneficial interest were as follows:
| FOR THE SIX MONTHS ENDED
June 30, 2024 | FOR THE YEAR ENDED
December 31, 2023 |
| | | | |
Alger Growth & Income Portfolio |
| | | | |
| | | | |
| | | | |
| | | | |
| | | | |
NOTE 7 — Income Tax Information:
At December 31, 2023, the Portfolio had no capital loss carryforwards for federal income tax purposes.
The difference between book-basis and tax-basis unrealized appreciation (depreciation) is determined annually and is attributable primarily to the tax deferral of losses on wash sales, REITs and partnership investments.
The Portfolio accrues tax on unrealized gains in foreign jurisdictions that impose a foreign capital tax, if applicable.
NOTE 8 — Fair Value Measurements:
The following is a summary of the inputs used as of June 30, 2024 in valuing the Portfolio's investments carried at fair value on a recurring basis. Based upon the nature, characteristics, and risks associated with its investments, the Portfolio has determined that presenting them by security type and sector is appropriate.
ALGER GROWTH & INCOME PORTFOLIONOTES TO FINANCIAL STATEMENTS (Unaudited) (Continued)
Alger Growth & Income Portfolio | | | | |
| | | | |
| | | | |
| | | | |
| | | | |
| | | | |
| | | | |
| | | | |
| | | | |
| | | | |
| | | | |
| | | | |
| | | | |
MASTER LIMITED PARTNERSHIP | | | | |
| | | | |
REAL ESTATE INVESTMENT TRUST | | | | |
| | | | |
| | | | |
TOTAL REAL ESTATE INVESTMENT TRUST | | | | |
| | | | |
| | | | |
TOTAL INVESTMENTS IN SECURITIES | | | | |
Certain of the Portfolio's assets and liabilities are held at carrying amount or face value, which approximates fair value for financial reporting purposes. As of June 30, 2024, there were no assets held at carrying amount or face value.
NOTE 9 — Principal Risks:
Investing in the stock market involves risks, including the potential loss of principal. The value of the securities owned by the Portfolio, like other investments, may move up or down, sometimes rapidly and unpredictably. Your Portfolio shares at any point in time may be worth less than what you invested, even after taking into account the reinvestment of Portfolio dividends and distributions. Local, regional or global events such as environmental or natural disasters, war, terrorism, pandemics, outbreaks of infectious diseases and similar public health threats, recessions, or other events could have a significant impact on investments. Growth stocks may be more volatile than other stocks as their prices tend to be higher in relation to their companies' earnings and may be more sensitive to market, political, and economic developments. A significant portion of assets may be invested in securities of companies in related sectors, and may be similarly affected by economic, political, or market events and conditions and may be more vulnerable to unfavorable sector developments.
ALGER GROWTH & INCOME PORTFOLIONOTES TO FINANCIAL STATEMENTS (Unaudited) (Continued)
Income-producing securities may cut or fail to declare dividends due to market downturns or for other reasons. At times, the Portfolio may hold a large cash position, which may underperform relative to equity securities.
NOTE 10 — Subsequent Events:
Management of the Portfolio has evaluated events that have occurred subsequent to June 30, 2024, through the issuance date of the Financial Statements. On August 16, 2024, shareholders of the Portfolio elected Jean Brownhill, Susan L. Moffet, Jay C. Nadel, and one current trustee, David Rosenberg, to the Board. No other events have been identified which require recognition and/or disclosure.
THE ALGER PORTFOLIOSOTHER INFORMATION (Unaudited)
Proxy Voting Policies
A description of the policies and procedures the Portfolio uses to determine how to vote proxies relating to portfolio securities and the proxy voting record is available, without charge, by calling (800) 992-3863 or online on the Portfolio's website at http://www.alger.com or on the SEC’s website at http://www.sec.gov.
The Board has adopted policies and procedures relating to disclosure of the Porfolio's securities. These policies and procedures recognize that there may be legitimate business reasons for holdings to be disclosed and seek to balance those interests to protect the proprietary nature of the trading strategies and implementation thereof by the Portfolio.
Generally, the policies prohibit the release of information concerning portfolio holdings, which have not previously been made public, to individual investors, institutional investors, intermediaries that distribute the Portfolio's shares and other parties which are not employed by the Investment Manager or its affiliates except when the legitimate business purposes for selective disclosure and other conditions (designed to protect the Portfolio) are acceptable.
The Portfolio files its complete schedule of portfolio holdings with the SEC semi-annually in shareholder reports on Form N-CSR and after the first and third fiscal quarters as an exhibit to its reports on Form N-PORT. The Portfolio's Forms N-CSR and N-PORT are available online on the SEC’s website at www.sec.gov.
In addition, the Portfolio makes publicly available its month-end top 10 holdings with a 10 day lag and its month-end full portfolio with a 60 day lag on its website www.alger.com and through other marketing communications (including printed advertising/sales literature and/or shareholder telephone customer service centers). No compensation or other consideration is received for the non-public disclosure of portfolio holdings information.
In accordance with the foregoing, the Portfolio provides portfolio holdings information to third parties including financial intermediaries and service providers who need access to this information in the performance of their services and are subject to duties of confidentiality (1) imposed by law, including a duty not to trade on non-public information, and/or (2) pursuant to an agreement that confidential information is not to be disclosed or used (including trading on such information) other than as required by law. From time to time, the Portfolio will communicate with these third parties to confirm that they understand the Portfolio's policies and procedures regarding such disclosure. These agreements must be approved by the Portfolio's Chief Compliance Officer.
The Board periodically reviews a report disclosing the third parties to whom the Portfolio's holdings information has been disclosed and the purpose for such
THE ALGER PORTFOLIOSOTHER INFORMATION (Unaudited) (Continued)
disclosure, and it considers whether or not the release of information to such third parties is in the best interest of the Portfolio and its shareholders.
In addition to material the Portfolio routinely provides to shareholders, the Investment Manager may make additional statistical information available regarding the Alger Family of Funds.
Such information may include, but not be limited to, relative weightings and characteristics of the Portfolio versus an index (such as P/E ratio, alpha, beta, capture ratio, maximum drawdown, standard deviation, EPS forecasts, Sharpe ratio, information ratio, R-squared, and market cap analysis), security specific impact on overall portfolio performance, month-end top ten contributors to and detractors from performance, portfolio turnover, and other similar information. Shareholders should visit www.alger.com or may also contact the Portfolio at (800) 992-3863 to obtain such information.
THE ALGER PORTFOLIOS
100 Pearl Street, 27th Floor
New York, NY 10004
(800) 992-3863
www.alger.com
Fred Alger Management, LLC
100 Pearl Street, 27th Floor
New York, NY 10004
Fred Alger & Company, LLC
100 Pearl Street, 27th Floor
New York, NY 10004
Transfer Agent and Dividend Disbursing Agent
UMB Fund Services, Inc.
235 W. Galena Street
Milwaukee, WI 53212
The Bank of New York
240 Greenwich Street
New York, NY 10286
Independent Registered Public Accounting Firm
Deloitte & Touche LLP
30 Rockefeller Plaza
New York, NY 10112
This report is submitted for the general information of the shareholders of the Alger Growth & Income Portfolio. It is not authorized for distribution to prospective investors unless accompanied by an effective Prospectus for the Portfolio, which contains information concerning the Portfolio’s investment policies, fees and expenses as well as other pertinent information.
Inspired by Change, Driven by Growth.
Item 8. Changes in and Disagreements with Accountants for Open-End Management Investment Companies
Item 9. Proxy Disclosures for Open-End Management Investment Companies
Item 10. Remuneration Paid to Directors,Officers, and Others of Open-End Management Investment Companies
Remuneration paid to directors, officers and others is included in the Statement of Operations under the line items “Trustee fees” and “Investment advisory fees” as part of the financial statements filed under Item 7 of this Form N-CSR.
Item 11. Statement Regarding Basis for Approval of Investment Advisory Contract
ITEM 7. FINANCIAL STATEMENTS AND FINANCIAL HIGHLIGHTS FOR OPEN_END MANAGEMENT INVESTMENT COMPANIES.
SEMI-ANNUAL FINANCIAL STATEMENTS AND OTHER INFORMATION
June 30, 2024 (UNAUDITED)
ALGER BALANCED PORTFOLIOSchedule of Investments June 30, 2024 (Unaudited)
| | |
|
|
| | |
| | |
|
|
| | |
APPLICATION SOFTWARE—0.7% |
| | |
ASSET MANAGEMENT & CUSTODY BANKS—2.4% |
| | |
| | |
Blue Owl Capital, Inc., Cl. A | | |
| | |
|
|
| | |
|
| | |
| | |
| | |
|
|
| | |
|
| | |
|
Johnson Controls International PLC | | |
|
| | |
|
| | |
COMMUNICATIONS EQUIPMENT—0.6% |
| | |
COMPUTER & ELECTRONICS RETAIL—0.3% |
| | |
CONSUMER ELECTRONICS—0.5% |
| | |
CONSUMER STAPLES MERCHANDISE RETAIL—0.7% |
| | |
|
| | |
|
| | |
| | |
| | |
|
|
| | |
See Notes to Financial Statements.
ALGER BALANCED PORTFOLIOSchedule of Investments June 30, 2024 (Unaudited) (Continued)
| | |
COMMON STOCKS—72.0% (CONT.) |
|
| | |
ELECTRICAL COMPONENTS & EQUIPMENT—1.5% |
| | |
FINANCIAL EXCHANGES & DATA—0.6% |
| | |
|
| | |
HEALTHCARE DISTRIBUTORS—0.4% |
| | |
HEALTHCARE EQUIPMENT—0.3% |
| | |
HOME IMPROVEMENT RETAIL—1.4% |
| | |
|
| | |
INDUSTRIAL CONGLOMERATES—1.0% |
Honeywell International, Inc. | | |
|
Air Products & Chemicals, Inc. | | |
INTEGRATED OIL & GAS—2.9% |
| | |
| | |
| | |
|
|
| | |
INTEGRATED TELECOMMUNICATION SERVICES—0.6% |
Verizon Communications, Inc. | | |
INTERACTIVE MEDIA & SERVICES—6.3% |
| | |
| | |
Meta Platforms, Inc., Cl. A | | |
|
|
| | |
INVESTMENT BANKING & BROKERAGE—1.5% |
| | |
IT CONSULTING & OTHER SERVICES—0.2% |
International Business Machines Corp. | | |
|
| | |
|
| | |
See Notes to Financial Statements.
ALGER BALANCED PORTFOLIOSchedule of Investments June 30, 2024 (Unaudited) (Continued)
| | |
COMMON STOCKS—72.0% (CONT.) |
|
Consolidated Edison, Inc. | | |
| | |
|
|
| | |
OIL & GAS STORAGE & TRANSPORTATION—0.4% |
| | |
|
| | |
| | |
| | |
| | |
| | |
| | |
| | |
| | |
|
|
| | |
PROPERTY & CASUALTY INSURANCE—0.4% |
The Hartford Financial Services Group, Inc. | | |
|
| | |
|
| | |
| | |
|
|
| | |
SEMICONDUCTOR MATERIALS & EQUIPMENT—3.2% |
| | |
|
| | |
| | |
Taiwan Semiconductor Manufacturing Co., Ltd. ADR | | |
|
|
| | |
SOFT DRINKS & NON-ALCOHOLIC BEVERAGES—1.7% |
| | |
| | |
|
|
| | |
|
| | |
| | |
|
|
| | |
TECHNOLOGY HARDWARE STORAGE & PERIPHERALS—6.0% |
| | |
See Notes to Financial Statements.
ALGER BALANCED PORTFOLIOSchedule of Investments June 30, 2024 (Unaudited) (Continued)
| | |
COMMON STOCKS—72.0% (CONT.) |
TECHNOLOGY HARDWARE STORAGE & PERIPHERALS—6.0% (CONT.) |
Dell Technologies, Inc., Cl. C | | |
|
|
| | |
|
| | |
Philip Morris International, Inc. | | |
|
|
| | |
TRADING COMPANIES & DISTRIBUTORS—0.5% |
| | |
TRANSACTION & PAYMENT PROCESSING SERVICES—1.1% |
| | |
TOTAL COMMON STOCKS
(Cost $15,208,476) | | |
MASTER LIMITED PARTNERSHIP—0.3% |
OIL & GAS STORAGE & TRANSPORTATION—0.3% |
Cheniere Energy Partners LP | | |
| | |
REAL ESTATE INVESTMENT TRUST—2.1% |
|
| | |
|
| | |
|
Simon Property Group, Inc. | | |
|
Lamar Advertising Co., Cl. A | | |
|
| | |
TOTAL REAL ESTATE INVESTMENT TRUST
(Cost $885,720) | | |
| | |
|
AGRICULTURAL & FARM MACHINERY—1.6% |
John Deere Capital Corp., 2.125%, 3/7/25 | | |
APPLICATION SOFTWARE—1.7% |
Salesforce, Inc., 0.625%, 7/15/24 | | |
AUTOMOBILE MANUFACTURERS—0.8% |
General Motors Financial Co., Inc., 1.5%, 6/10/26 | | |
|
AbbVie, Inc., 3.6%, 5/14/25 | | |
See Notes to Financial Statements.
ALGER BALANCED PORTFOLIOSchedule of Investments June 30, 2024 (Unaudited) (Continued)
| | |
CORPORATE BONDS—25.4% (CONT.) |
|
Amazon.com, Inc., 4.55%, 12/1/27 | | |
|
American Express Co., 5.85%, 11/5/27 | | |
CONSUMER STAPLES MERCHANDISE RETAIL—0.8% |
Walmart, Inc., 3.9%, 9/9/25 | | |
|
JPMorgan Chase Bank NA, 5.11%, 12/8/26 | | |
Wells Fargo & Co., 3.3%, 9/9/24 | | |
|
|
| | |
|
Haleon UK Capital PLC, 3.125%, 3/24/25(a) | | |
HOME IMPROVEMENT RETAIL—0.8% |
The Home Depot, Inc., 2.7%, 4/15/25 | | |
|
UnitedHealth Group, Inc., 3.7%, 5/15/27 | | |
|
| | |
PACKAGED FOODS & MEATS—0.9% |
Nestle Holdings, Inc., 0.606%, 9/14/24(a) | | |
|
AstraZeneca Finance LLC, 4.85%, 2/26/29 | | |
Johnson & Johnson, 4.8%, 6/1/29 | | |
|
|
| | |
|
McDonald's Corp., 4.8%, 8/14/28 | | |
SEMICONDUCTOR MATERIALS & EQUIPMENT—0.8% |
KLA Corp., 4.65%, 11/1/24 | | |
SOFT DRINKS & NON-ALCOHOLIC BEVERAGES—0.8% |
PepsiCo, Inc., 4.45%, 5/15/28 | | |
|
Crown Castle, Inc., 3.2%, 9/1/24 | | |
|
Ecolab, Inc., 5.25%, 1/15/28 | | |
|
Oracle Corp., 5.8%, 11/10/25 | | |
TECHNOLOGY HARDWARE STORAGE & PERIPHERALS—1.9% |
Apple, Inc., 1.125%, 5/11/25 | | |
TOTAL CORPORATE BONDS
(Cost $15,474,632) | | |
See Notes to Financial Statements.
ALGER BALANCED PORTFOLIOSchedule of Investments June 30, 2024 (Unaudited) (Continued)
| | |
SHORT-TERM SECURITIES—0.1% |
|
Dreyfus Treasury Obligations Cash Management Fund,
Institutional Shares, 5.18%(b) | | |
| | |
|
|
Total Investments
(Cost $31,749,928) | | |
Unaffiliated Securities (Cost $31,749,928) | | |
Other Assets in Excess of Liabilities | | |
| | |
| American Depositary Receipts |
| Pursuant to Securities and Exchange Commission Rule 144A, these securities may be sold prior to their maturity only to qualified institutional buyers. These securities represent 1.7% of the net assets of the Portfolio. |
| Rate shown reflects 7-day effective yield as of June 30, 2024. |
| Non-income producing security. |
See Notes to Financial Statements.
ALGER BALANCED PORTFOLIOStatement of Assets and Liabilities June 30, 2024 (Unaudited)
| |
|
Investments in unaffiliated securities, at value (Identified cost below)* see accompanying schedule of investments | |
Receivable for shares of beneficial interest sold | |
Dividends and interest receivable | |
| |
| |
|
Payable for shares of beneficial interest redeemed | |
Accrued investment advisory fees | |
Accrued professional fees | |
Accrued fund accounting fees | |
| |
Accrued administrative fees | |
| |
| |
| |
Accrued shareholder administrative fees | |
Accrued transfer agent fees | |
| |
| |
|
Paid in capital (par value of $.001 per share) | |
| |
| |
| |
| |
See Notes to Financial Statements.
ALGER BALANCED PORTFOLIOStatement of Assets and Liabilities June 30, 2024 (Unaudited) (Continued)
| |
|
| |
SHARES OF BENEFICIAL INTEREST OUTSTANDING — Note 6: |
| |
NET ASSET VALUE PER SHARE: |
| |
| At June 30, 2024, the net unrealized appreciation on investments, based on cost for federal income tax purposes of $31,752,314, amounted to $28,344,353, which consisted of aggregate gross unrealized appreciation of $28,963,015, and aggregate gross unrealized depreciation of $618,662. |
See Notes to Financial Statements.
ALGER BALANCED PORTFOLIOStatement of Operations for the six months ended June 30, 2024 (Unaudited)
| |
|
Dividends (net of foreign withholding taxes*) | |
| |
| |
|
Investment advisory fees — Note 3 | |
Administration fees — Note 3 | |
| |
| |
| |
| |
| |
Shareholder administrative fees — Note 3 | |
Transfer agent fees — Note 3 | |
| |
| |
| |
| |
| |
REALIZED AND UNREALIZED GAIN (LOSS) ON INVESTMENTS AND FOREIGN CURRENCY: |
Net realized gain on unaffiliated investments | |
| |
Net change in unrealized appreciation on unaffiliated investments | |
Total change in unrealized appreciation | |
Net realized and unrealized gain on investments and foreign currency | |
NET INCREASE IN NET ASSETS RESULTING FROM OPERATIONS | |
* Foreign withholding taxes | |
See Notes to Financial Statements.
ALGER BALANCED PORTFOLIOStatements of Changes in Net Assets (Unaudited)
| |
| For the
Six Months Ended
June 30, 2024 | For the
Year Ended
December 31, 2023 |
| | |
| | |
Net change in unrealized appreciation | | |
Net increase in net assets resulting from operations | | |
Dividends and distributions to shareholders: |
| | |
Total dividends and distributions to shareholders | | |
Decrease from shares of beneficial interest transactions: |
| | |
Net decrease from shares of beneficial interest transactions — Note 6 | | |
| | |
|
| | |
| | |
See Notes to Financial Statements.
THE ALGER PORTFOLIOSFinancial Highlights for a share outstanding throughout the period (Unaudited)
| |
| | | | | | |
Net asset value, beginning of period | | | | | | |
INCOME FROM INVESTMENT OPERATIONS: |
| | | | | | |
Net realized and unrealized gain (loss) on investments | | | | | | |
Total from investment operations | | | | | | |
Dividends from net investment income | | | | | | |
Distributions from net realized gains | | | | | | |
Net asset value, end of period | | | | | | |
| | | | | | |
RATIOS/SUPPLEMENTAL DATA: |
Net assets, end of period (000's omitted) | | | | | | |
Ratio of net expenses to average net assets | | | | | | |
Ratio of net investment income to average net assets | | | | | | |
| | | | | | |
| Ratios have been annualized; total return and portfolio turnover rate have not been annualized. |
| Amount was computed based on average shares outstanding during the period. |
See Notes to Financial Statements.
ALGER BALANCED PORTFOLIONOTES TO FINANCIAL STATEMENTS (Unaudited)
NOTE 1 — General:
The Alger Portfolios (the “Fund”) is an open-end registered investment company organized as a business trust under the laws of the Commonwealth of Massachusetts. The Fund qualifies as an investment company as defined in Financial Accounting Standards Board (“FASB”) Accounting Standards Codification 946 – Financial Services – Investment Companies. The Fund operates as a series company currently offering six series of shares of beneficial interest: Alger Capital Appreciation Portfolio, Alger Large Cap Growth Portfolio, Alger Growth & Income Portfolio, Alger Mid Cap Growth Portfolio, Alger Small Cap Growth Portfolio and Alger Balanced Portfolio (collectively, the “Portfolios”). These financial statements include only the Alger Balanced Portfolio (the “Portfolio”). The Portfolio’s investment objective is current income and long-term capital appreciation which it seeks to achieve through investing in equity and fixed-income securities. Shares of the Portfolio are available to investment vehicles for variable annuity contracts and variable life insurance policies offered by separate accounts of life insurance companies, as well as qualified pension and retirement plans.
On May 23, 2023, the Board of Trustees of the Fund (the “Board”) approved the transition of the Fund’s custodian and administrator from Brown Brothers Harriman & Company to The Bank of New York (collectively, the "Custodian"). This change became effective on March 18, 2024.
NOTE 2 — Significant Accounting Policies:
(a) Investment Valuation: The Portfolio values its financial instruments at fair value using independent dealers or pricing services under policies approved by the Board. Investments held by the Portfolio are valued on each day the New York Stock Exchange (the “NYSE”) is open, as of the close of the NYSE (normally 4:00 p.m. Eastern Time).
The Board has designated, pursuant to Rule 2a-5 under the Investment Company Act of 1940, as amended (the “1940 Act”), the Portfolio's investment adviser, Fred Alger Management, LLC (“Alger Management” or the “Investment Manager”) as its valuation designee (the “Valuation Designee”) to make fair value determinations subject to the Board’s review and oversight. The Valuation Designee has established a Valuation Committee (“Committee”) comprised of representatives of the Investment Manager and officers of the Portfolio to assist in performing the duties and responsibilities of the Valuation Designee.
The Valuation Designee has established valuation processes including but not limited to: (i) making fair value determinations when market quotations for financial instruments are not readily available in accordance with valuation policies and procedures adopted by the Board; (ii) assessing and managing material risks associated with fair valuation determinations; (iii) selecting, applying and testing fair valuation methodologies; and (iv) overseeing and
ALGER BALANCED PORTFOLIONOTES TO FINANCIAL STATEMENTS (Unaudited) (Continued)
evaluating pricing services used by the Portfolio. The Valuation Designee regularly reports its fair valuation determinations and related valuation information to the Board. The Committee generally meets quarterly and on an as-needed basis to review and evaluate the effectiveness of the valuation policies and procedures in accordance with the requirements of Rule 2a-5.
Investments in short-term securities held by the Portfolio having a remaining maturity of sixty days or less are valued at amortized cost which approximates market value. Investments in other open-end investment companies registered under the 1940 Act are valued at such investment companies' net asset value per share.
Equity securities, including traded rights, warrants and option contracts for which valuation information is readily available, are valued at the last quoted sales price or official closing price on the primary market or exchange on which they are traded as reported by an independent pricing service. In the absence of quoted sales, such securities are generally valued at the bid price or, in the absence of a recent bid price, the equivalent as obtained from one or more of the major market makers for the securities to be valued.
Debt securities generally trade in the over-the-counter market. Debt securities with remaining maturities of more than sixty days at the time of acquisition are valued on the basis of the last available bid prices or current market quotations provided by dealers or pricing services. In determining the value of a particular investment, pricing services may use certain information with respect to transactions in such investments, quotations from dealers, pricing matrixes, market transactions in comparable investments, various relationships observed in the market between investments and calculated yield measures based on valuation technology commonly employed in the market for such investments. Asset-backed and mortgage-backed securities are valued by independent pricing services using models that consider estimated cash flows of each tranche of the security, establish a benchmark yield and develop an estimated tranche-specific spread to the benchmark yield based on the unique attributes of the tranche. Debt securities with a remaining maturity of sixty days or less are valued at amortized cost which approximates market value.
Securities in which the Portfolio invests may be traded in foreign markets that close before the close of the NYSE. Developments that occur between the close of the foreign markets and the close of the NYSE may result in adjustments to the closing foreign prices to reflect what the Valuation Designee, through its Committee, believes to be the fair value of these securities as of the close of the NYSE. The Portfolio may also fair value securities in other situations, for example, when a particular foreign market is closed but the NYSE is open.
FASB Accounting Standards Codification 820 – Fair Value Measurements and Disclosures (“ASC 820”) defines fair value as the price that the Portfolio would
ALGER BALANCED PORTFOLIONOTES TO FINANCIAL STATEMENTS (Unaudited) (Continued)
receive upon selling an investment in a timely transaction to an independent buyer in the principal or most advantageous market of the investment. ASC 820 established a three-tier hierarchy to maximize the use of observable market data and minimize the use of unobservable inputs and to establish classification of fair value measurements for disclosure purposes. Inputs refer broadly to the assumptions that market participants would use in pricing the asset or liability and may be observable or unobservable. Observable inputs are based on market data obtained from sources independent of the Portfolio. Unobservable inputs are inputs that reflect the Portfolio's own assumptions based on the best information available in the circumstances. The three-tier hierarchy of inputs is summarized in the three broad Levels listed below.
• Level 1 – quoted prices in active markets for identical investments
• Level 2 – significant other observable inputs (including quoted prices for similar investments, amortized cost, interest rates, prepayment speeds, credit risk, etc.)
• Level 3 – significant unobservable inputs (including the Portfolio's own assumptions in determining the fair value of investments)
The Portfolio's valuation techniques are generally consistent with either the market or the income approach to fair value. The market approach considers prices and other relevant information generated by market transactions involving identical or comparable assets to measure fair value. The income approach converts future amounts to a current, or discounted, single amount. These fair value measurements are determined on the basis of the value indicated by current market expectations about such future events. Inputs for Level 1 include exchange-listed prices and broker quotes in an active market. Inputs for Level 2 include the last trade price in the case of a halted security, an exchange-listed price which has been adjusted for fair value factors, and prices of closely related securities. Additional Level 2 inputs include an evaluated price which is based upon a compilation of observable market information such as spreads for fixed income and preferred securities. Inputs for Level 3 include, but are not limited to, revenue multiples, earnings before interest, taxes, depreciation and amortization (“EBITDA”) multiples, discount rates, time to exit and the probabilities of success of certain outcomes. Such unobservable market information may be obtained from a company’s financial statements and from industry studies, market data, and market indicators such as benchmarks and indexes. Because of the inherent uncertainty and often limited markets for restricted securities, the valuations assigned to such securities by the Portfolio may significantly differ from the valuations that would have been assigned by the Portfolio had there been an active market for such securities.
(b) Cash and Cash Equivalents: Cash and cash equivalents include U.S. dollars and foreign cash.
ALGER BALANCED PORTFOLIONOTES TO FINANCIAL STATEMENTS (Unaudited) (Continued)
(c) Securities Transactions and Investment Income: Securities transactions are recorded on a trade date basis. Realized gains and losses from securities transactions are recorded on the identified cost basis. Dividend income is recognized on the ex-dividend date and interest income is recognized on the accrual basis.
Premiums and discounts on debt securities purchased are amortized or accreted over the lives of the respective securities.
(d) Foreign Currency Transactions: The books and records of the Portfolio are maintained in U.S. dollars. Foreign currencies, investments and other assets and liabilities are translated into U.S. dollars at the prevailing rates of exchange on the valuation date. Purchases and sales of investment securities and income and expenses are translated into U.S. dollars at the prevailing exchange rates on the respective dates of such transactions.
Net realized gains and losses on foreign currency transactions represent net gains and losses from the disposition of foreign currencies, currency gains and losses realized between the trade dates and settlement dates of security transactions, and the difference between the amount of net investment income accrued and the U.S. dollar amount actually received. The effects of changes in foreign currency exchange rates on investments in securities are included in realized and unrealized gain or loss on investments in the accompanying Statement of Operations.
(e) Lending of Fund Securities: The Portfolio may lend its securities to financial institutions (other than to the Investment Manager or its affiliates), provided that the market value of the securities loaned will not at any time exceed one third of the Portfolio’s total assets including borrowings, as defined in its prospectus. The Portfolio can earn fees on the securities loaned, which are included in income from securities lending in the accompanying Statement of Operations. In order to protect against the risk of failure by the borrower to return the securities loaned or any delay in the delivery of such securities, the loan is collateralized by cash or securities that are maintained with the Custodian, in an amount equal to at least 102% of the current market value of U.S. loaned securities or 105% for non-U.S. loaned securities. The market value of the loaned securities is determined at the close of each business day of the Portfolio. Any required additional collateral is delivered to the Custodian each day and any excess collateral is returned to the borrower on the next business day. In the event the borrower fails to return the loaned securities when due, the Portfolio may take the collateral to replace the securities. If the value of the collateral is less than the purchase cost of replacement securities, the Custodian shall be responsible for any shortfall, but only to the extent that the shortfall is not due to any diminution in collateral value, as defined in the securities lending agreement. The Portfolio is required to maintain the collateral in a segregated account and determine its value each day until the loaned securities are returned. Cash
ALGER BALANCED PORTFOLIONOTES TO FINANCIAL STATEMENTS (Unaudited) (Continued)
collateral may be invested as determined by the Portfolio. Collateral is returned to the borrower upon settlement of the loan. There were no securities loaned as of June 30, 2024.
(f) Dividends to Shareholders: Dividends and distributions payable to shareholders are recorded by the Portfolio on the ex-dividend date. The Portfolio declares and pays dividends from net investment income, if available, annually. Dividends from net realized gains, offset by any loss carryforward, are declared and paid annually.
The characterization of distributions to shareholders for financial reporting purposes is determined in accordance with federal income tax rules. Therefore, the source of the Portfolio’s distributions may be shown in the accompanying financial statements as either from, or in excess of, net investment income, net realized gain on investment transactions, or return of capital, depending on the type of book/tax differences that may exist. Capital accounts within the financial statements are adjusted for permanent book/tax differences. Reclassifications result primarily from the differences in tax treatment of real estate investment trusts ("REITs") and partnership investments. The reclassifications are done annually at year-end and have no impact on the net asset value of the Portfolio and are designed to present the Portfolio’s capital accounts on a tax basis.
(g) Federal Income Taxes: It is the Portfolio’s policy to comply with the requirements of the Internal Revenue Code Subchapter M applicable to regulated investment companies and to distribute all of its taxable income to its shareholders. Provided that the Portfolio maintains such compliance, no federal income tax provision is required.
FASB Accounting Standards Codification 740 – Income Taxes (“ASC 740”) requires the Portfolio to measure and recognize in its financial statements the benefit of a tax position taken (or expected to be taken) on an income tax return if such position will more likely than not be sustained upon examination based on the technical merits of the position. No tax years are currently under investigation. The Portfolio files income tax returns in the U.S. Federal jurisdiction, as well as the New York State and New York City jurisdictions. The statute of limitations on the Portfolio's tax returns remains open for the tax years 2020-2023. Management does not believe there are any uncertain tax positions that require recognition of a tax liability.
(h) Allocation Methods: The Fund accounts separately for the assets, liabilities and operations of the Portfolio. Expenses directly attributable to the Portfolio are charged to the Portfolio’s operations; expenses which are applicable to all Portfolios are allocated among them based on net assets.
(i) Estimates: These financial statements have been prepared in accordance with accounting principles generally accepted in the United States of America, which require using estimates and assumptions that affect the reported amounts
ALGER BALANCED PORTFOLIONOTES TO FINANCIAL STATEMENTS (Unaudited) (Continued)
therein. This unaudited Semi-Annual Report reflects all adjustments that are, in the opinion of management, necessary to present a fair statement of results of the semi-annual period. Actual results may differ from those estimates. All such estimates are of a normal recurring nature.
NOTE 3 — Investment Advisory Fees and Other Transactions with Affiliates:
(a) Investment Advisory Fees: Fees incurred by the Portfolio, pursuant to the provisions of the Fund's Investment Advisory Agreement with the Investment Manager, are payable monthly and computed based on the following annual rates. The actual rate paid as a percentage of average daily net assets, for the six months ended June 30, 2024, is set forth below under the heading “Actual Rate”:
| Tier 1 rate is paid on assets up to $1 billion and Tier 2 rate is paid on assets in excess of $1 billion. |
(b) Administration Fees: Fees incurred by the Portfolio, pursuant to the provisions of the Fund's Fund Administration Agreement with Alger Management, are payable monthly and computed based on the average daily net assets of the Portfolio at the annual rate of 0.0275%.
(c) Brokerage Commissions: During the six months ended June 30, 2024, the Portfolio did not pay Fred Alger & Company, LLC, the Fund's distributor and affiliate of Alger Management (the "Distributor"), in connection with securities transactions.
(d) Interfund Loans: The Portfolio, along with other funds in the Alger Fund Complex (as defined below), may borrow money from and lend money to each other for temporary or emergency purposes. To the extent permitted under its investment restrictions, the Portfolio may lend uninvested cash in an amount up to 15% of its net assets to other funds in the Alger Fund Complex. If the Portfolio has borrowed from other funds in the Alger Fund Complex and has aggregate borrowings from all sources that exceed 10% of the Portfolio's total assets, the Portfolio will secure all of its loans from other funds in the Alger Fund Complex. The interest rate charged on interfund loans is equal to the average of the overnight time deposit rate and bank loan rate available to the Portfolio. There were no interfund loans outstanding as of June 30, 2024.
(e) Shareholder Administrative Fees: The Fund has entered into a Shareholder Administrative Services Agreement with Alger Management to compensate Alger Management for providing administrative oversight of the Fund’s transfer agent, and for other related services. The Portfolio compensates Alger Management at the annual rate of 0.01% of the average daily net assets for these services.
ALGER BALANCED PORTFOLIONOTES TO FINANCIAL STATEMENTS (Unaudited) (Continued)
(f) Trustee Fees: Each trustee who is not an “interested person” of the Fund, as defined in the 1940 Act (“Independent Trustee”), receives a fee of $165,400 per annum, paid pro rata based on net assets by each fund in the Alger Fund Complex, plus travel expenses incurred for attending board meetings. The term “Alger Fund Complex” refers to the Fund, The Alger Institutional Funds, The Alger Funds II, The Alger Funds, Alger Global Focus Fund and The Alger ETF Trust, each of which is a registered investment company managed by Alger Management. The Independent Trustee appointed as Chair of the Board receives additional compensation of $22,000 per annum paid pro rata based on net assets by each fund in the Alger Fund Complex. Additionally, each member of the Audit Committee receives a fee of $13,000 per annum, paid pro rata based on net assets by each fund in the Alger Fund Complex. The Board has adopted a policy requiring Trustees to receive a minimum of 10% of their annual compensation in shares of one or more of the funds in the Alger Fund Complex.
(g) Interfund Trades: The Portfolio may engage in purchase and sale transactions with other funds advised by Alger Management or sub-advised by Weatherbie Capital LLC or Redwood Investments, LLC, affiliates of Alger Management. For the six months ended June 30, 2024, there were no interfund trades.
(h) Other Transactions with Affiliates: Certain officers and one Trustee of the Fund are directors and/or officers of Alger Management, the Distributor, or their affiliates. No shares of the Portfolio were held by Alger Management and its affiliated entities as of June 30, 2024.
NOTE 4 — Securities Transactions:
The following summarizes the securities transactions by the Portfolio, other than U.S. Government securities, and short-term securities, for the six months ended June 30, 2024:
The Portfolio may borrow from the Custodian on an uncommitted basis. The Portfolio pays the Custodian a market rate of interest, generally based upon a rate of return with respect to each respective currency borrowed, taking into consideration relevant overnight and short-term reference rates and the range of distribution between and among the interest rates paid on deposits to other institutions, less applicable commissions, if any. Borrowings from the Custodian are included in Bank overdrafts in the Statement of Assets and Liabilities. The Portfolio may also borrow from other funds in the Alger Fund Complex, as discussed in Note 3(d). The Portfolio had no borrowings for the six months ended June 30, 2024.
ALGER BALANCED PORTFOLIONOTES TO FINANCIAL STATEMENTS (Unaudited) (Continued)
NOTE 6 — Share Capital:
The Portfolio has an unlimited number of authorized shares of beneficial interest of $.001 par value. During the six months ended June 30, 2024, and the year ended December 31, 2023, transactions of shares of beneficial interest were as follows:
| FOR THE SIX MONTHS ENDED
June 30, 2024 | FOR THE YEAR ENDED
December 31, 2023 |
| | | | |
|
| | | | |
| | | | |
| | | | |
| | | | |
| | | | |
NOTE 7 — Income Tax Information:
At December 31, 2023, the Portfolio had no capital loss carryforwards for federal income tax purposes.
The difference between book-basis and tax-basis unrealized appreciation (depreciation) is determined annually and is attributable primarily to the tax deferral of losses on wash sales, REITs and partnership investments.
The Portfolio accrues tax on unrealized gains in foreign jurisdictions that impose a foreign capital tax, if applicable.
NOTE 8 — Fair Value Measurements:
The following is a summary of the inputs used as of June 30, 2024 in valuing the Portfolio's investments carried at fair value on a recurring basis. Based upon the nature, characteristics, and risks associated with its investments, the Portfolio has determined that presenting them by security type and sector is appropriate.
ALGER BALANCED PORTFOLIONOTES TO FINANCIAL STATEMENTS (Unaudited) (Continued)
| | | | |
| | | | |
| | | | |
| | | | |
| | | | |
| | | | |
| | | | |
| | | | |
| | | | |
| | | | |
| | | | |
| | | | |
| | | | |
| | | | |
| | | | |
| | | | |
| | | | |
| | | | |
| | | | |
| | | | |
| | | | |
| | | | |
| | | | |
| | | | |
MASTER LIMITED PARTNERSHIP | | | | |
| | | | |
REAL ESTATE INVESTMENT TRUST | | | | |
| | | | |
| | | | |
TOTAL REAL ESTATE INVESTMENT TRUST | | | | |
| | | | |
| | | | |
TOTAL INVESTMENTS IN SECURITIES | | | | |
Certain of the Portfolio's assets and liabilities are held at carrying amount or face value, which approximates fair value for financial reporting purposes. As of June 30, 2024, there were no assets held at carrying amount or face value.
NOTE 9 — Principal Risks:
Investing in the stock market involves risks, including the potential loss of principal. The value of the securities owned by the Portfolio, like other investments, may move up or down, sometimes rapidly and unpredictably. Your Portfolio shares at any point in time may be worth less than what you invested,
ALGER BALANCED PORTFOLIONOTES TO FINANCIAL STATEMENTS (Unaudited) (Continued)
even after taking into account the reinvestment of Portfolio dividends and distributions. Local, regional or global events such as environmental or natural disasters, war, terrorism, pandemics, outbreaks of infectious diseases and similar public health threats, recessions, or other events could have a significant impact on investments. Growth stocks may be more volatile than other stocks as their prices tend to be higher in relation to their companies’ earnings and may be more sensitive to market, political, and economic developments. The risks of investing in fixed-income securities include sensitivity to interest rate and credit rating changes, call risk, increased volatility for lower rated securities, and pre-payment risk. Income-producing securities may cut or fail to declare dividends due to market downturns or for other reasons. A significant portion of assets may be invested in securities of companies in related sectors, and may be similarly affected by economic, political, or market events and conditions and may be more vulnerable to unfavorable sector developments. At times, the Portfolio may hold a large cash position, which may underperform relative to equity securities.
NOTE 10 — Subsequent Events:
Management of the Portfolio has evaluated events that have occurred subsequent to June 30, 2024, through the issuance date of the Financial Statements. On August 16, 2024, shareholders of the Portfolio elected Jean Brownhill, Susan L. Moffet, Jay C. Nadel, and one current trustee, David Rosenberg, to the Board. No other events have been identified which require recognition and/or disclosure.
THE ALGER PORTFOLIOSOTHER INFORMATION (Unaudited)
Proxy Voting Policies
A description of the policies and procedures the Portfolio uses to determine how to vote proxies relating to portfolio securities and the proxy voting record is available, without charge, by calling (800) 992-3863 or online on the Portfolio's website at http://www.alger.com or on the SEC’s website at http://www.sec.gov.
The Board has adopted policies and procedures relating to disclosure of the Porfolio's securities. These policies and procedures recognize that there may be legitimate business reasons for holdings to be disclosed and seek to balance those interests to protect the proprietary nature of the trading strategies and implementation thereof by the Portfolio.
Generally, the policies prohibit the release of information concerning portfolio holdings, which have not previously been made public, to individual investors, institutional investors, intermediaries that distribute the Portfolio's shares and other parties which are not employed by the Investment Manager or its affiliates except when the legitimate business purposes for selective disclosure and other conditions (designed to protect the Portfolio) are acceptable.
The Portfolio files its complete schedule of portfolio holdings with the SEC semi-annually in shareholder reports on Form N-CSR and after the first and third fiscal quarters as an exhibit to its reports on Form N-PORT. The Portfolio's Forms N-CSR and N-PORT are available online on the SEC’s website at www.sec.gov.
In addition, the Portfolio makes publicly available its month-end top 10 holdings with a 10 day lag and its month-end full portfolio with a 60 day lag on its website www.alger.com and through other marketing communications (including printed advertising/sales literature and/or shareholder telephone customer service centers). No compensation or other consideration is received for the non-public disclosure of portfolio holdings information.
In accordance with the foregoing, the Portfolio provides portfolio holdings information to third parties including financial intermediaries and service providers who need access to this information in the performance of their services and are subject to duties of confidentiality (1) imposed by law, including a duty not to trade on non-public information, and/or (2) pursuant to an agreement that confidential information is not to be disclosed or used (including trading on such information) other than as required by law. From time to time, the Portfolio will communicate with these third parties to confirm that they understand the Portfolio's policies and procedures regarding such disclosure. These agreements must be approved by the Portfolio's Chief Compliance Officer.
The Board periodically reviews a report disclosing the third parties to whom the Portfolio's holdings information has been disclosed and the purpose for such
THE ALGER PORTFOLIOSOTHER INFORMATION (Unaudited) (Continued)
disclosure, and it considers whether or not the release of information to such third parties is in the best interest of the Portfolio and its shareholders.
In addition to material the Portfolio routinely provides to shareholders, the Investment Manager may make additional statistical information available regarding the Alger Family of Funds.
Such information may include, but not be limited to, relative weightings and characteristics of the Portfolio versus an index (such as P/E ratio, alpha, beta, capture ratio, maximum drawdown, standard deviation, EPS forecasts, Sharpe ratio, information ratio, R-squared, and market cap analysis), security specific impact on overall portfolio performance, month-end top ten contributors to and detractors from performance, portfolio turnover, and other similar information. Shareholders should visit www.alger.com or may also contact the Portfolio at (800) 992-3863 to obtain such information.
THE ALGER PORTFOLIOS
100 Pearl Street, 27th Floor
New York, NY 10004
(800) 992-3863
www.alger.com
Fred Alger Management, LLC
100 Pearl Street, 27th Floor
New York, NY 10004
Fred Alger & Company, LLC
100 Pearl Street, 27th Floor
New York, NY 10004
Transfer Agent and Dividend Disbursing Agent
UMB Fund Services, Inc.
235 W. Galena Street
Milwaukee, WI 53212
The Bank of New York
240 Greenwich Street
New York, NY 10286
Independent Registered Public Accounting Firm
Deloitte & Touche LLP
30 Rockefeller Plaza
New York, NY 10112
This report is submitted for the general information of the shareholders of the Alger Balanced Portfolio. It is not authorized for distribution to prospective investors unless accompanied by an effective Prospectus for the Portfolio, which contains information concerning the Portfolio’s investment policies, fees and expenses as well as other pertinent information.
Inspired by Change, Driven by Growth.
Item 8. Changes in and Disagreements with Accountants for Open-End Management Investment Companies
Item 9. Proxy Disclosures for Open-End Management Investment Companies
Item 10. Remuneration Paid to Directors,Officers, and Others of Open-End Management Investment Companies
Remuneration paid to directors, officers and others is included in the Statement of Operations under the line items “Trustee fees” and “Investment advisory fees” as part of the financial statements filed under Item 7 of this Form N-CSR.
Item 11. Statement Regarding Basis for Approval of Investment Advisory Contract
ITEM 8. CHANGES IN AND DISAGREEMENTS WITH ACCOUNTANTS FOR OPEN-END MANAGEMENT INVESTMENT COMPANIES.
Not applicable.
ITEM 9. PROXY DISCLOSURES FOR OPEN-END MANAGEMENT INVESTMENT COMPANIES
Not applicable.
ITEM 10. REMUNERATION PAID TO DIRECTORS, OFFICERS, AND OTHERS OF OPEN-END MANAGEMENT INVESTMENT COMPANIES.
Remuneration paid to directors, officers and other is included in the Statement of Operations under the line items “Trustee fees” and “Investment advisory fees” as part of the financial statements filed under Item 7 of this Form N-CSR.
ITEM 11. STATEMENT REGARDING BASIS FOR APPROVAL OF INVESTMENT ADVISORY CONTRACT.
Not applicable.
ITEM 12. DISCLOSURE OF PROXY VOTING POLICIES AND PROCEDURES FOR CLOSED-END MANAGEMENT INVESTMENT COMPANIES.
Not applicable.
ITEM 13. PORTFOLIO MANAGERS OF CLOSED-END MANAGEMENT INVESTMENT COMPANIES.
Not applicable.
ITEM 14. PURCHASES OF EQUITY SECURITIES BY CLOSED-END MANAGEMENT INVESTMENT COMPANY AND AFFILIATED PURCHASERS.
Not applicable.
ITEM 15. SUBMISSION OF MATTERS TO A VOTE OF SECURITY HOLDERS.
There have been no material changes to these procedures.
ITEM 16. CONTROLS AND PROCEDURES.
| | (a) | The Registrant’s principal executive officer and principal financial officer have concluded that the Registrant’s disclosure controls and procedures (as defined in Rule 30a-3(c) under the Investment Company Act of 1940, as amended) are effective based on their evaluation of the disclosure controls and procedures as of a date within 90 days of the filing date of this document. |
| | (b) | There were no changes in the Registrant's internal control over financial reporting (as defined in Rule 30a-3(d) under the 1940 Act) that occurred during the Registrant's second fiscal quarter of the period covered by this Form N-CSR, that have materially affected, or are reasonably likely to materially affect, the Registrant's internal control over financial reporting. |
ITEM 17. DISCLOSURE OF SECURITIES LENDING ACTIVITIES FOR CLOSED-END MANAGEMENT INVESTMENT COMPANIES.
Not applicable.
ITEM 18. RECOVERY OF ERRONEOUSLY AWARDED COMPENSATION
Not applicable.
ITEM 19. EXHIBITS.
SIGNATURES
Pursuant to the requirements of the Securities Exchange Act of 1934 and the Investment Company Act of 1940, the registrant has duly caused this report to be signed on its behalf by the undersigned, thereunto duly authorized.
The Alger Portfolios
| By: | /s/ Hal Liebes | |
| Name: | Hal Liebes | |
| Title: | Principal Executive Officer | |
| | | |
| Date: | August 20, 2024 | |
Pursuant to the requirements of the Securities Exchange Act of 1934 and the Investment Company Act of 1940, this report has been signed below by the following persons on behalf of the registrant and in the capacities and on the dates indicated.
| By: | /s/ Hal Liebes | |
| Name: | Hal Liebes | |
| Title: | Principal Executive Officer | |
| | | |
| Date: | August 20, 2024 | |
| By: | /s/ Michael D. Martins | |
| Name: | Michael D. Martins | |
| Title: | Principal Financial Officer | |
| | | |
| Date: | August 20, 2024 | |