ALGER BALANCED PORTFOLIO
| 1 |
| |
| 8 |
| |
| 10 |
| |
| 11 |
| |
| 17 |
| |
| 18 |
| |
| 19
|
| |
| 20 |
| |
| 21 |
| |
| 30 |
Shareholders’ Letter (Unaudited) | June 30, 2022 |
Dear Shareholders,
Many Investors Shun Powerful Wealth Creator
In 1924, economist John Maynard Keynes wrote that companies that reinvest profits can create “an element of compound interest operating in favour of a sound industrial investment.” At Alger, we believe reinvesting profits and producing compounding earnings growth is a powerful wealth creator. To that end, we seek companies that we believe have strong potential for compounding earnings growth, and we seek to avoid cyclical companies, including “short-duration” companies, or businesses with high current earnings that return most of their profits to shareholders. In most instances, these companies, in our view, have little or no potential for future long-term earnings growth.
As Warren Buffett has observed, investors “occasionally do crazy things,” which can create opportunities for investors who “disregard mob fears or enthusiasms….and focus on a few simple fundamentals.” We believe recent concerns about interest rates, inflation and valuations have caused many investors to act irrationally by focusing on cyclical short-duration companies while shunning the “sound industrial investment” identified by Keynes. Some of these same investors are so focused on current cash flows or income that they may be overlooking the potential for companies that are gaining market share at very fast rates but have not yet scaled their businesses to exhibit strong profitability.
Setting the Stage for a Difficult Six-Month Period
The recent trend of investors rejecting the appeal of long-term earnings growth, in our view, played a major role in the disappointing performance during the fiscal six-month period ended June 30, 2022. The fiscal period included a dramatic rotation by many investors who appeared to have sought instant gratification by favoring companies with high current earnings. It is our view that this rotation was initially fueled by rising interest rates, causing investors to question whether equity valuations were too high, and has more recently been propelled by risk aversion and recession fears.
These concerns were supported by the following developments:
| • | Rising interest rates on the back of inflation fears. |
| • | Data appeared to validate inflation concerns. After hitting a 6.8% year-over-year increase (or increase during the past 12-month period) in November 2021, and increasing each subsequent month, the Consumer Price Index hit 9.1% in June 2022. |
| • | Negative real personal income growth in the first half of 2022, along with a weakening of the employment market as indicated by rising jobless claims since April 2022. |
| • | In response to rising inflation, the Federal Reserve Board (the “Fed”) raised the federal funds rate by 25 basis points (“bps”) in March 2022, its first hike since cutting the rate to zero in 2020. Furthermore, it bumped rates up by 50bps in May and 75bps in June. Fears that rate hikes could eventually spark a recession have also weighed upon investor sentiment. |
Interest Rates Initially Support Rotation Away from Quality
The rotation to short-duration companies was also partially supported by investors reacting to higher interest rates in a fairly typical fashion—they adjusted their cash flow modeling by increasing the rate at which they discount future cash flows back to the present, thereby lowering the value of long-duration companies. This process is similar to how long-term bonds are impacted by rising rates more than short-term bonds.
The Fed rate hikes, combined with growing concerns that economic growth may be weakening, eventually sparked a reversal in investors’ preference for value stocks, which started on May 24, 2022. From that date until June 30, 2022, the Russell 3000 Growth Index declined 3.44%, outperforming the 5.80% decline of the Russell 3000 Value Index. The strong relative performance of value stocks earlier in the year, however, resulted in the Russell 3000 Value Index’s -13.1% return substantially outperforming the -28.2% return of the Russell 3000 Growth Index.
Not Just Growth, But High-Quality Growth, Underperforms
Many small cap growth companies may exhibit little or no current earnings, while maintaining strong potential for significant sales and earnings growth. Within the Russell 2000 Growth Index, for example, we believe many Healthcare companies are high-quality businesses even though they may not be currently generating profits due to their investments in new initiatives, among other things. However, their products or potential products can have high gross margins and potential for capturing market share. We believe, as a result of investors dismissing the appeal of potential earnings growth, the Healthcare sector was one of the worst performing sectors within the small cap growth category. From a broader perspective, sectors that generally consist of companies that provide dividends and appear to be less susceptible to inflation, such as Energy and Consumer Staples, tended to outperform their benchmarks.
Irrational Behavior Creates Opportunity
As a result of investors’ rotation out of long duration companies, growth equities, we believe, are trading at attractive valuations. Notably, the Russell 2000 Growth Index price-to-earnings (P/E) ratio based on the consensus of 12-month earnings estimates from analysts at financial services firms and provided by FactSet declined from 31x to approximately 21x during the six-month fiscal reporting period, while the Russell 1000 Growth Index declined from 44x to 23x.
Navigating Fed Rate Hikes
Investors who are concerned about monetary policy may want to consider that, historically, the later phases of monetary tightening periods have been accompanied by growth equities outperforming value equities. The six-month period starting approximately three months after the beginning of Fed tightening cycles initiated in 1994, 1999, 2004 and 2015 illustrate this point. Based on the returns of the Russell 3000 Growth and Russell 3000 Value indices, the median outperformance of growth companies during those periods was 400bps. During later phases of such rate hike periods, economic growth has typically slowed, so investors may be more willing to pay a premium for companies that can increase their earnings.
Chasing Yield
Yield hungry investors, furthermore, may want to broaden their search for income beyond dividends. For example, during the 12-month period ended March 31, 2022, the value of S&P 500 Index company share buybacks reached $985 billion, compared to only $525 billion for dividends. Buybacks reduce the number of shares outstanding at companies, effectively increasing the value of remaining shareholders’ interests. Because investors can choose when to sell their shares, they have discretion over when to realize the effective return of capital as capital gains. This can make share repurchases more tax efficient than dividends. We also believe that innovative companies that are growing by capturing market share may be candidates for share buyback programs. As they grow their sales and earnings, they may accumulate a cash “war chest” for buying back their shares.
Going Forward
We continue to believe that unprecedented levels of innovation, such as healthcare advancements in genetic science, and digital technologies including artificial intelligence, ecommerce, the metaverse, streaming entertainment, and cloud computing are providing opportunities for leading companies to reward investors by generating long-term earnings growth. We continue to focus on conducting in-depth fundamental research as we seek leaders of innovation rather than take short-term bets on the fickle nature of investor sentiment. We believe doing so is the best strategy for helping our valued shareholders reach their investment goals.
Portfolio Matters
Alger Balanced Portfolio
The Alger Balanced Portfolio returned -12.86% during the fiscal six-month period ended June 30, 2022. The equity portion of the Portfolio outperformed the -19.96% return of the S&P 500 Index and the fixed income portion outperformed the -11.05% return of the Bloomberg U.S. Government/Credit Bond Index. Regarding the equity portion of the Portfolio, the largest sector weightings were Information Technology and Healthcare. The largest sector overweight was Financials and the largest sector underweight was Information Technology.
Contributors to Performance
The Information Technology and Consumer Discretionary sectors provided the greatest contributions to relative performance. Regarding individual positions, AbbVie, Inc.; Exxon Mobil Corp.; Chevron Corp.; Eli Lilly & Co.; and Bristol-Myers Squibb Co. were among the top contributors to absolute performance. AbbVie is a global biopharmaceutical company that had been shunned by many investors due to the potential for the company’s Humira treatment to face increased competition in 2023. Humira is used for rheumatology, dermatology, gastroenterology and ophthalmology. We believe, however, that AbbVie has significantly diversified its revenue and that its launch of Rinvoq for psoriatic arthritis and atopic dermatitis is promising. We believe these developments contributed to the company’s recent release of favorable quarterly results and investor confidence in the company, which supported the performance of AbbVie shares during the six-month period.
Detractors from Performance
Financials and Real Estate were among the sectors that detracted from relative performance. Regarding individual positions, Microsoft Corp.; Apple, Inc.; The Home Depot, Inc.; JPMorgan Chase & Co.; and Alphabet, Inc., Cl. A were among the top detractors from absolute performance. Microsoft is a positive dynamic change beneficiary of corporate America’s transformative digitization. Microsoft’s CEO reported he expects that technology spending as a percent of GDP is likely to jump from about 5% today to 10% in a few years, and that Microsoft will continue to take market share within the technology industry.
Microsoft’s share price declined despite its high unit volume growth as the broad equity market was down due to higher interest rates and the Ukraine conflict. Its shares still outperformed the aggregate performance of the benchmark’s Information Technology sector counterparts. We believe this was a result of investors appreciating Microsoft’s strong free cash flow generation and its return of cash to shareholders in the form of dividends and share repurchases. Further, we believe the growth of Microsoft’s subscription-based software offerings and cloud computing services is durable because the products enhance customers’ growth initiatives and help reduce costs.
Fixed Income Assets of the Portfolio
At the end of the reporting period, the fixed income portion of the Portfolio consisted of 22 corporate bonds and represented 30% of non-cash Portfolio assets. The Bloomberg U.S. Corporate Bond Index entered the year with yields and spreads modestly above five-year lows. Yields moved sharply higher throughout the period to five-year highs as inflation data, exacerbated by the effects of the Ukraine invasion, continued to accelerate and the Federal Reserve moved to raise the Federal Funds rate more aggressively as a result. Spreads also widened to five-year high levels excluding the brief spike at the start of the Covid pandemic in 2020. As a result, total returns for corporates were sharply negative.
As always, we strive to deliver consistently superior investment results to you, our shareholders, and we thank you for your continued confidence in Alger.
Sincerely,
Daniel C. Chung, CFA
Chief Investment Officer
Fred Alger Management, LLC
Investors cannot invest directly in an index. Index performance does not reflect the deduction for fees, expenses, or taxes.
This report and the financial statements contained herein are submitted for the general information of shareholders of the Alger Balanced Portfolio. This report is not authorized for distribution to prospective investors in the Portfolio unless preceded or accompanied by an effective prospectus for the Portfolio. The Portfolio’s returns represent the fiscal six-month period return of Class I-2 shares. Returns include reinvestment of dividends and distributions.
The performance data quoted in these materials represents past performance, which is not an indication or guarantee of future results.
Standardized performance results can be found on the following pages. The investment return and principal value of an investment in the Portfolio will fluctuate so that an investor’s shares, when redeemed, may be worth more or less than their original cost. Current performance may be lower or higher than the performance quoted. For performance data current to the most recent month-end, visit us at www.alger.com, or call us at (800) 992-3863.
The views and opinions of the Portfolio’s management in this report are as of the date of the Shareholders’ Letter and are subject to change at any time subsequent to this date. There is no guarantee that any of the assumptions that formed the basis for the opinions stated herein are accurate or that they will materialize. Moreover, the information forming the basis for such assumptions is from sources believed to be reliable; however, there is no guarantee that such information is accurate. Any securities mentioned, whether owned in the Portfolio or otherwise, are considered in the context of the construction of an overall portfolio of securities and therefore reference to them should not be construed as a recommendation or offer to purchase or sell any such security. Inclusion of such securities in the Portfolio and transactions in such securities, if any, may be for a variety of reasons, including without limitation, in response to cash flows, inclusion in a benchmark, and risk control. The reference to a specific security should also be understood in such context and not viewed as a statement that the security is a significant holding in the Portfolio. Please refer to the Schedule of Investments for the Portfolio which is included in this report for a complete list of Portfolio holdings as of June 30, 2022. Securities mentioned in the Shareholders’ Letter, if not found in the Schedule of Investments, may have been held by the Portfolio during the six-month fiscal period.
Risk Disclosure
Investing in the stock market involves risks, including the potential loss of principal. Growth stocks may be more volatile than other stocks as their prices tend to be higher in relation to their companies’ earnings and may be more sensitive to market, political, and economic developments. Local, regional or global events such as environmental or natural disasters, war, terrorism, pandemics, outbreaks of infectious diseases and similar public health threats, recessions, or other events could have a significant impact on investments. The risks of investing in fixed-income securities include sensitivity to interest-rate and credit rating changes, call risk, increased volatility for lower rated securities, and pre-payment risk. Income-producing securities may cut or fail to declare dividends due to market downturns or for other reasons. Junk bonds are high risk investments that are considered speculative and may cause income and principal losses. A significant portion of assets may be invested in securities of companies in related sectors, and may be similarly affected by economic, political, or market events and conditions and may be more vulnerable to unfavorable sector developments. At times, the Portfolio may hold a large cash position, which may underperform relative to equity securities.
For a more detailed discussion of the risks associated with the Portfolio, please see the Portfolio’s Prospectus.
Before investing, carefully consider the Portfolio’s investment objective, risks, charges, and expenses. For a prospectus containing this and other information about The Alger Portfolios, call us at (800) 992-3863 or visit us at www.alger.com. Read the prospectus and summary prospectus carefully before investing.
Fred Alger & Company, LLC, Distributor.
NOT FDIC INSURED. NOT BANK GUARANTEED. MAY LOSE VALUE.
Definitions:
| • | The Consumer Price Index (CPI) is a measure of the average change over time in the prices paid by urban consumers for a market basket of consumer goods, and services. |
| • | Earnings per share (EPS) is calculated as a company’s profit divided by the outstanding shares of its common stock. |
| • | The price-to-book ratio is the ratio of a company’s market price to its book value. |
| • | Price-to-earnings is the ratio for valuing a company that measures its current share price relative to its EPS. |
| • | Free cash flow is the cash a company generates after taking into consideration cash outflows that support its operations and maintain its capital assets. |
| • | FactSet provides software and market data to financial professionals. FactSet is an independent source, which Alger believes to be a reliable source. Alger, however, makes no representation that it is complete or accurate. |
| • | The S&P 500 Index tracks the performance of 500 large companies listed on stock exchanges in the U.S. |
| • | The Russell 1000 Growth Index is an unmanaged index designed to measure the performance of the largest 1000 companies in the Russell 3000 Index with higher price to book ratios and higher forecasted growth values. |
| • | The Russell 2000 Growth Index measures the performance of the small cap growth segment of the U.S. equity universe. It includes those Russell 2000 companies with higher growth earning potential as defined by Russell’s leading style methodology. |
| • | The Russell Microcap Growth Index consists of the smallest 1,000 securities in the Russell 2000 Growth Index, plus the next 1,000 smallest eligible securities based on a combination of their market capitalization and current index membership weight. |
| • | The Russell 3000 Growth Index combines the large-cap Russell 1000 Growth, the small-cap Russell 2000 Growth and the Russell Microcap Growth Index. It includes companies that are considered more growth oriented relative to the overall market as defined by Russell’s leading style methodology. The Russell 3000 Growth Index is constructed to provide a comprehensive, unbiased, and stable barometer of the growth opportunities within the broad market. |
| • | The Russell 3000 Value Index measures the performance of the broad value segment of the U.S. equity value universe. It includes those Russell 3000 companies with lower price-to-book ratios and lower forecasted growth values. The Russell 3000 Value Index is constructed to provide a comprehensive, unbiased and stable barometer of the broad value market. |
| • | The Bloomberg U.S. Gov’t/Credit Bond Index is an index that measures performance of government and corporate bonds. |
| • | The Bloomberg U.S. Corporate Bond Index measures the investment grade, fixed-rate, taxable corporate bond market. |
ALGER BALANCED PORTFOLIO
Fund Highlights Through June 30, 2022 (Unaudited)
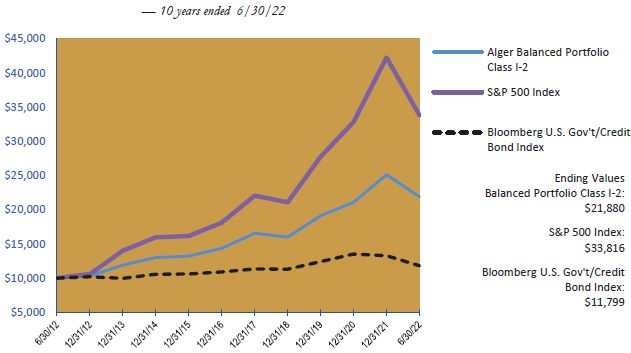
HYPOTHETICAL $10,000 INVESTMENT IN CLASS I-2 SHARES
The chart above illustrates the change in value of a hypothetical $10,000 investment made in Alger Balanced Portfolio Class I-2 shares, the S&P 500 Index (an unmanaged index of common stocks), and the Bloomberg U.S. Gov’t/Credit Bond Index (an unmanaged index of government and corporate bonds) for the ten years ended June 30, 2022. Figures for each of the Alger Balanced Portfolio Class I-2 shares, the Bloomberg U.S. Gov’t/Credit Bond Index and the S&P 500 Index include reinvestment of dividends. Figures for the Alger Balanced Portfolio Class I-2 shares also include reinvestment of capital gains. Investors cannot invest directly in any index. Index performance does not reflect deduction for fees, expenses, or taxes.
ALGER BALANCED PORTFOLIO
Fund Highlights Through June 30, 2022 (Unaudited) (Continued)
PERFORMANCE COMPARISON AS OF 6/30/22
AVERAGE ANNUAL TOTAL RETURNS
| | | 1 YEAR | | | 5 YEARS | | | 10 YEARS | | | Since 9/5/1989 | |
| Class I-2 (Inception 9/5/89) | | | (5.61 | )% | | | 7.26 | % | | | 8.14 | % | | | 7.54 | % |
| S&P 500 Index | | | (10.62 | )% | | | 11.31 | % | | | 12.96 | % | | | 9.78 | % |
| Bloomberg U.S. Gov’t/Credit Bond Index | | | (10.85 | )% | | | 1.05 | % | | | 1.67 | % | | | 5.41 | % |
The performance data quoted represents past performance, which is not an indication or a guarantee of future results. Investment return and principal will fluctuate and the Portfolio’s shares, when redeemed, may be worth more or less than their original cost. Current performance may be higher or lower than the performance quoted. For performance current to the most recent quarter end, visit us at www.alger.com or call us at (800) 992-3863.
Returns indicated assume reinvestment of all distributions, no transaction costs or taxes, and are net of management fees and fund operating expenses only. Total return does not include deductions at the Portfolio or contract level for the cost of the insurance charges, premium load, administrative charges, mortality and expense risk charges or other charges that may be incurred under the variable annuity contract, variable life insurance plan or retirement plan for which the Portfolio serves as an underlying investment vehicle. If these charges were deducted, the total return figures would be lower. Please refer to the variable insurance product or retirement plan disclosure documents for any additional applicable expenses. Investing in the stock market involves gains and losses and may not be suitable for all investors.
June 30, 2022 (Unaudited)
SECTORS/SECURITY TYPES | | Alger Balanced Portfolio | |
| Communication Services | | | 7.2 | % |
| Consumer Discretionary | | | 4.5 | |
| Consumer Staples | | | 5.1 | |
| Energy | | | 3.5 | |
| Financials | | | 7.7 | |
| Healthcare | | | 11.0 | |
| Industrials | | | 4.1 | |
| Information Technology | | | 16.9 | |
| Materials | | | 1.4 | |
| Real Estate | | | 2.5 | |
| Utilities | | | 0.9 | |
| Total Equity Securities | | | 64.8 | |
| Corporate Bonds | | | 30.1 | |
| Total Debt Securities | | | 30.1 | |
| Short-Term Investments and Net Other Assets | | | 5.1 | |
| | | 100.0 | % |
† Based on net assets for the Portfolio.
| THE ALGER PORTFOLIOS | ALGER BALANCED PORTFOLIO |
| Schedule of Investments June 30, 2022 (Unaudited) |
| COMMON STOCKS—61.4% | | SHARES | | | VALUE | |
| AEROSPACE & DEFENSE—1.4% | | | | | | |
| General Dynamics Corp. | | | 1,093 | | | $ | 241,826 | |
| Raytheon Technologies Corp. | | | 2,506 | | | | 240,852 | |
| TransDigm Group, Inc.* | | | 454 | | | | 243,648 | |
| | | | | | | | 726,326 | |
| ASSET MANAGEMENT & CUSTODY BANKS—2.0% | | | | | | | | |
| BlackRock, Inc., Cl. A | | | 929 | | | | 565,798 | |
| Blackstone, Inc. | | | 4,367 | | | | 398,402 | |
| The Carlyle Group, Inc. | | | 4,029 | | | | 127,558 | |
| | | | | | | | 1,091,758 | |
| AUTOMOBILE MANUFACTURERS—0.1% | | | | | | | | |
| General Motors Co.* | | | 2,124 | | | | 67,458 | |
| BIOTECHNOLOGY—2.2% | | | | | | | | |
| AbbVie, Inc. | | | 5,506 | | | | 843,299 | |
| Amgen, Inc. | | | 731 | | | | 177,852 | |
| Gilead Sciences, Inc. | | | 2,454 | | | | 151,682 | |
| | | | | | | | 1,172,833 | |
| BROADCASTING—0.3% | | | | | | | | |
| Paramount Global, Cl. B | | | 5,636 | | | | 139,096 | |
| BUILDING PRODUCTS—0.3% | | | | | | | | |
| Johnson Controls International PLC | | | 3,617 | | | | 173,182 | |
| CABLE & SATELLITE—0.8% | | | | | | | | |
| Comcast Corp., Cl. A |
|
| 10,272
|
|
|
| 403,073
| |
| COMMODITY CHEMICALS—0.2% | | | | | | | | |
| Dow, Inc. | | | 2,203 | | | | 113,697 | |
| COMMUNICATIONS EQUIPMENT—0.7% | | | | | | | | |
| Cisco Systems, Inc. | | | 8,623 | | | | 367,685 | |
| CONSUMER ELECTRONICS—0.3% | | | | | | | | |
| Garmin Ltd. | | | 1,685 | | | | 165,551 | |
| COPPER—0.3% | | | | | | | | |
| Southern Copper Corp. | | | 3,046 | | | | 151,721 | |
| DATA PROCESSING & OUTSOURCED SERVICES—1.0% | |
| Visa, Inc., Cl. A | | | 2,698 | | | | 531,209 | |
| DIVERSIFIED BANKS—2.5% | | | | | | | | |
| Bank of America Corp. | | | 14,212 | | | | 442,420 | |
| JPMorgan Chase & Co. | | | 8,038 | | | | 905,159 | |
| | | | | | | | 1,347,579 | |
| ELECTRIC UTILITIES—0.5% | | | | | | | | |
| NextEra Energy, Inc. | | | 3,710 | | | | 287,377 | |
| ELECTRICAL COMPONENTS & EQUIPMENT—0.7% | | | | | | | | |
| Eaton Corp. PLC | | | 3,127 | | | | 393,971 | |
| FINANCIAL EXCHANGES & DATA—0.9% | | | | | | | | |
| CME Group, Inc., Cl. A | | | 2,302 | | | | 471,219 | |
| FOOD DISTRIBUTORS—0.5% | | | | | | | | |
| Sysco Corp. | | | 2,852 | | | | 241,593 | |
| GOLD—0.2% | | | | | | | | |
| Newmont Corp. | | | 1,763 | | | | 105,198 | |
| HEALTHCARE EQUIPMENT—0.5% | | | | | | | | |
| Medtronic PLC | | | 2,865 | | | | 257,134 | |
| THE ALGER PORTFOLIOS | |
| Schedule of Investments June 30, 2022 (Unaudited) (Continued) |
| COMMON STOCKS—61.4% (CONT.) | | SHARES | | | VALUE | |
| HEALTHCARE SERVICES—1.0% | | | | | | |
| CVS Health Corp. | | | 5,659 | | | $ | 524,363 | |
| HOME IMPROVEMENT RETAIL—1.6% | | | | | | | | |
| The Home Depot, Inc. | | | 3,093 | | | | 848,317 | |
| HOUSEHOLD PRODUCTS—1.1% | | | | | | | | |
| The Procter & Gamble Co. | | | 4,258 | | | | 612,258 | |
| HYPERMARKETS & SUPER CENTERS—0.5% | | | | | | | | |
| Walmart, Inc. | | | 2,244 | | | | 272,826 | |
| INDUSTRIAL CONGLOMERATES—1.2% | | | | | | | | |
| Honeywell International, Inc. | | | 3,828 | | | | 665,345 | |
| INDUSTRIAL GASES—0.7% | | | | | | | | |
| Air Products & Chemicals, Inc. | | | 1,507 | | | | 362,403 | |
| INTEGRATED OIL & GAS—2.5% | | | | | | | | |
| Chevron Corp. | | | 4,514 | | | | 653,537 | |
| Exxon Mobil Corp. | | | 5,233 | | | | 448,154 | |
| TotalEnergies SE# | | | 4,927 | | | | 259,357 | |
| | | | | | | | 1,361,048 | |
| INTEGRATED TELECOMMUNICATION SERVICES—1.3% | | | | | | | | |
| AT&T, Inc. | | | 8,043 | | | | 168,581 | |
| Verizon Communications, Inc. | | | 10,096 | | | | 512,372 | |
| | | | | | | | 680,953 | |
| INTERACTIVE MEDIA & SERVICES—4.8% | | | | | | | | |
| Alphabet, Inc., Cl. A* | | | 519 | | | | 1,131,036 | |
| Alphabet, Inc., Cl. C* | | | 516 | | | | 1,128,724 | |
| Meta Platforms, Inc., Cl. A* | | | 1,861 | | | | 300,086 | |
| | | | | | | | 2,559,846 | |
| INTERNET & DIRECT MARKETING RETAIL—1.2% | | | | | | | | |
| Amazon.com, Inc.* | | | 5,800 | | | | 616,018 | |
| INVESTMENT BANKING & BROKERAGE—1.5% | | | | | | | | |
| Morgan Stanley | | | 10,656 | | | | 810,495 | |
| LEISURE FACILITIES—0.3% | | | | | | | | |
| Vail Resorts, Inc. | | | 783 | | | | 170,733 | |
| MANAGED HEALTHCARE—2.2% | | | | | | | | |
| UnitedHealth Group, Inc. | | | 2,238 | | | | 1,149,504 | |
| MULTI-LINE INSURANCE—0.3% | | | | | | | | |
| The Hartford Financial Services Group, Inc. | | | 2,582 | | | | 168,940 | |
| MULTI-UTILITIES—0.4% | | | | | | | | |
| Sempra Energy | | | 1,436 | | | | 215,788 | |
| OIL & GAS EXPLORATION & PRODUCTION—0.3% | | | | | | | | |
| Pioneer Natural Resources Co. | | | 731 | | | | 163,071 | |
| OIL & GAS STORAGE & TRANSPORTATION—0.3% | | | | | | | | |
| ONEOK, Inc. | | | 2,628 | | | | 145,854 | |
| |
| Schedule of Investments June 30, 2022 (Unaudited) (Continued) |
| COMMON STOCKS—61.4% (CONT.) | | SHARES | | | VALUE | |
| PHARMACEUTICALS—5.1% | | | | | | |
| AstraZeneca PLC# | | | 5,015 | | | $ | 331,341 | |
| Bristol-Myers Squibb Co. | | | 3,475 | | | | 267,575 | |
| Eli Lilly & Co. | | | 1,173 | | | | 380,322 | |
| GSK PLC# | | | 4,905 | | | | 213,515 | |
| Johnson & Johnson | | | 4,027 | | | | 714,833 | |
| Merck & Co., Inc. | | | 2,724 | | | | 248,347 | |
| Novartis AG# | | | 2,108 | | | | 178,189 | |
| Pfizer, Inc. | | | 6,956 | | | | 364,703 | |
| | | | | | | | 2,698,825 | |
| RAILROADS—0.5% | | | | | | | | |
| Union Pacific Corp. | | | 1,184 | | | | 252,524 | |
| RESTAURANTS—1.0% | | | | | | | | |
| McDonald’s Corp. | | | 1,234 | | | | 304,650 | |
| Starbucks Corp. | | | 2,764 | | | | 211,142 | |
| | | | | | | | 515,792 | |
| SEMICONDUCTOR EQUIPMENT—1.6% | | | | | | | | |
| KLA Corp. | | | 2,600 | | | | 829,608 | |
| SEMICONDUCTORS—3.0% | | | | | | | | |
| Broadcom, Inc. | | | 1,602 | | | | 778,268 | |
| QUALCOMM, Inc. | | | 4,759 | | | | 607,915 | |
| Taiwan Semiconductor Manufacturing Co., Ltd.# | | | 2,951 | | | | 241,244 | |
| | | | | | | | 1,627,427 | |
| SOFT DRINKS—2.2% | | | | | | | | |
| PepsiCo, Inc. | | | 3,863 | | | | 643,808 | |
| The Coca-Cola Co. | | | 8,784 | | | | 552,601 | |
| | | | | | | | 1,196,409 | |
| SYSTEMS SOFTWARE—5.5% | | | | | | | | |
| Microsoft Corp. | | | 11,454 | | | | 2,941,731 | |
| TECHNOLOGY HARDWARE STORAGE & PERIPHERALS—5.1% | |
| Apple, Inc. | | | 19,929 | | | | 2,724,693 | |
| TOBACCO—0.8% | | | | | | | | |
| Altria Group, Inc. | | | 5,538 | | | | 231,322 | |
| Philip Morris International, Inc. | | | 2,015 | | | | 198,961 | |
| | | | | | | | 430,283 | |
| TOTAL COMMON STOCKS | | | | | | | | |
(Cost $17,012,568) | | | | | | | 32,752,714 | |
| MASTER LIMITED PARTNERSHIP—0.4% | | SHARES | | | VALUE | |
| OIL & GAS STORAGE & TRANSPORTATION—0.4% | | | | | | | | |
Cheniere Energy Partners LP | | | 4,434 | | | | 198,954 | |
| (Cost $147,024) | | | | | | | 198,954 | |
| REAL ESTATE INVESTMENT TRUST—3.0% | | SHARES | | | VALUE | |
| HEALTHCARE—0.4% | | | | | | | | |
Welltower, Inc. | | | 2,974 | | | | 244,909 | |
| INDUSTRIAL—0.3% | | | | | | | | |
| Prologis, Inc. | | | 1,262 | | | | 148,474 | |
| MORTGAGE—0.5% | | | | | | | | |
| Blackstone Mortgage Trust, Inc., Cl. A | | | 8,983 | | | | 248,560 | |
| THE ALGER PORTFOLIOS | ALGER BALANCED PORTFOLIO |
| Schedule of Investments June 30, 2022 (Unaudited) (Continued) |
| REAL ESTATE INVESTMENT TRUST—3.0% (CONT.) | | SHARES | | | VALUE | |
| RETAIL—0.4% | | | | | | |
Simon Property Group, Inc. | | | 2,371 | | | $ | 225,055 | |
| SPECIALIZED—1.4% | | | | | | | | |
Crown Castle International Corp. | | | 3,235 | | | | 544,709 | |
Lamar Advertising Co., Cl. A | | | 2,052 | | | | 180,515 | |
| | | | | | | | 725,224 | |
| TOTAL REAL ESTATE INVESTMENT TRUST | | | | | | | | |
| (Cost $1,292,653) | | | | | | | 1,592,222 | |
| CORPORATE BONDS—30.1% | | PRINCIPAL AMOUNT | | | VALUE | |
| AGRICULTURAL & FARM MACHINERY—1.8% | | | | | | | | |
John Deere Capital Corp., 2.125%, 3/7/25 | | | 1,000,000 | | | | 966,935 | |
| APPLICATION SOFTWARE—1.8% | | | | | | | | |
Salesforce, Inc., 0.625%, 7/15/24 | | | 1,000,000 | | | | 947,846 | |
| AUTOMOBILE MANUFACTURERS—1.8% | | | | | | | | |
General Motors Financial Co., Inc., 1.5%, 6/10/26 | | | 500,000 | | | | 437,667 | |
Toyota Motor Credit Corp., 0.45%, 7/22/22 | | | 500,000 | | | | 499,624 | |
| | | | | | | | 937,291 | |
| BIOTECHNOLOGY—1.8% | | | | | | | | |
AbbVie, Inc., 3.6%, 5/14/25 | | | 1,000,000 | | | | 985,970 | |
| DATA PROCESSING & OUTSOURCED SERVICES—0.9% | | | | | | | | |
PayPal Holdings, Inc., 1.35%, 6/1/23 | | | 500,000 | | | | 491,819 | |
| DIVERSIFIED BANKS—2.8% | | | | | | | | |
Bank of America Corp., 1.938%, 5/28/24+ | | | | | | | | |
(3-Month BSBY + 0.43%) | | | 500,000 | | | | 492,330 | |
Wells Fargo & Co., 3.3%, 9/9/24 | | | 1,000,000 | | | | 988,565 | |
| | | | | | | | 1,480,895 | |
| ELECTRIC UTILITIES—0.9% | | | | | | | | |
NextEra Energy Capital Holdings, Inc. , 1.775%, 2/22/23+ | | | | | | | | |
| (3-Month LIBOR + 0.27%) | | | 500,000 | | | | 496,946 | |
| ELECTRICAL COMPONENTS & EQUIPMENT—0.9% | | | | | | | | |
Rockwell Automation, Inc., 0.35%, 8/15/23 | | | 500,000 | | | | 484,385 | |
| HEALTHCARE SERVICES—0.9% | | | | | | | | |
GSK Consumer Healthcare Capital UK PLC, 3.125%, 3/24/25(a) | | | 500,000 | | | | 487,983 | |
| HOME IMPROVEMENT RETAIL—0.9% | | | | | | | | |
The Home Depot, Inc., 2.7%, 4/15/25 | | | 500,000 | | | | 491,491 | |
| LIFE SCIENCES TOOLS & SERVICES—0.9% | | | | | | | | |
Thermo Fisher Scientific, Inc., 0.797%, 10/18/23 | | | 500,000 | | | | 485,026 | |
| MANAGED HEALTHCARE—1.9% | | | | | | | | |
UnitedHealth Group, Inc., 3.7%, 5/15/27 | | | 1,000,000 | | | | 996,360 | |
| PACKAGED FOODS & MEATS—1.0% | | | | | | | | |
Nestle Holdings, Inc., 0.606%, 9/14/24 | | | 550,000 | | | | 520,208 | |
| RESTAURANTS—0.9% | | | | | | | | |
Starbucks Corp. , 1.641%, 2/14/24+ | | | | | | | | |
| (1-Day SOFR + 0.42%) | | | 500,000 | | | | 497,132 | |
| SEMICONDUCTOR EQUIPMENT—1.0% | | | | | | | | |
KLA Corp., 4.65%, 11/1/24 | | | 500,000 | | | | 508,116 | |
| THE ALGER PORTFOLIOS | ALGER BALANCED PORTFOLIO |
| Schedule of Investments June 30, 2022 (Unaudited) (Continued) |
CORPORATE BONDS—30.1% (CONT.) | | PRINCIPAL AMOUNT | | | VALUE | |
| SEMICONDUCTORS—4.7% | | | | | | |
Altera Corp., 4.1%, 11/15/23 | | | 1,500,000 | | | $ | 1,518,485 | |
NVIDIA Corp., 0.309%, 6/15/23 | | | 1,000,000 | | | | 973,177 | |
| | | | | | | | 2,491,662 | |
| SPECIALIZED—2.2% | | | | | | | | |
Crown Castle International Corp., 3.2%, 9/1/24 | | | 1,200,000 | | | | 1,177,290 | |
| SYSTEMS SOFTWARE—0.9% | | | | | | | | |
VMware, Inc., 0.6%, 8/15/23 | | | 500,000 | | | | 483,685 | |
| TECHNOLOGY HARDWARE STORAGE & PERIPHERALS—2.1% | |
Apple, Inc., 1.125%, 5/11/25 | | | 1,200,000 | | | | 1,129,021 | |
| TOTAL CORPORATE BONDS | | | | | | | | |
| (Cost $16,568,550) | | | | | | | 16,060,061 | |
| Total Investments | | | | | | | | |
| (Cost $35,020,795) | | | 94.9 | % | | $ | 50,603,951 | |
| Unaffiliated Securities (Cost $35,020,795) | | | | | | | 50,603,951 | |
Other Assets in Excess of Liabilities | | | 5.1 | % | | | 2,724,177 | |
| NET ASSETS | | | 100.0 | % | | $ | 53,328,128 | |
| # | American Depositary Receipts. |
| (a) | Pursuant to Securities and Exchange Commission Rule 144A, this security may be sold prior to its maturity only to qualified institutional buyers. This security represents 0.9% of the net assets of the Portfolio. |
| + | Variable rate securities based on reference index and spread. The rate reported is the rate in effect as of June 30, 2022. |
| * | Non-income producing security. |
See Notes to Financial Statements.
ALGER BALANCED PORTFOLIO
Statement of Assets and Liabilities June 30, 2022 (Unaudited)
| | | Alger Balanced Portfolio | |
| ASSETS: | | | |
| Investments in unaffiliated securities, at value (Identified cost below)* see accompanying schedule of investments | | $ | 50,603,951 | |
| Cash and cash equivalents | | | 2,784,535 | |
| Receivable for shares of beneficial interest sold | | | 24,046 | |
| Dividends and interest receivable | | | 114,902 | |
| Prepaid expenses | | | 26,950 | |
| Total Assets | | | 53,554,384 | |
| | | | | |
| LIABILITIES: | | | | |
| Payable for investment securities purchased | | | 73,928 | |
| Payable for shares of beneficial interest redeemed | | | 68,605 | |
| Accrued investment advisory fees | | | 31,657 | |
| Accrued shareholder administrative fees | | | 446 | |
| Accrued administrative fees | | | 1,226 | |
| Accrued custodian fees | | | 1,293 | |
| Accrued transfer agent fees | | | 755 | |
| Accrued printing fees | | | 19,429 | |
| Accrued professional fees | | | 18,022 | |
| Accrued fund accounting fees | | | 10,013 | |
| Accrued other expenses | | | 882 | |
| Total Liabilities | | | 226,256 | |
| NET ASSETS | | $ | 53,328,128 | |
| | | | | |
| NET ASSETS CONSIST OF: | | | | |
| Paid in capital (par value of $.001 per share) | | | 35,296,620 | |
| Distributable earnings | | | 18,031,508 | |
| NET ASSETS | | $ | 53,328,128 | |
| * Identified cost | | $ | 35,020,795 | (a) |

See Notes to Financial Statements.
(a) At June 30, 2022, the net unrealized appreciation on investments, based on cost for federal income tax purposes of $34,864,250, amounted to $15,739,701, which consisted of aggregate gross unrealized appreciation of $16,819,787 and aggregate gross unrealized depreciation of $1,080,086.
ALGER BALANCED PORTFOLIO
Statement of Assets and Liabilities June 30, 2022 (Unaudited) (Continued)
| | | Alger Balanced Portfolio | |
| NET ASSETS BY CLASS: | | | |
| Class I-2 | | $ | 53,328,128 | |
| SHARES OF BENEFICIAL INTEREST OUTSTANDING — NOTE 6: | |
| Class I-2 | | | 3,124,377 | |
| NET ASSET VALUE PER SHARE: | | | | |
| Class I-2 | | $ | 17.07 | |
See Notes to Financial Statements.
ALGER BALANCED PORTFOLIO
Statement of Operations for the six months ended June 30, 2022 (Unaudited)
| | | Alger Balanced Portfolio | |
| INCOME: | | | |
| Dividends (net of foreign withholding taxes*) | | $ | 436,702 | |
| Interest | | | 133,633 | |
| Total Income | | | 570,335 | |
EXPENSES: | | | | |
| Investment advisory fees — Note 3(a) | | | 203,368 | |
| Shareholder administrative fees — Note 3(f) | | | 2,864 | |
| Administration fees — Note 3(b) | | | 7,877 | |
| Custodian fees | | | 3,114 | |
| Transfer agent fees | | | 2,455 | |
| Professional fees | | | 22,291 | |
| Registration fees | | | 11,296 | |
| Trustee fees — Note 3(g) | | | 1,058 | |
| Fund accounting fees | | | 30,984 | |
| Other expenses | | | 1,633 | |
| Total Expenses | | | 286,940 | |
| NET INVESTMENT INCOME | | | 283,395 | |
| | | | | |
| REALIZED AND UNREALIZED GAIN (LOSS) ON INVESTMENTS: | | | | |
| Net realized gain on unaffiliated investments | | | 906,718 | |
| Net change in unrealized depreciation on unaffiliated investments | | | (9,129,079 | ) |
| Net realized and unrealized loss on investments | | | (8,222,361 | ) |
| NET DECREASE IN NET ASSETS RESULTING FROM OPERATIONS | | $ | (7,938,966 | ) |
| * Foreign withholding taxes | | $ | 2,865 | |
See Notes to Financial Statements.
Statements of Changes in Net Assets (Unaudited)
| | | Alger Balanced Portfolio | |
| | | For the Six Months Ended June 30, 2022 | | | For the Year Ended December 31, 2021 | |
Net investment income | | $ | 283,395 | | | $ | 501,126 | |
Net realized gain on investments | | | 906,718 | | | | 2,693,011 | |
Net change in unrealized appreciation (depreciation) on investments | | | (9,129,079 | ) | | | 6,791,869 | |
Net increase (decrease) in net assets resulting from operations | | | (7,938,966 | ) | | | 9,986,006 | |
| | | | | | | | | |
Dividends and distributions to shareholders: | | | | | | | | |
| Class I-2 | | | — | | | | (2,215,274 | ) |
Total dividends and distributions to shareholders | | | — | | | | (2,215,274 | ) |
| | |
Increase (decrease) from shares of beneficial interest transactions — Note 6: | |
| Class I-2 | | | (1,053,819 | ) | | | 2,244,761 | |
Total increase (decrease) | | | (8,992,785 | ) | | | 10,015,493 | |
| | | | | | | | | |
Net Assets: | | | | | | | | |
| Beginning of period | | | 62,320,913 | | | | 52,305,420 | |
| END OF PERIOD | | $ | 53,328,128 | | | $ | 62,320,913 | |
See Notes to Financial Statements.
THE ALGER PORTFOLIOS
Financial Highlights for a share outstanding throughout the period (Unaudited)
| Alger Balanced Portfolio | | Class I-2 | |
| | Six months ended 6/30/2022(i) | | | Year ended 12/31/2021 | | | Year ended 12/31/2020 | | | Year ended 12/31/2019 | | | Year ended 12/31/2018 | | | Year ended 12/31/2017 | |
| Net asset value, beginning of period | | $ | 19.59 | | | $ | 17.05 | | | $ | 15.71 | | | $ | 13.67 | | | $ | 17.20 | | | $ | 15.32 | |
| INCOME FROM INVESTMENT OPERATIONS: | | | | | | | | | | | | | | | | | | | | | | | | |
Net investment income(ii) | | | 0.09 | | | | 0.16 | | | | 0.21 | | | | 0.25 | | | | 0.28 | | | | 0.29 | |
| Net realized and unrealized gain (loss) on investments | | | (2.61 | ) | | | 3.09 | | | | 1.39 | | | | 2.41 | | | | (0.84 | ) | | | 2.08 | |
| Total from investment operations | | | (2.52 | ) | | | 3.25 | | | | 1.60 | | | | 2.66 | | | | (0.56 | ) | | | 2.37 | |
| Dividends from net investment income | | | – | | | | (0.16 | ) | | | (0.20 | ) | | | (0.23 | ) | | | (0.72 | ) | | | (0.49 | ) |
| Distributions from net realized gains | | | – | | | | (0.55 | ) | | | (0.06 | ) | | | (0.39 | ) | | | (2.25 | ) | | | – | |
| Net asset value, end of period | | $ | 17.07 | | | $ | 19.59 | | | $ | 17.05 | | | $ | 15.71 | | | $ | 13.67 | | | $ | 17.20 | |
| Total return | | | (12.86 | )% | | | 19.12 | % | | | 10.23 | % | | | 19.50 | % | | | (3.32 | )% | | | 15.44 | % |
| RATIOS/SUPPLEMENTAL DATA: | | | | | | | | | | | | | | | | | | | | | | | | |
| Net assets, end of period (000’s omitted) | | $ | 53,328 | | | $ | 62,321 | | | $ | 52,305 | | | $ | 49,475 | | | $ | 42,037 | | | $ | 47,501 | |
| Ratio of net expenses to average net assets | | | 1.00 | % | | | 1.09 | % | | | 1.07 | % | | | 1.10 | % | | | 1.14 | % | | | 0.96 | % |
| Ratio of net investment income to average net assets | | | 0.99 | % | | | 0.88 | % | | | 1.34 | % | | | 1.67 | % | | | 1.61 | % | | | 1.77 | % |
| Portfolio turnover rate | | | 5.83 | % | | | 11.10 | % | | | 15.41 | % | | | 5.71 | % | | | 5.04 | % | | | 10.89 | % |
See Notes to Financial Statements.
| (i) | Ratios have been annualized; total return and portfolio turnover rate have not been annualized. |
| (ii) | Amount was computed based on average shares outstanding during the period. |
| THE ALGER PORTFOLIOS | Alger Balanced Portfolio |
NOTES TO FINANCIAL STATEMENTS (Unaudited) |
The Alger Portfolios (the “Fund”) is an open-end registered investment company organized as a business trust under the laws of the Commonwealth of Massachusetts. The Fund qualifies as an investment company as defined in Financial Accounting Standards Board (“FASB”) Accounting Standards Codification 946 – Financial Services – Investment Companies. The Fund operates as a series company currently offering seven series of shares of beneficial interest: Alger Capital Appreciation Portfolio, Alger Large Cap Growth Portfolio, Alger Growth & Income Portfolio, Alger Mid Cap Growth Portfolio, Alger Weatherbie Specialized Growth Portfolio, Alger Small Cap Growth Portfolio and Alger Balanced Portfolio (collectively, the “Portfolios”). These financial statements include only the Alger Balanced Portfolio (the “Portfolio”). The Portfolio’s investment objective is current income and long-term capital appreciation which it seeks to achieve through investing in equity and fixed-income securities. Shares of the Portfolio are available to investment vehicles for variable annuity contracts and variable life insurance policies offered by separate accounts of life insurance companies, as well as qualified pension and retirement plans.
NOTE 2 — Significant Accounting Policies: |
(a) Investment Valuation: The Portfolio values its financial instruments at fair value using independent dealers or pricing services under policies approved by the Fund’s Board of Trustees (the “Board”). Investments held by the Portfolio are valued on each day the New York Stock Exchange (the “NYSE”) is open, as of the close of the NYSE (normally 4:00 p.m. Eastern Time).
Investments in money market funds and short-term securities held by the Portfolio having a remaining maturity of sixty days or less are valued at amortized cost which approximates market value.
Equity securities, including traded rights, warrants and option contracts for which valuation information is readily available, are valued at the last quoted sales price or official closing price on the primary market or exchange on which they are traded as reported by an independent pricing service. In the absence of quoted sales, such securities are valued at the bid price or, in the absence of a recent bid price, the equivalent as obtained from one or more of the major market makers for the securities to be valued.
Debt securities generally trade in the over-the-counter market. Debt securities with remaining maturities of more than sixty days at the time of acquisition are valued on the basis of the last available bid prices or current market quotations provided by dealers or pricing services. In determining the value of a particular investment, pricing services may use certain information with respect to transactions in such investments, quotations from dealers, pricing matrixes, market transactions in comparable investments, various relationships observed in the market between investments and calculated yield measures based on valuation technology commonly employed in the market for such investments. Asset-backed and mortgage-backed securities are valued by independent pricing services using models that consider estimated cash flows of each tranche of the security, establish a benchmark yield and develop an estimated tranche-specific spread to the benchmark yield based on the unique attributes of the tranche. Debt securities with a remaining maturity of sixty days or less are valued at amortized cost which approximates market value.
| THE ALGER PORTFOLIOS | Alger Balanced Portfolio |
NOTES TO FINANCIAL STATEMENTS (Unaudited) (Continued) |
Securities for which market quotations are not readily available are valued at fair value, as determined in good faith pursuant to procedures established by the Board and described further herein.
Securities in which the Portfolio invests may be traded in foreign markets that close before the close of the NYSE. Developments that occur between the close of the foreign markets and the close of the NYSE may result in adjustments to the closing prices to reflect what the Portfolio’s investment adviser, pursuant to policies established by the Board, believes to be the fair value of these securities as of the close of the NYSE. The Portfolio may also fair value securities in other situations, for example, when a particular foreign market is closed but the Portfolio is open.
FASB Accounting Standards Codification 820 – Fair Value Measurements and Disclosures (“ASC 820”) defines fair value as the price that the Portfolio would receive upon selling an investment in a timely transaction to an independent buyer in the principal or most advantageous market of the investment. ASC 820 established a three-tier hierarchy to maximize the use of observable market data and minimize the use of unobservable inputs and to establish classification of fair value measurements for disclosure purposes. Inputs refer broadly to the assumptions that market participants would use in pricing the asset or liability and may be observable or unobservable. Observable inputs are based on market data obtained from sources independent of the Portfolio. Unobservable inputs are inputs that reflect the Portfolio’s own assumptions based on the best information available in the circumstances. The three-tier hierarchy of inputs is summarized in the three broad Levels listed below.
| • | Level 1 – quoted prices in active markets for identical investments |
| • | Level 2 – significant other observable inputs (including quoted prices for similar investments, amortized cost, interest rates, prepayment speeds, credit risk, etc.) |
| • | Level 3 – significant unobservable inputs (including the Portfolio’s own assumptions in determining the fair value of investments) |
The Portfolio’s valuation techniques are generally consistent with either the market or the income approach to fair value. The market approach considers prices and other relevant information generated by market transactions involving identical or comparable assets to measure fair value. The income approach converts future amounts to a current, or discounted, single amount. These fair value measurements are determined on the basis of the value indicated by current market expectations about such future events. Inputs for Level 1 include exchange-listed prices and broker quotes in an active market. Inputs for Level 2 include the last trade price in the case of a halted security, an exchange-listed price which has been adjusted for fair value factors, and prices of closely related securities. Additional Level 2 inputs include an evaluated price which is based upon a compilation of observable market information such as spreads for fixed income and preferred securities. Inputs for Level 3 include, but are not limited to, revenue multiples, earnings before interest, taxes, depreciation and amortization (“EBITDA”) multiples, discount rates, time to exit and the probabilities of success of certain outcomes. Such unobservable market information may be obtained from a company’s financial statements and from industry studies, market data, and market indicators such as benchmarks and indexes. Because of the inherent uncertainty and often limited markets for restricted securities, the valuations assigned to such securities by the Portfolio may significantly differ from the valuations that would have been assigned by the Portfolio had there been an active market for such securities.
| THE ALGER PORTFOLIOS | Alger Balanced Portfolio |
NOTES TO FINANCIAL STATEMENTS (Unaudited) (Continued) |
Valuation processes are determined by a Valuation Committee (“Committee”) authorized by the Board and comprised of representatives of the Portfolio’s investment adviser and officers of the Fund. The Committee reports its fair value determinations and related valuation information to the Board. The Board is responsible for approving the valuation policy and procedures.
While Committee meetings are held on an as-needed basis, the Committee generally meets quarterly to review and evaluate the effectiveness of the procedures for making fair value determinations. The Committee considers, among other things, the results of quarterly back testing of the fair value model for foreign securities, pricing comparisons between primary and secondary price sources, the outcome of price challenges put to the Portfolio’s pricing vendor, and variances between transactional prices and the previous day’s prices.
In December 2020, the Securities and Exchange Commission (the “SEC”) adopted Rule 2a-5 under the Investment Company Act of 1940, as amended (the “1940 Act”), which is intended to address valuation practices and the role of the board of directors with respect to the fair value of the investments of a registered investment company. Among other things, Rule 2a-5 will permit the Board to designate the Fund’s investment adviser, Fred Alger Management, LLC (“Alger Management” or the “Investment Manager”), to perform the Portfolio’s fair value determinations, which will be subject to the Board’s oversight and certain reporting and other requirements intended to ensure that the Board receives the information it needs to oversee the Investment Manager’s fair value determinations. Compliance with Rule 2a-5 will not be required until September 2022. The Fund, the Board, and the Investment Manager are currently in the process of implementing the requirements of Rule 2a-5 by the deadline.
(b) Cash and Cash Equivalents: Cash and cash equivalents include U.S. dollars, foreign cash and overnight time deposits.
(c) Securities Transactions and Investment Income: Securities transactions are recorded on a trade date basis. Realized gains and losses from securities transactions are recorded on the identified cost basis. Dividend income is recognized on the ex-dividend date and interest income is recognized on the accrual basis.
Premiums and discounts on debt securities purchased are amortized or accreted over the lives of the respective securities.
| THE ALGER PORTFOLIOS | Alger Balanced Portfolio |
NOTES TO FINANCIAL STATEMENTS (Unaudited) (Continued) |
(d) Foreign Currency Transactions: The books and records of the Portfolio are maintained in U.S. dollars. Foreign currencies, investments and other assets and liabilities are translated into U.S. dollars at the prevailing rates of exchange on the valuation date. Purchases and sales of investment securities and income and expenses are translated into U.S. dollars at the prevailing exchange rates on the respective dates of such transactions.
Net realized gains and losses on foreign currency transactions represent net gains and losses from the disposition of foreign currencies, currency gains and losses realized between the trade dates and settlement dates of security transactions, and the difference between the amount of net investment income accrued and the U.S. dollar amount actually received. The effects of changes in foreign currency exchange rates on investments in securities are included in realized and unrealized gain or loss on investments in the accompanying Statement of Operations.
(e) Lending of Fund Securities: The Portfolio may lend its securities to financial institutions, provided that the market value of the securities loaned will not at any time exceed one third of the Portfolio’s total assets including borrowings, as defined in its prospectus. The Portfolio earns fees on the securities loaned, which are included in interest income in the accompanying Statement of Operations. In order to protect against the risk of failure by the borrower to return the securities loaned or any delay in the delivery of such securities, the loan is collateralized by cash or securities that are maintained with Brown Brothers Harriman & Company, the Portfolio’s custodian (“BBH” or the “Custodian”), in an amount equal to at least 102% of the current market value of U.S. loaned securities or 105% for non-U.S. loaned securities. The market value of the loaned securities is determined at the close of business of the Portfolio. Any required additional collateral is delivered to the Custodian each day and any excess collateral is returned to the borrower on the next business day. In the event the borrower fails to return the loaned securities when due, the Portfolio may take the collateral to replace the securities. If the value of the collateral is less than the purchase cost of replacement securities, the Custodian shall be responsible for any shortfall, but only to the extent that the shortfall is not due to any diminution in collateral value, as defined in the securities lending agreement. The Portfolio is required to maintain the collateral in a segregated account and determine its value each day until the loaned securities are returned. Cash collateral may be invested as determined by the Portfolio. Collateral is returned to the borrower upon settlement of the loan. There were no securities loaned as of June 30, 2022.
(f) Dividends to Shareholders: Dividends and distributions payable to shareholders are recorded by the Portfolio on the ex-dividend date.
Dividends from net investment income, if available, are declared and paid annually. Dividends from net realized gains, offset by any loss carryforward, are declared and paid annually after the end of the fiscal year in which they were earned.
The characterization of distributions to shareholders for financial reporting purposes is determined in accordance with federal income tax rules. Therefore, the source of the Portfolio’s distributions may be shown in the accompanying financial statements as either from, or in excess of, net investment income, net realized gain on investment transactions, or return of capital, depending on the type of book/tax differences that may exist. Capital accounts within the financial statements are adjusted for permanent book/tax differences. Reclassifications result primarily from the differences in tax treatment of net operating losses, passive foreign investment companies, and foreign currency transactions. The reclassifications are done annually at year-end and have no impact on the net asset value of the Portfolio and are designed to present the Portfolio’s capital accounts on a tax basis.
| THE ALGER PORTFOLIOS | Alger Balanced Portfolio |
NOTES TO FINANCIAL STATEMENTS (Unaudited) (Continued) |
(g) Federal Income Taxes: It is the Portfolio’s policy to comply with the requirements of the Internal Revenue Code Subchapter M applicable to regulated investment companies and to distribute all of its taxable income to its shareholders. Provided that the Portfolio maintains such compliance, no federal income tax is required.
FASB Accounting Standards Codification 740 – Income Taxes (“ASC 740”) requires the Portfolio to measure and recognize in its financial statements the benefit of a tax position taken (or expected to be taken) on an income tax return if such position will more likely than not be sustained upon examination based on the technical merits of the position. No tax years are currently under investigation. The Portfolio files income tax returns in the U.S. Federal jurisdiction, as well as the New York State and New York City jurisdictions. The statute of limitations on the Portfolio’s tax returns remains open for the tax years 2018-2021. Management does not believe there are any uncertain tax positions that require recognition of a tax liability.
(h) Allocation Methods: The Fund accounts separately for the assets, liabilities and operations of the Portfolio. Expenses directly attributable to the Portfolio are charged to the Portfolio’s operations; expenses which are applicable to all Portfolios are allocated among them based on net assets.
(i) Estimates: These financial statements have been prepared in accordance with accounting principles generally accepted in the United States of America, which require using estimates and assumptions that affect the reported amounts therein. These unaudited interim financial statements reflect all adjustments that are, in the opinion of management, necessary to present a fair statement of results for the interim period. Actual results may differ from those estimates. All such estimates are of a normal recurring nature.
NOTE 3 — Investment Advisory Fees and Other Transactions with Affiliates:
|
(a) Investment Advisory Fees: Fees incurred by the Portfolio, pursuant to the provisions of the Fund’s Investment Advisory Agreement with the Investment Manager, are payable monthly and computed based on the following rates. The actual rate paid as a percentage of average daily net assets, for the six months ended June 30, 2022, is set forth below under the heading “Actual Rate”:
| | | Tier 1 | | | Tier 2 | | | Actual Rate | |
Alger Balanced Portfolio(a) | | | 0.71 | % | | | 0.55 | % | | | 0.71 | % |
(a) | Tier 1 rate is paid on assets up to $1 billion and Tier 2 rate is paid on assets in excess of $1 billion. |
| THE ALGER PORTFOLIOS | Alger Balanced Portfolio |
NOTES TO FINANCIAL STATEMENTS (Unaudited) (Continued) |
(b) Administration Fees: Fees incurred by the Portfolio, pursuant to the provisions of the Fund’s Fund Administration Agreement with Alger Management, are payable monthly and computed based on the average daily net assets of the Portfolio at the annual rate of 0.0275%.
(c) Brokerage Commissions: During the six months ended June 30, 2022, there were no payments to Fred Alger & Company, LLC, the Fund’s distributor and affiliate of Alger Management (the “Distributor”), in connection with securities transactions.
(d) Interfund Loans: The Portfolio, along with other funds in the Alger Fund Complex (as defined below), may borrow money from and lend money to each other for temporary or emergency purposes. To the extent permitted under its investment restrictions, the Portfolio may lend uninvested cash in an amount up to 15% of its net assets to other funds in the Alger Fund Complex. If the Portfolio has borrowed from other funds in the Alger Fund Complex and has aggregate borrowings from all sources that exceed 10% of the Portfolio’s total assets, the Portfolio will secure all of its loans from other funds in the Alger Fund Complex. The interest rate charged on interfund loans is equal to the average of the overnight time deposit rate and bank loan rate available to the Portfolio. There were no interfund loans outstanding as of June 30, 2022.
(e) Other Transactions with Affiliates: Certain officers and one Trustee of the Fund are directors and/or officers of Alger Management, the Distributor, or their affiliates. No shares of the Portfolio were held by Alger Management and its affiliated entities as of June 30, 2022.
(f) Shareholder Administrative Fees: The Fund has entered into a Shareholder Administrative Services Agreement with Alger Management to compensate Alger Management for providing administrative oversight of the Fund’s transfer agent and for other related services. The Portfolio compensates Alger Management at the annual rate of 0.01% of the average daily net assets for these services.
(g) Trustee Fees: Effective January 1, 2022, each trustee who is not an “interested person” of the Fund, as defined in the 1940 Act (“Independent Trustee”), receives a fee of $156,000 per annum, paid pro rata based on net assets by each fund in the Alger Fund Complex, plus travel expenses incurred for attending board meetings. The term “Alger Fund Complex” refers to the Fund, The Alger Institutional Funds, The Alger Funds II, The Alger Funds, Alger Global Focus Fund and The Alger ETF Trust, each of which is a registered investment company managed by Alger Management. The Independent Trustee appointed as Chairman of the Board receives additional compensation of $22,000 per annum paid pro rata based on net assets by each fund in the Alger Fund Complex. Additionally, each member of the Audit Committee receives a fee of $13,000 per annum, paid pro rata based on net assets by each fund in the Alger Fund Complex.
Effective January 1, 2022, the Board adopted a policy requiring Trustees to receive a minimum of 10% of their annual compensation in shares of one or more of the funds in the Alger Fund Complex.
| THE ALGER PORTFOLIOS | Alger Balanced Portfolio |
NOTES TO FINANCIAL STATEMENTS (Unaudited) (Continued) |
(h) Interfund Trades: The Portfolio may engage in purchase and sale transactions with other funds advised by Alger Management or Weatherbie Capital, LLC, an affiliate of Alger Management. There were no interfund trades during the six months ended June 30, 2022.
| NOTE 4 — Securities Transactions: |
Purchases and sales of securities, other than U.S. Government securities and short-term securities, for the six months ended June 30, 2022, were as follows:
| | | PURCHASES | | | SALES | |
Alger Balanced Portfolio | | $ | 5,157,990 | | | $ | 3,201,138 | |
The Portfolio may borrow from the Custodian on an uncommitted basis. The Portfolio pays the Custodian a market rate of interest, generally based upon a rate of return with respect to each respective currency borrowed, taking into consideration relevant overnight and short-term reference rates and the range of distribution between and among the interest rates paid on deposits to other institutions, less applicable commissions, if any. The Portfolio may also borrow from other funds in the Alger Fund Complex, as discussed in Note 3(d). For the six months ended June 30, 2022, the Portfolio had no borrowings from the Custodian or other funds in the Alger Fund Complex.
On September 7, 2021, BBH announced that it had entered into an agreement with State Street Bank and Trust Company (“State Street”) to sell BBH’s Investor Services business to State Street (the “Transaction”). The completion of the Transaction is subject to customary closing conditions and regulatory approvals. If the Transaction is finalized, it is expected that State Street will replace BBH as the Fund’s custodian. The timing for completion of the Transaction is not currently known.
The Portfolio has an unlimited number of authorized shares of beneficial interest of $.001 par value. During the six months ended June 30, 2022, and the year ended December 31, 2021, transactions of shares of beneficial interest were as follows:
| | | FOR THE SIX MONTHS ENDED JUNE 30, 2022 | | | FOR THE YEAR ENDED DECEMBER 31, 2021 | |
| | | SHARES | | | AMOUNT | | | SHARES | | | AMOUNT | |
| Alger Balanced Portfolio | | | | | | | | | | | | |
| Class I-2: | | | | | | | | | | | | |
| Shares sold | | | 166,850 | | | | 3,056,494 | | | | 674,212 | | | $ | 12,942,492 | |
| Dividends reinvested | | | — | | | | — | | | | 113,896 | | | | 2,215,274 | |
| Shares redeemed | | | (223,568 | ) | | | (4,110,313 | ) | | | (675,025 | ) | | | (12,913,005 | ) |
| Net increase (decrease) | | | (56,718 | ) | | | (1,053,819 | ) | | | 113,083 | | | $ | 2,244,761 | |
| NOTE 7 — Income Tax Information: |
At December 31, 2021, the Portfolio had no capital loss carryforwards utilized for federal income tax purposes.
| THE ALGER PORTFOLIOS | Alger Balanced Portfolio |
NOTES TO FINANCIAL STATEMENTS (Unaudited) (Continued) |
The difference between book-basis and tax-basis unrealized appreciation (depreciation) is determined annually and is attributable primarily to the tax deferral of losses on wash sales, U.S. Internal Revenue Code Section 988 currency transactions, tax treatment of partnership investments, realization of unrealized appreciation of passive foreign investment companies, and return of capital from real estate investment trust investments.
The Portfolio accrues tax on unrealized gains in foreign jurisdictions that impose a foreign capital tax.
| NOTE 8 — Fair Value Measurements: |
The major categories of securities and their respective fair value inputs are detailed in the Portfolio’s Schedule of Investments. Based upon the nature, characteristics, and risks associated with its investments as of June 30, 2022, the Portfolio has determined that presenting them by security type and sector is appropriate.
| Alger Balanced Portfolio | | TOTAL | | | LEVEL 1 | | | LEVEL 2 | | | LEVEL 3 | |
| COMMON STOCKS | |
| Communication Services | | $ | 3,782,968 | | | $ | 3,782,968 | | | $ | — | | | $ | — | |
| Consumer Discretionary | | | 2,383,869 | | | | 2,383,869 | | | | — | | | | — | |
| Consumer Staples | | | 2,753,369 | | | | 2,753,369 | | | | — | | | | — | |
| Energy | | | 1,669,973 | | | | 1,669,973 | | | | — | | | | — | |
| Financials | | | 3,889,991 | | | | 3,889,991 | | | | — | | | | — | |
| Healthcare | | | 5,802,659 | | | | 5,802,659 | | | | — | | | | — | |
| Industrials | | | 2,211,348 | | | | 2,211,348 | | | | — | | | | — | |
| Information Technology | | | 9,022,353 | | | | 9,022,353 | | | | — | | | | — | |
| Materials | | | 733,019 | | | | 733,019 | | | | — | | | | — | |
| Utilities | | | 503,165 | | | | 503,165 | | | | — | | | | — | |
| TOTAL COMMON STOCKS | | $ | 32,752,714 | | | $ | 32,752,714 | | | $ | — | | | $ | — | |
| MASTER LIMITED PARTNERSHIP | |
| Energy | | | 198,954 | | | $ | 198,954 | | | | — | | | | — | |
| REAL ESTATE INVESTMENT TRUST | |
| Financials | | | 248,560 | | | | 248,560 | | | | — | | | | — | |
| Real Estate | | | 1,343,662 | | | | 1,343,662 | | | | — | | | | — | |
| TOTAL REAL ESTATE INVESTMENT TRUST | | $ | 1,592,222 | | | $ | 1,592,222 | | | $ | — | | | $ | — | |
| | |
| CORPORATE BONDS | |
| Consumer Discretionary | | | 1,925,914 | | | $ | — | | | | 1,925,914 | | | $ | — | |
| Consumer Staples | | | 520,208 | | | | — | | | | 520,208 | | | | — | |
| Financials | | | 1,480,895 | | | | — | | | | 1,480,895 | | | | — | |
| Healthcare | | | 2,955,339 | | | | — | | | | 2,955,339 | | | | — | |
| Industrials | | | 1,451,320 | | | | — | | | | 1,451,320 | | | | — | |
| Information Technology | | | 6,052,149 | | | | — | | | | 6,052,149 | | | | — | |
| Real Estate | | | 1,177,290 | | | | — | | | | 1,177,290 | | | | — | |
| Utilities | | | 496,946 | | | | — | | | | 496,946 | | | | — | |
| TOTAL CORPORATE BONDS | | $ | 16,060,061 | | | $ | — | | | $ | 16,060,061 | | | $ | — | |
| TOTAL INVESTMENTS IN SECURITIES | | $ | 50,603,951 | | | $ | 34,543,890 | | | $ | 16,060,061 | | | $ | — | |
| THE ALGER PORTFOLIOS | Alger Balanced Portfolio |
| NOTES TO FINANCIAL STATEMENTS (Unaudited) (Continued) |
The significant unobservable inputs used in the fair value measurement of the Portfolio’s securities are revenue and EBITDA multiples, discount rates, and the probability of success of certain outcomes. Significant increases and decreases in these inputs in isolation and interrelationships between these inputs would have resulted in significantly higher or lower fair value measurements than those noted in the table above. Generally, all other things being equal, increases in revenue and EBITDA multiples, decreases in discount rates, and increases in the probability of success result in higher fair value measurements, whereas decreases in revenues and EBITDA multiples, increases in discount rates, and decreases in the probability of success result in lower fair value measurements.
Certain of the Portfolio’s assets and liabilities are held at carrying amount or face value, which approximates fair value for financial reporting purposes. As of June 30, 2022, such assets were categorized within the ASC 820 disclosure hierarchy as follows:
| | | TOTAL FUND | | | LEVEL 1 | | | LEVEL 2 | | | LEVEL 3 | |
| Cash and cash equivalents: | | $ | 2,784,535 | | | $ | — | | | $ | 2,784,535 | | | $ | — | |
| NOTE 9 — Risk Disclosures: |
Investing in the stock market involves risks, including the potential loss of principal. Your investment in Portfolio shares represents an indirect investment in the securities owned by the Portfolio. The value of these securities, like other investments, may move up or down, sometimes rapidly and unpredictably. Your Portfolio shares at any point in time may be worth less than what you invested, even after taking into account the reinvestment of Portfolio dividends and distributions. Local, regional or global events such as environmental or natural disasters, war, terrorism, pandemics, outbreaks of infectious diseases and similar public health threats, recessions, or other events could have a significant impact on investments. Growth stocks may be more volatile than other stocks as their prices tend to be higher in relation to their companies’ earnings and may be more sensitive to market, political, and economic developments. The risks of investing in fixed-income securities include sensitivity to interest-rate and credit rating changes, call risk, increased volatility for lower rated securities, and pre-payment risk. Income-producing securities may cut or fail to declare dividends due to market downturns or for other reasons. Junk bonds are high risk investments that are considered speculative and may cause income and principal losses. A significant portion of assets may be invested in securities of companies in related sectors, and may be similarly affected by economic, political, or market events and conditions and may be more vulnerable to unfavorable sector developments. At times, the Portfolio may hold a large cash position, which may underperform relative to equity securities.
| NOTE 10 — Subsequent Events: |
Management of the Portfolio has evaluated events that have occurred subsequent to June 30, 2022, through the issuance date of the financial statements. No such events have been identified which require recognition and/or disclosure.
| THE ALGER PORTFOLIOS | Alger Balanced Portfolio |
ADDITIONAL INFORMATION (Unaudited) |
| Shareholder Expense Example |
As a shareholder of the Portfolio, you incur two types of costs: transaction costs, if applicable; and ongoing costs, including management fees and other fund expenses. This example is intended to help you understand your ongoing costs (in dollars) of investing in the Portfolio and to compare these costs with the ongoing costs of investing in other mutual funds.
The example below is based on an investment of $1,000 invested at the beginning of the six-month period starting January 1, 2022 and ending June 30, 2022 and held for the entire period.
The first line for each class of shares in the table below provides information about actual account values and actual expenses. You may use the information in this line, together with the amount you invested, to estimate the expenses that you paid over the period. Simply divide your account value by $1,000 (for example, an $8,600 account value divided by $1,000
= 8.6), then multiply the result by the number in the first line under the heading entitled “Expenses Paid During the Six Months Ended June 30, 2022” to estimate the expenses you paid on your account during this period.
| Hypothetical Example for Comparison Purposes |
The second line for each class of shares in the table below provides information about hypothetical account values and hypothetical expenses based on the actual expense ratio for each class of the Portfolio’s shares and an assumed rate of return of 5% per year before expenses, which is not the Portfolio’s actual return. The hypothetical account values and expenses may not be used to estimate the actual ending account balance or expenses you paid for the period. You may use this information to compare the ongoing costs of investing in the Portfolio and other funds. To do so, compare this 5% hypothetical example with the 5% hypothetical examples that appear in the shareholder reports of other funds.
Please note that the expenses shown in the table are meant to highlight your ongoing costs only and do not reflect any transactional costs or deduction of insurance charges against assets or annuities. Therefore, the second line under each class of shares in the table is useful in comparing ongoing costs only, and will not help you determine the relative total costs of owning different funds. In addition, if these transactional costs were included, your costs would have been higher.
| |
| ADDITIONAL INFORMATION (Unaudited) (Continued) |
| | Beginning Account Value January 1, 2022 | | | Ending Account Value June 30, 2022 | | | Expenses Paid During the Six Months Ended June 30, 2022(a) | | | Annualized Expense Ratio For the Six Months Ended June 30, 2022(b) | |
| Alger Balanced Portfolio | |
| Class I-2 | Actual | | $ | 1,000.00 | | | $ | 871.40 | | | $ | 4.64 | | | | 1.00 | % |
| | Hypothetical(c) | | | 1,000.00 | | | | 1,019.84 | | | | 5.01 | | | | 1.00 | |
| (a) | Expenses are equal to the annualized expense ratio of the share class, multiplied by the average account value over the period, multiplied by 181/365 (to reflect the one-half year period). |
| (c) | 5% annual return before expenses. |
| THE ALGER PORTFOLIOS | Alger Balanced Portfolio |
| ADDITIONAL INFORMATION (Unaudited) (Continued) |
| U.S. Consumer Privacy Notice | Rev. 06/22/21 |
| FACTS | WHAT DOES ALGER DO WITH YOUR PERSONAL INFORMATION? |
| Why? | Financial companies choose how they share your personal information. Federal law gives consumers the right to limit some but not all sharing. Federal law also requires us to tell you how we collect, share, and protect your personal information. Please read this notice carefully to understand what we do. |
| What? | The types of personal information we collect and share depend on the product or service you have with us. This information can include: • Social Security number and • Account balances and • Transaction history and • Purchase history and • Assets When you are no longer our customer, we continue to share your information as described in this notice. |
| How? | All financial companies need to share personal information to run their everyday business. In the section below, we list the reasons financial companies can share their personal information; the reasons Alger chooses to share; and whether you can limit this sharing. |
| Reasons we can share your personal information | Does Alger share? | Can you limit this sharing? |
For our everyday business purposes — such as to process your transactions, maintain your account(s), respond to court orders and legal investigations, or report to credit bureaus | Yes | No |
For our marketing purposes — to offer our products and services to you | Yes | No |
For joint marketing with other financial companies | No | We don’t share |
For our affiliates’ everyday business purposes — information about your transactions and experiences | Yes | No |
For our affiliates’ everyday business purposes — information about your creditworthiness | No | We don’t share |
| For nonaffiliates to market to you | No | We don’t share |
| Questions? Call 1-800-223-3810 | | |
| THE ALGER PORTFOLIOS | Alger Balanced Portfolio |
| ADDITIONAL INFORMATION (Unaudited) (Continued) |
| Who we are | |
| Who is providing this notice? | Alger includes Fred Alger Management, LLC and Fred Alger & Company, LLC as well as the following funds: The Alger Funds, The Alger Funds II, The Alger Institutional Funds, The Alger Portfolios, Alger Global Focus Fund, and The Alger ETF Trust. |
What we do | |
| How does Alger protect my personal information? | To protect your personal information from unauthorized access and use, we use security measures that comply with federal law. These measures include computer safeguards and secured files and buildings. |
| How does Alger collect my personal information? | We collect your personal information, for example, when you: • Open an account or • Make deposits or withdrawals from your account or • Give us your contact information or • Provide account information or • Pay us by check. |
| Why can’t I limit all sharing? | Federal law gives you the right to limit some but not all sharing related to: • sharing for affiliates’ everyday business purposes ─ information about your credit worthiness • affiliates from using your information to market to you • sharing for nonaffiliates to market to you State laws and individual companies may give you additional rights to limit sharing. |
Definitions |
|
| Affiliates | Companies related by common ownership or control. They can be financial and nonfinancial companies. • Our affiliates include Fred Alger Management, LLC, Weatherbie Capital, LLC and Fred Alger & Company, LLC as well as the following funds: The Alger Funds, The Alger Funds II, The Alger Institutional Funds, The Alger Portfolios, Alger Global Focus Fund, and The Alger ETF Trust. |
| Nonaffiliates | Companies not related by common ownership or control. They can be financial and nonfinancial companies. |
| Joint marketing | A formal agreement between nonaffiliated financial companies that together market financial products or services to you. |
| THE ALGER PORTFOLIOS | Alger Balanced Portfolio |
| ADDITIONAL INFORMATION (Unaudited) (Continued) |
A description of the policies and procedures the Portfolio uses to determine how to vote proxies relating to portfolio securities and the proxy voting record is available, without charge, by calling (800) 992-3863 or online on the Portfolio’s website at http://www.alger.com or on the SEC’s website at http://www.sec.gov.
The Board has adopted policies and procedures relating to disclosure of the Portfolio’s securities. These policies and procedures recognize that there may be legitimate business reasons for holdings to be disclosed and seek to balance those interests to protect the proprietary nature of the trading strategies and implementation thereof by the Portfolio.
Generally, the policies prohibit the release of information concerning portfolio holdings, which have not previously been made public, to individual investors, institutional investors, intermediaries that distribute the Portfolio’s shares and other parties which are not employed by the Investment Manager or its affiliates except when the legitimate business purposes for selective disclosure and other conditions (designed to protect the Portfolio) are acceptable.
The Portfolio files its complete schedule of portfolio holdings with the SEC semi-annually in shareholder reports on Form N-CSR and after the first and third fiscal quarters as an exhibit to its reports on Form N-PORT. The Portfolio’s Forms N-CSR and N-PORT are available online on the SEC’s website at www.sec.gov.
In addition, the Portfolio makes publicly available its month-end top 10 holdings with a 10 day lag and its month-end full portfolio with a 60 day lag on its website www.alger.com and through other marketing communications (including printed advertising/sales literature and/or shareholder telephone customer service centers). No compensation or other consideration is directly received for the non-public disclosure of portfolio holdings information.
In accordance with the foregoing, the Portfolio provides portfolio holdings information to third parties including financial intermediaries and service providers who need access to this information in the performance of their services and are subject to duties of confidentiality (1) imposed by law, including a duty not to trade on non-public information, and/or (2) pursuant to an agreement that confidential information is not to be disclosed or used (including trading on such information) other than as required by law. From time to time, the Fund will communicate with these third parties to confirm that they understand the Portfolio’s policies and procedures regarding such disclosure. These agreements must be approved by the Portfolio’s Chief Compliance Officer.
The Board periodically reviews a report disclosing the third parties to whom the Portfolio’s holdings information has been disclosed and the purpose for such disclosure, and it considers whether or not the release of information to such third parties is in the best interest of the Portfolio and its shareholders.
| THE ALGER PORTFOLIOS | Alger Balanced Portfolio |
| ADDITIONAL INFORMATION (Unaudited) (Continued) |
In addition to material the Portfolio routinely provides to shareholders, the Investment Manager may make additional statistical information available regarding the Alger Family of Funds. Such information may include, but not be limited to, relative weightings and characteristics of the Portfolio versus an index (such as P/E ratio, alpha, beta, capture ratio, maximum drawdown, standard deviation, EPS forecasts, Sharpe ratio, information ratio, R-squared, and market cap analysis), security specific impact on overall portfolio performance, month-end top ten contributors to and detractors from performance, portfolio turnover, and other similar information. Shareholders should visit www.alger.com or may also contact the Funds at (800) 992-3863 to obtain such information.
100 Pearl Street, 27th Floor
New York, NY 10004
(800) 992-3863
www.alger.com
Fred Alger Management, LLC
100 Pearl Street, 27th Floor
New York, NY 10004
Fred Alger & Company, LLC
100 Pearl Street, 27th Floor
New York, NY 10004
| Transfer Agent and Dividend Disbursing Agent |
UMB Fund Services, Inc.
235 W. Galena Street
Milwaukee, WI 53212
Brown Brothers Harriman & Company
50 Post Office Square
Boston, MA 02110
| Independent Registered Public Accounting Firm |
Deloitte & Touche LLP
30 Rockefeller Plaza
New York, NY 10112
This report is submitted for the general information of the shareholders of Alger Balanced Portfolio. It is not authorized for distribution to prospective investors unless accompanied by an effective Prospectus for the Portfolio, which contains information concerning the Portfolio’s investment policies, fees and expenses as well as other pertinent information.
(This page has been intentionally left blank)
ITEM 2. CODE OF ETHICS.
ITEM 3. AUDIT COMMITTEE FINANCIAL EXPERT.
ITEM 4. PRINCIPAL ACCOUNTANT FEES AND SERVICES.
ITEM 5. AUDIT COMMITTEE OF LISTED REGISTRANTS.
ITEM 6. INVESTMENTS.
ITEM 7. DISCLOSURE OF PROXY VOTING POLICIES AND PROCEDURES FOR CLOSED-END MANAGEMENT INVESTMENT COMPANIES.
ITEM 8. PORTFOLIO MANAGERS OF CLOSED-END MANAGEMENT INVESTMENT COMPANIES.
ITEM 9. PURCHASES OF EQUITY SECURITIES BY CLOSED-END MANAGEMENT INVESTMENT COMPANY AND AFFILIATED PURCHASERS.
ITEM 10. SUBMISSION OF MATTERS TO A VOTE OF SECURITY HOLDERS.
ITEM 11. CONTROLS AND PROCEDURES.
| | (a) The Registrant’s principal executive officer and principal financial officer have concluded that the Registrant’s disclosure controls and procedures (as defined in Rule 30a-3(c) under the Investment Company Act of 1940, as amended) are effective based on their evaluation of the disclosure controls and procedures as of a date within 90 days of the filing date of this document. |
| | (b) No changes in the Registrant’s internal control over financial reporting occurred during the Registrant’s second fiscal quarter of the period covered by this report that materially affected, or are reasonably likely to materially affect, the Registrant’s internal control over financial reporting. |
ITEM 12. Disclosure of Securities Lending Activities for Closed-End Management Investment Companies.
ITEM 13. EXHIBITS.
| | (a)(1) | Not applicable. |
| | | |
| | (a)(3) | Not applicable. |
| | (a)(4) | Not applicable. |
| | | |
SIGNATURES
Pursuant to the requirements of the Securities Exchange Act of 1934 and the Investment Company Act of 1940, the registrant has duly caused this report to be signed on its behalf by the undersigned, thereunto duly authorized.
The Alger Portfolios
Alger Balanced Portfolio
| By: | /s/ Hal Liebes |
| Name: | Hal Liebes |
| Title: | President |
| Date: | August 18, 2022 |
Pursuant to the requirements of the Securities Exchange Act of 1934 and the Investment Company Act of 1940, this report has been signed below by the following persons on behalf of the registrant and in the capacities and on the dates indicated.
| By: | /s/ Hal Liebes |
| Name: | Hal Liebes |
| Title: | President |
| Date: | August 18, 2022 |
| By: | /s/ Michael D. Martins |
| Name: | Michael D. Martins |
| Title: | Treasurer |
| Date: | August 18, 2022 |