Washington, D.C. 20549
Mr. Hal Liebes
Form N-CSR is to be used by management investment companies to file reports with the Commission, not later than 10 days after the transmission to Stockholders of any report to be transmitted to Stockholders under Rule 30e-1 under the Investment Company Act of 1940 (17 CFR 270.30e1). The Commission may use the information provided on Form N-CSR in its regulatory, disclosure review, inspection, and policymaking roles.
A registrant is required to disclose the information specified by Form N-CSR, and the Commission will make this information public. A registrant is not required to respond to the collection of information contained in Form N-CSR unless the Form displays a currently valid Office of Management and Budget (“OMB”) control number. Please direct comments concerning the accuracy of the information collection burden estimate and any suggestions for reducing the burden to the Secretary, Securities and Exchange Commission, 100 F Street, NE, Washington, DC 20549. The OMB has reviewed this collection of information under the clearance requirements of 44 U.S.C. § 3507.

Table of Contents
ALGER BALANCED PORTFOLIO
| Shareholders’ Letter (Unaudited) | June 30, 2023 |
Dear Shareholders,
“Successful investing is about managing risk, not avoiding it.” - Benjamin Graham.
After a challenging 2022, bearish investor sentiment reversed course in the first half of 2023 on the realization that 1) inflation pressures have receded, 2) declining corporate profits are expected to bottom, and 3) the market has growing optimism for a soft-landing (i.e., an economic slowdown without a recession) in the United States, with the S&P 500 Index up 16.89% over the six months ended June 30, 2023.
At the end of June 2023, the price-to-earnings (P/E) multiple for the S&P 500 Index had expanded to 19.1x, from 16.7x at the beginning of the year, while the consensus estimated earnings growth for 2023 had declined approximately 3% over the first six months of the year. Given the low profit expectations during the first half of 2023, corporate earnings and guidance came in better-than-feared, driven by some notable themes including pricing power, margin expansion, normalization of supply chains, and consumer resilience. Further, a surge of enthusiasm around artificial intelligence (“AI”) contributed to outsized returns for certain of the largest companies within the Information Technology and Consumer Discretionary sectors. However, not all sectors shared in this rally, as the Energy and Utilities sectors underperformed the S&P 500 Index. Market breadth (i.e., the number of stocks advancing relative to those declining) collapsed at the end of June with only 32% of stocks outperforming the S&P 500 Index over the three months ended June 30, 2023, the lowest level since March 2000. While there were several factors that drove equity markets higher, the two most prominent, in our view, were the increased expectation of a soft-landing and the growing excitement around AI adoption.
As we moved into 2023, the first quarter saw an abrupt reversal in bearish investor sentiment that had marked much of the previous year. In February, the U.S. Federal Reserve (the “Fed”) reduced the pace of rate hikes to 25 basis points (“bps”), after a 50 bp hike in December 2022. Further, at the February Federal Open Market Committee meeting, Fed Chair Jerome Powell acknowledged the disinflation trend, which caused U.S. Treasury yields across the curve to fall. In March, concerns around bank funding and liquidity emerged following the collapse of two regional banks, leading to significant deposit outflows at the regional level. The Fed, U.S. Treasury, and Federal Deposit Insurance Corporation (FDIC) took steps to alleviate these market concerns, including the announcement of an emergency liquidity program, guarantee of uninsured deposits at the two collapsed banks, and allowing some bank mergers and acquisitions to take place.
Transitioning into the second quarter, U.S. economic data released in June reinforced the soft-landing narrative with signs of 1) disinflation, as evidenced by the May Consumer Price Index (“CPI”) coming in softer than expected, with headline CPI posting the lowest annual increase in more than two years, 2) resilient labor markets, as May payrolls beat estimates for a 14th straight month, and 3) a stronger housing market, with builder confidence the highest in nearly a year, housing starts the highest in over a year, and multi-unit starts the highest in nearly four decades. On the monetary policy front, the Fed hiked interest rates by 25 bps during its May meeting, bringing the Federal Funds rate to 5.00-5.25%. While the Fed left rates unchanged in June, Chair Powell noted the likelihood of two more rate hikes in 2023, leaving a potential overhang on risk sentiment, despite inflation levels trending lower as of this writing.
Among non-U.S. equities, developed markets saw strong performance during the fiscal six-month period ended June 30, 2023. Notable strength was driven by Europe avoiding an energy crisis due to a mild winter and Japan, bolstered by foreign investors following corporate reform to improve governance. As such, the MSCI ACWI ex-USA rose 9.86% during the fiscal six-month period ended June 30, 2023, with the Industrials and Information Technology sectors showing strong results, while the Real Estate and Energy sectors saw weaker performance. Within Emerging Markets, softer-than-expected economic data from China was slightly offset by strength in Taiwan and South Korea. As such, the MSCI Emerging Markets Index was up 5.10% during the fiscal six-month period ended June 30, 2023. Strong performance within the Financials and Information Technology sectors was partially offset by relative weakness in the Healthcare and Consumer Discretionary sectors.
During the fiscal six-month period, growth outperformed value, with the Russell 3000 Growth Index returning 28.05%, outperforming the Russell 3000 Value Index, which posted a return of 4.98% for the period. There was also a notable divergence between small and large cap stocks, as the 5.21% return of the Russell 2000 Index considerably lagged the 29.02% return of the Russell 1000 Index during the period.
Going Forward
We continue to believe that unprecedented levels of innovation are creating compelling investment opportunities -- corporations are digitizing their operations, cloud computing growth continues to support future innovation, and AI, which, in our view, is at an inflection point, potentially enabling significant increases in productivity. In the Healthcare sector, we believe that advances in surgical technologies and innovations within biotechnology offer attractive opportunities ahead. As such, we intend to continue to focus on conducting in-depth fundamental research as we seek leaders of innovation rather than taking short-term bets on market sentiment. We believe doing so is the best strategy for helping our valued shareholders reach their investment goals.
Portfolio Matters
Alger Balanced Portfolio
The Alger Balanced Portfolio returned 9.88% during the fiscal six-month period ended June 30, 2023. The equity portion of the Portfolio underperformed the 16.89% return of the S&P 500 Index and the fixed-income portion of the Portfolio underperformed the 2.21% return of the Bloomberg U.S. Government/Credit Bond Index. Regarding the equity portion of the Portfolio, the largest sector weightings were Information Technology and Healthcare. The largest sector overweight was Information Technology and the largest sector underweight was Consumer Discretionary.
Contributors to Performance
The Financials and Information Technology sectors provided the largest contributions to relative performance. Regarding individual positions, Apple Inc.; Microsoft Corporation; Broadcom Inc.; Alphabet Inc.; and Amazon.com, Inc. were among the top contributors to absolute performance.
Microsoft is a beneficiary of corporate America’s transformative digitization. Microsoft’s CEO expects technology spending as a percentage of GDP to jump from about 5% now to 10% in ten years, and that Microsoft will continue to capture market share within the technology sector. The company operates through three segments: Productivity and Business Processes (Office, LinkedIn, and Dynamics), Intelligent Cloud (Server Products and Cloud Services, Azure, and Enterprise Services), and More Personal Computing (Windows, Devices, Gaming, and Search). While the company reported operating results that met consensus estimates, its investment in OpenAI’s ChatGPT captured the attention of investors, contributing to positive performance. Throughout the period, Microsoft surprised investors with continual rollouts of new AI capabilities across the company’s portfolio (e.g., Bing, GitHub, Teams, Office 365). Furthermore, the company announced Microsoft 365 Copilot, which leverages GPT-4, a large language model, combined with the Microsoft Graph of data to provide AI virtual assistance. We believe Microsoft’s investment in OpenAI provides a first-mover advantage in the AI transformer model space.
Detractors from Performance
The Consumer Discretionary and Healthcare sectors were the largest detractors from relative performance. Regarding individual positions, AbbVie, Inc.; UnitedHealth Group Incorporated; Pfizer Inc.; Chevron Corporation; and Bank of America Corp. were among the top detractors from absolute performance.
UnitedHealth Group is an integrated healthcare benefits company uniquely positioned to address rising healthcare costs for its customers, due to its vertical integration, size, and scale. The Optum health benefits services unit, which accounts for approximately 45% of the company’s operating earnings has, in our view, the potential to grow even further as customers look for ways to manage rising healthcare costs. During the period, shares detracted from performance due to several factors: (1) many 2022 healthcare winners with shorter duration profiles and persistent earnings profiles, such as UnitedHealth Group, underperformed in the first quarter of 2023, (2) uncertainty surrounding Medicare Advantage reimbursement levels from the U.S. Federal government in 2023, which will be determined later in the year, and (3) increased regulatory scrutiny in the form of potential Medicare Advantage audits across the industry. While these concerns have impacted UnitedHealth in the near-term, we believe company fundamentals remain intact given its large-scale business model, competitive advantages, and medium- to long-term growth prospects.
At the end of the reporting period, the fixed-income portion of the Portfolio consisted of 23 corporate bonds and represented 27% of non-cash Portfolio assets. The Bloomberg U.S. Corporate Bond Index entered 2023 with a yield and spread to treasuries down from the October 2022 peak. Yields remained in a reasonably narrow range for the six-months fluctuating with inflation and rate hike expectations from the Fed, ending the period at similar levels to the start of the year. Spreads ended the period marginally tighter after experiencing a spike in March 2023 back to the highs from last October on the back of the turmoil caused by the regional bank collapses. As a result, total returns for corporates were modestly positive for the six-months.
Thank you for putting your trust in Alger.
Sincerely,

Daniel C. Chung, CFA
Chief Executive Officer, Chief Investment Officer
Fred Alger Management, LLC
Investors cannot invest directly in an index. Index performance does not reflect the deduction for fees, expenses, or taxes.
This report and the financial statements contained herein are submitted for the general information of shareholders of the Alger Balanced Portfolio. This report is not authorized for distribution to prospective investors in the Portfolio unless preceded or accompanied by an effective prospectus for the Portfolio. Returns include reinvestment of dividends and distributions.
The performance data quoted in these materials represent past performance, which is not an indication or guarantee of future results.
Standard performance results can be found on the following pages. The investment return and principal value of an investment in the Portfolio will fluctuate so that an investor’s shares, when redeemed, may be worth more or less than their original cost. Current performance may be lower or higher than the performance quoted. For performance data current to the most recent month-end, visit us at www.alger.com, or call us at (800) 992-3863.
The views and opinions of the Portfolio’s management in this report are as of the date of the Shareholders’ Letter and are subject to change at any time subsequent to this date. There is no guarantee that any of the assumptions that formed the basis for the opinions stated herein are accurate or that they will materialize. Moreover, the information forming the basis for such assumptions is from sources believed to be reliable; however, there is no guarantee that such information is accurate. Any securities mentioned, whether owned in the Portfolio or otherwise, are considered in the context of the construction of an overall portfolio of securities and therefore reference to them should not be construed as a recommendation or offer to purchase or sell any such security. Inclusion of such securities in the Portfolio and transactions in such securities, if any, may be for a variety of reasons, including without limitation, in response to cash flows, inclusion in a benchmark, and risk control. The reference to a specific security should also be understood in such context and not viewed as a statement that the security is a significant holding in the Portfolio. Please refer to the Schedule of Investments for the Portfolio which is included in this report for a complete list of Portfolio holdings as of June 30, 2023. Securities mentioned in the Shareholders’ Letter, if not found in the Schedule of Investments, may have been held by the Portfolio during the six-month fiscal period.
Risk Disclosure
Investing in the stock market involves risks, including the potential loss of principal. Growth stocks may be more volatile than other stocks as their prices tend to be higher in relation to their companies’ earnings and may be more sensitive to market, political, and economic developments. Local, regional or global events such as environmental or natural disasters, war, terrorism, pandemics, outbreaks of infectious diseases and similar public health threats, recessions, or other events could have a significant impact on investments. The risks of investing in fixed-income securities include sensitivity to interest-rate and credit rating changes, call risk, increased volatility for lower rated securities, and pre-payment risk. Income-producing securities may cut or fail to declare dividends due to market downturns or for other reasons. A significant portion of assets may be invested in securities of companies in related sectors, and may be similarly affected by economic, political, or market events and conditions and may be more vulnerable to unfavorable sector developments.
For a more detailed discussion of the risks associated with the Portfolio, please see the Portfolio’s prospectus.
Before investing, carefully consider the Portfolio’s investment objective, risks, charges, and expenses. For a prospectus containing this and other information about The Alger Portfolios, call us at (800) 992-3863 or visit us at www.alger.com. Read the prospectus and summary prospectus carefully before investing.
Fred Alger & Company, LLC, Distributor.
NOT FDIC INSURED. NOT BANK GUARANTEED. MAY LOSE VALUE.
Definitions:
| ● | Earnings per share (EPS) is calculated as a company’s profit divided by the outstanding shares of its common stock. |
| ● | Free cash flow is the cash a company generates after taking into consideration cash outflows that support its operations and maintain its capital assets. |
| ● | The Bloomberg U.S. Corporate Bond Index is an unmanaged market-value-weighted index of investment-grade corporate fixed-rate debt issues with maturities of one year or more. |
| ● | The Bloomberg U.S. Government/Credit Bond Index is an index that measures performance and government and corporate bonds. |
| ● | The Consumer Price Index (CPI) measures the monthly change in prices paid by U.S. consumers. The Bureau of Labor Statistics (BLS) calculates the CPI as a weighted average of prices for a basket of goods and services rep-resentative of aggregate U.S. consumer spending. |
| ● | The MSCI ACWI Index is a free float-adjusted market capitalization weighted index that is designed to measure the equity market performance of developed and emerging markets. The MSCI ACWI captures large and mid cap representation across Developed Markets (DM) and Emerging Markets (EM) countries. The MSCI ACWI Index performance does not reflect deductions for fees or expenses. |
| ● | The MSCI EAFE Index is designed to represent the performance of large and mid-cap securities across developed markets, including countries in Europe, Australasia and the Far East, excluding the U.S. and Canada. |
| ● | The MSCI Emerging Markets Index is a free float-adjusted market capital-ization index that is designed to measure equity market performance in the global emerging markets. |
| ● | The S&P 500 Index tracks the performance of 500 large companies listed on stock exchanges in the U.S. |
ALGER BALANCED PORTFOLIO
Fund Highlights Through June 30, 2023 (Unaudited)
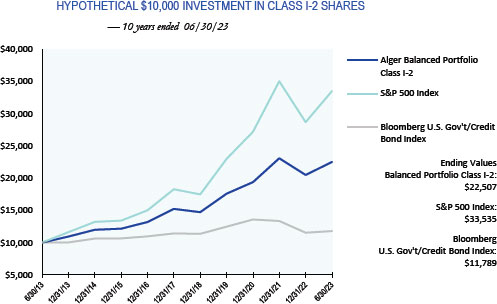
The chart above illustrates the change in value of a hypothetical $10,000 investment made in Alger Balanced Portfolio Class I-2 shares, the S&P 500 Index (an unmanaged index of common stocks), and the Bloomberg U.S. Gov’t/Credit Bond Index (an unmanaged index of government and corporate bonds) for the ten years ended June 30, 2023. Figures for each of the Alger Balanced Portfolio Class I-2 shares, the Bloomberg U.S. Gov’t/Credit Bond Index and the S&P 500 Index include reinvestment of dividends. Figures for the Alger Balanced Portfolio Class I-2 shares also include reinvestment of capital gains. Investors cannot invest directly in any index. Index performance does not reflect deduction for fees, expenses, or taxes.
ALGER BALANCED PORTFOLIO
Fund Highlights Through June 30, 2023 (Unaudited) (Continued)
PERFORMANCE COMPARISON AS OF 6/30/23
AVERAGE ANNUAL TOTAL RETURNS
| | | 1 YEAR | | | 5 YEARS | | | 10 YEARS | |
| Class I-2 | | 11.84% |
| | 8.28% |
| | 8.45% |
|
| S&P 500 Index | | 19.59% |
| | 12.31% |
| | 12.86% |
|
| Bloomberg U.S. Gov’t/Credit Bond Index | | (0.70)% |
| | 1.03% |
| | 1.66% |
|
The performance data quoted represents past performance, which is not an indication or a guarantee of future results. Investment return and principal will fluctuate and the Portfolio’s shares, when redeemed, may be worth more or less than their original cost. Current performance may be higher or lower than the performance quoted. For performance current to the most recent quarter end, visit us at www.alger.com or call us at (800) 992-3863.
Returns indicated assume reinvestment of all distributions, no transaction costs or taxes, and are net of management fees and fund operating expenses only. Total return does not include deductions at the Portfolio or contract level for the cost of the insurance charges, premium load, administrative charges, mortality and expense risk charges or other charges that may be incurred under the variable annuity contract, variable life insurance plan or retirement plan for which the Portfolio serves as an underlying investment vehicle. If these charges were deducted, the total return figures would be lower. Please refer to the variable insurance product or retirement plan disclosure documents for any additional applicable expenses. Investing in the stock market involves gains and losses and may not be suitable for all investors.
PORTFOLIO SUMMARY†
June 30, 2023 (Unaudited)
| SECTORS/SECURITY TYPES | | Alger Balanced
Portfolio | |
| Communication Services | | | 6.5 | % |
| Consumer Discretionary | | | 5.1 | |
| Consumer Staples | | | 4.9 | |
| Energy | | | 3.8 | |
| Financials | | | 8.5 | |
| Healthcare | | | 9.3 | |
| Industrials | | | 4.5 | |
| Information Technology | | | 22.1 | |
| Materials | | | 1.6 | |
| Real Estate | | | 2.6 | |
| Utilities | | | 0.9 | |
| Total Equity Securities | | | 69.8 | |
| Corporate Bonds | | | 27.3 | |
| Total Debt Securities | | | 27.3 | |
| Short-Term Investments and Net Other Assets | | | 2.9 | |
| | | | 100.0 | % |
| † | Based on net assets of the Portfolio. |
THE ALGER PORTFOLIOS | ALGER BALANCED PORTFOLIO
Schedule of Investments June 30, 2023 (Unaudited)
| COMMON STOCKS—66.8% | | SHARES | | | VALUE | |
| AEROSPACE & DEFENSE—1.2% | | | | | | |
| General Dynamics Corp. | | | 607 | | | $ | 130,596 | |
| Raytheon Technologies Corp. | | | 2,506 | | | | 245,488 | |
| TransDigm Group, Inc. | | | 286 | | | | 255,732 | |
| | | | | | | | 631,816 | |
| APPLICATION SOFTWARE—0.7% | | | | | | | | |
| Adobe, Inc.* | | | 803 | | | | 392,659 | |
| ASSET MANAGEMENT & CUSTODY BANKS—2.0% | | | | | | | | |
| BlackRock, Inc., Cl. A | | | 831 | | | | 574,337 | |
| Blackstone, Inc. | | | 4,076 | | | | 378,946 | |
| The Carlyle Group, Inc. | | | 4,029 | | | | 128,727 | |
| | | | | | | | 1,082,010 | |
| BIOTECHNOLOGY—2.0% | | | | | | | | |
| AbbVie, Inc. | | | 5,506 | | | | 741,823 | |
| Amgen, Inc. | | | 731 | | | | 162,297 | |
| Gilead Sciences, Inc. | | | 2,169 | | | | 167,165 | |
| | | | | | | | 1,071,285 | |
| BROADLINE RETAIL—1.6% | | | | | | | | |
| Amazon.com, Inc.* | | | 6,703 | | | | 873,803 | |
| BUILDING PRODUCTS—0.4% | | | | | | | | |
| Johnson Controls International PLC | | | 3,333 | | | | 227,111 | |
| CABLE & SATELLITE—0.8% | | | | | | | | |
| Comcast Corp., Cl. A | | | 10,272 | | | | 426,802 | |
| COMMODITY CHEMICALS—0.2% | | | | | | | | |
| Dow, Inc. | | | 2,203 | | | | 117,332 | |
| COMMUNICATIONS EQUIPMENT—0.8% | | | | | | | | |
| Cisco Systems, Inc. | | | 8,108 | | | | 419,508 | |
| CONSUMER ELECTRONICS—0.3% | | | | | | | | |
| Garmin Ltd. | | | 1,685 | | | | 175,729 | |
| CONSUMER STAPLES MERCHANDISE RETAIL—0.6% | | | | | | | | |
| Walmart, Inc. | | | 2,062 | | | | 324,105 | |
| COPPER—0.4% | | | | | | | | |
| Southern Copper Corp. | | | 3,046 | | | | 218,520 | |
| DIVERSIFIED BANKS—2.8% | | | | | | | | |
| Bank of America Corp. | �� | | 14,212 | | | | 407,742 | |
| JPMorgan Chase & Co. | | | 7,560 | | | | 1,099,527 | |
| | | | | | | | 1,507,269 | |
| ELECTRIC UTILITIES—0.5% | | | | | | | | |
| NextEra Energy, Inc. | | | 3,710 | | | | 275,282 | |
| ELECTRICAL COMPONENTS & EQUIPMENT—1.2% | | | | | | | | |
| Eaton Corp. PLC | | | 3,127 | | | | 628,840 | |
| FINANCIAL EXCHANGES & DATA—0.7% | | | | | | | | |
| CME Group, Inc., Cl. A | | | 1,948 | | | | 360,945 | |
| FOOD DISTRIBUTORS—0.4% | | | | | | | | |
| Sysco Corp. | | | 2,852 | | | | 211,618 | |
THE ALGER PORTFOLIOS | ALGER BALANCED PORTFOLIO
Schedule of Investments June 30, 2023 (Unaudited) (Continued)
| COMMON STOCKS—66.8% (CONT.) | | SHARES | | | VALUE | |
| GOLD—0.2% | | | | | | | | |
| Newmont Corp. | | | 2,982 | | | $ | 127,212 | |
| HEALTHCARE DISTRIBUTORS—0.2% | | | | | | | | |
| Cardinal Health, Inc. | | | 1,132 | | | | 107,053 | |
| HEALTHCARE EQUIPMENT—0.5% | | | | | | | | |
| Medtronic PLC | | | 2,865 | | | | 252,406 | |
| HOME IMPROVEMENT RETAIL—1.7% | | | | | | | | |
| The Home Depot, Inc. | | | 3,055 | | | | 949,005 | |
| HOUSEHOLD PRODUCTS—1.1% | | | | | | | | |
| The Procter & Gamble Co. | | | 3,979 | | | | 603,773 | |
| INDUSTRIAL CONGLOMERATES—1.3% | | | | | | | | |
| Honeywell International, Inc. | | | 3,528 | | | | 732,060 | |
| INDUSTRIAL GASES—0.8% | | | | | | | | |
| Air Products & Chemicals, Inc. | | | 1,507 | | | | 451,392 | |
| INTEGRATED OIL & GAS—2.8% | | | | | | | | |
| Chevron Corp. | | | 4,288 | | | | 674,717 | |
| Exxon Mobil Corp. | | | 5,233 | | | | 561,239 | |
| TotalEnergies SE# | | | 4,927 | | | | 283,992 | |
| | | | | | | | 1,519,948 | |
| INTEGRATED TELECOMMUNICATION SERVICES—0.9% | | | | | | | | |
| AT&T, Inc. | | | 8,043 | | | | 128,286 | |
| Verizon Communications, Inc. | | | 10,096 | | | | 375,470 | |
| | | | | | | | 503,756 | |
| INTERACTIVE MEDIA & SERVICES—4.8% | | | | | | | | |
| Alphabet, Inc., Cl. A* | | | 10,053 | | | | 1,203,344 | |
| Alphabet, Inc., Cl. C* | | | 7,838 | | | | 948,163 | |
| Meta Platforms, Inc., Cl. A* | | | 1,657 | | | | 475,526 | |
| | | | | | | | 2,627,033 | |
| INVESTMENT BANKING & BROKERAGE—1.5% | | | | | | | | |
| Morgan Stanley | | | 9,912 | | | | 846,485 | |
| LEISURE FACILITIES—0.4% | | | | | | | | |
| Vail Resorts, Inc. | | | 783 | | | | 197,128 | |
| MANAGED HEALTHCARE—1.9% | | | | | | | | |
| UnitedHealth Group, Inc. | | | 2,204 | | | | 1,059,331 | |
| MULTI-LINE INSURANCE—0.3% | | | | | | | | |
| The Hartford Financial Services Group, Inc. | | | 2,582 | | | | 185,956 | |
| MULTI-UTILITIES—0.4% | | | | | | | | |
| Sempra Energy | | | 1,436 | | | | 209,067 | |
| OIL & GAS EXPLORATION & PRODUCTION—0.3% | | | | | | | | |
| Pioneer Natural Resources Co. | | | 887 | | | | 183,769 | |
| OIL & GAS STORAGE & TRANSPORTATION—0.3% | | | | | | | | |
| ONEOK, Inc. | | | 2,628 | | | | 162,200 | |
| PERSONAL CARE PRODUCTS—0.0% | | | | | | | | |
| Kenvue, Inc.* | | | 222 | | | | 5,865 | |
THE ALGER PORTFOLIOS | ALGER BALANCED PORTFOLIO
Schedule of Investments June 30, 2023 (Unaudited) (Continued)
| COMMON STOCKS—66.8% (CONT.) | | SHARES | | | VALUE | |
| PHARMACEUTICALS—4.7% | | | | | | | | |
| AstraZeneca PLC# | | | 5,015 | | | $ | 358,924 | |
| Bristol-Myers Squibb Co. | | | 2,952 | | | | 188,780 | |
| Eli Lilly & Co. | | | 1,039 | | | | 487,270 | |
| GSK PLC# | | | 3,326 | | | | 118,539 | |
| Johnson & Johnson | | | 3,894 | | | | 644,535 | |
| Merck & Co., Inc. | | | 2,724 | | | | 314,322 | |
| Novartis AG# | | | 2,108 | | | | 212,718 | |
| Pfizer, Inc. | | | 6,956 | | | | 255,146 | |
| | | | | | | | 2,580,234 | |
| RAIL TRANSPORTATION—0.4% | | | | | | | | |
| Union Pacific Corp. | | | 1,184 | | | | 242,270 | |
| RESTAURANTS—1.1% | | | | | | | | |
| McDonald’s Corp. | | | 1,186 | | | | 353,914 | |
| Starbucks Corp. | | | 2,764 | | | | 273,802 | |
| | | | | | | | 627,716 | |
| SEMICONDUCTOR MATERIALS & EQUIPMENT—2.3% | | | | | | | | |
| KLA Corp. | | | 2,548 | | | | 1,235,831 | |
| SEMICONDUCTORS—4.1% | | | | | | | | |
| Broadcom, Inc. | | | 1,602 | | | | 1,389,623 | |
| QUALCOMM, Inc. | | | 4,759 | | | | 566,511 | |
| Taiwan Semiconductor Manufacturing Co., Ltd.# | | | 2,951 | | | | 297,815 | |
| | | | | | | | 2,253,949 | |
| SOFT DRINKS & NON-ALCOHOLIC BEVERAGES—2.0% | | | | | | | | |
| PepsiCo, Inc. | | | 3,594 | | | | 665,681 | |
| The Coca-Cola Co. | | | 7,503 | | | | 451,830 | |
| | | | | | | | 1,117,511 | |
| SYSTEMS SOFTWARE—7.3% | | | | | | | | |
| Microsoft Corp. | | | 10,976 | | | | 3,737,767 | |
| Oracle Corp. | | | 2,382 | | | | 283,672 | |
| | | | | | | | 4,021,439 | |
| TECHNOLOGY HARDWARE STORAGE & PERIPHERALS—6.9% | | | | | | | | |
| Apple, Inc. | | | 19,515 | | | | 3,785,325 | |
| TOBACCO—0.8% | | | | | | | | |
| Altria Group, Inc. | | | 5,538 | | | | 250,872 | |
| Philip Morris International, Inc. | | | 2,015 | | | | 196,704 | |
| | | | | | | | 447,576 | |
| TRANSACTION & PAYMENT PROCESSING SERVICES—1.2% | | | | | | | | |
| Visa, Inc., Cl. A | | | 2,698 | | | | 640,721 | |
| TOTAL COMMON STOCKS | | | | | | | | |
| (Cost $16,137,390) | | | | | | | 36,620,645 | |
| MASTER LIMITED PARTNERSHIP—0.4% | | | SHARES | | | | VALUE | |
| OIL & GAS STORAGE & TRANSPORTATION—0.4% | | | | | | | | |
| Cheniere Energy Partners LP | | | 4,434 | | | | 204,585 | |
| (Cost $147,024) | | | | | | | 204,585 | |
THE ALGER PORTFOLIOS | ALGER BALANCED PORTFOLIO
Schedule of Investments June 30, 2023 (Unaudited) (Continued)
| REAL ESTATE INVESTMENT TRUST—2.6% | | SHARES | | | VALUE | |
| HEALTHCARE—0.4% | | | | | | | | |
| Welltower, Inc. | | | 2,974 | | | $ | 240,567 | |
| INDUSTRIAL—0.3% | | | | | | | | |
| Prologis, Inc. | | | 1,262 | | | | 154,759 | |
| MORTGAGE—0.3% | | | | | | | | |
| Blackstone Mortgage Trust, Inc., Cl. A | | | 8,260 | | | | 171,891 | |
| RETAIL—0.5% | | | | | | | | |
| Simon Property Group, Inc. | | | 2,371 | | | | 273,803 | |
| SPECIALIZED—1.1% | | | | | | | | |
| Crown Castle, Inc. | | | 3,235 | | | | 368,596 | |
| Lamar Advertising Co., Cl. A | | | 2,052 | | | | 203,661 | |
| | | | | | | | 572,257 | |
| TOTAL REAL ESTATE INVESTMENT TRUST | | | | | | | | |
| (Cost $1,270,327) | | | | | | | 1,413,277 | |
| CORPORATE BONDS—27.3% | | PRINCIPAL
AMOUNT | | | VALUE | |
| AGRICULTURAL & FARM MACHINERY—1.8% | | | | | | | | |
| John Deere Capital Corp., 2.125%, 3/7/25 | | | 1,000,000 | | | | 951,465 | |
| APPLICATION SOFTWARE—1.7% | | | | | | | | |
| Salesforce, Inc., 0.625%, 7/15/24 | | | 1,000,000 | | | | 952,219 | |
| AUTOMOBILE MANUFACTURERS—0.8% | | | | | | | | |
| General Motors Financial Co., Inc., 1.5%, 6/10/26 | | | 500,000 | | | | 441,931 | |
| BIOTECHNOLOGY—1.8% | | | | | | | | |
| AbbVie, Inc., 3.6%, 5/14/25 | | | 1,000,000 | | | | 966,969 | |
| BROADLINE RETAIL—0.9% | | | | | | | | |
| Amazon.com, Inc., 4.55%, 12/1/27 | | | 500,000 | | | | 497,026 | |
| CONSUMER FINANCE—0.9% | | | | | | | | |
| American Express Co., 5.85%, 11/5/27 | | | 500,000 | | | | 512,203 | |
| CONSUMER STAPLES MERCHANDISE RETAIL—0.9% | | | | | | | | |
| Walmart, Inc., 3.9%, 9/9/25 | | | 500,000 | | | | 490,098 | |
| DIVERSIFIED BANKS—1.8% | | | | | | | | |
| Wells Fargo & Co., 3.3%, 9/9/24 | | | 1,000,000 | | | | 974,247 | |
| ELECTRICAL COMPONENTS & EQUIPMENT—0.9% | | | | | | | | |
| Rockwell Automation, Inc., 0.35%, 8/15/23 | | | 500,000 | | | | 497,170 | |
| HEALTHCARE SERVICES—0.9% | | | | | | | | |
| Haleon UK Capital PLC, 3.125%, 3/24/25(a) | | | 500,000 | | | | 477,895 | |
| HOME IMPROVEMENT RETAIL—0.9% | | | | | | | | |
| The Home Depot, Inc., 2.7%, 4/15/25 | | | 500,000 | | | | 479,703 | |
| LIFE SCIENCES TOOLS & SERVICES—0.9% | | | | | | | | |
| Thermo Fisher Scientific, Inc., 0.797%, 10/18/23 | | | 500,000 | | | | 493,517 | |
| MANAGED HEALTHCARE—1.8% | | | | | | | | |
| UnitedHealth Group, Inc., 3.7%, 5/15/27 | | | 1,000,000 | | | | 964,448 | |
| MULTI-UTILITIES—0.9% | | | | | | | | |
| Sempra Energy, 5.4%, 8/1/26 | | | 500,000 | | | | 497,689 | |
| PACKAGED FOODS & MEATS—0.9% | | | | | | | | |
| Nestle Holdings, Inc., 0.606%, 9/14/24(a) | | | 550,000 | | | | 520,582 | |
THE ALGER PORTFOLIOS | ALGER BALANCED PORTFOLIO
Schedule of Investments June 30, 2023 (Unaudited) (Continued)
| CORPORATE BONDS—27.3% (CONT.) | | PRINCIPAL AMOUNT | | | VALUE | |
| RESTAURANTS—0.9% | | | | | | | | |
| Starbucks Corp., 5.509%, 2/14/24+ | | | | | | | | |
| (1-Day SOFR + 0.42%) | | | 500,000 | | | $ | 500,002 | |
| SEMICONDUCTOR MATERIALS & EQUIPMENT—0.9% | | | | | | | | |
| KLA Corp., 4.65%, 11/1/24 | | | 500,000 | | | | 493,823 | |
| SOFT DRINKS & NON-ALCOHOLIC BEVERAGES—0.9% | | | | | | | | |
| PepsiCo, Inc., 4.45%, 5/15/28 | | | 500,000 | | | | 499,947 | |
| SPECIALIZED—2.1% | | | | | | | | |
| Crown Castle, Inc., 3.2%, 9/1/24 | | | 1,200,000 | | | | 1,163,380 | |
| SPECIALTY CHEMICALS—0.9% | | | | | | | | |
| Ecolab, Inc., 5.25%, 1/15/28 | | | 500,000 | | | | 508,143 | |
| SYSTEMS SOFTWARE—1.8% | | | | | | | | |
| Oracle Corp., 5.8%, 11/10/25 | | | 500,000 | | | | 505,783 | |
| VMware, Inc., 0.6%, 8/15/23 | | | 500,000 | | | | 497,016 | |
| | | | | | | | 1,002,799 | |
| TECHNOLOGY HARDWARE STORAGE & PERIPHERALS—2.0% | | | | | | | | |
| Apple, Inc., 1.125%, 5/11/25 | | | 1,200,000 | | | | 1,118,374 | |
| TOTAL CORPORATE BONDS | | | | | | | | |
| (Cost $15,518,930) | | | | | | | 15,003,630 | |
| Total Investments | | | | | | | | |
| (Cost $33,073,671) | | | 97.1 | % | | $ | 53,242,137 | |
| Unaffiliated Securities (Cost $33,073,671) | | | | | | | 53,242,137 | |
| Other Assets in Excess of Liabilities | | | 2.9 | % | | | 1,574,451 | |
| NET ASSETS | | | 100.0 | % | | $ | 54,816,588 | |
| * | Non-income producing security. |
| # | American Depositary Receipts. |
| (a) | Pursuant to Securities and Exchange Commission Rule 144A, these securities may be sold prior to their maturity only to qualified institutional buyers. These securities represent 1.8% of the net assets of the Portfolio. |
| + | Variable rate securities based on reference index and spread. The rate reported is the rate in effect as of June 30, 2023. |
Abbreviations:
SOFR - Secured Overnight Financing Rate
See Notes to Financial Statements.
ALGER BALANCED PORTFOLIO
Statement of Assets and Liabilities June 30, 2023 (Unaudited)
| | | Alger Balanced
Portfolio | |
| | | | |
| ASSETS: | | | | |
| Investments in unaffiliated securities, at value (Identified cost below)* see accompanying schedule of investments | | $ | 53,242,137 | |
| Cash and cash equivalents | | | 1,630,716 | |
| Receivable for shares of beneficial interest sold | | | 5,166 | |
| Dividends and interest receivable | | | 141,132 | |
| Prepaid expenses | | | 14,949 | |
| Total Assets | | | 55,034,100 | |
| | | | | |
| LIABILITIES: | | | | |
| Payable for shares of beneficial interest redeemed | | | 131,515 | |
| Accrued investment advisory fees | | | 31,675 | |
| Accrued shareholder administrative fees | | | 446 | |
| Accrued administrative fees | | | 1,227 | |
| Accrued professional fees | | | 19,878 | |
| Accrued printing fees | | | 14,656 | |
| Accrued fund accounting fees | | | 14,392 | |
| Accrued custodian fees | | | 1,119 | |
| Accrued trustee fees | | | 63 | |
| Accrued transfer agent fees | | | 43 | |
| Accrued other expenses | | | 2,498 | |
| Total Liabilities | | | 217,512 | |
| NET ASSETS | | $ | 54,816,588 | |
| | | | | |
| NET ASSETS CONSIST OF: | | | | |
| Paid in capital (par value of $.001 per share) | | | 33,785,311 | |
| Distributable earnings | | | 21,031,277 | |
| NET ASSETS | | $ | 54,816,588 | |
| * Identified cost | | $ | 33,073,671 | (a) |
See Notes to Financial Statements.
(a) At June 30, 2023, the net unrealized appreciation on investments, based on cost for federal income tax purposes of $32,891,926, amounted to $20,350,211, which consisted of aggregate gross unrealized appreciation of $21,368,070 and aggregate gross unrealized depreciation of $1,017,859.
ALGER BALANCED PORTFOLIO
Statement of Assets and Liabilities June 30, 2023 (Unaudited) (Continued)
| | | Alger Balanced
Portfolio | |
| NET ASSETS BY CLASS: | | | | |
| Class I-2 | | $ | 54,816,588 | |
| | | | | |
| SHARES OF BENEFICIAL INTEREST OUTSTANDING — NOTE 6: | | | | |
| Class I-2 | | | 3,041,503 | |
| | | | | |
| NET ASSET VALUE PER SHARE: | | | | |
| Class I-2 | | $ | 18.02 | |
| See Notes to Financial Statements. | | | | |
ALGER BALANCED PORTFOLIO
Statement of Operations for the six months ended June 30, 2023 (Unaudited)
| | | Alger Balanced
Portfolio | |
| INCOME: | | | | |
| Dividends (net of foreign withholding taxes*) | | $ | 431,766 | |
| Interest | | | 224,719 | |
| Total Income | | | 656,485 | |
| | | | | |
| EXPENSES: | | | | |
| Investment advisory fees — Note 3(a) | | | 185,523 | |
| Shareholder administrative fees — Note 3(f) | | | 2,613 | |
| Administration fees — Note 3(b) | | | 7,186 | |
| Fund accounting fees | | | 29,597 | |
| Professional fees | | | 20,016 | |
| Registration fees | | | 14,704 | |
| Printing fees | | | 4,702 | |
| Custodian fees | | | 2,636 | |
| Transfer agent fees — Note 3(f) | | | 2,410 | |
| Trustee fees — Note 3(g) | | | 1,357 | |
| Other expenses | | | 3,706 | |
| Total Expenses | | | 274,450 | |
| NET INVESTMENT INCOME | | | 382,035 | |
| | | | | |
| REALIZED AND UNREALIZED GAIN (LOSS) ON INVESTMENTS: | | | | |
| Net realized gain on unaffiliated investments | | | 299,031 | |
| Net change in unrealized appreciation on unaffiliated investments | | | 4,316,809 | |
| Net realized and unrealized gain on investments | | | 4,615,840 | |
| NET INCREASE IN NET ASSETS RESULTING FROM OPERATIONS | | $ | 4,997,875 | |
| * Foreign withholding taxes | | $ | 4,433 | |
See Notes to Financial Statements.
ALGER BALANCED PORTFOLIO
Statements of Changes in Net Assets (Unaudited)
| | | | Alger Balanced Portfolio | |
| | | | For the
Six Months Ended
June 30, 2023 | | | | For the
Year Ended
December 31, 2022 | |
| Net investment income | | $ | 382,035 | | | $ | 631,214 | |
| Net realized gain on investments | | | 299,031 | | | | 1,225,079 | |
| Net change in unrealized appreciation (depreciation) on investments | | | 4,316,809 | | | | (8,860,578 | ) |
| Net increase (decrease) in net assets resulting from operations | | | 4,997,875 | | | | (7,004,285 | ) |
| | | | | | | | | |
| Dividends and distributions to shareholders: | | | | | | | | |
| Class I-2 | | | — | | | | (2,940,829 | ) |
| Total dividends and distributions to shareholders | | | — | | | | (2,940,829 | ) |
| | | | | | | | | |
| Increase (decrease) from shares of beneficial interest transactions — Note 6: | | | | | | | | |
| Class I-2 | | | (2,098,606 | ) | | | (458,480 | ) |
| Total increase (decrease) | | | 2,899,269 | | | | (10,403,594 | ) |
| | | | | | | | | |
| Net Assets: | | | | | | | | |
| Beginning of period | | | 51,917,319 | | | | 62,320,913 | |
| END OF PERIOD | | $ | 54,816,588 | | | $ | 51,917,319 | |
| See Notes to Financial Statements. | |
THE ALGER PORTFOLIOS
Financial Highlights for a share outstanding throughout the period (Unaudited)
| Alger Balanced Portfolio | | Class I-2 | |
| | | Six months | | | | | | | | | | | | | | | | |
| | | ended | | | Year ended | | | Year ended | | | Year ended | | | Year ended | | | Year ended | |
| | | 6/30/2023(i) |
| | 12/31/2022 | | | 12/31/2021 | | | 12/31/2020 | | | 12/31/2019 | | | 12/31/2018 | |
| Net asset value, beginning of period | | $ | 16.40 | | | $ | 19.59 | | | $ | 17.05 | | | $ | 15.71 | | | $ | 13.67 | | | $ | 17.20 | |
| INCOME FROM INVESTMENT OPERATIONS: | | | | | | | | | | | | | | | | | | | | | | | | |
| Net investment income(ii) | | | 0.12 | | | | 0.20 | | | | 0.16 | | | | 0.21 | | | | 0.25 | | | | 0.28 | |
| Net realized and unrealized gain (loss) on investments | | | 1.50 | | | | (2.41 | ) | | | 3.09 | | | | 1.39 | | | | 2.41 | | | | (0.84 | ) |
| Total from investment operations | | | 1.62 | | | | (2.21 | ) | | | 3.25 | | | | 1.60 | | | | 2.66 | | | | (0.56 | ) |
| Dividends from net investment income | | | – | | | | (0.21 | ) | | | (0.16 | ) | | | (0.20 | ) | | | (0.23 | ) | | | (0.72 | ) |
| Distributions from net realized gains | | | – | | | | (0.77 | ) | | | (0.55 | ) | | | (0.06 | ) | | | (0.39 | ) | | | (2.25 | ) |
| Net asset value, end of period | | $ | 18.02 | | | $ | 16.40 | | | $ | 19.59 | | | $ | 17.05 | | | $ | 15.71 | | | $ | 13.67 | |
| Total return(iii) | | | 9.88 | % | | | (11.31 | )% | | | 19.12 | % | | | 10.23 | % | | | 19.50 | % | | | (3.32 | )% |
| RATIOS/SUPPLEMENTAL DATA: | | | | | | | | | | | | | | | | | | | | | | | | |
| Net assets, end of period (000’s omitted) | | $ | 54,817 | | | $ | 51,917 | | | $ | 62,321 | | | $ | 52,305 | | | $ | 49,475 | | | $ | 42,037 | |
| Ratio of net expenses to average net assets | | | 1.05 | % | | | 1.04 | % | | | 1.09 | % | | | 1.07 | % | | | 1.10 | % | | | 1.14 | % |
| Ratio of net investment income to average net assets | | | 1.46 | % | | | 1.14 | % | | | 0.88 | % | | | 1.34 | % | | | 1.67 | % | | | 1.61 | % |
| Portfolio turnover rate | | | 2.63 | % | | | 9.47 | % | | | 11.10 | % | | | 15.41 | % | | | 5.71 | % | | | 5.04 | % |
See Notes to Financial Statements.
| (i) | Ratios have been annualized; total return and portfolio turnover rate have not been annualized. |
| (ii) | Amount was computed based on average shares outstanding during the period. |
| (iii) | Does not reflect the effect of sales charges, if applicable. |
Alger Balanced Portfolio
NOTES TO FINANCIAL STATEMENTS (Unaudited)
NOTE 1 — General:
The Alger Portfolios (the “Fund”) is an open-end registered investment company organized as a business trust under the laws of the Commonwealth of Massachusetts. The Fund qualifies as an investment company as defined in Financial Accounting Standards Board (“FASB”) Accounting Standards Codification 946 – Financial Services – Investment Companies. The Fund operates as a series company currently offering seven series of shares of beneficial interest: Alger Capital Appreciation Portfolio, Alger Large Cap Growth Portfolio, Alger Growth & Income Portfolio, Alger Mid Cap Growth Portfolio, Alger Weatherbie Specialized Growth Portfolio, Alger Small Cap Growth Portfolio and Alger Balanced Portfolio (collectively, the “Portfolios”). These financial statements include only the Alger Balanced Portfolio (the “Portfolio”). The Portfolio’s investment objective is current income and long-term capital appreciation which it seeks to achieve through investing in equity and fixed-income securities. Shares of the Portfolio are available to investment vehicles for variable annuity contracts and variable life insurance policies offered by separate accounts of life insurance companies, as well as qualified pension and retirement plans.
On May 23, 2023, the Board of Trustees (the “Board”) approved the transition of the Fund’s custodian and administrator from Brown Brothers Harriman & Company (the “Custodian”) to The Bank of New York Mellon. This change is anticipated to become effective in early 2024.
NOTE 2 — Significant Accounting Policies:
(a) Investment Valuation: The Portfolio values its financial instruments at fair value using independent dealers or pricing services under policies approved by the Board. Investments held by the Portfolio are valued on each day the New York Stock Exchange (the “NYSE”) is open, as of the close of the NYSE (normally 4:00 p.m. Eastern Time).
The Board has designated, pursuant to Rule 2a-5 under the Investment Company Act of 1940, as amended (the “1940 Act”), the Portfolio’s investment adviser, Fred Alger Management, LLC (“Alger Management” or the “Investment Manager”) as its valuation designee (the “Valuation Designee”) to make fair value determinations subject to the Board’s review and oversight. The Valuation Designee has established a Valuation Committee (“Committee”) comprised of representatives of the Investment Manager and officers of the Portfolio to assist in performing the duties and responsibilities of the Valuation Designee.
The Valuation Designee has established valuation processes including but not limited to: (i) making fair value determinations when market quotations for financial instruments are not readily available in accordance with valuation policies and procedures adopted by the Board; (ii) assessing and managing material risks associated with fair valuation determinations; (iii) selecting, applying and testing fair valuation methodologies; and (iv) overseeing and evaluating pricing services used by the Portfolio. The Valuation Designee regularly reports its fair valuation determinations and related valuation information to the Board. The Committee generally meets quarterly and on an as-needed basis to review and evaluate the effectiveness of the valuation policies and procedures in accordance with the requirements of Rule 2a-5.
Alger Balanced Portfolio
NOTES TO FINANCIAL STATEMENTS (Unaudited) (Continued)
Investments in money market funds and short-term securities held by the Portfolio having a remaining maturity of sixty days or less are valued at amortized cost which approximates market value.
Equity securities, including traded rights, warrants and option contracts for which valuation information is readily available, are valued at the last quoted sales price or official closing price on the primary market or exchange on which they are traded as reported by an independent pricing service. In the absence of quoted sales, such securities are generally valued at the bid price or, in the absence of a recent bid price, the equivalent as obtained from one or more of the major market makers for the securities to be valued.
Debt securities generally trade in the over-the-counter market. Debt securities with remaining maturities of more than sixty days at the time of acquisition are valued on the basis of the last available bid prices or current market quotations provided by dealers or pricing services. In determining the value of a particular investment, pricing services may use certain information with respect to transactions in such investments, quotations from dealers, pricing matrixes, market transactions in comparable investments, various relationships observed in the market between investments and calculated yield measures based on valuation technology commonly employed in the market for such investments. Asset-backed and mortgage-backed securities are valued by independent pricing services using models that consider estimated cash flows of each tranche of the security, establish a benchmark yield and develop an estimated tranche-specific spread to the benchmark yield based on the unique attributes of the tranche. Debt securities with a remaining maturity of sixty days or less are valued at amortized cost which approximates market value.
Securities in which the Portfolio invests may be traded in foreign markets that close before the close of the NYSE. Developments that occur between the close of the foreign markets and the close of the NYSE may result in adjustments to the closing foreign prices to reflect what the Valuation Designee, through its Committee, believes to be the fair value of these securities as of the close of the NYSE. The Portfolio may also fair value securities in other situations, for example, when a particular foreign market is closed but the NYSE is open.
Alger Balanced Portfolio
NOTES TO FINANCIAL STATEMENTS (Unaudited) (Continued)
FASB Accounting Standards Codification 820 – Fair Value Measurements and Disclosures (“ASC 820”) defines fair value as the price that the Portfolio would receive upon selling an investment in a timely transaction to an independent buyer in the principal or most advantageous market of the investment. ASC 820 established a three-tier hierarchy to maximize the use of observable market data and minimize the use of unobservable inputs and to establish classification of fair value measurements for disclosure purposes. Inputs refer broadly to the assumptions that market participants would use in pricing the asset or liability and may be observable or unobservable. Observable inputs are based on market data obtained from sources independent of the Portfolio. Unobservable inputs are inputs that reflect the Portfolio’s own assumptions based on the best information available in the circumstances. The three-tier hierarchy of inputs is summarized in the three broad Levels listed below.
| ● | Level 1 – quoted prices in active markets for identical investments |
| ● | Level 2 – significant other observable inputs (including quoted prices for similar investments, amortized cost, interest rates, prepayment speeds, credit risk, etc.) |
| ● | Level 3 – significant unobservable inputs (including the Portfolio’s own assumptions in determining the fair value of investments) |
The Portfolio’s valuation techniques are generally consistent with either the market or the income approach to fair value. The market approach considers prices and other relevant information generated by market transactions involving identical or comparable assets to measure fair value. The income approach converts future amounts to a current, or discounted, single amount. These fair value measurements are determined on the basis of the value indicated by current market expectations about such future events. Inputs for Level 1 include exchange-listed prices and broker quotes in an active market. Inputs for Level 2 include the last trade price in the case of a halted security, an exchange-listed price which has been adjusted for fair value factors, and prices of closely related securities. Additional Level 2 inputs include an evaluated price which is based upon a compilation of observable market information such as spreads for fixed income and preferred securities. Inputs for Level 3 include, but are not limited to, revenue multiples, earnings before interest, taxes, depreciation and amortization (“EBITDA”) multiples, discount rates, time to exit and the probabilities of success of certain outcomes. Such unobservable market information may be obtained from a company’s financial statements and from industry studies, market data, and market indicators such as benchmarks and indexes. Because of the inherent uncertainty and often limited markets for restricted securities, the valuations assigned to such securities by the Portfolio may significantly differ from the valuations that would have been assigned by the Portfolio had there been an active market for such securities.
(b) Cash and Cash Equivalents: Cash and cash equivalents include U.S. dollars, foreign cash and overnight time deposits.
(c) Securities Transactions and Investment Income: Securities transactions are recorded on a trade date basis. Realized gains and losses from securities transactions are recorded on the identified cost basis. Dividend income is recognized on the ex-dividend date and interest income is recognized on the accrual basis.
Premiums and discounts on debt securities purchased are amortized or accreted over the lives of the respective securities.
(d) Foreign Currency Transactions: The books and records of the Portfolio are maintained in U.S. dollars. Foreign currencies, investments and other assets and liabilities are translated into U.S. dollars at the prevailing rates of exchange on the valuation date. Purchases and sales of investment securities and income and expenses are translated into U.S. dollars at the prevailing exchange rates on the respective dates of such transactions.
Alger Balanced Portfolio
NOTES TO FINANCIAL STATEMENTS (Unaudited) (Continued)
Net realized gains and losses on foreign currency transactions represent net gains and losses from the disposition of foreign currencies, currency gains and losses realized between the trade dates and settlement dates of security transactions, and the difference between the amount of net investment income accrued and the U.S. dollar amount actually received. The effects of changes in foreign currency exchange rates on investments in securities are included in realized and unrealized gain or loss on investments in the accompanying Statement of Operations.
(e) Lending of Fund Securities: The Portfolio may lend its securities to financial institutions (other than to the Investment Manager or its affiliates), provided that the market value of the securities loaned will not at any time exceed one third of the Portfolio’s total assets including borrowings, as defined in its prospectus. The Portfolio earns fees on the securities loaned, which are included in interest income in the accompanying Statement of Operations. In order to protect against the risk of failure by the borrower to return the securities loaned or any delay in the delivery of such securities, the loan is collateralized by cash or securities that are maintained with the Custodian in an amount equal to at least 102% of the current market value of U.S. loaned securities or 105 % for non-U.S. loaned securities. The market value of the loaned securities is determined at the close of business of the Portfolio. Any required additional collateral is delivered to the Custodian each day and any excess collateral is returned to the borrower on the next business day. In the event the borrower fails to return the loaned securities when due, the Portfolio may take the collateral to replace the securities. If the value of the collateral is less than the purchase cost of replacement securities, the Custodian shall be responsible for any shortfall, but only to the extent that the shortfall is not due to any diminution in collateral value, as defined in the securities lending agreement. The Portfolio is required to maintain the collateral in a segregated account and determine its value each day until the loaned securities are returned. Cash collateral may be invested as determined by the Portfolio. Collateral is returned to the borrower upon settlement of the loan. There were no securities loaned as of June 30, 2023.
(f) Dividends to Shareholders: Dividends and distributions payable to shareholders are recorded by the Portfolio on the ex-dividend date. The Portfolio declares and pays dividends from net investment income, if available, annually. Dividends from net realized gains, offset by any loss carryforward, are declared and paid annually.
The characterization of distributions to shareholders for financial reporting purposes is determined in accordance with federal income tax rules. Therefore, the source of the Portfolio’s distributions may be shown in the accompanying financial statements as either from, or in excess of, net investment income, net realized gain on investment transactions, or return of capital, depending on the type of book/tax differences that may exist. Capital accounts within the financial statements are adjusted for permanent book/tax differences. Reclassifications result primarily from the differences in tax treatment of net operating losses, passive foreign investment companies, and foreign currency transactions. The reclassifications are done annually at year-end and have no impact on the net asset value of the Portfolio and are designed to present the Portfolio’s capital accounts on a tax basis.
Alger Balanced Portfolio
NOTES TO FINANCIAL STATEMENTS (Unaudited) (Continued)
(g) Federal Income Taxes: It is the Portfolio’s policy to comply with the requirements of the Internal Revenue Code Subchapter M applicable to regulated investment companies and to distribute all of its taxable income to its shareholders. Provided that the Portfolio maintains such compliance, no federal income tax provision is required.
FASB Accounting Standards Codification 740 – Income Taxes (“ASC 740”) requires the Portfolio to measure and recognize in its financial statements the benefit of a tax position taken (or expected to be taken) on an income tax return if such position will more likely than not be sustained upon examination based on the technical merits of the position. No tax years are currently under investigation. The Portfolio files income tax returns in the U.S. Federal jurisdiction, as well as the New York State and New York City jurisdictions. The statute of limitations on the Portfolio’s tax returns remains open for the tax years 2019-2022. Management does not believe there are any uncertain tax positions that require recognition of a tax liability.
(h) Allocation Methods: The Fund accounts separately for the assets, liabilities and operations of the Portfolio. Expenses directly attributable to the Portfolio are charged to the Portfolio’s operations; expenses which are applicable to all Portfolios are allocated among them based on net assets.
(i) Estimates: These financial statements have been prepared in accordance with accounting principles generally accepted in the United States of America, which require using estimates and assumptions that affect the reported amounts therein. These unaudited interim financial statements reflect all adjustments that are, in the opinion of management, necessary to present a fair statement of results for the interim period. Actual results may differ from those estimates. All such estimates are of a normal recurring nature.
NOTE 3 — Investment Advisory Fees and Other Transactions with Affiliates:
(a) Investment Advisory Fees: Fees incurred by the Portfolio, pursuant to the provisions of the Fund’s Investment Advisory Agreement with the Investment Manager, are payable monthly and computed based on the following rates. The actual rate paid as a percentage of average daily net assets, for the six months ended June 30, 2023, is set forth below under the heading “Actual Rate”:
| | Tier 1 | Tier 2 | Actual Rate |
| Alger Balanced Portfolio(a) | 0.71% | 0.55% | 0.71% |
(a) Tier 1 rate is paid on assets up to $1 billion and Tier 2 rate is paid on assets in excess of $1 billion.
(b) Administration Fees: Fees incurred by the Portfolio, pursuant to the provisions of the Fund’s Fund Administration Agreement with Alger Management, are payable monthly and computed based on the average daily net assets of the Portfolio at the annual rate of 0.0275%.
(c) Brokerage Commissions: During the six months ended June 30, 2023, the Portfolio paid Fred Alger & Company, LLC, the Fund’s distributor and affiliate of Alger Management (the “Distributor”), $60 in connection with securities transactions.
Alger Balanced Portfolio
NOTES TO FINANCIAL STATEMENTS (Unaudited) (Continued)
(d) Interfund Loans: The Portfolio, along with other funds in the Alger Fund Complex (as defined below), may borrow money from and lend money to each other for temporary or emergency purposes. To the extent permitted under its investment restrictions, the Portfolio may lend uninvested cash in an amount up to 15% of its net assets to other funds in the Alger Fund Complex. If the Portfolio has borrowed from other funds in the Alger Fund Complex and has aggregate borrowings from all sources that exceed 10% of the Portfolio’s total assets, the Portfolio will secure all of its loans from other funds in the Alger Fund Complex. The interest rate charged on interfund loans is equal to the average of the overnight time deposit rate and bank loan rate available to the Portfolio. There were no interfund loans outstanding as of June 30, 2023.
(e) Other Transactions with Affiliates: Certain officers and one Trustee of the Fund are directors and/or officers of Alger Management, the Distributor, or their affiliates. No shares of the Portfolio were held by Alger Management and its affiliated entities as of June 30, 2023.
(f) Shareholder Administrative Fees: The Fund has entered into a Shareholder Administrative Services Agreement with Alger Management to compensate Alger Management for providing administrative oversight of the Fund’s transfer agent and for other related services. The Portfolio compensates Alger Management at the annual rate of 0.01% of the average daily net assets for these services.
(g) Trustee Fees: Each trustee who is not an “interested person” of the Fund, as defined in the 1940 Act (“Independent Trustee”), receives a fee of $156,000 per annum, paid pro rata based on net assets by each fund in the Alger Fund Complex, plus travel expenses incurred for attending board meetings. The term “Alger Fund Complex” refers to the Fund, The Alger Institutional Funds, The Alger Funds II, The Alger Funds, Alger Global Focus Fund and The Alger ETF Trust, each of which is a registered investment company managed by Alger Management. The Independent Trustee appointed as Chair of the Board receives additional compensation of $22,000 per annum paid pro rata based on net assets by each fund in the Alger Fund Complex. Additionally, each member of the Audit Committee receives a fee of $13,000 per annum, paid pro rata based on net assets by each fund in the Alger Fund Complex.
The Board has adopted a policy requiring Trustees to receive a minimum of 10% of their annual compensation in shares of one or more of the funds in the Alger Fund Complex.
(h) Interfund Trades: The Portfolio may engage in purchase and sale transactions with other funds advised by Alger Management or Weatherbie Capital, LLC, an affiliate of Alger Management. There were no interfund trades during the six months ended June 30, 2023.
NOTE 4 — Securities Transactions:
The following summarizes the securities transactions by the Fund, other than U.S. Government securities and short-term securities, for the six months ended June 30, 2023.
| | | PURCHASES | | | SALES | |
| Alger Balanced Portfolio | | $ | 1,366,592 | | | $ | 2,694,242 | |
Alger Balanced Portfolio
NOTES TO FINANCIAL STATEMENTS (Unaudited) (Continued)
NOTE 5 — Borrowings:
The Portfolio may borrow from the Custodian on an uncommitted basis. The Portfolio pays the Custodian a market rate of interest, generally based upon a rate of return with respect to each respective currency borrowed, taking into consideration relevant overnight and short-term reference rates and the range of distribution between and among the interest rates paid on deposits to other institutions, less applicable commissions, if any. The Portfolio may also borrow from other funds in the Alger Fund Complex, as discussed in Note 3(d). For the six months ended June 30, 2023, the Portfolio had no borrowings from the Custodian or other funds in the Alger Fund Complex.
NOTE 6 — Share Capital:
The Portfolio has an unlimited number of authorized shares of beneficial interest of $.001 par value. During the six months ended June 30, 2023, and the year ended December 31, 2022, transactions of shares of beneficial interest were as follows:
| | | FOR THE SIX MONTHS ENDED | | | FOR THE YEAR ENDED | |
| | | JUNE 30, 2023 | | | DECEMBER 31, 2022 | |
| | | SHARES | | | AMOUNT | | | SHARES | | | AMOUNT | |
| Alger Balanced Portfolio | | | | | | | | | | | | | | | | |
| Class I-2: | | | | | | | | | | | | | | | | |
| Shares sold | | | 91,654 | | | $ | 1,556,357 | | | | 288,791 | | | $ | 5,146,133 | |
| Dividends reinvested | | | — | | | | — | | | | 177,801 | | | | 2,940,829 | |
| Shares redeemed | | | (215,481 | ) | | | (3,654,963 | ) | | | (482,357 | ) | | | (8,545,442 | ) |
| Net decrease | | | (123,827 | ) | | $ | (2,098,606 | ) | | | (15,765 | ) | | $ | (458,480 | ) |
NOTE 7 — Income Tax Information:
At December 31, 2022, the Portfolio had no capital loss carryforwards utilized for federal income tax purposes.
The difference between book-basis and tax-basis unrealized appreciation (depreciation) is determined annually and is attributable primarily to the tax deferral of losses on wash sales, U.S. Internal Revenue Code Section 988 currency transactions, tax treatment of partnership investments, realization of unrealized appreciation of passive foreign investment companies, and the return of capital from real estate investment trust investments.
The Portfolio accrues tax on unrealized gains in foreign jurisdictions that impose a foreign capital tax.
NOTE 8 — Fair Value Measurements:
The following is a summary of the inputs used as of June 30, 2023, in valuing the Portfolio’s investments carried at fair value on a recurring basis. Based upon the nature, characteristics, and risks associated with its investments, the Portfolio has determined that presenting them by security type and sector is appropriate.
Alger Balanced Portfolio
NOTES TO FINANCIAL STATEMENTS (Unaudited) (Continued)
| Alger Balanced Portfolio | | TOTAL | | | LEVEL 1 | | | LEVEL 2 | | | LEVEL 3 | |
| COMMON STOCKS | | | | | | | | | | | | | | | | |
| Communication Services | | $ | 3,557,591 | | | $ | 3,557,591 | | | $ | — | | | $ | — | |
| Consumer Discretionary | | | 2,823,381 | | | | 2,823,381 | | | | — | | | | — | |
| Consumer Staples | | | 2,710,448 | | | | 2,710,448 | | | | — | | | | — | |
| Energy | | | 1,865,917 | | | | 1,865,917 | | | | — | | | | — | |
| Financials | | | 4,623,386 | | | | 4,623,386 | | | | — | | | | — | |
| Healthcare | | | 5,070,309 | | | | 5,070,309 | | | | — | | | | — | |
| Industrials | | | 2,462,097 | | | | 2,462,097 | | | | — | | | | — | |
| Information Technology | | | 12,108,711 | | | | 12,108,711 | | | | — | | | | — | |
| Materials | | | 914,456 | | | | 914,456 | | | | — | | | | — | |
| Utilities | | | 484,349 | | | | 484,349 | | | | — | | | | — | |
| TOTAL COMMON STOCKS | | $ | 36,620,645 | | | $ | 36,620,645 | | | $ | — | | | $ | — | |
| MASTER LIMITED PARTNERSHIP | | | | | | | | | | | | | | | | |
| Energy | | | 204,585 | | | | 204,585 | | | | — | | | | — | |
| REAL ESTATE INVESTMENT TRUST | | | | | | | | | | | | | | | | |
| Financials | | | 171,891 | | | | 171,891 | | | | — | | | | — | |
| Real Estate | | | 1,241,386 | | | | 1,241,386 | | | | — | | | | — | |
| TOTAL REAL ESTATE INVESTMENT TRUST | | $ | 1,413,277 | | | $ | 1,413,277 | | | $ | — | | | $ | — | |
| CORPORATE BONDS | | | | | | | | | | | | | | | | |
| Consumer Discretionary | | | 1,918,662 | | | | — | | | | 1,918,662 | | | | — | |
| Consumer Staples | | | 1,510,627 | | | | — | | | | 1,510,627 | | | | — | |
| Financials | | | 1,486,450 | | | | — | | | | 1,486,450 | | | | — | |
| Healthcare | | | 2,902,829 | | | | — | | | | 2,902,829 | | | | — | |
| Industrials | | | 1,448,635 | | | | — | | | | 1,448,635 | | | | — | |
| Information Technology | | | 3,567,215 | | | | — | | | | 3,567,215 | | | | — | |
| Materials | | | 508,143 | | | | — | | | | 508,143 | | | | — | |
| Real Estate | | | 1,163,380 | | | | — | | | | 1,163,380 | | | | — | |
| Utilities | | | 497,689 | | | | — | | | | 497,689 | | | | — | |
| TOTAL CORPORATE BONDS | | $ | 15,003,630 | | | $ | — | | | $ | 15,003,630 | | | $ | — | |
| TOTAL INVESTMENTS IN SECURITIES | | $ | 53,242,137 | | | $ | 38,238,507 | | | $ | 15,003,630 | | | $ | — | |
Certain of the Portfolio’s assets and liabilities are held at carrying amount or face value, which approximates fair value for financial reporting purposes. As of June 30, 2023, such assets were categorized within the ASC 820 disclosure hierarchy as follows:
| | | TOTAL FUND | | | LEVEL 1 | | | LEVEL 2 | | | LEVEL 3 | |
| Cash and cash equivalents | | $ | 1,630,716 | | | $ | — | | | $ | 1,630,716 | | | $ | — | |
NOTE 9 — Principal Risks:
Investing in the stock market involves risks, including the potential loss of principal. Your investment in Portfolio shares represents an indirect investment in the securities owned by the Portfolio. The value of these securities, like other investments, may move up or down, sometimes rapidly and unpredictably. Your Portfolio shares at any point in time may be worth less than what you invested, even after taking into account the reinvestment of Portfolio dividends and distributions. Local, regional or global events such as environmental or natural disasters, war, terrorism, pandemics, outbreaks of infectious diseases and similar public health threats, recessions, or other events could have a significant impact on investments. Growth stocks may be more volatile than other stocks as their prices tend to be higher in relation to their companies’ earnings and may be more sensitive to market, political, and economic developments. The risks of investing in fixed-income securities include sensitivity to interest rate and credit rating changes, call risk, increased volatility for lower rated securities, and pre-payment risk. Income-producing securities may cut or fail to declare dividends due to market downturns or for other reasons. Junk bonds are high risk investments that are considered speculative and may cause income and principal losses. A significant portion of assets may be invested in securities of companies in related sectors, and may be similarly affected by economic, political, or market events and conditions and may be more vulnerable to unfavorable sector developments. At times, the Portfolio may hold a large cash position, which may underperform relative to equity securities.
Alger Balanced Portfolio
NOTES TO FINANCIAL STATEMENTS (Unaudited) (Continued)
NOTE 10 — Subsequent Events:
Management of the Portfolio has evaluated events that have occurred subsequent to June 30, 2023, through the issuance date of the Financial Statements. No such events have been identified which require recognition and/or disclosure.
THE ALGER PORTFOLIOS | Alger Balanced Portfolio
ADDITIONAL INFORMATION (Unaudited)
Shareholder Expense Example
As a shareholder of the Portfolio, you incur two types of costs: transaction costs, if applicable; and ongoing costs, including management fees, distribution (12b-1) fees, if applicable, and other fund expenses. This example is intended to help you understand your ongoing costs (in dollars) of investing in the Portfolio and to compare these costs with the ongoing costs of investing in other mutual funds.
The example below is based on an investment of $1,000 invested at the beginning of the six-month period starting January 1, 2023 and ending June 30, 2023 and held for the entire period.
Actual Expenses
The first line for each class of shares in the table below provides information about actual account values and actual expenses. You may use the information in this line, together with the amount you invested, to estimate the expenses that you paid over the period. Simply divide your account value by $1,000 (for example, an $8,600 account value divided by $1,000 = 8.6), then multiply the result by the number in the first line under the heading entitled “Expenses Paid During the Six Months Ended June 30, 2023” to estimate the expenses you paid on your account during this period.
Hypothetical Example for Comparison Purposes
The second line for each class of shares in the table below provides information about hypothetical account values and hypothetical expenses based on the actual expense ratio for each class of the Portfolio’s shares and an assumed rate of return of 5% per year before expenses, which is not the Portfolio’s actual return. The hypothetical account values and expenses may not be used to estimate the actual ending account balance or expenses you paid for the period. You may use this information to compare the ongoing costs of investing in the Portfolio and other funds. To do so, compare this 5% hypothetical example with the 5% hypothetical examples that appear in the shareholder reports of other funds.
Please note that the expenses shown in the table are meant to highlight your ongoing costs only and do not reflect any transactional costs or deduction of insurance charges against assets or annuities. Therefore, the second line under each class of shares in the table is useful in comparing ongoing costs only, and will not help you determine the relative total costs of owning different funds. In addition, if these transactional costs were included, your costs would have been higher.
THE ALGER PORTFOLIOS | Alger Balanced Portfolio
ADDITIONAL INFORMATION (Unaudited) (Continued)
| | | | | | | | | | | | Annualized | |
| | | | | | | | | Expenses | | | Expense Ratio | |
| | | Beginning | | | Ending | | | Paid During | | | For the | |
| | | Account | | | Account | | | the Six Months | | | Six Months | |
| | | Value | | | Value | | | Ended | | | Ended | |
| | | January 1, 2023 | | | June 30, 2023 | | | June 30, 2023(a) | | | June 30, 2023(b) | |
| Alger Balanced Portfolio | | | | | | | | | | | | |
| Class I-2 Actual | | $ | 1,000.00 | | | $ | 1,098.80 | | | $ | 5.46 | | | | 1.05 | % |
| Hypothetical(c) | | | 1,000.00 | | | | 1,019.59 | | | | 5.26 | | | | 1.05 | |
| (a) | Expenses are equal to the annualized expense ratio of the share class, multiplied by the average account value over the period, multiplied by 181/365 (to reflect the one-half year period). |
| (c) | 5% annual return before expenses. |
THE ALGER PORTFOLIOS | Alger Balanced Portfolio
ADDITIONAL INFORMATION (Unaudited) (Continued)
Privacy Policy
| U.S. Consumer Privacy Notice | | Rev. 06/22/21 |
| | FACTS | | WHAT DOES ALGER DO WITH YOUR PERSONAL INFORMATION? | |
| | | | | |
| | Why? | | Financial companies choose how they share your personal information. Federal law gives consumers the right to limit some but not all sharing. Federal law also requires us to tell you how we collect, share, and protect your personal information. Please read this notice carefully to understand what we do. | |
| | What? | | The types of personal information we collect and share depend on the product or service you have with us. This information can include: • Social Security number and • Account balances and • Transaction history and • Purchase history and • Assets When you are no longer our customer, we continue to share your information as described in this notice. | |
| | How? | | All financial companies need to share personal information to run their everyday business. In the section below, we list the reasons financial companies can share their personal information; the reasons Alger chooses to share; and whether you can limit this sharing. | |
| | Reasons we can share your personal information | | Does Alger share? | | Can you limit this sharing? |
| | For our everyday business purposes — such as to process your transactions, maintain your account(s), respond to court orders and legal investigations, or report to credit bureaus | | Yes | | No |
| | For our marketing purposes — to offer our products and services to you | | Yes | | No |
| | For joint marketing with other financial companies | | No | | We don’t share |
| | For our affiliates’ everyday business purposes — information about your transactions and experiences | | Yes | | No |
| | For our affiliates’ everyday business purposes — information about your creditworthiness | | No | | We don’t share |
| | For nonaffiliates to market to you | | No | | We don’t share |
| | Questions? Call 1-800-223-3810 | | | | |
THE ALGER PORTFOLIOS | Alger Balanced Portfolio
ADDITIONAL INFORMATION (Unaudited) (Continued)
| | Who we are | | | |
| | Who is providing this notice? | | Alger includes Fred Alger Management, LLC and Fred Alger & Company, LLC as well as the following funds: The Alger Funds, The Alger Funds II, The Alger Institutional Funds, The Alger Portfolios, Alger Global Focus Fund, and The Alger ETF Trust. | |
| | What we do | | | |
| | How does Alger protect my personal information? | | To protect your personal information from unauthorized access and use, we use security measures that comply with federal law. These measures include computer safeguards and secured files and buildings. | |
| | How does Alger collect my personal information? | | We collect your personal information, for example, when you: • Open an account or • Make deposits or withdrawals from your account or • Give us your contact information or • Provide account information or • Pay us by check. | |
| | Why can’t I limit all sharing? | | Federal law gives you the right to limit some but not all sharing related to: • sharing for affiliates’ everyday business purposes ─ information about your credit worthiness • affiliates from using your information to market to you • sharing for nonaffiliates to market to you State laws and individual companies may give you additional rights to limit sharing. | |
| | Definitions | | | |
| | Affiliates | | Companies related by common ownership or control. They can be financial and nonfinancial companies. • Our affiliates include Fred Alger Management, LLC, Weatherbie Capital, LLC and Fred Alger & Company, LLC as well as the following funds: The Alger Funds, The Alger Funds II, The Alger Institutional Funds, The Alger Portfolios, Alger Global Focus Fund, and The Alger ETF Trust. | |
| | Nonaffiliates | | Companies not related by common ownership or control. They can be financial and nonfinancial companies. | |
| | Joint marketing | | A formal agreement between nonaffiliated financial companies that together market financial products or services to you. | |
THE ALGER PORTFOLIOS | Alger Balanced Portfolio
ADDITIONAL INFORMATION (Unaudited) (Continued)
Proxy Voting Policies
A description of the policies and procedures the Portfolio uses to determine how to vote proxies relating to portfolio securities and the proxy voting record is available, without charge, by calling (800) 992-3863 or online on the Portfolio’s website at http://www.alger. com or on the SEC’s website at http://www.sec.gov.
Fund Holdings
The Board has adopted policies and procedures relating to disclosure of the Portfolio’s securities. These policies and procedures recognize that there may be legitimate business reasons for holdings to be disclosed and seek to balance those interests to protect the proprietary nature of the trading strategies and implementation thereof by the Portfolio.
Generally, the policies prohibit the release of information concerning portfolio holdings, which have not previously been made public, to individual investors, institutional investors, intermediaries that distribute the Portfolio’s shares and other parties which are not employed by the Investment Manager or its affiliates except when the legitimate business purposes for selective disclosure and other conditions (designed to protect the Portfolio) are acceptable.
The Portfolio files its complete schedule of portfolio holdings with the SEC semi-annually in shareholder reports on Form N-CSR and after the first and third fiscal quarters as an exhibit to its reports on Form N-PORT. The Portfolio’s Forms N-CSR and N-PORT are available online on the SEC’s website at www.sec.gov.
In addition, the Portfolio makes publicly available its month-end top 10 holdings with a 10 day lag and its month-end full portfolio with a 60 day lag on its website www.alger. com and through other marketing communications (including printed advertising/sales literature and/or shareholder telephone customer service centers). No compensation or other consideration is directly received for the non-public disclosure of portfolio holdings information.
In accordance with the foregoing, the Portfolio provides portfolio holdings information to third parties including financial intermediaries and service providers who need access to this information in the performance of their services and are subject to duties of confidentiality (1) imposed by law, including a duty not to trade on non-public information, and/or (2) pursuant to an agreement that confidential information is not to be disclosed or used (including trading on such information) other than as required by law. From time to time, the Fund will communicate with these third parties to confirm that they understand the Portfolio’s policies and procedures regarding such disclosure. These agreements must be approved by the Portfolio’s Chief Compliance Officer.
The Board periodically reviews a report disclosing the third parties to whom the Portfolio’s holdings information has been disclosed and the purpose for such disclosure, and it considers whether or not the release of information to such third parties is in the best interest of the Portfolio and its shareholders.
THE ALGER PORTFOLIOS | Alger Balanced Portfolio
ADDITIONAL INFORMATION (Unaudited) (Continued)
In addition to material the Portfolio routinely provides to shareholders, the Investment Manager may make additional statistical information available regarding the Alger Family of Funds. Such information may include, but not be limited to, relative weightings and characteristics of the Portfolio versus an index (such as P/E ratio, alpha, beta, capture ratio, maximum drawdown, standard deviation, EPS forecasts, Sharpe ratio, information ratio, R-squared, and market cap analysis), security specific impact on overall portfolio performance, month-end top ten contributors to and detractors from performance, portfolio turnover, and other similar information. Shareholders should visit www.alger.com or may also contact the Funds at (800) 992-3863 to obtain such information.
THE ALGER PORTFOLIOS
100 Pearl Street, 27th Floor
New York, NY 10004
(800) 992-3863
www.alger.com
Investment Manager
Fred Alger Management, LLC
100 Pearl Street, 27th Floor
New York, NY 10004
Distributor
Fred Alger & Company, LLC
100 Pearl Street, 27th Floor
New York, NY 10004
Transfer Agent and Dividend Disbursing Agent
UMB Fund Services, Inc.
235 W. Galena Street
Milwaukee, WI 53212
Custodian
Brown Brothers Harriman & Company
50 Post Office Square
Boston, MA 02110
Independent Registered Public Accounting Firm
Deloitte & Touche LLP
30 Rockefeller Plaza
New York, NY 10112
This report is submitted for the general information of the shareholders of Alger Balanced Portfolio. It is not authorized for distribution to prospective investors unless accompanied by an effective Prospectus for the Portfolio, which contains information concerning the Portfolio’s investment policies, fees and expenses as well as other pertinent information.
Not applicable.
Not applicable.
Not applicable.
Not applicable.
Not applicable.
(a) A Schedule of Investments in securities of unaffiliated issuers as of the close of the Reporting Period is included as part of the report to shareholders filed under Item 1 of this Form N-CSR.
(b) Not applicable.
Not applicable.
Not applicable.
Not applicable.
Not applicable.
Not applicable.
Pursuant to the requirements of the Securities Exchange Act of 1934 and the Investment Company Act of 1940, the registrant has duly caused this report to be signed on its behalf by the undersigned, thereunto duly authorized.
Pursuant to the requirements of the Securities Exchange Act of 1934 and the Investment Company Act of 1940, this report has been signed below by the following persons on behalf of the registrant and in the capacities and on the dates indicated.