ANNUAL REPORT
September 30, 2016
A No-Load Mutual Fund
1-800-773-9665
www.reynoldsfunds.com
November 23, 2016
Dear Fellow Shareholders:
Reynolds Blue Chip Growth Fund’s 28th Anniversary
The Reynolds Blue Chip Growth Fund celebrated its 28th Anniversary last summer. It began operations on August 12, 1988.
Performance Highlights (September 30, 2016)(1)
The annualized average total returns of the Reynolds Blue Chip Growth Fund and S&P 500 Index for the 1-year, 5-year, and 10-year periods through September 30, 2016 were:
| | | Average Annual Total Returns |
| | | 1 Year | 5 Year | 10 Year |
| | Reynolds Blue Chip Growth Fund | 0.48% | 11.40% | 10.72% |
| | The Standard & Poor’s 500 Index(2) | 15.43% | 16.37% | 7.24% |
| | (1) | Performance data quoted represents past performance; past performance does not guarantee future results. The investment return and principal value of an investment will fluctuate so that an investor’s shares, when redeemed, may be worth more or less than their original cost. Current performance of the Fund may be lower or higher than the performance quoted. Returns do not reflect the deduction of taxes that a shareholder would pay on Fund distributions or the redemption of Fund shares. Performance data current to the most recent month-end may be obtained by visiting www.reynoldsfunds.com or by calling 1-800-773-9665. |
| | (2) | The Standard & Poor’s 500 Index (“S&P”) is a capitalization-weighted index, representing the aggregate market value of the common equity of 500 stocks primarily traded on the New York Stock Exchange. Returns shown include the reinvestment of all dividends. Past performance is not predictive of future performance. The table does not reflect the deduction of taxes that a shareholder would pay on fund distributions or the redemption of fund shares. Investment return and principal value will fluctuate, so that your shares, when redeemed, may be worth more or less than the original cost. |
As stated in the Prospectus dated January 31, 2016 the expense ratio of the Fund is 1.71%.
Web Site
Our website is www.reynoldsfunds.com. At our website you can access current information about your investment holdings. You must first request a personal identification number (PIN) by calling our shareholder service representatives at 1-800-773-9665. You will be able to view your account list, account detail (including balances), transaction history, distributions, and the current Reynolds Blue Chip Growth Fund net asset value. Additional information available (PIN not needed) includes quarterly updates of the returns of the Blue Chip Fund, top ten holdings, industry percentages, and news articles regarding the Fund. Detailed statistics and graphs of past performances from Morningstar are also available via a link on the Fund’s website.
Investment Strategy
We believe that many stocks are currently selling at attractive valuations based on historical valuation measures. One of these valuation measures is a company’s price earnings ratio (the “PE ratio”) relative to inflation, interest rates and the economic outlook. Another valuation measure is a company’s PE ratio relative to its forecasted earnings growth rate (the “PEG ratio”). Many stocks of high quality companies are currently selling at PE ratios and PEG ratios below their average historical ranges relative to inflation, interest rates and the economic outlook.
The U.S. Economy
The U.S. economic recovery that started in mid-2009 has continued so far in 2016. The U.S. economic recovery has been affected by a number of secular factors that are continuing to alter the pace and composition of growth. The U.S. economy in 2016 has been affected by greater prudence and less speculation in lending, low inflation and a higher savings rate. Although the U.S. economy is growing, it is growing at a lower than ideal rate. Currently, unemployment is 4.9%. Unemployment is estimated to average 4.7% in 2017. For 2017, the outlook remains for slower than ideal growth, low inflation and low interest rates. However, all of these items are estimated to be at a higher
level in 2017 than 2016. U.S. Gross Domestic Product (GDP) increased 2.6% in 2015, 2.4% in 2014, 1.5% in 2013 and 2.3% in 2012. GDP increased at a stronger than expected inflation-adjusted annual rate of 2.9% in the quarter ended September 30, 2016. GDP is estimated to increase at an inflation-adjusted annual rate of 1.9% in the quarter ended December 31, 2016. GDP is forecast to increase 1.5% for the year ended December 31, 2016. GDP is forecast to increase 2.3% for the year ended December 31, 2017.
U.S. inflation numbers have been helped in the last few years by global competition and technology innovations that are helping to lower production and distribution costs. Inflation, as measured by the Consumer Price Index, increased 0.1% in 2015, 1.6% in 2014, 1.5% in 2013 and 2.1% in 2012. U.S. inflation increased at a 1.1 % rate in the third quarter of 2016. U.S. inflation is estimated to increase at a 1.8 % rate in the quarter ending December 31, 2016 and increase 1.3% for the year ended December 31, 2016. U.S. inflation is forecast to increase 2.5% for the year ended December 31, 2017.
There are some current and potential economic and investment negatives at the present time: (1) worldwide economic growth continues at a slower than ideal rate; (2) growth in Brazil, Japan and Russia has been weak; (3) although continuing to improve, unemployment at 4.9% is higher than ideal; (4) mortgage rates are low, but mortgage credit is still somewhat tight; (5) capital spending has been lower than ideal; (6) whenever there is a change of administration there are uncertainties, this time more so; (7) the manufacturing sector remains mixed; (8) there is a widening disparity between higher and lower income levels; (9) productivity remains weaker than ideal; (10) Great Britain leaving the European Union (“Brexit”) is causing uncertainty; and (11) problems with the Middle East and other parts of the world.
Some current and potential economic and investment positives are: (1) monetary policy, financial conditions and future increased fiscal stimulus including increased infrastructure spending are supportive of growth; (2) the U.S. economy has grown in the last twenty-eight quarters and growth should continue in 2016 and 2017; (3) the U.S. economy has recently strengthened including retail sales, housing starts and orders for business equipment; (4) the rise in residential property values has added to net worth and households have strengthened their balance sheets; (5) unemployment is currently at 4.9%, the lowest in more than seven years, the labor market continues to tighten and unemployment is forecast to be 4.7% in 2017; (6) although the Federal Reserve probably will be raising interest rates near term, interest rates will still be very low by historical standards; (7) gasoline prices remain low; (8) there has been an increase in the willingness of companies to commit capital as evidenced by the increase in merger and acquisition activity; (9) businesses have been able to use the credit markets to strengthen their balance sheets; (10) the regulatory environment for business should improve; (11) many companies are repurchasing their shares; (12) current valuations of many stocks are reasonable taking into consideration inflation and interest rates; (13) the U.S. economy currently has better fundamentals than the economies of most other industrialized countries; (14) Euro-zone economic growth recently picked up to a faster level; (15) many central banks worldwide continue with monetary stimulus to boost growth; and (16) worldwide economic growth does not appear to be strong enough to lead to a significant rise in global inflationary pressures.
The World Economy
The global economic recovery that started in mid-2009 is continuing in 2016, although at a lower than ideal rate. The world economy is forecast to increase 2.6% in 2016 and 2.8% in 2017 after increasing 2.8% in 2015, 2.7% in 2014, 3.0% in 2013 and 2.7% in 2012.
The Eurozone’s GDP is forecast to increase 1.6% in 2016 and 1.6 % in 2017, after increasing 1.5% in 2015, 0.9% in 2014, and decreasing -0.4% in 2013 and -0.5% in 2012. Brexit has not weakened the U.K. economy yet. The United Kingdom’s economy grew at a stronger than expected 2.0% rate in the third quarter. The United Kingdom’s GDP is forecast to increase 2.0% in 2016 and increase 1.0% in 2017 after increasing 2.3% in 2015, 2.8% in 2014, 1.7% in 2013 and 0.3% in 2012.
Among larger industrialized economies, Canada’s GDP is forecast to increase 1.1% in 2016 and to increase 1.6% in 2017 after increasing 1.9% in 2015, 2.5% in 2014, 2.0% in 2013 and 1.8% in 2012. Japan’s GDP is forecast to increase 0.5% in 2016 and increase 0.4% in 2017 after increasing 1.5 % in 2015, decreasing -0.1% in 2014, and increasing 1.5% in 2013 and 1.9% in 2012. Korea’s GDP is forecast to increase 2.9% in 2016 and to increase 3.0% in 2017 after increasing 2.6% in 2015, 3.3% in 2014, 3.0% in 2013 and 2.0% in 2012.
The biggest developing economies are many times referred to as the “BRIC” economy, which is short for Brazil, Russia, India, and China. China currently has the second strongest growth among “developing economies.” It is also currently the world’s second fastest growing major economy. China’s population is approximately 18% of the world’s total population of approximately 7.4 billion. In the second quarter of 2010, China overtook Japan and became the world’s second largest economy after the U.S. Many economists believe that China has a particularly good long-term outlook. Near term, however, there have been cross currents in China’s economic outlook and growth has been slowing, although economic growth is at a high rate. China’s GDP is forecast to increase 6.6% in 2016 and to increase 6.0% in 2017 after increasing 6.9% in 2015, 7.4% in 2014, 7.1% in 2013 and 7.7% in 2012.
India’s population is approximately 17% of the world’s population. India currently has the fastest growth among “developing economies” and it currently is the world’s fastest growing major economy. India’s GDP is forecast to increase 7.6% in 2016 and to increase 7.5% in 2017 after increasing 7.2 % in 2015, 6.9% in 2014, 4.6% in 2013 and 5.0% in 2012.
Brazil is Latin America’s biggest economy. GDP is forecast to decrease -3.9% in 2016 and to increase 0.6% in 2017, after decreasing -3.9% in 2015, and increasing 0.1% in 2014, 2.3% in 2013 and 0.9% in 2012. Russia’s GDP is forecast to decrease -0.2% in 2016 and to increase 1.6% in 2017 after decreasing -3.7% in 2015, and increasing 0.7% in 2014, 1.0% in 2013 and 3.4% in 2012.
Opportunistic Investing in Companies of Various Sizes and Diversified Among Various Industries
The Reynolds Blue Chip Growth Fund usually invests in companies of various sizes as classified by their market capitalizations. A company’s market capitalization is calculated by taking the number of shares the company has outstanding multiplied by its current market price. Other considerations in selecting companies for the Fund include revenue growth rates, product innovations, financial strength, management’s knowledge and experience, plus the overall economic and geopolitical environments and interest rates. The Fund’s investments are diversified among various industries.
The long-term strategy of the Reynolds Blue Chip Growth Fund is to emphasize investment in worldwide “blue chip” growth companies. These companies are defined as companies with a minimum market capitalization of U.S. $1 billion. In the long-term, these companies build value as their earnings grow. This growth in value should ultimately be recognized in higher stock prices for these companies.
Industry Sectors(1)(2) as of September 30, 2016
| (1) | The Global Industry Classification Standard (“GICS®”) was developed by and/or is the exclusive property of MSCI, Inc. and Standard & Poor’s Financial Services LLC. GICS® is a service mark of MSCI and S&P and has been licensed for use by U.S. Bancorp Fund Services, LLC. |
| (2) | For presentation purposes within the Fund’s shareholder letter, the Fund has grouped some of the industry categories by sector. For purposes of categorizing securities for compliance with section 8(b)(1) of the Investment Company Act of 1940, as amended, the Fund uses more specific industry classifications for financial reporting within its Schedule of Investments. |
Low Long-Term Interest Rates by Historical Standards are a Significant Positive for Stock Valuations
Long-term interest rates remain near historically low levels. Low long-term interest rates usually result in higher stock valuations for many reasons including:
| | (1) | Long-term borrowing costs of corporations are lower resulting in higher business confidence and profits. |
| | (2) | Long-term borrowing costs of individuals are lower which increases consumer confidence and spending. |
| | (3) | A company’s stock is usually valued by placing a present value on that company’s future stream of earnings and dividends. The present value is higher when interest and inflation rates are low. |
Linked Money Market Fund
The First American Treasury Obligations Fund is a money market fund offered by an affiliate of our transfer agent, U.S. Bancorp Fund Services, LLC. The First American Treasury Obligations Fund is offered as a money market alternative to our shareholders. The First
American Treasury Obligations Fund offers many free shareholder conveniences including automatic investment and withdrawal plans and check writing access to your funds and is linked to your holdings in the Reynolds Blue Chip Growth Fund. The First American Treasury Obligations Fund is also included on your quarterly statements.
Information about the Reynolds Blue Chip Growth Fund and the First American Treasury Obligations Fund Reynoldsfunds.com website: You can access current information about your investment holdings via our website, reynoldsfunds.com. You will be able to view your account list, account detail (including balances), transaction history, distributions, and the current Reynolds Blue Chip Growth Fund net asset value. Additional information available (PIN not needed) includes quarterly updates of the returns of the Blue Chip Fund, top ten holdings, industry percentages, and news articles regarding the Fund. Detailed statistics and graphs of past performances from Morningstar are also available via a link on the Fund’s website.
For automatic current daily net asset values: Call 1-800-773-9665 (1-800-7REYNOLDS) twenty-four hours a day, seven days a week and press “any key” then “1”. The updated current net asset value for the Blue Chip Fund is usually available each business day after 5 P.M. (PST).
For the Reynolds Blue Chip Growth Fund shareholders to automatically access their current account information: Call 1-800-773-9665 (twenty-four hours a day, seven days a week), press “any key” then “2” and enter your 16 digit account number which appears at the top right of your statement.
To speak to a Fund representative regarding the current daily net asset value, current account information and any other questions: Call 1-800-773-9665 and press “0” from 6 A.M. to 5 P.M. (PST).
Shareholder statement frequency: Consolidated statements summarizing the Blue Chip Fund and First American Treasury Obligations Fund accounts held by a shareholder are sent quarterly. In addition, individual Blue Chip Fund statements are sent whenever a transaction occurs. These transactions are: (1) statements are sent for the Blue Chip Fund or First American Treasury Obligations Fund when a shareholder purchases or redeems shares; (2) Blue Chip Fund statements are sent if, and when, any ordinary income or capital gains are distributed.
Tax reporting: Individual 1099 forms, which summarize any dividend income and any long- or short-term capital gains, are sent annually to shareholders each January. The percentage of income earned from various government securities, if any, for the Blue Chip Fund and the First American Treasury Obligations Fund are also reported in January.
Minimum investment: $1,000 for regular and retirement accounts ($100 for additional investments for all accounts – except for the Automatic Investment Plan, which is $50 for regular and retirement plan accounts).
Retirement plans: All types are offered including Traditional IRA, Roth IRA, Coverdell Education Savings Account, SIMPLE IRA Plan, and SEP IRA.
Automatic Investment Plan: There is no charge to automatically debit your checking account to invest in the Blue Chip Fund or the First American Treasury Obligations Fund ($50 minimum for either of these Funds) at periodic intervals to make automatic purchases in either of these Funds. This is useful for dollar cost averaging for the Blue Chip Fund.
Systematic Withdrawal Plan: For shareholders with a $10,000 minimum starting balance, there is no charge to automatically redeem shares ($100 minimum) in the Blue Chip Fund or the First American Treasury Obligations Fund as often as monthly and send a check to you or transfer funds to your bank account.
Free Check Writing: Free check writing ($100 minimum) is offered for accounts invested in the First American Treasury Obligations Fund.
Exchanges or regular redemptions between the Blue Chip Fund and the First American Treasury Obligations Fund: As often as desired – no charge.
NASDAQ symbols: Reynolds Blue Chip Growth Fund – RBCGX and First American Treasury Obligations Fund – FATXX.
Portfolio Manager: Frederick Reynolds is the portfolio manager of the Reynolds Blue Chip Growth Fund. He has been the portfolio manager of the Fund since its inception in 1988.
The Reynolds Blue Chip Growth Fund and the First American Treasury Obligations Fund are No-Load: No front-end sales commissions or deferred sales charges (“loads”) are charged. Some mutual funds impose these marketing charges that are ultimately paid by the shareholder. These marketing charges are either: (1) a front-end fee or “load” in which up to 5% of a shareholder’s assets are deducted from the original investment (some funds even charge a fee when a shareholder reinvests capital gains or dividends); or (2) a back-end penalty fee or “load” which is typically deducted from a shareholder’s account if a shareholder redeems within five years of the original investment. These fees reduce a shareholder’s return. The Reynolds Blue Chip Fund and the First American Treasury Obligations Fund are No-Load as they do not have these extra charges.
We appreciate your continued confidence in the Reynolds Blue Chip Growth Fund and would like to welcome our new shareholders. We look forward to strong results in the future.
Sincerely,
Frederick L. Reynolds
President
This report is not authorized for use as an offer of sale or a solicitation of an offer to buy shares of the Reynolds Blue Chip Growth Fund unless accompanied or preceded by the Fund’s current prospectus.
Investors in the Fund may lose money. There are risks associated with investments in the types of securities in which the Fund invests. These risks include:
Market Risk – The prices of the stocks in which the Fund invests may decline for a number of reasons. These reasons include factors that are specific to one or more stocks in which the Fund invests as well as factors that affect the equity securities markets generally. The price declines may be steep, sudden and/or prolonged.
Growth Investing Risk – The investment adviser may be wrong in its assessment of a company’s potential for growth and the growth stocks the Fund holds may not grow as the investment adviser anticipates. Finally, there are periods when investing in growth stocks falls out of favor with investors and these stocks may underperform.
Smaller and Medium Capitalization Companies Risk – The Fund invests in smaller companies, which involve additional risks such as limited liquidity and greater volatility.
Foreign Securities Risk – The Fund invests in foreign securities which involve greater volatility and political, economic and currency risks and different accounting methods.
Additional risks associated with investing in the Fund are as follows: Technology Companies Risk, Consumer Discretionary Companies Risk, and Portfolio Turnover Risk. For details regarding these risks, please refer to the Fund’s Prospectus or Summary Prospectus dated January 31, 2016.
For additional information about the Directors and Officers or for a description of the policies and procedures that the Fund uses to determine how to vote proxies relating to portfolio securities, please call (800) 773-9665 and request a Statement of Additional Information. One will be mailed to you free of charge. The Statement of Additional Information is also available on the website of the Securities and Exchange Commission (the “Commission”) at http://www.sec.gov. Information on how the Fund voted proxies relating to portfolio securities is available on the Fund’s website at http://www.reynoldsfunds.com or the website of the Commission no later than August 31 for the prior 12 months ending June 30. The Fund files its complete schedule of portfolio holdings with the Commiss ion for the first and third quarters of each fiscal year on Form N-Q. The Fund’s Form N-Q is available on the Commission’s website. The Fund’s Form N-Q may be reviewed and copied at the Commission’s Public Reference Room in Washington, D.C., and that information on the operation of the Public Reference Room may be obtained by calling 1-800-SEC-0330.
Distributed by Rafferty Capital Markets, LLC
Reynolds Blue Chip Growth Fund
MANAGEMENT’S DISCUSSION OF FUND PERFORMANCE (Unaudited)
Some industries that were held in the Reynolds Blue Chip Growth Fund that underperformed the S&P 500 Index (the Blue Chip Fund’s benchmark) during the Fund’s fiscal year (twelve months ended September 30, 2016) were (1) Airlines, (2) Banks, (3) Financial Services, (4) Health Care including Biotechnology and Drugs , (5) Hotels, (6) Media, and (7) Retailers. Some of the Fund’s individual holdings that underperformed the benchmark were: (1) Alaska Air Group, (2) Allegiant Travel, (3) Baidu, (4) Bristol Myers, (5) Dollar General, (6) Dollar Tree, (7) Gilead Sciences, (8) Macy’s, (9) McDonalds, (10) Pfizer, (11) Viacom, and (12) Walt Disney.
Some of the Blue Chip Fund’s strongest industry performers during this period were: (1) Aerospace and Defense, (2) Basic Materials, (3) Basic Resources, (4) Construction, (5) Energy, (6) Gold, (7) Insurance, (8) Machinery, (9) Semiconductors, (10) Technology, and (11) Telecommunications. In addition, good individual stock selection was an important contributor to the Blue Chip Fund’s performance. Examples were: (1) AT&T, (2) Adobe, (3) Ali Baba, (4) Amazon, (5) Apple, (6) Baker Hughes, (7) Barrick Gold, (8) Caterpillar, (9) Facebook, (10) Federal Express, (11) Google, (12) Ingersoll Rand, (13) Newmont Mining, (14) Northrup Grumman, (15) Qualcomm, (16) Ross Stores, (17) Texas Instruments, and (18) Wal-Mart Stores. Also, contributing positively to the Reynolds Blue Chip Growth Fund’s performance were several companies held in the Fund that were acquired or partially acquired during this period. Examples of this were Starwood Hotels and Yahoo.
| |
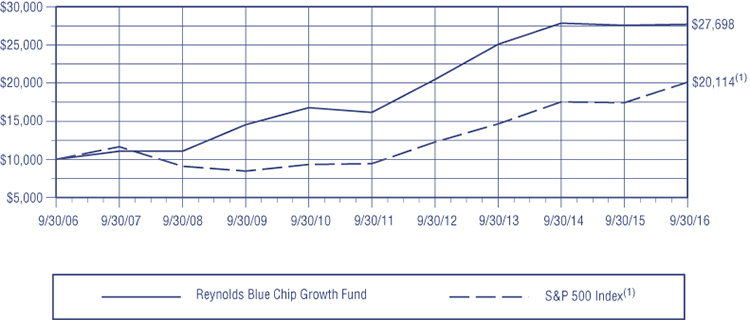
| COMPARISON OF CHANGE IN VALUE OF $10,000 INVESTMENT IN |
REYNOLDS BLUE CHIP GROWTH FUND AND S&P 500 INDEX(1) |
| |
 |
| |
| AVERAGE ANNUAL TOTAL RETURN |
| | 1-YEAR | 5-YEAR | 10-YEAR |
| Reynolds Blue Chip Growth Fund | 0.48% | 11.40% | 10.72% |
| S&P 500 Index | 15.43% | 16.37% | 7.24% |
Past performance does not predict future performance. The graph and the table do not reflect the deduction of taxes that a shareholder would pay on Fund distributions or the redemption of Fund shares.
| (1) | The S&P 500 is the Standard & Poor’s Composite Index of 500 stocks, a widely recognized unmanaged index of common stock prices and includes the reinvestment of all dividends. Investors cannot invest directly in an index or benchmark. |
Reynolds Blue Chip Growth Fund
EXPENSE EXAMPLE
(Unaudited)
As a shareholder of the Reynolds Blue Chip Growth Fund, you do not incur (except as described below) transaction costs, including sales charges (loads) on purchase payments, reinvested dividends, or other distributions; redemption fees; and exchange fees, but do incur ongoing costs, including management fees; distribution and/or service (12b-1) fees; and other Fund expenses. This example is intended to help you understand your ongoing costs (in dollars) of investing in the Fund and to compare these costs with the ongoing costs of investing in other mutual funds. The example is based on an investment of $1,000 invested at the beginning of the period and held for the entire period from April 1, 2016 through September 30, 2016.
Actual Expenses
The first line of the table below provides information about actual account values based on actual returns and actual expenses. You may use the information in this line, together with the amount you invested, to estimate the expenses that you paid over the period. Simply divide your account value by $1,000 (for example, an $8,600 account value divided by $1,000 = 8.6), then multiply the result by the number in the first line under the heading entitled “Expenses Paid During Period” to estimate the expenses you paid on your account during this period.
In addition to the costs highlighted and described below, the only Fund transaction costs you might currently incur would be wire fees ($15 per wire), if you choose to have proceeds from a redemption wired to your bank account instead of receiving a check. Additionally, U.S. Bancorp Fund Services, LLC charges an annual processing fee ($15) if you maintain an IRA account with the Fund. To determine your total costs of investing in the Fund, you would need to add any applicable wire or IRA processing fees you’ve incurred during the period to the costs provided in the example below.
Hypothetical Example for Comparison Purposes
The second line of the table below provides information about hypothetical account values and hypothetical expenses based on the Fund’s actual expense ratio and an assumed rate of return of 5% per year before expenses, which is not the Fund’s actual return. The hypothetical account values and expenses may not be used to estimate the actual ending account balance or expenses you paid for the period. You may use this information to compare the ongoing costs of investing in the Fund and other funds. To do so, compare this 5% hypothetical example with the 5% hypothetical examples that appear in the shareholder reports of the other funds. Please note that the expenses shown in the table are meant to highlight your ongoing costs only and do not reflect any transactional costs, such as sales charges (loads), redemption or exchange fees. Therefore, the second line of the table is useful in comparing ongoing costs only, and will not help you determine the relative total costs of owning different funds. In addition, if these transactional costs were included, your costs would have been higher.
| | Beginning Account | Ending Account | Expenses Paid During |
| | Value 4/1/16 | Value 9/30/16 | Period* 4/1/16-9/30/16 |
| Reynolds Blue Chip Growth Fund Actual | $1,000.00 | $1,017.80 | $9.69 |
| Hypothetical (5% return before expenses) | $1,000.00 | $1,015.40 | $9.67 |
| * | Expenses are equal to the Fund’s annualized expense ratio of 1.92% multiplied by the average account value over the period, multiplied by 183/366 (to reflect the one-half year period between April 1, 2016 and September 30, 2016). |
Reynolds Blue Chip Growth Fund
STATEMENT OF ASSETS AND LIABILITIES
September 30, 2016
| ASSETS: | | | |
| Investments in securities, at value (cost $66,333,575) | | $ | 79,352,853 | |
| Cash | | | 829 | |
| Receivable from investments sold | | | 7,487,397 | |
| Prepaid expenses | | | 53,822 | |
| Dividends and interest receivable | | | 44,483 | |
| Receivable from shareholders for purchases | | | 1,178 | |
| Total assets | | | 86,940,562 | |
| LIABILITIES: | | | | |
| Payable for investments purchased | | | 6,142,116 | |
| Payable to shareholders for redemptions | | | 175,530 | |
| Payable to adviser for management fees | | | 66,735 | |
| Payable for distribution expenses | | | 14,445 | |
| Other liabilities | | | 80,448 | |
| Total liabilities | | | 6,479,274 | |
| NET ASSETS | | $ | 80,461,288 | |
| NET ASSETS CONSIST OF: | | | | |
| Capital Stock, $0.01 par value; 40,000,000 shares authorized; 1,499,708 shares outstanding | | $ | 64,774,891 | |
| Net unrealized appreciation on investments | | | 13,019,278 | |
| Accumulated undistributed net realized gain on investments | | | 3,376,912 | |
| Accumulated net investment loss | | | (709,793 | ) |
| Net assets | | $ | 80,461,288 | |
| CALCULATION OF NET ASSET VALUE PER SHARE: | | | | |
| Net asset value, offering and redemption price per share ($80,461,288 ÷ 1,499,708 shares outstanding) | | $ | 53.65 | |
SCHEDULE OF INVESTMENTS
September 30, 2016
| Shares | | | | Value | |
| LONG-TERM INVESTMENTS — 96.5% (a) | | | |
| COMMON STOCKS — 96.5% (a) | | | |
| | | Aerospace & Defense — 1.1% | | | |
| | 3,100 | | The Boeing Company | | $ | 408,394 | |
| | 1,300 | | Honeywell International, Inc. | | | 151,567 | |
| | 300 | | Northrop Grumman Corporation | | | 64,185 | |
| | 400 | | Teledyne Technologies, Inc.* | | | 43,172 | |
| | 1,400 | | Textron, Inc. | | | 55,650 | |
| | 200 | | TransDigm Group, Inc.* | | | 57,824 | |
| | 800 | | United Technologies Corporation | | | 81,280 | |
| | | | | | | 862,072 | |
| | | | Air Freight & Logistics — 0.9% | | | | |
| | 2,700 | | FedEx Corporation | | | 471,636 | |
| | 2,300 | | United Parcel Service, Inc., Class B | | | 251,528 | |
| | | | | | | 723,164 | |
| | | | Airlines — 0.9% | | | | |
| | 400 | | Allegiant Travel Company | | | 52,828 | |
| | 1,000 | | American Airlines Group, Inc. | | | 36,610 | |
| | 7,900 | | JetBlue Airways Corporation* | | | 136,196 | |
| | 2,200 | | SkyWest, Inc. | | | 58,102 | |
| | 6,700 | | Southwest Airlines Company | | | 260,563 | |
| | 3,800 | | Spirit Airlines, Inc.* | | | 161,614 | |
| | | | | | | 705,913 | |
The accompanying notes are an integral part of these financial statements.
Reynolds Blue Chip Growth Fund
SCHEDULE OF INVESTMENTS (Continued)
September 30, 2016
| Shares | | | | Value | |
| LONG-TERM INVESTMENTS — 96.5% (a) (Continued) | | | |
| COMMON STOCKS — 96.5% (a) (Continued) | | | |
| | | Automobiles — 1.6% | | | |
| | 1,000 | | General Motors Company | | $ | 31,770 | |
| | 700 | | Harley-Davidson, Inc. | | | 36,813 | |
| | 4,200 | | Tata Motors, Ltd. — SP-ADR | | | 167,916 | |
| | 5,100 | | Tesla Motors, Inc.* | | | 1,040,553 | |
| | | | | | | 1,277,052 | |
| | | | Banks — 0.8% | | | | |
| | 4,200 | | Bank of America Corporation | | | 65,730 | |
| | 600 | | Bank of Hawaii Corporation | | | 43,572 | |
| | 500 | | Bank of Montreal | | | 32,785 | |
| | 3,300 | | Citigroup, Inc. | | | 155,859 | |
| | 810 | | Fifth Third Bancorp | | | 16,573 | |
| | 1,900 | | JPMorgan Chase & Company | | | 126,521 | |
| | 3,300 | | KeyCorp | | | 40,161 | |
| | 600 | | SVB Financial Group* | | | 66,324 | |
| | 800 | | Webster Financial Corporation | | | 30,408 | |
| | 1,400 | | Zions Bancorporation | | | 43,428 | |
| | | | | | | 621,361 | |
| | | | Beverages — 1.7% | | | | |
| | 3,200 | | The Coca-Cola Company | | | 135,424 | |
| | 300 | | Constellation Brands, Inc., Class A | | | 49,947 | |
| | 400 | | Diageo plc — SP-ADR | | | 46,416 | |
| | 900 | | Dr Pepper Snapple Group, Inc. | | | 82,179 | |
| | 800 | | Molson Coors Brewing Company, Class B | | | 87,840 | |
| | 400 | | Monster Beverage Corporation* | | | 58,724 | |
| | 8,500 | | PepsiCo, Inc. | | | 924,545 | |
| | | | | | | 1,385,075 | |
| | | | Biotechnology — 2.5% | | | | |
| | 2,100 | | AbbVie, Inc. | | | 132,447 | |
| | 3,300 | | Achillion Pharmaceuticals, Inc.* | | | 26,730 | |
| | 400 | | Alexion Pharmaceuticals, Inc.* | | | 49,016 | |
| | 1,300 | | Alkermes plc* | | | 61,139 | |
| | 1,500 | | Amgen, Inc. | | | 250,215 | |
| | 16,400 | | ARIAD Pharmaceuticals, Inc.* | | | 224,516 | |
| | 1,800 | | Biogen Idec, Inc.* | | | 563,454 | |
| | 1,200 | | Celgene Corporation* | | | 125,436 | |
| | 2,400 | | Cepheid* | | | 126,456 | |
| | 1,300 | | China Biologic Products, Inc.* | | | 161,824 | |
| | 700 | | Exact Sciences Corporation* | | | 12,999 | |
| | 500 | | Gilead Sciences, Inc. | | | 39,560 | |
| | 500 | | Incyte Corporation* | | | 47,145 | |
| | 300 | | Intercept Pharmaceuticals, Inc.* | | | 49,377 | |
| | 1,500 | | PTC Therapeutics, Inc.* | | | 21,015 | |
| | 100 | | Puma Biotechnology, Inc.* | | | 6,705 | |
| | 600 | | Radius Health, Inc.* | | | 32,454 | |
| | 400 | | Sage Therapeutics, Inc.* | | | 18,420 | |
| | 600 | | Sarepta Therapeutics, Inc.* | | | 36,846 | |
| | 400 | | United Therapeutics Corporation* | | | 47,232 | |
| | 600 | | ZIOPHARM Oncology, Inc.* | | | 3,378 | |
| | | | | | | 2,036,364 | |
| | | | Building Products — 0.3% | | | | |
| | 1,100 | | Lennox International, Inc. | | | 172,733 | |
| | 2,300 | | Masco Corporation | | | 78,913 | |
| | | | | | | 251,646 | |
| | | | Capital Markets — 3.4% | | | | |
| | 800 | | Ameriprise Financial, Inc. | | | 79,816 | |
| | 21,100 | | The Charles Schwab Corporation | | | 666,127 | |
| | 12,300 | | E*TRADE Financial Corporation* | | | 358,176 | |
| | 200 | | FactSet Research Systems, Inc. | | | 32,420 | |
| | 3,300 | | The Goldman Sachs Group, Inc. | | | 532,191 | |
| | 1,800 | | Janus Capital Group, Inc. | | | 25,218 | |
| | 1,000 | | Legg Mason, Inc. | | | 33,480 | |
| | 4,000 | | Morgan Stanley | | | 128,240 | |
| | 500 | | Piper Jaffray Companies* | | | 24,150 | |
| | 1,600 | | Raymond James Financial, Inc. | | | 93,136 | |
| | 900 | | SEI Investments Company | | | 41,049 | |
| | 4,200 | | State Street Corporation | | | 292,446 | |
| | 1,300 | | T. Rowe Price Group, Inc. | | | 86,450 | |
| | 8,600 | | TD Ameritrade Holding Corporation | | | 303,064 | |
| | | | | | | 2,695,963 | |
| | | | Chemicals — 0.6% | | | | |
| | 700 | | Albemarle Corporation | | | 59,843 | |
| | 1,000 | | The Dow Chemical Company | | | 51,830 | |
| | 400 | | Eastman Chemical Company | | | 27,072 | |
| | 800 | | Ecolab, Inc. | | | 97,376 | |
| | 1,400 | | International Flavors & Fragrances, Inc. | | | 200,158 | |
| | 900 | | LyondellBasell Industries N.V., Class A | | | 72,594 | |
| | | | | | | 508,873 | |
| | | | Commercial Services & Supplies — 0.6% | | | | |
| | 2,200 | | Cintas Corporation | | | 247,720 | |
| | 600 | | Copart, Inc.* | | | 32,136 | |
| | 2,100 | | KAR Auction Services, Inc. | | | 90,636 | |
| | 2,300 | | Tetra Tech, Inc. | | | 81,581 | |
| | 700 | | Waste Management, Inc. | | | 44,632 | |
| | | | | | | 496,705 | |
The accompanying notes are an integral part of these financial statements.
Reynolds Blue Chip Growth Fund
SCHEDULE OF INVESTMENTS (Continued)
September 30, 2016
| Shares | | | | Value | |
| LONG-TERM INVESTMENTS — 96.5% (a) (Continued) | | | |
| COMMON STOCKS — 96.5% (a) (Continued) | | | |
| | | Communications Equipment — 1.6% | | | |
| | 10,300 | | Cisco Systems, Inc. | | $ | 326,716 | |
| | 2,800 | | F5 Networks, Inc.* | | | 348,992 | |
| | 2,300 | | Finisar Corporation* | | | 68,540 | |
| | 1,300 | | InterDigital, Inc. | | | 102,960 | |
| | 2,700 | | NETGEAR, Inc.* | | | 163,323 | |
| | 1,600 | | Palo Alto Networks, Inc.* | | | 254,928 | |
| | | | | | | 1,265,459 | |
| | | | Construction & Engineering — 0.1% | | | | |
| | 1,200 | | EMCOR Group, Inc. | | | 71,544 | |
| | | | | | | | |
| | | | Consumer Finance — 0.2% | | | | |
| | 2,000 | | American Express Company | | | 128,080 | |
| | | | | | | | |
| | | | Consumer Services – Diversified — 0.0% | | | | |
| | 800 | | Sotheby’s | | | 30,416 | |
| | | | | | | | |
| | | | Electrical Equipment — 0.3% | | | | |
| | 700 | | Eaton Corporation plc | | | 45,997 | |
| | 3,300 | | Emerson Electric Company | | | 179,883 | |
| | 500 | | Sensata Technologies Holding N.V.* | | | 19,390 | |
| | | | | | | 245,270 | |
| | | | Electronic Equipment, | | | | |
| | | | Instruments & Components — 1.3% | | | | |
| | 2,900 | | Amphenol Corporation, Class A | | | 188,268 | |
| | 400 | | Coherent, Inc.* | | | 44,216 | |
| | 9,500 | | Corning, Inc. | | | 224,675 | |
| | 800 | | Littelfuse, Inc. | | | 103,048 | |
| | 900 | | Rogers Corporation* | | | 54,972 | |
| | 3,100 | | TE Connectivity, Ltd. | | | 199,578 | |
| | 400 | | Tech Data Corporation* | | | 33,884 | |
| | 700 | | Universal Display Corporation* | | | 38,857 | |
| | 4,400 | | VeriFone Systems, Inc.* | | | 69,256 | |
| | 800 | | Zebra Technologies Corporation, Class A* | | | 55,688 | |
| | | | | | | 1,012,442 | |
| | | | Energy Equipment & Services — 0.5% | | | | |
| | 800 | | Baker Hughes, Inc. | | | 40,376 | |
| | 800 | | Core Laboratories N.V. | | | 89,864 | |
| | 700 | | Dril-Quip, Inc.* | | | 39,018 | |
| | 1,000 | | Halliburton Company | | | 44,880 | |
| | 1,800 | | Helmerich & Payne, Inc. | | | 121,140 | |
| | 2,100 | | Newpark Resources, Inc.* | | | 15,456 | |
| | 1,000 | | Schlumberger, Ltd. | | | 78,640 | |
| | | | | | | 429,374 | |
| | | | Food & Staples Retailing — 3.6% | | | | |
| | 300 | | Casey’s General Stores, Inc. | | | 36,045 | |
| | 13,500 | | Costco Wholesale Corporation | | | 2,058,885 | |
| | 1,400 | | The Kroger Company | | | 41,552 | |
| | 500 | | PriceSmart, Inc. | | | 41,880 | |
| | 600 | | United Natural Foods, Inc.* | | | 24,024 | |
| | 1,500 | | Walgreens Boots Alliance, Inc. | | | 120,930 | |
| | 6,100 | | Wal-Mart Stores, Inc. | | | 439,932 | |
| | 4,000 | | Whole Foods Market, Inc. | | | 113,400 | |
| | | | | | | 2,876,648 | |
| | | | Food Products — 0.2% | | | | |
| | 300 | | Campbell Soup Company | | | 16,410 | |
| | 400 | | The Hershey Company | | | 38,240 | |
| | 1,000 | | Mondelez International, Inc., Class A | | | 43,900 | |
| | 1,100 | | The WhiteWave Foods Company* | | | 59,873 | |
| | | | | | | 158,423 | |
| | | | Health Care Equipment & Supplies — 5.5% | | | | |
| | 20,500 | | Abbott Laboratories | | | 866,945 | |
| | 1,400 | | ABIOMED, Inc.* | | | 180,012 | |
| | 6,400 | | Align Technology, Inc.* | | | 600,000 | |
| | 2,300 | | Baxter International, Inc. | | | 109,480 | |
| | 500 | | Becton, Dickinson and Company | | | 89,865 | |
| | 600 | | C.R. Bard, Inc. | | | 134,568 | |
| | 800 | | Dentsply Sirona, Inc. | | | 47,544 | |
| | 4,300 | | Edwards Lifesciences Corporation* | | | 518,408 | |
| | 2,700 | | IDEXX Laboratories, Inc.* | | | 304,371 | |
| | 400 | | Intuitive Surgical, Inc.* | | | 289,932 | |
| | 3,300 | | Medtronic plc | | | 285,120 | |
| | 600 | | ResMed, Inc. | | | 38,874 | |
| | 3,800 | | St. Jude Medical, Inc. | | | 303,088 | |
| | 2,300 | | Stryker Corporation | | | 267,743 | |
| | 200 | | Teleflex, Inc. | | | 33,610 | |
| | 3,600 | | Varian Medical Systems, Inc.* | | | 358,308 | |
| | | | | | | 4,427,868 | |
| | | | Health Care Providers & Services — 0.8% | | | | |
| | 400 | | Aetna, Inc. | | | 46,180 | |
| | 1,300 | | Air Methods Corporation* | | | 40,937 | |
| | 1,300 | | Cardinal Health, Inc. | | | 101,010 | |
| | 373 | | Centene Corporation* | | | 24,976 | |
| | 600 | | DaVita, Inc.* | | | 39,642 | |
| | 600 | | Express Scripts Holding Company* | | | 42,318 | |
| | 300 | | Henry Schein, Inc.* | | | 48,894 | |
| | 500 | | LifePoint Health, Inc.* | | | 29,615 | |
| | 1,500 | | Quest Diagnostics, Inc. | | | 126,945 | |
The accompanying notes are an integral part of these financial statements.
Reynolds Blue Chip Growth Fund
SCHEDULE OF INVESTMENTS (Continued)
September 30, 2016
| Shares | | | | Value | |
| LONG-TERM INVESTMENTS — 96.5% (a) (Continued) | | | |
| COMMON STOCKS — 96.5% (a) (Continued) | | | |
| | | Health Care Providers | | | |
| | | & Services — 0.8% (Continued) | | | |
| | 700 | | UnitedHealth Group, Inc. | | $ | 98,000 | |
| | 500 | | WellCare Health Plans, Inc.* | | | 58,545 | |
| | | | | | | 657,062 | |
| | | | Health Care Technology — 0.4% | | | | |
| | 1,800 | | Allscripts Healthcare Solutions, Inc.* | | | 23,706 | |
| | 600 | | athenahealth, Inc.* | | | 75,672 | |
| | 3,200 | | Cerner Corporation* | | | 197,600 | |
| | | | | | | 296,978 | |
| | | | Hotels, Restaurants & Leisure — 3.9% | | | | |
| | 1,200 | | Brinker International, Inc. | | | 60,516 | |
| | 1,000 | | Carnival Corporation | | | 48,820 | |
| | 1,800 | | The Cheesecake Factory, Inc. | | | 90,108 | |
| | 300 | | Chipotle Mexican Grill, Inc.* | | | 127,050 | |
| | 1,600 | | Darden Restaurants, Inc. | | | 98,112 | |
| | 3,800 | | Domino’s Pizza, Inc. | | | 577,030 | |
| | 4,800 | | Dunkin’ Brands Group, Inc. | | | 249,984 | |
| | 2,100 | | Hilton Worldwide Holdings, Inc. | | | 48,153 | |
| | 400 | | Hyatt Hotels Corporation, Class A* | | | 19,688 | |
| | 5,700 | | International Game Technology plc | | | 138,966 | |
| | 300 | | Jack in the Box, Inc. | | | 28,782 | |
| | 2,500 | | Las Vegas Sands Corporation | | | 143,850 | |
| | 3,680 | | Marriott International, Inc., Class A | | | 247,774 | |
| | 1,000 | | McDonald’s Corporation | | | 115,360 | |
| | 1,900 | | MGM Resorts International* | | | 49,457 | |
| | 3,900 | | Papa John’s International, Inc. | | | 307,515 | |
| | 19 | | Restaurant Brands International L.P. | | | 851 | |
| | 700 | | Royal Caribbean Cruises, Ltd. | | | 52,465 | |
| | 11,500 | | Starbucks Corporation | | | 622,610 | |
| | 600 | | Wyndham Worldwide Corporation | | | 40,398 | |
| | 900 | | Yum! Brands, Inc. | | | 81,729 | |
| | | | | | | 3,149,218 | |
| | | | Household Durables — 0.7% | | | | |
| | 400 | | Harman International Industries, Inc. | | | 33,780 | |
| | 400 | | Helen of Troy, Ltd.* | | | 34,468 | |
| | 900 | | iRobot Corporation* | | | 39,582 | |
| | 800 | | Leggett & Platt, Inc. | | | 36,464 | |
| | 800 | | Newell Brands, Inc. | | | 42,128 | |
| | 2,800 | | SodaStream International, Ltd.* | | | 74,368 | |
| | 400 | | Tempur Sealy International, Inc.* | | | 22,696 | |
| | 600 | | Toll Brothers, Inc.* | | | 17,916 | |
| | 3,600 | | Tupperware Brands Corporation | | | 235,332 | |
| | 300 | | Whirlpool Corporation | | | 48,648 | |
| | | | | | | 585,382 | |
| | | | Household Products — 2.2% | | | | |
| | 4,900 | | Church & Dwight Company, Inc. | | | 234,808 | |
| | 2,700 | | The Clorox Company | | | 337,986 | |
| | 5,300 | | Colgate-Palmolive Company | | | 392,942 | |
| | 900 | | Energizer Holdings, Inc. | | | 44,964 | |
| | 1,000 | | Kimberly-Clark Corporation | | | 126,140 | |
| | 5,600 | | The Procter & Gamble Company | | | 502,600 | |
| | 800 | | Spectrum Brands Holdings, Inc. | | | 110,152 | |
| | 300 | | WD-40 Company | | | 33,729 | |
| | | | | | | 1,783,321 | |
| | | | Industrial Conglomerates — 0.1% | | | | |
| | 400 | | 3M Company | | | 70,492 | |
| | 1,600 | | Koninklijke Philips N.V. — NY | | | 47,344 | |
| | | | | | | 117,836 | |
| | | | Insurance — 0.7% | | | | |
| | 600 | | Aflac, Inc. | | | 43,122 | |
| | 900 | | American International Group, Inc. | | | 53,406 | |
| | 1,300 | | Aon plc | | | 146,237 | |
| | 900 | | Assurant, Inc. | | | 83,025 | |
| | 2,400 | | China Life Insurance Company, Ltd. — ADR | | | 31,392 | |
| | 200 | | Chubb, Ltd. | | | 25,130 | |
| | 1,700 | | eHealth, Inc.* | | | 19,057 | |
| | 500 | | Hanover Insurance Group, Inc. | | | 37,710 | |
| | 600 | | Marsh & McLennan Companies, Inc. | | | 40,350 | |
| | 300 | | Prudential Financial, Inc. | | | 24,495 | |
| | 700 | | Willis Towers Watson plc | | | 92,939 | |
| | | | | | | 596,863 | |
| | | | Internet & Catalog Retail — 11.3% | | | | |
| | 7,900 | | Amazon.com, Inc.* | | | 6,614,749 | |
| | 2,600 | | Ctrip.com International, Ltd. — ADR* | | | 121,082 | |
| | 2,305 | | Expedia, Inc. | | | 269,040 | |
| | 9,100 | | Netflix, Inc.* | | | 896,805 | |
| | 700 | | The Priceline Group, Inc.* | | | 1,030,043 | |
| | 2,900 | | TripAdvisor, Inc.* | | | 183,222 | |
| | | | | | | 9,114,941 | |
| | | | Internet & Direct Marketing Retail — 0.1% | | | | |
| | 800 | | JD.com, Inc. — ADR* | | | 20,872 | |
| | 1,600 | | Liberty Interactive Corporation, Class A* | | | 32,016 | |
| | 2,300 | | Vipshop Holdings, Ltd. — ADR* | | | 33,741 | |
| | | | | | | 86,629 | |
The accompanying notes are an integral part of these financial statements.
Reynolds Blue Chip Growth Fund
SCHEDULE OF INVESTMENTS (Continued)
September 30, 2016
| Shares | | | | Value | |
| LONG-TERM INVESTMENTS — 96.5% (a) (Continued) | | | |
| COMMON STOCKS — 96.5% (a) (Continued) | | | |
| | | Internet Software & Services — 13.2% | | | |
| | 1,100 | | Akamai Technologies, Inc.* | | $ | 58,289 | |
| | 7,700 | | Alibaba Group Holding, Ltd. — SP-ADR* | | | 814,583 | |
| | 1,700 | | Alphabet, Inc., Class A* | | | 1,366,902 | |
| | 6,050 | | Alphabet, Inc., Class C* | | | 4,702,604 | |
| | 4,600 | | Baidu, Inc. — SP-ADR* | | | 837,522 | |
| | 13,500 | | eBay, Inc.* | | | 444,150 | |
| | 7,600 | | Facebook, Inc., Class A* | | | 974,852 | |
| | 900 | | IAC/InterActiveCorp | | | 56,223 | |
| | 1,100 | | Match Group, Inc.* | | | 19,569 | |
| | 700 | | MercadoLibre, Inc. | | | 129,479 | |
| | 2,600 | | SINA Corporation* | | | 191,958 | |
| | 3,600 | | Tencent Holdings, Ltd. | | | 100,350 | |
| | 1,700 | | Twilio, Inc., Class A* | | | 109,412 | |
| | 1,200 | | Twitter, Inc.* | | | 27,660 | |
| | 1,300 | | VeriSign, Inc.* | | | 101,712 | |
| | 900 | | WebMD Health Corporation* | | | 44,730 | |
| | 350 | | Weibo Corporation — SP-ADR* | | | 17,549 | |
| | 1,400 | | Yahoo!, Inc.* | | | 60,340 | |
| | 5,200 | | Yelp, Inc.* | | | 216,840 | |
| | 900 | | YY, Inc. — ADR* | | | 47,952 | |
| | 8,400 | | Zillow Group, Inc., Class C* | | | 291,060 | |
| | | | | | | 10,613,736 | |
| | | | IT Services — 2.1% | | | | |
| | 700 | | Accenture plc, Class A | | | 85,519 | |
| | 900 | | Amdocs, Ltd. | | | 52,065 | |
| | 700 | | Cognizant Technology Solutions | | | | |
| | | | Corporation, Class A* | | | 33,397 | |
| | 1,900 | | Computer Sciences Corporation | | | 99,199 | |
| | 400 | | DST Systems, Inc. | | | 47,168 | |
| | 1,799 | | Fiserv, Inc.* | | | 178,946 | |
| | 300 | | International Business | | | | |
| | | | Machines Corporation | | | 47,655 | |
| | 900 | | InterXion Holding N.V.* | | | 32,598 | |
| | 1,200 | | Jack Henry & Associates, Inc. | | | 102,660 | |
| | 3,100 | | MasterCard, Inc., Class A | | | 315,487 | |
| | 900 | | Paychex, Inc. | | | 52,083 | |
| | 1,700 | | PayPal Holdings, Inc.* | | | 69,649 | |
| | 6,700 | | Visa, Inc., Class A | | | 554,090 | |
| | | | | | | 1,670,516 | |
| | | | Leisure Products — 0.2% | | | | |
| | 1,400 | | Hasbro, Inc. | | | 111,062 | |
| | 400 | | Polaris Industries, Inc. | | | 30,976 | |
| | | | | | | 142,038 | |
| | | | Life Sciences Tools & Services — 0.8% | | | | |
| | 4,900 | | Agilent Technologies, Inc. | | | 230,741 | |
| | 500 | | Illumina, Inc.* | | | 90,830 | |
| | 1,400 | | Quintiles IMS Holdings, Inc.* | | | 113,484 | |
| | 1,200 | | Thermo Fisher Scientific, Inc. | | | 190,872 | |
| | 300 | | Waters Corporation* | | | 47,547 | |
| | | | | | | 673,474 | |
| | | | Machinery — 1.1% | | | | |
| | 2,800 | | Caterpillar, Inc. | | | 248,556 | |
| | 500 | | Cummins, Inc. | | | 64,075 | |
| | 1,000 | | Deere & Company | | | 85,350 | |
| | 1,100 | | IDEX Corporation | | | 102,927 | |
| | 400 | | Illinois Tool Works, Inc. | | | 47,936 | |
| | 700 | | Ingersoll-Rand plc | | | 47,558 | |
| | 300 | | Snap-on, Inc. | | | 45,588 | |
| | 1,200 | | Stanley Black & Decker, Inc. | | | 147,576 | |
| | 2,600 | | The Toro Company | | | 121,784 | |
| | | | | | | 911,350 | |
| | | | Media — 1.9% | | | | |
| | 900 | | CBS Corporation, Class B Non-Voting | | | 49,266 | |
| | 600 | | Charter Communications, Inc., Class A* | | | 161,982 | |
| | 5,800 | | Comcast Corporation, Class A | | | 384,772 | |
| | 3,300 | | DISH Network Corporation, Class A* | | | 180,774 | |
| | 100 | | IMAX Corporation* | | | 2,897 | |
| | 1,700 | | The Interpublic Group of Companies, Inc. | | | 37,995 | |
| | 300 | | Liberty Media Corporation, Class A* | | | 8,595 | |
| | 1,500 | | Omnicom Group, Inc. | | | 127,500 | |
| | 13,000 | | Sirius XM Holdings, Inc.* | | | 54,210 | |
| | 1,200 | | Starz, Class A* | | | 37,428 | |
| | 500 | | Time Warner, Inc. | | | 39,805 | |
| | 5,000 | | The Walt Disney Company | | | 464,300 | |
| | | | | | | 1,549,524 | |
| | | | Metals & Mining — 0.3% | | | | |
| | 1,900 | | Allegheny Technologies, Inc. | | | 34,333 | |
| | 2,300 | | Barrick Gold Corporation | | | 40,756 | |
| | 4,000 | | Freeport-McMoRan, Inc. | | | 43,440 | |
| | 2,300 | | Newmont Mining Corporation | | | 90,367 | |
| | 1,600 | | Teck Resources Ltd., Class B | | | 28,848 | |
| | | | | | | 237,744 | |
| | | | Multiline Retail — 1.4% | | | | |
| | 300 | | Dillard’s, Inc., Class A | | | 18,903 | |
| | 1,400 | | Dollar General Corporation | | | 97,986 | |
| | 500 | | Dollar Tree, Inc.* | | | 39,465 | |
| | 2,000 | | Kohl’s Corporation | | | 87,500 | |
| | 5,600 | | Macy’s, Inc. | | | 207,480 | |
The accompanying notes are an integral part of these financial statements.
Reynolds Blue Chip Growth Fund
SCHEDULE OF INVESTMENTS (Continued)
September 30, 2016
| Shares | | | | Value | |
| LONG-TERM INVESTMENTS —96.5% (a) (Continued) | | | |
| COMMON STOCKS — 96.5% (a) (Continued) | | | |
| | | Multiline Retail — 1.4% (Continued) | | | |
| | 10,400 | | Nordstrom, Inc. | | $ | 539,552 | |
| | 1,400 | | Target Corporation | | | 96,152 | |
| | | | | | | 1,087,038 | |
| | | | Multi-Utilities — 0.1% | | | | |
| | 800 | | WEC Energy Group, Inc. | | | 47,904 | |
| | | | | | | | |
| | | | Oil, Gas & Consumable Fuels — 0.7% | | | | |
| | 600 | | Anadarko Petroleum Corporation | | | 38,016 | |
| | 700 | | Apache Corporation | | | 44,709 | |
| | 2,400 | | Cabot Oil & Gas Corporation | | | 61,920 | |
| | 1,200 | | Canadian Natural Resources, Ltd. | | | 38,448 | |
| | 400 | | Chevron Corporation | | | 41,168 | |
| | 1,000 | | Enbridge, Inc. | | | 44,230 | |
| | 700 | | EQT Corporation | | | 50,834 | |
| | 900 | | Exxon Mobil Corporation | | | 78,552 | |
| | 700 | | Hess Corporation | | | 37,534 | |
| | 500 | | Marathon Petroleum Corporation | | | 20,295 | |
| | 600 | | Newfield Exploration Company* | | | 26,076 | |
| | 1,400 | | Noble Energy, Inc. | | | 50,036 | |
| | 200 | | Pioneer Natural Resources Company | | | 37,130 | |
| | | | | | | 568,948 | |
| | | | Personal Products — 0.2% | | | | |
| | 1,400 | | Coty, Inc., Class A | | | 32,900 | |
| | 500 | | The Estee Lauder Companies, Inc., Class A | | | 44,280 | |
| | 1,200 | | Unilever N.V. | | | 55,320 | |
| | | | | | | 132,500 | |
| | | | Pharmaceuticals — 3.7% | | | | |
| | 300 | | Allergan plc* | | | 69,093 | |
| | 1,700 | | Bristol-Myers Squibb Company | | | 91,664 | |
| | 4,400 | | Eli Lilly and Company | | | 353,144 | |
| | 1,200 | | GW Pharmaceuticals plc — ADR* | | | 159,276 | |
| | 400 | | Jazz Pharmaceuticals plc* | | | 48,592 | |
| | 9,300 | | Johnson & Johnson | | | 1,098,609 | |
| | 10,500 | | Merck & Company, Inc. | | | 655,305 | |
| | 600 | | Pacira Pharmaceuticals, Inc.* | | | 20,532 | |
| | 3,900 | | Pfizer, Inc. | | | 132,093 | |
| | 3,100 | | Sanofi — ADR | | | 118,389 | |
| | 600 | | Shire plc — ADR | | | 116,316 | |
| | 2,000 | | Teva Pharmaceutical | | | | |
| | | | Industries, Ltd. — SP-ADR | | | 92,020 | |
| | | | | | | 2,955,033 | |
| | | | Professional Services — 0.7% | | | | |
| | 1,600 | | Equifax, Inc. | | | 215,328 | |
| | 4,979 | | IHS Markit, Ltd.* | | | 186,961 | |
| | 700 | | Manpowergroup, Inc. | | | 50,582 | |
| | 1,100 | | Verisk Analytics, Inc., Class A* | | | 89,408 | |
| | | | | | | 542,279 | |
| | | | REITs — 0.5% | | | | |
| | 500 | | American Tower Corporation | | | 56,665 | |
| | 400 | | Boston Properties, Inc. | | | 54,516 | |
| | 1,800 | | Corrections Corporation of America | | | 24,966 | |
| | 1,000 | | Digital Realty Trust, Inc. | | | 97,120 | |
| | 100 | | Equinix, Inc. | | | 36,025 | |
| | 800 | | HCP, Inc. | | | 30,360 | |
| | 500 | | Lamar Advertising Company, Class A | | | 32,655 | |
| | 900 | | Life Storage, Inc. | | | 80,046 | |
| | 1,000 | | Weyerhaeuser Company | | | 31,940 | |
| | | | | | | 444,293 | |
| | | | Road & Rail — 0.5% | | | | |
| | 1,700 | | Avis Budget Group, Inc.* | | | 58,157 | |
| | 600 | | Canadian National Railway Company | | | 39,240 | |
| | 300 | | Canadian Pacific Railway, Ltd. | | | 45,810 | |
| | 1,400 | | CSX Corporation | | | 42,700 | |
| | 600 | | Old Dominion Freight Line, Inc.* | | | 41,166 | |
| | 700 | | Ryder System, Inc. | | | 46,165 | |
| | 1,500 | | Union Pacific Corporation | | | 146,295 | |
| | | | | | | 419,533 | |
| | | | Semiconductors & Semiconductor | | | | |
| | | | Equipment — 8.0% | | | | |
| | 1,300 | | Acacia Communications, Inc.* | | | 134,264 | |
| | 18,100 | | Advanced Micro Devices, Inc.* | | | 125,071 | |
| | 1,600 | | Ambarella, Inc.* | | | 117,776 | |
| | 5,300 | | Analog Devices, Inc. | | | 341,585 | |
| | 9,700 | | Applied Materials, Inc. | | | 292,455 | |
| | 4,100 | | ASML Holding N.V. | | | 449,278 | |
| | 900 | | Cavium, Inc.* | | | 52,380 | |
| | 500 | | Cirrus Logic, Inc.* | | | 26,575 | |
| | 2,700 | | First Solar, Inc.* | | | 106,623 | |
| | 16,500 | | Intel Corporation | | | 622,875 | |
| | 700 | | KLA-Tencor Corporation | | | 48,797 | |
| | 500 | | Lam Research Corporation | | | 47,355 | |
| | 2,400 | | Linear Technology Corporation | | | 142,296 | |
| | 2,100 | | Maxim Integrated Products, Inc. | | | 83,853 | |
| | 1,000 | | Mellanox Technologies, Ltd.* | | | 43,250 | |
| | 6,000 | | Microchip Technology, Inc. | | | 372,840 | |
| | 19,000 | | Micron Technology, Inc.* | | | 337,820 | |
The accompanying notes are an integral part of these financial statements.
Reynolds Blue Chip Growth Fund
SCHEDULE OF INVESTMENTS (Continued)
September 30, 2016
| Shares | | | | Value | |
| LONG-TERM INVESTMENTS — 96.5% (a) (Continued) | | | |
| COMMON STOCKS — 96.5% (a) (Continued) | | | |
| | | Semiconductors & Semiconductor | | | |
| | | Equipment — 8.0% (Continued) | | | |
| | 2,300 | | Microsemi Corporation* | | $ | 96,554 | |
| | 11,200 | | NVIDIA Corporation | | | 767,424 | |
| | 1,600 | | NXP Semiconductors N.V.* | | | 163,216 | |
| | 400 | | Qorvo, Inc.* | | | 22,296 | |
| | 7,100 | | QUALCOMM, Inc. | | | 486,350 | |
| | 4,500 | | Semtech Corporation* | | | 124,785 | |
| | 2,400 | | Skyworks Solutions, Inc. | | | 182,736 | |
| | 6,700 | | Taiwan Semiconductor Manufacturing | | | | |
| | | | Company, Ltd. — SP-ADR | | | 204,953 | |
| | 1,600 | | Teradyne, Inc. | | | 34,528 | |
| | 7,600 | | Texas Instruments, Inc. | | | 533,368 | |
| | 900 | | Ultratech, Inc.* | | | 20,772 | |
| | 7,800 | | Xilinx, Inc. | | | 423,852 | |
| | | | | | | 6,405,927 | |
| | | | Software — 4.3% | | | | |
| | 4,700 | | 8x8, Inc.* | | | 72,521 | |
| | 1,700 | | Adobe Systems, Inc.* | | | 184,518 | |
| | 4,400 | | Autodesk, Inc.* | | | 318,252 | |
| | 8,400 | | CA, Inc. | | | 277,872 | |
| | 3,800 | | Cadence Design Systems, Inc.* | | | 97,014 | |
| | 1,600 | | Check Point Software Technologies, Ltd.* | | | 124,176 | |
| | 1,200 | | Citrix Systems, Inc.* | | | 102,264 | |
| | 1,000 | | Dell Technologies Inc., Class V* | | | 47,823 | |
| | 900 | | Electronic Arts, Inc.* | | | 76,860 | |
| | 3,300 | | Fortinet, Inc.* | | | 121,869 | |
| | 900 | | Intuit, Inc. | | | 99,009 | |
| | 8,300 | | Microsoft Corporation | | | 478,080 | |
| | 300 | | MicroStrategy, Inc., Class A* | | | 50,232 | |
| | 1,000 | | PTC, Inc.* | | | 44,310 | |
| | 1,900 | | Red Hat, Inc.* | | | 153,577 | |
| | 6,000 | | Rosetta Stone, Inc.* | | | 50,880 | |
| | 1,300 | | Salesforce.com, Inc.* | | | 92,729 | |
| | 1,900 | | SAP SE — SP-ADR | | | 173,679 | |
| | 1,000 | | Splunk, Inc.* | | | 58,680 | |
| | 1,700 | | Symantec Corporation | | | 42,670 | |
| | 300 | | Synchronoss Technologies, Inc.* | | | 12,354 | |
| | 4,900 | | Synopsys, Inc.* | | | 290,815 | |
| | 1,000 | | Take-Two Interactive Software, Inc.* | | | 45,080 | |
| | 2,400 | | VMware, Inc., Class A* | | | 176,040 | |
| | 3,300 | | Workday, Inc., Class A* | | | 302,577 | |
| | | | | | | 3,493,881 | |
| | | | Specialty Retail — 4.0% | | | | |
| | 900 | | AutoNation, Inc.* | | | 43,839 | |
| | 1,300 | | AutoZone, Inc.* | | | 998,842 | |
| | 900 | | Bed Bath & Beyond, Inc. | | | 38,799 | |
| | 1,000 | | Best Buy Company, Inc. | | | 38,180 | |
| | 700 | | The Children’s Place, Inc. | | | 55,909 | |
| | 2,800 | | Dick’s Sporting Goods, Inc. | | | 158,816 | |
| | 1,900 | | DSW, Inc., Class A | | | 38,912 | |
| | 3,500 | | The Home Depot, Inc. | | | 450,380 | |
| | 800 | | L Brands, Inc. | | | 56,616 | |
| | 500 | | Lithia Motors, Inc., Class A | | | 47,760 | |
| | 6,700 | | Lowe’s Companies, Inc. | | | 483,807 | |
| | 200 | | O’Reilly Automotive, Inc.* | | | 56,022 | |
| | 600 | | Pier 1 Imports, Inc. | | | 2,544 | |
| | 1,800 | | Rent-A-Center, Inc. | | | 22,752 | |
| | 4,900 | | Ross Stores, Inc. | | | 315,070 | |
| | 3,000 | | The TJX Companies, Inc. | | | 224,340 | |
| | 500 | | Tractor Supply Company | | | 33,675 | |
| | 1,700 | | Urban Outfitters, Inc.* | | | 58,684 | |
| | 1,700 | | Williams-Sonoma, Inc. | | | 86,836 | |
| | | | | | | 3,211,783 | |
| | | | Technology Hardware, | | | | |
| | | | Storage & Peripherals — 3.7% | | | | |
| | 20,200 | | Apple, Inc. | | | 2,283,610 | |
| | 5,500 | | Hewlett Packard Enterprise Company | | | 125,125 | |
| | 4,200 | | Logitech International S.A. | | | 94,332 | |
| | 4,500 | | NetApp, Inc. | | | 161,190 | |
| | 3,800 | | Seagate Technology plc | | | 146,490 | |
| | 2,400 | | Stratasys, Ltd.* | | | 57,816 | |
| | 1,219 | | Western Digital Corporation | | | 71,275 | |
| | | | | | | 2,939,838 | |
| | | | Telecommunication Services – | | | | |
| | | | Diversified — 0.3% | | | | |
| | 1,000 | | AT&T Inc. | | | 40,610 | |
| | 700 | | SBA Communications Corporation, Class A* | | | 78,512 | |
| | 1,800 | | Verizon Communications, Inc. | | | 93,564 | |
| | 5,600 | | Windstream Holdings, Inc. | | | 56,280 | |
| | | | | | | 268,966 | |
| | | | Textiles, Apparel & Luxury Goods — 0.4% | | | | |
| | 1,100 | | Deckers Outdoor Corporation* | | | 65,505 | |
| | 1,500 | | NIKE, Inc., Class B | | | 78,975 | |
| | 400 | | PVH Corporation | | | 44,200 | |
| | 500 | | Ralph Lauren Corporation | | | 50,570 | |
| | 800 | | Skechers U.S.A., Inc., Class A* | | | 18,320 | |
| | 1,409 | | Under Armour, Inc., Class C* | | | 47,709 | |
The accompanying notes are an integral part of these financial statements.
Reynolds Blue Chip Growth Fund
SCHEDULE OF INVESTMENTS (Continued)
September 30, 2016
| Shares | | | | Value | |
| LONG-TERM INVESTMENTS — 96.5% (a) (Continued) | | | |
| COMMON STOCKS — 96.5% (a) (Continued) | | | |
| | | Textiles, Apparel & | | | |
| | | Luxury Goods — 0.4% (Continued) | | | |
| | 800 | | VF Corporation | | $ | 44,840 | |
| | | | | | | 350,119 | |
| | | | Trading Companies & Distributors — 0.3% | | | | |
| | 4,100 | | Fastenal Company | | | 171,298 | |
| | 500 | | United Rentals, Inc.* | | | 39,245 | |
| | 200 | | W.W. Grainger, Inc. | | | 44,968 | |
| | | | | | | 255,511 | |
| | | | Wireless Telecommunication Services — 0.2% | | | | |
| | 2,800 | | T-Mobile US, Inc.* | | | 130,816 | |
| | | | TOTAL COMMON STOCKS | | | | |
| | | | (cost $64,631,415) | | | 77,650,693 | |
| | | | | | | | |
| SHORT-TERM INVESTMENTS – 2.1% (a) | | | | |
| | | | MONEY MARKET FUNDS — 2.1% (a) | | | | |
| | 1,702,160 | | Fidelity Institutional Government Portfolio, | | | | |
| | | | Institutional Share Class, 0.270%^ | | | 1,702,160 | |
| | | | TOTAL MONEY MARKET FUNDS | | | | |
| | | | (cost $1,702,160) | | | 1,702,160 | |
| | | | TOTAL INVESTMENTS — 98.6% | | | | |
| | | | (cost $66,333,575) | | | 79,352,853 | |
| | | | Cash and receivables, | | | | |
| | | | less liabilities — 1.4%(a) | | | 1,108,435 | |
| | | | TOTAL NET ASSETS — 100.0% | | $ | 80,461,288 | |
| * | | Non-income producing security. |
| ^ | | Rate shown in the 7-day effective yield September 30, 2016. |
| (a) | | Percentages for the various classifications relate to net assets. |
ADR – Unsponsored American Depositary Receipt
L.P. – Limited Partnership
N.V. – Dutch Public Limited Liability Company
NY – New York Registered Security
plc – Public Limited Company
REITs – Real Estate Investment Trusts
S.A. – Societe Anonyme
SP-ADR – Sponsored American Depositary Receipt
The Global Industry Classification Standard (“GICS®”) was developed by and/or is the exclusive property of MSCI, Inc. and Standard & Poor’s Financial Services LLC (“S&P”). GICS® is a service mark of MSCI & S&P and has been licensed for use by U.S. Bancorp Fund Services, LLC. For presentation purposes, the Fund has grouped some of the industry categories. For purposes of categorizing securities for compliance with Section 8(b)(1) of the Investment Company Act of 1940, the Fund uses more specific industry classifications.
The accompanying notes are an integral part of these financial statements.
Reynolds Blue Chip Growth Fund
STATEMENT OF OPERATIONS
For the Year Ended September 30, 2016
| INVESTMENT INCOME: | | | |
| Dividends (net of foreign withholding tax of $2,883) | | $ | 935,748 | |
| Total investment income | | | 935,748 | |
| EXPENSES: | | | | |
| Management fees | | | 976,457 | |
| Distribution fees | | | 143,885 | |
| Transfer agent fees | | | 115,316 | |
| Custodian fees | | | 103,420 | |
| Administrative services | | | 100,272 | |
| Shareholder servicing fees | | | 85,297 | |
| Insurance expense | | | 69,853 | |
| Accounting services | | | 56,706 | |
| Professional fees | | | 47,381 | |
| Board of Directors fees | | | 28,000 | |
| Registration fees | | | 26,500 | |
| Printing and postage expense | | | 25,369 | |
| Chief Compliance Officer fees | | | 25,000 | |
| Other expenses | | | 12,783 | |
| Total expenses | | | 1,816,239 | |
| NET INVESTMENT LOSS | | | (880,491 | ) |
| NET REALIZED GAIN ON INVESTMENTS | | | 8,310,589 | |
| NET CHANGE IN UNREALIZED DEPRECIATION ON INVESTMENTS | | | (7,227,971 | ) |
| NET GAIN ON INVESTMENTS | | | 1,082,618 | |
| NET INCREASE IN NET ASSETS RESULTING FROM OPERATIONS | | $ | 202,127 | |
STATEMENTS OF CHANGES IN NET ASSETS
For the Years Ended September 30, 2016 and 2015
| | | 2016 | | | 2015 | |
| OPERATIONS: | | | | | | |
| Net investment loss | | $ | (880,491 | ) | | $ | (1,055,601 | ) |
| Net realized gain on investments | | | 8,310,589 | | | | 18,435,337 | |
| Net change in unrealized depreciation on investments | | | (7,227,971 | ) | | | (17,280,439 | ) |
| Net increase in net assets resulting from operations | | | 202,127 | | | | 99,297 | |
| DISTRIBUTIONS TO SHAREHOLDERS: | | | | | | | | |
| Distributions from net capital gains ($3.63788 per share and $18.93395 per share, respectively) | | | (6,849,459 | ) | | | (37,422,133 | ) |
| FUND SHARE ACTIVITIES: | | | | | | | | |
| Proceeds from shares issued (91,172 and 198,094 shares, respectively) | | | 4,930,707 | | | | 12,710,461 | |
| Net asset value of shares issued in distributions reinvested (114,964 and 592,591 shares, respectively) | | | 6,523,065 | | | | 34,891,785 | |
| Cost of shares redeemed (717,864 and 926,934 shares, respectively) | | | (38,684,802 | ) | | | (58,870,185 | ) |
| Net decrease in net assets derived from Fund share activities | | | (27,231,030 | ) | | | (11,267,939 | ) |
| TOTAL DECREASE IN NET ASSETS | | | (33,878,362 | ) | | | (48,590,775 | ) |
| NET ASSETS AT THE BEGINNING OF THE YEAR | | | 114,339,650 | | | | 162,930,425 | |
| NET ASSETS AT THE END OF THE YEAR (Includes accumulated net | | | | | | | | |
| investment loss of $(709,793) and $(820,037), respectively) | | $ | 80,461,288 | | | $ | 114,339,650 | |
The accompanying notes are an integral part of these financial statements.
Reynolds Blue Chip Growth Fund
FINANCIAL HIGHLIGHTS
(Selected data for each share of the Fund outstanding throughout each year)
| | | Year Ended September 30, | |
| | | 2016 | | | 2015 | | | 2014 | | | 2013 | | | 2012 | |
| PER SHARE OPERATING PERFORMANCE: | | | | | | | | | | | | | | | |
| Net asset value, beginning of year | | $ | 56.84 | | | $ | 75.86 | | | $ | 71.45 | | | $ | 58.97 | | | $ | 46.50 | |
| Income from investment operations: | | | | | | | | | | | | | | | | | | | | |
Net investment loss(1) | | | (0.49 | ) | | | (0.49 | ) | | | (0.49 | ) | | | (0.14 | ) | | | (0.19 | ) |
| Net realized and unrealized gains on investments | | | 0.94 | | | | 0.40 | | | | 8.28 | | | | 13.25 | | | | 12.66 | |
| Total from investment operations | | | 0.45 | | | | (0.09 | ) | | | 7.79 | | | | 13.11 | | | | 12.47 | |
| Less distributions: | | | | | | | | | | | | | | | | | | | | |
| Distributions from net capital gains | | | (3.64 | ) | | | (18.93 | ) | | | (3.38 | ) | | | (0.63 | ) | | | — | |
| Total from distributions | | | (3.64 | ) | | | (18.93 | ) | | | (3.38 | ) | | | (0.63 | ) | | | — | |
| Net asset value, end of year | | $ | 53.65 | | | $ | 56.84 | | | $ | 75.86 | | | $ | 71.45 | | | $ | 58.97 | |
| TOTAL RETURN | | | 0.48 | % | | | (1.00 | %) | | | 11.01 | % | | | 22.50 | % | | | 26.82 | % |
| RATIOS/SUPPLEMENTAL DATA: | | | | | | | | | | | | | | | | | | | | |
| Net assets, end of year (in 000’s) | | $ | 80,461 | | | $ | 114,340 | | | $ | 162,930 | | | $ | 205,879 | | | $ | 186,073 | |
| Ratio of expenses (after reimbursement) to average net assets | 1.86 | % | | | 1.71 | % | | | 1.59 | % | | | 1.58 | % | | | 1.53 | % |
| Ratio of net investment loss to average net assets | | | (0.90 | %) | | | (0.77 | %) | | | (0.65 | %) | | | (0.21 | %) | | | (0.34 | %) |
| Portfolio turnover rate | | | 491 | % | | | 272 | % | | | 102 | % | | | 133 | % | | | 99 | % |
(1) Amount calculated based on average shares outstanding throughout the year.
The accompanying notes are an integral part of these financial statements.
NOTES TO FINANCIAL STATEMENTS
September 30, 2016
| (1) | Summary of Significant Accounting Policies — |
| | The following is a summary of significant accounting policies of the Reynolds Funds, Inc. (the “Company”), which is registered as a diversified, open-end management investment company under the Investment Company Act of 1940 (the “Act”), as amended. This Company consists of one fund: the Reynolds Blue Chip Growth Fund (the “Fund”). The Company was incorporated under the laws of Maryland on April 28, 1988. The Fund is an investment company and accordingly follows the investment company accounting and reporting guidance of the Financial Accounting Standards Board (“FASB”) Accounting Standards Codification Topic 946 Financial Services – Investment Companies. |
| | The investment objective of the Fund is to produce long-term growth of capital by investing in a diversified portfolio of common stocks issued by well-established growth companies commonly referred to as “blue chip” companies, as defined in the prospectus. |
| | The following is a summary of the Fund’s pricing procedures. It is intended to be a general discussion and may not necessarily reflect all pricing procedures followed by the Fund. |
| | (a) Each security, excluding short-term investments, is valued at the last sale price reported by the principal security exchange on which the issue is traded (other than The NASDAQ OMX Group, Inc., referred to as “NASDAQ”), or if no sale is reported, the latest bid price. Securities which are traded on NASDAQ under one of its three listing tiers, NASDAQ Global Market, NASDAQ Global Select Market and NASDAQ Capital Market, are valued at the Nasdaq Official Closing Price, or if no |
Reynolds Blue Chip Growth Fund
NOTES TO FINANCIAL STATEMENTS (Continued)
September 30, 2016
| (1) | Summary of Significant Accounting Policies — (Continued) |
| | sale is reported, the latest bid price. Short-term investments with maturities of 60 days or less may be valued on an amortized cost basis to the extent it is equivalent to fair value, which involves valuing an instrument at its cost and thereafter assuming a constant amortization to maturity of any discount or premium, regardless of the impact of fluctuating rates on the fair value of the instrument. Amortized cost will not be used if its use would be inappropriate due to credit or other impairments of the issuer. Money market funds are valued at their net asset value per share. Securities for which quotations are not readily available are valued at fair value as determined by the investment adviser under the supervision of the Board of Directors. The fair value of a security is the amount which the Fund might receive upon a current sale. The fair value of a security may differ from the last quoted price and the Fund may not be able to sell a security at the fair value. Market quotations may not be available, for example, if trading in particular securities was halted during the day and not resumed prior to the close of trading on the New York Stock Exchange. |
| | Under accounting principles generally accepted in the United States of America (“GAAP”), fair value is defined as the price that would be received to sell an asset or paid to transfer a liability (i.e., the “exit price”) in an orderly transaction between market participants at the measurement date. |
| | In determining fair value, the Fund uses various valuation approaches. GAAP establishes a fair value hierarchy for inputs used in measuring fair value that maximizes the use of observable inputs and minimizes the use of unobservable inputs by generally requiring that the most observable inputs be used when available. Observable inputs are those that market participants would use in pricing the asset or liability based on market data obtained from sources independent of the Fund. Unobservable inputs reflect the Fund’s assumptions about the inputs market participants would use in pricing the asset or liability developed based on the best information available in the circumstances. The inputs or methodologies used for valuing securities are not necessarily an indication of the risks associated with investing in those securities. |
| | The fair value hierarchy is categorized into three levels based on the inputs as follows: |
| | Level 1— | Valuations based on unadjusted quoted prices in active markets for identical assets. |
| | Level 2— | Valuations based on quoted prices for similar securities or in markets that are not active or for which all significant inputs are observable, either directly or indirectly. |
| | Level 3— | Valuations based on inputs that are unobservable and significant to the overall fair value measurement. |
| | The following table summarizes the Fund’s investments as of September 30, 2016, based on the inputs used to value them: |
| | Valuation Inputs | Investments in Securities | |
| | Level 1— | Common Stocks* | | $ | 77,650,693 | | |
| | | | Money Market Funds | | | 1,702,160 | | |
| | | | Total Level 1 | | | 79,352,853 | | |
| | Level 2— | None | | | — | | |
| | Level 3— | None | | | — | | |
| | Total | | | $ | 79,352,853 | | |
| | * Please refer to the Schedule of Investments to view common stocks segregated by industry type. |
| | It is the Fund’s policy to recognize transfers between levels at the end of the reporting period. For the year ended September 30, 2016, there were no transfers between levels. The Fund did not invest in any Level 3 securities during the year. |
| | (b) Investment transactions are accounted for on a trade date basis for financial reporting purposes. Net realized gains and losses on sales of securities are computed on the highest amortized cost basis. |
| | (c) The Fund records dividend income on the ex-dividend date and interest income on an accrual basis. Withholding taxes on foreign dividends have been provided for in accordance with the Fund’s understanding of the applicable country’s tax rules and regulations. |
Reynolds Blue Chip Growth Fund
NOTES TO FINANCIAL STATEMENTS (Continued)
September 30, 2016
| (1) | Summary of Significant Accounting Policies — (Continued) |
| | (d) GAAP requires that certain components of net assets relating to permanent differences be reclassified between financial and tax reporting. These reclassifications have no effect on net assets or net asset value per share. The primary reason for this adjustment is because of net operating losses and equalization. For the year ended September 30, 2016, the following table shows the reclassifications made: |
| Accumulated Net | Accumulated Undistributed Net | |
Investment Loss | Realized Gain on Investments | Capital Stock |
| $990,735 | $(1,438,707) | $447,972 |
| | (e) The preparation of financial statements in conformity with GAAP requires management to make estimates and assumptions that affect the reported amounts of assets and liabilities and disclosure of contingent assets and liabilities at the date of the financial statements and the reported amounts of revenues and expenses during the reporting period. Actual results could differ from these estimates. |
| | (f) No provision has been made for Federal income taxes since the Fund has elected to be taxed as a “regulated investment company” and intends to distribute substantially all net investment company taxable income and net capital gains to shareholders and otherwise comply with the provisions of the Internal Revenue Code applicable to regulated investment companies. The Fund may utilize earnings and profits distributed to shareholders on redemption of shares as part of the dividends paid deduction. |
| | (g) The Fund has reviewed all open tax years and major jurisdictions, which include Federal and the state of Maryland, and concluded that there are no significant uncertain tax positions that would require recognition in the financial statements as of and for the year ended September 30, 2016. Open tax years are those that are open for exam by taxing authorities and, as of September 30, 2016, open Federal tax years include the tax years ended September 30, 2013 through 2016. The Fund recognizes interest and penalties, if any, related to unrecognized tax benefits as income tax expense in the Fund’s Statement of Operations. During the year ended September 30, 2016, the Fund did not incur any interest or penalties. The Fund has no examinations in progress and is also not aware of any tax positions for which it is reasonably possible that the total amounts of unrecognized tax benefits will significantly change in the next twelve months. |
| | (h) The Fund’s cash is held in accounts with balances which may exceed the amount of related federal insurance. The Fund has not experienced any loss in such accounts and believes it is not exposed to significant credit risk. |
| (2) | Investment Adviser and Management Agreement and Transactions With Related Parties — |
| | The Fund has a management agreement with Reynolds Capital Management, LLC (“RCM”), to serve as investment adviser and manager. The sole owner of RCM is Mr. Frederick L. Reynolds. Mr. Reynolds is also an officer and interested director of the Fund. Under the terms of the agreement, the Fund will pay RCM a monthly management fee at the annual rate of 1.00% of the daily net assets. |
| | The agreement further stipulates that RCM will reimburse the Fund for all expenses exceeding 2.00% of its daily average net assets (excluding interest, taxes, brokerage commissions and extraordinary items). The Fund is not obligated to reimburse RCM for any expenses reimbursed in previous fiscal years. No such reimbursements were required for the year ended September 30, 2016. |
| | The Fund has adopted a Service and Distribution Plan (the “Plan”) pursuant to Rule 12b-1 under the Act. The Plan provides that the Fund may incur certain costs which may not exceed a maximum amount equal to 0.25% per annum of the Fund’s average daily net assets. Payments made pursuant to the Plan may only be used to pay distribution expenses incurred in the current year, and may be less than the maximum amount allowed by the Plan. |
Reynolds Blue Chip Growth Fund
NOTES TO FINANCIAL STATEMENTS (Continued)
September 30, 2016
| (2) | Investment Adviser and Management Agreement and Transactions With Related Parties — (Continued) |
| | Under the Fund’s organizational documents, each director, officer, employee or other agent of the Fund (including the Fund’s investment manager) is indemnified, to the extent permitted by the Act, against certain liabilities that may arise out of performance of their duties to the Fund. Additionally, in the normal course of business, the Fund enters into contracts that contain a variety of indemnification clauses. The Fund’s maximum exposure under these arrangements is unknown as this would involve future claims that may be made against the Fund that have not yet occurred. However, the Fund has not had prior claims or losses pursuant to these contracts and believes the risk of loss to be remote. |
| (3) | Distributions to Shareholders — |
| | Net investment income and net realized gains, if any, for the Fund are distributed to shareholders at least annually and are recorded on the ex-dividend date. Please see Note 5 for more information. |
| (4) | Investment Transactions — |
| | For the year ended September 30, 2016, purchases and proceeds of sales of investment securities (excluding short-term securities) were $412,922,310 and $431,320,470, respectively. There were no purchases or sales of U.S. Government securities. |
| (5) | Income Tax Information — |
| | The following information for the Fund is presented on an income tax basis as of September 30, 2016: |
| | Tax cost of investments | | $ | 68,811,228 | | |
| | Gross tax unrealized appreciation | | $ | 13,591,683 | | |
| | Gross tax unrealized depreciation | | | (3,050,058 | ) | |
| | Net unrealized appreciation | | $ | 10,541,625 | | |
| | Distributable ordinary income | | $ | — | | |
| | Distributable long term capital gains | | | 6,090,024 | | |
| | Total distributable earnings | | $ | 6,090,024 | | |
| | Other accumulated losses | | $ | (945,252 | ) | |
| | Total accumulated gain | | $ | 15,686,397 | | |
| | The difference between the cost amount for financial statement and federal income tax purposes is due primarily to timing differences in recognizing certain gains and losses in security transactions. |
| | The tax components of dividends paid during the years ended September 30, 2016 and 2015: |
September 30, 2016 | September 30, 2015 |
| Ordinary Income | Long-Term Capital | Ordinary Income | Long-Term Capital |
Distributions | Gains Distributions | Distributions | Gains Distributions |
| $— | $6,849,459 | $2,431,799 | $34,990,334 |
| | The Fund designated as long-term capital gain dividend, pursuant to Internal Revenue Code Section 852(b)(3), the amount necessary to reduce the earnings and profits of the Fund related to net capital gain to zero for the tax year ended September 30, 2016. |
| | As of September 30, 2016, the Fund did not have a post-October capital loss or a capital loss carryforward. The Fund had a late year ordinary loss of $694,763. |
Reynolds Blue Chip Growth Fund
REPORT OF INDEPENDENT REGISTERED PUBLIC ACCOUNTING FIRM
To the Shareholders and Board of Directors of Reynolds Funds, Inc.
We have audited the accompanying statement of assets and liabilities, including the schedule of investments, of Reynolds Funds, Inc. comprising Reynolds Blue Chip Growth Fund (the “Fund”) as of September 30, 2016, and the related statement of operations for the year then ended, the statements of changes in net assets for each of the two years in the period then ended, and the financial highlights for each of the five years in the period then ended. These financial statements and financial highlights are the responsibility of the Fund’s management. Our responsibility is to express an opinion on these financial statements and financial highlights based on our audits.
We conducted our audits in accordance with the standards of the Public Company Accounting Oversight Board (United States). Those standards require that we plan and perform the audit to obtain reasonable assurance about whether the financial statements and financial highlights are free of material misstatement. An audit includes examining, on a test basis, evidence supporting the amounts and disclosures in the financial statements. Our procedures included confirmation of securities owned as of September 30, 2016, by correspondence with the custodian and brokers. An audit also includes assessing the accounting principles used and significant estimates made by management, as well as evaluating the overall financial statement presentation. We believe that our audits provide a reasonable basis for our opinion.
In our opinion, the financial statements and financial highlights referred to above present fairly, in all material respects, the financial position of Reynolds Blue Chip Growth Fund as of September 30, 2016, the results of its operations for the year then ended, the changes in its net assets for each of the two years in the period then ended, and the financial highlights for each of the five years in the period then ended, in conformity with accounting principles generally accepted in the United States of America.
COHEN & COMPANY, LTD.
Cleveland, Ohio
November 23, 2016
Reynolds Blue Chip Growth Fund
DIRECTORS AND OFFICERS
(Unaudited)
| | | Term of | | # of Funds | Other |
| | Position(s) | Office and | | in Complex | Directorships |
| Name, Age | Held with | Length of | Principal Occupation(s) | Overseen | Held by Director |
and Address | the Fund | Time Served | During Past Five Years | by Director | or Officer |
| | | | | | |
| Non-Interested Directors: | | | | | |
| Thomas F. Gilbertson, 73 | Director | Indefinite term | Mr. Gilbertson is an entrepreneur that owns | 1 | None |
| c/o Reynolds Capital | | since March | and operates restaurants in Naples, Florida. | | |
| Management, LLC | | 2015 | | | |
| 3565 South Las Vegas | | | | | |
| Blvd. #403 | | | | | |
| Las Vegas, NV 89109 | | | | | |
| | | | | | |
| Robert E. Stauder, 86 | Director | Indefinite term | Mr. Stauder is retired. He was a principal of | 1 | None |
| c/o Reynolds Capital | | since 1988 | Robinson Mills + Williams, an architectural | | |
| Management, LLC | | | and interior design firm, from 1991 until 1996. | | |
| 3565 South Las Vegas | | | | | |
| Blvd. #403 | | | | | |
| Las Vegas, NV 89109 | | | | | |
| | | | | | |
| Interested Director: | | | | | |
| Frederick L. Reynolds,* 74 | Director, | Indefinite term | Mr. Reynolds is the sole owner of | 1 | None |
| Reynolds Capital | | since 1988 | the Adviser, which business commenced in 1985. | | |
| Management, LLC | | | | | |
| 3565 South Las Vegas | President | One year term | | | |
| Blvd. #403 | and | since 1988 | | | |
| Las Vegas, NV 89109 | Treasurer | | | | |
| | | | | | |
| Other Officer: | | | | | |
| N. Lynn Bowley, 58 | Chief | At discretion | Mr. Bowley has been a Compliance Officer for | N/A | None |
| Northern Lights | Compliance | of Board | Northern Lights Compliance Services, LLC, | | |
| Compliance Services, LLC | Officer | since 2007 | (f/k/a) Fund Compliance Services, LLC, since | | |
| 17605 Wright Street | | | 2007. | | |
| Omaha, NE 68130 | | | | | |
| * | Mr. Reynolds is the only interested director of the Company as that term is defined in the Investment Company Act of 1940. Mr. Reynolds is an interested director of the Company by reason of his being an officer of the Company and the sole owner of the investment adviser. |
For additional information about the Directors and Officers or for a description of the policies and procedures that the Fund uses to determine how to vote proxies relating to portfolio securities, please call (800) 773-9665 and request a Statement of Additional Information. One will be mailed to you free of charge. The Statement of Additional Information is also available on the website of the Securities and Exchange Commission (the “Commission”) at http://www.sec.gov. Information on how the Fund voted proxies relating to portfolio securities is available on the Fund’s website at http://www.reynoldsfunds.com or the website of the Commission no later than August 31 for the prior 12 months ending June 30. The Fund files its complete schedule of portfolio holdings with the Commission for the first and third quarters of each fiscal year on Form N-Q. The Fund’s Form N-Q is available on the Commission’s website. The Fund’s Form N-Q may be reviewed and copied at the Commission’s Public Reference Room in Washington, D.C., and that information on the operation of the Public Reference Room may be obtained by calling 1-800-SEC-0330.
Reynolds Funds, Inc.
PRIVACY POLICY (Unaudited)
We collect the following nonpublic personal information about you:
| • | Information we receive from you on or in applications or other forms, correspondence or conversations. |
| • | Information about your transactions with us, our affiliates, or others. |
We do not disclose any nonpublic personal information about our current or former shareholders to anyone, except as permitted by law. For example, we are permitted by law to disclose all of the information we collect, as described above, to our transfer agent to process your transactions. Furthermore, we restrict access to your nonpublic personal information to those persons who require such information to provide products or services to you. We maintain physical, electronic and procedural safeguards that comply with federal standards to guard your nonpublic personal information.
In the event that you hold shares of the Fund through a financial intermediary, including, but not limited to, a broker-dealer, bank or trust company, the privacy policy of your financial intermediary may govern how your nonpublic personal information would be shared with nonaffiliated third parties.
HOUSEHOLDING (Unaudited)
In an effort to decrease costs, the Fund intends to reduce the number of duplicate prospectuses and annual and semi-annual reports you receive by sending only one copy of each to those addresses shared by two or more accounts and to shareholders the Fund reasonably believes are from the same family or household. Once implemented, if you would like to discontinue householding for your accounts, please call toll-free at 1-800-773-9665 to request individual copies of these documents. Once the Fund receives notice to stop householding, the Fund will begin sending individual copies 30 days after receiving your request. This policy does not apply to account statements.
QUALIFIED DIVIDEND INCOME/DIVIDEND RECEIVED DEDUCTION (Unaudited)
The Fund designated 0% of dividends declared and paid during the year ended September 30, 2016 from net investment income as qualified dividend income under the Jobs Growth and Tax Relief Reconciliation Act of 2003.
Corporate shareholders may be eligible for a dividend received deduction for certain ordinary income distributions paid by the Fund. The Fund designated 0% of dividends declared and paid during the year ended September 30, 2016 from net investment income as qualifying for the dividends received deduction. The deduction is a pass through of dividends paid by domestic corporations (i.e. only equities) subject to taxation.
REYNOLDS BLUE CHIP GROWTH FUND
c/o U.S. BANCORP FUND SERVICES, LLC
615 East Michigan Street
Milwaukee, Wisconsin 53202
www.reynoldsfunds.com
Board of Directors
THOMAS F. GILBERTSON
FREDERICK L. REYNOLDS
ROBERT E. STAUDER
Investment Adviser
REYNOLDS CAPITAL MANAGEMENT, LLC
3565 South Las Vegas Boulevard, #403
Las Vegas, Nevada 89109
Transfer Agent,
Dividend Disbursing Agent,
Administrator and Accountant
U.S. BANCORP FUND SERVICES, LLC
615 East Michigan Street
Milwaukee, Wisconsin 53202
1-800-773-9665
or 1-800-7REYNOLDS
Custodian
U.S. BANK, N.A.
1555 North RiverCenter Drive, Suite 302
Milwaukee, Wisconsin 53212
Independent Registered Public Accounting Firm
COHEN & COMPANY, LTD.
1350 Euclid Avenue, Suite 800
Cleveland, Ohio 44115
Legal Counsel
FOLEY & LARDNER LLP
777 East Wisconsin Avenue
Milwaukee, Wisconsin 53202
Distributor
RAFFERTY CAPITAL MARKETS, LLC
1010 Franklin Avenue
Garden City, New York 11530
Item 2. Code of Ethics.
The registrant has adopted a code of ethics that applies to the registrant’s principal executive officer and principal financial officer. The registrant has not made any amendments to its code of ethics during the period covered by this report. The registrant has not granted any waivers from any provisions of the code of ethics during the period covered by this report.
File: A copy of the registrant’s Code of Ethics is filed herewith.
Item 3. Audit Committee Financial Expert.
The registrant’s board of directors has determined that it does not have an audit committee financial expert serving on its audit committee. At this time, the registrant believes that the experience provided by each member of the audit committee together offers the registrant adequate oversight for the registrant’s level of financial complexity.
Item 4. Principal Accountant Fees and Services.
The registrant has engaged its principal accountant to perform audit services, audit-related services, tax services and other services during the past two fiscal years. “Audit services” refer to performing an audit of the registrant's annual financial statements or services that are normally provided by the accountant in connection with statutory and regulatory filings or engagements for those fiscal years. “Audit-related services” refer to the assurance and related services by the principal accountant that are reasonably related to the performance of the audit. “Tax services” refer to professional services rendered by the principal accountant for tax compliance, tax advice, and tax planning. The following table details the aggregate fees billed or expected to be billed for each of the last two fiscal years for audit fees, audit-related fees, tax fees and other fees by the principal accountant.
| | FYE 9/30/2016 | FYE 9/30/2015 |
| Audit Fees | 15,500 | 15,000 |
| Audit-Related Fees | 0 | 0 |
| Tax Fees | 0 | 0 |
| All Other Fees | 0 | 0 |
The audit committee has adopted pre-approval policies and procedures that require the audit committee to pre‑approve all audit and non‑audit services of the registrant, including services provided to any entity affiliated with the registrant.
The percentage of fees billed by Cohen & Company, Ltd. applicable to non-audit services pursuant to waiver of pre-approval requirement were as follows: