REYNOLDS BLUE CHIP GROWTH FUND
Annual Financial Statements
September 30, 2024
UNITED STATES
SECURITIES AND EXCHANGE COMMISSION
Washington, D.C. 20549
FORM N-CSR
CERTIFIED SHAREHOLDER REPORT OF REGISTERED
MANAGEMENT INVESTMENT COMPANIES
Investment Company Act file number: 811-05549
Reynolds Funds, Inc.
(Exact name of registrant as specified in charter)
c/o U.S. Bank Global Fund Services
615 East Michigan Street
Milwaukee, Wisconsin 53202
(Address of principal executive offices) (Zip code)
Frederick L. Reynolds
Reynolds Capital Management, LLC
125 East Harmon Avenue #102
Las Vegas, Nevada 89109
(Name and address of agent for service)
1-800-773-9665
Registrant’s telephone number, including area code
Date of fiscal year end: September 30, 2024
Date of reporting period: September 30, 2024
Item 1. Reports to Stockholders.
| (a) |
 | Reynolds Blue Chip Growth Fund | |
| RBCGX | ||
| Annual Shareholder Report | September 30, 2024 |
Fund Name | Costs of a $10,000 investment | Costs paid as a percentage of a $10,000 investment |
| Reynolds Blue Chip Growth Fund | $241 | 2.00% |
| Reynolds Blue Chip Growth Fund | PAGE 1 | TSR-AR-761724103 |
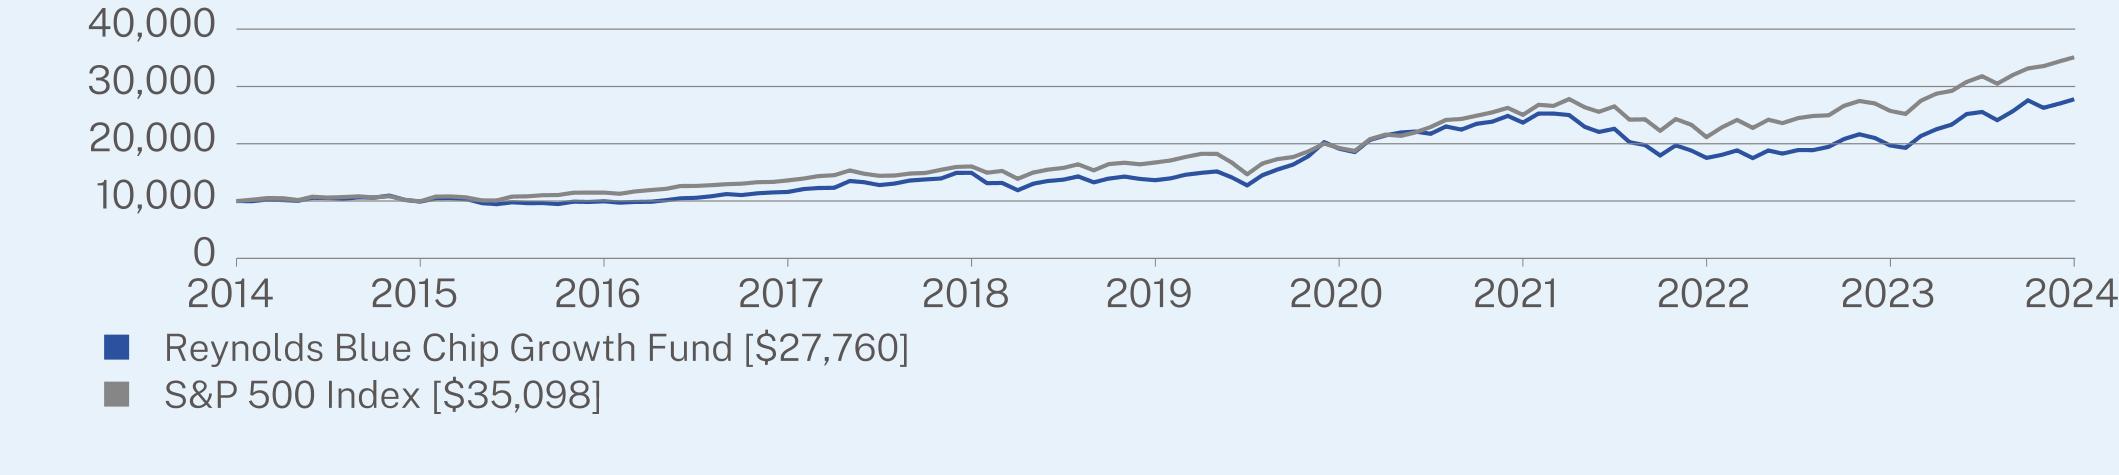
1 Year | 5 Year | 10 Year | |
Reynolds Blue Chip Growth Fund | 40.93 | 15.26 | 10.75 |
S&P 500 Index | 36.35 | 15.98 | 13.38 |
| * | The Fund’s past performance is not a good predictor of how the Fund will perform in the future. The graph and table do not reflect the deduction of taxes that a shareholder would pay on Fund distributions or redemption of Fund shares. |
Net Assets | $64,881,017 |
Number of Holdings | 275 |
Net Advisory Fee | $591,055 |
Portfolio Turnover | 269% |
Sector Breakdown | (%)† |
Information Technology | 42.0% |
Consumer Discretionary | 19.8% |
Communication Services | 19.6% |
Financials | 4.3% |
Industrials | 4.0% |
Health Care | 3.7% |
Consumer Staples | 2.5% |
Energy | 0.6% |
Real Estate | 0.6% |
Cash & Other | 2.9% |
Top Holdings | (%)† |
NVIDIA Corp. | 7.6% |
Meta Platforms, Inc. - Class A | 7.4% |
Amazon.com, Inc. | 6.3% |
Netflix, Inc. | 6.2% |
Microsoft Corp. | 5.3% |
Apple, Inc. | 4.9% |
Booking Holdings, Inc. | 2.9% |
Alphabet, Inc. - Class C | 2.8% |
First American Government Obligations Fund | 2.5% |
Salesforce, Inc. | 2.4% |
| † | Expressed as a percentage of net assets. |
| Reynolds Blue Chip Growth Fund | PAGE 2 | TSR-AR-761724103 |
| (b) | Not applicable. |
Item 2. Code of Ethics.
The registrant has adopted a code of ethics that applies to the registrant’s principal executive officer and principal financial officer. The registrant has not made any substantive amendments to its code of ethics during the period covered by this report. The registrant has not granted any waivers from any provisions of the code of ethics during the period covered by this report.
Item 3. Audit Committee Financial Expert.
The registrant’s board of directors has determined that it does not have an audit committee financial expert serving on its audit committee. At this time, the registrant believes that the experience provided by each member of the audit committee together offers the registrant adequate oversight for the registrant’s level of financial complexity.
Item 4. Principal Accountant Fees and Services.
(a)-(d) The registrant has engaged its principal accountant to perform audit services, audit-related services, tax services and other services during the past two fiscal years. “Audit services” refer to performing an audit of the registrant’s annual financial statements or services that are normally provided by the accountant in connection with statutory and regulatory filings or engagements for those fiscal years. “Audit-related services” refer to the assurance and related services by the principal accountant that are reasonably related to the performance of the audit. “Tax services” refer to professional services rendered by the principal accountant for tax compliance, tax advice, and tax planning. The following table details the aggregate fees billed or expected to be billed for each of the last two fiscal years for audit fees, audit-related fees, tax fees and other fees by the principal accountant.
| FYE 9/30/2024 | FYE 9/30/2023 | |
| Audit Fees | $16,500 | $16,500 |
| Audit-Related Fees | 0 | 0 |
| Tax Fees | 4,000 | 4,000 |
| All Other Fees | 0 | 0 |
(e)(1) The audit committee has adopted pre-approval policies and procedures that require the audit committee to pre-approve all audit and non-audit services of the registrant, including services provided to any entity affiliated with the registrant.
(e)(2) The percentage of fees billed by Cohen & Company, Ltd. applicable to non-audit services pursuant to waiver of pre-approval requirement were as follows:
| FYE 9/30/2024 | FYE 9/30/2023 | |
| Audit-Related Fees | 0% | 0% |
| Tax Fees | 0% | 0% |
| All Other Fees | 0% | 0% |
(f) All of the principal accountant’s hours spent on auditing the registrant’s financial statements were attributed to work performed by full time permanent employees of the principal accountant.
(g) The following table indicates the aggregate non-audit fees billed or expected to be billed by the registrant’s accountant for services to the registrant and to the registrant’s investment adviser for the last two years.
| Non-Audit Related Fees | FYE 9/30/2024 | FYE 9/30/2023 |
| Registrant | $0 | $0 |
| Registrant’s Investment Adviser | 0 | 0 |
(h) The audit committee of the board of directors has considered whether the provision of non-audit services that were rendered to the registrant’s investment adviser is compatible with maintaining the principal accountant’s independence and has concluded that the provision of such non-audit services by the accountant has not compromised the accountant’s independence.
(i) Not applicable.
(j) Not applicable.
Item 5. Audit Committee of Listed Registrants.
Not applicable.
Item 6. Investments.
| (a) | Schedule of Investments is included within the financial statements filed under Item 7 of this Form. |
| (b) | Not applicable. |
Item 7. Financial Statements and Financial Highlights for Open-End Management Investment Companies.
(a)
Page | |||
Shares | Value | |||||
COMMON STOCKS - 97.4% | ||||||
Aerospace & Defense - 0.8% | ||||||
General Electric Co. | 2,500 | $471,450 | ||||
Lockheed Martin Corp. | 100 | 58,456 | ||||
529,906 | ||||||
Air Freight & Logistics - 0.2% | ||||||
C.H. Robinson Worldwide, Inc. | 400 | 44,148 | ||||
United Parcel Service, Inc. - Class B | 450 | 61,353 | ||||
105,501 | ||||||
Automobile Components - 0.1% | ||||||
Mobileye Global, Inc. - Class A(a) | 2,000 | 27,400 | ||||
Modine Manufacturing Co.(a) | 400 | 53,116 | ||||
80,516 | ||||||
Automobiles - 0.6% | ||||||
Tesla, Inc.(a) | 1,475 | 385,904 | ||||
Banks - 0.7% | ||||||
JPMorgan Chase & Co. | 2,200 | 463,892 | ||||
Beverages - 0.1% | ||||||
Diageo PLC - ADR | 300 | 42,102 | ||||
Monster Beverage Corp.(a) | 900 | 46,953 | ||||
89,055 | ||||||
Biotechnology - 0.2% | ||||||
Ascendis Pharma AS - ADR(a) | 250 | 37,327 | ||||
CureVac NV(a) | 2,000 | 5,880 | ||||
Novavax, Inc.(a) | 1,200 | 15,156 | ||||
Summit Therapeutics, Inc.(a) | 1,500 | 32,850 | ||||
Viking Therapeutics, Inc.(a) | 500 | 31,655 | ||||
122,868 | ||||||
Broadline Retail - 6.6% | ||||||
Alibaba Group Holding Ltd. - ADR | 350 | 37,142 | ||||
Amazon.com, Inc.(a) | 21,950 | 4,089,943 | ||||
Coupang, Inc.(a) | 2,100 | 51,555 | ||||
eBay, Inc. | 700 | 45,577 | ||||
JD.com, Inc. - ADR | 500 | 20,000 | ||||
Nordstrom, Inc. | 1,500 | 33,735 | ||||
4,277,952 | ||||||
Building Products - 0.4% | ||||||
Carlisle Cos., Inc. | 100 | 44,975 | ||||
Carrier Global Corp. | 500 | 40,245 | ||||
Johnson Controls International PLC | 600 | 46,566 | ||||
Trane Technologies PLC | 300 | 116,619 | ||||
248,405 | ||||||
Capital Markets - 1.5% | ||||||
BlackRock, Inc. | 100 | 94,951 | ||||
Blackstone, Inc. | 250 | 38,283 | ||||
Carlyle Group, Inc. | 2,400 | 103,344 | ||||
Goldman Sachs Group, Inc. | 400 | 198,044 | ||||
Interactive Brokers Group, Inc. - Class A | 550 | 76,648 | ||||
Shares | Value | |||||
Intercontinental Exchange, Inc. | 200 | $32,128 | ||||
Jefferies Financial Group, Inc. | 600 | 36,930 | ||||
KKR & Co., Inc. | 400 | 52,232 | ||||
Morgan Stanley | 1,000 | 104,240 | ||||
Nasdaq, Inc. | 500 | 36,505 | ||||
Robinhood Markets, Inc. - Class A(a) | 2,900 | 67,918 | ||||
State Street Corp. | 500 | 44,235 | ||||
Stifel Financial Corp. | 400 | 37,560 | ||||
T Rowe Price Group, Inc. | 500 | 54,465 | ||||
977,483 | ||||||
Chemicals - 0.0%(b) | ||||||
Air Products and Chemicals, Inc. | 125 | 37,217 | ||||
Commercial Services & Supplies - 0.1% | ||||||
Waste Management, Inc. | 250 | 51,900 | ||||
Communications Equipment - 1.7% | ||||||
Arista Networks, Inc.(a) | 1,875 | 719,662 | ||||
Ciena Corp.(a) | 700 | 43,113 | ||||
Cisco Systems, Inc. | 1,200 | 63,864 | ||||
F5, Inc.(a) | 1,200 | 264,240 | ||||
1,090,879 | ||||||
Construction & Engineering - 0.1% | ||||||
Quanta Services, Inc. | 200 | 59,630 | ||||
Consumer Finance - 0.7% | ||||||
American Express Co. | 1,300 | 352,560 | ||||
SoFi Technologies, Inc.(a) | 9,500 | 74,670 | ||||
Upstart Holdings, Inc.(a) | 700 | 28,007 | ||||
455,237 | ||||||
Consumer Staples Distribution & Retail - 2.4% | ||||||
Costco Wholesale Corp. | 1,200 | 1,063,824 | ||||
Sprouts Farmers Market, Inc.(a) | 350 | 38,644 | ||||
Target Corp. | 650 | 101,309 | ||||
Walgreens Boots Alliance, Inc. | 2,000 | 17,920 | ||||
Walmart, Inc. | 4,200 | 339,150 | ||||
1,560,847 | ||||||
Containers & Packaging - 0.1% | ||||||
Avery Dennison Corp. | 250 | 55,190 | ||||
Diversified Consumer Services - 0.0%(b) | ||||||
WW International, Inc.(a) | 2,000 | 1,756 | ||||
Diversified Telecommunication Services - 0.1% | ||||||
Verizon Communications, Inc. | 1,100 | 49,401 | ||||
Electric Utilities - 0.2% | ||||||
Constellation Energy Corp. | 250 | 65,005 | ||||
NextEra Energy, Inc. | 450 | 38,039 | ||||
103,044 | ||||||
1 |
Shares | Value | |||||
COMMON STOCKS - (Continued) | ||||||
Electrical Equipment - 0.7% | ||||||
AMETEK, Inc. | 200 | $34,342 | ||||
Eaton Corp. PLC | 150 | 49,716 | ||||
Emerson Electric Co. | 350 | 38,279 | ||||
GE Vernova, Inc.(a) | 750 | 191,235 | ||||
Rockwell Automation, Inc. | 200 | 53,692 | ||||
Vertiv Holdings Co. - Class A | 900 | 89,541 | ||||
456,805 | ||||||
Electronic Equipment, Instruments & Components - 0.8% | ||||||
Amphenol Corp. - Class A | 1,100 | 71,676 | ||||
CDW Corp./DE | 200 | 45,260 | ||||
Coherent Corp.(a) | 2,400 | 213,384 | ||||
Corning, Inc. | 1,400 | 63,210 | ||||
Jabil, Inc. | 300 | 35,949 | ||||
Keysight Technologies, Inc.(a) | 250 | 39,732 | ||||
TE Connectivity PLC | 300 | 45,297 | ||||
514,508 | ||||||
Energy Equipment & Services - 0.1% | ||||||
Schlumberger NV | 1,000 | 41,950 | ||||
Entertainment - 6.7% | ||||||
Live Nation Entertainment, Inc.(a) | 400 | 43,796 | ||||
Netflix, Inc.(a) | 5,650 | 4,007,376 | ||||
ROBLOX Corp. - Class A(a) | 1,000 | 44,260 | ||||
Roku, Inc.(a) | 500 | 37,330 | ||||
Spotify Technology SA(a) | 400 | 147,412 | ||||
Walt Disney Co. | 900 | 86,571 | ||||
4,366,745 | ||||||
Financial Services - 1.2% | ||||||
Affirm Holdings, Inc.(a) | 1,500 | 61,230 | ||||
Apollo Global Management, Inc. | 350 | 43,718 | ||||
Berkshire Hathaway, Inc. - Class B(a) | 600 | 276,156 | ||||
Block, Inc.(a) | 1,700 | 114,121 | ||||
Fidelity National Information Services, Inc. | 1,900 | 159,125 | ||||
Fiserv, Inc.(a) | 250 | 44,913 | ||||
PayPal Holdings, Inc.(a) | 600 | 46,818 | ||||
Toast, Inc. - Class A(a) | 2,000 | 56,620 | ||||
802,701 | ||||||
Ground Transportation - 0.2% | ||||||
Avis Budget Group, Inc. | 500 | 43,795 | ||||
Uber Technologies, Inc.(a) | 1,500 | 112,740 | ||||
156,535 | ||||||
Health Care Equipment & Supplies - 1.7% | ||||||
Abbott Laboratories | 50 | 5,700 | ||||
Bausch + Lomb Corp.(a) | 2,000 | 38,580 | ||||
Boston Scientific Corp.(a) | 2,100 | 175,980 | ||||
Edwards Lifesciences Corp.(a) | 600 | 39,594 | ||||
GE HealthCare Technologies, Inc. | 1,100 | 103,235 | ||||
Intuitive Surgical, Inc.(a) | 1,400 | 687,778 | ||||
Shares | Value | |||||
Masimo Corp.(a) | 300 | $39,999 | ||||
1,090,866 | ||||||
Health Care Providers & Services - 0.4% | ||||||
DaVita, Inc.(a) | 600 | 98,358 | ||||
Encompass Health Corp. | 200 | 19,328 | ||||
HCA Healthcare, Inc. | 100 | 40,643 | ||||
Tenet Healthcare Corp.(a) | 450 | 74,790 | ||||
Universal Health Services, Inc. - Class B | 150 | 34,352 | ||||
267,471 | ||||||
Hotels, Restaurants & Leisure - 7.3% | ||||||
Airbnb, Inc. - Class A(a) | 1,050 | 133,150 | ||||
Booking Holdings, Inc. | 450 | 1,895,454 | ||||
Carnival Corp.(a) | 2,100 | 38,808 | ||||
Cava Group, Inc.(a) | 300 | 37,155 | ||||
Chipotle Mexican Grill, Inc.(a) | 16,700 | 962,254 | ||||
Choice Hotels International, Inc. | 350 | 45,605 | ||||
Darden Restaurants, Inc. | 250 | 41,032 | ||||
Domino’s Pizza, Inc. | 100 | 43,014 | ||||
DoorDash, Inc. - Class A(a) | 550 | 78,502 | ||||
DraftKings, Inc. - Class A(a) | 1,200 | 47,040 | ||||
Dutch Bros, Inc. - Class A(a) | 1,200 | 38,436 | ||||
Expedia Group, Inc.(a) | 300 | 44,406 | ||||
Flutter Entertainment PLC(a) | 200 | 47,456 | ||||
Hilton Worldwide Holdings, Inc. | 850 | 195,925 | ||||
Hyatt Hotels Corp. - Class A | 1,200 | 182,640 | ||||
Marriott International, Inc./MD - Class A | 1,350 | 335,610 | ||||
McDonald’s Corp. | 200 | 60,902 | ||||
MGM Resorts International(a) | 900 | 35,181 | ||||
Norwegian Cruise Line Holdings Ltd.(a) | 3,200 | 65,632 | ||||
Royal Caribbean Cruises Ltd. | 500 | 88,680 | ||||
Shake Shack, Inc. - Class A(a) | 850 | 87,729 | ||||
Wingstop, Inc. | 400 | 166,432 | ||||
Yum! Brands, Inc. | 300 | 41,913 | ||||
4,712,956 | ||||||
Household Durables - 1.1% | ||||||
Garmin Ltd. | 250 | 44,008 | ||||
KB Home | 500 | 42,845 | ||||
Lennar Corp. - Class A | 1,700 | 318,716 | ||||
PulteGroup, Inc. | 600 | 86,118 | ||||
Sonos, Inc.(a) | 2,000 | 24,580 | ||||
Toll Brothers, Inc. | 850 | 131,316 | ||||
Whirlpool Corp. | 400 | 42,800 | ||||
690,383 | ||||||
Independent Power and Renewable Electricity Producers - 0.1% | ||||||
Vistra Corp. | 650 | 77,051 | ||||
2 |
Shares | Value | |||||
COMMON STOCKS - (Continued) | ||||||
Industrial Conglomerates - 0.2% | ||||||
3M Co. | 400 | $54,680 | ||||
Honeywell International, Inc. | 250 | 51,678 | ||||
106,358 | ||||||
Insurance - 0.2% | ||||||
Assurant, Inc. | 200 | 39,772 | ||||
Progressive Corp. | 350 | 88,816 | ||||
128,588 | ||||||
Interactive Media & Services - 12.6% | ||||||
Alphabet, Inc. - Class A | 8,000 | 1,326,800 | ||||
Alphabet, Inc. - Class C | 11,000 | 1,839,090 | ||||
Baidu, Inc. - ADR(a) | 350 | 36,851 | ||||
Bumble, Inc. - Class A(a) | 4,500 | 28,710 | ||||
Meta Platforms, Inc. - Class A | 8,400 | 4,808,496 | ||||
Reddit, Inc. - Class A(a) | 1,300 | 85,696 | ||||
Snap, Inc. - Class A(a) | 5,500 | 58,850 | ||||
8,184,493 | ||||||
IT Services - 0.8% | ||||||
Accenture PLC - Class A | 125 | 44,185 | ||||
Akamai Technologies, Inc.(a) | 400 | 40,380 | ||||
Cloudflare, Inc. - Class A(a) | 1,000 | 80,890 | ||||
GoDaddy, Inc. - Class A(a) | 250 | 39,195 | ||||
International Business Machines Corp. | 250 | 55,270 | ||||
Shopify, Inc. - Class A(a) | 500 | 40,070 | ||||
Snowflake, Inc. - Class A(a) | 1,100 | 126,346 | ||||
Twilio, Inc. - Class A(a) | 600 | 39,132 | ||||
VeriSign, Inc.(a) | 250 | 47,490 | ||||
512,958 | ||||||
Life Sciences Tools & Services - 0.2% | ||||||
Illumina, Inc.(a) | 250 | 32,602 | ||||
OmniAb, Inc.(a) | 2,450 | 10,364 | ||||
Thermo Fisher Scientific, Inc. | 100 | 61,857 | ||||
104,823 | ||||||
Machinery - 0.2% | ||||||
Caterpillar, Inc. | 125 | 48,890 | ||||
Deere & Co. | 200 | 83,466 | ||||
Stanley Black & Decker, Inc. | 300 | 33,039 | ||||
165,395 | ||||||
Media - 0.1% | ||||||
Trade Desk, Inc. - Class A(a) | 650 | 71,273 | ||||
Metals & Mining - 0.1% | ||||||
Freeport-McMoRan, Inc. | 800 | 39,936 | ||||
Newmont Corp. | 1,000 | 53,450 | ||||
93,386 | ||||||
Oil, Gas & Consumable Fuels - 0.5% | ||||||
Diamondback Energy, Inc. | 450 | 77,580 | ||||
EOG Resources, Inc. | 350 | 43,025 | ||||
Shell PLC - ADR | 600 | 39,570 | ||||
Shares | Value | |||||
Targa Resources Corp. | 250 | $37,003 | ||||
Texas Pacific Land Corp. | 150 | 132,711 | ||||
Vitesse Energy, Inc. | 129 | 3,099 | ||||
332,988 | ||||||
Passenger Airlines - 0.6% | ||||||
Allegiant Travel Co. | 1,100 | 60,566 | ||||
Delta Air Lines, Inc. | 2,400 | 121,896 | ||||
Ryanair Holdings PLC - ADR | 875 | 39,532 | ||||
Southwest Airlines Co. | 2,100 | 62,223 | ||||
United Airlines Holdings, Inc.(a) | 1,900 | 108,414 | ||||
392,631 | ||||||
Pharmaceuticals - 1.2% | ||||||
Cassava Sciences, Inc.(a) | 400 | 11,772 | ||||
Eli Lilly & Co. | 590 | 522,705 | ||||
Johnson & Johnson | 600 | 97,236 | ||||
Merck & Co., Inc. | 50 | 5,678 | ||||
Novartis AG - ADR | 400 | 46,008 | ||||
Novo Nordisk AS - ADR | 400 | 47,628 | ||||
Sanofi SA - ADR | 600 | 34,578 | ||||
765,605 | ||||||
Professional Services - 0.5% | ||||||
Amentum Holdings, Inc.(a) | 300 | 9,675 | ||||
Equifax, Inc. | 200 | 58,772 | ||||
Jacobs Solutions, Inc. | 300 | 39,270 | ||||
Leidos Holdings, Inc. | 250 | 40,750 | ||||
Paychex, Inc. | 350 | 46,966 | ||||
Paycom Software, Inc. | 250 | 41,643 | ||||
Paylocity Holding Corp.(a) | 200 | 32,994 | ||||
TransUnion | 650 | 68,055 | ||||
338,125 | ||||||
Real Estate Management & Development - 0.4% | ||||||
Anywhere Real Estate, Inc.(a) | 3,500 | 17,780 | ||||
Redfin Corp.(a) | 13,000 | 162,890 | ||||
Zillow Group, Inc. - Class C(a) | 900 | 57,465 | ||||
238,135 | ||||||
Semiconductors & Semiconductor Equipment - 14.2% | ||||||
Advanced Micro Devices, Inc.(a) | 4,506 | 739,344 | ||||
Applied Materials, Inc. | 750 | 151,537 | ||||
ARM Holdings PLC - ADR(a) | 3,450 | 493,384 | ||||
ASML Holding NV | 90 | 74,993 | ||||
Broadcom, Inc. | 4,100 | 707,250 | ||||
Enphase Energy, Inc.(a) | 450 | 50,859 | ||||
First Solar, Inc.(a) | 200 | 49,888 | ||||
Impinj, Inc.(a) | 200 | 43,304 | ||||
Intel Corp. | 5,900 | 138,414 | ||||
KLA Corp. | 300 | 232,323 | ||||
Lam Research Corp. | 100 | 81,608 | ||||
Marvell Technology, Inc. | 2,500 | 180,300 | ||||
Micron Technology, Inc. | 1,100 | 114,081 | ||||
NVIDIA Corp. | 40,800 | 4,954,752 | ||||
NXP Semiconductors NV | 300 | 72,003 | ||||
3 |
Shares | Value | |||||
COMMON STOCKS - (Continued) | ||||||
Semiconductors & Semiconductor Equipment - (Continued) | ||||||
Qorvo, Inc.(a) | 400 | $41,320 | ||||
QUALCOMM, Inc. | 550 | 93,528 | ||||
Taiwan Semiconductor Manufacturing Co. Ltd. - ADR | 4,400 | 764,148 | ||||
Teradyne, Inc. | 300 | 40,179 | ||||
Universal Display Corp. | 800 | 167,920 | ||||
9,191,135 | ||||||
Software - 17.9% | ||||||
Adobe, Inc.(a) | 200 | 103,556 | ||||
AppLovin Corp. - Class A(a) | 650 | 84,857 | ||||
Aspen Technology, Inc.(a) | 400 | 95,528 | ||||
Autodesk, Inc.(a) | 550 | 151,514 | ||||
Box, Inc. - Class A(a) | 1,400 | 45,822 | ||||
C3.ai, Inc. - Class A(a) | 8,100 | 196,263 | ||||
Cadence Design Systems, Inc.(a) | 625 | 169,394 | ||||
CommVault Systems, Inc.(a) | 900 | 138,465 | ||||
Confluent, Inc., Class A - Class A(a) | 1,400 | 28,532 | ||||
CrowdStrike Holdings, Inc. - Class A(a) | 5,450 | 1,528,561 | ||||
CyberArk Software Ltd.(a) | 600 | 174,966 | ||||
Datadog, Inc. - Class A(a) | 850 | 97,801 | ||||
Fair Isaac Corp.(a) | 150 | 291,528 | ||||
Five9, Inc.(a) | 1,100 | 31,603 | ||||
Fortinet, Inc.(a) | 800 | 62,040 | ||||
Guidewire Software, Inc.(a) | 250 | 45,735 | ||||
Intuit, Inc. | 200 | 124,200 | ||||
JFrog Ltd.(a) | 1,500 | 43,560 | ||||
Microsoft Corp. | 7,950 | 3,420,885 | ||||
Monday.com Ltd.(a) | 150 | 41,666 | ||||
Nice Ltd. - ADR(a) | 200 | 34,734 | ||||
Oracle Corp. | 7,250 | 1,235,400 | ||||
Palantir Technologies, Inc. - Class A(a) | 12,500 | 465,000 | ||||
Palo Alto Networks, Inc.(a) | 2,850 | 974,130 | ||||
Salesforce, Inc. | 5,700 | 1,560,147 | ||||
Samsara, Inc. - Class A(a) | 800 | 38,496 | ||||
ServiceNow, Inc.(a) | 270 | 241,485 | ||||
SoundHound AI, Inc. - Class A(a) | 3,500 | 16,310 | ||||
Synopsys, Inc.(a) | 100 | 50,639 | ||||
Workday, Inc. - Class A(a) | 150 | 36,662 | ||||
Zoom Video Communications, Inc. - Class A(a) | 600 | 41,844 | ||||
Zscaler, Inc.(a) | 250 | 42,735 | ||||
11,614,058 | ||||||
Specialty Retail - 3.7% | ||||||
AutoNation, Inc.(a) | 250 | 44,730 | ||||
AutoZone, Inc.(a) | 300 | 945,012 | ||||
Best Buy Co., Inc. | 2,100 | 216,930 | ||||
CarMax, Inc.(a) | 600 | 46,428 | ||||
Carvana Co.(a) | 350 | 60,938 | ||||
Dick’s Sporting Goods, Inc. | 250 | 52,175 | ||||
Shares | Value | |||||
Home Depot, Inc. | 375 | $151,950 | ||||
Lowe’s Cos., Inc. | 570 | 154,385 | ||||
RH(a) | 150 | 50,165 | ||||
Ross Stores, Inc. | 1,300 | 195,663 | ||||
Signet Jewelers Ltd. | 400 | 41,256 | ||||
TJX Cos., Inc. | 2,300 | 270,342 | ||||
Ulta Beauty, Inc.(a) | 120 | 46,694 | ||||
Victoria’s Secret & Co.(a) | 1,400 | 35,980 | ||||
Wayfair, Inc. - Class A(a) | 1,000 | 56,180 | ||||
Williams-Sonoma, Inc. | 350 | 54,222 | ||||
2,423,050 | ||||||
Technology Hardware, Storage & Peripherals - 6.6% | ||||||
Apple, Inc. | 13,600 | 3,168,800 | ||||
Dell Technologies, Inc. - Class C | 3,050 | 361,547 | ||||
Hewlett Packard Enterprise Co. | 1,600 | 32,736 | ||||
NetApp, Inc. | 350 | 43,228 | ||||
Seagate Technology Holdings PLC | 500 | 54,765 | ||||
Super Micro Computer, Inc.(a) | 1,290 | 537,156 | ||||
Western Digital Corp.(a) | 900 | 61,461 | ||||
4,259,693 | ||||||
Textiles, Apparel & Luxury Goods - 0.4% | ||||||
Lululemon Athletica, Inc.(a) | 400 | 108,540 | ||||
NIKE, Inc. - Class B | 1,100 | 97,240 | ||||
On Holding AG - Class A(a) | 700 | 35,105 | ||||
Ralph Lauren Corp. | 250 | 48,468 | ||||
289,353 | ||||||
Wireless Telecommunication Services - 0.1% | ||||||
T-Mobile US, Inc. | 250 | 51,590 | ||||
TOTALCOMMON STOCKS (Cost $38,539,362) | 63,188,191 | |||||
REAL ESTATE INVESTMENT TRUSTS - 0.2% | ||||||
Specialized REITs - 0.2% | ||||||
American Tower Corp. | 250 | 58,140 | ||||
Digital Realty Trust, Inc. | 250 | 40,458 | ||||
98,598 | ||||||
TOTAL REAL ESTATE INVESTMENT TRUSTS (Cost $99,912) | 98,598 | |||||
Contracts | ||||||
RIGHTS - 0.0% | ||||||
Biotechnology- 0.0% | ||||||
OmniAb Operations, Inc. - $12.50 Earnout Shares(a)(c) | 189 | 0 | ||||
OmniAb Operations, Inc. - $15.00 Earnout Shares(a)(c) | 189 | 0 | ||||
0 | ||||||
TOTAL RIGHTS (Cost $0) | 0 | |||||
4 |
Shares | Value | |||||
SHORT-TERM INVESTMENTS - 2.5% | ||||||
Money Market Funds - 2.5% | ||||||
First American Government Obligations Fund - Class X, 4.82%(d) | 1,653,876 | $1,653,876 | ||||
TOTAL SHORT-TERM INVESTMENTS (Cost $1,653,876) | 1,653,876 | |||||
TOTAL INVESTMENTS - 100.1% (Cost $40,293,150) | 64,940,665 | |||||
Liabilities in Excess of Other Assets - (0.1)% | (59,648) | |||||
TOTAL NET ASSETS - 100.0% | $64,881,017 | |||||
(a) | Non-income producing security. |
(b) | Represents less than 0.05% of net assets. |
(c) | Fair value determined using significant unobservable inputs in accordance with fair value methodologies established and applied by the Adviser, acting as Valuation Designee. These securities represented $0 or 0.0% of net assets as of September 30, 2024. |
(d) | The rate shown represents the 7-day annualized effective yield as of September 30, 2024. |
5 |
ASSETS: | |||
Investments in securities, at value (cost $40,293,150) | $64,940,665 | ||
Receivable from shareholders for purchases | 1,926 | ||
Dividends and interest receivable | 32,009 | ||
Prepaid expenses | 44,641 | ||
Total assets | 65,019,241 | ||
LIABILITIES: | |||
Payable to shareholders for redemptions | 19,219 | ||
Payable to adviser for management fees, net | 49,134 | ||
Payable for distribution and service fees | 7,084 | ||
Other liabilities | 62,787 | ||
Total liabilities | 138,224 | ||
NET ASSETS | $64,881,017 | ||
Net Assets Consist of: | |||
Capital stock, $0.01 par value; 40,000,000 shares authorized; 971,329 shares outstanding | $38,937,496 | ||
Distributable earnings | 25,943,521 | ||
Net assets | $ 64,881,017 | ||
Calculation of Net Asset Value Per Share: | |||
Net asset value, offering and redemption price per share ($64,881,017 ÷ 971,329 shares outstanding) | $66.80 | ||
6 |
INVESTMENT INCOME: | |||
Dividends (net of foreign withholding tax of $2,917) | $285,420 | ||
Interest | 108,824 | ||
Total investment income | 394,244 | ||
EXPENSES: | |||
Management fees (See Note 2) | 593,866 | ||
Administration fees and expenses | 83,465 | ||
Transfer agent fees and expenses | 82,604 | ||
Distribution and service fees | 73,082 | ||
Professional fees and expenses | 63,242 | ||
Insurance expense | 62,587 | ||
Accounting fees and expenses | 43,777 | ||
Shareholder servicing fees | 41,173 | ||
Registration fees | 30,844 | ||
Chief Compliance Officer fees | 28,720 | ||
Custodian fees and expenses | 28,397 | ||
Board of Directors fees | 28,001 | ||
Printing and postage expenses | 17,227 | ||
Other expenses | 13,558 | ||
Total expenses | 1,190,543 | ||
Less expenses reimbursed by the investment adviser (See Note 2) | (2,811) | ||
Net expenses | 1,187,732 | ||
Net investment loss | (793,488) | ||
NET REALIZED GAIN ON INVESTMENTS AND FOREIGN CURRENCY TRANSACTIONS | 7,235,893 | ||
NET CHANGE IN UNREALIZED APPRECIATION/DEPRECIATION ON INVESTMENTS AND FOREIGN CURRENCY TRANSLATION | 13,464,014 | ||
NET GAIN ON INVESTMENTS | 20,699,907 | ||
NET INCREASE IN NET ASSETS RESULTING FROM OPERATIONS | $19,906,419 | ||
7 |
Years Ended September 30, | ||||||
2024 | 2023 | |||||
OPERATIONS: | ||||||
Net investment loss | $(793,488) | $(509,523) | ||||
Net realized gain on investments and foreign currency transactions | 7,235,893 | 1,280,752 | ||||
Net change in unrealized appreciation/depreciation on investments and foreign currency translation | 13,464,014 | 5,404,263 | ||||
Net increase in net assets resulting from operations | 19,906,419 | 6,175,492 | ||||
DISTRIBUTIONS TO SHAREHOLDERS | — | (3,002,381) | ||||
FUND SHARE ACTIVITIES: | ||||||
Proceeds from shares issued (47,995 and 33,898 shares, respectively) | 2,886,158 | 1,560,883 | ||||
Net asset value of shares issued in distributions reinvested (— and 66,276 shares, respectively) | — | 2,940,003 | ||||
Cost of shares redeemed (186,664 and 148,988 shares, respectively) | (10,521,845) | (6,860,981) | ||||
Net decrease in net assets derived from Fund share activities | (7,635,687) | (2,360,095) | ||||
TOTAL INCREASE IN NET ASSETS | 12,270,732 | 813,016 | ||||
NET ASSETS AT THE BEGINNING OF THE YEAR | 52,610,285 | 51,797,269 | ||||
NET ASSETS AT THE END OF THE YEAR | $64,881,017 | $52,610,285 | ||||
8 |
Year Ended September 30, | |||||||||||||||
2024 | 2023 | 2022 | 2021 | 2020 | |||||||||||
PER SHARE OPERATING PERFORMANCE: | |||||||||||||||
Net asset value, beginning of year | $47.40 | $44.70 | $77.51 | $68.96 | $51.48 | ||||||||||
Income from investment operations: | |||||||||||||||
Net investment loss(1) | (0.78) | (0.44) | (0.68) | (0.93) | (0.70) | ||||||||||
Net realized and unrealized gains (losses) on investments | 20.18 | 5.78 | (14.00) | 16.45 | 20.69 | ||||||||||
Total from investment operations | 19.40 | 5.34 | (14.68) | 15.52 | 19.99 | ||||||||||
Less distributions: | |||||||||||||||
Distributions from net capital gains | — | (2.64) | (18.13) | (6.97) | (2.51) | ||||||||||
Net asset value, end of year | $66.80 | $47.40 | $44.70 | $77.51 | $68.96 | ||||||||||
TOTAL RETURN | 40.93% | 12.53% | −25.97% | 23.72% | 40.26% | ||||||||||
RATIOS/SUPPLEMENTAL DATA: | |||||||||||||||
Net assets, end of year (in 000’s) | $64,881 | $52,610 | $51,797 | $77,991 | $68,718 | ||||||||||
Ratio of expenses to average net assets, net of reimbursement | 2.00% | 2.00% | 1.95% | 1.85% | 2.00% | ||||||||||
Ratio of expenses to average net assets, before reimbursement | 2.00% | 2.18% | 1.95% | 1.85% | 2.03% | ||||||||||
Ratio of net investment loss to average net assets | (1.34%) | (0.95%) | (1.18%) | (1.25%) | (1.25%) | ||||||||||
Portfolio turnover rate | 269% | 431% | 623% | 279% | 263% | ||||||||||
(1) | Amount calculated based on average shares outstanding throughout the year. |
9 |
10 |
Level 1 | Level 2 | Level 3 | Total | |||||||||
Investments: | ||||||||||||
Common Stocks | $63,188,191 | $ — | $ — | $63,188,191 | ||||||||
Real Estate Investment Trusts | 98,598 | — | — | 98,598 | ||||||||
Rights | — | — | 0 | 0 | ||||||||
Money Market Funds | 1,653,876 | — | — | 1,653,876 | ||||||||
Total Investments | $64,940,665 | $— | $0 | $64,940,665 | ||||||||
11 |
Tax cost of investments | $43,495,016 | ||
Gross tax unrealized appreciation | $25,028,311 | ||
Gross tax unrealized depreciation | (3,582,662) | ||
Net unrealized appreciation/depreciation | 21,445,649 | ||
Distributable ordinary income | 2,054,530 | ||
Distributable long-term capital gains | 3,121,916 | ||
Other accumulated loss | (678,574) | ||
Total distributable earnings | $25,943,521 | ||
12 |
Year Ended September 30, 2024 | Year Ended September 30, 2023 | ||||||||
Ordinary Income Distributions | Long-Term Capital Gains Distributions | Ordinary Income Distributions | Long-Term Capital Gains Distributions | ||||||
$— | $— | $— | $3,002,381 | ||||||
13 |

14 |
15 |
(b) Financial Highlights are included within the financial statements filed under Item 7(a) of this Form.
Item 8. Changes in and Disagreements with Accountants for Open-End Management Investment Companies.
There were no changes in or disagreements with accountants during the period covered by this report.
Item 9. Proxy Disclosures for Open-End Management Investment Companies.
There were no matters submitted to a vote of shareholders during the period covered by this report.
Item 10. Remuneration Paid to Directors, Officers, and Others of Open-End Management Investment Companies.
See Item 7(a).
Item 11. Statement Regarding Basis for Approval of Investment Advisory Contract.
Not applicable.
Item 12. Disclosure of Proxy Voting Policies and Procedures for Closed-End Management Investment Companies.
Not applicable to open-end management investment companies.
Item 13. Portfolio Managers of Closed-End Management Investment Companies.
Not applicable to open-end management investment companies.
Item 14. Purchases of Equity Securities by Closed-End Management Investment Company and Affiliated Purchasers.
Not applicable to open-end management investment companies.
Item 15. Submission of Matters to a Vote of Security Holders.
Not applicable.
Item 16. Controls and Procedures.
| (a) | The registrant’s Principal Executive Officer and Principal Financial Officer have reviewed the registrant’s disclosure controls and procedures (as defined in Rule 30a-3(c) under the Investment Company Act of 1940 (the “Act”)) as of a date within 90 days of the filing of this report, as required by Rule 30a-3(b) under the Act and Rules 13a-15(b) or 15d-15(b) under the Securities Exchange Act of 1934. Based on their review, such officers have concluded that the disclosure controls and procedures are effective in ensuring that information required to be disclosed in this report is appropriately recorded, processed, summarized and reported and made known to them by others within the registrant and by the registrant’s service provider. |
| (b) | There were no changes in the registrant’s internal control over financial reporting (as defined in Rule 30a-3(d) under the Act) that occurred during the period covered by this report that have materially affected, or are reasonably likely to materially affect, the registrant’s internal control over financial reporting. |
Item 17. Disclosure of Securities Lending Activities for Closed-End Management Investment Companies.
Not applicable to open-end management investment companies.
Item 18. Recovery of Erroneously Awarded Compensation.
Not applicable.
Item 19. Exhibits.
(2) Any policy required by the listing standards adopted pursuant to Rule 10D-1 under the Exchange Act (17 CFR 240.10D-1) by the registered national securities exchange or registered national securities association upon which the registrant’s securities are listed. Not applicable.
(4) Any written solicitation to purchase securities under Rule 23c-1 under the Act sent or given during the period covered by the report by or on behalf of the registrant to 10 or more persons. Not applicable to open-end investment companies.
(5) Change in the registrant’s independent public accountant. Not applicable.
| (b) | Certifications pursuant to Section 906 of the Sarbanes-Oxley Act of 2002. Furnished herewith. |
SIGNATURES
Pursuant to the requirements of the Securities Exchange Act of 1934 and the Investment Company Act of 1940, the registrant has duly caused this report to be signed on its behalf by the undersigned, thereunto duly authorized.
| (Registrant) | Reynolds Funds, Inc. |
| By (Signature and Title) | /s/ Frederick L. Reynolds | ||
| Frederick L. Reynolds, Principal Executive Officer and Principal Financial Officer |
| Date | 11/26/2024 |
Pursuant to the requirements of the Securities Exchange Act of 1934 and the Investment Company Act of 1940, this report has been signed below by the following persons on behalf of the registrant and in the capacities and on the dates indicated.
| By (Signature and Title) | /s/ Frederick L. Reynolds | ||
| Frederick L. Reynolds, Principal Executive Officer and Principal Financial Officer |
| Date | 11/26/2024 |