Table of Contents
UNITED STATES
SECURITIES AND EXCHANGE COMMISSION
WASHINGTON, D.C. 20549
FORM N-CSR
CERTIFIED SHAREHOLDER REPORT OF REGISTERED
MANAGEMENT INVESTMENT COMPANIES
Investment Company Act file number: 811-05555
SANFORD C. BERNSTEIN FUND, INC.
(Exact name of registrant as specified in charter)
1345 Avenue of the Americas, New York, New York 10105
(Address of principal executive offices) (Zip code)
Joseph J. Mantineo
AllianceBernstein L.P.
1345 Avenue of the Americas
New York, New York 10105
(Name and address of agent for service)
Registrant’s telephone number, including area code: (800) 221-5672
Date of fiscal year end: September 30, 2021
Date of reporting period: March 31, 2021
Table of Contents
ITEM 1. REPORTS TO STOCKHOLDERS.
Table of Contents
SANFORD C. BERNSTEIN FUND, INC.
Emerging Markets Portfolio
Short Duration Diversified Municipal Portfolio
California Municipal Portfolio
Diversified Municipal Portfolio
New York Municipal Portfolio
Intermediate Duration Portfolio
Short Duration Plus Portfolio
SEMI-ANNUAL REPORT
MARCH 31, 2021
As of January 1, 2021, as permitted by new regulations adopted by the Securities and Exchange Commission, each Fund’s annual and semi-annual shareholder reports are no longer sent by mail, unless you specifically requested paper copies of the reports. Instead, the reports are made available on a website, and you will be notified by mail each time a report is posted and provided with a website address to access the report.
You may elect to receive all future reports in paper form free of charge. If you invest through a financial intermediary, you can contact your financial intermediary to request that you continue to receive paper copies of your shareholder reports; if you invest directly with a Fund, you can call the Fund at 800.221.5672. Your election to receive reports in paper form will apply to all funds held in your account with your financial intermediary or, if you invest directly, to all AB Mutual Funds you hold.
Table of Contents
| 1 | ||||
| 5 | ||||
| 11 | ||||
| 15 | ||||
| 16 | ||||
| 20 | ||||
| 26 | ||||
| 30 | ||||
| 35 | ||||
| 44 | ||||
| 86 |
Before investing in any portfolio of the Sanford C. Bernstein Fund, Inc., a prospective investor should consider carefully the portfolio’s investment objectives and policies, charges, expenses and risks. These and other matters of importance to prospective investors are contained in the portfolio’s prospectus, an additional copy of which may be obtained by visiting our website at www.Bernstein.com and clicking on “Investments”, found in the footer, then “Mutual Fund Information—Prospectuses, SAIs and Shareholder Reports” or by calling your financial advisor or by calling Bernstein’s mutual fund shareholder help line at 212.756.4097. Please read the prospectus carefully before investing.
For performance information current to the most recent month-end, please visit our website at www.Bernstein.com and click on “Investments”, found in the footer, then “Mutual Fund Information—Mutual Fund Performance at a Glance”.
Sanford C. Bernstein Fund, Inc. (the “Fund”) operates as a series company currently comprised of 13 portfolios (hereafter collectively referred to as the “Portfolios” and each individually a “Portfolio”). This report relates only to the International Equity Portfolios, Fixed Income Municipal Portfolios and Fixed Income Taxable Portfolios (together the “SCB Portfolios”). The financial statements of the Overlay Portfolios and the financial highlights of Class A, Class C, Advisor Class and Class Z Shares (collectively “Retail Classes”) of California Municipal, Diversified Municipal, New York Municipal, Intermediate Duration and Short Duration Plus Portfolios are presented in separate financial reports.
This shareholder report must be preceded or accompanied by the Sanford C. Bernstein Fund, Inc. prospectus for individuals who are not shareholders of the Fund.
You may obtain a description of the Fund’s proxy voting policies and procedures, and information regarding how the Fund voted proxies relating to portfolio securities during the most recent 12-month period ended June 30, without charge. Simply visit www.AllianceBernstein.com, or go to the Securities and Exchange Commission’s website at www.sec.gov, or call AllianceBernstein at 800.227.4618.
The Fund will file its complete schedule of portfolio holdings with the Commission for the first and third quarters of each fiscal year as an exhibit to its reports on Form N-PORT. The Fund’s Form N-PORT reports are available on the Commission’s website at www.sec.gov. The Fund’s Forms N-PORT may also be reviewed and copied at the Commission’s Public Reference Room in Washington, D.C.; information on the operation of the Public Reference Room may be obtained by calling 800.SEC.0330.
The Report of Independent Registered Public Accounting Firm can be found with the applicable Portfolio’s Schedules of Investments. The Schedules of Investments, an integral part of the financial statements for each Portfolio, are included as inserts to this Report.
Investment Products Offered: · Are Not FDIC Insured · May Lose Value · Are Not Bank Guaranteed
Table of Contents
Portfolio Manager Commentary (Unaudited)
To Our Shareholders—May 17, 2021
On the following pages, you will find the 2021 semi-annual report for the Portfolios1 (collectively, the “Portfolios”, and individually, a “Portfolio”) of the Sanford C. Bernstein Fund, Inc. (the “SCB Fund”). The semi-annual report covers the six- and 12-month periods ended March 31, 2021, and includes financial statements as well as notes to the financial statements, information about the recent performance of the Portfolios and a listing of each Portfolio’s holdings as of the period end.
Global equities have rebounded strongly from last year’s market bottom, up 55% over the past year and 21% over the past six months. Continued optimism and promising data from the rollout of COVID-19 vaccines, along with ongoing economic support from governments, have propelled stocks to new highs. In the US, coronavirus cases fell by around 80% over the past three months as the holiday spread faded and over 100 million people received at least one dose of the vaccine.
For the past several years, market performance has been concentrated in high growth momentum stocks around the world, especially in the US. That pattern reversed in the final quarter of 2020 and has persisted in 2021, with a notable rebound in cyclical sectors, in particular in the small-cap space.
Fixed income has been more challenged than equities, rebounding in the early stages of the recovery as all assets recovered, but facing headwinds as investors’ risk appetite returned, and capital was reallocated to equities. In addition, in the first quarter of 2021, US interest rates rose significantly with the 10-year Treasury yield moving from 1% to over 1.7%. Price pressure on bonds was notable, but yields have readjusted meaningfully, and our portfolio teams are taking advantage of those with purchases of new issues.
The markets are now focused on the pace of the recovery, with estimates of global GDP and corporate earnings continuing to rise. We have increased our own estimates for global economic growth meaningfully. We continue to monitor how a recovery in global demand, likely led by the US given its substantial fiscal stimulus and reopening progress, will intersect with supply chains that are still coming back online. In addition, we’ll be watching the recovery in labor markets, which will be necessary to keep demand strong. Inflation expectations have rebounded to more normal levels and we’ll continue to track them and the potential path of interest rates.
Thank you for your continued confidence in our approach.
If you have any questions about your investments in the Portfolios, please contact your Bernstein Advisor by calling 212.756.4097, or visit www.Bernstein.com. As always, we are firmly dedicated to your investment success. Thank you for your continued interest in the Portfolios.
Sincerely,
Beata D. Kirr
President
Sanford C. Bernstein Fund, Inc.
| 1 | This performance discussion is intended as a general market commentary. Please note that the information for the Overlay Portfolios of the SCB Fund may be found in a separate report. |
Emerging Markets Portfolio
Investment Objective and Strategy
The Portfolio seeks to provide long-term capital growth through investments in equity securities of companies in emerging-market countries. The Portfolio invests, under normal circumstances, at least 80% of its net assets in securities of companies in emerging markets. AllianceBernstein L.P., the Portfolio’s investment adviser (the “Adviser”) invests the Portfolio’s assets using multiple disciplines. The Portfolio may own stocks selected using the Adviser’s bottom-up research in value, growth, core and other investment style disciplines. The Adviser may allocate assets to companies in different targeted ranges of market capitalization. Within each investment discipline, the Adviser draws on the capabilities of separate investment teams. The Adviser relies on both fundamental and quantitative research to manage risk and return for the Portfolio.
The Portfolio may invest in companies of any size. The Portfolio invests primarily in common stocks, but may also invest in preferred stocks, warrants and convertible securities
(Portfolio Manager Commentary continued on next page)
2021 Semi-Annual Report | 1 | |
Table of Contents
Portfolio Manager Commentary (continued)
of foreign issuers, including sponsored or unsponsored American Depositary Receipts (“ADRs”) and Global Depositary Receipts (“GDRs”). Under most conditions, the Portfolio intends to have its assets invested among multiple emerging-market countries, although the Portfolio may also invest in more developed-country markets. In allocating the Portfolio’s assets among emerging-market countries, the Adviser considers such factors as the geographical distribution of the Portfolio, the sizes of the stock markets represented and the various key economic characteristics of the countries. However, the Portfolio may not necessarily be diversified on a geographical basis. The Adviser also considers the transaction costs and volatility of each individual market.
The Portfolio may enter into foreign currency transactions for hedging and non-hedging purposes on a spot (i.e., cash) basis or through the use of derivatives transactions, such as forward currency exchange contracts, currency futures and options thereon, and options on currencies. An appropriate hedge of currency exposure resulting from the Portfolio’s securities positions may not be available or cost effective, or the Adviser may determine not to hedge the positions, possibly even under market conditions where doing so could benefit the Portfolio. The Portfolio generally invests in foreign-currency futures contracts or foreign-currency forward contracts with terms of up to one year. The Portfolio also purchases foreign currency for immediate settlement in order to purchase foreign securities. In addition, the Portfolio may invest a portion of its uncommitted cash balances in futures contracts on securities or baskets of securities to expose that portion of the Portfolio to the equity markets. The Portfolio may use derivatives, such as options, futures contracts, forward contracts and swaps. The Portfolio may use options strategies involving the purchase and/or writing of various combinations of call and/or put options, including on individual securities and stock indices, futures contracts (including futures contracts on individual securities and stock indices) or shares of exchange-traded funds (“ETFs”). These transactions may be used, for example, in an effort to earn extra income, to adjust exposure to individual securities or markets, or to protect all or a portion of the Portfolio from a decline in value, sometimes within certain ranges.
Short Duration Diversified Municipal Portfolio
Investment Objective and Strategy
The Portfolio seeks to provide safety of principal and a moderate rate of return after taking account of federal taxes. As a matter of fundamental policy, the Portfolio, under normal circumstances, invests at least 80% of its net assets in municipal securities. The Portfolio invests no more than 25% of its total assets in municipal securities of issuers located in any one state.
The Portfolio invests at least 80% of its total assets in municipal securities rated A or better by national rating agencies (or, if unrated, determined by the Adviser to be of comparable quality) and comparably rated municipal notes. The Portfolio may invest up to 20% of its total assets in fixed-income securities rated BB or B by national rating agencies, which are not investment-grade (commonly known as “junk bonds”).
The Portfolio may invest, without limit, in revenue bonds, which generally do not have the pledge of the credit of the issuer. The Portfolio may invest, without limit, in securities or obligations that are related in such a way that business or political developments or changes affecting one such security could also affect the others (for example, securities with interest that is paid from projects of a similar type).
The Portfolio may also invest up to 20% of its net assets in fixed-income securities of US issuers that are not municipal securities if, in the Adviser’s opinion, these securities will enhance the after-tax return for investors.
The Portfolio may use derivatives, such as options, futures contracts, forward contracts and swaps. The Portfolio seeks to maintain an effective duration of one-half year to two and one-half years under normal market conditions. Duration is a measure that relates the expected price volatility of a security to changes in interest rates. The duration of a debt security is the weighted average term to maturity, expressed in years, of the present value of all future cash flows, including coupon payments and principal repayments. Within the range described above, the Adviser may moderately shorten the average duration of the Portfolio when it expects interest rates to rise and moderately lengthen average duration when it anticipates that interest rates will fall. The Adviser selects securities for purchase or sale based on its assessment of the securities’ risk and return characteristics as well as the securities’ impact on the overall risk and return characteristics of the Portfolio. In making this assessment, the Adviser takes into account various factors including the credit quality and sensitivity to interest rates of the securities under consideration and of the Portfolio’s other holdings.
(Portfolio Manager Commentary continued on next page)
| 2 | Sanford C. Bernstein Fund, Inc. | |
Table of Contents
Portfolio Manager Commentary (continued)
California Municipal Portfolio
Diversified Municipal Portfolio
New York Municipal Portfolio
Investment Objective and Strategy
Each of the Portfolios seeks to provide safety of principal and maximize total return after taking account of federal taxes (and, in the case of the California Municipal Portfolio, California state taxes, and, in the case of the New York Municipal Portfolio, New York state and local taxes). As a matter of fundamental policy, each of the Portfolios, under normal circumstances, invests at least 80% of its net assets in municipal securities (and, in the case of the California Municipal and New York Municipal Portfolios, municipal securities issued by the State of California or the State of New York, or their political subdivisions, or otherwise exempt from California or New York state income tax, respectively). The Diversified Municipal Portfolio will invest no more than 25% of its total assets in municipal securities of issuers located in any one state.
Each of the Portfolios invests at least 80% of its total assets in municipal securities rated A or better by national rating agencies (or, if unrated, determined by the Adviser to be of comparable quality) and comparably rated municipal notes. Each of the Portfolios may invest up to 20% of their total assets in fixed-income securities rated BB or B by national rating agencies, which are not investment-grade (commonly known as “junk bonds”).
Each of the Portfolios may invest, without limit, in revenue bonds, which generally do not have the pledge of the credit of the issuer. Each of the Portfolios may invest, without limit, in securities or obligations that are related in such a way that business or political developments or changes affecting one such security could also affect the others (for example, securities with interest that is paid from projects of a similar type).
Each of the Portfolios may also invest up to 20% of its net assets in fixed-income securities of US issuers that are not municipal securities if, in the Adviser’s opinion, these securities will enhance the after-tax return for investors (and, in the case of the California Municipal and New York Municipal Portfolios, California investors and New York investors, respectively).
The Portfolios may use derivatives, such as options, futures contracts, forward contracts and swaps. Each Portfolio seeks to maintain an effective duration of three and one-half years to seven years under normal market conditions.
The Adviser selects securities for purchase or sale based on its assessment of the securities’ risk and return characteristics as well as the securities’ impact on the overall risk and return characteristics of each of the Portfolios. In making this assessment, the Adviser takes into account various factors including the credit quality and sensitivity to interest rates of the securities under consideration and of the Portfolios’ other holdings.
The California Municipal and New York Municipal Portfolios are “non-diversified,” which means that they may concentrate their assets in a smaller number of issuers than a diversified fund.
Intermediate Duration Portfolio
Investment Objective and Strategy
The Portfolio seeks to provide safety of principal and a moderate to high rate of income that is subject to taxes. The Portfolio seeks to maintain an average portfolio quality minimum of A, based on ratings given to the Portfolio’s securities by national rating agencies (or, if unrated, determined by the Adviser, to be of comparable quality). Many types of securities may be purchased by the Portfolio, including corporate bonds, notes, US government and agency securities, asset-backed securities, mortgage-related securities, bank loan debt, preferred stock and inflation-protected securities, as well as others. The Portfolio may also invest up to 25% of its total assets in fixed-income, non-US dollar denominated foreign securities, and may invest without limit in fixed-income, US dollar denominated foreign securities, in each case in developed- or emerging-market countries.
The Portfolio may use derivatives, such as options, futures contracts, forward contracts and swaps. The Portfolio may invest up to 25% of its total assets in fixed-income securities rated below investment-grade (BB or below) by national rating agencies (commonly known as “junk bonds”). No more than 5% of the Portfolio’s total assets may be invested in fixed-income securities rated CCC by national rating agencies. The Portfolio seeks to maintain an effective duration of three to seven years under normal market conditions. Duration is a measure that relates the expected price volatility of a security to changes in interest rates. The duration of a debt security is the weighted average term to maturity, expressed in years, of the present value of all future cash flows, including coupon payments and principal repayments. Within the range described above, the Adviser may moderately shorten the average duration of the Portfolio when it expects interest rates
(Portfolio Manager Commentary continued on next page)
2021 Semi-Annual Report | 3 | |
Table of Contents
Portfolio Manager Commentary (continued)
to rise and moderately lengthen average duration when it anticipates that interest rates will fall. The Adviser selects securities for purchase or sale based on its assessment of the securities’ risk and return characteristics as well as the securities’ impact on the overall risk and return characteristics of the Portfolio. In making this assessment, the Adviser takes into account various factors including the credit quality and sensitivity to interest rates of the securities under consideration and of the Portfolio’s other holdings.
The Portfolio may enter into foreign currency transactions on a spot (i.e., cash) basis or through the use of derivatives transactions, such as forward currency exchange contracts, currency futures and options thereon, and options on currencies. An appropriate hedge of currency exposure resulting from the Portfolio’s securities positions may not be available or cost effective, or the Adviser may determine not to hedge the positions, possibly even under market conditions where doing so could benefit the Portfolio.
Short Duration Plus Portfolio
Investment Objective and Strategy
The Portfolio seeks to provide safety of principal and a moderate rate of income that is subject to taxes. The Portfolio invests at least 80% of its total assets in securities rated A or better by national rating agencies (or, if unrated, determined by the Adviser, to be of comparable quality) and comparably rated commercial paper and notes. Many types of securities may be purchased by the Portfolio, including corporate bonds, notes, US government and agency securities, asset-backed securities, mortgage-related securities, inflation-protected securities, bank loan debt and preferred stock, as well as others. The Portfolio may also invest up to 20% of its total assets in fixed-income foreign securities in developed or emerging-market countries.
The Portfolio may use derivatives, such as options, futures contracts, forward contracts and swaps. The Portfolio may invest up to 20% of its total assets in fixed-income securities rated BB or B by national rating agencies, which are not investment-grade (commonly known as “junk bonds”). The Portfolio seeks to maintain an effective duration of one to three years under normal market conditions. Duration is a measure that relates the expected price volatility of a security to changes in interest rates. The duration of a debt security is the weighted average term to maturity, expressed in years, of the present value of all future cash flows, including coupon payments and principal repayments. Within the range described above, the Adviser may moderately shorten the average duration of the Portfolio when it expects interest rates to rise and moderately lengthen average duration when it anticipates that interest rates will fall. The Adviser selects securities for purchase or sale based on its assessment of the securities’ risk and return characteristics as well as the securities’ impact on the overall risk and return characteristics of the Portfolio. In making this assessment, the Adviser takes into account various factors including the credit quality and sensitivity to interest rates of the securities under consideration and of the Portfolio’s other holdings.
The Portfolio may enter into foreign currency transactions on a spot (i.e., cash) basis or through the use of derivatives transactions, such as forward currency exchange contracts, currency futures and options thereon, and options on currencies. An appropriate hedge of currency exposure resulting from the Portfolio’s securities positions may not be available or cost effective, or the Adviser may determine not to hedge the positions, possibly even under market conditions where doing so could benefit the Portfolio.
| 4 | Sanford C. Bernstein Fund, Inc. | |
Table of Contents
Disclosures and Risks (Unaudited)
Benchmark Disclosures
None of the following indices or averages reflects fees and expenses associated with the active management of a mutual fund portfolio. The Morgan Stanley Capital International Emerging Markets (“MSCI EM”) Index (net, free float-adjusted, market capitalization weighted) represents the equity market performance of emerging markets. The Bloomberg Barclays 1-Year Municipal Bond Index is a total-return performance benchmark for the short-term municipal bond market with maturities of up to 1.99 years. The Bloomberg Barclays 5-Year General Obligation “GO” Municipal Bond Index represents the performance of long-term, investment-grade tax-exempt bonds with maturities ranging from four to six years. The Bloomberg Barclays US Aggregate Bond Index represents the performance of securities within the US investment-grade fixed-rate bond market, with index components for government and corporate securities, mortgage pass-through securities, asset-backed securities and commercial mortgage-backed securities. The Intercontinental Exchange Bank of America® (“ICE BofA”) 1-3 Year US Treasury Index represents the performance of US dollar-denominated sovereign debt publicly issued by the US government in its domestic market with a remaining term to final maturity of one to three years. MSCI makes no express or implied warranties or representations, and shall have no liability whatsoever with respect to any MSCI data contained herein. The MSCI data may not be further redistributed or used as a basis for other indices, any securities or financial products. This report is not approved, reviewed or produced by MSCI. Net returns include the reinvestment of dividends after deduction of non-US withholding tax. Lipper Averages are the equal-weighted average returns of the funds in the relevant Lipper Inc. categories; the average fund in a category may differ in composition from the Portfolios. Investors cannot invest directly in indices, and their results are not indicative of the performance for any specific investment, including the Portfolios.
A Word About Risk
All Portfolios: The share price of the Portfolios will fluctuate and you may lose money. There is no guarantee that the Portfolios will achieve their investment objectives.
Cybersecurity Risk: Cybersecurity incidents, both intentional and unintentional, may allow an unauthorized party to gain access to Portfolio assets, customer data (including private shareholder information), or proprietary information, or cause the Portfolios, the Adviser, and/or its service providers (including, but not limited to, fund accountants, custodians, sub-custodians, transfer agents and financial intermediaries) to suffer data breaches, data corruption or lose operational functionality, or prevent Portfolio investors from purchasing, redeeming or exchanging shares or receiving distributions. A Portfolio and the Adviser have limited ability to prevent or mitigate cybersecurity incidents affecting third-party service providers. Cybersecurity incidents may result in financial losses to such Portfolio and its shareholders, and substantial costs may be incurred in order to prevent any future cybersecurity incidents.
Derivatives Risk: The Portfolios may use derivatives as direct investments to earn income, enhance return and broaden portfolio diversification, which entail greater risk than if used solely for hedging purposes. In addition to other risks such as the credit risk of the counterparty, derivatives involve the risk that changes in the value of the derivative may not correlate with relevant assets, rates or indices. Derivatives may be difficult to price or unwind, and small changes may produce disproportionate losses for the Portfolios. Certain derivatives have the potential for unlimited loss, regardless of the size of the initial investment. Assets required to be set aside or posted to cover or secure derivatives positions may themselves go down in value, and these collateral and other requirements may limit investment flexibility. Some derivatives involve leverage, which can make the Portfolios more volatile and can compound other risks. Derivatives, especially over-the-counter derivatives, are also subject to counterparty risk. Use of derivatives may have different tax consequences for the Portfolios than an investment in the underlying asset or index, and such differences may affect the amount, timing and character of income distributed to shareholders. The US government and certain foreign governments have adopted regulations governing derivatives markets, including mandatory clearing of certain derivatives and may impose additional regulations governing, margin, reporting and registration requirements. The ultimate impact of the regulations remains unclear. Additional regulation may make derivatives more costly, limit their availability or utility, otherwise adversely affect their performance, or disrupt markets.
Illiquid Investments Risk: Illiquid investments risk exists when particular investments are difficult to purchase or sell, possibly preventing the Portfolios from purchasing or selling these securities at an advantageous price. The municipal
(Disclosures and Risks continued on next page)
2021 Semi-Annual Report | 5 | |
Table of Contents
Disclosures and Risks (continued)
Portfolios are subject to greater risk because the market for municipal securities is generally smaller than many other markets, which may make municipal securities more difficult to trade or dispose of than other types of securities. Illiquid securities may also be difficult to value.
Management Risk: The Portfolios are subject to management risk because they are actively managed investment portfolios. The Adviser will apply its investment techniques and risk analyses in making investment decisions for the Portfolios, but these techniques, analyses and decisions may not work as intended or may not produce the desired results, and may, during certain periods, result in increased volatility for the Portfolios or cause the value of the Portfolios’ shares to go down. In some cases, derivatives and other investment techniques may be unavailable, or the Adviser may determine not to use them, possibly even under market conditions where their use could benefit the Portfolios. Some of these techniques may incorporate, or rely upon, quantitative models, but there is no guarantee that these models will generate accurate forecasts, reduce risk or otherwise perform as expected. In addition, the Adviser may change the Portfolios’ investment strategies or policies from time to time. Those changes may not lead to the results intended by the Adviser and could have an adverse effect on the value or performance of the Portfolios.
Market Risk: The Portfolios are subject to market risk, which is the risk that stock prices in general or in particular countries or sectors may decline over short or extended periods. Stock prices may decline in response to adverse changes in the economy or the economic outlook; deterioration in investor sentiment; interest rate, currency and commodity price fluctuations; adverse geopolitical, social or environmental developments; issuer- and sector-specific considerations; public health crises (including the occurrence of a contagious disease or illness); and other factors. In the past decade, financial markets in the United States, Europe and elsewhere have experienced increased volatility, decreased liquidity and heightened uncertainty. These market conditions may recur from time to time and have an adverse impact on various securities markets. Recently, certain governments and central banks have provided significant support to financial markets in response to serious economic disruptions, including, but not limited to, buying stocks, providing direct capital infusions into companies, implementing new monetary programs, dramatically lowering interest rates and through other market interventions. This and other government intervention into the economy and financial markets may not work as intended, particularly if the efforts are perceived by investors as being unlikely to achieve the desired results. Government actions to support the economy and financial markets have resulted in a large expansion of government deficits and debt, the long-term consequences of which are not known. The reversal of these policies, or their ineffectiveness, as well as further governmental or central bank actions could negatively affect financial markets generally, increase market volatility and reduce the value and liquidity of securities in which the Portfolios invest.
On January 31, 2020, the United Kingdom (the “UK”) formally left the European Union (the “EU”) (“Brexit”) and ceased to be a member of the EU. Brexit could adversely affect European or worldwide political, regulatory, economic or market conditions and could contribute to instability in global political institutions, regulatory agencies and financial markets. Brexit could also lead to legal uncertainty and politically divergent national laws and regulations as a new relationship between the UK and EU is developed and the UK determines which EU laws to replace or replicate in the future. Any of these effects of Brexit, and others the Adviser cannot anticipate, could adversely affect the value of the Portfolios’ investments and net asset value. The political, economic and legal consequences of Brexit continue to give rise to uncertainties. The UK may be less stable than it has been in recent years and investments in UK assets may be difficult to value, or subject to greater or more frequent rises and falls in value.
The United States has imposed tariffs and other trade barriers on Chinese exports and placed other restrictions on or barriers to investments in China. Trade disputes, particularly prolonged disputes, may adversely affect the economies of the United States and its trading partners, as well as the companies directly or indirectly affected by the dispute and financial markets generally, and thus may adversely affect the value of the Portfolios’ assets. Recently, the United States government acted to prohibit US persons, such as the Portfolios, from owning, and required them to divest, certain Chinese companies designated as related to the Chinese military. There is no assurance that more such companies will not be so designated in the future, which could limit the Portfolios’ opportunities for investment and require the sale of securities at a loss or make them illiquid. If the political climate between the United States and China continues to deteriorate, economies and markets may be adversely affected.
(Disclosures and Risks continued on next page)
| 6 | Sanford C. Bernstein Fund, Inc. | |
Table of Contents
Disclosures and Risks (continued)
Policy and legislative changes in the United States and in other countries are affecting many aspects of financial regulation, and may in some instances contribute to decreased liquidity and increased volatility in the financial markets. The impact of these changes, and the practical implications for market participants, may not be fully known for some time.
Economies and financial markets throughout the world are becoming increasingly interconnected. Economic, financial or political events, trading and tariff arrangements, terrorism, natural disasters (including the spread of infectious illness) and other circumstances in one country or region could have profound impacts on global economies or markets. As a result, whether or not the Portfolios invest in securities of issuers located in or with significant exposure to countries experiencing economic and financial difficulties, the value and liquidity of the Portfolios’ investments may be negatively affected.
Redemption Risk: The Portfolios may experience heavy redemptions that could cause the Portfolios to liquidate their assets at inopportune times or unfavorable prices or increase or accelerate taxable gains or transaction costs and may negatively affect the Portfolios’ net asset value, or performance, which could cause the value of your investment to decline. Redemption risk is heightened during periods of overall market turmoil.
Emerging Markets, Intermediate Duration and Short Duration Plus Portfolios:
Foreign Currency Risk: This is the risk that changes in foreign (non-US) currency exchange rates may negatively affect the value of the Portfolios’ investments or reduce the returns of the Portfolios. For example, the value of the Portfolios’ investments in foreign securities and foreign currency positions may decrease if the US dollar is strong (i.e., gaining value relative to other currencies) and other currencies are weak (i.e., losing value relative to the US dollar).
Actions by a Few Major Investors Risk: In certain countries, volatility may be heightened by actions of a few major investors. For example, substantial increases or decreases in cash flows of mutual funds investing in these markets could significantly affect local stock prices and, therefore, share prices of the Portfolios.
Emerging-Markets Securities Risk: The risks of investing in foreign (non-US) securities are heightened with respect to issuers in emerging-market countries because the markets are less developed and less liquid and there may be a greater amount of economic, political and social uncertainty, and these risks are even more pronounced in “frontier” markets, which are investable markets with lower total market capitalization and liquidity than the more developed emerging markets. In addition, the value of the Portfolios’ investments may decline because of factors such as unfavorable or unsuccessful government actions and reduction of government or central bank support.
Emerging Markets Portfolio:
Country Concentration Risk: The Portfolio may not always be diversified among countries or regions and the effect on the share price of the Portfolio of specific risks such as political, regulatory and currency may be magnified due to concentration of the Portfolio’s investments in a particular country or region.
Capitalization Risk: Investments in small- and mid-capitalization companies may be more volatile than investments in large-capitalization companies. Investments in small-capitalization companies may have additional risks because these companies have limited product lines, markets or financial resources.
Allocation Risk: The allocation of investments among investment disciplines may have a significant effect on the Portfolio’s performance when the investment disciplines in which the Portfolio has greater exposure perform worse than the investment disciplines with less exposure. Different investment styles tend to shift in and out of favor depending on market conditions and investor sentiment. The Portfolio may allocate a significant portion of its assets to securities of companies in broadly related industries within an economic sector. Companies in the same sector may be similarly affected by economic or market events, making the Portfolio more vulnerable to unfavorable developments in that sector than funds that invest more broadly.
Short Duration Diversified Municipal, California Municipal, Diversified Municipal, New York Municipal, Intermediate Duration and Short Duration Plus Portfolios:
Inflation Risk: This is the risk that the value of assets or income from investments will be less in the future as inflation decreases the value of money. As inflation increases, the value of the Portfolios’ assets can decline as can the value of the Portfolios’ distributions. This risk is significantly greater for fixed-income securities with longer maturities.
Interest-Rate Risk: Changes in interest rates will affect the value of investments in fixed-income securities. When interest
(Disclosures and Risks continued on next page)
2021 Semi-Annual Report | 7 | |
Table of Contents
Disclosures and Risks (continued)
rates rise, the value of existing investments in fixed-income securities tends to fall and this decrease in value may not be offset by higher income from new investments. Interest-rate risk is generally greater for fixed-income securities with longer maturities or durations. The current historically low interest rate environment heightens the risks associated with rising interest rates.
Credit Risk: This is the risk that the issuer or the guarantor of a debt security, or the counterparty to a derivatives or other contract, will be unable or unwilling to make timely principal and/or interest payments, or to otherwise honor its obligations. The issuer or guarantor may default, potentially causing a loss of the full principal amount of a security and accrued interest. The degree of risk for a particular security may be reflected in its credit rating. The credit rating of a fixed-income security may be downgraded after purchase, which may adversely affect the value of the security. Investments in fixed-income securities with lower ratings tend to have a higher probability that an issuer will default or fail to meet its payment obligations, making credit risk greater for medium-quality and lower-rated debt securities. Lower-rated debt securities and similar unrated securities (commonly known as “junk bonds”) have speculative elements or are predominantly speculative credit risks. At times when credit risk is perceived to be greater, credit “spreads” (i.e., the difference between the yields on lower quality securities and the yields on higher quality securities) may get larger or “widen”. As a result, the values of the lower quality securities may go down more and they may become harder to sell.
Duration Risk: The duration of a fixed-income security may be shorter than or equal to full maturity of the fixed-income security. Fixed-income securities with longer durations have more interest-rate risk and will decrease in price as interest rates rise. Securities that have final maturities longer than their durations may be affected by increased credit spreads to a far greater degree than their durations would suggest, because they are exposed to credit risk until final maturity.
Lower-rated Securities Risk: Lower-rated securities, or junk bonds/high-yield securities, are subject to greater risk of loss of principal and interest and greater market risk than higher-rated securities. The capacity of issuers of lower-rated securities to pay interest and repay principal is more likely to weaken than is that of issuers of higher-rated securities in times of deteriorating economic conditions or rising interest rates.
Prepayment and Extension Risk: Prepayment risk is the risk that a loan, bond or other security might be called or otherwise converted, prepaid or redeemed before maturity. If this happens, particularly during a time of declining interest rates or credit spreads, the Portfolios will not benefit from the rise in market price that normally accompanies a decline in interest rates, and may not be able to invest the proceeds in securities providing as much income, resulting in a lower yield to the Portfolios. Conversely, extension risk is the risk that as interest rates rise or spreads widen, payments of securities may occur more slowly than anticipated by the market. If this happens, the values of these securities may go down because their interest rates are lower than current market rates and they remain outstanding longer than anticipated.
Short Duration Diversified Municipal and Short Duration Plus Portfolios:
Riskier than a Money-Market Fund: Although the Portfolios maintain a short overall duration, they invest in securities with longer maturities and in some cases lower quality than the assets of the type of mutual fund known as a money-market fund. The risk of a decline in the market value of the Portfolios is greater than for a money-market fund since the credit quality of the Portfolios’ securities may be lower and the effective duration of the Portfolios will be longer.
Short Duration Diversified Municipal, California Municipal, Diversified Municipal and New York Municipal Portfolios:
Municipal Market Risk: This is the risk that special factors may adversely affect the value of municipal securities and have a significant effect on the yield or value of the Portfolios’ investments in municipal securities. These factors include economic conditions, political or legislative changes, uncertainties related to the tax status of municipal securities, or the rights of investors in these securities. The value of municipal securities may also be adversely affected by rising health care costs, increasing unfunded pension liabilities, and by the phasing out of federal programs providing financial support. In recent periods, a number of municipal issuers have defaulted on obligations, been downgraded or commenced insolvency proceedings. Financial difficulties of municipal issuers may continue or get worse, particularly in light of the economic impact of the recent spread of a novel coronavirus (COVID-19). To the extent the Portfolios invest in a particular state’s municipal securities, they may be vulnerable to events adversely affecting that state, including economic, political and regulatory occurrences, court decisions, terrorism, public health crises (including the occurrence of a contagious disease
(Disclosures and Risks continued on next page)
| 8 | Sanford C. Bernstein Fund, Inc. | |
Table of Contents
Disclosures and Risks (continued)
or illness) and catastrophic natural disasters, such as hurricanes, wildfires and earthquakes. The Portfolios’ investments in certain municipal securities with principal and interest payments that are made from the revenues of a specific project or facility, and not general tax revenues, are subject to the risk that factors affecting the project or facility, such as local business or economic conditions, could have a significant effect on the project’s ability to make payments of principal and interest on these securities.
In addition, tax law changes enacted as part of the Tax Cuts and Jobs Act of 2017 could have a material impact on the value of municipal securities. Because advance refunding bonds issued after December 31, 2017 are no longer tax exempt, the total supply of municipal bonds could decrease going forward. In addition, the reduction of the US corporate income tax rate to 21% could make municipal obligations less attractive to certain institutional investors such as banks and property and casualty insurance companies, resulting in lower demand for municipal obligations. Changes in tax rates or the treatment of income from certain types of municipal securities, among other things, could negatively affect the municipal securities markets.
The Portfolios may invest in municipal securities of issuers in Puerto Rico or other US territories and their governmental agencies and municipalities, which are exempt from federal, state, and, where applicable, local income taxes. These municipal securities may have more risks than those of other US issuers of municipal securities. Like many US states and municipalities, Puerto Rico experienced a significant downturn in the 2007–2009 recession. Puerto Rico’s downturn was particularly severe. In addition, Hurricane Maria caused significant damage to Puerto Rico. Hurricane Maria and severe weather events that may occur in the future could have significant and long-lasting impacts on Puerto Rico’s economy. Puerto Rico continues to face a very challenging economic and fiscal environment, worsened by the spread of COVID-19 and the adverse effect that related governmental and public responses have had on Puerto Rico’s economy. If the general economic situation in Puerto Rico continues to persist or worsens, the volatility and credit quality of Puerto Rican municipal securities could continue to be adversely affected, and the market for such securities may deteriorate further.
Tax Risk: There is no guarantee that the income on the Portfolios’ municipal securities will be exempt from regular federal income, and if applicable, state income taxes. Unfavorable legislation, adverse interpretations by federal or state authorities, litigation or noncompliant conduct by the issuer of a municipal security could affect the tax-exempt status of municipal securities. If the Internal Revenue Service or a state authority determines that an issuer of a municipal security has not complied with applicable requirements, interest from the security could become subject to regular federal income tax and/or state personal income tax, possibly retroactively to the date the security was issued, the value of the security could decline significantly, and a portion of the distributions to Portfolio shareholders could be recharacterized as taxable. The US Congress has considered changes to US federal tax law that would, if enacted, have a negative impact on certain types of municipal securities, such as private activity bonds, or would otherwise make investments in municipal bonds less attractive.
California Municipal and New York Municipal Portfolios:
Non-Diversification Risk: Concentration of investments in a small number of securities tends to increase risk. The Portfolios may have more risk because they are “non-diversified”, meaning that they can invest more of their assets in a relatively small number of issuers with greater concentration of risk. Matters affecting these issuers can have a more significant effect on the Portfolios’ net asset value.
Intermediate Duration and Short Duration Plus Portfolios:
Inflation-Protected Securities Risk: The terms of inflation-protected securities provide for the coupon and/or maturity value to be adjusted based on changes in an inflation index. Decreases in the inflation rate or in investors’ expectations about inflation could cause these securities to underperform non-inflation-adjusted securities on a total-return basis. In addition, there can be no assurance that the relevant inflation index will accurately measure the rate of inflation, in which case the securities may not work as intended. These securities may be more difficult to trade or dispose of than other types of securities.
(Disclosures and Risks continued on next page)
2021 Semi-Annual Report | 9 | |
Table of Contents
Disclosures and Risks (continued)
Foreign (Non-US) Securities Risk: Investments in foreign securities entail significant risks in addition to those customarily associated with investing in US securities. These risks include risks related to adverse market, economic, political and regulatory factors and social instability, all of which could disrupt the financial markets in which the Portfolios invest and adversely affect the value of the Portfolios’ assets.
Mortgage-Related and Asset-Related Securities Risk: Mortgage- and asset-related securities represent interests in “pools” of mortgages or other assets, including consumer loans or receivables held in trust. Mortgage- and asset-related securities are subject to credit, interest-rate, prepayment and extension risks. These securities also are subject to risk of default on the underlying mortgage or asset, particularly during periods of economic downturn. Small movements in interest rates (both increases and decreases) may quickly and significantly reduce the value of certain mortgage-related securities.
Subordination Risk: The Portfolios may invest in securities that are subordinated to more senior securities of an issuer, or which represent interests in pools of such subordinated securities. Subordinated securities will be disproportionately affected by a default or even a perceived decline in creditworthiness of the issuer. Subordinated securities are more likely to suffer a credit loss than non-subordinated securities of the same issuer, any loss incurred by the subordinated securities is likely to be proportionately greater, and any recovery of interest or principal may take more time.
These risks are discussed in further detail in the Portfolios’ prospectus.
An Important Note About Historical Performance
Except as noted, returns do not reflect the deduction of taxes that a shareholder would pay on portfolio distributions or the redemption of portfolio shares. Certain Emerging Markets Portfolio performance data presented herein does not reflect the deduction of historical purchase and redemption fees, which, if reflected, would reduce the level of performance quoted. All fees and expenses related to the operation of the Portfolios have been deducted, except as noted for the Emerging Markets Portfolio. Emerging Markets Portfolio returns throughout this report include dividends net of withholding taxes.
The performance shown in this report represents past performance and does not guarantee future results. Performance information is as of the dates shown. Current performance may be lower or higher than the performance information shown. You may obtain performance information current to the most recent month-end by calling 212.756.4097. The investment return and principal value of an investment in the Portfolios will fluctuate, so that shares, when redeemed, may be worth more or less than their original cost.
Investors should consider the investment objectives, risks, charges and expenses of the Portfolios carefully before investing. For copies of our prospectus or summary prospectus, which contain this and other information, visit www.Bernstein.com, click on “Investments”, found in the footer, then “Mutual Fund Information—Prospectuses, SAIs and Shareholder Reports”, or call Bernstein’s mutual fund shareholder help line at 212.756.4097 or contact your Bernstein Advisor. Please read the prospectus and/or summary prospectus carefully before investing.
| 10 | Sanford C. Bernstein Fund, Inc. | |
Table of Contents
Historical Performance (Unaudited)
Sanford C. Bernstein Fund Portfolios vs. Their Benchmarks and Lipper Averages
| TOTAL RETURNS | AVERAGE ANNUAL TOTAL RETURNS | |||||||||||||||||||||
| THROUGH MARCH 31, 2021 | PAST SIX MONTHS | PAST 12 MONTHS | PAST FIVE YEARS | PAST 10 YEARS | SINCE INCEPTION | INCEPTION DATE | ||||||||||||||||
Emerging Markets Portfolio1 | 27.75 | % | 62.95 | % | 10.54 | % | 2.65 | % | 7.04 | % | 12/15/1995 | |||||||||||
Emerging Markets Portfolio Class Z | 27.92 | % | 63.39 | % | 10.82 | % | — | 13.86 | % | 1/15/2016 | ||||||||||||
MSCI EM Index (net) | 22.43 | % | 58.39 | % | 12.07 | % | 3.65 | % | 6.78 | % | ||||||||||||
Lipper Emerging Markets Funds Average | 24.19 | % | 66.50 | % | 12.72 | % | 4.38 | % | — | |||||||||||||
Short Duration Diversified Municipal Portfolio | 0.64 | % | 3.11 | % | 1.25 | % | 1.00 | % | 2.36 | % | 10/3/1994 | |||||||||||
Bloomberg Barclays 1-Year Municipal Bond Index | 0.34 | % | 1.91 | % | 1.41 | % | 1.13 | % | — | |||||||||||||
Lipper Short-Term Municipal Debt Funds Average | 0.45 | % | 2.34 | % | 1.32 | % | 1.20 | % | — | |||||||||||||
California Municipal Portfolio | 1.43 | % | 5.86 | % | 2.17 | % | 2.65 | % | 4.10 | % | 8/6/1990 | |||||||||||
Bloomberg Barclays 5-Year GO Municipal Bond Index | 0.28 | % | 4.29 | % | 2.45 | % | 2.77 | % | — | |||||||||||||
Lipper California Intermediate Municipal Debt Funds Average | 0.90 | % | 4.65 | % | 2.39 | % | 3.34 | % | — | |||||||||||||
Diversified Municipal Portfolio | 1.88 | % | 6.14 | % | 2.43 | % | 2.78 | % | 4.34 | % | 1/9/1989 | |||||||||||
Bloomberg Barclays 5-Year GO Municipal Bond Index | 0.28 | % | 4.29 | % | 2.45 | % | 2.77 | % | — | |||||||||||||
Lipper Intermediate Municipal Debt Funds Average | 1.69 | % | 5.80 | % | 2.77 | % | 3.38 | % | — | |||||||||||||
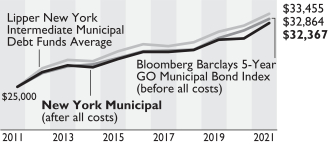
New York Municipal Portfolio | 2.48 | % | 5.74 | % | 2.19 | % | 2.62 | % | 4.31 | % | 1/9/1989 | |||||||||||
Bloomberg Barclays 5-Year GO Municipal Bond Index | 0.28 | % | 4.29 | % | 2.45 | % | 2.77 | % | — | |||||||||||||
Lipper New York Intermediate Municipal Debt Funds Average | 1.75 | % | 4.27 | % | 2.25 | % | 2.96 | % | — | |||||||||||||
Intermediate Duration Portfolio | -2.10 | % | 4.09 | % | 3.37 | % | 3.55 | % | 5.79 | % | 1/17/1989 | |||||||||||
Bloomberg Barclays US Aggregate Bond Index | -2.73 | % | 0.71 | % | 3.10 | % | 3.44 | % | 6.03 | % | ||||||||||||
Lipper Core Bond Funds Average | -1.54 | % | 4.60 | % | 3.33 | % | 3.44 | % | — | |||||||||||||
Short Duration Plus Portfolio | 0.08 | % | 1.04 | % | 1.43 | % | 1.01 | % | 3.73 | % | 12/12/1988 | |||||||||||
ICE BofA 1-3 Year US Treasury Index | 0.00 | % | 0.24 | % | 1.71 | % | 1.29 | % | — | |||||||||||||
Lipper Short-Term Investment Grade Debt Funds Average | 1.16 | % | 6.42 | % | 2.40 | % | 1.84 | % | — | |||||||||||||
See Disclosures, Risks and Note About Historical Performance on pages 5–10.
(Historical Performance and footnotes continued on next page)
2021 Semi-Annual Report | 11 | |
Table of Contents
Historical Performance (continued from previous page)
| Please keep in mind that high, double-digit returns are highly unusual and cannot be sustained. Investors should also be aware that these returns were primarily achieved during favorable market conditions. |
| Past performance is no guarantee of future results and an investment in the portfolios described could lose value. The current prospectus fee table shows the total operating expense ratios as 1.30% and 1.04%, for Bernstein Class and Class Z shares, respectively, for Emerging Markets Portfolio; and for the Bernstein Classes, as 0.50% for Short Duration Diversified Municipal Portfolio; 0.55% for California Municipal Portfolio; 0.47% for Diversified Municipal Portfolio; 0.54% for New York Municipal Portfolio; 0.57% for Intermediate Duration Portfolio and 0.56% for Short Duration Plus Portfolio. The Financial Highlights section of this report sets forth expense ratio data for the current reporting period; the expense ratios shown above may differ from the expense ratios in the Financial Highlights section since they are based on different time periods. |
| There are no sales charges associated with an investment in the Bernstein Classes of the Portfolios. Total returns and average annual returns are therefore the same. |
| 1 | Prior to May 2, 2005, the Portfolio imposed a 2% fee on purchases and redemptions. Effective May 2, 2005, the fees were reduced from 2% to 1%. This fee was eliminated effective February 2, 2015. |
See Disclosures, Risks and Note About Historical Performance on pages 5–10.
(Historical Performance continued on next page)
| 12 | Sanford C. Bernstein Fund, Inc. | |
Table of Contents
Historical Performance (continued from previous page)
| Foreign Stock Portfolios | Municipal Bond Portfolios | |||
| Emerging Markets—Bernstein Class Shares | Short Duration Diversified Municipal | |||
Growth of a $25,000 Investment in the Portfolio | Growth of a $25,000 Investment in the Portfolio | |||
|
| |||
| California Municipal | ||||
Growth of a $25,000 Investment in the Portfolio | ||||
| ||||
| Diversified Municipal | ||||
Growth of a $25,000 Investment in the Portfolio | ||||
|
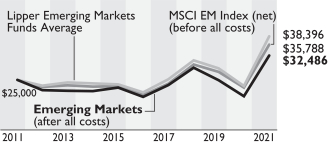
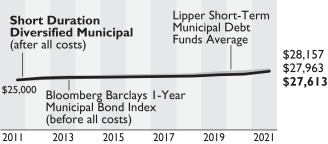
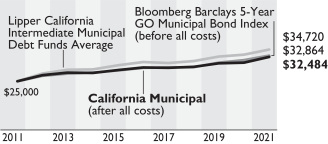
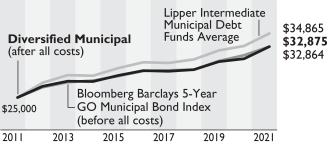
| Past performance is no guarantee of future results and an investment in the portfolios described could lose value. Except as noted, returns do not reflect the deduction of taxes that a shareholder would pay on portfolio distributions or the redemption of portfolio shares. All fees and expenses related to the operation of the Portfolios have been deducted. Emerging Markets Portfolio returns throughout this report include dividends net of withholding taxes. |
| Each chart illustrates the total value of an assumed $25,000 investment as compared to the performance of each Portfolio’s respective benchmark and Lipper Average for the 10-year period ended March 31, 2021. |
See Disclosures, Risks and Note About Historical Performance on pages 5–10.
(Historical Performance continued on next page)
2021 Semi-Annual Report | 13 | |
Table of Contents
Historical Performance (continued from previous page)
| Municipal Bond Portfolios | Taxable Bond Portfolios | |||
| New York Municipal | Intermediate Duration | |||
Growth of a $25,000 Investment in the Portfolio | Growth of a $25,000 Investment in the Portfolio | |||
|
| |||
| Short Duration Plus | ||||
Growth of a $25,000 Investment in the Portfolio | ||||
|
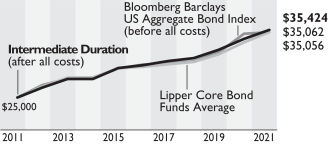
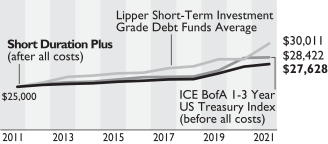
| Past performance is no guarantee of future results and an investment in the portfolios described could lose value. Except as noted, returns do not reflect the deduction of taxes that a shareholder would pay on portfolio distributions or the redemption of portfolio shares. All fees and expenses related to the operation of the Portfolios have been deducted. Portfolio returns throughout this report include dividends net of withholding taxes. |
| Each chart illustrates the total value of an assumed $25,000 investment as compared to the performance of each Portfolio’s respective benchmark and Lipper Average for the 10-year period ended March 31, 2021. |
See Disclosures, Risks and Note About Historical Performance on pages 5–10.
| 14 | Sanford C. Bernstein Fund, Inc. | |
Table of Contents
Expense Example—March 31, 2021 (Unaudited)
As a shareholder of a Portfolio, you incur various ongoing costs, including management fees and other Portfolio expenses. This example is intended to help you understand your ongoing costs (in dollars) of investing in the Portfolio and to compare these costs with the ongoing costs of investing in other mutual funds. The example is based on an investment of $1,000 invested at the beginning of the period and held for the entire period as indicated below.
Actual Expenses—The first line of the table below provides information about actual account values and actual expenses. You may use the information in this line, together with the amount you invested, to estimate the expenses that you paid over the period. Simply divide your account value by $1,000 (for example, an $8,600 account value divided by $1,000 = 8.6), then multiply the result by the number in the first line under the heading entitled “Expenses Paid During Period” to estimate the expenses you paid on your account during this period.
Hypothetical Example for Comparison Purposes—The second line of the table below provides information about hypothetical account values and hypothetical expenses based on a Portfolio’s actual expense ratio and an assumed annual rate of return of 5% before expenses, which is not the Portfolio’s actual return. The hypothetical account values and expenses may not be used to estimate the actual ending account balance or expenses you paid for the period. You may use this information to compare the ongoing costs of investing in the Portfolio and other funds by comparing this 5% hypothetical example with the 5% hypothetical examples that appear in the shareholder reports of other funds. Please note that the expenses shown in the table are meant to highlight your ongoing costs only and do not reflect any transactional costs, such as sales charges (loads), or contingent deferred sales charges on redemptions. Therefore, the second line of the table is useful in comparing ongoing costs only, and will not help you determine the relative total costs of owning different funds. In addition, if these transactional costs were included, your costs would have been higher.
| BEGINNING ACCOUNT VALUE OCTOBER 1, 2020 | ENDING ACCOUNT VALUE MARCH 31, 2021 | EXPENSES PAID DURING PERIOD* | ANNUALIZED EXPENSE RATIO* | |||||||||||||
Emerging Markets Class Shares | ||||||||||||||||
Actual | $ | 1,000 | $ | 1,277.50 | $ | 7.21 | 1.27 | % | ||||||||
Hypothetical** | $ | 1,000 | $ | 1,018.60 | $ | 6.39 | 1.27 | % | ||||||||
Class Z | ||||||||||||||||
Actual | $ | 1,000 | $ | 1,279.20 | $ | 5.80 | 1.02 | % | ||||||||
Hypothetical** | $ | 1,000 | $ | 1,019.85 | $ | 5.14 | 1.02 | % | ||||||||
Short Duration Diversified Municipal Class Shares | ||||||||||||||||
Actual | $ | 1,000 | $ | 1,006.40 | $ | 2.00 | 0.40 | % | ||||||||
Hypothetical** | $ | 1,000 | $ | 1,022.94 | $ | 2.02 | 0.40 | % | ||||||||
California Municipal Class Shares | ||||||||||||||||
Actual | $ | 1,000 | $ | 1,014.30 | $ | 2.71 | 0.54 | % | ||||||||
Hypothetical** | $ | 1,000 | $ | 1,022.24 | $ | 2.72 | 0.54 | % | ||||||||
Diversified Municipal Class Shares | ||||||||||||||||
Actual | $ | 1,000 | $ | 1,018.80 | $ | 2.37 | 0.47 | % | ||||||||
Hypothetical** | $ | 1,000 | $ | 1,022.59 | $ | 2.37 | 0.47 | % | ||||||||
New York Municipal Class Shares | ||||||||||||||||
Actual | $ | 1,000 | $ | 1,024.80 | $ | 2.68 | 0.53 | % | ||||||||
Hypothetical** | $ | 1,000 | $ | 1,022.29 | $ | 2.67 | 0.53 | % | ||||||||
Intermediate Duration Class Shares | ||||||||||||||||
Actual | $ | 1,000 | $ | 979.00 | $ | 2.76 | 0.56 | % | ||||||||
Hypothetical** | $ | 1,000 | $ | 1,022.14 | $ | 2.82 | 0.56 | % | ||||||||
Short Duration Plus Class Shares | ||||||||||||||||
Actual | $ | 1,000 | $ | 1,000.80 | $ | 2.34 | 0.47 | % | ||||||||
Hypothetical** | $ | 1,000 | $ | 1,022.59 | $ | 2.37 | 0.47 | % | ||||||||
| * | Expenses are equal to the classes’ annualized expense ratios, multiplied by the average account value over the period, multiplied by 182/365 (to reflect the one-half year period). |
| ** | Assumes 5% annual return before expenses. |
2021 Semi-Annual Report | 15 | |
Table of Contents
Portfolio Summary—March 31, 2021 (Unaudited)
| Emerging Markets Portfolio | ||||||
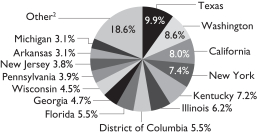
| Sector Breakdown1 | Country Breakdown1 | |||||
Information Technology | 24.7 | % | 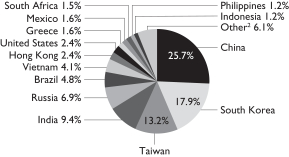 | |||
Financials | 24.4 | |||||
Consumer Discretionary | 16.3 | |||||
Industrials | 8.4 | |||||
Communication Services | 6.2 | |||||
Materials | 5.1 | |||||
Utilities | 3.8 | |||||
Health Care | 3.0 | |||||
Energy | 2.8 | |||||
Consumer Staples | 2.7 | |||||
Real Estate | 2.6 | |||||
| 1 | All data are as of March 31, 2021. The Portfolio’s country and sector breakdowns are expressed as a percentage of the Portfolio’s long-term investments and may vary over time. The Portfolio may also invest in other financial instruments, including derivative instruments, which provide investment exposure to a variety of asset classes (see “Schedule of Investments” section of the report for additional details). |
| 2 | “Other” represents 4.9% in MSCI EM Index countries, 0.6% in other emerging-market countries and 0.6% in Canada. |
| Please note: The sector classifications presented herein are based on the Global Industry Classification Standard (GICS) which was developed by Morgan Stanley Capital International and Standard & Poor’s. The components are divided into sector, industry group, and industry sub-indices as classified by the GICS for each of the market capitalization indices in the broad market. These sector classifications are broadly defined. The “Schedule of Investments” section of the report reflects more specific industry information and is consistent with the investment restrictions discussed in the Portfolio’s prospectus. |
| 16 | Sanford C. Bernstein Fund, Inc. | |
Table of Contents
Portfolio Summary—March 31, 2021 (Unaudited) (continued)
| Short Duration Diversified Municipal Portfolio | ||||
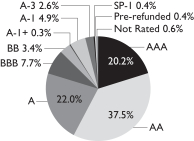
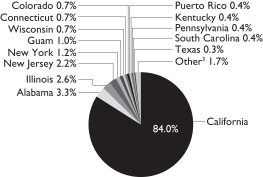
| Quality Rating Breakdown1 Highest of S&P, Moody’s and Fitch | State Breakdown1 | |||
 |
| |||
| California Municipal Portfolio | ||||
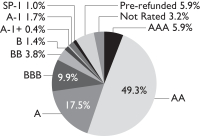
| Quality Rating Breakdown1 Highest of S&P, Moody’s and Fitch | State Breakdown1 | |||
 |
| |||
| Diversified Municipal Portfolio | ||||
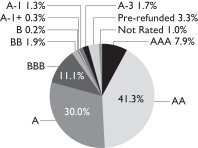
| Quality Rating Breakdown1 Highest of S&P, Moody’s and Fitch | State Breakdown1 | |||
 |
| |||
2021 Semi-Annual Report | 17 | |
Table of Contents
Portfolio Summary—March 31, 2021 (Unaudited) (continued)
| New York Municipal Portfolio | ||||
| Quality Rating Breakdown1 Highest of S&P, Moody’s and Fitch | State Breakdown1 | |||
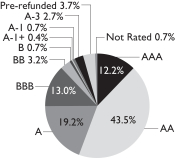 | 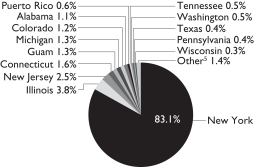 | |||
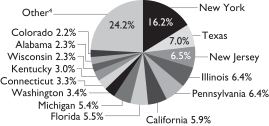
| 1 | All data are as of March 31, 2021. The Portfolio’s quality rating and state breakdowns are expressed as a percentage of the Portfolio’s total investments in municipal securities and may vary over time. The Portfolio also enters into derivative transactions, which may be used for hedging or investment purposes (see “Schedule of Investments” section of the report for additional details). The quality ratings are determined by using the S&P Global Ratings (“S&P”), Moody’s Investors Services, Inc. (“Moody’s”) and Fitch Ratings, Ltd. (“Fitch”). The Portfolio considers the credit ratings issued by S&P, Moody’s and Fitch and uses the highest rating issued by the agencies. These ratings are a measure of the quality and safety of a bond or portfolio, based on the issuer’s financial condition. AAA is the highest (best) and D is the lowest (worst). If applicable, the Pre-refunded category includes bonds which are secured by U.S. Government Securities and therefore are deemed high-quality investment grade by the Adviser. If applicable, Not Applicable (N/A) includes non-creditworthy investments such as, equities, currency contracts, futures and options. If applicable, the Not Rated category includes bonds that are not rated by a nationally recognized statistical rating organization. The Adviser evaluates the creditworthiness of non-rated securities based on a number of factors including, but not limited to, cash flows, enterprise value and economic environment. |
| 2 | “Other” represents less than 2.4% in 18 different states and Guam. |
| 3 | “Other” represents less than 0.3% in 12 different states and American Samoa. |
| 4 | “Other” represents less than 2.1% in 34 different states, American Samoa, District of Columbia, Guam and Puerto Rico. |
| 5 | “Other” represents less than 0.3% in 11 different states and American Samoa. |
| 18 | Sanford C. Bernstein Fund, Inc. | |
Table of Contents
Portfolio Summary—March 31, 2021 (Unaudited) (continued)
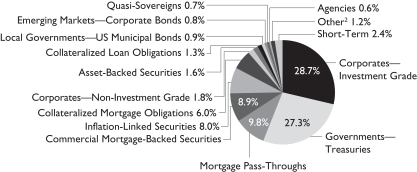
| Intermediate Duration Portfolio | ||||
| Security Type Breakdown1 | ||||
 | ||||
| Short Duration Plus Portfolio | ||||
| Security Type Breakdown1 | ||||
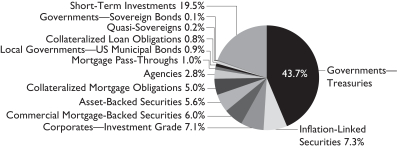 | ||||
| 1 | All data are as of March 31, 2021. The Portfolio’s security type breakdown is expressed as a percentage of total investments and may vary over time. The Portfolio also enters into derivative transactions, which may be used for hedging or investment purposes (see “Schedule of Investments” section of the report for additional details). |
| 2 | “Other” represents less than 0.5% in Common Stocks, Emerging Markets—Sovereigns and Governments—Sovereign Bonds |
2021 Semi-Annual Report | 19 | |
Table of Contents
Statement of Assets and Liabilities—March 31, 2021 (Unaudited)
| EMERGING MARKETS PORTFOLIO | SHORT DURATION DIVERSIFIED MUNICIPAL PORTFOLIO | CALIFORNIA MUNICIPAL PORTFOLIO | ||||||||||
| ASSETS |
| |||||||||||
Investments in securities at value |
| |||||||||||
Unaffiliated issuers | $ | 1,481,876,950 | $ | 237,126,849 | $ | 1,414,609,003 | ||||||
Affiliated issuers | 9,170,518 | 8,715,292 | 0 | |||||||||
Foreign currencies, at value (a) | 2,428,907 | 0 | 0 | |||||||||
Cash | 0 | 0 | 3,808,908 | |||||||||
Cash collateral due from broker | 20,117 | 136,417 | 4,591,190 | |||||||||
Due from custodian | 0 | 0 | 282 | |||||||||
Receivables: |
| |||||||||||
Dividends and interest | 4,419,272 | 2,945,469 | 16,987,008 | |||||||||
Affiliated dividends | 164 | 40 | 0 | |||||||||
Foreign withholding tax reclaims | 41,628 | 0 | 0 | |||||||||
Investment securities sold and foreign currency transactions | 3,369,642 | 520,000 | 16,941,535 | |||||||||
Capital shares sold | 394,383 | 491,672 | 3,385,209 | |||||||||
Variation margin on centrally cleared swaps | 0 | 2,906 | 42,577 | |||||||||
Unrealized appreciation of forward currency exchange contracts | 3,756,279 | 0 | 0 | |||||||||
Unrealized appreciation of interest rate swaps | 0 | 3,006 | 64,229 | |||||||||
|
|
|
|
|
| |||||||
Total assets | 1,505,477,860 | 249,941,651 | 1,460,429,941 | |||||||||
|
|
|
|
|
| |||||||
| LIABILITIES | ||||||||||||
Cash collateral due to broker | 2,740,000 | 0 | 0 | |||||||||
Payables: |
| |||||||||||
Dividends to shareholders | 0 | 57,935 | 649,659 | |||||||||
Investment securities purchased and foreign currency transactions | 3,611,611 | 8,976,921 | 34,683,791 | |||||||||
Capital shares redeemed | 549,188 | 654,613 | 1,644,114 | |||||||||
Management fee | 1,214,483 | 39,529 | 497,938 | |||||||||
Shareholder servicing fee | 272,062 | 19,880 | 108,046 | |||||||||
Distribution fee | 0 | 0 | 23,161 | |||||||||
Transfer Agent fee | 18,485 | 1,330 | 3,155 | |||||||||
Accrued expenses | 560,627 | 37,144 | 118,840 | |||||||||
Unrealized depreciation of forward currency exchange contracts | 2,662,042 | 0 | 0 | |||||||||
Market value on credit default swaps (b) | 0 | 0 | 1,274,193 | |||||||||
|
|
|
|
|
| |||||||
Total liabilities | 11,628,498 | 9,787,352 | 39,002,897 | |||||||||
|
|
|
|
|
| |||||||
NET ASSETS | $ | 1,493,849,362 | $ | 240,154,299 | $ | 1,421,427,044 | ||||||
|
|
|
|
|
| |||||||
Cost of investments | ||||||||||||
Unaffiliated issuers | $ | 1,153,676,444 | $ | 234,322,820 | $ | 1,360,051,763 | ||||||
Affiliated issuers | 9,170,518 | 8,715,292 | 0 | |||||||||
| NET ASSETS CONSIST OF: | ||||||||||||
Capital stock, at par | $ | 43,791 | $ | 18,790 | $ | 97,360 | ||||||
Additional paid-in capital | 1,126,348,044 | 238,569,578 | 1,372,906,749 | |||||||||
Distributable earnings (c) | 367,457,527 | 1,565,931 | 48,422,935 | |||||||||
|
|
|
|
|
| |||||||
| $ | 1,493,849,362 | $ | 240,154,299 | $ | 1,421,427,044 | |||||||
|
|
|
|
|
| |||||||
(a) Cost: $2,433,556, $0 and $0, respectively. (Note 1)
(b) Net premiums received of $0, $0 and $495,248, respectively.
(c) Net of accrued foreign capital gains taxes of $370,027, $0 and $0, respectively.
See Notes to Financial Statements. The Schedules of Investments, an integral part of the financial statements for each Portfolio, are included as inserts to this Report.
| 20 | Sanford C. Bernstein Fund, Inc. | |
Table of Contents
| EMERGING MARKETS PORTFOLIO | SHORT DURATION DIVERSIFIED MUNICIPAL PORTFOLIO | CALIFORNIA MUNICIPAL PORTFOLIO | ||||||||||
| CALCULATION OF MAXIMUM OFFERING PRICE | ||||||||||||
Emerging Markets Class/Short Duration Diversified Municipal Class/Municipal Class Shares | ||||||||||||
Net Assets | $ | 1,269,983,039 | $ | 240,154,299 | $ | 1,263,369,364 | ||||||
Shares of capital stock outstanding | 37,233,889 | 18,790,086 | 86,534,507 | |||||||||
|
|
|
|
|
| |||||||
Net asset value, offering and redemption price per share | $ | 34.11 | $ | 12.78 | $ | 14.60 | ||||||
|
|
|
|
|
| |||||||
Class A Shares | ||||||||||||
Net Assets | $ | 85,699,485 | ||||||||||
Shares of capital stock outstanding | 5,869,519 | |||||||||||
|
| |||||||||||
Net asset value and redemption price per share | $ | 14.60 | ||||||||||
Sales charge—3.00% of public offering price | 0.45 | |||||||||||
|
| |||||||||||
Maximum offering price | $ | 15.05 | ||||||||||
|
| |||||||||||
Class C Shares | ||||||||||||
Net Assets | $ | 6,052,308 | ||||||||||
Shares of capital stock outstanding | 414,599 | |||||||||||
|
| |||||||||||
Net asset value and offering price per share | $ | 14.60 | ||||||||||
|
| |||||||||||
Advisor Class Shares | ||||||||||||
Net Assets | $ | 66,305,887 | ||||||||||
Shares of capital stock outstanding | 4,541,589 | |||||||||||
|
| |||||||||||
Net asset value and offering price per share | $ | 14.60 | ||||||||||
|
| |||||||||||
Class Z Shares | ||||||||||||
Net Assets | $ | 223,866,323 | ||||||||||
Shares of capital stock outstanding | 6,557,382 | |||||||||||
|
| |||||||||||
Net asset value and offering price per share | $ | 34.14 | ||||||||||
|
| |||||||||||
See Notes to Financial Statements.
2021 Semi-Annual Report | 21 | |
Table of Contents
Statement of Assets and Liabilities—March 31, 2021 (Unaudited) (continued)
| DIVERSIFIED MUNICIPAL PORTFOLIO | NEW YORK MUNICIPAL PORTFOLIO | INTERMEDIATE DURATION PORTFOLIO | ||||||||||
| ASSETS |
| |||||||||||
Unaffiliated issuers | $ | 6,324,849,577 | $ | 1,772,439,447 | $ | 3,864,013,036 | ||||||
Foreign currencies, at value (a) | 0 | 0 | 731,391 | |||||||||
Cash | 142,781,653 | 41,022,720 | 39,384,919 | |||||||||
Cash collateral due from broker | 11,872,867 | 5,036,513 | 6,207,264 | |||||||||
Due from custodian | 323 | 909 | 654 | |||||||||
Receivables: |
| |||||||||||
Interest | 70,109,395 | 20,935,346 | 18,958,877 | |||||||||
Investment securities sold and foreign currency transactions | 38,286,099 | 695,000 | 195,482,928 | |||||||||
Capital shares sold | 6,783,760 | 2,197,630 | 2,730,620 | |||||||||
Variation margin on futures | 0 | 0 | 11,968,956 | |||||||||
Variation margin on centrally cleared swaps | 152,777 | 29,957 | 342,277 | |||||||||
Market value on credit default swaps (b) | 0 | 0 | 9,328,804 | |||||||||
Unrealized appreciation of forward currency exchange contracts | 0 | 0 | 7,339,067 | |||||||||
Unrealized appreciation of interest rate swaps | 296,193 | 87,987 | 0 | |||||||||
|
|
|
|
|
| |||||||
Total assets | 6,595,132,644 | 1,842,445,509 | 4,156,488,793 | |||||||||
|
|
|
|
|
| |||||||
| LIABILITIES |
| |||||||||||
Cash collateral due to broker | 0 | 0 | 6,909,000 | |||||||||
Payables: |
| |||||||||||
Dividends to shareholders | 3,405,226 | 919,313 | 2,448,726 | |||||||||
Investment securities purchased | 74,178,174 | 22,415,152 | 318,112,179 | |||||||||
Capital shares redeemed | 5,810,902 | 2,535,783 | 2,568,472 | |||||||||
Management fee | 1,898,174 | 622,665 | 1,395,478 | |||||||||
Shareholder servicing fee | 446,153 | 138,371 | 322,405 | |||||||||
Distribution fee | 95,924 | 39,018 | 379 | |||||||||
Transfer Agent fee | 17,703 | 4,078 | 4,659 | |||||||||
Accrued expenses | 330,113 | 132,014 | 245,543 | |||||||||
Market value on credit default swaps (c) | 5,327,097 | 1,779,292 | 14,021,498 | |||||||||
Unrealized depreciation of forward currency exchange contracts | 0 | 0 | 7,440,310 | |||||||||
|
|
|
|
|
| |||||||
Total liabilities | 91,509,466 | 28,585,686 | 353,468,649 | |||||||||
|
|
|
|
|
| |||||||
NET ASSETS | $ | 6,503,623,178 | $ | 1,813,859,823 | $ | 3,803,020,144 | ||||||
|
|
|
|
|
| |||||||
Cost of investments | $ | 6,020,648,223 | $ | 1,698,876,962 | $ | 3,789,114,999 | ||||||
|
|
|
|
|
| |||||||
| NET ASSETS CONSIST OF: |
| |||||||||||
Capital stock, at par | $ | 439,556 | $ | 127,303 | $ | 284,828 | ||||||
Additional paid-in capital | 6,206,312,207 | 1,753,868,582 | 3,750,841,346 | |||||||||
Distributable earnings | 296,871,415 | 59,863,938 | 51,893,970 | |||||||||
|
|
|
|
|
| |||||||
| $ | 6,503,623,178 | $ | 1,813,859,823 | $ | 3,803,020,144 | |||||||
|
|
|
|
|
| |||||||
(a) Cost: $0, $0 and $739,627, respectively. (Note 1)
(b) Net premiums paid of $0, $0 and $13,666,512, respectively.
(c) Net premiums received of $2,040,792, $681,664 and $5,139,861, respectively.
See Notes to Financial Statements. The Schedules of Investments, an integral part of the financial statements for each Portfolio, are included as inserts to this Report.
| 22 | Sanford C. Bernstein Fund, Inc. | |
Table of Contents
| DIVERSIFIED MUNICIPAL PORTFOLIO | NEW YORK MUNICIPAL PORTFOLIO | INTERMEDIATE DURATION PORTFOLIO | ||||||||||
| CALCULATION OF MAXIMUM OFFERING PRICE |
| |||||||||||
Municipal Class/Intermediate Duration Class Shares |
| |||||||||||
Net Assets | $ | 5,263,208,494 | $ | 1,620,075,743 | $ | 3,801,220,282 | ||||||
Shares of capital stock outstanding | 355,737,408 | 113,697,845 | 284,693,158 | |||||||||
|
|
|
|
|
| |||||||
Net asset value, offering and redemption price per share | $ | 14.80 | $ | 14.25 | $ | 13.35 | ||||||
|
|
|
|
|
| |||||||
Class A Shares |
| |||||||||||
Net Assets | $ | 322,537,723 | $ | 115,928,376 | $ | 1,778,504 | ||||||
Shares of capital stock outstanding | 21,784,342 | 8,138,710 | 133,038 | |||||||||
|
|
|
|
|
| |||||||
Net asset value and redemption price per share | $ | 14.81 | $ | 14.24 | $ | 13.37 | ||||||
Sales charge—3.00% for Diversified Municipal Portfolio and New York Municipal Portfolio, 4.25% for Intermediate Duration Portfolio of public offering price | 0.46 | 0.44 | 0.59 | |||||||||
|
|
|
|
|
| |||||||
Maximum offering price | $ | 15.27 | $ | 14.68 | $ | 13.96 | ||||||
|
|
|
|
|
| |||||||
Class C Shares |
| |||||||||||
Net Assets | $ | 31,578,133 | $ | 16,924,724 | ||||||||
Shares of capital stock outstanding | 2,133,664 | 1,188,033 | ||||||||||
|
|
|
| |||||||||
Net asset value and offering price per share | $ | 14.80 | $ | 14.25 | ||||||||
|
|
|
| |||||||||
Advisor Class Shares |
| |||||||||||
Net Assets | $ | 422,652,457 | $ | 60,930,980 | $ | 11,338 | ||||||
Shares of capital stock outstanding | 28,586,087 | 4,278,589 | 848.82 | |||||||||
|
|
|
|
|
| |||||||
Net asset value and offering price per share | $ | 14.79 | $ | 14.24 | $ | 13.36 | ||||||
|
|
|
|
|
| |||||||
Class Z Shares |
| |||||||||||
Net Assets | $ | 463,646,371 | $ | 10,020 | ||||||||
Shares of capital stock outstanding | 31,314,104 | 750 | ||||||||||
|
|
|
| |||||||||
Net asset value and offering price per share | $ | 14.81 | $ | 13.36 | ||||||||
|
|
|
| |||||||||
See Notes to Financial Statements.
2021 Semi-Annual Report | 23 | |
Table of Contents
Statement of Assets and Liabilities—March 31, 2021 (Unaudited) (continued)
| SHORT DURATION PLUS PORTFOLIO | ||||
| ASSETS |
| |||
Unaffiliated issuers | $ | 277,368,879 | ||
Cash | 12,940,919 | |||
Cash collateral due from broker | 568,867 | |||
Receivables: |
| |||
Interest | 740,466 | |||
Investment securities sold | 115 | |||
Capital shares sold | 457,857 | |||
Variation margin on centrally cleared swaps | 2,165 | |||
Market value on credit default swaps (a) | 573,152 | |||
|
| |||
Total assets | 292,652,420 | |||
|
| |||
| LIABILITIES |
| |||
Cash collateral due to broker | 338,000 | |||
Payables: |
| |||
Dividends to shareholders | 75,848 | |||
Investment securities purchased | 11,730,883 | |||
Capital shares redeemed | 156,899 | |||
Management fee | 59,789 | |||
Shareholder servicing fee | 21,474 | |||
Distribution fee | 5,422 | |||
Variation margin on futures | 4,916 | |||
Transfer Agent fee | 2,923 | |||
Accrued expenses | 89,646 | |||
Market value on credit default swaps (b) | 719,363 | |||
|
| |||
Total liabilities | 13,205,163 | |||
|
| |||
NET ASSETS | $ | 279,447,257 | ||
|
| |||
Cost of investments | $ | 276,364,067 | ||
|
| |||
| NET ASSETS CONSIST OF: |
| |||
Capital stock, at par | $ | 23,845 | ||
Additional paid-in capital | 289,675,651 | |||
Accumulated loss | (10,252,239 | ) | ||
|
| |||
| $ | 279,447,257 | |||
|
| |||
(a) Net premiums paid of $851,081.
(b) Net premiums received of $245,131.
See Notes to Financial Statements. The Schedules of Investments, an integral part of the financial statements for each Portfolio, are included as inserts to this Report.
| 24 | Sanford C. Bernstein Fund, Inc. | |
Table of Contents
| SHORT DURATION PLUS PORTFOLIO | ||||
| CALCULATION OF MAXIMUM OFFERING PRICE |
| |||
Short Duration Plus Class Shares |
| |||
Net Assets | $ | 260,272,736 | ||
Shares of capital stock outstanding | 22,209,581 | |||
|
| |||
Net asset value, offering and redemption price per share | $ | 11.72 | ||
|
| |||
Class A Shares |
| |||
Net Assets | $ | 16,992,036 | ||
Shares of capital stock outstanding | 1,448,972 | |||
|
| |||
Net asset value and redemption price per share | $ | 11.73 | ||
Sales charge—4.25% of public offering price | 0.52 | |||
|
| |||
Maximum offering price | $ | 12.25 | ||
|
| |||
Class C Shares |
| |||
Net Assets | $ | 2,182,485 | ||
Shares of capital stock outstanding | 186,505 | |||
|
| |||
Net asset value and offering price per share | $ | 11.70 | ||
|
| |||
See Notes to Financial Statements.
2021 Semi-Annual Report | 25 | |
Table of Contents
Statement of Operations—for the six months ended March 31, 2021 (Unaudited)
| EMERGING MARKETS PORTFOLIO | SHORT DURATION DIVERSIFIED MUNICIPAL PORTFOLIO | CALIFORNIA MUNICIPAL PORTFOLIO | ||||||||||
| INVESTMENT INCOME | ||||||||||||
Income: | ||||||||||||
Interest | $ | 0 | $ | 1,478,949 | $ | 16,185,621 | ||||||
Dividends |
| |||||||||||
Unaffiliated issuers (a) | 9,678,211 | 0 | 0 | |||||||||
Affiliated issuers | 2,671 | 876 | 0 | |||||||||
|
|
|
|
|
| |||||||
Total income | 9,680,882 | 1,479,825 | 16,185,621 | |||||||||
|
|
|
|
|
| |||||||
Expenses: | ||||||||||||
Management fee (see Note 2A) | 6,809,349 | 327,449 | 2,887,859 | |||||||||
Shareholder servicing fee (see Note 2B) | 1,524,839 | 109,150 | 625,971 | |||||||||
Custody and accounting fees | 272,445 | 45,562 | 103,110 | |||||||||
Transfer Agent fee—Non-Retail Class | 118,946 | 9,760 | 13,583 | |||||||||
Transfer Agent fee—Class A | 0 | 0 | 11,646 | |||||||||
Transfer Agent fee—Class C | 0 | 0 | 887 | |||||||||
Transfer Agent fee—Advisor Class | 0 | 0 | 8,808 | |||||||||
Transfer Agent fee—Class Z | 22,304 | 0 | 0 | |||||||||
Distribution fees—Class A | 0 | 0 | 105,970 | |||||||||
Distribution fees—Class C | 0 | 0 | 31,732 | |||||||||
Directors’ fees and expenses | 28,095 | 4,466 | 29,191 | |||||||||
Auditing and tax fees | 21,884 | 3,028 | 22,926 | |||||||||
Registration fees | 16,185 | 11,224 | 12,180 | |||||||||
Legal fees | 15,383 | 3,143 | 15,654 | |||||||||
Printing fees | 23,310 | 1,665 | 12,382 | |||||||||
Miscellaneous | 25,309 | 11,093 | 32,397 | |||||||||
|
|
|
|
|
| |||||||
Total expenses | 8,878,049 | 526,540 | 3,914,296 | |||||||||
Less: expenses waived and reimbursed by the Adviser (see Note 2A, 2B and 2E) | (8,774 | ) | (88,150 | ) | 0 | |||||||
|
|
|
|
|
| |||||||
Net expenses | 8,869,275 | 438,390 | 3,914,296 | |||||||||
|
|
|
|
|
| |||||||
Net investment income | 811,607 | 1,041,435 | 12,271,325 | |||||||||
|
|
|
|
|
| |||||||
| REALIZED AND UNREALIZED GAIN (LOSS) ON INVESTMENT AND FOREIGN CURRENCY TRANSACTIONS | ||||||||||||
Net realized gain (loss) on: | ||||||||||||
Investment transactions (b) | 99,211,176 | (13,766 | ) | 7,271,598 | ||||||||
Forward currency exchange contracts | 5,492,689 | 0 | 0 | |||||||||
Futures | 0 | 0 | 0 | |||||||||
Swaps | 0 | 63,033 | 217,871 | |||||||||
Swaptions written | 0 | 0 | 0 | |||||||||
Foreign currency transactions | 1,096,728 | 0 | 0 | |||||||||
|
|
|
|
|
| |||||||
Net realized gain (loss) on investment and foreign currency transactions | 105,800,593 | 49,267 | 7,489,469 | |||||||||
|
|
|
|
|
| |||||||
Net change in unrealized appreciation/depreciation of: | ||||||||||||
Investments (c) | 232,975,368 | 115,765 | (4,699,241 | ) | ||||||||
Forward currency exchange contracts | (756,090 | ) | 0 | 0 | ||||||||
Futures | 0 | 0 | 0 | |||||||||
Swaps | 0 | 116,304 | 4,424,977 | |||||||||
Foreign currency denominated assets and liabilities | (430,148 | ) | 0 | 0 | ||||||||
|
|
|
|
|
| |||||||
Net change in unrealized appreciation/depreciation of investments and foreign currency denominated assets and liabilities | 231,789,130 | 232,069 | (274,264 | ) | ||||||||
|
|
|
|
|
| |||||||
Net realized and unrealized gain (loss) on investment and foreign currency transactions | 337,589,723 | 281,336 | 7,215,205 | |||||||||
|
|
|
|
|
| |||||||
Net increase (decrease) in net assets resulting from operations | $ | 338,401,330 | $ | 1,322,771 | $ | 19,486,530 | ||||||
|
|
|
|
|
| |||||||
(a) Net of foreign withholding taxes of $2,161,006, $0, $0, $0, $0 and $0 for the Emerging Markets Portfolio, Short Duration Diversified Municipal Portfolio, California Municipal Portfolio, Diversified Municipal Portfolio, New York Municipal Portfolio and Intermediate Duration Portfolio, respectively.
(b) Net of foreign capital gains taxes of $9,742, $0, $0, $0, $0 and $(440,746) for the Emerging Markets Portfolio, Short Duration Diversified Municipal Portfolio, California Municipal Portfolio, Diversified Municipal Portfolio, New York Municipal Portfolio and Intermediate Duration Portfolio, respectively.
(c) Net of (increase) decrease in accrued foreign capital gains taxes of $311,397, $0, $0, $0, $0 and $(161,722) for the Emerging Markets Portfolio, Short Duration Diversified Municipal Portfolio, California Municipal Portfolio, Diversified Municipal Portfolio, New York Municipal Portfolio and Intermediate Duration Portfolio, respectively.
See Notes to Financial Statements.
| 26 | Sanford C. Bernstein Fund, Inc. | |
Table of Contents
| DIVERSIFIED MUNICIPAL PORTFOLIO | NEW YORK MUNICIPAL PORTFOLIO | INTERMEDIATE DURATION PORTFOLIO | ||||||||
| $ | 77,853,553 | $ | 22,333,570 | $ | 48,203,876 | |||||
| 0 | 0 | 85,554 | ||||||||
| 0 | 0 | 0 | ||||||||
|
|
|
|
|
| |||||
| 77,853,553 | 22,333,570 | 48,289,430 | ||||||||
|
|
|
|
|
| |||||
| 10,997,615 | 3,639,719 | 8,134,217 | ||||||||
| 2,573,864 | 807,089 | 1,877,167 | ||||||||
| 141,698 | 104,186 | 142,503 | ||||||||
| 57,827 | 18,594 | 92,476 | ||||||||
| 51,299 | 21,777 | 2,790 | ||||||||
| 5,762 | 3,503 | 0 | ||||||||
| 68,899 | 11,295 | 27 | ||||||||
| 48,536 | 0 | 1 | ||||||||
| 374,090 | 144,725 | 1,387 | ||||||||
| 164,494 | 90,579 | 0 | ||||||||
| 131,825 | 37,501 | 78,117 | ||||||||
| 93,880 | 28,767 | 56,792 | ||||||||
| 83,101 | 25,254 | 35,114 | ||||||||
| 67,519 | 19,898 | 41,336 | ||||||||
| 62,471 | 18,513 | 23,332 | ||||||||
| 77,118 | 32,319 | 53,407 | ||||||||
|
|
|
|
|
| |||||
| 14,999,998 | 5,003,719 | 10,538,666 | ||||||||
| 0 | 0 | (1,577 | ) | |||||||
|
|
|
|
|
| |||||
| 14,999,998 | 5,003,719 | 10,537,089 | ||||||||
|
|
|
|
|
| |||||
| 62,853,555 | 17,329,851 | 37,752,341 | ||||||||
|
|
|
|
|
| |||||
| |
|
| ||||||||
| 13,917,782 | 127,675 | 25,863,763 | ||||||||
| 0 | 0 | (358,257 | ) | |||||||
| 0 | 0 | (16,771,392 | ) | |||||||
| 5,955,926 | 2,345,021 | (19,629,388 | ) | |||||||
| 0 | 0 | 533,520 | ||||||||
| 0 | 0 | (3,370,420 | ) | |||||||
|
|
|
|
|
| |||||
| 19,873,708 | 2,472,696 | (13,732,174 | ) | |||||||
|
|
|
|
|
| |||||
| 17,213,269 | 21,985,341 | (108,637,737 | ) | |||||||
| 0 | 0 | (2,042,928 | ) | |||||||
| 0 | 0 | (1,606,249 | ) | |||||||
| 14,083,798 | 2,616,179 | 7,598,559 | ||||||||
| 0 | 0 | (109,027 | ) | |||||||
|
|
|
|
|
| |||||
| | 31,297,067 | 24,601,520 | (104,797,382 | ) | ||||||
|
|
|
|
|
| |||||
| | 51,170,775 | 27,074,216 | (118,529,556 | ) | ||||||
|
|
|
|
|
| |||||
| $ | 114,024,330 | $ | 44,404,067 | $ | (80,777,215 | ) | ||||
|
|
|
|
|
| |||||
| 2021 Semi-Annual Report | 27 | |||
Table of Contents
Statement of Operations—for the six months ended March 31, 2021 (Unaudited) (continued)
| SHORT DURATION PLUS PORTFOLIO | ||||
| INVESTMENT INCOME | ||||
Income: | ||||
Interest | $ | 2,050,253 | ||
|
| |||
Total income | 2,050,253 | |||
|
| |||
Expenses: | ||||
Management fee (see Note 2A) | 450,344 | |||
Shareholder servicing fee (see Note 2B) | 118,421 | |||
Custody and accounting fees | 55,138 | |||
Transfer Agent fee—Non-Retail Class | 10,015 | |||
Transfer Agent fee—Class A | 16,753 | |||
Transfer Agent fee—Class C | 2,495 | |||
Distribution fees—Class A | 22,322 | |||
Distribution fees—Class C | 13,202 | |||
Registration fees | 29,952 | |||
Printing fees | 19,612 | |||
Auditing and tax fees | 6,810 | |||
Directors’ fees and expenses | 5,229 | |||
Legal fees | 2,947 | |||
Miscellaneous | 13,645 | |||
|
| |||
Total expenses | 766,885 | |||
Less: expenses waived and reimbursed by the Adviser (see Note 2B and 2D) | (98,636 | ) | ||
|
| |||
Net expenses | 668,249 | |||
|
| |||
Net investment income | 1,382,004 | |||
|
| |||
| REALIZED AND UNREALIZED GAIN (LOSS) ON INVESTMENT AND FOREIGN CURRENCY TRANSACTIONS | ||||
Net realized gain (loss) on: | ||||
Investment transactions | 48,717 | |||
Futures | (292,358 | ) | ||
Swaps | (860,660 | ) | ||
|
| |||
Net realized loss on investment and foreign currency transactions | (1,104,301 | ) | ||
|
| |||
Net change in unrealized appreciation/depreciation of: | ||||
Investments | (627,387 | ) | ||
Futures | (72,473 | ) | ||
Swaps | 463,276 | |||
|
| |||
Net change in unrealized appreciation/depreciation of investments | (236,584 | ) | ||
|
| |||
Net realized and unrealized loss on investment and foreign currency transactions | (1,340,885 | ) | ||
|
| |||
Net increase in net assets resulting from operations | $ | 41,119 | ||
|
| |||
See Notes to Financial Statements.
| 28 | Sanford C. Bernstein Fund, Inc. | |
Table of Contents
This page intentionally left blank.
| 2021 Semi-Annual Report | 29 | |||
Table of Contents
Statement of Changes in Net Assets
| EMERGING MARKETS PORTFOLIO | SHORT DURATION DIVERSIFIED MUNICIPAL PORTFOLIO | |||||||||||||||||||
| SIX MONTHS ENDED 3/31/21 (UNAUDITED) | YEAR ENDED 9/30/20 | SIX MONTHS ENDED 3/31/21 (UNAUDITED) | YEAR ENDED 9/30/20 | |||||||||||||||||
| INCREASE (DECREASE) IN NET ASSETS FROM | ||||||||||||||||||||
Operations: | ||||||||||||||||||||
Net investment income | $ | 811,607 | $ | 15,909,386 | $ | 1,041,435 | $ | 2,319,682 | ||||||||||||
Net realized gain (loss) on investment and foreign currency transactions | 105,800,593 | (6,755,011 | ) | 49,267 | (34,936 | ) | ||||||||||||||
Net change in unrealized appreciation/depreciation of investments and foreign currency denominated assets and liabilities | 231,789,130 | 59,747,901 | 232,069 | 1,887,578 | ||||||||||||||||
Contributions from affiliates (see Note 2A) | 0 | 14,178 | 0 | 0 | ||||||||||||||||
|
|
|
|
|
|
|
| |||||||||||||
Net increase in net assets resulting from operations | 338,401,330 | 68,916,454 | 1,322,771 | 4,172,324 | ||||||||||||||||
|
|
|
|
|
|
|
| |||||||||||||
Distributions to shareholders (a) | (25,337,408 | ) | (22,100,317 | ) | (1,042,323 | ) | (2,352,824 | ) | ||||||||||||
|
|
|
|
|
|
|
| |||||||||||||
Capital-share transactions: | ||||||||||||||||||||
Net proceeds from sales of shares | 46,151,351 | 104,194,109 | 87,554,176 | 130,099,909 | ||||||||||||||||
Net proceeds from sales of shares issued to shareholders on reinvestment of dividends and distributions | 21,480,145 | 18,642,108 | 911,642 | 1,945,765 | ||||||||||||||||
|
|
|
|
|
|
|
| |||||||||||||
Total proceeds from shares sold | 67,631,496 | 122,836,217 | 88,465,818 | 132,045,674 | ||||||||||||||||
Cost of shares redeemed | (125,005,442 | ) | (228,806,667 | ) | (58,737,229 | ) | (114,810,808 | ) | ||||||||||||
|
|
|
|
|
|
|
| |||||||||||||
Net increase (decrease) in net assets from capital-share transactions | (57,373,946 | ) | (105,970,450 | ) | 29,728,589 | 17,234,866 | ||||||||||||||
|
|
|
|
|
|
|
| |||||||||||||
Net increase (decrease) in net assets | 255,689,976 | (59,154,313 | ) | 30,009,037 | 19,054,366 | |||||||||||||||
| NET ASSETS: | ||||||||||||||||||||
Beginning of period | 1,238,159,386 | 1,297,313,699 | 210,145,262 | 191,090,896 | ||||||||||||||||
|
|
|
|
|
|
|
| |||||||||||||
End of period | $ | 1,493,849,362 | $ | 1,238,159,386 | $ | 240,154,299 | $ | 210,145,262 | ||||||||||||
|
|
|
|
|
|
|
| |||||||||||||
(a) See page 33 for share class information on dividend distributions for the Emerging Markets, Short Duration Diversified Municipal. California Municipal, Diversified Municipal and New York Municipal Portfolios.
See Notes to Financial Statements.
| 30 | Sanford C. Bernstein Fund, Inc. | |
Table of Contents
| CALIFORNIA MUNICIPAL PORTFOLIO | DIVERSIFIED MUNICIPAL PORTFOLIO | NEW YORK MUNICIPAL PORTFOLIO | ||||||||||||||||||||||||||||
| SIX MONTHS ENDED 3/31/21 (UNAUDITED) | YEAR ENDED 9/30/20 | SIX MONTHS ENDED 3/31/21 (UNAUDITED) | YEAR ENDED 9/30/20 | SIX MONTHS ENDED 3/31/21 (UNAUDITED) | YEAR ENDED 9/30/20 | |||||||||||||||||||||||||
| $ | 12,271,325 | $ | 26,697,204 | $ | 62,853,555 | $ | 140,149,649 | $ | 17,329,851 | $ | 38,753,190 | |||||||||||||||||||
| | 7,489,469 | (1,581,124 | ) | 19,873,708 | 5,863,220 | 2,472,696 | (1,746,235 | ) | ||||||||||||||||||||||
| (274,264 | ) | 9,493,129 | 31,297,067 | 34,936,728 | 24,601,520 | (18,005,271 | ) | ||||||||||||||||||||||
| 0 | 0 | 0 | 0 | 0 | 0 | |||||||||||||||||||||||||
|
|
|
|
|
|
|
|
|
|
|
| |||||||||||||||||||
| 19,486,530 | 34,609,209 | 114,024,330 | 180,949,597 | 44,404,067 | 19,001,684 | |||||||||||||||||||||||||
|
|
|
|
|
|
|
|
|
|
|
| |||||||||||||||||||
| (12,236,749 | ) | (26,836,346 | ) | (62,855,761 | ) | (140,167,504 | ) | (17,333,000 | ) | (39,278,365 | ) | |||||||||||||||||||
|
|
|
|
|
|
|
|
|
|
|
| |||||||||||||||||||
| 202,021,502 | 319,192,474 | 830,025,176 | 1,437,290,166 | 191,197,266 | 293,320,188 | |||||||||||||||||||||||||
| 9,391,131 | 20,636,412 | 48,217,191 | 107,026,785 | 13,390,518 | 30,166,953 | |||||||||||||||||||||||||
|
|
|
|
|
|
|
|
|
|
|
| |||||||||||||||||||
| 211,412,633 | 339,828,886 | 878,242,367 | 1,544,316,951 | 204,587,784 | 323,487,141 | |||||||||||||||||||||||||
| (190,025,968 | ) | (291,077,178 | ) | (654,347,729 | ) | (1,744,585,893 | ) | (205,916,011 | ) | (348,266,278 | ) | |||||||||||||||||||
|
|
|
|
|
|
|
|
|
|
|
| |||||||||||||||||||
| 21,386,665 | 48,751,708 | 223,894,638 | (200,268,942 | ) | (1,328,227 | ) | (24,779,137 | ) | ||||||||||||||||||||||
|
|
|
|
|
|
|
|
|
|
|
| |||||||||||||||||||
| 28,636,446 | 56,524,571 | 275,063,207 | (159,486,849 | ) | 25,742,840 | (45,055,818 | ) | |||||||||||||||||||||||
| 1,392,790,598 | 1,336,266,027 | 6,228,559,971 | 6,388,046,820 | 1,788,116,983 | 1,833,172,801 | |||||||||||||||||||||||||
|
|
|
|
|
|
|
|
|
|
|
| |||||||||||||||||||
| $ | 1,421,427,044 | $ | 1,392,790,598 | $ | 6,503,623,178 | $ | 6,228,559,971 | $ | 1,813,859,823 | $ | 1,788,116,983 | |||||||||||||||||||
|
|
|
|
|
|
|
|
|
|
|
| |||||||||||||||||||
| 2021 Semi-Annual Report | 31 | |||
Table of Contents
Statement of Changes in Net Assets (continued)
| INTERMEDIATE DURATION PORTFOLIO | SHORT DURATION PLUS PORTFOLIO | |||||||||||||||||||
| SIX MONTHS ENDED 3/31/21 (UNAUDITED) | YEAR ENDED 9/30/20 | SIX MONTHS ENDED 3/31/21 (UNAUDITED) | YEAR ENDED 9/30/20 | |||||||||||||||||
| INCREASE (DECREASE) IN NET ASSETS FROM |
| |||||||||||||||||||
Operations: |
| |||||||||||||||||||
Net investment income | $ | 37,752,341 | $ | 88,958,663 | $ | 1,382,004 | $ | 3,500,807 | ||||||||||||
Net realized gain (loss) on investment and foreign currency transactions | (13,732,174 | ) | 76,198,038 | (1,104,301 | ) | 2,534,354 | ||||||||||||||
Net change in unrealized appreciation/depreciation of investments and foreign currency denominated assets and liabilities and other assets and liabilities | (104,797,382 | ) | 50,018,884 | (236,584 | ) | (1,260,369 | ) | |||||||||||||
|
|
|
|
|
|
|
| |||||||||||||
Net increase (decrease) in net assets resulting from operations | (80,777,215 | ) | 215,175,585 | 41,119 | 4,774,792 | |||||||||||||||
|
|
|
|
|
|
|
| |||||||||||||
Distributions to shareholders (a) | (103,370,813 | ) | (95,999,272 | ) | (1,439,720 | ) | (3,827,152 | ) | ||||||||||||
|
|
|
|
|
|
|
| |||||||||||||
Capital-share transactions: |
| |||||||||||||||||||
Net proceeds from sales of shares | 457,178,512 | 631,482,445 | 71,823,767 | 105,816,630 | ||||||||||||||||
Net proceeds from sales of shares issued to shareholders on reinvestment of dividends and distributions | 94,016,372 | 73,167,333 | 1,245,371 | 3,179,041 | ||||||||||||||||
|
|
|
|
|
|
|
| |||||||||||||
Total proceeds from shares sold | 551,194,884 | 704,649,778 | 73,069,138 | 108,995,671 | ||||||||||||||||
Cost of shares redeemed | (261,677,296 | ) | (542,664,238 | ) | (38,117,837 | ) | (115,940,511 | ) | ||||||||||||
|
|
|
|
|
|
|
| |||||||||||||
Net increase (decrease) in net assets from capital-share transactions | 289,517,588 | 161,985,540 | 34,951,301 | (6,944,840 | ) | |||||||||||||||
|
|
|
|
|
|
|
| |||||||||||||
Net increase (decrease) in net assets | 105,369,560 | 281,161,853 | 33,552,700 | (5,997,200 | ) | |||||||||||||||
| NET ASSETS: |
| |||||||||||||||||||
Beginning of period | 3,697,650,584 | 3,416,488,731 | 245,894,557 | 251,891,757 | ||||||||||||||||
|
|
|
|
|
|
|
| |||||||||||||
End of period | $ | 3,803,020,144 | $ | 3,697,650,584 | $ | 279,447,257 | $ | 245,894,557 | ||||||||||||
|
|
|
|
|
|
|
| |||||||||||||
(a) See page 34 for share class information on dividend distributions for the Intermediate Duration and Short Duration Plus Portfolios.
See Notes to Financial Statements.
| 32 | Sanford C. Bernstein Fund, Inc. | |
Table of Contents
| EMERGING MARKETS PORTFOLIO | ||||||||
| SIX MONTHS ENDED 3/31/21 (UNAUDITED) | YEAR ENDED 9/30/20 | |||||||
Distributions to shareholders: | ||||||||
Emerging Markets Class | $ | (21,154,691 | ) | $ | (18,666,186 | ) | ||
Class Z | (4,182,717 | ) | (3,434,131 | ) | ||||
|
|
|
| |||||
| $ | (25,337,408 | ) | $ | (22,100,317 | ) | |||
|
|
|
| |||||
| CALIFORNIA MUNICIPAL PORTFOLIO | DIVERSIFIED MUNICIPAL PORTFOLIO | |||||||||||||||||||
| SIX MONTHS ENDED 3/31/21 (UNAUDITED) | YEAR ENDED 9/30/20 | SIX MONTHS ENDED 3/31/21 (UNAUDITED) | YEAR ENDED 9/30/20 | |||||||||||||||||
Distributions to shareholders: | ||||||||||||||||||||
Municipal Class | $ | (10,964,306 | ) | $ | (24,351,450 | ) | $ | (50,946,439 | ) | $ | (113,116,688 | ) | ||||||||
Class A | (664,588 | ) | (1,430,864 | ) | (2,657,308 | ) | (5,075,417 | ) | ||||||||||||
Class B | 0 | 0 | 0 | (7 | ) | |||||||||||||||
Class C | (25,937 | ) | (99,775 | ) | (170,378 | ) | (513,838 | ) | ||||||||||||
Advisor Class | (581,918 | ) | (954,257 | ) | (4,074,582 | ) | (7,634,340 | ) | ||||||||||||
Class Z | 0 | 0 | (5,007,054 | ) | (13,827,214 | ) | ||||||||||||||
|
|
|
|
|
|
|
| |||||||||||||
| $ | (12,236,749 | ) | $ | (26,836,346 | ) | $ | (62,855,761 | ) | $ | (140,167,504 | ) | |||||||||
|
|
|
|
|
|
|
| |||||||||||||
| NEW YORK MUNICIPAL PORTFOLIO | ||||||||
| SIX MONTHS ENDED 3/31/21 (UNAUDITED) | YEAR ENDED 9/30/20 | |||||||
Distributions to shareholders: | ||||||||
Municipal Class | $ | (15,636,410 | ) | $ | (35,160,186 | ) | ||
Class A | (1,007,686 | ) | (2,395,768 | ) | ||||
Class C | (90,115 | ) | (300,634 | ) | ||||
Advisor Class | (598,789 | ) | (1,421,777 | ) | ||||
|
|
|
| |||||
| $ | (17,333,000 | ) | $ | (39,278,365 | ) | |||
|
|
|
| |||||
See Notes to Financial Statements.
2021 Semi-Annual Report | 33 | |
Table of Contents
Statement of Changes in Net Assets (continued)
| INTERMEDIATE DURATION PORTFOLIO | ||||||||
| SIX MONTHS ENDED 3/31/21 (UNAUDITED) | YEAR ENDED 9/30/20 | |||||||
Distributions to shareholders: | ||||||||
Intermediate Duration Portfolio | $ | (103,348,008 | ) | $ | (95,996,514 | ) | ||
Class A | (22,267 | ) | (2,333 | ) | ||||
Advisor Class | (261 | ) | (170 | ) | ||||
Class Z | (277 | ) | (255 | ) | ||||
|
|
|
| |||||
| $ | (103,370,813 | ) | $ | (95,999,272 | ) | |||
|
|
|
| |||||
| SHORT DURATION PLUS PORTFOLIO | ||||||||
| SIX MONTHS ENDED 3/31/21 (UNAUDITED) | YEAR ENDED 9/30/20 | |||||||
Distributions to shareholders: | ||||||||
Short Duration Plus Class | $ | (1,381,309 | ) | $ | (3,612,806 | ) | ||
Class A | (53,059 | ) | (194,967 | ) | ||||
Class B | 0 | (6 | ) | |||||
Class C | (5,352 | ) | (19,373 | ) | ||||
|
|
|
| |||||
| $ | (1,439,720 | ) | $ | (3,827,152 | ) | |||
|
|
|
| |||||
See Notes to Financial Statements.
| 34 | Sanford C. Bernstein Fund, Inc. | |
Table of Contents
Selected per share data and ratios for a share of capital stock outstanding for each respective Portfolio for each of the periods presented:
EMERGING MARKETS PORTFOLIO EMERGING MARKETS CLASS | ||||||||||||||||||||||||
| SIX MONTHS ENDED 3/31/21 (UNAUDITED) | YEAR ENDED 9/30/20 | YEAR ENDED 9/30/19 | YEAR ENDED 9/30/18 | YEAR ENDED 9/30/17 | YEAR ENDED 9/30/16 | |||||||||||||||||||
Net asset value, beginning of period | $ | 27.17 | $ | 26.03 | $ | 28.39 | $ | 31.25 | $ | 26.21 | $ | 22.77 | ||||||||||||
|
|
|
|
|
|
|
|
|
|
|
| |||||||||||||
Income from investment operations: |
| |||||||||||||||||||||||
Investment income, | 0.01 | 0.32 | 0.51 | 0.28 | 0.19 | 0.15 | (c) | |||||||||||||||||
Net realized and unrealized gain (loss) on investment and foreign currency transactions | 7.49 | 1.26 | (0.95 | ) | (2.90 | ) | 5.00 | 3.86 | ||||||||||||||||
Contributions from affiliates | 0 | 0.00 | (d) | 0.00 | (d) | 0.00 | (d) | 0.00 | (d) | 0 | ||||||||||||||
|
|
|
|
|
|
|
|
|
|
|
| |||||||||||||
Total from investment operations | 7.50 | 1.58 | (0.44 | ) | (2.62 | ) | 5.19 | 4.01 | ||||||||||||||||
|
|
|
|
|
|
|
|
|
|
|
| |||||||||||||
Less dividends and distributions: |
| |||||||||||||||||||||||
Dividends from net investment income | (0.56 | ) | (0.44 | ) | (0.33 | ) | (0.17 | ) | (0.15 | ) | (0.16 | ) | ||||||||||||
Distributions from net realized gain on investment transactions | 0 | 0 | (1.59 | ) | (0.07 | ) | 0 | (0.41 | ) | |||||||||||||||
|
|
|
|
|
|
|
|
|
|
|
| |||||||||||||
Total dividends and distributions | (0.56 | ) | (0.44 | ) | (1.92 | ) | (0.24 | ) | (0.15 | ) | (0.57 | ) | ||||||||||||
|
|
|
|
|
|
|
|
|
|
|
| |||||||||||||
Net asset value, end of period | $34.11 | $27.17 | $26.03 | $28.39 | $31.25 | $26.21 | ||||||||||||||||||
|
|
|
|
|
|
|
|
|
|
|
| |||||||||||||
Total return (e)(f) | 27.75% | 6.04% | (0.91)% | (8.46)% | (g) | 19.96% | (g) | 18.04% | (c) | |||||||||||||||
| RATIOS/SUPPLEMENTAL DATA | ||||||||||||||||||||||||
Net assets, end of period (000 omitted) | $1,269,983 | $1,056,249 | $1,120,427 | $1,174,312 | $1,308,216 | $1,215,605 | ||||||||||||||||||
Average net assets (000 omitted) | $1,223,223 | $1,085,654 | $1,123,274 | $1,316,137 | $1,233,869 | $1,137,202 | ||||||||||||||||||
Ratio to average net assets of: | ||||||||||||||||||||||||
Expenses, net of waivers/reimbursements | 1.27% | (h) | 1.29% | 1.30% | 1.33% | 1.46% | 1.48% | |||||||||||||||||
Expenses, before waivers/reimbursements | 1.28% | (h) | 1.30% | 1.30% | 1.33% | 1.48% | 1.52% | |||||||||||||||||
Net investment income (b) | 0.08% | (h) | 1.22% | 1.96% | 0.86% | 0.69% | 0.63% | (c) | ||||||||||||||||
Portfolio turnover rate | 41% | 85% | 92% | 65% | 63% | 71% | ||||||||||||||||||
See Footnote Summary on page 43.
See Notes to Financial Statements.
2021 Semi-Annual Report | 35 | |
Table of Contents
Financial Highlights (continued)
Selected per share data and ratios for a share of capital stock outstanding for each respective Portfolio for each of the periods presented:
EMERGING MARKETS PORTFOLIO CLASS Z | ||||||||||||||||||||||||
| SIX MONTHS ENDED 3/31/21 (UNAUDITED) | YEAR ENDED 9/30/20 | YEAR ENDED 9/30/19 | YEAR ENDED 9/30/18 | YEAR ENDED 9/30/17 | 01/15/2016(i) TO 09/30/2016 | |||||||||||||||||||
Net asset value, beginning of period | $ | 27.22 | $ | 26.08 | $ | 28.43 | $ | 31.32 | $ | 26.27 | $ | 19.92 | ||||||||||||
|
|
|
|
|
|
|
|
|
|
|
| |||||||||||||
Income from investment operations: | ||||||||||||||||||||||||
Net investment | .05 | .39 | .57 | .37 | .26 | .27 | (c) | |||||||||||||||||
Net realized and unrealized gain (loss) on investment and foreign currency transactions | 7.50 | 1.26 | (.93 | ) | (2.92 | ) | 5.01 | 6.08 | ||||||||||||||||
Contributions from affiliates | 0 | 0.00 | (d) | 0.00 | (d) | 0.00 | (d) | 0.00 | (d) | 0.00 | (d) | |||||||||||||
|
|
|
|
|
|
|
|
|
|
|
| |||||||||||||
Total from investment operations | 7.55 | 1.65 | (.36 | ) | (2.55 | ) | 5.27 | 6.35 | ||||||||||||||||
|
|
|
|
|
|
|
|
|
|
|
| |||||||||||||
Less dividends and distributions: | ||||||||||||||||||||||||
Dividends from net investment income | (.63 | ) | (.51 | ) | (.40 | ) | (.27 | ) | (.22 | ) | 0 | |||||||||||||
Distributions from net realized gain on investment transactions | 0 | 0 | (1.59 | ) | (.07 | ) | 0 | 0 | ||||||||||||||||
|
|
|
|
|
|
|
|
|
|
|
| |||||||||||||
Total dividends and distributions | (.63 | ) | (.51 | ) | (1.99 | ) | (.34 | ) | (.22 | ) | 0 | |||||||||||||
|
|
|
|
|
|
|
|
|
|
|
| |||||||||||||
Net asset value, end of period | $34.14 | $27.22 | $26.08 | $28.43 | $31.32 | $26.27 | ||||||||||||||||||
|
|
|
|
|
|
|
|
|
|
|
| |||||||||||||
Total Return (e)(f) | 27.92% | 6.33% | (.66)% | (8.26)% | (g) | 20.28% | (g) | 31.88% | (c) | |||||||||||||||
| RATIOS/SUPPLEMENTAL DATA | ||||||||||||||||||||||||
Net assets, end of period (000 omitted) | $223,866 | $181,910 | $176,887 | $177,907 | $177,853 | $122,726 | ||||||||||||||||||
Average net assets (000 omitted) | $214,263 | $178,143 | $175,583 | $189,542 | $137,242 | $95,977 | ||||||||||||||||||
Ratio to average net assets of: | ||||||||||||||||||||||||
Expenses, net of waivers/reimbursements | 1.02% | (h) | 1.04% | 1.04% | 1.07% | 1.21% | 1.22% | (h) | ||||||||||||||||
Expenses, before waivers/reimbursements | 1.03% | (h) | 1.04% | 1.04% | 1.08% | 1.24% | 1.25% | (h) | ||||||||||||||||
Net investment income (b) | .33% | (h) | 1.50% | 2.21% | 1.16% | .94% | 1.62% | (c)(h) | ||||||||||||||||
Portfolio turnover rate | 41% | 85% | 92% | 65% | 63% | 71% | ||||||||||||||||||
See Footnote Summary on page 43.
See Notes to Financial Statements.
| 36 | Sanford C. Bernstein Fund, Inc. | |
Table of Contents
SHORT DURATION DIVERSIFIED MUNICIPAL PORTFOLIO SHORT DURATION DIVERSIFIED MUNICIPAL CLASS | ||||||||||||||||||||||||
| SIX MONTHS ENDED 3/31/21 (UNAUDITED) | YEAR ENDED 9/30/20 | YEAR ENDED 9/30/19 | YEAR ENDED 9/30/18 | YEAR ENDED 9/30/17 | YEAR ENDED 9/30/16 | |||||||||||||||||||
Net asset value, beginning of period | $ | 12.76 | $ | 12.63 | $ | 12.50 | $ | 12.60 | $ | 12.60 | $ | 12.60 | ||||||||||||
|
|
|
|
|
|
|
|
|
|
|
| |||||||||||||
Income from investment operations |
| |||||||||||||||||||||||
Investment income, net (a) | 0.06 | (b) | 0.14 | (b) | 0.17 | (b) | 0.12 | (b) | 0.06 | 0.06 | (b)(c) | |||||||||||||
Net realized and unrealized gain (loss) on investment transactions | 0.02 | 0.14 | 0.13 | (0.10 | ) | 0.01 | 0.01 | |||||||||||||||||
|
|
|
|
|
|
|
|
|
|
|
| |||||||||||||
Total from investment operations | 0.08 | 0.28 | 0.30 | 0.02 | 0.07 | 0.07 | ||||||||||||||||||
|
|
|
|
|
|
|
|
|
|
|
| |||||||||||||
Less: Dividends and Distributions |
| |||||||||||||||||||||||
Dividends from net investment income | (0.06 | ) | (0.15 | ) | (0.17 | ) | (0.12 | ) | (0.06 | ) | (0.06 | ) | ||||||||||||
Distributions from net realized gain on investment transactions | 0 | 0 | 0 | 0 | (0.01 | ) | (0.01 | ) | ||||||||||||||||
|
|
|
|
|
|
|
|
|
|
|
| |||||||||||||
Total dividends and distributions | (0.06 | ) | (0.15 | ) | (0.17 | ) | (0.12 | ) | (0.07 | ) | (0.07 | ) | ||||||||||||
|
|
|
|
|
|
|
|
|
|
|
| |||||||||||||
Net asset value, end of period | $12.78 | $12.76 | $12.63 | $12.50 | $12.60 | $12.60 | ||||||||||||||||||
|
|
|
|
|
|
|
|
|
|
|
| |||||||||||||
Total return (e) | 0.64% | 2.20% | 2.41% | 0.18% | 0.58% | 0.55% | (c) | |||||||||||||||||
| RATIOS/SUPPLEMENTAL DATA | ||||||||||||||||||||||||
Net assets, end of period (000 omitted) | $240,154 | $210,145 | $191,091 | $188,148 | $203,306 | $148,489 | ||||||||||||||||||
Average net assets (000 omitted) | $218,899 | $205,125 | $186,888 | $199,804 | $169,137 | $164,757 | ||||||||||||||||||
Ratio to average net assets of: | ||||||||||||||||||||||||
Expenses, net of waivers/reimbursements (j) | 0.40% | (h) | 0.48% | 0.50% | 0.52% | 0.61% | 0.65% | |||||||||||||||||
Expenses, before waivers/reimbursements (j) | 0.48% | (h) | 0.49% | 0.50% | 0.52% | 0.61% | 0.65% | |||||||||||||||||
Net investment income | 0.95% | (b)(h) | 1.13% | (b) | 1.34% | (b) | 0.97% | (b) | 0.52% | 0.48% | (b)(c) | |||||||||||||
Portfolio turnover rate | 14% | 45% | 57% | 58% | 44% | 42% | ||||||||||||||||||
See Footnote Summary on page 43.
See Notes to Financial Statements.
2021 Semi-Annual Report | 37 | |
Table of Contents
Financial Highlights (continued)
Selected per share data and ratios for a share of capital stock outstanding for each respective Portfolio for each of the periods presented:
CALIFORNIA MUNICIPAL PORTFOLIO MUNICIPAL CLASS | ||||||||||||||||||||||||
| SIX MONTHS ENDED 3/31/21 (UNAUDITED) | YEAR ENDED 9/30/20 | YEAR ENDED 9/30/19 | YEAR ENDED 9/30/18 | YEAR ENDED 9/30/17 | YEAR ENDED 9/30/16 | |||||||||||||||||||
Net asset value, beginning of period | $ | 14.52 | $ | 14.44 | $ | 13.99 | $ | 14.32 | $ | 14.59 | $ | 14.40 | ||||||||||||
|
|
|
|
|
|
|
|
|
|
|
| |||||||||||||
Income from investment operations: | ||||||||||||||||||||||||
Investment income, net (a) | 0.13 | 0.29 | 0.31 | 0.31 | 0.30 | 0.31 | (c) | |||||||||||||||||
Net realized and unrealized gain (loss) on investment transactions | 0.08 | 0.08 | 0.45 | (0.33 | ) | (0.27 | ) | 0.18 | ||||||||||||||||
|
|
|
|
|
|
|
|
|
|
|
| |||||||||||||
Total from investment operations | 0.21 | 0.37 | 0.76 | (0.02 | ) | 0.03 | 0.49 | |||||||||||||||||
|
|
|
|
|
|
|
|
|
|
|
| |||||||||||||
Less dividends: | ||||||||||||||||||||||||
Dividends from net investment income | (0.13 | ) | (0.29 | ) | (0.31 | ) | (0.31 | ) | (0.30 | ) | (0.30 | ) | ||||||||||||
|
|
|
|
|
|
|
|
|
|
|
| |||||||||||||
Net asset value, end of period | $14.60 | $14.52 | $14.44 | $13.99 | $14.32 | $14.59 | ||||||||||||||||||
|
|
|
|
|
|
|
|
|
|
|
| |||||||||||||
Total return (e) | 1.43% | 2.59% | 5.50% | (0.13)% | 0.23% | 3.46% | (c) | |||||||||||||||||
| RATIOS/SUPPLEMENTAL DATA | ||||||||||||||||||||||||
Net assets, end of period (000 omitted) | $1,263,370 | $1,243,747 | $1,212,947 | $1,189,754 | $1,150,520 | $1,119,516 | ||||||||||||||||||
Average net assets (000 omitted) | $1,255,382 | $1,222,654 | $1,181,680 | $1,177,686 | $1,118,392 | $1,080,590 | ||||||||||||||||||
Ratio to average net assets of: | ||||||||||||||||||||||||
Expenses | 0.54% | (h) | 0.55% | 0.55% | 0.55% | 0.57% | 0.63% | |||||||||||||||||
Net investment income | 1.76% | (h) | 1.98% | 2.17% | 2.19% | 2.10% | 2.10% | (c) | ||||||||||||||||
Portfolio turnover rate | 15% | 16% | 24% | 38% | 17% | 12% | ||||||||||||||||||
See Footnote Summary on page 43.
See Notes to Financial Statements.
| 38 | Sanford C. Bernstein Fund, Inc. | |
Table of Contents
DIVERSIFIED MUNICIPAL PORTFOLIO MUNICIPAL CLASS | ||||||||||||||||||||||||
| SIX MONTHS ENDED 3/31/21 (UNAUDITED) | YEAR ENDED 9/30/20 | YEAR ENDED 9/30/19 | YEAR ENDED 9/30/18 | YEAR ENDED 9/30/17 | YEAR ENDED 9/30/16 | |||||||||||||||||||
Net asset value, beginning of period | $ | 14.67 | $ | 14.57 | $ | 14.05 | $ | 14.43 | $ | 14.67 | $ | 14.47 | ||||||||||||
|
|
|
|
|
|
|
|
|
|
|
| |||||||||||||
Income from investment operations: | ||||||||||||||||||||||||
Investment income, net (a) | 0.15 | 0.33 | 0.34 | 0.31 | 0.29 | 0.29 | (c) | |||||||||||||||||
Net realized and unrealized gain (loss) on investment transactions | 0.13 | 0.10 | 0.52 | (0.38 | ) | (0.24 | ) | 0.20 | ||||||||||||||||
|
|
|
|
|
|
|
|
|
|
|
| |||||||||||||
Total from investment operations | 0.28 | 0.43 | 0.86 | (0.07 | ) | 0.05 | 0.49 | |||||||||||||||||
|
|
|
|
|
|
|
|
|
|
|
| |||||||||||||
Less dividends: | ||||||||||||||||||||||||
Dividends from net investment income | (0.15 | ) | (0.33 | ) | (0.34 | ) | (0.31 | ) | (0.29 | ) | (0.29 | ) | ||||||||||||
|
|
|
|
|
|
|
|
|
|
|
| |||||||||||||
Net asset value, end of period | $14.80 | $14.67 | $14.57 | $14.05 | $14.43 | $14.67 | ||||||||||||||||||
|
|
|
|
|
|
|
|
|
|
|
| |||||||||||||
Total return (e) | 1.88% | 2.99% | 6.21% | (0.45)% | 0.37% | 3.40% | (c) | |||||||||||||||||
| RATIOS/SUPPLEMENTAL DATA | ||||||||||||||||||||||||
Net assets, end of period (000 omitted) | $5,263,208 | $5,035,751 | $4,989,558 | $5,479,314 | $5,377,573 | $5,276,927 | ||||||||||||||||||
Average net assets (000 omitted) | $5,161,869 | $5,013,687 | $5,238,466 | $5,511,547 | $5,274,036 | $5,048,509 | ||||||||||||||||||
Ratio to average net assets of: | ||||||||||||||||||||||||
Expenses | 0.47% | (h) | 0.47% | 0.47% | 0.46% | 0.49% | 0.54% | |||||||||||||||||
Net investment income | 1.98% | (h) | 2.26% | 2.38% | 2.20% | 2.02% | 1.98% | (c) | ||||||||||||||||
Portfolio turnover rate | 15% | 20% | 22% | 23% | 25% | 11% | ||||||||||||||||||
See Footnote Summary on page 43.
See Notes to Financial Statements.
2021 Semi-Annual Report | 39 | |
Table of Contents
Financial Highlights (continued)
Selected per share data and ratios for a share of capital stock outstanding for each respective Portfolio for each of the periods presented:
NEW YORK MUNICIPAL PORTFOLIO MUNICIPAL CLASS | ||||||||||||||||||||||||
| SIX MONTHS ENDED 3/31/21 (UNAUDITED) | YEAR ENDED 9/30/20 | YEAR ENDED 9/30/19 | YEAR ENDED 9/30/18 | YEAR ENDED 9/30/17 | YEAR ENDED 9/30/16 | |||||||||||||||||||
Net asset value, beginning of period | $ | 14.04 | $ | 14.18 | $ | 13.68 | $ | 14.07 | $ | 14.34 | $ | 14.10 | ||||||||||||
|
|
|
|
|
|
|
|
|
|
|
| |||||||||||||
Income from investment operations: | ||||||||||||||||||||||||
Investment income, net (a) | 0.14 | 0.30 | 0.32 | 0.31 | 0.30 | 0.32 | (c) | |||||||||||||||||
Net realized and unrealized gain (loss) on investment transactions | 0.21 | (0.13 | ) | 0.50 | (0.39 | ) | (0.27 | ) | 0.24 | |||||||||||||||
Contributions from affiliates | 0 | 0 | 0 | 0.00 | (d) | 0 | 0 | |||||||||||||||||
|
|
|
|
|
|
|
|
|
|
|
| |||||||||||||
Total from investment operations | 0.35 | 0.17 | 0.82 | (0.08 | ) | 0.03 | 0.56 | |||||||||||||||||
|
|
|
|
|
|
|
|
|
|
|
| |||||||||||||
Less dividends: | ||||||||||||||||||||||||
Dividends from net investment income | (0.14 | ) | (0.31 | ) | (0.32 | ) | (0.31 | ) | (0.30 | ) | (0.32 | ) | ||||||||||||
|
|
|
|
|
|
|
|
|
|
|
| |||||||||||||
Net asset value, end of period | $ | 14.25 | $ | 14.04 | $ | 14.18 | $ | 13.68 | $ | 14.07 | $ | 14.34 | ||||||||||||
|
|
|
|
|
|
|
|
|
|
|
| |||||||||||||
Total return (e) | 2.48% | 1.22% | 6.03% | (0.57)% | 0.29% | 3.90% | (c) | |||||||||||||||||
| RATIOS/SUPPLEMENTAL DATA | ||||||||||||||||||||||||
Net assets, end of period (000 omitted) | $1,620,076 | $1,585,884 | $1,629,139 | $1,631,011 | $1,595,536 | $1,560,549 | ||||||||||||||||||
Average net assets (000 omitted) | $1,618,613 | $1,599,889 | $1,619,580 | $1,621,380 | $1,557,199 | $1,504,287 | ||||||||||||||||||
Ratio to average net assets of: | ||||||||||||||||||||||||
Expenses | 0.53% | (h) | 0.54% | 0.53% | 0.53% | 0.56% | 0.61% | |||||||||||||||||
Net investment income | 1.94% | (h) | 2.17% | 2.27% | 2.23% | 2.12% | 2.23% | (c) | ||||||||||||||||
Portfolio turnover rate | 13% | 18% | 18% | 23% | 23% | 17% | ||||||||||||||||||
See Footnote Summary on page 43.
See Notes to Financial Statements.
| 40 | Sanford C. Bernstein Fund, Inc. | |
Table of Contents
INTERMEDIATE DURATION PORTFOLIO INTERMEDIATE DURATION CLASS | ||||||||||||||||||||||||
| SIX MONTHS ENDED 3/31/21 (UNAUDITED) | YEAR ENDED 9/30/20 | YEAR ENDED 9/30/19 | YEAR ENDED 9/30/18 | YEAR ENDED 9/30/17 | YEAR ENDED 9/30/16 | |||||||||||||||||||
Net asset value, beginning of period | $ | 14.02 | $ | 13.54 | $ | 12.76 | $ | 13.23 | $ | 13.63 | $ | 13.41 | ||||||||||||
|
|
|
|
|
|
|
|
|
|
|
| |||||||||||||
Income from investment operations: |
| |||||||||||||||||||||||
Investment income, net (a) | 0.14 | 0.35 | 0.38 | 0.30 | 0.30 | 0.36 | (c) | |||||||||||||||||
Net realized and unrealized gain (loss) on investment and foreign currency transactions | (0.42 | ) | 0.51 | 0.83 | (0.45 | ) | (0.21 | ) | 0.46 | |||||||||||||||
Contributions from affiliates | 0 | 0 | 0.00 | (d) | 0 | 0.00 | (d) | 0 | ||||||||||||||||
|
|
|
|
|
|
|
|
|
|
|
| |||||||||||||
Total from investment operations | (0.28 | ) | 0.86 | 1.21 | (0.15 | ) | 0.09 | 0.82 | ||||||||||||||||
|
|
|
|
|
|
|
|
|
|
|
| |||||||||||||
Less dividends and distributions: |
| |||||||||||||||||||||||
Dividends from net investment income | (0.15 | ) | (0.38 | ) | (0.43 | ) | (0.32 | ) | (0.34 | ) | (0.42 | ) | ||||||||||||
Distributions from net realized gain on investment transactions | (0.24 | ) | 0 | 0 | 0 | (0.15 | ) | (0.18 | ) | |||||||||||||||
|
|
|
|
|
|
|
|
|
|
|
| |||||||||||||
Total dividends and distributions | (0.39 | ) | (0.38 | ) | (0.43 | ) | (0.32 | ) | (0.49 | ) | (0.60 | ) | ||||||||||||
|
|
|
|
|
|
|
|
|
|
|
| |||||||||||||
Net asset value, end of period | $13.35 | $14.02 | $13.54 | $12.76 | $13.23 | $13.63 | ||||||||||||||||||
|
|
|
|
|
|
|
|
|
|
|
| |||||||||||||
Total return (e)(f) | (2.10)% | 6.35% | 9.70% | (1.14)% | 0.71% | 6.33% | (c) | |||||||||||||||||
| RATIOS/SUPPLEMENTAL DATA |
| |||||||||||||||||||||||
Net assets, end of period (000 omitted) | $3,801,220 | $3,696,937 | $3,416,459 | $3,291,645 | $3,363,353 | $3,443,945 | ||||||||||||||||||
Average net assets (000 omitted) | $3,764,648 | $3,503,078 | $3,289,133 | $3,339,472 | $3,350,914 | $3,395,239 | ||||||||||||||||||
Ratio to average net assets of: |
| |||||||||||||||||||||||
Expenses | 0.56% | (h) | 0.57% | 0.57% | 0.57% | 0.59% | 0.59% | |||||||||||||||||
Net investment income | 2.01% | (h) | 2.54% | 2.95% | 2.34% | 2.27% | 2.67% | (c) | ||||||||||||||||
Portfolio turnover rate (k) | 60% | 72% | 62% | 201% | 230% | 146% | ||||||||||||||||||
See Footnote Summary on page 43.
See Notes to Financial Statements.
2021 Semi-Annual Report | 41 | |
Table of Contents
Financial Highlights (continued)
Selected per share data and ratios for a share of capital stock outstanding for each respective Portfolio for each of the periods presented:
SHORT DURATION PLUS PORTFOLIO SHORT DURATION PLUS CLASS | ||||||||||||||||||||||||
| SIX MONTHS ENDED 3/31/21 (UNAUDITED) | YEAR ENDED 9/30/20 | YEAR ENDED 9/30/19 | YEAR ENDED 9/30/18 | YEAR ENDED 9/30/17 | YEAR ENDED 9/30/16 | |||||||||||||||||||
Net asset value, beginning of period | $ | 11.78 | $ | 11.74 | $ | 11.53 | $ | 11.68 | $ | 11.75 | $ | 11.74 | ||||||||||||
|
|
|
|
|
|
|
|
|
|
|
| |||||||||||||
Income from investment operations: |
| |||||||||||||||||||||||
Investment income, | 0.07 | 0.17 | 0.22 | 0.15 | 0.09 | 0.09 | (c) | |||||||||||||||||
Net realized and unrealized gain (loss) on investment and foreign currency transactions | (0.06 | ) | 0.06 | 0.23 | (0.13 | ) | (0.05 | ) | 0.02 | |||||||||||||||
Contributions from affiliates | 0 | 0 | 0 | 0 | 0.00 | (d) | 0 | |||||||||||||||||
|
|
|
|
|
|
|
|
|
|
|
| |||||||||||||
Total from investment operations | 0.01 | 0.23 | 0.45 | 0.02 | 0.04 | 0.11 | ||||||||||||||||||
|
|
|
|
|
|
|
|
|
|
|
| |||||||||||||
Less dividends: | ||||||||||||||||||||||||
Dividends from net investment income | (0.07 | ) | (0.19 | ) | (0.24 | ) | (0.17 | ) | (0.11 | ) | (0.10 | ) | ||||||||||||
|
|
|
|
|
|
|
|
|
|
|
| |||||||||||||
Net asset value, end of period | $ | 11.72 | $ | 11.78 | $ | 11.74 | $ | 11.53 | $ | 11.68 | $ | 11.75 | ||||||||||||
|
|
|
|
|
|
|
|
|
|
|
| |||||||||||||
Total return (e)(f) | 0.08% | 1.97% | 3.96% | 0.18% | 0.37% | 0.96% | (c) | |||||||||||||||||
| RATIOS/SUPPLEMENTAL DATA |
| |||||||||||||||||||||||
Net assets, end of period (000 omitted) | $260,273 | $225,045 | $229,120 | $188,523 | $224,323 | $313,720 | ||||||||||||||||||
Average net assets (000 omitted) | $237,492 | $223,901 | $213,653 | $207,677 | $266,909 | $281,499 | ||||||||||||||||||
Ratio to average net assets of: |
| |||||||||||||||||||||||
Expenses, net of waivers/reimbursements | 0.47% | (h) | 0.56% | 0.56% | 0.60% | 0.66% | 0.65% | |||||||||||||||||
Expenses, before waivers/reimbursements | 0.55% | (h) | 0.56% | 0.56% | 0.60% | 0.66% | 0.65% | |||||||||||||||||
Net investment income (b) | 1.12% | (h) | 1.48% | 1.93% | 1.30% | 0.75% | 0.73% | (c) | ||||||||||||||||
Portfolio turnover rate | 27% | 50% | 39% | 85% | (k) | 64% | (k) | 76% | (k) | |||||||||||||||
See Footnote Summary on page 43.
See Notes to Financial Statements.
| 42 | Sanford C. Bernstein Fund, Inc. | |
Table of Contents
| (a) | Based on average shares outstanding. |
| (b) | Net of expenses waived by the Adviser. |
| (c) | For the year ended September 30, 2016, the amount includes a refund for overbilling of prior years’ custody out of pocket fees as follows: |
| PORTFOLIO | NET INVESTMENT INCOME PER SHARE | NET INVESTMENT INCOME RATIO | TOTAL RETURN | |||||||||
Emerging Markets | $0.007 | 0.03% | 0.03% | |||||||||
Short Duration Diversified Municipal | $0.005 | 0.04% | 0.04% | |||||||||
California Municipal | $0.001 | 0.01% | 0.01% | |||||||||
Diversified Municipal | $0.001 | 0.004% | 0.004% | |||||||||
New York Municipal | $0.001 | 0.01% | 0.01% | |||||||||
Intermediate Duration | $0.001 | 0.01% | 0.01% | |||||||||
Short Duration Plus | $0.004 | 0.03% | 0.03% | |||||||||
| (d) | Amount is less than $.005. |
| (e) | Total investment return is calculated assuming an initial investment made at the net asset value at the beginning of the period, reinvestment of all dividends and distributions at net asset value during the period, and redemption on the last day of the period. Total return does not reflect the deduction of taxes that a shareholder would pay on fund distributions or the redemption of fund shares. Total investment return calculated for a period of less than one year is not annualized. |
| (f) | Includes the impact of proceeds received and credited to the Portfolio resulting from the class action settlements, which enhanced the performance for the Emerging Markets Portfolio for the years ended September 30, 2020 and September 30, 2018 by 0.32% and 0.03%, respectively, and the Intermediate Duration Portfolio for the year ended September 30, 2016 by 0.03% and the Short Duration Plus Portfolio for the years ended September 30, 2017 and September 30, 2016 by 0.11% and 0.05%, respectively. |
| (g) | The net asset value and total return include adjustments in accordance with accounting principles generally accepted in the United States of America for financial reporting purposes. As such, the net asset value and total return for shareholder transactions may differ from financial statements. |
| (h) | Annualized |
| (i) | Commencement of distributions. |
| (j) | In connection with the Portfolio’s investments in affiliated underlying portfolios, the Portfolio incurs no direct expenses, but bears proportionate shares of the fees and expenses (i.e., operating, administrative and investment advisory fees) of the affiliated underlying portfolios. The Adviser has contractually agreed to waive its fees from the Portfolio in an amount equal to the Portfolio’s pro rata share of certain acquired fund fees and expenses, and for the period shown below, such waiver amounted to: |
Acquired Fund Fees and Expenses:
| YEAR ENDED 09/30/20 | ||||
| Short Duration Diversified Municipal | 0.01% | |||
Waiver:
| YEAR ENDED 09/30/20 | ||||
| Short Duration Diversified Municipal | 0.01% | |||
| (k) | The Portfolio accounts for dollar roll transactions as purchases and sales. |
See Notes to Financial Statements.
2021 Semi-Annual Report | 43 | |
Table of Contents
| NOTE 1. | Organization and Significant Accounting Policies |
Sanford C. Bernstein Fund, Inc. (the “Fund”) is registered under the Investment Company Act of 1940 as an open-end registered investment company. The Fund, which is a Maryland corporation, operates as a series company currently comprised of 13 portfolios (hereafter collectively referred to as the “Portfolios” and each individually a “Portfolio”) with the following share classes offered:
INTERNATIONAL EQUITY PORTFOLIO | SHARE CLASSES OFFERED | |
Emerging Markets | Emerging Markets Class* and Class Z | |
FIXED INCOME MUNICIPAL PORTFOLIOS | ||
Short Duration Diversified Municipal | Short Duration Diversified Municipal Class* | |
California Municipal | Municipal Class*, Class A, Class C and Advisor Class | |
Diversified Municipal | Municipal Class*, Class A, Class C, Advisor Class and Class Z | |
New York Municipal | Municipal Class*, Class A, Class C and Advisor Class | |
FIXED INCOME TAXABLE PORTFOLIOS | ||
Intermediate Duration | Intermediate Duration Class*, Class A, Advisor Class and Class Z | |
Short Duration Plus | Short Duration Plus Class*, Class A, and Class C | |
| * | Bernstein Class |
OVERLAY PORTFOLIOS | ||
Overlay A | Class 1 and Class 2 | |
Tax-Aware Overlay A | Class 1 and Class 2 | |
Overlay B | Class 1 and Class 2 | |
Tax-Aware Overlay B | Class 1 and Class 2 | |
Tax-Aware Overlay C | Class 1 and Class 2 | |
Tax-Aware Overlay N | Class 1 and Class 2 |
Each Portfolio has its own investment objectives. This report relates only to the International Equity Portfolio, Fixed Income Municipal Portfolios and Fixed Income Taxable Portfolios (together the “SCB Portfolios”). The financial statements of the Overlay Portfolios and the financial highlights of Class A, Class C, Advisor Class and Class Z Shares (collectively “Retail Classes”) of California Municipal, Diversified Municipal, New York Municipal, Intermediate Duration and Short Duration Plus Portfolios are presented in separate financial reports. Each class of shares has identical voting, dividend, liquidation and other rights, except that the classes bear different distribution and transfer agency expenses. Each class has exclusive voting rights with respect to its distribution plan, as applicable. The financial statements have been prepared in conformity with U.S. generally accepted accounting principles (“U.S. GAAP”), which require management to make certain estimates and assumptions that affect the reported amounts of assets and liabilities in the financial statements and amounts of income and expenses during the reporting period. Actual results could differ from those estimates. Each Portfolio is an investment company under U.S. GAAP and follows the accounting and reporting guidance applicable to investment companies. The following is a summary of significant accounting policies followed by the Portfolios.
| A. | Portfolio Valuation |
Portfolio securities are valued at their current market value determined on the basis of market quotations or, if market quotations are not readily available or are deemed unreliable, at “fair value” as determined in accordance with procedures established by and under the general supervision of the Fund’s Board of Directors (the “Board”).
In general, the market values of securities which are readily available and deemed reliable are determined as follows: securities listed on a national securities exchange (other than securities listed on the NASDAQ Stock Market, Inc. (“NASDAQ”)) or on a foreign securities exchange are valued at the last sale price at the close of the exchange or foreign securities exchange. If there has been no sale on such day, the securities are valued at the last traded price from the
| 44 | Sanford C. Bernstein Fund, Inc. | |
Table of Contents
previous day. Securities listed on more than one exchange are valued by reference to the principal exchange on which the securities are traded; securities listed only on NASDAQ are valued in accordance with the NASDAQ Official Closing Price; listed or over the counter (“OTC”) market put or call options are valued at the mid level between the current bid and ask prices. If either a current bid or current ask price is unavailable, AllianceBernstein L.P. (the “Adviser”) will have discretion to determine the best valuation (e.g., last trade price in the case of listed options); open futures are valued using the closing settlement price or, in the absence of such a price, the most recent quoted bid price. If there are no quotations available for the day of valuation, the last available closing settlement price is used; U.S. Government securities and any other debt instruments having 60 days or less remaining until maturity are generally valued at market by an independent pricing vendor, if a market price is available. If a market price is not available, the securities are valued at amortized cost. This methodology is commonly used for short term securities that have an original maturity of 60 days or less, as well as short term securities that had an original term to maturity that exceeded 60 days. In instances when amortized cost is utilized, the Valuation Committee (the “Committee”) must reasonably conclude that the utilization of amortized cost is approximately the same as the fair value of the security. Factors the Committee will consider include, but are not limited to, an impairment of the creditworthiness of the issuer or material changes in interest rates. Fixed-income securities, including mortgage-backed and asset-backed securities, may be valued on the basis of prices provided by a pricing service or at a price obtained from one or more of the major broker-dealers. In cases where broker-dealer quotes are obtained, the Adviser may establish procedures whereby changes in market yields or spreads are used to adjust, on a daily basis, a recently obtained quoted price on a security. Swaps and other derivatives are valued daily, primarily using independent pricing services, independent pricing models using market inputs, as well as third party broker-dealers or counterparties. Open-end mutual funds are valued at the closing net asset value per share, while exchange traded funds are valued at the closing market price per share.
Securities for which market quotations are not readily available (including restricted securities) or are deemed unreliable are valued at fair value as deemed appropriate by the Adviser. Factors considered in making this determination may include, but are not limited to, information obtained by contacting the issuer, analysts, analysis of the issuer’s financial statements or other available documents. In addition, the Portfolios may use fair value pricing for securities primarily traded in non-U.S. markets because most foreign markets close well before the Portfolios value their securities at 4:00 p.m., Eastern Time. The earlier close of these foreign markets gives rise to the possibility that significant events, including broad market moves, may have occurred in the interim and may materially affect the value of those securities. To account for this, the Portfolios generally value many of their foreign equity securities using fair value prices based on third party vendor modeling tools to the extent available.
| B. | Fair Value Measurements |
In accordance with U.S. GAAP regarding fair value measurements, fair value is defined as the price that the Portfolios would receive to sell an asset or pay to transfer a liability in an orderly transaction between market participants at the measurement date. U.S. GAAP establishes a framework for measuring fair value, and a three-level hierarchy for fair value measurements based upon the transparency of inputs to the valuation of an asset or liability (including those valued based on their market values as described in Note 1.A above). Inputs may be observable or unobservable and refer broadly to the assumptions that market participants would use in pricing the asset or liability. Observable inputs reflect the assumptions market participants would use in pricing the asset or liability based on market data obtained from sources independent of the Portfolios. Unobservable inputs reflect the Portfolios’ own assumptions about the assumptions that market participants would use in pricing the asset or liability based on the best information available in the circumstances. Each investment is assigned a level based upon the observability of the inputs which are significant to the overall valuation. The three-tier hierarchy of inputs is summarized below.
| • | Level 1—quoted prices in active markets for identical investments |
| • | Level 2—other significant observable inputs (including quoted prices for similar investments, interest rates, prepayment speeds, credit risk, etc.) |
| • | Level 3—significant unobservable inputs (including the Portfolios’ own assumptions in determining the fair value of investments) |
The fair value of debt instruments, such as bonds, and over-the-counter derivatives is generally based on market price quotations, recently executed market transactions (where observable) or industry recognized modeling techniques and are
2021 Semi-Annual Report | 45 | |
Table of Contents
Notes to Financial Statements (continued)
generally classified as Level 2. Pricing vendor inputs to Level 2 valuations may include quoted prices for similar investments in active markets, interest rate curves, coupon rates, currency rates, yield curves, option adjusted spreads, default rates, credit spreads and other unique security features in order to estimate the relevant cash flows which are then discounted to calculate fair values. If these inputs are unobservable and significant to the fair value, these investments will be classified as Level 3.
Where readily available market prices or relevant bid prices are not available for certain equity investments, such investments may be valued based on similar publicly traded investments, movements in relevant indices since last available prices or based upon underlying company fundamentals and comparable company data (such as multiples to earnings or other multiples to equity). Where an investment is valued using an observable input, such as another publicly traded security, the investment will be classified as Level 2. If management determines that an adjustment is appropriate based on restrictions on resale, illiquidity or uncertainty, and such adjustment is a significant component of the valuation, the investment will be classified as Level 3. An investment will also be classified as Level 3 where management uses company fundamentals and other significant inputs to determine the valuation.
Options are valued using market-based inputs to models, broker or dealer quotations, or alternative pricing sources with reasonable levels of price transparency, where such inputs and models are available. Alternatively, the values may be obtained through unobservable management determined inputs and/or management’s proprietary models. Where models are used, the selection of a particular model to value an option depends upon the contractual terms of, and specific risks inherent in, the option as well as the availability of pricing information in the market. Valuation models require a variety of inputs, including contractual terms, market prices, measures of volatility and correlations of such inputs. Exchange traded options will be classified as Level 2. For options that do not trade on an exchange but trade in liquid markets, inputs can generally be verified and model selection does not involve significant management judgment. Options are classified within Level 2 on the fair value hierarchy when all of the significant inputs can be corroborated to market evidence. Otherwise such instruments are classified as Level 3.
Valuations of mortgage-backed or other asset-backed securities, by pricing vendors, are based on both proprietary and industry recognized models and discounted cash flow techniques. Significant inputs to the valuation of these instruments are: the value of collateral, the rates and timing of delinquencies, the rates and timing of prepayments, and default and loss expectations, which are driven in part by housing prices for residential mortgages. Significant inputs are determined based on relative value analyses, which incorporate comparisons to instruments with similar collateral and risk profiles, including relevant indices. Mortgage and asset-backed securities for which management has collected current observable data through pricing services are generally categorized within Level 2. Those investments for which current observable data has not been provided are classified as Level 3.
Other fixed income investments, including non-U.S. government and corporate debt, are generally valued using quoted market prices, if available, which are typically impacted by current interest rates, maturity dates and any perceived credit risk of the issuer. Additionally, in the absence of quoted market prices, these inputs are used by pricing vendors to derive a valuation based upon industry or proprietary models which incorporate issuer specific data with relevant yield/spread comparisons with more widely quoted bonds with similar key characteristics. Those investments for which there are observable inputs are classified as Level 2. Where the inputs are not observable, the investments are classified as Level 3.
| 46 | Sanford C. Bernstein Fund, Inc. | |
Table of Contents
The following tables summarize the valuation of the Portfolios’ investments by the above fair value hierarchy levels as of March 31, 2021:
EMERGING MARKETS PORTFOLIO INVESTMENTSIN SECURITIES: | LEVEL 1 | LEVEL 2 | LEVEL 3 | TOTAL | ||||||||||||
Assets: |
| |||||||||||||||
Common Stocks: | ||||||||||||||||
Financials | $ | 82,892,065 | $ | 273,299,104 | $ | 0 | $ | 356,191,169 | ||||||||
Information Technology | 35,372,094 | 304,853,399 | 0 | 340,225,493 | ||||||||||||
Consumer Discretionary | 32,027,587 | 207,207,811 | 0 | 239,235,398 | ||||||||||||
Industrials | 31,545,476 | 93,023,137 | 0 | 124,568,613 | ||||||||||||
Communication Services | 9,317,717 | 81,491,187 | 0 | 90,808,904 | ||||||||||||
Materials | 37,535,869 | 38,144,954 | 0 | 75,680,823 | ||||||||||||
Utilities | 12,579,651 | 43,944,022 | 0 | 56,523,673 | ||||||||||||
Health Care | 6,159,889 | 38,599,379 | 0 | 44,759,268 | ||||||||||||
Energy | 27,454,478 | 13,770,755 | 0 | 41,225,233 | ||||||||||||
Consumer Staples | 15,670,578 | 24,619,917 | 0 | 40,290,495 | ||||||||||||
Real Estate | 0 | 30,584,721 | 0 | 30,584,721 | ||||||||||||
Equity Linked Notes | 0 | 41,783,160 | 0 | 41,783,160 | ||||||||||||
Short-Term Investments | 9,170,518 | 0 | 0 | 9,170,518 | ||||||||||||
Total Investments in Securities | 299,725,922 | 1,191,321,546 | (a) | 0 | 1,491,047,468 | |||||||||||
Other Financial Instruments (b): | ||||||||||||||||
Assets: |
| |||||||||||||||
Forward Currency Exchange Contracts | 0 | 3,756,279 | 0 | 3,756,279 | ||||||||||||
Liabilities: |
| |||||||||||||||
Forward Currency Exchange Contracts | 0 | (2,662,042 | ) | 0 | (2,662,042 | ) | ||||||||||
Total | $ | 299,725,922 | $ | 1,192,415,783 | $ | 0 | $ | 1,492,141,705 | ||||||||
SHORT DURATION DIVERSIFIED MUNICIPAL PORTFOLIO INVESTMENTSIN SECURITIES: | LEVEL 1 | LEVEL 2 | LEVEL 3 | TOTAL | ||||||||||||
Assets: | ||||||||||||||||
Long-Term Municipal Bonds | $ | 0 | $ | 201,084,495 | $ | 0 | $ | 201,084,495 | ||||||||
Short-Term Municipal Notes | 0 | 35,782,311 | 0 | 35,782,311 | ||||||||||||
Corporates—Non-Investment Grade | 0 | 260,043 | 0 | 260,043 | ||||||||||||
Investment Companies | 8,715,292 | 0 | 0 | 8,715,292 | ||||||||||||
Total Investments in Securities | 8,715,292 | 237,126,849 | 0 | 245,842,141 | ||||||||||||
Other Financial Instruments (b): | ||||||||||||||||
Assets: | ||||||||||||||||
Centrally Cleared Inflation (CPI) Swaps | 0 | 198,891 | 0 | 198,891 | (c) | |||||||||||
Centrally Cleared Interest Rate Swaps | 0 | 7,935 | 0 | 7,935 | (c) | |||||||||||
Interest Rate Swaps | 0 | 3,006 | 0 | 3,006 | ||||||||||||
Liabilities: | ||||||||||||||||
Centrally Cleared Inflation (CPI) Swaps | 0 | (13,107 | ) | 0 | (13,107 | )(c) | ||||||||||
Centrally Cleared Interest Rate Swaps | 0 | (6,002 | ) | 0 | (6,002 | )(c) | ||||||||||
Total | $ | 8,715,292 | $ | 237,317,572 | $ | 0 | $ | 246,032,864 | ||||||||
2021 Semi-Annual Report | 47 | |
Table of Contents
Notes to Financial Statements (continued)
CALIFORNIA MUNICIPAL PORTFOLIO INVESTMENTSIN SECURITIES: | LEVEL 1 | LEVEL 2 | LEVEL 3 | TOTAL | ||||||||||||
Assets: | ||||||||||||||||
Long-Term Municipal Bonds | $ | 0 | $ | 1,285,940,392 | $ | 0 | $ | 1,285,940,392 | ||||||||
Short-Term Municipal Notes | 0 | 121,557,176 | 0 | 121,557,176 | ||||||||||||
Collateralized Mortgage Obligations | 0 | 4,575,556 | 0 | 4,575,556 | ||||||||||||
Governments—Treasuries | 0 | 2,535,879 | 0 | 2,535,879 | ||||||||||||
Total Investments in Securities | 0 | 1,414,609,003 | 0 | 1,414,609,003 | ||||||||||||
Other Financial Instruments (b): | ||||||||||||||||
Assets: | ||||||||||||||||
Centrally Cleared Inflation (CPI) Swaps | 0 | 4,964,754 | 0 | 4,964,754 | (c) | |||||||||||
Centrally Cleared Interest Rate Swaps | 0 | 1,309,070 | 0 | 1,309,070 | (c) | |||||||||||
Interest Rate Swaps | 0 | 64,229 | 0 | 64,229 | ||||||||||||
Liabilities: | ||||||||||||||||
Centrally Cleared Inflation (CPI) Swaps | 0 | (161,045 | ) | 0 | (161,045 | )(c) | ||||||||||
Centrally Cleared Interest Rate Swaps | 0 | (1,083,301 | ) | 0 | (1,083,301 | )(c) | ||||||||||
Credit Default Swaps | 0 | (1,274,193 | ) | 0 | (1,274,193 | ) | ||||||||||
Total | $ | 0 | $ | 1,418,428,517 | $ | 0 | $ | 1,418,428,517 | ||||||||
DIVERSIFIED MUNICIPAL PORTFOLIO INVESTMENTSIN SECURITIES: | LEVEL 1 | LEVEL 2 | LEVEL 3 | TOTAL | ||||||||||||
Assets: | ||||||||||||||||
Long-Term Municipal Bonds | $ | 0 | $ | 5,561,707,663 | $ | 40,500,314 | $ | 5,602,207,977 | ||||||||
Short-Term Municipal Notes | 0 | 670,200,560 | 0 | 670,200,560 | ||||||||||||
Collateralized Mortgage Obligations | 0 | 19,965,899 | 0 | 19,965,899 | ||||||||||||
Corporates—Investment Grade | 0 | 15,004,145 | 0 | 15,004,145 | ||||||||||||
Corporates—Non-Investment Grade | 0 | 7,471,259 | 0 | 7,471,259 | ||||||||||||
Short-Term Investments | 0 | 9,999,737 | 0 | 9,999,737 | ||||||||||||
Total Investments in Securities | 0 | 6,284,349,263 | 40,500,314 | 6,324,849,577 | ||||||||||||
Other Financial Instruments (b): | ||||||||||||||||
Assets | ||||||||||||||||
Centrally Cleared Inflation (CPI) Swaps | 0 | 23,039,523 | 0 | 23,039,523 | (c) | |||||||||||
Centrally Cleared Interest Rate Swaps | 0 | 4,847,611 | 0 | 4,847,611 | (c) | |||||||||||
Interest Rate Swaps | 0 | 296,193 | 0 | 296,193 | ||||||||||||
Liabilities: | ||||||||||||||||
Centrally Cleared Inflation (CPI) Swaps | 0 | (730,320 | ) | 0 | (730,320 | )(c) | ||||||||||
Centrally Cleared Interest Rate Swaps | 0 | (1,802,662 | ) | 0 | (1,802,662 | )(c) | ||||||||||
Credit Default Swaps | 0 | (5,327,097 | ) | 0 | (5,327,097 | ) | ||||||||||
Total | $ | 0 | $ | 6,304,672,511 | $ | 40,500,314 | $ | 6,345,172,825 | ||||||||
| 48 | Sanford C. Bernstein Fund, Inc. | |
Table of Contents
NEW YORK MUNICIPAL PORTFOLIO INVESTMENTIN SECURITIES: | LEVEL 1 | LEVEL 2 | LEVEL 3 | TOTAL | ||||||||||||
Assets: | ||||||||||||||||
Long-Term Municipal Bonds | $ | 0 | $ | 1,660,799,310 | $ | 0 | $ | 1,660,799,310 | ||||||||
Short-Term Municipal Notes | 102,672,660 | 102,672,660 | ||||||||||||||
Collateralized Mortgage Obligations | 0 | 6,398,089 | 0 | 6,398,089 | ||||||||||||
Governments—Treasuries | 0 | 2,569,388 | 0 | 2,569,388 | ||||||||||||
Total Investments in Securities | 0 | 1,772,439,447 | 0 | 1,772,439,447 | ||||||||||||
Other Financial Instruments (b): | ||||||||||||||||
Assets: | ||||||||||||||||
Centrally Cleared Inflation (CPI) Swaps | 0 | 6,557,280 | 0 | 6,557,280 | (c) | |||||||||||
Centrally Cleared Interest Rate Swaps | 0 | 344,770 | 0 | 344,770 | (c) | |||||||||||
Interest Rate Swaps | 0 | 87,987 | 0 | 87,987 | ||||||||||||
Liabilities: | ||||||||||||||||
Centrally Cleared Inflation (CPI) Swaps | 0 | (205,988 | ) | 0 | (205,988 | )(c) | ||||||||||
Centrally Cleared Interest Rate Swaps | 0 | (764,742 | ) | 0 | (764,742 | )(c) | ||||||||||
Credit Default Swaps | 0 | (1,779,292 | ) | 0 | (1,779,292 | ) | ||||||||||
Total | $ | 0 | $ | 1,776,679,462 | $ | 0 | $ | 1,776,679,462 | ||||||||
INTERMEDIATE DURATION PORTFOLIO INVESTMENTSIN SECURITIES: | LEVEL 1 | LEVEL 2 | LEVEL 3 | TOTAL | ||||||||||||
Assets: | ||||||||||||||||
Corporates—Investment Grade | $ | 0 | $ | 1,110,612,979 | $ | 0 | $ | 1,110,612,979 | ||||||||
Governments—Treasuries | 0 | 1,056,130,172 | 0 | 1,056,130,172 | ||||||||||||
Mortgage Pass-Throughs | 0 | 379,984,226 | 0 | 379,984,226 | ||||||||||||
Commercial Mortgage-Backed Securities | 0 | 343,247,108 | 1,563,911 | 344,811,019 | ||||||||||||
Inflation-Linked Securities | 0 | 308,034,066 | 0 | 308,034,066 | ||||||||||||
Collateralized Mortgage Obligations | 0 | 233,434,190 | 0 | 233,434,190 | ||||||||||||
Corporates—Non-Investment Grade | 0 | 68,963,809 | 0 | 68,963,809 | ||||||||||||
Asset-Backed Securities | 0 | 61,290,984 | 0 | 61,290,984 | ||||||||||||
Collateralized Loan Obligations | 0 | 48,137,591 | 0 | 48,137,591 | ||||||||||||
Local Governments—US Municipal Bonds | 0 | 35,457,202 | 0 | 35,457,202 | ||||||||||||
Emerging Markets—Corporate Bonds | 0 | 28,576,877 | 0 | 28,576,877 | ||||||||||||
Quasi-Sovereigns | 0 | 27,178,463 | 0 | 27,178,463 | ||||||||||||
Agencies | 0 | 23,565,529 | 0 | 23,565,529 | ||||||||||||
Governments—Sovereign Bonds | 0 | 18,404,744 | 0 | 18,404,744 | ||||||||||||
Emerging Markets—Sovereigns | 0 | 18,296,022 | 0 | 18,296,022 | ||||||||||||
Common Stocks | 0 | 0 | 9,141,237 | 9,141,237 | ||||||||||||
Short-Term Investments | 0 | 91,993,926 | 0 | 91,993,926 | ||||||||||||
Total Investments in Securities | 0 | 3,853,307,888 | 10,705,148 | 3,864,013,036 | ||||||||||||
Other Financial Instruments (b): | ||||||||||||||||
Assets: | ||||||||||||||||
Futures | 1,973,670 | 0 | 0 | 1,973,670 | (c) | |||||||||||
Forward Currency Exchange Contracts | 0 | 7,339,067 | 0 | 7,339,067 | ||||||||||||
Centrally Cleared Interest Rate Swaps | 0 | 5,517,442 | 0 | 5,517,442 | (c) | |||||||||||
Credit Default Swaps | 0 | 9,328,804 | 0 | 9,328,804 | ||||||||||||
2021 Semi-Annual Report | 49 | |
Table of Contents
Notes to Financial Statements (continued)
INTERMEDIATE DURATION PORTFOLIO INVESTMENTSIN SECURITIES: | LEVEL 1 | LEVEL 2 | LEVEL 3 | TOTAL | ||||||||||||
Liabilities: |
| |||||||||||||||
Futures | $ | (4,453,687 | ) | $ | 0 | $ | 0 | $ | (4,453,687 | )(c) | ||||||
Forward Currency Exchange Contracts | 0 | (7,440,310 | ) | 0 | (7,440,310 | ) | ||||||||||
Centrally Cleared Interest Rate Swaps | 0 | (6,130,275 | ) | 0 | (6,130,275 | )(c) | ||||||||||
Credit Default Swaps | 0 | (14,021,498 | ) | 0 | (14,021,498 | ) | ||||||||||
Total | $ | (2,480,017 | ) | $ | 3,847,901,118 | $ | 10,705,148 | $ | 3,856,126,249 | |||||||
SHORT DURATION PLUS PORTFOLIO INVESTMENTSIN SECURITIES: | LEVEL 1 | LEVEL 2 | LEVEL 3 | TOTAL | ||||||||||||
Assets: |
| |||||||||||||||
Governments—Treasuries | $ | 0 | $ | 121,254,415 | $ | 0 | $ | 121,254,415 | ||||||||
Inflation-Linked Securities | 0 | 20,210,247 | 0 | 20,210,247 | ||||||||||||
Corporates—Investment Grade | 0 | 19,519,100 | 0 | 19,519,100 | ||||||||||||
Commercial Mortgage-Backed Securities | 0 | 16,600,463 | 114,165 | 16,714,628 | ||||||||||||
Asset-Backed Securities | 0 | 15,578,024 | 0 | 15,578,024 | ||||||||||||
Collateralized Mortgage Obligations | 0 | 13,369,069 | 395,564 | 13,764,633 | ||||||||||||
Agencies | 0 | 7,802,769 | 0 | 7,802,769 | ||||||||||||
Mortgage Pass-Throughs | 0 | 2,818,472 | 0 | 2,818,472 | ||||||||||||
Local Governments—US Municipal Bonds | 0 | 2,520,676 | 0 | 2,520,676 | ||||||||||||
Collateralized Loan Obligations | 0 | 2,261,714 | 0 | 2,261,714 | ||||||||||||
Quasi-Sovereigns | 0 | 539,865 | 0 | 539,865 | ||||||||||||
Governments—Sovereign Bonds | 0 | 380,019 | 0 | 380,019 | ||||||||||||
Short-Term Investments | 0 | 54,004,317 | 0 | 54,004,317 | ||||||||||||
Total Investments in Securities | 0 | 276,859,150 | 509,729 | 277,368,879 | ||||||||||||
Other Financial Instruments (b): | ||||||||||||||||
Assets: |
| |||||||||||||||
Futures | 79,671 | 0 | 0 | 79,671 | (c) | |||||||||||
Centrally Cleared Credit Default Swaps | 0 | 40,683 | 0 | 40,683 | (c) | |||||||||||
Credit Default Swaps | 0 | 573,152 | 0 | 573,152 | ||||||||||||
Liabilities: |
| |||||||||||||||
Futures | (133,586 | ) | 0 | 0 | (133,586 | )(c) | ||||||||||
Credit Default Swaps | 0 | (719,363 | ) | 0 | (719,363 | ) | ||||||||||
Total | $ | (53,915 | ) | $ | 276,753,622 | $ | 509,729 | $ | 277,209,436 | |||||||
| (a) | A significant portion of the Portfolio’s foreign equity investments are categorized as Level 2 investments since they are valued using fair value prices based on third party vendor modeling tools to the extent available, see Note 1.A. |
| (b) | Other financial instruments are derivative instruments, such as futures, forwards and swaps, which are valued at the unrealized appreciation/(depreciation) on the instrument. Other financial instruments may also include swaps with upfront premiums, options written and swaptions written which are valued at market value. |
| (c) | Only variation margin receivable/(payable) at period end is reported within the statement of assets and liabilities. This amount reflects cumulative unrealized appreciation/(depreciation) on futures and centrally cleared swaps as reported in the schedule of investments. Where applicable, centrally cleared swaps with upfront premiums are presented here at market value. |
| 50 | Sanford C. Bernstein Fund, Inc. | |
Table of Contents
| C. | Foreign Currency Translation |
The accounting records of the Portfolios are maintained in U.S. dollars. Prices of securities and other assets and liabilities denominated in non-U.S. currencies are translated into U.S. dollars using the exchange rate at 4:00 p.m., Eastern Time. Amounts related to the purchases and sales of securities, investment income and expenses are translated at the rates of exchange prevailing on the respective dates of such transactions.
Net realized gain or loss on foreign currency transactions represents net foreign exchange gains or losses from the disposition of foreign currencies, currency gains or losses realized between the trade and settlement dates on security transactions and the difference between the amount of dividends, interest and foreign withholding taxes recorded on the Portfolios’ books and the U.S. dollar equivalent amount actually received or paid. Net unrealized currency gains and losses arising from valuing foreign currency denominated assets and liabilities, other than security investments, at the current exchange rate are reflected as part of unrealized appreciation/depreciation on foreign currencies.
The Portfolios do not isolate that portion of the results of operations arising as a result of changes in the foreign exchange rates from the changes in the market prices of securities held at period end. The Portfolios do isolate the effect of changes in foreign exchange rates from changes in market prices of securities sold during the year, as required by the Internal Revenue Code.
The Emerging Markets Portfolio, Intermediate Duration Portfolio and Short Duration Plus Portfolio may invest in foreign securities and foreign currency transactions that may involve risks not associated with domestic investments as a result of the level of governmental supervision and regulation of foreign securities markets and the possibility of political or economic instability, among others.
| D. | Taxes |
Each Portfolio is treated as a separate entity for federal income tax purposes. Each Portfolio intends to continue to comply with the requirements of Subchapter M of the Internal Revenue Code of 1986 as they apply to regulated investment companies. By so complying, each Portfolio will not be subject to federal and state income taxes to the extent that all of its income is distributed. The Portfolios may be subject to taxes imposed by countries in which they invest. Such taxes are generally based on income and/or capital gains earned or repatriated. Taxes are accrued and applied to net investment income, net realized gains and net unrealized appreciation/depreciation as such income and/or gains are earned based on management’s understanding of applicable local tax law.
In accordance with U.S. GAAP requirements regarding accounting for uncertainties in income taxes, management has analyzed the Portfolios’ tax positions taken or expected to be taken on federal and state income tax returns for all open tax years (the current and the prior three tax years) and has concluded that no provision for income tax is required in the Portfolios’ financial statements. As of September 30, 2020, the Portfolios did not have any unrecognized tax benefits.
| E. | Security Transactions and Related Investment Income |
Security transactions are accounted for on the trade date (the date the buy or sell order is executed). Securities gains and losses are calculated on the identified cost basis. Interest income is recorded on the accrual basis and dividend income is recorded on the ex-dividend date or as soon as the Portfolios are informed of the dividend. The Portfolios amortize premiums and accrete discounts as adjustments to interest income. The Portfolio accounts for distributions received from REIT investments or from regulated investment companies as dividend income, realized gain, or return of capital based on information provided by the REIT or the investment company.
| F. | Securities Transactions on a When-Issued or Delayed-Delivery Basis |
Each Portfolio may purchase securities on a when-issued basis or purchase or sell securities on a delayed-delivery basis. At the time a Portfolio commits to purchase a security on a when-issued or delayed-delivery basis, the Portfolio will record the transaction and use the security’s value in determining the Portfolio’s net asset value. At the time a Portfolio commits to sell a security on a delayed-delivery basis, the Portfolio will record the transaction and exclude the security’s value in determining the Portfolio’s net asset value.
2021 Semi-Annual Report | 51 | |
Table of Contents
Notes to Financial Statements (continued)
| G. | Class Allocations |
All income earned and expenses incurred by the Portfolios are borne on a pro-rata basis by each outstanding class of shares, based on the proportionate interest in the Portfolio represented by the shares of such class, except for class specific expenses which are allocated to the respective class. Expenses of the Fund are charged proportionately to each Portfolio or based on other appropriate methods. Realized and unrealized gains and losses are allocated among the various share classes based on respective net assets.
| H. | Distribution of Income and Gains |
Net investment income of each Portfolio except the Emerging Markets Portfolio is declared and recorded as a dividend to shareholders daily and is payable to shareholders monthly. Dividends from net investment income, if any, of the Emerging Markets Portfolio will be paid to shareholders at least once a year.
Distributions of net realized gains, less any available loss carryforwards, if any, for all the Portfolios will be paid to shareholders at least once a year, and recorded on the ex-dividend date.
Elements of realized gains and net investment income may be recorded in different accounting periods for financial reporting (book) and federal income tax (tax) purposes (temporary differences). To the extent that such distributions required for tax purposes exceed income and gains recorded for book purposes as a result of such temporary differences, “excess distributions” are reflected in the accompanying statement of assets and liabilities. To the extent distributions exceed income and gains for tax purposes, such distributions would be shown as “return of capital” on the statement of changes in net assets. Certain other differences—permanent differences—arise because treatment of elements of income and gains is different between book and tax accounting. Permanent differences are reclassified in the year they arise.
| NOTE 2. | Investment Management and Transactions with Affiliated Persons |
| A. | Management Fee |
Under the Investment Management Agreement between the Fund and the Adviser, the Adviser manages the investment of each Portfolio’s assets, places purchase and sale orders, and bears various expenses, including the salaries and expenses of all personnel except those of outside directors. In addition, the Adviser agrees to permit its directors, officers and employees who may be elected directors or officers of the Fund to serve in the capacities to which they are elected. The Adviser renders these services subject to the general oversight of the Board.
The Portfolios pay the Adviser an investment management fee, based on an annual rate, for such services as follows:
| ANNUAL PERCENTAGEOF AVERAGE DAILY NET ASSETSOF EACH PORTFOLIO | ||||||||||||||||||||
| PORTFOLIO | FIRST $2.5 BILLION | NEXT $2.5 BILLION | THEREAFTER | |||||||||||||||||
| Emerging Markets | 0.950 | % | 0.900 | % | 0.850 | % | ||||||||||||||
FIRST $750 MILLION | THEREAFTER | |||||||||||||||||||
| Short Duration Diversified Municipal | 0.300 | % | 0.250 | % | ||||||||||||||||
FIRST $1 BILLION | NEXT $2 BILLION | NEXT $2 BILLION | THEREAFTER | |||||||||||||||||
| California Municipal and New York Municipal | 0.425 | % | 0.375 | % | 0.325 | % | 0.275 | % | ||||||||||||
FIRST $1 BILLION | NEXT $2 BILLION | NEXT $2 BILLION | NEXT $2 BILLION | THEREAFTER | ||||||||||||||||
| Diversified Municipal | 0.425 | % | 0.375 | % | 0.325 | % | 0.275 | % | 0.225 | % | ||||||||||
FIRST $2.5 BILLION | NEXT $2.5 BILLION | NEXT $3 BILLION | THEREAFTER | |||||||||||||||||
| Intermediate Duration | 0.450 | % | 0.400 | % | 0.350 | % | 0.300 | % | ||||||||||||
FIRST $750 MILLION | THEREAFTER | |||||||||||||||||||
| Short Duration Plus | 0.350 | % | 0.300 | % | ||||||||||||||||
| 52 | Sanford C. Bernstein Fund, Inc. | |
Table of Contents
Effective January 28, 2021, the Adviser has agreed to waive its fees and bear certain expenses of the Intermediate Duration Portfolio to the extent necessary to limit the total other expenses (exclusive of advisory fees, distribution and/or service (Rule 12b-1) fees, extraordinary expenses, interest expense, acquired fund fees and expenses other than the advisory fees of any affiliated funds in which the Portfolio may invest, expenses associated with securities sold short, and brokerage commission and other transaction costs) to 0.22%, 0.22% and 0.13% for Class A, Advisor Class and Class Z shares, respectively. During the six months ended March 31, 2021, such reimbursements/waivers amounted to $1,577. The Expense Caps may not be terminated by the Adviser before January 28, 2022.
During the year ended September 30, 2020, the Adviser reimbursed the Emerging Markets Portfolio $14,178 for trading losses incurred due to trade entry errors.
During the second quarter of 2018, AXA S.A. (“AXA”), a French holding company for the AXA Group, completed the sale of a minority stake in its subsidiary, AXA Equitable Holdings, Inc. (now named Equitable Holdings, Inc.) (“Equitable”), through an initial public offering. Equitable is the holding company for a diverse group of financial services companies, including an approximate 65% economic interest in the Adviser and a 100% interest in AllianceBernstein Corporation, the general partner of the Adviser. Since the initial sale, AXA has completed additional offerings (and related transactions). As a result, as of May 20, 2021, AXA no longer owns shares of Equitable.
Sales that were completed on November 13, 2019 resulted in the indirect transfer of a “controlling block” of voting securities of the Adviser (a “Change of Control Event”) and may have been deemed to have been an “assignment” causing a termination of the Portfolios’ investment advisory and administration agreements. In order to ensure that investment advisory and administration services could continue uninterrupted in the event of a Change of Control Event, the Board previously approved new investment advisory and administration agreements with the Adviser, and shareholders of the Portfolios subsequently approved the new investment advisory agreement. These agreements became effective on November 13, 2019.
| B. | Shareholder Servicing Fee; Transfer Agency Fee |
Under the Shareholder Servicing Agreement between the Fund and the Adviser, the Adviser pays expenses it incurs in providing shareholder servicing to the Fund, the Portfolios and individual shareholders. The Shareholder Servicing Agreement does not apply to the Retail Classes. Such services include, but are not limited to, providing information to shareholders concerning their fund investments, systematic withdrawal plans, fund dividend payments and reinvestments, shareholder account or transactions status, net asset value of shares, fund performance, fund services, plans and options, fund investment policies, portfolio holdings and tax consequences of fund investments; dealing with shareholder complaints and other correspondence relating to fund matters; and communications with shareholders when proxies are being solicited from them with respect to voting their fund shares. Under the agreement, the fee paid by each Portfolio, except the Emerging Markets Portfolio, to the Adviser for services is 0.10 of 1%, annualized, of the average daily net assets attributable to the Bernstein Class during the month, and the fee paid by the Emerging Markets Portfolio for services is 0.25 of 1%, annualized, of the average daily net assets attributable to the Bernstein Class during the month. Effective November 13, 2020, the Adviser voluntarily agreed to waive the shareholder servicing fee of 0.10 of 1%, annualized, of the average daily net assets attributable to the Bernstein Class of the Short Duration Diversified Municipal Portfolio and the Short Duration Plus Portfolio. For the six months ended March 31, 2021, such waivers amounted to:
| PORTFOLIO | AMOUNT | |||
Short Duration Diversified Municipal | $ | 84,629 | ||
Short Duration Plus | 91,375 | |||
Under a Transfer Agency Agreement between the Fund on behalf of the Retail Classes, and AllianceBernstein Investor Services, Inc. (“ABIS”), the Retail Classes compensate ABIS, a wholly owned subsidiary of the Adviser, for providing personnel and facilities to perform transfer agency services. ABIS may make payments to intermediaries that provide omnibus account services, sub accounting services and/or networking services. For the six months ended March 31, 2021, the compensation retained by ABIS amounted to: Emerging Markets Portfolio, $21,368; California Municipal Portfolio, $9,061; Diversified Municipal Portfolio, $78,420; New York Municipal Portfolio, $10,191; Intermediate Duration Portfolio $7,589 and Short Duration Plus Portfolio, $8,709.
2021 Semi-Annual Report | 53 | |
Table of Contents
Notes to Financial Statements (continued)
| C. | Distribution Arrangements—the Portfolios Except the Retail Classes |
Under the Distribution Agreement between the Fund, on behalf of each Portfolio, and Sanford C. Bernstein & Co., LLC (the “Distributor”), the Distributor agrees to act as agent to sell shares of the SCB Portfolios. The Distributor receives no fee for this service, and furthermore agrees to pay all expenses arising from the performance of its obligations under this agreement. The Distributor is a wholly owned subsidiary of the Adviser.
| D. | Distribution Arrangements—the Retail Classes Only |
The Retail Classes of the Intermediate Municipal Portfolios and the Fixed Income Taxable Portfolios have adopted a Distribution Services Agreement (the “Agreement”), including a distribution plan pursuant to Rule 12b-1 under the Investment Company Act of 1940. Under the Agreement, each of the Retail Classes pays distribution services fees to AllianceBernstein Investments, Inc., (the “Retail Distributor”), a wholly owned subsidiary of the Adviser, at an annual rate of up to 0.30 of 1% of the Class A Shares, and 1% of the Class C Shares of the respective average daily net assets attributable to the Retail Classes. Payments under the Agreement in respect of Class A shares are currently limited to an annual rate of 0.25 of 1% of Class A shares’ average daily net assets. With respect to the Short Duration Plus Portfolio, effective April 1, 2012, the Retail Distributor voluntarily agreed to waive 0.55 of 1% to limit distribution service fees for Short Duration Plus Portfolio to 0.45 of 1% of the average daily net assets attributable to the Class C Shares. The fees are accrued daily and paid monthly. For the six months ended March 31, 2021, such waiver amounted to $7,261. The Agreement provides that the Retail Distributor will use such payments in their entirety for distribution assistance and promotional activities. The Retail Distributor has advised the Fund, that it has incurred expenses in excess of the distribution costs reimbursed by each of the Retail Classes as follows:
| PORTFOLIO | ||||||||||||||||
| CALIFORNIA MUNICIPAL | DIVERSIFIED MUNICIPAL | NEW YORK MUNICIPAL | SHORT DURATION PLUS | |||||||||||||
Class C | $ | 1,336,772 | $ | 3,270,231 | $ | 2,406,949 | $ | 1,031,965 | ||||||||
There are no distribution and servicing fees on the Advisor Class and Class Z Shares.
While such costs may be recovered from each Portfolio in future periods so long as the Agreement is in effect, the rate of the distribution and servicing fees payable under the Agreement may not be increased without a shareholder vote. In accordance with the Agreement, there is no provision for recovery of unreimbursed distribution costs incurred by the Retail Distributor beyond the current fiscal year for Class A shares. The Agreement also provides that the Adviser may use its own resources to finance the distribution of each Portfolio’s shares.
| E. | Investments in Affiliated Issuers |
The Emerging Markets Portfolio and the Short Duration Diversified Municipal Portfolio may invest in AB Government Money Market Portfolio (the “Government Money Market Portfolio”), advised by the Adviser, which has a contractual annual advisory fee rate of .20% of the portfolio’s average daily net assets and bears its own expenses. The Adviser has contractually agreed to waive .10% of the advisory fee of Government Money Market Portfolio (resulting in a net advisory fee of .10%) until August 31, 2021. In connection with the investment by the Portfolios in Government Money Market Portfolio, the Adviser has contractually agreed to waive its advisory fee from the Portfolios in an amount equal to each Portfolio’s pro rata share of the effective advisory fee of Government Money Market Portfolio, as borne indirectly by the Portfolios as an acquired fund fee and expense. For the six months ended March 31, 2021, such waivers amounted to:
| PORTFOLIO | AMOUNT | |||
Emerging Markets | $ | 8,774 | ||
Short Duration Diversified Municipal | 3,521 | |||
| 54 | Sanford C. Bernstein Fund, Inc. | |
Table of Contents
A summary of the Portfolios’ transactions in shares of the Government Money Market Portfolio for the six months ended March 31, 2021 is as follows:
| PORTFOLIO | MARKET VALUE 9/30/20 (000) | PURCHASES AT COST (000) | SALES PROCEEDS (000) | MARKET VALUE 3/31/21 (000) | DIVIDEND INCOME (000) | |||||||||||||||
Emerging Markets | $ | 28,862 | $ | 218,707 | $ | 238,398 | $ | 9,171 | $ | 3 | ||||||||||
Short Duration Diversified Municipal | 5,849 | 73,201 | 70,335 | 8,715 | 1 | |||||||||||||||
| F. | Other Transactions with Affiliates |
Class A Shares of the Retail Classes are sold with a front-end sales charge of up to 4.25% for purchases not exceeding $1,000,000. Effective October 1, 2009, the Intermediate Municipal Portfolios Class A shares are sold with a reduced front-end sales charge of up to 3.00% for purchases up to $500,000; purchases of $500,000 or more will not be subject to a sales charge. With respect to purchases of $1,000,000 or more ($500,000 or more with respect to the Intermediate Municipal Portfolios effective October 1, 2009), Class A Shares redeemed within one year of purchase may be subject to a contingent deferred sales charge of 1%. Effective August 2, 2019, sales of Class B shares were suspended. On November 7, 2019, all remaining outstanding Class B shares of the Fund were converted to Class A shares.
Class C Shares are subject to a contingent deferred sales charge of 1% on redemptions made within the first year after purchase, and 0% after the first year of purchase. Class C shares will automatically convert to Class A shares ten years after the end of the calendar month of purchase.
AllianceBernstein Investments, Inc. has advised the Fund, that it has retained front-end sales charges from sales of Class A Shares and received contingent deferred sales charges imposed upon redemptions by shareholders of Class A and Class C Shares for the six months ended March 31, 2021, as follows:
| PORTFOLIO | FRONT-END CLASS A | CONTINGENT DEFERRED SALES CHARGES | ||||||||||
| CLASS A | CLASS C | |||||||||||
California Municipal | $ | 20 | $ | 0 | $ | 0 | ||||||
Diversified Municipal | 0 | 22,604 | 305 | |||||||||
New York Municipal | 0 | 4,815 | 8 | |||||||||
Intermediate Duration | 7 | 0 | N/A | |||||||||
Short Duration Plus | 346 | 74 | 0 | |||||||||
| NOTE 3. | Investment Security Transactions |
| A. | Purchases and Sales |
For the six months ended March 31, 2021, the Portfolios had purchases and sales transactions, excluding transactions in short-term instruments, as follows:
| PORTFOLIO | PURCHASES EXCLUDING U.S. GOVERNMENT SECURITIES | PURCHASESOF U.S. GOVERNMENT SECURITIES | SALES EXCLUDING U.S. GOVERNMENT SECURITIES | SALESOF U.S. GOVERNMENT SECURITIES | ||||||||||||
Emerging Markets | $ | 556,987,406 | $ | 0 | $ | 610,025,684 | $ | 0 | ||||||||
Short Duration Diversified Municipal | 55,434,956 | 0 | 26,318,768 | 2,955,320 | ||||||||||||
California Municipal | 211,094,148 | 0 | 205,692,439 | 0 | ||||||||||||
Diversified Municipal | 1,020,375,564 | 43,817,771 | 795,570,385 | 115,115,692 | ||||||||||||
New York Municipal | 225,238,948 | 9,760,156 | 229,878,359 | 12,836,832 | ||||||||||||
Intermediate Duration | 719,184,018 | 1,932,137,910 | 650,216,364 | 1,621,903,202 | ||||||||||||
Short Duration Plus | 27,616,527 | 34,005,657 | 7,990,671 | 62,436,226 | ||||||||||||
2021 Semi-Annual Report | 55 | |
Table of Contents
Notes to Financial Statements (continued)
The cost of investments for federal income tax purposes was substantially the same as the cost for financial reporting purposes. Accordingly, gross unrealized appreciation and unrealized depreciation are as follows:
PORTFOLIO | GROSS UNREALIZED | NET UNREALIZED (DEPRECIATION) | ||||||||||
| APPRECIATION | (DEPRECIATION) | |||||||||||
Emerging Markets | $ | 356,382,992 | $ | (27,088,249 | ) | $ | 329,294,743 | |||||
Short Duration Diversified Municipal | 3,158,654 | (163,902 | ) | 2,994,752 | ||||||||
California Municipal | 63,379,665 | (4,507,663 | ) | 58,872,002 | ||||||||
Diversified Municipal | 341,831,671 | (16,965,692 | ) | 324,865,979 | ||||||||
New York Municipal | 82,692,623 | (4,208,459 | ) | 78,484,164 | ||||||||
Intermediate Duration | 135,439,183 | (77,149,366 | ) | 58,289,817 | ||||||||
Short Duration Plus | 1,843,717 | (1,628,182 | ) | 215,535 | ||||||||
| B. | Derivative Financial Instruments |
Each Portfolio may use derivatives in an effort to earn income and enhance returns, to replace more traditional direct investments, to obtain exposure to otherwise inaccessible markets (collectively, “investment purposes”), or to hedge or adjust the risk profile of its portfolio.
The principal types of derivatives utilized by the Portfolios, as well as the methods in which they may be used are:
| • | Futures |
Each Portfolio may buy or sell futures for investment purposes or for the purpose of hedging its portfolio against adverse effects of potential movements in the market. The Portfolios bear the market risk that arises from changes in the value of these instruments and the imperfect correlation between movements in the price of the futures and movements in the price of the assets, reference rates or indices which they are designed to track. Among other things, the Portfolios may purchase or sell futures for foreign currencies or options thereon for non-hedging purposes as a means of making direct investment in foreign currencies, as described below under “Currency Transactions”.
At the time a Portfolio enters into futures, a Portfolio deposits and maintains as collateral an initial margin with the broker, as required by the exchange on which the transaction is effected. Such amount is shown as cash collateral due from broker on the statement of assets and liabilities. Pursuant to the contract, the Portfolios agree to receive from or pay to the broker an amount of cash equal to the daily fluctuation in the value of the contract. Such receipts or payments are known as variation margin and are recorded by the Portfolios as unrealized gains or losses. Risks may arise from the potential inability of a counterparty to meet the terms of the contract. The credit/counterparty risk for exchange-traded futures is generally less than privately negotiated futures, since the clearinghouse, which is the issuer or counterparty to each exchange-traded future, has robust risk mitigation standards, including the requirement to provide initial and variation margin. When the contract is closed, the Portfolios record a realized gain or loss equal to the difference between the value of the contract at the time it was opened and the time it was closed.
Use of long futures subjects the Portfolios to risk of loss in excess of the amounts shown on the statement of assets and liabilities, up to the notional value of the futures. Use of short futures subjects the Portfolios to unlimited risk of loss. Each Portfolio may enter into futures only on exchanges or boards of trade. The exchange or board of trade acts as the counterparty to each futures transactions; therefore, the Portfolios’ credit risk is subject to failure of the exchange or board of trade. Under some circumstances, futures exchanges may establish daily limits on the amount that the price of futures can vary from the previous day’s settlement price, which could effectively prevent liquidation of unfavorable positions.
During the six months ended March 31, 2021, the Intermediate Duration Portfolio and Short Duration Plus Portfolio held futures for hedging and non-hedging purposes.
| • | Forward Currency Exchange Contracts |
The Emerging Markets Portfolio, Intermediate Duration Portfolio and Short Duration Plus Portfolio may enter into forward currency exchange contracts on either a spot (i.e., cash) or forward basis. Spot contracts are entered into at
| 56 | Sanford C. Bernstein Fund, Inc. | |
Table of Contents
the rate then prevailing in the currency-exchange market. Forward currency exchange contracts obligate the contracting parties to purchase or sell a specific currency at a specified future date at a specified price. The Portfolios will generally not enter into a forward currency exchange contract with a term greater than one year. The gain or loss arising from the difference between the original contract and the closing of such contract would be included in net realized gain or loss on foreign currency transactions. Fluctuations in the value of open forward currency exchange contracts are recorded for financial reporting purposes as unrealized appreciation and/or depreciation by the Portfolio. Risks may arise from the potential inability of a counterparty to meet the terms of a contract and from unanticipated movements in the value of a foreign currency relative to the U.S. dollar.
Forward currency exchange contracts used to protect the Portfolios from adverse currency movements involve the risk that the Adviser may not accurately predict currency movements. As a result, total return could be adversely affected. The Adviser may seek investment opportunities by taking long or short positions in currencies through the use of currency-related derivatives, including forward currency exchange contracts, futures and options on futures, swaps and other options. The Adviser may enter into foreign currency transactions for investment opportunities when it anticipates that a foreign currency will appreciate or depreciate in value.
Under certain circumstances, the Non-U.S. stock portfolios may commit a substantial portion or the entire value of the Portfolios to the consummation of these contracts. The Adviser will consider the effect that a substantial commitment of assets to forward currency exchange contracts would have on the investment program of the Portfolios and the flexibility of the Portfolios to purchase additional securities.
During the six months ended March 31, 2021, the Emerging Markets Portfolio held forward currency exchange contracts for hedging purposes and the Intermediate Duration Portfolio held forward currency exchange contracts for hedging and non-hedging purposes.
| • | Option Transactions |
For hedging and investment purposes, each Portfolio may purchase and write (sell) put and call options on U.S. and foreign securities, including government securities, and foreign currencies that are traded on U.S. and foreign securities exchanges and over-the-counter markets. Among other things, certain Portfolios may use options transactions for non-hedging purposes as a means of making direct investments in foreign currencies, as described below under “Currency Transactions” and may use options strategies involving the purchase and/or writing of various combinations of call and/or put options, for hedging and investment purposes.
The risk associated with purchasing an option is that the Portfolios pay a premium whether or not the option is exercised. Additionally, the Portfolios bear the risk of loss of the premium and change in market value should the counterparty not perform under the contract. If a put or call option purchased by the Portfolios were permitted to expire without being sold or exercised, its premium would represent a loss to the Portfolios. Put and call options purchased are accounted for in the same manner as portfolio securities. The cost of securities acquired through the exercise of call options is increased by premiums paid. The proceeds from securities sold through the exercise of put options are decreased by the premiums paid.
When a Portfolio writes an option, the premium received by the Portfolio is recorded as a liability and is subsequently adjusted to the current market value of the option written. The Portfolios’ maximum payment for written put options equates to the number of shares multiplied by the strike price. In certain circumstances maximum payout amounts may be partially offset by recovery values of the respective referenced assets and upfront premium received upon entering into the contract. Premiums received from written options which expire unexercised are recorded by the Portfolios on the expiration date as realized gains from options written. The difference between the premium received and the amount paid on effecting a closing purchase transaction, including brokerage commissions, is also treated as a realized gain, or if the premium received is less than the amount paid for the closing purchase transaction, as a realized loss. If a call option is exercised, the premium received is added to the proceeds from the sale of the underlying security or currency in determining whether the Portfolios have realized a gain or loss. If a put option is exercised, the premium received reduces the cost basis of the security or currency purchased by the Portfolios. In writing an option, the Portfolios bear the market risk of an unfavorable change in the price of the security or currency underlying the written option. Exercise of an option written by the Portfolios could result in the Portfolios selling or buying a security or currency at a price different from the current market value.
2021 Semi-Annual Report | 57 | |
Table of Contents
Notes to Financial Statements (continued)
A Portfolio may also invest in options on swap agreements, also called “swaptions”. A swaption is an option that gives the buyer the right, but not the obligation, to enter into a swap on a future date in exchange for paying a market-based “premium”. A receiver swaption gives the owner the right to receive the total return of a specified asset, reference rate, or index. A payer swaption gives the owner the right to pay the total return on a specified asset, reference rate, or index. Swaptions also include options that allow an existing swap to be terminated or extended by one of the counterparties.
During the six months ended March 31, 2021, the Intermediate Duration Portfolio held written swaptions for hedging and non-hedging purposes.
| • | Swaps |
The Portfolios may enter into swaps to hedge their exposure to interest rates, credit risk, or currencies. Certain Portfolios may also enter into swaps for non-hedging purposes as a means of gaining market exposures, including by making direct investments in foreign currencies, as described below under “Currency Transactions.” A swap is an agreement that obligates two parties to exchange a series of cash flows at specified intervals based upon or calculated by reference to changes in specified prices or rates for a specified amount of an underlying asset. The payment flows are usually netted against each other, with the difference being paid by one party to the other. In addition, collateral may be pledged or received by the Portfolios in accordance with the terms of the respective swaps to provide value and recourse to the Portfolios or their counterparties in the event of default, bankruptcy or insolvency by one of the parties to the swap.
Risks may arise as a result of the failure of the counterparty to the swap to comply with the terms of the swap. The loss incurred by the failure of a counterparty is generally limited to the net interim payment to be received by the Portfolios, and/or the termination value at the end of the contract. Therefore, the Portfolios consider the creditworthiness of each counterparty to a swap in evaluating potential counterparty risk. This risk is mitigated by having a netting arrangement between the Portfolios and the counterparty and by the posting of collateral by the counterparty to the Portfolios to cover the Portfolios’ exposure to the counterparty. Additionally, risks may arise from unanticipated movements in interest rates or in the value of the underlying securities. The Portfolios accrue for the interim payments on swaps on a daily basis, with the net amount recorded within unrealized appreciation/depreciation of swaps on the statement of assets and liabilities, where applicable. Once the interim payments are settled in cash, the net amount is recorded as realized gain/(loss) on swaps on the statement of operations, in addition to any realized gain/(loss) recorded upon the termination of swaps. Upfront premiums paid or received for OTC swaps are recognized as cost or proceeds on the statement of assets and liabilities and are amortized on a straight line basis over the life of the contract. Amortized upfront premiums are included in net realized gain/(loss) from swaps on the statement of operations. Fluctuations in the value of swaps are recorded as a component of net change in unrealized appreciation/depreciation of swaps on the statement of operations.
Certain standardized swaps, including certain interest rate swaps and credit default swaps are (or soon will be) subject to mandatory central clearing. Cleared swaps are transacted through futures commission merchants (“FCMs”) that are members of central clearinghouses, with the clearinghouse serving as central counterparty, similar to transactions in futures contracts. Centralized clearing will be required for additional categories of swaps on a phased-in basis based on requirements published by the Securities and Exchange Commission and Commodity Futures Trading Commission.
At the time the Portfolios enter into a centrally cleared swap, the Portfolios deposit and maintain as collateral an initial margin with the broker, as required by the clearinghouse on which the transaction is effected. Such amount is shown as cash collateral due from broker on the statement of assets and liabilities. Pursuant to the contract, the Portfolios agree to receive from or pay to the broker an amount of cash equal to the daily fluctuation in the value of the contract. Such receipts or payments are known as variation margin and are recorded by the Portfolios as unrealized gains or losses. Risks may arise from the potential inability of a counterparty to meet the terms of the contract. The credit/counterparty risk for centrally cleared swaps is generally less than non-centrally cleared swaps, since the clearinghouse, which is the issuer or counterparty to each centrally cleared swap, has robust risk mitigation standards, including the requirement to provide initial and variation margin. When the contract is closed, the Portfolios record a realized gain or loss equal to the difference between the value of the contract at the time it was opened and the time it was closed.
Interest Rate Swaps:
The Portfolios are subject to interest rate risk exposure in the normal course of pursuing its investment objectives. Because the Portfolios hold fixed rate bonds, the value of these bonds may decrease if interest rates rise. To help hedge against this risk and to maintain its ability to generate income at prevailing market rates, the Portfolios may enter into
| 58 | Sanford C. Bernstein Fund, Inc. | |
Table of Contents
interest rate swaps. Interest rate swaps are agreements between two parties to exchange cash flows based on a notional amount. The Portfolios may elect to pay a fixed rate and receive a floating rate, or receive a fixed rate and pay a floating rate on a notional amount.
In addition, a Portfolio may also enter into interest rate swap transactions to preserve a return or spread on a particular investment or portion of its portfolio, or protecting against an increase in the price of securities the Portfolio anticipates purchasing at a later date. Interest rate swaps involve the exchange by a Portfolio with another party of their respective commitments to pay or receive interest (e.g., an exchange of floating rate payments for fixed rate payments) computed based on a contractually-based principal (or “notional”) amount. Interest rate swaps are entered into on a net basis (i.e., the two payment streams are netted out, with the Portfolio receiving or paying, as the case may be, only the net amount of the two payments).
During the six months ended March 31, 2021, the Short Duration Diversified Municipal Portfolio, California Municipal Portfolio, Diversified Municipal Portfolio and New York Municipal Portfolio held interest rate swaps for hedging purposes and the Intermediate Duration Portfolio held interest rate swaps for hedging and non-hedging purposes.
Inflation (CPI) Swaps:
Inflation swap agreements are contracts in which one party agrees to pay the cumulative percentage increase in a price index (the Consumer Price Index with respect to CPI swaps) over the term of the swap (with some lag on the inflation index), and the other pays a compounded fixed rate. Inflation swaps may be used to protect the net asset value, or NAV, of a Portfolio against an unexpected change in the rate of inflation measured by an inflation index since the value of these agreements is expected to increase if there are unexpected inflation increases.
During the six months ended March 31, 2021, the California Municipal Portfolio, Diversified Municipal Portfolio and New York Municipal Portfolio held inflation (CPI) swaps for hedging purposes.
Credit Default Swaps:
The Fixed-Income Portfolios may enter into credit default swaps for multiple reasons, including to manage their exposure to the market or certain sectors of the market, to reduce their risk exposure to defaults by corporate and sovereign issuers held by the Portfolios, or to create exposure to corporate or sovereign issuers to which they are not otherwise exposed. The Portfolios may purchase credit protection (“Buy Contract”) or provide credit protection (“Sale Contract”) on the referenced obligation of the credit default swap. During the term of the swap, the Portfolios receive/(pay) fixed payments from/(to) the respective counterparty, calculated at the agreed upon rate applied to the notional amount. If the Portfolio is a buyer/(seller) of protection and a credit event occurs, as defined under the terms of the swap, the Portfolios will either (i) receive from the seller/(pay to the buyer) of protection an amount equal to the notional amount of the swap (the “Maximum Payout Amount”) and deliver/(take delivery of) the referenced obligation or (ii) receive/(pay) a net settlement amount in the form of cash or securities equal to the notional amount of the swap less the recovery value of the referenced obligation. In certain circumstances Maximum Payout Amounts may be partially offset by recovery values of the respective referenced obligations, upfront premium received upon entering into the agreement, or net amounts received from settlement of buy protection credit default swaps entered into by the Portfolios for the same referenced obligations with the same counterparty.
Credit default swaps may involve greater risks than if a Portfolio had invested in the referenced obligation directly. Credit default swaps are subject to general market risk, liquidity risk, counterparty risk and credit risk. If a Portfolio is a buyer of protection and no credit event occurs, it will lose the payments it made to its counterparty. If a Portfolio is a seller of protection and a credit event occurs, the value of the referenced obligation received by the Portfolio coupled with the periodic payments previously received, may be less than the Maximum Payout Amount it pays to the buyer, resulting in a net loss to the Portfolio.
Implied credit spreads over U.S. Treasuries of comparable maturity utilized in determining the market value of credit default swaps on issuers as of period end are disclosed in the schedule of investments. The implied spreads serve as an indicator of the current status of the payment/performance risk and typically reflect the market’s assessment of the likelihood of default by the issuer of the referenced obligation. The implied credit spread of a particular reference obligation also reflects the cost of buying/selling protection and may include upfront payments required to be made to enter into the agreement. Widening credit spreads typically represent a deterioration of the referenced obligation’s credit soundness and greater likelihood of default or other credit event occurring as defined under the terms of the agreement. A credit spread identified as “Defaulted” indicates a credit event has occurred for the referenced obligation.
2021 Semi-Annual Report | 59 | |
Table of Contents
Notes to Financial Statements (continued)
During the six months ended March 31, 2021, the California Municipal Portfolio, Diversified Municipal Portfolio, New York Municipal Portfolio, Intermediate Duration Portfolio and Short Duration Plus Portfolio held credit default swaps for hedging and non-hedging purposes.
A Portfolio typically enters into International Swaps and Derivatives Association, Inc. Master Agreements (“ISDA Master Agreement”) with its OTC derivative contract counterparties in order to, among other things, reduce its credit risk to OTC counterparties. ISDA Master Agreements include provisions for general obligations, representations, collateral and events of default or termination. Under an ISDA Master Agreement, a Portfolio typically may offset with the OTC counterparty certain derivative financial instruments’ payables and/or receivables with collateral held and/or posted and create one single net payment (close-out netting) in the event of default or termination. In the event of a default by an OTC counterparty, the return of collateral with market value in excess of a Portfolio’s net liability, held by the defaulting party, may be delayed or denied.
A Portfolio’s ISDA Master Agreements may contain provisions for early termination of OTC derivative transactions in the event the net assets of a Portfolio decline below specific levels (“net asset contingent features”). If these levels are triggered, a Portfolio’s OTC counterparty has the right to terminate such transaction and require the Portfolio to pay or receive a settlement amount in connection with the terminated transaction. If OTC derivatives were held at period end, please refer to netting arrangements by the OTC counterparty tables below for additional details.
During the six months ended March 31, 2021, the Portfolios had entered into the following derivatives:
| EMERGING MARKETS PORTFOLIO | ASSET DERIVATIVES | LIABILITY DERIVATIVES | ||||||||||
| DERIVATIVE TYPE | STATEMENTOF ASSETS AND LIABILITIES LOCATION | FAIR VALUE | STATEMENTOF ASSETS AND LIABILITIES LOCATION | FAIR VALUE | ||||||||
Foreign currency contracts | Unrealized appreciation on forward currency exchange contracts | $ | 3,756,279 | Unrealized depreciation on forward currency exchange contracts | $ | 2,662,042 | ||||||
Total | $ | 3,756,279 | $ | 2,662,042 | ||||||||
| DERIVATIVE TYPE | LOCATION OF GAIN OR (LOSS) ON DERIVATIVES WITHIN STATEMENT OF OPERATIONS | REALIZED GAIN OR (LOSS)ON DERIVATIVES | CHANGE IN UNREALIZED APPRECIATION OR (DEPRECIATION) | |||||||
Foreign exchange contracts | Net realized gain (loss) on forward currency exchange contracts; Net change in unrealized appreciation/depreciation of forward currency exchange contracts | $ | 5,492,689 | $ | (756,090 | ) | ||||
Total | $ | 5,492,689 | $ | (756,090 | ) | |||||
| SHORT DURATION DIVERSIFIED MUNICIPAL PORTFOLIO | ASSET DERIVATIVES | LIABILITY DERIVATIVES | ||||||||||
| DERIVATIVE TYPE | STATEMENTOF ASSETS AND LIABILITIES LOCATION | FAIR VALUE | STATEMENTOF ASSETS AND LIABILITIES LOCATION | FAIR VALUE | ||||||||
Interest rate contracts | Receivable/Payable for variation margin on centrally cleared swaps | $ | 206,826 | * | Receivable/Payable for variation margin on centrally cleared swaps | $ | 19,109 | * | ||||
Interest rate contracts | Unrealized appreciation on interest rate swaps | 3,006 | ||||||||||
Total | $ | 209,832 | $ | 19,109 | ||||||||
| * | Only variation margin receivable/payable at period end is reported within the statement of assets and liabilities. This amount reflects cumulative unrealized appreciation/(depreciation) on futures and centrally cleared swaps as reported in the schedule of investments. |
| 60 | Sanford C. Bernstein Fund, Inc. | |
Table of Contents
| DERIVATIVE TYPE | LOCATION OF GAIN OR (LOSS) ON DERIVATIVES WITHIN STATEMENT OF OPERATIONS | REALIZED GAIN OR (LOSS)ON DERIVATIVES | CHANGE IN UNREALIZED APPRECIATION OR (DEPRECIATION) | |||||||
Interest rate contracts | Net realized gain (loss) on swaps; Net change in unrealized appreciation/depreciation of swaps | $ | 63,033 | $ | 116,304 | |||||
Total | $ | 63,033 | $ | 116,304 | ||||||
| CALIFORNIA MUNICIPAL PORTFOLIO | ASSET DERIVATIVES | LIABILITY DERIVATIVES | ||||||||||
| DERIVATIVE TYPE | STATEMENTOF ASSETS AND LIABILITIES LOCATION | FAIR VALUE | STATEMENTOF ASSETS AND LIABILITIES LOCATION | FAIR VALUE | ||||||||
Interest rate contracts | Receivable/Payable for variation margin on centrally cleared swaps | $ | 6,273,824 | * | Receivable/Payable for variation margin on centrally cleared swaps | $ | 1,244,346 | * | ||||
Interest rate contracts | Unrealized appreciation on interest rate swaps | 64,229 | ||||||||||
Credit contracts | Market value on credit default swaps | 1,274,193 | ||||||||||
Total | $ | 6,338,053 | $ | 2,518,539 | ||||||||
| * | Only variation margin receivable/payable at period end is reported within the statement of assets and liabilities. This amount reflects cumulative unrealized appreciation/(depreciation) on futures and centrally cleared swaps as reported in the schedule of investments. |
| DERIVATIVE TYPE | LOCATION OF GAIN OR (LOSS) ON DERIVATIVES WITHIN STATEMENT OF OPERATIONS | REALIZED GAIN OR (LOSS)ON DERIVATIVES | CHANGE IN UNREALIZED APPRECIATION OR (DEPRECIATION) | |||||||
Interest rate contracts | Net realized gain (loss) on swaps; Net change in unrealized appreciation/depreciation of swaps | $ | 140,956 | $ | 4,127,250 | |||||
Credit contracts | Net realized gain (loss) on swaps; Net change in unrealized appreciation/depreciation of swaps | 76,915 | 297,727 | |||||||
Total | $ | 217,871 | $ | 4,424,977 | ||||||
| DIVERSIFIED MUNICIPAL PORTFOLIO | ASSET DERIVATIVES | LIABILITY DERIVATIVES | ||||||||||
| DERIVATIVE TYPE | STATEMENTOF ASSETS AND LIABILITIES LOCATION | FAIR VALUE | STATEMENTOF ASSETS AND LIABILITIES LOCATION | FAIR VALUE | ||||||||
Interest rate contracts | Receivable/Payable for variation margin on centrally cleared swaps | $ | 26,187,719 | * | Receivable/Payable for variation margin on centrally cleared swaps | $ | 2,532,982 | * | ||||
Interest rate contracts | Unrealized appreciation on interest rate swaps | 296,193 | ||||||||||
Credit contracts | Market value on credit default swaps | 5,327,097 | ||||||||||
Total | $ | 26,483,912 | $ | 7,860,079 | ||||||||
| * | Only variation margin receivable/payable at period end is reported within the statement of assets and liabilities. This amount reflects cumulative unrealized appreciation/(depreciation) on futures and centrally cleared swaps as reported in the schedule of investments. |
2021 Semi-Annual Report | 61 | |
Table of Contents
Notes to Financial Statements (continued)
| DERIVATIVE TYPE | LOCATION OF GAIN OR (LOSS) ON DERIVATIVES WITHIN STATEMENT OF OPERATIONS | REALIZED GAIN OR (LOSS)ON DERIVATIVES | CHANGE IN UNREALIZED APPRECIATION OR (DEPRECIATION) | |||||||
Interest rate contracts | Net realized gain (loss) on swaps; Net change in unrealized appreciation/depreciation of swaps | $ | 5,634,716 | $ | 12,838,723 | |||||
Credit contracts | Net realized gain (loss) on swaps; Net change in unrealized appreciation/depreciation of swaps | 321,210 | 1,245,075 | |||||||
Total | $ | 5,955,926 | $ | 14,083,798 | ||||||
| NEW YORK MUNICIPAL PORTFOLIO | ASSET DERIVATIVES | LIABILITY DERIVATIVES | ||||||||||
| DERIVATIVE TYPE | STATEMENTOF ASSETS AND LIABILITIES LOCATION | FAIR VALUE | STATEMENT OF ASSETS AND LIABILITIES LOCATION | FAIR VALUE | ||||||||
Interest rate contracts | Receivable/Payable for variation margin on centrally cleared swaps | $ | 6,902,050 | * | Receivable/Payable for variation margin on centrally cleared swaps | $ | 970,730 | * | ||||
Interest rate contracts | Unrealized appreciation on interest rate swaps | 87,987 | ||||||||||
Credit contracts | Market value on credit default swaps | 1,779,292 | ||||||||||
Total | $ | 6,990,037 | $ | 2,750,022 | ||||||||
| * | Only variation margin receivable/payable at period end is reported within the statement of assets and liabilities. This amount reflects cumulative unrealized appreciation/(depreciation) on futures and centrally cleared swaps as reported in the schedule of investments. |
| DERIVATIVE TYPE | LOCATION OF GAIN OR (LOSS) ON DERIVATIVES WITHIN STATEMENT OF OPERATIONS | REALIZED GAIN OR (LOSS)ON DERIVATIVES | CHANGE IN UNREALIZED APPRECIATION OR (DEPRECIATION) | |||||||
Interest rate contracts | Net realized gain (loss) on swaps; Net change in unrealized appreciation/depreciation of swaps | $ | 2,237,734 | $ | 2,200,314 | |||||
Credit contracts | Net realized gain (loss) on swaps; Net change in unrealized appreciation/depreciation of swaps | 107,287 | 415,865 | |||||||
Total | $ | 2,345,021 | $ | 2,616,179 | ||||||
| 62 | Sanford C. Bernstein Fund, Inc. | |
Table of Contents
| INTERMEDIATE DURATION PORTFOLIO | ASSET DERIVATIVES | LIABILITY DERIVATIVES | ||||||||||
| DERIVATIVE TYPE | STATEMENTOF ASSETS AND LIABILITIES LOCATION | FAIR VALUE | STATEMENTOF ASSETS AND LIABILITIES LOCATION | FAIR VALUE | ||||||||
Interest rate contracts | Receivable/Payable for variation margin on futures | $ | 1,973,670 | * | Receivable/Payable for variation margin on futures | $ | 4,453,687 | * | ||||
Interest rate contracts | Receivable/Payable for variation margin on centrally cleared swaps | 5,323,424 | * | Receivable/Payable for variation margin on centrally cleared swaps | 6,131,039 | * | ||||||
Foreign currency contracts | Unrealized appreciation on forward currency exchange contracts | 7,339,067 | Unrealized depreciation on forward currency exchange contracts | 7,440,310 | ||||||||
Credit contracts | Market value on credit default swaps | 9,328,804 | Market value on credit default swaps | 14,021,498 | ||||||||
Total | $ | 23,964,965 | $ | 32,046,534 | ||||||||
| * | Only variation margin receivable/payable at period end is reported within the statement of assets and liabilities. This amount reflects cumulative unrealized appreciation/(depreciation) on futures and centrally cleared swaps as reported in the schedule of investments. |
| DERIVATIVE TYPE | LOCATION OF GAIN OR (LOSS) ON DERIVATIVES WITHIN STATEMENT OF OPERATIONS | REALIZED GAIN OR (LOSS)ON DERIVATIVES | CHANGE IN UNREALIZED APPRECIATION OR (DEPRECIATION) | |||||||
Interest rate contracts | Net realized gain (loss) on futures; Net change in unrealized appreciation/depreciation of futures | $ | (16,771,392 | ) | $ | (1,606,249 | ) | |||
Foreign currency contracts | Net realized gain (loss) on forward currency exchange contracts; Net change in unrealized appreciation/depreciation of forward currency exchange contracts | (358,257 | ) | (2,042,928 | ) | |||||
Interest rate contracts | Net realized gain (loss) on swaptions written; Net change in unrealized appreciation/depreciation of swaptions written | 533,520 | 0 | |||||||
Interest rate contracts | Net realized gain (loss) on swaps; Net change in unrealized appreciation/depreciation of swaps | (4,978,735 | ) | 639,288 | ||||||
Credit contracts | Net realized gain (loss) on swaps; Net change in unrealized appreciation/depreciation of swaps | (14,650,653 | ) | 6,959,271 | ||||||
Total | $ | (36,225,517 | ) | $ | 3,949,382 | |||||
2021 Semi-Annual Report | 63 | |
Table of Contents
Notes to Financial Statements (continued)
| SHORT DURATION PLUS PORTFOLIO | ASSET DERIVATIVES | LIABILITY DERIVATIVES | ||||||||||
| DERIVATIVE TYPE | STATEMENTOF ASSETS AND LIABILITIES LOCATION | FAIR VALUE | STATEMENTOF ASSETS AND LIABILITIES LOCATION | FAIR VALUE | ||||||||
Interest rate contracts | Receivable/Payable for variation margin on futures | $ | 79,671 | * | Receivable/Payable for variation margin on futures | $ | 133,586 | * | ||||
Credit contracts | Receivable/Payable for variation margin on centrally cleared swaps | 16,799 | * | |||||||||
Credit contracts | Market value on credit default swaps | 573,152 | Market value on credit default swaps | 719,363 | ||||||||
Total | $ | 669,622 | $ | 852,949 | ||||||||
| * | Only variation margin receivable/payable at period end is reported within the statement of assets and liabilities. This amount reflects cumulative unrealized appreciation/(depreciation) on futures and centrally cleared swaps as reported in the schedule of investments. |
| DERIVATIVE TYPE | LOCATION OF GAIN OR (LOSS) ON DERIVATIVES WITHIN STATEMENT OF OPERATIONS | REALIZED GAIN OR (LOSS) ON DERIVATIVES | CHANGE IN UNREALIZED APPRECIATION OR (DEPRECIATION) | |||||||
Interest rate contracts | Net realized gain (loss) on futures; Net change in unrealized appreciation/depreciation of futures | $ | (292,358 | ) | $ | (72,473 | ) | |||
Credit contracts | Net realized gain (loss) on swaps; Net change in unrealized appreciation/depreciation of swaps | (860,660 | ) | 463,276 | ||||||
Total | $ | (1,153,018 | ) | $ | 390,803 | |||||
| EMERGING MARKETS PORTFOLIO | ||||||||
Forward Currency Exchange Contracts: | ||||||||
Average principal amount of buy contracts | $ | 267,825,053 | ||||||
Average principal amount of sale contracts | $ | 224,322,509 | ||||||
| SHORT DURATION DIVERSIFIED MUNICIPAL PORTFOLIO | ||||||||
Interest Rate Swaps: | ||||||||
Average notional amount | $ | 1,160,000 | ||||||
Centrally Cleared Interest Rate Swaps: | ||||||||
Average notional amount | $ | 1,308,571 | ||||||
Centrally Cleared Inflation Swaps: | ||||||||
Average notional amount | $ | 3,285,714 | ||||||
| 64 | Sanford C. Bernstein Fund, Inc. | |
Table of Contents
| CALIFORNIA MUNICIPAL PORTFOLIO | ||||||||
Interest Rate Swaps: | ||||||||
Average notional amount | $ | 24,790,000 | ||||||
Inflation Swaps: | ||||||||
Average notional amount | $ | 52,272,000 | (a) | |||||
Centrally Cleared Interest Rate Swaps: | ||||||||
Average notional amount | $ | 52,418,571 | ||||||
Centrally Cleared Inflation Swaps: | ||||||||
Average notional amount | $ | 54,584,286 | ||||||
Credit Default Swaps: | ||||||||
Average notional amount of sale contracts | $ | 4,730,000 | ||||||
| (a) | Positions were open for less than one month during the period. |
| DIVERSIFIED MUNICIPAL PORTFOLIO | ||||||||
Interest Rate Swaps: | ||||||||
Average notional amount | $ | 114,320,000 | ||||||
Inflation Swaps: | ||||||||
Average notional amount | $ | 267,138,000 | (a) | |||||
Centrally Cleared Interest Rate Swaps: | ||||||||
Average notional amount | $ | 163,224,286 | ||||||
Centrally Cleared Inflation Swaps: | ||||||||
Average notional amount | $ | 244,391,429 | ||||||
Credit Default Swaps: | ||||||||
Average notional amount of sale contracts | $ | 19,775,000 | ||||||
| (a) | Positions were open for less than one month during the period. |
| NEW YORK MUNICIPAL PORTFOLIO | ||||||||
Interest Rate Swaps: | ||||||||
Average notional amount | $ | 33,960,000 | ||||||
Inflation Swaps: | ||||||||
Average notional amount | $ | 55,634,000 | (a) | |||||
Centrally Cleared Interest Rate Swaps: | ||||||||
Average notional amount | $ | 43,128,571 | ||||||
Centrally Cleared Inflation Swaps: | ||||||||
Average notional amount | $ | 70,475,714 | ||||||
Credit Default Swaps: | ||||||||
Average notional amount of sale contracts | $ | 6,605,000 | ||||||
| (a) | Positions were open for less than one month during the period. |
2021 Semi-Annual Report | 65 | |
Table of Contents
Notes to Financial Statements (continued)
| INTERMEDIATE DURATION PORTFOLIO | ||||||||
Futures: | ||||||||
Average notional amount of buy contracts | $ | 1,172,384,232 | ||||||
Average notional amount of sale contracts | $ | 420,881,836 | ||||||
Forward Currency Exchange Contracts: | ||||||||
Average principal amount of buy contracts | $ | 339,076,546 | ||||||
Average principal amount of sale contracts | $ | 484,632,630 | ||||||
Written Swaptions: | ||||||||
Average notional amount | $ | 29,232,717 | (a) | |||||
Centrally Cleared Interest Rate Swaps: | ||||||||
Average notional amount | $ | 651,644,808 | ||||||
Credit Default Swaps: | ||||||||
Average notional amount of buy contracts | $ | 97,791,000 | ||||||
Average notional amount of sale contracts | $ | 91,639,857 | ||||||
Centrally Cleared Credit Default Swaps: | ||||||||
Average notional amount of buy contracts | $ | 58,142,726 | (b) | |||||
Average notional amount of sale contracts | $ | 58,142,726 | (b) | |||||
| (a) | Positions were open for one month during the period. |
| (b) | Positions were open for less than one month during the period. |
| SHORT DURATION PLUS PORTFOLIO | ||||||||
Futures: | ||||||||
Average notional amount of buy contracts | $ | 112,711,980 | ||||||
Average notional amount of sale contracts | $ | 4,303,423 | ||||||
Credit Default Swaps: | ||||||||
Average notional amount of buy contracts | $ | 5,217,000 | ||||||
Average notional amount of sale contracts | $ | 4,248,857 | ||||||
Centrally Cleared Credit Default Swaps: | ||||||||
Average notional amount of sale contracts | $ | 2,221,000 | ||||||
For financial reporting purposes, the Portfolios do not offset derivative assets and derivative liabilities that are subject to netting arrangements in the statement of assets and liabilities.
All OTC derivatives held at period end were subject to netting arrangements. The following tables present the Portfolios’ derivative assets and liabilities by OTC counterparty net of amounts available for offset under ISDA Master Agreements (“MA”) and net of the related collateral received/pledged by the Portfolios as of March 31, 2021. Exchange-traded derivatives and centrally cleared swaps are not subject to netting arrangements and as such are excluded from the tables.
| 66 | Sanford C. Bernstein Fund, Inc. | |
Table of Contents
| EMERGING MARKETS PORTFOLIO | ||||||||||||||||||||
| COUNTERPARTY | DERIVATIVE ASSETS SUBJECT TOA MA | DERIVATIVES AVAILABLE FOR OFFSET | CASH COLLATERAL RECEIVED* | SECURITY COLLATERAL RECEIVED* | NET AMOUNT OF DERIVATIVE ASSETS | |||||||||||||||
Barclays Bank PLC | $ | 19,532 | $ | (11,119 | ) | $ | 0 | $ | 0 | $ | 8,413 | |||||||||
Citibank, NA | 1,478,686 | (175,475 | ) | (1,303,211 | ) | 0 | 0 | |||||||||||||
Credit Suisse International | 10,394 | 0 | 0 | 0 | 10,394 | |||||||||||||||
Goldman Sachs Bank USA | 837,006 | (96,814 | ) | (740,192 | ) | 0 | 0 | |||||||||||||
HSBC Bank USA | 10,919 | 0 | 0 | 0 | 10,919 | |||||||||||||||
JPMorgan Chase Bank, NA | 38,185 | (38,185 | ) | 0 | 0 | 0 | ||||||||||||||
Morgan Stanley Capital Services, Inc. | 336,936 | (336,936 | ) | 0 | 0 | 0 | ||||||||||||||
Natwest Markets PLC | 94,681 | (83,733 | ) | 0 | 0 | 10,948 | ||||||||||||||
Standard Chartered Bank | 7,348 | 0 | 0 | 0 | 7,348 | |||||||||||||||
State Street Bank & Trust Co. | 401,398 | (295,260 | ) | 0 | 0 | 106,138 | ||||||||||||||
UBS AG | 521,194 | 0 | 0 | 0 | 521,194 | |||||||||||||||
Total | $ | 3,756,279 | $ | (1,037,522 | ) | $ | (2,043,403 | ) | $ | 0 | $ | 675,354 | ^ | |||||||
| COUNTERPARTY | DERIVATIVE LIABILITIES SUBJECT TOA MA | DERIVATIVES AVAILABLE FOR OFFSET | CASH COLLATERAL PLEDGED* | SECURITY COLLATERAL PLEDGED* | NET AMOUNTOF DERIVATIVE LIABILITIES | |||||||||||||||
Bank of America, NA | $ | 545 | $ | 0 | $ | 0 | $ | 0 | $ | 545 | ||||||||||
Barclays Bank PLC | 11,119 | (11,119 | ) | 0 | 0 | 0 | ||||||||||||||
BNP Paribas SA | 43,347 | 0 | 0 | 0 | 43,347 | |||||||||||||||
Citibank, NA | 175,475 | (175,475 | ) | 0 | 0 | 0 | ||||||||||||||
Goldman Sachs Bank USA | 96,814 | (96,814 | ) | 0 | 0 | 0 | ||||||||||||||
JPMorgan Chase Bank, NA | 149,845 | (38,185 | ) | 0 | 0 | 111,660 | ||||||||||||||
Morgan Stanley Capital Services, Inc. | 1,805,904 | (336,936 | ) | 0 | 0 | 1,468,968 | ||||||||||||||
Natwest Markets PLC | 83,733 | (83,733 | ) | 0 | 0 | 0 | ||||||||||||||
State Street Bank & Trust Co. | 295,260 | (295,260 | ) | 0 | 0 | 0 | ||||||||||||||
Total | $ | 2,662,042 | $ | (1,037,522 | ) | $ | 0 | $ | 0 | $ | 1,624,520 | ^ | ||||||||
| * | The actual collateral received/pledged may be more than the amount reported due to over-collateralization. |
| ^ | Net amount represents the net receivable/payable that would be due from/to the counterparty in the event of default or termination. The net amount from OTC financial derivative instruments can only be netted across transactions governed under the same master agreement with the same counterparty. |
| SHORT DURATION DIVERSIFIED MUNICIPAL PORTFOLIO | ||||||||||||||||||||
| COUNTERPARTY | DERIVATIVE ASSETS SUBJECT TOA MA | DERIVATIVES AVAILABLE FOR OFFSET | CASH COLLATERAL RECEIVED* | SECURITY COLLATERAL RECEIVED* | NET AMOUNT OF DERIVATIVE ASSETS | |||||||||||||||
Citibank, NA | $ | 3,006 | $ | 0 | $ | 0 | $ | 0 | $ | 3,006 | ||||||||||
Total | $ | 3,006 | $ | 0 | $ | 0 | $ | 0 | $ | 3,006 | ^ | |||||||||
| * | The actual collateral received/pledged may be more than the amount reported due to over-collateralization. |
| ^ | Net amount represents the net receivable/payable that would be due from/to the counterparty in the event of default or termination. The net amount from OTC financial derivative instruments can only be netted across transactions governed under the same master agreement with the same counterparty. |
2021 Semi-Annual Report | 67 | |
Table of Contents
Notes to Financial Statements (continued)
| CALIFORNIA MUNICIPAL PORTFOLIO | ||||||||||||||||||||
| COUNTERPARTY | DERIVATIVE ASSETS SUBJECT TOA MA | DERIVATIVES AVAILABLE FOR OFFSET | CASH COLLATERAL RECEIVED* | SECURITY COLLATERAL RECEIVED* | NET AMOUNT OF DERIVATIVE ASSETS | |||||||||||||||
Citibank, NA/Citigroup Global Markets, Inc. | $ | 64,229 | $ | (64,229 | ) | $ | 0 | $ | 0 | $ | 0 | |||||||||
Total | $ | 64,229 | $ | (64,229 | ) | $ | 0 | $ | 0 | $ | 0 | ^ | ||||||||
| COUNTERPARTY | DERIVATIVE LIABILITIES SUBJECT TOA MA | DERIVATIVES AVAILABLE FOR OFFSET | CASH COLLATERAL PLEDGED* | SECURITY COLLATERAL PLEDGED* | NET AMOUNTOF DERIVATIVE LIABILITIES | |||||||||||||||
Citibank, NA/Citigroup Global Markets, Inc. | $ | 409,489 | $ | (64,229 | ) | $ | (345,260 | ) | $ | 0 | $ | 0 | ||||||||
Credit Suisse International | 574,830 | 0 | (574,830 | ) | 0 | 0 | ||||||||||||||
Goldman Sachs International | 289,874 | 0 | 0 | (289,874 | ) | 0 | ||||||||||||||
Total | $ | 1,274,193 | $ | (64,229 | ) | $ | (920,090 | ) | $ | (289,874 | ) | $ | 0 | ^ | ||||||
| * | The actual collateral received/pledged may be more than the amount reported due to over-collateralization. |
| ^ | Net amount represents the net receivable/payable that would be due from/to the counterparty in the event of default or termination. The net amount from OTC financial derivative instruments can only be netted across transactions governed under the same master agreement with the same counterparty. |
| DIVERSIFIED MUNICIPAL PORTFOLIO | ||||||||||||||||||||
| COUNTERPARTY | DERIVATIVE ASSETS SUBJECT TOA MA | DERIVATIVES AVAILABLE FOR OFFSET | CASH COLLATERAL RECEIVED* | SECURITY COLLATERAL RECEIVED* | NET AMOUNT OF DERIVATIVE ASSETS | |||||||||||||||
Citibank, NA/Citigroup Global Markets, Inc. | $ | 296,193 | $ | (296,193 | ) | $ | 0 | $ | 0 | $ | 0 | |||||||||
Total | $ | 296,193 | $ | (296,193 | ) | $ | 0 | $ | 0 | $ | 0 | ^ | ||||||||
| COUNTERPARTY | DERIVATIVE LIABILITIES SUBJECT TOA MA | DERIVATIVES AVAILABLE FOR OFFSET | CASH COLLATERAL PLEDGED* | SECURITY COLLATERAL PLEDGED* | NET AMOUNTOF DERIVATIVE LIABILITIES | |||||||||||||||
Citibank, NA/Citigroup Global Markets, Inc. | $ | 587,831 | $ | (296,193 | ) | $ | (291,638 | ) | $ | 0 | $ | 0 | ||||||||
Credit Suisse International | 3,352,664 | 0 | (280,000 | ) | (2,996,122 | ) | 76,542 | |||||||||||||
Goldman Sachs International | 1,386,602 | 0 | 0 | (1,268,767 | ) | 117,835 | ||||||||||||||
Total | $ | 5,327,097 | $ | (296,193 | ) | $ | (571,638 | ) | $ | (4,264,889 | ) | $ | 194,377 | ^ | ||||||
| * | The actual collateral received/pledged may be more than the amount reported due to over-collateralization. |
| ^ | Net amount represents the net receivable/payable that would be due from/to the counterparty in the event of default or termination. The net amount from OTC financial derivative instruments can only be netted across transactions governed under the same master agreement with the same counterparty. |
| 68 | Sanford C. Bernstein Fund, Inc. | |
Table of Contents
| NEW YORK MUNICIPAL PORTFOLIO | ||||||||||||||||||||
| COUNTERPARTY | DERIVATIVE ASSETS SUBJECT TO A MA | DERIVATIVES AVAILABLE FOR OFFSET | CASH COLLATERAL RECEIVED* | SECURITY COLLATERAL RECEIVED* | NET AMOUNT OF DERIVATIVE ASSETS | |||||||||||||||
Citibank, NA/Citigroup Global Markets, Inc. | $ | 87,987 | $ | (87,987 | ) | $ | 0 | $ | 0 | $ | 0 | |||||||||
Total | $ | 87,987 | $ | (87,987 | ) | $ | 0 | $ | 0 | $ | 0 | ^ | ||||||||
| COUNTERPARTY | DERIVATIVE LIABILITIES SUBJECT TO A MA | DERIVATIVES AVAILABLE FOR OFFSET | CASH COLLATERAL PLEDGED* | SECURITY COLLATERAL PLEDGED* | NET AMOUNT OF DERIVATIVE LIABILITIES | |||||||||||||||
Citibank, NA/ Citigroup Global Markets, Inc. | $ | 196,393 | $ | (87,987 | ) | $ | 0 | $ | (108,406 | ) | $ | 0 | ||||||||
Credit Suisse International | 1,119,801 | 0 | (715,200 | ) | (287,529 | ) | 117,072 | |||||||||||||
Goldman Sachs International | 463,098 | 0 | 0 | (463,098 | ) | 0 | ||||||||||||||
Total | $ | 1,779,292 | $ | (87,987 | ) | $ | (715,200 | ) | $ | (859,033 | ) | $ | 117,072 | ^ | ||||||
| * | The actual collateral received/pledged may be more than the amount reported due to over-collateralization. |
| ^ | Net amount represents the net receivable/payable that would be due from/to the counterparty in the event of default or termination. The net amount from OTC financial derivative instruments can only be netted across transactions governed under the same master agreement with the same counterparty. |
| INTERMEDIATE DURATION PORTFOLIO | ||||||||||||||||||||
| COUNTERPARTY | DERIVATIVE ASSETS SUBJECT TO A MA | DERIVATIVES AVAILABLE FOR OFFSET | CASH COLLATERAL RECEIVED* | SECURITY COLLATERAL RECEIVED* | NET AMOUNT OF DERIVATIVE ASSETS | |||||||||||||||
Bank of America, NA | $ | 101,179 | $ | (101,179 | ) | $ | 0 | $ | 0 | $ | 0 | |||||||||
Barclays Bank PLC | 290,285 | (290,285 | ) | 0 | 0 | 0 | ||||||||||||||
BNP Paribas SA | 2,128,088 | (1,359,717 | ) | 0 | 0 | 768,371 | ||||||||||||||
Citibank, NA/Citigroup Global Markets, Inc. | 9,353,649 | (1,770,526 | ) | (6,110,000 | ) | 0 | 1,473,123 | |||||||||||||
Goldman Sachs International | 458,543 | (458,543 | ) | 0 | 0 | 0 | ||||||||||||||
HSBC Bank USA | 33,883 | (33,883 | ) | 0 | 0 | 0 | ||||||||||||||
JPMorgan Chase Bank, NA/JPMorgan Securities, LLC | 279,778 | (279,778 | ) | 0 | 0 | 0 | ||||||||||||||
Morgan Stanley & Co. International PLC/Morgan Stanley Capital Services, Inc./Morgan Stanley Capital Services LLC | 3,486,846 | (537,825 | ) | (799,000 | ) | 0 | 2,150,021 | |||||||||||||
Natwest Markets PLC | 73,918 | 0 | 0 | 0 | 73,918 | |||||||||||||||
Standard Chartered Bank | 40,858 | (40,858 | ) | 0 | 0 | 0 | ||||||||||||||
State Street Bank & Trust Co. | 80,411 | (80,411 | ) | 0 | 0 | 0 | ||||||||||||||
UBS AG | 340,433 | (340,433 | ) | 0 | 0 | 0 | ||||||||||||||
Total | $ | 16,667,871 | $ | (5,293,438 | ) | $ | (6,909,000 | ) | $ | 0 | $ | 4,465,433 | ^ | |||||||
2021 Semi-Annual Report | 69 | |
Table of Contents
Notes to Financial Statements (continued)
| COUNTERPARTY | DERIVATIVE LIABILITIES SUBJECT TOA MA | DERIVATIVES AVAILABLE FOR OFFSET | CASH COLLATERAL PLEDGED* | SECURITY COLLATERAL PLEDGED* | NET AMOUNT OF DERIVATIVE LIABILITIES | |||||||||||||||
Bank of America, NA | $ | 129,042 | $ | (101,179 | ) | $ | 0 | $ | 0 | $ | 27,863 | |||||||||
Barclays Bank PLC | 391,343 | (290,285 | ) | 0 | (101,058 | ) | 0 | |||||||||||||
BNP Paribas SA | 1,359,717 | (1,359,717 | ) | 0 | 0 | 0 | ||||||||||||||
Citibank, NA/Citigroup Global Markets, Inc. | 1,770,526 | (1,770,526 | ) | 0 | 0 | 0 | ||||||||||||||
Credit Suisse International | 4,313,375 | 0 | 0 | (4,160,758 | ) | 152,617 | ||||||||||||||
Deutsche Bank AG | 4,595,917 | 0 | (210,000 | ) | (4,194,362 | ) | 191,555 | |||||||||||||
Goldman Sachs International | 1,662,223 | (458,543 | ) | 0 | (1,072,111 | ) | 131,569 | |||||||||||||
HSBC Bank USA | 4,278,448 | (33,883 | ) | 0 | (312,375 | ) | 3,932,190 | |||||||||||||
JPMorgan Chase Bank, NA/JPMorgan Securities, LLC | 1,572,075 | (279,778 | ) | 0 | (729,617 | ) | 562,680 | |||||||||||||
Morgan Stanley & Co. International PLC/Morgan Stanley Capital Services, Inc./Morgan Stanley Capital Services LLC | 537,825 | (537,825 | ) | 0 | 0 | 0 | ||||||||||||||
Standard Chartered Bank | 42,433 | (40,858 | ) | 0 | 0 | 1,575 | ||||||||||||||
State Street Bank & Trust Co. | 113,103 | (80,411 | ) | 0 | 0 | 32,692 | ||||||||||||||
UBS AG | 695,781 | (340,433 | ) | (355,348 | ) | 0 | 0 | |||||||||||||
Total | $ | 21,461,808 | $ | (5,293,438 | ) | $ | (565,348 | ) | $ | (10,570,281 | ) | $ | 5,032,741 | ^ | ||||||
| * | The actual collateral received/pledged may be more than the amount reported due to over-collateralization. |
| ^ | Net amount represents the net receivable/payable that would be due from/to the counterparty in the event of default or termination. The net amount from OTC financial derivative instruments can only be netted across transactions governed under the same master agreement with the same counterparty. |
| SHORT DURATION PLUS PORTFOLIO | ||||||||||||||||||||
| COUNTERPARTY | DERIVATIVE ASSETS SUBJECT TOA MA | DERIVATIVES AVAILABLE FOR OFFSET | CASH COLLATERAL RECEIVED* | SECURITY COLLATERAL RECEIVED* | NET AMOUNT OF DERIVATIVE ASSETS | |||||||||||||||
Citigroup Global Markets, Inc. | $ | 476,475 | $ | (37,986 | ) | $ | (338,000 | ) | $ | 0 | $ | 100,489 | ||||||||
Goldman Sachs International | 31,757 | (31,757 | ) | 0 | 0 | 0 | ||||||||||||||
JPMorgan Securities, LLC | 14,044 | (14,044 | ) | 0 | 0 | 0 | ||||||||||||||
Morgan Stanley & Co. International PLC | 50,876 | 0 | 0 | 0 | 50,876 | |||||||||||||||
Total | $ | 573,152 | $ | (83,787 | ) | $ | (338,000 | ) | $ | 0 | $ | 151,365 | ^ | |||||||
| COUNTERPARTY | DERIVATIVE LIABILITIES SUBJECT TOA MA | DERIVATIVES AVAILABLE FOR OFFSET | CASH COLLATERAL PLEDGED* | SECURITY COLLATERAL PLEDGED* | NET AMOUNT OF DERIVATIVE LIABILITIES | |||||||||||||||
Citigroup Global Markets, Inc. | $ | 37,986 | $ | (37,986 | ) | $ | 0 | $ | 0 | $ | 0 | |||||||||
Credit Suisse International | 368,696 | 0 | 0 | (349,949 | ) | 18,747 | ||||||||||||||
Deutsche Bank AG | 119,846 | 0 | (119,846 | ) | 0 | 0 | ||||||||||||||
Goldman Sachs International | 144,627 | (31,757 | ) | 0 | 0 | 112,870 | ||||||||||||||
JPMorgan Securities, LLC | 48,208 | (14,044 | ) | 0 | 0 | 34,164 | ||||||||||||||
Total | $ | 719,363 | $ | (83,787 | ) | $ | (119,846 | ) | $ | (349,949 | ) | $ | 165,781 | ^ | ||||||
| 70 | Sanford C. Bernstein Fund, Inc. | |
Table of Contents
| * | The actual collateral received/pledged may be more than the amount reported due to over-collateralization. |
| ^ | Net amount represents the net receivable/payable that would be due from/to the counterparty in the event of default or termination. The net amount from OTC financial derivative instruments can only be netted across transactions governed under the same master agreement with the same counterparty. |
| C. | Currency Transactions |
The Emerging Markets, Intermediate Duration and Short Duration Plus Portfolios may invest in non-U.S. Dollar-denominated securities on a currency hedged or unhedged basis. The Portfolios may seek investment opportunities by taking long or short positions in currencies through the use of currency-related derivatives, including forward currency exchange contracts, futures and options on futures, swaps, and other options. The Portfolios may enter into transactions for investment opportunities when it anticipates that a foreign currency will appreciate or depreciate in value but securities denominated in that currency are not held by the Portfolios and do not present attractive investment opportunities. Such transactions may also be used when the Adviser believes that it may be more efficient than a direct investment in a foreign currency-denominated security. The Portfolios may also conduct currency exchange contracts on a spot basis (i.e., for cash at the spot rate prevailing in the currency exchange market for buying or selling currencies).
| D. | TBA and Dollar Rolls |
The Portfolios may invest in TBA mortgage-backed securities. A TBA, or “To Be Announced”, trade represents a contract for the purchase or sale of mortgage-backed securities to be delivered at a future agreed-upon date; however, the specific mortgage pool numbers or the number of pools that will be delivered to fulfill the trade obligation or terms of the contract are unknown at the time of the trade. Mortgage pools (including fixed-rate or variable-rate mortgages) guaranteed by the Government National Mortgage Association, or GNMA, the Federal National Mortgage Association, or FNMA, or the Federal Home Loan Mortgage Corporation, or FHLMC, are subsequently allocated to the TBA transactions.
The Intermediate Duration Portfolio may enter into certain TBA transactions known as dollar rolls. Dollar rolls involve sales by the Portfolios of securities for delivery in the current month and the Portfolio’s simultaneously contracting to repurchase substantially similar (same type and coupon) securities on a specified future date. During the roll period, the Portfolios forgo principal and interest paid on the securities. The Portfolios are compensated by the difference between the current sales price and the lower forward price for the future purchase (often referred to as the “drop”) as well as by the interest earned on the cash proceeds of the initial sale. Dollar rolls involve the risk that the market value of the securities the Portfolios are obligated to repurchase under the agreement may decline below the repurchase price. Dollar rolls are speculative techniques. For the six months ended March 31, 2021, Intermediate Duration Portfolio earned drop income of $1,343,042, which is included in interest income in the accompanying statement of operations.
| NOTE 4. | Distributions to Shareholders |
The tax character of distributions to be paid for the year ending September 30, 2021 will be determined at the end of the current fiscal year. The tax character of distributions paid during the fiscal years ended September 30, 2020 and September 30, 2019 were as follows:
| PORTFOLIO | 2020 | 2019 | ||||||
Emerging Markets | ||||||||
Distributions paid from: | ||||||||
Ordinary income | $ | 22,100,317 | $ | 16,035,424 | ||||
Long-term capital gains | 0 | 75,001,782 | ||||||
|
|
|
| |||||
Total distributions paid | $ | 22,100,317 | $ | 91,037,206 | ||||
|
|
|
| |||||
2021 Semi-Annual Report | 71 | |
Table of Contents
Notes to Financial Statements (continued)
| PORTFOLIO | 2020 | 2019 | ||||||
Short Duration Diversified Municipal | ||||||||
Distributions paid from: | ||||||||
Ordinary income | $ | 107,648 | $ | 156,661 | ||||
Long-term capital gains | 0 | 0 | ||||||
|
|
|
| |||||
Total taxable distributions | 107,648 | 156,661 | ||||||
Tax exempt distributions | 2,245,176 | 2,351,692 | ||||||
|
|
|
| |||||
Total distributions paid | $ | 2,352,824 | $ | 2,508,353 | ||||
|
|
|
| |||||
California Municipal | ||||||||
Distributions paid from: | ||||||||
Ordinary income | $ | 1,183,018 | $ | 744,579 | ||||
Long-term capital gains | 0 | 0 | ||||||
|
|
|
| |||||
Total taxable distributions | 1,183,018 | 744,579 | ||||||
Tax exempt distributions | 25,653,328 | 27,139,800 | ||||||
|
|
|
| |||||
Total distributions paid | $ | 26,836,346 | $ | 27,884,379 | ||||
|
|
|
| |||||
Diversified Municipal | ||||||||
Distributions paid from: | ||||||||
Ordinary income | $ | 5,117,332 | $ | 3,960,366 | ||||
Long-term capital gains | 0 | 0 | ||||||
|
|
|
| |||||
Total taxable distributions | 5,117,332 | 3,960,366 | ||||||
Tax exempt distributions | 135,050,172 | 153,350,600 | ||||||
|
|
|
| |||||
Total distributions paid | $ | 140,167,504 | $ | 157,310,966 | ||||
|
|
|
| |||||
New York Municipal | ||||||||
Distributions paid from: | ||||||||
Ordinary income | $ | 1,513,510 | $ | 709,436 | ||||
Long-term capital gains | 0 | 0 | ||||||
|
|
|
| |||||
Total taxable distributions | 1,513,510 | 709,436 | ||||||
Tax exempt distributions | 37,764,855 | 39,997,204 | ||||||
|
|
|
| |||||
Total distributions paid | $ | 39,278,365 | $ | 40,706,640 | ||||
|
|
|
| |||||
Intermediate Duration | ||||||||
Distributions paid from: | ||||||||
Ordinary income | $ | 95,999,272 | $ | 106,879,355 | ||||
|
|
|
| |||||
Total distributions paid | $ | 95,999,272 | $ | 106,879,355 | ||||
|
|
|
| |||||
Short Duration Plus | ||||||||
Distributions paid from: | ||||||||
Ordinary income | $ | 3,827,152 | $ | 4,908,029 | ||||
|
|
|
| |||||
Total distributions paid | $ | 3,827,152 | $ | 4,908,029 | ||||
|
|
|
| |||||
| 72 | Sanford C. Bernstein Fund, Inc. | |
Table of Contents
As of September 30, 2020, the components of accumulated earnings/(deficit) on a tax basis were as follows:
| PORTFOLIO | UNDISTRIBUTED INCOME(a) | UNDISTRIBUTED LONG TERM CAPITAL GAINS | ACCUMULATED CAPITALAND | UNREALIZED APPRECIATION/ | TOTAL ACCUMULATED EARNINGS/ (DEFICIT)(d) | |||||||||||||||
Emerging Markets | $ | 22,898,592 | $ | 0 | $ | (56,805,991 | ) | $ | 88,301,004 | $ | 54,393,605 | |||||||||
Short Duration Diversified Municipal | 42,208 | 0 | (1,469,284 | ) | 2,758,834 | 1,331,758 | ||||||||||||||
California Municipal | 0 | 0 | (18,403,235 | ) | 60,264,415 | 41,861,180 | ||||||||||||||
Diversified Municipal | 0 | 0 | (48,678,056 | ) | 298,073,206 | 249,395,150 | ||||||||||||||
New York Municipal | 0 | 0 | (21,374,943 | ) | 55,196,012 | 33,821,069 | ||||||||||||||
Intermediate Duration | 17,636,469 | 45,447,186 | (3,974,647 | ) | 180,590,365 | 239,699,373 | ||||||||||||||
Short Duration Plus | 32,452 | 0 | (10,428,126 | ) | 1,631,606 | (8,764,068 | ) | |||||||||||||
| (a) | Includes tax exempt income as shown below: |
Short Duration Diversified Municipal | $ | 42,208 |
| (b) | As of September 30, 2020, certain Portfolios had capital loss carryforwards for federal income tax purposes. During the fiscal year ended September 30, 2020 Intermediate Duration Portfolio, Short Duration Plus Portfolio, and Diversified Municipal Portfolio utilized capital loss carryforwards of $3,197,056, $2,376,325, and $5,624,338 respectively, to offset current year net realized gains. As of September 30, 2020, California Municipal, Diversified Municipal, and New York Municipal deferred $566,565, $1,252,408, and $463,594 respectively, in late year losses. As of September 30, 2020, Intermediate Duration Portfolio and Short Duration Plus Portfolio deferred $3,974,647 and $113,309 respectively, in straddle losses. |
| (c) | The differences between book-basis and tax-basis unrealized appreciation/(depreciation) are attributable primarily to the tax deferral of losses on wash sales, the tax treatment of swaps and passive foreign investment companies (PFICs), the tax treatment of partnership investments, the tax treatment of callable bonds, and the realization for tax purposes of gains/losses on certain derivative instruments. |
| (d) | The differences between book-basis and tax-basis components of accumulated earnings/(deficit) are attributable primarily to the tax treatment of the accrual of foreign capital gains tax, interest on defaulted securities, and dividends payable to shareholders. |
For tax purposes, net capital losses may be carried over to offset future capital gains, if any. Funds are permitted to carry forward capital losses for an indefinite period, and such losses will retain their character as either short-term or long-term capital losses.
As of September 30, 2020, the following Portfolios had net capital loss carryforwards as follows:
| PORTFOLIO | SHORT-TERM AMOUNT | LONG-TERM AMOUNT | ||||||
Emerging Markets | $ | 48,009,434 | $ | 8,796,557 | ||||
Short Duration Diversified Municipal | 255,099 | 1,214,185 | ||||||
California Municipal | 6,369,214 | 11,467,456 | ||||||
Diversified Municipal | 34,406,093 | 13,019,555 | ||||||
New York Municipal | 7,767,954 | 13,143,395 | ||||||
Intermediate Duration Portfolio | 0 | 0 | ||||||
Short Duration Plus | 3,066,216 | 7,248,601 | ||||||
2021 Semi-Annual Report | 73 | |
Table of Contents
Notes to Financial Statements (continued)
| NOTE 5. | Risks Involved in Investing in the Portfolios |
Interest Rate Risk—Changes in interest rates will affect the value of investments in fixed-income securities. When interest rates rise, the value of existing investments in fixed-income securities tends to fall and this decrease in value may not be offset by higher income from new investments. Interest rate risk is generally greater for fixed-income securities with longer maturities or durations. The current historically low interest rate environment heightens the risks associated with rising interest rates.
Credit Risk—This is the risk that the issuer or the guarantor of a debt security, or the counterparty to a derivatives or other contract, will be unable or unwilling to make timely principal and/or interest payments, or to otherwise honor its obligations. The issuer or guarantor may default, potentially causing a loss of the full principal amount of a security and accrued interest. The degree of risk for a particular security may be reflected in its credit rating. The credit rating of a fixed-income security may be downgraded after purchase, which may adversely affect the value of the security. Investments in fixed-income securities with lower ratings tend to have a higher probability that an issuer will default or fail to meet its payment obligations, making credit risk greater for medium-quality and lower-rated debt securities. Lower-rated debt securities and similar unrated securities (commonly known as “junk bonds”) have speculative elements or are predominantly speculative credit risks. At times when credit risk is perceived to be greater, credit “spreads” (i.e., the difference between the yields on lower quality securities and the yields on higher quality securities) may get larger or “widen”. As a result, the values of the lower quality securities may go down more and they may become harder to sell.
Duration Risk—The duration of a fixed-income security may be shorter than or equal to full maturity of the fixed-income security. Fixed-income securities with longer durations have more interest rate risk and will decrease in price as interest rates rise. Securities that have final maturities longer than their durations may be affected by increased credit spreads to a far greater degree than their durations would suggest, because they are exposed to credit risk until final maturity.
Municipal Market Risk—This is the risk that special factors may adversely affect the value of the municipal securities and have a significant effect on the yield or value of the Portfolios’ investments in municipal securities. These factors include economic conditions, political or legislative changes, public health crises, uncertainties related to the tax status of municipal securities, or the rights of investors in these securities. To the extent that the Portfolios invests more of its assets in a particular state’s municipal securities, the Portfolios may be vulnerable to events adversely affecting that state, including economic, political and regulatory occurrences, court decisions, terrorism, public health crises (including the occurrence of a contagious disease or illness) and catastrophic natural disasters, such as hurricanes, fires or earthquakes. For example, the novel coronavirus (COVID-19) pandemic has significantly stressed the financial resources of many issuers of municipal securities, which could impair any such issuer’s ability to meet its financial obligations when due and adversely impact the value of its securities held by the Fund. As the full effects of the COVID-19 pandemic on state and local economies and on issuers of municipal securities are still uncertain, the financial difficulties of issuers of municipal securities may continue or worsen, adversely affecting the performance of the Portfolios. The Portfolio’s investment in certain municipal securities with principal and interest payments that are made from the revenues of a specific project or facility, and not general tax revenues, may have increased risks. Factors affecting the project or facility, such as local business or economic conditions, could have a significant effect on the project’s ability to make payments of principal and interest on these securities.
In addition, tax law changes enacted as part of the Tax Cuts and Jobs Act of 2017 could have a material impact on the value of municipal securities. Because advance refunding bonds issued after December 31, 2017 are no longer tax exempt, the total supply of municipal bonds could decrease going forward. In addition, the reduction of the U.S. corporate income tax rate to 21% could make municipal obligations less attractive to certain institutional investors such as banks and property and casualty insurance companies, resulting in lower demand for municipal obligations. Changes in tax rates or the treatment of income from certain types of municipal securities, among other things, could negatively affect the municipal securities markets.
The Portfolios may invest in municipal securities of issuers in Puerto Rico or other U.S. territories and their governmental agencies and municipalities, which are exempt from federal, state, and, where applicable, local income taxes. These municipal securities may have more risks than those of other U.S. issuers of municipal securities. Like many U.S. states and municipalities, Puerto Rico experienced a significant downturn in the 2007-2009 recession. Puerto Rico’s downturn was particularly severe. In addition, Hurricane Maria caused significant damage to Puerto Rico. Hurricane Maria and severe weather events that may occur in the future could have significant and long-lasting impacts on Puerto Rico’s
| 74 | Sanford C. Bernstein Fund, Inc. | |
Table of Contents
economy. Puerto Rico continues to face a very challenging economic and fiscal environment, worsened by the spread of COVID-19 and the adverse effect that related governmental and public responses have had on Puerto Rico’s economy. If the general economic situation in Puerto Rico continues to persist or worsens, the volatility and credit quality of Puerto Rican municipal securities could continue to be adversely affected, and the market for such securities may deteriorate further.
Inflation Risk—This is the risk that the value of assets or income from investments will be less in the future as inflation decreases the value of money. As inflation increases, the value of the Portfolios’ assets can decline as can the value of the Portfolios’ distributions. This risk is significantly greater for fixed-income securities with longer maturities.
Non-diversification Risk—Concentration of investments in a small number of securities tends to increase risk. The New York Municipal and California Municipal Portfolios are not “diversified.” This means the Portfolios can invest more of their assets in a relatively small number of issuers with greater concentration of risk. Matters affecting these issuers can have a more significant effect on the Portfolios’ net asset value.
Inflation-Protected Securities Risk—The terms of inflation-protected securities provide for the coupon and/or maturity value to be adjusted based on changes in an inflation index. Decreases in the inflation rate or in investors’ expectations about inflation could cause these securities to underperform non-inflation-adjusted securities on a total-return basis. In addition, there can be no assurance that the relevant inflation index will accurately measure the rate of inflation, in which case the securities may not work as intended. These securities may be more difficult to trade or dispose of than other types of securities.
Foreign (Non-U.S.) Securities Risk—Investments in foreign securities entail significant risks in addition to those customarily associated with investing in U.S. securities. These risks include risks related to adverse market, economic, political and regulatory factors and social instability, all of which could disrupt the financial markets in which the Portfolios invest and adversely affect the value of the Portfolios’ assets.
Country Concentration Risk—The Portfolios may not always be diversified among countries or regions and the effect on the share price of the Portfolios of specific risks such as political, regulatory and currency may be magnified due to concentration of the Portfolios’ investments in a particular country or region.
Emerging Markets Securities Risk—The risks of investing in foreign (non-U.S.) securities are heightened with respect to issuers in emerging-market countries because the markets are less developed and less liquid and there may be a greater amount of economic, political and social uncertainty, and these risks are even more pronounced in “frontier” markets, which are investable markets with lower total market capitalization and liquidity than the more developed emerging markets. In addition, the value of the Portfolios’ investments may decline because of factors such as unfavorable or unsuccessful government actions and reduction of government or central bank support.
Derivatives Risk—The Portfolios may use derivatives as direct investments to earn income, enhance return and broaden portfolio diversification, which entail greater risk than if used solely for hedging purposes. In addition to other risks such as the credit risk of the counterparty, derivatives involve the risk that changes in the value of the derivative may not correlate with relevant assets, rates or indices. Derivatives may be difficult to price or unwind, and small changes may produce disproportionate losses for the Portfolios. Certain derivatives have the potential for unlimited loss, regardless of the size of the initial investment. Assets required to be set aside or posted to cover or secure derivatives positions may themselves go down in value, and these collateral and other requirements may limit investment flexibility. Some derivatives involve leverage, which can make the Portfolios more volatile and can compound other risks. Derivatives, especially over-the-counter derivatives, are also subject to counterparty risk. Use of derivatives may have different tax consequences for the Portfolios than an investment in the underlying asset or index, and such differences may affect the amount, timing and character of income distributed to shareholders, including the proportion of income consisting of exempt-interest dividends. The U.S. government and certain foreign governments have adopted regulations governing derivatives markets, including mandatory clearing of certain derivatives, and may impose additional regulations governing margin, reporting and registration requirements. The ultimate impact of the regulations remains unclear. Additional regulation may make derivatives more costly, limit their availability or utility, otherwise adversely affect their performance, or disrupt markets.
2021 Semi-Annual Report | 75 | |
Table of Contents
Notes to Financial Statements (continued)
Mortgage-Related and Asset-Related Securities Risk—Mortgage- and asset-related securities represent interests in “pools” of mortgages, or other assets including consumer loans or receivables held in trust. Mortgage- and asset-related securities are subject to credit, interest rate, prepayment and extension risks. These securities also are subject to risk of default on the underlying mortgage or asset, particularly during periods of economic downturn. Small movements in interest rates (both increases and decreases) may quickly and significantly reduce the value of certain mortgage-related securities.
Prepayment and Extension Risk—Prepayment risk is the risk that a loan, bond or other security might be called or otherwise converted, prepaid or redeemed before maturity. If this happens, particularly during a time of declining interest rates or credit spreads, the Portfolios will not benefit from the rise in market price that normally accompanies a decline in interest rates, and may not be able to invest the proceeds in securities providing as much income, resulting in a lower yield to the Portfolios. Conversely, extension risk is the risk that as interest rates rise or spreads widen, payments of securities may occur more slowly than anticipated by the market. If this happens, the values of these securities may go down because their interest rates are lower than current market rates and they remain outstanding longer than anticipated.
Subordination Risk—The Portfolios may invest in securities that are subordinated to more senior securities of an issuer, or which represent interests in pools of such subordinated securities. Subordinated securities will be disproportionately affected by a default or even a perceived decline in creditworthiness of the issuer. Subordinated securities are more likely to suffer a credit loss than non-subordinated securities of the same issuer, any loss incurred by the subordinated securities is likely to be proportionately greater, and any recovery of interest or principal may take more time.
Management Risk—The Portfolios are subject to management risk because they are actively managed investment portfolios. The Adviser will apply its investment techniques and risk analyses in making investment decisions for the Portfolios, but these techniques, analyses and decisions may not work as intended or may not produce the desired results, and may, during certain periods, result in increased volatility for the Portfolios or cause the value of the Portfolios’ shares to go down. In some cases, derivatives and other investment techniques may be unavailable, or the Adviser may determine not to use them, possibly even under market conditions where their use could benefit the Portfolios. Some of these techniques may incorporate, or rely upon, quantitative models, but there is no guarantee that these models will generate accurate forecasts, reduce risk or otherwise perform as expected. In addition, the Adviser may change the Portfolios’ investment strategies or policies from time to time. Those changes may not lead to the results intended by the Adviser and could also have an adverse effect on the value or performance of the Portfolios.
Illiquid Investments Risk—Illiquid investments risk exists when particular investments are difficult to purchase or sell, possibly preventing the Portfolios from purchasing or selling these securities at an advantageous price. The municipal Portfolios are subject to greater risk because the market for municipal securities is generally smaller than many other markets, which may make municipal securities more difficult to trade or dispose of than other types of securities. Illiquid securities may also be difficult to value.
Redemption Risk—The Portfolios may experience heavy redemptions that could cause the Portfolios to liquidate their assets at inopportune times or unfavorable prices or increase or accelerate taxable gains or transaction costs and may negatively affect the Portfolios’ net asset value, or performance, which could cause the value of your investment to decline. Redemption risk is heightened during periods of overall market turmoil.
Foreign Currency Risk—This is the risk that changes in foreign (non-U.S.) currency exchange rates may negatively affect the value of the Portfolios’ investments or reduce the returns of the Portfolios. For example, the value of the Portfolios’ investments in foreign securities and foreign currency positions may decrease if the U.S. Dollar is strong (i.e., gaining value relative to other currencies) and other currencies are weak (i.e., losing value relative to the U.S. Dollar).
Actions by a Few Major Investors—In certain countries, volatility may be heightened by actions of a few major investors. For example, substantial increases or decreases in cash flows of mutual funds investing in these markets could significantly affect local securities prices and, therefore, share prices of the Portfolios.
| 76 | Sanford C. Bernstein Fund, Inc. | |
Table of Contents
Market Risk—The Portfolios are subject to market risk, which is the risk that stock prices in general or in particular countries or sectors may decline over short or extended periods. Stock prices may decline in response to adverse changes in the economy or the economic outlook; deterioration in investor sentiment; interest rate, currency and commodity price fluctuations; adverse geopolitical, social or environmental developments; issuer- and sector-specific considerations; public health crises (including the occurrence of a contagious disease or illness); and other factors. In the past decade, financial markets in the United States, Europe and elsewhere have experienced increased volatility, decreased liquidity and heightened uncertainty. These market conditions may recur from time to time and have an adverse impact on various securities markets. Recently, certain governments and central banks have provided significant support to financial markets in response to serious economic disruptions, including, but not limited to, buying stocks, providing direct capital infusions into companies, implementing new monetary programs, dramatically lowering interest rates and through other market interventions. This and other government intervention into the economy and financial markets may not work as intended, particularly if the efforts are perceived by investors as being unlikely to achieve the desired results. Government actions to support the economy and financial markets have resulted in a large expansion of government deficits and debt, the long term consequences of which are not known. The reversal of these policies, or their ineffectiveness, as well as further governmental or central bank actions could negatively affect financial markets generally, increase market volatility and reduce the value and liquidity of securities in which the Portfolio invests.
On January 31, 2020, the United Kingdom (the “U.K.”) formally left the European Union (the “EU”) (“Brexit”) and ceased to be a member of the EU. Brexit could adversely affect European or worldwide political, regulatory, economic or market conditions and could contribute to instability in global political institutions, regulatory agencies and financial markets. Brexit could also lead to legal uncertainty and politically divergent national laws and regulations as a new relationship between the U.K. and EU is developed and the U.K. determines which EU laws to replace or replicate in the future. Any of these effects of Brexit, and others the Adviser cannot anticipate, could adversely affect the value of the Portfolio’s investments and its net asset value. The political, economic and legal consequences of Brexit continue to give rise to uncertainties. The U.K. may be less stable than it has been in recent years and investments in U.K. assets may be difficult to value, or subject to greater or more frequent rises and falls in value.
The United States and its trading partners are periodically involved in disputes over trade, which may result in tariffs on various categories of goods imported from the other country. For example, the current political climate between the United States and China has intensified concerns about protectionist trade policies and a potential trade war between China and the United States. The United States has imposed tariffs and other trade barriers on Chinese exports and placed other restrictions on or barriers to investments in China. Trade disputes, particularly prolonged disputes, may adversely affect the economies of the United States and its trading partners, as well as the companies directly or indirectly affected by the dispute and financial markets generally, and thus may adversely affect the value of the Portfolio’s assets. Recently, the United States government acted to prohibit U.S. persons, such as the Portfolio, from owning, and required them to divest, certain Chinese companies designated as related to the Chinese military. There is no assurance that more such companies will not be so designated in the future, which could limit the Portfolio’s opportunities for investment and require the sale of securities at a loss or make them illiquid. If the political climate between the United States and China continues to deteriorate, economies and markets may be adversely affected.
Policy and legislative changes in the United States and in other countries are affecting many aspects of financial regulation, and may in some instances contribute to decreased liquidity and increased volatility in the financial markets. The impact of these changes, and the practical implications for market participants, may not be fully known for some time.
Economies and financial markets throughout the world are becoming increasingly interconnected. Economic, financial or political events, trading and tariff arrangements, terrorism, natural disasters (including the spread of infectious illness) and other circumstances in one country or region could have profound impacts on global economies or markets. As a result, whether or not the Portfolio invests in securities of issuers located in or with significant exposure to countries experiencing economic and financial difficulties, the value and liquidity of the Portfolio’s investments may be negatively affected.
2021 Semi-Annual Report | 77 | |
Table of Contents
Notes to Financial Statements (continued)
Tax Risk—There is no guarantee that the income on a Municipal Portfolio’s municipal securities will be exempt from regular federal income, and if applicable, state income taxes. Unfavorable legislation, adverse interpretations by federal or state authorities, litigation or noncompliant conduct by the issuer of a municipal security could affect the tax-exempt status of municipal securities. If the Internal Revenue Service or a state authority determines that an issuer of a municipal security has not complied with applicable requirements, interest from the security could become subject to regular federal income tax and/or state personal income tax, possibly retroactively to the date the security was issued, the value of the security could decline significantly, and a portion of the distributions to Portfolio shareholders could be recharacterized as taxable. The U.S. Congress has considered changes to U.S. federal tax law that would, if enacted, have a negative impact on certain types of municipal securities, such as private activity bonds, or would otherwise make investments in municipal bonds less attractive.
Capitalization Risk—Investments in small- and mid-capitalization companies may be more volatile than investments in large-capitalization companies. Investments in small- and mid-capitalization companies may have additional risks because these companies have limited product lines, markets or financial resources.
Allocation Risk—The allocation of investments among investment disciplines may have a significant effect on the Portfolios’ performance when the investment disciplines in which the Portfolios have greater exposure perform worse than the investment disciplines with less exposure. Different investment styles tend to shift in and out of favor depending on market conditions and investor sentiment. The Portfolios may allocate a significant portion of its assets to securities of companies in broadly related industries within an economic sector. Companies in the same sector may be similarly affected by economic or market events, making the Portfolios more vulnerable to unfavorable developments in that sector than funds that invest more broadly.
Lower-rated Securities Risk—Lower-rated securities, or junk bonds/high-yield securities, are subject to greater risk of loss of principal and interest and greater market risk than higher-rated securities. The capacity of issuers of lower-rated securities to pay interest and repay principal is more likely to weaken than is that of issuers of higher-rated securities in times of deteriorating economic conditions or rising interest rates.
Riskier than a Money-Market Fund—Although the Short Duration Portfolios maintain a short overall duration, they invest in securities with longer maturities and in some cases lower quality than the assets of the type of mutual fund known as a money-market fund. The risk of a decline in the market value of the Portfolios is greater than for a money-market fund since the credit quality of the Portfolios’ securities may be lower and the effective duration of the Portfolios will be longer.
LIBOR Transition and Associated Risk—The Portfolios may invest in debt securities, derivatives or other financial instruments that utilize the London Interbank Offered Rate, or “LIBOR,” as a “benchmark” or “reference rate” for various interest rate calculations. The United Kingdom Financial Conduct Authority, which regulates LIBOR, will cease publishing certain LIBOR benchmarks at the end of 2021. Although certain LIBOR rates are intended to be published until June 2023, banks are strongly encouraged to cease entering into agreements with counterparties referencing LIBOR by the end of 2021. Although financial regulators and industry working groups have suggested alternative reference rates, such as the European Interbank Offer Rate, the Sterling Overnight Interbank Average Rate and the Secured Overnight Financing Rate, global consensus on alternative rates is lacking and the process for amending existing contracts or instruments to transition away from LIBOR is underway but remains incomplete. The elimination of LIBOR or changes to other reference rates or any other changes or reforms to the determination or supervision of reference rates could have an adverse impact on the market for, or value of, any securities or payments linked to those reference rates, which may adversely affect the Portfolios’ performance and/or net asset value. Uncertainty and risk also remain regarding the willingness and ability of issuers and lenders to include revised provisions in new and existing contracts or instruments. Consequently, the transition away from LIBOR to other reference rates may lead to increased volatility and illiquidity in markets that are tied to LIBOR, fluctuations in values of LIBOR-related investments or investments in issuers that utilize LIBOR, increased difficulty in borrowing or refinancing and diminished effectiveness of hedging strategies, potentially adversely affecting the Portfolios’ performance. Furthermore, the risks associated with the expected discontinuation of LIBOR and transition may be exacerbated if the work necessary to effect an orderly transition to an alternative reference rate is not completed in a timely manner. Because the usefulness of LIBOR as a benchmark could deteriorate during the transition period, these effects could occur prior to the end of 2021.
| 78 | Sanford C. Bernstein Fund, Inc. | |
Table of Contents
Cybersecurity Risk—Cybersecurity incidents, both intentional and unintentional, may allow an unauthorized party to gain access to Portfolio assets, customer data (including private shareholder information), or proprietary information, or cause the Portfolios, the Adviser, and/or its service providers (including, but not limited to, fund accountants, custodians, sub-custodians, transfer agents and financial intermediaries) to suffer data breaches, data corruption or lose operational functionality, or prevent Portfolio investors from purchasing, redeeming or exchanging shares or receiving distributions. A Portfolio and the Adviser have limited ability to prevent or mitigate cybersecurity incidents affecting third-party service providers. Cybersecurity incidents may result in financial losses to such Portfolio and its shareholders, and substantial costs may be incurred in order to prevent any future cybersecurity incidents.
Indemnification Risk—In the ordinary course of business, the Portfolios enter into contracts that contain a variety of indemnifications. The Portfolios’ maximum exposure under these arrangements is unknown. However, the Portfolios have not had prior claims or losses pursuant to these indemnification provisions and expect the risk of loss thereunder to be remote. Therefore, the Portfolios have not accrued any liability in connection with these indemnification provisions.
| NOTE 6. | Capital-Share Transactions |
The Fund has authorized 17.5 billion shares of common stock, par value $0.001 per share, of which 10.0 billion shares are allocated to the SCB Portfolios. The allocation is as follows:
| ALLOCATION OF SHARES (IN MILLIONS) | ||||||||||||||||||||||||||||||||||||
| PORTFOLIO | BERNSTEIN CLASS SHARES | CLASS A SHARES | CLASS B SHARES | CLASS C SHARES | ADVISOR CLASS SHARES | CLASS R SHARES | CLASS Z SHARES | CLASS T SHARES | TOTAL | |||||||||||||||||||||||||||
Emerging Markets | 200 | 0 | 0 | 0 | 0 | 0 | 300 | 0 | 500 | |||||||||||||||||||||||||||
Short Duration Diversified Municipal | 100 | 0 | 0 | 0 | 0 | 0 | 0 | 0 | 100 | |||||||||||||||||||||||||||
California Municipal | 200 | 200 | 200 | 200 | 200 | 0 | 200 | 300 | 1,500 | |||||||||||||||||||||||||||
Diversified Municipal | 800 | 400 | 400 | 400 | 400 | 0 | 600 | 300 | 3,300 | |||||||||||||||||||||||||||
New York Municipal | 400 | 200 | 200 | 200 | 200 | 0 | 200 | 300 | 1,700 | |||||||||||||||||||||||||||
Intermediate Duration | 600 | 300 | 0 | 0 | 300 | 0 | 400 | 0 | 1,600 | |||||||||||||||||||||||||||
Short Duration Plus | 200 | 200 | 200 | 200 | 0 | 200 | 0 | 300 | 1,300 | |||||||||||||||||||||||||||
Share transactions for each Portfolio for the six months ended March 31, 2021 and the year ended September 30, 2020, were as follows:
| EMERGING MARKETS PORTFOLIO | ||||||||||||||||||||
| SHARES | AMOUNT | |||||||||||||||||||
SIX MONTHS ENDED 3/31/21 (UNAUDITED) | YEAR ENDED 9/30/20 | SIX MONTHS ENDED 3/31/21 (UNAUDITED) | YEAR ENDED 9/30/20 | |||||||||||||||||
Emerging Markets Class Shares | ||||||||||||||||||||
Shares sold | 1,402,452 | 4,095,046 | $ | 46,151,351 | $ | 104,194,109 | ||||||||||||||
Shares issued to shareholders on reinvestment of dividends and distributions | 546,878 | 551,423 | 17,297,744 | 15,208,232 | ||||||||||||||||
Shares redeemed | (3,587,488 | ) | (8,814,966 | ) | (116,402,065 | ) | (222,592,458 | ) | ||||||||||||
|
|
|
|
|
|
|
| |||||||||||||
Net decrease | (1,638,158 | ) | (4,168,497 | ) | $ | (52,952,970 | ) | $ | (103,190,117 | ) | ||||||||||
|
|
|
|
|
|
|
| |||||||||||||
2021 Semi-Annual Report | 79 | |
Table of Contents
Notes to Financial Statements (continued)
| EMERGING MARKETS PORTFOLIO | ||||||||||||||||||||
| SHARES | AMOUNT | |||||||||||||||||||
SIX MONTHS ENDED 3/31/21 (UNAUDITED) | YEAR ENDED 9/30/20 | SIX MONTHS ENDED 3/31/21 (UNAUDITED) | YEAR ENDED 9/30/20 | |||||||||||||||||
Class Z Shares | ||||||||||||||||||||
Shares issued to shareholders on reinvestment of dividends and distributions | 132,229 | 124,551 | $ | 4,182,401 | $ | 3,433,876 | ||||||||||||||
Shares redeemed | (256,685 | ) | (225,702 | ) | (8,603,377 | ) | (6,214,209 | ) | ||||||||||||
|
|
|
|
|
|
|
| |||||||||||||
Net decrease | (124,456 | ) | (101,151 | ) | $ | (4,420,976 | ) | $ | (2,780,333 | ) | ||||||||||
|
|
|
|
|
|
|
| |||||||||||||
| SHORT DURATION DIVERSIFIED MUNICIPAL PORTFOLIO | ||||||||||||||||||||
| SHARES | AMOUNT | |||||||||||||||||||
SIX MONTHS ENDED 3/31/21 (UNAUDITED) | YEAR ENDED 9/30/20 | SIX MONTHS ENDED 3/31/21 (UNAUDITED) | YEAR ENDED 9/30/20 | |||||||||||||||||
Shares sold | 6,844,177 | 10,296,582 | $ | 87,554,176 | $ | 130,099,909 | ||||||||||||||
Shares issued to shareholders on reinvestment of dividends and distributions | 71,301 | 154,056 | 911,642 | 1,945,765 | ||||||||||||||||
Shares redeemed | (4,593,691 | ) | (9,114,304 | ) | (58,737,229 | ) | (114,810,808 | ) | ||||||||||||
|
|
|
|
|
|
|
| |||||||||||||
Net increase | 2,321,787 | 1,336,334 | $ | 29,728,589 | $ | 17,234,866 | ||||||||||||||
|
|
|
|
|
|
|
| |||||||||||||
| CALIFORNIA MUNICIPAL PORTFOLIO | ||||||||||||||||||||
| SHARES | AMOUNT | |||||||||||||||||||
SIX MONTHS ENDED 3/31/21 (UNAUDITED) | YEAR ENDED 9/30/20 | SIX MONTHS ENDED 3/31/21 (UNAUDITED) | YEAR ENDED 9/30/20 | |||||||||||||||||
Municipal Class Shares |
| |||||||||||||||||||
Shares sold | 11,708,246 | 18,304,334 | $ | 171,466,493 | $ | 262,591,109 | ||||||||||||||
Shares issued to shareholders on reinvestment of dividends | 582,578 | 1,319,973 | 8,514,562 | 18,912,474 | ||||||||||||||||
Shares redeemed | (11,420,858 | ) | (17,939,347 | ) | (166,775,243 | ) | (257,212,852 | ) | ||||||||||||
|
|
|
|
|
|
|
| |||||||||||||
Net increase | 869,966 | 1,684,960 | $ | 13,205,812 | $ | 24,290,731 | ||||||||||||||
|
|
|
|
|
|
|
| |||||||||||||
| 80 | Sanford C. Bernstein Fund, Inc. | |
Table of Contents
| CALIFORNIA MUNICIPAL PORTFOLIO | ||||||||||||||||||||
| SHARES | AMOUNT | |||||||||||||||||||
SIX MONTHS ENDED 3/31/21 (UNAUDITED) | YEAR ENDED 9/30/20 | SIX MONTHS ENDED 3/31/21 (UNAUDITED) | YEAR ENDED 9/30/20 | |||||||||||||||||
Class A Shares |
| |||||||||||||||||||
Shares sold | 711,540 | 1,531,470 | $ | 10,406,547 | $ | 21,731,549 | ||||||||||||||
Shares issued to shareholders on reinvestment of dividends | 30,192 | 67,572 | 441,251 | 967,916 | ||||||||||||||||
Shares converted from Class C | 38,840 | 196,520 | 563,574 | 2,841,205 | ||||||||||||||||
Shares redeemed | (580,397 | ) | (1,240,749 | ) | (8,500,863 | ) | (17,837,021 | ) | ||||||||||||
|
|
|
|
|
|
|
| |||||||||||||
Net increase | 200,175 | 554,813 | $ | 2,910,509 | $ | 7,703,649 | ||||||||||||||
|
|
|
|
|
|
|
| |||||||||||||
Class C Shares |
| |||||||||||||||||||
Shares sold | 95,698 | 58,513 | $ | 1,397,214 | $ | 830,225 | ||||||||||||||
Shares issued to shareholders on reinvestment of dividends | 1,230 | 4,847 | 17,969 | 69,332 | ||||||||||||||||
Shares converted to Class A | (38,840 | ) | (196,607 | ) | (563,574 | ) | (2,841,205 | ) | ||||||||||||
Shares redeemed | (97,189 | ) | (168,563 | ) | (1,421,098 | ) | (2,419,241 | ) | ||||||||||||
|
|
|
|
|
|
|
| |||||||||||||
Net decrease | (39,101 | ) | (301,810 | ) | $ | (569,489 | ) | $ | (4,360,889 | ) | ||||||||||
|
|
|
|
|
|
|
| |||||||||||||
Advisor Class Shares |
| |||||||||||||||||||
Shares sold | 1,244,261 | 2,177,882 | $ | 18,187,674 | $ | 31,198,386 | ||||||||||||||
Shares issued to shareholders on reinvestment of dividends | 28,552 | 47,880 | 417,349 | 686,690 | ||||||||||||||||
Shares redeemed | (873,379 | ) | (751,491 | ) | (12,765,190 | ) | (10,766,859 | ) | ||||||||||||
|
|
|
|
|
|
|
| |||||||||||||
Net increase | 399,434 | 1,474,271 | $ | 5,839,833 | $ | 21,118,217 | ||||||||||||||
|
|
|
|
|
|
|
| |||||||||||||
| DIVERSIFIED MUNICIPAL PORTFOLIO | ||||||||||||||||||||
| SHARES | AMOUNT | |||||||||||||||||||
SIX MONTHS ENDED 3/31/21 (UNAUDITED) | YEAR ENDED 9/30/20 | SIX MONTHS ENDED 3/31/21 (UNAUDITED) | YEAR ENDED 9/30/20 | |||||||||||||||||
Municipal Class Shares |
| |||||||||||||||||||
Shares sold | 40,884,494 | 65,669,903 | $ | 605,831,094 | $ | 953,324,442 | ||||||||||||||
Shares issued to shareholders on reinvestment of dividends and distributions | 2,646,986 | 5,921,505 | 39,160,071 | 85,677,553 | ||||||||||||||||
Shares redeemed | (30,983,729 | ) | (70,962,829 | ) | (458,831,188 | ) | (1,027,322,105 | ) | ||||||||||||
|
|
|
|
|
|
|
| |||||||||||||
Net increase | 12,547,751 | 628,579 | $ | 186,159,977 | $ | 11,679,890 | ||||||||||||||
|
|
|
|
|
|
|
| |||||||||||||
2021 Semi-Annual Report | 81 | |
Table of Contents
Notes to Financial Statements (continued)
| DIVERSIFIED MUNICIPAL PORTFOLIO | ||||||||||||||||||||
| SHARES | AMOUNT | |||||||||||||||||||
SIX MONTHS ENDED 3/31/21 (UNAUDITED) | YEAR ENDED 9/30/20 | SIX MONTHS ENDED 3/31/21 (UNAUDITED) | YEAR ENDED 9/30/20 | |||||||||||||||||
Class A Shares |
| |||||||||||||||||||
Shares sold | 5,013,696 | 8,506,533 | $ | 74,386,575 | $ | 123,402,971 | ||||||||||||||
Shares issued to shareholders on reinvestment of dividends and distributions | 111,885 | 216,415 | 1,656,645 | 3,136,627 | ||||||||||||||||
Shares converted from Class B | 0 | 396 | 0 | 5,757 | ||||||||||||||||
Shares converted from Class C | 229,654 | 668,163 | 3,385,505 | 9,741,190 | ||||||||||||||||
Shares redeemed | (2,031,361 | ) | (6,973,908 | ) | (30,044,040 | ) | (100,315,358 | ) | ||||||||||||
|
|
|
|
|
|
|
| |||||||||||||
Net increase | 3,323,874 | 2,417,599 | $ | 49,384,685 | $ | 35,971,187 | ||||||||||||||
|
|
|
|
|
|
|
| |||||||||||||
Shares issued to shareholders on reinvestment of dividends and distributions | 0 | 0 | (a) | 0 | 5 | |||||||||||||||
Shares converted to Class A | 0 | (396 | ) | 0 | (5,757 | ) | ||||||||||||||
|
|
|
|
|
|
|
| |||||||||||||
Net decrease | 0 | (396 | ) | $ | 0 | $ | (5,752 | ) | ||||||||||||
|
|
|
|
|
|
|
| |||||||||||||
Class C Shares |
| |||||||||||||||||||
Shares sold | 209,872 | 619,068 | $ | 3,100,900 | $ | 8,996,206 | ||||||||||||||
Shares issued to shareholders on reinvestment of dividends and distributions | 8,578 | 26,548 | 126,886 | 383,891 | ||||||||||||||||
Shares converted to Class A | (229,753 | ) | (668,532 | ) | (3,385,505 | ) | (9,741,190 | ) | ||||||||||||
Shares redeemed | (222,077 | ) | (503,171 | ) | (3,293,123 | ) | (7,258,503 | ) | ||||||||||||
|
|
|
|
|
|
|
| |||||||||||||
Net decrease | (233,380 | ) | (526,087 | ) | $ | (3,450,842 | ) | $ | (7,619,596 | ) | ||||||||||
|
|
|
|
|
|
|
| |||||||||||||
Advisor Class Shares |
| |||||||||||||||||||
Shares sold | 6,790,570 | 17,082,408 | $ | 100,489,082 | $ | 246,673,652 | ||||||||||||||
Shares issued to shareholders on reinvestment of dividends and distributions | 177,405 | 354,933 | 2,623,098 | 5,133,286 | ||||||||||||||||
Shares redeemed | (4,097,798 | ) | (10,848,498 | ) | (60,602,244 | ) | (156,298,402 | ) | ||||||||||||
|
|
|
|
|
|
|
| |||||||||||||
Net increase | 2,870,177 | 6,588,843 | $ | 42,509,936 | $ | 95,508,536 | ||||||||||||||
|
|
|
|
|
|
|
| |||||||||||||
Class Z Shares |
| |||||||||||||||||||
Shares sold | 2,886,455 | 6,546,888 | $ | 42,832,020 | $ | 95,145,948 | ||||||||||||||
Shares issued to shareholders on reinvestment of dividends and distributions | 314,191 | 877,402 | 4,650,491 | 12,695,423 | ||||||||||||||||
Shares redeemed | (6,610,697 | ) | (30,613,937 | ) | (98,191,629 | ) | (443,644,578 | ) | ||||||||||||
|
|
|
|
|
|
|
| |||||||||||||
Net decrease | (3,410,051 | ) | (23,189,647 | ) | $ | (50,709,118 | ) | $ | (335,803,207 | ) | ||||||||||
|
|
|
|
|
|
|
| |||||||||||||
| (a) | Amount is less than one share |
| 82 | Sanford C. Bernstein Fund, Inc. | |
Table of Contents
| NEW YORK MUNICIPAL PORTFOLIO | ||||||||||||||||||||
| SHARES | AMOUNT | |||||||||||||||||||
SIX MONTHS ENDED 3/31/21 (UNAUDITED) | YEAR ENDED 9/30/20 | SIX MONTHS ENDED 3/31/21 (UNAUDITED) | YEAR ENDED 9/30/20 | |||||||||||||||||
Municipal Class Shares |
| |||||||||||||||||||
Shares sold | 11,815,128 | 16,023,100 | $ | 168,063,080 | $ | 225,273,454 | ||||||||||||||
Shares issued to shareholders on reinvestment of dividends | 864,299 | 1,967,243 | 12,282,758 | 27,519,363 | ||||||||||||||||
Shares redeemed | (11,971,603 | ) | (19,922,598 | ) | (170,374,439 | ) | (278,806,797 | ) | ||||||||||||
|
|
|
|
|
|
|
| |||||||||||||
Net increase (decrease) | 707,824 | (1,932,255 | ) | $ | 9,971,399 | $ | (26,013,980 | ) | ||||||||||||
|
|
|
|
|
|
|
| |||||||||||||
Class A Shares |
| |||||||||||||||||||
Shares sold | 874,597 | 1,767,847 | $ | 12,447,424 | $ | 25,013,436 | ||||||||||||||
Shares issued to shareholders on reinvestment of dividends | 45,162 | 107,527 | 641,228 | 1,503,374 | ||||||||||||||||
Shares converted from Class C | 119,504 | 387,315 | 1,695,772 | 5,461,252 | ||||||||||||||||
Shares redeemed | (1,301,638 | ) | (2,309,293 | ) | (18,423,783 | ) | (32,190,853 | ) | ||||||||||||
|
|
|
|
|
|
|
| |||||||||||||
Net decrease | (262,375 | ) | (46,604 | ) | $ | (3,639,359 | ) | $ | (212,791 | ) | ||||||||||
|
|
|
|
|
|
|
| |||||||||||||
Class C Shares |
| |||||||||||||||||||
Shares sold | 11,247 | 111,298 | $ | 160,363 | $ | 1,575,487 | ||||||||||||||
Shares issued to shareholders on reinvestment of dividends | 4,898 | 16,401 | 69,480 | 229,424 | ||||||||||||||||
Shares converted to Class A | (119,489 | ) | (387,150 | ) | (1,695,772 | ) | (5,461,252 | ) | ||||||||||||
Shares redeemed | (120,563 | ) | (243,682 | ) | (1,706,729 | ) | (3,412,751 | ) | ||||||||||||
|
|
|
|
|
|
|
| |||||||||||||
Net decrease | (223,907 | ) | (503,133 | ) | $ | (3,172,658 | ) | $ | (7,069,092 | ) | ||||||||||
|
|
|
|
|
|
|
| |||||||||||||
Advisor Class Shares |
| |||||||||||||||||||
Shares sold | 620,770 | 2,556,570 | $ | 8,830,627 | $ | 35,996,559 | ||||||||||||||
Shares issued to shareholders on reinvestment of dividends | 27,973 | 65,496 | 397,052 | 914,792 | ||||||||||||||||
Shares redeemed | (971,508 | ) | (2,056,078 | ) | (13,715,288 | ) | (28,394,625 | ) | ||||||||||||
|
|
|
|
|
|
|
| |||||||||||||
Net increase (decrease) | (322,765 | ) | 565,988 | $ | (4,487,609 | ) | $ | 8,516,726 | ||||||||||||
|
|
|
|
|
|
|
| |||||||||||||
2021 Semi-Annual Report | 83 | |
Table of Contents
Notes to Financial Statements (continued)
| INTERMEDIATE DURATION PORTFOLIO | ||||||||||||||||||||
| SHARES | AMOUNT | |||||||||||||||||||
| SIX MONTHS ENDED 3/31/21 (UNAUDITED) | YEAR ENDED 9/30/20 | SIX MONTHS ENDED 3/31/21 (UNAUDITED) | YEAR ENDED 9/30/20 | |||||||||||||||||
Intermediate Duration Class Shares |
| |||||||||||||||||||
Shares sold | 33,187,212 | 45,936,902 | $ | 455,992,871 | $ | 630,770,763 | ||||||||||||||
Shares issued to shareholders on reinvestment of dividends and distributions | 6,810,545 | 5,362,105 | 93,995,745 | 73,165,522 | ||||||||||||||||
Shares redeemed | (19,005,813 | ) | (39,842,447 | ) | (261,624,081 | ) | (542,623,931 | ) | ||||||||||||
|
|
|
|
|
|
|
| |||||||||||||
Net increase | 20,991,944 | 11,456,560 | $ | 288,364,535 | $ | 161,312,354 | ||||||||||||||
|
|
|
|
|
|
|
| |||||||||||||
Class A Shares |
| |||||||||||||||||||
Shares sold | 86,011 | 51,389 | $ | 1,184,317 | $ | 711,682 | ||||||||||||||
Shares issued to shareholders on reinvestment of dividends and distributions | 1,498 | 131 | 20,626 | 1,811 | ||||||||||||||||
Shares redeemed | (3,836 | ) | (2,905 | ) | (53,215 | ) | (40,307 | ) | ||||||||||||
|
|
|
|
|
|
|
| |||||||||||||
Net increase | 83,673 | 48,615 | $ | 1,151,728 | $ | 673,186 | ||||||||||||||
|
|
|
|
|
|
|
| |||||||||||||
Advisor Class Shares |
| |||||||||||||||||||
Shares sold | 99 | 0 | $ | 1,324 | $ | 0 | ||||||||||||||
Shares issued to shareholders on reinvestment of dividends and distributions | 0 | (a) | 0 | 1 | 0 | |||||||||||||||
|
|
|
|
|
|
|
| |||||||||||||
Net increase | 99 | 0 | $ | 1,325 | $ | 0 | ||||||||||||||
|
|
|
|
|
|
|
| |||||||||||||
| (a) | Amount is less than one share |
| SHORT DURATION PLUS PORTFOLIO | ||||||||||||||||||||
| SHARES | AMOUNT | |||||||||||||||||||
| SIX MONTHS ENDED 3/31/21 (UNAUDITED) | YEAR ENDED 9/30/20 | SIX MONTHS ENDED 3/31/21 (UNAUDITED) | YEAR ENDED 9/30/20 | |||||||||||||||||
Short Duration Plus Class Shares |
| |||||||||||||||||||
Shares sold | 5,734,925 | 7,860,805 | $ | 67,374,953 | $ | 92,402,116 | ||||||||||||||
Shares issued to shareholders on reinvestment of dividends | 101,575 | 255,694 | 1,193,418 | 3,005,897 | ||||||||||||||||
Shares redeemed | (2,728,626 | ) | (8,538,329 | ) | (32,052,481 | ) | (100,401,349 | ) | ||||||||||||
|
|
|
|
|
|
|
| |||||||||||||
Net increase (decrease) | 3,107,874 | (421,830 | ) | $ | 36,515,890 | $ | (4,993,336 | ) | ||||||||||||
|
|
|
|
|
|
|
| |||||||||||||
| 84 | Sanford C. Bernstein Fund, Inc. | |
Table of Contents
| SHORT DURATION PLUS PORTFOLIO | ||||||||||||||||||||
| SHARES | AMOUNT | |||||||||||||||||||
| SIX MONTHS ENDED 3/31/21 (UNAUDITED) | YEAR ENDED 9/30/20 | SIX MONTHS ENDED 3/31/21 (UNAUDITED) | YEAR ENDED 9/30/20 | |||||||||||||||||
Class A Shares |
| |||||||||||||||||||
Shares sold | 325,882 | 864,056 | $ | 3,835,717 | $ | 10,214,178 | ||||||||||||||
Shares issued to shareholders on reinvestment of dividends | 4,014 | 13,543 | 47,205 | 159,270 | ||||||||||||||||
Shares converted from Class B | 0 | 632 | 0 | 7,412 | ||||||||||||||||
Shares converted from Class C | 9,264 | 55,302 | 108,994 | 652,856 | ||||||||||||||||
Shares redeemed | (406,259 | ) | (1,159,807 | ) | (4,777,603 | ) | (13,642,768 | ) | ||||||||||||
|
|
|
|
|
|
|
| |||||||||||||
Net decrease | (67,099 | ) | (226,274 | ) | $ | (785,687 | ) | $ | (2,609,052 | ) | ||||||||||
|
|
|
|
|
|
|
| |||||||||||||
Class B Shares |
| |||||||||||||||||||
Shares sold | 0 | 90 | $ | 0 | $ | 1,050 | ||||||||||||||
Shares issued to shareholders on reinvestment of dividends | 0 | 0 | (a) | 0 | 4 | |||||||||||||||
Shares converted to Class A | 0 | (633 | ) | 0 | (7,412 | ) | ||||||||||||||
|
|
|
|
|
|
|
| |||||||||||||
Net increase (decrease) | 0 | (543 | ) | $ | 0 | $ | (6,358 | ) | ||||||||||||
|
|
|
|
|
|
|
| |||||||||||||
Class C Shares |
| |||||||||||||||||||
Shares sold | 42,936 | 215,651 | $ | 504,103 | $ | 2,539,018 | ||||||||||||||
Shares issued to shareholders on reinvestment of dividends | 404 | 1,182 | 4,748 | 13,870 | ||||||||||||||||
Shares converted to Class A | (9,286 | ) | (55,436 | ) | (108,994 | ) | (652,856 | ) | ||||||||||||
Shares redeemed | (100,480 | ) | (105,045 | ) | (1,178,759 | ) | (1,236,126 | ) | ||||||||||||
|
|
|
|
|
|
|
| |||||||||||||
Net increase (decrease) | (66,426 | ) | 56,352 | $ | (778,902 | ) | $ | 663,906 | ||||||||||||
|
|
|
|
|
|
|
| |||||||||||||
| (a) | Amount is less than one share. |
At March 31, 2021, certain AllianceBernstein mutual funds owned 13% of Emerging Markets Portfolio respectively, in aggregate of the Portfolio’s shares outstanding. Significant transactions by such shareholders, if any, may impact the Portfolio’s performance.
| NOTE 7. | Subsequent Events |
As of March 31, 2021, Class C shares will automatically convert to Class A shares ten years after the end of the calendar month of purchase. Effective May 31, 2021, Class C shares will automatically convert to Class A shares after eight years instead of ten years.
Management has evaluated subsequent events for possible recognition or disclosure in the financial statements through the date the financial statements are issued. Management has determined that there are no other material events that would require disclosure in the Portfolios’ financial statements through this date.
2021 Semi-Annual Report | 85 | |
Table of Contents
Sanford C. Bernstein Fund, Inc.
BOARDOF DIRECTORS
Debra Perry*,^
Chair
Beata D. Kirr
President
R. Jay Gerken*,^
Director
Jeffrey R. Holland*
Director
William Kristol*
Director
Michelle McCloskey*
Director
Donald K. Peterson*
Director
OFFICERS
Laurent Saltiel(1)
Vice President
Henry S. D’Auria(1)
Vice President
Terrance T. Hults(1)
Vice President
Matthew J. Norton(1)
Vice President
Andrew Potter(1)
Vice President
Shawn E. Keegan(1)
Vice President
Michael Canter(1)
Vice President
Janaki Rao(1)
Vice President
Nelson Yu(1)
Vice President
Emilie D. Wrapp
Secretary
Michael B. Reyes
Senior Analyst
Joseph J. Mantineo
Treasurer and Chief Financial Officer
Phyllis J. Clarke
Controller
Vincent S. Noto
Chief Compliance Officer
INDEPENDENT REGISTEREDPUBLIC ACCOUNTING FIRM
PricewaterhouseCoopers LLP
300 Madison Avenue New York, New York 10017
LEGAL COUNSEL
Willkie Farr & Gallagher LLP
787 Seventh Avenue New York, New York 10019
CUSTODIANAND ACCOUNTING AGENT
State Street Bank and Trust Company
State Street Corporation CCB/5 1 Iron Street Boston, Massachusetts 02210
TRANSFER AGENT
DST Asset Manager Solutions
2000 Crown Colony Drive Quincy, Massachusetts 02169
INVESTMENT ADVISER
AllianceBernstein L.P.
1345 Avenue of the Americas New York, New York 10105
* Member of the Audit Committee, the Governance, Nominating and Compensation Committee, and the Independent Directors Committee.
^ Member of the Pricing Committee.
(1) The day-to-day management of, and investment decisions for, the Emerging Markets Portfolio are made by the Emerging Markets Team; Messrs. D’Auria, Saltiel and Yu are the investment professionals with the most significant responsibility for the day-to-day management of the Fund’s Portfolio. The day-to-day management of, and investment decisions for, the Short Duration Plus Portfolio are made by the U.S. Investment Grade: Liquid Markets Structured Products Investment Team; Messrs. Canter, Keegan and Rao are the professionals with the most significant responsibility for the day-to-day management of the Fund’s Portfolio. The day-to-day management of, and investment decisions for, the Intermediate Duration Portfolio are made by the U.S. Investment Grade: Core Fixed Income Team; Messrs. Canter, Keegan and Rao are the investment professionals with the most significant responsibility for the day-to-day management of the Fund’s Portfolio. The day-to-day management of, and investment decisions for, the Fixed Income Municipal Portfolios are made by the Municipal Bond Investment Team; Messrs. Hults, Norton and Potter are the investment professionals with the most significant responsibility for the day-to-day management of the Funds’ Portfolios.
| 86 | Sanford C. Bernstein Fund, Inc. | |
Table of Contents
Operation and Effectiveness of the Portfolios’ Liquidity Risk Management Program:
In October 2016, the Securities and Exchange Commission (“SEC”) adopted the open-end fund liquidity rule (the “Liquidity Rule”). In June 2018 the SEC adopted a requirement that funds disclose information about the operation and effectiveness of their Liquidity Risk Management Program (“LRMP”) in their reports to shareholders.
One of the requirements of the Liquidity Rule is for the Portfolios to designate an Administrator of the Portfolios’ Liquidity Risk Management Program. The Administrator of the Portfolios’ LRMP is AllianceBernstein L.P., the Portfolios’ investment adviser (the “Adviser”). The Adviser has delegated the responsibility to its Liquidity Risk Management Committee (the “Committee”).
Another requirement of the Liquidity Rule is for Fund’s Board of Directors (the “Fund Board”) to receive an annual written report from the Administrator of the LRMP, which addresses the operation of the Portfolios’ LRMP and assesses its adequacy and effectiveness. The Adviser provided the Fund Board with such annual report during the first quarter of 2021, which covered the period January 1, 2020 through December 31, 2020 (the “Program Reporting Period”).
The LRMP’s principal objectives include supporting the Portfolios’ compliance with limits on investments in illiquid assets and mitigating the risk that the Portfolios will be unable to meet their redemption obligations in a timely manner.
Pursuant to the LRMP, the Portfolios classify the liquidity of their portfolio investments into one of the four categories defined by the SEC: Highly Liquid, Moderately Liquid, Less Liquid, and Illiquid. These classifications are reported to the SEC on Form N-PORT.
During the Program Reporting Period, the Committee reviewed whether the Portfolios’ strategy is appropriate for an open-end structure, incorporating any holdings of less liquid and illiquid assets. If the Portfolios participated in derivative transactions, the exposure from such transactions were considered in the LRMP.
The Committee also performed an analysis to determine whether the Portfolios are required to maintain a Highly Liquid Investment Minimum (“HLIM”). The Committee also incorporated the following information when determining the Portfolios’ reasonably anticipated trading size for purposes of liquidity monitoring: historical net redemption activity, the Portfolios’ concentration in an issuer, shareholder concentration, investment performance, total net assets, and distribution channels.
The Adviser informed the Fund Board that the Committee believes the Portfolios’ LRMP is adequately designed, has been implemented as intended, and has operated effectively since its inception. No material exceptions have been noted since the implementation of the LRMP. During the Program Reporting Period, beginning in March 2020, all financial markets experienced extreme levels of price volatility and relative illiquidity resulting from the COVID-19 impacts on the global economy. This extreme relative illiquidity resulted in significantly wider bid-ask spreads to transact in securities, including many of those securities held by the Portfolios, and in a diminished depth of liquidity in most markets, to varying degrees. Nonetheless, there were no liquidity events that impacted the Portfolios or their ability to timely meet redemptions during the Program Reporting Period.
2021 Semi-Annual Report | 87 | |
Table of Contents
Board Consideration of Investment Management Arrangement
Sanford C. Bernstein Fund, Inc. (the “Fund”) is subject to Section 15 of the Investment Company Act of 1940, as amended. Section 15 provides that any investment advisory agreement with a registered investment company such as the Fund may continue in effect for a period of more than two years from the date of its execution, only so long as such continuance is specifically approved at least annually by the board of directors (or by vote of a majority of the outstanding voting securities of the investment company). Pursuant to this requirement, the Fund’s Board of Directors, including the Directors who are not interested persons of the Fund (the “Independent Directors”), unanimously approved the continuation of the Investment Management Agreement between the Fund, on behalf of the Tax-Managed International, International, Emerging Markets, Short Duration Diversified Municipal, New York Municipal, California Municipal, Diversified Municipal, Short Duration Plus, Intermediate Duration, Overlay A, Tax-Aware Overlay A, Overlay B, Tax-Aware Overlay B, Tax-Aware Overlay C and Tax-Aware Overlay N Portfolios (each, a “Portfolio” and collectively, the “Portfolios”) of the Fund, and AllianceBernstein L.P. (the “Adviser”) (the “Investment Management Agreement”) at a video conference meeting held on October 28-29, 2020.1
The following discussion describes the considerations in connection with the Board’s review of the Investment Management Agreement.
In connection with the annual review of the continuation of the Investment Management Agreement between the Fund and the Adviser, counsel to the Independent Directors sent a letter to the Adviser dated August 7, 2020, that contained a list of information requested by the Independent Directors to conduct their annual review. The Board of Directors, including the Independent Directors, met by video conference and telephonically and received and evaluated extensive materials relating to the continuation of the Investment Management Agreement from the Adviser during meetings in September and October 2020. In addition, the Board received materials from the Senior Analyst and an independent fee consultant as described below. On September 30, 2020, the Board of Directors held a video conference meeting to discuss its review of the Investment Management Agreement and the materials the Directors had been provided. At that meeting, the Independent Directors met separately with their independent counsel and the Senior Analyst and the independent fee consultant in executive sessions. Following the September 30, 2020 meeting, the Independent Directors, through counsel, requested certain additional information by means of a letter from their independent counsel dated October 5, 2020, and the Adviser provided certain additional information by means of a letter dated October 15, 2020. The Independent Directors held a telephonic meeting on October 20, 2020 with their independent counsel and the Senior Analyst to further discuss the contract renewal materials and supplemental materials provided in response to the Board’s request. On October 28-29, 2020, the Board of Directors held a video conference meeting to continue their review of the Investment Management Agreement. During this meeting, the Adviser provided further information to the Board relating to contract renewal, and the Independent Directors also met separately with counsel to the Independent Directors as well as the Senior Analyst to review the contract renewal materials provided by the Adviser and the materials prepared by the Senior Analyst. At the conclusion of this meeting, the Board approved the continuation of the Investment Management Agreement for an additional annual term as described below.
In approving the Investment Management Agreement, the Board, including the Independent Directors, considered all information it deemed reasonably necessary to evaluate the terms of the Investment Management Agreement and considered whether the Agreement would be in the best interests of the Fund. In particular, the Board considered the information that was provided to them by the Adviser in response to their requests, as well as information prepared by the Senior Analyst and the independent fee consultant at the request of the Board. The Fund’s Senior Analyst assists the Board (as well as the boards of other funds sponsored by the Adviser) in evaluating investment management agreements and certain other plans and agreements pursuant to which the Adviser or its affiliates provide services to the Funds. The Board also considered other information provided to the Board in connection with the September 30, 2020, and October 28-29, 2020 meetings and throughout the past year.
The information considered by the Board included information with respect to the nature, extent and quality of services provided, investment performance, fees and expenses, profitability, economies of scale, and fall-out benefits and other revenue.
| 1 | The meeting was held by video conference in view of the ongoing COVID-19 pandemic and based on exemptive relief issued by the Securities and Exchange Commission, with the Board’s intention to ratify the approval of the Investment Management Agreement at its next in-person meeting. |
| 88 | Sanford C. Bernstein Fund, Inc. | |
Table of Contents
In the Board’s consideration of the factors discussed below, no single factor was considered in isolation or to be determinative to the decision of the Board to approve the Investment Management Agreement. Rather, the Board concluded, in light of a weighing and balancing of all factors considered and in the exercise of the Directors’ business judgment, that it was in the best interests of the Fund to approve the Investment Management Agreement including the fees to be charged for services thereunder, as summarized below.
Fees and Expenses
The Board, including the Independent Directors, compared the fees and expense ratios of each Portfolio (before and after any fee waivers and expense reimbursements) against fees and expense ratios of a peer group of funds with similar investment objectives (“peer group”). Both the peer group and the funds within the peer group, with respect to the fee and expense data, were available from Strategic Insight, an independent provider of investment company data. The Senior Analyst also performed analyses of the advisory fees, and compared such analyses to the Portfolios’ peer groups. In addition, the Board received and considered information from an independent fee consultant regarding the fees and expenses of the Portfolios as well as their investment performance.
The Board also received and considered information about the services rendered, and the fee rates charged, to other clients advised by the Adviser, including information about any recent advisory fee changes with respect to other investment companies advised by the Adviser. The Board noted the differences between the services provided to the Portfolios in comparison to those provided to other types of clients, including institutional clients and other investment companies for which the Adviser acted as subadviser, and the differences in the entrepreneurial and other risks borne by the Adviser in serving the Portfolios compared to other types of clients.
The Board noted that the Adviser will begin voluntarily waiving the 0.10% shareholder servicing fee for the private client class of the Short Duration Plus Portfolio and the Short Duration Diversified Municipal Portfolio effective with the new term of the shareholder servicing agreement. The Board also noted the Adviser’s proposal to modify the advisory fee schedule of the Overlay A and Tax-Aware Overlay Portfolios by reducing the level where each Portfolio reaches its first breakpoint, and adding a new breakpoint on assets over $5 billion, and that this advisory fee change was expected to provide immediate savings to the Tax-Aware Overlay A Portfolio based on current asset levels.
On the basis of its review and consideration of the fees as described above and the Board’s consideration of the other factors described below, and in light of the Adviser’s agreement to reduce certain fees and to apply certain fee waivers and/or expense caps for certain Portfolios, the Board concluded that the contractual advisory fees as proposed were reasonable.
Nature, Extent and Quality of Services Provided
The Board, including the Independent Directors, considered the nature, quality and extent of services performed by the Adviser and its affiliates gained from their experience as Directors of the Fund, their overall confidence in the Adviser’s integrity and competence they have gained from that experience, and the Adviser’s initiative in identifying and raising potential issues with the Directors. The Board also considered the Adviser’s responsiveness, frankness and attention to concerns raised by the Directors from time to time, including the Adviser’s willingness to consider and implement organizational changes designed to improve investment results and the services provided to the Portfolios. The Board also considered the scope and quality of the Adviser’s investment management capabilities, other resources dedicated to performing its services, the quality of its compliance, administrative and other services provided to the Portfolios and the background and experience of the Adviser’s senior management. The Board reviewed the qualifications, backgrounds and responsibilities of the investment staff primarily responsible for day-to-day portfolio management services for each Portfolio and noted the Adviser’s commitment to strong research and investment management capabilities throughout changing market environments. The Board reviewed the compliance and administrative services of the Adviser that support the investment advisory services provided to the Portfolios. The Board also considered how the organizational capabilities and financial condition of the Adviser may affect the nature and quality of its services. In that regard, the Board considered information about the impact of the COVID-19 pandemic on the Adviser’s operations and the Adviser’s ability to continue to provide the same scope and quality of services to the Portfolios as before the pandemic. The Board considered the ongoing impacts of the relocation of substantial operations of the Adviser from the New York City area to Nashville, Tennessee as well as the implications of a substantial number of the Adviser’s employees working
2021 Semi-Annual Report | 89 | |
Table of Contents
Board Consideration of Investment Management Arrangement (continued)
from home during the pandemic. The Board also noted that the Adviser and its affiliates had continued to update the Board on matters relating to the sale by AXA, S.A., previously an indirect parent of AllianceBernstein Corporation, the general partner of the Adviser, of its remaining ownership interest in its U.S. subsidiary, Equitable Holdings, Inc. The Board considered the statements of the Adviser that it has continued to operate as an independent, publicly-traded US asset manager, that the divestiture has not materially changed the Adviser’s current management structure or strategy, and that the Adviser does not believe that the divestiture will have a material impact on the Adviser with respect to its operations, personnel, organizational structure, or capitalization, financial and other resources.
In considering the nature and quality of the services provided by the Adviser, the Board, including the Independent Directors, received and considered information about each Portfolio’s investment performance, as well as the performance of its peer group and the performance of an appropriate benchmark index. The Board was provided with performance data versus each Portfolio’s peer group, for the 1-year, 3-year, 5-year and 10-year periods, as applicable, ended July 31, 2020 and versus each Portfolio’s benchmark index, for the relevant periods, as well as the most recently available Morningstar rating for those Portfolios with an available rating. The Board also received certain updated performance information as of September 30, 2020. In addition, the Directors considered information showing performance compared to peer groups and benchmarks for rolling calendar year periods and the year to date. The Directors also receive detailed comparative performance information for the Portfolios at each regular Board meeting during the year. The Board recognized that the benchmark indices do not account for fees and expenses incurred by a fund, including the Portfolios. The Directors also considered how peer groups have changed over time and how comparisons may differ depending upon the selection of the peer groups or benchmark indices.
The Directors noted the complexity of the Overlay Portfolios, in particular the complexity of managing the globally diversified set of asset classes and derivatives in which the Overlay Portfolios can invest as well as the complexity of dynamically allocating assets through the Overlay Portfolios among various asset classes as economic and market conditions change in seeking to provide the desired risk/return trade-off for their investors in light of their overall portfolios (and not just their investment in the Overlay Portfolios themselves). The Board reviewed the performance of the Overlay Portfolios in response to the increased market volatility and the performance of the Overlay Portfolios’ dynamic asset allocation component during this unusual market environment. With respect to the International Portfolio and the Tax-Managed International Portfolio, the Board considered that, subject to shareholder approval, the two Portfolios would be merged into another portfolio managed by the Adviser in late 2020 or early 2021. In evaluating the performance of the Portfolios that invest primarily in fixed-income securities, the Directors considered whether those Portfolios may have incurred less credit risk or interest rate risk, or both, in relation to their peer groups and benchmark indices. Where the Portfolios had underperformed their peer groups or benchmark indices, the Directors considered the Adviser’s explanations for performance and, as applicable, measures the Adviser had taken or proposed to take to improve performance. In particular, for those Portfolios that pursue a value strategy, the Directors noted the Adviser’s explanation regarding the recent underperformance of value strategies generally versus growth strategies. The Directors also noted the Adviser’s explanation that certain Portfolios are designed to maintain higher credit quality and a more conservative approach versus the funds in its relevant peer group, and that as a result of a lower risk profile, those Portfolios have underperformed the peer group during periods when riskier assets have outperformed. The Directors noted generally the Adviser’s continued efforts to enhance the services provided to the Portfolios, including but not limited to, its continued research efforts to enhance the dynamic asset allocation component utilized by the Overlay Portfolios. The Directors also noted that they would continue to monitor investment performance closely.
The Board concluded that the Adviser had the experience and resources necessary to provide services of appropriate nature, quality and scope with respect to the Portfolios.
Profitability
The Board, including the Independent Directors, considered the level of the Adviser’s profits in respect of its management of the respective Portfolios. The materials provided to the Independent Directors included information indicating the profitability of the Portfolios to the Adviser for calendar years 2018 and 2019, which had been reviewed by an independent consultant. The Directors reviewed the assumptions and methods of allocation used by the Adviser in preparing fund-specific profitability data and noted that there are many potentially acceptable allocation methodologies for information of this type. The Directors noted that they received information regarding all revenues and expenses of the Adviser’s relationship with the Fund, including those relating to the Adviser’s subsidiaries that provide transfer
| 90 | Sanford C. Bernstein Fund, Inc. | |
Table of Contents
agency and, distribution services to the Fund, and that they had focused on profitability before taxes and distribution expenses. The Directors reviewed comparative information regarding profitability for other publicly-traded advisers, recognizing that it is difficult to make comparisons of profitability among fund advisory contracts because only limited comparative information is publicly available and the comparisons are affected by numerous factors including different cost accounting methodologies.
After reviewing all relevant factors, the Directors, including the Independent Directors, concluded that the levels of the Adviser’s profits in respect of its management of the Portfolios were not excessive.
Economies of Scale
The Board, including the Independent Directors, considered whether there have been economies of scale in respect of the management of the Portfolios, whether the Portfolios have appropriately benefited from any economies of scale, and whether there is potential for realization of any further economies of scale. The Directors discussed possible ways in which any such economies of scale may be shared with the Portfolios, including by investment in enhanced services.
The Directors also considered the Senior Analyst materials which they received in connection with the review of the Investment Management Agreement, which included information reflecting changes in asset levels of the Portfolios and in the profitability of the Adviser over various periods.
After reviewing the profitability and economies of scale information provided by the Adviser, the Board concluded that the benefits of any economies of scale were appropriately being shared with Portfolio investors by way of, among other things and as applicable, establishing advisory fees at levels that contemplated future achievement of scale, recent fee reductions for the Short Duration Diversified Municipal, Short Duration Plus, Intermediate Duration, Tax-Managed International, International, and Emerging Markets Portfolios, breakpoint arrangements including the lowering of the first breakpoint and the addition of a new breakpoint in the advisory fee schedule for the Overlay A and Tax-Aware Overlay A Portfolios as well as other recently adopted or modified breakpoints for certain Portfolios, expense caps and waivers applying to select Portfolios, and the Adviser’s continued reinvestment in the business, including by researching and implementing new product enhancements. The Directors also noted that they would continue to monitor the growth of the Portfolios.
Fall-Out Benefits and Other Revenue
The Board, including the Independent Directors, also took into account so-called “fall-out benefits” to the Adviser, such as soft dollar arrangements (whereby the Adviser receives the benefit of research services from many of the brokers and dealers that execute purchases and sales of securities on behalf of its clients on an agency basis), Rule 12b-1 fees and sales charges received by the principal underwriter (which is a wholly owned subsidiary of the Adviser) with respect to the retail share classes of certain Portfolios, and transfer agency fees paid by the retail share classes of certain Portfolios to a wholly-owned subsidiary of the Adviser. The Directors recognized that the Adviser’s profitability would be lower without these benefits. They also considered other benefits potentially derived from an increase in the Adviser’s business as a result of its relationship with the Fund. The Directors concluded that these fall-out benefits to the Adviser were acceptable.
Advisory Fee Rate Schedule
On the basis of the information considered, the Board determined to approve the continuation of the Investment Management Agreement for an additional annual term, without change to the contractual fee schedules of the Portfolios other than the new breakpoints established for the Overlay A Portfolio and the Tax-Aware Overlay Portfolio, as set forth below.
| PORTFOLIO | ANNUAL PERCENTAGE OF AVERAGE DAILY NET ASSETSOF EACH PORTFOLIO | |
| Short Duration Diversified Municipal Portfolio | 0.30% of the first $750 million; 0.25% of assets in excess of $750 million | |
| Short Duration Plus Portfolio | 0.35% of the first $750 million; 0.30% of assets in excess of $750 million | |
2021 Semi-Annual Report | 91 | |
Table of Contents
Board Consideration of Investment Management Arrangement (continued)
| PORTFOLIO | ANNUAL PERCENTAGE OF AVERAGE DAILY NET ASSETSOF EACH PORTFOLIO | |
| New York Municipal Portfolio | 0.425% of the first $1 billion; 0.375% in excess of $1 billion up to, but not exceeding $3 billion; 0.325% in excess of $3 billion up to, but not exceeding $5 billion; 0.275% of assets in excess of $5 billion | |
| California Municipal Portfolio | 0.425% of the first $1 billion; 0.375% in excess of $1 billion up to, but not exceeding $3 billion; 0.325% in excess of $3 billion up to, but not exceeding $5 billion; 0.275% of assets in excess of $5 billion | |
| Diversified Municipal Portfolio | 0.425% of the first $1 billion; 0.375% in excess of $1 billion up to, but not exceeding $3 billion; 0.325% in excess of $3 billion up to, but not exceeding $5 billion; 0.275% in excess of $5 billion up to, but not exceeding $7 billion; 0.225% of assets in excess of $7 billion | |
| Intermediate Duration Portfolio | 0.45% on the first $2.5 billion; 0.40% in excess of $2.5 billion up to, but not exceeding $5 billion; 0.35% in excess of $5 billion up to, but not exceeding $8 billion; 0.30% of assets in excess of $8 billion | |
| Tax-Managed International Portfolio | 0.75% on the first $2.5 billion; 0.65% in excess of $2.5 billion up to, but not exceeding $5 billion; 0.60% of assets in excess of $5 billion | |
| International Portfolio | 0.75% on the first $2.5 billion; 0.65% in excess of $2.5 billion up to, but not exceeding $5 billion; 0.60% of assets in excess of $5 billion | |
| Emerging Markets Portfolio | 0.95% of the first $2.5 billion; 0.90% in excess of $2.5 billion up to, but not exceeding $5 billion; 0.85% of assets in excess of $5 billion. | |
| Overlay A Portfolio | 0.90% of the first $2.5 billion; 0.875% in excess of $2.5 billion up to, but not exceeding $5 billion; 0.85% of assets in excess of $5 billion. | |
| Tax-Aware Overlay A Portfolio | 0.90% of the first $2.5 billion; 0.875% in excess of $2.5 billion up to, but not exceeding $5 billion; 0.85% of assets in excess of $5 billion. | |
| Overlay B Portfolio | 0.65% of assets. | |
| Tax-Aware Overlay B Portfolio | 0.65% of assets. | |
| Tax-Aware Overlay C Portfolio | 0.65% of assets. | |
| Tax-Aware Overlay N Portfolio | 0.65% of assets. |
| 92 | Sanford C. Bernstein Fund, Inc. | |
Table of Contents

Distributor
SANFORD C. BERNSTEIN FUND, INC.
1345 AVENUEOFTHE AMERICAS, NEW YORK, NY 10105
(212) 756-4097
SCBI-1947-0321
Table of Contents
Sanford C. Bernstein Fund, Inc.
March 31, 2021
Schedule of Investments
To the Semi-Annual Report
For the International Equity Portfolios
Emerging Markets
Table of Contents
Sanford C. Bernstein Fund, Inc.
Schedule of Investments
Emerging Markets Portfolio
March 31, 2021 (unaudited)
| Company | Shares | U.S. $ Value | ||||||
| COMMON STOCKS–96.4% |
| |||||||
| Financials–23.8% |
| |||||||
| Banks–17.8% |
| |||||||
Agricultural Bank of China Ltd.–Class H | 34,455,000 | $ | 13,811,699 | |||||
Bandhan Bank Ltd.(a)(b) | 1,440,300 | 6,731,403 | ||||||
Bank BTPN Syariah Tbk PT | 9,164,200 | 2,199,498 | ||||||
Bank for Foreign Trade of Vietnam JSC | 2,287,520 | 9,421,429 | ||||||
Bank Negara Indonesia Persero Tbk PT | 14,823,000 | 5,854,591 | ||||||
Bank of the Philippine Islands | 2,550,010 | 4,289,469 | ||||||
Bank Polska Kasa Opieki SA(b) | 357,340 | 6,375,874 | ||||||
BDO Unibank, Inc. | 486,890 | 1,024,483 | ||||||
Capitec Bank Holdings Ltd.(b) | 64,992 | 6,247,812 | ||||||
China Construction Bank Corp.–Class H | 26,770,000 | 22,564,871 | ||||||
City Union Bank Ltd. | 656,375 | 1,402,951 | ||||||
Credicorp Ltd. | 42,950 | 5,865,682 | ||||||
Grupo Financiero Banorte SAB de CV–Class O(b) | 281,540 | 1,587,489 | ||||||
Hana Financial Group, Inc. | 573,940 | 21,708,102 | ||||||
HDFC Bank Ltd.(b) | 749,082 | 15,341,212 | ||||||
ICICI Bank Ltd.(b) | 1,456,476 | 11,663,979 | ||||||
Industrial Bank Co., Ltd.–Class A | 1,801,193 | 6,637,161 | ||||||
Itau Unibanco Holding SA (ADR) | 1,504,720 | 7,463,411 | ||||||
Kasikornbank PCL | 1,137,600 | 5,314,867 | ||||||
KB Financial Group, Inc. | 513,257 | 25,297,186 | ||||||
Metropolitan Bank & Trust Co. | 7,677,800 | 7,030,602 | ||||||
Military Commercial Joint Stock Bank(b) | 2,673,400 | 3,274,397 | ||||||
OTP Bank Nyrt(b) | 153,590 | 6,565,421 | ||||||
Regional SAB de CV(b) | 566,946 | 2,664,490 | ||||||
Sberbank of Russia PJSC (Sponsored ADR) | 2,218,269 | 34,183,525 | ||||||
Shinhan Financial Group Co., Ltd. | 243,390 | 8,083,474 | ||||||
State Bank of India(b) | 1,997,683 | 10,012,376 | ||||||
TCS Group Holding PLC (GDR)(a) | 236,088 | 13,693,104 | ||||||
|
| |||||||
| 266,310,558 | ||||||||
|
| |||||||
| Capital Markets–1.0% |
| |||||||
B3 SA–Brasil Bolsa Balcao | 783,400 | 7,602,055 | ||||||
Banco BTG Pactual SA | 262,000 | 4,517,442 | ||||||
China Everbright Ltd. | 1,644,000 | 2,147,413 | ||||||
|
| |||||||
| 14,266,910 | ||||||||
|
| |||||||
| Consumer Finance–1.4% |
| |||||||
Manappuram Finance Ltd. | 2,947,023 | 6,035,263 | ||||||
Muangthai Capital PCL(b) | 3,510,100 | 7,946,867 | ||||||
| Company | Shares | U.S. $ Value | ||||||
Muthoot Finance Ltd. | 462,408 | $ | 7,625,634 | |||||
|
| |||||||
| 21,607,764 | ||||||||
|
| |||||||
| Diversified Financial Services–0.7% |
| |||||||
Fubon Financial Holding Co., Ltd. | 4,483,000 | 8,945,911 | ||||||
Metro Pacific Investments Corp. | 21,438,000 | 1,654,511 | ||||||
|
| |||||||
| 10,600,422 | ||||||||
|
| |||||||
| Insurance–1.5% |
| |||||||
AIA Group Ltd. | 1,416,800 | 17,337,049 | ||||||
Ping An Insurance Group Co. of China Ltd.–Class H | 311,000 | 3,719,982 | ||||||
TQM Corp. PCL | 387,900 | 1,520,568 | ||||||
|
| |||||||
| 22,577,599 | ||||||||
|
| |||||||
| Thrifts & Mortgage Finance–1.4% |
| |||||||
Housing Development Finance Corp., Ltd. | 604,739 | 20,827,916 | ||||||
|
| |||||||
| 356,191,169 | ||||||||
|
| |||||||
| Information Technology–22.8% |
| |||||||
| Electronic Equipment, Instruments & Components–1.9% |
| |||||||
Elite Material Co., Ltd. | 161,000 | 959,594 | ||||||
Samsung SDI Co., Ltd. | 21,370 | 12,566,029 | ||||||
Sinbon Electronics Co., Ltd. | 1,655,000 | 15,380,448 | ||||||
|
| |||||||
| 28,906,071 | ||||||||
|
| |||||||
| IT Services–1.2% |
| |||||||
FPT Corp. | 88,044 | 297,440 | ||||||
GDS Holdings Ltd. (ADR)(b) | 123,200 | 9,990,288 | ||||||
Globant SA(b) | 1,660 | 344,633 | ||||||
Locaweb Servicos de Internet SA(a) | 433,400 | 1,759,425 | ||||||
My EG Services Bhd | 5,712,400 | 2,723,609 | ||||||
Network International Holdings PLC(a)(b) | 413,747 | 2,355,356 | ||||||
NHN KCP Corp.(b) | 21,838 | 968,241 | ||||||
|
| |||||||
| 18,438,992 | ||||||||
|
| |||||||
| Semiconductors & Semiconductor Equipment–14.6% |
| |||||||
ASPEED Technology, Inc. | 30,000 | 1,830,025 | ||||||
Broadcom, Inc. | 23,140 | 10,729,092 | ||||||
eMemory Technology, Inc. | 53,000 | 1,653,878 | ||||||
Entegris, Inc. | 16,000 | 1,788,800 | ||||||
Koh Young Technology, Inc. | 24,260 | 2,474,362 | ||||||
LEENO Industrial, Inc. | 18,330 | 2,545,816 | ||||||
MediaTek, Inc. | 581,000 | 19,984,541 | ||||||
Micron Technology, Inc.(b) | 121,980 | 10,759,856 | ||||||
Nanya Technology Corp. | 5,983,000 | 19,482,056 | ||||||
Parade Technologies Ltd. | 25,000 | 1,079,534 | ||||||
Realtek Semiconductor Corp. | 140,000 | 2,443,998 | ||||||
Silergy Corp. | 21,000 | 1,732,113 | ||||||
SK Hynix, Inc. | 400,888 | 47,329,513 | ||||||
Taiwan Semiconductor Manufacturing Co., Ltd. | 3,355,706 | 70,668,461 | ||||||
Schedule of Investments—Emerging Markets Portfolio | 1 |
Table of Contents
| Company | Shares | U.S. $ Value | ||||||
United Microelectronics Corp. | 11,514,000 | $ | 20,652,200 | |||||
WONIK IPS Co., Ltd. | 52,100 | 2,397,024 | ||||||
|
| |||||||
| 217,551,269 | ||||||||
|
| |||||||
| Software–0.4% |
| |||||||
Beijing Thunisoft Corp., Ltd.–Class A | 490,980 | 1,425,100 | ||||||
Douzone Bizon Co., Ltd. | 20,960 | 1,827,375 | ||||||
Weimob, Inc.(a)(b) | 794,000 | 1,794,801 | ||||||
|
| |||||||
| 5,047,276 | ||||||||
|
| |||||||
| Technology Hardware, Storage & Peripherals–4.7% |
| |||||||
Samsung Electronics Co., Ltd. | 949,580 | 68,697,007 | ||||||
Samsung Electronics Co., Ltd. (Preference Shares) | 24,470 | 1,584,878 | ||||||
|
| |||||||
| 70,281,885 | ||||||||
|
| |||||||
| 340,225,493 | ||||||||
|
| |||||||
| Consumer Discretionary–16.0% |
| |||||||
| Auto Components–0.7% |
| |||||||
Balkrishna Industries Ltd. | 83,829 | 1,937,545 | ||||||
Hyundai Mobis Co., Ltd. | 29,960 | 7,771,376 | ||||||
|
| |||||||
| 9,708,921 | ||||||||
|
| |||||||
| Automobiles–2.9% |
| |||||||
Ford Otomotiv Sanayi AS | 324,230 | 7,590,137 | ||||||
Guangzhou Automobile Group Co., Ltd.–Class H | 9,780,000 | 8,252,631 | ||||||
Hyundai Motor Co. | 46,440 | 9,000,409 | ||||||
Kia Motors Corp. | 123,770 | 9,097,609 | ||||||
Maruti Suzuki India Ltd. | 58,427 | 5,504,662 | ||||||
SAIC Motor Corp., Ltd. | 1,346,644 | 4,056,242 | ||||||
|
| |||||||
| 43,501,690 | ||||||||
|
| |||||||
| Diversified Consumer Services–1.7% |
| |||||||
Fu Shou Yuan International Group Ltd. | 9,648,500 | 9,921,169 | ||||||
New Oriental Education & Technology Group, Inc.(b) | 907,810 | 12,574,123 | ||||||
YDUQS Participacoes SA | 469,000 | 2,225,576 | ||||||
|
| |||||||
| 24,720,868 | ||||||||
|
| |||||||
| Hotels, Restaurants & Leisure–2.4% |
| |||||||
Galaxy Entertainment Group Ltd.(b) | 705,000 | 6,373,432 | ||||||
Melco Resorts & Entertainment Ltd. (ADR) | 261,320 | 5,202,881 | �� | |||||
MGM China Holdings Ltd. | 1,362,400 | 2,422,498 | ||||||
OPAP SA | 1,615,478 | 21,824,815 | ||||||
|
| |||||||
| 35,823,626 | ||||||||
|
| |||||||
| Internet & Direct Marketing Retail–6.1% |
| |||||||
Alibaba Group Holding Ltd.(b) | 1,572,980 | 44,692,457 | ||||||
Allegro.eu SA(a)(b) | 4,813 | 67,750 | ||||||
Despegar.com Corp.(b) | 610,058 | 8,315,090 | ||||||
JD.com, Inc.–Class A(b) | 682,740 | 28,792,719 | ||||||
momo.com, Inc. | 48,000 | 1,674,210 | ||||||
| Company | Shares | U.S. $ Value | ||||||
Naspers Ltd.–Class N | 31,910 | $ | 7,642,772 | |||||
|
| |||||||
| 91,184,998 | ||||||||
|
| |||||||
| Multiline Retail–0.6% | ||||||||
Lojas Renner SA | 882,970 | 6,681,121 | ||||||
Poya International Co., Ltd. | 70,000 | 1,467,904 | ||||||
Trent Ltd. | 102,088 | 1,047,724 | ||||||
|
| |||||||
| 9,196,749 | ||||||||
|
| |||||||
| Specialty Retail–1.1% | ||||||||
Ace Hardware Indonesia Tbk PT | 19,289,400 | 2,028,684 | ||||||
China Meidong Auto Holdings Ltd. | 424,000 | 1,969,117 | ||||||
JUMBO SA | 120,460 | 2,210,244 | ||||||
Petrobras Distribuidora SA | 513,100 | 2,012,782 | ||||||
Wilcon Depot, Inc. | 5,331,400 | 1,957,398 | ||||||
Zhongsheng Group Holdings Ltd. | 950,500 | 6,733,567 | ||||||
|
| |||||||
| 16,911,792 | ||||||||
|
| |||||||
| Textiles, Apparel & Luxury Goods–0.5% |
| |||||||
Fila Holdings Corp. | 45,230 | 1,734,677 | ||||||
Samsonite International SA(a)(b) | 3,317,700 | 6,452,077 | ||||||
|
| |||||||
| 8,186,754 | ||||||||
|
| |||||||
| 239,235,398 | ||||||||
|
| |||||||
| Industrials–8.3% |
| |||||||
| Building Products–0.2% | ||||||||
Kajaria Ceramics Ltd. | 202,602 | 2,574,115 | ||||||
|
| |||||||
| Commercial Services & Supplies–2.0% |
| |||||||
A-Living Smart City Services Co., Ltd.–Class H(a) | 4,145,500 | 18,454,479 | ||||||
Ever Sunshine Lifestyle Services Group Ltd.(a) | 832,000 | 2,103,864 | ||||||
Sunny Friend Environmental Technology Co., Ltd. | 1,254,000 | 9,998,373 | ||||||
|
| |||||||
| 30,556,716 | ||||||||
|
| |||||||
| Construction & Engineering–0.4% |
| |||||||
Sinopec Engineering Group Co., Ltd. | 6,735,500 | 3,728,039 | ||||||
Voltas Ltd. | 159,039 | 2,186,395 | ||||||
|
| |||||||
| 5,914,434 | ||||||||
|
| |||||||
| Electrical Equipment–0.2% |
| |||||||
Bizlink Holding, Inc. | 81,000 | 761,393 | ||||||
Voltronic Power Technology Corp. | 41,158 | 1,605,238 | ||||||
|
| |||||||
| 2,366,631 | ||||||||
|
| |||||||
| Industrial Conglomerates–0.3% |
| |||||||
Bidvest Group Ltd. (The) | 408,100 | 4,706,345 | ||||||
|
| |||||||
| Machinery–1.9% | ||||||||
Airtac International Group | 66,000 | 2,354,226 | ||||||
Escorts Ltd. | 93,061 | 1,644,824 | ||||||
Techtronic Industries Co., Ltd. | 197,000 | 3,377,327 | ||||||
Weichai Power Co., Ltd.–Class H | 4,150,000 | 10,418,061 | ||||||
| 2 | Sanford C. Bernstein Fund, Inc.—2021 Semi-Annual Report |
Table of Contents
| Company | Shares | U.S. $ Value | ||||||
Zoomlion Heavy Industry Science and Technology Co., Ltd.–Class H | 7,136,800 | $ | 10,238,159 | |||||
|
| |||||||
| 28,032,597 | ||||||||
|
| |||||||
| Professional Services–1.6% |
| |||||||
Centre Testing International Group Co., Ltd.–Class A | 562,856 | 2,456,592 | ||||||
HeadHunter Group PLC (ADR) | 390,879 | 13,258,616 | ||||||
L&T Technology Services Ltd.(a) | 145,861 | 5,317,577 | ||||||
NICE Information Service Co., Ltd. | 57,270 | 1,286,256 | ||||||
Sporton International, Inc. | 142,300 | 1,226,853 | ||||||
|
| |||||||
| 23,545,894 | ||||||||
|
| |||||||
| Road & Retail–0.9% |
| |||||||
Globaltrans Investment PLC (Sponsored GDR)(a) | 1,868,401 | 12,460,022 | ||||||
Rumo SA(b) | 421,900 | 1,517,855 | ||||||
|
| |||||||
| 13,977,877 | ||||||||
|
| |||||||
| Trading Companies & Distributors–0.2% |
| |||||||
Barloworld Ltd.(b) | 593,490 | 3,629,698 | ||||||
|
| |||||||
| Transportation Infrastructure–0.6% |
| |||||||
Grupo Aeroportuario del Centro Norte SAB de CV(b) | 289,650 | 1,827,220 | ||||||
Jiangsu Expressway Co., Ltd.–Class H | 5,972,000 | 7,437,086 | ||||||
|
| |||||||
| 9,264,306 | ||||||||
|
| |||||||
| 124,568,613 | ||||||||
|
| |||||||
| Communication Services–6.1% |
| |||||||
| Diversified Telecommunication Services–0.5% |
| |||||||
Telkom Indonesia Persero Tbk PT | 29,802,500 | 7,034,450 | ||||||
|
| |||||||
| Entertainment–1.0% |
| |||||||
HUYA, Inc. (ADR)(b) | 309,180 | 6,022,826 | ||||||
NCSoft Corp. | 12,000 | 9,275,317 | ||||||
|
| |||||||
| 15,298,143 | ||||||||
|
| |||||||
| Interactive Media & Services–4.1% |
| |||||||
NAVER Corp. | 42,820 | 14,336,235 | ||||||
Tencent Holdings Ltd. | 584,200 | 46,623,551 | ||||||
|
| |||||||
| 60,959,786 | ||||||||
|
| |||||||
| Wireless Telecommunication Services–0.5% |
| |||||||
Bharti Airtel Ltd. | 595,948 | 4,221,634 | ||||||
Safaricom PLC | 9,898,250 | 3,294,891 | ||||||
|
| |||||||
| 7,516,525 | ||||||||
|
| |||||||
| 90,808,904 | ||||||||
|
| |||||||
| Materials–5.1% |
| |||||||
| Chemicals–1.4% |
| |||||||
Atul Ltd. | 20,397 | 1,981,034 | ||||||
Berger Paints India Ltd. | 174,472 | 1,829,227 | ||||||
Hansol Chemical Co., Ltd. | 12,300 | 2,632,972 | ||||||
| Company | Shares | U.S. $ Value | ||||||
LG Chem Ltd. | 5,940 | $ | 4,250,797 | |||||
Orbia Advance Corp. SAB de CV | 2,464,670 | 6,571,810 | ||||||
PI Industries Ltd. | 67,725 | 2,082,228 | ||||||
SRF Ltd. | 24,241 | 1,795,585 | ||||||
|
| |||||||
| 21,143,653 | ||||||||
|
| |||||||
| Construction Materials–0.2% |
| |||||||
Grupo Cementos de Chihuahua SAB de CV | 465,630 | 3,213,244 | ||||||
|
| |||||||
| Metals & Mining–3.5% |
| |||||||
Antofagasta PLC | 467,030 | 10,878,569 | ||||||
CAP SA | 99,140 | 1,605,162 | ||||||
CSN Mineracao SA(b) | 2,630,400 | 4,294,702 | ||||||
First Quantum Minerals Ltd. | 485,690 | 9,256,207 | ||||||
Freeport-McMoRan, Inc.(b) | 155,720 | 5,127,860 | ||||||
Gerdau SA (Preference Shares) | 441,900 | 2,372,544 | ||||||
Hindalco Industries Ltd. | 774,924 | 3,477,780 | ||||||
Hoa Phat Group JSC | 1,323,400 | 2,688,526 | ||||||
KGHM Polska Miedz SA(b) | 39,126 | 1,879,829 | ||||||
MMC Norilsk Nickel PJSC (ADR) | 214,110 | 6,699,502 | ||||||
POSCO | 10,740 | 3,043,245 | ||||||
|
| |||||||
| 51,323,926 | ||||||||
|
| |||||||
| 75,680,823 | ||||||||
|
| |||||||
| Utilities–3.8% |
| |||||||
| Electric Utilities–1.6% |
| |||||||
Centrais Eletricas Brasileiras SA | 372,700 | 2,269,181 | ||||||
Centrais Eletricas Brasileiras SA (Preference Shares) | 22,500 | 139,150 | ||||||
Equatorial Energia SA | 2,308,500 | 10,171,320 | ||||||
Power Grid Corp. of India Ltd. | 3,642,313 | 10,761,795 | ||||||
|
| |||||||
| 23,341,446 | ||||||||
|
| |||||||
| Gas Utilities–2.2% |
| |||||||
China Resources Gas Group Ltd. | 840,000 | 4,662,339 | ||||||
ENN Energy Holdings Ltd. | 205,100 | 3,308,114 | ||||||
GAIL India Ltd. | 6,312,742 | 11,747,651 | ||||||
Kunlun Energy Co., Ltd. | 12,762,000 | 13,464,123 | ||||||
|
| |||||||
| 33,182,227 | ||||||||
|
| |||||||
| 56,523,673 | ||||||||
|
| |||||||
| Health Care–3.0% |
| |||||||
| Biotechnology–0.2% |
| |||||||
Amicogen, Inc.(b) | 35,620 | 1,197,986 | ||||||
Zai Lab Ltd. (ADR)(b) | 12,080 | 1,611,835 | ||||||
|
| |||||||
| 2,809,821 | ||||||||
|
| |||||||
| Health Care Equipment & Supplies–0.0% |
| |||||||
Yestar Healthcare Holdings Co., Ltd.(b) | 1,997,500 | 295,484 | ||||||
|
| |||||||
| Health Care Providers & Services–1.6% |
| |||||||
Dr. Lal PathLabs Ltd.(a) | 60,725 | 2,245,444 | ||||||
Shanghai Pharmaceuticals Holding Co., Ltd.–Class H | 3,430,800 | 6,743,458 | ||||||
Schedule of Investments—Emerging Markets Portfolio | 3 |
Table of Contents
| Company | Shares | U.S. $ Value | ||||||
Universal Vision Biotechnology Co., Ltd. | 1,327,000 | $ | 15,074,772 | |||||
|
| |||||||
| 24,063,674 | ||||||||
|
| |||||||
| Health Care Technology–0.6% |
| |||||||
Alibaba Health Information Technology Ltd.(b) | 3,170,000 | 9,057,687 | ||||||
|
| |||||||
| Pharmaceuticals–0.6% |
| |||||||
Genomma Lab Internacional SAB de CV–Class B(b) | 4,211,260 | 4,252,570 | ||||||
Richter Gedeon Nyrt | 87,570 | 2,581,843 | ||||||
Yuhan Corp. | 30,439 | 1,698,189 | ||||||
|
| |||||||
| 8,532,602 | ||||||||
|
| |||||||
| 44,759,268 | ||||||||
|
| |||||||
| Energy–2.8% |
| |||||||
| Oil, Gas & Consumable Fuels–2.8% |
| |||||||
LUKOIL PJSC (Sponsored ADR) | 176,116 | 14,228,411 | ||||||
PetroChina Co., Ltd.–Class H | 37,982,000 | 13,770,755 | ||||||
Petroleo Brasileiro SA (Preference Shares) | 3,089,000 | 13,226,067 | ||||||
|
| |||||||
| 41,225,233 | ||||||||
|
| |||||||
| Consumer Staples–2.7% |
| |||||||
| Food & Staples Retailing–0.9% |
| |||||||
BGF retail Co., Ltd. | 14,030 | 1,963,590 | ||||||
GS Retail Co., Ltd. | 63,660 | 2,153,522 | ||||||
Raia Drogasil SA | 348,500 | 1,551,599 | ||||||
X5 Retail Group NV (GDR)(a) | 224,490 | 7,237,558 | ||||||
|
| |||||||
| 12,906,269 | ||||||||
|
| |||||||
| Food Products–0.9% |
| |||||||
Industrias Bachoco SAB de CV | 900,128 | 2,995,068 | ||||||
Minerva SA/Brazil | 2,144,600 | 3,886,353 | ||||||
WH Group Ltd.(a) | 9,088,000 | 7,383,365 | ||||||
|
| |||||||
| 14,264,786 | ||||||||
|
| |||||||
| Household Products–0.9% |
| |||||||
C&S Paper Co., Ltd. | 3,317,861 | 13,119,440 | ||||||
|
| |||||||
| 40,290,495 | ||||||||
|
| |||||||
| Real Estate–2.0% |
| |||||||
| Real Estate Management & Development–2.0% |
| |||||||
Ayala Land, Inc. | 3,281,300 | 2,326,626 | ||||||
China Overseas Property Holdings Ltd. | 2,710,000 | 2,537,345 | ||||||
CIFI Holdings Group Co., Ltd. | 10,920,000 | 10,625,779 | ||||||
Midea Real Estate Holding Ltd.(a) | 1,653,800 | 3,509,233 | ||||||
Times China Holdings Ltd. | 5,768,000 | 7,956,006 | ||||||
Vincom Retail JSC(b) | 2,551,433 | 3,629,732 | ||||||
|
| |||||||
| 30,584,721 | ||||||||
|
| |||||||
| Total Common Stocks (cost $1,124,094,474) | 1,440,093,790 | |||||||
|
| |||||||
| Company | Shares | U.S. $ Value | ||||||
| EQUITY LINKED NOTES–2.8% |
| |||||||
| Information Technology–1.7% |
| |||||||
| Electronic Equipment, Instruments & Components–1.7% |
| |||||||
FPT Corp., Macquarie Bank Ltd., expiring 03/31/2023(b) | 7,611,184 | $ | 25,628,995 | |||||
|
| |||||||
| Real Estate–0.5% |
| |||||||
| Real Estate Management & Development–0.5% |
| |||||||
Vincom Retail JSC, Macquarie Bank Ltd., expiring 03/31/2023(b) | 5,738,774 | 8,132,520 | ||||||
|
| |||||||
| Financials–0.4% |
| |||||||
| Banks–0.4% |
| |||||||
Asia Commercial Bank JSC, Macquarie Bank Ltd., expiring 09/03/2023(b) | 2,258,000 | 3,258,565 | ||||||
Bank for Foreign Trade of Vietnam JSC, Macquarie Bank Ltd., expiring 06/07/2021(b) | 149,890 | 615,800 | ||||||
Vietnam Technological & Commercial Joint Stock Bank, Macquarie Bank Ltd., expiring 08/10/2022(b) | 917,720 | 1,606,756 | ||||||
|
| |||||||
| 5,481,121 | ||||||||
|
| |||||||
| Consumer Discretionary–0.2% |
| |||||||
| Specialty Retail–0.2% |
| |||||||
Mobile World Investment Corp., Macquarie Bank Ltd., expiring 03/31/2023(b) | 451,986 | 2,540,524 | ||||||
|
| |||||||
| Total Equity Linked Notes (cost $29,581,970) | 41,783,160 | |||||||
|
| |||||||
| SHORT-TERM INVESTMENTS–0.6% |
| |||||||
| Investment Companies–0.6% |
| |||||||
AB Fixed Income Shares, Inc.–Government Money Market Portfolio–Class AB, | 9,170,518 | 9,170,518 | ||||||
|
| |||||||
| Total Investments—99.8% (cost $1,162,846,962) |
| 1,491,047,468 | ||||||
Other assets less liabilities—0.2% |
| 2,801,894 | ||||||
|
| |||||||
| Net Assets—100.0% |
| $ | 1,493,849,362 | |||||
|
| |||||||
| 4 | Sanford C. Bernstein Fund, Inc.—2021 Semi-Annual Report |
Table of Contents
FORWARD CURRENCY EXCHANGE CONTRACTS (see Note 3)
| Counterparty | Contracts to Deliver (000) | In Exchange For (000) | Settlement Date | Unrealized Appreciation/ (Depreciation) | ||||||||||||||||||||
| Bank of America, NA | EUR | 1,902 | USD | 2,232 | 05/27/2021 | $ | (545 | ) | ||||||||||||||||
| Barclays Bank PLC | PHP | 76,429 | USD | 1,561 | 04/22/2021 | (11,119 | ) | |||||||||||||||||
| Barclays Bank PLC | HUF | 1,409,180 | USD | 4,577 | 06/24/2021 | 19,532 | ||||||||||||||||||
| BNP Paribas SA | USD | 4,855 | CNY | 31,673 | 04/22/2021 | (34,575 | ) | |||||||||||||||||
| BNP Paribas SA | TRY | 18,552 | USD | 2,162 | 05/21/2021 | (8,772 | ) | |||||||||||||||||
| Citibank, NA | BRL | 96,721 | USD | 17,656 | 04/05/2021 | 472,245 | ||||||||||||||||||
| Citibank, NA | BRL | 56,553 | USD | 9,926 | 04/05/2021 | (121,066 | ) | |||||||||||||||||
| Citibank, NA | USD | 26,917 | BRL | 153,274 | 04/05/2021 | 313,640 | ||||||||||||||||||
| Citibank, NA | CNY | 110,568 | USD | 16,918 | 04/22/2021 | 92,233 | ||||||||||||||||||
| Citibank, NA | KRW | 31,454,391 | USD | 28,494 | 04/22/2021 | 600,568 | ||||||||||||||||||
| Citibank, NA | USD | 4,049 | KRW | 4,504,143 | 04/22/2021 | (54,409 | ) | |||||||||||||||||
| Credit Suisse International | USD | 8,852 | ZAR | 130,845 | 04/08/2021 | 10,394 | ||||||||||||||||||
| Goldman Sachs Bank USA | KRW | 2,553,051 | USD | 2,288 | 04/22/2021 | 24,217 | ||||||||||||||||||
| Goldman Sachs Bank USA | USD | 5,352 | CNY | 34,755 | 04/22/2021 | (63,031 | ) | |||||||||||||||||
| Goldman Sachs Bank USA | USD | 4,073 | KRW | 4,554,343 | 04/22/2021 | (33,783 | ) | |||||||||||||||||
| Goldman Sachs Bank USA | RUB | 3,289,593 | USD | 44,068 | 05/25/2021 | 812,789 | ||||||||||||||||||
| HSBC Bank USA | CNY | 40,438 | USD | 6,165 | 04/22/2021 | 10,919 | ||||||||||||||||||
| JPMorgan Chase Bank, NA | BRL | 21,295 | USD | 3,738 | 04/05/2021 | (45,587 | ) | |||||||||||||||||
| JPMorgan Chase Bank, NA | USD | 3,888 | BRL | 21,295 | 04/05/2021 | (104,258 | ) | |||||||||||||||||
| JPMorgan Chase Bank, NA | CNY | 61,160 | USD | 9,345 | 04/22/2021 | 38,185 | ||||||||||||||||||
| Morgan Stanley Capital Services, Inc. | USD | 3,057 | ZAR | 46,283 | 04/08/2021 | 78,246 | ||||||||||||||||||
| Morgan Stanley Capital Services, Inc. | USD | 3,084 | ZAR | 45,260 | 04/08/2021 | (18,616 | ) | |||||||||||||||||
| Morgan Stanley Capital Services, Inc. | CNY | 66,525 | USD | 10,224 | 04/22/2021 | 100,694 | ||||||||||||||||||
| Morgan Stanley Capital Services, Inc. | KRW | 6,144,699 | USD | 5,561 | 04/22/2021 | 111,454 | ||||||||||||||||||
| Morgan Stanley Capital Services, Inc. | PHP | 342,985 | USD | 7,101 | 04/22/2021 | 46,542 | ||||||||||||||||||
| Morgan Stanley Capital Services, Inc. | USD | 153,819 | CNY | 999,538 | 04/22/2021 | (1,709,158 | ) | |||||||||||||||||
| Morgan Stanley Capital Services, Inc. | USD | 15,213 | MYR | 62,927 | 09/23/2021 | (78,130 | ) | |||||||||||||||||
| Natwest Markets PLC | BRL | 18,873 | USD | 3,313 | 04/05/2021 | (40,403 | ) | |||||||||||||||||
| Natwest Markets PLC | USD | 3,388 | BRL | 18,873 | 04/05/2021 | (35,130 | ) | |||||||||||||||||
| Natwest Markets PLC | KRW | 4,469,963 | USD | 4,059 | 04/22/2021 | 94,681 | ||||||||||||||||||
| Natwest Markets PLC | USD | 3,155 | HKD | 24,458 | 05/21/2021 | (8,200 | ) | |||||||||||||||||
| Standard Chartered Bank | HKD | 63,743 | USD | 8,208 | 05/21/2021 | 7,348 | ||||||||||||||||||
| State Street Bank & Trust Co. | CNY | 52,813 | USD | 8,113 | 04/22/2021 | 76,149 | ||||||||||||||||||
| State Street Bank & Trust Co. | USD | 8,310 | CNY | 53,605 | 04/22/2021 | (152,857 | ) | |||||||||||||||||
| State Street Bank & Trust Co. | USD | 10,113 | THB | 311,647 | 05/13/2021 | (142,403 | ) | |||||||||||||||||
| State Street Bank & Trust Co. | EUR | 15,657 | USD | 18,706 | 05/27/2021 | 325,249 | ||||||||||||||||||
| UBS AG | USD | 16,161 | ZAR | 244,975 | 04/08/2021 | 431,402 | ||||||||||||||||||
| UBS AG | USD | 1,478 | MXN | 30,544 | 04/16/2021 | 14,434 | ||||||||||||||||||
| UBS AG | HKD | 219,189 | USD | 28,273 | 05/21/2021 | 75,358 | ||||||||||||||||||
|
| |||||||||||||||||||||||
| $ | 1,094,237 | |||||||||||||||||||||||
|
| |||||||||||||||||||||||
| (a) | Security is exempt from registration under Rule 144A of the Securities Act of 1933. These securities are considered restricted, but liquid and may be resold in transactions exempt from registration, normally to qualified institutional buyers. At March 31, 2021, the aggregate market value of these securities amounted to $91,565,458 or 6.1% of net assets. |
| (b) | Non-income producing security. |
| (c) | Affiliated investments. |
| (d) | The rate shown represents the 7-day yield as of period end. |
| (e) | To obtain a copy of the fund’s shareholder report, please go to the Securities and Exchange Commission’s website at www.sec.gov, or call AB at (800) 227-4618. |
Schedule of Investments—Emerging Markets Portfolio | 5 |
Table of Contents
Currency Abbreviations:
BRL—Brazilian Real
CNY—Chinese Yuan Renminbi
EUR—Euro
HKD—Hong Kong Dollar
HUF—Hungarian Forint
KRW—South Korean Won
MXN—Mexican Peso
MYR—Malaysian Ringgit
PHP—Philippine Peso
RUB—Russian Ruble
THB—Thailand Baht
TRY—Turkish Lira
USD—United States Dollar
ZAR—South African Rand
Glossary:
ADR—American Depositary Receipt
GDR—Global Depositary Receipt
JSC—Joint Stock Company
PJSC—Public Joint Stock Company
See notes to financial statements.
| 6 | Sanford C. Bernstein Fund, Inc.—2021 Semi-Annual Report |
Table of Contents
SCB–ST–1946–0321
Table of Contents
Sanford C. Bernstein Fund, Inc.
March 31, 2021
Schedule of Investments To the Semi-Annual
Report For the Fixed Income Taxable Portfolios
Intermediate Duration
Short Duration Plus
Table of Contents
Sanford C. Bernstein Fund, Inc.
Schedule of Investments
Intermediate Duration Portfolio
March 31, 2021 (unaudited)
| Principal Amount (000) | U.S. $ Value | |||||||||||
| CORPORATES-INVESTMENT GRADE–29.2% |
| |||||||||||
| Industrial–18.4% |
| |||||||||||
| Basic–1.4% |
| |||||||||||
Alpek SAB de CV | U.S.$ | 1,773 | $ | 1,746,848 | ||||||||
4.25%, 09/18/2029(a) | 449 | 475,519 | ||||||||||
DuPont de Nemours, Inc. | 4,915 | 5,335,577 | ||||||||||
4.493%, 11/15/2025 | 4,913 | 5,560,288 | ||||||||||
Eastman Chemical Co. | 2,282 | 2,481,196 | ||||||||||
Fresnillo PLC | 11,109 | 10,914,592 | ||||||||||
Glencore Funding LLC | 2,622 | 2,801,319 | ||||||||||
GUSAP III LP | 5,248 | 5,523,520 | ||||||||||
Industrias Penoles SAB de CV |
| 1,544 | 1,584,530 | |||||||||
Inversiones CMPC SA | 2,742 | 2,910,804 | ||||||||||
4.375%, 04/04/2027(a) | 2,062 | 2,257,168 | ||||||||||
Inversiones CMPC SA/Cayman Islands Branch |
| 1,151 | 1,210,708 | |||||||||
Nutrition & Biosciences, Inc. | 1,910 | 1,868,954 | ||||||||||
Orbia Advance Corp. SAB de CV |
| 3,400 | 3,690,062 | |||||||||
4.875%, 09/19/2022(a) | 1,519 | 1,596,374 | ||||||||||
Suzano Austria GmbH | 1,419 | 1,464,976 | ||||||||||
|
| |||||||||||
| 51,422,435 | ||||||||||||
|
| |||||||||||
| Capital Goods–0.2% | ||||||||||||
Raytheon Technologies Corp. |
| 6,049 | 6,722,677 | |||||||||
Westinghouse Air Brake Technologies Corp. | 1,117 | 1,185,729 | ||||||||||
|
| |||||||||||
| 7,908,406 | ||||||||||||
|
| |||||||||||
| Communications-Media–1.6% |
| |||||||||||
Charter Communications Operating LLC/Charter Communications Operating Capital | 868 | 957,595 | ||||||||||
4.80%, 03/01/2050 | 3,131 | 3,371,054 | ||||||||||
5.125%, 07/01/2049 | 1,949 | 2,200,187 | ||||||||||
Comcast Corp. | 3,250 | 3,338,205 | ||||||||||
4.15%, 10/15/2028 | 4,460 | 5,100,411 | ||||||||||
| Principal Amount (000) | U.S. $ Value | |||||||||||
Cox Communications, Inc. | U.S.$ | 2,401 | $ | 2,507,965 | ||||||||
Prosus NV | 550 | 568,563 | ||||||||||
4.027%, 08/03/2050(a) | 1,993 | 1,813,630 | ||||||||||
Tencent Holdings Ltd. |
| 5,470 | 5,487,777 | |||||||||
2.39%, 06/03/2030(a) | 3,060 | 2,949,412 | ||||||||||
3.24%, 06/03/2050(a) | 4,830 | 4,430,704 | ||||||||||
Time Warner Cable LLC |
| 2,370 | 2,532,748 | |||||||||
TWDC Enterprises 18 Corp. |
| 6,619 | 7,550,293 | |||||||||
ViacomCBS, Inc. |
| 3,742 | 3,980,552 | |||||||||
3.70%, 06/01/2028 | 1,731 | 1,875,660 | ||||||||||
4.95%, 01/15/2031 | 1,830 | 2,161,706 | ||||||||||
Weibo Corp. |
| 11,908 | 11,780,108 | |||||||||
|
| |||||||||||
| 62,606,570 | ||||||||||||
|
| |||||||||||
| Communications-Telecommunications–1.2% |
| |||||||||||
AT&T, Inc. |
| 1,793 | 1,786,222 | |||||||||
3.50%, 09/15/2053(a) | 10,244 | 9,473,344 | ||||||||||
3.65%, 09/15/2059(a) | 4,421 | 4,046,453 | ||||||||||
Empresa Nacional de Telecomunicaciones SA |
| 4,012 | 4,455,828 | |||||||||
Sprint Spectrum Co. LLC/Sprint Spectrum Co. II LLC/Sprint Spectrum Co. III LLC |
| 6,740 | 7,250,690 | |||||||||
Verizon Communications, Inc. |
| 4,503 | 3,961,469 | |||||||||
3.40%, 03/22/2041 | 11,399 | 11,578,306 | ||||||||||
4.862%, 08/21/2046 | 2,993 | 3,606,056 | ||||||||||
5.012%, 04/15/2049 | 422 | 521,200 | ||||||||||
|
| |||||||||||
| 46,679,568 | ||||||||||||
|
| |||||||||||
| Consumer Cyclical-Automotive–1.0% |
| |||||||||||
General Motors Co. |
| 1,152 | 1,357,044 | |||||||||
6.80%, 10/01/2027 | 1,611 | 2,002,989 | ||||||||||
General Motors Financial Co., Inc. |
| 1,405 | 1,545,135 | |||||||||
5.10%, 01/17/2024 | 6,170 | 6,826,056 | ||||||||||
5.25%, 03/01/2026 | 1,600 | 1,833,376 | ||||||||||
Harley-Davidson Financial Services, Inc. |
| 10,500 | 11,021,640 | |||||||||
Lear Corp. |
| 3,051 | 3,194,489 | |||||||||
3.80%, 09/15/2027 | 933 | 1,017,343 | ||||||||||
Nissan Motor Co., Ltd. |
| 8,330 | 9,074,452 | |||||||||
|
| |||||||||||
| 37,872,524 | ||||||||||||
|
| |||||||||||
Schedule of Investments—Intermediate Duration Portfolio | 1 |
Table of Contents
| Principal Amount (000) | U.S. $ Value | |||||||||||
| Consumer Cyclical-Other–0.3% |
| |||||||||||
Las Vegas Sands Corp. | ||||||||||||
2.90%, 06/25/2025 | U.S.$ | 4,875 | $ | 5,004,236 | ||||||||
3.20%, 08/08/2024 | 960 | 1,000,934 | ||||||||||
3.90%, 08/08/2029 | 3,987 | 4,096,324 | ||||||||||
Marriott International, Inc./MD |
| 530 | 607,274 | |||||||||
|
| |||||||||||
| 10,708,768 | ||||||||||||
|
| |||||||||||
| Consumer Cyclical-Retailers–0.9% |
| |||||||||||
Advance Auto Parts, Inc. | ||||||||||||
1.75%, 10/01/2027 | 2,127 | 2,093,266 | ||||||||||
3.90%, 04/15/2030 | 3,144 | 3,414,478 | ||||||||||
AutoNation, Inc. | 1,195 | 1,377,166 | ||||||||||
Falabella SA | 2,945 | 3,170,477 | ||||||||||
InRetail Consumer | 3,460 | 3,453,512 | ||||||||||
Ralph Lauren Corp. | 10,579 | 10,930,857 | ||||||||||
Ross Stores, Inc. | 7,988 | 9,113,270 | ||||||||||
|
| |||||||||||
| 33,553,026 | ||||||||||||
|
| |||||||||||
| Consumer Non-Cyclical–4.0% |
| |||||||||||
AbbVie, Inc. | ||||||||||||
2.95%, 11/21/2026 | 5,352 | 5,697,311 | ||||||||||
4.25%, 11/21/2049 | 5,424 | 6,139,751 | ||||||||||
Altria Group, Inc. | ||||||||||||
3.40%, 05/06/2030 | 7,300 | 7,622,441 | ||||||||||
4.80%, 02/14/2029 | 4,904 | 5,627,879 | ||||||||||
Anheuser-Busch InBev Worldwide, Inc. | ||||||||||||
4.60%, 06/01/2060 | 3,608 | 4,088,080 | ||||||||||
5.55%, 01/23/2049 | 9,040 | 11,658,074 | ||||||||||
Banner Health | 2,474 | 2,348,197 | ||||||||||
BAT Capital Corp. | ||||||||||||
2.259%, 03/25/2028 | 11,104 | 10,920,895 | ||||||||||
2.726%, 03/25/2031 | 4,352 | 4,229,709 | ||||||||||
4.70%, 04/02/2027 | 4,650 | 5,238,272 | ||||||||||
Biogen, Inc. | 7,188 | 7,987,234 | ||||||||||
Cencosud SA | 6,910 | 7,711,128 | ||||||||||
Cigna Corp. | ||||||||||||
3.40%, 03/01/2027 | 8,649 | 9,394,457 | ||||||||||
3.75%, 07/15/2023 | 820 | 876,449 | ||||||||||
4.125%, 11/15/2025 | 2,682 | 2,991,959 | ||||||||||
4.375%, 10/15/2028 | 3,600 | 4,120,452 | ||||||||||
Coca-Cola Femsa SAB de CV |
| |||||||||||
1.85%, 09/01/2032 | 1,899 | 1,738,178 | ||||||||||
2.75%, 01/22/2030 | 2,389 | 2,400,945 | ||||||||||
CVS Health Corp. | ||||||||||||
4.30%, 03/25/2028 | 460 | 522,155 | ||||||||||
5.05%, 03/25/2048 | 6,556 | 8,047,687 | ||||||||||
| Principal Amount (000) | U.S. $ Value | |||||||||||
Gilead Sciences, Inc. | U.S.$ | 10,009 | $ | 12,083,165 | ||||||||
Kimberly-Clark de Mexico SAB de CV | 1,585 | 1,551,319 | ||||||||||
Shire Acquisitions Investments Ireland DAC | 4,948 | 5,323,157 | ||||||||||
Sigma Alimentos SA de CV | 378 | 409,776 | ||||||||||
Takeda Pharmaceutical Co., Ltd. |
| 6,627 | 7,244,504 | |||||||||
Tyson Foods, Inc. | ||||||||||||
3.95%, 08/15/2024 | 5,908 | 6,460,162 | ||||||||||
4.00%, 03/01/2026 | 763 | 846,190 | ||||||||||
Utah Acquisition Sub, Inc. | 6,825 | 7,524,290 | ||||||||||
Zimmer Biomet Holdings, Inc. |
| 1,136 | 1,215,997 | |||||||||
|
| |||||||||||
| 152,019,813 | ||||||||||||
|
| |||||||||||
| Energy–5.0% | ||||||||||||
Baker Hughes a GE Co. LLC/Baker Hughes Co-Obligor, Inc. | 11,885 | 12,716,118 | ||||||||||
Boardwalk Pipelines LP | 3,871 | 3,897,052 | ||||||||||
BP Capital Markets America, Inc. |
| 12,047 | 10,752,911 | |||||||||
Cenovus Energy, Inc. | 2,065 | 2,323,786 | ||||||||||
Chevron USA, Inc. | ||||||||||||
3.90%, 11/15/2024 | 6,369 | 7,016,791 | ||||||||||
5.25%, 11/15/2043 | 5,674 | 7,389,761 | ||||||||||
Enbridge Energy Partners LP |
| 6,968 | 9,981,590 | |||||||||
Energy Transfer Operating LP |
| |||||||||||
4.75%, 01/15/2026 | 6,615 | 7,345,957 | ||||||||||
6.25%, 04/15/2049 | 3,278 | 3,866,401 | ||||||||||
Eni SpA | 3,228 | 3,606,967 | ||||||||||
Enterprise Products Operating LLC | ||||||||||||
3.35%, 03/15/2023 | 11 | 11,536 | ||||||||||
4.20%, 01/31/2050 | 9,811 | 10,457,447 | ||||||||||
Husky Energy, Inc. | 11,355 | 12,131,796 | ||||||||||
Kinder Morgan Energy Partners LP | 7 | 7,324 | ||||||||||
Kinder Morgan, Inc. | 5,150 | 5,375,312 | ||||||||||
Marathon Oil Corp. | 10,900 | 11,696,572 | ||||||||||
Marathon Petroleum Corp. | ||||||||||||
5.125%, 12/15/2026 | 9,518 | 11,094,657 | ||||||||||
6.50%, 03/01/2041 | 1,683 | 2,231,338 | ||||||||||
| 2 | Sanford C. Bernstein Fund, Inc.—2021 Semi-Annual Report |
Table of Contents
| Principal Amount (000) | U.S. $ Value | |||||||||||
MPLX LP | U.S.$ | 10,984 | $ | 12,563,829 | ||||||||
Oleoducto Central SA | 631 | 666,494 | ||||||||||
ONEOK, Inc. |
| |||||||||||
4.00%, 07/13/2027 | 4,900 | 5,315,912 | ||||||||||
4.35%, 03/15/2029 | 4,164 | 4,539,884 | ||||||||||
6.35%, 01/15/2031 | 1,192 | 1,495,507 | ||||||||||
Plains All American Pipeline LP/PAA |
| |||||||||||
3.55%, 12/15/2029 | 407 | 406,955 | ||||||||||
4.50%, 12/15/2026 | 2,027 | 2,225,443 | ||||||||||
4.65%, 10/15/2025 | 11,148 | 12,237,048 | ||||||||||
Saudi Arabian Oil Co. | 1,876 | 1,800,116 | ||||||||||
Suncor Energy, Inc. | 5,543 | 7,563,812 | ||||||||||
Tengizchevroil Finance Co. International Ltd. | 1,397 | 1,392,809 | ||||||||||
TransCanada PipeLines Ltd. |
| 8,737 | 11,492,038 | |||||||||
Valero Energy Corp. | 3,902 | 4,051,486 | ||||||||||
Williams Cos., Inc. (The) | 2,012 | 2,134,108 | ||||||||||
|
| |||||||||||
| 189,788,757 | ||||||||||||
|
| |||||||||||
| Other Industrial–0.1% |
| |||||||||||
Alfa SAB de CV | 3,311 | 3,608,990 | ||||||||||
|
| |||||||||||
| Services–0.5% |
| |||||||||||
Alibaba Group Holding Ltd. | 6,124 | 5,826,496 | ||||||||||
Booking Holdings, Inc. | 9,010 | 10,472,954 | ||||||||||
Expedia Group, Inc. | 211 | 243,990 | ||||||||||
Mastercard, Inc. | 2,665 | 2,930,434 | ||||||||||
|
| |||||||||||
| 19,473,874 | ||||||||||||
|
| |||||||||||
| Technology–1.8% |
| |||||||||||
Apple, Inc. | 7,394 | 6,445,646 | ||||||||||
Baidu, Inc. | 217 | 226,764 | ||||||||||
Broadcom Corp./Broadcom Cayman Finance Ltd. | 1,997 | 2,120,235 | ||||||||||
Broadcom, Inc. |
| |||||||||||
3.50%, 02/15/2041(a) | 5,266 | 5,044,881 | ||||||||||
4.11%, 09/15/2028 | 5,346 | 5,837,030 | ||||||||||
4.15%, 11/15/2030 | 6,902 | 7,447,051 | ||||||||||
5.00%, 04/15/2030 | 6,078 | 6,927,218 | ||||||||||
Dell International LLC/EMC Corp. |
| 1,615 | 1,910,981 | |||||||||
Infor, Inc. | 2,719 | 2,745,075 | ||||||||||
| Principal Amount (000) | U.S. $ Value | |||||||||||
Micron Technology, Inc. | U.S.$ | 9,824 | $ | 10,909,257 | ||||||||
NXP BV/NXP Funding LLC | 1,102 | 1,318,389 | ||||||||||
NXP BV/NXP Funding LLC/NXP USA, Inc. | 839 | 880,170 | ||||||||||
Oracle Corp. |
| |||||||||||
2.50%, 04/01/2025 | 6,769 | 7,100,004 | ||||||||||
3.95%, 03/25/2051 | 6,642 | 6,857,599 | ||||||||||
SK Hynix, Inc. | 1,818 | 1,722,101 | ||||||||||
|
| |||||||||||
| 67,492,401 | ||||||||||||
|
| |||||||||||
| Transportation-Airlines–0.3% |
| |||||||||||
Delta Air Lines, Inc./SkyMiles IP Ltd. |
| |||||||||||
4.50%, 10/20/2025(a) | 3,393 | 3,620,918 | ||||||||||
4.75%, 10/20/2028(a) | 3,940 | 4,286,799 | ||||||||||
Southwest Airlines Co. | 4,073 | 4,633,852 | ||||||||||
|
| |||||||||||
| 12,541,569 | ||||||||||||
|
| |||||||||||
| Transportation-Railroads–0.1% |
| |||||||||||
Lima Metro Line 2 Finance Ltd. |
| |||||||||||
4.35%, 04/05/2036(a) | 471 | 498,082 | ||||||||||
5.875%, 07/05/2034(a) | 1,161 | 1,353,524 | ||||||||||
|
| |||||||||||
| 1,851,606 | ||||||||||||
|
| |||||||||||
| Transportation-Services–0.0% |
| |||||||||||
ENA Master Trust | 1,235 | 1,245,806 | ||||||||||
|
| |||||||||||
| 698,774,113 | ||||||||||||
|
| |||||||||||
| Financial Institutions–10.2% |
| |||||||||||
| Banking–7.1% |
| |||||||||||
ABN AMRO Bank NV | 1,171 | 1,312,761 | ||||||||||
AIB Group PLC | 572 | 625,047 | ||||||||||
American Express Co. |
| |||||||||||
Series B |
| |||||||||||
3.622% (LIBOR 3 Month + 3.43%), 05/15/2021(b)(c) | 616 | 616,092 | ||||||||||
Series C |
| |||||||||||
3.469% (LIBOR 3 Month + 3.29%), 06/15/2021(b)(c) | 1,532 | 1,522,885 | ||||||||||
Australia & New Zealand Banking Group Ltd. | 405 | 453,697 | ||||||||||
Banco de Credito del Peru | 5,996 | 5,986,107 | ||||||||||
Banco Santander Mexico SA Institucion de Banca Multiple Grupo Financiero Santand | 2,650 | 2,975,420 | ||||||||||
Schedule of Investments—Intermediate Duration Portfolio | 3 |
Table of Contents
| Principal Amount (000) | U.S. $ Value | |||||||||||
Banco Santander SA |
| |||||||||||
2.749%, 12/03/2030 | U.S.$ | 3,000 | $ | 2,852,130 | ||||||||
3.49%, 05/28/2030 | 1,000 | 1,044,920 | ||||||||||
5.179%, 11/19/2025 | 9,800 | 11,135,152 | ||||||||||
Bank of America Corp. |
| |||||||||||
5.00%, 05/13/2021 | 10 | 10,051 | ||||||||||
Series DD |
| |||||||||||
6.30%, 03/10/2026(b) | 1,628 | 1,866,632 | ||||||||||
Series L |
| |||||||||||
3.95%, 04/21/2025 | 4,925 | 5,399,031 | ||||||||||
Series Z |
| |||||||||||
6.50%, 10/23/2024(b) | 2,548 | 2,861,328 | ||||||||||
Bank of New York Mellon Corp. (The) | 1,628 | 1,764,622 | ||||||||||
Barclays Bank PLC | 1,250 | 1,728,125 | ||||||||||
BBVA USA | 8,460 | 8,700,179 | ||||||||||
BNP Paribas SA | 3,168 | 3,101,187 | ||||||||||
BPCE SA |
| |||||||||||
2.75%, 01/11/2023(a) | 1,822 | 1,893,696 | ||||||||||
5.70%, 10/22/2023(a) | 1,991 | 2,223,808 | ||||||||||
Capital One Financial Corp. |
| |||||||||||
2.60%, 05/11/2023 | 3,355 | 3,491,213 | ||||||||||
3.30%, 10/30/2024 | 8,359 | 9,013,259 | ||||||||||
Series E |
| |||||||||||
3.991% (LIBOR 3 Month + 3.80%), 06/01/2021(b)(c) | 3,790 | 3,788,257 | ||||||||||
CITIC Ltd. | 3,688 | 3,654,577 | ||||||||||
Citigroup, Inc. |
| |||||||||||
4.45%, 09/29/2027 | 7,045 | 7,923,511 | ||||||||||
4.50%, 01/14/2022 | 11 | 11,357 | ||||||||||
5.95%, 01/30/2023(b) | 2,569 | 2,696,166 | ||||||||||
Series R |
| |||||||||||
4.672% (LIBOR 3 Month + 4.48%), 05/15/2021(b)(c) |
| 2,355 | 2,357,944 | |||||||||
Series W |
| |||||||||||
4.00%, 12/10/2025(b) | 3,243 | 3,270,922 | ||||||||||
Cooperatieve Rabobank UA |
| |||||||||||
3.95%, 11/09/2022 | 1,581 | 1,664,398 | ||||||||||
4.375%, 08/04/2025 | 6,380 | 7,068,976 | ||||||||||
Credit Agricole SA/London |
| |||||||||||
3.25%, 10/04/2024(a) | 1,287 | 1,382,199 | ||||||||||
3.375%, 01/10/2022(a) | 576 | 589,421 | ||||||||||
Danske Bank A/S | 2,594 | 2,761,417 | ||||||||||
Deutsche Bank AG/New York NY |
| |||||||||||
2.129%, 11/24/2026 | 4,221 | 4,229,147 | ||||||||||
3.961%, 11/26/2025 | 1,336 | 1,445,659 | ||||||||||
Discover Bank |
| 2,264 | 2,415,530 | |||||||||
| Principal Amount (000) | U.S. $ Value | |||||||||||
Goldman Sachs Group, Inc. (The) |
| |||||||||||
5.25%, 07/27/2021 | U.S.$ | 6 | $ | 6,092 | ||||||||
5.75%, 01/24/2022 | 14 | 14,608 | ||||||||||
HSBC Holdings PLC |
| |||||||||||
4.041%, 03/13/2028 | 7,182 | 7,875,207 | ||||||||||
4.25%, 03/14/2024 | 3,943 | 4,289,550 | ||||||||||
4.292%, 09/12/2026 | 2,495 | 2,762,938 | ||||||||||
6.375%, 03/30/2025(b) | 1,725 | 1,902,934 | ||||||||||
ING Groep NV |
| 6,439 | 6,433,076 | |||||||||
JPMorgan Chase & Co. |
| |||||||||||
2.083%, 04/22/2026 | 4,480 | 4,601,722 | ||||||||||
3.54%, 05/01/2028 | 10,073 | 10,981,484 | ||||||||||
Series I | ||||||||||||
3.682% (LIBOR 3 Month + 3.47%), 04/30/2021(b)(c) |
| 3,323 | 3,312,067 | |||||||||
Series V | ||||||||||||
3.558% (LIBOR 3 Month + 3.32%), 07/01/2021(b)(c) | 1,622 | 1,609,284 | ||||||||||
Series Z |
| |||||||||||
4.005% (LIBOR 3 Month + 3.80%), 05/01/2021(b)(c) |
| 2,716 | 2,717,711 | |||||||||
Morgan Stanley |
| |||||||||||
3.591%, 07/22/2028 | 8,591 | 9,361,870 | ||||||||||
5.00%, 11/24/2025 | 3,110 | 3,574,167 | ||||||||||
7.25%, 04/01/2032 | 15 | 21,074 | ||||||||||
Series H |
| |||||||||||
3.851% (LIBOR 3 Month + 3.61%), 07/15/2021(b)(c) |
| 772 | 771,359 | |||||||||
Series J | ||||||||||||
4.051% (LIBOR 3 Month + 3.81%), 04/15/2021(b)(c) |
| 7,335 | 7,337,494 | |||||||||
Natwest Group PLC |
| |||||||||||
8.625%, 08/15/2021(b) | 7,871 | 8,080,998 | ||||||||||
Series U |
| |||||||||||
2.574% (LIBOR 3 Month + 2.32%), 09/30/2027(b)(c) | 2,900 | 2,869,347 | ||||||||||
Santander Holdings USA, Inc. |
| 3,049 | 3,370,456 | |||||||||
Societe Generale SA |
| 6,700 | 7,292,280 | |||||||||
Standard Chartered PLC |
| |||||||||||
1.722% (LIBOR 3 Month + 1.51%), 01/30/2027(a)(b)(c) |
| 300 | 281,355 | |||||||||
4.30%, 02/19/2027(a) | 9,464 | 10,248,944 | ||||||||||
5.20%, 01/26/2024(a) | 3,782 | 4,153,657 | ||||||||||
7.50%, 04/02/2022(a)(b) | 1,882 | 1,969,155 | ||||||||||
7.75%, 04/02/2023(a)(b) | 822 | 892,002 | ||||||||||
State Street Corp. |
| 498 | 530,186 | |||||||||
Truist Financial Corp. |
| 6,656 | 7,258,501 | |||||||||
UBS AG/Stamford CT |
| 5,982 | 6,521,875 | |||||||||
UBS Group AG |
| 3,426 | 3,778,604 | |||||||||
| 4 | Sanford C. Bernstein Fund, Inc.—2021 Semi-Annual Report |
Table of Contents
| Principal Amount (000) | U.S. $ Value | |||||||||||
UniCredit SpA | U.S.$ | 11,095 | $ | 11,147,812 | ||||||||
US Bancorp | 3,485 | 3,816,110 | ||||||||||
Wells Fargo & Co. | ||||||||||||
2.188%, 04/30/2026 | 3,502 | 3,612,698 | ||||||||||
3.75%, 01/24/2024 | 6,552 | 7,084,612 | ||||||||||
3.90%, 03/15/2026(b) | 2,664 | 2,692,878 | ||||||||||
|
| |||||||||||
| 269,010,930 | ||||||||||||
|
| |||||||||||
| Brokerage–0.3% | ||||||||||||
Charles Schwab Corp. (The) |
| |||||||||||
Series G | ||||||||||||
5.375%, 06/01/2025(b) | 3,271 | 3,616,221 | ||||||||||
Series I | ||||||||||||
4.00%, 06/01/2026(b) | 7,570 | 7,687,562 | ||||||||||
|
| |||||||||||
| 11,303,783 | ||||||||||||
|
| |||||||||||
| Finance–1.8% | ||||||||||||
AerCap Ireland Capital DAC/AerCap Global Aviation Trust |
| 613 | 714,948 | |||||||||
Air Lease Corp. | ||||||||||||
2.875%, 01/15/2026 | 2,045 | 2,116,554 | ||||||||||
3.625%, 04/01/2027 | 303 | 320,007 | ||||||||||
3.875%, 07/03/2023 | 606 | 644,414 | ||||||||||
4.25%, 02/01/2024 | 2,411 | 2,615,043 | ||||||||||
Aircastle Ltd. | ||||||||||||
2.85%, 01/26/2028(a) | 8,390 | 8,002,634 | ||||||||||
4.125%, 05/01/2024 | 1,481 | 1,564,602 | ||||||||||
4.25%, 06/15/2026 | 530 | 558,106 | ||||||||||
4.40%, 09/25/2023 | 3,751 | 3,998,791 | ||||||||||
5.00%, 04/01/2023 | 306 | 326,242 | ||||||||||
5.25%, 08/11/2025(a) | 3,730 | 4,063,910 | ||||||||||
Aviation Capital Group LLC |
| |||||||||||
1.95%, 01/30/2026(a) | 4,176 | 4,069,053 | ||||||||||
2.875%, 01/20/2022(a) | 582 | 590,282 | ||||||||||
3.50%, 11/01/2027(a) | 1,314 | 1,351,042 | ||||||||||
3.875%, 05/01/2023(a) | 3,183 | 3,324,994 | ||||||||||
4.125%, 08/01/2025(a) | 35 | 37,282 | ||||||||||
4.375%, 01/30/2024(a) | 1,300 | 1,382,563 | ||||||||||
4.875%, 10/01/2025(a) | 1,447 | 1,579,357 | ||||||||||
5.50%, 12/15/2024(a) | 3,623 | 4,061,021 | ||||||||||
CDBL Funding 1 | 5,770 | 6,119,806 | ||||||||||
GE Capital European Funding Unlimited Co. | EUR | 250 | 366,035 | |||||||||
GE Capital Funding LLC | U.S.$ | 9,960 | 11,292,648 | |||||||||
GE Capital International Funding Co. Unlimited Co. |
| 2,843 | 3,253,415 | |||||||||
Synchrony Financial | 6,600 | 7,310,358 | ||||||||||
|
| |||||||||||
| 69,663,107 | ||||||||||||
|
| |||||||||||
| Principal Amount (000) | U.S. $ Value | |||||||||||
| Insurance–0.7% |
| |||||||||||
Alleghany Corp. | U.S.$ | 7,452 | $ | 8,035,194 | ||||||||
Guardian Life Insurance Co. of America (The) | 2,851 | 3,315,342 | ||||||||||
MetLife Capital Trust IV | 5,200 | 7,225,296 | ||||||||||
Nationwide Mutual Insurance Co. | 2,058 | 3,343,036 | ||||||||||
| Prudential Financial, Inc. |
| |||||||||||
5.20%, 03/15/2044 | 1,970 | 2,098,897 | ||||||||||
5.375%, 05/15/2045 | 615 | 674,040 | ||||||||||
5.875%, 09/15/2042 | 459 | 485,002 | ||||||||||
Voya Financial, Inc. | 3,089 | 3,298,589 | ||||||||||
|
| |||||||||||
| 28,475,396 | ||||||||||||
|
| |||||||||||
| Other Finance–0.2% |
| |||||||||||
AerCap Ireland Capital DAC/AerCap Global Aviation Trust |
| 656 | 711,950 | |||||||||
China Cinda 2020 I Management Ltd. | 5,905 | 5,936,371 | ||||||||||
|
| |||||||||||
| 6,648,321 | ||||||||||||
|
| |||||||||||
| REITS–0.1% |
| |||||||||||
Host Hotels & Resorts LP | 202 | 213,164 | ||||||||||
Rexford Industrial Realty LP | 5,037 | 4,705,213 | ||||||||||
|
| |||||||||||
| 4,918,377 | ||||||||||||
|
| |||||||||||
| 390,019,914 | ||||||||||||
|
| |||||||||||
| Utility–0.6% |
| |||||||||||
| Electric–0.6% |
| |||||||||||
AES Panama Generation Holdings SRL |
| 1,670 | 1,727,866 | |||||||||
Chile Electricity Pec SpA | 3,081 | 2,499,461 | ||||||||||
Colbun SA | 400 | 409,250 | ||||||||||
Enel Chile SA | 4,545 | 5,250,895 | ||||||||||
Israel Electric Corp., Ltd. | 7,000 | 7,880,075 | ||||||||||
NextEra Energy Capital Holdings, Inc. | 1,368 | 1,450,381 | ||||||||||
Schedule of Investments—Intermediate Duration Portfolio | 5 |
Table of Contents
| Principal Amount (000) | U.S. $ Value | |||||||||||
Star Energy Geothermal Darajat II/Star Energy Geothermal Salak | U.S.$ | 2,389 | $ | 2,601,024 | ||||||||
|
| |||||||||||
| 21,818,952 | ||||||||||||
|
| |||||||||||
| Total Corporates—Investment Grade (cost $1,079,604,667) |
| 1,110,612,979 | ||||||||||
|
| |||||||||||
| GOVERNMENTS-TREASURIES–27.8% |
| |||||||||||
| Malaysia–0.2% |
| |||||||||||
Malaysia Government Bond | MYR | 35,334 | 8,674,363 | |||||||||
|
| |||||||||||
| Netherlands–1.1% |
| |||||||||||
Netherlands Government Bond | EUR | 34,460 | 42,338,050 | |||||||||
|
| |||||||||||
| United States–26.5% |
| |||||||||||
| U.S. Treasury Bonds |
| |||||||||||
1.25%, 05/15/2050 | U.S.$ | 12,265 | 9,225,580 | |||||||||
1.875%, 02/15/2051 | 44,085 | 38,967,007 | ||||||||||
2.00%, 02/15/2050 | 2,460 | 2,242,828 | ||||||||||
2.25%, 08/15/2046 | 12,530 | 12,120,817 | ||||||||||
2.375%, 11/15/2049 | 2,885 | 2,857,502 | ||||||||||
2.50%, 02/15/2045–05/15/2046 |
| 25,872 | 26,288,227 | |||||||||
3.00%, 05/15/2045–02/15/2049 |
| 78,384 | 87,560,813 | |||||||||
3.375%, 05/15/2044 | 5,710 | 6,737,210 | ||||||||||
3.50%, 02/15/2039 | 4,254 | 5,085,524 | ||||||||||
3.75%, 11/15/2043 | 10,205 | 12,724,359 | ||||||||||
4.375%, 02/15/2038–11/15/2039 |
| 49,130 | 65,470,031 | |||||||||
4.50%, 02/15/2036 | 4,048 | 5,346,627 | ||||||||||
4.75%, 02/15/2037 | 4,156 | 5,674,239 | ||||||||||
5.50%, 08/15/2028 | 10,214 | 13,112,222 | ||||||||||
| U.S. Treasury Notes |
| |||||||||||
0.125%, 08/31/2022–02/28/2023 |
| 511,722 | 511,649,172 | |||||||||
0.875%, 11/15/2030 | 7,436 | 6,871,329 | ||||||||||
1.50%, 02/15/2030 | 11,115 | 10,970,852 | ||||||||||
1.75%, 11/30/2021(d) | 28,028 | 28,343,315 | ||||||||||
1.75%, 11/15/2029 | 11,550 | 11,679,938 | ||||||||||
1.875%, 01/31/2022 | 9,965 | 10,114,475 | ||||||||||
2.00%, 12/31/2021 | 26,704 | 27,092,042 | ||||||||||
2.125%, 08/15/2021(d) |
| 32,897 | 33,154,008 | |||||||||
2.25%, 04/30/2021–02/15/2027 |
| 38,231 | 38,479,261 | |||||||||
2.625%, 02/15/2029 | 30,853 | 33,350,381 | ||||||||||
|
| |||||||||||
| 1,005,117,759 | ||||||||||||
|
| |||||||||||
| Total Governments—Treasuries (cost $1,037,910,491) |
| 1,056,130,172 | ||||||||||
|
| |||||||||||
| Principal Amount (000) | U.S. $ Value | |||||||||||
| MORTGAGE PASS-THROUGHS–10.0% |
| |||||||||||
| Agency Fixed Rate 30-Year–9.1% |
| |||||||||||
Federal Home Loan Mortgage Corp. |
| |||||||||||
Series 2019 | ||||||||||||
3.50%, 09/01/2049–11/01/2049 | U.S.$ | 26,658 | $ | 28,595,510 | ||||||||
Series 2020 | ||||||||||||
3.50%, 01/01/2050 | 7,777 | 8,406,508 | ||||||||||
Federal Home Loan Mortgage Corp. Gold |
| |||||||||||
Series 2003 | ||||||||||||
5.00%, 08/01/2033 | 1 | 974 | ||||||||||
Series 2007 | ||||||||||||
5.50%, 07/01/2035 | 806 | 926,560 | ||||||||||
Series 2016 | ||||||||||||
4.00%, 02/01/2046 | 7,160 | 7,913,228 | ||||||||||
Series 2017 | ||||||||||||
4.00%, 07/01/2044 | 5,705 | 6,300,771 | ||||||||||
Series 2018 | ||||||||||||
4.00%, 08/01/2048 | 4,481 | 4,863,850 | ||||||||||
4.50%, 10/01/2048–11/01/2048 |
| 16,482 | 18,180,595 | |||||||||
5.00%, 09/01/2048–11/01/2048 |
| 6,049 | 6,785,383 | |||||||||
Federal National Mortgage Association |
| |||||||||||
Series 2001 | ||||||||||||
6.50%, 08/01/2031 | 2 | 1,993 | ||||||||||
Series 2002 | ||||||||||||
6.50%, 09/01/2032 | 0 | ** | 182 | |||||||||
Series 2003 | ||||||||||||
5.50%, 04/01/2033–11/01/2033 |
| 2,258 | 2,587,688 | |||||||||
Series 2004 | ||||||||||||
5.50%, 04/01/2034–11/01/2034 |
| 1,969 | 2,266,672 | |||||||||
6.50%, 08/01/2034 | 2 | 1,872 | ||||||||||
Series 2005 | ||||||||||||
5.50%, 02/01/2035 | 1,759 | 2,024,477 | ||||||||||
Series 2006 | ||||||||||||
5.50%, 04/01/2036 | 322 | 373,641 | ||||||||||
Series 2007 | ||||||||||||
5.50%, 09/01/2036 | 675 | 778,558 | ||||||||||
Series 2008 | ||||||||||||
6.00%, 03/01/2037 | 4 | 5,282 | ||||||||||
Series 2010 | ||||||||||||
4.00%, 12/01/2040 | 3,434 | 3,768,197 | ||||||||||
Series 2012 | ||||||||||||
3.50%, 02/01/2042–01/01/2043 |
| 26,333 | 28,577,770 | |||||||||
Series 2013 | ||||||||||||
3.50%, 04/01/2043 | 12,836 | 13,928,525 | ||||||||||
4.00%, 10/01/2043 | 10,671 | 11,762,684 | ||||||||||
Series 2015 | ||||||||||||
3.00%, 05/01/2045–08/01/2045 |
| 13,722 | 14,436,092 | |||||||||
Series 2018 | ||||||||||||
3.50%, 02/01/2048–05/01/2048 |
| 8,580 | 9,112,539 | |||||||||
4.50%, 09/01/2048 | 15,439 | 17,029,500 | ||||||||||
Series 2019 | ||||||||||||
3.50%, 08/01/2049–11/01/2049 |
| 29,174 | 31,220,892 | |||||||||
Series 2020 | ||||||||||||
3.50%, 01/01/2050 | 7,971 | 8,576,319 | ||||||||||
| 6 | Sanford C. Bernstein Fund, Inc.—2021 Semi-Annual Report |
Table of Contents
| Principal Amount (000) | U.S. $ Value | |||||||||||
Government National Mortgage Association | U.S.$ | 5,817 | $ | 6,137,693 | ||||||||
Uniform Mortgage-Backed Security |
| |||||||||||
Series 2021 | ||||||||||||
2.00%, 04/01/2051, TBA | 35,770 | 35,661,012 | ||||||||||
2.50%, 04/01/2051, TBA | 73,610 | 75,479,002 | ||||||||||
|
| |||||||||||
| 345,703,969 | ||||||||||||
|
| |||||||||||
| Agency Fixed Rate 15-Year–0.9% |
| |||||||||||
Federal National Mortgage Association |
| |||||||||||
Series 2012 | ||||||||||||
2.50%, 04/01/2027 | 16 | 16,169 | ||||||||||
Series 2016 | ||||||||||||
2.50%, 02/01/2031–01/01/2032 |
| 28,444 | 29,743,827 | |||||||||
Series 2017 | ||||||||||||
2.50%, 01/01/2032–02/01/2032 |
| 3,855 | 4,031,352 | |||||||||
|
| |||||||||||
| 33,791,348 | ||||||||||||
|
| |||||||||||
| Other Agency Fixed Rate Programs–0.0% |
| |||||||||||
Federal National Mortgage Association |
| 440 | 488,134 | |||||||||
|
| |||||||||||
| Agency ARMs–0.0% | ||||||||||||
Federal Home Loan Mortgage Corp. Gold |
| |||||||||||
Series 2006 | ||||||||||||
2.72% (LIBOR 12 Month + 2.18%), 12/01/2036(c) |
| 0 | ** | 170 | ||||||||
Series 2007 | ||||||||||||
2.475% (LIBOR 12 Month + 2.10%), 03/01/2037(c) |
| 1 | 605 | |||||||||
|
| |||||||||||
| 775 | ||||||||||||
|
| |||||||||||
| Total Mortgage Pass-Throughs (cost $369,484,900) |
| 379,984,226 | ||||||||||
|
| |||||||||||
| COMMERCIAL MORTGAGE-BACKED SECURITIES–9.1% |
| |||||||||||
| Non-Agency Fixed Rate CMBS–6.6% |
| |||||||||||
BAMLL Commercial Mortgage Securities Trust |
| 2,805 | 2,514,985 | |||||||||
Banc of America Commercial Mortgage Trust |
| 871 | 951,377 | |||||||||
Barclays Commercial Mortgage Trust |
| 3,523 | 3,827,901 | |||||||||
CCUBS Commercial Mortgage Trust |
| 8,525 | 9,328,060 | |||||||||
| Principal Amount (000) | U.S. $ Value | |||||||||||
CFCRE Commercial Mortgage Trust | U.S.$ | 3,655 | $ | 3,952,469 | ||||||||
CGRBS Commercial Mortgage Trust |
| 11,325 | 11,808,991 | |||||||||
Citigroup Commercial Mortgage Trust |
| |||||||||||
Series 2015-GC27, Class A5 |
| |||||||||||
3.137%, 02/10/2048 | 7,490 | 7,993,662 | ||||||||||
Series 2015-GC35, Class A4 |
| |||||||||||
3.818%, 11/10/2048 | 3,530 | 3,885,398 | ||||||||||
Series 2016-C1, Class A4 | ||||||||||||
3.209%, 05/10/2049 | 12,141 | 13,053,516 | ||||||||||
Series 2016-GC36, Class A5 |
| |||||||||||
3.616%, 02/10/2049 | 3,982 | 4,353,633 | ||||||||||
Series 2018-B2, Class A4 | ||||||||||||
4.009%, 03/10/2051 | 5,890 | 6,569,080 | ||||||||||
Commercial Mortgage Trust | ||||||||||||
Series 2012-CR3, Class E |
| |||||||||||
4.751%, 10/15/2045(a) | 3,938 | 2,104,528 | ||||||||||
Series 2013-SFS, Class A1 |
| |||||||||||
1.873%, 04/12/2035(a) | 1,359 | 1,364,688 | ||||||||||
Series 2015-3BP, Class A | ||||||||||||
3.178%, 02/10/2035(a) | 1,705 | 1,809,562 | ||||||||||
Series 2015-CR24, Class A5 |
| |||||||||||
3.696%, 08/10/2048 | 3,925 | 4,310,223 | ||||||||||
Series 2015-DC1, Class A5 |
| |||||||||||
3.35%, 02/10/2048 | 6,250 | 6,727,370 | ||||||||||
Series 2015-PC1, Class A5 |
| |||||||||||
3.902%, 07/10/2050 | 7,135 | 7,847,355 | ||||||||||
CSAIL Commercial Mortgage Trust |
| |||||||||||
Series 2015-C2, Class A4 | ||||||||||||
3.504%, 06/15/2057 | 3,451 | 3,724,605 | ||||||||||
Series 2015-C3, Class A4 | ||||||||||||
3.718%, 08/15/2048 | 6,101 | 6,654,315 | ||||||||||
Series 2015-C4, Class A4 | ||||||||||||
3.808%, 11/15/2048 | 7,715 | 8,463,343 | ||||||||||
GS Mortgage Securities Trust |
| |||||||||||
Series 2011-GC5, Class D |
| |||||||||||
5.406%, 08/10/2044(a) | 333 | 203,454 | ||||||||||
Series 2013-G1, Class A1 | ||||||||||||
2.059%, 04/10/2031(a) | 200 | 201,094 | ||||||||||
Series 2013-G1, Class A2 | ||||||||||||
3.557%, 04/10/2031(a) | 6,804 | 6,607,311 | ||||||||||
Series 2014-GC22, Class A5 |
| |||||||||||
3.862%, 06/10/2047 | 6,360 | 6,891,595 | ||||||||||
GSF | ||||||||||||
Series 2021-1, Class A1 | ||||||||||||
1.433%, 08/15/2026(e)(f)(g) |
| 406 | 406,191 | |||||||||
Series 2021-1, Class A2 | ||||||||||||
2.435%, 08/15/2026(e)(f)(g) |
| 907 | 934,210 | |||||||||
Series 2021-1, Class AS | ||||||||||||
2.638%, 08/15/2026(e)(f)(g) |
| 217 | 223,510 | |||||||||
Schedule of Investments—Intermediate Duration Portfolio | 7 |
Table of Contents
| Principal Amount (000) | U.S. $ Value | |||||||||||
JPMBB Commercial Mortgage Securities Trust | ||||||||||||
Series 2013-C14, Class D | ||||||||||||
4.703%, 08/15/2046(a) | U.S.$ | 2,527 | $ | 1,894,065 | ||||||||
Series 2014-C21, Class A5 |
| |||||||||||
3.775%, 08/15/2047 | 6,300 | 6,798,617 | ||||||||||
Series 2014-C21, Class B | ||||||||||||
4.341%, 08/15/2047 | 1,857 | 1,942,992 | ||||||||||
Series 2015-C27, Class AS |
| |||||||||||
3.634%, 02/15/2048 | 3,415 | 3,654,166 | ||||||||||
Series 2015-C30, Class A5 |
| |||||||||||
3.822%, 07/15/2048 | 3,820 | 4,200,349 | ||||||||||
Series 2015-C31, Class A3 |
| |||||||||||
3.801%, 08/15/2048 | 9,802 | 10,703,891 | ||||||||||
JPMorgan Chase Commercial Mortgage Securities Trust |
| |||||||||||
Series 2011-C5, Class D | ||||||||||||
5.425%, 08/15/2046(a) | 1,285 | 1,151,388 | ||||||||||
Series 2012-C6, Class E | ||||||||||||
5.142%, 05/15/2045(a) | 3,967 | 2,563,143 | ||||||||||
Series 2014-C20, Class A5 |
| |||||||||||
3.805%, 07/15/2047 | 9,950 | 10,735,116 | ||||||||||
Series 2016-JP3, Class B | ||||||||||||
3.397%, 08/15/2049 | 3,000 | 3,126,781 | ||||||||||
LB-UBS Commercial Mortgage Trust |
| 1,384 | 801,835 | |||||||||
LSTAR Commercial Mortgage Trust |
| 5,532 | 5,615,508 | |||||||||
Morgan Stanley Capital I Trust |
| 6,180 | 6,718,873 | |||||||||
UBS Commercial Mortgage Trust |
| |||||||||||
Series 2018-C10, Class A4 |
| |||||||||||
4.313%, 05/15/2051 | 7,900 | 8,963,079 | ||||||||||
Series 2018-C8, Class A4 | ||||||||||||
3.983%, 02/15/2051 | 6,400 | 7,098,242 | ||||||||||
Series 2018-C9, Class A4 | ||||||||||||
4.117%, 03/15/2051 | 10,270 | 11,467,250 | ||||||||||
UBS-Barclays Commercial Mortgage Trust |
| 9,507 | 9,795,362 | |||||||||
Wells Fargo Commercial Mortgage Trust |
| |||||||||||
Series 2015-SG1, Class AS |
| |||||||||||
4.047%, 09/15/2048 | 2,906 | 3,166,615 | ||||||||||
Series 2015-SG1, Class C |
| |||||||||||
4.463%, 09/15/2048 | 3,276 | 3,098,799 | ||||||||||
Series 2016-C35, Class XA |
| |||||||||||
1.922%, 07/15/2048(h) | 23,366 | 1,759,285 | ||||||||||
Series 2018-C43, Class A4 |
| |||||||||||
4.012%, 03/15/2051 | 4,550 | 5,079,159 | ||||||||||
Series 2019-C51, Class B | ||||||||||||
3.836%, 06/15/2052 | 1,269 | 1,350,270 | ||||||||||
| Principal Amount (000) | U.S. $ Value | |||||||||||
WF-RBS Commercial Mortgage Trust |
| |||||||||||
Series 2013-C11, Class XA |
| |||||||||||
1.17%, 03/15/2045(a)(h) | U.S.$ | 66,830 | $ | 1,148,139 | ||||||||
Series 2014-C19, Class A5 |
| |||||||||||
4.101%, 03/15/2047 | 1,600 | 1,739,796 | ||||||||||
Series 2014-C21, Class A5 |
| |||||||||||
3.678%, 08/15/2047 | 6,200 | 6,691,952 | ||||||||||
Series 2014-C24, Class AS |
| |||||||||||
3.931%, 11/15/2047 | 1,471 | 1,556,652 | ||||||||||
|
| |||||||||||
| 249,533,750 | ||||||||||||
|
| |||||||||||
| Non-Agency Floating Rate CMBS–2.5% |
| |||||||||||
Ashford Hospitality Trust | ||||||||||||
Series 2018-ASHF, Class A |
| |||||||||||
1.006% (LIBOR 1 Month + 0.90%), 04/15/2035(a)(c) |
| 3,638 | 3,631,266 | |||||||||
Series 2018-KEYS, Class A |
| |||||||||||
1.106% (LIBOR 1 Month + 1.00%), 06/15/2035(a)(c) |
| 7,150 | 7,143,397 | |||||||||
BAMLL Commercial Mortgage Securities Trust |
| 10,570 | 10,318,054 | |||||||||
BBCMS Mortgage Trust |
| 6,218 | 6,249,158 | |||||||||
BHMS |
| 5,580 | 5,576,839 | |||||||||
Braemar Hotels & Resorts Trust |
| 4,000 | 3,985,018 | |||||||||
BX Trust |
| 5,730 | 5,558,562 | |||||||||
CLNY Trust |
| 5,360 | 5,212,276 | |||||||||
DBWF Mortgage Trust |
| 5,912 | 5,908,546 | |||||||||
Federal Home Loan Mortgage Corp. |
| 1,459 | 1,462,274 | |||||||||
Great Wolf Trust |
| 5,961 | 5,953,806 | |||||||||
| 8 | Sanford C. Bernstein Fund, Inc.—2021 Semi-Annual Report |
Table of Contents
| Principal Amount (000) | U.S. $ Value | |||||||||||
GS Mortgage Securities Corp. Trust |
| |||||||||||
Series 2019-BOCA, Class A |
| |||||||||||
1.306% (LIBOR 1 Month + 1.20%), 06/15/2038(a)(c) | U.S.$ | 1,456 | $ | 1,457,084 | ||||||||
Series 2019-SMP, Class A |
| |||||||||||
1.256% (LIBOR 1 Month + 1.15%), 08/15/2032(a)(c) |
| 1,700 | 1,698,972 | |||||||||
HFX Funding |
| 6,860 | 7,078,898 | |||||||||
Invitation Homes Trust | ||||||||||||
Series 2018-SFR2, Class C |
| |||||||||||
1.386% (LIBOR 1 Month + 1.28%), 06/17/2037(a)(c) |
| 2,050 | 2,055,405 | |||||||||
Series 2018-SFR3, Class C |
| |||||||||||
1.408% (LIBOR 1 Month + 1.30%), 07/17/2037(a)(c) |
| 3,950 | 3,962,258 | |||||||||
JPMorgan Chase Commercial Mortgage Securities Trust |
| 530 | 527,955 | |||||||||
Morgan Stanley Capital I Trust |
| 2,464 | 2,096,413 | |||||||||
Natixis Commercial Mortgage Securities Trust |
| |||||||||||
Series 2018-850T, Class A |
| |||||||||||
0.89% (LIBOR 1 Month + 0.78%), 07/15/2033(a)(c) |
| 5,432 | 5,397,552 | |||||||||
Series 2019-MILE, Class A |
| |||||||||||
1.606% (LIBOR 1 Month + 1.50%), 07/15/2036(a)(c) |
| 2,750 | 2,758,502 | |||||||||
Starwood Retail Property Trust |
| 9,857 | 7,245,034 | |||||||||
|
| |||||||||||
| 95,277,269 | ||||||||||||
|
| |||||||||||
| Total Commercial Mortgage-Backed Securities (cost $341,191,172) |
| 344,811,019 | ||||||||||
|
| |||||||||||
| INFLATION-LINKED SECURITIES–8.1% |
| |||||||||||
| Canada–0.9% |
| |||||||||||
Canadian Government Real Return Bond |
| |||||||||||
0.50%, 12/01/2050 | CAD | 6,974 | 5,950,573 | |||||||||
1.50%, 12/01/2044 | 27,043 | 27,480,481 | ||||||||||
|
| |||||||||||
| 33,431,054 | ||||||||||||
|
| |||||||||||
| United States–7.2% | ||||||||||||
U.S. Treasury Inflation Index |
| |||||||||||
0.125%, 01/15/2031 (TIPS) | U.S.$ | 9,103 | 9,794,102 | |||||||||
0.25%, 01/15/2025 (TIPS) |
| 190,671 | 207,056,623 | |||||||||
0.375%, 07/15/2025 (TIPS) |
| 45,549 | 50,160,470 | |||||||||
| Principal Amount (000) | U.S. $ Value | |||||||||||
0.75%, 07/15/2028 (TIPS) | U.S.$ | 6,662 | $ | 7,591,817 | ||||||||
|
| |||||||||||
| 274,603,012 | ||||||||||||
|
| |||||||||||
| Total Inflation-Linked Securities (cost $302,736,238) |
| 308,034,066 | ||||||||||
|
| |||||||||||
| COLLATERALIZED MORTGAGE OBLIGATIONS–6.1% |
| |||||||||||
| Risk Share Floating Rate–4.2% |
| |||||||||||
Bellemeade Re Ltd. |
| |||||||||||
Series 2018-3A, Class M1B |
| |||||||||||
1.959% (LIBOR 1 Month + 1.85%), 10/25/2028(a)(c) | 1,763 | 1,772,411 | ||||||||||
Series 2019-3A, Class M1B |
| |||||||||||
1.709% (LIBOR 1 Month + |
| 3,489 | 3,505,193 | |||||||||
Series 2019-3A, Class M1C |
| |||||||||||
2.059% (LIBOR 1 Month + |
| 575 | 572,769 | |||||||||
Series 2020-2A, Class M1B |
| |||||||||||
3.309% (LIBOR 1 Month + |
| 3,206 | 3,231,267 | |||||||||
Series 2020-3A, Class M1B |
| |||||||||||
2.959% (LIBOR 1 Month + |
| 1,900 | 1,916,032 | |||||||||
Series 2021-1A, Class M1C |
| |||||||||||
2.967% (SOFR + 2.95%), 03/25/2031(a)(c) |
| 4,197 | 4,179,165 | |||||||||
Chase Mortgage Finance Corp. |
| 1,093 | 1,108,873 | |||||||||
Eagle Re Ltd. |
| |||||||||||
Series 2018-1, Class M2 |
| |||||||||||
3.109% (LIBOR 1 Month + |
| 617 | 622,579 | |||||||||
Series 2020-1, Class M1A |
| |||||||||||
1.009% (LIBOR 1 Month + |
| 6,400 | 6,381,560 | |||||||||
Federal Home Loan Mortgage Corp. Structured Agency Credit Risk Debt Notes |
| |||||||||||
Series 2013-DN2, Class M2 |
| |||||||||||
4.359% (LIBOR 1 Month + |
| 646 | 644,554 | |||||||||
Series 2014-DN3, Class M3 |
| |||||||||||
4.109% (LIBOR 1 Month + |
| 947 | 961,310 | |||||||||
Series 2015-DNA1, Class M3 |
| |||||||||||
3.409% (LIBOR 1 Month + |
| 4,718 | 4,809,401 | |||||||||
Series 2016-DNA3, Class M3 |
| |||||||||||
5.109% (LIBOR 1 Month + |
| 4,754 | 5,000,345 | |||||||||
Series 2016-DNA4, Class M3 |
| |||||||||||
3.909% (LIBOR 1 Month + |
| 6,741 | 7,004,339 | |||||||||
Schedule of Investments—Intermediate Duration Portfolio | 9 |
Table of Contents
| Principal Amount (000) | U.S. $ Value | |||||||||||
Series 2016-HQA2, Class M3 |
| |||||||||||
5.259% (LIBOR 1 Month + | U.S.$ | 298 | $ | 310,419 | ||||||||
Series 2016-HQA3, Class M3 |
| |||||||||||
3.959% (LIBOR 1 Month + |
| 2,030 | 2,103,007 | |||||||||
Series 2017-DNA2, Class M2 |
| |||||||||||
3.559% (LIBOR 1 Month + |
| 2,850 | 2,953,391 | |||||||||
Series 2017-DNA3, Class M2 |
| |||||||||||
2.609% (LIBOR 1 Month + |
| 7,295 | 7,433,482 | |||||||||
Series 2017-HQA2, Class M2B |
| |||||||||||
2.759% (LIBOR 1 Month + |
| 5,358 | 5,382,638 | |||||||||
Series 2017-HQA3, Class M2 |
| |||||||||||
2.459% (LIBOR 1 Month + |
| 8,623 | 8,731,795 | |||||||||
Series 2020-DNA5, Class M2 |
| |||||||||||
2.817% (SOFR + 2.80%), 10/25/2050(a)(c) |
| 6,500 | 6,537,597 | |||||||||
Federal National Mortgage Association Connecticut Avenue Securities |
| |||||||||||
Series 2015-C01, Class 2M2 |
| |||||||||||
4.659% (LIBOR 1 Month + |
| 385 | 386,166 | |||||||||
Series 2015-C02, Class 2M2 |
| |||||||||||
4.109% (LIBOR 1 Month + |
| 635 | 643,559 | |||||||||
Series 2015-C03, Class 2M2 |
| |||||||||||
5.109% (LIBOR 1 Month + |
| 1,265 | 1,281,447 | |||||||||
Series 2015-C04, Class 1M2 |
| |||||||||||
5.809% (LIBOR 1 Month + |
| 1,409 | 1,494,238 | |||||||||
Series 2016-C02, Class 1M2 |
| |||||||||||
6.109% (LIBOR 1 Month + |
| 736 | 775,081 | |||||||||
Series 2016-C03, Class 1M2 |
| |||||||||||
5.409% (LIBOR 1 Month + |
| 2,178 | 2,285,816 | |||||||||
Series 2016-C05, Class 2M2 |
| |||||||||||
4.559% (LIBOR 1 Month + |
| 4,607 | 4,793,115 | |||||||||
Series 2016-C06, Class 1M2 |
| |||||||||||
4.359% (LIBOR 1 Month + |
| 1,352 | 1,406,987 | |||||||||
Series 2016-C07, Class 2M2 |
| |||||||||||
4.459% (LIBOR 1 Month + |
| 779 | 810,979 | |||||||||
Series 2017-C01, Class 1M2 |
| |||||||||||
3.659% (LIBOR 1 Month + |
| 3,487 | 3,591,696 | |||||||||
Series 2017-C02, Class 2M2C |
| |||||||||||
3.759% (LIBOR 1 Month + |
| 6,096 | 6,259,894 | |||||||||
| Principal Amount (000) | U.S. $ Value | |||||||||||
Home Re Ltd. | U.S.$ | 5,050 | $ | 5,144,928 | ||||||||
JPMorgan Madison Avenue Securities Trust |
| 415 | 408,467 | |||||||||
Mortgage Insurance-Linked Notes |
| 4,533 | 4,539,251 | |||||||||
Oaktown Re V Ltd. |
| 9,200 | 9,345,359 | |||||||||
PMT Credit Risk Transfer Trust |
| |||||||||||
Series 2019-1R, Class A |
| |||||||||||
2.128% (LIBOR 1 Month + |
| 1,045 | 992,100 | |||||||||
Series 2019-2R, Class A |
| |||||||||||
2.865% (LIBOR 1 Month + |
| 2,436 | 2,410,622 | |||||||||
Series 2019-3R, Class A |
| |||||||||||
2.815% (LIBOR 1 Month + |
| 583 | 583,639 | |||||||||
Series 2020-1R, Class A |
| |||||||||||
2.465% (LIBOR 1 Month + |
| 2,363 | 2,347,309 | |||||||||
Radnor Re Ltd. |
| |||||||||||
Series 2019-1, Class M1B |
| |||||||||||
2.059% (LIBOR 1 Month + |
| 2,657 | 2,664,061 | |||||||||
Series 2019-2, Class M1B |
| |||||||||||
1.859% (LIBOR 1 Month + |
| 4,356 | 4,353,695 | |||||||||
Series 2020-1, Class M1A |
| |||||||||||
1.059% (LIBOR 1 Month + |
| 1,924 | 1,924,271 | |||||||||
Series 2020-2, Class M1C |
| |||||||||||
4.709% (LIBOR 1 Month + |
| 3,672 | 3,741,742 | |||||||||
Triangle Re Ltd. |
| |||||||||||
Series 2020-1, Class M1B |
| |||||||||||
4.009% (LIBOR 1 Month + |
| 10,600 | 10,770,637 | |||||||||
Series 2021-1, Class M1A |
| |||||||||||
1.807% (LIBOR 1 Month + |
| 7,563 | 7,563,445 | |||||||||
Wells Fargo Credit Risk Transfer Securities Trust |
| |||||||||||
Series 2015-WF1, Class 1M2 |
| |||||||||||
5.359% (LIBOR 1 Month + |
| 2,084 | 2,040,134 | |||||||||
| 10 | Sanford C. Bernstein Fund, Inc.—2021 Semi-Annual Report |
Table of Contents
| Principal Amount (000) | U.S. $ Value | |||||||||||
Series 2015-WF1, Class 2M2 |
| |||||||||||
5.609% (LIBOR 1 Month + 5.50%), | U.S.$ | 663 | $ | 655,398 | ||||||||
|
| |||||||||||
| 158,376,163 | ||||||||||||
|
| |||||||||||
| Agency Fixed Rate–0.9% |
| |||||||||||
Federal Home Loan Mortgage Corp. REMICs |
| |||||||||||
Series 4941, Class IO |
| |||||||||||
4.00%, 12/15/2047(h) | 23,702 | 3,577,881 | ||||||||||
Series 5008, Class AI |
| |||||||||||
3.50%, 09/25/2050(h) | 13,902 | 2,570,189 | ||||||||||
Series 5015, Class BI |
| |||||||||||
4.00%, 09/25/2050(h) | 20,981 | 3,877,340 | ||||||||||
Series 5040, Class AI |
| |||||||||||
3.50%, 11/25/2050(h) | 10,532 | 1,722,144 | ||||||||||
Series 5043, Class IO |
| |||||||||||
5.00%, 11/25/2050(h) | 26,795 | 5,136,104 | ||||||||||
Series 5049, Class CI |
| |||||||||||
3.50%, 12/25/2050(h) | 21,986 | 3,298,739 | ||||||||||
Series 5052, Class BI |
| |||||||||||
5.00%, 12/25/2050(h) | 21,334 | 3,548,443 | ||||||||||
Federal National Mortgage Association Grantor Trust |
| 1,605 | 1,539,560 | |||||||||
Federal National Mortgage Association REMICs |
| |||||||||||
Series 2015-30, Class EI |
| |||||||||||
5.00%, 05/25/2045(h) | 10,539 | 1,741,268 | ||||||||||
Series 2020-89, Class KI |
| |||||||||||
4.00%, 12/25/2050(h) | 42,785 | 7,097,035 | ||||||||||
|
| |||||||||||
| 34,108,703 | ||||||||||||
|
| |||||||||||
| Agency Floating Rate–0.8% |
| |||||||||||
Federal Home Loan Mortgage Corp. REMICs |
| |||||||||||
Series 4416, Class BS |
| |||||||||||
5.994% (6.10%–LIBOR 1 Month), 12/15/2044(c)(i) |
| 11,808 | 2,517,041 | |||||||||
Series 4585, Class DS |
| |||||||||||
5.894% (6.00%–LIBOR 1 Month), 05/15/2046(c)(i) |
| 6,984 | 1,683,411 | |||||||||
Series 4693, Class SL |
| |||||||||||
6.044% (6.15%–LIBOR 1 Month), 06/15/2047(c)(i) |
| 4,668 | 1,116,331 | |||||||||
Series 4954, Class SL |
| |||||||||||
5.941% (6.05%–LIBOR 1 Month), 02/25/2050(c)(i) |
| 4,042 | 755,985 | |||||||||
Series 4981, Class HS |
| |||||||||||
5.991% (6.10%–LIBOR 1 Month), 06/25/2050(c)(i) |
| 35,729 | 6,061,560 | |||||||||
Federal National Mortgage Association REMICs |
| |||||||||||
Series 2011-131, Class ST |
| |||||||||||
6.431% (6.54%–LIBOR 1 Month), 12/25/2041(c)(i) | 6,669 | 1,320,512 | ||||||||||
| Principal Amount (000) | U.S. $ Value | |||||||||||
Series 2014-17, Class SA |
| |||||||||||
5.941% (6.05%–LIBOR 1 Month), 04/25/2044(c)(i) | U.S.$ | 12,242 | $ | 2,996,001 | ||||||||
Series 2015-26, Class SH |
| |||||||||||
6.341% (6.45%–LIBOR 1 Month), 05/25/2045(c)(i) | 9,071 | 1,862,127 | ||||||||||
Series 2016-106, Class ES |
| |||||||||||
5.891% (6.00%–LIBOR 1 Month), 01/25/2047(c)(i) | 5,253 | 1,047,334 | ||||||||||
Series 2017-62, Class AS |
| |||||||||||
6.041% (6.15%–LIBOR 1 Month), 08/25/2047(c)(i) | 7,368 | 1,544,860 | ||||||||||
Series 2017-81, Class SA |
| |||||||||||
6.091% (6.20%–LIBOR 1 Month), 10/25/2047(c)(i) | 11,495 | 2,704,329 | ||||||||||
Series 2017-97, Class SW |
| |||||||||||
6.091% (6.20%–LIBOR 1 Month), 12/25/2047(c)(i) | 9,155 | 2,068,648 | ||||||||||
Government National Mortgage Association |
| |||||||||||
Series 2017-122, Class SA |
| |||||||||||
6.089% (6.20%–LIBOR 1 Month), 08/20/2047(c)(i) | 8,887 | 1,969,647 | ||||||||||
Series 2017-134, Class MS |
| |||||||||||
6.089% (6.20%–LIBOR 1 Month), 09/20/2047(c)(i) | 9,109 | 2,076,085 | ||||||||||
Series 2017-43, Class ST |
| |||||||||||
5.989% (6.10%–LIBOR 1 Month), 03/20/2047(c)(i) | 10,879 | 2,248,635 | ||||||||||
|
| |||||||||||
| 31,972,506 | ||||||||||||
|
| |||||||||||
| Non-Agency Fixed Rate–0.1% |
| |||||||||||
Alternative Loan Trust |
| |||||||||||
Series 2005-20CB, Class 3A6 |
| |||||||||||
5.50%, 07/25/2035 | 379 | 336,942 | ||||||||||
Series 2006-24CB, Class A16 |
| |||||||||||
5.75%, 08/25/2036 | 2,518 | 1,965,724 | ||||||||||
Series 2006-28CB, Class A14 |
| |||||||||||
6.25%, 10/25/2036 | 1,665 | 1,234,351 | ||||||||||
Series 2006-J1, Class 1A13 |
| |||||||||||
5.50%, 02/25/2036 | 663 | 599,367 | ||||||||||
Countrywide Home Loan Mortgage Pass-Through Trust |
| 715 | 479,250 | |||||||||
First Horizon Alternative Mortgage Securities Trust |
| 1,746 | 1,204,654 | |||||||||
|
| |||||||||||
| 5,820,288 | ||||||||||||
|
| |||||||||||
| Non-Agency Floating Rate–0.1% |
| |||||||||||
Deutsche Alt-A Securities Mortgage Loan Trust |
| 4,454 | 2,205,409 | |||||||||
Schedule of Investments—Intermediate Duration Portfolio | 11 |
Table of Contents
| Principal Amount (000) | U.S. $ Value | |||||||||||
HomeBanc Mortgage Trust | U.S.$ | 1,045 | $ | 951,121 | ||||||||
|
| |||||||||||
| 3,156,530 | ||||||||||||
|
| |||||||||||
| Total Collateralized Mortgage Obligations (cost $232,306,268) |
| 233,434,190 | ||||||||||
|
| |||||||||||
| CORPORATES-NON-INVESTMENT GRADE–1.8% |
| |||||||||||
| Industrial–1.4% |
| |||||||||||
| Capital Goods–0.3% |
| |||||||||||
Ardagh Metal Packaging Finance USA LLC/Ardagh Metal Packaging Finance PLC | 6,296 | 6,224,855 | ||||||||||
GFL Environmental, Inc. | 5,836 | 5,653,333 | ||||||||||
|
| |||||||||||
| 11,878,188 | ||||||||||||
|
| |||||||||||
| Communications-Media–0.3% |
| |||||||||||
Netflix, Inc. | 7,751 | 9,378,478 | ||||||||||
|
| |||||||||||
| Communications-Telecommunications–0.2% |
| |||||||||||
Lumen Technologies, Inc. | 5,698 | 5,559,995 | ||||||||||
T-Mobile USA, Inc. | ||||||||||||
2.625%, 04/15/2026 | 1,797 | 1,822,176 | ||||||||||
3.375%, 04/15/2029 | 1,895 | 1,917,323 | ||||||||||
|
| |||||||||||
| 9,299,494 | ||||||||||||
|
| |||||||||||
| Consumer Cyclical-Entertainment–0.2% |
| |||||||||||
Mattel, Inc. | ||||||||||||
3.375%, 04/01/2026(a) | 4,312 | 4,413,418 | ||||||||||
3.75%, 04/01/2029(a) | 4,311 | 4,342,643 | ||||||||||
|
| |||||||||||
| 8,756,061 | ||||||||||||
|
| |||||||||||
| Consumer Cyclical-Retailers–0.1% |
| |||||||||||
Levi Strauss & Co. | 3,832 | 3,699,911 | ||||||||||
|
| |||||||||||
| Consumer Non-Cyclical–0.2% |
| |||||||||||
Albertsons Cos., Inc./Safeway, Inc./New Albertsons LP/Albertsons LLC |
| 3,900 | 3,707,652 | |||||||||
Newell Brands, Inc. | ||||||||||||
4.70%, 04/01/2026 | 2,719 | 2,998,731 | ||||||||||
4.875%, 06/01/2025 | 669 | 738,542 | ||||||||||
|
| |||||||||||
| 7,444,925 | ||||||||||||
|
| |||||||||||
| Energy–0.1% |
| |||||||||||
Transocean Poseidon Ltd. | 2,143 | 1,975,760 | ||||||||||
|
| |||||||||||
| 52,432,817 | ||||||||||||
|
| |||||||||||
| Principal Amount (000) | U.S. $ Value | |||||||||||
| Financial Institutions–0.4% |
| |||||||||||
| Banking–0.4% |
| |||||||||||
Credit Suisse Group AG | ||||||||||||
6.375%, 08/21/2026(a)(b) | U.S.$ | 611 | $ | 649,224 | ||||||||
7.50%, 07/17/2023–12/11/2023(a)(b) |
| 8,565 | 9,118,974 | |||||||||
Intesa Sanpaolo SpA | 6,204 | 6,762,794 | ||||||||||
|
| |||||||||||
| 16,530,992 | ||||||||||||
|
| |||||||||||
| Total Corporates—Non-Investment Grade (cost $69,027,522) |
| 68,963,809 | ||||||||||
|
| |||||||||||
| ASSET-BACKED SECURITIES–1.6% |
| |||||||||||
| Other ABS-Fixed Rate–0.6% |
| |||||||||||
Affirm Asset Securitization Trust |
| 5,400 | 5,457,676 | |||||||||
Consumer Loan Underlying Bond CLUB Credit Trust |
| 3,500 | 3,564,872 | |||||||||
Hardee’s Funding LLC | ||||||||||||
Series 2018-1A, Class A23 |
| |||||||||||
5.71%, 06/20/2048(a) | 3,267 | 3,626,476 | ||||||||||
Series 2020-1A, Class A2 | ||||||||||||
3.981%, 12/20/2050(a) | 2,644 | 2,729,213 | ||||||||||
Marlette Funding Trust | ||||||||||||
Series 2018-4A, Class A | ||||||||||||
3.71%, 12/15/2028(a) | 39 | 38,856 | ||||||||||
Series 2020-1A, Class A | ||||||||||||
2.24%, 03/15/2030(a) | 479 | 480,359 | ||||||||||
Neighborly Issuer LLC |
| 3,256 | 3,266,119 | |||||||||
Prosper Marketplace Issuance Trust |
| 51 | 50,727 | |||||||||
SoFi Consumer Loan Program LLC | ||||||||||||
Series 2017-5, Class A2 | ||||||||||||
2.78%, 09/25/2026(a) | 840 | 844,418 | ||||||||||
Series 2017-6, Class A2 | ||||||||||||
2.82%, 11/25/2026(a) | 162 | 162,669 | ||||||||||
SoFi Consumer Loan Program Trust | ||||||||||||
Series 2018-3, Class A2 | ||||||||||||
3.67%, 08/25/2027(a) | 456 | 457,216 | ||||||||||
Series 2019-3, Class A | ||||||||||||
2.90%, 05/25/2028(a) | 1,256 | 1,265,981 | ||||||||||
Upstart Securitization Trust | 3,392 | 3,418,542 | ||||||||||
|
| |||||||||||
| 25,363,124 | ||||||||||||
|
| |||||||||||
| 12 | Sanford C. Bernstein Fund, Inc.—2021 Semi-Annual Report |
Table of Contents
| Principal Amount (000) | U.S. $ Value | |||||||||||
| Autos-Fixed Rate–0.6% |
| |||||||||||
Avis Budget Rental Car Funding AESOP LLC | U.S.$ | 1,959 | $ | 1,966,084 | ||||||||
Series 2018-2A, Class A | 6,700 | 7,262,805 | ||||||||||
CPS Auto Receivables Trust |
| 2,790 | 2,854,124 | |||||||||
First Investors Auto Owner Trust |
| 2,389 | 2,403,672 | |||||||||
Flagship Credit Auto Trust | 3,310 | 3,349,843 | ||||||||||
Hertz Vehicle Financing II LP |
| 1,077 | 1,081,483 | |||||||||
Series 2019-1A, Class A | 1,017 | 1,020,964 | ||||||||||
Series 2019-2A, Class A | 1,019 | 1,022,045 | ||||||||||
Hertz Vehicle Financing LLC |
| 660 | 663,549 | |||||||||
|
| |||||||||||
| 21,624,569 | ||||||||||||
|
| |||||||||||
| Credit Cards-Fixed Rate–0.4% |
| |||||||||||
Brex Commercial Charge Card Master Trust | 4,282 | 4,281,684 | ||||||||||
World Financial Network Credit Card Master Trust | 4,490 | 4,553,789 | ||||||||||
Series 2019-B, Class M | 5,000 | 5,129,098 | ||||||||||
|
| |||||||||||
| 13,964,571 | ||||||||||||
|
| |||||||||||
| Home Equity Loans-Floating Rate–0.0% |
| |||||||||||
ABFC Trust | 337 | 335,384 | ||||||||||
Wells Fargo Home Equity Trust Mortgage Pass-Through Certificates | 3 | 3,336 | ||||||||||
|
| |||||||||||
| 338,720 | ||||||||||||
|
| |||||||||||
| Total Asset-Backed Securities (cost $60,075,173) |
| 61,290,984 | ||||||||||
|
| |||||||||||
| Principal Amount (000) | U.S. $ Value | |||||||||||
| COLLATERALIZED LOAN OBLIGATIONS–1.3% |
| |||||||||||
| CLO-Floating Rate–1.3% |
| |||||||||||
Dryden CLO Ltd. | U.S.$ | 3,905 | $ | 3,912,083 | ||||||||
Series 2020-78A, Class C |
| 4,670 | 4,682,245 | |||||||||
Series 2020-78A, Class D |
| 2,130 | 2,134,867 | |||||||||
Elevation CLO Ltd. |
| 4,500 | 4,448,592 | |||||||||
Goldentree Loan Management US CLO Ltd. |
| 6,000 | 6,003,780 | |||||||||
Kayne CLO 7 Ltd. |
| 2,090 | 2,096,577 | |||||||||
Kayne CLO Ltd. |
| 3,800 | 3,800,403 | |||||||||
Magnetite XXVI Ltd. |
| 10,257 | 10,276,411 | |||||||||
OCP CLO Ltd. |
| 6,200 | 6,200,000 | |||||||||
SCFF I Ltd. |
| 2,770 | 2,772,036 | |||||||||
Voya CLO Ltd. |
| 1,850 | 1,810,597 | |||||||||
|
| |||||||||||
| Total Collateralized Loan Obligations (cost $48,130,263) |
| 48,137,591 | ||||||||||
|
| |||||||||||
Schedule of Investments—Intermediate Duration Portfolio | 13 |
Table of Contents
| Principal Amount (000) | U.S. $ Value | |||||||||||
| LOCAL GOVERNMENTS-US MUNICIPAL BONDS–0.9% |
| |||||||||||
| United States–0.9% | ||||||||||||
Port Authority of New York & New Jersey | U.S.$ | 4,170 | $ | 4,232,102 | ||||||||
State Board of Administration Finance Corp. |
| |||||||||||
Series 2020A | ||||||||||||
1.705%, 07/01/2027 | 6,821 | 6,846,062 | ||||||||||
State of California | ||||||||||||
5.70%, 11/01/2021 | 5,440 | 5,613,002 | ||||||||||
Series 2010 | ||||||||||||
7.625%, 03/01/2040 | 8,520 | 13,663,267 | ||||||||||
Tobacco Settlement Finance Authority/WV |
| |||||||||||
3.00%, 06/01/2035 | 4,970 | 5,102,769 | ||||||||||
|
| |||||||||||
| Total Local Governments—US Municipal Bonds (cost $30,206,028) |
| 35,457,202 | ||||||||||
|
| |||||||||||
| EMERGING MARKETS-CORPORATE BONDS–0.8% |
| |||||||||||
| Industrial–0.8% |
| |||||||||||
| Basic–0.1% |
| |||||||||||
Braskem Netherlands Finance BV | 3,420 | 3,428,379 | ||||||||||
Volcan Cia Minera SAA |
| 1,602 | 1,634,040 | |||||||||
|
| |||||||||||
| 5,062,419 | ||||||||||||
|
| |||||||||||
| Capital Goods–0.4% |
| |||||||||||
Cemex SAB de CV |
| 6,305 | 6,156,833 | |||||||||
Embraer Netherlands Finance BV |
| 4,960 | 5,170,428 | |||||||||
6.95%, 01/17/2028(a) | 1,797 | 1,968,254 | ||||||||||
Odebrecht Holdco Finance Ltd. |
| 3,418 | 79,052 | |||||||||
|
| |||||||||||
| 13,374,567 | ||||||||||||
|
| |||||||||||
| Communications-Media–0.0% |
| |||||||||||
Globo Comunicacao e Participacoes SA |
| 825 | 830,414 | |||||||||
|
| |||||||||||
| Consumer Cyclical-Other–0.1% |
| |||||||||||
Wynn Macau Ltd. |
| 2,862 | 2,970,184 | |||||||||
|
| |||||||||||
| Consumer Non-Cyclical–0.1% |
| |||||||||||
BRF GmbH | 1,272 | 1,301,017 | ||||||||||
Minerva Luxembourg SA |
| 376 | 393,268 | |||||||||
|
| |||||||||||
| 1,694,285 | ||||||||||||
|
| |||||||||||
| Principal Amount (000) | U.S. $ Value | |||||||||||
| Transportation-Services–0.1% |
| |||||||||||
Rumo Luxembourg SARL | U.S.$ | 3,438 | $ | 3,609,900 | ||||||||
|
| |||||||||||
| 27,541,769 | ||||||||||||
|
| |||||||||||
| Utility–0.0% |
| |||||||||||
| Electric–0.0% |
| |||||||||||
Terraform Global Operating LLC |
| 565 | 579,136 | |||||||||
|
| |||||||||||
| Financial Institutions–0.0% |
| |||||||||||
| Other Finance–0.0% |
| |||||||||||
OEC Finance Ltd. |
| |||||||||||
5.25%, 12/27/2033(a)(j) |
| 2,188 | 357,968 | |||||||||
7.125%, 12/26/2046(a)(j) |
| 609 | 98,004 | |||||||||
|
| |||||||||||
| 455,972 | ||||||||||||
|
| |||||||||||
| Total Emerging Markets—Corporate Bonds (cost $32,091,643) |
| 28,576,877 | ||||||||||
|
| |||||||||||
| QUASI-SOVEREIGNS–0.7% |
| |||||||||||
| Quasi-Sovereign Bonds–0.7% |
| |||||||||||
| Indonesia–0.3% |
| |||||||||||
Indonesia Asahan Aluminium Persero PT | 2,207 | 2,398,347 | ||||||||||
Pertamina Persero PT | 3,100 | 3,843,969 | ||||||||||
Perusahaan Perseroan Persero PT Perusahaan Listrik Negara |
| |||||||||||
5.45%, 05/21/2028(a) | 2,363 | 2,730,003 | ||||||||||
6.15%, 05/21/2048(a) | 900 | 1,094,697 | ||||||||||
|
| |||||||||||
| 10,067,016 | ||||||||||||
|
| |||||||||||
| Malaysia–0.0% |
| |||||||||||
Petronas Capital Ltd. | 1,474 | 1,728,766 | ||||||||||
|
| |||||||||||
| Mexico–0.3% |
| |||||||||||
Comision Federal de Electricidad |
| 6,919 | 6,640,078 | |||||||||
Petroleos Mexicanos |
| |||||||||||
6.75%, 09/21/2047 | 3,731 | 3,172,096 | ||||||||||
6.84%, 01/23/2030 | 1,419 | 1,434,822 | ||||||||||
|
| |||||||||||
| 11,246,996 | ||||||||||||
|
| |||||||||||
| Peru–0.1% |
| |||||||||||
Corp. Financiera de Desarrollo SA |
| 4,204 | 4,135,685 | |||||||||
|
| |||||||||||
| Total Quasi-Sovereigns (cost $26,176,455) |
| 27,178,463 | ||||||||||
|
| |||||||||||
| 14 | Sanford C. Bernstein Fund, Inc.—2021 Semi-Annual Report |
Table of Contents
| Principal Amount (000) | U.S. $ Value | |||||||||||
| AGENCIES–0.6% |
| |||||||||||
| Agency Debentures–0.6% |
| |||||||||||
Federal Home Loan Bank |
| |||||||||||
1.875%, 07/07/2021 | U.S.$ | 16,930 | $ | 17,012,619 | ||||||||
2.50%, 02/13/2024 | 6,170 | 6,552,910 | ||||||||||
|
| |||||||||||
| Total Agencies (cost $23,085,292) |
| 23,565,529 | ||||||||||
|
| |||||||||||
| GOVERNMENTS-SOVEREIGN BONDS–0.5% |
| |||||||||||
| Colombia–0.1% |
| |||||||||||
Colombia Government International Bond |
| 2,490 | 2,437,088 | |||||||||
|
| |||||||||||
| Israel–0.1% |
| |||||||||||
Israel Government International Bond |
| 3,465 | 3,806,086 | |||||||||
|
| |||||||||||
| Qatar–0.1% |
| |||||||||||
Qatar Government International Bond | 2,155 | 2,339,522 | ||||||||||
|
| |||||||||||
| Saudi Arabia–0.1% |
| |||||||||||
Saudi Government International Bond | 4,056 | 4,298,092 | ||||||||||
|
| |||||||||||
| United Arab Emirates–0.1% |
| |||||||||||
Abu Dhabi Government International Bond |
| 3,593 | 3,785,899 | |||||||||
|
| |||||||||||
| Uruguay–0.0% |
| |||||||||||
Uruguay Government International Bond |
| 1,501 | 1,738,057 | |||||||||
|
| |||||||||||
| Total Governments—Sovereign Bonds (cost $17,439,164) |
| 18,404,744 | ||||||||||
|
| |||||||||||
| EMERGING MARKETS-SOVEREIGNS–0.5% |
| |||||||||||
| Dominican Republic–0.2% |
| |||||||||||
Dominican Republic International Bond | 8,182 | 8,263,820 | ||||||||||
|
| |||||||||||
| Principal Amount (000) | U.S. $ Value | |||||||||||
| Egypt–0.2% |
| |||||||||||
Egypt Government International Bond | U.S.$ | 7,688 | $ | 7,188,280 | ||||||||
|
| |||||||||||
| Oman–0.1% |
| |||||||||||
Oman Government International Bond |
| |||||||||||
4.875%, 02/01/2025(a) | 1,111 | 1,157,871 | ||||||||||
6.25%, 01/25/2031(a) | 1,612 | 1,686,051 | ||||||||||
|
| |||||||||||
| 2,843,922 | ||||||||||||
|
| |||||||||||
| Total Emerging Markets—Sovereigns (cost $18,407,988) |
| 18,296,022 | ||||||||||
|
| |||||||||||
| Shares | ||||||||||||
| COMMON STOCKS–0.2% |
| |||||||||||
| Financials–0.2% |
| |||||||||||
| Insurance–0.2% |
| |||||||||||
Mt Logan Re Ltd. (Preference Shares)(e)(f)(k)(l) |
| 9,249 | 9,141,237 | |||||||||
|
| |||||||||||
| Principal Amount (000) | ||||||||||||
| SHORT-TERM INVESTMENTS–2.4% |
| |||||||||||
| U.S. Treasury Bills–2.4% |
| |||||||||||
U.S. Treasury Bill | U.S.$ | 91,995 | 91,993,926 | |||||||||
|
| |||||||||||
| Total Investments—101.6% (cost $3,789,114,999) |
| 3,864,013,036 | ||||||||||
Other assets less liabilities—(1.6)% |
| (60,992,892 | ) | |||||||||
|
| |||||||||||
| Net Assets—100.0% |
| $ | 3,803,020,144 | |||||||||
|
| |||||||||||
Schedule of Investments—Intermediate Duration Portfolio | 15 |
Table of Contents
FUTURES (see Note 3)
| Description | Number of Contracts | Expiration Month | Current Notional | Value and Unrealized Appreciation/ (Depreciation) | ||||||||||||
| Purchased Contracts | ||||||||||||||||
| Euro Buxl 30 Yr Bond Futures | 310 | June 2021 | $ | 74,903,164 | $ | (501,931 | ) | |||||||||
| U.S. 10 Yr Ultra Futures | 1,031 | June 2021 | 148,141,813 | (2,232,136 | ) | |||||||||||
| U.S. T-Note 2 Yr (CBT) Futures | 1,370 | June 2021 | 302,395,390 | (66,979 | ) | |||||||||||
| U.S. T-Note 5 Yr (CBT) Futures | 660 | June 2021 | 81,442,969 | (237,711 | ) | |||||||||||
| U.S. Ultra Bond (CBT) Futures | 325 | June 2021 | 58,896,094 | (1,029,141 | ) | |||||||||||
| Sold Contracts | ||||||||||||||||
| 10 Yr Canadian Bond Futures | 640 | June 2021 | 70,671,441 | (385,789 | ) | |||||||||||
| Long Gilt Futures | 887 | June 2021 | 156,019,281 | 1,973,670 | ||||||||||||
|
| |||||||||||||||
| $ | (2,480,017 | ) | ||||||||||||||
|
| |||||||||||||||
FORWARD CURRENCY EXCHANGE CONTRACTS (see Note 3)
| Counterparty | Contracts to Deliver (000) | In Exchange For (000) | Settlement Date | Unrealized Appreciation/ (Depreciation) | ||||||||||||||||||||
Bank of America, NA | BRL | 47,263 | USD | 8,268 | 04/05/2021 | $ | (129,042 | ) | ||||||||||||||||
Bank of America, NA | USD | 8,296 | BRL | 47,263 | 04/05/2021 | 101,179 | ||||||||||||||||||
Barclays Bank PLC | BRL | 47,332 | USD | 8,308 | 04/05/2021 | (101,327 | ) | |||||||||||||||||
Barclays Bank PLC | USD | 8,699 | BRL | 47,332 | 04/05/2021 | (290,016 | ) | |||||||||||||||||
Barclays Bank PLC | AUD | 98,616 | USD | 75,214 | 06/04/2021 | 290,285 | ||||||||||||||||||
BNP Paribas SA | ZAR | 143,147 | USD | 9,217 | 04/08/2021 | (478,064 | ) | |||||||||||||||||
BNP Paribas SA | CAD | 111,847 | USD | 88,123 | 04/22/2021 | (881,653 | ) | |||||||||||||||||
BNP Paribas SA | EUR | 101,523 | USD | 121,311 | 05/27/2021 | 2,128,088 | ||||||||||||||||||
Citibank, NA | IDR | 129,814,189 | USD | 8,902 | 04/15/2021 | 2,494 | ||||||||||||||||||
Citibank, NA | KRW | 616,991 | USD | 566 | 04/22/2021 | 18,901 | ||||||||||||||||||
Citibank, NA | JPY | 3,681,439 | USD | 34,739 | 05/20/2021 | 1,475,572 | ||||||||||||||||||
HSBC Bank USA | GBP | 1,978 | USD | 2,761 | 04/09/2021 | 33,883 | ||||||||||||||||||
HSBC Bank USA | USD | 9,416 | IDR | 131,846,729 | 04/15/2021 | (376,394 | ) | |||||||||||||||||
HSBC Bank USA | CAD | 16,573 | USD | 13,156 | 04/22/2021 | (32,597 | ) | |||||||||||||||||
HSBC Bank USA | USD | 76,802 | CHF | 69,183 | 05/06/2021 | (3,544,565 | ) | |||||||||||||||||
HSBC Bank USA | USD | 32,864 | JPY | 3,601,329 | 05/20/2021 | (324,892 | ) | |||||||||||||||||
JPMorgan Chase Bank, NA | MXN | 183,769 | USD | 8,551 | 04/16/2021 | (430,443 | ) | |||||||||||||||||
Morgan Stanley Capital Services, Inc. | NZD | 102,184 | USD | 74,063 | 05/27/2021 | 2,705,337 | ||||||||||||||||||
Morgan Stanley Capital Services, Inc. | MYR | 38,425 | USD | 9,289 | 09/23/2021 | 47,708 | ||||||||||||||||||
Natwest Markets PLC | USD | 6,730 | CAD | 8,550 | 04/22/2021 | 73,918 | ||||||||||||||||||
Standard Chartered Bank | GBP | 3,362 | USD | 4,675 | 04/09/2021 | 40,858 | ||||||||||||||||||
Standard Chartered Bank | USD | 1,693 | CHF | 1,569 | 05/06/2021 | (31,295 | ) | |||||||||||||||||
Standard Chartered Bank | NZD | 4,322 | USD | 3,007 | 05/27/2021 | (11,138 | ) | |||||||||||||||||
State Street Bank & Trust Co. | USD | 1 | GBP | 1 | 04/09/2021 | 11 | ||||||||||||||||||
State Street Bank & Trust Co. | USD | 4,235 | GBP | 3,039 | 04/09/2021 | (45,229 | ) | |||||||||||||||||
State Street Bank & Trust Co. | USD | 48 | SEK | 403 | 04/15/2021 | (2,198 | ) | |||||||||||||||||
State Street Bank & Trust Co. | CAD | 18,401 | USD | 14,579 | 04/22/2021 | (63,643 | ) | |||||||||||||||||
State Street Bank & Trust Co. | JPY | 8,017 | USD | 73 | 05/20/2021 | 598 | ||||||||||||||||||
State Street Bank & Trust Co. | USD | 89 | JPY | 9,780 | 05/20/2021 | (525 | ) | |||||||||||||||||
State Street Bank & Trust Co. | NZD | 2,834 | USD | 2,059 | 05/27/2021 | 79,802 | ||||||||||||||||||
State Street Bank & Trust Co. | AUD | 1,536 | USD | 1,165 | 06/04/2021 | (1,508 | ) | |||||||||||||||||
UBS AG | USD | 9,485 | ZAR | 143,776 | 04/08/2021 | 253,191 | ||||||||||||||||||
UBS AG | USD | 8,935 | MXN | 184,618 | 04/16/2021 | 87,242 | ||||||||||||||||||
UBS AG | USD | 37,782 | RUB | 2,820,436 | 05/25/2021 | (695,781 | ) | |||||||||||||||||
|
| |||||||||||||||||||||||
| $ | (101,243 | ) | ||||||||||||||||||||||
|
| |||||||||||||||||||||||
| 16 | Sanford C. Bernstein Fund, Inc.—2021 Semi-Annual Report |
Table of Contents
CENTRALLY CLEARED INTEREST RATE SWAPS (see Note 3)
| Rate Type | ||||||||||||||||||||||||
Notional Amount (000) | Termination Date | Payments made by the Fund | Payments received by the Fund | Payment Frequency Paid/Received | Market Value | Upfront Premiums Paid/ (Received) | Unrealized Appreciation/ (Depreciation) | |||||||||||||||||
| SEK | 1,163,650 | 08/30/2024 | 3 Month STIBOR | (0.165)% | Quarterly/Annual | $ | (1,502,818 | ) | $ | 764 | $ | (1,503,582 | ) | |||||||||||
| USD | 19,060 | 12/13/2029 | 1.764% | 3 Month LIBOR | Semi-Annual/Quarterly | (229,425 | ) | — | (229,425 | ) | ||||||||||||||
| CAD | 21,490 | 03/04/2051 | 2.333% | 3 Month CDOR | Semi-Annual | 770,525 | — | 770,525 | ||||||||||||||||
| EUR | 25,100 | 11/10/2050 | 6 Month EURIBOR | (0.043)% | Semi-Annual/Annual | (4,398,032 | ) | — | (4,398,032 | ) | ||||||||||||||
| EUR | 25,100 | 11/10/2050 | 0.022% | 6 Month EURIBOR | Annual/Semi-Annual | 3,843,079 | 193,155 | 3,649,924 | ||||||||||||||||
| CAD | 21,490 | 03/03/2051 | 2.297% | 3 Month CDOR | Semi-Annual | 903,838 | 863 | 902,975 | ||||||||||||||||
|
|
|
|
|
| |||||||||||||||||||
| $ | (612,833 | ) | $ | — | $ | (807,615 | ) | |||||||||||||||||
|
|
|
|
|
| |||||||||||||||||||
CREDIT DEFAULT SWAPS (see Note 3)
| Swap Counterparty & Referenced Obligation | Fixed Rate (Pay) Receive | Payment Frequency | Implied Credit Spread at March 31, 2021 | Notional Amount (000) | Market Value | Upfront Premiums Paid/ (Received) | Unrealized Appreciation/ (Depreciation) | |||||||||||||||||||||||||
| Buy Contracts |
| |||||||||||||||||||||||||||||||
Citigroup Global Markets, Inc. | ||||||||||||||||||||||||||||||||
CDX-CMBX.NA.BBB- Series 9, 09/17/2058* | (3.00 | )% | Monthly | 5.80 | % | USD | 8,912 | $ | 978,537 | $ | 605,227 | $ | 373,310 | |||||||||||||||||||
CDX-CMBX.NA.BBB- Series 9, 09/17/2058* | (3.00 | ) | Monthly | 5.80 | USD | 7,235 | 794,403 | 526,430 | 267,973 | |||||||||||||||||||||||
CDX-CMBX.NA.BBB- Series 9, 09/17/2058* | (3.00 | ) | Monthly | 5.80 | USD | 3,618 | 397,256 | 279,596 | 117,660 | |||||||||||||||||||||||
CDX-CMBX.NA.BBB- Series 9, 09/17/2058* | (3.00 | ) | Monthly | 5.80 | USD | 1,867 | 204,996 | 126,132 | 78,864 | |||||||||||||||||||||||
CDX-CMBX.NA.BBB- Series 9, 09/17/2058* | (3.00 | ) | Monthly | 5.80 | USD | 1,787 | 196,213 | 118,081 | 78,132 | |||||||||||||||||||||||
CDX-CMBX.NA.BBB- Series 9, 09/17/2058* | (3.00 | ) | Monthly | 5.80 | USD | 1,786 | 196,103 | 118,015 | 78,088 | |||||||||||||||||||||||
CDX-CMBX.NA.BBB- Series 9, 09/17/2058* | (3.00 | ) | Monthly | 5.80 | USD | 559 | 61,425 | 112,408 | (50,983 | ) | ||||||||||||||||||||||
CDX-CMBX.NA.BBB- Series 9, 09/17/2058* | (3.00 | ) | Monthly | 5.80 | USD | 559 | 61,425 | 112,495 | (51,070 | ) | ||||||||||||||||||||||
CDX-CMBX.NA.BBB- Series 9, 09/17/2058* | (3.00 | ) | Monthly | 5.80 | USD | 4,752 | 522,562 | 936,250 | (413,688 | ) | ||||||||||||||||||||||
CDX-CMBX.NA.BBB- Series 9, 09/17/2058* | (3.00 | ) | Monthly | 5.80 | USD | 4,797 | 526,311 | 977,837 | (451,526 | ) | ||||||||||||||||||||||
CDX-CMBX.NA.BBB- Series 9, 09/17/2058* | (3.00 | ) | Monthly | 5.80 | USD | 11,881 | 1,306,514 | 2,362,080 | (1,055,566 | ) | ||||||||||||||||||||||
CDX-CMBX.NA.BBB- Series 9, 09/17/2058* | (3.00 | ) | Monthly | 5.80 | USD | 23,761 | 2,610,937 | 4,813,066 | (2,202,129 | ) | ||||||||||||||||||||||
Goldman Sachs International |
| |||||||||||||||||||||||||||||||
CDX-CMBX.NA.BBB- Series 9, 09/17/2058* | (3.00 | ) | Monthly | 5.80 | USD | 4,173 | 458,543 | 723,802 | (265,259 | ) | ||||||||||||||||||||||
JPMorgan Securities, LLC |
| |||||||||||||||||||||||||||||||
CDX-CMBX.NA.BBB- Series 9, 09/17/2058* | (3.00 | ) | Monthly | 5.80 | USD | 2,550 | 279,778 | 514,443 | (234,665 | ) | ||||||||||||||||||||||
Morgan Stanley & Co. International PLC |
| |||||||||||||||||||||||||||||||
CDX-CMBX.NA.BBB- Series 9, 09/17/2058* | (3.00 | ) | Monthly | 5.80 | USD | 2,226 | 244,600 | 431,894 | (187,294 | ) | ||||||||||||||||||||||
CDX-CMBX.NA.BBB- Series 9, 09/17/2058* | (3.00 | ) | Monthly | 5.80 | USD | 4,452 | 489,201 | 908,756 | (419,555 | ) | ||||||||||||||||||||||
Schedule of Investments—Intermediate Duration Portfolio | 17 |
Table of Contents
| Swap Counterparty & Referenced Obligation | Fixed Rate (Pay) Receive | Payment Frequency | Implied Credit Spread at March 31, 2021 | Notional Amount (000) | Market Value | Upfront Premiums Paid/ (Received) | Unrealized Appreciation/ (Depreciation) | |||||||||||||||||||||||||
| Sale Contracts |
| |||||||||||||||||||||||||||||||
Citigroup Global Markets, Inc. | ||||||||||||||||||||||||||||||||
CDX-CMBX.NA.BBB- Series 6, 05/11/2063* | 3.00 | % | Monthly | 12.50 | % | USD | 39 | $ | (10,504 | ) | $ | (6,098 | ) | $ | (4,406 | ) | ||||||||||||||||
CDX-CMBX.NA.BBB- Series 6, 05/11/2063* | 3.00 | Monthly | 12.50 | USD | 129 | (34,763 | ) | (15,100 | ) | (19,663 | ) | |||||||||||||||||||||
CDX-CMBX.NA.BBB- Series 6, 05/11/2063* | 3.00 | Monthly | 12.50 | USD | 160 | (43,104 | ) | (20,364 | ) | (22,740 | ) | |||||||||||||||||||||
CDX-CMBX.NA.BBB- Series 6, 05/11/2063* | 3.00 | Monthly | 12.50 | USD | 138 | (37,166 | ) | (13,625 | ) | (23,541 | ) | |||||||||||||||||||||
CDX-CMBX.NA.BBB- Series 6, 05/11/2063* | 3.00 | Monthly | 12.50 | USD | 194 | (52,264 | ) | (23,893 | ) | (28,371 | ) | |||||||||||||||||||||
CDX-CMBX.NA.BBB- Series 6, 05/11/2063* | 3.00 | Monthly | 12.50 | USD | 260 | (70,023 | ) | (37,613 | ) | (32,410 | ) | |||||||||||||||||||||
CDX-CMBX.NA.BBB- Series 6, 05/11/2063* | 3.00 | Monthly | 12.50 | USD | 229 | (61,692 | ) | (29,132 | ) | (32,560 | ) | |||||||||||||||||||||
CDX-CMBX.NA.BBB- Series 6, 05/11/2063* | 3.00 | Monthly | 12.50 | USD | 225 | (60,615 | ) | (27,711 | ) | (32,904 | ) | |||||||||||||||||||||
CDX-CMBX.NA.BBB- Series 6, 05/11/2063* | 3.00 | Monthly | 12.50 | USD | 238 | (64,098 | ) | (30,640 | ) | (33,458 | ) | |||||||||||||||||||||
CDX-CMBX.NA.BBB- Series 6, 05/11/2063* | 3.00 | Monthly | 12.50 | USD | 248 | (66,791 | ) | (32,685 | ) | (34,106 | ) | |||||||||||||||||||||
CDX-CMBX.NA.BBB- Series 6, 05/11/2063* | 3.00 | Monthly | 12.50 | USD | 315 | (84,861 | ) | (38,795 | ) | (46,066 | ) | |||||||||||||||||||||
CDX-CMBX.NA.BBB- Series 6, 05/11/2063* | 3.00 | Monthly | 12.50 | USD | 320 | (86,208 | ) | (35,561 | ) | (50,647 | ) | |||||||||||||||||||||
CDX-CMBX.NA.BBB- Series 6, 05/11/2063* | 3.00 | Monthly | 12.50 | USD | 432 | (116,417 | ) | (50,568 | ) | (65,849 | ) | |||||||||||||||||||||
CDX-CMBX.NA.BBB- Series 6, 05/11/2063* | 3.00 | Monthly | 12.50 | USD | 460 | (123,924 | ) | (51,119 | ) | (72,805 | ) | |||||||||||||||||||||
CDX-CMBX.NA.BBB- Series 6, 05/11/2063* | 3.00 | Monthly | 12.50 | USD | 641 | (172,686 | ) | (68,292 | ) | (104,394 | ) | |||||||||||||||||||||
CDX-CMBX.NA.BBB- Series 6, 05/11/2063* | 3.00 | Monthy | 12.50 | USD | 2,545 | (685,410 | ) | (195,653 | ) | (489,757 | ) | |||||||||||||||||||||
Credit Suisse International |
| |||||||||||||||||||||||||||||||
CDX-CMBX.NA.BBB- Series 6, 05/11/2063* | 3.00 | Monthly | 12.50 | USD | 1 | (269 | ) | (121 | ) | (148 | ) | |||||||||||||||||||||
CDX-CMBX.NA.BBB- Series 6, 05/11/2063* | 3.00 | Monthly | 12.50 | USD | 1,375 | (370,311 | ) | (108,237 | ) | (262,074 | ) | |||||||||||||||||||||
CDX-CMBX.NA.BBB- Series 6, 05/11/2063* | 3.00 | Monthly | 12.50 | USD | 2,204 | (593,574 | ) | (317,390 | ) | (276,184 | ) | |||||||||||||||||||||
CDX-CMBX.NA.BBB- Series 6, 05/11/2063* | 3.00 | Monthly | 12.50 | USD | 1,776 | (478,306 | ) | (142,774 | ) | (335,532 | ) | |||||||||||||||||||||
CDX-CMBX.NA.BBB- Series 6, 05/11/2063* | 3.00 | Monthly | 12.50 | USD | 2,160 | (581,724 | ) | (124,871 | ) | (456,853 | ) | |||||||||||||||||||||
CDX-CMBX.NA.BBB- Series 6, 05/11/2063* | 3.00 | Monthly | 12.50 | USD | 8,500 | (2,289,191 | ) | (570,465 | ) | (1,718,726 | ) | |||||||||||||||||||||
Deutsche Bank AG |
| |||||||||||||||||||||||||||||||
CDX-CMBX.NA.A Series 6, 05/11/2063* | 2.00 | Monthly | 8.17 | USD | 7,805 | (614,340 | ) | (148,206 | ) | (466,134 | ) | |||||||||||||||||||||
CDX-CMBX.NA.BBB- Series 6, 05/11/2063* | 3.00 | Monthly | 12.50 | USD | 345 | (92,914 | ) | (39,256 | ) | (53,658 | ) | |||||||||||||||||||||
CDX-CMBX.NA.BBB- Series 6, 05/11/2063* | 3.00 | Monthly | 12.50 | USD | 1,496 | (402,898 | ) | (182,988 | ) | (219,910 | ) | |||||||||||||||||||||
| 18 | Sanford C. Bernstein Fund, Inc.—2021 Semi-Annual Report |
Table of Contents
| Swap Counterparty & Referenced Obligation | Fixed Rate (Pay) Receive | Payment Frequency | Implied Credit Spread at March 31, 2021 | Notional | Market Value | Upfront Premiums Paid/ (Received) | Unrealized Appreciation/ (Depreciation) | |||||||||||||||||||||||||
CDX-CMBX.NA.BBB- Series 6, 05/11/2063* | 3.00 | % | Monthly | 12.50 | % | USD | 1,727 | $ | (465,110 | ) | $ | (211,243 | ) | $ | (253,867 | ) | ||||||||||||||||
CDX-CMBX.NA.BBB- Series 6, 05/11/2063* | 3.00 | Monthly | 12.50 | USD | 3,315 | (892,785 | ) | (368,073 | ) | (524,712 | ) | |||||||||||||||||||||
CDX-CMBX.NA.BBB- Series 6, 05/11/2063* | 3.00 | Monthly | 12.50 | USD | 3,315 | (892,784 | ) | (367,929 | ) | (524,855 | ) | |||||||||||||||||||||
CDX-CMBX.NA.BBB- Series 6, 05/11/2063* | 3.00 | Monthly | 12.50 | USD | 4,586 | (1,235,086 | ) | (319,369 | ) | (915,717 | ) | |||||||||||||||||||||
Goldman Sachs International |
| |||||||||||||||||||||||||||||||
CDX-CMBX.NA.BBB- Series 6, 05/11/2063* | 3.00 | Monthly | 12.50 | USD | 148 | (39,859 | ) | (21,820 | ) | (18,039 | ) | |||||||||||||||||||||
CDX-CMBX.NA.BBB- Series 6, 05/11/2063* | 3.00 | Monthly | 12.50 | USD | 1,687 | (454,337 | ) | (267,651 | ) | (186,686 | ) | |||||||||||||||||||||
CDX-CMBX.NA.BBB- Series 6, 05/11/2063* | 3.00 | Monthly | 12.50 | USD | 1,982 | (533,786 | ) | (295,746 | ) | (238,040 | ) | |||||||||||||||||||||
CDX-CMBX.NA.BBB- Series 6, 05/11/2063* | 3.00 | Monthly | 12.50 | USD | 2,355 | (634,241 | ) | (379,009 | ) | (255,232 | ) | |||||||||||||||||||||
JPMorgan Securities, LLC |
| |||||||||||||||||||||||||||||||
CDX-CMBX.NA.BBB- Series 6, 05/11/2063* | 3.00 | Monthly | 12.50 | USD | 308 | (82,949 | ) | (29,166 | ) | (53,783 | ) | |||||||||||||||||||||
CDX-CMBX.NA.BBB- Series 6, 05/11/2063* | 3.00 | Monthly | 12.50 | USD | 323 | (86,989 | ) | (30,596 | ) | (56,393 | ) | |||||||||||||||||||||
CDX-CMBX.NA.BBB- Series 6, 05/11/2063* | 3.00 | Monthly | 12.50 | USD | 415 | (111,766 | ) | (49,403 | ) | (62,363 | ) | |||||||||||||||||||||
CDX-CMBX.NA.BBB- Series 6, 05/11/2063* | 3.00 | Monthly | 12.50 | USD | 616 | (165,899 | ) | (76,304 | ) | (89,595 | ) | |||||||||||||||||||||
CDX-CMBX.NA.BBB- Series 6, 05/11/2063* | 3.00 | Monthly | 12.50 | USD | 1,260 | (339,339 | ) | (151,319 | ) | (188,020 | ) | |||||||||||||||||||||
CDX-CMBX.NA.BBB- Series 6, 05/11/2063* | 3.00 | Monthly | 12.50 | USD | 1,317 | (354,690 | ) | (124,381 | ) | (230,309 | ) | |||||||||||||||||||||
Morgan Stanley Capital Services LLC |
| |||||||||||||||||||||||||||||||
CDX-CMBX.NA.BBB- Series 6, 05/11/2063* | 3.00 | Monthly | 12.50 | USD | 1,997 | (537,825 | ) | (136,695 | ) | (401,130 | ) | |||||||||||||||||||||
|
|
|
|
|
| |||||||||||||||||||||||||||
| $ | (4,692,694 | ) | $ | 8,526,651 | $ | (13,219,345 | ) | |||||||||||||||||||||||||
|
|
|
|
|
| |||||||||||||||||||||||||||
* Termination date
| ** | Principal amount less than 500. |
| (a) | Security is exempt from registration under Rule 144A of the Securities Act of 1933. These securities are considered restricted, but liquid and may be resold in transactions exempt from registration, normally to qualified institutional buyers. At March 31, 2021, the aggregate market value of these securities amounted to $782,050,193 or 20.6% of net assets. |
| (b) | Securities are perpetual and, thus, do not have a predetermined maturity date. The date shown, if applicable, reflects the next call date. |
| (c) | Floating Rate Security. Stated interest/floor/ceiling rate was in effect at March 31, 2021. |
| (d) | Position, or a portion thereof, has been segregated to collateralize OTC derivatives outstanding. |
| (e) | Security in which significant unobservable inputs (Level 3) were used in determining fair value. |
| (f) | Fair valued by the Adviser. |
| (g) | Security is exempt from registration under Rule 144A of the Securities Act of 1933. These securities, which represent 0.45% of net assets as of March 31, 2021, are considered illiquid and restricted. Additional information regarding such securities follows: |
| 144A/Restricted & Illiquid Securities | Acquisition Date | Cost | Market Value | Percentage of Net Assets | ||||||||||||
GSF | 03/15/2021 | $ | 406,191 | $ | 406,191 | 0.01 | % | |||||||||
GSF | 03/09/2021 | 933,762 | 934,210 | 0.02 | % | |||||||||||
Schedule of Investments���Intermediate Duration Portfolio | 19 |
Table of Contents
| 144A/Restricted & Illiquid Securities | Acquisition Date | Cost | Market Value | Percentage of Net Assets | ||||||||||||
GSF | 03/09/2021 | $ | 223,404 | $ | 223,510 | 0.01 | % | |||||||||
HFX Funding | 11/06/2015 | 7,350,792 | 7,078,898 | 0.19 | % | |||||||||||
JPMorgan Madison Avenue Securities Trust | 11/06/2015 | 412,499 | 408,467 | 0.01 | % | |||||||||||
Morgan Stanley Capital I Trust | 11/16/2015 | 2,460,137 | 2,096,413 | 0.06 | % | |||||||||||
PMT Credit Risk Transfer Trust | 02/11/2020 | 2,362,526 | 2,347,309 | 0.06 | % | |||||||||||
Terraform Global Operating LLC | 02/08/2018 | 565,000 | 579,136 | 0.02 | % | |||||||||||
Wells Fargo Credit Risk Transfer Securities Trust | 09/28/2015 | 2,083,501 | 2,040,134 | 0.05 | % | |||||||||||
Wells Fargo Credit Risk Transfer Securities Trust | 09/28/2015 | 660,072 | 655,398 | 0.02 | % | |||||||||||
| (h) | IO—Interest Only. |
| (i) | Inverse interest only security. |
| (j) | Pay-In-Kind Payments (PIK). The issuer may pay cash interest and/or interest in additional debt securities. Rates shown are the rates in effect at March 31, 2021. |
| (k) | Non-income producing security. |
| (l) | Restricted and illiquid security. |
| Restricted & Illiquid Securities | Acquisition Date | Cost | Market Value | Percentage of Net Assets | ||||||||||||
Mt Logan Re Ltd. (Preference Shares) | 12/30/2014 | $ | 9,248,550 | $ | 9,141,237 | 0.24 | % | |||||||||
Currency Abbreviations:
AUD—Australian Dollar
BRL—Brazilian Real
CAD—Canadian Dollar
CHF—Swiss Franc
EUR — Euro
GBP—Great British Pound
IDR—Indonesian Rupiah
JPY—Japanese Yen
KRW—South Korean Won
MXN—Mexican Peso
MYR—Malaysian Ringgit
NZD—New Zealand Dollar
RUB—Russian Ruble
SEK—Swedish Krona
USD—United States Dollar
ZAR—South African Rand
Glossary:
ABS—Asset-Backed Securities
ARMs—Adjustable Rate Mortgages
CBT—Chicago Board of Trade
CDOR—Canadian Dealer Offered Rate
CDX-CMBX.NA—North American Commercial Mortgage-Backed Index
CLO—Collateralized Loan Obligations
CMBS—Commercial Mortgage-Backed Securities
EURIBOR—Euro Interbank Offered Rate
LIBOR—London Interbank Offered Rate
REIT—Real Estate Investment Trust
REMICs—Real Estate Mortgage Investment Conduits
SOFR—Secured Overnight Financing Rate
STIBOR—Stockholm Interbank Offered Rate
TBA—To Be Announced
TIPS—Treasury Inflation Protected Security
See notes to financial statements.
| 20 | Sanford C. Bernstein Fund, Inc.—2021 Semi-Annual Report |
Table of Contents
Sanford C. Bernstein Fund, Inc.
Schedule of Investments
Short Duration Plus Portfolio
March 31, 2021 (unaudited)
| Principal Amount (000) | U.S. $ Value | |||||||||||
| GOVERNMENTS-TREASURIES–43.4% |
| |||||||||||
| United States–43.4% | ||||||||||||
U.S. Treasury Notes | ||||||||||||
0.125%, 08/31/2022 | U.S.$ | 56,525 | $ | 56,525,000 | ||||||||
1.125%, 09/30/2021(a) | 6,966 | 7,003,007 | ||||||||||
1.50%, 08/31/2021 | 13,536 | 13,616,370 | ||||||||||
1.625%, 06/30/2021–08/15/2022 |
| 13,944 | 14,110,875 | |||||||||
2.00%, 02/15/2022 | 3,007 | 3,057,743 | ||||||||||
2.25%, 04/30/2021 | 5,956 | 5,965,306 | ||||||||||
2.375%, 04/15/2021 | 14,135 | 14,146,043 | ||||||||||
2.875%, 11/15/2021 | 6,713 | 6,830,071 | ||||||||||
|
| |||||||||||
| Total Governments—Treasuries (cost $120,856,627) | 121,254,415 | |||||||||||
|
| |||||||||||
| INFLATION-LINKED SECURITIES–7.2% |
| |||||||||||
| United States–7.2% | ||||||||||||
U.S. Treasury Inflation Index | 4,689 | 5,071,023 | ||||||||||
0.25%, 01/15/2025 (TIPS) | 13,941 | 15,139,224 | ||||||||||
|
| |||||||||||
| Total Inflation-Linked Securities (cost $20,035,374) | 20,210,247 | |||||||||||
|
| |||||||||||
| CORPORATES-INVESTMENT GRADE–7.0% |
| |||||||||||
| Industrial–3.5% | ||||||||||||
| Capital Goods–0.3% | ||||||||||||
Boeing Co. (The) | 610 | 613,160 | ||||||||||
John Deere Capital Corp. | 236 | 241,291 | ||||||||||
|
| |||||||||||
| 854,451 | ||||||||||||
|
| |||||||||||
| Communications-Media–0.2% | ||||||||||||
Walt Disney Co. (The) | 561 | 608,242 | ||||||||||
|
| |||||||||||
| Consumer Cyclical-Automotive–0.3% |
| |||||||||||
General Motors Financial Co., Inc. |
| 274 | 297,147 | |||||||||
Harley-Davidson Financial Services, Inc. |
| 585 | 614,063 | |||||||||
|
| |||||||||||
| 911,210 | ||||||||||||
|
| |||||||||||
| Consumer Cyclical-Other–0.3% |
| |||||||||||
Las Vegas Sands Corp. | ||||||||||||
2.90%, 06/25/2025 | 393 | 403,419 | ||||||||||
3.20%, 08/08/2024 | 227 | 236,679 | ||||||||||
|
| |||||||||||
| 640,098 | ||||||||||||
|
| |||||||||||
| Consumer Non-Cyclical–1.6% |
| |||||||||||
BAT International Finance PLC | 740 | 732,341 | ||||||||||
| Principal Amount (000) | U.S. $ Value | |||||||||||
Biogen, Inc. | U.S.$ | 600 | $ | 666,714 | ||||||||
Cencosud SA | 481 | 536,766 | ||||||||||
GlaxoSmithKline Capital PLC | 875 | 899,229 | ||||||||||
Royalty Pharma PLC | 735 | 734,059 | ||||||||||
Sigma Alimentos SA de CV | 491 | 532,275 | ||||||||||
Sutter Health |
| 356 | 354,533 | |||||||||
|
| |||||||||||
| 4,455,917 | ||||||||||||
|
| |||||||||||
| Energy–0.3% | ||||||||||||
BP Capital Markets America, Inc. |
| 454 | 476,927 | |||||||||
Marathon Petroleum Corp. | 372 | 399,074 | ||||||||||
|
| |||||||||||
| 876,001 | ||||||||||||
|
| |||||||||||
| Technology–0.4% | ||||||||||||
Infor, Inc. | 157 | 159,313 | ||||||||||
International Business Machines Corp. |
| 675 | 694,244 | |||||||||
Leidos, Inc. | 137 | 143,232 | ||||||||||
|
| |||||||||||
| 996,789 | ||||||||||||
|
| |||||||||||
| Transportation-Airlines–0.1% |
| |||||||||||
Southwest Airlines Co. | 279 | 317,418 | ||||||||||
|
| |||||||||||
| 9,660,126 | ||||||||||||
|
| |||||||||||
| Financial Institutions–3.4% |
| |||||||||||
| Banking–2.7% | ||||||||||||
BPCE SA | 660 | 737,174 | ||||||||||
Capital One Financial Corp. | 230 | 239,338 | ||||||||||
Citigroup, Inc. | ||||||||||||
3.106%, 04/08/2026 | 346 | 369,531 | ||||||||||
3.142%, 01/24/2023 | 650 | 663,455 | ||||||||||
Cooperatieve Rabobank UA | 282 | 307,702 | ||||||||||
Credicorp Ltd. | 389 | 397,266 | ||||||||||
Danske Bank A/S | 525 | 558,884 | ||||||||||
Deutsche Bank AG/New York NY |
| 234 | 246,854 | |||||||||
Goldman Sachs Group, Inc. (The) |
| 222 | 242,499 | |||||||||
Lloyds Banking Group PLC | 350 | 377,591 | ||||||||||
Mitsubishi UFJ Financial Group, Inc. |
| 1,000 | 1,026,380 | |||||||||
Schedule of Investments—Short Duration Plus Portfolio | 21 |
Table of Contents
| Principal Amount (000) | U.S. $ Value | |||||||||||
NatWest Markets PLC | U.S.$ | 825 | $ | 863,123 | ||||||||
Royal Bank of Canada | 572 | 585,482 | ||||||||||
Standard Chartered PLC | 621 | 617,901 | ||||||||||
UBS AG/London | 212 | 214,915 | ||||||||||
|
| |||||||||||
| 7,448,095 | ||||||||||||
|
| |||||||||||
| Finance–0.5% | ||||||||||||
Aviation Capital Group LLC | ||||||||||||
1.95%, 01/30/2026(b) | 273 | 266,008 | ||||||||||
3.875%, 05/01/2023(b) | 214 | 223,547 | ||||||||||
5.50%, 12/15/2024(b) | 65 | 72,858 | ||||||||||
Azure Orbit IV International Finance Ltd. |
| 900 | 938,619 | |||||||||
|
| |||||||||||
| 1,501,032 | ||||||||||||
|
| |||||||||||
| Insurance–0.2% | ||||||||||||
Metropolitan Life Global Funding I |
| 650 | 665,996 | |||||||||
|
| |||||||||||
| 9,615,123 | ||||||||||||
|
| |||||||||||
| Utility–0.1% | ||||||||||||
| Electric–0.1% | ||||||||||||
NextEra Energy Capital Holdings, Inc. |
| 230 | 243,851 | |||||||||
|
| |||||||||||
| Total Corporates—Investment Grade (cost $19,097,320) |
| 19,519,100 | ||||||||||
|
| |||||||||||
| COMMERCIAL MORTGAGE-BACKED SECURITIES–6.0% |
| |||||||||||
| Non-Agency Fixed Rate CMBS–3.5% |
| |||||||||||
BAMLL Commercial Mortgage Securities Trust |
| 185 | 165,872 | |||||||||
Citigroup Commercial Mortgage Trust |
| |||||||||||
Series 2012-GC8, Class AS | ||||||||||||
3.683%, 09/10/2045(b) | 600 | 618,770 | ||||||||||
Series 2013-GC11, Class AS |
| |||||||||||
3.422%, 04/10/2046 | 771 | 800,815 | ||||||||||
Series 2013-GC11, Class B |
| |||||||||||
3.732%, 04/10/2046 | 350 | 362,959 | ||||||||||
Series 2013-GC11, Class XA |
| |||||||||||
1.365%, 04/10/2046(c) | 8,306 | 178,526 | ||||||||||
Series 2013-GC15, Class C |
| |||||||||||
5.181%, 09/10/2046 | 516 | 540,518 | ||||||||||
Commercial Mortgage Trust | ||||||||||||
Series 2013-LC6, Class XA |
| |||||||||||
1.313%, 01/10/2046(c) | 2,277 | 38,613 | ||||||||||
Series 2014-UBS4, Class A5 |
| 750 | 809,459 | |||||||||
| Principal Amount (000) | U.S. $ Value | |||||||||||
GS Mortgage Securities Corp. II | U.S.$ | 7,540 | $ | 169,308 | ||||||||
GS Mortgage Securities Trust | ||||||||||||
Series 2011-GC5, Class AS | 750 | 754,122 | ||||||||||
Series 2012-GC6, Class B | 450 | 457,974 | ||||||||||
Series 2012-GCJ7, Class AS | 500 | 511,973 | ||||||||||
Series 2012-GCJ9, Class AS | 518 | 533,495 | ||||||||||
Series 2015-GC28, Class A5 | 500 | 538,790 | ||||||||||
GSF | ||||||||||||
Series 2021-1, Class A1 | 36 | 35,885 | ||||||||||
Series 2021-1, Class A2 | 61 | 62,830 | ||||||||||
Series 2021-1, Class AS | 15 | 15,450 | ||||||||||
JPMBB Commercial Mortgage Securities Trust | 10,030 | 237,855 | ||||||||||
JPMorgan Chase Commercial Mortgage Securities Trust | ||||||||||||
Series 2010-C2, Class D | 546 | 472,608 | ||||||||||
Series 2012-C8, Class C | 355 | 330,578 | ||||||||||
LSTAR Commercial Mortgage Trust |
| 516 | 523,572 | |||||||||
Morgan Stanley Capital I Trust | 250 | 244,655 | ||||||||||
UBS-Barclays Commercial Mortgage Trust | ||||||||||||
Series 2012-C4, Class A3 | 612 | 612,655 | ||||||||||
Series 2013-C5, Class C | 505 | 494,652 | ||||||||||
Wells Fargo Commercial Mortgage Trust |
| 64 | 63,495 | |||||||||
WF-RBS Commercial Mortgage Trust |
| |||||||||||
Series 2011-C3, Class C | 250 | 249,120 | ||||||||||
Series 2012-C10, Class XA | 1,057 | 22,852 | ||||||||||
|
| |||||||||||
| 9,847,401 | ||||||||||||
|
| |||||||||||
| 22 | Sanford C. Bernstein Fund, Inc.—2021 Semi-Annual Report |
Table of Contents
| Principal Amount (000) | U.S. $ Value | |||||||||||
| Non-Agency Floating Rate CMBS–2.2% |
| |||||||||||
Ashford Hospitality Trust | U.S.$ | 225 | $ | 224,792 | ||||||||
BBCMS Mortgage Trust | 411 | 413,060 | ||||||||||
CLNY Trust | 180 | 175,039 | ||||||||||
DBWF Mortgage Trust | 297 | 296,682 | ||||||||||
GCT Commercial Mortgage Trust |
| 469 | 469,006 | |||||||||
Great Wolf Trust | 700 | 699,155 | ||||||||||
GS Mortgage Securities Corp. Trust |
| |||||||||||
Series 2019-BOCA, Class A | ||||||||||||
1.306% (LIBOR 1 Month + 1.20%), 06/15/2038(b)(g) | 503 | 503,030 | ||||||||||
Series 2019-SMP, Class A | ||||||||||||
1.256% (LIBOR 1 Month + 1.15%), 08/15/2032(b)(g) | 250 | 249,849 | ||||||||||
HFX Funding | 470 | 484,997 | ||||||||||
Invitation Homes Trust | ||||||||||||
Series 2018-SFR1, Class C | ||||||||||||
1.358% (LIBOR 1 Month + 1.25%), 03/17/2037(b)(g) | 880 | 881,516 | ||||||||||
Series 2018-SFR3, Class A | ||||||||||||
1.108% (LIBOR 1 Month + 1.00%), 07/17/2037(b)(g) | 207 | 207,690 | ||||||||||
JPMorgan Chase Commercial Mortgage Securities Trust | 43 | 43,023 | ||||||||||
Morgan Stanley Capital I Trust | 365 | 310,137 | ||||||||||
Natixis Commercial Mortgage Securities Trust | ||||||||||||
Series 2018-850T, Class A | ||||||||||||
0.89% (LIBOR 1 Month + 0.78%), 07/15/2033(b)(g) | 409 | 406,237 | ||||||||||
| Principal Amount (000) | U.S. $ Value | |||||||||||
Series 2019-MILE, Class A | U.S.$ | 166 | $ | 166,129 | ||||||||
Starwood Retail Property Trust |
| 859 | 631,266 | |||||||||
|
| |||||||||||
| 6,161,608 | ||||||||||||
|
| |||||||||||
| Agency CMBS–0.3% |
| |||||||||||
Federal Home Loan Mortgage Corp. Multifamily Structured Pass Through Certificates |
| 685 | 704,725 | |||||||||
Government National Mortgage Association |
| 357 | 894 | |||||||||
|
| |||||||||||
| 705,619 | ||||||||||||
|
| |||||||||||
| Total Commercial Mortgage-Backed Securities (cost $17,167,927) |
| 16,714,628 | ||||||||||
|
| |||||||||||
| ASSET-BACKED SECURITIES–5.6% |
| |||||||||||
| Autos-Fixed Rate–4.2% |
| |||||||||||
AmeriCredit Automobile Receivables Trust |
| 346 | 346,574 | |||||||||
Carmax Auto Owner Trust |
| 190 | 187,480 | |||||||||
Carvana Auto Receivables Trust |
| 622 | 621,721 | |||||||||
Chase Auto Credit Linked Notes |
| |||||||||||
Series 2020-1, Class C |
| |||||||||||
1.389%, 01/25/2028(b) |
| 618 | 621,697 | |||||||||
Series 2020-2, Class D |
| |||||||||||
1.487%, 02/25/2028(b) |
| 240 | 240,159 | |||||||||
Series 2021-1, Class B |
| |||||||||||
0.875%, 09/25/2028(b) |
| 829 | 828,307 | |||||||||
CPS Auto Receivables Trust |
| 603 | 604,649 | |||||||||
CPS Auto Trust |
| 635 | 633,899 | |||||||||
DT Auto Owner Trust |
| 760 | 757,839 | |||||||||
Exeter Automobile Receivables Trust |
| 540 | 538,541 | |||||||||
Schedule of Investments—Short Duration Plus Portfolio | 23 |
Table of Contents
| Principal Amount (000) | U.S. $ Value | |||||||||||
Exeter Automobile Receivables Trust |
| |||||||||||
Series 2019-3A, Class B |
| |||||||||||
2.58%, 08/15/2023(b) | U.S.$ | 313 | $ | 313,892 | ||||||||
Series 2020-3A, Class C |
| |||||||||||
1.32%, 07/15/2025 |
| 477 | 482,200 | |||||||||
First Investors Auto Owner Trust |
| |||||||||||
Series 2018-1A, Class E |
| |||||||||||
5.35%, 07/15/2024(b) |
| 650 | 680,058 | |||||||||
Series 2020-1A, Class A |
| |||||||||||
1.49%, 01/15/2025(b) |
| 154 | 154,924 | |||||||||
Series 2021-1A, Class C |
| |||||||||||
1.17%, 03/15/2027(b) |
| 351 | 350,857 | |||||||||
Flagship Credit Auto Trust |
| |||||||||||
Series 2019-4, Class B |
| |||||||||||
2.53%, 11/17/2025(b) |
| 590 | 607,343 | |||||||||
Series 2020-4, Class C |
| |||||||||||
1.28%, 02/16/2027(b) |
| 615 | 618,150 | |||||||||
Foursight Capital Automobile Receivables Trust |
| 229 | 226,736 | |||||||||
Hertz Vehicle Financing II LP |
| |||||||||||
Series 2017-1A, Class A |
| |||||||||||
2.96%, 10/25/2021(b) |
| 87 | 87,089 | |||||||||
Series 2019-2A, Class A |
| |||||||||||
3.42%, 05/25/2025(b) |
| 79 | 79,106 | |||||||||
Santander Consumer Auto Receivables Trust |
| 727 | 722,847 | |||||||||
Santander Drive Auto Receivables Trust |
| 424 | 426,496 | |||||||||
Westlake Automobile Receivables Trust |
| |||||||||||
Series 2020-3A, Class C |
| |||||||||||
1.24%, 11/17/2025(b) |
| 657 | 662,798 | |||||||||
Series 2021-1A, Class C |
| |||||||||||
0.95%, 03/16/2026(b) | 837 | 836,504 | ||||||||||
|
| |||||||||||
| 11,629,866 | ||||||||||||
|
| |||||||||||
| Other ABS-Fixed Rate–1.2% |
| |||||||||||
Affirm Asset Securitization Trust |
| |||||||||||
Series 2020-A, Class A |
| |||||||||||
2.10%, 02/18/2025(b) |
| 206 | 208,200 | |||||||||
Series 2021-A, Class A |
| |||||||||||
0.88%, 08/15/2025(b) |
| 479 | 479,323 | |||||||||
Consumer Loan Underlying Bond CLUB Credit Trust |
| 100 | 101,853 | |||||||||
Crossroads Asset Trust |
| 172 | 171,478 | |||||||||
Hardee’s Funding LLC | 874 | 970,417 | ||||||||||
| Principal Amount (000) | U.S. $ Value | |||||||||||
Marlette Funding Trust | ||||||||||||
Series 2019-1A, Class A | ||||||||||||
3.44%, 04/16/2029(b) | U.S.$ | 70 | $ | 70,518 | ||||||||
Series 2019-3A, Class A | ||||||||||||
2.69%, 09/17/2029(b) | 93 | 93,036 | ||||||||||
Series 2020-1A, Class A | ||||||||||||
2.24%, 03/15/2030(b) | 55 | 55,568 | ||||||||||
Neighborly Issuer LLC | 226 | 226,739 | ||||||||||
Prosper Marketplace Issuance Trust |
| 6 | 6,256 | |||||||||
SoFi Consumer Loan Program LLC |
| 63 | 63,258 | |||||||||
SoFi Consumer Loan Program Trust |
| |||||||||||
Series 2018-3, Class A2 | ||||||||||||
3.67%, 08/25/2027(b) | 17 | 17,463 | ||||||||||
Series 2019-3, Class A | ||||||||||||
2.90%, 05/25/2028(b) | 97 | 97,383 | ||||||||||
Upstart Holdings, Inc. | 224 | 224,434 | ||||||||||
Upstart Securitization Trust | 603 | 607,273 | ||||||||||
|
| |||||||||||
| 3,393,199 | ||||||||||||
|
| |||||||||||
| Credit Cards-Fixed Rate–0.2% |
| |||||||||||
Brex Commercial Charge Card Master Trust | 555 | 554,959 | ||||||||||
|
| |||||||||||
| Total Asset-Backed Securities (cost $15,519,153) |
| 15,578,024 | ||||||||||
|
| |||||||||||
| COLLATERALIZED MORTGAGE OBLIGATIONS–4.9% |
| |||||||||||
| Risk Share Floating Rate–2.7% |
| |||||||||||
Bellemeade Re Ltd. | ||||||||||||
Series 2019-1A, Class M1B | ||||||||||||
1.859% (LIBOR 1 Month + 1.75%), 03/25/2029(b)(g) | 400 | 395,768 | ||||||||||
Series 2019-3A, Class M1B | ||||||||||||
1.709% (LIBOR 1 Month + 1.60%), 07/25/2029(b)(g) | 260 | 260,793 | ||||||||||
Series 2020-2A, Class M1B | ||||||||||||
3.309% (LIBOR 1 Month + 3.20%), 08/26/2030(b)(g) | 220 | 222,138 | ||||||||||
Series 2020-3A, Class M1B | ||||||||||||
2.959% (LIBOR 1 Month + 2.85%), 10/25/2030(b)(g) | 151 | 152,549 | ||||||||||
Series 2021-1A, Class M1B | ||||||||||||
2.217% (SOFR + 2.20%), 03/25/2031(b)(g) | 684 | 683,292 | ||||||||||
| 24 | Sanford C. Bernstein Fund, Inc.—2021 Semi-Annual Report |
Table of Contents
| Principal Amount (000) | U.S. $ Value | |||||||||||
Chase Mortgage Finance Corp. | U.S.$ | 79 | $ | 80,085 | ||||||||
Eagle Re Ltd. | 375 | 373,920 | ||||||||||
Federal Home Loan Mortgage Corp. Structured Agency Credit Risk Debt Notes | ||||||||||||
Series 2015-DNA1, Class M3 | ||||||||||||
3.409% (LIBOR 1 Month + 3.30%), 10/25/2027(g) | 316 | 321,789 | ||||||||||
Series 2017-HQA3, Class M2 | ||||||||||||
2.459% (LIBOR 1 Month + 2.35%), 04/25/2030(g) | 664 | 672,515 | ||||||||||
Series 2020-DNA5, Class M1 | ||||||||||||
1.317% (SOFR+ 1.30%), 10/25/2050(b)(g) | 99 | 99,467 | ||||||||||
Series 2020-DNA6, Class M1 | ||||||||||||
0.917% (SOFR + 0.90%), 12/25/2050(b)(g) | 173 | 173,372 | ||||||||||
Federal National Mortgage Association Connecticut Avenue Securities | ||||||||||||
Series 2014-C04, Class 1M2 | ||||||||||||
5.009% (LIBOR 1 Month + 4.90%), 11/25/2024(g) | 358 | 368,598 | ||||||||||
Series 2015-C01, Class 1M2 | ||||||||||||
4.409% (LIBOR 1 Month + 4.30%), 02/25/2025(g) | 100 | 101,388 | ||||||||||
Series 2015-C02, Class 1M2 | ||||||||||||
4.109% (LIBOR 1 Month + 4.00%), 05/25/2025(g) | 24 | 24,030 | ||||||||||
Series 2016-C03, Class 2M2 | ||||||||||||
6.009% (LIBOR 1 Month + 5.90%), 10/25/2028(g) | 280 | 295,696 | ||||||||||
Series 2016-C06, Class 1M2 | ||||||||||||
4.359% (LIBOR 1 Month + 4.25%), 04/25/2029(g) | 159 | 165,835 | ||||||||||
Home Re Ltd. | ||||||||||||
Series 2020-1, Class M1B | ||||||||||||
3.359% (LIBOR 1 Month + 3.25%), 10/25/2030(b)(g) | 336 | 342,134 | ||||||||||
Series 2021-1, Class M1A | ||||||||||||
1.159% (LIBOR 1 Month + 1.05%), 07/25/2033(b)(g) | 754 | 752,708 | ||||||||||
Mortgage Insurance-Linked Notes |
| 284 | 284,738 | |||||||||
Oaktown Re V Ltd. | 151 | 152,446 | ||||||||||
| Principal Amount (000) | U.S. $ Value | |||||||||||
PMT Credit Risk Transfer Trust | ||||||||||||
Series 2019-2R, Class A | ||||||||||||
2.865% (LIBOR 1 Month + 2.75%), 05/27/2023(b)(g) | U.S.$ | 153 | $ | 151,169 | ||||||||
Series 2019-3R, Class A | ||||||||||||
2.815% (LIBOR 1 Month + 2.70%), 10/27/2022(b)(g) | 61 | 60,973 | ||||||||||
Radnor Re Ltd. | ||||||||||||
Series 2019-1, Class M1B | ||||||||||||
2.059% (LIBOR 1 Month + 1.95%), 02/25/2029(b)(g) | 192 | 192,076 | ||||||||||
Series 2019-2, Class M1B | ||||||||||||
1.859% (LIBOR 1 Month + 1.75%), 06/25/2029(b)(g) | 222 | 221,464 | ||||||||||
Series 2020-1, Class M1A | ||||||||||||
1.059% (LIBOR 1 Month + 0.95%), 02/25/2030(b)(g) | 185 | 184,733 | ||||||||||
Triangle Re Ltd. | ||||||||||||
Series 2020-1, Class M1A | ||||||||||||
3.109% (LIBOR 1 Month + 3.00%), 10/25/2030(b)(g) | 250 | 250,969 | ||||||||||
Series 2021-1, Class M1A | ||||||||||||
1.807% (LIBOR 1 Month + 1.70%), 08/25/2033(b)(g) | 494 | 493,657 | ||||||||||
|
| |||||||||||
| 7,478,302 | ||||||||||||
|
| |||||||||||
| Agency Fixed Rate–1.3% | ||||||||||||
Federal Home Loan Mortgage Corp. REMICs | ||||||||||||
Series 4029, Class NE | ||||||||||||
2.50%, 03/15/2041 | 537 | 552,282 | ||||||||||
Series 4941, Class IO | ||||||||||||
4.00%, 12/15/2047(c) | 1,797 | 271,232 | ||||||||||
Series 4976, Class MI | ||||||||||||
4.50%, 05/25/2050(c) | 1,731 | 315,782 | ||||||||||
Series 5008, Class AI | ||||||||||||
3.50%, 09/25/2050(c) | 2,037 | 376,522 | ||||||||||
Series 5013, Class JI | ||||||||||||
4.00%, 09/25/2050(c) | 3,030 | 419,164 | ||||||||||
Series 5015, Class DI | ||||||||||||
4.00%, 09/25/2050(c) | 2,421 | 426,182 | ||||||||||
Series 5034, Class BI | ||||||||||||
4.50%, 11/25/2050(c) | 1,656 | 338,761 | ||||||||||
Series 5049, Class CI | ||||||||||||
3.50%, 12/25/2050(c) | 1,457 | 218,547 | ||||||||||
Federal National Mortgage Association REMICs | ||||||||||||
Series 2014-54, Class LA | ||||||||||||
3.00%, 02/25/2044 | 101 | 102,809 | ||||||||||
Series 2020-89, Class KI | ||||||||||||
4.00%, 12/25/2050(c) | 2,935 | 486,789 | ||||||||||
|
| |||||||||||
| 3,508,070 | ||||||||||||
|
| |||||||||||
Schedule of Investments—Short Duration Plus Portfolio | 25 |
Table of Contents
| Principal Amount (000) | U.S. $ Value | |||||||||||
| Agency Floating Rate–0.5% |
| |||||||||||
Federal Home Loan Mortgage Corp. REMICs |
| |||||||||||
Series 4248, Class QF |
| |||||||||||
0.606% (LIBOR 1 Month + 0.50%), 06/15/2039(g) | U.S.$ | 404 | $ | 408,788 | ||||||||
Series 4286, Class VF |
| |||||||||||
0.556% (LIBOR 1 Month + 0.45%), 12/15/2043(g) |
| 365 | 368,384 | |||||||||
Federal National Mortgage Association REMICs |
| |||||||||||
Series 2013-57, Class FN |
| |||||||||||
0.459% (LIBOR 1 Month + 0.35%), 06/25/2043(g) |
| 282 | 283,525 | |||||||||
Series 2014-49, Class AF |
| |||||||||||
0.443% (LIBOR 1 Month + 0.32%), 08/25/2044(g) |
| 466 | 465,245 | |||||||||
|
| |||||||||||
| 1,525,942 | ||||||||||||
|
| |||||||||||
| Non-Agency Floating Rate–0.3% |
| |||||||||||
Mello Warehouse Securitization Trust |
| |||||||||||
Series 2020-1, Class A |
| |||||||||||
1.009% (LIBOR 1 Month + 0.90%), 10/25/2053(b)(g) |
| 514 | 514,049 | |||||||||
Series 2021-1, Class A |
| |||||||||||
0.809% (LIBOR 1 Month + 0.70%), 02/25/2055(b)(g) |
| 346 | 342,706 | |||||||||
|
| |||||||||||
| 856,755 | ||||||||||||
|
| |||||||||||
| Non-Agency Fixed Rate–0.1% |
| |||||||||||
Provident Funding Mortgage Warehouse Securitization Trust |
| 396 | 395,564 | |||||||||
|
| |||||||||||
| Total Collateralized Mortgage Obligations (cost $13,625,215) |
| 13,764,633 | ||||||||||
|
| |||||||||||
| AGENCIES–2.8% |
| |||||||||||
| Agency Debentures–2.8% |
| |||||||||||
Federal Home Loan Bank |
| |||||||||||
1.375%, 02/17/2023 | 750 | 766,845 | ||||||||||
2.50%, 02/13/2024 | 445 | 472,617 | ||||||||||
3.00%, 10/12/2021 | 1,450 | 1,472,663 | ||||||||||
Federal Home Loan Mortgage Corp. |
| 2,000 | 2,000,592 | |||||||||
Federal National Mortgage Association |
| |||||||||||
2.50%, 02/05/2024 | 810 | 859,661 | ||||||||||
2.75%, 06/22/2021 | 2,217 | 2,230,391 | ||||||||||
|
| |||||||||||
| Total Agencies (cost $7,667,041) |
| 7,802,769 | ||||||||||
|
| |||||||||||
| Principal Amount (000) | U.S. $ Value | |||||||||||
| MORTGAGE PASS-THROUGHS–1.0% |
| |||||||||||
| Agency Fixed Rate 30-Year–1.0% |
| |||||||||||
Federal Home Loan Mortgage Corp. | U.S.$ | 1,172 | $ | 1,257,706 | ||||||||
Federal National Mortgage Association |
| 861 | 980,261 | |||||||||
Government National Mortgage Association |
| |||||||||||
Series 2002 |
| |||||||||||
7.50%, 03/15/2032 |
| 41 | 48,165 | |||||||||
Series 2009 |
| |||||||||||
5.00%, 10/15/2039 |
| 346 | 393,498 | |||||||||
|
| |||||||||||
| 2,679,630 | ||||||||||||
|
| |||||||||||
| Agency Fixed Rate 15-Year–0.0% |
| |||||||||||
Federal Home Loan Mortgage Corp. Gold |
| |||||||||||
Series 2011 |
| |||||||||||
5.00%, 07/01/2025 |
| 56 | 57,893 | |||||||||
6.50%, 03/01/2026 |
| 75 | 79,433 | |||||||||
Federal National Mortgage Association |
| 0 | 226 | |||||||||
|
| |||||||||||
| 137,552 | ||||||||||||
|
| |||||||||||
| Agency ARMs–0.0% |
| |||||||||||
Federal National Mortgage Association |
| 1 | 1,290 | |||||||||
|
| |||||||||||
| Total Mortgage Pass-Throughs (cost $2,716,284) |
| 2,818,472 | ||||||||||
|
| |||||||||||
| LOCAL GOVERNMENTS-US MUNICIPAL BONDS–0.9% |
| |||||||||||
| United States–0.9% |
| |||||||||||
California Earthquake Authority |
| |||||||||||
Series 2020B |
| |||||||||||
1.227%, 07/01/2021 |
| 130 | 130,314 | |||||||||
City of New York NY |
| |||||||||||
Series 2021D |
| |||||||||||
0.982%, 08/01/2025 |
| 740 | 739,139 | |||||||||
New Jersey Turnpike Authority |
| |||||||||||
Series 2021B |
| |||||||||||
1.047%, 01/01/2026 |
| 125 | 122,948 | |||||||||
Port Authority of New York & New Jersey |
| |||||||||||
Series 2020A |
| |||||||||||
1.086%, 07/01/2023 |
| 280 | 284,170 | |||||||||
State of California |
| |||||||||||
5.70%, 11/01/2021 |
| 350 | 361,131 | |||||||||
| 26 | Sanford C. Bernstein Fund, Inc.—2021 Semi-Annual Report |
Table of Contents
| Principal Amount (000) | U.S. $ Value | |||||||||||
Tobacco Settlement Finance Authority/WV |
| |||||||||||
3.00%, 06/01/2035 | U.S.$ | 860 | $ | 882,974 | ||||||||
|
| |||||||||||
| Total Local Governments—US Municipal Bonds (cost $2,512,792) |
| 2,520,676 | ||||||||||
|
| |||||||||||
| COLLATERALIZED LOAN OBLIGATIONS–0.8% |
| |||||||||||
| CLO-Floating Rate–0.8% |
| |||||||||||
Dryden CLO Ltd. | 275 | 275,499 | ||||||||||
Series 2020-78A, Class C | 320 | 320,839 | ||||||||||
Elevation CLO Ltd. | 250 | 243,045 | ||||||||||
Goldentree Loan Management US CLO Ltd. | 404 | 404,435 | ||||||||||
Magnetite XXVI Ltd. | 472 | 472,542 | ||||||||||
OCP CLO Ltd. | 418 | 418,123 | ||||||||||
| Principal Amount (000) | U.S. $ Value | |||||||||||
Voya CLO Ltd. | U.S.$ | 130 | $ | 127,231 | ||||||||
|
| |||||||||||
| Total Collateralized Loan Obligations (cost $2,268,933) |
| 2,261,714 | ||||||||||
|
| |||||||||||
| QUASI-SOVEREIGNS–0.2% |
| |||||||||||
| Quasi-Sovereign Bonds–0.2% |
| |||||||||||
| China–0.2% |
| |||||||||||
Sinopec Group Overseas Development 2018 Ltd. | 516 | 539,865 | ||||||||||
|
| |||||||||||
| GOVERNMENTS-SOVEREIGN BONDS–0.2% |
| |||||||||||
| United Arab Emirates–0.2% |
| |||||||||||
Abu Dhabi Government International Bond | 379 | 380,019 | ||||||||||
|
| |||||||||||
| SHORT-TERM INVESTMENTS–19.3% |
| |||||||||||
| U.S. Treasury Bills–19.3% |
| |||||||||||
U.S. Treasury Bill Zero Coupon, 04/20/2021-06/17/2021 | 54,005 | 54,004,317 | ||||||||||
|
| |||||||||||
| Total Investments—99.3% (cost $276,364,067) |
| 277,368,879 | ||||||||||
Other assets less liabilities—0.7% |
| 2,078,378 | ||||||||||
|
| |||||||||||
| Net Assets—100.0% | $ | 279,447,257 | ||||||||||
|
| |||||||||||
FUTURES (see Note 3)
| Description | Number of Contracts | Expiration Month | Current Notional | Value and Unrealized Appreciation/ (Depreciation) | ||||||||||||
| Purchased Contracts | ||||||||||||||||
| U.S. T-Note 2 Yr (CBT) Futures | 621 | June 2021 | $ | 137,071,195 | $ | (110,297 | ) | |||||||||
| U.S. Ultra Bond (CBT) Futures | 5 | June 2021 | 906,094 | (23,289 | ) | |||||||||||
| Sold Contracts | ||||||||||||||||
| U.S. 10 Yr Ultra Futures | 15 | June 2021 | 2,155,313 | 29,761 | ||||||||||||
| U.S. T-Note 5 Yr (CBT) Futures | 107 | June 2021 | 13,203,633 | 49,910 | ||||||||||||
|
| |||||||||||||||
| $ | (53,915 | ) | ||||||||||||||
|
| |||||||||||||||
Schedule of Investments—Short Duration Plus Portfolio | 27 |
Table of Contents
CENTRALLY CLEARED CREDIT DEFAULT SWAPS (see Note 3)
| Description | Fixed Rate (Pay) Receive | Payment Frequency | Implied Credit Spread at March 31, 2021 | Notional | Market Value | Upfront Premiums Paid/ (Received) | Unrealized Appreciation/ (Depreciation) | |||||||||||||||||||||||||
| Sale Contracts | ||||||||||||||||||||||||||||||||
| CDX-NAIG Series 34, 5 Year Index, 06/20/2025* | 1.00 | % | Quarterly | 0.57 | % | USD | 2,221 | $ | 40,683 | $ | 23,884 | $ | 16,799 | |||||||||||||||||||
* Termination date
CREDIT DEFAULT SWAPS (see Note 3)
| Swap Counterparty & Referenced Obligation | Fixed Rate (Pay) Receive | Payment Frequency | Implied Credit Spread at March 31, 2021 | Notional Amount (000) | Market Value | Upfront Premiums Paid/ (Received) | Unrealized Appreciation/ (Depreciation) | |||||||||||||||||||||||||
| Buy Contracts | ||||||||||||||||||||||||||||||||
Citigroup Global Markets, Inc. | ||||||||||||||||||||||||||||||||
| CDX-CMBX.NA.BBB- Series 9, 09/17/2058* | (3.00 | )% | Monthly | 5.80 | % | USD | 363 | $ | 39,858 | $ | 24,652 | $ | 15,206 | |||||||||||||||||||
| CDX-CMBX.NA.BBB- Series 9, 09/17/2058* | (3.00 | ) | Monthly | 5.80 | USD | 295 | 32,391 | 20,734 | 11,657 | |||||||||||||||||||||||
| CDX-CMBX.NA.BBB- Series 9, 09/17/2058* | (3.00 | ) | Monthly | 5.80 | USD | 295 | 32,391 | 21,465 | 10,926 | |||||||||||||||||||||||
| CDX-CMBX.NA.BBB- Series 9, 09/17/2058* | (3.00 | ) | Monthly | 5.80 | USD | 119 | 13,066 | 7,863 | 5,203 | |||||||||||||||||||||||
| CDX-CMBX.NA.BBB- Series 9, 09/17/2058* | (3.00 | ) | Monthly | 5.80 | USD | 118 | 12,956 | 7,797 | 5,159 | |||||||||||||||||||||||
| CDX-CMBX.NA.BBB- Series 9, 09/17/2058* | (3.00 | ) | Monthly | 5.80 | USD | 147 | 16,141 | 11,360 | 4,781 | |||||||||||||||||||||||
| CDX-CMBX.NA.BBB- Series 9, 09/17/2058* | (3.00 | ) | Monthly | 5.80 | USD | 113 | 12,407 | 7,634 | 4,773 | |||||||||||||||||||||||
| CDX-CMBX.NA.BBB- Series 9, 09/17/2058* | (3.00 | ) | Monthly | 5.80 | USD | 239 | 26,282 | 47,088 | (20,806 | ) | ||||||||||||||||||||||
| CDX-CMBX.NA.BBB- Series 9, 09/17/2058* | (3.00 | ) | Monthly | 5.80 | USD | 241 | 26,442 | 49,126 | (22,684 | ) | ||||||||||||||||||||||
| CDX-CMBX.NA.BBB- Series 9, 09/17/2058* | (3.00 | ) | Monthly | 5.80 | USD | 308 | 33,844 | 61,935 | (28,091 | ) | ||||||||||||||||||||||
| CDX-CMBX.NA.BBB- Series 9, 09/17/2058* | (3.00 | ) | Monthly | 5.80 | USD | 308 | 33,844 | 61,983 | (28,139 | ) | ||||||||||||||||||||||
| CDX-CMBX.NA.BBB- Series 9, 09/17/2058* | (3.00 | ) | Monthly | 5.80 | USD | 597 | 65,651 | 118,691 | (53,040 | ) | ||||||||||||||||||||||
| CDX-CMBX.NA.BBB- Series 9, 09/17/2058* | (3.00 | ) | Monthly | 5.80 | USD | 1,194 | 131,202 | 241,859 | (110,657 | ) | ||||||||||||||||||||||
Goldman Sachs International | ||||||||||||||||||||||||||||||||
| CDX-CMBX.NA.BBB- Series 9, 09/17/2058* | (3.00 | ) | Monthly | 5.80 | USD | 289 | 31,757 | 50,127 | (18,370 | ) | ||||||||||||||||||||||
JPMorgan Securities, LLC | ||||||||||||||||||||||||||||||||
| CDX-CMBX.NA.BBB- Series 9, 09/17/2058* | (3.00 | ) | Monthly | 5.80 | USD | 128 | 14,044 | 25,823 | (11,779 | ) | ||||||||||||||||||||||
Morgan Stanley & Co. International PLC | ||||||||||||||||||||||||||||||||
| CDX-CMBX.NA.BBB- Series 9, 09/17/2058* | (3.00 | ) | Monthly | 5.80 | USD | 155 | 17,032 | 30,074 | (13,042 | ) | ||||||||||||||||||||||
| CDX-CMBX.NA.BBB- Series 9, 09/17/2058* | (3.00 | ) | Monthly | 5.80 | USD | 308 | 33,844 | 62,870 | (29,026 | ) | ||||||||||||||||||||||
| 28 | Sanford C. Bernstein Fund, Inc.—2021 Semi-Annual Report |
Table of Contents
| Swap Counterparty & Referenced Obligation | Fixed Rate (Pay) Receive | Payment Frequency | Implied Credit Spread at March 31, 2021 | Notional Amount (000) | Market Value | Upfront Premiums Paid/ (Received) | Unrealized Appreciation/ (Depreciation) | |||||||||||||||||||||||||
| Sale Contracts | ||||||||||||||||||||||||||||||||
Citigroup Global Markets, Inc. | ||||||||||||||||||||||||||||||||
| CDX-CMBX.NA.BBB- Series 6, 05/11/2063* | 3.00 | % | Monthly | 12.50 | % | USD | 3 | $ | (808 | ) | $ | (469 | ) | $ | (339 | ) | ||||||||||||||||
| CDX-CMBX.NA.BBB- Series 6, 05/11/2063* | 3.00 | Monthly | 12.50 | USD | 3 | (808 | ) | (375 | ) | (433 | ) | |||||||||||||||||||||
| CDX-CMBX.NA.BBB- Series 6, 05/11/2063* | 3.00 | Monthly | 12.50 | USD | 13 | (3,502 | ) | (1,601 | ) | (1,901 | ) | |||||||||||||||||||||
| CDX-CMBX.NA.BBB- Series 6, 05/11/2063* | 3.00 | Monthly | 12.50 | USD | 14 | (3,773 | ) | (1,639 | ) | (2,134 | ) | |||||||||||||||||||||
| CDX-CMBX.NA.BBB- Series 6, 05/11/2063* | 3.00 | Monthly | 12.50 | USD | 15 | (4,041 | ) | (1,908 | ) | (2,133 | ) | |||||||||||||||||||||
| CDX-CMBX.NA.BBB- Series 6, 05/11/2063* | 3.00 | Monthly | 12.50 | USD | 15 | (4,041 | ) | (1,847 | ) | (2,194 | ) | |||||||||||||||||||||
| CDX-CMBX.NA.BBB- Series 6, 05/11/2063* | 3.00 | Monthly | 12.50 | USD | 19 | (5,118 | ) | (2,111 | ) | (3,007 | ) | |||||||||||||||||||||
| CDX-CMBX.NA.BBB- Series 6, 05/11/2063* | 3.00 | Monthly | 12.50 | USD | 21 | (5,657 | ) | (2,586 | ) | (3,071 | ) | |||||||||||||||||||||
| CDX-CMBX.NA.BBB- Series 6, 05/11/2063* | 3.00 | Monthly | 12.50 | USD | 38 | (10,238 | ) | (4,130 | ) | (6,108 | ) | |||||||||||||||||||||
Credit Suisse International | ||||||||||||||||||||||||||||||||
| CDX-CMBX.NA.BBB- Series 6, 05/11/2063* | 3.00 | Monthly | 12.50 | USD | 132 | (35,550 | ) | (10,391 | ) | (25,159 | ) | |||||||||||||||||||||
| CDX-CMBX.NA.BBB- Series 6, 05/11/2063* | 3.00 | Monthly | 12.50 | USD | 168 | (45,246 | ) | (13,506 | ) | (31,740 | ) | |||||||||||||||||||||
| CDX-CMBX.NA.BBB- Series 6, 05/11/2063* | 3.00 | Monthly | 12.50 | USD | 209 | (56,287 | ) | (12,082 | ) | (44,205 | ) | |||||||||||||||||||||
| CDX-CMBX.NA.BBB- Series 6, 05/11/2063* | 3.00 | Monthly | 12.50 | USD | 860 | (231,613 | ) | (57,718 | ) | (173,895 | ) | |||||||||||||||||||||
Deutsche Bank AG | ||||||||||||||||||||||||||||||||
| CDX-CMBX.NA.BBB- Series 6, 05/11/2063* | 3.00 | Monthly | 12.50 | USD | 445 | (119,846 | ) | (30,990 | ) | (88,856 | ) | |||||||||||||||||||||
Goldman Sachs International | ||||||||||||||||||||||||||||||||
| CDX-CMBX.NA.BBB- Series 6, 05/11/2063* | 3.00 | Monthly | 12.50 | USD | 58 | (15,625 | ) | (7,220 | ) | (8,405 | ) | |||||||||||||||||||||
| CDX-CMBX.NA.BBB- Series 6, 05/11/2063* | 3.00 | Monthly | 12.50 | USD | 133 | (35,819 | ) | (21,101 | ) | (14,718 | ) | |||||||||||||||||||||
| CDX-CMBX.NA.BBB- Series 6, 05/11/2063* | 3.00 | Monthly | 12.50 | USD | 160 | (43,091 | ) | (23,875 | ) | (19,216 | ) | |||||||||||||||||||||
| CDX-CMBX.NA.BBB- Series 6, 05/11/2063* | 3.00 | Monthly | 12.50 | USD | 186 | (50,092 | ) | (29,934 | ) | (20,158 | ) | |||||||||||||||||||||
JPMorgan Securities, LLC | ||||||||||||||||||||||||||||||||
| CDX-CMBX.NA.BBB- Series 6, 05/11/2063* | 3.00 | Monthly | 12.50 | USD | 40 | (10,773 | ) | (4,955 | ) | (5,818 | ) | |||||||||||||||||||||
| CDX-CMBX.NA.BBB- Series 6, 05/11/2063* | 3.00 | Monthly | 12.50 | USD | 139 | (37,435 | ) | (16,693 | ) | (20,742 | ) | |||||||||||||||||||||
|
|
|
|
|
| |||||||||||||||||||||||||||
| $ | (146,211 | ) | $ | 605,950 | $ | (752,161 | ) | |||||||||||||||||||||||||
|
|
|
|
|
| |||||||||||||||||||||||||||
* Termination date
Schedule of Investments—Short Duration Plus Portfolio | 29 |
Table of Contents
| (a) | Position, or a portion thereof, has been segregated to collateralize OTC derivatives outstanding. |
| (b) | Security is exempt from registration under Rule 144A of the Securities Act of 1933. These securities are considered restricted, but liquid and may be resold in transactions exempt from registration, normally to qualified institutional buyers. At March 31, 2021, the aggregate market value of these securities amounted to $41,224,765 or 14.8% of net assets. |
| (c) | IO—Interest Only. |
| (d) | Security in which significant unobservable inputs (Level 3) were used in determining fair value. |
| (e) | Security is exempt from registration under Rule 144A of the Securities Act of 1933. These securities, which represent 0.21% of net assets as of March 31, 2021, are considered illiquid and restricted. Additional information regarding such securities follows: |
| 144A/Restricted & Illiquid Securities | Acquisition Date | Cost | Market Value | Percentage of Net Assets | ||||||||||||
GSF | 03/15/2021 | $ | 35,885 | $ | 35,885 | 0.01 | % | |||||||||
GSF | 03/09/2021 | 62,799 | 62,830 | 0.02 | % | |||||||||||
GSF | 03/09/2021 | 15,442 | 15,450 | 0.01 | % | |||||||||||
HFX Funding | 11/06/2015 | $ | 503,626 | $ | 484,997 | 0.17 | % | |||||||||
| (f) | Fair valued by the Adviser. |
| (g) | Floating Rate Security. Stated interest/floor/ceiling rate was in effect at March 31, 2021. |
Glossary:
ABS—Asset-Backed Securities
ARMs—Adjustable Rate Mortgages
CBT—Chicago Board of Trade
CDX-CMBX.NA—North American Commercial Mortgage-Backed Index
CDX-NAIG—North American Investment Grade Credit Default Swap Index
CLO—Collateralized Loan Obligations
CMBS—Commercial Mortgage-Backed Securities
LIBOR—London Interbank Offered Rate
REMICs—Real Estate Mortgage Investment Conduits
SOFR—Secured Overnight Financing Rate
TIPS—Treasury Inflation Protected Security
See notes to financial statements.
| 30 | Sanford C. Bernstein Fund, Inc.—2021 Semi-Annual Report |
Table of Contents
SCB–TAX–1944–0321
Table of Contents
Sanford C. Bernstein Fund, Inc.
March 31, 2021
Schedule of Investments To the Semi-Annual Report
For the Fixed Income Municipal Portfolios
Short Duration Diversified Municipal
California Municipal
Diversified Municipal
New York Municipal
Table of Contents
Sanford C. Bernstein Fund, Inc.
Schedule of Investments
Short Duration Diversified Municipal Portfolio
March 31, 2021 (unaudited)
| Principal Amount (000) | U.S. $ Value | |||||||
| MUNICIPAL OBLIGATIONS–98.7% |
| |||||||
| Long-Term Municipal Bonds–83.8% |
| |||||||
| Alabama–2.4% |
| |||||||
Lower Alabama Gas District (The) | $ | 5,000 | $ | 5,696,752 | ||||
|
| |||||||
| Arizona–0.2% |
| |||||||
City of Phoenix Civic Improvement Corp. | 420 | 424,893 | ||||||
|
| |||||||
| Arkansas–3.0% |
| |||||||
City of Fayetteville AR | 7,255 | 7,306,594 | ||||||
|
| |||||||
| California–6.6% |
| |||||||
Los Angeles Unified School District/CA | 1,915 | 2,119,081 | ||||||
San Francisco Intl Airport | 1,890 | 2,151,297 | ||||||
State of California | 3,540 | 3,696,632 | ||||||
Transbay Joint Powers Authority | 910 | 917,255 | ||||||
University of California | 6,500 | 6,908,228 | ||||||
|
| |||||||
| 15,792,493 | ||||||||
|
| |||||||
| Colorado–1.3% |
| |||||||
Colorado Health Facilities Authority | 1,885 | 2,307,063 | ||||||
Vauxmont Metropolitan District | 670 | 697,428 | ||||||
|
| |||||||
| 3,004,491 | ||||||||
|
| |||||||
| District of Columbia–4.9% |
| |||||||
District of Columbia | 3,055 | 3,462,962 | ||||||
| Principal Amount (000) | U.S. $ Value | |||||||
Metropolitan Washington Airports Authority | $ | 7,230 | $ | 8,331,203 | ||||
|
| |||||||
| 11,794,165 | ||||||||
|
| |||||||
| Florida–5.4% |
| |||||||
Capital Projects Finance Authority/FL | 1,000 | 1,140,645 | ||||||
Capital Trust Agency, Inc. | 365 | 384,934 | ||||||
County of Broward FL Airport System Revenue | 1,000 | 1,050,285 | ||||||
County of Osceola FL Transportation Revenue | 510 | 531,657 | ||||||
Palm Beach County Health Facilities Authority | 500 | 504,613 | ||||||
State of Florida | 8,485 | 8,997,434 | ||||||
Village Community Development District No. 13 | 380 | 386,693 | ||||||
|
| |||||||
| 12,996,261 | ||||||||
|
| |||||||
| Georgia–2.4% |
| |||||||
Cobb County Kennestone Hospital Authority | 1,200 | 1,309,907 | ||||||
Development Authority of Monroe County (The) | 2,150 | 2,192,425 | ||||||
State of Georgia | 2,110 | 2,178,021 | ||||||
|
| |||||||
| 5,680,353 | ||||||||
|
| |||||||
| Guam–0.8% |
| |||||||
Antonio B Won Pat International Airport Authority | 875 | 914,370 | ||||||
Schedule of Investments—Short Duration Diversified Municipal Portfolio | 1 |
Table of Contents
| Principal Amount (000) | U.S. $ Value | |||||||
Guam Department of Education | $ | 1,000 | $ | 1,036,220 | ||||
|
| |||||||
| 1,950,590 | ||||||||
|
| |||||||
| Illinois–6.1% |
| |||||||
Chicago Board of Education | 1,000 | 1,030,082 | ||||||
City of Chicago IL | 1,000 | 1,129,616 | ||||||
Illinois Finance Authority | 2,025 | 2,421,127 | ||||||
Railsplitter Tobacco Settlement Authority | 4,945 | 5,204,331 | ||||||
Sales Tax Securitization Corp. | 2,740 | 3,232,250 | ||||||
State of Illinois | 1,690 | 1,732,703 | ||||||
|
| |||||||
| 14,750,109 | ||||||||
|
| |||||||
| Indiana–1.8% |
| |||||||
Indiana Finance Authority | 3,950 | 4,298,477 | ||||||
|
| |||||||
| Iowa–0.3% |
| |||||||
Iowa Finance Authority | 670 | 682,533 | ||||||
|
| |||||||
| Kentucky–6.2% |
| |||||||
Kentucky Asset Liability Commission | 1,000 | 1,111,126 | ||||||
Kentucky Economic Development Finance Authority | 1,000 | 1,105,672 | ||||||
Kentucky Public Energy Authority | 5,800 | 6,357,248 | ||||||
| Principal Amount (000) | U.S. $ Value | |||||||
Louisville & Jefferson County Metropolitan Sewer District | $ | 4,505 | $ | 4,745,910 | ||||
Series 2016C | 1,470 | 1,478,033 | ||||||
|
| |||||||
| 14,797,989 | ||||||||
|
| |||||||
| Louisiana–0.2% |
| |||||||
Parish of St. James LA | 100 | 112,888 | ||||||
6.10%, 06/01/2038–12/01/2040(b) | 205 | 256,284 | ||||||
|
| |||||||
| 369,172 | ||||||||
|
| |||||||
| Maryland–0.8% |
| |||||||
State of Maryland Department of Transportation | 1,930 | 1,983,858 | ||||||
|
| |||||||
| Massachusetts–0.4% |
| |||||||
Massachusetts Development Finance Agency | 795 | 882,565 | ||||||
|
| |||||||
| Michigan–3.0% |
| |||||||
City of Detroit MI | 2,470 | 2,552,443 | ||||||
City of Detroit MI Sewage Disposal System Revenue | 1,530 | 1,502,583 | ||||||
NATL Series 2005B | 1,690 | 1,710,506 | ||||||
Michigan Finance Authority | 1,500 | 1,503,303 | ||||||
|
| |||||||
| 7,268,835 | ||||||||
|
| |||||||
| Nebraska–0.4% |
| |||||||
Central Plains Energy Project | 810 | 919,507 | ||||||
|
| |||||||
| Nevada–1.7% |
| |||||||
City of Sparks NV | 190 | 191,734 | ||||||
Clark County Water Reclamation District | 2,765 | 2,797,282 | ||||||
| 2 | Sanford C. Bernstein Fund, Inc.—2021 Semi-Annual Report |
Table of Contents
| Principal Amount (000) | U.S. $ Value | |||||||
State of Nevada Department of Business & Industry | $ | 1,000 | $ | 1,000,214 | ||||
|
| |||||||
| 3,989,230 | ||||||||
|
| |||||||
| New Jersey–3.7% |
| |||||||
New Jersey Economic Development Authority | 3,000 | 3,208,561 | ||||||
New Jersey Economic Development Authority | 4,000 | 4,050,054 | ||||||
New Jersey Transportation Trust Fund Authority | 490 | 566,426 | ||||||
New Jersey Turnpike Authority | 1,125 | 1,116,612 | ||||||
|
| |||||||
| 8,941,653 | ||||||||
|
| |||||||
| New Mexico–0.2% |
| |||||||
City of Santa Fe NM | 600 | 600,973 | ||||||
|
| |||||||
| New York–7.3% |
| |||||||
Metropolitan Transportation Authority | ||||||||
Series 2018C | 3,500 | 3,561,395 | ||||||
Series 2019D | 1,635 | 1,732,638 | ||||||
Series 2020A | 925 | 994,719 | ||||||
Metropolitan Transportation Authority | 1,555 | 1,620,153 | ||||||
New York City Transitional Finance Authority Future Tax Secured Revenue | 5,015 | 5,032,739 | ||||||
New York State Dormitory Authority | 1,335 | 1,454,500 | ||||||
| Principal Amount (000) | U.S. $ Value | |||||||
New York Transportation Development Corp. | $ | 1,880 | $ | 2,074,199 | ||||
Syracuse Industrial Development Agency | 1,060 | 1,103,471 | ||||||
|
| |||||||
| 17,573,814 | ||||||||
|
| |||||||
| Ohio–1.5% |
| |||||||
Buckeye Tobacco Settlement Financing Authority | 445 | 429,021 | ||||||
County of Allen OH Hospital Facilities Revenue | 445 | 463,716 | ||||||
State of Ohio | 2,000 | 2,054,132 | ||||||
5.00%, 12/15/2022 | 680 | 735,911 | ||||||
|
| |||||||
| 3,682,780 | ||||||||
|
| |||||||
| Oklahoma–0.7% |
| |||||||
Comanche County Memorial Hospital | 135 | 141,065 | ||||||
Oklahoma County Finance Authority | 1,500 | 1,534,715 | ||||||
Oklahoma Development Finance Authority | 100 | 100,461 | ||||||
|
| |||||||
| 1,776,241 | ||||||||
|
| |||||||
| Pennsylvania–3.7% |
| |||||||
Allentown Neighborhood Improvement Zone Development Authority | 535 | 574,946 | ||||||
Commonwealth Financing Authority | 1,535 | 1,545,919 | ||||||
Schedule of Investments—Short Duration Diversified Municipal Portfolio | 3 |
Table of Contents
| Principal Amount (000) | U.S. $ Value | |||||||
Pennsylvania Economic Development Financing Authority | $ | 170 | $ | 178,464 | ||||
Pennsylvania Intergovernmental Cooperation Authority | 2,380 | 2,402,001 | ||||||
Philadelphia Authority for Industrial Development | 800 | 873,700 | ||||||
Philadelphia Authority for Industrial Development | 970 | 1,041,752 | ||||||
5.00%, 11/01/2025–11/01/2026 | 1,850 | 2,202,141 | ||||||
|
| |||||||
| 8,818,923 | ||||||||
|
| |||||||
| Tennessee–0.8% |
| |||||||
County of Shelby TN | 1,910 | 1,910,000 | ||||||
|
| |||||||
| Texas–4.6% |
| |||||||
Harris County Cultural Education Facilities Finance Corp. | 5,355 | 6,366,955 | ||||||
Houston Independent School District | 2,030 | 2,193,789 | ||||||
Texas Transportation Commission State Highway Fund | 2,150 | 2,406,263 | ||||||
|
| |||||||
| 10,967,007 | ||||||||
|
| |||||||
| Virginia–2.0% |
| |||||||
Virginia Beach Development Authority | 2,790 | 2,833,937 | ||||||
Virginia Small Business Financing Authority | 1,805 | 1,961,690 | ||||||
|
| |||||||
| 4,795,627 | ||||||||
|
| |||||||
| Washington–6.7% |
| |||||||
State of Washington | 4,500 | 5,260,570 | ||||||
Series 2019R | 3,015 | 3,269,945 | ||||||
Tobacco Settlement Authority/WA | 855 | 940,524 | ||||||
| Principal Amount (000) | U.S. $ Value | |||||||
University of Washington | $ | 5,055 | $ | 5,055,000 | ||||
Washington Health Care Facilities Authority | 1,235 | 1,434,083 | ||||||
Washington State Housing Finance Commission | 105 | 104,229 | ||||||
|
| |||||||
| 16,064,351 | ||||||||
|
| |||||||
| West Virginia–0.3% |
| |||||||
Tobacco Settlement Finance Authority/WV | 600 | 616,028 | ||||||
West Virginia Economic Development Authority | 100 | 102,239 | ||||||
|
| |||||||
| 718,267 | ||||||||
|
| |||||||
| Wisconsin–4.4% |
| |||||||
State of Wisconsin | 3,985 | 4,193,313 | ||||||
Series 20212 | 3,275 | 3,603,216 | ||||||
Series 20213 | 2,000 | 1,995,071 | ||||||
UMA Education, Inc. | 710 | 754,757 | ||||||
Wisconsin Health & Educational Facilities Authority | 100 | 99,635 | ||||||
|
| |||||||
| 10,645,992 | ||||||||
|
| |||||||
| Total Long-Term Municipal Bonds (cost $198,296,616) |
| 201,084,495 | ||||||
|
| |||||||
| Short-Term Municipal Notes–14.9% |
| |||||||
| California–1.3% |
| |||||||
California State Public Works Board | 2,050 | 2,078,344 | ||||||
City of Los Angeles CA | 1,000 | 1,008,963 | ||||||
|
| |||||||
| 3,087,307 | ||||||||
|
| |||||||
| 4 | Sanford C. Bernstein Fund, Inc.—2021 Semi-Annual Report |
Table of Contents
| Principal Amount (000) | U.S. $ Value | |||||||
| District of Columbia–0.5% |
| |||||||
District of Columbia | $ | 1,300 | $ | 1,300,000 | ||||
|
| |||||||
| Georgia–2.3% |
| |||||||
Development Authority of Monroe County (The) | 2,600 | 2,600,000 | ||||||
Georgia State Road & Tollway Authority | 2,890 | 2,911,925 | ||||||
|
| |||||||
| 5,511,925 | ||||||||
|
| |||||||
| Iowa–0.4% |
| |||||||
Iowa Finance Authority | 900 | 900,000 | ||||||
|
| |||||||
| Kentucky–0.9% |
| |||||||
Louisville/Jefferson County Metropolitan Government | 2,200 | 2,200,000 | ||||||
|
| |||||||
| Maryland–0.4% |
| |||||||
Maryland Health & Higher Educational Facilities Authority | 1,000 | 1,000,000 | ||||||
|
| |||||||
| Minnesota–0.7% |
| |||||||
City of Minneapolis MN/St. Paul Housing & Redevelopment Authority | 1,800 | 1,800,000 | ||||||
|
| |||||||
| Oregon–1.1% |
| |||||||
Clackamas County Hospital Facility Authority | 2,700 | 2,700,000 | ||||||
|
| |||||||
| Pennsylvania–0.2% |
| |||||||
Pennsylvania Economic Development Financing Authority | 400 | 400,541 | ||||||
|
| |||||||
| Texas–5.3% |
| |||||||
City of Houston TX | 1,500 | 1,510,485 | ||||||
| Principal Amount (000) | U.S. $ Value | |||||||
City of Houston TX Combined Utility System Revenue | $ | 1,300 | $ | 1,300,000 | ||||
0.05%, 05/15/2034 | 625 | 625,000 | ||||||
0.07%, 05/15/2034(d) | 650 | 650,000 | ||||||
State of Texas | 8,400 | 8,532,229 | ||||||
|
| |||||||
| 12,617,714 | ||||||||
|
| |||||||
| Washington–1.8% |
| |||||||
Washington Health Care Facilities Authority | 160 | 164,824 | ||||||
Washington State Housing Finance Commission | 600 | 600,000 | ||||||
Washington State Housing Finance Commission | 3,500 | 3,500,000 | ||||||
|
| |||||||
| 4,264,824 | ||||||||
|
| |||||||
| Total Short-Term Municipal Notes (cost $35,776,204) |
| 35,782,311 | ||||||
|
| |||||||
| Total Municipal Obligations (cost $234,072,820) |
| 236,866,806 | ||||||
|
| |||||||
| CORPORATES-NON-INVESTMENT GRADE–0.1% |
| |||||||
| Industrial–0.1% |
| |||||||
| Transportation–Airlines–0.1% |
| |||||||
American Airlines, Inc./AAdvantage Loyalty IP Ltd. | 250 | 260,043 | ||||||
|
| |||||||
| Shares | ||||||||
| SHORT-TERM INVESTMENTS–3.6% |
| |||||||
| Investment Companies–3.6% |
| |||||||
AB Fixed Income Shares, Inc.–Government Money Market | 8,715,292 | 8,715,292 | ||||||
|
| |||||||
| Total Investments–102.4% (cost $243,038,112) | 245,842,141 | |||||||
Other assets less liabilities–(2.4)% | (5,687,842 | ) | ||||||
|
| |||||||
| Net Assets—100.0% | $ | 240,154,299 | ||||||
|
| |||||||
Schedule of Investments—Short Duration Diversified Municipal Portfolio | 5 |
Table of Contents
CENTRALLY CLEARED INFLATION (CPI) SWAPS (see Note 3)
| Rate Type | ||||||||||||||||||||||||
| Notional Amount (000) | Termination Date | Payments made by | Payments received by | Payment Frequency Paid/Received | Market Value | Upfront Premiums Paid/ (Received) | Unrealized Appreciation/ (Depreciation) | |||||||||||||||||
| USD | 450 | 01/15/2025 | 2.565% | CPI# | Maturity | $ | 936 | $ | — | $ | 936 | |||||||||||||
| USD | 225 | 01/15/2025 | 2.585% | CPI# | Maturity | 278 | — | 278 | ||||||||||||||||
| USD | 225 | 01/15/2025 | 2.613% | CPI# | Maturity | 16 | — | 16 | ||||||||||||||||
| USD | 875 | 01/15/2030 | 1.714% | CPI# | Maturity | 63,120 | — | 63,120 | ||||||||||||||||
| USD | 875 | 01/15/2030 | 1.731% | CPI# | Maturity | 61,597 | — | 61,597 | ||||||||||||||||
| USD | 425 | 01/15/2030 | 1.572% | CPI# | Maturity | 36,794 | — | 36,794 | ||||||||||||||||
| USD | 425 | 01/15/2030 | 1.587% | CPI# | Maturity | 36,150 | — | 36,150 | ||||||||||||||||
| USD | 350 | 02/15/2041 | CPI# | 2.282% | Maturity | (13,107 | ) | — | (13,107 | ) | ||||||||||||||
|
|
|
|
|
| |||||||||||||||||||
| $ | 185,784 | $ | — | $ | 185,784 | |||||||||||||||||||
|
|
|
|
|
| |||||||||||||||||||
# Variable interest rate based on the rate of inflation as determined by the Consumer Price Index (CPI).
CENTRALLY CLEARED INTEREST RATE SWAPS (see Note 3)
| Rate Type | ||||||||||||||||||||||||||||||
Notional | Termination Date | Payments the Fund | Payments the Fund | Payment Frequency Paid/Received | Market Value | Upfront Premiums Paid/ (Received) | Unrealized Appreciation/ (Depreciation) | |||||||||||||||||||||||
| USD | 430 | 10/09/2029 | 3 Month LIBOR | 1.470% | Quarterly/Semi-Annual | $ | (3,057 | ) | $ | — | $ | (3,057 | ) | |||||||||||||||||
| USD | 430 | 10/09/2029 | 3 Month LIBOR | 1.473% | Quarterly/Semi-Annual | (2,945 | ) | — | (2,945 | ) | ||||||||||||||||||||
| USD | 170 | 02/15/2041 | 1.868% | 3 Month LIBOR | Semi-Annual/Quarterly | 7,935 | — | 7,935 | ||||||||||||||||||||||
|
|
|
|
|
| |||||||||||||||||||||||||
| $ | 1,933 | $ | — | $ | 1,933 | |||||||||||||||||||||||||
|
|
|
|
|
| |||||||||||||||||||||||||
INTEREST RATE SWAPS (see Note 3)
| Rate Type | ||||||||||||||||||||||||||||||||||
Swap | Notional Amount (000) | Termination Date | Payments the Fund | Payments the Fund | Payment Frequency Paid/Received | Market Value | Upfront Premiums Paid/ (Received) | Unrealized Appreciation/ (Depreciation) | ||||||||||||||||||||||||||
| Citibank, NA | USD | 580 | 10/09/2029 | 1.120 | % | SIFMA | * | Quarterly | $ | 1,637 | $ | — | $ | 1,637 | ||||||||||||||||||||
| Citibank, NA | USD | 580 | 10/09/2029 | 1.125 | % | SIFMA | * | Quarterly | 1,369 | — | 1,369 | |||||||||||||||||||||||
|
|
|
|
|
| |||||||||||||||||||||||||||||
| $ | 3,006 | $ | — | $ | 3,006 | |||||||||||||||||||||||||||||
|
|
|
|
|
| |||||||||||||||||||||||||||||
* Variable interest rate based on the Securities Industry & Financial Markets Association (SIFMA) Municipal Swap Index.
| (a) | When-Issued or delayed delivery security. |
| (b) | Security is exempt from registration under Rule 144A of the Securities Act of 1933. These securities are considered restricted, but liquid and may be resold in transactions exempt from registration, normally to qualified institutional buyers. At March 31, 2021, the aggregate market value of these securities amounted to $8,447,497 or 3.5% of net assets. |
| (c) | Floating Rate Security. Stated interest/floor/ceiling rate was in effect at March 31, 2021. |
| (d) | Variable Rate Demand Notes are instruments whose interest rates change on a specific date (such as coupon date or interest payment date) or whose interest rates vary with changes in a designated base rate (such as the prime interest rate). This instrument is payable on demand and is secured by letters of credit or other credit support agreements from major banks. |
| (e) | Affiliated investments. |
| (f) | The rate shown represents the 7-day yield as of period end. |
| (g) | To obtain a copy of the fund’s shareholder report, please go to the Securities and Exchange Commission’s website at www.sec.gov, or call AB at (800) 227-4618. |
As of March 31, 2021, the Portfolio’s percentages of investments in municipal bonds that are insured and in insured municipal bonds that have been pre-refunded or escrowed to maturity are 2.0% and 0.0%, respectively.
| 6 | Sanford C. Bernstein Fund, Inc.—2021 Semi-Annual Report |
Table of Contents
Glossary:
AGM—Assured Guaranty Municipal
CCRC—Congregate Care Retirement Center
COP—Certificate of Participation
CPI—Consumer Price Index
ETM—Escrowed to Maturity
LIBOR—London Interbank Offered Rate
NATL—National Interstate Corporation
OSF—Order of St. Francis
UPMC—University of Pittsburgh Medical Center
See notes to financial statements.
Sanford C. Bernstein Fund, Inc.
Schedule of Investments
California Municipal Portfolio
March 31, 2021 (unaudited)
| Principal Amount (000) | U.S. $ Value | |||||||
| MUNICIPAL OBLIGATIONS–99.0% |
| |||||||
| Long-Term Municipal Bonds–90.5% |
| |||||||
| California–74.6% |
| |||||||
Abag Finance Authority for Nonprofit Corps. | $ | 1,000 | $ | 1,046,578 | ||||
Anaheim Housing & Public Improvements Authority | 3,850 | 3,889,335 | ||||||
Anaheim Public Financing Authority | 4,050 | 4,238,215 | ||||||
Bay Area Toll Authority | 5,000 | 5,003,337 | ||||||
Series 2012 | 1,610 | 1,688,450 | ||||||
5.00%, 04/01/2025 (Pre-refunded/ETM) | 12,235 | 12,831,171 | ||||||
Series 2013S | 2,845 | 3,120,118 | ||||||
Bay Area Water Supply & Conservation Agency | 4,710 | 5,163,137 | ||||||
California Community Housing Agency | 5,000 | 5,170,868 | ||||||
California Community Housing Agency | 2,000 | 2,109,685 | ||||||
California County Tobacco Securitization Agency | 1,510 | 1,797,660 | ||||||
5.00%, 06/01/2027–06/01/2032 | 2,700 | 3,464,152 | ||||||
Schedule of Investments—California Municipal Portfolio | 7 |
Table of Contents
| Principal Amount (000) | U.S. $ Value | |||||||
California Educational Facilities Authority | $ | 1,545 | $ | 1,840,035 | ||||
California Health Facilities Financing Authority | 19,500 | 23,280,827 | ||||||
California Health Facilities Financing Authority | 1,215 | 1,453,163 | ||||||
California Health Facilities Financing Authority | 5,650 | 7,254,903 | ||||||
California Health Facilities Financing Authority | 9,245 | 9,942,755 | ||||||
California Health Facilities Financing Authority | 11,365 | 13,477,664 | ||||||
California Housing Finance | 11,325 | 13,127,221 | ||||||
Series 2021–1, Class A | 10,000 | 11,404,935 | ||||||
California Infrastructure & Economic Development Bank | 6,000 | 6,000,566 | ||||||
California Infrastructure & Economic Development Bank | 10,650 | 10,730,456 | ||||||
California Infrastructure & Economic Development Bank | 5,000 | 5,812,454 | ||||||
Series 2018 | 13,965 | 17,673,745 | ||||||
California Infrastructure & Economic Development Bank | 2,370 | 2,688,631 | ||||||
| Principal Amount (000) | U.S. $ Value | |||||||
Series 2016B | $ | 12,760 | $ | 13,670,594 | ||||
California Municipal Finance Authority | 1,000 | 1,216,242 | ||||||
California Municipal Finance Authority | 15,730 | 19,291,399 | ||||||
California Municipal Finance Authority | 13,440 | 15,213,866 | ||||||
California Pollution Control Financing Authority | 4,735 | 5,666,200 | ||||||
Series 2012 | 3,825 | 4,100,919 | ||||||
California Public Finance Authority | 1,500 | 1,710,630 | ||||||
California School Finance Authority | 800 | 917,923 | ||||||
California School Finance Authority | 1,450 | 1,555,249 | ||||||
Series 2016A | 1,000 | 1,098,476 | ||||||
California State Public Works Board | 1,545 | 1,595,015 | ||||||
California State Public Works Board | 11,220 | 12,901,664 | ||||||
Series 2014B | 4,445 | 5,127,024 | ||||||
Series 2017H | 5,270 | 6,489,453 | ||||||
| 8 | Sanford C. Bernstein Fund, Inc.—2021 Semi-Annual Report |
Table of Contents
| Principal Amount (000) | U.S. $ Value | |||||||
Series 2020B | $ | 2,385 | $ | 3,038,960 | ||||
Series 2021A | 11,750 | 13,821,330 | ||||||
California State University | 5,500 | 5,662,524 | ||||||
Series 2012A | 10,930 | 11,772,960 | ||||||
Series 2014A | 16,650 | 19,347,242 | ||||||
Series 2017A | 5,620 | 6,923,082 | ||||||
Series 2020A | 1,000 | 1,317,471 | ||||||
Series 2020D | 1,500 | 1,460,929 | ||||||
California Statewide Communities Development Authority | 1,210 | 1,456,397 | ||||||
California Statewide Communities Development Authority | 1,255 | 1,561,172 | ||||||
California Statewide Communities Development Authority | 540 | 710,738 | ||||||
California Statewide Communities Development Authority | 675 | 767,290 | ||||||
California Statewide Communities Development Authority | 4,500 | 5,078,772 | ||||||
Series 2018A | 1,250 | 1,486,144 | ||||||
California Statewide Communities Development Authority | 1,065 | 1,103,090 | ||||||
City & County of San Francisco CA | 7,330 | 8,298,968 | ||||||
| Principal Amount (000) | U.S. $ Value | |||||||
Series 2018E | $ | 1,490 | $ | 1,648,609 | ||||
City & County of San Francisco CA | 7,405 | 7,919,919 | ||||||
City of Hayward CA | 6,205 | 6,660,111 | ||||||
City of Los Angeles CA Wastewater System Revenue | 2,765 | 2,919,286 | ||||||
City of Los Angeles Department of Airports | 4,205 | 4,700,135 | ||||||
5.00%, 05/15/2030–05/15/2035 | 9,210 | 11,611,598 | ||||||
Series 2017A | 4,015 | 4,912,090 | ||||||
Series 2018B | 2,195 | 2,727,229 | ||||||
Series 2018C | 5,145 | 6,230,662 | ||||||
Series 2020C | 9,260 | 11,630,050 | ||||||
City of Riverside CA Sewer Revenue | 5,320 | 6,283,587 | ||||||
Series 2018A | 2,785 | 3,526,169 | ||||||
City of Roseville CA | 2,305 | 2,795,558 | ||||||
City of Roseville CA | 1,110 | 1,285,465 | ||||||
City of San Francisco CA Public Utilities Commission Water Revenue | 11,320 | 11,639,883 | ||||||
City of San Jose CA Airport Revenue | 3,600 | 4,062,265 | ||||||
Schedule of Investments—California Municipal Portfolio | 9 |
Table of Contents
| Principal Amount (000) | U.S. $ Value | |||||||
Contra Costa Transportation Authority | $ | 3,000 | $ | 3,131,615 | ||||
Series 2017A | 1,250 | 1,536,650 | ||||||
Coronado Community Development Agency Successor Agency | 4,430 | 5,135,827 | ||||||
Cotati-Rohnert Park Unified School District | 3,000 | 3,046,947 | ||||||
County of San Diego CA | 1,725 | 1,772,124 | ||||||
CSCDA Community Improvement Authority | 4,000 | 3,859,082 | ||||||
CSCDA Community Improvement Authority | 5,000 | 4,965,454 | ||||||
Desert Sands Unified School District | 1,680 | 1,706,567 | ||||||
Fontana Redevelopment Agency Successor Agency | 1,750 | 2,171,014 | ||||||
Fremont Community Facilities District No. 1 | 1,000 | 1,165,376 | ||||||
Golden State Tobacco Securitization Corp. | 7,600 | 7,737,218 | ||||||
Lake Elsinore Public Financing Authority | 1,560 | 1,640,877 | ||||||
| Principal Amount (000) | U.S. $ Value | |||||||
Long Beach Bond Finance Authority | $ | 4,025 | $ | 4,132,418 | ||||
Long Beach Unified School District | 1,000 | 1,003,547 | ||||||
Los Angeles County Metropolitan Transportation Authority | 2,000 | 2,007,089 | ||||||
Los Angeles Department of Water | 1,540 | 1,632,641 | ||||||
Series 2018A | 1,345 | 1,692,883 | ||||||
Los Angeles Department of Water & Power Power System Revenue | 3,810 | 3,854,669 | ||||||
Series 2013A | 4,005 | 4,231,678 | ||||||
Series 2013B | 2,480 | 2,503,154 | ||||||
Series 2014B | 3,790 | 4,270,393 | ||||||
Series 2014C | 21,670 | 24,891,303 | ||||||
Series 2015E | 820 | 942,205 | ||||||
Series 2018B | 1,050 | 1,083,707 | ||||||
Series 2019B | 14,750 | 16,339,466 | ||||||
Los Angeles Unified School District/CA | 5,470 | 5,533,863 | ||||||
Series 2014C | 10,365 | 11,895,220 | ||||||
Series 2015A | 1,140 | 1,153,310 | ||||||
Series 2016A | 21,945 | 25,480,469 | ||||||
Series 2017A | 1,470 | 1,690,618 | ||||||
Series 2018B | 9,020 | 11,372,239 | ||||||
Series 2020R | 3,945 | 5,221,859 | ||||||
| 10 | Sanford C. Bernstein Fund, Inc.—2021 Semi-Annual Report |
Table of Contents
| Principal Amount (000) | U.S. $ Value | |||||||
Mammoth Unified School District/CA | $ | 2,100 | $ | 2,094,018 | ||||
Metropolitan Water District of Southern California | 165 | 167,230 | ||||||
5.75%, 07/01/2021 (Pre-refunded/ETM) | 710 | 719,648 | ||||||
Series 2020C | 2,415 | 3,152,367 | ||||||
Middle Fork Project Finance Authority | 3,900 | 4,764,151 | ||||||
Natomas Unified School District BAM Series 2014 | 4,950 | 5,351,920 | ||||||
Newport Mesa Unified School District | 4,890 | 5,254,379 | ||||||
Northern California Power Agency | 3,980 | 4,215,569 | ||||||
Oakland Unified School District/Alameda County | 1,575 | 1,738,585 | ||||||
Series 2016 | 1,420 | 1,708,235 | ||||||
Palm Desert Redevelopment Agency Successor Agency | 1,000 | 1,151,560 | ||||||
Peralta Community College District | 1,820 | 2,083,711 | ||||||
Pittsburg Successor Agency Redevelopment Agency | 2,785 | 3,355,058 | ||||||
Port of Los Angeles | 2,500 | 2,537,673 | ||||||
Series 2014A | 2,565 | 2,907,739 | ||||||
Port of Oakland | 5,720 | 5,989,827 | ||||||
5.00%, 05/01/2025 (Pre-refunded/ETM) | 11,225 | 11,785,583 | ||||||
Riverside County Public Financing Authority | 3,395 | 4,043,570 | ||||||
| Principal Amount (000) | U.S. $ Value | |||||||
Romoland School District | $ | 955 | $ | 1,052,386 | ||||
Sacramento City Unified School District/CA | 4,945 | 4,996,848 | ||||||
Sacramento County Sanitation Districts Financing Authority | 1,175 | 1,216,172 | ||||||
Sacramento Municipal Utility District | 4,555 | 4,854,354 | ||||||
Sacramento Regional Transit District | 630 | 631,280 | ||||||
San Bernardino Community College District | 1,000 | 1,015,748 | ||||||
San Diego Association of Governments | 3,200 | 3,286,339 | ||||||
San Diego County Regional Airport Authority | 9,715 | 12,582,125 | ||||||
San Diego County Water Authority | 1,000 | 1,003,545 | ||||||
Series 2021A | 19,400 | 22,333,118 | ||||||
San Diego Public Facilities Financing Authority | 4,785 | 5,044,197 | ||||||
San Diego Unified School District/CA | 8,525 | 8,625,366 | ||||||
San Francisco City & County Public Utilities Commission Wastewater Revenue | 4,000 | 4,286,546 | ||||||
San Francisco City & County Redevelopment Agency Successor Agency | 2,500 | 2,650,450 | ||||||
Schedule of Investments—California Municipal Portfolio | 11 |
Table of Contents
| Principal Amount (000) | U.S. $ Value | |||||||
San Francisco City & County Redevelopment Agency Successor Agency | $ | 1,070 | $ | 1,301,597 | ||||
San Francisco Intl Airport | 3,900 | 3,913,622 | ||||||
Series 2011S | 2,145 | 2,152,449 | ||||||
5.00%, 05/01/2025 (Pre-refunded/ETM) | 855 | 858,250 | ||||||
Series 2019A | 11,015 | 13,714,340 | ||||||
Series 2019E | 10,110 | 12,552,300 | ||||||
Series 2019H | 5,500 | 6,819,977 | ||||||
San Joaquin Delta Community College District | 1,385 | 1,474,075 | ||||||
San Mateo Joint Powers Financing Authority | 20,760 | 23,788,986 | ||||||
Saugus/Hart School Facilities Financing Authority | 2,365 | 2,757,529 | ||||||
Southern California Public Power Authority | 1,030 | 1,174,184 | ||||||
Southwestern Community College District | 13,640 | 15,508,051 | ||||||
State of California | 53,535 | 70,138,305 | ||||||
Series 2011 | 1,175 | 1,198,436 | ||||||
Series 2013 | 8,890 | 9,871,102 | ||||||
Series 2014 | 18,665 | 20,567,458 | ||||||
| Principal Amount (000) | U.S. $ Value | |||||||
Series 2015B | $ | 3,330 | $ | 3,856,038 | ||||
Series 2017 | 5,540 | 6,396,271 | ||||||
Series 2018 | 5,000 | 5,361,296 | ||||||
AGM | 1,820 | 2,529,736 | ||||||
State of California Department of Water Resources | 5,690 | 6,537,022 | ||||||
Stockton Public Financing Authority | 7,665 | 7,676,893 | ||||||
Stockton Unified School District | 7,770 | 9,324,201 | ||||||
Sweetwater Union High School District | 3,205 | 3,789,366 | ||||||
BAM Series 2014 | 7,980 | 9,047,064 | ||||||
Tobacco Securitization Authority of Northern California | 4,375 | 5,220,681 | ||||||
5.00%, 06/01/2026–06/01/2032 | 6,880 | 8,765,209 | ||||||
Transbay Joint Powers Authority | 4,650 | 5,841,824 | ||||||
Turlock Irrigation District | 4,115 | 4,261,692 | ||||||
University of California | 205 | 216,081 | ||||||
5.00%, 05/15/2025 | 5,170 | 5,443,941 | ||||||
Series 2012G | 4,625 | 4,874,996 | ||||||
Series 2013A | 8,785 | 9,283,015 | ||||||
Series 2014A | 1,000 | 1,141,128 | ||||||
Series 2015A | 2,280 | 2,613,997 | ||||||
Series 2015I | 2,935 | 2,950,938 | ||||||
| 12 | Sanford C. Bernstein Fund, Inc.—2021 Semi-Annual Report |
Table of Contents
| Principal Amount (000) | U.S. $ Value | |||||||
Series 2017A | $ | 6,465 | $ | 8,062,194 | ||||
Series 2017M | 4,000 | 4,961,842 | ||||||
Series 2018O | 8,320 | 9,526,011 | ||||||
Vacaville Unified School District BAM Series 2015C | 1,000 | 1,064,314 | ||||||
|
| |||||||
| 1,061,061,590 | ||||||||
|
| |||||||
| Alabama–3.3% |
| |||||||
Southeast Alabama Gas Supply District (The) | 16,575 | 18,132,697 | ||||||
Southeast Alabama Gas Supply District (The) | 24,615 | 27,078,518 | ||||||
Tuscaloosa County Industrial Development Authority | 1,080 | 1,200,264 | ||||||
|
| |||||||
| 46,411,479 | ||||||||
|
| |||||||
| American Samoa–0.1% |
| |||||||
American Samoa Economic Development Authority | 735 | 883,006 | ||||||
|
| |||||||
| Arizona–0.1% |
| |||||||
Tempe Industrial Development Authority | 1,015 | 1,015,302 | ||||||
|
| |||||||
| Colorado–0.6% |
| |||||||
City & County of Denver CO | 3,000 | 3,191,094 | ||||||
Colorado Health Facilities Authority | 4,750 | 5,982,666 | ||||||
|
| |||||||
| 9,173,760 | ||||||||
|
| |||||||
| Connecticut–0.7% |
| |||||||
State of Connecticut | ||||||||
Series 2018B | 5,755 | 7,038,967 | ||||||
| Principal Amount (000) | U.S. $ Value | |||||||
Series 2018D | $ | 2,280 | $ | 2,828,667 | ||||
|
| |||||||
| 9,867,634 | ||||||||
|
| |||||||
| Florida–0.1% |
| |||||||
Capital Trust Agency, Inc. | 100 | 113,556 | ||||||
City of Tampa FL | 175 | 126,879 | ||||||
County of Osceola FL Transportation Revenue | 955 | 698,238 | ||||||
New River Community Development District | 405 | 0 | ||||||
Palm Beach County Health Facilities Authority | 535 | 539,937 | ||||||
|
| |||||||
| 1,478,610 | ||||||||
|
| |||||||
| Georgia–0.2% |
| |||||||
Municipal Electric Authority of Georgia | 2,300 | 2,806,985 | ||||||
|
| |||||||
| Guam–0.9% |
| |||||||
Guam Department of Education | 1,500 | 1,577,486 | ||||||
5.00%, 02/01/2040 | 1,090 | 1,168,540 | ||||||
Territory of Guam | 580 | 640,964 | ||||||
Territory of Guam | 1,860 | 2,134,273 | ||||||
Territory of Guam | 5,240 | 5,893,923 | ||||||
Territory of Guam | 1,625 | 2,005,801 | ||||||
|
| |||||||
| 13,420,987 | ||||||||
|
| |||||||
Schedule of Investments—California Municipal Portfolio | 13 |
Table of Contents
| Principal Amount (000) | U.S. $ Value | |||||||
| Illinois–2.5% |
| |||||||
Chicago Board of Education | $ | 6,000 | $ | 6,791,155 | ||||
Illinois Finance Authority | 900 | 1,080,338 | ||||||
Metropolitan Pier & Exposition Authority | 2,185 | 2,279,936 | ||||||
Series 2017B | 3,250 | 3,868,963 | ||||||
State of Illinois | 405 | 426,584 | ||||||
Series 2016 | 1,200 | 1,362,553 | ||||||
Series 2017D | 13,465 | 14,948,148 | ||||||
Series 2021A | 825 | 965,680 | ||||||
Village of Bolingbrook IL | 4,450 | 4,094,105 | ||||||
|
| |||||||
| 35,817,462 | ||||||||
|
| |||||||
| Iowa–0.3% |
| |||||||
Iowa Finance Authority | 4,220 | 4,298,940 | ||||||
|
| |||||||
| Kentucky–0.4% |
| |||||||
City of Ashland KY | 850 | 996,034 | ||||||
Kentucky Economic Development Finance Authority | 1,000 | 1,259,509 | ||||||
Kentucky Economic Development Finance Authority | 3,500 | 4,032,981 | ||||||
Kentucky Public Energy Authority | 10 | 10,961 | ||||||
|
| |||||||
| 6,299,485 | ||||||||
|
| |||||||
| Principal Amount (000) | U.S. $ Value | |||||||
| Louisiana–0.1% |
| |||||||
Parish of St. James LA | $ | 185 | $ | 208,842 | ||||
6.10%, 06/01/2038–12/01/2040(b) | 625 | 781,354 | ||||||
|
| |||||||
| 990,196 | ||||||||
|
| |||||||
| Massachusetts–0.1% |
| |||||||
Massachusetts Development Finance Agency | 1,055 | 1,269,361 | ||||||
|
| |||||||
| Michigan–0.1% |
| |||||||
City of Detroit MI | 1,745 | 2,058,118 | ||||||
|
| |||||||
| Missouri–0.0% |
| |||||||
Howard Bend Levee District | 325 | 365,907 | ||||||
|
| |||||||
| Nevada–0.1% |
| |||||||
City of Sparks NV | 575 | 580,249 | ||||||
2.75%, 06/15/2028(b) | 525 | 535,698 | ||||||
|
| |||||||
| 1,115,947 | ||||||||
|
| |||||||
| New Jersey–2.1% |
| |||||||
New Jersey Transportation Trust Fund Authority | 8,070 | 9,511,164 | ||||||
Series 2018A | 4,000 | 4,727,188 | ||||||
New Jersey Transportation Trust Fund Authority | 5,905 | 7,203,070 | ||||||
Series 2019B | 3,225 | 3,998,841 | ||||||
Tobacco Settlement Financing Corp./NJ | 4,000 | 4,744,720 | ||||||
|
| |||||||
| 30,184,983 | ||||||||
|
| |||||||
| 14 | Sanford C. Bernstein Fund, Inc.—2021 Semi-Annual Report |
Table of Contents
| Principal Amount (000) | U.S. $ Value | |||||||
| New York–1.2% |
| |||||||
Metropolitan Transportation Authority | $ | 7,250 | $ | 8,995,875 | ||||
Series 2016A | 2,065 | 2,499,029 | ||||||
Series 2017C | 2,960 | 3,582,143 | ||||||
New York Transportation Development Corp. | 1,000 | 1,097,321 | ||||||
New York Transportation Development Corp. | 220 | 245,767 | ||||||
|
| |||||||
| 16,420,135 | ||||||||
|
| |||||||
| Ohio–0.3% |
| |||||||
Buckeye Tobacco Settlement Financing Authority | 1,175 | 1,471,576 | ||||||
Ohio Air Quality Development Authority | 920 | 936,437 | ||||||
Ohio Air Quality Development Authority | 100 | 103,000 | ||||||
Ohio Water Development Authority Water Pollution Control Loan Fund | 1,125 | 1,158,750 | ||||||
|
| |||||||
| 3,669,763 | ||||||||
|
| |||||||
| Pennsylvania–0.4% |
| |||||||
Allentown Neighborhood Improvement Zone Development Authority | 2,250 | 2,683,570 | ||||||
| Principal Amount (000) | U.S. $ Value | |||||||
Hospitals & Higher Education Facilities Authority of Philadelphia (The) | $ | 2,815 | $ | 3,064,925 | ||||
|
| |||||||
| 5,748,495 | ||||||||
|
| |||||||
| Puerto Rico–0.5% |
| |||||||
Puerto Rico Highway & Transportation Authority | ||||||||
AGC Series 2005L | 740 | 913,214 | ||||||
AGC Series 2007C | 150 | 184,702 | ||||||
NATL Series 2005L | 3,675 | 4,036,447 | ||||||
Puerto Rico Sales Tax Financing Corp. Sales Tax Revenue | 1,421 | 1,333,680 | ||||||
|
| |||||||
| 6,468,043 | ||||||||
|
| |||||||
| South Carolina–0.4% |
| |||||||
Patriots Energy Group Financing Agency | 5,000 | 5,457,962 | ||||||
|
| |||||||
| Tennessee–0.1% |
| |||||||
Chattanooga Health Educational & Housing Facility Board | 1,000 | 1,259,509 | ||||||
|
| |||||||
| Texas–0.4% |
| |||||||
Mission Economic Development Corp. | 3,205 | 3,406,065 | ||||||
Texas Municipal Gas Acquisition and Supply Corp. I | 1,370 | 1,609,634 | ||||||
|
| |||||||
| 5,015,699 | ||||||||
|
| |||||||
| Washington–0.2% |
| |||||||
Washington Health Care Facilities Authority | 2,575 | 3,256,123 | ||||||
|
| |||||||
Schedule of Investments—California Municipal Portfolio | 15 |
Table of Contents
| Principal Amount (000) | U.S. $ Value | |||||||
| Wisconsin–0.7% |
| |||||||
UMA Education, Inc. | $ | 3,695 | $ | 4,265,124 | ||||
Wisconsin Public Finance Authority | 5,335 | 5,859,787 | ||||||
|
| |||||||
| 10,124,911 | ||||||||
|
| |||||||
| Total Long-Term Municipal Bonds (cost $1,231,747,627) |
| 1,285,940,392 | ||||||
|
| |||||||
| Short-Term Municipal Notes–8.5% |
| |||||||
| California–8.5% |
| |||||||
Abag Finance Authority for Nonprofit Corps. | 5,950 | 5,950,000 | ||||||
Series 2009D | 7,770 | 7,770,000 | ||||||
California Health Facilities Financing Authority | 3,450 | 3,450,000 | ||||||
Series 2009C | 5,400 | 5,400,000 | ||||||
California State Public Works Board | 6,950 | 7,046,093 | ||||||
Series 2022A | 5,250 | 5,333,923 | ||||||
California Statewide Communities Development Authority | 3,370 | 3,370,000 | ||||||
Calleguas-Las Virgenes Public Financing Authority | 700 | 700,000 | ||||||
0.05%, 07/01/2037(h) | 500 | 500,000 | ||||||
City & County of San Francisco CA | 8,670 | 8,670,000 | ||||||
| Principal Amount (000) | U.S. $ Value | |||||||
City of Los Angeles CA | $ | 13,510 | $ | 13,631,098 | ||||
County of Los Angeles CA | 15,745 | 15,896,731 | ||||||
County of San Bernardino CA | 2,200 | 2,200,000 | ||||||
Northern California Power Agency | 10,990 | 10,990,000 | ||||||
Orange County Water District | 5,340 | 5,340,000 | ||||||
Riverside County Asset Leasing Corp. | 13,065 | 13,065,000 | ||||||
San Francisco City & County Redevelopment Agency Successor Agency | 2,045 | 2,045,000 | ||||||
Santa Clara County Financing Authority | 5,655 | 5,655,000 | ||||||
Tobacco Securitization Authority of Northern California | 4,525 | 4,544,331 | ||||||
|
| |||||||
| Total Short-Term Municipal Notes (cost $121,537,136) |
| 121,557,176 | ||||||
|
| |||||||
| Total Municipal Obligations (cost $1,353,284,763) |
| 1,407,497,568 | ||||||
|
| |||||||
| COLLATERALIZED MORTGAGE OBLIGATIONS–0.3% |
| |||||||
| Risk Share Floating Rate–0.3% |
| |||||||
Federal Home Loan Mortgage Corp. Structured Agency Credit Risk Debt Notes | 141 | 140,533 | ||||||
Series 2016-DNA1, Class M3 5.659% (LIBOR 1 Month + 5.55%), 07/25/2028(a) | 197 | 206,653 | ||||||
Series 2016-DNA4, Class M3 3.909% (LIBOR 1 Month + 3.80%), 03/25/2029(a) | 236 | 245,628 | ||||||
| 16 | Sanford C. Bernstein Fund, Inc.—2021 Semi-Annual Report |
Table of Contents
| Principal Amount (000) | U.S. $ Value | |||||||
Series 2016-HQA3, Class M3 3.959% (LIBOR 1 Month + 3.85%), 03/25/2029(a) | $ | 541 | $ | 560,457 | ||||
Series 2016-HQA4, Class M3 4.009% (LIBOR 1 Month + 3.90%), 04/25/2029(a) | 245 | 253,593 | ||||||
Series 2017-DNA3, Class M2 2.609% (LIBOR 1 Month + 2.50%), 03/25/2030(a) | 250 | 254,746 | ||||||
Series 2017-HQA3, Class M2 2.459% (LIBOR 1 Month + 2.35%), 04/25/2030(a) | 181 | 183,175 | ||||||
Series 2016-HQA2, Class M3 5.259% (LIBOR 1 Month + 5.15%), 11/25/2028(a) | 213 | 221,728 | ||||||
Series 2017-HQA1, Class M2 3.659% (LIBOR 1 Month + 3.55%), 08/25/2029(a) | 241 | 246,732 | ||||||
Federal National Mortgage Association Connecticut Avenue Securities | ||||||||
Series 2014-C03, Class 2M2 3.009% (LIBOR 1 Month + 2.90%), 07/25/2024(a) | 200 | 201,597 | ||||||
Series 2014-C04, Class 1M2 5.009% (LIBOR 1 Month + 4.90%), 11/25/2024(a) | 108 | 111,696 | ||||||
Series 2015-C01, Class 2M2 4.659% (LIBOR 1 Month + 4.55%), 02/25/2025(a) | 12 | 12,306 | ||||||
Series 2015-C02, Class 1M2 4.109% (LIBOR 1 Month + 4.00%), 05/25/2025(a) | 79 | 80,053 | ||||||
Series 2015-C03, Class 1M2 5.109% (LIBOR 1 Month + 5.00%), 07/25/2025(a) | 79 | 80,957 | ||||||
| Principal Amount (000) | U.S. $ Value | |||||||
Series 2016-C01, Class 1M2 6.859% (LIBOR 1 Month + 6.75%), 08/25/2028(a) | $ | 198 | $ | 209,256 | ||||
Series 2016-C02, Class 1M2 6.109% (LIBOR 1 Month + 6.00%), 09/25/2028(a) | 115 | 121,106 | ||||||
Series 2016-C03, Class 1M2 5.409% (LIBOR 1 Month + 5.30%), 10/25/2028(a) | 158 | 166,120 | ||||||
Series 2017-C02, Class 2M2 3.759% (LIBOR 1 Month + 3.65%), 09/25/2029(a) | 606 | 622,061 | ||||||
Series 2017-C03, Class 1M2 3.109% (LIBOR 1 Month + 3.00%), 10/25/2029(a) | 248 | 253,168 | ||||||
Series 2017-C05, Class 1M2 2.309% (LIBOR 1 Month + 2.20%), 01/25/2030(a) | 241 | 243,673 | ||||||
Series 2017-C06, Class 2M2 2.909% (LIBOR 1 Month + 2.80%), 02/25/2030(a) | 159 | 160,318 | ||||||
|
| |||||||
| Total Collateralized Mortgage Obligations (cost $4,310,824) |
| 4,575,556 | ||||||
|
| |||||||
| GOVERNMENTS-TREASURIES–0.2% |
| |||||||
| United States–0.2% |
| |||||||
U.S. Treasury Notes | 2,346 | 2,535,879 | ||||||
|
| |||||||
| Total Investments—99.5% (cost $1,360,051,763) |
| 1,414,609,003 | ||||||
Other assets less liabilities—0.5% |
| 6,818,041 | ||||||
|
| |||||||
| Net Assets—100.0% |
| $ | 1,421,427,044 | |||||
|
| |||||||
CENTRALLY CLEARED INFLATION (CPI) SWAPS (see Note 3)
| Rate Type | ||||||||||||||||||||||||
| Notional Amount (000) | Termination Date | Payments made by the Fund | Payments received by the Fund | Payment Frequency Paid/Received | Market Value | Upfront Premiums Paid/ (Received) | Unrealized Appreciation/ (Depreciation) | |||||||||||||||||
| USD | 5,605 | 01/15/2025 | 2.565% | CPI# | Maturity | $ | 11,664 | $ | — | $ | 11,664 | |||||||||||||
| USD | 2,803 | 01/15/2025 | 2.613% | CPI# | Maturity | 201 | — | 201 | ||||||||||||||||
| USD | 2,802 | 01/15/2025 | 2.585% | CPI# | Maturity | 3,461 | — | 3,461 | ||||||||||||||||
| USD | 21,750 | 01/15/2028 | 1.230% | CPI# | Maturity | 2,086,373 | — | 2,086,373 | ||||||||||||||||
| USD | 15,980 | 01/15/2028 | 0.735% | CPI# | Maturity | 2,156,788 | — | 2,156,788 | ||||||||||||||||
| USD | 4,115 | 01/15/2030 | 1.572% | CPI# | Maturity | 356,254 | — | 356,254 | ||||||||||||||||
| USD | 4,115 | 01/15/2030 | 1.587% | CPI# | Maturity | 350,013 | — | 350,013 | ||||||||||||||||
| USD | 4,300 | 02/15/2041 | CPI# | 2.282% | Maturity | (161,045 | ) | — | (161,045 | ) | ||||||||||||||
|
|
|
|
|
| |||||||||||||||||||
| $ | 4,803,709 | $ | — | $ | 4,803,709 | |||||||||||||||||||
|
|
|
|
|
| |||||||||||||||||||
# Variable interest rate based on the rate of inflation as determined by the Consumer Price Index (CPI).
Schedule of Investments—California Municipal Portfolio | 17 |
Table of Contents
CENTRALLY CLEARED INTEREST RATE SWAPS (see Note 3)
| Rate Type | ||||||||||||||||||||||||||
Notional | Termination Date | Payments made by the Fund | Payments received by the Fund | Payment Frequency Paid/Received | Market Value | Upfront Premiums Paid/ (Received) | Unrealized Appreciation/ (Depreciation) | |||||||||||||||||||
| USD | 35,040 | 02/06/2025 | 3 Month LIBOR | 0.378% | Quarterly/Semi-Annual | $ | (494,568 | ) | $ | — | $ | (494,568 | ) | |||||||||||||
| USD | 35,660 | 02/15/2025 | 3 Month LIBOR | 0.332% | Quarterly/Semi-Annual | (588,733 | ) | — | (588,733 | ) | ||||||||||||||||
| USD | 17,500 | 01/15/2028 | 1.173% | 3 Month LIBOR | Semi-Annual/Quarterly | 256,834 | — | 256,834 | ||||||||||||||||||
| USD | 8,030 | 11/05/2035 | 1.130% | 3 Month LIBOR | Semi-Annual/Quarterly | 954,215 | — | 954,215 | ||||||||||||||||||
| USD | 2,100 | 02/15/2041 | 1.868% | 3 Month LIBOR | Semi-Annual/Quarterly | 98,021 | — | 98,021 | ||||||||||||||||||
|
|
|
|
|
| |||||||||||||||||||||
| $ | 225,769 | $ | — | $ | 225,769 | |||||||||||||||||||||
|
|
|
|
|
| |||||||||||||||||||||
CREDIT DEFAULT SWAPS (see Note 3)
Swap Counterparty & | Fixed Rate (Pay) Receive | Payment Frequency | Implied Credit Spread at March 31, 2021 | Notional Amount (000) | Market Value | Upfront Premiums Paid/ (Received) | Unrealized Appreciation/ (Depreciation) | |||||||||||||||||||||||||
| Sale Contracts | ||||||||||||||||||||||||||||||||
Citigroup Global Markets, Inc. | ||||||||||||||||||||||||||||||||
| CDX-CMBX.NA.BBB- Series 6, 05/11/2063* | 3.00 | % | Monthly | 12.50 | % | USD | 1,399 | $ | (376,891 | ) | $ | (178,059 | ) | $ | (198,832 | ) | ||||||||||||||||
| CDX-CMBX.NA.BBB- Series 6, 05/11/2063* | 3.00 | Monthly | 12.50 | USD | 121 | (32,598 | ) | (11,725 | ) | (20,873 | ) | |||||||||||||||||||||
Credit Suisse International | ||||||||||||||||||||||||||||||||
| CDX-CMBX.NA.BBB- Series 6, 05/11/2063* | 3.00 | Monthly | 12.50 | USD | 1 | (269 | ) | (121 | ) | (148 | ) | |||||||||||||||||||||
| CDX-CMBX.NA.BBB- Series 6, 05/11/2063* | 3.00 | Monthly | 12.50 | USD | 825 | (222,186 | ) | (80,776 | ) | (141,410 | ) | |||||||||||||||||||||
| CDX-CMBX.NA.BBB- Series 6, 05/11/2063* | 3.00 | Monthly | 12.50 | USD | 66 | (17,780 | ) | (6,454 | ) | (11,326 | ) | |||||||||||||||||||||
| CDX-CMBX.NA.BBB- Series 6, 05/11/2063* | 3.00 | Monthly | 12.50 | USD | 1,242 | (334,595 | ) | (118,482 | ) | (216,113 | ) | |||||||||||||||||||||
Goldman Sachs International | ||||||||||||||||||||||||||||||||
| CDX-CMBX.NA.BBB- Series 6, 05/11/2063* | 3.00 | Monthly | 12.50 | USD | 1,076 | (289,874 | ) | (99,631 | ) | (190,243 | ) | |||||||||||||||||||||
|
|
|
|
|
| |||||||||||||||||||||||||||
| $ | (1,274,193 | ) | $ | (495,248 | ) | $ | (778,945 | ) | ||||||||||||||||||||||||
|
|
|
|
|
| |||||||||||||||||||||||||||
* Termination date
INTEREST RATE SWAPS (see Note 3)
| Rate Type | ||||||||||||||||||||||||||||||||||
Swap | Notional Amount (000) | Termination Date | Payments made by the Fund | Payments received by the Fund | Payment Frequency Paid/Received | Market Value | Upfront Premiums Paid/ (Received) | Unrealized Appreciation/ (Depreciation) | ||||||||||||||||||||||||||
| Citibank, NA | USD | 12,395 | 10/09/2029 | 1.120% | SIFMA* | Quarterly | $ | 34,978 | $ | — | $ | 34,978 | ||||||||||||||||||||||
| Citibank, NA | USD | 12,395 | 10/09/2029 | 1.125% | SIFMA* | Quarterly | 29,251 | — | 29,251 | |||||||||||||||||||||||||
|
|
|
|
|
| |||||||||||||||||||||||||||||
| $ | 64,229 | $ | — | $ | 64,229 | |||||||||||||||||||||||||||||
|
|
|
|
|
| |||||||||||||||||||||||||||||
* Variable interest rate based on the Securities Industry & Financial Markets Association (SIFMA) Municipal Swap Index.
| 18 | Sanford C. Bernstein Fund, Inc.—2021 Semi-Annual Report |
Table of Contents
| (a) | Floating Rate Security. Stated interest/floor/ceiling rate was in effect at March 31, 2021. |
| (b) | Security is exempt from registration under Rule 144A of the Securities Act of 1933. These securities are considered restricted, but liquid and may be resold in transactions exempt from registration, normally to qualified institutional buyers. At March 31, 2021, the aggregate market value of these securities amounted to $56,184,606 or 4.0% of net assets. |
| (c) | When-Issued or delayed delivery security. |
| (d) | Fair valued by the Adviser. |
| (e) | Defaulted matured security. |
| (f) | Non-income producing security. |
| (g) | Security in which significant unobservable inputs (Level 3) were used in determining fair value. |
| (h) | Variable Rate Demand Notes are instruments whose interest rates change on a specific date (such as coupon date or interest payment date) or whose interest rates vary with changes in a designated base rate (such as the prime interest rate). This instrument is payable on demand and is secured by letters of credit or other credit support agreements from major banks. |
| (i) | Position, or a portion thereof, has been segregated to collateralize OTC derivatives outstanding. |
As of March 31, 2021, the Portfolio’s percentages of investments in municipal bonds that are insured and in insured municipal bonds that have been pre-refunded or escrowed to maturity are 4.3% and 0.0%, respectively.
Glossary:
AGC—Assured Guaranty Corporation
AGM—Assured Guaranty Municipal
AMBAC—Ambac Assurance Corporation
BAM—Build American Mutual
CCRC—Congregate Care Retirement Center
CDX-CMBX.NA—North American Commercial Mortgage-Backed Index
COP—Certificate of Participation
CPI—Consumer Price Index
DOT—Department of Transportation
ETM—Escrowed to Maturity
LIBOR—London Interbank Offered Rate
MUNIPSA—Municipal Swap Index
NATL—National Interstate Corporation
SRF—State Revolving Fund
XLCA—XL Capital Assurance Inc.
See notes to financial statements.
Sanford C. Bernstein Fund, Inc.
Schedule of Investments
Diversified Municipal Portfolio
March 31, 2021 (unaudited)
| Principal Amount (000) | U.S. $ Value | |||||||
| MUNICIPAL OBLIGATIONS–96.5% |
| |||||||
| Long-Term Municipal Bonds–86.2% |
| |||||||
| Alabama–2.2% |
| |||||||
Alabama Federal Aid Highway Finance Authority | $ | 1,390 | $ | 1,603,676 | ||||
Alabama Public School & College Authority | 3,200 | 3,315,049 | ||||||
Black Belt Energy Gas District | 19,925 | 22,721,444 | ||||||
Lower Alabama Gas District (The) | 2,675 | 3,047,762 | ||||||
Southeast Alabama Gas Supply District (The) | 23,985 | 26,239,079 | ||||||
Southeast Alabama Gas Supply District (The) | 69,310 | 76,246,684 | ||||||
Tuscaloosa County Industrial Development Authority | 4,940 | 5,490,095 | ||||||
5.25%, 05/01/2044(a) | 2,775 | 3,153,555 | ||||||
|
| |||||||
| 141,817,344 | ||||||||
|
| |||||||
| Alaska–0.3% |
| |||||||
Municipality of Anchorage AK | 8,810 | 9,782,673 | ||||||
Series 2015C | 7,370 | 8,190,637 | ||||||
|
| |||||||
| 17,973,310 | ||||||||
|
| |||||||
| American Samoa–0.0% |
| |||||||
American Samoa Economic Development Authority | 1,920 | 2,306,628 | ||||||
|
| |||||||
Schedule of Investments—Diversified Municipal Portfolio | 19 |
Table of Contents
| Principal Amount (000) | U.S. $ Value | |||||||
| Arizona–1.7% |
| |||||||
Arizona Board of Regents | $ | 2,365 | $ | 2,487,049 | ||||
Arizona Department of Transportation State Highway Fund Revenue | 6,460 | 6,535,738 | ||||||
Arizona Health Facilities Authority (HonorHealth) | 2,770 | 3,166,901 | ||||||
Arizona Industrial Development Authority | 1,000 | 1,282,286 | ||||||
City of Glendale AZ | 16,955 | 18,942,309 | ||||||
City of Phoenix Civic Improvement Corp. | 13,225 | 17,328,770 | ||||||
Series 2020A | 8,895 | 11,669,847 | ||||||
Maricopa County Special Health Care District | 6,000 | 7,547,687 | ||||||
Salt Verde Financial Corp. | 1,430 | 1,472,787 | ||||||
State of Arizona Lottery Revenue | 30,105 | 34,584,565 | ||||||
Tempe Industrial Development Authority | 5,490 | 5,491,633 | ||||||
|
| |||||||
| 110,509,572 | ||||||||
|
| |||||||
| Arkansas–0.0% |
| |||||||
City of Fayetteville AR | 2,475 | 2,470,487 | ||||||
|
| |||||||
| California–5.7% |
| |||||||
California Community Housing Agency | $ | 10,000 | $ | 10,341,736 | ||||
California Housing Finance | 10,813 | 12,533,682 | ||||||
Series 2021-1, Class A | 3,500 | 3,991,727 | ||||||
California Municipal Finance Authority | 365 | 413,174 | ||||||
California State Public Works Board | 1,225 | 1,415,723 | ||||||
Series 2021A | 12,040 | 14,549,819 | ||||||
City of Los Angeles Department of Airports | 5,840 | 7,049,973 | ||||||
City of Riverside CA Electric Revenue | 5,230 | 6,696,540 | ||||||
Golden State Tobacco Securitization Corp. | 10,960 | 11,157,883 | ||||||
Los Angeles Unified School District/CA | 10,000 | 12,656,562 | ||||||
Series 2020R | 2,780 | 3,658,330 | ||||||
Metropolitan Water District of Southern California | 7,550 | 9,545,152 | ||||||
San Francisco Intl Airport | 5,880 | 5,900,537 | ||||||
State of California | 87,775 | 114,021,636 | ||||||
Series 2013 | 43,465 | 48,697,502 | ||||||
Series 2014 | 80,965 | 92,275,549 | ||||||
| 20 | Sanford C. Bernstein Fund, Inc.—2021 Semi-Annual Report |
Table of Contents
| Principal Amount (000) | U.S. $ Value | |||||||
University of California | $ | 10,000 | $ | 12,845,932 | ||||
|
| |||||||
| 367,751,457 | ||||||||
|
| |||||||
| Colorado–1.9% |
| |||||||
Centerra Metropolitan District No. 1 | 3,680 | 3,911,371 | ||||||
City & County of Denver CO Airport System Revenue | 1,025 | 1,101,503 | ||||||
Series 2016A | 4,085 | 4,584,800 | ||||||
Series 2018A | 46,840 | 57,335,138 | ||||||
City & County of Denver Co. Airport System Revenue | 5,605 | 6,031,299 | ||||||
Series 2018A | 24,320 | 30,825,865 | ||||||
Colorado Health Facilities Authority | 5,265 | 6,612,428 | ||||||
Colorado Health Facilities Authority | 5,900 | 7,491,028 | ||||||
Vauxmont Metropolitan District | 1,000 | 1,057,229 | ||||||
5.00%, 12/01/2024–12/01/2050 | 2,030 | 2,443,160 | ||||||
|
| |||||||
| 121,393,821 | ||||||||
|
| |||||||
| Connecticut–3.2% |
| |||||||
City of Bridgeport CT | 2,420 | 2,801,295 | ||||||
Series 2017B | 12,195 | 14,776,119 | ||||||
5.00%, 08/15/2027 (Pre-refunded/ETM) | 755 | 951,808 | ||||||
Series 2017C | 8,950 | 10,702,640 | ||||||
Connecticut State Health & Educational Facilities Authority | 5,425 | 6,765,084 | ||||||
Connecticut State Health & Educational Facilities Authority | ||||||||
Series 2018K-1 | 4,400 | 5,175,723 | ||||||
State of Connecticut | $ | 3,370 | $ | 3,456,377 | ||||
Series 2014A | 6,360 | 7,165,563 | ||||||
Series 2015B | 7,345 | 8,557,806 | ||||||
Series 2015F | 1,570 | 1,865,747 | ||||||
Series 2016A | 17,305 | 20,514,415 | ||||||
Series 2016B | 17,090 | 17,182,219 | ||||||
Series 2016E | 20,025 | 23,336,439 | ||||||
Series 2017A | 8,450 | 8,869,823 | ||||||
Series 2017B | 2,515 | 3,189,692 | ||||||
Series 2018C | 5,500 | 6,692,277 | ||||||
Series 2018D | 16,655 | 20,170,556 | ||||||
Series 2020A | 2,565 | 3,228,694 | ||||||
State of Connecticut Special Tax Revenue | 1,000 | 1,164,818 | ||||||
5.00%, 05/01/2028–05/01/2038 | 11,780 | 15,106,503 | ||||||
Series 2012 | 8,575 | 9,099,012 | ||||||
Town of Stratford CT | 13,370 | 16,030,604 | ||||||
|
| |||||||
| 206,803,214 | ||||||||
|
| |||||||
| Delaware–0.1% |
| |||||||
Delaware River & Bay Authority | 5,470 | 6,116,906 | ||||||
Delaware State Economic Development Authority | 575 | 659,677 | ||||||
5.00%, 09/01/2050 | 1,000 | 1,174,195 | ||||||
|
| |||||||
| 7,950,778 | ||||||||
|
| |||||||
| District of Columbia–1.9% |
| |||||||
District of Columbia | 59,115 | 65,057,794 | ||||||
District of Columbia | 5,545 | 5,980,080 | ||||||
Metropolitan Washington Airports Authority | 1,155 | 1,447,704 | ||||||
Schedule of Investments—Diversified Municipal Portfolio | 21 |
Table of Contents
| Principal Amount (000) | U.S. $ Value | |||||||
Series 2019A | $ | 8,840 | $ | 11,211,611 | ||||
Series 2020A | 26,400 | 34,053,944 | ||||||
Washington Metropolitan Area Transit Authority | 3,205 | 4,155,747 | ||||||
|
| |||||||
| 121,906,880 | ||||||||
|
| |||||||
| Florida–5.1% |
| |||||||
Capital Trust Agency, Inc. | 510 | 564,937 | ||||||
Central Florida Expressway Authority | 11,335 | 14,590,539 | ||||||
Citizens Property Insurance, Inc. | 27,105 | 28,615,632 | ||||||
Series 2015A | 1,795 | 1,851,776 | ||||||
City Of South Miami Health Facilities Authority, Inc. | 5,000 | 6,117,130 | ||||||
City of Tampa FL | 1,300 | 886,290 | ||||||
City of Tampa FL Water & Wastewater System Revenue | 3,895 | 3,988,455 | ||||||
County of Broward FL Airport System Revenue | 1,070 | 1,341,036 | ||||||
Series 2019C | 1,250 | 1,312,856 | ||||||
County of Broward FL Airport System Revenue | 5,000 | 5,355,068 | ||||||
County of Lee FL Airport Revenue | $ | 13,095 | $ | 13,327,886 | ||||
5.625%, 10/01/2025 | 2,550 | 2,596,345 | ||||||
County of Miami-Dade FL | 3,715 | 3,938,400 | ||||||
County of Miami-Dade FL Aviation Revenue | 4,975 | 5,514,447 | ||||||
County of Osceola FL Transportation Revenue | ||||||||
Zero Coupon, | 4,610 | 3,373,919 | ||||||
Duval County School Board | 4,280 | 5,027,594 | ||||||
Florida Department of Environmental Protection | 10,225 | 10,839,876 | ||||||
Florida Development Finance Corp. | 3,765 | 4,201,153 | ||||||
Florida Municipal Power Agency | 3,765 | 4,442,959 | ||||||
Florida State Board of Education | 3,545 | 3,743,850 | ||||||
Series 2017F | 2,775 | 2,796,185 | ||||||
Greater Orlando Aviation Authority | 13,335 | 16,241,794 | ||||||
Series 2019A | 7,975 | 10,001,246 | ||||||
Hillsborough County School Board | 1,480 | 1,745,975 | ||||||
Hillsborough County School Board | 2,650 | 2,951,105 | ||||||
Hollywood Community Redevelopment Agency | 3,645 | 3,848,549 | ||||||
| 22 | Sanford C. Bernstein Fund, Inc.—2021 Semi-Annual Report |
Table of Contents
| Principal Amount (000) | U.S. $ Value | |||||||
JEA Electric System Revenue | $ | 1,185 | $ | 1,473,794 | ||||
JEA Water & Sewer System Revenue | 1,565 | 1,779,679 | ||||||
5.00%, 10/01/2025 | 1,495 | 1,701,018 | ||||||
Series 2017A | 22,290 | 27,463,935 | ||||||
Manatee County School District | 14,010 | 16,863,146 | ||||||
North Broward Hospital District | 6,180 | 7,558,580 | ||||||
Orange County Health Facilities Authority | 18,515 | 20,564,401 | ||||||
Orange County School Board | 25,075 | 28,967,864 | ||||||
5.00%, 08/01/2029 (Pre-refunded/ETM) | 21,280 | 24,583,694 | ||||||
Palm Beach County Health Facilities Authority | 2,355 | 2,376,730 | ||||||
Polk County Industrial Development Authority | 2,000 | 2,109,405 | ||||||
Reedy Creek Improvement District | 1,820 | 1,833,691 | ||||||
South Broward Hospital District | 3,350 | 3,903,165 | ||||||
St. Lucie County School Board | 3,150 | 3,368,305 | ||||||
State Board of Administration Finance Corp. | 14,015 | 14,144,999 | ||||||
1.705%, 07/01/2027 | 9,575 | 9,610,180 | ||||||
Tampa Bay Water | $ | 2,050 | $ | 2,099,116 | ||||
|
| |||||||
| 329,616,704 | ||||||||
|
| |||||||
| Georgia–1.2% |
| |||||||
City of Atlanta GA Department of Aviation | 12,250 | 13,737,351 | ||||||
Cobb County Kennestone Hospital Authority | 2,275 | 2,829,296 | ||||||
Forsyth County Water & Sewerage Authority | 1,050 | 1,351,874 | ||||||
Main Street Natural Gas, Inc. | 34,735 | 37,507,839 | ||||||
Series 2018C | 18,000 | 19,563,046 | ||||||
Private Colleges & Universities Authority | 1,280 | 1,553,163 | ||||||
|
| |||||||
| 76,542,569 | ||||||||
|
| |||||||
| Guam–0.0% |
| |||||||
Territory of Guam | 1,000 | 1,105,111 | ||||||
|
| |||||||
| Hawaii–0.3% |
| |||||||
City & County of Honolulu HI | 7,865 | 9,244,050 | ||||||
State of Hawaii | 7,105 | 7,942,419 | ||||||
State of Hawaii Harbor System Revenue | 2,765 | 3,238,312 | ||||||
|
| |||||||
| 20,424,781 | ||||||||
|
| |||||||
| Idaho–0.1% |
| |||||||
Idaho Housing & Finance Association | 4,675 | 5,001,507 | ||||||
|
| |||||||
| Illinois–5.7% |
| |||||||
Chicago Board of Education | 7,000 | 7,719,834 | ||||||
Schedule of Investments—Diversified Municipal Portfolio | 23 |
Table of Contents
| Principal Amount (000) | U.S. $ Value | |||||||
Series 2018A | $ | 5,500 | $ | 5,787,696 | ||||
5.00%, 12/01/2026 | 1,000 | 1,176,688 | ||||||
Chicago O’Hare International Airport | 3,020 | 3,598,613 | ||||||
Chicago Transit Authority | 7,460 | 7,843,596 | ||||||
Illinois Finance Authority | 4,485 | 5,372,760 | ||||||
Illinois Finance Authority | 7,785 | 10,164,468 | ||||||
Illinois Finance Authority | 3,350 | 3,774,376 | ||||||
Illinois Finance Authority | 16,850 | 22,577,821 | ||||||
Illinois Municipal Electric Agency | 42,820 | 50,481,503 | ||||||
Illinois State Toll Highway Authority | 9,020 | 9,302,869 | ||||||
Series 2014D | 1,185 | 1,282,383 | ||||||
Metropolitan Pier & Exposition Authority | 565 | 596,565 | ||||||
5.00%, 06/15/2023–12/15/2028 | 13,575 | 14,196,202 | ||||||
Railsplitter Tobacco Settlement Authority | 12,450 | 14,525,942 | ||||||
Series 2017 | 19,260 | 21,075,167 | ||||||
State of Illinois | 1,500 | 1,845,420 | ||||||
Series 2012 | 20,610 | 21,590,683 | ||||||
5.50%, 07/01/2024 | 5,415 | 5,947,801 | ||||||
Series 2013A | 4,415 | 4,781,540 | ||||||
Series 2014 | 36,040 | 40,189,936 | ||||||
Series 2016 | 15,990 | 17,632,602 | ||||||
Series 2017A | 8,590 | 9,776,303 | ||||||
Series 2017D | $ | 66,070 | $ | 75,202,223 | ||||
Series 2019B | 9,000 | 10,080,981 | ||||||
State of Illinois | 2,525 | 2,642,643 | ||||||
Town of Cortland IL | 5,078 | 939,430 | ||||||
|
| |||||||
| 370,106,045 | ||||||||
|
| |||||||
| Indiana–0.2% |
| |||||||
City of Whiting IN | 9,670 | 11,737,889 | ||||||
|
| |||||||
| Iowa–0.3% |
| |||||||
PEFA, Inc. | 14,000 | 16,873,231 | ||||||
|
| |||||||
| Kansas–0.1% |
| |||||||
City of Junction City KS | 3,805 | 4,205,548 | ||||||
|
| |||||||
| Kentucky–2.6% |
| |||||||
County of Carroll KY | 3,835 | 3,833,635 | ||||||
Kentucky Economic Development Finance Authority | 1,000 | 1,224,821 | ||||||
Kentucky Economic Development Finance Authority | 14,650 | 16,910,571 | ||||||
Kentucky Public Energy Authority | 24,850 | 27,494,497 | ||||||
Kentucky Public Energy Authority | 41,090 | 45,037,812 | ||||||
Series 2018C | 36,475 | 41,043,891 | ||||||
Series 2019A | 10,855 | 12,225,235 | ||||||
| 24 | Sanford C. Bernstein Fund, Inc.—2021 Semi-Annual Report |
Table of Contents
| Principal Amount (000) | U.S. $ Value | |||||||
Kentucky Turnpike Authority | $ | 8,490 | $ | 9,003,833 | ||||
Series 2016A | 13,375 | 15,606,137 | ||||||
|
| |||||||
| 172,380,432 | ||||||||
|
| |||||||
| Louisiana–0.4% |
| |||||||
Consolidated Govt of the City of Baton Rouge & Parish of E Baton Rouge Sales Tax | 8,985 | 10,598,950 | ||||||
Parish of St. James LA | 2,250 | 2,539,972 | ||||||
6.10%, 06/01/2038–12/01/2040(a) | 5,625 | 7,032,186 | ||||||
St. Tammany Parish Finance Authority | 1,200 | 1,313,237 | ||||||
State of Louisiana Gasoline & Fuels Tax Revenue | 3,250 | 3,835,280 | ||||||
|
| |||||||
| 25,319,625 | ||||||||
|
| |||||||
| Maine–0.0% |
| |||||||
Maine Municipal Bond Bank | 1,000 | 1,149,149 | ||||||
|
| |||||||
| Maryland–0.4% |
| |||||||
City of Baltimore MD | 2,000 | 2,049,514 | ||||||
County of Frederick MD | 2,265 | 2,863,203 | ||||||
County of Howard MD | 8,465 | 11,317,893 | ||||||
County of Montgomery MD | 2,115 | 2,554,661 | ||||||
Maryland Health & Higher Educational Facilities Authority | 4,285 | 5,521,847 | ||||||
State of Maryland | 1,865 | 2,357,560 | ||||||
Series 2020A | 1,000 | 1,251,924 | ||||||
University System of Maryland | $ | 1,125 | $ | 1,125,000 | ||||
|
| |||||||
| 29,041,602 | ||||||||
|
| |||||||
| Massachusetts–1.7% |
| |||||||
Commonwealth of Massachusetts | 3,965 | 4,390,381 | ||||||
Series 2017D | 4,435 | 5,449,399 | ||||||
Series 2018B | 3,685 | 4,646,905 | ||||||
Series 2020 | 1,925 | 2,363,025 | ||||||
Series 2020E | 3,805 | 4,839,516 | ||||||
Massachusetts Bay Transportation Authority | 6,600 | 9,375,261 | ||||||
Massachusetts Development Finance Agency | 15,375 | 19,066,124 | ||||||
Massachusetts Development Finance Agency | 24,065 | 29,647,615 | ||||||
Massachusetts Development Finance Agency | 950 | 1,222,349 | ||||||
Massachusetts Development Finance Agency | 7,525 | 9,384,674 | ||||||
AGM Series 2020C | 2,405 | 3,041,048 | ||||||
Massachusetts Port Authority | 5,615 | 7,256,536 | ||||||
Massachusetts School Building Authority | 455 | 484,929 | ||||||
Schedule of Investments—Diversified Municipal Portfolio | 25 |
Table of Contents
| Principal Amount (000) | U.S. $ Value | |||||||
Massachusetts School Building Authority | $ | 10,225 | $ | 10,892,312 | ||||
|
| |||||||
| 112,060,074 | ||||||||
|
| |||||||
| Michigan–4.8% |
| |||||||
Great Lakes Water Authority Water Supply System Revenue | 12,505 | 14,700,671 | ||||||
Kalamazoo Economic Development Corp. | 1,150 | 1,153,215 | ||||||
Lake Orion Community School District | 2,915 | 3,324,734 | ||||||
Michigan Finance Authority | 48,585 | 57,351,250 | ||||||
Michigan Finance Authority | 500 | 503,172 | ||||||
3.80%, 10/01/2022 | 500 | 510,915 | ||||||
3.875%, 10/01/2023 | 2,000 | 2,065,616 | ||||||
4.00%, 10/01/2024 | 3,000 | 3,132,739 | ||||||
4.50%, 10/01/2029 | 12,065 | 12,546,170 | ||||||
Michigan Finance Authority | 39,940 | 45,696,908 | ||||||
Michigan Finance Authority | 54,355 | 62,216,424 | ||||||
Michigan Finance Authority | 15,000 | 15,292,750 | ||||||
Michigan Finance Authority | 350 | 351,490 | ||||||
4.00%, 06/01/2022–06/01/2039 | 9,000 | 10,577,678 | ||||||
5.00%, 06/01/2025–06/01/2031 | 5,645 | 7,114,421 | ||||||
Michigan Finance Authority | 1,580 | 1,723,194 | ||||||
| Principal Amount (000) | U.S. $ Value | |||||||
Series 2014B | $ | 7,450 | $ | 8,187,790 | ||||
Michigan Finance Authority | 13,075 | 15,027,880 | ||||||
5.50%, 12/01/2026–12/01/2027 | 7,220 | 8,643,852 | ||||||
Michigan Strategic Fund | 31,630 | 38,612,402 | ||||||
South Lyon Community Schools | 3,060 | 3,217,917 | ||||||
|
| |||||||
| 311,951,188 | ||||||||
|
| |||||||
| Minnesota–0.1% |
| |||||||
State of Minnesota | 3,745 | 3,986,373 | ||||||
Series 2019A | 1,205 | 1,527,512 | ||||||
|
| |||||||
| 5,513,885 | ||||||||
|
| |||||||
| Missouri–0.4% |
| |||||||
Cape Girardeau County Industrial Development Authority | 2,820 | 3,119,646 | ||||||
Health & Educational Facilities Authority of the State of Missouri | 10,500 | 12,642,195 | ||||||
5.00%, 07/01/2031(b) | 4,470 | 5,965,412 | ||||||
Howard Bend Levee District | 1,620 | 1,824,853 | ||||||
Missouri Joint Municipal Electric Utility Commission | 2,630 | 3,047,657 | ||||||
|
| |||||||
| 26,599,763 | ||||||||
|
| |||||||
| Montana–0.3% |
| |||||||
Montana Facility Finance Authority | 15,015 | 18,025,817 | ||||||
|
| |||||||
| Nebraska–1.0% |
| |||||||
Central Plains Energy Project | 57,465 | 64,011,821 | ||||||
|
| |||||||
| 26 | Sanford C. Bernstein Fund, Inc.—2021 Semi-Annual Report |
Table of Contents
| Principal Amount (000) | U.S. $ Value | |||||||
| Nevada–1.2% |
| |||||||
City of Las Vegas NV | $ | 8,605 | $ | 9,839,232 | ||||
Clark County School District | 17,785 | 18,783,025 | ||||||
Series 2016D | 26,915 | 30,738,359 | ||||||
County of Clark NV | 6,530 | 7,474,326 | ||||||
Las Vegas Valley Water District | 4,590 | 5,576,433 | ||||||
State of Nevada Department of Business & Industry | 3,000 | 3,000,641 | ||||||
|
| |||||||
| 75,412,016 | ||||||||
|
| |||||||
| New Hampshire–0.2% |
| |||||||
New Hampshire Business Finance Authority | 9,394 | 10,887,181 | ||||||
New Hampshire Business Finance Authority | 2,250 | 2,347,993 | ||||||
New Hampshire Business Finance Authority | 2,250 | 2,469,496 | ||||||
|
| |||||||
| 15,704,670 | ||||||||
|
| |||||||
| New Jersey–6.0% |
| |||||||
New Jersey Economic Development Authority | 4,930 | 5,934,855 | ||||||
Series 2011EE | 355 | 356,086 | ||||||
New Jersey Economic Development Authority | 1,075 | 1,111,033 | ||||||
5.50%, 01/01/2026–01/01/2027 | 2,000 | 2,251,035 | ||||||
New Jersey Economic Development Authority | 9,515 | 10,419,755 | ||||||
| Principal Amount (000) | U.S. $ Value | |||||||
New Jersey Economic Development Authority | $ | 4,500 | $ | 4,920,497 | ||||
New Jersey Economic Development Authority | 3,920 | 4,161,853 | ||||||
New Jersey Transit Corp. | 14,375 | 14,654,605 | ||||||
New Jersey Transportation Trust Fund Authority | 13,780 | 16,458,828 | ||||||
Series 2018A | 3,035 | 3,566,388 | ||||||
New Jersey Transportation Trust Fund Authority | 8,720 | 10,918,118 | ||||||
Series 2018A | 65,475 | 81,119,780 | ||||||
Series 2019B | 3,885 | 4,759,515 | ||||||
Series 2020A | 1,810 | 2,262,350 | ||||||
New Jersey Turnpike Authority | 6,015 | 6,522,519 | ||||||
5.00%, 01/01/2027 (Pre-refunded/ETM) | 6,685 | 7,249,050 | ||||||
Series 2014A | 75,940 | 86,464,216 | ||||||
Series 2014C | 14,720 | 16,541,596 | ||||||
Series 2017A | 7,235 | 8,810,725 | ||||||
Series 2017B | 40,050 | 49,566,601 | ||||||
Series 2021B | 6,625 | 6,390,172 | ||||||
AGM Series 2005D-3 | 14,770 | 17,866,994 | ||||||
State of New Jersey | 4,895 | 6,257,440 | ||||||
Tobacco Settlement Financing Corp./NJ | 17,385 | 20,965,741 | ||||||
|
| |||||||
| 389,529,752 | ||||||||
|
| |||||||
Schedule of Investments—Diversified Municipal Portfolio | 27 |
Table of Contents
| Principal Amount (000) | U.S. $ Value | |||||||
| New York–13.0% |
| |||||||
City of New York NY | $ | 1,130 | $ | 1,296,957 | ||||
Series 2015A | 2,040 | 2,260,913 | ||||||
Series 2018D | 2,435 | 3,004,355 | ||||||
Series 2020A | 14,900 | 18,517,999 | ||||||
Series 2020B | 14,880 | 18,512,879 | ||||||
Series 2020C | 3,150 | 4,105,856 | ||||||
Series 2021D | 18,930 | 18,584,467 | ||||||
1.623%, 08/01/2028 | 10,500 | 10,321,674 | ||||||
Series 2021F | 5,000 | 5,869,482 | ||||||
Series 2021L | 4,000 | 5,233,294 | ||||||
County of Nassau NY | 8,840 | 10,732,414 | ||||||
Dutchess County Local Development Corp. | 5,000 | 5,469,119 | ||||||
Metropolitan Transportation Authority | 6,890 | 7,301,245 | ||||||
Series 2012E | 6,055 | 6,531,473 | ||||||
Series 2012F | 55,610 | 59,331,361 | ||||||
Series 2012H | 3,335 | 3,597,434 | ||||||
5.00%, 11/15/2026 | 2,730 | 2,905,497 | ||||||
Series 2013B | 9,505 | 10,700,558 | ||||||
Series 2014A | 4,205 | 4,733,913 | ||||||
5.00%, 11/15/2027 (Pre-refunded/ETM) | 4,040 | 4,548,159 | ||||||
Series 2014C | 5,000 | 5,841,419 | ||||||
Series 2017C | 79,890 | 97,430,699 | ||||||
Metropolitan Transportation Authority | 4,505 | 4,829,872 | ||||||
| Principal Amount (000) | U.S. $ Value | |||||||
New York City Transitional Finance Authority Building Aid Revenue | $ | 53,945 | $ | 67,812,699 | ||||
New York City Transitional Finance Authority Future Tax Secured Revenue | 34,430 | 35,384,063 | ||||||
Series 2011C | 17,620 | 18,112,958 | ||||||
Series 2012A | 12,345 | 13,130,065 | ||||||
Series 2012B | 20,000 | 21,511,500 | ||||||
Series 2017A | 4,860 | 5,969,397 | ||||||
Series 2019B | 59,785 | 75,401,724 | ||||||
Series 2021E | 4,335 | 5,057,895 | ||||||
New York Liberty Development Corp. | 4,250 | 4,361,513 | ||||||
2.80%, 09/15/2069 | 11,555 | 11,418,420 | ||||||
New York State Dormitory Authority | 3,880 | 3,948,189 | ||||||
Series 2014C | 2,015 | 2,283,193 | ||||||
Series 2020D | 25,980 | 33,268,971 | ||||||
New York State Thruway Authority | 17,940 | 18,784,777 | ||||||
New York State Urban Development Corp. | 63,625 | 69,450,121 | ||||||
Series 2013D | 32,000 | 34,985,914 | ||||||
Series 2016A | 4,010 | 4,559,568 | ||||||
New York Transportation Development Corp. | 4,400 | 5,099,389 | ||||||
| 28 | Sanford C. Bernstein Fund, Inc.—2021 Semi-Annual Report |
Table of Contents
| Principal Amount (000) | U.S. $ Value | |||||||
Series 2018 | $ | 74,370 | $ | 90,217,009 | ||||
New York Transportation Development Corp. | 2,095 | 2,340,371 | ||||||
Port Authority of New York & New Jersey | 3,385 | 3,759,863 | ||||||
Series 20202 | 5,910 | 7,488,600 | ||||||
|
| |||||||
| 846,007,238 | ||||||||
|
| |||||||
| North Carolina–0.1% |
| |||||||
City of Charlotte NC Water & Sewer System Revenue | 2,800 | 3,493,841 | ||||||
North Carolina Eastern Municipal Power Agency | 1,720 | 1,794,669 | ||||||
|
| |||||||
| 5,288,510 | ||||||||
|
| |||||||
| North Dakota–0.1% |
| |||||||
County of Ward ND | 5,000 | 5,847,917 | ||||||
|
| |||||||
| Ohio–1.2% |
| |||||||
Buckeye Tobacco Settlement Financing Authority | 3,000 | 3,475,856 | ||||||
County of Allen OH Hospital Facilities Revenue | 6,965 | 8,998,218 | ||||||
Series 2017A | 20,420 | 25,278,487 | ||||||
County of Cuyahoga OH | 5,455 | 6,487,865 | ||||||
County of Franklin OH | 1,000 | 1,223,353 | ||||||
County of Hamilton OH Sewer System Revenue | 9,375 | 12,141,658 | ||||||
| Principal Amount (000) | U.S. $ Value | |||||||
Hamilton County Convention Facilities Authority | $ | 3,470 | $ | 3,688,221 | ||||
Ohio Air Quality Development Authority | 4,320 | 4,397,182 | ||||||
Ohio Air Quality Development Authority | 2,330 | 2,399,900 | ||||||
Ohio Water Development Authority Water Pollution Control Loan Fund | 4,970 | 6,578,293 | ||||||
Ohio Water Development Authority Water Pollution Control Loan Fund | 6,325 | 6,514,750 | ||||||
|
| |||||||
| 81,183,783 | ||||||||
|
| |||||||
| Oklahoma–0.2% |
| |||||||
Comanche County Memorial Hospital | 520 | 543,361 | ||||||
Series 2015 | 5,975 | 6,245,844 | ||||||
McGee Creek Authority | 995 | 1,061,424 | ||||||
Oklahoma Development Finance Authority | 3,005 | 3,018,862 | ||||||
|
| |||||||
| 10,869,491 | ||||||||
|
| |||||||
| Oregon–0.4% |
| |||||||
City of Portland OR Sewer System Revenue | 8,685 | 9,242,369 | ||||||
Hospital Facilities Authority of Multnomah County Oregon | 820 | 870,419 | ||||||
Medford Hospital Facilities Authority | 8,260 | 10,632,947 | ||||||
Schedule of Investments—Diversified Municipal Portfolio | 29 |
Table of Contents
| Principal Amount (000) | U.S. $ Value | |||||||
Salem Hospital Facility Authority | $ | 2,205 | $ | 2,733,043 | ||||
State of Oregon Department of Administrative Services | 90 | 90,311 | ||||||
Tri-County Metropolitan Transportation District of Oregon | 2,335 | 2,929,348 | ||||||
|
| |||||||
| 26,498,437 | ||||||||
|
| |||||||
| Other–1.0% |
| |||||||
Federal Home Loan Mortgage Corp. Enhanced Receipt | 23,648 | 25,696,293 | ||||||
Series 2019-C, | 5,516 | 5,803,323 | ||||||
Series 2019-D, | 5,037 | 5,383,733 | ||||||
Series 2019-E, | 3,384 | 3,616,965 | ||||||
Federal Home Loan Mortgage Corp. Multifamily VRD Certificates | 9,805 | 10,311,037 | ||||||
2.625%, 06/15/2035(a) | 9,850 | 10,344,711 | ||||||
2.65%, 06/15/2035(a) | 4,925 | 5,195,892 | ||||||
|
| |||||||
| 66,351,954 | ||||||||
|
| |||||||
| Pennsylvania–5.8% |
| |||||||
Allegheny County Hospital Development Authority | 19,390 | 24,871,239 | ||||||
Allegheny County Sanitary Authority | 3,500 | 3,931,978 | ||||||
Beaver County Industrial Development Authority | 2,420 | 2,492,600 | ||||||
Beaver County Industrial Development Authority | 2,120 | 2,183,600 | ||||||
City of Philadelphia PA | 2,200 | 2,227,615 | ||||||
Series 2019A | 1,420 | 1,729,835 | ||||||
| Principal Amount (000) | U.S. $ Value | |||||||
AGM Series 2017A | $ | 46,290 | $ | 57,547,696 | ||||
Series 2019B | 1,005 | 1,303,648 | ||||||
City of Philadelphia PA Water & Wastewater Revenue | 17,425 | 20,634,990 | ||||||
Commonwealth of Pennsylvania | 3,120 | 3,711,370 | ||||||
Series 2016 | 9,575 | 11,077,559 | ||||||
Series 2017 | 20,480 | 25,149,972 | ||||||
Geisinger Authority | 2,500 | 3,222,423 | ||||||
Hospitals & Higher Education Facilities Authority of Philadelphia (The) | 6,000 | 6,845,810 | ||||||
Montgomery County Higher Education & Health Authority | 5,000 | 5,629,022 | ||||||
Montgomery County Higher Education & Health Authority | 2,910 | 3,668,885 | ||||||
Series 2018 | 10,650 | 13,201,555 | ||||||
Pennsylvania Economic Development Financing Authority | 51,190 | 61,258,334 | ||||||
Pennsylvania Economic Development Financing Authority | 9,030 | 11,636,098 | ||||||
Pennsylvania Higher Educational Facilities Authority | 2,410 | 2,718,516 | ||||||
5.00%, 08/15/2029–08/15/2030(b) | 1,575 | 1,932,266 | ||||||
Pennsylvania Turnpike Commission | 13,890 | 17,822,468 | ||||||
| 30 | Sanford C. Bernstein Fund, Inc.—2021 Semi-Annual Report |
Table of Contents
| Principal Amount (000) | U.S. $ Value | |||||||
Series 2017B | $ | 13,280 | $ | 16,253,018 | ||||
Series 2019 | 5,250 | 5,674,511 | ||||||
Philadelphia Authority for Industrial Development | 5,560 | 6,366,668 | ||||||
5.00%, 11/01/2027–11/01/2034 | 11,940 | 14,976,721 | ||||||
Philadelphia Parking Authority (The) | 9,080 | 9,110,180 | ||||||
School District of Philadelphia (The) | 8,360 | 9,515,652 | ||||||
Series 2016F | 29,200 | 33,062,778 | ||||||
|
| |||||||
| 379,757,007 | ||||||||
|
| |||||||
| Puerto Rico–0.6% |
| |||||||
Commonwealth of Puerto Rico | 125 | 150,328 | ||||||
Puerto Rico Electric Power Authority | 5,150 | 6,266,183 | ||||||
NATL Series 2007V | 150 | 165,721 | ||||||
Puerto Rico Highway & Transportation Authority | 4,260 | 5,257,148 | ||||||
AGC Series 2007C | 510 | 627,987 | ||||||
AGC Series 2007N | 10,525 | 13,051,160 | ||||||
NATL Series 2005L | 500 | 549,176 | ||||||
NATL Series 2007N | 1,050 | 1,164,585 | ||||||
Puerto Rico Public Buildings Authority | 3,250 | 3,649,641 | ||||||
Puerto Rico Sales Tax Financing Corp. Sales Tax Revenue | 7,511 | 7,049,454 | ||||||
|
| |||||||
| 37,931,383 | ||||||||
|
| |||||||
| Rhode Island–0.8% |
| |||||||
Providence Public Building Authority | 12,390 | 15,382,665 | ||||||
| Principal Amount (000) | U.S. $ Value | |||||||
Rhode Island Commerce Corp. | $ | 10,565 | $ | 12,801,192 | ||||
Rhode Island Depositors Economic Protection Corp. | 5,780 | 6,198,907 | ||||||
Tobacco Settlement Financing Corp./RI | 14,635 | 15,478,076 | ||||||
|
| |||||||
| 49,860,840 | ||||||||
|
| |||||||
| South Carolina–1.0% |
| |||||||
Kershaw County School District/SC | 1,185 | 1,222,242 | ||||||
Patriots Energy Group Financing Agency | 48,725 | 53,187,840 | ||||||
SCAGO Educational Facilities Corp. for Pickens School District | 7,000 | 8,059,697 | ||||||
South Carolina Public Service Authority | 2,435 | 2,914,781 | ||||||
Series 2020A | 1,690 | 1,991,254 | ||||||
|
| |||||||
| 67,375,814 | ||||||||
|
| |||||||
| South Dakota–0.1% |
| |||||||
South Dakota Health & Educational Facilities Authority | 7,025 | 8,521,846 | ||||||
|
| |||||||
| Tennessee–0.9% |
| |||||||
Tennergy Corp./TN | 5,445 | 6,241,939 | ||||||
Schedule of Investments—Diversified Municipal Portfolio | 31 |
Table of Contents
| Principal Amount (000) | U.S. $ Value | |||||||
Tennessee Energy Acquisition Corp. | $ | 50,910 | $ | 54,387,357 | ||||
|
| |||||||
| 60,629,296 | ||||||||
|
| |||||||
| Texas–6.0% |
| |||||||
Alvin Independent School District/TX | 2,945 | 3,452,539 | ||||||
Austin Independent School District | 1,700 | 1,726,827 | ||||||
Board of Regents of the University of Texas System | 105 | 140,675 | ||||||
Central Texas Turnpike System | 1,000 | 1,149,708 | ||||||
City of Austin TX Airport System Revenue | 3,200 | 3,802,970 | ||||||
City of Austin TX Water & Wastewater System Revenue | 4,730 | 5,510,800 | ||||||
City of Houston TX | 16,370 | 19,219,454 | ||||||
City of Houston TX | 3,800 | 4,169,836 | ||||||
City of Houston TX Airport System Revenue | 6,160 | 7,657,275 | ||||||
City of Houston TX Airport System Revenue | 9,135 | 10,628,781 | ||||||
City of Houston TX Combined Utility System Revenue | 24,850 | 27,952,214 | ||||||
Dallas Independent School District | 1,355 | 1,690,747 | ||||||
Series 2011 | 5,165 | 5,183,193 | ||||||
Dallas/Fort Worth International Airport | 11,585 | 12,936,600 | ||||||
Denton Independent School District | $ | 1,220 | $ | 1,473,468 | ||||
Grand Parkway Transportation Corp. | 84,825 | 91,304,341 | ||||||
Harris County Hospital District | 3,705 | 4,196,549 | ||||||
Irving Hospital Authority | 3,220 | 3,784,574 | ||||||
Mission Economic Development Corp. | 10,680 | 11,350,007 | ||||||
New Hope Cultural Education Facilities Finance Corp. | 1,130 | 1,206,384 | ||||||
New Hope Cultural Education Facilities Finance Corp. | 7,250 | 8,820,764 | ||||||
New Hope Cultural Education Facilities Finance Corp. | 875 | 942,916 | ||||||
North Texas Tollway Authority | 5,000 | 5,098,480 | ||||||
5.25%, 09/01/2025 (Pre-refunded/ETM) | 18,130 | 18,505,460 | ||||||
5.25%, 09/01/2026 (Pre-refunded/ETM) | 17,810 | 18,178,833 | ||||||
Series 2014A | 4,000 | 4,143,507 | ||||||
North Texas Tollway Authority | 7,745 | 8,490,805 | ||||||
Series 2015B | 12,275 | 14,152,873 | ||||||
Series 2019B | 30,080 | 37,844,007 | ||||||
Port Beaumont Navigation District | 1,360 | 1,389,806 | ||||||
| 32 | Sanford C. Bernstein Fund, Inc.—2021 Semi-Annual Report |
Table of Contents
| Principal Amount (000) | U.S. $ Value | |||||||
San Antonio Independent School District/TX | $ | 1,430 | $ | 1,803,319 | ||||
San Antonio Water System | 3,000 | 3,294,541 | ||||||
Spring Branch Independent School District | 3,215 | 3,643,297 | ||||||
Series 2015B | 4,855 | 5,501,775 | ||||||
State of Texas | 5,500 | 5,627,838 | ||||||
5.00%, 10/01/2023–10/01/2025 | 11,425 | 11,697,912 | ||||||
5.00%, 10/01/2024 (Pre-refunded/ETM) | 5,440 | 5,566,443 | ||||||
5.00%, 10/01/2025 (Pre-refunded/ETM) | 3,025 | 3,095,311 | ||||||
Texas Water Development Board | 1,310 | 1,622,213 | ||||||
Texas Water Development Board | 2,000 | 2,440,974 | ||||||
Texas Water Development Board | 1,900 | 2,282,448 | ||||||
Texas Water Development Board | 3,640 | 4,596,213 | ||||||
|
| |||||||
| 387,276,677 | ||||||||
|
| |||||||
| Utah–0.1% |
| |||||||
Davis School District | 1,015 | 1,071,935 | ||||||
Utah Transit Authority | 2,000 | 2,376,762 | ||||||
5.00%, 06/15/2028 (Pre-refunded/ETM) | 2,150 | 2,555,019 | ||||||
Utah Transit Authority | 1,305 | 1,527,298 | ||||||
|
| |||||||
| 7,531,014 | ||||||||
|
| |||||||
| Principal Amount (000) | U.S. $ Value | |||||||
| Virginia–0.7% |
| |||||||
County of Fairfax VA | $ | 3,860 | $ | 5,044,942 | ||||
County of Henrico VA | 1,860 | 2,290,941 | ||||||
County of Loudoun VA | 7,315 | 8,851,827 | ||||||
Fairfax County Economic Development Authority | 8,040 | 9,960,098 | ||||||
Virginia College Building Authority | 4,435 | 4,825,412 | ||||||
Virginia Small Business Financing Authority | 10,720 | 13,060,342 | ||||||
|
| |||||||
| 44,033,562 | ||||||||
|
| |||||||
| Washington–2.7% |
| |||||||
Chelan County Public Utility District No. 1 | 5,000 | 5,056,541 | ||||||
5.25%, 07/01/2022 | 3,670 | 3,713,421 | ||||||
City of Seattle WA Municipal Light & Power Revenue | 4,280 | 5,208,264 | ||||||
City of Seattle WA Water System Revenue | 1,100 | 1,170,442 | ||||||
County of King WA | 2,485 | 2,750,418 | ||||||
Energy Northwest | 8,840 | 8,943,425 | ||||||
King County School District No. 49 Tahoma | 2,710 | 2,926,298 | ||||||
Port of Seattle WA | 2,500 | 3,075,378 | ||||||
Series 2010B | 1,995 | 1,999,197 | ||||||
Series 2015C | 4,320 | 4,537,472 | ||||||
Schedule of Investments—Diversified Municipal Portfolio | 33 |
Table of Contents
| Principal Amount (000) | U.S. $ Value | |||||||
Series 2018A | $ | 8,320 | $ | 9,686,566 | ||||
Series 2018B | 4,695 | 5,466,157 | ||||||
Snohomish County School District No. 2 Everett | 3,600 | 3,715,568 | ||||||
State of Washington | 6,765 | 7,169,337 | ||||||
Series 20152 | 9,895 | 10,961,289 | ||||||
Series 2015A-1 | 8,010 | 8,905,113 | ||||||
Series 2020 | 1,170 | 1,434,871 | ||||||
State of Washington | 8,805 | 9,396,559 | ||||||
State of Washington | 17,550 | 18,730,185 | ||||||
Washington Health Care Facilities Authority | 31,550 | 37,143,148 | ||||||
Washington Health Care Facilities Authority | 15,880 | 19,012,526 | ||||||
Washington State Housing Finance Commission | 3,505 | 3,479,267 | ||||||
|
| |||||||
| 174,481,442 | ||||||||
|
| |||||||
| West Virginia–0.2% |
| |||||||
Tobacco Settlement Finance Authority/WV | 16,125 | 16,374,694 | ||||||
|
| |||||||
| Wisconsin–2.2% |
| |||||||
State of Wisconsin | 45,000 | 55,477,007 | ||||||
Series 20211 | 14,150 | 18,100,367 | ||||||
Series 20212 | 29,485 | 34,220,689 | ||||||
| Principal Amount (000) | U.S. $ Value | |||||||
UMA Education, Inc. | $ | 16,760 | $ | 19,325,955 | ||||
Wisconsin Center District | 8,515 | 6,625,049 | ||||||
Wisconsin Health & Educational Facilities Authority | 2,445 | 2,436,083 | ||||||
Wisconsin Public Finance Authority | 3,750 | 4,404,983 | ||||||
Wisconsin Public Finance Authority | 1,000 | 1,098,367 | ||||||
Wisconsin Public Finance Authority | 355 | 363,993 | ||||||
WPPI Energy | ||||||||
5.00%, 07/01/2029 | 1,000 | 1,137,909 | ||||||
|
| |||||||
| 143,190,402 | ||||||||
|
| |||||||
| Total Long-Term Municipal Bonds (cost $5,300,606,783) |
| 5,602,207,977 | ||||||
|
| |||||||
| Short-Term Municipal Notes–10.3% |
| |||||||
| California–0.1% |
| |||||||
City & County of San Francisco CA | 2,855 | 2,855,000 | ||||||
County of San Bernardino CA | 400 | 400,000 | ||||||
|
| |||||||
| 3,255,000 | ||||||||
|
| |||||||
| Colorado–0.2% |
| |||||||
Colorado Health Facilities Authority | 15,000 | 15,000,000 | ||||||
|
| |||||||
| District of Columbia–0.2% |
| |||||||
District of Columbia | 5,505 | 5,505,000 | ||||||
District of Columbia | 3,530 | 3,530,000 | ||||||
| 34 | Sanford C. Bernstein Fund, Inc.—2021 Semi-Annual Report |
Table of Contents
| Principal Amount (000) | U.S. $ Value | |||||||
District of Columbia | $ | 2,345 | $ | 2,345,000 | ||||
|
| |||||||
| 11,380,000 | ||||||||
|
| |||||||
| Florida–0.3% |
| |||||||
City of Lakeland FL | 1,830 | 1,830,000 | ||||||
County of Palm Beach FL | 2,200 | 2,200,000 | ||||||
Florida Gulf Coast University Financing Corp. | 1,570 | 1,570,000 | ||||||
Florida Keys Aqueduct Authority | 1,100 | 1,100,000 | ||||||
Halifax Hospital Medical Center | 7,250 | 7,250,000 | ||||||
Orange County Health Facilities Authority | 1,405 | 1,405,000 | ||||||
Orange County Health Facilities Authority | 3,100 | 3,100,000 | ||||||
|
| |||||||
| 18,455,000 | ||||||||
|
| |||||||
| Georgia–0.5% |
| |||||||
Development Authority of Heard County | 2,820 | 2,820,000 | ||||||
Development Authority of Monroe County (The) | 30,000 | 30,000,000 | ||||||
|
| |||||||
| 32,820,000 | ||||||||
|
| |||||||
| Hawaii–0.1% |
| |||||||
Hawaii Housing Finance & Development Corp. | 3,640 | 3,640,000 | ||||||
|
| |||||||
| Illinois–0.6% |
| |||||||
Illinois Development Finance Authority | 560 | 560,000 | ||||||
| Principal Amount (000) | U.S. $ Value | |||||||
Illinois Educational Facilities Authority | $ | 100 | $ | 100,000 | ||||
Illinois Finance Authority | 8,305 | 8,305,000 | ||||||
Illinois Finance Authority | 995 | 995,000 | ||||||
Illinois Finance Authority | 8,880 | 8,880,000 | ||||||
Illinois Housing Development Authority | 14,500 | 14,500,000 | ||||||
Village of Brookfield IL | 2,940 | 2,940,000 | ||||||
|
| |||||||
| 36,280,000 | ||||||||
|
| |||||||
| Iowa–0.2% |
| |||||||
Iowa Finance Authority | 9,135 | 9,135,000 | ||||||
Iowa Finance Authority | 2,315 | 2,315,000 | ||||||
|
| |||||||
| 11,450,000 | ||||||||
|
| |||||||
| Kentucky–0.2% |
| |||||||
Louisville/Jefferson County Metropolitan Government | 13,450 | 13,450,000 | ||||||
|
| |||||||
| Louisiana–0.6% |
| |||||||
Louisiana Offshore Terminal Authority (Loop LLC) | 20,450 | 20,450,000 | ||||||
Louisiana Public Facilities Authority | 14,525 | 14,525,000 | ||||||
Louisiana Public Facilities Authority | 2,265 | 2,265,000 | ||||||
|
| |||||||
| 37,240,000 | ||||||||
|
| |||||||
Schedule of Investments—Diversified Municipal Portfolio | 35 |
Table of Contents
| Principal Amount (000) | U.S. $ Value | |||||||
| Maryland–0.2% |
| |||||||
Maryland Health & Higher Educational Facilities Authority | $ | 2,200 | $ | 2,200,000 | ||||
Series 2014B | 1,925 | 1,925,000 | ||||||
Maryland Health & Higher Educational Facilities Authority (Luminis Health Obligated Group) | 8,875 | 8,875,000 | ||||||
Montgomery County Housing Opportunities Commission | 1,875 | 1,875,000 | ||||||
|
| |||||||
| 14,875,000 | ||||||||
|
| |||||||
| Massachusetts–0.1% |
| |||||||
Commonwealth of Massachusetts | 5,415 | 5,420,652 | ||||||
Massachusetts Health & Educational Facilities Authority | 500 | 500,000 | ||||||
|
| |||||||
| 5,920,652 | ||||||||
|
| |||||||
| Michigan–0.4% |
| |||||||
Grand Valley State University | 18,590 | 18,590,000 | ||||||
Lakeview School District/MI | 6,025 | 6,025,000 | ||||||
Michigan Strategic Fund | 1,830 | 1,830,000 | ||||||
|
| |||||||
| 26,445,000 | ||||||||
|
| |||||||
| Minnesota–0.5% |
| |||||||
City of Minneapolis MN | 4,805 | 4,805,000 | ||||||
City of Minneapolis MN | 9,315 | 9,315,000 | ||||||
City of Minneapolis MN | 1,525 | 1,525,000 | ||||||
City of Minneapolis MN/St. Paul Housing & Redevelopment Authority | 11,925 | 11,925,000 | ||||||
0.06%, 11/15/2034(f) | 3,700 | 3,700,000 | ||||||
| Principal Amount (000) | U.S. $ Value | |||||||
Housing & Redevelopment Authority of The City of St. Paul Minnesota (Allina Health Obligated Group) | $ | 2,400 | $ | 2,400,000 | ||||
|
| |||||||
| 33,670,000 | ||||||||
|
| |||||||
| Nevada–0.5% |
| |||||||
County of Clark Department of Aviation | 26,075 | 26,075,000 | ||||||
Series 2014D | 9,510 | 9,510,000 | ||||||
|
| |||||||
| 35,585,000 | ||||||||
|
| |||||||
| New Jersey–0.3% |
| |||||||
New Jersey Health Care Facilities Financing Authority | 2,995 | 2,995,000 | ||||||
New Jersey Health Care Facilities Financing Authority | 2,270 | 2,270,000 | ||||||
Series 2008C | 15,955 | 15,955,000 | ||||||
|
| |||||||
| 21,220,000 | ||||||||
|
| |||||||
| New York–2.6% |
| |||||||
City of New York NY | ||||||||
Series 2016 | 3,370 | 3,370,000 | ||||||
Series 2019I | 5,450 | 5,450,000 | ||||||
Metropolitan Transportation Authority | 99,625 | 104,361,731 | ||||||
New York City Housing Development Corp. | 32,500 | 32,500,000 | ||||||
New York State Housing Finance Agency | 21,910 | 21,910,000 | ||||||
|
| |||||||
| 167,591,731 | ||||||||
|
| |||||||
| North Carolina–0.0% |
| |||||||
Durham County Industrial Facilities & Pollution Control Financing Authority | 780 | 780,000 | ||||||
|
| |||||||
| Ohio–0.1% |
| |||||||
Columbus Regional Airport Authority | 7,600 | 7,600,000 | ||||||
|
| |||||||
| 36 | Sanford C. Bernstein Fund, Inc.—2021 Semi-Annual Report |
Table of Contents
| Principal Amount (000) | U.S. $ Value | |||||||
| Oregon–0.5% |
| |||||||
Clackamas County Hospital Facility Authority | ||||||||
Series 2008A | $ | 14,825 | $ | 14,825,000 | ||||
Series 2008B | 18,615 | 18,615,000 | ||||||
|
| |||||||
| 33,440,000 | ||||||||
|
| |||||||
| Pennsylvania–0.3% |
| |||||||
Emmaus General Authority | ||||||||
Series 2008D | 2,000 | 2,000,000 | ||||||
Series 2008E | 4,500 | 4,500,000 | ||||||
Haverford Township School District | 2,425 | 2,425,000 | ||||||
Pennsylvania Turnpike Commission | 700 | 700,000 | ||||||
Philadelphia Gas Works Co. | 10,950 | 10,950,000 | ||||||
|
| |||||||
| 20,575,000 | ||||||||
|
| |||||||
| Rhode Island–0.1% |
| |||||||
Rhode Island Health and Educational Building Corp. | 3,445 | 3,445,000 | ||||||
Rhode Island Health and Educational Building Corp. | 1,050 | 1,050,000 | ||||||
|
| |||||||
| 4,495,000 | ||||||||
|
| |||||||
| Tennessee–0.1% | ||||||||
Greeneville Health & Educational Facilities Board | 3,150 | 3,150,000 | ||||||
Loudon Industrial Development Board (Tate & Lyle Ingredients Americas LLC) | 3,400 | 3,400,000 | ||||||
|
| |||||||
| 6,550,000 | ||||||||
|
| |||||||
| Texas–0.8% |
| |||||||
City of Houston TX Combined Utility System Revenue | 30,030 | 30,030,000 | ||||||
Dallas Performing Arts Cultural Facilities Corp. | 4,190 | 4,190,000 | ||||||
| Principal Amount (000) | U.S. $ Value | |||||||
State of Texas | $ | 19,895 | $ | 20,208,177 | ||||
Tarrant County Housing Finance Corp. | 270 | 270,000 | ||||||
|
| |||||||
| 54,698,177 | ||||||||
|
| |||||||
| Vermont–0.0% |
| |||||||
Vermont Educational & Health Buildings Financing Agency (University of Vermont Health Network Obligated Group) | 900 | 900,000 | ||||||
|
| |||||||
| Virginia–0.2% |
| |||||||
Loudoun County Economic Development Authority | 3,000 | 3,000,000 | ||||||
Roanoke Economic Development Authority | 11,680 | 11,680,000 | ||||||
|
| |||||||
| 14,680,000 | ||||||||
|
| |||||||
| Washington–0.6% |
| |||||||
Washington State Housing Finance Commission | 1,250 | 1,250,000 | ||||||
Washington State Housing Finance Commission | 1,500 | 1,500,000 | ||||||
Washington State Housing Finance Commission | 2,400 | 2,400,000 | ||||||
Washington State Housing Finance Commission | 9,440 | 9,440,000 | ||||||
Washington State Housing Finance Commission | 6,590 | 6,590,000 | ||||||
Washington State Housing Finance Commission | 15,920 | 15,920,000 | ||||||
West Virginia Hospital Finance Authority | 725 | 725,000 | ||||||
|
| |||||||
| 37,825,000 | ||||||||
|
| |||||||
Schedule of Investments—Diversified Municipal Portfolio | 37 |
Table of Contents
| Principal Amount (000) | U.S. $ Value | |||||||
| Wisconsin–0.0% |
| |||||||
Wisconsin Health & Educational Facilities Authority | $ | 380 | $ | 380,000 | ||||
|
| |||||||
| Total Short-Term Municipal Notes (cost $669,145,781) |
| 670,200,560 | ||||||
|
| |||||||
| Total Municipal Obligations (cost $5,969,752,564) |
| 6,272,408,537 | ||||||
|
| |||||||
| COLLATERALIZED MORTGAGE OBLIGATIONS–0.3% |
| |||||||
| Risk Share Floating Rate–0.3% |
| |||||||
Connecticut Avenue Securities Trust | 813 | 816,675 | ||||||
Federal Home Loan Mortgage Corp. Structured Agency Credit Risk Debt Notes | ||||||||
Series 2013-DN2, Class M2 | 367 | 366,510 | ||||||
Series 2014-DN3, Class M3 | 120 | 121,949 | ||||||
Series 2014-HQ2, Class M3 | 480 | 493,778 | ||||||
Series 2015-DN1, Class M3 | 19 | 18,956 | ||||||
Series 2015-DNA1, Class M3 | 783 | 797,896 | ||||||
Series 2015-DNA2, Class M3 | 262 | 266,844 | ||||||
Series 2015-DNA3, Class M3 | 231 | 239,119 | ||||||
Series 2015-HQA1, Class M3 | 181 | 188,072 | ||||||
Series 2016-DNA1, Class M3 | 874 | 917,538 | ||||||
Series 2016-DNA4, Class M3 | 1,519 | 1,577,917 | ||||||
Series 2016-HQA3, Class M3 | 250 | 258,991 | ||||||
Series 2016-HQA4, Class M3 | 788 | 815,555 | ||||||
| Principal Amount (000) | U.S. $ Value | |||||||
Series 2017-DNA1, Class M2 | $ | 324 | $ | 332,544 | ||||
Series 2017-DNA2, Class M2 | 550 | 569,953 | ||||||
Series 2017-DNA3, Class M2 | 911 | 928,294 | ||||||
Series 2017-HQA3, Class M2 | 232 | 235,196 | ||||||
Series 2019-DNA1, Class M2 | 1,461 | 1,469,366 | ||||||
Series 2019-DNA3, Class M2 | 708 | 706,448 | ||||||
Federal National Mortgage Association Connecticut Avenue Securities | ||||||||
Series 2014-C03, Class 2M2 | 947 | 955,734 | ||||||
Series 2014-C04, Class 1M2 | 304 | 312,749 | ||||||
Series 2015-C01, Class 2M2 | 13 | 12,606 | ||||||
Series 2015-C02, Class 1M2 | 617 | 624,417 | ||||||
Series 2016-C01, Class 1M2 | 704 | 744,428 | ||||||
Series 2016-C03, Class 1M2 | 272 | 285,727 | ||||||
Series 2016-C04, Class 1M2 | 162 | 169,039 | ||||||
Series 2016-C05, Class 2M2 | 674 | 700,911 | ||||||
Series 2017-C01, Class 1M2 | 457 | 470,808 | ||||||
Series 2017-C02, Class 2M2 | 1,729 | 1,776,007 | ||||||
Series 2017-C03, Class 1M2 | 1,343 | 1,372,629 | ||||||
Series 2017-C06, Class 1M2 | 586 | 590,400 | ||||||
| 38 | Sanford C. Bernstein Fund, Inc.—2021 Semi-Annual Report |
Table of Contents
| Principal Amount (000) | U.S. $ Value | |||||||
Series 2017-C06, Class 2M2 | $ | 299 | $ | 300,828 | ||||
STACR Trust | 530 | 528,015 | ||||||
|
| |||||||
| Total Collateralized Mortgage Obligations (cost $18,440,939) |
| 19,965,899 | ||||||
|
| |||||||
| CORPORATES-INVESTMENT GRADE–0.2% |
| |||||||
| Industrial–0.2% |
| |||||||
| Consumer Non-Cyclical–0.2% |
| |||||||
CommonSpirit Health | 4,513 | 4,536,513 | ||||||
Baylor Scott & White Holdings | ||||||||
Series 2021 | 5,835 | 5,714,332 | ||||||
1.777%, 11/15/2030 | 5,000 | 4,753,300 | ||||||
|
| |||||||
| Total Corporates–Investment Grade (cost $15,348,000) |
| 15,004,145 | ||||||
|
| |||||||
| Principal Amount (000) | U.S. $ Value | |||||||
| CORPORATES-NON-INVESTMENT GRADE–0.1% |
| |||||||
| Industrial–0.1% |
| |||||||
| Transportation-Airlines–0.1% |
| |||||||
American Airlines, Inc./AAdvantage Loyalty IP Ltd. | $ | 3,765 | $ | 3,916,240 | ||||
5.75%, 04/20/2029(a) | 3,342 | 3,555,019 | ||||||
|
| |||||||
| Total Corporates–Non-Investment Grade (cost $7,107,000) |
| 7,471,259 | ||||||
|
| |||||||
| SHORT-TERM INVESTMENTS–0.2% |
| |||||||
| U.S. Treasury Bills–0.2% |
| |||||||
U.S. Treasury Bill | ||||||||
Zero Coupon, 06/03/2021(h) | 10,000 | 9,999,737 | ||||||
|
| |||||||
| Total Investments—97.3% (cost $6,020,648,223) |
| 6,324,849,577 | ||||||
Other assets less liabilities—2.7% |
| 178,773,601 | ||||||
|
| |||||||
| Net Assets—100.0% |
| $ | 6,503,623,178 | |||||
|
| |||||||
CENTRALLY CLEARED INFLATION (CPI) SWAPS (see Note 3)
| Rate Type | ||||||||||||||||||||||||||||||
Notional | Termination Date | Payments made by the Fund | Payments received by the Fund | Payment Frequency Paid/Received | Market Value | Upfront Premiums Paid/ (Received) | Unrealized Appreciation/ (Depreciation) | |||||||||||||||||||||||
| USD | 25,420 | 01/15/2025 | 2.565% | CPI# | Maturity | $ | 52,900 | $ | — | $ | 52,900 | |||||||||||||||||||
| USD | 12,710 | 01/15/2025 | 2.585% | CPI# | Maturity | 15,701 | — | 15,701 | ||||||||||||||||||||||
| USD | 12,710 | 01/15/2025 | 2.613% | CPI# | Maturity | 912 | — | 912 | ||||||||||||||||||||||
| USD | 87,590 | 01/15/2028 | 1.230% | CPI# | Maturity | 8,402,090 | — | 8,402,090 | ||||||||||||||||||||||
| USD | 87,240 | 01/15/2028 | 0.735% | CPI# | Maturity | 11,774,604 | — | 11,774,604 | ||||||||||||||||||||||
| USD | 16,275 | 01/15/2030 | 1.572% | CPI# | Maturity | 1,408,998 | — | 1,408,998 | ||||||||||||||||||||||
| USD | 16,275 | 01/15/2030 | 1.587% | CPI# | Maturity | 1,384,318 | — | 1,384,318 | ||||||||||||||||||||||
| USD | 19,500 | 02/15/2041 | CPI# | 2.282% | Maturity | (730,320 | ) | — | (730,320 | ) | ||||||||||||||||||||
|
|
|
|
|
| |||||||||||||||||||||||||
| $ | 22,309,203 | $ | — | $ | 22,309,203 | |||||||||||||||||||||||||
|
|
|
|
|
| |||||||||||||||||||||||||
# Variable interest rate based on the rate of inflation as determined by the Consumer Price Index (CPI).
CENTRALLY CLEARED INTEREST RATE SWAPS (see Note 3)
| Rate Type | ||||||||||||||||||||||||||||||
| Notional Amount (000) | Termination Date | Payments made by the Fund | Payments received by the Fund | Payment Frequency Paid/Received | Market Value | Upfront Premiums Paid (Received) | Unrealized Appreciation/ (Depreciation) | |||||||||||||||||||||||
| USD | 43,750 | 01/15/2028 | 0.803% | 3 Month LIBOR | Semi-Annual/Quarterly | $ | 1,748,786 | $ | 1,699,415 | $ | 49,371 | |||||||||||||||||||
| USD | 43,750 | 01/15/2028 | 3 month LIBOR | 0.803% | Quarterly/Semi-Annual | (1,748,787 | ) | — | (1,748,787 | ) | ||||||||||||||||||||
| USD | 41,680 | 02/15/2029 | 0.597% | 3 Month LIBOR | Semi-Annual/Quarterly | 3,098,825 | — | 3,098,825 | ||||||||||||||||||||||
| USD | 22,000 | 02/15/2041 | 3 month LIBOR | 2.166% | Quarterly/Semi-Annual | (53,875 | ) | — | (53,875 | ) | ||||||||||||||||||||
|
|
|
|
|
| |||||||||||||||||||||||||
| $ | 3,044,949 | $ | 1,699,415 | $ | 1,345,534 | |||||||||||||||||||||||||
|
|
|
|
|
| |||||||||||||||||||||||||
Schedule of Investments—Diversified Municipal Portfolio | 39 |
Table of Contents
CREDIT DEFAULT SWAPS (see Note 3)
| Swap Counterparty & Referenced Obligation | Fixed Rate (Pay) Receive | Payment Frequency | Implied Credit Spread at March 31, 2021 | Notional Amount (000) | Market Value | Upfront Premiums Paid (Received) | Unrealized Appreciation/ (Depreciation) | |||||||||||||||||||||||||
| Sale Contracts | ||||||||||||||||||||||||||||||||
Citigroup Global Markets, Inc. | ||||||||||||||||||||||||||||||||
| CDX-CMBX.NA.BBB- Series 6, 05/11/2063* | 3.00 | % | Monthly | 12.50 | % | USD | 505 | $ | (136,047 | ) | $ | (48,933 | ) | $ | (87,114 | ) | ||||||||||||||||
| CDX-CMBX.NA.BBB- Series 6, 05/11/2063* | 3.00 | Monthly | 12.50 | USD | 1,677 | (451,784 | ) | (209,641 | ) | (242,143 | ) | |||||||||||||||||||||
Credit Suisse International | ||||||||||||||||||||||||||||||||
| CDX-CMBX.NA.BBB- Series 6, 05/11/2063* | 3.00 | Monthly | 12.50 | USD | 112 | (30,172 | ) | (13,578 | ) | (16,594 | ) | |||||||||||||||||||||
| CDX-CMBX.NA.BBB- Series 6, 05/11/2063* | 3.00 | Monthly | 12.50 | USD | 277 | (74,624 | ) | (27,088 | ) | (47,536 | ) | |||||||||||||||||||||
| CDX-CMBX.NA.BBB- Series 6, 05/11/2063* | 3.00 | Monthly | 12.50 | USD | 3,414 | (919,731 | ) | (411,150 | ) | (508,581 | ) | |||||||||||||||||||||
| CDX-CMBX.NA.BBB- Series 6, 05/11/2063* | 3.00 | Monthly | 12.50 | USD | 3,451 | (929,412 | ) | (337,890 | ) | (591,522 | ) | |||||||||||||||||||||
| CDX-CMBX.NA.BBB- Series 6, 05/11/2063* | 3.00 | Monthly | 12.50 | USD | 5,192 | (1,398,725 | ) | (495,296 | ) | (903,429 | ) | |||||||||||||||||||||
Goldman Sachs International | ||||||||||||||||||||||||||||||||
| CDX-CMBX.NA.BBB- Series 6, 05/11/2063* | 3.00 | Monthly | 12.50 | USD | 647 | (174,302 | ) | (80,543 | ) | (93,759 | ) | |||||||||||||||||||||
| CDX-CMBX.NA.BBB- Series 6, 05/11/2063* | 3.00 | Monthly | 12.50 | USD | 4,500 | (1,212,300 | ) | (416,673 | ) | (795,627 | ) | |||||||||||||||||||||
|
|
|
|
|
| |||||||||||||||||||||||||||
| $ | (5,327,097 | ) | $ | (2,040,792 | ) | $ | (3,286,305 | ) | ||||||||||||||||||||||||
|
|
|
|
|
| |||||||||||||||||||||||||||
* Termination date
INTEREST RATE SWAPS (see Note 3)
| Rate Type | ||||||||||||||||||||||||||||||||||
| Swap Counterparty | Notional Amount (000) | Termination Date | Payments made by the Fund | Payments received by the Fund | Payment Frequency Paid/Received | Market Value | Upfront Premiums Paid (Received) | Unrealized Appreciation/ (Depreciation) | ||||||||||||||||||||||||||
| Citibank, NA | USD | 57,160 | 10/09/2029 | 1.120% | SIFMA* | Quarterly | $ | 161,302 | $ | — | $ | 161,302 | ||||||||||||||||||||||
| Citibank, NA | USD | 57,160 | 10/09/2029 | 1.125% | SIFMA* | Quarterly | 134,891 | — | 134,891 | |||||||||||||||||||||||||
|
|
|
|
|
| |||||||||||||||||||||||||||||
| $ | 296,193 | $ | — | $ | 296,193 | |||||||||||||||||||||||||||||
|
|
|
|
|
| |||||||||||||||||||||||||||||
* Variable interest rate based on the Securities Industry & Financial Markets Association (SIFMA) Municipal Swap Index.
| (a) | Security is exempt from registration under Rule 144A of the Securities Act of 1933. These securities are considered restricted, but liquid and may be resold in transactions exempt from registration, normally to qualified institutional buyers. At March 31, 2021, the aggregate market value of these securities amounted to $171,213,169 or 2.6% of net assets. |
| (b) | When-Issued or delayed delivery security. |
| (c) | Non-income producing security. |
| (d) | Defaulted matured security. |
| (e) | Security in which significant unobservable inputs (Level 3) were used in determining fair value. |
| (f) | Variable Rate Demand Notes are instruments whose interest rates change on a specific date (such as coupon date or interest payment date) or whose interest rates vary with changes in a designated base rate (such as the prime interest rate). This instrument is payable on demand and is secured by letters of credit or other credit support agreements from major banks. |
| (g) | Floating Rate Security. Stated interest/floor/ceiling rate was in effect at March 31, 2021. |
| (h) | Position, or a portion thereof, has been segregated to collateralize OTC derivatives outstanding. |
As of March 31, 2021, the Portfolio’s percentages of investments in municipal bonds that are insured and in insured municipal bonds that have been pre-refunded or escrowed to maturity are 4.4% and 0.0%, respectively.
| 40 | Sanford C. Bernstein Fund, Inc.—2021 Semi-Annual Report |
Table of Contents
Glossary:
AGC—Assured Guaranty Corporation
AGM—Assured Guaranty Municipal
BAM—Build American Mutual
CCRC—Congregate Care Retirement Center
CDX-CMBX.NA—North American Commercial Mortgage-Backed Index
COP—Certificate of Participation
CPI—Consumer Price Index
DOT—Department of Transportation
ETM—Escrowed to Maturity
LIBOR—London Interbank Offered Rate
NATL—National Interstate Corporation
OSF—Order of St. Francis
SRF—State Revolving Fund
UPMC—University of Pittsburgh Medical Center
XLCA—XL Capital Assurance Inc.
See notes to financial statements.
Sanford C. Bernstein Fund, Inc.
Schedule of Investments
New York Municipal Portfolio
March 31, 2021 (unaudited)
| Principal Amount (000) | U.S. $ Value | |||||||
| MUNICIPAL OBLIGATIONS–97.2% | ||||||||
| Long-Term Municipal Bonds–91.6% | ||||||||
| New York–75.1% | ||||||||
Albany County Airport Authority | $ | 5,085 |
| $ | 5,758,341 |
| ||
Battery Park City Authority |
| 4,325 |
|
| 4,650,711 |
| ||
Broome County Local Development Corp. (United Health Services Hospitals Obligated Group) |
| 5,720 |
|
| 6,046,204 |
| ||
4.00%, 04/01/2034-04/01/2040 | 5,025 | 5,788,788 | ||||||
5.00%, 04/01/2030-04/01/2033 | 4,000 | 5,134,427 | ||||||
Buffalo & Erie County Industrial Land |
| 2,000 |
|
| 2,145,626 |
| ||
Build NYC Resource Corp. |
| 3,335 |
|
| 3,652,951 |
| ||
5.25%, 11/01/2029 | 1,900 | 2,085,650 | ||||||
City of New York NY |
| 6,855 |
|
| 6,962,340 |
| ||
Series 2011A | 3,960 | 4,022,754 | ||||||
5.00%, 08/01/2026 | 10,315 | 10,473,796 | ||||||
Series 2011D-1 | 2,860 | 2,926,663 | ||||||
Series 2012I | 2,320 | 2,467,608 | ||||||
Series 20171 | 1,130 | 1,340,831 | ||||||
Series 2017C | 2,335 | 2,639,378 | ||||||
Series 2018A | 7,690 | 9,394,850 | ||||||
Series 2018D | 9,665 | 11,934,924 | ||||||
Series 2019B | 4,205 | 5,382,035 | ||||||
Series 2019H | 5,615 | 7,075,305 | ||||||
Schedule of Investments—New York Municipal Portfolio | 41 |
Table of Contents
| Principal Amount (000) | U.S. $ Value | |||||||
Series 2020A | $ | 1,660 | $ | 2,122,129 | ||||
Series 2020B |
| 10,000 |
|
| 12,743,521 |
| ||
Series 2020C | 13,710 | 17,533,862 | ||||||
Series 2020I | 1,350 | 1,739,797 | ||||||
Series 2021D | 6,000 | 5,957,881 | ||||||
1.396%, 08/01/2027 | 5,000 | 4,908,734 | ||||||
1.623%, 08/01/2028 | 4,000 | 3,932,066 | ||||||
County of Albany NY |
| 5,655 |
|
| 6,038,889 |
| ||
County of Monroe NY |
| 10,660 |
|
| 10,943,941 |
| ||
BAM Series 2015 | 5,860 | 5,976,434 | ||||||
County of Nassau NY |
| 5,915 |
|
| 5,915,000 |
| ||
Series 2014A | 10,190 | 11,607,449 | ||||||
Series 2017C | 22,095 | 27,157,220 | ||||||
Dutchess County Local Development Corp. (Bard College) |
| 1,900 |
|
| 2,241,515 |
| ||
Series 2020B | 5,070 | 5,545,687 | ||||||
Dutchess County Local Development Corp. (Health QuestSystems Obligated Group) | ||||||||
Series 2016B | 4,890 | 5,688,794 | ||||||
Erie County Fiscal Stability Authority |
| 5,925 |
|
| 6,116,007 |
| ||
Erie County Industrial Development Agency (The) (Buffalo City School District) | ||||||||
Series 2011B | 5,800 | 5,819,957 | ||||||
Hudson Yards Infrastructure Corp. |
| 22,650 |
|
| 27,197,702 |
| ||
Jefferson County Industrial Development Agency (ReEnergy Black River LLC) | 1,250 | 1,207,906 | ||||||
Long Island Power Authority | 9,490 |
| 9,807,256 |
| ||||
Metropolitan Transportation Authority |
| 925 |
|
| 952,799 |
| ||
Series 2011C | 1,965 | 2,016,929 | ||||||
Series 2011D | 5,000 | 5,150,262 | ||||||
5.00%, 11/15/2023 (Pre-refunded/ETM) | 4,275 | 4,403,474 | ||||||
5.00%, 11/15/2025 (Pre-refunded/ETM) | 2,500 | 2,575,131 | ||||||
Series 2016D | 1,210 | 1,450,433 | ||||||
Series 2017B | 9,020 | 11,185,296 | ||||||
Series 2017C | 57,830 | 70,549,674 | ||||||
Series 2019D | 17,480 | 18,523,864 | ||||||
Series 2019F | 3,230 | 3,450,343 | ||||||
Series 2020A | 24,415 | 25,076,256 | ||||||
AGM Series 2021 11/01/2032(c)(d) | 3,000 | 3,000,003 | ||||||
0.807% (SOFR + 0.80%), 11/01/2032(c)(d) | 3,715 | 3,718,453 | ||||||
Metropolitan Transportation Authority (Metropolitan Transportation Authority Ded Tax) |
| 2,025 |
|
| 2,457,130 |
| ||
Metropolitan Transportation Authority (Metropolitan Transportation Authority Dedicated Tax Fund) |
| 14,130 |
|
| 15,171,268 |
| ||
Monroe County Industrial Development Corp./NY (Rochester Regional Health Obligated Group) | 510 | 586,656 | ||||||
Monroe County Industrial Development Corp./NY (St. Ann’s of Greater Rochester Obligated Group) | 2,825 | 3,032,885 | ||||||
Monroe County Industrial Development Corp/.NY (Rochester Regional Health Obligated Group) | 1,210 | 1,529,664 | ||||||
| 42 | Sanford C. Bernstein Fund, Inc.—2021 Semi-Annual Report |
Table of Contents
| Principal Amount (000) | U.S. $ Value | |||||||
Nassau County Local Economic Assistance Corp. (Catholic Health Services of Long Island Obligated Group) | ||||||||
Series 2014 | $ | 4,550 | $ | 5,171,201 | ||||
New York City Housing Development Corp. |
| 2,000 |
|
| 2,184,350 |
| ||
New York City Municipal Water Finance Authority | 4,495 | 4,752,264 | ||||||
5.00%, 06/15/2022-06/15/2038 | 10,580 | 11,759,405 | ||||||
Series 2011HH | 9,055 | 9,141,591 | ||||||
Series 2014D | 3,000 | 3,430,275 | ||||||
Series 2015F | 7,830 | 9,257,091 | ||||||
Series 2015G | 11,465 | 13,506,209 | ||||||
Series 2017E | 1,795 | 2,172,796 | ||||||
Series 2018AA 5.00%, 06/15/2024 |
| 8,280 |
|
| 9,501,734 |
| ||
Series 2019D | 1,005 | 1,087,460 | ||||||
Series 2019F | 6,190 | 7,727,919 | ||||||
Series 2020 | 9,070 | 12,278,433 | ||||||
New York City Transitional Finance Authority Building Aid Revenue (New York City Transitional Finance Authority Building Aid Revenue State Lease) | 4,420 | 4,477,277 | ||||||
Series 2012S | 7,390 | 7,827,668 | ||||||
Series 2018S | 18,065 | 22,676,232 | ||||||
New York City Transitional Finance Authority Future Tax Secured Revenue | 3,065 | 3,607,826 | ||||||
5.00%, 11/01/2027 | 2,500 | 3,152,276 | ||||||
Series 2011A-1 | 15,315 | 15,750,759 | ||||||
Series 2011B | 9,000 | 9,048,068 | ||||||
Series 2012B | 10,805 | 11,620,154 | ||||||
Series 2012D | 19,575 | 20,647,812 | ||||||
Series 2012E | $ | 6,600 | $ | 6,861,560 | ||||
Series 2014A | 6,655 | 7,631,135 | ||||||
Series 2014C | 6,345 | 7,236,857 | ||||||
Series 2014D-1 | 9,535 | 10,746,138 | ||||||
Series 2015C | 20,000 | 23,548,588 | ||||||
Series 2016B | 2,150 | 2,597,908 | ||||||
Series 2017F | 1,220 | 1,491,859 | ||||||
Series 2021 | 3,875 | 4,782,132 | ||||||
New York Liberty Development Corp. (One Bryant Park LLC) | 20,000 | 20,524,766 | ||||||
2.625%, 09/15/2069 | 22,240 | 22,434,909 | ||||||
2.80%, 09/15/2069 | 6,470 | 6,393,525 | ||||||
New York State Dormitory Authority | 40 | 45,339 | ||||||
Series 2011A | 3,125 | 3,161,714 | ||||||
Series 2012D | 1,290 | 1,343,474 | ||||||
5.00%, 02/15/2023 (Pre-refunded/ETM) | 865 | 900,856 | ||||||
5.00%, 02/15/2024 (Pre-refunded/ETM) | 815 | 848,784 | ||||||
5.00%, 02/15/2025 (Pre-refunded/ETM) | 880 | 916,478 | ||||||
New York State Dormitory Authority (Cornell University) | 1,020 | 1,485,247 | ||||||
New York State Dormitory Authority (Icahn School of Medicine at Mount Sinai) | 6,415 | 7,201,799 | ||||||
New York State Dormitory Authority (Multiple School Districts—NY) AGM | 5,185 | 6,456,969 | ||||||
New York State Dormitory Authority | 2,215 | 2,421,681 | ||||||
New York State Dormitory Authority | 2,040 | 2,254,977 | ||||||
Series 2019A | 2,975 | 3,844,430 | ||||||
Schedule of Investments—New York Municipal Portfolio | 43 |
Table of Contents
| Principal Amount (000) | U.S. $ Value | |||||||
New York State Dormitory Authority | $ | 4,600 | $ | 5,265,018 | ||||
New York State Dormitory Authority | 3,110 | 3,441,293 | ||||||
New York State Dormitory Authority | 1,130 | 1,286,227 | ||||||
New York State Dormitory Authority (State of New York Pers Income Tax) | 11,385 | 12,854,278 | ||||||
Series 2012 | 5,905 | 6,104,538 | ||||||
Series 2012B | 3,905 | 4,084,055 | ||||||
Series 2012D | 18,285 | 19,039,429 | ||||||
Series 2014A | 2,400 | 2,709,729 | ||||||
Series 2014C | 14,485 | 16,403,800 | ||||||
Series 2015B | 1,160 | 1,263,835 | ||||||
Series 2015E | 4,380 | 4,788,697 | ||||||
Series 2017 | 3,995 | 4,686,266 | ||||||
Series 2020A | 6,475 | 7,360,346 | ||||||
Series 2020D | 9,425 | 12,031,718 | ||||||
AMBAC Series 2005B | 5,000 | 5,515,047 | ||||||
New York State Dormitory Authority | 3,125 | 3,962,794 | ||||||
New York State Environmental Facilities Corp. (New York City Municipal Water Finance Authority) | 445 | 561,944 | ||||||
New York State Environmental Facilities Corp. (State of New York SRF) | 9,320 | 9,930,603 | ||||||
New York State Thruway Authority AGM | $ | 5,155 | $ | 5,342,302 | ||||
New York State Thruway Authority | 26,175 | 27,061,637 | ||||||
New York State Thruway Authority | 4,345 | 5,038,171 | ||||||
Series 2014J 5.00%, 01/01/2026-01/01/2027 | 33,900 | 38,068,857 | ||||||
New York State Urban Development Corp. (State of New York Pers Income Tax) | 6,020 | 7,071,288 | ||||||
Series 2020A | 4,350 | 5,068,767 | ||||||
New York Transportation Development Corp. (American Airlines, Inc.) | 2,985 | 3,024,342 | ||||||
New York Transportation Development Corp. (Delta Air Lines, Inc.) | 2,355 | 2,821,591 | ||||||
Series 2018 | 30,980 | 37,345,124 | ||||||
New York Transportation Development Corp. (Empire State Thruway Partners LLC) | 2,460 | 2,795,241 | ||||||
New York Transportation Development Corp. (JFK International Air Terminal LLC) | 5,705 | 7,032,570 | ||||||
New York Transportation Development Corp. (Laguardia Gateway Partners LLC) | ||||||||
Series 2016A 5.25%, 01/01/2050 | 2,535 | 2,854,544 | ||||||
New York Transportation Development Corp. (Terminal One Group Association LP) | 950 | 1,022,853 | ||||||
Niagara Area Development Corp. | ||||||||
Series 2018A | 1,000 | 1,045,097 | ||||||
| 44 | Sanford C. Bernstein Fund, Inc.—2021 Semi-Annual Report |
Table of Contents
| Principal Amount (000) | U.S. $ Value | |||||||
Series 2018B | $ | 3,400 | $ | 3,535,350 | ||||
Niagara Falls City School District | 11,580 | 12,887,023 | ||||||
Port Authority of New York & New Jersey | 8,345 | 10,372,995 | ||||||
Series 2011O | 5,215 | 5,346,129 | ||||||
Series 2013-178 | 10,480 | 11,755,640 | ||||||
Series 2014 | 12,470 | 14,069,927 | ||||||
Series 2014-1 | 3,455 | 3,856,912 | ||||||
Series 2014-186 | 12,575 | 13,125,798 | ||||||
Series 2015E | 16,390 | 18,750,563 | ||||||
Series 2016E | 6,655 | 6,810,016 | ||||||
Series 2017 | 6,925 | 8,514,819 | ||||||
Series 20182 | 12,350 | 15,175,865 | ||||||
Series 20202 | 18,290 | 23,077,914 | ||||||
Series 20212 | 5,750 | 6,201,611 | ||||||
Sales Tax Asset Receivable Corp. Series 2014A | 13,140 | 15,234,741 | ||||||
Suffolk County Economic Development Corp. (Peconic Landing at Southold, Inc.) | 1,500 | 1,723,299 | ||||||
Town of Oyster Bay NY Series 2018 | 11,660 | 12,180,590 | ||||||
Triborough Bridge & Tunnel Authority Series 2011A | 7,000 | 7,254,339 | ||||||
5.00%, 01/01/2028 (Pre-refunded/ETM) | 5,360 | 5,554,751 | ||||||
Series 2012B | 25,760 | 27,379,495 | ||||||
Series 2013A | 5,000 | 5,450,929 | ||||||
Series 2013B | 7,525 | 8,106,962 | ||||||
Troy Capital Resource Corp. | 8,385 | 10,736,591 | ||||||
Series 2010B | 1,000 | 1,003,197 | ||||||
Trust for Cultural Resources of The City of New York (The) (Lincoln Center for the Performing Arts, Inc.) | $ | 3,800 | $ | 4,938,858 | ||||
Series 2016A | 1,125 | 1,340,910 | ||||||
5.00%, 12/01/2026 | 7,175 | 8,742,834 | ||||||
TSASC, Inc./NY | 2,000 | 2,150,366 | ||||||
Utility Debt Securitization Authority | 34,825 | 39,157,221 | ||||||
|
| |||||||
| 1,362,143,020 | ||||||||
|
| |||||||
| Alabama–1.0% |
| |||||||
Black Belt Energy Gas District (Goldman Sachs Group, Inc.(The)) | 5,935 | 6,445,011 | ||||||
Southeast Alabama Gas Supply District (The) (Goldman Sachs Group, Inc.(The)) | 10,000 | 10,939,787 | ||||||
Tuscaloosa County Industrial Development Authority (Hunt Refining Co.) | 1,400 | 1,555,897 | ||||||
|
| |||||||
| 18,940,695 | ||||||||
|
| |||||||
| American Samoa–0.1% |
| |||||||
American Samoa Economic Development Authority (Territory of American Samoa) | 1,055 | 1,267,444 | ||||||
|
| |||||||
| Arizona–0.1% |
| |||||||
Tempe Industrial Development Authority (Mirabella at ASU, Inc.) | 1,430 | 1,430,425 | ||||||
|
| |||||||
| California–0.2% |
| |||||||
Golden State Tobacco Securitization Corp. | 2,860 | 2,911,637 | ||||||
|
| |||||||
| Colorado–1.2% |
| |||||||
City & County of Denver CO (United Airlines, Inc.) | 2,425 | 2,579,467 | ||||||
Colorado Health Facilities Authority (CommonSpirit Health) | 15,295 | 19,225,030 | ||||||
Vauxmont Metropolitan District AGM | ||||||||
5.00%, 12/01/2050 | 160 | 191,428 | ||||||
|
| |||||||
| 21,995,925 | ||||||||
|
| |||||||
Schedule of Investments—New York Municipal Portfolio | 45 |
Table of Contents
| Principal Amount (000) | U.S. $ Value | |||||||
| Connecticut–1.5% | ||||||||
State of Connecticut | ||||||||
Series 2018B | $ | 14,565 | $ | 17,143,090 | ||||
Series 2018C | 4,690 | 5,841,883 | ||||||
Series 2018F | 4,025 | 5,042,883 | ||||||
|
| |||||||
| 28,027,856 | ||||||||
|
| |||||||
| Florida–0.1% | ||||||||
County of Osceola FL Transportation Revenue | ||||||||
Series 2020A | ||||||||
Zero Coupon, 10/01/2030-10/01/2034 | 410 | 300,064 | ||||||
Volusia County School Board (Volusia County School Board COP) | ||||||||
Series 2014B | 1,000 | 1,144,184 | ||||||
|
| |||||||
| 1,444,248 | ||||||||
|
| |||||||
| Georgia–0.2% | ||||||||
Municipal Electric Authority of Georgia | 2,655 | 3,256,602 | ||||||
|
| |||||||
| Guam–1.3% | ||||||||
Guam Government Waterworks Authority | ||||||||
Series 2017 | 4,250 | 5,030,259 | ||||||
Guam Power Authority | ||||||||
Series 2017A | 5,435 | 6,365,856 | ||||||
Territory of Guam | 290 | 320,482 | ||||||
Territory of Guam (Guam Section 30 Income Tax) | ||||||||
Series 2016A | 2,545 | 2,920,260 | ||||||
Territory of Guam (Territory of Guam Business | ||||||||
Series 2015D | 7,150 | 8,042,210 | ||||||
|
| |||||||
| 22,679,067 | ||||||||
|
| |||||||
| Illinois–3.7% | ||||||||
Chicago Board of Education | ||||||||
Series 2017C | 8,160 | 8,999,120 | ||||||
Illinois Finance Authority | 1,580 | 1,913,074 | ||||||
Metropolitan Pier & Exposition Authority | ||||||||
Series 2012B | 5,090 | 5,311,156 | ||||||
Series 2017B | 2,000 | 2,413,764 | ||||||
State of Illinois | ||||||||
Series 2012 | $ | 10,490 | $ | 11,172,791 | ||||
Series 2013 | 7,435 | 8,149,234 | ||||||
Series 2014 | 2,540 | 2,845,890 | ||||||
Series 2016 | 4,200 | 4,672,907 | ||||||
Series 2017A | 2,060 | 2,344,492 | ||||||
Series 2017D | 13,005 | 14,485,694 | ||||||
Series 2018A | 2,910 | 3,296,804 | ||||||
Series 2018B | 1,405 | 1,574,203 | ||||||
Town of Cortland IL | ||||||||
Series 2006 | 1,307 | 241,795 | ||||||
|
| |||||||
| 67,420,924 | ||||||||
|
| |||||||
| Iowa–0.1% | ||||||||
Iowa Finance Authority | 2,350 | 2,393,960 | ||||||
|
| |||||||
| Kentucky–0.3% | ||||||||
City of Ashland KY | 1,210 | 1,416,489 | ||||||
Kentucky Economic Development Finance Authority (CommonSpirit Health) | ||||||||
Series 2019A | 3,190 | 3,991,453 | ||||||
|
| |||||||
| 5,407,942 | ||||||||
|
| |||||||
| Louisiana–0.1% | ||||||||
Parish of St. James LA | 240 | 270,930 | ||||||
6.10%, 06/01/2038-12/01/2040(a) | 805 | 1,006,384 | ||||||
|
| |||||||
| 1,277,314 | ||||||||
|
| |||||||
| Michigan–1.2% | ||||||||
City of Detroit MI | 1,255 | 1,479,677 | ||||||
City of Detroit MI Sewage Disposal System Revenue (Great Lakes Water Authority Sewage Disposal System Revenue) | ||||||||
Series 2012A | 3,055 | 3,233,195 | ||||||
Michigan Strategic Fund (Michigan Strategic Fund–I 75 Improvement Project) | ||||||||
Series 2018 | 14,290 | 17,853,055 | ||||||
|
| |||||||
| 22,565,927 | ||||||||
|
| |||||||
| 46 | Sanford C. Bernstein Fund, Inc.—2021 Semi-Annual Report |
Table of Contents
| Principal Amount (000) | U.S. $ Value | |||||||
| Missouri–0.0% | ||||||||
Howard Bend Levee District | ||||||||
XLCA | $ | 395 | $ | 447,934 | ||||
|
| |||||||
| Nevada–0.1% | ||||||||
City of Sparks NV | ||||||||
Series 2019A | 750 | 756,846 | ||||||
2.75%, 06/15/2028(a) | 715 | 729,570 | ||||||
|
| |||||||
| 1,486,416 | ||||||||
|
| |||||||
| New Jersey–2.5% | ||||||||
New Jersey Economic Development Authority (New Jersey Economic Development Authority State Lease) | ||||||||
Series 2013 | 1,445 | 1,555,120 | ||||||
New Jersey Transportation Trust Fund Authority (New Jersey Transportation Fed Hwy Grant) | ||||||||
Series 2016 | 10,000 | 11,670,350 | ||||||
Series 2018A | 11,630 | 13,781,445 | ||||||
New Jersey Transportation Trust Fund Authority (New Jersey Transportation Trust Fund Authority State Lease) | ||||||||
Series 2018A | 3,350 | 4,143,882 | ||||||
Series 2019B | 6,760 | 8,283,094 | ||||||
AMBAC Series 2005B | 4,700 | 5,295,172 | ||||||
|
| |||||||
| 44,729,063 | ||||||||
|
| |||||||
| Ohio–0.2% | ||||||||
Ohio Air Quality Development Authority (Energy Harbor Generation LLC) | ||||||||
Series 2009D | 1,305 | 1,328,315 | ||||||
Ohio Water Development Authority Water Pollution Control Loan Fund | ||||||||
Series 2016B | 1,650 | 1,699,500 | ||||||
|
| |||||||
| 3,027,815 | ||||||||
|
| |||||||
| Oklahoma–0.0% | ||||||||
Comanche County Memorial Hospital | ||||||||
5.00%, 07/01/2022 | 250 | 261,232 | ||||||
|
| |||||||
| Pennsylvania–0.4% |
| |||||||
Hospitals & Higher Education Facilities Authority of Philadelphia (The) (Temple University Health System Obligated Group) | ||||||||
Series 2017 | 3,775 | 4,148,724 | ||||||
Philadelphia Parking Authority (The) | ||||||||
Series 2009 | $ | 2,435 | $ | 2,443,299 | ||||
|
| |||||||
| 6,592,023 | ||||||||
|
| |||||||
| Puerto Rico–0.5% |
| |||||||
Puerto Rico Electric Power Authority | ||||||||
AGM Series 2007V | 1,390 | 1,691,261 | ||||||
NATL Series 2007V | 255 | 282,574 | ||||||
Puerto Rico Highway & Transportation Authority | ||||||||
AGC Series 2007N | 3,095 | 3,837,354 | ||||||
AGM Series 2007C | 1,370 | 1,686,946 | ||||||
NATL Series 2005L | 135 | 148,278 | ||||||
NATL Series 2007N | 275 | 305,010 | ||||||
Puerto Rico Sales Tax Financing Corp. Sales Tax Revenue | ||||||||
Series 2018A | ||||||||
Zero Coupon, 07/01/2024 | 2,035 | 1,909,950 | ||||||
|
| |||||||
| 9,861,373 | ||||||||
|
| |||||||
| Tennessee–0.5% |
| |||||||
Chattanooga Health Educational & Housing Facility Board | ||||||||
Series 2019A | 3,500 | 4,401,901 | ||||||
Tennergy Corp./TN | ||||||||
Series 2019A | 4,615 | 5,290,459 | ||||||
|
| |||||||
| 9,692,360 | ||||||||
|
| |||||||
| Texas–0.4% |
| |||||||
City of Houston TX Airport System Revenue | ||||||||
Series 2018 | 1,750 | 2,036,165 | ||||||
Mission Economic Development Corp. | ||||||||
Series 2018 | 4,540 | 4,824,815 | ||||||
|
| |||||||
| 6,860,980 | ||||||||
|
| |||||||
| Washington–0.5% | ||||||||
Washington Health Care Facilities Authority | ||||||||
Series 2019A | 7,280 | 9,133,859 | ||||||
|
| |||||||
Schedule of Investments—New York Municipal Portfolio | 47 |
Table of Contents
| Principal Amount (000) | U.S. $ Value | |||||||
| Wisconsin–0.3% | ||||||||
UMA Education, Inc. | $ | 4,810 | $ | 5,543,269 | ||||
|
| |||||||
| Total Long-Term Municipal Bonds (cost $1,587,631,518) | 1,660,799,310 | |||||||
|
| |||||||
| Short-Term Municipal Notes–5.6% |
| |||||||
| New York–5.6% | ||||||||
Build NYC Resource Corp. | 1,775 | 1,775,000 | ||||||
City of New York NY | ||||||||
Series 2008L | 530 | 530,000 | ||||||
Series 2009B | 5,850 | 5,850,000 | ||||||
Series 2016 | 8,995 | 8,995,000 | ||||||
Series 2019I | 7,250 | 7,250,000 | ||||||
Dutchess County Industrial Development Agency | 1,360 | 1,360,000 | ||||||
New York City Health and Hospitals Corp. | ||||||||
Series 2008B | 5,660 | 5,660,000 | ||||||
Series 2008E | 3,140 | 3,140,000 | ||||||
New York City Health and Hospitals Corp. (HHC Capital Corp.) | ||||||||
Series 2008C | 2,000 | 2,000,000 | ||||||
New York City Housing Development Corp. | 4,400 | 4,400,000 | ||||||
New York City Housing Development Corp. (201 Pearl LLC) | ||||||||
Series 2006A | 8,800 | 8,800,000 | ||||||
New York City Housing Development Corp. (Queenswood Apartments LP) | ||||||||
Series 2001A | 1,300 | 1,300,000 | ||||||
New York City Municipal Water Finance Authority | ||||||||
Series 2015F | 3,195 | 3,195,000 | ||||||
New York State Dormitory Authority | 2,495 | 2,495,000 | ||||||
New York State Dormitory Authority | ||||||||
Series 2008B | $ | 1,395 | $ | 1,395,000 | ||||
Series 2012B | 2,820 | 2,820,000 | ||||||
New York State Housing Finance Agency | 6,400 | 6,400,000 | ||||||
New York State Housing Finance Agency (42nd and 10th Associates LLC) | 1,835 | 1,835,000 | ||||||
New York State Housing Finance Agency (8 East 102nd Street LLC) | 3,140 | 3,140,000 | ||||||
New York State Housing Finance Agency (Liberty Street Realty LLC) | 2,300 | 2,300,000 | ||||||
New York State Housing Finance Agency (River Terrace Associates LLC) | 5,500 | 5,500,000 | ||||||
New York State Urban Development Corp. | ||||||||
Series 2008A | 5,870 | 5,870,000 | ||||||
Triborough Bridge & Tunnel Authority | ||||||||
Series 20182 | 150 | 150,000 | ||||||
Series 2018C | 8,210 | 8,210,000 | ||||||
Series 2021B | 5,150 | 5,147,660 | ||||||
Trust for Cultural Resources of The City of New York (The) | 3,155 | 3,155,000 | ||||||
|
| |||||||
| Total Short-Term Municipal Notes (cost $102,680,022) | 102,672,660 | |||||||
|
| |||||||
| Total Municipal Obligations (cost $1,690,311,540) | 1,763,471,970 | |||||||
|
| |||||||
| COLLATERALIZED MORTGAGE OBLIGATIONS–0.4% |
| |||||||
| Risk Share Floating Rate–0.4% |
| |||||||
Federal Home Loan Mortgage Corp. Structured | ||||||||
Series 2013-DN2, Class M2 | 207 | 206,303 | ||||||
| 48 | Sanford C. Bernstein Fund, Inc.—2021 Semi-Annual Report |
Table of Contents
| Principal Amount (000) | U.S. $ Value | |||||||
Series 2014-DN3, Class M3 | $ | 239 | $ | 242,157 | ||||
Series 2014-HQ2, Class M3 | 210 | 216,569 | ||||||
Series 2016-DNA1, Class M3 | ||||||||
5.659% (LIBOR 1 Month + 5.55%), | 197 | 206,653 | ||||||
Series 2016-HQA3, Class M3 3. | 250 | 258,991 | ||||||
Series 2016-HQA4, Class M3 | 245 | 253,593 | ||||||
Series 2017-DNA2, Class M2 | 320 | 331,609 | ||||||
Series 2017-DNA3, Class M2 | 500 | 509,491 | ||||||
Series 2019-DNA3, Class M2 | 163 | 162,329 | ||||||
Series 2016-HQA2, Class M3 | 264 | 274,942 | ||||||
Federal National Mortgage Association Connecticut Avenue Securities | ||||||||
Series 2014-C03, Class 2M2 | 273 | 275,493 | ||||||
Series 2015-C01, Class 2M2 | 12 | 12,006 | ||||||
Series 2015-C02, Class 1M2 | 222 | 224,150 | ||||||
Series 2016-C01, Class 1M2 | $ | 433 | $ | 457,747 | ||||
Series 2016-C02, Class 1M2 | 115 | 121,106 | ||||||
Series 2016-C03, Class 1M2 | 158 | 166,120 | ||||||
Series 2017-C01, Class 1M2 | 983 | 1,012,951 | ||||||
Series 2017-C02, Class 2M2 | 888 | 911,973 | ||||||
Series 2017-C03, Class 1M2 | 225 | 230,152 | ||||||
Series 2017-C05, Class 1M2 | 167 | 169,007 | ||||||
Series 2017-C06, Class 2M2 | ||||||||
2.909% (LIBOR 1 Month + 2.80%), | 154 | 154,747 | ||||||
|
| |||||||
| Total Collateralized Mortgage Obligations (cost $6,057,171) |
| 6,398,089 | ||||||
|
| |||||||
| GOVERNMENTS—TREASURIES – 0.1% |
| |||||||
| United States – 0.1% | ||||||||
U.S. Treasury Notes | 2,377 | 2,569,388 | ||||||
|
| |||||||
| Total Investments – 97.7% (cost $1,698,876,962) | 1,772,439,447 | |||||||
Other assets less liabilities – 2.3% | 41,420,376 | |||||||
|
| |||||||
| Net Assets – 100.0% | $ | 1,813,859,823 | ||||||
|
| |||||||
CENTRALLY CLEARED INFLATION (CPI) SWAPS (see Note 3)
| Rate Type | ||||||||||||||||||||||||
Notional (000) | Termination Date | Payments made by the Fund | Payments received by the Fund | Payment Frequency Paid/Received | Market Value | Upfront Premiums Paid/ (Received) | Unrealized Appreciation/ (Depreciation) | |||||||||||||||||
| USD | 7,130 | 01/15/2025 | 2.565% | CPI# | Maturity | $ | 14,838 | $ | — | $ | 14,838 | |||||||||||||
| USD | 3,565 | 01/15/2025 | 2.585% | CPI# | Maturity | 4,404 | — | 4,404 | ||||||||||||||||
| USD | 3,565 | 01/15/2025 | 2.613% | CPI# | Maturity | 256 | — | 256 | ||||||||||||||||
| USD | 27,600 | 01/15/2028 | 1.230% | CPI# | Maturity | 2,647,536 | — | 2,647,536 | ||||||||||||||||
| USD | 23,260 | 01/15/2028 | 0.735% | CPI# | Maturity | 3,139,355 | — | 3,139,355 | ||||||||||||||||
| USD | 4,375 | 01/15/2030 | 1.572% | CPI# | Maturity | 378,763 | — | 378,763 | ||||||||||||||||
| USD | 4,375 | 01/15/2030 | 1.587% | CPI# | Maturity | 372,128 | — | 372,128 | ||||||||||||||||
| USD | 5,500 | 02/15/2041 | CPI# | 2.282% | Maturity | (205,988 | ) | — | (205,988 | ) | ||||||||||||||
|
|
|
|
|
| |||||||||||||||||||
| $ | 6,351,292 | $ | — | $ | 6,351,292 | |||||||||||||||||||
|
|
|
|
|
| |||||||||||||||||||
# Variable interest rate based on the rate of inflation as determined by the Consumer Price Index (CPI).
Schedule of Investments—New York Municipal Portfolio | 49 |
Table of Contents
CENTRALLY CLEARED INTEREST RATE SWAPS (see Note 3)
| Rate Type | ||||||||||||||||||||||||
Notional | Termination Date | Payments made by the Fund | Payments received by the Fund | Payment Frequency Paid/Received | Market Value | Upfront Premiums Paid (Received) | Unrealized Appreciation/ (Depreciation) | |||||||||||||||||
| USD | 59,770 | 02/15/2025 | 3 Month LIBOR | 0.426% | Quarterly/Semi-Annual | $ | (764,742 | ) | $ | — | $ | (764,742 | ) | |||||||||||
| USD | 15,000 | 01/15/2028 | 1.173% | 3 Month LIBOR | Quarterly/Semi-Annual | 220,144 | — | 220,144 | ||||||||||||||||
| USD | 2,670 | 2/15/2041 | 1.868% | 3 Month LIBOR | Quarterly/Semi-Annual | 124,626 | — | 124,626 | ||||||||||||||||
|
|
|
|
|
| |||||||||||||||||||
| $ | (419,972 | ) | $ | — | $ | (419,972 | ) | |||||||||||||||||
|
|
|
|
|
| |||||||||||||||||||
CREDIT DEFAULT SWAPS (see Note 3)
| Swap Counterparty & Referenced Obligation | Fixed Rate (Pay) Receive | Payment Frequency | Implied Credit Spread at March 31, 2021 | Notional | Market Value | Upfront Premiums Paid (Received) | Unrealized Appreciation/ (Depreciation) | |||||||||||||||||||||||||
| Sale Contracts | ||||||||||||||||||||||||||||||||
Citigroup Global Markets, Inc. | ||||||||||||||||||||||||||||||||
| CDX-CMBX.NA.BBB- Series 6, 05/11/2063* | 3.00 | % | Monthly | 12.50 | % | USD | 169 | $ | (45,529 | ) | $ | (16,376 | ) | $ | (29,153 | ) | ||||||||||||||||
| CDX-CMBX.NA.BBB- Series 6, 05/11/2063* | 3.00 | Monthly | 12.50 | USD | 560 | (150,864 | ) | (70,005 | ) | (80,859 | ) | |||||||||||||||||||||
Credit Suisse International | ||||||||||||||||||||||||||||||||
| CDX-CMBX.NA.BBB- Series 6, 05/11/2063* | 3.00 | Monthly | 12.50 | USD | 37 | (9,968 | ) | (4,486 | ) | (5,482 | ) | |||||||||||||||||||||
| CDX-CMBX.NA.BBB- Series 6, 05/11/2063* | 3.00 | Monthly | 12.50 | USD | 93 | (25,055 | ) | (9,095 | ) | (15,960 | ) | |||||||||||||||||||||
| CDX-CMBX.NA.BBB- Series 6, 05/11/2063* | 3.00 | Monthly | 12.50 | USD | 1,142 | (307,655 | ) | (137,532 | ) | (170,123 | ) | |||||||||||||||||||||
| CDX-CMBX.NA.BBB- Series 6, 05/11/2063* | 3.00 | Monthly | 12.50 | USD | 1,151 | (309,983 | ) | (112,695 | ) | (197,288 | ) | |||||||||||||||||||||
| CDX-CMBX.NA.BBB- Series 6, 05/11/2063* | 3.00 | Monthly | 12.50 | USD | 1,734 | (467,140 | ) | (165,417 | ) | (301,723 | ) | |||||||||||||||||||||
Goldman Sachs International | ||||||||||||||||||||||||||||||||
| CDX-CMBX.NA.BBB- Series 6, 05/11/2063* | 3.00 | Monthly | 12.50 | USD | 216 | (58,190 | ) | (26,889 | ) | (31,301 | ) | |||||||||||||||||||||
| CDX-CMBX.NA.BBB- Series 6, 05/11/2063* | 3.00 | Monthly | 12.50 | USD | 1,503 | (404,908 | ) | (139,169 | ) | (265,739 | ) | |||||||||||||||||||||
|
|
|
|
|
| |||||||||||||||||||||||||||
| $ | (1,779,292 | ) | $ | (681,664 | ) | $ | (1,097,628 | ) | ||||||||||||||||||||||||
|
|
|
|
|
| |||||||||||||||||||||||||||
* Termination date
INTEREST RATE SWAPS (see Note 3)
| Rate Type | ||||||||||||||||||||||||||||||||||||
Swap | Notional Amount (000) | Termination Date | Payments made by the Fund | Payments received by the Fund | Payment Frequency Paid/Received | Market Value | Upfront Premiums Paid (Received) | Unrealized Appreciation/ (Depreciation) | ||||||||||||||||||||||||||||
| Citibank, NA | USD | 16,980 | 10/09/2029 | 1.120 | % | SIFMA | * | Quarterly | $ | 47,916 | $ | — | $ | 47,916 | ||||||||||||||||||||||
| Citibank, NA | USD | 16,980 | 10/09/2029 | 1.125 | % | SIFMA | * | Quarterly | 40,071 | — | 40,071 | |||||||||||||||||||||||||
|
|
|
|
|
| |||||||||||||||||||||||||||||||
| $ | 87,987 | $ | — | $ | 87,987 | |||||||||||||||||||||||||||||||
|
|
|
|
|
| |||||||||||||||||||||||||||||||
* Variable interest rate based on the Securities Industry & Financial Markets Association (SIFMA) Municipal Swap Index.
| 50 | Sanford C. Bernstein Fund, Inc.—2021 Semi-Annual Report |
Table of Contents
| (a) | Security is exempt from registration under Rule 144A of the Securities Act of 1933. These securities are considered restricted, but liquid and may be resold in transactions exempt from registration, normally to qualified institutional buyers. At March 31, 2021, the aggregate market value of these securities amounted to $35,180,576 or 1.9% of net assets. |
| (b) | Security is exempt from registration under Rule 144A of the Securities Act of 1933. These securities, which represent 0.07% of net assets as of March 31, 2021, are considered illiquid and restricted. Additional information regarding such securities follows: |
| 144A/Restricted & Illiquid Securities | Acquisition Date | Cost | Market Value | Percentage of Net Assets | ||||||||||||
Jefferson County Industrial Development Agency (ReEnergy Black River LLC) | 11/13/2014 | $ | 1,250,929 | $ | 1,207,906 | 0.07 | % | |||||||||
| (c) | When-Issued or delayed delivery security. |
| (d) | Floating Rate Security. Stated interest/floor/ceiling rate was in effect at March 31, 2021. |
| (e) | Defaulted matured security. |
| (f) | Non-income producing security. |
| (g) | Variable Rate Demand Notes are instruments whose interest rates change on a specific date (such as coupon date or interest payment date) or whose interest rates vary with changes in a designated base rate (such as the prime interest rate). This instrument is payable on demand and is secured by letters of credit or other credit support agreements from major banks. |
| (h) | Position, or a portion thereof, has been segregated to collateralize OTC derivatives outstanding. |
As of March 31, 2021, the Portfolio’s percentages of investments in municipal bonds that are insured and in insured municipal bonds that have been pre-refunded or escrowed to maturity are 3.6% and 0.3%, respectively.
Glossary:
AGC—Assured Guaranty Corporation
AGM—Assured Guaranty Municipal
AMBAC—Ambac Assurance Corporation
BAM—Build American Mutual
CDX-CMBX.NA—North American Commercial Mortgage-Backed Index
COP—Certificate of Participation
CPI—Consumer Price Index
ETM—Escrowed to Maturity
LIBOR—London Interbank Offered Rate
NATL—National Interstate Corporation
SRF—State Revolving Fund
SOFR—Secured Overnight Financing Rate.
XLCA—XL Capital Assurance Inc.
See notes to financial statements.
Schedule of Investments—New York Municipal Portfolio | 51 |
Table of Contents
SCB–MU–1945–0321
Table of Contents
MAR 03.31.21

SEMI-ANNUAL REPORT
AB BOND FUNDS
| + | AB INTERMEDIATE DURATION PORTFOLIO |
| + | AB SHORT DURATION PORTFOLIO |

As of January 1, 2021, as permitted by new regulations adopted by the Securities and Exchange Commission, each Fund’s annual and semi-annual shareholder reports are no longer sent by mail, unless you specifically requested paper copies of the reports. Instead, the reports are made available on a website, and you will be notified by mail each time a report is posted and provided with a website address to access the report.
You may elect to receive all future reports in paper form free of charge. If you invest through a financial intermediary, you can contact your financial intermediary to request that you continue to receive paper copies of your shareholder reports; if you invest directly with a Fund, you can call the Fund at (800) 221 5672. Your election to receive reports in paper form will apply to all funds held in your account with your financial intermediary or, if you invest directly, to all AB Mutual Funds you hold.
Table of Contents
| Investment Products Offered | • Are Not FDIC Insured • May Lose Value • Are Not Bank Guaranteed | |
Investors should consider the investment objectives, risks, charges and expenses of the Fund carefully before investing. For copies of our prospectus or summary prospectus, which contain this and other information, visit us online at www.abfunds.com or contact your AB representative. Please read the prospectus and/or summary prospectus carefully before investing.
This shareholder report must be preceded or accompanied by the Fund’s prospectus for individuals who are not current shareholders of the Fund.
You may obtain a description of the Fund’s proxy voting policies and procedures, and information regarding how the Fund voted proxies relating to portfolio securities during the most recent 12-month period ended June 30, without charge. Simply visit AB’s website at www.abfunds.com, or go to the Securities and Exchange Commission’s (the “Commission”) website at www.sec.gov, or call AB at (800) 227 4618.
The Fund files its complete schedule of portfolio holdings with the Commission for the first and third quarters of each fiscal year as an exhibit to its reports on Form N-PORT. The Fund’s Form N-PORT reports are available on the Commission’s website at www.sec.gov. The Fund’s Forms N-PORT may also be reviewed and copied at the Commission’s Public Reference Room in Washington, DC; information on the operation of the Public Reference Room may be obtained by calling (800) SEC 0330. AB publishes full portfolio holdings for the Fund monthly at www.abfunds.com.
AllianceBernstein Investments, Inc. (ABI) is the distributor of the AB family of mutual funds. ABI is a member of FINRA and is an affiliate of AllianceBernstein L.P., the Adviser of the funds.
The [A/B] logo is a registered service mark of AllianceBernstein and AllianceBernstein® is a registered service mark used by permission of the owner, AllianceBernstein L.P.
Table of Contents
| FROM THE ADVISER |  |
Dear Shareholder,
We’re pleased to provide this report for the AB Bond Funds: Intermediate Duration and Short Duration Portfolios (each a “Portfolio,” and collectively, the “Portfolios”). Please review the discussion of Portfolio performance, the market conditions during the reporting period and the Portfolios’ investment strategies.
As always, AB strives to keep clients ahead of what’s next by:
| + | Transforming uncommon insights into uncommon knowledge with a global research scope |
| + | Navigating markets with seasoned investment experience and sophisticated solutions |
| + | Providing thoughtful investment insights and actionable ideas |
Whether you’re an individual investor or a multi-billion-dollar institution, we put knowledge and experience to work for you.
AB’s global research organization connects and collaborates across platforms and teams to deliver impactful insights and innovative products. Better insights lead to better opportunities—anywhere in the world.
For additional information about AB’s range of products and shareholder resources, please log on to www.abfunds.com.
Thank you for your investment in the AB Mutual Funds.
Sincerely,

Onur Erzan
Senior Vice President of the Adviser
| abfunds.com | AB BOND FUNDS | 1 | |
Table of Contents
SEMI-ANNUAL REPORT
May 17, 2021
This report provides management’s discussion of fund performance for the AB Bond Funds: Intermediate Duration and Short Duration Portfolios for the semi-annual reporting period ended March 31, 2021.
The investment objective of the Intermediate Duration Portfolio is to provide safety of principal and a moderate to high rate of income that is subject to taxes. The investment objective of the Short Duration Portfolio is to provide safety of principal and a moderate rate of income that is subject to taxes.
NAV RETURNS AS OF MARCH 31, 2021 (unaudited)
| 6 Months | 12 Months | |||||||
| AB INTERMEDIATE DURATION PORTFOLIO | ||||||||
| Class A Shares | -2.48% | 3.23% | ||||||
| Advisor Class Shares1 | -2.37% | 3.49% | ||||||
| Class Z Shares1 | -2.20% | 3.95% | ||||||
| Bloomberg Barclays US Aggregate Bond Index | -2.73% | 0.71% | ||||||
| 6 Months | 12 Months | |||||||
| AB SHORT DURATION PORTFOLIO | ||||||||
| Class A Shares | -0.22% | 0.49% | ||||||
| Class C Shares | -0.40% | 0.20% | ||||||
| ICE BofA 1-3 Year US Treasury Index | 0.00% | 0.24% | ||||||
| 1 | Please note that these share classes are for investors purchasing shares through accounts established under certain fee-based programs sponsored and maintained by certain broker-dealers and financial intermediaries, institutional pension plans and/or investment advisory clients of, and certain other persons associated with, the Adviser and its affiliates or the Portfolio. |
INVESTMENT RESULTS
The preceding tables show performance for each Portfolio compared to their benchmarks, the Bloomberg Barclays US Aggregate Bond Index for the Intermediate Duration Portfolio, and the Intercontinental Exchange Bank of America (“ICE BofA”) 1-3 Year US Treasury Index for the Short Duration Portfolio, for the six- and 12-month periods ended March 31, 2021.
During the six-month period, all share classes of the Intermediate Duration Portfolio outperformed the benchmark, before sales charges. Sector allocation was the largest contributor, relative to the benchmark, mostly from underweights to US Treasuries and US agency mortgages, and
2 | AB BOND FUNDS | abfunds.com | |
Table of Contents
off-benchmark exposure to high-yield corporate bonds. Country and yield-curve positioning also contributed, due to an underweight to the 20-year part of the US curve. Security selection added to returns, as gains from selection in investment-grade corporate bonds more than offset losses from commercial mortgage-backed securities and high-yield corporate bonds. Currency decisions detracted, as losses from shorts in the Canadian dollar and New Zealand dollar, as well as long exposure to the Swiss franc, were greater than gains from long positions in the euro and Russian ruble.
During the 12-month period, all share classes of the Intermediate Duration Portfolio outperformed the benchmark, before sales charges. Sector allocation was the primary contributor to performance, as an underweight to US Treasuries, off-benchmark exposure to high-yield corporate bonds and agency risk-sharing transactions, along with an underweight to US agency mortgages and an overweight to investment-grade corporate bonds, exceeded a loss from utilizing interest rate swaps. Security selection also contributed, as selection in investment-grade corporate bonds and asset-backed securities offset losses within commercial mortgage-backed securities and high-yield corporate bonds. Country and yield-curve positioning added to returns, due to underweights to the 10- and 20-year parts of the US yield curve. Currency decisions detracted, as losses from shorts in the New Zealand, Australian and Canadian dollars, along with a long position in the Swiss franc, were partially offset by gains from long positions in the euro and Russian ruble.
During the six-month period, all share classes of the Short Duration Portfolio underperformed the benchmark, before sales charges. Yield-curve positioning on the two-year part of the curve detracted, relative to the benchmark. Sector allocation was the primary contributor, as off-benchmark allocations to inflation-linked bonds and asset-backed securities more than offset a loss from credit risk-transfer securities. Security selection also contributed, mostly within investment-grade corporate bonds. Currency decisions did not have a meaningful impact on returns.
During the 12-month period, Class A shares of the Short Duration Portfolio outperformed the benchmark, while Class C shares underperformed, before sales charges. Yield-curve positioning on the two-year part of the curve detracted. Sector allocation was the primary contributor to performance, due to off-benchmark allocations to inflation-linked bonds, asset-backed securities and investment-grade corporate bonds that more than offset a loss from credit risk-transfer securities. Security selection in investment-grade corporate bonds and US agency mortgages also contributed. Currency decisions did not have a meaningful impact on performance.
| abfunds.com | AB BOND FUNDS | 3 | |
Table of Contents
During both periods, the Intermediate Duration Portfolio utilized derivatives in the form of interest rate swaps, written swaptions and futures to manage and hedge duration risk and/or to take active yield-curve positioning. Currency forwards were used to hedge foreign currency exposure and to take active currency risk. Credit default swaps were utilized to hedge credit risk and as a tool to effectively gain exposure to specific sectors.
During both periods, the Short Duration Portfolio utilized derivatives in the form of futures to manage and hedge duration risk and/or to take active yield-curve positioning. Credit default swaps were utilized to hedge credit risk and as a tool to effectively gain exposure to specific sectors.
MARKET REVIEW AND INVESTMENT STRATEGY
Global fixed-income market returns were mixed, with an elevated amount of volatility and dispersion between regions and credit sectors over the six-month period ended March 31, 2021. After the positive impact of massive fiscal stimulus enacted by governments, and central bank monetary policies that anchored short-term interest rates at record lows to combat the COVID-19 pandemic, longer-term treasury yields continued to steadily rise during the period, based on expectations of an economic growth recovery. Developed-market government bond returns were negative, except in Italy, due to the European Central Bank’s bond-buying program to cap eurozone periphery yields. Historically low interest rates also set the stage for a sharp rebound in risk assets, which began to significantly rise in November, when positive vaccine news extended the credit rally. Emerging- and developed-market high-yield corporate bonds led gains, with significant positive returns, as investors searched for higher yields in a period of historically low interest rates. Emerging-market local-currency and hard-currency sovereign bonds, as well as emerging-market and developed-market investment-grade corporate bonds, also had positive results and outperformed global treasuries. Securitized assets also outperformed US Treasuries, with slightly negative results. The US dollar fell against most developed-market currencies and was mixed relative to emerging-market currencies. Brent crude oil prices rebounded by 54% on the improved economic outlook and OPEC+ production cuts. Copper gained 32% because of increased demand for infrastructure and green-energy initiatives. Gold prices fell about 9% due to the improved economic landscape.
INVESTMENT POLICIES
INTERMEDIATE DURATION PORTFOLIO
The Portfolio seeks to maintain an average portfolio quality minimum of A, based on ratings given to the Portfolio’s securities by national rating agencies (or, if unrated, determined by the Adviser to be of
(continued on next page)
4 | AB BOND FUNDS | abfunds.com | |
Table of Contents
comparable quality). Many types of securities may be purchased by the Portfolio, including corporate bonds, notes, US government and agency securities, asset-backed securities, mortgage-related securities, bank loan debt, preferred stock and inflation-protected securities, as well as others. The Portfolio may also invest up to 25% of its total assets in fixed-income, non-US dollar-denominated foreign securities, and may invest without limit in fixed-income, US dollar-denominated foreign securities, in each case in developed- or emerging-market countries. The Portfolio may use derivatives, such as options, futures contracts, forward contracts and swaps. The Portfolio may invest up to 25% of its total assets in fixed-income securities rated below investment-grade (BB or below) by national rating agencies (commonly known as “junk bonds”). No more than 5% of the Portfolio’s total assets may be invested in fixed-income securities rated CCC by national rating agencies.
In managing the Portfolio, the Adviser may use interest-rate forecasting to estimate an appropriate level of interest-rate risk at a given time. The Portfolio seeks to maintain an effective duration of three to seven years under normal market conditions. Duration is a measure that relates the expected price volatility of a security to changes in interest rates. The duration of a debt security is the weighted average term to maturity, expressed in years, of the present value of all future cash flows, including coupon payments and principal repayments. Within the range described above, the Adviser may moderately shorten the average duration of the Portfolio when it expects interest rates to rise and moderately lengthen average duration when it anticipates that interest rates will fall.
The Adviser selects securities for purchase or sale based on its assessment of the securities’ risk and return characteristics as well as the securities’ impact on the overall risk and return characteristics of the Portfolio. In making this assessment, the Adviser takes into account various factors including the credit quality and sensitivity to interest rates of the securities under consideration and of the Portfolio’s other holdings.
The Portfolio may enter into foreign currency transactions on a spot (i.e., cash) basis or through the use of derivatives transactions, such as forward currency exchange contracts, currency futures and options thereon, and options on currencies. An appropriate hedge of currency exposure resulting from the Portfolio’s securities positions may not be available or cost effective, or the Adviser may determine not to hedge the positions, possibly even under market conditions where doing so could benefit the Portfolio.
(continued on next page)
| abfunds.com | AB BOND FUNDS | 5 | |
Table of Contents
SHORT DURATION PORTFOLIO
The Portfolio invests at least 80% of its total assets in securities rated A or better by national rating agencies (or, if unrated, determined by the Adviser to be of comparable quality) and comparably rated commercial paper and notes. Many types of securities may be purchased by the Portfolio, including corporate bonds, notes, US government and agency securities, asset-backed securities, mortgage-related securities, inflation-protected securities, bank loan debt and preferred stock, as well as others. The Portfolio may also invest up to 20% of its total assets in fixed-income foreign securities in developed- or emerging-market countries. The Portfolio may use derivatives, such as options, futures contracts, forward contracts and swaps. The Portfolio may invest up to 20% of its total assets in fixed-income securities rated BB or B by national rating agencies, which are not investment-grade (commonly known as “junk bonds”).
In managing the Portfolio, the Adviser may use interest-rate forecasting to estimate an appropriate level of interest-rate risk at a given time. The Portfolio seeks to maintain an effective duration of one to three years under normal market conditions. Duration is a measure that relates the expected price volatility of a security to changes in interest rates. The duration of a debt security is the weighted average term to maturity, expressed in years, of the present value of all future cash flows, including coupon payments and principal repayments. Within the range described above, the Adviser may moderately shorten the average duration of the Portfolio when it expects interest rates to rise and moderately lengthen average duration when it anticipates that interest rates will fall.
The Adviser selects securities for purchase or sale based on its assessment of the securities’ risk and return characteristics as well as the securities’ impact on the overall risk and return characteristics of the Portfolio. In making this assessment, the Adviser takes into account various factors including the credit quality and sensitivity to interest rates of the securities under consideration and of the Portfolio’s other holdings.
The Portfolio may enter into foreign currency transactions on a spot (i.e., cash) basis or through the use of derivatives transactions, such as forward currency exchange contracts, currency futures and options thereon, and options on currencies. An appropriate hedge of currency exposure resulting from the Portfolio’s securities positions may not be available or cost effective, or the Adviser may determine not to hedge the positions, possibly even under market conditions where doing so could benefit the Portfolio.
6 | AB BOND FUNDS | abfunds.com | |
Table of Contents
DISCLOSURES AND RISKS
Benchmark Disclosure
The Bloomberg Barclays US Aggregate Bond Index and ICE BofA® 1-3 Year US Treasury Index are unmanaged and do not reflect fees and expenses associated with the active management of a mutual fund portfolio. The Bloomberg Barclays US Aggregate Bond Index represents the performance of securities within the US investment-grade fixed-rate bond market, with index components for government and corporate securities, mortgage pass-through securities, asset-backed securities and commercial mortgage-backed securities. The ICE BofA 1-3 Year US Treasury Index represents the performance of US dollar-denominated sovereign debt publicly issued by the US government in its domestic market with a remaining term to final maturity of one to three years. An investor cannot invest directly in an index, and its results are not indicative of the performance for any specific investment, including the Portfolio.
A Word About Risk
Cybersecurity Risk: Cybersecurity incidents, both intentional and unintentional, may allow an unauthorized party to gain access to Portfolio assets, customer data (including private shareholder information), or proprietary information, or cause the Portfolios, the Adviser, and/or its service providers (including, but not limited to, fund accountants, custodians, sub-custodians, transfer agents and financial intermediaries) to suffer data breaches, data corruption or lose operational functionality, or prevent Portfolio investors from purchasing, redeeming or exchanging shares or receiving distributions. A Portfolio and the Adviser have limited ability to prevent or mitigate cybersecurity incidents affecting third-party service providers. Cybersecurity incidents may result in financial losses to such Portfolio and its shareholders, and substantial costs may be incurred in order to prevent any future cybersecurity incidents.
Interest-Rate Risk: Changes in interest rates will affect the value of investments in fixed-income securities. When interest rates rise, the value of existing investments in fixed-income securities tends to fall and this decrease in value may not be offset by higher income from new investments. Interest-rate risk is generally greater for fixed-income securities with longer maturities or durations. The current historically low interest rate environment heightens the risks associated with rising interest rates.
Credit Risk: This is the risk that the issuer or the guarantor of a debt security, or the counterparty to a derivatives or other contract, will be unable or unwilling to make timely principal and/or interest payments, or to otherwise honor its obligations. The issuer or guarantor may default, potentially causing a loss of the full principal amount of a security and accrued interest. The degree of risk for a particular security may be
| abfunds.com | AB BOND FUNDS | 7 | |
Table of Contents
DISCLOSURES AND RISKS (continued)
reflected in its credit rating. The credit rating of a fixed-income security may be downgraded after purchase, which may adversely affect the value of the security. Investments in fixed-income securities with lower ratings tend to have a higher probability that an issuer will default or fail to meet its payment obligations, making credit risk greater for medium-quality and lower-rated debt securities. Lower-rated debt securities and similar unrated securities (commonly known as “junk bonds”) have speculative elements or are predominantly speculative credit risks. At times when credit risk is perceived to be greater, credit “spreads” (i.e., the difference between the yields on lower quality securities and the yields on higher quality securities) may get larger or “widen”. As a result, the values of the lower quality securities may go down more and they may become harder to sell.
Duration Risk: The duration of a fixed-income security may be shorter than or equal to full maturity of the fixed-income security. Fixed-income securities with longer durations have more interest-rate risk and will decrease in price as interest rates rise. Securities that have final maturities longer than their durations may be affected by increased credit spreads to a far greater degree than their durations would suggest, because they are exposed to credit risk until final maturity.
Inflation Risk: This is the risk that the value of assets or income from investments will be less in the future as inflation decreases the value of money. As inflation increases, the value of the Portfolios’ assets can decline as can the value of the Portfolios’ distributions. This risk is significantly greater for fixed-income securities with longer maturities.
Inflation-Protected Securities Risk: The terms of inflation-protected securities provide for the coupon and/or maturity value to be adjusted based on changes in an inflation index. Decreases in the inflation rate or in investors’ expectations about inflation could cause these securities to underperform non-inflation-adjusted securities on a total-return basis. In addition, there can be no assurance that the relevant inflation index will accurately measure the rate of inflation, in which case the securities may not work as intended. These securities may be more difficult to trade or dispose of than other types of securities.
Foreign (Non-US) Securities Risk: Investments in foreign securities entail significant risks in addition to those customarily associated with investing in US securities. These risks include risks related to adverse market, economic, political and regulatory factors and social instability, all of which could disrupt the financial markets in which the Portfolios invest and adversely affect the value of the Portfolios’ assets.
8 | AB BOND FUNDS | abfunds.com | |
Table of Contents
DISCLOSURES AND RISKS (continued)
Emerging-Markets Securities Risk: The risks of investing in foreign (non-US) securities are heightened with respect to issuers in emerging-market countries because the markets are less developed and less liquid and there may be a greater amount of economic, political and social uncertainty, and these risks are even more pronounced in “frontier” markets, which are investable markets with lower total market capitalization and liquidity than the more developed emerging markets. In addition, the value of the Portfolios’ investments may decline because of factors such as unfavorable or unsuccessful government actions and reduction of government or central bank support.
Derivatives Risk: The Portfolios may use derivatives as direct investments to earn income, enhance return and broaden portfolio diversification, which entail greater risk than if used solely for hedging purposes. In addition to other risks such as the credit risk of the counterparty, derivatives involve the risk that changes in the value of the derivative may not correlate with relevant assets, rates or indices. Derivatives may be difficult to price or unwind, and small changes may produce disproportionate losses for the Portfolios. Certain derivatives have the potential for unlimited loss, regardless of the size of the initial investment. Assets required to be set aside or posted to cover or secure derivatives positions may themselves go down in value, and these collateral and other requirements may limit investment flexibility. Some derivatives involve leverage, which can make the Portfolios more volatile and can compound other risks. Derivatives, especially over-the-counter derivatives, are also subject to counterparty risk. Use of derivatives may have different tax consequences for the Portfolios than an investment in the underlying asset or index, and such differences may affect the amount, timing and character of income distributed to shareholders. The US government and certain foreign governments have adopted regulations governing derivatives markets, including mandatory clearing of certain derivatives and may impose additional regulations governing, margin, reporting and registration requirements. The ultimate impact of the regulations remains unclear. Additional regulation may make derivatives more costly, limit their availability or utility, otherwise adversely affect their performance, or disrupt markets.
Mortgage-Related and Asset-Related Securities Risk: Mortgage- and asset-related securities represent interests in “pools” of mortgages or other assets, including consumer loans or receivables held in trust. Mortgage- and asset-related securities are subject to credit, interest-rate, prepayment and extension risks. These securities also are subject to risk of default on the underlying mortgage or asset, particularly during periods of economic downturn. Small movements in interest rates (both increases and decreases) may quickly and significantly reduce the value of certain mortgage-related securities.
| abfunds.com | AB BOND FUNDS | 9 | |
Table of Contents
DISCLOSURES AND RISKS (continued)
Prepayment and Extension Risk: Prepayment risk is the risk that a loan, bond or other security might be called or otherwise converted, prepaid or redeemed before maturity. If this happens, particularly during a time of declining interest rates or credit spreads, the Portfolios will not benefit from the rise in market price that normally accompanies a decline in interest rates, and may not be able to invest the proceeds in securities providing as much income, resulting in a lower yield to the Portfolios. Conversely, extension risk is the risk that as interest rates rise or spreads widen, payments of securities may occur more slowly than anticipated by the market. If this happens, the values of these securities may go down because their interest rates are lower than current market rates and they remain outstanding longer than anticipated.
Subordination Risk: The Portfolios may invest in securities that are subordinated to more senior securities of an issuer, or which represent interests in pools of such subordinated securities. Subordinated securities will be disproportionately affected by a default or even a perceived decline in creditworthiness of the issuer. Subordinated securities are more likely to suffer a credit loss than non-subordinated securities of the same issuer, any loss incurred by the subordinated securities is likely to be proportionately greater, and any recovery of interest or principal may take more time.
Management Risk: The Portfolios are subject to management risk because they are actively managed investment portfolios. The Adviser will apply its investment techniques and risk analyses in making investment decisions for the Portfolios, but these techniques, analyses and decisions may not work as intended or may not produce the desired results, and may, during certain periods, result in increased volatility for the Portfolios or cause the value of the Portfolios’ shares to go down. In some cases, derivatives and other investment techniques may be unavailable, or the Adviser may determine not to use them, possibly even under market conditions where their use could benefit the Portfolios. Some of these techniques may incorporate, or rely upon, quantitative models, but there is no guarantee that these models will generate accurate forecasts, reduce risk or otherwise perform as expected. In addition, the Adviser may change the Portfolios’ investment strategies or policies from time to time. Those changes may not lead to the results intended by the Adviser and could have an adverse effect on the value or performance of the Portfolios.
Illiquid Investments Risk: Illiquid investments risk exists when particular investments are difficult to purchase or sell, possibly preventing the Portfolios from purchasing or selling these securities at an advantageous price. Over recent years, regulatory changes have led to reduced liquidity in the marketplace, and the capacity of dealers to make markets in fixed-income securities has been outpaced by the growth in the size of the fixed-income
10 | AB BOND FUNDS | abfunds.com | |
Table of Contents
DISCLOSURES AND RISKS (continued)
markets. Illiquid investments risk may be magnified in a rising interest-rate environment, where the value and liquidity of fixed-income securities generally go down. Illiquid securities may also be difficult to value.
Redemption Risk: The Portfolios may experience heavy redemptions that could cause the Portfolios to liquidate their assets at inopportune times or unfavorable prices or increase or accelerate taxable gains or transaction costs and may negatively affect the Portfolios’ net asset value (“NAV”), or performance, which could cause the value of your investment to decline. Redemption risk is heightened during periods of overall market turmoil.
Foreign Currency Risk: This is the risk that changes in foreign (non-US) currency exchange rates may negatively affect the value of the Portfolios’ investments or reduce the returns of the Portfolios. For example, the value of the Portfolios’ investments in foreign securities and foreign currency positions may decrease if the US dollar is strong (i.e., gaining value relative to other currencies) and other currencies are weak (i.e., losing value relative to the US dollar).
Actions by a Few Major Investors: In certain countries, volatility may be heightened by actions of a few major investors. For example, substantial increases or decreases in cash flows of mutual funds investing in these markets could significantly affect local securities prices and, therefore, share prices of the Portfolios.
Market Risk: The Portfolios are subject to market risk, which is the risk that stock prices in general or in particular countries or sectors may decline over short or extended periods. Stock prices may decline in response to adverse changes in the economy or the economic outlook; deterioration in investor sentiment; interest rate, currency and commodity price fluctuations; adverse geopolitical, social or environmental developments; issuer- and sector-specific considerations; public health crises (including the occurrence of a contagious disease or illness); and other factors. In the past decade, financial markets in the United States, Europe and elsewhere have experienced increased volatility, decreased liquidity and heightened uncertainty. These market conditions may recur from time to time and have an adverse impact on various securities markets. Recently, certain governments and central banks have provided significant support to financial markets in response to serious economic disruptions, including, but not limited to, buying stocks, providing direct capital infusions into companies, implementing new monetary programs, dramatically lowering interest rates and through other market interventions. This and other government intervention into the economy and financial markets may not work as intended, particularly if the efforts are perceived by investors as being unlikely to achieve the desired results. Government actions to support the economy and financial markets have resulted in a
| abfunds.com | AB BOND FUNDS | 11 | |
Table of Contents
DISCLOSURES AND RISKS (continued)
large expansion of government deficits and debt, the long-term consequences of which are not known. The reversal of these policies, or their ineffectiveness, as well as further governmental or central bank actions could negatively affect financial markets generally, increase market volatility and reduce the value and liquidity of securities in which the Portfolios invest.
On January 31, 2020, the United Kingdom (the “UK”) formally left the European Union (the “EU”) (“Brexit”) and ceased to be a member of the EU. Brexit could adversely affect European or worldwide political, regulatory, economic or market conditions and could contribute to instability in global political institutions, regulatory agencies and financial markets. Brexit could also lead to legal uncertainty and politically divergent national laws and regulations as a new relationship between the UK and EU is developed and the UK determines which EU laws to replace or replicate in the future. Any of these effects of Brexit, and others the Adviser cannot anticipate, could adversely affect the value of the Portfolios’ investments and net asset value. The political, economic and legal consequences of Brexit continue to give rise to uncertainties. The UK may be less stable than it has been in recent years and investments in UK assets may be difficult to value, or subject to greater or more frequent rises and falls in value.
The United States has imposed tariffs and other trade barriers on Chinese exports and placed other restrictions on or barriers to investments in China. Trade disputes, particularly prolonged disputes, may adversely affect the economies of the United States and its trading partners, as well as the companies directly or indirectly affected by the dispute and financial markets generally, and thus may adversely affect the value of the Portfolios’ assets. Recently, the United States government acted to prohibit US persons, such as the Portfolios, from owning, and required them to divest, certain Chinese companies designated as related to the Chinese military. There is no assurance that more such companies will not be so designated in the future, which could limit the Portfolios’ opportunities for investment and require the sale of securities at a loss or make them illiquid. If the political climate between the United States and China continues to deteriorate, economies and markets may be adversely affected.
Policy and legislative changes in the United States and in other countries are affecting many aspects of financial regulation, and may in some instances contribute to decreased liquidity and increased volatility in the financial markets. The impact of these changes, and the practical implications for market participants, may not be fully known for some time.
Economies and financial markets throughout the world are becoming increasingly interconnected. Economic, financial or political events, trading
12 | AB BOND FUNDS | abfunds.com | |
Table of Contents
DISCLOSURES AND RISKS (continued)
and tariff arrangements, terrorism, natural disasters (including the spread of infectious illness) and other circumstances in one country or region could have profound impacts on global economies or markets. As a result, whether or not the Portfolios invest in securities of issuers located in or with significant exposure to countries experiencing economic and financial difficulties, the value and liquidity of the Portfolios’ investments may be negatively affected.
Lower-rated Securities Risk: Lower-rated securities, or junk bonds/high-yield securities, are subject to greater risk of loss of principal and interest and greater market risk than higher-rated securities. The capacity of issuers of lower-rated securities to pay interest and repay principal is more likely to weaken than is that of issuers of higher-rated securities in times of deteriorating economic conditions or rising interest rates.
Riskier than a Money-Market Fund: Although the Short Duration Portfolio maintains a short overall duration, it invests in securities with longer maturities and in some cases lower quality than the assets of the type of mutual fund known as a money-market fund. The risk of a decline in the market value of the Portfolio is greater than for a money-market fund since the credit quality of the Portfolio’s securities may be lower and the effective duration of the Portfolio will be longer.
These risks are fully discussed in the Portfolios’ prospectus. As with all investments, you may lose money by investing in the Portfolios.
An Important Note About Historical Performance
The investment return and principal value of an investment in the Portfolios will fluctuate, so that shares, when redeemed, may be worth more or less than their original cost. Performance shown in this report represents past performance and does not guarantee future results. Current performance may be lower or higher than the performance information shown. You may obtain performance information current to the most recent month-end by visiting www.abfunds.com. Class B shares are no longer being offered. Effective November 7, 2019, all outstanding Class B shares were converted to Class A shares. Please see Note A for more information. The retail share classes of the Intermediate Duration Portfolio have been in operation only for a short period of time, and therefore have a very limited historical performance period. This limited performance period is unlikely to be representative of the performance the Portfolio will achieve over a longer period.
| abfunds.com | AB BOND FUNDS | 13 | |
Table of Contents
DISCLOSURES AND RISKS (continued)
All fees and expenses related to the operation of the Portfolios have been deducted. NAV returns do not reflect sales charges; if sales charges were reflected, the Portfolios’ quoted performance would be lower. SEC returns reflect the applicable sales charges for each share class: a 4.25% maximum front-end sales charge for Class A shares and a 1% 1-year contingent deferred sales charge for Class C shares. Returns for the different share classes will vary due to different expenses associated with each class. Performance assumes reinvestment of distributions and does not account for taxes.
14 | AB BOND FUNDS | abfunds.com | |
Table of Contents
HISTORICAL PERFORMANCE
INTERMEDIATE DURATION PORTFOLIO
AVERAGE ANNUAL RETURNS AS OF MARCH 31, 2021 (unaudited)
| NAV Returns | SEC Returns (reflects applicable | SEC Yields1 | ||||||||||
| CLASS A SHARES | 0.57% | |||||||||||
| 1 Year | 3.23% | -1.13% | ||||||||||
| Since Inception2 | 2.48% | -0.11% | ||||||||||
| ADVISOR CLASS SHARES3 | 0.85% | |||||||||||
| 1 Year | 3.49% | 3.49% | ||||||||||
| Since Inception2 | 2.69% | 2.69% | ||||||||||
| CLASS Z SHARES3 | 1.34% | |||||||||||
| 1 Year | 3.95% | 3.95% | ||||||||||
| Since Inception2 | 3.41% | 3.41% | ||||||||||
SEC AVERAGE ANNUAL RETURNS
AS OF THE MOST RECENT CALENDAR QUARTER-END
MARCH 31, 2021 (unaudited)
SEC Returns (reflects applicable | ||||
| CLASS A SHARES | ||||
| 1 Year | -1.13% | |||
| Since Inception2 | -0.11% | |||
| ADVISOR CLASS SHARES3 | ||||
| 1 Year | 3.49% | |||
| Since Inception2 | 2.69% | |||
| CLASS Z SHARES3 | ||||
| 1 Year | 3.95% | |||
| Since Inception2 | 3.41% | |||
The Portfolio’s current prospectus fee table shows the Portfolio’s total annual operating expense ratios as 1.82%, 1.64% and 0.82% for Class A, Advisor Class and Class Z shares, respectively. Contractual fee waivers and/or expense reimbursements limit the Portfolio’s total other expenses (excluding advisory fees, distribution and/or service fees, extraordinary expenses, interest expense, acquired fund fees and expenses other than the advisory fees of any affiliated funds in which the Portfolio may invest, expenses associated with securities sold short, and brokerage commission and other transaction costs) to 0.22%, 0.22% and 0.13% for Class A, Advisor Class and Class Z shares, respectively. These waivers/reimbursements may not be terminated before January 28, 2022. Absent reimbursements or waivers, performance would have been lower. The Financial Highlights section of this report sets forth expense ratio data for the current reporting period; the expense ratios shown above may differ from the expense ratios in the Financial Highlights section since they are based on different time periods.
| 1 | SEC yields are calculated based on SEC guidelines for the 30-day period ended March 31, 2021. |
| 2 | Inception date: 7/22/2019. |
| 3 | These share classes are offered at NAV to eligible investors and their SEC returns are the same as their NAV returns. Please note that these share classes are for investors purchasing shares through accounts established under certain fee-based programs sponsored and maintained by certain broker-dealers and financial intermediaries, institutional pension plans and/or investment advisory clients of, and certain other persons associated with, the Adviser and its affiliates or the Portfolio. |
| abfunds.com | AB BOND FUNDS | 15 | |
Table of Contents
HISTORICAL PERFORMANCE
SHORT DURATION PORTFOLIO
AVERAGE ANNUAL RETURNS AS OF MARCH 31, 2021 (unaudited)
| NAV Returns | SEC Returns (reflects applicable | SEC Yields1 | ||||||||||
| CLASS A SHARES | -0.30% | |||||||||||
| 1 Year | 0.49% | -3.77% | ||||||||||
| 5 Years | 0.97% | 0.10% | ||||||||||
| 10 Years | 0.63% | 0.19% | ||||||||||
| CLASS C SHARES | -1.06% | |||||||||||
| 1 Year | 0.20% | -0.80% | ||||||||||
| 5 Years | 0.77% | 0.77% | ||||||||||
| 10 Years2 | 0.38% | 0.38% | ||||||||||
SEC AVERAGE ANNUAL RETURNS
AS OF THE MOST RECENT CALENDAR QUARTER-END
MARCH 31, 2021 (unaudited)
SEC Returns (reflects applicable | ||||
| CLASS A SHARES | ||||
| 1 Year | -3.77% | |||
| 5 Years | 0.10% | |||
| 10 Years | 0.19% | |||
| CLASS C SHARES | ||||
| 1 Year | -0.80% | |||
| 5 Years | 0.77% | |||
| 10 Years2 | 0.38% | |||
The Portfolio’s current prospectus fee table shows the Portfolio’s total annual operating expense ratios as 1.07% and 1.83% for Class A and Class C shares, respectively. The Financial Highlights section of this report sets forth expense ratio data for the current reporting period; the expense ratios shown above may differ from the expense ratios in the Financial Highlights section since they are based on different time periods.
| 1 | SEC yields are calculated based on SEC guidelines for the 30-day period ended March 31, 2021. |
| 2 | Assumes conversion of Class C shares into Class A shares after 10 years. |
16 | AB BOND FUNDS | abfunds.com | |
Table of Contents
EXPENSE EXAMPLE
(unaudited)
As a shareholder of a Portfolio, you incur two types of costs: (1) transaction costs, including sales charges (loads) on purchase payments, contingent deferred sales charges on redemptions and (2) ongoing costs, including management fees; distribution (12b-1) fees; and other Portfolio expenses. This example is intended to help you understand your ongoing costs (in dollars) of investing in the Portfolio and to compare these costs with the ongoing costs of investing in other mutual funds.
The Example is based on an investment of $1,000 invested at the beginning of the period and held for the entire period as indicated below.
Actual Expenses
The first line of the table below provides information about actual account values and actual expenses. You may use the information in this line, together with the amount you invested, to estimate the expenses that you paid over the period. Simply divide your account value by $1,000 (for example, an $8,600 account value divided by $1,000 = 8.6), then multiply the result by the number in the first line under the heading entitled “Expenses Paid During Period” to estimate the expenses you paid on your account during this period.
Hypothetical Example for Comparison Purposes
The second line of the table below provides information about hypothetical account values and hypothetical expenses based on a Portfolio’s actual expense ratio and an assumed annual rate of return of 5% before expenses, which is not the Portfolio’s actual return. The hypothetical account values and expenses may not be used to estimate the actual ending account balance or expenses you paid for the period. You may use this information to compare the ongoing costs of investing in the Portfolio and other funds by comparing this 5% hypothetical example with the 5% hypothetical examples that appear in the shareholder reports of other funds.
Please note that the expenses shown in the table are meant to highlight your ongoing costs only and do not reflect any transactional costs, such as sales charges (loads), or contingent deferred sales charges on redemptions. Therefore, the second line of the table is useful in comparing ongoing costs only, and will not help you determine the relative total costs of owning different funds. In addition, if these transactional costs were included, your costs would have been higher.
| abfunds.com | AB BOND FUNDS | 17 | |
Table of Contents
EXPENSE EXAMPLE (continued)
(unaudited)
Intermediate Duration Portfolio
| Beginning Account Value October 1, 2020 | Ending Account Value March 31, 2021 | Expenses Paid During Period* | Annualized Expense Ratio* | |||||||||||||
| Class A | ||||||||||||||||
Actual | $ | 1,000 | $ | 975.20 | $ | 6.11 | 1.24 | % | ||||||||
Hypothetical** | $ | 1,000 | $ | 1,018.75 | $ | 6.24 | 1.24 | % | ||||||||
| Advisor Class | ||||||||||||||||
Actual | $ | 1,000 | $ | 976.30 | $ | 5.37 | 1.09 | % | ||||||||
Hypothetical** | $ | 1,000 | $ | 1,019.50 | $ | 5.49 | 1.09 | % | ||||||||
| Class Z | ||||||||||||||||
Actual | $ | 1,000 | $ | 978.00 | $ | 3.75 | 0.76 | % | ||||||||
Hypothetical** | $ | 1,000 | $ | 1,021.14 | $ | 3.83 | 0.76 | % | ||||||||
Short Duration Plus Portfolio
| Beginning Account Value October 1, 2020 | Ending Account Value March 31, 2021 | Expenses Paid During Period* | Annualized Expense Ratio* | |||||||||||||
| Class A | ||||||||||||||||
Actual | $ | 1,000 | $ | 997.80 | $ | 5.23 | 1.05 | % | ||||||||
Hypothetical** | $ | 1,000 | $ | 1,019.70 | $ | 5.29 | 1.05 | % | ||||||||
| Class C | ||||||||||||||||
Actual | $ | 1,000 | $ | 996.00 | $ | 6.22 | 1.25 | % | ||||||||
Hypothetical** | $ | 1,000 | $ | 1,018.70 | $ | 6.29 | 1.25 | % | ||||||||
| * | Expenses are equal to the classes’ annualized expense ratios, multiplied by the average account value over the period, multiplied by 182/365 (to reflect the one-half year period). |
| ** | Assumes 5% annual return before expenses. |
18 | AB BOND FUNDS | abfunds.com | |
Table of Contents
PORTFOLIO SUMMARY
INTERMEDIATE DURATION PORTFOLIO
March 31, 2021 (unaudited)
PORTFOLIO STATISTICS
Net Assets ($mil): $3,803.0
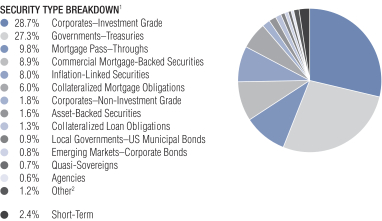
| 1 | All data are as of March 31, 2021. The Portfolio’s security type breakdown is expressed as a percentage of total investments and may vary over time. The Portfolio also enters into derivative transactions, which may be used for hedging or investment purposes (see “Portfolio of Investments” section of the report for additional details). |
| 2 | “Other” represents less than 0.5% in Common Stocks, Emerging Markets–Sovereigns and Governments–Sovereign Bonds |
| abfunds.com | AB BOND FUNDS | 19 | |
Table of Contents
PORTFOLIO SUMMARY
SHORT DURATION PLUS PORTFOLIO
March 31, 2021 (unaudited)
PORTFOLIO STATISTICS
Net Assets ($mil): $279.4
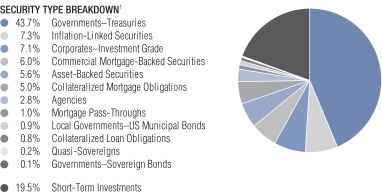
| 1 | All data are as of March 31, 2021. The Portfolio’s security type breakdown is expressed as a percentage of total investments and may vary over time. The Portfolio also enters into derivative transactions, which may be used for hedging or investment purposes (see “Portfolio of Investments” section of the report for additional details). |
20 | AB BOND FUNDS | abfunds.com | |
Table of Contents
PORTFOLIO OF INVESTMENTS
INTERMEDIATE DURATION PORTFOLIO
March 31, 2021 (unaudited)
Principal (000) | U.S. $ Value | |||||||||||
| ||||||||||||
CORPORATES - INVESTMENT | ||||||||||||
Industrial – 18.4% | ||||||||||||
Basic – 1.4% | ||||||||||||
Alpek SAB de CV | U.S.$ | 1,773 | $ | 1,746,848 | ||||||||
4.25%, 09/18/2029(a) | 449 | 475,519 | ||||||||||
DuPont de Nemours, Inc. | 4,915 | 5,335,577 | ||||||||||
4.493%, 11/15/2025 | 4,913 | 5,560,288 | ||||||||||
Eastman Chemical Co. | 2,282 | 2,481,196 | ||||||||||
Fresnillo PLC | 11,109 | 10,914,592 | ||||||||||
Glencore Funding LLC | 2,622 | 2,801,319 | ||||||||||
GUSAP III LP | 5,248 | 5,523,520 | ||||||||||
Industrias Penoles SAB de CV | 1,544 | 1,584,530 | ||||||||||
Inversiones CMPC SA | 2,742 | 2,910,804 | ||||||||||
4.375%, 04/04/2027(a) | 2,062 | 2,257,168 | ||||||||||
Inversiones CMPC SA/Cayman Islands Branch | 1,151 | 1,210,708 | ||||||||||
Nutrition & Biosciences, Inc. | 1,910 | 1,868,954 | ||||||||||
Orbia Advance Corp. SAB de CV | 3,400 | 3,690,062 | ||||||||||
4.875%, 09/19/2022(a) | 1,519 | 1,596,374 | ||||||||||
Suzano Austria GmbH | 1,419 | 1,464,976 | ||||||||||
|
| |||||||||||
| 51,422,435 | ||||||||||||
|
| |||||||||||
Capital Goods – 0.2% | ||||||||||||
Raytheon Technologies Corp. | 6,049 | 6,722,677 | ||||||||||
Westinghouse Air Brake Technologies Corp. | 1,117 | 1,185,729 | ||||||||||
|
| |||||||||||
| 7,908,406 | ||||||||||||
|
| |||||||||||
Communications - Media – 1.6% | ||||||||||||
Charter Communications Operating LLC/Charter Communications Operating Capital | 868 | 957,595 | ||||||||||
| abfunds.com | AB BOND FUNDS | 21 | |
Table of Contents
PORTFOLIO OF INVESTMENTS (continued)
INTERMEDIATE DURATION PORTFOLIO
Principal (000) | U.S. $ Value | |||||||||||
| ||||||||||||
4.80%, 03/01/2050 | U.S.$ | 3,131 | $ | 3,371,054 | ||||||||
5.125%, 07/01/2049 | 1,949 | 2,200,187 | ||||||||||
Comcast Corp. | 3,250 | 3,338,205 | ||||||||||
4.15%, 10/15/2028 | 4,460 | 5,100,411 | ||||||||||
Cox Communications, Inc. | 2,401 | 2,507,965 | ||||||||||
Prosus NV | 550 | 568,563 | ||||||||||
4.027%, 08/03/2050(a) | 1,993 | 1,813,630 | ||||||||||
Tencent Holdings Ltd. | 5,470 | 5,487,777 | ||||||||||
2.39%, 06/03/2030(a) | 3,060 | 2,949,412 | ||||||||||
3.24%, 06/03/2050(a) | 4,830 | 4,430,704 | ||||||||||
Time Warner Cable LLC | 2,370 | 2,532,748 | ||||||||||
TWDC Enterprises 18 Corp. | 6,619 | 7,550,293 | ||||||||||
ViacomCBS, Inc. | 3,742 | 3,980,552 | ||||||||||
3.70%, 06/01/2028 | 1,731 | 1,875,660 | ||||||||||
4.95%, 01/15/2031 | 1,830 | 2,161,706 | ||||||||||
Weibo Corp. | 11,908 | 11,780,108 | ||||||||||
|
| |||||||||||
| 62,606,570 | ||||||||||||
|
| |||||||||||
Communications - Telecommunications – 1.2% | ||||||||||||
AT&T, Inc. | 1,793 | 1,786,222 | ||||||||||
3.50%, 09/15/2053(a) | 10,244 | 9,473,344 | ||||||||||
3.65%, 09/15/2059(a) | 4,421 | 4,046,453 | ||||||||||
Empresa Nacional de Telecomunicaciones SA | 4,012 | 4,455,828 | ||||||||||
Sprint Spectrum Co. LLC/Sprint Spectrum Co. II LLC/Sprint Spectrum Co. III LLC | 6,740 | 7,250,690 | ||||||||||
Verizon Communications, Inc. | 4,503 | 3,961,469 | ||||||||||
3.40%, 03/22/2041 | 11,399 | 11,578,306 | ||||||||||
4.862%, 08/21/2046 | 2,993 | 3,606,056 | ||||||||||
5.012%, 04/15/2049 | 422 | 521,200 | ||||||||||
|
| |||||||||||
| 46,679,568 | ||||||||||||
|
| |||||||||||
22 | AB BOND FUNDS | abfunds.com | |
Table of Contents
PORTFOLIO OF INVESTMENTS (continued)
INTERMEDIATE DURATION PORTFOLIO
Principal (000) | U.S. $ Value | |||||||||||
| ||||||||||||
Consumer Cyclical - Automotive – 1.0% | ||||||||||||
General Motors Co. | U.S.$ | 1,152 | $ | 1,357,044 | ||||||||
6.80%, 10/01/2027 | 1,611 | 2,002,989 | ||||||||||
General Motors Financial Co., Inc. | 1,405 | 1,545,135 | ||||||||||
5.10%, 01/17/2024 | 6,170 | 6,826,056 | ||||||||||
5.25%, 03/01/2026 | 1,600 | 1,833,376 | ||||||||||
Harley-Davidson Financial Services, Inc. | 10,500 | 11,021,640 | ||||||||||
Lear Corp. | 3,051 | 3,194,489 | ||||||||||
3.80%, 09/15/2027 | 933 | 1,017,343 | ||||||||||
Nissan Motor Co., Ltd. | 8,330 | 9,074,452 | ||||||||||
|
| |||||||||||
| 37,872,524 | ||||||||||||
|
| |||||||||||
Consumer Cyclical - Other – 0.3% | ||||||||||||
Las Vegas Sands Corp. | 4,875 | 5,004,236 | ||||||||||
3.20%, 08/08/2024 | 960 | 1,000,934 | ||||||||||
3.90%, 08/08/2029 | 3,987 | 4,096,324 | ||||||||||
Marriott International, Inc./MD | 530 | 607,274 | ||||||||||
|
| |||||||||||
| 10,708,768 | ||||||||||||
|
| |||||||||||
Consumer Cyclical - Retailers – 0.9% | ||||||||||||
Advance Auto Parts, Inc. | 2,127 | 2,093,266 | ||||||||||
3.90%, 04/15/2030 | 3,144 | 3,414,478 | ||||||||||
AutoNation, Inc. | 1,195 | 1,377,166 | ||||||||||
Falabella SA | 2,945 | 3,170,477 | ||||||||||
InRetail Consumer | 3,460 | 3,453,512 | ||||||||||
Ralph Lauren Corp. | 10,579 | 10,930,857 | ||||||||||
Ross Stores, Inc. | 7,988 | 9,113,270 | ||||||||||
|
| |||||||||||
| 33,553,026 | ||||||||||||
|
| |||||||||||
Consumer Non-Cyclical – 4.0% | ||||||||||||
AbbVie, Inc. | 5,352 | 5,697,311 | ||||||||||
4.25%, 11/21/2049 | 5,424 | 6,139,751 | ||||||||||
| abfunds.com | AB BOND FUNDS | 23 | |
Table of Contents
PORTFOLIO OF INVESTMENTS (continued)
INTERMEDIATE DURATION PORTFOLIO
Principal (000) | U.S. $ Value | |||||||||||
| ||||||||||||
Altria Group, Inc. | U.S.$ | 7,300 | $ | 7,622,441 | ||||||||
4.80%, 02/14/2029 | 4,904 | 5,627,879 | ||||||||||
Anheuser-Busch InBev Worldwide, Inc. | 3,608 | 4,088,080 | ||||||||||
5.55%, 01/23/2049 | 9,040 | 11,658,074 | ||||||||||
Banner Health | 2,474 | 2,348,197 | ||||||||||
BAT Capital Corp. | 11,104 | 10,920,895 | ||||||||||
2.726%, 03/25/2031 | 4,352 | 4,229,709 | ||||||||||
4.70%, 04/02/2027 | 4,650 | 5,238,272 | ||||||||||
Biogen, Inc. | 7,188 | 7,987,234 | ||||||||||
Cencosud SA | 6,910 | 7,711,128 | ||||||||||
Cigna Corp. | 8,649 | 9,394,457 | ||||||||||
3.75%, 07/15/2023 | 820 | 876,449 | ||||||||||
4.125%, 11/15/2025 | 2,682 | 2,991,959 | ||||||||||
4.375%, 10/15/2028 | 3,600 | 4,120,452 | ||||||||||
Coca-Cola Femsa SAB de CV | 1,899 | 1,738,178 | ||||||||||
2.75%, 01/22/2030 | 2,389 | 2,400,945 | ||||||||||
CVS Health Corp. | 460 | 522,155 | ||||||||||
5.05%, 03/25/2048 | 6,556 | 8,047,687 | ||||||||||
Gilead Sciences, Inc. | 10,009 | 12,083,165 | ||||||||||
Kimberly-Clark de Mexico SAB de CV | 1,585 | 1,551,319 | ||||||||||
Shire Acquisitions Investments Ireland DAC | 4,948 | 5,323,157 | ||||||||||
Sigma Alimentos SA de CV | 378 | 409,776 | ||||||||||
Takeda Pharmaceutical Co., Ltd. | 6,627 | 7,244,504 | ||||||||||
Tyson Foods, Inc. | 5,908 | 6,460,162 | ||||||||||
4.00%, 03/01/2026 | 763 | 846,190 | ||||||||||
Utah Acquisition Sub, Inc. | 6,825 | 7,524,290 | ||||||||||
Zimmer Biomet Holdings, Inc. | 1,136 | 1,215,997 | ||||||||||
|
| |||||||||||
| 152,019,813 | ||||||||||||
|
| |||||||||||
24 | AB BOND FUNDS | abfunds.com | |
Table of Contents
PORTFOLIO OF INVESTMENTS (continued)
INTERMEDIATE DURATION PORTFOLIO
Principal (000) | U.S. $ Value | |||||||||||
| ||||||||||||
Energy – 5.0% | ||||||||||||
Baker Hughes a GE Co. LLC/Baker Hughes Co-Obligor, Inc. | U.S.$ | 11,885 | $ | 12,716,118 | ||||||||
Boardwalk Pipelines LP | 3,871 | 3,897,052 | ||||||||||
BP Capital Markets America, Inc. | 12,047 | 10,752,911 | ||||||||||
Cenovus Energy, Inc. | 2,065 | 2,323,786 | ||||||||||
Chevron USA, Inc. | 6,369 | 7,016,791 | ||||||||||
5.25%, 11/15/2043 | 5,674 | 7,389,761 | ||||||||||
Enbridge Energy Partners LP | 6,968 | 9,981,590 | ||||||||||
Energy Transfer Operating LP | 6,615 | 7,345,957 | ||||||||||
6.25%, 04/15/2049 | 3,278 | 3,866,401 | ||||||||||
Eni SpA | 3,228 | 3,606,967 | ||||||||||
Enterprise Products Operating LLC | 11 | 11,536 | ||||||||||
4.20%, 01/31/2050 | 9,811 | 10,457,447 | ||||||||||
Husky Energy, Inc. | 11,355 | 12,131,796 | ||||||||||
Kinder Morgan Energy Partners LP | 7 | 7,324 | ||||||||||
Kinder Morgan, Inc. | 5,150 | 5,375,312 | ||||||||||
Marathon Oil Corp. | 10,900 | 11,696,572 | ||||||||||
Marathon Petroleum Corp. | 9,518 | 11,094,657 | ||||||||||
6.50%, 03/01/2041 | 1,683 | 2,231,338 | ||||||||||
MPLX LP | 10,984 | 12,563,829 | ||||||||||
Oleoducto Central SA | 631 | 666,494 | ||||||||||
ONEOK, Inc. | 4,900 | 5,315,912 | ||||||||||
4.35%, 03/15/2029 | 4,164 | 4,539,884 | ||||||||||
6.35%, 01/15/2031 | 1,192 | 1,495,507 | ||||||||||
Plains All American Pipeline LP/PAA | 407 | 406,955 | ||||||||||
4.50%, 12/15/2026 | 2,027 | 2,225,443 | ||||||||||
| abfunds.com | AB BOND FUNDS | 25 | |
Table of Contents
PORTFOLIO OF INVESTMENTS (continued)
INTERMEDIATE DURATION PORTFOLIO
Principal (000) | U.S. $ Value | |||||||||||
| ||||||||||||
4.65%, 10/15/2025 | U.S.$ | 11,148 | $ | 12,237,048 | ||||||||
Saudi Arabian Oil Co. | 1,876 | 1,800,116 | ||||||||||
Suncor Energy, Inc. | 5,543 | 7,563,812 | ||||||||||
Tengizchevroil Finance Co. International Ltd. | 1,397 | 1,392,809 | ||||||||||
TransCanada PipeLines Ltd. | 8,737 | 11,492,038 | ||||||||||
Valero Energy Corp. | 3,902 | 4,051,486 | ||||||||||
Williams Cos., Inc. (The) | 2,012 | 2,134,108 | ||||||||||
|
| |||||||||||
| 189,788,757 | ||||||||||||
|
| |||||||||||
Other Industrial – 0.1% | ||||||||||||
Alfa SAB de CV | 3,311 | 3,608,990 | ||||||||||
|
| |||||||||||
Services – 0.5% | ||||||||||||
Alibaba Group Holding Ltd. | 6,124 | 5,826,496 | ||||||||||
Booking Holdings, Inc. | 9,010 | 10,472,954 | ||||||||||
Expedia Group, Inc. | 211 | 243,990 | ||||||||||
Mastercard, Inc. | 2,665 | 2,930,434 | ||||||||||
|
| |||||||||||
| 19,473,874 | ||||||||||||
|
| |||||||||||
Technology – 1.8% | ||||||||||||
Apple, Inc. | 7,394 | 6,445,646 | ||||||||||
Baidu, Inc. | 217 | 226,764 | ||||||||||
Broadcom Corp./Broadcom Cayman Finance Ltd. | 1,997 | 2,120,235 | ||||||||||
Broadcom, Inc. | 5,266 | 5,044,881 | ||||||||||
4.11%, 09/15/2028 | 5,346 | 5,837,030 | ||||||||||
4.15%, 11/15/2030 | 6,902 | 7,447,051 | ||||||||||
5.00%, 04/15/2030 | 6,078 | 6,927,218 | ||||||||||
Dell International LLC/EMC Corp. | 1,615 | 1,910,981 | ||||||||||
Infor, Inc. | 2,719 | 2,745,075 | ||||||||||
26 | AB BOND FUNDS | abfunds.com | |
Table of Contents
PORTFOLIO OF INVESTMENTS (continued)
INTERMEDIATE DURATION PORTFOLIO
Principal (000) | U.S. $ Value | |||||||||||
| ||||||||||||
Micron Technology, Inc. | U.S.$ | 9,824 | $ | 10,909,257 | ||||||||
NXP BV/NXP Funding LLC | 1,102 | 1,318,389 | ||||||||||
NXP BV/NXP Funding LLC/NXP USA, Inc. | 839 | 880,170 | ||||||||||
Oracle Corp. | 6,769 | 7,100,004 | ||||||||||
3.95%, 03/25/2051 | 6,642 | 6,857,599 | ||||||||||
SK Hynix, Inc. | 1,818 | 1,722,101 | ||||||||||
|
| |||||||||||
| 67,492,401 | ||||||||||||
|
| |||||||||||
Transportation - Airlines – 0.3% | ||||||||||||
Delta Air Lines, Inc./SkyMiles IP Ltd. | 3,393 | 3,620,918 | ||||||||||
4.75%, 10/20/2028(a) | 3,940 | 4,286,799 | ||||||||||
Southwest Airlines Co. | 4,073 | 4,633,852 | ||||||||||
|
| |||||||||||
| 12,541,569 | ||||||||||||
|
| |||||||||||
Transportation - Railroads – 0.1% | ||||||||||||
Lima Metro Line 2 Finance Ltd. | 471 | 498,082 | ||||||||||
5.875%, 07/05/2034(a) | 1,161 | 1,353,524 | ||||||||||
|
| |||||||||||
| 1,851,606 | ||||||||||||
|
| |||||||||||
Transportation - Services – 0.0% | ||||||||||||
ENA Master Trust | 1,235 | 1,245,806 | ||||||||||
|
| |||||||||||
| 698,774,113 | ||||||||||||
|
| |||||||||||
Financial Institutions – 10.2% | ||||||||||||
Banking – 7.1% | ||||||||||||
ABN AMRO Bank NV | 1,171 | 1,312,761 | ||||||||||
AIB Group PLC | 572 | 625,047 | ||||||||||
American Express Co. | 616 | 616,092 | ||||||||||
Series C | 1,532 | 1,522,885 | ||||||||||
Australia & New Zealand Banking Group Ltd. | 405 | 453,697 | ||||||||||
| abfunds.com | AB BOND FUNDS | 27 | |
Table of Contents
PORTFOLIO OF INVESTMENTS (continued)
INTERMEDIATE DURATION PORTFOLIO
Principal (000) | U.S. $ Value | |||||||||
| ||||||||||
Banco de Credito del Peru | U.S.$ | 5,996 | $ | 5,986,107 | ||||||
Banco Santander Mexico SA Institucion de Banca Multiple Grupo Financiero Santand 5.375%, 04/17/2025(a) | 2,650 | 2,975,420 | ||||||||
Banco Santander SA | 3,000 | 2,852,130 | ||||||||
3.49%, 05/28/2030 | 1,000 | 1,044,920 | ||||||||
5.179%, 11/19/2025 | 9,800 | 11,135,152 | ||||||||
Bank of America Corp. | 10 | 10,051 | ||||||||
Series DD | 1,628 | 1,866,632 | ||||||||
Series L | 4,925 | 5,399,031 | ||||||||
Series Z | 2,548 | 2,861,328 | ||||||||
Bank of New York Mellon Corp. (The) | 1,628 | 1,764,622 | ||||||||
Barclays Bank PLC | 1,250 | 1,728,125 | ||||||||
BBVA USA | 8,460 | 8,700,179 | ||||||||
BNP Paribas SA | 3,168 | 3,101,187 | ||||||||
BPCE SA | 1,822 | 1,893,696 | ||||||||
5.70%, 10/22/2023(a) | 1,991 | 2,223,808 | ||||||||
Capital One Financial Corp. | 3,355 | 3,491,213 | ||||||||
3.30%, 10/30/2024 | 8,359 | 9,013,259 | ||||||||
Series E | 3,790 | 3,788,257 | ||||||||
CITIC Ltd. | 3,688 | 3,654,577 | ||||||||
Citigroup, Inc. | 7,045 | 7,923,511 | ||||||||
4.50%, 01/14/2022 | 11 | 11,357 | ||||||||
5.95%, 01/30/2023(b) | 2,569 | 2,696,166 | ||||||||
Series R | 2,355 | 2,357,944 | ||||||||
Series W | 3,243 | 3,270,922 | ||||||||
28 | AB BOND FUNDS | abfunds.com | |
Table of Contents
PORTFOLIO OF INVESTMENTS (continued)
INTERMEDIATE DURATION PORTFOLIO
Principal (000) | U.S. $ Value | |||||||||
| ||||||||||
Cooperatieve Rabobank UA | U.S.$ | 1,581 | $ | 1,664,398 | ||||||
4.375%, 08/04/2025 | 6,380 | 7,068,976 | ||||||||
Credit Agricole SA/London | 1,287 | 1,382,199 | ||||||||
3.375%, 01/10/2022(a) | 576 | 589,421 | ||||||||
Danske Bank A/S | 2,594 | 2,761,417 | ||||||||
Deutsche Bank AG/New York NY | 4,221 | 4,229,147 | ||||||||
3.961%, 11/26/2025 | 1,336 | 1,445,659 | ||||||||
Discover Bank | 2,264 | 2,415,530 | ||||||||
Goldman Sachs Group, Inc. (The) | 6 | 6,092 | ||||||||
5.75%, 01/24/2022 | 14 | 14,608 | ||||||||
HSBC Holdings PLC | 7,182 | 7,875,207 | ||||||||
4.25%, 03/14/2024 | 3,943 | 4,289,550 | ||||||||
4.292%, 09/12/2026 | 2,495 | 2,762,938 | ||||||||
6.375%, 03/30/2025(b) | 1,725 | 1,902,934 | ||||||||
ING Groep NV | 6,439 | 6,433,076 | ||||||||
JPMorgan Chase & Co. | 4,480 | 4,601,722 | ||||||||
3.54%, 05/01/2028 | 10,073 | 10,981,484 | ||||||||
Series I | 3,323 | 3,312,067 | ||||||||
Series V | 1,622 | 1,609,284 | ||||||||
Series Z | 2,716 | 2,717,711 | ||||||||
Morgan Stanley | 8,591 | 9,361,870 | ||||||||
5.00%, 11/24/2025 | 3,110 | 3,574,167 | ||||||||
7.25%, 04/01/2032 | 15 | 21,074 | ||||||||
Series H | 772 | 771,359 | ||||||||
Series J | 7,335 | 7,337,494 | ||||||||
| abfunds.com | AB BOND FUNDS | 29 | |
Table of Contents
PORTFOLIO OF INVESTMENTS (continued)
INTERMEDIATE DURATION PORTFOLIO
Principal (000) | U.S. $ Value | |||||||||||
| ||||||||||||
Natwest Group PLC | U.S.$ | 7,871 | $ | 8,080,998 | ||||||||
Series U | 2,900 | 2,869,347 | ||||||||||
Santander Holdings USA, Inc. | 3,049 | 3,370,456 | ||||||||||
Societe Generale SA | 6,700 | 7,292,280 | ||||||||||
Standard Chartered PLC | 300 | 281,355 | ||||||||||
4.30%, 02/19/2027(a) | 9,464 | 10,248,944 | ||||||||||
5.20%, 01/26/2024(a) | 3,782 | 4,153,657 | ||||||||||
7.50%, 04/02/2022(a)(b) | 1,882 | 1,969,155 | ||||||||||
7.75%, 04/02/2023(a)(b) | 822 | 892,002 | ||||||||||
State Street Corp. | 498 | 530,186 | ||||||||||
Truist Financial Corp. | 6,656 | 7,258,501 | ||||||||||
UBS AG/Stamford CT | 5,982 | 6,521,875 | ||||||||||
UBS Group AG | 3,426 | 3,778,604 | ||||||||||
UniCredit SpA | 11,095 | 11,147,812 | ||||||||||
US Bancorp | 3,485 | 3,816,110 | ||||||||||
Wells Fargo & Co. | 3,502 | 3,612,698 | ||||||||||
3.75%, 01/24/2024 | 6,552 | 7,084,612 | ||||||||||
3.90%, 03/15/2026(b) | 2,664 | 2,692,878 | ||||||||||
|
| |||||||||||
| 269,010,930 | ||||||||||||
|
| |||||||||||
Brokerage – 0.3% | ||||||||||||
Charles Schwab Corp. (The) | 3,271 | 3,616,221 | ||||||||||
Series I | 7,570 | 7,687,562 | ||||||||||
|
| |||||||||||
| 11,303,783 | ||||||||||||
|
| |||||||||||
Finance – 1.8% | ||||||||||||
AerCap Ireland Capital DAC/AerCap Global Aviation Trust | 613 | 714,948 | ||||||||||
30 | AB BOND FUNDS | abfunds.com | |
Table of Contents
PORTFOLIO OF INVESTMENTS (continued)
INTERMEDIATE DURATION PORTFOLIO
Principal (000) | U.S. $ Value | |||||||||||
| ||||||||||||
Air Lease Corp. | U.S.$ | 2,045 | $ | 2,116,554 | ||||||||
3.625%, 04/01/2027 | 303 | 320,007 | ||||||||||
3.875%, 07/03/2023 | 606 | 644,414 | ||||||||||
4.25%, 02/01/2024 | 2,411 | 2,615,043 | ||||||||||
Aircastle Ltd. | 8,390 | 8,002,634 | ||||||||||
4.125%, 05/01/2024 | 1,481 | 1,564,602 | ||||||||||
4.25%, 06/15/2026 | 530 | 558,106 | ||||||||||
4.40%, 09/25/2023 | 3,751 | 3,998,791 | ||||||||||
5.00%, 04/01/2023 | 306 | 326,242 | ||||||||||
5.25%, 08/11/2025(a) | 3,730 | 4,063,910 | ||||||||||
Aviation Capital Group LLC | 4,176 | 4,069,053 | ||||||||||
2.875%, 01/20/2022(a) | 582 | 590,282 | ||||||||||
3.50%, 11/01/2027(a) | 1,314 | 1,351,042 | ||||||||||
3.875%, 05/01/2023(a) | 3,183 | 3,324,994 | ||||||||||
4.125%, 08/01/2025(a) | 35 | 37,282 | ||||||||||
4.375%, 01/30/2024(a) | 1,300 | 1,382,563 | ||||||||||
4.875%, 10/01/2025(a) | 1,447 | 1,579,357 | ||||||||||
5.50%, 12/15/2024(a) | 3,623 | 4,061,021 | ||||||||||
CDBL Funding 1 | 5,770 | 6,119,806 | ||||||||||
GE Capital European Funding Unlimited Co. | EUR | 250 | 366,035 | |||||||||
GE Capital Funding LLC | U.S.$ | 9,960 | 11,292,648 | |||||||||
GE Capital International Funding Co. Unlimited Co. | 2,843 | 3,253,415 | ||||||||||
Synchrony Financial | 6,600 | 7,310,358 | ||||||||||
|
| |||||||||||
| 69,663,107 | ||||||||||||
|
| |||||||||||
Insurance – 0.7% | ||||||||||||
Alleghany Corp. | 7,452 | 8,035,194 | ||||||||||
Guardian Life Insurance Co. of America (The) | 2,851 | 3,315,342 | ||||||||||
MetLife Capital Trust IV | 5,200 | 7,225,296 | ||||||||||
Nationwide Mutual Insurance Co. | 2,058 | 3,343,036 | ||||||||||
Prudential Financial, Inc. | 1,970 | 2,098,897 | ||||||||||
| abfunds.com | AB BOND FUNDS | 31 | |
Table of Contents
PORTFOLIO OF INVESTMENTS (continued)
INTERMEDIATE DURATION PORTFOLIO
Principal (000) | U.S. $ Value | |||||||||||
| ||||||||||||
5.375%, 05/15/2045 | U.S.$ | 615 | $ | 674,040 | ||||||||
5.875%, 09/15/2042 | 459 | 485,002 | ||||||||||
Voya Financial, Inc. | 3,089 | 3,298,589 | ||||||||||
|
| |||||||||||
| 28,475,396 | ||||||||||||
|
| |||||||||||
Other Finance – 0.2% | ||||||||||||
AerCap Ireland Capital DAC/AerCap Global Aviation Trust | 656 | 711,950 | ||||||||||
China Cinda 2020 I Management Ltd. | 5,905 | 5,936,371 | ||||||||||
|
| |||||||||||
| 6,648,321 | ||||||||||||
|
| |||||||||||
REITS – 0.1% | ||||||||||||
Host Hotels & Resorts LP | 202 | 213,164 | ||||||||||
Rexford Industrial Realty LP | 5,037 | 4,705,213 | ||||||||||
|
| |||||||||||
| 4,918,377 | ||||||||||||
|
| |||||||||||
| 390,019,914 | ||||||||||||
|
| |||||||||||
Utility – 0.6% | ||||||||||||
Electric – 0.6% | ||||||||||||
AES Panama Generation Holdings SRL | 1,670 | 1,727,866 | ||||||||||
Chile Electricity Pec SpA | 3,081 | 2,499,461 | ||||||||||
Colbun SA | 400 | 409,250 | ||||||||||
Enel Chile SA | 4,545 | 5,250,895 | ||||||||||
Israel Electric Corp., Ltd. | 7,000 | 7,880,075 | ||||||||||
NextEra Energy Capital Holdings, Inc. | 1,368 | 1,450,381 | ||||||||||
Star Energy Geothermal Darajat II/Star Energy Geothermal Salak | 2,389 | 2,601,024 | ||||||||||
|
| |||||||||||
| 21,818,952 | ||||||||||||
|
| |||||||||||
Total Corporates - Investment Grade | 1,110,612,979 | |||||||||||
|
| |||||||||||
32 | AB BOND FUNDS | abfunds.com | |
Table of Contents
PORTFOLIO OF INVESTMENTS (continued)
INTERMEDIATE DURATION PORTFOLIO
Principal (000) | U.S. $ Value | |||||||||||
| ||||||||||||
GOVERNMENTS - TREASURIES – 27.8% |
| |||||||||||
Malaysia – 0.2% | ||||||||||||
Malaysia Government Bond | MYR | 35,334 | $ | 8,674,363 | ||||||||
|
| |||||||||||
Netherlands – 1.1% | ||||||||||||
Netherlands Government Bond | EUR | 34,460 | 42,338,050 | |||||||||
|
| |||||||||||
United States – 26.5% | ||||||||||||
U.S. Treasury Bonds | U.S.$ | 12,265 | 9,225,580 | |||||||||
1.875%, 02/15/2051 | 44,085 | 38,967,007 | ||||||||||
2.00%, 02/15/2050 | 2,460 | 2,242,828 | ||||||||||
2.25%, 08/15/2046 | 12,530 | 12,120,817 | ||||||||||
2.375%, 11/15/2049 | 2,885 | 2,857,502 | ||||||||||
2.50%, 02/15/2045-05/15/2046 | 25,872 | 26,288,227 | ||||||||||
3.00%, 05/15/2045-02/15/2049 | 78,384 | 87,560,813 | ||||||||||
3.375%, 05/15/2044 | 5,710 | 6,737,210 | ||||||||||
3.50%, 02/15/2039 | 4,254 | 5,085,524 | ||||||||||
3.75%, 11/15/2043 | 10,205 | 12,724,359 | ||||||||||
4.375%, 02/15/2038-11/15/2039 | 49,130 | 65,470,031 | ||||||||||
4.50%, 02/15/2036 | 4,048 | 5,346,627 | ||||||||||
4.75%, 02/15/2037 | 4,156 | 5,674,239 | ||||||||||
5.50%, 08/15/2028 | 10,214 | 13,112,222 | ||||||||||
U.S. Treasury Notes | 511,722 | 511,649,172 | ||||||||||
0.875%, 11/15/2030 | 7,436 | 6,871,329 | ||||||||||
1.50%, 02/15/2030 | 11,115 | 10,970,852 | ||||||||||
1.75%, 11/30/2021(d) | 28,028 | 28,343,315 | ||||||||||
1.75%, 11/15/2029 | 11,550 | 11,679,938 | ||||||||||
1.875%, 01/31/2022 | 9,965 | 10,114,475 | ||||||||||
2.00%, 12/31/2021 | 26,704 | 27,092,042 | ||||||||||
2.125%, 08/15/2021(d) | 32,897 | 33,154,008 | ||||||||||
2.25%, 04/30/2021-02/15/2027 | 38,231 | 38,479,261 | ||||||||||
2.625%, 02/15/2029 | 30,853 | 33,350,381 | ||||||||||
|
| |||||||||||
| 1,005,117,759 | ||||||||||||
|
| |||||||||||
Total Governments - Treasuries | 1,056,130,172 | |||||||||||
|
| |||||||||||
MORTGAGE PASS-THROUGHS – 10.0% | ||||||||||||
Agency Fixed Rate 30-Year – 9.1% | ||||||||||||
Federal Home Loan Mortgage Corp. | 26,658 | 28,595,510 | ||||||||||
Series 2020 | 7,777 | 8,406,508 | ||||||||||
| abfunds.com | AB BOND FUNDS | 33 | |
Table of Contents
PORTFOLIO OF INVESTMENTS (continued)
INTERMEDIATE DURATION PORTFOLIO
Principal (000) | U.S. $ Value | |||||||||
| ||||||||||
Federal Home Loan Mortgage Corp. Gold | U.S.$ | 1 | $ | 974 | ||||||
Series 2007 | 806 | 926,560 | ||||||||
Series 2016 | 7,160 | 7,913,228 | ||||||||
Series 2017 | 5,705 | 6,300,771 | ||||||||
Series 2018 | 4,481 | 4,863,850 | ||||||||
4.50%, 10/01/2048-11/01/2048 | 16,482 | 18,180,595 | ||||||||
5.00%, 09/01/2048-11/01/2048 | 6,049 | 6,785,383 | ||||||||
Federal National Mortgage Association | 2 | 1,993 | ||||||||
Series 2002 | 0 | ** | 182 | |||||||
Series 2003 | 2,258 | 2,587,688 | ||||||||
Series 2004 | 1,969 | 2,266,672 | ||||||||
6.50%, 08/01/2034 | 2 | 1,872 | ||||||||
Series 2005 | 1,759 | 2,024,477 | ||||||||
Series 2006 | 322 | 373,641 | ||||||||
Series 2007 | 675 | 778,558 | ||||||||
Series 2008 | 4 | 5,282 | ||||||||
Series 2010 | 3,434 | 3,768,197 | ||||||||
Series 2012 | 26,333 | 28,577,770 | ||||||||
Series 2013 | 12,836 | 13,928,525 | ||||||||
4.00%, 10/01/2043 | 10,671 | 11,762,684 | ||||||||
Series 2015 | 13,722 | 14,436,092 | ||||||||
Series 2018 | 8,580 | 9,112,539 | ||||||||
4.50%, 09/01/2048 | 15,439 | 17,029,500 | ||||||||
Series 2019 | 29,174 | 31,220,892 | ||||||||
34 | AB BOND FUNDS | abfunds.com | |
Table of Contents
PORTFOLIO OF INVESTMENTS (continued)
INTERMEDIATE DURATION PORTFOLIO
Principal (000) | U.S. $ Value | |||||||||||
| ||||||||||||
Series 2020 | U.S.$ | 7,971 | $ | 8,576,319 | ||||||||
Government National Mortgage Association | 5,817 | 6,137,693 | ||||||||||
Uniform Mortgage-Backed Security | 35,770 | 35,661,012 | ||||||||||
2.50%, 04/01/2051, TBA | 73,610 | 75,479,002 | ||||||||||
|
| |||||||||||
| 345,703,969 | ||||||||||||
|
| |||||||||||
Agency Fixed Rate 15-Year – 0.9% | ||||||||||||
Federal National Mortgage Association | 16 | 16,169 | ||||||||||
Series 2016 | 28,444 | 29,743,827 | ||||||||||
Series 2017 | 3,855 | 4,031,352 | ||||||||||
|
| |||||||||||
| 33,791,348 | ||||||||||||
|
| |||||||||||
Other Agency Fixed Rate Programs – 0.0% | ||||||||||||
Federal National Mortgage Association | 440 | 488,134 | ||||||||||
|
| |||||||||||
Agency ARMs – 0.0% | ||||||||||||
Federal Home Loan Mortgage Corp. Gold | 0 | ** | 170 | |||||||||
Series 2007 | 1 | 605 | ||||||||||
|
| |||||||||||
| 775 | ||||||||||||
|
| |||||||||||
Total Mortgage Pass-Throughs | 379,984,226 | |||||||||||
|
| |||||||||||
COMMERCIAL MORTGAGE-BACKED SECURITIES – 9.1% | ||||||||||||
Non-Agency Fixed Rate CMBS – 6.6% | ||||||||||||
BAMLL Commercial Mortgage Securities Trust | 2,805 | 2,514,985 | ||||||||||
| abfunds.com | AB BOND FUNDS | 35 | |
Table of Contents
PORTFOLIO OF INVESTMENTS (continued)
INTERMEDIATE DURATION PORTFOLIO
Principal (000) | U.S. $ Value | |||||||||
| ||||||||||
Banc of America Commercial Mortgage Trust | U.S.$ | 871 | $ | 951,377 | ||||||
Barclays Commercial Mortgage Trust | 3,523 | 3,827,901 | ||||||||
CCUBS Commercial Mortgage Trust | 8,525 | 9,328,060 | ||||||||
CFCRE Commercial Mortgage Trust | 3,655 | 3,952,469 | ||||||||
CGRBS Commercial Mortgage Trust | 11,325 | 11,808,991 | ||||||||
Citigroup Commercial Mortgage Trust | 7,490 | 7,993,662 | ||||||||
Series 2015-GC35, Class A4 | 3,530 | 3,885,398 | ||||||||
Series 2016-C1, Class A4 | 12,141 | 13,053,516 | ||||||||
Series 2016-GC36, Class A5 | 3,982 | 4,353,633 | ||||||||
Series 2018-B2, Class A4 | 5,890 | 6,569,080 | ||||||||
Commercial Mortgage Trust | 3,938 | 2,104,528 | ||||||||
Series 2013-SFS, Class A1 | 1,359 | 1,364,688 | ||||||||
Series 2015-3BP, Class A | 1,705 | 1,809,562 | ||||||||
Series 2015-CR24, Class A5 | 3,925 | 4,310,223 | ||||||||
Series 2015-DC1, Class A5 | 6,250 | 6,727,370 | ||||||||
Series 2015-PC1, Class A5 | 7,135 | 7,847,355 | ||||||||
CSAIL Commercial Mortgage Trust | 3,451 | 3,724,605 | ||||||||
Series 2015-C3, Class A4 | 6,101 | 6,654,315 | ||||||||
36 | AB BOND FUNDS | abfunds.com | |
Table of Contents
PORTFOLIO OF INVESTMENTS (continued)
INTERMEDIATE DURATION PORTFOLIO
Principal (000) | U.S. $ Value | |||||||||
| ||||||||||
Series 2015-C4, Class A4 | U.S.$ | 7,715 | $ | 8,463,343 | ||||||
GS Mortgage Securities Trust | 333 | 203,454 | ||||||||
Series 2013-G1, Class A1 | 200 | 201,094 | ||||||||
Series 2013-G1, Class A2 | 6,804 | 6,607,311 | ||||||||
Series 2014-GC22, Class A5 | 6,360 | 6,891,595 | ||||||||
GSF | 406 | 406,191 | ||||||||
Series 2021-1, Class A2 | 907 | 934,210 | ||||||||
Series 2021-1, Class AS | 217 | 223,510 | ||||||||
JPMBB Commercial Mortgage Securities Trust | 2,527 | 1,894,065 | ||||||||
Series 2014-C21, Class A5 | 6,300 | 6,798,617 | ||||||||
Series 2014-C21, Class B | 1,857 | 1,942,992 | ||||||||
Series 2015-C27, Class AS | 3,415 | 3,654,166 | ||||||||
Series 2015-C30, Class A5 | 3,820 | 4,200,349 | ||||||||
Series 2015-C31, Class A3 | 9,802 | 10,703,891 | ||||||||
JPMorgan Chase Commercial Mortgage Securities Trust | 1,285 | 1,151,388 | ||||||||
Series 2012-C6, Class E | 3,967 | 2,563,143 | ||||||||
Series 2014-C20, Class A5 | 9,950 | 10,735,116 | ||||||||
Series 2016-JP3, Class B | 3,000 | 3,126,781 | ||||||||
LB-UBS Commercial Mortgage Trust | 1,384 | 801,835 | ||||||||
| abfunds.com | AB BOND FUNDS | 37 | |
Table of Contents
PORTFOLIO OF INVESTMENTS (continued)
INTERMEDIATE DURATION PORTFOLIO
Principal (000) | U.S. $ Value | |||||||||||
| ||||||||||||
LSTAR Commercial Mortgage Trust | U.S.$ | 5,532 | $ | 5,615,508 | ||||||||
Morgan Stanley Capital I Trust | 6,180 | 6,718,873 | ||||||||||
UBS Commercial Mortgage Trust | 7,900 | 8,963,079 | ||||||||||
Series 2018-C8, Class A4 | 6,400 | 7,098,242 | ||||||||||
Series 2018-C9, Class A4 | 10,270 | 11,467,250 | ||||||||||
UBS-Barclays Commercial Mortgage Trust | 9,507 | 9,795,362 | ||||||||||
Wells Fargo Commercial Mortgage Trust | 2,906 | 3,166,615 | ||||||||||
Series 2015-SG1, Class C | 3,276 | 3,098,799 | ||||||||||
Series 2016-C35, Class XA | 23,366 | 1,759,285 | ||||||||||
Series 2018-C43, Class A4 | 4,550 | 5,079,159 | ||||||||||
Series 2019-C51, Class B | 1,269 | 1,350,270 | ||||||||||
WF-RBS Commercial Mortgage Trust | 66,830 | 1,148,139 | ||||||||||
Series 2014-C19, Class A5 | 1,600 | 1,739,796 | ||||||||||
Series 2014-C21, Class A5 | 6,200 | 6,691,952 | ||||||||||
Series 2014-C24, Class AS | 1,471 | 1,556,652 | ||||||||||
|
| |||||||||||
| 249,533,750 | ||||||||||||
|
| |||||||||||
Non-Agency Floating Rate CMBS – 2.5% | ||||||||||||
Ashford Hospitality Trust | 3,638 | 3,631,266 | ||||||||||
Series 2018-KEYS, Class A | 7,150 | 7,143,397 | ||||||||||
38 | AB BOND FUNDS | abfunds.com | |
Table of Contents
PORTFOLIO OF INVESTMENTS (continued)
INTERMEDIATE DURATION PORTFOLIO
Principal (000) | U.S. $ Value | |||||||||
| ||||||||||
BAMLL Commercial Mortgage Securities Trust | U.S.$ | 10,570 | $ | 10,318,054 | ||||||
BBCMS Mortgage Trust | 6,218 | 6,249,158 | ||||||||
BHMS | 5,580 | 5,576,839 | ||||||||
Braemar Hotels & Resorts Trust | 4,000 | 3,985,018 | ||||||||
BX Trust | 5,730 | 5,558,562 | ||||||||
CLNY Trust | 5,360 | 5,212,276 | ||||||||
DBWF Mortgage Trust | 5,912 | 5,908,546 | ||||||||
Federal Home Loan Mortgage Corp. | 1,459 | 1,462,274 | ||||||||
Great Wolf Trust | 5,961 | 5,953,806 | ||||||||
GS Mortgage Securities Corp. Trust | 1,456 | 1,457,084 | ||||||||
Series 2019-SMP, Class A | 1,700 | 1,698,972 | ||||||||
| abfunds.com | AB BOND FUNDS | 39 | |
Table of Contents
PORTFOLIO OF INVESTMENTS (continued)
INTERMEDIATE DURATION PORTFOLIO
Principal (000) | U.S. $ Value | |||||||||||
| ||||||||||||
HFX Funding | U.S.$ | 6,860 | $ | 7,078,898 | ||||||||
Invitation Homes Trust | 2,050 | 2,055,405 | ||||||||||
Series 2018-SFR3, Class C | 3,950 | 3,962,258 | ||||||||||
JPMorgan Chase Commercial Mortgage Securities Trust | 530 | 527,955 | ||||||||||
Morgan Stanley Capital I Trust | 2,464 | 2,096,413 | ||||||||||
Natixis Commercial Mortgage Securities Trust | 5,432 | 5,397,552 | ||||||||||
Series 2019-MILE, Class A | 2,750 | 2,758,502 | ||||||||||
Starwood Retail Property Trust | 9,857 | 7,245,034 | ||||||||||
|
| |||||||||||
| 95,277,269 | ||||||||||||
|
| |||||||||||
Total Commercial Mortgage-Backed Securities | 344,811,019 | |||||||||||
|
| |||||||||||
INFLATION-LINKED | ||||||||||||
Canada – 0.9% | ||||||||||||
Canadian Government Real Return Bond | CAD | 6,974 | 5,950,573 | |||||||||
1.50%, 12/01/2044 | 27,043 | 27,480,481 | ||||||||||
|
| |||||||||||
| 33,431,054 | ||||||||||||
|
| |||||||||||
40 | AB BOND FUNDS | abfunds.com | |
Table of Contents
PORTFOLIO OF INVESTMENTS (continued)
INTERMEDIATE DURATION PORTFOLIO
Principal (000) | U.S. $ Value | |||||||||||
| ||||||||||||
United States – 7.2% | ||||||||||||
U.S. Treasury Inflation Index | U.S.$ | 9,103 | $ | 9,794,102 | ||||||||
0.25%, 01/15/2025 (TIPS) | 190,671 | 207,056,623 | ||||||||||
0.375%, 07/15/2025 (TIPS) | 45,549 | 50,160,470 | ||||||||||
0.75%, 07/15/2028 (TIPS) | 6,662 | 7,591,817 | ||||||||||
|
| |||||||||||
| 274,603,012 | ||||||||||||
|
| |||||||||||
Total Inflation-Linked Securities | 308,034,066 | |||||||||||
|
| |||||||||||
COLLATERALIZED MORTGAGE OBLIGATIONS – 6.1% | ||||||||||||
Risk Share Floating Rate – 4.2% | ||||||||||||
Bellemeade Re Ltd. | 1,763 | 1,772,411 | ||||||||||
Series 2019-3A, Class M1B | 3,489 | 3,505,193 | ||||||||||
Series 2019-3A, Class M1C | 575 | 572,769 | ||||||||||
Series 2020-2A, Class M1B | 3,206 | 3,231,267 | ||||||||||
Series 2020-3A, Class M1B | 1,900 | 1,916,032 | ||||||||||
Series 2021-1A, Class M1C | 4,197 | 4,179,165 | ||||||||||
Chase Mortgage Finance Corp. | 1,093 | 1,108,873 | ||||||||||
Eagle Re Ltd. | 617 | 622,579 | ||||||||||
Series 2020-1, Class M1A | 6,400 | 6,381,560 | ||||||||||
| abfunds.com | AB BOND FUNDS | 41 | |
Table of Contents
PORTFOLIO OF INVESTMENTS (continued)
INTERMEDIATE DURATION PORTFOLIO
Principal (000) | U.S. $ Value | |||||||||
| ||||||||||
Federal Home Loan Mortgage Corp. | ||||||||||
4.359% (LIBOR 1 Month + 4.25%), 11/25/2023(c) | U.S.$ | 646 | $ | 644,554 | ||||||
Series 2014-DN3, Class M3 | 947 | 961,310 | ||||||||
Series 2015-DNA1, Class M3 | 4,718 | 4,809,401 | ||||||||
Series 2016-DNA3, Class M3 | 4,754 | 5,000,345 | ||||||||
Series 2016-DNA4, Class M3 | 6,741 | 7,004,339 | ||||||||
Series 2016-HQA2, Class M3 | 298 | 310,419 | ||||||||
Series 2016-HQA3, Class M3 | 2,030 | 2,103,007 | ||||||||
Series 2017-DNA2, Class M2 | 2,850 | 2,953,391 | ||||||||
Series 2017-DNA3, Class M2 | 7,295 | 7,433,482 | ||||||||
Series 2017-HQA2, Class M2B | 5,358 | 5,382,638 | ||||||||
Series 2017-HQA3, Class M2 | 8,623 | 8,731,795 | ||||||||
Series 2020-DNA5, Class M2 | 6,500 | 6,537,597 | ||||||||
Federal National Mortgage Association Connecticut Avenue Securities | 385 | 386,166 | ||||||||
42 | AB BOND FUNDS | abfunds.com | |
Table of Contents
PORTFOLIO OF INVESTMENTS (continued)
INTERMEDIATE DURATION PORTFOLIO
Principal (000) | U.S. $ Value | |||||||||
| ||||||||||
Series 2015-C02, Class 2M2 | U.S.$ | 635 | $ | 643,559 | ||||||
Series 2015-C03, Class 2M2 | 1,265 | 1,281,447 | ||||||||
Series 2015-C04, Class 1M2 | 1,409 | 1,494,238 | ||||||||
Series 2016-C02, Class 1M2 | 736 | 775,081 | ||||||||
Series 2016-C03, Class 1M2 | 2,178 | 2,285,816 | ||||||||
Series 2016-C05, Class 2M2 | 4,607 | 4,793,115 | ||||||||
Series 2016-C06, Class 1M2 | 1,352 | 1,406,987 | ||||||||
Series 2016-C07, Class 2M2 | 779 | 810,979 | ||||||||
Series 2017-C01, Class 1M2 | 3,487 | 3,591,696 | ||||||||
Series 2017-C02, Class 2M2C | 6,096 | 6,259,894 | ||||||||
Home Re Ltd. | 5,050 | 5,144,928 | ||||||||
JPMorgan Madison Avenue Securities Trust | 415 | 408,467 | ||||||||
Mortgage Insurance-Linked Notes | 4,533 | 4,539,251 | ||||||||
Oaktown Re V Ltd. | 9,200 | 9,345,359 | ||||||||
| abfunds.com | AB BOND FUNDS | 43 | |
Table of Contents
PORTFOLIO OF INVESTMENTS (continued)
INTERMEDIATE DURATION PORTFOLIO
Principal (000) | U.S. $ Value | |||||||||||
| ||||||||||||
PMT Credit Risk Transfer Trust | U.S.$ | 1,045 | $ | 992,100 | ||||||||
Series 2019-2R, Class A | 2,436 | 2,410,622 | ||||||||||
Series 2019-3R, Class A | 583 | 583,639 | ||||||||||
Series 2020-1R, Class A | 2,363 | 2,347,309 | ||||||||||
Radnor Re Ltd. | 2,657 | 2,664,061 | ||||||||||
Series 2019-2, Class M1B | 4,356 | 4,353,695 | ||||||||||
Series 2020-1, Class M1A | 1,924 | 1,924,271 | ||||||||||
Series 2020-2, Class M1C | 3,672 | 3,741,742 | ||||||||||
Triangle Re Ltd. | 10,600 | 10,770,637 | ||||||||||
Series 2021-1, Class M1A | 7,563 | 7,563,445 | ||||||||||
Wells Fargo Credit Risk Transfer Securities Trust | 2,084 | 2,040,134 | ||||||||||
Series 2015-WF1, Class 2M2 | 663 | 655,398 | ||||||||||
|
| |||||||||||
| 158,376,163 | ||||||||||||
|
| |||||||||||
44 | AB BOND FUNDS | abfunds.com | |
Table of Contents
PORTFOLIO OF INVESTMENTS (continued)
INTERMEDIATE DURATION PORTFOLIO
Principal (000) | U.S. $ Value | |||||||||||
| ||||||||||||
Agency Fixed Rate – 0.9% | ||||||||||||
Federal Home Loan Mortgage Corp. REMICs | U.S.$ | 23,702 | $ | 3,577,881 | ||||||||
Series 5008, Class AI | 13,902 | 2,570,189 | ||||||||||
Series 5015, Class BI | 20,981 | 3,877,340 | ||||||||||
Series 5040, Class AI | 10,532 | 1,722,144 | ||||||||||
Series 5043, Class IO | 26,795 | 5,136,104 | ||||||||||
Series 5049, Class CI | 21,986 | 3,298,739 | ||||||||||
Series 5052, Class BI | 21,334 | 3,548,443 | ||||||||||
Federal National Mortgage Association Grantor Trust | 1,605 | 1,539,560 | ||||||||||
Federal National Mortgage Association REMICs | 10,539 | 1,741,268 | ||||||||||
Series 2020-89, Class KI | 42,785 | 7,097,035 | ||||||||||
|
| |||||||||||
| 34,108,703 | ||||||||||||
|
| |||||||||||
Agency Floating Rate – 0.8% | ||||||||||||
Federal Home Loan Mortgage Corp. REMICs | 11,808 | 2,517,041 | ||||||||||
Series 4585, Class DS | 6,984 | 1,683,411 | ||||||||||
Series 4693, Class SL | 4,668 | 1,116,331 | ||||||||||
Series 4954, Class SL | 4,042 | 755,985 | ||||||||||
Series 4981, Class HS | 35,729 | 6,061,560 | ||||||||||
| abfunds.com | AB BOND FUNDS | 45 | |
Table of Contents
PORTFOLIO OF INVESTMENTS (continued)
INTERMEDIATE DURATION PORTFOLIO
Principal (000) | U.S. $ Value | |||||||||||
| ||||||||||||
Federal National Mortgage Association REMICs | U.S.$ | 6,669 | $ | 1,320,512 | ||||||||
Series 2014-17, Class SA | 12,242 | 2,996,001 | ||||||||||
Series 2015-26, Class SH | 9,071 | 1,862,127 | ||||||||||
Series 2016-106, Class ES | 5,253 | 1,047,334 | ||||||||||
Series 2017-62, Class AS | 7,368 | 1,544,860 | ||||||||||
Series 2017-81, Class SA | 11,495 | 2,704,329 | ||||||||||
Series 2017-97, Class SW | 9,155 | 2,068,648 | ||||||||||
Government National Mortgage Association | 8,887 | 1,969,647 | ||||||||||
Series 2017-134, Class MS | 9,109 | 2,076,085 | ||||||||||
Series 2017-43, Class ST | 10,879 | 2,248,635 | ||||||||||
|
| |||||||||||
| 31,972,506 | ||||||||||||
|
| |||||||||||
Non-Agency Fixed Rate – 0.1% | ||||||||||||
Alternative Loan Trust | 379 | 336,942 | ||||||||||
Series 2006-24CB, Class A16 | 2,518 | 1,965,724 | ||||||||||
Series 2006-28CB, Class A14 | 1,665 | 1,234,351 | ||||||||||
Series 2006-J1, Class 1A13 | 663 | 599,367 | ||||||||||
46 | AB BOND FUNDS | abfunds.com | |
Table of Contents
PORTFOLIO OF INVESTMENTS (continued)
INTERMEDIATE DURATION PORTFOLIO
Principal (000) | U.S. $ Value | |||||||||||
| ||||||||||||
Countrywide Home Loan Mortgage Pass-Through Trust | U.S.$ | 715 | $ | 479,250 | ||||||||
First Horizon Alternative Mortgage Securities Trust | 1,746 | 1,204,654 | ||||||||||
|
| |||||||||||
| 5,820,288 | ||||||||||||
|
| |||||||||||
Non-Agency Floating Rate – 0.1% | ||||||||||||
Deutsche Alt-A Securities Mortgage Loan Trust | 4,454 | 2,205,409 | ||||||||||
HomeBanc Mortgage Trust | 1,045 | 951,121 | ||||||||||
|
| |||||||||||
| 3,156,530 | ||||||||||||
|
| |||||||||||
Total Collateralized Mortgage Obligations | 233,434,190 | |||||||||||
|
| |||||||||||
CORPORATES - NON-INVESTMENT GRADE – 1.8% | ||||||||||||
Industrial – 1.4% | ||||||||||||
Capital Goods – 0.3% | ||||||||||||
Ardagh Metal Packaging Finance USA LLC/Ardagh Metal Packaging Finance PLC | 6,296 | 6,224,855 | ||||||||||
GFL Environmental, Inc. | 5,836 | 5,653,333 | ||||||||||
|
| |||||||||||
| 11,878,188 | ||||||||||||
|
| |||||||||||
Communications - Media – 0.3% | ||||||||||||
Netflix, Inc. | 7,751 | 9,378,478 | ||||||||||
|
| |||||||||||
Communications - Telecommunications – 0.2% | ||||||||||||
Lumen Technologies, Inc. | 5,698 | 5,559,995 | ||||||||||
T-Mobile USA, Inc. | 1,797 | 1,822,176 | ||||||||||
3.375%, 04/15/2029 | 1,895 | 1,917,323 | ||||||||||
|
| |||||||||||
| 9,299,494 | ||||||||||||
|
| |||||||||||
| abfunds.com | AB BOND FUNDS | 47 | |
Table of Contents
PORTFOLIO OF INVESTMENTS (continued)
INTERMEDIATE DURATION PORTFOLIO
Principal (000) | U.S. $ Value | |||||||||||
| ||||||||||||
Consumer Cyclical - Entertainment – 0.2% | ||||||||||||
Mattel, Inc. | U.S.$ | 4,312 | $ | 4,413,418 | ||||||||
3.75%, 04/01/2029(a) | 4,311 | 4,342,643 | ||||||||||
|
| |||||||||||
| 8,756,061 | ||||||||||||
|
| |||||||||||
Consumer Cyclical - Retailers – 0.1% | ||||||||||||
Levi Strauss & Co. | 3,832 | 3,699,911 | ||||||||||
|
| |||||||||||
Consumer Non-Cyclical – 0.2% | ||||||||||||
Albertsons Cos., Inc./Safeway, Inc./New Albertsons LP/Albertsons LLC | 3,900 | 3,707,652 | ||||||||||
Newell Brands, Inc. | 2,719 | 2,998,731 | ||||||||||
4.875%, 06/01/2025 | 669 | 738,542 | ||||||||||
|
| |||||||||||
| 7,444,925 | ||||||||||||
|
| |||||||||||
Energy – 0.1% | ||||||||||||
Transocean Poseidon Ltd. | 2,143 | 1,975,760 | ||||||||||
|
| |||||||||||
| 52,432,817 | ||||||||||||
|
| |||||||||||
Financial Institutions – 0.4% | ||||||||||||
Banking – 0.4% | ||||||||||||
Credit Suisse Group AG | 611 | 649,224 | ||||||||||
7.50%, 07/17/2023-12/11/2023(a)(b) | 8,565 | 9,118,974 | ||||||||||
Intesa Sanpaolo SpA | 6,204 | 6,762,794 | ||||||||||
|
| |||||||||||
| 16,530,992 | ||||||||||||
|
| |||||||||||
Total Corporates - Non-Investment Grade | 68,963,809 | |||||||||||
|
| |||||||||||
ASSET-BACKED SECURITIES – 1.6% | ||||||||||||
Other ABS - Fixed Rate – 0.6% | ||||||||||||
Affirm Asset Securitization Trust | 5,400 | 5,457,676 | ||||||||||
Consumer Loan Underlying Bond CLUB Credit Trust | 3,500 | 3,564,872 | ||||||||||
48 | AB BOND FUNDS | abfunds.com | |
Table of Contents
PORTFOLIO OF INVESTMENTS (continued)
INTERMEDIATE DURATION PORTFOLIO
Principal (000) | U.S. $ Value | |||||||||||
| ||||||||||||
Hardee’s Funding LLC | U.S.$ | 3,267 | $ | 3,626,476 | ||||||||
Series 2020-1A, Class A2 | 2,644 | 2,729,213 | ||||||||||
Marlette Funding Trust | 39 | 38,856 | ||||||||||
Series 2020-1A, Class A | 479 | 480,359 | ||||||||||
Neighborly Issuer LLC | 3,256 | 3,266,119 | ||||||||||
Prosper Marketplace Issuance Trust | 51 | 50,727 | ||||||||||
SoFi Consumer Loan Program LLC | 840 | 844,418 | ||||||||||
Series 2017-6, Class A2 | 162 | 162,669 | ||||||||||
SoFi Consumer Loan Program Trust | 456 | 457,216 | ||||||||||
Series 2019-3, Class A | 1,256 | 1,265,981 | ||||||||||
Upstart Securitization Trust | 3,392 | 3,418,542 | ||||||||||
|
| |||||||||||
| 25,363,124 | ||||||||||||
|
| |||||||||||
Autos - Fixed Rate – 0.6% | ||||||||||||
Avis Budget Rental Car Funding AESOP LLC | 1,959 | 1,966,084 | ||||||||||
Series 2018-2A, Class A | 6,700 | 7,262,805 | ||||||||||
CPS Auto Receivables Trust | 2,790 | 2,854,124 | ||||||||||
First Investors Auto Owner Trust | 2,389 | 2,403,672 | ||||||||||
Flagship Credit Auto Trust | 3,310 | 3,349,843 | ||||||||||
| abfunds.com | AB BOND FUNDS | 49 | |
Table of Contents
PORTFOLIO OF INVESTMENTS (continued)
INTERMEDIATE DURATION PORTFOLIO
Principal (000) | U.S. $ Value | |||||||||||
| ||||||||||||
Hertz Vehicle Financing II LP | U.S.$ | 1,077 | $ | 1,081,483 | ||||||||
Series 2019-1A, Class A | 1,017 | 1,020,964 | ||||||||||
Series 2019-2A, Class A | 1,019 | 1,022,045 | ||||||||||
Hertz Vehicle Financing LLC | 660 | 663,549 | ||||||||||
|
| |||||||||||
| 21,624,569 | ||||||||||||
|
| |||||||||||
Credit Cards - Fixed Rate – 0.4% | ||||||||||||
Brex Commercial Charge Card Master Trust | 4,282 | 4,281,684 | ||||||||||
World Financial Network Credit Card Master Trust | 4,490 | 4,553,789 | ||||||||||
Series 2019-B, Class M | 5,000 | 5,129,098 | ||||||||||
|
| |||||||||||
| 13,964,571 | ||||||||||||
|
| |||||||||||
Home Equity Loans - Floating Rate – 0.0% | ||||||||||||
ABFC Trust | 337 | 335,384 | ||||||||||
Wells Fargo Home Equity Trust Mortgage Pass-Through Certificates | 3 | 3,336 | ||||||||||
|
| |||||||||||
| 338,720 | ||||||||||||
|
| |||||||||||
Total Asset-Backed Securities | 61,290,984 | |||||||||||
|
| |||||||||||
COLLATERALIZED LOAN OBLIGATIONS – 1.3% | ||||||||||||
CLO - Floating Rate – 1.3% | ||||||||||||
Dryden CLO Ltd. | 3,905 | 3,912,083 | ||||||||||
50 | AB BOND FUNDS | abfunds.com | |
Table of Contents
PORTFOLIO OF INVESTMENTS (continued)
INTERMEDIATE DURATION PORTFOLIO
Principal (000) | U.S. $ Value | |||||||||
| ||||||||||
Series 2020-78A, Class C | U.S.$ | 4,670 | $ | 4,682,245 | ||||||
Series 2020-78A, Class D | 2,130 | 2,134,867 | ||||||||
Elevation CLO Ltd. | 4,500 | 4,448,592 | ||||||||
Goldentree Loan Management US CLO Ltd. | 6,000 | 6,003,780 | ||||||||
Kayne CLO 7 Ltd. | 2,090 | 2,096,577 | ||||||||
Kayne CLO Ltd. | 3,800 | 3,800,403 | ||||||||
Magnetite XXVI Ltd. | 10,257 | 10,276,411 | ||||||||
OCP CLO Ltd. | 6,200 | 6,200,000 | ||||||||
SCFF I Ltd. | 2,770 | 2,772,036 | ||||||||
Voya CLO Ltd. | 1,850 | 1,810,597 | ||||||||
|
| |||||||||
Total Collateralized Loan Obligations | 48,137,591 | |||||||||
|
| |||||||||
| abfunds.com | AB BOND FUNDS | 51 | |
Table of Contents
PORTFOLIO OF INVESTMENTS (continued)
INTERMEDIATE DURATION PORTFOLIO
Principal (000) | U.S. $ Value | |||||||||||
| ||||||||||||
LOCAL GOVERNMENTS - US MUNICIPAL BONDS – 0.9% | ||||||||||||
United States – 0.9% |
| |||||||||||
Port Authority of New York & New Jersey | U.S.$ | 4,170 | $ | 4,232,102 | ||||||||
State Board of Administration Finance Corp. Series 2020A | 6,821 | 6,846,062 | ||||||||||
State of California | 5,440 | 5,613,002 | ||||||||||
Series 2010 | 8,520 | 13,663,267 | ||||||||||
Tobacco Settlement Finance Authority/WV 3.00%, 06/01/2035 | 4,970 | 5,102,769 | ||||||||||
|
| |||||||||||
Total Local Governments - US Municipal Bonds | 35,457,202 | |||||||||||
|
| |||||||||||
EMERGING MARKETS - CORPORATE BONDS – 0.8% | ||||||||||||
Industrial – 0.8% |
| |||||||||||
Basic – 0.1% |
| |||||||||||
Braskem Netherlands Finance BV | 3,420 | 3,428,379 | ||||||||||
Volcan Cia Minera SAA | 1,602 | 1,634,040 | ||||||||||
|
| |||||||||||
| 5,062,419 | ||||||||||||
|
| |||||||||||
Capital Goods – 0.4% |
| |||||||||||
Cemex SAB de CV | 6,305 | 6,156,833 | ||||||||||
Embraer Netherlands Finance BV | 4,960 | 5,170,428 | ||||||||||
6.95%, 01/17/2028(a) | 1,797 | 1,968,254 | ||||||||||
Odebrecht Holdco Finance Ltd. | 3,418 | 79,052 | ||||||||||
|
| |||||||||||
| 13,374,567 | ||||||||||||
|
| |||||||||||
Communications - Media – 0.0% |
| |||||||||||
Globo Comunicacao e Participacoes SA | 825 | 830,414 | ||||||||||
|
| |||||||||||
Consumer Cyclical - Other – 0.1% |
| |||||||||||
Wynn Macau Ltd. | 2,862 | 2,970,184 | ||||||||||
|
| |||||||||||
52 | AB BOND FUNDS | abfunds.com | |
Table of Contents
PORTFOLIO OF INVESTMENTS (continued)
INTERMEDIATE DURATION PORTFOLIO
Principal (000) | U.S. $ Value | |||||||||||
| ||||||||||||
Consumer Non-Cyclical – 0.1% |
| |||||||||||
BRF GmbH | U.S.$ | 1,272 | $ | 1,301,017 | ||||||||
Minerva Luxembourg SA | 376 | 393,268 | ||||||||||
|
| |||||||||||
| 1,694,285 | ||||||||||||
|
| |||||||||||
Transportation - Services – 0.1% |
| |||||||||||
Rumo Luxembourg SARL | 3,438 | 3,609,900 | ||||||||||
|
| |||||||||||
| 27,541,769 | ||||||||||||
|
| |||||||||||
Utility – 0.0% |
| |||||||||||
Electric – 0.0% |
| |||||||||||
Terraform Global Operating LLC | 565 | 579,136 | ||||||||||
|
| |||||||||||
Financial Institutions – 0.0% |
| |||||||||||
Other Finance – 0.0% |
| |||||||||||
OEC Finance Ltd. | 2,188 | 357,968 | ||||||||||
7.125%, 12/26/2046(a)(j) | 609 | 98,004 | ||||||||||
|
| |||||||||||
| 455,972 | ||||||||||||
|
| |||||||||||
Total Emerging Markets - Corporate Bonds | 28,576,877 | |||||||||||
|
| |||||||||||
QUASI-SOVEREIGNS – 0.7% |
| |||||||||||
Quasi-Sovereign Bonds – 0.7% |
| |||||||||||
Indonesia – 0.3% |
| |||||||||||
Indonesia Asahan Aluminium Persero PT | 2,207 | 2,398,347 | ||||||||||
Pertamina Persero PT | 3,100 | 3,843,969 | ||||||||||
Perusahaan Perseroan Persero PT Perusahaan Listrik Negara | 2,363 | 2,730,003 | ||||||||||
6.15%, 05/21/2048(a) | 900 | 1,094,697 | ||||||||||
|
| |||||||||||
| 10,067,016 | ||||||||||||
|
| |||||||||||
Malaysia – 0.0% |
| |||||||||||
Petronas Capital Ltd. | 1,474 | 1,728,766 | ||||||||||
|
| |||||||||||
Mexico – 0.3% |
| |||||||||||
Comision Federal de Electricidad | 6,919 | 6,640,078 | ||||||||||
| abfunds.com | AB BOND FUNDS | 53 | |
Table of Contents
PORTFOLIO OF INVESTMENTS (continued)
INTERMEDIATE DURATION PORTFOLIO
Principal (000) | U.S. $ Value | |||||||||||
| ||||||||||||
Petroleos Mexicanos | U.S.$ | 3,731 | $ | 3,172,096 | ||||||||
6.84%, 01/23/2030 | 1,419 | 1,434,822 | ||||||||||
|
| |||||||||||
| 11,246,996 | ||||||||||||
|
| |||||||||||
Peru – 0.1% |
| |||||||||||
Corp. Financiera de Desarrollo SA | 4,204 | 4,135,685 | ||||||||||
|
| |||||||||||
Total Quasi-Sovereigns | 27,178,463 | |||||||||||
|
| |||||||||||
AGENCIES – 0.6% | ||||||||||||
Agency Debentures – 0.6% | ||||||||||||
Federal Home Loan Bank | 16,930 | 17,012,619 | ||||||||||
2.50%, 02/13/2024 | 6,170 | 6,552,910 | ||||||||||
|
| |||||||||||
Total Agencies | 23,565,529 | |||||||||||
|
| |||||||||||
GOVERNMENTS - SOVEREIGN | ||||||||||||
Colombia – 0.1% | ||||||||||||
Colombia Government International Bond | 2,490 | 2,437,088 | ||||||||||
|
| |||||||||||
Israel – 0.1% | ||||||||||||
Israel Government International Bond | 3,465 | 3,806,086 | ||||||||||
|
| |||||||||||
Qatar – 0.1% | ||||||||||||
Qatar Government International Bond | 2,155 | 2,339,522 | ||||||||||
|
| |||||||||||
Saudi Arabia – 0.1% | ||||||||||||
Saudi Government International Bond | 4,056 | 4,298,092 | ||||||||||
|
| |||||||||||
United Arab Emirates – 0.1% | ||||||||||||
Abu Dhabi Government International Bond | 3,593 | 3,785,899 | ||||||||||
|
| |||||||||||
54 | AB BOND FUNDS | abfunds.com | |
Table of Contents
PORTFOLIO OF INVESTMENTS (continued)
INTERMEDIATE DURATION PORTFOLIO
Principal (000) | U.S. $ Value | |||||||||||
| ||||||||||||
Uruguay – 0.0% | ||||||||||||
Uruguay Government International Bond | U.S.$ | 1,501 | $ | 1,738,057 | ||||||||
|
| |||||||||||
Total Governments - Sovereign Bonds | 18,404,744 | |||||||||||
|
| |||||||||||
EMERGING MARKETS - SOVEREIGNS – 0.5% | ||||||||||||
Dominican Republic – 0.2% |
| |||||||||||
Dominican Republic International Bond | 8,182 | 8,263,820 | ||||||||||
|
| |||||||||||
Egypt – 0.2% | ||||||||||||
Egypt Government International Bond | 7,688 | 7,188,280 | ||||||||||
|
| |||||||||||
Oman – 0.1% | ||||||||||||
Oman Government International Bond | 1,111 | 1,157,871 | ||||||||||
6.25%, 01/25/2031(a) | 1,612 | 1,686,051 | ||||||||||
|
| |||||||||||
| 2,843,922 | ||||||||||||
|
| |||||||||||
Total Emerging Markets - Sovereigns | 18,296,022 | |||||||||||
|
| |||||||||||
| Shares | ||||||||||||
COMMON STOCKS – 0.2% | ||||||||||||
Financials – 0.2% | ||||||||||||
Insurance – 0.2% | ||||||||||||
Mt Logan Re Ltd. (Preference Shares)(e)(f)(k)(l) | 9,249 | 9,141,237 | ||||||||||
|
| |||||||||||
| abfunds.com | AB BOND FUNDS | 55 | |
Table of Contents
PORTFOLIO OF INVESTMENTS (continued)
INTERMEDIATE DURATION PORTFOLIO
Principal (000) | U.S. $ Value | |||||||||||
| ||||||||||||
SHORT-TERM INVESTMENTS – 2.4% |
| |||||||||||
U.S. Treasury Bills – 2.4% | ||||||||||||
U.S. Treasury Bill | U.S.$ | 91,995 | $ | 91,993,926 | ||||||||
|
| |||||||||||
Total Investments – 101.6% | 3,864,013,036 | |||||||||||
Other assets less liabilities – (1.6)% | (60,992,892 | ) | ||||||||||
|
| |||||||||||
Net Assets – 100.0% | $ | 3,803,020,144 | ||||||||||
|
| |||||||||||
FUTURES (see Note 3)
| Description | Number of Contracts | Expiration Month | Current Notional | Value and Unrealized Appreciation/ (Depreciation) | ||||||||||||
Purchased Contracts |
| |||||||||||||||
Euro Buxl 30 Yr Bond Futures | 310 | June 2021 | $ | 74,903,164 | $ | (501,931 | ) | |||||||||
U.S. 10 Yr Ultra Futures | 1,031 | June 2021 | 148,141,813 | (2,232,136 | ) | |||||||||||
U.S. T-Note 2 Yr (CBT) Futures | 1,370 | June 2021 | 302,395,390 | (66,979 | ) | |||||||||||
U.S. T-Note 5 Yr (CBT) Futures | 660 | June 2021 | 81,442,969 | (237,711 | ) | |||||||||||
U.S. Ultra Bond (CBT) Futures | 325 | June 2021 | 58,896,094 | (1,029,141 | ) | |||||||||||
Sold Contracts |
| |||||||||||||||
10 Yr Canadian Bond Futures | 640 | June 2021 | 70,671,441 | (385,789 | ) | |||||||||||
Long Gilt Futures | 887 | June 2021 | 156,019,281 | 1,973,670 | ||||||||||||
|
| |||||||||||||||
| $ | (2,480,017 | ) | ||||||||||||||
|
| |||||||||||||||
FORWARD CURRENCY EXCHANGE CONTRACTS (see Note 3)
| Counterparty | Contracts to Deliver (000) | In Exchange For (000) | Settlement Date | Unrealized Appreciation/ (Depreciation) | ||||||||||||
Bank of America, NA | BRL | 47,263 | USD | 8,268 | 04/05/2021 | $ | (129,042 | ) | ||||||||
Bank of America, NA | USD | 8,296 | BRL | 47,263 | 04/05/2021 | 101,179 | ||||||||||
Barclays Bank PLC | BRL | 47,332 | USD | 8,308 | 04/05/2021 | (101,327 | ) | |||||||||
Barclays Bank PLC | USD | 8,699 | BRL | 47,332 | 04/05/2021 | (290,016 | ) | |||||||||
Barclays Bank PLC | AUD | 98,616 | USD | 75,214 | 06/04/2021 | 290,285 | ||||||||||
BNP Paribas SA | ZAR | 143,147 | USD | 9,217 | 04/08/2021 | (478,064 | ) | |||||||||
BNP Paribas SA | CAD | 111,847 | USD | 88,123 | 04/22/2021 | (881,653 | ) | |||||||||
BNP Paribas SA | EUR | 101,523 | USD | 121,311 | 05/27/2021 | 2,128,088 | ||||||||||
Citibank, NA | IDR | 129,814,189 | USD | 8,902 | 04/15/2021 | 2,494 | ||||||||||
Citibank, NA | KRW | 616,991 | USD | 566 | 04/22/2021 | 18,901 | ||||||||||
Citibank, NA | JPY | 3,681,439 | USD | 34,739 | 05/20/2021 | 1,475,572 | ||||||||||
HSBC Bank USA | GBP | 1,978 | USD | 2,761 | 04/09/2021 | 33,883 | ||||||||||
HSBC Bank USA | USD | 9,416 | IDR | 131,846,729 | 04/15/2021 | (376,394 | ) | |||||||||
56 | AB BOND FUNDS | abfunds.com | |
Table of Contents
PORTFOLIO OF INVESTMENTS (continued)
INTERMEDIATE DURATION PORTFOLIO
| Counterparty | Contracts to Deliver (000) | In Exchange For (000) | Settlement Date | Unrealized Appreciation/ (Depreciation) | ||||||||||||
HSBC Bank USA | CAD | 16,573 | USD | 13,156 | 04/22/2021 | $ | (32,597 | ) | ||||||||
HSBC Bank USA | USD | 76,802 | CHF | 69,183 | 05/06/2021 | (3,544,565 | ) | |||||||||
HSBC Bank USA | USD | 32,864 | JPY | 3,601,329 | 05/20/2021 | (324,892 | ) | |||||||||
JPMorgan Chase Bank, NA | MXN | 183,769 | USD | 8,551 | 04/16/2021 | (430,443 | ) | |||||||||
Morgan Stanley Capital Services, Inc. | NZD | 102,184 | USD | 74,063 | 05/27/2021 | 2,705,337 | ||||||||||
Morgan Stanley Capital Services, Inc. | MYR | 38,425 | USD | 9,289 | 09/23/2021 | 47,708 | ||||||||||
Natwest Markets PLC | USD | 6,730 | CAD | 8,550 | 04/22/2021 | 73,918 | ||||||||||
Standard Chartered Bank | GBP | 3,362 | USD | 4,675 | 04/09/2021 | 40,858 | ||||||||||
Standard Chartered Bank | USD | 1,693 | CHF | 1,569 | 05/06/2021 | (31,295 | ) | |||||||||
Standard Chartered Bank | NZD | 4,322 | USD | 3,007 | 05/27/2021 | (11,138 | ) | |||||||||
State Street Bank & Trust Co. | USD | 1 | GBP | 1 | 04/09/2021 | 11 | ||||||||||
State Street Bank & Trust Co. | USD | 4,235 | GBP | 3,039 | 04/09/2021 | (45,229 | ) | |||||||||
State Street Bank & Trust Co. | USD | 48 | SEK | 403 | 04/15/2021 | (2,198 | ) | |||||||||
State Street Bank & Trust Co. | CAD | 18,401 | USD | 14,579 | 04/22/2021 | (63,643 | ) | |||||||||
State Street Bank & Trust Co. | JPY | 8,017 | USD | 73 | 05/20/2021 | 598 | ||||||||||
State Street Bank & Trust Co. | USD | 89 | JPY | 9,780 | 05/20/2021 | (525 | ) | |||||||||
State Street Bank & Trust Co. | NZD | 2,834 | USD | 2,059 | 05/27/2021 | 79,802 | ||||||||||
State Street Bank & Trust Co. | AUD | 1,536 | USD | 1,165 | 06/04/2021 | (1,508 | ) | |||||||||
UBS AG | USD | 9,485 | ZAR | 143,776 | 04/08/2021 | 253,191 | ||||||||||
UBS AG | USD | 8,935 | MXN | 184,618 | 04/16/2021 | 87,242 | ||||||||||
UBS AG | USD | 37,782 | RUB | 2,820,436 | 05/25/2021 | (695,781 | ) | |||||||||
|
| |||||||||||||||
| $ | (101,243 | ) | ||||||||||||||
|
| |||||||||||||||
CENTRALLY CLEARED INTEREST RATE SWAPS (see Note 3)
| Rate Type | ||||||||||||||||||||||||||||||
Notional Amount (000) | Termination Date | Payments made by the Fund | Payments received by the Fund | Payment Frequency Paid/ Received | Market Value | Upfront Premiums Paid/ (Received) | Unrealized Appreciation/ (Depreciation) | |||||||||||||||||||||||
| SEK | 1,163,650 | 08/30/2024 | | 3 Month STIBOR | | (0.165)% | Quarterly/ Annual | $ | (1,502,818 | ) | $ | 764 | $ | (1,503,582 | ) | |||||||||||||||
| USD | 19,060 | 12/13/2029 | 1.764% | | 3 Month LIBOR | | Semi- Annual/ Quarterly | (229,425 | ) | – 0 | – | (229,425 | ) | |||||||||||||||||
| CAD | 21,490 | 03/04/2051 | 2.333% | | 3 Month CDOR | | Semi- Annual | 770,525 | – 0 | – | 770,525 | |||||||||||||||||||
| EUR | 25,100 | 11/10/2050 | | 6 Month EURIBOR | | (0.043)% | Semi- Annual/ Annual | (4,398,032 | ) | – 0 | – | (4,398,032 | ) | |||||||||||||||||
| EUR | 25,100 | 11/10/2050 | 0.022% | | 6 Month EURIBOR | | Annual/ Semi- Annual | 3,843,079 | 193,155 | 3,649,924 | ||||||||||||||||||||
| CAD | 21,490 | 03/03/2051 | 2.297% | | 3 Month CDOR | | Semi- Annual | 903,838 | 863 | 902,975 | ||||||||||||||||||||
|
|
|
|
|
| |||||||||||||||||||||||||
| $ | (612,833 | ) | $ | – 0 | – | $ | (807,615 | ) | ||||||||||||||||||||||
|
|
|
|
|
| |||||||||||||||||||||||||
| abfunds.com | AB BOND FUNDS | 57 | |
Table of Contents
PORTFOLIO OF INVESTMENTS (continued)
INTERMEDIATE DURATION PORTFOLIO
CREDIT DEFAULT SWAPS (see Note 3)
| Swap Counterparty & Referenced Obligation | Fixed Rate (Pay) Receive | Payment Frequency | Implied Credit Spread at March 31, 2021 | Notional Amount (000) | Market Value | Upfront Premiums Paid/ (Received) | Unrealized Appreciation/ (Depreciation) | |||||||||||||||||||||||||
Buy Contracts |
| |||||||||||||||||||||||||||||||
Citigroup Global Markets, Inc. | ||||||||||||||||||||||||||||||||
CDX-CMBX. | (3.00 | )% | Monthly | 5.80 | % | USD | 8,912 | $ | 978,537 | $ | 605,227 | $ | 373,310 | |||||||||||||||||||
CDX-CMBX. NA.BBB- Series 9, 09/17/2058* | (3.00 | ) | Monthly | 5.80 | USD | 7,235 | 794,403 | 526,430 | 267,973 | �� | ||||||||||||||||||||||
CDX-CMBX. | (3.00 | ) | Monthly | 5.80 | USD | 3,618 | 397,256 | 279,596 | 117,660 | |||||||||||||||||||||||
CDX-CMBX. | (3.00 | ) | Monthly | 5.80 | USD | 1,867 | 204,996 | 126,132 | 78,864 | |||||||||||||||||||||||
CDX-CMBX. | (3.00 | ) | Monthly | 5.80 | USD | 1,787 | 196,213 | 118,081 | 78,132 | |||||||||||||||||||||||
CDX-CMBX. | (3.00 | ) | Monthly | 5.80 | USD | 1,786 | 196,103 | 118,015 | 78,088 | |||||||||||||||||||||||
CDX-CMBX. | (3.00 | ) | Monthly | 5.80 | USD | 559 | 61,425 | 112,408 | (50,983 | ) | ||||||||||||||||||||||
CDX-CMBX. | (3.00 | ) | Monthly | 5.80 | USD | 559 | 61,425 | 112,495 | (51,070 | ) | ||||||||||||||||||||||
CDX-CMBX. | (3.00 | ) | Monthly | 5.80 | USD | 4,752 | 522,562 | 936,250 | (413,688 | ) | ||||||||||||||||||||||
CDX-CMBX. | (3.00 | ) | Monthly | 5.80 | USD | 4,797 | 526,311 | 977,837 | (451,526 | ) | ||||||||||||||||||||||
CDX-CMBX. | (3.00 | ) | Monthly | 5.80 | USD | 11,881 | 1,306,514 | 2,362,080 | (1,055,566 | ) | ||||||||||||||||||||||
CDX-CMBX. | (3.00 | ) | Monthly | 5.80 | USD | 23,761 | 2,610,937 | 4,813,066 | (2,202,129 | ) | ||||||||||||||||||||||
58 | AB BOND FUNDS | abfunds.com | |
Table of Contents
PORTFOLIO OF INVESTMENTS (continued)
INTERMEDIATE DURATION PORTFOLIO
| Swap Counterparty & Referenced Obligation | Fixed Rate (Pay) Receive | Payment Frequency | Implied Credit Spread at March 31, 2021 | Notional Amount (000) | Market Value | Upfront Premiums Paid/ (Received) | Unrealized Appreciation/ (Depreciation) | |||||||||||||||||||||||||
Goldman Sachs International | ||||||||||||||||||||||||||||||||
CDX-CMBX. | (3.00 | ) % | Monthly | 5.80 | % | USD | 4,173 | $ | 458,543 | $ | 723,802 | $ | (265,259 | ) | ||||||||||||||||||
JPMorgan Securities, LLC | ||||||||||||||||||||||||||||||||
CDX-CMBX. | (3.00 | ) | Monthly | 5.80 | USD | 2,550 | 279,778 | 514,443 | (234,665 | ) | ||||||||||||||||||||||
Morgan Stanley & Co. International PLC | ||||||||||||||||||||||||||||||||
CDX-CMBX. | (3.00 | ) | Monthly | 5.80 | USD | 2,226 | 244,600 | 431,894 | (187,294 | ) | ||||||||||||||||||||||
CDX-CMBX. | (3.00 | ) | Monthly | 5.80 | USD | 4,452 | 489,201 | 908,756 | (419,555 | ) | ||||||||||||||||||||||
Sale Contracts |
| |||||||||||||||||||||||||||||||
Citigroup Global Markets, Inc. | ||||||||||||||||||||||||||||||||
CDX-CMBX. | 3.00 | Monthly | 12.50 | USD | 39 | (10,504 | ) | (6,098 | ) | (4,406 | ) | |||||||||||||||||||||
CDX-CMBX. | 3.00 | Monthly | 12.50 | USD | 129 | (34,763 | ) | (15,100 | ) | (19,663 | ) | |||||||||||||||||||||
CDX-CMBX. | 3.00 | Monthly | 12.50 | USD | 160 | (43,104 | ) | (20,364 | ) | (22,740 | ) | |||||||||||||||||||||
CDX-CMBX. | 3.00 | Monthly | 12.50 | USD | 138 | (37,166 | ) | (13,625 | ) | (23,541 | ) | |||||||||||||||||||||
CDX-CMBX. | 3.00 | Monthly | 12.50 | USD | 194 | (52,264 | ) | (23,893 | ) | (28,371 | ) | |||||||||||||||||||||
CDX-CMBX. | 3.00 | Monthly | 12.50 | USD | 260 | (70,023 | ) | (37,613 | ) | (32,410 | ) | |||||||||||||||||||||
CDX-CMBX. | 3.00 | Monthly | 12.50 | USD | 229 | (61,692 | ) | (29,132 | ) | (32,560 | ) | |||||||||||||||||||||
| abfunds.com | AB BOND FUNDS | 59 | |
Table of Contents
PORTFOLIO OF INVESTMENTS (continued)
INTERMEDIATE DURATION PORTFOLIO
| Swap Counterparty & Referenced Obligation | Fixed Rate (Pay) Receive | Payment Frequency | Implied Credit Spread at March 31, 2021 | Notional Amount (000) | Market Value | Upfront Premiums Paid/ (Received) | Unrealized Appreciation/ (Depreciation) | |||||||||||||||||||||||||
CDX-CMBX. | 3.00 | % | Monthly | 12.50 | % | USD | 225 | $ | (60,615 | ) | $ | (27,711 | ) | $ | (32,904 | ) | ||||||||||||||||
CDX-CMBX. | 3.00 | Monthly | 12.50 | USD | 238 | (64,098 | ) | (30,640 | ) | (33,458 | ) | |||||||||||||||||||||
CDX-CMBX. | 3.00 | Monthly | 12.50 | USD | 248 | (66,791 | ) | (32,685 | ) | (34,106 | ) | |||||||||||||||||||||
CDX-CMBX. | 3.00 | Monthly | 12.50 | USD | 315 | (84,861 | ) | (38,795 | ) | (46,066 | ) | |||||||||||||||||||||
CDX-CMBX. | 3.00 | Monthly | 12.50 | USD | 320 | (86,208 | ) | (35,561 | ) | (50,647 | ) | |||||||||||||||||||||
CDX-CMBX. | 3.00 | Monthly | 12.50 | USD | 432 | (116,417 | ) | (50,568 | ) | (65,849 | ) | |||||||||||||||||||||
CDX-CMBX. | 3.00 | Monthly | 12.50 | USD | 460 | (123,924 | ) | (51,119 | ) | (72,805 | ) | |||||||||||||||||||||
CDX-CMBX. | 3.00 | Monthly | 12.50 | USD | 641 | (172,686 | ) | (68,292 | ) | (104,394 | ) | |||||||||||||||||||||
CDX-CMBX. | 3.00 | Monthy | 12.50 | USD | 2,545 | (685,410 | ) | (195,653 | ) | (489,757 | ) | |||||||||||||||||||||
Credit Suisse International | ||||||||||||||||||||||||||||||||
CDX-CMBX. | 3.00 | Monthly | 12.50 | USD | 1 | (269 | ) | (121 | ) | (148 | ) | |||||||||||||||||||||
CDX-CMBX. | 3.00 | Monthly | 12.50 | USD | 1,375 | (370,311 | ) | (108,237 | ) | (262,074 | ) | |||||||||||||||||||||
CDX-CMBX. | 3.00 | Monthly | 12.50 | USD | 2,204 | (593,574 | ) | (317,390 | ) | (276,184 | ) | |||||||||||||||||||||
CDX-CMBX. | 3.00 | Monthly | 12.50 | USD | 1,776 | (478,306 | ) | (142,774 | ) | (335,532 | ) | |||||||||||||||||||||
60 | AB BOND FUNDS | abfunds.com | |
Table of Contents
PORTFOLIO OF INVESTMENTS (continued)
INTERMEDIATE DURATION PORTFOLIO
| Swap Counterparty & Referenced Obligation | Fixed Rate (Pay) Receive | Payment Frequency | Implied Credit Spread at March 31, 2021 | Notional Amount (000) | Market Value | Upfront Premiums Paid/ (Received) | Unrealized Appreciation/ (Depreciation) | |||||||||||||||||||||||||
CDX-CMBX. | 3.00 | % | Monthly | 12.50 | % | USD | 2,160 | $ | (581,724 | ) | $ | (124,871 | ) | $ | (456,853 | ) | ||||||||||||||||
CDX-CMBX. | 3.00 | Monthly | 12.50 | USD | 8,500 | (2,289,191 | ) | (570,465 | ) | (1,718,726 | ) | |||||||||||||||||||||
Deutsche Bank AG | ||||||||||||||||||||||||||||||||
CDX-CMBX. | 2.00 | Monthly | 8.17 | USD | 7,805 | (614,340 | ) | (148,206 | ) | (466,134 | ) | |||||||||||||||||||||
CDX-CMBX. | 3.00 | Monthly | 12.50 | USD | 345 | (92,914 | ) | (39,256 | ) | (53,658 | ) | |||||||||||||||||||||
CDX-CMBX. | 3.00 | Monthly | 12.50 | USD | 1,496 | (402,898 | ) | (182,988 | ) | (219,910 | ) | |||||||||||||||||||||
CDX-CMBX. | 3.00 | Monthly | 12.50 | USD | 1,727 | (465,110 | ) | (211,243 | ) | (253,867 | ) | |||||||||||||||||||||
CDX-CMBX. | 3.00 | Monthly | 12.50 | USD | 3,315 | (892,785 | ) | (368,073 | ) | (524,712 | ) | |||||||||||||||||||||
CDX-CMBX. | 3.00 | Monthly | 12.50 | USD | 3,315 | (892,784 | ) | (367,929 | ) | (524,855 | ) | |||||||||||||||||||||
CDX-CMBX. | 3.00 | Monthly | 12.50 | USD | 4,586 | (1,235,086 | ) | (319,369 | ) | (915,717 | ) | |||||||||||||||||||||
Goldman Sachs International | ||||||||||||||||||||||||||||||||
CDX-CMBX. | 3.00 | Monthly | 12.50 | USD | 148 | (39,859 | ) | (21,820 | ) | (18,039 | ) | |||||||||||||||||||||
CDX-CMBX. | 3.00 | Monthly | 12.50 | USD | 1,687 | (454,337 | ) | (267,651 | ) | (186,686 | ) | |||||||||||||||||||||
CDX-CMBX. | 3.00 | Monthly | 12.50 | USD | 1,982 | (533,786 | ) | (295,746 | ) | (238,040 | ) | |||||||||||||||||||||
CDX-CMBX. | 3.00 | Monthly | 12.50 | USD | 2,355 | (634,241 | ) | (379,009 | ) | (255,232 | ) | |||||||||||||||||||||
| abfunds.com | AB BOND FUNDS | 61 | |
Table of Contents
PORTFOLIO OF INVESTMENTS (continued)
INTERMEDIATE DURATION PORTFOLIO
| Swap Counterparty & Referenced Obligation | Fixed Rate (Pay) Receive | Payment Frequency | Implied Credit Spread at March 31, 2021 | Notional Amount (000) | Market Value | Upfront Premiums Paid/ (Received) | Unrealized Appreciation/ (Depreciation) | |||||||||||||||||||||||||
JPMorgan Securities, LLC | ||||||||||||||||||||||||||||||||
CDX-CMBX. | 3.00 | % | Monthly | 12.50 | % | USD | 308 | $ | (82,949 | ) | $ | (29,166 | ) | $ | (53,783 | ) | ||||||||||||||||
CDX-CMBX. | 3.00 | Monthly | 12.50 | USD | 323 | (86,989 | ) | (30,596 | ) | (56,393 | ) | |||||||||||||||||||||
CDX-CMBX. | 3.00 | Monthly | 12.50 | USD | 415 | (111,766 | ) | (49,403 | ) | (62,363 | ) | |||||||||||||||||||||
CDX-CMBX. | 3.00 | Monthly | 12.50 | USD | 616 | (165,899 | ) | (76,304 | ) | (89,595 | ) | |||||||||||||||||||||
CDX-CMBX. | 3.00 | Monthly | 12.50 | USD | 1,260 | (339,339 | ) | (151,319 | ) | (188,020 | ) | |||||||||||||||||||||
CDX-CMBX. | 3.00 | Monthly | 12.50 | USD | 1,317 | (354,690 | ) | (124,381 | ) | (230,309 | ) | |||||||||||||||||||||
Morgan Stanley Capital Services LLC | ||||||||||||||||||||||||||||||||
CDX-CMBX. | 3.00 | Monthly | 12.50 | USD | 1,997 | (537,825 | ) | (136,695 | ) | (401,130 | ) | |||||||||||||||||||||
|
|
|
|
|
| |||||||||||||||||||||||||||
| $ | (4,692,694 | ) | $ | 8,526,651 | $ | (13,219,345 | ) | |||||||||||||||||||||||||
|
|
|
|
|
| |||||||||||||||||||||||||||
| * | Termination date |
| ** | Principal amount less than 500. |
| (a) | Security is exempt from registration under Rule 144A of the Securities Act of 1933. These securities are considered restricted, but liquid and may be resold in transactions exempt from registration, normally to qualified institutional buyers. At March 31, 2021, the aggregate market value of these securities amounted to $782,050,193 or 20.6% of net assets. |
| (b) | Securities are perpetual and, thus, do not have a predetermined maturity date. The date shown, if applicable, reflects the next call date. |
| (c) | Floating Rate Security. Stated interest/floor/ceiling rate was in effect at March 31, 2021. |
| (d) | Position, or a portion thereof, has been segregated to collateralize OTC derivatives outstanding. |
| (e) | Security in which significant unobservable inputs (Level 3) were used in determining fair value. |
| (f) | Fair valued by the Adviser. |
62 | AB BOND FUNDS | abfunds.com | |
Table of Contents
PORTFOLIO OF INVESTMENTS (continued)
INTERMEDIATE DURATION PORTFOLIO
| (g) | Security is exempt from registration under Rule 144A of the Securities Act of 1933. These securities, which represent 0.45% of net assets as of March 31, 2021, are considered illiquid and restricted. Additional information regarding such securities follows: |
| 144A/Restricted & Illiquid Securities | Acquisition Date | Cost | Market Value | Percentage of Net Assets | ||||||||||||
GSF | 03/15/2021 | $ | 406,191 | $ | 406,191 | 0.01 | % | |||||||||
GSF | 03/09/2021 | 933,762 | 934,210 | 0.02 | % | |||||||||||
GSF | 03/09/2021 | 223,404 | 223,510 | 0.01 | % | |||||||||||
HFX Funding | 11/06/2015 | 7,350,792 | 7,078,898 | 0.19 | % | |||||||||||
JPMorgan Madison Avenue Securities Trust | 11/06/2015 | 412,499 | 408,467 | 0.01 | % | |||||||||||
Morgan Stanley Capital I Trust | 11/16/2015 | 2,460,137 | 2,096,413 | 0.06 | % | |||||||||||
PMT Credit Risk Transfer Trust | 02/11/2020 | 2,362,526 | 2,347,309 | 0.06 | % | |||||||||||
Terraform Global Operating LLC | 02/08/2018 | 565,000 | 579,136 | 0.02 | % | |||||||||||
Wells Fargo Credit Risk Transfer Securities Trust | 09/28/2015 | 2,083,501 | 2,040,134 | 0.05 | % | |||||||||||
Wells Fargo Credit Risk Transfer Securities Trust | 09/28/2015 | 660,072 | 655,398 | 0.02 | % | |||||||||||
| (h) | IO – Interest Only. |
| (i) | Inverse interest only security. |
| (j) | Pay-In-Kind Payments (PIK). The issuer may pay cash interest and/or interest in additional debt securities. Rates shown are the rates in effect at March 31, 2021. |
| (k) | Non-income producing security. |
| (l) | Restricted and illiquid security. |
| Restricted & Illiquid Securities | Acquisition Date | Cost | Market Value | Percentage of Net Assets | ||||||||||||
Mt Logan Re Ltd. (Preference Shares) | 12/30/2014 | $ | 9,248,550 | $ | 9,141,237 | 0.24 | % | |||||||||
| abfunds.com | AB BOND FUNDS | 63 | |
Table of Contents
PORTFOLIO OF INVESTMENTS (continued)
INTERMEDIATE DURATION PORTFOLIO
Currency Abbreviations:
AUD – Australian Dollar
BRL – Brazilian Real
CAD – Canadian Dollar
CHF – Swiss Franc
EUR – Euro
GBP – Great British Pound
IDR – Indonesian Rupiah
JPY – Japanese Yen
KRW – South Korean Won
MXN – Mexican Peso
MYR – Malaysian Ringgit
NZD – New Zealand Dollar
RUB – Russian Ruble
SEK – Swedish Krona
USD – United States Dollar
ZAR – South African Rand
Glossary:
ABS – Asset-Backed Securities
ARMs – Adjustable Rate Mortgages
CBT – Chicago Board of Trade
CDOR – Canadian Dealer Offered Rate
CDX-CMBX.NA – North American Commercial Mortgage-Backed Index
CLO – Collateralized Loan Obligations
CMBS – Commercial Mortgage-Backed Securities
EURIBOR – Euro Interbank Offered Rate
LIBOR – London Interbank Offered Rate
REIT – Real Estate Investment Trust
REMICs – Real Estate Mortgage Investment Conduits
SOFR – Secured Overnight Financing Rate
STIBOR – Stockholm Interbank Offered Rate
TBA – To Be Announced
TIPS – Treasury Inflation Protected Security
See notes to financial statements.
64 | AB BOND FUNDS | abfunds.com | |
Table of Contents
PORTFOLIO OF INVESTMENTS
SHORT DURATION PLUS PORTFOLIO
March 31, 2021 (unaudited)
| Principal Amount (000) | U.S. $ Value | |||||||||||
| ||||||||||||
GOVERNMENTS - TREASURIES – 43.4% | ||||||||||||
United States – 43.4% | ||||||||||||
U.S. Treasury Notes | U.S.$ | 56,525 | $ | 56,525,000 | ||||||||
1.125%, 09/30/2021(a) | 6,966 | 7,003,007 | ||||||||||
1.50%, 08/31/2021 | 13,536 | 13,616,370 | ||||||||||
1.625%, 06/30/2021-08/15/2022 | 13,944 | 14,110,875 | ||||||||||
2.00%, 02/15/2022 | 3,007 | 3,057,743 | ||||||||||
2.25%, 04/30/2021 | 5,956 | 5,965,306 | ||||||||||
2.375%, 04/15/2021 | 14,135 | 14,146,043 | ||||||||||
2.875%, 11/15/2021 | 6,713 | 6,830,071 | ||||||||||
|
| |||||||||||
Total Governments - Treasuries | 121,254,415 | |||||||||||
|
| |||||||||||
INFLATION-LINKED SECURITIES – 7.2% | ||||||||||||
United States – 7.2% | ||||||||||||
U.S. Treasury Inflation Index | 4,689 | 5,071,023 | ||||||||||
0.25%, 01/15/2025 (TIPS) | 13,941 | 15,139,224 | ||||||||||
|
| |||||||||||
Total Inflation-Linked Securities | 20,210,247 | |||||||||||
|
| |||||||||||
CORPORATES - INVESTMENT | ||||||||||||
Industrial – 3.5% | ||||||||||||
Capital Goods – 0.3% | ||||||||||||
Boeing Co. (The) | 610 | 613,160 | ||||||||||
John Deere Capital Corp. | 236 | 241,291 | ||||||||||
|
| |||||||||||
| 854,451 | ||||||||||||
|
| |||||||||||
Communications - Media – 0.2% | ||||||||||||
Walt Disney Co. (The) | 561 | 608,242 | ||||||||||
|
| |||||||||||
Consumer Cyclical - Automotive – 0.3% | ||||||||||||
General Motors Financial Co., Inc. | 274 | 297,147 | ||||||||||
Harley-Davidson Financial Services, Inc. | 585 | 614,063 | ||||||||||
|
| |||||||||||
| 911,210 | ||||||||||||
|
| |||||||||||
| abfunds.com | AB BOND FUNDS | 65 | |
Table of Contents
PORTFOLIO OF INVESTMENTS (continued)
SHORT DURATION PLUS PORTFOLIO
| Principal Amount (000) | U.S. $ Value | |||||||||||
| ||||||||||||
Consumer Cyclical - Other – 0.3% | ||||||||||||
Las Vegas Sands Corp. | U.S.$ | 393 | $ | 403,419 | ||||||||
3.20%, 08/08/2024 | 227 | 236,679 | ||||||||||
|
| |||||||||||
| 640,098 | ||||||||||||
|
| |||||||||||
Consumer Non-Cyclical – 1.6% | ||||||||||||
BAT International Finance PLC | 740 | 732,341 | ||||||||||
Biogen, Inc. | 600 | 666,714 | ||||||||||
Cencosud SA | 481 | 536,766 | ||||||||||
GlaxoSmithKline Capital PLC | 875 | 899,229 | ||||||||||
Royalty Pharma PLC | 735 | 734,059 | ||||||||||
Sigma Alimentos SA de CV | 491 | 532,275 | ||||||||||
Sutter Health | 356 | 354,533 | ||||||||||
|
| |||||||||||
| 4,455,917 | ||||||||||||
|
| |||||||||||
Energy – 0.3% | ||||||||||||
BP Capital Markets America, Inc. | 454 | 476,927 | ||||||||||
Marathon Petroleum Corp. | 372 | 399,074 | ||||||||||
|
| |||||||||||
| 876,001 | ||||||||||||
|
| |||||||||||
Technology – 0.4% | ||||||||||||
Infor, Inc. | 157 | 159,313 | ||||||||||
International Business Machines Corp. | 675 | 694,244 | ||||||||||
Leidos, Inc. | 137 | 143,232 | ||||||||||
|
| |||||||||||
| 996,789 | ||||||||||||
|
| |||||||||||
Transportation - Airlines – 0.1% | ||||||||||||
Southwest Airlines Co. | 279 | 317,418 | ||||||||||
|
| |||||||||||
| 9,660,126 | ||||||||||||
|
| |||||||||||
66 | AB BOND FUNDS | abfunds.com | |
Table of Contents
PORTFOLIO OF INVESTMENTS (continued)
SHORT DURATION PLUS PORTFOLIO
| Principal Amount (000) | U.S. $ Value | |||||||||||
| ||||||||||||
Financial Institutions – 3.4% | ||||||||||||
Banking – 2.7% | ||||||||||||
BPCE SA | U.S.$ | 660 | $ | 737,174 | ||||||||
Capital One Financial Corp. | 230 | 239,338 | ||||||||||
Citigroup, Inc. | 346 | 369,531 | ||||||||||
3.142%, 01/24/2023 | 650 | 663,455 | ||||||||||
Cooperatieve Rabobank UA | 282 | 307,702 | ||||||||||
Credicorp Ltd. | 389 | 397,266 | ||||||||||
Danske Bank A/S | 525 | 558,884 | ||||||||||
Deutsche Bank AG/New York NY | 234 | 246,854 | ||||||||||
Goldman Sachs Group, Inc. (The) | 222 | 242,499 | ||||||||||
Lloyds Banking Group PLC | 350 | 377,591 | ||||||||||
Mitsubishi UFJ Financial Group, Inc. | 1,000 | 1,026,380 | ||||||||||
NatWest Markets PLC | 825 | 863,123 | ||||||||||
Royal Bank of Canada | 572 | 585,482 | ||||||||||
Standard Chartered PLC | 621 | 617,901 | ||||||||||
UBS AG/London | 212 | 214,915 | ||||||||||
|
| |||||||||||
| 7,448,095 | ||||||||||||
|
| |||||||||||
Finance – 0.5% | ||||||||||||
Aviation Capital Group LLC | 273 | 266,008 | ||||||||||
3.875%, 05/01/2023(b) | 214 | 223,547 | ||||||||||
5.50%, 12/15/2024(b) | 65 | 72,858 | ||||||||||
Azure Orbit IV International Finance Ltd. | 900 | 938,619 | ||||||||||
|
| |||||||||||
| 1,501,032 | ||||||||||||
|
| |||||||||||
Insurance – 0.2% | ||||||||||||
Metropolitan Life Global Funding I | 650 | 665,996 | ||||||||||
|
| |||||||||||
| 9,615,123 | ||||||||||||
|
| |||||||||||
| abfunds.com | AB BOND FUNDS | 67 | |
Table of Contents
PORTFOLIO OF INVESTMENTS (continued)
SHORT DURATION PLUS PORTFOLIO
| Principal Amount (000) | U.S. $ Value | |||||||||||
| ||||||||||||
Utility – 0.1% | ||||||||||||
Electric – 0.1% | ||||||||||||
NextEra Energy Capital Holdings, Inc. | U.S.$ | 230 | $ | 243,851 | ||||||||
|
| |||||||||||
Total Corporates - Investment Grade | 19,519,100 | |||||||||||
|
| |||||||||||
COMMERCIAL MORTGAGE-BACKED SECURITIES – 6.0% | ||||||||||||
Non-Agency Fixed Rate CMBS – 3.5% | ||||||||||||
BAMLL Commercial Mortgage Securities Trust | 185 | 165,872 | ||||||||||
Citigroup Commercial Mortgage Trust | 600 | 618,770 | ||||||||||
Series 2013-GC11, Class AS | 771 | 800,815 | ||||||||||
Series 2013-GC11, Class B | 350 | 362,959 | ||||||||||
Series 2013-GC11, Class XA | 8,306 | 178,526 | ||||||||||
Series 2013-GC15, Class C | 516 | 540,518 | ||||||||||
Commercial Mortgage Trust | 2,277 | 38,613 | ||||||||||
Series 2014-UBS4, Class A5 | 750 | 809,459 | ||||||||||
GS Mortgage Securities Corp. II | 7,540 | 169,308 | ||||||||||
GS Mortgage Securities Trust | 750 | 754,122 | ||||||||||
Series 2012-GC6, Class B | 450 | 457,974 | ||||||||||
Series 2012-GCJ7, Class AS | 500 | 511,973 | ||||||||||
Series 2012-GCJ9, Class AS | 518 | 533,495 | ||||||||||
Series 2015-GC28, Class A5 | 500 | 538,790 | ||||||||||
GSF | 36 | 35,885 | ||||||||||
68 | AB BOND FUNDS | abfunds.com | |
Table of Contents
PORTFOLIO OF INVESTMENTS (continued)
SHORT DURATION PLUS PORTFOLIO
| Principal Amount (000) | U.S. $ Value | |||||||||||
| ||||||||||||
Series 2021-1, Class A2 | U.S.$ | 61 | $ | 62,830 | ||||||||
Series 2021-1, Class AS | 15 | 15,450 | ||||||||||
JPMBB Commercial Mortgage Securities Trust | 10,030 | 237,855 | ||||||||||
JPMorgan Chase Commercial Mortgage Securities Trust | 546 | 472,608 | ||||||||||
Series 2012-C8, Class C | 355 | 330,578 | ||||||||||
LSTAR Commercial Mortgage Trust | 516 | 523,572 | ||||||||||
Morgan Stanley Capital I Trust | 250 | 244,655 | ||||||||||
UBS-Barclays Commercial Mortgage Trust Series 2012-C4, Class A3 | 612 | 612,655 | ||||||||||
Series 2013-C5, Class C | 505 | 494,652 | ||||||||||
Wells Fargo Commercial Mortgage Trust | 64 | 63,495 | ||||||||||
WF-RBS Commercial Mortgage Trust | 250 | 249,120 | ||||||||||
Series 2012-C10, Class XA | 1,057 | 22,852 | ||||||||||
|
| |||||||||||
| 9,847,401 | ||||||||||||
|
| |||||||||||
Non-Agency Floating Rate CMBS – 2.2% | ||||||||||||
Ashford Hospitality Trust | 225 | 224,792 | ||||||||||
BBCMS Mortgage Trust | 411 | 413,060 | ||||||||||
CLNY Trust | 180 | 175,039 | ||||||||||
| abfunds.com | AB BOND FUNDS | 69 | |
Table of Contents
PORTFOLIO OF INVESTMENTS (continued)
SHORT DURATION PLUS PORTFOLIO
| Principal Amount (000) | U.S. $ Value | |||||||||
| ||||||||||
DBWF Mortgage Trust | U.S.$ | 297 | $ | 296,682 | ||||||
GCT Commercial Mortgage Trust | 469 | 469,006 | ||||||||
Great Wolf Trust | 700 | 699,155 | ||||||||
GS Mortgage Securities Corp. Trust |
| 503 |
|
| 503,030 |
| ||||
Series 2019-SMP, Class A |
| 250 |
|
| 249,849 |
| ||||
HFX Funding | 470 | 484,997 | ||||||||
Invitation Homes Trust |
| 880 |
|
| 881,516 |
| ||||
Series 2018-SFR3, Class A |
| 207 |
|
| 207,690 |
| ||||
JPMorgan Chase Commercial Mortgage Securities Trust | 43 | 43,023 | ||||||||
Morgan Stanley Capital I Trust | 365 | 310,137 | ||||||||
Natixis Commercial Mortgage Securities Trust |
| 409 |
|
| 406,237 |
| ||||
Series 2019-MILE, Class A | 166 | 166,129 | ||||||||
70 | AB BOND FUNDS | abfunds.com | |
Table of Contents
PORTFOLIO OF INVESTMENTS (continued)
SHORT DURATION PLUS PORTFOLIO
| Principal Amount (000) | U.S. $ Value | |||||||||||
| ||||||||||||
Starwood Retail Property Trust | U.S.$ | 859 | $ | 631,266 | ||||||||
|
| |||||||||||
| 6,161,608 | ||||||||||||
|
| |||||||||||
Agency CMBS – 0.3% | ||||||||||||
Federal Home Loan Mortgage Corp. Multifamily Structured Pass Through Certificates | 685 | 704,725 | ||||||||||
Government National Mortgage Association | 357 | 894 | ||||||||||
|
| |||||||||||
| 705,619 | ||||||||||||
|
| |||||||||||
Total Commercial Mortgage-Backed Securities | 16,714,628 | |||||||||||
|
| |||||||||||
ASSET-BACKED SECURITIES – 5.6% | ||||||||||||
Autos - Fixed Rate – 4.2% | ||||||||||||
AmeriCredit Automobile Receivables Trust | 346 | 346,574 | ||||||||||
Carmax Auto Owner Trust | 190 | 187,480 | ||||||||||
Carvana Auto Receivables Trust | 622 | 621,721 | ||||||||||
Chase Auto Credit Linked Notes |
| 618 |
|
| 621,697 |
| ||||||
Series 2020-2, Class D |
| 240 |
|
| 240,159 |
| ||||||
Series 2021-1, Class B |
| 829 |
|
| 828,307 |
| ||||||
CPS Auto Receivables Trust | 603 | 604,649 | ||||||||||
CPS Auto Trust | 635 | 633,899 | ||||||||||
DT Auto Owner Trust | 760 | 757,839 | ||||||||||
| abfunds.com | AB BOND FUNDS | 71 | |
Table of Contents
PORTFOLIO OF INVESTMENTS (continued)
SHORT DURATION PLUS PORTFOLIO
| Principal Amount (000) | U.S. $ Value | |||||||||||
| ||||||||||||
Exeter Automobile Receivables Trust | U.S.$ | 540 | $ | 538,541 | ||||||||
Exeter Automobile Receivables Trust |
| 313 |
| 313,892 | ||||||||
Series 2020-3A, Class C |
| 477 |
|
| 482,200 |
| ||||||
First Investors Auto Owner Trust |
| 650 |
|
| 680,058 |
| ||||||
Series 2020-1A, Class A |
| 154 |
|
| 154,924 |
| ||||||
Series 2021-1A, Class C |
| 351 |
|
| 350,857 |
| ||||||
Flagship Credit Auto Trust |
| 590 |
|
| 607,343 |
| ||||||
Series 2020-4, Class C |
| 615 |
|
| 618,150 |
| ||||||
Foursight Capital Automobile Receivables Trust | 229 | 226,736 | ||||||||||
Hertz Vehicle Financing II LP |
| 87 |
|
| 87,089 |
| ||||||
Series 2019-2A, Class A |
| 79 |
|
| 79,106 |
| ||||||
Santander Consumer Auto Receivables Trust | 727 | 722,847 | ||||||||||
Santander Drive Auto Receivables Trust | 424 | 426,496 | ||||||||||
Westlake Automobile Receivables Trust |
| 657 |
|
| 662,798 |
| ||||||
Series 2021-1A, Class C |
| 837 |
|
| 836,504 |
| ||||||
|
| |||||||||||
| 11,629,866 | ||||||||||||
|
| |||||||||||
Other ABS - Fixed Rate – 1.2% | ||||||||||||
Affirm Asset Securitization Trust |
| 206 |
|
| 208,200 |
| ||||||
Series 2021-A, Class A |
| 479 |
|
| 479,323 |
| ||||||
72 | AB BOND FUNDS | abfunds.com | |
Table of Contents
PORTFOLIO OF INVESTMENTS (continued)
SHORT DURATION PLUS PORTFOLIO
| Principal Amount (000) | U.S. $ Value | |||||||||||
| ||||||||||||
Consumer Loan Underlying Bond CLUB Credit Trust | U.S.$ | 100 | $ | 101,853 | ||||||||
Crossroads Asset Trust | 172 | 171,478 | ||||||||||
Hardee’s Funding LLC | 874 | 970,417 | ||||||||||
Marlette Funding Trust | 70 | 70,518 | ||||||||||
Series 2019-3A, Class A |
| 93 |
|
| 93,036 |
| ||||||
Series 2020-1A, Class A |
| 55 |
|
| 55,568 |
| ||||||
Neighborly Issuer LLC | 226 | 226,739 | ||||||||||
Prosper Marketplace Issuance Trust | 6 | 6,256 | ||||||||||
SoFi Consumer Loan Program LLC | 63 | 63,258 | ||||||||||
SoFi Consumer Loan Program Trust |
| 17 |
|
| 17,463 |
| ||||||
Series 2019-3, Class A |
| 97 |
|
| 97,383 |
| ||||||
Upstart Holdings, Inc. | 224 | 224,434 | ||||||||||
Upstart Securitization Trust | 603 | 607,273 | ||||||||||
|
| |||||||||||
| 3,393,199 | ||||||||||||
|
| |||||||||||
Credit Cards - Fixed Rate – 0.2% |
| |||||||||||
Brex Commercial Charge Card Master Trust | 555 | 554,959 | ||||||||||
|
| |||||||||||
Total Asset-Backed Securities | 15,578,024 | |||||||||||
|
| |||||||||||
| abfunds.com | AB BOND FUNDS | 73 | |
Table of Contents
PORTFOLIO OF INVESTMENTS (continued)
SHORT DURATION PLUS PORTFOLIO
| Principal Amount (000) | U.S. $ Value | |||||||||||
| ||||||||||||
COLLATERALIZED MORTGAGE OBLIGATIONS – 4.9% | ||||||||||||
Risk Share Floating Rate – 2.7% |
| |||||||||||
Bellemeade Re Ltd. | U.S.$ | 400 | $ | 395,768 | ||||||||
Series 2019-3A, Class M1B |
| 260 |
|
| 260,793 |
| ||||||
Series 2020-2A, Class M1B |
| 220 |
|
| 222,138 |
| ||||||
Series 2020-3A, Class M1B |
| 151 |
|
| 152,549 |
| ||||||
Series 2021-1A, Class M1B |
| 684 |
|
| 683,292 |
| ||||||
Chase Mortgage Finance Corp. | 79 | 80,085 | ||||||||||
Eagle Re Ltd. | 375 | 373,920 | ||||||||||
Federal Home Loan Mortgage Corp. Structured Agency Credit Risk Debt Notes | 316 | 321,789 | ||||||||||
Series 2017-HQA3, Class M2 | 664 | 672,515 | ||||||||||
Series 2020-DNA5, Class M1 | 99 | 99,467 | ||||||||||
Series 2020-DNA6, Class M1 | 173 | 173,372 | ||||||||||
Federal National Mortgage Association Connecticut Avenue Securities | 358 | 368,598 | ||||||||||
74 | AB BOND FUNDS | abfunds.com | |
Table of Contents
PORTFOLIO OF INVESTMENTS (continued)
SHORT DURATION PLUS PORTFOLIO
| Principal Amount (000) | U.S. $ Value | |||||||||
| ||||||||||
Series 2015-C01, Class 1M2 | U.S.$ | 100 | $ | 101,388 | ||||||
Series 2015-C02, Class 1M2 | 24 | 24,030 | ||||||||
Series 2016-C03, Class 2M2 | 280 | 295,696 | ||||||||
Series 2016-C06, Class 1M2 | 159 | 165,835 | ||||||||
Home Re Ltd. | 336 | 342,134 | ||||||||
Series 2021-1, Class M1A | 754 | 752,708 | ||||||||
Mortgage Insurance-Linked Notes | 284 | 284,738 | ||||||||
Oaktown Re V Ltd. | 151 | 152,446 | ||||||||
PMT Credit Risk Transfer Trust | 153 | 151,169 | ||||||||
Series 2019-3R, Class A | 61 | 60,973 | ||||||||
Radnor Re Ltd. | 192 | 192,076 | ||||||||
Series 2019-2, Class M1B | 222 | 221,464 | ||||||||
Series 2020-1, Class M1A | 185 | 184,733 | ||||||||
Triangle Re Ltd. | 250 | 250,969 | ||||||||
| abfunds.com | AB BOND FUNDS | 75 | |
Table of Contents
PORTFOLIO OF INVESTMENTS (continued)
SHORT DURATION PLUS PORTFOLIO
| Principal Amount (000) | U.S. $ Value | |||||||||||
| ||||||||||||
Series 2021-1, Class M1A | U.S.$ | 494 | $ | 493,657 | ||||||||
|
| |||||||||||
| 7,478,302 | ||||||||||||
|
| |||||||||||
Agency Fixed Rate – 1.3% |
| |||||||||||
Federal Home Loan Mortgage Corp. REMICs Series 4029, Class NE | 537 | 552,282 | ||||||||||
Series 4941, Class IO | 1,797 | 271,232 | ||||||||||
Series 4976, Class MI | 1,731 | 315,782 | ||||||||||
Series 5008, Class AI | 2,037 | 376,522 | ||||||||||
Series 5013, Class JI | 3,030 | 419,164 | ||||||||||
Series 5015, Class DI | 2,421 | 426,182 | ||||||||||
Series 5034, Class BI | 1,656 | 338,761 | ||||||||||
Series 5049, Class CI | 1,457 | 218,547 | ||||||||||
Federal National Mortgage Association REMICs | 101 | 102,809 | ||||||||||
Series 2020-89, Class KI | 2,935 | 486,789 | ||||||||||
|
| |||||||||||
| 3,508,070 | ||||||||||||
|
| |||||||||||
Agency Floating Rate – 0.5% |
| |||||||||||
Federal Home Loan Mortgage Corp. REMICs | 404 | 408,788 | ||||||||||
Series 4286, Class VF | 365 | 368,384 | ||||||||||
Federal National Mortgage Association REMICs | 282 | 283,525 | ||||||||||
Series 2014-49, Class AF | 466 | 465,245 | ||||||||||
|
| |||||||||||
| 1,525,942 | ||||||||||||
|
| |||||||||||
76 | AB BOND FUNDS | abfunds.com | |
Table of Contents
PORTFOLIO OF INVESTMENTS (continued)
SHORT DURATION PLUS PORTFOLIO
| Principal Amount (000) | U.S. $ Value | |||||||||||
| ||||||||||||
Non-Agency Floating Rate – 0.3% |
| |||||||||||
Mello Warehouse Securitization Trust | U.S.$ | 514 | $ | 514,049 | ||||||||
Series 2021-1, Class A | 346 | 342,706 | ||||||||||
|
| |||||||||||
| 856,755 | ||||||||||||
|
| |||||||||||
Non-Agency Fixed Rate – 0.1% |
| |||||||||||
Provident Funding Mortgage Warehouse Securitization Trust | 396 | 395,564 | ||||||||||
|
| |||||||||||
Total Collateralized Mortgage Obligations | 13,764,633 | |||||||||||
|
| |||||||||||
AGENCIES – 2.8% |
| |||||||||||
Agency Debentures – 2.8% |
| |||||||||||
Federal Home Loan Bank | 750 | 766,845 | ||||||||||
2.50%, 02/13/2024 | 445 | 472,617 | ||||||||||
3.00%, 10/12/2021 | 1,450 | 1,472,663 | ||||||||||
Federal Home Loan Mortgage Corp. | 2,000 | 2,000,592 | ||||||||||
Federal National Mortgage Association | 810 | 859,661 | ||||||||||
2.75%, 06/22/2021 | 2,217 | 2,230,391 | ||||||||||
|
| |||||||||||
Total Agencies | 7,802,769 | |||||||||||
|
| |||||||||||
MORTGAGE PASS-THROUGHS – 1.0% |
| |||||||||||
Agency Fixed Rate 30-Year – 1.0% |
| |||||||||||
Federal Home Loan Mortgage Corp. | 1,172 | 1,257,706 | ||||||||||
Federal National Mortgage Association | 861 | 980,261 | ||||||||||
Government National Mortgage Association | 41 | 48,165 | ||||||||||
Series 2009 | 346 | 393,498 | ||||||||||
|
| |||||||||||
| 2,679,630 | ||||||||||||
|
| |||||||||||
| abfunds.com | AB BOND FUNDS | 77 | |
Table of Contents
PORTFOLIO OF INVESTMENTS (continued)
SHORT DURATION PLUS PORTFOLIO
| Principal Amount (000) | U.S. $ Value | |||||||||||
| ||||||||||||
Agency Fixed Rate 15-Year – 0.0% |
| |||||||||||
Federal Home Loan Mortgage Corp. Gold | U.S.$ | 56 | $ | 57,893 | ||||||||
6.50%, 03/01/2026 | 75 | 79,433 | ||||||||||
Federal National Mortgage Association | – 0 | – | 226 | |||||||||
|
| |||||||||||
| 137,552 | ||||||||||||
|
| |||||||||||
Agency ARMs – 0.0% | ||||||||||||
Federal National Mortgage Association | 1 | 1,290 | ||||||||||
|
| |||||||||||
Total Mortgage Pass-Throughs | 2,818,472 | |||||||||||
|
| |||||||||||
LOCAL GOVERNMENTS - US MUNICIPAL BONDS – 0.9% | ||||||||||||
United States – 0.9% | ||||||||||||
California Earthquake Authority | 130 | 130,314 | ||||||||||
City of New York NY | 740 | 739,139 | ||||||||||
New Jersey Turnpike Authority | 125 | 122,948 | ||||||||||
Port Authority of New York & New Jersey | 280 | 284,170 | ||||||||||
State of California | 350 | 361,131 | ||||||||||
Tobacco Settlement Finance Authority/WV 3.00%, 06/01/2035 | 860 | 882,974 | ||||||||||
|
| |||||||||||
Total Local Governments - US Municipal Bonds (cost $2,512,792) | 2,520,676 | |||||||||||
|
| |||||||||||
78 | AB BOND FUNDS | abfunds.com | |
Table of Contents
PORTFOLIO OF INVESTMENTS (continued)
SHORT DURATION PLUS PORTFOLIO
| Principal Amount (000) | U.S. $ Value | |||||||||||
| ||||||||||||
COLLATERALIZED LOAN | ||||||||||||
CLO - Floating Rate – 0.8% |
| |||||||||||
Dryden CLO Ltd. | U.S.$ | 275 | $ | 275,499 | ||||||||
Series 2020-78A, Class C | 320 | 320,839 | ||||||||||
Elevation CLO Ltd. | 250 | 243,045 | ||||||||||
Goldentree Loan Management US CLO Ltd. | 404 | 404,435 | ||||||||||
Magnetite XXVI Ltd. | 472 | 472,542 | ||||||||||
OCP CLO Ltd. | 418 | 418,123 | ||||||||||
Voya CLO Ltd. | 130 | 127,231 | ||||||||||
|
| |||||||||||
Total Collateralized Loan Obligations | 2,261,714 | |||||||||||
|
| |||||||||||
QUASI-SOVEREIGNS – 0.2% | ||||||||||||
Quasi-Sovereign Bonds – 0.2% | ||||||||||||
China – 0.2% | ||||||||||||
Sinopec Group Overseas Development 2018 Ltd. | 516 | 539,865 | ||||||||||
|
| |||||||||||
| abfunds.com | AB BOND FUNDS | 79 | |
Table of Contents
PORTFOLIO OF INVESTMENTS (continued)
SHORT DURATION PLUS PORTFOLIO
| Principal Amount (000) | U.S. $ Value | |||||||||||
| ||||||||||||
GOVERNMENTS - SOVEREIGN | ||||||||||||
United Arab Emirates – 0.2% |
| |||||||||||
Abu Dhabi Government International Bond | U.S.$ | 379 | $ | 380,019 | ||||||||
|
| |||||||||||
SHORT-TERM INVESTMENTS – 19.3% | ||||||||||||
U.S. Treasury Bills – 19.3% | ||||||||||||
U.S. Treasury Bill | 54,005 | 54,004,317 | ||||||||||
|
| |||||||||||
Total Investments – 99.3% | 277,368,879 | |||||||||||
Other assets less liabilities – 0.7% | 2,078,378 | |||||||||||
|
| |||||||||||
Net Assets – 100.0% | $ | 279,447,257 | ||||||||||
|
| |||||||||||
FUTURES (see Note 3)
| Description | Number of Contracts | Expiration Month | Current Notional | Value and Unrealized Appreciation/ (Depreciation) | ||||||||||||
Purchased Contracts | ||||||||||||||||
U.S. T-Note 2 Yr (CBT) Futures | 621 | June 2021 | $ | 137,071,195 | $ | (110,297 | ) | |||||||||
U.S. Ultra Bond (CBT) Futures | 5 | June 2021 | 906,094 | (23,289 | ) | |||||||||||
Sold Contracts | ||||||||||||||||
U.S. 10 Yr Ultra Futures | 15 | June 2021 | 2,155,313 | 29,761 | ||||||||||||
U.S. T-Note 5 Yr (CBT) Futures | 107 | June 2021 | 13,203,633 | 49,910 | ||||||||||||
|
| |||||||||||||||
| $ | (53,915 | ) | ||||||||||||||
|
| |||||||||||||||
CENTRALLY CLEARED CREDIT DEFAULT SWAPS (see Note 3)
| Description | Fixed Rate (Pay) Receive | Payment Frequency | Implied Credit Spread at March 31, 2021 | Notional | Market Value | Upfront Premiums Paid/ (Received) | Unrealized Appreciation/ (Depreciation) | |||||||||||||||||||||||||
Sale Contracts |
| |||||||||||||||||||||||||||||||
CDX-NAIG Series 34, 5 Year Index, 06/20/2025* | 1.00 | % | Quarterly | 0.57 | % | USD | 2,221 | $ | 40,683 | $ | 23,884 | $ | 16,799 | |||||||||||||||||||
| * | Termination date |
80 | AB BOND FUNDS | abfunds.com | |
Table of Contents
PORTFOLIO OF INVESTMENTS (continued)
SHORT DURATION PLUS PORTFOLIO
CREDIT DEFAULT SWAPS (see Note 3)
| Swap Counterparty & Referenced Obligation | Fixed Rate (Pay) Receive | Payment Frequency | Implied Credit Spread at March 31, 2021 | Notional Amount (000) | Market Value | Upfront Premiums Paid/ (Received) | Unrealized Appreciation/ (Depreciation) | |||||||||||||||||||||||||
Buy Contracts |
| |||||||||||||||||||||||||||||||
Citigroup Global Markets, Inc. | ||||||||||||||||||||||||||||||||
CDX-CMBX. | (3.00 | )% | Monthly | 5.80 | % | USD | 363 | $ | 39,858 | $ | 24,652 | $ | 15,206 | |||||||||||||||||||
CDX-CMBX. | (3.00 | ) | Monthly | 5.80 | USD | 295 | 32,391 | 20,734 | 11,657 | |||||||||||||||||||||||
CDX-CMBX. | (3.00 | ) | Monthly | 5.80 | USD | 295 | 32,391 | 21,465 | 10,926 | |||||||||||||||||||||||
CDX-CMBX. | (3.00 | ) | Monthly | 5.80 | USD | 119 | 13,066 | 7,863 | 5,203 | |||||||||||||||||||||||
CDX-CMBX. | (3.00 | ) | Monthly | 5.80 | USD | 118 | 12,956 | 7,797 | 5,159 | |||||||||||||||||||||||
CDX-CMBX. | (3.00 | ) | Monthly | 5.80 | USD | 147 | 16,141 | 11,360 | 4,781 | |||||||||||||||||||||||
CDX-CMBX. | (3.00 | ) | Monthly | 5.80 | USD | 113 | 12,407 | 7,634 | 4,773 | |||||||||||||||||||||||
CDX-CMBX. | (3.00 | ) | Monthly | 5.80 | USD | 239 | 26,282 | 47,088 | (20,806 | ) | ||||||||||||||||||||||
CDX-CMBX. | (3.00 | ) | Monthly | 5.80 | USD | 241 | 26,442 | 49,126 | (22,684 | ) | ||||||||||||||||||||||
CDX-CMBX. | (3.00 | ) | Monthly | 5.80 | USD | 308 | 33,844 | 61,935 | (28,091 | ) | ||||||||||||||||||||||
CDX-CMBX. | (3.00 | ) | Monthly | 5.80 | USD | 308 | 33,844 | 61,983 | (28,139 | ) | ||||||||||||||||||||||
CDX-CMBX. | (3.00 | ) | Monthly | 5.80 | USD | 597 | 65,651 | 118,691 | (53,040 | ) | ||||||||||||||||||||||
| abfunds.com | AB BOND FUNDS | 81 | |
Table of Contents
PORTFOLIO OF INVESTMENTS (continued)
SHORT DURATION PLUS PORTFOLIO
| Swap Counterparty & Referenced Obligation | Fixed Rate (Pay) Receive | Payment Frequency | Implied Credit Spread at March 31, 2021 | Notional Amount (000) | Market Value | Upfront Premiums Paid/ (Received) | Unrealized Appreciation/ (Depreciation) | |||||||||||||||||||||||||
CDX-CMBX. | (3.00 | ) % | Monthly | 5.80 | % | USD | 1,194 | $ | 131,202 | $ | 241,859 | $ | (110,657 | ) | ||||||||||||||||||
Goldman Sachs International | ||||||||||||||||||||||||||||||||
CDX-CMBX. | (3.00 | ) | Monthly | 5.80 | USD | 289 | 31,757 | 50,127 | (18,370 | ) | ||||||||||||||||||||||
JPMorgan Securities, LLC | ||||||||||||||||||||||||||||||||
CDX-CMBX. | (3.00 | ) | Monthly | 5.80 | USD | 128 | 14,044 | 25,823 | (11,779 | ) | ||||||||||||||||||||||
Morgan Stanley & Co. International PLC | ||||||||||||||||||||||||||||||||
CDX-CMBX. | (3.00 | ) | Monthly | 5.80 | USD | 155 | 17,032 | 30,074 | (13,042 | ) | ||||||||||||||||||||||
CDX-CMBX. | (3.00 | ) | Monthly | 5.80 | USD | 308 | 33,844 | 62,870 | (29,026 | ) | ||||||||||||||||||||||
Sale Contracts |
| |||||||||||||||||||||||||||||||
Citigroup Global Markets, Inc. | ||||||||||||||||||||||||||||||||
CDX-CMBX. | 3.00 | Monthly | 12.50 | USD | 3 | (808 | ) | (469 | ) | (339 | ) | |||||||||||||||||||||
CDX-CMBX. | 3.00 | Monthly | 12.50 | USD | 3 | (808 | ) | (375 | ) | (433 | ) | |||||||||||||||||||||
CDX-CMBX. | 3.00 | Monthly | 12.50 | USD | 13 | (3,502 | ) | (1,601 | ) | (1,901 | ) | |||||||||||||||||||||
CDX-CMBX. | 3.00 | Monthly | 12.50 | USD | 14 | (3,773 | ) | (1,639 | ) | (2,134 | ) | |||||||||||||||||||||
CDX-CMBX. | 3.00 | Monthly | 12.50 | USD | 15 | (4,041 | ) | (1,908 | ) | (2,133 | ) | |||||||||||||||||||||
CDX-CMBX. | 3.00 | Monthly | 12.50 | USD | 15 | (4,041 | ) | (1,847 | ) | (2,194 | ) | |||||||||||||||||||||
82 | AB BOND FUNDS | abfunds.com | |
Table of Contents
PORTFOLIO OF INVESTMENTS (continued)
SHORT DURATION PLUS PORTFOLIO
| Swap Counterparty & Referenced Obligation | Fixed Rate (Pay) Receive | Payment Frequency | Implied Credit Spread at March 31, 2021 | Notional Amount (000) | Market Value | Upfront Premiums Paid/ (Received) | Unrealized Appreciation/ (Depreciation) | |||||||||||||||||||||||||
CDX-CMBX. | 3.00 | % | Monthly | 12.50 | % | USD | 19 | $ | (5,118 | ) | $ | (2,111 | ) | $ | (3,007 | ) | ||||||||||||||||
CDX-CMBX. | 3.00 | Monthly | 12.50 | USD | 21 | (5,657 | ) | (2,586 | ) | (3,071 | ) | |||||||||||||||||||||
CDX-CMBX. | 3.00 | Monthly | 12.50 | USD | 38 | (10,238 | ) | (4,130 | ) | (6,108 | ) | |||||||||||||||||||||
Credit Suisse International | ||||||||||||||||||||||||||||||||
CDX-CMBX. | 3.00 | Monthly | 12.50 | USD | 132 | (35,550 | ) | (10,391 | ) | (25,159 | ) | |||||||||||||||||||||
CDX-CMBX. | 3.00 | Monthly | 12.50 | USD | 168 | (45,246 | ) | (13,506 | ) | (31,740 | ) | |||||||||||||||||||||
CDX-CMBX. | 3.00 | Monthly | 12.50 | USD | 209 | (56,287 | ) | (12,082 | ) | (44,205 | ) | |||||||||||||||||||||
CDX-CMBX. | 3.00 | Monthly | 12.50 | USD | 860 | (231,613 | ) | (57,718 | ) | (173,895 | ) | |||||||||||||||||||||
Deutsche Bank AG | ||||||||||||||||||||||||||||||||
CDX-CMBX. | 3.00 | Monthly | 12.50 | USD | 445 | (119,846 | ) | (30,990 | ) | (88,856 | ) | |||||||||||||||||||||
Goldman Sachs International | ||||||||||||||||||||||||||||||||
CDX-CMBX. | 3.00 | Monthly | 12.50 | USD | 58 | (15,625 | ) | (7,220 | ) | (8,405 | ) | |||||||||||||||||||||
CDX-CMBX. | 3.00 | Monthly | 12.50 | USD | 133 | (35,819 | ) | (21,101 | ) | (14,718 | ) | |||||||||||||||||||||
CDX-CMBX. | 3.00 | Monthly | 12.50 | USD | 160 | (43,091 | ) | (23,875 | ) | (19,216 | ) | |||||||||||||||||||||
CDX-CMBX. | 3.00 | Monthly | 12.50 | USD | 186 | (50,092 | ) | (29,934 | ) | (20,158 | ) | |||||||||||||||||||||
| abfunds.com | AB BOND FUNDS | 83 | |
Table of Contents
PORTFOLIO OF INVESTMENTS (continued)
SHORT DURATION PLUS PORTFOLIO
| Swap Counterparty & Referenced Obligation | Fixed Rate (Pay) Receive | Payment Frequency | Implied Credit Spread at March 31, 2021 | Notional Amount (000) | Market Value | Upfront Premiums Paid/ (Received) | Unrealized Appreciation/ (Depreciation) | |||||||||||||||||||||||||
JPMorgan Securities, LLC | ||||||||||||||||||||||||||||||||
CDX-CMBX. | 3.00 | % | Monthly | 12.50 | % | USD | 40 | $ | (10,773 | ) | $ | (4,955 | ) | $ | (5,818 | ) | ||||||||||||||||
CDX-CMBX. | 3.00 | Monthly | 12.50 | USD | 139 | (37,435 | ) | (16,693 | ) | (20,742 | ) | |||||||||||||||||||||
|
|
|
|
|
| |||||||||||||||||||||||||||
| $ | (146,211 | ) | $ | 605,950 | $ | (752,161 | ) | |||||||||||||||||||||||||
|
|
|
|
|
| |||||||||||||||||||||||||||
| * | Termination date |
| (a) | Position, or a portion thereof, has been segregated to collateralize OTC derivatives outstanding. |
| (b) | Security is exempt from registration under Rule 144A of the Securities Act of 1933. These securities are considered restricted, but liquid and may be resold in transactions exempt from registration, normally to qualified institutional buyers. At March 31, 2021, the aggregate market value of these securities amounted to $41,224,765 or 14.8% of net assets. |
| (c) | IO – Interest Only. |
| (d) | Security in which significant unobservable inputs (Level 3) were used in determining fair value. |
| (e) | Security is exempt from registration under Rule 144A of the Securities Act of 1933. These securities, which represent 0.21% of net assets as of March 31, 2021, are considered illiquid and restricted. Additional information regarding such securities follows: |
| 144A/Restricted & Illiquid Securities | Acquisition Date | Cost | Market Value | Percentage of Net Assets | ||||||||||||
GSF | 03/15/2021 | $ | 35,885 | $ | 35,885 | 0.01 | % | |||||||||
GSF | 03/09/2021 | 62,799 | 62,830 | 0.02 | % | |||||||||||
GSF | 03/09/2021 | 15,442 | 15,450 | 0.01 | % | |||||||||||
HFX Funding | 11/06/2015 | 503,626 | 484,997 | 0.17 | % | |||||||||||
| (f) | Fair valued by the Adviser. |
| (g) | Floating Rate Security. Stated interest/floor/ceiling rate was in effect at March 31, 2021. |
84 | AB BOND FUNDS | abfunds.com | |
Table of Contents
PORTFOLIO OF INVESTMENTS (continued)
SHORT DURATION PLUS PORTFOLIO
Glossary:
ABS – Asset-Backed Securities
ARMs – Adjustable Rate Mortgages
CBT – Chicago Board of Trade
CDX-CMBX.NA – North American Commercial Mortgage-Backed Index
CDX-NAIG – North American Investment Grade Credit Default Swap Index
CLO – Collateralized Loan Obligations
CMBS – Commercial Mortgage-Backed Securities
LIBOR – London Interbank Offered Rate
REMICs – Real Estate Mortgage Investment Conduits
SOFR – Secured Overnight Financing Rate
TIPS – Treasury Inflation Protected Security
See notes to financial statements.
| abfunds.com | AB BOND FUNDS | 85 | |
Table of Contents
STATEMENT OF ASSETS AND LIABILITIES
March 31, 2021 (unaudited)
| Intermediate Duration Portfolio | Short Duration Plus Portfolio | |||||||
| Assets | ||||||||
Investments in securities, at value | $ | 3,864,013,036 | $ | 277,368,879 | ||||
Foreign currencies, at value(a) | 731,391 | – 0 | – | |||||
Cash | 39,384,919 | 12,940,919 | ||||||
Cash collateral due from broker | 6,207,264 | 568,867 | ||||||
Due from custodian | 654 | – 0 | – | |||||
Receivables: | ||||||||
Interest | 18,958,877 | 740,466 | ||||||
Investment securities sold and foreign currency transactions | 195,482,928 | 115 | ||||||
Capital shares sold | 2,730,620 | 457,857 | ||||||
Variation margin on futures | 11,968,956 | – 0 | – | |||||
Variation margin on centrally cleared swaps | 342,277 | 2,165 | ||||||
Market value on credit default swaps(b) | 9,328,804 | 573,152 | ||||||
Unrealized appreciation of forward currency exchange contracts | 7,339,067 | – 0 | – | |||||
|
|
|
| |||||
Total assets | 4,156,488,793 | 292,652,420 | ||||||
|
|
|
| |||||
| Liabilities | ||||||||
Cash collateral due to broker | 6,909,000 | 338,000 | ||||||
Payables: |
| |||||||
Dividends to shareholders | 2,448,726 | 75,848 | ||||||
Investment securities purchased | 318,112,179 | 11,730,883 | ||||||
Capital shares redeemed | 2,568,472 | 156,899 | ||||||
Management fee | 1,395,478 | 59,789 | ||||||
Shareholder servicing fee | 322,405 | 21,474 | ||||||
Distribution fee | 379 | 5,422 | ||||||
Variation margin on futures | – 0 | – | 4,916 | |||||
Transfer Agent fee | 4,659 | 2,923 | ||||||
Accrued expenses | 245,543 | 89,646 | ||||||
Market value on credit default swaps(c) | 14,021,498 | 719,363 | ||||||
Unrealized depreciation of forward currency exchange contracts | 7,440,310 | – 0 | – | |||||
|
|
|
| |||||
Total liabilities | 353,468,649 | 13,205,163 | ||||||
|
|
|
| |||||
Net Assets | $ | 3,803,020,144 | $ | 279,447,257 | ||||
|
|
|
| |||||
Cost of investments | $ | 3,789,114,999 | $ | 276,364,067 | ||||
|
|
|
| |||||
| Net Assets Consist of: |
| |||||||
Capital stock, at par | $ | 284,828 | $ | 23,845 | ||||
Additional paid-in capital | 3,750,841,346 | 289,675,651 | ||||||
Distributable earnings (accumulated loss) | 51,893,970 | (10,252,239 | ) | |||||
|
|
|
| |||||
| $ | 3,803,020,144 | $ | 279,447,257 | |||||
|
|
|
| |||||
| (a) | Cost: $739,627 and $0 respectively. (Note 1) |
| (b) | Net premiums paid of $13,666,512 and $851,081 respectively. |
| (c) | Net premiums received of $5,139,861 and $245,131 respectively. |
See Notes to Financial Statements.
86 | AB BOND FUNDS | abfunds.com | |
Table of Contents
STATEMENT OF ASSETS AND LIABILITIES (continued)
| Intermediate Duration Portfolio | Short Duration Plus Portfolio | |||||||
| Calculation Of Maximum Offering Price Intermediate Duration Class Shares/ Short Duration Plus Class Shares | ||||||||
Net Assets | $ | 3,801,220,282 | $ | 260,272,736 | ||||
Shares of capital stock outstanding | 284,693,158 | 22,209,581 | ||||||
|
|
|
| |||||
Net asset value, offering and redemption price per share | $ | 13.35 | $ | 11.72 | ||||
|
|
|
| |||||
| Class A Shares | ||||||||
Net Assets | $ | 1,778,504 | $ | 16,992,036 | ||||
Shares of capital stock outstanding | 133,038 | 1,448,972 | ||||||
|
|
|
| |||||
Net asset value and redemption price per share | $ | 13.37 | $ | 11.73 | ||||
Sales charge—4.25% of public offering price | 0.59 | 0.52 | ||||||
|
|
|
| |||||
Maximum offering price | $ | 13.96 | $ | 12.25 | ||||
|
|
|
| |||||
| Class C Shares | ||||||||
Net Assets | $ | 2,182,485 | ||||||
Shares of capital stock outstanding | 186,505 | |||||||
|
| |||||||
Net asset value and offering price per share | $ | 11.70 | ||||||
|
| |||||||
| Advisor Class Shares | ||||||||
Net Assets | $ | 11,338 | ||||||
Shares of capital stock outstanding | 848.82 | |||||||
|
| |||||||
Net asset value and offering price per share | $ | 13.36 | ||||||
|
| |||||||
| Class Z Shares | ||||||||
Net Assets | $ | 10,020 | ||||||
Shares of capital stock outstanding | 750 | |||||||
|
| |||||||
Net asset value and offering price per share | $ | 13.36 | ||||||
|
| |||||||
See Notes to Financial Statements.
| abfunds.com | AB BOND FUNDS | 87 | |
Table of Contents
STATEMENT OF OPERATIONS
For the Six Months Ended March 31, 2021 (unaudited)
| Intermediate Duration Portfolio | Short Duration Plus Portfolio | |||||||
| Investment Income | ||||||||
Income: | ||||||||
Interest | $ | 48,203,876 | $ | 2,050,253 | ||||
Dividends |
| |||||||
Unaffiliated issuers | 85,554 | – 0 | – | |||||
|
|
|
| |||||
Total income | 48,289,430 | 2,050,253 | ||||||
|
|
|
| |||||
| Expenses: | ||||||||
Management fee (see Note 2A) | 8,134,217 | 450,344 | ||||||
Shareholder servicing fee (see Note 2B) | 1,877,167 | 118,421 | ||||||
Custody and accounting fees | 142,503 | 55,138 | ||||||
Transfer Agent fee – Non-Retail Class | 92,476 | 10,015 | ||||||
Transfer Agent fee – Class A | 2,790 | 16,753 | ||||||
Transfer Agent fee – Class C | – 0 | – | 2,495 | |||||
Transfer Agent fee – Advisor Class | 27 | – 0 | – | |||||
Transfer Agent fee – Class Z | 1 | – 0 | – | |||||
Distribution fees – Class A | 1,387 | 22,322 | ||||||
Distribution fees – Class C | – 0 | – | 13,202 | |||||
Directors’ fees and expenses | 78,117 | 5,229 | ||||||
Auditing and tax fees | 56,792 | 6,810 | ||||||
Registration fees | 35,114 | 29,952 | ||||||
Legal fees | 41,336 | 2,947 | ||||||
Printing fees | 23,332 | 19,612 | ||||||
Miscellaneous | 53,407 | 13,645 | ||||||
|
|
|
| |||||
Total expenses | 10,538,666 | 766,885 | ||||||
Less: expenses waived and reimbursed by the Adviser (see Note 2A and 2B) | (1,577 | ) | (98,636 | ) | ||||
|
|
|
| |||||
Net expenses | 10,537,089 | 668,249 | ||||||
|
|
|
| |||||
Net investment income | 37,752,341 | 1,382,004 | ||||||
|
|
|
| |||||
See Notes to Financial Statements.
88 | AB BOND FUNDS | abfunds.com | |
Table of Contents
STATEMENT OF OPERATIONS (continued)
| Intermediate Duration Portfolio | Short Duration Plus Portfolio | |||||||
| Realized and Unrealized Gain (Loss) on Investment and Foreign Currency Transactions | ||||||||
Net realized gain (loss) on: | ||||||||
Investment transactions(a) | $ | 25,863,763 | $ | 48,717 | ||||
Forward currency exchange contracts | (358,257 | ) | – 0 | – | ||||
Futures | (16,771,392 | ) | (292,358 | ) | ||||
Swaps | (19,629,388 | ) | (860,660 | ) | ||||
Swaptions written | 533,520 | – 0 | – | |||||
Foreign currency transactions | (3,370,420 | ) | – 0 | – | ||||
|
|
|
| |||||
Net realized gain (loss) on investment and foreign currency transactions | (13,732,174 | ) | (1,104,301 | ) | ||||
|
|
|
| |||||
Net change in unrealized appreciation/depreciation of: | ||||||||
Investments(b) | (108,637,737 | ) | (627,387 | ) | ||||
Forward currency exchange contracts | (2,042,928 | ) | – 0 | – | ||||
Futures | (1,606,249 | ) | (72,473 | ) | ||||
Swaps | 7,598,559 | 463,276 | ||||||
Foreign currency denominated assets and liabilities | (109,027 | ) | – 0 | – | ||||
|
|
|
| |||||
Net change in unrealized appreciation/depreciation of investments and foreign currency denominated assets and liabilities | (104,797,382 | ) | (236,584 | ) | ||||
|
|
|
| |||||
Net realized and unrealized gain (loss) on investment and foreign currency transactions | (118,529,556 | ) | (1,340,885 | ) | ||||
|
|
|
| |||||
Net Increase (Decrease) in Net Assets Resulting from Operations | $ | (80,777,215 | ) | $ | 41,119 | |||
|
|
|
| |||||
| (a) | Net of foreign capital gains taxes of $(440,746) and $0, respectively. |
| (b) | Net of (increase) decrease in accrued foreign capital gains taxes of $(161,722) and $0, respectively. |
See Notes to Financial Statements.
| abfunds.com | AB BOND FUNDS | 89 | |
Table of Contents
STATEMENT OF CHANGES IN NET ASSETS
| Intermediate Duration Portfolio | ||||||||
| Six Months Ended 3/31/21 (Unaudited) | Year Ended 9/30/20 | |||||||
| Increase (Decrease) in Net Assets from Operations: | ||||||||
Net investment income | $ | 37,752,341 | $ | 88,958,663 | ||||
Net realized gain (loss) on investment and foreign currency transactions | (13,732,174 | ) | 76,198,038 | |||||
Net change in unrealized appreciation/depreciation of investments and foreign currency denominated assets and liabilities and other assets and liabilities | (104,797,382 | ) | 50,018,884 | |||||
|
|
|
| |||||
Net increase (decrease) in net assets resulting from operations | (80,777,215 | ) | 215,175,585 | |||||
|
|
|
| |||||
| Distributions to shareholders | ||||||||
Intermediate Duration Portfolio | (103,348,008 | ) | (95,996,514 | ) | ||||
Class A | (22,267 | ) | (2,333 | ) | ||||
Advisor Class | (261 | ) | (170 | ) | ||||
Class Z | (277 | ) | (255 | ) | ||||
|
|
|
| |||||
Total distributions to shareholders | (103,370,813 | ) | (95,999,272 | ) | ||||
|
|
|
| |||||
| Capital-share transactions: | ||||||||
Net proceeds from sales of shares | 457,178,512 | 631,482,445 | ||||||
Net proceeds from sales of shares issued to shareholders on reinvestment of dividends and distributions | 94,016,372 | 73,167,333 | ||||||
|
|
|
| |||||
Total proceeds from shares sold | 551,194,884 | 704,649,778 | ||||||
Cost of shares redeemed | (261,677,296 | ) | (542,664,238 | ) | ||||
|
|
|
| |||||
Net increase in net assets from capital-share transactions | 289,517,588 | 161,985,540 | ||||||
|
|
|
| |||||
Net increase in net assets | 105,369,560 | 281,161,853 | ||||||
| Net Assets: | ||||||||
Beginning of period | 3,697,650,584 | 3,416,488,731 | ||||||
|
|
|
| |||||
End of period | $ | 3,803,020,144 | $ | 3,697,650,584 | ||||
|
|
|
| |||||
See Notes to Financial Statements.
90 | AB BOND FUNDS | abfunds.com | |
Table of Contents
STATEMENT OF CHANGES IN NET ASSETS (continued)
| Short Duration Plus Portfolio | ||||||||
| Six Months Ended 3/31/21 (Unaudited) | Year Ended 9/30/20 | |||||||
| Increase (Decrease) in Net Assets from Operations: | ||||||||
Net investment income | $ | 1,382,004 | $ | 3,500,807 | ||||
Net realized gain (loss) on investment and foreign currency transactions | (1,104,301 | ) | 2,534,354 | |||||
Net change in unrealized appreciation/depreciation of investments and foreign currency denominated assets and liabilities and other assets and liabilities | (236,584 | ) | (1,260,369 | ) | ||||
|
|
|
| |||||
Net increase in net assets resulting from operations | 41,119 | 4,774,792 | ||||||
|
|
|
| |||||
| Distributions to shareholders | ||||||||
Short Duration Plus Class | (1,381,309 | ) | (3,612,806 | ) | ||||
Class A | (53,059 | ) | (194,967 | ) | ||||
Class B | – 0 | – | (6 | ) | ||||
Class C | (5,352 | ) | (19,373 | ) | ||||
|
|
|
| |||||
Total distributions to shareholders | (1,439,720 | ) | (3,827,152 | ) | ||||
|
|
|
| |||||
| Capital-share transactions: | ||||||||
Net proceeds from sales of shares | 71,823,767 | 105,816,630 | ||||||
Net proceeds from sales of shares issued to shareholders on reinvestment of dividends and distributions | 1,245,371 | 3,179,041 | ||||||
|
|
|
| |||||
Total proceeds from shares sold | 73,069,138 | 108,995,671 | ||||||
Cost of shares redeemed | (38,117,837 | ) | (115,940,511 | ) | ||||
|
|
|
| |||||
Net increase (decrease) in net assets from capital-share transactions | 34,951,301 | (6,944,840 | ) | |||||
|
|
|
| |||||
Net increase (decrease) in net assets | 33,552,700 | (5,997,200 | ) | |||||
| Net Assets: | ||||||||
Beginning of period | 245,894,557 | 251,891,757 | ||||||
|
|
|
| |||||
End of period | $ | 279,447,257 | $ | 245,894,557 | ||||
|
|
|
| |||||
See Notes to Financial Statements.
| abfunds.com | AB BOND FUNDS | 91 | |
Table of Contents
NOTES TO FINANCIAL STATEMENTS
March 31, 2021 (unaudited)
NOTE 1.
Organization and Significant Accounting Policies
The AB Intermediate Duration Class A, Advisor Class and Class Z shares and the AB Short Duration Plus Class A and C shares are (collectively, the “Bond Fund Retail Classes”) shares of Intermediate Duration Portfolio and Short Duration Plus Portfolio (the “Portfolios”) of the Sanford C. Bernstein Fund, Inc. (the “Fund”). The Fund is registered under the Investment Company Act of 1940 as an open-end registered investment company. The Fund, which is a Maryland corporation, operates as a series company currently comprised of 13 series each with its own investment objective. Class B, Class R and Class T shares of Short Duration Plus Portfolio have been authorized but currently are not offered. Effective July 23, 2019, Intermediate Duration Portfolio commenced offering of Class A, Advisor Class and Class Z shares. Effective August 2, 2019, sales of Class B shares of Short Duration Plus Portfolio were suspended. On November 7, 2019, all remaining outstanding Class B shares of Short Duration Plus Portfolio were converted to Class A shares. Class A shares are sold with a front-end sales charge of up to 4.25% for purchases not exceeding $1,000,000. With respect to purchases of $1,000,000 or more, Class A shares redeemed within one year of purchase may be subject to a contingent deferred sales charge of 1%. Class C shares are subject to a contingent deferred sales charge of 1% on redemptions made within the first year after purchase, and 0% after the first year of purchase. Class C shares will automatically convert to Class A shares ten years after the end of the calendar month of purchase. Advisor Class and Class Z shares are sold without an initial or contingent deferred sales charge and are not subject to ongoing distribution expenses. These financial statements include only the Bond Fund Retail Classes. The financial highlights of the Intermediate Duration Class and Short Duration Plus Class shares are presented in a separate financial report. All classes of shares have identical voting, dividend, liquidation and other rights, except that the classes bear different distribution and transfer agency expenses. Each class has exclusive voting rights with respect to its distribution plan. The financial statements have been prepared in conformity with U.S. generally accepted accounting principles (“U.S. GAAP”), which require management to make certain estimates and assumptions that affect the reported amounts of assets and liabilities in the financial statements and amounts of income and expenses during the reporting period. Actual results could differ from those estimates. Each Portfolio is an investment company under U.S. GAAP and follows the accounting and reporting guidance applicable to investment companies. The following is a summary of significant accounting policies followed by the Portfolios.
92 | AB BOND FUNDS | abfunds.com | |
Table of Contents
NOTES TO FINANCIAL STATEMENTS (continued)
A. Portfolio Valuation
Portfolio securities are valued at their current market value determined on the basis of market quotations or, if market quotations are not readily available or are deemed unreliable, at “fair value” as determined in accordance with procedures established by and under the general supervision of the Fund’s Board of Directors (the “Board”).
In general, the market values of securities which are readily available and deemed reliable are determined as follows: securities listed on a national securities exchange (other than securities listed on the NASDAQ Stock Market, Inc. (“NASDAQ”)) or on a foreign securities exchange are valued at the last sale price at the close of the exchange or foreign securities exchange. If there has been no sale on such day, the securities are valued at the last traded price from the previous day. Securities listed on more than one exchange are valued by reference to the principal exchange on which the securities are traded; securities listed only on NASDAQ are valued in accordance with the NASDAQ Official Closing Price; listed or over the counter (“OTC”) market put or call options are valued at the mid level between the current bid and ask prices. If either a current bid or current ask price is unavailable, AllianceBernstein L.P. (the “Adviser”) will have discretion to determine the best valuation (e.g., last trade price in the case of listed options); open futures are valued using the closing settlement price or, in the absence of such a price, the most recent quoted bid price. If there are no quotations available for the day of valuation, the last available closing settlement price is used; U.S. Government securities and any other debt instruments having 60 days or less remaining until maturity are generally valued at market by an independent pricing vendor, if a market price is available. If a market price is not available, the securities are valued at amortized cost. This methodology is commonly used for short term securities that have an original maturity of 60 days or less, as well as short term securities that had an original term to maturity that exceeded 60 days. In instances when amortized cost is utilized, the Valuation Committee (the “Committee”) must reasonably conclude that the utilization of amortized cost is approximately the same as the fair value of the security. Factors the Committee will consider include, but are not limited to, an impairment of the creditworthiness of the issuer or material changes in interest rates. Fixed-income securities, including mortgage-backed and asset-backed securities, may be valued on the basis of prices provided by a pricing service or at a price obtained from one or more of the major broker-dealers. In cases where broker-dealer quotes are obtained, the Adviser may establish procedures whereby changes in market yields or spreads are used to adjust, on a daily basis, a recently obtained quoted price on a security. Swaps and other derivatives are valued daily, primarily using independent pricing services, independent pricing models using market inputs, as well as third party broker-dealers or counterparties.
| abfunds.com | AB BOND FUNDS | 93 | |
Table of Contents
NOTES TO FINANCIAL STATEMENTS (continued)
Open-end mutual funds are valued at the closing net asset value per share, while exchange traded funds are valued at the closing market price per share.
Securities for which market quotations are not readily available (including restricted securities) or are deemed unreliable are valued at fair value as deemed appropriate by the Adviser. Factors considered in making this determination may include, but are not limited to, information obtained by contacting the issuer, analysts, analysis of the issuer’s financial statements or other available documents. In addition, the Portfolios may use fair value pricing for securities primarily traded in non-U.S. markets because most foreign markets close well before the Portfolios value their securities at 4:00 p.m., Eastern Time. The earlier close of these foreign markets gives rise to the possibility that significant events, including broad market moves, may have occurred in the interim and may materially affect the value of those securities. To account for this, the Portfolios generally value many of their foreign equity securities using fair value prices based on third party vendor modeling tools to the extent available.
B. Fair Value Measurements
In accordance with U.S. GAAP regarding fair value measurements, fair value is defined as the price that the Portfolios would receive to sell an asset or pay to transfer a liability in an orderly transaction between market participants at the measurement date. U.S. GAAP establishes a framework for measuring fair value, and a three-level hierarchy for fair value measurements based upon the transparency of inputs to the valuation of an asset or liability (including those valued based on their market values as described in Note 1.A above). Inputs may be observable or unobservable and refer broadly to the assumptions that market participants would use in pricing the asset or liability. Observable inputs reflect the assumptions market participants would use in pricing the asset or liability based on market data obtained from sources independent of the Portfolios. Unobservable inputs reflect the Portfolios’ own assumptions about the assumptions that market participants would use in pricing the asset or liability based on the best information available in the circumstances. Each investment is assigned a level based upon the observability of the inputs which are significant to the overall valuation. The three-tier hierarchy of inputs is summarized below.
| • | Level 1—quoted prices in active markets for identical investments |
| • | Level 2—other significant observable inputs (including quoted prices for similar investments, interest rates, prepayment speeds, credit risk, etc.) |
| • | Level 3—significant unobservable inputs (including the Portfolios’ own assumptions in determining the fair value of investments) |
94 | AB BOND FUNDS | abfunds.com | |
Table of Contents
NOTES TO FINANCIAL STATEMENTS (continued)
The fair value of debt instruments, such as bonds, and over-the-counter derivatives is generally based on market price quotations, recently executed market transactions (where observable) or industry recognized modeling techniques and are generally classified as Level 2. Pricing vendor inputs to Level 2 valuations may include quoted prices for similar investments in active markets, interest rate curves, coupon rates, currency rates, yield curves, option adjusted spreads, default rates, credit spreads and other unique security features in order to estimate the relevant cash flows which are then discounted to calculate fair values. If these inputs are unobservable and significant to the fair value, these investments will be classified as Level 3.
Valuations of mortgage-backed or other asset-backed securities, by pricing vendors, are based on both proprietary and industry recognized models and discounted cash flow techniques. Significant inputs to the valuation of these instruments are value of the collateral, the rates and timing of delinquencies, the rates and timing of prepayments, and default and loss expectations, which are driven in part by housing prices for residential mortgages. Significant inputs are determined based on relative value analyses, which incorporate comparisons to instruments with similar collateral and risk profiles, including relevant indices. Mortgage and asset-backed securities for which management has collected current observable data through pricing services are generally categorized within Level 2. Those investments for which current observable data has not been provided are classified as Level 3.
Other fixed income investments, including non-U.S. government and corporate debt, are generally valued using quoted market prices, if available, which are typically impacted by current interest rates, maturity dates and any perceived credit risk of the issuer. Additionally, in the absence of quoted market prices, these inputs are used by pricing vendors to derive a valuation based upon industry or proprietary models which incorporate issuer specific data with relevant yield/spread comparisons with more widely quoted bonds with similar key characteristics. Those investments for which there are observable inputs are classified as Level 2. Where the inputs are not observable, the investments are classified as Level 3.
| abfunds.com | AB BOND FUNDS | 95 | |
Table of Contents
NOTES TO FINANCIAL STATEMENTS (continued)
The following tables summarize the valuation of the Portfolios’ investments by the above fair value hierarchy levels as of March 31, 2021:
| Intermediate Duration Portfolio | ||||||||||||||||
| Investments in Securities: | Level 1 | Level 2 | Level 3 | Total | ||||||||||||
Assets: |
| |||||||||||||||
Corporates – Investment Grade | $ | – 0 | – | $ | 1,110,612,979 | $ | – 0 | – | $ | 1,110,612,979 | ||||||
Governments – Treasuries | – 0 | – | 1,056,130,172 | – 0 | – | 1,056,130,172 | ||||||||||
Mortgage Pass-Throughs | – 0 | – | 379,984,226 | – 0 | – | 379,984,226 | ||||||||||
Commercial Mortgage-Backed Securities | – 0 | – | 343,247,108 | 1,563,911 | 344,811,019 | |||||||||||
Inflation-Linked Securities | – 0 | – | 308,034,066 | – 0 | – | 308,034,066 | ||||||||||
Collateralized Mortgage Obligations | – 0 | – | 233,434,190 | – 0 | – | 233,434,190 | ||||||||||
Corporates – Non-Investment Grade | – 0 | – | 68,963,809 | – 0 | – | 68,963,809 | ||||||||||
Asset-Backed Securities | – 0 | – | 61,290,984 | – 0 | – | 61,290,984 | ||||||||||
Collateralized Loan Obligations | – 0 | – | 48,137,591 | – 0 | – | 48,137,591 | ||||||||||
Local Governments – US Municipal Bonds | – 0 | – | 35,457,202 | – 0 | – | 35,457,202 | ||||||||||
Emerging Markets – Corporate Bonds | – 0 | – | 28,576,877 | – 0 | – | 28,576,877 | ||||||||||
Quasi-Sovereigns | – 0 | – | 27,178,463 | – 0 | – | 27,178,463 | ||||||||||
Agencies | – 0 | – | 23,565,529 | – 0 | – | 23,565,529 | ||||||||||
Governments – Sovereign Bonds | – 0 | – | 18,404,744 | – 0 | – | 18,404,744 | ||||||||||
Emerging Markets – Sovereigns | – 0 | – | 18,296,022 | – 0 | – | 18,296,022 | ||||||||||
Common Stocks | – 0 | – | – 0 | – | 9,141,237 | 9,141,237 | ||||||||||
Short-Term Investments | – 0 | – | 91,993,926 | – 0 | – | 91,993,926 | ||||||||||
|
|
|
|
|
|
|
| |||||||||
Total Investments in Securities | – 0 | – | 3,853,307,888 | 10,705,148 | 3,864,013,036 | |||||||||||
Other Financial Instruments(a): | ||||||||||||||||
Assets: |
| |||||||||||||||
Futures | 1,973,670 | – 0 | – | – 0 | – | 1,973,670 | (b) | |||||||||
Forward Currency Exchange Contracts | – 0 | – | 7,339,067 | – 0 | – | 7,339,067 | ||||||||||
Centrally Cleared Interest Rate Swaps | – 0 | – | 5,517,442 | – 0 | – | 5,517,442 | (b) | |||||||||
Credit Default Swaps | – 0 | – | 9,328,804 | – 0 | – | 9,328,804 | ||||||||||
96 | AB BOND FUNDS | abfunds.com | |
Table of Contents
NOTES TO FINANCIAL STATEMENTS (continued)
| Investments in Securities: | Level 1 | Level 2 | Level 3 | Total | ||||||||||||
Liabilities: |
| |||||||||||||||
Futures | $ | (4,453,687 | ) | $ | – 0 | – | $ | – 0 | – | $ | (4,453,687 | )(b) | ||||
Forward Currency Exchange Contracts | – 0 | – | (7,440,310 | ) | – 0 | – | (7,440,310 | ) | ||||||||
Centrally Cleared Interest Rate Swaps | – 0 | – | (6,130,275 | ) | – 0 | – | (6,130,275 | )(b) | ||||||||
Credit Default Swaps | – 0 | – | (14,021,498 | ) | – 0 | – | (14,021,498 | ) | ||||||||
|
|
|
|
|
|
|
| |||||||||
Total | $ | (2,480,017 | ) | $ | 3,847,901,118 | $ | 10,705,148 | $ | 3,856,126,249 | |||||||
|
|
|
|
|
|
|
| |||||||||
| Short Duration Plus Portfolio | ||||||||||||||||
| Investments in Securities: | Level 1 | Level 2 | Level 3 | Total | ||||||||||||
Assets: |
| |||||||||||||||
Governments – Treasuries | $ | – 0 | – | $ | 121,254,415 | $ | – 0 | – | $ | 121,254,415 | ||||||
Inflation-Linked Securities | – 0 | – | 20,210,247 | – 0 | – | 20,210,247 | ||||||||||
Corporates – Investment Grade | – 0 | – | 19,519,100 | – 0 | – | 19,519,100 | ||||||||||
Commercial Mortgage-Backed Securities | – 0 | – | 16,600,463 | 114,165 | 16,714,628 | |||||||||||
Asset-Backed Securities | – 0 | – | 15,578,024 | – 0 | – | 15,578,024 | ||||||||||
Collateralized Mortgage Obligations | – 0 | – | 13,369,069 | 395,564 | 13,764,633 | |||||||||||
Agencies | – 0 | – | 7,802,769 | – 0 | – | 7,802,769 | ||||||||||
Mortgage Pass-Throughs | – 0 | – | 2,818,472 | – 0 | – | 2,818,472 | ||||||||||
Local Governments – US Municipal Bonds | – 0 | – | 2,520,676 | – 0 | – | 2,520,676 | ||||||||||
Collateralized Loan Obligations | – 0 | – | 2,261,714 | – 0 | – | 2,261,714 | ||||||||||
Quasi-Sovereigns | – 0 | – | 539,865 | – 0 | – | 539,865 | ||||||||||
Governments – Sovereign Bonds | – 0 | – | 380,019 | – 0 | – | 380,019 | ||||||||||
Short-Term Investments | – 0 | – | 54,004,317 | – 0 | – | 54,004,317 | ||||||||||
|
|
|
|
|
|
|
| |||||||||
Total Investments in Securities | – 0 | – | 276,859,150 | 509,729 | 277,368,879 | |||||||||||
Other Financial Instruments(a): | ||||||||||||||||
Assets: |
| |||||||||||||||
Futures | 79,671 | – 0 | – | – 0 | – | 79,671 | (b) | |||||||||
Centrally Cleared Credit Default Swaps | – 0 | – | 40,683 | – 0 | – | 40,683 | (b) | |||||||||
Credit Default Swaps | – 0 | – | 573,152 | – 0 | – | 573,152 | ||||||||||
Liabilities: |
| |||||||||||||||
Futures | (133,586 | ) | – 0 | – | – 0 | – | (133,586 | )(b) | ||||||||
Credit Default Swaps | – 0 | – | (719,363 | ) | – 0 | – | (719,363 | ) | ||||||||
|
|
|
|
|
|
|
| |||||||||
Total | $ | (53,915 | ) | $ | 276,753,622 | $ | 509,729 | $ | 277,209,436 | |||||||
|
|
|
|
|
|
|
| |||||||||
| (a) | Other financial instruments are derivative instruments, such as futures, forwards and swaps, which are valued at the unrealized appreciation/(depreciation) on the instrument. Other financial instruments may also include swaps with upfront premiums, options written and swaptions written which are valued at market value. |
| abfunds.com | AB BOND FUNDS | 97 | |
Table of Contents
NOTES TO FINANCIAL STATEMENTS (continued)
| (b) | Only variation margin receivable/(payable) at period end is reported within the statement of assets and liabilities. This amount reflects cumulative unrealized appreciation/(depreciation) on futures and centrally cleared swaps as reported in the schedule of investments. Where applicable, centrally cleared swaps with upfront premiums are presented here at market value. |
C. Foreign Currency Translation
The accounting records of the Portfolios are maintained in U.S. dollars. Prices of securities and other assets and liabilities denominated in non-U.S. currencies are translated into U.S. dollars using the exchange rate at 4:00 p.m., Eastern Time. Amounts related to the purchases and sales of securities, investment income and expenses are translated at the rates of exchange prevailing on the respective dates of such transactions.
Net realized gain or loss on foreign currency transactions represents net foreign exchange gains or losses from the disposition of foreign currencies, currency gains or losses realized between the trade and settlement dates on security transactions and the difference between the amount of dividends, interest and foreign withholding taxes recorded on the Portfolios’ books and the U.S. dollar equivalent amount actually received or paid. Net unrealized currency gains and losses arising from valuing foreign currency denominated assets and liabilities, other than security investments, at the current exchange rate are reflected as part of unrealized appreciation/depreciation on foreign currencies.
The Portfolios do not isolate that portion of the results of operations arising as a result of changes in the foreign exchange rates from the changes in the market prices of securities held at period end. The Portfolios do isolate the effect of changes in foreign exchange rates from changes in market prices of securities sold during the year, as required by the Internal Revenue Code.
The Portfolios may invest in foreign securities and foreign currency transactions that may involve risks not associated with domestic investments as a result of the level of governmental supervision and regulation of foreign securities markets and the possibility of political or economic instability, among others.
D. Taxes
Each Portfolio is treated as a separate entity for federal income tax purposes. Each Portfolio intends to continue to comply with the requirements of Subchapter M of the Internal Revenue Code of 1986 as they apply to regulated investment companies. By so complying, each Portfolio will not be subject to federal and state income taxes to the extent that all of its income is distributed. The Portfolios may be subject to taxes imposed by countries in which they invest. Such taxes are generally based on income and/or capital gains earned or repatriated. Taxes are accrued and applied
98 | AB BOND FUNDS | abfunds.com | |
Table of Contents
NOTES TO FINANCIAL STATEMENTS (continued)
to net investment income, net realized gains and net unrealized appreciation/depreciation as such income and/or gains are earned based on management’s understanding of applicable local tax law.
In accordance with U.S. GAAP requirements regarding accounting for uncertainties in income taxes, management has analyzed the Portfolios’ tax positions taken or expected to be taken on federal and state income tax returns for all open tax years (the current and the prior three tax years) and has concluded that no provision for income tax is required in the Portfolios’ financial statements. As of September 30, 2020, the Portfolios did not have any unrecognized tax benefits.
E. Security Transactions and Related Investment Income
Security transactions are accounted for on the trade date (the date the buy or sell order is executed). Securities gains and losses are calculated on the identified cost basis. Interest income is recorded on the accrual basis and dividend income is recorded on the ex-dividend date or as soon as the Portfolios are informed of the dividend. The Portfolios amortize premiums and accrete discounts as adjustments to interest income. The Portfolio accounts for distributions received from REIT investments or from regulated investment companies as dividend income, realized gain, or return of capital based on information provided by the REIT or the investment company.
F. Securities Transactions on a When-Issued or Delayed-Delivery Basis
Each Portfolio may purchase securities on a when-issued basis or purchase or sell securities on a delayed-delivery basis. At the time a Portfolio commits to purchase a security on a when-issued or delayed-delivery basis, the Portfolio will record the transaction and use the security’s value in determining the Portfolio’s net asset value. At the time a Portfolio commits to sell a security on a delayed-delivery basis, the Portfolio will record the transaction and exclude the security’s value in determining the Portfolio’s net asset value.
G. Class Allocations
All income earned and expenses incurred by the Portfolios are borne on a pro-rata basis by each outstanding class of shares, based on the proportionate interest in each Portfolio represented by the net assets of such class, except for class specific expenses which are allocated to the respective class. Expenses of the Fund are charged proportionately to each Portfolio or based on other appropriate methods. Realized and unrealized gains and losses are allocated among the various share classes based on respective net assets.
| abfunds.com | AB BOND FUNDS | 99 | |
Table of Contents
NOTES TO FINANCIAL STATEMENTS (continued)
H. Distribution of Income and Gains
Net investment income of each Portfolio is declared and recorded as a dividend to shareholders daily and is payable to shareholders monthly. Distributions of net realized gains, less any available loss carryforwards, if any, will be paid to shareholders at least once a year, and recorded on the ex-dividend date.
Elements of realized gains and net investment income may be recorded in different accounting periods for financial reporting (book) and federal income tax (tax) purposes (temporary differences). To the extent that such distributions required for tax purposes exceed income and gains recorded for book purposes as a result of such temporary differences, “excess distributions” are reflected in the accompanying statement of assets and liabilities. To the extent distributions exceed income and gains for tax purposes, such distributions would be shown as “return of capital” on the statement of changes in net assets. Certain other differences—permanent differences—arise because treatment of elements of income and gains is different between book and tax accounting. Permanent differences are reclassified in the year they arise.
NOTE 2.
Investment Management and Transactions with Affiliated Persons
A. Management Fee
Under the Investment Management Agreement between the Fund and the Adviser, the Adviser manages the investment of each Portfolio’s assets, places purchase and sale orders, and bears various expenses, including the salaries and expenses of all personnel except those of outside directors. In addition, the Adviser agrees to permit its directors, officers and employees who may be elected directors or officers of the Fund to serve in the capacities to which they are elected. The Adviser renders these services subject to the general oversight of the Board.
The Portfolios pay the Adviser an investment management fee, based on an annual rate, for such services as follows:
| Annual Percentage of Average Daily Net Assets of Each Portfolio | ||||||||||||||||
| Portfolio | First $2.5 Billion | Next $2.5 Billion | Next $3 Billion | Thereafter | ||||||||||||
Intermediate Duration | 0.450 | % | 0.400 | % | 0.350 | % | 0.300 | % | ||||||||
First $750 Million | Thereafter | |||||||
Short Duration Plus | 0.350 | % | 0.300 | % | ||||
Effective January 28, 2021, the Adviser has agreed to waive its fees and bear certain expenses of the Intermediate Duration Portfolio to the extent
100 | AB BOND FUNDS | abfunds.com | |
Table of Contents
NOTES TO FINANCIAL STATEMENTS (continued)
necessary to limit the total other expenses (exclusive of advisory fees, distribution and/or service (Rule 12b-1) fees, extraordinary expenses, interest expense, acquired fund fees and expenses other than the advisory fees of any affiliated funds in which the Portfolio may invest, expenses associated with securities sold short, and brokerage commission and other transaction costs) to 0.22%, 0.22% and 0.13% for Class A, Advisor Class and Class Z shares, respectively. During the six months ended March 31, 2021, such reimbursements/waivers amounted to $1,577. The Expense Caps may not be terminated by the Adviser before January 28, 2022.
During the second quarter of 2018, AXA S.A. (“AXA”), a French holding company for the AXA Group, completed the sale of a minority stake in its subsidiary, AXA Equitable Holdings, Inc. (now named Equitable Holdings, Inc.)(“Equitable”), through an initial public offering. Equitable is the holding company for a diverse group of financial services companies, including an approximate 65% economic interest in the Adviser and a 100% interest in AllianceBernstein Corporation, the general partner of the Adviser. Since the initial sale, AXA has completed additional offerings (and related transactions). As a result, as of May 20, 2021, AXA no longer owns shares of Equitable.
Sales that were completed on November 13, 2019 resulted in the indirect transfer of a “controlling block” of voting securities of the Adviser (a “Change of Control Event”) and may have been deemed to have been an “assignment” causing a termination of the Portfolios’ investment advisory and administration agreements. In order to ensure that investment advisory and administration services could continue uninterrupted in the event of a Change of Control Event, the Board previously approved new investment advisory and administration agreements with the Adviser, and shareholders of the Portfolios subsequently approved the new investment advisory agreement. These agreements became effective on November 13, 2019.
B. Transfer Agency Agreement; Shareholder Servicing Fee
Under a Transfer Agency Agreement between the Fund, on behalf of the Bond Fund Retail Classes, and AllianceBernstein Investor Services, Inc. (“ABIS”), the Bond Fund Retail Classes compensate ABIS, a wholly-owned subsidiary of the Adviser, for providing personnel and facilities to perform transfer agency services. ABIS may make payments to intermediaries that provide omnibus account services, sub-accounting services and/or networking services. For the six months ended March 31, 2021, the compensation retained by ABIS amounted to: Intermediate Duration Portfolio, $7,589 and Short Duration Plus Portfolio, $8,709.
Under the Shareholder Servicing Agreement between the Fund and the Adviser, the Adviser pays expenses it incurs in providing shareholder services to individual shareholders of the Portfolios (except the Retail Classes). Such
| abfunds.com | AB BOND FUNDS | 101 | |
Table of Contents
NOTES TO FINANCIAL STATEMENTS (continued)
services include, but are not limited to, providing information to shareholders concerning their fund investments, systematic withdrawal plans, fund dividend payments and reinvestments, shareholder account or transactions status, net asset value of shares, fund performance, fund services, plans and options, fund investment policies, portfolio holdings and tax consequences of fund investments; dealing with shareholder complaints and other correspondence relating to fund matters; and communications with shareholders when proxies are being solicited from them with respect to voting their fund shares. This agreement applies only to the Intermediate Duration and Short Duration Plus Class shares of the Portfolios. Under the agreement, the fee paid by the Intermediate Duration and Short Duration Plus Class shares to the Adviser for services under this agreement is at an annual rate of ..10% of the average daily net assets of the Portfolios attributable to the respective class during the month. Effective November 13, 2020, the Adviser voluntarily agreed to waive the shareholder servicing fee of 0.10 of 1%, annualized, of the average daily net assets attributable to the Bernstein Class of the Short Duration Plus Portfolio. For the six months ended March 31, 2021, such waivers amounted to $91,375.
C. Distribution Arrangements—Intermediate Duration and Short Duration Plus Class Shares
Under the Distribution Agreement between the Fund, on behalf of the Intermediate Duration and Short Duration Plus Class Shares of the Portfolios and Sanford C. Bernstein & Co., LLC (the “Distributor”), the Distributor agrees to act as agent to sell Intermediate Duration and Short Duration Plus Class shares of the Portfolios. This agreement does not apply to the Bond Fund Retail Classes of the Portfolios. The Distributor receives no fee for this service, and furthermore agrees to pay all expenses arising from the performance of its obligations under this agreement. The Distributor is a wholly owned subsidiary of the Adviser.
D. Distribution Arrangements—Bond Fund Retail Classes
The Retail Classes of the Portfolios have adopted a Distribution Services Agreement (the “Agreement”), including a distribution plan pursuant to Rule 12b-1 under the Investment Company Act of 1940. Under the Agreement, each such class pays distribution services fees to AllianceBernstein Investments, Inc., (the “Retail Distributor”), a wholly owned subsidiary of the Adviser, at an annual rate of up to .30 of 1% of the Class A Shares and 1% of the Class B and Class C Shares of the respective average daily net assets attributable to the Bond Fund Retail Classes. Payments under the Agreement in respect of Class A shares are currently limited to an annual rate of .25 of 1% of Class A shares’ average daily net assets attributable to the Bond Fund Retail Classes. Effective April 1, 2012, the Retail Distributor voluntarily agreed to waive .55 of 1% to limit distribution service fees to .45 of 1% of the average daily net assets
102 | AB BOND FUNDS | abfunds.com | |
Table of Contents
NOTES TO FINANCIAL STATEMENTS (continued)
attributable to the Class B Shares and Class C Shares of Short Duration Plus Portfolio. For the six months ended March 31, 2021, such waivers amounted to $7,261. The Agreement provides that the Retail Distributor will use such payments in their entirety for distribution assistance and promotional activities. Since the commencement of the Portfolios’ operations, the Retail Distributor has incurred expenses in excess of the distribution costs reimbursed by each Portfolio as follows:
Portfolio | Class C | |||
Short Duration Plus | $ | 1,031,965 | ||
There are no distribution and servicing fees on the Advisor Class and Class Z Shares.
While such costs may be recovered from each Portfolio in future periods so long as the Agreement is in effect, the rate of the distribution and servicing fees payable under the Agreement may not be increased without a shareholder vote. In accordance with the Agreement, there is no provision for recovery of unreimbursed distribution costs incurred by the Retail Distributor beyond the current fiscal year for Class A shares. The Agreement also provides that the Adviser may use its own resources to finance the distribution of each Portfolio’s shares.
E. Other Transactions with Affiliates
The Retail Distributor has advised the Fund that it has retained front-end sales charges from sales of Class A shares and received contingent deferred sales charges imposed upon redemptions by shareholders of Class A and Class C shares for the six months ended March 31, 2021, as follows:
| Front-End Sales Charges | Contingent Deferred Sales Charges | |||||||||||
| Portfolio | Class A | Class A | Class C | |||||||||
Intermediate Duration | $ | 7 | $ | – 0 | – | N/A | ||||||
Short Duration Plus | 346 | 74 | $ | – 0 | – | |||||||
| abfunds.com | AB BOND FUNDS | 103 | |
Table of Contents
NOTES TO FINANCIAL STATEMENTS (continued)
NOTE 3.
Investment Security Transactions
A. Purchases and Sales
Purchases and sales of investment securities (excluding short-term investments) for the six months ended March 31, 2021, were as follows:
| Portfolio | Purchases U.S. Securities | Purchases of U.S. Securities | Sales Excluding U.S. Securities | Sales of U.S. Securities | ||||||||||||
Intermediate Duration | $ | 719,184,018 | $ | 1,932,137,910 | $ | 650,216,364 | $ | 1,621,903,202 | ||||||||
Short Duration Plus | 27,616,527 | 34,005,657 | 7,990,671 | 62,436,226 | ||||||||||||
The cost of investments for federal income tax purposes was substantially the same as the cost for financial reporting purposes. Accordingly, gross unrealized appreciation and unrealized depreciation are as follows:
| Gross Unrealized | Net Unrealized Appreciation (Depreciation) | |||||||||||
Portfolio | Appreciation | (Depreciation) | ||||||||||
Intermediate Duration | $ | 135,439,183 | $ | (77,149,366 | ) | $ | 58,289,817 | |||||
Short Duration Plus | 1,843,717 | (1,628,182 | ) | 215,535 | ||||||||
B. Derivative Financial Instruments
Each Portfolio may use derivatives in an effort to earn income and enhance returns, to replace more traditional direct investments, to obtain exposure to otherwise inaccessible markets (collectively, “investment purposes”), or to hedge or adjust the risk profile of its portfolio.
The principal types of derivatives utilized by the Portfolios, as well as the methods in which they may be used are:
| • | Futures |
Each Portfolio may buy or sell futures for investment purposes or for the purpose of hedging its portfolio against adverse effects of potential movements in the market. The Portfolio bears the market risk that arises from changes in the value of these instruments and the imperfect correlation between movements in the price of the futures and movements in the price of the assets, reference rates or indices which they are designed to track. Among other things, the Portfolios may purchase or sell futures for foreign currencies or options thereon for non-hedging purposes as a means of making direct investment in foreign currencies, as described below under “Currency Transactions”.
104 | AB BOND FUNDS | abfunds.com | |
Table of Contents
NOTES TO FINANCIAL STATEMENTS (continued)
At the time a Portfolio enters into futures, a Portfolio deposits and maintains as collateral an initial margin with the broker, as required by the exchange on which the transaction is effected. Such amount is shown as cash collateral due from broker on the statement of assets and liabilities. Pursuant to the contract, the Portfolio agrees to receive from or pay to the broker an amount of cash equal to the daily fluctuation in the value of the contract. Such receipts or payments are known as variation margin and are recorded by the Portfolio as unrealized gains or losses. Risks may arise from the potential inability of a counterparty to meet the terms of the contract. The credit/counterparty risk for exchange-traded futures is generally less than privately negotiated futures, since the clearinghouse, which is the issuer or counterparty to each exchange-traded future, has robust risk mitigation standards, including the requirement to provide initial and variation margin. When the contract is closed, the Portfolio records a realized gain or loss equal to the difference between the value of the contract at the time it was opened and the time it was closed.
During the six months ended March 31, 2021, the the Intermediate Duration Portfolio and Short Duration Plus Portfolio held futures for hedging and non-hedging purposes.
| • | Forward Currency Exchange Contracts |
Each Portfolio may enter into forward currency exchange contracts on either a spot (i.e., cash) or forward basis. Spot contracts are entered into at the rate then prevailing in the currency-exchange market. Forward currency exchange contracts obligate the contracting parties to purchase or sell a specific currency at a specified future date at a specified price. The Portfolios will generally not enter into a forward currency exchange contract with a term greater than one year. The gain or loss arising from the difference between the original contract and the closing of such contract would be included in net realized gain or loss on foreign currency transactions. Fluctuations in the value of open forward currency exchange contracts are recorded for financial reporting purposes as unrealized appreciation and/or depreciation by the Portfolio. Risks may arise from the potential inability of a counterparty to meet the terms of a contract and from unanticipated movements in the value of a foreign currency relative to the U.S. dollar.
Forward currency exchange contracts used to protect the Portfolios from adverse currency movements involve the risk that the Adviser may not accurately predict currency movements. As a result, total return could be adversely affected. The Adviser may seek investment opportunities by taking long or short positions in currencies through the use of currency-related derivatives, including forward currency
| abfunds.com | AB BOND FUNDS | 105 | |
Table of Contents
NOTES TO FINANCIAL STATEMENTS (continued)
exchange contracts, futures and options on futures, swaps and other options. The Adviser may enter into foreign currency transactions for investment opportunities when it anticipates that a foreign currency will appreciate or depreciate in value.
During the six months ended March 31, 2021, the Intermediate Duration Portfolio held forward currency exchange contracts for hedging and non-hedging purposes.
| • | Options transactions |
For hedging and investment purposes, each Portfolio may purchase and write (sell) put and call options on U.S. and foreign securities, including government securities, and foreign currencies that are traded on U.S. and foreign securities exchanges and over-the-counter markets. Among other things, certain Portfolios may use options transactions for non-hedging purposes as a means of making direct investments in foreign currencies, as described below under “Currency Transactions” and may use options strategies involving the purchase and/or writing of various combinations of call and/or put options, for hedging and investment purposes.
The risk associated with purchasing an option is that the Portfolios pay a premium whether or not the option is exercised. Additionally, the Portfolios bear the risk of loss of the premium and change in market value should the counterparty not perform under the contract. If a put or call option purchased by the Portfolios were permitted to expire without being sold or exercised, its premium would represent a loss to the Portfolios. Put and call options purchased are accounted for in the same manner as portfolio securities. The cost of securities acquired through the exercise of call options is increased by premiums paid. The proceeds from securities sold through the exercise of put options are decreased by the premiums paid.
When a Portfolio writes an option, the premium received by the Portfolio is recorded as a liability and is subsequently adjusted to the current market value of the option written. The Portfolios’ maximum payment for written put options equates to the number of shares multiplied by the strike price. In certain circumstances maximum payout amounts may be partially offset by recovery values of the respective referenced assets and upfront premium received upon entering into the contract. Premiums received from written options which expire unexercised are recorded by the Portfolios on the expiration date as realized gains from options written. The difference between the premium received and the amount paid on effecting a closing purchase transaction, including brokerage commissions, is also treated as a realized gain, or if the premium received is less than the amount paid for the closing purchase transaction, as a realized
106 | AB BOND FUNDS | abfunds.com | |
Table of Contents
NOTES TO FINANCIAL STATEMENTS (continued)
loss. If a call option is exercised, the premium received is added to the proceeds from the sale of the underlying security or currency in determining whether the Portfolios have realized a gain or loss. If a put option is exercised, the premium received reduces the cost basis of the security or currency purchased by the Portfolios. In writing an option, the Portfolios bear the market risk of an unfavorable change in the price of the security or currency underlying the written option. Exercise of an option written by the Portfolios could result in the Portfolios selling or buying a security or currency at a price different from the current market value.
A Portfolio may also invest in options on swap agreements, also called “swaptions”. A swaption is an option that gives the buyer the right, but not the obligation, to enter into a swap on a future date in exchange for paying a market-based “premium”. A receiver swaption gives the owner the right to receive the total return of a specified asset, reference rate, or index. A payer swaption gives the owner the right to pay the total return on a specified asset, reference rate, or index. Swaptions also include options that allow an existing swap to be terminated or extended by one of the counterparties
During the six months ended March 31, 2021, the Intermediate Duration Portfolio held written swaptions for hedging and non-hedging purposes
| • | Swaps |
Each Portfolio may enter into swaps to hedge its exposure to interest rates, credit risk, equity markets or currencies. Each Portfolio may also enter into swaps for non-hedging purposes as a means of gaining market exposures, making direct investments in foreign currencies, as described below under “Currency Transactions.” A swap is an agreement that obligates two parties to exchange a series of cash flows at specified intervals based upon or calculated by reference to changes in specified prices or rates for a specified amount of an underlying asset. The payment flows are usually netted against each other, with the difference being paid by one party to the other. In addition, collateral may be pledged or received by the Portfolios in accordance with the terms of the respective swaps to provide value and recourse to the Portfolios or their counterparties in the event of default, bankruptcy or insolvency by one of the parties to the swap.
Risks may arise as a result of the failure of the counterparty to the swap to comply with the terms of the swap. The loss incurred by the failure of a counterparty is generally limited to the net interim payment to be received by the Portfolio, and/or the termination value at the end of the contract. Therefore, the Portfolio considers the creditworthiness
| abfunds.com | AB BOND FUNDS | 107 | |
Table of Contents
NOTES TO FINANCIAL STATEMENTS (continued)
of each counterparty to a swap in evaluating potential counterparty risk. This risk is mitigated by having a netting arrangement between the Portfolio and the counterparty and by the posting of collateral by the counterparty to the Portfolio to cover the Portfolios’ exposure to the counterparty. Additionally, risks may arise from unanticipated movements in interest rates or in the value of the underlying securities. The Portfolio accrues for the interim payments on swaps on a daily basis, with the net amount recorded within unrealized appreciation/depreciation of swaps on the statement of assets and liabilities, where applicable. Once the interim payments are settled in cash, the net amount is recorded as realized gain/(loss) on swaps on the statement of operations, in addition to any realized gain/(loss) recorded upon the termination of swaps. Upfront premiums paid or received for OTC swaps are recognized as cost or proceeds on the statement of assets and liabilities and are amortized on a straight line basis over the life of the contract. Amortized upfront premiums are included in net realized gain/(loss) from swaps on the statement of operations. Fluctuations in the value of swaps are recorded as a component of net change in unrealized appreciation/depreciation of swaps on the statement of operations.
Certain standardized swaps, including certain interest rate swaps and credit default swaps, are (or soon will be) subject to mandatory central clearing. Cleared swaps are transacted through futures commission merchants (“FCMs”) that are members of central clearinghouses, with the clearinghouse serving as central counterparty, similar to transactions in futures contracts. Centralized clearing will be required for additional categories of swaps on a phased-in basis based on requirements published by the Securities and Exchange Commission and Commodity Futures Trading Commission.
At the time the Portfolios enter into a centrally cleared swap, the Portfolios deposits and maintains as collateral an initial margin with the broker, as required by the clearinghouse on which the transaction is effected. Such amount is shown as cash collateral due from broker on the statement of assets and liabilities. Pursuant to the contract, the Portfolios agree to receive from or pay to the broker an amount of cash equal to the daily fluctuation in the value of the contract. Such receipts or payments are known as variation margin and are recorded by the Portfolios as unrealized gains or losses. Risks may arise from the potential inability of a counterparty to meet the terms of the contract. The credit/counterparty risk for centrally cleared swaps is generally less than non-centrally cleared swaps, since the clearinghouse, which is the issuer or counterparty to each centrally cleared swap, has robust risk mitigation standards, including the requirement to provide initial and variation margin. When the contract
108 | AB BOND FUNDS | abfunds.com | |
Table of Contents
NOTES TO FINANCIAL STATEMENTS (continued)
is closed, the Portfolios record a realized gain or loss equal to the difference between the value of the contract at the time it was opened and the time it was closed.
Interest Rate Swaps:
The Fixed-Income Portfolios are subject to interest rate risk exposure in the normal course of pursuing its investment objectives. Because the Portfolios hold fixed rate bonds, the value of these bonds may decrease if interest rates rise. To help hedge against this risk and to maintain its ability to generate income at prevailing market rates, the Portfolios may enter into interest rate swaps. Interest rate swaps are agreements between two parties to exchange cash flows based on a notional amount. The Portfolios may elect to pay a fixed rate and receive a floating rate, or receive a fixed rate and pay a floating rate on a notional amount.
In addition, a Portfolio may also enter into interest rate swap transactions to preserve a return or spread on a particular investment or portion of its portfolio, or protecting against an increase in the price of securities the Portfolio anticipates purchasing at a later date. Interest rate swaps involve the exchange by a Portfolio with another party of their respective commitments to pay or receive interest (e.g., an exchange of floating rate payments for fixed rate payments) computed based on a contractually-based principal (or “notional”) amount. Interest rate swaps are entered into on a net basis (i.e., the two payment streams are netted out, with the Portfolio receiving or paying, as the case may be, only the net amount of the two payments).
During the six months ended March 31, 2021, the Intermediate Duration Portfolio held interest rate swaps for hedging and non-hedging purposes
Credit Default Swaps:
Each Portfolio may enter into credit default swaps, including to manage its exposure to the market or certain sectors of the market, to reduce its risk exposure to defaults by corporate and sovereign issuers held by the Portfolio, or to create exposure to corporate or sovereign issuers to which it is not otherwise exposed. The Portfolio may purchase credit protection (“Buy Contract”) or provide credit protection (“Sale Contract”) on the referenced obligation of the credit default swap. During the term of the swap, the Portfolio receives/(pays) fixed payments from/(to) the respective counterparty, calculated at the agreed upon rate applied to the notional amount. If the Portfolio is a buyer/(seller) of protection and a credit event occurs, as defined under the terms of the swap, the Portfolio will either (i) receive from the seller/(pay to the buyer) of protection an amount equal to the
| abfunds.com | AB BOND FUNDS | 109 | |
Table of Contents
NOTES TO FINANCIAL STATEMENTS (continued)
notional amount of the swap (the “Maximum Payout Amount”) and deliver/(take delivery of) the referenced obligation or (ii) receive/(pay) a net settlement amount in the form of cash or securities equal to the notional amount of the swap less the recovery value of the referenced obligation. In certain circumstances Maximum Payout Amounts may be partially offset by recovery values of the respective referenced obligations, upfront premium received upon entering into the agreement, or net amounts received from settlement of buy protection credit default swaps entered into by the Portfolio for the same referenced obligations with the same counterparty.
Credit default swaps may involve greater risks than if a Portfolio had invested in the referenced obligation directly. Credit default swaps are subject to general market risk, liquidity risk, counterparty risk and credit risk. If the Portfolio is a buyer of protection and no credit event occurs, it will lose the payments it made to its counterparty. If the Portfolio is a seller of protection and a credit event occurs, the value of the referenced obligation received by the Portfolio coupled with the periodic payments previously received, may be less than the Maximum Payout Amount it pays to the buyer, resulting in a net loss to the Portfolio.
Implied credit spreads over U.S. Treasuries of comparable maturity utilized in determining the market value of credit default swaps on issuers as of period end are disclosed in the portfolio of investments. The implied spreads serve as an indicator of the current status of the payment/performance risk and typically reflect the likelihood of default by the issuer of the referenced obligation. The implied credit spread of a particular reference obligation also reflects the cost of buying/selling protection and may reflect upfront payments required to be made to enter into the agreement. Widening credit spreads typically represent a deterioration of the referenced obligation’s credit soundness and greater likelihood of default or other credit event occurring as defined under the terms of the agreement. A credit spread identified as “Defaulted” indicates a credit event has occurred for the referenced obligation.
During the six months ended March 31, 2021, the Intermediate Duration Portfolio and Short Duration Plus Portfolio held credit default swaps for hedging and non-hedging purposes
The Portfolios typically enter into International Swaps and Derivatives Association, Inc. Master Agreements (“ISDA Master Agreement”) with its OTC derivative contract counterparties in order to, among other things, reduce its credit risk to OTC counterparties. ISDA Master Agreements include provisions for general obligations, representations, collateral and events of default or termination. Under an ISDA Master Agreement, the Portfolios
110 | AB BOND FUNDS | abfunds.com | |
Table of Contents
NOTES TO FINANCIAL STATEMENTS (continued)
typically may offset with the OTC counterparty certain derivative financial instruments’ payables and/or receivables with collateral held and/or posted and create one single net payment (close-out netting) in the event of default or termination. In the event of a default by an OTC counterparty, the return of collateral with market value in excess of the Portfolios’ net liability, held by the defaulting party, may be delayed or denied.
The Portfolios’ ISDA Master Agreements may contain provisions for early termination of OTC derivative transactions in the event the net assets of the Portfolios decline below specific levels (“net asset contingent features”). If these levels are triggered, the Portfolios’ OTC counterparty has the right to terminate such transaction and require the Portfolios to pay or receive a settlement amount in connection with the terminated transaction. If OTC derivatives were held at period end, please refer to netting arrangements by the OTC counterparty tables below for additional details.
During the six months ended March 31, 2021, the Portfolios had entered into the following derivatives:
| Intermediate Duration Portfolio | ||||||||||||
Asset Derivatives | Liability Derivatives | |||||||||||
Derivative Type | Statement of | Fair Value | Statement of | Fair Value | ||||||||
Interest rate contracts | Receivable/Payable for variation margin on futures | $ | 1,973,670 | * | Receivable/Payable for variation margin on futures | $ | 4,453,687 | * | ||||
Interest rate contracts | Receivable/Payable for variation margin on centrally cleared swaps |
| 5,323,424 | * | Receivable/Payable for variation margin on centrally cleared swaps |
| 6,131,039 | * | ||||
Foreign currency contracts | Unrealized appreciation on forward currency exchange contracts |
| 7,339,067 |
| Unrealized depreciation on forward currency exchange contracts |
| 7,440,310 |
| ||||
Credit contracts | Market value on credit default swaps | 9,328,804 | Market value on credit default swaps | 14,021,498 | ||||||||
|
|
|
| |||||||||
Total | $ | 23,964,965 | $ | 32,046,534 | ||||||||
|
|
|
| |||||||||
| * | Only variation margin receivable/payable at period end is reported within the statement of assets and liabilities. This amount reflects cumulative unrealized appreciation/(depreciation) on futures and centrally cleared swaps as reported in the schedule of investments. |
| abfunds.com | AB BOND FUNDS | 111 | |
Table of Contents
NOTES TO FINANCIAL STATEMENTS (continued)
Derivative Type | Location of | Realized Gain or (Loss) on Derivatives | Change in Unrealized Appreciation or (Depreciation) | |||||||
Interest rate contracts | Net realized gain (loss) on futures; Net change in unrealized appreciation/depreciation of futures | $ | (16,771,392 | ) | $ | (1,606,249 | ) | |||
Foreign currency contracts | Net realized gain (loss) on forward currency exchange contracts; Net change in unrealized appreciation/depreciation of forward currency exchange contracts | (358,257 | ) | (2,042,928 | ) | |||||
Interest rate contracts | Net realized gain (loss) on swaptions written; Net change in unrealized appreciation/depreciation of swaptions written | 533,520 | – 0 | – | ||||||
Interest rate contracts | Net realized gain (loss) on swaps; Net change in unrealized appreciation/depreciation of swaps | (4,978,735 | ) | 639,288 | ||||||
Credit contracts | Net realized gain (loss) on swaps; Net change in unrealized appreciation/depreciation of swaps | (14,650,653 | ) | 6,959,271 | ||||||
|
|
|
| |||||||
Total | $ | (36,225,517 | ) | $ | 3,949,382 | |||||
|
|
|
| |||||||
| Short Duration Plus Portfolio | ||||||||||||
Asset Derivatives | Liability Derivatives | |||||||||||
Derivative Type | Statement of | Fair Value | Statement of | Fair Value | ||||||||
Interest rate contracts | Receivable/Payable for variation margin on futures | $ | 79,671 | * | Receivable/Payable for variation margin on futures | $ | 133,586 | * | ||||
Credit contracts | Receivable/Payable for variation margin on centrally cleared swaps | 16,799 | * | Receivable/Payable for variation margin on centrally cleared swaps | ||||||||
Credit contracts | Market value on credit default swaps | 573,152 | Market value on credit default swaps | 719,363 | ||||||||
|
|
|
| |||||||||
Total | $ | 669,622 | $ | 852,949 | ||||||||
|
|
|
| |||||||||
112 | AB BOND FUNDS | abfunds.com | |
Table of Contents
NOTES TO FINANCIAL STATEMENTS (continued)
| * | Only variation margin receivable/payable at period end is reported within the statement of assets and liabilities. This amount reflects cumulative unrealized appreciation/(depreciation) on futures and centrally cleared swaps as reported in the schedule of investments. |
Derivative Type | Location of | Realized Gain or (Loss) on Derivatives | Change in Unrealized Appreciation or (Depreciation) | |||||||
Interest rate contracts | Net realized gain (loss) on futures; Net change in unrealized appreciation/depreciation of futures | $ | (292,358 | ) | $ | (72,473 | ) | |||
Credit contracts | Net realized gain (loss) on swaps; Net change in unrealized appreciation/depreciation of swaps | (860,660 | ) | 463,276 | ||||||
|
|
|
| |||||||
Total | $ | (1,153,018 | ) | $ | 390,803 | |||||
|
|
|
| |||||||
| Intermediate Duration Portfolio | ||||
Futures: |
| |||
Average notional amount of buy contracts | $ | 1,172,384,232 | ||
Average notional amount of sale contracts | $ | 420,881,836 | ||
Forward Currency Exchange Contracts: |
| |||
Average principal amount of buy contracts | $ | 339,076,546 | ||
Average principal amount of sale contracts | $ | 484,632,630 | ||
Written Swaptions: |
| |||
Average notional amount | $ | 29,232,717 | (a) | |
Centrally Cleared Interest Rate Swaps: | ||||
Average notional amount | $ | 651,644,808 | ||
Credit Default Swaps: | ||||
Average notional amount of buy contracts | $ | 97,791,000 | ||
Average notional amount of sale contracts | $ | 91,639,857 | ||
Centrally Cleared Credit Default Swaps: | ||||
Average notional amount of buy contracts | $ | 58,142,726 | (b) | |
Average notional amount of sale contracts | $ | 58,142,726 | (b) | |
| (a) | Positions were open for one month during the period. |
| (b) | Positions were open for less than one month during the period. |
| Short Duration Plus Portfolio | ||||
Futures: | ||||
Average notional amount of buy contracts | $ | 112,711,980 | ||
Average notional amount of sale contracts | $ | 4,303,423 | ||
Credit Default Swaps: | ||||
Average notional amount of buy contracts | $ | 5,217,000 | ||
Average notional amount of sale contracts | $ | 4,248,857 | ||
Centrally Cleared Credit Default Swaps: | ||||
Average notional amount of sale contracts | $ | 2,221,000 | ||
| abfunds.com | AB BOND FUNDS | 113 | |
Table of Contents
NOTES TO FINANCIAL STATEMENTS (continued)
For financial reporting purposes, the Portfolios do not offset derivative assets and derivative liabilities that are subject to netting arrangements in the statement of assets and liabilities.
All OTC derivatives held at period end were subject to netting arrangements. The following tables present the Portfolios’ derivative assets and liabilities by OTC counterparty net of amounts available for offset under ISDA Master Agreements (“MA”) and net of the related collateral received/pledged by the Portfolios as of March 31, 2021. Exchange-traded derivatives and centrally cleared swaps are not subject to netting arrangements and as such are excluded from the tables.
| Intermediate Duration Portfolio | ||||||||||||||||||||
Counterparty | Derivative Assets Subject to a MA | Derivatives Available for Offset | Cash Collateral Received* | Security Collateral Received* | Net Amount of Derivative Assets | |||||||||||||||
Bank of America, NA | $ | 101,179 | $ | (101,179 | ) | $ | – 0 | – | $ | – 0 | – | $ | – 0 | – | ||||||
Barclays Bank PLC | 290,285 | (290,285 | ) | – 0 | – | – 0 | – | – 0 | – | |||||||||||
BNP Paribas SA | 2,128,088 | (1,359,717 | ) | – 0 | – | – 0 | – | 768,371 | ||||||||||||
Citibank, NA/ Citigroup Global Markets, Inc. | 9,353,649 | (1,770,526 | ) | (6,110,000 | ) | – 0 | – | 1,473,123 | ||||||||||||
Goldman Sachs International | 458,543 | (458,543 | ) | – 0 | – | – 0 | – | – 0 | – | |||||||||||
HSBC Bank USA | 33,883 | (33,883 | ) | – 0 | – | – 0 | – | – 0 | – | |||||||||||
JPMorgan Chase Bank, NA/JPMorgan Securities, LLC | 279,778 | (279,778 | ) | – 0 | – | – 0 | – | – 0 | – | |||||||||||
Morgan Stanley & Co. International PLC/Morgan Stanley Capital Services, Inc./Morgan Stanley Capital Services LLC | 3,486,846 | (537,825 | ) | (799,000 | ) | – 0 | – | 2,150,021 | ||||||||||||
Natwest Markets PLC | 73,918 | – 0 | – | – 0 | – | – 0 | – | 73,918 | ||||||||||||
Standard Chartered Bank | 40,858 | (40,858 | ) | – 0 | – | – 0 | – | – 0 | – | |||||||||||
State Street Bank & Trust Co. | 80,411 | (80,411 | ) | – 0 | – | – 0 | – | – 0 | – | |||||||||||
UBS AG | 340,433 | (340,433 | ) | – 0 | – | – 0 | – | – 0 | – | |||||||||||
|
|
|
|
|
|
|
|
|
| |||||||||||
Total | $ | 16,667,871 | $ | (5,293,438 | ) | $ | (6,909,000 | ) | $ | – 0 | – | $ | 4,465,433 | ^ | ||||||
|
|
|
|
|
|
|
|
|
| |||||||||||
114 | AB BOND FUNDS | abfunds.com | |
Table of Contents
NOTES TO FINANCIAL STATEMENTS (continued)
Counterparty | Derivative Liabilities Subject to a MA | Derivatives Available for Offset | Cash Collateral Pledged* | Security Collateral Pledged* | Net Amount of Derivative Liabilities | |||||||||||||||
Bank of America, NA | $ | 129,042 | $ | (101,179 | ) | $ | – 0 | – | $ | – 0 | – | $ | 27,863 | |||||||
Barclays Bank PLC | 391,343 | (290,285 | ) | – 0 | – | (101,058 | ) | – 0 | – | |||||||||||
BNP Paribas SA | 1,359,717 | (1,359,717 | ) | – 0 | – | – 0 | – | – 0 | – | |||||||||||
Citibank, NA/ Citigroup Global Markets, Inc. | 1,770,526 | (1,770,526 | ) | – 0 | – | – 0 | – | – 0 | – | |||||||||||
Credit Suisse International | 4,313,375 | – 0 | – | – 0 | – | (4,160,758 | ) | 152,617 | ||||||||||||
Deutsche Bank AG | 4,595,917 | – 0 | – | (210,000 | ) | (4,194,362 | ) | 191,555 | ||||||||||||
Goldman Sachs International | 1,662,223 | (458,543 | ) | – 0 | – | (1,072,111 | ) | 131,569 | ||||||||||||
HSBC Bank USA | 4,278,448 | (33,883 | ) | – 0 | – | (312,375 | ) | 3,932,190 | ||||||||||||
JPMorgan Chase Bank, NA/JPMorgan Securities, LLC | 1,572,075 | (279,778 | ) | – 0 | – | (729,617 | ) | 562,680 | ||||||||||||
Morgan Stanley & Co. International PLC/Morgan Stanley Capital Services, Inc./Morgan Stanley Capital Services LLC | 537,825 | (537,825 | ) | – 0 | – | – 0 | – | – 0 | – | |||||||||||
Standard Chartered Bank | 42,433 | (40,858 | ) | – 0 | – | – 0 | – | 1,575 | ||||||||||||
State Street Bank & Trust Co. | 113,103 | (80,411 | ) | – 0 | – | – 0 | – | 32,692 | ||||||||||||
UBS AG | 695,781 | (340,433 | ) | (355,348 | ) | – 0 | – | – 0 | – | |||||||||||
|
|
|
|
|
|
|
|
|
| |||||||||||
Total | $ | 21,461,808 | $ | (5,293,438 | ) | $ | (565,348 | ) | $ | (10,570,281 | ) | $ | 5,032,741 | ^ | ||||||
|
|
|
|
|
|
|
|
|
| |||||||||||
| * | The actual collateral received/pledged may be more than the amount reported due to over-collateralization. |
| ^ | Net amount represents the net receivable/payable that would be due from/to the counterparty in the event of default or termination. The net amount from OTC financial derivative instruments can only be netted across transactions governed under the same master agreement with the same counterparty. |
| abfunds.com | AB BOND FUNDS | 115 | |
Table of Contents
NOTES TO FINANCIAL STATEMENTS (continued)
| Short Duration Plus Portfolio | ||||||||||||||||||||
Counterparty | Derivative Assets Subject to a MA | Derivatives Available for Offset | Cash Collateral Received* | Security Collateral Received* | Net Amount of Derivative Assets | |||||||||||||||
Citigroup Global Markets, Inc. | $ | 476,475 | $ | (37,986 | ) | $ | (338,000 | ) | $ | – 0 | – | $ | 100,489 | |||||||
Goldman Sachs International | 31,757 | (31,757 | ) | – 0 | – | – 0 | – | – 0 | – | |||||||||||
JPMorgan Securities, LLC | 14,044 | (14,044 | ) | – 0 | – | – 0 | – | – 0 | – | |||||||||||
Morgan Stanley & Co. International PLC | 50,876 | – 0 | – | – 0 | – | – 0 | – | 50,876 | ||||||||||||
|
|
|
|
|
|
|
|
|
| |||||||||||
Total | $ | 573,152 | $ | (83,787 | ) | $ | (338,000 | ) | $ | – 0 | – | $ | 151,365 | ^ | ||||||
|
|
|
|
|
|
|
|
|
| |||||||||||
Counterparty | Derivative Liabilities Subject to a MA | Derivatives Available for Offset | Cash Collateral Pledged* | Security Collateral Pledged* | Net Amount of Derivative Liabilities | |||||||||||||||
Citigroup Global Markets, Inc. | $ | 37,986 | $ | (37,986 | ) | $ | – 0 | – | $ | – 0 | – | $ | – 0 | – | ||||||
Credit Suisse International | 368,696 | – 0 | – | – 0 | – | (349,949 | ) | 18,747 | ||||||||||||
Deutsche Bank AG | 119,846 | – 0 | – | (119,846 | ) | – 0 | – | – 0 | – | |||||||||||
Goldman Sachs International | 144,627 | (31,757 | ) | – 0 | – | – 0 | – | 112,870 | ||||||||||||
JPMorgan Securities, LLC | 48,208 | (14,044 | ) | – 0 | – | – 0 | – | 34,164 | ||||||||||||
|
|
|
|
|
|
|
|
|
| |||||||||||
Total | $ | 719,363 | $ | (83,787 | ) | $ | (119,846 | ) | $ | (349,949 | ) | $ | 165,781 | ^ | ||||||
|
|
|
|
|
|
|
|
|
| |||||||||||
| * | The actual collateral received/pledged may be more than the amount reported due to over-collateralization. |
| ^ | Net amount represents the net receivable/payable that would be due from/to the counterparty in the event of default or termination. The net amount from OTC financial derivative instruments can only be netted across transactions governed under the same master agreement with the same counterparty. |
C. Currency Transactions
The Portfolios may invest in non-U.S. Dollar-denominated securities on a currency hedged or unhedged basis. The Portfolios may seek investment opportunities by taking long or short positions in currencies through the use of currency-related derivatives, including forward currency exchange contracts, futures and options on futures, swaps, and other options. The Portfolios may enter into transactions for investment opportunities when it anticipates that a foreign currency will appreciate or depreciate in value but securities denominated in that currency are not held by the Portfolios and do not present attractive investment opportunities. Such transactions may also be used when the Adviser believes that it may be more efficient than a direct investment in a foreign currency-denominated security. The Portfolios may also conduct currency exchange contracts on a spot basis (i.e., for cash at the spot rate prevailing in the currency exchange market for buying or selling currencies).
116 | AB BOND FUNDS | abfunds.com | |
Table of Contents
NOTES TO FINANCIAL STATEMENTS (continued)
D. TBA and Dollar Rolls
The Portfolios may invest in TBA mortgage-backed securities. A TBA, or “To Be Announced”, trade represents a contract for the purchase or sale of mortgage-backed securities to be delivered at a future agree-upon date; however, the specific mortgage pool numbers or the number of pools that will be delivered to fulfill the trade obligation or terms of the contract are unknown at the time of the trade. Mortgage pools (including fixed-rate or variable-rate mortgages) guaranteed by the Government National Mortgage Association, or GNMA, the Federal National Mortgage Association, or FNMA, or the Federal Home Loan Mortgage Corporation, or FHLMC, are subsequently allocated to the TBA transactions.
The Intermediate Duration Portfolio may enter into certain TBA transactions known as dollar rolls. Dollar rolls involve sales by the Portfolios of securities for delivery in the current month and the Portfolios’ simultaneously contracting to repurchase substantially similar (same type and coupon) securities on a specified future date. During the roll period, the Portfolios forgo principal and interest paid on the securities. The Portfolios are compensated by the difference between the current sales price and the lower forward price for the future purchase (often referred to as the “drop”) as well as by the interest earned on the cash proceeds of the initial sale. Dollar rolls involve the risk that the market value of the securities the Portfolios are obligated to repurchase under the agreement may decline below the repurchase price. Dollar rolls are speculative techniques. For the six months ended March 31, 2021, Intermediate Duration Portfolio earned drop income of $1,343,042 which is included in interest income in the accompanying statement of operations.
NOTE 4.
Distributions to Shareholders
The tax character of distributions to be paid for the year ending September 30, 2021 will be determined at the end of the current fiscal year. The tax character of distributions paid during the fiscal years ended September 30, 2020 and September 30, 2019 were as follows:
| Intermediate Duration | 2020 | 2019 | ||||||
Distributions paid from: | ||||||||
Ordinary income | $ | 95,999,272 | $ | 106,879,355 | ||||
|
|
|
| |||||
Total distributions paid | $ | 95,999,272 | $ | 106,879,355 | ||||
|
|
|
| |||||
| Short Duration Plus | 2020 | 2019 | ||||||
Distributions paid from: | ||||||||
Ordinary income | $ | 3,827,152 | $ | 4,908,029 | ||||
|
|
|
| |||||
Total distributions paid | $ | 3,827,152 | $ | 4,908,029 | ||||
|
|
|
| |||||
| abfunds.com | AB BOND FUNDS | 117 | |
Table of Contents
NOTES TO FINANCIAL STATEMENTS (continued)
As of September 30, 2020, the components of accumulated earnings/(deficit) on a tax basis were as follows:
| Portfolio | Undistributed Ordinary Income | Undistributed Long-Term Capital Gains | Accumulated Capital and | Unrealized Appreciation/ (Depreciation)(b) | Total Accumulated Earnings/ (Deficit)(c) | |||||||||||||||
Intermediate Duration | $ | 17,636,469 | $ | 45,447,186 | $ | (3,974,647 | ) | $ | 180,590,365 | $ | 239,699,373 | |||||||||
Short Duration Plus | 32,452 | – 0 | – | (10,428,126 | ) | 1,631,606 | (8,764,068 | ) | ||||||||||||
| (a) | As of September 30, 2020, certain Portfolios had capital loss carryforwards for federal income tax purposes. During the fiscal year ended September 30, 2020, Intermediate Duration Portfolio and Short Duration Plus Portfolio utilized capital loss carryforwards of $3,197,056 and $2,376,325 respectively, to offset current year net realized gains. As of September 30, 2020, Intermediate Duration Portfolio and Short Duration Plus Portfolio deferred $3,974,647 and $113,309, respectively, in straddle losses. |
| (b) | The differences between book-basis and tax-basis unrealized appreciation/(depreciation) are attributable primarily to the tax deferral of losses on wash sales, the tax treatment of swaps and passive foreign investment companies (PFICs), the tax treatment of callable bonds, and the realization for tax purposes of gains/losses on certain derivative instruments. |
| (c) | The differences between book-basis and tax-basis components of accumulated earnings/(deficit) are attributable primarily to the tax treatment of the accrual of foreign capital gains tax, interest on defaulted securities, and dividends payable to shareholders. |
For tax purposes, net capital losses may be carried over to offset future capital gains, if any. Funds are permitted to carry forward capital losses for an indefinite period, and such losses will retain their character as either short-term or long-term capital losses.
As of September 30, 2020, the following Portfolios had net capital loss carryforwards which will expire as follows:
| Portfolio | Short-Term Amount | Long-Term Amount | ||||||
Intermediate Duration | $ | – 0 | – | $ | – 0 | – | ||
Short Duration Plus | 3,066,216 | 7,248,601 | ||||||
NOTE 5.
Risks Involved in Investing in the Portfolios
Interest Risk—Changes in interest rates will affect the value of investments in fixed-income securities. When interest rates rise, the value of existing investments in fixed-income securities tends to fall and this decrease in value may not be offset by higher income from new investments. Interest rate risk is generally greater for fixed-income securities with longer maturities or durations. The current historically low interest rate environment heightens the risks associated with rising interest rates.
Credit Risk—This is the risk that the issuer or the guarantor of a debt security, or the counterparty to a derivatives or other contract, will be
118 | AB BOND FUNDS | abfunds.com | |
Table of Contents
NOTES TO FINANCIAL STATEMENTS (continued)
unable or unwilling to make timely principal and/or interest payments, or to otherwise honor its obligations. The issuer or guarantor may default, potentially causing a loss of the full principal amount of a security and accrued interest. The degree of risk for a particular security may be reflected in its credit rating. The credit rating of a fixed-income security may be downgraded after purchase, which may adversely affect the value of the security. Investments in fixed-income securities with lower ratings tend to have a higher probability that an issuer will default or fail to meet its payment obligations, making credit risk greater for medium-quality and lower-rated debt securities and similar unrated securities (commonly known as “junk bonds”) have speculative elements or are predominantly speculative credit risks. At times when credit risk is perceived to be greater, credit “spreads” (i.e., the difference between the yields on lower quality securities and the yields on higher quality securities) may get larger or “widen”. As a result, the values of the lower quality securities may go down more and they may become harder to sell.
Duration Risk—The duration of a fixed-income security may be shorter than or equal to full maturity of the fixed-income security. Fixed-income securities with longer durations have more interest rate risk and will decrease in price as interest rates rise. Securities that have final maturities longer than their durations may be affected by increased credit spreads to a far greater degree than their durations would suggest, because they are exposed to credit risk until final maturity.
Inflation Risk—This is the risk that the value of assets or income from investments will be less in the future as inflation decreases the value of money. As inflation increases, the value of the Portfolios’ assets can decline as can the value of the Portfolios’ distributions. This risk is significantly greater for fixed-income securities with longer maturities.
Inflation-Protected Securities Risk—The terms of inflation-protected securities provide for the coupon and/or maturity value to be adjusted based on changes in an inflation index. Decreases in the inflation rate or in investors’ expectations about inflation could cause these securities to underperform non-inflation-adjusted securities on a total-return basis. In addition, there can be no assurance that the relevant inflation index will accurately measure the rate of inflation, in which case the securities may not work as intended. These securities may be more difficult to trade or dispose of than other types of securities.
Foreign (Non-U.S.) Securities Risk—Investments in foreign securities entail significant risks in addition to those customarily associated with investing in U.S. securities. These risks include risks related to adverse market, economic, political and regulatory factors and social instability, all
| abfunds.com | AB BOND FUNDS | 119 | |
Table of Contents
NOTES TO FINANCIAL STATEMENTS (continued)
of which could disrupt the financial markets in which the Portfolios invest and adversely affect the value of the Portfolios’ assets.
Emerging Markets Securities Risk—The risks of investing in foreign (non-U.S.) securities are heightened with respect to issuers in emerging-market countries because the markets are less developed and less liquid and there may be a greater amount of economic, political and social uncertainty, and these risks are even more pronounced in “frontier” markets, which are investable markets with lower total market capitalization and liquidity than the more developed emerging markets. In addition, the value of the Portfolio’s investments may decline because of factors such as unfavorable or unsuccessful government actions and reduction of government or central bank support.
Derivatives Risk—The Portfolios may use derivatives as direct investments to earn income, enhance return and broaden portfolio diversification, which entail greater risk than if used solely for hedging purposes. In addition to other risks such as the credit risk of the counterparty, derivatives involve the risk that changes in the value of the derivative may not correlate with relevant assets, rates or indices. Derivatives may be difficult to price or unwind, and small changes may produce disproportionate losses for the Portfolios. Certain derivatives have the potential for unlimited loss, regardless of the size of the initial investment. Assets required to be set aside or posted to cover or secure derivatives positions may themselves go down in value, and these collateral and other requirements may limit investment flexibility. Some derivatives involve leverage, which can make the Portfolios more volatile and can compound other risks. Derivatives, especially over-the-counter derivatives, are also subject to counterparty risk. Use of derivatives may have different tax consequences for the Portfolios than an investment in the underlying asset or index, and such differences may affect the amount, timing and character of income distributed to shareholders, including the proportion of income consisting of exempt-interest dividends. The U.S. government and certain foreign governments have adopted regulations governing derivatives markets, including mandatory clearing of certain derivatives, and may impose additional regulations governing margin, reporting and registration requirements. The ultimate impact of the regulations remains unclear. Additional regulation may make derivatives more costly, limit their availability or utility, otherwise adversely affect their performance, or disrupt markets.
Mortgage-Related and Asset-Related Securities Risk—Mortgage- and asset-related securities represent interests in “pools” of mortgages or other assets, including consumer loans or receivables held in trust. Mortgage- and asset-related securities are subject to credit, interest rate,
120 | AB BOND FUNDS | abfunds.com | |
Table of Contents
NOTES TO FINANCIAL STATEMENTS (continued)
prepayment and extension risks. These securities also are subject to risk of default on the underlying mortgage or asset, particularly during periods of economic downturn. Small movements in interest rates (both increases and decreases) may quickly and significantly reduce the value of certain mortgage-related securities.
Prepayment and Extension Risk—Prepayment risk is the risk that a loan, bond or other security might be called or otherwise converted, prepaid or redeemed before maturity. If this happens, particularly during a time of declining interest rates or credit spreads, the Portfolios will not benefit from the rise in market price that normally accompanies a decline in interest rates, and may not be able to invest the proceeds in securities providing as much income, resulting in a lower yield to the Portfolios. Conversely, extension risk is the risk that as interest rates rise or spreads widen, payments of securities may occur more slowly than anticipated by the market. If this happens, the values of these securities may go down because their interest rates are lower than current market rates and they remain outstanding longer than anticipated.
Subordination Risk—The Portfolios may invest in securities that are subordinated to more senior securities of an issuer, or which represent interests in pools of such subordinated securities. Subordinated securities will be disproportionately affected by a default or even a perceived decline in creditworthiness of the issuer. Subordinated securities are more likely to suffer a credit loss than non-subordinated securities of the same issuer, any loss incurred by the subordinated securities is likely to be proportionately greater, and any recovery of interest or principal may take more time.
Management Risk—The Portfolios are subject to management risk because they are actively managed investment portfolios. The Adviser will apply its investment techniques and risk analyses in making investment decisions for the Portfolios, but these techniques, analyses and decisions may not work as intended or may not produce the desired results, and may, during certain periods, result in increased volatility for the Portfolios or cause the value of the Portfolios’ shares to go down. In some cases, derivatives and other investment techniques may be unavailable, or the Adviser may determine not to use them, possibly even under market conditions where their use could benefit the Portfolios. Some of these techniques may incorporate, or rely upon, quantitative models, but there is no guarantee that these models will generate accurate forecasts, reduce risk or otherwise perform as expected. In addition, the Adviser may change the Portfolios’ investment strategies or policies from time to time. Those changes may not lead to the results intended by the Adviser and could have an adverse effect on the value or performance of the Portfolios.
| abfunds.com | AB BOND FUNDS | 121 | |
Table of Contents
NOTES TO FINANCIAL STATEMENTS (continued)
Illiquid Investments Risk—Illiquid investments risk exists when particular investments are difficult to purchase or sell, possibly preventing the Portfolios from purchasing or selling these securities at an advantageous price. The municipal Portfolios are subject to greater risk because the market for municipal securities is generally smaller than many other markets, which may make municipal securities more difficult to trade or dispose of than other types of securities. Illiquid securities may also be difficult to value.
Redemption Risk—The Portfolios may experience heavy redemptions that could cause a Portfolio to liquidate its assets at inopportune times or unfavorable prices or increase or accelerate taxable gains or transaction costs and may negatively affect the Portfolio’s net asset value, or performance, which could cause the value of your investment to decline. Redemption risk is heightened during periods of overall market turmoil.
Foreign Currency Risk—This is the risk that changes in foreign (non-U.S.) currency exchange rates may negatively affect the value of the Portfolios’ investments or reduce the returns of the Portfolios. For example, the value of the Portfolios’ investments in foreign securities and foreign currency positions may decrease if the U.S. Dollar is strong (i.e., gaining value relative to other currencies) and other currencies are weak (i.e., losing value relative to the U.S. Dollar).
Actions by a Few Major Investors—In certain countries, volatility may be heightened by actions of a few major investors. For example, substantial increases or decreases in cash flows of mutual funds investing in these markets could significantly affect local securities prices and, therefore, share prices of the Portfolios.
Market Risk—The Portfolios are subject to market risk, which is the risk that stock prices in general or in particular countries or sectors may decline over short or extended periods. Stock prices may decline in response to adverse changes in the economy or the economic outlook; deterioration in investor sentiment; interest rate, currency and commodity price fluctuations; adverse geopolitical, social or environmental developments; issuer- and sector-specific considerations; public health crises (including the occurrence of a contagious disease or illness); and other factors. In the past decade, financial markets in the United States, Europe and elsewhere have experienced increased volatility, decreased liquidity and heightened uncertainty. These market conditions may recur from time to time and have an adverse impact on various securities markets. Recently, certain governments and central banks have provided significant support to financial markets in response to serious economic disruptions, including, but not limited to, buying stocks, providing direct capital infusions into companies, implementing new monetary programs, dramatically lowering interest rates
122 | AB BOND FUNDS | abfunds.com | |
Table of Contents
NOTES TO FINANCIAL STATEMENTS (continued)
and through other market interventions. This and other government intervention into the economy and financial markets may not work as intended, particularly if the efforts are perceived by investors as being unlikely to achieve the desired results. Government actions to support the economy and financial markets have resulted in a large expansion of government deficits and debt, the long term consequences of which are not known. The reversal of these policies, or their ineffectiveness, as well as further governmental or central bank actions could negatively affect financial markets generally, increase market volatility and reduce the value and liquidity of securities in which the Portfolio invests.
On January 31, 2020, the United Kingdom (the “U.K.”) formally left the European Union (the “EU”) (“Brexit”) and ceased to be a member of the EU. Brexit could adversely affect European or worldwide political, regulatory, economic or market conditions and could contribute to instability in global political institutions, regulatory agencies and financial markets. Brexit could also lead to legal uncertainty and politically divergent national laws and regulations as a new relationship between the U.K. and EU is developed and the U.K. determines which EU laws to replace or replicate in the future. Any of these effects of Brexit, and others the Adviser cannot anticipate, could adversely affect the value of the Portfolio’s investments and its net asset value. The political, economic and legal consequences of Brexit continue to give rise to uncertainties. The U.K. may be less stable than it has been in recent years and investments in U.K. assets may be difficult to value, or subject to greater or more frequent rises and falls in value.
The United States and its trading partners are periodically involved in disputes over trade, which may result in tariffs on various categories of goods imported from the other country. For example, the current political climate between the United States and China has intensified concerns about protectionist trade policies and a potential trade war between China and the United States. The United States has imposed tariffs and other trade barriers on Chinese exports and placed other restrictions on or barriers to investments in China. Trade disputes, particularly prolonged disputes, may adversely affect the economies of the United States and its trading partners, as well as the companies directly or indirectly affected by the dispute and financial markets generally, and thus may adversely affect the value of the Portfolio’s assets. Recently, the United States government acted to prohibit U.S. persons, such as the Portfolio, from owning, and required them to divest, certain Chinese companies designated as related to the Chinese military. There is no assurance that more such companies will not be so designated in the future, which could limit the Portfolio’s opportunities for investment and require the sale of securities at a loss or make them illiquid. If the political climate between the United States and China continues to deteriorate, economies and markets may be adversely affected.
| abfunds.com | AB BOND FUNDS | 123 | |
Table of Contents
NOTES TO FINANCIAL STATEMENTS (continued)
Policy and legislative changes in the United States and in other countries are affecting many aspects of financial regulation, and may in some instances contribute to decreased liquidity and increased volatility in the financial markets. The impact of these changes, and the practical implications for market participants, may not be fully known for some time
Economies and financial markets throughout the world are becoming increasingly interconnected. Economic, financial or political events, trading and tariff arrangements, terrorism, natural disasters (including the spread of infectious illness) and other circumstances in one country or region could have profound impacts on global economies or markets. As a result, whether or not the Portfolio invests in securities of issuers located in or with significant exposure to countries experiencing economic and financial difficulties, the value and liquidity of the Portfolio’s investments may be negatively affected.
Lower-rated Securities Risk—Lower-rated securities, or junk bonds/high-yield securities, are subject to greater risk of loss of principal and interest and greater market risk than higher-rated securities. The capacity of issuers of lower-rated securities to pay interest and repay principal is more likely to weaken than is that of issuers of higher-rated securities in times of deteriorating economic conditions or rising interest rates.
Riskier than a Money-Market Fund—Although the Portfolios maintain a short overall duration, they invest in securities with longer maturities and in some cases lower quality than the assets of the type of mutual fund known as a money market fund. The risk of a decline in the market value of the Portfolios is greater than for a money-market fund since the credit quality of the Portfolios’ securities may be lower and the effective duration of the Portfolios will be longer.
LIBOR Transition and Associated Risk—The Portfolios may invest in debt securities, derivatives or other financial instruments that utilize the London Interbank Offered Rate, or “LIBOR,” as a “benchmark” or “reference rate” for various interest rate calculations. The United Kingdom Financial Conduct Authority, which regulates LIBOR, will cease publishing certain LIBOR benchmarks at the end of 2021. Although certain LIBOR rates are intended to be published until June 2023, banks are strongly encouraged to cease entering into agreements with counterparties referencing LIBOR by the end of 2021. Although financial regulators and industry working groups have suggested alternative reference rates, such as the European Interbank Offer Rate, the Sterling Overnight Interbank Average Rate and the Secured Overnight Financing Rate, global consensus on alternative rates is lacking and the process for amending existing contracts or instruments to transition away from LIBOR is underway
124 | AB BOND FUNDS | abfunds.com | |
Table of Contents
NOTES TO FINANCIAL STATEMENTS (continued)
but remains incomplete. The elimination of LIBOR or changes to other reference rates or any other changes or reforms to the determination or supervision of reference rates could have an adverse impact on the market for, or value of, any securities or payments linked to those reference rates, which may adversely affect the Portfolios’ performance and/or net asset value. Uncertainty and risk also remain regarding the willingness and ability of issuers and lenders to include revised provisions in new and existing contracts or instruments. Consequently, the transition away from LIBOR to other reference rates may lead to increased volatility and illiquidity in markets that are tied to LIBOR, fluctuations in values of LIBOR-related investments or investments in issuers that utilize LIBOR, increased difficulty in borrowing or refinancing and diminished effectiveness of hedging strategies, potentially adversely affecting the Portfolios’ performance. Furthermore, the risks associated with the expected discontinuation of LIBOR and transition may be exacerbated if the work necessary to effect an orderly transition to an alternative reference rate is not completed in a timely manner. Because the usefulness of LIBOR as a benchmark could deteriorate during the transition period, these effects could occur prior to the end of 2021.
Cybersecurity Risk—Cybersecurity incidents, both intentional and unintentional, may allow an unauthorized party to gain access to Portfolio assets, customer data (including private shareholder information), or proprietary information, or cause the Portfolios, the Adviser, and/or its service providers (including, but not limited to, fund accountants, custodians, sub-custodians, transfer agents and financial intermediaries) to suffer data breaches, data corruption or lose operational functionality, or prevent Portfolio investors from purchasing, redeeming or exchanging shares or receiving distributions. A Portfolio and the Adviser have limited ability to prevent or mitigate cybersecurity incidents affecting third-party service providers. Cybersecurity incidents may result in financial losses to such Portfolio and its shareholders, and substantial costs may be incurred in order to prevent any future cybersecurity incidents.
Indemnification Risk—In the ordinary course of business, the Portfolios enter into contracts that contain a variety of indemnifications. The Portfolios’ maximum exposure under these arrangements is unknown. However, the Portfolios have not had prior claims or losses pursuant to these indemnification provisions and expect the risk of loss thereunder to be remote. Therefore, the Portfolios have not accrued any liability in connection with these indemnification provisions.
| abfunds.com | AB BOND FUNDS | 125 | |
Table of Contents
NOTES TO FINANCIAL STATEMENTS (continued)
NOTE 6.
Capital-Share Transactions
The Fund has authorized 17.5 billion shares of common stock, par value $0.001 per share, of which 2.9 billion are allocated to the Intermediate Duration Portfolio and Short Duration Plus Portfolio. The allocation is as follows:
| Allocation of Shares (in Millions) | ||||||||||||||||||||||||||||||||||||
| Portfolio | Bernstein Class Shares | Retail Class A Shares | Retail Class B Shares | Retail Class C Shares | Retail Advisor Class Shares | Retail Class R Shares | Retail Class Z Shares | Retail Class T Shares | Total | |||||||||||||||||||||||||||
Intermediate Duration | 600 | 300 | – 0 | – | – 0 | – | 300 | – 0 | – | 400 | – 0 | – | 1,600 | |||||||||||||||||||||||
Short Duration Plus | 200 | 200 | 200 | 200 | – 0 | – | 200 | – 0 | – | 300 | 1,300 | |||||||||||||||||||||||||
Share transactions for each Portfolio for the six months ended March 31, 2021 and the year ended September 30, 2020, were as follows:
| Intermediate Duration Portfolio | ||||||||||||||||||||||||
| Shares | Amount | |||||||||||||||||||||||
| Six Months Ended 3/31/21 (unaudited) | Year Ended 9/30/20 | Six Months Ended 3/31/21 (unaudited) | Year Ended 9/30/20 | |||||||||||||||||||||
|
| |||||||||||||||||||||||
| Intermediate Duration Class Shares | ||||||||||||||||||||||||
Shares sold | 33,187,212 | 45,936,902 | $ | 455,992,871 | $ | 630,770,763 | ||||||||||||||||||
| ||||||||||||||||||||||||
Shares issued to shareholders on reinvestment of dividends and distributions | 6,810,545 | 5,362,105 | 93,995,745 | 73,165,522 | ||||||||||||||||||||
| ||||||||||||||||||||||||
Shares redeemed | (19,005,813 | ) | (39,842,447 | ) | (261,624,081 | ) | (542,623,931 | ) | ||||||||||||||||
| ||||||||||||||||||||||||
Net increase | 20,991,944 | 11,456,560 | $ | 288,364,535 | $ | 161,312,354 | ||||||||||||||||||
| ||||||||||||||||||||||||
| Class A Shares | ||||||||||||||||||||||||
Shares sold | 86,011 | 51,389 | $ | 1,184,317 | $ | 711,682 | ||||||||||||||||||
| ||||||||||||||||||||||||
Shares issued to shareholders on reinvestment of dividends and distributions | 1,498 | 131 | 20,626 | 1,811 | ||||||||||||||||||||
| ||||||||||||||||||||||||
Shares redeemed | (3,836 | ) | (2,905 | ) | (53,215 | ) | (40,307 | ) | ||||||||||||||||
| ||||||||||||||||||||||||
Net increase | 83,673 | 48,615 | $ | 1,151,728 | $ | 673,186 | ||||||||||||||||||
| ||||||||||||||||||||||||
126 | AB BOND FUNDS | abfunds.com | |
Table of Contents
NOTES TO FINANCIAL STATEMENTS (continued)
| Intermediate Duration Portfolio | ||||||||||||||||||||||||
| Shares | Amount | |||||||||||||||||||||||
| Six Months Ended 3/31/21 (unaudited) | Year Ended 9/30/20 | Six Months Ended 3/31/21 (unaudited) | Year Ended 9/30/20 | |||||||||||||||||||||
|
| |||||||||||||||||||||||
| Advisor Class Shares | ||||||||||||||||||||||||
Shares sold | 99 | – 0 | – | $ | 1,324 | $ | – 0 | – | ||||||||||||||||
| ||||||||||||||||||||||||
Shares issued to shareholders on reinvestment of dividends and distributions | 0 | (a) | – 0 | – | 1 | – 0 | – | |||||||||||||||||
| ||||||||||||||||||||||||
Net increase | 99 | – 0 | – | $ | 1,325 | $ | – 0 | – | ||||||||||||||||
| ||||||||||||||||||||||||
| (a) | Amount is less than one share. |
| Short Duration Plus Portfolio | ||||||||||||||||||||||||
| Shares | Amount | |||||||||||||||||||||||
| Six Months Ended 3/31/21 (unaudited) | Year Ended 9/30/20 | Six Months Ended 3/31/21 (unaudited) | Year Ended 9/30/20 | |||||||||||||||||||||
|
| |||||||||||||||||||||||
| Short Duration Plus Class Shares | ||||||||||||||||||||||||
Shares sold | 5,734,925 | 7,860,805 | $ | 67,374,953 | $ | 92,402,116 | ||||||||||||||||||
| ||||||||||||||||||||||||
Shares issued to shareholders on reinvestment of dividends | 101,575 | 255,694 | 1,193,418 | 3,005,897 | ||||||||||||||||||||
| ||||||||||||||||||||||||
Shares redeemed | (2,728,626 | ) | (8,538,329 | ) | (32,052,481 | ) | (100,401,349 | ) | ||||||||||||||||
| ||||||||||||||||||||||||
Net increase (decrease) | 3,107,874 | (421,830 | ) | $ | 36,515,890 | $ | (4,993,336 | ) | ||||||||||||||||
| ||||||||||||||||||||||||
| Class A Shares | ||||||||||||||||||||||||
Shares sold | 325,882 | 864,056 | $ | 3,835,717 | $ | 10,214,178 | ||||||||||||||||||
| ||||||||||||||||||||||||
Shares issued to shareholders on reinvestment of dividends | 4,014 | 13,543 | 47,205 | 159,270 | ||||||||||||||||||||
| ||||||||||||||||||||||||
Shares converted from Class B | – 0 | – | 632 | – 0 | – | 7,412 | ||||||||||||||||||
| ||||||||||||||||||||||||
Shares converted from Class C | 9,264 | 55,302 | 108,994 | 652,856 | ||||||||||||||||||||
| ||||||||||||||||||||||||
Shares redeemed | (406,259 | ) | (1,159,807 | ) | (4,777,603 | ) | (13,642,768 | ) | ||||||||||||||||
| ||||||||||||||||||||||||
Net decrease | (67,099 | ) | (226,274 | ) | $ | (785,687 | ) | $ | (2,609,052 | ) | ||||||||||||||
| ||||||||||||||||||||||||
| abfunds.com | AB BOND FUNDS | 127 | |
Table of Contents
NOTES TO FINANCIAL STATEMENTS (continued)
| Short Duration Plus Portfolio | ||||||||||||||||||||||||
| Shares | Amount | |||||||||||||||||||||||
| Six Months Ended 3/31/21 (unaudited) | Year Ended 9/30/20 | Six Months Ended 3/31/21 (unaudited) | Year Ended 9/30/20 | |||||||||||||||||||||
|
| |||||||||||||||||||||||
| Class B Shares | ||||||||||||||||||||||||
Shares sold | – 0 | – | 90 | $ | – 0 | – | $ | 1,050 | ||||||||||||||||
| ||||||||||||||||||||||||
Shares issued to shareholders on reinvestment of dividends | – 0 | – | 0 | (a) | – 0 | – | 4 | |||||||||||||||||
| ||||||||||||||||||||||||
Shares converted to Class A | – 0 | – | (633 | ) | – 0 | – | (7,412 | ) | ||||||||||||||||
| ||||||||||||||||||||||||
Net decrease | – 0 | – | (543 | ) | $ | – 0 | – | $ | (6,358 | ) | ||||||||||||||
| ||||||||||||||||||||||||
| Class C Shares | ||||||||||||||||||||||||
Shares sold | 42,936 | 215,651 | $ | 504,103 | $ | 2,539,018 | ||||||||||||||||||
| ||||||||||||||||||||||||
Shares issued to shareholders on reinvestment of dividends | 404 | 1,182 | 4,748 | 13,870 | ||||||||||||||||||||
| ||||||||||||||||||||||||
Shares converted to Class A | (9,286 | ) | (55,436 | ) | (108,994 | ) | (652,856 | ) | ||||||||||||||||
| ||||||||||||||||||||||||
Shares redeemed | (100,480 | ) | (105,045 | ) | (1,178,759 | ) | (1,236,126 | ) | ||||||||||||||||
| ||||||||||||||||||||||||
Net increase (decrease) | (66,426 | ) | 56,352 | $ | (778,902 | ) | $ | 663,906 | ||||||||||||||||
| ||||||||||||||||||||||||
| (a) | Amount is less than one share. |
NOTE 7.
Subsequent Events
As of March 31 2021, Class C shares will automatically convert to Class A shares ten years after the end of the calendar month of purchase. Effective May 31, 2021, Class C shares will automatically convert to Class A shares after eight years instead of ten years.
Management has evaluated subsequent events for possible recognition or disclosure in the financial statements through the date the financial statements are issued. Management has determined that there are no other material events that would require disclosure in the Portfolios’ financial statements through this date.
128 | AB BOND FUNDS | abfunds.com | |
Table of Contents
FINANCIAL HIGHLIGHTS
Selected Data For A Share Of Capital Stock Outstanding Throughout Each Period
| Intermediate Duration Portfolio | ||||||||||||
| Class A | ||||||||||||
| Six Months Ended March 31, 2021 (unaudited) | Year Ended September 30, 2020 | July 23, 2019(a) to September 30, 2019 | ||||||||||
|
| |||||||||||
Net asset value, beginning of period | $ 14.03 | $ 13.55 | $ 13.36 | |||||||||
|
| |||||||||||
Income From Investment Operations | ||||||||||||
Net investment income(b) | .09 | (c) | .15 | .04 | ||||||||
Net realized and unrealized gain (loss) on investment and foreign currency transactions | (.42 | ) | .52 | .18 | ||||||||
|
| |||||||||||
Total from investment operations | (.33 | ) | .67 | .22 | ||||||||
|
| |||||||||||
Less: Dividends and Distributions | ||||||||||||
Dividends from net investment income | (.09 | ) | (.19 | ) | (.03 | ) | ||||||
Distributions from net realized gain on investment transactions | (.24 | ) | – 0 | – | – 0 | – | ||||||
|
| |||||||||||
Total dividends and distributions | (.33 | ) | (.19 | ) | (.03 | ) | ||||||
|
| |||||||||||
Net asset value, end of period | $ 13.37 | $ 14.03 | $ 13.55 | |||||||||
|
| |||||||||||
Total Return | ||||||||||||
Total investment return based on net asset value(d) | (2.48 | )% | 5.08 | % | 1.71 | % | ||||||
Ratios/Supplemental Data | ||||||||||||
Net assets, end of period (000 omitted) | $1,779 | $693 | $10 | |||||||||
Average net assets (000 omitted) | $1,113 | $170 | $10 | |||||||||
Ratio to average net assets of: | ||||||||||||
Expenses, net of waivers/reimbursements | 1.24 | %(e) | 1.82 | % | 2.00 | %(e) | ||||||
Expenses, before waivers/reimbursements | 1.52 | %(e) | N/A | N/A | ||||||||
Net investment income | 1.34 | %(c)(e) | 1.11 | % | 1.34 | %(e) | ||||||
Portfolio turnover rate(f) | 60 | % | 72 | % | 62 | % | ||||||
See footnote summary on page 134.
| abfunds.com | AB BOND FUNDS | 129 | |
Table of Contents
FINANCIAL HIGHLIGHTS (continued)
Selected Data For A Share Of Capital Stock Outstanding Throughout Each Period
| Intermediate Duration Portfolio | ||||||||||||
| Advisor Class | ||||||||||||
| Six Months Ended March 31, 2021 (unaudited) | Year Ended September 30, 2020 | July 23, 2019(a) to September 30, 2019 | ||||||||||
|
| |||||||||||
Net asset value, beginning of period | $ 14.03 | $ 13.55 | $ 13.36 | |||||||||
|
| |||||||||||
Income From Investment Operations | ||||||||||||
Net investment income(b) | .10 | (c) | .20 | .04 | ||||||||
Net realized and unrealized gain (loss) on investment and foreign currency transactions | (.43 | ) | .51 | .19 | ||||||||
|
| |||||||||||
Total from investment operations | (.33 | ) | .71 | .23 | ||||||||
|
| |||||||||||
Less: Dividends and Distributions | ||||||||||||
Dividends from net investment income | (.10 | ) | (.23 | ) | (.04 | ) | ||||||
Distributions from net realized gain on investment transactions | (.24 | ) | – 0 | – | – 0 | – | ||||||
|
| |||||||||||
Total dividends and distributions | (.34 | ) | (.23 | ) | (.04 | ) | ||||||
|
| |||||||||||
Net asset value, end of period | $ 13.36 | $ 14.03 | $ 13.55 | |||||||||
|
| |||||||||||
Total Return | ||||||||||||
Total investment return based on net asset value(d) | (2.37 | )% | 5.28 | % | 1.76 | % | ||||||
Ratios/Supplemental Data | ||||||||||||
Net assets, end of period (000 omitted) | $11 | $11 | $10 | |||||||||
Average net assets (000 omitted) | $10 | $10 | $10 | |||||||||
Ratio to average net assets of: | ||||||||||||
Expenses, net of waivers/reimbursements | 1.09 | %(e) | 1.64 | % | 1.75 | %(e) | ||||||
Expenses, before waivers/reimbursements | 1.28 | %(e) | N/A | N/A | ||||||||
Net investment income | 1.47 | %(c)(e) | 1.47 | % | 1.64 | %(e) | ||||||
Portfolio turnover rate(f) | 60 | % | 72 | % | 62 | % | ||||||
See footnote summary on page 134.
130 | AB BOND FUNDS | abfunds.com | |
Table of Contents
FINANCIAL HIGHLIGHTS (continued)
Selected Data For A Share Of Capital Stock Outstanding Throughout Each Period
| Intermediate Duration Portfolio | ||||||||||||
| Class Z | ||||||||||||
| Six Months Ended March 31, 2021 (unaudited) | Year Ended September 30, 2020 | July 23, 2019(a) to September 30, 2019 | ||||||||||
|
| |||||||||||
Net asset value, beginning of period | $ 14.03 | $ 13.55 | $ 13.36 | |||||||||
|
| |||||||||||
Income From Investment Operations | ||||||||||||
Net investment income(b) | .13 | (c) | .31 | .07 | ||||||||
Net realized and unrealized gain (loss) on investment and foreign currency transactions | (.43 | ) | .51 | .18 | ||||||||
|
| |||||||||||
Total from investment operations | (.30 | ) | .82 | .25 | ||||||||
|
| |||||||||||
Less: Dividends and Distributions | ||||||||||||
Dividends from net investment income | (.13 | ) | (.34 | ) | (.06 | ) | ||||||
Distributions from net realized gain on investment transactions | (.24 | ) | – 0 | – | – 0 | – | ||||||
|
| |||||||||||
Total dividends and distributions | (.37 | ) | (.34 | ) | (.06 | ) | ||||||
|
| |||||||||||
Net asset value, end of period | $ 13.36 | $ 14.03 | $ 13.55 | |||||||||
|
| |||||||||||
Total Return | ||||||||||||
Total investment return based on net asset value(d) | (2.20 | )% | 6.16 | % | 1.95 | % | ||||||
Ratios/Supplemental Data | ||||||||||||
Net assets, end of period (000 omitted) | $10 | $10 | $10 | |||||||||
Average net assets (000 omitted) | $10 | $10 | $10 | |||||||||
Ratio to average net assets of: | ||||||||||||
Expenses, net of waivers/reimbursements | .76 | %(e) | .82 | % | .77 | %(e) | ||||||
Expenses, before waivers/reimbursements | .79 | %(e) | N/A | N/A | ||||||||
Net investment income | 1.82 | %(c)(e) | 2.30 | % | 2.62 | %(e) | ||||||
Portfolio turnover rate(f) | 60 | % | 72 | % | 62 | % | ||||||
See footnote summary on page 134.
| abfunds.com | AB BOND FUNDS | 131 | |
Table of Contents
FINANCIAL HIGHLIGHTS (continued)
Selected Data For A Share Of Capital Stock Outstanding Throughout Each Period
| Short Duration Plus Portfolio | ||||||||||||||||||||||||
| Class A | ||||||||||||||||||||||||
| Six Months Ended March 31, 2021 (unaudited) | Year Ended September 30, | |||||||||||||||||||||||
| 2020 | 2019 | 2018 | 2017 | 2016 | ||||||||||||||||||||
|
| |||||||||||||||||||||||
Net asset value, beginning of period | $ 11.79 | $ 11.74 | $ 11.54 | $ 11.69 | $ 11.76 | $ 11.75 | ||||||||||||||||||
|
| |||||||||||||||||||||||
Income From Investment Operations | ||||||||||||||||||||||||
Net investment income(b) | .03 | .11 | .18 | .11 | (c) | .03 | .05 | (g) | ||||||||||||||||
Net realized and unrealized gain (loss) on investment and foreign currency transactions | (.05 | ) | .07 | .22 | (.14 | ) | (.04 | ) | .02 | |||||||||||||||
Contributions from affiliates | – 0 | – | – 0 | – | – 0 | – | – 0 | – | .00 | (h) | – 0 | – | ||||||||||||
|
| |||||||||||||||||||||||
Total from investment operations | (.02 | ) | .18 | .40 | (.03 | ) | (.01 | ) | .07 | |||||||||||||||
|
| |||||||||||||||||||||||
Less: Dividends | ||||||||||||||||||||||||
Dividends from net investment income | (.04 | ) | (.13 | ) | (.20 | ) | (.12 | ) | (.06 | ) | (.06 | ) | ||||||||||||
|
| |||||||||||||||||||||||
Net asset value, end of period | $ 11.73 | $ 11.79 | $ 11.74 | $ 11.54 | $ 11.69 | $ 11.76 | ||||||||||||||||||
|
| |||||||||||||||||||||||
Total Return | ||||||||||||||||||||||||
Total investment return based on net asset value(d)(i) | (.22 | )% | 1.53 | % | 3.44 | % | (.24 | )% | (.10 | )% | .64 | %(g) | ||||||||||||
Ratios/Supplemental Data | ||||||||||||||||||||||||
Net assets, end of period (000 omitted) | $16,992 | $17,874 | $20,462 | $25,222 | $27,583 | $25,615 | ||||||||||||||||||
Average net assets (000 omitted) | $17,907 | $17,732 | $23,973 | $23,170 | $24,693 | $32,219 | ||||||||||||||||||
Ratio to average net assets of: | ||||||||||||||||||||||||
Expenses, net of waivers/reimbursements | 1.05 | %(e) | 1.07 | % | .97 | % | 1.01 | % | 1.13 | % | .95 | % | ||||||||||||
Expenses, before waivers/reimbursements | 1.05 | %(e) | 1.07 | % | .97 | % | 1.01 | % | 1.13 | % | .95 | % | ||||||||||||
Net investment income | .55 | %(e) | .97 | % | 1.50 | % | .93 | %(c) | .30 | % | .41 | %(g) | ||||||||||||
Portfolio turnover rate | 27 | % | 50 | % | 39 | % | 85 | % | 64 | % | 76 | % | ||||||||||||
See footnote summary on page 134.
132 | AB BOND FUNDS | abfunds.com | |
Table of Contents
FINANCIAL HIGHLIGHTS (continued)
Selected Data For A Share Of Capital Stock Outstanding Throughout Each Period
| Short Duration Plus Portfolio | ||||||||||||||||||||||||
| Class C | ||||||||||||||||||||||||
| Six Months Ended March 31, 2021 (unaudited) | Year Ended September 30, | |||||||||||||||||||||||
| 2020 | 2019 | 2018 | 2017 | 2016 | ||||||||||||||||||||
|
| |||||||||||||||||||||||
Net asset value, beginning of period | $ 11.76 | $ 11.72 | $ 11.52 | $ 11.67 | $ 11.73 | $ 11.72 | ||||||||||||||||||
|
| |||||||||||||||||||||||
Income From Investment Operations | ||||||||||||||||||||||||
Net investment income(b)(c) | .02 | .09 | .15 | .08 | .01 | .02 | (g) | |||||||||||||||||
Net realized and unrealized gain (loss) on investment and foreign currency transactions | (.05 | ) | .05 | .22 | (.14 | ) | (.03 | ) | .03 | |||||||||||||||
Contributions from affiliates | – 0 | – | – 0 | – | – 0 | – | – 0 | – | .00 | (h) | – 0 | – | ||||||||||||
|
| |||||||||||||||||||||||
Total from investment operations | (.03 | ) | .14 | .37 | (.06 | ) | (.02 | ) | .05 | |||||||||||||||
|
| |||||||||||||||||||||||
Less: Dividends | ||||||||||||||||||||||||
Dividends from net investment income | (.03 | ) | (.10 | ) | (.17 | ) | (.09 | ) | (.04 | ) | (.04 | ) | ||||||||||||
|
| |||||||||||||||||||||||
Net asset value, end of period | $ 11.70 | $ 11.76 | $ 11.72 | $ 11.52 | $ 11.67 | $ 11.73 | ||||||||||||||||||
|
| |||||||||||||||||||||||
Total Return | ||||||||||||||||||||||||
Total investment return based on net asset value(d)(i) | (.40 | )% | 1.32 | % | 3.24 | % | (.44 | )% | (.22 | )% | .42 | %(g) | ||||||||||||
Ratios/Supplemental Data | ||||||||||||||||||||||||
Net assets, end of period (000 omitted) | $2,182 | $2,976 | $2,304 | $2,976 | $5,091 | $10,582 | ||||||||||||||||||
Average net assets (000 omitted) | $2,648 | $2,214 | $2,573 | $3,778 | $8,270 | $12,845 | ||||||||||||||||||
Ratio to average net assets of: | ||||||||||||||||||||||||
Expenses, net of waivers/reimbursements | 1.25 | %(e) | 1.28 | % | 1.18 | % | 1.22 | % | 1.31 | % | 1.19 | % | ||||||||||||
Expenses, before waivers/reimbursements | 1.80 | %(e) | 1.83 | % | 1.73 | % | 1.77 | % | 1.86 | % | 1.74 | % | ||||||||||||
Net investment income(c) | .35 | %(e) | .74 | % | 1.29 | % | .67 | % | .09 | % | .18 | %(g) | ||||||||||||
Portfolio turnover rate | 27 | % | 50 | % | 39 | % | 85 | % | 64 | % | 76 | % | ||||||||||||
See footnote summary on page 134.
| abfunds.com | AB BOND FUNDS | 133 | |
Table of Contents
FINANCIAL HIGHLIGHTS (continued)
Selected Data For A Share Of Capital Stock Outstanding Throughout Each Period
| (a) | Commencement of distributions. |
| (b) | Based on average shares outstanding. |
| (c) | Net of expenses waived by the Adviser |
| (d) | Total investment return is calculated assuming an initial investment made at the net asset value at the beginning of the period, reinvestment of all dividends and distributions at net asset value during the period, and redemption on the last day of the period. Total return does not reflect the deduction of taxes that a shareholder would pay on fund distributions or the redemption of fund shares. Total investment return calculated for a period of less than one year is not annualized |
| (e) | Annualized |
| (f) | The portfolio accounts for dollar roll transactions as purchases and sales. |
| (g) | For the year ended September 30, 2016, the amount includes a refund for overbilling of prior years’ custody out of pocket fees as follows: |
| Net Investment Income Per Share | Net Investment Income Ratio | Total Return | ||
| $0.004 | 0.03% | 0.03% |
| (h) | Amount is less than $.005 |
| (i) | Includes the impact of proceeds received and credited to the Portfolio resulting from class action settlements, which enhanced the Portfolio’s performance for the years ended September 30, 2017 and September 30, 2016 by .11% and .05%, respectively. |
See notes to financial statements.
134 | AB BOND FUNDS | abfunds.com | |
Table of Contents
BOARD OF DIRECTORS
Debra Perry(1)(2), Chair Beata D. Kirr, President R. Jay Gerken(1)(2) Jeffrey R. Holland(1) | William Kristol(1) Michelle McCloskey(1) Donald K. Peterson(1) |
OFFICERS
Michael Canter, Vice President(3) Shawn E. Keegan, Vice President(3) Janaki Rao, Vice President(3) Emilie D. Wrapp, Secretary Michael B. Reyes, Senior Analyst | Joseph J. Mantineo, Treasurer and Chief Financial Officer Phyllis J. Clarke, Controller Vincent S. Noto, Chief Compliance Officer |
Custodian and Accounting Agent State Street Bank and Trust Company State Street Corporation CCB/5 1 Iron Street
Distributor† AllianceBernstein Investments, Inc. 1345 Avenue of the Americas New York, NY 10105
Transfer Agent† AllianceBernstein Investor Services, Inc. P.O. Box 786003 San Antonio, TX 78278-6003 Toll-Free (800) 221-5672 | Legal Counsel Willkie Farr & Gallagher LLP 787 Seventh Avenue New York, NY 10019
Independent Registered Public Accounting Firm PricewaterhouseCoopers LLP 300 Madison Avenue New York, NY 10017 |
| 1 | Member of the Audit Committee, the Nominating, Governance and Compensation Committee, and the Independent Directors Committee. |
| 2 | Member of the Pricing Committee. |
| 3 | The day-to-day management of, and investment decisions for, the AB Short Duration Portfolio are made by the Adviser’s U.S. Investment Grade: Liquid Markets Structured Products Investment Team. Messrs. Canter, Keegan and Rao are the investment professionals with the most significant responsibility for the day-to-day management of the Portfolio’s portfolio. |
The day-to-day management of, and investment decisions for, the AB Intermediate Duration Portfolio are made by the Adviser’s U.S. Investment Grade: Core Fixed Income Team. Messrs. Canter, Keegan and Rao are the investment professionals with the most significant responsibility for the day-to-day management of the Portfolio’s portfolio. |
| † | For the AB Short Duration Portfolio, Classes A and C shares only. For the AB Intermediate Duration Portfolio, Classes A, C and Advisor shares only. |
| abfunds.com | AB BOND FUNDS | 135 | |
Table of Contents
Operation and Effectiveness of the Portfolios’ Liquidity Risk Management Program:
In October 2016, the Securities and Exchange Commission (“SEC”) adopted the open-end fund liquidity rule (the “Liquidity Rule”). In June 2018 the SEC adopted a requirement that funds disclose information about the operation and effectiveness of their Liquidity Risk Management Program (“LRMP”) in their reports to shareholders.
One of the requirements of the Liquidity Rule is for the Portfolios to designate an Administrator of the Portfolios’ Liquidity Risk Management Program. The Administrator of the Portfolios’ LRMP is AllianceBernstein L.P., the Portfolios’ investment adviser (the “Adviser”). The Adviser has delegated the responsibility to its Liquidity Risk Management Committee (the “Committee”).
Another requirement of the Liquidity Rule is for the Fund’s Board of Directors (the “Fund Board”) to receive an annual written report from the Administrator of the LRMP, which addresses the operation of the Portfolios’ LRMP and assesses its adequacy and effectiveness. The Adviser provided the Fund Board with such annual report during the first quarter of 2021, which covered the period January 1, 2020 through December 31, 2020 (the “Program Reporting Period”).
The LRMP’s principal objectives include supporting the Portfolios’ compliance with limits on investments in illiquid assets and mitigating the risk that the Portfolios will be unable to meet their redemption obligations in a timely manner.
Pursuant to the LRMP, the Portfolios classify the liquidity of their portfolio investments into one of the four categories defined by the SEC: Highly Liquid, Moderately Liquid, Less Liquid, and Illiquid. These classifications are reported to the SEC on Form N-PORT.
During the Program Reporting Period, the Committee reviewed whether the Portfolios’ strategy is appropriate for an open-end structure, incorporating any holdings of less liquid and illiquid assets. If the Portfolios participated in derivative transactions, the exposure from such transactions were considered in the LRMP.
The Committee also performed an analysis to determine whether the Portfolios are required to maintain a Highly Liquid Investment Minimum (“HLIM”). The Committee also incorporated the following information when determining the Portfolios’ reasonably anticipated trading size for purposes of liquidity monitoring: historical net redemption activity, the Portfolios’ concentration in an issuer, shareholder concentration, investment performance, total net assets, and distribution channels.
136 | AB BOND FUNDS | abfunds.com | |
Table of Contents
The Adviser informed the Fund Board that the Committee believes the Portfolios’ LRMP is adequately designed, has been implemented as intended, and has operated effectively since its inception. No material exceptions have been noted since the implementation of the LRMP. During the Program Reporting Period, beginning in March 2020, all financial markets experienced extreme levels of price volatility and relative illiquidity resulting from the COVID-19 impacts on the global economy. This extreme relative illiquidity resulted in significantly wider bid-ask spreads to transact in securities, including many of those securities held by the Portfolios, and in a diminished depth of liquidity in most markets, to varying degrees. Nonetheless, there were no liquidity events that impacted the Portfolios or their ability to timely meet redemptions during the Program Reporting Period.
| abfunds.com | AB BOND FUNDS | 137 | |
Table of Contents
BOARD CONSIDERATION OF INVESTMENT MANAGEMENT ARRANGEMENT
Sanford C. Bernstein Fund, Inc. (the “Fund”) is subject to Section 15 of the Investment Company Act of 1940, as amended. Section 15 provides that any investment advisory agreement with a registered investment company such as the Fund may continue in effect for a period of more than two years from the date of its execution, only so long as such continuance is specifically approved at least annually by the board of directors (or by vote of a majority of the outstanding voting securities of the investment company). Pursuant to this requirement, the Fund’s Board of Directors, including the Directors who are not interested persons of the Fund (the “Independent Directors”), unanimously approved the continuation of the Investment Management Agreement between the Fund, on behalf of the Tax-Managed International, International, Emerging Markets, Short Duration Diversified Municipal, New York Municipal, California Municipal, Diversified Municipal, Short Duration Plus, Intermediate Duration, Overlay A, Tax-Aware Overlay A, Overlay B, Tax-Aware Overlay B, Tax-Aware Overlay C and Tax-Aware Overlay N Portfolios (each, a “Portfolio” and collectively, the “Portfolios”) of the Fund, and AllianceBernstein L.P. (the “Adviser”)( the “Investment Management Agreement”) at a video conference meeting held on October 28-29, 2020.1
The following discussion describes the considerations in connection with the Board’s review of the Investment Management Agreement.
In connection with the annual review of the continuation of the Investment Management Agreement between the Fund and the Adviser, counsel to the Independent Directors sent a letter to the Adviser dated August 7, 2020, that contained a list of information requested by the Independent Directors to conduct their annual review. The Board of Directors, including the Independent Directors, met by video conference and telephonically and received and evaluated extensive materials relating to the continuation of the Investment Management Agreement from the Adviser during meetings in September and October 2020. In addition, the Board received materials from the Senior Analyst and an independent fee consultant as described below. On September 30, 2020, the Board of Directors held a video conference meeting to discuss its review of the Investment Management Agreement and the materials the Directors had been provided. At that meeting, the Independent Directors met separately with their independent counsel and the Senior Analyst and the independent fee consultant in executive sessions. Following the September 30, 2020 meeting, the Independent Directors, through counsel, requested certain additional information by means of a letter from their independent counsel
| 1 | The meeting was held by video conference in view of the ongoing COVID-19 pandemic and based on exemptive relief issued by the Securities and Exchange Commission, with the Board’s intention to ratify the approval of the Investment Management Agreement at its next in-person meeting. |
138 | AB BOND FUNDS | abfunds.com | |
Table of Contents
BOARD CONSIDERATION OF INVESTMENT MANAGEMENT ARRANGEMENT (continued)
dated October 5, 2020, and the Adviser provided certain additional information by means of a letter dated October 15, 2020. The Independent Directors held a telephonic meeting on October 20, 2020 with their independent counsel and the Senior Analyst to further discuss the contract renewal materials and supplemental materials provided in response to the Board’s request. On October 28-29, 2020, the Board of Directors held a video conference meeting to continue their review of the Investment Management Agreement. During this meeting, the Adviser provided further information to the Board relating to contract renewal, and the Independent Directors also met separately with counsel to the Independent Directors as well as the Senior Analyst to review the contract renewal materials provided by the Adviser and the materials prepared by the Senior Analyst. At the conclusion of this meeting, the Board approved the continuation of the Investment Management Agreement for an additional annual term as described below.
In approving the Investment Management Agreement, the Board, including the Independent Directors, considered all information it deemed reasonably necessary to evaluate the terms of the Investment Management Agreement and considered whether the Agreement would be in the best interests of the Fund. In particular, the Board considered the information that was provided to them by the Adviser in response to their requests, as well as information prepared by the Senior Analyst and the independent fee consultant at the request of the Board. The Fund’s Senior Analyst assists the Board (as well as the boards of other funds sponsored by the Adviser) in evaluating investment management agreements and certain other plans and agreements pursuant to which the Adviser or its affiliates provide services to the Funds. The Board also considered other information provided to the Board in connection with the September 30, 2020, and October 28-29, 2020 meetings and throughout the past year.
The information considered by the Board included information with respect to the nature, extent and quality of services provided, investment performance, fees and expenses, profitability, economies of scale, and fall-out benefits and other revenue.
In the Board’s consideration of the factors discussed below, no single factor was considered in isolation or to be determinative to the decision of the Board to approve the Investment Management Agreement. Rather, the Board concluded, in light of a weighing and balancing of all factors considered and in the exercise of the Directors’ business judgment, that it was in the best interests of the Fund to approve the Investment Management Agreement including the fees to be charged for services thereunder, as summarized below.
| abfunds.com | AB BOND FUNDS | 139 | |
Table of Contents
BOARD CONSIDERATION OF INVESTMENT MANAGEMENT ARRANGEMENT (continued)
Fees and Expenses
The Board, including the Independent Directors, compared the fees and expense ratios of each Portfolio (before and after any fee waivers and expense reimbursements) against fees and expense ratios of a peer group of funds with similar investment objectives (“peer group”). Both the peer group and the funds within the peer group, with respect to the fee and expense data, were available from Strategic Insight, an independent provider of investment company data. The Senior Analyst also performed analyses of the advisory fees, and compared such analyses to the Portfolios’ peer groups. In addition, the Board received and considered information from an independent fee consultant regarding the fees and expenses of the Portfolios as well as their investment performance.
The Board also received and considered information about the services rendered, and the fee rates charged, to other clients advised by the Adviser, including information about any recent advisory fee changes with respect to other investment companies advised by the Adviser. The Board noted the differences between the services provided to the Portfolios in comparison to those provided to other types of clients, including institutional clients and other investment companies for which the Adviser acted as subadviser, and the differences in the entrepreneurial and other risks borne by the Adviser in serving the Portfolios compared to other types of clients.
The Board noted that the Adviser will begin voluntarily waiving the 0.10% shareholder servicing fee for the private client class of the Short Duration Plus Portfolio and the Short Duration Diversified Municipal Portfolio effective with the new term of the shareholder servicing agreement. The Board also noted the Adviser’s proposal to modify the advisory fee schedule of the Overlay A and Tax-Aware Overlay Portfolios by reducing the level where each Portfolio reaches its first breakpoint, and adding a new breakpoint on assets over $5 billion, and that this advisory fee change was expected to provide immediate savings to the Tax-Aware Overlay A Portfolio based on current asset levels.
On the basis of its review and consideration of the fees as described above and the Board’s consideration of the other factors described below, and in light of the Adviser’s agreement to reduce certain fees and to apply certain fee waivers and/or expense caps for certain Portfolios, the Board concluded that the contractual advisory fees as proposed were reasonable.
Nature, Extent and Quality of Services Provided
The Board, including the Independent Directors, considered the nature, quality and extent of services performed by the Adviser and its affiliates
140 | AB BOND FUNDS | abfunds.com | |
Table of Contents
BOARD CONSIDERATION OF INVESTMENT MANAGEMENT ARRANGEMENT (continued)
gained from their experience as Directors of the Fund, their overall confidence in the Adviser’s integrity and competence they have gained from that experience, and the Adviser’s initiative in identifying and raising potential issues with the Directors. The Board also considered the Adviser’s responsiveness, frankness and attention to concerns raised by the Directors from time to time, including the Adviser’s willingness to consider and implement organizational changes designed to improve investment results and the services provided to the Portfolios. The Board also considered the scope and quality of the Adviser’s investment management capabilities, other resources dedicated to performing its services, the quality of its compliance, administrative and other services provided to the Portfolios and the background and experience of the Adviser’s senior management. The Board reviewed the qualifications, backgrounds and responsibilities of the investment staff primarily responsible for day-to-day portfolio management services for each Portfolio and noted the Adviser’s commitment to strong research and investment management capabilities throughout changing market environments. The Board reviewed the compliance and administrative services of the Adviser that support the investment advisory services provided to the Portfolios. The Board also considered how the organizational capabilities and financial condition of the Adviser may affect the nature and quality of its services. In that regard, the Board considered information about the impact of the COVID-19 pandemic on the Adviser’s operations and the Adviser’s ability to continue to provide the same scope and quality of services to the Portfolios as before the pandemic. The Board considered the ongoing impacts of the relocation of substantial operations of the Adviser from the New York City area to Nashville, Tennessee as well as the implications of a substantial number of the Adviser’s employees working from home during the pandemic. The Board also noted that the Adviser and its affiliates had continued to update the Board on matters relating to the sale by AXA, S.A., previously an indirect parent of AllianceBernstein Corporation, the general partner of the Adviser, of its remaining ownership interest in its U.S. subsidiary, Equitable Holdings, Inc. The Board considered the statements of the Adviser that it has continued to operate as an independent, publicly-traded US asset manager, that the divestiture has not materially changed the Adviser’s current management structure or strategy, and that the Adviser does not believe that the divestiture will have a material impact on the Adviser with respect to its operations, personnel, organizational structure, or capitalization, financial and other resources.
In considering the nature and quality of the services provided by the Adviser, the Board, including the Independent Directors, received and considered information about each Portfolio’s investment performance, as well as the performance of its peer group and the performance of an
| abfunds.com | AB BOND FUNDS | 141 | |
Table of Contents
BOARD CONSIDERATION OF INVESTMENT MANAGEMENT ARRANGEMENT (continued)
appropriate benchmark index. The Board was provided with performance data versus each Portfolio’s peer group, for the 1-year, 3-year, 5-year and 10-year periods, as applicable, ended July 31, 2020 and versus each Portfolio’s benchmark index, for the relevant periods, as well as the most recently available Morningstar rating for those Portfolios with an available rating. The Board also received certain updated performance information as of September 30, 2020. In addition, the Directors considered information showing performance compared to peer groups and benchmarks for rolling calendar year periods and the year to date. The Directors also receive detailed comparative performance information for the Portfolios at each regular Board meeting during the year. The Board recognized that the benchmark indices do not account for fees and expenses incurred by a fund, including the Portfolios. The Directors also considered how peer groups have changed over time and how comparisons may differ depending upon the selection of the peer groups or benchmark indices.
The Directors noted the complexity of the Overlay Portfolios, in particular the complexity of managing the globally diversified set of asset classes and derivatives in which the Overlay Portfolios can invest as well as the complexity of dynamically allocating assets through the Overlay Portfolios among various asset classes as economic and market conditions change in seeking to provide the desired risk/return trade-off for their investors in light of their overall portfolios (and not just their investment in the Overlay Portfolios themselves). The Board reviewed the performance of the Overlay Portfolios in response to the increased market volatility and the performance of the Overlay Portfolios’ dynamic asset allocation component during this unusual market environment. With respect to the International Portfolio and the Tax-Managed International Portfolio, the Board considered that, subject to shareholder approval, the two Portfolios would be merged into another portfolio managed by the Adviser in late 2020 or early 2021. In evaluating the performance of the Portfolios that invest primarily in fixed-income securities, the Directors considered whether those Portfolios may have incurred less credit risk or interest rate risk, or both, in relation to their peer groups and benchmark indices. Where the Portfolios had underperformed their peer groups or benchmark indices, the Directors considered the Adviser’s explanations for performance and, as applicable, measures the Adviser had taken or proposed to take to improve performance. In particular, for those Portfolios that pursue a value strategy, the Directors noted the Adviser’s explanation regarding the recent underperformance of value strategies generally versus growth strategies. The Directors also noted the Adviser’s explanation that certain Portfolios are designed to maintain higher credit quality and a more conservative approach versus the funds in its relevant peer group, and that as a result of a lower risk profile, those Portfolios have underperformed the peer
142 | AB BOND FUNDS | abfunds.com | |
Table of Contents
BOARD CONSIDERATION OF INVESTMENT MANAGEMENT ARRANGEMENT (continued)
group during periods when riskier assets have outperformed. The Directors noted generally the Adviser’s continued efforts to enhance the services provided to the Portfolios, including but not limited to, its continued research efforts to enhance the dynamic asset allocation component utilized by the Overlay Portfolios. The Directors also noted that they would continue to monitor investment performance closely.
The Board concluded that the Adviser had the experience and resources necessary to provide services of appropriate nature, quality and scope with respect to the Portfolios.
Profitability
The Board, including the Independent Directors, considered the level of the Adviser’s profits in respect of its management of the respective Portfolios. The materials provided to the Independent Directors included information indicating the profitability of the Portfolios to the Adviser for calendar years 2018 and 2019, which had been reviewed by an independent consultant. The Directors reviewed the assumptions and methods of allocation used by the Adviser in preparing fund-specific profitability data and noted that there are many potentially acceptable allocation methodologies for information of this type. The Directors noted that they received information regarding all revenues and expenses of the Adviser’s relationship with the Fund, including those relating to the Adviser’s subsidiaries that provide transfer agency and, distribution services to the Fund, and that they had focused on profitability before taxes and distribution expenses. The Directors reviewed comparative information regarding profitability for other publicly-traded advisers, recognizing that it is difficult to make comparisons of profitability among fund advisory contracts because only limited comparative information is publicly available and the comparisons are affected by numerous factors including different cost accounting methodologies.
After reviewing all relevant factors, the Directors, including the Independent Directors, concluded that the levels of the Adviser’s profits in respect of its management of the Portfolios were not excessive.
Economies of Scale
The Board, including the Independent Directors, considered whether there have been economies of scale in respect of the management of the Portfolios, whether the Portfolios have appropriately benefited from any economies of scale, and whether there is potential for realization of any further economies of scale. The Directors discussed possible ways in which any such economies of scale may be shared with the Portfolios, including by investment in enhanced services.
| abfunds.com | AB BOND FUNDS | 143 | |
Table of Contents
BOARD CONSIDERATION OF INVESTMENT MANAGEMENT ARRANGEMENT (continued)
The Directors also considered the Senior Analyst materials which they received in connection with the review of the Investment Management Agreement, which included information reflecting changes in asset levels of the Portfolios and in the profitability of the Adviser over various periods.
After reviewing the profitability and economies of scale information provided by the Adviser, the Board concluded that the benefits of any economies of scale were appropriately being shared with Portfolio investors by way of, among other things and as applicable, establishing advisory fees at levels that contemplated future achievement of scale, recent fee reductions for the Short Duration Diversified Municipal, Short Duration Plus, Intermediate Duration, Tax-Managed International, International, and Emerging Markets Portfolios, breakpoint arrangements including the lowering of the first breakpoint and the addition of a new breakpoint in the advisory fee schedule for the Overlay A and Tax-Aware Overlay A Portfolios as well as other recently adopted or modified breakpoints for certain Portfolios, expense caps and waivers applying to select Portfolios, and the Adviser’s continued reinvestment in the business, including by researching and implementing new product enhancements. The Directors also noted that they would continue to monitor the growth of the Portfolios.
Fall-Out Benefits and Other Revenue
The Board, including the Independent Directors, also took into account so-called “fall-out benefits” to the Adviser, such as soft dollar arrangements (whereby the Adviser receives the benefit of research services from many of the brokers and dealers that execute purchases and sales of securities on behalf of its clients on an agency basis), Rule 12b-1 fees and sales charges received by the principal underwriter (which is a wholly owned subsidiary of the Adviser) with respect to the retail share classes of certain Portfolios, and transfer agency fees paid by the retail share classes of certain Portfolios to a wholly-owned subsidiary of the Adviser. The Directors recognized that the Adviser’s profitability would be lower without these benefits. They also considered other benefits potentially derived from an increase in the Adviser’s business as a result of its relationship with the Fund. The Directors concluded that these fall-out benefits to the Adviser were acceptable.
Advisory Fee Rate Schedule
On the basis of the information considered, the Board determined to approve the continuation of the Investment Management Agreement for an additional annual term, without change to the contractual fee schedules of
144 | AB BOND FUNDS | abfunds.com | |
Table of Contents
BOARD CONSIDERATION OF INVESTMENT MANAGEMENT ARRANGEMENT (continued)
the Portfolios other than the new breakpoints established for the Overlay A Portfolio and the Tax-Aware Overlay Portfolio, as set forth below.
| Portfolio | Annual Percentage of Average Daily Net Assets of Each Portfolio | |
| Short Duration Diversified Municipal Portfolio | 0.30% of the first $750 million; 0.25% of assets in excess of $750 million | |
| Short Duration Plus Portfolio | 0.35% of the first $750 million; 0.30% of assets in excess of $750 million | |
| New York Municipal Portfolio | 0.425% of the first $1 billion; 0.375% in excess of $1 billion up to, but not exceeding $3 billion; 0.325% in excess of $3 billion up to, but not exceeding $5 billion; 0.275% of assets in excess of $5 billion | |
| California Municipal Portfolio | 0.425% of the first $1 billion; 0.375% in excess of $1 billion up to, but not exceeding $3 billion; 0.325% in excess of $3 billion up to, but not exceeding $5 billion; 0.275% of assets in excess of $5 billion | |
| Diversified Municipal Portfolio | 0.425% of the first $1 billion; 0.375% in excess of $1 billion up to, but not exceeding $3 billion; 0.325% in excess of $3 billion up to, but not exceeding $5 billion; 0.275% in excess of $5 billion up to, but not exceeding $7 billion; 0.225% of assets in excess of $7 billion | |
| Intermediate Duration Portfolio | 0.45% on the first $2.5 billion; 0.40% in excess of $2.5 billion up to, but not exceeding $5 billion; 0.35% in excess of $5 billion up to, but not exceeding $8 billion; 0.30% of assets in excess of $8 billion | |
| Tax-Managed International Portfolio | 0.75% on the first $2.5 billion; 0.65% in excess of $2.5 billion up to, but not exceeding $5 billion; 0.60% of assets in excess of $5 billion | |
| International Portfolio | 0.75% on the first $2.5 billion; 0.65% in excess of $2.5 billion up to, but not exceeding $5 billion; 0.60% of assets in excess of $5 billion | |
| Emerging Markets Portfolio | 0.95% of the first $2.5 billion; 0.90% in excess of $2.5 billion up to, but not exceeding $5 billion; 0.85% of assets in excess of $5 billion. |
| abfunds.com | AB BOND FUNDS | 145 | |
Table of Contents
BOARD CONSIDERATION OF INVESTMENT MANAGEMENT ARRANGEMENT (continued)
| Portfolio | Annual Percentage of Average Daily Net Assets of Each Portfolio | |
| Overlay A Portfolio | 0.90% of the first $2.5 billion; 0.875% in excess of $2.5 billion up to, but not exceeding $5 billion; 0.85% of assets in excess of $5 billion. | |
| Tax-Aware Overlay A Portfolio | 0.90% of the first $2.5 billion; 0.875% in excess of $2.5 billion up to, but not exceeding $5 billion; 0.85% of assets in excess of $5 billion. | |
| Overlay B Portfolio | 0.65% of assets. | |
| Tax-Aware Overlay B Portfolio | 0.65% of assets. | |
| Tax-Aware Overlay C Portfolio | 0.65% of assets. | |
| Tax-Aware Overlay N Portfolio | 0.65% of assets. |
146 | AB BOND FUNDS | abfunds.com | |
Table of Contents
This page is not part of the Shareholder Report or the Financial Statements.
AB FAMILY OF FUNDS
US EQUITY
CORE
Core Opportunities Fund
FlexFee™ US Thematic Portfolio
Select US Equity Portfolio
GROWTH
Concentrated Growth Fund
Discovery Growth Fund
FlexFee™ Large Cap Growth Portfolio
Growth Fund
Large Cap Growth Fund
Small Cap Growth Portfolio
VALUE
Discovery Value Fund
Equity Income Fund
Relative Value Fund
Small Cap Value Portfolio
Value Fund
INTERNATIONAL/ GLOBAL EQUITY
CORE
Global Core Equity Portfolio
International Strategic Core Portfolio
Sustainable Global Thematic Fund
Tax-Managed Wealth Appreciation Strategy
Wealth Appreciation Strategy
GROWTH
Concentrated International Growth Portfolio
Sustainable International Thematic Fund
VALUE
All China Equity Portfolio
International Value Fund
FIXED INCOME
MUNICIPAL
High Income Municipal Portfolio
Intermediate California Municipal Portfolio
Intermediate Diversified Municipal Portfolio
Intermediate New York Municipal Portfolio
Municipal Bond Inflation Strategy
Tax-Aware Fixed Income Opportunities Portfolio
National Portfolio
Arizona Portfolio
California Portfolio
Massachusetts Portfolio
Minnesota Portfolio
New Jersey Portfolio
New York Portfolio
Ohio Portfolio
Pennsylvania Portfolio
Virginia Portfolio
TAXABLE
Bond Inflation Strategy
Global Bond Fund
High Income Fund
High Yield Portfolio1
Income Fund
Intermediate Duration Portfolio
Limited Duration High Income Portfolio
Short Duration Income Portfolio
Short Duration Portfolio
Sustainable Thematic Credit Portfolio
Total Return Bond Portfolio
ALTERNATIVES
All Market Real Return Portfolio
Global Real Estate Investment Fund
Select US Long/Short Portfolio
MULTI-ASSET
All Market Income Portfolio
All Market Total Return Portfolio
Conservative Wealth Strategy
Emerging Markets Multi-Asset Portfolio
Global Risk Allocation Fund
Tax-Managed All Market Income Portfolio
CLOSED-END FUNDS
AllianceBernstein Global High Income Fund
AllianceBernstein National Municipal Income Fund
We also offer Government Money Market Portfolio, which serves as the money market fund exchange vehicle for the AB mutual funds. You could lose money by investing in the Fund. Although the Fund seeks to preserve the value of your investment at $1.00 per share, it cannot guarantee it will do so. The Fund may impose a fee upon sale of your shares or may temporarily suspend your ability to sell shares if the Fund’s liquidity falls below required minimums because of market conditions or other factors. An investment in the Fund is not insured or guaranteed by the Federal Deposit Insurance Corporation or any other government agency. The Fund’s sponsor has no legal obligation to provide financial support to the Fund, and you should not expect that the sponsor will provide financial support to the Fund at any time.
Investors should consider the investment objectives, risks, charges and expenses of the Fund carefully before investing. For copies of our prospectus or summary prospectus, which contain this and other information, visit us online at www.abfunds.com or contact your AB representative. Please read the prospectus and/or summary prospectus carefully before investing.
| 1 | Prior to April 30, 2021, High Yield Portfolio was named FlexFee High Yield Portfolio. |
| abfunds.com | AB BOND FUNDS | 147 | |
Table of Contents
NOTES
148 | AB BOND FUNDS | abfunds.com | |
Table of Contents
AB BOND FUNDS
1345 Avenue of the Americas
New York, NY 10105
800 221 5672
BF-0152-0321 
Table of Contents
MAR 03.31.21

SEMI-ANNUAL REPORT
AB INTERMEDIATE MUNICIPAL PORTFOLIOS
| + | AB INTERMEDIATE CALIFORNIA MUNICIPAL PORTFOLIO |
| + | AB INTERMEDIATE DIVERSIFIED MUNICIPAL PORTFOLIO |
| + | AB INTERMEDIATE NEW YORK MUNICIPAL PORTFOLIO |

As of January 1, 2021, as permitted by new regulations adopted by the Securities and Exchange Commission, each Fund’s annual and semi-annual shareholder reports are no longer sent by mail, unless you specifically requested paper copies of the reports. Instead, the reports are made available on a website, and you will be notified by mail each time a report is posted and provided with a website address to access the report.
You may elect to receive all future reports in paper form free of charge. If you invest through a financial intermediary, you can contact your financial intermediary to request that you continue to receive paper copies of your shareholder reports; if you invest directly with a Fund, you can call the Fund at (800) 221 5672. Your election to receive reports in paper form will apply to all funds held in your account with your financial intermediary or, if you invest directly, to all AB Mutual Funds you hold.
Table of Contents
| Investment Products Offered | • Are Not FDIC Insured • May Lose Value • Are Not Bank Guaranteed | |
Investors should consider the investment objectives, risks, charges and expenses of the Fund carefully before investing. For copies of our prospectus or summary prospectus, which contain this and other information, visit us online at www.abfunds.com or contact your AB representative. Please read the prospectus and/or summary prospectus carefully before investing.
This shareholder report must be preceded or accompanied by the Fund’s prospectus for individuals who are not current shareholders of the Fund.
You may obtain a description of the Fund’s proxy voting policies and procedures, and information regarding how the Fund voted proxies relating to portfolio securities during the most recent 12-month period ended June 30, without charge. Simply visit AB’s website at www.abfunds.com, or go to the Securities and Exchange Commission’s (the “Commission”) website at www.sec.gov, or call AB at (800) 227 4618.
The Fund files its complete schedule of portfolio holdings with the Commission for the first and third quarters of each fiscal year as an exhibit to its reports on Form N-PORT. The Fund’s Form N-PORT reports are available on the Commission’s website at www.sec.gov. The Fund’s Forms N-PORT may also be reviewed and copied at the Commission’s Public Reference Room in Washington, DC; information on the operation of the Public Reference Room may be obtained by calling (800) SEC 0330. AB publishes full portfolio holdings for the Fund monthly at www.abfunds.com.
AllianceBernstein Investments, Inc. (ABI) is the distributor of the AB family of mutual funds. ABI is a member of FINRA and is an affiliate of AllianceBernstein L.P., the Adviser of the funds.
The [A/B] logo is a registered service mark of AllianceBernstein and AllianceBernstein® is a registered service mark used by permission of the owner, AllianceBernstein L.P.
Table of Contents
| FROM THE ADVISER |  |
Dear Shareholder,
We’re pleased to provide this report for the AB Intermediate Municipal Portfolios: California, Diversified and New York (each a “Portfolio,” and collectively, the “Portfolios”). Please review the discussion of Portfolio performance, the market conditions during the reporting period and the Portfolios’ investment strategies.
As always, AB strives to keep clients ahead of what’s next by:
| + | Transforming uncommon insights into uncommon knowledge with a global research scope |
| + | Navigating markets with seasoned investment experience and sophisticated solutions |
| + | Providing thoughtful investment insights and actionable ideas |
Whether you’re an individual investor or a multi-billion-dollar institution, we put knowledge and experience to work for you.
AB’s global research organization connects and collaborates across platforms and teams to deliver impactful insights and innovative products. Better insights lead to better opportunities—anywhere in the world.
For additional information about AB’s range of products and shareholder resources, please log on to www.abfunds.com.
Thank you for your investment in the AB Mutual Funds.
Sincerely,

Onur Erzan
Senior Vice President of the Adviser
| abfunds.com | AB INTERMEDIATE MUNICIPAL PORTFOLIOS | 1 | |
Table of Contents
SEMI-ANNUAL REPORT
May 18, 2021
This report provides management’s discussion of fund performance for the AB Intermediate Municipal Portfolios: California, Diversified and New York, for the semi-annual reporting period ended March 31, 2021.
Each of the Portfolios seeks to provide safety of principal and maximize total return after taking account of federal taxes (and, in the case of the Intermediate California Municipal Portfolio, California state taxes and, in the case of the Intermediate New York Municipal Portfolio, New York state and local taxes).
NAV RETURNS AS OF MARCH 31, 2021 (unaudited)
| 6 Months | 12 Months | |||||||
| AB INTERMEDIATE CALIFORNIA MUNICIPAL PORTFOLIO | ||||||||
| Class A Shares | 1.34% | 5.66% | ||||||
| Class C Shares | 0.96% | 4.87% | ||||||
| Advisor Class Shares1 | 1.47% | 5.92% | ||||||
| Bloomberg Barclays 5-Year GO Municipal Bond Index | 0.28% | 4.29% | ||||||
| Lipper California Intermediate Municipal Debt Funds Average | 0.90% | 4.65% | ||||||
| 6 Months | 12 Months | |||||||
| AB INTERMEDIATE DIVERSIFIED MUNICIPAL PORTFOLIO | ||||||||
| Class A Shares | 1.79% | 5.93% | ||||||
| Class C Shares | 1.34% | 5.14% | ||||||
| Advisor Class Shares1 | 1.92% | 6.20% | ||||||
| Class Z Shares1 | 1.93% | 6.22% | ||||||
| Bloomberg Barclays 5-Year GO Municipal Bond Index | 0.28% | 4.29% | ||||||
| Lipper Intermediate Municipal Debt Funds Average | 1.69% | 5.80% | ||||||
| 1 | Please note that these share classes are for investors purchasing shares through accounts established under certain fee-based programs sponsored and maintained by certain broker-dealers and financial intermediaries, institutional pension plans and/or investment advisory clients of, and certain other persons associated with, the Adviser and its affiliates or the Portfolio. |
2 | AB INTERMEDIATE MUNICIPAL PORTFOLIOS | abfunds.com | |
Table of Contents
NAV RETURNS AS OF MARCH 31, 2021 (unaudited)
| 6 Months | 12 Months | |||||||
| AB INTERMEDIATE NEW YORK MUNICIPAL PORTFOLIO | ||||||||
| Class A Shares | 2.38% | 5.46% | ||||||
| Class C Shares | 2.07% | 4.75% | ||||||
| Advisor Class Shares1 | 2.51% | 5.81% | ||||||
| Bloomberg Barclays 5-Year GO Municipal Bond Index | 0.28% | 4.29% | ||||||
| Lipper New York Intermediate Municipal Debt Funds Average | 1.75% | 4.27% | ||||||
| 1 | Please note that this share class is for investors purchasing shares through accounts established under certain fee-based programs sponsored and maintained by certain broker-dealers and financial intermediaries, institutional pension plans and/or investment advisory clients of, and certain other persons associated with, the Adviser and its affiliates or the Portfolio. |
INVESTMENT RESULTS
The preceding tables show performance for each Portfolio compared to its benchmark, the Bloomberg Barclays 5-Year General Obligation (“GO”) Municipal Bond Index, for the six- and 12-month periods ended March 31, 2021. The tables also include performance for each Portfolio’s peer group, as represented by the Lipper California Intermediate Municipal Debt Funds Average for the Intermediate California Municipal Portfolio, the Lipper Intermediate Municipal Debt Funds Average for the Intermediate Diversified Municipal Portfolio and the Lipper New York Intermediate Municipal Debt Funds Average for the Intermediate New York Municipal Portfolio. Funds in each Lipper Average have generally similar investment objectives to the Portfolios, although some of the funds have different investment policies, sales and management fees, and fund expenses.
During both periods, all share classes of the Intermediate California Municipal Portfolio and the Intermediate New York Municipal Portfolio outperformed the benchmark and the Lipper Average, before sales charges. During both periods, all share classes of the Intermediate Diversified Municipal Portfolio outperformed the benchmark, before sales charges, while all share classes except Class C outperformed the Lipper Average.
For both periods, the Portfolios’ outperformance versus the benchmark was largely attributable to an overweight to municipal credit, as spreads tightened after the 1Q:20 market dislocation. The Portfolios’ allocation to inflation hedges through the employment of Consumer Price Index swaps contributed as the economy continued to rebound. The Portfolios’ allocation to taxable bonds detracted from returns as tax-exempts outperformed.
The Portfolios utilized interest rate swaps for hedging purposes and credit default swaps for investment purposes, which had no material impact on absolute returns for either period. The Portfolios utilized inflation swaps for hedging purposes, which added to returns for both periods.
| abfunds.com | AB INTERMEDIATE MUNICIPAL PORTFOLIOS | 3 | |
Table of Contents
MARKET REVIEW AND INVESTMENT STRATEGY
During the six-month period ended March 31, 2021, the US economy moved closer to a full reopening and equity markets continued to rally, while interest rates and inflation expectations rose in anticipation of stronger growth ahead. The yield on the 10-year US Treasury rose 83 basis points (“b.p.”) in 2021, to 1.75% as of March 31, 2021. On the bright side for muni investors is that the 10-year AAA municipal bond yield rose just 41 b.p. to 1.12% in the same period—only around half as much as the 10-year Treasury. Municipals posted negative absolute quarterly returns but very strong relative returns compared to other fixed-income asset classes such as US Treasuries and US investment-grade corporates. The two main catalysts behind the municipal market’s outperformance were strong investor demand and generally improving fundamentals among municipal issuers. The first quarter of 2021 saw investors pour $32 billion into the market, on pace for a new calendar-year record, and marked 11 consecutive months of inflows following the dramatic sell-off in municipals associated with the 2020 pandemic.
Demand for income was very apparent during the quarter, as BBB-rated and high-yield credit spreads compressed—42 b.p. and 58 b.p., respectively—leading to outperformance by those credit indices versus high-grade counterparts. Investor concerns around issuer credit fundamentals were calmed by a combination of much better-than-expected tax revenue collections as well as a bevy of stimulus for municipal issuers from the federal government. Municipalities benefited from three separate stimulus packages. First was the CARES Act that supplied a much needed $347 billion to issuers. It has since been supplemented by a package passed in late December 2020, which had $167 billion appropriated for various municipal sectors. Finally, the American Rescue Plan Act, which supplied a whopping $649 billion for issuers. Public rating agencies reacted to the positive credit trends, evidenced by S&P 500’s removal of several noteworthy negative outlooks on large sectors, including state and local governments, school districts, mass transits, airports, toll roads and specific issuers such as the state of Illinois.
The Portfolios maintained an overweight to credit throughout the reporting period, and the Portfolios’ Senior Investment Management Team (“the Team”) increased this overweight starting in late March 2020. That said, in recognition of the uncertain path of both the virus and the economy, the Team added this risk cautiously through security selection by favoring issuers with liquidity.
The Portfolios may purchase municipal securities that are insured under policies issued by certain insurance companies. Historically, insured municipal securities typically received a higher credit rating, which meant that the issuer of the securities paid a lower interest rate. As a result of declines in the credit quality and associated downgrades of most bond insurers, insurance has less value than it did in the past. The market now
4 | AB INTERMEDIATE MUNICIPAL PORTFOLIOS | abfunds.com | |
Table of Contents
values insured municipal securities primarily based on the credit quality of the issuer of the security with little value given to the insurance feature. In purchasing such insured securities, the Adviser evaluates the risk and return of municipal securities through its own research. If an insurance company’s rating is downgraded or the company becomes insolvent, the prices of municipal securities insured by the insurance company may decline. As of March 31, 2021, the Portfolios’ percentages of investments in municipal bonds that are insured and insured municipal bonds that have been pre-refunded or escrowed to maturity were 4.30% and 0.00%, respectively, for the Intermediate California Municipal Portfolio; 4.42% and 0.00%, respectively, for the Intermediate Diversified Municipal Portfolio; and 3.60% and 0.30%, respectively, for the Intermediate New York Municipal Portfolio.
INVESTMENT POLICIES
As a matter of fundamental policy, the Portfolios, under normal circumstances, invest at least 80% of their net assets in municipal securities (and, in the case of the Intermediate California Municipal and Intermediate New York Municipal Portfolios, municipal securities issued by the State of California or the State of New York, or their political subdivisions, or otherwise exempt from California or New York state income tax, respectively). The Intermediate Diversified Municipal Portfolio invests no more than 25% of its total assets in municipal securities of issuers located in any one state. Each of the Portfolios invests at least 80% of its total assets in municipal securities rated A or better by national rating agencies (or, if unrated, determined by the Adviser to be of comparable quality) and comparably rated municipal notes. The Portfolios may invest up to 20% of their total assets in fixed-income securities rated BB or B by national rating agencies, which are not investment-grade (commonly known as “junk bonds”).
The Portfolios may invest, without limit, in revenue bonds, which generally do not have the pledge of the credit of the issuer. The Portfolios may invest, without limit, in securities or obligations that are related in such a way that business or political developments or changes affecting one such security could also affect the others (for example, securities with interest that is paid from projects of a similar type). Each of the Portfolios may invest up to 20% of their net assets in fixed-income securities of US issuers that are not municipal securities if, in the Adviser’s opinion, these securities will enhance the after-tax return for investors. The Portfolios may use derivatives, such as options, futures contracts, forward contracts and swaps. In managing the Portfolios, the Adviser may use interest-rate forecasting to estimate an appropriate level of interest-rate risk at a given time.
(continued on next page)
| abfunds.com | AB INTERMEDIATE MUNICIPAL PORTFOLIOS | 5 | |
Table of Contents
Each Portfolio seeks to maintain an effective duration of three and one-half years to seven years under normal market conditions. Within the ranges described in the prospectus, the Adviser may moderately shorten the average duration of the Portfolios when it expects interest rates to rise and moderately lengthen average duration when it anticipates that interest rates will fall.
The Intermediate California Municipal and Intermediate New York Municipal Portfolios are “non-diversified,” which means that they may concentrate their assets in a smaller number of issuers than a diversified fund.
6 | AB INTERMEDIATE MUNICIPAL PORTFOLIOS | abfunds.com | |
Table of Contents
DISCLOSURES AND RISKS
Benchmark Disclosure
The Bloomberg Barclays 5-Year GO Municipal Bond Index is unmanaged and does not reflect fees and expenses associated with the active management of a mutual fund portfolio. The Bloomberg Barclays 5-Year GO Municipal Bond Index represents the performance of long-term, investment-grade tax-exempt bonds with maturities ranging from four to six years. An investor cannot invest directly in an index or average, and their results are not indicative of the performance for any specific investment, including the Portfolios.
A Word About Risk
Cybersecurity Risk: Cybersecurity incidents, both intentional and unintentional, may allow an unauthorized party to gain access to Portfolio assets, customer data (including private shareholder information), or proprietary information, or cause the Portfolios, the Adviser, and/or its service providers (including, but not limited to, fund accountants, custodians, sub-custodians, transfer agents and financial intermediaries) to suffer data breaches, data corruption or lose operational functionality, or prevent Portfolio investors from purchasing, redeeming or exchanging shares or receiving distributions. A Portfolio and the Adviser have limited ability to prevent or mitigate cybersecurity incidents affecting third-party service providers. Cybersecurity incidents may result in financial losses to such Portfolio and its shareholders, and substantial costs may be incurred in order to prevent any future cybersecurity incidents.
Interest-Rate Risk: Changes in interest rates will affect the value of investments in fixed-income securities. When interest rates rise, the value of existing investments in fixed-income securities tends to fall and this decrease in value may not be offset by higher income from new investments. Interest-rate risk is generally greater for fixed-income securities with longer maturities or durations. The current historically low interest rate environment heightens the risks associated with rising interest rates.
Credit Risk: This is the risk that the issuer or the guarantor of a debt security, or the counterparty to a derivatives or other contract, will be unable or unwilling to make timely principal and/or interest payments, or to otherwise honor its obligations. The issuer or guarantor may default, potentially causing a loss of the full principal amount of a security and accrued interest. The degree of risk for a particular security may be reflected in its credit rating. The credit rating of a fixed-income security may be downgraded after purchase, which may adversely affect the value of the security. Investments in fixed-income securities with lower ratings tend to have a higher probability that an issuer will default or fail to meet its payment obligations, making credit risk greater for medium-quality and lower-rated debt securities. Lower-rated debt securities and similar unrated securities (commonly known
| abfunds.com | AB INTERMEDIATE MUNICIPAL PORTFOLIOS | 7 | |
Table of Contents
DISCLOSURES AND RISKS (continued)
as “junk bonds”) have speculative elements or are predominantly speculative credit risks. At times when credit risk is perceived to be greater, credit “spreads” (i.e., the difference between the yields on lower quality securities and the yields on higher quality securities) may get larger or “widen”. As a result, the values of the lower quality securities may go down more and they may become harder to sell.
Duration Risk: The duration of a fixed-income security may be shorter than or equal to full maturity of the fixed-income security. Fixed-income securities with longer durations have more interest-rate risk and will decrease in price as interest rates rise. Securities that have final maturities longer than their durations may be affected by increased credit spreads to a far greater degree than their durations would suggest, because they are exposed to credit risk until final maturity.
Municipal Market Risk: This is the risk that special factors may adversely affect the value of municipal securities and have a significant effect on the yield or value of the Portfolios’ investments in municipal securities. These factors include economic conditions, political or legislative changes, uncertainties related to the tax status of municipal securities, or the rights of investors in these securities. The value of municipal securities may also be adversely affected by rising health care costs, increasing unfunded pension liabilities, and by the phasing out of federal programs providing financial support. In recent periods, a number of municipal issuers have defaulted on obligations, been downgraded or commenced insolvency proceedings. Financial difficulties of municipal issuers may continue or get worse, particularly in light of the economic impact of the recent spread of a novel coronavirus (COVID-19). To the extent the Portfolios invest in a particular state’s municipal securities, they may be vulnerable to events adversely affecting that state, including economic, political and regulatory occurrences, court decisions, terrorism, public health crises (including the occurrence of a contagious disease or illness) and catastrophic natural disasters, such as hurricanes, wildfires and earthquakes. The Portfolios’ investments in certain municipal securities with principal and interest payments that are made from the revenues of a specific project or facility, and not general tax revenues, are subject to the risk that factors affecting the project or facility, such as local business or economic conditions, could have a significant effect on the project’s ability to make payments of principal and interest on these securities.
In addition, tax law changes enacted as part of the Tax Cuts and Jobs Act of 2017 could have a material impact on the value of municipal securities. Because advance refunding bonds issued after December 31, 2017 are no longer tax exempt, the total supply of municipal bonds could decrease going forward. In addition, the reduction of the US corporate income tax
8 | AB INTERMEDIATE MUNICIPAL PORTFOLIOS | abfunds.com | |
Table of Contents
DISCLOSURES AND RISKS (continued)
rate to 21% could make municipal obligations less attractive to certain institutional investors such as banks and property and casualty insurance companies, resulting in lower demand for municipal obligations. Changes in tax rates or the treatment of income from certain types of municipal securities, among other things, could negatively affect the municipal securities markets.
The Portfolios may invest in municipal securities of issuers in Puerto Rico or other US territories and their governmental agencies and municipalities, which are exempt from federal, state, and, where applicable, local income taxes. These municipal securities may have more risks than those of other US issuers of municipal securities. Like many US states and municipalities, Puerto Rico experienced a significant downturn in the 2007–2009 recession. Puerto Rico’s downturn was particularly severe. In addition, Hurricane Maria caused significant damage to Puerto Rico. Hurricane Maria and severe weather events that may occur in the future could have significant and long-lasting impacts on Puerto Rico’s economy. Puerto Rico continues to face a very challenging economic and fiscal environment, worsened by the spread of COVID-19 and the adverse effect that related governmental and public responses have had on Puerto Rico’s economy. If the general economic situation in Puerto Rico continues to persist or worsens, the volatility and credit quality of Puerto Rican municipal securities could continue to be adversely affected, and the market for such securities may deteriorate further.
Inflation Risk: This is the risk that the value of assets or income from investments will be less in the future as inflation decreases the value of money. As inflation increases, the value of the Portfolios’ assets can decline as can the value of the Portfolios’ distributions. This risk is significantly greater for fixed-income securities with longer maturities.
Non-Diversification Risk: Concentration of investments in a small number of securities tends to increase risk. The Intermediate California Municipal and Intermediate New York Municipal Portfolios may have more risk because they are “non-diversified”, meaning that they can invest more of their assets in a relatively small number of issuers with greater concentration of risk. Matters affecting these issuers can have a more significant effect on the Portfolios’ net asset value (“NAV”).
Illiquid Investments Risk: Illiquid investments risk exists when particular investments are difficult to purchase or sell, possibly preventing the Portfolios from purchasing or selling these securities at an advantageous price. Over recent years, regulatory changes have led to reduced liquidity in the marketplace, and the capacity of dealers to make markets in fixed-income securities has been outpaced by the growth in the size of the fixed-income
| abfunds.com | AB INTERMEDIATE MUNICIPAL PORTFOLIOS | 9 | |
Table of Contents
DISCLOSURES AND RISKS (continued)
markets. Illiquid investments risk may be magnified in a rising interest-rate environment, where the value and liquidity of fixed-income securities generally go down. The Portfolios are subject to greater risk because the market for municipal securities is generally smaller than many other markets, which may make municipal securities more difficult to trade or dispose of than other types of securities. Illiquid securities may also be difficult to value.
Redemption Risk: The Portfolios may experience heavy redemptions that could cause the Portfolios to liquidate their assets at inopportune times or unfavorable prices or increase or accelerate taxable gains or transaction costs and may negatively affect the Portfolios’ net asset value, or performance, which could cause the value of your investment to decline. Redemption risk is heightened during periods of overall market turmoil.
Derivatives Risk: The Portfolios may use derivatives as direct investments to earn income, enhance return and broaden portfolio diversification, which entail greater risk than if used solely for hedging purposes. In addition to other risks such as the credit risk of the counterparty, derivatives involve the risk that changes in the value of the derivative may not correlate with relevant assets, rates or indices. Derivatives may be difficult to price or unwind, and small changes may produce disproportionate losses for the Portfolios. Certain derivatives have the potential for unlimited loss, regardless of the size of the initial investment. Assets required to be set aside or posted to cover or secure derivatives positions may themselves go down in value, and these collateral and other requirements may limit investment flexibility. Some derivatives involve leverage, which can make the Portfolios more volatile and can compound other risks. Derivatives, especially over-the-counter derivatives, are also subject to counterparty risk. Use of derivatives may have different tax consequences for the Portfolios than an investment in the underlying asset or index, and such differences may affect the amount, timing and character of income distributed to shareholders. The US government and certain foreign governments have adopted regulations governing derivatives markets, including mandatory clearing of certain derivatives and may impose additional regulations governing, margin, reporting and registration requirements. The ultimate impact of the regulations remains unclear. Additional regulation may make derivatives more costly, limit their availability or utility, otherwise adversely affect their performance, or disrupt markets.
Management Risk: The Portfolios are subject to management risk because they are actively managed investment portfolios. The Adviser will apply its investment techniques and risk analyses in making investment decisions for the Portfolios, but these techniques, analyses and decisions may not work as intended or may not produce the desired results, and may, during certain periods, result in increased volatility for the Portfolios or
10 | AB INTERMEDIATE MUNICIPAL PORTFOLIOS | abfunds.com | |
Table of Contents
DISCLOSURES AND RISKS (continued)
cause the value of the Portfolios’ shares to go down. In some cases, derivatives and other investment techniques may be unavailable, or the Adviser may determine not to use them, possibly even under market conditions where their use could benefit the Portfolios. Some of these techniques may incorporate, or rely upon, quantitative models, but there is no guarantee that these models will generate accurate forecasts, reduce risk or otherwise perform as expected. In addition, the Adviser may change the Portfolios’ investment strategies or policies from time to time. Those changes may not lead to the results intended by the Adviser and could have an adverse effect on the value or performance of the Portfolios.
Market Risk: The Portfolios are subject to market risk, which is the risk that stock prices in general or in particular countries or sectors may decline over short or extended periods. Stock prices may decline in response to adverse changes in the economy or the economic outlook; deterioration in investor sentiment; interest rate, currency and commodity price fluctuations; adverse geopolitical, social or environmental developments; issuer- and sector-specific considerations; public health crises (including the occurrence of a contagious disease or illness); and other factors. In the past decade, financial markets in the United States, Europe and elsewhere have experienced increased volatility, decreased liquidity and heightened uncertainty. These market conditions may recur from time to time and have an adverse impact on various securities markets. Recently, certain governments and central banks have provided significant support to financial markets in response to serious economic disruptions, including, but not limited to, buying stocks, providing direct capital infusions into companies, implementing new monetary programs, dramatically lowering interest rates and through other market interventions. This and other government intervention into the economy and financial markets may not work as intended, particularly if the efforts are perceived by investors as being unlikely to achieve the desired results. Government actions to support the economy and financial markets have resulted in a large expansion of government deficits and debt, the long-term consequences of which are not known. The reversal of these policies, or their ineffectiveness, as well as further governmental or central bank actions could negatively affect financial markets generally, increase market volatility and reduce the value and liquidity of securities in which the Portfolios invest.
In addition, policy and legislative changes in the United States and in other countries are affecting many aspects of financial regulation, and may in some instances contribute to decreased liquidity and increased volatility in the financial markets. The impact of these changes, and the practical implications for market participants, may not be fully known for some time.
Tax Risk: There is no guarantee that the income on the Portfolios’ municipal securities will be exempt from regular federal income, and if applicable, state
| abfunds.com | AB INTERMEDIATE MUNICIPAL PORTFOLIOS | 11 | |
Table of Contents
DISCLOSURES AND RISKS (continued)
income taxes. Unfavorable legislation, adverse interpretations by federal or state authorities, litigation or noncompliant conduct by the issuer of a municipal security could affect the tax-exempt status of municipal securities. If the Internal Revenue Service or a state authority determines that an issuer of a municipal security has not complied with applicable requirements, interest from the security could become subject to regular federal income tax and/or state personal income tax, possibly retroactively to the date the security was issued, the value of the security could decline significantly, and a portion of the distributions to Portfolio shareholders could be recharacterized as taxable. The US Congress has considered changes to US federal tax law that would, if enacted, have a negative impact on certain types of municipal securities, such as private activity bonds, or would otherwise make investments in municipal bonds less attractive.
Lower-rated Securities Risk: Lower-rated securities, or junk bonds/high-yield securities, are subject to greater risk of loss of principal and interest and greater market risk than higher-rated securities. The capacity of issuers of lower-rated securities to pay interest and repay principal is more likely to weaken than is that of issuers of higher-rated securities in times of deteriorating economic conditions or rising interest rates.
Prepayment and Extension Risk: Prepayment risk is the risk that a loan, bond or other security might be called or otherwise converted, prepaid or redeemed before maturity. If this happens, particularly during a time of declining interest rates or credit spreads, the Portfolios will not benefit from the rise in market price that normally accompanies a decline in interest rates, and may not be able to invest the proceeds in securities providing as much income, resulting in a lower yield to the Portfolios. Conversely, extension risk is the risk that as interest rates rise or spreads widen, payments of securities may occur more slowly than anticipated by the market. If this happens, the values of these securities may go down because their interest rates are lower than current market rates and they remain outstanding longer than anticipated.
These risks are fully discussed in the Portfolios’ prospectus. As with all investments, you may lose money by investing in the Portfolios.
An Important Note About Historical Performance
The investment return and principal value of an investment in the Portfolios will fluctuate, so that shares, when redeemed, may be worth more or less than their original cost. Performance shown in this report represents past performance and does not guarantee future results. Current performance may be lower or higher than the performance information shown. You may obtain performance information current to the most recent month-end by visiting www.abfunds.com. Class B shares are no longer being offered.
12 | AB INTERMEDIATE MUNICIPAL PORTFOLIOS | abfunds.com | |
Table of Contents
DISCLOSURES AND RISKS (continued)
Effective November 7, 2019, all outstanding Class B shares were converted to Class A shares. Please see Note A for more information.
All fees and expenses related to the operation of the Portfolios have been deducted. NAV returns do not reflect sales charges; if sales charges were reflected, the Portfolios’ quoted performance would be lower. SEC returns reflect the applicable sales charges for each share class: a 3.00% maximum front-end sales charge for Class A shares and a 1% 1-year contingent deferred sales charge for Class C shares. Returns for the different share classes will vary due to different expenses associated with each class. Performance assumes reinvestment of distributions and does not account for taxes.
| abfunds.com | AB INTERMEDIATE MUNICIPAL PORTFOLIOS | 13 | |
Table of Contents
HISTORICAL PERFORMANCE
INTERMEDIATE CALIFORNIA MUNICIPAL PORTFOLIO
AVERAGE ANNUAL RETURNS AS OF MARCH 31, 2021 (unaudited)
| NAV Returns | SEC Returns (reflects applicable sales charges) | SEC Yields1 | Taxable Equivalent Yields2 | |||||||||||||
| CLASS A SHARES | 0.19% | 0.34% | ||||||||||||||
| 1 Year | 5.66% | 2.52% | ||||||||||||||
| 5 Years | 1.97% | 1.35% | ||||||||||||||
| 10 Years | 2.43% | 2.12% | ||||||||||||||
| CLASS C SHARES | -0.55% | -0.98% | ||||||||||||||
| 1 Year | 4.87% | 3.87% | ||||||||||||||
| 5 Years | 1.22% | 1.22% | ||||||||||||||
| 10 Years3 | 1.69% | 1.69% | ||||||||||||||
| ADVISOR CLASS SHARES4 | 0.44% | 0.78% | ||||||||||||||
| 1 Year | 5.92% | 5.92% | ||||||||||||||
| Since Inception5 | 2.08% | 2.08% | ||||||||||||||
The Portfolio’s current prospectus fee table shows the Portfolio’s total annual operating expense ratios as 0.73%, 1.48% and 0.49% for Class A, Class C and Advisor Class shares, respectively. The Financial Highlights section of this report sets forth expense ratio data for the current reporting period; the expense ratios shown above may differ from the expense ratios in the Financial Highlights section since they are based on different time periods.
| 1 | SEC yields are calculated based on SEC guidelines for the 30-day period ended March 31, 2021. |
| 2 | Taxable equivalent yields are based on SEC yields and a 35% marginal federal income tax rate and maximum state taxes where applicable. |
| 3 | Assumes conversion of Class C shares into Class A shares after 10 years. |
| 4 | This share class is offered at NAV to eligible investors and the SEC returns are the same as the NAV returns. Please note that this share class is for investors purchasing shares through accounts established under certain fee-based programs sponsored and maintained by certain broker-dealers and financial intermediaries, institutional pension plans and/or investment advisory clients of, and certain other persons associated with, the Adviser and its affiliates or the Portfolio. |
| 5 | Inception date: 7/25/2016. |
14 | AB INTERMEDIATE MUNICIPAL PORTFOLIOS | abfunds.com | |
Table of Contents
HISTORICAL PERFORMANCE (continued)
INTERMEDIATE CALIFORNIA MUNICIPAL PORTFOLIO
SEC AVERAGE ANNUAL RETURNS
AS OF THE MOST RECENT CALENDAR QUARTER-END
MARCH 31, 2021 (unaudited)
| SEC Returns (reflects applicable sales charges) | ||||
| CLASS A SHARES | ||||
| 1 Year | 2.52% | |||
| 5 Years | 1.35% | |||
| 10 Years | 2.12% | |||
| CLASS C SHARES | ||||
| 1 Year | 3.87% | |||
| 5 Years | 1.22% | |||
| 10 Years1 | 1.69% | |||
| ADVISOR CLASS SHARES2 | ||||
| 1 Year | 5.92% | |||
| Since Inception3 | 2.08% | |||
| 1 | Assumes conversion of Class C shares into Class A shares after 10 years. |
| 2 | Please note that this share class is for investors purchasing shares through accounts established under certain fee-based programs sponsored and maintained by certain broker-dealers and financial intermediaries, institutional pension plans and/or investment advisory clients of, and certain other persons associated with, the Adviser and its affiliates or the Portfolio. |
| 3 | Inception date: 7/25/2016. |
| abfunds.com | AB INTERMEDIATE MUNICIPAL PORTFOLIOS | 15 | |
Table of Contents
HISTORICAL PERFORMANCE
INTERMEDIATE DIVERSIFIED MUNICIPAL PORTFOLIO
AVERAGE ANNUAL RETURNS AS OF MARCH 31, 2021 (unaudited)
| NAV Returns | SEC Returns (reflects applicable sales charges) | SEC Yields1 | Taxable Equivalent Yields2 | |||||||||||||
| CLASS A SHARES | 0.27% | 0.42% | ||||||||||||||
| 1 Year | 5.93% | 2.75% | ||||||||||||||
| 5 Years | 2.20% | 1.59% | ||||||||||||||
| 10 Years | 2.52% | 2.21% | ||||||||||||||
| CLASS C SHARES | -0.46% | -0.71% | ||||||||||||||
| 1 Year | 5.14% | 4.14% | ||||||||||||||
| 5 Years | 1.43% | 1.43% | ||||||||||||||
| 10 Years3 | 1.77% | 1.77% | ||||||||||||||
| ADVISOR CLASS SHARES4 | 0.53% | 0.82% | ||||||||||||||
| 1 Year | 6.20% | 6.20% | ||||||||||||||
| 5 Years | 2.43% | 2.43% | ||||||||||||||
| Since Inception5 | 2.73% | 2.73% | ||||||||||||||
| CLASS Z SHARES4 | 0.56% | 0.86% | ||||||||||||||
| 1 Year | 6.22% | 6.22% | ||||||||||||||
| Since Inception5 | 4.08% | 4.08% | ||||||||||||||
The Portfolio’s current prospectus fee table shows the Portfolio’s total annual operating expense ratios as 0.67%, 1.43%, 0.39% and 0.43% for Class A, Class C, Advisor Class and Class Z shares, respectively. The Financial Highlights section of this report sets forth expense ratio data for the current reporting period; the expense ratios shown above may differ from the expense ratios in the Financial Highlights section since they are based on different time periods.
| 1 | SEC yields are calculated based on SEC guidelines for the 30-day period ended March 31, 2021. |
| 2 | Taxable equivalent yields are based on SEC yields and a 35% marginal federal income tax rate and maximum state taxes where applicable. |
| 3 | Assumes conversion of Class C shares into Class A shares after 10 years. |
| 4 | These share classes are offered at NAV to eligible investors and their SEC returns are the same as their NAV returns. Please note that these share classes are for investors purchasing shares through accounts established under certain fee-based programs sponsored and maintained by certain broker-dealers and financial intermediaries, institutional pension plans and/or investment advisory clients of, and certain other persons associated with, the Adviser and its affiliates or the Portfolio. |
| 5 | Inception dates: 6/26/2015 for Advisor Class shares; 7/2/2018 for Class Z shares. |
16 | AB INTERMEDIATE MUNICIPAL PORTFOLIOS | abfunds.com | |
Table of Contents
HISTORICAL PERFORMANCE (continued)
INTERMEDIATE DIVERSIFIED MUNICIPAL PORTFOLIO
SEC AVERAGE ANNUAL RETURNS
AS OF THE MOST RECENT CALENDAR QUARTER-END
MARCH 31, 2021 (unaudited)
| SEC Returns (reflects applicable sales charges) | ||||
| CLASS A SHARES | ||||
| 1 Year | 2.75% | |||
| 5 Years | 1.59% | |||
| 10 Years | 2.21% | |||
| CLASS C SHARES | ||||
| 1 Year | 4.14% | |||
| 5 Years | 1.43% | |||
| 10 Years1 | 1.77% | |||
| ADVISOR CLASS SHARES2 | ||||
| 1 Year | 6.20% | |||
| 5 Years | 2.43% | |||
| Since Inception3 | 2.73% | |||
| CLASS Z SHARES2 | ||||
| 1 Year | 6.22% | |||
| Since Inception3 | 4.08% | |||
| 1 | Assumes conversion of Class C shares into Class A shares after 10 years. |
| 2 | Please note that these share classes are for investors purchasing shares through accounts established under certain fee-based programs sponsored and maintained by certain broker-dealers and financial intermediaries, institutional pension plans and/or investment advisory clients of, and certain other persons associated with, the Adviser and its affiliates or the Portfolio. |
| 3 | Inception dates: 6/26/2015 for Advisor Class shares; 7/2/2018 for Class Z shares. |
| abfunds.com | AB INTERMEDIATE MUNICIPAL PORTFOLIOS | 17 | |
Table of Contents
HISTORICAL PERFORMANCE
INTERMEDIATE NEW YORK MUNICIPAL PORTFOLIO
AVERAGE ANNUAL RETURNS AS OF MARCH 31, 2021 (unaudited)
| NAV Returns | SEC Returns (reflects applicable sales charges) | SEC Yields1 | Taxable Equivalent Yields2 | |||||||||||||
| CLASS A SHARES | 0.27% | 0.46% | ||||||||||||||
| 1 Year | 5.46% | 2.27% | ||||||||||||||
| 5 Years | 1.97% | 1.35% | ||||||||||||||
| 10 Years | 2.39% | 2.08% | ||||||||||||||
| CLASS C SHARES | -0.46% | -0.78% | ||||||||||||||
| 1 Year | 4.75% | 3.75% | ||||||||||||||
| 5 Years | 1.22% | 1.22% | ||||||||||||||
| 10 Years3 | 1.65% | 1.65% | ||||||||||||||
| ADVISOR CLASS SHARES4 | 0.52% | 0.88% | ||||||||||||||
| 1 Year | 5.81% | 5.81% | ||||||||||||||
| Since Inception5 | 2.06% | 2.06% | ||||||||||||||
The Portfolio’s current prospectus fee table shows the Portfolio’s total annual operating expense ratios as 0.72%, 1.48% and 0.47% for Class A, Class C and Advisor Class shares, respectively. The Financial Highlights section of this report sets forth expense ratio data for the current reporting period; the expense ratios shown above may differ from the expense ratios in the Financial Highlights section since they are based on different time periods.
| 1 | SEC yields are calculated based on SEC guidelines for the 30-day period ended March 31, 2021. |
| 2 | Taxable equivalent yields are based on SEC yields and a 35% marginal federal income tax rate and maximum state taxes where applicable. |
| 3 | Assumes conversion of Class C shares into Class A shares after 10 years. |
| 4 | This share class is offered at NAV to eligible investors and the SEC returns are the same as the NAV returns. Please note that this share class is for investors purchasing shares through accounts established under certain fee-based programs sponsored and maintained by certain broker-dealers and financial intermediaries, institutional pension plans and/or investment advisory clients of, and certain other persons associated with, the Adviser and its affiliates or the Portfolio. |
| 5 | Inception date: 7/25/2016. |
18 | AB INTERMEDIATE MUNICIPAL PORTFOLIOS | abfunds.com | |
Table of Contents
HISTORICAL PERFORMANCE (continued)
INTERMEDIATE NEW YORK MUNICIPAL PORTFOLIO
SEC AVERAGE ANNUAL RETURNS
AS OF THE MOST RECENT CALENDAR QUARTER-END
MARCH 31, 2021 (unaudited)
| SEC Returns (reflects applicable sales charges) | ||||
| CLASS A SHARES | ||||
| 1 Year | 2.27% | |||
| 5 Years | 1.35% | |||
| 10 Years | 2.08% | |||
| CLASS C SHARES | ||||
| 1 Year | 3.75% | |||
| 5 Years | 1.22% | |||
| 10 Years1 | 1.65% | |||
| ADVISOR CLASS SHARES2 | ||||
| 1 Year | 5.81% | |||
| Since Inception3 | 2.06% | |||
| 1 | Assumes conversion of Class C shares into Class A shares after 10 years. |
| 2 | Please note that this share class is for investors purchasing shares through accounts established under certain fee-based programs sponsored and maintained by certain broker-dealers and financial intermediaries, institutional pension plans and/or investment advisory clients of, and certain other persons associated with, the Adviser and its affiliates or the Portfolio. |
| 3 | Inception date: 7/25/2016. |
| abfunds.com | AB INTERMEDIATE MUNICIPAL PORTFOLIOS | 19 | |
Table of Contents
EXPENSE EXAMPLE
(unaudited)
As a shareholder of a Portfolio, you incur two types of costs: (1) transaction costs, including sales charges (loads) on purchase payments, contingent deferred sales charges on redemptions and (2) ongoing costs, including management fees; distribution (12b-1) fees; and other Portfolio expenses. This example is intended to help you understand your ongoing costs (in dollars) of investing in the Portfolio and to compare these costs with the ongoing costs of investing in other mutual funds.
The Example is based on an investment of $1,000 invested at the beginning of the period and held for the entire period as indicated below.
Actual Expenses
The first line of the table below provides information about actual account values and actual expenses. You may use the information in this line, together with the amount you invested, to estimate the expenses that you paid over the period. Simply divide your account value by $1,000 (for example, an $8,600 account value divided by $1,000 = 8.6), then multiply the result by the number in the first line under the heading entitled “Expenses Paid During Period” to estimate the expenses you paid on your account during this period.
Hypothetical Example for Comparison Purposes
The second line of the table below provides information about hypothetical account values and hypothetical expenses based on a Portfolio’s actual expense ratio and an assumed annual rate of return of 5% before expenses, which is not the Portfolio’s actual return. The hypothetical account values and expenses may not be used to estimate the actual ending account balance or expenses you paid for the period. You may use this information to compare the ongoing costs of investing in the Portfolio and other funds by comparing this 5% hypothetical example with the 5% hypothetical examples that appear in the shareholder reports of other funds.
Please note that the expenses shown in the table are meant to highlight your ongoing costs only and do not reflect any transactional costs, such as sales charges (loads), or contingent deferred sales charges on redemptions. Therefore, the second line of the table is useful in comparing ongoing costs only, and will not help you determine the relative total costs of owning different funds. In addition, if these transactional costs were included, your costs would have been higher.
20 | AB INTERMEDIATE MUNICIPAL PORTFOLIOS | abfunds.com | |
Table of Contents
EXPENSE EXAMPLE (continued)
(unaudited)
California Municipal Portfolio
| Beginning Account Value October 1, 2020 | Ending Account Value March 31, 2021 | Expenses Paid During Period* | Annualized Expense Ratio* | |||||||||||||
| Class A | ||||||||||||||||
Actual | $ | 1,000 | $ | 1,013.40 | $ | 3.66 | 0.73 | % | ||||||||
Hypothetical** | $ | 1,000 | $ | 1,021.29 | $ | 3.68 | 0.73 | % | ||||||||
| Class C | ||||||||||||||||
Actual | $ | 1,000 | $ | 1,009.60 | $ | 7.42 | 1.48 | % | ||||||||
Hypothetical** | $ | 1,000 | $ | 1,017.55 | $ | 7.44 | 1.48 | % | ||||||||
| Advisor Class | ||||||||||||||||
Actual | $ | 1,000 | $ | 1,014.70 | $ | 2.41 | 0.48 | % | ||||||||
Hypothetical** | $ | 1,000 | $ | 1,022.54 | $ | 2.42 | 0.48 | % | ||||||||
Diversified Municipal Portfolio
| Beginning Account Value October 1, 2020 | Ending Account Value March 31, 2021 | Expenses Paid During Period* | Annualized Expense Ratio* | |||||||||||||
| Class A | ||||||||||||||||
Actual | $ | 1,000 | $ | 1,017.90 | $ | 3.32 | 0.66 | % | ||||||||
Hypothetical** | $ | 1,000 | $ | 1,021.64 | $ | 3.33 | 0.66 | % | ||||||||
| Class C | ||||||||||||||||
Actual | $ | 1,000 | $ | 1,013.40 | $ | 7.08 | 1.41 | % | ||||||||
Hypothetical** | $ | 1,000 | $ | 1,017.90 | $ | 7.09 | 1.41 | % | ||||||||
| Advisor Class | ||||||||||||||||
Actual | $ | 1,000 | $ | 1,019.20 | $ | 2.06 | 0.41 | % | ||||||||
Hypothetical** | $ | 1,000 | $ | 1,022.89 | $ | 2.07 | 0.41 | % | ||||||||
| Class Z | ||||||||||||||||
Actual | $ | 1,000 | $ | 1,019.30 | $ | 1.91 | 0.38 | % | ||||||||
Hypothetical** | $ | 1,000 | $ | 1,023.04 | $ | 1.92 | 0.38 | % | ||||||||
New York Municipal Portfolio
| Beginning Account Value October 1, 2020 | Ending Account Value March 31, 2021 | Expenses Paid During Period* | Annualized Expense Ratio* | |||||||||||||
| Class A | ||||||||||||||||
Actual | $ | 1,000 | $ | 1,023.80 | $ | 3.68 | 0.73 | % | ||||||||
Hypothetical** | $ | 1,000 | $ | 1,021.29 | $ | 3.68 | 0.73 | % | ||||||||
| Class C | ||||||||||||||||
Actual | $ | 1,000 | $ | 1,020.70 | $ | 7.46 | 1.48 | % | ||||||||
Hypothetical** | $ | 1,000 | $ | 1,017.55 | $ | 7.44 | 1.48 | % | ||||||||
| Advisor Class | ||||||||||||||||
Actual | $ | 1,000 | $ | 1,025.10 | $ | 2.42 | 0.48 | % | ||||||||
Hypothetical** | $ | 1,000 | $ | 1,022.54 | $ | 2.42 | 0.48 | % | ||||||||
| * | Expenses are equal to the classes’ annualized expense ratios, multiplied by the average account value over the period, multiplied by 182/365 (to reflect the one-half year period). |
| ** | Assumes 5% annual return before expenses |
| abfunds.com | AB INTERMEDIATE MUNICIPAL PORTFOLIOS | 21 | |
Table of Contents
PORTFOLIO SUMMARY
INTERMEDIATE CALIFORNIA MUNICIPAL PORTFOLIO
March 31, 2021 (unaudited)
PORTFOLIO STATISTICS
Net Assets ($mil): $1,421.4
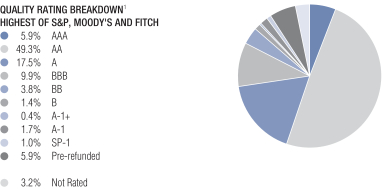
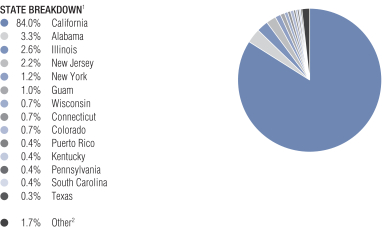
| 1 | All data are as of March 31, 2021. The Portfolio’s quality rating breakdown and state breakdown are expressed as a percentage of the Portfolio’s total investments in municipal securities and may vary over time. The quality ratings are determined by using the S&P Global Ratings (“S&P”), Moody’s Investors Services, Inc. (“Moody’s”) and Fitch Ratings, Ltd. (“Fitch”). The Portfolio considers the credit ratings issued by S&P, Moody’s and Fitch and uses the highest rating issued by the agencies. These ratings are a measure of the quality and safety of a bond or portfolio, based on the issuer’s financial condition. AAA is the highest (best) and D is the lowest (worst). If applicable, the pre-refunded category includes bonds which are secured by U.S. Government securities and therefore are deemed high-quality investment grade by the Adviser. If applicable, Not Applicable (N/A) includes non-credit worthy investments; such as, equities, currency contracts, futures and options. If applicable, the Not Rated category includes bonds that are not rated by a nationally recognized statistical rating organization. The Adviser evaluates the creditworthiness of non-rated securities based on a number of factors including, but not limited to, cash flows, enterprise value and economic environment. |
| 2 | “Other” represents less than 0.3% in 12 different states and American Samoa. |
22 | AB INTERMEDIATE MUNICIPAL PORTFOLIOS | abfunds.com | |
Table of Contents
PORTFOLIO SUMMARY
INTERMEDIATE DIVERSIFIED MUNICIPAL PORTFOLIO
March 31, 2021 (unaudited)
PORTFOLIO STATISTICS
Net Assets ($mil): $6,503.6
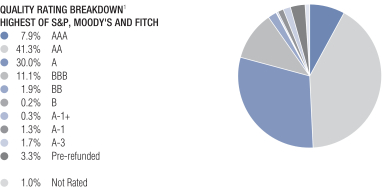
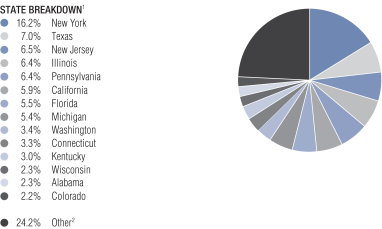
| 1 | All data are as of March 31, 2021. The Portfolio’s quality rating breakdown and state breakdown are expressed as a percentage of the Portfolio’s total investments in municipal securities and may vary over time. The quality ratings are determined by using the S&P Global Ratings (“S&P”), Moody’s Investors Services, Inc. (“Moody’s”) and Fitch Ratings, Ltd. (“Fitch”). The Portfolio considers the credit ratings issued by S&P, Moody’s and Fitch and uses the highest rating issued by the agencies. These ratings are a measure of the quality and safety of a bond or portfolio, based on the issuer’s financial condition. AAA is the highest (best) and D is the lowest (worst). If applicable, the pre-refunded category includes bonds which are secured by U.S. Government securities and therefore are deemed high-quality investment grade by the Adviser. If applicable, Not Applicable (N/A) includes non-credit worthy investments; such as, equities, currency contracts, futures and options. If applicable, the Not Rated category includes bonds that are not rated by a nationally recognized statistical rating organization. The Adviser evaluates the creditworthiness of non-rated securities based on a number of factors including, but not limited to, cash flows, enterprise value and economic environment. |
| 2 | “Other” represents less than 2.1% in 34 different states, American Samoa, District of Columbia, Guam and Puerto Rico. |
| abfunds.com | AB INTERMEDIATE MUNICIPAL PORTFOLIOS | 23 | |
Table of Contents
PORTFOLIO SUMMARY
INTERMEDIATE NEW YORK MUNICIPAL PORTFOLIO
March 31, 2021 (unaudited)
PORTFOLIO STATISTICS
Net Assets ($mil): $1,813.9
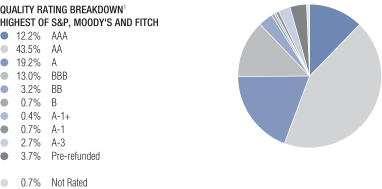
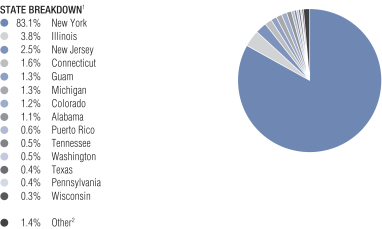
| 1 | All data are as of March 31, 2021. The Portfolio’s quality rating breakdown and state breakdown are expressed as a percentage of the Portfolio’s total investments in municipal securities and may vary over time. The quality ratings are determined by using the S&P Global Ratings (“S&P”), Moody’s Investors Services, Inc. (“Moody’s”) and Fitch Ratings, Ltd. (“Fitch”). The Portfolio considers the credit ratings issued by S&P, Moody’s and Fitch and uses the highest rating issued by the agencies. These ratings are a measure of the quality and safety of a bond or portfolio, based on the issuer’s financial condition. AAA is the highest (best) and D is the lowest (worst). If applicable, the pre-refunded category includes bonds which are secured by U.S. Government securities and therefore are deemed high-quality investment grade by the Adviser. If applicable, Not Applicable (N/A) includes non-credit worthy investments; such as, equities, currency contracts, futures and options. If applicable, the Not Rated category includes bonds that are not rated by a nationally recognized statistical rating organization. The Adviser evaluates the creditworthiness of non-rated securities based on a number of factors including, but not limited to, cash flows, enterprise value and economic environment. |
| 2 | “Other” represents less than 0.3% in 11 different states and American Samoa. |
24 | AB INTERMEDIATE MUNICIPAL PORTFOLIOS | abfunds.com | |
Table of Contents
PORTFOLIO OF INVESTMENTS
CALIFORNIA MUNICIPAL PORTFOLIO
March 31, 2021 (unaudited)
| Principal Amount (000) | U.S. $ Value | |||||||
| ||||||||
MUNICIPAL OBLIGATIONS – 99.0% | ||||||||
Long-Term Municipal Bonds – 90.5% | ||||||||
California – 74.6% |
| |||||||
Abag Finance Authority for Nonprofit Corps. | $ | 1,000 | $ | 1,046,578 | ||||
Anaheim Housing & Public Improvements Authority | 3,850 | 3,889,335 | ||||||
Anaheim Public Financing Authority | 4,050 | 4,238,215 | ||||||
Bay Area Toll Authority | 5,000 | 5,003,337 | ||||||
Series 2012 | 1,610 | 1,688,450 | ||||||
5.00%, 04/01/2025 (Pre-refunded/ETM) | 12,235 | 12,831,171 | ||||||
Series 2013S | 2,845 | 3,120,118 | ||||||
Bay Area Water Supply & Conservation Agency | 4,710 | 5,163,137 | ||||||
California Community Housing Agency | 5,000 | 5,170,868 | ||||||
California Community Housing Agency | 2,000 | 2,109,685 | ||||||
California County Tobacco Securitization Agency | 1,510 | 1,797,660 | ||||||
5.00%, 06/01/2027-06/01/2032 | 2,700 | 3,464,152 | ||||||
| abfunds.com | AB INTERMEDIATE MUNICIPAL PORTFOLIOS | 25 | |
Table of Contents
PORTFOLIO OF INVESTMENTS (continued)
CALIFORNIA MUNICIPAL PORTFOLIO
| Principal Amount (000) | U.S. $ Value | |||||||
| ||||||||
California Educational Facilities Authority | $ | 1,545 | $ | 1,840,035 | ||||
California Health Facilities Financing Authority | 19,500 | 23,280,827 | ||||||
California Health Facilities Financing Authority | 1,215 | 1,453,163 | ||||||
California Health Facilities Financing Authority | 5,650 | 7,254,903 | ||||||
California Health Facilities Financing Authority | 9,245 | 9,942,755 | ||||||
California Health Facilities Financing Authority | 11,365 | 13,477,664 | ||||||
California Housing Finance | 11,325 | 13,127,221 | ||||||
Series 2021-1, Class A | 10,000 | 11,404,935 | ||||||
California Infrastructure & Economic Development Bank | 6,000 | 6,000,566 | ||||||
California Infrastructure & Economic Development Bank | 10,650 | 10,730,456 | ||||||
California Infrastructure & Economic Development Bank | 5,000 | 5,812,454 | ||||||
26 | AB INTERMEDIATE MUNICIPAL PORTFOLIOS | abfunds.com | |
Table of Contents
PORTFOLIO OF INVESTMENTS (continued)
CALIFORNIA MUNICIPAL PORTFOLIO
| Principal Amount (000) | U.S. $ Value | |||||||
| ||||||||
Series 2018 | $ | 13,965 | $ | 17,673,745 | ||||
California Infrastructure & Economic Development Bank | 2,370 | 2,688,631 | ||||||
Series 2016B | 12,760 | 13,670,594 | ||||||
California Municipal Finance Authority | 1,000 | 1,216,242 | ||||||
California Municipal Finance Authority | 15,730 | 19,291,399 | ||||||
California Municipal Finance Authority | 13,440 | 15,213,866 | ||||||
California Pollution Control Financing Authority | 4,735 | 5,666,200 | ||||||
Series 2012 | 3,825 | 4,100,919 | ||||||
California Public Finance Authority | 1,500 | 1,710,630 | ||||||
California School Finance Authority | 800 | 917,923 | ||||||
California School Finance Authority | 1,450 | 1,555,249 | ||||||
Series 2016A | 1,000 | 1,098,476 | ||||||
California State Public Works Board | 1,545 | 1,595,015 | ||||||
California State Public Works Board | 11,220 | 12,901,664 | ||||||
| abfunds.com | AB INTERMEDIATE MUNICIPAL PORTFOLIOS | 27 | |
Table of Contents
PORTFOLIO OF INVESTMENTS (continued)
CALIFORNIA MUNICIPAL PORTFOLIO
| Principal Amount (000) | U.S. $ Value | |||||||
| ||||||||
Series 2014B | $ | 4,445 | $ | 5,127,024 | ||||
Series 2017H | 5,270 | 6,489,453 | ||||||
Series 2020B | 2,385 | 3,038,960 | ||||||
Series 2021A | 11,750 | 13,821,330 | ||||||
California State University | 5,500 | 5,662,524 | ||||||
Series 2012A | 10,930 | 11,772,960 | ||||||
Series 2014A | 16,650 | 19,347,242 | ||||||
Series 2017A | 5,620 | 6,923,082 | ||||||
Series 2020A | 1,000 | 1,317,471 | ||||||
Series 2020D | 1,500 | 1,460,929 | ||||||
California Statewide Communities Development Authority | 1,210 | 1,456,397 | ||||||
California Statewide Communities Development Authority | 1,255 | 1,561,172 | ||||||
California Statewide Communities Development Authority | 540 | 710,738 | ||||||
California Statewide Communities Development Authority | 675 | 767,290 | ||||||
California Statewide Communities Development Authority | 4,500 | 5,078,772 | ||||||
Series 2018A | 1,250 | 1,486,144 | ||||||
28 | AB INTERMEDIATE MUNICIPAL PORTFOLIOS | abfunds.com | |
Table of Contents
PORTFOLIO OF INVESTMENTS (continued)
CALIFORNIA MUNICIPAL PORTFOLIO
| Principal Amount (000) | U.S. $ Value | |||||||
| ||||||||
California Statewide Communities Development Authority | $ | 1,065 | $ | 1,103,090 | ||||
City & County of San Francisco CA | 7,330 | 8,298,968 | ||||||
Series 2018E | 1,490 | 1,648,609 | ||||||
City & County of San Francisco CA | 7,405 | 7,919,919 | ||||||
City of Hayward CA | 6,205 | 6,660,111 | ||||||
City of Los Angeles CA Wastewater System Revenue | 2,765 | 2,919,286 | ||||||
City of Los Angeles Department of Airports | 4,205 | 4,700,135 | ||||||
5.00%, 05/15/2030-05/15/2035 | 9,210 | 11,611,598 | ||||||
Series 2017A | 4,015 | 4,912,090 | ||||||
Series 2018B | 2,195 | 2,727,229 | ||||||
Series 2018C | 5,145 | 6,230,662 | ||||||
Series 2020C | 9,260 | 11,630,050 | ||||||
City of Riverside CA Sewer Revenue | 5,320 | 6,283,587 | ||||||
Series 2018A | 2,785 | 3,526,169 | ||||||
City of Roseville CA | 2,305 | 2,795,558 | ||||||
City of Roseville CA | 1,110 | 1,285,465 | ||||||
| abfunds.com | AB INTERMEDIATE MUNICIPAL PORTFOLIOS | 29 | |
Table of Contents
PORTFOLIO OF INVESTMENTS (continued)
CALIFORNIA MUNICIPAL PORTFOLIO
| Principal Amount (000) | U.S. $ Value | |||||||
| ||||||||
City of San Francisco CA Public Utilities Commission Water Revenue | $ | 11,320 | $ | 11,639,883 | ||||
City of San Jose CA Airport Revenue | 3,600 | 4,062,265 | ||||||
Contra Costa Transportation Authority | 3,000 | 3,131,615 | ||||||
Series 2017A | 1,250 | 1,536,650 | ||||||
Coronado Community Development Agency Successor Agency | 4,430 | 5,135,827 | ||||||
Cotati-Rohnert Park Unified School District | 3,000 | 3,046,947 | ||||||
County of San Diego CA | 1,725 | 1,772,124 | ||||||
CSCDA Community Improvement Authority | 4,000 | 3,859,082 | ||||||
CSCDA Community Improvement Authority | 5,000 | 4,965,454 | ||||||
Desert Sands Unified School District | 1,680 | 1,706,567 | ||||||
Fontana Redevelopment Agency Successor Agency | 1,750 | 2,171,014 | ||||||
Fremont Community Facilities District No. 1 | 1,000 | 1,165,376 | ||||||
30 | AB INTERMEDIATE MUNICIPAL PORTFOLIOS | abfunds.com | |
Table of Contents
PORTFOLIO OF INVESTMENTS (continued)
CALIFORNIA MUNICIPAL PORTFOLIO
| Principal Amount (000) | U.S. $ Value | |||||||
| ||||||||
Golden State Tobacco Securitization Corp. | $ | 7,600 | $ | 7,737,218 | ||||
Lake Elsinore Public Financing Authority | 1,560 | 1,640,877 | ||||||
Long Beach Bond Finance Authority | 4,025 | 4,132,418 | ||||||
Long Beach Unified School District | 1,000 | 1,003,547 | ||||||
Los Angeles County Metropolitan Transportation Authority | 2,000 | 2,007,089 | ||||||
Los Angeles Department of Water | 1,540 | 1,632,641 | ||||||
Series 2018A | 1,345 | 1,692,883 | ||||||
Los Angeles Department of Water & Power Power System Revenue | 3,810 | 3,854,669 | ||||||
Series 2013A | 4,005 | 4,231,678 | ||||||
Series 2013B | 2,480 | 2,503,154 | ||||||
Series 2014B | 3,790 | 4,270,393 | ||||||
Series 2014C | 21,670 | 24,891,303 | ||||||
Series 2015E | 820 | 942,205 | ||||||
Series 2018B | 1,050 | 1,083,707 | ||||||
Series 2019B | 14,750 | 16,339,466 | ||||||
Los Angeles Unified School District/CA | 5,470 | 5,533,863 | ||||||
Series 2014C | 10,365 | 11,895,220 | ||||||
| abfunds.com | AB INTERMEDIATE MUNICIPAL PORTFOLIOS | 31 | |
Table of Contents
PORTFOLIO OF INVESTMENTS (continued)
CALIFORNIA MUNICIPAL PORTFOLIO
| Principal Amount (000) | U.S. $ Value | |||||||
| ||||||||
Series 2015A | $ | 1,140 | $ | 1,153,310 | ||||
Series 2016A | 21,945 | 25,480,469 | ||||||
Series 2017A | 1,470 | 1,690,618 | ||||||
Series 2018B | 9,020 | 11,372,239 | ||||||
Series 2020R | 3,945 | 5,221,859 | ||||||
Mammoth Unified School District/CA | 2,100 | 2,094,018 | ||||||
Metropolitan Water District of Southern California | 165 | 167,230 | ||||||
5.75%, 07/01/2021 (Pre-refunded/ETM) | 710 | 719,648 | ||||||
Series 2020C | 2,415 | 3,152,367 | ||||||
Middle Fork Project Finance Authority | 3,900 | 4,764,151 | ||||||
Natomas Unified School District | 4,950 | 5,351,920 | ||||||
Newport Mesa Unified School District | 4,890 | 5,254,379 | ||||||
Northern California Power Agency | 3,980 | 4,215,569 | ||||||
Oakland Unified School District/Alameda County | 1,575 | 1,738,585 | ||||||
Series 2016 | 1,420 | 1,708,235 | ||||||
Palm Desert Redevelopment Agency Successor Agency | 1,000 | 1,151,560 | ||||||
Peralta Community College District | 1,820 | 2,083,711 | ||||||
Pittsburg Successor Agency Redevelopment Agency | 2,785 | 3,355,058 | ||||||
32 | AB INTERMEDIATE MUNICIPAL PORTFOLIOS | abfunds.com | |
Table of Contents
PORTFOLIO OF INVESTMENTS (continued)
CALIFORNIA MUNICIPAL PORTFOLIO
| Principal Amount (000) | U.S. $ Value | |||||||
| ||||||||
Port of Los Angeles | $ | 2,500 | $ | 2,537,673 | ||||
Series 2014A | 2,565 | 2,907,739 | ||||||
Port of Oakland | 5,720 | 5,989,827 | ||||||
5.00%, 05/01/2025 (Pre-refunded/ETM) | 11,225 | 11,785,583 | ||||||
Riverside County Public Financing Authority | 3,395 | 4,043,570 | ||||||
Romoland School District | 955 | 1,052,386 | ||||||
Sacramento City Unified School District/CA | 4,945 | 4,996,848 | ||||||
Sacramento County Sanitation Districts Financing Authority | 1,175 | 1,216,172 | ||||||
Sacramento Municipal Utility District | 4,555 | 4,854,354 | ||||||
Sacramento Regional Transit District | 630 | 631,280 | ||||||
San Bernardino Community College District | 1,000 | 1,015,748 | ||||||
San Diego Association of Governments | 3,200 | 3,286,339 | ||||||
San Diego County Regional Airport Authority | 9,715 | 12,582,125 | ||||||
San Diego County Water Authority | 1,000 | 1,003,545 | ||||||
Series 2021A | 19,400 | 22,333,118 | ||||||
| abfunds.com | AB INTERMEDIATE MUNICIPAL PORTFOLIOS | 33 | |
Table of Contents
PORTFOLIO OF INVESTMENTS (continued)
CALIFORNIA MUNICIPAL PORTFOLIO
| Principal Amount (000) | U.S. $ Value | |||||||
| ||||||||
San Diego Public Facilities Financing Authority | $ | 4,785 | $ | 5,044,197 | ||||
San Diego Unified School District/CA | 8,525 | 8,625,366 | ||||||
San Francisco City & County Public Utilities Commission Wastewater Revenue | 4,000 | 4,286,546 | ||||||
San Francisco City & County Redevelopment Agency Successor Agency | 2,500 | 2,650,450 | ||||||
San Francisco City & County Redevelopment Agency Successor Agency | 1,070 | 1,301,597 | ||||||
San Francisco Intl Airport | 3,900 | 3,913,622 | ||||||
Series 2011S | 2,145 | 2,152,449 | ||||||
5.00%, 05/01/2025 (Pre-refunded/ETM) | 855 | 858,250 | ||||||
Series 2019A | 11,015 | 13,714,340 | ||||||
Series 2019E | 10,110 | 12,552,300 | ||||||
Series 2019H | 5,500 | 6,819,977 | ||||||
San Joaquin Delta Community College District | 1,385 | 1,474,075 | ||||||
San Mateo Joint Powers Financing Authority | 20,760 | 23,788,986 | ||||||
34 | AB INTERMEDIATE MUNICIPAL PORTFOLIOS | abfunds.com | |
Table of Contents
PORTFOLIO OF INVESTMENTS (continued)
CALIFORNIA MUNICIPAL PORTFOLIO
| Principal Amount (000) | U.S. $ Value | |||||||
| ||||||||
Saugus/Hart School Facilities Financing Authority | $ | 2,365 | $ | 2,757,529 | ||||
Southern California Public Power Authority | 1,030 | 1,174,184 | ||||||
Southwestern Community College District | 13,640 | 15,508,051 | ||||||
State of California | 53,535 | 70,138,305 | ||||||
Series 2011 | 1,175 | 1,198,436 | ||||||
Series 2013 | 8,890 | 9,871,102 | ||||||
Series 2014 | 18,665 | 20,567,458 | ||||||
Series 2015B | 3,330 | 3,856,038 | ||||||
Series 2017 | 5,540 | 6,396,271 | ||||||
Series 2018 | 5,000 | 5,361,296 | ||||||
AGM | 1,820 | 2,529,736 | ||||||
State of California Department of Water Resources | 5,690 | 6,537,022 | ||||||
Stockton Public Financing Authority | 7,665 | 7,676,893 | ||||||
Stockton Unified School District | 7,770 | 9,324,201 | ||||||
Sweetwater Union High School District | 3,205 | 3,789,366 | ||||||
BAM Series 2014 | 7,980 | 9,047,064 | ||||||
| abfunds.com | AB INTERMEDIATE MUNICIPAL PORTFOLIOS | 35 | |
Table of Contents
PORTFOLIO OF INVESTMENTS (continued)
CALIFORNIA MUNICIPAL PORTFOLIO
| Principal Amount (000) | U.S. $ Value | |||||||
| ||||||||
Tobacco Securitization Authority of Northern California | $ | 4,375 | $ | 5,220,681 | ||||
5.00%, 06/01/2026-06/01/2032 | 6,880 | 8,765,209 | ||||||
Transbay Joint Powers Authority | 4,650 | 5,841,824 | ||||||
Turlock Irrigation District | 4,115 | 4,261,692 | ||||||
University of California | 205 | 216,081 | ||||||
5.00%, 05/15/2025 | 5,170 | 5,443,941 | ||||||
Series 2012G | 4,625 | 4,874,996 | ||||||
Series 2013A | 8,785 | 9,283,015 | ||||||
Series 2014A | 1,000 | 1,141,128 | ||||||
Series 2015A | 2,280 | 2,613,997 | ||||||
Series 2015I | 2,935 | 2,950,938 | ||||||
Series 2017A | 6,465 | 8,062,194 | ||||||
Series 2017M | 4,000 | 4,961,842 | ||||||
Series 2018O | 8,320 | 9,526,011 | ||||||
Vacaville Unified School District | 1,000 | 1,064,314 | ||||||
|
| |||||||
| 1,061,061,590 | ||||||||
|
| |||||||
Alabama – 3.3% |
| |||||||
Southeast Alabama Gas Supply District (The) (Goldman Sachs Group, Inc. (The)) | 16,575 | 18,132,697 | ||||||
Southeast Alabama Gas Supply District (The) (Morgan Stanley) | 24,615 | 27,078,518 | ||||||
36 | AB INTERMEDIATE MUNICIPAL PORTFOLIOS | abfunds.com | |
Table of Contents
PORTFOLIO OF INVESTMENTS (continued)
CALIFORNIA MUNICIPAL PORTFOLIO
| Principal Amount (000) | U.S. $ Value | |||||||
| ||||||||
Tuscaloosa County Industrial Development Authority | $ | 1,080 | $ | 1,200,264 | ||||
|
| |||||||
| 46,411,479 | ||||||||
|
| |||||||
American Samoa – 0.1% |
| |||||||
American Samoa Economic Development Authority | 735 | 883,006 | ||||||
|
| |||||||
Arizona – 0.1% |
| |||||||
Tempe Industrial Development Authority | 1,015 | 1,015,302 | ||||||
|
| |||||||
Colorado – 0.6% |
| |||||||
City & County of Denver CO | 3,000 | 3,191,094 | ||||||
Colorado Health Facilities Authority | 4,750 | 5,982,666 | ||||||
|
| |||||||
| 9,173,760 | ||||||||
|
| |||||||
Connecticut – 0.7% |
| |||||||
State of Connecticut | ||||||||
Series 2018B | 5,755 | 7,038,967 | ||||||
Series 2018D | 2,280 | 2,828,667 | ||||||
|
| |||||||
| 9,867,634 | ||||||||
|
| |||||||
Florida – 0.1% |
| |||||||
Capital Trust Agency, Inc. | 100 | 113,556 | ||||||
City of Tampa FL | 175 | 126,879 | ||||||
County of Osceola FL Transportation Revenue | 955 | 698,238 | ||||||
| abfunds.com | AB INTERMEDIATE MUNICIPAL PORTFOLIOS | 37 | |
Table of Contents
PORTFOLIO OF INVESTMENTS (continued)
CALIFORNIA MUNICIPAL PORTFOLIO
| Principal Amount (000) | U.S. $ Value | |||||||
| ||||||||
New River Community Development District | $ | 405 | $ | – 0 | – | |||
Palm Beach County Health Facilities Authority | 535 | 539,937 | ||||||
|
| |||||||
| 1,478,610 | ||||||||
|
| |||||||
Georgia – 0.2% |
| |||||||
Municipal Electric Authority of Georgia | 2,300 | 2,806,985 | ||||||
|
| |||||||
Guam – 0.9% |
| |||||||
Guam Department of Education | 1,500 | 1,577,486 | ||||||
5.00%, 02/01/2040 | 1,090 | 1,168,540 | ||||||
Territory of Guam | 580 | 640,964 | ||||||
Territory of Guam | 1,860 | 2,134,273 | ||||||
Territory of Guam | 5,240 | 5,893,923 | ||||||
Territory of Guam | 1,625 | 2,005,801 | ||||||
|
| |||||||
| 13,420,987 | ||||||||
|
| |||||||
Illinois – 2.5% |
| |||||||
Chicago Board of Education | 6,000 | 6,791,155 | ||||||
Illinois Finance Authority | 900 | 1,080,338 | ||||||
Metropolitan Pier & Exposition Authority | 2,185 | 2,279,936 | ||||||
Series 2017B | 3,250 | 3,868,963 | ||||||
State of Illinois | 405 | 426,584 | ||||||
38 | AB INTERMEDIATE MUNICIPAL PORTFOLIOS | abfunds.com | |
Table of Contents
PORTFOLIO OF INVESTMENTS (continued)
CALIFORNIA MUNICIPAL PORTFOLIO
| Principal Amount (000) | U.S. $ Value | |||||||
| ||||||||
Series 2016 | $ | 1,200 | $ | 1,362,553 | ||||
Series 2017D | 13,465 | 14,948,148 | ||||||
Series 2021A | 825 | 965,680 | ||||||
Village of Bolingbrook IL | 4,450 | 4,094,105 | ||||||
|
| |||||||
| 35,817,462 | ||||||||
|
| |||||||
Iowa – 0.3% |
| |||||||
Iowa Finance Authority | 4,220 | 4,298,940 | ||||||
|
| |||||||
Kentucky – 0.4% |
| |||||||
City of Ashland KY | 850 | 996,034 | ||||||
Kentucky Economic Development Finance Authority | 1,000 | 1,259,509 | ||||||
Kentucky Economic Development Finance Authority | 3,500 | 4,032,981 | ||||||
Kentucky Public Energy Authority | 10 | 10,961 | ||||||
|
| |||||||
| 6,299,485 | ||||||||
|
| |||||||
Louisiana – 0.1% |
| |||||||
Parish of St. James LA | 185 | 208,842 | ||||||
6.10%, 06/01/2038-12/01/2040(b) | 625 | 781,354 | ||||||
|
| |||||||
| 990,196 | ||||||||
|
| |||||||
| abfunds.com | AB INTERMEDIATE MUNICIPAL PORTFOLIOS | 39 | |
Table of Contents
PORTFOLIO OF INVESTMENTS (continued)
CALIFORNIA MUNICIPAL PORTFOLIO
| Principal Amount (000) | U.S. $ Value | |||||||
| ||||||||
Massachusetts – 0.1% |
| |||||||
Massachusetts Development Finance Agency | $ | 1,055 | $ | 1,269,361 | ||||
|
| |||||||
Michigan – 0.1% |
| |||||||
City of Detroit MI | 1,745 | 2,058,118 | ||||||
|
| |||||||
Missouri – 0.0% |
| |||||||
Howard Bend Levee District | 325 | 365,907 | ||||||
|
| |||||||
Nevada – 0.1% |
| |||||||
City of Sparks NV | 575 | 580,249 | ||||||
2.75%, 06/15/2028(b) | 525 | 535,698 | ||||||
|
| |||||||
| 1,115,947 | ||||||||
|
| |||||||
New Jersey – 2.1% |
| |||||||
New Jersey Transportation Trust Fund Authority | 8,070 | 9,511,164 | ||||||
Series 2018A | 4,000 | 4,727,188 | ||||||
New Jersey Transportation Trust Fund Authority | 5,905 | 7,203,070 | ||||||
Series 2019B | 3,225 | 3,998,841 | ||||||
Tobacco Settlement Financing Corp./NJ | 4,000 | 4,744,720 | ||||||
|
| |||||||
| 30,184,983 | ||||||||
|
| |||||||
New York – 1.2% |
| |||||||
Metropolitan Transportation Authority | 7,250 | 8,995,875 | ||||||
40 | AB INTERMEDIATE MUNICIPAL PORTFOLIOS | abfunds.com | |
Table of Contents
PORTFOLIO OF INVESTMENTS (continued)
CALIFORNIA MUNICIPAL PORTFOLIO
| Principal Amount (000) | U.S. $ Value | |||||||
| ||||||||
Series 2016A | $ | 2,065 | $ | 2,499,029 | ||||
Series 2017C | 2,960 | 3,582,143 | ||||||
New York Transportation Development Corp. | 1,000 | 1,097,321 | ||||||
New York Transportation Development Corp. | 220 | 245,767 | ||||||
|
| |||||||
| 16,420,135 | ||||||||
|
| |||||||
Ohio – 0.3% |
| |||||||
Buckeye Tobacco Settlement Financing Authority | 1,175 | 1,471,576 | ||||||
Ohio Air Quality Development Authority | 920 | 936,437 | ||||||
Ohio Air Quality Development Authority | 100 | 103,000 | ||||||
Ohio Water Development Authority Water Pollution Control Loan Fund | 1,125 | 1,158,750 | ||||||
|
| |||||||
| 3,669,763 | ||||||||
|
| |||||||
Pennsylvania – 0.4% |
| |||||||
Allentown Neighborhood Improvement Zone Development Authority | 2,250 | 2,683,570 | ||||||
Hospitals & Higher Education Facilities Authority of Philadelphia (The) | 2,815 | 3,064,925 | ||||||
|
| |||||||
| 5,748,495 | ||||||||
|
| |||||||
| abfunds.com | AB INTERMEDIATE MUNICIPAL PORTFOLIOS | 41 | |
Table of Contents
PORTFOLIO OF INVESTMENTS (continued)
CALIFORNIA MUNICIPAL PORTFOLIO
| Principal Amount (000) | U.S. $ Value | |||||||
| ||||||||
Puerto Rico – 0.5% |
| |||||||
Puerto Rico Highway & Transportation Authority | ||||||||
AGC Series 2005L | $ | 740 | $ | 913,214 | ||||
AGC Series 2007C | 150 | 184,702 | ||||||
NATL Series 2005L | 3,675 | 4,036,447 | ||||||
Puerto Rico Sales Tax Financing Corp. Sales Tax Revenue | 1,421 | 1,333,680 | ||||||
|
| |||||||
| 6,468,043 | ||||||||
|
| |||||||
South Carolina – 0.4% |
| |||||||
Patriots Energy Group Financing Agency | 5,000 | 5,457,962 | ||||||
|
| |||||||
Tennessee – 0.1% |
| |||||||
Chattanooga Health Educational & Housing Facility Board | 1,000 | 1,259,509 | ||||||
|
| |||||||
Texas – 0.4% |
| |||||||
Mission Economic Development Corp. | 3,205 | 3,406,065 | ||||||
Texas Municipal Gas Acquisition and Supply Corp. I | 1,370 | 1,609,634 | ||||||
|
| |||||||
| 5,015,699 | ||||||||
|
| |||||||
Washington – 0.2% |
| |||||||
Washington Health Care Facilities Authority | 2,575 | 3,256,123 | ||||||
|
| |||||||
42 | AB INTERMEDIATE MUNICIPAL PORTFOLIOS | abfunds.com | |
Table of Contents
PORTFOLIO OF INVESTMENTS (continued)
CALIFORNIA MUNICIPAL PORTFOLIO
| Principal Amount (000) | U.S. $ Value | |||||||
| ||||||||
Wisconsin – 0.7% |
| |||||||
UMA Education, Inc. | $ | 3,695 | $ | 4,265,124 | ||||
Wisconsin Public Finance Authority | 5,335 | 5,859,787 | ||||||
|
| |||||||
| 10,124,911 | ||||||||
|
| |||||||
Total Long-Term Municipal Bonds | 1,285,940,392 | |||||||
|
| |||||||
Short-Term Municipal Notes – 8.5% | ||||||||
California – 8.5% |
| |||||||
Abag Finance Authority for Nonprofit Corps. | 5,950 | 5,950,000 | ||||||
Series 2009D | 7,770 | 7,770,000 | ||||||
California Health Facilities Financing Authority | 3,450 | 3,450,000 | ||||||
Series 2009C | 5,400 | 5,400,000 | ||||||
California State Public Works Board | 6,950 | 7,046,093 | ||||||
Series 2022A | 5,250 | 5,333,923 | ||||||
California Statewide Communities Development Authority | 3,370 | 3,370,000 | ||||||
Calleguas-Las Virgenes Public Financing Authority | 700 | 700,000 | ||||||
0.05%, 07/01/2037(h) | 500 | 500,000 | ||||||
| abfunds.com | AB INTERMEDIATE MUNICIPAL PORTFOLIOS | 43 | |
Table of Contents
PORTFOLIO OF INVESTMENTS (continued)
CALIFORNIA MUNICIPAL PORTFOLIO
| Principal Amount (000) | U.S. $ Value | |||||||
| ||||||||
City & County of San Francisco CA | $ | 8,670 | $ | 8,670,000 | ||||
City of Los Angeles CA | 13,510 | 13,631,098 | ||||||
County of Los Angeles CA | 15,745 | 15,896,731 | ||||||
County of San Bernardino CA | 2,200 | 2,200,000 | ||||||
Northern California Power Agency | 10,990 | 10,990,000 | ||||||
Orange County Water District | 5,340 | 5,340,000 | ||||||
Riverside County Asset Leasing Corp. | 13,065 | 13,065,000 | ||||||
San Francisco City & County Redevelopment Agency Successor Agency | 2,045 | 2,045,000 | ||||||
Santa Clara County Financing Authority | 5,655 | 5,655,000 | ||||||
Tobacco Securitization Authority of Northern California | 4,525 | 4,544,331 | ||||||
|
| |||||||
Total Short-Term Municipal Notes | 121,557,176 | |||||||
|
| |||||||
Total Municipal Obligations | 1,407,497,568 | |||||||
|
| |||||||
44 | AB INTERMEDIATE MUNICIPAL PORTFOLIOS | abfunds.com | |
Table of Contents
PORTFOLIO OF INVESTMENTS (continued)
CALIFORNIA MUNICIPAL PORTFOLIO
| Principal Amount (000) | U.S. $ Value | |||||||
| ||||||||
COLLATERALIZED MORTGAGE OBLIGATIONS – 0.3% | ||||||||
Risk Share Floating Rate – 0.3% | ||||||||
Federal Home Loan Mortgage Corp. Structured Agency Credit Risk Debt Notes | $ | 141 | $ | 140,533 | ||||
Series 2016-DNA1, Class M3 5.659% (LIBOR 1 Month + 5.55%), 07/25/2028(a) | 197 | 206,653 | ||||||
Series 2016-DNA4, Class M3 3.909% (LIBOR 1 Month + 3.80%), 03/25/2029(a) | 236 | 245,628 | ||||||
Series 2016-HQA3, Class M3 3.959% (LIBOR 1 Month + 3.85%), 03/25/2029(a) | 541 | 560,457 | ||||||
Series 2016-HQA4, Class M3 4.009% (LIBOR 1 Month + 3.90%), 04/25/2029(a) | 245 | 253,593 | ||||||
Series 2017-DNA3, Class M2 2.609% (LIBOR 1 Month + 2.50%), 03/25/2030(a) | 250 | 254,746 | ||||||
Series 2017-HQA3, Class M2 2.459% (LIBOR 1 Month + 2.35%), 04/25/2030(a) | 181 | 183,175 | ||||||
Series 2016-HQA2, Class M3 5.259% (LIBOR 1 Month + 5.15%), 11/25/2028(a) | 213 | 221,728 | ||||||
Series 2017-HQA1, Class M2 3.659% (LIBOR 1 Month + 3.55%), 08/25/2029(a) | 241 | 246,732 | ||||||
Federal National Mortgage Association Connecticut Avenue Securities | ||||||||
Series 2014-C03, Class 2M2 3.009% (LIBOR 1 Month + 2.90%), 07/25/2024(a) | 200 | 201,597 | ||||||
Series 2014-C04, Class 1M2 5.009% (LIBOR 1 Month + 4.90%), 11/25/2024(a) | 108 | 111,696 | ||||||
Series 2015-C01, Class 2M2 4.659% (LIBOR 1 Month + 4.55%), 02/25/2025(a) | 12 | 12,306 | ||||||
Series 2015-C02, Class 1M2 4.109% (LIBOR 1 Month + 4.00%), 05/25/2025(a) | 79 | 80,053 | ||||||
Series 2015-C03, Class 1M2 5.109% (LIBOR 1 Month + 5.00%), 07/25/2025(a) | 79 | 80,957 | ||||||
Series 2016-C01, Class 1M2 6.859% (LIBOR 1 Month + 6.75%), 08/25/2028(a) | 198 | 209,256 | ||||||
Series 2016-C02, Class 1M2 6.109% (LIBOR 1 Month + 6.00%), 09/25/2028(a) | 115 | 121,106 | ||||||
Series 2016-C03, Class 1M2 5.409% (LIBOR 1 Month + 5.30%), 10/25/2028(a) | 158 | 166,120 | ||||||
Series 2017-C02, Class 2M2 3.759% (LIBOR 1 Month + 3.65%), 09/25/2029(a) | 606 | 622,061 | ||||||
Series 2017-C03, Class 1M2 3.109% (LIBOR 1 Month + 3.00%), 10/25/2029(a) | 248 | 253,168 | ||||||
Series 2017-C05, Class 1M2 2.309% (LIBOR 1 Month + 2.20%), 01/25/2030(a) | 241 | 243,673 | ||||||
| abfunds.com | AB INTERMEDIATE MUNICIPAL PORTFOLIOS | 45 | |
Table of Contents
PORTFOLIO OF INVESTMENTS (continued)
CALIFORNIA MUNICIPAL PORTFOLIO
| Principal Amount (000) | U.S. $ Value | |||||||
| ||||||||
Series 2017-C06, Class 2M2 2.909% (LIBOR 1 Month + 2.80%), 02/25/2030(a) | $ | 159 | $ | 160,318 | ||||
|
| |||||||
Total Collateralized Mortgage Obligations | 4,575,556 | |||||||
|
| |||||||
GOVERNMENTS - TREASURIES – 0.2% | ||||||||
United States – 0.2% |
| |||||||
U.S. Treasury Notes | 2,346 | 2,535,879 | ||||||
|
| |||||||
Total Investments – 99.5% | 1,414,609,003 | |||||||
Other assets less liabilities – 0.5% | 6,818,041 | |||||||
|
| |||||||
Net Assets – 100.0% | $ | 1,421,427,044 | ||||||
|
| |||||||
CENTRALLY CLEARED INFLATION (CPI) SWAPS (see Note 3)
| Rate Type | ||||||||||||||||||||||||||||||
| Notional Amount (000) | Termination Date | Payments made by the Fund | Payments received by the Fund | Payment Frequency Paid/ Received | Market Value | Upfront Premiums Paid/ (Received) | Unrealized Appreciation/ (Depreciation) | |||||||||||||||||||||||
| USD | 5,605 | 01/15/2025 | 2.565% | CPI# | Maturity | $ | 11,664 | $ | – 0 | – | $ | 11,664 | ||||||||||||||||||
| USD | 2,803 | 01/15/2025 | 2.613% | CPI# | Maturity | 201 | – 0 | – | 201 | |||||||||||||||||||||
| USD | 2,802 | 01/15/2025 | 2.585% | CPI# | Maturity | 3,461 | – 0 | – | 3,461 | |||||||||||||||||||||
| USD | 21,750 | 01/15/2028 | 1.230% | CPI# | Maturity | 2,086,373 | – 0 | – | 2,086,373 | |||||||||||||||||||||
| USD | 15,980 | 01/15/2028 | 0.735% | CPI# | Maturity | 2,156,788 | – 0 | – | 2,156,788 | |||||||||||||||||||||
| USD | 4,115 | 01/15/2030 | 1.572% | CPI# | Maturity | 356,254 | – 0 | – | 356,254 | |||||||||||||||||||||
| USD | 4,115 | 01/15/2030 | 1.587% | CPI# | Maturity | 350,013 | – 0 | – | 350,013 | |||||||||||||||||||||
| USD | 4,300 | 02/15/2041 | CPI# | 2.282% | Maturity | (161,045 | ) | – 0 | – | (161,045 | ) | |||||||||||||||||||
|
|
|
|
|
| |||||||||||||||||||||||||
| $ | 4,803,709 | $ | – 0 | – | $ | 4,803,709 | ||||||||||||||||||||||||
|
|
|
|
|
| |||||||||||||||||||||||||
| # | Variable interest rate based on the rate of inflation as determined by the Consumer Price Index (CPI). |
CENTRALLY CLEARED INTEREST RATE SWAPS (see Note 3)
| Rate Type | ||||||||||||||||||||||||||
| Notional Amount (000) | Termination Date | Payments made by the Fund | Payments received by the Fund | Payment Frequency Paid/ Received | Market Value | Upfront Premiums Paid/ (Received) | Unrealized Appreciation/ (Depreciation) | |||||||||||||||||||
| USD | 35,040 | 02/06/2025 | 3 Month LIBOR | 0.378% | Quarterly/ Semi-Annual | $ | (494,568 | ) | $ | – 0 | – | $ | (494,568 | ) | ||||||||||||
| USD |
| 35,660 |
| 02/15/2025 | 3 Month LIBOR | 0.332% | Quarterly/ Semi-Annual | (588,733 | ) | – 0 | – | (588,733 | ) | |||||||||||||
46 | AB INTERMEDIATE MUNICIPAL PORTFOLIOS | abfunds.com | |
Table of Contents
PORTFOLIO OF INVESTMENTS (continued)
CALIFORNIA MUNICIPAL PORTFOLIO
| Rate Type | ||||||||||||||||||||||||||
| Notional Amount (000) | Termination Date | Payments made by the Fund | Payments received by the Fund | Payment Frequency Paid/ Received | Market Value | Upfront Premiums Paid/ (Received) | Unrealized Appreciation/ (Depreciation) | |||||||||||||||||||
| USD | 17,500 | 01/15/2028 | 1.173% | 3 Month LIBOR | Semi-Annual/Quarterly | $ | 256,834 | $ | – 0 | – | $ | 256,834 | ||||||||||||||
| USD | 8,030 | 11/05/2035 | 1.130% | 3 Month LIBOR | Semi-Annual/Quarterly | 954,215 | – 0 | – | 954,215 | |||||||||||||||||
| USD | 2,100 | 02/15/2041 | 1.868% | 3 Month LIBOR | Semi-Annual/Quarterly | 98,021 | – 0 | – | 98,021 | |||||||||||||||||
|
|
|
|
|
| |||||||||||||||||||||
| $ | 225,769 | $ | – 0 | – | $ | 225,769 | ||||||||||||||||||||
|
|
|
|
|
| |||||||||||||||||||||
CREDIT DEFAULT SWAPS (see Note 3)
Swap Counterparty & | Fixed Rate (Pay) Receive | Payment Frequency | Implied Credit Spread at March 31, 2021 | Notional Amount (000) | Market Value | Upfront Premiums Paid/ (Received) | Unrealized Appreciation/ (Depreciation) | |||||||||||||||||||||||||
Sale Contracts | ||||||||||||||||||||||||||||||||
Citigroup Global Markets, Inc. | ||||||||||||||||||||||||||||||||
CDX-CMBX.NA.BBB- Series 6, 05/11/2063* | 3.00 | % | Monthly | 12.50 | % | USD | 1,399 | $ | (376,891 | ) | $ | (178,059 | ) | $ | (198,832 | ) | ||||||||||||||||
CDX-CMBX.NA.BBB- Series 6, 05/11/2063* | 3.00 | Monthly | 12.50 | USD | 121 | (32,598 | ) | (11,725 | ) | (20,873 | ) | |||||||||||||||||||||
Credit Suisse International | ||||||||||||||||||||||||||||||||
CDX-CMBX.NA.BBB- Series 6, 05/11/2063* | 3.00 | Monthly | 12.50 | USD | 1 | (269 | ) | (121 | ) | (148 | ) | |||||||||||||||||||||
CDX-CMBX.NA.BBB- Series 6, 05/11/2063* | 3.00 | Monthly | 12.50 | USD | 825 | (222,186 | ) | (80,776 | ) | (141,410 | ) | |||||||||||||||||||||
CDX-CMBX.NA.BBB- Series 6, 05/11/2063* | 3.00 | Monthly | 12.50 | USD | 66 | (17,780 | ) | (6,454 | ) | (11,326 | ) | |||||||||||||||||||||
CDX-CMBX.NA.BBB- Series 6, 05/11/2063* | 3.00 | Monthly | 12.50 | USD | 1,242 | (334,595 | ) | (118,482 | ) | (216,113 | ) | |||||||||||||||||||||
Goldman Sachs International | ||||||||||||||||||||||||||||||||
CDX-CMBX.NA.BBB- Series 6, 05/11/2063* | 3.00 | Monthly | 12.50 | USD | 1,076 | (289,874 | ) | (99,631 | ) | (190,243 | ) | |||||||||||||||||||||
|
|
|
|
|
| |||||||||||||||||||||||||||
| $ | (1,274,193 | ) | $ | (495,248 | ) | $ | (778,945 | ) | ||||||||||||||||||||||||
|
|
|
|
|
| |||||||||||||||||||||||||||
| * | Termination date |
| abfunds.com | AB INTERMEDIATE MUNICIPAL PORTFOLIOS | 47 | |
Table of Contents
PORTFOLIO OF INVESTMENTS (continued)
CALIFORNIA MUNICIPAL PORTFOLIO
INTEREST RATE SWAPS (see Note 3)
| Rate Type | ||||||||||||||||||||||||||||||||||||
Swap | Notional Amount (000) | Termination Date | Payments made by the Fund | Payments received by the Fund | Payment Frequency Paid/ Received | Market Value | Upfront Premiums Paid/ (Received) | Unrealized Appreciation/ (Depreciation) | ||||||||||||||||||||||||||||
Citibank, NA | USD | 12,395 | 10/09/2029 | 1.120 | % | SIFMA | * | Quarterly | $ | 34,978 | $ | – 0 | – | $ | 34,978 | |||||||||||||||||||||
Citibank, NA | USD | 12,395 | 10/09/2029 | 1.125 | % | SIFMA | * | Quarterly | 29,251 | – 0 | – | 29,251 | ||||||||||||||||||||||||
|
|
|
|
|
| |||||||||||||||||||||||||||||||
| $ | 64,229 | $ | – 0 | – | $ | 64,229 | ||||||||||||||||||||||||||||||
|
|
|
|
|
| |||||||||||||||||||||||||||||||
| * | Variable interest rate based on the Securities Industry & Financial Markets Association (SIFMA) Municipal Swap Index. |
| (a) | Floating Rate Security. Stated interest/floor/ceiling rate was in effect at March 31, 2021. |
| (b) | Security is exempt from registration under Rule 144A of the Securities Act of 1933. These securities are considered restricted, but liquid and may be resold in transactions exempt from registration, normally to qualified institutional buyers. At March 31, 2021, the aggregate market value of these securities amounted to $56,184,606 or 4.0% of net assets. |
| (c) | When-Issued or delayed delivery security. |
| (d) | Fair valued by the Adviser. |
| (e) | Defaulted matured security. |
| (f) | Non-income producing security. |
| (g) | Security in which significant unobservable inputs (Level 3) were used in determining fair value. |
| (h) | Variable Rate Demand Notes are instruments whose interest rates change on a specific date (such as coupon date or interest payment date) or whose interest rates vary with changes in a designated base rate (such as the prime interest rate). This instrument is payable on demand and is secured by letters of credit or other credit support agreements from major banks. |
| (i) | Position, or a portion thereof, has been segregated to collateralize OTC derivatives outstanding. |
As of March 31, 2021, the Portfolio’s percentages of investments in municipal bonds that are insured and in insured municipal bonds that have been pre-refunded or escrowed to maturity are 4.3% and 0.0%, respectively.
Glossary:
AGC – Assured Guaranty Corporation
AGM – Assured Guaranty Municipal
AMBAC – Ambac Assurance Corporation
BAM – Build American Mutual
CCRC – Congregate Care Retirement Center
CDX-CMBX.NA – North American Commercial Mortgage-Backed Index
COP – Certificate of Participation
CPI – Consumer Price Index
DOT – Department of Transportation
ETM – Escrowed to Maturity
LIBOR – London Interbank Offered Rate
MUNIPSA – Municipal Swap Index
NATL – National Interstate Corporation
SRF – State Revolving Fund
XLCA – XL Capital Assurance Inc.
See notes to financial statements.
48 | AB INTERMEDIATE MUNICIPAL PORTFOLIOS | abfunds.com | |
Table of Contents
PORTFOLIO OF INVESTMENTS
DIVERSIFIED MUNICIPAL PORTFOLIO
March 31, 2021 (unaudited)
| Principal Amount (000) | U.S. $ Value | |||||||
| ||||||||
MUNICIPAL OBLIGATIONS – 96.5% | ||||||||
Long-Term Municipal Bonds – 86.2% | ||||||||
Alabama – 2.2% |
| |||||||
Alabama Federal Aid Highway Finance Authority | $ | 1,390 | $ | 1,603,676 | ||||
Alabama Public School & College Authority | 3,200 | 3,315,049 | ||||||
Black Belt Energy Gas District | 19,925 | 22,721,444 | ||||||
Lower Alabama Gas District (The) | 2,675 | 3,047,762 | ||||||
Southeast Alabama Gas Supply District (The) | 23,985 | 26,239,079 | ||||||
Southeast Alabama Gas Supply District (The) | 69,310 | 76,246,684 | ||||||
Tuscaloosa County Industrial Development Authority | 4,940 | 5,490,095 | ||||||
5.25%, 05/01/2044(a) | 2,775 | 3,153,555 | ||||||
|
| |||||||
| 141,817,344 | ||||||||
|
| |||||||
Alaska – 0.3% |
| |||||||
Municipality of Anchorage AK | 8,810 | 9,782,673 | ||||||
Series 2015C | 7,370 | 8,190,637 | ||||||
|
| |||||||
| 17,973,310 | ||||||||
|
| |||||||
American Samoa – 0.0% |
| |||||||
American Samoa Economic Development Authority | 1,920 | 2,306,628 | ||||||
|
| |||||||
| abfunds.com | AB INTERMEDIATE MUNICIPAL PORTFOLIOS | 49 | |
Table of Contents
PORTFOLIO OF INVESTMENTS (continued)
DIVERSIFIED MUNICIPAL PORTFOLIO
| Principal Amount (000) | U.S. $ Value | |||||||
| ||||||||
Arizona – 1.7% |
| |||||||
Arizona Board of Regents | $ | 2,365 | $ | 2,487,049 | ||||
Arizona Department of Transportation State Highway Fund Revenue | 6,460 | 6,535,738 | ||||||
Arizona Health Facilities Authority | 2,770 | 3,166,901 | ||||||
Arizona Industrial Development Authority | 1,000 | 1,282,286 | ||||||
City of Glendale AZ | 16,955 | 18,942,309 | ||||||
City of Phoenix Civic Improvement Corp. | 13,225 | 17,328,770 | ||||||
Series 2020A | 8,895 | 11,669,847 | ||||||
Maricopa County Special Health Care District | 6,000 | 7,547,687 | ||||||
Salt Verde Financial Corp. | 1,430 | 1,472,787 | ||||||
State of Arizona Lottery Revenue | 30,105 | 34,584,565 | ||||||
Tempe Industrial Development Authority | 5,490 | 5,491,633 | ||||||
|
| |||||||
| 110,509,572 | ||||||||
|
| |||||||
Arkansas – 0.0% |
| |||||||
City of Fayetteville AR | 2,475 | 2,470,487 | ||||||
|
| |||||||
50 | AB INTERMEDIATE MUNICIPAL PORTFOLIOS | abfunds.com | |
Table of Contents
PORTFOLIO OF INVESTMENTS (continued)
DIVERSIFIED MUNICIPAL PORTFOLIO
| Principal Amount (000) | U.S. $ Value | |||||||
| ||||||||
California – 5.7% |
| |||||||
California Community Housing Agency | $ | 10,000 | $ | 10,341,736 | ||||
California Housing Finance | 10,813 | 12,533,682 | ||||||
Series 2021-1, Class A | 3,500 | 3,991,727 | ||||||
California Municipal Finance Authority | 365 | 413,174 | ||||||
California State Public Works Board | 1,225 | 1,415,723 | ||||||
Series 2021A | 12,040 | 14,549,819 | ||||||
City of Los Angeles Department of Airports | 5,840 | 7,049,973 | ||||||
City of Riverside CA Electric Revenue | 5,230 | 6,696,540 | ||||||
Golden State Tobacco Securitization Corp. | 10,960 | 11,157,883 | ||||||
Los Angeles Unified School District/CA | 10,000 | 12,656,562 | ||||||
Series 2020R | 2,780 | 3,658,330 | ||||||
Metropolitan Water District of Southern California | 7,550 | 9,545,152 | ||||||
San Francisco Intl Airport | 5,880 | 5,900,537 | ||||||
State of California | 87,775 | 114,021,636 | ||||||
Series 2013 | 43,465 | 48,697,502 | ||||||
Series 2014 | 80,965 | 92,275,549 | ||||||
| abfunds.com | AB INTERMEDIATE MUNICIPAL PORTFOLIOS | 51 | |
Table of Contents
PORTFOLIO OF INVESTMENTS (continued)
DIVERSIFIED MUNICIPAL PORTFOLIO
| Principal Amount (000) | U.S. $ Value | |||||||
| ||||||||
University of California | $ | 10,000 | $ | 12,845,932 | ||||
|
| |||||||
| 367,751,457 | ||||||||
|
| |||||||
Colorado – 1.9% |
| |||||||
Centerra Metropolitan District No. 1 | 3,680 | 3,911,371 | ||||||
City & County of Denver CO Airport System Revenue | 1,025 | 1,101,503 | ||||||
Series 2016A | 4,085 | 4,584,800 | ||||||
Series 2018A | 46,840 | 57,335,138 | ||||||
City & County of Denver Co. Airport System Revenue | 5,605 | 6,031,299 | ||||||
Series 2018A | 24,320 | 30,825,865 | ||||||
Colorado Health Facilities Authority | 5,265 | 6,612,428 | ||||||
Colorado Health Facilities Authority | 5,900 | 7,491,028 | ||||||
Vauxmont Metropolitan District | 1,000 | 1,057,229 | ||||||
5.00%, 12/01/2024-12/01/2050 | 2,030 | 2,443,160 | ||||||
|
| |||||||
| 121,393,821 | ||||||||
|
| |||||||
Connecticut – 3.2% |
| |||||||
City of Bridgeport CT | 2,420 | 2,801,295 | ||||||
Series 2017B | 12,195 | 14,776,119 | ||||||
5.00%, 08/15/2027 (Pre-refunded/ETM) | 755 | 951,808 | ||||||
Series 2017C | 8,950 | 10,702,640 | ||||||
52 | AB INTERMEDIATE MUNICIPAL PORTFOLIOS | abfunds.com | |
Table of Contents
PORTFOLIO OF INVESTMENTS (continued)
DIVERSIFIED MUNICIPAL PORTFOLIO
| Principal Amount (000) | U.S. $ Value | |||||||
| ||||||||
Connecticut State Health & Educational Facilities Authority | $ | 5,425 | $ | 6,765,084 | ||||
Connecticut State Health & Educational Facilities Authority | 4,400 | 5,175,723 | ||||||
State of Connecticut | 3,370 | 3,456,377 | ||||||
Series 2014A | 6,360 | 7,165,563 | ||||||
Series 2015B | 7,345 | 8,557,806 | ||||||
Series 2015F | 1,570 | 1,865,747 | ||||||
Series 2016A | 17,305 | 20,514,415 | ||||||
Series 2016B | 17,090 | 17,182,219 | ||||||
Series 2016E | 20,025 | 23,336,439 | ||||||
Series 2017A | 8,450 | 8,869,823 | ||||||
Series 2017B | 2,515 | 3,189,692 | ||||||
Series 2018C | 5,500 | 6,692,277 | ||||||
Series 2018D | 16,655 | 20,170,556 | ||||||
Series 2020A | 2,565 | 3,228,694 | ||||||
State of Connecticut Special Tax Revenue | 1,000 | 1,164,818 | ||||||
5.00%, 05/01/2028-05/01/2038 | 11,780 | 15,106,503 | ||||||
Series 2012 | 8,575 | 9,099,012 | ||||||
Town of Stratford CT | 13,370 | 16,030,604 | ||||||
|
| |||||||
| 206,803,214 | ||||||||
|
| |||||||
| abfunds.com | AB INTERMEDIATE MUNICIPAL PORTFOLIOS | 53 | |
Table of Contents
PORTFOLIO OF INVESTMENTS (continued)
DIVERSIFIED MUNICIPAL PORTFOLIO
| Principal Amount (000) | U.S. $ Value | |||||||
| ||||||||
Delaware – 0.1% |
| |||||||
Delaware River & Bay Authority | $ | 5,470 | $ | 6,116,906 | ||||
Delaware State Economic Development Authority | 575 | 659,677 | ||||||
5.00%, 09/01/2050 | 1,000 | 1,174,195 | ||||||
|
| |||||||
| 7,950,778 | ||||||||
|
| |||||||
District of Columbia – 1.9% |
| |||||||
District of Columbia | 59,115 | 65,057,794 | ||||||
District of Columbia | 5,545 | 5,980,080 | ||||||
Metropolitan Washington Airports Authority | 1,155 | 1,447,704 | ||||||
Series 2019A | 8,840 | 11,211,611 | ||||||
Series 2020A | 26,400 | 34,053,944 | ||||||
Washington Metropolitan Area Transit Authority | 3,205 | 4,155,747 | ||||||
|
| |||||||
| 121,906,880 | ||||||||
|
| |||||||
Florida – 5.1% |
| |||||||
Capital Trust Agency, Inc. | 510 | 564,937 | ||||||
Central Florida Expressway Authority | 11,335 | 14,590,539 | ||||||
Citizens Property Insurance, Inc. | 27,105 | 28,615,632 | ||||||
Series 2015A | 1,795 | 1,851,776 | ||||||
54 | AB INTERMEDIATE MUNICIPAL PORTFOLIOS | abfunds.com | |
Table of Contents
PORTFOLIO OF INVESTMENTS (continued)
DIVERSIFIED MUNICIPAL PORTFOLIO
| Principal Amount (000) | U.S. $ Value | |||||||
| ||||||||
City Of South Miami Health Facilities Authority, Inc. | $ | 5,000 | $ | 6,117,130 | ||||
City of Tampa FL | 1,300 | 886,290 | ||||||
City of Tampa FL Water & Wastewater System Revenue | 3,895 | 3,988,455 | ||||||
County of Broward FL Airport System Revenue | 1,070 | 1,341,036 | ||||||
Series 2019C | 1,250 | 1,312,856 | ||||||
County of Broward FL Airport System Revenue | 5,000 | 5,355,068 | ||||||
County of Lee FL Airport Revenue | 13,095 | 13,327,886 | ||||||
5.625%, 10/01/2025 | 2,550 | 2,596,345 | ||||||
County of Miami-Dade FL | 3,715 | 3,938,400 | ||||||
County of Miami-Dade FL Aviation Revenue | 4,975 | 5,514,447 | ||||||
County of Osceola FL Transportation Revenue | 4,610 | 3,373,919 | ||||||
Duval County School Board | 4,280 | 5,027,594 | ||||||
Florida Department of Environmental Protection | 10,225 | 10,839,876 | ||||||
Florida Development Finance Corp. | 3,765 | 4,201,153 | ||||||
| abfunds.com | AB INTERMEDIATE MUNICIPAL PORTFOLIOS | 55 | |
Table of Contents
PORTFOLIO OF INVESTMENTS (continued)
DIVERSIFIED MUNICIPAL PORTFOLIO
| Principal Amount (000) | U.S. $ Value | |||||||
| ||||||||
Florida Municipal Power Agency | $ | 3,765 | $ | 4,442,959 | ||||
Florida State Board of Education | 3,545 | 3,743,850 | ||||||
Series 2017F | 2,775 | 2,796,185 | ||||||
Greater Orlando Aviation Authority | 13,335 | 16,241,794 | ||||||
Series 2019A | 7,975 | 10,001,246 | ||||||
Hillsborough County School Board | 1,480 | 1,745,975 | ||||||
Hillsborough County School Board | 2,650 | 2,951,105 | ||||||
Hollywood Community Redevelopment Agency | 3,645 | 3,848,549 | ||||||
JEA Electric System Revenue | 1,185 | 1,473,794 | ||||||
JEA Water & Sewer System Revenue | 1,565 | 1,779,679 | ||||||
5.00%, 10/01/2025 | 1,495 | 1,701,018 | ||||||
Series 2017A | 22,290 | 27,463,935 | ||||||
Manatee County School District | 14,010 | 16,863,146 | ||||||
North Broward Hospital District | 6,180 | 7,558,580 | ||||||
Orange County Health Facilities Authority | 18,515 | 20,564,401 | ||||||
Orange County School Board | 25,075 | 28,967,864 | ||||||
56 | AB INTERMEDIATE MUNICIPAL PORTFOLIOS | abfunds.com | |
Table of Contents
PORTFOLIO OF INVESTMENTS (continued)
DIVERSIFIED MUNICIPAL PORTFOLIO
| Principal Amount (000) | U.S. $ Value | |||||||
| ||||||||
5.00%, 08/01/2029 (Pre-refunded/ETM) | $ | 21,280 | $ | 24,583,694 | ||||
Palm Beach County Health Facilities Authority | 2,355 | 2,376,730 | ||||||
Polk County Industrial Development Authority | 2,000 | 2,109,405 | ||||||
Reedy Creek Improvement District | 1,820 | 1,833,691 | ||||||
South Broward Hospital District | 3,350 | 3,903,165 | ||||||
St. Lucie County School Board | 3,150 | 3,368,305 | ||||||
State Board of Administration Finance Corp. | 14,015 | 14,144,999 | ||||||
1.705%, 07/01/2027 | 9,575 | 9,610,180 | ||||||
Tampa Bay Water | 2,050 | 2,099,116 | ||||||
|
| |||||||
| 329,616,704 | ||||||||
|
| |||||||
Georgia – 1.2% |
| |||||||
City of Atlanta GA Department of Aviation | 12,250 | 13,737,351 | ||||||
Cobb County Kennestone Hospital Authority | 2,275 | 2,829,296 | ||||||
Forsyth County Water & Sewerage Authority | 1,050 | 1,351,874 | ||||||
Main Street Natural Gas, Inc. | 34,735 | 37,507,839 | ||||||
Series 2018C | 18,000 | 19,563,046 | ||||||
| abfunds.com | AB INTERMEDIATE MUNICIPAL PORTFOLIOS | 57 | |
Table of Contents
PORTFOLIO OF INVESTMENTS (continued)
DIVERSIFIED MUNICIPAL PORTFOLIO
| Principal Amount (000) | U.S. $ Value | |||||||
| ||||||||
Private Colleges & Universities Authority | $ | 1,280 | $ | 1,553,163 | ||||
|
| |||||||
| 76,542,569 | ||||||||
|
| |||||||
Guam – 0.0% |
| |||||||
Territory of Guam | 1,000 | 1,105,111 | ||||||
|
| |||||||
Hawaii – 0.3% |
| |||||||
City & County of Honolulu HI | 7,865 | 9,244,050 | ||||||
State of Hawaii | 7,105 | 7,942,419 | ||||||
State of Hawaii Harbor System Revenue | 2,765 | 3,238,312 | ||||||
|
| |||||||
| 20,424,781 | ||||||||
|
| |||||||
Idaho – 0.1% |
| |||||||
Idaho Housing & Finance Association | 4,675 | 5,001,507 | ||||||
|
| |||||||
Illinois – 5.7% |
| |||||||
Chicago Board of Education | 7,000 | 7,719,834 | ||||||
Series 2018A | 5,500 | 5,787,696 | ||||||
5.00%, 12/01/2026 | 1,000 | 1,176,688 | ||||||
Chicago O’Hare International Airport | 3,020 | 3,598,613 | ||||||
Chicago Transit Authority | 7,460 | 7,843,596 | ||||||
Illinois Finance Authority | 4,485 | 5,372,760 | ||||||
Illinois Finance Authority | 7,785 | 10,164,468 | ||||||
58 | AB INTERMEDIATE MUNICIPAL PORTFOLIOS | abfunds.com | |
Table of Contents
PORTFOLIO OF INVESTMENTS (continued)
DIVERSIFIED MUNICIPAL PORTFOLIO
| Principal Amount (000) | U.S. $ Value | |||||||
| ||||||||
Illinois Finance Authority | $ | 3,350 | $ | 3,774,376 | ||||
Illinois Finance Authority | 16,850 | 22,577,821 | ||||||
Illinois Municipal Electric Agency | 42,820 | 50,481,503 | ||||||
Illinois State Toll Highway Authority | 9,020 | 9,302,869 | ||||||
Series 2014D | 1,185 | 1,282,383 | ||||||
Metropolitan Pier & Exposition Authority | 565 | 596,565 | ||||||
5.00%, 06/15/2023-12/15/2028 | 13,575 | 14,196,202 | ||||||
Railsplitter Tobacco Settlement Authority | 12,450 | 14,525,942 | ||||||
Series 2017 | 19,260 | 21,075,167 | ||||||
State of Illinois | 1,500 | 1,845,420 | ||||||
Series 2012 | 20,610 | 21,590,683 | ||||||
5.50%, 07/01/2024 | 5,415 | 5,947,801 | ||||||
Series 2013A | 4,415 | 4,781,540 | ||||||
Series 2014 | 36,040 | 40,189,936 | ||||||
Series 2016 | 15,990 | 17,632,602 | ||||||
Series 2017A | 8,590 | 9,776,303 | ||||||
Series 2017D | 66,070 | 75,202,223 | ||||||
Series 2019B | 9,000 | 10,080,981 | ||||||
State of Illinois | 2,525 | 2,642,643 | ||||||
| abfunds.com | AB INTERMEDIATE MUNICIPAL PORTFOLIOS | 59 | |
Table of Contents
PORTFOLIO OF INVESTMENTS (continued)
DIVERSIFIED MUNICIPAL PORTFOLIO
| Principal Amount (000) | U.S. $ Value | |||||||
| ||||||||
Town of Cortland IL | $ | 5,078 | $ | 939,430 | ||||
|
| |||||||
| 370,106,045 | ||||||||
|
| |||||||
Indiana – 0.2% |
| |||||||
City of Whiting IN | 9,670 | 11,737,889 | ||||||
|
| |||||||
Iowa – 0.3% |
| |||||||
PEFA, Inc. | 14,000 | 16,873,231 | ||||||
|
| |||||||
Kansas – 0.1% |
| |||||||
City of Junction City KS | 3,805 | 4,205,548 | ||||||
|
| |||||||
Kentucky – 2.6% |
| |||||||
County of Carroll KY | 3,835 | 3,833,635 | ||||||
Kentucky Economic Development Finance Authority | 1,000 | 1,224,821 | ||||||
Kentucky Economic Development Finance Authority | 14,650 | 16,910,571 | ||||||
Kentucky Public Energy Authority | 24,850 | 27,494,497 | ||||||
Kentucky Public Energy Authority | 41,090 | 45,037,812 | ||||||
Series 2018C | 36,475 | 41,043,891 | ||||||
Series 2019A | 10,855 | 12,225,235 | ||||||
60 | AB INTERMEDIATE MUNICIPAL PORTFOLIOS | abfunds.com | |
Table of Contents
PORTFOLIO OF INVESTMENTS (continued)
DIVERSIFIED MUNICIPAL PORTFOLIO
| Principal Amount (000) | U.S. $ Value | |||||||
| ||||||||
Kentucky Turnpike Authority | $ | 8,490 | $ | 9,003,833 | ||||
Series 2016A | 13,375 | 15,606,137 | ||||||
|
| |||||||
| 172,380,432 | ||||||||
|
| |||||||
Louisiana – 0.4% |
| |||||||
Consolidated Govt of the City of Baton Rouge & Parish of E Baton Rouge Sales Tax | 8,985 | 10,598,950 | ||||||
Parish of St. James LA | 2,250 | 2,539,972 | ||||||
6.10%, 06/01/2038-12/01/2040(a) | 5,625 | 7,032,186 | ||||||
St. Tammany Parish Finance Authority | 1,200 | 1,313,237 | ||||||
State of Louisiana Gasoline & Fuels Tax Revenue | 3,250 | 3,835,280 | ||||||
|
| |||||||
| 25,319,625 | ||||||||
|
| |||||||
Maine – 0.0% |
| |||||||
Maine Municipal Bond Bank | 1,000 | 1,149,149 | ||||||
|
| |||||||
Maryland – 0.4% |
| |||||||
City of Baltimore MD | 2,000 | 2,049,514 | ||||||
County of Frederick MD | 2,265 | 2,863,203 | ||||||
County of Howard MD | 8,465 | 11,317,893 | ||||||
County of Montgomery MD | 2,115 | 2,554,661 | ||||||
| abfunds.com | AB INTERMEDIATE MUNICIPAL PORTFOLIOS | 61 | |
Table of Contents
PORTFOLIO OF INVESTMENTS (continued)
DIVERSIFIED MUNICIPAL PORTFOLIO
| Principal Amount (000) | U.S. $ Value | |||||||
| ||||||||
Maryland Health & Higher Educational Facilities Authority | $ | 4,285 | $ | 5,521,847 | ||||
State of Maryland | 1,865 | 2,357,560 | ||||||
Series 2020A | 1,000 | 1,251,924 | ||||||
University System of Maryland | 1,125 | 1,125,000 | ||||||
|
| |||||||
| 29,041,602 | ||||||||
|
| |||||||
Massachusetts – 1.7% |
| |||||||
Commonwealth of Massachusetts | 3,965 | 4,390,381 | ||||||
Series 2017D | 4,435 | 5,449,399 | ||||||
Series 2018B | 3,685 | 4,646,905 | ||||||
Series 2020 | 1,925 | 2,363,025 | ||||||
Series 2020E | 3,805 | 4,839,516 | ||||||
Massachusetts Bay Transportation Authority | 6,600 | 9,375,261 | ||||||
Massachusetts Development Finance Agency | 15,375 | 19,066,124 | ||||||
Massachusetts Development Finance Agency | 24,065 | 29,647,615 | ||||||
Massachusetts Development Finance Agency | 950 | 1,222,349 | ||||||
Massachusetts Development Finance Agency | 7,525 | 9,384,674 | ||||||
62 | AB INTERMEDIATE MUNICIPAL PORTFOLIOS | abfunds.com | |
Table of Contents
PORTFOLIO OF INVESTMENTS (continued)
DIVERSIFIED MUNICIPAL PORTFOLIO
| Principal Amount (000) | U.S. $ Value | |||||||
| ||||||||
AGM Series 2020C | $ | 2,405 | $ | 3,041,048 | ||||
Massachusetts Port Authority | 5,615 | 7,256,536 | ||||||
Massachusetts School Building Authority | 455 | 484,929 | ||||||
Massachusetts School Building Authority | 10,225 | 10,892,312 | ||||||
|
| |||||||
| 112,060,074 | ||||||||
|
| |||||||
Michigan – 4.8% |
| |||||||
Great Lakes Water Authority Water Supply System Revenue | 12,505 | 14,700,671 | ||||||
Kalamazoo Economic Development Corp. | 1,150 | 1,153,215 | ||||||
Lake Orion Community School District | 2,915 | 3,324,734 | ||||||
Michigan Finance Authority | 48,585 | 57,351,250 | ||||||
Michigan Finance Authority | 500 | 503,172 | ||||||
3.80%, 10/01/2022 | 500 | 510,915 | ||||||
3.875%, 10/01/2023 | 2,000 | 2,065,616 | ||||||
4.00%, 10/01/2024 | 3,000 | 3,132,739 | ||||||
4.50%, 10/01/2029 | 12,065 | 12,546,170 | ||||||
Michigan Finance Authority | 39,940 | 45,696,908 | ||||||
| abfunds.com | AB INTERMEDIATE MUNICIPAL PORTFOLIOS | 63 | |
Table of Contents
PORTFOLIO OF INVESTMENTS (continued)
DIVERSIFIED MUNICIPAL PORTFOLIO
| Principal Amount (000) | U.S. $ Value | |||||||
| ||||||||
Michigan Finance Authority | $ | 54,355 | $ | 62,216,424 | ||||
Michigan Finance Authority | 15,000 | 15,292,750 | ||||||
Michigan Finance Authority | 350 | 351,490 | ||||||
4.00%, 06/01/2022-06/01/2039 | 9,000 | 10,577,678 | ||||||
5.00%, 06/01/2025-06/01/2031 | 5,645 | 7,114,421 | ||||||
Michigan Finance Authority | 1,580 | 1,723,194 | ||||||
Series 2014B | 7,450 | 8,187,790 | ||||||
Michigan Finance Authority | 13,075 | 15,027,880 | ||||||
5.50%, 12/01/2026-12/01/2027 | 7,220 | 8,643,852 | ||||||
Michigan Strategic Fund | 31,630 | 38,612,402 | ||||||
South Lyon Community Schools | 3,060 | 3,217,917 | ||||||
|
| |||||||
| 311,951,188 | ||||||||
|
| |||||||
Minnesota – 0.1% |
| |||||||
State of Minnesota | 3,745 | 3,986,373 | ||||||
Series 2019A | 1,205 | 1,527,512 | ||||||
|
| |||||||
| 5,513,885 | ||||||||
|
| |||||||
64 | AB INTERMEDIATE MUNICIPAL PORTFOLIOS | abfunds.com | |
Table of Contents
PORTFOLIO OF INVESTMENTS (continued)
DIVERSIFIED MUNICIPAL PORTFOLIO
| Principal Amount (000) | U.S. $ Value | |||||||
| ||||||||
Missouri – 0.4% |
| |||||||
Cape Girardeau County Industrial Development Authority | $ | 2,820 | $ | 3,119,646 | ||||
Health & Educational Facilities Authority of the State of Missouri | 10,500 | 12,642,195 | ||||||
5.00%, 07/01/2031(b) | 4,470 | 5,965,412 | ||||||
Howard Bend Levee District | 1,620 | 1,824,853 | ||||||
Missouri Joint Municipal Electric Utility Commission | 2,630 | 3,047,657 | ||||||
|
| |||||||
| 26,599,763 | ||||||||
|
| |||||||
Montana – 0.3% |
| |||||||
Montana Facility Finance Authority | 15,015 | 18,025,817 | ||||||
|
| |||||||
Nebraska – 1.0% |
| |||||||
Central Plains Energy Project | 57,465 | 64,011,821 | ||||||
|
| |||||||
Nevada – 1.2% |
| |||||||
City of Las Vegas NV | 8,605 | 9,839,232 | ||||||
Clark County School District | 17,785 | 18,783,025 | ||||||
Series 2016D | 26,915 | 30,738,359 | ||||||
County of Clark NV | 6,530 | 7,474,326 | ||||||
Las Vegas Valley Water District | 4,590 | 5,576,433 | ||||||
| abfunds.com | AB INTERMEDIATE MUNICIPAL PORTFOLIOS | 65 | |
Table of Contents
PORTFOLIO OF INVESTMENTS (continued)
DIVERSIFIED MUNICIPAL PORTFOLIO
| Principal Amount (000) | U.S. $ Value | |||||||
| ||||||||
State of Nevada Department of Business & Industry | $ | 3,000 | $ | 3,000,641 | ||||
|
| |||||||
| 75,412,016 | ||||||||
|
| |||||||
New Hampshire – 0.2% |
| |||||||
New Hampshire Business Finance Authority | 9,394 | 10,887,181 | ||||||
New Hampshire Business Finance Authority | 2,250 | 2,347,993 | ||||||
New Hampshire Business Finance Authority | 2,250 | 2,469,496 | ||||||
|
| |||||||
| 15,704,670 | ||||||||
|
| |||||||
New Jersey – 6.0% |
| |||||||
New Jersey Economic Development Authority | 4,930 | 5,934,855 | ||||||
Series 2011EE | 355 | 356,086 | ||||||
New Jersey Economic Development Authority | 1,075 | 1,111,033 | ||||||
5.50%, 01/01/2026-01/01/2027 | 2,000 | 2,251,035 | ||||||
New Jersey Economic Development Authority | 9,515 | 10,419,755 | ||||||
New Jersey Economic Development Authority | 4,500 | 4,920,497 | ||||||
New Jersey Economic Development Authority | 3,920 | 4,161,853 | ||||||
New Jersey Transit Corp. | 14,375 | 14,654,605 | ||||||
66 | AB INTERMEDIATE MUNICIPAL PORTFOLIOS | abfunds.com | |
Table of Contents
PORTFOLIO OF INVESTMENTS (continued)
DIVERSIFIED MUNICIPAL PORTFOLIO
| Principal Amount (000) | U.S. $ Value | |||||||
| ||||||||
New Jersey Transportation Trust Fund Authority | $ | 13,780 | $ | 16,458,828 | ||||
Series 2018A | 3,035 | 3,566,388 | ||||||
New Jersey Transportation Trust Fund Authority | 8,720 | 10,918,118 | ||||||
Series 2018A | 65,475 | 81,119,780 | ||||||
Series 2019B | 3,885 | 4,759,515 | ||||||
Series 2020A | 1,810 | 2,262,350 | ||||||
New Jersey Turnpike Authority | 6,015 | 6,522,519 | ||||||
5.00%, 01/01/2027 (Pre-refunded/ETM) | 6,685 | 7,249,050 | ||||||
Series 2014A | 75,940 | 86,464,216 | ||||||
Series 2014C | 14,720 | 16,541,596 | ||||||
Series 2017A | 7,235 | 8,810,725 | ||||||
Series 2017B | 40,050 | 49,566,601 | ||||||
Series 2021B | 6,625 | 6,390,172 | ||||||
AGM Series 2005D-3 | 14,770 | 17,866,994 | ||||||
State of New Jersey | 4,895 | 6,257,440 | ||||||
Tobacco Settlement Financing Corp./NJ | 17,385 | 20,965,741 | ||||||
|
| |||||||
| 389,529,752 | ||||||||
|
| |||||||
New York – 13.0% |
| |||||||
City of New York NY | 1,130 | 1,296,957 | ||||||
Series 2015A | 2,040 | 2,260,913 | ||||||
Series 2018D | 2,435 | 3,004,355 | ||||||
| abfunds.com | AB INTERMEDIATE MUNICIPAL PORTFOLIOS | 67 | |
Table of Contents
PORTFOLIO OF INVESTMENTS (continued)
DIVERSIFIED MUNICIPAL PORTFOLIO
| Principal Amount (000) | U.S. $ Value | |||||||
| ||||||||
Series 2020A | $ | 14,900 | $ | 18,517,999 | ||||
Series 2020B | 14,880 | 18,512,879 | ||||||
Series 2020C | 3,150 | 4,105,856 | ||||||
Series 2021D | 18,930 | 18,584,467 | ||||||
1.623%, 08/01/2028 | 10,500 | 10,321,674 | ||||||
Series 2021F | 5,000 | 5,869,482 | ||||||
Series 2021L | 4,000 | 5,233,294 | ||||||
County of Nassau NY | 8,840 | 10,732,414 | ||||||
Dutchess County Local Development Corp. | 5,000 | 5,469,119 | ||||||
Metropolitan Transportation Authority | 6,890 | 7,301,245 | ||||||
Series 2012E | 6,055 | 6,531,473 | ||||||
Series 2012F | 55,610 | 59,331,361 | ||||||
Series 2012H | 3,335 | 3,597,434 | ||||||
5.00%, 11/15/2026 | 2,730 | 2,905,497 | ||||||
Series 2013B | 9,505 | 10,700,558 | ||||||
Series 2014A | 4,205 | 4,733,913 | ||||||
5.00%, 11/15/2027 (Pre-refunded/ETM) | 4,040 | 4,548,159 | ||||||
Series 2014C | 5,000 | 5,841,419 | ||||||
Series 2017C | 79,890 | 97,430,699 | ||||||
Metropolitan Transportation Authority | 4,505 | 4,829,872 | ||||||
68 | AB INTERMEDIATE MUNICIPAL PORTFOLIOS | abfunds.com | |
Table of Contents
PORTFOLIO OF INVESTMENTS (continued)
DIVERSIFIED MUNICIPAL PORTFOLIO
| Principal Amount (000) | U.S. $ Value | |||||||
| ||||||||
New York City Transitional Finance Authority Building Aid Revenue | $ | 53,945 | $ | 67,812,699 | ||||
New York City Transitional Finance Authority Future Tax Secured Revenue | 34,430 | 35,384,063 | ||||||
Series 2011C | 17,620 | 18,112,958 | ||||||
Series 2012A | 12,345 | 13,130,065 | ||||||
Series 2012B | 20,000 | 21,511,500 | ||||||
Series 2017A | 4,860 | 5,969,397 | ||||||
Series 2019B | 59,785 | 75,401,724 | ||||||
Series 2021E | 4,335 | 5,057,895 | ||||||
New York Liberty Development Corp. | 4,250 | 4,361,513 | ||||||
2.80%, 09/15/2069 | 11,555 | 11,418,420 | ||||||
New York State Dormitory Authority | 3,880 | 3,948,189 | ||||||
Series 2014C | 2,015 | 2,283,193 | ||||||
Series 2020D | 25,980 | 33,268,971 | ||||||
New York State Thruway Authority | 17,940 | 18,784,777 | ||||||
New York State Urban Development Corp. | 63,625 | 69,450,121 | ||||||
Series 2013D | 32,000 | 34,985,914 | ||||||
Series 2016A | 4,010 | 4,559,568 | ||||||
| abfunds.com | AB INTERMEDIATE MUNICIPAL PORTFOLIOS | 69 | |
Table of Contents
PORTFOLIO OF INVESTMENTS (continued)
DIVERSIFIED MUNICIPAL PORTFOLIO
| Principal Amount (000) | U.S. $ Value | |||||||
| ||||||||
New York Transportation Development Corp. | $ | 4,400 | $ | 5,099,389 | ||||
Series 2018 | 74,370 | 90,217,009 | ||||||
New York Transportation Development Corp. | 2,095 | 2,340,371 | ||||||
Port Authority of New York & New Jersey | 3,385 | 3,759,863 | ||||||
Series 20202 | 5,910 | 7,488,600 | ||||||
|
| |||||||
| 846,007,238 | ||||||||
|
| |||||||
North Carolina – 0.1% |
| |||||||
City of Charlotte NC Water & Sewer System Revenue | 2,800 | 3,493,841 | ||||||
North Carolina Eastern Municipal Power Agency | 1,720 | 1,794,669 | ||||||
|
| |||||||
| 5,288,510 | ||||||||
|
| |||||||
North Dakota – 0.1% |
| |||||||
County of Ward ND | 5,000 | 5,847,917 | ||||||
|
| |||||||
Ohio – 1.2% |
| |||||||
Buckeye Tobacco Settlement Financing Authority | 3,000 | 3,475,856 | ||||||
County of Allen OH Hospital Facilities Revenue | 6,965 | 8,998,218 | ||||||
Series 2017A | 20,420 | 25,278,487 | ||||||
County of Cuyahoga OH | 5,455 | 6,487,865 | ||||||
70 | AB INTERMEDIATE MUNICIPAL PORTFOLIOS | abfunds.com | |
Table of Contents
PORTFOLIO OF INVESTMENTS (continued)
DIVERSIFIED MUNICIPAL PORTFOLIO
| Principal Amount (000) | U.S. $ Value | |||||||
| ||||||||
County of Franklin OH | $ | 1,000 | $ | 1,223,353 | ||||
County of Hamilton OH Sewer System Revenue | 9,375 | 12,141,658 | ||||||
Hamilton County Convention Facilities Authority | 3,470 | 3,688,221 | ||||||
Ohio Air Quality Development Authority | 4,320 | 4,397,182 | ||||||
Ohio Air Quality Development Authority | 2,330 | 2,399,900 | ||||||
Ohio Water Development Authority Water Pollution Control Loan Fund | 4,970 | 6,578,293 | ||||||
Ohio Water Development Authority Water Pollution Control Loan Fund | 6,325 | 6,514,750 | ||||||
|
| |||||||
| 81,183,783 | ||||||||
|
| |||||||
Oklahoma – 0.2% |
| |||||||
Comanche County Memorial Hospital | 520 | 543,361 | ||||||
Series 2015 | 5,975 | 6,245,844 | ||||||
McGee Creek Authority | 995 | 1,061,424 | ||||||
Oklahoma Development Finance Authority | 3,005 | 3,018,862 | ||||||
|
| |||||||
| 10,869,491 | ||||||||
|
| |||||||
Oregon – 0.4% |
| |||||||
City of Portland OR Sewer System Revenue | 8,685 | 9,242,369 | ||||||
| abfunds.com | AB INTERMEDIATE MUNICIPAL PORTFOLIOS | 71 | |
Table of Contents
PORTFOLIO OF INVESTMENTS (continued)
DIVERSIFIED MUNICIPAL PORTFOLIO
| Principal Amount (000) | U.S. $ Value | |||||||
| ||||||||
Hospital Facilities Authority of Multnomah County Oregon | $ | 820 | $ | 870,419 | ||||
Medford Hospital Facilities Authority | 8,260 | 10,632,947 | ||||||
Salem Hospital Facility Authority | 2,205 | 2,733,043 | ||||||
State of Oregon Department of Administrative Services | 90 | 90,311 | ||||||
Tri-County Metropolitan Transportation District of Oregon | 2,335 | 2,929,348 | ||||||
|
| |||||||
| 26,498,437 | ||||||||
|
| |||||||
Other – 1.0% |
| |||||||
Federal Home Loan Mortgage Corp. Enhanced Receipt | 23,648 | 25,696,293 | ||||||
Series 2019-C, | 5,516 | 5,803,323 | ||||||
Series 2019-D, | 5,037 | 5,383,733 | ||||||
Series 2019-E, | 3,384 | 3,616,965 | ||||||
Federal Home Loan Mortgage Corp. Multifamily VRD Certificates | 9,805 | 10,311,037 | ||||||
2.625%, 06/15/2035(a) | 9,850 | 10,344,711 | ||||||
2.65%, 06/15/2035(a) | 4,925 | 5,195,892 | ||||||
|
| |||||||
| 66,351,954 | ||||||||
|
| |||||||
Pennsylvania – 5.8% |
| |||||||
Allegheny County Hospital Development Authority | 19,390 | 24,871,239 | ||||||
72 | AB INTERMEDIATE MUNICIPAL PORTFOLIOS | abfunds.com | |
Table of Contents
PORTFOLIO OF INVESTMENTS (continued)
DIVERSIFIED MUNICIPAL PORTFOLIO
| Principal Amount (000) | U.S. $ Value | |||||||
| ||||||||
Allegheny County Sanitary Authority | $ | 3,500 | $ | 3,931,978 | ||||
Beaver County Industrial Development Authority | 2,420 | 2,492,600 | ||||||
Beaver County Industrial Development Authority | 2,120 | 2,183,600 | ||||||
City of Philadelphia PA | 2,200 | 2,227,615 | ||||||
Series 2019A | 1,420 | 1,729,835 | ||||||
AGM Series 2017A | 46,290 | 57,547,696 | ||||||
Series 2019B | 1,005 | 1,303,648 | ||||||
City of Philadelphia PA Water & Wastewater Revenue | 17,425 | 20,634,990 | ||||||
Commonwealth of Pennsylvania | 3,120 | 3,711,370 | ||||||
Series 2016 | 9,575 | 11,077,559 | ||||||
Series 2017 | 20,480 | 25,149,972 | ||||||
Geisinger Authority | 2,500 | 3,222,423 | ||||||
Hospitals & Higher Education Facilities Authority of Philadelphia (The) | 6,000 | 6,845,810 | ||||||
Montgomery County Higher Education & Health Authority | 5,000 | 5,629,022 | ||||||
| abfunds.com | AB INTERMEDIATE MUNICIPAL PORTFOLIOS | 73 | |
Table of Contents
PORTFOLIO OF INVESTMENTS (continued)
DIVERSIFIED MUNICIPAL PORTFOLIO
| Principal Amount (000) | U.S. $ Value | |||||||
| ||||||||
Montgomery County Higher Education & Health Authority | $ | 2,910 | $ | 3,668,885 | ||||
Series 2018 | 10,650 | 13,201,555 | ||||||
Pennsylvania Economic Development Financing Authority | 51,190 | 61,258,334 | ||||||
Pennsylvania Economic Development Financing Authority | 9,030 | 11,636,098 | ||||||
Pennsylvania Higher Educational Facilities Authority | 2,410 | 2,718,516 | ||||||
5.00%, 08/15/2029-08/15/2030(b) | 1,575 | 1,932,266 | ||||||
Pennsylvania Turnpike Commission | 13,890 | 17,822,468 | ||||||
Series 2017B | 13,280 | 16,253,018 | ||||||
Series 2019 | 5,250 | 5,674,511 | ||||||
Philadelphia Authority for Industrial Development | 5,560 | 6,366,668 | ||||||
5.00%, 11/01/2027-11/01/2034 | 11,940 | 14,976,721 | ||||||
Philadelphia Parking Authority (The) | 9,080 | 9,110,180 | ||||||
School District of Philadelphia (The) | 8,360 | 9,515,652 | ||||||
Series 2016F | 29,200 | 33,062,778 | ||||||
|
| |||||||
| 379,757,007 | ||||||||
|
| |||||||
Puerto Rico – 0.6% |
| |||||||
Commonwealth of Puerto Rico | 125 | 150,328 | ||||||
74 | AB INTERMEDIATE MUNICIPAL PORTFOLIOS | abfunds.com | |
Table of Contents
PORTFOLIO OF INVESTMENTS (continued)
DIVERSIFIED MUNICIPAL PORTFOLIO
| Principal Amount (000) | U.S. $ Value | |||||||
| ||||||||
Puerto Rico Electric Power Authority | $ | 5,150 | $ | 6,266,183 | ||||
NATL Series 2007V | 150 | 165,721 | ||||||
Puerto Rico Highway & Transportation Authority | 4,260 | 5,257,148 | ||||||
AGC Series 2007C | 510 | 627,987 | ||||||
AGC Series 2007N | 10,525 | 13,051,160 | ||||||
NATL Series 2005L | 500 | 549,176 | ||||||
NATL Series 2007N | 1,050 | 1,164,585 | ||||||
Puerto Rico Public Buildings Authority | 3,250 | 3,649,641 | ||||||
Puerto Rico Sales Tax Financing Corp. Sales Tax Revenue | 7,511 | 7,049,454 | ||||||
|
| |||||||
| 37,931,383 | ||||||||
|
| |||||||
Rhode Island – 0.8% |
| |||||||
Providence Public Building Authority | 12,390 | 15,382,665 | ||||||
Rhode Island Commerce Corp. | 10,565 | 12,801,192 | ||||||
Rhode Island Depositors Economic Protection Corp. | 5,780 | 6,198,907 | ||||||
Tobacco Settlement Financing Corp./RI | 14,635 | 15,478,076 | ||||||
|
| |||||||
| 49,860,840 | ||||||||
|
| |||||||
| abfunds.com | AB INTERMEDIATE MUNICIPAL PORTFOLIOS | 75 | |
Table of Contents
PORTFOLIO OF INVESTMENTS (continued)
DIVERSIFIED MUNICIPAL PORTFOLIO
| Principal Amount (000) | U.S. $ Value | |||||||
| ||||||||
South Carolina – 1.0% |
| |||||||
Kershaw County School District/SC | $ | 1,185 | $ | 1,222,242 | ||||
Patriots Energy Group Financing Agency | 48,725 | 53,187,840 | ||||||
SCAGO Educational Facilities Corp. for Pickens School District | 7,000 | 8,059,697 | ||||||
South Carolina Public Service Authority | 2,435 | 2,914,781 | ||||||
Series 2020A | 1,690 | 1,991,254 | ||||||
|
| |||||||
| 67,375,814 | ||||||||
|
| |||||||
South Dakota – 0.1% |
| |||||||
South Dakota Health & Educational Facilities Authority | 7,025 | 8,521,846 | ||||||
|
| |||||||
Tennessee – 0.9% |
| |||||||
Tennergy Corp./TN | 5,445 | 6,241,939 | ||||||
Tennessee Energy Acquisition Corp. | 50,910 | 54,387,357 | ||||||
|
| |||||||
| 60,629,296 | ||||||||
|
| |||||||
Texas – 6.0% |
| |||||||
Alvin Independent School District/TX | 2,945 | 3,452,539 | ||||||
Austin Independent School District | 1,700 | 1,726,827 | ||||||
76 | AB INTERMEDIATE MUNICIPAL PORTFOLIOS | abfunds.com | |
Table of Contents
PORTFOLIO OF INVESTMENTS (continued)
DIVERSIFIED MUNICIPAL PORTFOLIO
| Principal Amount (000) | U.S. $ Value | |||||||
| ||||||||
Board of Regents of the University of Texas System | $ | 105 | $ | 140,675 | ||||
Central Texas Turnpike System | 1,000 | 1,149,708 | ||||||
City of Austin TX Airport System Revenue | 3,200 | 3,802,970 | ||||||
City of Austin TX Water & Wastewater System Revenue | 4,730 | 5,510,800 | ||||||
City of Houston TX | 16,370 | 19,219,454 | ||||||
City of Houston TX | 3,800 | 4,169,836 | ||||||
City of Houston TX Airport System Revenue | 6,160 | 7,657,275 | ||||||
City of Houston TX Airport System Revenue | 9,135 | 10,628,781 | ||||||
City of Houston TX Combined Utility System Revenue | 24,850 | 27,952,214 | ||||||
Dallas Independent School District | 1,355 | 1,690,747 | ||||||
Series 2011 | 5,165 | 5,183,193 | ||||||
Dallas/Fort Worth International Airport | 11,585 | 12,936,600 | ||||||
Denton Independent School District | 1,220 | 1,473,468 | ||||||
Grand Parkway Transportation Corp. | 84,825 | 91,304,341 | ||||||
Harris County Hospital District | 3,705 | 4,196,549 | ||||||
| abfunds.com | AB INTERMEDIATE MUNICIPAL PORTFOLIOS | 77 | |
Table of Contents
PORTFOLIO OF INVESTMENTS (continued)
DIVERSIFIED MUNICIPAL PORTFOLIO
| Principal Amount (000) | U.S. $ Value | |||||||
| ||||||||
Irving Hospital Authority | $ | 3,220 | $ | 3,784,574 | ||||
Mission Economic Development Corp. | 10,680 | 11,350,007 | ||||||
New Hope Cultural Education Facilities Finance Corp. | 1,130 | 1,206,384 | ||||||
New Hope Cultural Education Facilities Finance Corp. | 7,250 | 8,820,764 | ||||||
New Hope Cultural Education Facilities Finance Corp. | 875 | 942,916 | ||||||
North Texas Tollway Authority | 5,000 | 5,098,480 | ||||||
5.25%, 09/01/2025 (Pre-refunded/ETM) | 18,130 | 18,505,460 | ||||||
5.25%, 09/01/2026 (Pre-refunded/ETM) | 17,810 | 18,178,833 | ||||||
Series 2014A | 4,000 | 4,143,507 | ||||||
North Texas Tollway Authority | 7,745 | 8,490,805 | ||||||
Series 2015B | 12,275 | 14,152,873 | ||||||
Series 2019B | 30,080 | 37,844,007 | ||||||
Port Beaumont Navigation District | 1,360 | 1,389,806 | ||||||
San Antonio Independent School District/TX | 1,430 | 1,803,319 | ||||||
78 | AB INTERMEDIATE MUNICIPAL PORTFOLIOS | abfunds.com | |
Table of Contents
PORTFOLIO OF INVESTMENTS (continued)
DIVERSIFIED MUNICIPAL PORTFOLIO
| Principal Amount (000) | U.S. $ Value | |||||||
| ||||||||
San Antonio Water System | $ | 3,000 | $ | 3,294,541 | ||||
Spring Branch Independent School District | 3,215 | 3,643,297 | ||||||
Series 2015B | 4,855 | 5,501,775 | ||||||
State of Texas | 5,500 | 5,627,838 | ||||||
5.00%, 10/01/2023-10/01/2025 | 11,425 | 11,697,912 | ||||||
5.00%, 10/01/2024 (Pre-refunded/ETM) | 5,440 | 5,566,443 | ||||||
5.00%, 10/01/2025 (Pre-refunded/ETM) | 3,025 | 3,095,311 | ||||||
Texas Water Development Board | 1,310 | 1,622,213 | ||||||
Texas Water Development Board | 2,000 | 2,440,974 | ||||||
Texas Water Development Board | 1,900 | 2,282,448 | ||||||
Texas Water Development Board | 3,640 | 4,596,213 | ||||||
|
| |||||||
| 387,276,677 | ||||||||
|
| |||||||
Utah – 0.1% |
| |||||||
Davis School District | 1,015 | 1,071,935 | ||||||
Utah Transit Authority | 2,000 | 2,376,762 | ||||||
5.00%, 06/15/2028 (Pre-refunded/ETM) | 2,150 | 2,555,019 | ||||||
Utah Transit Authority | 1,305 | 1,527,298 | ||||||
|
| |||||||
| 7,531,014 | ||||||||
|
| |||||||
Virginia – 0.7% |
| |||||||
County of Fairfax VA | 3,860 | 5,044,942 | ||||||
| abfunds.com | AB INTERMEDIATE MUNICIPAL PORTFOLIOS | 79 | |
Table of Contents
PORTFOLIO OF INVESTMENTS (continued)
DIVERSIFIED MUNICIPAL PORTFOLIO
| Principal Amount (000) | U.S. $ Value | |||||||
| ||||||||
County of Henrico VA | $ | 1,860 | $ | 2,290,941 | ||||
County of Loudoun VA | 7,315 | 8,851,827 | ||||||
Fairfax County Economic Development Authority | 8,040 | 9,960,098 | ||||||
Virginia College Building Authority | 4,435 | 4,825,412 | ||||||
Virginia Small Business Financing Authority | 10,720 | 13,060,342 | ||||||
|
| |||||||
| 44,033,562 | ||||||||
|
| |||||||
Washington – 2.7% |
| |||||||
Chelan County Public Utility District No. 1 | 5,000 | 5,056,541 | ||||||
5.25%, 07/01/2022 | 3,670 | 3,713,421 | ||||||
City of Seattle WA Municipal Light & Power Revenue | 4,280 | 5,208,264 | ||||||
City of Seattle WA Water System Revenue | 1,100 | 1,170,442 | ||||||
County of King WA | 2,485 | 2,750,418 | ||||||
Energy Northwest | 8,840 | 8,943,425 | ||||||
King County School District No. 49 Tahoma | 2,710 | 2,926,298 | ||||||
Port of Seattle WA | 2,500 | 3,075,378 | ||||||
Series 2010B | 1,995 | 1,999,197 | ||||||
80 | AB INTERMEDIATE MUNICIPAL PORTFOLIOS | abfunds.com | |
Table of Contents
PORTFOLIO OF INVESTMENTS (continued)
DIVERSIFIED MUNICIPAL PORTFOLIO
| Principal Amount (000) | U.S. $ Value | |||||||
| ||||||||
Series 2015C | $ | 4,320 | $ | 4,537,472 | ||||
Series 2018A | 8,320 | 9,686,566 | ||||||
Series 2018B | 4,695 | 5,466,157 | ||||||
Snohomish County School District No. 2 Everett | 3,600 | 3,715,568 | ||||||
State of Washington | 6,765 | 7,169,337 | ||||||
Series 20152 | 9,895 | 10,961,289 | ||||||
Series 2015A-1 | 8,010 | 8,905,113 | ||||||
Series 2020 | 1,170 | 1,434,871 | ||||||
State of Washington | 8,805 | 9,396,559 | ||||||
State of Washington | 17,550 | 18,730,185 | ||||||
Washington Health Care Facilities Authority | 31,550 | 37,143,148 | ||||||
Washington Health Care Facilities Authority | 15,880 | 19,012,526 | ||||||
Washington State Housing Finance Commission | 3,505 | 3,479,267 | ||||||
|
| |||||||
| 174,481,442 | ||||||||
|
| |||||||
West Virginia – 0.2% |
| |||||||
Tobacco Settlement Finance Authority/WV | 16,125 | 16,374,694 | ||||||
|
| |||||||
| abfunds.com | AB INTERMEDIATE MUNICIPAL PORTFOLIOS | 81 | |
Table of Contents
PORTFOLIO OF INVESTMENTS (continued)
DIVERSIFIED MUNICIPAL PORTFOLIO
| Principal Amount (000) | U.S. $ Value | |||||||
| ||||||||
Wisconsin – 2.2% |
| |||||||
State of Wisconsin | $ | 45,000 | $ | 55,477,007 | ||||
Series 20211 | 14,150 | 18,100,367 | ||||||
Series 20212 | 29,485 | 34,220,689 | ||||||
UMA Education, Inc. | 16,760 | 19,325,955 | ||||||
Wisconsin Center District | 8,515 | 6,625,049 | ||||||
Wisconsin Health & Educational Facilities Authority | 2,445 | 2,436,083 | ||||||
Wisconsin Public Finance Authority | 3,750 | 4,404,983 | ||||||
Wisconsin Public Finance Authority | 1,000 | 1,098,367 | ||||||
Wisconsin Public Finance Authority | 355 | 363,993 | ||||||
WPPI Energy | 1,000 | 1,137,909 | ||||||
|
| |||||||
| 143,190,402 | ||||||||
|
| |||||||
Total Long-Term Municipal Bonds | 5,602,207,977 | |||||||
|
| |||||||
Short-Term Municipal Notes – 10.3% |
| |||||||
California – 0.1% |
| |||||||
City & County of San Francisco CA | 2,855 | 2,855,000 | ||||||
County of San Bernardino CA | 400 | 400,000 | ||||||
|
| |||||||
| 3,255,000 | ||||||||
|
| |||||||
82 | AB INTERMEDIATE MUNICIPAL PORTFOLIOS | abfunds.com | |
Table of Contents
PORTFOLIO OF INVESTMENTS (continued)
DIVERSIFIED MUNICIPAL PORTFOLIO
| Principal Amount (000) | U.S. $ Value | |||||||
| ||||||||
Colorado – 0.2% |
| |||||||
Colorado Health Facilities Authority | $ | 15,000 | $ | 15,000,000 | ||||
|
| |||||||
District of Columbia – 0.2% |
| |||||||
District of Columbia | 5,505 | 5,505,000 | ||||||
District of Columbia | 3,530 | 3,530,000 | ||||||
District of Columbia | 2,345 | 2,345,000 | ||||||
|
| |||||||
| 11,380,000 | ||||||||
|
| |||||||
Florida – 0.3% |
| |||||||
City of Lakeland FL | 1,830 | 1,830,000 | ||||||
County of Palm Beach FL | 2,200 | 2,200,000 | ||||||
Florida Gulf Coast University Financing Corp. | 1,570 | 1,570,000 | ||||||
Florida Keys Aqueduct Authority | 1,100 | 1,100,000 | ||||||
Halifax Hospital Medical Center | 7,250 | 7,250,000 | ||||||
Orange County Health Facilities Authority | 1,405 | 1,405,000 | ||||||
Orange County Health Facilities Authority | 3,100 | 3,100,000 | ||||||
|
| |||||||
| 18,455,000 | ||||||||
|
| |||||||
| abfunds.com | AB INTERMEDIATE MUNICIPAL PORTFOLIOS | 83 | |
Table of Contents
PORTFOLIO OF INVESTMENTS (continued)
DIVERSIFIED MUNICIPAL PORTFOLIO
| Principal Amount (000) | U.S. $ Value | |||||||
| ||||||||
Georgia – 0.5% |
| |||||||
Development Authority of Heard County | $ | 2,820 | $ | 2,820,000 | ||||
Development Authority of Monroe County (The) | 30,000 | 30,000,000 | ||||||
|
| |||||||
| 32,820,000 | ||||||||
|
| |||||||
Hawaii – 0.1% |
| |||||||
Hawaii Housing Finance & Development Corp. | 3,640 | 3,640,000 | ||||||
|
| |||||||
Illinois – 0.6% |
| |||||||
Illinois Development Finance Authority | 560 | 560,000 | ||||||
Illinois Educational Facilities Authority | 100 | 100,000 | ||||||
Illinois Finance Authority | 8,305 | 8,305,000 | ||||||
Illinois Finance Authority | 995 | 995,000 | ||||||
Illinois Finance Authority | 8,880 | 8,880,000 | ||||||
Illinois Housing Development Authority | 14,500 | 14,500,000 | ||||||
Village of Brookfield IL | 2,940 | 2,940,000 | ||||||
|
| |||||||
| 36,280,000 | ||||||||
|
| |||||||
Iowa – 0.2% |
| |||||||
Iowa Finance Authority | 9,135 | 9,135,000 | ||||||
Iowa Finance Authority | 2,315 | 2,315,000 | ||||||
|
| |||||||
| 11,450,000 | ||||||||
|
| |||||||
84 | AB INTERMEDIATE MUNICIPAL PORTFOLIOS | abfunds.com | |
Table of Contents
PORTFOLIO OF INVESTMENTS (continued)
DIVERSIFIED MUNICIPAL PORTFOLIO
| Principal Amount (000) | U.S. $ Value | |||||||
| ||||||||
Kentucky – 0.2% |
| |||||||
Louisville/Jefferson County Metropolitan Government | $ | 13,450 | $ | 13,450,000 | ||||
|
| |||||||
Louisiana – 0.6% |
| |||||||
Louisiana Offshore Terminal Authority | 20,450 | 20,450,000 | ||||||
Louisiana Public Facilities Authority | 14,525 | 14,525,000 | ||||||
Louisiana Public Facilities Authority | 2,265 | 2,265,000 | ||||||
|
| |||||||
| 37,240,000 | ||||||||
|
| |||||||
Maryland – 0.2% |
| |||||||
Maryland Health & Higher Educational Facilities Authority | 2,200 | 2,200,000 | ||||||
Series 2014B | 1,925 | 1,925,000 | ||||||
Maryland Health & Higher Educational Facilities Authority | 8,875 | 8,875,000 | ||||||
Montgomery County Housing Opportunities Commission | 1,875 | 1,875,000 | ||||||
|
| |||||||
| 14,875,000 | ||||||||
|
| |||||||
Massachusetts – 0.1% |
| |||||||
Commonwealth of Massachusetts | 5,415 | 5,420,652 | ||||||
Massachusetts Health & Educational Facilities Authority | 500 | 500,000 | ||||||
|
| |||||||
| 5,920,652 | ||||||||
|
| |||||||
| abfunds.com | AB INTERMEDIATE MUNICIPAL PORTFOLIOS | 85 | |
Table of Contents
PORTFOLIO OF INVESTMENTS (continued)
DIVERSIFIED MUNICIPAL PORTFOLIO
| Principal Amount (000) | U.S. $ Value | |||||||
| ||||||||
Michigan – 0.4% |
| |||||||
Grand Valley State University | $ | 18,590 | $ | 18,590,000 | ||||
Lakeview School District/MI | 6,025 | 6,025,000 | ||||||
Michigan Strategic Fund | 1,830 | 1,830,000 | ||||||
|
| |||||||
| 26,445,000 | ||||||||
|
| |||||||
Minnesota – 0.5% |
| |||||||
City of Minneapolis MN | 4,805 | 4,805,000 | ||||||
City of Minneapolis MN | 9,315 | 9,315,000 | ||||||
City of Minneapolis MN | 1,525 | 1,525,000 | ||||||
City of Minneapolis MN/St. Paul Housing & Redevelopment Authority | 11,925 | 11,925,000 | ||||||
0.06%, 11/15/2034(f) | 3,700 | 3,700,000 | ||||||
Housing & Redevelopment Authority of The City of St. Paul Minnesota | 2,400 | 2,400,000 | ||||||
|
| |||||||
| 33,670,000 | ||||||||
|
| |||||||
Nevada – 0.5% |
| |||||||
County of Clark Department of Aviation | 26,075 | 26,075,000 | ||||||
Series 2014D | 9,510 | 9,510,000 | ||||||
|
| |||||||
| 35,585,000 | ||||||||
|
| |||||||
New Jersey – 0.3% |
| |||||||
New Jersey Health Care Facilities Financing Authority | 2,995 | 2,995,000 | ||||||
86 | AB INTERMEDIATE MUNICIPAL PORTFOLIOS | abfunds.com | |
Table of Contents
PORTFOLIO OF INVESTMENTS (continued)
DIVERSIFIED MUNICIPAL PORTFOLIO
| Principal Amount (000) | U.S. $ Value | |||||||
| ||||||||
New Jersey Health Care Facilities Financing Authority | $ | 2,270 | $ | 2,270,000 | ||||
Series 2008C | 15,955 | 15,955,000 | ||||||
|
| |||||||
| 21,220,000 | ||||||||
|
| |||||||
New York – 2.6% |
| |||||||
City of New York NY | 3,370 | 3,370,000 | ||||||
Series 2019I | 5,450 | 5,450,000 | ||||||
Metropolitan Transportation Authority | 99,625 | 104,361,731 | ||||||
New York City Housing Development Corp. | 32,500 | 32,500,000 | ||||||
New York State Housing Finance Agency | 21,910 | 21,910,000 | ||||||
|
| |||||||
| 167,591,731 | ||||||||
|
| |||||||
North Carolina – 0.0% |
| |||||||
Durham County Industrial Facilities & Pollution Control Financing Authority | 780 | 780,000 | ||||||
|
| |||||||
Ohio – 0.1% |
| |||||||
Columbus Regional Airport Authority | 7,600 | 7,600,000 | ||||||
|
| |||||||
Oregon – 0.5% |
| |||||||
Clackamas County Hospital Facility Authority | 14,825 | 14,825,000 | ||||||
Series 2008B | 18,615 | 18,615,000 | ||||||
|
| |||||||
| 33,440,000 | ||||||||
|
| |||||||
Pennsylvania – 0.3% |
| |||||||
Emmaus General Authority | 2,000 | 2,000,000 | ||||||
| abfunds.com | AB INTERMEDIATE MUNICIPAL PORTFOLIOS | 87 | |
Table of Contents
PORTFOLIO OF INVESTMENTS (continued)
DIVERSIFIED MUNICIPAL PORTFOLIO
| Principal Amount (000) | U.S. $ Value | |||||||
| ||||||||
Series 2008E | $ | 4,500 | $ | 4,500,000 | ||||
Haverford Township School District | 2,425 | 2,425,000 | ||||||
Pennsylvania Turnpike Commission | 700 | 700,000 | ||||||
Philadelphia Gas Works Co. | 10,950 | 10,950,000 | ||||||
|
| |||||||
| 20,575,000 | ||||||||
|
| |||||||
Rhode Island – 0.1% |
| |||||||
Rhode Island Health and Educational Building Corp. | 3,445 | 3,445,000 | ||||||
Rhode Island Health and Educational Building Corp. | 1,050 | 1,050,000 | ||||||
|
| |||||||
| 4,495,000 | ||||||||
|
| |||||||
Tennessee – 0.1% | ||||||||
Greeneville Health & Educational Facilities Board | 3,150 | 3,150,000 | ||||||
Loudon Industrial Development Board | 3,400 | 3,400,000 | ||||||
|
| |||||||
| 6,550,000 | ||||||||
|
| |||||||
Texas – 0.8% |
| |||||||
City of Houston TX Combined Utility System Revenue | 30,030 | 30,030,000 | ||||||
Dallas Performing Arts Cultural Facilities Corp. | 4,190 | 4,190,000 | ||||||
State of Texas | 19,895 | 20,208,177 | ||||||
Tarrant County Housing Finance Corp. | 270 | 270,000 | ||||||
|
| |||||||
| 54,698,177 | ||||||||
|
| |||||||
88 | AB INTERMEDIATE MUNICIPAL PORTFOLIOS | abfunds.com | |
Table of Contents
PORTFOLIO OF INVESTMENTS (continued)
DIVERSIFIED MUNICIPAL PORTFOLIO
| Principal Amount (000) | U.S. $ Value | |||||||
| ||||||||
Vermont – 0.0% |
| |||||||
Vermont Educational & Health Buildings Financing Agency | $ | 900 | $ | 900,000 | ||||
|
| |||||||
Virginia – 0.2% |
| |||||||
Loudoun County Economic Development Authority | 3,000 | 3,000,000 | ||||||
Roanoke Economic Development Authority | 11,680 | 11,680,000 | ||||||
|
| |||||||
| 14,680,000 | ||||||||
|
| |||||||
Washington – 0.6% |
| |||||||
Washington State Housing Finance Commission | 1,250 | 1,250,000 | ||||||
Washington State Housing Finance Commission | 1,500 | 1,500,000 | ||||||
Washington State Housing Finance Commission | 2,400 | 2,400,000 | ||||||
Washington State Housing Finance Commission | 9,440 | 9,440,000 | ||||||
Washington State Housing Finance Commission | 6,590 | 6,590,000 | ||||||
Washington State Housing Finance Commission | 15,920 | 15,920,000 | ||||||
West Virginia Hospital Finance Authority | 725 | 725,000 | ||||||
|
| |||||||
| 37,825,000 | ||||||||
|
| |||||||
| abfunds.com | AB INTERMEDIATE MUNICIPAL PORTFOLIOS | 89 | |
Table of Contents
PORTFOLIO OF INVESTMENTS (continued)
DIVERSIFIED MUNICIPAL PORTFOLIO
| Principal Amount (000) | U.S. $ Value | |||||||
| ||||||||
Wisconsin – 0.0% |
| |||||||
Wisconsin Health & Educational Facilities Authority | $ | 380 | $ | 380,000 | ||||
|
| |||||||
Total Short-Term Municipal Notes | 670,200,560 | |||||||
|
| |||||||
Total Municipal Obligations | 6,272,408,537 | |||||||
|
| |||||||
COLLATERALIZED MORTGAGE OBLIGATIONS – 0.3% | ||||||||
Risk Share Floating Rate – 0.3% |
| |||||||
Connecticut Avenue Securities Trust | 813 | 816,675 | ||||||
Federal Home Loan Mortgage Corp. Structured Agency Credit Risk Debt Notes | 367 | 366,510 | ||||||
Series 2014-DN3, Class M3 | 120 | 121,949 | ||||||
Series 2014-HQ2, Class M3 | 480 | 493,778 | ||||||
Series 2015-DN1, Class M3 | 19 | 18,956 | ||||||
Series 2015-DNA1, Class M3 | 783 | 797,896 | ||||||
Series 2015-DNA2, Class M3 | 262 | 266,844 | ||||||
Series 2015-DNA3, Class M3 | 231 | 239,119 | ||||||
Series 2015-HQA1, Class M3 | 181 | 188,072 | ||||||
Series 2016-DNA1, Class M3 | 874 | 917,538 | ||||||
90 | AB INTERMEDIATE MUNICIPAL PORTFOLIOS | abfunds.com | |
Table of Contents
PORTFOLIO OF INVESTMENTS (continued)
DIVERSIFIED MUNICIPAL PORTFOLIO
| Principal Amount (000) | U.S. $ Value | |||||||
| ||||||||
Series 2016-DNA4, Class M3 | $ | 1,519 | $ | 1,577,917 | ||||
Series 2016-HQA3, Class M3 | 250 | 258,991 | ||||||
Series 2016-HQA4, Class M3 | 788 | 815,555 | ||||||
Series 2017-DNA1, Class M2 | 324 | 332,544 | ||||||
Series 2017-DNA2, Class M2 | 550 | 569,953 | ||||||
Series 2017-DNA3, Class M2 | 911 | 928,294 | ||||||
Series 2017-HQA3, Class M2 | 232 | 235,196 | ||||||
Series 2019-DNA1, Class M2 | 1,461 | 1,469,366 | ||||||
Series 2019-DNA3, Class M2 | 708 | 706,448 | ||||||
Federal National Mortgage Association Connecticut Avenue Securities | 947 | 955,734 | ||||||
Series 2014-C04, Class 1M2 | 304 | 312,749 | ||||||
Series 2015-C01, Class 2M2 | 13 | 12,606 | ||||||
Series 2015-C02, Class 1M2 | 617 | 624,417 | ||||||
Series 2016-C01, Class 1M2 | 704 | 744,428 | ||||||
Series 2016-C03, Class 1M2 | 272 | 285,727 | ||||||
| abfunds.com | AB INTERMEDIATE MUNICIPAL PORTFOLIOS | 91 | |
Table of Contents
PORTFOLIO OF INVESTMENTS (continued)
DIVERSIFIED MUNICIPAL PORTFOLIO
| Principal Amount (000) | U.S. $ Value | |||||||
| ||||||||
Series 2016-C04, Class 1M2 | $ | 162 | $ | 169,039 | ||||
Series 2016-C05, Class 2M2 | 674 | 700,911 | ||||||
Series 2017-C01, Class 1M2 | 457 | 470,808 | ||||||
Series 2017-C02, Class 2M2 | 1,729 | 1,776,007 | ||||||
Series 2017-C03, Class 1M2 | 1,343 | 1,372,629 | ||||||
Series 2017-C06, Class 1M2 | 586 | 590,400 | ||||||
Series 2017-C06, Class 2M2 | 299 | 300,828 | ||||||
STACR Trust | 530 | 528,015 | ||||||
|
| |||||||
Total Collateralized Mortgage Obligations | 19,965,899 | |||||||
|
| |||||||
CORPORATES - INVESTMENT GRADE – 0.2% | ||||||||
Industrial – 0.2% | ||||||||
Consumer Non-Cyclical – 0.2% | ||||||||
CommonSpirit Health | 4,513 | 4,536,513 | ||||||
Baylor Scott & White Holdings | 5,835 | 5,714,332 | ||||||
1.777%, 11/15/2030 | 5,000 | 4,753,300 | ||||||
|
| |||||||
Total Corporates - Investment Grade | 15,004,145 | |||||||
|
| |||||||
92 | AB INTERMEDIATE MUNICIPAL PORTFOLIOS | abfunds.com | |
Table of Contents
PORTFOLIO OF INVESTMENTS (continued)
DIVERSIFIED MUNICIPAL PORTFOLIO
| Principal Amount (000) | U.S. $ Value | |||||||
| ||||||||
CORPORATES - NON-INVESTMENT GRADE – 0.1% | ||||||||
Industrial – 0.1% | ||||||||
Transportation-Airlines – 0.1% | ||||||||
American Airlines, Inc./AAdvantage Loyalty IP Ltd. | $ | 3,765 | $ | 3,916,240 | ||||
5.75%, 04/20/2029(a) | 3,342 | 3,555,019 | ||||||
|
| |||||||
Total Corporates - Non-Investment Grade | 7,471,259 | |||||||
|
| |||||||
SHORT-TERM INVESTMENTS – 0.2% | ||||||||
U.S. Treasury Bills – 0.2% | ||||||||
U.S. Treasury Bill | 10,000 | 9,999,737 | ||||||
|
| |||||||
Total Investments – 97.3% | 6,324,849,577 | |||||||
Other assets less liabilities – 2.7% | 178,773,601 | |||||||
|
| |||||||
Net Assets – 100.0% | $ | 6,503,623,178 | ||||||
|
| |||||||
CENTRALLY CLEARED INFLATION (CPI) SWAPS (see Note 3)
| Rate Type | ||||||||||||||||||||||||||||||||
Notional | Termination Date | Payments made by the Fund | Payments received by the Fund | Payment Frequency Paid/ Received | Market Value | Upfront Premiums Paid/ (Received) | Unrealized Appreciation/ (Depreciation) | |||||||||||||||||||||||||
USD | 25,420 | 01/15/2025 | 2.565% | CPI# | Maturity | $ | 52,900 | $ | – 0 | – | $ | 52,900 | ||||||||||||||||||||
USD | 12,710 | 01/15/2025 | 2.585% | CPI# | Maturity | 15,701 | – 0 | – | 15,701 | |||||||||||||||||||||||
USD | 12,710 | 01/15/2025 | 2.613% | CPI# | Maturity | 912 | – 0 | – | 912 | |||||||||||||||||||||||
USD | 87,590 | 01/15/2028 | 1.230% | CPI# | Maturity | 8,402,090 | – 0 | – | 8,402,090 | |||||||||||||||||||||||
USD | 87,240 | 01/15/2028 | 0.735% | CPI# | Maturity | 11,774,604 | – 0 | – | 11,774,604 | |||||||||||||||||||||||
USD | 16,275 | 01/15/2030 | 1.572% | CPI# | Maturity | 1,408,998 | – 0 | – | 1,408,998 | |||||||||||||||||||||||
USD | 16,275 | 01/15/2030 | 1.587% | CPI# | Maturity | 1,384,318 | – 0 | – | 1,384,318 | |||||||||||||||||||||||
USD | 19,500 | 02/15/2041 | CPI# | 2.282% | Maturity | (730,320 | ) | – 0 | – | (730,320 | ) | |||||||||||||||||||||
|
|
|
|
|
| |||||||||||||||||||||||||||
| $ | 22,309,203 | $ | – 0 | – | $ | 22,309,203 | ||||||||||||||||||||||||||
|
|
|
|
|
| |||||||||||||||||||||||||||
| # | Variable interest rate based on the rate of inflation as determined by the Consumer Price Index (CPI). |
| abfunds.com | AB INTERMEDIATE MUNICIPAL PORTFOLIOS | 93 | |
Table of Contents
PORTFOLIO OF INVESTMENTS (continued)
DIVERSIFIED MUNICIPAL PORTFOLIO
CENTRALLY CLEARED INTEREST RATE SWAPS (see Note 3)
| Rate Type | ||||||||||||||||||||||||||||||
| Notional Amount (000) | Termination Date | Payments made by the Fund | Payments received by the Fund | Payment Frequency Paid/ Received | Market Value | Upfront Premiums Paid (Received) | Unrealized Appreciation/ (Depreciation) | |||||||||||||||||||||||
| USD | 43,750 | 01/15/2028 | 0.803% | | 3 Month LIBOR | | Semi- Annual/ Quarterly | $ | 1,748,786 | $ | 1,699,415 | $ | 49,371 | |||||||||||||||||
| USD | 43,750 | 01/15/2028 | | 3 month LIBOR | | 0.803% | Quarterly/ Semi- Annual | (1,748,787 | ) | – 0 | – | (1,748,787 | ) | |||||||||||||||||
| USD | 41,680 | 02/15/2029 | 0.597% | | 3 Month LIBOR | | Semi- Annual/ Quarterly | 3,098,825 | – 0 | – | 3,098,825 | |||||||||||||||||||
| USD | 22,000 | 02/15/2041 | | 3 month LIBOR | | 2.166% | Quarterly/ Semi- Annual | (53,875 | ) | – 0 | – | (53,875 | ) | |||||||||||||||||
|
|
|
|
|
| |||||||||||||||||||||||||
| $ | 3,044,949 | $ | 1,699,415 | $ | 1,345,534 | |||||||||||||||||||||||||
|
|
|
|
|
| |||||||||||||||||||||||||
CREDIT DEFAULT SWAPS (see Note 3)
| Swap Counterparty & Referenced Obligation | Fixed Rate (Pay) Receive | Payment Frequency | Implied Credit Spread at March 31, 2021 | Notional Amount (000) | Market Value | Upfront Premiums Paid (Received) | Unrealized Appreciation/ (Depreciation) | |||||||||||||||||||||||||
Sale Contracts |
| |||||||||||||||||||||||||||||||
Citigroup Global Markets, Inc. |
| |||||||||||||||||||||||||||||||
CDX-CMBX.NA.BBB- Series 6, 05/11/2063* | 3.00 | % | Monthly | 12.50 | % | USD | 505 | $ | (136,047 | ) | $ | (48,933 | ) | $ | (87,114 | ) | ||||||||||||||||
CDX-CMBX.NA.BBB- Series 6, 05/11/2063* | 3.00 | Monthly | 12.50 | USD | 1,677 | (451,784 | ) | (209,641 | ) | (242,143 | ) | |||||||||||||||||||||
Credit Suisse International |
| |||||||||||||||||||||||||||||||
CDX-CMBX.NA.BBB- Series 6, 05/11/2063* | 3.00 | Monthly | 12.50 | USD | 112 | (30,172 | ) | (13,578 | ) | (16,594 | ) | |||||||||||||||||||||
CDX-CMBX.NA.BBB- Series 6, 05/11/2063* | 3.00 | Monthly | 12.50 | USD | 277 | (74,624 | ) | (27,088 | ) | (47,536 | ) | |||||||||||||||||||||
CDX-CMBX.NA.BBB- Series 6, 05/11/2063* | 3.00 | Monthly | 12.50 | USD | 3,414 | (919,731 | ) | (411,150 | ) | (508,581 | ) | |||||||||||||||||||||
CDX-CMBX.NA.BBB- Series 6, 05/11/2063* | 3.00 | Monthly | 12.50 | USD | 3,451 | (929,412 | ) | (337,890 | ) | (591,522 | ) | |||||||||||||||||||||
CDX-CMBX.NA.BBB- Series 6, 05/11/2063* | 3.00 | Monthly | 12.50 | USD | 5,192 | (1,398,725 | ) | (495,296 | ) | (903,429 | ) | |||||||||||||||||||||
Goldman Sachs International |
| |||||||||||||||||||||||||||||||
CDX-CMBX.NA.BBB- Series 6, 05/11/2063* | 3.00 | Monthly | 12.50 | USD | 647 | (174,302 | ) | (80,543 | ) | (93,759 | ) | |||||||||||||||||||||
CDX-CMBX.NA.BBB- Series 6, 05/11/2063* | 3.00 | Monthly | 12.50 | USD | 4,500 | (1,212,300 | ) | (416,673 | ) | (795,627 | ) | |||||||||||||||||||||
|
|
|
|
|
| |||||||||||||||||||||||||||
| $ | (5,327,097 | ) | $ | (2,040,792 | ) | $ | (3,286,305 | ) | ||||||||||||||||||||||||
|
|
|
|
|
| |||||||||||||||||||||||||||
| * | Termination date |
94 | AB INTERMEDIATE MUNICIPAL PORTFOLIOS | abfunds.com | |
Table of Contents
PORTFOLIO OF INVESTMENTS (continued)
DIVERSIFIED MUNICIPAL PORTFOLIO
INTEREST RATE SWAPS (see Note 3)
| Rate Type | ||||||||||||||||||||||||||||||||||||
| Swap Counterparty | Notional Amount (000) | Termination Date | Payments by the | Payments received by the Fund | Payment Received | Market Value | Upfront Premiums Paid (Received) | Unrealized Appreciation/ (Depreciation) | ||||||||||||||||||||||||||||
Citibank, NA | USD | 57,160 | 10/09/2029 | 1.120% | SIFMA* | Quarterly | $ | 161,302 | $ | – 0 | – | $ | 161,302 | |||||||||||||||||||||||
Citibank, NA | USD | 57,160 | 10/09/2029 | 1.125% | SIFMA* | Quarterly | 134,891 | – 0 | – | 134,891 | ||||||||||||||||||||||||||
|
|
|
|
|
| |||||||||||||||||||||||||||||||
| $ | 296,193 | $ | – 0 | – | $ | 296,193 | ||||||||||||||||||||||||||||||
|
|
|
|
|
| |||||||||||||||||||||||||||||||
| * | Variable interest rate based on the Securities Industry & Financial Markets Association (SIFMA) Municipal Swap Index. |
| (a) | Security is exempt from registration under Rule 144A of the Securities Act of 1933. These securities are considered restricted, but liquid and may be resold in transactions exempt from registration, normally to qualified institutional buyers. At March 31, 2021, the aggregate market value of these securities amounted to $171,213,169 or 2.6% of net assets. |
| (b) | When-Issued or delayed delivery security. |
| (c) | Non-income producing security. |
| (d) | Defaulted matured security. |
| (e) | Security in which significant unobservable inputs (Level 3) were used in determining fair value. |
| (f) | Variable Rate Demand Notes are instruments whose interest rates change on a specific date (such as coupon date or interest payment date) or whose interest rates vary with changes in a designated base rate (such as the prime interest rate). This instrument is payable on demand and is secured by letters of credit or other credit support agreements from major banks. |
| (g) | Floating Rate Security. Stated interest/floor/ceiling rate was in effect at March 31, 2021. |
| (h) | Position, or a portion thereof, has been segregated to collateralize OTC derivatives outstanding. |
As of March 31, 2021, the Portfolio’s percentages of investments in municipal bonds that are insured and in insured municipal bonds that have been pre-refunded or escrowed to maturity are 4.4% and 0.0%, respectively.
Glossary:
AGC – Assured Guaranty Corporation
AGM – Assured Guaranty Municipal
BAM – Build American Mutual
CCRC – Congregate Care Retirement Center
CDX-CMBX.NA – North American Commercial Mortgage-Backed Index
COP – Certificate of Participation
CPI – Consumer Price Index
DOT – Department of Transportation
ETM – Escrowed to Maturity
LIBOR – London Interbank Offered Rate
NATL – National Interstate Corporation
OSF – Order of St. Francis
SRF – State Revolving Fund
UPMC – University of Pittsburgh Medical Center
XLCA – XL Capital Assurance Inc.
See notes to financial statements.
| abfunds.com | AB INTERMEDIATE MUNICIPAL PORTFOLIOS | 95 | |
Table of Contents
PORTFOLIO OF INVESTMENTS
NEW YORK MUNICIPAL PORTFOLIO
March 31, 2021 (unaudited)
| Principal Amount (000) | U.S. $ Value | |||||||
| ||||||||
MUNICIPAL OBLIGATIONS – 97.2% | ||||||||
Long-Term Municipal Bonds – 91.6% | ||||||||
New York – 75.1% | ||||||||
Albany County Airport Authority | $ | 5,085 |
| $ | 5,758,341 |
| ||
Battery Park City Authority |
| 4,325 |
|
| 4,650,711 |
| ||
Broome County Local Development Corp. (United Health Services Hospitals Obligated Group) |
| 5,720 |
|
| 6,046,204 |
| ||
4.00%, 04/01/2034-04/01/2040 | 5,025 | 5,788,788 | ||||||
5.00%, 04/01/2030-04/01/2033 | 4,000 | 5,134,427 | ||||||
Buffalo & Erie County Industrial Land |
| 2,000 |
|
| 2,145,626 |
| ||
Build NYC Resource Corp. |
| 3,335 |
|
| 3,652,951 |
| ||
5.25%, 11/01/2029 | 1,900 | 2,085,650 | ||||||
City of New York NY |
| 6,855 |
|
| 6,962,340 |
| ||
Series 2011A | 3,960 | 4,022,754 | ||||||
5.00%, 08/01/2026 | 10,315 | 10,473,796 | ||||||
Series 2011D-1 | 2,860 | 2,926,663 | ||||||
Series 2012I | 2,320 | 2,467,608 | ||||||
Series 20171 | 1,130 | 1,340,831 | ||||||
Series 2017C | 2,335 | 2,639,378 | ||||||
Series 2018A | 7,690 | 9,394,850 | ||||||
Series 2018D | 9,665 | 11,934,924 | ||||||
Series 2019B | 4,205 | 5,382,035 | ||||||
96 | AB INTERMEDIATE MUNICIPAL PORTFOLIOS | abfunds.com | |
Table of Contents
PORTFOLIO OF INVESTMENTS (continued)
NEW YORK MUNICIPAL PORTFOLIO
| Principal Amount (000) | U.S. $ Value | |||||||
| ||||||||
Series 2019H | $ | 5,615 | $ | 7,075,305 | ||||
Series 2020A | 1,660 | 2,122,129 | ||||||
Series 2020B |
| 10,000 |
|
| 12,743,521 |
| ||
Series 2020C | 13,710 | 17,533,862 | ||||||
Series 2020I | 1,350 | 1,739,797 | ||||||
Series 2021D | 6,000 | 5,957,881 | ||||||
1.396%, 08/01/2027 | 5,000 | 4,908,734 | ||||||
1.623%, 08/01/2028 | 4,000 | 3,932,066 | ||||||
County of Albany NY |
| 5,655 |
|
| 6,038,889 |
| ||
County of Monroe NY |
| 10,660 |
|
| 10,943,941 |
| ||
BAM Series 2015 | 5,860 | 5,976,434 | ||||||
County of Nassau NY |
| 5,915 |
|
| 5,915,000 |
| ||
Series 2014A | 10,190 | 11,607,449 | ||||||
Series 2017C | 22,095 | 27,157,220 | ||||||
Dutchess County Local Development Corp. (Bard College) |
| 1,900 |
|
| 2,241,515 |
| ||
Series 2020B | 5,070 | 5,545,687 | ||||||
Dutchess County Local Development Corp. (Health QuestSystems Obligated Group) | 4,890 | 5,688,794 | ||||||
Erie County Fiscal Stability Authority |
| 5,925 |
|
| 6,116,007 |
| ||
Erie County Industrial Development Agency (The) | 5,800 | 5,819,957 | ||||||
| abfunds.com | AB INTERMEDIATE MUNICIPAL PORTFOLIOS | 97 | |
Table of Contents
PORTFOLIO OF INVESTMENTS (continued)
NEW YORK MUNICIPAL PORTFOLIO
| Principal Amount (000) | U.S. $ Value | |||||||
| ||||||||
Hudson Yards Infrastructure Corp. | $ | 22,650 | $ | 27,197,702 | ||||
Jefferson County Industrial Development Agency | 1,250 | 1,207,906 | ||||||
Long Island Power Authority | 9,490 | 9,807,256 | ||||||
Metropolitan Transportation Authority | 925 | 952,799 | ||||||
Series 2011C | 1,965 | 2,016,929 | ||||||
Series 2011D | 5,000 | 5,150,262 | ||||||
5.00%, 11/15/2023 (Pre-refunded/ETM) | 4,275 | 4,403,474 | ||||||
5.00%, 11/15/2025 (Pre-refunded/ETM) | 2,500 | 2,575,131 | ||||||
Series 2016D | 1,210 | 1,450,433 | ||||||
Series 2017B | 9,020 | 11,185,296 | ||||||
Series 2017C | 57,830 | 70,549,674 | ||||||
Series 2019D | 17,480 | 18,523,864 | ||||||
Series 2019F | 3,230 | 3,450,343 | ||||||
Series 2020A | 24,415 | 25,076,256 | ||||||
AGM Series 2021 | 3,000 | 3,000,003 | ||||||
0.807% (SOFR + 0.80%), 11/01/2032(c)(d) | 3,715 | 3,718,453 | ||||||
Metropolitan Transportation Authority (Metropolitan Transportation Authority Ded Tax) | 2,025 | 2,457,130 | ||||||
Metropolitan Transportation Authority (Metropolitan Transportation Authority Dedicated Tax Fund) | 14,130 | 15,171,268 | ||||||
98 | AB INTERMEDIATE MUNICIPAL PORTFOLIOS | abfunds.com | |
Table of Contents
PORTFOLIO OF INVESTMENTS (continued)
NEW YORK MUNICIPAL PORTFOLIO
| Principal Amount (000) | U.S. $ Value | |||||||
| ||||||||
Monroe County Industrial Development Corp./NY | $ | 510 | $ | 586,656 | ||||
Monroe County Industrial Development Corp./NY | 2,825 | 3,032,885 | ||||||
Monroe County Industrial Development Corp/.NY | 1,210 | 1,529,664 | ||||||
Nassau County Local Economic Assistance Corp. | 4,550 | 5,171,201 | ||||||
New York City Housing Development Corp. |
| 2,000 |
|
| 2,184,350 |
| ||
New York City Municipal Water Finance Authority | 4,495 | 4,752,264 | ||||||
5.00%, 06/15/2022-06/15/2038 | 10,580 | 11,759,405 | ||||||
Series 2011HH | 9,055 | 9,141,591 | ||||||
Series 2014D | 3,000 | 3,430,275 | ||||||
Series 2015F | 7,830 | 9,257,091 | ||||||
Series 2015G | 11,465 | 13,506,209 | ||||||
Series 2017E | 1,795 | 2,172,796 | ||||||
Series 2018AA |
| 8,280 |
|
| 9,501,734 |
| ||
Series 2019D | 1,005 | 1,087,460 | ||||||
Series 2019F | 6,190 | 7,727,919 | ||||||
Series 2020 | 9,070 | 12,278,433 | ||||||
| abfunds.com | AB INTERMEDIATE MUNICIPAL PORTFOLIOS | 99 | |
Table of Contents
PORTFOLIO OF INVESTMENTS (continued)
NEW YORK MUNICIPAL PORTFOLIO
| Principal Amount (000) | U.S. $ Value | |||||||
| ||||||||
New York City Transitional Finance Authority Building Aid Revenue | $ | 4,420 | $ | 4,477,277 | ||||
Series 2012S | 7,390 | 7,827,668 | ||||||
Series 2018S | 18,065 | 22,676,232 | ||||||
New York City Transitional Finance Authority Future Tax Secured Revenue | 3,065 | 3,607,826 | ||||||
5.00%, 11/01/2027 | 2,500 | 3,152,276 | ||||||
Series 2011A-1 | 15,315 | 15,750,759 | ||||||
Series 2011B | 9,000 | 9,048,068 | ||||||
Series 2012B | 10,805 | 11,620,154 | ||||||
Series 2012D | 19,575 | 20,647,812 | ||||||
Series 2012E | 6,600 | 6,861,560 | ||||||
Series 2014A | 6,655 | 7,631,135 | ||||||
Series 2014C | 6,345 | 7,236,857 | ||||||
Series 2014D-1 | 9,535 | 10,746,138 | ||||||
Series 2015C | 20,000 | 23,548,588 | ||||||
Series 2016B | 2,150 | 2,597,908 | ||||||
Series 2017F | 1,220 | 1,491,859 | ||||||
Series 2021 | 3,875 | 4,782,132 | ||||||
New York Liberty Development Corp. | 20,000 | 20,524,766 | ||||||
2.625%, 09/15/2069 | 22,240 | 22,434,909 | ||||||
2.80%, 09/15/2069 | 6,470 | 6,393,525 | ||||||
New York State Dormitory Authority | 40 | 45,339 | ||||||
Series 2011A | 3,125 | 3,161,714 | ||||||
100 | AB INTERMEDIATE MUNICIPAL PORTFOLIOS | abfunds.com | |
Table of Contents
PORTFOLIO OF INVESTMENTS (continued)
NEW YORK MUNICIPAL PORTFOLIO
| Principal Amount (000) | U.S. $ Value | |||||||
| ||||||||
Series 2012D | $ | 1,290 | $ | 1,343,474 | ||||
5.00%, 02/15/2023 (Pre-refunded/ETM) | 865 | 900,856 | ||||||
5.00%, 02/15/2024 (Pre-refunded/ETM) | 815 | 848,784 | ||||||
5.00%, 02/15/2025 (Pre-refunded/ETM) | 880 | 916,478 | ||||||
New York State Dormitory Authority | 1,020 | 1,485,247 | ||||||
New York State Dormitory Authority | 6,415 | 7,201,799 | ||||||
New York State Dormitory Authority | 5,185 | 6,456,969 | ||||||
New York State Dormitory Authority | 2,215 | 2,421,681 | ||||||
New York State Dormitory Authority | 2,040 | 2,254,977 | ||||||
Series 2019A | 2,975 | 3,844,430 | ||||||
New York State Dormitory Authority | 4,600 | 5,265,018 | ||||||
New York State Dormitory Authority | 3,110 | 3,441,293 | ||||||
New York State Dormitory Authority | 1,130 | 1,286,227 | ||||||
New York State Dormitory Authority | 11,385 | 12,854,278 | ||||||
Series 2012 | 5,905 | 6,104,538 | ||||||
Series 2012B | 3,905 | 4,084,055 | ||||||
Series 2012D | 18,285 | 19,039,429 | ||||||
| abfunds.com | AB INTERMEDIATE MUNICIPAL PORTFOLIOS | 101 | |
Table of Contents
PORTFOLIO OF INVESTMENTS (continued)
NEW YORK MUNICIPAL PORTFOLIO
| Principal Amount (000) | U.S. $ Value | |||||||
| ||||||||
Series 2014A | $ | 2,400 | $ | 2,709,729 | ||||
Series 2014C | 14,485 | 16,403,800 | ||||||
Series 2015B | 1,160 | 1,263,835 | ||||||
Series 2015E | 4,380 | 4,788,697 | ||||||
Series 2017 | 3,995 | 4,686,266 | ||||||
Series 2020A | 6,475 | 7,360,346 | ||||||
Series 2020D | 9,425 | 12,031,718 | ||||||
AMBAC Series 2005B | 5,000 | 5,515,047 | ||||||
New York State Dormitory Authority | 3,125 | 3,962,794 | ||||||
New York State Environmental Facilities Corp. (New York City Municipal Water Finance Authority) | 445 | 561,944 | ||||||
New York State Environmental Facilities Corp. (State of New York SRF) | 9,320 | 9,930,603 | ||||||
New York State Thruway Authority | 5,155 | 5,342,302 | ||||||
New York State Thruway Authority | 26,175 | 27,061,637 | ||||||
New York State Thruway Authority | 4,345 | 5,038,171 | ||||||
Series 2014J | 33,900 | 38,068,857 | ||||||
New York State Urban Development Corp. (State of New York Pers Income Tax) | 6,020 | 7,071,288 | ||||||
102 | AB INTERMEDIATE MUNICIPAL PORTFOLIOS | abfunds.com | |
Table of Contents
PORTFOLIO OF INVESTMENTS (continued)
NEW YORK MUNICIPAL PORTFOLIO
| Principal Amount (000) | U.S. $ Value | |||||||
| ||||||||
Series 2020A | $ | 4,350 | $ | 5,068,767 | ||||
New York Transportation Development Corp. (American Airlines, Inc.) | 2,985 | 3,024,342 | ||||||
New York Transportation Development Corp. (Delta Air Lines, Inc.) | 2,355 | 2,821,591 | ||||||
Series 2018 | 30,980 | 37,345,124 | ||||||
New York Transportation Development Corp. (Empire State Thruway Partners LLC) | 2,460 | 2,795,241 | ||||||
New York Transportation Development Corp. (JFK International Air Terminal LLC) | 5,705 | 7,032,570 | ||||||
New York Transportation Development Corp. (Laguardia Gateway Partners LLC) | 2,535 | 2,854,544 | ||||||
New York Transportation Development Corp. (Terminal One Group Association LP) | 950 | 1,022,853 | ||||||
Niagara Area Development Corp. | 1,000 | 1,045,097 | ||||||
Series 2018B | 3,400 | 3,535,350 | ||||||
Niagara Falls City School District | 11,580 | 12,887,023 | ||||||
Port Authority of New York & New Jersey | 8,345 | 10,372,995 | ||||||
Series 2011O | 5,215 | 5,346,129 | ||||||
Series 2013-178 | 10,480 | 11,755,640 | ||||||
Series 2014 | 12,470 | 14,069,927 | ||||||
Series 2014-1 | 3,455 | 3,856,912 | ||||||
Series 2014-186 | 12,575 | 13,125,798 | ||||||
| abfunds.com | AB INTERMEDIATE MUNICIPAL PORTFOLIOS | 103 | |
Table of Contents
PORTFOLIO OF INVESTMENTS (continued)
NEW YORK MUNICIPAL PORTFOLIO
| Principal Amount (000) | U.S. $ Value | |||||||
| ||||||||
Series 2015E | $ | 16,390 | $ | 18,750,563 | ||||
Series 2016E | 6,655 | 6,810,016 | ||||||
Series 2017 | 6,925 | 8,514,819 | ||||||
Series 20182 | 12,350 | 15,175,865 | ||||||
Series 20202 | 18,290 | 23,077,914 | ||||||
Series 20212 | 5,750 | 6,201,611 | ||||||
Sales Tax Asset Receivable Corp. | 13,140 | 15,234,741 | ||||||
Suffolk County Economic Development Corp. (Peconic Landing at Southold, Inc.) | 1,500 | 1,723,299 | ||||||
Town of Oyster Bay NY | 11,660 | 12,180,590 | ||||||
Triborough Bridge & Tunnel Authority | 7,000 | 7,254,339 | ||||||
5.00%, 01/01/2028 (Pre-refunded/ETM) | 5,360 | 5,554,751 | ||||||
Series 2012B | 25,760 | 27,379,495 | ||||||
Series 2013A | 5,000 | 5,450,929 | ||||||
Series 2013B | 7,525 | 8,106,962 | ||||||
Troy Capital Resource Corp. | 8,385 | 10,736,591 | ||||||
Series 2010B | 1,000 | 1,003,197 | ||||||
Trust for Cultural Resources of The City of New York (The) | 3,800 | 4,938,858 | ||||||
Series 2016A | 1,125 | 1,340,910 | ||||||
5.00%, 12/01/2026 | 7,175 | 8,742,834 | ||||||
TSASC, Inc./NY | 2,000 | 2,150,366 | ||||||
104 | AB INTERMEDIATE MUNICIPAL PORTFOLIOS | abfunds.com | |
Table of Contents
PORTFOLIO OF INVESTMENTS (continued)
NEW YORK MUNICIPAL PORTFOLIO
| Principal Amount (000) | U.S. $ Value | |||||||
| ||||||||
Utility Debt Securitization Authority | $ | 34,825 | $ | 39,157,221 | ||||
|
| |||||||
| 1,362,143,020 | ||||||||
|
| |||||||
Alabama – 1.0% |
| |||||||
Black Belt Energy Gas District | 5,935 | 6,445,011 | ||||||
Southeast Alabama Gas Supply District (The) (Goldman Sachs Group, Inc.(The)) | 10,000 | 10,939,787 | ||||||
Tuscaloosa County Industrial Development Authority | 1,400 | 1,555,897 | ||||||
|
| |||||||
| 18,940,695 | ||||||||
|
| |||||||
American Samoa – 0.1% |
| |||||||
American Samoa Economic Development Authority | 1,055 | 1,267,444 | ||||||
|
| |||||||
Arizona – 0.1% |
| |||||||
Tempe Industrial Development Authority (Mirabella at ASU, Inc.) | 1,430 | 1,430,425 | ||||||
|
| |||||||
California – 0.2% |
| |||||||
Golden State Tobacco Securitization Corp. | 2,860 | 2,911,637 | ||||||
|
| |||||||
Colorado – 1.2% |
| |||||||
City & County of Denver CO | 2,425 | 2,579,467 | ||||||
Colorado Health Facilities Authority (CommonSpirit Health) | 15,295 | 19,225,030 | ||||||
Vauxmont Metropolitan District | 160 | 191,428 | ||||||
|
| |||||||
| 21,995,925 | ||||||||
|
| |||||||
| abfunds.com | AB INTERMEDIATE MUNICIPAL PORTFOLIOS | 105 | |
Table of Contents
PORTFOLIO OF INVESTMENTS (continued)
NEW YORK MUNICIPAL PORTFOLIO
| Principal Amount (000) | U.S. $ Value | |||||||
| ||||||||
Connecticut – 1.5% | ||||||||
State of Connecticut | $ | 14,565 | $ | 17,143,090 | ||||
Series 2018C | 4,690 | 5,841,883 | ||||||
Series 2018F | 4,025 | 5,042,883 | ||||||
|
| |||||||
| 28,027,856 | ||||||||
|
| |||||||
Florida – 0.1% | ||||||||
County of Osceola FL Transportation Revenue | 410 | 300,064 | ||||||
Volusia County School Board | 1,000 | 1,144,184 | ||||||
|
| |||||||
| 1,444,248 | ||||||||
|
| |||||||
Georgia – 0.2% | ||||||||
Municipal Electric Authority of Georgia | 2,655 | 3,256,602 | ||||||
|
| |||||||
Guam – 1.3% | ||||||||
Guam Government Waterworks Authority | 4,250 | 5,030,259 | ||||||
Guam Power Authority | 5,435 | 6,365,856 | ||||||
Territory of Guam | 290 | 320,482 | ||||||
Territory of Guam | 2,545 | 2,920,260 | ||||||
Territory of Guam | 7,150 | 8,042,210 | ||||||
|
| |||||||
| 22,679,067 | ||||||||
|
| |||||||
Illinois – 3.7% | ||||||||
Chicago Board of Education | 8,160 | 8,999,120 | ||||||
106 | AB INTERMEDIATE MUNICIPAL PORTFOLIOS | abfunds.com | |
Table of Contents
PORTFOLIO OF INVESTMENTS (continued)
NEW YORK MUNICIPAL PORTFOLIO
| Principal Amount (000) | U.S. $ Value | |||||||
| ||||||||
Illinois Finance Authority | $ | 1,580 | $ | 1,913,074 | ||||
Metropolitan Pier & Exposition Authority | 5,090 | 5,311,156 | ||||||
Series 2017B | 2,000 | 2,413,764 | ||||||
State of Illinois | 10,490 | 11,172,791 | ||||||
Series 2013 | 7,435 | 8,149,234 | ||||||
Series 2014 | 2,540 | 2,845,890 | ||||||
Series 2016 | 4,200 | 4,672,907 | ||||||
Series 2017A | 2,060 | 2,344,492 | ||||||
Series 2017D | 13,005 | 14,485,694 | ||||||
Series 2018A | 2,910 | 3,296,804 | ||||||
Series 2018B | 1,405 | 1,574,203 | ||||||
Town of Cortland IL | 1,307 | 241,795 | ||||||
|
| |||||||
| 67,420,924 | ||||||||
|
| |||||||
Iowa – 0.1% | ||||||||
Iowa Finance Authority | 2,350 | 2,393,960 | ||||||
|
| |||||||
Kentucky – 0.3% | ||||||||
City of Ashland KY | 1,210 | 1,416,489 | ||||||
Kentucky Economic Development Finance Authority | 3,190 | 3,991,453 | ||||||
|
| |||||||
| 5,407,942 | ||||||||
|
| |||||||
| abfunds.com | AB INTERMEDIATE MUNICIPAL PORTFOLIOS | 107 | |
Table of Contents
PORTFOLIO OF INVESTMENTS (continued)
NEW YORK MUNICIPAL PORTFOLIO
| Principal Amount (000) | U.S. $ Value | |||||||
| ||||||||
Louisiana – 0.1% | ||||||||
Parish of St. James LA | $ | 240 | $ | 270,930 | ||||
6.10%, 06/01/2038-12/01/2040(a) | 805 | 1,006,384 | ||||||
|
| |||||||
| 1,277,314 | ||||||||
|
| |||||||
Michigan – 1.2% | ||||||||
City of Detroit MI | 1,255 | 1,479,677 | ||||||
City of Detroit MI Sewage Disposal System Revenue | 3,055 | 3,233,195 | ||||||
Michigan Strategic Fund | 14,290 | 17,853,055 | ||||||
|
| |||||||
| 22,565,927 | ||||||||
|
| |||||||
Missouri – 0.0% | ||||||||
Howard Bend Levee District | 395 | 447,934 | ||||||
|
| |||||||
Nevada – 0.1% | ||||||||
City of Sparks NV | 750 | 756,846 | ||||||
2.75%, 06/15/2028(a) | 715 | 729,570 | ||||||
|
| |||||||
| 1,486,416 | ||||||||
|
| |||||||
New Jersey – 2.5% | ||||||||
New Jersey Economic Development Authority | 1,445 | 1,555,120 | ||||||
New Jersey Transportation Trust Fund Authority | 10,000 | 11,670,350 | ||||||
Series 2018A | 11,630 | 13,781,445 | ||||||
108 | AB INTERMEDIATE MUNICIPAL PORTFOLIOS | abfunds.com | |
Table of Contents
PORTFOLIO OF INVESTMENTS (continued)
NEW YORK MUNICIPAL PORTFOLIO
| Principal Amount (000) | U.S. $ Value | |||||||
| ||||||||
New Jersey Transportation Trust Fund Authority (New Jersey Transportation Trust Fund Authority State Lease) | $ | 3,350 | $ | 4,143,882 | ||||
Series 2019B | 6,760 | 8,283,094 | ||||||
AMBAC Series 2005B | 4,700 | 5,295,172 | ||||||
|
| |||||||
| 44,729,063 | ||||||||
|
| |||||||
Ohio – 0.2% | ||||||||
Ohio Air Quality Development Authority | 1,305 | 1,328,315 | ||||||
Ohio Water Development Authority Water Pollution Control Loan Fund | 1,650 | 1,699,500 | ||||||
|
| |||||||
| 3,027,815 | ||||||||
|
| |||||||
Oklahoma – 0.0% | ||||||||
Comanche County Memorial Hospital | 250 | 261,232 | ||||||
|
| |||||||
Pennsylvania – 0.4% |
| |||||||
Hospitals & Higher Education Facilities Authority of Philadelphia (The) | 3,775 | 4,148,724 | ||||||
Philadelphia Parking Authority (The) | 2,435 | 2,443,299 | ||||||
|
| |||||||
| 6,592,023 | ||||||||
|
| |||||||
Puerto Rico – 0.5% |
| |||||||
Puerto Rico Electric Power Authority | 1,390 | 1,691,261 | ||||||
NATL Series 2007V | 255 | 282,574 | ||||||
Puerto Rico Highway & Transportation Authority | 3,095 | 3,837,354 | ||||||
| abfunds.com | AB INTERMEDIATE MUNICIPAL PORTFOLIOS | 109 | |
Table of Contents
PORTFOLIO OF INVESTMENTS (continued)
NEW YORK MUNICIPAL PORTFOLIO
| Principal Amount (000) | U.S. $ Value | |||||||
| ||||||||
AGM Series 2007C | $ | 1,370 | $ | 1,686,946 | ||||
NATL Series 2005L | 135 | 148,278 | ||||||
NATL Series 2007N | 275 | 305,010 | ||||||
Puerto Rico Sales Tax Financing Corp. Sales Tax Revenue | 2,035 | 1,909,950 | ||||||
|
| |||||||
| 9,861,373 | ||||||||
|
| |||||||
Tennessee – 0.5% |
| |||||||
Chattanooga Health Educational & Housing Facility Board | 3,500 | 4,401,901 | ||||||
Tennergy Corp./TN | 4,615 | 5,290,459 | ||||||
|
| |||||||
| 9,692,360 | ||||||||
|
| |||||||
Texas – 0.4% |
| |||||||
City of Houston TX Airport System Revenue | 1,750 | 2,036,165 | ||||||
Mission Economic Development Corp. | 4,540 | 4,824,815 | ||||||
|
| |||||||
| 6,860,980 | ||||||||
|
| |||||||
Washington – 0.5% | ||||||||
Washington Health Care Facilities Authority | 7,280 | 9,133,859 | ||||||
|
| |||||||
Wisconsin – 0.3% | ||||||||
UMA Education, Inc. | 4,810 | 5,543,269 | ||||||
|
| |||||||
Total Long-Term Municipal Bonds | 1,660,799,310 | |||||||
|
| |||||||
110 | AB INTERMEDIATE MUNICIPAL PORTFOLIOS | abfunds.com | |
Table of Contents
PORTFOLIO OF INVESTMENTS (continued)
NEW YORK MUNICIPAL PORTFOLIO
| Principal Amount (000) | U.S. $ Value | |||||||
| ||||||||
Short-Term Municipal Notes – 5.6% |
| |||||||
New York – 5.6% | ||||||||
Build NYC Resource Corp. | $ | 1,775 | $ | 1,775,000 | ||||
City of New York NY | 530 | 530,000 | ||||||
Series 2009B | 5,850 | 5,850,000 | ||||||
Series 2016 | 8,995 | 8,995,000 | ||||||
Series 2019I | 7,250 | 7,250,000 | ||||||
Dutchess County Industrial Development Agency | 1,360 | 1,360,000 | ||||||
New York City Health and Hospitals Corp. | 5,660 | 5,660,000 | ||||||
Series 2008E | 3,140 | 3,140,000 | ||||||
New York City Health and Hospitals Corp. (HHC Capital Corp.) | 2,000 | 2,000,000 | ||||||
New York City Housing Development Corp. | 4,400 | 4,400,000 | ||||||
New York City Housing Development Corp. (201 Pearl LLC) | 8,800 | 8,800,000 | ||||||
New York City Housing Development Corp. (Queenswood Apartments LP) | 1,300 | 1,300,000 | ||||||
New York City Municipal Water Finance Authority | 3,195 | 3,195,000 | ||||||
New York State Dormitory Authority | 2,495 | 2,495,000 | ||||||
| abfunds.com | AB INTERMEDIATE MUNICIPAL PORTFOLIOS | 111 | |
Table of Contents
PORTFOLIO OF INVESTMENTS (continued)
NEW YORK MUNICIPAL PORTFOLIO
| Principal Amount (000) | U.S. $ Value | |||||||
| ||||||||
New York State Dormitory Authority | $ | 1,395 | $ | 1,395,000 | ||||
Series 2012B | 2,820 | 2,820,000 | ||||||
New York State Housing Finance Agency | 6,400 | 6,400,000 | ||||||
New York State Housing Finance Agency | 1,835 | 1,835,000 | ||||||
New York State Housing Finance Agency | 3,140 | 3,140,000 | ||||||
New York State Housing Finance Agency | 2,300 | 2,300,000 | ||||||
New York State Housing Finance Agency | 5,500 | 5,500,000 | ||||||
New York State Urban Development Corp. | 5,870 | 5,870,000 | ||||||
Triborough Bridge & Tunnel Authority | 150 | 150,000 | ||||||
Series 2018C | 8,210 | 8,210,000 | ||||||
Series 2021B | 5,150 | 5,147,660 | ||||||
Trust for Cultural Resources of The City of New York (The) | 3,155 | 3,155,000 | ||||||
|
| |||||||
Total Short-Term Municipal Notes | 102,672,660 | |||||||
|
| |||||||
Total Municipal Obligations | 1,763,471,970 | |||||||
|
| |||||||
COLLATERALIZED MORTGAGE OBLIGATIONS – 0.4% | ||||||||
Risk Share Floating Rate – 0.4% |
| |||||||
Federal Home Loan Mortgage Corp. Structured | 207 | 206,303 | ||||||
112 | AB INTERMEDIATE MUNICIPAL PORTFOLIOS | abfunds.com | |
Table of Contents
PORTFOLIO OF INVESTMENTS (continued)
NEW YORK MUNICIPAL PORTFOLIO
| Principal Amount (000) | U.S. $ Value | |||||||
| ||||||||
Series 2014-DN3, Class M3 | $ | 239 | $ | 242,157 | ||||
Series 2014-HQ2, Class M3 | 210 | 216,569 | ||||||
Series 2016-DNA1, Class M3 | 197 | 206,653 | ||||||
Series 2016-HQA3, Class M3 | 250 | 258,991 | ||||||
Series 2016-HQA4, Class M3 | 245 | 253,593 | ||||||
Series 2017-DNA2, Class M2 | 320 | 331,609 | ||||||
Series 2017-DNA3, Class M2 | 500 | 509,491 | ||||||
Series 2019-DNA3, Class M2 | 163 | 162,329 | ||||||
Series 2016-HQA2, Class M3 | 264 | 274,942 | ||||||
Federal National Mortgage Association Connecticut Avenue Securities | 273 | 275,493 | ||||||
Series 2015-C01, Class 2M2 | 12 | 12,006 | ||||||
Series 2015-C02, Class 1M2 | 222 | 224,150 | ||||||
Series 2016-C01, Class 1M2 | 433 | 457,747 | ||||||
Series 2016-C02, Class 1M2 | 115 | 121,106 | ||||||
Series 2016-C03, Class 1M2 | 158 | 166,120 | ||||||
| abfunds.com | AB INTERMEDIATE MUNICIPAL PORTFOLIOS | 113 | |
Table of Contents
PORTFOLIO OF INVESTMENTS (continued)
NEW YORK MUNICIPAL PORTFOLIO
| Principal Amount (000) | U.S. $ Value | |||||||
| ||||||||
Series 2017-C01, Class 1M2 | $ | 983 | $ | 1,012,951 | ||||
Series 2017-C02, Class 2M2 | 888 | 911,973 | ||||||
Series 2017-C03, Class 1M2 | 225 | 230,152 | ||||||
Series 2017-C05, Class 1M2 | 167 | 169,007 | ||||||
Series 2017-C06, Class 2M2 | 154 | 154,747 | ||||||
|
| |||||||
Total Collateralized Mortgage Obligations | 6,398,089 | |||||||
|
| |||||||
GOVERNMENTS - TREASURIES – 0.1% |
| |||||||
United States – 0.1% | ||||||||
U.S. Treasury Notes | 2,377 | 2,569,388 | ||||||
|
| |||||||
Total Investments – 97.7% | 1,772,439,447 | |||||||
Other assets less liabilities – 2.3% | 41,420,376 | |||||||
|
| |||||||
Net Assets – 100.0% | $ | 1,813,859,823 | ||||||
|
| |||||||
CENTRALLY CLEARED INFLATION (CPI) SWAPS (see Note 3)
| Rate Type | ||||||||||||||||||||||||||
Notional (000) | Termination Date | Payments made by the Fund | Payments received by the Fund | Payment Frequency Paid/ Received | Market Value | Upfront Premiums Paid/ (Received) | Unrealized Appreciation/ (Depreciation) | |||||||||||||||||||
USD | 7,130 | 01/15/2025 | 2.565% | CPI# | Maturity | $ | 14,838 | $ | – 0 | – | $ | 14,838 | ||||||||||||||
USD | 3,565 | 01/15/2025 | 2.585% | CPI# | Maturity | 4,404 | – 0 | – | 4,404 | |||||||||||||||||
USD | 3,565 | 01/15/2025 | 2.613% | CPI# | Maturity | 256 | – 0 | – | 256 | |||||||||||||||||
USD | 27,600 | 01/15/2028 | 1.230% | CPI# | Maturity | 2,647,536 | – 0 | – | 2,647,536 | |||||||||||||||||
USD | 23,260 | 01/15/2028 | 0.735% | CPI# | Maturity | 3,139,355 | – 0 | – | 3,139,355 | |||||||||||||||||
USD | 4,375 | 01/15/2030 | 1.572% | CPI# | Maturity | 378,763 | – 0 | – | 378,763 | |||||||||||||||||
USD | 4,375 | 01/15/2030 | 1.587% | CPI# | Maturity | 372,128 | – 0 | – | 372,128 | |||||||||||||||||
USD | 5,500 | 02/15/2041 | CPI# | 2.282% | Maturity | (205,988 | ) | – 0 | – | (205,988 | ) | |||||||||||||||
|
|
|
|
|
| |||||||||||||||||||||
| $ | 6,351,292 | $ | – 0 | – | $ | 6,351,292 | ||||||||||||||||||||
|
|
|
|
|
| |||||||||||||||||||||
| # | Variable interest rate based on the rate of inflation as determined by the Consumer Price Index (CPI). |
114 | AB INTERMEDIATE MUNICIPAL PORTFOLIOS | abfunds.com | |
Table of Contents
PORTFOLIO OF INVESTMENTS (continued)
NEW YORK MUNICIPAL PORTFOLIO
CENTRALLY CLEARED INTEREST RATE SWAPS (see Note 3)
| Rate Type | ||||||||||||||||||||||||||
Notional | Termination Date | Payments made by the Fund | Payments received by the Fund | Payment Frequency Paid/ Received | Market Value | Upfront Premiums Paid (Received) | Unrealized Appreciation/ (Depreciation) | |||||||||||||||||||
| USD | 59,770 | 02/15/2025 | 3 Month LIBOR | 0.426% | Quarterly/ Semi-Annual | $ | (764,742 | ) | $ | – 0 | – | $ | (764,742 | ) | ||||||||||||
| USD | 15,000 | 01/15/2028 | 1.173% | 3 Month LIBOR | Quarterly/ Semi-Annual | 220,144 | – 0 | – | 220,144 | |||||||||||||||||
| USD | 2,670 | 2/15/2041 | 1.868% | 3 Month LIBOR | Quarterly/ Semi-Annual | 124,626 | – 0 | – | 124,626 | |||||||||||||||||
|
|
|
|
|
| |||||||||||||||||||||
| $ | (419,972 | ) | $ | – 0 | – | $ | (419,972 | ) | ||||||||||||||||||
|
|
|
|
|
| |||||||||||||||||||||
CREDIT DEFAULT SWAPS (see Note 3)
| Swap Counterparty & Referenced Obligation | Fixed Rate (Pay) Receive | Payment Frequency | Implied Credit Spread at March 31, 2021 | Notional | Market Value | Upfront Premiums Paid (Received) | Unrealized Appreciation/ (Depreciation) | |||||||||||||||||||||||||
Sale Contracts | ||||||||||||||||||||||||||||||||
Citigroup Global Markets, Inc. |
| |||||||||||||||||||||||||||||||
CDX-CMBX.NA.BBB- Series 6, 05/11/2063* | 3.00 | % | Monthly | 12.50 | % | USD | 169 | $ | (45,529 | ) | $ | (16,376 | ) | $ | (29,153 | ) | ||||||||||||||||
CDX-CMBX.NA.BBB- Series 6, 05/11/2063* | 3.00 | Monthly | 12.50 | USD | 560 | (150,864 | ) | (70,005 | ) | (80,859 | ) | |||||||||||||||||||||
Credit Suisse International |
| |||||||||||||||||||||||||||||||
CDX-CMBX.NA.BBB- Series 6, 05/11/2063* | 3.00 | Monthly | 12.50 | USD | 37 | (9,968 | ) | (4,486 | ) | (5,482 | ) | |||||||||||||||||||||
CDX-CMBX.NA.BBB- Series 6, 05/11/2063* | 3.00 | Monthly | 12.50 | USD | 93 | (25,055 | ) | (9,095 | ) | (15,960 | ) | |||||||||||||||||||||
CDX-CMBX.NA.BBB- Series 6, 05/11/2063* | 3.00 | Monthly | 12.50 | USD | 1,142 | (307,655 | ) | (137,532 | ) | (170,123 | ) | |||||||||||||||||||||
CDX-CMBX.NA.BBB- Series 6, 05/11/2063* | 3.00 | Monthly | 12.50 | USD | 1,151 | (309,983 | ) | (112,695 | ) | (197,288 | ) | |||||||||||||||||||||
CDX-CMBX.NA.BBB- Series 6, 05/11/2063* | 3.00 | Monthly | 12.50 | USD | 1,734 | (467,140 | ) | (165,417 | ) | (301,723 | ) | |||||||||||||||||||||
Goldman Sachs International |
| |||||||||||||||||||||||||||||||
CDX-CMBX.NA.BBB- Series 6, 05/11/2063* | 3.00 | Monthly | 12.50 | USD | 216 | (58,190 | ) | (26,889 | ) | (31,301 | ) | |||||||||||||||||||||
CDX-CMBX.NA.BBB- Series 6, 05/11/2063* | 3.00 | Monthly | 12.50 | USD | 1,503 | (404,908 | ) | (139,169 | ) | (265,739 | ) | |||||||||||||||||||||
|
|
|
|
|
| |||||||||||||||||||||||||||
| $ | (1,779,292 | ) | $ | (681,664 | ) | $ | (1,097,628 | ) | ||||||||||||||||||||||||
|
|
|
|
|
| |||||||||||||||||||||||||||
| * | Termination date |
| abfunds.com | AB INTERMEDIATE MUNICIPAL PORTFOLIOS | 115 | |
Table of Contents
PORTFOLIO OF INVESTMENTS (continued)
NEW YORK MUNICIPAL PORTFOLIO
INTEREST RATE SWAPS (see Note 3)
| Rate Type | ||||||||||||||||||||||||||||||
Swap | Notional Amount (000) | Termination Date | Payments made by the Fund | Payments received by the Fund | Payment Frequency Paid/ Received | Market Value | Upfront Premiums Paid (Received) | Unrealized Appreciation/ (Depreciation) | ||||||||||||||||||||||
Citibank, NA | USD | 16,980 | 10/09/2029 | 1.120% | SIFMA* | Quarterly | $ | 47,916 | $ | – 0 | – | $ | 47,916 | |||||||||||||||||
Citibank, NA | USD | 16,980 | 10/09/2029 | 1.125% | SIFMA* | Quarterly | 40,071 | – 0 | – | 40,071 | ||||||||||||||||||||
|
|
|
|
|
| |||||||||||||||||||||||||
| $ | 87,987 | $ | – 0 | – | $ | 87,987 | ||||||||||||||||||||||||
|
|
|
|
|
| |||||||||||||||||||||||||
| * | Variable interest rate based on the Securities Industry & Financial Markets Association (SIFMA) Municipal Swap Index. |
| (a) | Security is exempt from registration under Rule 144A of the Securities Act of 1933. These securities are considered restricted, but liquid and may be resold in transactions exempt from registration, normally to qualified institutional buyers. At March 31, 2021, the aggregate market value of these securities amounted to $35,180,576 or 1.9% of net assets. |
| (b) | Security is exempt from registration under Rule 144A of the Securities Act of 1933. These securities, which represent 0.07% of net assets as of March 31, 2021, are considered illiquid and restricted. Additional information regarding such securities follows: |
| 144A/Restricted & Illiquid Securities | Acquisition Date | Cost | Market Value | Percentage of Net Assets | ||||||||||||
Jefferson County Industrial Development Agency | ||||||||||||||||
5.25%, 01/01/2024 | 11/13/2014 | $ | 1,250,929 | $ | 1,207,906 | 0.07 | % | |||||||||
| (c) | When-Issued or delayed delivery security. |
| (d) | Floating Rate Security. Stated interest/floor/ceiling rate was in effect at March 31, 2021. |
| (e) | Defaulted matured security. |
| (f) | Non-income producing security. |
| (g) | Variable Rate Demand Notes are instruments whose interest rates change on a specific date (such as coupon date or interest payment date) or whose interest rates vary with changes in a designated base rate (such as the prime interest rate). This instrument is payable on demand and is secured by letters of credit or other credit support agreements from major banks. |
| (h) | Position, or a portion thereof, has been segregated to collateralize OTC derivatives outstanding. |
As of March 31, 2021, the Portfolio’s percentages of investments in municipal bonds that are insured and in insured municipal bonds that have been pre-refunded or escrowed to maturity are 3.6% and 0.3%, respectively.
Glossary:
AGC – Assured Guaranty Corporation
AGM – Assured Guaranty Municipal
AMBAC – Ambac Assurance Corporation
BAM – Build American Mutual
CDX-CMBX.NA – North American Commercial Mortgage-Backed Index
COP – Certificate of Participation
CPI – Consumer Price Index
ETM – Escrowed to Maturity
LIBOR – London Interbank Offered Rate
NATL – National Interstate Corporation
SRF – State Revolving Fund
SOFR – Secured Overnight Financing Rate.
XLCA – XL Capital Assurance Inc.
See notes to financial statements.
116 | AB INTERMEDIATE MUNICIPAL PORTFOLIOS | abfunds.com | |
Table of Contents
STATEMENT OF ASSETS AND LIABILITIES
March 31, 2021 (unaudited)
| California Municipal Portfolio | Diversified Municipal Portfolio | New York Municipal Portfolio | ||||||||||
| Assets | ||||||||||||
Investments in securities, at value | $ | 1,414,609,003 | $ | 6,324,849,577 | $ | 1,772,439,447 | ||||||
Cash | 3,808,908 | 142,781,653 | 41,022,720 | |||||||||
Cash collateral due from broker | 4,591,190 | 11,872,867 | 5,036,513 | |||||||||
Due from custodian | 282 | 323 | 909 | |||||||||
Receivables: | ||||||||||||
Interest | 16,987,008 | 70,109,395 | 20,935,346 | |||||||||
Investment securities sold | 16,941,535 | 38,286,099 | 695,000 | |||||||||
Capital shares sold | 3,385,209 | 6,783,760 | 2,197,630 | |||||||||
Variation margin on centrally cleared swaps | 42,577 | 152,777 | 29,957 | |||||||||
Unrealized appreciation of interest rate swaps | 64,229 | 296,193 | 87,987 | |||||||||
|
|
|
|
|
| |||||||
Total assets | 1,460,429,941 | 6,595,132,644 | 1,842,445,509 | |||||||||
|
|
|
|
|
| |||||||
| Liabilities | ||||||||||||
Payables: | ||||||||||||
Dividends to shareholders | 649,659 | 3,405,226 | 919,313 | |||||||||
Investment securities purchased | 34,683,791 | 74,178,174 | 22,415,152 | |||||||||
Capital shares redeemed | 1,644,114 | 5,810,902 | 2,535,783 | |||||||||
Management fee | 497,938 | 1,898,174 | 622,665 | |||||||||
Shareholder servicing fee | 108,046 | 446,153 | 138,371 | |||||||||
Distribution fee | 23,161 | 95,924 | 39,018 | |||||||||
Transfer Agent fee | 3,155 | 17,703 | 4,078 | |||||||||
Accrued expenses | 118,840 | 330,113 | 132,014 | |||||||||
Market value on credit default swaps(a) | 1,274,193 | 5,327,097 | 1,779,292 | |||||||||
|
|
|
|
|
| |||||||
Total liabilities | 39,002,897 | 91,509,466 | 28,585,686 | |||||||||
|
|
|
|
|
| |||||||
Net Assets | $ | 1,421,427,044 | $ | 6,503,623,178 | $ | 1,813,859,823 | ||||||
|
|
|
|
|
| |||||||
Cost of investments | $ | 1,360,051,763 | $ | 6,020,648,223 | $ | 1,698,876,962 | ||||||
|
|
|
|
|
| |||||||
| Net Assets Consist of: | ||||||||||||
Capital stock, at par | $ | 97,360 | $ | 439,556 | $ | 127,303 | ||||||
Additional paid-in capital | 1,372,906,749 | 6,206,312,207 | 1,753,868,582 | |||||||||
Distributable earnings | 48,422,935 | 296,871,415 | 59,863,938 | |||||||||
|
|
|
|
|
| |||||||
| $ | 1,421,427,044 | $ | 6,503,623,178 | $ | 1,813,859,823 | |||||||
|
|
|
|
|
| |||||||
| (a) | Net premiums received of $495,248, $2,040,792 and $681,664 respectively. |
See notes to financial statements.
| abfunds.com | AB INTERMEDIATE MUNICIPAL PORTFOLIOS | 117 | |
Table of Contents
STATEMENT OF ASSETS AND LIABILITIES (continued)
| California Municipal Portfolio | Diversified Municipal Portfolio | New York Municipal Portfolio | ||||||||||
| CALCULATION OF MAXIMUM OFFERING PRICE | ||||||||||||
| Municipal Class Shares | ||||||||||||
Net Assets | $ | 1,263,369,364 | $ | 5,263,208,494 | $ | 1,620,075,743 | ||||||
Shares of capital stock outstanding | 86,534,507 | 355,737,408 | 113,697,845 | |||||||||
|
|
|
|
|
| |||||||
Net asset value, offering and redemption price per share | $ | 14.60 | $ | 14.80 | $ | 14.25 | ||||||
|
|
|
|
|
| |||||||
| Class A Shares | ||||||||||||
Net Assets | $ | 85,699,485 | $ | 322,537,723 | $ | 115,928,376 | ||||||
Shares of capital stock outstanding | 5,869,519 | 21,784,342 | 8,138,710 | |||||||||
|
|
|
|
|
| |||||||
Net asset value and redemption price per share | $ | 14.60 | $ | 14.81 | $ | 14.24 | ||||||
Sales charge – 3.00% of public offering price | 0.45 | 0.46 | 0.44 | |||||||||
|
|
|
|
|
| |||||||
Maximum offering price | $ | 15.05 | $ | 15.27 | $ | 14.68 | ||||||
|
|
|
|
|
| |||||||
| Class C Shares | ||||||||||||
Net Assets | $ | 6,052,308 | $ | 31,578,133 | $ | 16,924,724 | ||||||
Shares of capital stock outstanding | 414,599 | 2,133,664 | 1,188,033 | |||||||||
|
|
|
|
|
| |||||||
Net asset value and offering price per share | $ | 14.60 | $ | 14.80 | $ | 14.25 | ||||||
|
|
|
|
|
| |||||||
| Advisor Class Shares | ||||||||||||
Net Assets | $ | 66,305,887 | $ | 422,652,457 | $ | 60,930,980 | ||||||
Shares of capital stock outstanding | 4,541,589 | 28,586,087 | 4,278,589 | |||||||||
|
|
|
|
|
| |||||||
Net asset value and offering price per share | $ | 14.60 | $ | 14.79 | $ | 14.24 | ||||||
|
|
|
|
|
| |||||||
| Class Z Shares | ||||||||||||
Net Assets | $ | 463,646,371 | ||||||||||
Shares of capital stock outstanding | 31,314,104 | |||||||||||
|
| |||||||||||
Net asset value and offering price per share | $ | 14.81 | ||||||||||
|
| |||||||||||
See notes to financial statements.
118 | AB INTERMEDIATE MUNICIPAL PORTFOLIOS | abfunds.com | |
Table of Contents
STATEMENT OF OPERATIONS
For the Six Months Ended March 31, 2021 (unaudited)
| California Municipal Portfolio | Diversified Municipal Portfolio | New York Municipal Portfolio | ||||||||||
| Investment Income | ||||||||||||
Interest | $ | 16,185,621 | $ | 77,853,553 | $ | 22,333,570 | ||||||
|
|
|
|
|
| |||||||
Total income | 16,185,621 | 77,853,553 | 22,333,570 | |||||||||
|
|
|
|
|
| |||||||
| Expenses: | ||||||||||||
Management fee | 2,887,859 | 10,997,615 | 3,639,719 | |||||||||
Shareholder servicing fee (see Note 2B) | 625,971 | 2,573,864 | 807,089 | |||||||||
Custody and accounting fees | 103,110 | 141,698 | 104,186 | |||||||||
Transfer Agent fee – Non-Retail Class | 13,583 | 57,827 | 18,594 | |||||||||
Transfer Agent fee – Class A | 11,646 | 51,299 | 21,777 | |||||||||
Transfer Agent fee – Class C | 887 | 5,762 | 3,503 | |||||||||
Transfer Agent fee – Advisor Class | 8,808 | 68,899 | 11,295 | |||||||||
Transfer Agent fee – Class Z | – 0 | – | 48,536 | – 0 | – | |||||||
Distribution fees – Class A | 105,970 | 374,090 | 144,725 | |||||||||
Distribution fees – Class C | 31,732 | 164,494 | 90,579 | |||||||||
Directors’ fees and expenses | 29,191 | 131,825 | 37,501 | |||||||||
Auditing and tax fees | 22,926 | 93,880 | 28,767 | |||||||||
Registration fees | 12,180 | 83,101 | 25,254 | |||||||||
Legal fees | 15,654 | 67,519 | 19,898 | |||||||||
Printing fees | 12,382 | 62,471 | 18,513 | |||||||||
Miscellaneous | 32,397 | 77,118 | 32,319 | |||||||||
|
|
|
|
|
| |||||||
Total expenses | 3,914,296 | 14,999,998 | 5,003,719 | |||||||||
|
|
|
|
|
| |||||||
Net investment income | 12,271,325 | 62,853,555 | 17,329,851 | |||||||||
|
|
|
|
|
| |||||||
| Realized and Unrealized Gain (Loss) on Investment and Foreign Currency Transactions | ||||||||||||
Net realized gain on: | ||||||||||||
Investment transactions | 7,271,598 | 13,917,782 | 127,675 | |||||||||
Swaps | 217,871 | 5,955,926 | 2,345,021 | |||||||||
|
|
|
|
|
| |||||||
Net realized gain on investment and foreign currency transactions | 7,489,469 | 19,873,708 | 2,472,696 | |||||||||
|
|
|
|
|
| |||||||
Net change in unrealized appreciation/depreciation of: | ||||||||||||
Investments | (4,699,241 | ) | 17,213,269 | 21,985,341 | ||||||||
Swaps | 4,424,977 | 14,083,798 | 2,616,179 | |||||||||
|
|
|
|
|
| |||||||
Net change in unrealized appreciation/depreciation of investments and foreign currency denominated assets and liabilities | (274,264 | ) | 31,297,067 | 24,601,520 | ||||||||
|
|
|
|
|
| |||||||
Net realized and unrealized gain on investment and foreign currency transactions | 7,215,205 | 51,170,775 | 27,074,216 | |||||||||
|
|
|
|
|
| |||||||
Net increase in net assets resulting from operations | $ | 19,486,530 | $ | 114,024,330 | $ | 44,404,067 | ||||||
|
|
|
|
|
| |||||||
See notes to financial statements.
| abfunds.com | AB INTERMEDIATE MUNICIPAL PORTFOLIOS | 119 | |
Table of Contents
STATEMENT OF CHANGES IN NET ASSETS
| California Municipal Portfolio | ||||||||
| Six Months Ended 3/31/21 (unaudited) | Year Ended 9/30/20 | |||||||
| Increase (Decrease) in Net Assets from Operations: | ||||||||
Net investment income | $ | 12,271,325 | $ | 26,697,204 | ||||
Net realized gain (loss) on investment and foreign currency transactions | 7,489,469 | (1,581,124 | ) | |||||
Net change in unrealized appreciation/depreciation of investments and foreign currency denominated assets and liabilities | (274,264 | ) | 9,493,129 | |||||
|
|
|
| |||||
Net increase in net assets resulting from operations | 19,486,530 | 34,609,209 | ||||||
|
|
|
| |||||
| Distributions to Shareholders | ||||||||
Municipal Class | (10,964,306 | ) | (24,351,450 | ) | ||||
Class A | (664,588 | ) | (1,430,864 | ) | ||||
Class C | (25,937 | ) | (99,775 | ) | ||||
Advisor Class | (581,918 | ) | (954,257 | ) | ||||
|
|
|
| |||||
Total distributions to shareholders | (12,236,749 | ) | (26,836,346 | ) | ||||
|
|
|
| |||||
| Capital-Share Transactions: | ||||||||
Net proceeds from sales of shares | 202,021,502 | 319,192,474 | ||||||
Net proceeds from sales of shares issued to shareholders on reinvestment of dividends and distributions | 9,391,131 | 20,636,412 | ||||||
|
|
|
| |||||
Total proceeds from shares sold | 211,412,633 | 339,828,886 | ||||||
Cost of shares redeemed | (190,025,968 | ) | (291,077,178 | ) | ||||
|
|
|
| |||||
Net increase in net assets from capital-share transactions | 21,386,665 | 48,751,708 | ||||||
|
|
|
| |||||
Net increase in net assets | 28,636,446 | 56,524,571 | ||||||
| Net Assets: | ||||||||
Beginning of period | 1,392,790,598 | 1,336,266,027 | ||||||
|
|
|
| |||||
End of period | $ | 1,421,427,044 | $ | 1,392,790,598 | ||||
|
|
|
| |||||
See notes to financial statements.
120 | AB INTERMEDIATE MUNICIPAL PORTFOLIOS | abfunds.com | |
Table of Contents
STATEMENT OF CHANGES IN NET ASSETS (continued)
| Diversified Municipal Portfolio | ||||||||
| Six Months Ended 3/31/21 (unaudited) | Year Ended 9/30/20 | |||||||
| Increase (Decrease) in Net Assets from Operations: | ||||||||
Net investment income | $ | 62,853,555 | $ | 140,149,649 | ||||
Net realized gain on investment transactions | 19,873,708 | 5,863,220 | ||||||
Net change in unrealized appreciation/depreciation of investments | 31,297,067 | 34,936,728 | ||||||
|
|
|
| |||||
Net increase in net assets resulting from operations | 114,024,330 | 180,949,597 | ||||||
|
|
|
| |||||
| Distributions to Shareholders | ||||||||
Municipal Class | (50,946,439 | ) | (113,116,688 | ) | ||||
Class A | (2,657,308 | ) | (5,075,417 | ) | ||||
Class B | – 0 | – | (7 | ) | ||||
Class C | (170,378 | ) | (513,838 | ) | ||||
Advisor Class | (4,074,582 | ) | (7,634,340 | ) | ||||
Class Z | (5,007,054 | ) | (13,827,214 | ) | ||||
|
|
|
| |||||
Total distributions to shareholders | (62,855,761 | ) | (140,167,504 | ) | ||||
|
|
|
| |||||
| Capital-Share Transactions: | ||||||||
Net proceeds from sales of shares | 830,025,176 | 1,437,290,166 | ||||||
Net proceeds from sales of shares issued to shareholders on reinvestment of dividends and distributions | 48,217,191 | 107,026,785 | ||||||
|
|
|
| |||||
Total proceeds from shares sold | 878,242,367 | 1,544,316,951 | ||||||
Cost of shares redeemed | (654,347,729 | ) | (1,744,585,893 | ) | ||||
|
|
|
| |||||
Net increase (decrease) in net assets from capital-share transactions | 223,894,638 | (200,268,942 | ) | |||||
|
|
|
| |||||
Net increase (decrease) in net assets | 275,063,207 | (159,486,849 | ) | |||||
| Net Assets: |
| |||||||
Beginning of period | 6,228,559,971 | 6,388,046,820 | ||||||
|
|
|
| |||||
End of period | $ | 6,503,623,178 | $ | 6,228,559,971 | ||||
|
|
|
| |||||
See notes to financial statements.
| abfunds.com | AB INTERMEDIATE MUNICIPAL PORTFOLIOS | 121 | |
Table of Contents
STATEMENT OF CHANGES IN NET ASSETS (continued)
| New York Municipal Portfolio | ||||||||
| Six Months Ended 3/31/21 (unaudited) | Year Ended 9/30/20 | |||||||
| Increase (Decrease) in Net Assets from Operations: | ||||||||
Net investment income | $ | 17,329,851 | $ | 38,753,190 | ||||
Net realized gain (loss) on investment transactions | 2,472,696 | (1,746,235 | ) | |||||
Net change in unrealized appreciation/depreciation of investments | 24,601,520 | (18,005,271 | ) | |||||
|
|
|
| |||||
Net increase in net assets resulting from operations | 44,404,067 | 19,001,684 | ||||||
|
|
|
| |||||
| Distributions to Shareholders | ||||||||
Municipal Class | (15,636,410 | ) | (35,160,186 | ) | ||||
Class A | (1,007,686 | ) | (2,395,768 | ) | ||||
Class C | (90,115 | ) | (300,634 | ) | ||||
Advisor Class | (598,789 | ) | (1,421,777 | ) | ||||
|
|
|
| |||||
Total distributions to shareholders | (17,333,000 | ) | (39,278,365 | ) | ||||
|
|
|
| |||||
| Capital-Share Transactions: | ||||||||
Net proceeds from sales of shares | 191,197,266 | 293,320,188 | ||||||
Net proceeds from sales of shares issued to shareholders on reinvestment of dividends and distributions | 13,390,518 | 30,166,953 | ||||||
|
|
|
| |||||
Total proceeds from shares sold | 204,587,784 | 323,487,141 | ||||||
Cost of shares redeemed | (205,916,011 | ) | (348,266,278 | ) | ||||
|
|
|
| |||||
Net decrease in net assets from capital-share transactions | (1,328,227 | ) | (24,779,137 | ) | ||||
|
|
|
| |||||
Net increase (decrease) in net assets | 25,742,840 | (45,055,818 | ) | |||||
| Net Assets: |
| |||||||
Beginning of period | 1,788,116,983 | 1,833,172,801 | ||||||
|
|
|
| |||||
End of period | $ | 1,813,859,823 | $ | 1,788,116,983 | ||||
|
|
|
| |||||
See notes to financial statements.
122 | AB INTERMEDIATE MUNICIPAL PORTFOLIOS | abfunds.com | |
Table of Contents
NOTES TO FINANCIAL STATEMENTS
March 31, 2021 (unaudited)
NOTE 1.
Organization and Significant Accounting Policies
The AB Intermediate Municipal Class A, Class C, Advisor Class and Class Z shares are (collectively, the “Intermediate Municipal Retail Classes”) shares of three Portfolios of the Sanford C. Bernstein Fund, Inc. (the “Fund”): California Municipal Portfolio, Diversified Municipal Portfolio and New York Municipal Portfolio (collectively, “Intermediate Municipal Portfolios” or “Portfolios”). The Fund is registered under the Investment Company Act of 1940 as an open-end registered investment company. The Fund, which is a Maryland corporation, operates as a series company currently comprised of 13 portfolios each with its own investment objective. Class B and Class T shares have been authorized but currently are not offered. Effective August 2, 2019, sales of Class B shares were suspended. On November 7, 2019, all remaining outstanding Class B shares of the Portfolios were converted to Class A shares. Class A shares of the Portfolios are sold with a front-end sales charge of up to 3% for purchases up to $500,000. With respect to purchases of $500,000 or more, Class A shares redeemed within one year of purchase may be subject to a contingent deferred sales charge of 1%. Class C shares are subject to a contingent deferred sales charge of 1% on redemptions made within the first year after purchase, and 0% after the first year of purchase. Class C shares will automatically convert to Class A shares ten years after the end of the calendar month of purchase. These financial statements include only the Intermediate Municipal Portfolios. The financial highlights of the Municipal Class shares are presented in a separate financial report. All classes of shares have identical voting, dividend, liquidation and other rights, except that the classes bear different distribution and transfer agency expenses. Each class has exclusive voting rights with respect to its distribution plan, as applicable. The financial statements have been prepared in conformity with U.S. generally accepted accounting principles (“U.S. GAAP”), which require management to make certain estimates and assumptions that affect the reported amounts of assets and liabilities in the financial statements and amounts of income and expenses during the reporting period. Actual results could differ from those estimates. Each Portfolio is an investment company under U.S. GAAP and follows the accounting and reporting guidance applicable to investment companies. The following is a summary of significant accounting policies followed by the Portfolios.
A. Portfolio Valuation
Portfolio securities are valued at their current market value determined on the basis of market quotations or, if market quotations are not readily available or are deemed unreliable, at “fair value” as determined in accordance with procedures established by and under the general supervision of the Fund’s Board of Directors (the “Board”).
| abfunds.com | AB INTERMEDIATE MUNICIPAL PORTFOLIOS | 123 | |
Table of Contents
NOTES TO FINANCIAL STATEMENTS (continued)
In general, the market values of securities which are readily available and deemed reliable are determined as follows: securities listed on a national securities exchange (other than securities listed on the NASDAQ Stock Market, Inc. (“NASDAQ”)) or on a foreign securities exchange are valued at the last sale price at the close of the exchange or foreign securities exchange. If there has been no sale on such day, the securities are valued at the last traded price from the previous day. Securities listed on more than one exchange are valued by reference to the principal exchange on which the securities are traded; securities listed only on NASDAQ are valued in accordance with the NASDAQ Official Closing Price; listed or over the counter (“OTC”) market put or call options are valued at the mid level between the current bid and ask prices. If either a current bid or current ask price is unavailable, AllianceBernstein L.P. (the “Adviser”) will have discretion to determine the best valuation (e.g., last trade price in the case of listed options); open futures are valued using the closing settlement price or, in the absence of such a price, the most recent quoted bid price. If there are no quotations available for the day of valuation, the last available closing settlement price is used; U.S. Government securities and any other debt instruments having 60 days or less remaining until maturity are generally valued at market by an independent pricing vendor, if a market price is available. If a market price is not available, the securities are valued at amortized cost. This methodology is commonly used for short term securities that have an original maturity of 60 days or less, as well as short term securities that had an original term to maturity that exceeded 60 days. In instances when amortized cost is utilized, the Valuation Committee (the “Committee”) must reasonably conclude that the utilization of amortized cost is approximately the same as the fair value of the security. Factors the Committee will consider include, but are not limited to, an impairment of the creditworthiness of the issuer or material changes in interest rates. Fixed-income securities, including mortgage-backed and asset-backed securities, may be valued on the basis of prices provided by a pricing service or at a price obtained from one or more of the major broker-dealers. In cases where broker-dealer quotes are obtained, the Adviser may establish procedures whereby changes in market yields or spreads are used to adjust, on a daily basis, a recently obtained quoted price on a security. Swaps and other derivatives are valued daily, primarily using independent pricing services, independent pricing models using market inputs, as well as third party broker-dealers or counterparties. Open-end mutual funds are valued at the closing net asset value per share, while exchange traded funds are valued at the closing market price per share.
Securities for which market quotations are not readily available (including restricted securities) or are deemed unreliable are valued at fair value as deemed appropriate by the Adviser. Factors considered in making this
124 | AB INTERMEDIATE MUNICIPAL PORTFOLIOS | abfunds.com | |
Table of Contents
NOTES TO FINANCIAL STATEMENTS (continued)
determination may include, but are not limited to, information obtained by contacting the issuer, analysts, analysis of the issuer’s financial statements or other available documents. In addition, the Portfolios may use fair value pricing for securities primarily traded in non-U.S. markets because most foreign markets close well before the Portfolios value their securities at 4:00 p.m., Eastern Time. The earlier close of these foreign markets gives rise to the possibility that significant events, including broad market moves, may have occurred in the interim and may materially affect the value of those securities. To account for this, the Portfolios generally value many of their foreign equity securities using fair value prices based on third party vendor modeling tools to the extent available.
B. Fair Value Measurements
In accordance with U.S. GAAP regarding fair value measurements, fair value is defined as the price that the Portfolios would receive to sell an asset or pay to transfer a liability in an orderly transaction between market participants at the measurement date. U.S. GAAP establishes a framework for measuring fair value, and a three-level hierarchy for fair value measurements based upon the transparency of inputs to the valuation of an asset or liability (including those valued based on their market values as described in Note 1.A above). Inputs may be observable or unobservable and refer broadly to the assumptions that market participants would use in pricing the asset or liability. Observable inputs reflect the assumptions market participants would use in pricing the asset or liability based on market data obtained from sources independent of the Portfolios. Unobservable inputs reflect the Portfolios’ own assumptions about the assumptions that market participants would use in pricing the asset or liability based on the best information available in the circumstances. Each investment is assigned a level based upon the observability of the inputs which are significant to the overall valuation. The three-tier hierarchy of inputs is summarized below.
| • | Level 1—quoted prices in active markets for identical investments |
| • | Level 2—other significant observable inputs (including quoted prices for similar investments, interest rates, prepayment speeds, credit risk, etc.) |
| • | Level 3—significant unobservable inputs (including the Portfolios’ own assumptions in determining the fair value of investments) |
The fair value of debt instruments, such as bonds, and over-the-counter derivatives is generally based on market price quotations, recently executed market transactions (where observable) or industry recognized modeling techniques and are generally classified as Level 2. Pricing vendor inputs to Level 2 valuations may include quoted prices for similar investments in active markets, interest rate curves, coupon rates, currency rates, yield curves, option adjusted spreads, default rates, credit spreads and
| abfunds.com | AB INTERMEDIATE MUNICIPAL PORTFOLIOS | 125 | |
Table of Contents
NOTES TO FINANCIAL STATEMENTS (continued)
other unique security features in order to estimate the relevant cash flows which are then discounted to calculate fair values. If these inputs are unobservable and significant to the fair value, these investments will be classified as Level 3.
Other fixed income investments, including non-U.S. government and corporate debt, are generally valued using quoted market prices, if available, which are typically impacted by current interest rates, maturity dates and any perceived credit risk of the issuer. Additionally, in the absence of quoted market prices, these inputs are used by pricing vendors to derive a valuation based upon industry or proprietary models which incorporate issuer specific data with relevant yield/spread comparisons with more widely quoted bonds with similar key characteristics. Those investments for which there are observable inputs are classified as Level 2. Where the inputs are not observable, the investments are classified as Level 3.
The following tables summarize the valuation of the Portfolios’ investments by the above fair value hierarchy levels as of March 31, 2021:
| California Municipal Portfolio | ||||||||||||||||
| Investments in Securities: | Level 1 | Level 2 | Level 3 | Total | ||||||||||||
Assets: |
| |||||||||||||||
Long-Term Municipal Bonds | $ | – 0 | – | $ | 1,285,940,392 | $ | – 0 | – | $ | 1,285,940,392 | ||||||
Short-Term Municipal Notes | – 0 | – | 121,557,176 | – 0 | – | 121,557,176 | ||||||||||
Collateralized Mortgage Obligations | – 0 | – | 4,575,556 | – 0 | – | 4,575,556 | ||||||||||
Governments – Treasuries | – 0 | – | 2,535,879 | – 0 | – | 2,535,879 | ||||||||||
|
|
|
|
|
|
|
| |||||||||
Total Investments in Securities | – 0 | – | 1,414,609,003 | – 0 | – | 1,414,609,003 | ||||||||||
Other Financial Instruments(a): | ||||||||||||||||
Assets: |
| |||||||||||||||
Centrally Cleared Inflation (CPI) Swaps | – 0 | – | 4,964,754 | – 0 | – | 4,964,754 | (b) | |||||||||
Centrally Cleared Interest Rate Swaps | – 0 | – | 1,309,070 | – 0 | – | 1,309,070 | (b) | |||||||||
Interest Rate Swaps | – 0 | – | 64,229 | – 0 | – | 64,229 | ||||||||||
Liabilities: |
| |||||||||||||||
Centrally Cleared Inflation (CPI) Swaps | – 0 | – | (161,045 | ) | – 0 | – | (161,045 | )(b) | ||||||||
Centrally Cleared Interest Rate Swaps | – 0 | – | (1,083,301 | ) | – 0 | – | (1,083,301 | )(b) | ||||||||
Credit Default Swaps | – 0 | – | (1,274,193 | ) | – 0 | – | (1,274,193 | ) | ||||||||
|
|
|
|
|
|
|
| |||||||||
Total | $ | – 0 | – | $ | 1,418,428,517 | $ | – 0 | – | $ | 1,418,428,517 | ||||||
|
|
|
|
|
|
|
| |||||||||
126 | AB INTERMEDIATE MUNICIPAL PORTFOLIOS | abfunds.com | |
Table of Contents
NOTES TO FINANCIAL STATEMENTS (continued)
| Diversified Municipal Portfolio | ||||||||||||||||
| Investments in Securities: | Level 1 | Level 2 | Level 3 | Total | ||||||||||||
Assets: |
| |||||||||||||||
Long-Term Municipal Bonds | $ | – 0 | – | $ | 5,561,707,663 | $ | 40,500,314 | $ | 5,602,207,977 | |||||||
Short-Term Municipal Notes | – 0 | – | 670,200,560 | – 0 | – | 670,200,560 | ||||||||||
Collateralized Mortgage Obligations | – 0 | – | 19,965,899 | – 0 | – | 19,965,899 | ||||||||||
Corporates – Investment Grade | – 0 | – | 15,004,145 | – 0 | – | 15,004,145 | ||||||||||
Corporates – Non-Investment Grade | – 0 | – | 7,471,259 | – 0 | – | 7,471,259 | ||||||||||
Short-Term Investments | – 0 | – | 9,999,737 | – 0 | – | 9,999,737 | ||||||||||
|
|
|
|
|
|
|
| |||||||||
Total Investments in Securities | – 0 | – | 6,284,349,263 | 40,500,314 | 6,324,849,577 | |||||||||||
Other Financial Instruments(a): | ||||||||||||||||
Assets | ||||||||||||||||
Centrally Cleared Inflation (CPI) Swaps | – 0 | – | 23,039,523 | – 0 | – | 23,039,523 | (b) | |||||||||
Centrally Cleared Interest Rate Swaps | – 0 | – | 4,847,611 | – 0 | – | 4,847,611 | (b) | |||||||||
Interest Rate Swaps | – 0 | – | 296,193 | – 0 | – | 296,193 | ||||||||||
Liabilities: |
| |||||||||||||||
Centrally Cleared Inflation (CPI) Swaps | – 0 | – | (730,320 | ) | – 0 | – | (730,320 | )(b) | ||||||||
Centrally Cleared Interest Rate Swaps | – 0 | – | (1,802,662 | ) | – 0 | – | (1,802,662 | )(b) | ||||||||
Credit Default Swaps | – 0 | – | (5,327,097 | ) | – 0 | – | (5,327,097 | ) | ||||||||
|
|
|
|
|
|
|
| |||||||||
Total | $ | – 0 | – | $ | 6,304,672,511 | $ | 40,500,314 | $ | 6,345,172,825 | |||||||
|
|
|
|
|
|
|
| |||||||||
| New York Municipal Portfolio | ||||||||||||||||
| Investments in Securities: | Level 1 | Level 2 | Level 3 | Total | ||||||||||||
Assets: |
| |||||||||||||||
Long-Term Municipal Bonds | $ | – 0 | – | $ | 1,660,799,310 | $ | – 0 | – | $ | 1,660,799,310 | ||||||
Short-Term Municipal Notes | – 0 | – | 102,672,660 | – 0 | – | 102,672,660 | ||||||||||
Collateralized Mortgage Obligations | – 0 | – | 6,398,089 | – 0 | – | 6,398,089 | ||||||||||
Governments – Treasuries | – 0 | – | 2,569,388 | – 0 | – | 2,569,388 | ||||||||||
|
|
|
|
|
|
|
| |||||||||
Total Investments in Securities | – 0 | – | 1,772,439,447 | – 0 | – | 1,772,439,447 | ||||||||||
| abfunds.com | AB INTERMEDIATE MUNICIPAL PORTFOLIOS | 127 | |
Table of Contents
NOTES TO FINANCIAL STATEMENTS (continued)
| New York Municipal Portfolio | ||||||||||||||||
| Investments in Securities: | Level 1 | Level 2 | Level 3 | Total | ||||||||||||
Other Financial Instruments(a): | ||||||||||||||||
Assets: |
| |||||||||||||||
Centrally Cleared Inflation (CPI) Swaps | $ | – 0 | – | $ | 6,557,280 | $ | – 0 | – | $ | 6,557,280 | (b) | |||||
Centrally Cleared Interest Rate Swaps | – 0 | – | 344,770 | – 0 | – | 344,770 | (b) | |||||||||
Interest Rate Swaps | – 0 | – | 87,987 | – 0 | – | 87,987 | ||||||||||
Liabilities: |
| |||||||||||||||
Centrally Cleared Inflation (CPI) Swaps | – 0 | – | (205,988 | ) | – 0 | – | (205,988 | )(b) | ||||||||
Centrally Cleared Interest Rate Swaps | – 0 | – | (764,742 | ) | – 0 | – | (764,742 | )(b) | ||||||||
Credit Default Swaps | – 0 | – | (1,779,292 | ) | – 0 | – | (1,779,292 | ) | ||||||||
|
|
|
|
|
|
|
| |||||||||
Total | $ | – 0 | – | $ | 1,776,679,462 | $ | – 0 | – | $ | 1,776,679,462 | ||||||
|
|
|
|
|
|
|
| |||||||||
| (a) | Other financial instruments are derivative instruments, such as futures, forwards and swaps, which are valued at the unrealized appreciation/(depreciation) on the instrument. Other financial instruments may also include swaps with upfront premiums, options written and swaptions written which are valued at market value. |
| (b) | Only variation margin receivable/(payable) at period end is reported within the statement of assets and liabilities. This amount reflects cumulative unrealized appreciation/(depreciation) on futures and centrally cleared swaps as reported in the schedule of investments. Where applicable, centrally cleared swaps with upfront premiums are presented here at market value. |
C. Taxes
Each Portfolio is treated as a separate entity for federal income tax purposes. Each Portfolio intends to continue to comply with the requirements of Subchapter M of the Internal Revenue Code of 1986 as they apply to regulated investment companies. By so complying, each Portfolio will not be subject to federal and state income taxes to the extent that all of its income is distributed. The Portfolios may be subject to taxes imposed by countries in which they invest. Such taxes are generally based on income and/or capital gains earned or repatriated. Taxes are accrued and applied to net investment income, net realized gains and net unrealized appreciation/depreciation as such income and/or gains are earned based on management’s understanding of applicable local tax law.
In accordance with U.S. GAAP requirements regarding accounting for uncertainties in income taxes, management has analyzed the Portfolios’ tax positions taken or expected to be taken on federal and state income tax returns for all open tax years (the current and the prior three tax years) and has concluded that no provision for income tax is required in the Portfolios’ financial statements. As of September 30, 2020, the Portfolios did not have any unrecognized tax benefits.
128 | AB INTERMEDIATE MUNICIPAL PORTFOLIOS | abfunds.com | |
Table of Contents
NOTES TO FINANCIAL STATEMENTS (continued)
D. Security Transactions and Related Investment Income
Security transactions are accounted for on the trade date (the date the buy or sell order is executed). Securities gains and losses are calculated on the identified cost basis. Interest income is recorded on the accrual basis and dividend income is recorded on the ex-dividend date or as soon as the Portfolios are informed of the dividend. The Portfolios amortize premiums and accrete discounts as adjustments to interest income. The Portfolio accounts for distributions received from REIT investments or from regulated investment companies as dividend income, realized gain, or return of capital based on information provided by the REIT or the investment company.
E. Securities Transactions on a When-Issued or Delayed-Delivery Basis
Each Portfolio may purchase securities on a when-issued basis or purchase or sell securities on a delayed-delivery basis. At the time a Portfolio commits to purchase a security on a when-issued or delayed-delivery basis, the Portfolio will record the transaction and use the security’s value in determining the Portfolio’s net asset value. At the time a Portfolio commits to sell a security on a delayed-delivery basis, the Portfolio will record the transaction and exclude the security’s value in determining the Portfolio’s net asset value.
F. Class Allocations
All income earned and expenses incurred by the Portfolios are borne on a pro-rata basis by each outstanding class of shares, based on the proportionate interest in each Portfolio represented by the shares of such class, except for class specific expenses which are allocated to the respective class. Expenses of the Fund are charged proportionately to each Portfolio or based on other appropriate methods. Realized and unrealized gains and losses are allocated among the various share classes based on respective net assets.
G. Distribution of Income and Gains
Net investment income of each Portfolio is declared and recorded as a dividend to shareholders daily and is payable to shareholders monthly. Distributions of net realized gains, less any available loss carryforwards, if any, will be paid to shareholders at least once a year, and recorded on the ex-dividend date.
Elements of realized gains and net investment income may be recorded in different accounting periods for financial reporting (book) and federal income tax (tax) purposes (temporary differences). To the extent that such distributions required for tax purposes exceed income and gains recorded for book purposes as a result of such temporary differences, “excess distributions” are reflected in the accompanying statement of assets and
| abfunds.com | AB INTERMEDIATE MUNICIPAL PORTFOLIOS | 129 | |
Table of Contents
NOTES TO FINANCIAL STATEMENTS (continued)
liabilities. To the extent distributions exceed income and gains for tax purposes, such distributions would be shown as “return of capital” on the statement of changes in net assets. Certain other differences—permanent differences—arise because treatment of elements of income and gains is different between book and tax accounting. Permanent differences are reclassified in the year they arise.
NOTE 2.
Investment Management and Transactions with Affiliated Persons
A. Management Fee
Under the Investment Management Agreement between the Fund and the Adviser, the Adviser manages the investment of each Portfolio’s assets, places purchase and sale orders, and bears various expenses, including the salaries and expenses of all personnel except those of outside directors. In addition, the Adviser agrees to permit its directors, officers and employees who may be elected directors or officers of the Fund to serve in the capacities to which they are elected. The Adviser renders these services subject to the general oversight of the Board.
The Portfolios pay the Adviser an investment management fee, based on an annual rate, for such services as follows:
| Annual Percentage of Average Daily Net Assets of Each Portfolio | ||||||||||||||||
| Portfolio | First $1 Billion | Next $2 Billion | Next $2 Billion | Thereafter | ||||||||||||
California Municipal and New York Municipal | 0.425 | % | 0.375 | % | 0.325 | % | 0.275 | % | ||||||||
First $1 Billion | Next $2 Billion | Next $2 Billion | Next $2 Billion | Thereafter | ||||||||||||||||
Diversified Municipal | 0.425 | % | 0.375 | % | 0.325 | % | 0.275 | % | 0.225 | % | ||||||||||
During the second quarter of 2018, AXA S.A. (“AXA”), a French holding company for the AXA Group, completed the sale of a minority stake in its subsidiary, AXA Equitable Holdings, Inc. (now named Equitable Holdings, Inc.)(“Equitable”), through an initial public offering. Equitable is the holding company for a diverse group of financial services companies, including an approximate 65% economic interest in the Adviser and a 100% interest in AllianceBernstein Corporation, the general partner of the Adviser. Since the initial sale, AXA has completed additional offerings (and related transactions). As a result, as of May 20, 2021, AXA no longer owns shares of Equitable.
Sales that were completed on November 13, 2019 resulted in the indirect transfer of a “controlling block” of voting securities of the Adviser (a “Change
130 | AB INTERMEDIATE MUNICIPAL PORTFOLIOS | abfunds.com | |
Table of Contents
NOTES TO FINANCIAL STATEMENTS (continued)
of Control Event”) and may have been deemed to have been an “assignment” causing a termination of the Portfolios’ investment advisory and administration agreements. In order to ensure that investment advisory and administration services could continue uninterrupted in the event of a Change of Control Event, the Board previously approved new investment advisory and administration agreements with the Adviser, and shareholders of the Portfolios subsequently approved the new investment advisory agreement. These agreements became effective on November 13, 2019.
B. Transfer Agency Agreement; Shareholder Servicing Fee
Under a Transfer Agency Agreement between the Fund, on behalf of the Intermediate Municipal Retail Classes, and AllianceBernstein Investor Services, Inc. (“ABIS”), the Intermediate Municipal Retail Classes compensate ABIS, a wholly-owned subsidiary of the Adviser, for providing personnel and facilities to perform transfer agency services. ABIS may make payments to intermediaries that provide omnibus account services, sub-accounting services and/or networking services. For the six months ended March 31, 2021, the compensation retained by ABIS amounted to: California Municipal Portfolio, $9,061; Diversified Municipal Portfolio, $78,420; and New York Municipal Portfolio, $10,191.
Under the Shareholder Servicing Agreement between the Fund and the Adviser, the Adviser pays expenses it incurs in providing shareholder services to individual shareholders of the Portfolios (except the Retail Classes). Such services include, but are not limited to, providing information to shareholders concerning their fund investments, systematic withdrawal plans, fund dividend payments and reinvestments, shareholder account or transactions status, net asset value of shares, fund performance, fund services, plans and options, fund investment policies, portfolio holdings and tax consequences of fund investments; dealing with shareholder complaints and other correspondence relating to fund matters; and communications with shareholders when proxies are being solicited from them with respect to voting their fund shares. This agreement applies only to the Municipal Class shares of the Portfolios. Under the agreement, the fee paid by each of the Municipal Class shares to the Adviser for services under this agreement is at an annual rate of 0.10% of the average daily net assets of each Portfolio attributable to the respective class during the month.
C. Distribution Arrangements—Municipal Class Shares
Under the Distribution Agreement between the Fund, on behalf of the Municipal Class shares of each Portfolio and Sanford C. Bernstein & Co., LLC (the “Distributor”), the Distributor agrees to act as agent to sell Municipal Class shares of the Portfolios. This agreement does not apply to the Intermediate Municipal Retail Classes of the Portfolios. The Distributor
| abfunds.com | AB INTERMEDIATE MUNICIPAL PORTFOLIOS | 131 | |
Table of Contents
NOTES TO FINANCIAL STATEMENTS (continued)
receives no fee for this service, and furthermore agrees to pay all expenses arising from the performance of its obligations under this agreement. The Distributor is a wholly owned subsidiary of the Adviser.
D. Distribution Arrangements—Intermediate Municipal Retail Classes
The Intermediate Municipal Retail Class shares of the Portfolios have adopted a Distribution Services Agreement (the “Agreement”), including a distribution plan pursuant to Rule 12b-1 under the Investment Company Act of 1940. Under the Agreement, each of the Retail Classes pays distribution services fees to AllianceBernstein Investments, Inc., (the “Retail Distributor”), a wholly owned subsidiary of the Adviser, at an annual rate of up to 0.30% of each Portfolio’s average daily net assets attributable to the Intermediate Municipal Class A shares and 1% of each Intermediate Municipal Portfolio’s average daily net assets attributable to Class C shares. Payments under the Agreement in respect of Class A shares are currently limited to an annual rate of 0.25% of Class A shares’ average daily net assets. The fees are accrued daily and paid monthly. The Agreement provides that the Retail Distributor will use such payments in their entirety for distribution assistance and promotional activities. Since commencement of the Portfolios’ operations, the Retail Distributor has incurred expenses in excess of the distribution costs reimbursed by each Portfolio as follows:
Portfolio | Class C | |||
California Municipal | $ | 1,336,772 | ||
Diversified Municipal | 3,270,231 | |||
New York Municipal | 2,406,949 | |||
There are no distribution and servicing fees on the Advisor Class and Class Z Shares.
While such costs may be recovered from each Portfolio in future periods so long as the Agreement is in effect, the rate of the distribution and servicing fees payable under the Agreement may not be increased without a shareholder vote. In accordance with the Agreement, there is no provision for recovery of unreimbursed distribution costs incurred by the Retail Distributor beyond the current fiscal year for Class A shares. The Agreement also provides that the Adviser may use its own resources to finance the distribution of each Portfolio’s shares.
132 | AB INTERMEDIATE MUNICIPAL PORTFOLIOS | abfunds.com | |
Table of Contents
NOTES TO FINANCIAL STATEMENTS (continued)
E. Other Transactions with Affiliates
The Retail Distributor has advised the Fund that it has retained front-end sales charges from sales of Class A shares and received contingent deferred sales charges imposed upon redemptions by shareholders of Class A and Class C shares for the six months ended March 31, 2021, as follows:
| Front-End Sales Charges | Contingent Deferred Sales Charges | |||||||||||
| Portfolio | Class A | Class A | Class C | |||||||||
California Municipal | $ | 20 | $ | – 0 | – | $ | – 0 | – | ||||
Diversified Municipal | – 0 | – | 22,604 | 305 | ||||||||
New York Municipal | – 0 | – | 4,815 | 8 | ||||||||
NOTE 3.
Investment Security Transactions
A. Purchases and Sales
Purchases and sales of investment securities (excluding short-term investments) for the six months ended March 31, 2021, were as follows:
| Portfolio | Purchases Excluding U.S. Government Securities | Purchases of U.S. Government Securities | Sales Excluding U.S. Government Securities | Sales of U.S. Government Securities | ||||||||||||
California Municipal | $ | 211,094,148 | $ | – 0 | – | $ | 205,692,439 | $ | – 0 | – | ||||||
Diversified Municipal | 1,020,375,564 | 43,817,771 | 795,570,385 | 115,115,692 | ||||||||||||
New York Municipal | 225,238,948 | 9,760,156 | 229,878,359 | 12,836,832 | ||||||||||||
The cost of investments for federal income tax purposes was substantially the same as the cost for financial reporting purposes. Accordingly, gross unrealized appreciation and unrealized depreciation are as follows:
| Gross Unrealized | Net Unrealized Appreciation (Depreciation) | |||||||||||
Portfolio | Appreciation | (Depreciation) | ||||||||||
California Municipal | $ | 63,379,665 | $ | (4,507,663 | ) | $ | 58,872,002 | |||||
Diversified Municipal | 341,831,671 | (16,965,692 | ) | 324,865,979 | ||||||||
New York Municipal | 82,692,623 | (4,208,459 | ) | 78,484,164 | ||||||||
B. Derivative Financial Instruments
Each Portfolio may use derivatives in an effort to earn income and enhance returns, to replace more traditional direct investments, to obtain exposure to otherwise inaccessible markets (collectively, “investment purposes”), or to hedge or adjust the risk profile of its portfolio.
| abfunds.com | AB INTERMEDIATE MUNICIPAL PORTFOLIOS | 133 | |
Table of Contents
NOTES TO FINANCIAL STATEMENTS (continued)
The principal types of derivatives utilized by the Portfolios, as well as the methods in which they may be used are:
| • | Swaps |
Each Portfolio may enter into swaps to hedge its exposure to interest rates, credit risk, or currencies and for other purposes discussed below. A swap is an agreement that obligates two parties to exchange a series of cash flows at specified intervals based upon or calculated by reference to changes in specified prices or rates for a specified amount of an underlying asset. The payment flows are usually netted against each other, with the difference being paid by one party to the other. In addition, collateral may be pledged or received by the Portfolios in accordance with the terms of the respective swaps to provide value and recourse to the Portfolios or their counterparties in the event of default, bankruptcy or insolvency by one of the parties to the swap.
Risks may arise as a result of the failure of the counterparty to the swap to comply with the terms of the swap. The loss incurred by the failure of a counterparty is generally limited to the net interim payment to be received by the Portfolio, and/or the termination value at the end of the contract. Therefore, the Portfolio considers the creditworthiness of each counterparty to a swap in evaluating potential counterparty risk. This risk is mitigated by having a netting arrangement between the Portfolio and the counterparty and by the posting of collateral by the counterparty to the Portfolio to cover the Portfolios’ exposure to the counterparty. Additionally, risks may arise from unanticipated movements in interest rates or in the value of the underlying securities. The Portfolio accrues for the interim payments on swaps on a daily basis, with the net amount recorded within unrealized appreciation/depreciation of swaps on the statement of assets and liabilities, where applicable. Once the interim payments are settled in cash, the net amount is recorded as realized gain/(loss) on swaps on the statement of operations, in addition to any realized gain/(loss) recorded upon the termination of swaps. Upfront premiums paid or received for OTC swaps are recognized as cost or proceeds on the statement of assets and liabilities and are amortized on a straight line basis over the life of the contract. Amortized upfront premiums are included in net realized gain/(loss) from swaps on the statement of operations. Fluctuations in the value of swaps are recorded as a component of net change in unrealized appreciation/depreciation of swaps on the statement of operations.
Certain standardized swaps, including certain interest rate swaps and credit default swaps, are (or soon will be) subject to mandatory central clearing. Cleared swaps are transacted through futures commission merchants (“FCMs”) that are members of central clearinghouses, with
134 | AB INTERMEDIATE MUNICIPAL PORTFOLIOS | abfunds.com | |
Table of Contents
NOTES TO FINANCIAL STATEMENTS (continued)
the clearinghouse serving as central counterparty, similar to transactions in futures contracts. Centralized clearing will be required for additional categories of swaps on a phased-in basis based on requirements published by the Securities and Exchange Commission and Commodity Futures Trading Commission.
At the time the Portfolios enter into a centrally cleared swap, each Portfolio deposits and maintains as collateral an initial margin with the broker, as required by the clearinghouse on which the transaction is effected. Such amount is shown as cash collateral due from broker on the statement of assets and liabilities. Pursuant to the contract, the Portfolios agree to receive from or pay to the broker an amount of cash equal to the daily fluctuation in the value of the contract. Such receipts or payments are known as variation margin and are recorded by the Portfolios as unrealized gains or losses. Risks may arise from the potential inability of a counterparty to meet the terms of the contract. The credit/counterparty risk for centrally cleared swaps is generally less than non-centrally cleared swaps, since the clearinghouse, which is the issuer or counterparty to each centrally cleared swap, has robust risk mitigation standards, including the requirement to provide initial and variation margin. When the contract is closed, the Portfolios record a realized gain or loss equal to the difference between the value of the contract at the time it was opened and the time it was closed.
Interest Rate Swaps:
Each Portfolio is subject to interest rate risk exposure in the normal course of pursuing its investment objectives. Because the Portfolios hold fixed rate bonds, the value of these bonds may decrease if interest rates rise. To help hedge against this risk and to maintain its ability to generate income at prevailing market rates, the Portfolios may enter into interest rate swaps. Interest rate swaps are agreements between two parties to exchange cash flows based on a notional amount. The Portfolios may elect to pay a fixed rate and receive a floating rate, or, receive a fixed rate and pay a floating rate on a notional amount.
In addition, the Portfolios may also enter into interest rate swap transactions to preserve a return or spread on a particular investment or portion of its portfolio, or protecting against an increase in the price of securities the Portfolios anticipate purchasing at a later date. Interest rate swaps involve the exchange by a Portfolio with another party of their respective commitments to pay or receive interest (e.g., an exchange of floating rate payments for fixed rate payments) computed based on a contractually-based principal (or “notional”) amount. Interest rate swaps are entered into on a net basis (i.e., the two payment streams are netted out, with the Portfolios receiving or paying, as the case may be, only the net amount of the two payments).
| abfunds.com | AB INTERMEDIATE MUNICIPAL PORTFOLIOS | 135 | |
Table of Contents
NOTES TO FINANCIAL STATEMENTS (continued)
During the six months ended March 31, 2021, the Portfolios held interest rate swaps for hedging purposes.
Inflation (CPI) Swaps:
Inflation swap agreements are contracts in which one party agrees to pay the cumulative percentage increase in a price index (the Consumer Price Index with respect to CPI swaps) over the term of the swap (with some lag on the inflation index), and the other pays a compounded fixed rate. Inflation swaps may be used to protect the net asset value, or NAV, of a Portfolio against an unexpected change in the rate of inflation measured by an inflation index since the value of these agreements is expected to increase if there are unexpected inflation increases.
During the six months ended March 31, 2021, the Portfolios held inflation (CPI) swaps for hedging purposes.
Credit Default Swaps:
Each Portfolio may enter into credit default swaps, including to manage its exposure to the market or certain sectors of the market, to reduce its risk exposure to defaults by corporate and sovereign issuers held by the Portfolio, or to create exposure to corporate or sovereign issuers to which it is not otherwise exposed. The Portfolio may purchase credit protection (“Buy Contract”) or provide credit protection (“Sale Contract”) on the referenced obligation of the credit default swap. During the term of the swap, the Portfolio receives/(pays) fixed payments from/(to) the respective counterparty, calculated at the agreed upon rate applied to the notional amount. If the Portfolio is a buyer/(seller) of protection and a credit event occurs, as defined under the terms of the swap, the Portfolio will either (i) receive from the seller/(pay to the buyer) of protection an amount equal to the notional amount of the swap (the “Maximum Payout Amount”) and deliver/(take delivery of) the referenced obligation or (ii) receive/(pay) a net settlement amount in the form of cash or securities equal to the notional amount of the swap less the recovery value of the referenced obligation. In certain circumstances Maximum Payout Amounts may be partially offset by recovery values of the respective referenced obligations, upfront premium received upon entering into the agreement, or net amounts received from settlement of buy protection credit default swaps entered into by the Portfolio for the same referenced obligations with the same counterparty.
Credit default swaps may involve greater risks than if a Portfolio had invested in the referenced obligation directly. Credit default swaps are subject to general market risk, liquidity risk, counterparty risk and credit risk. If the Portfolio is a buyer of protection and no credit event occurs, it will lose the payments it made to its counterparty. If the Portfolio is a seller of protection and a credit event occurs, the value
136 | AB INTERMEDIATE MUNICIPAL PORTFOLIOS | abfunds.com | |
Table of Contents
NOTES TO FINANCIAL STATEMENTS (continued)
of the referenced obligation received by the Portfolio coupled with the periodic payments previously received, may be less than the Maximum Payout Amount it pays to the buyer, resulting in a net loss to the Portfolio.
Implied credit spreads over U.S. Treasuries of comparable maturity utilized in determining the market value of credit default swaps on issuers as of period end are disclosed in the portfolio of investments. The implied spreads serve as an indicator of the current status of the payment/performance risk and typically reflect the market’s assessment of the likelihood of default by the issuer of the referenced obligation. The implied credit spread of a particular reference obligation also reflects the cost of buying/selling protection and may include upfront payments required to be made to enter into the agreement. Widening credit spreads typically represent a deterioration of the referenced obligation’s credit soundness and greater likelihood of default or other credit event occurring as defined under the terms of the agreement. A credit spread identified as “Defaulted” indicates a credit event has occurred for the referenced obligation.
During the six months ended March 31, 2021, the Portfolios held credit default swaps for hedging and non-hedging purposes.
A Portfolio typically enters into International Swaps and Derivatives Association, Inc. Master Agreements (“ISDA Master Agreement”) with its OTC derivative contract counterparties in order to, among other things, reduce its credit risk to OTC counterparties. ISDA Master Agreements include provisions for general obligations, representations, collateral and events of default or termination. Under an ISDA Master Agreement, a Portfolio typically may offset with the OTC counterparty certain derivative financial instruments’ payables and/or receivables with collateral held and/or posted and create one single net payment (close-out netting) in the event of default or termination. In the event of a default by an OTC counterparty, the return of collateral with market value in excess of a Portfolio’s net liability, held by the defaulting party, may be delayed or denied.
A Portfolio’s ISDA Master Agreements may contain provisions for early termination of OTC derivative transactions in the event the net assets of a Portfolio decline below specific levels (“net asset contingent features”). If these levels are triggered, a Portfolio’s OTC counterparty has the right to terminate such transaction and require the Portfolio to pay or receive a settlement amount in connection with the terminated transaction. If OTC derivatives were held at period end, please refer to netting arrangements by the OTC counterparty tables below for additional details.
| abfunds.com | AB INTERMEDIATE MUNICIPAL PORTFOLIOS | 137 | |
Table of Contents
NOTES TO FINANCIAL STATEMENTS (continued)
During the six months ended March 31, 2021, the Portfolios had entered into the following derivatives:
| California Municipal Portfolio | ||||||||||||
Asset Derivatives | Liability Derivatives | |||||||||||
Derivative Type | Statement of | Fair Value | Statement of | Fair Value | ||||||||
Interest rate contracts | Receivable/Payable for variation margin on centrally cleared swaps | $ | 6,273,824 | * | Receivable/Payable for variation margin on centrally cleared swaps | $ | 1,244,346 | * | ||||
Interest rate contracts | Unrealized appreciation on interest rate swaps |
| 64,229 |
| ||||||||
Credit contracts | Market value on credit default swaps | 1,274,193 | ||||||||||
|
|
|
| |||||||||
Total | $ | 6,338,053 | $ | 2,518,539 | ||||||||
|
|
|
| |||||||||
| * | Only variation margin receivable/payable at period end is reported within the statement of assets and liabilities. This amount reflects cumulative unrealized appreciation/(depreciation) on futures and centrally cleared swaps as reported in the schedule of investments. |
Derivative Type | Location of | Realized Gain or (Loss) on Derivatives | Change in Unrealized Appreciation or (Depreciation) | |||||||
Interest rate contracts | Net realized gain (loss) on swaps; Net change in unrealized appreciation/depreciation of swaps | $ | 140,956 | $ | 4,127,250 | |||||
Credit contracts | Net realized gain (loss) on swaps; Net change in unrealized appreciation/depreciation of swaps | 76,915 | 297,727 | |||||||
|
|
|
| |||||||
Total | $ | 217,871 | $ | 4,424,977 | ||||||
|
|
|
| |||||||
138 | AB INTERMEDIATE MUNICIPAL PORTFOLIOS | abfunds.com | |
Table of Contents
NOTES TO FINANCIAL STATEMENTS (continued)
| Diversified Municipal Portfolio | ||||||||||||
Asset Derivatives | Liability Derivatives | |||||||||||
Derivative Type | Statement of Assets and Liabilities Location | Fair Value | Statement of Assets and Liabilities Location | Fair Value | ||||||||
Interest rate contracts | Receivable/Payable for variation margin on centrally cleared swaps | $ | 26,187,719 | * | Receivable/Payable for variation margin on centrally cleared swaps | $ | 2,532,982 | * | ||||
Interest rate contracts | Unrealized appreciation on interest rate swaps |
| 296,193 |
| ||||||||
Credit contracts | Market value on credit default swaps |
| 5,327,097 |
| ||||||||
|
|
|
| |||||||||
Total | $ | 26,483,912 | $ | 7,860,079 | ||||||||
|
|
|
| |||||||||
| * | Only variation margin receivable/payable at period end is reported within the statement of assets and liabilities. This amount reflects cumulative unrealized appreciation/(depreciation) on futures and centrally cleared swaps as reported in the schedule of investments. |
Derivative Type | Location of of Operations | Realized Gain or (Loss) on Derivatives | Change in Unrealized Appreciation or (Depreciation) | |||||||
Interest rate contracts | Net realized gain (loss) on swaps; Net change in unrealized appreciation/depreciation of swaps | $ | 5,634,716 | $ | 12,838,723 | |||||
Credit contracts | Net realized gain (loss) on swaps; Net change in unrealized appreciation/depreciation of swaps | 321,210 | 1,245,075 | |||||||
|
|
|
| |||||||
Total | $ | 5,955,926 | $ | 14,083,798 | ||||||
|
|
|
| |||||||
| abfunds.com | AB INTERMEDIATE MUNICIPAL PORTFOLIOS | 139 | |
Table of Contents
NOTES TO FINANCIAL STATEMENTS (continued)
| New York Municipal Portfolio | ||||||||||||
Asset Derivatives | Liability Derivatives | |||||||||||
Derivative Type | Statement of | Fair Value | Statement of | Fair Value | ||||||||
Interest rate contracts | Receivable/Payable for variation margin on centrally cleared swaps | $ | 6,902,050 | * | Receivable/Payable for variation margin on centrally cleared swaps | $ | 970,730 | * | ||||
Interest rate contracts | Unrealized appreciation on interest rate swaps |
| 87,987 |
| ||||||||
Credit contracts | Market value on credit default swaps | 1,779,292 | ||||||||||
|
|
|
| |||||||||
Total | $ | 6,990,037 | $ | 2,750,022 | ||||||||
|
|
|
| |||||||||
| * | Only variation margin receivable/payable at period end is reported within the statement of assets and liabilities. This amount reflects cumulative unrealized appreciation/(depreciation) on futures and centrally cleared swaps as reported in the schedule of investments. |
Derivative Type | Location of | Realized Gain or (Loss) on Derivatives | Change in Unrealized Appreciation or (Depreciation) | |||||||
Interest rate contracts | Net realized gain (loss) on swaps; Net change in unrealized appreciation/depreciation of swaps | $ | 2,237,734 | $ | 2,200,314 | |||||
Credit contracts | Net realized gain (loss) on swaps; Net change in unrealized appreciation/depreciation of swaps | 107,287 | 415,865 | |||||||
|
|
|
| |||||||
Total | $ | 2,345,021 | $ | 2,616,179 | ||||||
|
|
|
| |||||||
140 | AB INTERMEDIATE MUNICIPAL PORTFOLIOS | abfunds.com | |
Table of Contents
NOTES TO FINANCIAL STATEMENTS (continued)
| California Municipal Portfolio | ||||
Interest Rate Swaps: | ||||
Average notional amount | $ | 24,790,000 | ||
Inflation Swaps: | ||||
Average notional amount | $ | 52,272,000 | (a) | |
Centrally Cleared Interest Rate Swaps: | ||||
Average notional amount | $ | 52,418,571 | ||
Centrally Cleared Inflation Swaps: | ||||
Average notional amount | $ | 54,584,286 | ||
Credit Default Swaps: | ||||
Average notional amount of sale contracts | $ | 4,730,000 | ||
| (a) | Positions were open for less than one month during the period. |
| Diversified Municipal Portfolio | ||||
Interest Rate Swaps: | ||||
Average notional amount | $ | 114,320,000 | ||
Inflation Swaps: | ||||
Average notional amount | $ | 267,138,000 | (a) | |
Centrally Cleared Interest Rate Swaps: | ||||
Average notional amount | $ | 163,224,286 | ||
Centrally Cleared Inflation Swaps: | ||||
Average notional amount | $ | 244,391,429 | ||
Credit Default Swaps: | ||||
Average notional amount of sale contracts | $ | 19,775,000 | ||
| (a) | Positions were open for less than one month during the period. |
| New York Municipal Portfolio | ||||
Interest Rate Swaps: | ||||
Average notional amount | $ | 33,960,000 | ||
Inflation Swaps: | ||||
Average notional amount | $ | 55,634,000 | (a) | |
Centrally Cleared Interest Rate Swaps: | ||||
Average notional amount | $ | 43,128,571 | ||
Centrally Cleared Inflation Swaps: | ||||
Average notional amount | $ | 70,475,714 | ||
Credit Default Swaps: | ||||
Average notional amount of sale contracts | $ | 6,605,000 | ||
| (a) | Positions were open for less than one month during the period. |
For financial reporting purposes, the Portfolios do not offset derivative assets and derivative liabilities that are subject to netting arrangements in the statement of assets and liabilities.
All OTC derivatives held at period end were subject to netting arrangements. The following tables present the Portfolios’ derivative assets and liabilities by OTC counterparty net of amounts available for offset under ISDA Master Agreements (“MA”) and net of the related collateral received/pledged by the Portfolios as of March 31, 2021. Exchange-traded
| abfunds.com | AB INTERMEDIATE MUNICIPAL PORTFOLIOS | 141 | |
Table of Contents
NOTES TO FINANCIAL STATEMENTS (continued)
derivatives and centrally cleared swaps are not subject to netting arrangements and as such are excluded from the tables.
| California Municipal Portfolio | ||||||||||||||||||||
Counterparty | Derivative Assets Subject to a MA | Derivatives Available for Offset | Cash Collateral Received* | Security Collateral Received* | Net Amount of Derivative Assets | |||||||||||||||
Citibank, NA/Citigroup Global Markets, Inc. | $ | 64,229 | $ | (64,229 | ) | $ | – 0 | – | $ | – 0 | – | $ | – 0 | – | ||||||
|
|
|
|
|
|
|
|
|
| |||||||||||
Total | $ | 64,229 | $ | (64,229 | ) | $ | – 0 | – | $ | – 0 | – | $ | 0 | ^ | ||||||
|
|
|
|
|
|
|
|
|
| |||||||||||
Counterparty | Derivative Liabilities Subject to a MA | Derivatives Available for Offset | Cash Collateral Pledged* | Security Collateral Pledged* | Net Amount of Derivative Liabilities | |||||||||||||||
Citibank, NA/Citigroup Global Markets, Inc. | $ | 409,489 | $ | (64,229 | ) | $ | (345,260 | ) | $ | – 0 | – | $ | – 0 | – | ||||||
Credit Suisse International | 574,830 | – 0 | – | (574,830 | ) | – 0 | – | – 0 | – | |||||||||||
Goldman Sachs International | 289,874 | – 0 | – | – 0 | – | (289,874 | ) | – 0 | – | |||||||||||
|
|
|
|
|
|
|
|
|
| |||||||||||
Total | $ | 1,274,193 | $ | (64,229 | ) | $ | (920,090 | ) | $ | (289,874 | ) | $ | 0 | ^ | ||||||
|
|
|
|
|
|
|
|
|
| |||||||||||
| * | The actual collateral received/pledged may be more than the amount reported due to over-collateralization. |
| ^ | Net amount represents the net receivable/payable that would be due from/to the counterparty in the event of default or termination. The net amount from OTC financial derivative instruments can only be netted across transactions governed under the same master agreement with the same counterparty. |
| Diversified Municipal Portfolio | ||||||||||||||||||||
Counterparty | Derivative Assets Subject to a MA | Derivatives Available for Offset | Cash Collateral Received* | Security Collateral Received* | Net Amount of Derivative Assets | |||||||||||||||
Citibank, NA/Citigroup Global Markets, Inc. | $ | 296,193 | $ | (296,193 | ) | $ | – 0 | – | $ | – 0 | – | $ | – 0 | – | ||||||
|
|
|
|
|
|
|
|
|
| |||||||||||
Total | $ | 296,193 | $ | (296,193 | ) | $ | – 0 | – | $ | – 0 | – | $ | 0 | ^ | ||||||
|
|
|
|
|
|
|
|
|
| |||||||||||
142 | AB INTERMEDIATE MUNICIPAL PORTFOLIOS | abfunds.com | |
Table of Contents
NOTES TO FINANCIAL STATEMENTS (continued)
| Diversified Municipal Portfolio | ||||||||||||||||||||
Counterparty | Derivative Liabilities Subject to a MA | Derivatives Available for Offset | Cash Collateral Pledged* | Security Collateral Pledged* | Net Amount of Derivative Liabilities | |||||||||||||||
Citibank, NA/Citigroup Global Markets, Inc. | $ | 587,831 | $ | (296,193 | ) | $ | (291,638 | ) | $ | – 0 | – | $ | – 0 | – | ||||||
Credit Suisse International | 3,352,664 | – 0 | – | (280,000 | ) | (2,996,122 | ) | 76,542 | ||||||||||||
Goldman Sachs International | 1,386,602 | – 0 | – | – 0 | – | (1,268,767 | ) | 117,835 | ||||||||||||
|
|
|
|
|
|
|
|
|
| |||||||||||
Total | $ | 5,327,097 | $ | (296,193 | ) | $ | (571,638 | ) | $ | (4,264,889 | ) | $ | 194,377 | ^ | ||||||
|
|
|
|
|
|
|
|
|
| |||||||||||
| * | The actual collateral received/pledged may be more than the amount reported due to over-collateralization. |
| ^ | Net amount represents the net receivable/payable that would be due from/to the counterparty in the event of default or termination. The net amount from OTC financial derivative instruments can only be netted across transactions governed under the same master agreement with the same counterparty. |
| New York Municipal Portfolio | ||||||||||||||||||||
Counterparty | Derivative Assets Subject to a MA | Derivatives Available for Offset | Cash Collateral Received* | Security Collateral Received* | Net Amount of Derivative Assets | |||||||||||||||
Citibank, NA/ Citigroup Global Markets, Inc. | $ | 87,987 | $ | (87,987 | ) | $ | – 0 | – | $ | – 0 | – | $ | – 0 | – | ||||||
|
|
|
|
|
|
|
|
|
| |||||||||||
Total | $ | 87,987 | $ | (87,987 | ) | $ | – 0 | – | $ | – 0 | – | $ | 0 | ^ | ||||||
|
|
|
|
|
|
|
|
|
| |||||||||||
Counterparty | Derivative Liabilities Subject to a MA | Derivatives Available for Offset | Cash Collateral Pledged* | Security Collateral Pledged* | Net Amount of Derivative Liabilities | |||||||||||||||
Citibank, NA/ Citigroup Global Markets, Inc. | $ | 196,393 | $ | (87,987 | ) | $ | – 0 | – | $ | (108,406 | ) | $ | – 0 | – | ||||||
Credit Suisse International | 1,119,801 | – 0 | – | (715,200 | ) | (287,529 | ) | 117,072 | ||||||||||||
Goldman Sachs International | 463,098 | – 0 | – | – 0 | – | (463,098 | ) | – 0 | – | |||||||||||
|
|
|
|
|
|
|
|
|
| |||||||||||
Total | $ | 1,779,292 | $ | (87,987 | ) | $ | (715,200 | ) | $ | (859,033 | ) | $ | 117,072 | ^ | ||||||
|
|
|
|
|
|
|
|
|
| |||||||||||
| * | The actual collateral received/pledged may be more than the amount reported due to over-collateralization. |
| ^ | Net amount represents the net receivable/payable that would be due from/to the counterparty in the event of default or termination. The net amount from OTC financial derivative instruments can only be netted across transactions governed under the same master agreement with the same counterparty. |
| abfunds.com | AB INTERMEDIATE MUNICIPAL PORTFOLIOS | 143 | |
Table of Contents
NOTES TO FINANCIAL STATEMENTS (continued)
NOTE 4.
Distributions to Shareholders
The tax character of distributions to be paid for the year ending September 30, 2021 will be determined at the end of the current fiscal year. The tax character of distributions paid during the fiscal years ended September 30, 2020 and September 30, 2019 were as follows:
Portfolio | 2020 | 2019 | ||||||
California Municipal | ||||||||
Distributions paid from: | ||||||||
Ordinary income | $ | 1,183,018 | $ | 744,579 | ||||
Long-term capital gains | – 0 | – | – 0 | – | ||||
|
|
|
| |||||
Total taxable distributions paid | 1,183,018 | 744,579 | ||||||
Tax exempt distributions | 25,653,328 | 27,139,800 | ||||||
|
|
|
| |||||
Total distributions paid | $ | 26,836,346 | $ | 27,884,379 | ||||
|
|
|
| |||||
Diversified Municipal | ||||||||
Distributions paid from: | ||||||||
Ordinary income | $ | 5,117,332 | $ | 3,960,366 | ||||
Long-term capital gains | – 0 | – | – 0 | – | ||||
|
|
|
| |||||
Total taxable distributions paid | 5,117,332 | 3,960,366 | ||||||
Tax exempt distributions | 135,050,172 | 153,350,600 | ||||||
|
|
|
| |||||
Total distributions paid | $ | 140,167,504 | $ | 157,310,966 | ||||
|
|
|
| |||||
New York Municipal | ||||||||
Distributions paid from: | ||||||||
Ordinary income | $ | 1,513,510 | $ | 709,436 | ||||
Long-term capital gains | – 0 | – | – 0 | – | ||||
|
|
|
| |||||
Total taxable distributions paid | 1,513,510 | 709,436 | ||||||
Tax exempt distributions | 37,764,855 | 39,997,204 | ||||||
|
|
|
| |||||
Total distributions paid | $ | 39,278,365 | $ | 40,706,640 | ||||
|
|
|
| |||||
As of September 30, 2020, the components of accumulated earnings/(deficit) on a tax basis were as follows:
| Portfolio | Undistributed Income | Accumulated Capital Losses(a) | Unrealized Appreciation (Depreciation)(b) | Total Accumulated Earnings/ (Deficit)(c) | ||||||||||||
California Municipal | $ | – 0 | – | $ | (18,403,235 | ) | $ | 60,264,415 | $ | 41,861,180 | ||||||
Diversified Municipal | – 0 | – | (48,678,056 | ) | 298,073,206 | 249,395,150 | ||||||||||
New York Municipal | – 0 | – | (21,374,943 | ) | 55,196,012 | 33,821,069 | ||||||||||
| (a) | As of September 30, 2020, certain Portfolios had capital loss carryforwards for federal income tax purposes. During the fiscal year ended September 30, 2020, Diversified Municipal Portfolio utilized capital loss carryforwards of $5,624,338 to offset current year net realized gains. As of September 30, 2020, California Municipal, Diversified Municipal, and New York Municipal deferred $566,565, $1,252,408, and $463,594 respectively, in late year losses. |
144 | AB INTERMEDIATE MUNICIPAL PORTFOLIOS | abfunds.com | |
Table of Contents
NOTES TO FINANCIAL STATEMENTS (continued)
| (b) | The differences between book-basis and tax-basis unrealized appreciation/(depreciation) are attributable primarily to the tax deferral of losses on wash sales, and the tax treatment of swaps. |
| (c) | The differences between book-basis and tax-basis components of accumulated earnings/(deficit) are attributable primarily to the tax treatment of dividends payable to shareholders. |
For tax purposes, net capital losses may be carried over to offset future capital gains, if any. Funds are permitted to carry forward capital losses for an indefinite period, and such losses will retain their character as either short-term or long-term capital losses.
As of September 30, 2020, the following Portfolios had net capital loss carryforwards which will expire as follows:
| Portfolio | Short-Term Amount | Long-Term Amount | ||||||
California Municipal | $ | 6,369,214 | $ | 11,467,456 | ||||
Diversified Municipal | 34,406,093 | 13,019,555 | ||||||
New York Municipal | 7,767,954 | 13,143,395 | ||||||
NOTE 5.
Risks Involved in Investing in the Portfolios
Interest Rate Risk—Changes in interest rates will affect the value of the Portfolios’ investments in fixed-income securities. When interest rates rise, the value of the Portfolios’ existing investments in fixed-income securities tends to fall and this decrease in value may not be offset by higher income from new investments. Interest rate risk is generally greater for fixed-income securities with longer maturities or durations. The current historically low interest rate environment heightens the risks associated with rising interest rates.
Credit Risk—This is the risk that the issuer or the guarantor of a debt security, or the counterparty to a derivatives or other contract, will be unable or unwilling to make timely principal and/or interest payments, or to otherwise honor its obligations. The issuer or guarantor may default, potentially causing a loss of the full principal amount of a security and accrued interest. The degree of risk for a particular security may be reflected in its credit rating. The credit rating of a fixed-income security may be downgraded after purchase, which may adversely affect the value of the security. Investments in fixed-income securities with lower ratings tend to have a higher probability that an issuer will default or fail to meet its payment obligations, making credit risk greater for medium-quality and lower-rated debt securities. Lower-rated debt securities and similar unrated securities (commonly known as “junk bonds”) have speculative elements or are predominantly speculative credit risks. At times when credit risk is perceived to be greater, credit “spreads” (i.e., the difference between the yields on lower quality securities and the yields on higher quality securities) may get larger
| abfunds.com | AB INTERMEDIATE MUNICIPAL PORTFOLIOS | 145 | |
Table of Contents
NOTES TO FINANCIAL STATEMENTS (continued)
or “widen”. As a result, the values of the lower quality securities may go down more and they may become harder to sell.
Duration Risk—The duration of a fixed-income security may be shorter than or equal to full maturity of the fixed-income security. Fixed-income securities with longer durations have more interest rate risk and will decrease in price as interest rates rise. Securities that have final maturities longer than their durations may be affected by increased credit spreads to a far greater degree than their durations would suggest, because they are exposed to credit risk until final maturity.
Municipal Market Risk—This is the risk that special factors may adversely affect the value of the municipal securities and have a significant effect on the yield or value of the Portfolios’ investments in municipal securities. These factors include economic conditions, political or legislative changes, public health crises, uncertainties related to the tax status of municipal securities, or the rights of investors in these securities. To the extent that the Portfolios invests more of its assets in a particular state’s municipal securities, the Portfolios may be vulnerable to events adversely affecting that state, including economic, political and regulatory occurrences, court decisions, terrorism, public health crises (including the occurrence of a contagious disease or illness) and catastrophic natural disasters, such as hurricanes, fires or earthquakes. For example, the novel coronavirus (COVID-19) pandemic has significantly stressed the financial resources of many issuers of municipal securities, which could impair any such issuer’s ability to meet its financial obligations when due and adversely impact the value of its securities held by the Fund. As the full effects of the COVID-19 pandemic on state and local economies and on issuers of municipal securities are still uncertain, the financial difficulties of issuers of municipal securities may continue or worsen, adversely affecting the performance of the Portfolios. The Portfolio’s investment in certain municipal securities with principal and interest payments that are made from the revenues of a specific project or facility, and not general tax revenues, may have increased risks. Factors affecting the project or facility, such as local business or economic conditions, could have a significant effect on the project’s ability to make payments of principal and interest on these securities.
In addition, tax law changes enacted as part of the Tax Cuts and Jobs Act of 2017 could have a material impact on the value of municipal securities. Because advance refunding bonds issued after December 31, 2017 are no longer tax exempt, the total supply of municipal bonds could decrease going forward. In addition, the reduction of the U.S. corporate income tax rate to 21% could make municipal obligations less attractive to certain institutional investors such as banks and property and casualty insurance
146 | AB INTERMEDIATE MUNICIPAL PORTFOLIOS | abfunds.com | |
Table of Contents
NOTES TO FINANCIAL STATEMENTS (continued)
companies, resulting in lower demand for municipal obligations. Changes in tax rates or the treatment of income from certain types of municipal securities, among other things, could negatively affect the municipal securities markets.
The Portfolios may invest in municipal securities of issuers in Puerto Rico or other U.S. territories and their governmental agencies and municipalities, which are exempt from federal, state, and, where applicable, local income taxes. These municipal securities may have more risks than those of other U.S. issuers of municipal securities. Like many U.S. states and municipalities, Puerto Rico experienced a significant downturn in the 2007-2009 recession. Puerto Rico’s downturn was particularly severe. In addition, Hurricane Maria caused significant damage to Puerto Rico. Hurricane Maria and severe weather events that may occur in the future could have significant and long-lasting impacts on Puerto Rico’s economy. Puerto Rico continues to face a very challenging economic and fiscal environment, worsened by the spread of COVID-19 and the adverse effect that related governmental and public responses have had on Puerto Rico’s economy. If the general economic situation in Puerto Rico continues to persist or worsens, the volatility and credit quality of Puerto Rican municipal securities could continue to be adversely affected, and the market for such securities may deteriorate further.
Inflation Risk—This is the risk that the value of assets or income from investments will be less in the future as inflation decreases the value of money. As inflation increases, the value of the Portfolios’ assets can decline as can the value of the Portfolios’ distributions. This risk is significantly greater for fixed-income securities with longer maturities.
Non-diversification Risk—Concentration of investments in a small number of securities tends to increase risk. The California Municipal and New York Municipal Portfolios are not “diversified”. This means the Portfolios can invest more of their assets in a relatively small number of issuers with greater concentration of risk. Matters affecting these issuers can have a more significant effect on the Portfolios’ net asset value.
Illiquid Investment Risk—Illiquid investments risk exists when particular investments are difficult to purchase or sell, possibly preventing the Portfolios from purchasing or selling these securities at an advantageous price. The municipal Portfolios are subject to greater risk because the market for municipal securities is generally smaller than many other markets, which may make municipal securities more difficult to trade or dispose of than other types of securities. Illiquid securities may also be difficult to value.
| abfunds.com | AB INTERMEDIATE MUNICIPAL PORTFOLIOS | 147 | |
Table of Contents
NOTES TO FINANCIAL STATEMENTS (continued)
Redemption Risk—The Portfolios may experience heavy redemptions that could cause a Portfolio to liquidate its assets at inopportune times or unfavorable prices or increase or accelerate taxable gains or transaction costs and may negatively affect the Portfolio’s net asset value, or performance, which could cause the value of your investment to decline. Redemption risk is heightened during periods of overall market turmoil.
Derivatives Risk—The Portfolios may use derivatives as direct investments to earn income, enhance return and broaden portfolio diversification, which entail greater risk than if used solely for hedging purposes. In addition to other risks such as the credit risk of the counterparty, derivatives involve the risk that changes in the value of the derivative may not correlate with relevant assets, rates or indices. Derivatives may be difficult to price or unwind, and small changes may produce disproportionate losses for the Portfolios. Certain derivatives have the potential for unlimited loss, regardless of the size of the initial investment. Assets required to be set aside or posted to cover or secure derivatives positions may themselves go down in value, and these collateral and other requirements may limit investment flexibility. Some derivatives involve leverage, which can make the Portfolios more volatile and can compound other risks. Derivatives, especially over-the-counter derivatives, are also subject to counterparty risk. Use of derivatives may have different tax consequences for the Portfolios than an investment in the underlying asset or index, and such differences may affect the amount, timing and character of income distributed to shareholders, including the proportion of income consisting of exempt-interest dividends. The U.S. government and certain foreign governments have adopted regulations governing derivatives markets, including mandatory clearing of certain derivatives and may impose additional regulations governing margin, reporting and registration requirements. The ultimate impact of the regulations remains unclear. Additional regulation may make derivatives more costly, limit their availability or utility, otherwise adversely affect their performance, or disrupt markets.
Management Risk—The Portfolios are subject to management risk because they are actively managed investment portfolios. The Adviser will apply its investment techniques and risk analyses in making investment decisions for the Portfolios, but these techniques, analyses and decisions may not work as intended or may not produce the desired results, and may, during certain periods, result in increased volatility for the Portfolios or cause the value of the Portfolios’ shares to go down. In some cases, derivatives and other investment techniques may be unavailable, or the Adviser may determine not to use them, possibly even under market conditions where their use could benefit the Portfolios. Some of these techniques may incorporate, or rely upon, quantitative models, but there is no
148 | AB INTERMEDIATE MUNICIPAL PORTFOLIOS | abfunds.com | |
Table of Contents
NOTES TO FINANCIAL STATEMENTS (continued)
guarantee that these models will generate accurate forecasts, reduce risk or otherwise perform as expected. In addition, the Adviser may change the Portfolios’ investment strategies or policies from time to time. Those changes may not lead to the results intended by the Adviser and could have an adverse effect on the value or performance of the Portfolios.
Market Risk—The Portfolios are subject to market risk, which is the risk that stock prices in general or in particular countries or sectors may decline over short or extended periods. Stock prices may decline in response to adverse changes in the economy or the economic outlook; deterioration in investor sentiment; interest rate, currency and commodity price fluctuations; adverse geopolitical, social or environmental developments; issuer- and sector-specific considerations; public health crises (including the occurrence of a contagious disease or illness); and other factors. In the past decade, financial markets in the United States, Europe and elsewhere have experienced increased volatility, decreased liquidity and heightened uncertainty. These market conditions may recur from time to time and have an adverse impact on various securities markets. Recently, certain governments and central banks have provided significant support to financial markets in response to serious economic disruptions, including, but not limited to, buying stocks, providing direct capital infusions into companies, implementing new monetary programs, dramatically lowering interest rates and through other market interventions. This and other government intervention into the economy and financial markets may not work as intended, particularly if the efforts are perceived by investors as being unlikely to achieve the desired results. Government actions to support the economy and financial markets have resulted in a large expansion of government deficits and debt, the long term consequences of which are not known. The reversal of these policies, or their ineffectiveness, as well as further governmental or central bank actions could negatively affect financial markets generally, increase market volatility and reduce the value and liquidity of securities in which the Portfolio invests.
On January 31, 2020, the United Kingdom (the “U.K.”) formally left the European Union (the “EU”) (“Brexit”) and ceased to be a member of the EU. Brexit could adversely affect European or worldwide political, regulatory, economic or market conditions and could contribute to instability in global political institutions, regulatory agencies and financial markets. Brexit could also lead to legal uncertainty and politically divergent national laws and regulations as a new relationship between the U.K. and EU is developed and the U.K. determines which EU laws to replace or replicate in the future. Any of these effects of Brexit, and others the Adviser cannot anticipate, could adversely affect the value of the Portfolio’s investments and its net asset value. The political, economic and legal consequences of
| abfunds.com | AB INTERMEDIATE MUNICIPAL PORTFOLIOS | 149 | |
Table of Contents
NOTES TO FINANCIAL STATEMENTS (continued)
Brexit continue to give rise to uncertainties. The U.K. may be less stable than it has been in recent years and investments in U.K. assets may be difficult to value, or subject to greater or more frequent rises and falls in value.
The United States and its trading partners are periodically involved in disputes over trade, which may result in tariffs on various categories of goods imported from the other country. For example, the current political climate between the United States and China has intensified concerns about protectionist trade policies and a potential trade war between China and the United States. The United States has imposed tariffs and other trade barriers on Chinese exports and placed other restrictions on or barriers to investments in China. Trade disputes, particularly prolonged disputes, may adversely affect the economies of the United States and its trading partners, as well as the companies directly or indirectly affected by the dispute and financial markets generally, and thus may adversely affect the value of the Portfolio’s assets. Recently, the United States government acted to prohibit U.S. persons, such as the Portfolio, from owning, and required them to divest, certain Chinese companies designated as related to the Chinese military. There is no assurance that more such companies will not be so designated in the future, which could limit the Portfolio’s opportunities for investment and require the sale of securities at a loss or make them illiquid. If the political climate between the United States and China continues to deteriorate, economies and markets may be adversely affected.
Policy and legislative changes in the United States and in other countries are affecting many aspects of financial regulation, and may in some instances contribute to decreased liquidity and increased volatility in the financial markets. The impact of these changes, and the practical implications for market participants, may not be fully known for some time.
Economies and financial markets throughout the world are becoming increasingly interconnected. Economic, financial or political events, trading and tariff arrangements, terrorism, natural disasters (including the spread of infectious illness) and other circumstances in one country or region could have profound impacts on global economies or markets. As a result, whether or not the Portfolio invests in securities of issuers located in or with significant exposure to countries experiencing economic and financial difficulties, the value and liquidity of the Portfolio’s investments may be negatively affected.
Tax Risk—There is no guarantee that the income on a Portfolio’s municipal securities will be exempt from regular federal income, and if applicable, state income taxes. Unfavorable legislation, adverse interpretations by
150 | AB INTERMEDIATE MUNICIPAL PORTFOLIOS | abfunds.com | |
Table of Contents
NOTES TO FINANCIAL STATEMENTS (continued)
federal or state authorities, litigation or noncompliant conduct by the issuer of a municipal security could affect the tax-exempt status of municipal securities. If the Internal Revenue Service or a state authority determines that an issuer of a municipal security has not complied with applicable requirements, interest from the security could become subject to regular federal income tax and/or state personal income tax, possibly retroactively to the date the security was issued, the value of the security could decline significantly, and a portion of the distributions to Portfolios’ shareholders could be recharacterized as taxable. The U.S. Congress has considered changes to U.S. federal tax law that would, if enacted, have a negative impact on certain types of municipal securities, such as private activity bonds, or would otherwise make investments in municipal bonds less attractive.
Lower-rated Securities Risk—Lower-rated securities, or junk bonds/high-yield securities, are subject to greater risk of loss of principal and interest and greater market risk than higher-rated securities. The capacity of issuers of lower-rated securities to pay interest and repay principal is more likely to weaken than is that of issuers of higher-rated securities in times of deteriorating economic conditions or rising interest rates.
Prepayment and Extension Risk—Prepayment risk is the risk that a loan, bond or other security might be called or otherwise converted, prepaid or redeemed before maturity. If this happens, particularly during a time of declining interest rates or credit spreads, the Portfolios will not benefit from the rise in market price that normally accompanies a decline in interest rates, and may not be able to invest the proceeds in securities providing as much income, resulting in a lower yield to the Portfolios. Conversely, extension risk is the risk that as interest rates rise or spreads widen, payments of securities may occur more slowly than anticipated by the market. If this happens, the values of these securities may go down because their interest rates are lower than current market rates and they remain outstanding longer than anticipated.
LIBOR Transition and Associated Risk—The Portfolios may invest in debt securities, derivatives or other financial instruments that utilize the London Interbank Offered Rate, or “LIBOR,” as a “benchmark” or “reference rate” for various interest rate calculations. The United Kingdom Financial Conduct Authority, which regulates LIBOR, will cease publishing certain LIBOR benchmarks at the end of 2021. Although certain LIBOR rates are intended to be published until June 2023, banks are strongly encouraged to cease entering into agreements with counterparties referencing LIBOR by the end of 2021. Although financial regulators and industry working groups have suggested alternative reference rates, such as the European Interbank Offer Rate, the Sterling Overnight Interbank
| abfunds.com | AB INTERMEDIATE MUNICIPAL PORTFOLIOS | 151 | |
Table of Contents
NOTES TO FINANCIAL STATEMENTS (continued)
Average Rate and the Secured Overnight Financing Rate, global consensus on alternative rates is lacking and the process for amending existing contracts or instruments to transition away from LIBOR is underway but remains incomplete. The elimination of LIBOR or changes to other reference rates or any other changes or reforms to the determination or supervision of reference rates could have an adverse impact on the market for, or value of, any securities or payments linked to those reference rates, which may adversely affect the Portfolios’ performance and/or net asset value. Uncertainty and risk also remain regarding the willingness and ability of issuers and lenders to include revised provisions in new and existing contracts or instruments. Consequently, the transition away from LIBOR to other reference rates may lead to increased volatility and illiquidity in markets that are tied to LIBOR, fluctuations in values of LIBOR-related investments or investments in issuers that utilize LIBOR, increased difficulty in borrowing or refinancing and diminished effectiveness of hedging strategies, potentially adversely affecting the Portfolios’ performance. Furthermore, the risks associated with the expected discontinuation of LIBOR and transition may be exacerbated if the work necessary to effect an orderly transition to an alternative reference rate is not completed in a timely manner. Because the usefulness of LIBOR as a benchmark could deteriorate during the transition period, these effects could occur prior to the end of 2021.
Cybersecurity Risk—Cybersecurity incidents, both intentional and unintentional, may allow an unauthorized party to gain access to Portfolio assets, customer data (including private shareholder information), or proprietary information, or cause the Portfolios, the Adviser, and/or its service providers (including, but not limited to, fund accountants, custodians, sub-custodians, transfer agents and financial intermediaries) to suffer data breaches, data corruption or lose operational functionality, or prevent Portfolio investors from purchasing, redeeming or exchanging shares or receiving distributions. A Portfolio and the Adviser have limited ability to prevent or mitigate cybersecurity incidents affecting third-party service providers. Cybersecurity incidents may result in financial losses to such Portfolio and its shareholders, and substantial costs may be incurred in order to prevent any future cybersecurity incidents.
Indemnification Risk—In the ordinary course of business, the Portfolios enter into contracts that contain a variety of indemnifications. The Portfolios’ maximum exposure under these arrangements is unknown. However, the Portfolios have not had prior claims or losses pursuant to these indemnification provisions and expect the risk of loss thereunder to be remote. Therefore, the Portfolios have not accrued any liability in connection with these indemnification provisions.
152 | AB INTERMEDIATE MUNICIPAL PORTFOLIOS | abfunds.com | |
Table of Contents
NOTES TO FINANCIAL STATEMENTS (continued)
NOTE 6.
Capital-Share Transactions
The Fund has authorized 17.5 billion shares of common stock, par value $0.001 per share, of which of which 6.5 billion shares are allocated to the California Municipal Portfolio, Diversified Municipal Portfolio and New York Municipal Portfolio. The allocation is as follows:
| Allocation of Shares (in Millions) | ||||||||||||||||||||||||||||||||
Portfolio | Bernstein Class Shares | Retail Class A Shares | Retail Class B Shares | Retail Class C Shares | Retail Advisor Class Shares | Retail Class Z Shares | Retail Class T Shares | Total | ||||||||||||||||||||||||
California Municipal | 200 | 200 | 200 | 200 | 200 | 200 | 300 | 1,500 | ||||||||||||||||||||||||
Diversified Municipal | 800 | 400 | 400 | 400 | 400 | 600 | 300 | 3,300 | ||||||||||||||||||||||||
New York Municipal | 400 | 200 | 200 | 200 | 200 | 200 | 300 | 1,700 | ||||||||||||||||||||||||
Share transactions for each Portfolio for the six months ended March 31, 2021 and the year ended September 30, 2020, were as follows:
| California Municipal Portfolio | ||||||||||||||||||||||||
| Shares | Amount | |||||||||||||||||||||||
| Six Months Ended 3/31/21 (unaudited) | Year Ended 9/30/20 | Six Months Ended 3/31/21 (unaudited) | Year Ended 9/30/20 | |||||||||||||||||||||
|
| |||||||||||||||||||||||
| Municipal Class Shares | ||||||||||||||||||||||||
Shares sold | 11,708,246 | 18,304,334 | $ | 171,466,493 | $ | 262,591,109 | ||||||||||||||||||
| ||||||||||||||||||||||||
Shares issued to shareholders on reinvestment of dividends | 582,578 | 1,319,973 | 8,514,562 | 18,912,474 | ||||||||||||||||||||
| ||||||||||||||||||||||||
Shares redeemed | (11,420,858 | ) | (17,939,347 | ) | (166,775,243 | ) | (257,212,852 | ) | ||||||||||||||||
| ||||||||||||||||||||||||
Net increase | 869,966 | 1,684,960 | $ | 13,205,812 | $ | 24,290,731 | ||||||||||||||||||
| ||||||||||||||||||||||||
| Class A Shares |
| |||||||||||||||||||||||
Shares sold | 711,540 | 1,531,470 | $ | 10,406,547 | $ | 21,731,549 | ||||||||||||||||||
| ||||||||||||||||||||||||
Shares issued to shareholders on reinvestment of dividends | 30,192 | 67,572 | 441,251 | 967,916 | ||||||||||||||||||||
| ||||||||||||||||||||||||
Shares converted from Class C | 38,840 | 196,520 | 563,574 | 2,841,205 | ||||||||||||||||||||
| ||||||||||||||||||||||||
Shares redeemed | (580,397 | ) | (1,240,749 | ) | (8,500,863 | ) | (17,837,021 | ) | ||||||||||||||||
| ||||||||||||||||||||||||
Net increase | 200,175 | 554,813 | $ | 2,910,509 | $ | 7,703,649 | ||||||||||||||||||
| ||||||||||||||||||||||||
| abfunds.com | AB INTERMEDIATE MUNICIPAL PORTFOLIOS | 153 | |
Table of Contents
NOTES TO FINANCIAL STATEMENTS (continued)
| California Municipal Portfolio | ||||||||||||||||||||||||
| Shares | Amount | |||||||||||||||||||||||
| Six Months Ended 3/31/21 (unaudited) | Year Ended 9/30/20 | Six Months Ended 3/31/21 (unaudited) | Year Ended 9/30/20 | |||||||||||||||||||||
|
| |||||||||||||||||||||||
| Class C Shares |
| |||||||||||||||||||||||
Shares sold | 95,698 | 58,513 | $ | 1,397,214 | $ | 830,225 | ||||||||||||||||||
| ||||||||||||||||||||||||
Shares issued to shareholders on reinvestment of dividends | 1,230 | 4,847 | 17,969 | 69,332 | ||||||||||||||||||||
| ||||||||||||||||||||||||
Shares converted to Class A | (38,840 | ) | (196,607 | ) | (563,574 | ) | (2,841,205 | ) | ||||||||||||||||
| ||||||||||||||||||||||||
Shares redeemed | (97,189 | ) | (168,563 | ) | (1,421,098 | ) | (2,419,241 | ) | ||||||||||||||||
| ||||||||||||||||||||||||
Net decrease | (39,101 | ) | (301,810 | ) | $ | (569,489 | ) | $ | (4,360,889 | ) | ||||||||||||||
| ||||||||||||||||||||||||
| Advisor Class Shares | ||||||||||||||||||||||||
Shares sold | 1,244,261 | 2,177,882 | $ | 18,187,674 | $ | 31,198,386 | ||||||||||||||||||
| ||||||||||||||||||||||||
Shares issued to shareholders on reinvestment of dividends | 28,552 | 47,880 | 417,349 | 686,690 | ||||||||||||||||||||
| ||||||||||||||||||||||||
Shares redeemed | (873,379 | ) | (751,491 | ) | (12,765,190 | ) | (10,766,859 | ) | ||||||||||||||||
| ||||||||||||||||||||||||
Net increase | 399,434 | 1,474,271 | $ | 5,839,833 | $ | 21,118,217 | ||||||||||||||||||
| ||||||||||||||||||||||||
| Diversified Municipal Portfolio | ||||||||||||||||||||||||
| Shares | Amount | |||||||||||||||||||||||
| Six Months Ended 3/31/21 (unaudited) | Year Ended 9/30/20 | Six Months Ended 3/31/21 (unaudited) | Year Ended 9/30/20 | |||||||||||||||||||||
|
| |||||||||||||||||||||||
| Municipal Class Shares | ||||||||||||||||||||||||
Shares sold | 40,884,494 | 65,669,903 | $ | 605,831,094 | $ | 953,324,442 | ||||||||||||||||||
| ||||||||||||||||||||||||
Shares issued to shareholders on reinvestment of dividends and distributions | 2,646,986 | 5,921,505 | 39,160,071 | 85,677,553 | ||||||||||||||||||||
| ||||||||||||||||||||||||
Shares redeemed | (30,983,729 | ) | (70,962,829 | ) | (458,831,188 | ) | (1,027,322,105 | ) | ||||||||||||||||
| ||||||||||||||||||||||||
Net increase | 12,547,751 | 628,579 | $ | 186,159,977 | $ | 11,679,890 | ||||||||||||||||||
| ||||||||||||||||||||||||
154 | AB INTERMEDIATE MUNICIPAL PORTFOLIOS | abfunds.com | |
Table of Contents
NOTES TO FINANCIAL STATEMENTS (continued)
| Diversified Municipal Portfolio | ||||||||||||||||||||||||
| Shares | Amount | |||||||||||||||||||||||
| Six Months Ended 3/31/21 (unaudited) | Year Ended 9/30/20 | Six Months Ended 3/31/21 (unaudited) | Year Ended 9/30/20 | |||||||||||||||||||||
|
| |||||||||||||||||||||||
| Class A Shares |
| |||||||||||||||||||||||
Shares sold | 5,013,696 | 8,506,533 | $ | 74,386,575 | $ | 123,402,971 | ||||||||||||||||||
| ||||||||||||||||||||||||
Shares issued to shareholders on reinvestment of dividends and distributions | 111,885 | 216,415 | 1,656,645 | 3,136,627 | ||||||||||||||||||||
| ||||||||||||||||||||||||
Shares converted from Class B | – 0 | – | 396 | – 0 | – | 5,757 | ||||||||||||||||||
| ||||||||||||||||||||||||
Shares converted from Class C | 229,654 | 668,163 | 3,385,505 | 9,741,190 | ||||||||||||||||||||
| ||||||||||||||||||||||||
Shares redeemed | (2,031,361 | ) | (6,973,908 | ) | (30,044,040 | ) | (100,315,358 | ) | ||||||||||||||||
| ||||||||||||||||||||||||
Net increase | 3,323,874 | 2,417,599 | $ | 49,384,685 | $ | 35,971,187 | ||||||||||||||||||
| ||||||||||||||||||||||||
Shares issued to shareholders on reinvestment of dividends and distributions | – 0 | – | 0 | (a) | $ | – 0 | – | $ | 5 | |||||||||||||||
| ||||||||||||||||||||||||
Shares converted to Class A | – 0 | – | (396 | ) | – 0 | – | (5,757 | ) | ||||||||||||||||
| ||||||||||||||||||||||||
Net decrease | – 0 | – | (396 | ) | $ | – 0 | – | $ | (5,752 | ) | ||||||||||||||
| ||||||||||||||||||||||||
| Class C Shares |
| |||||||||||||||||||||||
Shares sold | 209,872 | 619,068 | $ | 3,100,900 | $ | 8,996,206 | ||||||||||||||||||
| ||||||||||||||||||||||||
Shares issued to shareholders on reinvestment of dividends and distributions | 8,578 | 26,548 | 126,886 | 383,891 | ||||||||||||||||||||
| ||||||||||||||||||||||||
Shares converted to Class A | (229,753 | ) | (668,532 | ) | (3,385,505 | ) | (9,741,190 | ) | ||||||||||||||||
| ||||||||||||||||||||||||
Shares redeemed | (222,077 | ) | (503,171 | ) | (3,293,123 | ) | (7,258,503 | ) | ||||||||||||||||
| ||||||||||||||||||||||||
Net decrease | (233,380 | ) | (526,087 | ) | $ | (3,450,842 | ) | $ | (7,619,596 | ) | ||||||||||||||
| ||||||||||||||||||||||||
| Advisor Class Shares | ||||||||||||||||||||||||
Shares sold | 6,790,570 | 17,082,408 | $ | 100,489,082 | $ | 246,673,652 | ||||||||||||||||||
| ||||||||||||||||||||||||
Shares issued to shareholders on reinvestment of dividends and distributions | 177,405 | 354,933 | 2,623,098 | 5,133,286 | ||||||||||||||||||||
| ||||||||||||||||||||||||
Shares redeemed | (4,097,798 | ) | (10,848,498 | ) | (60,602,244 | ) | (156,298,402 | ) | ||||||||||||||||
| ||||||||||||||||||||||||
Net increase | 2,870,177 | 6,588,843 | $ | 42,509,936 | $ | 95,508,536 | ||||||||||||||||||
| ||||||||||||||||||||||||
| abfunds.com | AB INTERMEDIATE MUNICIPAL PORTFOLIOS | 155 | |
Table of Contents
NOTES TO FINANCIAL STATEMENTS (continued)
| Diversified Municipal Portfolio | ||||||||||||||||||||||||
| Shares | Amount | |||||||||||||||||||||||
| Six Months Ended 3/31/21 (unaudited) | Year Ended 9/30/20 | Six Months Ended 3/31/21 (unaudited) | Year Ended 9/30/20 | |||||||||||||||||||||
|
| |||||||||||||||||||||||
| Class Z Shares | ||||||||||||||||||||||||
Shares sold | 2,886,455 | 6,546,888 | $ | 42,832,020 | $ | 95,145,948 | ||||||||||||||||||
| ||||||||||||||||||||||||
Shares issued to shareholders on reinvestment of dividends and distributions | 314,191 | 877,402 | 4,650,491 | 12,695,423 | ||||||||||||||||||||
| ||||||||||||||||||||||||
Shares redeemed | (6,610,697 | ) | (30,613,937 | ) | (98,191,629 | ) | (443,644,578 | ) | ||||||||||||||||
| ||||||||||||||||||||||||
Net decrease | (3,410,051 | ) | (23,189,647 | ) | $ | (50,709,118 | ) | $ | (335,803,207 | ) | ||||||||||||||
| ||||||||||||||||||||||||
| (a) | Amount is less than one share |
| New York Municipal Portfolio | ||||||||||||||||||||||||
| Shares | Amount | |||||||||||||||||||||||
| Six Months Ended 3/31/21 (unaudited) | Year Ended 9/30/20 | Six Months Ended 3/31/21 (unaudited) | Year Ended 9/30/20 | |||||||||||||||||||||
|
| |||||||||||||||||||||||
| Municipal Class Shares | ||||||||||||||||||||||||
Shares sold | 11,815,128 | 16,023,100 | $ | 168,063,080 | $ | 225,273,454 | ||||||||||||||||||
| ||||||||||||||||||||||||
Shares issued to shareholders on reinvestment of dividends | 864,299 | 1,967,243 | 12,282,758 | 27,519,363 | ||||||||||||||||||||
| ||||||||||||||||||||||||
Shares redeemed | (11,971,603 | ) | (19,922,598 | ) | (170,374,439 | ) | (278,806,797 | ) | ||||||||||||||||
| ||||||||||||||||||||||||
Net increase (decrease) | 707,824 | (1,932,255 | ) | $ | 9,971,399 | $ | (26,013,980 | ) | ||||||||||||||||
| ||||||||||||||||||||||||
| Class A Shares | ||||||||||||||||||||||||
Shares sold | 874,597 | 1,767,847 | $ | 12,447,424 | $ | 25,013,436 | ||||||||||||||||||
| ||||||||||||||||||||||||
Shares issued to shareholders on reinvestment of dividends | 45,162 | 107,527 | 641,228 | 1,503,374 | ||||||||||||||||||||
| ||||||||||||||||||||||||
Shares converted from Class C | 119,504 | 387,315 | 1,695,772 | 5,461,252 | ||||||||||||||||||||
| ||||||||||||||||||||||||
Shares redeemed | (1,301,638 | ) | (2,309,293 | ) | (18,423,783 | ) | (32,190,853 | ) | ||||||||||||||||
| ||||||||||||||||||||||||
Net decrease | (262,375 | ) | (46,604 | ) | $ | (3,639,359 | ) | $ | (212,791 | ) | ||||||||||||||
| ||||||||||||||||||||||||
156 | AB INTERMEDIATE MUNICIPAL PORTFOLIOS | abfunds.com | |
Table of Contents
NOTES TO FINANCIAL STATEMENTS (continued)
| New York Municipal Portfolio | ||||||||||||||||||||||||
| Shares | Amount | |||||||||||||||||||||||
| Six Months Ended 3/31/21 (unaudited) | Year Ended 9/30/20 | Six Months Ended 3/31/21 (unaudited) | Year Ended 9/30/20 | |||||||||||||||||||||
|
| |||||||||||||||||||||||
| Class C Shares | ||||||||||||||||||||||||
Shares sold | 11,247 | 111,298 | $ | 160,363 | $ | 1,575,487 | ||||||||||||||||||
| ||||||||||||||||||||||||
Shares issued to shareholders on reinvestment of dividends | 4,898 | 16,401 | 69,480 | 229,424 | ||||||||||||||||||||
| ||||||||||||||||||||||||
Shares converted to Class A | (119,489 | ) | (387,150 | ) | (1,695,772 | ) | (5,461,252 | ) | ||||||||||||||||
| ||||||||||||||||||||||||
Shares redeemed | (120,563 | ) | (243,682 | ) | (1,706,729 | ) | (3,412,751 | ) | ||||||||||||||||
| ||||||||||||||||||||||||
Net decrease | (223,907 | ) | (503,133 | ) | $ | (3,172,658 | ) | $ | (7,069,092 | ) | ||||||||||||||
| ||||||||||||||||||||||||
| Advisor Class Shares | ||||||||||||||||||||||||
Shares sold | 620,770 | 2,556,570 | $ | 8,830,627 | $ | 35,996,559 | ||||||||||||||||||
| ||||||||||||||||||||||||
Shares issued to shareholders on reinvestment of dividends | 27,973 | 65,496 | 397,052 | 914,792 | ||||||||||||||||||||
| ||||||||||||||||||||||||
Shares redeemed | (971,508 | ) | (2,056,078 | ) | (13,715,288 | ) | (28,394,625 | ) | ||||||||||||||||
| ||||||||||||||||||||||||
Net increase (decrease) | (322,765 | ) | 565,988 | $ | (4,487,609 | ) | $ | 8,516,726 | ||||||||||||||||
| ||||||||||||||||||||||||
NOTE 7.
Subsequent Events
As of March 31, 2021, Class C shares will automatically convert to Class A shares ten years after the end of the calendar month of purchase. Effective May 31, 2021, Class C shares will automatically convert to Class A shares after eight years instead of ten years.
Management has evaluated subsequent events for possible recognition or disclosure in the financial statements through the date the financial statements are issued. Management has determined that there are no other material events that would require disclosure in the Portfolios’ financial statements through this date.
| abfunds.com | AB INTERMEDIATE MUNICIPAL PORTFOLIOS | 157 | |
Table of Contents
FINANCIAL HIGHLIGHTS
Selected Data For A Share Of Capital Stock Outstanding Throughout Each Period
| California Municipal Portfolio | ||||||||||||||||||||||||
| Class A | ||||||||||||||||||||||||
Six Months (unaudited) | Year Ended September 30, | |||||||||||||||||||||||
| 2020 | 2019 | 2018 | 2017 | 2016 | ||||||||||||||||||||
|
| |||||||||||||||||||||||
Net asset value, beginning of period | $ 14.52 | $ 14.44 | $ 13.99 | $ 14.33 | $ 14.59 | $ 14.40 | ||||||||||||||||||
|
| |||||||||||||||||||||||
Income From Investment Operations | ||||||||||||||||||||||||
Net investment income(a) | .11 | .26 | .28 | .28 | .27 | .28 | (b) | |||||||||||||||||
Net realized and unrealized gain (loss) on investment transactions | .08 | .08 | .46 | (.34 | ) | (.26 | ) | .19 | ||||||||||||||||
|
| |||||||||||||||||||||||
Total from investment operations | .19 | .34 | .74 | (.06 | ) | .01 | .47 | |||||||||||||||||
|
| |||||||||||||||||||||||
Less: Dividends | ||||||||||||||||||||||||
Dividends from net investment income | (.11 | ) | (.26 | ) | (.29 | ) | (.28 | ) | (.27 | ) | (.28 | ) | ||||||||||||
|
| |||||||||||||||||||||||
Net asset value, end of period | $ 14.60 | $ 14.52 | $ 14.44 | $ 13.99 | $ 14.33 | $ 14.59 | ||||||||||||||||||
|
| |||||||||||||||||||||||
Total Return | ||||||||||||||||||||||||
Total investment return based on net asset value(c) | 1.34 | % | 2.39 | % | 5.30 | % | (.33 | )% | .04 | % | 3.24 | %(b) | ||||||||||||
Ratios/Supplemental Data | ||||||||||||||||||||||||
Net assets, end of period (000 omitted) | $85,699 | $82,318 | $73,875 | $77,469 | $83,361 | $92,258 | ||||||||||||||||||
Average net assets (000 omitted) | $85,009 | $79,385 | $66,990 | $85,754 | $85,429 | $92,455 | ||||||||||||||||||
Ratio to average net assets of: | ||||||||||||||||||||||||
Expenses | .73 | %(d) | .73 | % | .73 | % | .75 | % | .76 | % | .83 | % | ||||||||||||
Net investment income | 1.57 | %(d) | 1.79 | % | 1.98 | % | 1.98 | % | 1.90 | % | 1.89 | %(b) | ||||||||||||
Portfolio turnover rate | 15 | % | 16 | % | 24 | % | 38 | % | 17 | % | 12 | % | ||||||||||||
See footnote summary on page 168.
158 | AB INTERMEDIATE MUNICIPAL PORTFOLIOS | abfunds.com | |
Table of Contents
FINANCIAL HIGHLIGHTS (continued)
Selected Data For A Share Of Capital Stock Outstanding Throughout Each Period
| California Municipal Portfolio | ||||||||||||||||||||||||
| Class C | ||||||||||||||||||||||||
| Six Months Ended March 31, 2021 (unaudited) | Year Ended September 30, | |||||||||||||||||||||||
| 2020 | 2019 | 2018 | 2017 | 2016 | ||||||||||||||||||||
|
| |||||||||||||||||||||||
Net asset value, beginning of period | $ 14.52 | $ 14.44 | $ 13.98 | $ 14.32 | $ 14.59 | $ 14.40 | ||||||||||||||||||
|
| |||||||||||||||||||||||
Income From Investment Operations | ||||||||||||||||||||||||
Net investment income(a) | .06 | .15 | .18 | .17 | .17 | .17 | (b) | |||||||||||||||||
Net realized and unrealized gain (loss) on investment transactions | .08 | .08 | .46 | (.33 | ) | (.28 | ) | .19 | ||||||||||||||||
|
| |||||||||||||||||||||||
Total from investment operations | .14 | .23 | .64 | (.16 | ) | (.11 | ) | .36 | ||||||||||||||||
|
| |||||||||||||||||||||||
Less: Dividends | ||||||||||||||||||||||||
Dividends from net investment income | (.06 | ) | (.15 | ) | (.18 | ) | (.18 | ) | (.16 | ) | (.17 | ) | ||||||||||||
|
| |||||||||||||||||||||||
Net asset value, end of period | $ 14.60 | $ 14.52 | $ 14.44 | $ 13.98 | $ 14.32 | $ 14.59 | ||||||||||||||||||
|
| |||||||||||||||||||||||
Total Return | ||||||||||||||||||||||||
Total investment return based on net asset value(c) | .96 | % | 1.62 | % | 4.59 | % | (1.15 | )% | (.71 | )% | 2.48 | %(b) | ||||||||||||
Ratios/Supplemental Data | ||||||||||||||||||||||||
Net assets, end of period (000 omitted) | $6,052 | $6,586 | $10,910 | $11,886 | $17,028 | $22,273 | ||||||||||||||||||
Average net assets (000 omitted) | $6,364 | $9,405 | $11,297 | $14,022 | $20,405 | $21,831 | ||||||||||||||||||
Ratio to average net assets of: | ||||||||||||||||||||||||
Expenses | 1.48 | %(d) | 1.48 | % | 1.49 | % | 1.50 | % | 1.52 | % | 1.58 | % | ||||||||||||
Net investment income | .82 | %(d) | 1.05 | % | 1.24 | % | 1.23 | % | 1.16 | % | 1.15 | %(b) | ||||||||||||
Portfolio turnover rate | 15 | % | 16 | % | 24 | % | 38 | % | 17 | % | 12 | % | ||||||||||||
See footnote summary on page 168.
| abfunds.com | AB INTERMEDIATE MUNICIPAL PORTFOLIOS | 159 | |
Table of Contents
FINANCIAL HIGHLIGHTS (continued)
Selected Data For A Share Of Capital Stock Outstanding Throughout Each Period
| California Municipal Portfolio | ||||||||||||||||||||||||
| Advisor Class | ||||||||||||||||||||||||
| Six Months Ended March 31, 2021 (unaudited) | Year Ended September 30, | July 25, 2016(e) to September 30, | ||||||||||||||||||||||
| 2020 | 2019 | 2018 | 2017 | |||||||||||||||||||||
|
| |||||||||||||||||||||||
Net asset value, beginning of period | $ 14.52 | $ 14.44 | $ 13.99 | $ 14.32 | $ 14.59 | $ 14.65 | ||||||||||||||||||
|
| |||||||||||||||||||||||
Income From Investment Operations | ||||||||||||||||||||||||
Net investment income(a) | .13 | .29 | .31 | .32 | .31 | .05 | (b) | |||||||||||||||||
Net realized and unrealized gain (loss) on investment transactions | .08 | .08 | .46 | (.33 | ) | (.27 | ) | (.06 | ) | |||||||||||||||
|
| |||||||||||||||||||||||
Total from investment operations | .21 | .37 | .77 | (.01 | ) | .04 | (.01 | ) | ||||||||||||||||
|
| |||||||||||||||||||||||
Less: Dividends | ||||||||||||||||||||||||
Dividends from net investment income | (.13 | ) | (.29 | ) | (.32 | ) | (.32 | ) | (.31 | ) | (.05 | ) | ||||||||||||
|
| |||||||||||||||||||||||
Net asset value, end of period | $ 14.60 | $ 14.52 | $ 14.44 | $ 13.99 | $ 14.32 | $ 14.59 | ||||||||||||||||||
|
| |||||||||||||||||||||||
Total Return | ||||||||||||||||||||||||
Total investment return based on net asset value(c) | 1.47 | % | 2.65 | % | 5.56 | % | (.08 | )% | .30 | % | (.04 | )%(b) | ||||||||||||
Ratios/Supplemental Data | ||||||||||||||||||||||||
Net assets, end of period (000 omitted) | $66,306 | $60,140 | $38,534 | $21,792 | $12,903 | $3,266 | ||||||||||||||||||
Average net assets (000 omitted) | $64,334 | $46,691 | $27,392 | $17,250 | $9,154 | $204 | ||||||||||||||||||
Ratio to average net assets of: | ||||||||||||||||||||||||
Expenses | .48 | %(d) | .49 | % | .48 | % | .50 | % | .49 | % | .85 | %(d) | ||||||||||||
Net investment income | 1.82 | %(d) | 2.03 | % | 2.21 | % | 2.24 | % | 2.17 | % | 1.77 | %(b)(d) | ||||||||||||
Portfolio turnover rate | 15 | % | 16 | % | 24 | % | 38 | % | 17 | % | 12 | % | ||||||||||||
See footnote summary on page 168.
160 | AB INTERMEDIATE MUNICIPAL PORTFOLIOS | abfunds.com | |
Table of Contents
FINANCIAL HIGHLIGHTS (continued)
Selected Data For A Share Of Capital Stock Outstanding Throughout Each Period
| Diversified Municipal Portfolio | ||||||||||||||||||||||||
| Class A | ||||||||||||||||||||||||
Six Months (unaudited) | Year Ended September 30, | |||||||||||||||||||||||
| 2020 | 2019 | 2018 | 2017 | 2016 | ||||||||||||||||||||
|
| |||||||||||||||||||||||
Net asset value, beginning of period | $ 14.68 | $ 14.58 | $ 14.06 | $ 14.44 | $ 14.68 | $ 14.48 | ||||||||||||||||||
|
| |||||||||||||||||||||||
Income From Investment Operations | ||||||||||||||||||||||||
Net investment income(a) | .13 | .30 | .31 | .27 | .25 | .25 | (b) | |||||||||||||||||
Net realized and unrealized gain (loss) on investment transactions | .13 | .10 | .53 | (.38 | ) | (.24 | ) | .20 | ||||||||||||||||
Contributions from affiliates | – 0 | – | – 0 | – | – 0 | – | – 0 | – | .00 | (f) | – 0 | – | ||||||||||||
|
| |||||||||||||||||||||||
Total from investment operations | .26 | .40 | .84 | (.11 | ) | .01 | .45 | |||||||||||||||||
|
| |||||||||||||||||||||||
Less: Dividends | ||||||||||||||||||||||||
Dividends from net investment income | (.13 | ) | (.30 | ) | (.32 | ) | (.27 | ) | (.25 | ) | (.25 | ) | ||||||||||||
|
| |||||||||||||||||||||||
Net asset value, end of period | $ 14.81 | $ 14.68 | $ 14.58 | $ 14.06 | $ 14.44 | $ 14.68 | ||||||||||||||||||
|
| |||||||||||||||||||||||
Total Return | ||||||||||||||||||||||||
Total investment return based on net asset value(c) | 1.79 | % | 2.78 | % | 5.99 | % | (.73 | )% | .11 | % | 3.14 | %(b) | ||||||||||||
Ratios/Supplemental Data | ||||||||||||||||||||||||
Net assets, end of period (000 omitted) | $322,538 | $271,074 | $233,833 | $225,477 | $342,340 | $450,882 | ||||||||||||||||||
Average net assets (000 omitted) | $300,094 | $248,192 | $221,783 | $286,472 | $378,242 | $462,433 | ||||||||||||||||||
Ratio to average net assets of: | ||||||||||||||||||||||||
Expenses | .66 | %(d) | .67 | % | .66 | % | .73 | % | .75 | % | .79 | % | ||||||||||||
Net investment income | 1.78 | %(d) | 2.04 | % | 2.18 | % | 1.92 | % | 1.75 | % | 1.73 | %(b) | ||||||||||||
Portfolio turnover rate | 15 | % | 20 | % | 22 | % | 23 | % | 25 | % | 11 | % | ||||||||||||
See footnote summary on page 168.
| abfunds.com | AB INTERMEDIATE MUNICIPAL PORTFOLIOS | 161 | |
Table of Contents
FINANCIAL HIGHLIGHTS (continued)
Selected Data For A Share Of Capital Stock Outstanding Throughout Each Period
| Diversified Municipal Portfolio | ||||||||||||||||||||||||
| Class C | ||||||||||||||||||||||||
Six Months (unaudited) | Year Ended September 30, | |||||||||||||||||||||||
| 2020 | 2019 | 2018 | 2017 | 2016 | ||||||||||||||||||||
|
| |||||||||||||||||||||||
Net asset value, beginning of period | $ 14.68 | $ 14.57 | $ 14.05 | $ 14.44 | $ 14.68 | $ 14.48 | ||||||||||||||||||
|
| |||||||||||||||||||||||
Income From Investment Operations | ||||||||||||||||||||||||
Net investment income(a) | .08 | .19 | .20 | .17 | .14 | .14 | (b) | |||||||||||||||||
Net realized and unrealized gain (loss) on investment transactions | .12 | .11 | .53 | (.39 | ) | (.24 | ) | .20 | ||||||||||||||||
Contributions from affiliates | – 0 | – | – 0 | – | – 0 | – | – 0 | – | .00 | (f) | – 0 | – | ||||||||||||
|
| |||||||||||||||||||||||
Total from investment operations | .20 | .30 | .73 | (.22 | ) | (.10 | ) | .34 | ||||||||||||||||
|
| |||||||||||||||||||||||
Less: Dividends | ||||||||||||||||||||||||
Dividends from net investment income | (.08 | ) | (.19 | ) | (.21 | ) | (.17 | ) | (.14 | ) | (.14 | ) | ||||||||||||
|
| |||||||||||||||||||||||
Net asset value, end of period | $ 14.80 | $ 14.68 | $ 14.57 | $ 14.05 | $ 14.44 | $ 14.68 | ||||||||||||||||||
|
| |||||||||||||||||||||||
Total Return | ||||||||||||||||||||||||
Total investment return based on net asset value(c) | 1.34 | % | 2.07 | % | 5.20 | % | (1.54 | )% | (.64 | )% | 2.37 | %(b) | ||||||||||||
Ratios/Supplemental Data | ||||||||||||||||||||||||
Net assets, end of period (000 omitted) | $31,578 | $34,743 | $42,152 | $56,339 | $73,746 | $108,640 | ||||||||||||||||||
Average net assets (000 omitted) | $32,989 | $39,529 | $50,386 | $64,699 | $89,853 | $113,511 | ||||||||||||||||||
Ratio to average net assets of: | ||||||||||||||||||||||||
Expenses | 1.41 | %(d) | 1.43 | % | 1.43 | % | 1.48 | % | 1.50 | % | 1.55 | % | ||||||||||||
Net investment income | 1.04 | %(d) | 1.30 | % | 1.42 | % | 1.17 | % | 1.00 | % | .98 | %(b) | ||||||||||||
Portfolio turnover rate | 15 | % | 20 | % | 22 | % | 23 | % | 25 | % | 11 | % | ||||||||||||
See footnote summary on page 168.
162 | AB INTERMEDIATE MUNICIPAL PORTFOLIOS | abfunds.com | |
Table of Contents
FINANCIAL HIGHLIGHTS (continued)
Selected Data For A Share Of Capital Stock Outstanding Throughout Each Period
| Diversified Municipal Portfolio | ||||||||||||||||||||||||
| Advisor Class | ||||||||||||||||||||||||
Six Months (unaudited) | Year Ended September 30, | |||||||||||||||||||||||
| 2020 | 2019 | 2018 | 2017 | 2016 | ||||||||||||||||||||
|
| |||||||||||||||||||||||
Net asset value, beginning of period | $ 14.66 | $ 14.55 | $ 14.04 | $ 14.42 | $ 14.66 | $ 14.47 | ||||||||||||||||||
|
| |||||||||||||||||||||||
Income From Investment Operations | ||||||||||||||||||||||||
Net investment income(a) | .15 | .33 | .34 | .31 | .29 | .29 | (b) | |||||||||||||||||
Net realized and unrealized gain (loss) on investment transactions | .13 | .11 | .52 | (.38 | ) | (.24 | ) | .19 | ||||||||||||||||
|
| |||||||||||||||||||||||
Total from investment operations | .28 | .44 | .86 | (.07 | ) | .05 | .48 | |||||||||||||||||
|
| |||||||||||||||||||||||
Less: Dividends | ||||||||||||||||||||||||
Dividends from net investment income | (.15 | ) | (.33 | ) | (.35 | ) | (.31 | ) | (.29 | ) | (.29 | ) | ||||||||||||
|
| |||||||||||||||||||||||
Net asset value, end of period | $ 14.79 | $ 14.66 | $ 14.55 | $ 14.04 | $ 14.42 | $ 14.66 | ||||||||||||||||||
|
| |||||||||||||||||||||||
Total Return | ||||||||||||||||||||||||
Total investment return based on net asset value(c) | 1.92 | % | 3.11 | % | 6.20 | % | (.48 | )% | .36 | % | 3.36 | %(b) | ||||||||||||
Ratios/Supplemental Data | ||||||||||||||||||||||||
Net assets, end of period (000 omitted) | $422,652 | $377,082 | $278,371 | $761,637 | $1,163,196 | $1,127,335 | ||||||||||||||||||
Average net assets (000 omitted) | $402,224 | $332,267 | $306,629 | $1,161,023 | $1,112,997 | $1,108,033 | ||||||||||||||||||
Ratio to average net assets of: | ||||||||||||||||||||||||
Expenses | .41 | %(d) | .43 | % | .43 | % | .48 | % | .50 | % | .56 | % | ||||||||||||
Net investment income | 2.03 | %(d) | 2.29 | % | 2.40 | % | 2.17 | % | 2.01 | % | 1.96 | %(b) | ||||||||||||
Portfolio turnover rate | 15 | % | 20 | % | 22 | % | 23 | % | 25 | % | 11 | % | ||||||||||||
See footnote summary on page 168.
| abfunds.com | AB INTERMEDIATE MUNICIPAL PORTFOLIOS | 163 | |
Table of Contents
FINANCIAL HIGHLIGHTS (continued)
Selected Data For A Share Of Capital Stock Outstanding Throughout Each Period
| Diversified Municipal Portfolio | ||||||||||||||||
| Class Z | ||||||||||||||||
| Six Months Ended March 31, 2021 (unaudited) | Year Ended September 30, | July 2, 2018(e) to September 30, 2018 | ||||||||||||||
| 2020 | 2019 | |||||||||||||||
|
| |||||||||||||||
Net asset value, beginning of period | $ 14.68 | $ 14.58 | $ 14.06 | $ 14.15 | ||||||||||||
|
| |||||||||||||||
Income From Investment Operations | ||||||||||||||||
Net investment income(a) | .15 | .34 | .35 | .08 | ||||||||||||
Net realized and unrealized gain (loss) on investment transactions | .13 | .10 | .53 | (.10 | ) | |||||||||||
|
| |||||||||||||||
Total from investment operations | .28 | .44 | .88 | (.02 | ) | |||||||||||
|
| |||||||||||||||
Less: Dividends | ||||||||||||||||
Dividends from net investment income | (.15 | ) | (.34 | ) | (.36 | ) | (.07 | ) | ||||||||
|
| |||||||||||||||
Net asset value, end of period | $ 14.81 | $ 14.68 | $ 14.58 | $ 14.06 | ||||||||||||
|
| |||||||||||||||
Total Return | ||||||||||||||||
Total investment return based on net asset value(c) | 1.93 | % | 3.08 | % | 6.29 | % | (.06 | )% | ||||||||
Ratios/Supplemental Data | ||||||||||||||||
Net assets, end of period (000 omitted) | $463,646 | $509,910 | $844,127 | $472,528 | ||||||||||||
Average net assets (000 omitted) | $486,698 | $590,892 | $776,520 | $258,733 | ||||||||||||
Ratio to average net assets of: | ||||||||||||||||
Expenses | .38 | %(d) | .39 | % | .38 | % | .40 | %(d)(g) | ||||||||
Net investment income | 2.06 | %(d) | 2.34 | % | 2.47 | % | 2.49 | %(d)(g) | ||||||||
Portfolio turnover rate | 15 | % | 20 | % | 22 | % | 23 | % | ||||||||
See footnote summary on page 168.
164 | AB INTERMEDIATE MUNICIPAL PORTFOLIOS | abfunds.com | |
Table of Contents
FINANCIAL HIGHLIGHTS (continued)
Selected Data For A Share Of Capital Stock Outstanding Throughout Each Period
| New York Municipal Portfolio | ||||||||||||||||||||||||
| Class A | ||||||||||||||||||||||||
Six Months (unaudited) | Year Ended September 30, | |||||||||||||||||||||||
| 2020 | 2019 | 2018 | 2017 | 2016 | ||||||||||||||||||||
|
| |||||||||||||||||||||||
Net asset value, beginning of period | $ 14.03 | $ 14.17 | $ 13.68 | $ 14.07 | $ 14.33 | $ 14.10 | ||||||||||||||||||
|
| |||||||||||||||||||||||
Income From Investment Operations | ||||||||||||||||||||||||
Net investment income(a) | .12 | .28 | .29 | .28 | .27 | .29 | (b) | |||||||||||||||||
Net realized and unrealized gain (loss) on investment transactions | .21 | (.14 | ) | .49 | (.39 | ) | (.26 | ) | .23 | |||||||||||||||
|
| |||||||||||||||||||||||
Total from investment operations | .33 | .14 | .78 | (.11 | ) | .01 | .52 | |||||||||||||||||
|
| |||||||||||||||||||||||
Less: Dividends | ||||||||||||||||||||||||
Dividends from net investment income | (.12 | ) | (.28 | ) | (.29 | ) | (.28 | ) | (.27 | ) | (.29 | ) | ||||||||||||
|
| |||||||||||||||||||||||
Net asset value, end of period | $ 14.24 | $ 14.03 | $ 14.17 | $ 13.68 | $ 14.07 | $ 14.33 | ||||||||||||||||||
|
| |||||||||||||||||||||||
Total Return | ||||||||||||||||||||||||
Total investment return based on net asset value(c) | 2.38 | % | 1.03 | % | 5.74 | % | (.77 | )% | .08 | % | 3.68 | %(b) | ||||||||||||
Ratios/Supplemental Data | ||||||||||||||||||||||||
Net assets, end of period (000 omitted) | $115,928 | $117,874 | $119,718 | $121,201 | $141,325 | $181,488 | ||||||||||||||||||
Average net assets (000 omitted) | $116,098 | $119,315 | $121,023 | $130,420 | $155,464 | $182,379 | ||||||||||||||||||
Ratio to average net assets of: | ||||||||||||||||||||||||
Expenses | .73 | %(d) | .72 | % | .74 | % | .73 | % | .76 | % | .82 | % | ||||||||||||
Net investment income | 1.74 | %(d) | 1.98 | % | 2.06 | % | 2.03 | % | 1.92 | % | 2.03 | %(b) | ||||||||||||
Portfolio turnover rate | 13 | % | 18 | % | 18 | % | 23 | % | 23 | % | 17 | % | ||||||||||||
See footnote summary on page 168.
| abfunds.com | AB INTERMEDIATE MUNICIPAL PORTFOLIOS | 165 | |
Table of Contents
FINANCIAL HIGHLIGHTS (continued)
Selected Data For A Share Of Capital Stock Outstanding Throughout Each Period
| New York Municipal Portfolio | ||||||||||||||||||||||||
| Class C | ||||||||||||||||||||||||
Six Months (unaudited) | Year Ended September 30, | |||||||||||||||||||||||
| 2020 | 2019 | 2018 | 2017 | 2016 | ||||||||||||||||||||
|
| |||||||||||||||||||||||
Net asset value, beginning of period | $ 14.03 | $ 14.17 | $ 13.68 | $ 14.07 | $ 14.33 | $ 14.10 | ||||||||||||||||||
|
| |||||||||||||||||||||||
Income From Investment Operations | ||||||||||||||||||||||||
Net investment income(a) | .07 | .17 | .18 | .18 | .16 | .18 | (b) | |||||||||||||||||
Net realized and unrealized gain (loss) on investment transactions | .22 | (.13 | ) | .49 | (.39 | ) | (.26 | ) | .23 | |||||||||||||||
|
| |||||||||||||||||||||||
Total from investment operations | .29 | .04 | .67 | (.21 | ) | (.10 | ) | .41 | ||||||||||||||||
|
| |||||||||||||||||||||||
Less: Dividends | ||||||||||||||||||||||||
Dividends from net investment income | (.07 | ) | (.18 | ) | (.18 | ) | (.18 | ) | (.16 | ) | (.18 | ) | ||||||||||||
|
| |||||||||||||||||||||||
Net asset value, end of period | $ 14.25 | $ 14.03 | $ 14.17 | $ 13.68 | $ 14.07 | $ 14.33 | ||||||||||||||||||
|
| |||||||||||||||||||||||
Total Return | ||||||||||||||||||||||||
Total investment return based on net asset value(c) | 2.07 | % | .27 | % | 4.95 | % | (1.50 | )% | (.67 | )% | 2.91 | %(b) | ||||||||||||
Ratios/Supplemental Data | ||||||||||||||||||||||||
Net assets, end of period (000 omitted) | $16,925 | $19,813 | $27,143 | $33,716 | $42,821 | $56,849 | ||||||||||||||||||
Average net assets (000 omitted) | $18,166 | $23,921 | $29,799 | $38,176 | $49,277 | $57,855 | ||||||||||||||||||
Ratio to average net assets of: | ||||||||||||||||||||||||
Expenses | 1.48 | %(d) | 1.48 | % | 1.49 | % | 1.48 | % | 1.51 | % | 1.57 | % | ||||||||||||
Net investment income | .99 | %(d) | 1.23 | % | 1.31 | % | 1.28 | % | 1.17 | % | 1.28 | %(b) | ||||||||||||
Portfolio turnover rate | 13 | % | 18 | % | 18 | % | 23 | % | 23 | % | 17 | % | ||||||||||||
See footnote summary on page 168.
166 | AB INTERMEDIATE MUNICIPAL PORTFOLIOS | abfunds.com | |
Table of Contents
FINANCIAL HIGHLIGHTS (continued)
Selected Data For A Share Of Capital Stock Outstanding Throughout Each Period
| New York Municipal Portfolio | ||||||||||||||||||||||||
| Advisor Class | ||||||||||||||||||||||||
Six Months (unaudited) | Year Ended September 30, | July 25, 2016(e) to September 30, 2016 | ||||||||||||||||||||||
| 2020 | 2019 | 2018 | 2017 | |||||||||||||||||||||
|
| |||||||||||||||||||||||
Net asset value, beginning of period | $ 14.03 | $ 14.17 | $ 13.68 | $ 14.07 | $ 14.33 | $ 14.37 | ||||||||||||||||||
|
| |||||||||||||||||||||||
Income From Investment Operations | ||||||||||||||||||||||||
Net investment income(a) | .14 | .31 | .32 | .32 | .30 | .06 | (b) | |||||||||||||||||
Net realized and unrealized gain (loss) on investment transactions | .21 | (.13 | ) | .49 | (.39 | ) | (.26 | ) | (.04 | ) | ||||||||||||||
|
| |||||||||||||||||||||||
Total from investment operations | .35 | .18 | .81 | (.07 | ) | .04 | .02 | |||||||||||||||||
|
| |||||||||||||||||||||||
Less: Dividends | ||||||||||||||||||||||||
Dividends from net investment income | (.14 | ) | (.32 | ) | (.32 | ) | (.32 | ) | (.30 | ) | (.06 | ) | ||||||||||||
|
| |||||||||||||||||||||||
Net asset value, end of period | $ 14.24 | $ 14.03 | $ 14.17 | $ 13.68 | $ 14.07 | $ 14.33 | ||||||||||||||||||
|
| |||||||||||||||||||||||
Total Return | ||||||||||||||||||||||||
Total investment return based on net asset value(c) | 2.51 | % | 1.28 | % | 6.00 | % | (.51 | )% | .35 | % | .12 | %(b) | ||||||||||||
Ratios/Supplemental Data | ||||||||||||||||||||||||
Net assets, end of period (000 omitted) | $60,931 | $64,546 | $57,173 | $37,003 | $26,267 | $3,226 | ||||||||||||||||||
Average net assets (000 omitted) | $60,307 | $63,077 | $45,530 | $32,710 | $15,836 | $205 | ||||||||||||||||||
Ratio to average net assets of: | ||||||||||||||||||||||||
Expenses | .48 | %(d) | .47 | % | .49 | % | .48 | % | .50 | % | .67 | %(d) | ||||||||||||
Net investment income | 1.99 | %(d) | 2.22 | % | 2.30 | % | 2.28 | % | 2.18 | % | 2.38 | %(b)(d) | ||||||||||||
Portfolio turnover rate | 13 | % | 18 | % | 18 | % | 23 | % | 23 | % | 17 | % | ||||||||||||
See footnote summary on page 168.
| abfunds.com | AB INTERMEDIATE MUNICIPAL PORTFOLIOS | 167 | |
Table of Contents
FINANCIAL HIGHLIGHTS (continued)
Selected Data For A Share Of Capital Stock Outstanding Throughout Each Period
| (a) | Based on average shares outstanding. |
| (b) | For the year ended September 30, 2016, the amount includes a refund for overbilling of prior years’ custody out of pocket fees as follows: |
Portfolio | Net Investment Income Per Share | Net Investment Income Ratio | Total Return | |||||||||
California Municipal | $ | .001 | .01 | % | .01 | % | ||||||
Diversified Municipal | $ | .001 | .004 | % | .004 | % | ||||||
New York Municipal | $ | .001 | .01 | % | .01 | % | ||||||
| (c) | Total investment return is calculated assuming an initial investment made at the net asset value at the beginning of the period, reinvestment of all dividends and distributions at net asset value during the period, and redemption on the last day of the period. Total return does not reflect the deduction of taxes that a shareholder would pay on fund distributions or the redemption of fund shares. Total investment return calculated for a period of less than one year is not annualized. |
| (d) | Annualized. |
| (e) | Commencement of distributions. |
| (f) | Amount is less than $.005. |
| (g) | The ratio includes expenses attributable to costs of proxy solicitation. |
See notes to financial statements.
168 | AB INTERMEDIATE MUNICIPAL PORTFOLIOS | abfunds.com | |
Table of Contents
BOARD OF DIRECTORS
Debra Perry(1)(2), Chair Beata D. Kirr, President R. Jay Gerken(1)(2) Jeffrey R. Holland(1) | William Kristol(1) Michelle McCloskey(1) Donald K. Peterson(1) |
OFFICERS
Terrance T. Hults, Vice President(3) Matthew J. Norton, Vice President(3) Andrew D. Potter, Vice President(3) Emilie D. Wrapp, Secretary | Michael B. Reyes, Senior Analyst Joseph J. Mantineo, Treasurer and Chief Financial Officer Phyllis J. Clarke, Controller Vincent S. Noto, Chief Compliance Officer |
Custodian and Accounting Agent State Street Bank and Trust Company Boston, MA 02210
Distributor† AllianceBernstein Investments, Inc.
Transfer Agent† AllianceBernstein Investor | Legal Counsel Willkie Farr & Gallagher LLP
Independent Registered PricewaterhouseCoopers LLP |
| 1 | Member of the Audit Committee, the Governance, Nominating and Compensation Committee, and the Independent Directors Committee. |
| 2 | Member of the Pricing Committee. |
| 3 | The day-to-day management of, and investment decisions for, the AB Intermediate Municipal Portfolios are made by the Municipal Bond Investment Team. Messrs. Hults, Norton and Potter are the investment professionals with the most significant responsibility for the day-to-day management of the Funds’ portfolios. |
| † | For the AB Intermediate Municipal Portfolios, Classes A,C and Advisor Class shares only. |
| abfunds.com | AB INTERMEDIATE MUNICIPAL PORTFOLIOS | 169 | |
Table of Contents
Operation and Effectiveness of the Portfolios’ Liquidity Risk Management Program:
In October 2016, the Securities and Exchange Commission (“SEC”) adopted the open-end fund liquidity rule (the “Liquidity Rule”). In June 2018 the SEC adopted a requirement that funds disclose information about the operation and effectiveness of their Liquidity Risk Management Program (“LRMP”) in their reports to shareholders.
One of the requirements of the Liquidity Rule is for the Portfolios to designate an Administrator of the Portfolios’ Liquidity Risk Management Program. The Administrator of the Portfolios’ LRMP is AllianceBernstein L.P., the Portfolios’ investment adviser (the “Adviser”). The Adviser has delegated the responsibility to its Liquidity Risk Management Committee (the “Committee”).
Another requirement of the Liquidity Rule is for the Fund’s Board of Directors (the “Fund Board”) to receive an annual written report from the Administrator of the LRMP, which addresses the operation of the Portfolios’ LRMP and assesses its adequacy and effectiveness. The Adviser provided the Fund Board with such annual report during the first quarter of 2021, which covered the period January 1, 2020 through December 31, 2020 (the “Program Reporting Period”).
The LRMP’s principal objectives include supporting the Portfolios’ compliance with limits on investments in illiquid assets and mitigating the risk that the Portfolios will be unable to meet their redemption obligations in a timely manner.
Pursuant to the LRMP, the Portfolios classify the liquidity of their portfolio investments into one of the four categories defined by the SEC: Highly Liquid, Moderately Liquid, Less Liquid, and Illiquid. These classifications are reported to the SEC on Form N-PORT.
During the Program Reporting Period, the Committee reviewed whether the Portfolios’ strategy is appropriate for an open-end structure, incorporating any holdings of less liquid and illiquid assets. If the Portfolios participated in derivative transactions, the exposure from such transactions were considered in the LRMP.
The Committee also performed an analysis to determine whether the Portfolios are required to maintain a Highly Liquid Investment Minimum (“HLIM”). The Committee also incorporated the following information when determining the Portfolios’ reasonably anticipated trading size for purposes of liquidity monitoring: historical net redemption activity, the Portfolios’ concentration in an issuer, shareholder concentration, investment performance, total net assets, and distribution channels.
170 | AB INTERMEDIATE MUNICIPAL PORTFOLIOS | abfunds.com | |
Table of Contents
The Adviser informed the Fund Board that the Committee believes the Portfolios’ LRMP is adequately designed, has been implemented as intended, and has operated effectively since its inception. No material exceptions have been noted since the implementation of the LRMP. During the Program Reporting Period, beginning in March 2020, all financial markets experienced extreme levels of price volatility and relative illiquidity resulting from the COVID-19 impacts on the global economy. This extreme relative illiquidity resulted in significantly wider bid-ask spreads to transact in securities, including many of those securities held by the Portfolios, and in a diminished depth of liquidity in most markets, to varying degrees. Nonetheless, there were no liquidity events that impacted the Portfolios or their ability to timely meet redemptions during the Program Reporting Period.
| abfunds.com | AB INTERMEDIATE MUNICIPAL PORTFOLIOS | 171 | |
Table of Contents
BOARD CONSIDERATION OF INVESTMENT
MANAGEMENT ARRANGEMENT
Sanford C. Bernstein Fund, Inc. (the “Fund”) is subject to Section 15 of the Investment Company Act of 1940, as amended. Section 15 provides that any investment advisory agreement with a registered investment company such as the Fund may continue in effect for a period of more than two years from the date of its execution, only so long as such continuance is specifically approved at least annually by the board of directors (or by vote of a majority of the outstanding voting securities of the investment company). Pursuant to this requirement, the Fund’s Board of Directors, including the Directors who are not interested persons of the Fund (the “Independent Directors”), unanimously approved the continuation of the Investment Management Agreement between the Fund, on behalf of the Tax-Managed International, International, Emerging Markets, Short Duration Diversified Municipal, New York Municipal, California Municipal, Diversified Municipal, Short Duration Plus, Intermediate Duration, Overlay A, Tax-Aware Overlay A, Overlay B, Tax-Aware Overlay B, Tax-Aware Overlay C and Tax-Aware Overlay N Portfolios (each, a “Portfolio” and collectively, the “Portfolios”) of the Fund, and AllianceBernstein L.P. (the “Adviser”)( the “Investment Management Agreement”) at a video conference meeting held on October 28-29, 2020.1
The following discussion describes the considerations in connection with the Board’s review of the Investment Management Agreement.
In connection with the annual review of the continuation of the Investment Management Agreement between the Fund and the Adviser, counsel to the Independent Directors sent a letter to the Adviser dated August 7, 2020, that contained a list of information requested by the Independent Directors to conduct their annual review. The Board of Directors, including the Independent Directors, met by video conference and telephonically and received and evaluated extensive materials relating to the continuation of the Investment Management Agreement from the Adviser during meetings in September and October 2020. In addition, the Board received materials from the Senior Analyst and an independent fee consultant as described below. On September 30, 2020, the Board of Directors held a video conference meeting to discuss its review of the Investment Management Agreement and the materials the Directors had been provided. At that meeting, the Independent Directors met separately with their independent counsel and the Senior Analyst and the independent fee consultant in executive sessions. Following the September 30, 2020 meeting, the Independent Directors, through counsel, requested certain additional information by means of a letter from their independent counsel
| 1 | The meeting was held by video conference in view of the ongoing COVID-19 pandemic and based on exemptive relief issued by the Securities and Exchange Commission, with the Board’s intention to ratify the approval of the Investment Management Agreement at its next in-person meeting. |
172 | AB INTERMEDIATE MUNICIPAL PORTFOLIOS | abfunds.com | |
Table of Contents
BOARD CONSIDERATION OF INVESTMENT
MANAGEMENT ARRANGEMENT (continued)
dated October 5, 2020, and the Adviser provided certain additional information by means of a letter dated October 15, 2020. The Independent Directors held a telephonic meeting on October 20, 2020 with their independent counsel and the Senior Analyst to further discuss the contract renewal materials and supplemental materials provided in response to the Board’s request. On October 28-29, 2020, the Board of Directors held a video conference meeting to continue their review of the Investment Management Agreement. During this meeting, the Adviser provided further information to the Board relating to contract renewal, and the Independent Directors also met separately with counsel to the Independent Directors as well as the Senior Analyst to review the contract renewal materials provided by the Adviser and the materials prepared by the Senior Analyst. At the conclusion of this meeting, the Board approved the continuation of the Investment Management Agreement for an additional annual term as described below.
In approving the Investment Management Agreement, the Board, including the Independent Directors, considered all information it deemed reasonably necessary to evaluate the terms of the Investment Management Agreement and considered whether the Agreement would be in the best interests of the Fund. In particular, the Board considered the information that was provided to them by the Adviser in response to their requests, as well as information prepared by the Senior Analyst and the independent fee consultant at the request of the Board. The Fund’s Senior Analyst assists the Board (as well as the boards of other funds sponsored by the Adviser) in evaluating investment management agreements and certain other plans and agreements pursuant to which the Adviser or its affiliates provide services to the Funds. The Board also considered other information provided to the Board in connection with the September 30, 2020, and October 28-29, 2020 meetings and throughout the past year.
The information considered by the Board included information with respect to the nature, extent and quality of services provided, investment performance, fees and expenses, profitability, economies of scale, and fall-out benefits and other revenue.
In the Board’s consideration of the factors discussed below, no single factor was considered in isolation or to be determinative to the decision of the Board to approve the Investment Management Agreement. Rather, the Board concluded, in light of a weighing and balancing of all factors considered and in the exercise of the Directors’ business judgment, that it was in the best interests of the Fund to approve the Investment
| abfunds.com | AB INTERMEDIATE MUNICIPAL PORTFOLIOS | 173 | |
Table of Contents
BOARD CONSIDERATION OF INVESTMENT
MANAGEMENT ARRANGEMENT (continued)
Management Agreement including the fees to be charged for services thereunder, as summarized below.
Fees and Expenses
The Board, including the Independent Directors, compared the fees and expense ratios of each Portfolio (before and after any fee waivers and expense reimbursements) against fees and expense ratios of a peer group of funds with similar investment objectives (“peer group”). Both the peer group and the funds within the peer group, with respect to the fee and expense data, were available from Strategic Insight, an independent provider of investment company data. The Senior Analyst also performed analyses of the advisory fees, and compared such analyses to the Portfolios’ peer groups. In addition, the Board received and considered information from an independent fee consultant regarding the fees and expenses of the Portfolios as well as their investment performance.
The Board also received and considered information about the services rendered, and the fee rates charged, to other clients advised by the Adviser, including information about any recent advisory fee changes with respect to other investment companies advised by the Adviser. The Board noted the differences between the services provided to the Portfolios in comparison to those provided to other types of clients, including institutional clients and other investment companies for which the Adviser acted as subadviser, and the differences in the entrepreneurial and other risks borne by the Adviser in serving the Portfolios compared to other types of clients.
The Board noted that the Adviser will begin voluntarily waiving the 0.10% shareholder servicing fee for the private client class of the Short Duration Plus Portfolio and the Short Duration Diversified Municipal Portfolio effective with the new term of the shareholder servicing agreement. The Board also noted the Adviser’s proposal to modify the advisory fee schedule of the Overlay A and Tax-Aware Overlay Portfolios by reducing the level where each Portfolio reaches its first breakpoint, and adding a new breakpoint on assets over $5 billion, and that this advisory fee change was expected to provide immediate savings to the Tax-Aware Overlay A Portfolio based on current asset levels.
On the basis of its review and consideration of the fees as described above and the Board’s consideration of the other factors described below, and in light of the Adviser’s agreement to reduce certain fees and to apply certain fee waivers and/or expense caps for certain Portfolios, the Board concluded that the contractual advisory fees as proposed were reasonable.
174 | AB INTERMEDIATE MUNICIPAL PORTFOLIOS | abfunds.com | |
Table of Contents
BOARD CONSIDERATION OF INVESTMENT
MANAGEMENT ARRANGEMENT (continued)
Nature, Extent and Quality of Services Provided
The Board, including the Independent Directors, considered the nature, quality and extent of services performed by the Adviser and its affiliates gained from their experience as Directors of the Fund, their overall confidence in the Adviser’s integrity and competence they have gained from that experience, and the Adviser’s initiative in identifying and raising potential issues with the Directors. The Board also considered the Adviser’s responsiveness, frankness and attention to concerns raised by the Directors from time to time, including the Adviser’s willingness to consider and implement organizational changes designed to improve investment results and the services provided to the Portfolios. The Board also considered the scope and quality of the Adviser’s investment management capabilities, other resources dedicated to performing its services, the quality of its compliance, administrative and other services provided to the Portfolios and the background and experience of the Adviser’s senior management. The Board reviewed the qualifications, backgrounds and responsibilities of the investment staff primarily responsible for day-to-day portfolio management services for each Portfolio and noted the Adviser’s commitment to strong research and investment management capabilities throughout changing market environments. The Board reviewed the compliance and administrative services of the Adviser that support the investment advisory services provided to the Portfolios. The Board also considered how the organizational capabilities and financial condition of the Adviser may affect the nature and quality of its services. In that regard, the Board considered information about the impact of the COVID-19 pandemic on the Adviser’s operations and the Adviser’s ability to continue to provide the same scope and quality of services to the Portfolios as before the pandemic. The Board considered the ongoing impacts of the relocation of substantial operations of the Adviser from the New York City area to Nashville, Tennessee as well as the implications of a substantial number of the Adviser’s employees working from home during the pandemic. The Board also noted that the Adviser and its affiliates had continued to update the Board on matters relating to the sale by AXA, S.A., previously an indirect parent of AllianceBernstein Corporation, the general partner of the Adviser, of its remaining ownership interest in its U.S. subsidiary, Equitable Holdings, Inc. The Board considered the statements of the Adviser that it has continued to operate as an independent, publicly-traded US asset manager, that the divestiture has not materially changed the Adviser’s current management structure or strategy, and that the Adviser does not believe that the divestiture will have a material impact on the Adviser with respect to its operations, personnel, organizational structure, or capitalization, financial and other resources.
| abfunds.com | AB INTERMEDIATE MUNICIPAL PORTFOLIOS | 175 | |
Table of Contents
BOARD CONSIDERATION OF INVESTMENT
MANAGEMENT ARRANGEMENT (continued)
In considering the nature and quality of the services provided by the Adviser, the Board, including the Independent Directors, received and considered information about each Portfolio’s investment performance, as well as the performance of its peer group and the performance of an appropriate benchmark index. The Board was provided with performance data versus each Portfolio’s peer group, for the 1-year, 3-year, 5-year and 10-year periods, as applicable, ended July 31, 2020 and versus each Portfolio’s benchmark index, for the relevant periods, as well as the most recently available Morningstar rating for those Portfolios with an available rating. The Board also received certain updated performance information as of September 30, 2020. In addition, the Directors considered information showing performance compared to peer groups and benchmarks for rolling calendar year periods and the year to date. The Directors also receive detailed comparative performance information for the Portfolios at each regular Board meeting during the year. The Board recognized that the benchmark indices do not account for fees and expenses incurred by a fund, including the Portfolios. The Directors also considered how peer groups have changed over time and how comparisons may differ depending upon the selection of the peer groups or benchmark indices.
The Directors noted the complexity of the Overlay Portfolios, in particular the complexity of managing the globally diversified set of asset classes and derivatives in which the Overlay Portfolios can invest as well as the complexity of dynamically allocating assets through the Overlay Portfolios among various asset classes as economic and market conditions change in seeking to provide the desired risk/return trade-off for their investors in light of their overall portfolios (and not just their investment in the Overlay Portfolios themselves). The Board reviewed the performance of the Overlay Portfolios in response to the increased market volatility and the performance of the Overlay Portfolios’ dynamic asset allocation component during this unusual market environment. With respect to the International Portfolio and the Tax-Managed International Portfolio, the Board considered that, subject to shareholder approval, the two Portfolios would be merged into another portfolio managed by the Adviser in late 2020 or early 2021. In evaluating the performance of the Portfolios that invest primarily in fixed-income securities, the Directors considered whether those Portfolios may have incurred less credit risk or interest rate risk, or both, in relation to their peer groups and benchmark indices. Where the Portfolios had underperformed their peer groups or benchmark indices, the Directors considered the Adviser’s explanations for performance and, as applicable, measures the Adviser had taken or proposed to take to improve performance. In particular, for those Portfolios that pursue a value strategy, the Directors noted the Adviser’s explanation regarding the recent underperformance of value strategies generally versus growth strategies. The
176 | AB INTERMEDIATE MUNICIPAL PORTFOLIOS | abfunds.com | |
Table of Contents
BOARD CONSIDERATION OF INVESTMENT
MANAGEMENT ARRANGEMENT (continued)
Directors also noted the Adviser’s explanation that certain Portfolios are designed to maintain higher credit quality and a more conservative approach versus the funds in its relevant peer group, and that as a result of a lower risk profile, those Portfolios have underperformed the peer group during periods when riskier assets have outperformed. The Directors noted generally the Adviser’s continued efforts to enhance the services provided to the Portfolios, including but not limited to, its continued research efforts to enhance the dynamic asset allocation component utilized by the Overlay Portfolios. The Directors also noted that they would continue to monitor investment performance closely.
The Board concluded that the Adviser had the experience and resources necessary to provide services of appropriate nature, quality and scope with respect to the Portfolios.
Profitability
The Board, including the Independent Directors, considered the level of the Adviser’s profits in respect of its management of the respective Portfolios. The materials provided to the Independent Directors included information indicating the profitability of the Portfolios to the Adviser for calendar years 2018 and 2019, which had been reviewed by an independent consultant. The Directors reviewed the assumptions and methods of allocation used by the Adviser in preparing fund-specific profitability data and noted that there are many potentially acceptable allocation methodologies for information of this type. The Directors noted that they received information regarding all revenues and expenses of the Adviser’s relationship with the Fund, including those relating to the Adviser’s subsidiaries that provide transfer agency and, distribution services to the Fund, and that they had focused on profitability before taxes and distribution expenses. The Directors reviewed comparative information regarding profitability for other publicly-traded advisers, recognizing that it is difficult to make comparisons of profitability among fund advisory contracts because only limited comparative information is publicly available and the comparisons are affected by numerous factors including different cost accounting methodologies.
After reviewing all relevant factors, the Directors, including the Independent Directors, concluded that the levels of the Adviser’s profits in respect of its management of the Portfolios were not excessive.
Economies of Scale
The Board, including the Independent Directors, considered whether there have been economies of scale in respect of the management of the Portfolios, whether the Portfolios have appropriately benefited from any economies of scale, and whether there is potential for realization of any further
| abfunds.com | AB INTERMEDIATE MUNICIPAL PORTFOLIOS | 177 | |
Table of Contents
BOARD CONSIDERATION OF INVESTMENT
MANAGEMENT ARRANGEMENT (continued)
economies of scale. The Directors discussed possible ways in which any such economies of scale may be shared with the Portfolios, including by investment in enhanced services.
The Directors also considered the Senior Analyst materials which they received in connection with the review of the Investment Management Agreement, which included information reflecting changes in asset levels of the Portfolios and in the profitability of the Adviser over various periods.
After reviewing the profitability and economies of scale information provided by the Adviser, the Board concluded that the benefits of any economies of scale were appropriately being shared with Portfolio investors by way of, among other things and as applicable, establishing advisory fees at levels that contemplated future achievement of scale, recent fee reductions for the Short Duration Diversified Municipal, Short Duration Plus, Intermediate Duration, Tax-Managed International, International, and Emerging Markets Portfolios, breakpoint arrangements including the lowering of the first breakpoint and the addition of a new breakpoint in the advisory fee schedule for the Overlay A and Tax-Aware Overlay A Portfolios as well as other recently adopted or modified breakpoints for certain Portfolios, expense caps and waivers applying to select Portfolios, and the Adviser’s continued reinvestment in the business, including by researching and implementing new product enhancements. The Directors also noted that they would continue to monitor the growth of the Portfolios.
Fall-Out Benefits and Other Revenue
The Board, including the Independent Directors, also took into account so-called “fall-out benefits” to the Adviser, such as soft dollar arrangements (whereby the Adviser receives the benefit of research services from many of the brokers and dealers that execute purchases and sales of securities on behalf of its clients on an agency basis), Rule 12b-1 fees and sales charges received by the principal underwriter (which is a wholly owned subsidiary of the Adviser) with respect to the retail share classes of certain Portfolios, and transfer agency fees paid by the retail share classes of certain Portfolios to a wholly-owned subsidiary of the Adviser. The Directors recognized that the Adviser’s profitability would be lower without these benefits. They also considered other benefits potentially derived from an increase in the Adviser’s business as a result of its relationship with the Fund. The Directors concluded that these fall-out benefits to the Adviser were acceptable.
Advisory Fee Rate Schedule
On the basis of the information considered, the Board determined to approve the continuation of the Investment Management Agreement for an additional annual term, without change to the contractual fee schedules of
178 | AB INTERMEDIATE MUNICIPAL PORTFOLIOS | abfunds.com | |
Table of Contents
BOARD CONSIDERATION OF INVESTMENT
MANAGEMENT ARRANGEMENT (continued)
the Portfolios other than the new breakpoints established for the Overlay A Portfolio and the Tax-Aware Overlay Portfolio, as set forth below.
| Portfolio | Annual Percentage of Average Daily Net Assets of Each Portfolio | |
| Short Duration Diversified Municipal Portfolio | 0.30% of the first $750 million; 0.25% of assets in excess of $750 million | |
| Short Duration Plus Portfolio | 0.35% of the first $750 million; 0.30% of assets in excess of $750 million | |
| New York Municipal Portfolio | 0.425% of the first $1 billion; 0.375% in excess of $1 billion up to, but not exceeding $3 billion; 0.325% in excess of $3 billion up to, but not exceeding $5 billion; 0.275% of assets in excess of $5 billion | |
| California Municipal Portfolio | 0.425% of the first $1 billion; 0.375% in excess of $1 billion up to, but not exceeding $3 billion; 0.325% in excess of $3 billion up to, but not exceeding $5 billion; 0.275% of assets in excess of $5 billion | |
| Diversified Municipal Portfolio | 0.425% of the first $1 billion; 0.375% in excess of $1 billion up to, but not exceeding $3 billion; 0.325% in excess of $3 billion up to, but not exceeding $5 billion; 0.275% in excess of $5 billion up to, but not exceeding $7 billion; 0.225% of assets in excess of $7 billion | |
| Intermediate Duration Portfolio | 0.45% on the first $2.5 billion; 0.40% in excess of $2.5 billion up to, but not exceeding $5 billion; 0.35% in excess of $5 billion up to, but not exceeding $8 billion; 0.30% of assets in excess of $8 billion | |
| Tax-Managed International Portfolio | 0.75% on the first $2.5 billion; 0.65% in excess of $2.5 billion up to, but not exceeding $5 billion; 0.60% of assets in excess of $5 billion | |
| International Portfolio | 0.75% on the first $2.5 billion; 0.65% in excess of $2.5 billion up to, but not exceeding $5 billion; 0.60% of assets in excess of $5 billion | |
| Emerging Markets Portfolio | 0.95% of the first $2.5 billion; 0.90% in excess of $2.5 billion up to, but not exceeding $5 billion; 0.85% of assets in excess of $5 billion. | |
| abfunds.com | AB INTERMEDIATE MUNICIPAL PORTFOLIOS | 179 | |
Table of Contents
BOARD CONSIDERATION OF INVESTMENT
MANAGEMENT ARRANGEMENT (continued)
| Portfolio | Annual Percentage of Average Daily Net Assets of Each Portfolio | |
| Overlay A Portfolio | 0.90% of the first $2.5 billion; 0.875% in excess of $2.5 billion up to, but not exceeding $5 billion; 0.85% of assets in excess of $5 billion. | |
| Tax-Aware Overlay A Portfolio | 0.90% of the first $2.5 billion; 0.875% in excess of $2.5 billion up to, but not exceeding $5 billion; 0.85% of assets in excess of $5 billion. | |
| Overlay B Portfolio | 0.65% of assets. | |
| Tax-Aware Overlay B Portfolio | 0.65% of assets. | |
| Tax-Aware Overlay C Portfolio | 0.65% of assets. | |
| Tax-Aware Overlay N Portfolio | 0.65% of assets. |
180 | AB INTERMEDIATE MUNICIPAL PORTFOLIOS | abfunds.com | |
Table of Contents
This page is not part of the Shareholder Report or the Financial Statements.
AB FAMILY OF FUNDS
US EQUITY
CORE
Core Opportunities Fund
FlexFee™ US Thematic Portfolio
Select US Equity Portfolio
GROWTH
Concentrated Growth Fund
Discovery Growth Fund
FlexFee™ Large Cap Growth Portfolio
Growth Fund
Large Cap Growth Fund
Small Cap Growth Portfolio
VALUE
Discovery Value Fund
Equity Income Fund
Relative Value Fund
Small Cap Value Portfolio
Value Fund
INTERNATIONAL/ GLOBAL EQUITY
CORE
Global Core Equity Portfolio
International Strategic Core Portfolio
Sustainable Global Thematic Fund
Tax-Managed Wealth Appreciation Strategy
Wealth Appreciation Strategy
GROWTH
Concentrated International Growth Portfolio
Sustainable International Thematic Fund
VALUE
All China Equity Portfolio
International Value Fund
FIXED INCOME
MUNICIPAL
High Income Municipal Portfolio
Intermediate California Municipal Portfolio
Intermediate Diversified Municipal Portfolio
Intermediate New York Municipal Portfolio
Municipal Bond Inflation Strategy
Tax-Aware Fixed Income Opportunities Portfolio
National Portfolio
Arizona Portfolio
California Portfolio
Massachusetts Portfolio
Minnesota Portfolio
New Jersey Portfolio
New York Portfolio
Ohio Portfolio
Pennsylvania Portfolio
Virginia Portfolio
TAXABLE
Bond Inflation Strategy
Global Bond Fund
High Income Fund
High Yield Portfolio1
Income Fund
Intermediate Duration Portfolio
Limited Duration High Income Portfolio
Short Duration Income Portfolio
Short Duration Portfolio
Sustainable Thematic Credit Portfolio
Total Return Bond Portfolio
ALTERNATIVES
All Market Real Return Portfolio
Global Real Estate Investment Fund
Select US Long/Short Portfolio
MULTI-ASSET
All Market Income Portfolio
All Market Total Return Portfolio
Conservative Wealth Strategy
Emerging Markets Multi-Asset Portfolio
Global Risk Allocation Fund
Tax-Managed All Market Income Portfolio
CLOSED-END FUNDS
AllianceBernstein Global High Income Fund
AllianceBernstein National Municipal Income Fund
We also offer Government Money Market Portfolio, which serves as the money market fund exchange vehicle for the AB mutual funds. You could lose money by investing in the Fund. Although the Fund seeks to preserve the value of your investment at $1.00 per share, it cannot guarantee it will do so. The Fund may impose a fee upon sale of your shares or may temporarily suspend your ability to sell shares if the Fund’s liquidity falls below required minimums because of market conditions or other factors. An investment in the Fund is not insured or guaranteed by the Federal Deposit Insurance Corporation or any other government agency. The Fund’s sponsor has no legal obligation to provide financial support to the Fund, and you should not expect that the sponsor will provide financial support to the Fund at any time.
Investors should consider the investment objectives, risks, charges and expenses of the Fund carefully before investing. For copies of our prospectus or summary prospectus, which contain this and other information, visit us online at www.abfunds.com or contact your AB representative. Please read the prospectus and/or summary prospectus carefully before investing.
| 1 | Prior to April 30, 2021, High Yield Portfolio was named FlexFee High Yield Portfolio. |
| abfunds.com | AB INTERMEDIATE MUNICIPAL PORTFOLIOS | 181 | |
Table of Contents
NOTES
182 | AB INTERMEDIATE MUNICIPAL PORTFOLIOS | abfunds.com | |
Table of Contents
NOTES
| abfunds.com | AB INTERMEDIATE MUNICIPAL PORTFOLIOS | 183 | |
Table of Contents
NOTES
184 | AB INTERMEDIATE MUNICIPAL PORTFOLIOS | abfunds.com | |
Table of Contents
AB INTERMEDIATE MUNICIPAL PORTFOLIOS
1345 Avenue of the Americas
New York, NY 10105
800 221 5672
IM-0152-0321 
Table of Contents
SANFORD C. BERNSTEIN FUND, INC.
Overlay Portfolios
Overlay A Portfolio
Tax-Aware Overlay A Portfolio
Overlay B Portfolio
Tax-Aware Overlay B Portfolio
Tax-Aware Overlay C Portfolio
Tax-Aware Overlay N Portfolio
SEMI-ANNUAL REPORT
MARCH 31, 2021
As of January 1, 2021, as permitted by new regulations adopted by the Securities and Exchange Commission, each Fund’s annual and semi-annual shareholder reports are no longer sent by mail, unless you specifically requested paper copies of the reports. Instead, the reports are made available on a website, and you will be notified by mail each time a report is posted and provided with a website address to access the report.
You may elect to receive all future reports in paper form free of charge. If you invest through a financial intermediary, you can contact your financial intermediary to request that you continue to receive paper copies of your shareholder reports; if you invest directly with a Fund, you can call the Fund at 800.221.5672. Your election to receive reports in paper form will apply to all funds held in your account with your financial intermediary or, if you invest directly, to all AB Mutual Funds you hold.
Table of Contents
| 1 | ||||
| 3 | ||||
| 10 | ||||
| 14 | ||||
| 16 | ||||
| 17 | ||||
| 95 | ||||
| 99 | ||||
| 101 | ||||
| 105 | ||||
| 119 | ||||
| 165 |
Before investing in any portfolio of the Sanford C. Bernstein Fund, Inc., a prospective investor should consider carefully the portfolio’s investment objectives and policies, charges, expenses and risks. These and other matters of importance to prospective investors are contained in the portfolios’ prospectus, an additional copy of which may be obtained by visiting our website at www.Bernstein.com and clicking on “Investments”, found in the footer, then “Mutual Fund Information—Prospectuses, SAIs and Shareholder Reports” or by calling your financial advisor or by calling Bernstein’s mutual fund shareholder help line at 212.756.4097. Please read the prospectus carefully before investing.
For performance information current to the most recent month-end, please call (collect) 212.486.5800.
You may obtain a description of the Fund’s proxy voting policies and procedures, and information regarding how the Fund voted proxies relating to portfolio securities during the most recent 12-month period ended June 30, without charge. Simply visit www.AllianceBernstein.com or go to the Securities and Exchange Commission’s website at www.sec.gov, or call AllianceBernstein at 800.227.4618.
This shareholder report must be preceded or accompanied by the Sanford C. Bernstein Fund, Inc. prospectus for individuals who are not shareholders of the Fund.
The Fund will file its complete schedule of portfolio holdings with the Commission for the first and third quarters of each fiscal year as an exhibit to its reports on Form N-PORT. The Fund’s Form N-PORT reports are available on the Commission’s website at www.sec.gov. The Fund’s Forms N-PORT may also be reviewed and copied at the Commission’s Public Reference Room in Washington, D.C.; information on the operation of the Public Reference Room may be obtained by calling 800.SEC.0330.
Investment Products Offered: · Are Not FDIC Insured · May Lose Value · Are Not Bank Guaranteed
Table of Contents
Portfolio Manager Commentary (Unaudited)
To Our Shareholders—May 17, 2021
On the following pages, you will find the 2021 semi-annual report for the Overlay Portfolios1 of the Sanford C. Bernstein Fund, Inc. (collectively, the “Portfolios”, and individually, a “Portfolio”). The semi-annual report covers the six- and 12-month periods ended March 31, 2021, and includes financial statements as well as notes to the financial statements, information about the recent performance of the Portfolios and a listing of each Portfolio’s holdings as of the period end.
Global equities have rebounded strongly from last year’s market bottom, up 55% over the past year and 21% over the past six months. Continued optimism and promising data from the rollout of COVID-19 vaccines, along with ongoing economic support from governments, have propelled stocks to new highs. In the US, coronavirus cases fell by around 80% over the past three months as the holiday spread faded and over 100 million people received at least one dose of the vaccine.
For the past several years, market performance has been concentrated in high growth momentum stocks around the world, especially in the US. That pattern reversed in the final quarter of 2020 and has persisted in 2021, with a notable rebound in cyclical sectors, in particular in the small-cap space.
Fixed income has been more challenged than equities, rebounding in the early stages of the recovery as all assets recovered, but facing headwinds as investors’ risk appetite returned, and capital was reallocated to equities. In addition, in the first quarter of 2021, US interest rates rose significantly with the 10-year Treasury yield moving from 1% to over 1.7%. Price pressure on bonds was notable, but yields have readjusted meaningfully, and our portfolio teams are taking advantage of those with purchases of new issues.
The markets are now focused on the pace of the recovery, with estimates of global GDP and corporate earnings continuing to rise. We have increased our own estimates for global economic growth meaningfully. We continue to monitor how a recovery in global demand, likely led by the US given its substantial fiscal stimulus and reopening progress, will intersect with supply chains that are still coming back online. In addition, we’ll be watching the recovery in labor markets, which will be necessary to keep demand strong. Inflation expectations have rebounded to more normal levels and we’ll continue to track them and the potential path of interest rates.
Thank you for your continued confidence in our approach.
If you have any questions about your investments in the Portfolios, please contact your Bernstein Advisor by calling 212.756.4097, or visit www.Bernstein.com. As always, we are firmly dedicated to your investment success. Thank you for your continued interest in the Portfolios.
Sincerely,
Beata D. Kirr
President
Sanford C. Bernstein Fund, Inc.
| 1 | This performance discussion is intended as a general market commentary. Please note that information for the Emerging Markets, California Municipal, Diversified Municipal, New York Municipal, Short Duration Diversified Municipal, Intermediate Duration and Short Duration Plus Portfolios of the Sanford C. Bernstein Fund, Inc. may be found in a separate report. |
The Portfolios are intended to be used as part of a broader investment program administered directly by Sanford C. Bernstein & Co. LLC. The performance and objectives of the Portfolios should be evaluated only in the context of the investor’s complete investment program. The Portfolios are NOT designed to be used as a standalone investment.
Investment Objectives and Policies
The investment objective of the Overlay A and Tax-Aware Overlay A Portfolios is to manage the volatility of an equity-oriented asset allocation over the long term, as part of a Private Client’s overall asset allocation managed by Sanford C. Bernstein & Co. LLC (“Bernstein”). The investment objective of the Overlay B, Tax-Aware Overlay B, Tax-Aware Overlay C and Tax-Aware Overlay N Portfolios is to manage the volatility of a fixed-income-oriented asset allocation over the long term, as part of a Private Client’s overall asset allocation managed by Bernstein.
(Portfolio Manager Commentary continued on next page)
2021 Semi-Annual Report | 1 | |
Table of Contents
Portfolio Manager Commentary (continued)
The Portfolios may invest in a diversified portfolio of securities and other financial instruments, including derivative instruments that provide investment exposure to a variety of asset classes. These asset classes may include: equity securities and fixed-income instruments of issuers located within and outside the United States, real estate-related securities, below investment-grade (“high yield”) securities (commonly known as “junk bonds”), currencies and commodities. The Overlay A and Tax-Aware Overlay A Portfolios obtain equity exposure by investing directly in equity securities and through investments in other registered funds, including, but not limited to, other funds managed by AllianceBernstein L.P. (the “Adviser”). By adjusting investment exposure among the various asset classes in the Portfolios, the Adviser seeks to manage the volatility of diversified client portfolios managed by Bernstein that reflect a significant allocation to equity securities, in the case of the Overlay A and Tax-Aware Overlay A Portfolios, and a significant allocation to taxable or municipal fixed-income securities in the case of the Overlay B, Tax-Aware Overlay B, Tax-Aware Overlay C and Tax-Aware Overlay N Portfolios. The Portfolios’ asset class exposures may be implemented and adjusted either through transactions in individual securities or through derivatives.
The Adviser alters asset class exposures as market and economic conditions change. The Adviser employs risk/return tools and fundamental research insights to determine how to adjust the Portfolios’ exposures to various asset classes. These dynamic adjustments to the Portfolios’ asset class exposures are implemented principally through the use of derivatives.
The Adviser also may use exchange-traded funds (“ETFs”), exchange traded notes, structured investments and commodity-linked notes in seeking to carry out the Portfolios’ investment strategies. The Portfolios may enter into foreign currency transactions for hedging and non-hedging purposes on a spot (i.e., cash) basis or through the use of derivatives. An appropriate hedge of currency exposure resulting from the Portfolios’ securities positions may not be available or cost effective, or the Adviser may determine not to hedge the positions, possibly even under market conditions where doing so could benefit the Portfolios. The Portfolios may use options strategies (involving the purchase and/or writing of various combinations of call and/or put options, including on individual securities and stock indices), futures contracts (including futures contracts on individual securities and stock indices), swap agreements (including interest rate swaps and currency swaps) or shares of ETFs. These transactions may be used, for example, in an effort to earn extra income, to adjust exposure to individual securities or markets, or to protect all or a portion of the Portfolios from a decline in value, sometimes within certain ranges.
Exposure to certain other asset classes may also be achieved through investments in other AB mutual funds. The Overlay A and Overlay B Portfolios are managed without regard to potential tax consequences to the shareholder. In the case of the Tax-Aware Portfolios, the Adviser will employ tax management strategies in an attempt to reduce the impact of taxes on shareholders in the Portfolios.
| 2 | Sanford C. Bernstein Fund, Inc. | |
Table of Contents
Disclosures and Risks (Unaudited)
Benchmark Disclosures
None of the following indices or averages reflects fees and expenses associated with the active management of a mutual fund portfolio. The Standard and Poor’s (“S&P”) 500® Index includes 500 US stocks and is a common representation of the performance of the overall US stock market. The Bloomberg Barclays Global Aggregate Bond Index (USD hedged) represents the performance of the global investment-grade developed fixed-income markets, hedged to the US dollar. The Bloomberg Barclays 5-Year General Obligation (“GO”) Municipal Bond Index represents the performance of long-term, investment-grade tax-exempt bonds with maturities ranging from four to six years. The Russell 3000® Index measures the performance of the largest 3,000 US public companies representing approximately 98% of the investible US equity market by stock market capitalization. The Morgan Stanley Capital International (“MSCI”) All Country World Index (“ACWI”) ex USA Investable Markets Index (“IMI”) (net) captures large-, mid- and small-cap representation across 22 of 23 developed-market countries (excluding the US) and 23 emerging-market countries. The MSCI ACWI Commodity Producers Index captures the global opportunity set of commodity producers in the energy, metal and agricultural sectors. Constituents are selected from the equity universe of MSCI ACWI, the parent index, which covers mid- and large-cap securities across 23 developed markets and 23 emerging-markets countries. The Financial Times Stock Exchange® European Public Real Estate Association/National Association of Real Estate Investment Trusts (“FTSE EPRA/NAREIT”) Global Index is a free-float adjusted index designed to track the performance of listed real estate companies and real estate investment trusts (“REITs”) worldwide. The Bloomberg Commodity Index is made up of 22 exchange-traded futures on physical commodities. The Bloomberg Barclays US Aggregate Bond Index represents the performance of securities within the US investment-grade fixed rate bond market, with index components for government and corporate securities, mortgage pass-through securities, asset-backed securities and commercial mortgage-backed securities. The Bloomberg Barclays 1-10 Year US TIPS Index measures the performance of the US Treasury inflation-protected securities market, with maturities between one and ten years. The Bloomberg Barclays 1-10 Year Municipal Bond Index represents the performance of the long-term tax-exempt bond market consisting of investment-grade bonds.
The composite benchmark for a Portfolio is a customized benchmark and uses index returns to represent performance of the asset classes. The Composite Benchmark for Overlay A is 44% Russell 3000, 29.4% MSCI ACWI ex USA IMI (net), 6.6% MSCI ACWI Commodity Producers (net), 10% Bloomberg Barclays US Aggregate Bond, 10% Bloomberg Barclays Global Aggregate Bond (USD hedged). The Composite Benchmark for Tax-Aware Overlay A is 44.2% Russell 3000, 29.5% MSCI ACWI ex USA IMI (net), 6.3% MSCI ACWI Commodity Producers (net), 20% Bloomberg Barclays US Aggregate Bond. The Composite Benchmark for Overlay B is 15.9% Russell 3000, 10.8% MSCI ACWI ex USA IMI (net), 3.3% MSCI ACWI Commodity Producers (net), 24.5% Bloomberg Barclays US Aggregate Bond, 24.5% Bloomberg Barclays Global Aggregate Bond (USD hedged), 21% Bloomberg Barclays 1-10 Year US TIPS. The Composite Benchmark for Tax-Aware Overlay B is 17.9% Russell 3000, 12.1% MSCI ACWI ex USA IMI (net), 42% Bloomberg Barclays 1-10 Year Municipal Bond, 28% Bloomberg Barclays 1-10 Year US TIPS. The Composite Benchmark for Tax-Aware Overlay C and N is 19.3% Russell 3000, 10.7% MSCI ACWI ex USA IMI (net), 28% Bloomberg Barclays 1-10 Year US TIPS, 42% Bloomberg Barclays 1-10 Year Municipal Bond.
The Russell 3000, MSCI ACWI ex USA IMI (net) and MSCI ACWI Commodity Producers Index (net) represent the allocation to global stocks. The FTSE EPRA/NAREIT Global Index represents the allocation to real estate. The Bloomberg Commodity, the Bloomberg Barclays US Aggregate Bond, Bloomberg Barclays 1-10 Year US TIPS, Bloomberg Barclays 1-10 Year Municipal Bond and Bloomberg Barclays Global Aggregate Bond (USD hedged) represent the allocation to bonds.
MSCI makes no express or implied warranties or representations, and shall have no liability whatsoever with respect to any MSCI data contained herein. The MSCI data may not be further redistributed or used as a basis for other indices, any securities or financial products. This report is not approved, reviewed or produced by MSCI. Net returns include the reinvestment of dividends after deduction of non-US withholding tax. Investors cannot invest directly in an index, and their results are not indicative of the performance for any specific investment, including the Portfolios.
(Disclosures and Risks continued on next page)
2021 Semi-Annual Report | 3 | |
Table of Contents
Disclosures and Risks (continued)
A Word About Risk
All Overlay Portfolios:
The share price of the Portfolios will fluctuate and you may lose money. There is no guarantee that the Portfolios will achieve their investment objective.
The Portfolios are intended to be used as part of a broader investment program administered directly by Bernstein. The performance and objectives of the Portfolios should be evaluated only in the context of the Private Client’s complete investment program. Changes in value of the Portfolios may be particularly pronounced because the Portfolios are managed in such a fashion as to affect the investor’s assets subject to that broader investment program. The Portfolios are NOT designed to be used as a standalone investment.
Cybersecurity Risk: Cybersecurity incidents, both intentional and unintentional, may allow an unauthorized party to gain access to Portfolio assets, customer data (including private shareholder information), or proprietary information, or cause the Portfolios, the Adviser, and/or its service providers (including, but not limited to, fund accountants, custodians, sub-custodians, transfer agents and financial intermediaries) to suffer data breaches, data corruption or lose operational functionality, or prevent Portfolio investors from purchasing, redeeming or exchanging shares or receiving distributions. A Portfolio and the Adviser have limited ability to prevent or mitigate cybersecurity incidents affecting third-party service providers. Cybersecurity incidents may result in financial losses to such Portfolio and its shareholders, and substantial costs may be incurred in order to prevent any future cybersecurity incidents.
Market Risk: The Portfolios are subject to market risk, which is the risk that stock prices in general or in particular countries or sectors may decline over short or extended periods. Stock prices may decline in response to adverse changes in the economy or the economic outlook; deterioration in investor sentiment; interest rate, currency and commodity price fluctuations; adverse geopolitical, social or environmental developments; issuer- and sector-specific considerations; public health crises (including the occurrence of a contagious disease or illness); and other factors. In the past decade, financial markets in the United States, Europe and elsewhere have experienced increased volatility, decreased liquidity and heightened uncertainty. These market conditions may recur from time to time and have an adverse impact on various securities markets. Recently, certain governments and central banks have provided significant support to financial markets in response to serious economic disruptions, including, but not limited to, buying stocks, providing direct capital infusions into companies, implementing new monetary programs, dramatically lowering interest rates and through other market interventions. This and other government intervention into the economy and financial markets may not work as intended, particularly if the efforts are perceived by investors as being unlikely to achieve the desired results. Government actions to support the economy and financial markets have resulted in a large expansion of government deficits and debt, the long-term consequences of which are not known. The reversal of these policies, or their ineffectiveness, as well as further governmental or central bank actions could negatively affect financial markets generally, increase market volatility and reduce the value and liquidity of securities in which the Portfolios invest.
On January 31, 2020, the United Kingdom (the “UK”) formally left the European Union (the “EU”) (“Brexit”) and ceased to be a member of the EU. Brexit could adversely affect European or worldwide political, regulatory, economic or market conditions and could contribute to instability in global political institutions, regulatory agencies and financial markets. Brexit could also lead to legal uncertainty and politically divergent national laws and regulations as a new relationship between the UK and EU is developed and the UK determines which EU laws to replace or replicate in the future. Any of these effects of Brexit, and others the Adviser cannot anticipate, could adversely affect the value of the Portfolios’ investments and net asset value. The political, economic and legal consequences of Brexit continue to give rise to uncertainties. The UK may be less stable than it has been in recent years and investments in UK assets may be difficult to value, or subject to greater or more frequent rises and falls in value.
The United States has imposed tariffs and other trade barriers on Chinese exports and placed other restrictions on or barriers to investments in China. Trade disputes, particularly prolonged disputes, may adversely affect the economies of the United States and its trading partners, as well as the companies directly or indirectly affected by the dispute and financial markets generally, and thus may adversely affect the value of the Portfolios’ assets. Recently, the United States government acted to prohibit US persons, such as the Portfolios, from owning, and required them to divest, certain Chinese companies designated as related to the Chinese military. There
(Disclosures and Risks continued on next page)
| 4 | Sanford C. Bernstein Fund, Inc. | |
Table of Contents
Disclosures and Risks (continued)
is no assurance that more such companies will not be so designated in the future, which could limit the Portfolios’ opportunities for investment and require the sale of securities at a loss or make them illiquid. If the political climate between the United States and China continues to deteriorate, economies and markets may be adversely affected.
Policy and legislative changes in the United States and in other countries are affecting many aspects of financial regulation, and may in some instances contribute to decreased liquidity and increased volatility in the financial markets. The impact of these changes, and the practical implications for market participants, may not be fully known for some time.
Economies and financial markets throughout the world are becoming increasingly interconnected. Economic, financial or political events, trading and tariff arrangements, terrorism, natural disasters (including the spread of infectious illness) and other circumstances in one country or region could have profound impacts on global economies or markets. As a result, whether or not the Portfolios invest in securities of issuers located in or with significant exposure to countries experiencing economic and financial difficulties, the value and liquidity of the Portfolios’ investments may be negatively affected.
Management Risk: The Portfolios are subject to management risk because they are actively managed investment portfolios. The Adviser will apply its investment techniques and risk analyses in making investment decisions for the Portfolios, but these techniques, analyses and decisions may not work as intended or may not produce the desired results, and may, during certain periods, result in increased volatility for the Portfolios or cause the value of the Portfolios’ shares to go down. In some cases, derivatives and other investment techniques may be unavailable or the Adviser may determine not to use them, possibly even under market conditions where their use could benefit the Portfolios. Some of these techniques may incorporate, or rely upon, quantitative models, but there is no guarantee that these models will generate accurate forecasts, reduce risk or otherwise perform as expected. In addition, the Adviser may change the Portfolios’ investment strategies or policies from time to time. Those changes may not lead to the results intended by the Adviser and could have an adverse effect on the value or performance of the Portfolios.
Allocation Risk: The allocation of investments among different global asset classes may have a significant effect on the Portfolios’ net asset value (“NAV”) when one of these asset classes is performing more poorly than others. As direct investments, investments in other funds and derivative positions will be periodically rebalanced to reflect the Adviser’s view of market and economic conditions, there will be transaction costs which may be, over time, significant. In addition, there is a risk that certain asset allocation decisions may not achieve the desired results and, as a result, the Portfolios may incur significant losses.
Derivatives Risk: The Portfolios intend to use derivatives as direct investments to earn income, enhance return and broaden portfolio diversification, which entail greater risk than if used solely for hedging purposes. In addition to other risks such as the credit risk of the counterparty, derivatives involve the risk that changes in the value of the derivative may not correlate with relevant assets, rates or indices. Derivatives may be difficult to price or unwind, and small changes may produce disproportionate losses for the Portfolios. Certain derivatives have the potential for unlimited loss, regardless of the size of the initial investment. Assets required to be set aside or posted to cover or secure derivatives positions may themselves go down in value, and these collateral and other requirements may limit investment flexibility. Some derivatives involve leverage, which can make the Portfolios more volatile and can compound other risks. Derivatives, especially over-the-counter derivatives, are also subject to counterparty risk. Use of derivatives may have different tax consequences for the Portfolios than an investment in the underlying asset or index, and such differences may affect the amount, timing and character of income distributed to shareholders. The US government and certain foreign governments have adopted regulations governing derivatives markets, including mandatory clearing of certain derivatives and may impose additional regulations governing margin, reporting and registration requirements. The ultimate impact of the regulations remains unclear. Additional regulation may make derivatives more costly, limit their availability or utility, otherwise adversely affect their performance, or disrupt markets.
Leverage Risk: Leverage creates exposure to gains and losses in a greater amount than the dollar amount made in an investment by attempting to enhance return or value without increasing the investment amount. Leverage can magnify the effects of changes in the value of the Portfolios’ investments and make them more volatile. The use of leverage may cause the Portfolios to liquidate portfolio positions when it may not be advantageous to do so.
(Disclosures and Risks continued on next page)
2021 Semi-Annual Report | 5 | |
Table of Contents
Disclosures and Risks (continued)
Illiquid Investments Risk: Illiquid investments risk exists when particular investments are difficult to purchase or sell, possibly preventing the Portfolios from purchasing or selling these securities at an advantageous price. Over recent years, regulatory changes have led to reduced liquidity in the marketplace, and the capacity of dealers to make markets in fixed-income securities has been outpaced by the growth in the size of the fixed-income markets. Illiquid investments risk may be magnified in a rising interest-rate environment, where the value and liquidity of fixed-income securities generally go down. Illiquid securities may also be difficult to value.
Redemption Risk: The Portfolios may experience heavy redemptions that could cause the Portfolios to liquidate their assets at inopportune times or unfavorable prices or increase or accelerate taxable gains or transaction costs and may negatively affect the Portfolios’ net asset value, or performance, which could cause the value of your investment to decline. Redemption risk is heightened during periods of overall market turmoil.
Foreign (Non-US) Securities Risk: Investments in foreign securities entail significant risks in addition to those customarily associated with investing in US securities. These risks include risks related to adverse market, economic, political and regulatory factors and social instability, all of which could disrupt the financial markets in which the Portfolios invest and adversely affect the value of the Portfolios’ assets.
Emerging-Markets Securities Risk: The risks of investing in foreign (non-US) securities are heightened with respect to issuers in emerging-market countries, because the markets are less developed and less liquid and there may be a greater amount of economic, political and social uncertainty. In addition, the value of the Portfolios’ investments may decline because of factors such as unfavorable or unsuccessful government actions and reduction of government or central bank support.
Foreign Currency Risk: This is the risk that changes in foreign (non-US) currency exchange rates may negatively affect the value of the Portfolios’ investments or reduce the returns of the Portfolios. For example, the value of the Portfolios’ investments in foreign securities and foreign currency positions may decrease if the US dollar is strong (i.e., gaining value relative to other currencies) and other currencies are weak (i.e., losing value relative to the US dollar).
Actions by a Few Major Investors: In certain countries, volatility may be heightened by actions of a few major investors. For example, substantial increases or decreases in cash flows of mutual funds investing in these markets could significantly affect local stock prices and, therefore, share prices of the Portfolios.
Interest-Rate Risk: Changes in interest rates will affect the value of investments in fixed-income securities. When interest rates rise, the value of existing investments in fixed-income securities tends to fall and this decrease in value may not be offset by higher income from new investments. Interest-rate risk is generally greater for fixed-income securities with longer maturities or durations. The current historically low interest rate environment heightens the risks associated with rising interest rates.
Credit Risk: This is the risk that the issuer or the guarantor of a debt security, or the counterparty to a derivatives or other contracts, will be unable or unwilling to make timely principal and/or interest payments, or to otherwise honor its obligations. The issuer or guarantor may default, potentially causing a loss of the full principal amount of a security and accrued interest. The degree of risk for a particular security may be reflected in its credit rating. The credit rating of a fixed-income security may be downgraded after purchase, which may adversely affect the value of the security. Investments in fixed-income securities with lower ratings tend to have a higher probability that an issuer will default or fail to meet its payment obligations, making credit risk greater for medium-quality and lower-rated debt securities. Lower-rated debt securities and similar unrated securities (commonly known as “junk bonds”) have speculative elements or are predominantly speculative credit risks. At times when credit risk is perceived to be greater, credit “spreads” (i.e., the difference between the yields on lower quality securities and the yields on higher quality securities) may get larger or “widen”. As a result, the values of the lower quality securities may go down more and they may become harder to sell.
Duration Risk: Duration is a measure that relates the expected price volatility of a fixed-income security to changes in interest rates. The duration of a fixed-income security may be shorter than or equal to full maturity of the fixed-income security. Fixed-income securities with longer durations have more interest-rate risk and will decrease in price as interest rates rise. Securities that have final maturities longer than their durations may be affected by increased credit spreads to a far greater
(Disclosures and Risks continued on next page)
| 6 | Sanford C. Bernstein Fund, Inc. | |
Table of Contents
Disclosures and Risks (continued)
degree than their durations would suggest, because they are exposed to credit risk until final maturity.
Commodity Risk: The value of commodity-linked derivatives, exchange traded notes and exchange traded funds may be affected by changes in overall market movements, commodity index volatility, changes in interest rates, or factors affecting a particular industry or commodity, such as drought, floods, weather, livestock disease, embargoes, tariffs and international economic, political and regulatory developments.
Inflation Risk: This is the risk that the value of assets or income from investments will be less in the future as inflation decreases the value of money. As inflation increases, the value of the Portfolios’ assets can decline as can the value of the Portfolios’ distributions. This risk is significantly greater for fixed-income securities with longer maturities.
Inflation-Protected Securities Risk: The terms of inflation-protected securities provide for the coupon and/or maturity value to be adjusted based on changes in an inflation index. Decreases in the inflation rate or in investors’ expectations about inflation could cause these securities to underperform non-inflation-adjusted securities on a total-return basis. In addition, there can be no assurance that the relevant inflation index will accurately measure the rate of inflation, in which case the securities may not work as intended. These securities may be more difficult to trade or dispose of than other types of securities.
Prepayment and Extension Risk: Prepayment risk is the risk that a loan, bond or other security might be called or otherwise converted, prepaid or redeemed before maturity. If this happens, particularly during a time of declining interest rates or credit spreads, the Portfolios will not benefit from the rise in market price that normally accompanies a decline in interest rates, and may not be able to invest the proceeds in securities providing as much income, resulting in a lower yield to the Portfolios. Conversely, extension risk is the risk that as interest rates rise or spreads widen, payments of securities may occur more slowly than anticipated by the market. If this happens, the values of these securities may go down because their interest rates are lower than current market rates and they remain outstanding longer than anticipated.
Lower-rated Securities Risk: Lower-rated securities, or junk bonds/high-yield securities, are subject to greater risk of loss of principal and interest and greater market risk than higher-rated securities. The capacity of issuers of lower-rated securities to pay interest and repay principal is more likely to weaken than is that of issuers of higher-rated securities in times of deteriorating economic conditions or rising interest rates.
Real Estate Related Securities Risk: Investing in real estate related securities includes, among others, the following risks: possible declines in the value of real estate; risks related to general and local economic conditions, including increases in the rate of inflation; possible lack of availability of mortgage funds; overbuilding; extended vacancies of properties; increases in competition, property taxes and operating expenses; changes in zoning laws; costs resulting from the clean-up of, and liability to third parties for damages resulting from, environmental problems; casualty or condemnation losses; uninsured damages from floods, earthquakes or other natural disasters; limitations on and variations in rents; and changes in interest rates. Investing in REITs involves certain unique risks in addition to those risks associated with investing in the real estate industry in general. Equity REITs may be affected by changes in the value of the underlying property owned by the REITs, while mortgage REITs may be affected by the quality of any credit extended. REITs are dependent upon management skills, are not diversified, and are subject to heavy cash flow dependency, default by borrowers and self-liquidation. Investing in REITs also involves risks similar to those associated with investing in small-capitalization companies. REITs may have limited financial resources, may trade less frequently and in a limited volume and may be subject to more abrupt or erratic price movements than larger company securities.
Investment in Other Investment Companies Risk: As with other investments, investments in other investment companies, including other AB Mutual Funds and ETFs, are subject to market and management risk. In addition, if the Portfolios acquire shares of investment companies, shareholders bear both their proportionate share of expenses in the Portfolios (including management and advisory fees) and, indirectly, the expenses of the investment companies in which the Portfolios invest.
Tax-Aware Overlay B, Tax-Aware Overlay C and Tax-Aware Overlay N Portfolios
Municipal Market Risk: This is the risk that special factors may adversely affect the value of municipal securities and have a significant effect on the yield or value of the Portfolios’ investments in municipal securities. These factors include economic conditions, political or legislative changes, uncertainties related to the tax status of municipal securities, or
(Disclosures and Risks continued on next page)
2021 Semi-Annual Report | 7 | |
Table of Contents
Disclosures and Risks (continued)
the rights of investors in these securities. The value of municipal securities may also be adversely affected by rising health care costs, increasing unfunded pension liabilities, and by the phasing out of federal programs providing financial support. In recent periods, a number of municipal issuers have defaulted on obligations, been downgraded or commenced insolvency proceedings. Financial difficulties of municipal issuers may continue or get worse, particularly in light of the economic impact of the recent spread of a novel coronavirus (COVID-19). To the extent the Portfolios invest in a particular state’s municipal securities, they may be vulnerable to events adversely affecting that state, including economic, political and regulatory occurrences, court decisions, terrorism, public health crises (including the occurrence of a contagious disease or illness) and catastrophic natural disasters, such as hurricanes, wildfires and earthquakes. The Portfolios’ investments in certain municipal securities with principal and interest payments that are made from the revenues of a specific project or facility, and not general tax revenues, are subject to the risk that factors affecting the project or facility, such as local business or economic conditions, could have a significant effect on the project’s ability to make payments of principal and interest on these securities.
In addition, tax law changes enacted as part of the Tax Cuts and Jobs Act of 2017 could have a material impact on the value of municipal securities. Because advance refunding bonds issued after December 31, 2017 are no longer tax exempt, the total supply of municipal bonds could decrease going forward. In addition, the reduction of the US corporate income tax rate to 21% could make municipal obligations less attractive to certain institutional investors such as banks and property and casualty insurance companies, resulting in lower demand for municipal obligations. Changes in tax rates or the treatment of income from certain types of municipal securities, among other things, could negatively affect the municipal securities markets.
The Portfolios may invest in municipal securities of issuers in Puerto Rico or other US territories and their governmental agencies and municipalities, which are exempt from federal, state, and, where applicable, local income taxes. These municipal securities may have more risks than those of other US issuers of municipal securities. Like many US states and municipalities, Puerto Rico experienced a significant downturn in the 2007–2009 recession. Puerto Rico’s downturn was particularly severe. In addition, Hurricane Maria caused significant damage to Puerto Rico. Hurricane Maria and severe weather events that may occur in the future could have significant and long-lasting impacts on Puerto Rico’s economy. Puerto Rico continues to face a very challenging economic and fiscal environment, worsened by the spread of COVID-19 and the adverse effect that related governmental and public responses have had on Puerto Rico’s economy. If the general economic situation in Puerto Rico continues to persist or worsens, the volatility and credit quality of Puerto Rican municipal securities could continue to be adversely affected, and the market for such securities may deteriorate further.
Tax Risk: There is no guarantee that the income on the Portfolios’ municipal securities will be exempt from regular federal income, and if applicable, state income taxes. Unfavorable legislation, adverse interpretations by federal or state authorities, litigation or noncompliant conduct by the issuer of a municipal security could affect the tax-exempt status of municipal securities. If the Internal Revenue Service or a state authority determines that an issuer of a municipal security has not complied with applicable requirements, interest from the security could become subject to regular federal income tax and/or state personal income tax, possibly retroactively to the date the security was issued, the value of the security could decline significantly, and a portion of the distributions to Portfolio shareholders could be recharacterized as taxable. The US Congress has considered changes to US federal tax law that would, if enacted, have a negative impact on certain types of municipal securities, such as private activity bonds, or would otherwise make investments in municipal bonds less attractive.
Overlay A, Tax-Aware Overlay A, Overlay B and Tax-Aware Overlay B Portfolios
Subordination Risk: The Portfolios may invest in securities that are subordinated to more senior securities of an issuer, or which represent interests in pools of such subordinated securities. Subordinated securities will be disproportionately affected by a default or even a perceived decline in creditworthiness of the issuer. Subordinated securities are more likely to suffer a credit loss than non-subordinated securities of the same issuer, any loss incurred by the subordinated securities is likely to be proportionately greater, and any recovery of interest or principal may take more time.
(Disclosures and Risks continued on next page)
| 8 | Sanford C. Bernstein Fund, Inc. | |
Table of Contents
Disclosures and Risks (continued)
Overlay B and Tax-Aware Overlay B Portfolios:
Mortgage-Related and Asset-Related Securities Risk: Mortgage- and asset-related securities represent interests in “pools” of mortgages or other assets, including consumer loans or receivables held in trust. Mortgage- and asset-related securities are subject to credit, interest-rate, prepayment and extension risks. These securities also are subject to risk of default on the underlying mortgage or asset, particularly during periods of economic downturn. Small movements in interest rates (both increases and decreases) may quickly and significantly reduce the value of certain mortgage-related securities.
These risks are discussed in further detail in the Portfolios’ prospectus.
An Important Note About Historical Performance
Except as noted, returns do not reflect the deduction of taxes that a shareholder would pay on portfolio distributions or the redemption of portfolio shares. All fees and expenses related to the operation of the Portfolios have been deducted.
The performance shown in this report represents past performance and does not guarantee future results. Performance information is as of the dates shown. Current performance may be lower or higher than the performance information shown. You may obtain performance information current to the most recent month-end by calling 212.756.4097. The investment return and principal value of an investment in the Portfolios will fluctuate, so that shares, when redeemed, may be worth more or less than their original cost. Performance assumes reinvestment of distributions and does not account for taxes.
Investors should consider the investment objectives, risks, charges and expenses of the Portfolios carefully before investing. For copies of our prospectus or summary prospectus, which contain this and other information, visit www.Bernstein.com, click on “Investments”, found in the footer, then “Mutual Fund Information—Prospectuses, SAIs and Shareholder Reports”, or call Bernstein’s mutual fund shareholder help line at 212.756.4097 or contact your Bernstein Advisor. Please read the prospectus and/or summary prospectus carefully before investing.
2021 Semi-Annual Report | 9 | |
Table of Contents
Historical Performance (Unaudited)
Overlay Portfolios vs. Their Benchmarks
| TOTAL RETURNS | AVERAGE ANNUAL TOTAL RETURNS | |||||||||||||||||||
| THROUGH MARCH 31, 2021 | PAST SIX MONTHS | PAST 12 MONTHS | PAST FIVE YEARS | PAST 10 YEARS | SINCE INCEPTION1 | |||||||||||||||
Overlay A Portfolio Class 1 | 17.50 | % | 36.46 | % | 7.17 | % | 5.41 | % | 6.57 | % | ||||||||||
Return after taxes on Distributions2 | 17.25 | % | 36.18 | % | 6.78 | % | 4.67 | % | 5.86 | % | ||||||||||
Return after taxes on Distributions and sale of shares2 | 10.51 | % | 21.77 | % | 5.57 | % | 4.12 | % | 5.14 | % | ||||||||||
Overlay A Portfolio Class 2 | 17.61 | % | 36.78 | % | 7.40 | % | 5.62 | % | 6.78 | % | ||||||||||
Return after taxes on Distributions2 | 17.31 | % | 36.44 | % | 6.96 | % | 4.84 | % | 6.02 | % | ||||||||||
Return after taxes on Distributions and sale of shares2 | 10.61 | % | 22.00 | % | 5.75 | % | 4.29 | % | 5.30 | % | ||||||||||
Composite Benchmark | 18.05 | % | 45.94 | % | 11.42 | % | 8.16 | % | 9.46 | % | ||||||||||
S&P 500 Index | 19.07 | % | 56.35 | % | 16.29 | % | 13.91 | % | 14.94 | % | ||||||||||
Tax-Aware Overlay A Portfolio Class 1 | 17.19 | % | 36.25 | % | 7.09 | % | 5.05 | % | 6.46 | % | ||||||||||
Return after taxes on Distributions2 | 16.91 | % | 35.94 | % | 6.68 | % | 4.52 | % | 5.96 | % | ||||||||||
Return after taxes on Distributions and sale of shares2 | 10.32 | % | 21.63 | % | 5.48 | % | 3.92 | % | 5.15 | % | ||||||||||
Tax-Aware Overlay A Portfolio Class 2 | 17.29 | % | 36.54 | % | 7.32 | % | 5.25 | % | 6.68 | % | ||||||||||
Return after taxes on Distributions2 | 16.96 | % | 36.16 | % | 6.85 | % | 4.67 | % | 6.13 | % | ||||||||||
Return after taxes on Distributions and sale of shares2 | 10.41 | % | 21.84 | % | 5.65 | % | 4.08 | % | 5.32 | % | ||||||||||
Composite Benchmark | 17.84 | % | 45.38 | % | 11.51 | % | 8.34 | % | 9.61 | % | ||||||||||
S&P 500 Index | 19.07 | % | 56.35 | % | 16.29 | % | 13.91 | % | 14.94 | % | ||||||||||
| Please keep in mind that high, double-digit returns are highly unusual and cannot be sustained. Investors should also be aware that these returns were primarily achieved during favorable market conditions. |
| The current prospectus fee table shows the total operating expense ratios for Class 1 and Class 2 shares as 1.50% and 1.30% for Overlay A, and 1.46% and 1.26% for Tax-Aware Overlay A. The Financial Highlights section of this report sets forth expense ratio data for the current reporting period; the expense ratios shown above may differ from the expense ratios in the Financial Highlights section since they are based on different time periods. |
| There are no sales charges associated with an investment in the Bernstein funds. Total returns and average annual returns are therefore the same. The Portfolios are not standalone Portfolios and are used only in conjunction with globally diversified Private Client portfolios. |
| 1 | Inception date: 2/8/2010. |
| 2 | After-tax returns are an estimate, which is based on the highest historical individual federal marginal income-tax rates, and do not reflect the impact of state and local taxes; actual after-tax returns depend on an individual investor’s tax situation and are likely to differ from those shown, and are not relevant to investors who hold Portfolio shares through tax-deferred arrangements such as 401(k) plans or individual retirement accounts. |
See Disclosures, Risks and Note About Historical Performance on pages 3–9.
(Historical Performance continued on next page)
| 10 | Sanford C. Bernstein Fund, Inc. | |
Table of Contents
Historical Performance (continued from previous page)
| TOTAL RETURNS | AVERAGE ANNUAL TOTAL RETURNS | |||||||||||||||||||
| THROUGH MARCH 31, 2021 | PAST SIX MONTHS | PAST 12 MONTHS | PAST FIVE YEARS | PAST 10 YEARS | SINCE INCEPTION1 | |||||||||||||||
Overlay B Portfolio Class 1 | 7.58 | % | 21.56 | % | 5.25 | % | 4.30 | % | 4.85 | % | ||||||||||
Return after taxes on Distributions2 | 6.56 | % | 20.40 | % | 4.07 | % | 3.00 | % | 3.58 | % | ||||||||||
Return after taxes on Distributions and sale of shares2 | 4.58 | % | 12.86 | % | 3.56 | % | 2.83 | % | 3.31 | % | ||||||||||
Overlay B Portfolio Class 2 | 7.62 | % | 21.80 | % | 5.42 | % | 4.47 | % | 5.00 | % | ||||||||||
Return after taxes on Distributions2 | 6.54 | % | 20.57 | % | 4.19 | % | 3.11 | % | 3.69 | % | ||||||||||
Return after taxes on Distributions and sale of shares2 | 4.60 | % | 13.00 | % | 3.67 | % | 2.93 | % | 3.41 | % | ||||||||||
Composite Benchmark | 6.19 | % | 18.77 | % | 6.25 | % | 4.82 | % | 5.48 | % | ||||||||||
Bloomberg Barclays Global Aggregate Bond Index (USD hedged) | -1.60 | % | 1.50 | % | 3.29 | % | 3.94 | % | 3.83 | % | ||||||||||
Tax-Aware Overlay B Portfolio Class 1 | 8.75 | % | 20.15 | % | 4.68 | % | 3.96 | % | 4.53 | % | ||||||||||
Return after taxes on Distributions2 | 8.58 | % | 19.96 | % | 4.21 | % | 3.38 | % | 3.94 | % | ||||||||||
Return after taxes on Distributions and sale of shares2 | 5.99 | % | 12.82 | % | 3.75 | % | 3.13 | % | 3.60 | % | ||||||||||
Tax-Aware Overlay B Portfolio Class 2 | 8.90 | % | 20.29 | % | 4.83 | % | 4.11 | % | 4.69 | % | ||||||||||
Return after taxes on Distributions2 | 8.72 | % | 20.09 | % | 4.35 | % | 3.52 | % | 4.08 | % | ||||||||||
Return after taxes on Distributions and sale of shares2 | 6.13 | % | 12.96 | % | 3.89 | % | 3.27 | % | 3.74 | % | ||||||||||
Composite Benchmark | 7.10 | % | 19.94 | % | 6.37 | % | 5.32 | % | 5.80 | % | ||||||||||
Bloomberg Barclays 5-Year GO Municipal Bond Index | 0.28 | % | 4.29 | % | 2.45 | % | 2.77 | % | 2.74 | % | ||||||||||
| Please keep in mind that high, double-digit returns are highly unusual and cannot be sustained. Investors should also be aware that these returns were primarily achieved during favorable market conditions. |
| The current prospectus fee table shows the total operating expense ratios for Class 1 and Class 2 shares as 0.90% and 0.75% for Overlay B and 0.86% and 0.71% for Tax-Aware Overlay B. The Financial Highlights section of this report sets forth expense ratio data for the current reporting period; the expense ratios shown above may differ from the expense ratios in the Financial Highlights section since they are based on different time periods. |
| There are no sales charges associated with an investment in the Bernstein funds. Total returns and average annual returns are therefore the same. The Portfolios are not standalone Portfolios and are used only in conjunction with globally diversified Private Client portfolios. |
| 1 | Inception date: 2/8/2010. |
| 2 | After-tax returns are an estimate, which is based on the highest historical individual federal marginal income-tax rates, and do not reflect the impact of state and local taxes; actual after-tax returns depend on an individual investor’s tax situation and are likely to differ from those shown, and are not relevant to investors who hold Portfolio shares through tax-deferred arrangements such as 401(k) plans or individual retirement accounts. |
See Disclosures, Risks and Note About Historical Performance on pages 3–9.
(Historical Performance continued on next page)
2021 Semi-Annual Report | 11 | |
Table of Contents
Historical Performance (continued from previous page)
| TOTAL RETURNS | AVERAGE ANNUAL TOTAL RETURNS | |||||||||||||||||||
| THROUGH MARCH 31, 2021 | PAST SIX MONTHS | PAST 12 MONTHS | PAST FIVE YEARS | PAST 10 YEARS | SINCE INCEPTION1 | |||||||||||||||
Tax-Aware Overlay C Portfolio Class 1 | 8.39 | % | 19.31 | % | 4.48 | % | 3.79 | % | 4.39 | % | ||||||||||
Return after taxes on Distributions2 | 8.15 | % | 19.04 | % | 4.01 | % | 3.20 | % | 3.78 | % | ||||||||||
Return after taxes on Distributions and sale of shares2 | 5.67 | % | 12.20 | % | 3.55 | % | 2.96 | % | 3.45 | % | ||||||||||
Tax-Aware Overlay C Portfolio Class 2 | 8.46 | % | 19.58 | % | 4.64 | % | 3.94 | % | 4.54 | % | ||||||||||
Return after taxes on Distributions2 | 8.20 | % | 19.29 | % | 4.15 | % | 3.34 | % | 3.92 | % | ||||||||||
Return after taxes on Distributions and sale of shares2 | 5.75 | % | 12.41 | % | 3.69 | % | 3.10 | % | 3.59 | % | ||||||||||
Composite Benchmark | 7.11 | % | 20.06 | % | 6.46 | % | 5.44 | % | 5.91 | % | ||||||||||
Bloomberg Barclays 5-Year GO Municipal Bond Index | 0.28 | % | 4.29 | % | 2.45 | % | 2.77 | % | 2.74 | % | ||||||||||
Tax-Aware Overlay N Portfolio Class 1 | 9.58 | % | 20.51 | % | 4.47 | % | 3.80 | % | 4.38 | % | ||||||||||
Return after taxes on Distributions2 | 9.42 | % | 20.34 | % | 3.98 | % | 3.21 | % | 3.76 | % | ||||||||||
Return after taxes on Distributions and sale of shares2 | 6.43 | % | 12.98 | % | 3.55 | % | 2.97 | % | 3.44 | % | ||||||||||
Tax-Aware Overlay N Portfolio Class 2 | 9.63 | % | 20.66 | % | 4.64 | % | 3.96 | % | 4.54 | % | ||||||||||
Return after taxes on Distributions2 | 9.46 | % | 20.47 | % | 4.14 | % | 3.35 | % | 3.90 | % | ||||||||||
Return after taxes on Distributions and sale of shares2 | 6.51 | % | 13.12 | % | 3.70 | % | 3.11 | % | 3.59 | % | ||||||||||
Composite Benchmark | 7.11 | % | 20.06 | % | 6.46 | % | 5.44 | % | 5.91 | % | ||||||||||
Bloomberg Barclays 5-Year GO Municipal Bond Index | 0.28 | % | 4.29 | % | 2.45 | % | 2.77 | % | 2.74 | % | ||||||||||
| Please keep in mind that high, double-digit returns are highly unusual and cannot be sustained. Investors should also be aware that these returns were primarily achieved during favorable market conditions. |
| The current prospectus fee table shows the total operating expense ratios for Class 1 and Class 2 shares as 0.91% and 0.76% for Tax-Aware Overlay C and 0.94% and 0.79% for Tax-Aware Overlay N. The Financial Highlights section of this report sets forth expense ratio data for the current reporting period; the expense ratios shown above may differ from the expense ratios in the Financial Highlights section since they are based on different time periods. |
| There are no sales charges associated with an investment in the Bernstein funds. Total returns and average annual returns are therefore the same. The Portfolios are not standalone Portfolios and are used only in conjunction with globally diversified Private Client portfolios. |
| 1 | Inception date: 2/8/2010. |
| 2 | After-tax returns are an estimate, which is based on the highest historical individual federal marginal income-tax rates, and do not reflect the impact of state and local taxes; actual after-tax returns depend on an individual investor’s tax situation and are likely to differ from those shown, and are not relevant to investors who hold Portfolio shares through tax-deferred arrangements such as 401(k) plans or individual retirement accounts. |
See Disclosures, Risks and Note About Historical Performance on pages 3–9.
(Historical Performance continued on next page)
| 12 | Sanford C. Bernstein Fund, Inc. | |
Table of Contents
Historical Performance (continued from previous page)
| Overlay A Class 1 Shares | Tax-Aware Overlay A Class 1 Shares | |||
Growth of a $25,000 Investment in the Portfolio | Growth of a $25,000 Investment in the Portfolio | |||
|
| |||
| Overlay B Class 1 Shares | Tax-Aware Overlay B Class 1 Shares | |||
Growth of a $25,000 Investment in the Portfolio | Growth of a $25,000 Investment in the Portfolio | |||
|
| |||
| Tax-Aware Overlay C Class 1 Shares | Tax-Aware Overlay N Class 1 Shares | |||
Growth of a $25,000 Investment in the Portfolio | Growth of a $25,000 Investment in the Portfolio | |||
|
|
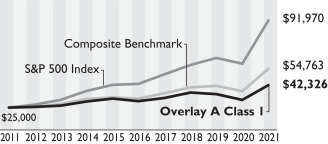
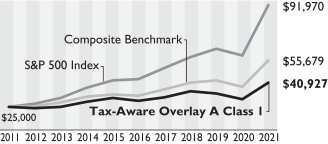

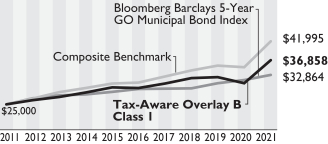
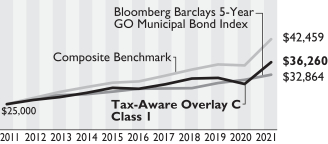
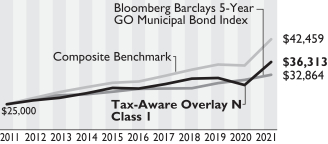
| Each chart illustrates the total value of an assumed $25,000 investment as compared to the performance of each Portfolio’s respective benchmark and composite benchmark for the 10-year period ended March 31, 2021. |
See Disclosures, Risks and Note About Historical Performance on pages 3–9.
2021 Semi-Annual Report | 13 | |
Table of Contents
Expense Example—March 31, 2021 (Unaudited)
Fund Expenses—As a shareholder of a Portfolio, you incur various ongoing costs, including management fees and other Portfolio expenses. This example is intended to help you understand your ongoing costs (in dollars) of investing in the Portfolio and to compare these costs with the ongoing costs of investing in other mutual funds. The example is based on an investment of $1,000 invested at the beginning of the period and held for the entire period as indicated below.
Actual Expenses—The first line of the table below provides information about actual account values and actual expenses. You may use the information in this line, together with the amount you invested, to estimate the expenses that you paid over the period. Simply divide your account value by $1,000 (for example, an $8,600 account value divided by $1,000 = 8.6), then multiply the result by the number in the first line under the heading entitled “Expenses Paid During Period” to estimate the expenses you paid on your account during this period.
Hypothetical Example for Comparison Purposes—The second line of the table below provides information about hypothetical account values and hypothetical expenses based on a Portfolio’s actual expense ratio and an assumed annual rate of return of 5% before expenses, which is not the Portfolio’s actual return. The hypothetical account values and expenses may not be used to estimate the actual ending account balance or expenses you paid for the period. You may use this information to compare the ongoing costs of investing in the Portfolio and other funds by comparing this 5% hypothetical example with the 5% hypothetical examples that appear in the shareholder reports of other funds. Please note that the expenses shown in the table are meant to highlight your ongoing costs only and do not reflect any transactional costs, such as sales charges (loads), or contingent deferred sales charges on redemptions. Therefore, the second line of the table is useful in comparing ongoing costs only, and will not help you determine the relative total costs of owning different funds. In addition, if these transactional costs were included, your costs would have been higher.
| BEGINNING ACCOUNT VALUE OCTOBER 1, 2020 | ENDING ACCOUNT VALUE MARCH 31, 2021 | EXPENSES PAID DURING PERIOD* | ANNUALIZED EXPENSE RATIO* | TOTAL EXPENSES PAID DURING PERIOD+ | TOTAL ANNUALIZED EXPENSE RATIO+ | |||||||||||||||||||
Overlay A | ||||||||||||||||||||||||
Class 1 | ||||||||||||||||||||||||
Actual | $ | 1,000 | $ | 1,175.00 | $ | 4.23 | 0.78 | % | $ | 6.34 | 1.17 | % | ||||||||||||
Hypothetical** | $ | 1,000 | $ | 1,021.04 | $ | 3.93 | 0.78 | % | $ | 5.89 | 1.17 | % | ||||||||||||
Class 2 | ||||||||||||||||||||||||
Actual | $ | 1,000 | $ | 1,176.10 | $ | 3.15 | 0.58 | % | $ | 5.26 | 0.97 | % | ||||||||||||
Hypothetical** | $ | 1,000 | $ | 1,022.04 | $ | 2.92 | 0.58 | % | $ | 4.89 | 0.97 | % | ||||||||||||
Tax-Aware Overlay A | ||||||||||||||||||||||||
Class 1 | ||||||||||||||||||||||||
Actual | $ | 1,000 | $ | 1,171.90 | $ | 4.06 | 0.75 | % | $ | 6.12 | 1.13 | % | ||||||||||||
Hypothetical** | $ | 1,000 | $ | 1,021.19 | $ | 3.78 | 0.75 | % | $ | 5.69 | 1.13 | % | ||||||||||||
Class 2 | ||||||||||||||||||||||||
Actual | $ | 1,000 | $ | 1,172.90 | $ | 2.98 | 0.55 | % | $ | 5.04 | 0.93 | % | ||||||||||||
Hypothetical** | $ | 1,000 | $ | 1,022.19 | $ | 2.77 | 0.55 | % | $ | 4.68 | 0.93 | % | ||||||||||||
Overlay B | ||||||||||||||||||||||||
Class 1 | ||||||||||||||||||||||||
Actual | $ | 1,000 | $ | 1,075.80 | $ | 4.30 | 0.83 | % | $ | 4.45 | 0.86 | % | ||||||||||||
Hypothetical** | $ | 1,000 | $ | 1,020.79 | $ | 4.18 | 0.83 | % | $ | 4.33 | 0.86 | % | ||||||||||||
Class 2 | ||||||||||||||||||||||||
Actual | $ | 1,000 | $ | 1,076.20 | $ | 3.52 | 0.68 | % | $ | 3.68 | 0.71 | % | ||||||||||||
Hypothetical** | $ | 1,000 | $ | 1,021.54 | $ | 3.43 | 0.68 | % | $ | 3.58 | 0.71 | % | ||||||||||||
Tax-Aware Overlay B | ||||||||||||||||||||||||
Class 1 | ||||||||||||||||||||||||
Actual | $ | 1,000 | $ | 1,087.50 | $ | 4.37 | 0.84 | % | $ | 4.48 | 0.86 | % | ||||||||||||
Hypothetical** | $ | 1,000 | $ | 1,020.74 | $ | 4.23 | 0.84 | % | $ | 4.33 | 0.86 | % | ||||||||||||
Class 2 | ||||||||||||||||||||||||
Actual | $ | 1,000 | $ | 1,089.00 | $ | 3.54 | 0.68 | % | $ | 3.65 | 0.70 | % | ||||||||||||
Hypothetical** | $ | 1,000 | $ | 1,021.54 | $ | 3.43 | 0.68 | % | $ | 3.53 | 0.70 | % | ||||||||||||
Tax-Aware Overlay C | ||||||||||||||||||||||||
Class 1 | ||||||||||||||||||||||||
Actual | $ | 1,000 | $ | 1,083.90 | $ | 4.57 | 0.88 | % | $ | 4.68 | 0.90 | % | ||||||||||||
Hypothetical** | $ | 1,000 | $ | 1,020.54 | $ | 4.43 | 0.88 | % | $ | 4.53 | 0.90 | % | ||||||||||||
Class 2 | ||||||||||||||||||||||||
Actual | $ | 1,000 | $ | 1,084.60 | $ | 3.79 | 0.73 | % | $ | 3.90 | 0.75 | % | ||||||||||||
Hypothetical** | $ | 1,000 | $ | 1,021.29 | $ | 3.68 | 0.73 | % | $ | 3.78 | 0.75 | % | ||||||||||||
| 14 | Sanford C. Bernstein Fund, Inc. | |
Table of Contents
Expense Example—March 31, 2021 (Unaudited) (continued)
| BEGINNING ACCOUNT VALUE OCTOBER 1, 2020 | ENDING ACCOUNT VALUE MARCH 31, 2021 | EXPENSES PAID DURING PERIOD* | ANNUALIZED EXPENSE RATIO* | TOTAL EXPENSES PAID DURING PERIOD+ | TOTAL ANNUALIZED EXPENSE RATIO+ | |||||||||||||||||||
Tax-Aware Overlay N | ||||||||||||||||||||||||
Class 1 | ||||||||||||||||||||||||
Actual | $ | 1,000 | $ | 1,095.80 | $ | 4.70 | 0.90 | % | $ | 4.81 | 0.92 | % | ||||||||||||
Hypothetical** | $ | 1,000 | $ | 1,020.44 | $ | 4.53 | 0.90 | % | $ | 4.63 | 0.92 | % | ||||||||||||
Class 2 | ||||||||||||||||||||||||
Actual | $ | 1,000 | $ | 1,096.30 | $ | 3.92 | 0.75 | % | $ | 4.02 | 0.77 | % | ||||||||||||
Hypothetical** | $ | 1,000 | $ | 1,021.19 | $ | 3.78 | 0.75 | % | $ | 3.88 | 0.77 | % | ||||||||||||
| * | Expenses are equal to the classes’ annualized expense ratios, multiplied by the average account value over the period, multiplied by 182/365 (to reflect the one-half year period). |
| ** | Assumes 5% annual return before expenses. |
| + | In connection with the Portfolio’s investments in affiliated/unaffiliated underlying portfolios, the Portfolio incurs no direct expenses, but bears proportionate shares of the fees and expenses (i.e., operating, administrative and investment advisory fees) of the affiliated/unaffiliated underlying portfolios. The Adviser has contractually agreed to waive its fees from the Portfolio in an amount equal to the Portfolio’s pro rata share of certain acquired fund fees and expenses of the affiliated underlying portfolios. The Portfolio’s total expenses are equal to the classes’ annualized expense ratio plus the Portfolio’s pro rata share of the weighted average expense ratio of the affiliated/unaffiliated underlying portfolios in which it invests, multiplied by the average account value over the period, multiplied by 182/365 (to reflect the one-half year period). |
2021 Semi-Annual Report | 15 | |
Table of Contents
Portfolio Summary—March 31, 2021 (Unaudited)
| PORTFOLIO BREAKDOWN1 | OVERLAY A PORTFOLIO | TAX-AWARE OVERLAY A PORTFOLIO | ||||||
Global Equity | ||||||||
US | 65.5 | % | 64.9 | % | ||||
Developed International | 27.8 | % | 27.7 | % | ||||
Emerging Markets | 9.0 | % | 9.0 | % | ||||
Real Assets | 8.2 | % | 7.7 | % | ||||
Global Bond | ||||||||
US | 35.6 | % | 46.6 | % | ||||
Developed International | 10.9 | % | 0.0 | % | ||||
| PORTFOLIO BREAKDOWN1 | OVERLAY B PORTFOLIO | TAX-AWARE OVERLAY B PORTFOLIO | ||||||
Global Equity | ||||||||
US | 23.5 | % | 25.5 | % | ||||
Developed International | 10.3 | % | 11.2 | % | ||||
Emerging Markets | 3.4 | % | 3.8 | % | ||||
Global Credit | ||||||||
Investment Grade | 9.4 | % | 0.0 | % | ||||
Real Assets | 3.9 | % | 0.0 | % | ||||
Global Bond | ||||||||
US | 43.1 | % | 80.4 | % | ||||
Developed International | 15.9 | % | 0.0 | % | ||||
Linkers | 20.4 | % | 0.0 | % | ||||
| PORTFOLIO BREAKDOWN1 | TAX-AWARE OVERLAY C PORTFOLIO | TAX-AWARE OVERLAY N PORTFOLIO | ||||||
Global Equity | ||||||||
US | 25.6 | % | 25.6 | % | ||||
Developed International | 11.2 | % | 11.3 | % | ||||
Emerging Markets | 3.8 | % | 3.8 | % | ||||
Global Bond | ||||||||
US | 80.6 | % | 81.0 | % | ||||
| 1 | All data are as of March 31, 2021. The Portfolio’s portfolio breakdown includes derivative exposure and is expressed as approximate percentages of the Portfolio’s total net assets, based on the Adviser’s internal classification. The percentages will vary over time, and the total of the percentages may be less than or greater than 100% in light of the leveraging effect of the derivative transactions. |
| 16 | Sanford C. Bernstein Fund, Inc. | |
Table of Contents
Sanford C. Bernstein Fund, Inc.
Schedule of Investments
Overlay A Portfolio
March 31, 2021 (Unaudited)
| Company | Shares | U.S. $ Value | ||||||
| COMMON STOCKS–44.0% |
| |||||||
| Information Technology–11.3% |
| |||||||
| Communications Equipment–0.0% |
| |||||||
NetScout Systems, Inc.(a) | 1,582 | $ | 44,549 | |||||
|
| |||||||
| Electronic Equipment, Instruments & Components–0.6% |
| |||||||
Avnet, Inc. | 14,100 | 585,291 | ||||||
Belden, Inc. | 10,273 | 455,813 | ||||||
CDW Corp./DE | 45,582 | 7,555,217 | ||||||
Cognex Corp. | 9,600 | 796,704 | ||||||
IPG Photonics Corp.(a) | 2,550 | 537,897 | ||||||
Littelfuse, Inc. | 2,030 | 536,813 | ||||||
Novanta, Inc.(a) | 3,780 | 498,544 | ||||||
Shoals Technologies Group, Inc.(a) | 11,297 | 392,910 | ||||||
Vishay Intertechnology, Inc. | 15,290 | 368,183 | ||||||
|
| |||||||
| 11,727,372 | ||||||||
|
| |||||||
| IT Services–2.3% |
| |||||||
Amdocs Ltd. | 5,159 | 361,904 | ||||||
Automatic Data Processing, Inc. | 37,641 | 7,094,199 | ||||||
Digitalocean Holdings, Inc.(a) | 3,546 | 149,393 | ||||||
Genpact Ltd. | 178,206 | 7,630,781 | ||||||
MongoDB, Inc.(a) | 2,340 | 625,786 | ||||||
PayPal Holdings, Inc.(a) | 30,590 | 7,428,476 | ||||||
Shift4 Payments, Inc.–Class A(a) | 6,988 | 573,086 | ||||||
Visa, Inc.–Class A | 94,193 | 19,943,484 | ||||||
|
| |||||||
| 43,807,109 | ||||||||
|
| |||||||
| Semiconductors & Semiconductor Equipment–2.5% |
| |||||||
Cree, Inc.(a) | 3,780 | 408,731 | ||||||
Entegris, Inc. | 8,138 | 909,828 | ||||||
Kulicke & Soffa Industries, Inc. | 10,066 | 494,341 | ||||||
Lattice Semiconductor Corp.(a) | 13,950 | 628,029 | ||||||
MaxLinear, Inc.–Class A(a) | 8,682 | 295,883 | ||||||
MKS Instruments, Inc. | 3,740 | 693,471 | ||||||
Monolithic Power Systems, Inc. | 2,590 | 914,814 | ||||||
NVIDIA Corp. | 13,478 | 7,196,309 | ||||||
NXP Semiconductors NV | 44,641 | 8,988,019 | ||||||
ON Semiconductor Corp.(a) | 15,780 | 656,606 | ||||||
QUALCOMM, Inc. | 76,875 | 10,192,856 | ||||||
Synaptics, Inc.(a) | 3,530 | 478,033 | ||||||
Texas Instruments, Inc. | 52,918 | 10,000,973 | ||||||
Universal Display Corp. | 2,652 | 627,914 | ||||||
Xilinx, Inc. | 41,729 | 5,170,223 | ||||||
|
| |||||||
| 47,656,030 | ||||||||
|
| |||||||
| Software–4.0% |
| |||||||
Adobe, Inc.(a) | 13,218 | 6,283,441 | ||||||
Anaplan, Inc.(a) | 9,049 | 487,289 | ||||||
Avalara, Inc.(a) | 3,882 | 517,975 | ||||||
Citrix Systems, Inc. | 41,718 | 5,855,538 | ||||||
CommVault Systems, Inc.(a) | 9,510 | 613,395 | ||||||
Coupa Software, Inc.(a) | 1,370 | 348,638 | ||||||
| Company | Shares | U.S. $ Value | ||||||
Fair Isaac Corp.(a) | 1,420 | $ | 690,191 | |||||
HubSpot, Inc.(a) | 1,735 | 788,054 | ||||||
Manhattan Associates, Inc.(a) | 6,021 | 706,745 | ||||||
Microsoft Corp.(b) | 206,115 | 48,595,734 | ||||||
Oracle Corp.(b) | 127,110 | 8,919,309 | ||||||
RingCentral, Inc.–Class A(a) | 1,080 | 321,710 | ||||||
Smartsheet, Inc.–Class A(a) | 9,435 | 603,085 | ||||||
Varonis Systems, Inc.(a) | 9,974 | 512,065 | ||||||
Zendesk, Inc.(a) | 5,870 | 778,479 | ||||||
|
| |||||||
| 76,021,648 | ||||||||
|
| |||||||
| Technology Hardware, Storage & Peripherals–1.9% |
| |||||||
Alignment Healthcare, Inc.(a) | 10,494 | 230,133 | ||||||
Apple, Inc. | 229,775 | 28,067,016 | ||||||
NCR Corp.(a) | 12,864 | 488,189 | ||||||
Western Digital Corp. | 99,581 | 6,647,032 | ||||||
|
| |||||||
| 35,432,370 | ||||||||
|
| |||||||
| 214,689,078 | ||||||||
|
| |||||||
| Consumer Discretionary–6.4% |
| |||||||
| Auto Components–0.5% |
| |||||||
Dana, Inc. | 20,472 | 498,084 | ||||||
Goodyear Tire & Rubber Co. (The)(a) | 39,260 | 689,798 | ||||||
Lear Corp. | 3,566 | 646,338 | ||||||
Magna International, Inc.–Class A (United States) | 93,276 | 8,212,019 | ||||||
|
| |||||||
| 10,046,239 | ||||||||
|
| |||||||
| Automobiles–0.3% |
| |||||||
Stellantis NV | 284,514 | 5,061,504 | ||||||
|
| |||||||
| Distributors–0.3% |
| |||||||
LKQ Corp.(a) | 138,620 | 5,867,785 | ||||||
Pool Corp. | 1,610 | 555,836 | ||||||
|
| |||||||
| 6,423,621 | ||||||||
|
| |||||||
| Diversified Consumer Services–0.2% |
| |||||||
Chegg, Inc.(a) | 41,751 | 3,576,391 | ||||||
Hillenbrand, Inc. | 11,730 | 559,638 | ||||||
Houghton Mifflin Harcourt Co.(a) | 31,112 | 237,073 | ||||||
|
| |||||||
| 4,373,102 | ||||||||
|
| |||||||
| Hotels, Restaurants & Leisure–0.2% |
| |||||||
Dine Brands Global, Inc.(a) | 5,238 | 471,577 | ||||||
Hilton Grand Vacations, Inc.(a) | 17,560 | 658,325 | ||||||
Papa John’s International, Inc. | 5,790 | 513,226 | ||||||
Penn National Gaming, Inc.(a) | 3,750 | 393,150 | ||||||
Planet Fitness, Inc.(a) | 5,774 | 446,330 | ||||||
Vail Resorts, Inc.(a) | 720 | 209,995 | ||||||
|
| |||||||
| 2,692,603 | ||||||||
|
| |||||||
| Household Durables–0.2% |
| |||||||
KB Home | 14,700 | 683,991 | ||||||
NVR, Inc.(a) | 97 | 456,960 | ||||||
PulteGroup, Inc. | 17,520 | 918,749 | ||||||
Taylor Morrison Home Corp.–Class A(a) | 14,643 | 451,151 | ||||||
Tempur Sealy International, Inc. | 13,602 | 497,289 | ||||||
TopBuild Corp.(a) | 2,397 | 502,004 | ||||||
|
| |||||||
| 3,510,144 | ||||||||
|
| |||||||
2021 Semi-Annual Report | 17 | |
Table of Contents
Schedule of Investments (continued)
| Company | Shares | U.S. $ Value | ||||||
| Internet & Direct Marketing Retail–1.4% |
| |||||||
Amazon.com, Inc.(a)(b) | 8,320 | $ | 25,742,746 | |||||
Etsy, Inc.(a) | 2,630 | 530,392 | ||||||
|
| |||||||
| 26,273,138 | ||||||||
|
| |||||||
| Leisure Products–0.0% |
| |||||||
Brunswick Corp./DE | 5,066 | 483,144 | ||||||
|
| |||||||
| Specialty Retail–2.2% |
| |||||||
AutoZone, Inc.(a) | 7,911 | 11,109,417 | ||||||
Five Below, Inc.(a) | 3,218 | 613,962 | ||||||
Floor & Decor Holdings, Inc.–Class A(a) | 7,060 | 674,089 | ||||||
Foot Locker, Inc. | 13,906 | 782,212 | ||||||
Gap, Inc. (The)(a) | 20,370 | 606,619 | ||||||
Home Depot, Inc. (The)(b) | 58,353 | 17,812,253 | ||||||
Lithia Motors, Inc.–Class A | 1,575 | 614,392 | ||||||
National Vision Holdings, Inc.(a) | 13,196 | 578,381 | ||||||
Sally Beauty Holdings, Inc.(a) | 27,810 | 559,815 | ||||||
TJX Cos., Inc. (The) | 129,999 | 8,599,434 | ||||||
Williams-Sonoma, Inc. | 3,395 | 608,384 | ||||||
|
| |||||||
| 42,558,958 | ||||||||
|
| |||||||
| Textiles, Apparel & Luxury Goods–1.1% |
| |||||||
Carter’s, Inc.(a) | 1,821 | 161,942 | ||||||
Deckers Outdoor Corp.(a) | 20,496 | 6,772,288 | ||||||
Kontoor Brands, Inc. | 14,860 | 721,156 | ||||||
NIKE, Inc.–Class B | 81,978 | 10,894,056 | ||||||
Ralph Lauren Corp.(a) | 5,800 | 714,328 | ||||||
Skechers U.S.A., Inc.–Class A(a) | 4,978 | 207,632 | ||||||
Steven Madden Ltd. | 13,323 | 496,415 | ||||||
Tapestry, Inc.(a) | 20,000 | 824,200 | ||||||
|
| |||||||
| 20,792,017 | ||||||||
|
| |||||||
| 122,214,470 | ||||||||
|
| |||||||
| Health Care–5.6% |
| |||||||
| Biotechnology–0.9% |
| |||||||
ADC Therapeutics SA(a) | 7,742 | 188,982 | ||||||
Allogene Therapeutics, Inc.(a) | 6,332 | 223,520 | ||||||
Arena Pharmaceuticals, Inc.(a) | 2,396 | 166,258 | ||||||
Arrowhead Pharmaceuticals, Inc.(a) | 4,550 | 301,710 | ||||||
Ascendis Pharma A/S (Sponsored ADR)(a) | 1,335 | 172,055 | ||||||
Biohaven Pharmaceutical Holding Co., Ltd.(a) | 3,418 | 233,620 | ||||||
Blueprint Medicines Corp.(a) | 3,206 | 311,719 | ||||||
Coherus Biosciences, Inc.(a) | 10,615 | 155,085 | ||||||
Deciphera Pharmaceuticals, Inc.(a) | 5,076 | 227,608 | ||||||
Intellia Therapeutics, Inc.(a) | 4,330 | 347,504 | ||||||
Iovance Biotherapeutics, Inc.(a) | 7,740 | 245,048 | ||||||
Kodiak Sciences, Inc.(a) | 2,217 | 251,386 | ||||||
Legend Biotech Corp. ADR(a) | 5,977 | 173,453 | ||||||
PTC Therapeutics, Inc.(a) | 3,980 | 188,453 | ||||||
Regeneron Pharmaceuticals, Inc.(a) | 8,890 | 4,206,215 | ||||||
Sage Therapeutics, Inc.(a) | 2,430 | 181,885 | ||||||
Turning Point Therapeutics, Inc.–Class I(a) | 2,516 | 237,988 | ||||||
Ultragenyx Pharmaceutical, Inc.(a) | 2,453 | 279,299 | ||||||
Vertex Pharmaceuticals, Inc.(a) | 36,976 | 7,945,773 | ||||||
Vir Biotechnology, Inc.(a) | 4,244 | 217,590 | ||||||
|
| |||||||
| 16,255,151 | ||||||||
|
| |||||||
| Company | Shares | U.S. $ Value | ||||||
| Health Care Equipment & Supplies–1.5% |
| |||||||
AtriCure, Inc.(a) | 6,760 | $ | 442,915 | |||||
Edwards Lifesciences Corp.(a) | 82,466 | 6,897,456 | ||||||
Insulet Corp.(a) | 1,745 | 455,305 | ||||||
iRhythm Technologies, Inc.(a) | 1,950 | 270,777 | ||||||
Medtronic PLC | 118,866 | 14,041,641 | ||||||
Silk Road Medical, Inc.(a) | 6,595 | 334,037 | ||||||
Zimmer Biomet Holdings, Inc. | 37,789 | 6,049,263 | ||||||
|
| |||||||
| 28,491,394 | ||||||||
|
| |||||||
| Health Care Providers & Services–1.8% |
| |||||||
Amedisys, Inc.(a) | 2,410 | 638,144 | ||||||
Anthem, Inc. | 27,381 | 9,828,410 | ||||||
Guardant Health, Inc.(a) | 3,979 | 607,394 | ||||||
Instil Bio, Inc.(a) | 8,935 | 224,090 | ||||||
MEDNAX, Inc.(a) | 27,850 | 709,340 | ||||||
UnitedHealth Group, Inc.(b) | 60,104 | 22,362,895 | ||||||
|
| |||||||
| 34,370,273 | ||||||||
|
| |||||||
| Health Care Technology–0.0% |
| |||||||
American Well Corp.–Class A(a) | 8,859 | 153,881 | ||||||
|
| |||||||
| Life Sciences Tools & Services–0.1% |
| |||||||
10X Genomics, Inc.(a) | 3,614 | 654,134 | ||||||
Berkeley Lights, Inc.(a) | 6,589 | 330,966 | ||||||
ICON PLC(a) | 1,501 | 294,751 | ||||||
Repligen Corp.(a) | 3,641 | 707,847 | ||||||
|
| |||||||
| 1,987,698 | ||||||||
|
| |||||||
| Pharmaceuticals–1.3% |
| |||||||
Johnson & Johnson | 33,623 | 5,525,940 | ||||||
Revance Therapeutics, Inc.(a) | 8,606 | 240,537 | ||||||
Roche Holding AG (Sponsored ADR) | 291,471 | 11,822,064 | ||||||
Zoetis, Inc. | 51,058 | 8,040,614 | ||||||
|
| |||||||
| 25,629,155 | ||||||||
|
| |||||||
| 106,887,552 | ||||||||
|
| |||||||
| Financials–5.0% |
| |||||||
| Banks–2.7% |
| |||||||
Bank of America Corp. | 416,154 | 16,100,998 | ||||||
Citigroup, Inc. | 138,413 | 10,069,546 | ||||||
Comerica, Inc. | 12,090 | 867,337 | ||||||
First Citizens BancShares, Inc./NC–Class A | 1,100 | 919,347 | ||||||
Pinnacle Financial Partners, Inc. | 3,500 | 310,310 | ||||||
PNC Financial Services Group, Inc. (The) | 37,488 | 6,575,770 | ||||||
Sterling Bancorp/DE | 29,700 | 683,694 | ||||||
SVB Financial Group(a) | 997 | 492,179 | ||||||
Synovus Financial Corp. | 18,814 | 860,741 | ||||||
Texas Capital Bancshares, Inc.(a) | 10,145 | 719,483 | ||||||
Umpqua Holdings Corp. | 26,258 | 460,828 | ||||||
Webster Financial Corp. | 13,422 | 739,686 | ||||||
Wells Fargo & Co. | 295,432 | 11,542,528 | ||||||
Wintrust Financial Corp. | 9,850 | 746,630 | ||||||
Zions Bancorp NA | 11,171 | 613,958 | ||||||
|
| |||||||
| 51,703,035 | ||||||||
|
| |||||||
| 18 | Sanford C. Bernstein Fund, Inc. | |
Table of Contents
| Company | Shares | U.S. $ Value | ||||||
| Capital Markets–1.5% |
| |||||||
Ares Management Corp.–Class A | 10,303 | $ | 577,277 | |||||
CME Group, Inc.–Class A | 32,250 | 6,586,417 | ||||||
Goldman Sachs Group, Inc. (The) | 43,264 | 14,147,328 | ||||||
LPL Financial Holdings, Inc. | 32,279 | 4,588,783 | ||||||
Moelis & Co. | 12,203 | 669,701 | ||||||
PJT Partners, Inc. | 2,438 | 164,931 | ||||||
Stifel Financial Corp. | 12,165 | 779,290 | ||||||
|
| |||||||
| 27,513,727 | ||||||||
|
| |||||||
| Consumer Finance–0.0% |
| |||||||
Fisker, Inc.(a) | 8,300 | 142,926 | ||||||
OneMain Holdings, Inc. | 7,367 | 395,755 | ||||||
|
| |||||||
| 538,681 | ||||||||
|
| |||||||
| Diversified Financial Services–0.0% |
| |||||||
Voya Financial, Inc. | 8,500 | 540,940 | ||||||
|
| |||||||
| Insurance–0.8% |
| |||||||
American Financial Group, Inc./OH | 5,442 | 620,932 | ||||||
Everest Re Group Ltd. | 2,450 | 607,135 | ||||||
Goosehead Insurance, Inc.–Class A | 2,540 | 272,237 | ||||||
Hanover Insurance Group, Inc. (The) | 4,020 | 520,429 | ||||||
Inari Medical, Inc.(a) | 5,918 | 633,226 | ||||||
Kinsale Capital Group, Inc. | 2,334 | 384,643 | ||||||
Progressive Corp. (The) | 57,322 | 5,480,557 | ||||||
Reinsurance Group of America, Inc.–Class A | 45,948 | 5,791,745 | ||||||
Selective Insurance Group, Inc. | 5,154 | 373,871 | ||||||
|
| |||||||
| 14,684,775 | ||||||||
|
| |||||||
| Thrifts & Mortgage Finance–0.0% |
| |||||||
BankUnited, Inc. | 17,380 | 763,851 | ||||||
|
| |||||||
| 95,745,009 | ||||||||
|
| |||||||
| Communication Services–5.0% |
| |||||||
| Diversified Telecommunication Services–0.8% |
| |||||||
Comcast Corp.–Class A | 268,649 | 14,536,598 | ||||||
|
| |||||||
| Entertainment–0.5% |
| |||||||
Electronic Arts, Inc. | 71,823 | 9,722,680 | ||||||
|
| |||||||
| Interactive Media & Services–3.2% |
| |||||||
Alphabet, Inc.–Class C(a) | 18,431 | 38,126,919 | ||||||
Bumble, Inc.(a) | 1,666 | 103,925 | ||||||
Facebook, Inc.–Class A(a) | 76,137 | 22,424,631 | ||||||
|
| |||||||
| 60,655,475 | ||||||||
|
| |||||||
| Media–0.0% |
| |||||||
Criteo SA (Sponsored ADR)(a) | 15,866 | 551,026 | ||||||
|
| |||||||
| Wireless Telecommunication Services–0.5% |
| |||||||
T-Mobile US, Inc.(a) | 72,753 | 9,115,223 | ||||||
|
| |||||||
| 94,581,002 | ||||||||
|
| |||||||
| Industrials–4.9% |
| |||||||
| Aerospace & Defense–0.5% |
| |||||||
AAR Corp.(a) | 10,953 | 456,192 | ||||||
Axon Enterprise, Inc.(a) | 3,592 | 511,573 | ||||||
L3Harris Technologies, Inc. | 40,328 | 8,173,679 | ||||||
|
| |||||||
| 9,141,444 | ||||||||
|
| |||||||
| Company | Shares | U.S. $ Value | ||||||
| Air Freight & Logistics–0.0% |
| |||||||
XPO Logistics, Inc.(a) | 5,634 | $ | 694,672 | |||||
|
| |||||||
| Airlines–0.4% |
| |||||||
Alaska Air Group, Inc.(a) | 8,134 | 562,954 | ||||||
SkyWest, Inc.(a) | 11,962 | 651,690 | ||||||
Southwest Airlines Co.(a) | 93,238 | 5,693,112 | ||||||
|
| |||||||
| 6,907,756 | ||||||||
|
| |||||||
| Building Products–0.1% |
| |||||||
Masonite International Corp.(a) | 5,747 | 662,284 | ||||||
Trex Co., Inc.(a) | 6,724 | 615,515 | ||||||
|
| |||||||
| 1,277,799 | ||||||||
|
| |||||||
| Commercial Services & Supplies–0.1% |
| |||||||
ADT, Inc. | 15,581 | 131,504 | ||||||
Copart, Inc.(a) | 3,250 | 352,983 | ||||||
Herman Miller, Inc. | 16,730 | 688,439 | ||||||
|
| |||||||
| 1,172,926 | ||||||||
|
| |||||||
| Construction & Engineering–0.5% |
| |||||||
AECOM(a) | 146,793 | 9,410,899 | ||||||
|
| |||||||
| Electrical Equipment–0.7% |
| |||||||
AMETEK, Inc. | 4,526 | 578,106 | ||||||
Eaton Corp. PLC | 65,256 | 9,023,600 | ||||||
Plug Power, Inc.(a) | 7,012 | 251,310 | ||||||
Regal Beloit Corp. | 31,616 | 4,510,971 | ||||||
|
| |||||||
| 14,363,987 | ||||||||
|
| |||||||
| Industrial Conglomerates–0.2% |
| |||||||
Honeywell International, Inc. | 19,847 | 4,308,188 | ||||||
|
| |||||||
| Machinery–0.2% |
| |||||||
Crane Co. | 6,146 | 577,171 | ||||||
Ingersoll Rand, Inc.(a) | 11,870 | 584,123 | ||||||
Kennametal, Inc. | 16,316 | 652,151 | ||||||
Middleby Corp. (The)(a) | 3,390 | 561,892 | ||||||
Oshkosh Corp. | 8,070 | 957,586 | ||||||
Welbilt, Inc.(a) | 31,980 | 519,675 | ||||||
|
| |||||||
| 3,852,598 | ||||||||
|
| |||||||
| Professional Services–0.7% |
| |||||||
Booz Allen Hamilton Holding Corp. | 45,356 | 3,652,519 | ||||||
Jacobs Engineering Group, Inc. | 4,670 | 603,691 | ||||||
Korn Ferry | 8,860 | 552,598 | ||||||
Robert Half International, Inc. | 101,028 | 7,887,256 | ||||||
|
| |||||||
| 12,696,064 | ||||||||
|
| |||||||
| Road & Rail–1.0% |
| |||||||
CSX Corp. | 115,855 | 11,170,739 | ||||||
Kansas City Southern | 1,690 | 446,025 | ||||||
Knight-Swift Transportation Holdings, Inc. | 168,754 | 8,115,380 | ||||||
|
| |||||||
| 19,732,144 | ||||||||
|
| |||||||
| Trading Companies & Distributors–0.5% |
| |||||||
GATX Corp. | 5,080 | 471,119 | ||||||
MRC Global, Inc.(a) | 47,709 | 430,812 | ||||||
SiteOne Landscape Supply, Inc.(a) | 3,560 | 607,834 | ||||||
United Rentals, Inc.(a) | 26,240 | 8,641,095 | ||||||
|
| |||||||
| 10,150,860 | ||||||||
|
| |||||||
| 93,709,337 | ||||||||
|
| |||||||
2021 Semi-Annual Report | 19 | |
Table of Contents
Schedule of Investments (continued)
| Company | Shares | U.S. $ Value | ||||||
| Consumer Staples–1.9% |
| |||||||
| Food & Staples Retailing–0.9% |
| |||||||
Casey’s General Stores, Inc. | 1,930 | $ | 417,247 | |||||
Costco Wholesale Corp. | 11,557 | 4,073,611 | ||||||
Grocery Outlet Holding Corp.(a) | 4,106 | 151,470 | ||||||
Walmart, Inc. | 83,684 | 11,366,798 | ||||||
|
| |||||||
| 16,009,126 | ||||||||
|
| |||||||
| Food Products–0.1% |
| |||||||
Freshpet, Inc.(a) | 3,515 | 558,217 | ||||||
Hain Celestial Group, Inc. (The)(a) | 14,527 | 633,378 | ||||||
Nomad Foods Ltd.(a) | 21,574 | 592,422 | ||||||
|
| |||||||
| 1,784,017 | ||||||||
|
| |||||||
| Household Products–0.9% |
| |||||||
Procter & Gamble Co. (The)(b) | 126,484 | 17,129,728 | ||||||
|
| |||||||
| 34,922,871 | ||||||||
|
| |||||||
| Real Estate–1.4% |
| |||||||
| Equity Real Estate Investment Trusts (REITs)–1.4% |
| |||||||
American Campus Communities, Inc. | 125,256 | 5,407,301 | ||||||
American Tower Corp. | 20,542 | 4,910,770 | ||||||
Camden Property Trust | 5,218 | 573,510 | ||||||
Cousins Properties, Inc. | 13,977 | 494,087 | ||||||
CubeSmart | 14,991 | 567,110 | ||||||
MGM Growth Properties LLC–Class A | 16,280 | 531,054 | ||||||
Mid-America Apartment Communities, Inc. | 48,644 | 7,022,248 | ||||||
Physicians Realty Trust | 28,776 | 508,472 | ||||||
Prologis, Inc. | 47,104 | 4,993,024 | ||||||
RLJ Lodging Trust | 32,587 | 504,447 | ||||||
Safehold, Inc. | 4,930 | 345,593 | ||||||
STAG Industrial, Inc. | 15,030 | 505,158 | ||||||
|
| |||||||
| 26,362,774 | ||||||||
|
| |||||||
| Utilities–1.0% |
| |||||||
| Electric Utilities–1.0% |
| |||||||
American Electric Power Co., Inc. | 95,165 | 8,060,476 | ||||||
IDACORP, Inc. | 6,071 | 606,918 | ||||||
NextEra Energy, Inc. | 139,709 | 10,563,397 | ||||||
|
| |||||||
| 19,230,791 | ||||||||
|
| |||||||
| Gas Utilities–0.0% |
| |||||||
Southwest Gas Holdings, Inc. | 6,000 | 412,260 | ||||||
|
| |||||||
| 19,643,051 | ||||||||
|
| |||||||
| Energy–0.9% |
| |||||||
| Energy Equipment & Services–0.0% |
| |||||||
Dril-Quip, Inc.(a) | 11,269 | 374,469 | ||||||
|
| |||||||
| Oil, Gas & Consumable Fuels–0.9% |
| |||||||
Chevron Corp. | 74,515 | 7,808,427 | ||||||
Cimarex Energy Co. | 9,887 | 587,189 | ||||||
EOG Resources, Inc. | 95,456 | 6,923,423 | ||||||
HollyFrontier Corp. | 20,095 | 718,999 | ||||||
| Company | Shares | U.S. $ Value | ||||||||||
Matador Resources Co. | 9,860 | $ | 231,217 | |||||||||
|
| |||||||||||
| 16,269,255 | ||||||||||||
|
| |||||||||||
| 16,643,724 | ||||||||||||
|
| |||||||||||
| Materials–0.6% |
| |||||||||||
| Chemicals–0.4% |
| |||||||||||
FMC Corp. | 3,820 | 422,530 | ||||||||||
GCP Applied Technologies, Inc.(a) | 15,802 | 387,781 | ||||||||||
Innospec, Inc. | 3,110 | 319,366 | ||||||||||
LyondellBasell Industries NV–Class A | 63,477 | 6,604,782 | ||||||||||
Orion Engineered Carbons SA(a) | 22,745 | 448,531 | ||||||||||
Trinseo SA | 8,755 | 557,431 | ||||||||||
|
| |||||||||||
| 8,740,421 | ||||||||||||
|
| |||||||||||
| Containers & Packaging–0.1% |
| |||||||||||
Graphic Packaging Holding Co. | 31,373 | 569,734 | ||||||||||
Sealed Air Corp. | 11,188 | 512,634 | ||||||||||
|
| |||||||||||
| 1,082,368 | ||||||||||||
|
| |||||||||||
| Metals & Mining–0.1% |
| |||||||||||
Carpenter Technology Corp. | 14,231 | 585,606 | ||||||||||
Reliance Steel & Aluminum Co. | 5,333 | 812,162 | ||||||||||
|
| |||||||||||
| 1,397,768 | ||||||||||||
|
| |||||||||||
| Steel–0.0% |
| |||||||||||
Commercial Metals Co. | 20,740 | 639,622 | ||||||||||
|
| |||||||||||
| 11,860,179 | ||||||||||||
|
| |||||||||||
| Total Common Stocks (cost $501,237,432) | 837,259,047 | |||||||||||
|
| |||||||||||
| INVESTMENT COMPANIES–41.5% |
| |||||||||||
| Funds and Investment Trusts–41.5%(c)(d) |
| |||||||||||
AB All Market Real Return Portfolio–Class Z | 16,806,689 | 154,789,606 | ||||||||||
Bernstein Fund, Inc.–International Small Cap Portfolio–Class Z | 8,784,887 | 112,007,309 | ||||||||||
Bernstein Fund, Inc.–International Strategic Equities Portfolio–Class Z | 32,752,419 | 434,297,081 | ||||||||||
Bernstein Fund, Inc.–Small Cap Core Portfolio–Class Z | 2,407,302 | 35,868,807 | ||||||||||
Sanford C. Bernstein Fund, Inc.–Emerging Markets Portfolio–Class Z | 1,537,339 | 52,484,766 | ||||||||||
|
| |||||||||||
| Total Investment Companies (cost $638,377,965) | 789,447,569 | |||||||||||
|
| |||||||||||
| Notional Amount | ||||||||||||
| OPTIONS PURCHASED—PUTS–1.1% |
| |||||||||||
| Options on Equity Indices–1.1% |
| |||||||||||
Euro STOXX 50 Index | EUR | 53,520,250 | 1,616,923 | |||||||||
| 20 | Sanford C. Bernstein Fund, Inc. | |
Table of Contents
| Notional Amount | U.S. $ Value | |||||||||||
Euro STOXX 50 Index | EUR | 27,132,000 | $ | 819,697 | ||||||||
FTSE 100 Index | GBP | 20,196,000 | 666,867 | |||||||||
FTSE 100 Index | 10,251,000 | 338,486 | ||||||||||
Nikkei 225 Index | JPY | 2,790,000,000 | 691,526 | |||||||||
Nikkei 225 Index | 2,587,500,000 | 641,335 | ||||||||||
Nikkei 225 Index | 2,475,000,000 | 613,451 | ||||||||||
S&P 500 Index | USD | 447,300,000 | 9,888,259 | |||||||||
| Notional Amount | U.S. $ Value | |||||||||||
S&P 500 Index | USD | 218,400,000 | $ | 4,828,070 | ||||||||
|
| |||||||||||
| Total Options Purchased—Puts (premiums paid $32,054,223) | 20,104,614 | |||||||||||
|
| |||||||||||
| Shares | ||||||||||||
| SHORT-TERM INVESTMENTS–12.6% |
| |||||||||||
| Investment Companies–12.4% |
| |||||||||||
AB Fixed Income Shares, Inc.—Government Money Market Portfolio—Class AB, 0.01%(c)(d)(e) (cost $235,773,243) |
| 235,773,243 | 235,773,243 | |||||||||
|
| |||||||||||
| Principal Amount (000) | ||||||||||||
| U.S. Treasury Bills–0.2% |
| |||||||||||
U.S. Treasury Bill | U.S.$ | 4,000 | 3,999,875 | |||||||||
|
| |||||||||||
| Total Short-Term Investments (cost $239,773,160) | 239,773,118 | |||||||||||
|
| |||||||||||
| Total Investments—99.2% (cost $1,411,442,780) |
| 1,886,584,348 | ||||||||||
Other assets less liabilities—0.8% |
| 15,613,449 | ||||||||||
|
| |||||||||||
| Net Assets—100.0% |
| $ | 1,902,197,797 | |||||||||
|
| |||||||||||
| FUTURES (see Note 3) | ||||||||||||||
| Description | Number of Contracts | Expiration Month | Current Notional | Value and Unrealized Appreciation/ (Depreciation) | ||||||||||
| Purchased Contracts |
| |||||||||||||
10 Yr Australian Bond Futures | 1,840 | June 2021 | $ | 193,024,765 | $ | (850,283 | ) | |||||||
10 Yr Canadian Bond Futures | 1,124 | June 2021 | 124,116,718 | (2,128,626 | ) | |||||||||
Euro Buxl 30 Yr Bond Futures | 27 | June 2021 | 6,523,824 | (43,726 | ) | |||||||||
Euro STOXX 50 Index Futures | 1,886 | June 2021 | 85,504,795 | 2,242,805 | ||||||||||
Euro-BOBL Futures | 75 | June 2021 | 11,880,624 | 6,070 | ||||||||||
Hang Seng Index Futures | 46 | April 2021 | 8,377,407 | 39,212 | ||||||||||
MSCI Singapore IX ETS Futures | 1,496 | April 2021 | 39,807,701 | 225,463 | ||||||||||
Nikkei 225 (OSE) Futures | 51 | June 2021 | 13,440,325 | 195,875 | ||||||||||
OMXS 30 Index Futures | 2,699 | April 2021 | 67,595,140 | 985,376 | ||||||||||
Russell 2000 E-Mini Futures | 395 | June 2021 | 43,894,375 | (738,182 | ) | |||||||||
S&P 500 E-Mini Futures | 2,008 | June 2021 | 398,326,960 | 7,152,148 | ||||||||||
S&P Mid 400 E-Mini Futures | 121 | June 2021 | 31,524,130 | 5,648 | ||||||||||
2021 Semi-Annual Report | 21 | |
Table of Contents
Schedule of Investments (continued)
| Description | Number of Contracts | Expiration Month | Current Notional | Value and Unrealized Appreciation/ (Depreciation) | ||||||||||
S&P/TSX 60 Index Futures | 92 | June 2021 | $ | 16,268,194 | $ | (16,997 | ) | |||||||
TOPIX Index Futures | 450 | June 2021 | 79,412,960 | 932,136 | ||||||||||
U.S. T-Note 2 Yr (CBT) Futures | 736 | June 2021 | 162,454,750 | (161,876 | ) | |||||||||
U.S. T-Note 10 Yr (CBT) Futures | 3,309 | June 2021 | 433,272,188 | (7,747,763 | ) | |||||||||
U.S. Ultra Bond (CBT) Futures | 350 | June 2021 | 63,426,563 | (2,999,145 | ) | |||||||||
| Sold Contracts |
| |||||||||||||
10 Yr Japan Bond (OSE) Futures | 68 | June 2021 | 92,832,513 | (156,994 | ) | |||||||||
Euro-Bund Futures | 2 | June 2021 | 401,720 | (518 | ) | |||||||||
FTSE 100 Index Futures | 524 | June 2021 | 48,251,771 | 204,222 | ||||||||||
Long Gilt Futures | 210 | June 2021 | 36,938,048 | 251,302 | ||||||||||
MSCI Emerging Markets Futures | 681 | June 2021 | 45,031,125 | 385,045 | ||||||||||
SPI 200 Futures | 468 | June 2021 | 60,127,650 | (61,564 | ) | |||||||||
|
| |||||||||||||
| $ | (2,280,372 | ) | ||||||||||||
|
| |||||||||||||
| FORWARD CURRENCY EXCHANGE CONTRACTS (see Note 3) |
| |||||||||||||||||||
| Counterparty | Contracts to Deliver (000) | In Exchange For (000) | Settlement Date | Unrealized Appreciation/ (Depreciation) | ||||||||||||||||
Bank of America, NA | CAD | 21,306 | USD | 17,034 | 04/22/2021 | $ | 79,210 | |||||||||||||
Barclays Bank PLC | USD | 23,910 | NZD | 32,933 | 05/27/2021 | (911,499 | ) | |||||||||||||
BNP Paribas SA | SEK | 106,441 | USD | 12,496 | 04/15/2021 | 307,075 | ||||||||||||||
BNP Paribas SA | CAD | 55,705 | USD | 44,324 | 04/22/2021 | (4,938 | ) | |||||||||||||
BNP Paribas SA | USD | 25,893 | CAD | 32,754 | 04/22/2021 | 171,661 | ||||||||||||||
BNP Paribas SA | JPY | 3,267,242 | USD | 30,059 | 05/20/2021 | 537,883 | ||||||||||||||
BNP Paribas SA | NZD | 13,760 | USD | 9,849 | 05/27/2021 | 240,161 | ||||||||||||||
Citibank, NA | SEK | 69,627 | USD | 8,369 | 04/15/2021 | 396,246 | ||||||||||||||
Citibank, NA | USD | 73,903 | CAD | 93,703 | 04/22/2021 | 663,517 | ||||||||||||||
Citibank, NA | EUR | 57,376 | USD | 68,496 | 05/27/2021 | 1,139,642 | ||||||||||||||
Deutsche Bank AG | AUD | 19,355 | USD | 14,762 | 06/04/2021 | 57,049 | ||||||||||||||
Goldman Sachs Bank USA | CHF | 40,281 | USD | 45,438 | 05/06/2021 | 2,784,692 | ||||||||||||||
Goldman Sachs Bank USA | USD | 1,697 | CHF | 1,533 | 05/06/2021 | (73,720 | ) | |||||||||||||
JPMorgan Chase Bank, NA | GBP | 2,502 | USD | 3,475 | 04/09/2021 | 25,841 | ||||||||||||||
JPMorgan Chase Bank, NA | GBP | 40,161 | USD | 54,846 | 04/09/2021 | (520,530 | ) | |||||||||||||
JPMorgan Chase Bank, NA | USD | 24,808 | GBP | 17,669 | 04/09/2021 | (448,916 | ) | |||||||||||||
JPMorgan Chase Bank, NA | NOK | 64,962 | USD | 7,606 | 04/15/2021 | 11,283 | ||||||||||||||
JPMorgan Chase Bank, NA | SEK | 379,048 | USD | 45,684 | 04/15/2021 | 2,278,715 | ||||||||||||||
JPMorgan Chase Bank, NA | USD | 52,439 | NOK | 444,626 | 04/15/2021 | (455,019 | ) | |||||||||||||
JPMorgan Chase Bank, NA | USD | 92,810 | SEK | 780,406 | 04/15/2021 | (3,444,041 | ) | |||||||||||||
JPMorgan Chase Bank, NA | CAD | 46,531 | USD | 36,707 | 04/22/2021 | (320,805 | ) | |||||||||||||
JPMorgan Chase Bank, NA | CHF | 11,510 | USD | 12,385 | 05/06/2021 | 197,403 | ||||||||||||||
JPMorgan Chase Bank, NA | JPY | 3,747,216 | USD | 35,080 | 05/20/2021 | 1,222,374 | ||||||||||||||
Morgan Stanley & Co., Inc. | USD | 39,831 | JPY | 4,334,434 | 05/20/2021 | (667,109 | ) | |||||||||||||
Natwest Markets PLC | GBP | 7,748 | USD | 10,590 | 04/09/2021 | (91,440 | ) | |||||||||||||
| 22 | Sanford C. Bernstein Fund, Inc. | |
Table of Contents
| Counterparty | Contracts to Deliver (000) | In Exchange For (000) | Settlement Date | Unrealized Appreciation/ (Depreciation) | ||||||||||||||||
Natwest Markets PLC | JPY | 1,269,550 | USD | 11,973 | 05/20/2021 | $ | 501,901 | |||||||||||||
State Street Bank & Trust Co. | GBP | 14 | USD | 19 | 04/09/2021 | (158 | ) | |||||||||||||
State Street Bank & Trust Co. | USD | 9,787 | GBP | 7,137 | 04/09/2021 | 53,475 | ||||||||||||||
State Street Bank & Trust Co. | USD | 1,236 | NOK | 10,663 | 04/15/2021 | 10,892 | ||||||||||||||
State Street Bank & Trust Co. | USD | 1,225 | SEK | 10,523 | 04/15/2021 | (20,219 | ) | |||||||||||||
State Street Bank & Trust Co. | USD | 8,694 | CAD | 10,935 | 04/22/2021 | 8,021 | ||||||||||||||
State Street Bank & Trust Co. | USD | 3,469 | CHF | 3,236 | 05/06/2021 | (42,863 | ) | |||||||||||||
State Street Bank & Trust Co. | USD | 36,887 | JPY | 3,949,574 | 05/20/2021 | (1,200,978 | ) | |||||||||||||
State Street Bank & Trust Co. | USD | 23,498 | EUR | 19,828 | 05/27/2021 | (220,141 | ) | |||||||||||||
UBS AG | USD | 11,143 | NOK | 94,729 | 04/15/2021 | (67,311 | ) | |||||||||||||
|
| |||||||||||||||||||
| $ | 2,197,354 | |||||||||||||||||||
|
| |||||||||||||||||||
| TOTAL RETURN SWAPS (see Note 3) |
| |||||||||||||||||||||
| Counterparty & Referenced Obligation | Rate Paid/ Received | Payment Frequency | Current Notional (000) | Maturity Date | Unrealized Appreciation/ (Depreciation) | |||||||||||||||||
| Pay Total Return on Reference Obligation |
| |||||||||||||||||||||
Morgan Stanley Capital Services LLC |
| |||||||||||||||||||||
Swiss Market Index Futures | 0.00% | Maturity | CHF | 38,500 | 06/18/2021 | $ | (106,054 | ) | ||||||||||||||
| (a) | Non-income producing security. |
| (b) | Position, or a portion thereof, has been segregated to collateralize margin requirements for open futures contracts. |
| (c) | Affiliated investments. |
| (d) | To obtain a copy of the fund’s shareholder report, please go to the Securities and Exchange Commission’s website at www.sec.gov, or call AB at (800) 227-4618. |
| (e) | The rate shown represents the 7-day yield as of period end. |
Currency Abbreviations:
AUD—Australian Dollar
CAD—Canadian Dollar
CHF—Swiss Franc
EUR—Euro
GBP—Great British Pound
JPY—Japanese Yen
NOK—Norwegian Krone
NZD—New Zealand Dollar
SEK—Swedish Krona
USD—United States Dollar
Glossary:
ADR—American Depositary Receipt
BOBL—Bundesobligationen
CBT—Chicago Board of Trade
ETS—Emission Trading Scheme
FTSE—Financial Times Stock Exchange
MSCI—Morgan Stanley Capital International
OMXS—Stockholm Stock Exchange
OSE—Osaka Securities Exchange
REIT—Real Estate Investment Trust
SPI—Share Price Index
TOPIX—Tokyo Price Index
TSX—Toronto Stock Exchange
See notes to financial statements.
2021 Semi-Annual Report | 23 | |
Table of Contents
Schedule of Investments
Sanford C. Bernstein Fund, Inc.
Schedule of Investments
Tax-Aware Overlay A Portfolio
March 31, 2021 (Unaudited)
| Company | Shares | U.S. $ Value | ||||||
| COMMON STOCKS–44.6% |
| |||||||
| Information Technology–11.1% |
| |||||||
| Communications Equipment–0.0% |
| |||||||
NetScout Systems, Inc.(a) | 3,411 | $ | 96,054 | |||||
|
| |||||||
| Electronic Equipment, Instruments & Components–0.5% |
| |||||||
Arrow Electronics, Inc.(a) | 7,070 | 783,497 | ||||||
Avnet, Inc. | 11,830 | 491,063 | ||||||
Belden, Inc. | 22,184 | 984,304 | ||||||
CDW Corp./DE | 64,259 | 10,650,929 | ||||||
Cognex Corp. | 20,880 | 1,732,831 | ||||||
IPG Photonics Corp.(a) | 5,530 | 1,166,498 | ||||||
Littelfuse, Inc. | 8,500 | 2,247,740 | ||||||
Novanta, Inc.(a) | 8,210 | 1,082,817 | ||||||
Shoals Technologies Group, Inc.(a) | 24,675 | 858,197 | ||||||
Vishay Intertechnology, Inc. | 33,030 | 795,363 | ||||||
|
| |||||||
| 20,793,239 | ||||||||
|
| |||||||
| IT Services–2.3% |
| |||||||
Amdocs Ltd. | 11,143 | 781,681 | ||||||
Automatic Data Processing, Inc. | 57,394 | 10,817,047 | ||||||
Digitalocean Holdings, Inc.(a) | 7,695 | 324,190 | ||||||
Genpact Ltd. | 373,591 | 15,997,167 | ||||||
MongoDB, Inc.(a) | 5,080 | 1,358,544 | ||||||
PayPal Holdings, Inc.(a) | 62,637 | 15,210,769 | ||||||
Shift4 Payments, Inc.–Class A(a) | 29,264 | 2,399,941 | ||||||
Visa, Inc.–Class A | 204,772 | 43,356,376 | ||||||
|
| |||||||
| 90,245,715 | ||||||||
|
| |||||||
| Semiconductors & Semiconductor Equipment–2.6% |
| |||||||
Cree, Inc.(a) | 8,216 | 888,396 | ||||||
Entegris, Inc. | 34,074 | 3,809,473 | ||||||
Kulicke & Soffa Industries, Inc. | 21,752 | 1,068,241 | ||||||
Lattice Semiconductor Corp.(a) | 30,417 | 1,369,373 | ||||||
MaxLinear, Inc.–Class A(a) | 18,761 | 639,375 | ||||||
MKS Instruments, Inc. | 15,650 | 2,901,823 | ||||||
Monolithic Power Systems, Inc. | 10,880 | 3,842,925 | ||||||
NVIDIA Corp. | 42,026 | 22,438,942 | ||||||
NXP Semiconductors NV | 75,111 | 15,122,849 | ||||||
ON Semiconductor Corp.(a) | 34,290 | 1,426,807 | ||||||
QUALCOMM, Inc. | 178,290 | 23,639,471 | ||||||
Synaptics, Inc.(a) | 7,650 | 1,035,963 | ||||||
Texas Instruments, Inc. | 78,355 | 14,808,311 | ||||||
Universal Display Corp. | 5,753 | 1,362,138 | ||||||
Xilinx, Inc. | 69,234 | 8,578,093 | ||||||
|
| |||||||
| 102,932,180 | ||||||||
|
| |||||||
| Software–3.8% |
| |||||||
Adobe, Inc.(a) | 19,797 | 9,410,900 | ||||||
Anaplan, Inc.(a) | 19,683 | 1,059,929 | ||||||
Avalara, Inc.(a) | 8,436 | 1,125,615 | ||||||
Citrix Systems, Inc. | 68,149 | 9,565,394 | ||||||
CommVault Systems, Inc.(a) | 20,552 | 1,325,604 | ||||||
| Company | Shares | U.S. $ Value | ||||||
Coupa Software, Inc.(a) | 2,970 | $ | 755,806 | |||||
Fair Isaac Corp.(a) | 3,070 | 1,492,173 | ||||||
HubSpot, Inc.(a) | 3,792 | 1,722,364 | ||||||
Manhattan Associates, Inc.(a) | 25,239 | 2,962,554 | ||||||
Microsoft Corp. | 411,588 | 97,040,103 | ||||||
Oracle Corp.(b) | 261,027 | 18,316,265 | ||||||
RingCentral, Inc.–Class A(a) | 2,336 | 695,848 | ||||||
Smartsheet, Inc.–Class A(a) | 20,510 | 1,310,999 | ||||||
Varonis Systems, Inc.(a) | 21,665 | 1,112,281 | ||||||
Zendesk, Inc.(a) | 12,750 | 1,690,905 | ||||||
|
| |||||||
| 149,586,740 | ||||||||
|
| |||||||
| Technology Hardware, Storage & Peripherals–1.9% |
| |||||||
Alignment Healthcare, Inc.(a) | 22,811 | 500,245 | ||||||
Apple, Inc.(b) | 509,142 | 62,191,696 | ||||||
NCR Corp.(a) | 27,798 | 1,054,934 | ||||||
Western Digital Corp. | 181,905 | 12,142,159 | ||||||
|
| |||||||
| 75,889,034 | ||||||||
|
| |||||||
| 439,542,962 | ||||||||
|
| |||||||
| Consumer Discretionary–6.4% |
| |||||||
| Auto Components–0.5% |
| |||||||
Dana, Inc. | 44,225 | 1,075,994 | ||||||
Goodyear Tire & Rubber Co. (The)(a) | 84,840 | 1,490,639 | ||||||
Lear Corp. | 7,712 | 1,397,800 | ||||||
Magna International, Inc.–Class A (United States) | 184,035 | 16,202,442 | ||||||
|
| |||||||
| 20,166,875 | ||||||||
|
| |||||||
| Automobiles–0.2% |
| |||||||
Stellantis NV | 491,003 | 8,734,943 | ||||||
|
| |||||||
| Distributors–0.3% |
| |||||||
LKQ Corp.(a) | 263,293 | 11,145,193 | ||||||
Pool Corp. | 6,740 | 2,326,917 | ||||||
|
| |||||||
| 13,472,110 | ||||||||
|
| |||||||
| Diversified Consumer Services–0.2% |
| |||||||
Chegg, Inc.(a) | 67,993 | 5,824,280 | ||||||
Hillenbrand, Inc. | 25,330 | 1,208,494 | ||||||
Houghton Mifflin Harcourt Co.(a) | 67,264 | 512,552 | ||||||
|
| |||||||
| 7,545,326 | ||||||||
|
| |||||||
| Hotels, Restaurants & Leisure–0.2% |
| |||||||
Dine Brands Global, Inc.(a) | 10,537 | 948,646 | ||||||
Hilton Grand Vacations, Inc.(a) | 37,950 | 1,422,745 | ||||||
Papa John’s International, Inc. | 12,501 | 1,108,089 | ||||||
Penn National Gaming, Inc.(a) | 8,140 | 853,398 | ||||||
Planet Fitness, Inc.(a) | 24,299 | 1,878,313 | ||||||
Vail Resorts, Inc.(a) | 1,570 | 457,906 | ||||||
|
| |||||||
| 6,669,097 | ||||||||
|
| |||||||
| Household Durables–0.2% |
| |||||||
KB Home | 31,760 | 1,477,793 | ||||||
NVR, Inc.(a) | 405 | 1,907,926 | ||||||
PulteGroup, Inc. | 37,850 | 1,984,854 | ||||||
Taylor Morrison Home Corp.–Class A(a) | 31,636 | 974,705 | ||||||
| 24 | Sanford C. Bernstein Fund, Inc. | |
Table of Contents
| Company | Shares | U.S. $ Value | ||||||
Tempur Sealy International, Inc. | 29,666 | $ | 1,084,589 | |||||
TopBuild Corp.(a) | 5,197 | 1,088,408 | ||||||
|
| |||||||
| 8,518,275 | ||||||||
|
| |||||||
| Internet & Direct Marketing Retail–1.4% |
| |||||||
Amazon.com, Inc.(a)(b) | 17,318 | 53,583,278 | ||||||
Etsy, Inc.(a) | 5,700 | 1,149,519 | ||||||
|
| |||||||
| 54,732,797 | ||||||||
|
| |||||||
| Leisure Products–0.0% |
| |||||||
Brunswick Corp./DE | 10,950 | 1,044,302 | ||||||
|
| |||||||
| Specialty Retail–2.3% |
| |||||||
AutoZone, Inc.(a) | 16,432 | 23,075,457 | ||||||
Five Below, Inc.(a) | 13,482 | 2,572,231 | ||||||
Floor & Decor Holdings, Inc.–Class A(a) | 15,320 | 1,462,754 | ||||||
Foot Locker, Inc. | 30,028 | 1,689,075 | ||||||
Gap, Inc. (The)(a) | 43,970 | 1,309,427 | ||||||
Home Depot, Inc. (The) | 117,140 | 35,756,985 | ||||||
Lithia Motors, Inc.–Class A | 3,411 | 1,330,597 | ||||||
National Vision Holdings, Inc.(a) | 55,567 | 2,435,502 | ||||||
Sally Beauty Holdings, Inc.(a) | 60,080 | 1,209,410 | ||||||
TJX Cos., Inc. (The) | 275,167 | 18,202,297 | ||||||
Williams-Sonoma, Inc. | 7,327 | 1,312,998 | ||||||
|
| |||||||
| 90,356,733 | ||||||||
|
| |||||||
| Textiles, Apparel & Luxury Goods–1.1% |
| |||||||
Carter’s, Inc. | 2,853 | 253,717 | ||||||
Deckers Outdoor Corp.(a) | 38,900 | 12,853,338 | ||||||
Kontoor Brands, Inc. | 32,100 | 1,557,813 | ||||||
NIKE, Inc.–Class B | 168,329 | 22,369,241 | ||||||
Ralph Lauren Corp.(a) | 12,530 | 1,543,195 | ||||||
Skechers U.S.A., Inc.–Class A(a) | 10,758 | 448,716 | ||||||
Steven Madden Ltd. | 28,788 | 1,072,641 | ||||||
Tapestry, Inc.(a) | 43,190 | 1,779,860 | ||||||
|
| |||||||
| 41,878,521 | ||||||||
|
| |||||||
| 253,118,979 | ||||||||
|
| |||||||
| Health Care–5.7% |
| |||||||
| Biotechnology–0.9% |
| |||||||
ADC Therapeutics SA(a) | 30,983 | 756,295 | ||||||
Allogene Therapeutics, Inc.(a) | 13,748 | 485,304 | ||||||
Arena Pharmaceuticals, Inc.(a) | 5,201 | 360,897 | ||||||
Arrowhead Pharmaceuticals, Inc.(a) | 9,870 | 654,480 | ||||||
Ascendis Pharma A/S (Sponsored ADR)(a) | 2,897 | 373,365 | ||||||
Biohaven Pharmaceutical Holding Co., Ltd.(a) | 7,411 | 506,542 | ||||||
Blueprint Medicines Corp.(a) | 6,959 | 676,624 | ||||||
Coherus Biosciences, Inc.(a) | 23,186 | 338,748 | ||||||
Deciphera Pharmaceuticals, Inc.(a) | 11,033 | 494,720 | ||||||
Intellia Therapeutics, Inc.(a) | 9,400 | 754,397 | ||||||
Iovance Biotherapeutics, Inc.(a) | 16,810 | 532,205 | ||||||
Kodiak Sciences, Inc.(a) | 4,823 | 546,880 | ||||||
Legend Biotech Corp. ADR(a) | 12,993 | 377,057 | ||||||
PTC Therapeutics, Inc.(a) | 16,680 | 789,798 | ||||||
Regeneron Pharmaceuticals, Inc.(a) | 18,141 | 8,583,233 | ||||||
Sage Therapeutics, Inc.(a) | 10,180 | 761,973 | ||||||
| Company | Shares | U.S. $ Value | ||||||
Turning Point Therapeutics, Inc.–Class I(a) | 5,458 | $ | 516,272 | |||||
Ultragenyx Pharmaceutical, Inc.(a) | 5,326 | 606,418 | ||||||
Vertex Pharmaceuticals, Inc.(a) | 74,235 | 15,952,359 | ||||||
Vir Biotechnology, Inc.(a) | 9,216 | 472,504 | ||||||
|
| |||||||
| 34,540,071 | ||||||||
|
| |||||||
| Health Care Equipment & Supplies–1.4% |
| |||||||
AtriCure, Inc.(a) | 14,680 | 961,834 | ||||||
Edwards Lifesciences Corp.(a) | 176,469 | 14,759,867 | ||||||
Insulet Corp.(a) | 3,807 | 993,322 | ||||||
iRhythm Technologies, Inc.(a) | 4,260 | 591,544 | ||||||
Medtronic PLC | 222,376 | 26,269,277 | ||||||
Silk Road Medical, Inc.(a) | 14,326 | 725,612 | ||||||
Zimmer Biomet Holdings, Inc. | 66,463 | 10,639,397 | ||||||
|
| |||||||
| 54,940,853 | ||||||||
|
| |||||||
| Health Care Providers & Services–1.8% |
| |||||||
Amedisys, Inc.(a) | 5,230 | 1,384,852 | ||||||
Anthem, Inc. | 60,016 | 21,542,743 | ||||||
Guardant Health, Inc.(a) | 8,629 | 1,317,217 | ||||||
Instil Bio, Inc.(a) | 19,431 | 487,329 | ||||||
MEDNAX, Inc.(a) | 60,180 | 1,532,785 | ||||||
UnitedHealth Group, Inc. | 123,201 | 45,839,396 | ||||||
|
| |||||||
| 72,104,322 | ||||||||
|
| |||||||
| Health Care Technology–0.0% |
| |||||||
American Well Corp.–Class A(a) | 19,271 | 334,737 | ||||||
|
| |||||||
| Life Sciences Tools & Services–0.1% |
| |||||||
10X Genomics, Inc.(a) | 7,842 | 1,419,402 | ||||||
Berkeley Lights, Inc.(a) | 14,316 | 719,093 | ||||||
ICON PLC(a) | 3,254 | 638,988 | ||||||
Repligen Corp.(a) | 15,233 | 2,961,447 | ||||||
|
| |||||||
| 5,738,930 | ||||||||
|
| |||||||
| Pharmaceuticals–1.5% |
| |||||||
Johnson & Johnson(b) | 77,882 | 12,799,907 | ||||||
Pfizer, Inc. | 52,952 | 1,918,451 | ||||||
Revance Therapeutics, Inc.(a) | 36,123 | 1,009,638 | ||||||
Roche Holding AG (Sponsored ADR) | 637,188 | 25,844,345 | ||||||
Viatris, Inc.(a) | 23,223 | 324,425 | ||||||
Zoetis, Inc. | 105,826 | 16,665,478 | ||||||
|
| |||||||
| 58,562,244 | ||||||||
|
| |||||||
| 226,221,157 | ||||||||
|
| |||||||
| Financials–5.3% |
| |||||||
| Banks–2.5% |
| |||||||
Bank of America Corp. | 962,082 | 37,222,953 | ||||||
Citigroup, Inc. | 204,566 | 14,882,176 | ||||||
Comerica, Inc. | 26,120 | 1,873,849 | ||||||
First Citizens BancShares, Inc./NC–Class A | 2,390 | 1,997,490 | ||||||
Pinnacle Financial Partners, Inc. | 7,620 | 675,589 | ||||||
PNC Financial Services Group, Inc. (The) | 64,594 | 11,330,434 | ||||||
Sterling Bancorp/DE | 64,160 | 1,476,963 | ||||||
SVB Financial Group(a) | 2,163 | 1,067,787 | ||||||
Synovus Financial Corp. | 40,658 | 1,860,103 | ||||||
Texas Capital Bancshares, Inc.(a) | 20,403 | 1,446,981 | ||||||
2021 Semi-Annual Report | 25 | |
Table of Contents
Schedule of Investments (continued)
| Company | Shares | U.S. $ Value | ||||||
Umpqua Holdings Corp. | 56,743 | $ | 995,840 | |||||
Webster Financial Corp. | 29,074 | 1,602,268 | ||||||
Wells Fargo & Co. | 522,145 | 20,400,205 | ||||||
Wintrust Financial Corp. | 21,280 | 1,613,024 | ||||||
Zions Bancorp NA | 24,126 | 1,325,965 | ||||||
|
| |||||||
| 99,771,627 | ||||||||
|
| |||||||
| Capital Markets–1.7% |
| |||||||
Ares Management Corp.–Class A | 22,496 | 1,260,451 | ||||||
CME Group, Inc.–Class A | 86,000 | 17,563,780 | ||||||
Goldman Sachs Group, Inc. (The) | 78,712 | 25,738,824 | ||||||
LPL Financial Holdings, Inc. | 144,461 | 20,536,576 | ||||||
Moelis & Co. | 27,513 | 1,509,913 | ||||||
PJT Partners, Inc. | 5,401 | 365,378 | ||||||
Stifel Financial Corp. | 26,290 | 1,684,137 | ||||||
|
| |||||||
| 68,659,059 | ||||||||
|
| |||||||
| Consumer Finance–0.0% |
| |||||||
Fisker, Inc.(a) | 18,010 | 310,132 | ||||||
OneMain Holdings, Inc. | 15,914 | 854,900 | ||||||
|
| |||||||
| 1,165,032 | ||||||||
|
| |||||||
| Diversified Financial Services–0.0% |
| |||||||
Voya Financial, Inc. | 18,365 | 1,168,749 | ||||||
|
| |||||||
| Insurance–1.0% |
| |||||||
American Financial Group, Inc./OH | 11,753 | 1,341,017 | ||||||
Everest Re Group Ltd. | 5,301 | 1,313,641 | ||||||
Goosehead Insurance, Inc.–Class A | 5,513 | 590,883 | ||||||
Hanover Insurance Group, Inc. (The) | 8,690 | 1,125,007 | ||||||
Inari Medical, Inc.(a) | 24,804 | 2,654,028 | ||||||
Kinsale Capital Group, Inc. | 9,807 | 1,616,194 | ||||||
Progressive Corp. (The) | 172,240 | 16,467,867 | ||||||
Reinsurance Group of America, Inc.–Class A | 89,733 | 11,310,845 | ||||||
Selective Insurance Group, Inc. | 11,130 | 807,370 | ||||||
|
| |||||||
| 37,226,852 | ||||||||
|
| |||||||
| Thrifts & Mortgage Finance–0.1% |
| |||||||
BankUnited, Inc. | 37,552 | 1,650,410 | ||||||
|
| |||||||
| 209,641,729 | ||||||||
|
| |||||||
| Industrials–5.3% |
| |||||||
| Aerospace & Defense–0.5% |
| |||||||
AAR Corp.(a) | 23,672 | 985,939 | ||||||
Axon Enterprise, Inc.(a) | 7,793 | 1,109,879 | ||||||
L3Harris Technologies, Inc. | 67,035 | 13,586,653 | ||||||
Raytheon Technologies Corp. | 25,403 | 1,962,890 | ||||||
|
| |||||||
| 17,645,361 | ||||||||
|
| |||||||
| Air Freight & Logistics–0.0% |
| |||||||
XPO Logistics, Inc.(a) | 12,175 | 1,501,178 | ||||||
|
| |||||||
| Airlines–0.4% |
| |||||||
Alaska Air Group, Inc.(a) | 17,592 | 1,217,542 | ||||||
SkyWest, Inc.(a) | 25,843 | 1,407,927 | ||||||
Southwest Airlines Co.(a) | 244,852 | 14,950,663 | ||||||
|
| |||||||
| 17,576,132 | ||||||||
|
| |||||||
| Company | Shares | U.S. $ Value | ||||||
| Building Products–0.2% |
| |||||||
Masco Corp. | 104,482 | $ | 6,258,472 | |||||
Masonite International Corp.(a) | 12,436 | 1,433,125 | ||||||
Trex Co., Inc.(a) | 14,614 | 1,337,765 | ||||||
|
| |||||||
| 9,029,362 | ||||||||
|
| |||||||
| Commercial Services & Supplies–0.1% |
| |||||||
ADT, Inc. | 22,180 | 187,199 | ||||||
Copart, Inc.(a) | 7,058 | 766,569 | ||||||
Herman Miller, Inc. | 36,130 | 1,486,750 | ||||||
|
| |||||||
| 2,440,518 | ||||||||
|
| |||||||
| Construction & Engineering–0.6% |
| |||||||
AECOM(a) | 355,257 | 22,775,526 | ||||||
|
| |||||||
| Electrical Equipment–0.6% |
| |||||||
AMETEK, Inc. | 9,829 | 1,255,458 | ||||||
Eaton Corp. PLC | 116,795 | 16,150,412 | ||||||
Plug Power, Inc.(a) | 15,220 | 545,485 | ||||||
Regal Beloit Corp. | 51,851 | 7,398,101 | ||||||
|
| |||||||
| 25,349,456 | ||||||||
|
| |||||||
| Industrial Conglomerates–0.2% |
| |||||||
Honeywell International, Inc. | 42,965 | 9,326,413 | ||||||
|
| |||||||
| Machinery–0.5% |
| |||||||
Crane Co. | 13,272 | 1,246,374 | ||||||
Ingersoll Rand, Inc.(a) | 228,459 | 11,242,468 | ||||||
Kennametal, Inc. | 35,255 | 1,409,142 | ||||||
Middleby Corp. (The)(a) | 7,370 | 1,221,577 | ||||||
Oshkosh Corp. | 17,440 | 2,069,430 | ||||||
Welbilt, Inc.(a) | 69,270 | 1,125,638 | ||||||
|
| |||||||
| 18,314,629 | ||||||||
|
| |||||||
| Professional Services–0.6% |
| |||||||
Booz Allen Hamilton Holding Corp. | 88,714 | 7,144,138 | ||||||
Jacobs Engineering Group, Inc. | 10,140 | 1,310,798 | ||||||
Korn Ferry | 19,350 | 1,206,859 | ||||||
Robert Half International, Inc. | 166,365 | 12,988,116 | ||||||
|
| |||||||
| 22,649,911 | ||||||||
|
| |||||||
| Road & Rail–1.0% |
| |||||||
CSX Corp. | 202,813 | 19,555,229 | ||||||
Kansas City Southern | 3,680 | 971,226 | ||||||
Knight-Swift Transportation Holdings, Inc. | 350,446 | 16,852,948 | ||||||
|
| |||||||
| 37,379,403 | ||||||||
|
| |||||||
| Trading Companies & Distributors–0.6% |
| |||||||
GATX Corp. | 10,980 | 1,018,285 | ||||||
MRC Global, Inc.(a) | 103,058 | 930,614 | ||||||
SiteOne Landscape Supply, Inc.(a) | 7,734 | 1,320,503 | ||||||
United Rentals, Inc.(a) | 66,293 | 21,830,948 | ||||||
|
| |||||||
| 25,100,350 | ||||||||
|
| |||||||
| 209,088,239 | ||||||||
|
| |||||||
| Communication Services–5.3% |
| |||||||
| Diversified Telecommunication Services–0.9% |
| |||||||
Comcast Corp.–Class A | 617,183 | 33,395,772 | ||||||
|
| |||||||
| 26 | Sanford C. Bernstein Fund, Inc. | |
Table of Contents
| Company | Shares | U.S. $ Value | ||||||
| Entertainment–0.8% |
| |||||||
Electronic Arts, Inc. | 158,933 | $ | 21,514,760 | |||||
Take-Two Interactive Software, Inc.(a) | 56,473 | 9,978,779 | ||||||
|
| |||||||
| 31,493,539 | ||||||||
|
| |||||||
| Interactive Media & Services–3.2% |
| |||||||
Alphabet, Inc.–Class C(a) | 39,348 | 81,396,454 | ||||||
Bumble, Inc.(a) | 3,637 | 226,876 | ||||||
Facebook, Inc.–Class A(a)(b) | 155,217 | 45,716,063 | ||||||
|
| |||||||
| 127,339,393 | ||||||||
|
| |||||||
| Media–0.0% |
| |||||||
Criteo SA (Sponsored ADR)(a) | 37,462 | 1,301,055 | ||||||
|
| |||||||
| Wireless Telecommunication Services–0.4% |
| |||||||
T-Mobile US, Inc.(a) | 122,794 | 15,384,860 | ||||||
|
| |||||||
| 208,914,619 | ||||||||
|
| |||||||
| Consumer Staples–1.8% |
| |||||||
| Food & Staples Retailing–0.9% |
| |||||||
Casey’s General Stores, Inc. | 4,220 | 912,322 | ||||||
Costco Wholesale Corp. | 20,268 | 7,144,065 | ||||||
Grocery Outlet Holding Corp.(a) | 8,907 | 328,579 | ||||||
Walmart, Inc.(b) | 191,475 | 26,008,049 | ||||||
|
| |||||||
| 34,393,015 | ||||||||
|
| |||||||
| Food Products–0.1% |
| |||||||
Freshpet, Inc.(a) | 7,631 | 1,211,879 | ||||||
Hain Celestial Group, Inc. (The)(a) | 31,384 | 1,368,342 | ||||||
Nomad Foods Ltd.(a) | 46,591 | 1,279,389 | ||||||
|
| |||||||
| 3,859,610 | ||||||||
|
| |||||||
| Household Products–0.8% |
| |||||||
Procter & Gamble Co. (The)(b) | 247,272 | 33,488,047 | ||||||
|
| |||||||
| 71,740,672 | ||||||||
|
| |||||||
| Real Estate–1.2% |
| |||||||
| Equity Real Estate Investment Trusts (REITs)–1.2% |
| |||||||
American Campus Communities, Inc. | 192,541 | 8,311,995 | ||||||
American Tower Corp. | 35,093 | 8,389,332 | ||||||
Americold Realty Trust | 50,583 | 1,945,928 | ||||||
Camden Property Trust | 11,689 | 1,284,738 | ||||||
Cousins Properties, Inc. | 30,359 | 1,073,191 | ||||||
CubeSmart | 32,397 | 1,225,578 | ||||||
MGM Growth Properties LLC–Class A | 36,630 | 1,194,871 | ||||||
Mid-America Apartment Communities, Inc. | 72,758 | 10,503,345 | ||||||
Physicians Realty Trust | 62,180 | 1,098,721 | ||||||
Prologis, Inc. | 79,995 | 8,479,470 | ||||||
RLJ Lodging Trust | 70,507 | 1,091,448 | ||||||
Safehold, Inc. | 10,700 | 750,070 | ||||||
STAG Industrial, Inc. | 32,480 | 1,091,653 | ||||||
|
| |||||||
| 46,440,340 | ||||||||
|
| |||||||
| Utilities–1.0% |
| |||||||
| Electric Utilities–1.0% |
| |||||||
American Electric Power Co., Inc. | 239,972 | 20,325,628 | ||||||
IDACORP, Inc. | 13,114 | 1,311,007 | ||||||
NextEra Energy, Inc. | 222,822 | 16,847,572 | ||||||
|
| |||||||
| 38,484,207 | ||||||||
|
| |||||||
| Company | Shares | U.S. $ Value | ||||||
| Gas Utilities–0.0% |
| |||||||
Southwest Gas Holdings, Inc. | 12,975 | $ | 891,512 | |||||
|
| |||||||
| 39,375,719 | ||||||||
|
| |||||||
| Energy–0.9% |
| |||||||
| Energy Equipment & Services–0.0% |
| |||||||
Dril-Quip, Inc.(a) | 24,355 | 809,317 | ||||||
|
| |||||||
| Oil, Gas & Consumable Fuels–0.9% |
| |||||||
Chevron Corp. | 83,625 | 8,763,064 | ||||||
Cimarex Energy Co. | 21,353 | 1,268,155 | ||||||
ConocoPhillips | 164,747 | 8,726,648 | ||||||
EOG Resources, Inc. | 97,400 | 7,064,422 | ||||||
HollyFrontier Corp. | 43,421 | 1,553,603 | ||||||
Matador Resources Co. | 21,440 | 502,768 | ||||||
Valero Energy Corp. | 108,622 | 7,777,335 | ||||||
|
| |||||||
| 35,655,995 | ||||||||
|
| |||||||
| 36,465,312 | ||||||||
|
| |||||||
| Materials–0.6% |
| |||||||
| Chemicals–0.4% |
| |||||||
FMC Corp. | 8,300 | 918,063 | ||||||
GCP Applied Technologies, Inc.(a) | 34,359 | 843,170 | ||||||
Innospec, Inc. | 6,780 | 696,238 | ||||||
LyondellBasell Industries NV–Class A | 108,038 | 11,241,354 | ||||||
Orion Engineered Carbons SA(a) | 49,134 | 968,922 | ||||||
Trinseo SA | 18,928 | 1,205,146 | ||||||
|
| |||||||
| 15,872,893 | ||||||||
|
| |||||||
| Containers & Packaging–0.1% | ||||||||
Graphic Packaging Holding Co. | 67,789 | 1,231,048 | ||||||
Sealed Air Corp. | 24,179 | 1,107,882 | ||||||
|
| |||||||
| 2,338,930 | ||||||||
|
| |||||||
| Metals & Mining–0.1% | ||||||||
Carpenter Technology Corp. | 30,748 | 1,265,280 | ||||||
Commercial Metals Co. | 44,790 | 1,381,324 | ||||||
Reliance Steel & Aluminum Co. | 11,517 | 1,753,924 | ||||||
|
| |||||||
| 4,400,528 | ||||||||
|
| |||||||
| 22,612,351 | ||||||||
|
| |||||||
| Total Common Stocks (cost $953,977,727) |
| 1,763,162,079 | ||||||
|
| |||||||
| INVESTMENT COMPANIES–40.9% |
| |||||||
| Funds and Investment Trusts–40.9%(c)(d) |
| |||||||
AB All Market Real Return Portfolio–Class Z | 33,003,315 | 303,960,533 | ||||||
Bernstein Fund, Inc.–International Small Cap Portfolio–Class Z | 18,226,797 | 232,391,665 | ||||||
Bernstein Fund, Inc.–International Strategic Equities Portfolio–Class Z | 67,755,710 | 898,440,719 | ||||||
Bernstein Fund, Inc.–Small Cap Core Portfolio–Class Z | 4,781,248 | 71,240,593 | ||||||
Sanford C. Bernstein Fund, Inc.–Emerging Markets Portfolio–Class Z | 3,204,446 | 109,399,788 | ||||||
|
| |||||||
| Total Investment Companies (cost $1,296,569,271) |
| 1,615,433,298 | ||||||
|
| |||||||
2021 Semi-Annual Report | 27 | |
Table of Contents
Schedule of Investments (continued)
| Notional Amount | U.S. $ Value | |||||||||||
| OPTIONS PURCHASED—PUTS–1.0% |
| |||||||||||
| Options on Equity Indices–1.0% |
| |||||||||||
Euro STOXX 50 Index | EUR | 110,164,250 | $ | 3,328,220 | ||||||||
Euro STOXX 50 Index | 55,870,500 | 1,687,928 | ||||||||||
FTSE 100 Index | GBP | 41,361,000 | 1,365,730 | |||||||||
FTSE 100 Index | 21,267,000 | 702,231 | ||||||||||
Nikkei 225 Index | JPY | 5,805,000,000 | 1,438,821 | |||||||||
Nikkei 225 Index | 5,287,500,000 | 1,310,554 | ||||||||||
Nikkei 225 Index | 5,062,500,000 | 1,254,785 | ||||||||||
S&P 500 Index | USD | 915,600,000 | 20,240,756 | |||||||||
| Notional Amount | U.S. $ Value | |||||||||||
S&P 500 Index | USD | 455,100,000 | $ | 10,060,690 | ||||||||
|
| |||||||||||
| Total Options Purchased—Puts (cost $65,903,553) | 41,389,715 | |||||||||||
|
| |||||||||||
| Shares | ||||||||||||
| SHORT-TERM INVESTMENTS–12.7% |
| |||||||||||
| Investment Companies–12.4% |
| |||||||||||
AB Fixed Income Shares, Inc.—Government Money Market Portfolio—Class AB, 0.01%(c)(d)(e) |
| 490,047,467 | 490,047,467 | |||||||||
|
| |||||||||||
| Principal Amount (000) | ||||||||||||
| U.S. Treasury Bills–0.3% |
| |||||||||||
U.S. Treasury Bill | U.S.$ | 10,500 | 10,499,904 | |||||||||
|
| |||||||||||
| Total Short-Term Investments (cost $500,547,033) | 500,547,371 | |||||||||||
|
| |||||||||||
| Total Investments—99.2% (cost $2,816,997,584) |
| 3,920,532,463 | ||||||||||
Other assets less liabilities—0.8% |
| 33,155,647 | ||||||||||
|
| |||||||||||
| Net Assets—100.0% |
| $ | 3,953,688,110 | |||||||||
|
| |||||||||||
| FUTURES (see Note 3) | ||||||||||||||
| Description | Number of Contracts | Expiration Month | Current Notional | Value and Unrealized Appreciation/ (Depreciation) | ||||||||||
| Purchased Contracts |
| |||||||||||||
Euro STOXX 50 Index Futures | 3,896 | June 2021 | $ | 176,631,325 | $ | 4,656,860 | ||||||||
Hang Seng Index Futures | 109 | April 2021 | 19,850,812 | 92,916 | ||||||||||
MSCI Singapore IX ETS Futures | 3,080 | April 2021 | 81,957,033 | 464,189 | ||||||||||
Nikkei 225 (OSE) Futures | 105 | June 2021 | 27,671,258 | 394,412 | ||||||||||
OMXS 30 Index Futures | 5,563 | April 2021 | 139,322,625 | 2,036,131 | ||||||||||
| 28 | Sanford C. Bernstein Fund, Inc. | |
Table of Contents
| Description | Number of Contracts | Expiration Month | Current Notional | Value and Unrealized Appreciation/ (Depreciation) | ||||||||||
Russell 2000 E-Mini Futures | 814 | June 2021 | $ | 90,455,750 | $ | (1,200,293 | ) | |||||||
S&P 500 E-Mini Futures | 4,159 | June 2021 | 825,020,830 | 14,835,717 | ||||||||||
S&P Mid 400 E-Mini Futures | 233 | June 2021 | 60,703,490 | 12,752 | ||||||||||
S&P/TSX 60 Index Futures | 189 | June 2021 | 33,420,530 | 7,580 | ||||||||||
TOPIX Index Futures | 930 | June 2021 | 164,120,117 | 1,873,872 | ||||||||||
U.S. T-Note 2 Yr (CBT) Futures | 2,325 | June 2021 | 513,189,257 | (511,361 | ) | |||||||||
U.S. T-Note 10 Yr (CBT) Futures | 7,500 | June 2021 | 982,031,250 | (20,188,705 | ) | |||||||||
U.S. Ultra Bond (CBT) Futures | 1,275 | June 2021 | 231,053,906 | (9,765,851 | ) | |||||||||
| Sold Contracts |
| |||||||||||||
FTSE 100 Index Futures | 1,079 | June 2021 | 99,358,131 | 424,086 | ||||||||||
MSCI Emerging Markets Futures | 1,424 | June 2021 | 94,162,000 | 805,145 | ||||||||||
SPI 200 Futures | 963 | June 2021 | 123,724,203 | (125,513 | ) | |||||||||
|
| |||||||||||||
| $ | (6,188,063) | |||||||||||||
|
| |||||||||||||
| FORWARD CURRENCY EXCHANGE CONTRACTS (see Note 3) | ||||||||||||||||||||
| Counterparty | Contracts to Deliver (000) | In Exchange For (000) | Settlement Date | Unrealized Appreciation/ (Depreciation) | ||||||||||||||||
Bank of America, NA | CAD | 41,151 | USD | 32,900 | 04/22/2021 | $ | 152,989 | |||||||||||||
Barclays Bank PLC | USD | 48,875 | NZD | 67,321 | 05/27/2021 | (1,863,237) | ||||||||||||||
BNP Paribas SA | SEK | 214,637 | USD | 25,198 | 04/15/2021 | 619,214 | ||||||||||||||
BNP Paribas SA | CAD | 114,831 | USD | 91,369 | 04/22/2021 | (10,179 | ) | |||||||||||||
BNP Paribas SA | USD | 53,899 | CAD | 68,181 | 04/22/2021 | 357,331 | ||||||||||||||
BNP Paribas SA | JPY | 6,630,798 | USD | 61,004 | 05/20/2021 | 1,091,622 | ||||||||||||||
BNP Paribas SA | NZD | 28,158 | USD | 20,155 | 05/27/2021 | 491,458 | ||||||||||||||
Citibank, NA | SEK | 141,395 | USD | 16,996 | 04/15/2021 | 804,678 | ||||||||||||||
Citibank, NA | USD | 149,296 | CAD | 189,295 | 04/22/2021 | 1,340,415 | ||||||||||||||
Citibank, NA | EUR | 119,481 | USD | 142,638 | 05/27/2021 | 2,373,214 | ||||||||||||||
Deutsche Bank AG | AUD | 36,574 | USD | 27,895 | 06/04/2021 | 107,802 | ||||||||||||||
Goldman Sachs Bank USA | CHF | 83,276 | USD | 93,937 | 05/06/2021 | 5,757,001 | ||||||||||||||
Goldman Sachs Bank USA | USD | 3,362 | CHF | 3,037 | 05/06/2021 | (146,045 | ) | |||||||||||||
JPMorgan Chase Bank, NA | GBP | 5,702 | USD | 7,920 | 04/09/2021 | 58,890 | ||||||||||||||
JPMorgan Chase Bank, NA | GBP | 81,679 | USD | 111,545 | 04/09/2021 | (1,058,644 | ) | |||||||||||||
JPMorgan Chase Bank, NA | USD | 51,143 | GBP | 36,426 | 04/09/2021 | (925,474 | ) | |||||||||||||
JPMorgan Chase Bank, NA | NOK | 132,072 | USD | 15,464 | 04/15/2021 | 22,939 | ||||||||||||||
JPMorgan Chase Bank, NA | SEK | 773,879 | USD | 93,273 | 04/15/2021 | 4,654,594 | ||||||||||||||
JPMorgan Chase Bank, NA | USD | 107,529 | NOK | 911,728 | 04/15/2021 | (931,931 | ) | |||||||||||||
JPMorgan Chase Bank, NA | USD | 189,428 | SEK | 1,592,862 | 04/15/2021 | (7,025,913 | ) | |||||||||||||
JPMorgan Chase Bank, NA | CAD | 95,869 | USD | 75,631 | 04/22/2021 | (659,284 | ) | |||||||||||||
JPMorgan Chase Bank, NA | CHF | 23,569 | USD | 25,361 | 05/06/2021 | 404,222 | ||||||||||||||
JPMorgan Chase Bank, NA | JPY | 7,692,390 | USD | 72,013 | 05/20/2021 | 2,509,323 | ||||||||||||||
Morgan Stanley & Co., Inc. | GBP | 1,077 | USD | 1,467 | 04/09/2021 | (17,545 | ) | |||||||||||||
Morgan Stanley & Co., Inc. | USD | 81,628 | JPY | 8,882,872 | 05/20/2021 | (1,367,155 | ) | |||||||||||||
Natwest Markets PLC | GBP | 15,779 | USD | 21,567 | 04/09/2021 | (186,224 | ) | |||||||||||||
Natwest Markets PLC | JPY | 2,590,597 | USD | 24,431 | 05/20/2021 | 1,024,160 | ||||||||||||||
2021 Semi-Annual Report | 29 | |
Table of Contents
Schedule of Investments (continued)
| Counterparty | Contracts to Deliver (000) | In Exchange For (000) | Settlement Date | Unrealized Appreciation/ (Depreciation) | ||||||||||||||||||
Standard Chartered Bank | USD | 40,669 | JPY | 4,310,283 | 05/20/2021 | $ | (1,724,007 | ) | ||||||||||||||
State Street Bank & Trust Co. | USD | 20,961 | GBP | 15,286 | 04/09/2021 | 111,702 | ||||||||||||||||
State Street Bank & Trust Co. | USD | 3,239 | NOK | 27,947 | 04/15/2021 | 28,549 | ||||||||||||||||
State Street Bank & Trust Co. | USD | 2,638 | SEK | 22,661 | 04/15/2021 | (43,538 | ) | |||||||||||||||
State Street Bank & Trust Co. | USD | 19,552 | CAD | 24,591 | 04/22/2021 | 17,855 | ||||||||||||||||
State Street Bank & Trust Co. | USD | 7,091 | CHF | 6,614 | 05/06/2021 | (87,611 | ) | |||||||||||||||
State Street Bank & Trust Co. | USD | 34,264 | JPY | 3,720,630 | 05/20/2021 | (646,981 | ) | |||||||||||||||
State Street Bank & Trust Co. | USD | 50,190 | EUR | 42,352 | 05/27/2021 | (470,582 | ) | |||||||||||||||
UBS AG | USD | 22,532 | NOK | 191,551 | 04/15/2021 | (136,109 | ) | |||||||||||||||
|
| |||||||||||||||||||||
| $ | 4,627,499 | |||||||||||||||||||||
|
| |||||||||||||||||||||
| TOTAL RETURN SWAPS (see Note 3) |
| |||||||||||||||||||||
| Counterparty & Referenced Obligation | Rate Paid/ Received | Payment Frequency | Current Notional (000) | Maturity Date | Unrealized Appreciation/ (Depreciation) | |||||||||||||||||
| Pay Total Return on Reference Obligation |
| |||||||||||||||||||||
Morgan Stanley Capital Services LLC | ||||||||||||||||||||||
Swiss Market Index Futures | 0.00% | Maturity | CHF | 79,261 | 06/18/2021 | $ | (218,333 | ) | ||||||||||||||
| (a) | Non-income producing security. |
| (b) | Position, or a portion thereof, has been segregated to collateralize margin requirements for open futures contracts. |
| (c) | Affiliated investments. |
| (d) | To obtain a copy of the fund’s shareholder report, please go to the Securities and Exchange Commission’s website at www.sec.gov, or call AB at (800) 227-4618. |
| (e) | The rate shown represents the 7-day yield as of period end. |
Currency Abbreviations:
AUD—Australian Dollar
CAD—Canadian Dollar
CHF—Swiss Franc
EUR—Euro
GBP—Great British Pound
JPY—Japanese Yen
NOK—Norwegian Krone
NZD—New Zealand Dollar
SEK—Swedish Krona
USD—United States Dollar
Glossary:
ADR—American Depositary Receipt
CBT—Chicago Board of Trade
ETS—Emission Trading Scheme
FTSE—Financial Times Stock Exchange
MSCI—Morgan Stanley Capital International
OMXS—Stockholm Stock Exchange
OSE—Osaka Securities Exchange
SPI—Share Price Index
TOPIX—Tokyo Price Index
TSX—Toronto Stock Exchange
See notes to financial statements.
| 30 | Sanford C. Bernstein Fund, Inc. | |
Table of Contents
Schedule of Investments
Sanford C. Bernstein Fund, Inc.
Schedule of Investments
Overlay B Portfolio
March 31, 2021 (Unaudited)
| Principal Amount (000) | U.S. $ Value | |||||||||||
| INFLATION-LINKED SECURITIES–23.2% |
| |||||||||||
| Canada–0.4% |
| |||||||||||
Canadian Government Real Return Bond | CAD | 2,770 | $ | 2,362,994 | ||||||||
1.50%, 12/01/2044 | 2,134 | 2,168,074 | ||||||||||
|
| |||||||||||
| 4,531,068 | ||||||||||||
|
| |||||||||||
| France–0.5% |
| |||||||||||
French Republic Government Bond OAT | EUR | 4,624 | 5,947,944 | |||||||||
|
| |||||||||||
| Germany–0.5% |
| |||||||||||
Deutsche Bundesrepublik Inflation Linked Bond | 4,605 | 5,959,980 | ||||||||||
|
| |||||||||||
| United States–21.8% |
| |||||||||||
U.S. Treasury Inflation Index | U.S.$ | 21,139 | 21,964,801 | |||||||||
0.125%, 01/15/2022–07/15/2030 (TIPS) | 65,390 | 69,691,295 | ||||||||||
0.25%, 01/15/2025–07/15/2029 (TIPS) | 36,280 | 39,518,632 | ||||||||||
0.375%, 07/15/2023–07/15/2027 (TIPS)(c) | 39,396 | 43,210,112 | ||||||||||
0.50%, 01/15/2028 (TIPS) | 2,190 | 2,436,936 | ||||||||||
0.625%, 07/15/2021–01/15/2026 (TIPS) | 29,124 | 31,229,295 | ||||||||||
0.75%, 07/15/2028 (TIPS) | 13,399 | 15,269,122 | ||||||||||
0.875%, 01/15/2029 (TIPS) | 5,034 | 5,767,174 | ||||||||||
1.75%, 01/15/2028 (TIPS) | 4,438 | 5,333,516 | ||||||||||
2.00%, 01/15/2026 (TIPS) | 3,288 | 3,882,186 | ||||||||||
2.375%, 01/15/2025–01/15/2027 (TIPS) | 5,568 | 6,731,614 | ||||||||||
2.50%, 01/15/2029 (TIPS) | 6,115 | 7,816,200 | ||||||||||
3.875%, 04/15/2029 (TIPS) | 3,500 | 4,906,781 | ||||||||||
U.S. Treasury Notes | 7,311 | 7,865,988 | ||||||||||
|
| |||||||||||
| 265,623,652 | ||||||||||||
|
| |||||||||||
| Total Inflation-Linked Securities (cost $267,019,034) |
| 282,062,644 | ||||||||||
|
| |||||||||||
| CORPORATES—INVESTMENT GRADE–17.7% |
| |||||||||||
| Industrial–9.6% |
| |||||||||||
| Basic–1.0% |
| |||||||||||
Alpek SAB de CV | 1,289 | 1,269,987 | ||||||||||
4.25%, 09/18/2029(a) | 478 | 506,232 | ||||||||||
| Principal Amount (000) | U.S. $ Value | |||||||||||
AngloGold Ashanti Holdings PLC | U.S.$ | 228 | $ | 228,499 | ||||||||
DuPont de Nemours, Inc. | 675 | 732,760 | ||||||||||
4.493%, 11/15/2025 | 675 | 763,931 | ||||||||||
Eastman Chemical Co. | 216 | 234,855 | ||||||||||
Equate Petrochemical BV | 625 | 633,906 | ||||||||||
Fresnillo PLC | 1,956 | 1,921,769 | ||||||||||
Glencore Finance Europe Ltd. | GBP | 219 | 321,858 | |||||||||
Glencore Funding LLC | U.S.$ | 225 | 240,387 | |||||||||
Gold Fields Orogen Holdings BVI Ltd. | 276 | 299,201 | ||||||||||
GUSAP III LP | 905 | 952,513 | ||||||||||
Industrias Penoles SAB de CV | 495 | 507,994 | ||||||||||
Inversiones CMPC SA | 665 | 705,939 | ||||||||||
4.375%, 04/04/2027(a) | 935 | 1,023,498 | ||||||||||
Inversiones CMPC SA/Cayman Islands Branch | 467 | 491,226 | ||||||||||
LyondellBasell Industries NV | 485 | 547,856 | ||||||||||
Nutrition & Biosciences, Inc. | 280 | 273,983 | ||||||||||
SABIC Capital II BV | 467 | 502,463 | ||||||||||
Suzano Austria GmbH | 384 | 396,441 | ||||||||||
|
| |||||||||||
| 12,555,298 | ||||||||||||
|
| |||||||||||
| Capital Goods–0.1% |
| |||||||||||
General Electric Co. | EUR | 102 | 130,185 | |||||||||
Raytheon Technologies Corp. | U.S.$ | 460 | 511,230 | |||||||||
Westinghouse Air Brake Technologies Corp. | 210 | 222,921 | ||||||||||
4.40%, 03/15/2024 | 210 | 228,365 | ||||||||||
|
| |||||||||||
| 1,092,701 | ||||||||||||
|
| |||||||||||
| Communications—Media–0.9% |
| |||||||||||
Charter Communications Operating LLC/Charter Communications Operating Capital | 36 | 39,716 | ||||||||||
4.80%, 03/01/2050 | 167 | 179,804 | ||||||||||
5.125%, 07/01/2049 | 517 | 583,631 | ||||||||||
5.375%, 05/01/2047 | 140 | 162,450 | ||||||||||
5.75%, 04/01/2048 | 130 | 157,700 | ||||||||||
2021 Semi-Annual Report | 31 | |
Table of Contents
Schedule of Investments (continued)
| Principal Amount (000) | U.S. $ Value | |||||||||||
Comcast Corp. | U.S.$ | 261 | $ | 268,084 | ||||||||
Cox Communications, Inc. | 213 | 222,489 | ||||||||||
Fox Corp. | 800 | 922,176 | ||||||||||
Prosus NV | 1,628 | 1,682,945 | ||||||||||
Tencent Holdings Ltd. | 930 | 933,022 | ||||||||||
2.39%, 06/03/2030(a) | 460 | 443,375 | ||||||||||
3.24%, 06/03/2050(a) | 525 | 481,599 | ||||||||||
Time Warner Cable LLC | 494 | 527,923 | ||||||||||
TWDC Enterprises 18 Corp. | 694 | 791,646 | ||||||||||
ViacomCBS, Inc. | 251 | 267,001 | ||||||||||
3.70%, 06/01/2028 | 212 | 229,717 | ||||||||||
4.95%, 01/15/2031 | 264 | 311,852 | ||||||||||
Weibo Corp. | 2,373 | 2,347,515 | ||||||||||
|
| |||||||||||
| 10,552,645 | ||||||||||||
|
| |||||||||||
| Communications—Telecommunications–0.6% |
| |||||||||||
AT&T, Inc. | 240 | 239,093 | ||||||||||
3.50%, 09/15/2053(a) | 1,499 | 1,386,230 | ||||||||||
3.65%, 09/15/2059(a) | 352 | 322,179 | ||||||||||
Series B | EUR | 400 | 468,545 | |||||||||
British Telecommunications PLC | U.S.$ | 466 | 720,431 | |||||||||
Sprint Spectrum Co. LLC/Sprint Spectrum Co. II LLC/Sprint Spectrum Co. III LLC | 1,145 | 1,231,756 | ||||||||||
Verizon Communications, Inc. | 413 | 363,333 | ||||||||||
3.40%, 03/22/2041 | 1,641 | 1,666,813 | ||||||||||
4.862%, 08/21/2046 | 368 | 443,378 | ||||||||||
5.012%, 04/15/2049 | 37 | 45,697 | ||||||||||
|
| |||||||||||
| 6,887,455 | ||||||||||||
|
| |||||||||||
| Consumer Cyclical—Automotive–0.7% |
| |||||||||||
General Motors Co. | 169 | 199,080 | ||||||||||
6.80%, 10/01/2027 | 239 | 297,154 | ||||||||||
General Motors Financial Co., Inc. | 498 | 550,952 | ||||||||||
5.25%, 03/01/2026 | 339 | 388,446 | ||||||||||
Harley-Davidson Financial Services, Inc. | EUR | 850 | 1,013,601 | |||||||||
3.35%, 06/08/2025(a) | U.S.$ | 1,669 | 1,751,916 | |||||||||
Lear Corp. | 411 | 430,329 | ||||||||||
3.80%, 09/15/2027 | 597 | 650,970 | ||||||||||
| Principal Amount (000) | U.S. $ Value | |||||||||||
Nissan Motor Co., Ltd. | U.S.$ | 2,205 | $ | 2,402,060 | ||||||||
Volkswagen Bank GmbH | EUR | 500 | 607,799 | |||||||||
Volkswagen Leasing GmbH | 228 | 286,204 | ||||||||||
|
| |||||||||||
| 8,578,511 | ||||||||||||
|
| |||||||||||
| Consumer Cyclical—Other–0.2% |
| |||||||||||
Las Vegas Sands Corp. | U.S.$ | 723 | 742,167 | |||||||||
3.20%, 08/08/2024 | 137 | 142,842 | ||||||||||
3.50%, 08/18/2026 | 313 | 326,522 | ||||||||||
3.90%, 08/08/2029 | 877 | 901,047 | ||||||||||
Marriott International, Inc./MD | 77 | 88,226 | ||||||||||
|
| |||||||||||
| 2,200,804 | ||||||||||||
|
| |||||||||||
| Consumer Cyclical—Retailers–0.4% |
| |||||||||||
Advance Auto Parts, Inc. | 308 | 303,115 | ||||||||||
3.90%, 04/15/2030 | 459 | 498,488 | ||||||||||
AutoNation, Inc. | 172 | 198,219 | ||||||||||
Falabella SA | 420 | 452,157 | ||||||||||
InRetail Consumer | 602 | 600,872 | ||||||||||
Ralph Lauren Corp. | 1,542 | 1,593,287 | ||||||||||
Ross Stores, Inc. | 1,186 | 1,353,071 | ||||||||||
|
| |||||||||||
| 4,999,209 | ||||||||||||
|
| |||||||||||
| Consumer Non-Cyclical–1.6% |
| |||||||||||
AbbVie, Inc. | 410 | 436,453 | ||||||||||
Altria Group, Inc. | EUR | 768 | 1,038,034 | |||||||||
3.40%, 05/06/2030 | U.S.$ | 985 | 1,028,507 | |||||||||
4.80%, 02/14/2029 | 200 | 229,522 | ||||||||||
Anheuser-Busch InBev Worldwide, Inc. | 520 | 589,191 | ||||||||||
5.55%, 01/23/2049 | 1,720 | 2,218,129 | ||||||||||
Banner Health | 310 | 294,237 | ||||||||||
BAT Capital Corp. | 1,614 | 1,587,385 | ||||||||||
2.726%, 03/25/2031 | 313 | 304,204 | ||||||||||
4.70%, 04/02/2027 | 625 | 704,069 | ||||||||||
4.906%, 04/02/2030 | 170 | 193,927 | ||||||||||
BAT Netherlands Finance BV | EUR | 520 | 695,366 | |||||||||
Baxalta, Inc. | U.S.$ | 56 | 57,720 | |||||||||
| 32 | Sanford C. Bernstein Fund, Inc. | |
Table of Contents
| Principal Amount (000) | U.S. $ Value | |||||||||||
Biogen, Inc. | U.S.$ | 563 | $ | 625,600 | ||||||||
Cencosud SA | 997 | 1,112,590 | ||||||||||
Cigna Corp. | 522 | 566,991 | ||||||||||
3.75%, 07/15/2023 | 94 | 100,471 | ||||||||||
4.125%, 11/15/2025 | 320 | 356,982 | ||||||||||
4.375%, 10/15/2028 | 416 | 476,141 | ||||||||||
Coca-Cola Femsa SAB de CV | 520 | 475,962 | ||||||||||
2.75%, 01/22/2030 | 447 | 449,235 | ||||||||||
CVS Health Corp. | 81 | 91,945 | ||||||||||
5.05%, 03/25/2048 | 1,155 | 1,417,797 | ||||||||||
DH Europe Finance II SARL | EUR | 422 | 497,443 | |||||||||
Kimberly-Clark de Mexico SAB de CV | U.S.$ | 497 | 486,439 | |||||||||
Shire Acquisitions Investments Ireland DAC | 285 | 306,609 | ||||||||||
Sigma Alimentos SA de CV | 207 | 224,401 | ||||||||||
Sutter Health | 337 | 335,612 | ||||||||||
Takeda Pharmaceutical Co., Ltd. | 676 | 738,990 | ||||||||||
Tyson Foods, Inc. | 630 | 688,880 | ||||||||||
4.00%, 03/01/2026 | 65 | 72,087 | ||||||||||
Utah Acquisition Sub, Inc. | 745 | 821,333 | ||||||||||
Zimmer Biomet Holdings, Inc. | 90 | 96,338 | ||||||||||
|
| |||||||||||
| 19,318,590 | ||||||||||||
|
| |||||||||||
| Energy–2.3% |
| |||||||||||
Baker Hughes a GE Co. LLC/Baker Hughes Co-Obligor, Inc. | 1,017 | 1,088,119 | ||||||||||
Boardwalk Pipelines LP | 559 | 562,762 | ||||||||||
4.80%, 05/03/2029 | 465 | 515,136 | ||||||||||
BP Capital Markets America, Inc. | 1,736 | 1,549,518 | ||||||||||
BP Capital Markets PLC | EUR | 202 | 255,739 | |||||||||
3.25%, 03/22/2026(a)(d) | 565 | 710,639 | ||||||||||
Cenovus Energy, Inc. | U.S.$ | 54 | 58,400 | |||||||||
5.375%, 07/15/2025 | 406 | 456,880 | ||||||||||
Chevron USA, Inc. | 173 | 192,852 | ||||||||||
3.90%, 11/15/2024 | 675 | 743,654 | ||||||||||
5.25%, 11/15/2043 | 816 | 1,062,750 | ||||||||||
| Principal Amount (000) | U.S. $ Value | |||||||||||
Empresa Electrica Cochrane SpA | U.S.$ | 451 | $ | 472,559 | ||||||||
Enbridge Energy Partners LP | 1,171 | 1,677,445 | ||||||||||
Energy Transfer Operating LP | 510 | 566,355 | ||||||||||
5.50%, 06/01/2027 | 375 | 432,574 | ||||||||||
6.25%, 04/15/2049 | 1,125 | 1,326,938 | ||||||||||
Eni SpA | 775 | 865,985 | ||||||||||
Series NC5. | EUR | 483 | 592,441 | |||||||||
Enterprise Products Operating LLC | U.S.$ | 912 | 1,001,130 | |||||||||
Husky Energy, Inc. | 2,263 | 2,417,812 | ||||||||||
Marathon Oil Corp. | 341 | 365,920 | ||||||||||
Marathon Petroleum Corp. | 269 | 313,560 | ||||||||||
6.50%, 03/01/2041 | 240 | 318,194 | ||||||||||
Oleoducto Central SA | 1,046 | 1,104,838 | ||||||||||
ONEOK, Inc. | 263 | 285,323 | ||||||||||
4.35%, 03/15/2029 | 333 | 363,060 | ||||||||||
4.55%, 07/15/2028 | 518 | 572,877 | ||||||||||
6.35%, 01/15/2031 | 650 | 815,504 | ||||||||||
Plains All American Pipeline LP/PAA Finance Corp. | 83 | 82,990 | ||||||||||
3.80%, 09/15/2030 | 177 | 180,312 | ||||||||||
4.50%, 12/15/2026 | 189 | 207,503 | ||||||||||
4.65%, 10/15/2025 | 217 | 238,199 | ||||||||||
Saudi Arabian Oil Co. | 380 | 381,752 | ||||||||||
2.25%, 11/24/2030(a) | 536 | 514,319 | ||||||||||
2.875%, 04/16/2024(a) | 440 | 462,009 | ||||||||||
Spectra Energy Partners LP | 675 | 724,856 | ||||||||||
Suncor Energy, Inc. | 436 | 594,953 | ||||||||||
Sunoco Logistics Partners Operations LP | 407 | 437,407 | ||||||||||
Tengizchevroil Finance Co. International Ltd. | 438 | 436,686 | ||||||||||
4.00%, 08/15/2026(a) | 363 | 386,595 | ||||||||||
TOTAL SE | EUR | 358 | 443,299 | |||||||||
TransCanada PipeLines Ltd. | U.S.$ | 1,255 | 1,650,739 | |||||||||
Valero Energy Corp. | 561 | 582,492 | ||||||||||
6.625%, 06/15/2037 | 120 | 155,953 | ||||||||||
|
| |||||||||||
| 28,169,028 | ||||||||||||
|
| |||||||||||
2021 Semi-Annual Report | 33 | |
Table of Contents
Schedule of Investments (continued)
| Principal Amount (000) | U.S. $ Value | |||||||||||
| Other Industrial–0.1% |
| |||||||||||
Alfa SAB de CV | U.S.$ | 668 | $ | 728,120 | ||||||||
|
| |||||||||||
| Services–0.4% |
| |||||||||||
Alibaba Group Holding Ltd. | 2,429 | 2,310,999 | ||||||||||
Booking Holdings, Inc. | EUR | 160 | 188,857 | |||||||||
4.625%, 04/13/2030 | U.S.$ | 1,321 | 1,535,492 | |||||||||
Expedia Group, Inc. | 51 | 58,973 | ||||||||||
Mastercard, Inc. | 384 | 422,247 | ||||||||||
|
| |||||||||||
| 4,516,568 | ||||||||||||
|
| |||||||||||
| Technology–0.9% |
| |||||||||||
Apple, Inc. | 596 | 519,557 | ||||||||||
Baidu, Inc. | 496 | 521,360 | ||||||||||
3.425%, 04/07/2030 | 401 | 419,045 | ||||||||||
Broadcom Corp./Broadcom Cayman Finance Ltd. | 220 | 233,576 | ||||||||||
Broadcom, Inc. | 1,090 | 1,190,116 | ||||||||||
4.15%, 11/15/2030 | 1,005 | 1,084,365 | ||||||||||
5.00%, 04/15/2030 | 713 | 812,620 | ||||||||||
Dell International LLC/EMC Corp. | 33 | 36,064 | ||||||||||
6.02%, 06/15/2026(a) | 551 | 651,982 | ||||||||||
Fidelity National Information Services, Inc. | EUR | 126 | 151,946 | |||||||||
Fiserv, Inc. | 526 | 644,999 | ||||||||||
Hewlett Packard Enterprise Co. | U.S.$ | 680 | 775,118 | |||||||||
Infor, Inc. | 398 | 401,817 | ||||||||||
Micron Technology, Inc. | 1,417 | 1,573,536 | ||||||||||
NXP BV/NXP Funding LLC/NXP USA, Inc. | 132 | 138,477 | ||||||||||
Oracle Corp. | 973 | 1,020,580 | ||||||||||
3.95%, 03/25/2051 | 1,046 | 1,079,954 | ||||||||||
SK Hynix, Inc. | 468 | 443,313 | ||||||||||
|
| |||||||||||
| 11,698,425 | ||||||||||||
|
| |||||||||||
| Transportation—Airlines–0.2% |
| |||||||||||
Delta Air Lines, Inc. | 411 | 473,238 | ||||||||||
Delta Air Lines, Inc./SkyMiles IP Ltd. | 488 | 521,104 | ||||||||||
4.75%, 10/20/2028(a) | 563 | 612,555 | ||||||||||
| Principal Amount (000) | U.S. $ Value | |||||||||||
Southwest Airlines Co. | U.S.$ | 605 | $ | 688,308 | ||||||||
|
| |||||||||||
| 2,295,205 | ||||||||||||
|
| |||||||||||
| Transportation—Railroads–0.0% |
| |||||||||||
Lima Metro Line 2 Finance Ltd. | 422 | 446,265 | ||||||||||
|
| |||||||||||
| Transportation—Services–0.2% |
| |||||||||||
Adani Ports & Special Economic Zone Ltd. | 245 | 258,245 | ||||||||||
ENA Master Trust | 1,113 | 1,122,739 | ||||||||||
Heathrow Funding Ltd. | GBP | 414 | 719,058 | |||||||||
|
| |||||||||||
| 2,100,042 | ||||||||||||
|
| |||||||||||
| 116,138,866 | ||||||||||||
|
| |||||||||||
| Financial Institutions–7.5% |
| |||||||||||
| Banking–5.2% |
| |||||||||||
American Express Co. | U.S.$ | 117 | 117,017 | |||||||||
Series C | 521 | 517,900 | ||||||||||
Australia & New Zealand Banking Group Ltd. | 1,405 | 1,573,937 | ||||||||||
Banco de Credito del Peru | 1,095 | 1,093,193 | ||||||||||
Banco Santander Mexico SA Institucion de Banca Multiple Grupo Financiero Santand | 537 | 602,944 | ||||||||||
Banco Santander SA | 200 | 190,142 | ||||||||||
5.179%, 11/19/2025 | 1,800 | 2,045,232 | ||||||||||
Bank of America Corp. | EUR | 928 | 1,171,366 | |||||||||
Series DD | U.S.$ | 223 | 255,688 | |||||||||
Series L | 1,429 | 1,566,541 | ||||||||||
Series Z | 189 | 212,241 | ||||||||||
Bank of New York Mellon Corp. (The) | 236 | 255,805 | ||||||||||
Barclays Bank PLC | 205 | 283,412 | ||||||||||
BBVA USA | 510 | 524,479 | ||||||||||
| 34 | Sanford C. Bernstein Fund, Inc. | |
Table of Contents
| Principal Amount (000) | U.S. $ Value | |||||||||||
BNP Paribas SA | U.S.$ | 575 | $ | 562,873 | ||||||||
6.75%, 03/14/2022(a)(d) | 660 | 686,209 | ||||||||||
BPCE SA | 250 | 276,162 | ||||||||||
5.15%, 07/21/2024(a) | 535 | 599,596 | ||||||||||
5.70%, 10/22/2023(a) | 480 | 536,126 | ||||||||||
CaixaBank SA | EUR | 600 | 703,113 | |||||||||
Capital One Financial Corp. | U.S.$ | 486 | 505,731 | |||||||||
3.30%, 10/30/2024 | 628 | 677,154 | ||||||||||
Series E | 709 | 708,674 | ||||||||||
CIT Group, Inc. | 565 | 636,919 | ||||||||||
CITIC Ltd. | 626 | 620,327 | ||||||||||
Citigroup, Inc. | EUR | 370 | 457,434 | |||||||||
4.45%, 09/29/2027 | U.S.$ | 1,029 | 1,157,316 | |||||||||
5.95%, 01/30/2023(d) | 491 | 515,303 | ||||||||||
Series P | 367 | 398,199 | ||||||||||
Series Q | 915 | 913,755 | ||||||||||
Series R | 416 | 416,520 | ||||||||||
Series W | 574 | 578,942 | ||||||||||
Cooperatieve Rabobank UA | EUR | 600 | 719,557 | |||||||||
3.95%, 11/09/2022 | U.S.$ | 285 | 300,034 | |||||||||
4.375%, 08/04/2025 | 470 | 520,755 | ||||||||||
Credit Agricole SA/London | 355 | 363,271 | ||||||||||
Credit Suisse Group AG | 263 | 266,816 | ||||||||||
4.194%, 04/01/2031(a) | 593 | 644,911 | ||||||||||
Danske Bank A/S | 350 | 372,589 | ||||||||||
3.875%, 09/12/2023(a) | 542 | 580,601 | ||||||||||
5.375%, 01/12/2024(a) | 1,030 | 1,148,440 | ||||||||||
Deutsche Bank AG/New York NY | 272 | 272,525 | ||||||||||
2.222%, 09/18/2024 | 229 | 234,748 | ||||||||||
3.961%, 11/26/2025 | 455 | 492,347 | ||||||||||
Discover Bank | 300 | 320,079 | ||||||||||
DNB Bank ASA | 800 | 830,648 | ||||||||||
Fifth Third Bancorp | 518 | 551,379 | ||||||||||
| Principal Amount (000) | U.S. $ Value | |||||||||||
Goldman Sachs Group, Inc. (The) | EUR | 705 | $ | 855,698 | ||||||||
HSBC Holdings PLC | U.S.$ | 305 | 334,439 | |||||||||
4.292%, 09/12/2026 | 561 | 621,246 | ||||||||||
6.375%, 03/30/2025(d) | 949 | 1,046,889 | ||||||||||
ING Groep NV | 252 | 252,202 | ||||||||||
2.727%, 04/01/2032 | 1,304 | 1,302,801 | ||||||||||
3.00%, 02/18/2026(a) | GBP | 400 | 595,059 | |||||||||
6.50%, 04/16/2025(d) | U.S.$ | 201 | 221,426 | |||||||||
6.875%, 04/16/2022(a)(d) | 835 | 869,093 | ||||||||||
Intesa Sanpaolo SpA | 436 | 448,522 | ||||||||||
3.375%, 01/12/2023(a) | 600 | 625,590 | ||||||||||
JPMorgan Chase & Co. | EUR | 735 | 898,834 | |||||||||
2.083%, 04/22/2026 | U.S.$ | 646 | 663,552 | |||||||||
Series I | 609 | 606,997 | ||||||||||
Series V | 549 | 544,696 | ||||||||||
Series X | 360 | 389,182 | ||||||||||
Series Z | 601 | 601,379 | ||||||||||
Morgan Stanley | 875 | 953,514 | ||||||||||
3.737%, 04/24/2024 | 503 | 534,553 | ||||||||||
5.00%, 11/24/2025 | 302 | 347,073 | ||||||||||
Series G | EUR | 430 | 535,374 | |||||||||
1.75%, 03/11/2024 | 268 | 330,941 | ||||||||||
3.70%, 10/23/2024 | U.S.$ | 905 | 991,319 | |||||||||
Series H | 147 | 146,879 | ||||||||||
Series J | 1,584 | 1,584,539 | ||||||||||
Natwest Group PLC | 1,335 | 1,370,618 | ||||||||||
Series U | 1,300 | 1,286,259 | ||||||||||
PNC Financial Services Group, Inc. (The) | 56 | 56,856 | ||||||||||
Santander Holdings USA, Inc. | 358 | 395,744 | ||||||||||
Societe Generale SA |
| 939 | 1,018,275 | |||||||||
4.75%, 11/24/2025(a) | 416 | 460,504 | ||||||||||
2021 Semi-Annual Report | 35 | |
Table of Contents
Schedule of Investments (continued)
| Principal Amount (000) | U.S. $ Value | |||||||||||
Standard Chartered PLC | U.S.$ | 1,100 | $ | 1,031,635 | ||||||||
4.30%, 02/19/2027(a) | 719 | 778,634 | ||||||||||
5.20%, 01/26/2024(a) | 750 | 823,702 | ||||||||||
7.50%, 04/02/2022(a)(d) | 557 | 582,795 | ||||||||||
State Street Corp. | 70 | 74,525 | ||||||||||
Truist Financial Corp. | 1,295 | 1,412,223 | ||||||||||
UBS AG/Stamford CT | 280 | 305,270 | ||||||||||
UBS Group AG | 400 | 460,400 | ||||||||||
7.125%, 08/10/2021(a)(d) | 1,263 | 1,286,820 | ||||||||||
UniCredit SpA | 2,270 | 2,280,805 | ||||||||||
US Bancorp | 198 | 197,754 | ||||||||||
Series J | 423 | 463,189 | ||||||||||
Wells Fargo & Co. | EUR | 215 | 261,895 | |||||||||
1.375%, 10/26/2026(a) | 278 | 344,701 | ||||||||||
2.188%, 04/30/2026 | U.S.$ | 508 | 524,057 | |||||||||
3.75%, 01/24/2024 | 522 | 564,433 | ||||||||||
3.90%, 03/15/2026(d) | 389 | 393,217 | ||||||||||
4.125%, 08/15/2023 | 875 | 946,558 | ||||||||||
|
| |||||||||||
| 62,601,616 | ||||||||||||
|
| |||||||||||
| Brokerage–0.2% |
| |||||||||||
Charles Schwab Corp. (The) | 478 | 528,448 | ||||||||||
Series I | 1,867 | 1,895,995 | ||||||||||
|
| |||||||||||
| 2,424,443 | ||||||||||||
|
| |||||||||||
| Finance–1.2% |
| |||||||||||
Air Lease Corp. | 583 | 603,399 | ||||||||||
3.625%, 04/01/2027 | 96 | 101,389 | ||||||||||
3.875%, 07/03/2023 | 114 | 121,227 | ||||||||||
4.25%, 02/01/2024 | 453 | 491,338 | ||||||||||
Aircastle Ltd. | 1,492 | 1,423,115 | ||||||||||
4.125%, 05/01/2024 | 331 | 349,684 | ||||||||||
4.25%, 06/15/2026 | 104 | 109,515 | ||||||||||
4.40%, 09/25/2023 | 834 | 889,094 | ||||||||||
5.00%, 04/01/2023 | 60 | 63,969 | ||||||||||
5.25%, 08/11/2025(a) | 849 | 925,003 | ||||||||||
Aviation Capital Group LLC | 604 | 588,531 | ||||||||||
2.875%, 01/20/2022(a) | 109 | 110,551 | ||||||||||
| Principal Amount (000) | U.S. $ Value | |||||||||||
3.50%, 11/01/2027(a) | U.S.$ | 267 | $ | 274,527 | ||||||||
3.875%, 05/01/2023(a) | 584 | 610,051 | ||||||||||
4.125%, 08/01/2025(a) | 12 | 12,783 | ||||||||||
4.375%, 01/30/2024(a) | 290 | 308,418 | ||||||||||
4.875%, 10/01/2025(a) | 271 | 295,788 | ||||||||||
5.50%, 12/15/2024(a) | 828 | 928,105 | ||||||||||
CDBL Funding 1 | 850 | 901,532 | ||||||||||
GE Capital European Funding UnLtd. Co. | EUR | 400 | 585,656 | |||||||||
GE Capital Funding LLC | U.S.$ | 2,119 | 2,402,522 | |||||||||
GE Capital International Funding Co. Unlimited Co. | 207 | 236,883 | ||||||||||
Synchrony Financial | 242 | 260,791 | ||||||||||
4.50%, 07/23/2025 | 1,238 | 1,371,245 | ||||||||||
|
| |||||||||||
| 13,965,116 | ||||||||||||
|
| |||||||||||
| Insurance–0.6% |
| |||||||||||
Alleghany Corp. | 1,561 | 1,683,164 | ||||||||||
ASR Nederland NV | EUR | 219 | 286,723 | |||||||||
Assicurazioni Generali SpA | 331 | 474,580 | ||||||||||
Centene Corp. | U.S.$ | 303 | 318,487 | |||||||||
4.625%, 12/15/2029 | 365 | 395,145 | ||||||||||
CNP Assurances | EUR | 600 | 844,907 | |||||||||
Credit Agricole Assurances SA | 400 | 522,630 | ||||||||||
Guardian Life Insurance Co. of America (The) | U.S.$ | 423 | 491,894 | |||||||||
Liberty Mutual Group, Inc. | EUR | 365 | 436,588 | |||||||||
Nationwide Mutual Insurance Co. | U.S.$ | 420 | 682,253 | |||||||||
Prudential Financial, Inc. | 189 | 199,707 | ||||||||||
Voya Financial, Inc. | 895 | 955,725 | ||||||||||
|
| |||||||||||
| 7,291,803 | ||||||||||||
|
| |||||||||||
| Other Finance–0.1% |
| |||||||||||
AerCap Ireland Capital DAC/AerCap Global Aviation Trust | 454 | 492,721 | ||||||||||
China Cinda 2020 I Management Ltd. | 870 | 874,622 | ||||||||||
|
| |||||||||||
| 1,367,343 | ||||||||||||
|
| |||||||||||
| 36 | Sanford C. Bernstein Fund, Inc. | |
Table of Contents
| Principal Amount (000) | U.S. $ Value | |||||||||||
| REITS–0.2% |
| |||||||||||
CyrusOne LP/CyrusOne Finance Corp. | EUR | 227 | $ | 268,205 | ||||||||
Digital Euro Finco LLC | 820 | 1,058,285 | ||||||||||
Host Hotels & Resorts LP | U.S.$ | 25 | 26,381 | |||||||||
Rexford Industrial Realty LP | 517 | 482,945 | ||||||||||
WPC Eurobond BV | EUR | 240 | 290,694 | |||||||||
2.125%, 04/15/2027 | 601 | 762,741 | ||||||||||
|
| |||||||||||
| 2,889,251 | ||||||||||||
|
| |||||||||||
| 90,539,572 | ||||||||||||
|
| |||||||||||
| Utility–0.6% |
| |||||||||||
| Electric–0.6% |
| |||||||||||
Adani Transmission Ltd. | U.S.$ | 328 | 349,989 | |||||||||
AES Panama Generation Holdings SRL | 731 | 756,329 | ||||||||||
Berkshire Hathaway Energy Co. | 209 | 283,414 | ||||||||||
Chile Electricity Pec SpA | 910 | 738,238 | ||||||||||
Colbun SA | 1,115 | 1,140,784 | ||||||||||
E.ON International Finance BV | EUR | 201 | 250,947 | |||||||||
Enel Chile SA | U.S.$ | 756 | 873,416 | |||||||||
Enel Finance International NV | 865 | 910,378 | ||||||||||
Iberdrola International BV | EUR | 200 | 235,835 | |||||||||
Israel Electric Corp., Ltd. | U.S.$ | 776 | 873,562 | |||||||||
Naturgy Finance BV | EUR | 400 | 493,782 | |||||||||
NextEra Energy Capital Holdings, Inc. | U.S.$ | 201 | 213,104 | |||||||||
SSE PLC | EUR | 135 | 169,355 | |||||||||
Star Energy Geothermal Darajat II/Star Energy Geothermal Salak | U.S.$ | 544 | 592,281 | |||||||||
|
| |||||||||||
| 7,881,414 | ||||||||||||
|
| |||||||||||
| Total Corporates—Investment Grade (cost $207,347,825) |
| 214,559,852 | ||||||||||
|
| |||||||||||
| Principal Amount (000) | U.S. $ Value | |||||||||||
| GOVERNMENTS—TREASURIES–13.8% |
| |||||||||||
| Australia–1.1% |
| |||||||||||
Australia Government Bond | AUD | 2,900 | $ | 2,628,873 | ||||||||
Series 145 | 1,875 | 1,523,135 | ||||||||||
Series 150 | 4,135 | 3,319,479 | ||||||||||
Series 160 | 1,670 | 1,182,384 | ||||||||||
Series 161 | 3,774 | 2,811,991 | ||||||||||
Series 164 | 1,770 | 1,316,265 | ||||||||||
|
| |||||||||||
| 12,782,127 | ||||||||||||
|
| |||||||||||
| Austria–0.2% |
| |||||||||||
Republic of Austria Government Bond | EUR | 2,255 | 2,851,842 | |||||||||
|
| |||||||||||
| Canada–0.1% |
| |||||||||||
Canadian Government Bond | CAD | 1,580 | 1,211,836 | |||||||||
|
| |||||||||||
| China–0.8% |
| |||||||||||
China Government Bond | CNY | 34,900 | 5,349,422 | |||||||||
3.39%, 03/16/2050 | 31,520 | 4,478,417 | ||||||||||
|
| |||||||||||
| 9,827,839 | ||||||||||||
|
| |||||||||||
| Colombia–0.1% |
| |||||||||||
Colombian TES | COP | 4,470,000 | 1,186,771 | |||||||||
|
| |||||||||||
| France–0.1% |
| |||||||||||
French Republic Government Bond OAT | EUR | 1,259 | 1,446,606 | |||||||||
|
| |||||||||||
| Germany–0.8% |
| |||||||||||
Bundesrepublik Deutschland Bundesanleihe | 2,900 | 3,400,763 | ||||||||||
Series 2007 | 2,049 | 4,277,672 | ||||||||||
Series | 1,070 | 2,086,664 | ||||||||||
|
| |||||||||||
| 9,765,099 | ||||||||||||
|
| |||||||||||
| Italy–1.0% |
| |||||||||||
Italy Buoni Poliennali Del Tesoro | 6,000 | 7,353,744 | ||||||||||
1.50%, 04/30/2045(a) | 2,505 | 2,948,189 | ||||||||||
1.80%, 03/01/2041(a) | 1,058 | 1,332,232 | ||||||||||
|
| |||||||||||
| 11,634,165 | ||||||||||||
|
| |||||||||||
2021 Semi-Annual Report | 37 | |
Table of Contents
Schedule of Investments (continued)
| Principal Amount (000) | U.S. $ Value | |||||||||||
| Japan–2.1% |
| |||||||||||
Japan Government Ten Year Bond | JPY | 1,210,150 | $ | 10,969,549 | ||||||||
Series 360 | 153,450 | 1,388,042 | ||||||||||
Japan Government Thirty Year Bond | 35,600 | 416,262 | ||||||||||
Series 62 | 161,750 | 1,408,134 | ||||||||||
Series 65 | 248,150 | 2,089,749 | ||||||||||
Series 68 | 296,000 | 2,626,079 | ||||||||||
Japan Government Twenty Year Bond | 176,850 | 1,863,981 | ||||||||||
Series 150 | 387,400 | 4,031,444 | ||||||||||
Series 171 | 112,650 | 989,194 | ||||||||||
|
| |||||||||||
| 25,782,434 | ||||||||||||
|
| |||||||||||
| Malaysia–0.2% |
| |||||||||||
Malaysia Government Bond | MYR | 6,236 | 1,530,914 | |||||||||
Series 0310 | 4,736 | 1,234,517 | ||||||||||
|
| |||||||||||
| 2,765,431 | ||||||||||||
|
| |||||||||||
| Mexico–0.1% |
| |||||||||||
Mexican Bonos | MXN | 11,735 | 611,811 | |||||||||
|
| |||||||||||
| Netherlands–0.3% |
| |||||||||||
Netherlands Government Bond | EUR | 2,755 | 3,384,833 | |||||||||
|
| |||||||||||
| Spain–0.2% |
| |||||||||||
Spain Government Bond |
| |||||||||||
1.20%, 10/31/2040(a) | 1,615 | 1,970,633 | ||||||||||
4.20%, 01/31/2037(a) | 492 | 876,715 | ||||||||||
|
| |||||||||||
| 2,847,348 | ||||||||||||
|
| |||||||||||
| United Kingdom–0.5% |
| |||||||||||
United Kingdom Gilt |
| |||||||||||
0.625%, 10/22/2050(a) | GBP | 782 | 877,674 | |||||||||
1.25%, 10/22/2041(a) | 1,135 | 1,532,211 | ||||||||||
1.75%, 09/07/2037(a) | 2,663 | 3,936,491 | ||||||||||
|
| |||||||||||
| 6,346,376 | ||||||||||||
|
| |||||||||||
| United States–6.2% |
| |||||||||||
U.S. Treasury Bonds | U.S.$ | 9,220 | 7,483,598 | |||||||||
1.25%, 05/15/2050 | 1,210 | 910,147 | ||||||||||
| Principal Amount (000) | U.S. $ Value | |||||||||||
1.625%, 11/15/2050 | U.S.$ | 130 | $ | 107,941 | ||||||||
1.875%, 02/15/2051 | 6,053 | 5,350,284 | ||||||||||
2.00%, 02/15/2050 | 215 | 196,020 | ||||||||||
2.25%, 08/15/2046–08/15/2049 | 1,444 | 1,394,909 | ||||||||||
2.375%, 11/15/2049 | 450 | 445,711 | ||||||||||
2.875%, 05/15/2049 | 905 | 990,834 | ||||||||||
3.375%, 11/15/2048 | 495 | 592,685 | ||||||||||
3.50%, 02/15/2039 | 188 | 224,748 | ||||||||||
3.625%, 08/15/2043 | 1,873 | 2,291,009 | ||||||||||
4.375%, 11/15/2039(c) | 5,290 | 7,052,231 | ||||||||||
U.S. Treasury Notes | 12,737 | 12,737,000 | ||||||||||
0.25%, 05/31/2025 | 5,615 | 5,506,209 | ||||||||||
0.875%, 11/15/2030 | 1,011 | 934,227 | ||||||||||
1.50%, 02/15/2030(c) | 3,867 | 3,816,850 | ||||||||||
1.625%, 10/31/2026 | 5,260 | 5,408,759 | ||||||||||
1.75%, 11/30/2021(b)(c) | 8,919 | 9,019,339 | ||||||||||
2.125%, 05/31/2026 | 8,435 | 8,920,012 | ||||||||||
2.75%, 02/15/2028 | 2,236 | 2,437,240 | ||||||||||
|
| |||||||||||
| 75,819,753 | ||||||||||||
|
| |||||||||||
| Total Governments—Treasuries (cost $170,386,265) |
| 168,264,271 | ||||||||||
|
| |||||||||||
| COLLATERALIZED MORTGAGE OBLIGATIONS–4.6% |
| |||||||||||
| Risk Share Floating Rate–3.9% |
| |||||||||||
Bellemeade Re Ltd. | 360 | 362,165 | ||||||||||
Series 2019-1A, Class M1B | 1,469 | 1,453,944 | ||||||||||
Series 2019-2A, Class M1C | 829 | 832,448 | ||||||||||
Series 2019-3A, Class M1B | 1,011 | 1,015,404 | ||||||||||
Series 2019-3A, Class M1C | 441 | 439,338 | ||||||||||
Series 2019-4A, Class M1B | 910 | 911,217 | ||||||||||
Series 2019-4A, Class M1C | 235 | 236,181 | ||||||||||
Series 2019-4A, Class M2 | 330 | 330,001 | ||||||||||
Series 2020-2A, Class M1B | 584 | 588,384 | ||||||||||
| 38 | Sanford C. Bernstein Fund, Inc. | |
Table of Contents
| Principal Amount (000) | U.S. $ Value | |||||||||||
Series 2020-3A, Class M1B | U.S.$ | 392 | $ | 395,643 | ||||||||
Series 2020-4A, Class M2A | 570 | 570,000 | ||||||||||
Series 2021-1A, Class M1C | 602 | 599,654 | ||||||||||
Chase Mortgage Reference Notes | 188 | 190,973 | ||||||||||
Connecticut Avenue Securities Trust | 287 | 287,558 | ||||||||||
Series 2019-R02, Class 1M2 | 308 | 308,184 | ||||||||||
Series 2019-R03, Class 1M2 | 193 | 193,118 | ||||||||||
Series 2019-R04, Class 2M2 | 285 | 285,721 | ||||||||||
Series 2019-R05, Class 1M2 | 263 | 263,117 | ||||||||||
Series 2019-R06, Class 2M2 | 634 | 635,281 | ||||||||||
Series 2019-R07, Class 1M2 | 924 | 925,141 | ||||||||||
Series 2020-R01, Class 1M2 | 910 | 908,680 | ||||||||||
Series 2020-R02, Class 2M1 | 84 | 84,217 | ||||||||||
Series 2020-R02, Class 2M2 | 750 | 747,680 | ||||||||||
Eagle RE Ltd. | 208 | 208,593 | ||||||||||
Series 2018-1, Class M2 | 295 | 297,571 | ||||||||||
Series 2020-1, Class M1A | 1,045 | 1,041,989 | ||||||||||
| Principal Amount (000) | U.S. $ Value | |||||||||||
Federal Home Loan Mortgage Corp. Structured Agency Credit Risk Debt Notes | U.S.$ | 221 | $ | 220,046 | ||||||||
Series 2015-DNA1, Class M3 | 281 | 286,824 | ||||||||||
Series 2015-DNA3, Class M3 | 284 | 294,161 | ||||||||||
Series 2015-HQA2, Class M3 | 419 | 434,838 | ||||||||||
Series 2016-DNA2, Class M3 | 488 | 510,251 | ||||||||||
Series 2016-DNA4, Class M3 | 1,182 | 1,228,142 | ||||||||||
Series 2017-DNA2, Class M2 | 434 | 449,347 | ||||||||||
Series 2017-DNA3, Class M2 | 1,040 | 1,059,743 | ||||||||||
Series 2017-HQA1, Class M2 | 507 | 519,436 | ||||||||||
Series 2017-HQA2, Class M2 | 230 | 231,463 | ||||||||||
Series 2017-HQA2, Class M2B | 975 | 979,430 | ||||||||||
Series 2017-HQA3, Class M2 | 994 | 1,006,945 | ||||||||||
Series 2019-DNA3, Class M2 | 131 | 130,771 | ||||||||||
Series 2019-DNA4, Class M2 | 788 | 786,957 | ||||||||||
Series 2019-FTR2, Class M2 | 482 | 477,773 | ||||||||||
Series 2019-HQA3, Class M2 | 195 | 193,948 | ||||||||||
Series 2020-DNA1, Class M2 | 891 | 888,391 | ||||||||||
Series 2020-DNA5, Class M2 | 1,611 | 1,620,197 | ||||||||||
2021 Semi-Annual Report | 39 | |
Table of Contents
Schedule of Investments (continued)
| Principal Amount (000) | U.S. $ Value | |||||||||||
Federal National Mortgage Association Connecticut Avenue Securities | U.S.$ | 411 | $ | 423,695 | ||||||||
Series 2014-C04, Class 2M2 | 260 | 262,269 | ||||||||||
Series 2015-C01, Class 1M2 | 817 | 827,065 | ||||||||||
Series 2015-C01, Class 2M2 | 97 | 97,038 | ||||||||||
Series 2015-C02, Class 1M2 | 486 | 492,012 | ||||||||||
Series 2015-C02, Class 2M2 | 303 | 306,770 | ||||||||||
Series 2015-C03, Class 1M2 | 549 | 563,222 | ||||||||||
Series 2015-C03, Class 2M2 | 325 | 329,020 | ||||||||||
Series 2015-C04, Class 1M2 | 473 | 501,223 | ||||||||||
Series 2015-C04, Class 2M2 | 266 | 280,865 | ||||||||||
Series 2016-C01, Class 2M2 | 94 | 99,726 | ||||||||||
Series 2016-C02, Class 1M2 | 350 | 368,648 | ||||||||||
Series 2016-C03, Class 2M2 | 336 | 355,206 | ||||||||||
Series 2016-C04, Class 1M2 | 215 | 223,808 | ||||||||||
Series 2016-C05, Class 2M2 | 1,138 | 1,184,160 | ||||||||||
Series 2016-C06, Class 1M2 | 240 | 249,590 | ||||||||||
Series 2016-C07, Class 2M2 | 253 | 263,562 | ||||||||||
Series 2017-C01, Class 1M2 | 864 | 889,870 | ||||||||||
| Principal Amount (000) | U.S. $ Value | |||||||||||
Series 2017-C02, Class 2M2 | U.S.$ | 539 | $ | 553,309 | ||||||||
Series 2017-C02, Class 2M2C | 1,070 | 1,098,700 | ||||||||||
Series 2017-C04, Class 2M2 | 462 | 467,676 | ||||||||||
Series 2018-C01, Class 1M2 | 253 | 253,088 | ||||||||||
Home Re Ltd. | 873 | 889,305 | ||||||||||
JPMorgan Madison Avenue Securities Trust | 40 | 39,496 | ||||||||||
Mortgage Insurance-Linked Notes | 875 | 876,301 | ||||||||||
Oaktown Re V Ltd. | 1,626 | 1,651,610 | ||||||||||
PMT Credit Risk Transfer Trust | 428 | 406,686 | ||||||||||
Series 2019-2R, Class A | 675 | 668,077 | ||||||||||
Series 2019-3R, Class A | 182 | 182,394 | ||||||||||
Series 2020-1R, Class A | 401 | 398,599 | ||||||||||
Radnor RE Ltd. | 809 | 811,346 | ||||||||||
Series 2019-2, Class M1B | 1,148 | 1,147,378 | ||||||||||
Series 2020-1, Class M1A | 417 | 416,974 | ||||||||||
RMIR M1C | 654 | 666,585 | ||||||||||
| 40 | Sanford C. Bernstein Fund, Inc. | |
Table of Contents
| Principal Amount (000) | U.S. $ Value | |||||||||||
STACR Trust | U.S.$ | 483 | $ | 481,649 | ||||||||
Triangle Re Ltd. | 868 | 867,566 | ||||||||||
Series 2020-1, Class M1B | 1,870 | 1,899,874 | ||||||||||
Wells Fargo Credit Risk Transfer Securities Trust | 266 | 260,711 | ||||||||||
Series 2015-WF1, Class 2M2 | 83 | 81,580 | ||||||||||
|
| |||||||||||
| 47,267,518 | ||||||||||||
|
| |||||||||||
| Agency Floating Rate–0.5% |
| |||||||||||
Federal Home Loan Mortgage Corp. REMICs | 2,039 | 487,525 | ||||||||||
Series 4719, Class JS | 744 | 143,973 | ||||||||||
Series 4727, Class SA | 2,070 | 447,365 | ||||||||||
Series 4954, Class SL | 2,576 | 481,774 | ||||||||||
Series 4981, Class HS | 6,483 | 1,099,874 | ||||||||||
Federal National Mortgage Association REMICs | 949 | 187,981 | ||||||||||
Series 2014-17, Class SA | 2,638 | 645,538 | ||||||||||
Series 2014-78, Class SE | 783 | 150,794 | ||||||||||
Series 2016-77, Class DS | 1,835 | 392,782 | ||||||||||
Series 2017-62, Class AS | 928 | 194,624 | ||||||||||
| Principal Amount (000) | U.S. $ Value | |||||||||||
Series 2017-81, Class SA | U.S.$ | 822 | $ | 193,290 | ||||||||
Series 2017-97, Class LS | 1,566 | 389,015 | ||||||||||
Series 2017-97, Class SW | 824 | 186,148 | ||||||||||
Series 2020-26, Class GS | 1,540 | 266,786 | ||||||||||
Government National Mortgage Association | 906 | 200,720 | ||||||||||
Series 2017-134, Class SE | 743 | 149,088 | ||||||||||
Series 2017-65, Class ST | 1,021 | 223,986 | ||||||||||
|
| |||||||||||
| 5,841,263 | ||||||||||||
|
| |||||||||||
| Agency Fixed Rate–0.2% |
| |||||||||||
Federal Home Loan Mortgage Corp. REMICs | 4,598 | 838,824 | ||||||||||
Series 5015, Class BI | 3,537 | 653,708 | ||||||||||
Series 5049, Class CI | 3,891 | 583,798 | ||||||||||
Federal National Mortgage Association REMICs | 7,552 | 1,252,698 | ||||||||||
|
| |||||||||||
| 3,329,028 | ||||||||||||
|
| |||||||||||
| Total Collateralized Mortgage Obligations (cost $55,354,244) |
| 56,437,809 | ||||||||||
|
| |||||||||||
| MORTGAGE PASS-THROUGHS–4.2% |
| |||||||||||
| Agency Fixed Rate 30-Year–4.0% |
| |||||||||||
Federal Home Loan Mortgage Corp. | 1,829 | 1,964,684 | ||||||||||
4.00%, 06/01/2049 | 644 | 702,368 | ||||||||||
Series 2020 | 559 | 577,766 | ||||||||||
3.50%, 01/01/2050 | 1,780 | 1,923,781 | ||||||||||
Federal Home Loan Mortgage Corp. Gold | 796 | 879,248 | ||||||||||
2021 Semi-Annual Report | 41 | |
Table of Contents
Schedule of Investments (continued)
| Principal Amount (000) | U.S. $ Value | |||||||||||
Series 2017 | U.S.$ | 602 | $ | 665,019 | ||||||||
Series 2018 | 1,002 | 1,104,845 | ||||||||||
5.00%, 11/01/2048 | 321 | 360,516 | ||||||||||
Series 2019 | 573 | 635,613 | ||||||||||
Federal National Mortgage Association | 200 | 232,345 | ||||||||||
Series 2010 | 353 | 387,144 | ||||||||||
Series 2012 | 4,049 | 4,393,997 | ||||||||||
Series 2013 | 1,980 | 2,149,006 | ||||||||||
4.00%, 10/01/2043 | 990 | 1,091,585 | ||||||||||
Series 2014 | 547 | 634,363 | ||||||||||
Series 2015 | 1,287 | 1,353,612 | ||||||||||
Series 2018 | 2,587 | 2,775,000 | ||||||||||
4.50%, 09/01/2048 | 2,685 | 2,961,407 | ||||||||||
Series 2019 | 1,419 | 1,516,800 | ||||||||||
Series 2020 | 3,167 | 3,286,307 | ||||||||||
3.50%, 01/01/2050 | 2,041 | 2,195,537 | ||||||||||
Government National Mortgage Association | 485 | 511,644 | ||||||||||
Uniform Mortgage-Backed Security | 1,450 | 1,486,816 | ||||||||||
2.00%, 04/01/2051, TBA | 3,415 | 3,404,595 | ||||||||||
2.50%, 04/01/2051, TBA | 4,800 | 4,921,875 | ||||||||||
2.50%, 04/01/2051, TBA | 5,795 | 5,942,139 | ||||||||||
|
| |||||||||||
| 48,058,012 | ||||||||||||
|
| |||||||||||
| Agency Fixed Rate 15-Year–0.2% |
| |||||||||||
Federal National Mortgage Association | 58 | 60,543 | ||||||||||
Series 2014 | 151 | 157,328 | ||||||||||
Series 2016 | 2,452 | 2,564,462 | ||||||||||
Series 2017 | 118 | 123,253 | ||||||||||
|
| |||||||||||
| 2,905,586 | ||||||||||||
|
| |||||||||||
| Total Mortgage Pass-Throughs (cost $49,963,054) |
| 50,963,598 | ||||||||||
|
| |||||||||||
| Shares | U.S. $ Value | |||||||||||
| INVESTMENT COMPANIES–3.9% |
| |||||||||||
| Funds and Investment Trusts–3.9% |
| |||||||||||
AB All Market Real Return Portfolio–Class Z(i)(j) |
| 5,123,656 | $ | 47,188,876 | ||||||||
|
| |||||||||||
| Principal Amount (000) | ||||||||||||
| CORPORATES—NON-INVESTMENT GRADE–3.7% |
| |||||||||||
| Industrial–2.9% |
| |||||||||||
| Basic–0.4% |
| |||||||||||
Axalta Coating Systems LLC | U.S.$ | 1,222 | 1,191,572 | |||||||||
INEOS Quattro Finance 2 PLC | EUR | 709 | 831,735 | |||||||||
3.375%, 01/15/2026(a) | U.S.$ | 306 | 305,676 | |||||||||
Ingevity Corp. | 1,125 | 1,091,182 | ||||||||||
Solvay SA | EUR | 300 | 360,148 | |||||||||
SPCM SA | 311 | 370,735 | ||||||||||
WEPA Hygieneprodukte GmbH | 447 | 524,197 | ||||||||||
|
| |||||||||||
| 4,675,245 | ||||||||||||
|
| |||||||||||
| Capital Goods–0.4% | ||||||||||||
Ardagh Metal Packaging Finance USA LLC/Ardagh Metal Packaging Finance PLC | ||||||||||||
2.00%, 09/01/2028(a) | 500 | 586,496 | ||||||||||
3.25%, 09/01/2028(a) | U.S.$ | 652 | 644,633 | |||||||||
GFL Environmental, Inc. | 861 | 834,051 | ||||||||||
Rolls-Royce PLC | EUR | 531 | 600,000 | |||||||||
Silgan Holdings, Inc. | 122 | 143,427 | ||||||||||
TransDigm, Inc. | U.S.$ | 864 | 915,952 | |||||||||
Vertical Midco GmbH | EUR | 605 | 745,908 | |||||||||
|
| |||||||||||
| 4,470,467 | ||||||||||||
|
| |||||||||||
| Communications—Media–0.3% | ||||||||||||
Cable One, Inc. | U.S.$ | 792 | 783,177 | |||||||||
CCO Holdings LLC/CCO Holdings Capital Corp. | 725 | 733,019 | ||||||||||
CSC Holdings LLC | 285 | 293,193 | ||||||||||
Netflix, Inc. |
| |||||||||||
3.625%, 05/15/2027 | EUR | 275 | 369,254 | |||||||||
4.625%, 05/15/2029 | 260 | 378,438 | ||||||||||
5.875%, 11/15/2028 | U.S.$ | 1,118 | 1,352,747 | |||||||||
|
| |||||||||||
| 3,909,828 | ||||||||||||
|
| |||||||||||
| 42 | Sanford C. Bernstein Fund, Inc. | |
Table of Contents
| Principal Amount (000) | U.S. $ Value | |||||||||||
| Communications—Telecommunications–0.3% |
| |||||||||||
Lumen Technologies, Inc. | U.S.$ | 1,285 | $ | 1,253,877 | ||||||||
T-Mobile USA, Inc. | ||||||||||||
2.625%, 04/15/2026 | 538 | 545,537 | ||||||||||
2.875%, 02/15/2031 | 686 | 663,135 | ||||||||||
3.375%, 04/15/2029 | 567 | 573,680 | ||||||||||
Telecom Italia SpA/Milano | EUR | 153 | 175,530 | |||||||||
Telefonica Europe BV | 400 | 482,496 | ||||||||||
|
| |||||||||||
| 3,694,255 | ||||||||||||
|
| |||||||||||
| Consumer Cyclical—Automotive–0.2% |
| |||||||||||
Allison Transmission, Inc. | U.S.$ | 1,262 | 1,225,465 | |||||||||
Clarios Global LP/Clarios US Finance Co. | EUR | 385 | 467,549 | |||||||||
Ford Motor Co. | U.S.$ | 475 | 529,639 | |||||||||
Tenneco, Inc. | EUR | 260 | 312,525 | |||||||||
|
| |||||||||||
| 2,535,178 | ||||||||||||
|
| |||||||||||
| Consumer Cyclical—Entertainment–0.2% |
| |||||||||||
Carnival Corp. | U.S.$ | 170 | 194,040 | |||||||||
Carnival PLC | EUR | 490 | 442,075 | |||||||||
Mattel, Inc. |
| |||||||||||
3.375%, 04/01/2026(a) | U.S.$ | 464 | 474,913 | |||||||||
3.75%, 04/01/2029(a) | 464 | 467,406 | ||||||||||
Royal Caribbean Cruises Ltd. |
| |||||||||||
10.875%, 06/01/2023(a) | 416 | 478,475 | ||||||||||
11.50%, 06/01/2025(a) | 747 | 871,009 | ||||||||||
|
| |||||||||||
| 2,927,918 | ||||||||||||
|
| |||||||||||
| Consumer Cyclical—Other–0.1% |
| |||||||||||
Hilton Domestic Operating Co., Inc. | 1,594 | 1,592,852 | ||||||||||
International Game Technology PLC | 200 | 219,538 | ||||||||||
|
| |||||||||||
| 1,812,390 | ||||||||||||
|
| |||||||||||
| Consumer Cyclical—Restaurants–0.1% |
| |||||||||||
1011778 BC ULC/New Red Finance, Inc. | 1,691 | 1,644,498 | ||||||||||
|
| |||||||||||
| Consumer Cyclical—Retailers–0.1% |
| |||||||||||
Dufry One BV | EUR | 242 | 279,219 | |||||||||
Levi Strauss & Co. | U.S.$ | 756 | 729,940 | |||||||||
|
| |||||||||||
| 1,009,159 | ||||||||||||
|
| |||||||||||
| Principal Amount (000) | U.S. $ Value | |||||||||||
| Consumer Non-Cyclical–0.3% |
| |||||||||||
Albertsons Cos., Inc./Safeway, Inc./New Albertsons LP/Albertsons LLC | U.S.$ | 811 | $ | 788,100 | ||||||||
Avantor Funding, Inc. | EUR | 293 | 351,803 | |||||||||
Cheplapharm Arzneimittel GmbH | 123 | 146,133 | ||||||||||
Grifols SA | 537 | 631,182 | ||||||||||
IQVIA, Inc. | 630 | 740,552 | ||||||||||
Newell Brands, Inc. | ||||||||||||
4.70%, 04/01/2026 | U.S.$ | 689 | 759,884 | |||||||||
4.875%, 06/01/2025 | 171 | 188,775 | ||||||||||
Spectrum Brands, Inc. | 50 | 51,600 | ||||||||||
Tenet Healthcare Corp. | 426 | 434,848 | ||||||||||
|
| |||||||||||
| 4,092,877 | ||||||||||||
|
| |||||||||||
| Energy–0.1% |
| |||||||||||
Hess Midstream Operations LP | 546 | 562,298 | ||||||||||
Transocean Poseidon Ltd. | 375 | 345,735 | ||||||||||
|
| |||||||||||
| 908,033 | ||||||||||||
|
| |||||||||||
| Other Industrial–0.1% |
| |||||||||||
H&E Equipment Services, Inc. | 503 | 488,634 | ||||||||||
Rexel SA | EUR | 450 | 531,847 | |||||||||
|
| |||||||||||
| 1,020,481 | ||||||||||||
|
| |||||||||||
| Services–0.1% |
| |||||||||||
Intertrust Group BV | 555 | 667,810 | ||||||||||
|
| |||||||||||
| Technology–0.1% |
| |||||||||||
CommScope, Inc. | U.S.$ | 225 | 232,006 | |||||||||
Dell International LLC/EMC Corp. | 51 | 52,489 | ||||||||||
EMC Corp. | 645 | 666,208 | ||||||||||
|
| |||||||||||
| 950,703 | ||||||||||||
|
| |||||||||||
| Transportation—Services–0.1% |
| |||||||||||
Chicago Parking Meters LLC | 800 | 864,683 | ||||||||||
|
| |||||||||||
| 35,183,525 | ||||||||||||
|
| |||||||||||
2021 Semi-Annual Report | 43 | |
Table of Contents
Schedule of Investments (continued)
| Principal Amount (000) | U.S. $ Value | |||||||||||
| Financial Institutions–0.8% |
| |||||||||||
| Banking–0.5% |
| |||||||||||
Banco Bilbao Vizcaya Argentaria SA | U.S.$ | 400 | $ | 431,660 | ||||||||
Banco Santander SA | EUR | 500 | 617,866 | |||||||||
Credit Suisse Group AG | U.S.$ | 2,194 | 2,343,818 | |||||||||
Discover Financial Services | 2,363 | 2,621,702 | ||||||||||
Intesa Sanpaolo SpA | ||||||||||||
5.017%, 06/26/2024(a) | 400 | 436,028 | ||||||||||
Series E | EUR | 29 | 38,395 | |||||||||
|
| |||||||||||
| 6,489,469 | ||||||||||||
|
| |||||||||||
| Finance–0.3% |
| |||||||||||
Lincoln Financing SARL | 445 | 527,232 | ||||||||||
Navient Corp. | U.S.$ | 1,140 | 1,161,592 | |||||||||
SLM Corp. | 1,428 | 1,499,100 | ||||||||||
|
| |||||||||||
| 3,187,924 | ||||||||||||
|
| |||||||||||
| REITS–0.0% |
| |||||||||||
MGM Growth Properties Operating Partnership LP/MGP Finance Co-Issuer, Inc. | 241 | 253,978 | ||||||||||
|
| |||||||||||
| 9,931,371 | ||||||||||||
|
| |||||||||||
| Total Corporates—Non-Investment Grade (cost $44,285,901) |
| 45,114,896 | ||||||||||
|
| |||||||||||
| COMMERCIAL MORTGAGE-BACKED SECURITIES–3.5% |
| |||||||||||
| Non-Agency Fixed Rate CMBS–2.0% |
| |||||||||||
BAMLL Commercial Mortgage Securities Trust | 500 | 448,304 | ||||||||||
Banc of America Commercial Mortgage Trust | 85 | 92,844 | ||||||||||
CCUBS Commercial Mortgage Trust |
| 615 | 672,933 | |||||||||
CFCRE Commercial Mortgage Trust |
| 1,250 | 1,351,733 | |||||||||
| Principal Amount (000) | U.S. $ Value | |||||||||||
CGRBS Commercial Mortgage Trust | U.S.$ | 2,120 | $ | 2,210,601 | ||||||||
Citigroup Commercial Mortgage Trust | ||||||||||||
Series 2016-C1, Class A4 | 1,411 | 1,517,051 | ||||||||||
Series 2017-P8, Class AS | 267 | 291,914 | ||||||||||
Series 2018-B2, Class A4 | 450 | 501,882 | ||||||||||
Commercial Mortgage Trust | ||||||||||||
Series 2010-C1, Class D | 1,070 | 1,086,690 | ||||||||||
Series 2013-CR12, Class A4 | 500 | 537,473 | ||||||||||
Series 2014-UBS5, Class A4 | 990 | 1,078,286 | ||||||||||
Series 2015-3BP, Class A | 280 | 297,171 | ||||||||||
Series 2015-CR24, Class A5 | 655 | 719,286 | ||||||||||
Series 2015-LC21, Class XA | 4,859 | 118,487 | ||||||||||
CSAIL Commercial Mortgage Trust | 736 | 794,192 | ||||||||||
GS Mortgage Securities Trust | ||||||||||||
Series 2011-GC5, Class AS | 650 | 653,572 | ||||||||||
Series 2011-GC5, Class D | 114 | 69,855 | ||||||||||
Series 2013-G1, Class A1 | 118 | 119,278 | ||||||||||
Series 2013-G1, Class A2 | 1,094 | 1,062,026 | ||||||||||
Series 2013-GC12, Class B | 465 | 486,363 | ||||||||||
Series 2014-GC18, Class D | 100 | 32,730 | ||||||||||
GSF | ||||||||||||
Series 2021-1, Class A1 | 72 | 71,815 | ||||||||||
Series 2021-1, Class A2 | 123 | 126,690 | ||||||||||
Series 2021-1, Class AS | 37 | 38,110 | ||||||||||
JP Morgan Chase Commercial Mortgage Securities Trust | ||||||||||||
Series 2011-C5, Class D | 116 | 103,703 | ||||||||||
Series 2012-C6, Class E | 375 | 242,067 | ||||||||||
Series 2012-C8, Class AS | 1,400 | 1,441,248 | ||||||||||
| 44 | Sanford C. Bernstein Fund, Inc. | |
Table of Contents
| Principal Amount (000) | U.S. $ Value | |||||||||||
Series 2012-CBX, Class E | U.S.$ | 103 | $ | 43,278 | ||||||||
JPMBB Commercial Mortgage Securities Trust | ||||||||||||
Series 2014-C21, Class B | 150 | 156,396 | ||||||||||
Series 2014-C22, Class XA | 14,357 | 340,469 | ||||||||||
Series 2014-C26, Class AS | 770 | 831,019 | ||||||||||
Series 2015-C33, Class AS | 440 | 483,071 | ||||||||||
JPMCC Commercial Mortgage Securities Trust | 4,233 | 198,958 | ||||||||||
LB-UBS Commercial Mortgage Trust | 198 | 114,748 | ||||||||||
LSTAR Commercial Mortgage Trust | 1,166 | 1,183,505 | ||||||||||
Morgan Stanley Capital I Trust | 380 | 371,875 | ||||||||||
UBS Commercial Mortgage Trust | 364 | 374,165 | ||||||||||
UBS-Barclays Commercial Mortgage Trust | 2,030 | 2,091,947 | ||||||||||
Wells Fargo Commercial Mortgage Trust | ||||||||||||
Series 2015-SG1, Class C | 361 | 341,248 | ||||||||||
Series 2016-LC25, Class C | 125 | 131,375 | ||||||||||
Series 2016-NXS6, Class C | 750 | 782,382 | ||||||||||
Series 2018-C48, Class A5 | 152 | 173,042 | ||||||||||
WF-RBS Commercial Mortgage Trust | ||||||||||||
Series 2011-C3, Class C | 410 | 408,557 | ||||||||||
Series 2014-C24, Class AS | 143 | 151,146 | ||||||||||
|
| |||||||||||
| 24,343,485 | ||||||||||||
|
| |||||||||||
| Non-Agency Floating Rate CMBS–1.5% |
| |||||||||||
Ashford Hospitality Trust | 600 | 599,446 | ||||||||||
| Principal Amount (000) | U.S. $ Value | |||||||||||
BAMLL Commercial Mortgage Securities Trust | U.S.$ | 1,935 | $ | 1,888,877 | ||||||||
BBCMS Mortgage Trust | 1,089 | 1,094,457 | ||||||||||
BHMS | 1,512 | 1,510,644 | ||||||||||
BHP Trust | 235 | 234,429 | ||||||||||
BX Commercial Mortgage Trust | 712 | 709,456 | ||||||||||
BX Trust | 1,484 | 1,439,152 | ||||||||||
CLNY Trust | 915 | 889,782 | ||||||||||
DBWF Mortgage Trust | 1,631 | 1,630,175 | ||||||||||
Federal Home Loan Mortgage Corp. | 208 | 208,896 | ||||||||||
Great Wolf Trust | 570 | 569,312 | ||||||||||
GS Mortgage Securities Corp. Trust | ||||||||||||
Series 2019-BOCA, Class A | 751 | 751,338 | ||||||||||
Series 2019-SMP, Class A | 820 | 819,505 | ||||||||||
Series 2019-SMP, Class D | 230 | 224,346 | ||||||||||
HFX Funding | 1,230 | 1,269,248 | ||||||||||
Invitation Homes Trust | ||||||||||||
Series 2018-SFR2, Class C | 313 | 313,614 | ||||||||||
2021 Semi-Annual Report | 45 | |
Table of Contents
Schedule of Investments (continued)
| Principal Amount (000) | U.S. $ Value | |||||||||||
Series 2018-SFR3, Class C | U.S.$ | 582 | $ | 583,307 | ||||||||
Series 2018-SFR4, Class A | 841 | 843,406 | ||||||||||
JP Morgan Chase Commercial Mortgage Securities Trust | 88 | 87,890 | ||||||||||
Morgan Stanley Capital I Trust | 246 | 209,140 | ||||||||||
Natixis Commercial Mortgage Securities Trust | ||||||||||||
Series 2018-850T, Class A | 830 | 825,263 | ||||||||||
Series 2019-MILE, Class A | 372 | 373,407 | ||||||||||
Starwood Retail Property Trust | 1,909 | 1,402,826 | ||||||||||
|
| |||||||||||
| 18,477,916 | ||||||||||||
|
| |||||||||||
| Total Commercial Mortgage-Backed Securities (cost $43,318,731) |
| 42,821,401 | ||||||||||
|
| |||||||||||
| QUASI-SOVEREIGNS–1.5% |
| |||||||||||
| Quasi-Sovereign Bonds–1.5% |
| |||||||||||
| Chile–0.0% |
| |||||||||||
Empresa de Transporte de Pasajeros Metro SA | 200 | 216,500 | ||||||||||
|
| |||||||||||
| China–0.8% |
| |||||||||||
China Development Bank | ||||||||||||
Series 1805 | CNY | 37,240 | 6,116,831 | |||||||||
Series 1904 | 19,350 | 2,986,999 | ||||||||||
State Grid Overseas Investment Ltd. | U.S.$ | 951 | 1,043,128 | |||||||||
|
| |||||||||||
| 10,146,958 | ||||||||||||
|
| |||||||||||
| Indonesia–0.3% |
| |||||||||||
Indonesia Asahan Aluminium Persero PT | 762 | 828,066 | ||||||||||
Pertamina Persero PT | 525 | 650,994 | ||||||||||
| Principal Amount (000) | U.S. $ Value | |||||||||||
Perusahaan Perseroan Persero PT Perusahaan Listrik Negara | U.S.$ | 294 | $ | 295,562 | ||||||||
4.125%, 05/15/2027(a) | 495 | 531,739 | ||||||||||
5.45%, 05/21/2028(a) | 618 | 713,983 | ||||||||||
|
| |||||||||||
| 3,020,344 | ||||||||||||
|
| |||||||||||
| Malaysia–0.1% |
| |||||||||||
Petronas Capital Ltd. | 647 | 758,827 | ||||||||||
|
| |||||||||||
| Mexico–0.3% |
| |||||||||||
Comision Federal de Electricidad | 1,672 | 1,604,597 | ||||||||||
Petroleos Mexicanos |
| |||||||||||
5.95%, 01/28/2031 | 131 | 125,105 | ||||||||||
6.75%, 09/21/2047 | 588 | 499,917 | ||||||||||
6.84%, 01/23/2030 | 381 | 385,249 | ||||||||||
7.69%, 01/23/2050 | 445 | 411,180 | ||||||||||
|
| |||||||||||
| 3,026,048 | ||||||||||||
|
| |||||||||||
| South Africa–0.0% |
| |||||||||||
Eskom Holdings SOC Ltd. | 319 | 337,542 | ||||||||||
|
| |||||||||||
| United Arab Emirates–0.0% |
| |||||||||||
DP World Crescent Ltd. |
| |||||||||||
3.75%, 01/30/2030(a) | 226 | 234,475 | ||||||||||
3.875%, 07/18/2029(a) | 219 | 229,403 | ||||||||||
|
| |||||||||||
| 463,878 | ||||||||||||
|
| |||||||||||
| Total Quasi-Sovereigns (cost $16,948,575) | 17,970,097 | |||||||||||
|
| |||||||||||
| COLLATERALIZED LOAN OBLIGATIONS–1.1% |
| |||||||||||
| CLO—Floating Rate–1.1% |
| |||||||||||
Ballyrock CLO 15 Ltd. | 375 | 375,000 | ||||||||||
Black Diamond CLO Ltd. | 250 | 245,582 | ||||||||||
Dryden CLO Ltd. | ||||||||||||
Series 2020-77A, Class A | 730 | 731,325 | ||||||||||
Series 2020-78A, Class C | 830 | 832,176 | ||||||||||
Series 2020-78A, Class D | 500 | 501,142 | ||||||||||
Elevation CLO Ltd. | 670 | 651,360 | ||||||||||
| 46 | Sanford C. Bernstein Fund, Inc. | |
Table of Contents
| Principal Amount (000) | U.S. $ Value | |||||||||||
Goldentree Loan Management US CLO Ltd. | U.S.$ | 1,079 | $ | 1,079,645 | ||||||||
Greywolf CLO VI Ltd. | 250 | 250,024 | ||||||||||
ICG US CLO Ltd. | 557 | 556,769 | ||||||||||
Kayne CLO 7 Ltd. | 250 | 250,787 | ||||||||||
Magnetite CLO Ltd. | 1,351 | 1,353,220 | ||||||||||
Marble Point CLO XI Ltd. | 678 | 677,959 | ||||||||||
OCP CLO Ltd. | 1,089 | 1,088,608 | ||||||||||
Octagon Loan Funding Ltd. | 461 | 460,747 | ||||||||||
OZLM XVIII Ltd. | 745 | 742,144 | ||||||||||
OZLM XXII Ltd. | 302 | 300,883 | ||||||||||
Romark CLO III Ltd. | 650 | 650,247 | ||||||||||
SCFF I Ltd. | 250 | 250,184 | ||||||||||
Sound Point CLO XIX Ltd. | 1,050 | 1,048,171 | ||||||||||
THL Credit Wind River CLO Ltd. | ||||||||||||
Series 2014-2A, Class AR 1.381% (LIBOR 3 Month + 1.14%), 01/15/2031(a)(e) | 722 | 722,351 | ||||||||||
| Principal Amount (000) | U.S. $ Value | |||||||||||
Series 2017-4A, Class B | U.S.$ | 300 | $ | 300,024 | ||||||||
Voya CLO Ltd. | 340 | 332,759 | ||||||||||
|
| |||||||||||
| Total Collateralized Loan Obligations (cost $13,421,557) |
| 13,401,107 | ||||||||||
|
| |||||||||||
| ASSET-BACKED SECURITIES–0.9% |
| |||||||||||
| Other ABS—Fixed Rate–0.4% |
| |||||||||||
Affirm Asset Securitization Trust | 815 | 823,705 | ||||||||||
Consumer Loan Underlying Bond CLUB Credit Trust | 350 | 356,487 | ||||||||||
Hardee’s Funding LLC | ||||||||||||
Series 2018-1A, Class A23 | 576 | 639,471 | ||||||||||
Series 2020-1A, Class A2 | 437 | 450,702 | ||||||||||
Marlette Funding Trust | ||||||||||||
Series 2018-4A, Class A | 10 | 10,167 | ||||||||||
Series 2019-1A, Class A | 72 | 72,158 | ||||||||||
Series 2019-3A, Class A | 212 | 212,910 | ||||||||||
Series 2020-1A, Class A | 121 | 121,933 | ||||||||||
Neighborly Issuer LLC | 451 | 452,800 | ||||||||||
Prosper Marketplace Issuance Trust | 11 | 11,413 | ||||||||||
SBA Tower Trust | 774 | 819,955 | ||||||||||
SoFi Consumer Loan Program LLC | ||||||||||||
Series 2017-5, Class A2 | 138 | 138,285 | ||||||||||
Series 2017-6, Class A2 | 27 | 27,152 | ||||||||||
SoFi Consumer Loan Program Trust | ||||||||||||
Series 2018-1, Class B | 258 | 262,613 | ||||||||||
Series 2018-3, Class A2 | 74 | 73,722 | ||||||||||
Series 2019-3, Class A | 122 | 122,703 | ||||||||||
2021 Semi-Annual Report | 47 | |
Table of Contents
Schedule of Investments (continued)
| Principal Amount (000) | U.S. $ Value | |||||||||||
Upstart Securitization Trust | U.S.$ | 582 | $ | 587,031 | ||||||||
|
| |||||||||||
| 5,183,207 | ||||||||||||
|
| |||||||||||
| Autos—Fixed Rate–0.3% |
| |||||||||||
Avis Budget Rental Car Funding AESOP LLC | ||||||||||||
Series 2018-1A, Class A | 1,240 | 1,321,707 | ||||||||||
Series 2018-2A, Class A | 500 | 542,000 | ||||||||||
Exeter Automobile Receivables Trust | 331 | 332,001 | ||||||||||
First Investors Auto Owner Trust | 411 | 413,132 | ||||||||||
Flagship Credit Auto Trust | 424 | 429,214 | ||||||||||
Hertz Vehicle Financing II LP | ||||||||||||
Series 2015-3A, Class A | 104 | 104,323 | ||||||||||
Series 2017-1A, Class A | 220 | 220,888 | ||||||||||
Series 2018-1A, Class A | 71 | 71,004 | ||||||||||
Series 2019-1A, Class A | 178 | 178,908 | ||||||||||
Series 2019-2A, Class A | 84 | 83,852 | ||||||||||
Hertz Vehicle Financing LLC | 79 | 79,467 | ||||||||||
|
| |||||||||||
| 3,776,496 | ||||||||||||
|
| |||||||||||
| Credit Cards—Fixed Rate–0.2% |
| |||||||||||
Brex Commercial Charge Card Master Trust | 602 | 601,955 | ||||||||||
World Financial Network Credit Card Master Trust | ||||||||||||
Series 2018-B, Class M | 445 | 451,322 | ||||||||||
Series 2019-B, Class M | 1,065 | 1,092,498 | ||||||||||
|
| |||||||||||
| 2,145,775 | ||||||||||||
|
| |||||||||||
| Total Asset-Backed Securities (cost $10,836,569) | 11,105,478 | |||||||||||
|
| |||||||||||
| Principal Amount (000) | U.S. $ Value | |||||||||||
| EMERGING MARKETS—CORPORATE BONDS–0.8% |
| |||||||||||
| Industrial–0.8% |
| |||||||||||
| Basic–0.1% |
| |||||||||||
Braskem Netherlands Finance BV | U.S.$ | 295 | $ | 295,723 | ||||||||
Klabin Austria GmbH | 213 | 202,350 | ||||||||||
Vedanta Resources Finance II PLC | 661 | 713,260 | ||||||||||
Volcan Cia Minera SAA | 319 | 325,380 | ||||||||||
|
| |||||||||||
| 1,536,713 | ||||||||||||
|
| |||||||||||
| Capital Goods–0.2% |
| |||||||||||
Cemex SAB de CV | 1,137 | 1,110,281 | ||||||||||
Embraer Netherlands Finance BV | ||||||||||||
5.40%, 02/01/2027 | 853 | 889,188 | ||||||||||
6.95%, 01/17/2028(a) | 1,052 | 1,152,256 | ||||||||||
Odebrecht Holdco Finance Ltd. | 639 | 14,782 | ||||||||||
|
| |||||||||||
| 3,166,507 | ||||||||||||
|
| |||||||||||
| Communications—Media–0.1% |
| |||||||||||
Globo Comunicacao e Participacoes SA | 1,127 | 1,134,396 | ||||||||||
|
| |||||||||||
| Consumer Cyclical—Other–0.1% |
| |||||||||||
Wynn Macau Ltd. | 587 | 609,189 | ||||||||||
|
| |||||||||||
| Consumer Non-Cyclical–0.1% |
| |||||||||||
BRF GmbH | 473 | 483,790 | ||||||||||
BRF SA | 290 | 295,517 | ||||||||||
|
| |||||||||||
| 779,307 | ||||||||||||
|
| |||||||||||
| Energy–0.0% |
| |||||||||||
Leviathan Bond Ltd. | 196 | 213,136 | ||||||||||
|
| |||||||||||
| Services–0.1% |
| |||||||||||
MercadoLibre, Inc. | ||||||||||||
2.375%, 01/14/2026 | 600 | 592,620 | ||||||||||
3.125%, 01/14/2031 | 307 | 292,264 | ||||||||||
|
| |||||||||||
| 884,884 | ||||||||||||
|
| |||||||||||
| Transportation—Services–0.1% |
| |||||||||||
Rumo Luxembourg SARL | 615 | 645,750 | ||||||||||
|
| |||||||||||
| 8,969,882 | ||||||||||||
|
| |||||||||||
| 48 | Sanford C. Bernstein Fund, Inc. | |
Table of Contents
| Principal Amount (000) | U.S. $ Value | |||||||||||
| Utility–0.0% |
| |||||||||||
| Electric–0.0% |
| |||||||||||
Terraform Global Operating LLC | U.S.$ | 133 | $ | 136,328 | ||||||||
|
| |||||||||||
| Financial Institutions–0.0% |
| |||||||||||
| Other Finance–0.0% |
| |||||||||||
OEC Finance Ltd. | ||||||||||||
5.25%, 12/27/2033(a)(m) | 112 | 18,272 | ||||||||||
7.125%, 12/26/2046(a)(m) | 411 | 66,207 | ||||||||||
|
| |||||||||||
| 84,479 | ||||||||||||
|
| |||||||||||
| Total Emerging Markets—Corporate Bonds (cost $9,426,112) |
| 9,190,689 | ||||||||||
|
| |||||||||||
| EMERGING MARKETS—TREASURIES–0.5% |
| |||||||||||
| Brazil–0.5% |
| |||||||||||
Brazil Notas do Tesouro Nacional Serie F | BRL | 35,120 | 6,570,085 | |||||||||
|
| |||||||||||
| EMERGING MARKETS—SOVEREIGNS–0.5% |
| |||||||||||
| Bahrain–0.1% |
| |||||||||||
Bahrain Government International Bond | U.S.$ | 690 | 680,944 | |||||||||
|
| |||||||||||
| Dominican Republic–0.1% |
| |||||||||||
Dominican Republic International Bond | 1,307 | 1,320,070 | ||||||||||
|
| |||||||||||
| Egypt–0.1% |
| |||||||||||
Egypt Government International Bond | 1,719 | 1,607,265 | ||||||||||
|
| |||||||||||
| Ivory Coast–0.0% |
| |||||||||||
Ivory Coast Government International Bond | EUR | 290 | 359,000 | |||||||||
|
| |||||||||||
| Oman–0.1% |
| |||||||||||
Oman Government International Bond | ||||||||||||
4.875%, 02/01/2025(a) | U.S.$ | 850 | 885,859 | |||||||||
6.25%, 01/25/2031(a) | 586 | 612,920 | ||||||||||
|
| |||||||||||
| 1,498,779 | ||||||||||||
|
| |||||||||||
| Senegal–0.0% |
| |||||||||||
Senegal Government International Bond | 415 | 446,125 | ||||||||||
|
| |||||||||||
| Principal Amount (000) | U.S. $ Value | |||||||||||
| South Africa–0.1% |
| |||||||||||
Republic of South Africa Government International Bond | U.S.$ | 515 | $ | 507,436 | ||||||||
|
| |||||||||||
| Total Emerging Markets—Sovereigns (cost $6,351,069) |
| 6,419,619 | ||||||||||
|
| |||||||||||
| GOVERNMENTS—SOVEREIGN BONDS–0.4% |
| |||||||||||
| Chile–0.0% |
| |||||||||||
Chile Government International Bond | EUR | 438 | 545,424 | |||||||||
|
| |||||||||||
| Indonesia–0.1% |
| |||||||||||
Indonesia Government International Bond | ||||||||||||
1.10%, 03/12/2033 | 174 | 198,030 | ||||||||||
3.375%, 07/30/2025(a) | 470 | 611,798 | ||||||||||
|
| |||||||||||
| 809,828 | ||||||||||||
|
| |||||||||||
| Israel–0.1% |
| |||||||||||
Israel Government International Bond | U.S.$ | 766 | 841,403 | |||||||||
|
| |||||||||||
| Mexico–0.1% |
| |||||||||||
Mexico Government International Bond | 745 | 825,786 | ||||||||||
|
| |||||||||||
| Qatar–0.0% |
| |||||||||||
Qatar Government International Bond | 443 | 480,932 | ||||||||||
|
| |||||||||||
| Saudi Arabia–0.0% |
| |||||||||||
Saudi Government International Bond | 428 | 453,546 | ||||||||||
|
| |||||||||||
| United Arab Emirates–0.1% |
| |||||||||||
Abu Dhabi Government International Bond | 695 | 732,313 | ||||||||||
|
| |||||||||||
| Uruguay–0.0% |
| |||||||||||
Uruguay Government International Bond | 268 | 310,954 | ||||||||||
|
| |||||||||||
| Total Governments—Sovereign Bonds (cost $4,792,325) |
| 5,000,186 | ||||||||||
|
| |||||||||||
2021 Semi-Annual Report | 49 | |
Table of Contents
Schedule of Investments (continued)
| Notional Amount | U.S. $ Value | |||||||||||
| OPTIONS PURCHASED—PUTS–0.4% |
| |||||||||||
| Options on Equity Indices–0.4% |
| |||||||||||
Euro STOXX 50 Index | EUR | 12,703,250 | $ | 383,783 | ||||||||
Euro STOXX 50 Index | EUR | 6,515,250 | 196,835 | |||||||||
FTSE 100 Index | GBP | 4,845,000 | 159,981 | |||||||||
FTSE 100 Index | 2,397,000 | 79,148 | ||||||||||
Nikkei 225 Index | JPY | 652,500,000 | 161,728 | |||||||||
Nikkei 225 Index | JPY | 630,000,000 | 156,151 | |||||||||
Nikkei 225 Index | JPY | 585,000,000 | 144,997 | |||||||||
S&P 500 Index | USD | 106,200,000 | 2,347,716 | |||||||||
S&P 500 Index | USD | 52,200,000 | 1,153,962 | |||||||||
|
| |||||||||||
| Total Options Purchased—Puts (premiums paid $7,624,899) |
| 4,784,301 | ||||||||||
|
| |||||||||||
| Principal Amount (000) | U.S. $ Value | |||||||||||
| LOCAL GOVERNMENTS—US MUNICIPAL BONDS–0.3% |
| |||||||||||
| United States–0.3% |
| |||||||||||
City of New York | U.S.$ | 885 | $ | 824,078 | ||||||||
Port Authority of New York & New Jersey | 745 | 756,094 | ||||||||||
State Board of Administration Finance Corp. | 652 | 654,396 | ||||||||||
State of California | 935 | 964,735 | ||||||||||
Tobacco Settlement Finance Authority/WV | 875 | 898,375 | ||||||||||
|
| |||||||||||
| Total Local Governments—US Municipal Bonds (cost $4,119,952) |
| 4,097,678 | ||||||||||
|
| |||||||||||
| COVERED BONDS–0.3% |
| |||||||||||
Commonwealth Bank of Australia | EUR | 610 | 720,562 | |||||||||
DNB Boligkreditt AS | 473 | 559,513 | ||||||||||
Turkiye Vakiflar Bankasi TAO | 435 | 508,084 | ||||||||||
UBS AG/London |
| |||||||||||
1.375%, 04/16/2021(a) | 1,105 | 1,296,520 | ||||||||||
4.00%, 04/08/2022(a) | 495 | 606,812 | ||||||||||
|
| |||||||||||
| Total Covered Bonds (cost $3,547,293) |
| 3,691,491 | ||||||||||
|
| |||||||||||
| GOVERNMENTS—SOVEREIGN AGENCIES–0.3% |
| |||||||||||
| Canada–0.3% |
| |||||||||||
Canada Housing Trust No. 1 |
| |||||||||||
1.80%, 12/15/2024(a) | CAD | 3,065 | 2,517,705 | |||||||||
1.95%, 12/15/2025(a) | 835 | 687,514 | ||||||||||
|
| |||||||||||
| Total Governments—Sovereign Agencies (cost $3,073,195) |
| 3,205,219 | ||||||||||
|
| |||||||||||
| LOCAL GOVERNMENTS—PROVINCIAL BONDS–0.2% |
| |||||||||||
| Canada–0.2% |
| |||||||||||
Province of Ontario Canada | 885 | 744,465 | ||||||||||
Province of Quebec Canada | 1,735 | 1,476,441 | ||||||||||
|
| |||||||||||
| Total Local Governments—Provincial Bonds (cost $2,278,045) |
| 2,220,906 | ||||||||||
|
| |||||||||||
| 50 | Sanford C. Bernstein Fund, Inc. | |
Table of Contents
| Principal Amount (000) | U.S. $ Value | |||||||||||
| AGENCIES–0.2% |
| |||||||||||
| Agency Debentures–0.2% |
| |||||||||||
Federal Home Loan Bank |
| |||||||||||
2.50%, 02/13/2024 | U.S.$ | 585 | $ | 621,305 | ||||||||
1.875%, 07/07/2021 | 1,210 | 1,215,905 | ||||||||||
|
| |||||||||||
| Total Agencies (cost $1,793,648) |
| 1,837,210 | ||||||||||
|
| |||||||||||
| Shares | ||||||||||||
| SHORT-TERM INVESTMENTS–18.6% |
| |||||||||||
| Investment Companies–17.1% |
| |||||||||||
AB Fixed Income Shares, Inc.– |
| 208,055,429 | 208,055,429 | |||||||||
|
| |||||||||||
| Principal Amount (000) | U.S. $ Value | |||||||||||
| U.S. Treasury Bills–1.5% |
| |||||||||||
U.S. Treasury Bill | U.S.$ | 17,990 | $ | 17,989,797 | ||||||||
|
| |||||||||||
| Total Short-Term Investments (cost $226,045,215) |
| 226,045,226 | ||||||||||
|
| |||||||||||
| Total Investments—100.6% (cost $1,201,744,527) |
| 1,222,952,639 | ||||||||||
Other assets less liabilities—(0.6)% |
| (7,451,414 | ) | |||||||||
|
| |||||||||||
| Net Assets—100.0% |
| $ | 1,215,501,225 | |||||||||
|
| |||||||||||
| FUTURES (see Note 3) |
| |||||||||||||
| Description | Number of Contracts | Expiration Month | Current Notional | Value and Unrealized Appreciation/ (Depreciation) | ||||||||||
| Purchased Contracts |
| |||||||||||||
10 Yr Australian Bond Futures | 436 | June 2021 | $ | 45,738,477 | $ | (201,480 | ) | |||||||
10 Yr Canadian Bond Futures | 261 | June 2021 | 28,820,697 | (506,583 | ) | |||||||||
Euro Buxl 30 Yr Bond Futures | 49 | June 2021 | 11,839,532 | (79,354 | ) | |||||||||
Euro STOXX 50 Index Futures | 1,117 | June 2021 | 50,640,963 | 1,103,891 | ||||||||||
Euro-Bund Futures | 13 | June 2021 | 2,611,181 | 2,729 | ||||||||||
FTSE 100 Index Futures | 19 | June 2021 | 1,749,587 | (5,879 | ) | |||||||||
Hang Seng Index Futures | 28 | April 2021 | 5,099,291 | (24,876 | ) | |||||||||
MSCI Emerging Markets Futures | 625 | June 2021 | 41,328,125 | (329,431 | ) | |||||||||
MSCI Singapore IX ETS Futures | 399 | April 2021 | 10,617,161 | 60,134 | ||||||||||
Nikkei 225 (OSE) Futures | 12 | June 2021 | 3,162,429 | 39,250 | ||||||||||
OMXS 30 Index Futures | 765 | April 2021 | 19,159,052 | 279,288 | ||||||||||
Russell 2000 E-Mini Futures | 255 | June 2021 | 28,336,875 | (765,192 | ) | |||||||||
S&P 500 E-Mini Futures | 1,330 | June 2021 | 263,832,100 | 5,236,263 | ||||||||||
S&P Mid 400 E-Mini Futures | 77 | June 2021 | 20,060,810 | (2,781 | ) | |||||||||
S&P/TSX 60 Index Futures | 72 | June 2021 | 12,731,630 | 43,419 | ||||||||||
TOPIX Index Futures | 223 | June 2021 | 39,353,534 | 980,544 | ||||||||||
U.S. 10 Yr Ultra Futures | 65 | June 2021 | 9,339,688 | (85,650 | ) | |||||||||
U.S. Long Bond (CBT) Futures | 35 | June 2021 | 5,410,781 | (210,736 | ) | |||||||||
U.S. T-Note 2 Yr (CBT) Futures | 155 | June 2021 | 34,212,617 | (9,138 | ) | |||||||||
U.S. T-Note 5 Yr (CBT) Futures | 112 | June 2021 | 13,820,625 | (65,967 | ) | |||||||||
U.S. T-Note 10 Yr (CBT) Futures | 529 | June 2021 | 69,265,938 | (1,058,946 | ) | |||||||||
U.S. Ultra Bond (CBT) Futures | 102 | June 2021 | 18,484,313 | (694,842 | ) | |||||||||
| Sold Contracts |
| |||||||||||||
10 Yr Canadian Bond Futures | 134 | June 2021 | 14,796,833 | (33,569 | ) | |||||||||
10 Yr Japan Bond (OSE) Futures | 24 | June 2021 | 32,764,416 | (55,410 | ) | |||||||||
Euro-BOBL Futures | 26 | June 2021 | 4,118,616 | (2,469 | ) | |||||||||
2021 Semi-Annual Report | 51 | |
Table of Contents
Schedule of Investments (continued)
| Description | Number of Contracts | Expiration Month | Current Notional | Value and Unrealized Appreciation/ (Depreciation) | ||||||||||
Euro-Bund Futures | 17 | June 2021 | $ | 3,414,621 | $ | (4,405 | ) | |||||||
Euro-Buxl 30-year Bond Futures | 3 | June 2021 | 724,869 | 4,781 | ||||||||||
FTSE 100 Index Futures | 18 | June 2021 | 1,657,504 | (10,002 | ) | |||||||||
Long Gilt Futures | 214 | June 2021 | 37,641,631 | 401,453 | ||||||||||
SPI 200 Futures | 69 | June 2021 | 8,864,974 | (15,789 | ) | |||||||||
U.S. 10 Yr Ultra Futures | 152 | June 2021 | 21,840,500 | 539,335 | ||||||||||
U.S. T-Note 2 Yr (CBT) Futures | 310 | June 2021 | 68,425,234 | 36,311 | ||||||||||
U.S. T-Note 5 Yr (CBT) Futures | 116 | June 2021 | 14,314,219 | 51,239 | ||||||||||
U.S. T-Note 10 Yr (CBT) Futures | 61 | June 2021 | 7,987,188 | 125,785 | ||||||||||
U.S. Ultra Bond (CBT) Futures | 51 | June 2021 | 9,242,156 | 366,091 | ||||||||||
|
| |||||||||||||
| $ | 5,108,014 | |||||||||||||
|
| |||||||||||||
| FORWARD CURRENCY EXCHANGE CONTRACTS (see Note 3) |
| |||||||||||||||||||
| Counterparty | Contracts to Deliver (000) | In Exchange For (000) | Settlement Date | Unrealized Appreciation/ (Depreciation) | ||||||||||||||||
Bank of America, NA | BRL | 5,752 | USD | 1,006 | 04/05/2021 | $ | (15,703 | ) | ||||||||||||
Bank of America, NA | USD | 1,010 | BRL | 5,752 | 04/05/2021 | 12,313 | ||||||||||||||
Bank of America, NA | CAD | 4,768 | USD | 3,812 | 04/22/2021 | 17,726 | ||||||||||||||
Bank of America, NA | USD | 623 | JPY | 66,361 | 05/20/2021 | (23,728 | ) | |||||||||||||
Barclays Bank PLC | BRL | 14,047 | USD | 2,465 | 04/05/2021 | (30,070 | ) | |||||||||||||
Barclays Bank PLC | USD | 2,582 | BRL | 14,047 | 04/05/2021 | (86,067 | ) | |||||||||||||
Barclays Bank PLC | USD | 625 | GBP | 442 | 04/09/2021 | (15,393 | ) | |||||||||||||
Barclays Bank PLC | AUD | 31,207 | USD | 23,801 | 06/04/2021 | 91,858 | ||||||||||||||
BNP Paribas SA | ZAR | 11,288 | USD | 727 | 04/08/2021 | (37,697 | ) | |||||||||||||
BNP Paribas SA | GBP | 558 | USD | 772 | 04/09/2021 | 3,490 | ||||||||||||||
BNP Paribas SA | GBP | 11,003 | USD | 15,007 | 04/09/2021 | (163,119 | ) | |||||||||||||
BNP Paribas SA | USD | 1,541 | GBP | 1,109 | 04/09/2021 | (11,500 | ) | |||||||||||||
BNP Paribas SA | NOK | 13,172 | USD | 1,525 | 04/15/2021 | (15,113 | ) | |||||||||||||
BNP Paribas SA | SEK | 38,200 | USD | 4,536 | 04/15/2021 | 161,405 | ||||||||||||||
BNP Paribas SA | MXN | 34,014 | USD | 1,621 | 04/16/2021 | (41,238 | ) | |||||||||||||
BNP Paribas SA | CAD | 58,099 | USD | 45,877 | 04/22/2021 | (356,398 | ) | |||||||||||||
BNP Paribas SA | USD | 6,055 | CAD | 7,659 | 04/22/2021 | 40,140 | ||||||||||||||
BNP Paribas SA | JPY | 1,215,953 | USD | 11,186 | 05/20/2021 | 199,360 | ||||||||||||||
BNP Paribas SA | EUR | 68,434 | USD | 81,773 | 05/27/2021 | 1,434,501 | ||||||||||||||
BNP Paribas SA | NZD | 3,170 | USD | 2,269 | 05/27/2021 | 55,328 | ||||||||||||||
BNP Paribas SA | USD | 1,398 | NZD | 1,953 | 05/27/2021 | (33,998 | ) | |||||||||||||
BNP Paribas SA | PLN | 5,998 | USD | 1,526 | 06/24/2021 | 7,487 | ||||||||||||||
Brown Brothers Harriman & Co. | USD | 5,934 | NZD | 8,186 | 05/27/2021 | (217,266 | ) | |||||||||||||
Citibank, NA | BRL | 87,473 | USD | 15,923 | 04/05/2021 | 381,948 | ||||||||||||||
Citibank, NA | USD | 15,353 | BRL | 87,473 | 04/05/2021 | 187,258 | ||||||||||||||
Citibank, NA | ZAR | 22,275 | USD | 1,506 | 04/08/2021 | (2,861 | ) | |||||||||||||
Citibank, NA | GBP | 139 | USD | 193 | 04/09/2021 | 408 | ||||||||||||||
Citibank, NA | IDR | 15,655,207 | USD | 1,074 | 04/15/2021 | 301 | ||||||||||||||
Citibank, NA | INR | 255,452 | USD | 3,450 | 04/15/2021 | (33,782 | ) | |||||||||||||
Citibank, NA | SEK | 17,621 | USD | 2,118 | 04/15/2021 | 100,283 | ||||||||||||||
| 52 | Sanford C. Bernstein Fund, Inc. | |
Table of Contents
| Counterparty | Contracts to Deliver (000) | In Exchange For (000) | Settlement Date | Unrealized Appreciation/ (Depreciation) | ||||||||||||||||
Citibank, NA | KRW | 109,577 | USD | 101 | 04/22/2021 | $ | 3,357 | |||||||||||||
Citibank, NA | USD | 27,462 | CAD | 34,820 | 04/22/2021 | 246,563 | ||||||||||||||
Citibank, NA | USD | 3,096 | KRW | 3,411,905 | 04/22/2021 | (70,084 | ) | |||||||||||||
Citibank, NA | TWD | 43,113 | USD | 1,566 | 04/27/2021 | 47,957 | ||||||||||||||
Citibank, NA | USD | 1,549 | TWD | 42,804 | 04/27/2021 | (41,681 | ) | |||||||||||||
Citibank, NA | USD | 225 | BRL | 1,274 | 05/04/2021 | 1,475 | ||||||||||||||
Citibank, NA | COP | 5,317,920 | USD | 1,505 | 05/20/2021 | 54,432 | ||||||||||||||
Citibank, NA | JPY | 4,206,819 | USD | 39,697 | 05/20/2021 | 1,686,153 | ||||||||||||||
Citibank, NA | USD | 1,478 | COP | 5,480,640 | 05/20/2021 | 17,591 | ||||||||||||||
Credit Suisse International | ZAR | 27,870 | USD | 1,913 | 04/08/2021 | 25,704 | ||||||||||||||
Deutsche Bank AG | USD | 3,450 | INR | 256,561 | 04/15/2021 | 48,394 | ||||||||||||||
Deutsche Bank AG | COP | 5,053,113 | USD | 1,413 | 05/20/2021 | 33,873 | ||||||||||||||
Deutsche Bank AG | USD | 1,410 | EUR | 1,191 | 05/27/2021 | (11,839 | ) | |||||||||||||
Goldman Sachs Bank USA | IDR | 3,097,670 | USD | 221 | 04/15/2021 | 8,796 | ||||||||||||||
Goldman Sachs Bank USA | USD | 4,740 | CAD | 5,961 | �� | 04/22/2021 | 3,215 | |||||||||||||
Goldman Sachs Bank USA | CHF | 1,004 | USD | 1,132 | 05/06/2021 | 69,374 | ||||||||||||||
Goldman Sachs Bank USA | USD | 5,991 | RUB | 447,178 | 05/25/2021 | (111,239 | ) | |||||||||||||
HSBC Bank USA | USD | 4,889 | IDR | 68,456,316 | 04/15/2021 | (195,428 | ) | |||||||||||||
HSBC Bank USA | CAD | 1,308 | USD | 1,039 | 04/22/2021 | (2,574 | ) | |||||||||||||
HSBC Bank USA | CNY | 2,901 | USD | 442 | 04/22/2021 | 783 | ||||||||||||||
HSBC Bank USA | USD | 11,069 | CHF | 9,970 | 05/06/2021 | (510,834 | ) | |||||||||||||
HSBC Bank USA | USD | 5,894 | JPY | 645,853 | 05/20/2021 | (58,265 | ) | |||||||||||||
JPMorgan Chase Bank, NA | ZAR | 44,596 | USD | 2,968 | 04/08/2021 | (52,216 | ) | |||||||||||||
JPMorgan Chase Bank, NA | GBP | 604 | USD | 839 | 04/09/2021 | 6,238 | ||||||||||||||
JPMorgan Chase Bank, NA | GBP | 9,959 | USD | 13,601 | 04/09/2021 | (129,079 | ) | |||||||||||||
JPMorgan Chase Bank, NA | USD | 3,539 | GBP | 2,601 | 04/09/2021 | 46,660 | ||||||||||||||
JPMorgan Chase Bank, NA | USD | 6,724 | GBP | 4,789 | 04/09/2021 | (121,674 | ) | |||||||||||||
JPMorgan Chase Bank, NA | IDR | 48,714,107 | USD | 3,427 | 04/15/2021 | 87,369 | ||||||||||||||
JPMorgan Chase Bank, NA | NOK | 14,950 | USD | 1,751 | 04/15/2021 | 2,597 | ||||||||||||||
JPMorgan Chase Bank, NA | SEK | 84,958 | USD | 10,234 | 04/15/2021 | 505,165 | ||||||||||||||
JPMorgan Chase Bank, NA | USD | 14,314 | NOK | 121,293 | 04/15/2021 | (132,417 | ) | |||||||||||||
JPMorgan Chase Bank, NA | USD | 24,368 | SEK | 204,853 | 04/15/2021 | (910,228 | ) | |||||||||||||
JPMorgan Chase Bank, NA | MXN | 15,340 | USD | 714 | 04/16/2021 | (35,932 | ) | |||||||||||||
JPMorgan Chase Bank, NA | CAD | 10,456 | USD | 8,249 | 04/22/2021 | (72,031 | ) | |||||||||||||
JPMorgan Chase Bank, NA | USD | 2,054 | CAD | 2,564 | 04/22/2021 | (13,832 | ) | |||||||||||||
JPMorgan Chase Bank, NA | CHF | 2,693 | USD | 2,898 | 05/06/2021 | 46,186 | ||||||||||||||
JPMorgan Chase Bank, NA | JPY | 878,584 | USD | 8,225 | 05/20/2021 | 286,602 | ||||||||||||||
JPMorgan Chase Bank, NA | USD | 1,014 | JPY | 108,904 | 05/20/2021 | (29,550 | ) | |||||||||||||
JPMorgan Chase Bank, NA | PLN | 5,782 | USD | 1,478 | 06/24/2021 | 14,584 | ||||||||||||||
Morgan Stanley Capital Services, Inc. | USD | 17,251 | GBP | 12,655 | 04/09/2021 | 194,663 | ||||||||||||||
Morgan Stanley Capital Services, Inc. | CNY | 86,745 | USD | 13,351 | 04/22/2021 | 149,893 | ||||||||||||||
Morgan Stanley Capital Services, Inc. | USD | 7,317 | BRL | 41,334 | 05/04/2021 | 14,051 | ||||||||||||||
Morgan Stanley Capital Services, Inc. | JPY | 79,718 | USD | 748 | 05/20/2021 | 28,134 | ||||||||||||||
Morgan Stanley Capital Services, Inc. | USD | 10,317 | JPY | 1,122,740 | 05/20/2021 | (172,800 | ) | |||||||||||||
Morgan Stanley Capital Services, Inc. | EUR | 1,669 | USD | 1,970 | 05/27/2021 | 10,939 | ||||||||||||||
Morgan Stanley Capital Services, Inc. | NZD | 15,499 | USD | 11,234 | 05/27/2021 | 410,346 | ||||||||||||||
Morgan Stanley Capital Services, Inc. | MYR | 12,301 | USD | 2,974 | 09/23/2021 | 15,272 | ||||||||||||||
2021 Semi-Annual Report | 53 | |
Table of Contents
Schedule of Investments (continued)
| Counterparty | Contracts to Deliver (000) | In Exchange For (000) | Settlement Date | Unrealized Appreciation/ (Depreciation) | ||||||||||||||||
Natwest Markets PLC | GBP | 1,415 | USD | 1,934 | 04/09/2021 | $ | (16,700 | ) | ||||||||||||
Natwest Markets PLC | USD | 1,686 | CAD | 2,142 | 04/22/2021 | 18,519 | ||||||||||||||
Natwest Markets PLC | JPY | 256,177 | USD | 2,416 | 05/20/2021 | 101,276 | ||||||||||||||
Standard Chartered Bank | IDR | 22,189,031 | USD | 1,572 | 04/15/2021 | 50,461 | ||||||||||||||
Standard Chartered Bank | USD | 1,493 | IDR | 21,277,775 | 04/15/2021 | (34,460 | ) | |||||||||||||
Standard Chartered Bank | KRW | 3,403,531 | USD | 3,055 | 04/22/2021 | 36,885 | ||||||||||||||
Standard Chartered Bank | KRW | 1,710,102 | USD | 1,503 | 04/22/2021 | (13,866 | ) | |||||||||||||
Standard Chartered Bank | USD | 30,951 | JPY | 3,280,296 | 05/20/2021 | (1,312,037 | ) | |||||||||||||
State Street Bank & Trust Co. | USD | 360 | ZAR | 5,445 | 04/08/2021 | 8,890 | ||||||||||||||
State Street Bank & Trust Co. | ZAR | 5,421 | USD | 349 | 04/08/2021 | (17,908 | ) | |||||||||||||
State Street Bank & Trust Co. | GBP | 1,316 | USD | 1,832 | 04/09/2021 | 17,871 | ||||||||||||||
State Street Bank & Trust Co. | GBP | 119 | USD | 163 | 04/09/2021 | (1,869 | ) | |||||||||||||
State Street Bank & Trust Co. | USD | 732 | GBP | 533 | 04/09/2021 | 1,870 | ||||||||||||||
State Street Bank & Trust Co. | USD | 927 | GBP | 666 | 04/09/2021 | (9,440 | ) | |||||||||||||
State Street Bank & Trust Co. | SEK | 56,787 | USD | 6,808 | 04/15/2021 | 305,374 | ||||||||||||||
State Street Bank & Trust Co. | USD | 2,914 | SEK | 24,349 | 04/15/2021 | (125,413 | ) | |||||||||||||
State Street Bank & Trust Co. | MXN | 12,624 | USD | 597 | 04/16/2021 | (19,505 | ) | |||||||||||||
State Street Bank & Trust Co. | USD | 358 | MXN | 7,403 | 04/16/2021 | 3,886 | ||||||||||||||
State Street Bank & Trust Co. | CAD | 2,149 | USD | 1,702 | 04/22/2021 | (7,593 | ) | |||||||||||||
State Street Bank & Trust Co. | USD | 431 | CAD | 545 | 04/22/2021 | 3,206 | ||||||||||||||
State Street Bank & Trust Co. | USD | 522 | CAD | 655 | 04/22/2021 | (859 | ) | |||||||||||||
State Street Bank & Trust Co. | CHF | 1,469 | USD | 1,646 | 05/06/2021 | 90,224 | ||||||||||||||
State Street Bank & Trust Co. | USD | 501 | CHF | 467 | 05/06/2021 | (7,540 | ) | |||||||||||||
State Street Bank & Trust Co. | USD | 18 | JPY | 2,031 | 05/20/2021 | (101 | ) | |||||||||||||
State Street Bank & Trust Co. | EUR | 16,318 | USD | 19,481 | 05/27/2021 | 323,886 | ||||||||||||||
State Street Bank & Trust Co. | NZD | 453 | USD | 327 | 05/27/2021 | 10,899 | ||||||||||||||
State Street Bank & Trust Co. | NZD | 306 | USD | 213 | 05/27/2021 | (802 | ) | |||||||||||||
State Street Bank & Trust Co. | USD | 17,825 | EUR | 14,940 | 05/27/2021 | (284,843 | ) | |||||||||||||
State Street Bank & Trust Co. | USD | 140 | NZD | 195 | 05/27/2021 | (4,521 | ) | |||||||||||||
State Street Bank & Trust Co. | AUD | 99 | USD | 75 | 06/04/2021 | (108 | ) | |||||||||||||
State Street Bank & Trust Co. | USD | 2,471 | AUD | 3,239 | 06/04/2021 | (10,224 | ) | |||||||||||||
UBS AG | BRL | 80,076 | USD | 14,055 | 04/05/2021 | (171,421 | ) | |||||||||||||
UBS AG | USD | 13,964 | BRL | 80,076 | 04/05/2021 | 262,476 | ||||||||||||||
UBS AG | USD | 4,081 | ZAR | 61,860 | 04/08/2021 | 108,935 | ||||||||||||||
UBS AG | USD | 3,188 | NOK | 27,102 | 04/15/2021 | (19,258 | ) | |||||||||||||
UBS AG | USD | 2,017 | MXN | 41,682 | 04/16/2021 | 19,697 | ||||||||||||||
UBS AG | BRL | 80,076 | USD | 13,945 | 05/04/2021 | (256,792 | ) | |||||||||||||
UBS AG | USD | 1,321 | CHF | 1,232 | 05/06/2021 | (16,775 | ) | |||||||||||||
UBS AG | USD | 5,117 | JPY | 541,503 | 05/20/2021 | (224,627 | ) | |||||||||||||
UBS AG | USD | 2,452 | RUB | 183,054 | 05/25/2021 | (45,158 | ) | |||||||||||||
UBS AG | USD | 555 | EUR | 467 | 05/27/2021 | (6,601 | ) | |||||||||||||
|
| |||||||||||||||||||
| $ | 1,760,470 | |||||||||||||||||||
|
| |||||||||||||||||||
| 54 | Sanford C. Bernstein Fund, Inc. | |
Table of Contents
| CENTRALLY CLEARED CREDIT DEFAULT SWAPS (see Note 3) |
| |||||||||||||||||||||||||||||
| Description | Fixed Rate (Pay) Receive | Payment Frequency | Implied Credit Spread at March 31, 2021 | Notional Amount (000) | Market Value | Upfront Premiums Paid/ (Received) | Unrealized Appreciation/ (Depreciation) | |||||||||||||||||||||||
| Buy Contracts |
| |||||||||||||||||||||||||||||
CDX-NAIG Series 36, 5 Year Index, 06/20/2026* | (1.00 | )% | Quarterly | 0.54 | % | USD | 44,580 | $ | (1,057,797 | ) | $ | (961,577 | ) | $ | (96,220 | ) | ||||||||||||||
Malaysia, 06/20/2026* | (1.00 | ) | Quarterly | 0.45 | USD | 26,220 | (743,755 | ) | (751,094 | ) | 7,339 | |||||||||||||||||||
People’s Republic of China, 7.500%, 10/28/2027, 6/20/2026* | (1.00 | ) | Quarterly | 0.35 | USD | 13,820 | (467,002 | ) | (468,297 | ) | 1,295 | |||||||||||||||||||
| Sale Contracts |
| |||||||||||||||||||||||||||||
CDX-NAHY Series 33, 5 Year Index, 12/20/2024* | 5.00 | Quarterly | 2.33 | USD | 1,765 | 168,521 | (153,969 | ) | 322,490 | |||||||||||||||||||||
CDX-NAHY Series 34, 5 Year Index, 6/20/2025* | 5.00 | Quarterly | 2.66 | USD | 1,570 | 146,050 | 83,265 | 62,785 | ||||||||||||||||||||||
|
|
|
|
|
| |||||||||||||||||||||||||
| $ | (1,953,983 | ) | $ | (2,251,672 | ) | $ | 297,689 | |||||||||||||||||||||||
|
|
|
|
|
| |||||||||||||||||||||||||
* Termination date
| CENTRALLY CLEARED INFLATION (CPI) SWAPS (see Note 3) | ||||||||||||||||||||||||||||
Rate Type | Payment | Market Value | Upfront Premiums Paid/ (Received) | Unrealized Appreciation/ (Depreciation) | ||||||||||||||||||||||||
| Notional Amount (000) | Termination Date | Payments made by the Fund | Payments received by the Fund | |||||||||||||||||||||||||
| USD | 28,500 | 02/26/2022 | CPI# | 1.440% | Maturity | $ | (341,062 | ) | $ | — | $ | (341,062 | ) | |||||||||||||||
| USD | 17,150 | 02/28/2022 | CPI# | 1.352% | Maturity | (236,951 | ) | — | (236,951 | ) | ||||||||||||||||||
| USD | 5,000 | 07/15/2022 | 1.484% | CPI# | Maturity | 96,226 | — | 96,226 | ||||||||||||||||||||
| USD | 28,500 | 02/26/2025 | 1.589% | CPI# | Maturity | 1,099,130 | — | 1,099,130 | ||||||||||||||||||||
| USD | 17,150 | 02/28/2025 | 1.527% | CPI# | Maturity | 716,333 | — | 716,333 | ||||||||||||||||||||
|
|
|
|
|
| |||||||||||||||||||||||
| $ | 1,333,676 | $ | — | $ | 1,333,676 | |||||||||||||||||||||||
|
|
|
|
|
| |||||||||||||||||||||||
# Variable interest rate based on the rate of inflation as determined by the Consumer Price Index (CPI).
| CENTRALLY CLEARED INTEREST RATE SWAPS (see Note 3) | ||||||||||||||||||||||||||||
Rate Type | Payment | Market Value | Upfront Premiums Paid/ (Received) | Unrealized Appreciation/ (Depreciation) | ||||||||||||||||||||||||
| Notional Amount (000) | Termination Date | Payments made by the Fund | Payments received by the Fund | |||||||||||||||||||||||||
| USD | 4,550 | 04/02/2021 | 2.403% | 3 Month LIBOR | Semi-Annual/Quarterly | $ | (53,082 | ) | $ | — | $ | (53,082 | ) | |||||||||||||||
| USD | 1,220 | 04/18/2021 | 2.508% | 3 Month LIBOR | Semi-Annual/Quarterly | (14,514 | ) | — | (14,514 | ) | ||||||||||||||||||
| BRL | 15,065 | 01/02/2023 | 1 Day CDI | 4.910% | Maturity | (47,764 | ) | — | (47,764 | ) | ||||||||||||||||||
| BRL | 12,043 | 01/02/2023 | 1 Day CDI | 4.590% | Maturity | (34,820 | ) | — | (34,820 | ) | ||||||||||||||||||
| BRL | 12,043 | 01/02/2023 | 4.590% | 1 Day CDI | Maturity | 34,820 | 32,345 | 2,475 | ||||||||||||||||||||
| BRL | 4,981 | 01/02/2023 | 1 Day CDI | 4.915% | Maturity | (15,907 | ) | — | (15,907 | ) | ||||||||||||||||||
| CAD | 13,360 | 05/22/2024 | 3 Month CDOR | 1.980% | Semi-Annual | 387,022 | 5 | 387,017 | ||||||||||||||||||||
| SEK | 204,850 | 08/30/2024 | 3 Month STIBOR | (0.165)% | Quarterly/Annual | (264,891 | ) | 55 | (264,946 | ) | ||||||||||||||||||
| USD | 610 | 04/21/2025 | 1.972% | 3 Month LIBOR | Semi-Annual/Quarterly | (28,756 | ) | — | (28,756 | ) | ||||||||||||||||||
| USD | 370 | 06/09/2025 | 2.470% | 3 Month LIBOR | Semi-Annual/Quarterly | (27,848 | ) | — | (27,848 | ) | ||||||||||||||||||
2021 Semi-Annual Report | 55 | |
Table of Contents
Schedule of Investments (continued)
Rate Type | Payment | Market Value | Upfront Premiums Paid/ (Received) | Unrealized Appreciation/ (Depreciation) | ||||||||||||||||||||||||
| Notional Amount (000) | Termination Date | Payments made by the Fund | Payments received by the Fund | |||||||||||||||||||||||||
| USD | 484 | 08/04/2025 | 2.285% | 3 Month LIBOR | Semi-Annual/Quarterly | $ | (30,836 | ) | $ | — | $ | (30,836 | ) | |||||||||||||||
| USD | 1,990 | 04/27/2026 | 1.773% | 3 Month LIBOR | Semi-Annual/Quarterly | (84,704 | ) | — | (84,704 | ) | ||||||||||||||||||
| USD | 840 | 10/04/2026 | 1.459% | 3 Month LIBOR | Semi-Annual/Quarterly | (18,904 | ) | 37,257 | (56,161 | ) | ||||||||||||||||||
| USD | 420 | 11/08/2026 | 1.657% | 3 Month LIBOR | Semi-Annual/Quarterly | (13,521 | ) | — | (13,521 | ) | ||||||||||||||||||
| USD | 420 | 11/09/2026 | 1.672% | 3 Month LIBOR | Semi-Annual/Quarterly | (13,866 | ) | — | (13,866 | ) | ||||||||||||||||||
| USD | 1,040 | 04/04/2027 | 2.436% | 3 Month LIBOR | Semi-Annual/Quarterly | (82,527 | ) | (8,664 | ) | (73,863 | ) | |||||||||||||||||
| USD | 580 | 04/26/2027 | 2.287% | 3 Month LIBOR | Semi-Annual/Quarterly | (39,623 | ) | 17 | (39,640 | ) | ||||||||||||||||||
| USD | 10,260 | 06/05/2027 | 0.558% | 3 Month LIBOR | Semi-Annual/Quarterly | 453,546 | — | 453,546 | ||||||||||||||||||||
| USD | 6,030 | 07/20/2027 | 2.227% | 3 Month LIBOR | Semi-Annual/Quarterly | (353,904 | ) | 24,497 | (378,401 | ) | ||||||||||||||||||
| USD | 1,360 | 09/27/2029 | 1.593% | 3 Month LIBOR | Semi-Annual/Quarterly | 6,828 | — | 6,828 | ||||||||||||||||||||
| USD | 1,830 | 12/13/2029 | 1.764% | 3 Month LIBOR | Semi-Annual/Quarterly | (22,028 | ) | — | (22,028 | ) | ||||||||||||||||||
| USD | 1,010 | 11/10/2035 | 2.613% | 3 Month LIBOR | Semi-Annual/Quarterly | (85,793 | ) | — | (85,793 | ) | ||||||||||||||||||
| EUR | 2,300 | 09/30/2050 | 0.122% | 6 Month EURIBOR | Annual/ Semi-Annual | 278,234 | — | 278,234 | ||||||||||||||||||||
| EUR | 2,300 | 09/30/2050 | 6 Month EURIBOR | (0.017)% | Semi-Annual/ Annual | (386,233 | ) | — | (386,233 | ) | ||||||||||||||||||
| EUR | 4,690 | 11/10/2050 | 0.023% | 6 Month EURIBOR | Annual/ Semi-Annual | 719,317 | — | 719,317 | ||||||||||||||||||||
| EUR | 4,690 | 11/10/2050 | 6 Month EURIBOR | (0.043)% | Semi-Annual/ Annual | (824,720 | ) | — | (824,720 | ) | ||||||||||||||||||
| CAD | 2,930 | 03/03/2051 | 2.297% | 3 Month CDOR | Semi-Annual | 123,232 | 118 | 123,114 | ||||||||||||||||||||
| CAD | 2,930 | 03/04/2051 | 2.333% | 3 Month CDOR | Semi-Annual | 105,055 | — | 105,055 | ||||||||||||||||||||
|
|
|
|
|
| |||||||||||||||||||||||
| $ | (336,187 | ) | $ | 85,630 | $ | (421,817 | ) | |||||||||||||||||||||
|
|
|
|
|
| |||||||||||||||||||||||
| CREDIT DEFAULT SWAPS (see Note 3) |
| |||||||||||||||||||||||||||||
| Swap Counterparty & Referenced Obligation | Fixed Rate (Pay) Receive | Payment Frequency | Implied Credit Spread at March 31, 2021 | Notional Amount (000) | Market Value | Upfront Premiums Paid/ (Received) | Unrealized Appreciation/ (Depreciation) | |||||||||||||||||||||||
| Buy Contracts |
| |||||||||||||||||||||||||||||
| Citigroup Global Markets, Inc. |
| |||||||||||||||||||||||||||||
CDX-CMBX.NA.BBB- | (3.00 | )% | Monthly | 5.80 | % | USD | 1,502 | $ | 164,931 | $ | 102,003 | $ | 62,928 | |||||||||||||||||
CDX-CMBX.NA.BBB- | (3.00 | ) | Monthly | 5.80 | USD | 1,219 | 133,857 | 85,676 | 48,181 | |||||||||||||||||||||
CDX-CMBX.NA.BBB- | (3.00 | ) | Monthly | 5.80 | USD | 302 | 33,162 | 19,955 | 13,207 | |||||||||||||||||||||
CDX-CMBX.NA.BBB- | (3.00 | ) | Monthly | 5.80 | USD | 302 | 33,162 | 19,955 | 13,207 | |||||||||||||||||||||
| 56 | Sanford C. Bernstein Fund, Inc. | |
Table of Contents
| Swap Counterparty & Referenced Obligation | Fixed Rate (Pay) Receive | Payment Frequency | Implied Credit Spread at March 31, 2021 | Notional Amount (000) | Market Value | Upfront Premiums Paid/ (Received) | Unrealized Appreciation/ (Depreciation) | |||||||||||||||||||||||
CDX-CMBX.NA.BBB- | (3.00 | ) % | Monthly | 5.80 | % | USD | 286 | $ | 31,405 | $ | 19,322 | $ | 12,083 | |||||||||||||||||
CDX-CMBX.NA.BBB- | (3.00 | ) | Monthly | 5.80 | USD | 153 | 16,802 | 11,133 | 5,669 | |||||||||||||||||||||
CDX-CMBX.NA.BBB- | (3.00 | ) | Monthly | 5.80 | USD | 76 | 8,346 | 5,873 | 2,473 | |||||||||||||||||||||
CDX-CMBX.NA.BBB- | (3.00 | ) | Monthly | 5.80 | USD | 654 | 71,923 | 128,853 | (56,930 | ) | ||||||||||||||||||||
CDX-CMBX.NA.BBB- | (3.00 | ) | Monthly | 5.80 | USD | 647 | 70,991 | 131,887 | (60,896 | ) | ||||||||||||||||||||
CDX-CMBX.NA.BBB- | (3.00 | ) | Monthly | 5.80 | USD | 796 | 87,473 | 160,065 | (72,592 | ) | ||||||||||||||||||||
CDX-CMBX.NA.BBB- | (3.00 | ) | Monthly | 5.80 | USD | 795 | 87,362 | 159,988 | (72,626 | ) | ||||||||||||||||||||
CDX-CMBX.NA.BBB- | (3.00 | ) | Monthly | 5.80 | USD | 1,636 | 179,912 | 325,256 | (145,344 | ) | ||||||||||||||||||||
CDX-CMBX.NA.BBB- | (3.00 | ) | Monthly | 5.80 | USD | 3,272 | 359,553 | 662,782 | (303,229 | ) | ||||||||||||||||||||
Goldman Sachs International |
| |||||||||||||||||||||||||||||
CDX-CMBX.NA.BBB- | (3.00 | ) | Monthly | 5.80 | USD | 745 | 81,867 | 129,219 | (47,352 | ) | ||||||||||||||||||||
JPMorgan Securities, LLC |
| |||||||||||||||||||||||||||||
CDX-CMBX.NA.BBB- | (3.00 | ) | Monthly | 5.80 | USD | 344 | 37,747 | 69,399 | (31,652 | ) | ||||||||||||||||||||
Morgan Stanley & Co. International PLC |
| |||||||||||||||||||||||||||||
CDX-CMBX.NA.BBB- | (3.00 | ) | Monthly | 5.80 | USD | 396 | 43,517 | 76,833 | (33,316 | ) | ||||||||||||||||||||
CDX-CMBX.NA.BBB- | (3.00 | ) | Monthly | 5.80 | USD | 795 | 87,362 | 162,278 | (74,916 | ) | ||||||||||||||||||||
| Sale Contracts |
| |||||||||||||||||||||||||||||
Citigroup Global Markets, Inc. |
| |||||||||||||||||||||||||||||
CDX-CMBX.NA.BBB- | 3.00 | Monthly | 12.50 | USD | 8 | (2,155 | ) | (1,251 | ) | (904 | ) | |||||||||||||||||||
CDX-CMBX.NA.BBB- | 3.00 | Monthly | 12.50 | USD | 8 | (2,155 | ) | (1,000 | ) | (1,155 | ) | |||||||||||||||||||
CDX-CMBX.NA.BBB- | 3.00 | Monthly | 12.50 | USD | 17 | (4,578 | ) | (1,678 | ) | (2,900 | ) | |||||||||||||||||||
CDX-CMBX.NA.BBB- | 3.00 | Monthly | 12.50 | USD | 25 | (6,734 | ) | (3,295 | ) | (3,439 | ) | |||||||||||||||||||
CDX-CMBX.NA.BBB- | 3.00 | Monthly | 12.50 | USD | 23 | (6,198 | ) | (2,692 | ) | (3,506 | ) | |||||||||||||||||||
CDX-CMBX.NA.BBB- | 3.00 | Monthly | 12.50 | USD | 36 | (9,696 | ) | (5,208 | ) | (4,488 | ) | |||||||||||||||||||
CDX-CMBX.NA.BBB- | 3.00 | Monthly | 12.50 | USD | 34 | (9,157 | ) | (4,377 | ) | (4,780 | ) | |||||||||||||||||||
CDX-CMBX.NA.BBB- | 3.00 | Monthly | 12.50 | USD | 33 | (8,890 | ) | (4,064 | ) | (4,826 | ) | |||||||||||||||||||
CDX-CMBX.NA.BBB- | 3.00 | Monthly | 12.50 | USD | 38 | (10,237 | ) | (4,834 | ) | (5,403 | ) | |||||||||||||||||||
CDX-CMBX.NA.BBB- | 3.00 | Monthly | 12.50 | USD | 38 | (10,238 | ) | (4,680 | ) | (5,558 | ) | |||||||||||||||||||
CDX-CMBX.NA.BBB- | 3.00 | Monthly | 12.50 | USD | 53 | (14,278 | ) | (6,527 | ) | (7,751 | ) | |||||||||||||||||||
2021 Semi-Annual Report | 57 | |
Table of Contents
Schedule of Investments (continued)
| Swap Counterparty & Referenced Obligation | Fixed Rate (Pay) Receive | Payment Frequency | Implied Credit Spread at March 31, 2021 | Notional Amount (000) | Market Value | Upfront Premiums Paid/ (Received) | Unrealized Appreciation/ (Depreciation) | |||||||||||||||||||||||
CDX-CMBX.NA.BBB- | 3.00 | % | Monthly | 12.50 | % | USD | 49 | $ | (13,201 | ) | $ | (5,325 | ) | $ | (7,876 | ) | ||||||||||||||
CDX-CMBX.NA.BBB- | 3.00 | Monthly | 12.50 | USD | 54 | (14,549 | ) | (6,001 | ) | (8,548 | ) | |||||||||||||||||||
CDX-CMBX.NA.BBB- | 3.00 | Monthly | 12.50 | USD | 58 | (15,626 | ) | (6,179 | ) | (9,447 | ) | |||||||||||||||||||
CDX-CMBX.NA.BBB- | 3.00 | Monthly | 12.50 | USD | 76 | (20,481 | ) | (8,896 | ) | (11,585 | ) | |||||||||||||||||||
CDX-CMBX.NA.BBB- | 3.00 | Monthly | 12.50 | USD | 78 | (21,014 | ) | (8,668 | ) | (12,346 | ) | |||||||||||||||||||
Credit Suisse International |
| |||||||||||||||||||||||||||||
CDX-CMBX.NA.A | 2.00 | Monthly | 8.17 | USD | 370 | (29,124 | ) | (7,988 | ) | (21,136 | ) | |||||||||||||||||||
CDX-CMBX.NA.BBB- | 3.00 | Monthly | 12.50 | USD | 301 | (81,066 | ) | (43,346 | ) | (37,720 | ) | |||||||||||||||||||
CDX-CMBX.NA.BBB- | 3.00 | Monthly | 12.50 | USD | 198 | (53,325 | ) | (13,289 | ) | (40,036 | ) | |||||||||||||||||||
Deutsche Bank AG |
| |||||||||||||||||||||||||||||
CDX-CMBX.NA.BBB- | 3.00 | Monthly | 12.50 | USD | 35 | (9,427 | ) | (3,983 | ) | (5,444 | ) | |||||||||||||||||||
CDX-CMBX.NA.BBB- | 3.00 | Monthly | 12.50 | USD | 36 | (9,696 | ) | (2,006 | ) | (7,690 | ) | |||||||||||||||||||
CDX-CMBX.NA.BBB- | 3.00 | Monthly | 12.50 | USD | 218 | (58,712 | ) | (26,665 | ) | (32,047 | ) | |||||||||||||||||||
CDX-CMBX.NA.BBB- | 3.00 | Monthly | 12.50 | USD | 242 | (65,176 | ) | (26,870 | ) | (38,306 | ) | |||||||||||||||||||
CDX-CMBX.NA.BBB- | 3.00 | Monthly | 12.50 | USD | 243 | (65,447 | ) | (26,970 | ) | (38,477 | ) | |||||||||||||||||||
CDX-CMBX.NA.BBB- | 3.00 | Monthly | 12.50 | USD | 257 | (69,214 | ) | (17,484 | ) | (51,730 | ) | |||||||||||||||||||
CDX-CMBX.NA.BBB- | 3.00 | Monthly | 12.50 | USD | 2,000 | (538,633 | ) | (198,871 | ) | (339,762 | ) | |||||||||||||||||||
Goldman Sachs International |
| |||||||||||||||||||||||||||||
CDX-CMBX.NA.BBB- | 3.00 | Monthly | 12.50 | USD | 20 | (5,387 | ) | (2,949 | ) | (2,438 | ) | |||||||||||||||||||
CDX-CMBX.NA.BBB- | 3.00 | Monthly | 12.50 | USD | 18 | (4,848 | ) | (1,566 | ) | (3,282 | ) | |||||||||||||||||||
CDX-CMBX.NA.BBB- | 3.00 | Monthly | 12.50 | USD | 35 | (9,427 | ) | (3,356 | ) | (6,071 | ) | |||||||||||||||||||
CDX-CMBX.NA.BBB- | 3.00 | Monthly | 12.50 | USD | 35 | (9,427 | ) | (3,101 | ) | (6,326 | ) | |||||||||||||||||||
CDX-CMBX.NA.BBB- | 3.00 | Monthly | 12.50 | USD | 69 | (18,583 | ) | (7,231 | ) | (11,352 | ) | |||||||||||||||||||
CDX-CMBX.NA.BBB- | 3.00 | Monthly | 12.50 | USD | 150 | (40,411 | ) | (18,673 | ) | (21,738 | ) | |||||||||||||||||||
CDX-CMBX.NA.BBB- | 3.00 | Monthly | 12.50 | USD | 345 | (92,918 | ) | (54,736 | ) | (38,182 | ) | |||||||||||||||||||
CDX-CMBX.NA.BBB- | 3.00 | Monthly | 12.50 | USD | 209 | (56,287 | ) | (17,531 | ) | (38,756 | ) | |||||||||||||||||||
CDX-CMBX.NA.BBB- | 3.00 | Monthly | 12.50 | USD | 239 | (64,370 | ) | (24,717 | ) | (39,653 | ) | |||||||||||||||||||
CDX-CMBX.NA.BBB- | 3.00 | Monthly | 12.50 | USD | 353 | (95,070 | ) | (46,634 | ) | (48,436 | ) | |||||||||||||||||||
| 58 | Sanford C. Bernstein Fund, Inc. | |
Table of Contents
| Swap Counterparty & Referenced Obligation | Fixed Rate (Pay) Receive | Payment Frequency | Implied Credit Spread at March 31, 2021 | Notional Amount (000) | Market Value | Upfront Premiums Paid/ (Received) | Unrealized Appreciation/ (Depreciation) | |||||||||||||||||||||||
CDX-CMBX.NA.BBB- | 3.00 | % | Monthly | 12.50 | % | USD | 483 | $ | (130,085 | ) | $ | (77,733 | ) | $ | (52,352 | ) | ||||||||||||||
CDX-CMBX.NA.BBB- | 3.00 | Monthly | 12.50 | USD | 496 | (133,585 | ) | (74,011 | ) | (59,574 | ) | |||||||||||||||||||
CDX-CMBX.NA.BBB- | 3.00 | Monthly | 12.50 | USD | 700 | (188,522 | ) | (51,946 | ) | (136,576 | ) | |||||||||||||||||||
JPMorgan Securities, LLC |
| |||||||||||||||||||||||||||||
CDX-CMBX.NA.BBB- | 3.00 | Monthly | 12.50 | USD | 39 | (10,504 | ) | (3,693 | ) | (6,811 | ) | |||||||||||||||||||
CDX-CMBX.NA.BBB- | 3.00 | Monthly | 12.50 | USD | 40 | (10,776 | ) | (3,789 | ) | (6,987 | ) | |||||||||||||||||||
CDX-CMBX.NA.BBB- | 3.00 | Monthly | 12.50 | USD | 103 | (27,741 | ) | (12,759 | ) | (14,982 | ) | |||||||||||||||||||
CDX-CMBX.NA.BBB- | 3.00 | Monthly | 12.50 | USD | 165 | (44,440 | ) | (15,583 | ) | (28,857 | ) | |||||||||||||||||||
CDX-CMBX.NA.BBB- | 3.00 | Monthly | 12.50 | USD | 220 | (59,252 | ) | (26,421 | ) | (32,831 | ) | |||||||||||||||||||
CDX-CMBX.NA.BBB- | 3.00 | Monthly | 12.50 | USD | 637 | (171,561 | ) | (75,831 | ) | (95,730 | ) | |||||||||||||||||||
CDX-CMBX.NA.BBB- | 3.00 | Monthly | 12.50 | USD | 940 | (253,163 | ) | (72,641 | ) | (180,522 | ) | |||||||||||||||||||
CDX-CMBX.NA.BBB- | 3.00 | Monthly | 12.50 | USD | 2,473 | (666,019 | ) | (201,732 | ) | (464,287 | ) | |||||||||||||||||||
Morgan Stanley Capital Services LLC |
| |||||||||||||||||||||||||||||
CDX-CMBX.NA.BBB- | 3.00 | Monthly | 12.50 | USD | 272 | (73,254 | ) | (18,618 | ) | (54,636 | ) | |||||||||||||||||||
|
|
|
|
|
| |||||||||||||||||||||||||
| $ | (1,785,265 | ) | $ | 1,013,079 | $ | (2,798,344 | ) | |||||||||||||||||||||||
|
|
|
|
|
| |||||||||||||||||||||||||
* Termination date
| TOTAL RETURN SWAPS (see Note 3) |
| |||||||||||||||||||||
| Counterparty & Referenced Obligation | Rate Paid/ Received | Payment Frequency | Current Notional (000) | Maturity Date | Unrealized Appreciation/ (Depreciation) | |||||||||||||||||
| Pay Total Return on Reference Obligation |
| |||||||||||||||||||||
Barclays Bank PLC |
| |||||||||||||||||||||
iBoxx $ Liquid High Yield Index | 3 Month LIBOR | Quarterly | USD | 10,553 | 06/20/2021 | $ | (112,319 | ) | ||||||||||||||
| Receive Total Return on Reference Obligation |
| |||||||||||||||||||||
Morgan Stanley Capital Services LLC |
| |||||||||||||||||||||
Swiss Market Index Futures | 0.00% | Monthly | CHF | 2,773 | 06/18/2021 | 46,036 | ||||||||||||||||
|
| |||||||||||||||||||||
| $ | (66,283 | ) | ||||||||||||||||||||
|
| |||||||||||||||||||||
| (a) | Security is exempt from registration under Rule 144A of the Securities Act of 1933. These securities are considered restricted, but liquid and may be resold in transactions exempt from registration, normally to qualified institutional buyers. At March 31, 2021, the aggregate market value of these securities amounted to $290,746,690 or 23.9% of net assets. |
| (b) | Position, or a portion thereof, has been segregated to collateralize OTC derivatives outstanding. |
| (c) | Position, or a portion thereof, has been segregated to collateralize margin requirements for open futures contracts. |
| (d) | Securities are perpetual and, thus, do not have a predetermined maturity date. The date shown, if applicable, reflects the next call date. |
| (e) | Floating Rate Security. Stated interest/floor/ceiling rate was in effect at March 31, 2021. |
2021 Semi-Annual Report | 59 | |
Table of Contents
Schedule of Investments (continued)
| (f) | Security is exempt from registration under Rule 144A of the Securities Act of 1933. These securities, which represent 0.21% of net assets as of March 31, 2021, are considered illiquid and restricted. Additional information regarding such securities follows: |
| 144A/Restricted & Illiquid Securities | Acquisition Date | Cost | Market Value | Percentage of Net Assets | ||||||||||
GSF | 03/15/2021 | $ 71,815 | $ | 71,815 | 0.01 | % | ||||||||
GSF | 03/09/2021 | 126,628 | 126,690 | 0.01 | % | |||||||||
GSF | 03/09/2021 | 38,093 | 38,110 | 0.00 | % | |||||||||
HFX Funding | 11/19/2020 | 1,317,999 | 1,269,248 | 0.10 | % | |||||||||
JPMorgan Madison Avenue Securities Trust | 11/06/2015 | 39,886 | 39,496 | 0.00 | % | |||||||||
Morgan Stanley Capital I Trust | 11/16/2015 | 245,425 | 209,140 | 0.02 | % | |||||||||
PMT Credit Risk Transfer Trust | 03/29/2021 | 401,184 | 398,599 | 0.03 | % | |||||||||
Terraform Global Operating LLC | 02/08/2018 | 133,000 | 136,328 | 0.01 | % | |||||||||
Wells Fargo Credit Risk Transfer Securities Trust | 09/28/2015 | 266,253 | 260,711 | 0.02 | % | |||||||||
Wells Fargo Credit Risk Transfer Securities Trust | 09/28/2015 | 82,160 | 81,580 | 0.01 | % | |||||||||
| (g) | Inverse interest only security. |
| (h) | IO—Interest Only. |
| (i) | Affiliated investments. |
| (j) | To obtain a copy of the fund’s shareholder report, please go to the Securities and Exchange Commission’s website at www.sec.gov, or call AB at (800) 227-4618. |
| (k) | Fair valued by the Adviser. |
| (l) | Non-income producing security. |
| (m) | Pay-In-Kind Payments (PIK). The issuer may pay cash interest and/or interest in additional debt securities. Rates shown are the rates in effect at March 31, 2021. |
| (n) | The rate shown represents the 7-day yield as of period end. |
Currency Abbreviations:
AUD—Australian Dollar
BRL—Brazilian Real
CAD—Canadian Dollar
CHF—Swiss Franc
CNY—Chinese Yuan Renminbi
COP—Colombian Peso
EUR—Euro
GBP—Great British Pound
IDR—Indonesian Rupiah
INR—Indian Rupee
JPY—Japanese Yen
KRW—South Korean Won
MXN—Mexican Peso
MYR—Malaysian Ringgit
NOK—Norwegian Krone
NZD—New Zealand Dollar
PLN—Polish Zloty
RUB—Russian Ruble
SEK—Swedish Krona
TWD—New Taiwan Dollar
USD—United States Dollar
ZAR—South African Rand
| 60 | Sanford C. Bernstein Fund, Inc. | |
Table of Contents
Glossary:
ABS—Asset-Backed Securities
BKBM—Bank Bill Benchmark (New Zealand)
BOBL—Bundesobligationen
CBT—Chicago Board of Trade
CDI—Brazil CETIP Interbank Deposit Rate
CDOR—Canadian Dealer Offered Rate
CDX-CMBX.NA—North American Commercial Mortgage-Backed Index
CDX-NAHY—North American High Yield Credit Default Swap Index
CDX-NAIG—North American Investment Grade Credit Default Swap Index
CLO—Collateralized Loan Obligations
CMBS—Commercial Mortgage-Backed Securities
CPI—Consumer Price Index
ETS—Emission Trading Scheme
EURIBOR—Euro Interbank Offered Rate
FTSE—Financial Times Stock Exchange
LIBOR—London Interbank Offered Rate
MSCI—Morgan Stanley Capital International
OAT—Obligations Assimilables du Trésor
OMXS—Stockholm Stock Exchange
OSE—Osaka Securities Exchange
REIT—Real Estate Investment Trust
REMICs—Real Estate Mortgage Investment Conduits
SOFR—Secured Overnight Financing Rate
SPI—Share Price Index
STIBOR—Stockholm Interbank Offered Rate
TBA—To Be Announced
TIPS—Treasury Inflation Protected Security
TOPIX—Tokyo Price Index
TSX—Toronto Stock Exchange
See notes to financial statements.
2021 Semi-Annual Report | 61 | |
Table of Contents
Schedule of Investments
Sanford C. Bernstein Fund, Inc.
Schedule of Investments
Tax-Aware Overlay B Portfolio
March 31, 2021 (unaudited)
| Principal Amount (000) | U.S. $ Value | |||||||||||
| MUNICIPAL OBLIGATIONS–67.3% |
| |||||||||||
| Long-Term Municipal Bonds–67.3% |
| |||||||||||
| Alabama–0.4% |
| |||||||||||
Lower Alabama Gas District (The) |
| $ | 3,015 | $ | 3,435,142 | |||||||
Tuscaloosa County Industrial Development Authority |
| 2,095 | 2,328,289 | |||||||||
5.25%, 05/01/2044(a) |
| 785 | 892,087 | |||||||||
|
| |||||||||||
| 6,655,518 | ||||||||||||
|
| |||||||||||
| American Samoa–0.0% |
| |||||||||||
American Samoa Economic Development Authority |
| 400 | 480,547 | |||||||||
|
| |||||||||||
| Arizona–2.6% |
| |||||||||||
Arizona Industrial Development Authority |
| 2,450 | 2,838,914 | |||||||||
5.00%, 11/01/2035 |
| 850 | 1,085,576 | |||||||||
County of Pima AZ Sewer System Revenue |
| 2,500 | 2,529,310 | |||||||||
5.00%, 07/01/2024 (Pre-refunded/ETM) |
| 4,085 | 4,132,893 | |||||||||
Pima County Regional Transportation Authority |
| 1,685 | 1,778,707 | |||||||||
Salt River Project Agricultural Improvement & Power District |
| 23,120 | 23,855,965 | |||||||||
State of Arizona |
| 7,000 | 7,506,906 | |||||||||
Tempe Industrial Development Authority |
| 1,070 | 1,070,318 | |||||||||
|
| |||||||||||
| 44,798,589 | ||||||||||||
|
| |||||||||||
| California–1.2% |
| |||||||||||
California Community Housing Agency |
| $ | 2,000 | $ | 2,068,347 | |||||||
California Housing Finance |
| 2,232 | 2,586,785 | |||||||||
Series 2021-1, Class A |
| 1,000 | 1,140,494 | |||||||||
California Municipal Finance Authority |
| 4,710 | 5,117,609 | |||||||||
Golden State Tobacco Securitization Corp. |
| 2,025 | 2,061,561 | |||||||||
San Francisco Intl Airport |
| 3,755 | 4,274,137 | |||||||||
State of California |
| 50 | 57,841 | |||||||||
Series 2015 |
| 3,500 | 3,954,621 | |||||||||
|
| |||||||||||
| 21,261,395 | ||||||||||||
|
| |||||||||||
| Colorado–1.4% |
| |||||||||||
Centerra Metropolitan District No. 1 |
| 2,375 | 2,524,322 | |||||||||
Colorado Health Facilities Authority |
| 16,920 | 21,066,955 | |||||||||
Vauxmont Metropolitan District AGM |
| 215 | 227,304 | |||||||||
5.00%, 12/01/2024–12/01/2050 |
| 430 | 517,119 | |||||||||
|
| |||||||||||
| 24,335,700 | ||||||||||||
|
| |||||||||||
| Connecticut–2.8% |
| |||||||||||
City of Bridgeport CT |
| 1,650 | 2,038,082 | |||||||||
5.00%, 11/01/2027–11/01/2031 |
| 6,975 | 8,527,968 | |||||||||
Series 2017C |
| 1,000 | 1,168,291 | |||||||||
State of Connecticut |
| 27,430 | 30,105,883 | |||||||||
Series 2018C |
| 1,415 | 1,762,530 | |||||||||
State of Connecticut Special Tax Revenue |
| 2,835 | 3,628,435 | |||||||||
|
| |||||||||||
| 47,231,189 | ||||||||||||
|
| |||||||||||
| 62 | Sanford C. Bernstein Fund, Inc. | |
Table of Contents
| Principal Amount (000) | U.S. $ Value | |||||||||||
| District of Columbia–0.6% |
| |||||||||||
Metropolitan Washington Airports Authority |
| $ | 6,180 | $ | 7,738,818 | |||||||
Washington Metropolitan Area Transit Authority |
| 3,015 | 3,190,474 | |||||||||
|
| |||||||||||
| 10,929,292 | ||||||||||||
|
| |||||||||||
| Florida–4.0% | ||||||||||||
Capital Trust Agency, Inc. |
| 385 | 411,855 | |||||||||
Citizens Property Insurance, Inc. |
| 7,660 | 8,086,912 | |||||||||
Series 2012A-1 |
| 10,490 | 10,569,248 | |||||||||
City of Jacksonville FL |
| 2,500 | 2,558,483 | |||||||||
City of South Miami Health Facilities Authority, Inc. |
| 10,925 | 13,551,200 | |||||||||
County of Lee FL Airport Revenue |
| 2,470 | 2,513,887 | |||||||||
County of Osceola FL Transportation Revenue |
| 300 | 222,211 | |||||||||
Florida State Board of Education |
| 1,310 | 1,446,539 | |||||||||
Lakewood Ranch Stewardship District AGM |
| 1,830 | 1,888,365 | |||||||||
North Broward Hospital District |
| 13,610 | 16,488,600 | |||||||||
Palm Beach County Health Facilities Authority |
| 455 | 459,198 | |||||||||
5.00%, 06/01/2055 |
| 200 | 210,674 | |||||||||
Polk County Industrial Development Authority |
| 1,000 | 1,054,702 | |||||||||
School District of Broward County/FL |
| $ | 2,210 | $ | 2,235,748 | |||||||
St. Lucie County School Board |
| 1,565 | 1,738,279 | |||||||||
State of Florida Department of Transportation Turnpike System Revenue |
| 3,795 | 4,361,899 | |||||||||
|
| |||||||||||
| 67,797,800 | ||||||||||||
|
| |||||||||||
| Georgia–1.1% |
| |||||||||||
City of Atlanta GA Airport Passenger Facility Charge |
| 4,000 | 4,742,813 | |||||||||
Main Street Natural Gas, Inc. |
| 6,465 | 6,981,091 | |||||||||
Municipal Electric Authority of Georgia |
| 180 | 224,226 | |||||||||
Private Colleges & Universities Authority (Emory University) |
| 5,000 | 6,043,888 | |||||||||
|
| |||||||||||
| 17,992,018 | ||||||||||||
|
| |||||||||||
| Guam–0.0% |
| |||||||||||
Territory of Guam |
| 210 | 232,073 | |||||||||
|
| |||||||||||
| Hawaii–2.2% |
| |||||||||||
City & County of Honolulu HI |
| 5,800 | 5,891,721 | |||||||||
Series 2011B |
| 4,000 | 4,063,255 | |||||||||
5.00%, 08/01/2025 (Pre-refunded/ETM) |
| 6,205 | 6,303,125 | |||||||||
University of Hawaii |
| 18,785 | 21,528,058 | |||||||||
|
| |||||||||||
| 37,786,159 | ||||||||||||
|
| |||||||||||
| Illinois–7.6% |
| |||||||||||
Chicago Board of Education |
| 1,000 | 1,169,882 | |||||||||
Series 2019A |
| 2,030 | 2,488,073 | |||||||||
Series 2019B |
| 940 | 1,144,920 | |||||||||
Chicago O’Hare International Airport |
| 18,115 | 20,589,314 | |||||||||
2021 Semi-Annual Report | 63 | |
Table of Contents
Schedule of Investments (continued)
| Principal Amount (000) | U.S. $ Value | |||||||||||
Illinois Finance Authority |
| $ | 900 | $ | 1,080,337 | |||||||
Illinois Finance Authority |
| 7,195 | 8,993,572 | |||||||||
Illinois Finance Authority |
| 26,905 | 33,365,700 | |||||||||
Illinois Finance Authority |
| 1,000 | 1,361,701 | |||||||||
State of Illinois |
| |||||||||||
Series 2012 |
| 1,665 | 1,688,957 | |||||||||
Series 2013 |
| 1,805 | 1,843,961 | |||||||||
Series 2013A |
| 1,970 | 2,054,447 | |||||||||
Series 2014 |
| 3,170 | 3,551,760 | |||||||||
Series 2016 |
| 6,750 | 7,299,391 | |||||||||
Series 2017A |
| 3,810 | 4,437,465 | |||||||||
Series 2017D |
| 12,010 | 13,574,045 | |||||||||
Series 2019A |
| 5,740 | 6,806,472 | |||||||||
State of Illinois |
| 16,965 | 17,801,125 | |||||||||
|
| |||||||||||
| 129,251,122 | ||||||||||||
|
| |||||||||||
| Kentucky–1.7% |
| |||||||||||
City of Ashland KY |
| 815 | 955,088 | |||||||||
Kentucky Economic Development Finance Authority |
| 10,460 | 11,980,890 | |||||||||
Kentucky Public Energy Authority |
| 6,370 | 7,292,789 | |||||||||
Kentucky Public Energy Authority |
| 8,500 | 9,564,718 | |||||||||
|
| |||||||||||
| 29,793,485 | ||||||||||||
|
| |||||||||||
| Louisiana–0.6% |
| |||||||||||
Louisiana Local Government Environmental Facilities & Community Development Auth |
| $ | 1,550 | $ | 1,715,013 | |||||||
Parish of St. James LA |
| 435 | 491,061 | |||||||||
6.10%, 06/01/2038–12/01/2040(a) |
| 1,085 | 1,356,430 | |||||||||
Parish of St. John the Baptist LA |
| 4,885 | 4,981,929 | |||||||||
2.10%, 06/01/2037 |
| 1,570 | 1,613,228 | |||||||||
|
| |||||||||||
| 10,157,661 | ||||||||||||
|
| |||||||||||
| Maryland–0.3% |
| |||||||||||
State of Maryland Department of Transportation |
| |||||||||||
Series 2018 5.00%, 10/01/2024 |
| 4,860 | 5,640,503 | |||||||||
|
| |||||||||||
| Michigan–3.2% |
| |||||||||||
City of Detroit MI |
| 3,675 | 4,340,588 | |||||||||
City of Detroit MI Sewage Disposal System Revenue |
| |||||||||||
NATL Series 2005B |
| 3,585 | 3,628,499 | |||||||||
City of Detroit MI Water Supply System Revenue |
| |||||||||||
Series 2011C |
| 7,490 | 7,582,285 | |||||||||
5.25%, 07/01/2025 (Pre-refunded/ETM) |
| 1,900 | 1,923,410 | |||||||||
Great Lakes Water Authority Water Supply System Revenue |
| |||||||||||
Series 2018A |
| 7,245 | 8,525,886 | |||||||||
Michigan Finance Authority |
| |||||||||||
Series 2015F |
| 900 | 935,893 | |||||||||
Michigan Finance Authority |
| |||||||||||
AGM Series 2014C |
| 10,115 | 11,566,032 | |||||||||
Michigan Finance Authority |
| 5,000 | 5,097,584 | |||||||||
Michigan Strategic Fund |
| 1,090 | 1,340,833 | |||||||||
| 64 | Sanford C. Bernstein Fund, Inc. | |
Table of Contents
| Principal Amount (000) | U.S. $ Value | |||||||||||
South Lyon Community Schools |
| $ | 5,080 | $ | 5,856,967 | |||||||
University of Michigan |
| |||||||||||
Series 2017A |
| 1,955 | 2,143,641 | |||||||||
Walled Lake Consolidated School District |
| 2,000 | 2,100,991 | |||||||||
|
| |||||||||||
| 55,042,609 | ||||||||||||
|
| |||||||||||
| Mississippi–0.5% |
| |||||||||||
Mississippi Development Bank |
| 5,445 | 5,462,950 | |||||||||
Series 2010D 5.00%, 08/01/2023 |
| 3,695 | 3,706,441 | |||||||||
|
| |||||||||||
| 9,169,391 | ||||||||||||
|
| |||||||||||
| Missouri–0.0% |
| |||||||||||
Howard Bend Levee District XLCA |
| 340 | 382,728 | |||||||||
|
| |||||||||||
| Nebraska–1.1% |
| |||||||||||
Central Plains Energy Project |
| 17,000 | 18,936,761 | |||||||||
|
| |||||||||||
| Nevada–0.1% |
| |||||||||||
County of Clark NV |
| 2,000 | 2,055,811 | |||||||||
|
| |||||||||||
| New Hampshire–0.1% |
| |||||||||||
New Hampshire Business Finance Authority |
| 1,767 | 2,048,200 | |||||||||
|
| |||||||||||
| New Jersey–4.6% |
| |||||||||||
New Jersey Economic Development Authority (New Jersey Economic Development Authority State Lease) |
| 1,610 | 1,769,741 | |||||||||
Series 2017B 5.00%, 11/01/2022 |
| 5,025 | 5,395,983 | |||||||||
New Jersey Economic Development Authority (United Airlines, Inc.) |
| 1,185 | 1,258,111 | |||||||||
New Jersey Health Care Facilities Financing Authority |
| 1,325 | 1,650,373 | |||||||||
New Jersey Transportation Trust Fund Authority |
| $ | 7,340 | $ | 7,752,803 | |||||||
Series 2018A 5.00%, 06/15/2024–06/15/2030 |
| 6,055 | 7,000,999 | |||||||||
New Jersey Transportation Trust Fund Authority |
| |||||||||||
5.00%, 06/15/2029 |
| 3,075 | 3,841,170 | |||||||||
Series 2012A 5.00%, 06/15/2024 |
| 2,500 | 2,631,677 | |||||||||
Series 2018A 5.00%, 12/15/2029–12/15/2030 |
| 6,135 | 7,590,005 | |||||||||
Series 2019B 5.00%, 06/15/2034 |
| 2,820 | 3,443,599 | |||||||||
New Jersey Turnpike Authority |
| |||||||||||
Series 2014C 5.00%, 01/01/2023 |
| 8,955 | 9,674,576 | |||||||||
Series 2017B 5.00%, 01/01/2030 |
| 1,565 | 1,937,236 | |||||||||
Series 2020D 5.00%, 01/01/2028 |
| 4,840 | 5,878,838 | |||||||||
Series 2021B 1.713%, 01/01/2029 |
| 1,225 | 1,181,579 | |||||||||
AGM Series 2005D-3 5.25%, 01/01/2026 |
| 11,070 | 13,391,173 | |||||||||
Tobacco Settlement Financing Corp./NJ |
| 3,450 | 4,357,983 | |||||||||
|
| |||||||||||
| 78,755,846 | ||||||||||||
|
| |||||||||||
| New York–7.3% |
| |||||||||||
City of New York NY |
| 2,510 | 2,782,428 | |||||||||
Series 2014J 5.00%, 08/01/2022 |
| 1,290 | 1,372,075 | |||||||||
Series 2015A 5.00%, 08/01/2023 |
| 7,220 | 8,001,858 | |||||||||
Series 2021D 1.396%, 08/01/2027 |
| 3,415 | 3,352,665 | |||||||||
1.623%, 08/01/2028 |
| 2,000 | 1,966,033 | |||||||||
Metropolitan Transportation Authority |
| 3,065 | 3,262,032 | |||||||||
Series 2012F 5.00%, 11/15/2022–11/15/2023 |
| 13,835 | 14,815,074 | |||||||||
Series 2017C 5.00%, 11/15/2030 |
| 4,340 | 5,299,287 | |||||||||
2021 Semi-Annual Report | 65 | |
Table of Contents
Schedule of Investments (continued)
| Principal Amount (000) | U.S. $ Value | |||||||||||
New York City Transitional Finance Authority Future Tax Secured Revenue |
| $ | 20,280 | $ | 22,968,205 | |||||||
Series 2014C 5.00%, 11/01/2028 |
| 10,665 | 12,128,927 | |||||||||
New York Liberty Development Corp. |
| 855 | 877,434 | |||||||||
2.80%, 09/15/2069 |
| 2,370 | 2,341,987 | |||||||||
New York State Dormitory Authority |
| 5 | 5,169 | |||||||||
New York State Dormitory Authority |
| 8,610 | 9,313,322 | |||||||||
Series 2014C 5.00%, 03/15/2027-03/15/2029 |
| 22,340 | 25,308,156 | |||||||||
New York Transportation Development Corp. |
| 6,765 | 7,823,979 | |||||||||
4.375%, 10/01/2045 |
| 1,355 | 1,546,303 | |||||||||
Series 2018 5.00%, 01/01/2031 |
| 1,590 | 1,912,654 | |||||||||
|
| |||||||||||
| 125,077,588 | ||||||||||||
|
| |||||||||||
| North Carolina–0.4% |
| |||||||||||
State of North Carolina |
| 5,350 | 5,971,015 | |||||||||
|
| |||||||||||
| Ohio–1.2% |
| |||||||||||
American Municipal Power, Inc. |
| 8,345 | 10,574,583 | |||||||||
County of Cuyahoga OH |
| |||||||||||
Series 2017 5.00%, 02/15/2025–02/15/2028 |
| 5,500 | 6,521,746 | |||||||||
County of Hamilton OH Sewer System Revenue |
| 2,000 | 2,063,125 | |||||||||
Ohio Air Quality Development Authority (Energy Harbor Nuclear Generation LLC) |
| |||||||||||
Series 2009A 4.375%, 06/01/2033 |
| 475 | 489,250 | |||||||||
Ohio Water Development Authority Water Pollution Control Loan Fund |
| |||||||||||
Series 2016B 4.375%, 06/01/2033 |
| 425 | 437,750 | |||||||||
State of Ohio Major New State Infrastructure Project |
| |||||||||||
Series 2014 5.00%, 12/15/2021 |
| 1,105 | 1,142,577 | |||||||||
|
| |||||||||||
| 21,229,031 | ||||||||||||
|
| |||||||||||
| Oklahoma–0.2% |
| |||||||||||
Comanche County Memorial Hospital |
| $ | 250 | $ | 261,231 | |||||||
Series 2015 5.00%, 07/01/2026–07/01/2029 |
| 3,000 | 3,277,129 | |||||||||
Oklahoma Development Finance Authority |
| 610 | 612,814 | |||||||||
|
| |||||||||||
| 4,151,174 | ||||||||||||
|
| |||||||||||
| Oregon–0.4% |
| |||||||||||
Oregon State Lottery |
| |||||||||||
Series 2011A 5.25%, 04/01/2026 (Pre-refunded/ETM) |
| 5,105 | 5,105,000 | |||||||||
5.25%, 04/01/2026 |
| 825 | 826,840 | |||||||||
|
| |||||||||||
| 5,931,840 | ||||||||||||
|
| |||||||||||
| Other–0.3% |
| |||||||||||
Federal Home Loan Mortgage Corp. Multifamily VRD Certificates |
| |||||||||||
Series 2019M 2.65%, 06/15/2035(a) |
| 4,920 | �� | 5,190,617 | ||||||||
|
| |||||||||||
| Pennsylvania–5.1% |
| |||||||||||
Allegheny County Sanitary Authority |
| |||||||||||
BAM Series 2013 5.00%, 12/01/2024–12/01/2025 |
| 7,470 | 8,398,850 | |||||||||
Allentown Neighborhood Improvement Zone Development Authority |
| |||||||||||
Series 2017 5.00%, 05/01/2022(a) |
| 925 | 961,667 | |||||||||
Beaver County Industrial Development Authority |
| 1,245 | 1,282,350 | |||||||||
Capital Region Water Revenue |
| |||||||||||
Series 2018 5.00%, 07/15/2029 |
| 1,500 | 1,902,663 | |||||||||
City of Philadelphia PA |
| |||||||||||
Series 2019B 5.00%, 02/01/2032 |
| 2,890 | 3,719,901 | |||||||||
City of Philadelphia PA Water & Wastewater Revenue |
| |||||||||||
Series 2020A 5.00%, 11/01/2037–11/01/2038 |
| 2,340 | 3,035,227 | |||||||||
Coatesville School District |
| |||||||||||
AGM 5.00%, 08/01/2022 (Pre-refunded/ETM) |
| 105 | 111,637 | |||||||||
5.00%, 08/01/2022 |
| 1,020 | 1,079,010 | |||||||||
AGM Series 2017 5.00%, 08/01/2023 |
| 1,250 | 1,382,285 | |||||||||
Commonwealth of Pennsylvania |
| |||||||||||
Series 2017 5.00%, 01/01/2026 |
| 1,000 | 1,205,853 | |||||||||
| 66 | Sanford C. Bernstein Fund, Inc. | |
Table of Contents
| Principal Amount (000) | U.S. $ Value | |||||||||||
Moon Industrial Development Authority (Baptist Homes Society) |
| $ | 2,535 | $ | 2,710,270 | |||||||
Pennsylvania Turnpike Commission |
| |||||||||||
Series 2011E 5.00%, 12/01/2025 (Pre-refunded/ETM) |
| 9,585 | 9,890,114 | |||||||||
5.00%, 12/01/2026 (Pre-refunded/ETM) |
| 4,080 | 4,209,876 | |||||||||
Series 2017 5.00%, 06/01/2028 |
| 2,905 | 3,608,924 | |||||||||
Series 2017B 5.00%, 06/01/2031 |
| 11,050 | 13,378,008 | |||||||||
Series 2017S 5.00%, 12/01/2028–12/01/2030 |
| 8,105 | 10,134,500 | |||||||||
Series 2019 5.00%, 12/01/2024–12/01/2025 |
| 7,900 | 9,378,224 | |||||||||
Series 2019A 5.00%, 12/01/2031–12/01/2032 |
| 4,005 | 5,173,454 | |||||||||
Philadelphia Authority for Industrial Development |
| |||||||||||
Series 2018 5.00%, 05/01/2032 |
| 3,205 | 3,999,937 | |||||||||
State Public School Building Authority |
| |||||||||||
Series 2012 5.00%, 04/01/2026 (Pre-refunded/ETM) |
| 1,110 | 1,163,746 | |||||||||
|
| |||||||||||
| 86,726,496 | ||||||||||||
|
| |||||||||||
| Puerto Rico–0.7% |
| |||||||||||
Puerto Rico Electric Power Authority |
| |||||||||||
AGM Series 2007V 5.25%, 07/01/2031 |
| 1,010 | 1,228,902 | |||||||||
Puerto Rico Highway & Transportation Authority |
| |||||||||||
AGC Series 2005L 5.25%, 07/01/2041 |
| 905 | 1,116,835 | |||||||||
AGC Series 2007N 5.25%, 07/01/2034-07/01/2036 |
| 2,115 | 2,622,754 | |||||||||
AGM Series 2007C 5.50%, 07/01/2031 |
| 100 | 123,135 | |||||||||
NATL Series 2005L 5.25%, 07/01/2035 |
| 155 | 170,245 | |||||||||
NATL Series 2007N 5.25%, 07/01/2032 |
| 200 | 221,826 | |||||||||
Puerto Rico Industrial Tourist Educational Medical & Environmental Control Facilities Financing Auth |
| 3,680 | 3,799,600 | |||||||||
Puerto Rico Public Buildings Authority |
| |||||||||||
NATL Series 2007 6.00%, 07/01/2025 |
| 415 | 466,031 | |||||||||
Puerto Rico Sales Tax Financing Corp. Sales Tax Revenue |
| |||||||||||
Series 2018A |
| |||||||||||
Zero Coupon, 07/01/2024 |
| 1,477 | 1,386,239 | |||||||||
|
| |||||||||||
| 11,135,567 | ||||||||||||
|
| |||||||||||
| South Carolina–1.0% |
| |||||||||||
Patriots Energy Group Financing Agency |
| |||||||||||
Series 2018A 4.00%, 10/01/2048 |
| $ | 7,390 | $ | 8,066,868 | |||||||
Renewable Water Resources |
| |||||||||||
Series 2018A 5.00%, 01/01/2025 |
| 7,220 | 8,442,450 | |||||||||
|
| |||||||||||
| 16,509,318 | ||||||||||||
|
| |||||||||||
| South Dakota–0.1% |
| |||||||||||
South Dakota Health & Educational Facilities Authority |
| |||||||||||
Series 2017 5.00%, 09/01/2028 |
| 2,000 | 2,454,461 | |||||||||
|
| |||||||||||
| Tennessee–0.8% |
| |||||||||||
Tennessee Energy Acquisition Corp. |
| |||||||||||
Series 2017A 4.00%, 05/01/2048 |
| 5,415 | 5,784,866 | |||||||||
Series 2018 4.00%, 11/01/2049 |
| 6,500 | 7,374,344 | |||||||||
|
| |||||||||||
| 13,159,210 | ||||||||||||
|
| |||||||||||
| Texas–5.1% |
| |||||||||||
Austin Community College District Public Facility Corp. |
| |||||||||||
Series 2015 5.00%, 08/01/2022 |
| 1,000 | 1,063,348 | |||||||||
City of Austin TX Water & Wastewater System Revenue |
| 215 | 221,245 | |||||||||
5.00%, 11/15/2025–11/15/2026 |
| 11,600 | 11,949,570 | |||||||||
5.00%, 11/15/2026 (Pre-refunded/ETM) |
| 175 | 180,083 | |||||||||
City of Corpus Christi TX Utility System Revenue |
| |||||||||||
Series 2015 5.00%, 07/15/2024 |
| 1,290 | 1,482,450 | |||||||||
Series 2015C 5.00%, 07/15/2022–07/15/2026 |
| 3,030 | 3,339,301 | |||||||||
City of Dallas TX |
| |||||||||||
Series 2014 5.00%, 02/15/2022 |
| 19,045 | 19,837,851 | |||||||||
City of Houston TX Airport System Revenue |
| |||||||||||
Series 2014 5.00%, 07/01/2029 |
| 375 | 408,376 | |||||||||
County of Fort Bend TX |
| 2,880 | 3,007,700 | |||||||||
Dallas/Fort Worth International Airport |
| 3,725 | 4,601,602 | |||||||||
2021 Semi-Annual Report | 67 | |
Table of Contents
Schedule of Investments (continued)
| Principal Amount (000) | U.S. $ Value | |||||||||||
Irving Hospital Authority | $ | 1,100 | $ | 1,301,775 | ||||||||
Metropolitan Transit Authority of Harris County | 1,185 | 1,514,827 | ||||||||||
New Hope Cultural Education Facilities Finance Corp. | 1,160 | 1,284,369 | ||||||||||
Port Beaumont Navigation District | 300 | 306,575 | ||||||||||
State of Texas | 1,790 | 1,876,304 | ||||||||||
Texas A&M University | 3,950 | 4,353,711 | ||||||||||
Texas Transportation Commission State Highway Fund | 10,035 | 10,760,121 | ||||||||||
Texas Water Development Board | 1,255 | 1,609,309 | ||||||||||
University of Houston | 13,870 | 15,116,995 | ||||||||||
Via Metropolitan Transit | 2,580 | 2,950,352 | ||||||||||
|
| |||||||||||
| 87,165,864 | ||||||||||||
|
| |||||||||||
| Virginia–0.3% |
| |||||||||||
Greater Richmond Convention Center Authority | 4,815 | 5,086,537 | ||||||||||
|
| |||||||||||
| Washington–5.7% |
| |||||||||||
Chelan County Public Utility District No. 1 | 7,835 | 7,927,697 | ||||||||||
Series 2011B | 5,540 | 5,608,888 | ||||||||||
Energy Northwest | 14,690 | 14,860,311 | ||||||||||
Franklin County School District No. 1 Pasco | $ | 8,615 | $ | 10,045,559 | ||||||||
Port of Seattle WA | 5,490 | 5,501,275 | ||||||||||
Series 2018A | 14,375 | 17,408,807 | ||||||||||
Series 2018B | 16,040 | 19,639,122 | ||||||||||
Snohomish & Island Counties School District No. 41 Stanwood-Camano | 1,000 | 1,271,844 | ||||||||||
Snohomish County Public Utility District No. 1 | 6,065 | 6,554,355 | ||||||||||
State of Washington | 3,755 | 4,322,496 | ||||||||||
Series 2015R | 3,735 | 4,137,485 | ||||||||||
Washington State Housing Finance Commission | 740 | 734,567 | ||||||||||
|
| |||||||||||
| 98,012,406 | ||||||||||||
|
| |||||||||||
| West Virginia–0.2% |
| |||||||||||
Tobacco Settlement Finance Authority/WV |
| 3,070 | 3,117,539 | |||||||||
|
| |||||||||||
| Wisconsin–2.4% |
| |||||||||||
State of Wisconsin | 6,300 | 8,223,775 | ||||||||||
Series 20212 | 17,000 | 22,335,933 | ||||||||||
UMA Education, Inc. | 3,315 | 3,812,559 | ||||||||||
Wisconsin Health & Educational Facilities Authority | 515 | 513,122 | ||||||||||
Wisconsin Public Finance Authority | 3,245 | 3,564,201 | ||||||||||
Series 2016B 5.00%, 12/01/2025 | 2,510 | 2,914,609 | ||||||||||
|
| |||||||||||
| 41,364,199 | ||||||||||||
|
| |||||||||||
| Total Municipal Obligations (cost $1,092,480,936) |
| 1,153,017,259 | ||||||||||
|
| |||||||||||
| 68 | Sanford C. Bernstein Fund, Inc. | |
Table of Contents
| Shares | U.S. $ Value | |||||||||||
| INVESTMENT COMPANIES–27.9% |
| |||||||||||
| Funds and Investment Trusts–27.9%(d) |
| |||||||||||
iShares Core MSCI EAFE ETF |
| 1,820,051 | $ | 131,134,675 | ||||||||
iShares Core MSCI Emerging Markets ETF |
| 1,013,239 | 65,212,062 | |||||||||
SPDR S&P 500 ETF Trust |
| 667,241 | 264,447,626 | |||||||||
Vanguard Mid-Cap ETF |
| 75,875 | 16,794,172 | |||||||||
|
| |||||||||||
Total Investment Companies (cost $326,140,476) |
| 477,588,535 | ||||||||||
|
| |||||||||||
| Principal Amount (000) | ||||||||||||
| GOVERNMENTS–TREASURIES–0.6% |
| |||||||||||
| United States–0.6% |
| |||||||||||
U.S. Treasury Notes | U.S.$ | 1,698 | 1,781,308 | |||||||||
2.625%, 02/15/2029(e)(f) | 7,796 | 8,426,989 | ||||||||||
|
| |||||||||||
| Total Governments–Treasuries (cost $9,593,574) | 10,208,297 | |||||||||||
|
| |||||||||||
| Notional Amount | ||||||||||||
| OPTIONS PURCHASED–PUTS–0.4% |
| |||||||||||
| Options on Equity Indices–0.4% |
| |||||||||||
Euro STOXX 50 Index | EUR | 17,790,500 | 537,477 | |||||||||
Euro STOXX 50 Index | EUR | 9,133,250 | 275,929 | |||||||||
FTSE 100 Index | GBP | 6,783,000 | 223,973 | |||||||||
FTSE 100 Index | GBP | 3,366,000 | 111,145 | |||||||||
Nikkei 225 Index | JPY | 922,500,000 | 228,650 | |||||||||
Nikkei 225 Index | JPY | 855,000,000 | 211,919 | |||||||||
Nikkei 225 Index | JPY | 832,500,000 | $ | 206,342 | ||||||||
S&P 500 Index | USD | 148,500,000 | 3,282,822 | |||||||||
S&P 500 Index | USD | 73,800,000 | 1,631,463 | |||||||||
|
| |||||||||||
| Total Options Purchased–Puts (premium paid $10,685,860) | 6,709,720 | |||||||||||
|
| |||||||||||
| Principal Amount (000) | ||||||||||||
| COLLATERALIZED MORTGAGE OBLIGATIONS–0.3% |
| |||||||||||
| Risk Share Floating Rate–0.3% |
| |||||||||||
Bellemeade Re Ltd. | $ | 220 | 221,665 | |||||||||
Connecticut Avenue Securities Trust | 250 | 251,130 | ||||||||||
Federal Home Loan Mortgage Corp. Structured Agency Credit Risk Debt Notes Series 2013-DN2, Class M2 | 141 | 140,533 | ||||||||||
Series 2016-DNA1, Class M3 | 197 | 206,653 | ||||||||||
Series 2016-DNA4, Class M3 | 426 | 442,131 | ||||||||||
Series 2017-DNA2, Class M2 | 270 | 279,795 | ||||||||||
Series 2017-DNA3, Class M2 | 250 | 254,746 | ||||||||||
Series 2017-HQA1, Class M2 | 241 | 246,732 | ||||||||||
Series 2019-DNA3, Class M2 | 163 | 162,329 | ||||||||||
Federal National Mortgage Association Connecticut Avenue Securities Series 2014-C03, Class 2M2 | 179 | 180,792 | ||||||||||
2021 Semi-Annual Report | 69 | |
Table of Contents
Schedule of Investments (continued)
| Principal Amount (000) | U.S. $ Value | |||||||||||
Series 2015-C01, Class 2M2 | $ | 24 | $ | 24,312 | ||||||||
Series 2015-C03, Class 2M2 | 75 | 76,003 | ||||||||||
Series 2016-C01, Class 1M2 | 200 | 211,871 | ||||||||||
Series 2016-C05, Class 2M2 | 122 | 126,977 | ||||||||||
Series 2017-C01, Class 1M2 | 440 | 453,688 | ||||||||||
Series 2017-C02, Class 2M2 | 484 | 496,732 | ||||||||||
Series 2017-C03, Class 1M2 | 450 | 460,305 | ||||||||||
Series 2015-C03, Class 1M2 | 82 | 84,402 | ||||||||||
Series 2016-C02, Class 1M2 | 115 | 121,106 | ||||||||||
Series 2017-C05, Class 1M2 | 202 | 204,152 | ||||||||||
|
| |||||||||||
| Total Collateralized Mortgage Obligations (cost $4,251,001) |
| 4,646,054 | ||||||||||
|
| |||||||||||
| CORPORATES—INVESTMENT GRADE–0.1% |
| |||||||||||
| Industrial–0.1% |
| |||||||||||
| Consumer Non-Cyclical–0.1% |
| |||||||||||
Baylor Scott & White Holdings |
| |||||||||||
0.827%, 11/15/2025 | 1,075 | 1,052,769 | ||||||||||
1.777%, 11/15/2030 | 1,000 | 950,660 | ||||||||||
|
| |||||||||||
| Total Corporates—Investment Grade (cost $2,075,000) |
| 2,003,429 | ||||||||||
|
| |||||||||||
| CORPORATES—NON-INVESTMENT GRADE–0.1% |
| |||||||||||
| Industrial–0.1% |
| |||||||||||
| Transportation—Airlines–0.1% |
| |||||||||||
American Airlines, Inc./AAdvantage Loyalty IP Ltd. |
| |||||||||||
5.50%, 04/20/2026(a) | $ | 700 | $ | 728,119 | ||||||||
5.75%, 04/20/2029(a) | 620 | 659,519 | ||||||||||
|
| |||||||||||
| Total Corporates—Non-Investment Grade (cost $1,320,000) |
| 1,387,638 | ||||||||||
|
| |||||||||||
| Shares | ||||||||||||
| SHORT-TERM INVESTMENTS–1.8% |
| |||||||||||
| Investment Companies–1.0% |
| |||||||||||
AB Fixed Income Shares, Inc.—Government Money Market Portfolio—Class AB, 0.01%(d)(h)(i) | 17,807,976 | 17,807,976 | ||||||||||
|
| |||||||||||
| Principal Amount (000) | ||||||||||||
| U.S. Treasury Bills–0.8% | ||||||||||||
U.S. Treasury Bill | ||||||||||||
Zero Coupon, 04/27/2021(e) | $ | 13,000 | 12,999,859 | |||||||||
|
| |||||||||||
| Total Short-Term Investments (cost $30,807,331) | 30,807,835 | |||||||||||
|
| |||||||||||
| Total Investments—98.5% (cost $1,477,354,178) | 1,686,368,767 | |||||||||||
Other assets less liabilities—1.5% | 26,366,995 | |||||||||||
|
| |||||||||||
| Net Assets—100.0% | $ | 1,712,735,762 | ||||||||||
|
| |||||||||||
| FUTURES (see Note 3) |
| |||||||||||||
| Description | Number of Contracts | Expiration Month | Current Notional | Value and Unrealized Appreciation/ (Depreciation) | ||||||||||
| Purchased Contracts |
| |||||||||||||
Euro STOXX 50 Index Futures | 618 | June 2021 | $ | 28,018,008 | $ | 654,422 | ||||||||
FTSE 100 Index Futures | 27 | June 2021 | 2,486,254 | (7,475 | ) | |||||||||
Hang Seng Index Futures | 18 | April 2021 | 3,278,116 | (15,992 | ) | |||||||||
MSCI Singapore IX ETS Futures | 512 | April 2021 | 13,624,026 | 77,164 | ||||||||||
Nikkei 225 (OSE) Futures | 17 | June 2021 | 4,480,109 | 59,600 | ||||||||||
| 70 | Sanford C. Bernstein Fund, Inc. | |
Table of Contents
| Description | Number of Contracts | Expiration Month | Current Notional | Value and Unrealized Appreciation/ (Depreciation) | ||||||||||
OMXS 30 Index Futures | 900 | April 2021 | $ | 22,540,061 | $ | 329,356 | ||||||||
Russell 2000 E-Mini Futures | 373 | June 2021 | 41,449,625 | (1,119,280 | ) | |||||||||
S&P 500 E-Mini Futures | 691 | June 2021 | 137,073,670 | 2,622,101 | ||||||||||
S&P Mid 400 E-Mini Futures | 52 | June 2021 | 13,547,560 | 98 | ||||||||||
S&P/TSX 60 Index Futures | 109 | June 2021 | 19,274,274 | 67,960 | ||||||||||
TOPIX Index Futures | 145 | June 2021 | 25,588,621 | 441,378 | ||||||||||
U.S. T-Note 2 Yr (CBT) Futures | 222 | June 2021 | 49,001,297 | (48,827 | ) | |||||||||
U.S. T-Note 10 Yr (CBT) Futures | 694 | June 2021 | 90,870,625 | (1,921,922 | ) | |||||||||
U.S. Ultra Bond (CBT) Futures | 119 | June 2021 | 21,565,031 | (922,788 | ) | |||||||||
| Sold Contracts |
| |||||||||||||
FTSE 100 Index Futures | 209 | June 2021 | 19,245,458 | 72,486 | ||||||||||
SPI 200 Futures | 160 | June 2021 | 20,556,461 | (22,385 | ) | |||||||||
|
| |||||||||||||
| $ | 265,896 | |||||||||||||
|
| |||||||||||||
| FORWARD CURRENCY EXCHANGE CONTRACTS (see Note 3) |
| |||||||||||||||||||||
| Counterparty | Contracts to Deliver (000) | In Exchange For (000) | Settlement Date | Unrealized Appreciation/ (Depreciation) | ||||||||||||||||||
Bank of America, NA | CAD | 6,314 | USD | 5,048 | 04/22/2021 | $ | 23,474 | |||||||||||||||
Barclays Bank PLC | USD | 7,896 | NZD | 10,876 | 05/27/2021 | (301,003 | ) | |||||||||||||||
BNP Paribas SA | SEK | 38,574 | USD | 4,528 | 04/15/2021 | 111,283 | ||||||||||||||||
BNP Paribas SA | CAD | 18,301 | USD | 14,562 | 04/22/2021 | (1,622 | ) | |||||||||||||||
BNP Paribas SA | USD | 8,701 | CAD | 11,007 | 04/22/2021 | 57,687 | ||||||||||||||||
BNP Paribas SA | JPY | 1,106,021 | USD | 10,175 | 05/20/2021 | 182,083 | ||||||||||||||||
BNP Paribas SA | NZD | 4,379 | USD | 3,134 | 05/27/2021 | 76,429 | ||||||||||||||||
Citibank, NA | SEK | 23,929 | USD | 2,876 | 04/15/2021 | 136,179 | ||||||||||||||||
Citibank, NA | USD | 39,382 | CAD | 49,933 | 04/22/2021 | 353,582 | ||||||||||||||||
Citibank, NA | EUR | 12,703 | USD | 15,165 | 05/27/2021 | 252,310 | ||||||||||||||||
Goldman Sachs Bank USA | CHF | 11,264 | USD | 12,706 | 05/06/2021 | 778,670 | ||||||||||||||||
JPMorgan Chase Bank, NA | GBP | 857 | USD | 1,190 | 04/09/2021 | 8,851 | ||||||||||||||||
JPMorgan Chase Bank, NA | GBP | 13,878 | USD | 18,953 | 04/09/2021 | (179,873 | ) | |||||||||||||||
JPMorgan Chase Bank, NA | USD | 7,923 | GBP | 5,643 | 04/09/2021 | (143,372 | ) | |||||||||||||||
JPMorgan Chase Bank, NA | NOK | 26,263 | USD | 3,075 | 04/15/2021 | 4,561 | ||||||||||||||||
JPMorgan Chase Bank, NA | SEK | 118,774 | USD | 14,309 | 04/15/2021 | 707,400 | ||||||||||||||||
JPMorgan Chase Bank, NA | USD | 17,817 | NOK | 151,083 | 04/15/2021 | (152,315 | ) | |||||||||||||||
JPMorgan Chase Bank, NA | USD | 31,157 | SEK | 262,046 | 04/15/2021 | (1,149,634 | ) | |||||||||||||||
JPMorgan Chase Bank, NA | CAD | 14,590 | USD | 11,510 | 04/22/2021 | (100,136 | ) | |||||||||||||||
JPMorgan Chase Bank, NA | CHF | 3,855 | USD | 4,148 | 05/06/2021 | 66,115 | ||||||||||||||||
JPMorgan Chase Bank, NA | JPY | 1,179,021 | USD | 11,038 | 05/20/2021 | 384,607 | ||||||||||||||||
Morgan Stanley & Co., Inc. | USD | 3,481 | GBP | 2,555 | 04/09/2021 | 41,636 | ||||||||||||||||
Morgan Stanley & Co., Inc. | USD | 13,132 | JPY | 1,429,092 | 05/20/2021 | (219,951 | ) | |||||||||||||||
Natwest Markets PLC | GBP | 2,113 | USD | 2,888 | 04/09/2021 | (24,938 | ) | |||||||||||||||
Natwest Markets PLC | JPY | 441,779 | USD | 4,166 | 05/20/2021 | 174,652 | ||||||||||||||||
State Street Bank & Trust Co. | SEK | 3,522 | USD | 426 | 04/15/2021 | 23,074 | ||||||||||||||||
State Street Bank & Trust Co. | USD | 425 | SEK | 3,522 | 04/15/2021 | (21,868 | ) | |||||||||||||||
2021 Semi-Annual Report | 71 | |
Table of Contents
Schedule of Investments (continued)
| Counterparty | Contracts to Deliver (000) | In Exchange For (000) | Settlement Date | Unrealized Appreciation/ (Depreciation) | ||||||||||||||||||
State Street Bank & Trust Co. | USD | 12,252 | JPY | 1,297,729 | 05/20/2021 | $ | (526,458 | ) | ||||||||||||||
State Street Bank & Trust Co. | AUD | 5,044 | USD | 3,848 | 06/04/2021 | 15,921 | ||||||||||||||||
UBS AG | USD | 4,432 | NOK | 37,679 | 04/15/2021 | (26,773 | ) | |||||||||||||||
|
| |||||||||||||||||||||
| $ | 550,571 | |||||||||||||||||||||
|
| |||||||||||||||||||||
| CENTRALLY CLEARED INFLATION (CPI) SWAPS (see Note 3) | ||||||||||||||||||||||||||||
Rate Type | Payment Frequency Paid/ Received | Market | Upfront Premiums Paid/ (Received) | Unrealized | ||||||||||||||||||||||||
| Notional Amount (000) | Termination Date | Payments made by the Fund | Payments received by the Fund | |||||||||||||||||||||||||
| USD | 4,710 | 01/15/2025 | 2.565% | CPI# | Maturity | $ | 9,802 | $ | — | $ | 9,802 | |||||||||||||||||
| USD | 2,355 | 01/15/2025 | 2.585% | CPI# | Maturity | 2,909 | — | 2,909 | ||||||||||||||||||||
| USD | 2,355 | 01/15/2025 | 2.613% | CPI# | Maturity | 169 | — | 169 | ||||||||||||||||||||
| USD | 20,920 | 01/15/2028 | 1.230% | CPI# | Maturity | 2,006,756 | — | 2,006,756 | ||||||||||||||||||||
| USD | 16,190 | 01/15/2028 | 0.735% | CPI# | Maturity | 2,185,130 | — | 2,185,130 | ||||||||||||||||||||
| USD | 5,125 | 01/15/2030 | 1.572% | CPI# | Maturity | 443,694 | — | 443,694 | ||||||||||||||||||||
| USD | 5,125 | 01/15/2030 | 1.587% | CPI# | Maturity | 435,922 | — | 435,922 | ||||||||||||||||||||
| USD | 1,130 | 01/15/2030 | 1.714% | CPI# | Maturity | 81,515 | — | 81,515 | ||||||||||||||||||||
| USD | 1,130 | 01/15/2030 | 1.731% | CPI# | Maturity | 79,549 | — | 79,549 | ||||||||||||||||||||
|
|
|
|
|
| |||||||||||||||||||||||
| $ | 5,245,446 | $ | — | $ | 5,245,446 | |||||||||||||||||||||||
|
|
|
|
|
| |||||||||||||||||||||||
# Variable interest rate based on the rate of inflation as determined by the Consumer Price Index (CPI).
| CENTRALLY CLEARED INTEREST RATE SWAPS (see Note 3) | ||||||||||||||||||||||||||||
Rate Type | Payment | Market | Upfront Premiums Paid/ (Received) | Unrealized | ||||||||||||||||||||||||
| Notional Amount (000) | Termination Date | Payments made by the Fund | Payments received by the Fund | |||||||||||||||||||||||||
| USD | 61,040 | 06/17/2021 | 3 Month LIBOR | 1.907% | Quarterly/ Semi-Annual | $ | 553,294 | $ | — | $ | 553,294 | |||||||||||||||||
| USD | 32,500 | 09/10/2024 | 3 Month LIBOR | 1.341% | Quarterly/ Semi-Annual | 813,195 | — | 813,195 | ||||||||||||||||||||
| USD | 13,760 | 01/15/2025 | 3 Month LIBOR | 1.566% | Quarterly/ Semi-Annual | 467,908 | — | 467,908 | ||||||||||||||||||||
| USD | 9,275 | 10/09/2029 | 3 Month LIBOR | 1.473% | Quarterly/ Semi-Annual | (63,560 | ) | — | (63,560 | ) | ||||||||||||||||||
|
|
|
|
|
| |||||||||||||||||||||||
| $ | 1,770,837 | $ | — | $ | 1,770,837 | |||||||||||||||||||||||
|
|
|
|
|
| |||||||||||||||||||||||
| 72 | Sanford C. Bernstein Fund, Inc. | |
Table of Contents
| CREDIT DEFAULT SWAPS (see Note 3) |
| |||||||||||||||||||||||||||||||
| Swap Counterparty & Referenced Obligation | Fixed Rate (Pay) Receive | Payment Frequency | Implied Credit Spread at March 31, 2021 | Notional Amount (000) | Market Value | Upfront Premiums Paid/ (Received) | Unrealized Appreciation/ (Depreciation) | |||||||||||||||||||||||||
| Sale Contracts | ||||||||||||||||||||||||||||||||
| Citigroup Global Markets, Inc. | ||||||||||||||||||||||||||||||||
CDX-CMBX.NA.BBB- Series 6, 05/11/2063* | 3.00 | % | Monthly | 12.50 | % | USD | 97 | $ | (26,132 | ) | $ | (9,399 | ) | $ | (16,733 | ) | ||||||||||||||||
CDX-CMBX.NA.BBB- Series 6, 05/11/2063* | 3.00 | Monthly | 12.50 | USD | 1,344 | (362,074 | ) | (171,059 | ) | (191,015 | ) | |||||||||||||||||||||
| Credit Suisse International |
| |||||||||||||||||||||||||||||||
CDX-CMBX.NA.BBB- Series 6, 05/11/2063* | 3.00 | Monthly | 12.50 | USD | 1 | (269 | ) | (121 | ) | (148 | ) | |||||||||||||||||||||
CDX-CMBX.NA.BBB- Series 6, 05/11/2063* | 3.00 | Monthly | 12.50 | USD | 53 | (14,278 | ) | (5,183 | ) | (9,095 | ) | |||||||||||||||||||||
CDX-CMBX.NA.BBB- Series 6, 05/11/2063* | 3.00 | Monthly | 12.50 | USD | 662 | (178,288 | ) | (64,817 | ) | (113,471 | ) | |||||||||||||||||||||
CDX-CMBX.NA.BBB- Series 6, 05/11/2063* | 3.00 | Monthly | 12.50 | USD | 995 | (268,053 | ) | (94,919 | ) | (173,134 | ) | |||||||||||||||||||||
| Goldman Sachs International |
| |||||||||||||||||||||||||||||||
CDX-CMBX.NA.BBB- Series 6, 05/11/2063* | 3.00 | Monthly | 12.50 | USD | 863 | (232,492 | ) | (79,909 | ) | (152,583 | ) | |||||||||||||||||||||
|
|
|
|
|
| |||||||||||||||||||||||||||
| $ | (1,081,586 | ) | $ | (425,407 | ) | $ | (656,179 | ) | ||||||||||||||||||||||||
|
|
|
|
|
| |||||||||||||||||||||||||||
* Termination date
| INFLATION (CPI) SWAPS (see Note 3) |
| |||||||||||||||||||||||||||||||
Swap Counterparty | Notional Amount | Termination | Rate Type | Payment | Market | Upfront Premiums Paid/ (Received) | Unrealized | |||||||||||||||||||||||||
| Payments made by the Fund | Payments received by the Fund | |||||||||||||||||||||||||||||||
| Barclays Bank PLC | USD | 12,000 | 10/23/2026 | 2.310% | CPI# | Maturity | $ | (511,579 | ) | $ | — | $ | (511,579 | ) | ||||||||||||||||||
| Barclays Bank PLC | USD | 10,000 | 12/04/2027 | 2.170% | CPI# | Maturity | 173,168 | — | 173,168 | |||||||||||||||||||||||
| Barclays Bank PLC | USD | 10,000 | 10/23/2029 | 2.388% | CPI# | Maturity | (513,306 | ) | — | (513,306 | ) | |||||||||||||||||||||
| Barclays Bank PLC | USD | 13,000 | 12/04/2032 | 2.233% | CPI# | Maturity | 302,298 | — | 302,298 | |||||||||||||||||||||||
| Citibank, NA | USD | 28,000 | 10/23/2021 | 2.039% | CPI# | Maturity | (810,689 | ) | — | (810,689 | ) | |||||||||||||||||||||
| Citibank, NA | USD | 22,000 | 11/04/2023 | 1.900% | CPI# | Maturity | 560,736 | — | 560,736 | |||||||||||||||||||||||
| Citibank, NA | USD | 10,000 | 07/20/2027 | 2.104% | CPI# | Maturity | 258,676 | — | 258,676 | |||||||||||||||||||||||
| Deutsche Bank AG | USD | 10,000 | 09/04/2025 | 1.818% | CPI# | Maturity | 348,892 | — | 348,892 | |||||||||||||||||||||||
| JPMorgan Chase Bank, NA | USD | 10,000 | 03/02/2024 | 2.175% | CPI# | Maturity | 23,554 | — | 23,554 | |||||||||||||||||||||||
| JPMorgan Chase Bank, NA | USD | 33,000 | 07/20/2024 | 1.995% | CPI# | Maturity | 717,992 | — | 717,992 | |||||||||||||||||||||||
| JPMorgan Chase Bank, NA | USD | 13,000 | 11/04/2026 | 2.015% | CPI# | Maturity | 427,521 | — | 427,521 | |||||||||||||||||||||||
| JPMorgan Chase Bank, NA | USD | 28,000 | 12/27/2028 | 2.009% | CPI# | Maturity | 991,369 | — | 991,369 | |||||||||||||||||||||||
| Morgan Stanley Capital Services LLC | USD | 56,000 | 07/20/2022 | 1.939% | CPI# | Maturity | 705,425 | — | 705,425 | |||||||||||||||||||||||
|
|
|
|
|
| |||||||||||||||||||||||||||
| $ | 2,674,057 | $ | — | $ | 2,674,057 | |||||||||||||||||||||||||||
|
|
|
|
|
| |||||||||||||||||||||||||||
# Variable interest rate based on the rate of inflation as determined by the Consumer Price Index (CPI).
2021 Semi-Annual Report | 73 | |
Table of Contents
Schedule of Investments (continued)
| INTEREST RATE SWAPS (see Note 3) |
| |||||||||||||||||||||||||||||
Rate Type | Payment Frequency Paid/ Received | Market Value | Upfront Premiums Paid/ (Received) | Unrealized Appreciation/ (Depreciation) | ||||||||||||||||||||||||||
| Swap Counterparty | Notional Amount (000) | Termination Date | Payments made by the Fund | Payments received by the Fund | ||||||||||||||||||||||||||
| Citibank, NA | USD | 12,470 | 10/09/2029 | 1.120% | SIFMA* | Quarterly | $ | 35,190 | $ | — | $ | 35,190 | ||||||||||||||||||
| Citibank, NA | USD | 12,470 | 10/09/2029 | 1.125% | SIFMA* | Quarterly | 29,428 | — | 29,428 | |||||||||||||||||||||
|
|
|
|
|
| |||||||||||||||||||||||||
| $ | 64,618 | $ | — | $ | 64,618 | |||||||||||||||||||||||||
|
|
|
|
|
| |||||||||||||||||||||||||
* Variable interest rate based on the Securities Industry & Financial Markets Association (SIFMA) Municipal Swap Index.
| TOTAL RETURN SWAPS (see Note 3) |
| |||||||||||||||||||
| Counterparty & Referenced Obligation | Rate Paid/ Received | Payment Frequency | Current Notional (000) | Maturity Date | UnrealizedAppreciation/ (Depreciation) | |||||||||||||||
| Pay Total Return on Reference Obligation |
| |||||||||||||||||||
Morgan Stanley Capital Services LLC |
| |||||||||||||||||||
Swiss Market Index Futures | 0.00% | Monthly | CHF | 6,661 | 06/18/2021 | $ | (18,347 | ) | ||||||||||||
| (a) | Security is exempt from registration under Rule 144A of the Securities Act of 1933. These securities are considered restricted, but liquid and may be resold in transactions exempt from registration, normally to qualified institutional buyers. At March 31, 2021, the aggregate market value of these securities amounted to $25,706,705 or 1.5% of net assets. |
| (b) | When-Issued or delayed delivery security. |
| (c) | Non-income producing security. |
| (d) | To obtain a copy of the fund’s shareholder report, please go to the Securities and Exchange Commission’s website at www.sec.gov. Additionally, shareholder reports for AB funds can be obtained by calling AB at (800) 227-4618. |
| (e) | Position, or a portion thereof, has been segregated to collateralize margin requirements for open futures contracts. |
| (f) | Position, or a portion thereof, has been segregated to collateralize OTC derivatives outstanding. |
| (g) | Floating Rate Security. Stated interest/floor/ceiling rate was in effect at March 31, 2021. |
| (h) | Affiliated investments. |
| (i) | The rate shown represents the 7-day yield as of period end. |
As of March 31, 2021, the Portfolio’s percentages of investments in municipal bonds that are insured and in insured municipal bonds that have been pre-refunded or escrowed to maturity are 4.4% and 0.0%, respectively.
Currency Abbreviations:
AUD—Australian Dollar
CAD—Canadian Dollar
CHF—Swiss Franc
EUR—Euro
GBP—Great British Pound
JPY—Japanese Yen
NOK—Norwegian Krone
NZD—New Zealand Dollar
SEK—Swedish Krona
USD—United States Dollar
Glossary:
AGC—Assured Guaranty Corporation
AGM—Assured Guaranty Municipal
BAM—Build American Mutual
CBT—Chicago Board of Trade
CCRC—Congregate Care Retirement Center
COP—Certificate of Participation
CPI—Consumer Price Index
EAFE—Europe, Australia, and Far East
ETF—Exchange Traded Fund
ETM—Escrowed to Maturity
ETS—Emission Trading Scheme
FTSE—Financial Times Stock Exchange
LIBOR—London Interbank Offered Rate
MSCI—Morgan Stanley Capital International
NATL—National Interstate Corporation
OMXS—Stockholm Stock Exchange
OSE—Osaka Securities Exchange
OSF—Order of St. Francis
SPDR—Standard & Poor’s Depository Receipt
SPI—Share Price Index
TOPIX—Tokyo Price Index
TSX—Toronto Stock Exchange
XLCA—XL Capital Assurance Inc.
See notes to financial statements.
| 74 | Sanford C. Bernstein Fund, Inc. | |
Table of Contents
Schedule of Investments
Sanford C. Bernstein Fund, Inc.
Schedule of Investments
Tax-Aware Overlay C Portfolio
March 31, 2021 (Unaudited)
| Principal Amount (000) | U.S. $ Value | |||||||||||
| MUNICIPAL OBLIGATIONS–68.1% |
| |||||||||||
| Long-Term Municipal Bonds–66.3% |
| |||||||||||
| Alabama–1.7% | ||||||||||||
Southeast Alabama Gas Supply District (The) |
| $ | 7,525 | $ | 8,232,190 | |||||||
Tuscaloosa County Industrial Development Authority |
| 365 | 405,644 | |||||||||
|
| |||||||||||
| 8,637,834 | ||||||||||||
|
| |||||||||||
| American Samoa–0.1% | ||||||||||||
American Samoa Economic Development Authority |
| 235 | 282,322 | |||||||||
|
| |||||||||||
| Arizona–0.5% | ||||||||||||
State of Arizona Lottery Revenue |
| 2,000 | 2,295,965 | |||||||||
Tempe Industrial Development Authority |
| 305 | 305,091 | |||||||||
|
| |||||||||||
| 2,601,056 | ||||||||||||
|
| |||||||||||
| California–52.7% | ||||||||||||
Abag Finance Authority for Nonprofit Corps. |
| 1,000 | 1,000,000 | |||||||||
Anaheim Housing & Public Improvements Authority |
| 1,150 | 1,161,749 | |||||||||
Antelope Valley-East Kern Water Agency |
| 2,000 | 2,293,955 | |||||||||
Bay Area Toll Authority |
| 2,700 | 3,423,689 | |||||||||
California Community Housing Agency |
| 1,000 | 1,034,174 | |||||||||
| Principal Amount (000) | U.S. $ Value | |||||||||
California Community Housing Agency | $ | 1,000 | $ | 1,054,842 | ||||||
California Educational Facilities Authority | 2,000 | 2,387,088 | ||||||||
California Health Facilities Financing Authority | 1,850 | 2,165,824 | ||||||||
California Health Facilities Financing Authority | 3,430 | 3,688,875 | ||||||||
California Health Facilities Financing Authority | 900 | 1,122,074 | ||||||||
California Housing Finance | 2,183 | 2,529,932 | ||||||||
Series 2021-1, Class A | 2,650 | 3,022,308 | ||||||||
California Infrastructure & Economic Development Bank | 1,500 | 1,500,141 | ||||||||
California Infrastructure & Economic Development Bank | 3,000 | 3,022,664 | ||||||||
California Municipal Finance Authority | 1,000 | 1,195,344 | ||||||||
California Municipal Finance Authority | 2,320 | 2,866,454 | ||||||||
California Municipal Finance Authority | 5,025 | 6,288,452 | ||||||||
California Municipal Finance Authority | 2,635 | 2,982,778 | ||||||||
2021 Semi-Annual Report | 75 | |
Table of Contents
Schedule of Investments (continued)
| Principal Amount (000) | U.S. $ Value | |||||||||
California Pollution Control Financing Authority | $ | 450 | $ | 550,054 | ||||||
California Public Finance Authority | 1,000 | 1,140,420 | ||||||||
California School Finance Authority | 600 | 654,936 | ||||||||
California School Finance Authority | 705 | 756,173 | ||||||||
California State Public Works Board | 3,215 | 3,319,077 | ||||||||
California State Public Works Board | 4,375 | 5,030,729 | ||||||||
Series 2019C | 1,670 | 2,113,028 | ||||||||
California State University | 2,035 | 2,095,134 | ||||||||
Series 2016A | 1,000 | 1,204,037 | ||||||||
Series 2017A | 3,160 | 3,836,835 | ||||||||
Series 2020D | 400 | 389,581 | ||||||||
California Statewide Communities Development Authority | 2,200 | 2,636,584 | ||||||||
California Statewide Communities Development Authority | 375 | 432,110 | ||||||||
California Statewide Communities Development Authority | 500 | 607,518 | ||||||||
| Principal Amount (000) | U.S. $ Value | |||||||||
California Statewide Communities Development Authority | $ | 5,705 | $ | 7,053,133 | ||||||
California Statewide Communities Development Authority | 335 | 346,975 | ||||||||
City & County of San Francisco CA | 4,175 | 4,643,222 | ||||||||
City of Hayward CA | 3,365 | 3,616,752 | ||||||||
City of Los Angeles Department of Airports | 1,000 | 1,117,749 | ||||||||
5.00%, 05/15/2031–05/15/2033 | 1,485 | 1,908,867 | ||||||||
Series 2016A | 4,470 | 5,328,775 | ||||||||
Series 2017A | 4,860 | 5,887,690 | ||||||||
Series 2017B | 1,875 | 1,884,862 | ||||||||
Series 2018D | 2,890 | 3,492,158 | ||||||||
City of Oakland CA | 1,380 | 1,432,004 | ||||||||
City of Riverside CA Electric Revenue | 5,490 | 5,621,175 | ||||||||
City of Roseville CA | 1,000 | 1,191,568 | ||||||||
City of Roseville CA | 340 | 393,746 | ||||||||
City of San Francisco CA Public Utilities Commission Water Revenue | 5,385 | 5,537,170 | ||||||||
City of San Jose CA Airport Revenue | 1,955 | 2,210,280 | ||||||||
| 76 | Sanford C. Bernstein Fund, Inc. | |
Table of Contents
| Principal Amount (000) | U.S. $ Value | |||||||||
Series 2014B | $ | 2,360 | $ | 2,674,768 | ||||||
Coronado Community Development Agency Successor Agency | 3,080 | 3,570,733 | ||||||||
County of Monterey CA | 4,870 | 6,125,512 | ||||||||
County of Sacramento CA Airport System Revenue | 1,280 | 1,583,729 | ||||||||
County of San Diego CA | 2,550 | 2,952,714 | ||||||||
CSCDA Community Improvement Authority | 1,000 | 964,771 | ||||||||
Fremont Community Facilities District No. 1 | 1,505 | 1,744,614 | ||||||||
Golden State Tobacco Securitization Corp. | 2,335 | 2,377,158 | ||||||||
Irvine Unified School District | 925 | 1,027,556 | ||||||||
Long Beach Bond Finance Authority | 1,460 | 1,500,399 | ||||||||
Los Angeles Department of Water & Power | 820 | 1,072,111 | ||||||||
Los Angeles Department of Water & Power Power System Revenue | 1,660 | 2,112,721 | ||||||||
Los Angeles Unified School District/CA | 6,815 | 7,821,122 | ||||||||
Series 2015A | 4,785 | 4,840,866 | ||||||||
Middle Fork Project Finance Authority | 450 | 551,955 | ||||||||
Newport Mesa Unified School District | 1,555 | 1,671,084 | ||||||||
| Principal Amount (000) | U.S. $ Value | |||||||||
Oakland Unified School District/Alameda County | $ | 2,335 | $ | 2,755,769 | ||||||
Peralta Community College District | 5,855 | 6,713,803 | ||||||||
Series 2020A | 3,545 | 3,770,059 | ||||||||
Port of Oakland | 5,000 | 5,249,703 | ||||||||
5.00%, 05/01/2025 | 1,405 | 1,475,167 | ||||||||
Riverside County Redevelopment Successor Agency | 1,900 | 2,364,081 | ||||||||
Romoland School District | 300 | 330,593 | ||||||||
Sacramento City Unified School District/CA | 2,380 | 2,404,759 | ||||||||
Sacramento County Sanitation Districts Financing Authority | 2,000 | 2,278,384 | ||||||||
San Diego Association of Governments | 1,500 | 1,540,471 | ||||||||
San Diego County Regional Airport Authority | 2,990 | 3,872,405 | ||||||||
San Diego County Water Authority | 4,860 | 4,877,334 | ||||||||
Series 2021A | 5,810 | 6,876,398 | ||||||||
San Francisco Community College District | 5,000 | 5,289,274 | ||||||||
San Francisco Intl Airport | 1,775 | 1,781,606 | ||||||||
5.00%, 05/01/2024 | 695 | 697,419 | ||||||||
Series 20122 | 1,270 | 1,334,968 | ||||||||
Series 2016S | 2,730 | 3,293,167 | ||||||||
2021 Semi-Annual Report | 77 | |
Table of Contents
Schedule of Investments (continued)
| Principal Amount (000) | U.S. $ Value | |||||||||||
Saugus/Hart School Facilities Financing Authority |
| $ | 750 | $ | 888,115 | |||||||
Simi Valley Unified School District |
| 2,500 | 2,612,285 | |||||||||
State of California |
| 3,975 | 4,385,837 | |||||||||
Series 2018B |
| 7,615 | 9,778,847 | |||||||||
Stockton Redevelopment Agency Successor Agency |
| 1,900 | 2,252,317 | |||||||||
Tobacco Securitization Authority of Southern California |
| 960 | 1,252,863 | |||||||||
University of California |
| 130 | 137,027 | |||||||||
5.00%, 05/15/2023 |
| 4,625 | 4,871,130 | |||||||||
series 2012G |
| 2,645 | 2,787,970 | |||||||||
Series 2013A |
| 6,000 | 6,597,119 | |||||||||
Series 2015A |
| 5,355 | 5,384,201 | |||||||||
Series 2018A |
| 2,120 | 2,364,923 | |||||||||
Upper Santa Clara Valley Joint Powers Authority |
| 1,790 | 1,818,484 | |||||||||
Vista Unified School District |
| 2,090 | 2,224,417 | |||||||||
5.00%, 08/01/2025 (Pre-refunded/ETM) |
| 2,150 | 2,288,276 | |||||||||
Walnut Energy Center Authority |
| 2,800 | 3,207,671 | |||||||||
|
| |||||||||||
| 271,521,340 | ||||||||||||
|
| |||||||||||
| Colorado–0.6% | ||||||||||||
City & County of Denver CO |
| 1,000 | 1,063,698 | |||||||||
| Principal Amount (000) | U.S. $ Value | |||||||||||
Plaza Metropolitan District No. 1 |
| $ | 690 | $ | 725,702 | |||||||
Sterling Ranch Community Authority Board |
| 1,000 | 1,068,281 | |||||||||
Vauxmont Metropolitan District |
| 100 | 119,642 | |||||||||
|
| |||||||||||
| 2,977,323 | ||||||||||||
|
| |||||||||||
| Connecticut–0.3% | ||||||||||||
State of Connecticut |
| 1,250 | 1,457,814 | |||||||||
|
| |||||||||||
| Florida–0.1% | ||||||||||||
Capital Trust Agency, Inc. |
| 100 | 113,557 | |||||||||
County of Osceola FL Transportation Revenue |
| 100 | 76,942 | |||||||||
Palm Beach County Health Facilities Authority |
| 140 | 141,292 | |||||||||
|
| |||||||||||
| 331,791 | ||||||||||||
|
| |||||||||||
| Guam–0.5% | ||||||||||||
Territory of Guam |
| 95 | 104,985 | |||||||||
Territory of Guam |
| 570 | 654,067 | |||||||||
Territory of Guam (Territory of Guam Business Privilege Tax) |
| 1,610 | 1,810,898 | |||||||||
|
| |||||||||||
| 2,569,950 | ||||||||||||
|
| |||||||||||
| Illinois–2.4% | ||||||||||||
Chicago Board of Education |
| 2,000 | 2,263,718 | |||||||||
Illinois Finance Authority |
| 300 | 360,597 | |||||||||
Metropolitan Pier & Exposition Authority |
| 1,400 | 1,682,725 | |||||||||
| 78 | Sanford C. Bernstein Fund, Inc. | |
Table of Contents
| Principal Amount (000) | U.S. $ Value | |||||||||||
State of Illinois |
| $ | 350 | $ | 355,036 | |||||||
Series 2014 |
| 2,165 | 2,414,762 | |||||||||
Series 2016 |
| 1,520 | 1,574,722 | |||||||||
Series 2017D |
| 3,190 | 3,605,429 | |||||||||
|
| |||||||||||
| 12,256,989 | ||||||||||||
|
| |||||||||||
| Kentucky–0.1% | ||||||||||||
City of Ashland KY |
| 240 | 282,156 | |||||||||
|
| |||||||||||
| Louisiana–0.1% | ||||||||||||
Parish of St. James LA |
| 210 | 262,535 | |||||||||
|
| |||||||||||
| Michigan–2.1% | ||||||||||||
City of Detroit MI |
| 2,600 | 3,097,529 | |||||||||
Michigan Finance Authority |
| 2,175 | 2,423,481 | |||||||||
Michigan Strategic Fund |
| 4,325 | 5,400,765 | |||||||||
|
| |||||||||||
| 10,921,775 | ||||||||||||
|
| |||||||||||
| Missouri–0.0% | ||||||||||||
Howard Bend Levee District |
| 100 | 114,455 | |||||||||
|
| |||||||||||
| Nebraska–0.5% | ||||||||||||
Central Plains Energy Project |
| 2,290 | 2,550,893 | |||||||||
|
| |||||||||||
| Nevada–0.1% | ||||||||||||
City of Sparks NV |
| 420 | 428,558 | |||||||||
|
| |||||||||||
| New Jersey–1.9% | ||||||||||||
New Jersey Transportation Trust Fund Authority |
| 6,950 | 7,340,869 | |||||||||
| Principal Amount (000) | U.S. $ Value | |||||||||||
New Jersey Transportation Trust Fund Authority (New Jersey Transportation Trust Fund Authority State Lease) |
| $ | 2,000 | $ | 2,488,139 | |||||||
|
| |||||||||||
| 9,829,008 | ||||||||||||
|
| |||||||||||
| New York–0.0% | ||||||||||||
New York Transportation Development Corp. |
| 210 | 230,437 | |||||||||
|
| |||||||||||
| Ohio–0.3% | ||||||||||||
Ohio Air Quality Development Authority |
| 160 | 164,800 | |||||||||
Ohio Air Quality Development Authority |
| 890 | 965,095 | |||||||||
Ohio Water Development Authority Water Pollution Control Loan Fund |
| 180 | 185,400 | |||||||||
Series 2016B |
| 350 | 360,500 | |||||||||
|
| |||||||||||
| 1,675,795 | ||||||||||||
|
| |||||||||||
| Pennsylvania–0.2% | ||||||||||||
Hospitals & Higher Education Facilities Authority of Philadelphia (The) |
| 1,000 | 1,044,800 | |||||||||
|
| |||||||||||
| Puerto Rico–0.6% | ||||||||||||
Puerto Rico Highway & Transportation Authority |
| 190 | 234,474 | |||||||||
AGC Series 2007C |
| 110 | 135,448 | |||||||||
NATL Series 2005L |
| 1,170 | 1,285,073 | |||||||||
Puerto Rico Industrial Tourist Educational Medical & Environmental Control Facilities Financing Auth |
| 1,105 | 1,140,912 | |||||||||
2021 Semi-Annual Report | 79 | |
Table of Contents
Schedule of Investments (continued)
| Principal Amount (000) | U.S. $ Value | |||||||||||
Puerto Rico Sales Tax Financing Corp. Sales Tax Revenue |
| $ | 448 | $ | 420,471 | |||||||
|
| |||||||||||
| 3,216,378 | ||||||||||||
|
| |||||||||||
| Texas–0.9% | ||||||||||||
Mission Economic Development Corp. (Natgasoline LLC) |
| 1,010 | 1,073,362 | |||||||||
Texas Municipal Gas Acquisition & Supply Corp. I (Bank of America Corp.) |
| 2,950 | 3,466,000 | |||||||||
|
| |||||||||||
| 4,539,362 | ||||||||||||
|
| |||||||||||
| Washington–0.2% | ||||||||||||
Kalispel Tribe of Indians |
| 1,000 | 1,142,791 | |||||||||
|
| |||||||||||
| Wisconsin–0.4% | ||||||||||||
UMA Education, Inc. |
| 1,040 | 1,200,521 | |||||||||
Wisconsin Public Finance Authority |
| 1,135 | 1,246,648 | |||||||||
|
| |||||||||||
| 2,447,169 | ||||||||||||
|
| |||||||||||
| Total Long-Term Municipal Bonds (cost $324,406,793) |
| 341,322,531 | ||||||||||
|
| |||||||||||
| Short-Term Municipal Notes–1.8% |
| |||||||||||
| California–1.1% | ||||||||||||
County of Los Angeles CA |
| 5,495 | 5,547,954 | |||||||||
|
| |||||||||||
| Texas–0.7% | ||||||||||||
State of Texas |
| 3,625 | 3,682,063 | |||||||||
|
| |||||||||||
| Total Short-Term Municipal Notes (cost $9,226,060) |
| 9,230,017 | ||||||||||
|
| |||||||||||
| Total Municipal Obligations (cost $333,632,853) |
| 350,552,548 | ||||||||||
|
| |||||||||||
| Shares | ||||||||||||
| INVESTMENT COMPANIES–28.0% |
| |||||||||||
| Funds and Investment Trusts–28.0%(c) |
| |||||||||||
iShares Core MSCI EAFE ETF |
| 555,459 | 40,020,821 | |||||||||
iShares Core MSCI Emerging Markets ETF |
| 304,022 | 19,566,856 | |||||||||
| Shares | U.S. $ Value | |||||||||||
SPDR S&P 500 ETF Trust |
| 200,877 | $ | 79,613,581 | ||||||||
Vanguard Mid-Cap ETF |
| 23,156 | 5,125,349 | |||||||||
|
| |||||||||||
| Total Investment Companies (cost $100,324,653) |
| 144,326,607 | ||||||||||
|
| |||||||||||
| Principal Amount (000) | ||||||||||||
| GOVERNMENTS—TREASURIES–0.7% |
| |||||||||||
| United States–0.7% | ||||||||||||
U.S. Treasury Notes | U.S. $ | 200 | 209,813 | |||||||||
2.625%, 02/15/2029(d)(e) | 2,920 | 3,156,337 | ||||||||||
|
| |||||||||||
| Total Governments—Treasuries (cost $3,286,510) |
| 3,366,150 | ||||||||||
|
| |||||||||||
| Notional Amount | ||||||||||||
| OPTIONS PURCHASED—PUTS –0.4% |
| |||||||||||
| Options on Equity Indices–0.4% | ||||||||||||
Euro STOXX 50 Index | EUR | 5,355,000 | 161,782 | |||||||||
Euro STOXX 50 Index | EUR | 2,766,750 | 83,588 | |||||||||
FTSE 100 Index | GBP | 2,040,000 | 67,360 | |||||||||
FTSE 100 Index | GBP | 1,020,000 | 33,680 | |||||||||
Nikkei 225 Index | JPY | 270,000,000 | 66,922 | |||||||||
Nikkei 225 Index | JPY | 270,000,000 | 66,922 | |||||||||
Nikkei 225 Index | JPY | 247,500,000 | 61,345 | |||||||||
| 80 | Sanford C. Bernstein Fund, Inc. | |
Table of Contents
| Notional Amount | U.S. $ Value | |||||||||||
S&P 500 Index Expiration: Jan 2022; Contracts: 14,900; Exercise Price:USD 3,000.00; Counterparty: UBS AG(b) | USD | 44,700,000 | $ | 988,163 | ||||||||
S&P 500 Index | USD | 22,200,000 | 490,765 | |||||||||
|
| |||||||||||
| Total Options Purchased—Puts (cost $3,218,099) |
| 2,020,527 | ||||||||||
|
| |||||||||||
| Principal Amount(000) | ||||||||||||
| COLLATERALIZED MORTGAGE OBLIGATIONS–0.2% |
| |||||||||||
| Risk Share Floating Rate–0.2% |
| |||||||||||
Federal National Mortgage Association Connecticut Avenue Securities |
| $ | 89 | 89,679 | ||||||||
Series 2015-C01, Class 2M2 4.659% (LIBOR 1 Month + 4.55%), 02/25/2025(f) |
| 12 | 12,006 | |||||||||
Series 2015-C02, Class 1M2 4.109% (LIBOR 1 Month + 4.00%), 05/25/2025(f) |
| 79 | 80,053 | |||||||||
Series 2016-C07, Class 2M2 4.459% (LIBOR 1 Month + 4.35%), 05/25/2029(f) |
| 221 | 229,576 | |||||||||
| Principal Amount(000) | U.S. $ Value | |||||||||||
Series 2017-C01, Class 1M2 3.659% (LIBOR 1 Month + 3.55%), 07/25/2029(f) |
| $ | 242 | $ | 249,671 | |||||||
Series 2017-C02, Class 2M2 3.759% (LIBOR 1 Month + 3.65%), 09/25/2029(f) |
| 374 | 384,394 | |||||||||
Series 2017-C06, Class 2M2 2.909% (LIBOR 1 Month + 2.80%), 02/25/2030(f) |
| 187 | 187,553 | |||||||||
|
| |||||||||||
| Total Collateralized Mortgage Obligations (cost $1,140,099) |
| 1,232,932 | ||||||||||
|
| |||||||||||
| Shares | ||||||||||||
| SHORT-TERM INVESTMENTS–0.2% |
| |||||||||||
| Investment Companies–0.2% | ||||||||||||
AB Fixed Income Shares, Inc.—Government Money Market Portfolio—Class AB, | 1,116,829 | 1,116,829 | ||||||||||
|
| |||||||||||
| Total Investments—97.6% (cost $442,719,043) |
| 502,615,593 | ||||||||||
Other assets less liabilities—2.4% |
| 12,202,581 | ||||||||||
|
| |||||||||||
| Net Assets—100.0% |
| $ | 514,818,174 | |||||||||
|
| |||||||||||
| FUTURES (see Note 3) |
| |||||||||||||
| Description | Number of Contracts | Expiration Month | Current Notional | Value and Unrealized Appreciation/ (Depreciation) | ||||||||||
| Purchased Contracts | ||||||||||||||
Euro STOXX 50 Index Futures | 183 | June 2021 | $ | 8,296,595 | $ | 194,573 | ||||||||
FTSE 100 Index Futures | 8 | June 2021 | 736,668 | (2,193 | ) | |||||||||
Hang Seng Index Futures | 5 | April 2021 | 910,588 | (4,442 | ) | |||||||||
MSCI Singapore IX ETS Futures | 154 | April 2021 | 4,097,852 | 23,209 | ||||||||||
Nikkei 225 (OSE) Futures | 5 | June 2021 | 1,317,679 | 17,342 | ||||||||||
OMXS 30 Index Futures | 270 | April 2021 | 6,762,018 | 98,807 | ||||||||||
Russell 2000 E-Mini Futures | 112 | June 2021 | 12,446,000 | (336,084 | ) | |||||||||
S&P 500 E-Mini Futures | 209 | June 2021 | 41,459,330 | 792,034 | ||||||||||
S&P Mid 400 E-Mini Futures | 16 | June 2021 | 4,168,480 | (1,202 | ) | |||||||||
S&P/TSX 60 Index Futures | 33 | June 2021 | 5,835,330 | 20,453 | ||||||||||
TOPIX Index Futures | 43 | June 2021 | 7,588,349 | 127,341 | ||||||||||
U.S. T-Note 2 Yr (CBT) Futures | 67 | June 2021 | 14,788,680 | (14,736 | ) | |||||||||
U.S. T-Note 10 Yr (CBT) Futures | 209 | June 2021 | 27,365,937 | (581,085 | ) | |||||||||
U.S. Ultra Bond (CBT) Futures | 36 | June 2021 | 6,523,875 | (280,739 | ) | |||||||||
2021 Semi-Annual Report | 81 | |
Table of Contents
Schedule of Investments (continued)
| Description | Number of Contracts | Expiration Month | Current Notional | Value and Unrealized Appreciation/ (Depreciation) | ||||||||||
| Sold Contracts | ||||||||||||||
FTSE 100 Index Futures | 64 | June 2021 | $ | 5,893,346 | $ | 22,475 | ||||||||
SPI 200 Futures | 49 | June 2021 | 6,295,416 | (6,470 | ) | |||||||||
|
| |||||||||||||
| $ | 69,283 | |||||||||||||
|
| |||||||||||||
| FORWARD CURRENCY EXCHANGE CONTRACTS (see Note 3) |
| |||||||||||||||||||||
| Counterparty | Contracts to Deliver (000) | In Exchange For (000) | Settlement Date | Unrealized Appreciation/ (Depreciation) | ||||||||||||||||||
Bank of America, NA | CAD | 1,876 | USD | 1,500 | 04/22/2021 | $ | 6,975 | |||||||||||||||
BNP Paribas SA | SEK | 11,173 | USD | 1,312 | 04/15/2021 | 32,233 | ||||||||||||||||
BNP Paribas SA | CAD | 5,472 | USD | 4,354 | 04/22/2021 | (485 | ) | |||||||||||||||
BNP Paribas SA | USD | 2,606 | CAD | 3,297 | 04/22/2021 | 17,279 | ||||||||||||||||
BNP Paribas SA | JPY | 332,156 | USD | 3,056 | 05/20/2021 | 54,683 | ||||||||||||||||
BNP Paribas SA | NZD | 1,321 | USD | 946 | 05/27/2021 | 23,056 | ||||||||||||||||
Citibank, NA | SEK | 7,311 | USD | 879 | 04/15/2021 | 41,609 | ||||||||||||||||
Citibank, NA | USD | 11,839 | CAD | 15,011 | 04/22/2021 | 106,296 | ||||||||||||||||
Deutsche Bank AG | AUD | 1,583 | USD | 1,207 | 06/04/2021 | 4,665 | ||||||||||||||||
Goldman Sachs Bank USA | CHF | 3,438 | USD | 3,878 | 05/06/2021 | 237,653 | ||||||||||||||||
JPMorgan Chase Bank, NA | GBP | 4,105 | USD | 5,606 | 04/09/2021 | (53,205 | ) | |||||||||||||||
JPMorgan Chase Bank, NA | USD | 2,388 | GBP | 1,701 | 04/09/2021 | (43,217 | ) | |||||||||||||||
JPMorgan Chase Bank, NA | NOK | 8,196 | USD | 960 | 04/15/2021 | 1,424 | ||||||||||||||||
JPMorgan Chase Bank, NA | SEK | 35,937 | USD | 4,329 | 04/15/2021 | 213,914 | ||||||||||||||||
JPMorgan Chase Bank, NA | USD | 5,360 | NOK | 45,454 | 04/15/2021 | (45,827 | ) | |||||||||||||||
JPMorgan Chase Bank, NA | USD | 9,032 | SEK | 75,934 | 04/15/2021 | (336,605 | ) | |||||||||||||||
JPMorgan Chase Bank, NA | CAD | 4,406 | USD | 3,476 | 04/22/2021 | (30,244 | ) | |||||||||||||||
JPMorgan Chase Bank, NA | CHF | 1,159 | USD | 1,247 | 05/06/2021 | 19,877 | ||||||||||||||||
JPMorgan Chase Bank, NA | JPY | 354,867 | USD | 3,322 | 05/20/2021 | 115,761 | ||||||||||||||||
Morgan Stanley & Co., Inc. | USD | 994 | GBP | 730 | 04/09/2021 | 11,896 | ||||||||||||||||
Morgan Stanley & Co., Inc. | USD | 4,095 | JPY | 445,645 | 05/20/2021 | (68,589 | ) | |||||||||||||||
Natwest Markets PLC | GBP | 620 | USD | 847 | 04/09/2021 | (7,317 | ) | |||||||||||||||
Natwest Markets PLC | JPY | 131,277 | USD | 1,238 | 05/20/2021 | 51,899 | ||||||||||||||||
Standard Chartered Bank | USD | 3,516 | JPY | 372,655 | 05/20/2021 | (149,053 | ) | |||||||||||||||
State Street Bank & Trust Co. | GBP | 274 | USD | 380 | 04/09/2021 | 2,393 | ||||||||||||||||
State Street Bank & Trust Co. | GBP | 110 | USD | 150 | 04/09/2021 | (1,463 | ) | |||||||||||||||
State Street Bank & Trust Co. | SEK | 1,206 | USD | 146 | 04/15/2021 | 7,903 | ||||||||||||||||
State Street Bank & Trust Co. | USD | 455 | SEK | 3,841 | 04/15/2021 | (15,106 | ) | |||||||||||||||
State Street Bank & Trust Co. | EUR | 3,942 | USD | 4,705 | 05/27/2021 | 77,091 | ||||||||||||||||
State Street Bank & Trust Co. | USD | 2,378 | NZD | 3,272 | 05/27/2021 | (92,891 | ) | |||||||||||||||
UBS AG | USD | 1,362 | NOK | 11,581 | 04/15/2021 | (8,229 | ) | |||||||||||||||
|
| |||||||||||||||||||||
| $ | 174,376 | |||||||||||||||||||||
|
| |||||||||||||||||||||
| 82 | Sanford C. Bernstein Fund, Inc. | |
Table of Contents
| CENTRALLY CLEARED INFLATION (CPI) SWAPS (see Note 3) | ||||||||||||||||||||||||||||
Rate Type | Payment Frequency Paid/ Received | Market Value | Upfront Premiums Paid/ (Received) | Unrealized Appreciation/ (Depreciation) | ||||||||||||||||||||||||
| Notional Amount (000) | Termination Date | Payments made by the Fund | Payments received by the Fund | |||||||||||||||||||||||||
| USD | 1,420 | 01/15/2025 | 2.565% | CPI# | Maturity | $ | 2,955 | $ | — | $ | 2,955 | |||||||||||||||||
| USD | 710 | 01/15/2025 | 2.585% | CPI# | Maturity | 877 | — | 877 | ||||||||||||||||||||
| USD | 710 | 01/15/2025 | 2.613% | CPI# | Maturity | 51 | — | 51 | ||||||||||||||||||||
| USD | 6,470 | 01/15/2028 | 1.230% | CPI# | Maturity | 620,636 | — | 620,636 | ||||||||||||||||||||
| USD | 5,230 | 01/15/2028 | 0.735% | CPI# | Maturity | 705,881 | — | 705,881 | ||||||||||||||||||||
| USD | 1,575 | 01/15/2030 | 1.572% | CPI# | Maturity | 136,355 | — | 136,355 | ||||||||||||||||||||
| USD | 1,575 | 01/15/2030 | 1.587% | CPI# | Maturity | 133,966 | — | 133,966 | ||||||||||||||||||||
| USD | 240 | 01/15/2030 | 1.714% | CPI# | Maturity | 17,313 | — | 17,313 | ||||||||||||||||||||
| USD | 240 | 01/15/2030 | 1.731% | CPI# | Maturity | 16,895 | — | 16,895 | ||||||||||||||||||||
|
|
|
|
|
| |||||||||||||||||||||||
| $ | 1,634,929 | $ | — | $ | 1,634,929 | |||||||||||||||||||||||
|
|
|
|
|
| |||||||||||||||||||||||
# Variable interest rate based on the rate of inflation as determined by the Consumer Price Index (CPI).
| CENTRALLY CLEARED INTEREST RATE SWAPS (see Note 3) | ||||||||||||||||||||||||||||
Rate Type | Payment | Market | Upfront Premiums Paid/ (Received) | Unrealized | ||||||||||||||||||||||||
| Notional Amount (000) | Termination Date | Payments made by the Fund | Payments received by the Fund | |||||||||||||||||||||||||
| USD | 13,270 | 06/17/2021 | 3 Month LIBOR | 1.907% | Quarterly/ Semi-Annual | $ | 120,285 | $ | — | $ | 120,285 | |||||||||||||||||
| USD | 14,000 | 09/10/2024 | 3 Month LIBOR | 1.341% | Quarterly/ Semi-Annual | 350,300 | — | 350,300 | ||||||||||||||||||||
| USD | 4,180 | 01/15/2025 | 3 Month LIBOR | 1.566% | Quarterly/ Semi-Annual | 142,141 | — | 142,141 | ||||||||||||||||||||
| USD | 3,000 | 04/16/2034 | 3 Month LIBOR | 2.673% | Quarterly/ Semi-Annual | 275,024 | — | 275,024 | ||||||||||||||||||||
|
|
|
|
|
| |||||||||||||||||||||||
| $ | 887,750 | $ | — | $ | 887,750 | |||||||||||||||||||||||
|
|
|
|
|
| |||||||||||||||||||||||
| CREDIT DEFAULT SWAPS (see Note 3) |
| |||||||||||||||||||||||||||
| Swap Counterparty & Referenced Obligation | Fixed Rate (Pay) Receive | Payment Frequency | Implied Credit Spread at March31, 2021 | Notional Amount (000) | Market Value | Upfront Premiums Paid/ (Received) | Unrealized Appreciation/ (Depreciation) | |||||||||||||||||||||
| Sale Contracts | ||||||||||||||||||||||||||||
| Citigroup Global Markets, Inc. | ||||||||||||||||||||||||||||
CDX-CMBX.NA.BBB- | 3.00 | % | Monthly | 12.50 | % | USD | 37 | $ | (9,968 | ) | $ | (3,585 | ) | $ | (6,383 | ) | ||||||||||||
CDX-CMBX.NA.BBB- | 3.00 | Monthly | 12.50 | USD | 123 | (33,136 | ) | (15,376 | ) | (17,760 | ) | |||||||||||||||||
| Credit Suisse International | ||||||||||||||||||||||||||||
CDX-CMBX.NA.BBB- | 3.00 | Monthly | 12.50 | USD | 8 | (2,155 | ) | (970 | ) | (1,185 | ) | |||||||||||||||||
CDX-CMBX.NA.BBB- | 3.00 | Monthly | 12.50 | USD | 20 | (5,388 | ) | (1,956 | ) | (3,432 | ) | |||||||||||||||||
CDX-CMBX.NA.BBB- | 3.00 | Monthly | 12.50 | USD | 251 | (67,619 | ) | (30,228 | ) | (37,391 | ) | |||||||||||||||||
CDX-CMBX.NA.BBB- | 3.00 | Monthly | 12.50 | USD | 255 | (68,676 | ) | (24,967 | ) | (43,709 | ) | |||||||||||||||||
2021 Semi-Annual Report | 83 | |
Table of Contents
Schedule of Investments (continued)
| Swap Counterparty & Referenced Obligation | Fixed Rate (Pay) Receive | Payment Frequency | Implied Credit Spread at March 31, 2021 | Notional Amount (000) | Market Value | Upfront Premiums Paid/ (Received) | Unrealized Appreciation/ (Depreciation) | |||||||||||||||||||
CDX-CMBX.NA.BBB- | 3.00 | % | Monthly | 12.50 | % | USD | 382 | $ | (102,910 | ) | $ | (36,441 | ) | $ | (66,469 | ) | ||||||||||
| Goldman Sachs International | ||||||||||||||||||||||||||
CDX-CMBX.NA.BBB- | 3.00 | Monthly | 12.50 | USD | 48 | (12,931 | ) | (5,975 | ) | (6,956 | ) | |||||||||||||||
CDX-CMBX.NA.BBB- | 3.00 | Monthly | 12.50 | USD | 331 | (89,172 | ) | (30,649 | ) | (58,523 | ) | |||||||||||||||
|
|
|
|
|
| |||||||||||||||||||||
| $ | (391,955 | ) | $ | (150,147 | ) | $ | (241,808 | ) | ||||||||||||||||||
|
|
|
|
|
| |||||||||||||||||||||
* Termination date
| INFLATION (CPI) SWAPS (see Note 3) |
| |||||||||||||||||||||||||||||||||
| Rate Type | Payment Frequency Paid Received | Market Value | Upfront Premiums Paid (Received) | Unrealized Appreciation/ (Depreciation) | ||||||||||||||||||||||||||||||
| Swap Counterparty | Notional Amount (000) | Termination Date | Payments made by the Fund | Payments received by the Fund | ||||||||||||||||||||||||||||||
Barclays Bank PLC | USD | 5,000 | 10/23/2026 | 2.310% | CPI# | Maturity | $ (213,158) | $ — | $ (213,158) | |||||||||||||||||||||||||
Barclays Bank PLC | USD | 5,000 | 12/04/2027 | 2.170% | CPI# | Maturity | 86,584 | — | 86,584 | |||||||||||||||||||||||||
Barclays Bank PLC | USD | 1,000 | 10/23/2029 | 2.388% | CPI# | Maturity | (51,331) | — | (51,331) | |||||||||||||||||||||||||
Citibank, NA | USD | 6,400 | 10/23/2021 | 2.039% | CPI# | Maturity | (185,300) | — | (185,300) | |||||||||||||||||||||||||
Citibank, NA | USD | 7,000 | 11/04/2023 | 1.900% | CPI# | Maturity | 178,416 | — | 178,416 | |||||||||||||||||||||||||
Citibank, NA | USD | 3,000 | 07/20/2027 | 2.104% | CPI# | Maturity | 77,603 | — | 77,603 | |||||||||||||||||||||||||
Deutsche Bank AG | USD | 4,000 | 09/04/2025 | 1.818% | CPI# | Maturity | 139,557 | — | 139,557 | |||||||||||||||||||||||||
JPMorgan Chase Bank, NA | USD | 3,000 | 03/02/2024 | 2.175% | CPI# | Maturity | 7,066 | — | 7,066 | |||||||||||||||||||||||||
JPMorgan Chase Bank, NA | USD | 5,000 | 07/20/2024 | 1.995% | CPI# | Maturity | 108,787 | — | 108,787 | |||||||||||||||||||||||||
JPMorgan Chase Bank, NA | USD | 4,000 | 11/04/2026 | 2.015% | CPI# | Maturity | 131,545 | — | 131,545 | |||||||||||||||||||||||||
JPMorgan Chase Bank, NA | USD | 7,000 | 12/27/2028 | 2.009% | CPI# | Maturity | 247,842 | — | 247,842 | |||||||||||||||||||||||||
Morgan Stanley Capital Services LLC | USD | 19,000 | 07/20/2022 | 1.939% | CPI# | Maturity | 239,341 | — | 239,341 | |||||||||||||||||||||||||
Morgan Stanley Capital Services LLC | USD | 5,000 | 07/20/2032 | 2.158% | CPI# | Maturity | 184,914 | — | 184,914 | |||||||||||||||||||||||||
|
|
|
|
|
| |||||||||||||||||||||||||||||
| $ 951,866 | $ — | $ 951,866 | ||||||||||||||||||||||||||||||||
|
|
|
|
|
| |||||||||||||||||||||||||||||
# Variable interest rate based on the rate of inflation as determined by the Consumer Price Index (CPI).
| 84 | Sanford C. Bernstein Fund, Inc. | |
Table of Contents
| INTEREST RATE SWAPS (see Note 3) |
| |||||||||||||||||||||||||||||||||
| Rate Type | Payment Frequency Paid/ Received | Market Value | Upfront Premiums Paid/ (Received) | Unrealized Appreciation/ (Depreciation) | ||||||||||||||||||||||||||||||
| Swap Counterparty | Notional Amount (000) | Termination Date | Payments made by the Fund | Payments received by the Fund | ||||||||||||||||||||||||||||||
Citibank, NA | USD | 3,815 | 10/09/2029 | 1.120% | SIFMA* | Quarterly | $ | 10,766 | $ | — | $ | 10,766 | ||||||||||||||||||||||
Citibank, NA | USD | 3,815 | 10/09/2029 | 1.125% | SIFMA* | Quarterly | 9,003 | — | 9,003 | |||||||||||||||||||||||||
|
|
|
|
|
| |||||||||||||||||||||||||||||
| $ | 19,769 | $ | — | $ | 19,769 | |||||||||||||||||||||||||||||
|
|
|
|
|
| |||||||||||||||||||||||||||||
* Variable interest rate based on the Securities Industry & Financial Markets Association (SIFMA) Municipal Swap Index.
| TOTAL RETURN SWAPS (see Note 3) |
| |||||||||||||||||||||
| Counterparty & Referenced Obligation | Rate Paid/ Received | Payment Frequency | Current Notional (000) | Maturity Date | Unrealized Appreciation/ (Depreciation) | |||||||||||||||||
| Pay Total Return on Reference Obligation |
| |||||||||||||||||||||
Morgan Stanley Capital Services LLC | ||||||||||||||||||||||
Swiss Market Index Futures | 0.00% | Monthly | CHF | 2,075 | 06/18/2021 | $ | (5,715 | ) | ||||||||||||||
| (a) | Security is exempt from registration under Rule 144A of the Securities Act of 1933. These securities are considered restricted, but liquid and may be resold in transactions exempt from registration, normally to qualified institutional buyers. At March 31, 2021, the aggregate market value of these securities amounted to $15,947,292 or 3.1%of net assets. |
| (b) | Non-income producing security. |
| (c) | To obtain a copy of the fund’s shareholder report, please go to the Securities and Exchange Commission’s website at www.sec.gov. Additionally, shareholder reports for AB funds can be obtained by calling AB at (800) 227-4618. |
| (d) | Position, or a portion thereof, has been segregated to collateralize OTC derivatives outstanding. |
| (e) | Position, or a portion thereof, has been segregated to collateralize margin requirements for open futures contracts. |
| (f) | Floating Rate Security. Stated interest/floor/ceiling rate was in effect at March 31, 2021. |
| (g) | Affiliated investments. |
| (h) | The rate shown represents the 7-day yield as of period end. |
As of March 31, 2021, the Portfolio’s percentages of investments in municipal bonds that are insured and in insured municipal bonds that have been pre-refunded or escrowed to maturity are 1.9%and 0.0%, respectively.
Currency Abbreviations:
AUD—Australian Dollar
CAD—Canadian Dollar
CHF—Swiss Franc
EUR—Euro
GBP—Great British Pound
JPY—Japanese Yen
NOK–Norwegian Krone
NZD–New Zealand Dollar
SEK–Swedish Krona
USD–United States Dollar
Glossary:
AGC—Assured Guaranty Corporation
AGM—Assured Guaranty Municipal
CBT—Chicago Board of Trade
CCRC—Congregate Care Retirement Center
COP—Certificate of Participation
CPI—Consumer Price Index
DOT—Department of Transportation
EAFE—Europe, Australia, and Far East
ETF—Exchange Traded Fund
ETM—Escrowed to Maturity
ETS—Emission Trading Scheme
FTSE—Financial Times Stock Exchange
LIBOR—London Interbank Offered Rate
MSCI—Morgan Stanley Capital International
NATL—National Interstate Corporation
OMXS—Stockholm Stock Exchange
OSE—Osaka Securities Exchange
SPDR—Standard & Poor’s Depository Receipt
SPI—Share Price Index
TOPIX—Tokyo Price Index
TSX—Toronto Stock Exchange
XLCA—XL Capital Assurance Inc.
See notes to financial statements.
2021 Semi-Annual Report | 85 | |
Table of Contents
Schedule of Investments
Sanford C. Bernstein Fund, Inc.
Schedule of Investments
Tax-Aware Overlay N Portfolio
March 31, 2021 (Unaudited)
| Principal Amount (000) | U.S. $ Value | |||||||||||
| MUNICIPAL OBLIGATIONS–63.2% |
| |||||||||||
| Long-Term Municipal Bonds–63.2% |
| |||||||||||
| Alabama–0.4% | ||||||||||||
County of Jefferson AL Sewer Revenue |
| $ | 1,000 | $ | 1,072,727 | |||||||
Tuscaloosa County Industrial Development Authority |
| 345 | 383,418 | |||||||||
|
| |||||||||||
| 1,456,145 | ||||||||||||
|
| |||||||||||
| American Samoa–0.1% |
| |||||||||||
American Samoa Economic Development Authority |
| 180 | 216,246 | |||||||||
|
| |||||||||||
| Arizona–0.1% | ||||||||||||
Tempe Industrial Development Authority |
| 250 | 250,075 | |||||||||
|
| |||||||||||
| Arkansas–0.7% | ||||||||||||
City of Fayetteville AR |
| 2,745 | 2,764,521 | |||||||||
|
| |||||||||||
| California–0.1% | ||||||||||||
Golden State Tobacco Securitization Corp. |
| 515 | 524,298 | |||||||||
|
| |||||||||||
| Colorado–0.5% | ||||||||||||
City & County of Denver CO |
| 1,000 | 1,063,698 | |||||||||
Plaza Metropolitan District No. 1 |
| 600 | 631,045 | |||||||||
Vauxmont Metropolitan District |
| 100 | 119,642 | |||||||||
|
| |||||||||||
| 1,814,385 | ||||||||||||
|
| |||||||||||
| Connecticut–0.7% | ||||||||||||
State of Connecticut |
| 2,280 | 2,828,668 | |||||||||
|
| |||||||||||
| Principal Amount (000) | U.S. $ Value | |||||||||||
| Florida–0.8% |
| |||||||||||
Capital Trust Agency, Inc. |
| $ | 100 | $ | 113,557 | |||||||
Citizens Property Insurance, Inc. |
| 2,840 | 2,861,455 | |||||||||
County of Osceola FL Transportation Revenue |
| 100 | 73,875 | |||||||||
|
| |||||||||||
| 3,048,887 | ||||||||||||
|
| |||||||||||
| Guam–0.5% |
| |||||||||||
Territory of Guam |
| 95 | 104,985 | |||||||||
Territory of Guam |
| 425 | 487,670 | |||||||||
Territory of Guam |
| 1,205 | 1,355,433 | |||||||||
|
| |||||||||||
| 1,948,088 | ||||||||||||
|
| |||||||||||
| Illinois–2.8% |
| |||||||||||
Chicago Board of Education |
| 1,465 | 1,615,651 | |||||||||
Illinois Finance Authority |
| 300 | 352,306 | |||||||||
Metropolitan Pier & Exposition Authority |
| 1,000 | 1,165,642 | |||||||||
State of Illinois |
| 4,990 | 5,379,617 | |||||||||
Series 2017D |
| 2,000 | 2,260,457 | |||||||||
|
| |||||||||||
| 10,773,673 | ||||||||||||
|
| |||||||||||
| Kentucky–0.1% |
| |||||||||||
City of Ashland KY |
| 200 | 234,346 | |||||||||
|
| |||||||||||
| Louisiana–0.1% |
| |||||||||||
Parish of St. James LA |
| 100 | 112,888 | |||||||||
6.10%, 06/01/2038(a) |
| 100 | 125,016 | |||||||||
|
| |||||||||||
| 237,904 | ||||||||||||
|
| |||||||||||
| Michigan–2.1% |
| |||||||||||
City of Detroit MI |
| 2,115 | 2,357,346 | |||||||||
| 86 | Sanford C. Bernstein Fund, Inc. | |
Table of Contents
| Principal Amount (000) | U.S. $ Value | |||||||||
Michigan Finance Authority | $ | 5,055 | $ | 5,787,190 | ||||||
|
| |||||||||
| 8,144,536 | ||||||||||
|
| |||||||||
| Nebraska–1.0% | ||||||||||
Central Plains Energy Project | 3,290 | 3,664,820 | ||||||||
|
| |||||||||
| Nevada–0.1% | ||||||||||
City of Sparks NV | 300 | 306,113 | ||||||||
|
| |||||||||
| New Jersey–4.8% | ||||||||||
New Jersey Economic Development Authority | 4,555 | 4,597,016 | ||||||||
New Jersey Economic Development Authority | 125 | 132,712 | ||||||||
New Jersey Transit Corp. | 2,410 | 2,456,876 | ||||||||
New Jersey Transportation Trust Fund Authority | 3,410 | 3,883,900 | ||||||||
New Jersey Transportation Trust Fund Authority | 3,490 | 4,341,803 | ||||||||
New Jersey Turnpike Authority | 2,555 | 3,090,736 | ||||||||
|
| |||||||||
| 18,503,043 | ||||||||||
|
| |||||||||
| New York–43.5% | ||||||||||
Albany County Airport Authority | 855 | 968,565 | ||||||||
Build NYC Resource Corp. | 1,000 | 1,097,710 | ||||||||
| Principal Amount (000) | U.S. $ Value | |||||||||
City of New York NY | $ | 1,285 | $ | 1,473,023 | ||||||
Series 2014J | 1,085 | 1,245,308 | ||||||||
Series 2018E | 1,055 | 1,309,755 | ||||||||
Series 2020B | 2,120 | 2,668,507 | ||||||||
Series 2020C | 6,315 | 8,175,552 | ||||||||
Series 2021D | 3,000 | 2,945,240 | ||||||||
County of Albany NY | 1,595 | 1,853,384 | ||||||||
County of Nassau NY | 4,775 | 5,439,212 | ||||||||
Series 2017C | 1,875 | 2,219,311 | ||||||||
County of Westchester NY | 2,435 | 2,640,009 | ||||||||
Dutchess County Local Development Corp. | 1,000 | 1,093,824 | ||||||||
Hempstead Town Local Development Corp. | 700 | 707,659 | ||||||||
Long Island Power Authority | 2,960 | 2,970,514 | ||||||||
Metropolitan Transportation Authority | 2,075 | 2,137,359 | ||||||||
Series 2011C | 4,430 | 4,545,926 | ||||||||
Series 2017C | 12,180 | 14,991,434 | ||||||||
AGM | 1,000 | 1,000,001 | ||||||||
Metropolitan Transportation Authority | 1,375 | 1,644,128 | ||||||||
2021 Semi-Annual Report | 87 | |
Table of Contents
Schedule of Investments (continued)
| Principal Amount (000) | U.S. $ Value | |||||||||
Metropolitan Transportation Authority | $ | 8,840 | $ | 9,483,902 | ||||||
Series 2019A | 2,005 | 2,089,007 | ||||||||
Monroe County Industrial Development Corp./NY | 955 | 1,237,428 | ||||||||
New York City Municipal Water Finance Authority | 825 | 832,889 | ||||||||
Series 2015G | 2,885 | 3,414,414 | ||||||||
New York City Transitional Finance Authority Building Aid Revenue | 1,955 | 2,412,601 | ||||||||
Series 2018S | 1,460 | 1,838,453 | ||||||||
New York City Transitional Finance Authority Future Tax Secured Revenue | 1,255 | 1,439,429 | ||||||||
Series 2013I | 2,270 | 2,388,662 | ||||||||
Series 2014B | 4,000 | 4,562,242 | ||||||||
Series 2015C | 2,145 | 2,517,066 | ||||||||
Series 2017 | 1,925 | 2,376,081 | ||||||||
New York Liberty Development Corp. | 2,900 | 2,976,091 | ||||||||
2.625%, 09/15/2069 | 320 | 322,805 | ||||||||
2.80%, 09/15/2069 | 4,250 | 4,199,765 | ||||||||
New York State Dormitory Authority | 1,965 | 2,084,180 | ||||||||
Series 2013A | 1,000 | 1,011,626 | ||||||||
New York State Dormitory Authority | 700 | 794,906 | ||||||||
New York State Dormitory Authority | 3,240 | 4,169,633 | ||||||||
| Principal Amount (000) | U.S. $ Value | |||||||||
New York State Dormitory Authority | $ | 1,100 | $ | 1,137,170 | ||||||
Series 2012A | 1,605 | 1,736,107 | ||||||||
Series 2014A | 2,035 | 2,297,625 | ||||||||
Series 2014C | 3,000 | 3,397,404 | ||||||||
Series 2018A | 2,675 | 2,797,656 | ||||||||
New York State Urban Development Corp. | 6,600 | 7,142,931 | ||||||||
New York Transportation Development Corp. | 455 | 460,997 | ||||||||
New York Transportation Development Corp. | 1,495 | 1,791,201 | ||||||||
Series 2018 | 3,565 | 4,304,495 | ||||||||
New York Transportation Development Corp. | 2,755 | 2,845,741 | ||||||||
Niagara Area Development Corp. | 600 | 623,885 | ||||||||
Port Authority of New York & New Jersey | 1,455 | 1,847,463 | ||||||||
Series 2013-178 | 2,515 | 2,821,129 | ||||||||
Series 2014 | 5,615 | 6,335,669 | ||||||||
Series 2015E | 1,000 | 1,116,328 | ||||||||
Sales Tax Asset Receivable Corp. | 3,750 | 4,350,893 | ||||||||
Troy Capital Resource Corp. | 1,115 | 1,427,047 | ||||||||
Trust for Cultural Resources of The City of New York (The) | 5,575 | 6,793,213 | ||||||||
| 88 | Sanford C. Bernstein Fund, Inc. | |
Table of Contents
| Principal Amount (000) | U.S. $ Value | |||||||||
Utility Debt Securitization Authority Series 2015 | $ | 1,500 | $ | 1,621,471 | ||||||
|
| |||||||||
| 166,126,026 | ||||||||||
|
| |||||||||
| Ohio–0.4% | ||||||||||
Ohio Air Quality Development Authority | 210 | 213,752 | ||||||||
Ohio Air Quality Development Authority | 890 | 965,095 | ||||||||
Ohio Water Development Authority Water Pollution Control Loan Fund | 300 | 309,000 | ||||||||
|
| |||||||||
| 1,487,847 | ||||||||||
|
| |||||||||
| Pennsylvania–1.4% | ||||||||||
Hospitals & Higher Education Facilities Authority of Philadelphia (The) | 1,000 | 1,113,016 | ||||||||
Philadelphia Parking Authority (The) | 200 | 200,682 | ||||||||
Sports & Exhibition Authority of Pittsburgh and Allegheny County | 4,000 | 4,011,754 | ||||||||
|
| |||||||||
| 5,325,452 | ||||||||||
|
| |||||||||
| Puerto Rico–0.6% | ||||||||||
Puerto Rico Electric Power Authority | 230 | 279,849 | ||||||||
Puerto Rico Highway & Transportation Authority | 205 | 252,985 | ||||||||
AGC Series 2007N | 380 | 471,323 | ||||||||
NATL Series 2007N | 100 | 110,913 | ||||||||
Puerto Rico Industrial Tourist Educational Medical & Environmental Control Facilities Financing Auth | 830 | 856,975 | ||||||||
| Principal Amount (000) | U.S. $ Value | |||||||||||
Puerto Rico Public Buildings Authority (Commonwealth of Puerto Rico) |
| $ | 100 | $ | 112,297 | |||||||
Puerto Rico Sales Tax Financing Corp. |
| 339 | 318,169 | |||||||||
|
| |||||||||||
| 2,402,511 | ||||||||||||
|
| |||||||||||
| South Carolina–0.9% |
| |||||||||||
Patriots Energy Group Financing Agency (Royal Bank of Canada) |
| 3,000 | 3,274,777 | |||||||||
|
| |||||||||||
| Tennessee–1.1% |
| |||||||||||
Tennessee Energy Acquisition Corp. (Goldman Sachs Group, Inc. (The)) Series 2018 |
| 3,880 | 4,401,916 | |||||||||
|
| |||||||||||
| Texas–0.0% |
| |||||||||||
City of Houston TX Airport System Revenue |
| 100 | 108,900 | |||||||||
|
| |||||||||||
| Washington–0.2% |
| |||||||||||
Kalispel Tribe of Indians |
| 700 | 799,954 | |||||||||
|
| |||||||||||
| Wisconsin–0.2% |
| |||||||||||
UMA Education, Inc. |
| 705 | 820,372 | |||||||||
|
| |||||||||||
| Total Municipal Obligations (cost $228,989,657) |
| 241,463,503 | ||||||||||
|
| |||||||||||
| Shares | ||||||||||||
| INVESTMENT COMPANIES–28.3% |
| |||||||||||
| Funds and Investment Trusts–28.3%(e) |
| |||||||||||
iShares Core MSCI EAFE ETF |
| 408,084 | 29,402,452 | |||||||||
iShares Core MSCI Emerging Markets ETF |
| 239,172 | 15,393,110 | |||||||||
SPDR S&P 500 ETF Trust |
| 150,716 | 59,733,272 | |||||||||
Vanguard Mid-Cap ETF |
| 17,013 | 3,765,658 | |||||||||
|
| |||||||||||
| Total Investment Companies (cost $74,929,059) |
| 108,294,492 | ||||||||||
|
| |||||||||||
| Principal Amount (000) | ||||||||||||
| GOVERNMENTS—TREASURIES–1.3% |
| |||||||||||
| United States–1.3% | ||||||||||||
U.S. Treasury Notes | U.S.$ | 1,219 | 1,103,957 | |||||||||
2.625%, 02/15/2029(f)(g) |
| 3,543 | 3,829,761 | |||||||||
|
| |||||||||||
| Total Governments—Treasuries (cost $4,964,583) | 4,933,718 | |||||||||||
|
| |||||||||||
2021 Semi-Annual Report | 89 | |
Table of Contents
Schedule of Investments (continued)
| Notional Amount | U.S. $ Value | |||||||||||
| OPTIONS PURCHASED—PUTS–0.4% |
| |||||||||||
| Options on Equity Indices–0.4% |
| |||||||||||
Euro STOXX 50 Index | EUR | 3,986,500 | $ | 120,438 | ||||||||
Euro STOXX 50 Index | EUR | 2,052,750 | 62,017 | |||||||||
FTSE 100 Index | GBP | 1,530,000 | 50,520 | |||||||||
FTSE 100 Index | GBP | 765,000 | 25,260 | |||||||||
Nikkei 225 Index | JPY | 202,500,000 | 50,191 | |||||||||
Nikkei 225 Index | JPY | 202,500,000 | 50,191 | |||||||||
Nikkei 225 Index | JPY | 180,000,000 | 44,615 | |||||||||
S&P 500 Index | USD | 33,600,000 | 742,780 | |||||||||
S&P 500 Index | USD | 16,200,000 | 358,126 | |||||||||
|
| |||||||||||
| Total Options Purchased—Puts (premiums paid $2,400,507) | 1,504,138 | |||||||||||
|
| |||||||||||
| Principal Amount (000) | U.S. $ Value | |||||||||||
| COLLATERALIZED MORTGAGE OBLIGATIONS–0.2% |
| |||||||||||
| Risk Share Floating Rate–0.2% | ||||||||||||
Federal Home Loan Mortgage Corp. Structured Agency Credit Risk Debt Notes | $ | 260 | $ | 269,351 | ||||||||
Federal National Mortgage Association Connecticut Avenue Securities | 12 | 12,006 | ||||||||||
Series 2016-C01, Class 1M2 |
| 124 | 130,785 | |||||||||
Series 2017-C01, Class 1M2 |
| 173 | 178,336 | |||||||||
Series 2018-C03, Class 1M2 |
| 66 | 65,703 | |||||||||
|
| |||||||||||
| Total Collateralized Mortgage Obligations (cost $631,307) |
| 656,181 | ||||||||||
|
| |||||||||||
| Shares | ||||||||||||
| SHORT-TERM INVESTMENTS–4.7% |
| |||||||||||
| Investment Companies–4.1% | ||||||||||||
AB Fixed Income Shares, Inc.—Government Money Market Portfolio—Class AB, 0.01%(e)(h)(i) |
| 15,539,753 | 15,539,753 | |||||||||
|
| |||||||||||
| Principal Amount (000) | ||||||||||||
| U.S. Treasury Bills–0.6% | ||||||||||||
U.S. Treasury Bill |
| $ | 2,500 | 2,499,973 | ||||||||
|
| |||||||||||
| Total Short-Term Investments (cost $18,039,629) |
| 18,039,726 | ||||||||||
|
| |||||||||||
| Total Investments—98.1% (cost $329,954,742) |
| 374,891,758 | ||||||||||
Other assets less liabilities—1.9% |
| 7,302,537 | ||||||||||
|
| |||||||||||
| Net Assets—100.0% | $ | 382,194,295 | ||||||||||
|
| |||||||||||
| 90 | Sanford C. Bernstein Fund, Inc. | |
Table of Contents
| FUTURES (see Note 3) |
| |||||||||||||||
| Description | Number of Contracts | Expiration Month | Current Notional | Value and Unrealized Appreciation/ (Depreciation) | ||||||||||||
| Purchased Contracts |
| |||||||||||||||
Euro STOXX 50 Index Futures | 138 | June 2021 | $ | 6,256,449 | $ | 145,856 | ||||||||||
FTSE 100 Index Futures | 6 | June 2021 | 552,501 | (1,794 | ) | |||||||||||
Hang Seng Index Futures | 4 | April 2021 | 728,470 | (3,554) | ||||||||||||
MSCI Singapore IX ETS Futures | 116 | April 2021 | 3,086,693 | 17,483 | ||||||||||||
Nikkei 225 (OSE) Futures | 4 | June 2021 | 1,054,143 | 17,981 | ||||||||||||
OMXS 30 Index Futures | 201 | April 2021 | 5,033,947 | 73,609 | ||||||||||||
Russell 2000 E-Mini Futures | 84 | June 2021 | 9,334,500 | (252,063) | ||||||||||||
S&P 500 E-Mini Futures | 152 | June 2021 | 30,152,240 | 575,177 | ||||||||||||
S&P Mid 400 E-Mini Futures | 12 | June 2021 | 3,126,360 | (902) | ||||||||||||
S&P/TSX 60 Index Futures | 25 | June 2021 | 4,420,705 | 15,897 | ||||||||||||
TOPIX Index Futures | 33 | June 2021 | 5,823,617 | 97,815 | ||||||||||||
U.S. T-Note 2 Yr (CBT) Futures | 49 | June 2021 | 10,815,602 | (10,777) | ||||||||||||
U.S. T-Note 10 Yr (CBT) Futures | 156 | June 2021 | 20,426,250 | (427,209) | ||||||||||||
U.S. Ultra Bond (CBT) Futures | 27 | June 2021 | 4,892,906 | (203,687) | ||||||||||||
| Sold Contracts |
| |||||||||||||||
FTSE 100 Index Futures | 47 | June 2021 | 4,327,926 | 16,202 | ||||||||||||
MSCI Emerging Markets Futures | 11 | June 2021 | 727,375 | 6,220 | ||||||||||||
SPI 200 Futures | 36 | June 2021 | 4,625,204 | (4,444 | ) | |||||||||||
|
| |||||||||||||||
| $ | 61,810 | |||||||||||||||
|
| |||||||||||||||
| FORWARD CURRENCY EXCHANGE CONTRACTS (see Note 3) |
| |||||||||||||||||||
| Counterparty | Contracts to Deliver (000) | In Exchange For (000) | Settlement Date | Unrealized Appreciation/ (Depreciation) | ||||||||||||||||
Bank of America, NA | CAD | 1,469 | USD | 1,174 | 04/22/2021 | $ | 5,461 | |||||||||||||
Barclays Bank PLC | USD | 1,787 | NZD | 2,461 | 05/27/2021 | (68,121 | ) | |||||||||||||
BNP Paribas SA | SEK | 8,680 | USD | 1,019 | 04/15/2021 | 25,041 | ||||||||||||||
BNP Paribas SA | CAD | 4,113 | USD | 3,273 | 04/22/2021 | (365 | ) | |||||||||||||
BNP Paribas SA | USD | 1,961 | CAD | 2,481 | 04/22/2021 | 13,004 | ||||||||||||||
BNP Paribas SA | JPY | 250,016 | USD | 2,300 | 05/20/2021 | 41,160 | ||||||||||||||
BNP Paribas SA | NZD | 994 | USD | 711 | 05/27/2021 | 17,349 | ||||||||||||||
Citibank, NA | SEK | 5,434 | USD | 653 | 04/15/2021 | 30,924 | ||||||||||||||
Goldman Sachs Bank USA | CHF | 2,525 | USD | 2,849 | 05/06/2021 | 174,592 | ||||||||||||||
JPMorgan Chase Bank, NA | GBP | 3,015 | USD | 4,117 | 04/09/2021 | (39,078 | ) | |||||||||||||
JPMorgan Chase Bank, NA | USD | 1,794 | GBP | 1,278 | 04/09/2021 | (32,470 | ) | |||||||||||||
JPMorgan Chase Bank, NA | NOK | 5,767 | USD | 675 | 04/15/2021 | 1,002 | ||||||||||||||
JPMorgan Chase Bank, NA | SEK | 26,878 | USD | 3,238 | 04/15/2021 | 160,052 | ||||||||||||||
JPMorgan Chase Bank, NA | USD | 4,026 | NOK | 34,139 | 04/15/2021 | (34,442 | ) | |||||||||||||
JPMorgan Chase Bank, NA | USD | 6,780 | SEK | 57,001 | 04/15/2021 | (253,081 | ) | |||||||||||||
JPMorgan Chase Bank, NA | CAD | 3,315 | USD | 2,615 | 04/22/2021 | (22,757 | ) | |||||||||||||
JPMorgan Chase Bank, NA | CHF | 871 | USD | 937 | 05/06/2021 | 14,938 | ||||||||||||||
JPMorgan Chase Bank, NA | JPY | 267,291 | USD | 2,502 | 05/20/2021 | 87,192 | ||||||||||||||
Morgan Stanley & Co., Inc. | USD | 755 | GBP | 554 | 04/09/2021 | 9,028 | ||||||||||||||
2021 Semi-Annual Report | 91 | |
Table of Contents
Schedule of Investments (continued)
| Counterparty | Contracts to Deliver (000) | In Exchange For (000) | Settlement Date | Unrealized Appreciation/ (Depreciation) | ||||||||||||||||
Morgan Stanley & Co., Inc. | USD | 2,923 | JPY | 318,111 | 05/20/2021 | $ | (48,960 | ) | ||||||||||||
Natwest Markets PLC | GBP | 423 | USD | 578 | 04/09/2021 | (4,992 | ) | |||||||||||||
Natwest Markets PLC | JPY | 98,406 | USD | 928 | 05/20/2021 | 38,904 | ||||||||||||||
Standard Chartered Bank | USD | 2,808 | JPY | 297,602 | 05/20/2021 | (119,032 | ) | |||||||||||||
State Street Bank & Trust Co. | GBP | 191 | USD | 265 | 04/09/2021 | 1,668 | ||||||||||||||
State Street Bank & Trust Co. | GBP | 131 | USD | 179 | 04/09/2021 | (1,742 | ) | |||||||||||||
State Street Bank & Trust Co. | SEK | 859 | USD | 104 | 04/15/2021 | 5,627 | ||||||||||||||
State Street Bank & Trust Co. | USD | 335 | SEK | 2,833 | 04/15/2021 | (11,038 | ) | |||||||||||||
State Street Bank & Trust Co. | USD | 8,893 | CAD | 11,278 | 04/22/2021 | 81,242 | ||||||||||||||
State Street Bank & Trust Co. | EUR | 2,816 | USD | 3,360 | 05/27/2021 | 55,065 | ||||||||||||||
State Street Bank & Trust Co. | AUD | 1,469 | USD | 1,121 | 06/04/2021 | 4,636 | ||||||||||||||
UBS AG | USD | 979 | NOK | 8,322 | 04/15/2021 | (5,913 | ) | |||||||||||||
|
| |||||||||||||||||||
| $ | 124,894 | |||||||||||||||||||
|
| |||||||||||||||||||
| CENTRALLY CLEARED INFLATION (CPI) SWAPS (see Note 3) | ||||||||||||||||||||||||||||
Rate Type | Payment | Market Value | Upfront Premiums Paid/ (Received) | Unrealized Appreciation/ (Depreciation) | ||||||||||||||||||||||||
| Notional Amount (000) | Termination Date | Payments made by the Fund | Payments received by the Fund | |||||||||||||||||||||||||
| USD | 1,060 | 01/15/2025 | 2.565% | CPI# | Maturity | $ | 2,206 | $ | — | $ | 2,206 | |||||||||||||||||
| USD | 530 | 01/15/2025 | 2.585% | CPI# | Maturity | 655 | — | 655 | ||||||||||||||||||||
| USD | 530 | 01/15/2025 | 2.613% | CPI# | Maturity | 38 | — | 38 | ||||||||||||||||||||
| USD | 4,950 | 01/15/2028 | 1.230% | CPI# | Maturity | 474,830 | — | 474,830 | ||||||||||||||||||||
| USD | 3,410 | 01/15/2028 | 0.735% | CPI# | Maturity | 460,241 | — | 460,241 | ||||||||||||||||||||
| USD | 1,125 | 01/15/2030 | 1.572% | CPI# | Maturity | 97,396 | — | 97,396 | ||||||||||||||||||||
| USD | 1,125 | 01/15/2030 | 1.587% | CPI# | Maturity | 95,690 | — | 95,690 | ||||||||||||||||||||
| USD | 180 | 01/15/2030 | 1.714% | CPI# | Maturity | 12,985 | — | 12,985 | ||||||||||||||||||||
| USD | 180 | 01/15/2030 | 1.731% | CPI# | Maturity | 12,670 | — | 12,670 | ||||||||||||||||||||
|
|
|
|
|
| |||||||||||||||||||||||
| $ | 1,156,711 | $ | — | $ | 1,156,711 | |||||||||||||||||||||||
|
|
|
|
|
| |||||||||||||||||||||||
# Variable interest rate based on the rate of inflation as determined by the Consumer Price Index (CPI).
| CENTRALLY CLEARED INTEREST RATE SWAPS (see Note 3) | ||||||||||||||||||||||||||||
Rate Type | Payment | Market Value | Upfront Premiums Paid/ (Received) | Unrealized Appreciation/ (Depreciation) | ||||||||||||||||||||||||
| Notional Amount (000) | Termination Date | Payments made by the Fund | Payments received by the Fund | |||||||||||||||||||||||||
| USD | 2,110 | 10/09/2029 | 3 Month LIBOR | 1.470% | Quarterly/Semi-Annual | $ | (15,006 | ) | $ | — | $ | (15,006 | ) | |||||||||||||||
| USD | 2,110 | 10/09/2029 | 3 Month LIBOR | 1.473% | Quarterly/Semi-Annual | (14,459 | ) | — | (14,459 | ) | ||||||||||||||||||
|
|
|
|
|
| |||||||||||||||||||||||
| $ | (29,465 | ) | $ | — | $ | (29,465 | ) | |||||||||||||||||||||
|
|
|
|
|
| |||||||||||||||||||||||
| 92 | Sanford C. Bernstein Fund, Inc. | |
Table of Contents
| CREDIT DEFAULT SWAPS (see Note 3) |
| |||||||||||||||||||||||||||||||
| Swap Counterparty & Referenced Obligation | Fixed Rate (Pay) Receive | Payment Frequency | Implied Credit Spread at March 31, 2021 | Notional Amount (000) | Market Value | Upfront Premiums Paid/ (Received) | Unrealized Appreciation/ (Depreciation) | |||||||||||||||||||||||||
| Sale Contracts |
| |||||||||||||||||||||||||||||||
| Citigroup Global Markets, Inc. |
| |||||||||||||||||||||||||||||||
CDX-CMBX.NA.BBB- | 3.00 | % | Monthly | 12.50 | % | USD | 30 | $ | (8,082 | ) | $ | (2,907 | ) | $ | (5,175 | ) | ||||||||||||||||
CDX-CMBX.NA.BBB- | 3.00 | Monthly | 12.50 | USD | 99 | (26,671 | ) | (12,376 | ) | (14,295 | ) | |||||||||||||||||||||
| Credit Suisse International |
| |||||||||||||||||||||||||||||||
CDX-CMBX.NA.BBB- | 3.00 | Monthly | 12.50 | USD | 7 | (1,886 | ) | (849 | ) | (1,037 | ) | |||||||||||||||||||||
CDX-CMBX.NA.BBB- | 3.00 | Monthly | 12.50 | USD | 17 | (4,579 | ) | (1,662 | ) | (2,917 | ) | |||||||||||||||||||||
CDX-CMBX.NA.BBB- | 3.00 | Monthly | 12.50 | USD | 201 | (54,150 | ) | (24,207 | ) | (29,943 | ) | |||||||||||||||||||||
CDX-CMBX.NA.BBB- | 3.00 | Monthly | 12.50 | USD | 205 | (55,210 | ) | (20,072 | ) | (35,138 | ) | |||||||||||||||||||||
CDX-CMBX.NA.BBB- | 3.00 | Monthly | 12.50 | USD | 310 | (83,514 | ) | (29,573 | ) | (53,941 | ) | |||||||||||||||||||||
| Goldman Sachs International |
| |||||||||||||||||||||||||||||||
CDX-CMBX.NA.BBB- | 3.00 | Monthly | 12.50 | USD | 38 | (10,238 | ) | (4,731 | ) | (5,507 | ) | |||||||||||||||||||||
CDX-CMBX.NA.BBB- | 3.00 | Monthly | 12.50 | USD | 268 | (72,199 | ) | (24,815 | ) | (47,384 | ) | |||||||||||||||||||||
|
|
|
|
|
| |||||||||||||||||||||||||||
| $ | (316,529 | ) | $ | (121,192 | ) | $ | (195,337 | ) | ||||||||||||||||||||||||
|
|
|
|
|
| |||||||||||||||||||||||||||
* Termination date
| INFLATION (CPI) SWAPS (see Note 3) |
| |||||||||||||||||||||||||||||
Rate Type | Payment Frequency Paid/ Received | Market Value | Upfront Premiums Paid/ (Received) | Unrealized Appreciation/ (Depreciation) | ||||||||||||||||||||||||||
| Swap Counterparty | Notional Amount (000) | Termination Date | Payments made by the Fund | Payments received by the Fund | ||||||||||||||||||||||||||
Barclays Bank PLC | USD | 4,000 | 10/23/2026 | 2.310% | CPI# | Maturity | $ | (170,526 | ) | $ | — | $ | (170,526 | ) | ||||||||||||||||
Barclays Bank PLC | USD | 1,000 | 10/23/2029 | 2.388% | CPI# | Maturity | (51,331 | ) | — | (51,331 | ) | |||||||||||||||||||
Barclays Bank PLC | USD | 3,000 | 12/04/2032 | 2.233% | CPI# | Maturity | 69,761 | — | 69,761 | |||||||||||||||||||||
Citibank, NA | USD | 3,800 | 10/23/2021 | 2.039% | CPI# | Maturity | (110,022 | ) | — | (110,022 | ) | |||||||||||||||||||
Citibank, NA | USD | 7,000 | 11/04/2023 | 1.900% | CPI# | Maturity | 178,416 | — | 178,416 | |||||||||||||||||||||
Citibank, NA | USD | 3,500 | 07/20/2027 | 2.104% | CPI# | Maturity | 90,537 | — | 90,537 | |||||||||||||||||||||
Deutsche Bank AG | USD | 4,000 | 09/04/2025 | 1.818% | CPI# | Maturity | 139,557 | — | 139,557 | |||||||||||||||||||||
JPMorgan Chase Bank, NA | USD | 2,500 | 03/02/2024 | 2.175% | CPI# | Maturity | 5,889 | — | 5,889 | |||||||||||||||||||||
JPMorgan Chase Bank, NA | USD | 7,000 | 07/20/2024 | 1.995% | CPI# | Maturity | 152,301 | — | 152,301 | |||||||||||||||||||||
JPMorgan Chase Bank, NA | USD | 3,000 | 11/04/2026 | 2.015% | CPI# | Maturity | 98,659 | — | 98,659 | |||||||||||||||||||||
JPMorgan Chase Bank, NA | USD | 5,000 | 12/27/2028 | 2.009% | CPI# | Maturity | 177,030 | — | 177,030 | |||||||||||||||||||||
Morgan Stanley Capital Services LLC | USD | 8,500 | 07/20/2022 | 1.939% | CPI# | Maturity | 107,073 | — | 107,073 | |||||||||||||||||||||
Morgan Stanley Capital Services LLC | USD | 1,800 | 07/20/2032 | 2.158% | CPI# | Maturity | 66,569 | — | 66,569 | |||||||||||||||||||||
|
|
|
|
|
| |||||||||||||||||||||||||
| $ | 753,913 | $ | — | $ | 753,913 | |||||||||||||||||||||||||
|
|
|
|
|
| |||||||||||||||||||||||||
# Variable interest rate based on the rate of inflation as determined by the Consumer Price Index (CPI).
2021 Semi-Annual Report | 93 | |
Table of Contents
Schedule of Investments (continued)
| INTEREST RATE SWAPS (see Note 3) |
| |||||||||||||||||||||||||||
Swap Counterparty | Notional Amount (000) | Termination Date | Payments made by the Fund | Payments received by the Fund | Payment Frequency Paid/ Received | Market Value | Upfront Premiums Paid/ (Received) | Unrealized Appreciation/ (Depreciation) | ||||||||||||||||||||
| Citibank, NA | USD | 2,840 | 10/09/2029 | 1.120% | SIFMA* | Quarterly | $ | 8,014 | $ | — | $ | 8,014 | ||||||||||||||||
| Citibank, NA | USD | 2,840 | 10/09/2029 | 1.125% | SIFMA* | Quarterly | 6,702 | — | 6,702 | |||||||||||||||||||
|
|
|
|
|
| |||||||||||||||||||||||
| $ | 14,716 | $ | — | $ | 14,716 | |||||||||||||||||||||||
|
|
|
|
|
| |||||||||||||||||||||||
* Variable interest rate based on the Securities Industry & Financial Markets Association (SIFMA) Municipal Swap Index.
| TOTAL RETURN SWAPS (see Note 3) | ||||||||||||||||||||||
| Counterparty & Referenced Obligation | Rate Paid/ Received | Payment Frequency | Current Notional (000) | Maturity Date | Unrealized Appreciation/ (Depreciation) | |||||||||||||||||
| Pay Total Return on Reference Obligation |
| |||||||||||||||||||||
| Morgan Stanley Capital Services LLC | ||||||||||||||||||||||
Swiss Market Index Futures | 0.00 | % | Monthly | CHF | 1,529 | 06/18/2021 | $ | (4,211 | ) | |||||||||||||
| (a) | Security is exempt from registration under Rule 144A of the Securities Act of 1933. These securities are considered restricted, but liquid and may be resold in transactions exempt from registration, normally to qualified institutional buyers. At March 31, 2021, the aggregate market value of these securities amounted to $7,236,394 or 1.9% of net assets. |
| (b) | Floating Rate Security. Stated interest/floor/ceiling rate was in effect at March 31, 2021. |
| (c) | When-Issued or delayed delivery security. |
| (d) | Non-income producing security. |
| (e) | To obtain a copy of the fund’s shareholder report, please go to the Securities and Exchange Commission’s website at www.sec.gov, or call AB at (800) 227-4618. |
| (f) | Position, or a portion thereof, has been segregated to collateralize OTC derivatives outstanding. |
| (g) | Position, or a portion thereof, has been segregated to collateralize margin requirements for open futures contracts. |
| (h) | Affiliated investments. |
| (i) | The rate shown represents the 7-day yield as of period end. |
As of March 31, 2021, the Portfolio’s percentages of investments in municipal bonds that are insured and in insured municipal bonds that have been pre-refunded or escrowed to maturity are 6.3% and 0.0%, respectively.
Currency Abbreviations:
AUD—Australian Dollar
CAD—Canadian Dollar
CHF—Swiss Franc
EUR—Euro
GBP—Great British Pound
JPY—Japanese Yen
NOK—Norwegian Krone
NZD—New Zealand Dollar
SEK—Swedish Krona
USD—United States Dollar
Glossary:
AGC—Assured Guaranty Corporation
AGM—Assured Guaranty Municipal
CBT—Chicago Board of Trade
CPI—Consumer Price Index
EAFE—Europe, Australia, and Far East
ETF—Exchange Traded Fund
ETM—Escrowed to Maturity
ETS—Emission Trading Scheme
FTSE—Financial Times Stock Exchange
LIBOR—London Interbank Offered Rate
MSCI—Morgan Stanley Capital International
NATL—National Interstate Corporation
OMXS—Stockholm Stock Exchange
OSE—Osaka Securities Exchange
SPDR—Standard & Poor’s Depository Receipt
SPI—Share Price Index
TOPIX—Tokyo Price Index
TSX—Toronto Stock Exchange
See notes to financial statements.
| 94 | Sanford C. Bernstein Fund, Inc. | |
Table of Contents
Statement of Assets and Liabilities—March 31, 2021 (Unaudited)
| OVERLAY A PORTFOLIO | TAX-AWARE OVERLAY A PORTFOLIO | OVERLAY B PORTFOLIO | ||||||||||
| ASSETS | ||||||||||||
Investments in securities at value | ||||||||||||
Unaffiliated issuers | $ | 861,363,536 | $ | 1,815,051,698 | $ | 967,708,334 | ||||||
Affiliated issuers | 1,025,220,812 | 2,105,480,765 | 255,244,305 | |||||||||
Foreign currencies, at value (a) | 7,322,526 | 14,806,209 | 1,173,158 | |||||||||
Cash | 0 | 0 | 158,732 | |||||||||
Cash collateral due from broker | 0 | 270,000 | 4,388,783 | |||||||||
Receivables: |
| |||||||||||
Unaffiliated interest and dividends | 631,640 | 1,060,123 | 4,644,125 | |||||||||
Affiliated dividends | 1,024 | 1,899 | 1,735 | |||||||||
Foreign withholding tax reclaims | 184,097 | 398,015 | 0 | |||||||||
Investment securities sold and foreign currency transactions | 33,562,400 | 68,500,911 | 44,470,847 | |||||||||
Capital shares sold | 231,005 | 322,975 | 165,310 | |||||||||
Variation margin on futures | 0 | 0 | 940,218 | |||||||||
Variation margin on centrally cleared swaps | 0 | 0 | 207,594 | |||||||||
Unrealized appreciation of forward currency exchange contracts | 10,687,041 | 21,927,958 | 8,124,527 | |||||||||
Market value on credit default swaps (b) | 0 | 0 | 1,529,372 | |||||||||
Unrealized appreciation of total return swaps | 0 | 0 | 46,036 | |||||||||
|
|
|
|
|
| |||||||
Total assets | 1,939,204,081 | 4,027,820,553 | 1,288,803,076 | |||||||||
|
|
|
|
|
| |||||||
| LIABILITIES | ||||||||||||
Cash collateral due to broker | 24,090,000 | 47,680,000 | 7,084,000 | |||||||||
Payables: |
| |||||||||||
Investment securities purchased and foreign currency transactions | 721,596 | 543,942 | 55,072,301 | |||||||||
Variation margin on futures | 1,553,787 | 3,557,790 | 0 | |||||||||
Capital shares redeemed | 758,735 | 2,399,192 | 303,572 | |||||||||
Management fee | 855,892 | 1,733,657 | 632,647 | |||||||||
Shareholder servicing fee | 268,624 | 508,807 | 129,258 | |||||||||
Transfer Agent fee | 6,095 | 8,634 | 6,303 | |||||||||
Newly entered centrally cleared interest rate swaps | 0 | 0 | 32,344 | |||||||||
Accrued expenses | 155,814 | 181,629 | 250,413 | |||||||||
Unrealized depreciation of forward currency exchange contracts | 8,489,687 | 17,300,459 | 6,364,057 | |||||||||
Market value on credit default swaps (c) | 0 | 0 | 3,314,637 | |||||||||
Unrealized depreciation of total return swaps | 106,054 | 218,333 | 112,319 | |||||||||
|
|
|
|
|
| |||||||
Total liabilities | 37,006,284 | 74,132,443 | 73,301,851 | |||||||||
|
|
|
|
|
| |||||||
NET ASSETS | $ | 1,902,197,797 | $ | 3,953,688,110 | $ | 1,215,501,225 | ||||||
|
|
|
|
|
| |||||||
Cost of investments |
| |||||||||||
Unaffiliated issuers | $ | 537,291,572 | $ | 1,030,380,846 | $ | 946,947,949 | ||||||
Affiliated issuers | 874,151,208 | 1,786,616,738 | 254,796,578 | |||||||||
| NET ASSETS CONSIST OF: |
| |||||||||||
Capital stock, at par | $ | 127,513 | $ | 249,427 | $ | 105,749 | ||||||
Additional paid-in capital | 1,311,227,416 | 2,630,164,336 | 1,092,058,495 | |||||||||
Distributable earnings (d) | 590,842,868 | 1,323,274,347 | 123,336,981 | |||||||||
|
|
|
|
|
| |||||||
| $ | 1,902,197,797 | $ | 3,953,688,110 | $ | 1,215,501,225 | |||||||
|
|
|
|
|
| |||||||
(a) Cost: $7,426,410, $15,021,823 and $1,201,847, respectively. (Note 1)
(b) Net premiums paid of $0, $0 and $2,270,477, respectively.
(c) Net premiums received of $0, $0 and $1,257,398, respectively.
(d) Net of accrued foreign capital gains taxes of $0, $0 and $2,388, respectively.
See Notes to Financial Statements.
2021 Semi-Annual Report | 95 | |
Table of Contents
Statement of Assets and Liabilities—March 31, 2021 (Unaudited) (continued)
| OVERLAY A PORTFOLIO | TAX-AWARE OVERLAY A PORTFOLIO | OVERLAY B PORTFOLIO | ||||||||||
| NET ASSET VALUE PER SHARE |
| |||||||||||
Class 1 Shares |
| |||||||||||
Net Assets | $ | 1,587,826,837 | $ | 3,012,942,167 | $ | 1,013,204,625 | ||||||
Shares of capital stock outstanding | 106,459,718 | 190,160,726 | 88,185,872 | |||||||||
|
|
|
|
|
| |||||||
Net asset value, offering and redemption price per share | $ | 14.91 | $ | 15.84 | $ | 11.49 | ||||||
|
|
|
|
|
| |||||||
Class 2 Shares |
| |||||||||||
Net Assets | $ | 314,370,960 | $ | 940,745,943 | $ | 202,296,600 | ||||||
Shares of capital stock outstanding | 21,053,138 | 59,266,099 | 17,563,538 | |||||||||
|
|
|
|
|
| |||||||
Net asset value, offering and redemption price per share | $ | 14.93 | $ | 15.87 | $ | 11.52 | ||||||
|
|
|
|
|
| |||||||
See Notes to Financial Statements.
| 96 | Sanford C. Bernstein Fund, Inc. | |
Table of Contents
| TAX-AWARE OVERLAY B PORTFOLIO | TAX-AWARE OVERLAY C PORTFOLIO | TAX-AWARE OVERLAY N PORTFOLIO | ||||||||||
| ASSETS |
| |||||||||||
Investments in securities at value |
| |||||||||||
Unaffiliated issuers | $ | 1,668,560,791 | $ | 501,498,764 | $ | 359,352,005 | ||||||
Affiliated issuers | 17,807,976 | 1,116,829 | 15,539,753 | |||||||||
Foreign currencies, at value (a) | 2,008,398 | 560,699 | 444,154 | |||||||||
Cash collateral due from broker | 4,489,701 | 1,164,763 | 664,608 | |||||||||
Receivables: |
| |||||||||||
Unaffiliated interest and dividends | 15,220,832 | 4,953,745 | 3,221,547 | |||||||||
Affiliated dividends | 179 | 23 | 104 | |||||||||
Investment securities sold | 1,865,869 | 130,000 | 369,839 | |||||||||
Capital shares sold | 675,200 | 2,265 | 11,730 | |||||||||
Variation margin on futures | 14,240,341 | 8,375,413 | 5,444,636 | |||||||||
Variation margin on centrally cleared swaps | 7,253 | 0 | 6,433 | |||||||||
Unrealized appreciation of inflation swaps | 4,509,631 | 1,401,655 | 1,085,792 | |||||||||
Unrealized appreciation of forward currency exchange contracts | 3,398,514 | 1,026,607 | 766,885 | |||||||||
Unrealized appreciation of interest rate swaps | 64,618 | 19,769 | 14,716 | |||||||||
|
|
|
|
|
| |||||||
Total assets | 1,732,849,303 | 520,250,532 | 386,922,202 | |||||||||
|
|
|
|
|
| |||||||
| LIABILITIES |
| |||||||||||
Cash collateral due to broker | 11,010,000 | 2,970,000 | 1,900,000 | |||||||||
Payables: |
| |||||||||||
Investment securities purchased and foreign currency transactions | 1,343,189 | 810 | 1,000,608 | |||||||||
Management fee | 942,526 | 284,066 | 211,642 | |||||||||
Capital shares redeemed | 729,683 | 318,906 | 175,807 | |||||||||
Shareholder servicing fee | 151,005 | 40,925 | 39,449 | |||||||||
Transfer Agent fee | 4,979 | 1,577 | 1,607 | |||||||||
Variation margin on centrally cleared swaps | 0 | 6,630 | 0 | |||||||||
Accrued expenses | 148,709 | 109,754 | 104,184 | |||||||||
Unrealized depreciation of forward currency exchange contracts | 2,847,943 | 852,231 | 641,991 | |||||||||
Unrealized depreciation of inflation swaps | 1,835,574 | 449,789 | 331,879 | |||||||||
Market value on credit default swaps (b) | 1,081,586 | 391,955 | 316,529 | |||||||||
Unrealized depreciation of total return swaps | 18,347 | 5,715 | 4,211 | |||||||||
|
|
|
|
|
| |||||||
Total liabilities | 20,113,541 | 5,432,358 | 4,727,907 | |||||||||
|
|
|
|
|
| |||||||
NET ASSETS | $ | 1,712,735,762 | $ | 514,818,174 | $ | 382,194,295 | ||||||
|
|
|
|
|
| |||||||
Cost of investments |
| |||||||||||
Unaffiliated issuers | $ | 1,459,546,202 | $ | 441,602,214 | $ | 314,414,989 | ||||||
Affiliated issuers | 17,807,976 | 1,116,829 | 15,539,753 | |||||||||
| NET ASSETS CONSIST OF: |
| |||||||||||
Capital stock, at par | $ | 142,782 | $ | 43,090 | $ | 32,338 | ||||||
Additional paid-in capital | 1,486,414,154 | 449,652,345 | 334,426,898 | |||||||||
Distributable earnings | 226,178,826 | 65,122,739 | 47,735,059 | |||||||||
|
|
|
|
|
| |||||||
| $ | 1,712,735,762 | $ | 514,818,174 | $ | 382,194,295 | |||||||
|
|
|
|
|
| |||||||
(a) Cost: $2,037,407, $568,862 and $450,352, respectively. (Note 1)
(b) Net premiums received of $425,407, $150,147 and $121,192, respectively.
See Notes to Financial Statements.
2021 Semi-Annual Report | 97 | |
Table of Contents
Statement of Assets and Liabilities—March 31, 2021 (Unaudited) (continued)
| TAX-AWARE OVERLAY B PORTFOLIO | TAX-AWARE OVERLAY C PORTFOLIO | TAX-AWARE OVERLAY N PORTFOLIO | ||||||||||
| NET ASSET VALUE PER SHARE |
| |||||||||||
Class 1 Shares |
| |||||||||||
Net Assets | $ | 1,190,384,895 | $ | 320,642,515 | $ | 309,222,533 | ||||||
Shares of capital stock outstanding | 99,292,047 | 26,851,502 | 26,172,489 | |||||||||
|
|
|
|
|
| |||||||
Net asset value, offering and redemption price per share | $ | 11.99 | $ | 11.94 | $ | 11.81 | ||||||
|
|
|
|
|
| |||||||
Class 2 Shares |
| |||||||||||
Net Assets | $ | 522,350,867 | $ | 194,175,659 | $ | 72,971,762 | ||||||
Shares of capital stock outstanding | 43,490,147 | 16,238,910 | 6,165,497 | |||||||||
|
|
|
|
|
| |||||||
Net asset value, offering and redemption price per share | $ | 12.01 | $ | 11.96 | $ | 11.84 | ||||||
|
|
|
|
|
| |||||||
See Notes to Financial Statements.
| 98 | Sanford C. Bernstein Fund, Inc. | |
Table of Contents
Statement of Operations—for the six months ended March 31, 2021 (Unaudited)
| OVERLAY A PORTFOLIO | TAX-AWARE OVERLAY A PORTFOLIO | OVERLAY B PORTFOLIO | ||||||||||
| INVESTMENT INCOME |
| |||||||||||
Income: |
| |||||||||||
Interest | $ | 0 | $ | 0 | $ | 12,977,684 | ||||||
Dividends |
| |||||||||||
Unaffiliated issuers (net of foreign withholding taxes of $82,122, $169,052 and $920, respectively) | 6,885,214 | 13,963,506 | 0 | |||||||||
Affiliated issuers | 12,565,954 | 26,477,997 | 1,459,813 | |||||||||
|
|
|
|
|
| |||||||
Total income | 19,451,168 | 40,441,503 | 14,437,497 | |||||||||
|
|
|
|
|
| |||||||
Expenses: |
| |||||||||||
Management fee (see Note 2A) | 8,410,291 | 16,982,373 | 3,953,210 | |||||||||
Shareholder servicing fee (see Note 2B) | 1,548,679 | 2,899,457 | 760,919 | |||||||||
Custody and accounting fees | 118,965 | 121,027 | 184,817 | |||||||||
Transfer Agent fee—Class 1 | 32,596 | 41,797 | 32,620 | |||||||||
Transfer Agent fee—Class 2 | 6,737 | 13,027 | 6,488 | |||||||||
Auditing and tax fees | 56,504 | 50,227 | 61,563 | |||||||||
Directors’ fees and expenses | 37,152 | 75,288 | 24,880 | |||||||||
Legal fees | 20,322 | 40,751 | 14,516 | |||||||||
Registration fees | 19,078 | 19,849 | 20,377 | |||||||||
Printing fees | 10,765 | 14,856 | 10,882 | |||||||||
Miscellaneous | 126,033 | 236,502 | 41,177 | |||||||||
|
|
|
|
|
| |||||||
Total expenses | 10,387,122 | 20,495,154 | 5,111,449 | |||||||||
Less: expenses waived and reimbursed by the Adviser (see Note 2D) | (3,458,455 | ) | (7,066,831 | ) | (205,109 | ) | ||||||
|
|
|
|
|
| |||||||
Net expenses | 6,928,667 | 13,428,323 | 4,906,340 | |||||||||
|
|
|
|
|
| |||||||
Net investment income | 12,522,501 | 27,013,180 | 9,531,157 | |||||||||
|
|
|
|
|
| |||||||
| REALIZED AND UNREALIZED GAIN (LOSS) ON INVESTMENT AND FOREIGN CURRENCY TRANSACTIONS | ||||||||||||
Net realized gain (loss) on: |
| |||||||||||
Investment transactions (a) | 130,689,750 | 285,604,843 | 21,022,348 | |||||||||
Affiliated Underlying Portfolios | 5,636,963 | 12,594,853 | 0 | |||||||||
Forward currency exchange contracts | 5,963,673 | 12,066,958 | (3,268,200 | ) | ||||||||
Futures | (16,666,609 | ) | (49,129,621 | ) | 73,029,562 | |||||||
Options written | 3,454,286 | 6,912,884 | 1,476,584 | |||||||||
Swaps | 627,337 | 1,270,117 | (5,628,096 | ) | ||||||||
Swaptions written | 0 | 0 | 1,195,649 | |||||||||
Foreign currency transactions | 200,110 | 360,769 | 5,496,341 | |||||||||
|
|
|
|
|
| |||||||
Net realized gain on investment and foreign currency transactions | 129,905,510 | 269,680,803 | 93,324,188 | |||||||||
|
|
|
|
|
| |||||||
Net change in unrealized appreciation/depreciation of: |
| |||||||||||
Investments (b) | 36,531,032 | 56,655,603 | (35,884,828 | ) | ||||||||
Affiliated Underlying Portfolios | 126,668,918 | 257,519,741 | 7,539,498 | |||||||||
Forward currency exchange contracts | (383,602 | ) | (583,128 | ) | 1,438,538 | |||||||
Futures | (7,647,950 | ) | (13,424,920 | ) | 8,216,231 | |||||||
Options written | 0 | 0 | (185,830 | ) | ||||||||
Swaps | (106,054 | ) | (218,333 | ) | 4,794,325 | |||||||
Swaptions written | 0 | 0 | (121,782 | ) | ||||||||
Foreign currency denominated assets and liabilities | (121,774 | ) | (215,521 | ) | (66,301 | ) | ||||||
|
|
|
|
|
| |||||||
Net change in unrealized appreciation/depreciation of investments and foreign currency denominated assets and liabilities | 154,940,570 | 299,733,442 | (14,270,149 | ) | ||||||||
|
|
|
|
|
| |||||||
Net realized and unrealized gain on investment and foreign currency transactions | 284,846,080 | 569,414,245 | 79,054,039 | |||||||||
|
|
|
|
|
| |||||||
Net increase in net assets resulting from operations | $ | 297,368,581 | $ | 596,427,425 | $ | 88,585,196 | ||||||
|
|
|
|
|
| |||||||
(a) Net of foreign capital gains taxes of $0, $0 and $6,022, respectively.
(b) Net of increase in accrued foreign capital gains taxes of $0, $0 and $408, respectively.
See Notes to Financial Statements.
2021 Semi-Annual Report | 99 | |
Table of Contents
Statement of Operations—for the six months ended March 31, 2021 (Unaudited) (continued)
| TAX-AWARE OVERLAY B PORTFOLIO | TAX-AWARE OVERLAY C PORTFOLIO | TAX-AWARE OVERLAY N PORTFOLIO | ||||||||||
| INVESTMENT INCOME | ||||||||||||
Income: | ||||||||||||
Interest | $ | 16,239,313 | $ | 4,654,820 | $ | 3,433,338 | ||||||
Dividends |
| |||||||||||
Unaffiliated issuers | 3,585,045 | 1,076,837 | 809,082 | |||||||||
Affiliated issuers | 6,561 | 1,418 | 1,353 | |||||||||
|
|
|
|
|
| |||||||
Total income | 19,830,919 | 5,733,075 | 4,243,773 | |||||||||
|
|
|
|
|
| |||||||
Expenses: | ||||||||||||
Management fee (see Note 2A) | 5,537,838 | 1,678,948 | 1,239,609 | |||||||||
Shareholder servicing fee (see Note 2B) | 879,774 | 239,665 | 231,241 | |||||||||
Custody and accounting fees | 108,095 | 72,124 | 65,734 | |||||||||
Transfer Agent fee—Class 1 | 21,152 | 6,912 | 9,006 | |||||||||
Transfer Agent fee—Class 2 | 9,576 | 4,262 | 2,135 | |||||||||
Auditing and tax fees | 50,247 | 50,247 | 50,247 | |||||||||
Registration fees | 21,281 | 18,052 | 18,052 | |||||||||
Directors’ fees and expenses | 34,481 | 10,358 | 7,730 | |||||||||
Legal fees | 20,257 | 6,544 | 4,847 | |||||||||
Printing fees | 9,089 | 4,310 | 6,713 | |||||||||
Miscellaneous | 44,750 | 33,617 | 26,445 | |||||||||
|
|
|
|
|
| |||||||
Total expenses | 6,736,540 | 2,125,039 | 1,661,759 | |||||||||
Less: expenses waived and reimbursed by the Adviser (see Note 2D) | (20,284 | ) | (4,110 | ) | (4,564 | ) | ||||||
|
|
|
|
|
| |||||||
Net expenses | 6,716,256 | 2,120,929 | 1,657,195 | |||||||||
|
|
|
|
|
| |||||||
Net investment income | 13,114,663 | 3,612,146 | 2,586,578 | |||||||||
|
|
|
|
|
| |||||||
| REALIZED AND UNREALIZED GAIN (LOSS) ON INVESTMENT AND FOREIGN CURRENCY TRANSACTIONS | ||||||||||||
Net realized gain on: | ||||||||||||
Investment transactions | 19,571,975 | 14,033,563 | 8,365,279 | |||||||||
Forward currency exchange contracts | 5,841,433 | 1,847,970 | 1,225,769 | |||||||||
Futures | 36,793,826 | 10,758,611 | 7,631,425 | |||||||||
Options written | 1,223,226 | 389,433 | 270,320 | |||||||||
Swaps | 885,018 | 254,815 | 614,819 | |||||||||
Foreign currency transactions | 202,663 | 104,719 | 125,755 | |||||||||
|
|
|
|
|
| |||||||
Net realized gain on investment and foreign currency transactions | 64,518,141 | 27,389,111 | 18,233,367 | |||||||||
|
|
|
|
|
| |||||||
Net change in unrealized appreciation/depreciation of: | ||||||||||||
Investments | 52,479,958 | 6,396,028 | 11,196,820 | |||||||||
Forward currency exchange contracts | (262,747 | ) | (79,210 | ) | (59,199 | ) | ||||||
Futures | 1,068,372 | 816,483 | 154,795 | |||||||||
Swaps | 13,347,362 | 3,723,290 | 2,551,027 | |||||||||
Foreign currency denominated assets and liabilities | (116,131 | ) | (34,649 | ) | (27,115 | ) | ||||||
|
|
|
|
|
| |||||||
Net change in unrealized appreciation/depreciation of investments and foreign currency denominated assets and liabilities | 66,516,814 | 10,821,942 | 13,816,328 | |||||||||
|
|
|
|
|
| |||||||
Net realized and unrealized gain on investment and foreign currency transactions | 131,034,955 | 38,211,053 | 32,049,695 | |||||||||
|
|
|
|
|
| |||||||
Net increase in net assets resulting from operations | $ | 144,149,618 | $ | 41,823,199 | $ | 34,636,273 | ||||||
|
|
|
|
|
| |||||||
See Notes to Financial Statements.
| 100 | Sanford C. Bernstein Fund, Inc. | |
Table of Contents
Statement of Changes in Net Assets
OVERLAY A PORTFOLIO | TAX-AWARE OVERLAY A PORTFOLIO | |||||||||||||||||||
| SIX MONTHS ENDED 3/31/21 (UNAUDITED) | YEAR ENDED 9/30/20 | SIX MONTHS ENDED 3/31/21 (UNAUDITED) | YEAR ENDED 9/30/20 | |||||||||||||||||
| INCREASE (DECREASE) IN NET ASSETS FROM |
| |||||||||||||||||||
Operations: |
| |||||||||||||||||||
Net investment income | $ | 12,522,501 | $ | 19,432,460 | $ | 27,013,180 | $ | 40,226,657 | ||||||||||||
Net realized gain (loss) on investment and foreign currency transactions | 129,905,510 | (15,552,142 | ) | 269,680,803 | (33,688,779 | ) | ||||||||||||||
Net change in unrealized appreciation/depreciation of investments and foreign currency denominated assets and liabilities | 154,940,570 | (16,742,348 | ) | 299,733,442 | (21,662,261 | ) | ||||||||||||||
|
|
|
|
|
|
|
| |||||||||||||
Net increase (decrease) in net assets resulting from operations | 297,368,581 | (12,862,030 | ) | 596,427,425 | (15,124,383 | ) | ||||||||||||||
|
|
|
|
|
|
|
| |||||||||||||
Distributions to shareholders (a) | (17,000,914 | ) | (27,475,125 | ) | (36,651,710 | ) | (55,053,958 | ) | ||||||||||||
|
|
|
|
|
|
|
| |||||||||||||
Capital-share transactions |
| |||||||||||||||||||
Net proceeds from sales of shares | 87,516,190 | 177,043,428 | 109,219,930 | 236,616,530 | ||||||||||||||||
Net proceeds from sales of shares issued to shareholders on reinvestment of dividends and distributions | 15,070,832 | 23,199,365 | 27,249,489 | 42,862,296 | ||||||||||||||||
|
|
|
|
|
|
|
| |||||||||||||
Total proceeds from shares sold | 102,587,022 | 200,242,793 | 136,469,419 | 279,478,826 | ||||||||||||||||
Cost of shares redeemed | (255,762,966 | ) | (369,299,731 | ) | (301,985,199 | ) | (834,543,575 | ) | ||||||||||||
|
|
|
|
|
|
|
| |||||||||||||
Net decrease in net assets from capital-share transactions | (153,175,944 | ) | (169,056,938 | ) | (165,515,780 | ) | (555,064,749 | ) | ||||||||||||
|
|
|
|
|
|
|
| |||||||||||||
Net increase (decrease) in net assets | 127,191,723 | (209,394,093 | ) | 394,259,935 | (625,243,090 | ) | ||||||||||||||
| NET ASSETS: |
| |||||||||||||||||||
Beginning of period | 1,775,006,074 | 1,984,400,167 | 3,559,428,175 | 4,184,671,265 | ||||||||||||||||
|
|
|
|
|
|
|
| |||||||||||||
End of period | $ | 1,902,197,797 | $ | 1,775,006,074 | $ | 3,953,688,110 | $ | 3,559,428,175 | ||||||||||||
|
|
|
|
|
|
|
| |||||||||||||
(a) See page 104 for share class information on dividend distributions for the Overlay A and Tax-Aware Overlay A Portfolios.
See Notes to Financial Statements.
2021 Semi-Annual Report | 101 | |
Table of Contents
Statement of Changes in Net Assets (continued)
OVERLAY B PORTFOLIO | TAX-AWARE OVERLAY B PORTFOLIO | |||||||||||||||||||
| SIX MONTHS ENDED 3/31/21 (UNAUDITED) | YEAR ENDED 9/30/20 | SIX MONTHS ENDED 3/31/21 (UNAUDITED) | YEAR ENDED 9/30/20 | |||||||||||||||||
| INCREASE (DECREASE) IN NET ASSETS FROM |
| |||||||||||||||||||
Operations: |
| |||||||||||||||||||
Net investment income | $ | 9,531,157 | $ | 18,438,489 | $ | 13,114,663 | $ | 31,268,532 | ||||||||||||
Net realized gain (loss) on investment and foreign currency transactions | 93,324,188 | 24,991,174 | 64,518,141 | (19,530,472 | ) | |||||||||||||||
Net change in unrealized appreciation/depreciation of investments and foreign currency denominated assets and liabilities | (14,270,149 | ) | (2,181,151 | ) | 66,516,814 | 30,319,385 | ||||||||||||||
|
|
|
|
|
|
|
| |||||||||||||
Net increase in net assets resulting from operations | 88,585,196 | 41,248,512 | 144,149,618 | 42,057,445 | ||||||||||||||||
|
|
|
|
|
|
|
| |||||||||||||
Distributions to shareholders (a) | (31,639,231 | ) | (41,357,860 | ) | (39,931,578 | ) | (27,707,869 | ) | ||||||||||||
|
|
|
|
|
|
|
| |||||||||||||
Capital-share transactions |
| |||||||||||||||||||
Net proceeds from sales of shares | 70,256,896 | 144,744,261 | 63,025,161 | 163,671,586 | ||||||||||||||||
Net proceeds from sales of shares issued to shareholders on reinvestment of dividends and distributions | 27,251,385 | 32,701,023 | 29,470,081 | 21,096,970 | ||||||||||||||||
|
|
|
|
|
|
|
| |||||||||||||
Total proceeds from shares sold | 97,508,281 | 177,445,284 | 92,495,242 | 184,768,556 | ||||||||||||||||
Cost of shares redeemed | (133,568,288 | ) | (225,503,576 | ) | (146,556,605 | ) | (378,674,260 | ) | ||||||||||||
|
|
|
|
|
|
|
| |||||||||||||
Net decrease in net assets from capital-share transactions | (36,060,007 | ) | (48,058,292 | ) | (54,061,363 | ) | (193,905,704 | ) | ||||||||||||
|
|
|
|
|
|
|
| |||||||||||||
Net increase (decrease) in net assets | 20,885,958 | (48,167,640 | ) | 50,156,677 | (179,556,128 | ) | ||||||||||||||
| NET ASSETS: |
| |||||||||||||||||||
Beginning of period | 1,194,615,267 | 1,242,782,907 | 1,662,579,085 | 1,842,135,213 | ||||||||||||||||
|
|
|
|
|
|
|
| |||||||||||||
End of period | $ | 1,215,501,225 | $ | 1,194,615,267 | $ | 1,712,735,762 | $ | 1,662,579,085 | ||||||||||||
|
|
|
|
|
|
|
| |||||||||||||
(a) See page 104 for share class information on dividend distributions for the Overlay B and Tax-Aware Overlay B Portfolios.
See Notes to Financial Statements.
| 102 | Sanford C. Bernstein Fund, Inc. | |
Table of Contents
TAX-AWARE OVERLAY C PORTFOLIO | TAX-AWARE OVERLAY N PORTFOLIO | |||||||||||||||||||
| SIX MONTHS ENDED 3/31/21 (UNAUDITED) | YEAR ENDED | SIX MONTHS ENDED 3/31/21 (UNAUDITED) | YEAR ENDED | |||||||||||||||||
| INCREASE (DECREASE) IN NET ASSETS FROM |
| |||||||||||||||||||
Operations: |
| |||||||||||||||||||
Net investment income | $ | 3,612,146 | $ | 9,006,083 | $ | 2,586,578 | $ | 6,640,671 | ||||||||||||
Net realized gain (loss) on investment and foreign currency transactions | 27,389,111 | (13,822,517 | ) | 18,233,367 | (8,824,210 | ) | ||||||||||||||
Net change in unrealized appreciation/depreciation of investments and foreign currency denominated assets and liabilities | 10,821,942 | 17,088,630 | 13,816,328 | 6,280,909 | ||||||||||||||||
|
|
|
|
|
|
|
| |||||||||||||
Net increase in net assets resulting from operations | 41,823,199 | 12,272,196 | 34,636,273 | 4,097,370 | ||||||||||||||||
|
|
|
|
|
|
|
| |||||||||||||
Distributions to shareholders (a) | (11,727,730 | ) | (8,087,751 | ) | (8,250,017 | ) | (6,580,805 | ) | ||||||||||||
|
|
|
|
|
|
|
| |||||||||||||
Capital-share transactions |
| |||||||||||||||||||
Net proceeds from sales of shares | 12,299,940 | 53,517,358 | 9,810,487 | 29,344,538 | ||||||||||||||||
Net proceeds from sales of shares issued to shareholders on reinvestment of dividends and distributions | 8,192,214 | 6,243,843 | 6,209,530 | 5,164,172 | ||||||||||||||||
|
|
|
|
|
|
|
| |||||||||||||
Total proceeds from shares sold | 20,492,154 | 59,761,201 | 16,020,017 | 34,508,710 | ||||||||||||||||
Cost of shares redeemed | (47,351,038 | ) | (119,191,467 | ) | (34,671,440 | ) | (78,469,725 | ) | ||||||||||||
|
|
|
|
|
|
|
| |||||||||||||
Net decrease in net assets from capital-share transactions | (26,858,884 | ) | (59,430,266 | ) | (18,651,423 | ) | (43,961,015 | ) | ||||||||||||
|
|
|
|
|
|
|
| |||||||||||||
Net increase (decrease) in net assets | 3,236,585 | (55,245,821 | ) | 7,734,833 | (46,444,450 | ) | ||||||||||||||
| NET ASSETS: |
| |||||||||||||||||||
Beginning of period | 511,581,589 | 566,827,410 | 374,459,462 | 420,903,912 | ||||||||||||||||
|
|
|
|
|
|
|
| |||||||||||||
End of period | $ | 514,818,174 | $ | 511,581,589 | $ | 382,194,295 | $ | 374,459,462 | ||||||||||||
|
|
|
|
|
|
|
| |||||||||||||
(a) See page 104 for share class information on dividend distributions for the Tax-Aware Overlay C and Tax-Aware Overlay N Portfolios.
See Notes to Financial Statements.
2021 Semi-Annual Report | 103 | |
Table of Contents
Statement of Changes in Net Assets (continued)
PORTFOLIO | TAX-AWARE OVERLAY A PORTFOLIO | |||||||||||||||||||
| SIX MONTHS ENDED 3/31/21 (UNAUDITED) | YEAR ENDED 9/30/20 | SIX MONTHS ENDED 3/31/21 (UNAUDITED) | YEAR ENDED 9/30/20 | |||||||||||||||||
Distributions to shareholders: | ||||||||||||||||||||
Class 1 | $ | (13,630,162 | ) | $ | (22,455,773 | ) | $ | (26,615,502 | ) | $ | (40,026,066 | ) | ||||||||
Class 2 | (3,370,752 | ) | (5,019,352 | ) | (10,036,208 | ) | (15,027,892 | ) | ||||||||||||
|
|
|
|
|
|
|
| |||||||||||||
| $ | (17,000,914 | ) | $ | (27,475,125 | ) | $ | (36,651,710 | ) | $ | (55,053,958 | ) | |||||||||
|
|
|
|
|
|
|
| |||||||||||||
PORTFOLIO | TAX-AWARE OVERLAY B PORTFOLIO | |||||||||||||||||||
| SIX MONTHS ENDED 3/31/21 (UNAUDITED) | YEAR ENDED 9/30/20 | SIX MONTHS ENDED 3/31/21 (UNAUDITED) | YEAR ENDED 9/30/20 | |||||||||||||||||
Distributions to shareholders: | ||||||||||||||||||||
Class 1 | $ | (26,263,245 | ) | $ | (33,698,470 | ) | $ | (26,876,499 | ) | $ | (18,276,724 | ) | ||||||||
Class 2 | (5,375,986 | ) | (7,659,390 | ) | (13,055,079 | ) | (9,431,145 | ) | ||||||||||||
|
|
|
|
|
|
|
| |||||||||||||
| $ | (31,639,231 | ) | $ | (41,357,860 | ) | $ | (39,931,578 | ) | $ | (27,707,869 | ) | |||||||||
|
|
|
|
|
|
|
| |||||||||||||
OVERLAY C PORTFOLIO | TAX-AWARE OVERLAY N PORTFOLIO | |||||||||||||||||||
| SIX MONTHS ENDED 3/31/21 (UNAUDITED) | YEAR ENDED 9/30/20 | SIX MONTHS ENDED 3/31/21 (UNAUDITED) | YEAR ENDED 9/30/20 | |||||||||||||||||
Distributions to shareholders: | ||||||||||||||||||||
Class 1 | $ | (7,015,375 | ) | $ | (4,982,671 | ) | $ | (6,618,995 | ) | $ | (5,143,246 | ) | ||||||||
Class 2 | (4,712,355 | ) | (3,105,080 | ) | (1,631,022 | ) | (1,437,559 | ) | ||||||||||||
|
|
|
|
|
|
|
| |||||||||||||
| $ | (11,727,730 | ) | $ | (8,087,751 | ) | $ | (8,250,017 | ) | $ | (6,580,805 | ) | |||||||||
|
|
|
|
|
|
|
| |||||||||||||
See Notes to Financial Statements.
| 104 | Sanford C. Bernstein Fund, Inc. | |
Table of Contents
Selected per share data and ratios for a share of capital stock outstanding for each respective Portfolio for each of the periods presented:
OVERLAY A PORTFOLIO | ||||||||||||||||||||||||
| CLASS 1 | ||||||||||||||||||||||||
| SIX MONTHS ENDED 3/31/21 (UNAUDITED) | YEAR ENDED 9/30/20 | YEAR ENDED 9/30/19 | YEAR ENDED 9/30/18 | YEAR ENDED 9/30/17 | YEAR ENDED 9/30/16 | |||||||||||||||||||
Net asset value, beginning of period | $ | 12.81 | $ | 13.05 | $ | 13.69 | $ | 13.18 | $ | 11.62 | $ | 11.80 | ||||||||||||
|
|
|
|
|
|
|
|
|
|
|
| |||||||||||||
Income from investment operations: | ||||||||||||||||||||||||
Investment income, net (a)(b) | 0.09 | 0.13 | 0.14 | 0.12 | 0.10 | 0.03 | (c) | |||||||||||||||||
Net realized and unrealized gain (loss) on investment and foreign currency transactions | 2.13 | (0.19 | ) | (0.37 | ) | 0.57 | 1.52 | 0.31 | ||||||||||||||||
Contributions from affiliates | 0 | 0 | 0.00 | (d) | 0 | 0.00 | (d) | 0 | ||||||||||||||||
|
|
|
|
|
|
|
|
|
|
|
| |||||||||||||
Total from investment operations | 2.22 | (0.06 | ) | (0.23 | ) | 0.69 | 1.62 | 0.34 | ||||||||||||||||
|
|
|
|
|
|
|
|
|
|
|
| |||||||||||||
Less dividends and distributions: | ||||||||||||||||||||||||
Dividends from net investment income | (0.12 | ) | (0.15 | ) | (0.13 | ) | (0.18 | ) | (0.06 | ) | (0.05 | ) | ||||||||||||
Distributions from net realized gain on investment transactions | 0 | (0.03 | ) | (0.28 | ) | 0 | 0 | (0.47 | ) | |||||||||||||||
|
|
|
|
|
|
|
|
|
|
|
| |||||||||||||
Total dividends and distributions | (0.12 | ) | (0.18 | ) | (0.41 | ) | (0.18 | ) | (0.06 | ) | (0.52 | ) | ||||||||||||
|
|
|
|
|
|
|
|
|
|
|
| |||||||||||||
Net asset value, end of period | $ | 14.91 | $ | 12.81 | $ | 13.05 | $ | 13.69 | $ | 13.18 | $ | 11.62 | ||||||||||||
|
|
|
|
|
|
|
|
|
|
|
| |||||||||||||
Total return (e)(f) | 17.50% | (0.45)% | (1.46)% | 5.21% | 14.04% | 2.84% | (c) | |||||||||||||||||
| RATIOS/SUPPLEMENTAL DATA | ||||||||||||||||||||||||
Net assets, end of period (000 omitted) | $1,587,827 | $1,465,081 | $1,653,447 | $1,811,002 | $1,784,355 | $1,638,587 | ||||||||||||||||||
Average net assets (000 omitted) | $1,552,934 | $1,539,035 | $1,663,944 | $1,829,185 | $1,687,556 | $1,582,586 | ||||||||||||||||||
Ratio to average net assets of: | ||||||||||||||||||||||||
Expenses, net of waivers | 0.78% | (i) | 0.81% | 0.80% | 0.78% | 0.83% | 1.00% | |||||||||||||||||
Expenses, before waivers | 1.15% | (i) | 1.15% | 1.14% | 1.13% | 1.13% | 1.14% | |||||||||||||||||
Net investment income (b) | 1.31% | (i) | 1.02% | 1.11% | 0.88% | 0.79% | 0.22% | (c) | ||||||||||||||||
Portfolio turnover rate | 11% | 22% | 21% | 39% | 48% | 71% | ||||||||||||||||||
See Footnote Summary on pages 117–118.
See Notes to Financial Statements.
2021 Semi-Annual Report | 105 | |
Table of Contents
Financial Highlights (continued)
Selected per share data and ratios for a share of capital stock outstanding for each respective Portfolio for each of the periods presented:
OVERLAY A PORTFOLIO | ||||||||||||||||||||||||
| CLASS 2 | ||||||||||||||||||||||||
| SIX MONTHS ENDED 3/31/21 (UNAUDITED) | YEAR ENDED 9/30/20 | YEAR ENDED 9/30/19 | YEAR ENDED 9/30/18 | YEAR ENDED 9/30/17 | YEAR ENDED 9/30/16 | |||||||||||||||||||
Net asset value, beginning of period | $ | 12.84 | $ | 13.07 | $ | 13.72 | $ | 13.22 | $ | 11.65 | $ | 11.83 | ||||||||||||
|
|
|
|
|
|
|
|
|
|
|
| |||||||||||||
Income from investment operations: | ||||||||||||||||||||||||
Investment income, net (a)(b) | 0.11 | 0.15 | 0.18 | 0.15 | 0.12 | 0.05 | (c) | |||||||||||||||||
Net realized and unrealized gain (loss) on investment and foreign currency transactions | 2.13 | (0.17 | ) | (0.39 | ) | 0.56 | 1.54 | 0.31 | ||||||||||||||||
Contributions from affiliates | 0 | 0 | 0.00 | (d) | 0 | 0.00 | (d) | 0 | ||||||||||||||||
|
|
|
|
|
|
|
|
|
|
|
| |||||||||||||
Total from investment operations | 2.24 | (0.02 | ) | (0.21 | ) | 0.71 | 1.66 | 0.36 | ||||||||||||||||
|
|
|
|
|
|
|
|
|
|
|
| |||||||||||||
Less dividends and distributions: | ||||||||||||||||||||||||
Dividends from net investment income | (0.15 | ) | (0.18 | ) | (0.16 | ) | (0.21 | ) | (0.09 | ) | (0.07 | ) | ||||||||||||
Distributions from net realized gain on investment transactions | 0 | (0.03 | ) | (0.28 | ) | 0 | 0 | (0.47 | ) | |||||||||||||||
|
|
|
|
|
|
|
|
|
|
|
| |||||||||||||
Total dividends and distributions | (0.15 | ) | (0.21 | ) | (0.44 | ) | (0.21 | ) | (0.09 | ) | (0.54 | ) | ||||||||||||
|
|
|
|
|
|
|
|
|
|
|
| |||||||||||||
Net asset value, end of period | $ | 14.93 | $ | 12.84 | $ | 13.07 | $ | 13.72 | $ | 13.22 | $ | 11.65 | ||||||||||||
|
|
|
|
|
|
|
|
|
|
|
| |||||||||||||
Total return (e)(f) | 17.61% | (0.25)% | (1.23)% | 5.37% | 14.31% | 3.14% | (c) | |||||||||||||||||
| RATIOS/SUPPLEMENTAL DATA | ||||||||||||||||||||||||
Net assets, end of period (000 omitted) | $314,371 | $309,925 | $330,953 | $427,346 | $431,755 | $395,657 | ||||||||||||||||||
Average net assets (000 omitted) | $321,154 | $319,363 | $367,721 | $420,846 | $408,460 | $381,197 | ||||||||||||||||||
Ratio to average net assets of: | ||||||||||||||||||||||||
Expenses, net of waivers/reimbursements (g)(h) | 0.58% | (i) | 0.61% | 0.60% | 0.58% | 0.63% | 0.80% | |||||||||||||||||
Expenses, before waivers/reimbursements (g)(h) | 0.95% | (i) | 0.95% | 0.94% | 0.93% | 0.93% | 0.94% | |||||||||||||||||
Net investment income (b) | 1.50% | (i) | 1.17% | 1.37% | 1.09% | 0.99% | 0.42% | (c) | ||||||||||||||||
Portfolio turnover rate | 11% | 22% | 21% | 39% | 48% | 71% | ||||||||||||||||||
See Footnote Summary on pages 117–118.
See Notes to Financial Statements.
| 106 | Sanford C. Bernstein Fund, Inc. | |
Table of Contents
TAX-AWARE OVERLAY A PORTFOLIO | ||||||||||||||||||||||||
| CLASS 1 | ||||||||||||||||||||||||
| SIX MONTHS ENDED 3/31/21 (UNAUDITED) | YEAR ENDED 9/30/20 | YEAR ENDED 9/30/19 | YEAR ENDED 9/30/18 | YEAR ENDED 9/30/17 | YEAR ENDED 9/30/16 | |||||||||||||||||||
Net asset value, beginning of period | $ | 13.65 | $ | 13.78 | $ | 14.29 | $ | 13.95 | $ | 12.30 | $ | 12.52 | ||||||||||||
|
|
|
|
|
|
|
|
|
|
|
| |||||||||||||
Income from investment operations: | ||||||||||||||||||||||||
Investment income, net (a)(b) | 0.10 | 0.13 | 0.15 | 0.13 | 0.11 | 0.03 | (c) | |||||||||||||||||
Net realized and unrealized gain (loss) on investment and foreign currency transactions | 2.23 | (0.08 | ) | (0.37 | ) | 0.55 | 1.60 | 0.27 | ||||||||||||||||
Contributions from affiliates | 0 | 0 | 0 | 0 | 0.00 | (d) | 0.00 | (d) | ||||||||||||||||
|
|
|
|
|
|
|
|
|
|
|
| |||||||||||||
Total from investment operations | 2.33 | 0.05 | (0.22 | ) | 0.68 | 1.71 | 0.30 | |||||||||||||||||
|
|
|
|
|
|
|
|
|
|
|
| |||||||||||||
Less dividends and distributions: | ||||||||||||||||||||||||
Dividends from net investment income | (0.14 | ) | (0.18 | ) | (0.12 | ) | (0.30 | ) | (0.06 | ) | (0.04 | ) | ||||||||||||
Distributions from net realized gain on investment transactions | 0 | (0.00 | ) (d) | (0.17 | ) | (0.04 | ) | 0 | (0.48 | ) | ||||||||||||||
|
|
|
|
|
|
|
|
|
|
|
| |||||||||||||
Total dividends and distributions | (0.14 | ) | (0.18 | ) | (0.29 | ) | (0.34 | ) | (0.06 | ) | (0.52 | ) | ||||||||||||
|
|
|
|
|
|
|
|
|
|
|
| |||||||||||||
Net asset value, end of period | $ | 15.84 | $ | 13.65 | $ | 13.78 | $ | 14.29 | $ | 13.95 | $ | 12.30 | ||||||||||||
|
|
|
|
|
|
|
|
|
|
|
| |||||||||||||
Total return (e)(f) | 17.19% | 0.29% | (1.28)% | 4.85% | (j) | 13.99% | 2.37% | (c) | ||||||||||||||||
| RATIOS/SUPPLEMENTAL DATA | ||||||||||||||||||||||||
Net assets, end of period (000 omitted) | $3,012,942 | $2,712,320 | $3,143,494 | $3,464,533 | $3,418,084 | $3,183,118 | ||||||||||||||||||
Average net assets (000 omitted) | $2,907,423 | $2,913,890 | $3,181,790 | $3,513,988 | $3,258,122 | $3,133,499 | ||||||||||||||||||
Ratio to average net assets of: |
| |||||||||||||||||||||||
Expenses, net of waivers/reimbursements (g)(h) | 0.75% | (i) | 0.80% | 0.80% | 0.77% | 0.82% | 0.99% | |||||||||||||||||
Expenses, before waivers/reimbursements (g)(h) | 1.13% | (i) | 1.13% | 1.13% | 1.12% | 1.12% | 1.13% | |||||||||||||||||
Net investment income (b) | 1.37% | (i) | 0.99% | 1.09% | 0.89% | 0.85% | 0.28% | (c) | ||||||||||||||||
Portfolio turnover rate | 11% | 22% | 20% | 42% | 49% | 71% | ||||||||||||||||||
See Footnote Summary on pages 117–118.
See Notes to Financial Statements.
2021 Semi-Annual Report | 107 | |
Table of Contents
Financial Highlights (continued)
Selected per share data and ratios for a share of capital stock outstanding for each respective Portfolio for each of the periods presented:
TAX-AWARE OVERLAY A PORTFOLIO | ||||||||||||||||||||||||
| CLASS 2 | ||||||||||||||||||||||||
| SIX MONTHS ENDED 3/31/21 (UNAUDITED) | YEAR ENDED 9/30/20 | YEAR ENDED 9/30/19 | YEAR ENDED 9/30/18 | YEAR ENDED 9/30/17 | YEAR ENDED 9/30/16 | |||||||||||||||||||
Net asset value, beginning of period | $ | 13.69 | $ | 13.82 | $ | 14.33 | $ | 14.00 | $ | 12.34 | $ | 12.55 | ||||||||||||
|
|
|
|
|
|
|
|
|
|
|
| |||||||||||||
Income from investment operations: | ||||||||||||||||||||||||
Investment income, net (a)(b) | 0.12 | 0.16 | 0.17 | 0.16 | 0.14 | 0.06 | (c) | |||||||||||||||||
Net realized and unrealized gain (loss) on investment and foreign currency transactions | 2.23 | (0.08 | ) | (0.36 | ) | 0.54 | 1.61 | 0.27 | ||||||||||||||||
Contributions from affiliates | 0 | 0 | 0 | 0 | 0.00 | (d) | 0.00 | (d) | ||||||||||||||||
|
|
|
|
|
|
|
|
|
|
|
| |||||||||||||
Total from investment operations | 2.35 | 0.08 | (0.19 | ) | 0.70 | 1.75 | 0.33 | |||||||||||||||||
|
|
|
|
|
|
|
|
|
|
|
| |||||||||||||
Less dividends and distributions: | ||||||||||||||||||||||||
Dividends from net investment income | (0.17 | ) | (0.21 | ) | (0.15 | ) | (0.33 | ) | (0.09 | ) | (0.06 | ) | ||||||||||||
Distributions from net realized gain on investment transactions | 0 | (0.00 | ) (d) | (0.17 | ) | (0.04 | ) | 0 | (0.48 | ) | ||||||||||||||
|
|
|
|
|
|
|
|
|
|
|
| |||||||||||||
Total dividends and distributions | (0.17 | ) | (0.21 | ) | (0.32 | ) | (0.37 | ) | (0.09 | ) | (0.54 | ) | ||||||||||||
|
|
|
|
|
|
|
|
|
|
|
| |||||||||||||
Net asset value, end of period | $ | 15.87 | $ | 13.69 | $ | 13.82 | $ | 14.33 | $ | 14.00 | $ | 12.34 | ||||||||||||
|
|
|
|
|
|
|
|
|
|
|
| |||||||||||||
Total return (e)(f) | 17.29% | 0.56% | (1.12)% | 5.01% | (j) | 14.25% | 2.61% | (c) | ||||||||||||||||
| RATIOS/SUPPLEMENTAL DATA | ||||||||||||||||||||||||
Net assets, end of period (000 omitted) | $940,746 | $847,108 | $1,041,177 | $1,119,490 | $1,075,867 | $985,732 | ||||||||||||||||||
Average net assets (000 omitted) | $906,094 | $935,278 | $1,048,726 | $1,114,328 | $1,020,239 | $955,478 | ||||||||||||||||||
Ratio to average net assets of: | ||||||||||||||||||||||||
Expenses, net of waivers/reimbursements (g)(h) | 0.55% | (i) | 0.60% | 0.60% | 0.57% | 0.62% | 0.79% | |||||||||||||||||
Expenses, before waivers/reimbursements (g)(h) | 0.93% | (i) | 0.93% | 0.93% | 0.92% | 0.92% | 0.93% | |||||||||||||||||
Net investment income (b) | 1.57% | (i) | 1.21% | 1.28% | 1.09% | 1.05% | 0.48% | (c) | ||||||||||||||||
Portfolio turnover rate | 11% | 22% | 20% | 42% | 49% | 71% | ||||||||||||||||||
See Footnote Summary on pages 117–118.
See Notes to Financial Statements.
| 108 | Sanford C. Bernstein Fund, Inc. | |
Table of Contents
OVERLAY B PORTFOLIO | ||||||||||||||||||||||||
| CLASS 1 | ||||||||||||||||||||||||
| SIX MONTHS ENDED 3/31/21 (UNAUDITED) | YEAR ENDED 9/30/20 | YEAR ENDED 9/30/19 | YEAR ENDED 9/30/18 | YEAR ENDED 9/30/17 | YEAR ENDED 9/30/16 | |||||||||||||||||||
Net asset value, beginning of period | $ | 10.96 | $ | 10.94 | $ | 10.96 | $ | 11.00 | $ | 10.67 | $ | 10.22 | ||||||||||||
|
|
|
|
|
|
|
|
|
|
|
| |||||||||||||
Income from investment operations: | ||||||||||||||||||||||||
Investment income, net (a)(b) | 0.09 | 0.16 | 0.21 | 0.20 | 0.16 | 0.12 | (c) | |||||||||||||||||
Net realized and unrealized gain on investment and foreign currency transactions | 0.74 | 0.22 | 0.17 | 0.01 | 0.42 | 0.48 | ||||||||||||||||||
Contributions from affiliates | 0 | 0 | 0.00 | (d) | 0.00 | (d) | 0.00 | (d) | 0 | |||||||||||||||
|
|
|
|
|
|
|
|
|
|
|
| |||||||||||||
Total from investment operations | 0.83 | 0.38 | 0.38 | 0.21 | 0.58 | 0.60 | ||||||||||||||||||
|
|
|
|
|
|
|
|
|
|
|
| |||||||||||||
Less dividends and distributions: | ||||||||||||||||||||||||
Dividends from net investment income | (0.25 | ) | (0.32 | ) | (0.26 | ) | (0.23 | ) | (0.25 | ) | 0 | |||||||||||||
Distributions from net realized gain on investment transactions | (0.05 | ) | (0.04 | ) | (0.14 | ) | (0.02 | ) | 0 | (0.15 | ) | |||||||||||||
|
|
|
|
|
|
|
|
|
|
|
| |||||||||||||
Total dividends and distributions | (0.30 | ) | (0.36 | ) | (0.40 | ) | (0.25 | ) | (0.25 | ) | (0.15 | ) | ||||||||||||
|
|
|
|
|
|
|
|
|
|
|
| |||||||||||||
Net asset value, end of period | $ | 11.49 | $ | 10.96 | $ | 10.94 | $ | 10.96 | $ | 11.00 | $ | 10.67 | ||||||||||||
|
|
|
|
|
|
|
|
|
|
|
| |||||||||||||
Total return (e) | 7.58% | 3.56% | 3.75% | 1.93% | 5.59% | 5.83% | (c) | |||||||||||||||||
| RATIOS/SUPPLEMENTAL DATA | ||||||||||||||||||||||||
Net assets, end of period (000 omitted) | $1,013,204 | $991,266 | $1,024,761 | $1,052,414 | $1,037,681 | $971,463 | ||||||||||||||||||
Average net assets (000 omitted) | $1,017,346 | $991,542 | $1,014,279 | $1,055,548 | $985,539 | $932,575 | ||||||||||||||||||
Ratio to average net assets of: | ||||||||||||||||||||||||
Expenses, net of waivers/reimbursements (g) | 0.83% | (i) | 0.84% | 0.83% | 0.81% | 0.84% | 0.85% | |||||||||||||||||
Expenses, before waivers/reimbursements (g) | 0.87% | (i) | 0.87% | 0.86% | 0.86% | 0.87% | 0.87% | |||||||||||||||||
Net investment income (b) | 1.54% | (i) | 1.51% | 1.95% | 1.78% | 1.49% | 1.19% | (c) | ||||||||||||||||
Portfolio turnover rate | 48% | 74% | 67% | 116% | 115% | 105% | ||||||||||||||||||
See Footnote Summary on pages 117–118.
See Notes to Financial Statements.
2021 Semi-Annual Report | 109 | |
Table of Contents
Financial Highlights (continued)
Selected per share data and ratios for a share of capital stock outstanding for each respective Portfolio for each of the periods presented:
OVERLAY B PORTFOLIO | ||||||||||||||||||||||||
| CLASS 2 | ||||||||||||||||||||||||
| SIX MONTHS ENDED 3/31/21 (UNAUDITED) | YEAR ENDED 9/30/20 | YEAR ENDED 9/30/19 | YEAR ENDED 9/30/18 | YEAR ENDED 9/30/17 | YEAR ENDED 9/30/16 | |||||||||||||||||||
Net asset value, beginning of period | $ | 11.00 | $ | 10.97 | $ | 10.98 | $ | 11.03 | $ | 10.69 | $ | 10.23 | ||||||||||||
|
|
|
|
|
|
|
|
|
|
|
| |||||||||||||
Income from investment operations: | ||||||||||||||||||||||||
Investment income, net (a)(b) | 0.10 | 0.18 | 0.22 | 0.21 | 0.18 | 0.14 | (c) | |||||||||||||||||
Net realized and unrealized gain on | 0.73 | 0.23 | 0.18 | 0.01 | 0.42 | 0.47 | ||||||||||||||||||
Contributions from affiliates | 0 | 0 | 0.00 | (d) | 0.00 | (d) | 0.00 | (d) | 0 | |||||||||||||||
|
|
|
|
|
|
|
|
|
|
|
| |||||||||||||
Total from investment operations | 0.83 | 0.41 | 0.40 | 0.22 | 0.60 | 0.61 | ||||||||||||||||||
|
|
|
|
|
|
|
|
|
|
|
| |||||||||||||
Less dividends and distributions: | ||||||||||||||||||||||||
Dividends from net investment income | (0.26 | ) | (0.34 | ) | (0.27 | ) | (0.25 | ) | (0.26 | ) | 0 | |||||||||||||
Distributions from net realized gain on investment transactions | (0.05 | ) | (0.04 | ) | (0.14 | ) | (0.02 | ) | 0 | (0.15 | ) | |||||||||||||
|
|
|
|
|
|
|
|
|
|
|
| |||||||||||||
Total dividends and distributions | (0.31 | ) | (0.38 | ) | (0.41 | ) | (0.27 | ) | (0.26 | ) | (0.15 | ) | ||||||||||||
|
|
|
|
|
|
|
|
|
|
|
| |||||||||||||
Net asset value, end of period | $ | 11.52 | $ | 11.00 | $ | 10.97 | $ | 10.98 | $ | 11.03 | $ | 10.69 | ||||||||||||
|
|
|
|
|
|
|
|
|
|
|
| |||||||||||||
Total return (e) | 7.62% | 3.76% | 3.97% | 2.02% | 5.83% | 5.92% | (c) | |||||||||||||||||
| RATIOS/SUPPLEMENTAL DATA | ||||||||||||||||||||||||
Net assets, end of period (000 omitted) | $202,297 | $203,349 | $218,022 | $228,731 | $217,317 | $242,915 | ||||||||||||||||||
Average net assets (000 omitted) | $202,368 | $209,927 | $226,099 | $226,777 | $228,978 | $234,250 | ||||||||||||||||||
Ratio to average net assets of: | ||||||||||||||||||||||||
Expenses, net of waivers/reimbursements (g) | 0.68% | (i) | 0.69% | 0.68% | 0.66% | 0.69% | 0.71% | |||||||||||||||||
Expenses, before waivers/reimbursements (g) | 0.72% | (i) | 0.72% | 0.71% | 0.71% | 0.71% | 0.72% | |||||||||||||||||
Net investment income (b) | 1.69% | (i) | 1.66% | 2.10% | 1.93% | 1.65% | 1.34% | (c) | ||||||||||||||||
Portfolio turnover rate | 48% | 74% | 67% | 116% | 115% | 105% | ||||||||||||||||||
See Footnote Summary on pages 117–118.
See Notes to Financial Statements.
| 110 | Sanford C. Bernstein Fund, Inc. | |
Table of Contents
TAX-AWARE OVERLAY B PORTFOLIO | ||||||||||||||||||||||||
| CLASS 1 | ||||||||||||||||||||||||
| SIX MONTHS ENDED 3/31/21 (UNAUDITED) | YEAR ENDED 9/30/20 | YEAR ENDED 9/30/19 | YEAR ENDED 9/30/18 | YEAR ENDED 9/30/17 | YEAR ENDED 9/30/16 | |||||||||||||||||||
Net asset value, beginning of period | $ | 11.27 | $ | 11.12 | $ | 11.25 | $ | 11.50 | $ | 11.10 | $ | 10.81 | ||||||||||||
|
|
|
|
|
|
|
|
|
|
|
| |||||||||||||
Income from investment operations: | ||||||||||||||||||||||||
Investment income, net (a)(b) | 0.09 | 0.19 | 0.21 | 0.19 | 0.17 | 0.13 | (c) | |||||||||||||||||
Net realized and unrealized gain (loss) on investment and foreign currency transactions | 0.90 | 0.12 | (0.03 | ) | 0.02 | 0.50 | 0.32 | |||||||||||||||||
Contributions from affiliates | 0 | 0 | 0 | 0 | 0.00 | (d) | 0 | |||||||||||||||||
|
|
|
|
|
|
|
|
|
|
|
| |||||||||||||
Total from investment operations | 0.99 | 0.31 | 0.18 | 0.21 | 0.67 | 0.45 | ||||||||||||||||||
|
|
|
|
|
|
|
|
|
|
|
| |||||||||||||
Less dividends and distributions: | ||||||||||||||||||||||||
Dividends from net investment income | (0.27 | ) | (0.16 | ) | (0.20 | ) | (0.18 | ) | (0.17 | ) | (0.14 | ) | ||||||||||||
Distributions from net realized gain on investment transactions | 0 | 0 | (0.11 | ) | (0.28 | ) | (0.10 | ) | (0.02 | ) | ||||||||||||||
|
|
|
|
|
|
|
|
|
|
|
| |||||||||||||
Total dividends and distributions | (0.27 | ) | (0.16 | ) | (0.31 | ) | (0.46 | ) | (0.27 | ) | (0.16 | ) | ||||||||||||
|
|
|
|
|
|
|
|
|
|
|
| |||||||||||||
Net asset value, end of period | $ | 11.99 | $ | 11.27 | $ | 11.12 | $ | 11.25 | $ | 11.50 | $ | 11.10 | ||||||||||||
|
|
|
|
|
|
|
|
|
|
|
| |||||||||||||
Total return (e) | 8.75% | 2.93% | 1.81% | 1.86% | 6.23% | 4.19% | (c) | |||||||||||||||||
| RATIOS/SUPPLEMENTAL DATA | ||||||||||||||||||||||||
Net assets, end of period (000 omitted) | $1,190,385 | $1,140,951 | $1,240,530 | $1,314,251 | $1,299,848 | $1,284,948 | ||||||||||||||||||
Average net assets (000 omitted) | $1,176,255 | $1,191,962 | $1,254,989 | $1,319,846 | $1,271,281 | $1,256,664 | ||||||||||||||||||
Ratio to average net assets of: | ||||||||||||||||||||||||
Expenses, net of waivers/reimbursements (g) | 0.84% | (i) | 0.84% | 0.83% | 0.81% | 0.82% | 0.82% | |||||||||||||||||
Expenses, before waivers/reimbursements (g) | 0.84% | (i) | 0.84% | 0.84% | 0.83% | 0.84% | 0.84% | |||||||||||||||||
Net investment income (b) | 1.49% | (i) | 1.74% | 1.89% | 1.68% | 1.50% | 1.20% | (c) | ||||||||||||||||
Portfolio turnover rate | 10% | 8% | 12% | 22% | 22% | 41% | ||||||||||||||||||
See Footnote Summary on pages 117–118.
See Notes to Financial Statements.
2021 Semi-Annual Report | 111 | |
Table of Contents
Financial Highlights (continued)
Selected per share data and ratios for a share of capital stock outstanding for each respective Portfolio for each of the periods presented:
TAX-AWARE OVERLAY B PORTFOLIO | ||||||||||||||||||||||||
| CLASS 2 | ||||||||||||||||||||||||
| SIX MONTHS ENDED 3/31/21 (UNAUDITED) | YEAR ENDED 9/30/20 | YEAR ENDED 9/30/19 | YEAR ENDED 9/30/18 | YEAR ENDED 9/30/17 | YEAR ENDED 9/30/16 | |||||||||||||||||||
Net asset value, beginning of period | $ | 11.30 | $ | 11.14 | $ | 11.27 | $ | 11.52 | $ | 11.12 | $ | 10.83 | ||||||||||||
|
|
|
|
|
|
|
|
|
|
|
| |||||||||||||
Income from investment operations: | ||||||||||||||||||||||||
Investment income, net (a)(b) | 0.10 | 0.21 | 0.22 | 0.21 | 0.18 | 0.15 | (c) | |||||||||||||||||
Net realized and unrealized gain (loss) on investment and foreign currency transactions | 0.90 | 0.13 | (0.02 | ) | 0.02 | 0.51 | 0.32 | |||||||||||||||||
Contributions from affiliates | 0 | 0 | 0 | 0 | 0.00 | (d) | 0 | |||||||||||||||||
|
|
|
|
|
|
|
|
|
|
|
| |||||||||||||
Total from investment operations | 1.00 | 0.34 | 0.20 | 0.23 | 0.69 | 0.47 | ||||||||||||||||||
|
|
|
|
|
|
|
|
|
|
|
| |||||||||||||
Less dividends and distributions: | ||||||||||||||||||||||||
Dividends from net investment income | (0.29 | ) | (0.18 | ) | (0.22 | ) | (0.20 | ) | (0.19 | ) | (0.16 | ) | ||||||||||||
Distributions from net realized gain on investment transactions | 0 | 0 | (0.11 | ) | (0.28 | ) | (0.10 | ) | (0.02 | ) | ||||||||||||||
|
|
|
|
|
|
|
|
|
|
|
| |||||||||||||
Total dividends and distributions | (0.29 | ) | (0.18 | ) | (0.33 | ) | (0.48 | ) | (0.29 | ) | (0.18 | ) | ||||||||||||
|
|
|
|
|
|
|
|
|
|
|
| |||||||||||||
Net asset value, end of period | $ | 12.01 | $ | 11.30 | $ | 11.14 | $ | 11.27 | $ | 11.52 | $ | 11.12 | ||||||||||||
|
|
|
|
|
|
|
|
|
|
|
| |||||||||||||
Total return (e) | 8.90% | 3.04% | 1.93% | 2.01% | 6.38% | 4.38% | (c) | |||||||||||||||||
| RATIOS/SUPPLEMENTAL DATA | ||||||||||||||||||||||||
Net assets, end of period (000 omitted) | $522,351 | $521,628 | $601,605 | $643,676 | $632,692 | $620,156 | ||||||||||||||||||
Average net assets (000 omitted) | $532,377 | $559,800 | $611,585 | $646,854 | $616,284 | $585,731 | ||||||||||||||||||
Ratio to average net assets of: | ||||||||||||||||||||||||
Expenses, net of waivers/reimbursements (g) | 0.68% | (i) | 0.69% | 0.68% | 0.66% | 0.67% | 0.67% | |||||||||||||||||
Expenses, before waivers/reimbursements (g) | 0.69% | (i) | 0.69% | 0.69% | 0.68% | 0.69% | 0.69% | |||||||||||||||||
Net investment income (b) | 1.64% | (i) | 1.89% | 2.03% | 1.83% | 1.65% | 1.35% | (c) | ||||||||||||||||
Portfolio turnover rate | 10% | 8% | 12% | 22% | 22% | 41% | ||||||||||||||||||
See Footnote Summary on pages 117–118.
See Notes to Financial Statements.
| 112 | Sanford C. Bernstein Fund, Inc. | |
Table of Contents
TAX-AWARE OVERLAY C PORTFOLIO | ||||||||||||||||||||||||
| CLASS 1 | ||||||||||||||||||||||||
| SIX MONTHS ENDED 3/31/21 (UNAUDITED) | YEAR ENDED 9/30/20 | YEAR ENDED 9/30/19 | YEAR ENDED 9/30/18 | YEAR ENDED 9/30/17 | YEAR ENDED 9/30/16 | |||||||||||||||||||
Net asset value, beginning of period | $ | 11.26 | $ | 11.14 | $ | 11.29 | $ | 11.49 | $ | 11.02 | $ | 10.80 | ||||||||||||
|
|
|
|
|
|
|
|
|
|
|
| |||||||||||||
Income from investment operations: | ||||||||||||||||||||||||
Investment income, net (a)(b) | 0.08 | 0.18 | 0.19 | 0.17 | 0.14 | 0.11 | (c) | |||||||||||||||||
Net realized and unrealized gain (loss) on investment and foreign currency transactions | 0.86 | 0.10 | (0.03 | ) | 0.07 | 0.52 | 0.31 | |||||||||||||||||
Contributions from affiliates | 0 | 0 | 0 | 0 | 0.00 | (d) | 0 | |||||||||||||||||
|
|
|
|
|
|
|
|
|
|
|
| |||||||||||||
Total from investment operations | 0.94 | 0.28 | 0.16 | 0.24 | 0.66 | 0.42 | ||||||||||||||||||
|
|
|
|
|
|
|
|
|
|
|
| |||||||||||||
Less dividends and distributions: | ||||||||||||||||||||||||
Dividends from net investment income | (0.26 | ) | (0.16 | ) | (0.18 | ) | (0.18 | ) | (0.09 | ) | (0.15 | ) | ||||||||||||
Distributions from net realized gain on investment transactions | 0 | 0 | (0.13 | ) | (0.26 | ) | (0.10 | ) | (0.05 | ) | ||||||||||||||
|
|
|
|
|
|
|
|
|
|
|
| |||||||||||||
Total dividends and distributions | (0.26 | ) | (0.16 | ) | (0.31 | ) | (0.44 | ) | (0.19 | ) | (0.20 | ) | ||||||||||||
|
|
|
|
|
|
|
|
|
|
|
| |||||||||||||
Net asset value, end of period | $ | 11.94 | $ | 11.26 | $ | 11.14 | $ | 11.29 | $ | 11.49 | $ | 11.02 | ||||||||||||
|
|
|
|
|
|
|
|
|
|
|
| |||||||||||||
Total return (e) | 8.39% | 2.48% | 1.53% | 2.13% | 6.13% | 3.94% | (c) | |||||||||||||||||
| RATIOS/SUPPLEMENTAL DATA | ||||||||||||||||||||||||
Net assets, end of period (000 omitted) | $320,642 | $315,270 | $356,936 | $368,640 | $359,764 | $349,358 | ||||||||||||||||||
Average net assets (000 omitted) | $320,431 | $339,567 | $355,345 | $366,150 | $348,603 | $342,317 | ||||||||||||||||||
Ratio to average net assets of: | ||||||||||||||||||||||||
Expenses, net of waivers/reimbursements (g) | 0.88% | (i) | 0.88% | 0.86% | 0.85% | 0.86% | 0.87% | |||||||||||||||||
Expenses, before waivers/reimbursements (g) | 0.88% | (i) | 0.88% | 0.87% | 0.87% | 0.87% | 0.88% | |||||||||||||||||
Net investment income (b) | 1.34% | (i) | 1.60% | 1.75% | 1.49% | 1.29% | 1.02% | (c) | ||||||||||||||||
Portfolio turnover rate | 10% | 13% | 14% | 28% | 23% | 33% | ||||||||||||||||||
See Footnote Summary on pages 117–118.
See Notes to Financial Statements.
2021 Semi-Annual Report | 113 | |
Table of Contents
Financial Highlights (continued)
Selected per share data and ratios for a share of capital stock outstanding for each respective Portfolio for each of the periods presented:
TAX-AWARE OVERLAY C PORTFOLIO | ||||||||||||||||||||||||
| CLASS 2 | ||||||||||||||||||||||||
| SIX MONTHS ENDED 3/31/21 (UNAUDITED) | YEAR ENDED 9/30/20 | YEAR ENDED 9/30/19 | YEAR ENDED 9/30/18 | YEAR ENDED 9/30/17 | YEAR ENDED 9/30/16 | |||||||||||||||||||
Net asset value, beginning of period | $ | 11.29 | $ | 11.16 | $ | 11.31 | $ | 11.50 | $ | 11.04 | $ | 10.82 | ||||||||||||
|
|
|
|
|
|
|
|
|
|
|
| |||||||||||||
Income from investment operations: | ||||||||||||||||||||||||
Investment income, net (a)(b) | 0.09 | 0.19 | 0.21 | 0.19 | 0.16 | 0.13 | (c) | |||||||||||||||||
Net realized and unrealized gain (loss) on investment and foreign currency transactions | 0.86 | 0.11 | (0.04 | ) | 0.08 | 0.51 | 0.31 | |||||||||||||||||
Contributions from affiliates | 0 | 0 | 0 | 0 | 0.00 | (d) | 0 | |||||||||||||||||
|
|
|
|
|
|
|
|
|
|
|
| |||||||||||||
Total from investment operations | 0.95 | 0.30 | 0.17 | 0.27 | 0.67 | 0.44 | ||||||||||||||||||
|
|
|
|
|
|
|
|
|
|
|
| |||||||||||||
Less dividends and distributions: | ||||||||||||||||||||||||
Dividends from net investment income | (0.28 | ) | (0.17 | ) | (0.19 | ) | (0.20 | ) | (0.11 | ) | (0.17 | ) | ||||||||||||
Distributions from net realized gain on investment transactions | 0 | 0 | (0.13 | ) | (0.26 | ) | (0.10 | ) | (0.05 | ) | ||||||||||||||
|
|
|
|
|
|
|
|
|
|
|
| |||||||||||||
Total dividends and distributions | (0.28 | ) | (0.17 | ) | (0.32 | ) | (0.46 | ) | (0.21 | ) | (0.22 | ) | ||||||||||||
|
|
|
|
|
|
|
|
|
|
|
| |||||||||||||
Net asset value, end of period | $ | 11.96 | $ | 11.29 | $ | 11.16 | $ | 11.31 | $ | 11.50 | $ | 11.04 | ||||||||||||
|
|
|
|
|
|
|
|
|
|
|
| |||||||||||||
Total return (e) | 8.46% | 2.68% | 1.65% | 2.37% | (j) | 6.28% | 4.13% | (c) | ||||||||||||||||
| RATIOS/SUPPLEMENTAL DATA | ||||||||||||||||||||||||
Net assets, end of period (000 omitted) | $194,176 | $196,312 | $209,891 | $221,368 | $221,485 | $204,539 | ||||||||||||||||||
Average net assets (000 omitted) | $197,587 | $203,874 | $217,264 | $225,633 | $207,974 | $185,830 | ||||||||||||||||||
Ratio to average net assets of: | ||||||||||||||||||||||||
Expenses, net of waivers/reimbursements (g) | 0.73% | (i) | 0.73% | 0.71% | 0.70% | 0.71% | 0.72% | |||||||||||||||||
Expenses, before waivers/reimbursements (g) | 0.73% | (i) | 0.73% | 0.72% | 0.72% | 0.72% | 0.73% | |||||||||||||||||
Net investment income (b) | 1.49% | (i) | 1.75% | 1.90% | 1.64% | 1.45% | 1.17% | (c) | ||||||||||||||||
Portfolio turnover rate | 10% | 13% | 14% | 28% | 23% | 33% | ||||||||||||||||||
See Footnote Summary on pages 117–118.
See Notes to Financial Statements.
| 114 | Sanford C. Bernstein Fund, Inc. | |
Table of Contents
TAX-AWARE OVERLAY N PORTFOLIO | ||||||||||||||||||||||||
| CLASS 1 | ||||||||||||||||||||||||
| SIX MONTHS ENDED 3/31/21 (UNAUDITED) | YEAR ENDED 9/30/20 | YEAR ENDED 9/30/19 | YEAR ENDED 9/30/18 | YEAR ENDED 9/30/17 | YEAR ENDED 9/30/16 | |||||||||||||||||||
Net asset value, beginning of period | $ | 11.02 | $ | 11.04 | $ | 11.19 | $ | 11.43 | $ | 10.99 | $ | 10.72 | ||||||||||||
|
|
|
|
|
|
|
|
|
|
|
| |||||||||||||
Income from investment operations: | ||||||||||||||||||||||||
Investment income, net (a)(b) | 0.08 | 0.18 | 0.20 | 0.17 | 0.15 | 0.12 | (c) | |||||||||||||||||
Net realized and unrealized gain (loss) on investment and foreign currency transactions | 0.96 | (0.03 | ) | (0.03 | ) | 0.04 | 0.52 | 0.34 | ||||||||||||||||
Contributions from affiliates | 0 | 0 | 0 | 0 | 0.00 | (d) | 0 | |||||||||||||||||
|
|
|
|
|
|
|
|
|
|
|
| |||||||||||||
Total from investment operations | 1.04 | 0.15 | 0.17 | 0.21 | 0.67 | 0.46 | ||||||||||||||||||
|
|
|
|
|
|
|
|
|
|
|
| |||||||||||||
Less dividends and distributions: | ||||||||||||||||||||||||
Dividends from net investment income | (0.25 | ) | (0.17 | ) | (0.19 | ) | (0.18 | ) | (0.11 | ) | (0.16 | ) | ||||||||||||
Distributions from net realized gain on investment transactions | 0 | 0 | (0.13 | ) | (0.27 | ) | (0.12 | ) | (0.03 | ) | ||||||||||||||
|
|
|
|
|
|
|
|
|
|
|
| |||||||||||||
Total dividends and distributions | (0.25 | ) | (0.17 | ) | (0.32 | ) | (0.45 | ) | (0.23 | ) | (0.19 | ) | ||||||||||||
|
|
|
|
|
|
|
|
|
|
|
| |||||||||||||
Net asset value, end of period | $ | 11.81 | $ | 11.02 | $ | 11.04 | $ | 11.19 | $ | 11.43 | $ | 10.99 | ||||||||||||
|
|
|
|
|
|
|
|
|
|
|
| |||||||||||||
Total return (e) | 9.58% | 1.35% | 1.67% | 1.84% | 6.17% | 4.21% | (c) | |||||||||||||||||
| RATIOS/SUPPLEMENTAL DATA | ||||||||||||||||||||||||
Net assets, end of period (000 omitted) | $309,222 | $303,111 | $335,908 | $372,015 | $369,475 | $360,981 | ||||||||||||||||||
Average net assets (000 omitted) | $309,168 | $317,504 | $343,928 | $375,576 | $362,361 | $354,792 | ||||||||||||||||||
Ratio to average net assets of: | ||||||||||||||||||||||||
Expenses, net of waivers/reimbursements (g) | 0.90% | (i) | 0.90% | 0.88% | 0.86% | 0.87% | 0.88% | |||||||||||||||||
Expenses, before waivers/reimbursements (g) | 0.90% | (i) | 0.91% | 0.89% | 0.88% | 0.88% | 0.89% | |||||||||||||||||
Net investment income (b) | 1.33% | (i) | 1.65% | 1.84% | 1.54% | 1.32% | 1.08% | (c) | ||||||||||||||||
Portfolio turnover rate | 8% | 11% | 19% | 31% | 17% | 39% | ||||||||||||||||||
See Footnote Summary on pages 117–118.
See Notes to Financial Statements.
2021 Semi-Annual Report | 115 | |
Table of Contents
Financial Highlights (continued)
Selected per share data and ratios for a share of capital stock outstanding for each respective Portfolio for each of the periods presented:
TAX-AWARE OVERLAY N PORTFOLIO | ||||||||||||||||||||||||
| CLASS 2 | ||||||||||||||||||||||||
| SIX MONTHS ENDED 3/31/21 (UNAUDITED) | YEAR ENDED 9/30/20 | YEAR ENDED 9/30/19 | YEAR ENDED 9/30/18 | YEAR ENDED 9/30/17 | YEAR ENDED 9/30/16 | |||||||||||||||||||
Net asset value, beginning of period | $ | 11.05 | $ | 11.06 | $ | 11.21 | $ | 11.45 | $ | 11.02 | $ | 10.75 | ||||||||||||
|
|
|
|
|
|
|
|
|
|
|
| |||||||||||||
Income from investment operations: | ||||||||||||||||||||||||
Investment income, net (a)(b) | 0.08 | 0.20 | 0.22 | 0.19 | 0.16 | 0.13 | (c) | |||||||||||||||||
Net realized and unrealized gain (loss) on | 0.98 | (0.02 | ) | (0.04 | ) | 0.04 | 0.51 | 0.35 | ||||||||||||||||
Contributions from affiliates | 0 | 0 | 0 | 0 | 0.00 | (d) | 0 | |||||||||||||||||
|
|
|
|
|
|
|
|
|
|
|
| |||||||||||||
Total from investment operations | 1.06 | 0.18 | 0.18 | 0.23 | 0.67 | 0.48 | ||||||||||||||||||
|
|
|
|
|
|
|
|
|
|
|
| |||||||||||||
Less dividends and distributions: | ||||||||||||||||||||||||
Dividends from net investment income | (0.27 | ) | (0.19 | ) | (0.20 | ) | (0.20 | ) | (0.12 | ) | (0.18 | ) | ||||||||||||
Distributions from net realized gain on investment transactions | 0 | 0 | (0.13 | ) | (0.27 | ) | (0.12 | ) | (0.03 | ) | ||||||||||||||
|
|
|
|
|
|
|
|
|
|
|
| |||||||||||||
Total dividends and distributions | (0.27 | ) | (0.19 | ) | (0.33 | ) | (0.47 | ) | (0.24 | ) | (0.21 | ) | ||||||||||||
|
|
|
|
|
|
|
|
|
|
|
| |||||||||||||
Net asset value, end of period | $ | 11.84 | $ | 11.05 | $ | 11.06 | $ | 11.21 | $ | 11.45 | $ | 11.02 | ||||||||||||
|
|
|
|
|
|
|
|
|
|
|
| |||||||||||||
Total return (e) | 9.63% | 1.60% | 1.79% | 1.99% | 6.23% | 4.49% | (c) | |||||||||||||||||
| RATIOS/SUPPLEMENTAL DATA | ||||||||||||||||||||||||
Net assets, end of period (000 omitted) | $72,972 | $71,348 | $84,996 | $85,946 | $88,232 | $88,167 | ||||||||||||||||||
Average net assets (000 omitted) | $73,298 | $78,103 | $81,875 | $87,212 | $87,691 | $78,704 | ||||||||||||||||||
Ratio to average net assets of: | ||||||||||||||||||||||||
Expenses, net of waivers/reimbursements (g) | 0.75% | (i) | 0.75% | 0.73% | 0.71% | 0.72% | 0.73% | |||||||||||||||||
Expenses, before waivers/reimbursements (g) | 0.75% | (i) | 0.76% | 0.74% | 0.73% | 0.73% | 0.74% | |||||||||||||||||
Net investment income (b) | 1.47% | (i) | 1.80% | 1.99% | 1.69% | 1.47% | 1.23% | (c) | ||||||||||||||||
Portfolio turnover rate | 8% | 11% | 19% | 31% | 17% | 39% | ||||||||||||||||||
See Footnote Summary on pages 117–118.
See Notes to Financial Statements.
| 116 | Sanford C. Bernstein Fund, Inc. | |
Table of Contents
Selected per share data and ratios for a share of capital stock outstanding for each respective Portfolio for each of the periods presented:
| (a) | Based on average shares outstanding. |
| (b) | Net of expenses waived/reimbursed by the Adviser. |
| (c) | For the year ended September 30, 2017, the amount includes a refund for overbilling of prior years’ custody out of pocket fees as follows: |
PORTFOLIO | NET INCOME PER | NET INCOME | TOTAL RETURN | |||||||||
Overlay A | $0.0002 | 0.002% | 0.002% | |||||||||
Tax-Aware Overlay A | 0.0002 | 0.002% | 0.002% | |||||||||
Overlay B | 0.0003 | 0.002% | 0.002% | |||||||||
Tax-Aware Overlay B | 0.0003 | 0.002% | 0.002% | |||||||||
Tax-Aware Overlay C | 0.0003 | 0.003% | 0.003% | |||||||||
Tax-Aware Overlay N | 0.0003 | 0.003% | 0.003% | |||||||||
| (d) | Amount is less than $.005. |
| (e) | Total investment return is calculated assuming an initial investment made at the net asset value at the beginning of the period, reinvestment of all dividends and distributions at net asset value during the period, and redemption on the last day of the period. Initial sales charges or contingent deferred sales charges are not reflected in the calculation of total investment return. Total return does not reflect the deduction of taxes that a shareholder would pay on fund distributions or the redemption of fund shares. Total investment return calculated for a period of less than one year is not annualized. |
| (f) | Includes the impact of proceeds received and credited to the Portfolio resulting from the class action settlements, which enhanced the performance for the Overlay A Portfolio for the year ended September 30, 2020 by .02% and the Tax-Aware Overlay A Portfolio for the year ended September 30, 2020 by .02%. |
| (g) | In connection with the Portfolio’s investments in affiliated underlying portfolios, the Portfolio incurs no direct expenses, but bears proportionate shares of the fees and expenses (i.e., operating, administrative and investment advisory fees) of the affiliated underlying portfolios. The Adviser has contractually agreed to waive its fees from the Portfolio in an amount equal to the Portfolio’s pro rata share of certain acquired fund fees and expenses, and for the period shown below, such waiver amounted to: |
Acquired Fund Fees and Expenses:
SIX MONTHS ENDED 3/31/21 (UNAUDITED) | YEAR ENDED 9/30/20 | YEAR ENDED 9/30/19 | YEAR ENDED 9/30/18 | YEAR ENDED 9/30/17 | YEAR ENDED 9/30/16 | |||||||||||||||||||
Overlay A Portfolio | .39% (i) | .35% | .34% | .37% | .31% | .14% | ||||||||||||||||||
Tax-Aware Overlay A Portfolio | .38% (i) | .34% | .34% | .36% | .31% | .14% | ||||||||||||||||||
Overlay B Portfolio | .04% (i) | .03% | .05% | .07% | .02% | N/A | ||||||||||||||||||
Tax-Aware Overlay B Portfolio | .00% (d | )(i) | .02% | .05% | .04% | .02% | N/A | |||||||||||||||||
Tax-Aware Overlay C Portfolio | .00% (d | )(i) | .03% | .03% | .04% | .03% | N/A | |||||||||||||||||
Tax-Aware Overlay N Portfolio | .03% (i) | .03% | .03% | .04% | .02% | N/A | ||||||||||||||||||
Waiver:
SIX MONTHS ENDED 3/31/21 (UNAUDITED) | YEAR ENDED 9/30/20 | YEAR ENDED 9/30/19 | YEAR ENDED 9/30/18 | YEAR ENDED 9/30/17 | YEAR ENDED 9/30/16 | |||||||||||||||||||
Overlay A Portfolio | .38% (i) | .34% | .33% | .37% | .31% | .14% | ||||||||||||||||||
Tax-Aware Overlay A Portfolio | .37% (i) | .34% | .33% | .36% | .31% | .14% | ||||||||||||||||||
Overlay B Portfolio | .03% (i) | .03% | .03% | .07% | .02% | N/A | ||||||||||||||||||
Tax-Aware Overlay B Portfolio | .00% (d | )(i) | .00% (d) | .02% | .04% | .02% | N/A | |||||||||||||||||
Tax-Aware Overlay C Portfolio | .00% (d | )(i) | .00% (d) | .01% | .04% | .03% | N/A | |||||||||||||||||
Tax-Aware Overlay N Portfolio | .00% (d | )(i) | .00% (d) | .01% | .04% | .02% | N/A | |||||||||||||||||
See Notes to Financial Statements.
2021 Semi-Annual Report | 117 | |
Table of Contents
Financial Highlights (continued)
| (h) | The expense ratios presented below exclude interest/bank overdraft expense: |
SIX MONTHS ENDED MARCH 31, 2021 (UNAUDITED) | ||||||||||||||||||||||||||||
| YEAR ENDED SEPTEMBER 30, | ||||||||||||||||||||||||||||
| 2020 | 2019 | 2018 | 2017 | 2016 | ||||||||||||||||||||||||
Overlay A Portfolio |
| |||||||||||||||||||||||||||
Class 1 |
| |||||||||||||||||||||||||||
Expenses, net of waivers/reimbursements | N/A | .80% | N/A | N/A | N/A | N/A | ||||||||||||||||||||||
Expenses, before waivers/reimbursements | N/A | 1.14% | N/A | N/A | N/A | N/A | ||||||||||||||||||||||
Class 2 |
| |||||||||||||||||||||||||||
Expenses, net of waivers/reimbursements | N/A | .60% | N/A | N/A | N/A | N/A | ||||||||||||||||||||||
Expenses, before waivers/reimbursements | N/A | .94% | N/A | N/A | N/A | N/A | ||||||||||||||||||||||
Tax-Aware Overlay A Portfolio |
| |||||||||||||||||||||||||||
Class 1 |
| |||||||||||||||||||||||||||
Expenses, net of waivers/reimbursements | N/A | .79% | N/A | N/A | N/A | N/A | ||||||||||||||||||||||
Expenses, before waivers/reimbursements | N/A | 1.13% | N/A | N/A | N/A | N/A | ||||||||||||||||||||||
Class 2 |
| |||||||||||||||||||||||||||
Expenses, net of waivers/reimbursements | N/A | .59% | N/A | N/A | N/A | N/A | ||||||||||||||||||||||
Expenses, before waivers/reimbursements | N/A | .92% | N/A | N/A | N/A | N/A | ||||||||||||||||||||||
| (i) | Annualized. |
See Notes to Financial Statements.
| 118 | Sanford C. Bernstein Fund, Inc. | |
Table of Contents
| NOTE 1. | Organization and Significant Accounting Policies |
Sanford C. Bernstein Fund, Inc. (the “Fund”) is registered under the Investment Company Act of 1940 as an open-end registered investment company. The Fund, which is a Maryland corporation, operates as a series company currently comprised of 13 portfolios (hereafter collectively referred to as the “Portfolios” and each individually a “Portfolio”) with the following share classes offered:
INTERNATIONAL EQUITY PORTFOLIO | SHARE CLASSES OFFERED | |
Emerging Markets | Emerging Markets Class* and Class Z | |
FIXED INCOME MUNICIPAL PORTFOLIOS | ||
Short Duration Diversified Municipal | Short Duration Diversified Municipal Class* | |
California Municipal | Municipal Class*, Class A, Class C and Advisor Class | |
Diversified Municipal | Municipal Class*, Class A, Class C, Advisor Class and Class Z | |
New York Municipal | Municipal Class*, Class A, Class C and Advisor Class | |
FIXED INCOME TAXABLE PORTFOLIOS | ||
Intermediate Duration | Intermediate Duration Class*, Class A, Advisor Class and Class Z | |
Short Duration Plus | Short Duration Plus Class*, Class A and Class C | |
* Bernstein Class | ||
OVERLAY PORTFOLIOS | ||
Overlay A | Class 1 and Class 2 | |
Tax-Aware Overlay A | Class 1 and Class 2 | |
Overlay B | Class 1 and Class 2 | |
Tax-Aware Overlay B | Class 1 and Class 2 | |
Tax-Aware Overlay C | Class 1 and Class 2 | |
Tax-Aware Overlay N | Class 1 and Class 2 | |
Each Portfolio has its own investment objectives. This report relates only to the Overlay A, Tax-Aware Overlay A, Overlay B, Tax-Aware Overlay B, Tax-Aware Overlay C and Tax-Aware Overlay N Portfolios. Each class of shares has identical voting, dividend, liquidation and other rights, except that the classes bear different distribution and transfer agency expenses. Each class has exclusive voting rights with respect to its distribution plan, as applicable. The financial statements have been prepared in conformity with U.S. generally accepted accounting principles (“U.S. GAAP”), which require management to make certain estimates and assumptions that affect the reported amounts of assets and liabilities in the financial statements and amounts of income and expenses during the reporting period. Actual results could differ from those estimates. Each Portfolio is an investment company under U.S. GAAP and follows the accounting and reporting guidance applicable to investment companies. The following is a summary of significant accounting policies followed by the Portfolios.
| A. | Portfolio Valuation |
Portfolio securities are valued at their current market value determined on the basis of market quotations or, if market quotations are not readily available or are deemed unreliable, at “fair value” as determined in accordance with procedures established by and under the general supervision of the Fund’s Board of Directors (the “Board”).
In general, the market values of securities which are readily available and deemed reliable are determined as follows: securities listed on a national securities exchange (other than securities listed on the NASDAQ Stock Market, Inc. (“NASDAQ”)) or on a foreign securities exchange are valued at the last sale price at the close of the exchange or foreign securities exchange. If there has been no sale on such day, the securities are valued at the last traded price from the previous day. Securities listed on more than one exchange are valued by reference to the principal exchange on which the
2021 Semi-Annual Report | 119 | |
Table of Contents
Notes to Financial Statements (continued)
securities are traded; securities listed only on NASDAQ are valued in accordance with the NASDAQ Official Closing Price; listed or over the counter (“OTC”) market put or call options are valued at the mid level between the current bid and ask prices. If either a current bid or current ask price is unavailable, AllianceBernstein L.P. (the “Adviser”) will have discretion to determine the best valuation (e.g., last trade price in the case of listed options); open futures are valued using the closing settlement price or, in the absence of such a price, the most recent quoted bid price. If there are no quotations available for the day of valuation, the last available closing settlement price is used; U.S. Government securities and any other debt instruments having 60 days or less remaining until maturity are generally valued at market by an independent pricing vendor, if a market price is available. If a market price is not available, the securities are valued at amortized cost. This methodology is commonly used for short term securities that have an original maturity of 60 days or less, as well as short term securities that had an original term to maturity that exceeded 60 days. In instances when amortized cost is utilized, the Valuation Committee (the “Committee”) must reasonably conclude that the utilization of amortized cost is approximately the same as the fair value of the security. Factors the Committee will consider include, but are not limited to, an impairment of the creditworthiness of the issuer or material changes in interest rates. Fixed-income securities, including mortgage-backed and asset-backed securities, may be valued on the basis of prices provided by a pricing service or at a price obtained from one or more of the major broker-dealers. In cases where broker-dealer quotes are obtained, the Adviser may establish procedures whereby changes in market yields or spreads are used to adjust, on a daily basis, a recently obtained quoted price on a security. Swaps and other derivatives are valued daily, primarily using independent pricing services, independent pricing models using market inputs, as well as third party broker-dealers or counterparties. Open-end mutual funds are valued at the closing net asset value per share, while exchange traded funds are valued at the closing market price per share.
Securities for which market quotations are not readily available (including restricted securities) or are deemed unreliable are valued at fair value as deemed appropriate by the Adviser. Factors considered in making this determination may include, but are not limited to, information obtained by contacting the issuer, analysts, analysis of the issuer’s financial statements or other available documents. In addition, the Portfolios may use fair value pricing for securities primarily traded in non-U.S. markets because most foreign markets close well before the Portfolios value their securities at 4:00 p.m., Eastern Time. The earlier close of these foreign markets gives rise to the possibility that significant events, including broad market moves, may have occurred in the interim and may materially affect the value of those securities. To account for this, the Portfolios generally value many of their foreign equity securities using fair value prices based on third party vendor modeling tools to the extent available.
| B. | Fair Value Measurements |
In accordance with U.S. GAAP regarding fair value measurements, fair value is defined as the price that the Portfolios would receive to sell an asset or pay to transfer a liability in an orderly transaction between market participants at the measurement date. U.S. GAAP establishes a framework for measuring fair value, and a three-level hierarchy for fair value measurements based upon the transparency of inputs to the valuation of an asset or liability (including those valued based on their market values as described in Note A above). Inputs may be observable or unobservable and refer broadly to the assumptions that market participants would use in pricing the asset or liability. Observable inputs reflect the assumptions market participants would use in pricing the asset or liability based on market data obtained from sources independent of the Portfolios. Unobservable inputs reflect the Portfolios’ own assumptions about the assumptions that market participants would use in pricing the asset or liability based on the best information available in the circumstances. Each investment is assigned a level based upon the observability of the inputs which are significant to the overall valuation. The three-tier hierarchy of inputs is summarized below.
| • | Level 1—quoted prices in active markets for identical investments |
| • | Level 2—other significant observable inputs (including quoted prices for similar investments, interest rates, prepayment speeds, credit risk, etc.) |
| • | Level 3—significant unobservable inputs (including the Portfolios’ own assumptions in determining the fair value of investments) |
The fair value of debt instruments, such as bonds, and over-the-counter derivatives is generally based on market price quotations, recently executed market transactions (where observable) or industry recognized modeling techniques and are generally classified as Level 2. Pricing vendor inputs to Level 2 valuations may include quoted prices for similar
| 120 | Sanford C. Bernstein Fund, Inc. | |
Table of Contents
investments in active markets, interest rate curves, coupon rates, currency rates, yield curves, option adjusted spreads, default rates, credit spreads and other unique security features in order to estimate the relevant cash flows which are then discounted to calculate fair values. If these inputs are unobservable and significant to the fair value, these investments will be classified as Level 3.
Where readily available market prices or relevant bid prices are not available for certain equity investments, such investments may be valued based on similar publicly traded investments, movements in relevant indices since last available prices or based upon underlying company fundamentals and comparable company data (such as multiples to earnings or other multiples to equity). Where an investment is valued using an observable input, such as another publicly traded security, the investment will be classified as Level 2. If management determines that an adjustment is appropriate based on restrictions on resale, illiquidity or uncertainty, and such adjustment is a significant component of the valuation, the investment will be classified as Level 3. An investment will also be classified as Level 3 where management uses company fundamentals and other significant inputs to determine the valuation.
Options are valued using market-based inputs to models, broker or dealer quotations, or alternative pricing sources with reasonable levels of price transparency, where such inputs and models are available. Alternatively, the values may be obtained through unobservable management determined inputs and/or management’s proprietary models. Where models are used, the selection of a particular model to value an option depends upon the contractual terms of, and specific risks inherent in, the option as well as the availability of pricing information in the market. Valuation models require a variety of inputs, including contractual terms, market prices, measures of volatility and correlations of such inputs. Exchange traded options will be classified as Level 2. For options that do not trade on an exchange but trade in liquid markets, inputs can generally be verified and model selection does not involve significant management judgment. Options are classified within Level 2 on the fair value hierarchy when all of the significant inputs can be corroborated to market evidence. Otherwise such instruments are classified as Level 3.
Valuations of mortgage-backed or other asset-backed securities, by pricing vendors, are based on both proprietary and industry recognized models and discounted cash flow techniques. Significant inputs to the valuation of these instruments are: the value of collateral, the rates and timing of delinquencies, the rates and timing of prepayments, and default and loss expectations, which are driven in part by housing prices for residential mortgages. Significant inputs are determined based on relative value analyses, which incorporate comparisons to instruments with similar collateral and risk profiles, including relevant indices. Mortgage and asset-backed securities for which management has collected current observable data through pricing services are generally categorized within Level 2. Those investments for which current observable data has not been provided are classified as Level 3.
Other fixed income investments, including non-U.S. government and corporate debt, are generally valued using quoted market prices, if available, which are typically impacted by current interest rates, maturity dates and any perceived credit risk of the issuer. Additionally, in the absence of quoted market prices, these inputs are used by pricing vendors to derive a valuation based upon industry or proprietary models which incorporate issuer specific data with relevant yield/spread comparisons with more widely quoted bonds with similar key characteristics. Those investments for which there are observable inputs are classified as Level 2. Where the inputs are not observable, the investments are classified as Level 3.
2021 Semi-Annual Report | 121 | |
Table of Contents
Notes to Financial Statements (continued)
The following tables summarize the valuation of the Portfolios’ investments by the above fair value hierarchy levels as of March 31, 2021:
OVERLAY A PORTFOLIO INVESTMENTSIN SECURITIES: | LEVEL 1 | LEVEL 2 | LEVEL 3 | TOTAL | ||||||||||||
Assets: |
| |||||||||||||||
Common Stocks (a) | $ | 837,259,047 | $ | 0 | $ | 0 | $ | 837,259,047 | ||||||||
Investment Companies | 789,447,569 | 0 | 0 | 789,447,569 | ||||||||||||
Options Purchased—Puts | 0 | 20,104,614 | 20,104,614 | |||||||||||||
Short-Term Investments: | ||||||||||||||||
Investment Companies | 235,773,243 | 0 | 0 | 235,773,243 | ||||||||||||
U.S. Treasury Bills | 0 | 3,999,875 | 0 | 3,999,875 | ||||||||||||
Total Investments in Securities | 1,862,479,859 | 24,104,489 | 0 | 1,886,584,348 | ||||||||||||
Other Financial Instruments (b): | ||||||||||||||||
Assets: |
| |||||||||||||||
Futures | 12,625,302 | 0 | 0 | 12,625,302 | (c) | |||||||||||
Forward Currency Exchange Contracts | 0 | 10,687,041 | 0 | 10,687,041 | ||||||||||||
Liabilities: |
| |||||||||||||||
Futures | (14,905,674 | ) | 0 | 0 | (14,905,674 | )(c) | ||||||||||
Forward Currency Exchange Contracts | 0 | (8,489,687 | ) | 0 | (8,489,687 | ) | ||||||||||
Total Return Swaps | 0 | (106,054 | ) | 0 | (106,054 | ) | ||||||||||
Total | $ | 1,860,199,487 | $ | 26,195,789 | $ | 0 | $ | 1,886,395,276 | ||||||||
| TAX-AWARE OVERLAY A PORTFOLIO INVESTMENTSIN SECURITIES: | LEVEL 1 | LEVEL 2 | LEVEL 3 | TOTAL | ||||||||||||
Assets: |
| |||||||||||||||
Common Stocks (a) | $ | 1,763,162,079 | $ | 0 | $ | 0 | $ | 1,763,162,079 | ||||||||
Investment Companies | 1,615,433,298 | 0 | 0 | 1,615,433,298 | ||||||||||||
Options Purchased—Puts | 0 | 41,389,715 | 0 | 41,389,715 | ||||||||||||
Short-Term Investments: | ||||||||||||||||
Investment Companies | 490,047,467 | 0 | 0 | 490,047,467 | ||||||||||||
U.S. Treasury Bills | 0 | 10,499,904 | 0 | 10,499,904 | ||||||||||||
Total Investments in Securities | 3,868,642,844 | 51,889,619 | 0 | 3,920,532,463 | ||||||||||||
Other Financial Instruments (b): | ||||||||||||||||
Assets: |
| |||||||||||||||
Futures | 25,603,660 | 0 | 0 | 25,603,660 | (c) | |||||||||||
Forward Currency Exchange Contracts | 0 | 21,927,958 | 0 | 21,927,958 | ||||||||||||
Liabilities: |
| |||||||||||||||
Futures | (31,791,723 | ) | 0 | 0 | (31,791,723 | )(c) | ||||||||||
Forward Currency Exchange Contracts | 0 | (17,300,459 | ) | 0 | (17,300,459 | ) | ||||||||||
Total Return Swaps | 0 | (218,333 | ) | 0 | (218,333 | ) | ||||||||||
Total | $ | 3,862,454,781 | $ | 56,298,785 | $ | 0 | $ | 3,918,753,566 | ||||||||
| 122 | Sanford C. Bernstein Fund, Inc. | |
Table of Contents
| OVERLAY B PORTFOLIO INVESTMENTSIN SECURITIES: | LEVEL 1 | LEVEL 2 | LEVEL 3 | TOTAL | ||||||||||||
Assets: |
| |||||||||||||||
Inflation-Linked Securities | $ | 0 | $ | 282,062,644 | $ | 0 | $ | 282,062,644 | ||||||||
Corporates—Investment Grade | 0 | 214,559,852 | 0 | 214,559,852 | ||||||||||||
Governments—Treasuries | 0 | 168,264,271 | 0 | 168,264,271 | ||||||||||||
Collateralized Mortgage Obligations | 0 | 56,437,809 | 0 | 56,437,809 | ||||||||||||
Mortgage Pass-Throughs | 0 | 50,963,598 | 0 | 50,963,598 | ||||||||||||
Investment Companies | 47,188,876 | 0 | 0 | 47,188,876 | ||||||||||||
Corporates—Non-Investment Grade | 0 | 45,114,896 | 0 | 45,114,896 | ||||||||||||
Commercial Mortgage-Backed Securities | 0 | 42,584,786 | 236,615 | 42,821,401 | ||||||||||||
Quasi-Sovereigns | 0 | 17,970,097 | 0 | 17,970,097 | ||||||||||||
Collateralized Loan Obligations | 0 | 13,401,107 | 0 | 13,401,107 | ||||||||||||
Asset-Backed Securities | 0 | 11,105,478 | 0 | 11,105,478 | ||||||||||||
Emerging Markets—Corporate Bonds | 0 | 9,190,689 | 0 | 9,190,689 | ||||||||||||
Emerging Markets—Treasuries | 0 | 6,570,085 | 0 | 6,570,085 | ||||||||||||
Emerging Markets—Sovereigns | 0 | 6,419,619 | 0 | 6,419,619 | ||||||||||||
Governments—Sovereign Bonds | 0 | 5,000,186 | 0 | 5,000,186 | ||||||||||||
Options Purchased—Puts | 0 | 4,784,301 | 0 | 4,784,301 | ||||||||||||
Local Governments—US Municipal Bonds | 0 | 4,097,678 | 0 | 4,097,678 | ||||||||||||
Covered Bonds | 0 | 3,691,491 | 0 | 3,691,491 | ||||||||||||
Governments—Sovereign Agencies | 0 | 3,205,219 | 0 | 3,205,219 | ||||||||||||
Local Governments—Provincial Bonds | 0 | 2,220,906 | 0 | 2,220,906 | ||||||||||||
Agencies | 0 | 1,837,210 | 0 | 1,837,210 | ||||||||||||
Short-Term Investments: | ||||||||||||||||
Investment Companies | 208,055,429 | 0 | 0 | 208,055,429 | ||||||||||||
U.S. Treasury Bills | 0 | 17,989,797 | 0 | 17,989,797 | ||||||||||||
Total Investments in Securities | 255,244,305 | 967,471,719 | 236,615 | 1,222,952,639 | ||||||||||||
Other Financial Instruments (b): | ||||||||||||||||
Assets: |
| |||||||||||||||
Futures | 9,270,513 | 0 | 0 | 9,270,513 | (c) | |||||||||||
Forward Currency Exchange Contracts | 0 | 8,124,527 | 0 | 8,124,527 | ||||||||||||
Centrally Cleared Credit Default Swaps | 0 | 314,571 | 0 | 314,571 | (c) | |||||||||||
Centrally Cleared Inflation (CPI) Swaps | 0 | 1,911,689 | 0 | 1,911,689 | (c) | |||||||||||
Centrally Cleared Interest Rate Swaps | 0 | 2,108,054 | 0 | 2,108,054 | (c) | |||||||||||
Credit Default Swaps | 0 | 1,529,372 | 0 | 1,529,372 | ||||||||||||
Total Return Swaps | 0 | 46,036 | 0 | 46,036 | ||||||||||||
Liabilities: |
| |||||||||||||||
Futures | (4,162,499 | ) | 0 | 0 | (4,162,499 | )(c) | ||||||||||
Forward Currency Exchange Contracts | 0 | (6,364,057 | ) | 0 | (6,364,057 | ) | ||||||||||
Centrally Cleared Credit Default Swaps | 0 | (2,268,554 | ) | 0 | (2,268,554 | )(c) | ||||||||||
Centrally Cleared Inflation (CPI) Swaps | 0 | (578,013 | ) | 0 | (578,013 | )(c) | ||||||||||
Centrally Cleared Interest Rate Swaps | 0 | (2,444,241 | ) | 0 | (2,444,241 | )(c) | ||||||||||
Credit Default Swaps | 0 | (3,314,637 | ) | 0 | (3,314,637 | ) | ||||||||||
Total Return Swaps | 0 | (112,319 | ) | 0 | (112,319 | ) | ||||||||||
Total | $ | 260,352,319 | $ | 966,424,147 | $ | 236,615 | $ | 1,227,013,081 | ||||||||
2021 Semi-Annual Report | 123 | |
Table of Contents
Notes to Financial Statements (continued)
| TAX-AWARE OVERLAY B PORTFOLIO INVESTMENTSIN SECURITIES: | LEVEL 1 | LEVEL 2 | LEVEL 3 | TOTAL | ||||||||||||
Assets: |
| |||||||||||||||
Long-Term Municipal Bonds | $ | 0 | $ | 1,153,017,259 | $ | 0 | $ | 1,153,017,259 | ||||||||
Investment Companies | 477,588,535 | 0 | 0 | 477,588,535 | ||||||||||||
Governments—Treasuries | 0 | 10,208,297 | 0 | 10,208,297 | ||||||||||||
Options Purchased—Puts | 0 | 6,709,720 | 0 | 6,709,720 | ||||||||||||
Collateralized Mortgage Obligations | 0 | 4,646,054 | 0 | 4,646,054 | ||||||||||||
Corporates—Investment Grade | 0 | 2,003,429 | 0 | 2,003,429 | ||||||||||||
Corporates—Non-Investment Grade | 0 | 1,387,638 | �� | 0 | 1,387,638 | |||||||||||
Short-Term Investments: | ||||||||||||||||
Investment Companies | 17,807,976 | 0 | 0 | 17,807,976 | ||||||||||||
U.S. Treasury Bills | 0 | 12,999,859 | 0 | 12,999,859 | ||||||||||||
Total Investments in Securities | 495,396,511 | 1,190,972,256 | 0 | 1,686,368,767 | ||||||||||||
Other Financial Instruments (b): | ||||||||||||||||
Assets: |
| |||||||||||||||
Futures | 4,324,565 | 0 | 0 | 4,324,565 | (c) | |||||||||||
Forward Currency Exchange Contracts | 0 | 3,398,514 | 0 | 3,398,514 | ||||||||||||
Centrally Cleared Inflation (CPI) Swaps | 0 | 5,245,446 | 0 | 5,245,446 | (c) | |||||||||||
Centrally Cleared Interest Rate Swaps | 0 | 1,834,397 | 0 | 1,834,397 | (c) | |||||||||||
Inflation (CPI) Swaps | 0 | 4,509,631 | 0 | 4,509,631 | ||||||||||||
Interest Rate Swaps | 0 | 64,618 | 0 | 64,618 | ||||||||||||
Liabilities: |
| |||||||||||||||
Futures | (4,058,669 | ) | 0 | 0 | (4,058,669 | )(c) | ||||||||||
Forward Currency Exchange Contracts | 0 | (2,847,943 | ) | 0 | (2,847,943 | ) | ||||||||||
Centrally Cleared Interest Rate Swaps | 0 | (63,560 | ) | 0 | (63,560 | )(c) | ||||||||||
Credit Default Swaps | 0 | (1,081,586 | ) | 0 | (1,081,586 | ) | ||||||||||
Inflation (CPI) Swaps | 0 | (1,835,574 | ) | 0 | (1,835,574 | ) | ||||||||||
Total Return Swaps | 0 | (18,347 | ) | 0 | (18,347 | ) | ||||||||||
Total | $ | 495,662,407 | $ | 1,200,177,852 | $ | 0 | $ | 1,695,840,259 | ||||||||
| TAX-AWARE OVERLAY C PORTFOLIO INVESTMENTIN SECURITIES: | LEVEL 1 | LEVEL 2 | LEVEL 3 | TOTAL | ||||||||||||
Assets: |
| |||||||||||||||
Long-Term Municipal Bonds | $ | 0 | $ | 341,322,531 | $ | 0 | $ | 341,322,531 | ||||||||
Short-Term Municipal Notes | 0 | 9,230,017 | 0 | 9,230,017 | ||||||||||||
Investment Companies | 144,326,607 | 0 | 0 | 144,326,607 | ||||||||||||
Governments—Treasuries | 0 | 3,366,150 | 0 | 3,366,150 | ||||||||||||
Options Purchased—Puts | 0 | 2,020,527 | 0 | 2,020,527 | ||||||||||||
Collateralized Mortgage Obligations | 0 | 1,232,932 | 0 | 1,232,932 | ||||||||||||
Short-Term Investments | 1,116,829 | 0 | 0 | 1,116,829 | ||||||||||||
Total Investments in Securities | 145,443,436 | 357,172,157 | 0 | 502,615,593 | ||||||||||||
| 124 | Sanford C. Bernstein Fund, Inc. | |
Table of Contents
| TAX-AWARE OVERLAY C PORTFOLIO INVESTMENTIN SECURITIES: | LEVEL 1 | LEVEL 2 | LEVEL 3 | TOTAL | ||||||||||||
Other Financial Instruments (b): | ||||||||||||||||
Assets: |
| |||||||||||||||
Futures | $ | 1,296,234 | $ | 0 | $ | 0 | $ | 1,296,234 | (c) | |||||||
Forward Currency Exchange Contracts | 0 | 1,026,607 | 0 | 1,026,607 | ||||||||||||
Centrally Cleared Inflation (CPI) Swaps | 0 | 1,634,929 | 0 | 1,634,929 | (c) | |||||||||||
Centrally Cleared Interest Rate Swaps | 0 | 887,750 | 0 | 887,750 | (c) | |||||||||||
Inflation (CPI) Swaps | 0 | 1,401,655 | 0 | 1,401,655 | ||||||||||||
Interest Rate Swaps | 0 | 19,769 | 0 | 19,769 | ||||||||||||
Liabilities: |
| |||||||||||||||
Futures | (1,226,951 | ) | 0 | 0 | (1,226,951 | )(c) | ||||||||||
Forward Currency Exchange Contracts | 0 | (852,231 | ) | 0 | (852,231 | ) | ||||||||||
Credit Default Swaps | 0 | (391,955 | ) | 0 | (391,955 | ) | ||||||||||
Inflation (CPI) Swaps | 0 | (449,789 | ) | 0 | (449,789 | ) | ||||||||||
Total Return Swaps | 0 | (5,715 | ) | 0 | (5,715 | ) | ||||||||||
Total | $ | 145,512,719 | $ | 360,443,177 | $ | 0 | $ | 505,955,896 | ||||||||
| TAX-AWARE OVERLAY N PORTFOLIO INVESTMENTSIN SECURITIES: | LEVEL 1 | LEVEL 2 | LEVEL 3 | TOTAL | ||||||||||||
Assets: |
| |||||||||||||||
Long-Term Municipal Bonds | $ | 0 | $ | 241,463,503 | $ | 0 | $ | 241,463,503 | ||||||||
Investment Companies | 108,294,492 | 0 | 0 | 108,294,492 | ||||||||||||
Governments—Treasuries | 0 | 4,933,718 | 0 | 4,933,718 | ||||||||||||
Options Purchased—Puts | 0 | 1,504,138 | 0 | 1,504,138 | ||||||||||||
Collateralized Mortgage Obligations | 0 | 656,181 | 0 | 656,181 | ||||||||||||
Short-Term Investments: | ||||||||||||||||
Investment Companies | 15,539,753 | 0 | 0 | 15,539,753 | ||||||||||||
U.S. Treasury Bills | 0 | 2,499,973 | 0 | 2,499,973 | ||||||||||||
Total Investments in Securities | 123,834,245 | 251,057,513 | 0 | 374,891,758 | ||||||||||||
Other Financial Instruments (b): | ||||||||||||||||
Assets: |
| |||||||||||||||
Futures | 966,240 | 0 | 0 | 966,240 | (c) | |||||||||||
Forward Currency Exchange Contracts | 0 | 766,885 | 0 | 766,885 | ||||||||||||
Centrally Cleared Inflation (CPI) Swaps | 0 | 1,156,711 | 0 | 1,156,711 | (c) | |||||||||||
Inflation (CPI) Swaps | 0 | 1,085,792 | 0 | 1,085,792 | ||||||||||||
Interest Rate Swaps | 0 | 14,716 | 0 | 14,716 | ||||||||||||
Liabilities: |
| |||||||||||||||
Futures | (904,430 | ) | 0 | 0 | (904,430 | )(c) | ||||||||||
Forward Currency Exchange Contracts | 0 | (641,991 | ) | 0 | (641,991 | ) | ||||||||||
Centrally Cleared Interest Rate Swaps | 0 | (29,465 | ) | 0 | (29,465 | )(c) | ||||||||||
Credit Default Swaps | 0 | (316,529 | ) | 0 | (316,529 | ) | ||||||||||
Inflation (CPI) Swaps | 0 | (331,879 | ) | 0 | (331,879 | ) | ||||||||||
Total Return Swaps | 0 | (4,211 | ) | 0 | (4,211 | ) | ||||||||||
Total | $ | 123,896,055 | $ | 252,757,542 | $ | 0 | $ | 376,653,597 | ||||||||
| (a) | See Schedule of Investments for sector classifications. |
2021 Semi-Annual Report | 125 | |
Table of Contents
Notes to Financial Statements (continued)
| (b) | Other financial instruments are derivative instruments, such as futures, forwards and swaps, which are valued at the unrealized appreciation/(depreciation) on the instrument. Other financial instruments may also include swaps with upfront premiums, options written and swaptions written which are valued at market value. |
| (c) | Only variation margin receivable/(payable) at period end is reported within the statement of assets and liabilities. This amount reflects cumulative unrealized appreciation/(depreciation) on futures and centrally cleared swaps as reported in the schedule of investments. Where applicable, centrally cleared swaps with upfront premiums are presented here at market value. |
| C. | Foreign Currency Translation |
The accounting records of the Portfolios are maintained in U.S. dollars. Prices of securities and other assets and liabilities denominated in non-U.S. currencies are translated into U.S. dollars using the exchange rate at 4:00 p.m., Eastern Time. Amounts related to the purchases and sales of securities, investment income and expenses are translated at the rates of exchange prevailing on the respective dates of such transactions.
Net realized gain or loss on foreign currency transactions represents net foreign exchange gains or losses from the disposition of foreign currencies, currency gains or losses realized between the trade and settlement dates on security transactions and the difference between the amount of dividends, interest and foreign withholding taxes recorded on the Portfolios’ books and the U.S. dollar equivalent amount actually received or paid. Net unrealized currency gains and losses arising from valuing foreign currency denominated assets and liabilities, other than security investments, at the current exchange rate are reflected as part of unrealized appreciation/depreciation on foreign currencies.
The Portfolios do not isolate that portion of the results of operations arising as a result of changes in the foreign exchange rates from the changes in the market prices of securities held at period end. The Portfolios do isolate the effect of changes in foreign exchange rates from changes in market prices of securities sold during the year, as required by the Internal Revenue Code.
The Portfolios may invest in foreign securities and foreign currency transactions that may involve risks not associated with domestic investments as a result of the level of governmental supervision and regulation of foreign securities markets and the possibility of political or economic instability, among others.
| D. | Taxes |
Each Portfolio is treated as a separate entity for federal income tax purposes. Each Portfolio intends to continue to comply with the requirements of Subchapter M of the Internal Revenue Code of 1986 as they apply to regulated investment companies. By so complying, each Portfolio will not be subject to federal and state income taxes to the extent that all of its income is distributed. The Portfolios may be subject to taxes imposed by countries in which they invest. Such taxes are generally based on income and/or capital gains earned or repatriated. Taxes are accrued and applied to net investment income, net realized gains and net unrealized appreciation/depreciation as such income and/or gains are earned based on, management’s understanding of applicable local tax law.
In consideration of recent decisions rendered by the European courts, certain Portfolios filed reclaims to recover taxes withheld on dividends earned from certain European Union countries during calendar years 2008 through 2010. These filing are subject to various administrative and judicial proceedings within these countries. No amounts for additional tax reclaims are disclosed in the financial statements due to the uncertainty as to the ultimate resolution of proceedings, the likelihood of receipt of these reclaims, and the potential timing of payment.
In accordance with U.S. GAAP requirements regarding accounting for uncertainties in income taxes, management has analyzed the Portfolios’ tax positions taken or expected to be taken on federal and state income tax returns for all open tax years (the current and the prior three tax years) and has concluded that no provision for income tax is required in the Portfolios’ financial statements. As of September 30, 2020, the Portfolios did not have any unrecognized tax benefits.
| E. | Security Transactions and Related Investment Income |
Security transactions are accounted for on the trade date (the date the buy or sell order is executed). Securities gains and losses are calculated on the identified cost basis. Interest income is recorded on the accrual basis and dividend income is
| 126 | Sanford C. Bernstein Fund, Inc. | |
Table of Contents
recorded on the ex-dividend date or as soon as the Fund is informed of the dividend. The Portfolios amortize premiums and accrete discounts as adjustments to interest income. The Portfolio accounts for distributions received from REIT investments or from regulated investment companies as dividend income, realized gain, or return of capital based on information provided by the REIT or the investment company.
| F. | Securities Transactions on a When-Issued or Delayed-Delivery Basis |
Each Portfolio may purchase securities on a when-issued basis or purchase or sell securities on a delayed-delivery basis. At the time a Portfolio commits to purchase a security on a when-issued or delayed-delivery basis, the Portfolio will record the transaction and use the security’s value in determining the Portfolio’s net asset value. At the time a Portfolio commits to sell a security on a delayed-delivery basis, the Portfolio will record the transaction and exclude the security’s value in determining the Portfolio’s net asset value.
| G. | Class Allocations |
All income earned and expenses incurred by the Portfolios are borne on a pro-rata basis by each outstanding class of shares, based on the proportionate interest in the Portfolio represented by the shares of such class, except for class specific expenses which are allocated to the respective class. Expenses of the Fund are charged proportionately to each Portfolio or based on other appropriate methods. Realized and unrealized gains and losses are allocated among the various share classes based on respective net assets.
| H. | Distribution of Income and Gains |
Dividends from net investment income, if any, will be paid to shareholders at least once a year.
Distributions of net realized gains, less any available loss carryforwards, if any, for all the Portfolios will be paid to shareholders at least once a year, and recorded on the ex-dividend date.
Elements of realized gains and net investment income may be recorded in different accounting periods for financial reporting (book) and federal income tax (tax) purposes (temporary differences). To the extent that such distributions required for tax purposes exceed income and gains recorded for book purposes as a result of such temporary differences, “excess distributions” are reflected in the accompanying statement of assets and liabilities. To the extent distributions exceed income and gains for tax purposes, such distributions would be shown as “return of capital” on the statement of changes in net assets. Certain other differences—permanent differences—arise because treatment of elements of income and gains is different between book and tax accounting. Permanent differences are reclassified in the year they arise.
| NOTE 2. | Investment Management and Transactions with Affiliated Persons |
| A. | Management Fee |
Under the Investment Management Agreement between the Fund and the Adviser, the Adviser manages the investment of each Portfolio’s assets, places purchase and sale orders, and bears various expenses, including the salaries and expenses of all personnel except those of outside directors. In addition, the Adviser agrees to permit its directors, officers and employees who may be elected directors or officers of the Fund to serve in the capacities to which they are elected. The Adviser renders these services subject to the general oversight of the Board.
The Portfolios pay the Adviser an investment management fee at an annual rate of 0.90% of the first $2.5 billion, 0.875% of the next $2.5 billion and 0.85% in excess of $5 billion for Overlay A and Tax-Aware Overlay A; 0.65% for Overlay B, Tax-Aware Overlay B, Tax-Aware Overlay C and Tax-Aware Overlay N, of the average daily net assets of each Portfolio. Prior to November 13, 2020, the Overlay A and Tax-Aware Overlay paid the Adviser an investment management fee at an annual rate of 0.90% of the first $5 billion and 0.875% in excess of $5 billion of the average daily net assets of each respective Portfolio.
The Adviser has agreed to waive its fees and bear certain expenses, exclusive of acquired fund fees and other than the advisory fees of any registered funds advised by the Adviser in which a Portfolio may invest, interest expense, taxes,
2021 Semi-Annual Report | 127 | |
Table of Contents
Notes to Financial Statements (continued)
extraordinary expenses, brokerage commission, and other transaction costs, to the extent necessary to limit the total portfolio operating expenses as a percentage of daily average net assets on an annual basis as follows:
| PORTFOLIO | CLASS 1 | CLASS 2 | ||||||
Overlay A | 1.20 | % | 1.00 | % | ||||
Tax-Aware Overlay A | 1.20 | % | 1.00 | % | ||||
Overlay B | 0.90 | % | 0.75 | % | ||||
Tax-Aware Overlay B | 0.90 | % | 0.75 | % | ||||
Tax-Aware Overlay C | 0.90 | % | 0.75 | % | ||||
Tax-Aware Overlay N | 0.90 | % | 0.75 | % | ||||
This fee waiver and/or expense limitation agreement will remain in effect until January 28, 2022 and then may be extended by the Adviser for additional one year terms. During the six months ended March 31, 2021, such reimbursements/waivers amounted to $37 for the Tax-Aware Overlay N Portfolio.
During the second quarter of 2018, AXA S.A. (“AXA”), a French holding company for the AXA Group, completed the sale of a minority stake in its subsidiary, AXA Equitable Holdings, Inc. (now named Equitable Holdings, Inc.)(“Equitable”), through an initial public offering. Equitable is the holding company for a diverse group of financial services companies, including an approximate 65% economic interest in the Adviser and a 100% interest in AllianceBernstein Corporation, the general partner of the Adviser. Since the initial sale, AXA has completed additional offerings (and related transactions). As a result, as of May 20, 2021, AXA no longer owns shares of Equitable.
Sales that were completed on November 13, 2019 resulted in the indirect transfer of a “controlling block” of voting securities of the Adviser (a “Change of Control Event”) and may have been deemed to have been an “assignment” causing a termination of the Portfolios’ investment advisory and administration agreements. In order to ensure that investment advisory and administration services could continue uninterrupted in the event of a Change of Control Event, the Board previously approved new investment advisory and administration agreements with the Adviser, and shareholders of the Portfolios subsequently approved the new investment advisory agreement. These agreements became effective on November 13, 2019.
| B. | Shareholder Servicing Fee |
Under the Shareholder Servicing Agreement between the Fund and the Adviser, the Adviser pays expenses it incurs in providing shareholder servicing to the Fund, the Portfolios and individual shareholders. Such services include, but are not limited to, providing information to shareholders concerning their fund investments, systematic withdrawal plans, fund dividend payments and reinvestments, shareholder account or transactions status, net asset value of shares, fund performance, fund services, plans and options, fund investment policies, portfolio holdings and tax consequences of fund investments; dealing with shareholder complaints and other correspondence relating to fund matters; and communications with shareholders when proxies are being solicited from them with respect to voting their fund shares. Under the agreement, the fee paid by each Portfolio to the Adviser for services is 0.20 of 1%, annualized, of the average daily net assets of Class 1 Shares of Overlay A and Tax-Aware Overlay A Portfolios during the month, and 0.15 of 1%, annualized, of the average daily net assets of Class 1 Shares of Overlay B, Tax-Aware Overlay B, Tax-Aware Overlay C and Tax-Aware Overlay N Portfolios during the month.
| C. | Distribution Arrangements |
Under the Distribution Agreement between the Fund, on behalf of each Portfolio, and Sanford C. Bernstein & Co., LLC (the “Distributor”), the Distributor agrees to act as agent to sell shares of the Portfolios. The Distributor receives no fee for this service, and furthermore agrees to pay all expenses arising from the performance of its obligations under this agreement. The Distributor is a wholly owned subsidiary of the Adviser.
| 128 | Sanford C. Bernstein Fund, Inc. | |
Table of Contents
| D. | Investments in Affiliated Issuers |
The Portfolios may invest in other investment companies advised by the Adviser, including AB Government Money Market Portfolio (the “Government Money Market Portfolio”) and AB All-Market Real Return Portfolio—Class Z (“AMRR”) which have contractual annual advisory fee rates of 0.20% and 0.75%, respectively, of the portfolios’ average daily net assets and bear their own expenses. The Adviser has contractually agreed to waive .10% of the advisory fee of Government Money Market Portfolio (resulting in a net advisory fee of .10%) until August 31, 2021. In connection with the investment by the Portfolios in affiliated registered investment companies, the Adviser has contractually agreed to waive its advisory fee from the Portfolios in an amount equal to the Portfolios’ pro rata share of the effective advisory fee of the underlying affiliated registered investment company, as borne indirectly by the Portfolios as an acquired fund fee and expense.
For the six months ended March 31, 2021, such waivers amounted to:
| PORTFOLIO | GOVERNMENT MONEY MARKET PORTFOLIO | AMRR | ||||||
Overlay A | $ | 39,748 | $ | 529,224 | ||||
Tax-Aware Overlay A | 61,398 | 1,039,237 | ||||||
Overlay B | 43,771 | 161,338 | ||||||
Tax-Aware Overlay B | 20,284 | 0 | ||||||
Tax-Aware Overlay C | 4,110 | 0 | ||||||
Tax-Aware Overlay N | 4,527 | 0 | ||||||
Overlay A Portfolio and Tax-Aware Overlay A Portfolio currently invest in Bernstein Fund, Inc.—International Small Cap Portfolio—Class Z, Bernstein Fund, Inc.—International Strategic Equities Portfolio—Class Z, Bernstein Fund Inc.—Small Cap Core Portfolio—Class Z and Sanford C. Bernstein Fund, Inc.—Emerging Markets Portfolio—Class Z, respectively. With respect to the Overlay A Portfolio and Tax-Aware Overlay A Portfolio, the Adviser has contractually agreed to waive its management fees and/or bear Portfolio expenses through January 28, 2022, in an amount equal to the Portfolios’ proportionate share of all advisory fees and other expenses of the aforementioned funds that are indirectly borne by the Portfolios. For the six months ended March 31, 2021, such waivers amounted to:
| SANFORD C. BERNSTEIN FUND, INC. | BERNSTEIN FUND, INC. | |||||||||||||||||||||||
| PORTFOLIO | TAX MANAGED INTERNATIONAL PORTFOLIO CLASS Z | INTERNATIONAL PORTFOLIO CLASS Z | EMERGING MARKETS PORTFOLIO CLASS Z | INTERNATIONAL STRATEGIC EQUITIES PORTFOLIO CLASS Z | INTERNATIONAL SMALL CAP PORTFOLIO CLASS Z | SMALL CAP CORE PORTFOLIO CLASS Z | ||||||||||||||||||
Overlay A | $ | 0 | $ | 294,485 | $ | 252,454 | $ | 1,658,226 | $ | 546,789 | $ | 137,529 | ||||||||||||
Tax-Aware Overlay A | 589,756 | 0 | 526,217 | 3,442,598 | 1,134,473 | 273,152 | ||||||||||||||||||
2021 Semi-Annual Report | 129 | |
Table of Contents
Notes to Financial Statements (continued)
The Portfolios may invest in other investment companies managed by the Adviser. A summary of the Portfolios’ transactions in such holdings for the six months ended March 31, 2021 is as follows:
| SANFORD C. BERNSTEIN FUND, INC.—OVERLAY A PORTFOLIO | ||||||||||||||||||||||||||||||||
| DISTRIBUTIONS | ||||||||||||||||||||||||||||||||
| FUND | MARKET VALUE 9/30/20 (000) | PURCHASES AT COST (000) | SALES PROCEEDS (000) | REALIZED GAIN (LOSS) (000) | CHANGEIN UNREALIZED APPR./(DEPR.) (000) | MARKET VALUE 3/31/21 (000) | DIVIDEND INCOME (000) | REALIZED GAINS (000) | ||||||||||||||||||||||||
Government Money Market Portfolio | $ | 92,201 | $ | 301,856 | $ | 158,284 | $ | 0 | $ | 0 | $ | 235,773 | $ | 12 | $ | 0 | ||||||||||||||||
AB Bond Fund, Inc.: AB All Market Real Return Portfolio | 125,304 | 4,754 | 0 | 0 | 24,732 | 154,790 | 4,754 | 0 | ||||||||||||||||||||||||
Bernstein Fund, Inc.: International Small Cap Portfolio | 90,463 | 1,183 | 0 | 0 | 20,361 | 112,007 | 1,183 | 0 | ||||||||||||||||||||||||
International Strategic Equities Portfolio | 309,359 | 163,007 | (a) | 123,216 | 5,637 | 79,510 | 434,297 | 4,394 | 0 | |||||||||||||||||||||||
Small Cap Core Portfolio | 24,953 | 160 | 0 | 0 | 10,756 | 35,869 | 160 | 0 | ||||||||||||||||||||||||
Sanford C. Bernstein Fund, Inc.—AB Emerging Markets Portfolio | 41,032 | 947 | 0 | 0 | 10,506 | 52,485 | 947 | 0 | ||||||||||||||||||||||||
AB International Portfolio | 176,692 | 1,116 | 158,612 | (a) | 0 | (19,196 | ) | 0 | 1,116 | 0 | ||||||||||||||||||||||
Total | $ | 5,637 | $ | 126,669 | $ | 1,025,221 | $ | 12,566 | $ | 0 | ||||||||||||||||||||||
| (a) | Includes $158,612,012 of purchases / sales resulting from the merger of the International Portfolio into the International Strategic Equities Portfolio, which took place on December 4, 2020. |
| SANFORD C. BERNSTEIN FUND, INC.—TAX-AWARE OVERLAY A PORTFOLIO | ||||||||||||||||||||||||||||||||
| DISTRIBUTIONS | ||||||||||||||||||||||||||||||||
| FUND | MARKET VALUE 9/30/20 (000) | PURCHASES AT COST (000) | SALES PROCEEDS (000) | REALIZED GAIN (LOSS) (000) | CHANGEIN UNREALIZED APPR./(DEPR.) (000) | MARKET VALUE 3/31/21 (000) | DIVIDEND INCOME (000) | REALIZED GAINS (000) | ||||||||||||||||||||||||
Government Money Market Portfolio | $ | 108,532 | $ | 603,476 | $ | 221,962 | $ | 0 | $ | 0 | $ | 490,046 | $ | 16 | $ | 0 | ||||||||||||||||
AB Bond Fund, Inc.: AB All Market Real Return Portfolio | 246,060 | 9,337 | 0 | 0 | 48,564 | 303,961 | 9,336 | 0 | ||||||||||||||||||||||||
Bernstein Fund, Inc.: International Small Cap Portfolio | 187,691 | 2,455 | 0 | 0 | 42,246 | 232,392 | 2,455 | 0 | ||||||||||||||||||||||||
International Strategic Equities Portfolio | 642,544 | 330,144 | (a) | 258,978 | 12,595 | 172,136 | 898,441 | 9,127 | 0 | |||||||||||||||||||||||
Small Cap Core Portfolio | 49,560 | 318 | 0 | 0 | 21,363 | 71,241 | 318 | 0 | ||||||||||||||||||||||||
| 130 | Sanford C. Bernstein Fund, Inc. | |
Table of Contents
| SANFORD C. BERNSTEIN FUND, INC.—TAX-AWARE OVERLAY A PORTFOLIO | ||||||||||||||||||||||||||||||||
| DISTRIBUTIONS | ||||||||||||||||||||||||||||||||
| FUND | MARKET VALUE 9/30/20 (000) | PURCHASES AT COST (000) | SALES PROCEEDS (000) | REALIZED GAIN (LOSS) (000) | CHANGEIN UNREALIZED APPR./(DEPR.) (000) | MARKET VALUE 3/31/21 (000) | DIVIDEND INCOME (000) | REALIZED GAINS (000) | ||||||||||||||||||||||||
Sanford C. Bernstein Fund, Inc.—AB Emerging Markets Portfolio | $ | 85,527 | $ | 1,973 | $ | 0 | $ | 0 | $ | 21,900 | $ | 109,400 | $ | 1,974 | $ | 0 | ||||||||||||||||
AB Tax-Managed International Portfolio | 366,453 | 3,252 | 321,016 | (a) | 0 | (48,689 | ) | 0 | 3,252 | 0 | ||||||||||||||||||||||
Total | $ | 12,595 | $ | 257,520 | $ | 2,105,481 | $ | 26,478 | $ | 0 | ||||||||||||||||||||||
| (a) | Includes $ 321,016,479 of purchases / sales resulting from the merger of the Tax-Managed International Portfolio into the International Strategic Equities Portfolio, which took place on December 4, 2020. |
| SANFORD C. BERNSTEIN FUND, INC.—OVERLAY B PORTFOLIO | ||||||||||||||||||||||||||||||||
| DISTRIBUTIONS | ||||||||||||||||||||||||||||||||
| FUND | MARKET VALUE 9/30/20 (000) | PURCHASES AT COST (000) | SALES PROCEEDS (000) | REALIZED GAIN (LOSS) (000) | CHANGEIN UNREALIZED APPR./(DEPR.) (000) | MARKET VALUE 3/31/21 (000) | DIVIDEND INCOME (000) | REALIZED GAINS (000) | ||||||||||||||||||||||||
Government Money Market Portfolio | $ | 41,075 | $ | 457,328 | $ | 290,348 | $ | 0 | $ | 0 | $ | 208,055 | $ | 11 | $ | 0 | ||||||||||||||||
AB Bond Fund, Inc.: AB All Market Real Return Portfolio | 38,200 | 1,450 | 0 | 0 | 7,539 | 47,189 | 1,449 | 0 | ||||||||||||||||||||||||
Total | $ | 0 | $ | 7,539 | $ | 255,244 | $ | 1,460 | $ | 0 | ||||||||||||||||||||||
| SANFORD C. BERNSTEIN FUND, INC.—TAX-AWARE OVERLAY B PORTFOLIO | ||||||||||||||||||||
| PORTFOLIO | MARKET VALUE 9/30/20 (000) | PURCHASES AT COST (000) | SALES PROCEEDS (000) | MARKET VALUE 3/31/21 (000) | DIVIDEND INCOME (000) | |||||||||||||||
Government Money Market Portfolio | $ | 14,382 | $ | 248,326 | $ | 244,900 | $ | 17,808 | $ | 7 | ||||||||||
| SANFORD C. BERNSTEIN FUND, INC.—TAX-AWARE OVERLAY C PORTFOLIO | ||||||||||||||||||||
| PORTFOLIO | MARKET VALUE 9/30/20 (000) | PURCHASES AT COST (000) | SALES PROCEEDS (000) | MARKET VALUE 3/31/21 (000) | DIVIDEND INCOME (000) | |||||||||||||||
Government Money Market Portfolio | $ | 9,214 | $ | 78,785 | $ | 86,882 | $ | 1,117 | $ | 1 | ||||||||||
| SANFORD C. BERNSTEIN FUND, INC.—TAX-AWARE OVERLAY N PORTFOLIO | ||||||||||||||||||||
| PORTFOLIO | MARKET VALUE 9/30/20 (000) | PURCHASES AT COST (000) | SALES PROCEEDS (000) | MARKET VALUE 3/31/21 (000) | DIVIDEND INCOME (000) | |||||||||||||||
Government Money Market Portfolio | $ | 7,125 | $ | 53,970 | $ | 45,555 | $ | 15,540 | $ | 1 | ||||||||||
2021 Semi-Annual Report | 131 | |
Table of Contents
Notes to Financial Statements (continued)
| NOTE 3. | Investment Security Transactions |
| A. | Purchases and Sales |
For the six months ended March 31, 2021, the Portfolios had purchases and sales transactions, excluding transactions in short-term instruments, as follows:
| PORTFOLIO | PURCHASES EXCLUDING U.S. GOVERNMENT SECURITIES | PURCHASESOF U.S. GOVERNMENT SECURITIES | SALES EXCLUDING U.S. GOVERNMENT SECURITIES | SALESOF U.S. GOVERNMENT SECURITIES | ||||||||||||
Overlay A | $ | 195,579,356 | $ | 0 | $ | 558,849,046 | $ | 0 | ||||||||
Tax-Aware Overlay A | 405,464,551 | 0 | 1,100,678,090 | 0 | ||||||||||||
Overlay B | 242,337,256 | 291,902,391 | 310,180,579 | 354,517,875 | ||||||||||||
Tax-Aware Overlay B | 168,815,346 | 0 | 176,558,244 | 30,000 | ||||||||||||
Tax-Aware Overlay C | 48,865,123 | 0 | 57,977,512 | 4,097,520 | ||||||||||||
Tax-Aware Overlay N | 29,511,364 | 0 | 43,743,298 | 0 | ||||||||||||
The cost of investments for federal income tax purposes was substantially the same as the cost for financial reporting purposes. Accordingly, gross unrealized appreciation and unrealized depreciation are as follows:
| GROSS UNREALIZED | NET UNREALIZED APPRECIATION | |||||||||||
| PORTFOLIO | APPRECIATION | (DEPRECIATION) | ||||||||||
Overlay A | $ | 513,435,120 | $ | (38,482,624 | ) | $ | 474,952,496 | |||||
Tax-Aware Overlay A | 1,178,341,057 | (76,585,075 | ) | 1,101,755,982 | ||||||||
Overlay B | 57,613,290 | (31,191,773 | ) | 26,421,517 | ||||||||
Tax-Aware Overlay B | 233,039,006 | (14,127,518 | ) | 218,911,488 | ||||||||
Tax-Aware Overlay C | 68,021,434 | (4,634,434 | ) | 63,387,000 | ||||||||
Tax-Aware Overlay N | 50,172,088 | (3,352,041 | ) | 46,820,047 | ||||||||
| B. | Derivative Financial Instruments |
Each Portfolio may use derivatives in an effort to earn income and enhance returns, to replace more traditional direct investments, to obtain exposure to otherwise inaccessible markets (collectively, “investment purposes”), or to hedge or adjust the risk profile of its portfolio.
The principal types of derivatives utilized by the Portfolios, as well as the methods in which they may be used are:
| • | Futures |
Each Portfolio may buy or sell futures for investment purposes or for the purpose of hedging its portfolio against adverse effects of potential movements in the market. The Portfolios bear the market risk that arises from changes in the value of these instruments and the imperfect correlation between movements in the price of the futures and movements in the price of the assets, reference rates or indices which they are designed to track. Among other things, the Portfolios may purchase or sell futures for foreign currencies or options thereon for non-hedging purposes as a means of making direct investment in foreign currencies, as described below under “Currency Transactions”.
At the time a Portfolio enters into futures, a Portfolio deposits and maintains as collateral an initial margin with the broker, as required by the exchange on which the transaction is effected. Such amount is shown as cash collateral due from broker on the statement of assets and liabilities. Pursuant to the contract, the Portfolios agree to receive from or pay to the broker an amount of cash equal to the daily fluctuation in the value of the contract. Such receipts or payments are known as variation margin and are recorded by the Portfolios as unrealized gains or losses. Risks may arise from the potential inability of a counterparty to meet the terms of the contract. The credit/counterparty risk for exchange-traded futures is generally less than privately negotiated futures, since the clearinghouse, which is the issuer or counterparty to each exchange-traded future, has robust risk mitigation standards, including the requirement to provide initial and variation margin. When the contract is closed, the Portfolios record a realized gain or loss equal to the difference between the value of the contract at the time it was opened and the time it was closed.
| 132 | Sanford C. Bernstein Fund, Inc. | |
Table of Contents
Use of long futures subjects the Portfolios to risk of loss in excess of the amounts shown on the statement of assets and liabilities, up to the notional value of the futures. Use of short futures subjects the Portfolios to unlimited risk of loss. Each Portfolio may enter into futures only on exchanges or boards of trade. The exchange or board of trade acts as the counterparty to each futures transactions; therefore, the Portfolios’ credit risk is subject to failure of the exchange or board of trade. Under some circumstances, futures exchanges may establish daily limits on the amount that the price of futures can vary from the previous day’s settlement price, which could effectively prevent liquidation of unfavorable positions.
During the six months ended March 31, 2021, the Portfolios held futures for hedging and non-hedging purposes.
| • | Forward Currency Exchange Contracts |
Each Portfolio may enter into forward currency exchange contracts on either a spot (i.e., cash) or forward basis. Spot contracts are entered into at the rate then prevailing in the currency-exchange market. Forward currency exchange contracts obligate the contracting parties to purchase or sell a specific currency at a specified future date at a specified price. The Portfolios will generally not enter into a forward currency exchange contract with a term greater than one year. The gain or loss arising from the difference between the original contract and the closing of such contract would be included in net realized gain or loss on foreign currency transactions. Fluctuations in the value of open forward currency exchange contracts are recorded for financial reporting purposes as unrealized appreciation and/or depreciation by the Portfolio. Risks may arise from the potential inability of a counterparty to meet the terms of a contract and from unanticipated movements in the value of a foreign currency relative to the U.S. dollar.
Forward currency exchange contracts used to protect the Portfolios from adverse currency movements involve the risk that the Adviser may not accurately predict currency movements. As a result, total return could be adversely affected. The Adviser may seek investment opportunities by taking long or short positions in currencies through the use of currency-related derivatives, including forward currency exchange contracts, futures and options on futures, swaps and other options. The Adviser may enter into foreign currency transactions for investment opportunities when it anticipates that a foreign currency will appreciate or depreciate in value.
Under certain circumstances, the Portfolios may commit a substantial portion or the entire value of the Portfolios to the consummation of these contracts. The Adviser will consider the effect that a substantial commitment of assets to forward currency exchange contracts would have on the investment program of the Portfolios and the flexibility of the Portfolios to purchase additional securities.
During the six months ended March 31, 2021, the Portfolios held forward currency exchange contracts for hedging and non-hedging purposes.
| • | Option Transactions |
For hedging and investment purposes, each Portfolio may purchase and write (sell) put and call options on U.S. and foreign securities, including government securities, and foreign currencies that are traded on U.S. and foreign securities exchanges and over-the-counter markets. Among other things, certain Portfolios may use options transactions for non-hedging purposes as a means of making direct investments in foreign currencies, as described below under “Currency Transactions” and may use options strategies involving the purchase and/or writing of various combinations of call and/or put options, for hedging and investment purposes.
The risk associated with purchasing an option is that the Portfolios pay a premium whether or not the option is exercised. Additionally, the Portfolios bear the risk of loss of the premium and change in market value should the counterparty not perform under the contract. If a put or call option purchased by the Portfolios were permitted to expire without being sold or exercised, its premium would represent a loss to the Portfolios. Put and call options purchased are accounted for in the same manner as portfolio securities. The cost of securities acquired through the exercise of call options is increased by premiums paid. The proceeds from securities sold through the exercise of put options are decreased by the premiums paid.
When a Portfolio writes an option, the premium received by the Portfolio is recorded as a liability and is subsequently adjusted to the current market value of the option written. The Portfolios’ maximum payment for written put options equates to the number of shares multiplied by the strike price. In certain circumstances maximum payout amounts may be partially offset by recovery values of the respective referenced assets and upfront premium received upon entering into
2021 Semi-Annual Report | 133 | |
Table of Contents
Notes to Financial Statements (continued)
the contract. Premiums received from written options which expire unexercised are recorded by the Portfolios on the expiration date as realized gains from options written. The difference between the premium received and the amount paid on effecting a closing purchase transaction, including brokerage commissions, is also treated as a realized gain, or if the premium received is less than the amount paid for the closing purchase transaction, as a realized loss. If a call option is exercised, the premium received is added to the proceeds from the sale of the underlying security or currency in determining whether the Portfolios have realized a gain or loss. If a put option is exercised, the premium received reduces the cost basis of the security or currency purchased by the Portfolios. In writing an option, the Portfolios bear the market risk of an unfavorable change in the price of the security or currency underlying the written option. Exercise of an option written by the Portfolios could result in the Portfolios selling or buying a security or currency at a price different from the current market value.
A Portfolio may also invest in options on swap agreements, also called “swaptions”. A swaption is an option that gives the buyer the right, but not the obligation, to enter into a swap on a future date in exchange for paying a market-based “premium”. A receiver swaption gives the owner the right to receive the total return of a specified asset, reference rate, or index. A payer swaption gives the owner the right to pay the total return on a specified asset, reference rate, or index. Swaptions also include options that allow an existing swap to be terminated or extended by one of the counterparties.
During the six months ended March 31, 2021, the Portfolios held purchased options for hedging and non-hedging purposes. During the six months ended March 31, 2021, the Portfolios held written options for hedging and non-hedging purposes.
During the six months ended March 31, 2021, the Overlay B Portfolio held purchased swaptions for hedging and non-hedging purposes. During the six months ended March 31, 2021, the Overlay B Portfolio held written swaptions for hedging and non-hedging purposes.
| • | Swaps |
The Portfolios may enter into swaps to hedge their exposure to interest rates, credit risk, or currencies. Certain Portfolios may also enter into swaps for non-hedging purposes as a means of gaining market exposures, including by making direct investments in foreign currencies, as described below under “Currency Transactions.” A swap is an agreement that obligates two parties to exchange a series of cash flows at specified intervals based upon or calculated by reference to changes in specified prices or rates for a specified amount of an underlying asset. The payment flows are usually netted against each other, with the difference being paid by one party to the other. In addition, collateral may be pledged or received by the Portfolios in accordance with the terms of the respective swaps to provide value and recourse to the Portfolios or their counterparties in the event of default, bankruptcy or insolvency by one of the parties to the swap.
Risks may arise as a result of the failure of the counterparty to the swap to comply with the terms of the swap. The loss incurred by the failure of a counterparty is generally limited to the net interim payment to be received by the Portfolios, and/or the termination value at the end of the contract. Therefore, the Portfolios consider the creditworthiness of each counterparty to a swap in evaluating potential counterparty risk. This risk is mitigated by having a netting arrangement between the Portfolios and the counterparty and by the posting of collateral by the counterparty to the Portfolios to cover the Portfolios’ exposure to the counterparty. Additionally, risks may arise from unanticipated movements in interest rates or in the value of the underlying securities. The Portfolios accrue for the interim payments on swaps on a daily basis, with the net amount recorded within unrealized appreciation/depreciation of swaps on the statement of assets and liabilities, where applicable. Once the interim payments are settled in cash, the net amount is recorded as realized gain/(loss) on swaps on the statement of operations, in addition to any realized gain/(loss) recorded upon the termination of swaps. Upfront premiums paid or received for OTC swaps are recognized as cost or proceeds on the statement of assets and liabilities and are amortized on a straight line basis over the life of the contract. Amortized upfront premiums are included in net realized gain/(loss) from swaps on the statement of operations. Fluctuations in the value of swaps are recorded as a component of net change in unrealized appreciation/depreciation of swaps on the statement of operations.
Certain standardized swaps, including certain interest rate swaps and credit default swaps are (or soon will be) subject to mandatory central clearing. Cleared swaps are transacted through futures commission merchants (“FCMs”) that are members of central clearinghouses, with the clearinghouse serving as central counterparty, similar to transactions in futures contracts. Centralized clearing will be required for additional categories of swaps on a phased-in basis based on requirements published by the Securities and Exchange Commission and Commodity Futures Trading Commission.
| 134 | Sanford C. Bernstein Fund, Inc. | |
Table of Contents
At the time the Portfolios enter into a centrally cleared swap, the Portfolios deposit and maintain as collateral an initial margin with the broker, as required by the clearinghouse on which the transaction is effected. Such amount is shown as cash collateral due from broker on the statement of assets and liabilities. Pursuant to the contract, the Portfolios agree to receive from or pay to the broker an amount of cash equal to the daily fluctuation in the value of the contract. Such receipts or payments are known as variation margin and are recorded by the Portfolios as unrealized gains or losses. Risks may arise from the potential inability of a counterparty to meet the terms of the contract. The credit/counterparty risk for centrally cleared swaps is generally less than non-centrally cleared swaps, since the clearinghouse, which is the issuer or counterparty to each centrally cleared swap, has robust risk mitigation standards, including the requirement to provide initial and variation margin. When the contract is closed, the Portfolios record a realized gain or loss equal to the difference between the value of the contract at the time it was opened and the time it was closed.
Interest Rate Swaps:
The Portfolios are subject to interest rate risk exposure in the normal course of pursuing its investment objectives. Because the Portfolios hold fixed rate bonds, the value of these bonds may decrease if interest rates rise. To help hedge against this risk and to maintain its ability to generate income at prevailing market rates, the Portfolios may enter into interest rate swaps. Interest rate swaps are agreements between two parties to exchange cash flows based on a notional amount. The Portfolios may elect to pay a fixed rate and receive a floating rate, or receive a fixed rate and pay a floating rate on a notional amount.
In addition, a Portfolio may also enter into interest rate swap transactions to preserve a return or spread on a particular investment or portion of its portfolio, or protecting against an increase in the price of securities the Portfolio anticipates purchasing at a later date. Interest rate swaps involve the exchange by a Portfolio with another party of their respective commitments to pay or receive interest (e.g., an exchange of floating rate payments for fixed rate payments) computed based on a contractually-based principal (or “notional”) amount. Interest rate swaps are entered into on a net basis (i.e., the two payment streams are netted out, with the Portfolio receiving or paying, as the case may be, only the net amount of the two payments).
During the six months ended March 31, 2021, the Overlay B, Tax-Aware Overlay B, Tax-Aware Overlay C and Tax-Aware Overlay N Portfolios held interest rate swaps for hedging and non-hedging purposes.
Inflation (CPI) Swaps:
Inflation swap agreements are contracts in which one party agrees to pay the cumulative percentage increase in a price index (the Consumer Price Index with respect to CPI swaps) over the term of the swap (with some lag on the inflation index), and the other pays a compounded fixed rate. Inflation swaps may be used to protect the net asset value, or NAV, of a Portfolio against an unexpected change in the rate of inflation measured by an inflation index since the value of these agreements is expected to increase if there are unexpected inflation increases.
During the six months ended March 31, 2021, the Overlay B, Tax-Aware Overlay B, Tax-Aware Overlay C and Tax-Aware Overlay N Portfolios held inflation (CPI) swaps for hedging and non-hedging purposes.
Credit Default Swaps:
The Portfolios may enter into credit default swaps, including to manage their exposure to the market or certain sectors of the market, to reduce their risk exposure to defaults by corporate and sovereign issuers held by the Portfolios, or to create exposure to corporate or sovereign issuers to which they are not otherwise exposed. The Portfolios may purchase credit protection (“Buy Contract”) or provide credit protection (“Sale Contract”) on the referenced obligation of the credit default swap. During the term of the swap, the Portfolios receive/(pay) fixed payments from/(to) the respective counterparty, calculated at the agreed upon rate applied to the notional amount. If a Portfolio is a buyer/(seller) of protection and a credit event occurs, as defined under the terms of the swap, the Portfolios will either (i) receive from the seller/(pay to the buyer) of protection an amount equal to the notional amount of the swap (the “Maximum Payout Amount”) and deliver/(take delivery of) the referenced obligation or (ii) receive/(pay) a net settlement amount in the form of cash or securities equal to the notional amount of the swap less the recovery value of the referenced obligation. In certain circumstances Maximum Payout Amounts may be partially offset by recovery values of the respective referenced obligations, upfront premium received upon entering into the agreement, or net amounts received from settlement of buy protection credit default swaps entered into by the Portfolios for the same referenced obligations with the same counterparty.
2021 Semi-Annual Report | 135 | |
Table of Contents
Notes to Financial Statements (continued)
Credit default swaps may involve greater risks than if a Portfolio had invested in the referenced obligation directly. Credit default swaps are subject to general market risk, liquidity risk, counterparty risk and credit risk. If a Portfolio is a buyer of protection and no credit event occurs, it will lose the payments it made to its counterparty. If a Portfolio is a seller of protection and a credit event occurs, the value of the referenced obligation received by the Portfolio coupled with the periodic payments previously received, may be less than the Maximum Payout Amount it pays to the buyer, resulting in a net loss to the Portfolio.
Implied credit spreads over U.S. Treasuries of comparable maturity utilized in determining the market value of credit default swaps on issuers as of period end are disclosed in the schedule of investments. The implied spreads serve as an indicator of the current status of the payment/performance risk and typically reflect the market’s assessment of the likelihood of default by the issuer of the referenced obligation. The implied credit spread of a particular reference obligation also reflects the cost of buying/selling protection and may include upfront payments required to be made to enter into the agreement. Widening credit spreads typically represent a deterioration of the referenced obligation’s credit soundness and greater likelihood of default or other credit event occurring as defined under the terms of the agreement. A credit spread identified as “Defaulted” indicates a credit event has occurred for the referenced obligation.
During the six months ended March 31, 2021, the Overlay B, Tax-Aware Overlay B, Tax-Aware Overlay C and Tax-Aware Overlay N Portfolios held credit default swaps for hedging and non-hedging purposes.
Total Return Swaps:
Each Portfolio may enter into total return swaps in order to take a “long” or “short” position with respect to an underlying referenced asset. A Portfolio is subject to market price volatility of the underlying referenced asset. A total return swap involves commitments to pay interest in exchange for a market linked return based on a notional amount. To the extent that the total return of the security, group of securities or index underlying the transaction exceeds or falls short of the offsetting interest obligation, the Portfolio will receive a payment from or make a payment to the counterparty.
During the six months ended March 31, 2021, the Portfolios held total return swaps for hedging and non-hedging purposes.
A Portfolio typically enters into International Swaps and Derivatives Association, Inc. Master Agreements (“ISDA Master Agreement”) with its OTC derivative contract counterparties in order to, among other things, reduce its credit risk to OTC counterparties. ISDA Master Agreements include provisions for general obligations, representations, collateral and events of default or termination. Under an ISDA Master Agreement, a Portfolio typically may offset with the OTC counterparty certain derivative financial instruments’ payables and/or receivables with collateral held and/or posted and create one single net payment (close-out netting) in the event of default or termination. In the event of a default by an OTC counterparty, the return of collateral with market value in excess of a Portfolio’s net liability, held by the defaulting party, may be delayed or denied.
A Portfolio’s ISDA Master Agreements may contain provisions for early termination of OTC derivative transactions in the event the net assets of a Portfolio decline below specific levels (“net asset contingent features”). If these levels are triggered, a Portfolio’s OTC counterparty has the right to terminate such transaction and require the Portfolio to pay or receive a settlement amount in connection with the terminated transaction. If OTC derivatives were held at period end, please refer to netting arrangements by the OTC counterparty tables below for additional details.
During the six months ended March 31, 2021, the Portfolios had entered into the following derivatives:
| OVERLAY A PORTFOLIO | ASSET DERIVATIVES | LIABILITY DERIVATIVES | ||||||||||
| DERIVATIVE TYPE | STATEMENTOF ASSETS AND LIABILITIES LOCATION | FAIR VALUE | STATEMENTOF ASSETS AND LIABILITIES LOCATION | FAIR VALUE | ||||||||
Interest rate contracts | Receivable/Payable for variation margin on futures | $ | 257,372 | * | Receivable/Payable for variation margin on futures | $ | 14,088,931 | * | ||||
Equity contracts | Receivable/Payable for variation margin on futures | 12,367,930 | * | Receivable/Payable for variation margin on futures | 816,743 | * | ||||||
| 136 | Sanford C. Bernstein Fund, Inc. | |
Table of Contents
| OVERLAY A PORTFOLIO | ASSET DERIVATIVES | LIABILITY DERIVATIVES | ||||||||||
| DERIVATIVE TYPE | STATEMENTOF ASSETS AND LIABILITIES LOCATION | FAIR VALUE | STATEMENTOF ASSETS AND LIABILITIES LOCATION | FAIR VALUE | ||||||||
Foreign currency contracts | Unrealized appreciation on forward currency exchange contracts | $ | 10,687,041 | Unrealized depreciation on forward currency exchange contracts | $ | 8,489,687 | ||||||
Equity contracts | Investments in securities, at value | 20,104,614 | ||||||||||
Equity contracts | Unrealized depreciation on total return swaps | 106,054 | ||||||||||
Total | $ | 43,416,957 | $ | 23,501,415 | ||||||||
| * | Only variation margin receivable/payable at period end is reported within the statement of assets and liabilities. This amount reflects cumulative unrealized appreciation/(depreciation) on futures and centrally cleared swaps as reported in the schedule of investments. |
| DERIVATIVE TYPE | LOCATIONOF GAINOR (LOSS)ON DERIVATIVES WITHIN STATEMENT OF OPERATIONS | REALIZED GAIN OR (LOSS) ON DERIVATIVES | CHANGE IN UNREALIZED APPRECIATION OR (DEPRECIATION) | |||||||
Interest rate contracts | Net realized gain (loss) on futures; Net change in unrealized appreciation/depreciation of futures | $ | (27,782,824 | ) | $ | (14,349,626 | ) | |||
Equity contracts | Net realized gain (loss) on futures; Net change in unrealized appreciation/depreciation of futures | 11,116,215 | 6,701,676 | |||||||
Foreign currency contracts | Net realized gain (loss) on forward currency exchange contracts; Net change in unrealized appreciation/depreciation of forward currency exchange contracts | 5,963,673 | (383,602 | ) | ||||||
Equity contracts | Net realized gain (loss) on investment transactions; Net change in unrealized appreciation/depreciation of investments | (1,190,489 | ) | (11,949,609 | ) | |||||
Equity contracts | Net realized gain (loss) on options written; Net change in unrealized appreciation/depreciation of options written | 3,454,286 | 0 | |||||||
Equity contracts | Net realized gain (loss) on swaps; Net change in unrealized appreciation/depreciation of swaps | 627,337 | (106,054 | ) | ||||||
Total | $ | (7,811,802 | ) | $ | (20,087,215 | ) | ||||
2021 Semi-Annual Report | 137 | |
Table of Contents
Notes to Financial Statements (continued)
| TAX-AWARE OVERLAY A PORTFOLIO | ASSET DERIVATIVES | LIABILITY DERIVATIVES | ||||||||||
| DERIVATIVE TYPE | STATEMENTOF ASSETS AND LIABILITIES LOCATION | FAIR VALUE | STATEMENTOF ASSETS AND LIABILITIES LOCATION | FAIR VALUE | ||||||||
Interest rate contracts | Receivable/Payable for variation margin on futures | $ | 30,465,917 | * | ||||||||
Equity contracts | Receivable/Payable for variation margin on futures | $ | 25,603,660 | * | Receivable/Payable for variation margin on futures | 1,325,806 | * | |||||
Foreign currency contracts | Unrealized appreciation on forward currency exchange contracts | 21,927,958 | Unrealized depreciation on forward currency exchange contracts | 17,300,459 | ||||||||
Equity contracts | Investments in securities, at value | 41,389,715 | ||||||||||
Equity contracts | Unrealized depreciation on total return swaps | 218,333 | ||||||||||
Total | $ | 88,921,333 | $ | 49,310,515 | ||||||||
| * | Only variation margin receivable/payable at period end is reported within the statement of assets and liabilities. This amount reflects cumulative unrealized appreciation/(depreciation) on futures and centrally cleared swaps as reported in the schedule of investments. |
| DERIVATIVE TYPE | LOCATION OF GAIN OR (LOSS) ON DERIVATIVES WITHIN STATEMENT OF OPERATIONS | REALIZED GAIN OR (LOSS) ON DERIVATIVES | CHANGE IN UNREALIZED APPRECIATION OR (DEPRECIATION) | |||||||
Interest rate contracts | Net realized gain (loss) on futures; Net change in unrealized appreciation/depreciation of futures | $ | (57,730,372 | ) | $ | (27,907,437 | ) | |||
Equity contracts | Net realized gain (loss) on futures; Net change in unrealized appreciation/depreciation of futures | 8,600,751 | 14,482,517 | |||||||
Foreign currency contracts | Net realized gain (loss) on forward currency exchange contracts; Net change in unrealized appreciation/depreciation of forward currency exchange contracts | 12,066,958 | (583,128 | ) | ||||||
Equity contracts | Net realized gain (loss) on investment transactions; Net change in unrealized appreciation/depreciation of investments | (2,411,277 | ) | (24,513,838 | ) | |||||
Equity contracts | Net realized gain (loss) on options written; Net change in unrealized appreciation/depreciation of options written | 6,912,884 | 0 | |||||||
Equity contracts | Net realized gain (loss) on swaps; Net change in unrealized appreciation/depreciation of swaps | 1,270,117 | (218,333 | ) | ||||||
Total | $ | (31,290,939 | ) | $ | (38,740,219 | ) | ||||
| 138 | Sanford C. Bernstein Fund, Inc. | |
Table of Contents
| OVERLAY B PORTFOLIO | ASSET DERIVATIVES | LIABILITY DERIVATIVES | ||||||||||
| DERIVATIVE TYPE | STATEMENTOF ASSETS AND LIABILITIES LOCATION | FAIR VALUE | STATEMENTOF ASSETS AND LIABILITIES LOCATION | FAIR VALUE | ||||||||
Interest rate contracts | Receivable/Payable for variation margin on futures | $ | 1,527,724 | * | Receivable/Payable for variation margin on futures | $ | 3,008,549 | * | ||||
Equity contracts | Receivable/Payable for variation margin on futures | 7,742,789 | * | Receivable/Payable for variation margin on futures | 1,153,950 | * | ||||||
Credit contracts | Receivable/Payable for variation margin on centrally cleared swaps | 393,909 | * | Receivable/Payable for variation margin on centrally cleared swaps | 96,220 | * | ||||||
Interest rate contracts | Receivable/Payable for variation margin on centrally cleared swaps | 3,987,275 | * | Receivable/Payable for variation margin on centrally cleared swaps | 3,075,416 | * | ||||||
Foreign currency contracts | Unrealized appreciation on forward currency exchange contracts | 8,124,527 | Unrealized depreciation on forward currency exchange contracts | 6,364,057 | ||||||||
Equity contracts | Investments in securities, at value | 4,784,301 | ||||||||||
Credit contracts | Market value on credit default swaps | 1,529,372 | Market value on credit default swaps | 3,314,637 | ||||||||
Credit contracts | Unrealized depreciation on total return swaps | 112,319 | ||||||||||
Equity contracts | Unrealized appreciation on total return swaps | 46,036 | ||||||||||
Total | $ | 28,135,933 | $ | 17,125,148 | ||||||||
| * | Only variation margin receivable/payable at period end is reported within the statement of assets and liabilities. This amount reflects cumulative unrealized appreciation/(depreciation) on futures and centrally cleared swaps as reported in the schedule of investments. |
| DERIVATIVE TYPE | LOCATION OF GAIN OR (LOSS) ON DERIVATIVES WITHIN STATEMENT OF OPERATIONS | REALIZED GAIN OR (LOSS)ON DERIVATIVES | CHANGE IN UNREALIZED APPRECIATION OR (DEPRECIATION) | |||||||
Interest rate contracts | Net realized gain (loss) on futures; Net change in unrealized appreciation/depreciation of futures | $ | 717,018 | $ | (1,389,311 | ) | ||||
Equity contracts | Net realized gain (loss) on futures; Net change in unrealized appreciation/depreciation of futures | 72,312,544 | 9,605,542 | |||||||
Foreign currency contracts | Net realized gain (loss) on forward currency exchange contracts; Net change in unrealized appreciation/depreciation of forward currency exchange contracts | (3,268,200 | ) | 1,438,538 | ||||||
Interest rate contracts | Net realized gain (loss) on investment transactions; Net change in unrealized appreciation/depreciation of investments | 83,805 | (4,171 | ) | ||||||
Equity contracts | Net realized gain (loss) on investment transactions; Net change in unrealized appreciation/depreciation of investments | 195,871 | (2,840,598 | ) | ||||||
2021 Semi-Annual Report | 139 | |
Table of Contents
Notes to Financial Statements (continued)
| DERIVATIVE TYPE | LOCATION OF GAIN OR (LOSS) ON DERIVATIVES WITHIN STATEMENT OF OPERATIONS | REALIZED GAIN OR (LOSS)ON DERIVATIVES | CHANGE IN UNREALIZED APPRECIATION OR (DEPRECIATION) | |||||||
Equity contracts | Net realized gain (loss) on options written; Net change in unrealized appreciation/depreciation of options written | $ | 1,476,584 | $ | (185,830 | ) | ||||
Interest rate contracts | Net realized gain (loss) on swaptions written; Net change in unrealized appreciation/depreciation of swaptions written | 271,182 | (178,520 | ) | ||||||
Credit contracts | Net realized gain (loss) on swaptions written; Net change in unrealized appreciation/depreciation of swaptions written | 924,467 | 56,738 | |||||||
Interest rate contracts | Net realized gain (loss) on swaps; Net change in unrealized appreciation/depreciation of swaps | (1,571,455 | ) | 2,889,074 | ||||||
Credit contracts | Net realized gain (loss) on swaps; Net change in unrealized appreciation/depreciation of swaps | (4,435,216 | ) | 1,859,215 | ||||||
Equity contracts | Net realized gain (loss) on swaps; Net change in unrealized appreciation/depreciation of swaps | 378,575 | 46,036 | |||||||
Total | $ | 67,085,175 | $ | 11,296,713 | ||||||
| TAX-AWARE OVERLAY B PORTFOLIO | ASSET DERIVATIVES | LIABILITY DERIVATIVES | ||||||||||
| DERIVATIVE TYPE | STATEMENTOF ASSETS AND LIABILITIES LOCATION | FAIR VALUE | STATEMENTOF ASSETS AND LIABILITIES LOCATION | FAIR VALUE | ||||||||
Interest rate contracts | Receivable/Payable for variation margin on futures | $ | 2,893,537 | * | ||||||||
Equity contracts | Receivable/Payable for variation margin on futures | $ | 4,324,565 | * | Receivable/Payable for variation margin on futures | 1,165,132 | * | |||||
Interest rate contracts | Receivable/Payable for variation margin on centrally cleared swaps | 7,079,843 | * | Receivable/Payable for variation margin on centrally cleared swaps | 63,560 | * | ||||||
Foreign currency contracts | Unrealized appreciation on forward currency exchange contracts | 3,398,514 | Unrealized depreciation on forward currency exchange contracts | 2,847,943 | ||||||||
Equity contracts | Investments in securities, at value | 6,709,720 | ||||||||||
Interest rate contracts | Unrealized appreciation on inflation swaps | 4,509,631 | Unrealized depreciation on inflation swaps | 1,835,574 | ||||||||
Interest rate contracts | Unrealized appreciation on interest rate swaps | 64,618 | ||||||||||
Credit contracts | Market value on credit default swaps | 1,081,586 | ||||||||||
Equity contracts | Unrealized depreciation on total return swaps | 18,347 | ||||||||||
Total | $ | 26,086,891 | $ | 9,905,679 | ||||||||
| * | Only variation margin receivable/payable at period end is reported within the statement of assets and liabilities. This amount reflects cumulative unrealized appreciation/(depreciation) on futures and centrally cleared swaps as reported in the schedule of investments. |
| 140 | Sanford C. Bernstein Fund, Inc. | |
Table of Contents
| DERIVATIVE TYPE | LOCATIONOF GAINOR (LOSS)ON DERIVATIVES WITHIN STATEMENT OF OPERATIONS | REALIZED GAIN OR (LOSS) ON DERIVATIVES | CHANGE IN UNREALIZED APPRECIATIONOR (DEPRECIATION) | |||||||
Interest rate contracts | Net realized gain (loss) on futures; Net change in unrealized appreciation/depreciation of futures | $ | (5,909,066 | ) | $ | (2,556,538 | ) | |||
Equity contracts | Net realized gain (loss) on futures; Net change in unrealized appreciation/depreciation of futures | 42,702,892 | 3,624,910 | |||||||
Foreign currency contracts | Net realized gain (loss) on forward currency exchange contracts; Net change in unrealized appreciation/depreciation of forward currency exchange contracts | 5,841,433 | (262,747 | ) | ||||||
Equity contracts | Net realized gain (loss) on investment transactions; Net change in unrealized appreciation/depreciation of investments | 274,761 | (3,976,140 | ) | ||||||
Equity contracts | Net realized gain (loss) on options written; Net change in unrealized appreciation/depreciation of options written | 1,223,226 | 0 | |||||||
Interest rate contracts | Net realized gain (loss) on swaps; Net change in unrealized appreciation/depreciation of swaps | 519,873 | 13,113,047 | |||||||
Credit contracts | Net realized gain (loss) on swaps; Net change in unrealized appreciation/depreciation of swaps | 65,347 | 252,662 | |||||||
Equity contracts | Net realized gain (loss) on swaps; Net change in unrealized appreciation/depreciation of swaps | 299,798 | (18,347 | ) | ||||||
Total | $ | 45,018,264 | $ | 10,176,847 | ||||||
| TAX-AWARE OVERLAY C PORTFOLIO | ASSET DERIVATIVES | LIABILITY DERIVATIVES | ||||||||||
| DERIVATIVE TYPE | STATEMENTOF ASSETS AND LIABILITIES LOCATION | FAIR VALUE | STATEMENTOF ASSETS AND LIABILITIES LOCATION | FAIR VALUE | ||||||||
Interest rate contracts | Receivable/Payable for variation margin on futures | $ | 876,560 | * | ||||||||
Equity contracts | Receivable/Payable for variation margin on futures | $ | 1,296,234 | * | Receivable/Payable for variation margin on futures | 350,391 | * | |||||
Interest rate contracts | Receivable/Payable for variation margin on centrally cleared swaps | 2,522,679 | * | |||||||||
Foreign currency contracts | Unrealized appreciation on forward currency exchange contracts | 1,026,607 | Unrealized depreciation on forward currency exchange contracts | 852,231 | ||||||||
Equity contracts | Investments in securities, at value | 2,020,527 | ||||||||||
2021 Semi-Annual Report | 141 | |
Table of Contents
Notes to Financial Statements (continued)
| TAX-AWARE OVERLAY C PORTFOLIO | ASSET DERIVATIVES | LIABILITY DERIVATIVES | ||||||||||
| DERIVATIVE TYPE | STATEMENTOF ASSETS AND LIABILITIES LOCATION | FAIR VALUE | STATEMENTOF ASSETS AND LIABILITIES LOCATION | FAIR VALUE | ||||||||
Interest rate contracts | Unrealized appreciation on inflation swaps | $ | 1,401,655 | Unrealized depreciation on inflation swaps | $ | 449,789 | ||||||
Interest rate contracts | Unrealized appreciation on interest rate swaps | 19,769 | ||||||||||
Credit contracts | Market value on credit default swaps | 391,955 | ||||||||||
Equity contracts | Unrealized depreciation on total return swaps | 5,715 | ||||||||||
Total | $ | 8,287,471 | $ | 2,926,641 | ||||||||
| * | Only variation margin receivable/payable at period end is reported within the statement of assets and liabilities. This amount reflects cumulative unrealized appreciation/(depreciation) on futures and centrally cleared swaps as reported in the schedule of investments. |
| DERIVATIVE TYPE | LOCATION OF GAIN OR (LOSS) ON DERIVATIVES WITHIN STATEMENT OF OPERATIONS | REALIZED GAIN OR (LOSS)ON DERIVATIVES | CHANGE IN UNREALIZED APPRECIATIONOR (DEPRECIATION) | |||||||
Interest rate contracts | Net realized gain (loss) on futures; Net change in unrealized appreciation/depreciation of futures | $ | (1,812,153 | ) | $ | (772,119 | ) | |||
Equity contracts | Net realized gain (loss) on futures; Net change in unrealized appreciation/depreciation of futures | 12,570,764 | 1,588,602 | |||||||
Foreign currency contracts | Net realized gain (loss) on forward currency exchange contracts; Net change in unrealized appreciation/depreciation of forward currency exchange contracts | 1,847,970 | (79,210 | ) | ||||||
Equity contracts | Net realized gain (loss) on investment transactions; Net change in unrealized appreciation/depreciation of investments | 82,492 | (1,197,572 | ) | ||||||
Equity contracts | Net realized gain (loss) on options written; Net change in unrealized appreciation/depreciation of options written | 389,433 | 0 | |||||||
Interest rate contracts | Net realized gain (loss) on swaps; Net change in unrealized appreciation/depreciation of swaps | 158,532 | 3,637,395 | |||||||
Credit contracts | Net realized gain (loss) on swaps; Net change in unrealized appreciation/depreciation of swaps | 23,633 | 91,610 | |||||||
Equity contracts | Net realized gain (loss) on swaps; Net change in unrealized appreciation/depreciation of swaps | 72,650 | (5,715 | ) | ||||||
Total | $ | 13,333,321 | $ | 3,262,991 | ||||||
| 142 | Sanford C. Bernstein Fund, Inc. | |
Table of Contents
| TAX-AWARE OVERLAY N PORTFOLIO | ASSET DERIVATIVES | LIABILITY DERIVATIVES | ||||||||||
| DERIVATIVE TYPE | STATEMENTOF ASSETS AND LIABILITIES LOCATION | FAIR VALUE | STATEMENTOF ASSETS AND LIABILITIES LOCATION | FAIR VALUE | ||||||||
Interest rate contracts | Receivable/Payable for variation margin on futures | $ | 641,673 | * | ||||||||
Equity contracts | Receivable/Payable for variation margin on futures | $ | 966,240 | * | Receivable/Payable for variation margin on futures | 262,757 | * | |||||
Interest rate contracts | Receivable/Payable for variation margin on centrally cleared swaps | 1,156,711 | * | Receivable/Payable for variation margin on centrally cleared swaps | 29,465 | * | ||||||
Foreign currency contracts | Unrealized appreciation on forward currency exchange contracts | 766,885 | Unrealized depreciation on forward currency exchange contracts | 641,991 | ||||||||
Equity contracts | Investments in securities, at value | 1,504,138 | ||||||||||
Interest rate contracts | Unrealized appreciation on inflation swaps | 1,085,792 | Unrealized depreciation on inflation swaps | 331,879 | ||||||||
Interest rate contracts | Unrealized appreciation on interest rate swaps | 14,716 | ||||||||||
Credit contracts | Market value on credit default swaps | 316,529 | ||||||||||
Equity contracts | Unrealized depreciation on total return swaps | 4,211 | ||||||||||
Total | $ | 5,494,482 | $ | 2,228,505 | ||||||||
| * | Only variation margin receivable/payable at period end is reported within the statement of assets and liabilities. This amount reflects cumulative unrealized appreciation/(depreciation) on futures and centrally cleared swaps as reported in the schedule of investments. |
| DERIVATIVE TYPE | LOCATIONOF GAINOR (LOSS)ON DERIVATIVES WITHIN STATEMENT OF OPERATIONS | REALIZED GAIN OR (LOSS)ON DERIVATIVES | CHANGE IN UNREALIZED APPRECIATIONOR (DEPRECIATION) | |||||||
Interest rate contracts | Net realized gain (loss) on futures; Net change in unrealized appreciation/depreciation of futures | $ | (1,316,019 | ) | $ | (565,103 | ) | |||
Equity contracts | Net realized gain (loss) on futures; Net change in unrealized appreciation/depreciation of futures | 8,947,444 | 719,898 | |||||||
Foreign currency contracts | Net realized gain (loss) on forward currency exchange contracts; Net change in unrealized appreciation/depreciation of forward currency exchange contracts | 1,225,769 | (59,199 | ) | ||||||
Equity contracts | Net realized gain (loss) on investment transactions; Net change in unrealized appreciation/depreciation of investments | 61,512 | (896,369 | ) | ||||||
2021 Semi-Annual Report | 143 | |
Table of Contents
Notes to Financial Statements (continued)
| DERIVATIVE TYPE | LOCATIONOF GAINOR (LOSS)ON DERIVATIVES WITHIN STATEMENT OF OPERATIONS | REALIZED GAIN OR (LOSS)ON DERIVATIVES | CHANGE IN UNREALIZED APPRECIATIONOR (DEPRECIATION) | |||||||
Equity contracts | Net realized gain (loss) on options written; Net change in unrealized appreciation/depreciation of options written | $ | 270,320 | $ | 0 | |||||
Interest rate contracts | Net realized gain (loss) on swaps; Net change in unrealized appreciation/depreciation of swaps | 538,538 | 2,481,256 | |||||||
Credit contracts | Net realized gain (loss) on swaps; Net change in unrealized appreciation/depreciation of swaps | 19,085 | 73,982 | |||||||
Equity contracts | Net realized gain (loss) on swaps; Net change in unrealized appreciation/depreciation of swaps | 57,196 | (4,211 | ) | ||||||
Total | $ | 9,803,845 | $ | 1,750,254 | ||||||
The following tables represent the average monthly volume of the Portfolios’ derivative transactions during the six months ended March 31, 2021:
| OVERLAY A PORTFOLIO | ||||||||
Futures: | ||||||||
Average notional amount of buy contracts | $ | 1,392,176,360 | ||||||
Average notional amount of sale contracts | $ | 227,597,173 | ||||||
Forward Currency Exchange Contracts: | ||||||||
Average principal amount of buy contracts | $ | 389,362,225 | ||||||
Average principal amount of sale contracts | $ | 414,910,134 | ||||||
Purchased Options: | ||||||||
Average notional amount | $ | 520,162,185 | (a) | |||||
Written Options: | ||||||||
Average notional amount | $ | 411,800,000 | ||||||
Total Return Swaps: | ||||||||
Average notional amount | $ | 24,657,664 | (b) | |||||
| (a) | Positions were open for three months during the period. |
| (b) | Positions were open for two months during the period. |
| TAX-AWARE OVERLAY A PORTFOLIO | ||||||||
Futures: | ||||||||
Average notional amount of buy contracts | $ | 2,628,528,110 | ||||||
Average notional amount of sale contracts | $ | 414,189,853 | ||||||
Forward Currency Exchange Contracts: | ||||||||
Average principal amount of buy contracts | $ | 789,114,401 | ||||||
Average principal amount of sale contracts | $ | 849,556,918 | ||||||
Purchased Options: | ||||||||
Average notional amount | $ | 1,067,396,033 | (a) | |||||
| 144 | Sanford C. Bernstein Fund, Inc. | |
Table of Contents
| TAX-AWARE OVERLAY A PORTFOLIO | ||||||||
Written Options: | ||||||||
Average notional amount | $ | 827,150,000 | ||||||
Total Return Swaps: | ||||||||
Average notional amount | $ | 50,387,186 | (b) | |||||
| (a) | Positions were open for three months during the period. |
| (b) | Positions were open for two months during the period. |
| OVERLAY B PORTFOLIO | ||||||||
Futures: | ||||||||
Average notional amount of buy contracts | $ | 690,378,673 | ||||||
Average notional amount of sale contracts | $ | 195,665,136 | ||||||
Forward Currency Exchange Contracts: | ||||||||
Average principal amount of buy contracts | $ | 307,431,574 | ||||||
Average principal amount of sale contracts | $ | 427,359,764 | ||||||
Purchased Options: | ||||||||
Average notional amount | $ | 168,736,921 | (a) | |||||
Purchased Swaptions: | ||||||||
Average notional amount | $ | 5,530,000 | (b) | |||||
Written Options: | ||||||||
Average notional amount | $ | 69,786,830 | (a) | |||||
Written Swaptions: | ||||||||
Average notional amount | $ | 46,832,736 | (a) | |||||
Interest Rate Swaps: | ||||||||
Average notional amount | $ | 5,634,848 | (c) | |||||
Centrally Cleared Interest Rate Swaps: | ||||||||
Average notional amount | $ | 216,480,168 | ||||||
Centrally Cleared Inflation Swaps: | ||||||||
Average notional amount | $ | 96,300,000 | ||||||
Credit Default Swaps: | ||||||||
Average notional amount of buy contracts | $ | 15,291,429 | ||||||
Average notional amount of sale contracts | $ | 18,032,429 | ||||||
Centrally Cleared Credit Default Swaps: | ||||||||
Average notional amount of buy contracts | $ | 99,379,581 | ||||||
Average notional amount of sale contracts | $ | 5,332,034 | ||||||
Total Return Swaps: | ||||||||
Average notional amount | $ | 12,534,439 | ||||||
| (a) | Positions were open for two months during the period. |
| (b) | Positions were open for less than one month during the period. |
| (c) | Positions were open for five months during the period. |
2021 Semi-Annual Report | 145 | |
Table of Contents
Notes to Financial Statements (continued)
| TAX-AWARE OVERLAY B PORTFOLIO | ||||||||
Futures: | ||||||||
Average notional amount of buy contracts | $ | 458,086,372 | ||||||
Average notional amount of sale contracts | $ | 40,520,543 | ||||||
Forward Currency Exchange Contracts: | ||||||||
Average principal amount of buy contracts | $ | 177,922,682 | ||||||
Average principal amount of sale contracts | $ | 127,249,642 | ||||||
Purchased Options: | ||||||||
Average notional amount | $ | 236,476,194 | (a) | |||||
Written Options: | ||||||||
Average notional amount | $ | 145,550,000 | (b) | |||||
Interest Rate Swaps: | ||||||||
Average notional amount | $ | 24,940,000 | ||||||
Inflation Swaps: | ||||||||
Average notional amount | $ | 273,843,000 | ||||||
Centrally Cleared Interest Rate Swaps: | ||||||||
Average notional amount | $ | 121,489,286 | ||||||
Centrally Cleared Inflation Swaps: | ||||||||
Average notional amount | $ | 50,965,714 | ||||||
Credit Default Swaps: | ||||||||
Average notional amount of sale contracts | $ | 4,015,000 | ||||||
Total Return Swaps: | ||||||||
Average notional amount | $ | 6,402,028 | (a) | |||||
| (a) | Positions were open for two months during the period. |
| (b) | Positions were open for less than one month during the period. |
| TAX-AWARE OVERLAY C PORTFOLIO | ||||||||
Futures: | ||||||||
Average notional amount of buy contracts | $ | 135,933,231 | ||||||
Average notional amount of sale contracts | $ | 10,634,121 | ||||||
Forward Currency Exchange Contracts: | ||||||||
Average principal amount of buy contracts | $ | 55,738,036 | ||||||
Average principal amount of sale contracts | $ | 39,589,260 | ||||||
Purchased Options: | ||||||||
Average notional amount | $ | 71,118,927 | (a) | |||||
Written Options: | ||||||||
Average notional amount | $ | 46,150,000 | ||||||
Interest Rate Swaps: | ||||||||
Average notional amount | $ | 7,630,000 | ||||||
Inflation Swaps: | ||||||||
Average notional amount | $ | 79,864,571 | ||||||
| 146 | Sanford C. Bernstein Fund, Inc. | |
Table of Contents
| TAX-AWARE OVERLAY C PORTFOLIO | ||||||||
Centrally Cleared Interest Rate Swaps: | ||||||||
Average notional amount | $ | 35,978,571 | ||||||
Centrally Cleared Inflation Swaps: | ||||||||
Average notional amount | $ | 15,735,714 | ||||||
Credit Default Swaps: | ||||||||
Average notional amount of sale contracts | $ | 1,455,000 | ||||||
Total Return Swaps: | ||||||||
Average notional amount | $ | 1,741,395 | (a) | |||||
| (a) | Positions were open for two months during the period. |
| TAX-AWARE OVERLAY N PORTFOLIO | ||||||||
Futures: | ||||||||
Average notional amount of buy contracts | $ | 99,965,528 | ||||||
Average notional amount of sale contracts | $ | 9,390,112 | ||||||
Forward Currency Exchange Contracts: | ||||||||
Average principal amount of buy contracts | $ | 39,857,513 | ||||||
Average principal amount of sale contracts | $ | 28,601,118 | ||||||
Purchased Options: | ||||||||
Average notional amount | $ | 53,115,721 | (a) | |||||
Written Options: | ||||||||
Average notional amount | $ | 31,950,000 | (b) | |||||
Interest Rate Swaps: | ||||||||
Average notional amount | $ | 5,680,000 | ||||||
Inflation Swaps: | ||||||||
Average notional amount | $ | 58,447,857 | ||||||
Centrally Cleared Interest Rate Swaps: | ||||||||
Average notional amount | $ | 17,124,286 | ||||||
Centrally Cleared Inflation Swaps: | ||||||||
Average notional amount | $ | 11,272,857 | ||||||
Credit Default Swaps: | ||||||||
Average notional amount of sale contracts | $ | 1,175,000 | ||||||
Total Return Swaps: | ||||||||
Average notional amount | $ | 1,335,816 | (a) | |||||
| (a) | Positions were open for two months during the period. |
| (b) | Positions were open for less than one month during the period. |
For financial reporting purposes, the Portfolios do not offset derivative assets and derivative liabilities that are subject to netting arrangements in the statement of assets and liabilities.
All OTC derivatives held at period end were subject to netting arrangements. The following tables present the Portfolios’ derivative assets and liabilities by OTC counterparty net of amounts available for offset under ISDA Master Agreements (“MA”) and net of the related collateral received/pledged by the Portfolios as of March 31, 2021. Exchange-traded derivatives and centrally cleared swaps are not subject to netting arrangements and as such are excluded from the tables.
2021 Semi-Annual Report | 147 | |
Table of Contents
Notes to Financial Statements (continued)
OVERLAY A PORTFOLIO |
| |||||||||||||||||||
| COUNTERPARTY | DERIVATIVE ASSETS SUBJECT TO A MA | DERIVATIVES AVAILABLE FOR OFFSET | CASH COLLATERAL RECEIVED* | SECURITY COLLATERAL RECEIVED* | NET AMOUNT OF DERIVATIVE ASSETS | |||||||||||||||
Bank of America, NA | $ | 79,210 | $ | 0 | $ | 0 | $ | 0 | $ | 79,210 | ||||||||||
BNP Paribas SA | 1,256,780 | (4,938 | ) | 0 | 0 | 1,251,842 | ||||||||||||||
Citibank, NA | 2,199,405 | 0 | 0 | 0 | 2,199,405 | |||||||||||||||
Deutsche Bank AG | 57,049 | 0 | 0 | 0 | 57,049 | |||||||||||||||
Goldman Sachs Bank USA | 2,784,692 | (73,720 | ) | (2,610,000 | ) | 0 | 100,972 | |||||||||||||
JPMorgan Chase Bank, NA | 4,740,969 | (4,740,969 | ) | 0 | 0 | 0 | ||||||||||||||
Natwest Markets PLC | 501,901 | (91,440 | ) | 0 | 0 | 410,461 | ||||||||||||||
State Street Bank & Trust Co. | 72,388 | (72,388 | ) | 0 | 0 | 0 | ||||||||||||||
UBS AG | 19,099,261 | (67,311 | ) | (19,031,950 | ) | 0 | 0 | |||||||||||||
Total | $ | 30,791,655 | $ | (5,050,766 | ) | $ | (21,641,950 | ) | $ | 0 | $ | 4,098,939 | ^ | |||||||
| COUNTERPARTY | DERIVATIVE LIABILITIES SUBJECT TO A MA | DERIVATIVES AVAILABLE FOR OFFSET | CASH COLLATERAL PLEDGED* | SECURITY COLLATERAL PLEDGED* | NET AMOUNT OF DERIVATIVE LIABILITIES | |||||||||||||||
Barclays Bank PLC | $ | 911,499 | $ | 0 | $ | 0 | $ | 0 | $ | 911,499 | ||||||||||
BNP Paribas SA | 4,938 | (4,938 | ) | 0 | 0 | 0 | ||||||||||||||
Goldman Sachs Bank USA | 73,720 | (73,720 | ) | 0 | 0 | 0 | ||||||||||||||
JPMorgan Chase Bank, NA | 5,189,311 | (4,740,969 | ) | 0 | 0 | 448,342 | ||||||||||||||
Morgan Stanley & Co., Inc./Morgan Stanley Capital Services LLC | 773,163 | 0 | 0 | 0 | 773,163 | |||||||||||||||
Natwest Markets PLC | 91,440 | (91,440 | ) | 0 | 0 | 0 | ||||||||||||||
State Street Bank & Trust Co. | 1,484,359 | (72,388 | ) | 0 | 0 | 1,411,971 | ||||||||||||||
UBS AG | 67,311 | (67,311 | ) | 0 | 0 | 0 | ||||||||||||||
Total | $ | 8,595,741 | $ | (5,050,766 | ) | $ | 0 | $ | 0 | $ | 3,544,975 | ^ | ||||||||
| * | The actual collateral received/pledged may be more than the amount reported due to over-collateralization. |
| ^ | Net amount represents the net receivable/payable that would be due from/to the counterparty in the event of default or termination. The net amount from OTC financial derivative instruments can only be netted across transactions governed under the same master agreement with the same counterparty. |
TAX-AWARE OVERLAY A PORTFOLIO |
| |||||||||||||||||||
| COUNTERPARTY | DERIVATIVE ASSETS SUBJECT TO A MA | DERIVATIVES AVAILABLE FOR OFFSET | CASH COLLATERAL RECEIVED* | SECURITY COLLATERAL RECEIVED* | NET AMOUNT OF DERIVATIVE ASSETS | |||||||||||||||
Bank of America, NA | $ | 152,989 | $ | 0 | $ | 0 | $ | 0 | $ | 152,989 | ||||||||||
BNP Paribas SA | 2,559,625 | (10,179 | ) | 0 | 0 | 2,549,446 | ||||||||||||||
Citibank, NA | 4,518,307 | 0 | 0 | 0 | 4,518,307 | |||||||||||||||
Deutsche Bank AG | 107,802 | 0 | 0 | 0 | 107,802 | |||||||||||||||
Goldman Sachs Bank USA | 5,757,001 | (146,045 | ) | �� | (5,410,000 | ) | 0 | 200,956 | ||||||||||||
JPMorgan Chase Bank, NA | 9,717,929 | (9,717,929 | ) | 0 | 0 | 0 | ||||||||||||||
Natwest Markets PLC | 1,024,160 | (186,224 | ) | 0 | 0 | 837,936 | ||||||||||||||
State Street Bank & Trust Co. | 158,106 | (158,106 | ) | 0 | 0 | 0 | ||||||||||||||
UBS AG | 39,321,754 | (136,109 | ) | (39,185,645 | ) | 0 | 0 | |||||||||||||
Total | $ | 63,317,673 | $ | (10,354,592 | ) | $ | (44,595,645 | ) | $ | 0 | $ | 8,367,436 | ^ | |||||||
| 148 | Sanford C. Bernstein Fund, Inc. | |
Table of Contents
| COUNTERPARTY | DERIVATIVE LIABILITIES SUBJECT TOA MA | DERIVATIVES AVAILABLE FOR OFFSET | CASH COLLATERAL PLEDGED* | SECURITY COLLATERAL PLEDGED* | NET AMOUNT OF DERIVATIVE LIABILITIES | |||||||||||||||
Barclays Bank PLC | $ | 1,863,237 | $ | 0 | $ | 0 | $ | 0 | $ | 1,863,237 | ||||||||||
BNP Paribas SA | 10,179 | (10,179 | ) | 0 | 0 | 0 | ||||||||||||||
Goldman Sachs Bank USA | 146,045 | (146,045 | ) | 0 | 0 | 0 | ||||||||||||||
JPMorgan Chase Bank, NA | 10,601,246 | (9,717,929 | ) | 0 | 0 | 883,317 | ||||||||||||||
Morgan Stanley & Co., Inc./Morgan Stanley Capital Services LLC | 1,603,033 | 0 | (270,000 | ) | 0 | 1,333,033 | ||||||||||||||
Natwest Markets PLC | 186,224 | (186,224 | ) | 0 | 0 | 0 | ||||||||||||||
Standard Chartered Bank | 1,724,007 | 0 | 0 | 0 | 1,724,007 | |||||||||||||||
State Street Bank & Trust Co. | 1,248,712 | (158,106 | ) | 0 | 0 | 1,090,606 | ||||||||||||||
UBS AG | 136,109 | (136,109 | ) | 0 | 0 | 0 | ||||||||||||||
Total | $ | 17,518,792 | $ | (10,354,592 | ) | $ | (270,000 | ) | $ | 0 | $ | 6,894,200 | ^ | |||||||
| * | The actual collateral received/pledged may be more than the amount reported due to over-collateralization. |
| ^ | Net amount represents the net receivable/payable that would be due from/to the counterparty in the event of default or termination. The net amount from OTC financial derivative instruments can only be netted across transactions governed under the same master agreement with the same counterparty. |
OVERLAY B PORTFOLIO |
| |||||||||||||||||||
| COUNTERPARTY | DERIVATIVE ASSETS SUBJECT TO A MA | DERIVATIVES AVAILABLE FOR OFFSET | CASH COLLATERAL RECEIVED* | SECURITY COLLATERAL RECEIVED* | NET AMOUNT OF DERIVATIVE ASSETS | |||||||||||||||
Bank of America, NA | $ | 30,039 | $ | (30,039 | ) | $ | 0 | $ | 0 | $ | 0 | |||||||||
Barclays Bank PLC | 91,858 | (91,858 | ) | 0 | 0 | 0 | ||||||||||||||
BNP Paribas SA | 1,901,711 | (659,063 | ) | 0 | 0 | 1,242,648 | ||||||||||||||
Citibank, NA/Citigroup Global Markets, Inc. | 4,006,605 | (317,595 | ) | (1,874,000 | ) | 0 | 1,815,010 | |||||||||||||
Credit Suisse International | 25,704 | (25,704 | ) | 0 | 0 | 0 | ||||||||||||||
Deutsche Bank AG | 82,267 | (82,267 | ) | 0 | 0 | 0 | ||||||||||||||
Goldman Sachs Bank USA/Goldman Sachs International | 163,252 | (163,252 | ) | 0 | 0 | 0 | ||||||||||||||
HSBC Bank USA | 783 | (783 | ) | 0 | 0 | 0 | ||||||||||||||
JPMorgan Chase Bank, NA/JPMorgan Securities, LLC | 1,272,277 | (1,272,277 | ) | 0 | 0 | 0 | ||||||||||||||
Morgan Stanley & Co. International PLC/Morgan Stanley Capital Services LLC/Morgan Stanley Capital Services, Inc. | 1,000,213 | (246,054 | ) | 0 | 0 | 754,159 | ||||||||||||||
Natwest Markets PLC | 119,795 | (16,700 | ) | 0 | 0 | 103,095 | ||||||||||||||
Standard Chartered Bank | 87,346 | (87,346 | ) | 0 | 0 | 0 | ||||||||||||||
State Street Bank & Trust Co. | 766,106 | (490,726 | ) | 0 | 0 | 275,380 | ||||||||||||||
UBS AG | 4,936,280 | (740,632 | ) | (4,195,648 | ) | 0 | 0 | |||||||||||||
Total | $ | 14,484,236 | $ | (4,224,296 | ) | $ | (6,069,648 | ) | $ | 0 | $ | 4,190,292 | ^ | |||||||
2021 Semi-Annual Report | 149 | |
Table of Contents
Notes to Financial Statements (continued)
| COUNTERPARTY | DERIVATIVE LIABILITIES SUBJECT TO A MA | DERIVATIVES AVAILABLE FOR OFFSET | CASH COLLATERAL PLEDGED* | SECURITY COLLATERAL PLEDGED* | NET AMOUNT OF DERIVATIVE LIABILITIES | |||||||||||||||
Bank of America, NA | $ | 39,431 | $ | (30,039 | ) | $ | 0 | $ | 0 | $ | 9,392 | |||||||||
Barclays Bank PLC | 243,849 | (91,858 | ) | 0 | (102,237 | ) | 49,754 | |||||||||||||
BNP Paribas SA | 659,063 | (659,063 | ) | 0 | 0 | 0 | ||||||||||||||
Brown Brothers Harriman & Co. | 217,266 | 0 | 0 | 0 | 217,266 | |||||||||||||||
Citibank, NA/Citigroup Global Markets, Inc. | 317,595 | (317,595 | ) | 0 | 0 | 0 | ||||||||||||||
Credit Suisse International | 163,515 | (25,704 | ) | (137,811 | ) | 0 | 0 | |||||||||||||
Deutsche Bank AG | 828,144 | (82,267 | ) | 0 | (745,877 | ) | 0 | |||||||||||||
Goldman Sachs Bank USA/Goldman Sachs International | 960,159 | (163,252 | ) | 0 | (796,907 | ) | 0 | |||||||||||||
HSBC Bank USA | 767,101 | (783 | ) | 0 | (278,300 | ) | 488,018 | |||||||||||||
JPMorgan Chase Bank, NA/JPMorgan Securities, LLC | 2,740,415 | (1,272,277 | ) | 0 | (894,147 | ) | 573,991 | |||||||||||||
Morgan Stanley & Co. International PLC/Morgan Stanley Capital Services LLC/Morgan Stanley Capital Services, Inc. | 246,054 | (246,054 | ) | 0 | 0 | 0 | ||||||||||||||
Natwest Markets PLC | 16,700 | (16,700 | ) | 0 | 0 | 0 | ||||||||||||||
Standard Chartered Bank | 1,360,363 | (87,346 | ) | 0 | 0 | 1,273,017 | ||||||||||||||
State Street Bank & Trust Co. | 490,726 | (490,726 | ) | 0 | 0 | 0 | ||||||||||||||
UBS AG | 740,632 | (740,632 | ) | 0 | 0 | 0 | ||||||||||||||
Total | $ | 9,791,013 | $ | (4,224,296 | ) | $ | (137,811 | ) | $ | (2,817,468 | ) | $ | 2,611,438 | ^ | ||||||
| * | The actual collateral received/pledged may be more than the amount reported due to over-collateralization. |
| ^ | Net amount represents the net receivable/payable that would be due from/to the counterparty in the event of default or termination. The net amount from OTC financial derivative instruments can only be netted across transactions governed under the same master agreement with the same counterparty. |
TAX-AWARE OVERLAY B PORTFOLIO |
| |||||||||||||||||||
| COUNTERPARTY | DERIVATIVE ASSETS SUBJECT TO A MA | DERIVATIVES AVAILABLE FOR OFFSET | CASH COLLATERAL RECEIVED* | SECURITY COLLATERAL RECEIVED* | NET AMOUNT OF DERIVATIVE ASSETS | |||||||||||||||
Bank of America, NA | $ | 23,474 | $ | 0 | $ | 0 | $ | 0 | $ | 23,474 | ||||||||||
Barclays Bank PLC | 475,466 | (475,466 | ) | 0 | 0 | 0 | ||||||||||||||
BNP Paribas SA | 427,482 | (1,622 | ) | 0 | 0 | 425,860 | ||||||||||||||
Citibank, NA/Citigroup Global Markets, Inc. | 1,626,101 | (1,198,895 | ) | 0 | 0 | 427,206 | ||||||||||||||
Deutsche Bank AG | 348,892 | 0 | (270,000 | ) | 0 | 78,892 | ||||||||||||||
Goldman Sachs Bank USA/Goldman Sachs International | 778,670 | (232,492 | ) | (546,178 | ) | 0 | 0 | |||||||||||||
JPMorgan Chase Bank, NA | 3,667,088 | (1,725,330 | ) | (1,941,758 | ) | 0 | 0 | |||||||||||||
Morgan Stanley & Co., Inc./Morgan Stanley Capital Services LLC | 747,061 | (238,298 | ) | (508,763 | ) | 0 | 0 | |||||||||||||
Natwest Markets PLC | 174,652 | (24,938 | ) | 0 | 0 | 149,714 | ||||||||||||||
State Street Bank & Trust Co. | 38,995 | (38,995 | ) | 0 | 0 | 0 | ||||||||||||||
UBS AG | 6,374,602 | (26,773 | ) | (6,347,829 | ) | 0 | 0 | |||||||||||||
Total | $ | 14,682,483 | $ | (3,962,809 | ) | $ | (9,614,528 | ) | $ | 0 | $ | 1,105,146 | ^ | |||||||
| 150 | Sanford C. Bernstein Fund, Inc. | |
Table of Contents
| COUNTERPARTY | DERIVATIVE LIABILITIES SUBJECT TO A MA | DERIVATIVES AVAILABLE FOR OFFSET | CASH COLLATERAL PLEDGED* | SECURITY COLLATERAL PLEDGED* | NET AMOUNT OF DERIVATIVE LIABILITIES | |||||||||||||||
Barclays Bank PLC | $ | 1,325,888 | $ | (475,466 | ) | $ | (31,475 | ) | $ | (593,327 | ) | $ | 225,620 | |||||||
BNP Paribas SA | 1,622 | (1,622 | ) | 0 | 0 | 0 | ||||||||||||||
Citibank, NA/Citigroup Global Markets, Inc. | 1,198,895 | (1,198,895 | ) | 0 | 0 | 0 | ||||||||||||||
Credit Suisse International | 460,888 | 0 | (460,888 | ) | 0 | 0 | ||||||||||||||
Goldman Sachs Bank USA/Goldman Sachs International | 232,492 | (232,492 | ) | 0 | 0 | 0 | ||||||||||||||
JPMorgan Chase Bank, NA | 1,725,330 | (1,725,330 | ) | 0 | 0 | 0 | ||||||||||||||
Morgan Stanley & Co., Inc./Morgan Stanley Capital Services LLC | 238,298 | (238,298 | ) | 0 | 0 | 0 | ||||||||||||||
Natwest Markets PLC | 24,938 | (24,938 | ) | 0 | 0 | 0 | ||||||||||||||
State Street Bank & Trust Co. | 548,326 | (38,995 | ) | 0 | 0 | 509,331 | ||||||||||||||
UBS AG | 26,773 | (26,773 | ) | 0 | 0 | 0 | ||||||||||||||
Total | $ | 5,783,450 | $ | (3,962,809 | ) | $ | (492,363 | ) | $ | (593,327 | ) | $ | 734,951 | ^ | ||||||
| * | The actual collateral received/pledged may be more than the amount reported due to over-collateralization. |
| ^ | Net amount represents the net receivable/payable that would be due from/to the counterparty in the event of default or termination. The net amount from OTC financial derivative instruments can only be netted across transactions governed under the same master agreement with the same counterparty. |
TAX-AWARE OVERLAY C PORTFOLIO |
| |||||||||||||||||||
| COUNTERPARTY | DERIVATIVE ASSETS SUBJECT TOA MA | DERIVATIVES AVAILABLE FOR OFFSET | CASH COLLATERAL RECEIVED* | SECURITY COLLATERAL RECEIVED* | NET AMOUNT OF DERIVATIVE ASSETS | |||||||||||||||
Bank of America, NA | $ | 6,975 | $ | 0 | $ | 0 | $ | 0 | $ | 6,975 | ||||||||||
Barclays Bank PLC | 86,584 | (86,584 | ) | 0 | 0 | 0 | ||||||||||||||
BNP Paribas SA | 127,251 | (485 | ) | 0 | 0 | 126,766 | ||||||||||||||
Citibank, NA/Citigroup Global Markets, Inc. | 423,693 | (228,404 | ) | 0 | 0 | 195,289 | ||||||||||||||
Deutsche Bank AG | 144,222 | 0 | 0 | 0 | 144,222 | |||||||||||||||
Goldman Sachs Bank USA/Goldman Sachs International | 237,653 | 0 | 0 | 0 | 237,653 | |||||||||||||||
JPMorgan Chase Bank, NA | 947,256 | (509,098 | ) | (438,158 | ) | 0 | 0 | |||||||||||||
Morgan Stanley & Co., Inc./Morgan Stanley Capital Services LLC | 436,151 | (74,304 | ) | (260,000 | ) | 0 | 101,847 | |||||||||||||
Natwest Markets PLC | 51,899 | (7,317 | ) | 0 | 0 | 44,582 | ||||||||||||||
State Street Bank & Trust Co. | 87,387 | (87,387 | ) | 0 | 0 | 0 | ||||||||||||||
UBS AG | 1,919,487 | (8,229 | ) | (1,911,258 | ) | 0 | 0 | |||||||||||||
Total | $ | 4,468,558 | $ | (1,001,808 | ) | $ | (2,609,416 | ) | $ | 0 | $ | 857,334 | ^ | |||||||
2021 Semi-Annual Report | 151 | |
Table of Contents
Notes to Financial Statements (continued)
| COUNTERPARTY | DERIVATIVE LIABILITIES SUBJECT TOA MA | DERIVATIVES AVAILABLE FOR OFFSET | CASH COLLATERAL PLEDGED* | SECURITY COLLATERAL PLEDGED* | NET AMOUNT OF DERIVATIVE LIABILITIES | |||||||||||||||
Barclays Bank PLC | $ | 264,489 | $ | (86,584 | ) | $ | 0 | $ | (177,905 | ) | $ | 0 | ||||||||
BNP Paribas SA | 485 | (485 | ) | 0 | 0 | 0 | ||||||||||||||
Citibank, NA/Citigroup Global Markets, Inc. | 228,404 | (228,404 | ) | 0 | 0 | 0 | ||||||||||||||
Credit Suisse International | 246,748 | 0 | 0 | (245,805 | ) | 943 | ||||||||||||||
Goldman Sachs Bank USA/Goldman Sachs International | 102,103 | 0 | 0 | 0 | 102,103 | |||||||||||||||
JPMorgan Chase Bank, NA | 509,098 | (509,098 | ) | 0 | 0 | 0 | ||||||||||||||
Morgan Stanley & Co., Inc./Morgan Stanley Capital Services LLC | 74,304 | (74,304 | ) | 0 | 0 | 0 | ||||||||||||||
Natwest Markets PLC | 7,317 | (7,317 | ) | 0 | 0 | 0 | ||||||||||||||
Standard Chartered Bank | 149,053 | 0 | 0 | 0 | 149,053 | |||||||||||||||
State Street Bank & Trust Co. | 109,460 | (87,387 | ) | 0 | 0 | 22,073 | ||||||||||||||
UBS AG | 8,229 | (8,229 | ) | 0 | 0 | 0 | ||||||||||||||
Total | $ | 1,699,690 | $ | (1,001,808 | ) | $ | 0 | $ | (423,710 | ) | $ | 274,172 | ^ | |||||||
| * | The actual collateral received/pledged may be more than the amount reported due to over-collateralization. |
| ^ | Net amount represents the net receivable/payable that would be due from/to the counterparty in the event of default or termination. The net amount from OTC financial derivative instruments can only be netted across transactions governed under the same master agreement with the same counterparty. |
TAX-AWARE OVERLAY N PORTFOLIO |
| |||||||||||||||||||
| COUNTERPARTY | DERIVATIVE ASSETS SUBJECT TO A MA | DERIVATIVES AVAILABLE FOR OFFSET | CASH COLLATERAL RECEIVED* | SECURITY COLLATERAL RECEIVED* | NET AMOUNT OF DERIVATIVE ASSETS | |||||||||||||||
Bank of America, NA | $ | 5,461 | $ | 0 | $ | 0 | $ | 0 | $ | 5,461 | ||||||||||
Barclays Bank PLC | 69,761 | (69,761 | ) | 0 | 0 | 0 | ||||||||||||||
BNP Paribas SA | 96,554 | (365 | ) | 0 | 0 | 96,189 | ||||||||||||||
Citibank, NA/Citigroup Global Markets, Inc. | 314,593 | (144,775 | ) | 0 | 0 | 169,818 | ||||||||||||||
Deutsche Bank AG | 139,557 | 0 | 0 | 0 | 139,557 | |||||||||||||||
Goldman Sachs Bank USA/Goldman Sachs International | 174,592 | (82,437 | ) | 0 | 0 | 92,155 | ||||||||||||||
JPMorgan Chase Bank, NA | 772,843 | (381,828 | ) | (300,000 | ) | 0 | 91,015 | |||||||||||||
Morgan Stanley & Co., Inc./Morgan Stanley Capital Services LLC | 182,670 | (53,171 | ) | 0 | 0 | 129,499 | ||||||||||||||
Natwest Markets PLC | 38,904 | (4,992 | ) | 0 | 0 | 33,912 | ||||||||||||||
State Street Bank & Trust Co. | 148,238 | (12,780 | ) | 0 | 0 | 135,458 | ||||||||||||||
UBS AG | 1,428,358 | (5,913 | ) | (1,422,445 | ) | 0 | 0 | |||||||||||||
Total | $ | 3,371,531 | $ | (756,022 | ) | $ | (1,722,445 | ) | $ | 0 | $ | 893,064 | ^ | |||||||
| 152 | Sanford C. Bernstein Fund, Inc. | |
Table of Contents
| COUNTERPARTY | DERIVATIVE LIABILITIES SUBJECT TOA MA | DERIVATIVES AVAILABLE FOR OFFSET | CASH COLLATERAL PLEDGED* | SECURITY COLLATERAL PLEDGED* | NET AMOUNT OF DERIVATIVE LIABILITIES | |||||||||||||||
Barclays Bank PLC | $ | 289,978 | $ | (69,761 | ) | $ | 0 | $ | (220,217 | ) | $ | 0 | ||||||||
BNP Paribas SA | 365 | (365 | ) | 0 | 0 | 0 | ||||||||||||||
Citibank, NA/Citigroup Global Markets, Inc. | 144,775 | (144,775 | ) | 0 | 0 | 0 | ||||||||||||||
Credit Suisse International | 199,339 | 0 | 0 | (199,339 | ) | 0 | ||||||||||||||
Goldman Sachs Bank USA/Goldman Sachs International | 82,437 | (82,437 | ) | 0 | 0 | 0 | ||||||||||||||
JPMorgan Chase Bank, NA | 381,828 | (381,828 | ) | 0 | 0 | 0 | ||||||||||||||
Morgan Stanley & Co., Inc./Morgan Stanley Capital Services LLC | 53,171 | (53,171 | ) | 0 | 0 | 0 | ||||||||||||||
Natwest Markets PLC | 4,992 | (4,992 | ) | 0 | 0 | 0 | ||||||||||||||
Standard Chartered Bank | 119,032 | 0 | 0 | 0 | 119,032 | |||||||||||||||
State Street Bank & Trust Co. | 12,780 | (12,780 | ) | 0 | 0 | 0 | ||||||||||||||
UBS AG | 5,913 | (5,913 | ) | 0 | 0 | 0 | ||||||||||||||
Total | $ | 1,294,610 | $ | (756,022 | ) | $ | 0 | $ | (419,556 | ) | $ | 119,032 | ^ | |||||||
| * | The actual collateral received/pledged may be more than the amount reported due to over-collateralization. |
| ^ | Net amount represents the net receivable/payable that would be due from/to the counterparty in the event of default or termination. The net amount from OTC financial derivative instruments can only be netted across transactions governed under the same master agreement with the same counterparty. |
| C. | Currency Transactions |
The Portfolios may invest in non-U.S. Dollar-denominated securities on a currency hedged or unhedged basis. The Portfolios may seek investment opportunities by taking long or short positions in currencies through the use of currency-related derivatives, including forward currency exchange contracts, futures and options on futures, swaps, and other options. The Portfolios may enter into transactions for investment opportunities when it anticipates that a foreign currency will appreciate or depreciate in value but securities denominated in that currency are not held by the Portfolios and do not present attractive investment opportunities. Such transactions may also be used when the Adviser believes that it may be more efficient than a direct investment in a foreign currency-denominated security. The Portfolios may also conduct currency exchange contracts on a spot basis (i.e., for cash at the spot rate prevailing in the currency exchange market for buying or selling currencies).
| D. | TBA |
The Portfolios may invest in TBA mortgage-backed securities. A TBA, or “To Be Announced”, trade represents a contract for the purchase or sale of mortgage-backed securities to be delivered at a future agreed-upon date; however, the specific mortgage pool numbers or the number of pools that will be delivered to fulfill the trade obligation or terms of the contract are unknown at the time of the trade. Mortgage pools (including fixed-rate or variable-rate mortgages) guaranteed by the Government National Mortgage Association, or GNMA, the Federal National Mortgage Association, or FNMA, or the Federal Home Loan Mortgage Corporation, or FHLMC, are subsequently allocated to the TBA transactions.
2021 Semi-Annual Report | 153 | |
Table of Contents
Notes to Financial Statements (continued)
| NOTE 4. | Distributions to Shareholders |
The tax character of distributions to be paid for the year ending September 30, 2021 will be determined at the end of the current fiscal year. The tax character of distributions paid during the fiscal years ended September 30, 2020 and September 30, 2019 were as follows:
| PORTFOLIO | 2020 | 2019 | ||||||
Overlay A | ||||||||
Distributions paid from: | ||||||||
Ordinary income | $ | 22,505,099 | $ | 21,093,519 | ||||
Long-term capital gains | 4,970,026 | 45,307,130 | ||||||
|
|
|
| |||||
Total distributions paid | $ | 27,475,125 | $ | 66,400,649 | ||||
|
|
|
| |||||
Tax-Aware Overlay A | ||||||||
Distributions paid from: | ||||||||
Ordinary income | $ | 53,912,765 | $ | 43,993,489 | ||||
Long-term capital gains | 1,141,193 | 49,726,586 | ||||||
|
|
|
| |||||
Total distributions paid | $ | 55,053,958 | $ | 93,720,075 | ||||
|
|
|
| |||||
Overlay B | ||||||||
Distributions paid from: | ||||||||
Ordinary income | $ | 41,357,860 | $ | 45,406,425 | ||||
Long-term capital gains | 0 | 512,267 | ||||||
|
|
|
| |||||
Total distributions paid | $ | 41,357,860 | $ | 45,918,692 | ||||
|
|
|
| |||||
Tax-Aware Overlay B | ||||||||
Distributions paid from: | ||||||||
Ordinary income | $ | 7,744,728 | $ | 24,847,095 | ||||
Long-term capital gains | 0 | 2,592,439 | ||||||
|
|
|
| |||||
Total taxable distributions | 7,744,728 | 27,439,534 | ||||||
Tax exempt distributions | 19,963,141 | 26,971,666 | ||||||
|
|
|
| |||||
Total distributions paid | $ | 27,707,869 | $ | 54,411,200 | ||||
|
|
|
| |||||
Tax-Aware Overlay C | ||||||||
Distributions paid from: | ||||||||
Ordinary income | $ | 2,444,068 | $ | 6,624,803 | ||||
Long-term capital gains | 0 | 2,822,085 | ||||||
|
|
|
| |||||
Total taxable distributions | 2,444,068 | 9,446,888 | ||||||
Tax exempt distributions | 5,643,683 | 6,629,473 | ||||||
|
|
|
| |||||
Total distributions paid | $ | 8,087,751 | $ | 16,076,361 | ||||
|
|
|
| |||||
Tax-Aware Overlay N | ||||||||
Distributions paid from: | ||||||||
Ordinary income | $ | 2,247,485 | $ | 5,555,885 | ||||
Long-term capital gains | 0 | 1,438,981 | ||||||
|
|
|
| |||||
Total taxable distributions | 2,247,485 | 6,994,866 | ||||||
Tax exempt distributions | 4,333,320 | 5,474,752 | ||||||
|
|
|
| |||||
Total distributions paid | $ | 6,580,805 | $ | 12,469,618 | ||||
|
|
|
| |||||
| 154 | Sanford C. Bernstein Fund, Inc. | |
Table of Contents
As of September 30, 2020, the components of accumulated earnings/(deficit) on a tax basis were as follows:
| PORTFOLIO | UNDISTRIBUTED ORDINARY INCOME(a) | UNDISTRIBUTED LONG-TERM | ACCUMULATED CAPITALAND OTHER (LOSSES)(b) | UNREALIZED APPRECIATION/ | TOTAL ACCUMULATED EARNINGS/ (DEFICIT)(d) | |||||||||||||||
Overlay A | $ | 13,788,168 | $ | 0 | $ | (17,113,741 | ) | $ | 313,810,795 | $ | 310,485,222 | |||||||||
Tax-Aware Overlay A | 6,392,252 | 0 | (37,239,095 | ) | 794,355,494 | 763,508,651 | ||||||||||||||
Overlay B | 25,508,692 | 5,134,169 | (11,722,105 | ) | 47,669,274 | 66,590,030 | ||||||||||||||
Tax-Aware Overlay B | 32,200,100 | 0 | (63,985,171 | ) | 153,755,876 | 121,970,805 | ||||||||||||||
Tax-Aware Overlay C | 9,571,200 | 0 | (28,104,427 | ) | 53,570,517 | 35,037,290 | ||||||||||||||
Tax-Aware Overlay N | 6,640,395 | 0 | (18,502,874 | ) | 33,221,301 | 21,358,822 | ||||||||||||||
| (a) | Includes tax exempt income as shown below: |
Tax-Aware Overlay B | $ | 23,306,046 | ||
Tax-Aware Overlay C | 6,468,256 | |||
Tax-Aware Overlay N | 4,857,867 | |||
| (b) | As of September 30, 2020 certain Portfolios had capital loss carryforwards for federal income tax purposes. As of September 30, 2020 Overlay A Portfolio, Tax-Aware Overlay A Portfolio, Overlay B Portfolio, Tax-Aware Overlay B Portfolio, Tax-Aware Overlay C Portfolio, and Tax-Aware Overlay N Portfolio deferred $2,164,703, $3,619,914, $11,722,105, $57,375,036, $20,614,390, and $11,576,569 in straddle losses, respectively. |
| (c) | The differences between book-basis and tax-basis unrealized appreciation/(depreciation) are attributable primarily to the tax deferral of losses on wash sales, the tax treatment of swaps and passive foreign investment companies (PFICs), the realization for tax purposes of gains/losses on certain derivative instruments, and the tax treatment of Treasury inflation-protected securities. |
| (d) | The differences between book-basis and tax-basis components of accumulated earnings/(deficit) are attributable primarily to the amortization of offering costs, the accrual of foreign capital gains tax and the tax treatment of interest on defaulted securities. |
For tax purposes, net capital losses may be carried over to offset future capital gains, if any. Portfolios are permitted to carry forward capital losses for an indefinite period, and such losses will retain their character as either short-term or long-term capital losses.
As of September 30, 2020, the following Portfolios had net capital loss carryforwards as follows:
| PORTFOLIO | SHORT-TERM AMOUNT | LONG-TERM AMOUNT | ||||||
Overlay A | $ | 14,949,038 | $ | 0 | ||||
Tax-Aware Overlay A | 33,619,181 | 0 | ||||||
Tax-Aware Overlay B | 6,610,135 | 0 | ||||||
Tax-Aware Overlay C | 7,490,037 | 0 | ||||||
Tax-Aware Overlay N | 6,448,071 | 479,234 | ||||||
| NOTE 5. | Risks Involved in Investing in the Portfolios |
Market Risk—The Portfolios are subject to market risk, which is the risk that stock and bond prices in general or in particular countries or sectors may decline over short or extended periods. In the past decade, financial markets in the United States, Europe and elsewhere have experienced increased volatility, decreased liquidity and heightened uncertainty. These market conditions may recur from time to time and have an adverse impact on various securities markets. Recently, certain governments and central banks have provided significant support to financial markets in
2021 Semi-Annual Report | 155 | |
Table of Contents
Notes to Financial Statements (continued)
response to serious economic disruptions, including, but not limited to, buying stocks, providing direct capital infusions into companies, implementing new monetary programs, dramatically lowering interest rates and through other market interventions. This and other government intervention into the economy and financial markets may not work as intended, particularly if the efforts are perceived by investors as being unlikely to achieve the desired results. Government actions to support the economy and financial markets have resulted in a large expansion of government deficits and debt, the long term consequences of which are not known. The reversal of these policies, or their ineffectiveness, as well as further governmental or central bank actions could negatively affect financial markets generally, increase market volatility and reduce the value and liquidity of securities in which the Portfolios invests.
On January 31, 2020, the United Kingdom (the “U.K.”) formally left the European Union (the “EU”) (“Brexit”) and ceased to be a member of the EU. Brexit could also lead to legal uncertainty and politically divergent national laws and regulations as a new relationship between the U.K. and EU is developed and the U.K. determines which EU laws to replace or replicate in the future. Any of these effects of Brexit, and others the Adviser cannot anticipate, could adversely affect the value of the Portfolio’s investments and its net asset value. The political, economic and legal consequences of Brexit continue to give rise to uncertainties. The U.K. may be less stable than it has been in recent years and investments in U.K. assets may be difficult to value, or subject to greater or more frequent rises and falls in value.
The United States and its trading partners are periodically involved in disputes over trade, which may result in tariffs on various categories of goods imported from the other country. For example, the current political climate between the United States and China has intensified concerns about protectionist trade policies and a potential trade war between China and the United States. The United States has imposed tariffs and other trade barriers on Chinese exports and placed other restrictions on or barriers to investments in China. Trade disputes, particularly prolonged disputes, may adversely affect the economies of the United States and its trading partners, as well as the companies directly or indirectly affected by the dispute and financial markets generally, and thus may adversely affect the value of the Portfolio’s assets. Recently, the United States government acted to prohibit U.S. persons, such as the Portfolio, from owning, and required them to divest, certain Chinese companies designated as related to the Chinese military. There is no assurance that more such companies will not be so designated in the future, which could limit the Portfolio’s opportunities for investment and require the sale of securities at a loss or make them illiquid. If the political climate between the United States and China continues to deteriorate, economies and markets may be adversely affected.
Policy and legislative changes in the United States and in other countries are affecting many aspects of financial regulation, and may in some instances contribute to decreased liquidity and increased volatility in the financial markets. The impact of these changes, and the practical implications for market participants, may not be fully known for some time.
Economies and financial markets throughout the world are becoming increasingly interconnected. Economic, financial or political events, trading and tariff arrangements, terrorism, natural disasters (including the spread of infectious illness) and other circumstances in one country or region could have profound impacts on global economies or markets. As a result, whether or not the Portfolios invests in securities of issuers located in or with significant exposure to countries experiencing economic and financial difficulties, the value and liquidity of the Portfolio’s investments may be negatively affected.
Management Risk—The Portfolios are subject to management risk because they are actively managed investment portfolios. The Adviser will apply its investment techniques and risk analyses in making investment decisions for the Portfolios, but these techniques, analyses and decisions may not work as intended or may not produce the desired results, and may, during certain periods, result in increased volatility for the Portfolios or cause the value of the Portfolios’ shares to go down. In some cases, derivatives and other investment techniques may be unavailable or the Adviser may determine not to use them, possibly even under market conditions where their use could benefit the Portfolios. Some of these techniques may incorporate, or rely upon, quantitative models, but there is no guarantee that these models will generate accurate forecasts, reduce risk or otherwise perform as expected. In addition, the Adviser may change the Portfolios’ investment strategies or policies from time to time. Those changes may not lead to the results intended by the Adviser and could have an adverse effect on the value or performance of the Portfolios.
Allocation Risk—The allocation of investments among different global asset classes may have a significant effect on the Portfolios’ net asset value when one of these asset classes is performing more poorly than others. As the direct
| 156 | Sanford C. Bernstein Fund, Inc. | |
Table of Contents
investments, investments in other funds and derivative positions will be periodically rebalanced to reflect the Adviser’s view of market and economic conditions, there will be transaction costs which may be, over time, significant. In addition, there is a risk that certain asset allocation decisions may not achieve the desired results and, as a result, the Portfolios may incur significant losses.
Derivatives Risk—The Portfolios intends to use derivatives as direct investments to earn income, enhance return and broaden portfolio diversification, which entail greater risk than if used solely for hedging purposes. In addition to other risks such as the credit risk of the counterparty, derivatives involve the risk that changes in the value of the derivative may not correlate with relevant assets, rates or indices. Derivatives may be difficult to price or unwind, and small changes may produce disproportionate losses for the Portfolios. Certain derivatives have the potential for unlimited loss, regardless of the size of the initial investment. Assets required to be set aside or posted to cover or secure derivatives positions may themselves go down in value, and these collateral and other requirements may limit investment flexibility. Some derivatives involve leverage, which can make the Portfolios more volatile and can compound other risks. Derivatives, especially over-the-counter derivatives, are also subject to counterparty risk. Use of derivatives may have different tax consequences for the Portfolios than an investment in the underlying asset or index, and such differences may affect the amount, timing and character of income distributed to shareholders. The U.S. government and certain foreign governments have adopted regulations governing derivatives markets, including mandatory clearing of certain derivatives and may impose additional regulations governing margin, reporting and registration requirements. The ultimate impact of the regulations remains unclear. Additional regulation may make derivatives more costly, limit their availability or utility, otherwise adversely affect their performance, or disrupt markets.
Leverage Risk—Leverage creates exposure to gains and losses in a greater amount than the dollar amount made in an investment by attempting to enhance return or value without increasing the investment amount. Leverage can magnify the effects of changes in the value of the Portfolios’ investments and make it more volatile. The use of leverage may cause the Portfolios to liquidate portfolio positions when it may not be advantageous to do so.
Illiquid Investments Risk—Illiquid investments risk exists when particular investments are difficult to purchase or sell, possibly preventing the Portfolios from purchasing or selling these securities at an advantageous price. Over recent years, regulatory changes have led to reduced liquidity in the marketplace, and the capacity of dealers to make markets in fixed-income securities has been outpaced by the growth in the size of the fixed-income markets. Illiquid investments risk may be magnified in a rising interest rate environment, where the value and liquidity of fixed-income securities generally go down. Illiquid securities may also be difficult to value.
Redemption Risk—The Portfolios may experience heavy redemptions that could cause the Portfolios to liquidate their assets at inopportune times or unfavorable prices or increase or accelerate taxable gains or transaction costs and may negatively affect the Portfolios’ net asset value, or performance, which could cause the value of your investment to decline. Redemption risk is heightened during periods of overall market turmoil.
Mortgage-Related and Asset-Related Securities Risk—Mortgage- and asset-related securities represent interests in “pools” of mortgages, including consumer loans or receivables held in trust. Mortgage- and asset-related securities are subject to credit, interest rate, prepayment and extension risks. These securities also are subject to risk of default on the underlying mortgage or asset, particularly during periods of economic downturn. Small movements in interest rates (both increases and decreases) may quickly and significantly reduce the value of certain mortgage-related securities.
Prepayment and Extension Risk—Prepayment risk is the risk that a loan, bond or other security might be called or otherwise converted, prepaid or redeemed before maturity. If this happens, particularly during a time of declining interest rates or credit spreads, the Portfolios will not benefit from the rise in market price that normally accompanies a decline in interest rates, and may not be able to invest the proceeds in securities providing as much income, resulting in a lower yield to the Portfolio. Conversely, extension risk is the risk that as interest rates rise or spreads widen, payments of securities may occur more slowly than anticipated by the market. If this happens, the values of these securities may go down because their interest rates are lower than current market rates and they remain outstanding longer than anticipated.
Subordination Risk—The Portfolios may invest in securities that are subordinated to more senior securities of an issuer, or which represent interests in pools of such subordinated securities. Subordinated securities will be disproportionately affected by a default or even a perceived decline in creditworthiness of the issuer. Subordinated securities are more likely
2021 Semi-Annual Report | 157 | |
Table of Contents
Notes to Financial Statements (continued)
to suffer a credit loss than non-subordinated securities of the same issuer, any loss incurred by the subordinated securities is likely to be proportionately greater, and any recovery of interest or principal may take more time.
Municipal Market Risk—This is the risk that special factors may adversely affect the value of the municipal securities and have a significant effect on the yield or value of the Portfolios’ investments in municipal securities. These factors include economic conditions, political or legislative changes, public health crises, uncertainties related to the tax status of municipal securities, or the rights of investors in these securities. To the extent that the Portfolios invests more of its assets in a particular state’s municipal securities, the Portfolio may be vulnerable to events adversely affecting that state, including economic, political and regulatory occurrences, court decisions, terrorism, public health crises (including the occurrence of a contagious disease or illness) and catastrophic natural disasters, such as hurricanes, wildfires or earthquakes. For example, the novel coronavirus (COVID-19) pandemic has significantly stressed the financial resources of many issuers of municipal securities, which could impair any such issuer’s ability to meet its financial obligations when due and adversely impact the value of its securities held by the Portfolios. As the full effects of the COVID-19 pandemic on state and local economies and on issuers of municipal securities are still uncertain, the financial difficulties of issuers of municipal securities may continue or worsen, adversely affecting the performance of the Portfolios. The Portfolios’ investments in certain municipal securities with principal and interest payments that are made from the revenues of a specific project or facility, and not general tax revenues, may have increased risks. Factors affecting the project or facility, such as local business or economic conditions, could have a significant effect on the project’s ability to make payments of principal and interest on these securities.
In addition, tax law changes enacted as part of the Tax Cuts and Jobs Act of 2017 could have a material impact on the value of municipal securities. Because advance refunding bonds issued after December 31, 2017 are no longer tax exempt, the total supply of municipal bonds could decrease going forward. In addition, the reduction of the U.S. corporate income tax rate to 21% could make municipal obligations less attractive to certain institutional investors such as banks and property and casualty insurance companies, resulting in lower demand for municipal obligations. Changes in tax rates or the treatment of income from certain types of municipal securities, among other things, could negatively affect the municipal securities markets.
The Portfolios may invest in municipal securities of issuers in Puerto Rico or other U.S. territories and their governmental agencies and municipalities, which are exempt from federal, state, and, where applicable, local income taxes. These municipal securities may have more risks than those of other U.S. issuers of municipal securities. Like many U.S. states and municipalities, Puerto Rico experienced a significant downturn in the 2007–2009 recession. Puerto Rico’s downturn was particularly severe. In addition, Hurricane Maria caused significant damage to Puerto Rico. Hurricane Maria and severe weather events that may occur in the future could have significant and long-lasting impacts on Puerto Rico’s economy. Puerto Rico continues to face a very challenging economic and fiscal environment, worsened by the spread of COVID-19 and the adverse effect that related governmental and public responses have had on Puerto Rico’s economy. If the general economic situation in Puerto Rico continues to persist or worsens, the volatility and credit quality of Puerto Rican municipal securities could continue to be adversely affected, and the market for such securities may deteriorate further.
Interest Rate Risk—Changes in interest rates will affect the value of investments in fixed-income securities. When interest rates rise, the value of existing investments in fixed-income securities tends to fall and this decrease in value may not be offset by higher income from new investments. Interest rate risk is generally greater for fixed-income securities with longer maturities or durations. The current historically low interest rate environment heightens the risks associated with rising interest rates.
Credit Risk—This is the risk that the issuer or the guarantor of a debt security, or the counterparty to a derivatives or other contract, will be unable or unwilling to make timely principal and/or interest payments, or to otherwise honor its obligations. The issuer or guarantor may default, potentially causing a loss of the full principal amount of a security and accrued interest. The degree of risk for a particular security may be reflected in its credit rating. The credit rating of a fixed-income security may be downgraded after purchase, which may adversely affect the value of the security. Investments in fixed-income securities with lower ratings tend to have a higher probability that an issuer will default or fail to meet its payment obligations, making credit risk greater for medium-quality and lower-rated debt securities. Lower-rated debt securities and similar unrated securities (commonly known as “junk bonds”) have speculative elements or are predominantly speculative credit risks. At times when credit risk is perceived to be greater, credit “spreads” (i.e.,
| 158 | Sanford C. Bernstein Fund, Inc. | |
Table of Contents
the difference between the yields on lower quality securities and the yields on higher quality securities) may get larger or “widen”. As a result, the values of the lower quality securities may go down more and they may become harder to sell.
Duration Risk—Duration is a measure that relates the expected price volatility of a fixed-income security to changes in interest rates. The duration of a fixed-income security may be shorter than or equal to full maturity of the fixed-income security. Fixed-income securities with longer durations have more interest rate risk and will decrease in price as interest rates rise. Securities that have final maturities longer than their durations may be affected by increased credit spreads to a far greater degree than their durations would suggest, because they are exposed to credit risk until final maturity.
Foreign (Non-U.S.) Securities Risk—Investments in foreign securities entail significant risks in addition to those customarily associated with investing in U.S. securities. These risks include risks related to adverse market, economic, political and regulatory factors and social instability, all of which could disrupt the financial markets in which the Portfolios invest and adversely affect the value of the Portfolios’ assets.
Emerging Markets Securities Risk—The risks of investing in foreign (non-U.S.) securities are heightened with respect to issuers in emerging-market countries, because the markets are less developed and less liquid and there may be a greater amount of economic, political and social uncertainty. In addition, the value of the Portfolios’ investments may decline because of factors such as unfavorable or unsuccessful government actions and reduction of government or central bank support.
Foreign Currency Risk—This is the risk that changes in foreign (non-U.S.) currency exchange rates may negatively affect the value of the Portfolios investments or reduce the returns of the Portfolios. For example, the value of the Portfolios’ investments in foreign securities and foreign currency positions may decrease if the U.S. Dollar is strong (i.e., gaining value relative to other currencies) and other currencies are weak (i.e., losing value relative to the U.S. Dollar).
Actions by a Few Major Investors—In certain countries, volatility may be heightened by actions of a few major investors. For example, substantial increases or decreases in cash flows of mutual funds investing in these markets could significantly affect local securities prices and, therefore, share prices of the Portfolios.
Commodity Risk—The value of commodity-linked derivatives, exchange traded notes and exchange traded funds may be affected by changes in overall market movements, commodity index volatility, changes in interest rates, or factors affecting a particular industry or commodity, such as drought, floods, weather, livestock disease, embargoes, tariffs and international economic, political and regulatory developments.
Inflation Risk—This is the risk that the value of assets or income from investments will be less in the future as inflation decreases the value of money. As inflation increases, the value of the Portfolios’ assets can decline as can the value of the Portfolios’ distributions. This risk is significantly greater for fixed-income securities with longer maturities.
Inflation-Protected Securities Risk—The terms of inflation-protected securities provide for the coupon and/or maturity value to be adjusted based on changes in an inflation index. Decreases in the inflation rate or in investors’ expectations about inflation could cause these securities to underperform non-inflation-adjusted securities on a total-return basis. In addition, there can be no assurance that the relevant inflation index will accurately measure the rate of inflation, in which case the securities may not work as intended. These securities may be more difficult to trade or dispose of than other types of securities.
Lower-rated Securities Risk—Lower-rated securities, or junk bonds/high-yield securities, are subject to greater risk of loss of principal and interest and greater market risk than higher-rated securities. The capacity of issuers of lower-rated securities to pay interest and repay principal is more likely to weaken than is that of issuers of higher-rated securities in times of deteriorating economic conditions or rising interest rates.
Real Estate Related Securities Risk—Investing in real estate related securities includes, among others, the following risks: possible declines in the value of real estate; risks related to general and local economic conditions, including increases in the rate of inflation; possible lack of availability of mortgage funds; overbuilding; extended vacancies of properties; increases in competition, property taxes and operating expenses; changes in zoning laws; costs resulting from the clean-up of, and liability to third parties for damages resulting from, environmental problems; casualty or condemnation losses; uninsured damages from floods, earthquakes or other natural disasters; limitations on and variations in rents; and changes in interest rates. Investing in Real Estate Investment Trusts (“REITs”) involves certain unique risks in addition to
2021 Semi-Annual Report | 159 | |
Table of Contents
Notes to Financial Statements (continued)
those risks associated with investing in the real estate industry in general. Equity REITs may be affected by changes in the value of the underlying property owned by the REITs, while mortgage REITs may be affected by the quality of any credit extended. REITs are dependent upon management skills, are not diversified, and are subject to heavy cash flow dependency, default by borrowers and self-liquidation. Investing in REITs also involves risks similar to those associated with investing in small-capitalization companies. REITs may have limited financial resources, may trade less frequently and in a limited volume and may be subject to more abrupt or erratic price movements than larger company securities.
Investment in Other Investment Companies Risk—As with other investments, investments in other investment companies, including other AB mutual funds and ETFs, are subject to market and management risk. In addition, if the Portfolios acquire shares of investment companies, shareholders bear both their proportionate share of expenses in the Portfolios (including management and advisory fees) and, indirectly, the expenses of the investment companies in which the Portfolios invest.
Tax Risk—There is no guarantee that the income on a Portfolio’s municipal securities will be exempt from regular federal income, and if applicable, state income taxes. Unfavorable legislation, adverse interpretations by federal or state authorities, litigation or noncompliant conduct by the issuer of a municipal security could affect the tax-exempt status of municipal securities. If the Internal Revenue Service or a state authority determines that an issuer of a municipal security has not complied with applicable requirements, interest from the security could become subject to regular federal income tax and/or state personal income tax, possibly retroactively to the date the security was issued, the value of the security could decline significantly, and a portion of the distributions to Portfolio shareholders could be recharacterized as taxable. The U.S. Congress has considered changes to U.S. federal tax law that would, if enacted, have a negative impact on certain types of municipal securities, such as private activity bonds, or would otherwise make investments in municipal bonds less attractive.
LIBOR Transition and Associated Risk—The Portfolios may invest in debt securities, derivatives or other financial instruments that utilize the London Interbank Offered Rate, or “LIBOR,” as a “benchmark” or “reference rate” for various interest rate calculations. The United Kingdom Financial Conduct Authority, which regulates LIBOR, will cease publishing certain LIBOR benchmarks at the end of 2021. Although certain LIBOR rates are intended to be published until June 2023, banks are strongly encouraged to cease entering into agreements with counterparties referencing LIBOR by the end of 2021. Although financial regulators and industry working groups have suggested alternative reference rates, such as the European Interbank Offer Rate, the Sterling Overnight Interbank Average Rate and the Secured Overnight Financing Rate, global consensus on alternative rates is lacking and the process for amending existing contracts or instruments to transition away from LIBOR is underway but remains incomplete. The elimination of LIBOR or changes to other reference rates or any other changes or reforms to the determination or supervision of reference rates could have an adverse impact on the market for, or value of, any securities or payments linked to those reference rates, which may adversely affect the Portfolios’ performance and/or net asset value. Uncertainty and risk also remain regarding the willingness and ability of issuers and lenders to include revised provisions in new and existing contracts or instruments. Consequently, the transition away from LIBOR to other reference rates may lead to increased volatility and illiquidity in markets that are tied to LIBOR, fluctuations in values of LIBOR-related investments or investments in issuers that utilize LIBOR, increased difficulty in borrowing or refinancing and diminished effectiveness of hedging strategies, potentially adversely affecting the Portfolios’ performance. Furthermore, the risks associated with the expected discontinuation of LIBOR and transition may be exacerbated if the work necessary to effect an orderly transition to an alternative reference rate is not completed in a timely manner. Because the usefulness of LIBOR as a benchmark could deteriorate during the transition period, these effects could occur prior to the end of 2021.
Cybersecurity Risk—Cybersecurity incidents, both intentional and unintentional, may allow an unauthorized party to gain access to Portfolio assets, customer data (including private shareholder information), or proprietary information, or cause the Portfolios, the Adviser, and/or its service providers (including, but not limited to, fund accountants, custodians, sub-custodians, transfer agents and financial intermediaries) to suffer data breaches, data corruption or lose operational functionality, or prevent Portfolio investors from purchasing, redeeming or exchanging shares or receiving distributions. A Portfolio and the Adviser have limited ability to prevent or mitigate cybersecurity incidents affecting third-party service providers. Cybersecurity incidents may result in financial losses to such Portfolio and its shareholders, and substantial costs may be incurred in order to prevent any future cybersecurity incidents.
| 160 | Sanford C. Bernstein Fund, Inc. | |
Table of Contents
Indemnification Risk—In the ordinary course of business, the Portfolios enter into contracts that contain a variety of indemnifications. The Portfolios’ maximum exposure under these arrangements is unknown. However, the Portfolios have not had prior claims or losses pursuant to these indemnification provisions and expect the risk of loss thereunder to be remote. Therefore, the Portfolios have not accrued any liability in connection with these indemnification provisions.
| NOTE 6. | Capital-Share Transactions |
As of March 31, 2021, the Sanford C. Bernstein Fund, Inc., has authorized 17.5 billion shares of common stock, par value $0.001 per share, of which 3.7 billion shares are allocated to the Overlay Portfolios. Each Class 1 and Class 2 of the Overlay Portfolios with the exception of Class 1 of the Tax-Aware Overlay A Portfolio, is allocated 300 million shares, Class 1 of the Tax-Aware Overlay A Portfolio is allocated 400 million shares.
Share transactions for each Portfolio for the six months ended March 31, 2021 and the year ended September 30, 2020, were as follows:
| OVERLAY A PORTFOLIO | ||||||||||||||||||||
| SHARES | AMOUNT | |||||||||||||||||||
| SIX MONTHS ENDED 3/31/21 (UNAUDITED) | YEAR ENDED 9/30/20 | SIX MONTHS ENDED 3/31/21 (UNAUDITED) | YEAR ENDED 9/30/20 | |||||||||||||||||
Class 1 Shares |
| |||||||||||||||||||
Shares sold | 3,910,319 | 9,674,012 | $ | 55,643,064 | $ | 119,729,191 | ||||||||||||||
Shares issued on reinvestment of dividends and distributions | 859,674 | 1,383,148 | 12,087,010 | 18,658,662 | ||||||||||||||||
Shares redeemed | (12,647,761 | ) | (23,440,896 | ) | (177,806,582 | ) | (292,755,966 | ) | ||||||||||||
|
|
|
|
|
|
|
| |||||||||||||
Net decrease | (7,877,768 | ) | (12,383,736 | ) | $ | (110,076,508 | ) | $ | (154,368,113 | ) | ||||||||||
|
|
|
|
|
|
|
| |||||||||||||
Class 2 Shares |
| |||||||||||||||||||
Shares sold | 2,206,218 | 4,501,945 | $ | 31,873,126 | $ | 57,314,237 | ||||||||||||||
Shares issued on reinvestment of dividends and distributions | 212,069 | 336,348 | 2,983,822 | 4,540,703 | ||||||||||||||||
Shares redeemed | (5,501,345 | ) | (6,014,690 | ) | (77,956,384 | ) | (76,543,765 | ) | ||||||||||||
|
|
|
|
|
|
|
| |||||||||||||
Net decrease | (3,083,058 | ) | (1,176,397 | ) | $ | (43,099,436 | ) | $ | (14,688,825 | ) | ||||||||||
|
|
|
|
|
|
|
| |||||||||||||
2021 Semi-Annual Report | 161 | |
Table of Contents
Notes to Financial Statements (continued)
| TAX-AWARE OVERLAY A PORTFOLIO | ||||||||||||||||||||
| SHARES | AMOUNT | |||||||||||||||||||
| SIX MONTHS ENDED 3/31/21 (UNAUDITED) | YEAR ENDED 9/30/20 | SIX MONTHS ENDED 3/31/21 (UNAUDITED) | YEAR ENDED 9/30/20 | |||||||||||||||||
Class 1 Shares |
| |||||||||||||||||||
Shares sold | 5,282,840 | 13,259,385 | $ | 80,092,319 | $ | 174,460,497 | ||||||||||||||
Shares issued on reinvestment of dividends and distributions | 1,373,309 | 2,217,627 | 20,517,230 | 31,645,542 | ||||||||||||||||
Shares redeemed | (15,220,368 | ) | (44,851,390 | ) | (227,465,826 | ) | (585,524,292 | ) | ||||||||||||
|
|
|
|
|
|
|
| |||||||||||||
Net decrease | (8,564,219 | ) | (29,374,378 | ) | $ | (126,856,277 | ) | $ | (379,418,253 | ) | ||||||||||
|
|
|
|
|
|
|
| |||||||||||||
Class 2 Shares |
| |||||||||||||||||||
Shares sold | 1,906,955 | 4,715,526 | $ | 29,127,611 | $ | 62,156,033 | ||||||||||||||
Shares issued on reinvestment of dividends and distributions | 450,318 | 784,938 | 6,732,259 | 11,216,754 | ||||||||||||||||
Shares redeemed | (4,986,723 | ) | (18,952,303 | ) | (74,519,373 | ) | (249,019,283 | ) | ||||||||||||
|
|
|
|
|
|
|
| |||||||||||||
Net decrease | (2,629,450 | ) | (13,451,839 | ) | $ | (38,659,503 | ) | $ | (175,646,496 | ) | ||||||||||
|
|
|
|
|
|
|
| |||||||||||||
| OVERLAY B PORTFOLIO | ||||||||||||||||||||
| SHARES | AMOUNT | |||||||||||||||||||
| SIX MONTHS ENDED 3/31/21 (UNAUDITED) | YEAR ENDED 9/30/20 | SIX MONTHS ENDED 3/31/21 (UNAUDITED) | YEAR ENDED 9/30/20 | |||||||||||||||||
Class 1 Shares |
| |||||||||||||||||||
Shares sold | 4,028,592 | 10,330,776 | $ | 45,787,073 | $ | 109,177,108 | ||||||||||||||
Shares issued on reinvestment of dividends and distributions | 1,996,152 | 2,409,907 | 22,576,479 | 25,954,700 | ||||||||||||||||
Shares redeemed | (8,269,159 | ) | (16,004,959 | ) | (94,045,126 | ) | (168,880,381 | ) | ||||||||||||
|
|
|
|
|
|
|
| |||||||||||||
Net decrease | (2,244,415 | ) | (3,264,276 | ) | $ | (25,681,574 | ) | $ | (33,748,573 | ) | ||||||||||
|
|
|
|
|
|
|
| |||||||||||||
Class 2 Shares |
| |||||||||||||||||||
Shares sold | 2,134,211 | 3,292,713 | $ | 24,469,823 | $ | 35,567,153 | ||||||||||||||
Shares issued on reinvestment of dividends and distributions | 412,613 | 624,660 | 4,674,906 | 6,746,323 | ||||||||||||||||
Shares redeemed | (3,476,443 | ) | (5,305,376 | ) | (39,523,162 | ) | (56,623,195 | ) | ||||||||||||
|
|
|
|
|
|
|
| |||||||||||||
Net decrease | (929,619 | ) | (1,388,003 | ) | $ | (10,378,433 | ) | $ | (14,309,719 | ) | ||||||||||
|
|
|
|
|
|
|
| |||||||||||||
| 162 | Sanford C. Bernstein Fund, Inc. | |
Table of Contents
| TAX-AWARE OVERLAY B PORTFOLIO | ||||||||||||||||||||
| SHARES | AMOUNT | |||||||||||||||||||
| SIX MONTHS ENDED 3/31/21 (UNAUDITED) | YEAR ENDED 9/30/20 | SIX MONTHS ENDED 3/31/21 (UNAUDITED) | YEAR ENDED 9/30/20 | |||||||||||||||||
Class 1 Shares |
| |||||||||||||||||||
Shares sold | 3,663,572 | 10,681,471 | $ | 43,054,789 | $ | 116,429,580 | ||||||||||||||
Shares issued on reinvestment of dividends and distributions | 1,732,503 | 1,265,015 | 20,200,980 | 14,180,821 | ||||||||||||||||
Shares redeemed | (7,298,814 | ) | (22,327,779 | ) | (85,691,911 | ) | (241,712,461 | ) | ||||||||||||
|
|
|
|
|
|
|
| |||||||||||||
Net decrease | (1,902,739 | ) | (10,381,293 | ) | $ | (22,436,142 | ) | $ | (111,102,060 | ) | ||||||||||
|
|
|
|
|
|
|
| |||||||||||||
Class 2 Shares |
| |||||||||||||||||||
Shares sold | 1,688,248 | 4,282,458 | $ | 19,970,372 | $ | 47,242,006 | ||||||||||||||
Shares issued on reinvestment of dividends and distributions | 793,587 | 616,413 | 9,269,101 | 6,916,149 | ||||||||||||||||
Shares redeemed | (5,138,093 | ) | (12,746,387 | ) | (60,864,694 | ) | (136,961,799 | ) | ||||||||||||
|
|
|
|
|
|
|
| |||||||||||||
Net decrease | (2,656,258 | ) | (7,847,516 | ) | $ | (31,625,221 | ) | $ | (82,803,644 | ) | ||||||||||
|
|
|
|
|
|
|
| |||||||||||||
| TAX-AWARE OVERLAY C PORTFOLIO | ||||||||||||||||||||
| SHARES | AMOUNT | |||||||||||||||||||
| SIX MONTHS ENDED 3/31/21 (UNAUDITED) | YEAR ENDED 9/30/20 | SIX MONTHS ENDED 3/31/21 (UNAUDITED) | YEAR ENDED 9/30/20 | |||||||||||||||||
Class 1 Shares |
| |||||||||||||||||||
Shares sold | 966,277 | 2,855,197 | $ | 11,293,348 | $ | 30,972,528 | ||||||||||||||
Shares issued on reinvestment of dividends and distributions | 443,699 | 344,619 | 5,160,211 | 3,873,519 | ||||||||||||||||
Shares redeemed | (2,554,194 | ) | (7,247,190 | ) | (29,769,124 | ) | (78,693,920 | ) | ||||||||||||
|
|
|
|
|
|
|
| |||||||||||||
Net decrease | (1,144,218 | ) | (4,047,374 | ) | $ | (13,315,565 | ) | $ | (43,847,873 | ) | ||||||||||
|
|
|
|
|
|
|
| |||||||||||||
Class 2 Shares |
| |||||||||||||||||||
Shares sold | 85,858 | 2,112,043 | $ | 1,006,592 | $ | 22,544,830 | ||||||||||||||
Shares issued on reinvestment of dividends and distributions | 260,481 | 210,696 | 3,032,003 | 2,370,324 | ||||||||||||||||
Shares redeemed | (1,502,134 | ) | (3,737,794 | ) | (17,581,914 | ) | (40,497,547 | ) | ||||||||||||
|
|
|
|
|
|
|
| |||||||||||||
Net decrease | (1,155,795 | ) | (1,415,055 | ) | $ | (13,543,319 | ) | $ | (15,582,393 | ) | ||||||||||
|
|
|
|
|
|
|
| |||||||||||||
2021 Semi-Annual Report | 163 | |
Table of Contents
Notes to Financial Statements (continued)
| TAX-AWARE OVERLAY N PORTFOLIO | ||||||||||||||||||||
| SHARES | AMOUNT | |||||||||||||||||||
| SIX MONTHS ENDED 3/31/21 (UNAUDITED) | YEAR ENDED 9/30/20 | SIX MONTHS ENDED 3/31/21 (UNAUDITED) | YEAR ENDED 9/30/20 | |||||||||||||||||
Class 1 Shares |
| |||||||||||||||||||
Shares sold | 528,024 | 2,133,996 | $ | 6,093,154 | $ | 22,688,560 | ||||||||||||||
Shares issued on reinvestment of dividends and distributions | 443,500 | 362,597 | 5,086,947 | 4,032,078 | ||||||||||||||||
Shares redeemed | (2,302,826 | ) | (5,428,887 | ) | (26,423,185 | ) | (57,916,974 | ) | ||||||||||||
|
|
|
|
|
|
|
| |||||||||||||
Net decrease | (1,331,302 | ) | (2,932,294 | ) | $ | (15,243,084 | ) | $ | (31,196,336 | ) | ||||||||||
|
|
|
|
|
|
|
| |||||||||||||
Class 2 Shares |
| |||||||||||||||||||
Shares sold | 319,197 | 621,765 | $ | 3,717,333 | $ | 6,655,978 | ||||||||||||||
Shares issued on reinvestment of dividends and distributions | 97,786 | 101,716 | 1,122,583 | 1,132,094 | ||||||||||||||||
Shares redeemed | (709,434 | ) | (1,947,578 | ) | (8,248,255 | ) | (20,552,751 | ) | ||||||||||||
|
|
|
|
|
|
|
| |||||||||||||
Net decrease | (292,451 | ) | (1,224,097 | ) | $ | (3,408,339 | ) | $ | (12,764,679 | ) | ||||||||||
|
|
|
|
|
|
|
| |||||||||||||
| NOTE 7. | Subsequent Events |
Management has evaluated subsequent events for possible recognition or disclosure in the financial statements through the date the financial statements are issued. Management has determined that there are no material events that would require disclosure in the Portfolios’ financial statements through this date.
| 164 | Sanford C. Bernstein Fund, Inc. | |
Table of Contents
Sanford C. Bernstein Fund, Inc.—Overlay Portfolios
BOARDOF DIRECTORS
Debra Perry*,^
Chair
Beata D. Kirr
President
R. Jay Gerken*,^
Director
Jeffrey R. Holland*
Director
William Kristol*
Director
Michelle McCloskey*
Director
Donald K. Peterson*
Director
OFFICERS
Alexander Barenboym(1)
Vice President
Daniel J. Loewy(1)
Vice President
Caglasu Altunkopru(1)
Vice President
Emilie D. Wrapp
Secretary
Michael B. Reyes
Senior Analyst
Joseph J. Mantineo
Treasurer and Chief Financial Officer
Phyllis J. Clarke
Controller
Vincent S. Noto
Chief Compliance Officer
INDEPENDENT REGISTEREDPUBLIC ACCOUNTING FIRM
PricewaterhouseCoopers LLP
300 Madison Avenue
New York, New York 10017
LEGAL COUNSEL
Willkie Farr & Gallagher LLP
787 Seventh Avenue
New York, New York 10019
CUSTODIANAND ACCOUNTING AGENT
State Street Bank and Trust Company
State Street Corporation CCB/5
1 Iron Street
Boston, Massachusetts 02210
TRANSFER AGENT
DST Asset Manager Solutions
2000 Crown Colony Drive
Quincy, Massachusetts 02169
INVESTMENT ADVISER
AllianceBernstein L.P.
1345 Avenue of the Americas
New York, New York 10105
| * | Member of the Audit Committee, the Governance, Nominating and Compensation Committee, and the Independent Directors Committee. |
| ^ | Member of the Pricing Committee. |
| (1) | The day-to-day management of, and investment decisions for, the Overlay Portfolios are made by the Asset Allocation Team. Messrs. Barenboym and Loewy, and Ms. Altunkopru are the investment professionals with the most significant responsibility for the day-to-day management of the Funds’ portfolios. |
2021 Semi-Annual Report | 165 | |
Table of Contents
Operation and Effectiveness of the Portfolios’ Liquidity Risk Management Program:
In October 2016, the Securities and Exchange Commission (“SEC”) adopted the open-end fund liquidity rule (the “Liquidity Rule”). In June 2018 the SEC adopted a requirement that funds disclose information about the operation and effectiveness of their Liquidity Risk Management Program (“LRMP”) in their reports to shareholders.
One of the requirements of the Liquidity Rule is for the Portfolios to designate an Administrator of the Portfolios’ Liquidity Risk Management Program. The Administrator of the Portfolios’ LRMP is AllianceBernstein L.P., the Portfolios’ investment adviser (the “Adviser”). The Adviser has delegated the responsibility to its Liquidity Risk Management Committee (the “Committee”).
Another requirement of the Liquidity Rule is for the Fund’s Board of Directors (the “Fund Board”) to receive an annual written report from the Administrator of the LRMP, which addresses the operation of the Portfolios’ LRMP and assesses its adequacy and effectiveness. The Adviser provided the Fund Board with such annual report during the first quarter of 2021, which covered the period January 1, 2020 through December 31, 2020 (the “Program Reporting Period”).
The LRMP’s principal objectives include supporting the Portfolios’ compliance with limits on investments in illiquid assets and mitigating the risk that the Portfolios will be unable to meet their redemption obligations in a timely manner.
Pursuant to the LRMP, the Portfolios classify the liquidity of their portfolio investments into one of the four categories defined by the SEC: Highly Liquid, Moderately Liquid, Less Liquid, and Illiquid. These classifications are reported to the SEC on Form N-PORT.
During the Program Reporting Period, the Committee reviewed whether the Portfolios’ strategy is appropriate for an open-end structure, incorporating any holdings of less liquid and illiquid assets. If the Portfolios participated in derivative transactions, the exposure from such transactions were considered in the LRMP.
The Committee also performed an analysis to determine whether the Portfolios are required to maintain a Highly Liquid Investment Minimum (“HLIM”). The Committee also incorporated the following information when determining the Portfolios’ reasonably anticipated trading size for purposes of liquidity monitoring: historical net redemption activity, the Portfolios’ concentration in an issuer, shareholder concentration, investment performance, total net assets, and distribution channels.
The Adviser informed the Fund Board that the Committee believes the Portfolios’ LRMP is adequately designed, has been implemented as intended, and has operated effectively since its inception. No material exceptions have been noted since the implementation of the LRMP. During the Program Reporting Period, beginning in March 2020, all financial markets experienced extreme levels of price volatility and relative illiquidity resulting from the COVID-19 impacts on the global economy. This extreme relative illiquidity resulted in significantly wider bid-ask spreads to transact in securities, including many of those securities held by the Portfolios, and in a diminished depth of liquidity in most markets, to varying degrees. Nonetheless, there were no liquidity events that impacted the Portfolios or their ability to timely meet redemptions during the Program Reporting Period.
| 166 | Sanford C. Bernstein Fund, Inc. | |
Table of Contents
Board Consideration of Investment Management Arrangement
Sanford C. Bernstein Fund, Inc. (the “Fund”) is subject to Section 15 of the Investment Company Act of 1940, as amended. Section 15 provides that any investment advisory agreement with a registered investment company such as the Fund may continue in effect for a period of more than two years from the date of its execution, only so long as such continuance is specifically approved at least annually by the board of directors (or by vote of a majority of the outstanding voting securities of the investment company). Pursuant to this requirement, the Fund’s Board of Directors, including the Directors who are not interested persons of the Fund (the “Independent Directors”), unanimously approved the continuation of the Investment Management Agreement between the Fund, on behalf of the Tax-Managed International, International, Emerging Markets, Short Duration Diversified Municipal, New York Municipal, California Municipal, Diversified Municipal, Short Duration Plus, Intermediate Duration, Overlay A, Tax-Aware Overlay A, Overlay B, Tax-Aware Overlay B, Tax-Aware Overlay C and Tax-Aware Overlay N Portfolios (each, a “Portfolio” and collectively, the “Portfolios”) of the Fund, and AllianceBernstein L.P. (the “Adviser”)( the “Investment Management Agreement”) at a video conference meeting held on October 28-29, 2020.1
The following discussion describes the considerations in connection with the Board’s review of the Investment Management Agreement.
In connection with the annual review of the continuation of the Investment Management Agreement between the Fund and the Adviser, counsel to the Independent Directors sent a letter to the Adviser dated August 7, 2020, that contained a list of information requested by the Independent Directors to conduct their annual review. The Board of Directors, including the Independent Directors, met by video conference and telephonically and received and evaluated extensive materials relating to the continuation of the Investment Management Agreement from the Adviser during meetings in September and October 2020. In addition, the Board received materials from the Senior Analyst and an independent fee consultant as described below. On September 30, 2020, the Board of Directors held a video conference meeting to discuss its review of the Investment Management Agreement and the materials the Directors had been provided. At that meeting, the Independent Directors met separately with their independent counsel and the Senior Analyst and the independent fee consultant in executive sessions. Following the September 30, 2020 meeting, the Independent Directors, through counsel, requested certain additional information by means of a letter from their independent counsel dated October 5, 2020, and the Adviser provided certain additional information by means of a letter dated October 15, 2020. The Independent Directors held a telephonic meeting on October 20, 2020 with their independent counsel and the Senior Analyst to further discuss the contract renewal materials and supplemental materials provided in response to the Board’s request. On October 28-29, 2020, the Board of Directors held a video conference meeting to continue their review of the Investment Management Agreement. During this meeting, the Adviser provided further information to the Board relating to contract renewal, and the Independent Directors also met separately with counsel to the Independent Directors as well as the Senior Analyst to review the contract renewal materials provided by the Adviser and the materials prepared by the Senior Analyst. At the conclusion of this meeting, the Board approved the continuation of the Investment Management Agreement for an additional annual term as described below.
In approving the Investment Management Agreement, the Board, including the Independent Directors, considered all information it deemed reasonably necessary to evaluate the terms of the Investment Management Agreement and considered whether the Agreement would be in the best interests of the Fund. In particular, the Board considered the information that was provided to them by the Adviser in response to their requests, as well as information prepared by the Senior Analyst and the independent fee consultant at the request of the Board. The Fund’s Senior Analyst assists the Board (as well as the boards of other funds sponsored by the Adviser) in evaluating investment management agreements and certain other plans and agreements pursuant to which the Adviser or its affiliates provide services to the Funds. The Board also considered other information provided to the Board in connection with the September 30, 2020, and October 28-29, 2020 meetings and throughout the past year.
The information considered by the Board included information with respect to the nature, extent and quality of services provided, investment performance, fees and expenses, profitability, economies of scale, and fall-out benefits and other revenue.
1 The meeting was held by video conference in view of the ongoing COVID-19 pandemic and based on exemptive relief issued by the Securities and Exchange Commission, with the Board’s intention to ratify the approval of the Investment Management Agreement at its next in-person meeting.
2021 Semi-Annual Report | 167 | |
Table of Contents
Board Consideration of Investment Management Arrangement (continued)
In the Board’s consideration of the factors discussed below, no single factor was considered in isolation or to be determinative to the decision of the Board to approve the Investment Management Agreement. Rather, the Board concluded, in light of a weighing and balancing of all factors considered and in the exercise of the Directors’ business judgment, that it was in the best interests of the Fund to approve the Investment Management Agreement including the fees to be charged for services thereunder, as summarized below.
Fees and Expenses
The Board, including the Independent Directors, compared the fees and expense ratios of each Portfolio (before and after any fee waivers and expense reimbursements) against fees and expense ratios of a peer group of funds with similar investment objectives (“peer group”). Both the peer group and the funds within the peer group, with respect to the fee and expense data, were available from Strategic Insight, an independent provider of investment company data. The Senior Analyst also performed analyses of the advisory fees, and compared such analyses to the Portfolios’ peer groups. In addition, the Board received and considered information from an independent fee consultant regarding the fees and expenses of the Portfolios as well as their investment performance.
The Board also received and considered information about the services rendered, and the fee rates charged, to other clients advised by the Adviser, including information about any recent advisory fee changes with respect to other investment companies advised by the Adviser. The Board noted the differences between the services provided to the Portfolios in comparison to those provided to other types of clients, including institutional clients and other investment companies for which the Adviser acted as subadviser, and the differences in the entrepreneurial and other risks borne by the Adviser in serving the Portfolios compared to other types of clients.
The Board noted that the Adviser will begin voluntarily waiving the 0.10% shareholder servicing fee for the private client class of the Short Duration Plus Portfolio and the Short Duration Diversified Municipal Portfolio effective with the new term of the shareholder servicing agreement. The Board also noted the Adviser’s proposal to modify the advisory fee schedule of the Overlay A and Tax-Aware Overlay Portfolios by reducing the level where each Portfolio reaches its first breakpoint, and adding a new breakpoint on assets over $5 billion, and that this advisory fee change was expected to provide immediate savings to the Tax-Aware Overlay A Portfolio based on current asset levels.
On the basis of its review and consideration of the fees as described above and the Board’s consideration of the other factors described below, and in light of the Adviser’s agreement to reduce certain fees and to apply certain fee waivers and/or expense caps for certain Portfolios, the Board concluded that the contractual advisory fees as proposed were reasonable.
Nature, Extent and Quality of Services Provided
The Board, including the Independent Directors, considered the nature, quality and extent of services performed by the Adviser and its affiliates gained from their experience as Directors of the Fund, their overall confidence in the Adviser’s integrity and competence they have gained from that experience, and the Adviser’s initiative in identifying and raising potential issues with the Directors. The Board also considered the Adviser’s responsiveness, frankness and attention to concerns raised by the Directors from time to time, including the Adviser’s willingness to consider and implement organizational changes designed to improve investment results and the services provided to the Portfolios. The Board also considered the scope and quality of the Adviser’s investment management capabilities, other resources dedicated to performing its services, the quality of its compliance, administrative and other services provided to the Portfolios and the background and experience of the Adviser’s senior management. The Board reviewed the qualifications, backgrounds and responsibilities of the investment staff primarily responsible for day-to-day portfolio management services for each Portfolio and noted the Adviser’s commitment to strong research and investment management capabilities throughout changing market environments. The Board reviewed the compliance and administrative services of the Adviser that support the investment advisory services provided to the Portfolios. The Board also considered how the organizational capabilities and financial condition of the Adviser may affect the nature and quality of its services. In that regard, the Board considered information about the impact of the COVID-19 pandemic on the Adviser’s operations and the Adviser’s ability to continue to provide the same scope and quality of services to the Portfolios as before the pandemic. The Board considered the ongoing impacts of the relocation of substantial operations of the Adviser from the New York City area to Nashville, Tennessee as well as the implications of a substantial number of the Adviser’s employees working
| 168 | Sanford C. Bernstein Fund, Inc. | |
Table of Contents
from home during the pandemic. The Board also noted that the Adviser and its affiliates had continued to update the Board on matters relating to the sale by AXA, S.A., previously an indirect parent of AllianceBernstein Corporation, the general partner of the Adviser, of its remaining ownership interest in its U.S. subsidiary, Equitable Holdings, Inc. The Board considered the statements of the Adviser that it has continued to operate as an independent, publicly-traded US asset manager, that the divestiture has not materially changed the Adviser’s current management structure or strategy, and that the Adviser does not believe that the divestiture will have a material impact on the Adviser with respect to its operations, personnel, organizational structure, or capitalization, financial and other resources.
In considering the nature and quality of the services provided by the Adviser, the Board, including the Independent Directors, received and considered information about each Portfolio’s investment performance, as well as the performance of its peer group and the performance of an appropriate benchmark index. The Board was provided with performance data versus each Portfolio’s peer group, for the 1-year, 3-year, 5-year and 10-year periods, as applicable, ended July 31, 2020 and versus each Portfolio’s benchmark index, for the relevant periods, as well as the most recently available Morningstar rating for those Portfolios with an available rating. The Board also received certain updated performance information as of September 30, 2020. In addition, the Directors considered information showing performance compared to peer groups and benchmarks for rolling calendar year periods and the year to date. The Directors also receive detailed comparative performance information for the Portfolios at each regular Board meeting during the year. The Board recognized that the benchmark indices do not account for fees and expenses incurred by a fund, including the Portfolios. The Directors also considered how peer groups have changed over time and how comparisons may differ depending upon the selection of the peer groups or benchmark indices.
The Directors noted the complexity of the Overlay Portfolios, in particular the complexity of managing the globally diversified set of asset classes and derivatives in which the Overlay Portfolios can invest as well as the complexity of dynamically allocating assets through the Overlay Portfolios among various asset classes as economic and market conditions change in seeking to provide the desired risk/return trade-off for their investors in light of their overall portfolios (and not just their investment in the Overlay Portfolios themselves). The Board reviewed the performance of the Overlay Portfolios in response to the increased market volatility and the performance of the Overlay Portfolios’ dynamic asset allocation component during this unusual market environment. With respect to the International Portfolio and the Tax-Managed International Portfolio, the Board considered that, subject to shareholder approval, the two Portfolios would be merged into another portfolio managed by the Adviser in late 2020 or early 2021. In evaluating the performance of the Portfolios that invest primarily in fixed-income securities, the Directors considered whether those Portfolios may have incurred less credit risk or interest rate risk, or both, in relation to their peer groups and benchmark indices. Where the Portfolios had underperformed their peer groups or benchmark indices, the Directors considered the Adviser’s explanations for performance and, as applicable, measures the Adviser had taken or proposed to take to improve performance. In particular, for those Portfolios that pursue a value strategy, the Directors noted the Adviser’s explanation regarding the recent underperformance of value strategies generally versus growth strategies. The Directors also noted the Adviser’s explanation that certain Portfolios are designed to maintain higher credit quality and a more conservative approach versus the funds in its relevant peer group, and that as a result of a lower risk profile, those Portfolios have underperformed the peer group during periods when riskier assets have outperformed. The Directors noted generally the Adviser’s continued efforts to enhance the services provided to the Portfolios, including but not limited to, its continued research efforts to enhance the dynamic asset allocation component utilized by the Overlay Portfolios. The Directors also noted that they would continue to monitor investment performance closely.
The Board concluded that the Adviser had the experience and resources necessary to provide services of appropriate nature, quality and scope with respect to the Portfolios.
Profitability
The Board, including the Independent Directors, considered the level of the Adviser’s profits in respect of its management of the respective Portfolios. The materials provided to the Independent Directors included information indicating the profitability of the Portfolios to the Adviser for calendar years 2018 and 2019, which had been reviewed by an independent consultant. The Directors reviewed the assumptions and methods of allocation used by the Adviser in preparing fund-specific profitability data and noted that there are many potentially acceptable allocation methodologies for information of this type. The Directors noted that they received information regarding all revenues and expenses of
2021 Semi-Annual Report | 169 | |
Table of Contents
Board Consideration of Investment Management Arrangement (continued)
the Adviser’s relationship with the Fund, including those relating to the Adviser’s subsidiaries that provide transfer agency and, distribution services to the Fund, and that they had focused on profitability before taxes and distribution expenses. The Directors reviewed comparative information regarding profitability for other publicly-traded advisers, recognizing that it is difficult to make comparisons of profitability among fund advisory contracts because only limited comparative information is publicly available and the comparisons are affected by numerous factors including different cost accounting methodologies.
After reviewing all relevant factors, the Directors, including the Independent Directors, concluded that the levels of the Adviser’s profits in respect of its management of the Portfolios were not excessive.
Economies of Scale
The Board, including the Independent Directors, considered whether there have been economies of scale in respect of the management of the Portfolios, whether the Portfolios have appropriately benefited from any economies of scale, and whether there is potential for realization of any further economies of scale. The Directors discussed possible ways in which any such economies of scale may be shared with the Portfolios, including by investment in enhanced services.
The Directors also considered the Senior Analyst materials which they received in connection with the review of the Investment Management Agreement, which included information reflecting changes in asset levels of the Portfolios and in the profitability of the Adviser over various periods.
After reviewing the profitability and economies of scale information provided by the Adviser, the Board concluded that the benefits of any economies of scale were appropriately being shared with Portfolio investors by way of, among other things and as applicable, establishing advisory fees at levels that contemplated future achievement of scale, recent fee reductions for the Short Duration Diversified Municipal, Short Duration Plus, Intermediate Duration, Tax-Managed International, International, and Emerging Markets Portfolios, breakpoint arrangements including the lowering of the first breakpoint and the addition of a new breakpoint in the advisory fee schedule for the Overlay A and Tax-Aware Overlay A Portfolios as well as other recently adopted or modified breakpoints for certain Portfolios, expense caps and waivers applying to select Portfolios, and the Adviser’s continued reinvestment in the business, including by researching and implementing new product enhancements. The Directors also noted that they would continue to monitor the growth of the Portfolios.
Fall-Out Benefits and Other Revenue
The Board, including the Independent Directors, also took into account so-called “fall-out benefits” to the Adviser, such as soft dollar arrangements (whereby the Adviser receives the benefit of research services from many of the brokers and dealers that execute purchases and sales of securities on behalf of its clients on an agency basis), Rule 12b-1 fees and sales charges received by the principal underwriter (which is a wholly owned subsidiary of the Adviser) with respect to the retail share classes of certain Portfolios, and transfer agency fees paid by the retail share classes of certain Portfolios to a wholly-owned subsidiary of the Adviser. The Directors recognized that the Adviser’s profitability would be lower without these benefits. They also considered other benefits potentially derived from an increase in the Adviser’s business as a result of its relationship with the Fund. The Directors concluded that these fall-out benefits to the Adviser were acceptable.
| 170 | Sanford C. Bernstein Fund, Inc. | |
Table of Contents
Advisory Fee Rate Schedule
On the basis of the information considered, the Board determined to approve the continuation of the Investment Management Agreement for an additional annual term, without change to the contractual fee schedules of the Portfolios other than the new breakpoints established for the Overlay A Portfolio and the Tax-Aware Overlay Portfolio, as set forth below.
| PORTFOLIO | ANNUAL PERCENTAGE OF AVERAGE DAILY NET ASSETS OF EACH PORTFOLIO | |
| Short Duration Diversified Municipal Portfolio | 0.30% of the first $750 million; 0.25% of assets in excess of $750 million | |
| Short Duration Plus Portfolio | 0.35% of the first $750 million; 0.30% of assets in excess of $750 million | |
| New York Municipal Portfolio | 0.425% of the first $1 billion; 0.375% in excess of $1 billion up to, but not exceeding $3 billion; 0.325% in excess of $3 billion up to, but not exceeding $5 billion; 0.275% of assets in excess of $5 billion | |
| California Municipal Portfolio | 0.425% of the first $1 billion; 0.375% in excess of $1 billion up to, but not exceeding $3 billion; 0.325% in excess of $3 billion up to, but not exceeding $5 billion; 0.275% of assets in excess of $5 billion | |
| Diversified Municipal Portfolio | 0.425% of the first $1 billion; 0.375% in excess of $1 billion up to, but not exceeding $3 billion; 0.325% in excess of $3 billion up to, but not exceeding $5 billion; 0.275% in excess of $5 billion up to, but not exceeding $7 billion; 0.225% of assets in excess of $7 billion | |
| Intermediate Duration Portfolio | 0.45% on the first $2.5 billion; 0.40% in excess of $2.5 billion up to, but not exceeding $5 billion; 0.35% in excess of $5 billion up to, but not exceeding $8 billion; 0.30% of assets in excess of $8 billion | |
| Tax-Managed International Portfolio | 0.75% on the first $2.5 billion; 0.65% in excess of $2.5 billion up to, but not exceeding $5 billion; 0.60% of assets in excess of $5 billion | |
| International Portfolio | 0.75% on the first $2.5 billion; 0.65% in excess of $2.5 billion up to, but not exceeding $5 billion; 0.60% of assets in excess of $5 billion | |
| Emerging Markets Portfolio | 0.95% of the first $2.5 billion; 0.90% in excess of $2.5 billion up to, but not exceeding $5 billion; 0.85% of assets in excess of $5 billion. | |
| Overlay A Portfolio | 0.90% of the first $2.5 billion; 0.875% in excess of $2.5 billion up to, but not exceeding $5 billion; 0.85% of assets in excess of $5 billion. | |
| Tax-Aware Overlay A Portfolio | 0.90% of the first $2.5 billion; 0.875% in excess of $2.5 billion up to, but not exceeding $5 billion; 0.85% of assets in excess of $5 billion. | |
| Overlay B Portfolio | 0.65% of assets. | |
| Tax-Aware Overlay B Portfolio | 0.65% of assets. | |
| Tax-Aware Overlay C Portfolio | 0.65% of assets. | |
| Tax-Aware Overlay N Portfolio | 0.65% of assets. |
2021 Semi-Annual Report | 171 | |
Table of Contents

Distributor
SANFORD C. BERNSTEIN FUND, INC.
1345 AVENUEOFTHE AMERICAS, NEW YORK, NY 10105
(212) 756-4097
SCBII-1947-0321
Table of Contents
ITEM 2. CODE OF ETHICS.
Not applicable when filing a semi-annual report to shareholders.
ITEM 3. AUDIT COMMITTEE FINANCIAL EXPERT.
Not applicable when filing a semi-annual report to shareholders.
ITEM 4. PRINCIPAL ACCOUNTANT FEES AND SERVICES.
Not applicable when filing a semi-annual report to shareholders.
ITEM 5. AUDIT COMMITTEE OF LISTED REGISTRANTS.
Not applicable to the registrant.
ITEM 6. INVESTMENTS.
Please see Schedule of Investments contained in the Report to Shareholders included under Item 1 of this Form N-CSR.
ITEM 7. DISCLOSURE OF PROXY VOTING POLICIES AND PROCEDURES FOR CLOSED-END MANAGEMENT INVESTMENT COMPANIES.
Not applicable to the registrant.
ITEM 8. PORTFOLIO MANAGERS OF CLOSED-END MANAGEMENT INVESTMENT COMPANIES.
Not applicable to the registrant.
ITEM 9. PURCHASES OF EQUITY SECURITIES BY CLOSED-END MANAGEMENT INVESTMENT COMPANY AND AFFILIATED PURCHASERS.
Not applicable to the registrant.
ITEM 10. SUBMISSION OF MATTERS TO A VOTE OF SECURITY HOLDERS.
There have been no material changes to the procedures by which shareholders may recommend nominees to the Fund’s Board of Directors since the Fund last provided disclosure in response to this item.
Table of Contents
ITEM 11. CONTROLS AND PROCEDURES.
(a) The registrant’s principal executive officer and principal financial officer have concluded that the registrant’s disclosure controls and procedures (as defined in Rule 30a-2(c) under the Investment Company Act of 1940, as amended) are effective at the reasonable assurance level based on their evaluation of these controls and procedures as of a date within 90 days of the filing date of this document.
(b) There were no changes in the registrant’s internal controls over financial reporting that occurred during the second fiscal quarter of the period that has materially affected, or is reasonably likely to materially affect, the registrant’s internal control over financial reporting.
ITEM 12. DISCLOSURE OF SECURITIES LENDING ACTIVITIES FOR CLOSED-END MANAGEMENT INVESTMENT COMPANIES.
Not applicable to the registrant.
ITEM 13. EXHIBITS.
The following exhibits are attached to this Form N-CSR:
Table of Contents
SIGNATURES
Pursuant to the requirements of the Securities Exchange Act of 1934 and the Investment Company Act of 1940, the registrant has duly caused this report to be signed on its behalf by the undersigned, thereunto duly authorized.
(Registrant): Sanford C. Bernstein Fund, Inc.
| By: | /s/ Beata Kirr | |
| Beata Kirr | ||
| President |
| Date: May 27, 2021 | ||
Pursuant to the requirements of the Securities Exchange Act of 1934 and the Investment Company Act of 1940, this report has been signed below by the following persons on behalf of the registrant and in the capacities and on the dates indicated.
| By: | /s/ Beata Kirr | |
| Beata Kirr | ||
| President |
| Date: May 27, 2021 | ||
| By: | /s/ Joseph J. Mantineo | |
| Joseph J. Mantineo | ||
| Treasurer and Chief Financial Officer | ||
| Date: May 27, 2021 | ||