UNITED STATES
SECURITIES AND EXCHANGE COMMISSION
Washington, D.C. 20549
FORM N-CSRS
CERTIFIED SHAREHOLDER REPORT OF REGISTERED MANAGEMENT
INVESTMENT COMPANIES
Investment Company Act file number 811-05557
Prospect Street® High Income Portfolio Inc.
(Exact name of registrant as specified in charter)
13455 Noel Road, Suite 800
Dallas, Texas 75240
(Address of principal executive offices) (Zip code)
James D. Dondero
Highland Capital Management, L.P.
13455 Noel Road, Suite 800
Dallas, Texas 75240
(Name and address of agent for service)
Registrant’s telephone number, including area code: (877) 532-2834
| | | | | |
| Date of fiscal year end: | | October 31 | | |
| Date of reporting period: | | April 30, 2006 | | |
Form N-CSR is to be used by management investment companies to file reports with the Commission not later than 10 days after the transmission to stockholders of any report that is required to be transmitted to stockholders under Rule 30e-1 under the Investment Company Act of 1940 (17 CFR 270.30e-1). The Commission may use the information provided on Form N-CSR in its regulatory, disclosure review, inspection, and policymaking roles.
A registrant is required to disclose the information specified by Form N-CSR, and the Commission will make this information public. A registrant is not required to respond to the collection of information contained in Form N-CSR unless the Form displays a currently valid Office of Management and Budget (“OMB”) control number. Please direct comments concerning the accuracy of the information collection burden estimate and any suggestions for reducing the burden to Secretary, Securities and Exchange Commission, 100 F Street, NE, Washington, DC 20549. The OMB has reviewed this collection of information under the clearance requirements of 44 U.S.C. § 3507.
Item 1. Reports to Stockholders.
The Report to Shareholders is attached herewith.
Prospect Street High Income Portfolio, Inc.
13455 Noel Road, Suite 800
Dallas, TX 75240
PHYMC-2QR-0406
Prospect Street®
High Income Portfolio, Inc.
Semi-Annual Report
April 30, 2006
Contents
This report has been prepared for the information of shareholders of Prospect Street High Income Portfolio, Inc.
2
June 1, 2006
Letter to Shareholders
Dear Shareholders:
We are pleased to provide you with our report for the six months ended April 30, 2006. On April 30, 2006, the net asset value of the Fund was $3.57 per share, as compared to $3.25 on October 31, 2005. On April 30, 2006, the closing market price of the Fund’s shares on the New York Stock Exchange was $3.14 per share, as compared to $2.77 on October 31, 2005. During the six months ended April 30, 2006, the Fund distributed to common stock shareholders $0.13 per share, including potential returns of capital.
The Fund’s Investments:
The total return on the Fund’s per share market price, assuming reinvestment of dividends, for the six months ended April 30, 2006, including any potential returns of capital, was 18.17%. The total return on the Fund’s net assets, including any potential returns of capital, was 14.50% for the six months ended April 30, 2006. The variation in total returns is attributable to the increase in the market price of the Fund’s shares of 13.36% relative to an increase in the net asset value of the Fund’s shares of 9.85% during the period.
Dividend Declaration:
On May 19, 2006, the Board of Directors declared a dividend of $0.023 per common share, payable on the last day of business for the month of June and July.
Respectfully submitted,

James Dondero
President

Mark Okada
Executive Vice President
3
PROSPECT STREET HIGH INCOME PORTFOLIO, INC.
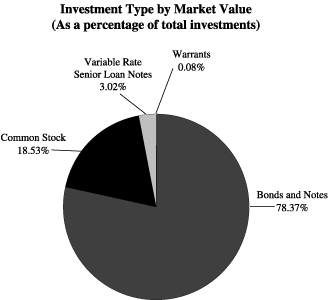
Portfolio Statistics
As of April 30, 2006 (unaudited)
4
PROSPECT STREET HIGH INCOME PORTFOLIO, INC.
Schedule of Investments (unaudited)
As of April 30, 2006
| | | | | | | | | | | | | | | | | |
| | | | | | | Ratings | | | | |
| Principal | | | | | | | | | Standard & | | | Value | |
| Amount | | | Description | | Moody's | | | Poor's | | | (Note 2a) | |
| Variable Rate Senior Loan Notes (c) — 3.84% (a) | | | | | | | | | | | | |
| | | | | Aerospace and Defense - 1.85% | | | | | | | | | | | | |
| $ | 2,000,000 | | | IAP Worldwide Services, Inc., 12.63%, 06/20/13 | | | B3 | | | | B3 | | | $ | 2,047,500 | |
| | | | | | | | | | | | | | | | |
| | | | | | | | | | | | | | | | 2,047,500 | |
| | | | | | | | | | | | | | | | |
| | | | | Hotels, Motels, Inns and Gaming - 0.09% | | | | | | | | | | | | |
| | 98,541 | | | Resorts International Holdings, LLC, 12.03%, 04/26/13 | | Caa2 | | | CCC- | | | | 100,019 | |
| | | | | | | | | | | | | | | | |
| | | | | | | | | | | | | | | | 100,019 | |
| | | | | | | | | | | | | | | | |
| | | | | Utilities - 1.90% | | | | | | | | | | | | |
| | 2,000,000 | | | Calpine Generating Co., LLC, 8.58%, 04/01/2009 | | | B3 | | | | D | | | | 2,092,860 | |
| | | | | | | | | | | | | | | | |
| | | | | | | | | | | | | | | | 2,092,860 | |
| | | | | | | | | | | | | | | | |
| | | | | Total Variable Rate Senior Loan Notes (cost $4,150,873) | | | | | | | | | | | 4,240,379 | |
| | | | | | | | | | | | | | | | |
| Bonds and Notes - 99.85% (a) | | | | | | | | | | | | |
| | | | | Automobile - 3.62% | | | | | | | | | | | | |
| | 2,000,000 | | | American Tire Distributors Holdings, Inc., 11.24%, 04/01/2012 | | Caa2 | | | CCC+ | | | | 1,880,000 | |
| | 3,000,000 | | | Delphi Corp., 6.50%, 05/01/2009 (e) (f) | | WR | | | NR | | | | 2,107,500 | |
| | | | | | | | | | | | | | | | |
| | | | | | | | | | | | | | | | 3,987,500 | |
| | | | | | | | | | | | | | | | |
| | | | | Broadcasting and Entertainment - 8.43% | | | | | | | | | | | | |
| | 2,861,000 | | | CCH I, LLC, 11.00%, 10/01/2015 | | Caa3 | | | CCC- | | | | 2,560,595 | |
| | 3,000,000 | | | CCO Holdings, LLC, 8.75%, 11/15/2013 | | | B3 | | | CCC- | | | | 2,955,000 | |
| | 1,000,000 | | | PRIMEDIA, Inc., 10.12%, 05/15/2010 | | | B2 | | | | B | | | | 1,027,500 | |
| | 3,000,000 | | | Young Broadcasting, Inc., 10.00%, 03/01/2011 (f) | | Caa2 | | | CCC- | | | | 2,752,500 | |
| | | | | | | | | | | | | | | | |
| | | | | | | | | | | | | | | | 9,295,595 | |
| | | | | | | | | | | | | | | | |
| | | | | Buildings and Real Estate - 7.24% | | | | | | | | | | | | |
| | 2,000,000 | | | Builders FirstSource, Inc., 9.00%, 02/15/2012 | | | B3 | | | | B | | | | 2,085,000 | |
| | 2,000,000 | | | Goodman Global Holding Co., Inc., 7.88%, 12/15/2012 | | | B3 | | | | B- | | | | 2,010,000 | |
| | 2,000,000 | | | MMI Products, Inc., Series B, 11.25%, 04/15/2007 | | Caa2 | | | CCC | | | | 2,015,000 | |
| | 2,000,000 | | | Technical Olympic USA, Inc., 7.50%, 03/15/2011 (f) | | | B2 | | | | B- | | | | 1,872,500 | |
| | | | | | | | | | | | | | | | |
| | | | | | | | | | | | | | | | 7,982,500 | |
| | | | | | | | | | | | | | | | |
| | | | | Cable and Other Pay Television Services - 0.47% | | | | | | | | | | | | |
| | 500,000 | | | NTL Cable PLC, 8.75%, 04/15/2014 | | | B2 | | | | B- | | | | 515,625 | |
| | | | | | | | | | | | | | | | |
| | | | | | | | | | | | | | | | 515,625 | |
| | | | | | | | | | | | | | | | |
| | | | | Cargo Transport - 2.48% | | | | | | | | | | | | |
| | 2,890,000 | | | Quality Distribution, Inc., 9.00%, 11/15/2010 | | Caa3 | | | CCC | | | | 2,738,275 | |
| | | | | | | | | | | | | | | | |
| | | | | | | | | | | | | | | | 2,738,275 | |
| | | | | | | | | | | | | | | | |
| | | | | Chemicals, Plastics and Rubber - 2.39% | | | | | | | | | | | | |
| | 1,100,000 | | | Berry Plastics Corp., 10.75%, 07/15/2012 | | | B3 | | | | B- | | | | 1,204,500 | |
| | 1,500,000 | | | PQ Corp., 7.75%, 02/15/2013 (b) | | | B3 | | | | B- | | | | 1,432,500 | |
| | | | | | | | | | | | | | | | |
| | | | | | | | | | | | | | | | 2,637,000 | |
| | | | | | | | | | | | | | | | |
See accompanying notes.
5
PROSPECT STREET HIGH INCOME PORTFOLIO, INC.
Schedule of Investments (unaudited) (continued)
As of April 30, 2006
| | | | | | | | | | | | | | | | | |
| | | | | | | Ratings | | | | |
| Principal | | | | | | | | | Standard & | | | Value | |
| Amount | | | Description | | Moody's | | | Poor's | | | (Note 2a) | |
| Bonds and Notes (continued) | | | | | | | | | | | | |
| | | | | Containers, Packaging and Glass - 1.73% | | | | | | | | | | | | |
| $ | 2,000,000 | | | Solo Cup Co., 8.50%, 02/15/2014 (f) | | Caa1 | | | | B- | | | $ | 1,910,000 | |
| | | | | | | | | | | | | | | | |
| | | | | | | | | | | | | | | | 1,910,000 | |
| | | | | | | | | | | | | | | | |
| | | | | Diversified/Conglomerate Service - 0.91% | | | | | | | | | | | | |
| | 1,000,000 | | | HydroChem Industrial Services, Inc., 9.25%, 02/15/2013 (b) | | Caa1 | | | CCC+ | | | | 997,500 | |
| | | | | | | | | | | | | | | | |
| | | | | | | | | | | | | | | | 997,500 | |
| | | | | | | | | | | | | | | | |
| | | | | Electronics - 2.08% | | | | | | | | | | | | |
| | 250,000 | | | Serena Software, Inc., 10.38%, 03/15/2016 (b) | | Caa1 | | | CCC+ | | | | 266,875 | |
| | 1,000,000 | | | Viasystems, Inc., 10.50%, 01/15/2011 | | Caa2 | | | CCC+ | | | | 1,005,000 | |
| | 1,000,000 | | | WII Components, Inc., 10.00%, 02/15/2012 | | | B2 | | | | B- | | | | 1,025,000 | |
| | | | | | | | | | | | | | | | |
| | | | | | | | | | | | | | | | 2,296,875 | |
| | | | | | | | | | | | | | | | |
| | | | | Farming and Agriculture - 1.87% | | | | | | | | | | | | |
| | 2,000,000 | | | GSI Group, Inc., 12.00%, 05/15/2013 (f) | | | B3 | | | | B- | | | | 2,065,000 | |
| | | | | | | | | | | | | | | | |
| | | | | | | | | | | | | | | | 2,065,000 | |
| | | | | | | | | | | | | | | | |
| | | | | Finance - 0.99% | | | | | | | | | | | | |
| | 1,064,403 | | | Innophos Investments Holdings, Inc., 12.75%, 02/15/2015 (d) | | NR | | | CCC+ | | | | 1,096,335 | |
| | | | | | | | | | | | | | | | |
| | | | | | | | | | | | | | | | 1,096,335 | |
| | | | | | | | | | | | | | | | |
| | | | | Food, Beverage and Tobacco - 5.70% | | | | | | | | | | | | |
| | 3,000,000 | | | Chiquita Brands, International, Inc. 7.50%, 11/01/2014 | | | B3 | | | | B- | | | | 2,610,000 | |
| | 2,000,000 | | | Jean Coutu Group PLC, 7.63%, 08/01/2012 | | | B3 | | | | B- | | | | 1,975,000 | |
| | 500,000 | | | Land O’ Lakes Capital Trust I, 7.45%, 03/15/2028 (b) | | | B3 | | | CCC+ | | | | 402,500 | |
| | 2,000,000 | | | Merisant Co., 9.50%, 07/15/2013 (f) | | Ca | | | CCC- | | | | 1,300,000 | |
| | | | | | | | | | | | | | | | |
| | | | | | | | | | | | | | | | 6,287,500 | |
| | | | | | | | | | | | | | | | |
| | | | | Healthcare, Education and Childcare - 12.46% | | | | | | | | | | | | |
| | 2,000,000 | | | Athena Neuro Finance, LLC, 7.25%, 02/21/2008 | | | B3 | | | | B | | | | 1,997,500 | |
| | 3,000,000 | | | Elan Financial PLC, 7.75%, 11/15/2011 | | | B3 | | | | B | | | | 2,895,000 | |
| | 5,010,000 | | | La Petite Academy, Inc., 10.00%, 05/15/2008 | | Ca | | | CC | | | | 4,859,700 | |
| | 2,000,000 | | | Pharma II (Risperidone), 7.00%, 01/01/2018 (f) | | NR | | | NR | | | | 1,860,000 | |
| | 2,000,000 | | | Pharma IV (Eszopiclone), 12.00%, 06/30/2014 | | NR | | | NR | | | | 2,130,000 | |
| | | | | | | | | | | | | | | | |
| | | | | | | | | | | | | | | | 13,742,200 | |
| | | | | | | | | | | | | | | | |
| | | | | Home and Office Furnishings, Housewares, and Durable Consumer - 2.10% | | | | | | | | | | | | |
| | 1,500,000 | | | American Achievement Corp., 8.25%, 04/01/2012 | | | B2 | | | | B- | | | | 1,530,000 | |
| | 1,000,000 | | | Home Products International, Inc., 9.63%, 05/15/2008 | | Caa2 | | | CCC- | | | | 787,500 | |
| | | | | | | | | | | | | | | | |
| | | | | | | | | | | | | | | | 2,317,500 | |
| | | | | | | | | | | | | | | | |
| | | | | Hotels, Motels, Inns, and Gaming - 4.31% | | | | | | | | | | | | |
| | 3,000,000 | | | Trump Entertainment Resorts, Inc. 8.50%, 06/01/2015 (f) | | Caa1 | | | | B- | | | | 2,970,000 | |
| | 1,750,000 | | | Virgin River Casino Corp., 9.00%, 01/15/2012 | | | B3 | | | | B | | | | 1,785,000 | |
| | | | | | | | | | | | | | | | |
| | | | | | | | | | | | | | | | 4,755,000 | |
| | | | | | | | | | | | | | | | |
See accompanying notes.
6
PROSPECT STREET HIGH INCOME PORTFOLIO, INC.
Schedule of Investments (unaudited) (continued)
As of April 30, 2006
| | | | | | | | | | | | | | | | | |
| | | | | | | Ratings | | | | |
| Principal | | | | | | | | | Standard & | | | Value | |
| Amount | | | Description | | Moody's | | | Poor's | | | (Note 2a) | |
| Bonds and Notes (continued) | | | | | | | | | | | | |
| | | | | Leisure, Amusement, Entertainment - 4.23% | | | | | | | | | | | | |
| $ | 2,000,000 | | | Ames True Temper, Inc., 9.07%, 01/15/2012 (d) | | Caa1 | | | CCC+ | | | $ | 1,940,000 | |
| | 3,000,000 | | | Amscan Holdings, Inc., 8.75%, 05/01/2014 | | Caa1 | | | CCC+ | | | | 2,722,500 | |
| | | | | | | | | | | | | | | | |
| | | | | | | | | | | | | | | | 4,662,500 | |
| | | | | | | | | | | | | | | | |
| | | | | Leisure, Amusement, Motion Pictures, Entertainment - 2.84% | | | | | | | | | | | | |
| | 1,000,000 | | | AMC Entertainment. Inc., 11.00%, 02/01/2016 (b) | | | B3 | | | CCC+ | | | | 1,090,000 | |
| | 2,000,000 | | | Six Flags, Inc., 9.75%, 04/15/2013 | | Caa1 | | CCC | | | | 2,045,000 | |
| | | | | | | | | | | | | | | | |
| | | | | | | | | | | | | | | | 3,135,000 | |
| | | | | | | | | | | | | | | | |
| | | | | Machinery, Diversified - 0.94% | | | | | | | | | | | | |
| | 1,000,000 | | | Chart Industries, Inc., 9.13%, 10/15/2015 (b) | | | B3 | | | | B- | | | | 1,035,000 | |
| | | | | | | | | | | | | | | | |
| | | | | | | | | | | | | | | | 1,035,000 | |
| | | | | | | | | | | | | | | | |
| | | | | Machinery (Non-Agriculture, Non-Construction, Non-Electronic) - 1.79% | | | | | | | | | | | | |
| | 2,000,000 | | | ALH Finance LLC, 8.50%, 01/15/2013 (f) | | | B3 | | | CCC+ | | | | 1,970,000 | |
| | | | | | | | | | | | | | | | |
| | | | | | | | | | | | | | | | 1,970,000 | |
| | | | | | | | | | | | | | | | |
| | | | | Mining, Steel, Iron and Nonprecious Metals - 6.34% | | | | | | | | | | | | |
| | 3,000,000 | | | Hudbay Mining & Smelting Co., Ltd., 9.63%, 01/15/2012 | | | B3 | | | | B | | | | 3,322,500 | |
| | 1,500,000 | | | IMCO Recycling, Inc., 10.38%, 10/15/2010 | | | B2 | | | | B+ | | | | 1,653,750 | |
| | 2,000,000 | | | United Rental North America, Inc., 7.75%, 11/15/2013 | | Caa1 | | | | B | | | | 2,020,000 | |
| | | | | | | | | | | | | | | | |
| | | | | | | | | | | | | | | | 6,996,250 | |
| | | | | | | | | | | | | | | | |
| | | | | Oil and Gas - 1.83% | | | | | | | | | | | | |
| | 1,000,000 | | | North American Energy Partners, 8.75%, 12/01/2011 | | Caal | | | CCC | | | | 987,500 | |
| | 1,000,000 | | | SemGroup, LP, 8.75%, 11/15/2015 (b) (f) | | | B1 | | | NR | | | | 1,025,000 | |
| | | | | | | | | | | | | | | | |
| | | | | | | | | | | | | | | | 2,012,500 | |
| | | | | | | | | | | | | | | | |
| | | | | Personal and Non Durable Consumer Products - 2.40% | | | | | | | | | | | | |
| | 1,000,000 | | | ACCO Brands Corp., 7.63%, 08/15/2015 | | | B2 | | | | B | | | | 955,000 | |
| | 2,000,000 | | | Spectrum Brands, Inc., 7.38%, 02/01/2015 | | Caa1 | | | CCC | | | | 1,690,000 | |
| | | | | | | | | | | | | | | | |
| | | | | | | | | | | | | | | | 2,645,000 | |
| | | | | | | | | | | | | | | | |
| | | | | Personal, Food and Miscellaneous Services - 0.00% | | | | | | | | | | | | |
| | 700,333 | | | Outsourcing Services Group, 9.00%, 07/15/2009 (b) ^ | | NR | | | NR | | | | — | |
| | | | | | | | | | | | | | | | |
| | | | | | | | | | | | | | | | — | |
| | | | | | | | | | | | | | | | |
| | | | | Personal Transportation - 2.55% | | | | | | | | | | | | |
| | | | | Continental Airlines, Inc., Pass Thru Certificates, | | | | | | | | | | | | |
| | 851,561 | | | Series RJ03, 7.88%, 07/02/2018 | | Ba3 | | | BB+ | | | | 826,547 | |
| | 2,000,000 | | | Series D, 7.57%, 12/01/2006 | | | B3 | | | | B | | | | 1,989,085 | |
| | | | | | | | | | | | | | | | |
| | | | | | | | | | | | | | | | 2,815,632 | |
| | | | | | | | | | | | | | | | |
| | | | | Retail Stores - 5.47% | | | | | | | | | | | | |
| | 3,000,000 | | | Bon-Ton Department Stores, Inc., 10.25%, 03/15/2014 (b) (f) | | | B2 | | | | B- | | | | 2,880,000 | |
| | 1,000,000 | | | Linen ‘n Things, Inc., 10.70%, 01/15/2014 (b) (d) (f) | | | B3 | | | | B | | | | 1,017,500 | |
| | 4,000,000 | | | Movie Gallery, Inc., 11.00%, 05/01/2012 (f) | | Caa3 | | | CCC- | | | | 2,140,000 | |
| | | | | | | | | | | | | | | | |
| | | | | | | | | | | | | | | | 6,037,500 | |
| | | | | | | | | | | | | | | | |
See accompanying notes.
7
PROSPECT STREET HIGH INCOME PORTFOLIO, INC.
Schedule of Investments (unaudited) (continued)
As of April 30, 2006
| | | | | | | | | | | | | | | | | |
| | | | | | | Ratings | | | | |
| Principal | | | | | | | | | Standard & | | | Value | |
| Amount | | | Description | | Moody's | | | Poor's | | | (Note 2a) | |
| Bonds and Notes (continued) | | | | | | | | | | | | |
| | | | | Structured Finance Obligations - 0.00% | | | | | | | | | | | | |
| $ | 4,000,000 | | | DLJ CBO , 11.96%, 04/15/2011 * ^ | | NR | | NR | | $ | — | |
| | | | | | | | | | | | | | | | |
| | | | | | | | | | | | | | | | — | |
| | | | | | | | | | | | | | | | |
| | | | | Telecommunications - 10.85% | | | | | | | | | | | | |
| | 4,000,000 | | | BTI Telecom Corp., 10.50%, 09/15/2007 ^ | | WR | | NR | | | 2,000,000 | |
| | 2,000,000 | | | Eschelon Operating Co., 8.38%, 03/15/2010 | | | B3 | | | | B- | | | | 1,915,000 | |
| | 2,000,000 | | | Grande Communications Holdings, Inc. 14.00%, 04/01/2011 | | Caa2 | | CCC+ | | | 2,020,000 | |
| | 2,000,000 | | | Intelsat, Ltd., 7.63%, 04/15/2112 | | Caa1 | | | B | | | | 1,725,000 | |
| | 500,000 | | | Nordic Telephone Co. Holdings, 8.88%, 05/01/2016 (b) | | | B2 | | | | B | | | | 520,000 | |
| | 2,000,000 | | | Nortel Networks Corp., 6.88%, 09/01/2023 | | | B2 | | | | B- | | | | 1,875,000 | |
| | 2,000,000 | | | Triton PCS, Inc., 8.50%, 06/01/2013 (f) | | Caa2 | | CCC- | | | 1,920,000 | |
| | | | | | | | | | | | | | | | |
| | | | | | | | | | | | | | | | 11,975,000 | |
| | | | | | | | | | | | | | | | |
| | | | | Utilities - 3.83% | | | | | | | | | | | | |
| | 3,953,187 | | | Elwood Energy LLC, 8.16%, 07/05/2026 | | Ba2 | | | B+ | | | | 4,222,704 | |
| | 56,303 | | | USGen New England, Inc., 7.46%, 01/02/2015 (b) (e) ^ | | WR | | NR | | | — | |
| | | | | | | | | | | | | | | | |
| | | | | | | | | | | | | | | | 4,222,704 | |
| | | | | | | | | | | | | | | | |
| | | | | Total Bonds and Notes (cost $115,958,960) | | | | | | | | | | | 110,131,491 | |
| | | | | | | | | | | | | | | | |
See accompanying notes.
8
PROSPECT STREET HIGH INCOME PORTFOLIO, INC.
Schedule of Investments (unaudited) (continued)
As of April 30, 2006
| | | | | | | | | |
| | | | | | | Value | |
| Shares | | | | | (Note 2a) | |
| Common Stock — 23.61% (a) | | | | |
| | 555,258 | | | Altiva Financial Corp. * | | $ | 2,221 | |
| | 46,601 | | | American Banknote Corp. * | | | 1,374,729 | |
| | 853,905 | | | ICO Global Communications (Holdings) Ltd. * | | | 4,696,478 | |
| | 1,155,224 | | | Motient Corp. * | | | 19,939,166 | |
| | 2,975 | | | New World Restaurant Group, Inc. * | | | 30,494 | |
| | 24,015 | | | Outsourcing Services Group * ^ | | | — | |
| | 303 | | | Viatel Holding Bermuda Ltd * | | | 5 | |
| | | | | | | | |
| | | | | Total Common Stock (cost $23,613,448) | | | 26,043,093 | |
| | | | | | | | |
| | | | | | | | | |
| Units | | | | | | | |
| Warrants — 0.11% (a) | | | | |
| | 210,943 | | | ICO Global Communications (Holdings) Ltd., 05/16/2006 * | | | 1,266 | |
| | 57,276 | | | Loral Space & Communications, 12/26/2006 * | | | — | |
| | 5,000 | | | Xm Satellite Radio, Inc., 03/15/2010 * | | | 115,000 | |
| | | | | | | | |
| | | | | Total Warrants (cost $870,339) | | | 116,266 | |
| | | | | | | | |
| | | | | Total Common Stock and Warrants (cost $24,483,787) | | | 26,159,359 | |
| | | | | | | | |
| | | | | Total Investments in Securities — 127.41% (cost $144,593,620) | | | 140,531,229 | |
| | | | | | | | |
| | | | | Other Assets Less Liabilities — 8.85% | | | 9,767,827 | |
| | | | | | | | |
| | | | | Preferred Stock — (36.26%) | | | (40,000,000 | ) |
| | | | | | | | |
| | | | | Net Assets Applicable to Common Stock — 100.00% | | $ | 110,299,056 | |
| | | | | | | | |
| (a) | | Percentages are based on net assets applicable to common stock.
|
| |
| (b) | | Rule 144A security — Private placement securities issued under Rule 144A are exempt from the registration requirement of the Securities Act of 1933. These securities may only be resold, in transactions exempt from registration, to qualified institutional buyers. As of April 30, 2006, the market value of these securities aggregated $10,666,875 or 9.67% of net assets applicable to common stock. |
| |
| (c) | | Senior loans in which the Fund invests generally pay interest at rates which are periodically predetermined by reference to a base lending rate plus a premium. These base lending rates are generally (i) the prime rate offered by one or more major United States banks, (ii) the lending rate offered by one or more European banks such as the London Inter-Bank Offered Rate (“LIBOR”) or (iii) the certificate of deposit rate. Rate shown represents the weighted average rate at April 30, 2006. Senior loans, while exempt from registration under the Security Act of 1933, as amended, contain certain restrictions on resale and cannot be sold publicly. Senior secured floating rate loans often require prepayments from excess cash flow or permit the borrower to repay at its election. The degree to which borrowers repay, whether as a contractual requirement or at their election, cannot be predicted with accuracy. As a result, the actual remaining maturity may be substantially less than the stated maturities shown. |
| |
| (d) | | Variable rate security. The interest rate shown reflects the rate in effect at April 30, 2006. |
| |
| (e) | | The issuer is in default on certain debt covenants. Income is not being accrued. |
| |
| (f) | | Securities (or a portion of securities) on loan as of April 30, 2006. See footnote 8. |
| |
| | | * Non income producing security company. |
| |
| | | ^ Fair value priced by the Board of Directors. See footnote 2. |
| |
| | | “NR” denotes not rated. |
See accompanying notes.
9
PROSPECT STREET HIGH INCOME PORTFOLIO, INC.
Statement of Assets and Liabilities (unaudited)
As of April 30, 2006
| | | | | |
Assets: | | | | |
| Investments in securities at value ($144,593,620 at cost; see Schedule of Investments and Note 2) | | $ | 140,531,229 | |
| Cash and cash equivalents | | | 3,868,670 | |
| Cash held as collateral for securities loaned | | | 26,593,370 | |
| Interest receivable | | | 3,006,831 | |
| Receivable for investments sold | | | 14,151,612 | |
| Other | | | 90,098 | |
| | | | |
| Total assets | | $ | 188,241,810 | |
| | | | |
| | | | | |
Liabilities: | | | | |
| Payables: | | | | |
| Payable upon return of securities loaned | | $ | 26,593,370 | |
| Investment advisory fee payable | | | 80,543 | |
| Director fees payable | | | 3,748 | |
| Preferred share distribution payable | | | 24,513 | |
| Payable for investments purchased | | | 10,982,565 | |
| Other accounts payable | | | 258,015 | |
| | | | |
| Total liabilities | | $ | 37,942,754 | |
| | | | |
| | | | | |
Preferred Stock: | | | | |
Preferred stock, $0.01 par value ($40,000,000 liquidation preference)
Authorized — 1,000,000 shares Issued and outstanding — 1,600 Series W shares | | $ | 40,000,000 | |
| | | | |
| Total preferred stock | | $ | 40,000,000 | |
| | | | |
| | | | | |
Net Assets Applicable to Common Stock: | | | | |
Common stock, $0.03 par value
Authorized — 100,000,000 shares Issued and outstanding — 30,874,699 shares | | $ | 926,241 | |
| Capital in excess of par value | | | 280,778,320 | |
| Undistributed net investment income | | | 439,878 | |
| Accumulated net realized gain/(loss) from security transactions | | | (167,782,992 | ) |
| Net unrealized appreciation/(depreciation) on investments | | | (4,062,391 | ) |
| | | | |
| Net assets applicable to common stock | | $ | 110,299,056 | |
| | | | |
| Net asset value per common share outstanding | | $ | 3.57 | |
| | | | |
See accompanying notes.
10
PROSPECT STREET HIGH INCOME PORTFOLIO, INC.
Statement of Operations
For the Six Months Ended April 30, 2006 (unaudited)
| | | | | | | | | |
Investment Income: | | | | | | | | |
| Interest income | | | | | | $ | 5,559,441 | |
| Accretion of bond discount | | | | | | | 433,044 | |
| Securities lending income | | | | | | | 3,642 | |
| Miscellaneous income | | | | | | | 15,232 | |
| | | | | | | | |
| | | | | | | | | |
| Total investment income | | | | | | $ | 6,011,359 | |
| | | | | | | | |
| | | | | | | | | |
Expenses: | | | | | | | | |
| Investment advisory fees (Note 3) | | $ | 479,179 | | | | | |
| Administration fees | | | 4,184 | | | | | |
| Transfer agent fees | | | 27,546 | | | | | |
| Registration expenses | | | 12,223 | | | | | |
| Legal fees | | | 40,124 | | | | | |
| Professional fees | | | 37,344 | | | | | |
| Insurance expense | | | 105,505 | | | | | |
| Director fees | | | 31,242 | | | | | |
| Printing and postage expense | | | 33,558 | | | | | |
| Preferred shares broker expense | | | 52,314 | | | | | |
| Rating Agency fees | | | 8,159 | | | | | |
| Custodian fees | | | 31,226 | | | | | |
| Miscellaneous expense | | | 12,206 | | | | | |
| | | | | | | | |
| Total expenses | | | | | | $ | 874,810 | |
| | | | | | | | |
| Net investment income | | | | | | $ | 5,136,549 | |
| | | | | | | | |
| | | | | | | | | |
Realized and Unrealized Gain/(Loss) on Investments: | | | | | | | | |
| Net realized gain/(loss) on investments | | | | | | $ | 7,407,844 | |
| Net realized gain/(loss) from foreign currency transactions | | | | | | | 128,567 | |
| Net change in unrealized appreciation/(depreciation) on investments (Note 2) | | | | | | | 1,992,468 | |
| | | | | | | | |
| | | | | | | | | |
| Net realized and unrealized gain/(loss) on investments | | | | | | $ | 9,528,879 | |
| | | | | | | | |
| | | | | | | | | |
| Distributions to preferred stockholders | | | | | | $ | (888,257 | ) |
| | | | | | | | |
| | | | | | | | | |
| Net change in net assets resulting from operations | | | | | | $ | 13,777,171 | |
| | | | | | | | |
See accompanying notes.
11
PROSPECT STREET HIGH INCOME PORTFOLIO, INC.
Statement of Cash Flows
For the Six Months Ended April 30, 2006 (unaudited)
| | | | | |
Cash Flows from Operating Activities: | | | | |
| Interest received | | $ | 5,348,133 | |
| Operating expenses paid | | | (749,710 | ) |
| Preferred shares distributions | | | (863,744 | ) |
| Purchase of portfolio securities | | | (129,811,933 | ) |
| Sales and maturities of portfolio securities | | | 131,226,848 | |
| | | | |
| Net cash provided by operating activities | | $ | 5,149,594 | |
| | | | |
Cash Flows from Financing Activities: | | | | |
| Common stock distributions paid from net investment income | | $ | (3,921,086 | ) |
| | | | |
| Net cash used by financing activities | | $ | (3,921,086 | ) |
| | | | |
Net change in cash | | $ | 1,228,508 | |
Cash, beginning of period | | | 2,640,162 | |
| | | | |
Cash, end of period | | $ | 3,868,670 | |
| | | | |
Reconciliation of net change in net assets resulting from operations to net cash used by operating activities: | | | | |
| Net change in net assets resulting from operations | | $ | 13,777,171 | |
| Change in interest and dividends receivable | | | (230,182 | ) |
| Change in investments | | | 1,414,915 | |
| Change in prepaids | | | 90,875 | |
| Change in investment advisory fee payable | | | 2,306 | |
| Change in accrued expenses | | | 56,432 | |
| Net realized (gain)/loss on investments | | | (7,536,411 | ) |
| Net change in unrealized (appreciation)/depreciation on investments | | | (1,992,468 | ) |
| Accretion of bond discount | | | (433,044 | ) |
| | | | |
| Net cash provided by operating activities | | $ | 5,149,594 | |
| | | | |
See accompanying notes.
12
PROSPECT STREET HIGH INCOME PORTFOLIO, INC.
Statements of Changes in Net Assets
| | | | | | | | | |
| | | Six Months | | | | |
| | | Ended | | | Year | |
| | | April 30, 2006 | | | Ended | |
| | | (unaudited) | | | October 31, 2005 | |
From Operations | | | | | | | | |
| Net investment income | | $ | 5,136,549 | | | $ | 11,007,792 | |
| Net realized gain/(loss) on investments sold and foreign currency transactions | | | 7,536,411 | | | | (2,406,796 | ) |
| Net change in unrealized appreciation/(depreciation) on investments | | | 1,992,468 | | | | 6,787,682 | |
| Distributions to preferred stockholders | | | (888,257 | ) | | | (1,203,281 | ) |
| | | | | | | |
| Net change in net assets resulting from operations | | $ | 13,777,171 | | | $ | 14,185,397 | |
| | | | | | | |
From Fund Share Transactions: | | | | | | | | |
| Shares issued to common stockholders as part of new share issuance (0 and 37,200, respectively) | | $ | — | | | $ | 67,959 | |
| Shares issued (0 and 258,227, respectively) in capital shares transactions | | | — | | | | 1,004,504 | |
| Shares issued (0 and 103,301, respectively) to common shareholders for reinvestment of dividends | | | — | | | | 354,466 | |
| | | | | | | |
| Net increase in net assets resulting from fund share transactions | | $ | — | | | $ | 1,426,929 | |
| | | | | | | |
From Distributions to Stockholders: | | | | | | | | |
| Common distributions from accumulated net investment income | | $ | (3,921,086 | ) | | $ | (9,063,083 | ) |
| | | | | | | |
| Net decrease in net assets resulting from distributions | | $ | (3,921,086 | ) | | $ | (9,063,083 | ) |
| | | | | | | |
| Total increase in net assets | | $ | 9,856,085 | | | $ | 6,549,243 | |
Net Assets Applicable to Common Stock: | | | | | | | | |
| Beginning of year | | | 100,442,971 | | | | 93,893,728 | |
| | | | | | | |
| End of year (including undistributed net investment income of $439,878 and $112,672, respectively) | | $ | 110,299,056 | | | $ | 100,442,971 | |
| | | | | | | |
See accompanying notes.
13
PROSPECT STREET HIGH INCOME PORTFOLIO, INC.
Financial Highlights
Selected per share data and ratios
For each share of common stock outstanding throughout the periods presented
| | | | | | | | | | | | | | | | | | | | | | | | | |
| | | Six months | | | | |
| | | Ended | | | | |
| | | April 30, | | | | |
| | | 2006 | | | For the Years Ended October 31, | |
| | | (unaudited) | | | 2005 | | | 2004 | | | 2003 | | | 2002 | | | 2001 | |
| Net asset value, beginning of period | | $ | 3.25 | | | $ | 3.08 | | | $ | 2.61 | | | $ | 1.77 | | | $ | 3.12 | | | $ | 5.30 | |
| | | | | | | | | | | | | | | | | | | |
| Net investment income# | | $ | 0.17 | | | $ | 0.36 | | | $ | 0.35 | | | $ | 0.37 | | | $ | 0.46 | | | $ | 0.74 | |
| Net realized and unrealized gain/(loss) on investments# | | $ | 0.31 | | | $ | 0.14 | | | $ | 0.47 | | | $ | 0.81 | | | $ | (0.95 | ) | | $ | (1.96 | ) |
| Distributions to preferred stockholders | | $ | (0.03 | ) | | $ | (0.04 | ) | | $ | (0.02 | ) | | $ | (0.02 | ) | | $ | (0.05 | )(e) | | $ | (0.07 | )(e) |
| | | | | | | | | | | | | | | | | | | |
| Total from investment operations | | $ | 0.45 | | | $ | 0.46 | | | $ | 0.80 | | | $ | 1.16 | | | $ | (0.54 | ) | | $ | (1.29 | ) |
| Distributions: | | | | | | | | | | | | | | | | | | | | | | | | |
| Distributions from accumulated net investment income: | | | | | | | | | | | | | | | | | | | | | | | | |
| To common stockholders | | $ | (0.13 | ) | | $ | (0.29 | ) | | $ | (0.33 | ) | | $ | (0.32 | ) | | $ | (0.42 | )(d) | | $ | (0.76 | )(d) |
| Distributions to common stockholders from paid in capital† | | | — | | | | — | | | | — | | | | — | | | | (0.39 | ) | | | (0.14 | ) |
| | | | | | | | | | | | | | | | | | | |
| Total distributions | | $ | (0.13 | ) | | $ | (0.29 | ) | | $ | (0.33 | ) | | $ | (0.32 | ) | | $ | (0.81 | ) | | $ | (0.90 | ) |
| | | | | | | | | | | | | | | | | | | |
| Effect of common stock issue | | $ | — | | | $ | — | | | $ | — | | | $ | — | | | $ | — | | | $ | 0.06 | |
| Effect of related expenses from equity and rights Offerings | | $ | — | | | $ | — | | | $ | — | | | $ | — | | | $ | — | | | $ | (0.05 | ) |
| | | | | | | | | | | | | | | | | | | |
| Net asset value, end of period | | $ | 3.57 | | | $ | 3.25 | | | $ | 3.08 | | | $ | 2.61 | | | $ | 1.77 | | | $ | 3.12 | |
| | | | | | | | | | | | | | | | | | | |
| Per share market value, end of period | | $ | 3.14 | | | $ | 2.77 | | | $ | 3.24 | | | $ | 2.96 | | | $ | 2.02 | | | $ | 4.24 | |
| | | | | | | | | | | | | | | | | | | |
| Total investment return based on market value(b)(f) | | | 18.17 | % | | | (6.90 | %) | | | 21.61 | % | | | 66.45 | % | | | (42.19 | %) | | | (9.82 | %) |
| | | | | | | | | | | | | | | | | | | |
| Net assets, end of period(a) | | $ | 110,299 | | | $ | 100,443 | | | $ | 93,894 | | | $ | 74,113 | | | $ | 49,182 | | | $ | 86,048 | |
| | | | | | | | | | | | | | | | | | | |
| Ratio of operating expenses to average net assets, applicable to common stock(c) | | | 1.62 | % | | | 1.85 | % | | | 2.18 | % | | | 4.07 | % | | | 3.22 | % | | | 3.75 | % |
| Ratio of net investment income to average net assets, applicable to common stock(c) | | | 9.53 | % | | | 10.08 | % | | | 11.88 | % | | | 16.60 | % | | | 15.99 | % | | | 20.06 | % |
| Portfolio turnover rate | | | 82.14 | %(f) | | | 72.84 | % | | | 81.25 | % | | | 111.35 | % | | | 96.89 | % | | | 73.63 | % |
| (a) | | Dollars in thousands |
| (b) | | Total investment return based on market value may result in substantially different returns than investment return based on net asset value, because market value can be significantly greater or less than the net asset value. Total investment return calculation assumes reinvestment of dividends, and does not contemplate any over distribution. |
| (c) | | Ratios do not reflect the effect of dividend payments to preferred stockholders. |
| (d) | | Presentation has been changed from prior financial reports filed by the Fund due to the reclassification of the distributions paid to common stockholders from net investment income to return of capital. |
| (e) | | Presentation of distributions paid to preferred shareholders has been changed from prior financial reports filed by the Fund due to the reclassification from Distribution Section to Total from investment operations. |
| (f) | | Not annualized |
| # | | Calculation is based on average shares outstanding during the indicated period due to the per share effect of the Fund’s rights offerings. |
| † | | Taxes are calculated on a calendar year, where as this data is calculated on a fiscal year ended 10/31. |
See accompanying notes.
14
PROSPECT STREET HIGH INCOME PORTFOLIO, INC.
Information Regarding Senior Securities
| | | | | | | | | | | | | | | | | | | | | |
| | | As of October 31, | |
| | | 2005 | | | 2004 | | | 2003 | | | 2002 | | | 2001 | |
| Total Amount Outstanding: | | | | | | | | | | | | | | | | | | | | |
| Indebtedness | | $ | — | | | $ | — | | | $ | — | | | $ | — | | | $ | — | |
| Preferred stock | | | 40,000,000 | | | | 40,000,000 | | | | 40,000,000 | | | | 56,500,000 | | | | 75,000,000 | |
| Asset Coverage: | | | | | | | | | | | | | | | | | | | | |
| Per Indebtedness(a) | | | N/A | | | | N/A | | | | N/A | | | | N/A | | | | N/A | |
| Per preferred stock share(b) | | | 351 | % | | | 334 | % | | | 285 | % | | | 187 | % | | | 215 | % |
| Involuntary Liquidation Preference: | | | | | | | | | | | | | | | | | | | | |
| Per preferred stock share(c) | | $ | 25,000 | | | $ | 25,000 | | | $ | 25,000 | | | $ | 25,000 | | | $ | 25,000 | |
| Approximate Market Value: | | | | | | | | | | | | | | | | | | | | |
| Per note | | | N/A | | | | N/A | | | | N/A | | | | N/A | | | | N/A | |
| Per preferred stock share | | $ | 25,000 | | | $ | 25,000 | | | $ | 25,000 | | | $ | 25,000 | | | $ | 25,000 | |
| (a) | | Calculated by subtracting the Fund’s total liabilities (not including bank loans and senior securities) from the Fund’s total assets and dividing such amount by the principal amount of the debt outstanding. |
| |
| (b) | | Calculated by subtracting the Fund’s total liabilities (not including bank loans and senior securities) from the Fund’s total assets and dividing such amount by the principal amount of the debt outstanding and aggregate liquidation preference of the outstanding shares of Taxable Auction Rate Preferred Stock. |
| |
| (c) | | Plus accumulated and unpaid dividends. |
See accompanying notes.
15
PROSPECT STREET HIGH INCOME PORTFOLIO, INC.
NOTES TO FINANCIAL STATEMENTS
April 30, 2006 (unaudited)
(1) Organization and Operations:
Prospect Street High Income Portfolio, Inc. (the “Fund”) was organized as a corporation in the state of Maryland on May 13, 1988, and is registered with the Securities and Exchange Commission as a diversified, closed-end, management investment company under the Investment Company Act of 1940. The Fund commenced operations on December 5, 1988. The Fund’s financial statements have been prepared in conformity with accounting principles generally accepted in the United States of America, which require the management of the Fund to make estimates and assumptions that affect the reported amounts of assets and liabilities, the disclosure of contingent assets and liabilities at the date of the financial statements and the reported amounts of income and expenses during the reporting periods. Actual results could differ from those estimates. The following is a summary of significant accounting policies consistently followed by the Fund, which are in conformity with those generally accepted in the investment company industry.
The Fund invests primarily in securities of fixed-maturity, corporate debt securities and redeemable preferred stocks that are rated less than investment grade. Risk of loss upon default by the issuer is significantly greater with respect to such securities compared to investment-grade securities because these securities are generally unsecured and are often subordinated to other creditors of the issuer, and because these issuers usually have high levels of indebtedness and are more sensitive to adverse economic conditions, such as a recession, than are investment-grade issuers. In some cases, the collection of principal and timely receipt of interest is dependent upon the issuer attaining improved operating results, selling assets or obtaining additional financing.
See the Schedule of Investments for information on individual securities, as well as industry diversification and credit quality ratings.
(2) Significant Accounting Policies:
(a) Valuation of Investments
Investments for which listed market quotations are readily available are stated at market value, which is determined by using the last reported sale price or, if no sales are reported, as in the case of some securities traded over-the-counter, the last reported bid price. Short-term investments having remaining maturities of 60 days or less are stated at amortized cost, which approximates market value.
Other investments, which comprise the major portion of the Fund’s portfolio holdings, are primarily non-investment grade corporate debt securities, for which market quotations are not readily available due to a thinly traded market with a limited number of market makers. These investments are stated at fair value on the basis of subjective valuations furnished by an independent pricing service or broker dealers, subject to review and adjustment by Highland Capital Management, L.P. (“Highland,” or “Investment Advisor”) based upon quotations obtained from market makers. The independent pricing service determines value based primarily on quotations from dealers and brokers, market transactions, accessing data from quotation services, offering sheets obtained from dealers and various relationships between securities. The independent pricing service utilizes the last sales price based on odd-lot trades, if available. If such price is not available, the price furnished is based on round-lot or institutional size trades. For securities in which there is no independent price from a pricing service or from round-lot or institutional size trades, they are fair value priced in good faith by the Board of Directors.
The fair value of restricted securities is determined by the Investment Advisor pursuant to procedures approved by the Board of Directors.
16
PROSPECT STREET HIGH INCOME PORTFOLIO, INC.
NOTES TO FINANCIAL STATEMENTS (unaudited) (continued)
Credit Risk
Credit risk is the risk that the issuer of a security owned by the Fund will be unable to pay the interest or principal when due. The degree of credit risk depends on both the financial condition of the issuer and the terms of the obligation.
Interest Rate Risk
Interest rate risk is the risk that prices of securities owned by the Fund generally increase when interest rates decline and decrease when interest rates increase.
Foreign Currency Risk
Foreign currencies, investments and other assets and liabilities are translated into U.S. dollars at the exchange rates using the current 4:00 p.m. London Time Spot Rate. Fluctuations in the value of the foreign currencies and other assets and liabilities resulting from changes in exchange rates, between trade and settlement dates on securities transactions and between the accrual and payment dates on dividends, interest income and foreign withholding taxes, are recorded as unrealized foreign currency gains (losses). Realized gains (losses) and unrealized appreciation (depreciation) on investment securities and income and expenses are translated on the respective dates of such transactions.
(b) Security Transactions and Related Investment Income
Realized gains and losses on investments sold are recorded on the identified-cost basis. Interest income and accretion of discounts are recorded on the accrual basis. It is the Fund’s policy to place securities on non-accrual status when collection of interest is doubtful.
(c) Federal Income Taxes
It is the Fund’s policy to comply with the requirements of subchapter M of the Internal Revenue Code of 1986, as amended, applicable to regulated investment companies, and to distribute substantially all of its investment company taxable income to its stockholders each year. Therefore, no Federal income tax provision is required. Gains and losses on sales of investments are calculated on the identified cost method for both financial reporting and federal income tax purposes.
The accumulated capital losses available to offset future capital gains, if any, expire in the amounts indicated below on the following dates:
| | | | | |
| Carryover | | | |
| Available | | | Expiration Date |
| $ | 4,688,248 | | | October 31, 2006 |
| | 37,335,815 | | | October 31, 2007 |
| | 35,790,515 | | | October 31, 2008 |
| | 36,946,575 | | | October 31, 2009 |
| | 15,212,478 | | | October 31, 2010 |
| | 21,799,603 | | | October 31, 2011 |
| | 21,289,289 | | | October 31, 2012 |
| | 2,406,796 | | | October 31, 2013 |
| | | | |
| $ | 175,469,319 | | | |
| | | | |
17
PROSPECT STREET HIGH INCOME PORTFOLIO, INC.
NOTES TO FINANCIAL STATEMENTS (unaudited) (continued)
(d) Cash Flow Information
The Fund invests primarily in corporate debt securities and distributes dividends from net investment income, which are paid in cash or shares of common stock of the Fund. These activities are reported in the accompanying statement of changes in net assets, and additional information on cash receipts and cash payments is presented in the accompanying statement of cash flows.
(e) Cash and Cash Equivalents
The company considers all highly liquid investments purchased with initial maturity equal to or less than three months to be cash equivalents.
(3) Investment Advisory Agreement:
Highland Capital Management, L.P. (“Highland,” or “Investment Advisor”) earned $479,179 in management fees for the six months ended April 30, 2006. Management fees paid by the Fund to Highland were calculated at .65% (on an annual basis) of the average weekly net asset value, defined as total assets of the Fund less accrued liabilities (excluding the principal amount of the bank loan, notes and including the liquidation preference of any share of preferred stock and accrued and unpaid dividends on any shares of preferred stock up to and including $175,000,000 of net assets, .55% on the next $50,000,000 of net assets and .50% of the excess of net assets over $225,000,000). On April 30, 2006, the fee payable to the investment advisor was $80,543, which is included in the accompanying statement of assets and liabilities.
(4) Purchases and Sales of Securities:
For the six months ended April 30, 2006, the aggregate cost of purchases and proceeds from sales of investment securities other than U.S. Government obligations and short-term investments aggregated approximately $115,922,331 and $120,115,716, respectively. There were no purchases or sales of U.S. Government obligations for the six months ended April 30, 2006.
The Investment Advisor and its affiliates manage other accounts, including registered and private funds and individual accounts, that also invest in high yield fixed-income securities. Although investment decisions for the Fund are made independently from those of such other accounts, investments of the type the Fund may make may also be made on behalf of such other accounts. When the Fund and one or more of such other accounts is prepared to invest in, or desires to dispose of, the same security, available investments or opportunities for each will be allocated in a manner believed by the Investment Advisor to be equitable to the fund and such other accounts. The Investment Advisor also may aggregate orders to purchase and sell securities for the Fund and such other accounts. Although the Investment Advisor believes that, over time, the potential benefits of participating in volume transactions and negotiating lower transaction costs should benefit all accounts including the Fund, in some cases these activities may adversely affect the price paid or received by the Fund or the size of the position obtained or disposed of by the Fund.
(5) Certain Transactions:
Certain officers of the Investment Advisor serve on the Board of Directors of the Fund. They receive no compensation in this capacity.
Directors who are not officers or employees of the Investment Advisor receive fees of $15,000 per year, together with the reimbursement of actual out-of-pocket expenses incurred relating to attendance at such meetings. For the six months ended April 30, 2006, the Fund incurred Board of Directors fees and expenses of $31,242.
18
PROSPECT STREET HIGH INCOME PORTFOLIO, INC.
NOTES TO FINANCIAL STATEMENTS (unaudited) (continued)
(6) Dividends and Distributions:
Distributions on common stock are declared based on annual projections of the Fund’s net investment income (defined as dividends and interest income, net of Fund expenses). The Fund plans to pay monthly distributions to common shareholders. As a result of market conditions or investment decisions, the amount of distributions may exceed net investment income earned at certain times throughout the period. It is anticipated that, on an annual basis, the amount of distributions to common shareholders will not exceed net investment income (as defined) allocated to common shareholders for income tax purposes. All shareholders of the Fund are automatically considered participants in the Dividend Reinvestment Plan (the “Plan”) unless they elect to do otherwise. Under the Plan, when the market price of common stock is equal to or exceeds the net asset value on the record date for distributions, participants will be issued shares of common stock at the most recently determined net asset value, but in no event less than 95% of the market price, and when the net asset value of the common stock exceeds its market price, or if the Fund declares a dividend or capital gains distribution payable only in cash, the dividend-paying agent will buy the common stock in the open market for the participants’ accounts. Participants are not charged a service fee for the Plan but are subject to a pro rata share of brokerage fees incurred with respect to open market purchases of common stock.
For the year ended October 31, 2005, the tax character of distributions paid by the Fund to common shareholders were as follows:
| | | | | |
| Distributions from net investment income | | $ | 9,063,083 | |
| Distributions from paid in capital | | | 0 | |
| | | | |
| | | $ | 9,063,083 | |
For the year ended October 31, 2004, the tax character of distributions paid by the Fund to common shareholders were as follows:
| | | | | |
| Distributions from net investment income | | $ | 9,526,324 | |
| Distributions from paid in capital | | | 0 | |
| | | | |
| | | $ | 9,526,324 | |
The following is the history of the Fund’s calendar year distributions and their composition to common stockholders in calendar years 2001 through 2005.
| | | | | | | | | | | | | | | | | | | | | |
| | | 2005 | | | 2004 | | | 2003 | | | 2002 | | | 2001 | |
| Distributions to Shareholders | | $ | 0.28 | | | $ | 0.33 | | | $ | 0.31 | | | $ | 0.72 | | | $ | 0.90 | |
| Composition of Distributions* | | | | | | | | | | | | | | | | | | �� | | |
| Ordinary Income | | | 100 | % | | | 100 | % | | | 100 | % | | | 58 | % | | | 77 | % |
| Return of Capital | | | 0 | % | | | 0 | % | | | 0 | % | | | 42 | % | | | 23 | % |
| Capital Gains | | | 0 | % | | | 0 | % | | | 0 | % | | | 0 | % | | | 0 | % |
| | | | | | | | | | | | | | | | |
| Total | | | 100 | % | | | 100 | % | | | 100 | % | | | 100 | % | | | 100 | % |
| | | | | | | | | | | | | | | | |
| Ordinary Income | | $ | 0.28 | | | $ | 0.33 | | | $ | 0.31 | | | $ | 0.42 | | | $ | 0.70 | |
| Return of Capital | | $ | — | | | $ | — | | | $ | — | | | $ | 0.30 | | | $ | 0.20 | |
| Capital Gains | | $ | — | | | $ | — | | | $ | — | | | $ | — | | | $ | — | |
| | | | | | | | | | | | | | | | |
| Total | | $ | 0.28 | | | $ | 0.33 | | | $ | 0.31 | | | $ | 0.72 | | | $ | 0.90 | |
| | | | | | | | | | | | | | | | |
| * | | Distributions and their composition may differ for stockholders who bought or sold shares mid-year. |
19
PROSPECT STREET HIGH INCOME PORTFOLIO, INC.
NOTES TO FINANCIAL STATEMENTS (unaudited) (continued)
(7) Preferred Stock:
On March 16, 2001, the Fund issued 3,000 shares each of Series W Auction Rate Cumulative “Preferred Shares” with $.01 par value, $25,000 liquidation preference, for a total issuance of $75,000,000. As of April 30, 2006, 1,600 Preferred Shares were outstanding. The Fund may reborrow amounts in the future to increase its use of leverage which will be consistent with the limitations imposed by the Investment Company Act of 1940. Significant provisions of Series W cumulative preferred shares follow.
Redemption
Shares of preferred stock are not subject to any sinking fund, but are subject to mandatory redemption under certain circumstances. If the Fund does not timely cure a failure to meet certain asset coverages as defined in the prospectus or timely filing requirements, the Preferred Shares are subject to mandatory redemption out of funds legally available in accordance with the Charter and applicable law, at a redemption price of $25,000 per share plus an amount equal to accumulated but unpaid dividends thereon, whether or not earned or declared to the date fixed for redemption. In addition, the Fund at its option may redeem Preferred Shares having a dividend period of one year or less at this same redemption price to the extent permitted under the 1940 Act and Maryland law. Any Preferred Shares repurchased or redeemed by the Fund will be classified as authorized but unissued Preferred Shares. The Preferred Shares have no preemptive, exchange or conversion rights. The Fund will not issue any class of stock senior to or on a parity with the preferred stock.
Dividends
The Preferred Shares pay dividends based on a rate set at auctions, normally held every seven days. In most instances dividends are payable every seven days, on the first business day following the end of the dividend period. The dividend payment date for special dividend periods of more than seven days are set out in a notice designating a special dividend period. Dividends are cumulative from the date the shares are first issued and will be paid out of legally available funds. At April 30, 2006 the rate on the Preferred Shares was 4.81%.
In general, when the Fund has any Preferred Shares outstanding, the Fund may not pay any dividend or distribution in respect of Common Stock unless the Fund has paid all cumulative dividends on Preferred Shares.
Voting Rights
The Fund’s Preferred Shares and Common Stock have equal voting rights of one vote per share and vote together as a single class. The Preferred Shares and Common Stock vote as a separate class on other matters as required under the Fund’s Charter, the 1940 Act and Maryland law.
Liquidation
In the event of a liquidation of the Fund, whether voluntary or involuntary, the holders of the Preferred Shares are entitled to receive, prior to and in preference to any distribution of any of the assets of the Fund available for distribution to common stockholders, a liquidation preference in the amount of $25,000 for each share outstanding plus an amount equal to all dividends thereon, whether or not earned or declared, accumulated but unpaid to and including the date of final distribution. After the payment to the holders of Preferred Shares of the full preferential amounts, the holders of Preferred Shares will have no right or claim to any of the remaining assets of the Fund.
20
PROSPECT STREET HIGH INCOME PORTFOLIO, INC.
NOTES TO FINANCIAL STATEMENTS (unaudited) (continued)
(8) Securities Loans:
At a meeting held on March 3, 2006, the Fund’s Board of Trustees approved an agreement allowing the Fund to enter into securities lending transactions. The Fund may make secured loans of its portfolio securities amounting to not more than one-third of the value of its total assets, thereby realizing additional income. The risks in lending portfolio securities, as with other extensions of credit, consist of possible delays in recovery of the securities or possible loss of rights in the collateral should the borrower fail financially. As a matter of policy, securities loans are made to unaffiliated broker-dealers pursuant to agreements requiring that loans be continuously secured by collateral in cash or short-term debt obligations at least equal at all times to the value of the securities subject to the loan. The borrower pays to the Fund an amount equal to any interest or dividends received on securities subject to the loan. The Fund retains all or a portion of the interest received on investment of the cash collateral or receives a fee from the borrower. As of April 30, 2006, the market value of securities loaned by the Fund was $26,007,988. The loans were secured with cash collateral of $26,593,370.
21
ADDITIONAL INFORMATION (unaudited)
Approval of Investment Advisory Contract
At a meeting of the Fund’s Board of Trustees held on December 9, 2005, the Board approved an investment management agreement with Highland Capital Management, L.P. (“Highland”). The Board members who are not “interested persons” (as defined in the 1940 Act (the “Independent Trustees”)) of the Fund were assisted in their review by independent legal counsel and met with counsel in executive session separate from representatives of Highland.
Nature, Extent And Quality of The Services Provided
The Board considered the nature, quality and extent of the advisory services to be provided by Highland. The Board considered the investment approach employed by Highland, Highland’s research capabilities, the nature of Highland’s experience and resources, the experience of relevant Highland personnel, and Highland’s resources, practices and procedures designed to address regulatory compliance matters.
Investment Performance
The Board reviewed the performance of other investment companies with similar investment styles to the Fund.
Expense Information, Profitability and Economies of Scale
To assist in evaluating the reasonableness of the fees to be paid to Highland, the Board reviewed a comparison of the fees payable under the investment management agreement to fees paid under investment advisory agreements to investment advisers serving other investment companies with similar investment programs to the Fund. The Board also considered so called “fallout benefits” to Highland, such as any incremental increase to its reputation derived from serving as investment adviser to the Fund. The Board also considered information regarding the fees paid by certain similar registered and private funds managed by Highland, and discussed with Highland why Highland believed that any differences in fees charged were appropriate. The Board considered the expense ratios of other investment companies with similar investment styles. In addition, the Board considered the effective fees under the investment advisory agreement as a percentage of assets at different Fund asset levels, and possible economies of scale with respect to the management of the Fund. In this regard, the Board considered the Fund’s foreseeable asset levels and information related to Highland’s estimated costs.
Other Considerations
The Board also considered the terms of the investment management agreement, including the standard of care applicable to Highland, and the structure of, and the method used to determine, the compensation of Highland’s portfolio managers.
Conclusions
Based on these considerations and following deliberation, the Board reached the following conclusions and determined to approve the investment management agreement:
| | • | | Highland has sufficient resources to fulfill its duties under the investment management agreement. |
| |
| | • | | The scope and quality of services provided under the current investment management agreement is consistent with the Fund’s operational requirements. |
| |
| | • | | The advisory fees paid to Highland under the current investment management agreement are reasonable in light of the services that Highland provides, its costs and reasonably foreseeable Fund asset levels. |
22
This page left blank intentionally.
PROSPECT STREET HIGH INCOME PORTFOLIO, INC.
Investment Advisor
Highland Capital Management, L.P.
13455 Noel Road
Suite 800
Dallas, TX 75240
Officers
James D. Dondero — President
Mark Okada — Executive Vice President
R. Joseph Dougherty — Senior Vice President
M. Jason Blackburn — Secretary and Treasurer
Michael S. Minces — Compliance Officer
Directors
R. Joseph Dougherty
Bryan A. Ward
Timothy K. Hui
Scott F. Kavanaugh
James F. Leary
Transfer and Shareholders’ Servicing Agent
American Stock Transfer & Trust Company
59 Maiden Lane
New York, NY 10038
www.amstock.com
Independent Registered Public Accounting Firm
Deloitte & Touche LLP
JPMorgan Chase Tower
2200 Ross Avenue
Suite 1600
Dallas, TX
75201-6778
Legal Advisor
Skadden, Arps, Slate, Meagher & Flom LLP
Four Times Square
New York, NY 10036
Custodian
PFPC Trust Company
8800 Tinicum Boulevard
Philadelphia, PA 19153
Facts for Shareholders:
Prospect Street High Income Portfolio, Inc. is listed on the New York Stock Exchange under the symbol “PHY”. The Wall Street Journal and Wall Street Journal Online publish Friday’s closing net asset value of the Fund every Monday and lists the market price of the Fund daily. They are also published in Barron’s Market Week every Saturday. Our website is www.prospectstreet.net. A description of the policies and procedures that the Fund uses to determine how to vote proxies relating to portfolio securities and the Fund’s proxy voting record for the most recent 12-month period ended June 30th, are available (1) without charge, by calling (877) 532-2834 and (2) on the Securities and Exchange Commission’s website at http://www.sec.gov.
The Fund files its complete schedule of portfolio holdings with the Securities and Exchange Commission for the first and third quarters of each fiscal year on Form N-Q. The Fund’s Forms N-Q are available on the Commission’s website at http:/www.sec.gov and also may be reviewed and copied at the Commission’s Public Reference Room in Washington, DC. Information on the Public Reference Room may be obtained by calling 1-800-SEC-0330.
Questions Regarding Your Account: Please telephone American Stock Transfer & Trust Company at their toll free number 1-800-937-5449 Monday through Friday from 9:00 a.m. to 5:00 p.m. e.s.t.
Written Correspondence Regarding Your Account: Please mail all correspondence directly to Prospect Street High Income Portfolio, Inc., c/o American Stock Transfer & Trust Company, P.O. Box 922, Wall Street Station, New York, NY 10269.
Item 2. Code of Ethics.
Not applicable.
Item 3. Audit Committee Financial Expert.
Not applicable.
Item 4. Principal Accountant Fees and Services.
Not applicable.
Item 5. Audit Committee of Listed registrants.
Not applicable.
Item 6. Schedule of Investments.
Schedule of Investments in securities of unaffiliated issuers as of the close of the reporting period is included as part of the report to shareholders filed under Item 1 of this form.
Item 7. Disclosure of Proxy Voting Policies and Procedures for Closed-End Management Investment Companies.
Not applicable.
Item 8. Portfolio Managers of Closed-End Management Investment Companies.
Not applicable.
Item 9. Purchases of Equity Securities by Closed-End Management Investment Company and Affiliated Purchasers.
REGISTRANT PURCHASES OF EQUITY SECURITIES
| | | | | | | | | | | | | | | | | |
| | | | | | | | | | | | | | | (d) Maximum Number | |
| | | | | | | | | | | (c) Total Number of | | | (or Approximate | |
| | | | | | | | | | | Shares (or Units) | | | Dollar Value) of | |
| | | | | | | | | | | Purchased as Part | | | Shares (or Units) | |
| | | (a) Total Number of | | | (b) Average Price | | | of Publicly | | | that May Yet Be | |
| | | Shares (or Units) | | | Paid per Share (or | | | Announced Plans or | | | Purchased Under the | |
| Period | | Purchased | | | Unit) | | | Programs | | | Plans or Programs | |
| November 1 — November 30 | | | — | | | | — | | | | — | | | | — | |
| December 1 — December 31 | | | — | | | | — | | | | — | | | | — | |
| January 1 — January 31 | | | — | | | | — | | | | — | | | | — | |
| February 1 — February 28 | | | — | | | | — | | | | — | | | | — | |
| March 1 — March 31 | | | 255,000 | | | $ | 3.1838 | | | | — | | | | — | |
| April 1 — April 30 | | | 45,000 | | | $ | 3.3978 | | | | — | | | | — | |
| Total | | | 300,000 | | | $ | 3.2159 | | | | | | | | | |
Note: All purchases made in open-market transactions.
Item 10. Submission of Matters to a Vote of Security Holders.
There have been no material changes to the procedures by which the shareholders may recommend nominees to the registrant’s board of directors, where those changes were implemented after the registrant last provided disclosure in response to the requirements of Item 7(d)(2)(ii)(G) of Schedule 14A (17 CFR 240.14a-101), or this Item.
Item 11. Controls and Procedures.
| | (a) | | The registrant’s principal executive and principal financial officers have concluded, based on their evaluation of the registrant’s disclosure controls and procedures as of a date within 90 days of the filing date of this report, that the Registrant’s disclosure controls and procedures are reasonably designed to ensure that information required to be disclosed by the registrant on Form N-CSR is recorded, processed, summarized and reported within the required time periods and that information required to be disclosed by the registrant in the reports that it files or submits on Form N-CSR is accumulated and communicated to the registrant’s management, including its |
principal executive and principal financial officers, as appropriate to allow timely decisions regarding required disclosure.
| | (b) | | There were no changes to the registrant’s internal control over financial reporting that occurred during the registrant’s second fiscal quarter of the period covered by this report that have materially affected, or are reasonably likely to materially affect, the registrant’s internal control over financial reporting. |
Item 12. Exhibits.
| | | |
| | | |
| (a)(1) | | Not applicable. |
| | | |
| (a)(2) | | Certifications pursuant to Rule 30a-2(a) under the 1940 Act and Section 302 of the Sarbanes-Oxley Act of 2002 are attached hereto. |
| | | |
| (a)(3) | | Not applicable. |
| | | |
| (b) | | Certifications pursuant to Rule 30a-2(b) under the 1940 Act and Section 906 of the Sarbanes-Oxley Act of 2002 are attached hereto. |
SIGNATURES
Pursuant to the requirements of the Securities Exchange Act of 1934 and the Investment Company Act of 1940, the registrant has duly caused this report to be signed on its behalf by the undersigned, thereunto duly authorized.
| | |
| (registrant) | | Prospect Street® High Income Portfolio Inc. |
| | |
| By (Signature and Title)* | | /s/ James D. Dondero James D. Dondero, Chief Executive Officer
(principal executive officer) |
Pursuant to the requirements of the Securities Exchange Act of 1934 and the Investment Company Act of 1940, this report has been signed below by the following persons on behalf of the registrant and in the capacities and on the dates indicated.
| | |
| By (Signature and Title)* | | /s/ James D. Dondero James D. Dondero, Chief Executive Officer
(principal executive officer) |
| | |
| By (Signature and Title)* | | /s/ M. Jason Blackburn M. Jason Blackburn, Chief Financial Officer
(principal financial officer) |
* Print the name and title of each signing officer under his or her signature.