UNITED STATES
SECURITIES AND EXCHANGE COMMISSION
Washington, DC 20549
FORMN-CSR
CERTIFIED SHAREHOLDER REPORT OF REGISTERED
MANAGEMENT INVESTMENT COMPANIES
Investment Company Act file number 811-01700
Franklin Gold and Precious Metals Fund
(Exact name of registrant as specified in charter)
One Franklin Parkway, San Mateo, CA 94403-1906
(Address of principal executive offices) (Zip code)
Craig S. Tyle, One Franklin Parkway, San Mateo, CA 94403-1906
(Name and address of agent for service)
Registrant’s telephone number, including area code: 650312-2000
Date of fiscal year end: 7/31
Date of reporting period: 7/31/19
| Item 1. | Reports to Stockholders. |
Sign up for electronic delivery at franklintempleton.com/edelivery
Internet Delivery of Fund Reports Unless You Request Paper Copies:Effective January 1, 2021, as permitted by the SEC, paper copies of the Fund’s shareholder reports will no longer be sent by mail, unless you specifically request them from the Fund or your financial intermediary. Instead, the reports will be made available on a website, and you will be notified by mail each time a report is posted and provided with a website link to access the report.
If you already elected to receive shareholder reports electronically, you will not be affected by this change and you need not take any action. If you have not signed up for electronic delivery, we would encourage you to join fellow shareholders who have. You may elect to receive shareholder reports and other communications electronically from the Fund by calling (800)632-2301 or by contacting your financial intermediary.
You may elect to continue to receive paper copies of all your future shareholder reports free of charge by contacting your financial intermediary or, if you invest directly with a Fund, calling (800)632-2301 to let the Fund know of your request. Your election to receive reports in paper will apply to all funds held in your account.
FRANKLIN TEMPLETON
Successful investing begins with ambition. And achievement only comes when you reach for it. That’s why we continually strive to deliver better outcomes for investors. No matter what your goals are, our deep, global investment expertise allows us to offer solutions that can help.
During our more than 70 years of experience, we’ve managed through all kinds of markets—up, down and those in between. We’re always preparing for what may come next. It’s because of this, combined with our strength as one of the world’s largest asset managers that we’ve earned the trust of millions of investors around the world.
Dear Shareholder:
During the 12 months ended July 31, 2019, the global economy generally expanded amid positive economic data in certain regions, healthy corporate earnings, and the U.S. Federal Reserve’s (Fed’s) patient monetary policy stance. The European Central Bank left its benchmark interest rate unchanged and announced it would not raise rates in the next year due to risks including Brexit and global trade tensions. The Fed raised its target range for the federal funds rate by 0.25% at its September and December 2018 meetings, to 2.25%–2.50%. However, at its July 2019 meeting, the Fed lowered its target range to 2.00%–2.25%, citing muted inflation and the implications of global developments for the U.S. economy. Global markets were pressured by trade tensions between the U.S. and its trading partners and other geopolitical risks. In this environment, U.S. stocks, as measured by the Standard & Poor’s® 500 Index, and global developed market stocks, as measured by the MSCI World Index, ended the period with positive returns.
After falling in August and September, gold prices rallied through January, gave back some of the gains through May but finished the period with a strong move higher in June and July. Solid gains for the gold price were supported by investor concerns about global economic weakness and heightened market volatility. Slower growth in the eurozone, a potential U.S. recession, and U.S.-China trade tensions spurred investments into gold, as did a July U.S. Federal Reserve
(Fed) interest-rate cut that left investors with concerns about the U.S. economy and the expectation of further Fed rate decreases in 2019. Central bank and exchange-traded fund purchases of gold also rose, lifting the prices of gold and gold-mining equities. In this environment, gold stocks, as measured by the FTSE® Gold Mines Index, posted a total return of +31.03% for the12-month period.1
We are committed to our long-term perspective and disciplined investment approach as we conduct a rigorous, fundamental analysis of securities with a regular emphasis on investment risk management.
We believe active, professional investment management serves investors well. We also recognize the important role of financial advisors in today’s markets and encourage investors to continue to seek their advice. Amid changing markets and economic conditions, we are confident investors with a well-diversified portfolio and a patient, long-term outlook should be well positioned for the years ahead.
Franklin Gold & Precious Metals Fund’s annual report includes more detail about prevailing conditions and discussions about investment decisions during the period. Please remember all securities markets fluctuate, as do mutual fund share prices.
1. Source: Morningstar.
See www.franklintempletondatasources.com for additional data provider information.
| Not FDIC Insured | | | May Lose Value | | | No Bank Guarantee |
| franklintempleton.com | Not part of the annual report | 1 | ||
We thank you for investing with Franklin Templeton, welcome your questions and comments, and look forward to serving your future investment needs.
Sincerely,

Edward Perks, CFA
President and Chief Executive Officer –
Investment Management
Franklin Gold and Precious Metals Fund
This letter reflects our analysis and opinions as of July 31, 2019, unless otherwise indicated. The information is not a complete analysis of every aspect of any market, country, industry, security or fund. Statements of fact are from sources considered reliable.
| ||||
| 3 | ||||
| 7 | ||||
| 10 | ||||
| 11 | ||||
| 15 | ||||
| 21 | ||||
| 31 | ||||
| 32 | ||||
| 33 | ||||
| 38 | ||||
| Visitfranklintempleton.comfor fund updates, to access your account, or to find helpful financial planning tools. |
CFA® is a trademark owned by CFA Institute.
| 2 | Not part of the annual report | franklintempleton.com | ||
Franklin Gold and Precious Metals Fund
This annual report for Franklin Gold and Precious Metals Fund covers the fiscal year ended July 31, 2019.
Your Fund’s Goals and Main Investments
The Fund seeks capital appreciation, with current income as its secondary goal, by investing under normal market conditions at least 80% of its net assets in securities of gold and precious metals operation companies. The Fund primarily invests in equity securities, mainly common stock, and also invests in American, global and European depositary receipts.
Performance Overview
The Fund’s Class A shares posted a +23.01% cumulative total return for the 12 months under review. In comparison, the Fund’s primary benchmark, the sector-specific FTSE Gold Mines Index, which comprises companies whose principal activity is gold mining, posted a +31.03% total return.1 The Fund’s secondary benchmark, the Standard & Poor’s 500 Index (S&P 500®), which is a broad measure of U.S. stock performance, posted a +8.52% total return.1 You can find the Fund’s long-term performance data in the Performance Summary beginning on page 7.
Performance data represent past performance, which does not guarantee future results. Investment return and principal value will fluctuate, and you may have a gain or loss when you sell your shares. Current performance may differ from figures shown. For most recentmonth-end performance, go tofranklintempleton.comor call(800)342-5236.
Economic and Market Overview
The U.S. economy grew during the 12 months ended July 31, 2019. After moderating for two consecutive quarters, the economy grew significantly faster in 2019’s first quarter. However, the economy moderated again in the second quarter, due to weakness in inventory investment, exports, business investment and housing investment. The unemployment rate decreased from 3.9% in July 2018 to 3.7% atperiod-end.2 The annual inflation rate, as measured
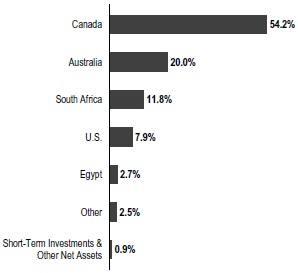
Geographic Composition
Based on Total Net Assets as of 7/31/19
by the Consumer Price Index, decreased from 2.9% in July 2018 to 1.9% atperiod-end.2
The U.S. Federal Reserve (Fed) raised its target range for the federal funds rate by 0.25% at its September and December 2018 meetings, to 2.25%–2.50%. However, at its July 2019 meeting, the Fed lowered the federal funds target rate for the first time since December 2008, to 2.00%–2.25%, citing muted inflation pressures and the potential effects of global trade tensions on economic growth. Furthermore, the Fed ended its balance sheet normalization program two months earlier than previously indicated. The broad U.S. stock market, as measured by the Standard & Poor’s® 500 Index, posted a +8.52% total return for the 12 months under review.1
The global economy expanded during the period, despite weakness in certain regions. Global developed and emerging market stocks were aided by upbeat economic data in some regions, encouraging corporate earnings reports and periods of optimism about a potential U.S.-China trade deal. The Fed’s patient approach to its monetary policy
1. Source: Morningstar.
The indexes are unmanaged and include reinvestment of any income or distributions. They do not reflect any fees, expenses or sales charges. One cannot invest directly in an index, and an index is not representative of the Fund’s portfolio.
2. Source: U.S. Bureau of Labor Statistics.
The dollar value, number of shares or principal amount, and names of all portfolio holdings are listed in the Fund’s Statement of Investments (SOI). The SOI begins on page 15.
| franklintempleton.com | Annual Report | 3 | ||
FRANKLIN GOLD AND PRECIOUS METALS FUND
in early 2019, recent rate cut and indications it will act appropriately to sustain U.S. economic expansion and achieve its inflation objective aided market sentiment.
However, markets reflected concerns about the Fed’s interest-rate hikes and the European Central Bank’s (ECB’s) unwinding of its bond purchase program in 2018, political uncertainties in the U.S. and the European Union, and the impact of U.S. trade disputes with China and other trading partners on global growth and corporate earnings. In this environment, global developed and emerging market stocks, as measured by the MSCI All Country World Index, posted a +3.52% total return for the12-month period.1
In Europe, the U.K.’s quarterly gross domestic product (GDP) growth accelerated in 2018’s third quarter, moderated in the fourth quarter and reaccelerated in 2019’s first quarter. However, GDP contracted in the second quarter compared with the first quarter, as Brexit uncertainties weighed on business sentiment. The Bank of England raised its key policy rate once during the period. The eurozone’s quarterly GDP growth moderated in 2018’s third quarter and accelerated in the next two quarters, before moderating again in 2019’s second quarter. The bloc’s annual inflation rate decreased during the period. The ECB concluded its bond purchase program at the end of 2018 and kept its benchmark interest rate unchanged. In June, the ECB mentioned it would leave interest rates unchanged through the first half of 2020 and provided details of its new stimulus. However, the ECB signaled in July the potential for a rate cut, while indicating support for additional stimulus to bolster economic expansion.
In Asia, Japan’s quarterly GDP growth contracted in 2018’s third quarter, accelerated in the next two quarters and moderated in 2019’s second quarter. The Bank of Japan (BOJ) left its benchmark interest rate unchanged and continued its stimulus measures during the period. In July, the BOJ expressed its openness to increase stimulus to sustain economic growth and achieve its inflation goal. China’s annual GDP growth rate moderated in 2018’s third and fourth quarters, held steady in 2019’s first quarter and moderated in the second quarter to its lowest level since 1992, amid trade tensions with the U.S. and weak global demand. The People’s Bank of China left its benchmark interest rate unchanged, but it took measures to improve financial liquidity to mitigate the effects of the U.S.-China trade dispute and support economic growth.
Precious Metals Sector Overview
After declining in the first two weeks of August 2018 to a period low of $1,174 per ounce, gold prices pushed higher, ending July at $1,414 per ounce, near the period high, to deliver a solid gain for the 12 months under review.3 During the period’s first two months, a strengthening U.S. dollar, robust returns from other asset classes, concerns about demand from emerging market countries, lower global holdings in gold-backed exchange-traded funds (ETFs) and the Fed’s interest-rate increase caused gold prices to continue a downward trend that began in early 2018. However, gold prices began to rise in 2018’s fourth quarter as investors sought perceived safe-haven investments due to concerns about a weaker global economy and heightened market volatility. Further supporting gold prices later in the period were the partial U.S. government shutdown, purchases by central banks, higher global holdings in gold-backed ETFs, and investor concerns about the U.K.’s pending withdrawal from the EU and ongoing U.S.-China trade tensions. Gold also benefited from the Fed’s decisions to leave the federal funds target rate unchanged in 2019’s first half and to reduce it in July. As gold climbed to its highest price levels since 2013, investors indicated they increasingly viewed the metal as a good alternative to paper money and government bonds in an environment of low U.S. inflation, accommodative monetary policies by many central banks and heightened geopolitical risks in certain regions. Silver prices also increased during the period, broadly following the directional lead of gold. Palladium prices rose strongly, ending the period near the record high reached in March 2019, and spent most of 2019’s first seven months at a premium to gold due to tight supplies and strong demand for auto catalytic converters and other applications. Platinum prices rose modestly during the reporting period amid ebbing demand for its use in diesel engines.
Investment Strategy
Gold and precious metals operation companies include companies that mine, process, or deal in gold or other precious metals, such as silver, platinum and palladium, including mining finance and exploration companies as well as operating companies with long- or medium-life mines. The Fund may buy securities of gold and precious metals operation companies of any market capitalization size, located anywhere in the world, and in general invests predominantly innon-U.S. companies. The Fund’s investment manager looks for companies with low cost reserves and experienced management teams with
3. Source: Bloomberg LP. Based on spot prices quoted in U.S. dollars per troy ounce.
| 4 | Annual Report | franklintempleton.com | ||
FRANKLIN GOLD AND PRECIOUS METALS FUND
Precious Metals Prices(7/31/18–7/31/19)*
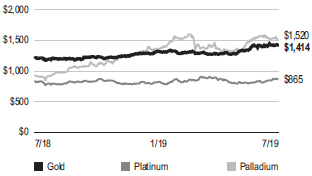
*Source: Bloomberg LP. Amounts shown are based on spot prices quoted in US dollars per troy ounce. For illustrative purposes only; not representative of the Fund’s portfolio composition or performance.
established track records, particularly focusing on companies with long life production profiles, expandable resources basis, and active exploration programs that can potentially drive future reserve and production growth.
Manager’s Discussion
Key contributors to the Fund’s absolute performance during the12-month period under review included the Fund’s holdings in AngloGold Ashanti, Barrick Gold and Newcrest Mining.
AngloGold Ashanti was a major contributor as it benefited from higher gold prices, a change in management and solid first-quarter 2019 results. AngloGold Ashanti said costs improved in the first quarter and all aspects of full-year 2019 guidance remained on track. The company is streamlining its asset portfolio with the aim of ensuring greater management focus to concentrate its capital on projects delivering the highest returns. As part of these plans, AngloGold announced that it had begun reviewing options to exit its remaining gold mines in South Africa.
Barrick Gold announced ano-premium merger with Randgold Resources in September 2018 bringing together Barrick’stop-quality asset base with Randgold’s highly regarded management team as the new managers of the combined company. The deal closed atyear-end to a positive market response. In February Barrick launched a hostile proposal to merge with Newmont as an alternative to Newmont’s proposed merger with Goldcorp, citing the significant synergy potential between the two company’s Nevada assets. Barrick ultimately backed down and Newmont’s merger with Goldcorp proceeded, but Barrick convinced Newmont to create a joint venture of the two company’s Nevada assets with Barrick as operator which closed in June. Although it is still early in the process,
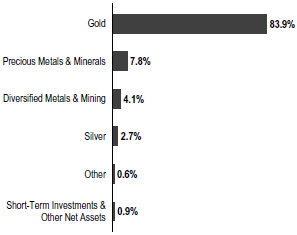
Portfolio Composition
Based on Total Net Assets as of 7/31/19
investors are excited about the value that may be unlocked from this deal given the large scale of the two company’s operations in Nevada and significant synergy targets.
Newcrest Mining delivered improving operational results over the period from its key operations: Cadia Valley in Australia and Lihir in Papua New Guinea. They also announced a joint venture with Imperial Metals (also a holding of the fund), to acquire a 70% joint-venture interest in, and operatorship of, the Red Chris mine and surrounding tenements in British Columbia, Canada. This added another potential world-class asset to Newcrest’s portfolio. Newcrest also made significant progress reducing net debt over the year, positioning the company to advance internal projects and to pursue mergers and acquisitions to drive growth and asset diversification.
Detractors from the Fund’s absolute performance during the period under review included the Fund’s holdings in Dacian Gold, IAMGOLD and Stornoway Diamond.
Dacian Gold declared commercial production in January on their primary asset, the Mt. Morgan’s gold mine in Western Australia having completed construction in 2018. Dacian Gold’s share price fell sharply in June after the Australia-based mining company lowered its production guidance for its fiscal fourth-quarter 2019 (ended June 30) and provided weaker-than-expected production guidance looking forward. Issues are common with new startup mines, and although this information did come as a surprise to us and to the market, we incrementally added to the position after the decline, with a view that the company will be able to operate through these issues, supported by record Australian dollar gold prices.
| franklintempleton.com | Annual Report | 5 | ||
FRANKLIN GOLD AND PRECIOUS METALS FUND
Shares of gold miner IAMGOLD declined sharply in April and early May after the company disclosed poor first quarter results and seismic concerns at their Westwood mine in Canada that forced the company to reduce gold production guidance and increase cost forecasts for the year. IAMGOLD delayed development of the large Cote Gold development project in Canada and started a process to explore strategic alternatives for the company which could include a merger or sale of the company.
Top 10 Holdings
7/31/19
Company Sector/Industry, Country | % of Total Net Assets | |||
B2Gold Corp. | 6.5 | % | ||
Gold, Canada | ||||
Newcrest Mining Ltd. | 5.7 | % | ||
Gold, Australia | ||||
Barrick Gold Corp. | 5.6 | % | ||
Gold, Canada | ||||
Alamos Gold Inc. | 5.0 | % | ||
Gold, Canada | ||||
AngloGold Ashanti Ltd. | 4.9 | % | ||
Gold, South Africa | ||||
Perseus Mining Ltd. | 3.8 | % | ||
Gold, Australia | ||||
Newmont Goldcorp Corp. | 3.5 | % | ||
Gold, U.S. | ||||
Centerra Gold Inc. | 3.4 | % | ||
Gold, Canada | ||||
Alacer Gold Corp. | 3.0 | % | ||
Gold, U.S. | ||||
Agnico Eagle Mines Ltd. | 2.9 | % | ||
Gold, Canada | ||||
Stornoway Diamond reported quarter-over-quarter declines in the price of mined diamonds, reflecting price weakness in smaller and lower-quality precious gemstones attributed to challenging trading conditions in India, while prices for larger, higher-quality diamonds remained firm. Additionally, Stornoway’s mining production and processing rates were negatively impacted by a summer forest fire-related stoppage at the Renard Mine in Quebec, Canada. Renard continued to bolster its mining activities toward full production, complicated by the company transitioning from an open pit to an underground ore feed. Due to ongoing operational challenges and weaker-than-expected diamond markets, the fund exited this position.
For the 12 months ended July 31, 2019, the U.S. dollar rose in value relative to certain currencies in which the Fund’s
investments were traded. As a result, the Fund’s performance was negatively affected by currency depreciation from the portfolio’s investment predominantly in securities withnon-U.S. currency exposure. Whether the U.S. dollar advances or weakens compared with foreign currencies, company-specific factors may offset the effects of the currency movements, or the value of individual investments and, possibly, the Fund’s performance overall.
Thank you for your continued participation in Franklin Gold and Precious Metals Fund. We look forward to serving your future investment needs.
 | ||
 | ||
| Stephen M. Land, CFA |
 | ||
| ||
| Frederick G. Fromm, CFA | ||
Portfolio Management Team
| ||

The foregoing information reflects our analysis, opinions and portfolio holdings as of July 31, 2019, the end of the reporting period. The way we implement our main investment strategies and the resulting portfolio holdings may change depending on factors such as market and economic conditions. These opinions may not be relied upon as investment advice or an offer for a particular security. The information is not a complete analysis of every aspect of any market, country, industry, security or the Fund.
Statements of fact are from sources considered reliable, but the investment manager makes no representation or warranty as to their completeness or accuracy. Although historical performance is no guarantee of future results, these insights may help you understand our investment management philosophy.
| 6 | Annual Report | franklintempleton.com | ||
FRANKLIN GOLD AND PRECIOUS METALS FUND
Performance Summary as of July 31, 2019
The performance table and graphs do not reflect any taxes that a shareholder would pay on Fund dividends, capital gain distributions, if any, or any realized gains on the sale of Fund shares. Total return reflects reinvestment of the Fund’s dividends and capital gain distributions, if any, and any unrealized gains or losses. Your dividend income will vary depending on dividends or interest paid by securities in the Fund’s portfolio, adjusted for operating expenses of each class. Capital gain distributions are net profits realized from the sale of portfolio securities.
Performance as of 7/31/191
Cumulative total return excludes sales charges. Average annual total return includes maximum sales charges. Sales charges will vary depending on the size of the investment and the class of share purchased. The maximum is 5.50% and the minimum is 0%.Class A:5.50% maximum initial sales charge;Advisor Class:no sales charges. For other share classes, visitfranklintempleton.com.
| Share Class | | Cumulative Total Return | 2 | Average Annual Total Return3 | ||
A4 | ||||||
1-Year | +23.01% | +16.24% | ||||
5-Year | -9.25% | -3.03% | ||||
10-Year | -27.78% | -3.75% | ||||
Advisor | ||||||
1-Year | +23.30% | +23.30% | ||||
5-Year | -8.13% | -1.68% | ||||
10-Year | -25.97% | -2.96% | ||||
Performance data represent past performance, which does not guarantee future results. Investment return and principal value will fluctuate, and you may have a gain or loss when you sell your shares. Current performance may differ from figures shown. For most recentmonth-end performance, go tofranklintempleton.comor call(800)342-5236.
| franklintempleton.com | Annual Report | 7 | ||
FRANKLIN GOLD AND PRECIOUS METALS FUND
PERFORMANCE SUMMARY
Total Return Index Comparison for a Hypothetical $10,000 Investment1
Total return represents the change in value of an investment over the periods shown. It includes any applicable maximum sales charge, Fund expenses, account fees and reinvested distributions. The unmanaged indexes include reinvestment of any income or distributions. They differ from the Fund in composition and do not pay management fees or expenses. One cannot invest directly in an index.
Class A(8/1/09–7/31/19)
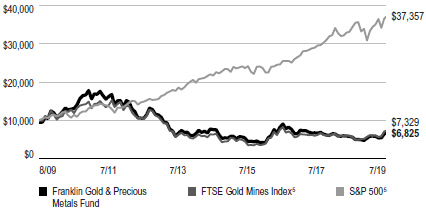
Advisor Class(8/1/09–7/31/19)

See page 9 for Performance Summary footnotes.
| 8 | Annual Report | franklintempleton.com | ||
FRANKLIN GOLD AND PRECIOUS METALS FUND
PERFORMANCE SUMMARY
Total Annual Operating Expenses6
| Share Class | With Fee Waiver | Without Fee Waiver | ||
A | 0.98% | 0.98% | ||
Advisor | 0.73% | 0.73% |
Each class of shares is available to certain eligible investors and has different annual fees and expenses, as described in the prospectus.
All investments involve risks, including possible loss of principal. The Fund concentrates in the precious metals sector, which involves fluctuations in the prices of gold and other precious metals and increased susceptibility to adverse economic and regulatory developments affecting the sector. In times of stable economic growth, traditional equity and debt investments could offer greater appreciation potential and the prices of gold and other precious metals may be adversely affected. In addition, the Fund is subject to the risks of currency fluctuation and political uncertainty associated with foreign(non-U.S.) investing. Investments in emerging and frontier markets involve heightened risks related to the same factors, in addition to those associated with their relatively small size and lesser liquidity. The Fund may also heavily invest in smaller companies, which can be particularly sensitive to changing economic conditions, and their prospects for growth are less certain than those of larger, more established companies. Investing in anon-diversified fund involves the risk of greater price fluctuation than a more diversified portfolio. The Fund is actively managed but there is no guarantee that the manager’s investment decisions will produce the desired results. The Fund’s prospectus also includes a description of the main investment risks.
1. The Fund has a fee waiver associated with any investment it makes in a Franklin Templeton money fund and/or other Franklin Templeton fund, contractually guaranteed through 11/30/19. Fund investment results reflect the fee waiver; without this waiver, the results would have been lower.
2. Cumulative total return represents the change in value of an investment over the periods indicated.
3. Average annual total return represents the average annual change in value of an investment over the periods indicated. Return for less than one year, if any, has not been annualized.
4. Prior to 9/10/18 these shares were offered at a higher initial sales charge of 5.75%, thus actual returns (with sales charges) would have differed. Average annual total returns (with sales charges) have been restated to reflect the current maximum initial sales charge of 5.50%.
5. Source: Morningstar. The FTSE Gold Mines Index is a free float-weighted index that comprises companies whose principal activity is gold mining. The S&P 500 is a market capitalization-weighted index of 500 stocks designed to measure total U.S. equity market performance.
6. Figures are as stated in the Fund’s current prospectus and may differ from the expense ratios disclosed in the Your Fund’s Expenses and Financial Highlights sections in this report. In periods of market volatility, assets may decline significantly, causing total annual Fund operating expenses to become higher than the figures shown.
See www.franklintempletondatasources.com for additional data provider information.
| franklintempleton.com | Annual Report | 9 | ||
FRANKLIN GOLD AND PRECIOUS METALS FUND
As a Fund shareholder, you can incur two types of costs: (1) transaction costs, including sales charges (loads) on Fund purchases and redemptions; and (2) ongoing Fund costs, including management fees, distribution and service(12b-1) fees, and other Fund expenses. All mutual funds have ongoing costs, sometimes referred to as operating expenses. The table below shows ongoing costs of investing in the Fund and can help you understand these costs and compare them with those of other mutual funds. The table assumes a $1,000 investment held for the six months indicated.
Actual Fund Expenses
The table below provides information about actual account values and actual expenses in the columns under the heading “Actual.” In these columns the Fund’s actual return, which includes the effect of Fund expenses, is used to calculate the “Ending Account Value” for each class of shares. You can estimate the expenses you paid during the period by following these steps (ofcourse, your account value and expenses will differ from those in this illustration):Divide your account value by $1,000 (ifyour account had an $8,600 value, then $8,600÷ $1,000 = 8.6). Then multiply the result by the number in the row for your class of shares under the headings “Actual” and “Expenses Paid During Period” (ifActual Expenses Paid During Period were $7.50, then 8.6 x $7.50 = $64.50). In this illustration, the actual expenses paid this period are $64.50.
Hypothetical Example for Comparison with Other Funds
Under the heading “Hypothetical” in the table, information is provided about hypothetical account values and hypothetical expenses based on the Fund’s actual expense ratio and an assumed rate of return of 5% per year before expenses, which is not the Fund’s actual return. This information may not be used to estimate the actual ending account balance or expenses you paid for the period, but it can help you compare ongoing costs of investing in the Fund with those of other funds. To do so, compare this 5% hypothetical example for the class of shares you hold with the 5% hypothetical examples that appear in the shareholder reports of other funds.
Please note that expenses shown in the table are meant to highlight ongoing costs and do not reflect any transactional costs. Therefore, information under the heading “Hypothetical” is useful in comparing ongoing costs only, and will not help you compare total costs of owning different funds. In addition, if transactional costs were included, your total costs would have been higher.
Actual (actual return after expenses) | Hypothetical (5% annual return before expenses) | |||||||||||||||||
|
| |||||||||||||||||
| Share Class | Beginning Account Value 2/1/19 | Ending Account Value 7/31/19 | Expenses Paid During 2/1/19–7/31/191, 2 | Ending Account Value 7/31/19 | Expenses Paid During 2/1/19–7/31/191, 2 | Net Annualized Expense Ratio2 | ||||||||||||
|
|
|
| |||||||||||||||
| A | $1,000 | $1,175.50 | $5.18 | $1,020.03 | $4.81 | 0.96% | ||||||||||||
| C | $1,000 | $1,170.50 | $9.20 | $1,016.31 | $8.55 | 1.71% | ||||||||||||
| R6 | $1,000 | $1,176.90 | $3.13 | $1,021.92 | $2.91 | 0.58% | ||||||||||||
| Advisor | $1,000 | $1,176.50 | $3.83 | $1,021.27 | $3.56 | 0.71% | ||||||||||||
1. Expenses are equal to the annualized expense ratio for thesix-month period as indicated above—in the far right column—multiplied by the simple average account value over the period indicated, and then multiplied by 181/365 to reflect theone-half year period.
2. Reflects expenses after fee waivers and expense reimbursements. Does not include acquired fund fees and expenses.
| 10 | Annual Report | franklintempleton.com | ||
FRANKLIN GOLD AND PRECIOUS METALS FUND
| Year Ended July 31, | ||||||||||||||||||||
| 2019 | 2018 | 2017 | 2016 | 2015 | ||||||||||||||||
Class A | ||||||||||||||||||||
Per share operating performance (for a share outstanding throughout the year) | ||||||||||||||||||||
Net asset value, beginning of year | $13.56 | $16.19 | $24.06 | $11.63 | $20.27 | |||||||||||||||
Income from investment operationsa: | ||||||||||||||||||||
Net investment income (loss)b | (0.02 | ) | (0.06 | ) | (0.04 | ) | (0.09 | ) | (0.05 | ) | ||||||||||
Net realized and unrealized gains (losses) | 3.14 | (2.51 | ) | (6.45 | ) | 12.52 | (8.43 | ) | ||||||||||||
Total from investment operations | 3.12 | (2.57 | ) | (6.49 | ) | 12.43 | (8.48 | ) | ||||||||||||
Less distributions from: | ||||||||||||||||||||
Net investment income | — | (0.06 | ) | (1.38 | ) | — | (0.16 | ) | ||||||||||||
Net asset value, end of year | $16.68 | $13.56 | $16.19 | $24.06 | $11.63 | |||||||||||||||
Total returnc | 23.01% | (15.92)% | (26.85)% | 106.88% | (42.02)% | |||||||||||||||
Ratios to average net assets | ||||||||||||||||||||
Expensesd | 0.98% | e | 1.02% | e | 0.98% | e | 1.11% | 1.09% | e | |||||||||||
Net investment income (loss) | (0.15)% | (0.37)% | (0.24)% | (0.57)% | (0.35)% | |||||||||||||||
Supplemental data | ||||||||||||||||||||
Net assets, end of year (000’s) | $645,108 | $587,294 | $776,677 | $988,701 | $444,295 | |||||||||||||||
Portfolio turnover rate | 12.82% | 8.36% | 13.99% | 16.76% | 12.52% | |||||||||||||||
aThe amount shown for a share outstanding throughout the period may not correlate with the Statement of Operations for the period due to the timing of sales and repurchases of the Fund’s shares in relation to income earned and/or fluctuating fair value of the investments of the Fund.
bBased on average daily shares outstanding.
cTotal return does not reflect sales commissions or contingent deferred sales charges, if applicable.
dBenefit of waiver and payments by affiliates rounds to less than 0.01%.
eBenefit of expense reduction rounds to less than 0.01%.
| franklintempleton.com | The accompanying notes are an integral part of these financial statements. | Annual Report | 11 | ||
FRANKLIN GOLD AND PRECIOUS METALS FUND
FINANCIAL HIGHLIGHTS
| Year Ended July 31, | ||||||||||||||||||||
| 2019 | 2018 | 2017 | 2016 | 2015 | ||||||||||||||||
Class C | ||||||||||||||||||||
Per share operating performance (for a share outstanding throughout the year) | ||||||||||||||||||||
Net asset value, beginning of year | $12.49 | $14.96 | $22.39 | $10.90 | $18.97 | |||||||||||||||
Income from investment operationsa: | ||||||||||||||||||||
Net investment income (loss)b | (0.11 | ) | (0.15 | ) | (0.17 | ) | (0.18 | ) | (0.16 | ) | ||||||||||
Net realized and unrealized gains (losses) | 2.86 | (2.32 | ) | (5.99 | ) | 11.67 | (7.89 | ) | ||||||||||||
Total from investment operations | 2.75 | (2.47 | ) | (6.16 | ) | 11.49 | (8.05 | ) | ||||||||||||
Less distributions from: | ||||||||||||||||||||
Net investment income | — | — | (1.27 | ) | — | (0.02 | ) | |||||||||||||
Net asset value, end of year | $15.24 | $12.49 | $14.96 | $22.39 | $10.90 | |||||||||||||||
Total returnc | 22.02% | (16.51)% | (27.41)% | 105.41% | (42.45)% | |||||||||||||||
Ratios to average net assets | ||||||||||||||||||||
Expensesd | 1.73% | e | 1.77% | e | 1.73% | e | 1.86% | 1.84% | e | |||||||||||
Net investment income (loss) | (0.90)% | (1.12)% | (0.99)% | (1.32)% | (1.10)% | |||||||||||||||
Supplemental data | ||||||||||||||||||||
Net assets, end of year (000’s) | $75,129 | $94,997 | $137,487 | $200,179 | $97,483 | |||||||||||||||
Portfolio turnover rate | 12.82% | 8.36% | 13.99% | 16.76% | 12.52% | |||||||||||||||
aThe amount shown for a share outstanding throughout the period may not correlate with the Statement of Operations for the period due to the timing of sales and repurchases of the Fund’s shares in relation to income earned and/or fluctuating fair value of the investments of the Fund.
bBased on average daily shares outstanding.
cTotal return does not reflect sales commissions or contingent deferred sales charges, if applicable.
dBenefit of waiver and payments by affiliates rounds to less than 0.01%.
eBenefit of expense reduction rounds to less than 0.01%.
| 12 | Annual Report | The accompanying notes are an integral part of these financial statements. | franklintempleton.com | ||
FRANKLIN GOLD AND PRECIOUS METALS FUND
FINANCIAL HIGHLIGHTS
| Year Ended July 31, | ||||||||||||||||||||
| 2019 | 2018 | 2017 | 2016 | 2015 | ||||||||||||||||
Class R6 | ||||||||||||||||||||
Per share operating performance (for a share outstanding throughout the year) | ||||||||||||||||||||
Net asset value, beginning of year | $14.50 | $17.31 | $25.58 | $12.29 | $21.44 | |||||||||||||||
Income from investment operationsa: | ||||||||||||||||||||
Net investment income (loss)b | 0.04 | 0.01 | 0.04 | (0.01 | ) | 0.03 | ||||||||||||||
Net realized and unrealized gains (losses) | 3.36 | (2.68 | ) | (6.87 | ) | 13.30 | (8.93 | ) | ||||||||||||
Total from investment operations | 3.40 | (2.67 | ) | (6.83 | ) | 13.29 | (8.90 | ) | ||||||||||||
Less distributions from: | ||||||||||||||||||||
Net investment income | — | (0.14 | ) | (1.44 | ) | — | (0.25 | ) | ||||||||||||
Net asset value, end of year | $17.90 | $14.50 | $17.31 | $25.58 | $12.29 | |||||||||||||||
Total return | 23.45% | (15.50)% | (26.53)% | 108.14% | (41.74)% | |||||||||||||||
Ratios to average net assets | ||||||||||||||||||||
Expenses before waiver and payments by affiliates | 0.83% | 0.79% | 0.57% | 0.63% | 0.62% | |||||||||||||||
Expenses net of waiver and payments by affiliates | 0.58% | c | 0.55% | c | 0.52% | c | 0.59% | 0.55% | c | |||||||||||
Net investment income (loss) | 0.25% | 0.10% | 0.21% | (0.05)% | 0.19% | |||||||||||||||
Supplemental data | ||||||||||||||||||||
Net assets, end of year (000’s) | $10,808 | $8,153 | $4,635 | $3,764 | $1,188 | |||||||||||||||
Portfolio turnover rate | 12.82% | 8.36% | 13.99% | 16.76% | 12.52% | |||||||||||||||
aThe amount shown for a share outstanding throughout the period may not correlate with the Statement of Operations for the period due to the timing of sales and repurchases of the Fund’s shares in relation to income earned and/or fluctuating fair value of the investments of the Fund.
bBased on average daily shares outstanding.
cBenefit of expense reduction rounds to less than 0.01%.
| franklintempleton.com | The accompanying notes are an integral part of these financial statements. | Annual Report | 13 | ||
FRANKLIN GOLD AND PRECIOUS METALS FUND
FINANCIAL HIGHLIGHTS
| Year Ended July 31, | ||||||||||||||||||||
| 2019 | 2018 | 2017 | 2016 | 2015 | ||||||||||||||||
Advisor Class | ||||||||||||||||||||
Per share operating performance (for a share outstanding throughout the year) | ||||||||||||||||||||
Net asset value, beginning of year | $14.38 | $17.17 | $25.38 | $12.23 | $21.32 | |||||||||||||||
Income from investment operationsa: | ||||||||||||||||||||
Net investment income (loss)b | 0.01 | (0.02 | ) | — | c | (0.05 | ) | (0.02 | ) | |||||||||||
Net realized and unrealized gains (losses) | 3.34 | (2.67 | ) | (6.81 | ) | 13.20 | (8.87 | ) | ||||||||||||
Total from investment operations | 3.35 | (2.69 | ) | (6.81 | ) | 13.15 | (8.89 | ) | ||||||||||||
Less distributions from: | ||||||||||||||||||||
Net investment income | — | (0.10 | ) | (1.40 | ) | — | (0.20 | ) | ||||||||||||
Net asset value, end of year | $17.73 | $14.38 | $17.17 | $25.38 | $12.23 | |||||||||||||||
Total return | 23.30% | (15.70)% | (26.69)% | 107.52% | (41.90)% | |||||||||||||||
Ratios to average net assets | ||||||||||||||||||||
Expensesd | 0.73% | e | 0.77% | e | 0.73% | e | 0.86% | 0.84% | e | |||||||||||
Net investment income (loss) | 0.10% | (0.12)% | 0.01% | (0.32)% | (0.10)% | |||||||||||||||
Supplemental data | ||||||||||||||||||||
Net assets, end of year (000’s) | $143,589 | $130,812 | $164,253 | $207,574 | $90,628 | |||||||||||||||
Portfolio turnover rate | 12.82% | 8.36% | 13.99% | 16.76% | 12.52% | |||||||||||||||
aThe amount shown for a share outstanding throughout the period may not correlate with the Statement of Operations for the period due to the timing of sales and repurchases of the Fund’s shares in relation to income earned and/or fluctuating fair value of the investments of the Fund.
bBased on average daily shares outstanding.
cAmount rounds to less than $0.01 per share.
dBenefit of waiver and payments by affiliates rounds to less than 0.01%.
eBenefit of expense reduction rounds to less than 0.01%.
| 14 | Annual Report | The accompanying notes are an integral part of these financial statements. | franklintempleton.com | ||
FRANKLIN GOLD AND PRECIOUS METALS FUND
Statement of Investments, July 31, 2019
| Country | Shares/ Rights/ Warrants | Value | ||||||||||
Common Stocks and Other Equity Interests 98.9% | ||||||||||||
Copper 0.6% | ||||||||||||
a Imperial Metals Corp. | Canada | 1,950,300 | $ | 3,694,450 | ||||||||
Sandfire Resources NL | Australia | 370,309 | 1,706,310 | |||||||||
|
| |||||||||||
| 5,400,760 | ||||||||||||
|
| |||||||||||
Diversified Metals & Mining 4.1% | ||||||||||||
a Adventus Mining Corp. | Canada | 3,500,000 | 2,864,179 | |||||||||
a,b Bluestone Resources Inc., 144A. | Canada | 2,500,000 | 2,235,272 | |||||||||
a,c Bluestone Resources Inc., wts., 3/19/21 | Canada | 550,000 | 26,646 | |||||||||
a,d Geopacific Resources Ltd. | Australia | 165,027,382 | 1,917,956 | |||||||||
a,b,d INV Metals Inc., 144A | Canada | 6,565,000 | 1,790,794 | |||||||||
a,b Ivanhoe Mines Ltd., 144A | Canada | 5,735,000 | 17,990,453 | |||||||||
a Ivanhoe Mines Ltd., A | Canada | 441,800 | 1,385,908 | |||||||||
a,c,d Nautilus Minerals Inc. | Canada | 9,222,015 | — | |||||||||
a,c,d,e Nautilus Minerals Inc., 144A. | Canada | 28,535,816 | — | |||||||||
a Orla Mining Ltd. | Canada | 4,770,713 | 5,386,143 | |||||||||
a,c Orla Mining Ltd., wts., 2/15/21 | Canada | 460,000 | 16,364 | |||||||||
a Pantoro Ltd. | Australia | 15,400,000 | 2,000,360 | |||||||||
|
| |||||||||||
| 35,614,075 | ||||||||||||
|
| |||||||||||
Gold 83.9% | ||||||||||||
Agnico Eagle Mines Ltd. (CAD Traded) | Canada | 317,797 | 16,603,223 | |||||||||
Agnico Eagle Mines Ltd. (USD Traded) | Canada | 170,000 | 8,879,100 | |||||||||
a Alacer Gold Corp. | United States | 5,092,500 | 20,258,098 | |||||||||
a,b Alacer Gold Corp., 144A | United States | 1,500,000 | 5,967,039 | |||||||||
Alamos Gold Inc., A (CAD Traded) | Canada | 4,368,316 | 28,664,229 | |||||||||
Alamos Gold Inc., A (USD Traded) | Canada | 2,209,500 | 14,472,225 | |||||||||
AngloGold Ashanti Ltd., ADR | South Africa | 2,499,823 | 42,646,980 | |||||||||
a Asanko Gold Inc. | Canada | 11,203,375 | 8,743,683 | |||||||||
a Ascot Resources Ltd. | Canada | 700,000 | 339,458 | |||||||||
a,c,e Ascot Resources Ltd. | Canada | 5,000,000 | 2,347,759 | |||||||||
a,c,e Ascot Resources Ltd., wts., 5/21/20 | Canada | 5,000,000 | 47,236 | |||||||||
a B2Gold Corp. | Canada | 17,738,694 | 56,586,400 | |||||||||
Barrick Gold Corp. | Canada | 3,014,383 | 49,013,868 | |||||||||
a Belo Sun Mining Corp. | Canada | 3,405,750 | 709,666 | |||||||||
a,b Belo Sun Mining Corp., 144A | Canada | 13,800,000 | 2,875,545 | |||||||||
Centamin PLC | Egypt | 15,015,200 | 23,695,339 | |||||||||
a Centerra Gold Inc. | Canada | 825,700 | 6,594,338 | |||||||||
a,b Centerra Gold Inc., 144A | Canada | 2,893,400 | 23,107,737 | |||||||||
d Chalice Gold Mines Ltd. | Australia | 31,072,008 | 3,504,992 | |||||||||
a Continental Gold Inc. | Canada | 5,961,230 | 17,480,553 | |||||||||
a,bContinental Gold Inc., 144A | Canada | 1,000,000 | 2,932,374 | |||||||||
aDacian Gold Ltd. | Australia | 6,645,412 | 3,793,518 | |||||||||
aDetour Gold Corp. | Canada | 1,181,300 | 18,045,090 | |||||||||
aEldorado Gold Corp. | Canada | 3,113,724 | 23,876,406 | |||||||||
aEndeavour Mining Corp. | Canada | 1,160,000 | 21,675,014 | |||||||||
a,cGascoyne Resources Ltd. | Australia | 23,023,100 | 306,925 | |||||||||
aGold Standard Ventures Corp. | Canada | 1,870,000 | 1,912,862 | |||||||||
aGolden Star Resources Ltd. | United States | 3,479,533 | 12,352,342 | |||||||||
| franklintempleton.com | Annual Report | 15 | ||
FRANKLIN GOLD AND PRECIOUS METALS FUND
STATEMENT OF INVESTMENTS
| Country | Shares/ Rights/ Warrants | Value | ||||||||||
Common Stocks and Other Equity Interests(continued) | ||||||||||||
Gold(continued) | ||||||||||||
aGreat Panther Mining Ltd. | Canada | 7,871,889 | $ | 6,462,821 | ||||||||
a,dGuyana Goldfields Inc. | Canada | 8,705,100 | 7,387,545 | |||||||||
a,b,dGuyana Goldfields Inc., 144A | Canada | 6,220,000 | 5,278,575 | |||||||||
aIAMGOLD Corp. | Canada | 4,350,500 | 15,792,315 | |||||||||
a,dLion One Metals Ltd. | Canada | 4,500,000 | 2,591,400 | |||||||||
a,b,dLion One Metals Ltd., 144A | Canada | 2,935,000 | 1,690,169 | |||||||||
a,dLydian International Ltd. | Canada | 6,375,000 | 483,046 | |||||||||
a,b,dLydian International Ltd., 144A | Canada | 31,610,500 | 2,395,189 | |||||||||
aMidas Gold Corp. | Canada | 4,020,900 | 2,193,634 | |||||||||
a,bMidas Gold Corp., 144A | Canada | 4,030,000 | 2,198,598 | |||||||||
Newcrest Mining Ltd. | Australia | 2,061,439 | 50,142,992 | |||||||||
Newmont Goldcorp Corp. | United States | 847,614 | 30,954,863 | |||||||||
OceanaGold Corp. | Australia | 9,088,488 | 24,653,751 | |||||||||
Osisko Gold Royalties Ltd. | Canada | 200,000 | 2,359,538 | |||||||||
a,dPerseus Mining Ltd. | Australia | 69,959,901 | 33,001,379 | |||||||||
aPretium Resources Inc. | Canada | 2,069,000 | 22,434,090 | |||||||||
a,dRed 5 Ltd. | Australia | 117,268,146 | 18,840,036 | |||||||||
a,dRTG Mining Inc. | Australia | 1,769,918 | 120,699 | |||||||||
a,b,dRTG Mining Inc., 144A | Australia | 2,397,790 | 163,517 | |||||||||
a,dRTG Mining Inc., IDR | Australia | 41,087,582 | 2,766,818 | |||||||||
a,dRubicon Minerals Corp. | Canada | 6,038,900 | 3,431,843 | |||||||||
aSEMAFO Inc. | Canada | 3,309,200 | 13,264,382 | |||||||||
b,fShandong Gold Mining Co. Ltd., 144A, Reg S | China | 2,500,000 | 4,930,922 | |||||||||
aSolGold PLC | Australia | 14,650,000 | 5,383,785 | |||||||||
aSt. Augustine Gold and Copper Ltd. | Philippines | 8,136,836 | 138,722 | |||||||||
a,bSt. Augustine Gold and Copper Ltd., 144A, (CAD Traded) | Philippines | 16,383,333 | 279,315 | |||||||||
a,bSt. Augustine Gold and Copper Ltd., 144A, (USD Traded) | Philippines | 10,000,000 | 170,487 | |||||||||
St. Barbara Ltd. | Australia | 9,508,021 | 24,050,586 | |||||||||
aTeranga Gold Corp. | Canada | 1,257,751 | 4,889,004 | |||||||||
aTMAC Resources Inc. | Canada | 510,000 | 2,307,028 | |||||||||
aTorex Gold Resources Inc. | Canada | 327,000 | 4,212,161 | |||||||||
a,bTorex Gold Resources Inc., 144A | Canada | 1,450,000 | 18,678,212 | |||||||||
aWest African Resources Ltd. | Australia | 9,450,000 | 2,325,777 | |||||||||
|
| |||||||||||
| 733,405,198 | ||||||||||||
|
| |||||||||||
Precious Metals & Minerals 7.6% | ||||||||||||
Anglo American Platinum Ltd. | South Africa | 287,656 | 17,098,671 | |||||||||
aEastern Platinum Ltd. | Canada | 2,592,102 | 471,381 | |||||||||
Fresnillo PLC | United Kingdom | 1,120,000 | 8,177,398 | |||||||||
aImpala Platinum Holdings Ltd. | South Africa | 3,065,000 | 16,439,011 | |||||||||
aImpala Platinum Holdings Ltd., ADR | South Africa | 1,506,100 | 8,071,943 | |||||||||
aNortham Platinum Ltd. | South Africa | 1,259,019 | 5,522,547 | |||||||||
a,dPlatinum Group Metals Ltd. (CAD Traded) | South Africa | 2,252,787 | 3,174,983 | |||||||||
a,dPlatinum Group Metals Ltd. (USD Traded) | South Africa | 1,610,015 | 2,270,121 | |||||||||
a,d,ePlatinum Group Metals Ltd., 144A | South Africa | 134,388 | 189,401 | |||||||||
a,dPlatinum Group Metals Ltd., wts., 11/15/19 | South Africa | 7,593,795 | 75,938 | |||||||||
aRoyal Bafokeng Platinum Ltd. | South Africa | 2,193,527 | 5,208,490 | |||||||||
|
| |||||||||||
| 66,699,884 | ||||||||||||
|
| |||||||||||
| 16 | Annual Report | franklintempleton.com | ||
FRANKLIN GOLD AND PRECIOUS METALS FUND
STATEMENT OF INVESTMENTS
| Country | Shares/ Rights/ Warrants | Value | ||||||||||
Common Stocks and Other Equity Interests(continued) | ||||||||||||
Silver 2.7% | ||||||||||||
Hochschild Mining PLC | Peru | 3,268,520 | $ | 8,259,184 | ||||||||
aMAG Silver Corp. | Canada | 647,000 | 7,226,202 | |||||||||
a,bMAG Silver Corp., 144A | Canada | 240,000 | 2,680,508 | |||||||||
Pan American Silver Corp. | Canada | 327,021 | 4,980,581 | |||||||||
a,cPan American Silver Corp., rts., 2/20/49 | Canada | 1,850,600 | 559,255 | |||||||||
|
| |||||||||||
| 23,705,730 | ||||||||||||
|
| |||||||||||
Total Common Stocks and Other Equity Interests | 864,825,647 | |||||||||||
|
| |||||||||||
| Principal Amount* | ||||||||||||
Convertible Bonds (Cost $3,000,000) 0.2% | ||||||||||||
Precious Metals & Minerals 0.2% | ||||||||||||
dPlatinum Group Metals Ltd., cvt., 6.875%, 7/01/22 | South Africa | $ | 3,000,000 | 2,206,500 | ||||||||
|
| |||||||||||
Total Investments before Short Term Investments | 867,032,147 | |||||||||||
|
| |||||||||||
| Shares | ||||||||||||
Short Term Investments (Cost $4,722) 0.0%† | ||||||||||||
Money Market Funds 0.0%† | ||||||||||||
g,hInstitutional Fiduciary Trust Money Market Portfolio, 2.00% | United States | 4,722 | 4,722 | |||||||||
|
| |||||||||||
Total Investments (Cost $890,158,240) 99.1% | 867,036,869 | |||||||||||
Other Assets, less Liabilities 0.9% | 7,597,400 | |||||||||||
|
| |||||||||||
Net Assets 100.0% | $ | 874,634,269 | ||||||||||
|
| |||||||||||
See Abbreviations on page 30.
†Rounds to less than 0.1% of net assets.
*The principal amount is stated in U.S. dollars unless otherwise indicated.
aNon-income producing.
bSecurity was purchased pursuant to Rule 144A under the Securities Act of 1933 and may be sold in transactions exempt from registration only to qualified institutional buyers or in a public offering registered under the Securities Act of 1933. These securities have been deemed liquid under guidelines approved by the Fund’s Board of Trustees. At July 31, 2019, the aggregate value of these securities was $95,364,706, representing 10.9% of net assets.
cFair valued using significant unobservable inputs. See Note 11 regarding fair value measurements.
dSee Note 9 regarding holdings of 5% voting securities.
eSee Note 8 regarding restricted securities.
fSecurity was purchased pursuant to Regulation S under the Securities Act of 1933, which exempts from registration securities offered and sold outside of the United States. Such a security cannot be sold in the United States without either an effective registration statement filed pursuant to the Securities Act of 1933, or pursuant to an exemption from registration. This security has been deemed liquid under guidelines approved by the Fund’s Board of Trustees. At July 31, 2019, the value of this security was $4,930,922, representing 0.6% of net assets.
gSee Note 3(f) regarding investments in affiliated management investment companies.
hThe rate shown is the annualizedseven-day effective yield at period end.
| franklintempleton.com | The accompanying notes are an integral part of these financial statements. | Annual Report | 17 | ||
FRANKLIN GOLD AND PRECIOUS METALS FUND
FINANCIAL STATEMENTS
Statement of Assets and Liabilities
July 31, 2019
Assets: | ||||
Investments in securities: | ||||
Cost - Unaffiliated issuers | $ | 640,091,078 | ||
Cost -Non-controlled affiliates (Note 3f and 9) | 250,067,162 | |||
|
| |||
Value - Unaffiliated issuers | $ | 773,751,246 | ||
Value -Non-controlled affiliates (Note 3f and 9) | 93,285,623 | |||
Cash | 1,711,456 | |||
Receivables: | ||||
Investment securities sold | 4,155,884 | |||
Capital shares sold | 6,318,446 | |||
Dividends and interest | 46,675 | |||
Other assets | 508 | |||
|
| |||
Total assets | 879,269,838 | |||
|
| |||
Liabilities: | ||||
Payables: | ||||
Capital shares redeemed | 3,714,600 | |||
Management fees | 347,443 | |||
Distribution fees | 201,703 | |||
Transfer agent fees | 204,452 | |||
Accrued expenses and other liabilities | 167,371 | |||
|
| |||
Total liabilities | 4,635,569 | |||
|
| |||
Net assets, at value | $ | 874,634,269 | ||
|
| |||
Net assets consist of: | ||||
Paid-in capital | $ | 1,666,223,079 | ||
Total distributable earnings (loss) | (791,588,810 | ) | ||
|
| |||
Net assets, at value | $ | 874,634,269 | ||
|
| |||
Class A: | ||||
Net assets, at value | $ | 645,108,331 | ||
|
| |||
Shares outstanding | 38,683,178 | |||
|
| |||
Net asset value per sharea | $16.68 | |||
|
| |||
Maximum offering price per share (net asset value per share ÷ 94.50%) | $17.65 | |||
|
| |||
Class C: | ||||
Net assets, at value | $ | 75,128,850 | ||
|
| |||
Shares outstanding | 4,929,808 | |||
|
| |||
Net asset value and maximum offering price per sharea | $15.24 | |||
|
| |||
Class R6: | ||||
Net assets, at value | $ | 10,808,169 | ||
|
| |||
Shares outstanding | 603,760 | |||
|
| |||
Net asset value and maximum offering price per share | $17.90 | |||
|
| |||
Advisor Class: | ||||
Net assets, at value | $ | 143,588,919 | ||
|
| |||
Shares outstanding | 8,098,230 | |||
|
| |||
Net asset value and maximum offering price per share | $17.73 | |||
|
| |||
aRedemption price is equal to net asset value less contingent deferred sales charges, if applicable.
| 18 | Annual Report | The accompanying notes are an integral part of these financial statements. | franklintempleton.com | ||
FRANKLIN GOLD AND PRECIOUS METALS FUND
FINANCIAL STATEMENTS
Statement of Operations
for the year ended July 31, 2019
Investment income: | ||||
Dividends: (net of foreign taxes)* | ||||
Unaffiliated issuers | $ | 5,373,490 | ||
Non-controlled affiliates (Note 3f and 9) | 860,196 | |||
Interest: | ||||
Non-controlled affiliates (Note 9) | 233,343 | |||
|
| |||
Total investment income | 6,467,029 | |||
|
| |||
Expenses: | ||||
Management fees (Note 3a) | 3,744,620 | |||
Distribution fees: (Note 3c) | ||||
Class A | 1,443,452 | |||
Class C | 701,855 | |||
Transfer agent fees: (Note 3e) | ||||
Class A | 1,034,478 | |||
Class C | 125,763 | |||
Class R6 | 22,015 | |||
Advisor Class | 214,157 | |||
Custodian fees (Note 4) | 122,599 | |||
Reports to shareholders | 126,175 | |||
Registration and filing fees | 92,210 | |||
Professional fees | 118,504 | |||
Trustees’ fees and expenses | 52,738 | |||
Other | 30,777 | |||
|
| |||
Total expenses | 7,829,343 | |||
Expense reductions (Note 4) | (358 | ) | ||
Expenses waived/paid by affiliates (Note 3f and 3g) | (35,630 | ) | ||
|
| |||
Net expenses | 7,793,355 | |||
|
| |||
Net investment income (loss) | (1,326,326 | ) | ||
|
| |||
Realized and unrealized gains (losses): | ||||
Net realized gain (loss) from: | ||||
Investments: | ||||
Unaffiliated issuers | (28,752,740 | ) | ||
Non-controlled affiliates (Note 3f and 9) | (16,994,870 | ) | ||
Foreign currency transactions | (23,567 | ) | ||
|
| |||
Net realized gain (loss) | (45,771,177 | ) | ||
|
| |||
Net change in unrealized appreciation (depreciation) on: | ||||
Investments: | ||||
Unaffiliated issuers | 206,606,942 | |||
Non-controlled affiliates (Note 3f and 9) | 13,210,604 | |||
Translation of other assets and liabilities denominated in foreign currencies | (7,469 | ) | ||
|
| |||
Net change in unrealized appreciation (depreciation) | 219,810,077 | |||
|
| |||
Net realized and unrealized gain (loss) | 174,038,900 | |||
|
| |||
Net increase (decrease) in net assets resulting from operations | $ | 172,712,574 | ||
|
| |||
*Foreign taxes withheld on dividends | $ | 291,872 | | |
| franklintempleton.com | The accompanying notes are an integral part of these financial statements. | Annual Report | 19 | ||
FRANKLIN GOLD AND PRECIOUS METALS FUND
FINANCIAL STATEMENTS
Statements of Changes in Net Assets
| Year Ended July 31, | ||||||||
|
| |||||||
| 2019 | 2018 | |||||||
| ||||||||
Increase (decrease) in net assets: | ||||||||
Operations: | ||||||||
Net investment income (loss) | $ | (1,326,326 | ) | $ | (4,028,486 | ) | ||
Net realized gain (loss) | (45,771,177 | ) | 14,625,179 | |||||
Net change in unrealized appreciation (depreciation) | 219,810,077 | (171,679,838 | ) | |||||
|
| |||||||
Net increase (decrease) in net assets resulting from operations | 172,712,574 | (161,083,145 | ) | |||||
|
| |||||||
Distributions to shareholders: (Note 1d) | ||||||||
Class A | — | (2,669,273 | ) | |||||
Class R6 | — | (42,473 | ) | |||||
Advisor Class | — | (990,657 | ) | |||||
|
| |||||||
Total distributions to shareholders | — | (3,702,403 | ) | |||||
|
| |||||||
Capital share transactions: (Note 2) | ||||||||
Class A | (75,849,158 | ) | (72,490,928 | ) | ||||
Class C | (31,756,462 | ) | (21,657,772 | ) | ||||
Class R6 | 971,552 | 4,662,395 | ||||||
Advisor Class | (12,700,287 | ) | (7,524,340 | ) | ||||
|
| |||||||
Total capital share transactions | (119,334,355 | ) | (97,010,645 | ) | ||||
|
| |||||||
Net increase (decrease) in net assets | 53,378,219 | (261,796,193 | ) | |||||
Net assets: | ||||||||
Beginning of year | 821,256,050 | 1,083,052,243 | ||||||
|
| |||||||
End of year (Note 1d) | $ | 874,634,269 | $ | 821,256,050 | ||||
|
| |||||||
| 20 | Annual Report | The accompanying notes are an integral part of these financial statements. | franklintempleton.com | ||
FRANKLIN GOLD AND PRECIOUS METALS FUND
1. Organization and Significant Accounting Policies
Franklin Gold and Precious Metals Fund (Fund) is registered under the Investment Company Act of 1940 (1940 Act) as anopen-end management investment company and applies the specialized accounting and reporting guidance in U.S. Generally Accepted Accounting Principles (U.S. GAAP). The Fund offers four classes of shares: Class A, Class C, Class R6 and Advisor Class. Beginning on October 19, 2018, Class C shares automatically convert to Class A shares after they have been held for 10 years. Each class of shares may differ by its initial sales load, contingent deferred sales charges, voting rights on matters affecting a single class, its exchange privilege and fees due to differing arrangements for distribution and transfer agent fees.
The following summarizes the Fund’s significant accounting policies.
a. Financial Instrument Valuation
The Fund’s investments in financial instruments are carried at fair value daily. Fair value is the price that would be received to sell an asset or paid to transfer a liability in an orderly transaction between market participants on the measurement date. The Fund calculates the net asset value (NAV) per share each business day as of 4 p.m. Eastern time or the regularly scheduled close of the New York Stock Exchange (NYSE), whichever is earlier. Under compliance policies and procedures approved by the Fund’s Board of Trustees (the Board), the Fund’s administrator has responsibility for oversight of valuation, including leading the cross-functional Valuation Committee (VC). The Fund may utilize independent pricing services, quotations from securities and financial instrument dealers, and other market sources to determine fair value.
Equity securities listed on an exchange or on the NASDAQ National Market System are valued at the last quoted sale price or the official closing price of the day, respectively. Foreign equity securities are valued as of the close of trading on the foreign stock exchange on which the security is primarily traded, or as of 4 p.m. Eastern time. The value is then converted into its U.S. dollar equivalent at the foreign exchange rate in effect at 4 p.m. Eastern time on the day that the value of the security is determined.Over-the-counter (OTC) securities are valued within the range of the most recent quoted bid and ask prices. Securities that trade in multiple markets or on multiple exchanges are valued
according to the broadest and most representative market. Certain equity securities are valued based upon fundamental characteristics or relationships to similar securities.
Investments inopen-end mutual funds are valued at the closing NAV.
The Fund has procedures to determine the fair value of financial instruments for which market prices are not reliable or readily available. Under these procedures, the Fund primarily employs a market-based approach which may use related or comparable assets or liabilities, recent transactions, market multiples, book values, and other relevant information for the investment to determine the fair value of the investment. An income-based valuation approach may also be used in which the anticipated future cash flows of the investment are discounted to calculate fair value. Discounts may also be applied due to the nature or duration of any restrictions on the disposition of the investments. Due to the inherent uncertainty of valuations of such investments, the fair values may differ significantly from the values that would have been used had an active market existed.
Trading in securities on foreign securities stock exchanges and OTC markets may be completed before 4 p.m. Eastern time. In addition, trading in certain foreign markets may not take place on every Fund’s business day. Occasionally, events occur between the time at which trading in a foreign security is completed and 4 p.m. Eastern time that might call into question the reliability of the value of a portfolio security held by the Fund. As a result, differences may arise between the value of the Fund’s portfolio securities as determined at the foreign market close and the latest indications of value at 4 p.m. Eastern time. In order to minimize the potential for these differences, the VC monitors price movements following the close of trading in foreign stock markets through a series of country specific market proxies (such as baskets of American Depositary Receipts, futures contracts and exchange traded funds). These price movements are measured against established trigger thresholds for each specific market proxy to assist in determining if an event has occurred that may call into question the reliability of the values of the foreign securities held by the Fund. If such an event occurs, the securities may be valued using fair value procedures, which may include the use of independent pricing services.
| franklintempleton.com | Annual Report | 21 | ||
FRANKLIN GOLD AND PRECIOUS METALS FUND
NOTES TO FINANCIAL STATEMENTS
1. Organization and Significant Accounting
Policies(continued)
a. Financial Instrument Valuation(continued)
When the last day of the reporting period is anon-business day, certain foreign markets may be open on those days that the Fund’s NAV is not calculated, which could result in differences between the value of the Fund’s portfolio securities on the last business day and the last calendar day of the reporting period. Any significant security valuation changes due to an open foreign market are adjusted and reflected by the Fund for financial reporting purposes.
b. Foreign Currency Translation
Portfolio securities and other assets and liabilities denominated in foreign currencies are translated into U.S. dollars based on the exchange rate of such currencies against U.S. dollars on the date of valuation. The Fund may enter into foreign currency exchange contracts to facilitate transactions denominated in a foreign currency. Purchases and sales of securities, income and expense items denominated in foreign currencies are translated into U.S. dollars at the exchange rate in effect on the transaction date. Portfolio securities and assets and liabilities denominated in foreign currencies contain risks that those currencies will decline in value relative to the U.S. dollar. Occasionally, events may impact the availability or reliability of foreign exchange rates used to convert the U.S. dollar equivalent value. If such an event occurs, the foreign exchange rate will be valued at fair value using procedures established and approved by the Board.
The Fund does not separately report the effect of changes in foreign exchange rates from changes in market prices on securities held. Such changes are included in net realized and unrealized gain or loss from investments in the Statement of Operations.
Realized foreign exchange gains or losses arise from sales of foreign currencies, currency gains or losses realized between the trade and settlement dates on securities transactions and the difference between the recorded amounts of dividends, interest, and foreign withholding taxes and the U.S. dollar equivalent of the amounts actually received or paid. Net unrealized foreign exchange gains and losses arise from changes in foreign exchange rates on foreign denominated assets and liabilities other than investments in securities held at the end of the reporting period.
c. Income and Deferred Taxes
It is the Fund’s policy to qualify as a regulated investment company under the Internal Revenue Code. The Fund intends to distribute to shareholders substantially all of its taxable income and net realized gains to relieve it from federal income and excise taxes. As a result, no provision for U.S. federal income taxes is required.
The Fund may be subject to foreign taxation related to income received, capital gains on the sale of securities and certain foreign currency transactions in the foreign jurisdictions in which it invests. Foreign taxes, if any, are recorded based on the tax regulations and rates that exist in the foreign markets in which the Fund invests. When a capital gain tax is determined to apply, the Fund records an estimated deferred tax liability in an amount that would be payable if the securities were disposed of on the valuation date.
The Fund may recognize an income tax liability related to its uncertain tax positions under U.S. GAAP when the uncertain tax position has a less than 50% probability that it will be sustained upon examination by the tax authorities based on its technical merits. As of July 31, 2019, the Fund has determined that no tax liability is required in its financial statements related to uncertain tax positions for any open tax years (or expected to be taken in future tax years). Open tax years are those that remain subject to examination and are based on the statute of limitations in each jurisdiction in which the Fund invests.
d. Security Transactions, Investment Income,
Expenses and Distributions
Security transactions are accounted for on trade date. Realized gains and losses on security transactions are determined on a specific identification basis. Interest income and estimated expenses are accrued daily. Dividend income is recorded on theex-dividend date except for certain dividends from securities where the dividend rate is not available. In such cases, the dividend is recorded as soon as the information is received by the Fund. Distributions to shareholders are recorded on theex-dividend date. Distributable earnings are determined according to income tax regulations (tax basis) and may differ from earnings recorded in accordance with U.S. GAAP. These differences may be permanent or temporary. Permanent differences are reclassified among capital accounts to reflect their tax
| 22 | Annual Report | franklintempleton.com | ||
FRANKLIN GOLD AND PRECIOUS METALS FUND
NOTES TO FINANCIAL STATEMENTS
character. These reclassifications have no impact on net assets or the results of operations. Temporary differences are not reclassified, as they may reverse in subsequent periods.*
Realized and unrealized gains and losses and net investment income, excluding class specific expenses, are allocated daily to each class of shares based upon the relative proportion of net assets of each class. Differences in per share distributions by class are generally due to differences in class specific expenses.
e. Accounting Estimates
The preparation of financial statements in accordance with U.S. GAAP requires management to make estimates and assumptions that affect the reported amounts of assets and liabilities at the date of the financial statements and the amounts of income and expenses during the reporting period. Actual results could differ from those estimates.
f. Guarantees and Indemnifications
Under the Fund’s organizational documents, its officers and trustees are indemnified by the Fund against certain liabilities arising out of the performance of their duties to the Fund. Additionally, in the normal course of business, the Fund enters into contracts with service providers that contain general indemnification clauses. The Fund’s maximum exposure under these arrangements is unknown as this would involve future claims that may be made against the Fund that have not yet occurred. Currently, the Fund expects the risk of loss to be remote.
*Effective during the current reporting period, it is no longer required to present certain line items in the Statements of Changes in Net Assets. The below prior period amounts affected by this change are shown as they were in the prior year Statements of Changes in Net Assets.
For the year ended July 31, 2018, distributions to shareholders were as follows:
Distributions from net investment income: | ||||
Class A | $ | (2,669,273 | ) | |
Class R6 | (42,473 | ) | ||
Advisor Class | (990,657 | ) |
For the year ended July 31, 2018, distributions in excess of net investment income included in net assets was $(156,416,032).
2. Shares of Beneficial Interest
At July 31, 2019, there were an unlimited number of shares authorized (without par value). Transactions in the Fund’s shares were as follows:
| Year Ended July 31, | ||||||||||||||||
| 2019 | 2018 | |||||||||||||||
| Shares | Amount | Shares | Amount | |||||||||||||
Class A Shares: | ||||||||||||||||
Shares solda | 23,599,735 | $ | 320,367,522 | 21,932,108 | $ | 334,081,638 | ||||||||||
Shares issued in reinvestment of distributions | — | — | 136,248 | 2,017,824 | ||||||||||||
Shares redeemed | (28,218,476) | ( 396,216,680) | (26,747,211) | (408,590,390) | ||||||||||||
Net increase (decrease) | (4,618,741) | $ | (75,849,158) | (4,678,855) | $ | (72,490,928) | ||||||||||
| franklintempleton.com | Annual Report | 23 | ||
FRANKLIN GOLD AND PRECIOUS METALS FUND
NOTES TO FINANCIAL STATEMENTS
2. Shares of Beneficial Interest(continued)
Year Ended July 31,
| ||||||||||||||||
2019
| 2018
| |||||||||||||||
Shares
| Amount
| Shares
| Amount
| |||||||||||||
Class C Shares: | ||||||||||||||||
Shares sold | 864,478 | $ | 10,574,026 | 955,568 | $ | 13,443,635 | ||||||||||
Shares redeemeda | (3,542,905 | ) | (42,330,488 | ) | (2,539,818 | ) | (35,101,407 | ) | ||||||||
Net increase (decrease) | (2,678,427 | ) | $ | (31,756,462 | ) | (1,584,250 | ) | $ | (21,657,772 | ) | ||||||
Class R6 Shares: | ||||||||||||||||
Shares sold | 431,162 | $ | 6,434,093 | 476,053 | $ | 7,584,565 | ||||||||||
Shares issued in reinvestment of distributions | — | — | 2,671 | 42,201 | ||||||||||||
Shares redeemed | (389,580 | ) | (5,462,541 | ) | (184,220 | ) | (2,964,371 | ) | ||||||||
Net increase (decrease) | 41,582 | $ | 971,552 | 294,504 | $ | 4,662,395 | ||||||||||
Advisor Class Shares: | ||||||||||||||||
Shares sold | 3,233,625 | $ | 45,629,801 | 3,574,164 | $ | 57,004,070 | ||||||||||
Shares issued in reinvestment of distributions | — | — | 55,251 | 866,343 | ||||||||||||
Shares redeemed | (4,229,531 | ) | (58,330,088 | ) | (4,101,007 | ) | (65,394,753 | ) | ||||||||
Net increase (decrease) | (995,906 | ) | $ | (12,700,287 | ) | (471,592 | ) | $ | (7,524,340 | ) | ||||||
aMay include a portion of Class C shares that were automatically converted to Class A.
3. Transactions with Affiliates
Franklin Resources, Inc. is the holding company for various subsidiaries that together are referred to as Franklin Templeton. Certain officers and trustees of the Fund are also officers and/or directors of the following subsidiaries:
Subsidiary
| Affiliation
| |
Franklin Advisers, Inc. (Advisers)
| Investment manager
| |
Franklin Templeton Services, LLC (FT Services)
| Administrative manager
| |
Franklin Templeton Distributors, Inc. (Distributors)
| Principal underwriter
| |
Franklin Templeton Investor Services, LLC (Investor Services)
| Transfer agent
| |
a. Management Fees
The Fund pays an investment management fee to Advisers based on themonth-end net assets of the Fund as follows:
Annualized Fee Rate
| Net Assets
| |
0.625%
| Up to and including $100 million
| |
0.500%
| Over $100 million, up to and including $250 million
| |
0.450%
| Over $250 million, up to and including $7.5 billion
| |
0.440%
| Over $7.5 billion, up to and including $10 billion
| |
0.430%
| Over $10 billion, up to and including $12.5 billion
| |
0.420% | Over $12.5 billion, up to and including $15 billion | |
0.400% |
In excess of $15 billion | |
| 24 | Annual Report | franklintempleton.com | ||
FRANKLIN GOLD AND PRECIOUS METALS FUND
NOTES TO FINANCIAL STATEMENTS
For the year ended July 31, 2019, the gross effective investment management fee rate was 0.483% of the Fund’s average daily net assets.
b. Administrative Fees
Under an agreement with Advisers, FT Services provides administrative services to the Fund. The fee is paid by Advisers based on the Fund’s average daily net assets, and is not an additional expense of the Fund.
c. Distribution Fees
The Board has adopted distribution plans for Class A and Class C shares, pursuant to Rule12b-1 under the 1940 Act. Under the Fund’s Class A reimbursement distribution plan, the Fund reimburses Distributors for costs incurred in connection with the servicing, sale and distribution of the Fund’s shares up to the maximum annual plan rate. Under the Class A reimbursement distribution plan, costs exceeding the maximum for the current plan year cannot be reimbursed in subsequent periods. In addition, under the Fund’s Class C compensation distribution plan, the Fund pays Distributors for costs incurred in connection with the servicing, sale and distribution of each Fund’s shares up to the maximum annual plan rate. The plan year, for purposes of monitoring compliance with the maximum annual plan rates, is February 1 through January 31.
The maximum annual plan rates, based on the average daily net assets, for each class, are as follows:
Class A | 0.25 | % | ||
Class C | 1.00 | % |
d. Sales Charges/Underwriting Agreements
Front-end sales charges and contingent deferred sales charges (CDSC) do not represent expenses of the Fund. These charges are deducted from the proceeds of sales of Fund shares prior to investment or from redemption proceeds prior to remittance, as applicable. Distributors has advised the Fund of the following commission transactions related to the sales and redemptions of the Fund’s shares for the year:
Sales charges retained net of commissions paid to unaffiliated brokers/dealers | $ | 42,903 | ||
CDSC retained | $ | 5,602 |
Effective September 10, 2018, the Board approved changes to certainfront-end sales charges and dealer commissions on Class A shares. Further details are disclosed in the Fund’s Prospectus.
e. Transfer Agent Fees
Each class of shares pays transfer agent fees to Investor Services for its performance of shareholder servicing obligations. The fees are based on an annualized asset based fee of 0.02% plus a transaction based fee. In addition, each class reimburses Investor Services for out of pocket expenses incurred and, except for Class R6, reimburses shareholder servicing fees paid to third parties. These fees are allocated daily based upon their relative proportion of such classes’ aggregate net assets. Class R6 pays Investor Services transfer agent fees specific to that class.
For the year ended July 31, 2019, the Fund paid transfer agent fees of $1,396,413, of which $612,385 was retained by Investor Services.
| franklintempleton.com | Annual Report | 25 | ||
FRANKLIN GOLD AND PRECIOUS METALS FUND
NOTES TO FINANCIAL STATEMENTS
3. Transactions with Affiliates(continued)
f. Investments in Affiliated Management Investment Companies
The Fund invests in one or more affiliated management investment companies for purposes other than exercising a controlling influence over the management or policies. Management fees paid by the Fund are waived on assets invested in the affiliated management investment companies, as noted in the Statement of Operations, in an amount not to exceed the management and administrative fees paid directly or indirectly by each affiliate. During the year ended July 31, 2019, the Fund held investments in affiliated management investment companies as follows:
| Value at Beginning of Year | Purchases | Sales | Realized Gain (Loss) | Net Change in Unrealized Appreciation (Depreciation) | Value at End of Year | Number of of Year | Dividend Income | |||||||||||||||||||||||||
Non-Controlled Affiliates | ||||||||||||||||||||||||||||||||
Institutional Fiduciary Trust Money Market Portfolio, 2.00% | $755,389 | $ | 155,039,774 | $ | (155,790,441 | ) | $ — | $ — | $ | 4,722 | 4,722 | $88,196 | ||||||||||||||||||||
g. Waiver and Expense Reimbursements
Investor Services has contractually agreed in advance to waive or limit its fees so that the Class R6 transfer agent fees do not exceed 0.03% based on the average net assets of the class until November 30, 2019.
4. Expense Offset Arrangement
The Fund has entered into an arrangement with its custodian whereby credits realized as a result of uninvested cash balances are used to reduce a portion of the Fund’s custodian expenses. During the year ended July 31, 2019, the custodian fees were reduced as noted in the Statement of Operations.
5. Income Taxes
For tax purposes, capital losses may be carried over to offset future capital gains.
At July 31, 2019, the capital loss carryforwards were as follows:
Capital loss carryforwards not subject to expiration:
Short term | $ | 9,915,934 | ||
Long term | 636,684,167 | |||
Total capital loss carryforwards | $ | 646,600,101 | ||
For tax purposes, the Fund may elect to defer any portion of a post-October capital loss or late-year ordinary loss to the first day of the following fiscal year. At July 31, 2019, the Fund deferred late-year ordinary losses of $573,902.
The tax character of distributions paid during the years ended July 31, 2019 and 2018, was as follows:
| 2019 | 2018 | |||||||
Distributions paid from ordinary income | $ | — | �� | $ | 3,696,662 | |||
| 26 | Annual Report | franklintempleton.com | ||
FRANKLIN GOLD AND PRECIOUS METALS FUND
NOTES TO FINANCIAL STATEMENTS
At July 31, 2019, the cost of investments and net unrealized appreciation (depreciation) for income tax purposes were as follows:
Cost of investments | $ | 1,011,448,224 | ||
Unrealized appreciation | $ | 284,769,067 | ||
Unrealized depreciation | (429,180,422 | ) | ||
Net unrealized appreciation (depreciation) | $ | (144,411,355 | ) | |
Differences between income and/or capital gains as determined on a book basis and a tax basis are primarily due to differing treatments of passive foreign investment company shares.
6. Investment Transactions
Purchases and sales of investments (excluding short term securities) for the year ended July 31, 2019, aggregated $99,482,752 and $227,609,379, respectively.
7. Concentration of Risk
Investing in foreign securities may include certain risks and considerations not typically associated with investing in U.S. securities, such as fluctuating currency values and changing local and regional economic, political and social conditions, which may result in greater market volatility. Current political and financial uncertainty surrounding the European Union may increase market volatility and the economic risk of investing in securities in Europe. In addition, certain foreign securities may not be as liquid as U.S. securities.
8. Restricted Securities
The Fund invests in securities that are restricted under the Securities Act of 1933 (1933 Act). Restricted securities are often purchased in private placement transactions, and cannot be sold without prior registration unless the sale is pursuant to an exemption under the 1933 Act. Disposal of these securities may require greater effort and expense, and prompt sale at an acceptable price may be difficult. The Fund may have registration rights for restricted securities. The issuer generally incurs all registration costs.
At July 31, 2019, investments in restricted securities, excluding securities exempt from registration under the 1933 Act deemed to be liquid, were as follows:
| Shares/ | Acquisition | |||||||||||||||
| Warrants | Issuer | Date | Cost | Value | ||||||||||||
| 5,000,000 | aAscot Resources Ltd. | 5/22/19 | $ | 2,441,417 | $ | 2,347,759 | ||||||||||
| 5,000,000 | aAscot Resources Ltd., wts., 5/21/20 | 5/22/19 | 170,134 | 47,236 | ||||||||||||
| 28,535,816 | bNautilus Minerals Inc., 144A | 2/08/07 - 4/05/16 | 10,752,996 | — | ||||||||||||
| 134,388 | cPlatinum Group Metals Ltd., 144A | 9/29/08 - 1/03/18 | 16,407,905 | 189,401 | ||||||||||||
| Total Restricted Securities(Value is 0.3% of Net Assets) | $ | 29,772,452 | $ | 2,584,396 | ||||||||||||
aThe Fund also invests in unrestricted securities of the issuer, valued at $339,458 as of July 31, 2019.
bThe Fund also invests in unrestricted securities of the issuer, determined to have no value as of July 31, 2019.
cThe Fund also invests in unrestricted securities of the issuer, valued at $7,727,542 as of July 31, 2019.
| franklintempleton.com | Annual Report | 27 | ||
FRANKLIN GOLD AND PRECIOUS METALS FUND
NOTES TO FINANCIAL STATEMENTS
9. Holdings of 5% Voting Securities of Portfolio Companies
The 1940 Act defines “affiliated companies” to include investments in portfolio companies in which a fund owns 5% or more of the outstanding voting securities. During the year ended July 31, 2019, investments in “affiliated companies” were as follows:
| Name of Issuer | Value at Beginning of Year | Purchases | Sales | Realized Gain (Loss) | Net Change in Unrealized Appreciation (Depreciation) | Value at Year | Number of Shares/ Warrants/ Principal Amount* Held at End of Year | Investment Income | ||||||||||||||||||||||||||||||||
| Non-Controlled Affiliates | ||||||||||||||||||||||||||||||||||||||||
| Dividends | ||||||||||||||||||||||||||||||||||||||||
Chalice Gold Mines Ltd. | $ | 3,579,130 | $ | — | $ | — | $ | — | $ | (74,138 | ) | $ | 3,504,992 | 31,072,008 | $772,000 | |||||||||||||||||||||||||
Geopacific Resources Ltd. | 3,188,643 | — | — | — | (1,270,687 | ) | 1,917,956 | 165,027,382 | — | |||||||||||||||||||||||||||||||
Guyana Goldfields Inc. | 5,673,432 | 6,864,431 | — | — | (5,150,318 | ) | 7,387,545 | 8,705,100 | — | |||||||||||||||||||||||||||||||
Guyana Goldfields Inc., 144A | 19,126,690 | — | — | — | (13,848,115 | ) | 5,278,575 | 6,220,000 | — | |||||||||||||||||||||||||||||||
INV Metals Inc., 144A | 2,372,040 | — | — | — | (581,246 | ) | 1,790,794 | 6,565,000 | — | |||||||||||||||||||||||||||||||
Lion One Metals Ltd. | 2,198,647 | — | (531,932 | ) | (352,150 | ) | 1,276,835 | 2,591,400 | 4,500,000 | — | ||||||||||||||||||||||||||||||
Lion One Metals Ltd., 144A | 1,173,278 | — | — | — | 516,891 | 1,690,169 | 2,935,000 | — | ||||||||||||||||||||||||||||||||
Lydian International Ltd. | 4,886,439 | — | (2,455,380 | ) | (3,224,830 | ) | 1,276,817 | 483,046 | 6,375,000 | — | ||||||||||||||||||||||||||||||
Lydian International Ltd., 144A | 7,587,639 | — | (461,799 | ) | (854,221 | ) | (3,876,430 | ) | 2,395,189 | 31,610,500 | — | |||||||||||||||||||||||||||||
Nautilus Minerals Inc. | 992,529 | — | — | — | (992,529 | ) | — | 9,222,015 | — | |||||||||||||||||||||||||||||||
Nautilus Minerals Inc., 144A | 3,071,198 | — | — | — | (3,071,198 | ) | — | 28,535,816 | — | |||||||||||||||||||||||||||||||
Perseus Mining Ltd. | 18,208,334 | 6,985,582 | a | (4,534,174 | ) | 583,115 | 11,758,522 | 33,001,379 | 69,959,901 | — | ||||||||||||||||||||||||||||||
Perseus Mining Ltd., wts., 4/19/19 | 78,503 | — | (1,017,584 | )a | — | 939,081 | — | — | — | |||||||||||||||||||||||||||||||
Platinum Group Metals Ltd. (CAD Traded) | 615,852 | 2,440,152 | a | — | — | 118,979 | 3,174,983 | 2,252,787 | — | |||||||||||||||||||||||||||||||
Platinum Group Metals Ltd., (units consisting of common stock and wts.) | 1,346,039 | — | (1,814,069 | )a | — | 468,030 | — | — | — | |||||||||||||||||||||||||||||||
Platinum Group Metals Ltd. (USD Traded) | 1,547,983 | 130,218 | a | — | — | 591,920 | 2,270,121 | 1,610,015 | — | |||||||||||||||||||||||||||||||
Platinum Group Metals Ltd., 144A | 139,471 | — | — | — | 49,930 | 189,401 | 134,388 | |||||||||||||||||||||||||||||||||
Platinum Group Metals Ltd., wts., 11/15/19 | — | 220,551 | a | (82,065 | )a | — | (62,548 | ) | 75,938 | 7,593,795 | — | |||||||||||||||||||||||||||||
Red 5 Ltd. | 6,242,235 | — | (1,632,551 | ) | (13,146,784 | ) | 27,377,136 | 18,840,036 | 117,268,146 | — | ||||||||||||||||||||||||||||||
RTG Mining Inc. | 136,064 | — | — | — | (15,365 | ) | 120,699 | 1,769,918 | — | |||||||||||||||||||||||||||||||
RTG Mining Inc., 144A | 184,332 | — | — | — | (20,815 | ) | 163,517 | 2,397,790 | — | |||||||||||||||||||||||||||||||
RTG Mining Inc., IDR | 3,206,095 | — | — | — | (439,277 | ) | 2,766,818 | 41,087,582 | — | |||||||||||||||||||||||||||||||
Rubicon Minerals Corp. | 3,425,817 | 1,740,893 | — | — | (1,734,867 | ) | 3,431,843 | 6,038,900 | — | |||||||||||||||||||||||||||||||
| $ | 88,980,390 | $ | 18,381,827 | $ | (12,529,554 | ) | $ | (16,994,870 | ) | $ | 13,236,608 | $ | 91,074,401 | $772,000 | ||||||||||||||||||||||||||
| 28 | Annual Report | franklintempleton.com | ||
FRANKLIN GOLD AND PRECIOUS METALS FUND
NOTES TO FINANCIAL STATEMENTS
| Name of Issuer | Value at Beginning of Year | Purchases | Sales | Realized Gain (Loss) | Net Change in Unrealized | Value at End of Year | Number of Warrants/ Principal at End of Year | Investment Income | ||||||||||||||||||||||||
Non-Controlled Affiliates(continued) |
| |||||||||||||||||||||||||||||||
| Interest | ||||||||||||||||||||||||||||||||
Platinum Group Metals Ltd., cvt., 6.875%, 7/01/22 | $ 2,232,504 | $ — | $ — | $ — | $ (26,004 | ) | $ 2,206,500 | 3,000,000 | $ 233,343 | b | ||||||||||||||||||||||
Total Affiliated Securities(Value is 10.7% of Net Assets) | $91,212,894 | $18,381,827 | $(12,529,554 | ) | $(16,994,870 | ) | $13,210,604 | $93,280,901 | $1,005,343 | |||||||||||||||||||||||
aMay include accretion, amortization, partnership adjustments, and/or other cost basis adjustments.
bIncludesnon-cash dividend/interest received.
*In U.S. dollars unless otherwise indicated.
10. Credit Facility
The Fund, together with other U.S. registered and foreign investment funds (collectively, Borrowers), managed by Franklin Templeton, are borrowers in a joint syndicated senior unsecured credit facility totaling $2 billion (Global Credit Facility) which matures on February 7, 2020. This Global Credit Facility provides a source of funds to the Borrowers for temporary and emergency purposes, including the ability to meet future unanticipated or unusually large redemption requests.
Under the terms of the Global Credit Facility, the Fund shall, in addition to interest charged on any borrowings made by the Fund and other costs incurred by the Fund, pay its share of fees and expenses incurred in connection with the implementation and maintenance of the Global Credit Facility, based upon its relative share of the aggregate net assets of all of the Borrowers, including an annual commitment fee of 0.15% based upon the unused portion of the Global Credit Facility. These fees are reflected in other expenses in the Statement of Operations. During the year ended July 31, 2019, the Fund did not use the Global Credit Facility.
11. Fair Value Measurements
The Fund follows a fair value hierarchy that distinguishes between market data obtained from independent sources
(observable inputs) and the Fund’s own market assumptions (unobservable inputs). These inputs are used in determining the value of the Fund’s financial instruments and are summarized in the following fair value hierarchy:
| • | Level 1 – quoted prices in active markets for identical financial instruments |
| • | Level 2 – other significant observable inputs (including quoted prices for similar financial instruments, interest rates, prepayment speed, credit risk, etc.) |
| • | Level 3 – significant unobservable inputs (including the Fund’s own assumptions in determining the fair value of financial instruments) |
The input levels are not necessarily an indication of the risk or liquidity associated with financial instruments at that level.
| franklintempleton.com | Annual Report | 29 | ||
FRANKLIN GOLD AND PRECIOUS METALS FUND
NOTES TO FINANCIAL STATEMENTS
11. Fair Value Measurements(continued)
A summary of inputs used as of July 31, 2019, in valuing the Fund’s assets carried at fair value, is as follows:
| Level 1 | Level 2 | Level 3 | Total | |||||||||||||
Assets: | ||||||||||||||||
Investments in Securities:a | ||||||||||||||||
Equity Investments:b | ||||||||||||||||
Diversified Metals & Mining | $ | 35,571,065 | $ | — | $ | 43,010 | c | $ | 35,614,075 | |||||||
Gold | 730,703,278 | — | 2,701,920 | 733,405,198 | ||||||||||||
Precious Metals & Minerals | 66,623,946 | 75,938 | — | 66,699,884 | ||||||||||||
Silver | 23,146,475 | — | 559,255 | 23,705,730 | ||||||||||||
All Other Equity Investments | 5,400,760 | — | — | 5,400,760 | ||||||||||||
Convertible Bonds | — | 2,206,500 | — | 2,206,500 | ||||||||||||
Short Term Investments | 4,722 | — | — | 4,722 | ||||||||||||
Total Investments in Securities | $ | 861,450,246 | $ | 2,282,438 | $ | 3,304,185 | $ | 867,036,869 | ||||||||
aFor detailed categories, see the accompanying Statement of Investments.
bIncludes common stocks as well as other equity investments.
cIncludes securities determined to have no value at July 31, 2019.
A reconciliation of assets in which Level 3 inputs are used in determining fair value is presented when there are significant Level 3 financial instruments at the beginning and/or end of the year.
12. Subsequent Events
The Fund has evaluated subsequent events through the issuance of the financial statements and determined that no events have occurred that require disclosure.
Abbreviations
| Currency | Selected Portfolio | |||||||
| CAD | Canadian Dollar | ADR | American Depositary Receipt | |||||
| USD | United States Dollar | IDR | International Depositary Receipt | |||||
| 30 | Annual Report | franklintempleton.com | ||
FRANKLIN GOLD AND PRECIOUS METALS FUND
Report of Independent Registered Public Accounting Firm
To the Board of Trustees and Shareholders of Franklin Gold and Precious Metals Fund
Opinion on the Financial Statements
We have audited the accompanying statement of assets and liabilities, including the statement of investments, of Franklin Gold and Precious Metals Fund (the “Fund”) as of July 31, 2019, the related statement of operations for the year ended July 31, 2019, the statement of changes in net assets for each of the two years in the period ended July 31, 2019, including the related notes, and the financial highlights for each of the five years in the period ended July 31, 2019 (collectively referred to as the “financial statements”). In our opinion, the financial statements present fairly, in all material respects, the financial position of the Fund as of July 31, 2019, the results of its operations for the year then ended, the changes in its net assets for each of the two years in the period ended July 31, 2019 and the financial highlights for each of the five years in the period ended July 31, 2019 in conformity with accounting principles generally accepted in the United States of America.
Basis for Opinion
These financial statements are the responsibility of the Fund’s management. Our responsibility is to express an opinion on the Fund’s financial statements based on our audits. We are a public accounting firm registered with the Public Company Accounting Oversight Board (United States) (PCAOB) and are required to be independent with respect to the Fund in accordance with the U.S. federal securities laws and the applicable rules and regulations of the Securities and Exchange Commission and the PCAOB.
We conducted our audits of these financial statements in accordance with the standards of the PCAOB. Those standards require that we plan and perform the audit to obtain reasonable assurance about whether the financial statements are free of material misstatement, whether due to error or fraud.
Our audits included performing procedures to assess the risks of material misstatement of the financial statements, whether due to error or fraud, and performing procedures that respond to those risks. Such procedures included examining, on a test basis, evidence regarding the amounts and disclosures in the financial statements. Our audits also included evaluating the accounting principles used and significant estimates made by management, as well as evaluating the overall presentation of the financial statements. Our procedures included confirmation of securities owned as of July 31, 2019 by correspondence with the custodian, transfer agent, and brokers; when replies were not received from brokers, we performed other auditing procedures. We believe that our audits provide a reasonable basis for our opinion.
PricewaterhouseCoopers LLP
San Francisco, California
September 17, 2019
We have served as the auditor of one or more investment companies in the Franklin Templeton Group of Funds since 1948.
| franklintempleton.com | Annual Report | 31 | ||
FRANKLIN GOLD AND PRECIOUS METALS FUND
Under Section 854(b)(1)(B) of the Internal Revenue Code, the Fund hereby reports the maximum amount allowable but no less than $3,938,982 as qualified dividends for purposes of the maximum rate under Section 1(h)(11) of the Internal Revenue Code for the fiscal year ended July 31, 2019. Distributions, including qualified dividend income, paid during calendar year 2019 will be reported to shareholders on Form1099-DIV bymid-February 2020. Shareholders are advised to check with their tax advisors for information on the treatment of these amounts on their individual income tax returns.
| 32 | Annual Report | franklintempleton.com | ||
FRANKLIN GOLD AND PRECIOUS METALS FUND
The name, year of birth and address of the officers and board members, as well as their affiliations, positions held with the Fund, principal occupations during at least the past five years and number of U.S. registered portfolios overseen in the Franklin Templeton fund complex, are shown below. Generally, each board member serves until that person’s successor is elected and qualified.
Independent Board Members
Name, Year of Birth and Address
| Position
| Length of Time Served
| Number of Portfolios in by Board Member*
| Other Directorships Held
| ||||
Harris J. Ashton (1932) One Franklin Parkway | Trustee | Since 1982 | 137 | Bar-S Foods (meat packing company) (1981-2010). | ||||
| San Mateo, CA 94403-1906 | ||||||||
| Principal Occupation During at Least the Past 5 Years: | ||||||||
Director of various companies; andformerly, Director, RBC Holdings, Inc. (bank holding company) (until 2002); and President, Chief Executive Officer and Chairman of the Board, General Host Corporation (nursery and craft centers) (until 1998).
| ||||||||
| Terrence J. Checki (1945) | Trustee | Since 2017 | 113 | Hess Corporation (exploration of oil | ||||
| One Franklin Parkway | and gas) (2014-present). | |||||||
| San Mateo, CA 94403-1906 | ||||||||
| Principal Occupation During at Least the Past 5 Years: | ||||||||
Member of the Council on Foreign Relations (1996-present); Member of the National Committee on U.S.-China Relations (1999-present); member of the Board of Trustees of the Economic Club of New York (2013-present); member of the Board of Trustees of the Foreign Policy Association (2005-present) and member of various other boards of trustees and advisory boards; andformerly, Executive Vice President of the Federal Reserve Bank of New York and Head of its Emerging Markets and Internal Affairs Group and Member of Management Committee (1995-2014); and Visiting Fellow at the Council on Foreign Relations (2014).
| ||||||||
| Mary C. Choksi (1950) | Trustee | Since 2014 | 137 | Avis Budget Group Inc. (car rental) | ||||
| One Franklin Parkway | (2007-present), Omnicom Group Inc. | |||||||
| San Mateo, CA 94403-1906 | (advertising and marketing | |||||||
| communications services) | ||||||||
| (2011-present) and White Mountains | ||||||||
| Insurance Group, Ltd. (holding | ||||||||
| company) (2017-present). | ||||||||
| Principal Occupation During at Least the Past 5 Years: | ||||||||
Director of various companies; andformerly, Founder and Senior Advisor, Strategic Investment Group (investment management group) (2015-2017); Founding Partner and Senior Managing Director, Strategic Investment Group (1987-2015); Founding Partner and Managing Director, Emerging Markets Management LLC (investment management firm) (1987-2011); and Loan Officer/Senior Loan Officer/Senior Pension Investment Officer, World Bank Group (international financial institution) (1977-1987).
| ||||||||
| Edith E. Holiday (1952) | Lead | Trustee since | 137 | Hess Corporation (exploration of oil | ||||
| One Franklin Parkway | Independent | 2003 and Lead | and gas) (1993-present), Canadian | |||||
| San Mateo, CA 94403-1906 | Trustee | Independent | National Railway (railroad) | |||||
| Trustee since | (2001-present), White Mountains | |||||||
| March 2019 | Insurance Group, Ltd. (holding company) (2004-present), Santander Consumer USA Holdings, Inc. (consumer finance) (2016-present), RTI International Metals, Inc. (manufacture and distribution of titanium) (1999-2015) and H.J. Heinz Company (processed foods and allied products) (1994-2013). | |||||||
Principal Occupation During at Least the Past 5 Years: Director or Trustee of various companies and trusts; andformerly,Assistant to the President of the United States and Secretary of the Cabinet (1990-1993); General Counsel to the United States Treasury Department (1989-1990); and Counselor to the Secretary and Assistant Secretary for Public Affairs and Public Liaison-United States Treasury Department (1988-1989). | ||||||||
| franklintempleton.com | Annual Report | 33 | ||
FRANKLIN GOLD AND PRECIOUS METALS FUND
Independent Board Members(continued)
Name, Year of Birth and Address
| Position
| Length of Time Served
| Number of Portfolios in by Board Member*
| Other Directorships Held
| ||||
J. Michael Luttig (1954) One Franklin Parkway San Mateo, CA 94403-1906 | Trustee | Since 2009 | 137 | Boeing Capital Corporation (aircraft financing) (2006-2013). | ||||
| Principal Occupation During at Least the Past 5 Years: | ||||||||
Executive Vice President, Counselor and Senior Advisor to Boeing Chairman and Board of Directors, The Boeing Company (aerospace company) (May 2019); andformerly, General Counsel and member of the Executive Council, The Boeing Company (2006-2019) and Federal Appeals Court Judge, U.S. Court of Appeals for the Fourth Circuit (1991-2006).
| ||||||||
Larry D. Thompson (1945) One Franklin Parkway San Mateo, CA 94403-1906 | Trustee | Since 2007 | 137 | The Southern Company (energy company) (2014-present; previously 2010-2012), Graham Holdings Company (education and media organization) (2011-present) and Cbeyond, Inc. (business communications provider) (2010-2012). | ||||
| Principal Occupation During at Least the Past 5 Years: | ||||||||
Director of various companies; Counsel, Finch McCranie, LLP (law firm) (2015-present); Independent Compliance Monitor and Auditor, Volkswagen AG (manufacturer of automobiles and commercial vehicles) (2017-present); John A. Sibley Professor of Corporate and Business Law, University of Georgia School of Law (2015-present; previously 2011-2012); andformerly, Executive Vice President - Government Affairs, General Counsel and Corporate Secretary, PepsiCo, Inc. (consumer products) (2012-2014); Senior Vice President - Government Affairs, General Counsel and Secretary, PepsiCo, Inc. (2004-2011); Senior Fellow of The Brookings Institution (2003-2004); Visiting Professor, University of Georgia School of Law (2004); and Deputy Attorney General, U.S. Department of Justice (2001-2003).
| ||||||||
Interested Board Members and Officers
| ||||||||
Name, Year of Birth and Address
| Position
| Length of Time Served
| Number of Portfolios in Fund Complex Overseen by Board Member*
| Other Directorships Held During at Least the Past 5 Years
| ||||
| **Gregory E. Johnson (1961) | Trustee | Since 2007 | 151 | None | ||||
| One Franklin Parkway | ||||||||
| San Mateo, CA 94403-1906 | ||||||||
| Principal Occupation During at Least the Past 5 Years: | ||||||||
Chairman of the Board, Member – Office of the Chairman, Director and Chief Executive Officer, Franklin Resources, Inc.; officer and/or director or trustee, as the case may be, of some of the other subsidiaries of Franklin Resources, Inc. and of 42 of the investment companies in Franklin Templeton; Vice Chairman, Investment Company Institute; andformerly, President, Franklin Resources, Inc. (1994-2015).
| ||||||||
| **Rupert H. Johnson, Jr. (1940) | Chairman of | Since 2013 | 137 | None | ||||
| One Franklin Parkway | the Board and | |||||||
| San Mateo, CA 94403-1906 | Trustee | |||||||
| Principal Occupation During at Least the Past 5 Years: | ||||||||
Vice Chairman, Member – Office of the Chairman and Director, Franklin Resources, Inc.; Director, Franklin Advisers, Inc.; and officer and/or director or trustee, as the case may be, of some of the other subsidiaries of Franklin Resources, Inc. and of 40 of the investment companies in Franklin Templeton.
| ||||||||
| Alison E. Baur (1964) | Vice President | Since 2012 | Not Applicable | Not Applicable | ||||
| One Franklin Parkway | ||||||||
| San Mateo, CA 94403-1906 | ||||||||
Principal Occupation During at Least the Past 5 Years: Deputy General Counsel, Franklin Templeton; and officer of some of the other subsidiaries of Franklin Resources, Inc. and of 44 of the investment companies in Franklin Templeton.
| ||||||||
| 34 | Annual Report | franklintempleton.com | ||
FRANKLIN GOLD AND PRECIOUS METALS FUND
Interested Board Members and Officers(continued)
Name, Year of Birth and Address
| Position
| Length of Time Served
| Number of Portfolios in by Board Member*
| Other Directorships Held
| ||||
| Gaston Gardey (1967) | Treasurer, Chief | Since 2009 | Not Applicable | Not Applicable | ||||
| One Franklin Parkway | Financial | |||||||
| San Mateo, CA 94403-1906 | Officer and | |||||||
| Chief | ||||||||
| Accounting | ||||||||
| Officer | ||||||||
| Principal Occupation During at Least the Past 5 Years: | ||||||||
Treasurer, U.S. Fund Administration & Reporting and officer of 26 of the investment companies in Franklin Templeton.
| ||||||||
| Aliya S. Gordon (1973) | Vice President | Since 2009 | Not Applicable | Not Applicable | ||||
| One Franklin Parkway | ||||||||
| San Mateo, CA 94403-1906 | ||||||||
| Principal Occupation During at Least the Past 5 Years: | ||||||||
Senior Associate General Counsel, Franklin Templeton; Vice President and Secretary, Franklin Resources, Inc.; and officer of 44 of the investment companies in Franklin Templeton.
| ||||||||
| Steven J. Gray (1955) | Vice President | Vice President | Not Applicable | Not Applicable | ||||
| One Franklin Parkway | and Co- | since 2009 and | ||||||
| San Mateo, CA 94403-1906 | Secretary | Co-Secretary | ||||||
| since | ||||||||
| January 2019 | ||||||||
| Principal Occupation During at Least the Past 5 Years: | ||||||||
Senior Associate General Counsel, Franklin Templeton; Vice President, Franklin Templeton Distributors, Inc. and FASA, LLC; and officer of 44 of the investment companies in Franklin Templeton.
| ||||||||
| Matthew T. Hinkle (1971) | Chief Executive | Since 2017 | Not Applicable | Not Applicable | ||||
| One Franklin Parkway | Officer – | |||||||
| San Mateo, CA 94403-1906 | Finance and | |||||||
| Administration | ||||||||
| Principal Occupation During at Least the Past 5 Years: | ||||||||
Senior Vice President, Franklin Templeton Services, LLC; officer of 44 of the investment companies in Franklin Templeton; andformerly, Vice President, Global Tax (2012-April 2017) and Treasurer/Assistant Treasurer, Franklin Templeton (2009-2017).
| ||||||||
| Robert Lim (1948) | Vice President | Since 2016 | Not Applicable | Not Applicable | ||||
| One Franklin Parkway | – AML | |||||||
| San Mateo, CA 94403-1906 | Compliance | |||||||
| Principal Occupation During at Least the Past 5 Years: | ||||||||
Vice President, Franklin Templeton Companies, LLC; Chief Compliance Officer, Franklin Templeton Distributors, Inc. and Franklin Templeton Investor Services, LLC; and officer of 44 of the investment companies in Franklin Templeton.
| ||||||||
| Kimberly H. Novotny (1972) | Vice President | Since 2013 | Not Applicable | Not Applicable | ||||
| 300 S.E. 2nd Street | ||||||||
| Fort Lauderdale, FL 33301-1923 | ||||||||
| Principal Occupation During at Least the Past 5 Years: | ||||||||
Senior Associate General Counsel, Franklin Templeton; Vice President and Corporate Secretary, Fiduciary Trust International of the South; Vice President, Templeton Investment Counsel, LLC; Assistant Secretary, Franklin Resources, Inc.; and officer of 44 of the investment companies in Franklin Templeton.
| ||||||||
| franklintempleton.com | Annual Report | 35 | ||
FRANKLIN GOLD AND PRECIOUS METALS FUND
Interested Board Members and Officers(continued)
Name, Year of Birth and Address
| Position
| Length of Time Served
| Number of Portfolios in by Board Member*
| Other Directorships Held
| ||||
| Edward D. Perks (1970) | President and | Since December | Not Applicable | Not Applicable | ||||
| One Franklin Parkway | Chief Executive | 2018 | ||||||
| San Mateo, CA 94403-1906 | Officer – | |||||||
| Investment | ||||||||
| Management | ||||||||
| Principal Occupation During at Least the Past 5 Years: | ||||||||
President and Director, Franklin Advisers, Inc.; and officer of nine of the investment companies in Franklin Templeton (since December 2018).
| ||||||||
| Robert C. Rosselot (1960) | Chief | Since 2013 | Not Applicable | Not Applicable | ||||
| 300 S.E. 2nd Street | Compliance | |||||||
| Fort Lauderdale, FL 33301-1923 | Officer | |||||||
| Principal Occupation During at Least the Past 5 Years: | ||||||||
Director, Global Compliance, Franklin Templeton; Vice President, Franklin Templeton Companies, LLC; officer of 44 of the investment companies in Franklin Templeton; andformerly, Senior Associate General Counsel, Franklin Templeton (2007-2013); and Secretary and Vice President, Templeton Group of Funds (2004-2013).
| ||||||||
| Navid J. Tofigh (1972) | Vice President | Since 2015 | Not Applicable | Not Applicable | ||||
| One Franklin Parkway | ||||||||
| San Mateo, CA 94403-1906 | ||||||||
| Principal Occupation During at Least the Past 5 Years: | ||||||||
Associate General Counsel and officer of 44 of the investment companies in Franklin Templeton.
| ||||||||
| Craig S. Tyle (1960) | Vice President | Since 2005 | Not Applicable | Not Applicable | ||||
| One Franklin Parkway | ||||||||
| San Mateo, CA 94403-1906 | ||||||||
| Principal Occupation During at Least the Past 5 Years: | ||||||||
General Counsel and Executive Vice President, Franklin Resources, Inc.; and officer of some of the other subsidiaries of Franklin Resources, Inc. and of 44 of the investment companies in Franklin Templeton.
| ||||||||
| Lori A. Weber (1964) | Vice President | Vice President | Not Applicable | Not Applicable | ||||
| 300 S.E. 2nd Street | and Co- | since 2011 and | ||||||
| Fort Lauderdale, FL33301-1923 | Secretary | Co-Secretary | ||||||
| since | ||||||||
| January 2019 | ||||||||
| Principal Occupation During at Least the Past 5 Years: | ||||||||
Senior Associate General Counsel, Franklin Templeton; Assistant Secretary, Franklin Resources, Inc.; Vice President and Secretary, Templeton Investment Counsel, LLC; and officer of 44 of the investment companies in Franklin Templeton.
| ||||||||
| 36 | Annual Report | franklintempleton.com | ||
FRANKLIN GOLD AND PRECIOUS METALS FUND
*We base the number of portfolios on each separate series of the U.S. registered investment companies within the Franklin Templeton fund complex. These portfolios have a common investment manager or affiliated investment managers.
**Gregory E. Johnson is considered to be an interested person of the Fund under the federal securities laws due to his position as an officer and director of Franklin Resources, Inc. (Resources), which is the parent company of the Fund’s investment manager and distributor. Rupert H. Johnson, Jr. is considered to be an interested person of the Fund under the federal securities laws due to his position as an officer and director and major shareholder of Resources.
Note 1: Rupert H. Johnson, Jr. is the uncle of Gregory E. Johnson.
Note 2: Effective March 12, 2019, John B. Wilson ceased to be a trustee of the Trust.
Note 3: Officer information is current as of the date of this report. It is possible that after this date, information about officers may change.
The Sarbanes-Oxley Act of 2002 and Rules adopted by the Securities and Exchange Commission require the Fund to disclose whether the Fund’s Audit Committee includes at least one member who is an audit committee financial expert within the meaning of such Act and Rules. The Fund’s Board has determined that there is at least one such financial expert on the Audit Committee and has designated Mary C. Choksi as its audit committee financial expert. The Board believes that Ms. Choksi qualifies as such an expert in view of her extensive business background and experience. She currently serves as a director of Avis Budget Group, Inc. (2007-present) and formerly, Founder and Senior Advisor, Strategic Investment Group (1987 to 2017). Ms. Choksi has been a Member of the Fund’s Audit Committee since 2014. As a result of such background and experience, the Board believes that Ms. Choksi has acquired an understanding of generally accepted accounting principles and financial statements, the general application of such principles in connection with the accounting estimates, accruals and reserves, and analyzing and evaluating financial statements that present a breadth and level of complexity of accounting issues generally comparable to those of the Fund, as well as an understanding of internal controls and procedures for financial reporting and an understanding of audit committee functions. Ms. Choksi is an independent Board member as that term is defined under the relevant Securities and Exchange Commission Rules and Releases.
The Statement of Additional Information (SAI) includes additional information about the board members and is available, without charge, upon request. Shareholders may call (800) DIALBEN/342-5236 to request the SAI.
| franklintempleton.com | Annual Report | 37 | ||
FRANKLIN GOLD AND PRECIOUS METALS FUND
Board Approval of Investment
Management Agreements
FRANKLIN GOLD AND PRECIOUS METALS FUND
(Fund)
At anin-person meeting held on April 16, 2019 (Meeting), the Board of Trustees (Board) of the Fund, including a majority of the trustees who are not “interested persons” as defined in the Investment Company Act of 1940 (Independent Trustees), reviewed and approved the continuance of the investment management agreement between Franklin Advisers, Inc. (Manager) and the Fund (Management Agreement) for an additionalone-year period. The Independent Trustees received advice from and met separately with Independent Trustee counsel in considering whether to approve the continuation of the Management Agreement.
In considering the continuation of the Management Agreement, the Board reviewed and considered information provided by the Manager at the Meeting and throughout the year at meetings of the Board and its committees. The Board also reviewed and considered information provided in response to a detailed set of requests for information submitted to the Manager by Independent Trustee counsel on behalf of the Independent Trustees in connection with the annual contract renewal process. In addition, prior to the Meeting, the Independent Trustees held a telephonic contract renewal meeting at which the Independent Trustees conferred amongst themselves and Independent Trustee counsel about contract renewal matters. The Board reviewed and considered all of the factors it deemed relevant in approving the continuance of the Management Agreement, including, but not limited to: (i) the nature, extent and quality of the services provided by the Manager; (ii) the investment performance of the Fund; (iii) the costs of the services provided and profits realized by the Manager and its affiliates from the relationship with the Fund; (iv) the extent to which economies of scale are realized as the Fund grows; and (v) whether fee levels reflect these economies of scale for the benefit of Fund investors.
In approving the continuance of the Management Agreement, the Board, including a majority of the Independent Trustees, determined that the terms of the Management Agreement are fair and reasonable and that the continuance of such Management Agreement is in the interests of the Fund and its shareholders. While attention was given to all information furnished, the following
discusses some primary factors relevant to the Board’s determination.
Nature, Extent and Quality of Services
The Board reviewed and considered information regarding the nature, extent and quality of investment management services provided by the Manager and its affiliates to the Fund and its shareholders. This information included, among other things, the qualifications, background and experience of the senior management and investment personnel of the Manager; the structure of investment personnel compensation; oversight of third-party service providers; investment performance reports and related financial information for the Fund; reports on expenses, shareholder services, marketing support payments made to financial intermediaries and third party servicing arrangements; legal and compliance matters; risk controls; pricing and other services provided by the Manager and its affiliates; and management fees charged by the Manager and its affiliates to US funds and other accounts, including management’s explanation of differences among accounts where relevant. The Board also reviewed and considered an annual report on payments made by Franklin Templeton Investments (FTI) or the Fund to financial intermediaries, as well as a memorandum relating to third-party servicing arrangements in response to a guidance update in 2016 from the US Securities and Exchange Commission (SEC) relating to mutual fund distribution andsub-accounting fees. The Board noted management’s continuing efforts and expenditures in establishing effective business continuity plans and developing strategies to address areas of heightened concern in the mutual fund industry, such as cybersecurity and liquidity risk management. The Board also recognized management’s commitment to facilitating Board oversight of liquidity through the designation of a liquidity/risk administrator and the development of reports that highlight the amount of illiquid investments for the Fund.
The Board also reviewed and considered the benefits provided to Fund shareholders of investing in a fund that is part of the Franklin Templeton family of funds. The Board noted the financial position of Franklin Resources, Inc. (FRI), the Manager’s parent, and its commitment to the mutual fund business as evidenced by its continued introduction of new funds, reassessment of the fund offerings in response to the market environment and project initiatives and capital investments relating to the services provided to the Fund by the FTI organization.
| 38 | Annual Report | franklintempleton.com | ||
FRANKLIN GOLD AND PRECIOUS METALS FUND
SHAREHOLDER INFORMATION
Following consideration of such information, the Board was satisfied with the nature, extent and quality of services provided by the Manager and its affiliates to the Fund and its shareholders.
Fund Performance
The Board reviewed and considered the performance results of the Fund over various time periods ended January 31, 2019. The Board considered the performance returns for the Fund in comparison to the performance returns of mutual funds deemed comparable to the Fund included in a universe (Performance Universe) selected by Broadridge Financial Solutions, Inc. (Broadridge), an independent provider of investment company data. The Board received a description of the methodology used by Broadridge to select the mutual funds included in a Performance Universe. The Board also reviewed and considered Fund performance reports provided and discussions that occurred with portfolio managers at Board meetings throughout the year. A summary of the Fund’s performance results is below.
The Performance Universe for the Fund included the Fund and all retail and institutional precious metals equity funds. The Board noted that the Fund’s annualized total return for theone-, three-, five- and10-year periods was below the median of its Performance Universe. The Board discussed this performance with management and management explained that the Fund is more geographically diversified than the average fund in its Performance Universe. Management also explained that the Fund had more exposure to securities in diversified metals and mining and precious metals and minerals over theone- and three-year periods as compared to the average peer fund and the Fund’s benchmark, which distracted from the Fund’s performance. The Board also noted management’s explanation that, unlike its peers, the Fund does not invest in physical gold bullion, which hurt the Fund’s relative performance. Management further explained that the Fund continues to be managed with a long-term focus consistent with the Fund’s low historical turnover and described some recent portfolio repositioning in light of the challenging market for gold companies. In light of this explanation and management’s continued attention to the Fund’s challenges, the Board concluded that the Fund’s Management Agreement should be continued for an additionalone-year period, and the Fund’s performance continued to be monitored.
Comparative Fees and Expenses
The Board reviewed and considered information regarding
the Fund’s actual total expense ratio and its various components, including, as applicable, management fees; transfer agent expenses; underlying fund expenses; Rule12b-1 andnon-Rule12b-1 service fees; and othernon-management fees. The Board also noted the quarterly and annual reports it receives on all marketing support payments made by FTI to financial intermediaries. The Board considered the actual total expense ratio and, separately, the contractual management fee rate, without the effect of fee waivers, if any (Management Rate) of the Fund in comparison to the median expense ratio and median Management Rate, respectively, of other mutual funds deemed comparable to and with a similar expense structure as the Fund selected by Broadridge (Expense Group). Broadridge fee and expense data is based upon information taken from each fund’s most recent annual report, which reflects historical asset levels that may be quite different from those currently existing, particularly in a period of market volatility. While recognizing such inherent limitation and the fact that expense ratios and Management Rates generally increase as assets decline and decrease as assets grow, the Board believed the independent analysis conducted by Broadridge to be an appropriate measure of comparative fees and expenses. The Broadridge Management Rate includes administrative charges, and the actual total expense ratio, for comparative consistency, was shown for Class A shares for funds with multiple classes of shares. The Board received a description of the methodology used by Broadridge to select the mutual funds included in an Expense Group.
The Expense Group for the Fund included the Fund and eight other precious metals equity funds. The Board noted that the Management Rate and actual total expense ratio for the Fund were below the medians and in the first quintile (least expensive) of its Expense Group. The Board concluded that the Management Rate charged to the Fund is reasonable.
Profitability
The Board reviewed and considered information regarding the profits realized by the Manager and its affiliates in connection with the operation of the Fund. In this respect, the Board considered the Fund profitability analysis provided by the Manager that addresses the overall profitability of FTI’s US fund business, as well as its profits in providing investment management and other services to each of the individual funds during the12-month period ended September 30, 2018, being the most recent fiscalyear-end for FRI. The Board noted that although management
| franklintempleton.com | Annual Report | 39 | ||
FRANKLIN GOLD AND PRECIOUS METALS FUND
SHAREHOLDER INFORMATION
continually makes refinements to its methodologies used in calculating profitability in response to organizational and product-related changes, the overall methodology has remained consistent with that used in the Fund’s profitability report presentations from prior years. Additionally, PricewaterhouseCoopers LLP, auditor to FRI and certain Franklin Templeton funds, has been engaged by the Manager to periodically review and assess the allocation methodologies to be used solely by the Fund’s Board with respect to the profitability analysis.
The Board noted management’s belief that costs incurred in establishing the infrastructure necessary for the type of mutual fund operations conducted by the Manager and its affiliates may not be fully reflected in the expenses allocated to the Fund in determining its profitability, as well as the fact that the level of profits, to a certain extent, reflected operational cost savings and efficiencies initiated by management. The Board also noted management’s expenditures in improving shareholder services provided to the Fund, as well as the need to implement systems and meet additional regulatory and compliance requirements resulting from recent SEC and other regulatory requirements.
The Board also considered the extent to which the Manager and its affiliates might derive ancillary benefits from fund operations, including revenues generated from transfer agent services, potential benefits resulting from personnel and systems enhancements necessitated by fund growth, as well as increased leverage with service providers and counterparties. Based upon its consideration of all these factors, the Board concluded that the level of profits realized by the Manager and its affiliates from providing services to the Fund was not excessive in view of the nature, extent and quality of services provided to the Fund.
Economies of Scale
The Board reviewed and considered the extent to which the Manager may realize economies of scale, if any, as the Fund grows larger and whether the Fund’s management fee structure reflects any economies of scale for the benefit of shareholders. With respect to possible economies of scale, the Board noted the existence of management fee breakpoints, which operate generally to share any economies of scale with the Fund’s shareholders by reducing the Fund’s effective management fees as the Fund grows in size. The Board considered the Manager’s view that any analyses of potential economies of scale in managing a particular fund are inherently limited in light of the joint and
common costs and investments the Manager incurs across the Franklin Templeton family of funds as a whole. The Board concluded that to the extent economies of scale may be realized by the Manager and its affiliates, the Fund’s management fee structure provided a sharing of benefits with the Fund and its shareholders as the Fund grows.
Conclusion
Based on its review, consideration and evaluation of all factors it believed relevant, including the above-described factors and conclusions, the Board unanimously approved the continuation of the Management Agreement for an additionalone-year period.
Proxy Voting Policies and Procedures
The Fund’s investment manager has established Proxy Voting Policies and Procedures (Policies) that the Fund uses to determine how to vote proxies relating to portfolio securities. Shareholders may view the Fund’s complete Policies online at franklintempleton.com. Alternatively, shareholders may request copies of the Policies free of charge by calling the Proxy Group collect at (954)527-7678 or by sending a written request to: Franklin Templeton Companies, LLC, 300 S.E. 2nd Street, Fort Lauderdale, FL 33301, Attention: Proxy Group. Copies of the Fund’s proxy voting records are also made available online at franklintempleton.com and posted on the U.S. Securities and Exchange Commission’s website at sec.gov and reflect the most recent12-month period ended June 30.
Quarterly Statement of Investments
The Fund files a complete statement of investments with the U.S. Securities and Exchange Commission for the first and third quarters for each fiscal year as an exhibit to its report on FormN-PORT. Shareholders may view the filed FormN-PORT by visiting the Commission’s website at sec.gov. The filed form may also be viewed and copied at the Commission’s Public Reference Room in Washington, DC. Information regarding the operations of the Public Reference Room may be obtained by calling(800) SEC-0330.
Householding of Reports and Prospectuses
You will receive the Fund’s financial reports every six months as well as an annual updated summary prospectus (prospectus available upon request). To reduce Fund expenses, we try to identify related shareholders in a
| 40 | Annual Report | franklintempleton.com | ||
FRANKLIN GOLD AND PRECIOUS METALS FUND
SHAREHOLDER INFORMATION
household and send only one copy of the financial reports and summary prospectus. This process, called “householding,” will continue indefinitely unless you instruct us otherwise. If you prefer not to have these documents householded, please call us at (800)632-2301. At any time you may view current prospectuses/summary prospectuses and financial reports on our website. If you choose, you may receive these documents through electronic delivery.
| franklintempleton.com | Annual Report | 41 | ||
This page intentionally left blank.
This page intentionally left blank.
This page intentionally left blank.
Authorized for distribution only when accompanied or preceded by a summary prospectus and/or prospectus. Investors should carefully consider a fund’s investment goals, risks, charges and expenses before investing. A prospectus contains this and other information; please read it carefully before investing.
To help ensure we provide you with quality service, all calls to and from our service areas are monitored and/or recorded.
 | Annual Report and Shareholder Letter Franklin Gold and Precious Metals Fund | |||||
| Investment Manager | Distributor | Shareholder Services | ||||
| Franklin Advisers, Inc. | Franklin Templeton Distributors, Inc. | (800)632-2301 | ||||
| (800) DIAL BEN®/342-5236 | ||||||
| franklintempleton.com | ||||||
| © 2019 Franklin Templeton Investments. All rights reserved. | 132 A 09/19 | |||||
| Item 2. | Code of Ethics. |
(a) The Registrant has adopted a code of ethics that applies to its principal executive officers and principal financial and accounting officer.
(c) N/A
(d) N/A
(f) Pursuant to Item 13(a)(1), the Registrant is attaching as an exhibit a copy of its code of ethics that applies to its principal executive officers and principal financial and accounting officer.
| Item 3. | Audit Committee Financial Expert. |
(a)(1) The Registrant has an audit committee financial expert serving on its audit committee.
(2) The audit committee financial expert is Mary C. Choksi and she is “independent” as defined under the relevant Securities and Exchange Commission Rules and Releases.
| Item 4. | Principal Accountant Fees and Services. |
(a) Audit Fees
The aggregate fees paid to the principal accountant for professional services rendered by the principal accountant for the audit of the registrant’s annual financial statements or for services that are normally provided by the principal accountant in connection with statutory and regulatory filings or engagements were $58,629 for the fiscal year ended July 31, 2019 and $60,693 for the fiscal year ended July 31, 2018.
(b) Audit-Related Fees
The aggregate fees paid to the principal accountant for assurance and related services rendered by the principal accountant to the registrant that are reasonably related to the performance of the audit of the registrant’s financial statements and are not reported under paragraph (a) of Item 4 were $3,133 for the fiscal year ended July 31, 2019 and $3,102 for the fiscal year ended July 31, 2018. The services for which these fees were paid included attestation services.
There were no fees paid to the principal accountant for assurance and related services rendered by the principal accountant to the registrant’s investment adviser and any entity controlling, controlled by or under common control with the investment adviser that provides ongoing services to the registrant that are reasonably related to the performance of the audit of their financial statements.
(c) Tax Fees
There were no fees paid to the principal accountant for professional services rendered by the principal accountant to the registrant for tax compliance, tax advice and tax planning.
The aggregate fees paid to the principal accountant for professional services rendered by the principal accountant to the registrant’s investment adviser and any entity controlling, controlled by or under common control with the investment adviser that provides ongoing services to the registrant for tax compliance, tax advice and tax planning were $20,000 for the fiscal year ended July 31, 2019 and $5,000 for the fiscal year ended July 31, 2018. The services for which these fees were paid included professional fees in connection with tax treatment of equipment lease transactions, professional fees in connection with an Indonesia withholding tax refund claim, and tax consulting services related to the operating agreement and term sheet for the launch of a new fund.
(d) All Other Fees
The aggregate fees paid to the principal accountant for products and services rendered by the principal accountant to the registrant not reported in paragraphs (a)-(c) of Item 4 were $0 for the fiscal year ended July 31, 2019 and $363 for the fiscal year ended July 31, 2018. The services for which these fees were paid included review of materials provided to the fund Board in connection with the investment management contract renewal process.
The aggregate fees paid to the principal accountant for products and services rendered by the principal accountant to the registrant’s
investment adviser and any entity controlling, controlled by or under common control with the investment adviser that provides ongoing services to the registrant not reported in paragraphs (a)-(c) of Item 4 were $14,500 for the fiscal year ended July 31, 2019 and $30,500 for the fiscal year ended July 31, 2018. The services for which these fees were paid included benchmarking services in connection with the ICI TA survey, the issuance of an Auditors’ Certificate for South Korean regulatory shareholder disclosures and assets under management certification.
(e) (1) The registrant’s audit committee is directly responsible for approving the services to be provided by the auditors, including:
(i)pre-approval of all audit and audit related services;
(ii)pre-approval of allnon-audit related services to be provided to the Fund by the auditors;
(iii)pre-approval of allnon-audit related services to be provided to the registrant by the auditors to the registrant’s investment adviser or to any entity that controls, is controlled by or is under common control with the registrant’s investment adviser and that provides ongoing services to the registrant where thenon-audit services relate directly to the operations or financial reporting of the registrant; and
(iv) establishment by the audit committee, if deemed necessary or appropriate, as an alternative to committeepre-approval of services to be provided by the auditors, as required by paragraphs (ii) and (iii) above, of policies and procedures to permit such services to bepre-approved by other means, such as through establishment of guidelines or by action of a designated member or members of the committee; provided the policies and procedures are detailed as to the particular service and the committee is informed of each service and such policies and procedures do not include delegation of audit committee responsibilities, as contemplated under the Securities Exchange Act of 1934, to management; subject, in the case of (ii) through (iv), to any waivers, exceptions or exemptions that may be available under applicable law or rules.
(e) (2) None of the services provided to the registrant described in paragraphs (b)-(d) of Item 4 were approved by the audit committee pursuant to paragraph (c)(7)(i)(C) of Rule2-01 of regulationS-X.
(f) No disclosures are required by this Item 4(f).
(g) The aggregatenon-audit fees paid to the principal accountant for services rendered by the principal accountant to the registrant and the registrant’s investment adviser and any entity controlling, controlled by or under common control with the investment adviser that provides ongoing services to the registrant were $37,633 for the fiscal year ended July 31, 2019 and $38,965 for the fiscal year ended July 31, 2018.
(h) The registrant’s audit committee of the board has considered whether the provision ofnon-audit services that were rendered to the registrant’s investment adviser (not including anysub-adviser whose
role is primarily portfolio management and is subcontracted with or overseen by another investment adviser), and any entity controlling, controlled by, or under common control with the investment adviser that provides ongoing services to the registrant that were notpre-approved pursuant to paragraph (c)(7)(ii) of Rule2-01 of RegulationS-X is compatible with maintaining the principal accountant’s independence.
| Item 5. | Audit Committee of Listed Registrants. N/A |
| Item 6. | Schedule of Investments. N/A |
| Item 7. | Disclosure of Proxy Voting Policies and Procedures forClosed-End Management Investment Companies. N/A |
| Item 8. | Portfolio Managers ofClosed-End Management Investment Companies. N/A |
| Item 9. | Purchases of Equity Securities byClosed-End Management Investment Company and Affiliated Purchasers. N/A |
| Item 10. | Submission of Matters to a Vote of Security Holders. |
There have been no changes to the procedures by which shareholders may recommend nominees to the Registrant’s Board of Trustees that would require disclosure herein.
| Item 11. | Controls and Procedures. |
(a) Evaluation of Disclosure Controls and Procedures. The Registrant maintains disclosure controls and procedures that are designed to provide reasonable assurance that information required to be disclosed in the Registrant’s filings under the Securities Exchange Act of 1934, as amended, and the Investment Company Act of 1940 is recorded, processed, summarized and reported within the periods specified in the rules and forms of the Securities and Exchange Commission. Such information is accumulated and communicated to the Registrant’s management, including its principal executive officer and principal financial officer, as appropriate, to allow timely decisions regarding required disclosure. The Registrant’s management, including the principal executive officer and the principal financial officer, recognizes that any set of controls and procedures, no matter how well designed and operated, can provide only reasonable assurance of achieving the desired control objectives.
Within 90 days prior to the filing date of this Shareholder Report on FormN-CSR, the Registrant had carried out an evaluation, under the supervision and with the participation of the Registrant’s management, including the Registrant’s principal executive officer and the Registrant’s principal financial officer, of the effectiveness of the design and operation of the Registrant’s disclosure controls and
procedures. Based on such evaluation, the Registrant’s principal executive officer and principal financial officer concluded that the Registrant’s disclosure controls and procedures are effective.
(b) Changes in Internal Controls.Effective November 1, 2018, the Registrant’s controls were enhanced through the implementation of a daily secondary review of market events following the close of trading on foreign stock markets to ensure the appropriate application of market level fair value.
| Item 12. | Disclosure of Securities Lending Activities forClosed-End Management Investment Company N/A |
| Item 13. | Exhibits. |
(a) (1) Code of Ethics
(a) (2) Certifications pursuant to Section 302 of the Sarbanes-Oxley Act of 2002 of Matthew T. Hinkle, Chief Executive Officer - Finance and Administration, and Gaston Gardey, Chief Financial Officer and Chief Accounting Officer
(b) Certifications pursuant to Section 906 of the Sarbanes-Oxley Act of 2002 of Matthew T. Hinkle, Chief Executive Officer - Finance and Administration, and Gaston Gardey, Chief Financial Officer and Chief Accounting Officer
SIGNATURES
Pursuant to the requirements of the Securities Exchange Act of 1934 and the Investment Company Act of 1940, the registrant has duly caused this report to be signed on its behalf by the undersigned, thereunto duly authorized.
| FRANKLIN GOLD AND PRECIOUS METALS FUND | ||
| By | /s/ MATTHEW T. HINKLE | |
| Matthew T. Hinkle | ||
| Chief Executive Officer – Finance and Administration | ||
Date September 30, 2019
Pursuant to the requirements of the Securities Exchange Act of 1934 and the Investment Company Act of 1940, this report has been signed below by the following persons on behalf of the registrant and in the capacities and on the dates indicated.
| By | /s/ MATTHEW T. HINKLE | |
| Matthew T. Hinkle | ||
| Chief Executive Officer – Finance and Administration |
Date September 30, 2019
| By | /s/ GASTON GARDEY | |
| Gaston Gardey | ||
| Chief Financial Officer and Chief Accounting Officer |
Date September 30, 2019