UNITED STATES
SECURITIES AND EXCHANGE COMMISSION Washington, D.C. 20549
FORM N-CSR
CERTIFIED SHAREHOLDER REPORT OF REGISTERED MANAGEMENT INVESTMENT COMPANIES
Investment Company Act file number 811-05567
MFS INTERMEDIATE HIGH INCOME FUND
(Exact name of registrant as specified in charter)
111 Huntington Avenue, Boston, Massachusetts 02199 (Address of principal executive offices) (Zip code)
Christopher R. Bohane
Massachusetts Financial Services Company
111Huntington Avenue Boston, Massachusetts 02199
(Name and address of agents for service)
Registrant’s telephone number, including area code: (617) 954-5000
Date of fiscal year end: November 30
Date of reporting period: November 30, 2024
ITEM 1. REPORTS TO STOCKHOLDERS.
Item 1(a):
Annual Report
November 30, 2024
MFS® Intermediate High
Income Fund
MANAGED DISTRIBUTION POLICY DISCLOSURE
The MFS Intermediate High Income Fund’s (the fund) Board of Trustees adopted a managed distribution policy. The fund seeks to pay monthly distributions based on an annual rate of 9.50% of the fund’s average monthly net asset value. The primary purpose of the managed distribution policy is to provide shareholders with a constant, but not guaranteed, fixed rate of distribution each month. You should not draw any conclusions about the fund’s investment performance from the amount of the current distribution or from the terms of the fund’s managed distribution policy. The Board may amend or terminate the managed distribution policy at any time without prior notice to fund shareholders. The amendment or termination of the managed distribution policy could have an adverse effect on the market price of the fund’s shares.
With each distribution, the fund will issue a notice to shareholders and an accompanying press release which will provide detailed information regarding the amount and composition of the distribution and other related information. The amounts and sources of distributions reported in the notice to shareholders are only estimates and are not being provided for tax reporting purposes. The actual amounts and sources of the amounts for tax reporting purposes will depend upon the fund’s investment experience during its fiscal year and may be subject to changes based on tax regulations. The fund will send you a Form 1099-DIV for the calendar year that will tell you how to report these distributions for federal income tax purposes. Please refer to “Tax Matters and Distributions” under Note 2 of the Notes to Financial Statements for information regarding the tax character of the fund’s distributions.
Under a managed distribution policy the fund may at times distribute more than its net investment income and net realized capital gains; therefore, a portion of your distribution may result in a return of capital. A return of capital may occur, for example, when some or all of the money that you invested in the fund is paid back to you. Any such returns of capital will decrease the fund’s total assets and, therefore, could have the effect of increasing the fund’s expense ratio. In addition, in order to make the level of distributions called for under its managed distribution policy, the fund may have to sell portfolio securities at a less than opportune time. A return of capital does not necessarily reflect the fund’s investment performance and should not be confused with ‘yield’ or ‘income’. The fund’s total return in relation to changes in net asset value is presented in the Financial Highlights.
MFS® Intermediate High
Income Fund
New York Stock Exchange Symbol: CIF
| 1 |
| 3 |
| 6 |
| 8 |
| 19 |
| 20 |
| 21 |
| 22 |
| 36 |
| 37 |
| 38 |
| 39 |
| 40 |
| 42 |
| 54 |
| 56 |
| 57 |
| 62 |
| 66 |
| 66 |
| 66 |
| 66 |
| 66 |
| 67 |
NOT FDIC INSURED • MAY LOSE VALUE • NO BANK GUARANTEE
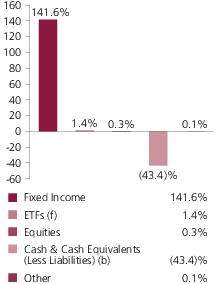
Portfolio structure (i)
Top five industries (i)
| Midstream | 9.2% |
| Medical & Health Technology & Services | 9.0% |
| Cable TV | 7.9% |
| Building | 7.1% |
| Insurance - Property & Casualty | 6.1% |
Composition including fixed income credit quality (a)(i)
| BBB | 0.9% |
| BB | 64.0% |
| B | 55.7% |
| CCC | 19.7% |
| CC | 0.6% |
| C | 0.4% |
| Not Rated | 0.3% |
| Non-Fixed Income | 1.7% |
Cash & Cash Equivalents
(Less Liabilities) (b) | (43.4)% |
| Other | 0.1% |
Portfolio facts
| Average Duration (d) | 4.3 |
| Average Effective Maturity (m) | 4.1 yrs. |
| (a) | For all securities other than those specifically described below, ratings are assigned to underlying securities utilizing ratings from Moody’s, Fitch, and Standard & Poor’s rating agencies and applying the following hierarchy: If all three agencies provide a rating, the middle rating (after dropping the highest and lowest ratings) is assigned; if two of the three agencies rate a security, the lower of the two is assigned. If none of the 3 rating agencies above assign a rating, but the security is rated by DBRS Morningstar, then the DBRS Morningstar rating is assigned. If none of the 4 rating agencies listed above rate the security, but the security is rated by the Kroll Bond Rating Agency (KBRA), then the KBRA rating is assigned. Ratings are shown in the S&P and Fitch scale (e.g., AAA). Securities rated BBB or higher are considered investment grade. All ratings are subject to change. Not Rated includes fixed income securities and fixed income derivatives that have not been rated by any rating agency. Non-Fixed Income includes equity securities (including convertible bonds and equity derivatives), ETFs and Options on ETFs, and/or commodity-linked derivatives. The fund may or may not have held all of these instruments on this date. The fund is not rated by these agencies. |
Portfolio Composition - continued
| (b) | Cash & Cash Equivalents (Less Liabilities) includes any cash, investments in money market funds, short-term securities, and other assets less liabilities. Liabilities include the value of outstanding borrowings made by the fund for leverage transactions. Cash & Cash Equivalents (Less Liabilities) is negative due to these borrowings. Please see the Statement of Assets and Liabilities for additional information related to the fund’s cash position and other assets and liabilities. Please see Note 6 in the Notes to Financial Statements for more information on the fund's outstanding borrowings. |
| (d) | Duration is a measure of how much a bond’s price is likely to fluctuate with general changes in interest rates, e.g., if rates rise 1.00%, a bond with a 5-year duration is likely to lose about 5.00% of its value due to the interest rate move. The Average Duration calculation reflects the impact of the equivalent exposure of derivative positions, if any. |
| (f) | The fund invests a portion of its assets in Exchange-Traded Funds (ETFs) or Options on ETFs to gain fixed income exposure. Percentages include the direct exposure from investing in ETFs or Options on ETFs and not the indirect exposure to the underlying holdings. |
| (i) | For purposes of this presentation, the components include the value of securities, and reflect the impact of the equivalent exposure of derivative positions, if any. These amounts may be negative from time to time. Equivalent exposure is a calculated amount that translates the derivative position into a reasonable approximation of the amount of the underlying asset that the portfolio would have to hold at a given point in time to have the same price sensitivity that results from the portfolio’s ownership of the derivative contract. When dealing with derivatives, equivalent exposure is a more representative measure of the potential impact of a position on portfolio performance than value. The bond component will include any accrued interest amounts. |
| (m) | In determining each instrument’s effective maturity for purposes of calculating the fund’s dollar-weighted average effective maturity, MFS uses the instrument’s stated maturity or, if applicable, an earlier date on which MFS believes it is probable that a maturity-shortening feature (such as a put, pre-refunding or prepayment) will cause the instrument to be repaid. Such an earlier date can be substantially shorter than the instrument’s stated maturity. |
Where the fund holds convertible bonds, they are treated as part of the equity portion of the portfolio.
Other includes equivalent exposure from currency derivatives and/or any offsets to derivative positions and may be negative.
Percentages are based on net assets as of November 30, 2024.
The portfolio is actively managed and current holdings may be different.
Management Review
Summary of Results
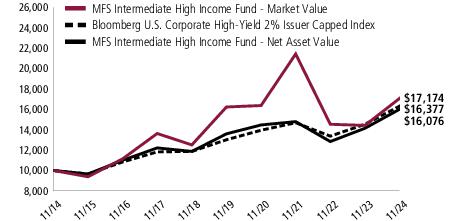
For the twelve months ended November 30, 2024, shares of the MFS Intermediate High Income Fund (fund) provided a total return of 13.70%, at net asset value, and a total return of 19.09%, at market value. This compares with a return of 12.71% for the fund’s benchmark, the Bloomberg U.S. Corporate High-Yield 2% Issuer Capped Index.
The performance commentary below is based on the net asset value performance of the fund, which reflects the performance of the underlying pool of assets held by the fund. The total return at market value represents the return earned by owners of the shares of the fund, which are traded publicly on the exchange.
Market Environment
With inflation subsiding, global central banks in recent months have changed gears, focusing more on supporting economic growth. In the United States, the U.S. Federal Reserve has eased interest rates 0.75% since September after several months of softer labor market data. In the eurozone, the European Central Bank lowered rates a total of 1% beginning in June as inflation fell back to target and growth nearly stalled. China recently loosened monetary policy and ramped up fiscal stimulus after a period of subpar growth amid ongoing weakness in the country’s property market and flagging business and consumer sentiment.
Global equity markets have performed strongly, with several themes playing out at once. The most prominent has been continued investment in artificial intelligence, helping boost the share prices of a handful of megacap technology stocks. Enormous demand for GLP-1 weight-loss medications is another trend. A renewed focus on corporate governance, and greater attention paid to shareholder returns, helped boost share prices in Japan. Corporate earnings have been strong, but tighter labor markets, the potential for higher input costs due to deglobalization, and the likelihood that interest rates and inflation will remain more elevated than in the prepandemic period could weigh on margins in the future.
Heightened geopolitical uncertainty lingers as Russia and Ukraine fight a seeming war of attrition while Israel continues to do battle with Iranian-backed proxy groups as well as withstanding several missile attacks from Iran itself, leading to bouts of market volatility and fears of energy disruptions. Equity markets reacted favorably to the result of the U.S. presidential election, anticipating a low-tax, pro-growth, lighter regulatory touch from a second Trump administration. However, rates markets are wary of a potential erosion of the U.S. government’s fiscal footing.
Factors Affecting Performance
Relative to the Bloomberg U.S. Corporate High-Yield 2% Issuer Capped Index, the fund’s yield curve(y) positioning and longer duration(d) stance enhanced performance as interest rates generally declined throughout the reporting period. From a quality perspective, the fund’s overweight allocation to “CCC” rated(r) securities benefited relative returns.
Management Review - continued
Conversely, the fund’s overweight allocation to “BB” rated bonds and underweight allocation to “CC” rated securities detracted from relative performance. Weak security selection within “CCC” rated bonds further weighed on the fund’s relative returns. From a sector perspective, bond selection within both the consumer cyclicals and consumer non-cyclicals sectors held back relative performance. The fund’s overweight exposure to the capital goods and insurance sectors also dampened relative results.
The fund employs leverage and, to the extent that investments are purchased through the use of leverage, the fund’s net asset value may increase or decrease at a greater rate than a comparable unleveraged fund. During the reporting period, the use of leverage strengthened relative returns.
The fund has a managed distribution policy, the primary purpose of which is to provide shareholders with a constant, but not guaranteed, fixed rate of distribution each month. This policy had no material impact on the fund's investment strategies during its most recent fiscal year. The level of distributions paid by the fund pursuant to its managed distribution policy may cause the fund's net asset value (NAV) per share to decline more so than if the policy were not in place, including if distributions are in excess of fund returns. However, the adviser believes the policy may benefit the fund’s market price and premium/discount to the fund’s NAV. For the twelve months ended November 30, 2024, the tax character of dividends paid pursuant to the managed distribution policy includes an ordinary income distribution of $1,870,641 and a tax return of capital distribution of $1,327,359. See “Managed Distribution Policy Disclosure” in the inside cover page of this Annual Report for additional details regarding the policy and related implications for the fund and shareholders.
Respectfully,
Portfolio Manager(s)
David Cole and Michael Skatrud
| (d) | Duration is a measure of how much a bond’s price is likely to fluctuate with general changes in interest rates, e.g., if rates rise 1.00%, a bond with a 5-year duration is likely to lose about 5.00% of its value. |
| (r) | Securities rated “BBB”, “Baa”, or higher are considered investment grade; securities rated “BB”, “Ba”, or below are considered non-investment grade. Ratings are assigned to underlying securities utilizing ratings from Moody's, Fitch, and Standard & Poor's and applying the following hierarchy: If all three agencies provide a rating, the middle rating (after dropping the highest and lowest ratings) is assigned; if two of the three agencies rate a security, the lower of the two is assigned. If none of the 3 rating agencies above assign a rating, but the security is rated by DBRS Morningstar, then the DBRS Morningstar rating is assigned. If none of the 4 rating agencies listed above rate the security, but the security is rated by the Kroll Bond Rating Agency (KBRA), then the KBRA rating is assigned. Ratings are shown in the S&P and Fitch scale (e.g., AAA). For securities that are not rated by any of the rating agencies, the security is considered Not Rated. |
| (y) | A yield curve graphically depicts the yields of different maturity bonds of the same credit quality and type; a normal yield curve is upward sloping, with short-term rates lower than long-term rates. |
The views expressed in this report are those of the portfolio manager(s) only through the end of the period of the report as stated on the cover and do not necessarily reflect the views of MFS or any other person in the MFS organization. These views are subject to change at any time based on market or other conditions, and MFS disclaims any responsibility to update such views. These
Management Review - continued
views may not be relied upon as investment advice or an indication of trading intent on behalf of any MFS portfolio. References to specific securities are not recommendations of such securities, and may not be representative of any MFS portfolio’s current or future investments.
Performance Summary THROUGH 11/30/24
The following chart illustrates the fund’s historical performance in comparison to its benchmark(s). Performance results reflect the percentage change in net asset value and market value, including reinvestment of fund distributions. Benchmarks are unmanaged and may not be invested in directly. Benchmark returns do not reflect commissions or expenses. (See Notes to Performance Summary.)
Performance data shown represents past performance and is no guarantee of future results. Investment return and principal value fluctuate so your shares, when sold, may be worth more or less than the original cost; current performance may be lower or higher than quoted. The performance shown does not reflect the deduction of taxes, if any, that a shareholder would pay on fund distributions or the sale of fund shares.
Growth of a Hypothetical $10,000 Investment
Average Annual Total Returns through 11/30/24
| | Inception Date | 1-yr | 5-yr | 10-yr |
| Market Value (r) | 7/21/1988 | 19.09% | 1.14% | 5.56% |
| Net Asset Value (r) | 7/21/1988 | 13.70% | 3.41% | 4.86% |
Comparative benchmark(s)
| | | | |
| Bloomberg U.S. Corporate High-Yield 2% Issuer Capped Index (f) | 12.71% | 4.70% | 5.06% |
| (f) | Source: FactSet Research Systems Inc. |
| (r) | Includes reinvestment of all distributions. Market value references New York Stock Exchange Price. |
Benchmark Definition(s)
Bloomberg U.S. Corporate High-Yield 2% Issuer Capped Index(a) – a component of the Bloomberg U.S. Corporate High-Yield Index, which measures performance of non-investment grade, fixed rate debt. The index limits the maximum exposure to any one issuer to 2%.
Performance Summary - continued
It is not possible to invest directly in an index.
| (a) | Source: Bloomberg Index Services Limited. BLOOMBERG® is a trademark and service mark of Bloomberg Finance L.P. and its affiliates (collectively “Bloomberg”). Bloomberg or Bloomberg's licensors own all proprietary rights in the Bloomberg Indices. Bloomberg neither approves or endorses this material, or guarantees the accuracy or completeness of any information herein, or makes any warranty, express or implied, as to the results to be obtained therefrom and, to the maximum extent allowed by law, neither shall have any liability or responsibility for injury or damages arising in connection therewith. |
Notes to Performance Summary
The fund’s shares may trade at a discount or premium to net asset value. When fund shares trade at a premium, buyers pay more than the net asset value of the underlying fund shares, and shares purchased at a premium would receive less than the amount paid for them in the event of the fund’s concurrent liquidation.
The fund's target annual distribution rate is calculated based on an annual rate of 9.50% of the fund's average monthly net asset value, not a fixed share price, and the fund's distribution amount will fluctuate with changes in the fund's average monthly net assets.
Performance results based on net asset value per share do not include adjustments made for financial reporting purposes in accordance with U.S. generally accepted accounting principles and may differ from amounts reported in the Financial Highlights.
From time to time the fund may receive proceeds from litigation settlements, without which performance would be lower.
In accordance with Section 23(c) of the Investment Company Act of 1940, the fund hereby gives notice that it may from time to time repurchase shares of the fund in the open market at the option of the Board of Trustees and on such terms as the Trustees shall determine.
Investment Objective, Principal Investment Strategies and Principal Risks
Investment Objective
The fund’s investment objective is to seek high current income, but may also consider capital appreciation. The fund’s objective may be changed without shareholder approval.
Principal Investment Strategies
MFS normally invests at least 80% of the fund’s net assets, including borrowings for investment purposes, in high income debt instruments.
MFS may invest the fund’s assets in other types of debt instruments and equity securities.
MFS may invest up to 100% of the fund’s assets in below investment grade quality debt instruments.
MFS may invest the fund’s assets in foreign securities.
MFS normally invests the fund's assets across different industries and sectors, but MFS may invest a significant percentage of the fund's assets in issuers in a single industry or sector.
The fund’s dollar-weighted average effective maturity will normally be between three and ten years. In determining an instrument’s effective maturity, MFS uses the instrument’s stated maturity or, if applicable, an earlier date on which MFS believes it is probable that a maturity-shortening device (such as a call, put, pre-refunding, prepayment or redemption provision, or an adjustable coupon) will cause the instrument to be repaid. Such an earlier date can be substantially shorter than the instrument’s stated maturity.
The fund seeks to make a monthly distribution at an annual fixed rate of 9.50% of the fund’s average monthly net asset value.
While MFS may use derivatives for any investment purpose, to the extent MFS uses derivatives, MFS expects to use derivatives primarily to increase or decrease exposure to a particular market, segment of the market, or security, to increase or decrease interest rate exposure, or as alternatives to direct investments.
MFS uses an active bottom-up investment approach to buying and selling investments for the fund. Investments are selected primarily based on fundamental analysis of individual issuers and/or instruments in light of the issuer’s financial condition and market, economic, political, and regulatory conditions. Factors considered for debt instruments may include the instrument’s credit quality, collateral characteristics, and indenture provisions, and the issuer’s management ability, capital structure, leverage, and ability to meet its current obligations. Factors considered for equity securities may include analysis of an issuer’s earnings, cash flows, competitive position, and management ability. MFS may also consider environmental, social, and governance (ESG) factors in its fundamental investment analysis where MFS believes such factors could materially impact the economic value of an issuer or instrument. ESG factors
Investment Objective, Principal Investment Strategies and Principal Risks - continued
considered may include, but are not limited to, climate change, resource depletion, an issuer's governance structure and practices, data protection and privacy issues, and diversity and labor practices. Quantitative screening tools that systematically evaluate the structure of a debt instrument and its features or the valuation, price and earnings momentum, earnings quality, and other factors of the issuer of an equity security may also be considered.
The fund may use leverage by borrowing up to 33 1/3% of the fund’s assets, including borrowings for investment purposes, and investing the proceeds pursuant to its investment strategies. If approved by the fund’s Board of Trustees, the fund may use leverage by other methods.
Principal Investment Types
The principal investment types in which the fund may invest are:
Debt Instruments: Debt instruments represent obligations of corporations, governments, and other entities to repay money borrowed, or other instruments believed to have debt-like characteristics. The issuer or borrower usually pays a fixed, variable, or floating rate of interest, and must repay the amount borrowed, usually at the maturity of the instrument. Debt instruments generally trade in the over-the-counter market and can be less liquid than other types of investments, particularly during adverse market and economic conditions. During certain market conditions, debt instruments in some or many segments of the debt market can trade at a negative interest rate (i.e., the price to purchase the debt instrument is more than the present value of expected interest payments and principal due at the maturity of the instrument). Some debt instruments, such as zero coupon bonds or payment-in-kind bonds, do not pay current interest. Other debt instruments, such as certain mortgage-backed securities and other securitized instruments, make periodic payments of interest and/or principal. Some debt instruments are partially or fully secured by collateral supporting the payment of interest and principal.
Corporate Bonds: Corporate bonds are debt instruments issued by corporations or similar entities.
U.S. Government Securities: U.S. Government securities are securities issued or guaranteed as to the payment of principal and interest by the U.S. Treasury, by an agency or instrumentality of the U.S. Government, or by a U.S. Government-sponsored entity, including mortgage-backed securities and other types of securitized instruments issued or guaranteed by such entities. Certain U.S. Government securities are not supported as to the payment of principal and interest by the full faith and credit of the U.S. Treasury or the ability to borrow from the U.S. Treasury. Some U.S. Government securities are supported as to the payment of principal and interest only by the credit of the entity issuing or guaranteeing the security.
Foreign Government Securities: Foreign government securities are debt instruments issued, guaranteed, or supported, as to the payment of principal and interest, by foreign governments, foreign government agencies, foreign semi-governmental entities or supranational entities, or debt instruments issued by entities organized and operated for the purpose of restructuring outstanding foreign government securities. Foreign government securities may not be supported as to the payment of principal and interest by the full faith and credit of the foreign government.
Investment Objective, Principal Investment Strategies and Principal Risks - continued
Floating Rate Loans: Floating rate loans are debt instruments issued by companies or other entities with interest rates that reset periodically (typically daily, monthly, quarterly, or semiannually), based on a base lending rate such as the Secured Overnight Financing Rate (SOFR), plus a premium. Floating rate loans are typically structured and administered by a third party that acts as agent for the lenders participating in the floating rate loan. Floating rate loans can be acquired directly through the agent, by assignment from a third party holder of the loan, or as a participation interest in a third party holder’s portion of the loan. Senior floating rate loans are secured by specific collateral of the borrower, and are senior to most other securities of the borrower (e.g., common stocks or other debt instruments) in the event of bankruptcy. Floating rate loans can be subject to restrictions on resale and can be less liquid than other types of securities.
Equity Securities: Equity securities represent an ownership interest, or the right to acquire an ownership interest, in a company or other issuer. Different types of equity securities provide different voting and dividend rights and priorities in the event of bankruptcy of the issuer. Equity securities include common stocks, preferred stocks, securities convertible into stocks, equity interests in real estate investment trusts, and depositary receipts for such securities.
Derivatives: Derivatives are financial contracts whose value is based on the value of one or more underlying indicators or the difference between underlying indicators. Underlying indicators may include a security or other financial instrument, asset, currency, interest rate, credit rating, commodity, volatility measure, or index. Derivatives involve a counterparty to the transaction. Derivatives include futures, forward contracts, options, swaps, and certain complex structured securities.
Principal Risks
The share price of the fund will change daily based on changes in market, economic, industry, political, regulatory, geopolitical, environmental, public health, and other conditions. As with any mutual fund, the fund may not achieve its objective and/or you could lose money on your investment in the fund. An investment in the fund is not a bank deposit and is not insured or guaranteed by the Federal Deposit Insurance Corporation or any other governmental agency. The significance of any specific risk to an investment in the fund will vary over time depending on the composition of the fund's portfolio, market conditions, and other factors. You should read all of the risk information below carefully, because any one or more of these risks may result in losses to the fund.
The principal risks of investing in the fund are:
Investment Selection Risk: MFS' investment analysis and its selection of investments may not produce the intended results and/or can lead to an investment focus that results in the fund underperforming other funds with similar investment strategies and/or underperforming the markets in which the fund invests. In addition, to the extent MFS considers quantitative tools in managing the fund, such tools may not work as expected or produce the intended results. In addition, MFS or the fund's other service providers may experience disruptions or operating errors that could negatively impact the fund.
Investment Objective, Principal Investment Strategies and Principal Risks - continued
Debt Market Risk: Debt markets can be volatile and can decline significantly in response to changes in, or investor perceptions of, issuer, market, economic, industry, political, regulatory, geopolitical, environmental, public health, and other conditions. These conditions can affect a single instrument, issuer, or borrower, a particular type of instrument, issuer, or borrower, a segment of the debt markets, or debt markets generally. Certain changes or events, such as political, social, or economic developments, including increasing and negative interest rates or the U.S. government's inability at times to agree on a long-term budget and deficit reduction plan (which has in the past resulted and may in the future result in a government shutdown); market closures and/or trading halts; government or regulatory actions, including sanctions, the imposition of tariffs or other protectionist actions and changes in fiscal, monetary, or tax policies; natural disasters; outbreaks of pandemic and epidemic diseases; terrorist attacks; war; and other geopolitical changes or events can have a dramatic adverse effect on debt markets and may lead to periods of high volatility and reduced liquidity in a debt market or a segment of a debt market.
Interest Rate Risk: The price of a debt instrument typically changes in response to interest rate changes. Interest rates can change in response to the supply and demand for credit, government and/or central bank monetary policy and action, inflation rates, and other factors. In general, the price of a debt instrument falls when interest rates rise and rises when interest rates fall. Inflationary price movements may cause fixed income securities markets to experience heightened levels of interest rate volatility and liquidity risk. Potential future changes in government and/or central bank monetary policy and action may also affect the level of interest rates. Monetary policy measures have in the past, and may in the future, exacerbate risks associated with rising interest rates. Interest rate risk is generally greater for fixed-rate instruments than floating-rate instruments and for instruments with longer maturities or durations, or that do not pay current interest. In addition, short-term and long-term interest rates, and interest rates in different countries, do not necessarily move in the same direction or by the same amount. An instrument’s reaction to interest rate changes depends on the timing of its interest and principal payments and the current interest rate for each of those time periods. The price of an instrument trading at a negative interest rate responds to interest rate changes like other debt instruments; however, an instrument purchased at a negative interest rate is expected to produce a negative return if held to maturity. Fluctuations in the market price of fixed-rate instruments held by the fund may not affect interest income derived from those instruments, but may nonetheless affect the fund's share price, especially if an instrument has a longer maturity or duration and is therefore more sensitive to changes in interest rates.
Investment Objective, Principal Investment Strategies and Principal Risks - continued
Credit Risk: The price of a debt instrument depends, in part, on the issuer's or borrower's credit quality or ability to pay principal and interest when due. The price of a debt instrument is likely to fall if an issuer or borrower defaults on its obligation to pay principal or interest, if the instrument's credit rating is downgraded by a credit rating agency, or based on other changes in, or perceptions of, the financial condition of the issuer or borrower. Debt instruments may be more susceptible to downgrades or defaults during economic downturns or similar periods of economic stress, which in turn could negatively affect the market value and liquidity of a debt instrument. For certain types of instruments, including derivatives, the price of the instrument depends in part on the credit quality of the counterparty to the transaction. For other types of debt instruments, including mortgage-backed securities and other securitized instruments, the price of the debt instrument also depends on the credit quality and adequacy of the underlying assets or collateral as well as whether there is a security interest in the underlying assets or collateral. Enforcing rights, if any, against the underlying assets or collateral may be difficult.
Below investment grade quality debt instruments can involve a substantially greater risk of default or can already be in default, and their values can decline significantly over short periods of time. Below investment grade quality debt instruments are regarded as having predominantly speculative characteristics with respect to capacity to pay interest and principal. Below investment grade quality debt instruments tend to be more sensitive to adverse news about the issuer, or the market or economy in general, than higher quality debt instruments. The market for below investment grade quality debt instruments can be less liquid, especially during periods of recession or general market decline.
Foreign Risk: Investments in securities of foreign issuers, securities of companies with significant foreign exposure, and foreign currencies can involve additional risks relating to market, economic, industry, political, regulatory, geopolitical, environmental, public health, and other conditions. Political, social, diplomatic, and economic developments, U.S. and foreign government action, or the threat thereof, such as the imposition of currency or capital blockages, controls, or tariffs, economic and trade sanctions or embargoes, security trading suspensions, entering or exiting trade or other intergovernmental agreements, or the expropriation or nationalization of assets in a particular country, can cause dramatic declines in certain or all securities with exposure to that country and other countries. Sanctions, or the threat of sanctions, may cause volatility in regional and global markets and may negatively impact the performance of various sectors and industries, as well as companies in other countries, which could have a negative effect on the performance of the fund. In the event of nationalization, expropriation, confiscation or other government action, intervention, or restriction, the fund could lose its entire investment in a particular foreign issuer or country. Civil unrest, geopolitical tensions, armed conflicts, wars, and acts of terrorism are other potential risks that could adversely affect an investment in a foreign security or in foreign markets or issuers generally. Economies and financial markets are interconnected, which increases the likelihood that conditions in one country or region can adversely impact issuers in different countries and regions. Less stringent regulatory, accounting, auditing, and disclosure requirements for issuers and markets are more common in certain foreign countries. Enforcing legal rights can be difficult, costly, and slow in certain foreign countries and with respect to certain types of investments, and can be particularly difficult against foreign governments. Changes in currency exchange rates can significantly impact the financial condition of a company
Investment Objective, Principal Investment Strategies and Principal Risks - continued
or other issuer with exposure to multiple countries as well as affect the U.S. dollar value of foreign currency investments and investments denominated in foreign currencies. Additional risks of foreign investments include trading, settlement, custodial, and other operational risks, and withholding and other taxes. These factors can make foreign investments, especially those tied economically to countries with developing economies, more volatile and less liquid than U.S. investments. In addition, foreign markets can react differently to market, economic, industry, political, regulatory, geopolitical, environmental, public health, and other conditions than the U.S. market. Investments in foreign issuers through depositary receipts generally involve risks applicable to other types of foreign investments. Investments in depositary receipts may be less liquid and more volatile than the underlying securities in their primary trading market.
Focus Risk: Issuers in a single industry, sector, country, or region can react similarly to market, currency, political, economic, regulatory, geopolitical, environmental, public health, and other conditions. These conditions include business environment changes; economic factors such as fiscal, monetary, and tax policies; inflation and unemployment rates; and government and regulatory changes. The fund's performance will be affected by the conditions in the industries, sectors, countries, and regions to which the fund is exposed.
Prepayment/Extension Risk: Many types of debt instruments, including mortgage-backed securities, securitized instruments, certain corporate bonds, and municipal housing bonds, and certain derivatives, are subject to the risk of prepayment and/or extension. Prepayment occurs when unscheduled payments of principal are made or the instrument is called or redeemed prior to an instrument’s maturity. When interest rates decline, the instrument is called, or for other reasons, these debt instruments may be repaid more quickly than expected. As a result, the holder of the debt instrument may not be able to reinvest the proceeds at the same interest rate or on the same terms, reducing the potential for gain. When interest rates increase or for other reasons, these debt instruments may be repaid more slowly than expected, increasing the potential for loss. In addition, prepayment rates are difficult to predict and the potential impact of prepayment on the price of a debt instrument depends on the terms of the instrument.
Equity Market Risk: Equity markets are volatile and can decline significantly in response to changes in, or investor perceptions of, issuer, market, economic, industry, political, regulatory, geopolitical, environmental, public health, and other conditions. These conditions can affect a single issuer or type of security, issuers within a broad market sector, industry or geographic region, or the equity markets in general. Different parts of the market and different types of securities can react differently to these conditions. For example, the stocks of growth companies can react differently from the stocks of value companies, and the stocks of large cap companies can react differently from the stocks of small cap companies. Certain changes or events, such as political, social, or economic developments, including political elections, increasing or negative interest rates or the U.S. government's inability at times to agree on a long-term budget and deficit reduction plan (which has in the past resulted and may in the future result in a government shutdown); market closures and/or trading halts; government or regulatory actions, including sanctions, the imposition of tariffs or other protectionist actions and changes in fiscal, monetary, or tax policies; natural disasters;
Investment Objective, Principal Investment Strategies and Principal Risks - continued
outbreaks of pandemic and epidemic diseases; terrorist attacks; war; and other geopolitical changes or events, can have a dramatic adverse effect on equity markets and may lead to periods of high volatility in an equity market or a segment of an equity market.
Company Risk: Changes in the financial condition of a company or other issuer, changes in specific market, economic, industry, political, regulatory, geopolitical, environmental, public health, and other conditions that affect a particular type of investment or issuer, and changes in general market, economic, political, regulatory, geopolitical, environmental, public health, and other conditions can adversely affect the prices of investments. The value of an investment held by the fund may decline due to factors directly related to the issuer, such as competitive pressures, cybersecurity incidents, financial leverage, historical and/or prospective earnings, management performance, labor and supply shortages, investor perceptions, and other factors. The prices of securities of smaller, less well-known issuers can be more volatile than the prices of securities of larger issuers or the market in general.
Managed Distribution Plan Risk: The fund may not be able to maintain a monthly distribution at an annual fixed rate of up to 9.50% of the fund’s average monthly net asset value due to many factors, including but not limited to, changes in market returns, fluctuations in market interest rates, and other factors. If income from the fund’s investments is less than the amount needed to make a monthly distribution, the fund may distribute a return of capital to pay the distribution. In certain cases, the fund may sell portfolio investments at less opportune times in order to pay such distribution. Distributions that are treated as tax return of capital will have the effect of reducing the fund’s assets and could increase the fund’s expense ratio. If a portion of the fund’s distributions represents returns of capital over extended periods, the fund’s assets may be reduced over time to levels where the fund is no longer viable and might be liquidated. Please see “Managed Distribution Policy Disclosure” in this report for additional information regarding the plan.
Market Discount/Premium Risk: The market price of shares of the fund will be based on factors such as the supply and demand for shares in the market and general market, economic, industry, political or regulatory conditions. Whether shareholders will realize gains or losses upon the sale of shares of the fund will depend on the market price of shares at the time of the sale, not on the fund’s net asset value. The market price may be lower or higher than the fund’s net asset value. Shares of closed-end funds frequently trade at a discount to their net asset value.
Leveraging Risk: If the fund utilizes investment leverage, there can be no assurance that such a leveraging strategy will be successful during any period in which it is employed. The use of leverage is a speculative investment technique that results in greater volatility in the fund’s net asset value. To the extent that investments are purchased with the proceeds from the borrowings from a bank, the issuance of preferred shares, or the creation of tender option bonds, the fund’s net asset value will increase or decrease at a greater rate than a comparable unleveraged fund. If the investment income or gains earned from the investments purchased with the proceeds from the borrowings from a bank, the issuance of preferred shares, or the creation of tender option bonds, fails to cover the expenses of leveraging, the fund’s net asset value is likely to decrease more quickly than if the fund was not leveraged. In addition, the fund’s distributions could be reduced. The fund is currently required under the
Investment Objective, Principal Investment Strategies and Principal Risks - continued
Investment Company Act of 1940 (“1940 Act”) to maintain asset coverage of at least 200% on outstanding preferred shares and at least 300% on outstanding indebtedness; however, the fund may be required to abide by asset coverage or other requirements that are more stringent than those imposed by the 1940 Act. The fund may be required to sell a portion of its investments at a time when it may be disadvantageous to do so in order to redeem preferred shares or to reduce outstanding indebtedness to comply with asset coverage or other restrictions including those imposed by the 1940 Act, any applicable loan agreement, any applicable offering documents for preferred shares issued by the fund, and the rating agencies that rate the preferred shares. The fund may be prohibited from declaring and paying common share dividends and distributions if the fund fails to satisfy the 1940 Act’s asset coverage requirements or other agreed upon asset coverage requirements. In these situations, the fund may choose to repurchase or redeem any outstanding leverage to the extent necessary in order to maintain compliance with such asset coverage requirements. The expenses of leveraging are paid by the holders of common shares. Borrowings from a bank or preferred shares may have a stated maturity. If this leverage is not extended prior to maturity or replaced with the same or a different form of leverage, distributions to common shareholders may be decreased.
Certain transactions and investment strategies can result in leverage. Because movements in a fund’s share price generally correlate over time with the fund’s net asset value, the market price of a leveraged fund will also tend to be more volatile than that of a comparable unleveraged fund. The costs of an offering of preferred shares and/or borrowing program would be borne by shareholders.
Under the terms of any loan agreement or of a purchase agreement between the fund and the investor in the preferred shares, as the case may be, the fund may be required to, among other things, limit its ability to pay dividends and distributions on common shares in certain circumstances, incur additional debts, engage in certain transactions, and pledge some or all of its assets at an inopportune time. Such agreements could limit the fund’s ability to pursue its investment strategies. The terms of any loan agreement or purchase agreement could be more or less restrictive than those described.
Derivatives Risk: Derivatives can be highly volatile and involve risks in addition to, and potentially greater than, the risks of the underlying indicator(s). Gains or losses from derivatives can be substantially greater than the derivatives’ original cost and can sometimes be unlimited. Derivatives can involve leverage. Derivatives can be complex instruments and can involve analysis and processing that differs from that required for other investment types used by the fund. If the value of a derivative does not change as expected relative to the value of the market or other indicator to which the derivative is intended to provide exposure, the derivative may not have the effect intended. Derivatives can also reduce the opportunity for gains or result in losses by offsetting positive returns in other investments. Derivatives can be less liquid than other types of investments.
Counterparty and Third Party Risk: Transactions involving a counterparty other than the issuer of the instrument, including clearing organizations, or a third party responsible for servicing the instrument or effecting the transaction, are subject to the credit risk of the counterparty or third party, and to the counterparty’s or third party’s ability or willingness to perform in accordance with the terms of the transaction. If a
Investment Objective, Principal Investment Strategies and Principal Risks - continued
counterparty or third party fails to meet its contractual obligations, goes bankrupt, or otherwise experiences a business interruption, the fund could miss investment opportunities, lose value on its investments, or otherwise hold investments it would prefer to sell, resulting in losses for the fund.
Liquidity Risk: Certain investments and types of investments are subject to restrictions on resale, may trade in the over-the-counter market, or may not have an active trading market due to adverse market, economic, industry, political, regulatory, geopolitical, environmental, public health, and other conditions, including trading halts, sanctions, or wars. Investors trying to sell large quantities of a particular investment or type of investment, or lack of market makers or other buyers for a particular investment or type of investment may also adversely affect liquidity. At times, all or a significant portion of a market may not have an active trading market. Without an active trading market, it may be difficult to value, and it may not be possible to sell, these investments and the fund could miss other investment opportunities and hold investments it would prefer to sell, resulting in losses for the fund. In addition, the fund may have to sell certain of these investments at prices or times that are not advantageous in order to meet redemptions or other cash needs, which could result in dilution of remaining investors' interests in the fund. The prices of illiquid securities may be more volatile than more liquid investments.
Anti-Takeover Provisions Risk: The fund’s declaration of trust includes provisions that could limit the ability of other persons or entities to acquire control of the fund, to convert the fund to an open-end fund, or to change the composition of the fund’s Board of Trustees. These provisions could reduce the opportunities for shareholders to sell their shares at a premium over the then-current market price.
Other Investment Strategies and Risks
Active and Frequent Trading: MFS may engage in active and frequent trading in pursuing the fund's principal investment strategies. Frequent trading may increase transaction costs, which can reduce the fund's return. Frequent trading can also increase the possibility of capital gain and ordinary distributions. Frequent trading can also result in the realization of a higher percentage of short-term capital gains and a lower percentage of long-term capital gains as compared to a fund that trades less frequently. Because short-term capital gains are distributed as ordinary income, this would generally increase your tax liability unless you hold your shares through a tax-advantaged or tax-exempt vehicle.
Operational and Cybersecurity Risk: The fund and its service providers, and your ability to transact in fund shares, may be negatively impacted due to operational matters arising from, among other issues, human errors, systems and technology disruptions or failures, fraudulent activities, or cybersecurity incidents. Operational issues and cybersecurity incidents may cause the fund or its service providers, as well as securities trading venues and other market participants, to suffer data corruption and/or lose operational functionality, and could, among other things, impair the ability to calculate the fund's net asset value per share, impede trading of portfolio securities, and result in the theft, misuse, and/or improper release of confidential information relating to the fund or its shareholders. Such operational issues and cybersecurity incidents may result in losses to the fund and its shareholders. Because technology is frequently changing, new ways to carry out cyberattacks continue to develop. Therefore, there is a chance that certain risks have not been identified or prepared for,
Investment Objective, Principal Investment Strategies and Principal Risks - continued
or that an attack may not be detected, which puts limitations on the ability of the fund and its service providers to plan for or respond to a cyberattack. Furthermore, geopolitical tensions could increase the scale and sophistication of deliberate cybersecurity attacks, particularly those from nation-states or from entities with nation-state backing.
Temporary Defensive Strategy: In response to adverse market, economic, industry, political, or other conditions, MFS may depart from the fund’s principal investment strategies by temporarily investing for defensive purposes. When MFS invests defensively, different factors could affect the fund’s performance and the fund may not achieve its investment objective. In addition, the defensive strategy may not work as intended.
Investment Restrictions
The Fund has adopted the following policies which cannot be changed without the approval of a “majority of its outstanding voting securities” as such term is defined by the 1940 Act. Under the 1940 Act, the vote of a “majority of its outstanding voting securities” means the vote of the lesser of (i) 67% or more of the voting securities present at a meeting at which holders of voting securities representing more than 50% of the outstanding voting securities are present or represented by proxy, or (ii) more than 50% of the outstanding voting securities. Except for fundamental investment restriction (1), these investment restrictions are adhered to at the time of purchase or utilization of assets; a subsequent change in circumstances will not be considered to result in a violation of policy.
The Fund may not:
| (1) | borrow money except to the extent not prohibited by the 1940 Act and exemptive orders granted under such Act. |
| (2) | underwrite securities issued by other persons, except that all or any portion of the assets of the Fund may be invested in one or more investment companies, to the extent not prohibited by the 1940 Act and exemptive orders granted under such Act, and except insofar as the Fund may technically be deemed an underwriter under the Securities Act of 1933, as amended, in selling a portfolio security. |
| (3) | issue any senior securities except to the extent not prohibited by the 1940 Act and exemptive orders granted under such Act. For purposes of this restriction, collateral arrangements with respect to any type of swap, option, Forward Contracts and Futures Contracts and collateral arrangements with respect to initial and variation margin are not deemed to be the issuance of a senior security. |
| (4) | make loans except to the extent not prohibited by the 1940 Act and exemptive orders granted under such Act. |
| (5) | purchase or sell real estate (excluding securities secured by real estate or interests therein and securities of companies, such as real estate investment trusts, which deal in real estate or interests therein), interests in oil, gas or mineral leases, commodities or commodity contracts (excluding currencies and any type of option, Futures Contracts and Forward Contracts or other derivative instruments whose value is related to commodities or other commodity contracts) in the ordinary course of its business. The Fund reserves the freedom of action to hold and to sell |
Investment Objective, Principal Investment Strategies and Principal Risks - continued
real estate, mineral leases, commodities or commodity contracts (including currencies and any type of option, Futures Contracts and Forward Contracts) acquired as a result of the ownership of securities.
| (6) | purchase any securities of an issuer in a particular industry if as a result 25% or more of its total assets (taken at market value at the time of purchase) would be invested in securities of issuers whose principal business activities are in the same industry. |
For purposes of fundamental investment restriction (6), investments in securities issued or guaranteed by the U.S. Government or its agencies or instrumentalities and tax-exempt obligations issued or guaranteed by a U.S. territory or possession, a state or local government, or a political subdivision of any of the foregoing, are not considered an investment in any particular industry.
For purposes of fundamental investment restriction (6), investments in other investment companies are not considered an investment in any particular industry and portfolio securities held by an underlying fund in which the Fund may invest are not considered to be securities purchased by the Fund.
For purposes of fundamental investment restriction (6), MFS uses a customized set of industry groups for classifying securities based on classifications developed by third party providers.
Effects of Leverage
The following table is furnished in response to requirements of the Securities and Exchange Commission (the “SEC”). It is designed to, among other things, illustrate the effects of leverage through the use of senior securities, as that term is defined under Section 18 of the Investment Company Act of 1940 (the “1940 Act”), on fund total return, assuming investment portfolio total returns (consisting of income and changes in the value of investments held in a fund’s portfolio) of –10%, –5%, 0%, 5% and 10%. The table below assumes the fund’s continued use of line of credit borrowings (“leverage”), as applicable, as of November 30, 2024, as a percentage of total assets (including assets attributable to such leverage), the estimated annual effective interest expense rate payable by the fund on such line of credit borrowings (based on market conditions as of November 30, 2024), and the annual return that the fund’s portfolio would need to experience (net of expenses) in order to cover such costs. The information below does not reflect the fund’s possible use of certain other forms of economic leverage through the use of other instruments or transactions not considered to be senior securities under the 1940 Act, if any.
The assumed investment portfolio returns in the table below are hypothetical figures and are not necessarily indicative of the investment portfolio returns experienced or expected to be experienced by the fund. Your actual returns may be greater or less than those appearing below. In addition, actual borrowing expenses associated with line of credit borrowings used by the fund may vary frequently and may be significantly higher or lower than the rate used for the example below.
| Line of Credit Borrowings as a Percentage of Total Assets (Including Assets Attributable to Leverage) | 30.78% |
| Estimated Annual Effective Rate of Interest Expense on Line of Credit Borrowings | 5.57% |
| Annual Return Fund Portfolio Must Experience (net of expenses) to Cover Estimated Annual Effective Interest Expense on Line of Credit Borrowings | 1.72% |
| Assumed Return on Portfolio (Net of Expenses) | -10.00% | -5.00% | 0.00% | 5.00% | 10.00% |
| Corresponding Return to Shareholder | -16.92% | -9.70% | -2.48% | 4.75% | 11.97% |
The table reflects hypothetical performance of the fund’s portfolio and not the actual performance of the fund’s shares, the value of which is determined by market forces and other factors.
Should the fund elect to add additional leverage to its portfolio, any benefits of such additional leverage cannot be fully achieved until the proceeds resulting from the use of such leverage have been received by the fund and invested in accordance with the fund’s investment objectives and policies. The fund’s willingness to use additional leverage, and the extent to which leverage is used at any time, will depend on many factors.
Portfolio Managers' Profiles
| Portfolio Manager | Primary Role | Since | Title and Five Year History |
| David Cole | Portfolio Manager | 2007 | Investment Officer of MFS; employed in the investment management area of MFS since 2004. |
| Michael Skatrud | Portfolio Manager | 2018 | Investment Officer of MFS; employed in the investment management area of MFS since 2013. |
Dividend Reinvestment And Cash Purchase Plan
The fund offers a Dividend Reinvestment and Cash Purchase Plan (the “Plan”) that allows common shareholders to reinvest either all of the distributions paid by the fund or only the long-term capital gains. Generally, purchases are made at the market price unless that price exceeds the net asset value (the shares are trading at a premium). If the shares are trading at a premium, the fund will issue shares at a price of either the net asset value or 95% of the market price, whichever is greater. You can also buy shares on a quarterly basis in any amount $100 and over. Computershare Trust Company, N.A. (the Transfer Agent for the fund) (the “Plan Agent”) will purchase shares under the Plan on the 15th of January, April, July, and October or shortly thereafter. You may obtain a copy of the Plan by contacting the Plan Agent at 1-800-637-2304 any business day from 9 a.m. to 5 p.m. Eastern time or by visiting the Plan Agent's Web site at www.computershare.com/investor.
If shares are registered in your own name, new shareholders will automatically participate in the Plan, unless you have indicated that you do not wish to participate. If your shares are in the name of a brokerage firm, bank, or other nominee, you can ask the firm or nominee to participate in the Plan on your behalf. If the nominee does not offer the Plan, you may wish to request that your shares be re-registered in your own name so that you can participate. There is no service charge to reinvest distributions, nor are there brokerage charges for shares issued directly by the fund. However, when shares are bought on the New York Stock Exchange or otherwise on the open market, each participant pays a pro rata share of the transaction expenses, including commissions. The tax status of dividends and capital gain distributions does not change whether received in cash or reinvested in additional shares – the automatic reinvestment of distributions does not relieve you of any income tax that may be payable (or required to be withheld) on the distributions.
If your shares are held directly with the Plan Agent, you may withdraw from the Plan at any time by contacting the Plan Agent. Please have available the name of the fund and your account number. For certain types of registrations, such as corporate accounts, instructions must be submitted in writing. Please call for additional details. When you withdraw from the Plan, you can receive the value of the reinvested shares in one of three ways: your full shares will be held in your account, the Plan Agent will sell your shares and send the proceeds to you, or you may transfer your full shares to your investment professional who can hold or sell them. Additionally, the Plan Agent will sell your fractional shares and send the proceeds to you.
If you have any questions, contact the Plan Agent by calling 1-800-637-2304, visit the Plan Agent’s Web site at www.computershare.com/investor, or by writing to the Plan Agent at P.O. Box 43078, Providence, RI 02940-3078.
Portfolio of Investments
11/30/24
The Portfolio of Investments is a complete list of all securities owned by your fund. It is categorized by broad-based asset classes.
| Issuer | | | Shares/Par | Value ($) |
| Bonds – 139.4% |
| Aerospace & Defense – 5.1% |
| Bombardier, Inc., 7.5%, 2/01/2029 (n) | | $ | 85,000 | $88,729 |
| Bombardier, Inc., 8.75%, 11/15/2030 (n) | | | 54,000 | 58,446 |
| Bombardier, Inc., 7.25%, 7/01/2031 (n) | | | 88,000 | 90,896 |
| Bombardier, Inc., 7%, 6/01/2032 (n) | | | 94,000 | 95,920 |
| F-Brasile S.p.A./F-Brasile U.S. LLC, 7.375%, 8/15/2026 (n) | | | 200,000 | 199,100 |
| Moog, Inc., 4.25%, 12/15/2027 (n) | | | 212,000 | 203,974 |
| Spirit AeroSystems, Inc., 9.75%, 11/15/2030 (n) | | | 128,000 | 142,195 |
| TransDigm, Inc., 5.5%, 11/15/2027 | | | 158,000 | 156,643 |
| TransDigm, Inc., 6.75%, 8/15/2028 (n) | | | 149,000 | 151,974 |
| TransDigm, Inc., 4.625%, 1/15/2029 | | | 151,000 | 143,234 |
| TransDigm, Inc., 6.375%, 3/01/2029 (n) | | | 88,000 | 89,434 |
| TransDigm, Inc., 6.875%, 12/15/2030 (n) | | | 294,000 | 302,845 |
| | | | | $1,723,390 |
| Airlines – 1.1% |
| Air Canada, 3.875%, 8/15/2026 (n) | | $ | 169,000 | $164,875 |
| American Airlines, Inc./AAdvantage Loyalty IP Ltd., 5.75%, 4/20/2029 (n) | | | 221,939 | 221,569 |
| | | | | $386,444 |
| Automotive – 2.7% |
| Allison Transmission, Inc., 3.75%, 1/30/2031 (n) | | $ | 279,000 | $250,778 |
| Clarios Global LP/Clarios U.S. Finance Co., 8.5%, 5/15/2027 (n) | | | 161,000 | 161,836 |
| Clarios Global LP/Clarios U.S. Finance Co., 6.75%, 5/15/2028 (n) | | | 77,000 | 78,894 |
| Dealer Tire LLC/DT Issuer LLC, 8%, 2/01/2028 (n) | | | 117,000 | 116,275 |
| Dornoch Debt Merger Sub, Inc., 6.625%, 10/15/2029 (n) | | | 161,000 | 127,463 |
| Real Hero Merger Sub 2, Inc., 6.25%, 2/01/2029 (n) | | | 123,000 | 110,850 |
| Wabash National Corp., 4.5%, 10/15/2028 (n) | | | 72,000 | 66,906 |
| | | | | $913,002 |
| Broadcasting – 1.8% |
| Banijay Group S.A.S., 8.125%, 5/01/2029 (n) | | $ | 200,000 | $208,274 |
| Midas OpCo Holdings LLC, 5.625%, 8/15/2029 (n) | | | 162,000 | 156,191 |
| Nexstar Broadcasting, Inc., 4.75%, 11/01/2028 (n) | | | 50,000 | 47,212 |
| Univision Communications, Inc., 8%, 8/15/2028 (n) | | | 59,000 | 60,206 |
| Univision Communications, Inc., 8.5%, 7/31/2031 (n) | | | 143,000 | 141,861 |
| | | | | $613,744 |
Portfolio of Investments – continued
| Issuer | | | Shares/Par | Value ($) |
| Bonds – continued |
| Brokerage & Asset Managers – 2.3% |
| AG TTMT Escrow Issuer LLC, 8.625%, 9/30/2027 (n) | | $ | 177,000 | $183,771 |
| Aretec Escrow Issuer 2, Inc., 10%, 8/15/2030 (n) | | | 154,000 | 170,457 |
| Aretec Escrow Issuer, Inc., 7.5%, 4/01/2029 (n) | | | 63,000 | 62,997 |
| Hightower Holding LLC, 6.75%, 4/15/2029 (n) | | | 93,000 | 92,987 |
| Hightower Holding LLC, 9.125%, 1/31/2030 (n) | | | 37,000 | 39,147 |
| Jane Street Group/JSG Finance, Inc., 6.125%, 11/01/2032 (n) | | | 240,000 | 240,971 |
| | | | | $790,330 |
| Building – 7.0% |
| ABC Supply Co., Inc., 3.875%, 11/15/2029 (n) | | $ | 169,000 | $156,352 |
| AmeriTex Holdco Intermediate LLC, 10.25%, 10/15/2028 (n) | | | 100,000 | 106,448 |
| BCPE Ulysses Intermediate, Inc., 7.75% (7.75% Cash or 8.5% PIK), 4/01/2027 (n)(p) | | | 57,000 | 55,881 |
| Cornerstone Building Brands, Inc., 6.125%, 1/15/2029 (n) | | | 121,000 | 101,948 |
| Cornerstone Building Brands, Inc., 9.5%, 8/15/2029 (n) | | | 57,000 | 56,756 |
| Foundation Building Materials LLC, 6%, 3/01/2029 (n) | | | 176,000 | 157,422 |
| GYP Holding III Corp., 4.625%, 5/01/2029 (n) | | | 231,000 | 218,879 |
| Knife River Corp., 7.75%, 5/01/2031 (n) | | | 172,000 | 180,387 |
| LBM Acquisition LLC, 6.25%, 1/15/2029 (n) | | | 101,000 | 94,497 |
| Miter Brands Acquisition Holdco, Inc., 6.75%, 4/01/2032 (n) | | | 45,000 | 45,809 |
| MIWD Holdco II LLC/MIWD Finance Co., 5.5%, 2/01/2030 (n) | | | 175,000 | 167,976 |
| New Enterprise Stone & Lime Co., Inc., 5.25%, 7/15/2028 (n) | | | 180,000 | 174,290 |
| New Enterprise Stone & Lime Co., Inc., 9.75%, 7/15/2028 (n) | | | 56,000 | 57,268 |
| Patrick Industries, Inc., 6.375%, 11/01/2032 (n) | | | 217,000 | 214,682 |
| Standard Building Solutions, Inc., 6.5%, 8/15/2032 (n) | | | 86,000 | 87,964 |
| Standard Industries, Inc., 4.75%, 1/15/2028 (n) | | | 81,000 | 78,716 |
| Standard Industries, Inc., 4.375%, 7/15/2030 (n) | | | 237,000 | 220,463 |
| White Cap Buyer LLC, 6.875%, 10/15/2028 (n) | | | 169,000 | 170,254 |
| | | | | $2,345,992 |
| Business Services – 1.8% |
| athenahealth, Inc., 6.5%, 2/15/2030 (n) | | $ | 71,000 | $67,962 |
| Iron Mountain, Inc., 4.875%, 9/15/2027 (n) | | | 149,000 | 146,726 |
| Iron Mountain, Inc., 5.25%, 3/15/2028 (n) | | | 128,000 | 125,986 |
| Iron Mountain, Inc., 5.625%, 7/15/2032 (n) | | | 122,000 | 119,214 |
| Shift4 Payments LLC/Shift4 Payments Finance Sub, Inc., 6.75%, 8/15/2032 (n) | | | 128,000 | 132,375 |
| | | | | $592,263 |
| Cable TV – 7.6% |
| Cable One, Inc., 4%, 11/15/2030 (n) | | $ | 197,000 | $164,235 |
| CCO Holdings LLC/CCO Holdings Capital Corp., 4.75%, 3/01/2030 (n) | | | 477,000 | 443,230 |
| CCO Holdings LLC/CCO Holdings Capital Corp., 4.5%, 8/15/2030 (n) | | | 348,000 | 316,688 |
| CCO Holdings LLC/CCO Holdings Capital Corp., 4.5%, 5/01/2032 | | | 84,000 | 74,218 |
Portfolio of Investments – continued
| Issuer | | | Shares/Par | Value ($) |
| Bonds – continued |
| Cable TV – continued |
| CCO Holdings LLC/CCO Holdings Capital Corp., 4.25%, 1/15/2034 (n) | | $ | 137,000 | $114,230 |
| CSC Holdings LLC, 5.375%, 2/01/2028 (n) | | | 200,000 | 174,228 |
| CSC Holdings LLC, 5.75%, 1/15/2030 (n) | | | 200,000 | 119,588 |
| DIRECTV Financing LLC, 8.875%, 2/01/2030 (n) | | | 65,000 | 65,401 |
| DISH DBS Corp., 7.75%, 7/01/2026 | | | 96,000 | 82,564 |
| DISH DBS Corp., 5.125%, 6/01/2029 | | | 98,000 | 64,902 |
| DISH Network Corp., 11.75%, 11/15/2027 (n) | | | 94,000 | 99,867 |
| EchoStar Corp., 10.75%, 11/30/2029 | | | 99,000 | 107,096 |
| Virgin Media Finance PLC, 5%, 7/15/2030 (n) | | | 200,000 | 170,583 |
| Virgin Media Vendor Financing Notes IV DAC, 5%, 7/15/2028 (n) | | | 225,000 | 215,304 |
| Ziggo Bond Finance B.V., 5.125%, 2/28/2030 (n) | | | 400,000 | 361,456 |
| | | | | $2,573,590 |
| Chemicals – 4.2% |
| Cerdia Finanz GmbH, 9.375%, 10/03/2031 (n) | | $ | 200,000 | $208,818 |
| Chemours Co., 4.625%, 11/15/2029 (n) | | | 212,000 | 189,262 |
| Chemours Co., 8%, 1/15/2033 (n) | | | 57,000 | 57,318 |
| Consolidated Energy Finance S.A., 5.625%, 10/15/2028 (n) | | | 150,000 | 129,159 |
| Element Solutions, Inc., 3.875%, 9/01/2028 (n) | | | 150,000 | 143,999 |
| LSF11 A5 HoldCo LLC, 6.625%, 10/15/2029 (n) | | | 172,000 | 177,628 |
| SCIH Salt Holdings, Inc., 6.625%, 5/01/2029 (n) | | | 200,000 | 194,701 |
| SNF Group SACA, 3.375%, 3/15/2030 (n) | | | 250,000 | 223,353 |
| Windsor Holdings III, LLC, 8.5%, 6/15/2030 (n) | | | 91,000 | 96,677 |
| | | | | $1,420,915 |
| Computer Software – 1.3% |
| Amentum Escrow Corp., 7.25%, 8/01/2032 (n) | | $ | 102,000 | $104,780 |
| Cloud Software Group, Inc., 8.25%, 6/30/2032 (n) | | | 117,000 | 121,901 |
| Dun & Bradstreet Corp., 5%, 12/15/2029 (n) | | | 98,000 | 95,080 |
| Neptune Bidco U.S., Inc., 9.29%, 4/15/2029 (n) | | | 134,000 | 124,342 |
| | | | | $446,103 |
| Computer Software - Systems – 1.6% |
| Sabre GLBL, Inc., 8.625%, 6/01/2027 (n) | | $ | 87,000 | $85,988 |
| Sabre GLBL, Inc., 10.75%, 11/15/2029 (n) | | | 63,867 | 64,411 |
| SS&C Technologies Holdings, Inc., 5.5%, 9/30/2027 (n) | | | 304,000 | 303,024 |
| Virtusa Corp., 7.125%, 12/15/2028 (n) | | | 90,000 | 86,944 |
| | | | | $540,367 |
| Conglomerates – 3.5% |
| BWX Technologies, Inc., 4.125%, 6/30/2028 (n) | | $ | 125,000 | $118,708 |
| BWX Technologies, Inc., 4.125%, 4/15/2029 (n) | | | 279,000 | 262,332 |
| Chart Industries, Inc., 9.5%, 1/01/2031 (n) | | | 83,000 | 89,657 |
| Emerald Debt Merger, 6.625%, 12/15/2030 (n) | | | 185,000 | 187,045 |
Portfolio of Investments – continued
| Issuer | | | Shares/Par | Value ($) |
| Bonds – continued |
| Conglomerates – continued |
| Gates Corp., 6.875%, 7/01/2029 (n) | | $ | 114,000 | $117,003 |
| Husky Injection Molding Systems Ltd., 9%, 2/15/2029 (n) | | | 117,000 | 121,714 |
| Madison IAQ LLC, 5.875%, 6/30/2029 (n) | | | 122,000 | 116,507 |
| TriMas Corp., 4.125%, 4/15/2029 (n) | | | 165,000 | 153,677 |
| | | | | $1,166,643 |
| Construction – 1.9% |
| Beazer Homes USA, Inc., 7.5%, 3/15/2031 (n) | | $ | 174,000 | $177,512 |
| Empire Communities Corp., 9.75%, 5/01/2029 (n) | | | 161,000 | 171,571 |
| Mattamy Group Corp., 5.25%, 12/15/2027 (n) | | | 65,000 | 64,104 |
| Mattamy Group Corp., 4.625%, 3/01/2030 (n) | | | 107,000 | 101,020 |
| Weekley Homes LLC/Weekley Finance Corp., 4.875%, 9/15/2028 (n) | | | 122,000 | 116,503 |
| | | | | $630,710 |
| Consumer Products – 4.1% |
| Acushnet Co., 7.375%, 10/15/2028 (n) | | $ | 146,000 | $152,545 |
| Amer Sports Co., 6.75%, 2/16/2031 (n) | | | 200,000 | 204,366 |
| CD&R Smokey Buyer, Inc./Radio Systems Corp., 9.5%, 10/15/2029 (n) | | | 100,000 | 100,800 |
| Champ Acquisition Corp., 8.375%, 12/01/2031 (n) | | | 71,000 | 73,446 |
| HFC Prestige Products, Inc./HFC Prestige International US LLC, 6.625%, 7/15/2030 (n) | | | 176,000 | 180,154 |
| Newell Brands, Inc., 6.375%, 5/15/2030 | | | 101,000 | 102,879 |
| Newell Brands, Inc., 6.625%, 5/15/2032 | | | 43,000 | 43,755 |
| Perrigo Finance Unlimited Co., 6.125%, 9/30/2032 | | | 185,000 | 184,377 |
| Prestige Consumer Healthcare, Inc., 5.125%, 1/15/2028 (n) | | | 212,000 | 208,590 |
| Prestige Consumer Healthcare, Inc., 3.75%, 4/01/2031 (n) | | | 144,000 | 129,139 |
| | | | | $1,380,051 |
| Consumer Services – 5.5% |
| Allied Universal Holdco LLC, 9.75%, 7/15/2027 (n) | | $ | 358,000 | $361,187 |
| Arches Buyer, Inc., 6.125%, 12/01/2028 (n) | | | 165,000 | 149,343 |
| Garda World Security Corp., 8.375%, 11/15/2032 (n) | | | 99,000 | 101,570 |
| GoDaddy, Inc., 3.5%, 3/01/2029 (n) | | | 254,000 | 235,559 |
| Match Group Holdings II LLC, 5%, 12/15/2027 (n) | | | 38,000 | 37,040 |
| Match Group Holdings II LLC, 4.625%, 6/01/2028 (n) | | | 104,000 | 99,741 |
| Raven Acquisition Holdings LLC, 6.875%, 11/15/2031 (n) | | | 142,000 | 142,025 |
| Realogy Group LLC/Realogy Co-Issuer Corp., 5.75%, 1/15/2029 (n) | | | 50,000 | 43,437 |
| Realogy Group LLC/Realogy Co-Issuer Corp., 5.25%, 4/15/2030 (n) | | | 135,000 | 109,097 |
| Service Corp. International, 5.75%, 10/15/2032 | | | 167,000 | 166,381 |
| TriNet Group, Inc., 3.5%, 3/01/2029 (n) | | | 232,000 | 212,987 |
| TriNet Group, Inc., 7.125%, 8/15/2031 (n) | | | 29,000 | 29,820 |
| WASH Multi-Family Acquisition, Inc., 5.75%, 4/15/2026 (n) | | | 155,000 | 154,815 |
| | | | | $1,843,002 |
Portfolio of Investments – continued
| Issuer | | | Shares/Par | Value ($) |
| Bonds – continued |
| Containers – 3.2% |
| Ardagh Metal Packaging Finance USA LLC, 3.25%, 9/01/2028 (n) | | $ | 200,000 | $180,081 |
| Ball Corp., 2.875%, 8/15/2030 | | | 231,000 | 202,894 |
| Can-Pack S.A./Eastern PA Land Investment Holding LLC, 3.875%, 11/15/2029 (n) | | | 275,000 | 249,788 |
| Clydesdale Acquisition Holdings, Inc., 8.75%, 4/15/2030 (n) | | | 143,000 | 143,510 |
| Titan Holdings II B.V., 5.125%, 7/15/2029 | | EUR | 100,000 | 107,369 |
| Trivium Packaging Finance B.V., 8.5%, 8/15/2027 (n) | | $ | 200,000 | 200,357 |
| | | | | $1,083,999 |
| Electrical Equipment – 0.1% |
| CommScope Technologies LLC, 5%, 3/15/2027 (n) | | $ | 36,000 | $30,895 |
| Electronics – 0.7% |
| Entegris Escrow Corp., 5.95%, 6/15/2030 (n) | | $ | 44,000 | $44,074 |
| Entegris, Inc., 4.375%, 4/15/2028 (n) | | | 79,000 | 75,701 |
| Entegris, Inc., 3.625%, 5/01/2029 (n) | | | 123,000 | 113,263 |
| | | | | $233,038 |
| Emerging Market Quasi-Sovereign – 0.3% |
| Eustream A.S. (Slovak Republic), 1.625%, 6/25/2027 | | EUR | 100,000 | $99,017 |
| Energy - Independent – 6.0% |
| Civitas Resources, Inc., 8.375%, 7/01/2028 (n) | | $ | 130,000 | $135,690 |
| Civitas Resources, Inc., 8.625%, 11/01/2030 (n) | | | 50,000 | 52,984 |
| Civitas Resources, Inc., 8.75%, 7/01/2031 (n) | | | 107,000 | 113,431 |
| Comstock Resources, Inc., 6.75%, 3/01/2029 (n) | | | 275,000 | 271,141 |
| Encino Acquisition Partners Holdings LLC, 8.75%, 5/01/2031 (n) | | | 144,000 | 152,067 |
| Gulfport Energy Corp., 6.75%, 9/01/2029 (n) | | | 157,000 | 160,382 |
| Magnolia Oil & Gas Operating LLC/Magnolia Oil & Gas Finance Corp., 6.875%, 12/01/2032 (n) | | | 128,000 | 128,437 |
| Matador Resources Co., 6.875%, 4/15/2028 (n) | | | 162,000 | 165,861 |
| Matador Resources Co., 6.5%, 4/15/2032 (n) | | | 60,000 | 60,149 |
| Permian Resources Operating LLC, 5.875%, 7/01/2029 (n) | | | 176,000 | 175,119 |
| Permian Resources Operating LLC, 7%, 1/15/2032 (n) | | | 96,000 | 98,838 |
| Permian Resources Operating LLC, 6.25%, 2/01/2033 (n) | | | 56,000 | 56,419 |
| Sitio Royalties Operating Partnership LP, 7.875%, 11/01/2028 (n) | | | 188,000 | 196,282 |
| Vital Energy, Inc., 7.875%, 4/15/2032 (n) | | | 149,000 | 146,584 |
| Wildfire Intermediate Holdings LLC, 7.5%, 10/15/2029 (n) | | | 115,000 | 112,399 |
| | | | | $2,025,783 |
| Energy - Integrated – 0.5% |
| Citgo Petroleum Corp., 8.375%, 1/15/2029 (n) | | $ | 150,000 | $156,013 |
Portfolio of Investments – continued
| Issuer | | | Shares/Par | Value ($) |
| Bonds – continued |
| Entertainment – 5.2% |
| Life Time, Inc., 6%, 11/15/2031 (n) | | $ | 129,000 | $129,042 |
| Lindblad Expeditions Holdings, Inc., 9%, 5/15/2028 (n) | | | 143,000 | 150,598 |
| Motion Bondco DAC, 6.625%, 11/15/2027 (n) | | | 200,000 | 187,307 |
| NCL Corp. Ltd., 5.875%, 3/15/2026 (n) | | | 89,000 | 88,995 |
| NCL Corp. Ltd., 6.25%, 3/01/2030 (n) | | | 146,000 | 145,471 |
| Royal Caribbean Cruises Ltd., 5.375%, 7/15/2027 (n) | | | 142,000 | 141,786 |
| Royal Caribbean Cruises Ltd., 5.5%, 4/01/2028 (n) | | | 105,000 | 105,022 |
| Royal Caribbean Cruises Ltd., 5.625%, 9/30/2031 (n) | | | 73,000 | 73,127 |
| Royal Caribbean Cruises Ltd., 6%, 2/01/2033 (n) | | | 171,000 | 173,149 |
| SeaWorld Parks & Entertainment, 5.25%, 8/15/2029 (n) | | | 131,000 | 126,437 |
| Six Flags Entertainment Corp., 6.625%, 5/01/2032 (n) | | | 201,000 | 205,992 |
| Viking Cruises Ltd. Co., 5.875%, 9/15/2027 (n) | | | 59,000 | 58,592 |
| Viking Ocean Cruises Ship VII Ltd., 5.625%, 2/15/2029 (n) | | | 183,000 | 180,674 |
| | | | | $1,766,192 |
| Financial Institutions – 6.0% |
| Avation Capital S.A., 8.25% (8.25% Cash or 9% PIK), 10/31/2026 (n)(p) | | $ | 210,916 | $202,026 |
| Azorra Finance Ltd., 7.75%, 4/15/2030 (n) | | | 217,000 | 218,018 |
| Credit Acceptance Corp., 9.25%, 12/15/2028 (n) | | | 69,000 | 73,502 |
| Freedom Mortgage Corp., 7.625%, 5/01/2026 (n) | | | 143,000 | 144,061 |
| Freedom Mortgage Holdings LLC, 9.25%, 2/01/2029 (n) | | | 71,000 | 73,575 |
| FTAI Aviation Ltd., 5.5%, 5/01/2028 (n) | | | 170,000 | 167,933 |
| FTAI Aviation Ltd., 7.875%, 12/01/2030 (n) | | | 106,000 | 112,553 |
| FTAI Aviation Ltd., 7%, 6/15/2032 (n) | | | 59,000 | 60,941 |
| Icahn Enterprises LP/Icahn Enterprises Finance Corp., 9.75%, 1/15/2029 | | | 85,000 | 87,275 |
| Icahn Enterprises LP/Ichan Enterprises Finance Corp., 10%, 11/15/2029 (n) | | | 57,000 | 58,458 |
| Jefferson Capital Holdings LLC, 9.5%, 2/15/2029 (n) | | | 137,000 | 146,282 |
| Nationstar Mortgage Holdings, Inc., 6%, 1/15/2027 (n) | | | 253,000 | 252,998 |
| Nationstar Mortgage Holdings, Inc., 6.5%, 8/01/2029 (n) | | | 36,000 | 36,361 |
| OneMain Finance Corp., 6.625%, 5/15/2029 | | | 140,000 | 142,842 |
| OneMain Finance Corp., 5.375%, 11/15/2029 | | | 176,000 | 171,312 |
| OneMain Finance Corp., 7.5%, 5/15/2031 | | | 89,000 | 92,667 |
| | | | | $2,040,804 |
| Food & Beverages – 4.7% |
| B&G Foods, Inc., 8%, 9/15/2028 (n) | | $ | 129,000 | $132,742 |
| Chobani LLC/Chobani Finance Corp., 7.625%, 7/01/2029 (n) | | | 116,000 | 122,105 |
| Fiesta Purchaser, Inc., 7.875%, 3/01/2031 (n) | | | 94,000 | 98,595 |
| Fiesta Purchaser, Inc., 9.625%, 9/15/2032 (n) | | | 92,000 | 97,043 |
| Performance Food Group Co., 5.5%, 10/15/2027 (n) | | | 181,000 | 179,983 |
| Performance Food Group, Inc., 6.125%, 9/15/2032 (n) | | | 95,000 | 95,842 |
Portfolio of Investments – continued
| Issuer | | | Shares/Par | Value ($) |
| Bonds – continued |
| Food & Beverages – continued |
| Post Holdings, Inc., 4.625%, 4/15/2030 (n) | | $ | 230,000 | $215,664 |
| Post Holdings, Inc., 6.25%, 10/15/2034 (n) | | | 63,000 | 62,256 |
| Primo Water Holding, Inc., 4.375%, 4/30/2029 (n) | | | 244,000 | 229,434 |
| U.S. Foods Holding Corp., 4.75%, 2/15/2029 (n) | | | 248,000 | 239,284 |
| U.S. Foods Holding Corp., 5.75%, 4/15/2033 (n) | | | 38,000 | 37,520 |
| Viking Baked Goods Acquisition Corp., 8.625%, 11/01/2031 (n) | | | 72,000 | 70,656 |
| | | | | $1,581,124 |
| Forest & Paper Products – 0.6% |
| Graphic Packaging International LLC, 6.375%, 7/15/2032 (n) | | $ | 214,000 | $217,981 |
| Gaming & Lodging – 5.8% |
| Caesars Entertainment, Inc., 7%, 2/15/2030 (n) | | $ | 133,000 | $137,160 |
| CCM Merger, Inc., 6.375%, 5/01/2026 (n) | | | 157,000 | 157,004 |
| CDI Escrow Issuer, Inc., 5.75%, 4/01/2030 (n) | | | 286,000 | 283,924 |
| Flutter Treasury DAC, 5%, 4/29/2029 (n) | | EUR | 100,000 | 110,214 |
| Hilton Domestic Operating Co., Inc., 4.875%, 1/15/2030 | | $ | 307,000 | 298,572 |
| Hilton Domestic Operating Co., Inc., 3.625%, 2/15/2032 (n) | | | 149,000 | 131,374 |
| Melco Resorts Finance Limited, 5.375%, 12/04/2029 | | | 200,000 | 182,283 |
| Wyndham Hotels & Resorts, Inc., 4.375%, 8/15/2028 (n) | | | 263,000 | 252,014 |
| Wynn Macau Ltd., 5.625%, 8/26/2028 (n) | | | 200,000 | 191,266 |
| Wynn Resorts Finance LLC/Wynn Resorts Capital Corp., 5.125%, 10/01/2029 (n) | | | 185,000 | 180,245 |
| Wynn Resorts Finance LLC/Wynn Resorts Capital Corp., 7.125%, 2/15/2031 (n) | | | 36,000 | 38,022 |
| | | | | $1,962,078 |
| Industrial – 2.0% |
| Albion Financing 1 S.à r.l., 6.125%, 10/15/2026 (n) | | $ | 200,000 | $200,112 |
| APi Escrow Corp., 4.75%, 10/15/2029 (n) | | | 254,000 | 243,375 |
| Williams Scotsman, Inc., 4.625%, 8/15/2028 (n) | | | 226,000 | 217,492 |
| | | | | $660,979 |
| Insurance - Property & Casualty – 6.0% |
| Acrisure LLC/Acrisure Finance, Inc., 8.25%, 2/01/2029 (n) | | $ | 115,000 | $118,152 |
| Acrisure LLC/Acrisure Finance, Inc., 6%, 8/01/2029 (n) | | | 99,000 | 94,845 |
| Alliant Holdings Intermediate LLC/Alliant Holdings Co-Issuer, 5.875%, 11/01/2029 (n) | | | 101,000 | 97,117 |
| Alliant Holdings Intermediate LLC/Alliant Holdings Co-Issuer, 7%, 1/15/2031 (n) | | | 118,000 | 119,827 |
| Alliant Holdings Intermediate LLC/Alliant Holdings Co-Issuer, 6.5%, 10/01/2031 (n) | | | 220,000 | 220,006 |
| AmWINS Group Benefits, Inc., 6.375%, 2/15/2029 (n) | | | 28,000 | 28,270 |
| AmWINS Group Benefits, Inc., 4.875%, 6/30/2029 (n) | | | 147,000 | 139,217 |
Portfolio of Investments – continued
| Issuer | | | Shares/Par | Value ($) |
| Bonds – continued |
| Insurance - Property & Casualty – continued |
| Ardonagh Finco Ltd., 7.75%, 2/15/2031 (n) | | $ | 200,000 | $204,193 |
| AssuredPartners, Inc., 5.625%, 1/15/2029 (n) | | | 181,000 | 171,915 |
| Baldwin Insurance Group Holdings LLC, 7.125%, 5/15/2031 (n) | | | 205,000 | 210,965 |
| Hub International Ltd., 5.625%, 12/01/2029 (n) | | | 74,000 | 72,064 |
| Hub International Ltd., 7.25%, 6/15/2030 (n) | | | 199,000 | 206,426 |
| Hub International Ltd., 7.375%, 1/31/2032 (n) | | | 100,000 | 102,306 |
| Panther Escrow Issuer, 7.125%, 6/01/2031 (n) | | | 221,000 | 226,378 |
| | | | | $2,011,681 |
| Machinery & Tools – 1.4% |
| Ritchie Bros Holdings, Inc., 7.75%, 3/15/2031 (n) | | $ | 291,000 | $307,775 |
| The Manitowoc Co., Inc., 9.25%, 10/01/2031 (n) | | | 102,000 | 107,100 |
| United Rentals North America, Inc., 6.125%, 3/15/2034 (n) | | | 72,000 | 73,074 |
| | | | | $487,949 |
| Medical & Health Technology & Services – 8.9% |
| 180 Medical, Inc., 3.875%, 10/15/2029 (n) | | $ | 200,000 | $184,431 |
| Avantor Funding, Inc., 4.625%, 7/15/2028 (n) | | | 203,000 | 196,127 |
| Bausch & Lomb Escrow Corp., 8.375%, 10/01/2028 (n) | | | 124,000 | 129,607 |
| Charles River Laboratories International, Inc., 3.75%, 3/15/2029 (n) | | | 255,000 | 236,224 |
| CHS/Community Health Systems, Inc., 8%, 12/15/2027 (n) | | | 104,000 | 104,342 |
| CHS/Community Health Systems, Inc., 6.125%, 4/01/2030 (n) | | | 86,000 | 63,660 |
| CHS/Community Health Systems, Inc., 5.25%, 5/15/2030 (n) | | | 344,000 | 293,630 |
| Concentra, Inc., 6.875%, 7/15/2032 (n) | | | 145,000 | 149,388 |
| Encompass Health Corp., 5.75%, 9/15/2025 | | | 8,000 | 7,971 |
| Encompass Health Corp., 4.75%, 2/01/2030 | | | 181,000 | 175,201 |
| Encompass Health Corp., 4.625%, 4/01/2031 | | | 58,000 | 54,695 |
| IQVIA, Inc., 5%, 5/15/2027 (n) | | | 200,000 | 197,764 |
| IQVIA, Inc., 6.5%, 5/15/2030 (n) | | | 200,000 | 205,306 |
| Lifepoint Health, Inc., 9.875%, 8/15/2030 (n) | | | 85,000 | 92,314 |
| Lifepoint Health, Inc., 11%, 10/15/2030 (n) | | | 94,000 | 103,565 |
| Lifepoint Health, Inc., 10%, 6/01/2032 (n) | | | 116,000 | 121,395 |
| Surgery Center Holdings, Inc., 7.25%, 4/15/2032 (n) | | | 104,000 | 106,905 |
| Tenet Healthcare Corp., 6.125%, 10/01/2028 | | | 107,000 | 107,253 |
| Tenet Healthcare Corp., 4.375%, 1/15/2030 | | | 109,000 | 102,121 |
| Tenet Healthcare Corp., 6.125%, 6/15/2030 | | | 237,000 | 238,213 |
| U.S. Acute Care Solutions LLC, 9.75%, 5/15/2029 (n) | | | 118,000 | 122,480 |
| | | | | $2,992,592 |
| Medical Equipment – 1.4% |
| Garden SpinCo Corp., 8.625%, 7/20/2030 (n) | | $ | 96,000 | $103,412 |
| Medline Borrower LP, 3.875%, 4/01/2029 (n) | | | 73,000 | 68,440 |
| Medline Borrower LP, 5.25%, 10/01/2029 (n) | | | 201,000 | 196,236 |
Portfolio of Investments – continued
| Issuer | | | Shares/Par | Value ($) |
| Bonds – continued |
| Medical Equipment – continued |
| Medline Borrower LP/Medline Co-Issuer, Inc., 6.25%, 4/01/2029 (n) | | $ | 110,000 | $112,042 |
| | | | | $480,130 |
| Metals & Mining – 3.3% |
| Baffinland Iron Mines Corp./Baffinland Iron Mines LP, 8.75%, 7/15/2026 (n) | | $ | 155,000 | $144,782 |
| FMG Resources Ltd., 4.375%, 4/01/2031 (n) | | | 452,000 | 414,266 |
| Novelis Corp., 3.25%, 11/15/2026 (n) | | | 128,000 | 123,146 |
| Novelis Corp., 4.75%, 1/30/2030 (n) | | | 170,000 | 159,981 |
| Novelis Corp., 3.875%, 8/15/2031 (n) | | | 82,000 | 72,037 |
| Petra Diamonds US$ Treasury PLC, 9.75%, 3/08/2026 (n) | | | 98,203 | 77,960 |
| Taseko Mines Ltd., 8.25%, 5/01/2030 (n) | | | 121,000 | 125,111 |
| | | | | $1,117,283 |
| Midstream – 9.0% |
| Delek Logistics Partners LP/Delek Logistics Corp., 8.625%, 3/15/2029 (n) | | $ | 171,000 | $178,292 |
| DT Midstream, Inc., 4.125%, 6/15/2029 (n) | | | 168,000 | 159,582 |
| DT Midstream, Inc., 4.375%, 6/15/2031 (n) | | | 199,000 | 185,098 |
| EQM Midstream Partners LP, 5.5%, 7/15/2028 | | | 247,000 | 251,039 |
| EQM Midstream Partners LP, 6.375%, 4/01/2029 (n) | | | 59,000 | 60,216 |
| Genesis Energy LP/Genesis Energy Finance Corp., 8.25%, 1/15/2029 | | | 57,000 | 58,264 |
| Kinetik Holdings, Inc., 5.875%, 6/15/2030 (n) | | | 148,000 | 147,693 |
| NuStar Logistics LP, 6.375%, 10/01/2030 | | | 174,000 | 179,194 |
| Prairie Acquiror LP, 9%, 8/01/2029 (n) | | | 115,000 | 119,018 |
| Rockies Express Pipeline LLC, 6.875%, 4/15/2040 (n) | | | 117,000 | 113,134 |
| Sunoco LP, 7.25%, 5/01/2032 (n) | | | 176,000 | 184,158 |
| Tallgrass Energy Partners LP, 5.5%, 1/15/2028 (n) | | | 244,000 | 237,297 |
| Tallgrass Energy Partners LP, 7.375%, 2/15/2029 (n) | | | 88,000 | 89,567 |
| Venture Global Calcasieu Pass LLC, 3.875%, 8/15/2029 (n) | | | 152,000 | 141,192 |
| Venture Global Calcasieu Pass LLC, 4.125%, 8/15/2031 (n) | | | 147,000 | 133,829 |
| Venture Global LNG, Inc., 8.125%, 6/01/2028 (n) | | | 128,000 | 133,766 |
| Venture Global LNG, Inc., 9.5%, 2/01/2029 (n) | | | 164,000 | 183,203 |
| Venture Global LNG, Inc., 7%, 1/15/2030 (n) | | | 59,000 | 60,325 |
| Venture Global LNG, Inc., 8.375%, 6/01/2031 (n) | | | 222,000 | 233,987 |
| Venture Global LNG, Inc., 9% to 9/30/2029, FLR (CMT - 5yr. + 5.44%) to 3/30/2173 (n) | | | 181,000 | 187,571 |
| | | | | $3,036,425 |
| Network & Telecom – 1.8% |
| Frontier Communications Holdings LLC, 6.75%, 5/01/2029 (n) | | $ | 185,000 | $187,344 |
| Iliad Holding S.A.S., 7%, 10/15/2028 (n) | | | 200,000 | 203,103 |
| Iliad Holding S.A.S., 5.375%, 4/15/2030 (n) | | EUR | 100,000 | 106,963 |
Portfolio of Investments – continued
| Issuer | | | Shares/Par | Value ($) |
| Bonds – continued |
| Network & Telecom – continued |
| Iliad Holding S.A.S., 6.875%, 4/15/2031 (n) | | EUR | 100,000 | $112,709 |
| | | | | $610,119 |
| Oil Services – 1.5% |
| Archrock Partners LP, 6.625%, 9/01/2032 (n) | | $ | 114,000 | $115,558 |
| Nabors Industries, Inc., 8.875%, 8/15/2031 (n) | | | 158,000 | 152,647 |
| U.S.A. Compression Partners LP/Finance Co., 7.125%, 3/15/2029 (n) | | | 173,000 | 177,240 |
| Valaris Ltd., 8.375%, 4/30/2030 (n) | | | 71,000 | 72,311 |
| | | | | $517,756 |
| Pharmaceuticals – 1.1% |
| 1375209 B.C. Ltd., 9%, 1/30/2028 (n) | | $ | 74,000 | $73,959 |
| Bausch Health Co., Inc., 4.875%, 6/01/2028 (n) | | | 70,000 | 57,930 |
| Bausch Health Co., Inc., 5.25%, 1/30/2030 (n) | | | 62,000 | 34,720 |
| Organon Finance 1 LLC, 4.125%, 4/30/2028 (n) | | | 200,000 | 189,547 |
| | | | | $356,156 |
| Pollution Control – 0.9% |
| GFL Environmental, Inc., 4%, 8/01/2028 (n) | | $ | 176,000 | $167,500 |
| GFL Environmental, Inc., 6.75%, 1/15/2031 (n) | | | 47,000 | 48,741 |
| Wrangler Holdco Corp., 6.625%, 4/01/2032 (n) | | | 74,000 | 76,230 |
| | | | | $292,471 |
| Precious Metals & Minerals – 1.3% |
| Coeur Mining, Inc., 5.125%, 2/15/2029 (n) | | $ | 58,000 | $55,515 |
| Eldorado Gold Corp., 6.25%, 9/01/2029 (n) | | | 177,000 | 175,267 |
| IAMGOLD Corp., 5.75%, 10/15/2028 (n) | | | 206,000 | 201,017 |
| | | | | $431,799 |
| Real Estate - Healthcare – 0.2% |
| MPT Operating Partnership LP/MPT Finance Corp., REIT, 5%, 10/15/2027 | | $ | 70,000 | $59,151 |
| Real Estate - Other – 1.6% |
| Park Intermediate Holdings LLC, 4.875%, 5/15/2029 (n) | | $ | 136,000 | $130,570 |
| RHP Hotel Properties LP/RHP Finance Corp., 7.25%, 7/15/2028 (n) | | | 238,000 | 246,982 |
| XHR LP, REIT, 4.875%, 6/01/2029 (n) | | | 175,000 | 166,473 |
| | | | | $544,025 |
| Restaurants – 1.2% |
| 1011778 B.C. ULC/New Red Finance, Inc., 6.125%, 6/15/2029 (n) | | $ | 87,000 | $88,438 |
| 1011778 B.C. ULC/New Red Finance, Inc., 4%, 10/15/2030 (n) | | | 103,000 | 93,539 |
| Fertitta Entertainment LLC, 6.75%, 1/15/2030 (n) | | | 159,000 | 148,957 |
Portfolio of Investments – continued
| Issuer | | | Shares/Par | Value ($) |
| Bonds – continued |
| Restaurants – continued |
| New Red Finance, Inc., 5.625%, 9/15/2029 (n) | | $ | 73,000 | $73,045 |
| | | | | $403,979 |
| Retailers – 2.5% |
| L Brands, Inc., 6.625%, 10/01/2030 (n) | | $ | 129,000 | $132,087 |
| Macy's Retail Holdings LLC, 5.875%, 4/01/2029 (n) | | | 112,000 | 109,552 |
| Mavis Tire Express Services Corp., 6.5%, 5/15/2029 (n) | | | 100,000 | 96,312 |
| Maxeda DIY Holding B.V., 5.875%, 10/01/2026 | | EUR | 100,000 | 75,782 |
| Parkland Corp., 4.625%, 5/01/2030 (n) | | $ | 252,000 | 234,682 |
| Parkland Corp., 6.625%, 8/15/2032 (n) | | | 29,000 | 29,179 |
| Penske Automotive Group Co., 3.75%, 6/15/2029 | | | 191,000 | 176,201 |
| | | | | $853,795 |
| Specialty Stores – 1.8% |
| Carvana Co., 12% (9% Cash or 12% PIK) to 8/15/2025, 9% Cash to 12/01/2028 (n)(p) | | $ | 58,000 | $61,778 |
| Carvana Co., 14% (9% Cash or 14% PIK) to 8/15/2025, 9% Cash to 6/01/2031 (n)(p) | | | 157,304 | 188,210 |
| Michael Cos., Inc., 5.25%, 5/01/2028 (n) | | | 84,000 | 60,911 |
| Michael Cos., Inc., 7.875%, 5/01/2029 (n) | | | 94,000 | 50,317 |
| PetSmart, Inc./PetSmart Finance Corp., 7.75%, 2/15/2029 (n) | | | 250,000 | 245,833 |
| | | | | $607,049 |
| Supermarkets – 0.6% |
| KeHE Distributors LLC/KeHE Finance Corp., 9%, 2/15/2029 (n) | | $ | 194,000 | $203,105 |
| Telecommunications - Wireless – 2.2% |
| Altice France S.A., 5.125%, 7/15/2029 (n) | | $ | 200,000 | $152,415 |
| SBA Communications Corp., 3.875%, 2/15/2027 | | | 134,000 | 130,168 |
| SBA Communications Corp., 3.125%, 2/01/2029 | | | 259,000 | 236,954 |
| Zegona Finance PLC, 8.625%, 7/15/2029 (n) | | | 200,000 | 212,500 |
| | | | | $732,037 |
| Telephone Services – 0.5% |
| Level 3 Financing, Inc., 11%, 11/15/2029 (n) | | $ | 73,039 | $82,992 |
| Level 3 Financing, Inc., 3.875%, 10/15/2030 (n) | | | 80,343 | 64,074 |
| Uniti Group/CSL Capital Co., 6.5%, 2/15/2029 (n) | | | 43,000 | 37,711 |
| | | | | $184,777 |
| Transportation - Services – 0.6% |
| Avis Budget Finance PLC, 7.25%, 7/31/2030 (n) | | EUR | 178,000 | $195,703 |
Portfolio of Investments – continued
| Issuer | | | Shares/Par | Value ($) |
| Bonds – continued |
| Utilities - Electric Power – 5.0% |
| Calpine Corp., 4.5%, 2/15/2028 (n) | | $ | 247,000 | $238,919 |
| Calpine Corp., 5.125%, 3/15/2028 (n) | | | 139,000 | 135,743 |
| Clearway Energy Operating LLC, 3.75%, 2/15/2031 (n) | | | 334,000 | 295,846 |
| Clearway Energy Operating LLC, 3.75%, 1/15/2032 (n) | | | 50,000 | 43,429 |
| NextEra Energy, Inc., 4.5%, 9/15/2027 (n) | | | 132,000 | 125,546 |
| NextEra Energy, Inc., 7.25%, 1/15/2029 (n) | | | 107,000 | 109,498 |
| PG&E Corp., 5.25%, 7/01/2030 | | | 245,000 | 240,718 |
| TerraForm Global Operating LLC, 6.125%, 3/01/2026 (n) | | | 155,000 | 154,969 |
| TerraForm Power Operating LLC, 5%, 1/31/2028 (n) | | | 237,000 | 229,789 |
| TerraForm Power Operating LLC, 4.75%, 1/15/2030 (n) | | | 108,000 | 101,264 |
| | | | | $1,675,721 |
| Total Bonds (Identified Cost, $47,050,553) | | $47,018,152 |
| Exchange-Traded Funds – 1.4% |
| Special Products & Services – 1.4% | |
| Invesco Senior Loan Fund ETF (Identified Cost, $490,634) | | 23,200 | $489,752 |
| Common Stocks – 0.3% |
| Cable TV – 0.2% | |
| Intelsat Emergence S.A. (a) | | 1,566 | $46,589 |
| Oil Services – 0.1% | |
| LTRI Holdings LP (a)(u) | | 200 | $45,514 |
| Total Common Stocks (Identified Cost, $204,858) | | $92,103 |
| | Strike
Price | First
Exercise | | |
| Warrants – 0.0% | | | | |
| Other Banks & Diversified Financials – 0.0% |
| Avation Capital S.A. (1 share for 1 warrant, Expiration 10/31/26) (a) (Identified Cost, $0) | GBP 1.14 | N/A | 3,500 | $1,963 |
| | | | | |
| Investment Companies (h) – 1.8% |
| Money Market Funds – 1.8% | |
| MFS Institutional Money Market Portfolio, 4.66% (v) (Identified Cost, $599,082) | | | 599,078 | $599,137 |
Portfolio of Investments – continued
| Underlying/Expiration Date/Exercise Price | Put/Call | Counterparty | Notional
Amount | Par Amount/
Number of
Contracts | Value ($) |
| Purchased Options – 0.0% | |
| Market Index Securities – 0.0% | |
| Russell 2000 Index – December 2024 @ $1,500 (Premiums Paid, $35,795) | Put | Exchange Traded | $ 1,217,363 | 5 | $50 |
|
|
| Other Assets, Less Liabilities – (42.9)% | | (14,469,622) |
| Net Assets – 100.0% | $33,731,535 |
| (a) | Non-income producing security. | | | |
| (h) | An affiliated issuer, which may be considered one in which the fund owns 5% or more of the outstanding voting securities, or a company which is under common control. At period end, the aggregate values of the fund's investments in affiliated issuers and in unaffiliated issuers were $599,137 and $47,602,020, respectively. | | | |
| (n) | Securities exempt from registration under Rule 144A of the Securities Act of 1933. These securities may be sold in the ordinary course of business in transactions exempt from registration, normally to qualified institutional buyers. At period end, the aggregate value of these securities was $42,414,947, representing 125.7% of net assets. | | | |
| (p) | Payment-in-kind (PIK) security for which interest income may be received in additional securities and/or cash. | | | |
| (u) | The security was valued using significant unobservable inputs and is considered level 3 under the fair value hierarchy. For further information about the fund’s level 3 holdings, please see Note 2 in the Notes to Financial Statements. | | | |
| (v) | Affiliated issuer that is available only to investment companies managed by MFS. The rate quoted for the MFS Institutional Money Market Portfolio is the annualized seven-day yield of the fund at period end. | | | |
| The following abbreviations are used in this report and are defined: |
| CDI | Interbank Deposit Certificates |
| CMT | Constant Maturity Treasury |
| ETF | Exchange-Traded Fund |
| FLR | Floating Rate. Interest rate resets periodically based on the parenthetically disclosed reference rate plus a spread (if any). The period-end rate reported may not be the current rate. All reference rates are USD unless otherwise noted. |
| REIT | Real Estate Investment Trust |
| Abbreviations indicate amounts shown in currencies other than the U.S. dollar. All amounts are stated in U.S. dollars unless otherwise indicated. A list of abbreviations is shown below: |
| EUR | Euro |
| GBP | British Pound |
Portfolio of Investments – continued
Derivative Contracts at 11/30/24
| Forward Foreign Currency Exchange Contracts |
Currency
Purchased | Currency
Sold | Counterparty | Settlement
Date | Unrealized
Appreciation
(Depreciation) |
| Asset Derivatives |
| USD | 797,605 | EUR | 725,535 | BNP Paribas S.A. | 1/17/2025 | $29,521 |
| USD | 1,663 | GBP | 1,276 | State Street Corp. | 1/17/2025 | 37 |
| | | | | | | $29,558 |
| Liability Derivatives |
| USD | 105,546 | EUR | 100,000 | UBS AG | 1/17/2025 | $(494) |
See Notes to Financial Statements
Financial Statements
Statement of Assets and Liabilities
At 11/30/24
This statement represents your fund’s balance sheet, which details the assets and liabilities comprising the total value of the fund.
| Assets | |
| Investments in unaffiliated issuers, at value (identified cost, $47,781,840) | $47,602,020 |
| Investments in affiliated issuers, at value (identified cost, $599,082) | 599,137 |
| Receivables for | |
| Forward foreign currency exchange contracts | 29,558 |
| Interest | 741,095 |
| Receivable from investment adviser | 785 |
| Other assets | 2,007 |
| Total assets | $48,974,602 |
| Liabilities | |
| Notes payable | $15,000,000 |
| Payables for | |
| Distributions | 17,014 |
| Forward foreign currency exchange contracts | 494 |
| Investments purchased | 105,329 |
| Payable to affiliates | |
| Administrative services fee | 193 |
| Transfer agent and dividend disbursing costs | 388 |
| Accrued interest expense | 4,644 |
| Accrued expenses and other liabilities | 115,005 |
| Total liabilities | $15,243,067 |
| Net assets | $33,731,535 |
| Net assets consist of | |
| Paid-in capital | $43,598,978 |
| Total distributable earnings (loss) | (9,867,443) |
| Net assets | $33,731,535 |
| Shares of beneficial interest outstanding (18,007,370 shares issued less 3,284 capital shares to be retired) (unlimited number of shares authorized) | 18,004,086 |
| Net asset value per share (net assets of $33,731,535 / 18,004,086 shares of beneficial interest outstanding) | $1.87 |
See Notes to Financial Statements
Financial Statements
Statement of Operations
Year ended 11/30/24
This statement describes how much your fund earned in investment income and accrued in expenses. It also describes any gains and/or losses generated by fund operations.
| Net investment income (loss) | |
| Income | |
| Interest | $3,176,259 |
| Dividends from affiliated issuers | 52,965 |
| Dividends from unaffiliated issuers | 51,670 |
| Other | 14 |
| Total investment income | $3,280,908 |
| Expenses | |
| Management fee | $217,455 |
| Transfer agent and dividend disbursing costs | 15,061 |
| Administrative services fee | 17,500 |
| Independent Trustees' compensation | 6,310 |
| Stock exchange fee | 23,758 |
| Custodian fee | 3,850 |
| Shareholder communications | 53,922 |
| Audit and tax fees | 103,157 |
| Legal fees | 774 |
| Interest expense and fees | 960,540 |
| Miscellaneous | 39,329 |
| Total expenses | $1,441,656 |
| Reduction of expenses by investment adviser | (28,336) |
| Net expenses | $1,413,320 |
| Net investment income (loss) | $1,867,588 |
| Realized and unrealized gain (loss) |
| Realized gain (loss) (identified cost basis) | |
| Unaffiliated issuers | $(785,675) |
| Affiliated issuers | 240 |
| Forward foreign currency exchange contracts | (5,283) |
| Foreign currency | (1,287) |
| Net realized gain (loss) | $(792,005) |
| Change in unrealized appreciation or depreciation | |
| Unaffiliated issuers | $3,071,851 |
| Affiliated issuers | (94) |
| Forward foreign currency exchange contracts | 35,721 |
| Translation of assets and liabilities in foreign currencies | 355 |
| Net unrealized gain (loss) | $3,107,833 |
| Net realized and unrealized gain (loss) | $2,315,828 |
| Change in net assets from operations | $4,183,416 |
See Notes to Financial Statements
Financial Statements
Statements of Changes in Net Assets
These statements describe the increases and/or decreases in net assets resulting from operations, any distributions, and any shareholder transactions.
| | Year ended |
| | 11/30/24 | 11/30/23 |
| Change in net assets | | |
| From operations | | |
| Net investment income (loss) | $1,867,588 | $1,804,521 |
| Net realized gain (loss) | (792,005) | (2,583,921) |
| Net unrealized gain (loss) | 3,107,833 | 3,630,479 |
| Change in net assets from operations | $4,183,416 | $2,851,079 |
| Distributions to shareholders | $(1,870,641) | $(1,732,737) |
| Tax return of capital distributions to shareholders | $(1,327,359) | $(1,565,334) |
| Change in net assets from fund share transactions | $(865,747) | $(1,486,097) |
| Total change in net assets | $119,669 | $(1,933,089) |
| Net assets | | |
| At beginning of period | 33,611,866 | 35,544,955 |
| At end of period | $33,731,535 | $33,611,866 |
See Notes to Financial Statements
Financial Statements
Statement of Cash Flows
Year ended 11/30/24
This statement provides a summary of cash flows from investment activity for the fund.
| Cash flows from operating activities: | |
| Change in net assets from operations | $4,183,416 |
| Adjustments to reconcile change in net assets from operations to net cash provided by operating activities: | |
| Purchase of investment securities | (28,702,262) |
| Proceeds from disposition of investment securities | 29,967,217 |
| Proceeds from disposition of short-term investments, net | 1,208,576 |
| Realized gain/loss on investments | 785,675 |
| Unrealized appreciation/depreciation on investments | (3,071,757) |
| Unrealized appreciation/depreciation on foreign currency contracts | (35,721) |
| Net amortization/accretion of income | (227,033) |
| Amortization of debt issuance costs | 8,009 |
| Increase in interest receivable | (2,874) |
| Increase in accrued expenses and other liabilities | 4,354 |
| Decrease in receivable from investment adviser | 704 |
| Decrease in other assets | 7 |
| Decrease in interest payable | (24,374) |
| Net cash provided by operating activities | $4,093,937 |
| Cash flows from financing activities: | |
| Adjustment for debt issuance costs | $1,768 |
| Distributions paid in cash | (3,196,770) |
| Repurchase of shares of beneficial interest | (898,940) |
| Net cash used by financing activities | $(4,093,942) |
| Net decrease in cash and restricted cash | $(5) |
| Cash and restricted cash: | |
| Beginning of period | $5 |
| End of period | $— |
Supplemental disclosure of cash flow information:
Cash paid during the year ended November 30, 2024 for interest was $976,905.
See Notes to Financial Statements
Financial Statements
Financial Highlights
The financial highlights table is intended to help you understand the fund's financial performance for the past 5 years. Certain information reflects financial results for a single fund share. The total returns in the table represent the rate that an investor would have earned (or lost) on an investment in the fund share class (assuming reinvestment of all distributions) held for the entire period.
| | Year ended |
| | 11/30/24 | 11/30/23 | 11/30/22 | 11/30/21 | 11/30/20 |
| Net asset value, beginning of period | $1.82 | $1.83 | $2.32 | $2.47 | $2.56 |
| Income (loss) from investment operations |
| Net investment income (loss) (d) | $0.10 | $0.09 | $0.11 | $0.13 | $0.14 |
| Net realized and unrealized gain (loss) | 0.13 | 0.06 | (0.40) | (0.05) | (0.00)(w) |
| Total from investment operations | $0.23 | $0.15 | $(0.29) | $0.08 | $0.14 |
| Less distributions declared to shareholders |
| From net investment income | $(0.11) | $(0.09) | $(0.12) | $(0.14) | $(0.15) |
| From tax return of capital | (0.07) | (0.08) | (0.08) | (0.09) | (0.08) |
| Total distributions declared to shareholders | $(0.18) | $(0.17) | $(0.20) | $(0.23) | $(0.23) |
| Net increase from repurchase of capital shares | $0.00(w) | $0.01 | $— | $— | $0.00(w) |
| Net asset value, end of period (x) | $1.87 | $1.82 | $1.83 | $2.32 | $2.47 |
| Market value, end of period | $1.77 | $1.64 | $1.83 | $2.97 | $2.47 |
| Total return at market value (%) | 19.09 | (0.77) | (32.19) | 30.89 | 0.89 |
| Total return at net asset value (%) (j)(r)(s)(x) | 13.70 | 10.13 | (13.19) | 2.25 | 6.40 |
Ratios (%) (to average net assets)
and Supplemental data: |
| Expenses before expense reductions | 4.27 | 4.03 | 2.53 | 1.84 | 2.05 |
| Expenses after expense reductions | 4.18 | 3.95 | 2.23 | 1.65 | 1.82 |
| Net investment income (loss) | 5.53 | 5.20 | 5.54 | 5.27 | 5.75 |
| Portfolio turnover rate | 59 | 44 | 31 | 65 | 57 |
| Net assets at end of period (000 omitted) | $33,732 | $33,612 | $35,545 | $44,943 | $47,585 |
| Supplemental Ratios (%): |
| Ratios of expenses to average net assets after expense reductions and excluding interest expense and fees | 1.34 | 1.34 | 1.34 | 1.34 | 1.34 |
| Senior Securities: |
| Total notes payable outstanding (000 omitted) | $15,000 | $15,000 | $16,000 | $18,500 | $18,500 |
| Asset coverage per $1,000 of indebtedness (k) | $3,249 | $3,241 | $3,222 | $3,429 | $3,572 |
See Notes to Financial Statements
Financial Highlights – continued
| (d) | Per share data is based on average shares outstanding. |
| (j) | Total return at net asset value is calculated using the net asset value of the fund, not the publicly traded price and therefore may be different than the total return at market value. |
| (k) | Calculated by subtracting the fund's total liabilities (not including notes payable) from the fund's total assets and dividing this number by the notes payable outstanding and then multiplying by 1,000. |
| (r) | Certain expenses have been reduced without which performance would have been lower. |
| (s) | From time to time the fund may receive proceeds from litigation settlements, without which performance would be lower. |
| (w) | Per share amount was less than $0.01. |
| (x) | The net asset values and total returns at net asset value have been calculated on net assets which include adjustments made in accordance with U.S. generally accepted accounting principles required at period end for financial reporting purposes. |
See Notes to Financial Statements
Notes to Financial Statements
(1) Business and Organization
MFS Intermediate High Income Fund (the fund) is organized as a Massachusetts business trust and is registered under the Investment Company Act of 1940, as amended, as a diversified closed-end management investment company.
The fund is an investment company and accordingly follows the investment company accounting and reporting guidance of the Financial Accounting Standards Board (FASB) Accounting Standards Codification Topic 946 Financial Services - Investment Companies.
(2) Significant Accounting Policies
General — The preparation of financial statements in conformity with U.S. generally accepted accounting principles requires management to make estimates and assumptions that affect the reported amounts of assets and liabilities, and disclosure of contingent assets and liabilities at the date of the financial statements and the reported amounts of increases and decreases in net assets from operations during the reporting period. Actual results could differ from those estimates. In the preparation of these financial statements, management has evaluated subsequent events occurring after the date of the fund’s Statement of Assets and Liabilities through the date that the financial statements were issued. The fund invests in high-yield securities rated below investment grade. Investments in below investment grade quality securities can involve a substantially greater risk of default or can already be in default, and their values can decline significantly. Below investment grade quality securities tend to be more sensitive to adverse news about the issuer, or the market or economy in general, than higher quality debt instruments. The fund invests in foreign securities. Investments in foreign securities are vulnerable to the effects of changes in the relative values of the local currency and the U.S. dollar and to the effects of changes in each country’s market, economic, industrial, political, regulatory, geopolitical, environmental, public health, and other conditions.
In November 2023, the FASB issued Accounting Standards Update 2023-07, Segment Reporting (Topic 280) – Improvements to Reportable Segment Disclosures (“ASU 2023-07”), which affects all public entities that are required to report segment information in accordance with Topic 280. ASU 2023-07 is effective for fiscal years beginning after December 15, 2023 and interim periods within fiscal years beginning after December 15, 2024. The intent of ASU 2023-07 is, through improved segment disclosures, to enable investors to better understand an entity’s overall performance and to assess its potential future cash flows. Although management is still evaluating the disclosures required by ASU 2023-07, adoption of the standard will not affect the fund's financial position or its results of operations.
Balance Sheet Offsetting — The fund's accounting policy with respect to balance sheet offsetting is that, absent an event of default by the counterparty or a termination of the agreement, the International Swaps and Derivatives Association (ISDA) Master Agreement, or similar agreement, does not result in an offset of reported amounts of financial assets and financial liabilities in the Statement of Assets and Liabilities across transactions between the fund and the applicable counterparty. The fund's right to setoff may be restricted or prohibited by the bankruptcy or insolvency laws of the particular jurisdiction to which a specific master netting agreement counterparty is
Notes to Financial Statements - continued
subject. Balance sheet offsetting disclosures, to the extent applicable to the fund, have been included in the fund’s Significant Accounting Policies note under the captions for each of the fund’s in-scope financial instruments and transactions.
Investment Valuations — Subject to its oversight, the fund's Board of Trustees has delegated primary responsibility for determining or causing to be determined the value of the fund’s investments to MFS as the fund's adviser, pursuant to the fund’s valuation policy and procedures which have been adopted by the adviser and approved by the Board. In accordance with Rule 2a-5 under the Investment Company Act of 1940, the Board of Trustees designated the adviser as the “valuation designee” of the fund. If the adviser, as valuation designee, determines that reliable market quotations are not readily available for an investment, the investment is valued at fair value as determined in good faith by the adviser in accordance with the adviser’s fair valuation policy and procedures.
Under the fund's valuation policy and procedures, equity securities, including restricted equity securities, are generally valued at the last sale or official closing price on their primary market or exchange as provided by a third-party pricing service. Equity securities, for which there were no sales reported that day, are generally valued at the last quoted daily bid quotation on their primary market or exchange as provided by a third-party pricing service. Debt instruments and floating rate loans, including restricted debt instruments, are generally valued at an evaluated or composite bid as provided by a third-party pricing service. Short-term instruments with a maturity at issuance of 60 days or less may be valued at amortized cost, which approximates market value.
Exchange-traded options are generally valued at the last sale or official closing price on their primary exchange as provided by a third-party pricing service. Exchange-traded options for which there were no sales reported that day are generally valued at the last daily bid quotation on their primary exchange as provided by a third-party pricing service. For put options, the position may be valued at the last daily ask quotation if there are no trades reported during the day. Options not traded on an exchange are generally valued at a broker/dealer bid quotation. Foreign currency options are generally valued at valuations provided by a third-party pricing service. Forward foreign currency exchange contracts are generally valued at the mean of bid and asked prices for the time period interpolated from rates provided by a third-party pricing service for proximate time periods. Open-end investment companies are generally valued at net asset value per share. Funds traded on a recognized securities exchange (such as Exchange Traded Funds or Closed End Funds) are generally valued at the official closing price on their primary market or exchange as provided by a third-party pricing service. If no sales are reported that day for these funds, generally they will be valued at the last quoted daily bid quotation on their primary market or exchange as provided by a third-party pricing service. The values of foreign securities and other assets and liabilities expressed in foreign currencies are converted to U.S. dollars using the mean of bid and asked prices for rates provided by a third-party pricing service.
Under the fund’s valuation policy and procedures, market quotations are not considered to be readily available for debt instruments, floating rate loans, and many types of derivatives. These investments are generally valued at fair value based on information from third-party pricing services or otherwise determined by the adviser in accordance with the adviser’s fair valuation policy and procedures. Securities and other assets generally valued on the basis of information from a third-party pricing service may also be valued at a broker/dealer bid quotation. In determining values, third-party pricing services can utilize both transaction data and market information such as yield,
Notes to Financial Statements - continued
quality, coupon rate, maturity, type of issue, trading characteristics, spreads and other market data. Pricing services generally value debt instruments assuming orderly transactions of institutional round lot sizes, but a fund may hold or transact in such securities in smaller, odd lot sizes. Odd lots may trade at lower prices than institutional round lots, and the fund may receive different prices when it sells odd lot positions than it would receive for sales of institutional round lot positions. An investment may also be valued at fair value if the adviser determines that the investment’s value has been materially affected by events occurring after the close of the exchange or market on which the investment is principally traded (such as foreign exchange or market) and prior to the determination of the fund’s net asset value, or after the halt of trading of a specific security where trading does not resume prior to the close of the exchange or market on which the security is principally traded. The adviser generally relies on third-party pricing services or other information (such as the correlation with price movements of similar securities in the same or other markets; the type, cost and investment characteristics of the security; the business and financial condition of the issuer; and trading and other market data) to assist in determining whether to fair value and at what value to fair value an investment. The value of an investment for purposes of calculating the fund’s net asset value can differ depending on the source and method used to determine value. When fair valuation is used, the value of an investment used to determine the fund’s net asset value may differ from quoted or published prices for the same investment. There can be no assurance that the fund could obtain the fair value assigned to an investment if it were to sell the investment at the same time at which the fund determines its net asset value per share.
Various inputs are used in determining the value of the fund's assets or liabilities. These inputs are categorized into three broad levels. In certain cases, the inputs used to measure fair value may fall into different levels of the fair value hierarchy. In such cases, an investment's level within the fair value hierarchy is based on the lowest level of input that is significant to the fair value measurement. The fund's assessment of the significance of a particular input to the fair value measurement in its entirety requires judgment, and considers factors specific to the investment. Level 1 includes unadjusted quoted prices in active markets for identical assets or liabilities. Level 2 includes other significant observable market-based inputs (including quoted prices for similar securities, interest rates, prepayment speed, and credit risk). Level 3 includes significant unobservable inputs, which may include the adviser's own assumptions in determining the fair value of investments. Other financial instruments are derivative instruments, such as forward foreign currency exchange contracts. The following is a summary of the levels used as of November 30, 2024 in valuing the fund's assets and liabilities:
Notes to Financial Statements - continued
| Financial Instruments | Level 1 | Level 2 | Level 3 | Total |
| Equity Securities: | | | | |
| United States | $489,802 | $— | $45,514 | $535,316 |
| Luxembourg | — | 46,589 | — | 46,589 |
| United Kingdom | — | 1,963 | — | 1,963 |
| Non - U.S. Sovereign Debt | — | 99,017 | — | 99,017 |
| U.S. Corporate Bonds | — | 38,339,388 | — | 38,339,388 |
| Foreign Bonds | — | 8,579,747 | — | 8,579,747 |
| Mutual Funds | 599,137 | — | — | 599,137 |
| Total | $1,088,939 | $47,066,704 | $45,514 | $48,201,157 |
| Other Financial Instruments | | | | |
| Forward Foreign Currency Exchange Contracts – Assets | $— | $29,558 | $— | $29,558 |
| Forward Foreign Currency Exchange Contracts – Liabilities | — | (494) | — | (494) |
For further information regarding security characteristics, see the Portfolio of Investments.
The following is a reconciliation of level 3 assets for which significant unobservable inputs were used to determine fair value. The table presents the activity of level 3 securities held at the beginning and the end of the period.
| | Equity
Securities |
| Balance as of 11/30/23 | $71,234 |
| Change in unrealized appreciation or depreciation | (25,720) |
| Balance as of 11/30/24 | $45,514 |
At November 30, 2024, the fund held one level 3 security.
Foreign Currency Translation — Purchases and sales of foreign investments, income, and expenses are converted into U.S. dollars based upon currency exchange rates prevailing on the respective dates of such transactions or on the reporting date for foreign denominated receivables and payables. Gains and losses attributable to foreign currency exchange rates on sales of securities are recorded for financial statement purposes as net realized gains and losses on investments. Gains and losses attributable to foreign exchange rate movements on receivables, payables, income and expenses are recorded for financial statement purposes as foreign currency transaction gains and losses. That portion of both realized and unrealized gains and losses on investments that results from fluctuations in foreign currency exchange rates is not separately disclosed.
Derivatives — The fund uses derivatives primarily to increase or decrease exposure to a particular market or segment of the market, or security, to increase or decrease interest rate exposure, or as alternatives to direct investments. Derivatives are used for hedging or non-hedging purposes. While hedging can reduce or eliminate losses, it can also reduce or eliminate gains. When the fund uses derivatives as an investment to increase market exposure, or for hedging purposes, gains and losses from derivative instruments may be substantially greater than the derivative’s original cost.
Notes to Financial Statements - continued
The derivative instruments used by the fund during the period were purchased options and forward foreign currency exchange contracts. Depending on the type of derivative, a fund may exit a derivative position by entering into an offsetting transaction with a counterparty or exchange, negotiating an agreement with the derivative counterparty, or novating the position to a third party. The fund's period end derivatives, as presented in the Portfolio of Investments and the associated Derivative Contract tables, generally are indicative of the volume of its derivative activity during the period.
The following table presents, by major type of derivative contract, the fair value, on a gross basis, of the asset and liability components of derivatives held by the fund at November 30, 2024 as reported in the Statement of Assets and Liabilities:
| | | Fair Value (a) |
| Risk | Derivative Contracts | Asset Derivatives | Liability Derivatives |
| Equity | Purchased Option Contracts | $50 | $— |
| Foreign Exchange | Forward Foreign Currency Exchange Contracts | 29,558 | (494) |
| Total | | $29,608 | $(494) |
| (a) | The value of purchased options outstanding is included in investments in unaffiliated issuers, at value, within the Statement of Assets and Liabilities. |
The following table presents, by major type of derivative contract, the realized gain (loss) on derivatives held by the fund for the year ended November 30, 2024 as reported in the Statement of Operations:
| Risk | Forward Foreign
Currency
Exchange
Contracts |
| Foreign Exchange | $(5,283) |
The following table presents, by major type of derivative contract, the change in unrealized appreciation or depreciation on derivatives held by the fund for the year ended November 30, 2024 as reported in the Statement of Operations:
| Risk | Forward Foreign
Currency
Exchange
Contracts | Unaffiliated Issuers
(Purchased
Options) |
| Foreign Exchange | $35,721 | $— |
| Equity | — | (20,250) |
| Total | $35,721 | $(20,250) |
Derivative counterparty credit risk is managed through formal evaluation of the creditworthiness of all potential counterparties. On certain, but not all, uncleared derivatives, the fund attempts to reduce its exposure to counterparty credit risk whenever possible by entering into an ISDA Master Agreement on a bilateral basis. The ISDA Master Agreement gives each party to the agreement the right to terminate all transactions traded under such agreement if there is a specified deterioration in the credit quality of the other party. Upon an event of default or a termination of the ISDA
Notes to Financial Statements - continued
Master Agreement, the non-defaulting party has the right to close out all transactions traded under such agreement and to net amounts owed under each agreement to one net amount payable by one party to the other. This right to close out and net payments across all transactions traded under the ISDA Master Agreement could result in a reduction of the fund's credit risk to such counterparty equal to any amounts payable by the fund under the applicable transactions, if any.
Collateral and margin requirements differ by type of derivative. For cleared derivatives (e.g., futures contracts, cleared swaps, and exchange-traded options), margin requirements are set by the clearing broker and the clearing house and collateral, in the form of cash or securities, is posted by the fund directly with the clearing broker. Collateral terms are counterparty agreement specific for uncleared derivatives (e.g., forward foreign currency exchange contracts, uncleared swap agreements, and uncleared options). Collateral, in the form of cash and securities, is held in segregated accounts with the fund's custodian in connection with these agreements. For derivatives traded under an ISDA Master Agreement, which contains a credit support annex, the collateral requirements are netted across all transactions traded under such counterparty-specific agreement and an amount is posted from one party to the other to collateralize such obligations. Cash that has been segregated or delivered to cover the fund's collateral or margin obligations under derivative contracts, if any, will be reported separately in the Statement of Assets and Liabilities as restricted cash for uncleared derivatives and/or deposits with brokers for cleared derivatives. Securities pledged as collateral or margin for the same purpose, if any, are noted in the Portfolio of Investments. The fund may be required to make payments of interest on uncovered collateral or margin obligations with the broker. Any such payments are included in “Interest expense and fees” in the Statement of Operations.
Purchased Options — The fund purchased put options for a premium. Purchased put options entitle the holder to sell a specified number of shares or units of a particular security, currency or index at a specified price at a specified date or within a specified period of time. Purchasing put options may hedge against an anticipated decline in the value of portfolio securities or currency or decrease the fund's exposure to an underlying instrument.
The premium paid is initially recorded as an investment in the Statement of Assets and Liabilities. That investment is subsequently marked-to-market daily with the difference between the premium paid and the market value of the purchased option being recorded as unrealized appreciation or depreciation. Premiums paid for purchased put options which have expired are treated as realized losses on investments in the Statement of Operations. Upon the exercise or closing of a purchased put option, the premium paid is offset against the proceeds on the sale of the underlying security or financial instrument in order to determine the realized gain or loss on investments.
Whether or not the option is exercised, the fund's maximum risk of loss from purchasing an option is the amount of premium paid. All option contracts involve credit risk if the counterparty to the option contract fails to perform. For uncleared options, this risk is mitigated in cases where there is an ISDA Master Agreement between the fund and the counterparty providing for netting as described above and, where applicable, by the posting of collateral by the counterparty to the fund to cover the fund’s exposure to the counterparty under such ISDA Master Agreement.
Notes to Financial Statements - continued
Forward Foreign Currency Exchange Contracts — The fund entered into forward foreign currency exchange contracts for the purchase or sale of a specific foreign currency at a fixed price on a future date. These contracts may be used to hedge the fund’s currency risk or for non-hedging purposes. For hedging purposes, the fund may enter into contracts to deliver or receive foreign currency that the fund will receive from or use in its normal investment activities. The fund may also use contracts to hedge against declines in the value of foreign currency denominated securities due to unfavorable exchange rate movements. For non-hedging purposes, the fund may enter into contracts with the intent of changing the relative exposure of the fund’s portfolio of securities to different currencies to take advantage of anticipated exchange rate changes.
Forward foreign currency exchange contracts are adjusted by the daily exchange rate of the underlying currency and any unrealized gains or losses are recorded as a receivable or payable for forward foreign currency exchange contracts until the contract settlement date. On contract settlement date, any gain or loss on the contract is recorded as realized gains or losses on forward foreign currency exchange contracts.
Risks may arise upon entering into these contracts from unanticipated movements in the value of the contract and from the potential inability of counterparties to meet the terms of their contracts. Generally, the fund’s maximum risk due to counterparty credit risk is the unrealized gain on the contract due to the use of Continuous Linked Settlement, a multicurrency cash settlement system for the centralized settlement of foreign transactions. This risk is mitigated in cases where there is an ISDA Master Agreement between the fund and the counterparty providing for netting as described above and, where applicable, by the posting of collateral by the counterparty to the fund to cover the fund’s exposure to the counterparty under such ISDA Master Agreement.
Statement of Cash Flows — Information on financial transactions which have been settled through the receipt or disbursement of cash or restricted cash is presented in the Statement of Cash Flows. Cash as presented in the fund's Statement of Assets and Liabilities includes cash on hand at the fund's custodian bank and does not include any short-term investments. Restricted cash is presented in the fund's Statement of Assets and Liabilities as restricted cash for uncleared derivatives and/or deposits with brokers for cleared derivatives and represents cash that has been segregated or delivered to cover the fund's collateral or margin obligations under derivative contracts.
Indemnifications — Under the fund's organizational documents, its officers and Trustees may be indemnified against certain liabilities and expenses arising out of the performance of their duties to the fund. Additionally, in the normal course of business, the fund enters into agreements with service providers that may contain indemnification clauses. The fund's maximum exposure under these agreements is unknown as this would involve future claims that may be made against the fund that have not yet occurred.
Investment Transactions and Income — Interest income is recorded on the accrual basis. All premium and discount is amortized or accreted for financial statement purposes in accordance with U.S. generally accepted accounting principles. Dividends received in cash are recorded on the ex-dividend date. Certain dividends from foreign securities will be recorded when the fund is informed of the dividend if such
Notes to Financial Statements - continued
information is obtained subsequent to the ex-dividend date. Dividend and interest payments received in additional securities are recorded on the ex-dividend or ex-interest date in an amount equal to the value of the security on such date.
The fund may receive proceeds from litigation settlements. Any proceeds received from litigation involving portfolio holdings are reflected in the Statement of Operations in realized gain/loss if the security has been disposed of by the fund or in unrealized gain/loss if the security is still held by the fund. Any other proceeds from litigation not related to portfolio holdings are reflected as other income in the Statement of Operations.
Investment transactions are recorded on the trade date. In determining the net gain or loss on securities sold, the cost of securities is determined on the identified cost basis.
Tax Matters and Distributions — The fund intends to qualify as a regulated investment company, as defined under Subchapter M of the Internal Revenue Code, and to distribute all of its taxable income, including realized capital gains. As a result, no provision for federal income tax is required. The fund’s federal tax returns, when filed, will remain subject to examination by the Internal Revenue Service for a three year period. Management has analyzed the fund’s tax positions taken on federal and state tax returns for all open tax years and does not believe that there are any uncertain tax positions that require recognition of a tax liability. Foreign taxes, if any, have been accrued by the fund in the accompanying financial statements in accordance with the applicable foreign tax law. Foreign income taxes may be withheld by certain countries in which the fund invests. Additionally, capital gains realized by the fund on securities issued in or by certain foreign countries may be subject to capital gains tax imposed by those countries.
Distributions to shareholders are recorded on the ex-dividend date. The fund employs a managed distribution policy whereby the fund seeks to pay monthly distributions based on an annual rate of 9.50% of the fund’s average monthly net asset value. As a result, distributions may exceed actual earnings which may result in a tax return of capital. Distributions in any year may include a substantial return of capital component. Please refer to the Financial Highlights for distributions of tax returns of capital made during the prior five years. Income and capital gain distributions are determined in accordance with income tax regulations, which may differ from U.S. generally accepted accounting principles. Certain capital accounts in the financial statements are periodically adjusted for permanent differences in order to reflect their tax character. These adjustments have no impact on net assets or net asset value per share. Temporary differences which arise from recognizing certain items of income, expense, gain or loss in different periods for financial statement and tax purposes will reverse at some time in the future.
Book/tax differences primarily relate to amortization of premium and accretion of discount of debt securities.
Notes to Financial Statements - continued
The tax character of distributions declared to shareholders for the last two fiscal years is as follows:
| | Year ended
11/30/24 | Year ended
11/30/23 |
| Ordinary income (including any short-term capital gains) | $1,870,641 | $1,732,737 |
| Tax return of capital (b) | 1,327,359 | 1,565,334 |
| Total distributions | $3,198,000 | $3,298,071 |
| (b) | Distributions in excess of tax basis earnings and profits are reported in the financial statements as a tax return of capital. |
The federal tax cost and the tax basis components of distributable earnings were as follows:
| As of 11/30/24 | |
| Cost of investments | $48,164,569 |
| Gross appreciation | 1,312,148 |
| Gross depreciation | (1,246,496) |
| Net unrealized appreciation (depreciation) | $65,652 |
| Capital loss carryforwards | (9,916,433) |
| Other temporary differences | (16,662) |
| Total distributable earnings (loss) | $(9,867,443) |
As of November 30, 2024, the fund had capital loss carryforwards available to offset future realized gains. These net capital losses may be carried forward indefinitely and their character is retained as short-term and/or long-term losses. Such losses are characterized as follows:
| Short-Term | $(499,487) |
| Long-Term | (9,416,946) |
| Total | $(9,916,433) |
(3) Transactions with Affiliates
Investment Adviser — The fund has an investment advisory agreement with MFS to provide overall investment management and related administrative services and facilities to the fund. The management fee is computed daily and paid monthly at an annual rate of 0.65% of the fund’s average daily net assets. The fund pays the adviser a monthly fee equal to 20% of the fund’s leverage income after deducting the expenses of leveraging (“net leverage income”); provided, however, if the fund’s net leverage income is less than zero, MFS will reduce its management fee by an amount equivalent to the percentage indicated of the fund’s net leverage income. The management fee incurred for the year ended November 30, 2024 was equivalent to an annual effective rate of 0.64% of the fund's average daily net assets.
The investment adviser has agreed in writing to pay a portion of the fund’s total annual operating expenses, excluding interest, taxes, extraordinary expenses, brokerage and transaction costs, certain tax reclaim recovery expenses (including contingency fees and closing agreement expenses), and investment-related expenses, such that total fund operating expenses do not exceed 1.34% annually of the fund’s average daily net assets. This written agreement will continue until modified by the fund’s Board of
Notes to Financial Statements - continued
Trustees, but such agreement will continue at least until November 30, 2025. For the year ended November 30, 2024, this reduction amounted to $28,336, which is included in the reduction of total expenses in the Statement of Operations.
Transfer Agent — The fund engages Computershare Trust Company, N.A. (“Computershare”) as the sole transfer agent for the fund. MFS Service Center, Inc. (MFSC) monitors and supervises the activities of Computershare for an agreed upon fee approved by the Board of Trustees. For the year ended November 30, 2024, fees paid to MFSC amounted to $2,777.
Administrator — MFS provides certain financial, legal, shareholder communications, compliance, and other administrative services to the fund. Under an administrative services agreement, the fund reimburses MFS the costs incurred to provide these services. The fund is charged an annual fixed amount of $17,500 plus a fee based on average daily net assets. The administrative services fee is computed daily and paid monthly. The administrative services fee incurred for the year ended November 30, 2024 was equivalent to an annual effective rate of 0.0518% of the fund's average daily net assets.
Trustees’ and Officers’ Compensation — The fund pays compensation to independent Trustees in the form of a retainer, attendance fees, and additional compensation to Board and Committee chairpersons. Independent Trustees’ compensation is accrued daily and paid subsequent to each Trustee Board meeting. The fund does not pay compensation directly to Trustees or officers of the fund who are also officers of the investment adviser, all of whom receive remuneration from MFS for their services to the fund. Certain officers and Trustees of the fund are officers or directors of MFS and MFSC.
Other — The fund invests in the MFS Institutional Money Market Portfolio which is managed by MFS and seeks current income consistent with preservation of capital and liquidity. This money market fund does not pay a management fee to MFS but does incur investment and operating costs.
(4) Portfolio Securities
For the year ended November 30, 2024, purchases and sales of investments, other than short-term obligations, aggregated $28,057,724 and $29,201,565, respectively.
(5) Shares of Beneficial Interest
The fund's Declaration of Trust permits the Trustees to issue an unlimited number of full and fractional shares of beneficial interest. The Trustees have authorized the repurchase by the fund of up to 10% annually of its own shares of beneficial interest.
The fund repurchased 506,945 shares of beneficial interest during the year ended November 30, 2024 at an average price per share of $1.71 and a weighted average discount of 7.85% per share. The fund repurchased 919,104 shares of beneficial
Notes to Financial Statements - continued
interest during the year ended November 30, 2023 at an average price per share of $1.64 and a weighted average discount of 8.56% per share. Transactions in fund shares were as follows:
| | Year ended
11/30/24 | | Year ended
11/30/23 |
| | Shares | Amount | | Shares | Amount |
| Shares issued to shareholders in reinvestment of distributions | — | $— | | 13,107 | $24,238 |
| Capital shares repurchased | (506,945) | (865,747) | | (919,104) | (1,510,335) |
| Net change | (506,945) | $(865,747) | | (905,997) | $(1,486,097) |
(6) Loan Agreement
The fund has a credit agreement with a bank for a revolving secured line of credit that can be drawn upon up to $17,000,000. At November 30, 2024, the fund had outstanding borrowings under this agreement in the amount of $15,000,000, which are secured by a lien on the fund’s assets. Costs directly related to the closing of the credit agreement are considered debt issuance costs, which are being amortized into interest expense over twelve months from the closing date. The loan’s carrying value in the fund’s Statement of Assets and Liabilities approximates its fair value. The loan value as of the reporting date is considered level 2 under the fair value hierarchy. The credit agreement has no explicit maturity date but may be terminated with appropriate notice by either party. Borrowings under the agreement can be made for liquidity or leverage purposes. Interest is charged at a rate per annum equal to the one-month term SOFR (Secured Overnight Financing Rate) plus 0.10% plus an agreed upon spread, or at the option of the borrower, an alternate base rate plus an agreed upon spread. The fund incurred interest expense of $949,990 during the period, which is included in “Interest expense and fees” in the Statement of Operations. The fund may also be charged a commitment fee based on the average daily unused portion of the line of credit. The fund paid a commitment fee of $2,541 during the period, which is included in “Interest expense and fees” in the Statement of Operations. For the year ended November 30, 2024, the average loan balance was $15,000,000 at a weighted average annual interest rate of 6.33%. The fund is subject to certain covenants including, but not limited to, requirements with respect to asset coverage, portfolio diversification and liquidity.
(7) Investments in Affiliated Issuers
An affiliated issuer may be considered one in which the fund owns 5% or more of the outstanding voting securities, or a company which is under common control. For the purposes of this report, the following were affiliated issuers for the year ended November 30, 2024:
| Affiliated Issuers | Beginning
Value | Purchases | Sales
Proceeds | Realized
Gain
(Loss) | Change in
Unrealized
Appreciation or
Depreciation | Ending
Value |
| MFS Institutional Money Market Portfolio | $1,807,807 | $14,145,420 | $15,354,236 | $240 | $(94) | $599,137 |
Notes to Financial Statements - continued
| Affiliated Issuers | Dividend
Income | Capital Gain
Distributions |
| MFS Institutional Money Market Portfolio | $52,965 | $— |
Report of Independent Registered Public Accounting Firm
To the Shareholders and the Board of Trustees of MFS Intermediate High Income Fund
Opinion on the Financial Statements
We have audited the accompanying statement of assets and liabilities of MFS Intermediate High Income Fund (the “Fund”), including the portfolio of investments, as of November 30, 2024, and the related statements of operations and cash flows for the year then ended, the statements of changes in net assets for each of the two years in the period then ended, the financial highlights for each of the five years in the period then ended and the related notes (collectively referred to as the “financial statements”). In our opinion, the financial statements present fairly, in all material respects, the financial position of the Fund at November 30, 2024, the results of its operations and its cash flows for the year then ended, the changes in its net assets for each of the two years in the period then ended and its financial highlights for each of the five years in the period then ended, in conformity with U.S. generally accepted accounting principles.
Basis for Opinion
These financial statements are the responsibility of the Fund’s management. Our responsibility is to express an opinion on the Fund’s financial statements based on our audits. We are a public accounting firm registered with the Public Company Accounting Oversight Board (United States) (“PCAOB”) and are required to be independent with respect to the Fund in accordance with the U.S. federal securities laws and the applicable rules and regulations of the Securities and Exchange Commission and the PCAOB.
We conducted our audits in accordance with the standards of the PCAOB. Those standards require that we plan and perform the audit to obtain reasonable assurance about whether the financial statements are free of material misstatement, whether due to error or fraud. The Fund is not required to have, nor were we engaged to perform, an audit of the Fund’s internal control over financial reporting. As part of our audits, we are required to obtain an understanding of internal control over financial reporting but not for the purpose of expressing an opinion on the effectiveness of the Fund’s internal control over financial reporting. Accordingly, we express no such opinion.
Report of Independent Registered Public Accounting Firm – continued
Our audits included performing procedures to assess the risks of material misstatement of the financial statements, whether due to error or fraud, and performing procedures that respond to those risks. Such procedures included examining, on a test basis, evidence regarding the amounts and disclosures in the financial statements. Our procedures included confirmation of securities owned as of November 30, 2024, by correspondence with the custodian, brokers and others; when replies were not received from brokers and others, we performed other auditing procedures. Our audits also included evaluating the accounting principles used and significant estimates made by management, as well as evaluating the overall presentation of the financial statements. We believe that our audits provide a reasonable basis for our opinion.
/s/ Ernst & Young LLP
We have served as the auditor of one or more MFS investment companies since 1993.
Boston, Massachusetts
January 14, 2025
Results of Shareholder Meeting (unaudited)
At the annual meeting of shareholders of MFS Intermediate High Income Fund, which was held on October 3, 2024, the following action was taken:
Item 1: To elect the following individuals as Trustees:
| | | Number of Shares |
| Nominee | | For | | Against/Withheld |
| John A. Caroselli | | 10,307,577.196 | | 549,288.000 |
| James W. Kilman, Jr. | | 10,217,564.196 | | 639,301.000 |
| Clarence Otis, Jr. | | 10,306,026.196 | | 550,839.000 |
Trustees and Officers — Identification and Background
The Trustees and Officers of the Trust, as of January 1, 2025, are listed below, together with their principal occupations during the past five years. (Their titles may have varied during that period.) The address of each Trustee and Officer is 111 Huntington Avenue, Boston, Massachusetts 02199-7618.
| Name, Age | | Position(s) Held with Fund | | Trustee/Officer Since(h) | | Term
Expiring | | Number
of MFS
Funds
overseen
by the
Trustee | | Principal
Occupations
During
the Past
Five Years | | Other
Directorships
During
the Past
Five Years (j) |
| INTERESTED TRUSTEE | | | | | | | | | | | | |
Michael W. Roberge (k)
(age 58) | | Trustee | | January 2021 | | 2026 | | 140 | | Massachusetts Financial Services Company, Chairman (since January 2021); Chief Executive Officer (until 2024); Director; Chairman of the Board (since January 2022) | | N/A |
| INDEPENDENT TRUSTEES | | | | | | | | | | | | |
John P. Kavanaugh
(age 70) | | Trustee and Chair of Trustees | | January 2009 | | 2026 | | 140 | | Private investor | | N/A |
Steven E. Buller
(age 73) | | Trustee | | February 2014 | | 2026 | | 140 | | Private investor | | N/A |
John A. Caroselli
(age 70) | | Trustee | | March 2017 | | 2027 | | 140 | | Private investor; JC Global Advisors, LLC (management consulting), President (since 2015) | | N/A |
Maureen R. Goldfarb
(age 69) | | Trustee | | January 2009 | | 2025 | | 140 | | Private investor | | N/A |
Peter D. Jones
(age 69) | | Trustee | | January 2019 | | 2026 | | 140 | | Private investor | | N/A |
James W. Kilman, Jr.
(age 63) | | Trustee | | January 2019 | | 2027 | | 140 | | Burford Capital Limited (finance and investment management), Senior Advisor (since 2021), Chief Financial Officer (2019 - 2021); KielStrand Capital LLC (family office), Chief Executive Officer (since 2016) | | Alpha-En Corporation, Director (2016-2019) |
Trustees and Officers - continued
| Name, Age | | Position(s) Held with Fund | | Trustee/Officer Since(h) | | Term
Expiring | | Number
of MFS
Funds
overseen
by the
Trustee | | Principal
Occupations
During
the Past
Five Years | | Other
Directorships
During
the Past
Five Years (j) |
Clarence Otis, Jr.
(age 68) | | Trustee | | March 2017 | | 2027 | | 140 | | Private investor | | VF Corporation, Director; Verizon Communications, Inc., Director; The Travelers Companies, Director |
Maryanne L. Roepke
(age 68) | | Trustee | | May 2014 | | 2025 | | 140 | | Private investor | | N/A |
Paula E. Smith
(age 61) | | Trustee | | January 2025 | | 2025 | | 140 | | PricewaterhouseCoopers
LLP (accounting), Partner (until June 2023) | | N/A |
Laurie J. Thomsen
(age 67) | | Trustee | | March 2005 | | 2025 | | 140 | | Private investor | | The Travelers Companies, Director; Dycom Industries, Inc., Director |
Darrell A. Williams
(age 65) | | Trustee | | January 2025 | | 2026 | | 140 | | DuSable Group, LLC (financial advisory and consulting services), Founder & Managing Member (since June 2023), Loop Capital LLC (investment banking, brokerage and advisory services), Managing Partner (2018 – 2020) and Managing Director (2020 – March 2023) | | |
| Name, Age | | Position(s) Held with
Fund | | Trustee/Officer Since(h) | | Term Expiring | | Number
of MFS
Funds for
which the Person is an Officer | | Principal
Occupations
During
the Past
Five Years |
| OFFICERS | | | | | | | | | | |
William T. Allen (k)
(age 57) | | Deputy Assistant Treasurer | | April 2024 | | N/A | | 140 | | Massachusetts Financial Services Company, Vice President |
Brian Balasco (k)
(age 47) | | Assistant Treasurer | | April 2024 | | N/A | | 140 | | Massachusetts Financial Services Company, Vice President |
Trustees and Officers - continued
| Name, Age | | Position(s) Held with
Fund | | Trustee/Officer Since(h) | | Term Expiring | | Number
of MFS
Funds for
which the Person is an Officer | | Principal
Occupations
During
the Past
Five Years |
Christopher R. Bohane (k)
(age 50) | | Assistant Secretary and Assistant Clerk | | July 2005 | | N/A | | 140 | | Massachusetts Financial Services Company, Senior Vice President and Deputy General Counsel |
James L. Byrne (k)
(age 48) | | Assistant Treasurer | | April 2024 | | N/A | | 140 | | Massachusetts Financial Services Company, Vice President |
John W. Clark, Jr. (k)
(age 57) | | Deputy Treasurer | | April 2017 | | N/A | | 140 | | Massachusetts Financial Services Company, Vice President |
David L. DiLorenzo (k)
(age 56) | | President | | July 2005 | | N/A | | 140 | | Massachusetts Financial Services Company, Senior Vice President |
Heidi W. Hardin (k)
(age 57) | | Secretary and Clerk | | April 2017 | | N/A | | 140 | | Massachusetts Financial Services Company, Executive Vice President and General Counsel |
Brian E. Langenfeld (k)
(age 51) | | Assistant Secretary and Assistant Clerk | | June 2006 | | N/A | | 140 | | Massachusetts Financial Services Company, Vice President and Managing Counsel |
Rosa E. Licea-Mailloux (k)
(age 48) | | Chief Compliance Officer | | March 2022 | | N/A | | 140 | | Massachusetts Financial Services Company, Vice President (since 2018); Director of Corporate Compliance (2018-2021), Senior Director Compliance (2021-2022), Senior Managing Director of North American Compliance & Chief Compliance Officer (since March 2022) |
Amanda S. Mooradian (k)
(age 45) | | Assistant Secretary and Assistant Clerk | | September 2018 | | N/A | | 140 | | Massachusetts Financial Services Company, Vice President and Senior Counsel |
Susan A. Pereira (k)
(age 54) | | Assistant Secretary and Assistant Clerk | | July 2005 | | N/A | | 140 | | Massachusetts Financial Services Company, Vice President and Managing Counsel |
Kasey L. Phillips (k)
(age 53) | | Treasurer | | September 2012 | | N/A | | 140 | | Massachusetts Financial Services Company, Vice President |
Trustees and Officers - continued
| Name, Age | | Position(s) Held with
Fund | | Trustee/Officer Since(h) | | Term Expiring | | Number
of MFS
Funds for
which the Person is an Officer | | Principal
Occupations
During
the Past
Five Years |
Matthew A. Stowe (k)
(age 50) | | Assistant Secretary and Assistant Clerk | | October 2014 | | N/A | | 140 | | Massachusetts Financial Services Company, Senior Vice President and Senior Managing Counsel |
William B. Wilson (k)
(age 42) | | Assistant Secretary and Assistant Clerk | | October 2022 | | N/A | | 140 | | Massachusetts Financial Services Company, Assistant Vice President and Senior Counsel |
| (h) | Date first appointed to serve as Trustee/Officer of an MFS Fund. Each Trustee has served continuously since appointment unless indicated otherwise. From January 2012 through December 2016, Mr. DiLorenzo served as Treasurer of the Funds. From September 2012 through March 2024, Ms. Phillips served as Assistant Treasurer of the Funds. From April 2017 through March 2024, Mr. Clark served as Assistant Treasurer of the Funds. |
| (j) | Directorships or trusteeships of companies required to report to the Securities and Exchange Commission (i.e., “public companies”). |
| (k) | “Interested person” of the Trust within the meaning of the Investment Company Act of 1940 (referred to as the 1940 Act), which is the principal federal law governing investment companies like the fund, as a result of a position with MFS. The address of MFS is 111 Huntington Avenue, Boston, Massachusetts 02199-7618. |
The Trust holds annual shareholder meetings for the purpose of electing Trustees, and Trustees are elected for fixed terms. The Board of Trustees is currently divided into three classes, each having a term of three years which term expires on the date of the third annual meeting following the election to office of the Trustee’s class. Each year the term of one class expires. Each Trustee and officer will serve until next elected or his or her earlier death, resignation, retirement or removal. Under the terms of the Board's retirement policy, an Independent Trustee shall retire at the end of the calendar year in which he or she reaches the earlier of 75 years of age or 15 years of service on the Board (or, in the case of any Independent Trustee who joined the Board prior to 2015, 20 years of service on the Board).
Messrs. Buller, Caroselli, Jones, Otis, and Williams are members of the Trust’s Audit Committee.
Trustees and Officers - continued
Each of the Interested Trustees and certain Officers hold comparable officer positions with certain affiliates of MFS.
| Investment Adviser | Custodian |
Massachusetts Financial Services Company
111 Huntington Avenue
Boston, MA 02199-7618 | State Street Bank and Trust Company
1 Congress Street, Suite 1
Boston, MA 02114-2016 |
| Portfolio Manager(s) | Independent Registered Public Accounting Firm |
David Cole
Michael Skatrud | Ernst & Young LLP
200 Clarendon Street
Boston, MA 02116 |
MFS Intermediate High Income Fund
Board Review of Investment Advisory Agreement
MFS Intermediate High Income Fund
The Investment Company Act of 1940 requires that both the full Board of Trustees and a majority of the non-interested (“independent”) Trustees, voting separately, annually approve the continuation of the Fund’s investment advisory agreement with MFS. The Trustees consider matters bearing on the Fund and its advisory arrangements at their meetings throughout the year, including a review of performance data at each regular meeting. In addition, the independent Trustees met several times over the course of three months beginning in May and ending in July, 2024 (“contract review meetings”) for the specific purpose of considering whether to approve the continuation of the investment advisory agreement for the Fund and the other investment companies that the Board oversees (the “MFS Funds”). The independent Trustees were assisted in their evaluation of the Fund’s investment advisory agreement by independent legal counsel, from whom they received separate legal advice and with whom they met separately from MFS during various contract review meetings. The independent Trustees were also assisted in this process by an independent consultant who was retained by and reported to the independent Trustees.
In connection with their deliberations regarding the continuation of the investment advisory agreement, the Trustees, including the independent Trustees, considered such information and factors as they believed, in light of the legal advice furnished to them and their own business judgment, to be relevant. The investment advisory agreement for the Fund was considered separately, although the Trustees also took into account the common interests of all MFS Funds in their review. As described below, the Trustees considered the nature, quality, and extent of the various investment advisory, administrative, and shareholder services performed by MFS under the existing investment advisory agreement and other arrangements with the Fund.
In connection with their contract review meetings, the Trustees received and relied upon materials that included, among other items: (i) information provided by Broadridge Financial Solutions, Inc. (“Broadridge”), an independent third party, on the investment performance (based on net asset value) of the Fund for various time periods ended December 31, 2023 and the investment performance (based on net asset value) of a group of funds with substantially similar investment classifications/ objectives (the “Broadridge performance universe”), (ii) information provided by Broadridge on the Fund’s advisory fees and other expenses and the advisory fees and other expenses of comparable funds identified by Broadridge as well as all other funds in the same investment classification/category (the “Broadridge expense group and universe”), (iii) information provided by MFS on the advisory fees of portfolios of other clients of MFS, including institutional separate accounts and other clients, (iv) information as to whether and to what extent applicable expense waivers, reimbursements or fee “breakpoints” are observed for the Fund, (v) information regarding MFS’ financial results and financial condition, including MFS’ and certain of its affiliates’ estimated profitability from services performed for the Fund and the MFS Funds as a whole, and compared to MFS’ institutional business, (vi) MFS’ views regarding the outlook for the mutual fund industry and the strategic business plans of MFS, (vii) descriptions of various functions performed by MFS for the Funds, such as compliance monitoring and
Board Review of Investment Advisory Agreement - continued
portfolio trading practices, and (viii) information regarding the overall organization of MFS, including information about MFS’ senior management and other personnel providing investment advisory, administrative and other services to the Fund and the other MFS Funds. The comparative performance, fee and expense information prepared and provided by Broadridge was not independently verified and the independent Trustees did not independently verify any information provided to them by MFS.
The Trustees’ conclusion as to the continuation of the investment advisory agreement was based on a comprehensive consideration of all information provided to the Trustees and not the result of any single factor. Some of the factors that figured particularly in the Trustees’ deliberations are described below, although individual Trustees may have evaluated the information presented differently from one another, giving different weights to various factors. It is also important to recognize that the fee arrangements for the Fund and other MFS Funds are the result of years of review and discussion between the independent Trustees and MFS, that certain aspects of such arrangements may receive greater scrutiny in some years than in others, and that the Trustees’ conclusions may be based, in part, on their consideration of these same arrangements during the course of the year and in prior years.
Based on information provided by Broadridge and MFS, the Trustees reviewed the Fund’s total return investment performance as well as the Broadridge performance universe over various time periods. The Trustees placed particular emphasis on the total return performance of the Fund’s common shares in comparison to the performance of funds in its Broadridge performance universe over the five-year period ended December 31, 2023, which the Trustees believed was a long enough period to reflect differing market conditions. The total return performance of the Fund’s common shares ranked 18th out of a total of 31 funds in the Broadridge performance universe for the five-year period (a ranking of first place out of the total number of funds in the performance universe indicating the best performer and a ranking of last place out of the total number of funds in the performance universe indicating the worst performer). The total return performance of the Fund’s common shares ranked 13th out of a total of 36 funds for the one-year period and 28th out of a total of 35 funds for the three-year period ended December 31, 2023. Given the size of the Broadridge performance universe and information previously provided by MFS regarding differences between the Fund and other funds in its Broadridge performance universe, the Trustees also reviewed the Fund’s performance in comparison to the Bloomberg U.S. Corporate High-Yield Bond 2% Issuer Capped Index. The Fund outperformed its benchmark for the one-year period and underperformed its benchmark for each of the three- and five-year periods ended December 31, 2023 (one-year: 16.3% total return for the Fund versus 13.4% total return for the benchmark; three-year: 0.2% total return for the Fund versus 2.0% total return for the benchmark; five-year: 5.0% total return for the Fund versus 5.4% total return for the benchmark). Because of the passage of time, these performance results may differ from the performance results for more recent periods, including those shown elsewhere in this report.
In addition to considering the performance information provided in connection with the contract review meetings, the Trustees noted that, in light of the Fund’s substandard relative performance at the time of their contract review meetings in 2023, they had met at each of their regular meetings since then with MFS’ senior investment management personnel to discuss the Fund’s performance and MFS’ efforts
Board Review of Investment Advisory Agreement - continued
to improve the Fund’s performance. The Trustees further noted that the Fund’s five-year performance as compared to its Broadridge performance universe improved for the period ended December 31, 2023, as compared to the prior year. Taking this information into account, the Trustees concluded, within the context of their overall conclusions regarding the investment advisory agreement, that they were satisfied with MFS’ responses and efforts relating to investment performance.
In assessing the reasonableness of the Fund’s advisory fee, the Trustees considered, among other information, the Fund’s advisory fee and the total expense ratio of the Fund’s common shares as a percentage of average daily net assets and the advisory fee and total expense ratios of the Broadridge expense group based on information provided by Broadridge. The Trustees considered that MFS currently observes an expense limitation for the Fund, which may not be changed without the Trustees’ approval. The Trustees also considered that, according to the data provided by Broadridge (which takes into account any fee reductions or expense limitations that were in effect during the Fund’s last fiscal year), the Fund’s effective advisory fee rate was lower than the Broadridge expense group median and the Fund’s total expense ratio was higher than the Broadridge expense group median.
The Trustees also considered the advisory fees charged by MFS to any institutional separate accounts advised by MFS (“separate accounts”) and unaffiliated investment companies for which MFS serves as subadviser (“subadvised funds”) that have comparable investment strategies to the Fund, if any. In comparing these fees, the Trustees considered information provided by MFS as to the generally broader scope of services provided by MFS to the Fund, as well as the more extensive regulatory burdens imposed on MFS in managing the Fund, in comparison to separate accounts and subadvised funds.
The Trustees considered that, as a closed-end fund, the Fund is unlikely to experience meaningful asset growth. As a result, the Trustees did not view the potential for realization of economies of scale as the Fund’s assets grow to be a material factor in their deliberations. The Trustees noted that they would consider economies of scale in the future in the event the Fund experiences significant asset growth, such as through an offering of preferred shares (which is not currently contemplated) or a material increase in the market value of the Fund’s portfolio securities.
The Trustees also considered information prepared by MFS relating to MFS’ costs and profits with respect to the Fund, the MFS Funds considered as a group, and other investment companies and accounts advised by MFS, as well as MFS’ methodologies used to determine and allocate its costs to the MFS Funds, the Fund and other accounts and products for purposes of estimating profitability.
After reviewing these and other factors described herein, the Trustees concluded, within the context of their overall conclusions regarding the investment advisory agreement, that the advisory fees charged to the Fund represent reasonable compensation in light of the services being provided by MFS to the Fund.
In addition, the Trustees considered MFS’ resources and related efforts to continue to retain, attract and motivate capable personnel to serve the Fund. The Trustees also considered current and developing conditions in the financial services industry, including the presence of large and well-capitalized companies which are spending, and appear to be prepared to continue to spend, substantial sums to engage personnel and to provide services to competing investment companies. In this regard, the
Board Review of Investment Advisory Agreement - continued
Trustees also considered the financial resources of MFS and its ultimate parent, Sun Life Financial Inc. The Trustees also considered the advantages and possible disadvantages to the Fund of having an adviser that also serves other investment companies as well as other accounts.
The Trustees also considered the nature, quality, cost, and extent of administrative services provided to the Fund by MFS under agreements other than the investment advisory agreement. The Trustees also considered the nature, extent and quality of certain other services MFS performs or arranges for on the Fund’s behalf, which may include securities lending programs, directed expense payment programs, class action recovery programs, and MFS’ interaction with third-party service providers, principally custodians and sub-custodians. The Trustees concluded that the various non-advisory services provided by MFS and its affiliates on behalf of the Fund were satisfactory.
The Trustees considered so-called “fall-out benefits” to MFS such as reputational value derived from serving as investment manager to the MFS Funds. The Trustees also considered that MFS discontinued its historic practice of obtaining investment research from portfolio brokerage commissions paid by certain MFS Funds effective January 2018, and directly pays or voluntarily reimburses a Fund, if applicable, for the costs of external research acquired through the use of the Fund’s portfolio brokerage commissions.
Based on their evaluation of factors that they deemed to be material, including those factors described above, the Board of Trustees, including the independent Trustees, concluded that the Fund’s investment advisory agreement with MFS should be continued for an additional one-year period, commencing August 1, 2024.
Proxy Voting Policies and Information
MFS votes proxies on behalf of the fund pursuant to proxy voting policies and procedures that are available without charge, upon request, by calling 1-800-225-2606, by visiting mfs.com/proxyvoting, or by visiting the SEC’s Web site at http://www.sec.gov.
Information regarding how the fund voted proxies relating to portfolio securities during the most recent twelve-month period ended June 30 is available by August 31 of each year without charge by visiting mfs.com/proxyvoting, or by visiting the SEC’s Web site at http://www.sec.gov.
Quarterly Portfolio Disclosure
The fund files a complete schedule of portfolio holdings with the SEC for the first and third quarters of each fiscal year as an exhibit to its reports on Form N-PORT. The fund’s Form N-PORT reports are available on the SEC’s Web site at http://www.sec.gov. A shareholder can obtain the portfolio holdings report for the first and third quarters of the fund's fiscal year at mfs.com/closedendfunds by choosing the fund's name and then scrolling to the “Resources” section and clicking on the “Reports and Other Documents” tab.
Further Information
From time to time, MFS may post important information about the fund or the MFS Funds on the MFS Web site (mfs.com). This information is available at https://www.mfs.com/announcements or at mfs.com/closedendfunds by choosing the fund's name and then scrolling to the “Resources” section and clicking on the “Announcements” tab, if any.
Additional information about the fund (e.g., performance, dividends and the fund’s price history) is also available at mfs.com/closedendfunds by choosing the fund's name, if any.
INFORMATION ABOUT FUND CONTRACTS AND LEGAL CLAIMS
The fund has entered into contractual arrangements with an investment adviser, administrator, transfer agent, and custodian who each provide services to the fund. Unless expressly stated otherwise, shareholders are not parties to, or intended beneficiaries of these contractual arrangements, and these contractual arrangements are not intended to create any shareholder right to enforce them against the service providers or to seek any remedy under them against the service providers, either directly or on behalf of the fund.
Under the Trust’s By-Laws, any claims asserted against or on behalf of the MFS Funds, including claims against Trustees and Officers, must be brought in state and federal courts located within the Commonwealth of Massachusetts.
Federal Tax Information (unaudited)
The fund will notify shareholders of amounts for use in preparing 2024 income tax forms in January 2025. The following information is provided pursuant to provisions of the Internal Revenue Code.
The fund intends to pass through the maximum amount allowable as Section 163(j) Interest Dividends as defined in Treasury Regulation §1.163(j)-1(b).
| FACTS | WHAT DOES MFS DO WITH YOUR PERSONAL INFORMATION? |
| Why? | Financial companies choose how they share your personal information. Federal law gives consumers the right to limit some but not all sharing. Federal law also requires us to tell you how we collect, share, and protect your personal information. Please read this notice carefully to understand what we do. |
| What? | The types of personal information we collect and share depend on the product or service you have with us. This information can include: |
| • Social Security number and account balances |
| • Account transactions and transaction history |
| • Checking account information and wire transfer instructions |
| When you are no longer our customer, we continue to share your information as described in this notice. |
| How? | All financial companies need to share customers' personal information to run their everyday business. In the section below, we list the reasons financial companies can share their customers' personal information; the reasons MFS chooses to share; and whether you can limit this sharing. |
Reasons we can share your
personal information | Does MFS share? | Can you limit
this sharing? |
For our everyday business purposes –
such as to process your transactions, maintain your
account(s), respond to court orders and legal
investigations, or report to credit bureaus | Yes | No |
For our marketing purposes –
to offer our products and services to you | No | We don't share |
For joint marketing with other
financial companies | No | We don't share |
For our affiliates' everyday business purposes –
information about your transactions and experiences | No | We don't share |
For our affiliates' everyday business purposes –
information about your creditworthiness | No | We don't share |
| For nonaffiliates to market to you | No | We don't share |
| Questions? | Call 800-225-2606 or go to mfs.com. |
| Who we are |
| Who is providing this notice? | MFS Funds, MFS Investment Management, MFS Institutional Advisors, Inc., and MFS Heritage Trust Company. |
| What we do |
How does MFS
protect my personal
information? | To protect your personal information from unauthorized access and use, we use security measures that comply with federal law. These measures include procedural, electronic, and physical safeguards for the protection of the personal information we collect about you. |
How does MFS
collect my personal
information? | We collect your personal information, for example, when you |
| • open an account or provide account information |
| • direct us to buy securities or direct us to sell your securities |
| • make a wire transfer |
| We also collect your personal information from others, such as credit bureaus, affiliates, or other companies. |
| Why can't I limit all sharing? | Federal law gives you the right to limit only |
| • sharing for affiliates' everyday business purposes – information about your creditworthiness |
| • affiliates from using your information to market to you |
| • sharing for nonaffiliates to market to you |
| State laws and individual companies may give you additional rights to limit sharing. |
| Definitions |
| Affiliates | Companies related by common ownership or control. They can be financial and nonfinancial companies. |
| • MFS does not share personal information with affiliates, except for everyday business purposes as described on page one of this notice. |
| Nonaffiliates | Companies not related by common ownership or control. They can be financial and nonfinancial companies. |
| • MFS does not share with nonaffiliates so they can market to you. |
| Joint marketing | A formal agreement between nonaffiliated financial companies that together market financial products or services to you. |
| • MFS doesn't jointly market. |
| Other important information |
| If you own an MFS product or receive an MFS service in the name of a third party such as a bank or broker-dealer, their privacy policy may apply to you instead of ours. |
CONTACT US
COMPUTERSHARE TRUST COMPANY, N.A.
TRANSFER AGENT, REGISTRAR, AND
DIVIDEND DISBURSING AGENT
CALL
1-800-637-2304
9 a.m. to 5 p.m. Eastern time
WRITE
Computershare Trust Company, N.A.
P.O. Box 43078
Providence, RI 02940-3078
New York Stock Exchange Symbol: CIF
Item 1(b):
A copy of the notice transmitted to the Registrant’s shareholders in reliance on Rule 30e-3 of the Investment Company Act of 1940, as amended that contains disclosure specified by paragraph (c)(3) of Rule 30e-3 is attached hereto as EX-99.30e-3Notice.
ITEM 2. CODE OF ETHICS.
The Registrant has adopted a Code of Ethics (the “Code”) pursuant to Section 406 of the Sarbanes-Oxley Act and as defined in Form N-CSR that applies to the Registrant’s principal executive officer and principal financial and accounting officer. During the period covered by this report, the Registrant has not amended any provision in the Code that relates to an element of the Code’s definition enumerated in paragraph
(b)of Item 2 of this Form N-CSR. During the period covered by this report, the Registrant did not grant a waiver, including an implicit
waiver, from any provision of the Code. David L. DiLorenzo (Principal Executive Officer) and James O. Yost (Principal Financial Officer) were the two persons covered by the Code prior to April 1, 2024. Beginning April 1, 2024, David L. DiLorenzo (Principal Executive Officer) and Kasey L. Phillips (Principal Financial Officer) are the two persons covered by the Code.
A copy of the Code is attached hereto as EX-99.COE.
ITEM 3. AUDIT COMMITTEE FINANCIAL EXPERT.
Messrs. Steven E. Buller, Clarence Otis, Jr., and Darrell A. Williams, members of the Audit Committee, have been determined by the Board of Trustees in their reasonable business judgment to meet the definition of “audit committee financial expert” as such term is defined in Form N-CSR. In addition, Messrs. Buller, Otis, and Williams are “independent” members of the Audit Committee (as such term has been defined by the Securities and Exchange Commission in regulations implementing Section 407 of the Sarbanes-Oxley Act of 2002). The Securities and Exchange Commission has stated that the designation of a person as an audit committee financial expert pursuant to this Item 3 on the Form N-CSR does not impose on such a person any duties, obligations or liability that are greater than the duties, obligations or liability imposed on such person as a member of the Audit Committee and the Board of Trustees in the absence of such designation or identification.
ITEM 4. PRINCIPAL ACCOUNTANT FEES AND SERVICES.
Items 4(a) through 4(d) and 4(g):
The Board of Trustees has appointed Ernst & Young LLP (“E&Y”) to serve as independent accountants to the Registrant (hereinafter the “Registrant” or the “Fund”). The tables below set forth the audit fees billed to the Fund as well as fees for non-audit services provided to the Fund and/or to the Fund’s investment adviser, Massachusetts Financial Services Company (“MFS”), and to various entities either controlling, controlled by, or under common control with MFS that provide ongoing services to the Fund (“MFS Related Entities”).
For the fiscal years ended November 30, 2024 and 2023, audit fees billed to the Fund by E&Y were as follows:
Fees billed by E&Y: | | Audit Fees |
| 2024 | | 2023 |
MFS Intermediate High Income Fund | 74,456 | | 71,828 |
For the fiscal years ended November 30, 2024 and 2023, fees billed by E&Y for audit-related, tax and other services provided to the Fund and for audit-related, tax and other services provided to MFS and MFS Related Entities were as follows:
Fees billed by E&Y: | Audit-Related Fees1 | | Tax Fees2 | All Other Fees3 |
| | 2024 | 2023 | | 2024 | 2023 | 2024 | | 2023 |
To MFS Intermediate High | 14,482 | 13,965 | | 267 | 259 | 0 | | 0 |
Income Fund | | | | | | | | | | |
| | | | | | | |
Fees billed by E&Y: | | Audit-Related Fees1 | | Tax Fees2 | All Other Fees3 |
| | 2024 | 2023 | | 2024 | 2023 | 2024 | | 2023 |
To MFS and MFS Related | | 0 | 0 | | 0 | 0 | | 3,600 | | 3,600 |
Entities of MFS Intermediate | | | | | | | | | | | |
High Income Fund* | | | | | | | | | | | |
| | | | | | |
Fees Billed by E&Y: | | | | Aggregate Fees for Non-audit Services | |
| | | | | 2024 | | | 2023 | |
To MFS Intermediate High Income Fund, | | | 324,289 | | | 192,574 | |
MFS and MFS Related Entities# | | | | | | | | | | |
*This amount reflects the fees billed to MFS and MFS Related Entities for non-audit services relating directly to the operations and financial reporting of the Fund (portions of which services also related to the operations and financial reporting of other funds within the MFS Funds complex).
# This amount reflects the aggregate fees billed by E&Y for non-audit services rendered to the Fund and for non- audit services rendered to MFS and the MFS Related Entities.
1 The fees included under “Audit-Related Fees” are fees related to assurance and related services that are reasonably related to the performance of the audit or review of financial statements, but not reported under ‘‘Audit Fees,’’ including accounting consultations, agreed-upon procedure reports, attestation reports, comfort letters and internal control reviews.
2 The fees included under “Tax Fees” are fees associated with tax compliance, tax advice and tax planning, including services relating to the filing or amendment of federal, state or local income tax returns, regulated investment company qualification reviews and tax distribution and analysis.
3 The fees included under “All Other Fees” are fees for products and services provided by E&Y other than those reported under “Audit Fees,” “Audit-Related Fees” and “Tax Fees”.
Item 4(e)(1):
Set forth below are the policies and procedures established by the Audit Committee of the Board of Trustees relating to the pre-approval of audit and non-audit related services:
To the extent required by applicable law, pre-approval by the Audit Committee of the Board is needed for all audit and permissible non-audit services rendered to the Fund and all permissible non-audit services rendered to MFS or MFS Related Entities if the services relate directly to the operations and financial reporting of the Registrant. Pre- approval is currently on an engagement-by-engagement basis. In the event pre-approval of such services is necessary between regular meetings of the Audit Committee and it is not practical to wait to seek pre-approval at the next regular meeting of the Audit Committee, pre-approval of such services may be referred to the Chair of the Audit Committee for approval; provided that the Chair may not pre-approve any individual engagement for such services exceeding $50,000 or multiple engagements for such services in the aggregate exceeding $100,000 between such regular meetings of the Audit Committee. Any engagement pre-approved by the Chair between regular meetings of the Audit Committee shall be presented for ratification by the entire Audit Committee at its next regularly scheduled meeting.
Item 4(e)(2):
None, or 0%, of the services relating to the Audit-Related Fees, Tax Fees and All Other Fees paid by the Fund and MFS and MFS Related Entities relating directly to the operations and financial reporting of the Registrant disclosed above were approved by the audit committee pursuant to paragraphs (c)(7)(i)(C) of Rule 2-01 of Regulation S-X (which permits audit committee approval after the start of the engagement with respect to services other than audit, review or attest services, if certain conditions are satisfied).
Item 4(f):
Not applicable.
Item 4(h):
The Registrant’s Audit Committee has considered whether the provision by a Registrant’s independent registered public accounting firm of non-audit services to MFS and MFS Related Entities that were not pre-approved by the Committee (because such services were provided prior to the effectiveness of SEC rules requiring pre-approval or because such services did not relate directly to the operations and financial reporting of the Registrant) was compatible with maintaining the independence of the independent registered public accounting firm as the Registrant’s principal auditors.
Item 4(i):
Not applicable.
Item 4(j):
Not applicable.
ITEM 5. AUDIT COMMITTEE OF LISTED REGISTRANTS.
The Registrant has an Audit Committee established in accordance with Section 3(a)(58)(A) of the Securities Exchange Act of 1934. Effective January 1, 2025, the members of the Audit Committee are Messrs. Steven E. Buller, John A. Caroselli, Peter D. Jones, Clarence Otis, Jr, and Darrell A. Williams.
ITEM 6. INVESTMENTS
A schedule of investments of the Registrant is included as part of the report to shareholders of the Registrant under Item 1(a) of this Form N-CSR.
ITEM 7. FINANCIAL STATEMENTS AND FINANCIAL HIGHLIGHTS FOR OPEN-END MANAGEMENT INVESTMENT COMPANIES.
Not applicable to the Registrant.
ITEM 8. CHANGES IN AND DISAGREEMENTS WITH ACCOUNTANTS FOR OPEN-END MANAGEMENT INVESTMENT COMPANIES.
Not applicable to the Registrant.
ITEM 9. PROXY DISCLOSURES FOR OPEN-END MANAGEMENT INVESTMENT COMPANIES.
Not applicable to the Registrant.
ITEM 10. RENUMERATION PAID TO DIRECTORS, OFFICERS, AND OTHERS OF OPEN-END MANAGEMENT INVESTMENT COMPANIES.
Not applicable to the Registrant.
ITEM 11. STATEMENT REGARDING BASES FOR APPROVAL OF INVESTMENT ADVISORY CONTRACT.
This information is disclosed as part of the financial statements included in Item 1 above.
ITEM 12. DISCLOSURE OF PROXY VOTING POLICIES AND PROCEDURES FOR CLOSED-END MANAGEMENT INVESTMENT COMPANIES.
A copy of the proxy voting policies and procedures are attached hereto as Ex-99.PROXYPOL.
Item 13. PORTFOLIO MANAGERS OF CLOSED-END MANAGEMENT
INVESTMENT COMPANIES.
Portfolio Manager(s)
Information regarding the portfolio manager(s) of the MFS Intermediate High Income Fund (the "Fund"), is set forth below. Each portfolio manager is primarily responsible for the day-to-day management of the Fund.
Portfolio Manager | Primary Role | Since | Title and Five Year History |
David Cole | Portfolio Manager | 2007 | Investment Officer of MFS; employed in the investment area of MFS |
| | | since 2004. |
Michael Skatrud | Portfolio Manager | 2018 | Investment Officer of MFS; employed in the investment area of MFS |
| | | since 2013. |
| | | |
Compensation
MFS’ philosophy is to align portfolio manager compensation with the goal to provide shareholders with long-term value through a collaborative investment process. Therefore, MFS uses long-term investment performance as well as contribution to the overall investment process and collaborative culture as key factors in determining portfolio manager compensation. In addition, MFS seeks to maintain total compensation programs that are competitive in the asset management industry in each geographic market where it has employees. MFS uses competitive compensation data to ensure that compensation practices are aligned with its goals of attracting, retaining, and motivating the highest-quality professionals.
MFS reviews portfolio manager compensation annually. In determining portfolio manager compensation, MFS uses quantitative means and qualitative means to help ensure a durable investment process. As of December 31, 2023, portfolio manager total cash compensation is a combination of base salary and performance bonus:
Base Salary – Base salary generally represents a smaller percentage of portfolio manager total cash compensation than performance bonus. Performance Bonus – Generally, the performance bonus represents more than a majority of portfolio manager total cash compensation.
The performance bonus is based on a combination of quantitative and qualitative factors, generally with more weight given to the former and less weight given to the latter. The quantitative portion is primarily based on the pre-tax performance of accounts managed by the portfolio manager over a range of fixed-length time periods, intended to provide the ability to assess performance over time periods consistent with a full market cycle and a strategy's investment horizon. The fixed-length time periods include the portfolio manager's full tenure on each Fund/strategy and, when available, 10-, 5-, and 3-year periods. For portfolio managers who have served for less than three years, shorter- term periods, including the one-year period, will also be considered, as will performance in previous roles, if any, held at the firm. Emphasis is generally placed on longer performance periods when multiple performance periods are available. Performance is evaluated across the full set of strategies and portfolios managed by a given portfolio manager, relative to appropriate peer group universes and/or representative indices (“benchmarks”). As of December 31, 2023, the following benchmarks were used to measure the following portfolio manager's performance for the Fund:
Fund | Portfolio Manager | Benchmark(s) |
MFS Intermediate High Income Fund | David Cole | Bloomberg U.S. Corporate High-Yield 2% Issuer Capped |
| | Index |
| | |
| Michael Skatrud | Bloomberg U.S. Corporate High-Yield 2% Issuer Capped |
| | Index |
Benchmarks may include versions and components of indices, custom indices, and linked indices that combine performance of different indices for different portions of the time period, where appropriate.
The qualitative portion is based on the results of an annual internal peer review process (where portfolio managers are evaluated by other portfolio managers, analysts, and traders) and management’s assessment of overall portfolio manager contributions to the MFS investment process and the client experience (distinct from fund and other account performance).
The performance bonus may be in the form of cash and/or a deferred cash award, at the discretion of management. A deferred cash award is issued for a cash value and becomes payable over a three-year vesting period if the portfolio manager remains in the continuous employ of MFS or its affiliates. During the vesting period, the value of the unfunded deferred cash award will fluctuate as though the portfolio manager had invested the cash value of the award in an MFS fund(s) selected by the portfolio manager. A selected fund may, but is not required to, be a fund that is managed by the portfolio manager.
MFS Equity Plan – Portfolio managers also typically benefit from the opportunity to participate in the MFS Equity Plan. Equity interests are awarded by management, on a discretionary basis, taking into account tenure at MFS, contribution to the investment process, and other factors.
Finally, portfolio managers also participate in benefit plans (including a defined contribution plan and health and other insurance plans) and programs available generally to other employees of MFS. The percentage such benefits represent of any portfolio manager’s compensation depends upon the length of the individual’s tenure at MFS and salary level, as well as other factors.
Ownership of Fund Shares
The following table shows the dollar range of equity securities of the Fund beneficially owned by the Fund’s portfolio manager(s) as of the Fund's fiscal year ended November 30, 2024. The following dollar ranges apply:
N. None
A. $1 – $10,000
B. $10,001 – $50,000
C. $50,001 – $100,000
D. $100,001 – $500,000
E. $500,001 – $1,000,000
F. Over $1,000,000
Name of Portfolio Manager | Dollar Range of Equity Securities in Fund |
David Cole | N |
Michael Skatrud | N |
Other Accounts
In addition to the Fund, each portfolio manager of the Fund is named as a portfolio manager of certain other accounts managed or sub- advised by MFS or an affiliate. The number and assets of these accounts were as follows as of the Fund's fiscal year ended November 30, 2024:
| Registered Investment Companies* | Other Pooled Investment Vehicles | Other Accounts |
| Number of Accounts | Total | Number of | Total Assets | Number of | Total Assets |
Name | | Assets | Accounts | | Accounts | |
David Cole | 13 | $12.7 billion | 10 | $6.3 billion | 7 | $1.5 billion |
| | | | | | |
Michael Skatrud | 11 | $12.6 billion | 6 | $1.3 billion | 4 | $1.1 billion |
| | | | | | |
* Includes the Fund. | | | | | | |
Advisory fees are not based upon performance of any of the accounts identified in the table above.
Potential Conflicts of Interest
MFS seeks to identify potential conflicts of interest resulting from a portfolio manager’s management of both the Fund and other accounts, and has adopted policies and procedures reasonably designed to address such potential conflicts. There is no guarantee that MFS will be successful in identifying or mitigating conflicts of interest.
The management of multiple funds and accounts (including accounts in which MFS, an affiliate, an employee, an officer, or a director has an interest) gives rise to conflicts of interest if the funds and accounts have different objectives and strategies, benchmarks, time horizons, and fees, as a portfolio manager must allocate his or her time and investment ideas across multiple funds and accounts. In certain instances, there are securities which are suitable for the Fund’s portfolio as well as for one or more other accounts advised by MFS or its subsidiaries (including accounts in which MFS, an affiliate, an employee, an officer, or a director has an interest). MFS' trade allocation policies could have a detrimental effect on the Fund if the Fund’s orders do not get fully executed or are delayed in getting executed due to being aggregated with those of other accounts advised by MFS or its subsidiaries. A portfolio manager may execute transactions for another fund or account that may adversely affect the value of the Fund’s investments. Investments selected for funds or accounts other than the Fund may outperform investments selected for the Fund.
When two or more accounts are simultaneously engaged in the purchase or sale of the same security, the securities are allocated among clients in a manner believed by MFS to be fair and equitable to each over time. Allocations may be based on many factors and may not always be pro rata based on assets managed. The allocation methodology could have a detrimental effect on the price or availability of a security with respect to the Fund.
MFS and/or a portfolio manager may have a financial incentive to allocate favorable or limited opportunity investments or structure the timing of investments to favor accounts other than the Fund; for instance, those that pay a higher advisory fee and/or have a performance adjustment, those that include an investment by the portfolio manager, and/or those in which MFS, its affiliates, its employees, its officers, and/or its directors own or have an interest.
To the extent permitted by applicable law, certain accounts may invest their assets in other accounts advised by MFS or its affiliates, including accounts that are advised by one or more of the same portfolio manager(s), which could result in conflicts of interest relating to asset allocation, timing of purchases and redemptions, and increased profitability for MFS, its affiliates, and/or its personnel, including portfolio managers.
ITEM 14. PURCHASES OF EQUITY SECURITIES BY CLOSED-END MANAGEMENT INVESTMENT COMPANY AND AFFILIATED PURCHASERS.
MFS Intermediate High Income Fund
| | | | (c) Total | (d) Maximum |
| | | | Number of | Number (or |
| | (a) Total number | (b) | Shares | Approximate |
| Period | of Shares | Average | Purchased as | Dollar Value) of |
| | Purchased | Price | Part of Publicly | Shares that May |
| | | Paid per | Announced | Yet Be Purchased |
| | | Share | Plans or | under the Plans |
| | | | Programs | or Programs |
| | | | | |
| 12/01/23-12/31/23 | 181,765 | 1.71 | 181,765 | 1,451,824 |
| 01/01/24-01/31/24 | 83,789 | 1.73 | 83,789 | 1,368,035 |
| 02/01/24-02/28/24 | 20,482 | 1.72 | 20,482 | 1,347,553 |
| 03/01/24-03/31/24 | 256 | 1.74 | 256 | 1,347,297 |
| 04/01/24-04/30/24 | 76,186 | 1.68 | 76,186 | 1,271,111 |
| 05/01/24-05/31/24 | 68,199 | 1.70 | 68,199 | 1,202,912 |
| 06/01/24-06/30/24 | 64,043 | 1.71 | 64,043 | 1,138,869 |
| 07/01/24-07/31/24 | 8,941 | 1.72 | 8,941 | 1,129,928 |
| 08/01/24- 8/31/24 | 0 | N/A | 0 | 1,129,928 |
| 09/01/24-09/30/24 | 0 | N/A | 0 | 1,129,928 |
| 10/01/24-10/31/24 | 0 | N/A | 0 | 1,800,737 |
| 11/01/24-11/30/24 | 3,284 | 1.73 | 3,284 | 1,797,453 |
| Total | 506,945 | 1.71 | 506,945 | |
| | | | | |
Note: The Board approved procedures to repurchase shares and reviews the results periodically. The notification to shareholders of the program is part of the semi-annual and annual reports sent to shareholders. These annual programs begin on October 1st of each year. The programs conform to the conditions of Rule 10b-18 of the Securities Exchange Act of 1934 and limit the aggregate number of shares that may be purchased in each annual period (October 1 through the following September 30) to 10% of the Registrant’s outstanding shares as of the first day of the plan year (October 1). The aggregate number of shares available for purchase for the October 1, 2024 plan year is 1,800,737.
ITEM 15. SUBMISSION OF MATTERS TO A VOTE OF SECURITY HOLDERS.
There were no material changes to the procedures by which shareholders may send recommendations to the Board for nominees to the Registrant’s Board since the Registrant last provided disclosure as to such procedures in response to the requirements of Item 407 (c)(2)(iv) of Regulation S-K or this Item.
ITEM 16. CONTROLS AND PROCEDURES.
(a)Based upon their evaluation of the effectiveness of the registrant’s disclosure controls and procedures (as defined in Rule 30a-3(c) under the Investment Company Act of 1940 (the “Act”)) as conducted within 90 days of the filing date of this report on Form N-CSR, the Registrant’s principal financial officer and principal executive officer have concluded that those disclosure controls and procedures provide reasonable assurance that the material information required to be disclosed by the Registrant on this report is recorded, processed, summarized and reported within the time periods specified in the Securities and Exchange Commission’s rules and forms.
(b)There were no changes in the Registrant’s internal controls over financial reporting (as defined in Rule 30a-3(d) under the Act) that occurred during the period covered by the report that have materially affected, or are reasonably likely to materially affect, the Registrant’s internal control over financial reporting.
ITEM 17. DISCLOSURE OF SECURITIES LENDING ACTIVITIES FOR CLOSED-END MANAGEMENT INVESTMENT COMPANIES.
During the fiscal year ended November 30, 2024, there were no fees or income related to securities lending activities of the Registrant.
ITEM 18. RECOVERY OF ERRONEOUSLY AWARDED COMPENSATION.
Not applicable.
ITEM 19. EXHIBITS.
(a)(1) Any code of ethics, or amendment thereto, that is the subject of the disclosure required by Item 2, to the extent that the registrant intends to satisfy the Item 2 requirements through filing of an exhibit: Attached hereto as EX-99.COE.
(2)A separate certification for each principal executive officer and principal financial officer of the registrant as required by Rule 30a-2(a) under the Act (17 CFR 270.30a-2): Attached hereto as EX-99.302CERT.
(3)Any written solicitation to purchase securities under Rule 23c-1 under the Act (17 CFR 270.23c-1) sent or given during the period covered by the report by or on behalf of the registrant to 10 or more persons. Not applicable.
(4)Change in the registrant’s independent public accountant. Not applicable.
(b)If the report is filed under Section 13(a) or 15(d) of the Exchange Act, provide the certifications required by Rule 30a-2(b) under the Act (17 CFR 270.30a-2(b)), Rule 13a-14(b) or Rule 15d-14(b) under the Exchange Act (17 CFR 240.13a-14(b) or 240.15d-14(b)) and Section 1350 of Chapter 63 of Title 18 of the United States Code (18 U.S.C. 1350) as an exhibit. A certification furnished pursuant to this paragraph will not be deemed “filed” for the purposes of Section 18 of the Exchange Act (15 U.S.C. 78r), or otherwise subject to the liability of that section. Such certification will not be deemed to be incorporated by reference into any filing under the Securities Act of 1933 or the Exchange Act, except to the extent that the registrant specifically incorporates it by reference. Attached hereto as EX-99.906CERT.
(c)Registrant’s Rule 30e-3 Notice pursuant to Item 1(b) of Form N-CSR. Attached hereto as EX-99.30e-3Notice.
(d)Proxy Voting Policies and Procedures pursuant to Item 7 of Form N-CSR. Attached hereto as EX-99.PROXYPOL.
(e) Notices to Trust’s common shareholders in accordance with Investment Company Act Section 19(a) and Rule 19a-1. Attached hereto as
Notice
A copy of the Amended and Restated Declaration of Trust, as amended, of the Registrant is on file with the Secretary of State of The Commonwealth of Massachusetts and notice is hereby given that this instrument is executed on behalf of the Registrant by an officer of the Registrant as an officer and not individually and the obligations of or arising out of this instrument are not binding upon any of the Trustees or shareholders individually, but are binding only upon the assets and property of the respective constituent series of the Registrant.
SIGNATURES
Pursuant to the requirements of the Securities Exchange Act of 1934 and the Investment Company Act of 1940, the registrant has duly caused this report to be signed on its behalf by the undersigned, thereunto duly authorized.
(Registrant) MFS INTERMEDIATE HIGH INCOME FUND
By (Signature and Title)*
/S/ DAVID L. DILORENZO
David L. DiLorenzo, President
Date: January 14, 2025
Pursuant to the requirements of the Securities Exchange Act of 1934 and the Investment Company Act of 1940, this report has been signed below by the following persons on behalf of the registrant and in the capacities and on the dates indicated.
By (Signature and Title)*
/S/ DAVID L. DILORENZO
David L. DiLorenzo, President (Principal Executive Officer)
Date: January 14, 2025
By (Signature and Title)*
/S/ KASEY L. PHILLIPS
Kasey L. Phillips, Treasurer (Principal Financial Officer and Accounting Officer) Date: January 14, 2025
* Print name and title of each signing officer under his or her signature.