FILE NO 1-9945
SECURITIES AND EXCHANGE COMMISSION
WASHINGTON DC 20549
FORM 6-K
REPORT OF FOREIGN ISSUER
Pursuant to Rule 13a-16 or 15d-16 of
the Securities Exchange Act of 1934
For the month of September 2005
National Australia Bank Limited
ACN 004 044 937
(Registrant’s Name)
Level 24
500 Bourke Street
MELBOURNE VICTORIA 3000
AUSTRALIA
Indicate by check mark whether the registrant files or will file annual reports under cover of Form 20-F or Form 40-F.
| Form 20-F | ý | Form 40-F | o |
Indicate by check mark whether the registrant by furnishing the information contained in this Form is also thereby furnishing the information to the Commission pursuant to Rule 12g3-2(b) under the Securities Exchange Act of 1934.
| Yes | o | No | ý |
If “Yes” is marked, indicate below the file number assigned to the registrant in connection with Rule 12g3-2(b): 82
|
| Group Corporate Affairs |
|
|
|
ASX Announcement |
| 800 Bourke Street |

Wednesday, 28 September 2005
NAB plan to stabilise and rebuild the Australian business
A comprehensive plan to stabilise and rebuild the NAB’s Australian business was outlined in a market update by the Executive Director and Chief Executive of the National’s Australian operations, Mr Ahmed Fahour.
“We are half-way through a three year turnaround,” Mr Fahour said. “We have the right people in place and they are focused on the right things. We have broadly stabilised the business and are now embarking on the rebuilding phase.”
Highlights of the briefing include a three year plan to:
• release new products and improve customer service in Australia
• complete the integration and restructuring of the Australian businesses
• invest $1.8 billion in rebuilding the Australian business, and
• having regard to the $1.8 billion investment, keep underlying cost growth in the Australian business under 3% per annum
Four key priorities for the next three years include:
Helping our customers fulfil their aspirations
“We have a clear purpose: to help our customers fulfil their aspirations,” Mr Fahour said. “We are freeing up our people to achieve this, by simplifying processes and policies.
“We are also committed to reinvesting in skills and capability development, including new quality management approaches and systems that improve both the employee and customer experience.
“We will continue to launch market-leading, customer-focused products. New products such as the Business Cash Maximiser, Personal Project Loan and iSaver Account have been launched recently.”
1
Rebuilding critical infrastructure
“As announced in May, we are also reinvesting $1.8 billion over three years in rebuilding the business,” Mr Fahour said.
“This will go to product and service innovation, building infrastructure, and compliance/regulatory issues.
“In 2006 and beyond, the investment mix will shift towards projects that give us bottom line returns and rejuvenate our systems and infrastructure. This includes investments in our Retail branch network, re-engineering of our lending processes and building new products and services for our customers.”
Becoming cost-competitive
“We are still inefficient compared to best practice,” Mr Fahour said. “We intend to keep underlying cost growth under 3% per annum on average over the next three years.”
Early gains have been achieved through a number of initiatives including the integration of support functions across the business, cancellation of low-value projects and reduction in the use of consultants.
The 1000 job reductions announced in May have been completed.
Longer-term, value-adding initiatives include process re-engineering to free up capacity, simplification of technology architecture and rationalisation of suppliers. We will ‘right-source’ to ensure functions are performed in-house or externally in Australia or overseas as appropriate and this will mean another 1000 job reductions over the next two years, as announced in May.
Managing our portfolio of businesses
“Each of the NAB’s business units is at a different starting position, and each has a plan to become truly competitive,” Mr Fahour said.
Business & Private Banking:
Business and Private is very strongly positioned. Features of the growth strategy include:
• Further specialisation in specific industry groups;
• Greater banker empowerment and authority;
• Cross-sell into transaction banking and wealth management.
Retail Banking:
The Retail business faces reinvigorated incumbents and a raft of new competitors. A major improvement program will include:
• Re-investment and training for sales and service;
• Re-investing in and upgrading our branches;
• Profit and Loss accountability to be managed by new local area markets;
• Increased sales capabilities to be put back into major outlets.
2
Wealth Management:
The Wealth Management business enjoys a strong brand and market position. There will be a strong focus on:
• Improving service levels;
• Revitalising the ‘manager of managers’ platform;
• Investment in product innovation;
• Cross-sell into the bank channel.
These plans will ensure the Wealth Management business participates in the exciting growth opportunities available to it.
For further information:
Geoff Lynch
Head of Media Relations Australia
03 8634 1564 work
0405 319 819 mobile
Samantha Evans
External Relations Manager
03 8641 4982 work
0404 883 509 mobile
Hany Messieh
Group Manager, Investor Relations
03 8641 2312 work
0414 446 876 mobile
Mr Fahour’s full strategy presentation is available on www.nabgroup.com and www.national.com.au.
DISCLAIMER
This statement contains certain “forward-looking statements” within the meaning of Section 21E of the US Securities Exchange Act of 1934 and the US Private Securities Litigation Reform Act of 1995. The words “anticipate”, “believe”, “expect”, “project”, “estimate”, “likely”, “intend”, “should”, “could”, “may”, “target”, “plan” and other similar expressions are intended to identify forward-looking statements. Indications of and guidance on future earnings and financial position and performance are also forward-looking statements. Such forward-looking statements are not guarantees of future performance and involve known and unknown risks, uncertainties and other factors, many of which are beyond the control of the Group, that may cause actual results to differ materially from those expressed or implied in such statements. There can be no assurance that actual outcomes will not differ materially from these statements. For further information relating to the identification of forward-looking statements and important factors that could cause actual results to differ materially from those projected in such statements, see “Presentation of Information - Forward-Looking Statements” and “Risk Factors” in the Group’s Annual Report on Form 20-F filed with the US Securities & Exchange Commission.
3

Link to searchable text of slide shown above

Link to searchable text of slide shown above
Link to searchable text of slide shown above

Link to searchable text of slide shown above
Link to searchable text of slide shown above

Link to searchable text of slide shown above

Link to searchable text of slide shown above

Link to searchable text of slide shown above

Link to searchable text of slide shown above
Link to searchable text of slide shown above
Link to searchable text of slide shown above
Link to searchable text of slide shown above
Link to searchable text of slide shown above

Link to searchable text of slide shown above
Link to searchable text of slide shown above
Link to searchable text of slide shown above
Link to searchable text of slide shown above

Link to searchable text of slide shown above

Link to searchable text of slide shown above
Link to searchable text of slide shown above

Link to searchable text of slide shown above
Link to searchable text of slide shown above
Link to searchable text of slide shown above
Link to searchable text of slide shown above
Link to searchable text of slide shown above

Link to searchable text of slide shown above

Link to searchable text of slide shown above
Link to searchable text of slide shown above

Link to searchable text of slide shown above
Link to searchable text of slide shown above

Link to searchable text of slide shown above

Link to searchable text of slide shown above

Link to searchable text of slide shown above
Link to searchable text of slide shown above
Link to searchable text of slide shown above
Link to searchable text of slide shown above

Link to searchable text of slide shown above

Link to searchable text of slide shown above

Link to searchable text of slide shown above
Link to searchable text of slide shown above
Link to searchable text of slide shown above
Link to searchable text of slide shown above

Link to searchable text of slide shown above

Link to searchable text of slide shown above
Link to searchable text of slide shown above
Link to searchable text of slide shown above
Link to searchable text of slide shown above
Link to searchable text of slide shown above
Link to searchable text of slide shown above

Link to searchable text of slide shown above
Link to searchable text of slide shown above
Link to searchable text of slide shown above
Link to searchable text of slide shown above
Link to searchable text of slide shown above
Link to searchable text of slide shown above
Link to searchable text of slide shown above
Link to searchable text of slide shown above

Link to searchable text of slide shown above
Link to searchable text of slide shown above
Link to searchable text of slide shown above
Link to searchable text of slide shown above

Link to searchable text of slide shown above
Link to searchable text of slide shown above
Link to searchable text of slide shown above

Link to searchable text of slide shown above
Link to searchable text of slide shown above

Link to searchable text of slide shown above
Link to searchable text of slide shown above
Link to searchable text of slide shown above
Link to searchable text of slide shown above
Link to searchable text of slide shown above
Link to searchable text of slide shown above
Link to searchable text of slide shown above

Link to searchable text of slide shown above

Link to searchable text of slide shown above

Link to searchable text of slide shown above

Link to searchable text of slide shown above
Link to searchable text of slide shown above
Link to searchable text of slide shown above
Link to searchable text of slide shown above
Link to searchable text of slide shown above
Link to searchable text of slide shown above
Link to searchable text of slide shown above
Link to searchable text of slide shown above
Link to searchable text of slide shown above
Link to searchable text of slide shown above

Link to searchable text of slide shown above

Link to searchable text of slide shown above

Link to searchable text of slide shown above

Link to searchable text of slide shown above
Link to searchable text of slide shown above

Link to searchable text of slide shown above

Link to searchable text of slide shown above

Link to searchable text of slide shown above
Link to searchable text of slide shown above
Link to searchable text of slide shown above
Link to searchable text of slide shown above
Link to searchable text of slide shown above
Link to searchable text of slide shown above
Link to searchable text of slide shown above
Link to searchable text of slide shown above
Link to searchable text of slide shown above
Link to searchable text of slide shown above
Link to searchable text of slide shown above

Link to searchable text of slide shown above
Link to searchable text of slide shown above
Link to searchable text of slide shown above

Link to searchable text of slide shown above
Searchable text section of graphics shown above
National Australia Bank
Australian Region Market Update
28 September 2005
Victory Room Telstra Dome, Melbourne
[LOGO]
Agenda
9:30am | Welcome | John Stewart |
9:40am | Organisation & Strategy | Ahmed Fahour |
10:15am | Business & Private Banking | George Frazis |
|
| joined by Bruce Munro |
10:50am | Q&A | Presenter’s Panel |
11:15am | Break / Tea / Coffee |
|
11:30am | Introduction to Section | Ahmed Fahour |
11:35am | Retail Banking | Andrew Thorburn |
12:00pm | Product & Service | Jeremy Dean |
12:20pm | Wealth Management | Steve Tucker |
12:45pm | Q&A | Presenter’s Panel |
1:35pm | Close | Ahmed Fahour |
1:45pm | Lunch Break |
|
From 2:15pm | Docklands Tour |
|
2:45pm | Media Conference |
|
3:15pm | Close |
|
2
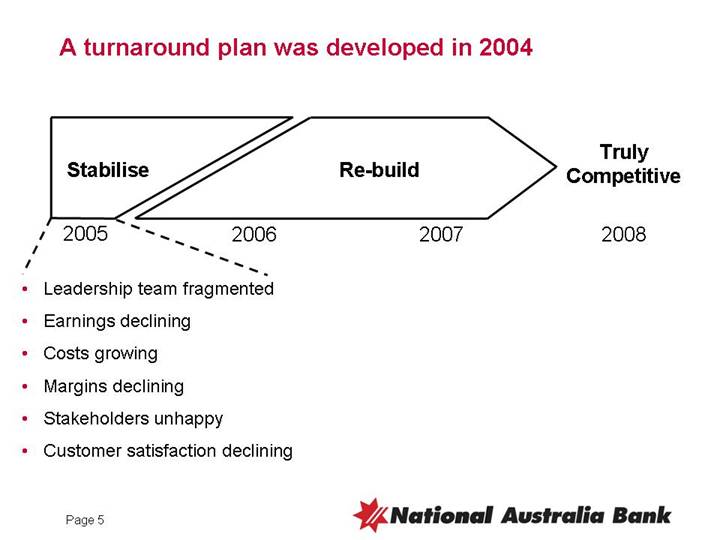
A turnaround plan was developed in 2004
[CHART]
• Leadership team fragmented
• Earnings declining
• Costs growing
• Margins declining
• Stakeholders unhappy
• Customer satisfaction declining
5
New Australian Region…customer focus and simplicity
Three Silos |
| New Australian Model | ||
|
|
| ||
CIB | FSA | MLC |
| Support |
6
Australian Executive Team
Distribution |
| Product |
| Support |
[GRAPHIC] |
| [GRAPHIC] |
| [GRAPHIC] |
George Frazis |
| Bruce Munro |
| Ewen Stafford |
Business & Private Banking |
| Business Products & Services |
| Chief Financial Officer |
|
|
|
|
|
[GRAPHIC] |
| [GRAPHIC] |
| [GRAPHIC] |
Andrew Thorburn |
| Jeremy Dean |
| Bob Stribling |
Retail Banking |
| Consumer Products & Services |
| Chief Risk Officer |
|
|
|
|
|
[GRAPHIC] |
| [GRAPHIC] |
| [GRAPHIC] |
Matt Lawler |
| Steve Tucker |
| Elizabeth Hunter |
Financial Planning & Third Party |
| Wealth Management Services |
| People & Culture |
Distribution |
|
|
|
|
|
|
|
|
|
|
|
|
| [GRAPHIC] |
|
|
|
| Michelle Tredenick |
|
|
|
| Chief Information Officer |
|
|
|
|
|
|
|
|
| [GRAPHIC] |
|
|
|
| Greg Sutherland |
|
|
|
| Strategy & Marketing |
7
Our leaders are clear about their accountabilities
Distribution |
| Product |
| Support |
• Revenue Growth |
| • Profit After Tax Growth |
| • Cost Efficiency |
• Gross Margin |
| • Return on Equity/Return on Economic Capital |
| • Speed |
• Market Share/Share of Wallet |
| • Market Share |
| • Product/Distribution Satisfaction |
• Risk Profile/Business Quality |
| • Risk Profile/Business Quality |
| • MI Quality |
• Cross-Sell |
| • Unit Cost |
| • Risk Profile |
• Customer Satisfaction |
| • Cross-sell |
| • Employee Satisfaction |
• Employee Satisfaction |
| • Employee Satisfaction |
| • Stakeholder Engagement |
• Stakeholder Engagement |
| • Stakeholder Engagement |
|
|
|
|
|
|
|
Customer/Distribution |
| Product Segment |
| Overall Business/ |
|
|
8
Customer numbers and satisfaction are growing again
Customer Movements (Feb 2004 – July 2005)^
[CHART]
Customer Satisfaction (August 2005*)
|
| % of each institutions’ |
| August 2004 – |
|
|
| customers who are satisfied** |
| August 2005 |
|
Major Bank 1 |
| 73.2 | % | +2.7 | % |
Major Bank 2 |
| 62.2 | % | +0.9 | % |
NAB |
| 64.7 | % | +3.4 | % |
Major Bank 3 |
| 68.9 | % | +2.2 | % |
Total of the Four Major Banks |
| 65.9 | % | +2.0 | % |
Total Market |
| 70.9 | % | +1.9 | % |
^ Total Australian Region
* August 2005 results are preliminary only
** Satisfaction is based on customers who answered very or fairly satisfied
Base: Population Aged 14+, all time periods relate to a 6 month average
Source: Customer Satisfaction – Roy Morgan Research
9
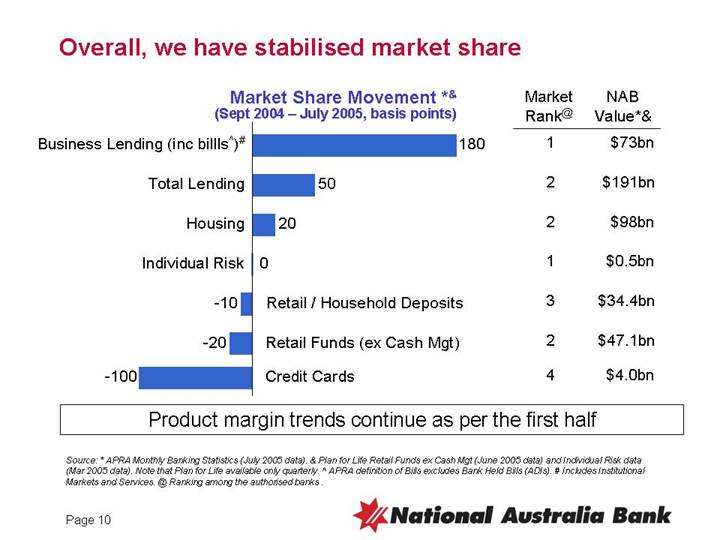
Overall, we have stabilised market share
Market Share Movement *&
(Sept 2004 – July 2005, basis points)
[CHART]
Market |
| NAB |
| |
1 |
| $ | 73 | bn |
2 |
| $ | 191 | bn |
2 |
| $ | 98 | bn |
1 |
| $ | 0.5 | bn |
3 |
| $ | 34.4 | bn |
2 |
| $ | 47.1 | bn |
4 |
| $ | 4.0 | bn |
Product margin trends continue as per the first half
Source: * APRA Monthly Banking Statistics (July 2005 data). & Plan for Life Retail Funds ex Cash Mgt (June 2005 data) and Individual Risk data (Mar 2005 data). Note that Plan for Life available only quarterly. ^ APRA definition of Bills excludes Bank Held Bills (ADIs). #Includes Institutional Markets and Services. @ Ranking among the authorised banks .
10
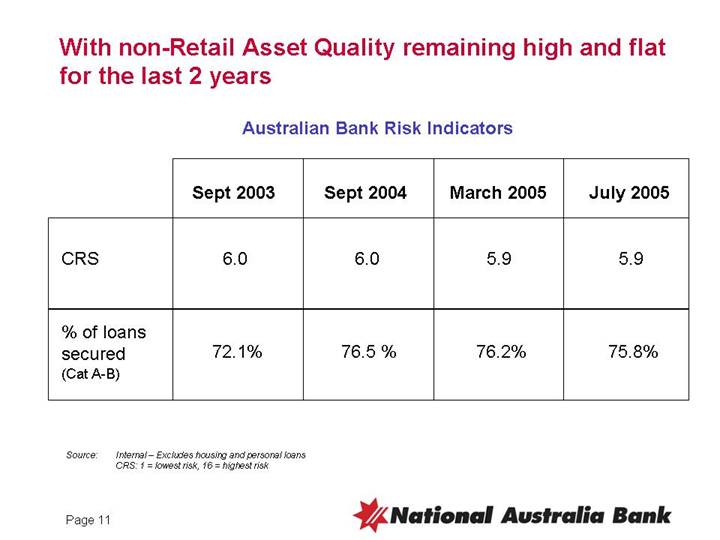
With non-Retail Asset Quality remaining high and flat for the last 2 years
Australian Bank Risk Indicators
|
| Sept 2003 |
| Sept 2004 |
| March 2005 |
| July 2005 |
|
|
|
|
|
|
|
|
|
|
|
CRS |
| 6.0 |
| 6.0 |
| 5.9 |
| 5.9 |
|
|
|
|
|
|
|
|
|
|
|
% of loans secured (Cat A-B) |
| 72.1 | % | 76.5 | % | 76.2 | % | 75.8 | % |
Source: Internal – Excludes housing and personal loans
CRS: 1 = lowest risk, 16 = highest risk
11
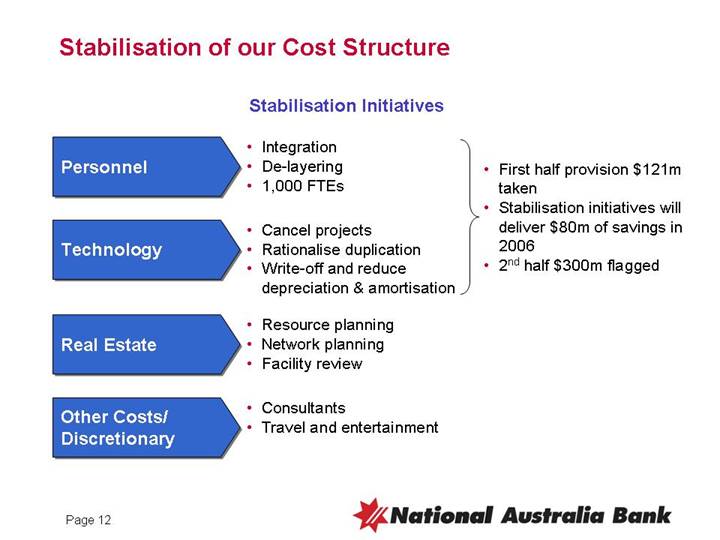
Stabilisation of our Cost Structure
Stabilisation Initiatives
Personnel |
| • Integration |
|
|
| • De-layering |
|
| |
| • 1,000 FTEs |
| • First half provision $121m taken | |
|
|
|
|
|
Technology |
| • Cancel projects |
| • Stabilisation initiatives will deliver $80m of savings in 2006 |
| • Rationalise duplication |
|
| |
| • Write-off and reduce depreciation & amortisation |
| • 2nd half $300m flagged | |
|
|
|
|
|
Real Estate |
| • Resource planning |
|
|
| • Network planning |
|
| |
| • Facility review |
|
| |
|
|
|
|
|
Other Costs/ |
| • Consultants • Travel and entertainment |
|
|
|
|
|
12
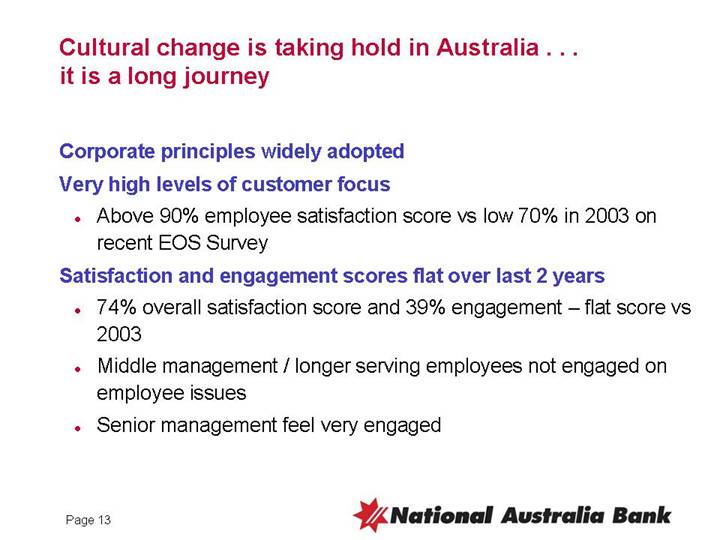
Cultural change is taking hold in Australia . . . it is a long journey
Corporate principles widely adopted
Very high levels of customer focus
• Above 90% employee satisfaction score vs low 70% in 2003 on recent EOS Survey
Satisfaction and engagement scores flat over last 2 years
• 74% overall satisfaction score and 39% engagement – flat score vs 2003
• Middle management / longer serving employees not engaged on employee issues
• Senior management feel very engaged
13
Significant progress has been made in stabilising the business
Summary
Culture and People |
| External Stakeholders |
• Refresh Leadership team |
| • Delivering on enforceable undertakings |
• Build an integrated regional model organised around the customer |
| • Embed a Compliance Gateway |
• Clear performance targets and accountability for achievements |
| • Make significant effort against audit items |
• Embed our Corporate Principles |
| • Strengthen relationship with regulators |
|
| • Re-engage with community groups |
|
|
|
Business Efficiency/Cost Platform |
| Revenue Growth |
• Business unit efficiency initiatives |
| • Improve customer service proposition |
• Halt discretionary spend |
| • Develop several new products |
• Start to gain control of expenses |
| • Stabilise market share in key segments |
• Impose productivity improvements on suppliers |
| • Energise frontline |
• Cancelled unnecessary projects |
| • Address credit settings |
|
| • Focus on margin management / asset quality |
14
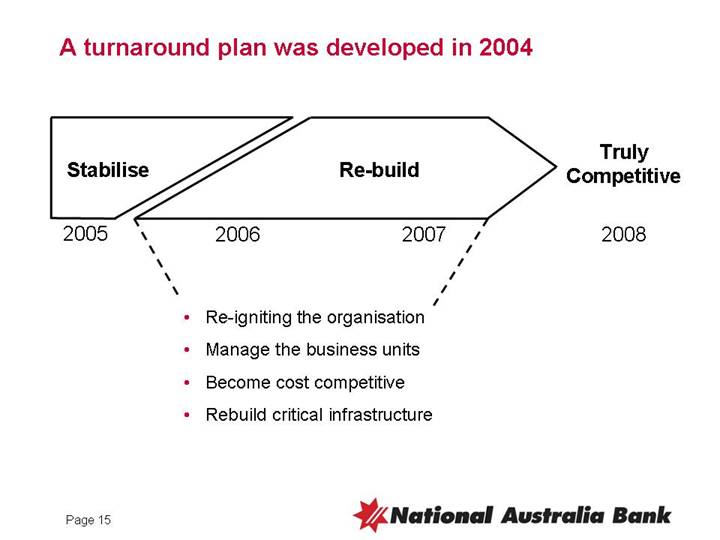
A turnaround plan was developed in 2004
[CHART]
• Re-igniting the organisation
• Manage the business units
• Become cost competitive
• Rebuild critical infrastructure
15
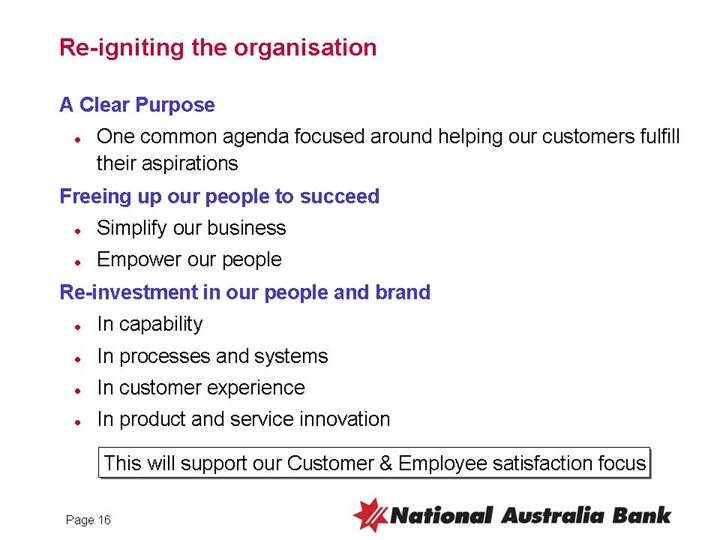
Re-igniting the organisation
A Clear Purpose
• One common agenda focused around helping our customers fulfill their aspirations
Freeing up our people to succeed
• Simplify our business
• Empower our people
Re-investment in our people and brand
• In capability
• In processes and systems
• In customer experience
• In product and service innovation
This will support our Customer & Employee satisfaction focus
16
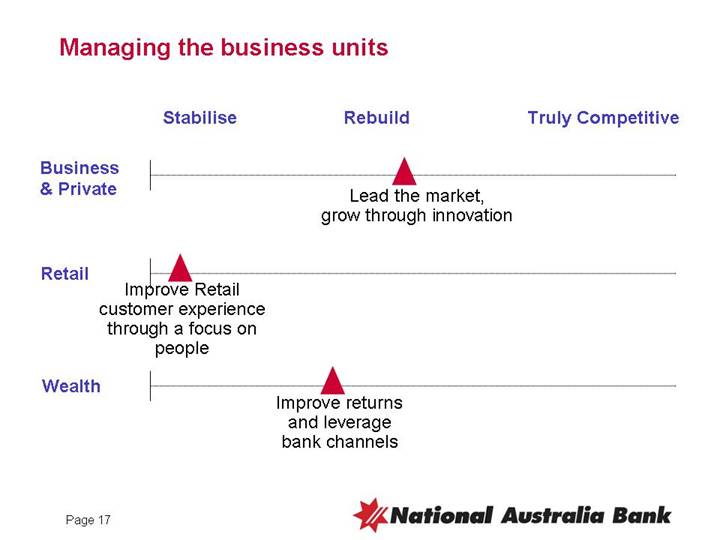
Managing the business units
|
| Stabilise |
| Rebuild |
| Truly Competitive |
|
|
|
|
|
|
|
Business & Private |
|
|
| [GRAPHIC] |
|
|
|
|
|
|
|
|
|
Retail |
| [GRAPHIC] |
|
|
|
|
|
|
|
|
|
|
|
Wealth |
|
|
| [GRAPHIC] |
|
|
17
Becoming cost competitive
|
| Stabilisation Initiation |
| Rebuilding (benefits in 2007/2008) |
|
|
|
|
|
|
| • Integration |
| • Quality process management |
Personnel |
| • De-layering |
| • Reengineering |
|
| • 1,000 FTEs |
| • 1,000 FTEs |
|
|
|
|
|
|
| • Cancel projects |
| • Simplify our architecture |
Technology |
| • Rationalise duplication |
| • Cost effective platforms |
|
| • Write-off and reduce depreciation & amortisation contracts |
| • Improve delivery capability |
|
|
|
| • Negotiate better supplier |
|
|
|
|
|
|
| • Resource planning |
| • Rationalisation of non-Network |
Real Estate |
| • Network planning |
| • Network adjustments |
|
| • Facility review |
| • Improved facility management |
|
|
|
|
|
Other Costs/ |
| • Consultants • Travel /Entertainment |
| • Supplier rationalisation • Right sourcing |
|
|
18
Our cost reduction efforts will more than offset normal cost growth
Cost Movement from 2006 – 2008*
[CHART]
eg | Labour | Outsourced |
* Indicative, not to scale
19
Reinvesting in our business
• Significant investment in rebuilding our business - $1.8bn over three years for Australia which is 70% of our Group forecast of around $2.5bn
• Re-investment already built into our plans
• Profile/mix of investment is changing
• Compliance/regulatory
• Product and service innovation
• Infrastructure
• Strengthening our investment disciplines
• Governance
• Culture
• Sustainable and strategic
20
Becoming cost competitive in a sustainable way. . . while investing in critical infrastructure
Cost Movement from 2006 – 2008*
[CHART]
Eg | Labour | Outsourced |
* Indicative, not to scale
21
Summary
This is a turnaround plan, problems understood Right people in right place – focused on the right things Significant progress in stabilising the business Future built on strong customer franchise and executing well
Four key priorities in rebuilding the business
• Re-igniting organisation
• Managing business units
• Becoming cost competitive
• Rebuilding critical infrastructure
Will be truly competitive in 2008
22
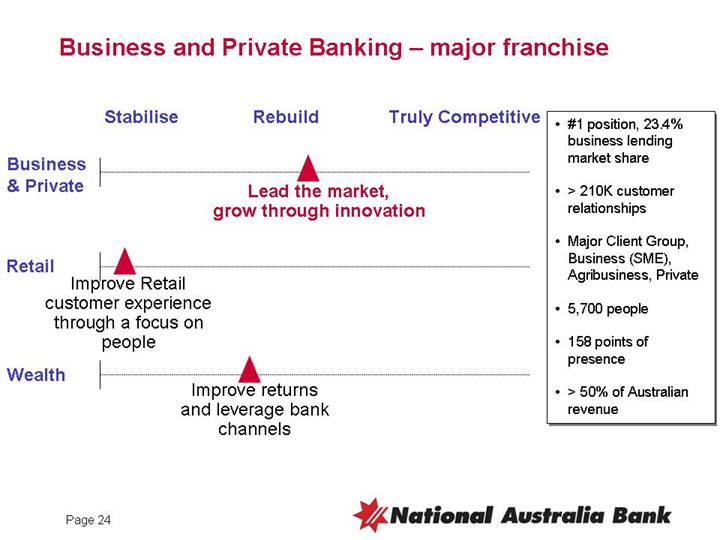
Business and Private Banking – major franchise
|
| Stabilise |
| Rebuild |
| Truly Competitive |
|
|
|
|
|
|
|
Business & Private |
|
|
| [GRAPHIC] |
|
|
|
|
|
|
|
|
|
Retail |
| [GRAPHIC] |
|
|
|
|
|
|
|
|
|
|
|
Wealth |
|
|
| [GRAPHIC] |
|
|
• #1 position, 23.4% business lending market share
• > 210K customer relationships
• Major Client Group, Business (SME), Agribusiness, Private
• 5,700 people
• 158 points of presence
• > 50% of Australian revenue
24
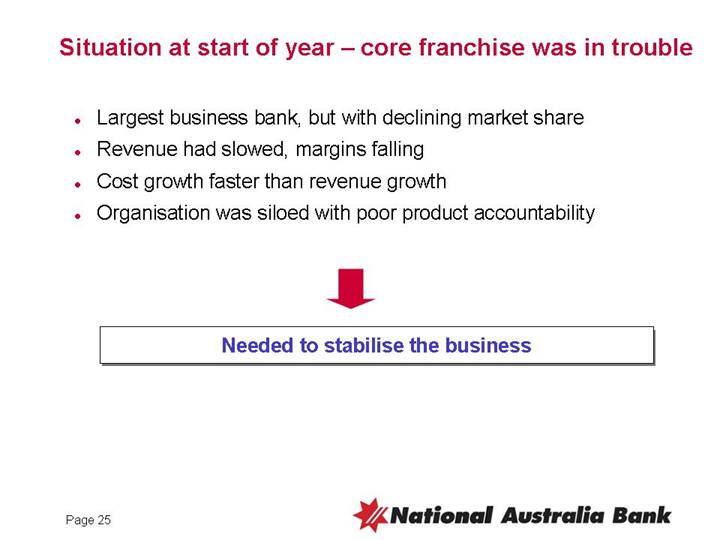
Situation at start of year – core franchise was in trouble
• Largest business bank, but with declining market share
• Revenue had slowed, margins falling
• Cost growth faster than revenue growth
• Organisation was siloed with poor product accountability
[GRAPHIC]
Needed to stabilise the business
25
Strong growth – Business and Private Banking driving both business and home lending growth
|
|
|
| Growth July YTD Annualised |
| |||
|
|
|
|
|
| Market |
| |
|
| Volumes |
| Business & |
| (RBA, |
| |
|
| ($bn)* |
| Private* |
| July 2005) |
| |
|
|
|
|
|
|
|
| |
Business Lending |
| $ | 64.3 |
| 19.8 | % | 11.9 | % |
|
|
|
|
|
|
|
| |
Home Lending |
| $ | 33.8 |
| 18.0 | % | 13.6 | % |
|
|
|
|
|
|
|
| |
Deposits |
| $ | 46.4 |
| 8.6 | % | 11.1 | % |
|
|
|
|
|
|
|
| |
Funds Under Management |
| $ | 4.8 |
| 31.4 | % | — |
|
*Includes Major Client Group, Business (SME), Agribusiness and Private Banking – excludes Corporate/IMS
26
We are gaining share – organically adding more than BankWest’s business lending**
Business Lending Growth YTD
APRA July 2005
[CHART]
Multiple of System |
| 1.88 |
| 1.21 |
| 0.91 |
| 0.38 |
| 1.27 |
| 0.95 |
| 0.81 |
| |||||||
Market Share |
| 23.4 | % | 19.1 | % | 14.9 | % | 12.9 | % | 4.7 | % | 4.4 | % | 3.2 | % | |||||||
Change in Market Share |
| 182 | bps | 38 | bps | -13 | bps | -81 | bps | 12 | bps | -2 | bps | -6 | bps | |||||||
Business Lending ($bn) |
| $ | 72.7 | * | $ | 59.3 |
| $ | 46.1 |
| $ | 40.0 |
| $ | 14.4 |
| $ | 13.7 |
| $ | 9.9 |
|
*Includes Corporate/IMS
** Using APRA data from September to July 2005
^System measures authorised banks
27
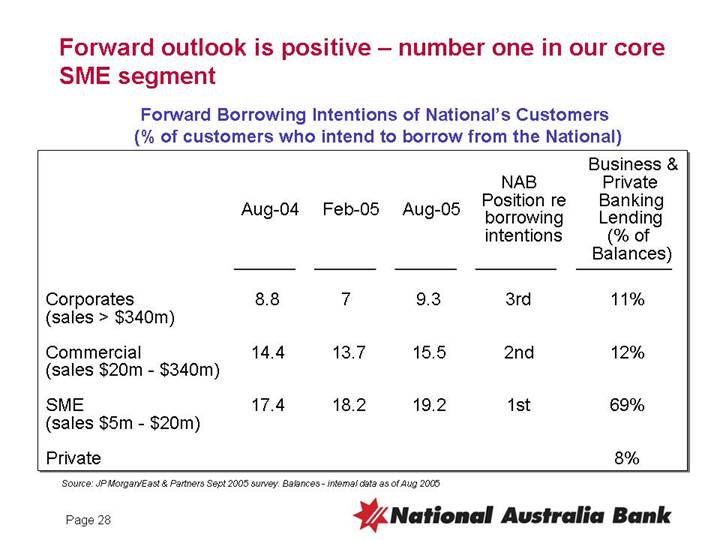
Forward outlook is positive – number one in our core SME segment
Forward Borrowing Intentions of National’s Customers
(% of customers who intend to borrow from the National)
|
|
|
|
|
|
|
|
|
| Business & |
|
|
|
|
|
|
|
|
| NAB |
| Banking |
|
|
|
|
|
|
|
|
| Position re |
| Lending |
|
|
|
|
|
|
|
|
| borrowing |
| (% of |
|
|
| Aug-04 |
| Feb-05 |
| Aug-05 |
| intentions |
| Balances) |
|
|
|
|
|
|
|
|
|
|
|
|
|
Corporates |
| 8.8 |
| 7 |
| 9.3 |
| 3rd |
| 11 | % |
|
|
|
|
|
|
|
|
|
|
|
|
Commercial |
| 14.4 |
| 13.7 |
| 15.5 |
| 2nd |
| 12 | % |
|
|
|
|
|
|
|
|
|
|
|
|
SME |
| 17.4 |
| 18.2 |
| 19.2 |
| 1st |
| 69 | % |
|
|
|
|
|
|
|
|
|
|
|
|
Private |
|
|
|
|
|
|
|
|
| 8 | % |
Source: JP Morgan/East & Partners Sept 2005 survey. Balances - internal data as of Aug 2005
28
Key indicators are positive – well managed, profitable growth
|
|
| Change |
|
|
|
| YTD |
|
Growth | Number of Customer Relationships |
| é |
|
Revenue / Customer Relationship |
| é |
| |
Return | Return on Economic Capital |
| è |
|
ROA |
| è |
| |
Productivity | Revenue / FTE |
| é |
|
Cost-to-income |
| ê |
| |
Number of People |
| ê |
| |
Risk | Avg. CRS (Customer Risk Rating) |
| è |
|
% Bus. Lending secured by Property |
| è |
| |
Price | Margin |
| è |
|
People | Satisfaction |
| è |
|
29
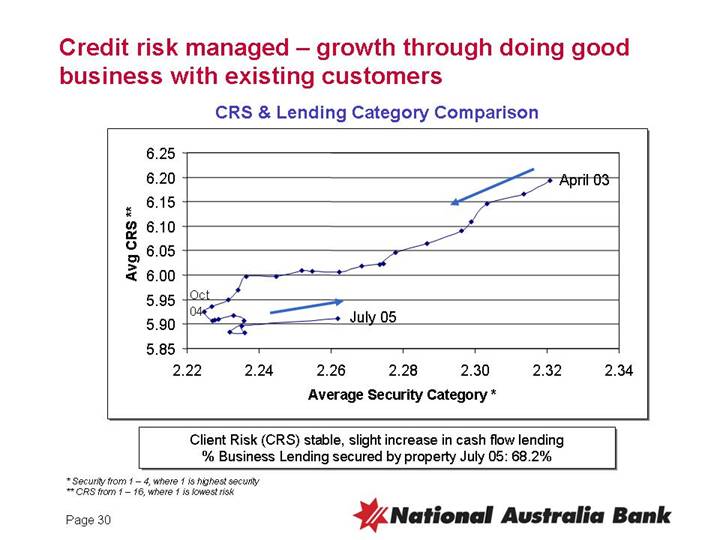
Credit risk managed – growth through doing good business with existing customers
CRS & Lending Category Comparison
[CHART]
Client Risk (CRS) stable, slight increase in cash flow lending
% Business Lending secured by property July 05: 68.2%
* Security from 1 – 4, where 1 is highest security
** CRS from 1 – 16, where 1 is lowest risk
30
Structured plan implemented achieving quick performance improvement
1. Structure, People and Culture
• Performance and customer focus
• Organised around customers
• Decentralised credit, increased authority
• Best business bankers
2. 100 Initiatives Implemented
• Stretch target
• Quick decisions
• Monthly incentives
• Innovative products
• Reduced management levels
31
Our challenges
1. Competitor reaction, niche players
2. From lending to including transaction/deposit and insurance/wealth
3. Process improvement
4. Cultural journey – providing the environment for people to excel
32
Growth built on real advantage…
1. Continue leading in distribution, best bankers, more bankers in more places
2. Quick decisions, decentralised, connected to customers
3. Clear link between sales performance and reward
. . . good opportunities for further profitable growth
4. Innovative products, quick to market
5. New client segment businesses
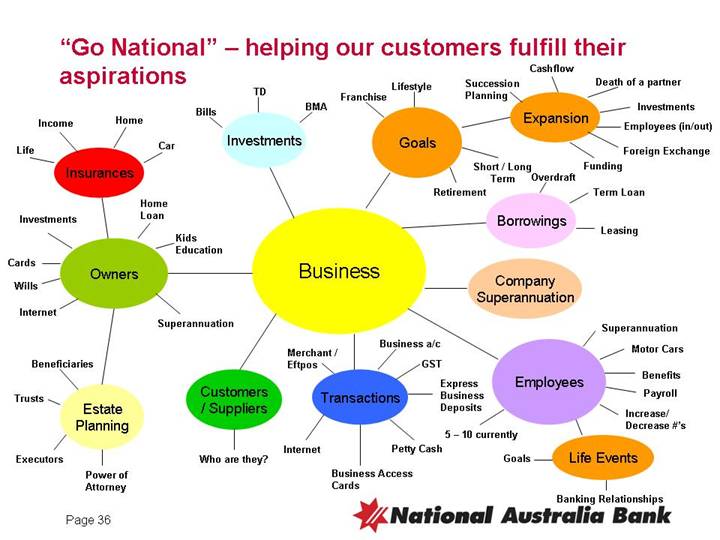
6. “Go National” – cross-sell deposits and wealth
33
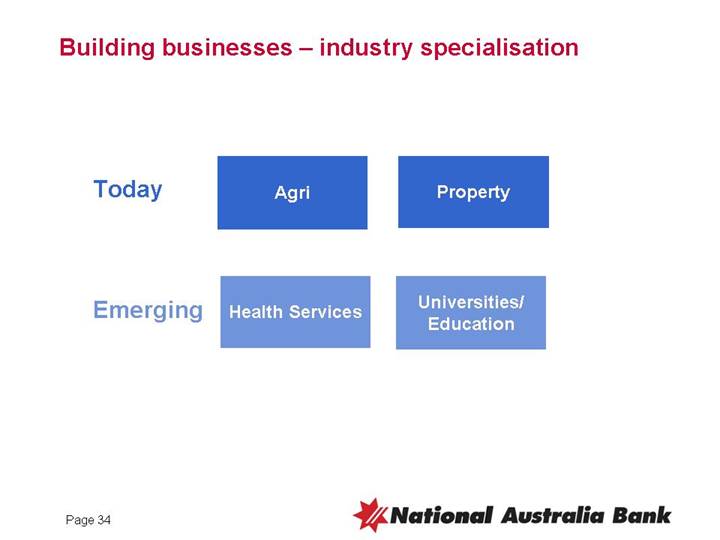
Building businesses – industry specialisation
Today |
| Agri |
| Property |
|
|
|
|
|
Emerging |
| Health Services |
| Universities/ Education |
34
Why transaction banking?
[CHART]
• Strong positive correlation between being a transaction bank and being regarded as the “primary bank”
• Being a transaction bank extends life of relationship by at least 30%
Source: East and Partners Top 500 Corporate Banking Report 2002 and December 2000; BCG Analysis
38
Lending vs Transactional Banking Share of SME Relationships: 2005 (% of principal supplier relationships)
[CHART]
Source: East and Partners (SME lending shares), RBA (lending shares) 2005
39
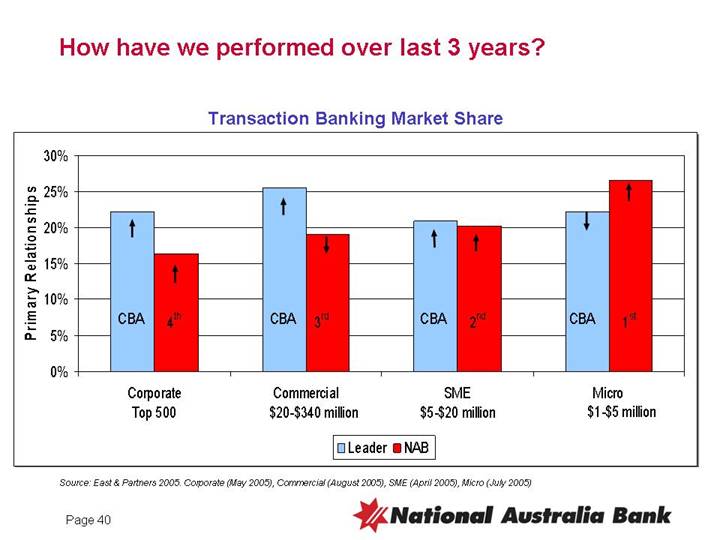
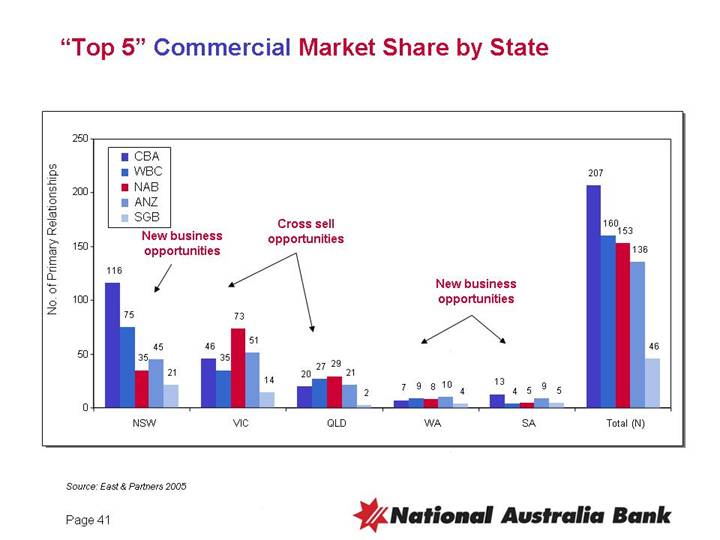
How have we performed over last 3 years?
Transaction Banking Market Share
[CHART]
Source: East & Partners 2005. Corporate (May 2005), Commercial (August 2005), SME (April 2005), Micro (July 2005)
40
What we are doing?
• New business model – end-to-end accountability
• The best people
• Banker – Specialist engagement
• New products and technology re-investment
42
Summary
• Major franchise back on growth path
• Volumes increasing
• Revenue increasing, margins stabilising
• Cost and FTEs reduced, improved productivity
• Underlying profit increasing
• Credit risk stable
• Growth based on a differentiated approach and sustainable
• Further profitable growth prospects going forward
43
National Australia Bank
Australian Region Market Update
28 September 2005
Victory Room Telstra Dome, Melbourne
Agenda
• Outline the situation in 2004
• Outline the actions we have taken to stabilise the business and the results
• Present our longer-term plans to grow the business
47
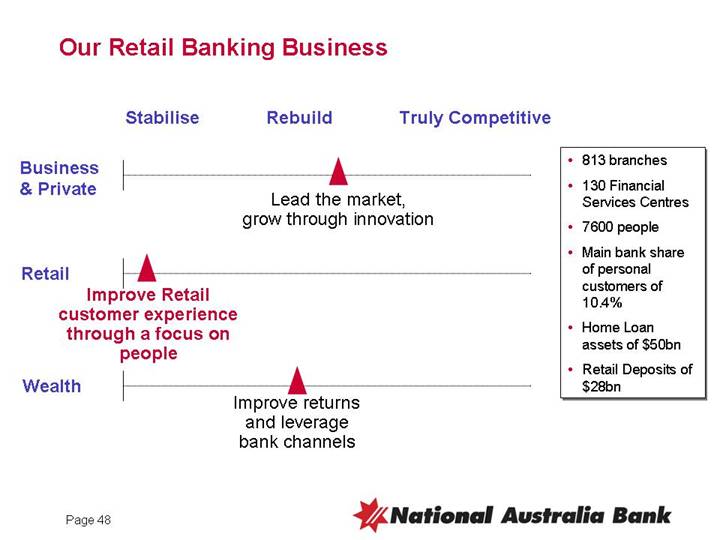
Our Retail Banking Business
[CHART]
• 813 branches
• 130 Financial Services Centres
• 7600 people
• Main bank share of personal customers of 10.4%
• Home Loan assets of $50bn
• Retail Deposits of $28bn
48
Business situation at the end of 2004
• Customer satisfaction below the average of the four majors
• Declining customer numbers
• Personal customer numbers declined over 2004
• Market share declining in key segments – home loans and retail deposits
• Stalled revenue growth
• No growth in revenue in 2004
49
The root causes of our problems were substantive, but are fixable
Low sales capability in branches
Lack of focus on people capability
• Limited incentives for performance
• Lack of core training for frontline staff
Underinvestment in physical network
• Property refresh cycle of 19 years
• Outdated Teller platform
Strained relationship platform
• Large set sizes
• Lack of focus on acquisition
Missing geographic opportunities
Manual processes
Lack of product competitiveness and innovation
Current Sales Capability in Branches
[CHART]
Current Incentive Pay
[CHART]
Source: Internal
50
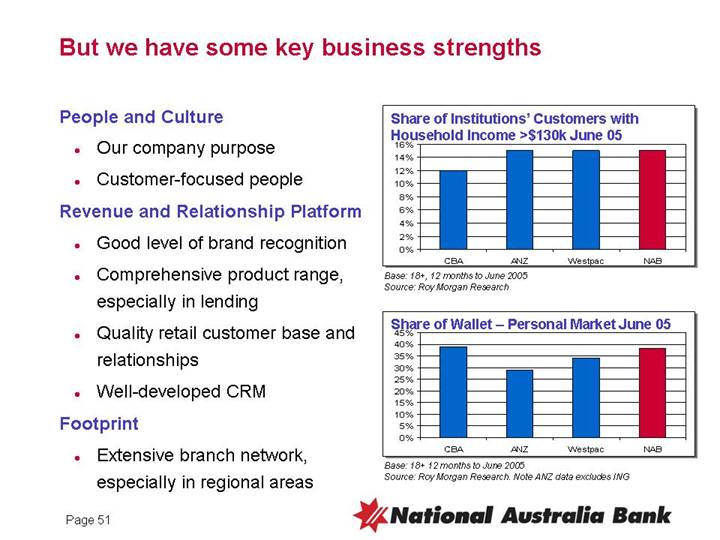
But we have some key business strengths
People and Culture
• Our company purpose
• Customer-focused people
Revenue and Relationship Platform
• Good level of brand recognition
• Comprehensive product range, especially in lending
• Quality retail customer base and relationships
• Well-developed CRM
Footprint
• Extensive branch network, especially in regional areas
Share of Institutions’ Customers with Household Income >$130k June 05
[CHART]
Base: 18+, 12 months to June 2005
Source: Roy Morgan Research
Share of Wallet – Personal Market June 05
[CHART]
Base: 18+ 12 months to June 2005
Source: Roy Morgan Research. Note ANZ data excludes ING
51
We focused on a number of key actions to stabilise the business
People and Structure
• Appointed right leaders within the right business model
• Re-connected with and energised front-line staff
Sales and Service
• Reinforced basic sales and service disciplines across network
• Launched new recognition programs
• Driven new product launches
• Consumer Finance
• Deposits
• Wealth focus
• Committed to growth
• New branches
• NSW/Qld focus
52
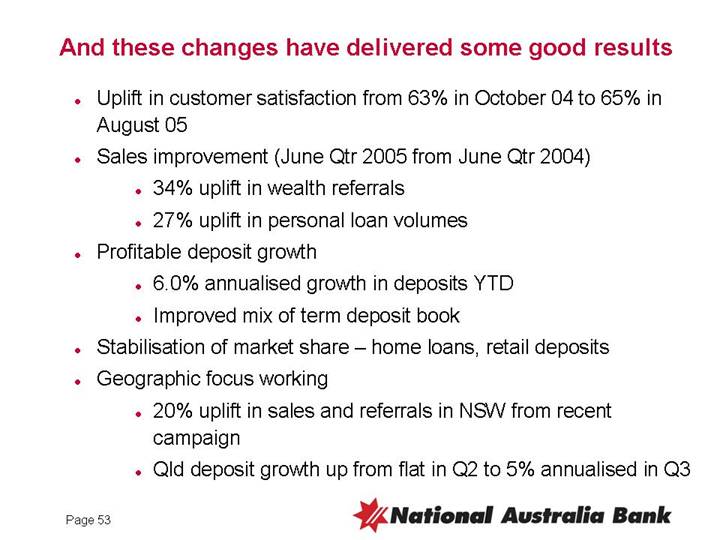
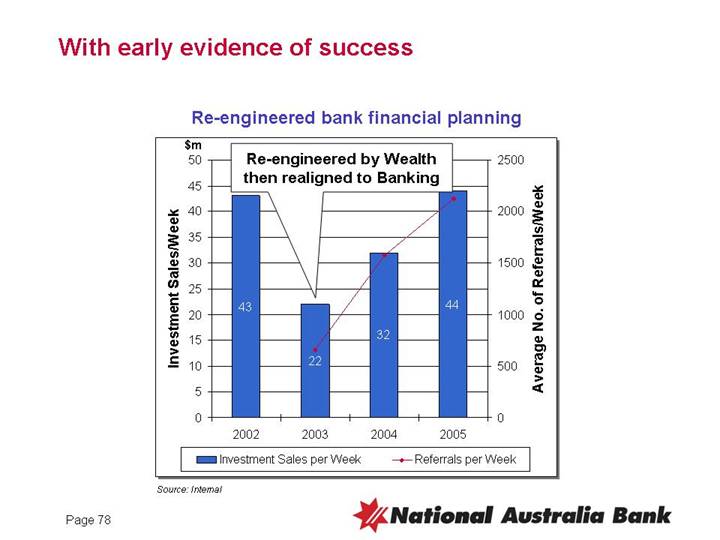
And these changes have delivered some good results
• Uplift in customer satisfaction from 63% in October 04 to 65% in August 05
• Sales improvement (June Qtr 2005 from June Qtr 2004)
• 34% uplift in wealth referrals
• 27% uplift in personal loan volumes
• Profitable deposit growth
• 6.0% annualised growth in deposits YTD
• Improved mix of term deposit book
• Stabilisation of market share – home loans, retail deposits
• Geographic focus working
• 20% uplift in sales and referrals in NSW from recent campaign
• Qld deposit growth up from flat in Q2 to 5% annualised in Q3
53
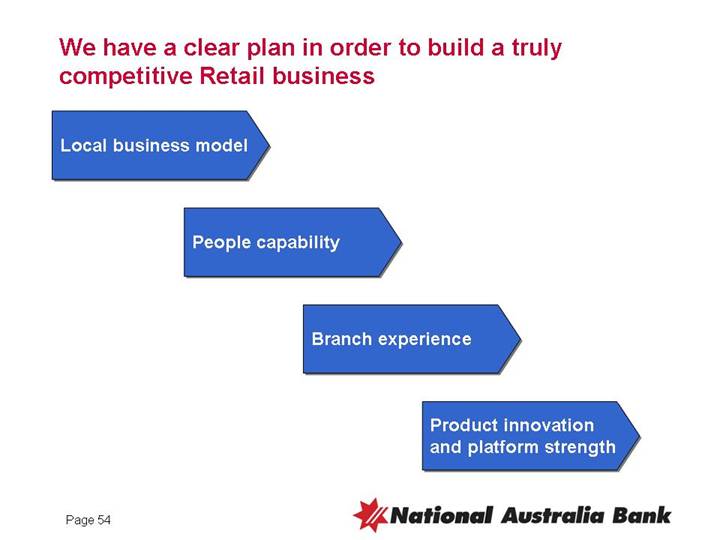
We have a clear plan in order to build a truly competitive Retail business
Local business model
People capability
Branch experience
Product innovation and platform strength
54
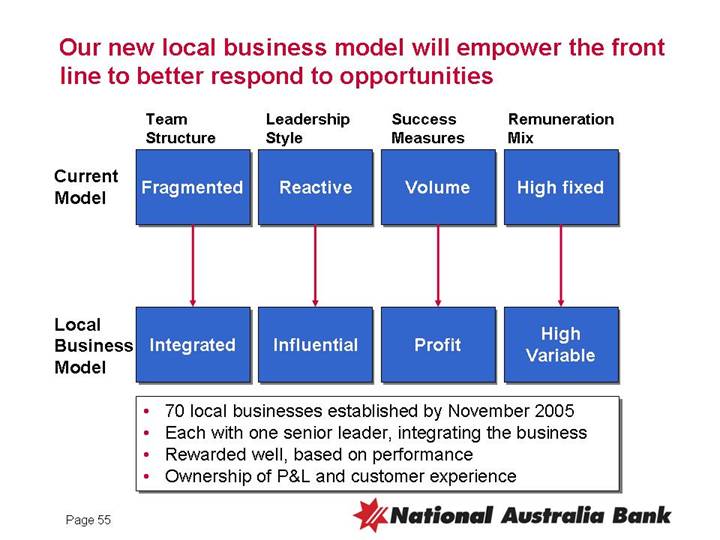
Our new local business model will empower the front line to better respond to opportunities
|
| Team |
| Leadership |
| Success |
| Remuneration |
|
| Structure |
| Style |
| Measures |
| Mix |
|
|
|
|
|
|
|
|
|
Current Model |
| Fragmented |
| Reactive |
| Volume |
| High fixed |
|
|
|
|
|
|
|
|
|
Local Business Model |
| Integrated |
| Influential |
| Profit |
| High Variable |
• 70 local businesses established by November 2005
• Each with one senior leader, integrating the business
• Rewarded well, based on performance
• Ownership of P&L and customer experience
55
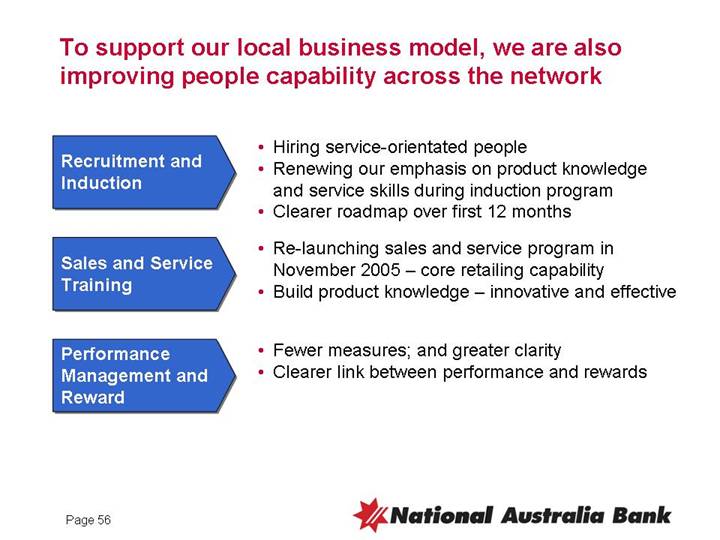
To support our local business model, we are also improving people capability across the network
Recruitment and Induction |
| • Hiring service-orientated people |
| • Renewing our emphasis on product knowledge and service skills during induction program | |
| • Clearer roadmap over first 12 months | |
|
|
|
Sales and Service Training |
| • Re-launching sales and service program in November 2005 – core retailing capability |
| • Build product knowledge – innovative and effective | |
|
|
|
Performance Management and Reward |
| • Fewer measures; and greater clarity |
| • Clearer link between performance and rewards |
56
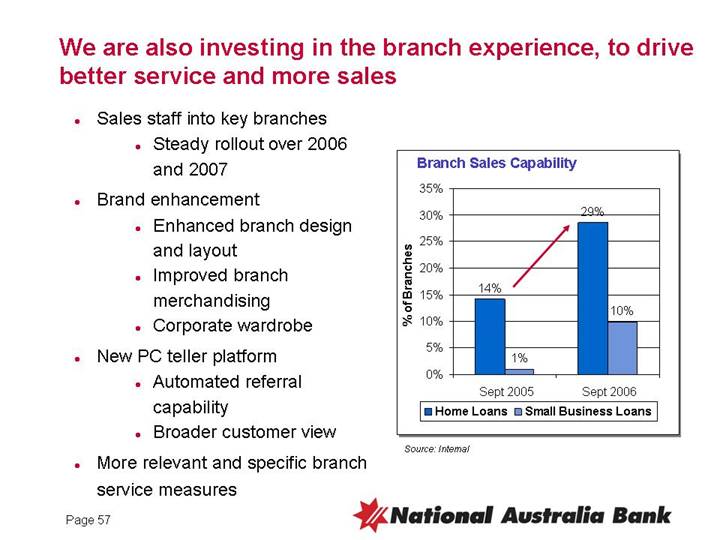
We are also investing in the branch experience, to drive better service and more sales
• Sales staff into key branches
• Steady rollout over 2006 and 2007
• Brand enhancement
• Enhanced branch design and layout
• Improved branch merchandising
• Corporate wardrobe
• New PC teller platform
• Automated referral capability
• Broader customer view
• More relevant and specific branch service measures
Branch Sales Capability
[CHART]
Source: Internal
57
Key messages
• We have substantive issues, but they are fixable
• We have implemented an action plan to stabilise the business and this has delivered good results
• Our longer term plan is simple and clear and is focused on:
• Local business model
• People capability
• Improved branch experience
• Product innovation and platform strengths
• The Retail Bank is being run like a business, for growth
58
Key design principles
• Restore product and process focus and accountability
• Align product, service and manufacturing to customer delivery
• Bring all of this closer to our customers
60
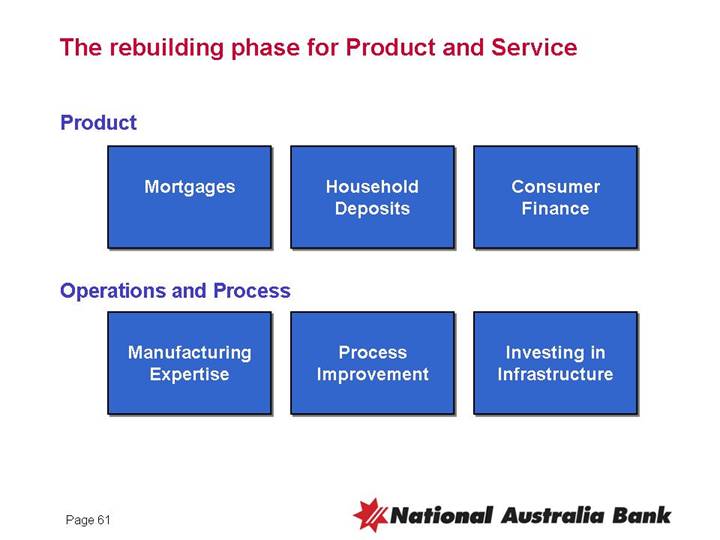
The rebuilding phase for Product and Service
Product
Mortgages |
| Household Deposits |
| Consumer Finance |
Operations and Process
Manufacturing Expertise |
| Process Improvement |
| Investing in Infrastructure |
61
We are managing the Mortgage portfolio for yield and growth
Share of Banking System – Housing Lending (Inc. Securitisation)
[CHART]
Source: APRA, July 2005
• Above system growth
• Market share stabilised
• Enhanced retention
• Limited margin decline
• Product innovation
• Driving tactical marketing campaigns
62
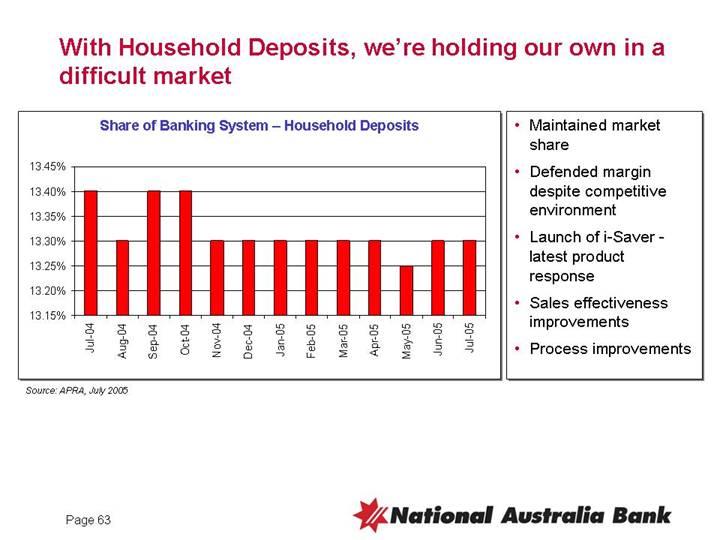
With Household Deposits, we’re holding our own in a difficult market
Share of Banking System – Household Deposits
[CHART]
Source: APRA, July 2005
• Maintained market share
• Defended margin despite competitive environment
• Launch of i-Saver - latest product response
• Sales effectiveness improvements
• Process improvements
63
In Consumer Finance, we are balancing a mature cards portfolio with other growth opportunities
Cards - Maturing
• Increased market saturation
• Structural change in market economics focussing on revolvers
• Low rate offers increasingly commonplace
Consumer Finance/Personal Loans - Growth opportunities
• Strong demand expected to continue into 2006
How are we re-building Consumer Finance?
• Simplification of product range eg Cards 39 to 4 core products.
• Innovative offers eg Visa Mini, Personal Project Loan
• Process improvements eg web-based approval for cards/personal loans – 20% of personal loans from web
• Revamp focus on consumer finance cross-sell opportunities
• Investigating non-conforming market
64
Summary – Product
• We’re recovering market share where it makes sense
• Our product margins are moving at industry levels of performance, we’re not buying volume
• We have not compromised our credit or risk settings for growth
65
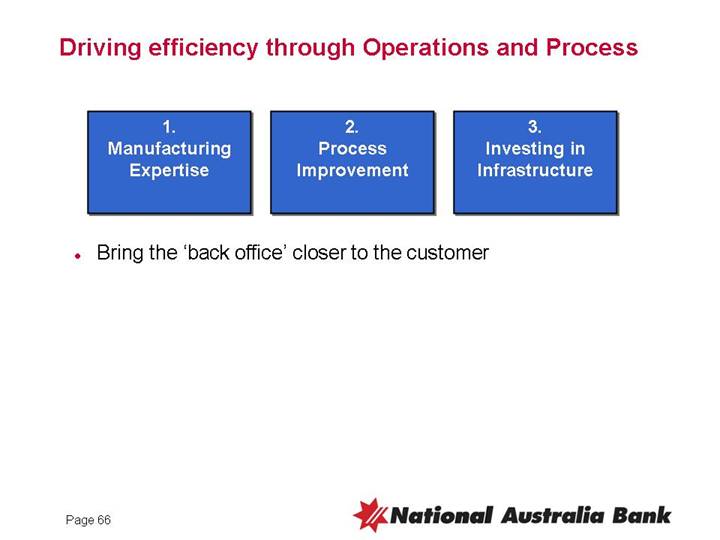
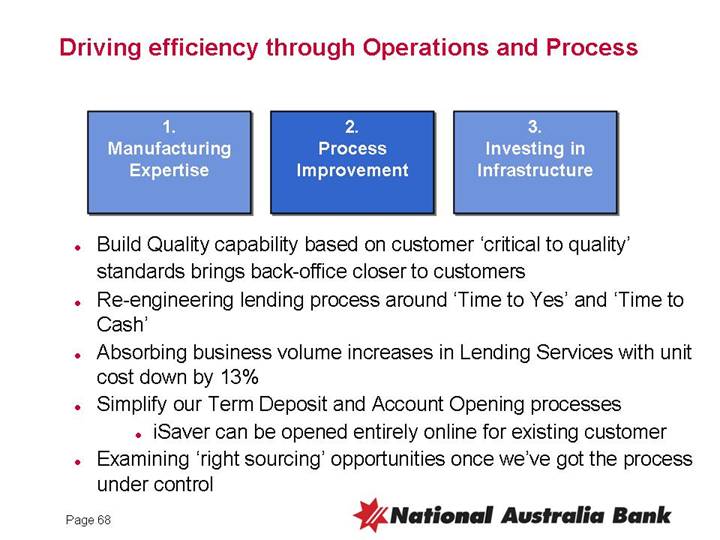
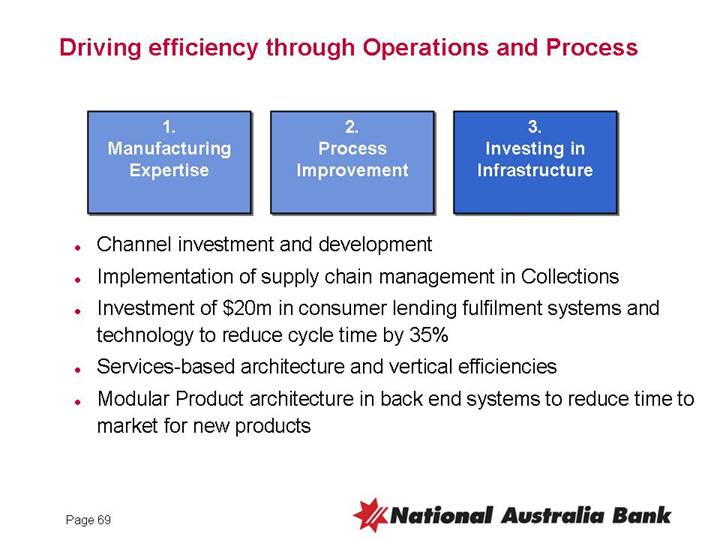
Driving efficiency through Operations and Process
1. |
| 2. |
| 3. |
Manufacturing Expertise |
| Process Improvement |
| Investing in Infrastructure |
• Bring the ‘back office’ closer to the customer
66
• Recruiting and developing manufacturing and operations expertise
• Embedding Active Operations Management in our Operations units
• Absorbing volume increases within flat or lower fixed costs
• Unit cost reductions through productivity improvements
• FTE saves through flexible workforce planning
• For example, Our Customer Service & Delivery unit in the last year;
• Volume increase of 11%, but
• Unit Cost reduction of 10%,
• Total Direct Costs reduced by 7.4% year on year
• Productivity Improvement of 21%
67
• Build Quality capability based on customer ‘critical to quality’ standards brings back-office closer to customers
• Re-engineering lending process around ‘Time to Yes’ and ‘Time to Cash’
• Absorbing business volume increases in Lending Services with unit cost down by 13%
• Simplify our Term Deposit and Account Opening processes
• iSaver can be opened entirely online for existing customer
• Examining ‘right sourcing’ opportunities once we’ve got the process under control
68
• Channel investment and development
• Implementation of supply chain management in Collections
• Investment of $20m in consumer lending fulfilment systems and technology to reduce cycle time by 35%
• Services-based architecture and vertical efficiencies
• Modular Product architecture in back end systems to reduce time to market for new products
69
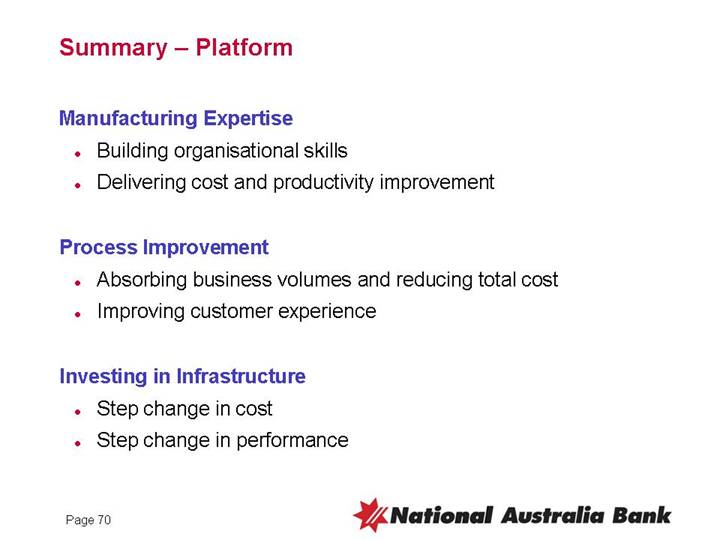
Summary – Platform
Manufacturing Expertise
• Building organisational skills
• Delivering cost and productivity improvement
Process Improvement
• Absorbing business volumes and reducing total cost
• Improving customer experience
Investing in Infrastructure
• Step change in cost
• Step change in performance
70
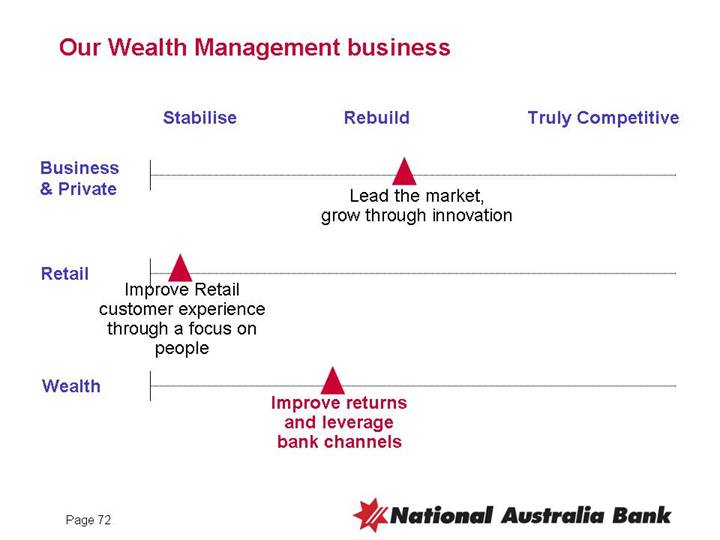
Our Wealth Management business
|
| Stablilise |
| Rebuild |
| Truly Competitive |
|
|
|
|
|
|
|
|
|
Business & Private |
|
|
| [GRAPHIC] |
|
|
|
|
|
|
|
|
|
|
|
Retail |
| [GRAPHIC] |
|
|
|
|
|
|
|
|
|
|
|
|
|
Wealth |
|
|
| [GRAPHIC] |
|
|
|
72
Overview
• Internal focus has set us up for growth
• Integration will deliver results
• Positioned for profitable growth in retail investments
• Capitalise on popularity of Manager of Managers style
• Accelerate sustainable growth in insurance
73
We are maintaining margins via efficiency gains
Our cost reductions are ahead of price declines
[CHART]
Source: Internal
75
Embracing the opportunities of the Regional Model
Retail |
| Fin Planning |
| Business |
| Corporates & |
| & Third Party |
|
| Institutional | ||
|
|
|
|
|
|
|
“Distribution” | ||||||
|
|
|
|
|
|
|
|
|
|
|
|
| Institutional |
Consumer |
| Wealth |
| Business |
| Markets & |
|
|
|
|
|
| Services |
|
|
|
|
|
|
|
“Products and Services” | ||||||
76
Retail |
| Fin Planning |
| Business |
| Corporates & |
| & Third Party |
|
| Institutional | ||
|
|
|
|
|
|
|
“Distribution” | ||||||
|
|
|
|
|
|
|
|
|
|
|
|
| Institutional |
Consumer |
| Wealth |
| Business |
| Markets & |
|
|
|
|
|
| Services |
|
|
|
|
|
|
|
“Products and Services” | ||||||
77
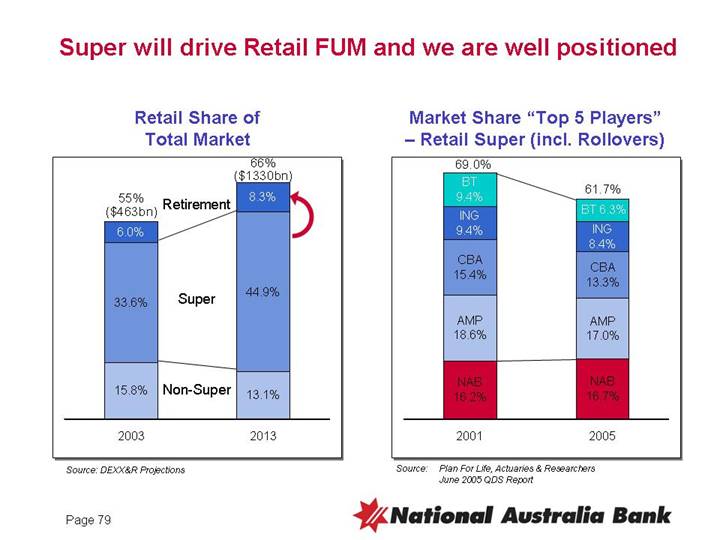
Super will drive Retail FUM and we are well positioned
Retail Share of Total Market
[CHART]
Source: DEXX&R Projections
Market Share “Top 5 Players” – Retail Super (incl. Rollovers)
[CHART]
Source: Plan For Life, Actuaries & Researchers June 2005 QDS Report
79
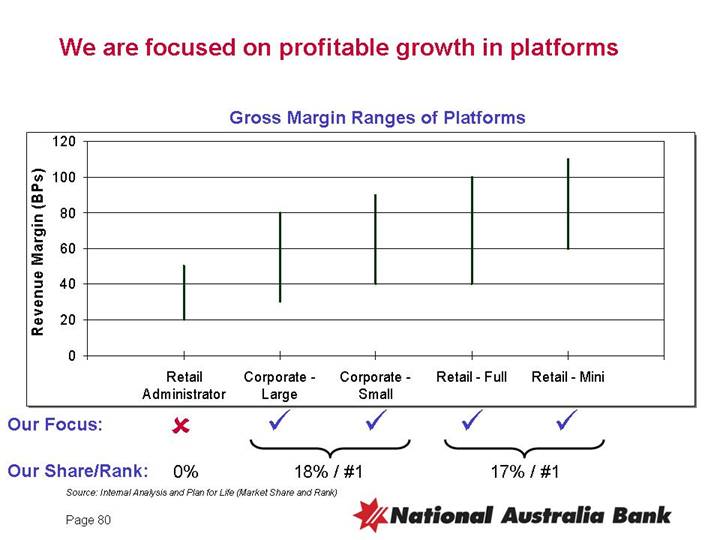
We are focused on profitable growth in platforms
Gross Margin Ranges of Platforms
[CHART]
Our Focus: |
| o |
| ý |
| ý |
| ý |
| ý |
|
|
|
|
|
|
|
|
|
|
|
|
|
Our Share/Rank: |
| 0% |
| 18% / #1 |
| 17% / #1 |
| ||||
Source: Internal Analysis and Plan for Life (Market Share and Rank)
80
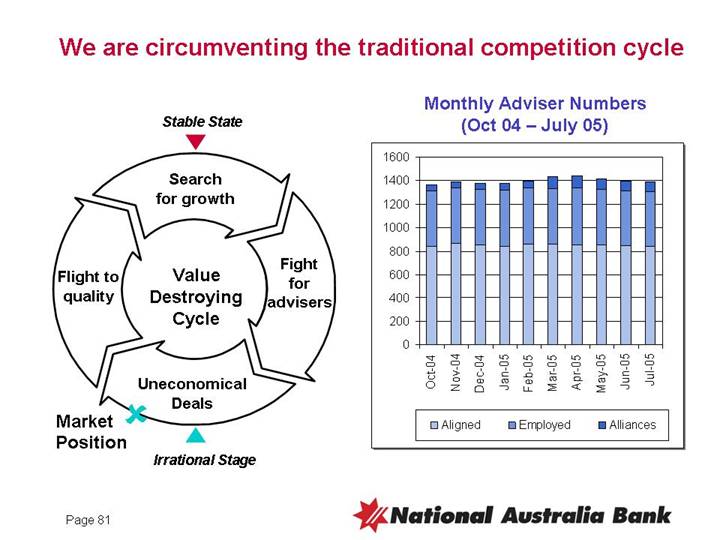
We are circumventing the traditional competition cycle
[GRAPHIC]
Monthly Adviser Numbers (Oct 04 – July 05)
[CHART]
81
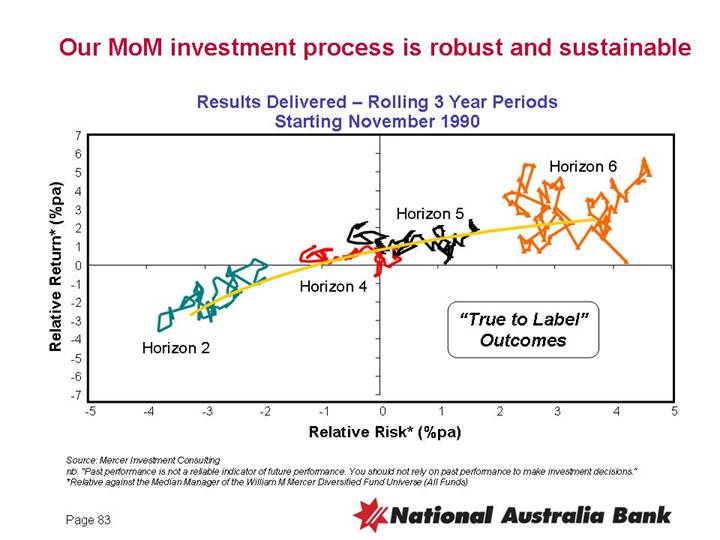
Our MoM investment process is robust and sustainable
Results Delivered – Rolling 3 Year Periods Starting November 1990
[CHART]
Source: Mercer Investment Consulting
nb. “Past performance is not a reliable indicator of future performance. You should not rely on past performance to make investment decisions.”
*Relative against the Median Manager of the William M Mercer Diversified Fund Universe (All Funds)
83
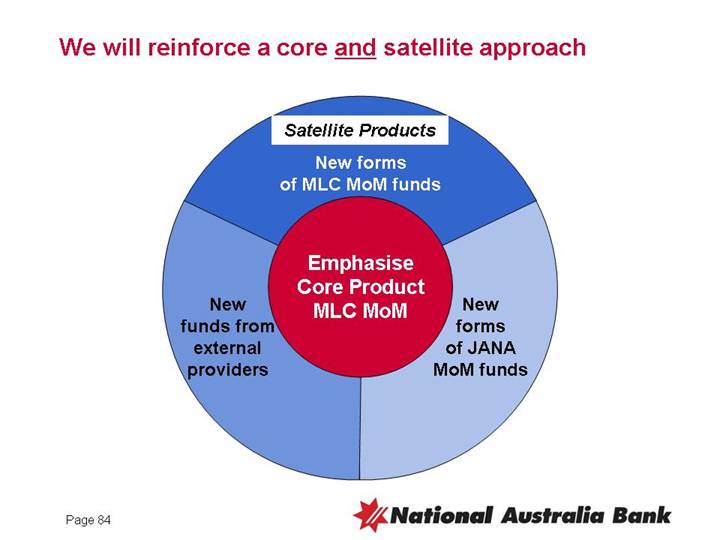
We will reinforce a core and satellite approach
|
| Satellite Products |
|
|
|
| New forms of MLC MoM funds |
|
|
|
|
|
|
|
|
| Emphasise Core Product MLC MoM |
|
|
New funds from external providers |
|
|
| New forms of JANA MoM funds |
84
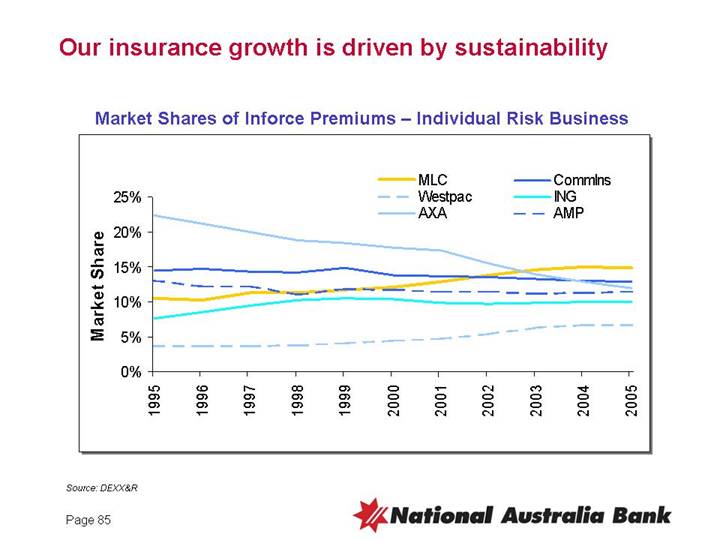
Our insurance growth is driven by sustainability
Market Shares of Inforce Premiums – Individual Risk Business
[CHART]
Source: DEXX&R
85
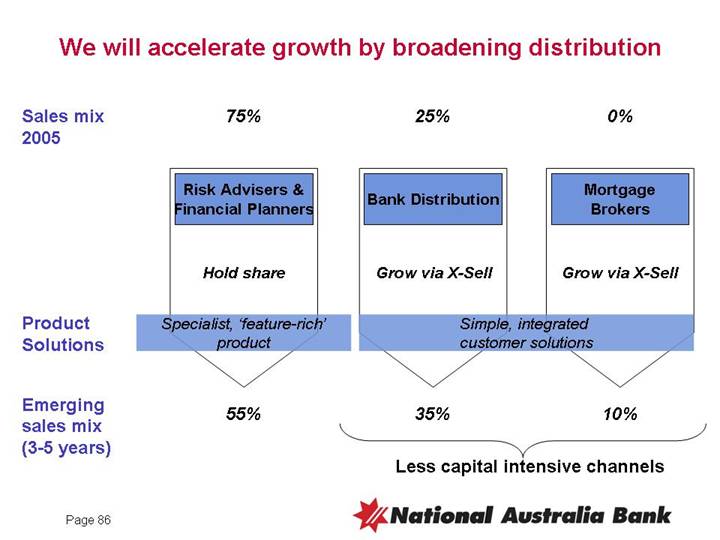
We will accelerate growth by broadening distribution
Sales mix 2005 |
| 75% |
| 25% |
| 0% |
|
|
|
|
|
|
|
|
|
|
|
|
|
|
|
| Risk Advisers & |
| Bank Distribution |
| Mortgage |
|
|
|
|
|
|
|
|
| Hold share |
| Grow via X-Sell |
| Grow via X-Sell |
|
|
|
|
|
|
|
Product Solutions |
| Specialist, ‘feature-rich’ |
| Simple, integrated | ||
|
|
|
|
|
|
|
|
|
|
|
|
|
|
Emerging |
|
|
|
|
|
|
sales mix |
| 55% |
| 35% |
| 10% |
(3-5 years) |
|
|
|
|
|
|
|
|
|
|
|
|
|
|
|
|
| Less capital intensive channels | ||
86
Summary
• Internal focus has set us up for growth
• Integration will deliver results
• Positioned for profitable growth in retail investments
• Capitalise on popularity of Manager of Managers style
• Accelerate sustainable growth in insurance
87
Disclaimer
This document is a presentation of general background information about the Group’s activities current at the date of the presentation, 28 September 2005. It is information in a summary form and does not purport to be complete. It is not intended to be relied upon as advice to investors or potential investors and does not take into account the investment objectives, financial situation or needs of any particular investor. These should be considered, with or without professional advice, when deciding if an investment is appropriate.
This document contains certain “forward-looking statements” within the meaning of Section 21E of the US Securities Exchange Act of 1934 and the US Private Securities Litigation Reform Act of 1995. The words “anticipate”, “believe”, “expect”, “project”, “estimate”, “intend”, “should”, “could”, “may”, “target”, “plan” and other similar expressions are intended to identify forward-looking statements. Indications of and guidance on future earnings and financial position and performance are also forward-looking statements. Such forward-looking statements are not guarantees of future performance and involve known and unknown risks, uncertainties and other factors, many of which are beyond the control of the Group, that may cause actual results to differ materially from those expressed or implied in such statements. There can be no assurance that actual outcomes will not differ materially from these statements. For further information relating to the identification of forward-looking statements and important factors that could cause actual results to differ materially from those projected in such statements, see “Presentation of Information - Forward-Looking Statements” and “Risk Factors” in the Group’s Annual Report on Form 20-F filed with the US Securities & Exchange Commission.
90
National Australia Bank
Australian Region Market Update
28 September 2005
Victory Room Telstra Dome, Melbourne
Turnaround plan
This is a turnaround plan, problems understood
Right people in right place – focused on the right things
Significant progress in stabilising the business
Future built on strong customer franchise and executing well
Four key priorities in rebuilding the business
• Re-igniting organisation
• Managing business units
• Becoming cost competitive
• Rebuilding critical infrastructure
Will be truly competitive in 2008
93
Appendix Economic Outlook
This document is a presentation of general background information about the Group’s activities current at the date of the presentation, 28 September 2005. It is information in a summary form and does not purport to be complete. It is not intended to be relied upon as advice to investors or potential investors and does not take into account the investment objectives, financial situation or needs of any particular investor. These should be considered, with or without professional advice, when deciding if an investment is appropriate.
This document contains certain “forward-looking statements” within the meaning of Section 21E of the US Securities Exchange Act of 1934 and the US Private Securities Litigation Reform Act of 1995. The words “anticipate”, “believe”, “expect”, “project”, “estimate”, “intend”, “should”, “could”, “may”, “target”, “plan” and other similar expressions are intended to identify forward-looking statements. Indications of and guidance on future earnings and financial position and performance are also forward-looking statements. Such forward-looking statements are not guarantees of future performance and involve known and unknown risks, uncertainties and other factors, many of which are beyond the control of the Group, that may cause actual results to differ materially from those expressed or implied in such statements. There can be no assurance that actual outcomes will not differ materially from these statements. For further information relating to the identification of forward-looking statements and important factors that could cause actual results to differ materially from those projected in such statements, see “Presentation of Information - Forward-Looking Statements” and “Risk Factors” in the Group’s Annual Report on Form 20-F filed with the US Securities & Exchange Commission.
94
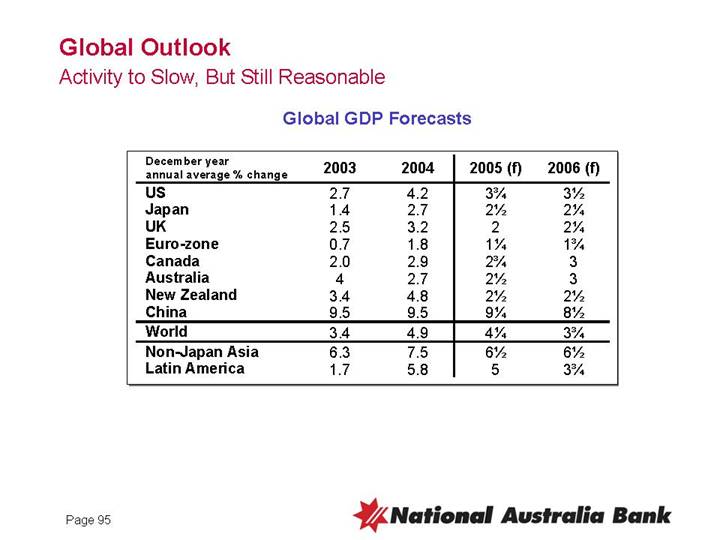
Global Outlook
Activity to Slow, But Still Reasonable
Global GDP Forecasts
December year |
|
|
|
|
|
|
|
|
|
annual average % change |
| 2003 |
| 2004 |
| 2005 (f) |
| 2006 (f) |
|
US |
| 2.7 |
| 4.2 |
| 3¾ |
| 3½ |
|
Japan |
| 1.4 |
| 2.7 |
| 2½ |
| 2¼ |
|
UK |
| 2.5 |
| 3.2 |
| 2 |
| 2¼ |
|
Euro-zone |
| 0.7 |
| 1.8 |
| 1¼ |
| 1¾ |
|
Canada |
| 2.0 |
| 2.9 |
| 2¾ |
| 3 |
|
Australia |
| 4 |
| 2.7 |
| 2½ |
| 3 |
|
New Zealand |
| 3.4 |
| 4.8 |
| 2½ |
| 2½ |
|
China |
| 9.5 |
| 9.5 |
| 9¼ |
| 8½ |
|
World |
| 3.4 |
| 4.9 |
| 4¼ |
| 3¾ |
|
Non-Japan Asia |
| 6.3 |
| 7.5 |
| 6½ |
| 6½ |
|
Latin America |
| 1.7 |
| 5.8 |
| 5 |
| 3¾ |
|
95
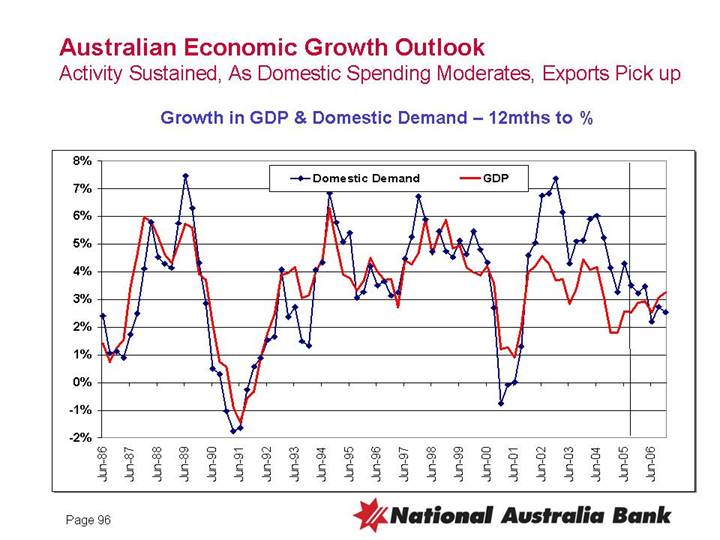
Australian Economic Growth Outlook
Activity Sustained, As Domestic Spending Moderates, Exports Pick up
Growth in GDP & Domestic Demand – 12mths to %
[CHART]
96
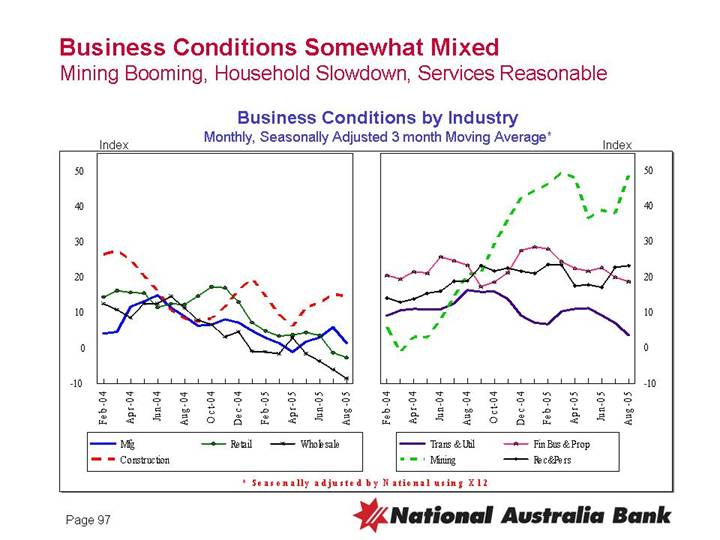
Business Conditions Somewhat Mixed
Mining Booming, Household Slowdown, Services Reasonable
Business Conditions by Industry
Monthly, Seasonally Adjusted 3 month Moving Average*
[CHART]
* Seasonally adjusted by National using X12
97
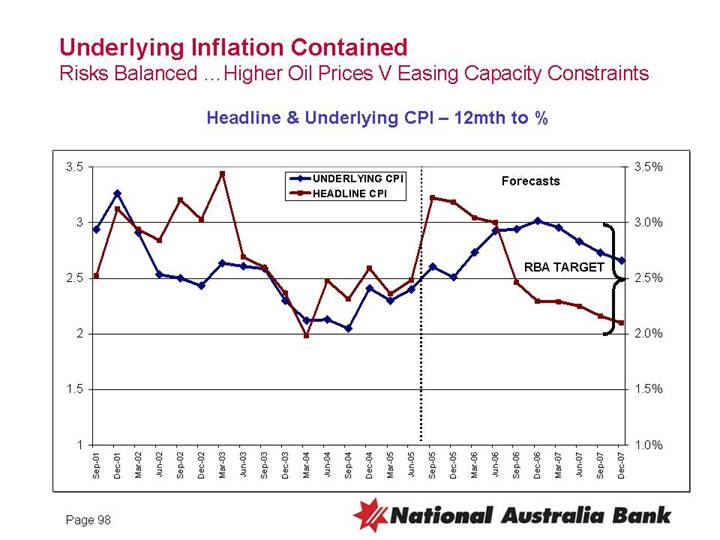
Underlying Inflation Contained
Risks Balanced …Higher Oil Prices V Easing Capacity Constraints
Headline & Underlying CPI – 12mth to %
[CHART]
98
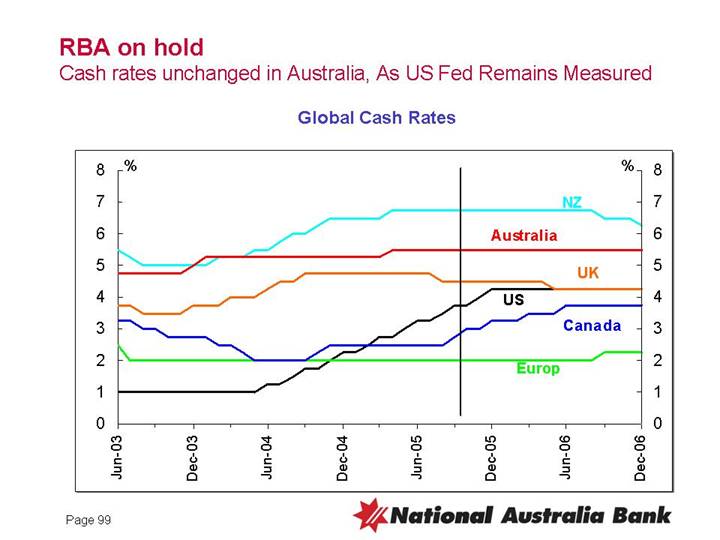
RBA on hold
Cash rates unchanged in Australia, As US Fed Remains Measured
Global Cash Rates
[CHART]
99
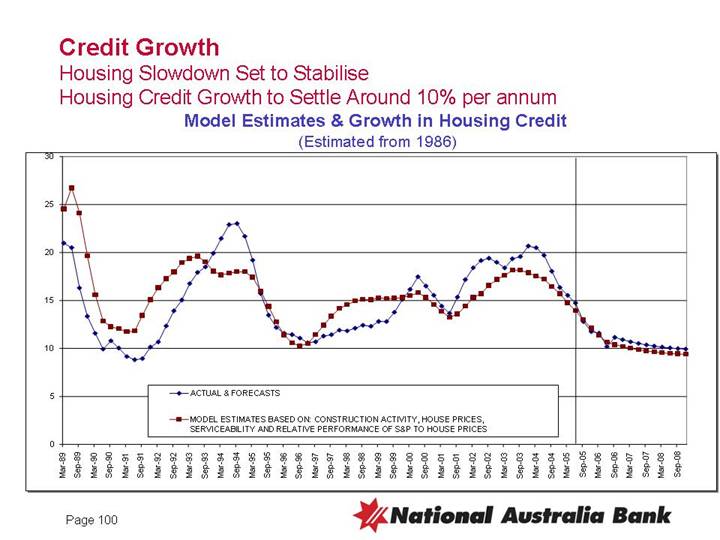
Credit Growth
Housing Slowdown Set to Stabilise
Housing Credit Growth to Settle Around 10% per annum
Model Estimates & Growth in Housing Credit
(Estimated from 1986)
[CHART]
100
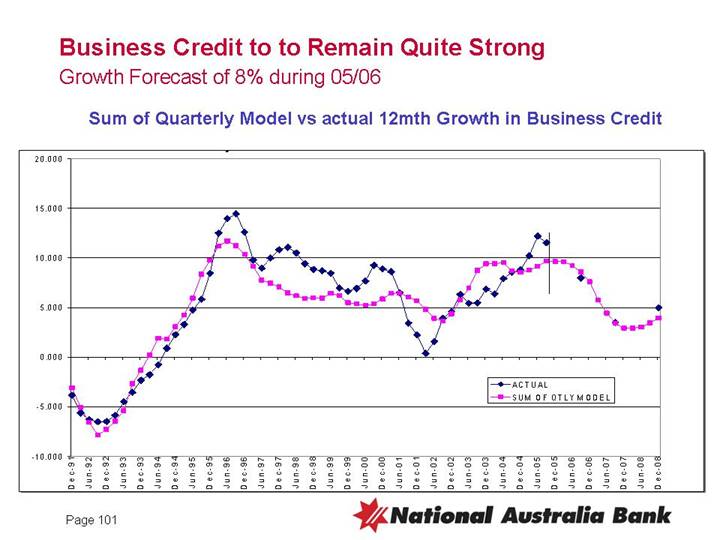
Business Credit to to Remain Quite Strong
Growth Forecast of 8% during 05/06
Sum of Quarterly Model vs actual 12mth Growth in Business Credit
[CHART]
101
Australian Executive Committee Biographies
[GRAPHIC]
Ahmed Fahour - Executive Director & Chief Executive Officer Australia
Ahmed Fahour joined the National Australia Bank in September 2004 as an Executive Director and Chief Executive Officer Australia. Ahmed is responsible for managing the Australian and Asian region, which includes Retail, Business and Corporate Banking. Ahmed also oversees MLC which includes retail investments, insurance and wholesale superannuation (PLUM). The Australian and Asian region comprises approximately $2.5 billion of profit, $160 billion of assets, $75 billion of funds under management and 23,000 employees. They represent around 70% of the total NAB group. Previously Ahmed was with Citigroup from 2000-2004. Ahmed was appointed as the Chief Executive Office for Australia and New Zealand early in 2004. Prior to this, Ahmed was based in Citigroup’s New York office and was the Head of Corporate Development and a member of Citigroup’s Global Management Committee. Part of Corporate Development involved overseeing the development of cross selling within Citigroup globally. This time marked a rise in Citigroup’s development of cross-sell ratio and number of products per customer. In 2001 Ahmed was subsequently appointed Vice Chairman Citigroup Investments as well as CEO Alternative Investments. In the global division Ahmed was responsible for USD$85 billion of investments, in the area of Private Equity, Real Estate, Hedge Funds, Structured Products and Futures. Prior to Citigroup, Ahmed was Managing Director of iFormation Group, a private equity joint venture with Goldman Sachs, General Atlantic Partners and BCG.
In 1987 Ahmed joined Boston Consulting Group. After undertaking roles that covered post-merger integration, corporate vision and strategy and merger and acquisition he was appointed a director in 1997. As a member of the International Partner Group of BCG he was responsible for Corporate Development in the Asia Pacific region. Ahmed holds a Bachelor of Economics from La Trobe University and an MBA from the University of Melbourne. He won a number of prizes during both degrees.
[GRAPHIC]
Andrew Thorburn - Executive General Manager, Retail Banking
Andrew Thorburn joined the National Australia Bank in February 2005. As Executive General Manager Australia – Retail Banking, he leads over 8000 staff at nearly 1000 locations across Australia, delivering banking services and products to retail customers. The key distribution channels include branches, mobile mortgage managers, financial planners and financial services centres.
With over two decades’ experience in financial services, Andrew has worked for some of the most well known financial institutions in Australia and New Zealand, including ASB Bank in NZ, Commonwealth Bank of Australia and St George Bank. Andrew has a Bachelor of Commerce Degree, a Diploma in Marketing, and an MBA.
103
[GRAPHIC]
George Frazis - Executive General Manager, Business and Private Banking
As Executive General Manager Business and Private Banking, George is responsible for Corporate, Business, Agribusiness and Private banking operations at the National Australia Bank.
He oversees more than 4,000 business banking specialists in over 158 financial services banking centres across Australia. Business and Private Banking is one of the market leaders in providing these services to Australian business; its solution focused approach provides each individual client with tailored service, innovative products and customised solutions.
Prior to joining the National in November 2004, Mr Frazis spent three years at Commonwealth Bank Australia as an Executive General Manager where his role included Business and Private Banking, Global Business Lending, and Finance & Strategy within Institutional Business Services.
Prior to that he was a Partner at Boston Consulting Group having working in the UK and Australia. He has also held roles in the civil and military aviation industries.
George has a Bachelor of Engineering with Honours and a Masters of Business Administration at AGSM/Wharton Business School.
[GRAPHIC]
Matt Lawler - - Regional General Manager, Financial Planning and Third Party
Matt was appointed Regional General Manager of Financial Planning and Third Party in October 2004.
In this role, Matt is responsible for leading the group’s strategies around financial advice and third party distribution. This includes leading the evolution of the financial advice industry in Australia through the execution of our multi-channel distribution strategy.
In his former role of General Manager MLC Advice Solutions, Matt advanced the group’s integrated financial services strategy, developing solutions to provide investments, debt and insurance advice to customers. He was also involved in leveraging our knowledge of distribution into the Wealth Management international businesses.
Matt joined MLC in 1991 and has held various senior management positions throughout his 15-year career in the financial services industry. Matt is a director on the boards of GWM Adviser Services, Godfrey Pembroke, Apogee Financial Planning and MLC Lifetime. Matt holds a Diploma of Financial Planning and a Graduate Diploma with the Securities Institute of Australia. He has recently been appointed a Director of the Financial Planning Association.
104
[GRAPHIC]
Jeremy Dean - - Executive General Manager, Consumer Products & Services
Jeremy Dean has been involved in banking his entire career. A New Zealander, Jeremy began his career as a junior with Westpac over 20 years ago. Since then he has spent time with a range of institutions including American Express and ASB Bank. In 1999, Jeremy joined the Bank of New Zealand (BNZ) where he became General Manager of Cards before being appointed to the role of General Manager, Direct Retailing and Channel Management. At the start of 2002, he moved across to BNZ’s parent company, the National Australia Bank, joining the management team of Financial Services Australia as General Manager of Channel and Process Optimisation. In this role, Jeremy was responsible for the roll-out of the National’s CRM platform, Siebel Sales and Service along with oversight of the Australian bank’s electronic distribution channels, call centres and a range of major projects including the construction of electronic consumer and business banking platforms. In 2004, Jeremy was appointed to the position of General Manager, Business Financial Services Australia (BFS) where he began the recovery of this business unit. In November 2004, Jeremy was appointed to the role of Executive General Manager Consumer Banking Products & Services for the Australian region. Consumer Banking Products & Services is responsible for the end-to-end processing, marketing and risk management of the National’s consumer product portfolio including mortgages, credit cards, personal loans, deposits and transaction accounts. Jeremy is also responsible for Direct Financial Services, National Australia Bank’s three major contact centres. Jeremy has a MBA from The University of Melbourne.
[GRAPHIC]
Bruce Munro - - Executive General Manager, Business Products and Services
Bruce is the Executive General Manager (Australia), National Australia Bank with responsibility for Business Products & Services (BP&S). BP&S is one of the three products businesses within the National’s Australian operations. It covers a wide range of activities including cash management/transaction banking, merchant acquiring, trade finance, debtor finance, e-business, asset finance, custom and commercial fleet, and business lending. There are also specialist sales, client management, service and operational functions. Bruce joined the National in December 2004, prior to which he had a lengthy career with the Commonwealth Bank (CBA). Responsibilities at CBA included general management responsibility for a similar array of product businesses, with particular emphasis on building the transaction banking business to number one position in the market. Bruce has had an extensive involvement in the payments industry, previously holding the position of Deputy Chair of the Australian Payments Clearing Association, and member of the Visa Executive Committee and board member of Austraclear Ltd.
105
[GRAPHIC]
Steve Tucker - Executive General Manager, Wealth Management Services
Steve joined MLC, the wealth management division of the National Australia Bank in 1988, and was appointed as Executive General Manager (Australia) - Wealth Management Services and CEO MLC in October 2004. MLC is responsible for investment and insurance product and platform development, asset management, corporate superannuation and customer service. MLC manages more than $78 million on behalf of individual investors and corporate customers in Australia. Prior to this appointment, Steve headed up MLC’s Retail Investments business, a position he had held since July 2003. Prior to this, Steve led MLC’s Distribution business for more than 3 years, where he was responsible for MLC’s partnership with financial advisers. Steve is a Director on the IFSA Board, a Member of the FPA and a Senior Associate of the ABA as well as a Director of a number of National Companies including MLC Ltd, MLC Hong Kong and GWM Adviser Services.
[GRAPHIC]
Ewen Stafford - Chief Financial Officer
As Chief Financial Officer for the Australian region, Ewen is responsible for delivering a full service Finance offering to support the National Australia Bank’s Australian businesses achieve their objectives. Under Ewen’s leadership are the traditional professional services including Decision Support, Financial Governance, Banking and Wealth Management Financial Control, Taxation and Treasury as well as specialist business services including Business Efficiency and Quality (incorporating the Investment Portfolio), Property and Procurement Operations.
Prior to this, Ewen held a number of senior leadership positions within MLC (the Wealth Management division of the National), most recently as Chief Financial Officer for MLC’s Australian and international operations. A champion of organisational change, Ewen played a critical role in the integration of the National and MLC businesses, influencing the people agenda and was a driving force behind the National @ Docklands workplace project to bring these two groups together under the one roof in Melbourne.
Ewen joined MLC from Colliers International where he held a number of senior roles including Australian Director of Business Services responsible for finance, insurance, technology, human resources, quality assurance and risk management. Early in his career Ewen worked with the State Bank of South Australia for two years before moving to KPMG in 1986 for eight years. Ewen holds a Bachelor of Arts in Accountancy, is a member of the Institute of Chartered Accountants and holds an MBA from the University of Adelaide.
106
[GRAPHIC]
Michelle Tredenick - Chief Information Officer
Michelle Tredenick was appointed as Chief Information Officer (Australia) for the National in October 2004. Since her appointment, Michelle has overseen the integration of the various technology operations into the regional delivery model. She has appointed a new leadership team and is driving a business partnership approach for the NAB Technology division. Michelle came to MLC (now NAB’s Wealth Management division) in 1998 with extensive experience in financial services. At that time she already had more than 15 years’ experience in the industry, including executive positions at Suncorp-Metway with responsibility for IT, and then Business Strategy and Planning, before joining the Lend Lease Group as CIO for MLC. In October 2002, Michelle was appointed to lead the combined areas of Technology and Corporate Development for MLC. Her responsibilities included Strategy, Corporate Affairs, Mergers &Acquisitions and Business Processes as well as continuing as CIO for MLC’s Technology division. In addition, Michelle also took executive ownership of MLC’s New Zealand business. Michelle was appointed CEO of MLC Corporate Solutions in July 2003 and continued with her responsibilities in leading the Wealth Management New Zealand Investments and Insurance business, before her current appointment as CIO (Australia). As CEO of MLC Corporate Solutions, Michelle managed a Business Unit that provides corporate superannuation, insurance, investment and employee benefit solutions to businesses, organisations, and their employees - from small enterprises to large institutions.
[GRAPHIC]
Greg Sutherland - Executive General Manager, Strategy and Marketing
Greg joined National Australia Bank in October 2004 and is responsible for strategy development, marketing and corporate affairs in the Australian business. This portfolio enables critical linkages between customer insight, business strategy creation and distribution and external marketing and employee communications.
Prior to joining the National, Greg was a Partner with The Boston Consulting Group with extensive experience advising and supporting consumer businesses in USA, Europe and Asia. He has also held sales and engineering roles with Honeywell and Woodside. He has an MBA and Bachelor of Engineering (Electronics).
107
[GRAPHIC]
Bob Stribling - Chief Risk Officer
Bob Stribling joined the National as Chief Risk Officer, Australia in May, 2005. He has spent more than 15 years in different risk management roles, most recently at the ANZ, where he was Chief Operating Officer for ANZ’s Group Risk function.
In risk management circles, he is best known for his work in modelling risk in trading books - both from a traditional market risk perspective, and also from the perspective of modelling credit risk on derivatives using near real-time Monte Carlo techniques.
In addition to holding various risk management roles, Bob has also held different IT and front-line sales roles. At the Commonwealth Bank during 2000/2001, he managed technology for CBA’s Institutional Division. Prior to this, he also served as CBA’s Global Head of Structured Solutions in the dealing room, managing a team of front-line derivatives sales specialists. He was best known during this period for his innovative work in the area of environmental derivatives.
Bob also worked extensively with the Federal Government and other state governments, along with the Murray-Darling Basin Commission, in an effort to devise market-based solutions for the salinity crisis facing Australia’s key river and agricultural resources.
[GRAPHIC]
Elizabeth Hunter - Executive General Manager, People and Culture
Elizabeth Hunter has been with the National Australia Bank Group since 1995, and has held a variety of leadership roles in People & Culture during that time. She currently holds the dual roles of Executive General Manager, People & Culture across the global operations, along with General Manager, People & Culture (Australia). Elizabeth’s global role includes overall accountability for the strategic direction of people and culture initiatives across all the National’s regions (Australia, United Kingdom and New Zealand). Her Australian role gives her responsibility for leading and implementing people initiatives and culture change across the region. Elizabeth took up her current Executive General Manager role in January 2005, following more than a year in the National’s United Kingdom division as General Manager, People & Culture Europe (2003 to 2004). During her time in the UK, Elizabeth was responsible for leading major change, restructuring, and executive talent programs, as well as the realignment of people and culture strategies to support a range of new business initiatives. Prior to joining the National Elizabeth held human resources roles in the health industry. She has an MBA from RMIT.
108
SIGNATURE PAGE
Pursuant to the requirements of the Securities Exchange Act of 1934, the registrant has duly caused this report to be signed on its behalf by the undersigned, thereunto duly authorised.
|
| NATIONAL AUSTRALIA BANK LIMITED | |
|
|
| |
|
|
| |
|
| /s/ Brendan T Case |
|
Date: 28 September 2005 | Title: | Associate Company Secretary | |