FILE NO 1-9945
SECURITIES AND EXCHANGE COMMISSION
WASHINGTON DC 20549
FORM 6-K
REPORT OF FOREIGN ISSUER
Pursuant to Rule 13a-16 or 15d-16 of
the Securities Exchange Act of 1934
For the month of November 2005
National Australia Bank Limited
ACN 004 044 937
(Registrant’s Name)
Level 24
500 Bourke Street
MELBOURNE VICTORIA 3000
AUSTRALIA
Indicate by check mark whether the registrant files or will file annual reports under cover of Form 20-F or Form 40-F.
Form 20-F | ý |
| Form 40-F | o |
Indicate by check mark whether the registrant by furnishing the information contained in this Form is also thereby furnishing the information to the Commission pursuant to Rule 12g3-2(b) under the Securities Exchange Act of 1934.
Yes | o |
| No | ý |
If “Yes” is marked, indicate below the file number assigned to the registrant in connection with Rule 12g3-2(b): 82
Link to searchable text of slide shown above

Link to searchable text of slide shown above
Link to searchable text of slide shown above
Link to searchable text of slide shown above
Link to searchable text of slide shown above
Link to searchable text of slide shown above
Link to searchable text of slide shown above
Link to searchable text of slide shown above
Link to searchable text of slide shown above
Link to searchable text of slide shown above
Link to searchable text of slide shown above

Link to searchable text of slide shown above
Link to searchable text of slide shown above

Link to searchable text of slide shown above
Link to searchable text of slide shown above
Link to searchable text of slide shown above

Link to searchable text of slide shown above
Link to searchable text of slide shown above
Link to searchable text of slide shown above
Link to searchable text of slide shown above
Link to searchable text of slide shown above
Link to searchable text of slide shown above
Link to searchable text of slide shown above

Link to searchable text of slide shown above
Link to searchable text of slide shown above

Link to searchable text of slide shown above
Link to searchable text of slide shown above
Link to searchable text of slide shown above
Link to searchable text of slide shown above
Link to searchable text of slide shown above
Link to searchable text of slide shown above
Link to searchable text of slide shown above
Link to searchable text of slide shown above

Link to searchable text of slide shown above
Link to searchable text of slide shown above

Link to searchable text of slide shown above
Link to searchable text of slide shown above

Link to searchable text of slide shown above

Link to searchable text of slide shown above

Link to searchable text of slide shown above

Link to searchable text of slide shown above
Link to searchable text of slide shown above

Link to searchable text of slide shown above

Link to searchable text of slide shown above

Link to searchable text of slide shown above
Link to searchable text of slide shown above

Link to searchable text of slide shown above

Link to searchable text of slide shown above
Link to searchable text of slide shown above
Link to searchable text of slide shown above
Link to searchable text of slide shown above
Link to searchable text of slide shown above
Link to searchable text of slide shown above
Link to searchable text of slide shown above
Link to searchable text of slide shown above
Link to searchable text of slide shown above
Link to searchable text of slide shown above
Link to searchable text of slide shown above
Link to searchable text of slide shown above

Link to searchable text of slide shown above
Link to searchable text of slide shown above
Link to searchable text of slide shown above
Link to searchable text of slide shown above

Link to searchable text of slide shown above

Link to searchable text of slide shown above

Link to searchable text of slide shown above

Link to searchable text of slide shown above
Link to searchable text of slide shown above

Link to searchable text of slide shown above

Link to searchable text of slide shown above

Link to searchable text of slide shown above
Link to searchable text of slide shown above
Link to searchable text of slide shown above
Link to searchable text of slide shown above

Link to searchable text of slide shown above

Link to searchable text of slide shown above

Link to searchable text of slide shown above
Link to searchable text of slide shown above
Link to searchable text of slide shown above
Link to searchable text of slide shown above
Link to searchable text of slide shown above
Link to searchable text of slide shown above
Link to searchable text of slide shown above
Searchable text section of graphics shown above
FULL YEAR |
| 05 |
| [LOGO] |
RESULTS |
|
| John Stewart, | Michael Ullmer, |
|
|
|
| Managing Director | Director, Finance |
|
|
|
|
|
|
| November 9, 2005 |
|
Agenda
Introduction |
| John Stewart |
|
|
|
Group Results |
| Michael Ullmer |
|
|
|
Outlook & Update |
| John Stewart |
|
|
|
Questions and Answers |
|
|
|
|
|
|
| [LOGO] |
2
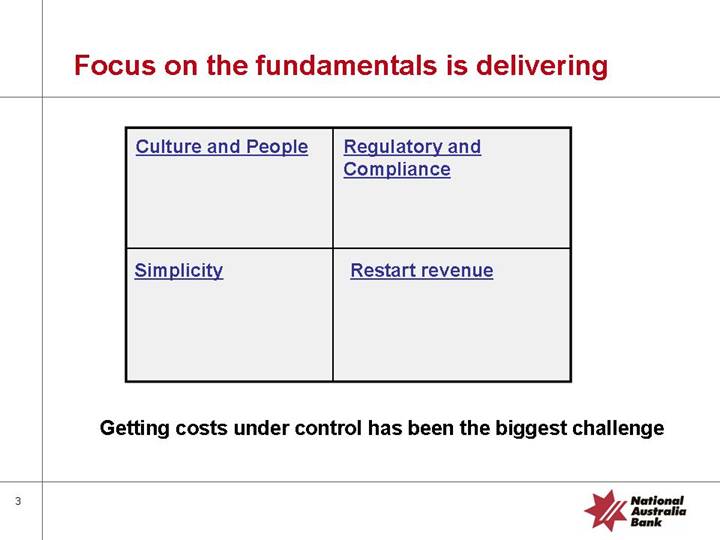
Focus on the fundamentals is delivering
Culture and People |
| Regulatory and Compliance |
|
|
|
Simplicity |
| Restart revenue |
Getting costs under control has been the biggest challenge
3
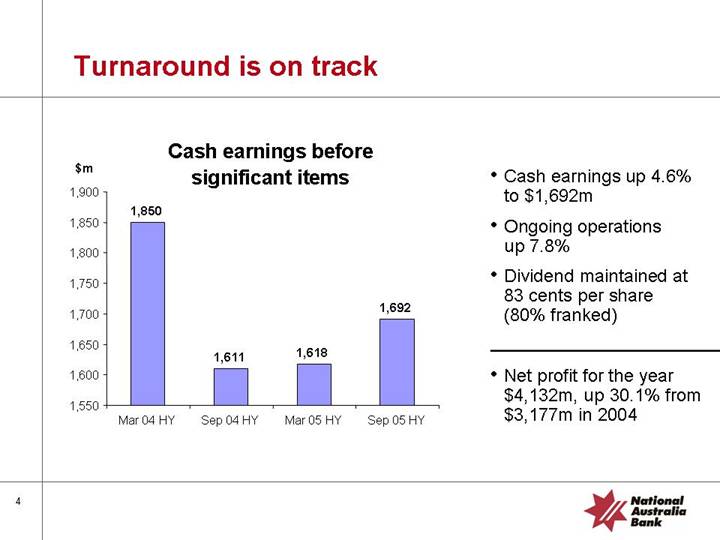
Turnaround is on track
Cash earnings before significant items
[CHART]
• Cash earnings up 4.6% to $1,692m
• Ongoing operations up 7.8%
• Dividend maintained at 83 cents per share (80% franked)
• Net profit for the year $4,132m, up 30.1% from $3,177m in 2004
4
Agenda
Introduction |
| John Stewart |
|
|
|
Group Results |
| Michael Ullmer |
|
|
|
Outlook & Update |
| John Stewart |
|
|
|
Questions and Answers |
|
|
5
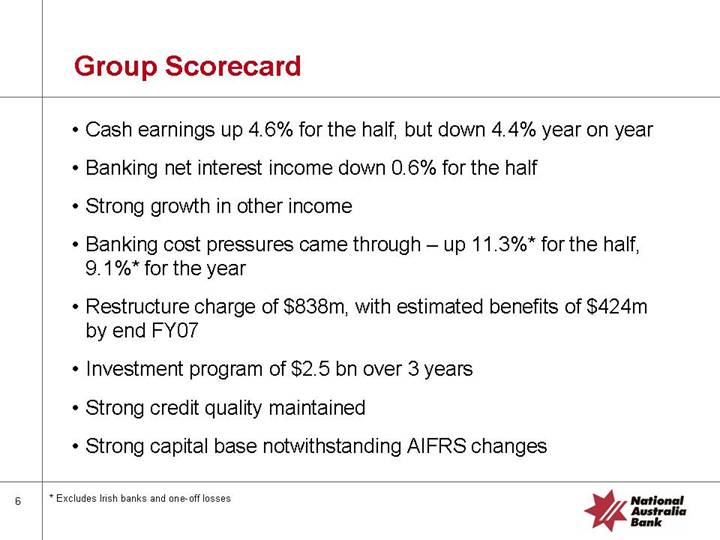
Group Scorecard
• Cash earnings up 4.6% for the half, but down 4.4% year on year
• Banking net interest income down 0.6% for the half
• Strong growth in other income
• Banking cost pressures came through – up 11.3%* for the half, 9.1%* for the year
• Restructure charge of $838m, with estimated benefits of $424m by end FY07
• Investment program of $2.5 bn over 3 years
• Strong credit quality maintained
• Strong capital base notwithstanding AIFRS changes
* Excludes Irish banks and one-off losses
6
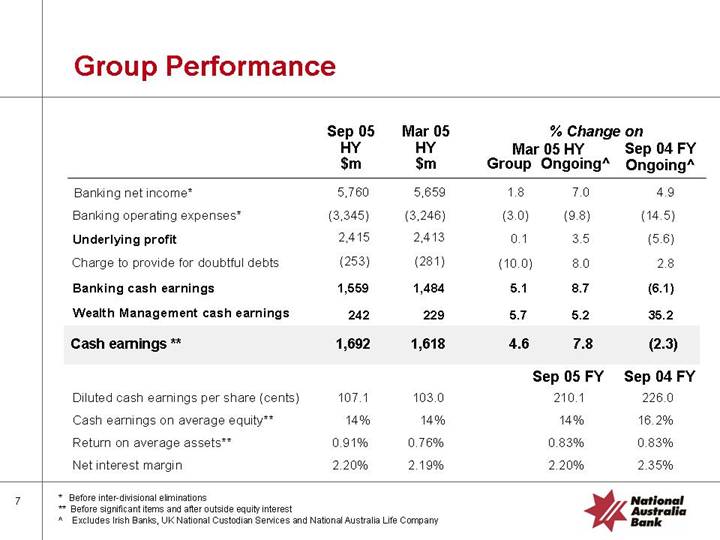
Group Performance
|
| Sep 05 |
| Mar 05 |
| % Change on |
| ||||
|
| HY |
| HY |
| Mar 05 HY |
| Sep 04 FY |
| ||
|
| $m |
| $m |
| Group |
| Ongoing^ |
| Ongoing^ |
|
Banking net income* |
| 5,760 |
| 5,659 |
| 1.8 |
| 7.0 |
| 4.9 |
|
Banking operating expenses* |
| (3,345 | ) | (3,246 | ) | (3.0 | ) | (9.8 | ) | (14.5 | ) |
Underlying profit |
| 2,415 |
| 2,413 |
| 0.1 |
| 3.5 |
| (5.6 | ) |
Charge to provide for doubtful debts |
| (253 | ) | (281 | ) | (10.0 | ) | 8.0 |
| 2.8 |
|
Banking cash earnings |
| 1,559 |
| 1,484 |
| 5.1 |
| 8.7 |
| (6.1 | ) |
Wealth Management cash earnings |
| 242 |
| 229 |
| 5.7 |
| 5.2 |
| 35.2 |
|
Cash earnings ** |
| 1,692 |
| 1,618 |
| 4.6 |
| 7.8 |
| (2.3 | ) |
|
|
|
|
|
| Sep 05 FY |
| Sep 04 FY |
|
Diluted cash earnings per share (cents) |
| 107.1 |
| 103.0 |
| 210.1 |
| 226.0 |
|
Cash earnings on average equity** |
| 14 | % | 14 | % | 14 | % | 16.2 | % |
Return on average assets** |
| 0.91 | % | 0.76 | % | 0.83 | % | 0.83 | % |
Net interest margin |
| 2.20 | % | 2.19 | % | 2.20 | % | 2.35 | % |
* Before inter-divisional eliminations
** Before significant items and after outside equity interest
^ Excludes Irish Banks, UK National Custodian Services and National Australia Life Company
7
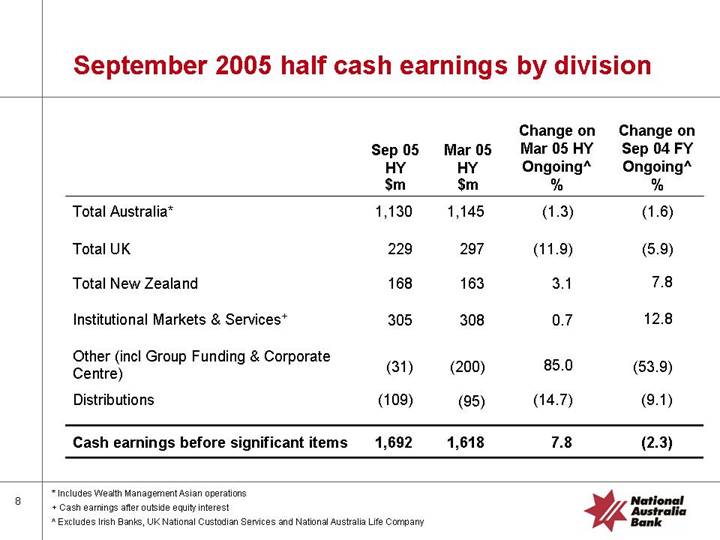
September 2005 half cash earnings by division
|
| Sep 05 |
| Mar 05 |
| Change on |
| Change on |
|
|
| $m |
| $m |
| % |
| % |
|
Total Australia* |
| 1,130 |
| 1,145 |
| (1.3 | ) | (1.6 | ) |
|
|
|
|
|
|
|
|
|
|
Total UK |
| 229 |
| 297 |
| (11.9 | ) | (5.9 | ) |
|
|
|
|
|
|
|
|
|
|
Total New Zealand |
| 168 |
| 163 |
| 3.1 |
| 7.8 |
|
|
|
|
|
|
|
|
|
|
|
Institutional Markets & Services+ |
| 305 |
| 308 |
| 0.7 |
| 12.8 |
|
|
|
|
|
|
|
|
|
|
|
Other (incl Group Funding & Corporate Centre) |
| (31 | ) | (200 | ) | 85.0 |
| (53.9 | ) |
|
|
|
|
|
|
|
|
|
|
Distributions |
| (109 | ) | (95 | ) | (14.7 | ) | (9.1 | ) |
|
|
|
|
|
|
|
|
|
|
Cash earnings before significant items |
| 1,692 |
| 1,618 |
| 7.8 |
| (2.3 | ) |
* Includes Wealth Management Asian operations
+ Cash earnings after outside equity interest
^ Excludes Irish Banks, UK National Custodian Services and National Australia Life Company
8
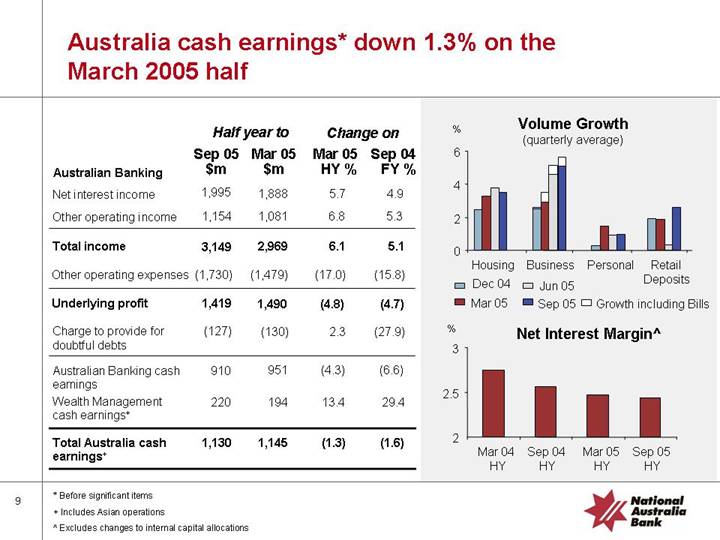
Australia cash earnings* down 1.3% on the March 2005 half
|
| Half year to |
| Change on |
| ||||
|
| Sep 05 |
| Mar 05 |
| Mar 05 |
| Sep 04 |
|
Australian Banking |
| $m |
| $m |
| HY % |
| FY % |
|
Net interest income |
| 1,995 |
| 1,888 |
| 5.7 |
| 4.9 |
|
Other operating income |
| 1,154 |
| 1,081 |
| 6.8 |
| 5.3 |
|
|
|
|
|
|
|
|
|
|
|
Total income |
| 3,149 |
| 2,969 |
| 6.1 |
| 5.1 |
|
|
|
|
|
|
|
|
|
|
|
Other operating expenses |
| (1,730 | ) | (1,479 | ) | (17.0 | ) | (15.8 | ) |
|
|
|
|
|
|
|
|
|
|
Underlying profit |
| 1,419 |
| 1,490 |
| (4.8 | ) | (4.7 | ) |
|
|
|
|
|
|
|
|
|
|
Charge to provide for doubtful debts |
| (127 | ) | (130 | ) | 2.3 |
| (27.9 | ) |
|
|
|
|
|
|
|
|
|
|
Australian Banking cash earnings |
| 910 |
| 951 |
| (4.3 | ) | (6.6 | ) |
Wealth Management cash earnings+ |
| 220 |
| 194 |
| 13.4 |
| 29.4 |
|
|
|
|
|
|
|
|
|
|
|
Total Australia cash earnings+ |
| 1,130 |
| 1,145 |
| (1.3 | ) | (1.6 | ) |
Volume Growth
(quarterly average)
[CHART]
Net Interest Margin^
[CHART]
* Before significant items
+ Includes Asian operations
^ Excludes changes to internal capital allocations
9
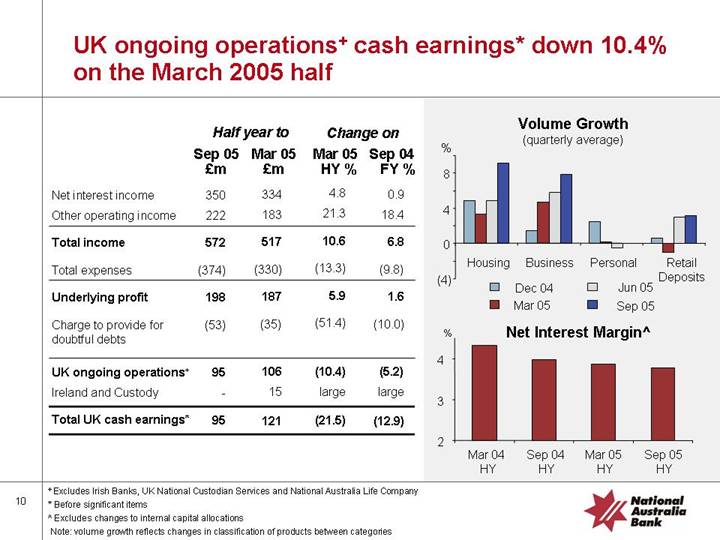
UK ongoing operations+ cash earnings* down 10.4% on the March 2005 half
|
| Half year to |
| Change on |
| ||||
|
| Sep 05 |
| Mar 05 |
| Mar 05 |
| Sep 04 |
|
|
| £m |
| £m |
| HY % |
| FY % |
|
Net interest income |
| 350 |
| 334 |
| 4.8 |
| 0.9 |
|
Other operating income |
| 222 |
| 183 |
| 21.3 |
| 18.4 |
|
|
|
|
|
|
|
|
|
|
|
Total income |
| 572 |
| 517 |
| 10.6 |
| 6.8 |
|
|
|
|
|
|
|
|
|
|
|
Total expenses |
| (374 | ) | (330 | ) | (13.3 | ) | (9.8 | ) |
|
|
|
|
|
|
|
|
|
|
Underlying profit |
| 198 |
| 187 |
| 5.9 |
| 1.6 |
|
|
|
|
|
|
|
|
|
|
|
Charge to provide for doubtful debts |
| (53 | ) | (35 | ) | (51.4 | ) | (10.0 | ) |
|
|
|
|
|
|
|
|
|
|
UK ongoing operations+ |
| 95 |
| 106 |
| (10.4 | ) | (5.2 | ) |
|
|
|
|
|
|
|
|
|
|
Ireland and Custody |
| — |
| 15 |
| large |
| large |
|
|
|
|
|
|
|
|
|
|
|
Total UK cash earnings* |
| 95 |
| 121 |
| (21.5 | ) | (12.9 | ) |
Volume Growth
(quarterly average)
[CHART]
Net Interest Margin^
[CHART]
+ Excludes Irish Banks, UK National Custodian Services and National Australia Life Company
* Before significant items
^ Excludes changes to internal capital allocations
Note: volume growth reflects changes in classification of products between categories
10
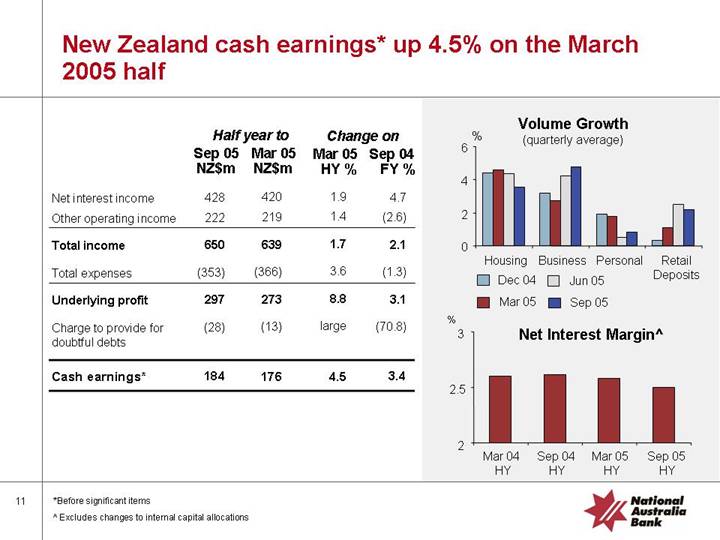
New Zealand cash earnings* up 4.5% on the March 2005 half
|
| Half year to |
| Change on |
| ||||
|
| Sep 05 |
| Mar 05 |
| Mar 05 |
| Sep 04 |
|
|
| NZ$m |
| NZ$m |
| HY % |
| FY % |
|
Net interest income |
| 428 |
| 420 |
| 1.9 |
| 4.7 |
|
|
|
|
|
|
|
|
|
|
|
Other operating income |
| 222 |
| 219 |
| 1.4 |
| (2.6 | ) |
|
|
|
|
|
|
|
|
|
|
Total income |
| 650 |
| 639 |
| 1.7 |
| 2.1 |
|
|
|
|
|
|
|
|
|
|
|
Total expenses |
| (353 | ) | (366 | ) | 3.6 |
| (1.3 | ) |
|
|
|
|
|
|
|
|
|
|
Underlying profit |
| 297 |
| 273 |
| 8.8 |
| 3.1 |
|
|
|
|
|
|
|
|
|
|
|
Charge to provide for doubtful debts |
| (28 | ) | (13 | ) | large |
| (70.8 | ) |
|
|
|
|
|
|
|
|
|
|
Cash earnings* |
| 184 |
| 176 |
| 4.5 |
| 3.4 |
|
Volume Growth
(quarterly average)
[CHART]
Net Interest Margin^
[CHART]
* Before significant items
^ Excludes changes to internal capital allocations
11
Institutional Markets & Services ongoing+ cash earnings* up 0.7% on the March 2005 half
|
| Half year to |
| Change on+ |
| ||||
|
| Sep 05 |
| Mar 05+ |
| Mar 05 |
| Sep 04 |
|
|
| $m |
| $m |
| HY % |
| FY % |
|
Net interest income |
| 262 |
| 277 |
| (5.4 | ) | (11.3 | ) |
|
|
|
|
|
|
|
|
|
|
Other operating income |
| 433 |
| 478 |
| (9.4 | ) | 7.8 |
|
|
|
|
|
|
|
|
|
|
|
Total income |
| 695 |
| 755 |
| (7.9 | ) | (0.2 | ) |
|
|
|
|
|
|
|
|
|
|
Total expenses |
| (369 | ) | (361 | ) | (2.2 | ) | (5.2 | ) |
|
|
|
|
|
|
|
|
|
|
Underlying profit |
| 326 |
| 394 |
| (17.3 | ) | (5.1 | ) |
|
|
|
|
|
|
|
|
|
|
Charge to provide for B&DD |
| 24 |
| (48 | ) | large |
| (80.0 | ) |
|
|
|
|
|
|
|
|
|
|
Cash earnings* |
| 305 |
| 303 |
| 0.7 |
| 12.8 |
|
|
|
|
|
|
|
|
|
|
|
Return on Avg RWA |
| 0.87 | % | 0.80 | % | 8.7 |
| 18.3 |
|
Total Income down 7.9%+
[CHART]
* Before significant items and after outside equity interest
+ Excludes Irish Banks
12
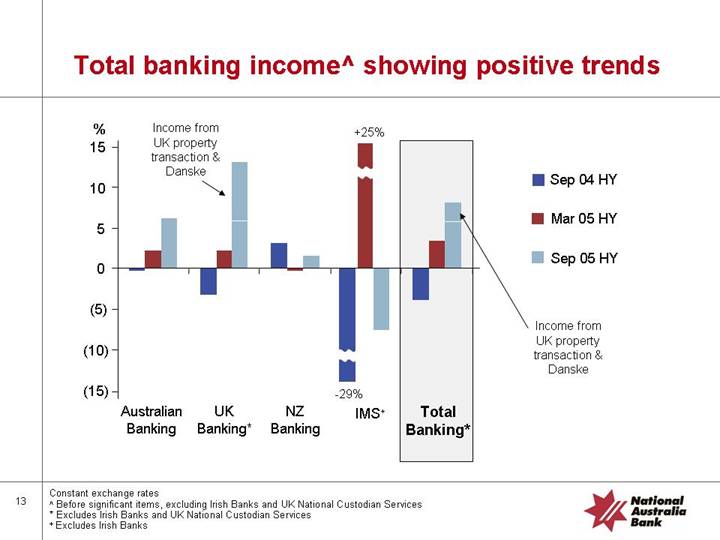
Total banking income^ showing positive trends
[CHART]
Constant exchange rates
^ Before significant items, excluding Irish Banks and UK National Custodian Services
* Excludes Irish Banks and UK National Custodian Services
+ Excludes Irish Banks
13
Key areas of focus
1. |
| Margins |
|
|
|
2. |
| Expenses |
|
|
|
3. |
| Asset Quality |
|
|
|
4. |
| Capital |
14
Key area 1 - Margins
• Regional declines in line with expectation
• Group outcome result of portfolio effect
15
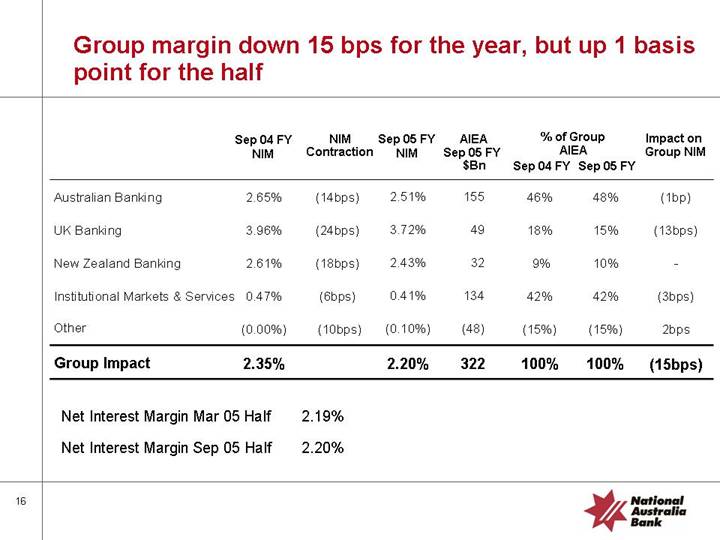
Group margin down 15 bps for the year, but up 1 basis point for the half
|
| Sep 04 FY |
| NIM |
| Sep 05 FY |
| AIEA |
| % of Group |
| Impact on |
| ||
Sep 04 FY |
| Sep 05 FY | |||||||||||||
|
|
|
|
|
|
|
|
|
|
|
|
|
|
|
|
Australian Banking |
| 2.65 | % | (14bps) |
| 2.51 | % | 155 |
| 46 | % | 48 | % | (1bp) |
|
|
|
|
|
|
|
|
|
|
|
|
|
|
|
|
|
UK Banking |
| 3.96 | % | (24bps) |
| 3.72 | % | 49 |
| 18 | % | 15 | % | (13bps) |
|
|
|
|
|
|
|
|
|
|
|
|
|
|
|
|
|
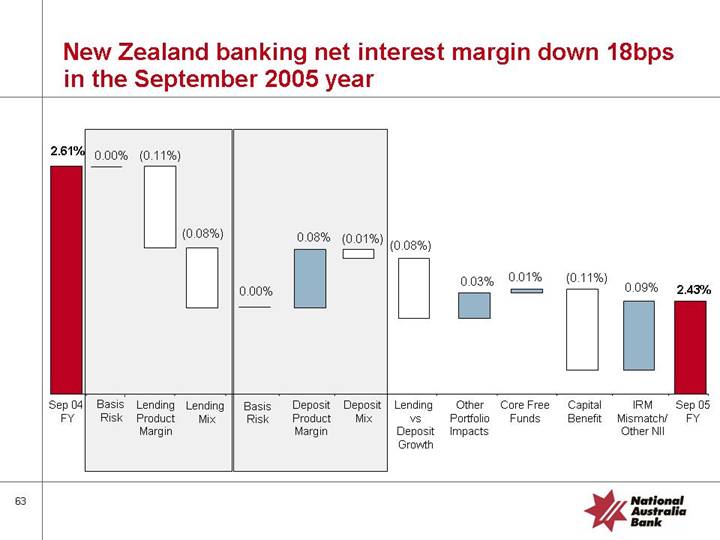
New Zealand Banking |
| 2.61 | % | (18bps) |
| 2.43 | % | 32 |
| 9 | % | 10 | % | — |
|
|
|
|
|
|
|
|
|
|
|
|
|
|
|
|
|
Institutional Markets & Services |
| 0.47 | % | (6bps) |
| 0.41 | % | 134 |
| 42 | % | 42 | % | (3bps) |
|
|
|
|
|
|
|
|
|
|
|
|
|
|
|
|
|
Other |
| (0.00 | )% | (10bps) |
| (0.10 | )% | (48 | ) | (15 | )% | (15 | )% | 2bps |
|
|
|
|
|
|
|
|
|
|
|
|
|
|
|
|
|
Group Impact |
| 2.35 | % |
|
| 2.20 | % | 322 |
| 100 | % | 100 | % | (15bps) |
|
Net Interest Margin Mar 05 Half |
| 2.19 | % |
|
|
|
|
Net Interest Margin Sep 05 Half |
| 2.20 | % |
16
Key area 2 - Expenses
• Bow wave of costs coming through
• Tactical initiatives implemented
• Restructuring plans developed
• Comprehensive three year investment slate
17
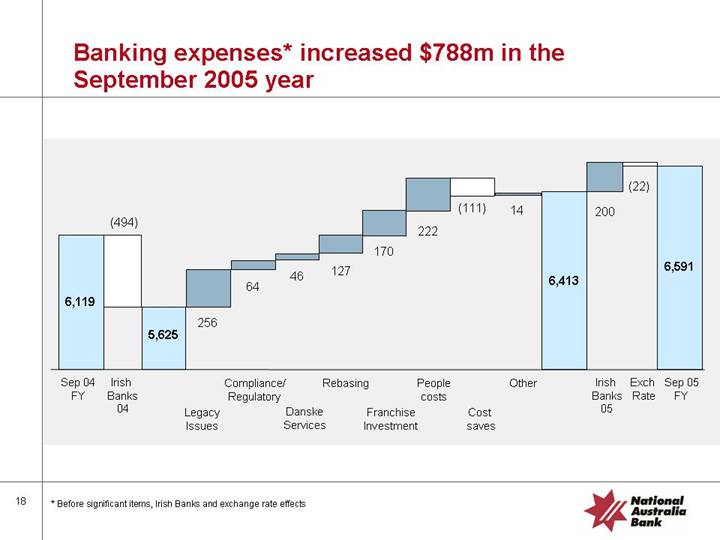
Banking expenses* increased $788m in the September 2005 year
[CHART]
* Before significant items, Irish Banks and exchange rate effects
18
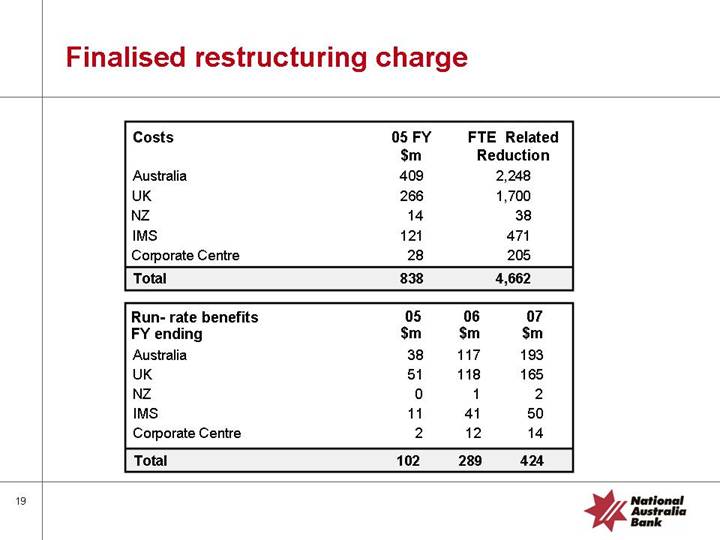
Finalised restructuring charge
Costs |
| 05 FY |
| FTE Related |
|
Australia |
| 409 |
| 2,248 |
|
UK |
| 266 |
| 1,700 |
|
NZ |
| 14 |
| 38 |
|
IMS |
| 121 |
| 471 |
|
Corporate Centre |
| 28 |
| 205 |
|
Total |
| 838 |
| 4,662 |
|
Run- rate benefits |
| 05 |
| 06 |
| 07 |
|
Australia |
| 38 |
| 117 |
| 193 |
|
UK |
| 51 |
| 118 |
| 165 |
|
NZ |
| 0 |
| 1 |
| 2 |
|
IMS |
| 11 |
| 41 |
| 50 |
|
Corporate Centre |
| 2 |
| 12 |
| 14 |
|
Total |
| 102 |
| 289 |
| 424 |
|
19
Investment spend
• Investment spend of $2.5b over the next three years
• in line with prior years
• Approximately 70% will be in the Australian region
• Compliance and infrastructure programmes continue to be the focus in the short term
• Weighting will change in favour of franchise development over time
20
Key area 3 – Asset Quality
• Strong growth in business banking
• Pick up in mortgage lending
• UK expansion
• Devolved credit processes with Group oversight
• Consistent methodology
21
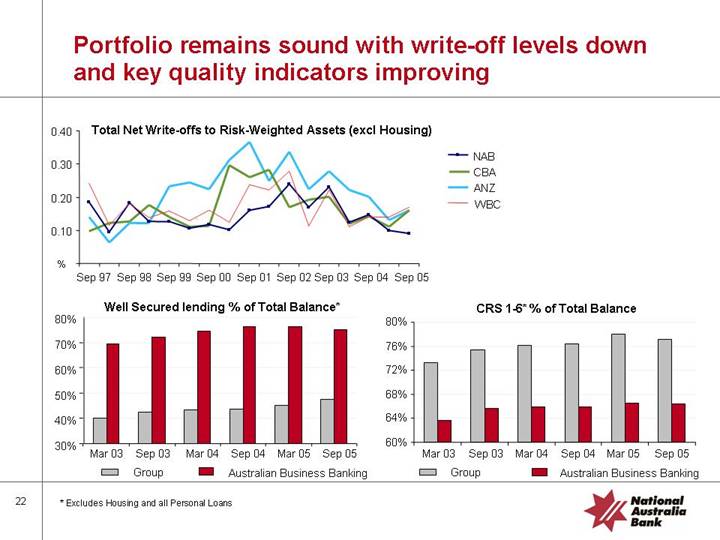
Portfolio remains sound with write-off levels down and key quality indicators improving
Total Net Write-offs to Risk-Weighted Assets (excl Housing)
[CHART]
Well Secured lending % of Total Balance*
[CHART]
CRS 1-6* % of Total Balance
[CHART]
* Excludes Housing and all Personal Loans
22
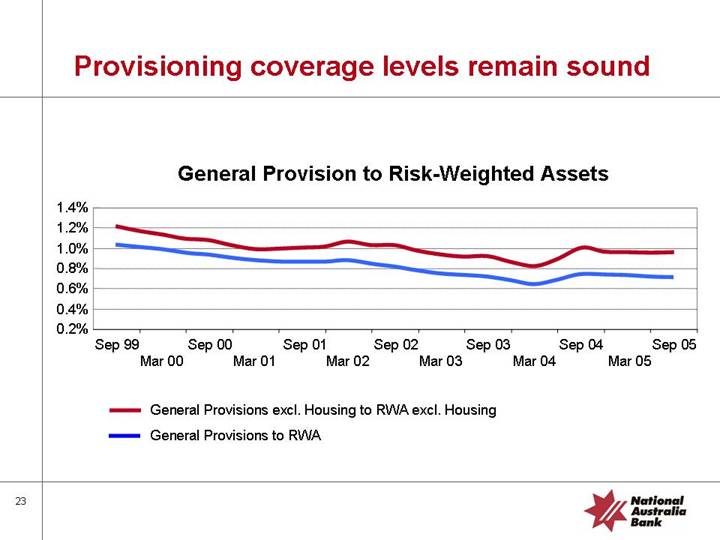
Provisioning coverage levels remain sound
General Provision to Risk-Weighted Assets
[CHART]
23
Credit Provisioning will change on transition to AIFRS
• Transition to AIFRS currently estimated to result in a decrease in the general (collective) provision for doubtful debts of approximately $350m
• This would give coverage of non-housing RWA’s
• AGAAP | 0.99% |
• IFRS | 0.83% |
24
Key area 4 - Capital
• Gaining more clarity on AIFRS impacts
• Some significant issues outstanding
• Capital base adequate to absorb changes
25
Strong ACE and Tier 1 ratios maintained
[CHART]
• Surplus provides flexibility to cater for expected impact of AIFRS
• Continued focus on improving ROE and internal capital allocation
|
| Target |
| 30 Sep 05 |
|
Targets |
| Ranges (%) |
| Actual |
|
|
|
|
|
|
|
ACE/RWA |
| 4.75 – 5.25 |
| 5.49 |
|
|
|
|
|
|
|
Tier 1 |
| 7.00 – 7.50 |
| 7.86 |
|
|
|
|
|
|
|
Total Regulatory |
| 10.00 – 10.50 |
| 10.45 |
|
26
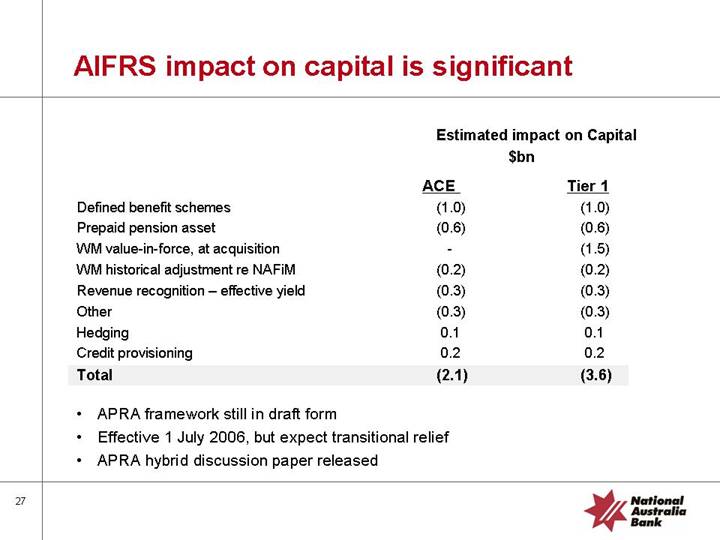
AIFRS impact on capital is significant
|
| Estimated impact on Capital |
| ||
|
| $bn |
| ||
|
| ACE |
| Tier 1 |
|
Defined benefit schemes |
| (1.0 | ) | (1.0 | ) |
Prepaid pension asset |
| (0.6 | ) | (0.6 | ) |
WM value-in-force, at acquisition |
| — |
| (1.5 | ) |
WM historical adjustment re NAFiM |
| (0.2 | ) | (0.2 | ) |
Revenue recognition – effective yield |
| (0.3 | ) | (0.3 | ) |
Other |
| (0.3 | ) | (0.3 | ) |
Hedging |
| 0.1 |
| 0.1 |
|
Credit provisioning |
| 0.2 |
| 0.2 |
|
Total |
| (2.1 | ) | (3.6 | ) |
• APRA framework still in draft form
• Effective 1 July 2006, but expect transitional relief
• APRA hybrid discussion paper released
27
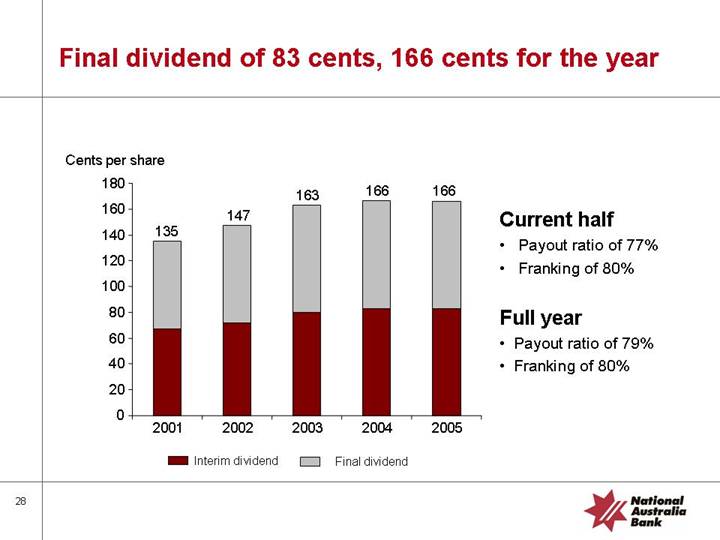
Final dividend of 83 cents, 166 cents for the year
[CHART]
Current half
• Payout ratio of 77%
• Franking of 80%
Full year
• Payout ratio of 79%
• Franking of 80%
28
Group Scorecard
• Our results bottomed in the first half
• Acceptable growth by each of the regional businesses
• Franchises being rebuilt and extended
• Compliance and infrastructure programmes will continue
• Objective to deliver satisfactory long-term returns to our shareholders
29
Agenda
Introduction | John Stewart |
|
|
Group Results | Michael Ullmer |
|
|
Outlook & Update | John Stewart |
|
|
Questions and Answers |
|
30
Economic environment to soften in our key markets
• Economic outlook is subdued
• Slowing credit growth
• But business momentum is building
31
Headwinds for 2006
• Continuing reinvestment in core infrastructure
• Compliance cost
• Basel ‘gaps’, enforceable undertakings, APRA
• Compliance Infrastructure
• Internal model re–accreditation
• Wealth Management – transitional tax relief
• Current year IORE due to market levels
• IMS business continues to rebase
32
Regional accountability model
• Refreshed Leadership
• Leaders demonstrating the Corporate Principles
• Setting high standards for our customers
• Rewarding behaviours & results
• Clear direction – clear accountabilities
33
Corporate Centre
• Emphasis on clear accountability for decisions and outcomes
Corporate Centre to focus on:
• Value creation
• Target/ expectation setting and sign off of proposed strategies
• Performance monitoring
• Validation and oversight required to provide assurance required for financial and risk governance
• Capital and balance sheet management
• Mergers and acquisitions
34
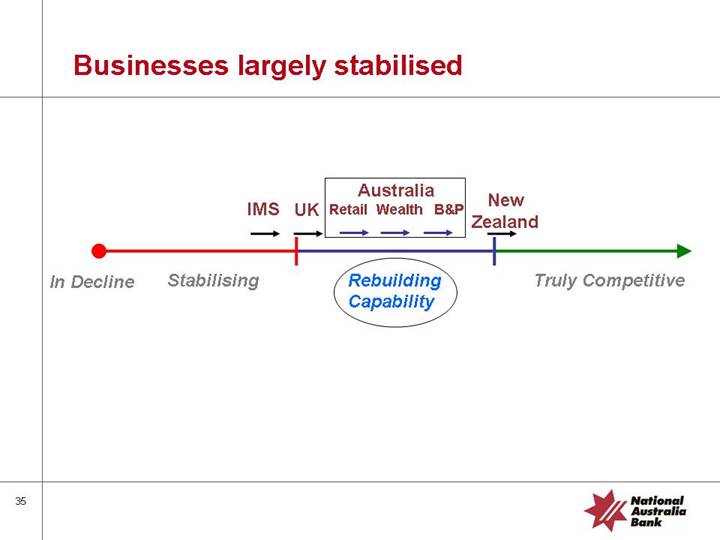
Businesses largely stabilised
[CHART]
35
IMS
IMS
Focus on 5 strategies
| In Decline | Stabilising |
[GRAPHIC]
[LOGO]
• Reduce reliance on low ROE lending
• Increase capital velocity
• Align presence to market potential
• Drive efficiency
• Create products for the new capital pools
36
| UK |
|
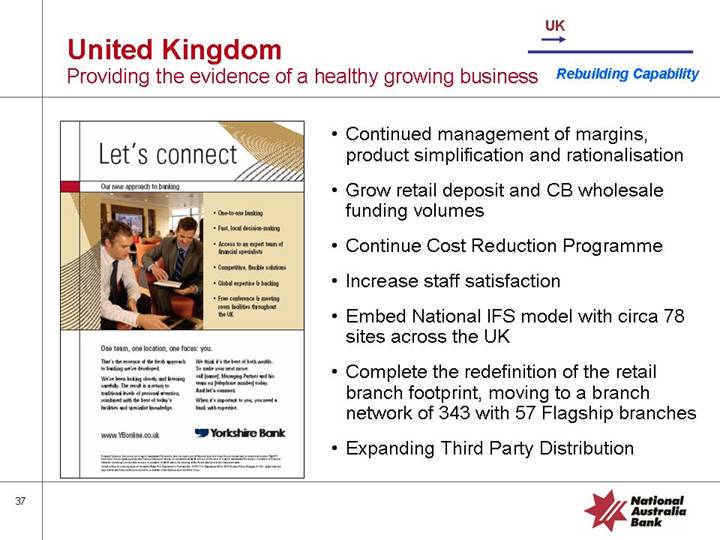
United Kingdom |
|
|
Providing the evidence of a healthy growing business | Rebuilding Capability | |
[GRAPHIC]
• Continued management of margins, product simplification and rationalisation
• Grow retail deposit and CB wholesale funding volumes
• Continue Cost Reduction Programme
• Increase staff satisfaction
• Embed National IFS model with circa 78 sites across the UK
• Complete the redefinition of the retail branch footprint, moving to a branch network of 343 with 57 Flagship branches
• Expanding Third Party Distribution
37
| Australia |
Australia | Retail Wealth B&P |
Helping our customers fulfil their aspirations |
|
| Rebuilding Capability |
[GRAPHIC]
38
| Retail Wealth B&P |
Australian Region – Retail |
|
Rebuilding through people capability |
|
| Rebuilding Capability |
[GRAPHIC]
• Major rebuilding program across the entire Retail network
• Focusing our brand on key customer segments and geographic locations
• Focus on building sales capabilities in key branches
• Customer driven product innovation including wealth products
• Distribution model with executives having full P&L accountability and ownership of their local market
39
| Retail Wealth B&P |
Australian Region – Wealth |
|
Improve returns and leverage bank channels |
|
| Rebuilding Capability |
[GRAPHIC]
• Accelerate insurance sales by broadening distribution
• Offer our bank customers simple, integrated solutions
• Assert our Manager of Managers credentials and build new investment offers
• Continue to develop our leading platform proposition
40
Australian Region - Business & Private | Retail Wealth B&P |
Lead the market, grow through innovation |
|
| Rebuilding Capability |
[GRAPHIC]
• Greater banker empowerment, quick decisions, decentralised, streamlined servicing process
• New client segment businesses and specialisation- health and education
• New Sales & Service program ‘Go National’
• Innovative products, quick to market:
• CBIB Transaction Banking Platform (internet)
• New protected loans (integrating insurance)
• Alternative investments
41
| New Zealand |
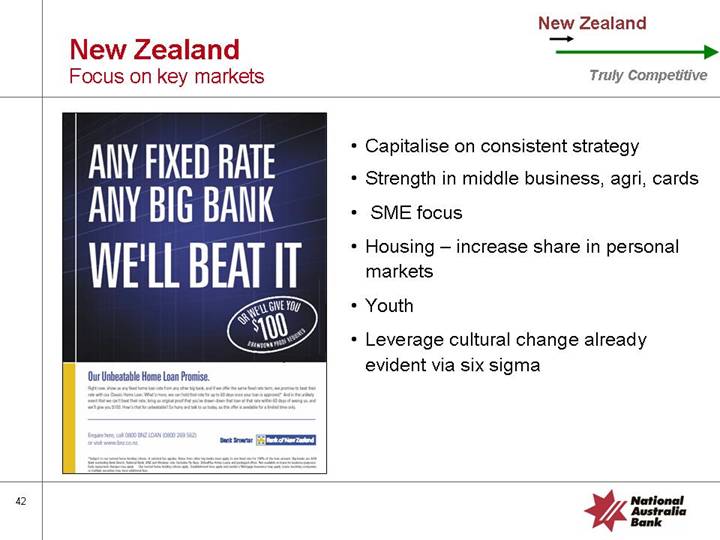
New Zealand |
|
Focus on key markets | Truly Competitive |
[GRAPHIC]
• Capitalise on consistent strategy
• Strength in middle business, agri, cards
• SME focus
• Housing – increase share in personal markets
• Youth
• Leverage cultural change already evident via six sigma
42
Summary
• Revenue momentum is building
• Costs are under control
• Turnaround is on track
43
Agenda
Introduction |
| John Stewart |
|
|
|
Group Results |
| Michael Ullmer |
|
|
|
Outlook & Update |
| John Stewart |
|
|
|
Questions and Answers |
|
|
44
FULL YEAR |
| 05 |
| [LOGO] |
RESULTS |
|
Appendix
• Group Performance
• Divisional Performance
• Asset Quality
• Capital & Funding
• Other Matters
• Economic Outlook
[LOGO]
46
FULL YEAR |
| 05 |
| [LOGO] |
RESULTS |
|
Group Performance
Volume growth across the Group
Group Lending Growth*^ |
| Retail Deposits Growth* |
(quarterly average) |
| (quarterly average) |
|
|
|
[CHART] |
| [CHART] |
* At constant exchange rates
^ Excludes Irish Banks and UK National Custodian Services
+ Excludes securitisation
[LOGO]
48
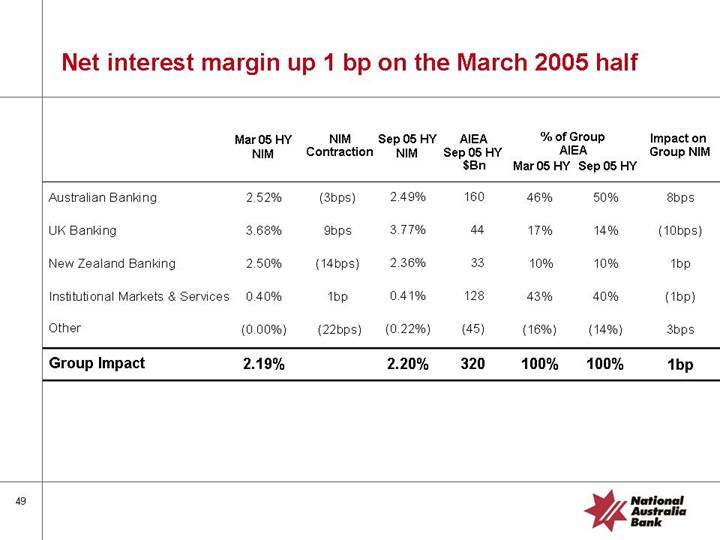
Net interest margin up 1 bp on the March 2005 half
|
|
|
|
|
|
|
| AIEA |
| % of Group |
|
|
| ||
|
| Mar 05 HY |
| NIM |
| Sep 05 HY |
| Sep 05 HY |
| AIEA |
| Impact on |
| ||
|
| NIM |
| Contraction |
| NIM |
| $Bn |
| Mar 05 HY |
| Sep 05 HY |
| Group NIM |
|
|
|
|
|
|
|
|
|
|
|
|
|
|
|
|
|
Australian Banking |
| 2.52 | % | (3bps) |
| 2.49 | % | 160 |
| 46 | % | 50 | % | 8bps |
|
|
|
|
|
|
|
|
|
|
|
|
|
|
|
|
|
UK Banking |
| 3.68 | % | 9bps) |
| 3.77 | % | 44 |
| 17 | % | 14 | % | (10bps) |
|
|
|
|
|
|
|
|
|
|
|
|
|
|
|
|
|
New Zealand Banking |
| 2.50 | % | (14bps) |
| 2.36 | % | 33 |
| 10 | % | 10 | % | 1bp |
|
|
|
|
|
|
|
|
|
|
|
|
|
|
|
|
|
Institutional Markets & Services |
| 0.40 | % | 1bp |
| 0.41 | % | 128 |
| 43 | % | 40 | % | (1bp) |
|
|
|
|
|
|
|
|
|
|
|
|
|
|
|
|
|
Other |
| (0.00 | )% | (22bps) |
| (0.22 | )% | (45 | ) | (16 | )% | (14 | )% | 3bps |
|
|
|
|
|
|
|
|
|
|
|
|
|
|
|
|
|
Group Impact |
| 2.19 | % |
|
| 2.20 | % | 320 |
| 100 | % | 100 | % | 1bp |
|
49
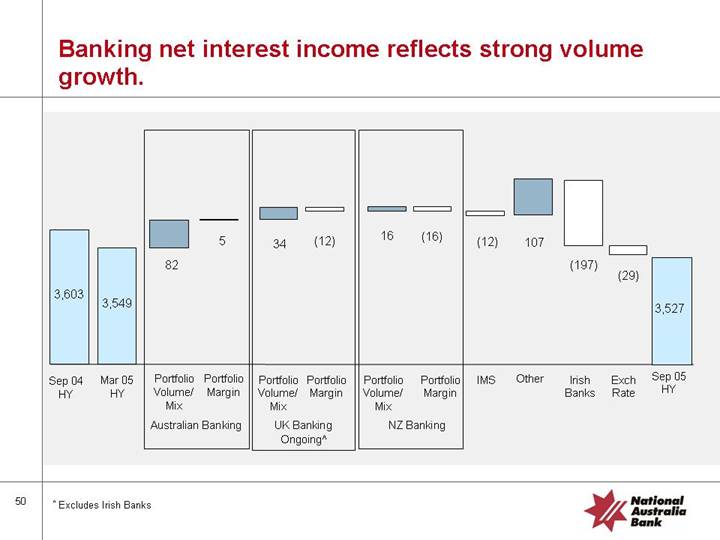
Banking net interest income reflects strong volume growth.
[CHART]
^ Excludes Irish Banks
50
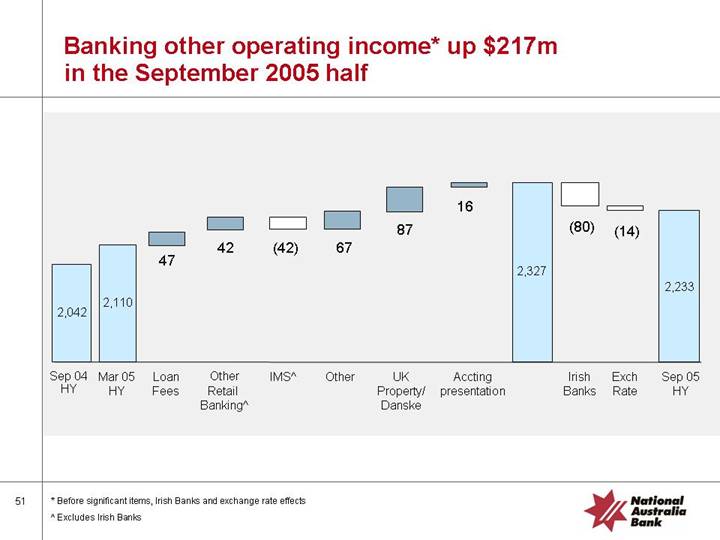
Banking other operating income* up $217m in the September 2005 half
[CHART]
* Before significant items, Irish Banks and exchange rate effects
^ Excludes Irish Banks
51
FULL YEAR |
| 05 |
| [LOGO] |
RESULTS |
|
| Divisional |
| Performance |
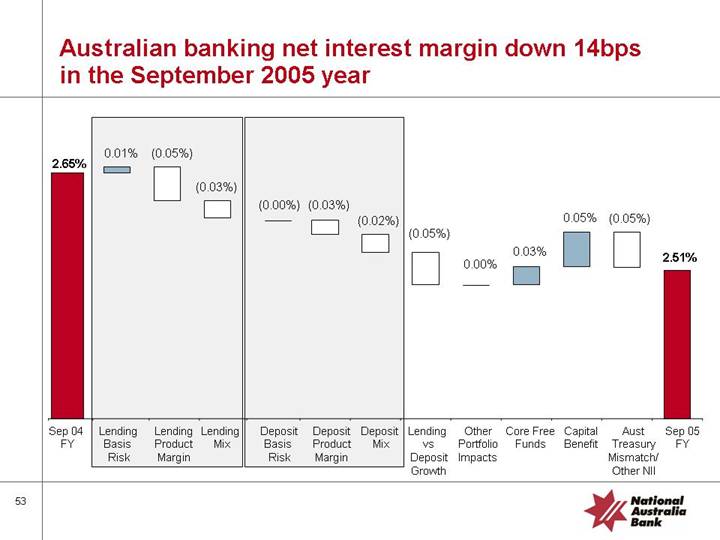
Australian banking net interest margin down 14bps in the September 2005 year
[CHART]
[LOGO]
53
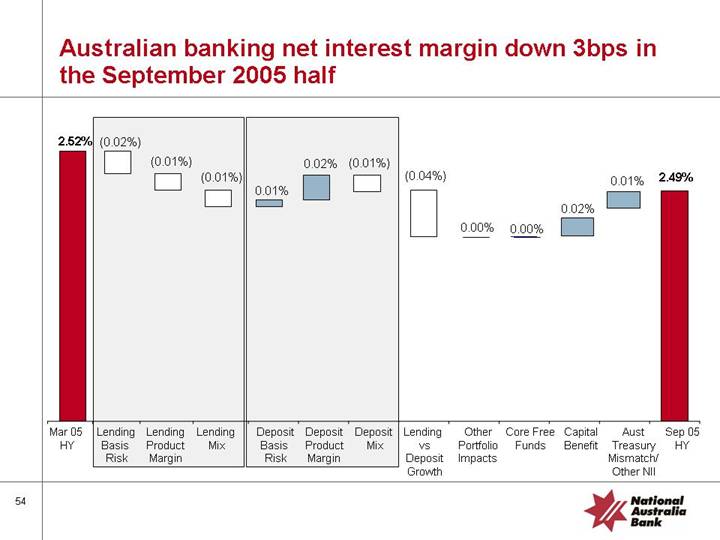
Australian banking net interest margin down 3bps in the September 2005 half
[CHART]
54
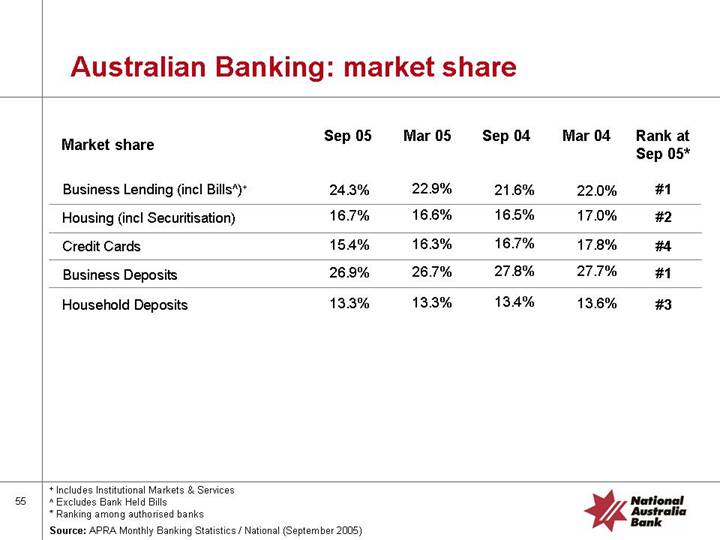
Australian Banking: market share
Market share |
| Sep 05 |
| Mar 05 |
| Sep 04 |
| Mar 04 |
| Rank at |
|
|
|
|
|
|
|
|
|
|
|
|
|
Business Lending (incl Bills^)+ |
| 24.3 | % | 22.9 | % | 21.6 | % | 22.0 | % | #1 |
|
Housing (incl Securitisation) |
| 16.7 | % | 16.6 | % | 16.5 | % | 17.0 | % | #2 |
|
Credit Cards |
| 15.4 | % | 16.3 | % | 16.7 | % | 17.8 | % | #4 |
|
Business Deposits |
| 26.9 | % | 26.7 | % | 27.8 | % | 27.7 | % | #1 |
|
Household Deposits |
| 13.3 | % | 13.3 | % | 13.4 | % | 13.6 | % | #3 |
|
+ Includes Institutional Markets & Services
^ Excludes Bank Held Bills
* Ranking among authorised banks
Source: APRA Monthly Banking Statistics / National (September 2005)
55
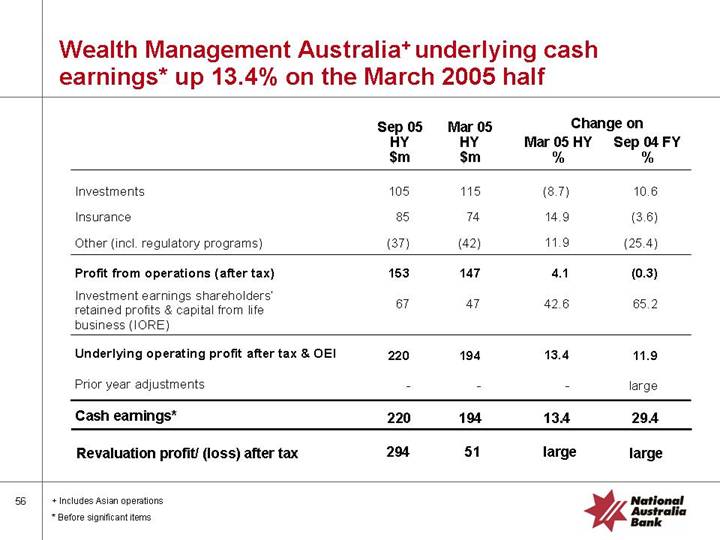
Wealth Management Australia+ underlying cash earnings* up 13.4% on the March 2005 half
|
| Sep 05 |
| Mar 05 |
| Change on |
| ||
|
| HY |
| HY |
| Mar 05 HY |
| Sep 04 FY |
|
|
| $m |
| $m |
| % |
| % |
|
|
|
|
|
|
|
|
|
|
|
Investments |
| 105 |
| 115 |
| (8.7 | ) | 10.6 |
|
|
|
|
|
|
|
|
|
|
|
Insurance |
| 85 |
| 74 |
| 14.9 |
| (3.6 | ) |
|
|
|
|
|
|
|
|
|
|
Other (incl. regulatory programs) |
| (37 | ) | (42 | ) | 11.9 |
| (25.4 | ) |
|
|
|
|
|
|
|
|
|
|
Profit from operations (after tax) |
| 153 |
| 147 |
| 4.1 |
| (0.3 | ) |
|
|
|
|
|
|
|
|
|
|
Investment earnings shareholders’ retained profits & capital from life business (IORE) |
| 67 |
| 47 |
| 42.6 |
| 65.2 |
|
|
|
|
|
|
|
|
|
|
|
Underlying operating profit after tax & OEI |
| 220 |
| 194 |
| 13.4 |
| 11.9 |
|
|
|
|
|
|
|
|
|
|
|
Prior year adjustments |
| — |
| — |
| — |
| large |
|
|
|
|
|
|
|
|
|
|
|
Cash earnings* |
| 220 |
| 194 |
| 13.4 |
| 29.4 |
|
|
|
|
|
|
|
|
|
|
|
Revaluation profit/ (loss) after tax |
| 294 |
| 51 |
| large |
| large |
|
+ Includes Asian operations
* Before significant items
56
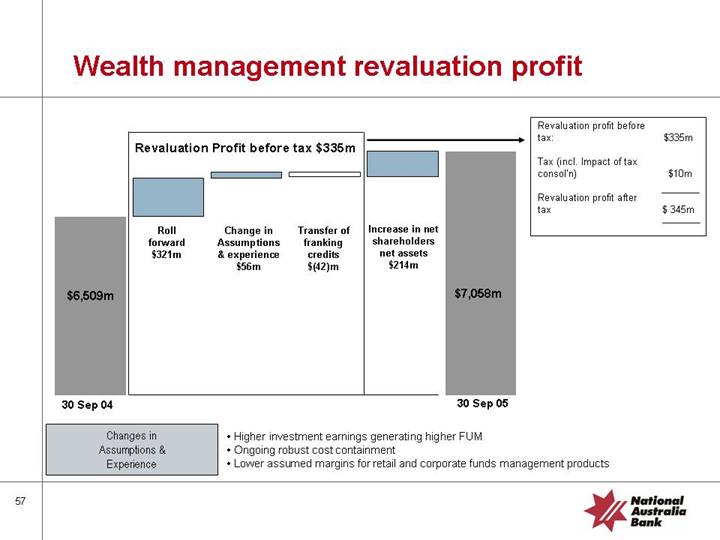
Wealth management revaluation profit
[CHART]
Revaluation profit before tax: |
| $ | 335m |
|
|
|
|
| |
Tax (incl. Impact of tax consol’n) |
| $ | 10m |
|
|
|
|
| |
Revaluation profit after tax |
| $ | 345m |
|
Changes in
Assumptions &
Experience
• Higher investment earnings generating higher FUM
• Ongoing robust cost containment
• Lower assumed margins for retail and corporate funds management products
57
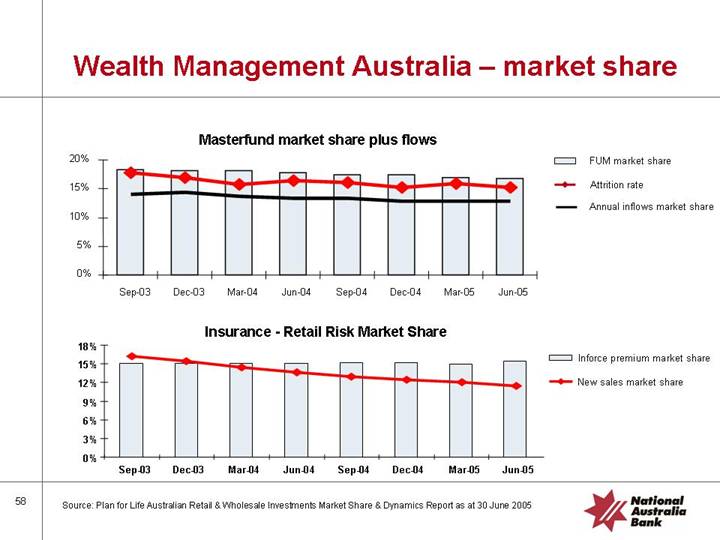
Wealth Management Australia – market share
Masterfund market share plus flows
[CHART]
Insurance - Retail Risk Market Share
[CHART]
Source: Plan for Life Australian Retail & Wholesale Investments Market Share & Dynamics Report as at 30 June 2005
58
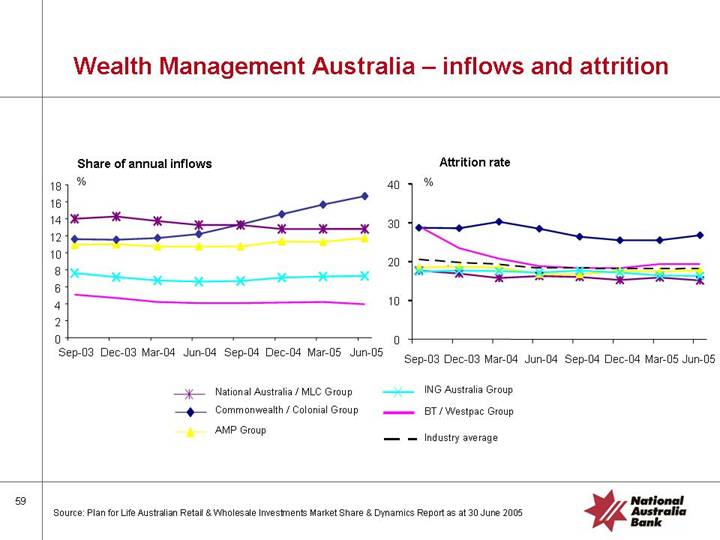
Wealth Management Australia – inflows and attrition
Share of annual inflows
[CHART]
Attrition rate
[CHART]
Source: Plan for Life Australian Retail & Wholesale Investments Market Share & Dynamics Report as at 30 June 2005
59
UK banking ongoing operations^ net interest margin down 14bps in the September 2005 half
[CHART]
^ Excludes Irish Banks and UK National Custodian Services
60
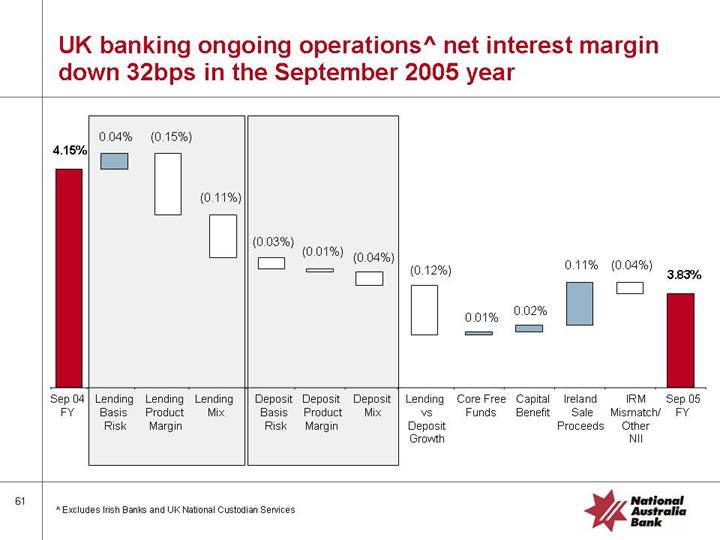
UK banking ongoing operations^ net interest margin down 32bps in the September 2005 year
[CHART]
^ Excludes Irish Banks and UK National Custodian Services
61
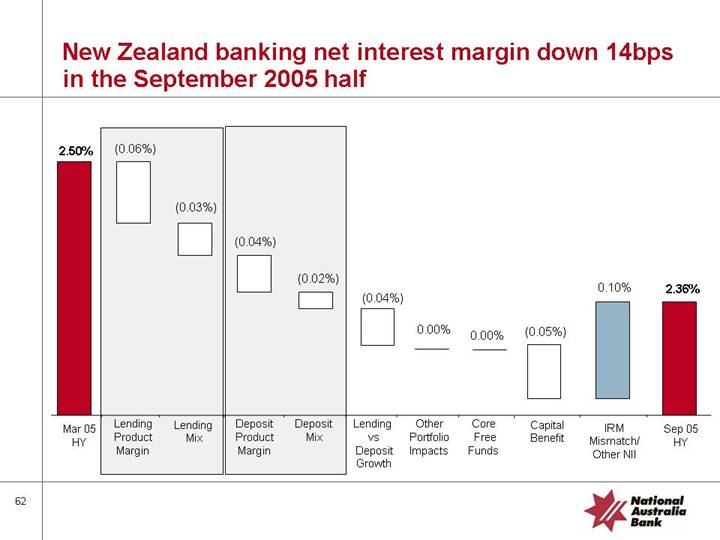
New Zealand banking net interest margin down 14bps in the September 2005 half
[CHART]
62
New Zealand banking net interest margin down 18bps in the September 2005 year
[CHART]
63
Total IMS Return on Risk Weighted Assets+ (RWA) and Total IMS External Assets Vs RWA
[CHART]
• Strong improvement in Return on Risk Weighted Assets
• Reduction of $565m (14.5%) in capital since September 2004 *
• Reduction of $29Bn (23.2%) in External Assets since September 2004
* Based off the mid-point of the ACE target range
+ Excludes Irish Banks
64
FULL YEAR |
| 05 |
| [LOGO] |
RESULTS |
|
Asset Quality
Non-accrual levels stable
Gross Non-Accrual Loans
[CHART]
90+ Delinquency and Gross 12 Month Rolling Write Off Rates Total Personal Lending
[CHART]
[LOGO]
66
Australian Housing metrics
Low Doc Loans
• $1.3bn outstanding
• LVR capped at 60%
Inner City Apartments
• $2.0bn outstanding
• 90 days past due improving
Origination source
|
| Mar 05 |
| Sep 05 |
|
|
|
|
|
|
|
Proprietory |
| 72 | % | 70 | % |
|
|
|
|
|
|
Introducer |
| 10 | % | 12 | % |
|
|
|
|
|
|
Broker |
| 18 | % | 18 | % |
67
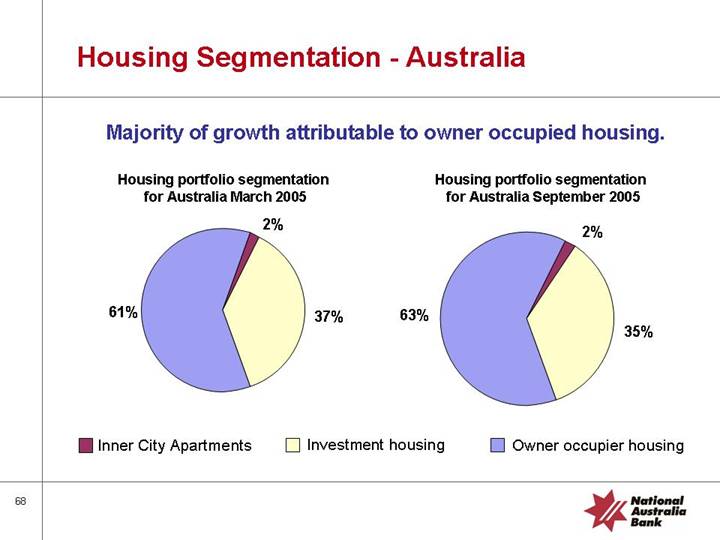
Housing Segmentation - Australia
Majority of growth attributable to owner occupied housing.
Housing portfolio segmentation |
| Housing portfolio segmentation |
for Australia March 2005 |
| for Australia September 2005 |
|
|
|
[CHART] |
| [CHART] |
68
FULL YEAR |
| 05 |
| [LOGO] |
RESULTS |
|
Capital & Funding
Core capital movement
Movement in ACE ratio
[CHART]
70
FULL YEAR |
| 05 |
| [LOGO] |
RESULTS |
|
Other Matters
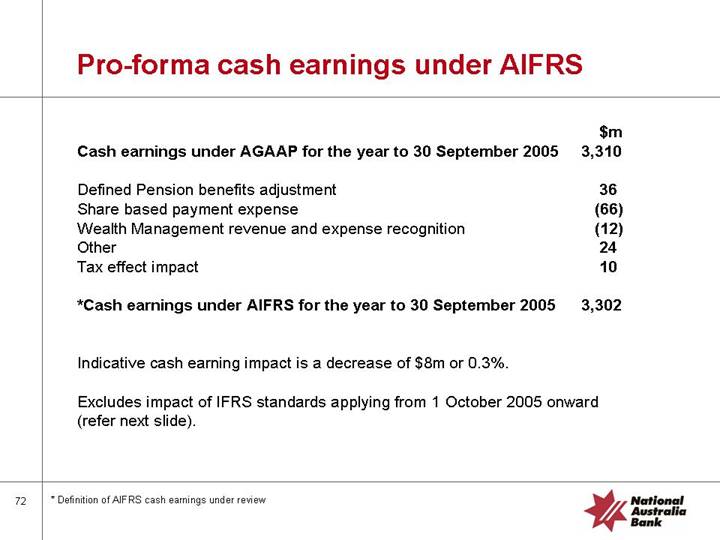
Pro-forma cash earnings under AIFRS
|
| $m |
|
Cash earnings under AGAAP for the year to 30 September 2005 |
| 3,310 |
|
|
|
|
|
Defined Pension benefits adjustment |
| 36 |
|
Share based payment expense |
| (66 | ) |
Wealth Management revenue and expense recognition |
| (12 | ) |
Other |
| 24 |
|
Tax effect impact |
| 10 |
|
|
|
|
|
*Cash earnings under AIFRS for the year to 30 September 2005 |
| 3,302 |
|
Indicative cash earning impact is a decrease of $8m or 0.3%.
Excludes impact of IFRS standards applying from 1 October 2005 onward (refer next slide).
* Definition of AIFRS cash earnings under review
[LOGO]
72
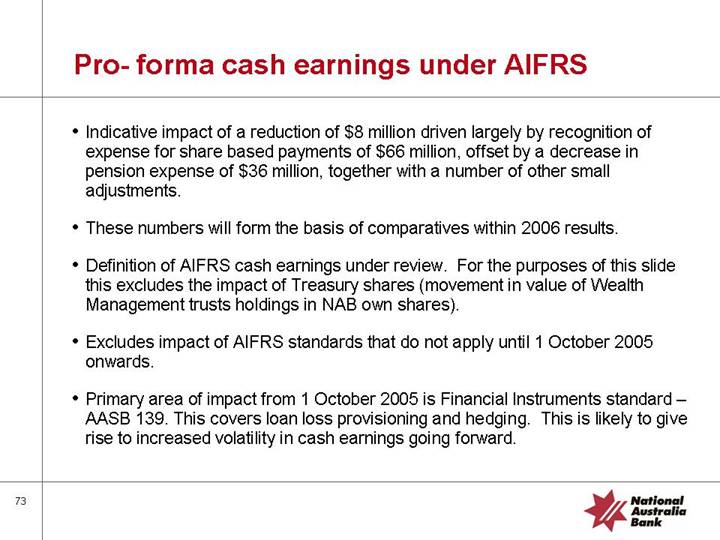
Pro- forma cash earnings under AIFRS
• Indicative impact of a reduction of $8 million driven largely by recognition of expense for share based payments of $66 million, offset by a decrease in pension expense of $36 million, together with a number of other small adjustments.
• These numbers will form the basis of comparatives within 2006 results.
• Definition of AIFRS cash earnings under review. For the purposes of this slide this excludes the impact of Treasury shares (movement in value of Wealth Management trusts holdings in NAB own shares).
• Excludes impact of AIFRS standards that do not apply until 1 October 2005 onwards.
• Primary area of impact from 1 October 2005 is Financial Instruments standard – AASB 139. This covers loan loss provisioning and hedging. This is likely to give rise to increased volatility in cash earnings going forward.
73
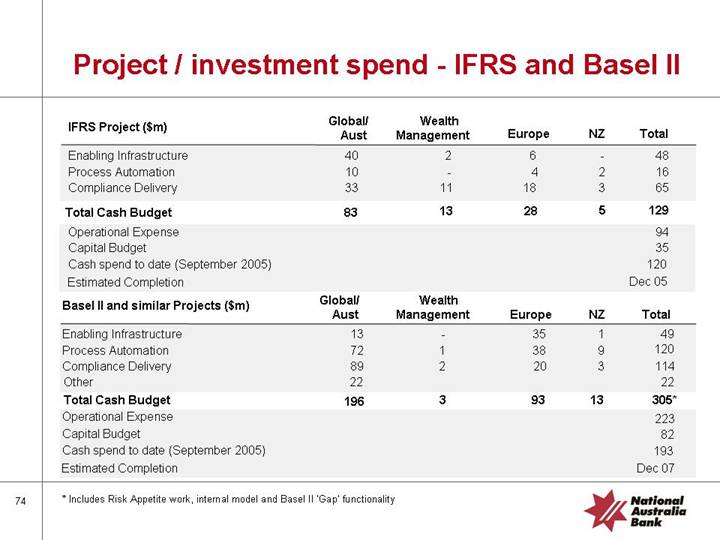
Project / investment spend - IFRS and Basel II
|
| Global/ |
| Wealth |
|
|
|
|
|
|
|
IFRS Project ($m) |
| Aust |
| Management |
| Europe |
| NZ |
| Total |
|
Enabling Infrastructure |
| 40 |
| 2 |
| 6 |
| — |
| 48 |
|
Process Automation |
| 10 |
| — |
| 4 |
| 2 |
| 16 |
|
Compliance Delivery |
| 33 |
| 11 |
| 18 |
| 3 |
| 65 |
|
|
|
|
|
|
|
|
|
|
|
|
|
Total Cash Budget |
| 83 |
| 13 |
| 28 |
| 5 |
| 129 |
|
|
|
|
|
|
|
|
|
|
|
|
|
Operational Expense |
|
|
|
|
|
|
|
|
| 94 |
|
Capital Budget |
|
|
|
|
|
|
|
|
| 35 |
|
Cash spend to date (September 2005) |
|
|
|
|
|
|
|
|
| 120 |
|
Estimated Completion |
|
|
|
|
|
|
|
|
| Dec 05 |
|
|
| Global/ |
| Wealth |
|
|
|
|
|
|
|
Basel II and similar Projects ($m) |
| Aust |
| Management |
| Europe |
| NZ |
| Total |
|
Enabling Infrastructure |
| 13 |
| — |
| 35 |
| 1 |
| 49 |
|
Process Automation |
| 72 |
| 1 |
| 38 |
| 9 |
| 120 |
|
Compliance Delivery |
| 89 |
| 2 |
| 20 |
| 3 |
| 114 |
|
Other |
| 22 |
|
|
|
|
|
|
| 22 |
|
|
|
|
|
|
|
|
|
|
|
|
|
Total Cash Budget |
| 196 |
| 3 |
| 93 |
| 13 |
| 305 | * |
|
|
|
|
|
|
|
|
|
|
|
|
Operational Expense |
|
|
|
|
|
|
|
|
| 223 |
|
Capital Budget |
|
|
|
|
|
|
|
|
| 82 |
|
Cash spend to date (September 2005) |
|
|
|
|
|
|
|
|
| 193 |
|
Estimated Completion |
|
|
|
|
|
|
|
|
| Dec 07 |
|
* Includes Risk Appetite work, internal model and Basel II ‘Gap’ functionality
74
Taxation
|
| Potential |
|
|
|
|
| ||
|
| Amount in |
|
|
| Amount |
| ||
|
| Dispute |
| Status |
| Provided |
| ||
TrUEPrs capital raising |
| $ | 210 million |
| In-principle agreement |
| $ | 96.5million |
|
|
|
|
|
|
|
|
|
|
|
ExCapscapital raising |
| $ | 552 million | * | In dispute |
| $ | Nil |
|
|
|
|
|
|
|
|
|
|
|
NZ structured finance transactions |
| NZ$ | 533 million | ** | In dispute |
| $ | Nil |
|
• TrUEPrS tax dispute - in-principle agreement to settle with ATO for $96.5 million
• ExCaps remains in dispute – confidence of legal merits of case reinforced by recent Macquarie Finance decision
• NZ structured finance transactions remain in dispute – underlying transactions have all terminated following legislative change effective 1 July 2005
* Includes primary tax, penalties and interest (net of tax)
** Includes primary tax and interest (net of tax) but not the possible imposition of penalties
75
FULL YEAR |
| 05 |
| [LOGO] |
RESULTS |
|
Economic Outlook
The following slides contain forward looking statements. Refer to disclaimer on page 82
Global economy strong and only marginally weaker in 2006
World GDP Growth
[CHART]
• Global growth strong
• Growth underpinned by US, China and India
• Inflationary concerns remain
• Upward bias on rate rises
• European growth to remain sluggish
[LOGO]
77
Economic outlook
Economic environment to soften in our key market:
• Overall, sustained income and credit growth, albeit at a bit slower. Slightly higher unemployment & inflation. Monetary conditions remain about “neutral”.
• 2005/06 GDP growth is forecast to be 3% in Australia, 2.5% in the UK & 2.2% in NZ
• In Australia, some moderation in domestic activity (largely household spending) offset by a pick up in exports.
• In NZ, domestic conditions are forecast to moderate significantly during the next year, due to tighter financial conditions & slower immigration.
• In the UK, business activity is expected to ease back to trend reflecting some moderation in household spending & external demand.
78
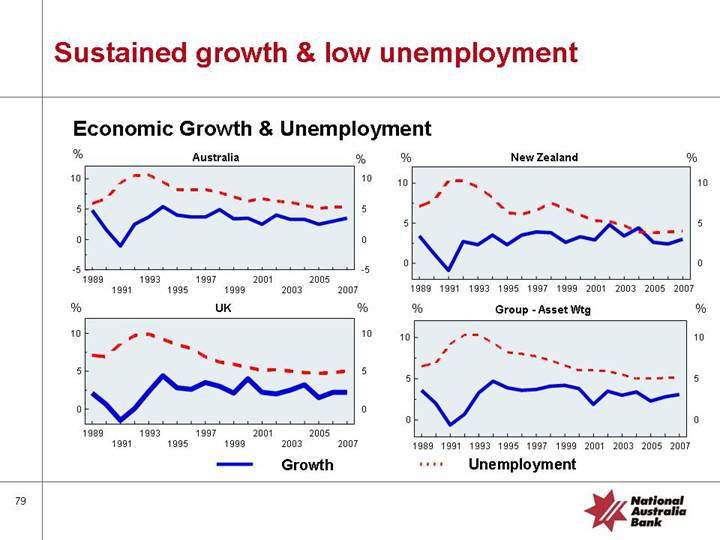
Sustained growth & low unemployment
Economic Growth & Unemployment
Australia |
| New Zealand |
|
|
|
[CHART] |
| [CHART] |
UK |
| Group - Asset Wtg |
|
|
|
[CHART] |
| [CHART] |
79
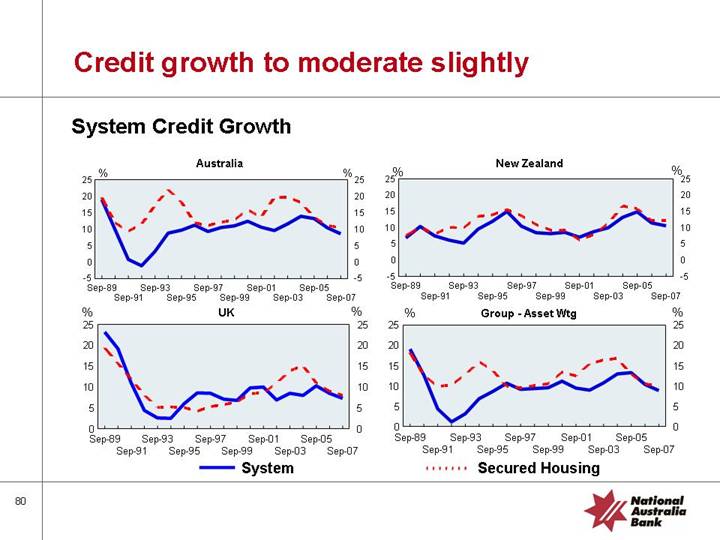
Credit growth to moderate slightly
System Credit Growth
Australia |
| New Zealand |
|
|
|
[CHART] |
| [CHART] |
UK |
| Group - Asset Wtg |
|
|
|
[CHART] |
| [CHART] |
80
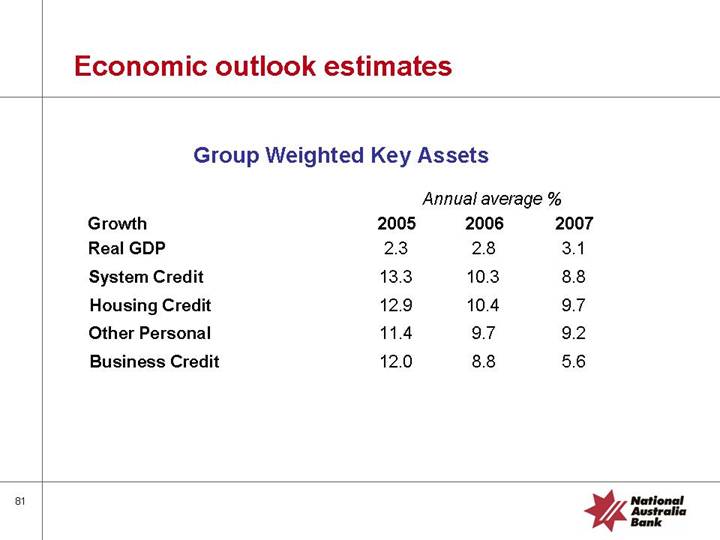
Economic outlook estimates
Group Weighted Key Assets
|
| Annual average % |
| ||||
Growth |
| 2005 |
| 2006 |
| 2007 |
|
Real GDP |
| 2.3 |
| 2.8 |
| 3.1 |
|
System Credit |
| 13.3 |
| 10.3 |
| 8.8 |
|
Housing Credit |
| 12.9 |
| 10.4 |
| 9.7 |
|
Other Personal |
| 11.4 |
| 9.7 |
| 9.2 |
|
Business Credit |
| 12.0 |
| 8.8 |
| 5.6 |
|
81
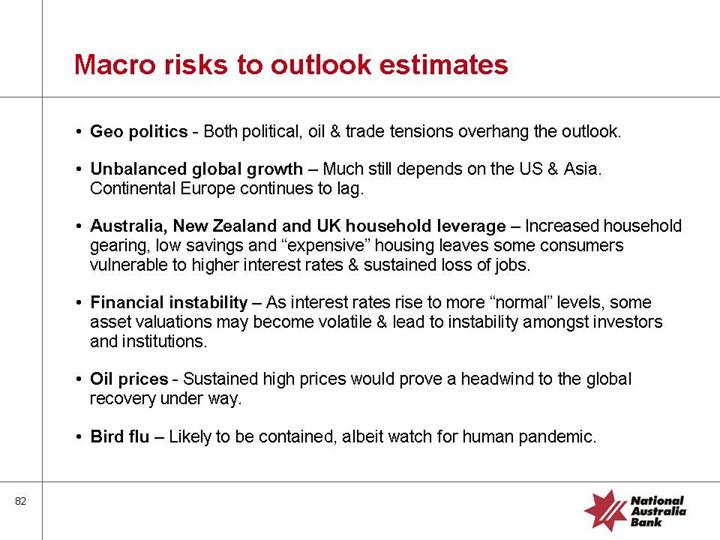
Macro risks to outlook estimates
• Geo politics - Both political, oil & trade tensions overhang the outlook.
• Unbalanced global growth – Much still depends on the US & Asia. Continental Europe continues to lag.
• Australia, New Zealand and UK household leverage – Increased household gearing, low savings and “expensive” housing leaves some consumers vulnerable to higher interest rates & sustained loss of jobs.
• Financial instability – As interest rates rise to more “normal” levels, some asset valuations may become volatile & lead to instability amongst investors and institutions.
• Oil prices - Sustained high prices would prove a headwind to the global recovery under way.
• Bird flu – Likely to be contained, albeit watch for human pandemic.
82
Disclaimer
This document is a presentation of general background information about the Group’s activities current at the date of the presentation, 9 November, 2005. It is information in a summary form and does not purport to be complete. It is not intended to be relied upon as advice to investors or potential investors and does not take into account the investment objectives, financial situation or needs of any particular investor. These should be considered, with or without professional advice, when deciding if an investment is appropriate.
This document contains certain “forward-looking statements” within the meaning of Section 21E of the US Securities Exchange Act of 1934 and the US Private Securities Litigation Reform Act of 1995. The words “anticipate”, “believe”, “expect”, “project”, “estimate”, “intend”, “should”, “could”, “may”, “target”, “plan” and other similar expressions are intended to identify forward-looking statements. Indications of and guidance on future earnings and financial position and performance are also forward-looking statements. Such forward-looking statements are not guarantees of future performance and involve known and unknown risks, uncertainties and other factors, many of which are beyond the control of the Group, that may cause actual results to differ materially from those expressed or implied in such statements. There can be no assurance that actual outcomes will not differ materially from these statements. For further information relating to the identification of forward-looking statements and important factors that could cause actual results to differ materially from those projected in such statements, see “Presentation of Information - Forward-Looking Statements” and “Risk Factors” in the Group’s Annual Report on Form 20-F filed with the US Securities & Exchange Commission.
83
SIGNATURE PAGE
Pursuant to the requirements of the Securities Exchange Act of 1934, the registrant has duly caused this report to be signed on its behalf by the undersigned, thereunto duly authorised.
|
| NATIONAL AUSTRALIA BANK LIMITED | ||||
|
|
|
| |||
|
|
|
| |||
/s/ | Brendan T. Case | |||||
|
|
| Brendan T. Case | |||
Date: | 14 November 2005 | Title: | Associate Company Secretary | |||