Table of Contents
UNITED STATES
SECURITIES AND EXCHANGE COMMISSION
Washington, D.C. 20549
FORM 10-Q
| | |
ý |
|
QUARTERLY REPORT PURSUANT TO SECTION 13 OR 15(d) OF THE SECURITIES EXCHANGE ACT OF 1934 |
For the Quarterly Period Ended December 28, 2012 |
or |
o |
|
TRANSITION REPORT PURSUANT TO SECTION 13 OR 15(d) OF THE SECURITIES EXCHANGE ACT OF 1934 |
001-13836
(Commission File Number)
TYCO INTERNATIONAL LTD.
(Exact name of Registrant as specified in its charter)
| | |
Switzerland
(Jurisdiction of Incorporation) | | 98-0390500
(I.R.S. Employer Identification Number) |
Freier Platz 10, CH-8200 Schaffhausen, Switzerland
(Address of registrant's principal executive office) |
41-52-633-02-44
(Registrant's telephone number)
|
Indicate by check mark whether the registrant (1) has filed all reports required to be filed by Section 13 or 15(d) of the Securities Exchange Act of 1934 during the preceding 12 months (or for such shorter period that the registrant was required to file such reports), and (2) has been subject to such filing requirements for the past 90 days. Yes ý No o
Indicate by check mark whether the registrant has submitted electronically and posted on its corporate Web site, if any, every Interactive Data File required to be submitted and posted pursuant to Rule 405 of Regulation S-T during the preceding 12 months (or for such shorter period that the registrant was required to submit and post such files). Yes ý No o
Indicate by check mark whether the registrant is a large accelerated filer, an accelerated filer, a non-accelerated filer, or a smaller reporting company. See definitions of "large accelerated filer," "accelerated filer," and "smaller reporting company" in Rule 12b-2 of the Exchange Act. (Check one):
| | | | | | |
| Large accelerated filer ý | | Accelerated filer o | | Non-accelerated filer o
(Do not check if a smaller
reporting company) | | Smaller reporting company o |
Indicate by check mark whether the registrant is a shell company (as defined in Rule 12b-2 of the Exchange Act). Yes o No ý
The number of common shares outstanding as of January 23, 2013 was 466,018,445.
TYCO INTERNATIONAL LTD.
INDEX TO FORM 10-Q
| | | | |
| |
| | Page |
|---|
| Part I. | | Financial Information | | |
Item 1. |
|
Financial Statements |
|
1 |
|
|
Consolidated Statements of Operations (Unaudited) for the quarters ended December 28, 2012 and December 30, 2011 |
|
1 |
|
|
Consolidated Statements of Comprehensive Income (Unaudited) for the quarters ended December 28, 2012 and December 30, 2011 |
|
2 |
|
|
Consolidated Balance Sheets (Unaudited) as of December 28, 2012 and September 28, 2012 |
|
3 |
|
|
Consolidated Statements of Cash Flows (Unaudited) for the quarters ended December 28, 2012 and December 30, 2011 |
|
4 |
|
|
Consolidated Statements of Shareholders' Equity (Unaudited) for the quarters ended December 28, 2012 and December 30, 2011 |
|
5 |
|
|
Notes to Consolidated Financial Statements (Unaudited) |
|
6 |
Item 2. |
|
Management's Discussion and Analysis of Financial Condition and Results of Operations |
|
41 |
Item 3. |
|
Quantitative and Qualitative Disclosures About Market Risk |
|
54 |
Item 4. |
|
Controls and Procedures |
|
54 |
Part II. |
|
Other Information |
|
|
Item 1. |
|
Legal Proceedings |
|
56 |
Item 1A. |
|
Risk Factors |
|
59 |
Item 2. |
|
Unregistered Sales of Equity Securities and Use of Proceeds |
|
59 |
Item 3. |
|
Defaults Upon Senior Securities |
|
59 |
Item 4. |
|
Mine Safety Disclosures |
|
59 |
Item 5. |
|
Other Information |
|
60 |
Item 6. |
|
Exhibits |
|
60 |
Signatures |
|
61 |
Table of Contents
PART I. FINANCIAL INFORMATION
Item 1. Financial Statements
TYCO INTERNATIONAL LTD.
CONSOLIDATED STATEMENTS OF OPERATIONS (UNAUDITED)
(in millions, except per share data)
| | | | | | | |
| | For the
Quarters Ended | |
|---|
| | December 28,
2012 | | December 30,
2011 | |
|---|
Revenue from product sales | | $ | 1,443 | | $ | 1,369 | |
Service revenue | | | 1,157 | | | 1,109 | |
| | | | | | |
Net revenue | | | 2,600 | | | 2,478 | |
Cost of product sales | | | 1,004 | | | 769 | |
Cost of services | | | 664 | | | 810 | |
Selling, general and administrative expenses | | | 682 | | | 677 | |
Separation costs (see Note 2) | | | 5 | | | — | |
Restructuring and asset impairment charges, net (see Note 4) | | | 10 | | | 36 | |
| | | | | | |
Operating income | | | 235 | | | 186 | |
Interest income | | | 4 | | | 5 | |
Interest expense | | | (24 | ) | | (58 | ) |
Other (expense) income, net | | | (9 | ) | | 2 | |
| | | | | | |
Income from continuing operations before income taxes | | | 206 | | | 135 | |
Income tax expense | | | (39 | ) | | (27 | ) |
Equity loss in earnings of unconsolidated subsidiaries | | | (6 | ) | | (10 | ) |
| | | | | | |
Income from continuing operations | | | 161 | | | 98 | |
Income from discontinued operations, net of income taxes | | | 4 | | | 224 | |
| | | | | | |
Net income | | | 165 | | | 322 | |
Less: noncontrolling interest in subsidiaries net income | | | 2 | | | — | |
| | | | | | |
Net income attributable to Tyco common shareholders | | $ | 163 | | $ | 322 | |
| | | | | | |
Amounts attributable to Tyco common shareholders: | | | | | | | |
Income from continuing operations | | $ | 159 | | $ | 98 | |
Income from discontinued operations | | | 4 | | | 224 | |
| | | | | | |
Net income attributable to Tyco common shareholders | | $ | 163 | | $ | 322 | |
| | | | | | |
Basic earnings per share attributable to Tyco common shareholders: | | | | | | | |
Income from continuing operations | | $ | 0.34 | | $ | 0.21 | |
Income from discontinued operations | | | 0.01 | | | 0.48 | |
| | | | | | |
Net income attributable to Tyco common shareholders | | $ | 0.35 | | $ | 0.69 | |
| | | | | | |
Diluted earnings per share attributable to Tyco common shareholders: | | | | | | | |
Income from continuing operations | | $ | 0.34 | | $ | 0.21 | |
Income from discontinued operations | | | — | | | 0.48 | |
| | | | | | |
Net income attributable to Tyco common shareholders | | $ | 0.34 | | $ | 0.69 | |
| | | | | | |
Weighted average number of shares outstanding: | | | | | | | |
Basic | | | 466 | | | 464 | |
Diluted | | | 473 | | | 469 | |
See Notes to Unaudited Consolidated Financial Statements.
1
Table of Contents
TYCO INTERNATIONAL LTD.
CONSOLIDATED STATEMENTS OF COMPREHENSIVE INCOME (UNAUDITED)
(in millions)
| | | | | | | |
| | For the Quarters Ended | |
|---|
| | December 28,
2012 | | December 30,
2011 | |
|---|
Net income | | $ | 165 | | $ | 322 | |
| | | | | | |
Other comprehensive income (loss), net of tax | | | | | | | |
Foreign currency translation | | | 11 | | | (79 | ) |
Defined benefit and post retirement plans | | | 4 | | | 4 | |
Unrealized gain on marketable securities and derivative instruments | | | 1 | | | 2 | |
| | | | | | |
Total other comprehensive income (loss), net of tax | | | 16 | | | (73 | ) |
| | | | | | |
Comprehensive income | | | 181 | | | 249 | |
Less: comprehensive income attributable to noncontrolling interests | | | 2 | | | — | |
| | | | | | |
Comprehensive income attributable to Tyco common shareholders | | $ | 179 | | $ | 249 | |
| | | | | | |
See Notes to Unaudited Consolidated Financial Statements.
2
Table of Contents
TYCO INTERNATIONAL LTD.
CONSOLIDATED BALANCE SHEETS (UNAUDITED)
(in millions, except per share data)
| | | | | | | |
| | December 28,
2012 | | September 28,
2012 | |
|---|
Assets | | | | | | | |
Current Assets: | | | | | | | |
Cash and cash equivalents | | $ | 501 | | $ | 844 | |
Accounts receivable, less allowance for doubtful accounts of $72 and $62, respectively | | | 1,709 | | | 1,711 | |
Inventories | | | 664 | | | 634 | |
Prepaid expenses and other current assets | | | 912 | | | 850 | |
Deferred income taxes | | | 295 | | | 295 | |
| | | | | | |
Total current assets | | | 4,081 | | | 4,334 | |
Property, plant and equipment, net | | | 1,682 | | | 1,670 | |
Goodwill | | | 4,406 | | | 4,377 | |
Intangible assets, net | | | 765 | | | 780 | |
Other assets | | | 1,191 | | | 1,204 | |
| | | | | | |
Total Assets | | $ | 12,125 | | $ | 12,365 | |
| | | | | | |
Liabilities and Equity | | | | | | | |
Current Liabilities: | | | | | | | |
Loans payable and current maturities of long-term debt | | $ | 10 | | $ | 10 | |
Accounts payable | | | 839 | | | 897 | |
Accrued and other current liabilities | | | 1,522 | | | 1,788 | |
Deferred revenue | | | 364 | | | 402 | |
| | | | | | |
Total current liabilities | | | 2,735 | | | 3,097 | |
Long-term debt | | | 1,481 | | | 1,481 | |
Deferred revenue | | | 416 | | | 424 | |
Other liabilities | | | 2,337 | | | 2,341 | |
| | | | | | |
Total Liabilities | | | 6,969 | | | 7,343 | |
| | | | | | |
Commitments and Contingencies (see Note 11) | | | | | | | |
Redeemable noncontrolling interest | | | 12 | | | 12 | |
| | | | | | |
Tyco Shareholders' Equity: | | | | | | | |
Common shares, CHF 6.70 par value, 825,222,070 shares authorized, 486,363,050 shares issued as of December 28, 2012 and September 28, 2012 | | | 2,792 | | | 2,792 | |
Common shares held in treasury, 21,022,567 and 24,174,397 shares, as of December 28, 2012 and September 28, 2012, respectively | | | (913 | ) | | (1,094 | ) |
Contributed surplus | | | 1,535 | | | 1,763 | |
Accumulated earnings | | | 2,662 | | | 2,499 | |
Accumulated other comprehensive loss | | | (950 | ) | | (966 | ) |
| | | | | | |
Total Tyco Shareholders' Equity | | | 5,126 | | | 4,994 | |
Nonredeemable noncontrolling interest | | | 18 | | | 16 | |
| | | | | | |
Total Equity | | | 5,144 | | | 5,010 | |
| | | | | | |
Total Liabilities, Redeemable Noncontrolling Interest and Equity | | $ | 12,125 | | $ | 12,365 | |
| | | | | | |
See Notes to Unaudited Consolidated Financial Statements.
3
Table of Contents
TYCO INTERNATIONAL LTD.
CONSOLIDATED STATEMENTS OF CASH FLOWS (UNAUDITED)
(in millions)
| | | | | | | |
| | For the Quarters Ended | |
|---|
| | December 28,
2012 | | December 30,
2011 | |
|---|
Cash Flows From Operating Activities: | | | | | | | |
Net income attributable to Tyco common shareholders | | $ | 163 | | $ | 322 | |
Noncontrolling interest in subsidiaries net income | | | 2 | | | — | |
Income from discontinued operations, net of income taxes | | | (4 | ) | | (224 | ) |
| | | | | | |
Income from continuing operations | | | 161 | | | 98 | |
Adjustments to reconcile net cash provided by operating activities: | | | | | | | |
Depreciation and amortization | | | 105 | | | 101 | |
Non-cash compensation expense | | | 14 | | | 21 | |
Deferred income taxes | | | 10 | | | 2 | |
Provision for losses on accounts receivable and inventory | | | 18 | | | 11 | |
Other non-cash items | | | 6 | | | 40 | |
Changes in assets and liabilities, net of the effects of acquisitions and divestitures: | | | | | | | |
Accounts receivable, net | | | (9 | ) | | 43 | |
Contracts in progress | | | (2 | ) | | (14 | ) |
Inventories | | | (29 | ) | | (33 | ) |
Prepaid expenses and other current assets | | | 31 | | | (52 | ) |
Accounts payable | | | (61 | ) | | (34 | ) |
Accrued and other liabilities | | | (228 | ) | | (159 | ) |
Deferred revenue | | | (47 | ) | | (28 | ) |
Other | | | (8 | ) | | (72 | ) |
| | | | | | |
Net cash used in operating activities | | | (39 | ) | | (76 | ) |
| | | | | | |
Net cash provided by discontinued operating activities | | | 4 | | | 414 | |
| | | | | | |
Cash Flows From Investing Activities: | | | | | | | |
Capital expenditures | | | (90 | ) | | (90 | ) |
Proceeds from disposal of assets | | | 3 | | | 1 | |
Acquisition of businesses, net of cash acquired | | | (23 | ) | | (95 | ) |
Acquisition of dealer generated customer accounts and bulk account purchases | | | (6 | ) | | (6 | ) |
Sales and maturities of investments | | | 11 | | | 32 | |
Purchases of investments | | | (91 | ) | | (23 | ) |
Other | | | 8 | | | 19 | |
| | | | | | |
Net cash used in investing activities | | | (188 | ) | | (162 | ) |
| | | | | | |
Net cash used in discontinued investing activities | | | — | | | (279 | ) |
| | | | | | |
Cash Flows From Financing Activities: | | | | | | | |
Proceeds from issuance of short-term debt | | | — | | | 411 | |
Repayment of short-term debt | | | — | | | (376 | ) |
Proceeds from exercise of share options | | | 46 | | | 29 | |
Dividends paid | | | (70 | ) | | (116 | ) |
Repurchase of common shares by treasury | | | (50 | ) | | (200 | ) |
Transfer (to) from discontinued operations | | | (29 | ) | | 82 | |
Other | | | (16 | ) | | (19 | ) |
| | | | | | |
Net cash used in financing activities | | | (119 | ) | | (189 | ) |
| | | | | | |
Net cash provided by (used in) discontinued financing activities | | | 29 | | | (82 | ) |
| | | | | | |
Effect of currency translation on cash | | | 3 | | | (3 | ) |
| | | | | | |
Net decrease in cash and cash equivalents | | | (310 | ) | | (377 | ) |
Less: net increase in cash and cash equivalents related to discontinued operations | | | 33 | | | 53 | |
Cash and cash equivalents at beginning of period | | | 844 | | | 1,229 | |
| | | | | | |
Cash and cash equivalents at end of period | | $ | 501 | | $ | 799 | |
| | | | | | |
See Notes to Unaudited Consolidated Financial Statements.
4
Table of Contents
TYCO INTERNATIONAL LTD.
CONSOLIDATED STATEMENTS OF SHAREHOLDERS' EQUITY (UNAUDITED)
For the Quarters Ended December 28, 2012 and December 30, 2011
(in millions)
| | | | | | | | | | | | | | | | | | | | | | | | | | | | |
| | Number of
Common
Shares | | Common
Shares at
Par Value | | Treasury
Shares | | Contributed
Surplus | | Accumulated
Earnings | | Accumulated
Other
Comprehensive
(Loss) Income | | Total Tyco
Shareholders'
Equity | | Nonredeemable
Noncontrolling
Interest | | Total
Equity | |
|---|
Balance as of September 30, 2011 | | | 465 | | $ | 2,792 | | $ | (951 | ) | $ | 10,717 | | $ | 2,027 | | $ | (436 | ) | $ | 14,149 | | $ | 5 | | $ | 14,154 | |
Comprehensive income: | | | | | | | | | | | | | | | | | | | | | | | | | | | | |
Net income | | | | | | | | | | | | | | | 322 | | | | | | 322 | | | | | | 322 | |
Foreign currency translation, net of income tax expense of $1 million | | | | | | | | | | | | | | | | | | (79 | ) | | (79 | ) | | | | | (79 | ) |
Unrealized gain on marketable securities and derivative instruments, net of income tax benefit of $2 million | | | | | | | | | | | | | | | | | | 2 | | | 2 | | | | | | 2 | |
Defined benefit and post retirement plans, net of income tax expense of $2 million | | | | | | | | | | | | | | | | | | 4 | | | 4 | | | | | | 4 | |
| | | | | | | | | | | | | | | | | | | | | | | | | | |
Total comprehensive income | | | | | | | | | | | | | | | | | | | | | 249 | | | — | | | 249 | |
Dividends declared | | | | | | | | | | | | 1 | | | | | | | | | 1 | | | | | | 1 | |
Shares issued from treasury for vesting of share based equity awards | | | 3 | | | | | | 138 | | | (109 | ) | | | | | | | | 29 | | | | | | 29 | |
Repurchase of common shares | | | (5 | ) | | | | | (200 | ) | | | | | | | | | | | (200 | ) | | | | | (200 | ) |
Compensation expense | | | | | | | | | | | | 26 | | | | | | | | | 26 | | | | | | 26 | |
Other | | | | | | | | | (19 | ) | | | | | | | | | | | (19 | ) | | | | | (19 | ) |
| | | | | | | | | | | | | | | | | | | | |
Balance as of December 30, 2011 | | | 463 | | $ | 2,792 | | $ | (1,032 | ) | $ | 10,635 | | $ | 2,349 | | $ | (509 | ) | $ | 14,235 | | $ | 5 | | $ | 14,240 | |
| | | | | | | | | | | | | | | | | | | | |
| | | | | | | | | | | | | | | | | | | | | | | | | | | | |
| | Number of
Common
Shares | | Common
Shares at
Par Value | | Treasury
Shares | | Contributed
Surplus | | Accumulated
Earnings | | Accumulated
Other
Comprehensive
(Loss) Income | | Total Tyco
Shareholders'
Equity | | Nonredeemable
Noncontrolling
Interest | | Total
Equity | |
|---|
Balance as of September 28, 2012 | | | 462 | | $ | 2,792 | | $ | (1,094 | ) | $ | 1,763 | | $ | 2,499 | | $ | (966 | ) | $ | 4,994 | | $ | 16 | | $ | 5,010 | |
Comprehensive income: | | | | | | | | | | | | | | | | | | | | | | | | | | | | |
Net income | | | | | | | | | | | | | | | 163 | | | | | | 163 | | | 2 | | | 165 | |
Foreign currency translation, net of income tax expense of $7 million | | | | | | | | | | | | | | | | | | 11 | | | 11 | | | | | | 11 | |
Unrealized gain on marketable securities and derivative instruments, net of income tax benefit of $2 million | | | | | | | | | | | | | | | | | | 1 | | | 1 | | | | | | 1 | |
Defined benefit and post retirement plans, net of income tax expense of $2 million | | | | | | | | | | | | | | | | | | 4 | | | 4 | | | | | | 4 | |
| | | | | | | | | | | | | | | | | | | | | | | | | | |
Total comprehensive income | | | | | | | | | | | | | | | | | | | | | 179 | | | 2 | | | 181 | |
Dividends declared | | | | | | | | | | | | (1 | ) | | | | | | | | (1 | ) | | | | | (1 | ) |
Shares issued from treasury for vesting of share based equity awards | | | 6 | | | | | | 247 | | | (201 | ) | | | | | | | | 46 | | | | | | 46 | |
Repurchase of common shares | | | (2 | ) | | | | | (50 | ) | | | | | | | | | | | (50 | ) | | | | | (50 | ) |
Compensation expense | | | | | | | | | | | | 14 | | | | | | | | | 14 | | | | | | 14 | |
Other | | | (1 | ) | | | | | (16 | ) | | (40 | ) | | | | | | | | (56 | ) | | — | | | (56 | ) |
| | | | | | | | | | | | | | | | | | | | |
Balance as of December 28, 2012 | | | 465 | | $ | 2,792 | | $ | (913 | ) | $ | 1,535 | | $ | 2,662 | | $ | (950 | ) | $ | 5,126 | | $ | 18 | | $ | 5,144 | |
| | | | | | | | | | | | | | | | | | | | |
See Notes to Unaudited Consolidated Financial Statements.
5
Table of Contents
TYCO INTERNATIONAL LTD.
NOTES TO UNAUDITED CONSOLIDATED FINANCIAL STATEMENTS
1. Basis of Presentation and Summary of Significant Accounting Policies
Basis of Presentation—The Consolidated Financial Statements included herein are unaudited, but in the opinion of management, such financial statements include all adjustments, consisting of normal recurring adjustments, necessary to summarize fairly the Company's financial position, results of operations and cash flows for the interim period. The Unaudited Consolidated Financial Statements include the consolidated results of Tyco International Ltd., a corporation organized under the laws of Switzerland, and its subsidiaries (Tyco and all its subsidiaries, hereinafter collectively referred to as the "Company" or "Tyco"). The financial statements have been prepared in United States dollars ("USD") and in accordance with the instructions to Form 10-Q under the Securities Exchange Act of 1934, as amended. The results reported in these Unaudited Consolidated Financial Statements should not be taken as indicative of results that may be expected for the entire year. These financial statements should be read in conjunction with the Consolidated Financial Statements and accompanying notes contained in the Company's Annual Report on Form 10-K for the fiscal year ended September 28, 2012 (the "2012 Form 10-K").
Effective September 28, 2012, Tyco completed the spin-offs of The ADT Corporation ("ADT") and Pentair Ltd. (formerly known as Tyco Flow Control International Ltd. ("Tyco Flow Control")), formerly the North American residential security and flow control businesses of Tyco, respectively, into separate, publicly traded companies in the form of a distribution to Tyco shareholders. Immediately following the spin-off, Pentair, Inc. was merged with a subsidiary of Tyco Flow Control in a tax-free, all-stock merger (the "Merger"), with Pentair Ltd. ("Pentair") succeeding Pentair Inc. as an independent publicly traded company. The distribution was made on September 28, 2012, to Tyco shareholders of record on September 17, 2012. Each Tyco shareholder received 0.50 of a common share of ADT and approximately 0.24 of a common share of Pentair for each Tyco common share held on the record date. The distribution was structured to be tax-free to Tyco shareholders except to the extent of cash received in lieu of fractional shares. The distributions, the Merger and related transactions are collectively referred to herein as the "2012 Separation". As a result of the distribution, the operations of Tyco's former flow control and North American residential security businesses are now classified as discontinued operations in all periods presented.
After giving effect to the 2012 Separation, the Company operates and reports financial and operating information in the following three segments: North America Systems Installation & Services ("NA Installation & Services"), Rest of World Systems Installation & Services ("ROW Installation & Services") and Global Products. The Company also provides general corporate services to its segments which is reported as a fourth, non-operating segment, Corporate and Other and accordingly, prior period segment amounts have been recast to conform to the current period presentation. See Note 15.
References to 2013 and 2012 are to Tyco's fiscal quarters ending December 28, 2012 and December 30, 2011, respectively, unless otherwise indicated.
The Company has a 52 or 53-week fiscal year that ends on the last Friday in September. Fiscal years 2013 and 2012 are both 52-week years.
Recently Adopted Accounting Pronouncements—In June 2011, the Financial Accounting Standards Board ("FASB") issued authoritative guidance for the presentation of comprehensive income. The guidance amended the reporting of Other Comprehensive Income ("OCI") by eliminating the option to present OCI as part of the Consolidated Statement of Shareholders' Equity. The amendment will not impact the accounting for OCI, but only its presentation in the Company's Unaudited Consolidated Financial Statements. The guidance requires that items of net income and OCI be presented either in a
6
Table of Contents
TYCO INTERNATIONAL LTD.
NOTES TO UNAUDITED CONSOLIDATED FINANCIAL STATEMENTS (Continued)
1. Basis of Presentation and Summary of Significant Accounting Policies (Continued)
single continuous statement of comprehensive income or in two separate but consecutive statements which include total net income and its components, consecutively followed by total OCI and its components to arrive at total comprehensive income. In December 2011, the FASB issued authoritative guidance to defer the effective date for those aspects of the guidance relating to the presentation of reclassification adjustments out of accumulated other comprehensive income by component. The guidance became effective for Tyco in the first quarter of fiscal 2013 and was applied retrospectively to prior periods. See Note 14.
In September 2011, the FASB issued authoritative guidance which amends the process of testing goodwill for impairment. Additionally, in July 2012, the FASB issued authoritative guidance which similarly amended the process of testing indefinite-lived intangible assets for impairment. The guidance permits an entity to first assess qualitative factors to determine whether the existence of events or circumstances leads to a determination that it is more likely than not (defined as having a likelihood of more than fifty percent) that the fair value of a reporting unit or indefinite-lived intangible asset is less than its carrying amount. If an entity determines it is not more likely than not that the fair value of a reporting unit is less than its carrying amount, performing the traditional two step goodwill impairment test is unnecessary. If an entity concludes otherwise, it would be required to perform the first step of the two step goodwill impairment test. If the carrying amount of the reporting unit exceeds its fair value, then the entity is required to perform the second step of the goodwill impairment test. If an entity determines it is not more likely than not that the fair value of an indefinite-lived intangible asset is less than its carrying amount, then the entity is not required to take further action. If an entity concludes otherwise, it would be required to perform a quantitative impairment test by calculating the fair value of the asset and comparing it with its carrying amount. If the carrying amount of the reporting unit exceeds its fair value, then the entity shall recognize an impairment loss in an amount equal to that excess. However, an entity has the option to bypass the qualitative assessment in any period and proceed directly to the quantitative assessment. The guidance became effective for Tyco for interim impairment testing beginning in the first quarter of fiscal 2013. Annually, on the first day of the fourth quarter of its fiscal year, and more frequently if triggering events occur, the Company tests goodwill and indefinite lived intangible assets for impairment.
2. 2012 Separation Transaction
On September 28, 2012, the Company completed the spin-offs of ADT and Tyco Flow Control, formerly the North American residential security and flow control businesses of Tyco, respectively, into separate, publicly traded companies in the form of a distribution to Tyco shareholders.
During the quarters ended December 28, 2012 and December 30, 2011, the Company incurred total pre-tax charges of $14 million and $57 million, respectively, in connection with activities taken to complete the 2012 Separation and to create the revised organizational structure of the Company ("Separation Charges"). The Company incurred $18 million of pre-tax charges primarily related to marketing and information technology related costs and $26 million of pre-tax charges primarily related to asset impairments and employee compensation costs within income from continuing operations for the quarters ended December 28, 2012 and December 30, 2011, respectively. Additionally, the Company incurred $4 million of a pre-tax gain and $31 million of pre-tax charges which have been presented in income from discontinued operations for the quarters ended December 28, 2012 and December 30, 2011, respectively. The pre-tax gain recognized during the quarter ended December 28, 2012 primarily related to the recognition of a cumulative foreign currency translation gain upon the
7
Table of Contents
TYCO INTERNATIONAL LTD.
NOTES TO UNAUDITED CONSOLIDATED FINANCIAL STATEMENTS (Continued)
2. 2012 Separation Transaction (Continued)
liquidation of certain entities that were liquidated in connection with the 2012 Separation, which commenced during fiscal 2012 but were not finalized until fiscal 2013, partially offset by professional fees. The pre-tax charges recognized during the quarter ended December 30, 2011 primarily related to professional fees. Tax benefits on Separation charges classified within continuing operations were $5 million and $1 million for the quarters ended December 28, 2012 and December 30, 2011, respectively. There was no tax benefit for charges classified as discontinued operations. Additionally, the Company incurred $4 million of tax related Separation charges within continuing operations during the quarter ended December 28, 2012 as compared to nil for the quarter ended December 30, 2011. There were no tax related Separation charges recorded within discontinued operations. The amounts presented within discontinued operations are costs directly related to the 2012 Separation that are not expected to provide a future benefit to the Company.
Separation Charges were classified in continuing operations within the Company's Consolidated Statement of Operations as follows ($ in millions):
| | | | | | | |
| | For the Quarters Ended | |
|---|
| | December 28,
2012 | | December 30,
2011 | |
|---|
Selling, general and administrative expenses ("SG&A") | | $ | 13 | | $ | — | |
Separation costs | | | 5 | | | — | |
Restructuring and asset impairment charges, net | | | — | | | 26 | |
| | | | | | |
Total | | $ | 18 | | $ | 26 | |
| | | | | | |
3. Divestitures
The Company continually assesses the strategic fit of its various businesses and from time to time divests businesses which do not align with its long-term strategy.
Fiscal 2013 and 2012
During the quarters ended December 28, 2012 and December 30, 2011 there were no businesses divested by the Company.
On September 28, 2012, Tyco completed the 2012 Separation and has presented its former North American residential security and flow control businesses as discontinued operations in all periods prior to the completion of the 2012 Separation. See Note 2 for additional information regarding the 2012 Separation.
At the time of the 2012 Separation, the Company used available information to develop its best estimates for certain assets and liabilities related to the Separation. In limited instances, final determination of the balances will be made in subsequent periods, such as in the case of working capital and the cash adjustments specified in the 2012 Separation and Distribution Agreement entered among the parties, and when final income tax returns are filed in certain jurisdictions where those returns include a combination of Tyco, ADT and/or Tyco Flow Control legal entities. During the first quarter of 2013, $40 million was recorded within the Consolidated Statement of Shareholders' Equity as Other, primarily related to a cash true-up adjustment with ADT, as pursuant to the 2012 Separation and Distribution Agreement. The Company expects to finalize the cash true-up and working capital adjustments with Pentair during the second quarter of fiscal year 2013 which will be recorded through shareholders' equity. Any additional adjustments are not expected to be material.
8
Table of Contents
TYCO INTERNATIONAL LTD.
NOTES TO UNAUDITED CONSOLIDATED FINANCIAL STATEMENTS (Continued)
3. Divestitures (Continued)
Net revenue, pre-tax income from discontinued operations, pre-tax separation benefit, income tax expense and income from discontinued operations, net of income taxes are as follows ($ millions):
| | | | | | | |
| | For the Quarters Ended | |
|---|
| | December 28,
2012 | | December 30,
2011 | |
|---|
Net revenue | | $ | — | | $ | 1,717 | |
| | | | | | |
Pre-tax income | | $ | — | | $ | 274 | |
Pre-tax separation gain (charges), net (See Note 2) | | | 4 | | | — | |
Income tax expense | | | — | | | (50 | ) |
| | | | | | |
Income from discontinued operations, net of income taxes | | $ | 4 | | $ | 224 | |
| | | | | | |
There were no material pending divestitures as of December 28, 2012 and September 28, 2012.
Divestiture Charges (Gains), Net
During the quarters ended December 28, 2012 and December 30, 2011, the Company recorded a net gain of $3 million and nil, respectively, in Selling, general and administrative in the Company's Consolidated Statements of Operations in connection with the divestiture of certain businesses that did not meet the criteria for discontinued operations. The net gain for the quarter ended December 28, 2012 primarily related to the favorable settlement of an indemnification resulting from the divestiture of the Company's Electrical and Metal Products business.
4. Restructuring and Asset Impairment Charges, Net
The Company continues to identify and pursue opportunities for cost savings through restructuring activities and workforce reductions to improve operating efficiencies across its businesses. The Company expects to incur restructuring and restructuring related charges of approximately $50 million in fiscal 2013.
The Company recorded restructuring and asset impairment charges by action and Consolidated Statement of Operations classification as follows ($ in millions):
| | | | | | | |
| | For the Quarter
Ended December 28, 2012 | | For the Quarter
Ended December 30, 2011 | |
|---|
2013 actions | | $ | 5 | | $ | — | |
2012 actions | | | 4 | | | 32 | |
2011 and prior actions | | | 1 | | | 4 | |
| | | | | | |
Total restructuring and asset impairment charges, net | | $ | 10 | | $ | 36 | |
| | | | | | |
Charges reflected in cost of sales | | | — | | | — | |
Charges reflected in SG&A | | | — | | | — | |
Charges reflected in restructuring and asset impairment charges, net | | $ | 10 | | $ | 36 | |
9
Table of Contents
TYCO INTERNATIONAL LTD.
NOTES TO UNAUDITED CONSOLIDATED FINANCIAL STATEMENTS (Continued)
4. Restructuring and Asset Impairment Charges, Net (Continued)
2013 Actions
Restructuring and asset impairment charges, net, during the quarter ended December 28, 2012 related to the 2013 actions are as follows ($ in millions):
| | | | | | | | | | |
| | For the Quarter Ended December 28, 2012 | |
|---|
| | Employee
Severance and
Benefits | | Facility Exit
and Other
Charges | | Total | |
|---|
ROW Installation & Services | | $ | 2 | | $ | 1 | | $ | 3 | |
Global Products | | | 1 | | | — | | | 1 | |
Corporate and Other | | | 1 | | | — | | | 1 | |
| | | | | | | | |
Total | | $ | 4 | | $ | 1 | | $ | 5 | |
| | | | | | | | |
The rollforward of the reserves from September 28, 2012 to December 28, 2012 is as follows ($ in millions):
| | | | |
Balance as of September 28, 2012 | | $ | — | |
Charges | | | 5 | |
Utilization | | | (1 | ) |
Currency translation | | | (1 | ) |
| | | | |
Balance as of December 28, 2012 | | $ | 3 | |
| | | | |
2012 Actions
Restructuring and asset impairment charges, net, during the quarter ended December 28, 2012 related to the 2012 actions are as follows ($ in millions):
| | | | |
| | For the Quarter Ended
December 28, 2012 | |
|---|
| | Employee
Severance and
Benefits | |
|---|
ROW Installation & Services | | $ | 3 | |
Global Products | | | 1 | |
| | | | |
Total | | $ | 4 | |
| | | | |
10
Table of Contents
TYCO INTERNATIONAL LTD.
NOTES TO UNAUDITED CONSOLIDATED FINANCIAL STATEMENTS (Continued)
4. Restructuring and Asset Impairment Charges, Net (Continued)
| | | | | | | | | | |
| | For the Quarter Ended December 30, 2011 | |
|---|
| | Employee
Severance and
Benefits | | Facility Exit
and Other
Charges(1) | | Total | |
|---|
NA Installation & Services | | $ | — | | $ | 21 | | $ | 21 | |
ROW Installation & Services | | | 3 | | | 1 | | | 4 | |
Global Products | | | 1 | | | 2 | | | 3 | |
Corporate and Other | | | 3 | | | 1 | | | 4 | |
| | | | | | | | |
Total | | $ | 7 | | $ | 25 | | $ | 32 | |
| | | | | | | | |
- (1)
- Includes $20 million, $1 million and $2 million of asset impairment charges recorded by NA Installation & Services, ROW Installation & Services and Global Products, respectively, for the quarter ended December 30, 2011 related to the 2012 Separation.
Restructuring and asset impairment charges, net, incurred cumulative to date from initiation of the 2012 actions are as follows ($ in millions):
| | | | | | | | | | |
| | Employee
Severance and
Benefits | | Facility Exit
and Other
Charges | | Total | |
|---|
NA Installation & Services | | $ | 10 | | $ | 34 | | $ | 44 | |
ROW Installation & Services | | | 25 | | | 5 | | | 30 | |
Global Products | | | 8 | | | 3 | | | 11 | |
Corporate and Other | | | 9 | | | 4 | | | 13 | |
| | | | | | | | |
Total | | $ | 52 | | $ | 46 | | $ | 98 | |
| | | | | | | | |
The rollforward of the reserves from September 28, 2012 to December 28, 2012 is as follows ($ in millions):
| | | | |
Balance as of September 28, 2012 | | $ | 38 | |
Charges | | | 4 | |
Utilization | | | (10 | ) |
Currency translation | | | 1 | |
| | | | |
Balance as of December 28, 2012 | | $ | 33 | |
| | | | |
2011 and prior actions
The Company continues to maintain restructuring reserves related to actions initiated prior to fiscal 2012. The total amount of these reserves were $59 million and $65 million as of December 28, 2012 and September 28, 2012, respectively. The Company incurred $1 million and $4 million of restructuring charges, net for the quarters ended December 28, 2012 and December 30, 2011, respectively, related to 2011 and prior actions. The aggregate remaining reserves primarily relate to facility exit costs for long-term non-cancelable lease obligations primarily within the Company's ROW Installation & Services segment.
11
Table of Contents
TYCO INTERNATIONAL LTD.
NOTES TO UNAUDITED CONSOLIDATED FINANCIAL STATEMENTS (Continued)
4. Restructuring and Asset Impairment Charges, Net (Continued)
The rollforward of the reserves from September 28, 2012 to December 28, 2012 is as follows ($ in millions):
| | | | |
Balance as of September 28, 2012 | | $ | 65 | |
Charges | | | 2 | |
Reversals | | | (1 | ) |
Utilization | | | (8 | ) |
Reclass/transfers | | | 1 | |
| | | | |
Balance as of December 28, 2012 | | $ | 59 | |
| | | | |
Total Restructuring Reserves
As of December 28, 2012 and September 28, 2012, restructuring reserves related to all actions were included in the Company's Consolidated Balance Sheets as follows ($ in millions):
| | | | | | | |
| | December 28,
2012 | | September 28,
2012 | |
|---|
Accrued and other current liabilities | | $ | 77 | | $ | 84 | |
Other liabilities | | | 18 | | | 19 | |
| | | | | | |
Total | | $ | 95 | | $ | 103 | |
| | | | | | |
5. Acquisitions
Acquisitions
During the quarter ended December 28, 2012, cash paid for acquisitions included in continuing operations totaled $23 million, which is related to an acquisition within the Company's NA Installation & Services segment.
During the quarter ended December 30, 2011, cash paid for acquisitions included in continuing operations totaled $95 million, which primarily related to the acquisition of Visonic Ltd. ("Visonic"). Visonic is a global developer and manufacturer of electronic security systems and components. Cash paid for Visonic totaled approximately $94 million, net of cash acquired of $5 million by the Company's Global Products segment.
Acquisition and Integration Related Costs
Acquisition and integration costs are expensed as incurred. During the quarters ended December 28, 2012 and December 30, 2011, the Company incurred acquisition and integration costs of $1 million and $2 million, respectively. Such costs are recorded in Selling, general and administrative expenses in the Company's Consolidated Statements of Operations.
6. Income Taxes
The Company did not have a significant change to its unrecognized tax benefits during the quarter ended December 28, 2012.
12
Table of Contents
TYCO INTERNATIONAL LTD.
NOTES TO UNAUDITED CONSOLIDATED FINANCIAL STATEMENTS (Continued)
6. Income Taxes (Continued)
Many of Tyco's uncertain tax positions relate to tax years that remain subject to audit by the taxing authorities in U.S. federal, state and local or foreign jurisdictions. Open tax years in significant jurisdictions are as follows:
| | | | |
Jurisdiction | | Years Open
To Audit | |
|---|
Australia | | | 2004-2012 | |
Canada | | | 2002-2012 | |
Germany | | | 2005-2012 | |
South Korea | | | 2007-2012 | |
Switzerland | | | 2003-2012 | |
United Kingdom | | | 2003-2012 | |
United States | | | 1997-2012 | |
Based on the current status of its income tax audits, the Company believes that it is reasonably possible that between nil and $30 million in unrecognized tax benefits may be resolved in the next twelve months.
At each balance sheet date, management evaluates whether it is more likely than not that the Company's deferred tax assets will be realized and if sufficient future taxable income will be available by assessing current period and projected operating results and other pertinent data. As of December 28, 2012, the Company had recorded deferred tax assets of $0.5 billion, which is comprised of $2.3 billion gross deferred tax assets net of $1.8 billion valuation allowances.
Tax Sharing Agreement and Other Income Tax Matters
In connection with the 2012 and 2007 Separations, the Company entered into the 2012 and 2007 Tax Sharing Agreements, respectively, that govern the respective rights, responsibilities, and obligations of the Company, Pentair and ADT after the 2012 Separation and the Company, Covidien and TE Connectivity after the 2007 Separation with respect to taxes. Specifically this includes ordinary course of business taxes and taxes, if any, incurred as a result of any failure of the respective distributions to qualify tax-free for U.S. federal income tax purposes within the meaning of Section 355 of the Internal Revenue Code ("the Code") or certain internal transactions undertaken in anticipation of the spin-offs to qualify for tax-favored treatment under the Code.
Under the 2012 Tax Sharing Agreement, Tyco, Pentair and ADT share (i) certain pre-Distribution income tax liabilities that arise from adjustments made by tax authorities to ADT's, Tyco Flow Control's and Tyco's income tax returns, and (ii) payments required to be made by Tyco with respect to the 2007 Tax Sharing Agreement, excluding approximately $175 million of pre-2012 Separation related tax liabilities that were anticipated to be paid prior to the 2012 Separation (collectively, "Shared Tax Liabilities"). Tyco will be responsible for the first $500 million of Shared Tax Liabilities. Pentair and ADT will share 42% and 58%, respectively, of the next $225 million of Shared Tax Liabilities. Tyco, Pentair and ADT will share 52.5% 20% and 27.5%, respectively, of Shared Tax Liabilities above $725 million. All costs and expenses associated with the management of these shared tax liabilities will generally be shared 20%, 27.5%, and 52.5% by Pentair, ADT and Tyco, respectively. As of September 28, 2012, Tyco established liabilities representing the fair market value of its obligations under the 2012 Tax Sharing Arrangement which is recorded in other liabilities in the Company's Consolidated Balance Sheet with an offset to Tyco shareholders' equity.
13
Table of Contents
TYCO INTERNATIONAL LTD.
NOTES TO UNAUDITED CONSOLIDATED FINANCIAL STATEMENTS (Continued)
6. Income Taxes (Continued)
Under the 2007 Tax Sharing Agreement, Tyco shares responsibility for certain of its, Covidien's and TE Connectivity's income tax liabilities, which result in cash payments, based on a sharing formula for periods prior to and including June 29, 2007. More specifically, Tyco, Covidien and TE Connectivity share 27%, 42% and 31%, respectively, of shared income tax liabilities that arise from adjustments made by tax authorities to Tyco's, Covidien's and TE Connectivity's U.S. and certain non-U.S. income tax returns. The costs and expenses associated with the management of these shared tax liabilities are generally shared equally among the parties. In connection with the execution of the 2007 Tax Sharing Agreement, Tyco established a net receivable from Covidien and TE Connectivity representing the amount Tyco expected to receive for pre-2007 Separation uncertain tax positions, including amounts owed to the Internal Revenue Service ("IRS"). Tyco also established liabilities representing the fair market value of its share of Covidien's and TE Connectivity's estimated obligations, primarily to the IRS, for their pre-2007 Separation taxes covered by the 2007 Tax Sharing Agreement.
Tyco assesses the shared tax liabilities and related guaranteed liabilities related to both the 2012 and 2007 Tax Sharing Agreements at each reporting period. Tyco will provide payment to Pentair and ADT under the 2012 Tax Sharing Agreement and Covidien and TE Connectivity under the 2007 Tax Sharing Agreement as the shared income tax liabilities are settled. Settlement is expected to occur as the audit process by applicable taxing authorities is completed for the impacted years and cash payments are made. Due to the nature of the unresolved adjustments described in the next paragraph, the maximum amount of potential future payments under the 2012 and 2007 Tax Sharing Agreements is not determinable. Such cash payments, when they occur, will reduce the guarantor liability as such payments represent an equivalent reduction of risk. Tyco also assesses the sufficiency of the 2012 and 2007 Tax Sharing Agreements guarantee liabilities on a quarterly basis and will increase the liability when it is probable that cash payments expected to be made under the 2012 or 2007 Tax Sharing Agreements exceed the recorded balance.
Tyco and its subsidiaries' income tax returns are examined periodically by various tax authorities. In connection with these examinations, tax authorities, including the IRS, have raised issues and proposed tax adjustments, in particular with respect to years preceding the 2007 Separation. The issues and proposed adjustments related to such years are generally subject to the sharing provisions of the 2007 Tax Sharing Agreement and Tyco's liabilities under the 2007 Tax Sharing Agreement are further subject to the sharing provisions in the 2012 Tax Sharing Agreement. Tyco is reviewing and contesting certain of the proposed tax adjustments. With respect to adjustments raised by the IRS, although Tyco has resolved a substantial number of these adjustments, a few significant items are expected to remain open with respect to the audit of the 1997 through 2004 years. As of the date hereof, it is unlikely that Tyco will be able to resolve all the open items, which primarily involve the treatment of certain intercompany debt transactions during the period, through the IRS appeals process. As a result, Tyco expects to litigate these matters once it receives the requisite statutory notices from the IRS, which is expected to occur during fiscal 2013. The Company has assessed its obligations under the 2007 Tax Sharing Agreement to determine that its recorded liability is sufficient to cover the indemnifications made by the Company under such agreement. In the absence of observable transactions for identical or similar guarantees, the Company determined the fair value of these guarantees and indemnifications utilizing expected present value measurement techniques. Significant assumptions utilized to determine fair value included determining a range of potential outcomes, assigning a probability weighting to each potential outcome and estimating the anticipated timing of resolution. The probability weighted outcomes were discounted using the Company's incremental borrowing rate. However, the ultimate resolution of these matters is uncertain and could result in a material adverse impact to the Company's financial position, results of operations, cash flows or the effective tax rate in future reporting periods.
14
Table of Contents
TYCO INTERNATIONAL LTD.
NOTES TO UNAUDITED CONSOLIDATED FINANCIAL STATEMENTS (Continued)
6. Income Taxes (Continued)
In connection with the aforementioned audits, the IRS has assessed a civil fraud penalty of $21 million during the first quarter of fiscal 2013 against a prior subsidiary that was distributed to TE Connectivity in connection with the 2007 Separation. The penalties arise from actions of former executives taken in connection with intercompany transfers of stock of Simplex Technologies in 1998 and 1999. This is a pre-2007 Separation tax liability that is covered by the provisions of the 2007 Tax Sharing Agreement.
In addition to dealing with tax liabilities for periods prior to the respective Separations, the 2012 and 2007 Tax Sharing Agreements contain sharing provisions to address the contingencies that the 2012 or 2007 Separations, or internal transactions related thereto, may be deemed taxable by U.S. or non U.S. taxing authorities. In the event the 2012 Separation is determined to be taxable and such determination was the result of actions taken after the 2012 Separations by Tyco, ADT or Pentair, the party responsible for such failure would be responsible for all taxes imposed on each company as a result thereof. If such determination is not the result of actions taken by Tyco, ADT or Pentair after the 2012 Separation, then Tyco, ADT and Pentair would be responsible for any taxes imposed on any of the companies as a result of such determination in the same manner and in the same proportions as described above. Similar provisions exist in the 2007 Tax Sharing Agreement. If either of the 2007 or 2012 Separation, or internal transactions taken in anticipation thereof, were deemed taxable, the associated liability could be significant. The Company is responsible for all of its own taxes that are not shared pursuant to the 2012 and 2007 Tax Sharing Agreements sharing formulas. In addition, Pentair and ADT, and Covidien and TE Connectivity are responsible for their tax liabilities that are not subject to the 2012 or 2007 Tax Sharing Agreements' sharing formula, respectively.
Each of the 2012 and 2007 Tax Sharing Agreements provides that, if any party to such agreement were to default in its obligation to another party to pay its share of the distribution taxes that arise as a result of no party's fault, each non-defaulting party to the agreement would be required to pay, equally with any other non-defaulting party to the agreement, the amounts in default. In addition, if another party to the 2012 or 2007 Tax Sharing Agreements that is responsible for all or a portion of an income tax liability were to default in its payment of such liability to a taxing authority, Tyco could be liable under applicable tax law for such liabilities and required to make additional tax payments. Accordingly, under certain circumstances, Tyco may be obligated to pay amounts in excess of its agreed-upon share of its tax liabilities under either of the 2012 or 2007 Tax Sharing Agreements.
The receivables and liabilities related to the 2012 and 2007 Tax Sharing Agreements as of December 28, 2012 and September 28, 2012, are as follows ($ in millions):
| | | | | | | | | | | | | |
| | 2012 Tax Sharing Agreement | | 2007 Tax Sharing Agreement | |
|---|
| | As of
December 28,
2012 | | As of
September 28,
2012 | | As of
December 28,
2012 | | As of
September 28,
2012 | |
|---|
Prepaid expenses and other current assets | | $ | — | | $ | — | | $ | 9 | | $ | 9 | |
Other assets | | | — | | | — | | | 66 | | | 66 | |
| | | | | | | | | | |
| | | — | | | — | | | 75 | | | 75 | |
| | | | | | | | | | |
Accrued and other current liabilities | | | — | | | — | | | (14 | ) | | (14 | ) |
Other liabilities | | | (71 | ) | | (71 | ) | | (394 | ) | | (394 | ) |
| | | | | | | | | | |
| | | (71 | ) | | (71 | ) | | (408 | ) | | (408 | ) |
| | | | | | | | | | |
Net liability | | $ | (71 | ) | $ | (71 | ) | $ | (333 | ) | $ | (333 | ) |
| | | | | | | | | | |
15
Table of Contents
TYCO INTERNATIONAL LTD.
NOTES TO UNAUDITED CONSOLIDATED FINANCIAL STATEMENTS (Continued)
6. Income Taxes (Continued)
The Company recorded income (loss) in conjunction with the 2012 and 2007 Tax Sharing Agreements for the quarters ended December 28, 2012 and December 30, 2011 as follows ($ in millions):
| | | | | | | |
| | For the Quarters Ended | |
|---|
| | December 28,
2012 | | December 30,
2011 | |
|---|
(Expense)/income | | | | | | | |
2012 Tax Sharing Agreement | | $ | (10 | ) | $ | N/A | |
2007 Tax Sharing Agreement | | | — | | | 1 | |
As a result of the 2012 separation, equity awards of certain employees were converted into the three companies. Pursuant to the terms of the 2012 Separation and Distribution Agreement, each of the three companies is responsible for issuing its own shares upon employee exercise of a stock option award or vesting of a restricted unit award. However, the 2012 Tax Sharing Agreement provides that any allowable compensation tax deduction for such awards is to be claimed by the employee's current employer. The 2012 Tax Sharing Agreement requires the employer claiming a tax deduction for shares issued by the other companies to pay a percentage of the allowable tax deduction to the company issuing the equity.
During the quarter ended December 28, 2012, the Company incurred an obligation to make a payment to ADT and Pentair in the amount of $14 million based on estimated allowable deductions for ADT and Pentair shares issued to Company employees, offset by payments to be received from ADT and Pentair in the amount of $4 million, for Company shares issued to their employees, resulting in a net impact of approximately $10 million, which was recorded in Other (expense) income, net within the Company's Consolidated Statement of Operations.
Other Income Tax Matters
Except for earnings that are currently distributed, no additional material provision has been made for U.S. or non-U.S. income taxes on the undistributed earnings of subsidiaries or for unrecognized deferred tax liabilities for temporary differences related to investments in subsidiaries, since the earnings are expected to be permanently reinvested, the investments are essentially permanent in duration, or the Company has concluded that no additional tax liability will arise as a result of the distribution of such earnings. A liability could arise if amounts are distributed by such subsidiaries or if such subsidiaries are ultimately disposed. It is not practicable to estimate the additional income taxes related to permanently reinvested earnings or the basis differences related to investments in subsidiaries.
7. Earnings Per Share
The reconciliations between basic and diluted earnings per share attributable to Tyco common shareholders are as follows (in millions, except per share data):
| | | | | | | | | | | | | | | | | | | |
| | For the Quarter Ended
December 28, 2012 | | For the Quarter Ended
December 30, 2011 | |
|---|
| | Income | | Shares | | Per Share
Amount | | Income | | Shares | | Per Share
Amount | |
|---|
Basic earnings per share attributable to Tyco common shareholders: | | | | | | | | | | | | | | | | | | | |
Income from continuing operations | | $ | 159 | | | 466 | | $ | 0.34 | | $ | 98 | | | 464 | | $ | 0.21 | |
Share options and restricted share awards | | | — | | | 7 | | | | | | — | | | 5 | | | | |
| | | | | | | | | | | | | | | | |
Diluted earnings per share attributable to Tyco common shareholders: | | | | | | | | | | | | | | | | | | | |
Income from continuing operations attributable to Tyco common shareholders, giving effect to dilutive adjustments | | $ | 159 | | | 473 | | $ | 0.34 | | $ | 98 | | | 469 | | $ | 0.21 | |
| | | | | | | | | | | | | | |
16
Table of Contents
TYCO INTERNATIONAL LTD.
NOTES TO UNAUDITED CONSOLIDATED FINANCIAL STATEMENTS (Continued)
7. Earnings Per Share (Continued)
The computation of diluted earnings per share for the quarter ended December 28, 2012 excludes the effect of the potential exercise of stock options to purchase approximately 7 million shares and excludes restricted stock units of 1 million because the effect would be anti-dilutive. The computation of diluted earnings per share for the quarter ended December 30, 2011 excludes the effect of the potential exercise of stock options to purchase approximately 8 million shares because the effect would be anti-dilutive.
8. Goodwill and Intangible Assets
The changes in the carrying amount of goodwill by segment are as follows ($ in millions):
| | | | | | | | | | | | | |
| | NA Installation
& Services | | ROW Installation &
Services | | Global
Products | | Total | |
|---|
As of September 30, 2011 | | | | | | | | | | | | | |
Gross Goodwill | | $ | 2,129 | | $ | 2,241 | | $ | 1,629 | | $ | 5,999 | |
Impairments | | | (126 | ) | | (1,068 | ) | | (567 | ) | | (1,761 | ) |
| | | | | | | | | | |
Carrying Amount of Goodwill | | | 2,003 | | | 1,173 | | | 1,062 | | | 4,238 | |
| | | | | | | | | | |
Acquisitions/ Purchase Accounting Adjustments | | | — | | | 38 | | | 66 | | | 104 | |
Currency Translation | | | 8 | | | 26 | | | 1 | | | 35 | |
| | | | | | | | | | |
As of September 28, 2012 | | $ | 2,011 | | $ | 1,237 | | $ | 1,129 | | $ | 4,377 | |
| | | | | | | | | | |
Gross Goodwill | | $ | 2,137 | | $ | 2,305 | | $ | 1,696 | | $ | 6,138 | |
Impairments | | | (126 | ) | | (1,068 | ) | | (567 | ) | | (1,761 | ) |
| | | | | | | | | | |
Carrying Amount of Goodwill | | | 2,011 | | | 1,237 | | | 1,129 | | | 4,377 | |
| | | | | | | | | | |
Acquisitions / Purchase Accounting Adjustments | | | 24 | | | — | | | (1 | ) | | 23 | |
Currency Translation | | | (2 | ) | | 6 | | | 2 | | | 6 | |
| | | | | | | | | | |
As of December 28, 2012 | | $ | 2,033 | | $ | 1,243 | | $ | 1,130 | | $ | 4,406 | |
| | | | | | | | | | |
The following table sets forth the gross carrying amount and accumulated amortization of the Company's intangible assets as of December 28, 2012 and September 28, 2012 ($ in millions):
| | | | | | | | | | | | | |
| | As of | |
|---|
| | December 28, 2012 | | September 28, 2012 | |
|---|
| | Gross
Carrying
Amount | | Accumulated
Amortization | | Gross
Carrying
Amount | | Accumulated
Amortization | |
|---|
Amortizable: | | | | | | | | | | | | | |
Contracts and related customer relationships | | $ | 1,617 | | $ | 1,266 | | $ | 1,608 | | $ | 1,246 | |
Intellectual property | | | 552 | | | 470 | | | 552 | | | 468 | |
Other | | | 37 | | | 11 | | | 36 | | | 9 | |
| | | | | | | | | | |
Total | | $ | 2,206 | | $ | 1,747 | | $ | 2,196 | | $ | 1,723 | |
| | | | | | | | | | |
Non-Amortizable: | | | | | | | | | | | | | |
Intellectual property | | $ | 223 | | | | | $ | 224 | | | | |
Franchise rights | | | 77 | | | | | | 77 | | | | |
Trade names | | | 6 | | | | | | 6 | | | | |
| | | | | | | | | | | | |
Total | | $ | 306 | | | | | $ | 307 | | | | |
| | | | | | | | | | | | |
17
Table of Contents
TYCO INTERNATIONAL LTD.
NOTES TO UNAUDITED CONSOLIDATED FINANCIAL STATEMENTS (Continued)
8. Goodwill and Intangible Assets (Continued)
Intangible asset amortization expense for both quarters ended December 28, 2012 and December 30, 2011 was $25 million.
The estimated aggregate amortization expense on intangible assets is expected to be approximately $74 million for the remainder of 2013, $80 million for 2014, $67 million for 2015, $62 million for 2016, $51 million for 2017 and $125 million for 2018 and thereafter.
9. Debt
Debt as of December 28, 2012 and September 28, 2012 is as follows ($ in millions):
| | | | | | | |
| | As of
December 28,
2012 | | As of
September 28,
2012 | |
|---|
3.375% public notes due 2015 | | | 257 | | | 257 | |
3.75% public notes due 2018 | | | 67 | | | 67 | |
8.5% public notes due 2019 | | | 364 | | | 364 | |
7.0% public notes due 2019 | | | 247 | | | 247 | |
6.875% public notes due 2021 | | | 466 | | | 466 | |
4.625% public notes due 2023 | | | 42 | | | 42 | |
Other(1)(2) | | | 48 | | | 48 | |
| | | | | | |
Total debt | | | 1,491 | | | 1,491 | |
Less current portion | | | 10 | | | 10 | |
| | | | | | |
Long-term debt | | $ | 1,481 | | $ | 1,481 | |
| | | | | | |
- (1)
- $10 million of the amount shown as other, comprises the current portion of the Company's total debt as of December 28, 2012.
- (2)
- $10 million of the amount shown as other, comprises the current portion of the Company's total debt as of September 28, 2012.
The carrying amount of Tyco's debt subject to the fair value disclosure requirements as of December 28, 2012 and September 28, 2012 was $1,443 million for both periods. The Company utilizes various valuation methodologies to determine the fair value of its debt, which is primarily dependent on the type of market in which the Company's debt is traded. When available, the Company uses quoted market prices to determine the fair value of its debt that is traded in active markets. As of December 28, 2012 and September 28, 2012, the fair value of the Company's debt which was actively traded was $1,766 million and $1,786 million, respectively. As of December 28, 2012 and September 28, 2012, the Company's debt that was subject to the fair value disclosure requirements was all actively traded and is classified as Level 1 in the fair value hierarchy.
From time to time Tyco International Finance S.A. ("TIFSA") may issue commercial paper for general corporate purposes. The maximum aggregate amount of unsecured commercial paper notes available to be issued on a private placement basis under the commercial paper program is $1.0 billion as of December 28, 2012. As of December 28, 2012 and September 28, 2012, TIFSA had no commercial paper outstanding.
18
Table of Contents
TYCO INTERNATIONAL LTD.
NOTES TO UNAUDITED CONSOLIDATED FINANCIAL STATEMENTS (Continued)
9. Debt (Continued)
The Company's committed revolving credit facilities totaled $1.0 billion as of December 28, 2012. These revolving credit facilities may be used for working capital, capital expenditures and general corporate purposes. As of both December 28, 2012 and September 28, 2012, there were no amounts drawn under the Company's revolving credit facilities. Interest under the revolving credit facilities is variable and is calculated by reference to LIBOR or an alternate base rate.
10. Financial Instruments
The Company's financial instruments consist primarily of cash and cash equivalents, accounts receivable, investments, accounts payable, debt and derivative financial instruments. The fair value of cash and cash equivalents, accounts receivable and accounts payable approximated book value as of December 28, 2012 and September 28, 2012. The fair value of derivative financial instruments was not material to any of the periods presented. See below for the fair value of investments and Note 9 for the fair value of debt.
Derivative Instruments
In the normal course of business, Tyco is exposed to market risk arising from changes in currency exchange rates, interest rates and commodity prices. The Company may use derivative financial instruments to manage exposures to foreign currency, interest rate and commodity risks. The Company's objective for utilizing derivative financial instruments is to manage these risks using the most effective methods to eliminate or reduce the impacts of these exposures. The Company does not use derivative financial instruments for trading or speculative purposes.
For derivative instruments that are designated and qualified as hedging instruments for accounting purposes, the Company documents and links the relationships between the hedging instruments and hedged items. The Company also assesses and documents at the hedge's inception whether the derivatives used in hedging transactions are effective in offsetting changes in fair values associated with the hedged items. These hedges did not result in any hedge ineffectiveness for the quarters ended December 28, 2012 and December 30, 2011.
All derivative financial instruments are reported on the Consolidated Balance Sheet at fair value with changes in the fair value of the derivative financial instruments recognized currently in the Company's Statement of Operations. The derivative financial instruments and impact of such changes in the fair value of the derivative financial instruments was not material to the Consolidated Balance Sheets as of December 28, 2012 and September 28, 2012 or Consolidated Statements of Operations, Consolidated Statements of Comprehensive Income and Statement of Cash Flows for the quarters ended December 28, 2012 and December 30, 2011.
Foreign Currency Exposures
The Company manages foreign currency exchange rate risk through the use of derivative financial instruments comprised principally of forward contracts on foreign currency which are not designated as hedging instruments for accounting purposes. The objective of the derivative instruments is to minimize the income statement impact and potential variability in cash flows associated with intercompany loans, accounts receivable, accounts payable and forecasted transactions that are denominated in certain foreign currencies. As of December 28, 2012 and September 28, 2012, the total gross notional amount of the Company's foreign exchange contracts was $233 million and $225 million, respectively.
19
Table of Contents
TYCO INTERNATIONAL LTD.
NOTES TO UNAUDITED CONSOLIDATED FINANCIAL STATEMENTS (Continued)
10. Financial Instruments (Continued)
Counterparty Credit Risk
The use of derivative financial instruments exposes the Company to counterparty credit risk. If the counterparty fails to perform, the Company is exposed to losses if the derivative is in an asset position. When the fair value of a derivative instrument is an asset, the counterparty has to pay the Company to settle the contract. This exposes the Company to credit risk. However, when the fair value of a derivative instrument is a liability, the Company has to pay the counterparty to settle the contract and therefore there is no counterparty credit risk. Tyco has established policies and procedures to limit the potential for counterparty credit risk, including establishing limits for credit exposure and continually assessing the creditworthiness of counterparties. As a matter of practice, the Company deals with major banks worldwide having strong investment grade long-term credit ratings from Standard & Poor's and Moody's. To further reduce the risk of loss, the Company generally enters into International Swaps and Derivatives Association master agreements with substantially all of its counterparties. Master netting agreements provide protection in bankruptcy in certain circumstances and, in some cases, enable receivables and payables with the same counterparty to be offset on the Consolidated Balance Sheets, providing for a more meaningful balance sheet presentation of credit exposure. The Company's derivative contracts do not contain any credit risk related contingent features and do not require collateral or other security to be furnished by the Company or the counterparties.
The Company's exposure to credit risk associated with its derivative instruments is measured on an individual counterparty basis, as well as by groups of counterparties that share similar attributes. As of December 28, 2012, the Company was exposed to industry concentration with financial institutions as well as risk of loss if an individual counterparty or issuer failed to perform its obligations under contractual terms. The maximum amount of loss that the Company would incur as of December 28, 2012 without giving consideration to the effects of legally enforceable master netting agreements was approximately $1 million.
Fair Value of Financial Instruments
Authoritative guidance for fair value measurements establishes a three-level hierarchy that ranks the quality and reliability of information used in developing fair value estimates. The hierarchy gives the highest priority to quoted prices in active markets and the lowest priority to unobservable data. In cases where two or more levels of inputs are used to determine fair value, a financial instrument's level is determined based on the lowest level input that is considered significant to the fair value measurement in its entirety. The three levels of the fair value hierarchy are summarized as follows:
- •
- Level 1—inputs are based upon quoted prices (unadjusted) in active markets for identical assets or liabilities which are accessible as of the measurement date.
- •
- Level 2—inputs are based upon quoted prices for similar assets or liabilities in active markets, quoted prices for identical or similar assets or liabilities in markets that are not active, and model-derived valuations for the asset or liability that are derived principally from or corroborated by market data for which the primary inputs are observable, including forward interest rates, yield curves, credit risk and exchange rates.
- •
- Level 3—inputs for the valuations are unobservable and are based on management's estimates of assumptions that market participants would use in pricing the asset or liability. The fair values are therefore determined using model-based techniques such as option pricing models and discounted cash flow models.
20
Table of Contents
TYCO INTERNATIONAL LTD.
NOTES TO UNAUDITED CONSOLIDATED FINANCIAL STATEMENTS (Continued)
10. Financial Instruments (Continued)
Investments
Investments primarily include U.S. government obligations, U.S. government agency securities and corporate debt securities.
When available, the Company uses quoted market prices to determine the fair value of investment securities. Such investments are included in Level 1. When quoted market prices are not readily available, pricing determinations are made based on the results of market approach valuation models using observable market data such as recently reported trades, bid and offer information and benchmark securities. These investments are included in Level 2 and consist primarily of U.S. government agency securities and corporate debt securities.
Assets and Liabilities Measured at Fair Value on a Recurring Basis
| | | | | | | | | | | | | | | | |
| |
| |
| |
| | Consolidated Balance Sheet Classification | |
|---|
| | Fair Value | |
|---|
| | Prepaids and
Other Current
Assets | |
| |
|---|
As of December 28, 2012:
($ in millions) | | Level 1 | | Level 2 | | Total | | Other Assets | |
|---|
Available-for-Sale Securities: | | | | | | | | | | | | | | | | |
Corporate debt securities | | $ | — | | $ | 30 | | $ | 30 | | $ | 6 | | $ | 24 | |
U.S. Government debt securities | | | 170 | | | 81 | | | 251 | | | 151 | | | 100 | |
| | | | | | | | | | | | |
Total | | $ | 170 | | $ | 111 | | $ | 281 | | $ | 157 | | $ | 124 | |
| | | | | | | | | | | | |
| | | | | | | | | | | | | | | | |
| |
| |
| |
| | Consolidated Balance Sheet Classification | |
|---|
| | Fair Value | |
|---|
| | Prepaids and
Other Current
Assets | |
| |
|---|
As of September 28, 2012:
($ in millions) | | Level 1 | | Level 2 | | Total | | Other Assets | |
|---|
Available-for-Sale Securities: | | | | | | | | | | | | | | | | |
Corporate debt securities | | $ | — | | $ | 34 | | $ | 34 | | $ | 7 | | $ | 27 | |
U.S. Government debt securities | | | 86 | | | 83 | | | 169 | | | 63 | | | 106 | |
| | | | | | | | | | | | |
Total | | $ | 86 | | $ | 117 | | $ | 203 | | $ | 70 | | $ | 133 | |
| | | | | | | | | | | | |
During the quarter ended December 28, 2012, the Company did not have any significant transfers within the fair value hierarchy.
Other
The Company had $2.0 billion of intercompany loans designated as permanent in nature as of both December 28, 2012 and September 28, 2012. For the quarters ended December 28, 2012 and December 30, 2011, the Company recorded $22 million of cumulative translation gain and $15 million of cumulative translation loss, respectively, through accumulated other comprehensive loss related to these loans.
11. Commitments and Contingencies
Legacy Matters Related to Former Management
The Company is a party to several lawsuits involving disputes with former management, including its former chief executive officer, Mr. L. Dennis Kozlowski, its former chief financial officer, Mr. Mark
21
Table of Contents
TYCO INTERNATIONAL LTD.
NOTES TO UNAUDITED CONSOLIDATED FINANCIAL STATEMENTS (Continued)
11. Commitments and Contingencies (Continued)
Swartz and a former director, Mr. Frank Walsh Jr. The Company has filed civil complaints against Mr. Kozlowski and Mr. Swartz for breach of fiduciary duty and other wrongful conduct relating to alleged abuses of the Company's Key Employee Loan Program and relocation program, unauthorized bonuses, unauthorized payments, self dealing transactions and other improper conduct. In connection with Tyco's affirmative actions against Mr. Kozlowski and Mr. Swartz, Mr. Kozlowski, through counterclaims, and Mr. Swartz, through a separate lawsuit, are seeking an aggregate of approximately $140 million allegedly due in connection with their compensation and retention arrangements and under the Employee Retirement Income Security Act ("ERISA"). Mr. Walsh is seeking indemnification for legal and other expenses incurred by him in connection with the Company's affirmative action against him for breaches of fiduciary duties.
With respect to Mr. Kozlowski, on December 1, 2010, the U.S. District Court for the Southern District of New York ruled in favor of several of the Company's affirmative claims against him before trial, while dismissing all of Mr. Kozlowski's counterclaims for pay and benefits after 1995. Prior to the commencement of trial scheduled for August 2012, the parties reached an agreement in principle to resolve the matter, with Mr. Kozlowski agreeing to release the Company from any claims to monetary amounts related to compensation, retention or other arrangements alleged to have existed between him and the Company. Although the parties have reached an agreement in principle, until the settlement agreement is signed, the Company will continue to maintain the amounts recorded in its Consolidated Balance Sheet, which reflect a net liability of approximately $91 million, for the amounts allegedly due under his compensation and retention arrangements and under ERISA.
With respect to Mr. Swartz, on March 3, 2011, the U.S. District Court for the Southern District of New York granted the Company's motion for summary judgment as to liability for its affirmative actions and further ruled that issues related to damages would need to be resolved at trial. During the second quarter of fiscal 2012, the Company reversed a $50 million liability related to Mr. Swartz's pay and benefits due to the expiration of the statute of limitations, which was recorded in Selling, general and administrative expenses in the Consolidated Statement of Operations. On May 15, 2012, Mr. Swartz filed a lawsuit against Tyco in New York state court claiming entitlement to monies under ERISA. The Company removed the case to the U.S. district court for the Southern District of New York and filed a motion to dismiss Mr. Swartz's claims for multiple reasons, including that the statute of limitations had expired, at the latest, during the second quarter of fiscal 2012. A trial to determine the Company's damages from Mr. Swartz's breaches of fiduciary duty concluded on October 17, 2012. At the conclusion of the trial, the Court ruled that the Company was entitled to recover all monies earned by Mr. Swartz in connection with his employment by Tyco between September 1, 1995 and June 1, 2002. The Company filed a motion requesting the entry of monetary sum certain judgment in conformity with the Court's ruling regarding the time period of disgorgement. In connection with Mr. Swartz's affirmative claims against the Company, the Court dismissed all of Mr. Swartz's claims except one claim in which Mr. Swartz contends he is entitled to reimbursement from the Company for taxes he paid in connection with his 2002 Separation Agreement. The Court has not opined on the merits of this claim, and the Company intends to continue to vigorously defend this claim.
With respect to Mr. Walsh, in June 2002, the Company filed a civil complaint against him for breach of fiduciary duty, inducing breaches of fiduciary duty and related wrongful conduct involving a $20 million payment by Tyco, $10 million of which was paid to Mr. Walsh with the balance paid to a charity of which Mr. Walsh is trustee. The payment was purportedly made for Mr. Walsh's assistance in arranging the Company's acquisition of The CIT Group, Inc. On December 17, 2002, Mr. Walsh
22
Table of Contents
TYCO INTERNATIONAL LTD.
NOTES TO UNAUDITED CONSOLIDATED FINANCIAL STATEMENTS (Continued)
11. Commitments and Contingencies (Continued)
pleaded guilty to a felony violation of New York law in the Supreme Court of the State of New York, (New York County) and settled a civil action for violation of federal securities laws brought by the U.S. Securities and Exchange Commission (the "SEC") in United States District Court for the Southern District of New York. Both the felony charge and the civil action were brought against Mr. Walsh based on such payment. The felony charge accused Mr. Walsh of intentionally concealing information concerning the payment from Tyco's directors and shareholders while engaged in the sale of Tyco securities in the State of New York. The SEC action alleged that Mr. Walsh knew that the registration statement covering the sale of Tyco securities as part of the CIT Group acquisition contained a material misrepresentation concerning fees payable in connection with the acquisition. Pursuant to the plea and settlement, Mr. Walsh paid $20 million in restitution to Tyco on December 17, 2002. In October 2010, the U.S. District Court for the Southern District of New York denied the Company's affirmative claims for recovery of damages against Mr. Walsh. In January 2012, the United States Court of Appeals for the Second Circuit reversed the District Court's ruling that Tyco's Board of Directors could ratify breaches of fiduciary duties owed by Mr. Walsh to Tyco's shareholders, and remanded the case to the District Court to resolve certain issues relating to consequential damages. On June 20, 2012, the District Court ruled in Tyco's favor and entered a judgment against Mr. Walsh. Separately, Mr. Walsh is pursuing a New York state court claim against the Company asserting his entitlement to indemnification. Any judgment against the Company related to this matter would be shared with Covidien and TE Connectivity under the agreements governing the 2007 Separation.
Environmental Matters
Tyco is involved in various stages of investigation and cleanup related to environmental remediation matters at a number of sites. The ultimate cost of site cleanup is difficult to predict given the uncertainties regarding the extent of the required cleanup, the interpretation of applicable laws and regulations and alternative cleanup methods. As of December 28, 2012, Tyco concluded that it was probable that it would incur remedial costs in the range of approximately $45 million to $70 million. As of December 28, 2012, Tyco concluded that the best estimate within this range is approximately $47 million, of which $40 million is included in accrued and other current liabilities and $7 million is included in other liabilities in the Company's Consolidated Balance Sheet. In view of the Company's financial position and reserves for environmental matters, the Company believes that any potential payments of such estimated amounts will not have a material adverse effect on its financial position, results of operations or cash flows.
Asbestos Matters
The Company and certain of its subsidiaries along with numerous other companies are named as defendants in personal injury lawsuits based on alleged exposure to asbestos-containing materials. These cases typically involve product liability claims based primarily on allegations of manufacture, sale or distribution of industrial products that either contained asbestos or were attached to or used with asbestos-containing components manufactured by third-parties. Each case typically names between dozens to hundreds of corporate defendants. While the Company has observed an increase in the number of these lawsuits over the past several years, including lawsuits by plaintiffs with mesothelioma-related claims, a large percentage of these suits have not presented viable legal claims and, as a result, have been dismissed by the courts. The Company's historical strategy has been to mount a vigorous defense aimed at having unsubstantiated suits dismissed, and, where appropriate, settling suits before trial. Although a large percentage of litigated suits have been dismissed, the Company cannot predict
23
Table of Contents
TYCO INTERNATIONAL LTD.
NOTES TO UNAUDITED CONSOLIDATED FINANCIAL STATEMENTS (Continued)
11. Commitments and Contingencies (Continued)
the extent to which it will be successful in resolving lawsuits in the future. In addition, the Company continues to assess its strategy for resolving asbestos claims. Due to the number of claims and limited amount of assets at one of the Company's non-operating subsidiaries, the Company is pursuing alternatives for this subsidiary, including a negotiated settlement with representatives of all current and future asbestos claimants against such subsidiary. While the Company has not finalized its approach, if the Company is ultimately successful with this alternative, it will likely assign rights to certain insurance assets and make a cash payment in order to fully resolve the claims against the subsidiary.
As of December 28, 2012, the Company has determined that there were approximately 5,700 claims pending against it, its subsidiaries or entities for which the Company has assumed responsibility in connection with acquisitions and divestitures. This amount reflects the Company's current estimate of the number of viable claims made against such entities and includes adjustments for claims that are not actively being prosecuted, identify incorrect defendants, are duplicative of other actions or for which the Company is indemnified.
Annually, during the Company's third quarter, the Company performs an analysis with the assistance of outside counsel and other experts to update its estimated asbestos-related assets and liabilities. In addition, on a quarterly basis, the Company re-evaluates the assumptions used to perform the annual analysis and records an expense as necessary to reflect changes in its estimated liability and related insurance asset. The Company's estimate of the liability and corresponding insurance recovery for pending and future claims and defense costs is based on the Company's historical claim experience, and estimates of the number and resolution cost of potential future claims that may be filed. The Company's legal strategy for resolving claims also impacts these estimates. The Company considers various trends and developments in evaluating the period of time (the look-back period) over which historical claim and settlement experience is used to estimate and value claims reasonably projected to be made in the future during a defined period of time (the look-forward period). As part of the Company's annual valuation process in the third quarter of fiscal 2012, the Company determined that a look-back period of three years was more appropriate than a five year period because the Company has experienced a higher and more consistent level of claims activity and settlement costs in the past three years. As a result, the Company believes a three year look-back period is more representative of future claim and settlement activity than the five year period it previously used. The Company also revised its look-forward period from seven years to fifteen years. The Company's decision to revise its look- forward period was primarily based on improvements in the consistency of observable data and the Company's more extensive experience with asbestos claims since the look-forward period was originally established in 2005. The revisions to the Company's look-forward and look-back periods do not apply to claims made against the subsidiary described above for which the Company is pursuing alternatives, including a negotiated settlement with representatives of all current and future asbestos claimants. Excluding these claims, the Company believes it can make a more reliable estimate of pending and future claims beyond seven years. The Company believes valuation of pending claims and future claims to be filed over the next fifteen years produces a reasonable estimate of its asbestos liability, which it records in the unaudited consolidated financial statements on an undiscounted basis.
The Company's estimate of asbestos related insurance recoveries represents estimated amounts due to the Company for previously paid and settled claims and the probable reimbursements relating to its estimated liability for pending and future claims. In determining the amount of insurance recoverable, the Company considers a number of factors, including available insurance, allocation methodologies, and the solvency and creditworthiness of insurers. During the fourth quarter of fiscal
24
Table of Contents
TYCO INTERNATIONAL LTD.
NOTES TO UNAUDITED CONSOLIDATED FINANCIAL STATEMENTS (Continued)
11. Commitments and Contingencies (Continued)
2012, the Company reached an agreement with one of its primary insurance carriers for asbestos related claims. Under the terms of the settlement, the Company agreed with the insurance carrier to accept a lump sum cash payment of $97 million in respect of certain policies, and has reached a coverage-in-place agreement with the insurance carrier with respect to certain claims. Upon receipt of the payments from the insurance carrier in the first quarter of fiscal 2013, the Company terminated a cost-sharing agreement that it had entered into with an entity that it had acquired a business from several decades ago and as a result, has access to all of the insurance policies and is responsible for all liabilities arising from asbestos claims made against the subsidiary that was acquired.
As of December 28, 2012, the Company's estimated net liability of $215 million was recorded within the Company's Consolidated Balance Sheet as a liability for pending and future claims and related defense costs of $376 million, and separately as an asset for insurance recoveries of $161 million. The Company believes that its asbestos-related liabilities and insurance-related assets as of December 28, 2012 are appropriate. Similarly, as of September 28, 2012, the Company's estimated net liability of $155 million was recorded within the Company's Consolidated Balance Sheet as a liability for pending and future claims and related defense costs of $401 million, and separately as an asset for insurance recoveries of $246 million.
The amounts recorded by the Company for asbestos-related liabilities and insurance-related assets are based on the Company's strategies for resolving its asbestos claims, currently available information, and a number of estimates and assumptions. Key variables and assumptions include the number and type of new claims that are filed each year, the average cost of resolution of claims, the resolution of coverage issues with insurance carriers, amount of insurance and the solvency risk with respect to the Company's insurance carriers. Furthermore, predictions with respect to these variables are subject to greater uncertainty in the later portion of the projection period. Other factors that may affect the Company's liability and cash payments for asbestos-related matters include uncertainties surrounding the litigation process from jurisdiction to jurisdiction and from case to case, reforms of state or federal tort legislation and the applicability of insurance policies among subsidiaries. As a result, actual liabilities or insurance recoveries could be significantly higher or lower than those recorded if assumptions used in the Company's calculations vary significantly from actual results.
Compliance Matters
As previously reported in the Company's periodic filings, in the fourth fiscal quarter of 2012, the Company settled with the Department of Justice ("DOJ") and the SEC charges related to alleged improper payments made by the Company's subsidiaries and agents in recent years, and agreed to pay approximately $26 million in fines, disgorgement and prejudgment interest to the DOJ and SEC, which the Company had previously reserved in the fourth quarter of fiscal 2011. The Company paid the DOJ approximately $13 million in the first quarter of fiscal 2013, and expects to make the payment of approximately $13 million to the SEC in the second quarter of fiscal 2013.
Covidien and TE Connectivity agreed, in connection with the 2007 Separation, to cooperate with the Company in its responses regarding these matters, and agreed that liabilities primarily related to the former Healthcare and Electronics businesses of the Company would be assigned to Covidien and TE Connectivity, respectively. As a result, Covidien and TE Connectivity have contributed approximately $5 million and immaterial amounts, respectively, toward the aforementioned $26 million.
25
Table of Contents
TYCO INTERNATIONAL LTD.
NOTES TO UNAUDITED CONSOLIDATED FINANCIAL STATEMENTS (Continued)
11. Commitments and Contingencies (Continued)
Tax Litigation
Tyco and its subsidiaries' income tax returns are examined periodically by various tax authorities. In connection with these examinations, tax authorities, including the IRS, have raised issues and proposed tax adjustments, in particular with respect to years preceding the 2007 Separation. The issues and proposed adjustments related to such years are generally subject to the sharing provisions of a tax sharing agreement entered in 2007 with Covidien and TE Connectivity (the "2007 Tax Sharing Agreement") under which Tyco, Covidien and TE Connectivity share 27%, 42% and 31%, respectively, of shared income tax liabilities that arise from adjustments made by tax authorities to Tyco's, Covidien's and TE Connectivity's U.S. and certain non-U.S. income tax returns. The costs and expenses associated with the management of these shared tax liabilities are generally shared equally among the parties. Tyco is reviewing and contesting certain tax adjustments proposed by tax authorities. With respect to adjustments raised by the IRS, although the Company has resolved a substantial number of these adjustments, a few significant items are expected to remain open with respect to the audit of the 1997 through 2004 years. As of the date hereof, it is unlikely that Tyco will be able to resolve all the open items, which primarily involve the treatment of certain intercompany debt transactions during the period, through the IRS appeals process. As a result, Tyco expects to litigate these matters once it receives the requisite statutory notices from the IRS, which is expected to occur during fiscal 2013. The Company has assessed its obligations under the 2007 Tax Sharing Agreement and determined that its recorded liability is sufficient to cover the indemnifications made by the Company under such agreement. However, the ultimate resolution of these matters is uncertain and could result in a material adverse impact to the Company's financial position, results of operations, cash flows or the effective tax rate in future reporting periods. See Note 6 for additional information related to income tax matters.
Other Matters
In addition to the foregoing, the Company is subject to claims and suits, including from time to time, contractual disputes and product and general liability claims, incidental to present and former operations, acquisitions and dispositions. With respect to many of these claims, the Company either self-insures or maintains insurance through third-parties, with varying deductibles. While the ultimate outcome of these matters cannot be predicted with certainty, the Company believes that the resolution of any such proceedings, whether the underlying claims are covered by insurance or not, will not have a material adverse effect on the Company's financial condition, results of operations or cash flows beyond amounts recorded for such matters.
12. Retirement Plans
Defined Benefit Pension Plans—The Company sponsors a number of pension plans. The following disclosures exclude the impact of plans which are immaterial individually and in the aggregate. The net
26
Table of Contents
TYCO INTERNATIONAL LTD.
NOTES TO UNAUDITED CONSOLIDATED FINANCIAL STATEMENTS (Continued)
12. Retirement Plans (Continued)
periodic benefit cost for the Company's material U.S. and non-U.S. defined benefit pension plans is as follows ($ in millions):
| | | | | | | | | | | | | |
| | U.S. Plans | | Non-U.S. Plans | |
|---|
| | For the Quarters
Ended | | For the Quarters
Ended | |
|---|
| | December 28,
2012 | | December 30,
2011 | | December 28,
2012 | | December 30,
2011 | |
|---|
Service cost | | $ | 1 | | $ | 1 | | $ | 5 | | $ | 3 | |
Interest cost | | | 8 | | | 9 | | | 13 | | | 14 | |
Expected return on plan assets | | | (12 | ) | | (10 | ) | | (16 | ) | | (15 | ) |
Amortization of net actuarial loss | | | 4 | | | 3 | | | 2 | | | 2 | |
| | | | | | | | | | |
Net periodic benefit cost | | $ | 1 | | $ | 3 | | $ | 4 | | $ | 4 | |
| | | | | | | | | | |
The estimated net actuarial loss for U.S. pension benefit plans that will be amortized from accumulated other comprehensive loss into net periodic benefit cost over the current fiscal year is expected to be $14 million. The estimated net actuarial loss for non-U.S. pension benefit plans that will be amortized from accumulated other comprehensive income into net periodic benefit cost over the current fiscal year is expected to be $12 million.
The Company's funding policy is to make contributions in accordance with the laws and customs of the various countries in which it operates and to make discretionary voluntary contributions from time-to-time. The Company anticipates that it will contribute at least the minimum required to its pension plans in fiscal year 2013 of $11 million for U.S. plans and $50 million for non-U.S. plans. During the quarter ended December 28, 2012, the Company made required contributions of $1 million to its U.S. pension plans and $13 million to its non-U.S. pension plans.
Postretirement Benefit Plans—Net periodic postretirement benefit cost was insignificant for both periods.
13. Share Plans
During the quarter ended December 28, 2012, the Company issued its annual share-based compensation grants. The total number of awards issued was approximately 4.2 million, of which 2.6 million were stock options, 0.7 million were restricted unit awards and 0.9 million were performance share unit awards. The options and restricted stock units vest in equal annual installments over a period of 4 years, and the performance share unit awards vest after a period of 3 years based on the level of attainment of the applicable performance metrics, which are determined by the Compensation and Human Resources Committee of the Board. The weighted-average grant-date fair value of the stock options, restricted unit awards and performance share unit awards was $7.16, $27.14 and $30.36, respectively. The weighted-average assumptions used in the Black-Scholes option pricing model included an expected stock price volatility of 35%, a risk free interest rate of 0.86%, an expected annual dividend per share of $0.60 and an expected option life of 5.7 years. The fair value of restricted stock units is determined based on the closing market price of the Company's shares on the grant date. Performance share units, which are restricted share awards that vest dependent upon attainment of various levels of performance that equal or exceed targeted levels generally vest in their entirety three
27
Table of Contents
TYCO INTERNATIONAL LTD.
NOTES TO UNAUDITED CONSOLIDATED FINANCIAL STATEMENTS (Continued)
13. Share Plans (Continued)
years from the grant date. The fair value of performance share units is determined based on the Monte Carlo valuation model. The compensation expense recognized for all restricted share awards is net of estimated forfeitures.
In addition to the annual grant and in connection with the 2012 Separation, the Compensation and Human Resources Committee of the Board awarded as a one-time event leadership grants to selected employees in order to strengthen the alignment of the new senior management team with the shareholders of the post-Separation Company and to enhance employee retention. The total number of leadership awards issued was approximately 1.9 million, of which 1.5 million were stock options and 0.4 million were restricted unit awards. The options vest after a period of 3 years and restricted stock units vest in equal installments on the third and fourth anniversary of the grant date. The weighted-average grant-date fair value of the stock options and restricted unit awards was $7.20 and $27.14, respectively. The weighted-average assumptions used in the Black-Scholes option pricing model included an expected stock price volatility of 35%, a risk free interest rate of 0.87%, an expected annual dividend per share of $0.60 and an expected option life of 5.8 years.
14. Equity and Comprehensive Income
Dividends
Under Swiss law, the authority to declare dividends is vested in the general meeting of shareholders, and on September 17, 2012, the Company's shareholders approved a cash dividend of $0.30 per share, payable to shareholders in two quarterly installments of $0.15 on November 15, 2012 and February 20, 2013. The $0.30 dividend reflects the impact of the 2012 Separation on the Company's dividend policy. As a result, the Company recorded an accrued dividend of $139 million as of September 17, 2012 within accrued and other current liabilities and a corresponding reduction to contributed surplus. The first installment of $0.15 was paid on November 15, 2012 to shareholders of record on October 16, 2012. The second installment of $0.15 is to be paid on February 20, 2013 to shareholders of record on January 25, 2013.
Share Repurchase Program
The Company's Board of Directors approved a $1.0 billion share repurchase program in April 2011. During the quarter ended December 28, 2012, the Company repurchased approximately 2 million shares for approximately $50 million under the 2011 share repurchase program, which reduced the amount of common shares outstanding and decreased the dividends declared on the Consolidated Statement of Shareholders' Equity as of December 28, 2012. As of December 28, 2012, approximately $150 million remained outstanding under the 2011 share repurchase program.
28
Table of Contents
TYCO INTERNATIONAL LTD.
NOTES TO UNAUDITED CONSOLIDATED FINANCIAL STATEMENTS (Continued)
14. Equity and Comprehensive Income (Continued)
Comprehensive Income
| | | | | | | |
| | For the Quarters Ended | |
|---|
| | December 28,
2012 | | December 30,
2011 | |
|---|
Net income | | $ | 165 | | $ | 322 | |
| | | | | | |
Foreign currency translation | | | 28 | | | (78 | ) |
Liquidation of foreign entities | | | (10 | ) | | — | |
Income tax expense | | | (7 | ) | | (1 | ) |
| | | | | | |
Foreign currency translation, net of tax | | | 11 | | | (79 | ) |
| | | | | | |
Amortization of net actuarial losses | | | 6 | | | 6 | |
Income tax expense | | | (2 | ) | | (2 | ) |
| | | | | | |
Defined benefit and post-retirement plan, net of tax | | | 4 | | | 4 | |
| | | | | | |
Unrealized (loss) on marketable securities and derivative instruments | | | (1 | ) | | — | |
Income tax benefit | | | 2 | | | 2 | |
| | | | | | |
Unrealized gain on marketable securities and derivative instruments, net of tax | | | 1 | | | 2 | |
| | | | | | |
Total other comprehensive income (loss), net of tax | | | 16 | | | (73 | ) |
| | | | | | |
Comprehensive income | | | 181 | | | 249 | |
Less: comprehensive income attributable to noncontrolling interests | | | 2 | | | — | |
| | | | | | |
Comprehensive income attributable to Tyco common shareholders | | $ | 179 | | $ | 249 | |
| | | | | | |
15. Consolidated Segment Data
Segment information is consistent with how management reviews the businesses, makes investing and resource allocation decisions and assesses operating performance. The Company, from time to time, may realign business and management responsibility within its operating segments based on considerations such as opportunity for market or operating synergies and/or to more fully leverage existing capabilities and enhance development for future products and services.
In connection with the 2012 Separation, the Company has realigned its management and segment reporting structure beginning in the fourth quarter of fiscal 2012. The Company operates and reports financial and operating information in the following three segments:
- •
- NA Installation & Services designs, sells, installs, services and monitors electronic security systems and fire detection and suppression systems for commercial, industrial, retail, institutional and governmental customers in North America.
- •
- ROW Installation & Services designs, sells, installs, services and monitors electronic security systems and fire detection and suppression systems for commercial, industrial, retail, residential, small business, institutional and governmental customers in the Rest of World ("ROW") regions.
29
Table of Contents
TYCO INTERNATIONAL LTD.
NOTES TO UNAUDITED CONSOLIDATED FINANCIAL STATEMENTS (Continued)
15. Consolidated Segment Data (Continued)
- •
- Global Products designs, manufactures and sells fire protection, security and life safety products, including intrusion security, anti-theft devices, breathing apparatus and access control and video management systems, for commercial, industrial, retail, residential, small business, institutional and governmental customers worldwide, including products installed and serviced by our NA and ROW Installation & Services segments.
The Company also provides general corporate services to its segments which is reported as a fourth, non-operating segment, Corporate and Other.
As a result of the 2012 Separation, net revenue and operating income for the quarter ended December 30, 2011 have been recast for the new segment structure. Selected information by segment is presented in the following tables ($ in millions):
| | | | | | | |
| | For the Quarters Ended | |
|---|
| | December 28,
2012 | | December 30,
2011 | |
|---|
Net revenue(1): | | | | | | | |
NA Installation & Services | | $ | 976 | | $ | 962 | |
ROW Installation & Services | | | 1,090 | | | 1,056 | |
Global Products | | | 534 | | | 460 | |
| | | | | | |
Net revenue | | $ | 2,600 | | $ | 2,478 | |
| | | | | | |
- (1)
- Net revenue by operating segment excludes intercompany transactions.
| | | | | | | |
| | For the Quarters Ended | |
|---|
| | December 28,
2012 | | December 30,
2011 | |
|---|
Operating income (loss): | | | | | | | |
NA Installation & Services | | $ | 108 | | $ | 86 | |
ROW Installation & Services | | | 114 | | | 110 | |
Global Products | | | 74 | | | 81 | |
Corporate and Other | | | (61 | ) | | (91 | ) |
| | | | | | |
Operating income | | $ | 235 | | $ | 186 | |
| | | | | | |
16. Inventory
Inventories consisted of the following ($ in millions):
| | | | | | | |
| | As of
December 28,
2012 | | As of
September 28,
2012 | |
|---|
Purchased materials and manufactured parts | | $ | 145 | | $ | 135 | |
Work in process | | | 71 | | | 80 | |
Finished goods | | | 448 | | | 419 | |
| | | | | | |
Inventories | | $ | 664 | | $ | 634 | |
| | | | | | |
Inventories are recorded at the lower of cost (primarily first-in, first-out) or market value.
30
Table of Contents
TYCO INTERNATIONAL LTD.
NOTES TO UNAUDITED CONSOLIDATED FINANCIAL STATEMENTS (Continued)
17. Property, Plant and Equipment
Property, plant and equipment consisted of the following ($ in millions):
| | | | | | | |
| | As of
December 28,
2012 | | As of
September 28,
2012 | |
|---|
Land | | $ | 44 | | $ | 44 | |
Buildings | | | 358 | | | 358 | |
Subscriber systems | | | 3,088 | | | 3,063 | |
Machinery and equipment | | | 1,195 | | | 1,160 | |
Property under capital leases | | | 16 | | | 16 | |
Construction in progress | | | 88 | | | 102 | |
Accumulated depreciation(1) | | | (3,107 | ) | | (3,073 | ) |
| | | | | | |
Property, Plant and Equipment, net | | $ | 1,682 | | $ | 1,670 | |
| | | | | | |
- (1)
- Accumulated amortization of capital lease assets was $16 million as of both December 28, 2012 and September 28, 2012.
18. Guarantees
Certain of the Company's business segments have guaranteed the performance of third-parties and provided financial guarantees for uncompleted work and financial commitments. The terms of these guarantees vary with end dates ranging from the current fiscal year through the completion of such transactions. The guarantees would typically be triggered in the event of nonperformance and performance under the guarantees, if required, would not have a material effect on the Company's financial position, results of operations or cash flows.
There are certain guarantees or indemnifications extended among Tyco, Covidien, TE Connectivity, ADT and Pentair in accordance with the terms of the 2007 and 2012 Separation and Distribution Agreements and Tax Sharing Agreements. These guarantees primarily relate to certain contingent tax liabilities included in the Tax Sharing Agreements. See Note 6.
In addition, Tyco historically provided support in the form of financial and/or performance guarantees to various Covidien, TE Connectivity, ADT and Tyco Flow Control operating entities. In connection with both the 2012 and 2007 Separations, the Company worked with the guarantee counterparties to cancel or assign these guarantees to Covidien, TE Connectivity, ADT or Pentair, as appropriate. To the extent these guarantees were not assigned prior to the Separation dates, Tyco remained as the guarantor, but was typically indemnified by the former subsidiary. The Company's obligations related to the 2012 Separation were $3 million which were included in other liabilities on the Company's Consolidated Balance Sheet as of both December 28, 2012 and September 28, 2012, with an offset to Tyco's shareholders' equity on the 2012 Separation date. The Company's obligations related to the 2007 Separation were $3 million which were included in other liabilities on the Company's Consolidated Balance Sheets as of both December 28, 2012 and September 28, 2012, with an offset to Tyco's shareholders' equity on the 2007 Separation date.
In disposing of assets or businesses, the Company often provides representations, warranties and/or indemnities to cover various risks including, for example, unknown damage to the assets, environmental
31
Table of Contents
TYCO INTERNATIONAL LTD.
NOTES TO UNAUDITED CONSOLIDATED FINANCIAL STATEMENTS (Continued)
18. Guarantees (Continued)
risks involved in the sale of real estate, liability to investigate and remediate environmental contamination at waste disposal sites and manufacturing facilities and unidentified tax liabilities and legal fees related to periods prior to disposition. The Company has no reason to believe that these contingencies, if realized, would have a material adverse effect on the Company's financial position, results of operations or cash flows. The Company has recorded liabilities for known indemnifications included as part of environmental liabilities. See Note 11.
In the normal course of business, the Company is liable for contract completion and product performance. In the opinion of management, such obligations will not significantly affect the Company's financial position, results of operations or cash flows.
| | | | |
Balance as of September 28, 2012 | | $ | 30 | |
Warranties issued | | | 3 | |
Changes in estimates | | | (1 | ) |
Settlements | | | (2 | ) |
| | | | |
Balance as of December 28, 2012 | | $ | 30 | |
| | | | |
19. Tyco International Finance S.A.
TIFSA, a wholly-owned subsidiary of the Company, has public debt securities outstanding which are fully and unconditionally guaranteed by Tyco. The following tables present condensed consolidating financial information for Tyco, TIFSA and all other subsidiaries. Condensed financial information for Tyco and TIFSA on a stand-alone basis is presented using the equity method of accounting for subsidiaries.
32
Table of Contents
TYCO INTERNATIONAL LTD.
NOTES TO UNAUDITED CONSOLIDATED FINANCIAL STATEMENTS (Continued)
19. Tyco International Finance S.A. (Continued)
CONDENSED CONSOLIDATING STATEMENT OF OPERATIONS
For the Quarter Ended December 28, 2012
($ in millions)
| | | | | | | | | | | | | | | | |
| | Tyco
International
Ltd. | | Tyco
International
Finance S.A. | | Other
Subsidiaries | | Consolidating
Adjustments | | Total | |
|---|
Net revenue | | $ | — | | $ | — | | $ | 2,600 | | $ | — | | $ | 2,600 | |
Cost of product sales and services | | | — | | | — | | | 1,668 | | | — | | | 1,668 | |
Selling, general and administrative expenses | | | 5 | | | 1 | | | 676 | | | — | | | 682 | |
Separation costs | | | 3 | | | — | | | 2 | | | — | | | 5 | |
Restructuring and asset impairment charges, net | | | — | | | — | | | 10 | | | — | | | 10 | |
| | | | | | | | | | | | |
Operating (loss) income | | | (8 | ) | | (1 | ) | | 244 | | | — | | | 235 | |
Interest income | | | — | | | — | | | 4 | | | — | | | 4 | |
Interest expense | | | — | | | (24 | ) | | — | | | — | | | (24 | ) |
Other (expense) income, net | | | (10 | ) | | — | | | 1 | | | — | | | (9 | ) |
Equity in net income of subsidiaries | | | 203 | | | 68 | | | — | | | (271 | ) | | — | |
Intercompany interest and fees | | | (22 | ) | | 49 | | | (27 | ) | | — | | | — | |
| | | | | | | | | | | | |
Income from continuing operations before income taxes | | | 163 | | | 92 | | | 222 | | | (271 | ) | | 206 | |
Income tax expense | | | — | | | — | | | (39 | ) | | — | | | (39 | ) |
Equity loss in earnings of unconsolidated subsidiaries | | | — | | | — | | | (6 | ) | | — | | | (6 | ) |
| | | | | | | | | | | | |
Income from continuing operations | | | 163 | | | 92 | | | 177 | | | (271 | ) | | 161 | |
Income from discontinued operations, net of income taxes | | | — | | | — | | | 4 | | | — | | | 4 | |
| | | | | | | | | | | | |
Net income | | | 163 | | | 92 | | | 181 | | | (271 | ) | | 165 | |
Less: noncontrolling interest in subsidiaries net income | | | — | | | — | | | 2 | | | — | | | 2 | |
| | | | | | | | | | | | |
Net income attributable to Tyco common shareholders | | $ | 163 | | $ | 92 | | $ | 179 | | $ | (271 | ) | $ | 163 | |
| | | | | | | | | | | | |
33
Table of Contents
TYCO INTERNATIONAL LTD.
NOTES TO UNAUDITED CONSOLIDATED FINANCIAL STATEMENTS (Continued)
19. Tyco International Finance S.A. (Continued)
CONDENSED CONSOLIDATING STATEMENT OF COMPREHENSIVE INCOME
For the Quarter Ended December 28, 2012
(in millions)
| | | | | | | | | | | | | | | | |
| | Tyco
International
Ltd. | | Tyco
International
Finance S.A. | | Other
Subsidiaries | | Consolidating
Adjustments | | Total | |
|---|
Net income | | $ | 163 | | $ | 92 | | $ | 181 | | $ | (271 | ) | $ | 165 | |
| | | | | | | | | | | | |
Other comprehensive income, net of tax | | | | | | | | | | | | | | | | |
Foreign currency translation | | | 11 | | | — | | | 11 | | | (11 | ) | | 11 | |
Defined benefit and post retirement plans | | | 4 | | | — | | | 4 | | | (4 | ) | | 4 | |
Unrealized gain on marketable securities and derivative instruments | | | 1 | | | — | | | 1 | | | (1 | ) | | 1 | |
| | | | | | | | | | | | |
Total other comprehensive income, net of tax | | | 16 | | | — | | | 16 | | | (16 | ) | | 16 | |
| | | | | | | | | | | | |
Comprehensive income | | | 179 | | | 92 | | | 197 | | | (287 | ) | | 181 | |
Less: comprehensive income attributable to noncontrolling interests | | | — | | | — | | | 2 | | | — | | | 2 | |
| | | | | | | | | | | | |
Comprehensive income attributable to Tyco common shareholders | | $ | 179 | | $ | 92 | | $ | 195 | | $ | (287 | ) | $ | 179 | |
| | | | | | | | | | | | |
34
Table of Contents
TYCO INTERNATIONAL LTD.
NOTES TO UNAUDITED CONSOLIDATED FINANCIAL STATEMENTS (Continued)
19. Tyco International Finance S.A. (Continued)
CONDENSED CONSOLIDATING STATEMENT OF OPERATIONS
For the Quarter Ended December 30, 2011
($ in millions)
| | | | | | | | | | | | | | | | |
| | Tyco
International
Ltd. | | Tyco
International
Finance S.A. | | Other
Subsidiaries | | Consolidating
Adjustments | | Total | |
|---|
Net revenue | | $ | — | | $ | — | | $ | 2,478 | | $ | — | | $ | 2,478 | |
Cost of product sales and services | | | — | | | — | | | 1,579 | | | — | | | 1,579 | |
Selling, general and administrative expenses | | | 4 | | | 3 | | | 670 | | | — | | | 677 | |
Restructuring and asset impairment charges, net | | | 1 | | | — | | | 35 | | | — | | | 36 | |
| | | | | | | | | | | | |
Operating (loss) income | | | (5 | ) | | (3 | ) | | 194 | | | — | | | 186 | |
Interest income | | | — | | | — | | | 5 | | | — | | | 5 | |
Interest expense | | | — | | | (57 | ) | | (1 | ) | | — | | | (58 | ) |
Other income, net | | | 1 | | | — | | | 1 | | | — | | | 2 | |
Equity in net income of subsidiaries | | | 444 | | | 219 | | | — | | | (663 | ) | | — | |
Intercompany interest and fees | | | (118 | ) | | 87 | | | 39 | | | (8 | ) | | — | |
| | | | | | | | | | | | |
Income from continuing operations before income taxes | | | 322 | | | 246 | | | 238 | | | (671 | ) | | 135 | |
Income tax expense | | | — | | | (7 | ) | | (20 | ) | | — | | | (27 | ) |
Equity loss in earnings of unconsolidated subsidiaries | | | — | | | — | | | (10 | ) | | — | | | (10 | ) |
| | | | | | | | | | | | |
Income from continuing operations | | | 322 | | | 239 | | | 208 | | | (671 | ) | | 98 | |
Income from discontinued operations, net of income taxes | | | — | | | — | | | 216 | | | 8 | | | 224 | |
| | | | | | | | | | | | |
Net income | | | 322 | | | 239 | | | 424 | | | (663 | ) | | 322 | |
Less: noncontrolling interest in subsidiaries net income | | | — | | | — | | | — | | | — | | | — | |
| | | | | | | | | | | | |
Net income attributable to Tyco common shareholders | | $ | 322 | | $ | 239 | | $ | 424 | | $ | (663 | ) | $ | 322 | |
| | | | | | | | | | | | |
35
Table of Contents
TYCO INTERNATIONAL LTD.
NOTES TO UNAUDITED CONSOLIDATED FINANCIAL STATEMENTS (Continued)
19. Tyco International Finance S.A. (Continued)
CONDENSED CONSOLIDATING STATEMENT OF COMPREHENSIVE INCOME
For the Quarter Ended December 30, 2011
(in millions)
| | | | | | | | | | | | | | | | |
| | Tyco
International
Ltd. | | Tyco
International
Finance S.A. | | Other
Subsidiaries | | Consolidating
Adjustments | | Total | |
|---|
Net income | | $ | 322 | | $ | 239 | | $ | 424 | | $ | (663 | ) | $ | 322 | |
| | | | | | | | | | | | |
Other comprehensive loss, net of tax | | | | | | | | | | | | | | | | |
Foreign currency translation | | | (79 | ) | | (5 | ) | | (74 | ) | | 79 | | | (79 | ) |
Defined benefit and post retirement plans | | | 4 | | | — | | | 4 | | | (4 | ) | | 4 | |
Unrealized gain on marketable securities and derivative instruments | | | 2 | | | — | | | 2 | | | (2 | ) | | 2 | |
| | | | | | | | | | | | |
Total other comprehensive loss, net of tax | | | (73 | ) | | (5 | ) | | (68 | ) | | 73 | | | (73 | ) |
| | | | | | | | | | | | |
Comprehensive income | | | 249 | | | 234 | | | 356 | | | (590 | ) | | 249 | |
Less: comprehensive income attributable to noncontrolling interests | | | — | | | — | | | — | | | — | | | — | |
| | | | | | | | | | | | |
Comprehensive income attributable to Tyco common shareholders | | $ | 249 | | $ | 234 | | $ | 356 | | $ | (590 | ) | $ | 249 | |
| | | | | | | | | | | | |
36
Table of Contents
TYCO INTERNATIONAL LTD.
NOTES TO UNAUDITED CONSOLIDATED FINANCIAL STATEMENTS (Continued)
19. Tyco International Finance S.A. (Continued)
CONDENSED CONSOLIDATING BALANCE SHEET
As of December 28, 2012
($ in millions)
| | | | | | | | | | | | | | | | |
| | Tyco
International
Ltd. | | Tyco
International
Finance S.A. | | Other
Subsidiaries | | Consolidating
Adjustments | | Total | |
|---|
Assets | | | | | | | | | | | | | | | | |
Current Assets: | | | | | | | | | | | | | | | | |
Cash and cash equivalents | | $ | — | | $ | — | | $ | 501 | | $ | — | | $ | 501 | |
Accounts receivable, net | | | — | | | — | | | 1,709 | | | — | | | 1,709 | |
Inventories | | | — | | | — | | | 664 | | | — | | | 664 | |
Intercompany receivables | | | 1,251 | | | 1,957 | | | 10,557 | | | (13,765 | ) | | — | |
Prepaid expenses and other current assets | | | 15 | | | — | | | 897 | | | — | | | 912 | |
Deferred income taxes | | | — | | | — | | | 295 | | | — | | | 295 | |
| | | | | | | | | | | | |
Total current assets | | | 1,266 | | | 1,957 | | | 14,623 | | | (13,765 | ) | | 4,081 | |
Property, plant and equipment, net | | | — | | | — | | | 1,682 | | | — | | | 1,682 | |
Goodwill | | | — | | | — | | | 4,406 | | | — | | | 4,406 | |
Intangible assets, net | | | — | | | — | | | 765 | | | — | | | 765 | |
Investment in subsidiaries | | | 25,839 | | | 12,613 | | | — | | | (38,452 | ) | | — | |
Intercompany loans receivable | | | 1,921 | | | 7,041 | | | 19,957 | | | (28,919 | ) | | — | |
Other assets | | | 67 | | | 7 | | | 1,117 | | | — | | | 1,191 | |
| | | | | | | | | | | | |
Total Assets | | $ | 29,093 | | $ | 21,618 | | $ | 42,550 | | $ | (81,136 | ) | $ | 12,125 | |
| | | | | | | | | | | | |
Liabilities and Equity | | | | | | | | | | | | | | | | |
Current Liabilities: | | | | | | | | | | | | | | | | |
Loans payable and current maturities of long-term debt | | $ | — | | $ | — | | $ | 10 | | $ | — | | $ | 10 | |
Accounts payable | | | — | | | — | | | 839 | | | — | | | 839 | |
Accrued and other current liabilities | | | 117 | | | 33 | | | 1,372 | | | — | | | 1,522 | |
Deferred revenue | | | — | | | — | | | 364 | | | — | | | 364 | |
Intercompany payables | | | 3,696 | | | 6,867 | | | 3,202 | | | (13,765 | ) | | — | |
| | | | | | | | | | | | |
Total current liabilities | | | 3,813 | | | 6,900 | | | 5,787 | | | (13,765 | ) | | 2,735 | |
Long-term debt | | | — | | | 1,443 | | | 38 | | | — | | | 1,481 | |
Intercompany loans payable | | | 19,682 | | | 3,055 | | | 6,182 | | | (28,919 | ) | | — | |
Deferred revenue | | | — | | | — | | | 416 | | | — | | | 416 | |
Other liabilities | | | 472 | | | — | | | 1,865 | | | — | | | 2,337 | |
| | | | | | | | | | | | |
Total Liabilities | | | 23,967 | | | 11,398 | | | 14,288 | | | (42,684 | ) | | 6,969 | |
| | | | | | | | | | | | |
Redeemable noncontrolling interest | | | — | | | — | | | 12 | | | — | | | 12 | |
| | | | | | | | | | | | |
Tyco Shareholders' Equity: | | | | | | | | | | | | | | | | |
Common shares | | | 2,792 | | | — | | | — | | | — | | | 2,792 | |
Common shares held in treasury | | | — | | | — | | | (913 | ) | | — | | | (913 | ) |
Other shareholders' equity | | | 2,334 | | | 10,220 | | | 29,145 | | | (38,452 | ) | | 3,247 | |
| | | | | | | | | | | | |
Total Tyco Shareholders' Equity | | | 5,126 | | | 10,220 | | | 28,232 | | | (38,452 | ) | | 5,126 | |
Nonredeemable noncontrolling interest | | | — | | | — | | | 18 | | | — | | | 18 | |
| | | | | | | | | | | | |
Total Equity | | | 5,126 | | | 10,220 | | | 28,250 | | | (38,452 | ) | | 5,144 | |
| | | | | | | | | | | | |
Total Liabilities, Redeemable Noncontrolling Interest and Equity | | $ | 29,093 | | $ | 21,618 | | $ | 42,550 | | $ | (81,136 | ) | $ | 12,125 | |
| | | | | | | | | | | | |
37
Table of Contents
TYCO INTERNATIONAL LTD.
NOTES TO UNAUDITED CONSOLIDATED FINANCIAL STATEMENTS (Continued)
19. Tyco International Finance S.A. (Continued)
CONDENSED CONSOLIDATING BALANCE SHEET
As of September 28, 2012
($ in millions)
| | | | | | | | | | | | | | | | |
| | Tyco
International
Ltd. | | Tyco
International
Finance S.A. | | Other
Subsidiaries | | Consolidating
Adjustments | | Total | |
|---|
Assets | | | | | | | | | | | | | | | | |
Current Assets: | | | | | | | | | | | | | | | | |
Cash and cash equivalents | | $ | — | | $ | — | | $ | 844 | | $ | — | | $ | 844 | |
Accounts receivable, net | | | 7 | | | — | | | 1,704 | | | — | | | 1,711 | |
Inventories | | | — | | | — | | | 634 | | | — | | | 634 | |
Intercompany receivables | | | 1,220 | | | 1,890 | | | 10,361 | | | (13,471 | ) | | — | |
Prepaid expenses and other current assets | | | 14 | | | — | | | 836 | | | — | | | 850 | |
Deferred income taxes | | | — | | | — | | | 295 | | | — | | | 295 | |
| | | | | | | | | | | | |
Total current assets | | | 1,241 | | | 1,890 | | | 14,674 | | | (13,471 | ) | | 4,334 | |
Property, plant and equipment, net | | | — | | | — | | | 1,670 | | | — | | | 1,670 | |
Goodwill | | | — | | | — | | | 4,377 | | | — | | | 4,377 | |
Intangible assets, net | | | — | | | — | | | 780 | | | — | | | 780 | |
Investment in subsidiaries | | | 25,666 | | | 12,274 | | | — | | | (37,940 | ) | | — | |
Intercompany loans receivable | | | 1,921 | | | 7,031 | | | 19,956 | | | (28,908 | ) | | — | |
Other assets | | | 67 | | | 260 | | | 877 | | | — | | | 1,204 | |
| | | | | | | | | | | | |
Total Assets | | $ | 28,895 | | $ | 21,455 | | $ | 42,334 | | $ | (80,319 | ) | $ | 12,365 | |
| | | | | | | | | | | | |
Liabilities and Equity | | | | | | | | | | | | | | | | |
Current Liabilities: | | | | | | | | | | | | | | | | |
Loans payable and current maturities of long-term debt | | $ | — | | $ | — | | $ | 10 | | $ | — | | $ | 10 | |
Accounts payable | | | — | | | — | | | 897 | | | — | | | 897 | |
Accrued and other current liabilities | | | 187 | | | 23 | | | 1,578 | | | — | | | 1,788 | |
Deferred revenue | | | — | | | — | | | 402 | | | — | | | 402 | |
Intercompany payables | | | 3,571 | | | 6,793 | | | 3,107 | | | (13,471 | ) | | — | |
| | | | | | | | | | | | |
Total current liabilities | | | 3,758 | | | 6,816 | | | 5,994 | | | (13,471 | ) | | 3,097 | |
Long-term debt | | | — | | | 1,443 | | | 38 | | | — | | | 1,481 | |
Intercompany loans payable | | | 19,672 | | | 3,055 | | | 6,181 | | | (28,908 | ) | | — | |
Deferred revenue | | | — | | | — | | | 424 | | | — | | | 424 | |
Other liabilities | | | 471 | | | — | | | 1,870 | | | — | | | 2,341 | |
| | | | | | | | | | | | |
Total Liabilities | | | 23,901 | | | 11,314 | | | 14,507 | | | (42,379 | ) | | 7,343 | |
| | | | | | | | | | | | |
Redeemable noncontrolling interest | | | — | | | — | | | 12 | | | — | | | 12 | |
| | | | | | | | | | | | |
Tyco Shareholders' Equity: | | | | | | | | | | | | | | | | |
Common shares | | | 2,792 | | | — | | | — | | | — | | | 2,792 | |
Common shares held in treasury | | | — | | | — | | | (1,094 | ) | | — | | | (1,094 | ) |
Other shareholders' equity | | | 2,202 | | | 10,141 | | | 28,893 | | | (37,940 | ) | | 3,296 | |
| | | | | | | | | | | | |
Total Tyco Shareholders' Equity | | | 4,994 | | | 10,141 | | | 27,799 | | | (37,940 | ) | | 4,994 | |
Nonredeemable noncontrolling interest | | | — | | | — | | | 16 | | | — | | | 16 | |
| | | | | | | | | | | | |
Total Equity | | | 4,994 | | | 10,141 | | | 27,815 | | | (37,940 | ) | | 5,010 | |
| | | | | | | | | | | | |
Total Liabilities, Redeemable Noncontrolling Interest and Equity | | $ | 28,895 | | $ | 21,455 | | $ | 42,334 | | $ | (80,319 | ) | $ | 12,365 | |
| | | | | | | | | | | | |
38
Table of Contents
TYCO INTERNATIONAL LTD.
NOTES TO UNAUDITED CONSOLIDATED FINANCIAL STATEMENTS (Continued)
19. Tyco International Finance S.A. (Continued)
CONDENSED CONSOLIDATING STATEMENT OF CASH FLOWS
For the Quarter Ended December 28, 2012
($ in millions)
| | | | | | | | | | | | | | | | |
| | Tyco
International
Ltd. | | Tyco
International Finance S.A. | | Other
Subsidiaries | | Consolidating
Adjustments | | Total | |
|---|
Cash Flows From Operating Activities: | | | | | | | | | | | | | | | | |
Net cash provided by (used in) operating activities | | $ | 60 | | $ | 42 | | $ | (141 | ) | $ | — | | $ | (39 | ) |
Net cash provided by discontinued operating activities | | | — | | | — | | | 4 | | | — | | | 4 | |
Cash Flows From Investing Activities: | | | | | | | | | | | | | | | | |
Capital expenditures | | | — | | | — | | | (90 | ) | | — | | | (90 | ) |
Proceeds from disposal of assets | | | — | | | — | | | 3 | | | — | | | 3 | |
Acquisition of businesses, net of cash acquired | | | — | | | — | | | (23 | ) | | — | | | (23 | ) |
Acquisition of dealer generated customer accounts and bulk account purchases | | | — | | | — | | | (6 | ) | | — | | | (6 | ) |
Net increase in intercompany loans | | | — | | | (10 | ) | | — | | | 10 | | | — | |
Net increase in investments | | | — | | | — | | | (80 | ) | | — | | | (80 | ) |
Other | | | — | | | — | | | 8 | | | — | | | 8 | |
| | | | | | | | | | | | |
Net cash used in investing activity | | | — | | | (10 | ) | | (188 | ) | | 10 | | | (188 | ) |
Cash Flows From Financing Activities: | | | | | | | | | | | | | | | | |
Proceeds from exercise of share options | | | — | | | — | | | 46 | | | — | | | 46 | |
Dividends paid | | | (70 | ) | | — | | | — | | | — | | | (70 | ) |
Repurchase of common shares by treasury | | | — | | | — | | | (50 | ) | | — | | | (50 | ) |
Net intercompany loan borrowings | | | 10 | | | — | | | — | | | (10 | ) | | — | |
Transfer (to) from discontinued operations | | | — | | | (32 | ) | | 3 | | | — | | | (29 | ) |
Other | | | — | | | — | | | (16 | ) | | — | | | (16 | ) |
| | | | | | | | | | | | |
Net cash used in financing activities | | | (60 | ) | | (32 | ) | | (17 | ) | | (10 | ) | | (119 | ) |
Net cash provided by discontinued financing activities | | | — | | | — | | | 29 | | | — | | | 29 | |
Effect of currency translation on cash | | | — | | | — | | | 3 | | | — | | | 3 | |
| | | | | | | | | | | | |
Net decrease in cash and cash equivalents | | | — | | | — | | | (310 | ) | | — | | | (310 | ) |
Less: net increase in cash and cash equivalents related to discontinued operations | | | — | | | — | | | 33 | | | — | | | 33 | |
Cash and cash equivalents at beginning of period | | | — | | | — | | | 844 | | | — | | | 844 | |
| | | | | | | | | | | | |
Cash and cash equivalents at end of period | | $ | — | | $ | — | | $ | 501 | | $ | — | | $ | 501 | |
| | | | | | | | | | | | |
39
Table of Contents
TYCO INTERNATIONAL LTD.
NOTES TO UNAUDITED CONSOLIDATED FINANCIAL STATEMENTS (Continued)
19. Tyco International Finance S.A. (Continued)
CONDENSED CONSOLIDATING STATEMENT OF CASH FLOWS
For the Quarter Ended December 30, 2011
($ in millions)
| | | | | | | | | | | | | | | | |
| | Tyco
International
Ltd. | | Tyco
International
Finance S.A. | | Other
Subsidiaries | | Consolidating
Adjustments | | Total | |
|---|
Cash Flows From Operating Activities: | | | | | | | | | | | | | | | | |
Net cash (used in) provided by operating activities | | $ | (118 | ) | $ | 242 | | $ | (200 | ) | $ | — | | $ | (76 | ) |
Net cash provided by discontinued operating activities | | | — | | | — | | | 414 | | | — | | | 414 | |
Cash Flows From Investing Activities: | | | | | | | | | | | | | | | | |
Capital expenditures | | | — | | | — | | | (90 | ) | | — | | | (90 | ) |
Proceeds from disposal of assets | | | — | | | — | | | 1 | | | — | | | 1 | |
Acquisition of businesses, net of cash acquired | | | — | | | — | | | (95 | ) | | — | | | (95 | ) |
Acquisition of dealer generated customer accounts and bulk account purchases | | | — | | | — | | | (6 | ) | | — | | | (6 | ) |
Net increase in intercompany loans | | | — | | | (273 | ) | | — | | | 273 | | | — | |
Increase in investment in subsidiaries | | | (47 | ) | | (4 | ) | | — | | | 51 | | | — | |
Net decrease in investments | | | — | | | — | | | 9 | | | — | | | 9 | |
Other | | | — | | | — | | | 19 | | | — | | | 19 | |
| | | | | | | | | | | | |
Net cash used in investing activities | | | (47 | ) | | (277 | ) | | (162 | ) | | 324 | | | (162 | ) |
Net cash used in discontinued investing activities | | | — | | | — | | | (279 | ) | | — | | | (279 | ) |
Cash Flows From Financing Activities: | | | | | | | | | | | | | | | | |
Net borrowings of debt | | | — | | | 35 | | | — | | | — | | | 35 | |
Proceeds from exercise of share options | | | — | | | — | | | 29 | | | — | | | 29 | |
Dividends paid | | | (116 | ) | | — | | | — | | | — | | | (116 | ) |
Repurchase of common shares by treasury | | | — | | | — | | | (200 | ) | | — | | | (200 | ) |
Net intercompany loan borrowings (repayments) | | | 281 | | | — | | | (8 | ) | | (273 | ) | | — | |
Increase in equity from parent | | | — | | | — | | | 47 | | | (47 | ) | | — | |
Transfer from discontinued operations | | | — | | | — | | | 86 | | | (4 | ) | | 82 | |
Other | | | — | | | — | | | (19 | ) | | — | | | (19 | ) |
| | | | | | | | | | | | |
Net cash provided by (used in) financing activities | | | 165 | | | 35 | | | (65 | ) | | (324 | ) | | (189 | ) |
Net cash used in discontinued financing activities | | | — | | | — | | | (78 | ) | | (4 | ) | | (82 | ) |
Effect of currency translation on cash | | | — | | | — | | | (3 | ) | | — | | | (3 | ) |
| | | | | | | | | | | | |
Net decrease in cash and cash equivalents | | | — | | | — | | | (373 | ) | | (4 | ) | | (377 | ) |
Less: net increase in cash and cash equivalents related to discontinued operations | | | — | | | — | | | 57 | | | (4 | ) | | 53 | |
Cash and cash equivalents at beginning of period | | | — | | | — | | | 1,229 | | | — | | | 1,229 | |
| | | | | | | | | | | | |
Cash and cash equivalents at end of period | | $ | — | | $ | — | | $ | 799 | | $ | — | | $ | 799 | |
| | | | | | | | | | | | |
20. Subsequent Events
On January 29, 2013, the Company announced that its Board of Directors approved $600 million in share repurchase authority in addition to the $150 million share repurchase authority currently outstanding under the 2011 Share Repurchase Program.
40
Table of Contents
Item 2. Management's Discussion and Analysis of Financial Condition and Results of Operations
Results of Operations
The following discussion and analysis of the Company's financial condition and results of operations should be read together with our Unaudited Consolidated Financial Statements and the related notes included elsewhere in this Quarterly Report. This discussion and analysis contains forward-looking statements that involve risks, uncertainties and assumptions. The Company's actual results may differ materially from those anticipated in these forward-looking statements as a result of many factors, including but not limited to those under the headings "Risk Factors" and "Forward-Looking Information".
Organization
The Unaudited Consolidated Financial Statements include the consolidated results of Tyco International Ltd., a company organized under the laws of Switzerland, and its subsidiaries (hereinafter collectively referred to as "we", the "Company" or "Tyco"). The financial statements have been prepared in United States dollars ("USD"), in accordance with accounting principles generally accepted in the United States ("GAAP").
Effective September 28, 2012, Tyco completed the spin-offs of The ADT Corporation ("ADT") and Pentair Ltd. (formerly known as Tyco Flow Control International Ltd. ("Tyco Flow Control")), formerly our North American residential security and flow control businesses, respectively, into separate, publicly traded companies in the form of a distribution to Tyco shareholders. Immediately following the spin-off, Pentair Inc. was merged with a subsidiary of Tyco Flow Control in a tax-free, all-stock merger ("the Merger"), with Pentair Ltd. ("Pentair") succeeding Pentair Inc. as an independent publicly traded company. The distribution was made on September 28, 2012, to Tyco shareholders of record on September 17, 2012. Each Tyco shareholder received 0.50 of a common share of ADT and approximately 0.24 of a common share of Pentair Ltd. for each Tyco common share held on the record date. The distribution was structured to be tax-free to Tyco shareholders except to the extent of cash received in lieu of fractional shares. The distributions, the Merger and related transactions are collectively referred to herein as the "2012 Separation". As a result of the distribution, the operations of Tyco's former flow control and North American residential security businesses are now classified as discontinued operations in all periods presented.
After giving effect to the 2012 Separation, we operate and report financial and operating information in the following three segments:
- •
- NA Installation & Services designs, sells, installs, services and monitors electronic security systems and fire detection and suppression systems for commercial, industrial, retail, institutional and governmental customers in North America.
- •
- ROW Installation & Services designs, sells, installs, services and monitors electronic security systems and fire detection and suppression systems for commercial, industrial, retail, residential, small business, institutional and governmental customers in the Rest of World regions.
- •
- Global Products designs, manufactures and sells fire protection, security and life safety products, including intrusion security, anti-theft devices, breathing apparatus and access control and video management systems, for commercial, industrial, retail, residential, small business, institutional and governmental customers worldwide, including products installed and serviced by our NA and ROW Installation & Services segments.
We also provide general corporate services to our segments which is reported as a fourth, non-operating segment, Corporate and Other.
References to the segment data are to the Company's continuing operations. As discussed above, as a result of the 2012 Separation, the Company reports under a new segment structure beginning in the fourth quarter of fiscal 2012 and accordingly has recast prior period segment amounts. See Note 15 to the Unaudited Consolidated Financial Statements.
41
Table of Contents
Business Overview
We are a leading global provider of security products and services, fire detection and suppression products and services and life safety products. We utilize our extensive global footprint of over 1,200 locations, including manufacturing facilities, service and distribution centers, monitoring centers and sales offices, to provide solutions and localized expertise to our global customer base. We provide an extensive range of product and service offerings to over 3 million customers in more than 100 countries through multiple channels. Our revenues are broadly diversified across the United States and Canada (collectively "North America"); Central America and South America (collectively "Latin America"); Europe, the Middle East, and Africa (collectively "EMEA") and the Asia-Pacific region. We refer to Latin America, EMEA, and Asia-Pacific region collectively as "Rest of World" or "ROW". The following chart reflects our first fiscal quarter 2013 net revenue by region.
Quarter Ended December 28, 2012
Net Revenue by Region
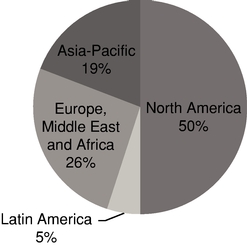
Our end-use customers, to whom we may sell directly or through wholesalers, distributors, commercial builders or contractors, are also broadly diversified and include:
- •
- Commercial customers, including residential and commercial property developers, financial institutions, food service businesses and commercial enterprises;
- •
- Industrial customers, including companies in the oil & gas, power generation, mining, petrochemical and other industries;
- •
- Retail customers, including international, regional and local consumer outlets, from national chains to specialty stores;
- •
- Institutional customers, including a broad range of healthcare facilities, academic institutions, museums and foundations;
- •
- Governmental customers, including federal, state and local governments, defense installations, mass transportation networks, public utilities and other government-affiliated entities and applications;
- •
- Residential and small business customers outside of North America, including owners of single family homes and local providers of a wide range of goods and services.
As a global business with a varied customer base and an extensive range of products and services, our operations and results are impacted by global, regional and industry specific factors, and by political factors. Our geographic diversity and the diversity in our customer base and our products and services has helped mitigate the impact of any one industry or the economy of any single country on our consolidated operating results, financial condition and cash flows. Due to the global nature of our business and the variety of our customers, products and services, no single factor is predominantly used
42
Table of Contents
to forecast Company results. Rather, management monitors a number of factors to develop expectations regarding future results, including the activity of key competitors and customers, order rates for longer lead time projects, and capital expenditure budgets and spending patterns of our customers. We also monitor trends throughout the commercial and residential fire and security markets, including building codes and fire-safety standards. Our commercial installation businesses are impacted by trends in commercial construction starts, while our residential business, which is located outside of the United States, is impacted by new housing starts.
Results of Operations
Consolidated financial information is as follows:
| | | | | | | |
| | For the
Quarters Ended | |
|---|
($ in millions) | | December 28,
2012 | | December 30,
2011 | |
|---|
Net revenue | | $ | 2,600 | | $ | 2,478 | |
Net revenue growth | | | 4.9 | % | | N/A | |
Organic revenue growth | | | 1.2 | % | | N/A | |
Operating income | | $ | 235 | | $ | 186 | |
Operating margin | | | 9.0 | % | | 7.5 | % |
Interest income | | $ | 4 | | $ | 5 | |
Interest expense | | | 24 | | | 58 | |
Other (expense) income, net | | | (9 | ) | | 2 | |
Income tax expense | | | 39 | | | 27 | |
Equity loss in earnings of unconsolidated subsidiaries | | | 6 | | | 10 | |
Net Revenue
Net revenue for the quarter ended December 28, 2012 increased by $122 million, or 4.9%, to $2.6 billion as compared to net revenue of $2.5 billion for the quarter ended December 30, 2011. On an organic basis, net revenue grew by $30 million, or 1.2% year over year, primarily driven by our Global Products segment. Net revenue was favorably impacted by acquisitions of $76 million, or 3.1%, primarily due to the acquisition of Visonic as well as other acquisitions within our Global Products and ROW Installation & Services segments. Favorable changes in foreign currency exchange rates impacted net revenue by $9 million, or 0.4%.
Operating Income
Operating income for the quarter ended December 28, 2012 increased by $49 million, or 26.3% to $235 million, as compared to operating income of $186 million for the quarter ended December 30, 2011. Operating income for the quarter ended December 28, 2012 increased primarily due to improved performance in our NA Installation & Services segment, as well as lower corporate expense given our smaller corporate footprint. Additionally, we continue to see the benefit of ongoing cost containment and restructuring actions. Items impacting operating income for first quarter of fiscal 2013 and the first quarter of fiscal 2012 are as follows:
| | | | | | | |
| | For the
Quarters Ended | |
|---|
($ in millions) | | December 28,
2012 | | December 30,
2011 | |
|---|
Separation costs | | $ | 18 | | $ | — | |
Gain on divestitures | | | (3 | ) | | — | |
Restructuring and asset impairment charges | | | 10 | | | 36 | |
Acquisition and integration costs | | | 1 | | | 2 | |
Asbestos related (gains) charges | | | (1 | ) | | — | |
43
Table of Contents
Interest Income and Expense
Interest income was $4 million and $5 million for the quarters ended December 28, 2012 and December 30, 2011, respectively.
Interest expense was $24 million in the quarter ended December 28, 2012 compared to $58 million in the quarter ended December 30, 2011. The decrease in interest expense is primarily related to savings realized from the redemption of $2.6 billion of aggregate principal amounts of various debt securities in connection with the 2012 Separation.
Other Expense, Net
Significant components of Other (expense) income, net for the quarters ended December 28, 2012 and December 30, 2011 are as follows ($ in millions):
| | | | | | | |
| | For the
Quarters Ended | |
|---|
| | December 28,
2012 | | December 30,
2011 | |
|---|
2012 Tax Sharing Agreement charges (see Note 6 to the Unaudited Consolidated Financial Statements) | | $ | (10 | ) | $ | — | |
2007 Tax Sharing Agreement gain (see Note 6 to the Unaudited Consolidated Financial Statements) | | | — | | | 1 | |
Other | | | 1 | | | 1 | |
| | | | | | |
Total | | $ | (9 | ) | $ | 2 | |
| | | | | | |
Effective Income Tax Rate
Our effective income tax rate was 18.9% and 20.0% during the quarters ended December 28, 2012 and December 30, 2011, respectively. The decrease in our effective tax rate was primarily related to non-recurring tax expense items during the comparable period. The rate can vary from quarter to quarter due to discrete items, such as the settlement of income tax audits and changes in tax laws, as well as recurring factors such as the geographic mix of income before taxes.
Equity Loss in Earnings of Unconsolidated Subsidiaries
Equity loss in earnings of unconsolidated subsidiaries during the quarters ended December 28, 2012 and December 30, 2011 of $6 million and $10 million, respectively, reflects our share of Atkore International Group's ("Atkore") net loss which is accounted for under the equity method of accounting.
44
Table of Contents
Segment Results
The following chart reflects our first quarter of fiscal 2013 and first quarter of fiscal 2012 revenue by operating segment, as well as % of net revenue by operating segment.
($ in billions)
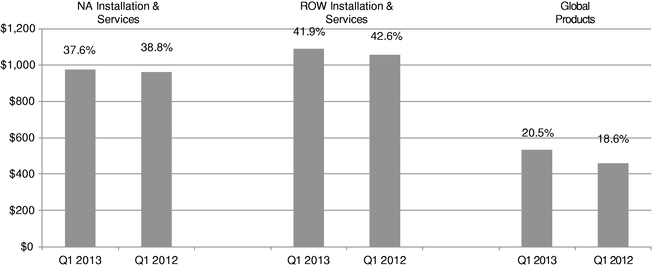
The segment discussions that follow describe the significant factors contributing to the changes in results for each of our segments included in continuing operations.
NA Installation & Services
NA Installation & Services designs, sells, installs, services and monitors electronic security systems and fire detection and suppression systems for commercial, industrial, retail, institutional and governmental customers in North America.
Financial information for NA Installation & Services for the quarters ended December 28, 2012 and December 30, 2011 were as follows:
| | | | | | | |
| | For the
Quarters Ended | |
|---|
($ in millions) | | December 28,
2012 | | December 30,
2011 | |
|---|
Net revenue | | $ | 976 | | $ | 962 | |
Net revenue growth | | | 1.5 | % | | N/A | |
Organic revenue growth | | | 0.8 | % | | N/A | |
Operating income | | $ | 108 | | $ | 86 | |
Operating margin | | | 11.1 | % | | 8.9 | % |
Net Revenue
The change in net revenue compared to the prior periods is attributable to the following:
| | | | |
Factors Contributing to Year-Over-Year Change | | First Quarter of Fiscal 2013
Compared to
First Quarter of Fiscal 2012 | |
|---|
Organic revenue growth | | $ | 8 | |
Acquisitions | | | 2 | |
Impact of foreign currency | | | 4 | |
| | | | |
Total change | | $ | 14 | |
| | | | |
45
Table of Contents
Organic revenue increase for the quarter ended December 28, 2012 was primarily driven by an increase in service revenue for the NA Fire business, partially offset by a decline in the NA Security business primarily as a result of project selectivity.
Operating Income
Operating income for the quarter ended December 28, 2012 increased $22 million, or 25.6%, to $108 million, as compared to operating income of $86 million for the quarter ended December 30, 2011. Operating income for the quarter ended December 28, 2012 increased due to a higher mix of service revenue across all of our businesses, efficiencies gained through improved installation execution and project selectivity in our NA Security business. In addition, the increase in operating income was due to lower restructuring charges incurred during the current quarter when compared to the comparable period in the prior year as noted in the table below. Items impacting operating income for the first quarter of fiscal 2013 and the first quarter of fiscal 2012 are as follows:
| | | | | | | |
| | For the
Quarters Ended | |
|---|
($ in millions) | | December 28,
2012 | | December 30,
2011 | |
|---|
Restructuring and asset impairment charges, net | | $ | — | | $ | 21 | |
Separation costs | | | 12 | | | — | |
Acquisition and integration costs | | | — | | | 1 | |
ROW Installation & Services
ROW Installation & Services designs, sells, installs, services and monitors electronic security systems and fire detection and suppression systems for commercial, industrial, retail, residential, small business, institutional and governmental customers in the Latin America, EMEA and Asia-Pacific regions.
Financial information for ROW Installation & Services for the quarters ended December 28, 2012 and December 30, 2011 were as follows:
| | | | | | | |
| | For the
Quarters Ended | |
|---|
($ in millions) | | December 28,
2012 | | December 30,
2011 | |
|---|
Net revenue | | $ | 1,090 | | $ | 1,056 | |
Net revenue growth | | | 3.2 | % | | N/A | |
Organic revenue decline | | | (0.4 | )% | | N/A | |
Operating income | | $ | 114 | | $ | 110 | |
Operating margin | | | 10.5 | % | | 10.4 | % |
Net Revenue
The change in net revenue compared to the prior periods is attributable to the following:
| | | | |
Factors Contributing to Year-Over-Year Change | | First Quarter of Fiscal 2013
Compared to
First Quarter of Fiscal 2012 | |
|---|
Organic revenue decline | | $ | (4 | ) |
Acquisitions | | | 35 | |
Impact of foreign currency | | | 3 | |
| | | | |
Total change | | $ | 34 | |
| | | | |
Organic revenue decline for the quarter ended December 28, 2012 was driven by decreased installation revenue in Asia and Europe, partially offset by our continued focus to grow service revenue. Net revenue was favorably impacted by the net impact of acquisitions of $35 million or 3.3%, primarily due an acquisition within Asia during the second quarter of fiscal 2012.
46
Table of Contents
Operating Income
Operating income for the quarter ended December 28, 2012 increased $4 million, or 3.6%, to $114 million, as compared to operating income of $110 million for the quarter ended December 30, 2011. Operating income for the quarter ended December 28, 2012 increased primarily due to our continued focus on higher margin services, as well as the benefit of ongoing cost containment and restructuring savings in most regions, partially offset by additional investments in our service sales force. Items impacting operating income for the first quarter of fiscal 2013 and the first quarter of fiscal 2012 are as follows:
| | | | | | | |
| | For the
Quarters Ended | |
|---|
($ in millions) | | December 28,
2012 | | December 30,
2011 | |
|---|
Restructuring and asset impairment charges, net | | | 7 | | | 7 | |
Acquisition and integration costs | | | — | | | 1 | |
Global Products
Global Products designs, manufactures and sells fire protection, security and life safety products, including intrusion security, anti-theft devices, breathing apparatus and access control and video management systems, for commercial, industrial, retail, residential, small business, institutional and governmental customers worldwide including products installed and serviced by our NA and ROW Installation & Services segments.
Financial information for Global Products for the quarters ended December 28, 2012 and December 30, 2011 were as follows:
| | | | | | | |
| | For the
Quarters Ended | |
|---|
($ in millions) | | December 28,
2012 | | December 30,
2011 | |
|---|
Net revenue | | $ | 534 | | $ | 460 | |
Net revenue growth | | | 16.1 | % | | N/A | |
Organic revenue growth | | | 5.7 | % | | N/A | |
Operating income | | $ | 74 | | $ | 81 | |
Operating margin | | | 13.9 | % | | 17.6 | % |
Net Revenue
The change in net revenue compared to the prior periods is attributable to the following:
| | | | |
Factors Contributing to Year-Over-Year Change | | First Quarter of Fiscal 2013
Compared to
First Quarter of Fiscal 2012 | |
|---|
Organic revenue growth | | $ | 26 | |
Acquisitions | | | 39 | |
Impact of foreign currency | | | 2 | |
Other(1) | | | 7 | |
| | | | |
Total change | | $ | 74 | |
| | | | |
- (1)
- Represents contractual revenue from ADT under the 2012 Separation and Distribution Agreement.
Organic revenue growth for the quarter ended December 28, 2012 was driven by strong growth within our Life Safety and Security Products businesses, and to a lesser extent Fire Products, expansion in key verticals and introduction of new products. Net revenue was favorably impacted by acquisitions of $39 million, or 8.5%.
47
Table of Contents
Operating Income
Operating income for the quarter ended December 28, 2012 decreased $7 million, or 8.6%, to $74 million, as compared to operating income of $81 million for the quarter ended December 30, 2011. Although net revenue increased, operating income for the quarter ended December 28, 2012 decreased primarily due to additional investments in research and development and sales and marketing costs. Furthermore, operating income was unfavorably impacted by additional environmental remediation costs of $6 million at a facility in North America. Items impacting operating income for the first quarter of fiscal 2013 and the first quarter of fiscal 2012 are as follows:
| | | | | | | |
| | For the
Quarters Ended | |
|---|
($ in millions) | | December 28,
2012 | | December 30,
2011 | |
|---|
Restructuring and asset impairment charges, net | | | 2 | | | 3 | |
Acquisition and integration costs | | | 1 | | | — | |
Corporate and Other
Corporate expense decreased $30 million, or 33.0%, to $61 million for the quarter ended December 28, 2012 as compared to an expense of $91 million for the quarter ended December 30, 2011. Key items included in corporate expense for the first quarter of fiscal 2013 and the first quarter of fiscal 2012 are as follows:
| | | | | | | |
| | For the Quarters Ended | |
|---|
($ in millions) | | December 28,
2012 | | December 30,
2011 | |
|---|
Gain on divestitures | | $ | (3 | ) | $ | — | |
Asbestos related (gains) charges | | | (1 | ) | | — | |
Separation costs | | | 6 | | | — | |
Restructuring and asset impairment charges, net | | | 1 | | | 5 | |
Additionally, corporate expense was favorably impacted by a smaller corporate footprint as a result of the 2012 Separation and the impact from previous cost containment initiatives.
Critical Accounting Policies and Estimates
The preparation of the Unaudited Consolidated Financial Statements in conformity with US GAAP requires management to use judgment in making estimates and assumptions that affect the reported amounts of assets and liabilities, disclosure of contingent assets and liabilities and the reported amounts of revenue and expenses. We believe that our accounting policies for depreciation and amortization methods of security monitoring-related assets, revenue recognition, loss contingencies, income taxes, goodwill and indefinite-lived intangible assets, long-lived assets and pension and postretirement benefits are based on, among other things, judgments and assumptions made by management that include inherent risks and uncertainties. During fiscal 2013, there have been no significant changes to these policies or in the underlying accounting assumptions and estimates used in the above critical accounting policies from those disclosed in the Unaudited Consolidated Financial Statements and accompanying notes contained in the Company's Annual Report on Form 10-K for the fiscal year ended September 28, 2012 (the "2012 Form 10-K"). See Note 1 to the Unaudited Consolidated Financial Statements for the adoption of new accounting standards during fiscal 2013.
Liquidity and Capital Resources
A fundamental objective of the Company is to have sufficient liquidity, balance sheet strength, and financial flexibility to fund the operating and capital requirements of its core businesses around the world. The primary source of funds to finance our operations and capital expenditures is cash generated by operations. In addition, we maintain a commercial paper program, have access to committed revolving credit facility and have access to equity and debt capital from public and private
48
Table of Contents
sources. We continue to balance our operating, investing and financing uses of cash through investments and acquisitions in our core businesses, dividends and share repurchases. In addition, we believe our cash position, amounts available under our credit facility, commercial paper program and cash provided by operating activities will be adequate to cover our operational and business needs in the foreseeable future.
As of December 28, 2012 and September 28, 2012, our cash and cash equivalents, total debt, and Tyco shareholders' equity are as follows:
| | | | | | | |
| | As of | |
|---|
($ in millions) | | December 28,
2012 | | September 28,
2012 | |
|---|
Cash and cash equivalents(1) | | $ | 501 | | $ | 844 | |
Total debt | | $ | 1,491 | | $ | 1,491 | |
Total Tyco Shareholders' equity | | $ | 5,126 | | $ | 4,994 | |
Total debt as a % of total capital | | | 22.5 | % | | 23.0 | % |
- (1)
- Cash and cash equivalents includes $175 million reserved for certain pre-2012 Separation related tax liabilities for which the timing of payment is uncertain.
Sources and uses of cash
In summary, our cash flows from operating, investing, and financing from continuing operations for the quarters ended December 28, 2012 and December 30, 2011 were as follows:
| | | | | | | |
| | For the Quarters Ended | |
|---|
($ in millions) | | December 28,
2012 | | December 30,
2011 | |
|---|
Net cash used in operating activities | | $ | (39 | ) | $ | (76 | ) |
Net cash used in investing activities | | | (188 | ) | | (162 | ) |
Net cash used in financing activities | | | (119 | ) | | (189 | ) |
Cash flow from operating activities
Cash flow from operating activities can fluctuate significantly from period to period as working capital needs and the timing of payments for items such as restructuring activities, pension funding, income taxes and other items impact reported cash flow.
The net change in working capital decreased operating cash flow by $353 million in the quarter ended December 28, 2012. The significant changes in working capital included a $228 million decrease in accrued and other liabilities, a $61 million decrease in accounts payable, a $47 million decrease in deferred revenue, partially offset by a $31 million decrease in prepaid expenses and other current assets.
The net change in working capital decreased operating cash flow by $349 million in the quarter ended December 30, 2011. The significant changes in working capital included a $159 million decrease in accrued and other liabilities, a $52 million increase in prepaid expenses and other current assets, a $34 million decrease in accounts payable, partially offset by a $43 million decrease in accounts receivable.
During the quarters ended December 28, 2012 and December 30, 2011, we paid approximately $19 million and $23 million, respectively, in cash related to restructuring activities. See Note 4 to our Unaudited Consolidated Financial Statements for further information regarding our restructuring activities.
In connection with the 2012 Separation, we paid $73 million and nil in separation costs during the quarters ended December 28, 2012 and December 30, 2011, respectively.
During the quarters ended December 28, 2012 and December 30, 2011, we made required contributions of $1 million and $3 million, respectively, to our U.S. pension plans and $13 million for both periods in our non-U.S. pension plans. We anticipate that we will contribute at least the minimum required to our pension plans in 2013 of $11 million for our U.S. plans and $50 million for our non-U.S. plans.
49
Table of Contents
Income taxes paid, net of refunds, related to continuing operations were $28 million and $27 million during the quarters ended December 28, 2012 and December 30, 2011, respectively.
Net interest paid related to continuing operations were $8 million and $28 million for the quarters ended December 28, 2012 and December 30, 2011, respectively. The decrease in cash paid for interest primarily related to savings realized from the redemption of $2.6 billion of aggregate principal amounts of various debt securities in connection with the 2012 Separation.
Cash flow from investing activities
Cash flows related to investing activities consist primarily of cash used for capital expenditures, acquisitions, proceeds derived from divestitures of businesses, assets and the purchase and sales and maturities of investments.
We made capital expenditures of $90 million for both the quarters ended December 28, 2012 and December 30, 2011. The level of capital expenditures in fiscal 2013 is expected to exceed the spending levels in fiscal 2012 and is also expected to exceed depreciation expense.
During the quarter ended December 28, 2012, we paid cash for acquisitions included in continuing operations totaling $23 million which primarily related to an acquisition within our NA Installation & Services segment. During the quarter ended December 30, 2011, we paid cash for acquisitions included in continuing operations totaling $95 million, net of cash acquired of $5 million, which primarily related to the acquisition of Visonic within our Global Products segment.
We maintain a captive insurance company to manage certain of our insurable liabilities. The captive insurance company holds certain investments in an escrow account for the purpose of providing collateral for our insurable liabilities. During the quarter ended December 28, 2012, our captive insurance company made net purchases of approximately $80 million.
Cash flow from financing activities
Cash flows from financing activities relate primarily to proceeds received from incurring debt and issuing stock, and cash used to repay debt, repurchase stock and make dividend payments to shareholders.
As of December 28, 2012 and September 28, 2012, TIFSA had no commercial paper outstanding. The maximum aggregate amount of unsecured commercial paper notes available to be issued, on a private placement basis, under the commercial paper program is $1 billion as of December 28, 2012.
Pursuant to our share repurchase program, we may repurchase Tyco shares from time to time in open market purchases at prevailing market prices, in negotiated transactions off the market, or pursuant to an approved trading plan in accordance with applicable regulations. During the quarter ended December 28, 2012, we repurchased approximately 2 million common shares for approximately $50 million under our 2011 share repurchase program. During the quarter ended December 30, 2011, we repurchased approximately 5 million common shares for approximately $200 million under our 2011 share repurchase program.
On September 17, 2012, our shareholders approved a cash dividend of $0.30 per common share payable to shareholders in two quarterly installments of $0.15 per share to be paid November 15, 2012 and February 20, 2013. During the quarters ended December 28, 2012 and December 30, 2011, we paid cash dividends of approximately $70 million and $116 million, respectively.
Management believes that cash generated by or available to us should be sufficient to fund our capital and operational business needs for the foreseeable future, including capital expenditures, quarterly dividend payments, share repurchases, and separation-related expenses.
50
Table of Contents
Commitments and Contingencies
For a detailed discussion of contingencies related to tax and litigation matters and governmental investigations, see Notes 6 and 11 to our Unaudited Consolidated Financial Statements.
Backlog
We had a backlog of unfilled orders $5,189 million and $5,142 million as of December 28, 2012 and September 28, 2012, respectively. Backlog by segment was as follows ($ in millions):
| | | | | | | |
| | As of
December 28,
2012 | | As of
September 28,
2012 | |
|---|
NA Installation & Services | | $ | 2,433 | | $ | 2,507 | |
ROW Installation & Services | | | 2,572 | | | 2,476 | |
Global Products | | | 184 | | | 159 | |
| | | | | | |
| | $ | 5,189 | | $ | 5,142 | |
| | | | | | |
The Company's backlog includes recurring revenue-in-force and long-term deferred revenue for upfront fees. Revenue-in-force represents 12 months' revenue associated with monitoring and maintenance services under contract in the security and fire business. The Company's backlog of $5,189 million and $5,142 million as of December 28, 2012 and September 28, 2012, respectively, consists primarily of $2,827 million and $2,723 million of recurring revenue in force and $388 million and $395 million of deferred revenue as of December 28, 2012 and September 28, 2012, respectively. NA Installation & Service's backlog of $2,433 million and $2,507 million, as of December 28, 2012 and September 28, 2012, respectively, consists primarily of $1,235 million and $1,227 million of recurring revenue in force and $318 million and $325 million of deferred revenue as of December 28, 2012 and September 28, 2012, respectively. ROW Installation & Service's backlog of $2,572 million and $2,476 million, as of December 28, 2012 and September 28, 2012, respectively, consists primarily of $1,592 million and $1,496 million of recurring revenue in force and $70 million of deferred revenue as of both December 28, 2012 and September 28, 2012.
Backlog increased $47 million, or 0.9%, to $5,189 million as of December 28, 2012. The net increase in backlog was primarily related to an increase in recurring revenue-in-force in our ROW Installation & Services segment. Changes in foreign currency favorably impacted backlog by $17 million, or 0.3%.
Guarantees
Certain of our business segments have guaranteed the performance of third-parties and provided financial guarantees for uncompleted work and financial commitments. The terms of these guarantees vary with end dates ranging from the current fiscal year through the completion of such transactions. The guarantees would typically be triggered in the event of nonperformance, and performance under the guarantees, if required, would not have a material effect on our financial position, results of operations or cash flows.
There are certain guarantees or indemnifications extended among Tyco, Covidien, TE Connectivity, ADT and Pentair in accordance with the terms of the 2007 and 2012 Separation and Distribution Agreements and the Tax Sharing Agreements. The guarantees primarily relate to certain contingent tax liabilities included in the Tax Sharing Agreement. At the time of the 2007 and 2012 Separations, we recorded liabilities necessary to recognize the fair value of such guarantees and indemnifications. See Note 6 to the Unaudited Consolidated Financial Statements for further discussion of the Tax Sharing Agreement. In addition, prior to the 2007 and 2012 Separations we provided support in the form of financial and/or performance guarantees to various Covidien, TE Connectivity, ADT and Tyco Flow
51
Table of Contents
Control operating entities. To the extent these guarantees were not assigned in connection with the 2007 and 2012 Separations, we remained as the guarantor, but were typically indemnified by the former subsidiary. See Note 18 to the Unaudited Consolidated Financial Statements for a discussion of these liabilities.
In disposing of assets or businesses, we often provide representations, warranties and/or indemnities to cover various risks including, for example, unknown damage to the assets, environmental risks involved in the sale of real estate, liability to investigate and remediate environmental contamination at waste disposal sites and manufacturing facilities, and unidentified tax liabilities and legal fees related to periods prior to disposition. We have no reason to believe that these uncertainties would have a material adverse effect on our financial position, results of operations or cash flows. We have recorded liabilities for known indemnifications included as part of environmental liabilities. See Note 11 to the Unaudited Consolidated Financial Statements for a discussion of these liabilities.
In the normal course of business, we are liable for contract completion and product performance. We record estimated product warranty costs at the time of sale. In the opinion of management, such obligations will not significantly affect our financial position, results of operations or cash flows.
For a detailed discussion of guarantees and indemnifications, see Note 18 to the Unaudited Consolidated Financial Statements.
Non-U.S. GAAP Measure
In an effort to provide investors with additional information regarding our results as determined by U.S. GAAP, we also disclose the non-U.S. GAAP measure of organic revenue growth (decline). We believe that this measure is useful to investors in evaluating our operating performance for the periods presented. When read in conjunction with our U.S. GAAP revenue, it enables investors to better evaluate our operations without giving effect to, among other things, fluctuations in foreign exchange rates, which may be significant from period to period. In addition, organic revenue growth (decline) is a factor we use in internal evaluations of the overall performance of our business. This measure is not a financial measure under U.S. GAAP and should not be considered as a substitute for revenue as determined in accordance with U.S. GAAP, and it may not be comparable to similarly titled measures reported by other companies. Organic revenue growth (decline) presented herein is defined as revenue growth (decline) excluding the effects of foreign currency fluctuations, acquisitions and divestitures and other changes that may not reflect underlying results and trends. Our organic growth (decline) calculations incorporate an estimate of prior year reported net revenue associated with acquired entities that have been fully integrated within the first year, and exclude prior year net revenue associated with entities that do not meet the criteria for discontinued operations which have been divested within the past year ("adjusted number"). We calculate the rate of organic growth (decline) based on the adjusted number to better reflect the rate of growth (decline) of the combined business, in the case of acquisitions, or the remaining business, in the case of dispositions. We base the rate of organic growth (decline) for acquired businesses that are not fully integrated within the first year upon unadjusted historical revenue. We may use organic revenue growth (decline) as a component of our compensation programs.
52
Table of Contents
The table below details the components of organic revenue growth (decline) and reconciles the non-U.S. GAAP measure to U.S. GAAP net revenue growth (decline).
First Quarter of Fiscal 2013
| | | | | | | | | | | | | | | | | | | | | | | | | | | | |
| | Net Revenue
for the
Quarter Ended
December 30,
2011 | | Base Year
Adjustments
(Divestitures) | | Adjusted
Fiscal
2012 Base
Revenue | | Foreign
Currency | | Acquisitions | | Other(2) | | Organic
Revenue(1) | | Organic
Growth
Percentage | | Net Revenue
for the
Quarter Ended
December 28,
2012 | |
|---|
| | ($ in millions)
| |
|---|
NA Installation & Services | | $ | 962 | | $ | — | | $ | 962 | | $ | 4 | | $ | 2 | | $ | — | | $ | 8 | | | 0.8 | % | $ | 976 | |
ROW Installation & Services | | | 1,056 | | | — | | | 1,056 | | | 3 | | | 35 | | | — | | | (4 | ) | | (0.4 | )% | | 1,090 | |
Global Products | | | 460 | | | — | | | 460 | | | 2 | | | 39 | | | 7 | | | 26 | | | 5.7 | % | | 534 | |
| | | | | | | | | | | | | | | | | | | | | |
Total Net Revenue | | $ | 2,478 | | $ | — | | $ | 2,478 | | $ | 9 | | $ | 76 | | $ | 7 | | $ | 30 | | | 1.2 | % | $ | 2,600 | |
- (1)
- Organic revenue growth percentage based on adjusted 2012 base revenue.
- (2)
- Amount represents contractual revenue from ADT under the 2012 Separation and Distribution Agreement which is excluded from the organic revenue calculation.
Forward-Looking Information
Certain statements in this report are "forward-looking statements" within the meaning of the U.S. Private Securities Litigation Reform Act of 1995. All forward-looking statements involve risks and uncertainties. All statements contained herein that are not clearly historical in nature are forward-looking, and the words "anticipate," "believe," "expect," "estimate," "project" and similar expressions are generally intended to identify forward-looking statements. Any forward-looking statement contained herein, in press releases, written statements or other documents filed with the SEC, or in Tyco's communications and discussions with investors and analysts in the normal course of business through meetings, webcasts, phone calls and conference calls, regarding expectations with respect to future events, including sales, earnings, cash flows, operating and tax efficiencies, product expansion, backlog, the consummation and benefits of acquisitions and divestitures, as well as financings and repurchases of debt or equity securities, are subject to known and unknown risks, uncertainties and contingencies. Many of these risks, uncertainties and contingencies are beyond our control, and may cause actual results, performance or achievements to differ materially from anticipated results, performances or achievements. Factors that might affect such forward-looking statements include, among other things:
- •
- overall economic and business conditions, and overall demand for Tyco's goods and services;
- •
- economic and competitive conditions in the industries, end markets and regions served by our businesses;
- •
- changes in legal and tax requirements (including tax rate changes, new tax laws or treaties and revised tax law interpretations);
- •
- results and consequences of Tyco's internal investigations and governmental investigations concerning the Company's governance, management, internal controls and operations including its business operations outside the United States;
- •
- the outcome of litigation, arbitrations and governmental proceedings;
- •
- effect of income tax audit settlements and appeals;
- •
- our ability to repay or refinance our outstanding indebtedness as it matures;
53
Table of Contents
- •
- our ability to operate within the limitations imposed by financing arrangements and to maintain our credit ratings;
- •
- interest rate fluctuations and other changes in borrowing costs, or other consequences of volatility in the capital or credit markets;
- •
- other capital market conditions, including availability of funding sources and currency exchange rate fluctuations;
- •
- availability of and fluctuations in the prices of key raw materials;
- •
- changes affecting customers or suppliers;
- •
- economic and political conditions in international markets, including governmental changes and restrictions on the ability to transfer capital across borders;
- •
- our ability to achieve anticipated cost savings;
- •
- our ability to execute our portfolio refinement and acquisition strategies, including successfully integrating acquired operations;
- •
- potential impairment of our goodwill, intangibles and/or our long-lived assets;
- •
- our ability to realize the intended benefits of the 2012 Separation, including the integration of our commercial security and fire protection businesses;
- •
- Other risks associated with the 2012 Separation, for example the risk that we may be liable for certain contingent liabilities of the spun-off entities if they were to become insolvent;
- •
- risks associated with our Swiss incorporation, including the possibility of reduced flexibility with respect to certain aspects of capital management, increased or different regulatory burdens, and the possibility that we may not realize anticipated tax benefits;
- •
- the possible effects of future legislation in the United States that may limit or eliminate potential U.S. tax benefits resulting from Tyco International's Swiss incorporation or deny U.S. government contracts to Tyco based upon its Swiss incorporation; and
- •
- natural events such as severe weather, fires, floods and earthquakes, or acts of terrorism.
Item 3. Quantitative and Qualitative Disclosures About Market Risk
The Company's exposure to market risk from changes in interest rates, foreign currency exchange rates and commodity prices has not changed materially from our exposure discussed in the 2012 Form 10-K. In order to manage the volatility relating to our more significant market risks, we may enter into forward foreign currency exchange contracts, interest rate swaps and commodity swaps.
We utilize established risk management policies and procedures in executing derivative financial instrument transactions. We do not execute transactions or hold derivative financial instruments for trading or speculative purposes. Derivative financial instruments related to non-functional currency cash flows are used with the goal of mitigating a significant portion of these exposures when it is cost effective to do so. Counterparties to derivative financial instruments are limited to financial institutions with strong investment grade long-term credit ratings.
Item 4. Controls and Procedures
The Company, under the supervision and with the participation of its management, including its Chief Executive Officer and Chief Financial Officer, carried out an evaluation of the effectiveness of the design and operation of its disclosure controls and procedures (as such term is defined under Rule 13a-15 of the Securities and Exchange Act (the Exchange Act)) as of the end of the period
54
Table of Contents
covered by this report. There are inherent limitations to the effectiveness of any system of disclosure controls and procedures, including the possibility of human error and the circumvention or overriding of the controls and procedures. Accordingly, even effective disclosure controls and procedures can only provide reasonable assurance of achieving their control objectives. Based upon that evaluation, the Chief Executive Officer and Chief Financial Officer concluded that, as of December 28, 2012, the Company's disclosure controls and procedures were effective to provide reasonable assurance that information required to be disclosed in the reports that the Company files or submits under the Exchange Act is recorded, processed, summarized and reported within the time periods specified in the applicable rules and forms, and that it is accumulated and communicated to management, including the Chief Executive Officer and Chief Financial Officer, as appropriate, to allow timely decisions regarding required disclosure.
There has been no change in our internal control over financial reporting during the quarter ended December 28, 2012 that has materially affected, or is reasonably likely to materially affect, the Company's internal control over financial reporting.
55
Table of Contents
PART II. OTHER INFORMATION
Item 1. Legal Proceedings
Legacy Matters Related to Former Management
Tyco is a party to several lawsuits involving disputes with former management, including its former chief executive officer, Mr. L. Dennis Kozlowski, its former chief financial officer, Mr. Mark Swartz and a former director, Mr. Frank Walsh Jr. The Company has filed civil complaints against Mr. Kozlowski and Mr. Swartz for breach of fiduciary duty and other wrongful conduct relating to alleged abuses of the Company's Key Employee Loan Program and relocation program, unauthorized bonuses, unauthorized payments, self dealing transactions and other improper conduct. In connection with Tyco's affirmative actions against Mr. Kozlowski and Mr. Swartz, Mr. Kozlowski, through counterclaims, and Mr. Swartz, through a separate lawsuit, are seeking an aggregate of approximately $140 million allegedly due in connection with their compensation and retention arrangements and under the Employee Retirement Income Security Act ("ERISA"). Mr. Walsh is seeking indemnification for legal and other expenses incurred by him in connection with the Company's affirmative action against him for breaches of fiduciary duties.
With respect to Mr. Kozlowski, on December 1, 2010, the U.S. District Court for the Southern District of New York ruled in favor of several of the Company's affirmative claims against him before trial, while dismissing all of Mr. Kozlowski's counterclaims for pay and benefits after 1995. Prior to the commencement of trial scheduled for August 2012, the parties reached an agreement in principle to resolve the matter, with Mr. Kozlowski agreeing to release the Company from any claims to monetary amounts related to compensation, retention or other arrangements alleged to have existed between him and the Company. Although the parties have reached an agreement in principle, until the settlement agreement is signed, the Company will continue to maintain the amounts recorded in its Consolidated Balance Sheet, which reflect a net liability of approximately $91 million, for the amounts allegedly due under his compensation and retention arrangements and under ERISA.
With respect to Mr. Swartz, on March 3, 2011, the U.S. District Court for the Southern District of New York granted Tyco's motion for summary judgment as to liability for its affirmative actions and further ruled that issues related to damages would need to be resolved at trial. During the second quarter of fiscal 2012, the Company reversed a $50 million liability related to Mr. Swartz's pay and benefits due to the expiration of the statute of limitations, which was recorded in selling, general and administrative expenses in the Consolidated Statement of Operations. On May 15, 2012, Mr. Swartz filed a lawsuit against Tyco in New York state court claiming entitlement to monies under ERISA. The Company removed the case to the U.S. district court for the Southern District of New York and filed a motion to dismiss Mr. Swartz's claims for multiple reasons, including that the statute of limitations had expired, at the latest, during the second quarter of fiscal 2012. A trial to determine the Company's damages from Mr. Swartz's breaches of fiduciary duty concluded on October 17, 2012. At the conclusion of the trial, the Court ruled that the Company was entitled to recover all monies earned by Mr. Swartz in connection with his employment by Tyco between September 1, 1995 and June 1, 2002. The Company filed a motion requesting the entry of monetary sum certain judgment in conformity with the Court's ruling regarding the time period of disgorgement. In connection with Mr. Swartz's affirmative claims against the Company, the Court dismissed all of Mr. Swartz's claims except one claim in which Mr. Swartz contends he is entitled to reimbursement from the Company for taxes he paid in connection with his 2002 Separation Agreement. The Court has not opined on the merits of this claim, and the Company intends to continue to vigorously defend this claim.
With respect to Mr. Walsh, in June 2002, the Company filed a civil complaint against him for breach of fiduciary duty, inducing breaches of fiduciary duty and related wrongful conduct involving a $20 million payment by Tyco, $10 million of which was paid to Mr. Walsh with the balance paid to a charity of which Mr. Walsh is trustee. The payment was purportedly made for Mr. Walsh's assistance in
56
Table of Contents
arranging the Company's acquisition of The CIT Group, Inc. On December 17, 2002, Mr. Walsh pleaded guilty to a felony violation of New York law in the Supreme Court of the State of New York, (New York County) and settled a civil action for violation of federal securities laws brought by the U.S. Securities and Exchange Commission (the "SEC") in United States District Court for the Southern District of New York. Both the felony charge and the civil action were brought against Mr. Walsh based on such payment. The felony charge accused Mr. Walsh of intentionally concealing information concerning the payment from Tyco's directors and shareholders while engaged in the sale of Tyco securities in the State of New York. The SEC action alleged that Mr. Walsh knew that the registration statement covering the sale of Tyco securities as part of the CIT Group acquisition contained a material misrepresentation concerning fees payable in connection with the acquisition. Pursuant to the plea and settlement, Mr. Walsh paid $20 million in restitution to Tyco on December 17, 2002. In October 2010, the U.S. District Court for the Southern District of New York denied the Company's affirmative claims for recovery of damages against Mr. Walsh. In January 2012, the United States Court of Appeals for the Second Circuit reversed the District Court's ruling that Tyco's Board of Directors could ratify breaches of fiduciary duties owed by Mr. Walsh to Tyco's shareholders, and remanded the case to the District Court to resolve certain issues relating to consequential damages. On June 20, 2012, the District Court ruled in Tyco's favor and entered a judgment against Mr. Walsh. Separately, Mr. Walsh is pursuing a New York state court claim against the Company asserting his entitlement to indemnification. Any judgment against the Company related to this matter would be shared with Covidien and TE Connectivity under the agreements governing the 2007 Separation.
Environmental Matters
Tyco is involved in various stages of investigation and cleanup related to environmental remediation matters at a number of sites. The ultimate cost of site cleanup is difficult to predict given the uncertainties regarding the extent of the required cleanup, the interpretation of applicable laws and regulations and alternative cleanup methods. As of December 28, 2012, Tyco concluded that it was probable that it would incur remedial costs in the range of approximately $45 million to $70 million. As of December 28, 2012, Tyco concluded that the best estimate within this range is approximately $47 million, of which $40 million is included in accrued and other current liabilities and $7 million is included in other liabilities in the Company's Consolidated Balance Sheet. In view of the Company's financial position and reserves for environmental matters, the Company believes that any potential payments of such estimated amounts will not have a material adverse effect on its financial position, results of operations or cash flows.
Asbestos Matters
The Company and certain of its subsidiaries along with numerous other companies are named as defendants in personal injury lawsuits based on alleged exposure to asbestos-containing materials. These cases typically involve product liability claims based primarily on allegations of manufacture, sale or distribution of industrial products that either contained asbestos or were attached to or used with asbestos-containing components manufactured by third-parties. Each case typically names between dozens to hundreds of corporate defendants. While the Company has observed an increase in the number of these lawsuits over the past several years, including lawsuits by plaintiffs with mesothelioma-related claims, a large percentage of these suits have not presented viable legal claims and, as a result, have been dismissed by the courts. The Company's historical strategy has been to mount a vigorous defense aimed at having unsubstantiated suits dismissed, and, where appropriate, settling suits before trial. Although a large percentage of litigated suits have been dismissed, the Company cannot predict the extent to which it will be successful in resolving lawsuits in the future. In addition, the Company continues to assess its strategy for resolving asbestos claims. Due to the number of claims and limited amount of assets at one of the Company's non-operating subsidiaries, the Company is pursuing alternatives for this subsidiary, including a negotiated settlement with representatives of all current and
57
Table of Contents
future asbestos claimants against such subsidiary. While the Company has not finalized its approach, if the Company is ultimately successful with this alternative, it will likely assign rights to certain insurance assets and make a cash payment in order to fully resolve the claims against the subsidiary.
As of December 28, 2012, the Company has determined that there were approximately 5,700 claims pending against it, its subsidiaries or entities for which the Company has assumed responsibility in connection with acquisitions and divestitures. This amount reflects the Company's current estimate of the number of viable claims made against such entities and includes adjustments for claims that are not actively being prosecuted, identify incorrect defendants, are duplicative of other actions or for which the Company is indemnified.
For a detailed discussion of asbestos-related matters, see Note 11 of the Unaudited Consolidated Financial Statements.
Income Tax Matters
Tyco and its subsidiaries' income tax returns are examined periodically by various tax authorities. In connection with these examinations, tax authorities, including the IRS, have raised issues and proposed tax adjustments, in particular with respect to years preceding the 2007 Separation. The issues and proposed adjustments related to such years are generally subject to the sharing provisions of the 2007 Tax Sharing Agreement pursuant to which Tyco, Covidien and TE Connectivity share 27%, 42% and 31%, respectively, of shared income tax liabilities that arise from adjustments made by tax authorities to Tyco's, Covidien's and TE Connectivity's U.S. and certain non-U.S. income tax returns. The costs and expenses associated with the management of these shared tax liabilities are generally shared equally among the parties. Tyco is reviewing and contesting certain tax adjustments proposed by tax authorities. With respect to adjustments raised by the IRS, although the Company has resolved a substantial number of these adjustments, a few significant items are expected to remain open with respect to the audit of the 1997 through 2004 years. As of the date hereof, it is unlikely that Tyco will be able to resolve all the open items, which primarily involve the treatment of certain intercompany debt transactions during the period, through the IRS appeals process. As a result, Tyco expects to litigate these matters once it receives the requisite statutory notices from the IRS, which is expected to occur during fiscal 2013. The Company has assessed its obligations under the 2007 Tax Sharing Agreement and determined that its recorded liability is sufficient to cover the indemnifications made by the Company under such agreement. However, the ultimate resolution of these matters is uncertain and could result in a material adverse impact to the Company's financial position, results of operations, cash flows or the effective tax rate in future reporting periods.
For a detailed discussion of contingencies related to Tyco's income taxes, see Note 6 to the Unaudited Consolidated Financial Statements.
Compliance Matters
As previously reported in the Company's periodic filings, in the fourth fiscal quarter of 2012, the Company settled with the Department of Justice ("DOJ") and the SEC charges related to alleged improper payments made by the Company's subsidiaries and agents in recent years, and agreed to pay approximately $26 million in fines, disgorgement and prejudgment interest to the DOJ and SEC, which the Company had previously reserved in the fourth quarter of fiscal 2011. The Company paid the DOJ approximately $13 million in the first quarter of fiscal 2013, and expects to make the payment of approximately $13 million to the SEC in the second quarter of fiscal 2013.
Covidien and TE Connectivity agreed, in connection with the 2007 Separation, to cooperate with the Company in its responses regarding these matters, and agreed that liabilities primarily related to the former Healthcare and Electronics businesses of the Company would be assigned to Covidien and
58
Table of Contents
TE Connectivity, respectively. As a result, Covidien and TE Connectivity contributed approximately $5 million and immaterial amounts, respectively, toward the aforementioned $26 million.
Other Matters
In addition to the foregoing, the Company is subject to claims and suits, including from time to time, contractual disputes and product and general liability claims, incidental to present and former operations, acquisitions and dispositions. With respect to many of these claims, the Company either self-insures or maintains insurance through third-parties, with varying deductibles. While the ultimate outcome of these matters cannot be predicted with certainty, the Company believes that the resolution of any such proceedings, whether the underlying claims are covered by insurance or not, will not have a material adverse effect on the Company's financial condition, results of operations or cash flows beyond amounts recorded for such matters.
Item 1A. Risk Factors
Tyco's significant business risks are described in Part I, Item 1A in our 2012 Form 10-K, to which reference is made herein. Management does not believe that there have been any significant changes in the Company's risk factors since the Company filed the 2012 Form 10-K.
Item 2. Unregistered Sales of Equity Securities and Use of Proceeds
Issuer Purchases of Equity Securities
| | | | | | | | | | | | | |
Period | | Total Number
of Shares
Purchased | | Average
Price Paid
Per Share | | Total Number of
Shares Purchased
as Part of Publicly
Announced
Plans or Programs | | Maximum Approximate
Dollar Value of
Shares that May
Yet Be Purchased
Under Publicly Announced
Plans or Programs | |
|---|
9/29/12–10/26/12 | | | 588,972 | | $ | 27.00 | | | — | | | | |
10/27/12–11/30/12 | | | 1,070,607 | | $ | 27.57 | | | 1,070,607 | | | | |
12/1/12–12/28/12 | | | 738,063 | | $ | 28.32 | | | 725,500 | | $ | 149,954,229 | |
The transactions described in the table above represent the repurchase of common shares on the New York Stock Exchange as part of the $1.0 billion share repurchase program approved by the Board of Directors in April 2011 ("2011 Share Repurchase Program"). In addition, the Company also acquired shares from certain employees in order to satisfy employee tax withholding requirements in connection with the vesting of restricted shares. Approximately 601,535 shares were acquired in these vesting-related transactions outside of the share repurchase program during the quarter ended December 28, 2012. The average price paid per share is calculated by dividing the total cash paid for the shares by the total number of shares repurchased. As of December 28, 2012, approximately $150 million remained outstanding under the 2011 Share Repurchase Program.
Item 3. Defaults Upon Senior Securities
None.
Item 4. Mine Safety Disclosures
None.
59
Table of Contents
Item 5. Other Information
None.
Item 6. Exhibits
| | |
Exhibit
Number | | Exhibit |
|---|
| 31.1 | | Certification by the Chief Executive Officer pursuant to 18 U.S.C. Section 1350, as Adopted Pursuant to Section 302 of the Sarbanes-Oxley Act of 2002 (Filed herewith). |
31.2 |
|
Certification by the Chief Financial Officer pursuant to 18 U.S.C. Section 1350, as Adopted Pursuant to Section 302 of the Sarbanes-Oxley Act of 2002 (Filed herewith). |
32.1 |
|
Certification by the Chief Executive Officer and Chief Financial Officer pursuant to 18 U.S.C. Section 1350, as Adopted Pursuant to Section 906 of the Sarbanes-Oxley Act of 2002 (Filed herewith). |
101 |
|
Financial statements from the quarterly report on Form 10-Q of Tyco International Ltd. for the quarter ended December 28, 2012 formatted in XBRL: (i) the Consolidated Statements of Operations, (ii) the Consolidated Statements of Comprehensive Income, (iii) the Consolidated Balance Sheets, (iv) the Consolidated Statements of Cash Flows, (v) the Consolidated Statements of Shareholders' Equity, and (vi) the Notes to Unaudited Consolidated Financial Statements. |
60
Table of Contents
SIGNATURES
Pursuant to the requirements of Section 13 or 15(d) of the Securities Exchange Act of 1934, the Registrant has duly caused this report to be signed on its behalf by the undersigned, thereunto duly authorized.
| | | | |
| | | TYCO INTERNATIONAL LTD. |
|
|
By: |
|
/s/ ARUN NAYAR
Arun Nayar
Executive Vice President
and Chief Financial Officer
(Principal Financial Officer) |
Date: January 29, 2013
61