Exhibit 99.2
The ADT Corporation
INVESTOR DAY PRESENTATION
SEPTEMBER 18, 2012
Safe Harbor
Some of the statements included herein constitute “forward-looking statements” regarding business strategies, market potential, future financial performance and other matters. Words such as “anticipates,” “estimates,” “expects,” “projects,” “forecasts,” “intends,” “plans,” “believes” and words and terms of similar substance used in connection with any discussion of future operating or financial performance identify forward-looking statements. These forward-looking statements are based on management’s current expectations and beliefs about future events. As with any projection or forecast, they are inherently susceptible to uncertainty and changes in circumstances. Except for our ongoing obligations to disclose material information under the U.S. federal securities laws, neither we nor Tyco are under any obligation to, and expressly disclaim any obligation to, update or alter any forward-looking statements whether as a result of such changes, new information, subsequent events or otherwise.
Various factors could adversely affect our operations, business or financial results in the future and cause our actual results to differ materially from those contained in the forward-looking statements.
Our actual results could differ materially from management’s expectations because of these factors, including:
competition in the markets we serve, including new entrants in these markets;
our ability to develop or acquire new technology;
failure to maintain the security of our information and technology networks;
allegations that we have infringed the intellectual property rights of third parties;
unauthorized use of our brand name;
risks associated with Tyco’s ownership of the ADT® brand name outside of the United States and Canada;
failure to enforce our intellectual property rights;
our dependence on certain software technology that we license from third parties;
failure or interruption in products or services of third-party providers;
our greater exposure to liability for employee acts or omissions or system failures;
an increase in the rate of customer attrition;
downturns in the housing market and consumer discretionary income;
risks associated with our non-compete and non-solicit arrangements with Tyco;
entry of potential competitors upon the expiration of non-competition agreements;
shifts in consumers’ choice of, or telecommunication providers’ support for, telecommunication services and equipment;
interruption to our monitoring facilities;
interference with our customer’s access to some of our products and services through the Internet by broadband service providers;
potential impairment of our deferred tax assets;
changes in U.S. and non-U.S. governmental laws and regulations; ??risks associated with acquiring and integrating customer accounts;
potential loss of authorized dealers and affinity marketing relationships;
failure to realize expected benefits from acquisitions;
risks associated with pursuing business opportunities that diverge from our current business model;
potential liabilities for obligations of The Brink’s Company under the Coal Act;
capital market conditions, including availability of funding sources;
failure to fully realize expected benefits from the spin-off; and
difficulty in operating as an independent public company separate from Tyco.
Given these risks and uncertainties, you are cautioned not to place undue reliance on such forward-looking statements. These factors should not be construed as exhaustive. If one or more of these or other risks or uncertainties materialize or if our underlying assumptions prove to be incorrect, actual results may vary materially from what we projected. Consequently, actual events and results may vary significantly from those included in or contemplated or implied by our forward-looking statements. The forward-looking statements included herein are made only as of the date hereof, and we undertake no obligation to publicly update or review any forward-looking statement made by us or on our behalf, whether as a result of new information, future developments, subsequent events or circumstances or otherwise. The information contained herein should be considered in conjunction with our Form 10 and related exhibits originally filed with the Securities and Exchange Commission on April 10, 2012 and most recently amended September 7, 2012 including the sections entitled “Risk Factors”, “Management’s Discussion and Analysis of Financial Condition and Results of Operations,” the financial statements and the related notes thereto and other financial data included elsewhere in the Form 1 0.

Introduction to Today’s Presentation
Naren Gursahaney
Chief Executive Officer
Kathryn Mikells
Chief Financial Officer
Don Boerema
Chief Corporate Development Officer
Agenda
Introduction to ADT
Residential and Small Business Security Market Strategic Priorities Financial Overview Closing Remarks Q&A

Creating Customers for Life – and Value for Our Shareholders
Strategy builds on demonstrated capabilities, providing for significant growth opportunities Business model provides strong returns and predictable, recurring cash flows
Our Mission
Creating customers for Life
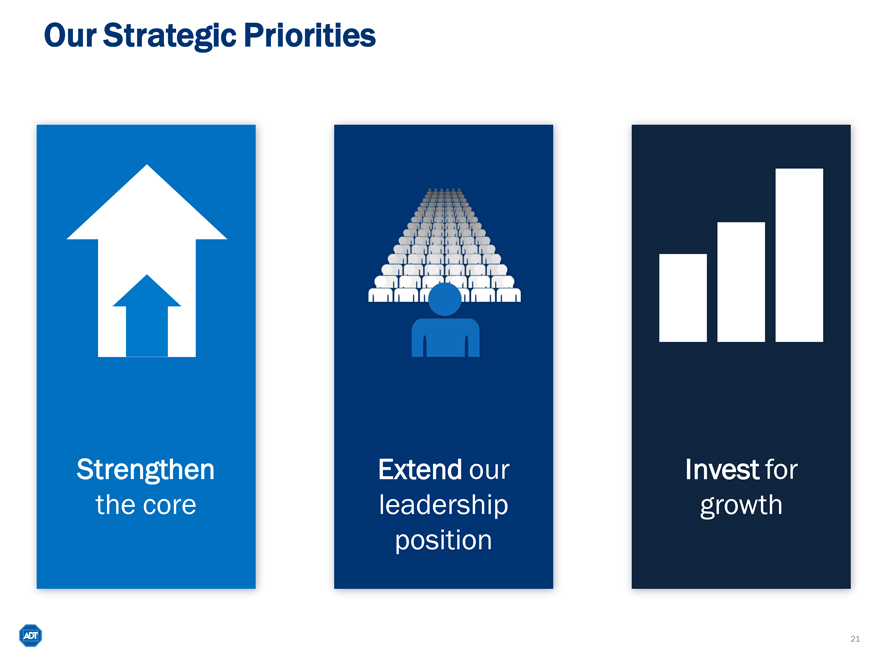
Our Strategic Priorities
Strengthen the core
Extend our leadership position
Invest for growth
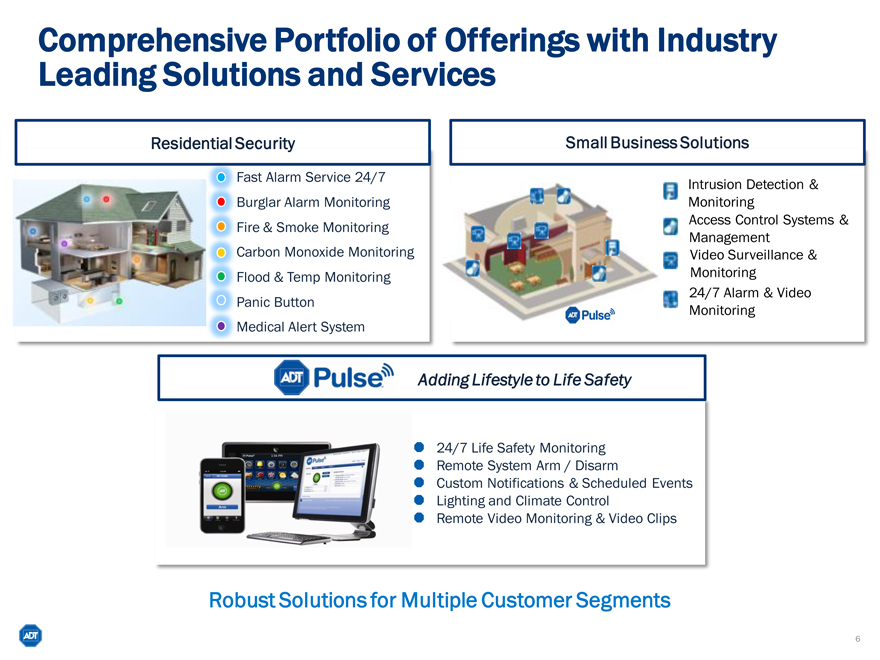
Comprehensive Portfolio of Offerings with Industry Leading Solutions and Services
Residential Security
Fast Alarm Service 24/7
Burglar Alarm Monitoring Fire & Smoke Monitoring
Carbon Monoxide Monitoring Flood & Temp Monitoring
Panic Button
Medical Alert System
Small Business Solutions
Intrusion Detection &
Monitoring
Access Control Systems &
Management
Video Surveillance &
Monitoring
24/7 Alarm & Video Monitoring
Adding Lifestyle to Life Safety
24/7 Life Safety Monitoring
Remote System Arm / Disarm
Custom Notifications & Scheduled Events Lighting and Climate Control Remote Video Monitoring & Video Clips
Robust Solutions for Multiple Customer Segments
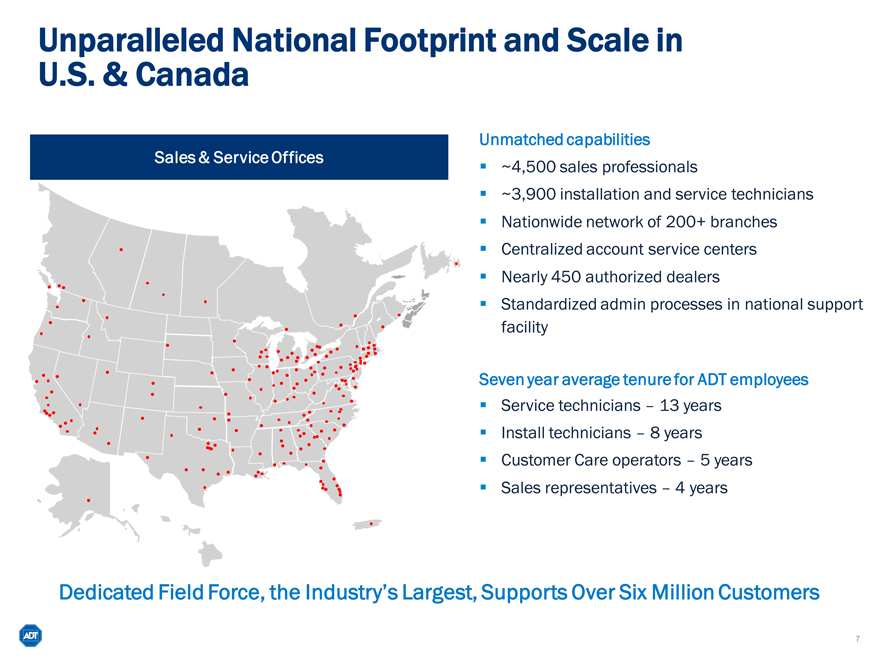
Unparalleled National Footprint and Scale in U.S. & Canada
Sales & Service Offices
Unmatched capabilities
~4,500 sales professionals
~3,900 installation and service technicians
Nationwide network of 200+ branches
Centralized account service centers
Nearly 450 authorized dealers
Standardized admin processes in national support facility
Seven year average tenure for ADT employees
Service technicians – 13 years
Install technicians – 8 years
Customer Care operators – 5 years
Sales representatives – 4 years
Dedicated Field Force, the Industry’s Largest, Supports Over Six Million Customers
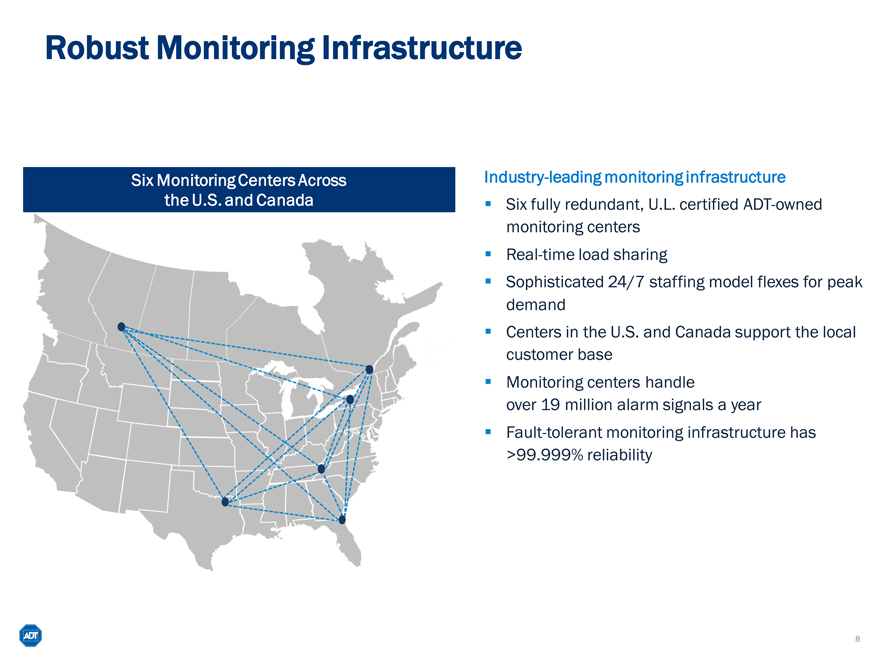
Robust Monitoring Infrastructure
Six Monitoring Centers Across the U.S. and Canada
Industry-leading monitoring infrastructure
Six fully redundant, U.L. certified ADT-owned monitoring centers
Real-time load sharing
Sophisticated 24/7 staffing model flexes for peak demand
Centers in the U.S. and Canada support the local customer base
Monitoring centers handle over 19 million alarm signals a year
Fault-tolerant monitoring infrastructure has >99.999% reliability
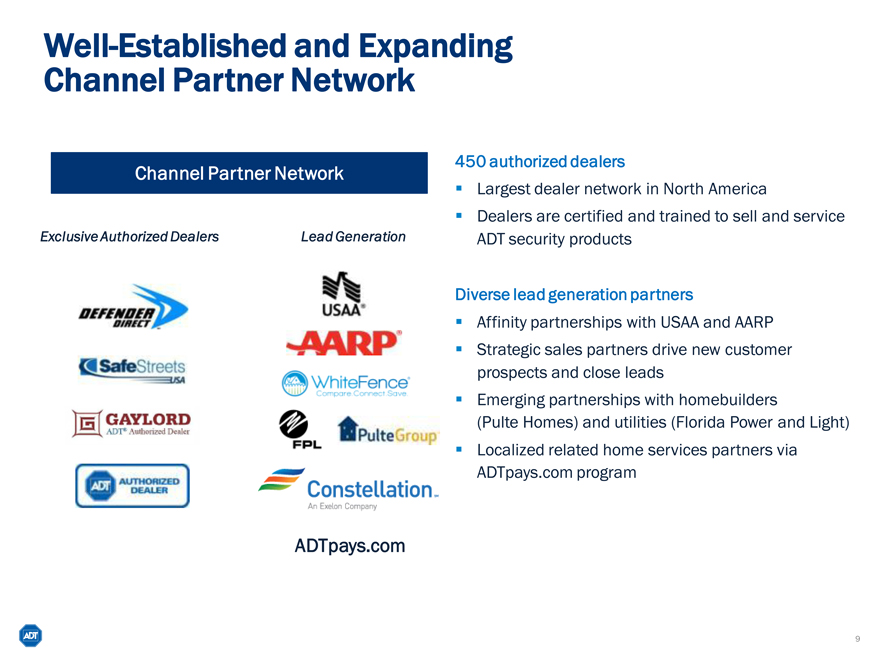
Well-Established and Expanding Channel Partner Network
Channel Partner Network
Exclusive Authorized Dealers Lead Generation
450 authorized dealers
Largest dealer network in North America
Dealers are certified and trained to sell and service ADT security products
Diverse lead generation partners
Affinity partnerships with USAA and AARP
Strategic sales partners drive new customer prospects and close leads
Emerging partnerships with homebuilders
(Pulte Homes) and utilities (Florida Power and Light)
Localized related home services partners via ADTpays.com program
ADTpays.com
9
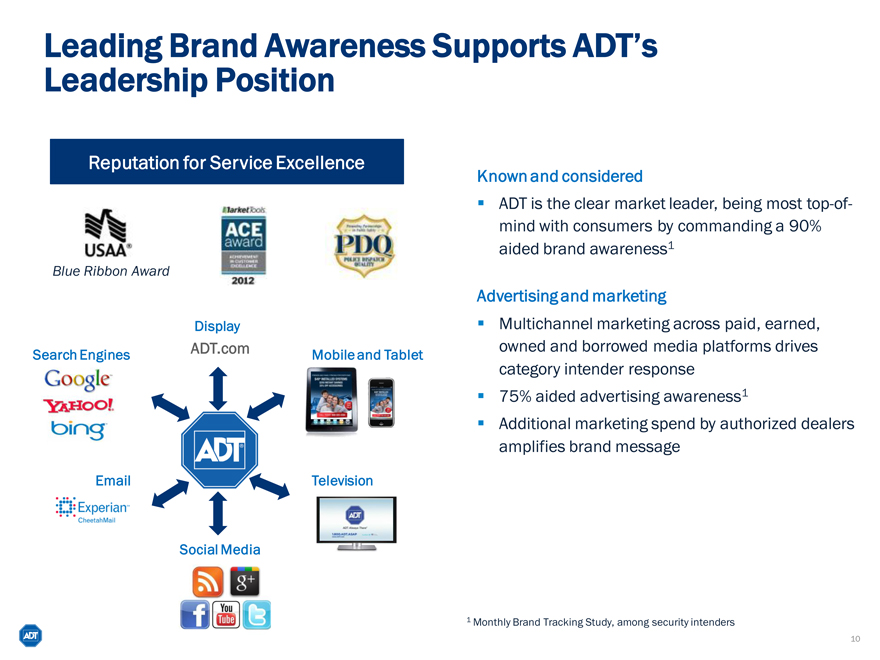
Leading Brand Awareness Supports ADT’s
Leadership Position
Reputation for Service Excellence
Blue Ribbon Award
Display
ADT.com
Search Engines
Mobile and Tablet
Email
Television
Social Media
Known and considered
ADT is the clear market leader, being most top-of-mind with consumers by commanding a 90% aided brand awareness1
Advertising and marketing
Multichannel marketing across paid, earned, owned and borrowed media platforms drives category intender response
75% aided advertising awareness1
Additional marketing spend by authorized dealers amplifies brand message
1 | | Monthly Brand Tracking Study, among security intenders |
10
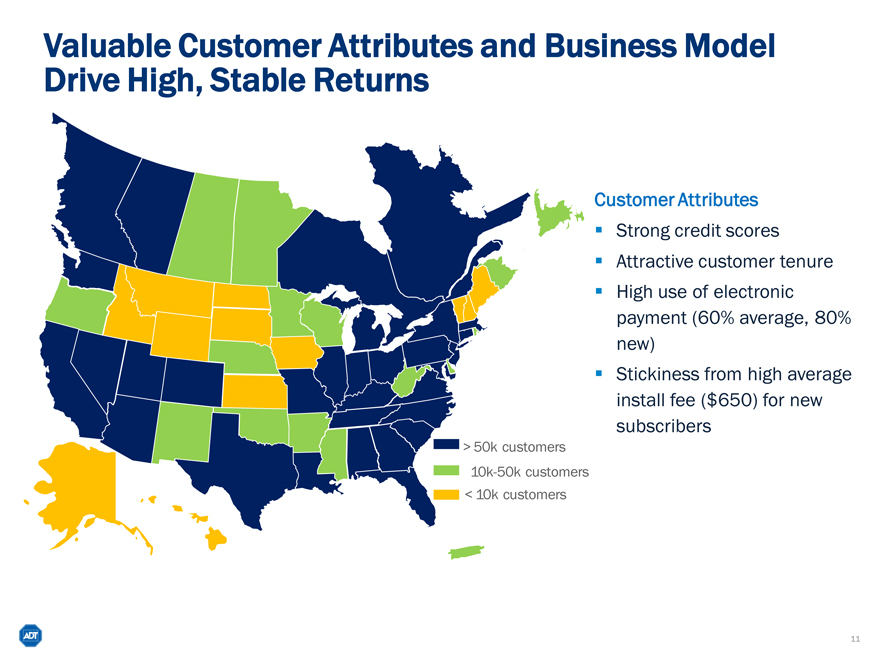
Valuable Customer Attributes and Business Model Drive High, Stable Returns
Customer Attributes
Strong credit scores
Attractive customer tenure
High use of electronic payment (60% average, 80% new)
Stickiness from high average install fee ($650) for new subscribers
> 50k customers 10k-50k customers
< 10k customers
11
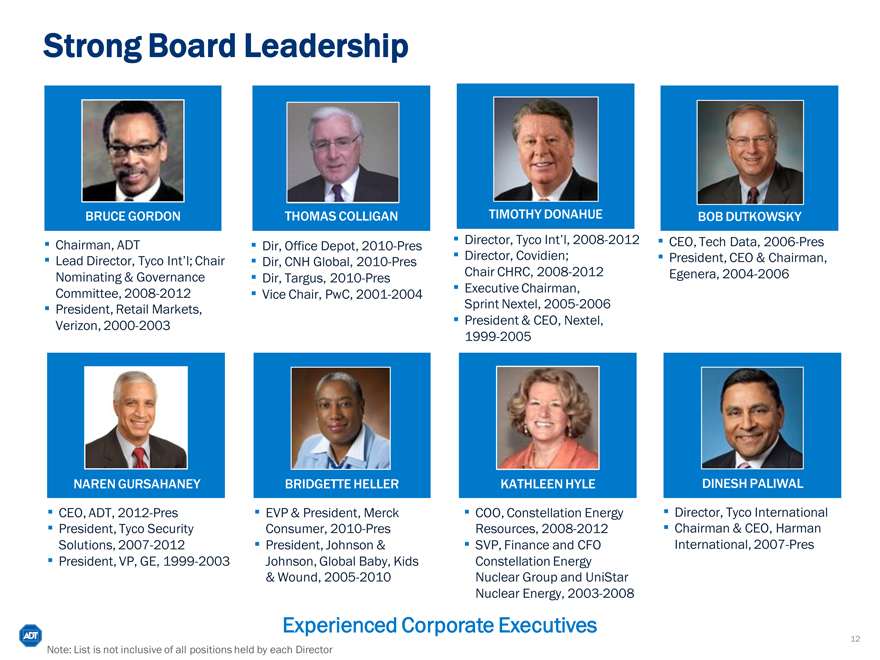
Strong Board Leadership
BRUCE GORDON
? Chairman, ADT
? Lead Director, Tyco Int’l; Chair
Nominating & Governance Committee, 2008-2012
? President, Retail Markets, Verizon, 2000-2003
THOMAS COLLIGAN
? Dir, Office Depot, 2010-Pres
? Dir, CNH Global, 2010-Pres
? Dir, Targus, 2010-Pres
? Vice Chair, PwC, 2001-2004
TIMOTHY DONAHUE
? Director, Tyco Int’l, 2008-2012
? Director, Covidien; Chair CHRC, 2008-2012
? Executive Chairman, Sprint Nextel, 2005-2006
? President & CEO, Nextel, 1999-2005
BOB DUTKOWSKY
? CEO, Tech Data, 2006-Pres
? President, CEO & Chairman, Egenera, 2004-2006
NAREN GURSAHANEY
? CEO, ADT, 2012-Pres
? President, Tyco Security Solutions, 2007-2012
? President, VP, GE, 1999-2003
BRIDGETTE HELLER
? EVP & President, Merck Consumer, 2010-Pres
? President, Johnson & Johnson, Global Baby, Kids
& Wound, 2005-2010
KATHLEEN HYLE
? COO, Constellation Energy Resources, 2008-2012
? SVP, Finance and CFO Constellation Energy Nuclear Group and UniStar Nuclear Energy, 2003-2008
DINESH PALIWAL
? Director, Tyco International
? Chairman & CEO, Harman International, 2007-Pres
Experienced Corporate Executives
Note: List is not inclusive of all positions held by each Director
12
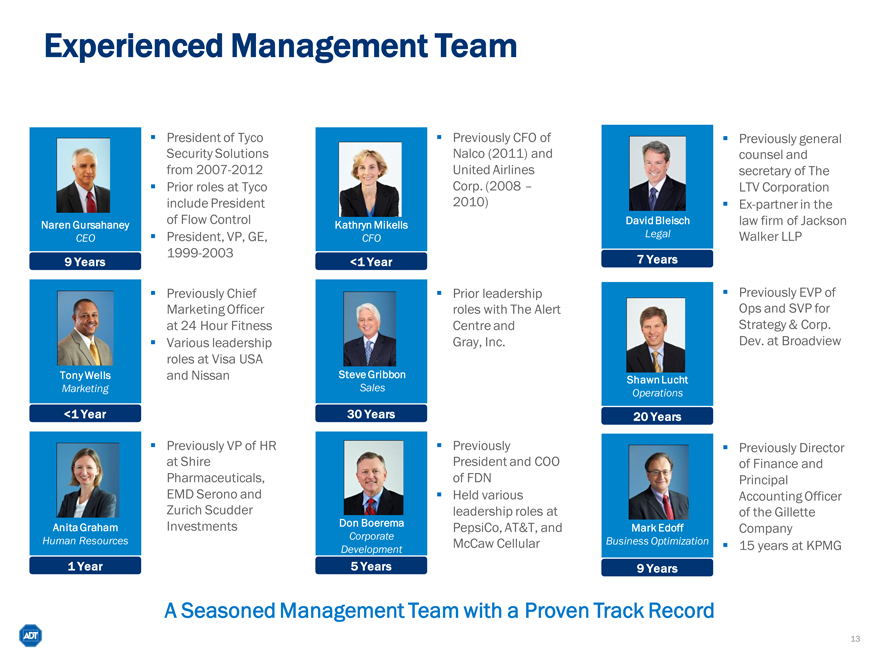
Experienced Management Team
Naren Gursahaney
CEO
9 Years
President of Tyco Security Solutions from 2007-2012
Prior roles at Tyco include President of Flow Control
President, VP, GE, 1999-2003
Tony Wells
Marketing
<1 Year
Previously Chief Marketing Officer at 24 Hour Fitness
Various leadership roles at Visa USA and Nissan
Anita Graham
Human Resources
Previously VP of HR at Shire Pharmaceuticals, EMD Serono and Zurich Scudder Investments
Kathryn Mikells
CFO
<1 Year
Previously CFO of Nalco (2011) and United Airlines Corp. (2008 – 2010)
Steve Gribbon
Sales
30 Years
Prior leadership roles with The Alert Centre and Gray, Inc.
Don Boerema
Corporate Development
Previously
President and COO of FDN
Held various leadership roles at PepsiCo, AT&T, and McCaw Cellular
David Bleisch
Legal
Previously general counsel and secretary of The LTV Corporation
Ex-partner in the law firm of Jackson Walker LLP
Shawn Lucht
Operations
20 Years
Previously EVP of Ops and SVP for Strategy & Corp.
Dev. at Broadview
Mark Edoff
Business Optimization
9 Years
Previously Director of Finance and Principal Accounting Officer of the Gillette Company
15 years at KPMG
A Seasoned Management Team with a Proven Track Record
13
Agenda
Introduction to ADT
Residential and Small Business Security Market Strategic Priorities Financial Overview Closing Remarks Q&A
14
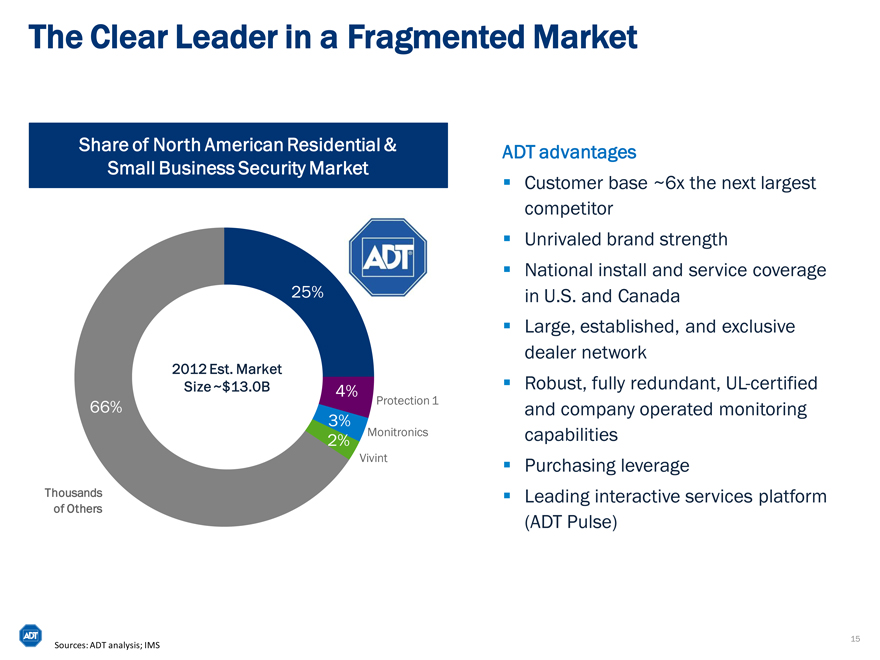
The Clear Leader in a Fragmented Market
Share of North American Residential & Small Business Security Market
0%
25% &
4%
Protection 1
3%
2% Monitronics Vivint
66%
2012 Est. Market
Size ~$13.0B
Thousands of Others
ADT advantages
Customer base ~6x the next largest competitor
Unrivaled brand strength
National install and service coverage in U.S. and Canada
Large, established, and exclusive dealer network
Robust, fully redundant, UL-certified and company operated monitoring capabilities
Purchasing leverage
Leading interactive services platform (ADT Pulse)
15
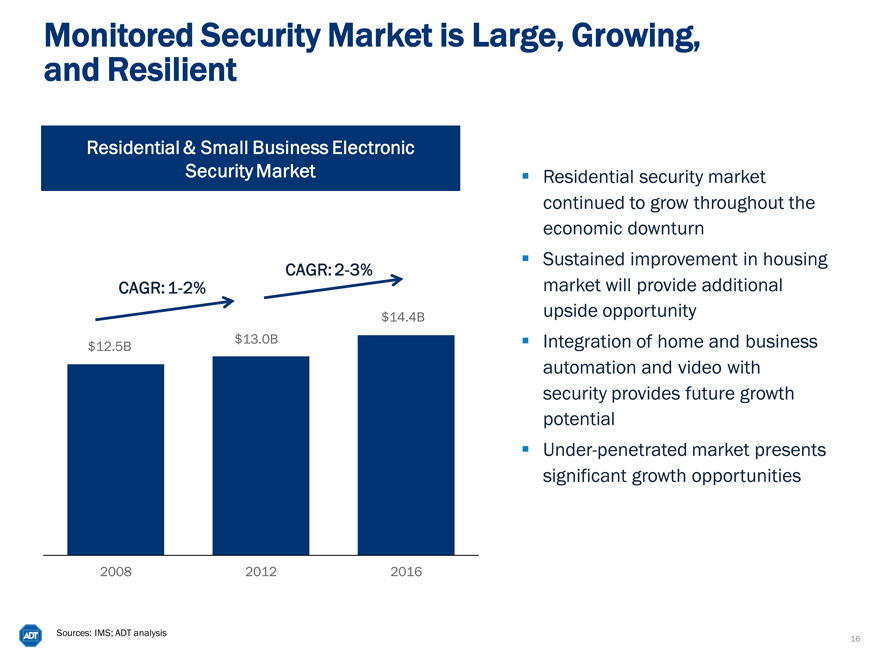
Monitored Security Market is Large, Growing, and Resilient
Residential & Small Business Electronic Security Market
CAGR: 2-3%
CAGR: 1-2%
$12.5B
$13.0B
$14.4B
2008
2012
2016
Residential security market continued to grow throughout the economic downturn
Sustained improvement in housing market will provide additional upside opportunity Integration of home and business automation and video with security provides future growth potential
Under-penetrated market presents significant growth opportunities
16
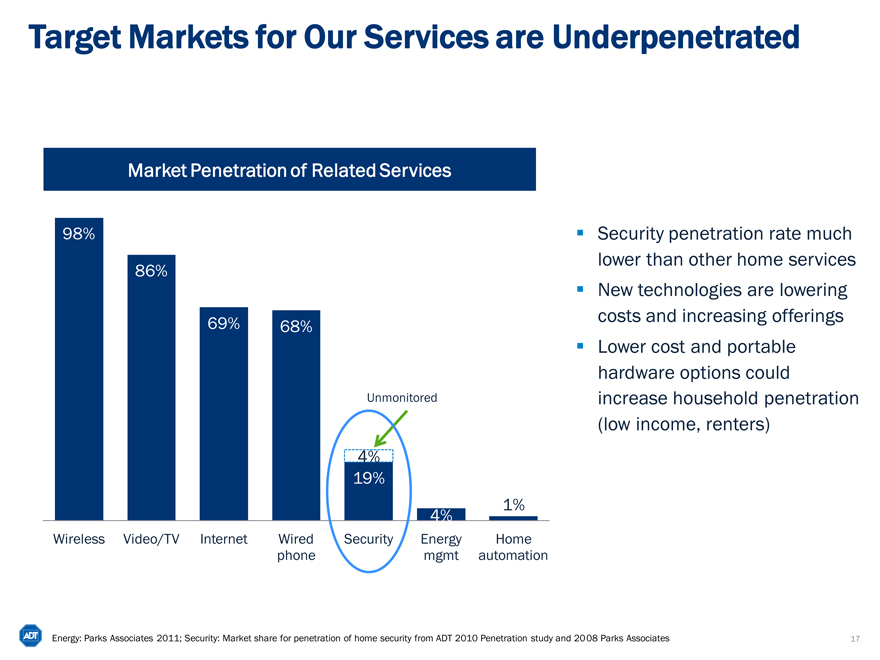
Target Markets for Our Services are Underpenetrated
Market Penetration of Related Services
98%
86%
69%
68%
Unmonitored
4%
19%
1%
4%
Wireless Video/TV Internet Wired Security Energy Home phone mgmt automation
Security penetration rate much lower than other home services
New technologies are lowering costs and increasing offerings
Lower cost and portable hardware options could increase household penetration (low income, renters)
Energy: Parks Associates 2011; Security: Market share for penetration of home security from ADT 2010 Penetration study and 20 08 Parks Associates
17
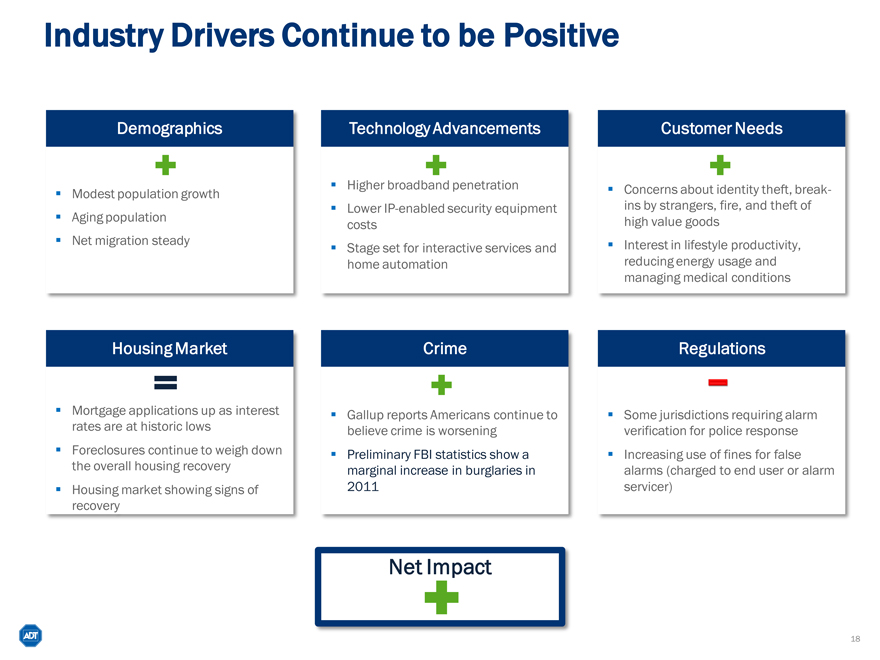
Industry Drivers Continue to be Positive
Demographics
Modest population growth
Aging population
Net migration steady
Technology Advancements
Higher broadband penetration
Lower IP-enabled security equipment costs
Stage set for interactive services and home automation
Customer Needs
Concerns about identity theft, break-ins by strangers, fire, and theft of high value goods
Interest in lifestyle productivity, reducing energy usage and managing medical conditions
Housing Market
Mortgage applications up as interest rates are at historic lows
Foreclosures continue to weigh down the overall housing recovery
Housing market showing signs of recovery
Crime
Gallup reports Americans continue to believe crime is worsening
Preliminary FBI statistics show a marginal increase in burglaries in 2011
Regulations
Some jurisdictions requiring alarm verification for police response
Increasing use of fines for false alarms (charged to end user or alarm servicer)
Net Impact
18
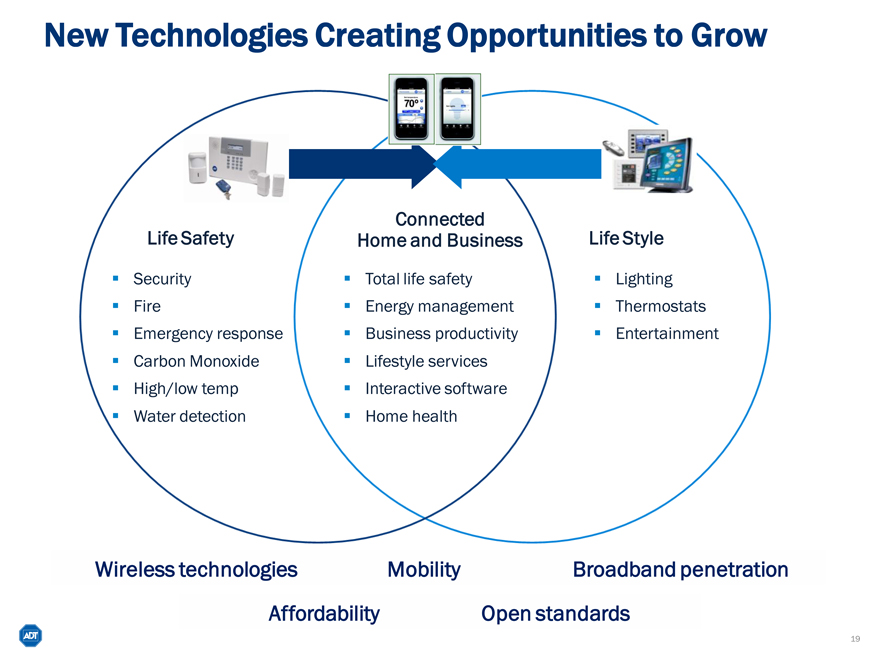
New Technologies Creating Opportunities to Grow
Life Safety
Security
Fire
Emergency response
Carbon Monoxide
High/low temp
Water detection
Connected
Home and Business
Total life safety
Energy management
Business productivity
Lifestyle services
Interactive software
Home health
Life Style
Lighting
Thermostats
Entertainment
Wireless technologies
Mobility
Broadband penetration
Affordability
Open standards
19
Agenda
Introduction to ADT
Residential and Small Business
Security Market
Strategic Priorities
Financial Overview
Closing Remarks
Q&A
20
Our Strategic Priorities
Strengthen the core
Extend our leadership position
Invest for growth
21
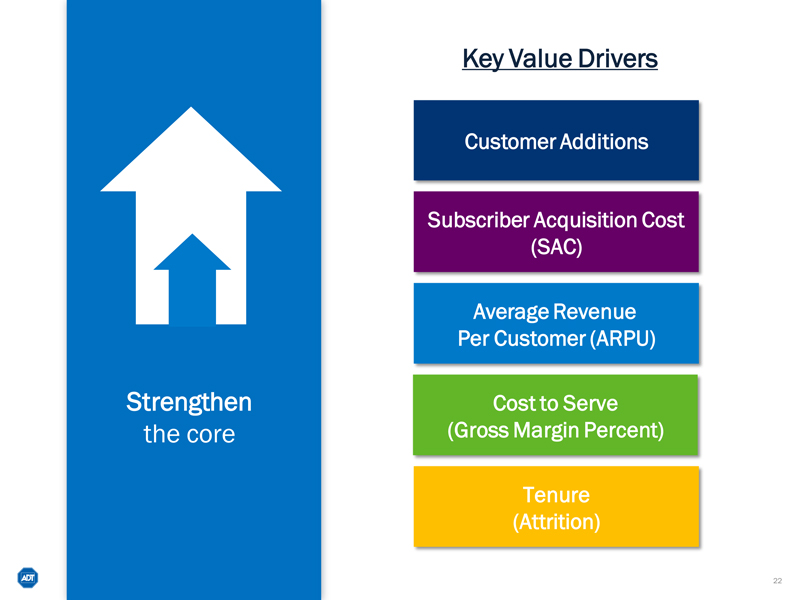
Strengthen the core
Key Value Drivers
Customer Additions
Subscriber Acquisition Cost (SAC)
Average Revenue Per Customer (ARPU)
Cost to Serve (Gross Margin Percent)
Tenure
(Attrition)
22
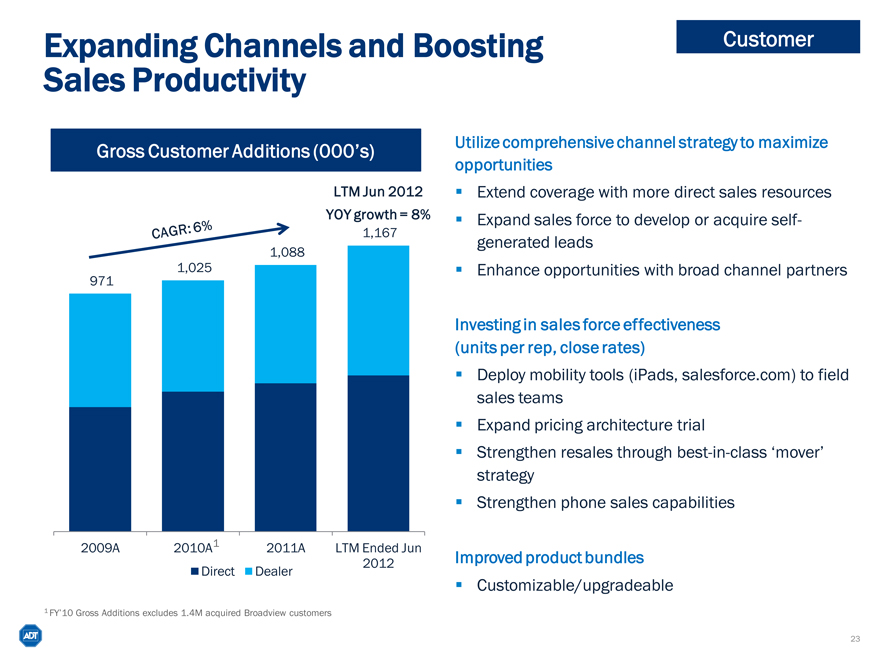
Expanding Channels and Boosting Sales Productivity
Gross Customer Additions (000’s)
LTM Jun 2012
YOY growth = 8%
971
1,025
1,088
1,167
2009A
2010A1
2011A
LTM Ended Jun 2012
Direct
Dealer
Utilize comprehensive channel strategy to maximize opportunities
Extend coverage with more direct sales resources
Expand sales force to develop or acquire self-generated leads
Enhance opportunities with broad channel partners
Investing in sales force effectiveness (units per rep, close rates)
Deploy mobility tools (iPads, salesforce.com) to field sales teams
Expand pricing architecture trial
Strengthen resales through best-in-class ‘mover’ strategy
Strengthen phone sales capabilities
Improved product bundles
Customizable/upgradeable
1 | | FY’10 Gross Additions excludes 1.4M acquired Broadview customers |
23
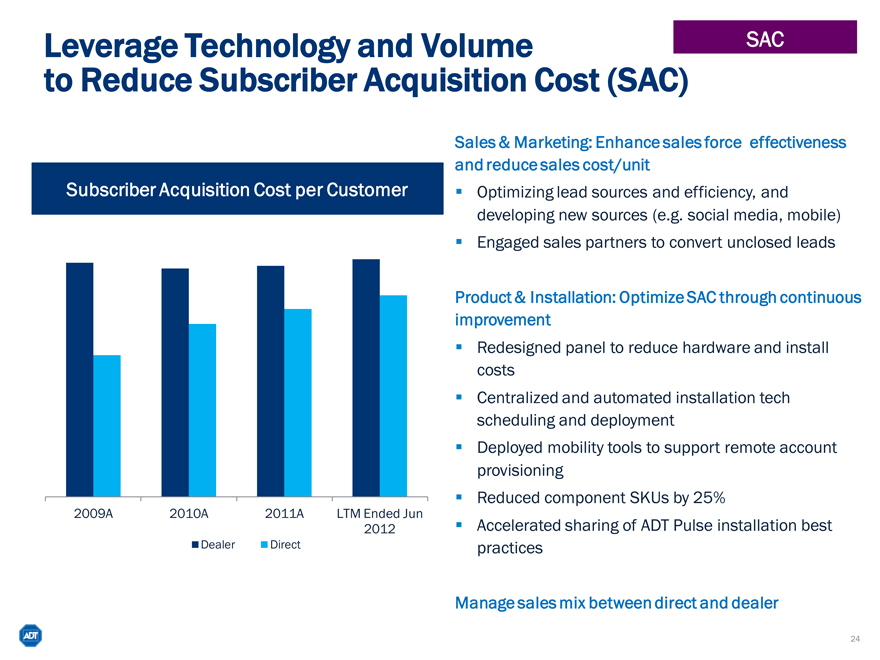
Leverage Technology and Volume to Reduce Subscriber Acquisition Cost (SAC)
SAC
Subscriber Acquisition Cost per Customer
2009A
2010A
2011A
LTM Ended Jun 2012
Dealer
Direct
Sales & Marketing: Enhance sales force effectiveness and reduce sales cost/unit
Optimizing lead sources and efficiency, and developing new sources (e.g. social media, mobile)
Engaged sales partners to convert unclosed leads
Product & Installation: Optimize SAC through continuous improvement
Redesigned panel to reduce hardware and install costs
Centralized and automated installation tech scheduling and deployment
Deployed mobility tools to support remote account provisioning
Reduced component SKUs by 25%
Accelerated sharing of ADT Pulse installation best practices
Manage sales mix between direct and dealer
24
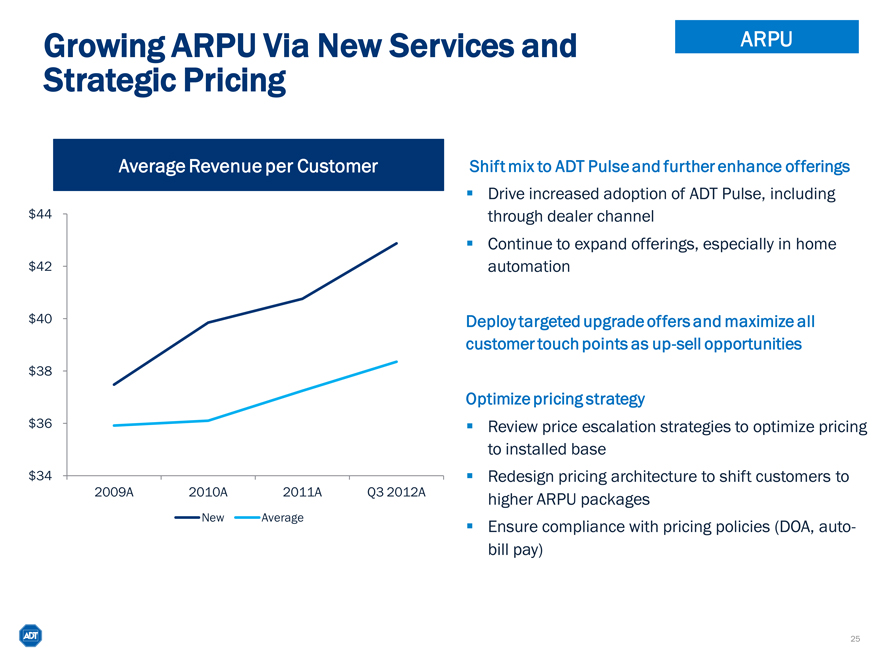
Growing ARPU Via New Services and Strategic Pricing
ARPU
Average Revenue per Customer
$44
$42
$40
$38
$36
$34
2009A
2010A
2011A
Q3 2012A
New
Average
Shift mix to ADT Pulse and further enhance offerings
Drive increased adoption of ADT Pulse, including through dealer channel
Continue to expand offerings, especially in home automation
Deploy targeted upgrade offers and maximize all customer touch points as up-sell opportunities
Optimize pricing strategy
Review price escalation strategies to optimize pricing to installed base
Redesign pricing architecture to shift customers to higher ARPU packages
Ensure compliance with pricing policies (DOA, auto-bill pay)
25
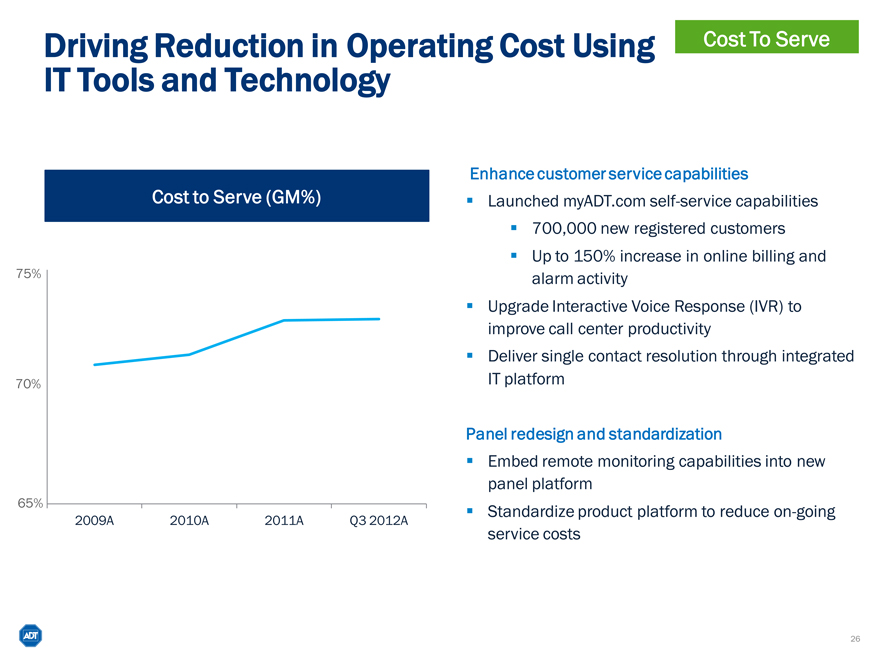
Driving Reduction in Operating Cost Using IT Tools and Technology
Cost To Serve
Cost to Serve (GM%)
75%
70%
65%
2009A
2010A
2011A
Q3 2012A
Enhance customer service capabilities
Launched myADT.com self-service capabilities
700,000 new registered customers
Up to 150% increase in online billing and alarm activity
Upgrade Interactive Voice Response (IVR) to improve call center productivity
Deliver single contact resolution through integrated IT platform
Panel redesign and standardization
Embed remote monitoring capabilities into new panel platform
Standardize product platform to reduce on-going service costs
26
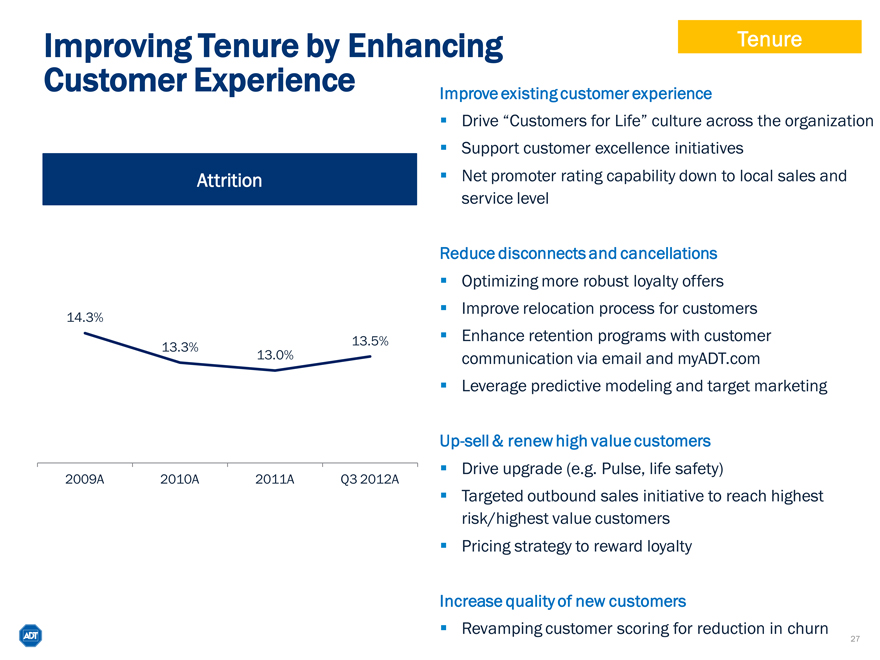
Improving Tenure by Enhancing Customer Experience
Tenure
Attrition
14.3%
13.3%
13.5%
13.0%
2009A
2010A
2011A
Q3 2012A
Improve existing customer experience
Drive “Customers for Life” culture across the organization
Support customer excellence initiatives
Net promoter rating capability down to local sales and service level
Reduce disconnects and cancellations
Optimizing more robust loyalty offers
Improve relocation process for customers
Enhance retention programs with customer communication via email and myADT.com
Leverage predictive modeling and target marketing
Up-sell & renew high value customers
Drive upgrade (e.g. Pulse, life safety)
Targeted outbound sales initiative to reach highest risk/highest value customers
Pricing strategy to reward loyalty
Increase quality of new customers
Revamping customer scoring for reduction in churn
27
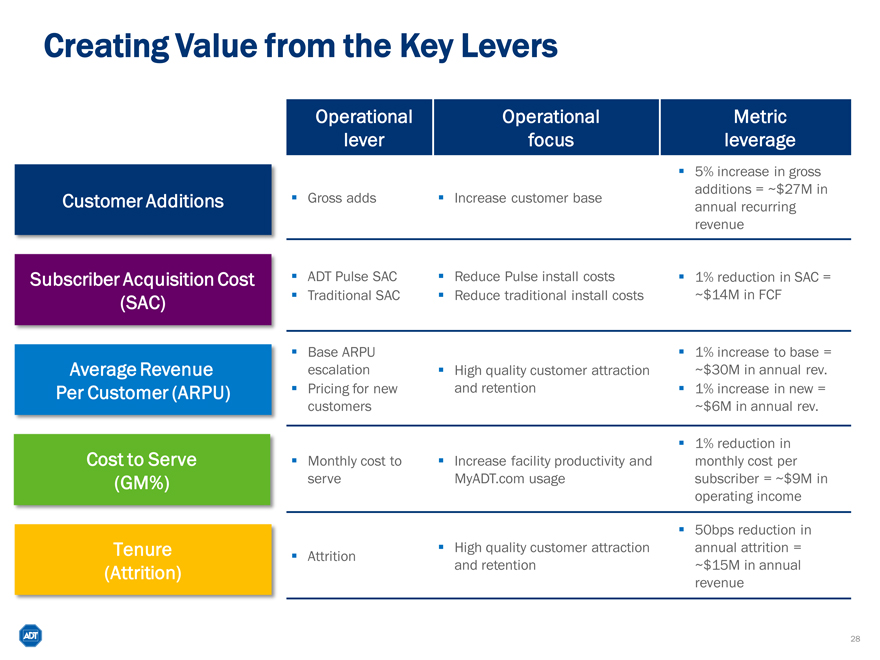
Creating Value from the Key Levers
Customer Additions
Subscriber Acquisition Cost (SAC)
Average Revenue Per Customer (ARPU)
Cost to Serve (GM%)
Tenure (Attrition)
Operational lever
Gross adds
ADT Pulse SAC
Traditional SAC
Base ARPU escalation
Pricing for new customers
Monthly cost to serve
Attrition
Operational focus
Increase customer base
Reduce Pulse install costs
Reduce traditional install costs
High quality customer attraction and retention
Increase facility productivity and MyADT.com usage
High quality customer attraction and retention
Metric leverage
5% increase in gross additions = ~$27M in annual recurring revenue
1% reduction in SAC = ~$14M in FCF
1% increase to base = ~$30M in annual rev.
1% increase in new = ~$6M in annual rev.
1% reduction in monthly cost per subscriber = ~$9M in operating income
50bps reduction in annual attrition = ~$15M in annual revenue
28
Extend our leadership position
Marketing
Sales
Install & Service
Monitoring
Products & Solutions
29
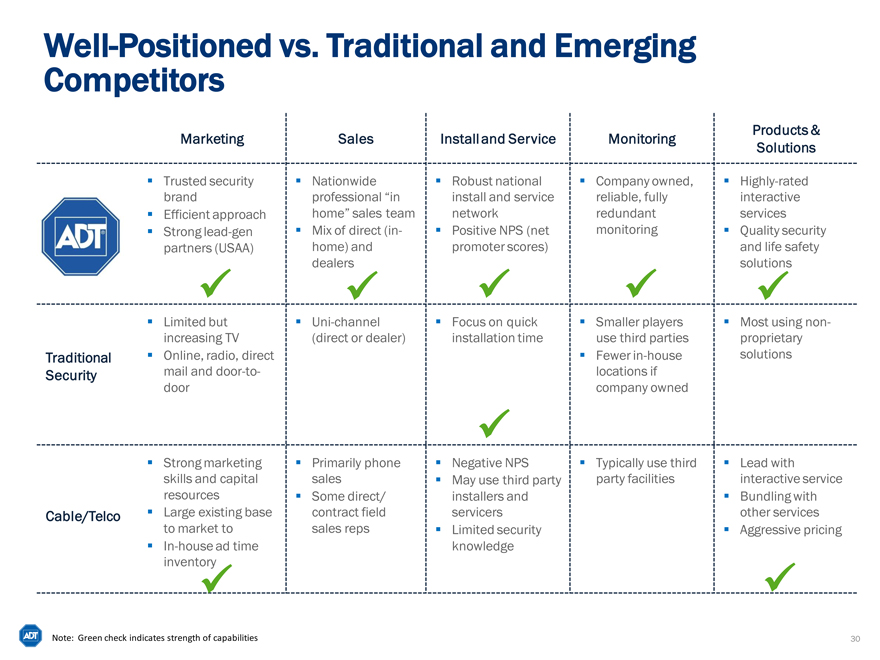
Well-Positioned vs. Traditional and Emerging Competitors
Traditional
Security
Cable/Telco
Marketing
Trusted security brand
Efficient approach
Strong lead-gen partners (USAA)
Limited but increasing TV
Online, radio, direct mail and door-to-door
Strong marketing skills and capital resources
Large existing base to market to In-house ad time inventory
Sales
Nationwide professional “in home” sales team
Mix of direct (in-home) and dealers
Uni-channel (direct or dealer)
Primarily phone sales
Some direct/ contract field sales reps
Install and Service
Robust national install and service network
Positive NPS (net promoter scores)
Focus on quick installation time
Negative NPS
May use third party installers and servicers
Limited security knowledge
Monitoring
Company owned, reliable, fully redundant monitoring
Smaller players use third parties
Fewer in-house locations if company owned
Typically use third party facilities
Products & Solutions
Highly-rated interactive services
Quality security and life safety solutions
Most using non-proprietary solutions
Lead with interactive service
Bundling with other services
Aggressive pricing
Note: Green check indicates strength of capabilities
30
Utilize Full Breadth of Marketing Channels to Attract New Customers
Marketing
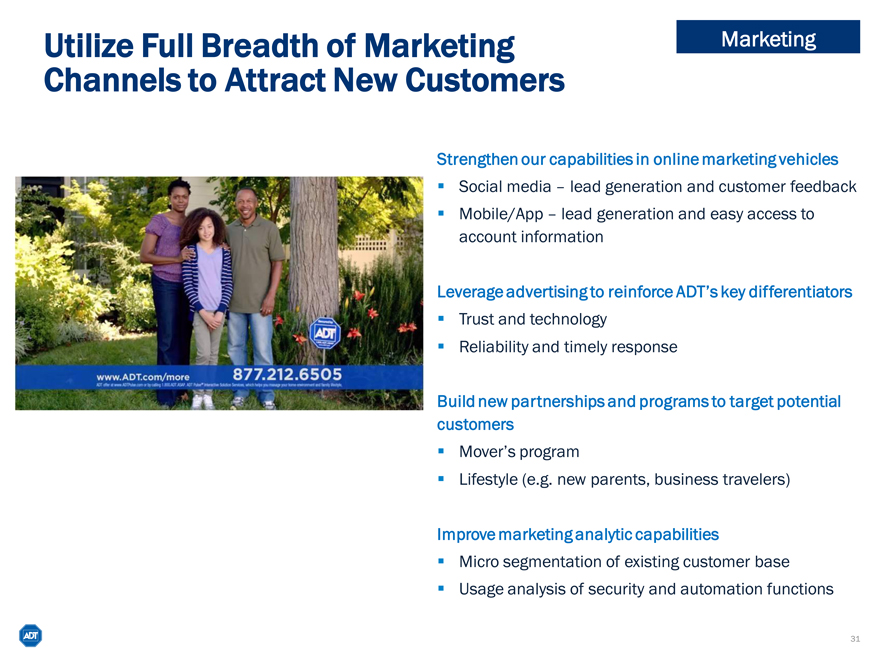
Strengthen our capabilities in online marketing vehicles
Social media – lead generation and customer feedback
Mobile/App – lead generation and easy access to account information
Leverage advertising to reinforce ADT’s key differentiators
Trust and technology
Reliability and timely response
Build new partnerships and programs to target potential customers
Mover’s program
Lifestyle (e.g. new parents, business travelers)
Improve marketing analytic capabilities
Micro segmentation of existing customer base
Usage analysis of security and automation functions
31
Expand and Improve Productivity of Sales Channels
Sales
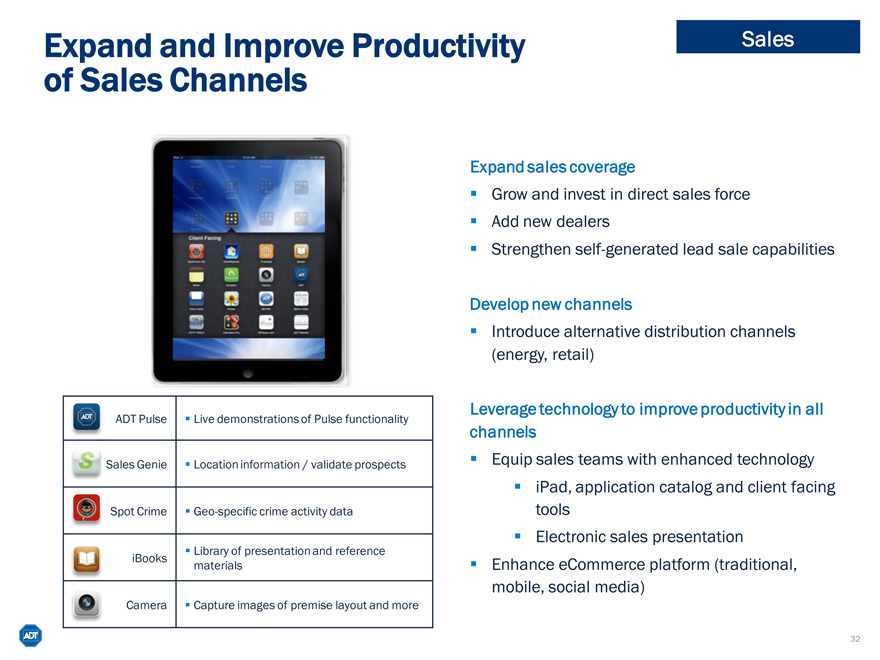
ADT Pulse
Live demonstrations of Pulse functionality
Sales Genie
Location information / validate prospects
Spot Crime
Geo-specific crime activity data
Library of presentation and reference
iBooks
materials
Camera
Capture images of premise layout and more
Expand sales coverage
Grow and invest in direct sales force
Add new dealers
Strengthen self-generated lead sale capabilities
Develop new channels
Introduce alternative distribution channels (energy, retail)
Leverage technology to improve productivity in all channels
Equip sales teams with enhanced technology
iPad, application catalog and client facing tools
Electronic sales presentation
Enhance eCommerce platform (traditional, mobile, social media)
32
Enhance Customer Ease of Use for Product Install and Service
Install & Service
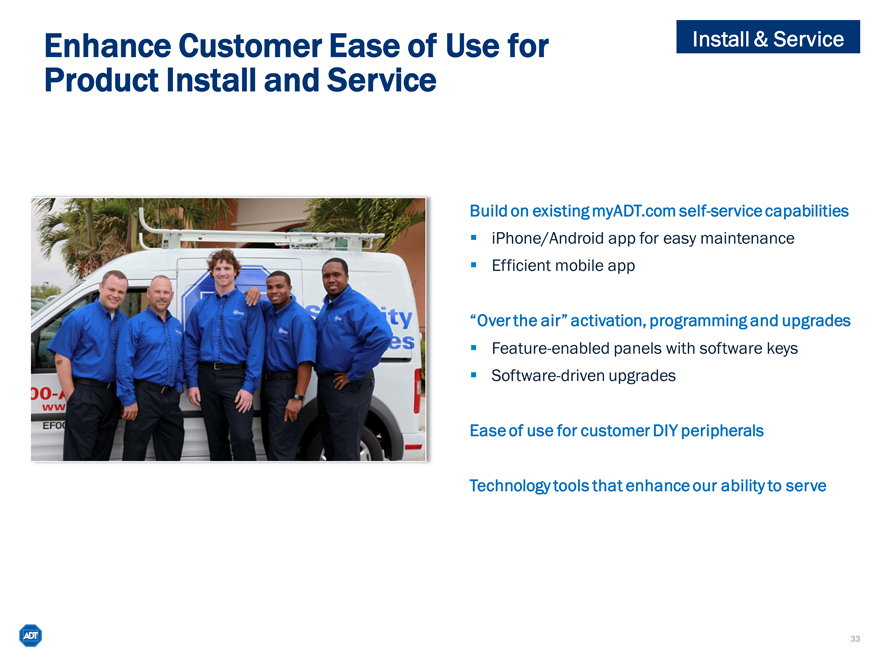
Build on existing myADT.com self-service capabilities
iPhone/Android app for easy maintenance
Efficient mobile app
“Over the air” activation, programming and upgrades
Feature-enabled panels with software keys
Software-driven upgrades
Ease of use for customer DIY peripherals
Technology tools that enhance our ability to serve
33
Build on Best-in-Class Monitoring Capabilities
Monitoring
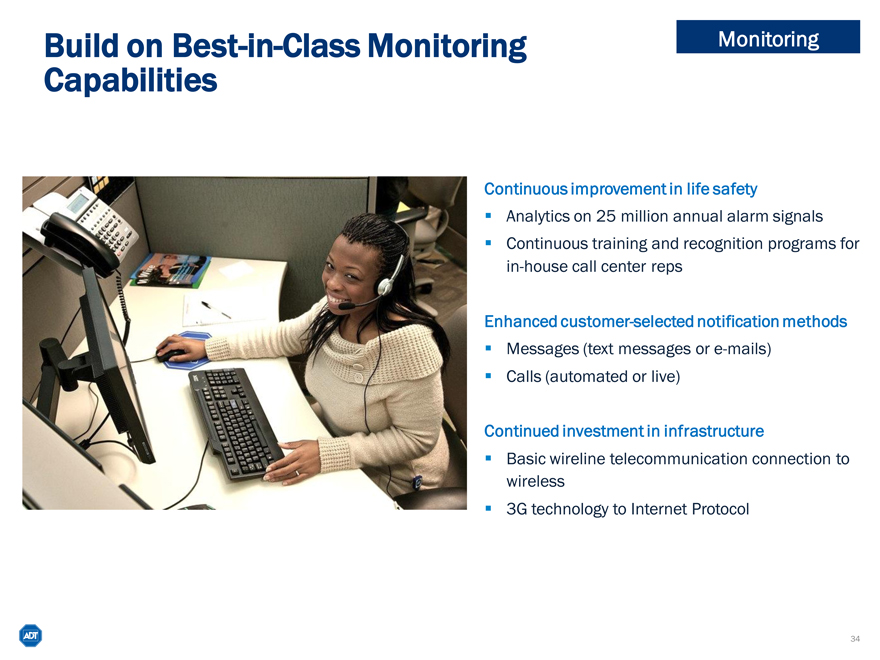
Continuous improvement in life safety
Analytics on 25 million annual alarm signals
Continuous training and recognition programs for in-house call center reps
Enhanced customer-selected notification methods
Messages (text messages or e-mails)
Calls (automated or live)
Continued investment in infrastructure
Basic wireline telecommunication connection to wireless
3G technology to Internet Protocol
34
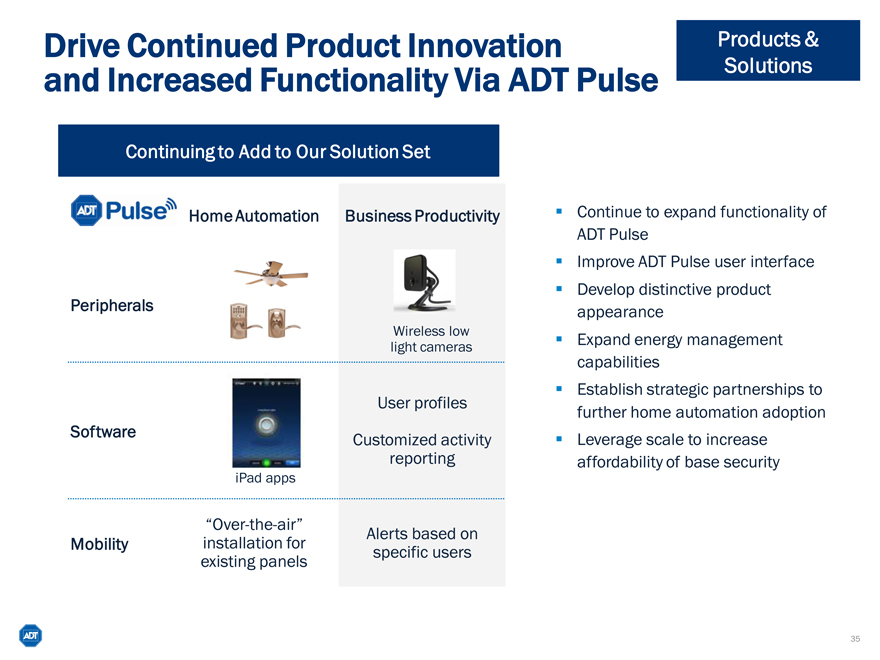
Drive Continued Product Innovation and Increased Functionality Via ADT Pulse
Products & Solutions
Continuing to Add to Our Solution Set
Home Automation
Business Productivity
Peripherals
Wireless loW light cameras
User profiles
Software
Customized activity reporting
iPad apps
Mobility
“Over-the-air” installation for existing panels
Alerts based on specific users
Continue to expand functionality of ADT Pulse
Improve ADT Pulse user interface
Develop distinctive product appearance
Expand energy management capabilities
Establish strategic partnerships to further home automation adoption
Leverage scale to increase affordability of base security
35
Invest for growth
Residential
Small Business
Health Monitoring
36
ADT Pulse Interactive Solutions
37
ADT Pulse Features & Capabilities
38
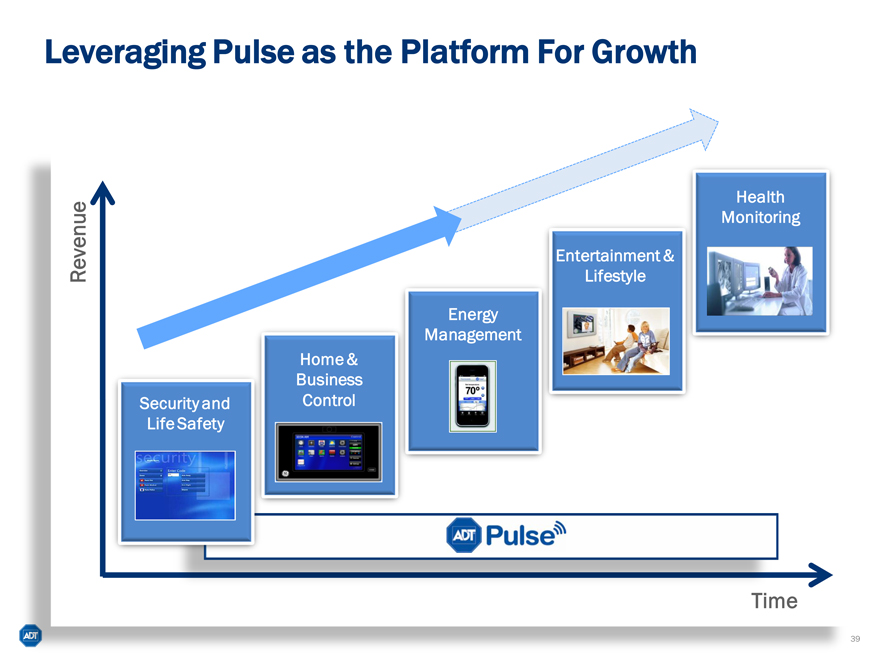
Leveraging Pulse as the Platform For Growth
Revenue
Security and Life Safety
Home & Business Control
Energy Management
Entertainment & Lifestyle
Health Monitoring
39
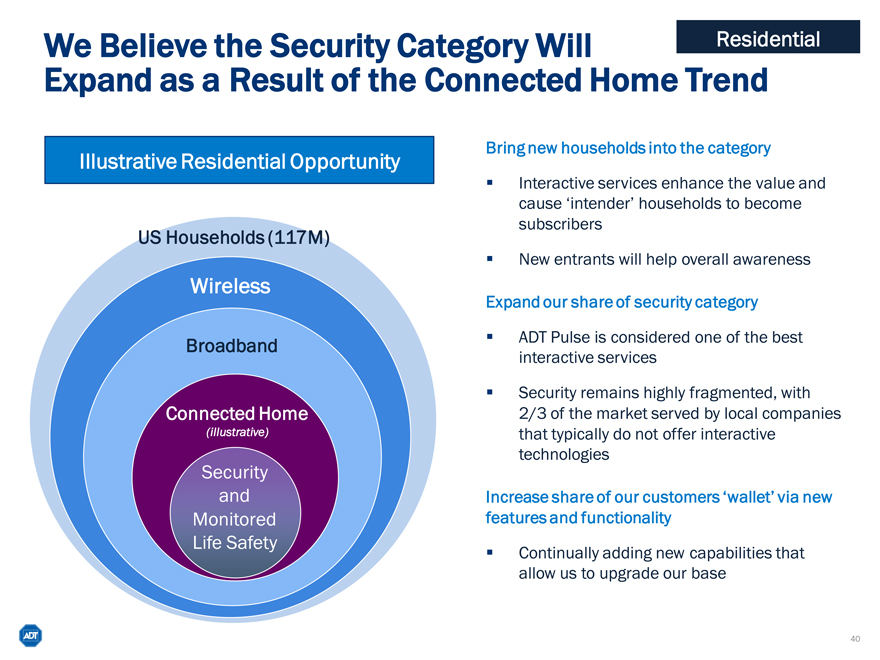
We Believe the Security Category Will Expand as a Result of the Connected Home Trend
Residential
Illustrative Residential Opportunity
US Households Households (117M)
Wireless
Broadband
Connected Home (illustrative)
Security and Monitored Life Safety
Bring new households into the category
Interactive services enhance the value and cause ‘intender’ households to become subscribers New entrants will help overall awareness
Expand our share of security category
ADT Pulse is considered one of the best interactive services
Security remains highly fragmented, with 2/3 of the market served by local companies that typically do not offer interactive technologies
Increase share of our customers ‘wallet’ via new features and functionality
Continually adding new capabilities that allow us to upgrade our base
40
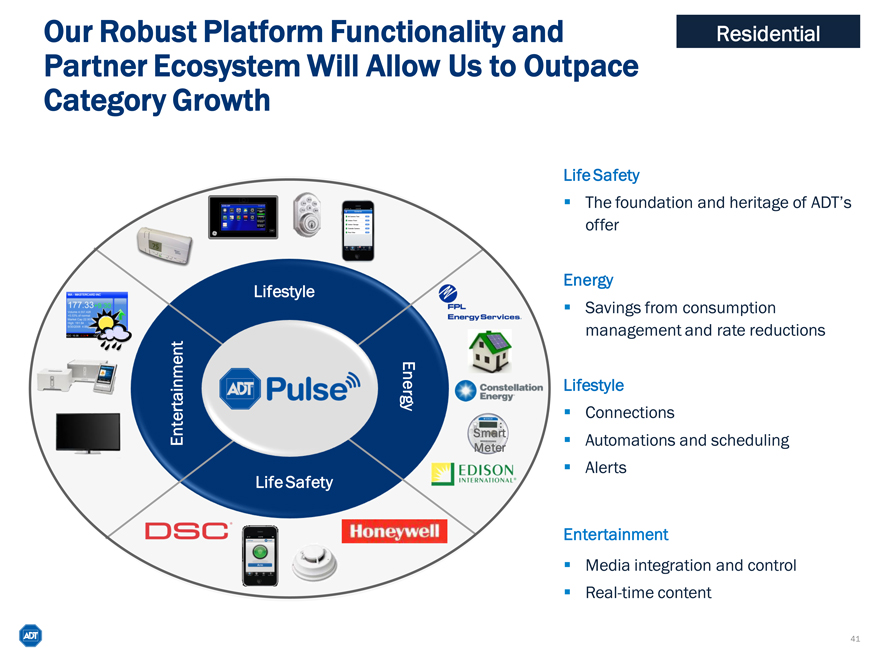
Our Robust Platform Functionality and Partner Ecosystem Will Allow Us to Outpace Category Growth
Residential
Life Safety
The foundation and heritage of ADT’s offer
Energy
Savings from consumption management and rate reductions
Lifestyle
Connections
Automations and scheduling
Alerts
Entertainment
Media integration and control
Real-time content
41
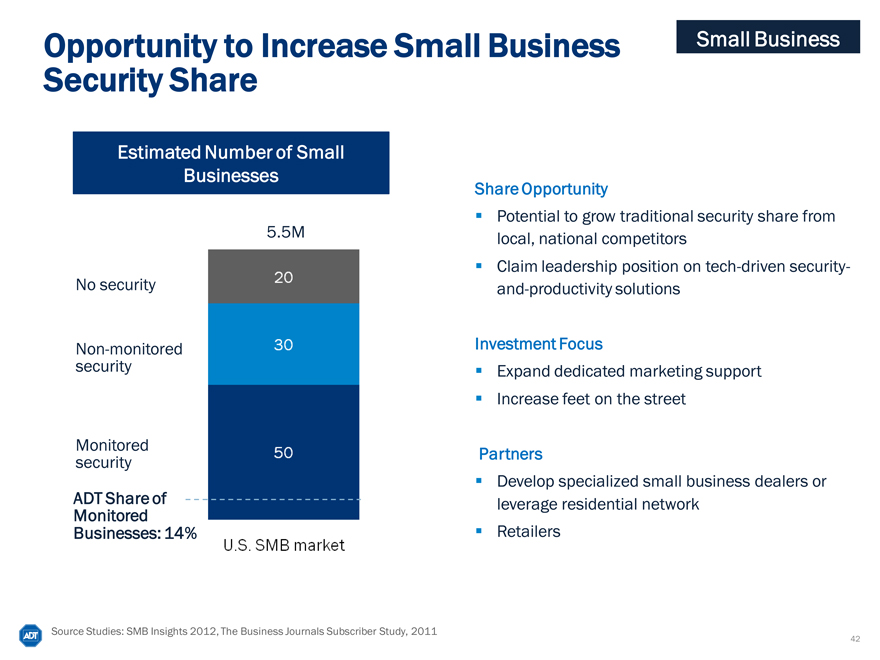
Opportunity to Increase Small Business Security Share
Small Business
Estimated Number of Small Businesses
5.5M
No security 20
Non-monitored
security
Monitored 30
security
ADT Share of
Monitored 50
Businesses: 14%
Share Opportunity
Potential to grow traditional security share from local, national competitors
Claim leadership position on tech-driven security-and-productivity solutions
Investment Focus
Expand dedicated marketing support
Increase feet on the street
Partners
Develop specialized small business dealers or leverage residential network
Retailers
Source Studies: SMB Insights 2012, The Business Journals Subscriber Study, 2011
42
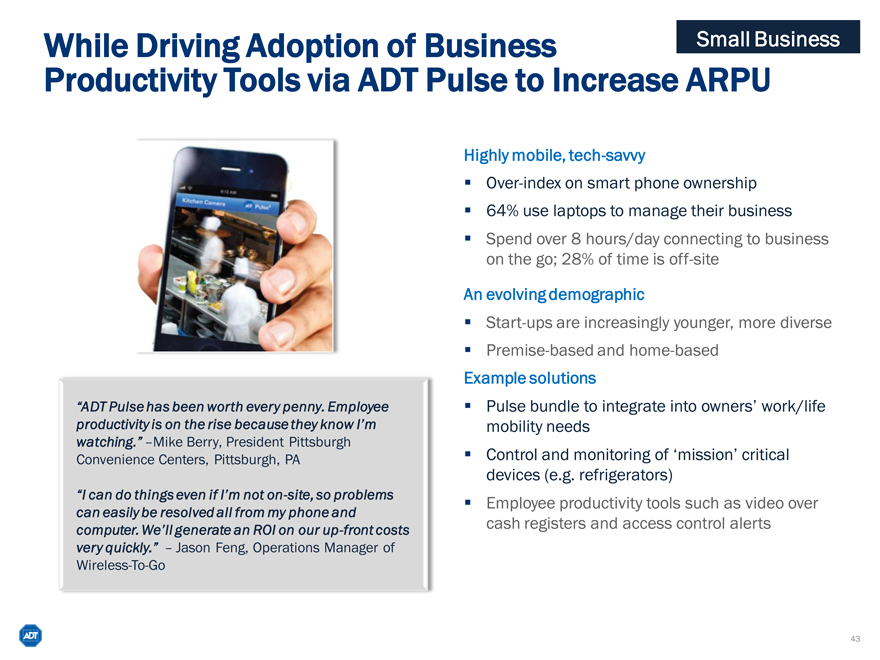
While Driving Adoption of Business
Productivity Tools via ADT Pulse to Increase ARPU
Small Business
“ADT Pulse has been worth every penny. Employee productivity is on the rise because they know I’m watching.” –Mike Berry, President Pittsburgh
Convenience Centers, Pittsburgh, PA
“I can do things even if I’m not on-site, so problems can easily be resolved all from my phone and computer. We’ll generate an ROI on our up-front costs very quickly.” – Jason Feng, Operations Manager of
Wireless-To-Go
Highly mobile, tech-savvy
Over-index on smart phone ownership
64% use laptops to manage their business
Spend over 8 hours/day connecting to business on the go; 28% of time is off-site
An evolving demographic
Start-ups are increasingly younger, more diverse
Premise-based and home-based
Example solutions
Pulse bundle to integrate into owners’ work/life mobility needs
Control and monitoring of ‘mission’ critical devices (e.g. refrigerators)
Employee productivity tools such as video over cash registers and access control alerts
43
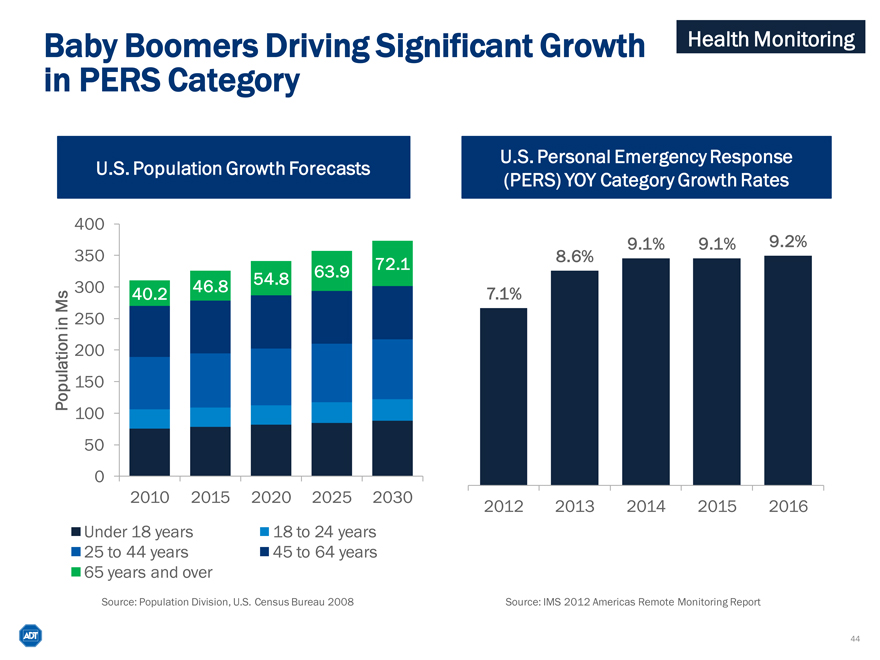
Baby Boomers Driving Significant Growth in PERS Category
Health Monitoring
U.S. Population Growth Forecasts
U.S. Personal Emergency Response (PERS) YOY Category Growth Rates
400
350
54.8 63.9 72.1
300 40.2 46.8
250
200
Population in Ms 150
100
50
0
2010 2015 2020 2025 2030
9.1% 9.1% 9.2%
8.6%
7.1%
2012 2013 2014 2015 2016
Under 18 years 18 to 24 years
25 to 44 years 45 to 64 years
65 years and over
Source: Population Division, U.S. Census Bureau 2008
Source: IMS 2012 Americas Remote Monitoring Report
44
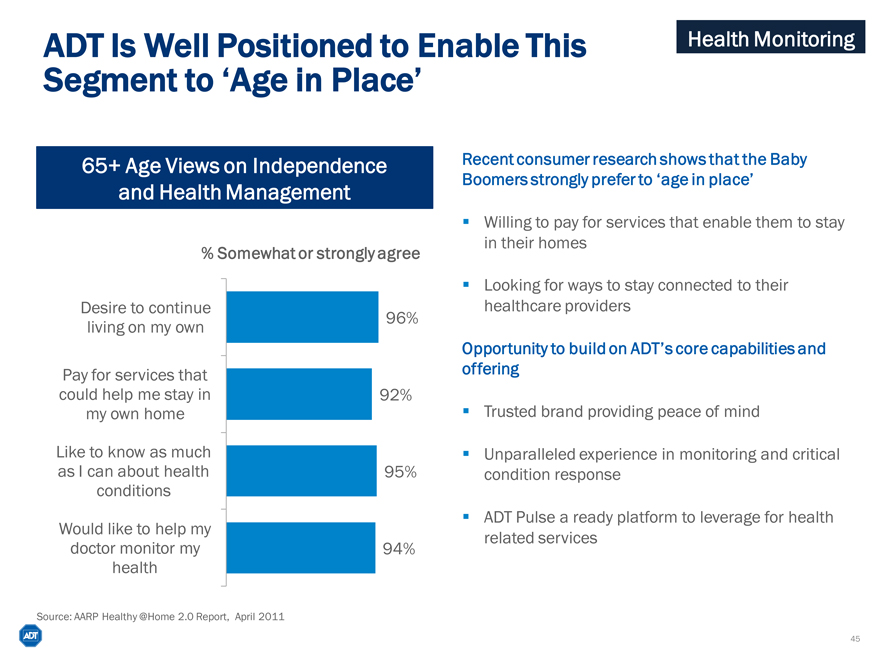
ADT Is Well Positioned to Enable This
Segment to ‘Age in Place’
Health Monitoring
65+ Age Views on Independence and Health Management
% Somewhat or strongly agree
Desire to continue living on my own
Pay for services that could help me stay in my own home
Like to know as much as I can about health conditions
Would like to help my doctor monitor my health
96% 92% 95% 94%
Recent consumer research shows that the Baby
Boomers strongly prefer to ‘age in place’
Willing to pay for services that enable them to stay in their homes
Looking for ways to stay connected to their healthcare providers
Opportunity to build on ADT’s core capabilities and offering
Trusted brand providing peace of mind
Unparalleled experience in monitoring and critical condition response
ADT Pulse a ready platform to leverage for health related services
Source: AARP Healthy @Home 2.0 Report, April 2011
45
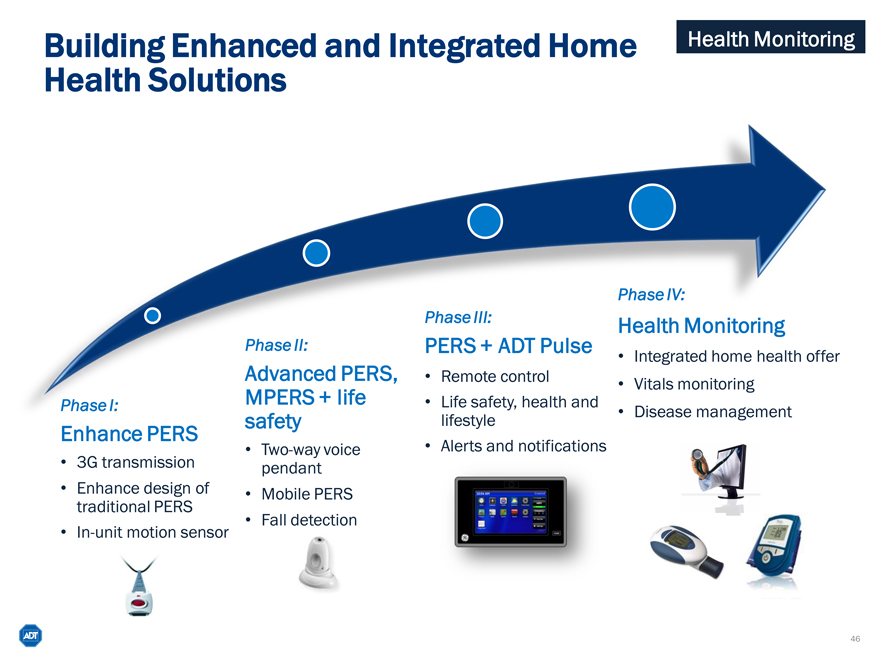
Building Enhanced and Integrated Home Health Solutions
Health Monitoring
Phase I:
Enhance PERS
3G transmission
Enhance design of traditional PERS
In-unit motion sensor
Phase II:
Advanced PERS, MPERS + life safety
Two-way voice pendant
Mobile PERS
Fall detection
Phase III:
PERS + ADT Pulse
Remote control
Life safety, health and lifestyle
Alerts and notifications
Phase IV:
Health Monitoring
Integrated home health offer
Vitals monitoring
Disease management
46

Agenda
Introduction to ADT
Residential and Small Business Security Market Strategic Priorities Financial Overview Closing Remarks Q&A
47
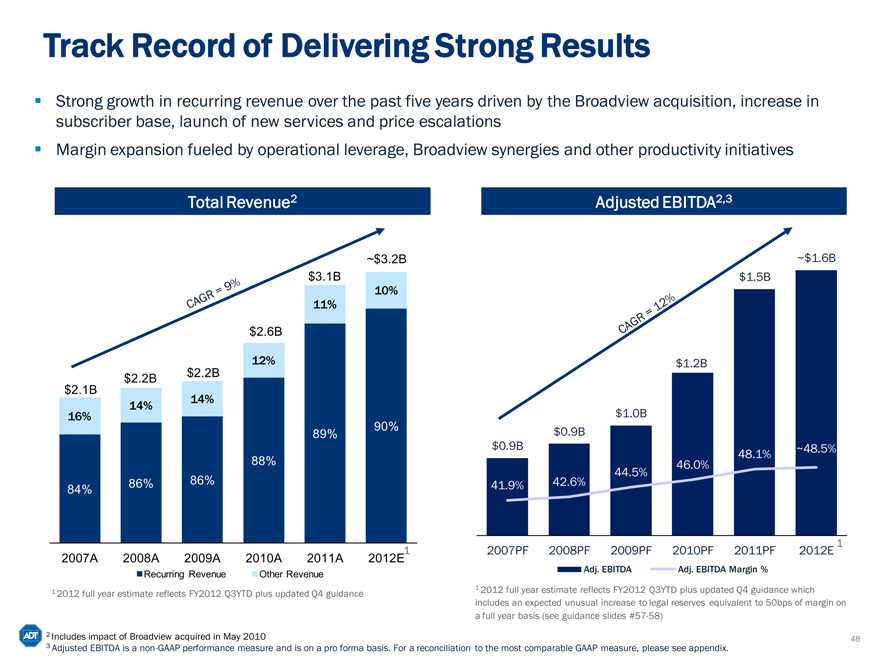
Track Record of Delivering Strong Results
Strong growth in recurring revenue over the past five years driven by the Broadview acquisition, increase in subscriber base, launch of new services and price escalations Margin expansion fueled by operational leverage, Broadview synergies and other productivity initiatives
Total Revenue2
CAGR = 9% ~$3.2B
$3.1B
10%
11%
$2.6B
12%
$2.2B $2.2B
$2.1B
14% 14%
16%
89% 90%
88%
84% 86% 86%
2007A 2008A 2009A 2010A 2011A 2012E1
Recurring Revenue Other Revenue
1 | | 2012 full year estimate reflects FY2012 Q3YTD plus updated Q4 guidance |
Adjusted EBITDA2,3
CAGR = 12% ~$1.6B
$1.5B
$1.2B
$1.0B
$0.9B
$0.9B 48.1% ~48.5%
44.5% 46.0%
41.9% 42.6%
2007PF 2008PF 2009PF 2010PF 2011PF 2012E 1
Adj. EBITDA Adj. EBITDA Margin %
1 2012 full year estimate reflects FY2012 Q3YTD plus updated Q4 guidance which includes an expected unusual increase to legal reserves equivalent to 50bps of margin on a full year basis (see guidance slides #57-58)
2 | | Includes impact of Broadview acquired in May 2010 |
3 Adjusted EBITDA is a non-GAAP performance measure and is on a pro forma basis. For a reconciliation to the most comparable GAAP measure, please see appendix.
48
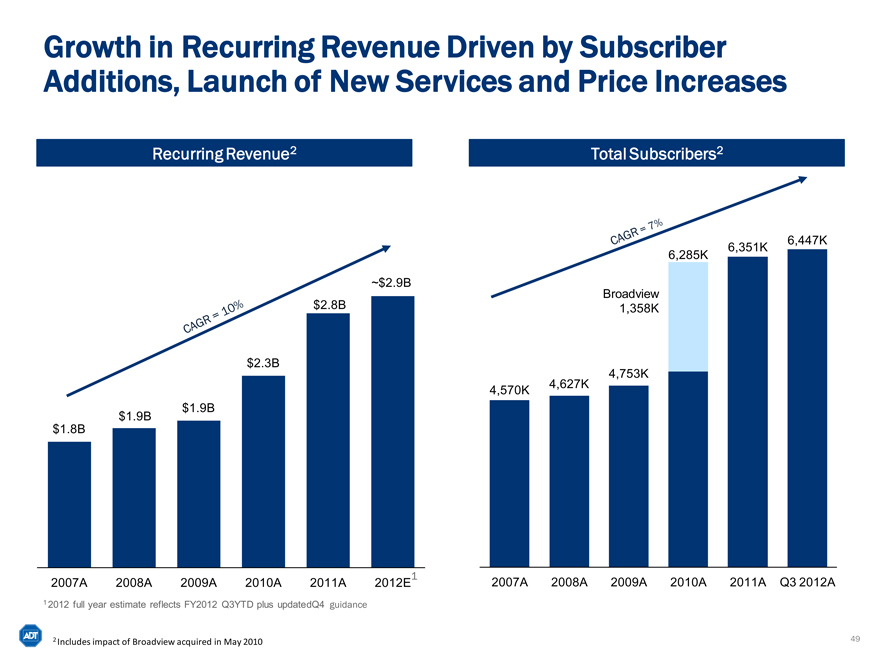
Growth in Recurring Revenue Driven by Subscriber Additions, Launch of New Services and Price Increases
Recurring Revenue2
CAGR = 10% ~$2.9B
$2.8B
$2.3B
$1.9B
$1.9B
$1.8B
2007A 2008A 2009A 2010A 2011A 2012E1
1 | | 2012 full year estimate reflects FY2012 Q3YTD plus updatedQ4 guidance |
Total Subscribers2
CAGR = 7% 6,351K 6,447K
6,285K
Broadview
1,358K
4,753K
4,570K 4,627K
2007A 2008A 2009A 2010A 2011A Q3 2012A
2 | | Includes impact of Broadview acquired in May 2010 |
49
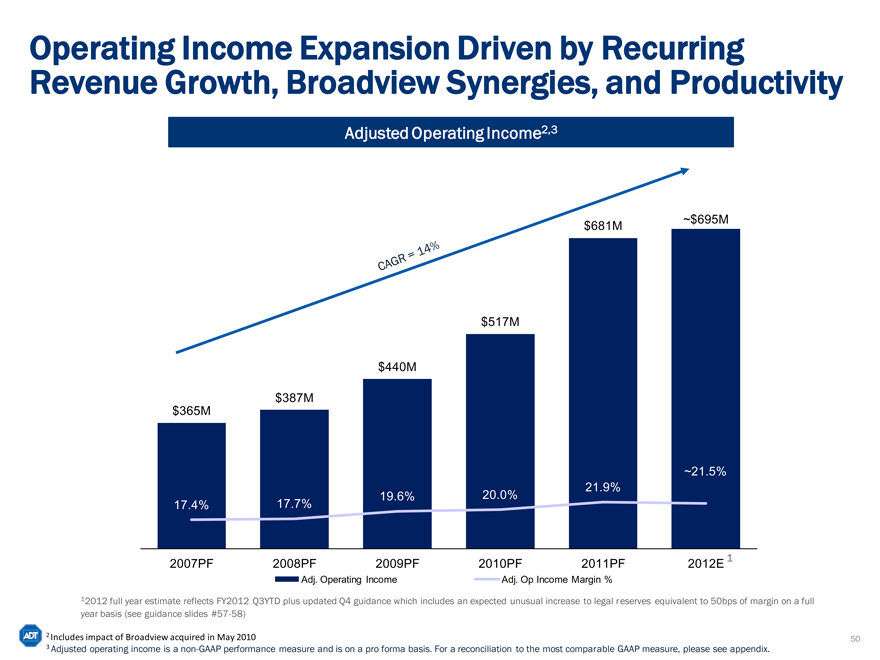
Operating Income Expansion Driven by Recurring Revenue Growth, Broadview Synergies, and Productivity
Adjusted Operating Income2,3
CAGR = 14% $681M ~$695M
$517M
$440M
$387M
$365M
~21.5%
21.9%
17.4% 17.7% 19.6% 20.0%
2007PF 2008PF 2009PF 2010PF 2011PF 2012E 1
Adj. Operating Income Adj. Op Income Margin %
12012 full year estimate reflects FY2012 Q3YTD plus updated Q4 guidance which includes an expected unusual increase to legal reserves equivalent to 50bps of margin on a full year basis (see guidance slides #57-58)
2 | | Includes impact of Broadview acquired in May 2010 |
3 Adjusted operating income is a non-GAAP performance measure and is on a pro forma basis. For a reconciliation to the most comparable GAAP measure, please see appendix.
50
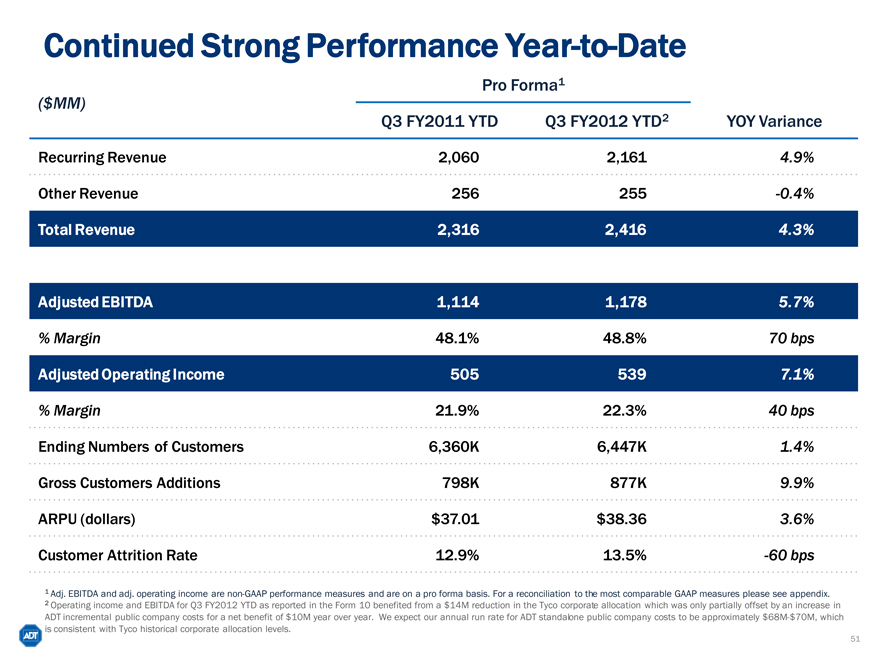
Continued Strong Performance Year-to-Date
Pro Forma1
($MM)
Q3 FY2011 YTD Q3 FY2012 YTD2 YOY Variance
Recurring Revenue 2,060 2,161 4.9%
Other Revenue 256 255 -0.4%
Total Revenue 2,316 2,416 4.3%
Adjusted EBITDA 1,114 1,178 5.7%
% Margin 48.1% 48.8% 70 bps
Adjusted Operating Income 505 539 7.1%
% Margin 21.9% 22.3% 40 bps
Ending Numbers of Customers 6,360K 6,447K 1.4%
Gross Customers Additions 798K 877K 9.9%
ARPU (dollars) $37.01 $38.36 3.6%
Customer Attrition Rate 12.9% 13.5% -60 bps
1 Adj. EBITDA and adj. operating income are non-GAAP performance measures and are on a pro forma basis. For a reconciliation to the most comparable GAAP measures please see appendix.
2 Operating income and EBITDA for Q3 FY2012 YTD as reported in the Form 10 benefited from a $14M reduction in the Tyco corporate allocation which was only partially offset by an increase in ADT incremental public company costs for a net benefit of $10M year over year. We expect our annual run rate for ADT standalone public company costs to be approximately $68M-$70M, which is consistent with Tyco historical corporate allocation levels.
51
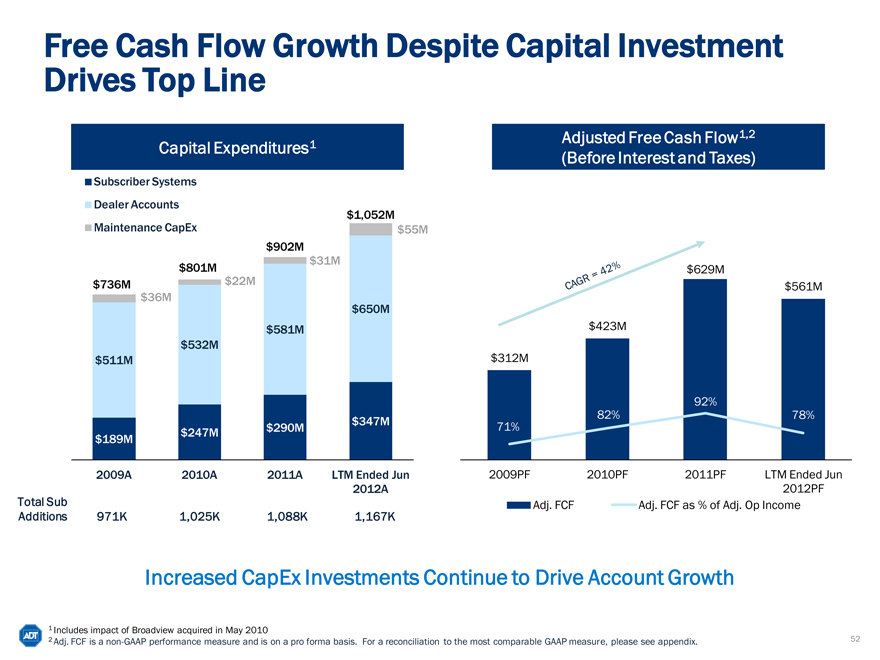
Free Cash Flow Growth Despite Capital Investment Drives Top Line
Capital Expenditures1
Subscriber Systems
Dealer Accounts
$1,052M
Maintenance CapEx $55M
$ 902M
$801M $31M
$736M $ 22M
$36M
$650M
$581M
$532M
$511M
$347M
$189M $247M $290M
2009A 2010A 2011A LTM Ended Jun
2012A
Total Sub
Additions 971K 1,025K 1,088K 1,167K
Adjusted Free Cash Flow1,2 (Before Interest and Taxes)
$629M
CAGR = 42% $561M
$423M
$312M
92%
82% 78%
71%
2009PF 2010PF 2011PF LTM Ended Jun
2012PF
Adj. FCF Adj. FCF as % of Adj. Op Income
Increased CapEx Investments Continue to Drive Account Growth
1 | | Includes impact of Broadview acquired in May 2010 |
2 Adj. FCF is a non-GAAP performance measure and is on a pro forma basis. For a reconciliation to the most comparable GAAP measure, please see appendix.
52
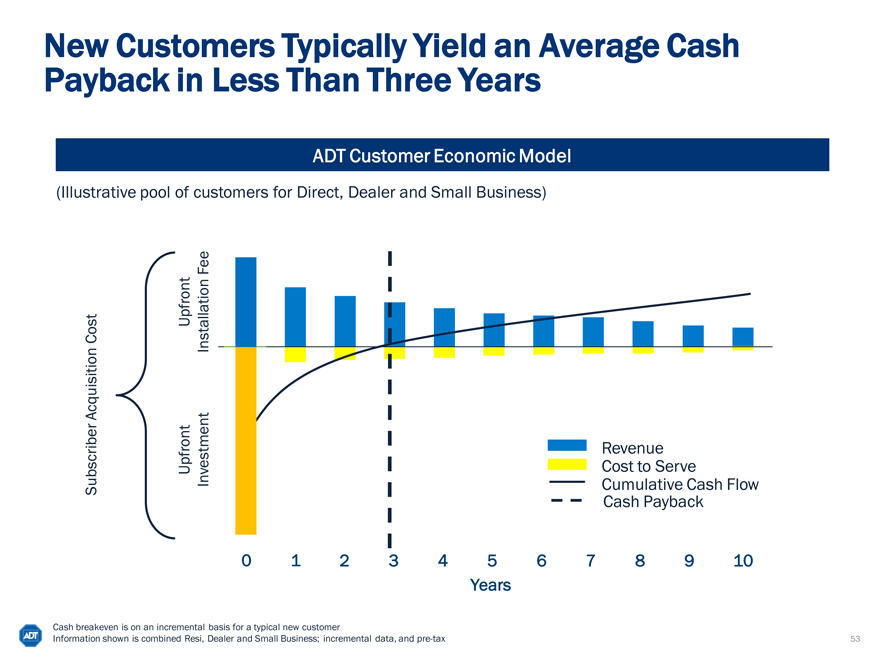
New Customers Typically Yield an Average Cash Payback in Less Than Three Years
ADT Customer Economic Model
(Illustrative pool of customers for Direct, Dealer and Small Business)
Subscriber Acquisition Cost
Upfront Upfront Investment Installation Fee
Revenue Cost to Serve
Cumulative Cash Flow Cash Payback
0 1 2 3 4 5 6 7 8 9 10
Years
Cash breakeven is on an incremental basis for a typical new customer
Information shown is combined Resi, Dealer and Small Business; incremental data, and pre-tax
53
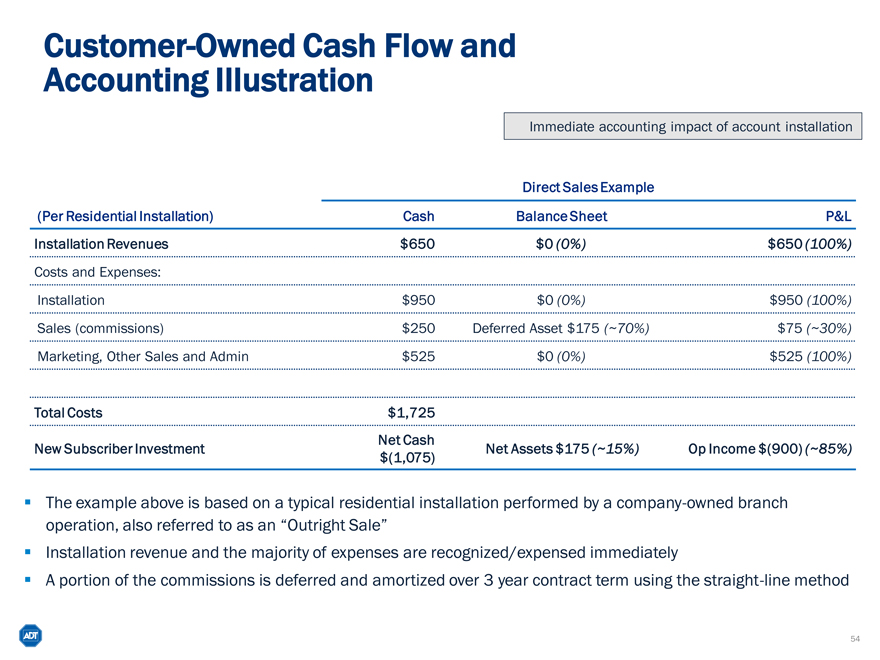
Customer-Owned Cash Flow and Accounting Illustration
Immediate accounting impact of account installation
Direct Sales Example
(Per Residential Installation) Cash Balance Sheet P&L
Installation Revenues $650 $0 (0%) $650 (100%)
Costs and Expenses:
Installation $950 $0 (0%) $950 (100%)
Sales (commissions) $250 Deferred Asset $175 (~70%) $75 (~30%)
Marketing, Other Sales and Admin $525 $0 (0%) $525 (100%)
Total Costs $1,725
Net Cash
New Subscriber Investment Net Assets $175 (~15%) Op Income $(900) (~85%)
$(1,075)
The example above is based on a typical residential installation performed by a company-owned branch operation, also referred to as an “Outright Sale”
Installation revenue and the majority of expenses are recognized/expensed immediately
A portion of the commissions is deferred and amortized over 3 year contract term using the straight-line method
54
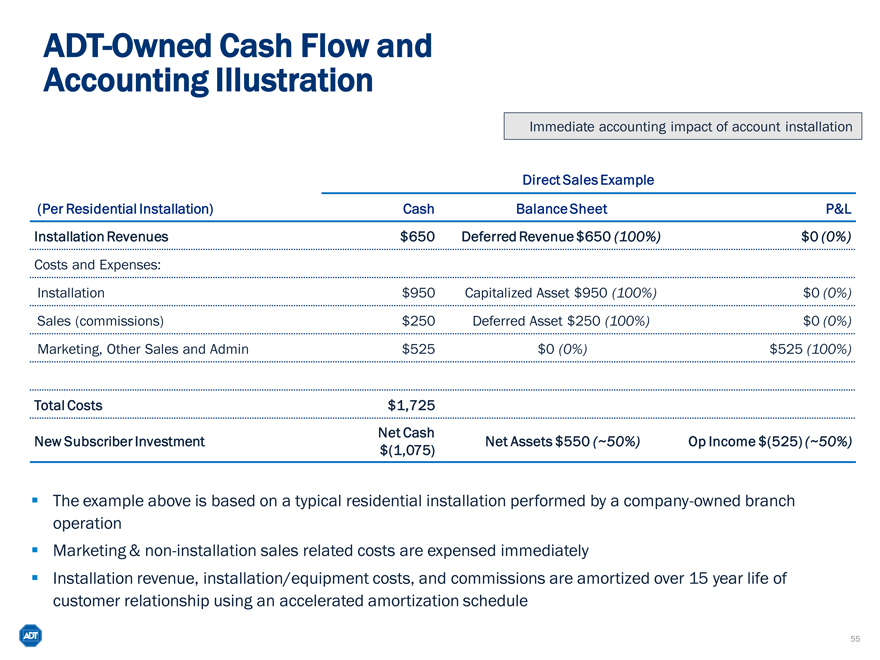
ADT-Owned Cash Flow and Accounting Illustration
Immediate accounting impact of account installation
Direct Sales Example
(Per Residential Installation) Cash Balance Sheet P&L
Installation Revenues $650 Deferred Revenue $650 (100%) $0 (0%)
Costs and Expenses:
Installation $950 Capitalized Asset $950 (100%) $0 (0%)
Sales (commissions) $250 Deferred Asset $250 (100%) $0 (0%)
Marketing, Other Sales and Admin $525 $0 (0%) $525 (100%)
Total Costs $1,725
Net Cash
New Subscriber Investment Net Assets $550 (~50%) Op Income $(525) (~50%)
$(1,075)
The example above is based on a typical residential installation performed by a company-owned branch operation Marketing & non-installation sales related costs are expensed immediately Installation revenue, installation/equipment costs, and commissions are amortized over 15 year life of customer relationship using an accelerated amortization schedule
55
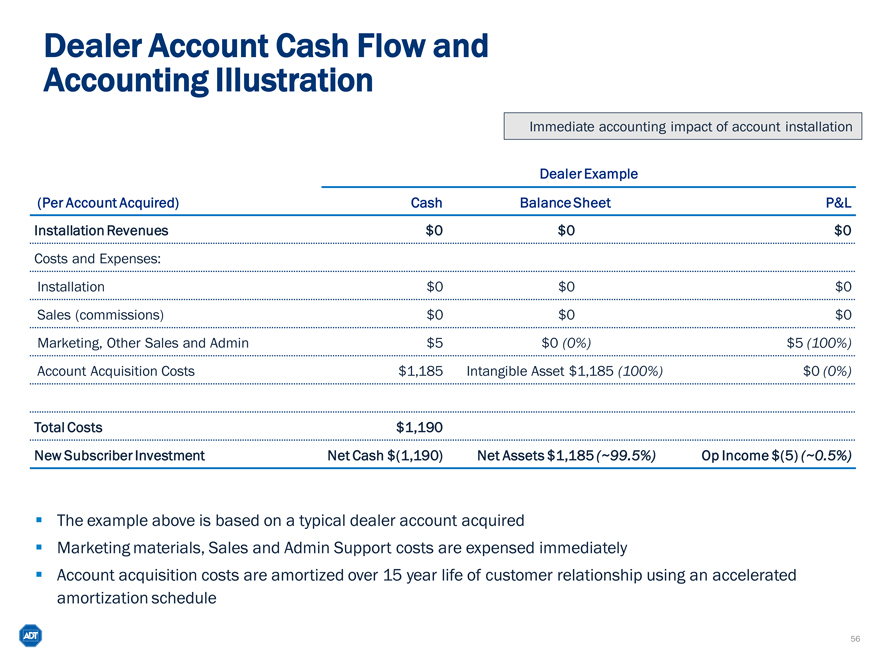
Dealer Account Cash Flow and Accounting Illustration
Immediate accounting impact of account installation
Dealer Example
(Per Account Acquired) Cash Balance Sheet P&L
Installation Revenues $0 $0 $0
Costs and Expenses:
Installation $0 $0 $0
Sales (commissions) $0 $0 $0
Marketing, Other Sales and Admin $5 $0 (0%) $5 (100%)
Account Acquisition Costs $1,185 Intangible Asset $1,185 (100%) $0 (0%)
Total Costs $1,190
New Subscriber Investment Net Cash $(1,190) Net Assets $1,185 (~99.5%) Op Income $(5) (~0.5%)
The example above is based on a typical dealer account acquired
Marketing materials, Sales and Admin Support costs are expensed immediately
Account acquisition costs are amortized over 15 year life of customer relationship using an accelerated amortization schedule
56
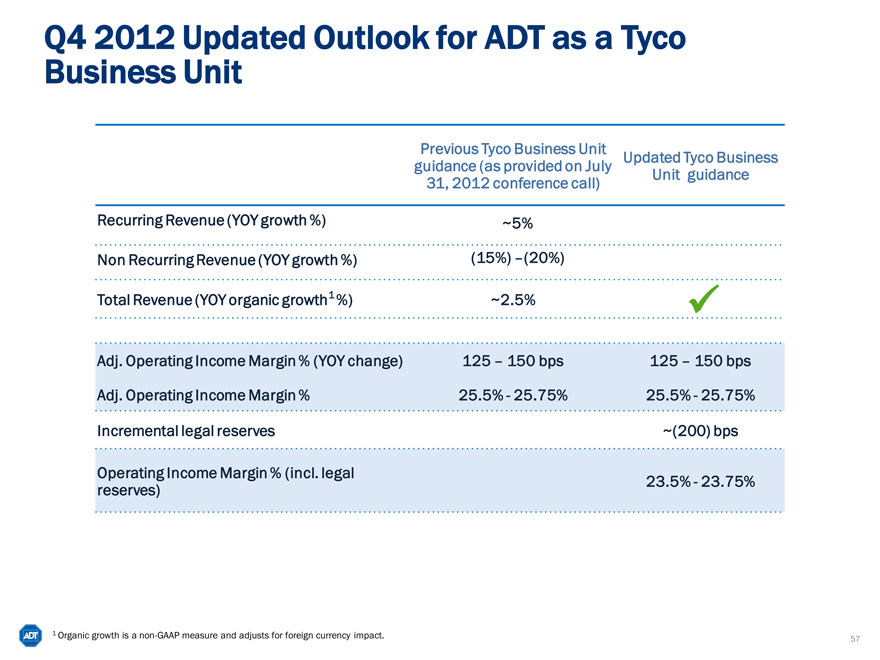
Q4 2012 Updated Outlook for ADT as a Tyco Business Unit
Previous Tyco Business Unit Updated Tyco Business
guidance (as provided on July Unit guidance
31, 2012 conference call)
Recurring Revenue (YOY growth %) ~5%
Non Recurring Revenue (YOY growth %) (15%) –(20%)
Total Revenue (YOY organic growth1 %) ~2.5%
Adj. Operating Income Margin % (YOY change) 125 – 150 bps 125 – 150 bps
Adj. Operating Income Margin % 25.5%—25.75% 25.5%—25.75%
Incremental legal reserves ~(200) bps
Operating Income Margin % (incl. legal 23.5%—23.75%
reserves)
1 | | Organic growth is a non-GAAP measure and adjusts for foreign currency impact. |
57
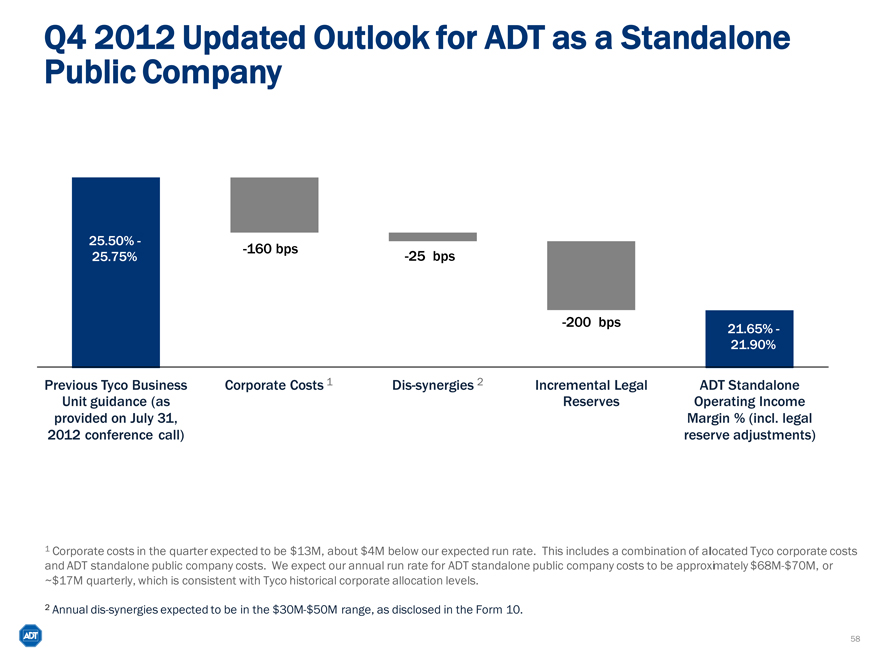
Q4 2012 Updated Outlook for ADT as a Standalone Public Company
25.50%— -160 bps
25.75% -25 bps
23.65%—
23.9%
-200 bps 21.65% -
21.90%
Previous Tyco Business Corporate Costs 1 Dis-synergies 2 Incremental Legal ADT Standalone
Unit guidance (as Reserves Operating Income
provided on July 31,
Margin % (incl. legal
2012 conference call)
reserve adjustments)
1 Corporate costs in the quarter expected to be $13M, about $4M below our expected run rate. This includes a combination of allocated Tyco corporate costs and ADT standalone public company costs. We expect our annual run rate for ADT standalone public company costs to be approximately $68M-$70M, or
~$17M quarterly, which is consistent with Tyco historical corporate allocation levels.
2 | | Annual dis-synergies expected to be in the $30M-$50M range, as disclosed in the Form 10. |
58
Significant Tax Assets Enable Low Cash Tax Rate
GAAP income tax rate will be in the 36%-38% range
ADT will have significant deferred tax assets which results in the cash tax rate being significantly below the P&L rate
ADT expects to have $1.0-$1.2 billion of federal tax loss carry forwards at the time of the separation1
In addition, ADT expects to have the ability to accelerate certain tax deductions that would allow us to minimize our cash tax rate for a period of time beyond the full utilization of the initial deferred tax assets
Expect cash taxes to be driven by Federal AMT, state taxes and
Canadian income and withholding taxes resulting in a cash tax rate ranging from 6-8%2
1 Per Form 10 proforma, expected $411 million deferred tax asset that included $1.024 million NOL carryforward at 6/29/12. Actual deferred tax asset balance will be determined and transferred at the time of spin and will include 4th quarter earnings/loss activity. Ultimately the actual NOL carryforward will be determined by the outcome of the pre-spin/Tyco IRS audits.
2 Actual cash tax rates will depend on level and mix of pre-tax earnings, the actual NOL carryforward and other tax credit utilization over the period.
59
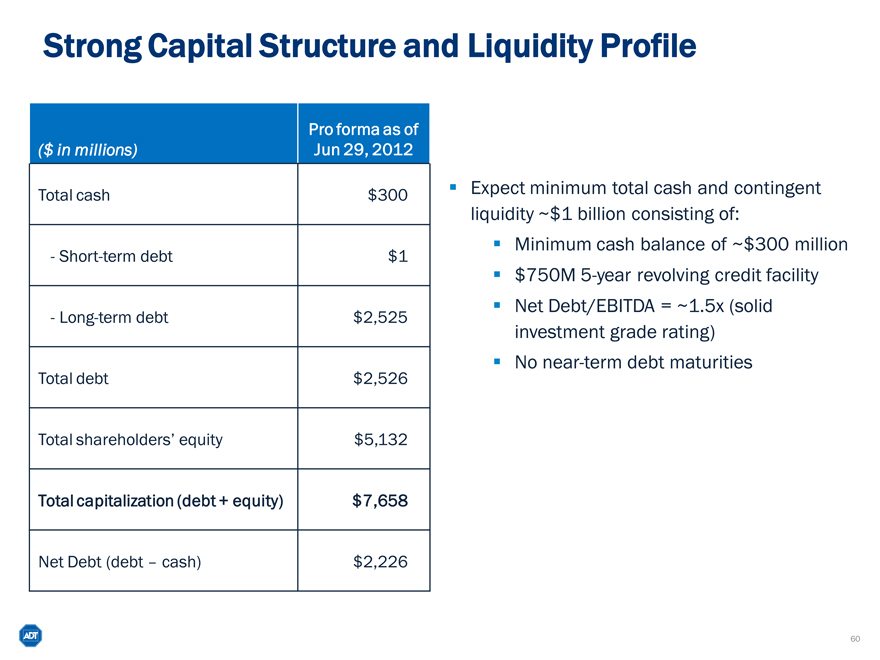
Strong Capital Structure and Liquidity Profile
($ in millions) Pro forma as of Jun 29, 2012
Total cash $300
- Short-term debt $1
- Long-term debt $2,525
Total debt $2,526
Total shareholders’ equity $5,132
Total capitalization (debt + equity) $7,658
Net Debt (debt – cash) $2,226
Expect minimum total cash and contingent liquidity ~$1 billion consisting of:
Minimum cash balance of ~$300 million
$750M 5-year revolving credit facility
Net Debt/EBITDA = ~1.5x (solid investment grade rating)
No near-term debt maturities
60
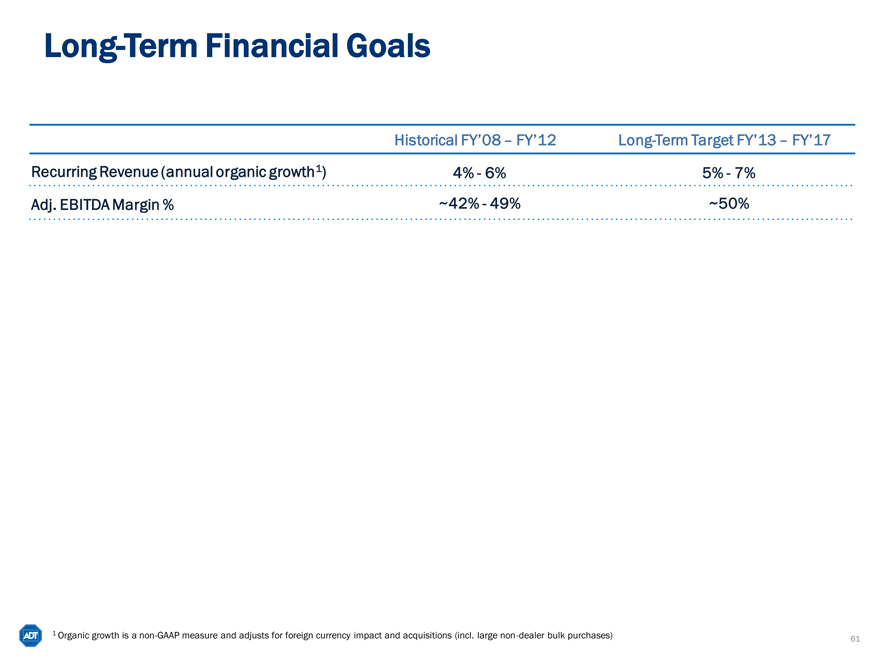
Long-Term Financial Goals
Historical FY’08 – FY’12 Long-Term Target FY’13 – FY’17
Recurring Revenue (annual organic growth1) 4%— 6% 5%—7%
Adj. EBITDA Margin % ~42% —49% ~50%
1 Organic growth is a non-GAAP measure and adjusts for foreign currency impact and acquisitions (incl. large non-dealer bulk purchases)
61
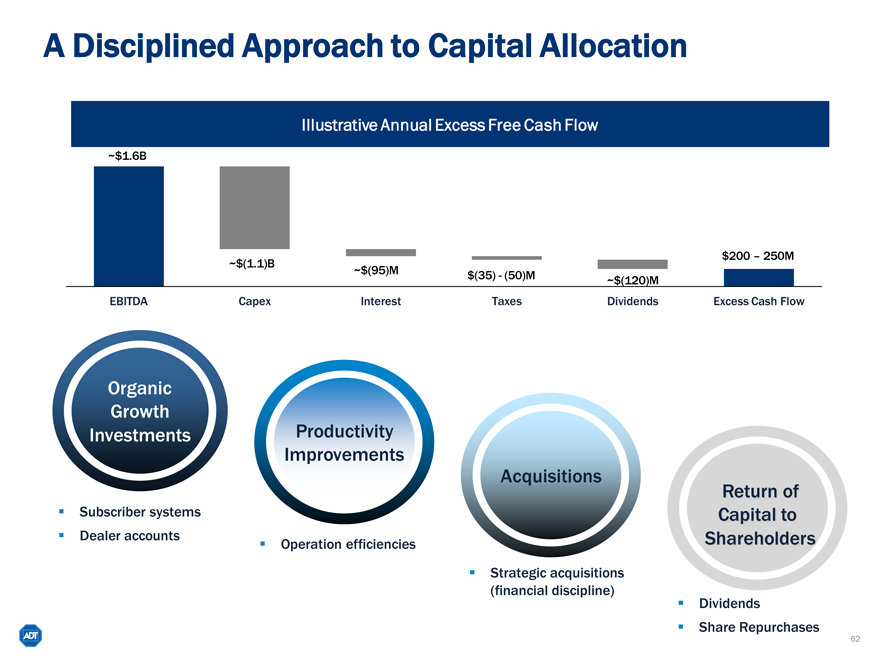
A Disciplined Approach to Capital Allocation
Illustrative Annual Excess Free Cash Flow
~$1.6B
$200 – 250M
~$(1.1)B ~$(95)M
$(35)—(50)M ~$(120)M
EBITDA Capex Interest Taxes Dividends Excess Cash Flow
Organic Growth Investments
Productivity Improvements
Acquisitions
Return of Capital to Shareholders
Subscriber systems Dealer accounts
Operation efficiencies
Strategic acquisitions (financial discipline)
Dividends
Share Repurchases
62
Agenda
Introduction to ADT
Residential and Small Business Security Market Strategic Priorities Financial Overview Closing Remarks Q&A
63
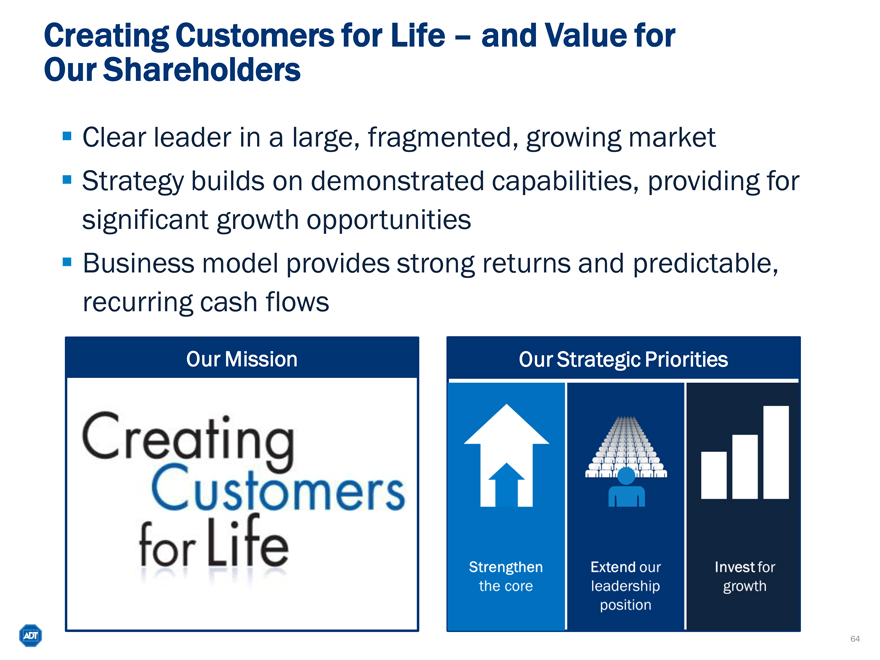
Creating Customers for Life – and Value for Our Shareholders
Clear leader in a large, fragmented, growing market Strategy builds on demonstrated capabilities, providing for significant growth opportunities Business model provides strong returns and predictable, recurring cash flows
Our Mission
Creating Customers for life
Our Strategic Priorities
Strengthen the core
Extend our leadership position
Invest for growth
64
Agenda
Introduction to ADT
Residential and Small Business Security Market Strategic Priorities Financial Overview Closing Remarks Q&A
65

Q&A
Appendix
67
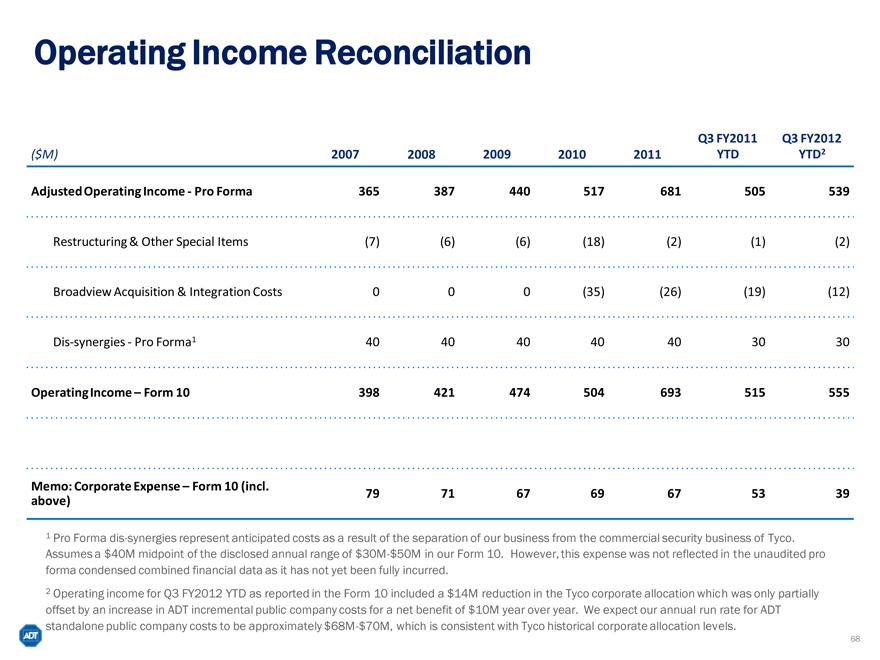
Operating Income Reconciliation
Q3 FY2011 Q3 FY2012
($M) 2007 2008 2009 2010 2011 YTD YTD2
Adjusted Operating Income—Pro Forma 365 387 440 517 681 505 539
Restructuring & Other Special Items (7) (6) (6) (18) (2) (1) (2)
Broadview Acquisition & Integration Costs 0 0 0 (35) (26) (19) (12)
Dis-synergies—Pro Forma1 40 40 40 40 40 30 30
Operating Income – Form 10 398 421 474 504 693 515 555
Memo: Corporate Expense – Form 10 (incl.
above) 79 71 67 69 67 53 39
1 Pro Forma dis-synergies represent anticipated costs as a result of the separation of our business from the commercial security business of Tyco.
Assumes a $40M midpoint of the disclosed annual range of $30M-$50M in our Form 10. However, this expense was not reflected in the unaudited pro forma condensed combined financial data as it has not yet been fully incurred.
2 Operating income for Q3 FY2012 YTD as reported in the Form 10 included a $14M reduction in the Tyco corporate allocation which was only partially offset by an increase in ADT incremental public company costs for a net benefit of $10M year over year. We expect our annual run rate for ADT standalone public company costs to be approximately $68M-$70M, which is consistent with Tyco historical corporate allocation levels.
68
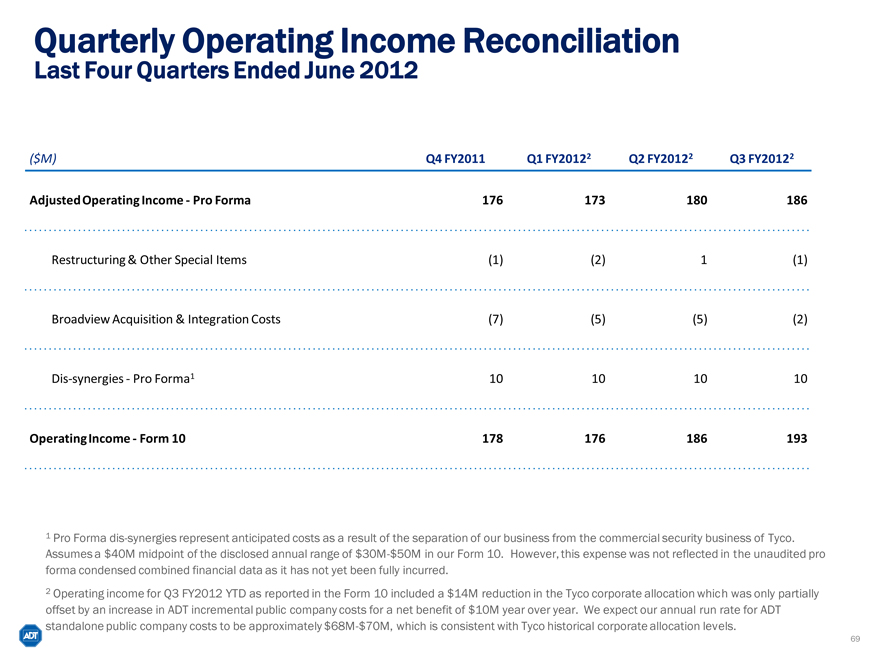
Quarterly Operating Income Reconciliation
Last Four Quarters Ended June 2012
($M) Q4 FY2011 Q1 FY20122 Q2 FY20122 Q3 FY20122
Adjusted Operating Income—Pro Forma 176 173 180 186
Restructuring & Other Special Items (1) (2) 1 (1)
Broadview Acquisition & Integration Costs (7) (5) (5) (2)
Dis-synergies—Pro Forma1 10 10 10 10
Operating Income—Form 10 178 176 186 193
1 Pro Forma dis-synergies represent anticipated costs as a result of the separation of our business from the commercial security business of Tyco.
Assumes a $40M midpoint of the disclosed annual range of $30M-$50M in our Form 10. However, this expense was not reflected in the unaudited pro forma condensed combined financial data as it has not yet been fully incurred.
2 Operating income for Q3 FY2012 YTD as reported in the Form 10 included a $14M reduction in the Tyco corporate allocation which was only partially offset by an increase in ADT incremental public company costs for a net benefit of $10M year over year. We expect our annual run rate for ADT standalone public company costs to be approximately $68M-$70M, which is consistent with Tyco historical corporate allocation levels.
69
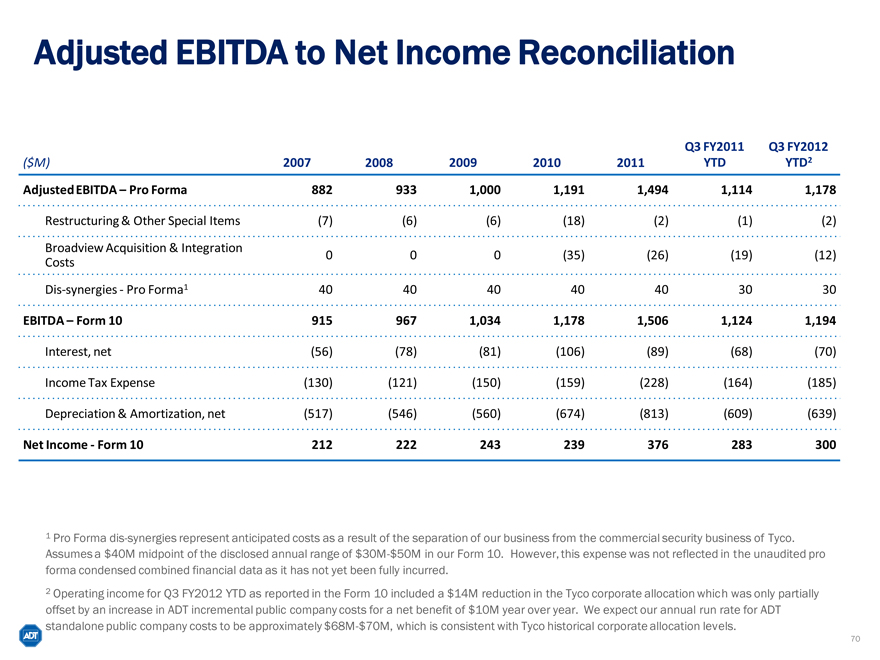
Adjusted EBITDA to Net Income Reconciliation
Q3 FY2011 Q3 FY2012
($M) 2007 2008 2009 2010 2011 YTD YTD2
Adjusted EBITDA – Pro Forma 882 933 1,000 1,191 1,494 1,114 1,178
Restructuring & Other Special Items (7) (6) (6) (18) (2) (1) (2)
Broadview Acquisition & Integration
Costs 0 0 0 (35) (26) (19) (12)
Dis-synergies—Pro Forma1 40 40 40 40 40 30 30
EBITDA – Form 10 915 967 1,034 1,178 1,506 1,124 1,194
Interest, net (56) (78) (81) (106) (89) (68) (70)
Income Tax Expense (130) (121) (150) (159) (228) (164) (185)
Depreciation & Amortization, net (517) (546) (560) (674) (813) (609) (639)
Net Income—Form 10 212 222 243 239 376 283 300
1 Pro Forma dis-synergies represent anticipated costs as a result of the separation of our business from the commercial security business of Tyco.
Assumes a $40M midpoint of the disclosed annual range of $30M-$50M in our Form 10. However, this expense was not reflected in the unaudited pro forma condensed combined financial data as it has not yet been fully incurred.
2 Operating income for Q3 FY2012 YTD as reported in the Form 10 included a $14M reduction in the Tyco corporate allocation which was only partially offset by an increase in ADT incremental public company costs for a net benefit of $10M year over year. We expect our annual run rate for ADT standalone public company costs to be approximately $68M-$70M, which is consistent with Tyco historical corporate allocation levels.
70
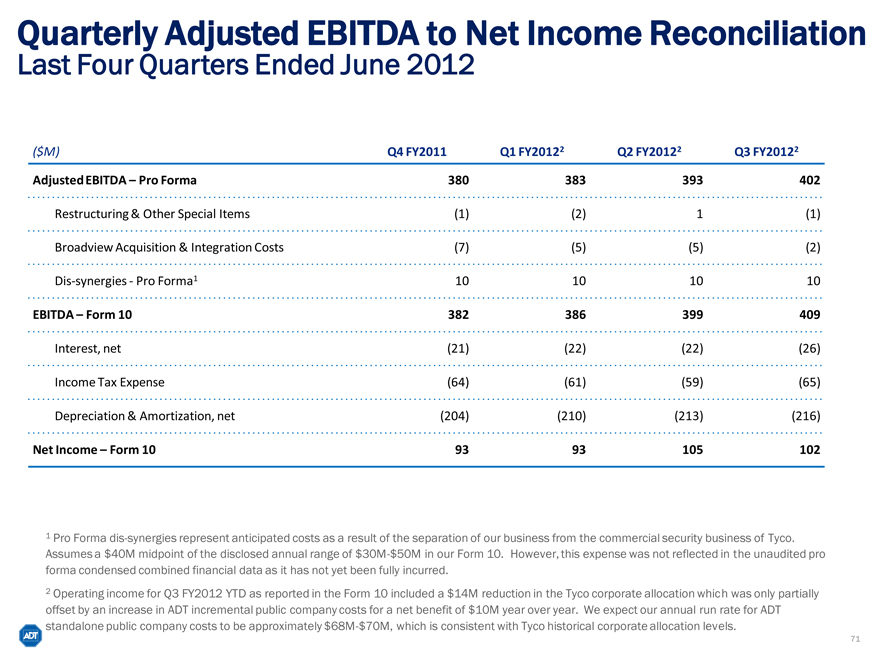
Quarterly Adjusted EBITDA to Net Income Reconciliation
Last Four Quarters Ended June 2012
($M) Q4 FY2011 Q1 FY20122 Q2 FY20122 Q3 FY20122
Adjusted EBITDA – Pro Forma 380 383 393 402
Restructuring & Other Special Items (1) (2) 1 (1)
Broadview Acquisition & Integration Costs (7) (5) (5) (2)
Dis-synergies—Pro Forma1 10 10 10 10
EBITDA – Form 10 382 386 399 409
Interest, net (21) (22) (22) (26)
Income Tax Expense (64) (61) (59) (65)
Depreciation & Amortization, net (204) (210) (213) (216)
Net Income – Form 10 93 93 105 102
1 Pro Forma dis-synergies represent anticipated costs as a result of the separation of our business from the commercial security business of Tyco.
Assumes a $40M midpoint of the disclosed annual range of $30M-$50M in our Form 10. However, this expense was not reflected in the unaudited pro forma condensed combined financial data as it has not yet been fully incurred.
2 Operating income for Q3 FY2012 YTD as reported in the Form 10 included a $14M reduction in the Tyco corporate allocation which was only partially offset by an increase in ADT incremental public company costs for a net benefit of $10M year over year. We expect our annual run rate for ADT standalone public company costs to be approximately $68M-$70M, which is consistent with Tyco historical corporate allocation levels.
71
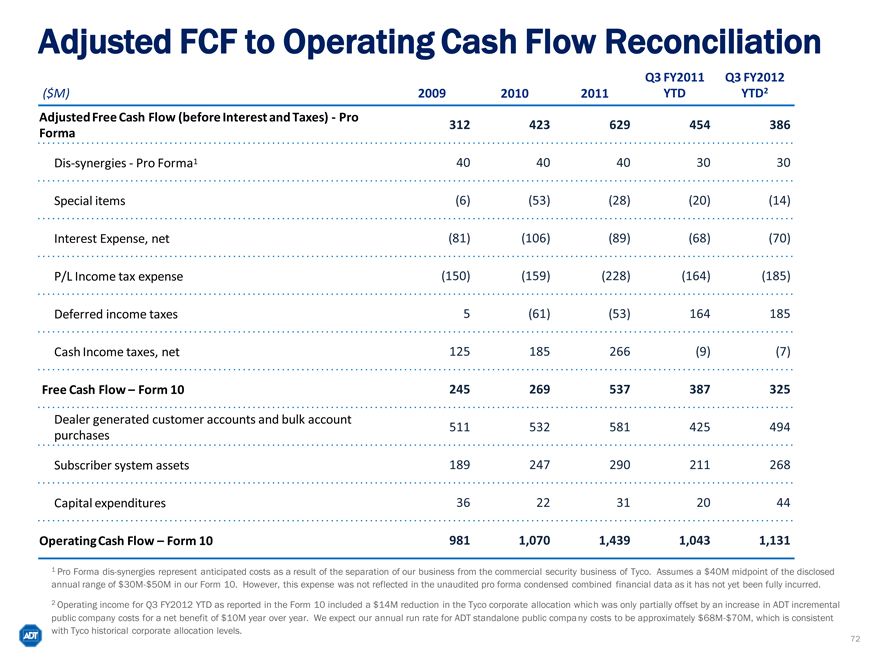
Adjusted FCF to Operating Cash Flow Reconciliation
Q3 FY2011 Q3 FY2012
($M) 2009 2010 2011 YTD YTD2
Adjusted Free Cash Flow (before Interest and Taxes)—Pro 312 423 629 454 386
Forma
Dis-synergies—Pro Forma1 40 40 40 30 30
Special items (6) (53) (28) (20) (14)
Interest Expense, net (81) (106) (89) (68) (70)
P/L Income tax expense (150) (159) (228) (164) (185)
Deferred income taxes 5 (61) (53) 164 185
Cash Income taxes, net 125 185 266 (9) (7)
Free Cash Flow – Form 10 245 269 537 387 325
Dealer generated customer accounts and bulk account 511 532 581 425 494
purchases
Subscriber system assets 189 247 290 211 268
Capital expenditures 36 22 31 20 44
Operating Cash Flow – Form 10 981 1,070 1,439 1,043 1,131
1 Pro Forma dis-synergies represent anticipated costs as a result of the separation of our business from the commercial security business of Tyco. Assumes a $40M midpoint of the disclosed annual range of $30M-$50M in our Form 10. However, this expense was not reflected in the unaudited pro forma condensed combined financial data as it has not yet been fully incurred.
2 Operating income for Q3 FY2012 YTD as reported in the Form 10 included a $14M reduction in the Tyco corporate allocation which was only partially offset by an increase in ADT incremental public company costs for a net benefit of $10M year over year. We expect our annual run rate for ADT standalone public company costs to be approximately $68M-$70M, which is consistent with Tyco historical corporate allocation levels.
72
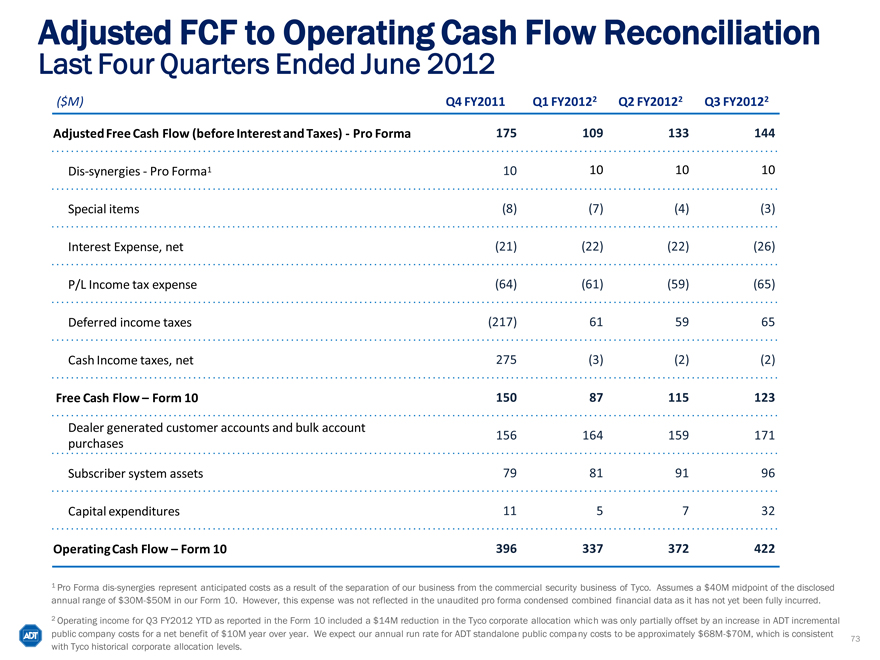
Adjusted FCF to Operating Cash Flow Reconciliation
Last Four Quarters Ended June 2012
($M) Q4 FY2011 Q1 FY20122 Q2 FY20122 Q3 FY20122
Adjusted Free Cash Flow (before Interest and Taxes)—Pro Forma 175 109 133 144
Dis-synergies—Pro Forma1 10 10 10 10
Special items (8) (7) (4) (3)
Interest Expense, net (21) (22) (22) (26)
P/L Income tax expense (64) (61) (59) (65)
Deferred income taxes (217) 61 59 65
Cash Income taxes, net 275 (3) (2) (2)
Free Cash Flow – Form 10 150 87 115 123
Dealer generated customer accounts and bulk account 156 164 159 171
purchases
Subscriber system assets 79 81 91 96
Capital expenditures 11 5 7 32
Operating Cash Flow – Form 10 396 337 372 422
1 Pro Forma dis-synergies represent anticipated costs as a result of the separation of our business from the commercial security business of Tyco. Assumes a $40M midpoint of the disclosed annual range of $30M-$50M in our Form 10. However, this expense was not reflected in the unaudited pro forma condensed combined financial data as it has not yet been fully incurred.
2 Operating income for Q3 FY2012 YTD as reported in the Form 10 included a $14M reduction in the Tyco corporate allocation which was only partially offset by an increase in ADT incremental public company costs for a net benefit of $10M year over year. We expect our annual run rate for ADT standalone public company costs to be approximately $68M-$70M, which is consistent with Tyco historical corporate allocation levels.
73