Exhibit 99.1
 | Presentation to Fixed Income Investors May 2012 |
 | Disclaimer [] This presentation includes certain "forward- looking statements" within the meaning of The U. S. Private Securities Litigation Reform Act of 1995. [] These statements are based on current expectations and currently available information. [] Actual results may differ materially from these expectations due to certain risks, uncertainties and other important factors, including the risk factors set forth in the most recent annual and periodic reports of Toyota Motor Corporation and Toyota Motor Credit Corporation [] We do not undertake to update the forward-looking statements to reflect actual results or changes in the factors affecting the forward-looking statements. [] This presentation does not constitute an offer to sell or a solicitation of an offer to purchase any securities. Any offer or sale of securities will be made only by means of a prospectus and related documentation. 2 |
 | 3 |
 |
TMC Consolidated Financial Results


                                      Fiscal Year Ended March 31,
(JPY billions)             2010     2011     2012
----------------------- -------- -------- -----------------------
Net Revenues            18,950.9 18,993.6 18,583.6
Operating Income (Loss)    147.5   468.2    355.6
Net Income (Loss)         209.4    408.1    283.5


Source: Toyota Motor Corporation FY2010 , FY2011 and FY2012 Financial Summary

4
|
 |
TMC Consolidated Balance Sheet


                                                    FY2011               FY2012
(JPY billions)                           As of March 31, 2011 As of March 31, 2012
---------------------------------------- -------------------- --------------------
Current assets                                     11,829.8              12,321.2
Noncurrent finance receivables, net                5,556.7               5,602.5
Investment and other assets                           6,122.5              6,491.9
Property, plant and equipment, net                   6,309.2               6,235.4
                                         -------------------- --------------------
Total Assets                                      29,818.2              30,651.0
                                         -------------------- --------------------
Liabilities                                       18,898.2              19,584.5
Shareholders' equity                               10,920.0             11,066.5
                                         -------------------- --------------------
Total Liabilities and Shareholders' Equity          29,818.2              30,651.0
                                         -------------------- --------------------


Source: Toyota Motor Corporation FY2011 and FY2012 Financial Summary

5
|
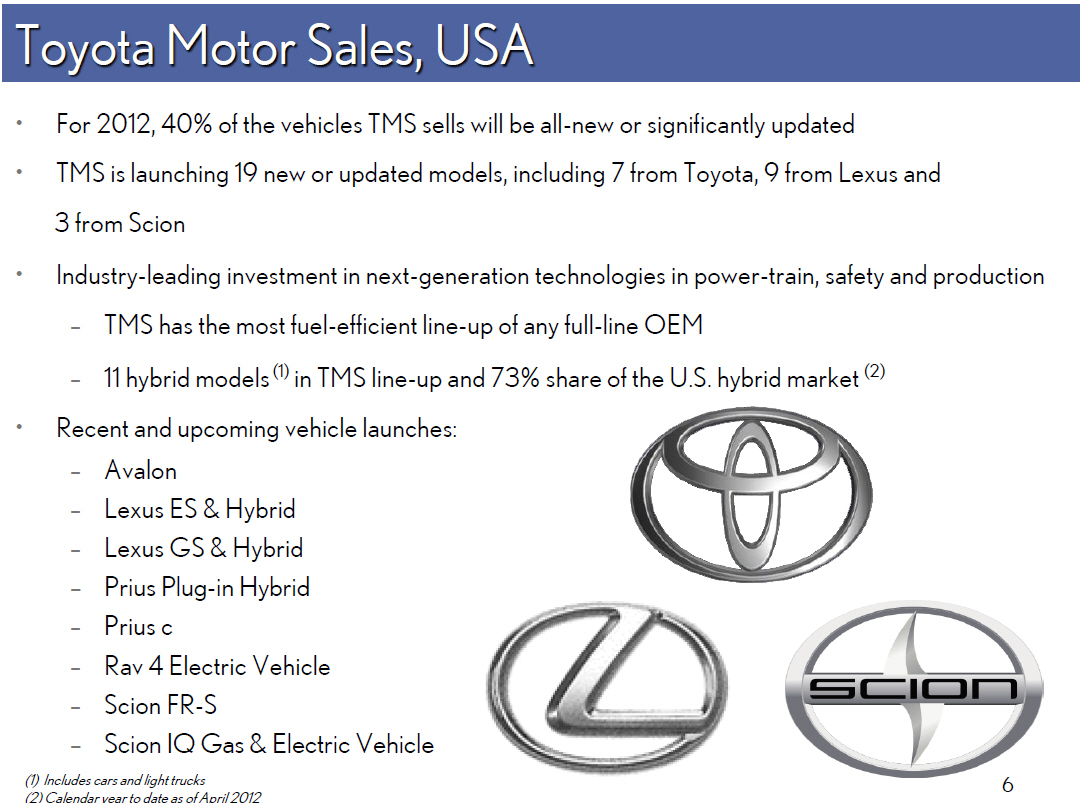 | Toyota Motor Sales, USA [] For 2012, 40% of the vehicles TMS sells will be all-new or significantly updated [] TMS is launching 19 new or updated models, including 7 from Toyota, 9 from Lexus and 3 from Scion [] Industry-leading investment in next-generation technologies in power-train, safety and production -- TMS has the most fuel-efficient line-up of any full-line OEM -- 11 hybrid models (1) in TMS line-up and 73% share of the U. S. hybrid market (2) [] Recent and upcoming vehicle launches: -- Avalon -- Lexus ES and Hybrid -- Lexus GS and Hybrid -- Prius Plug-in Hybrid -- Prius c -- Rav 4 Electric Vehicle -- Scion FR-S -- Scion IQ Gas and Electric Vehicle (1) Includes cars and light trucks 6 (2) Calendar year to date as of April 2012 |
 |
Toyota Motor Sales, USA (2)

[] Quality, safety, reliability and product appeal remain high as reflected by
numerous 3(rd) party accolades


        2012 JD Power Vehicle              2012 IIHS "Top Safety"                     2012 Forbes
          Dependability Study                     TMS earns 16                   "Safest Small Cars"
Lexus ranked #1, Toyota ranked #3  "top safety" awards, more than any    Lexus CT 200H, Scion tC and
     highest non-premium brand                  other automaker                        Toyota Prius
--------------------------------- ----------------------------------- ----------------------------------
                                           Kelley Blue Book 2012
      Consumer Reports' 2012                                                Q42011 Kelley Blue Book
                                              "Best Resale Value"
   Car-Brand Perception Survey                                                      "Brand Loyalty"
                                      Toyota best automotive brand
              Toyota ranks #1                                              Toyota #1; Lexus #1 (luxury)
                                           Lexus best luxury brand
--------------------------------- ----------------------------------- ----------------------------------
                2011 Forbes
         "Safest Trucks of 2011"               2011 Interbrand's                 2011 JD Power IQS:
             8 Toyota and Lexus          "Best Global Green Brands"        Lexus earns 4 segment awards,
              Trucks and SUVs                      Toyota ranks #1      ranks highest among all nameplates
--------------------------------- ----------------------------------- ----------------------------------
           2011 JD Power CSI                 2011 Edmunds.com                  2011 IIHS "Top Safety"
      Lexus ranks highest of any  Lexus receives "Best Retained Value   TMS earns 8 "top safety" awards
                luxury brand              Award" for luxury brands


7
|
 | Toyota Motor Sales, USA (3) Avalon Prius Plug-In 8 |
 | Toyota Motor Sales, USA (4) Lexus GS Prius c 9 |
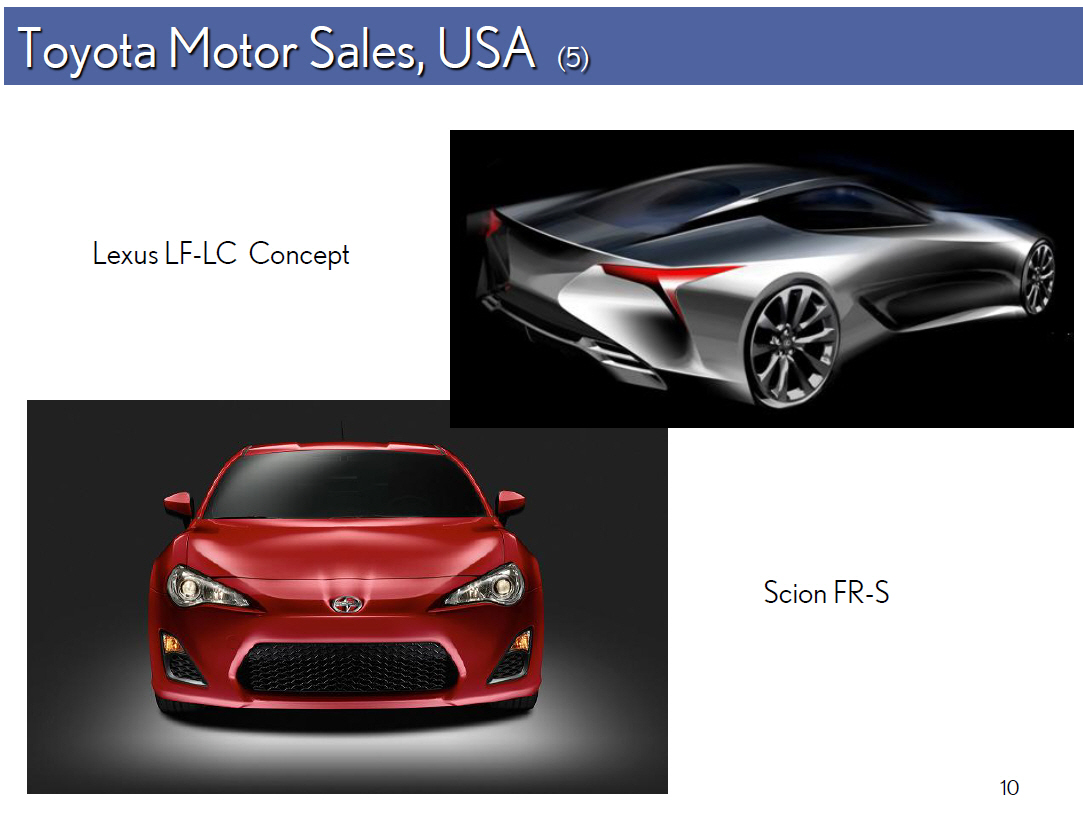 | Toyota Motor Sales, USA (5) Lexus LF-LC Concept Scion FR-S 10 |
 | Toyota Financial Services 11 |
 | TFS Group Global Presence [] 34 Countries and Regions Worldwide 12 |
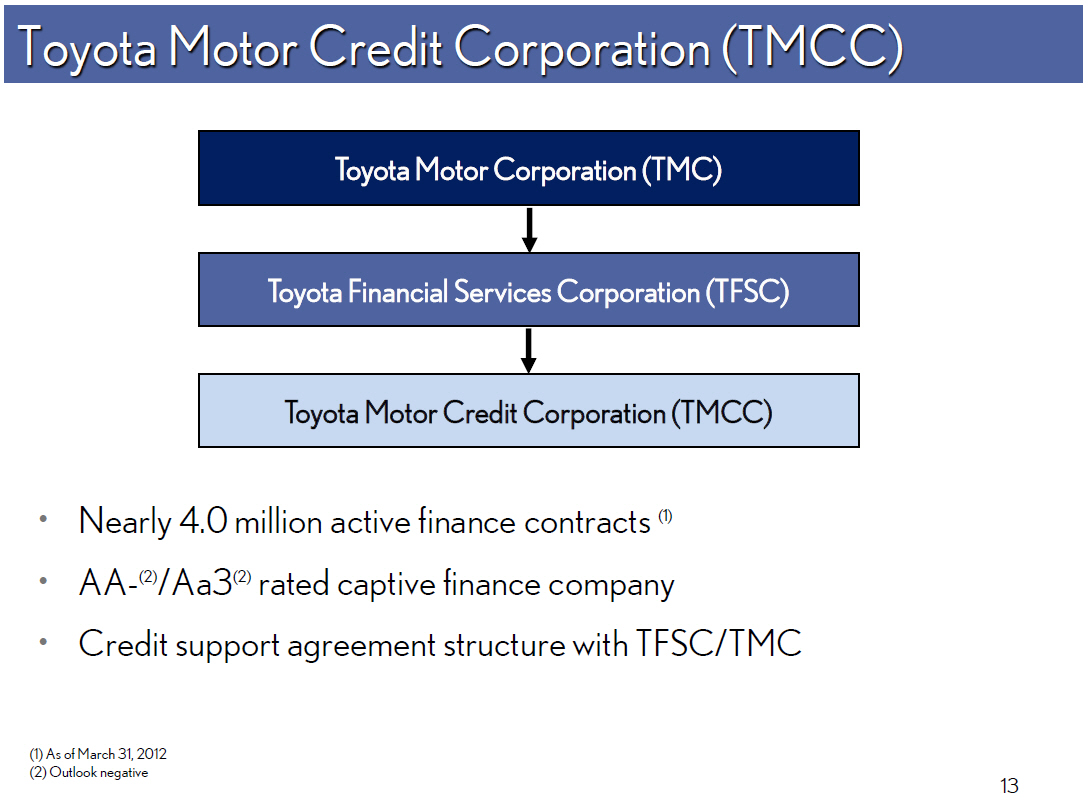 | Toyota Motor Credit Corporation (TMCC) Toyota Motor Corporation (TMC) Toyota Financial Services Corporation (TFSC) Toyota Motor Credit Corporation (TMCC) [] Nearly 4.0 million active finance contracts (1) [] AA- (2)/Aa3(2) rated captive finance company [] Credit support agreement structure with TFSC/TMC (1) As of March 31, 2012 (2) Outlook negative 13 |
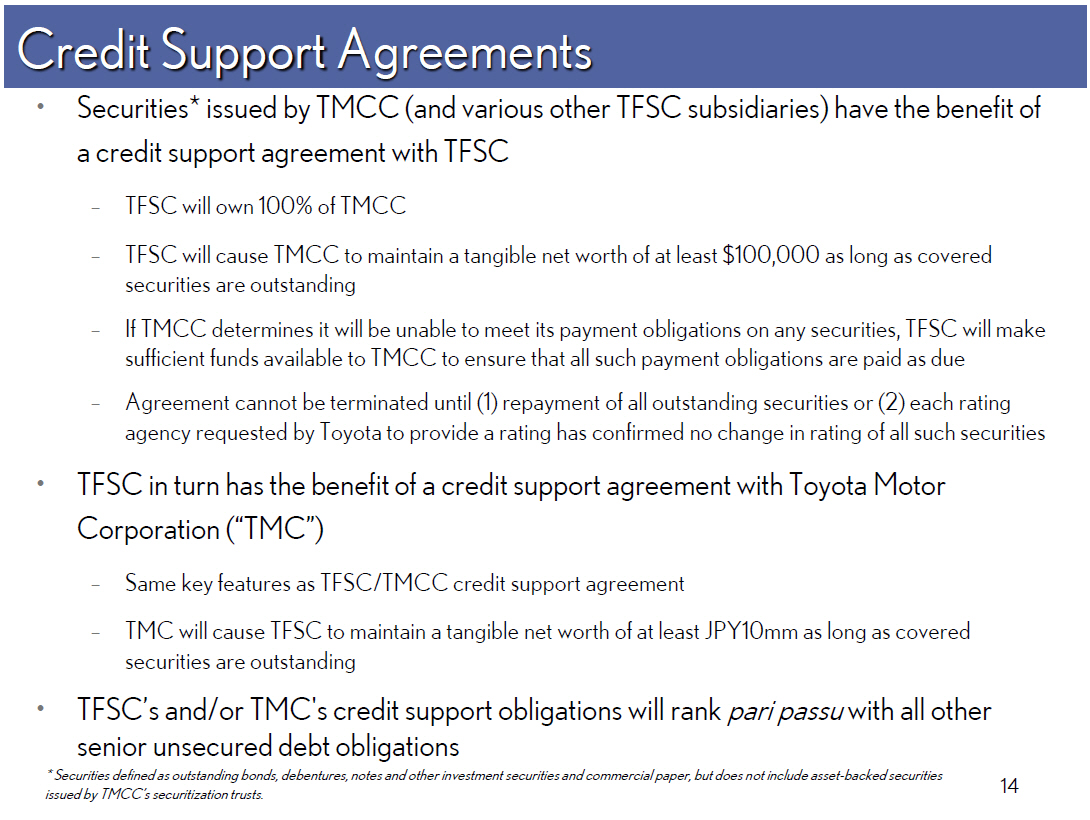 |
Credit Support Agreements

[] Securities* issued by TMCC (and various other TFSC subsidiaries) have the
benefit of a credit support agreement with TFSC

-- TFSC will own 100% of TMCC

-- TFSC will cause TMCC to maintain a tangible net worth of at least $100,000
as long as covered securities are outstanding

-- If TMCC determines it will be unable to meet its payment obligations on any
securities, TFSC will make sufficient funds available to TMCC to ensure that
all such payment obligations are paid as due

-- Agreement cannot be terminated until (1) repayment of all outstanding
securities or (2) each rating agency requested by Toyota to provide a rating
has confirmed no change in rating of all such securities

[] TFSC in turn has the benefit of a credit support agreement with Toyota Motor


Corporation ("TMC")

-- Same key features as TFSC/TMCC credit support agreement

-- TMC will cause TFSC to maintain a tangible net worth of at least JPY10mm as
long as covered securities are outstanding

[] TFSC's and/or TMC's credit support obligations will rank pari passu with all
other senior unsecured debt obligations


* Securities defined as outstanding bonds,debentures, notes and other investment securities and commercialpaper, but does not
 include asset-backed securities
issued by TMCC's securitization trusts.
                          14
|
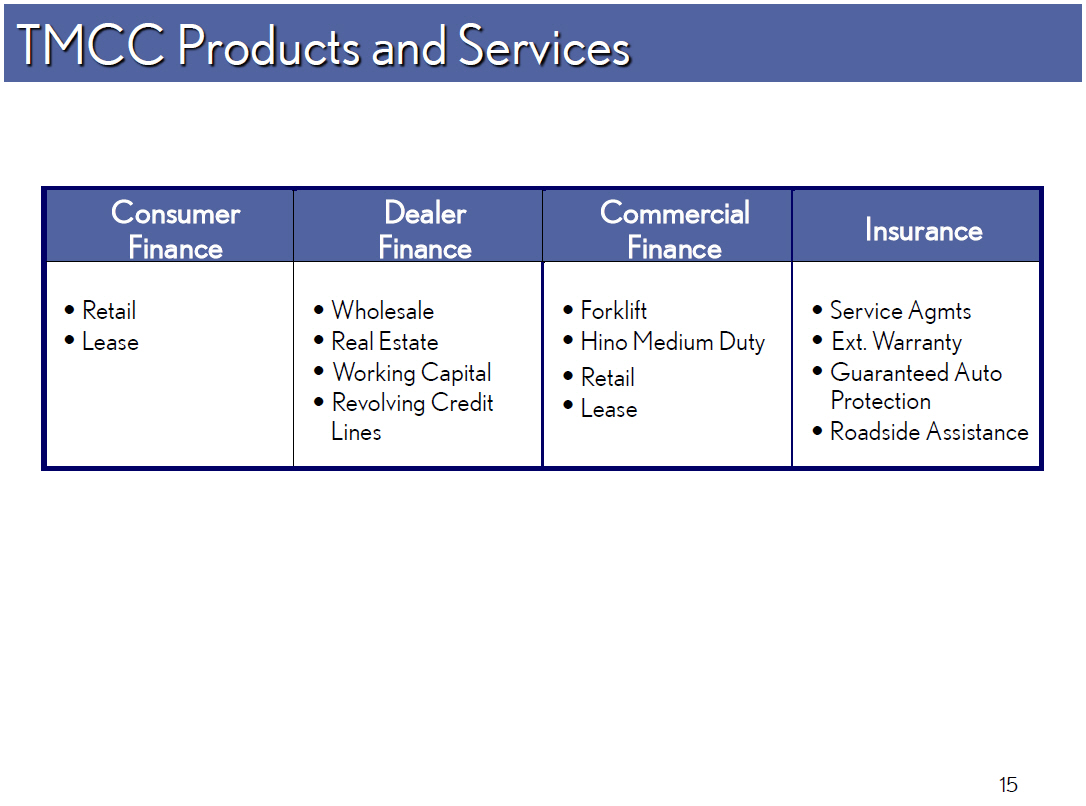 |
TMCC Products and Services


         Consumer                Dealer        Commercial             Insurance
                                                            ----------------------
            Finance             Finance             Finance
------------------- ------------------- ------------------- ----------------------
[] Retail           [] Wholesale        [] Forklift         [] Service Agmts
[] Lease            [] Real Estate      [] Hino Medium Duty [] Ext. Warranty
                    [] Working Capital  [] Retail           [] Guaranteed Auto
                    [] Revolving Credit [] Lease               Protection
                       Lines                                [] Roadside Assistance


15
|
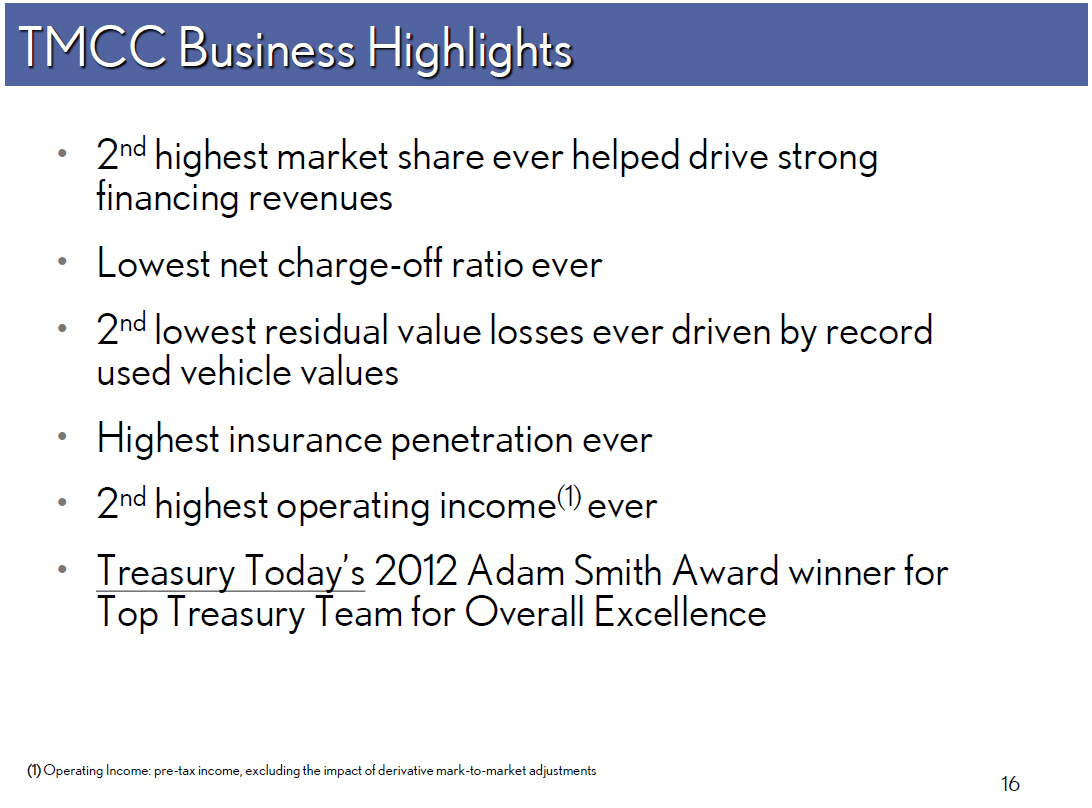 | TMCC Business Highlights [] 2(nd) highest market share ever helped drive strong financing revenues [] Lowest net charge-off ratio ever [] 2(nd) lowest residual value losses ever driven by record used vehicle values [] Highest insurance penetration ever [] 2(nd) highest operating income(1) ever [] Treasury Today's 2012 Adam Smith Award winner for Top Treasury Team for Overall Excellence (1) Operating Income: pre-tax income, excluding the impact of derivative mark-to-market adjustments 16 |
 |
l e s s :  I n t e r e s


                                                                                   a n d d
N e t F i n a n c i n g R e
                                                                                   a n d O
N e t I n c o m e ( L o s


Source: TMCC March 31, 2011 10-K and December 31, 2011 10-Q

17
|
 | TMCC Earning Asset Composition Managed Assets (USD billions) Lease Retail Sold (ABS) Wholesale and Other Source: TMCC March 31, 2011 10-K and December 31, 2011 10-Q 18 |
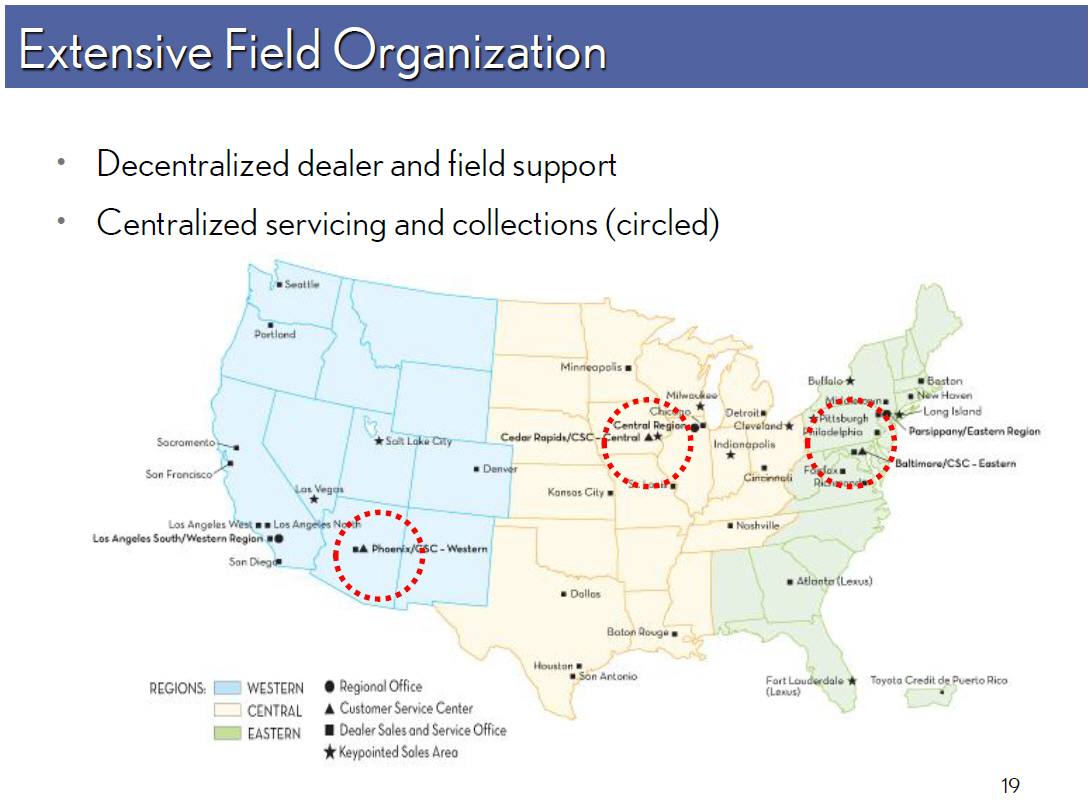 | Extensive Field Organization [] Decentralized dealer and field support [] Centralized servicing and collections (circled) 19 |
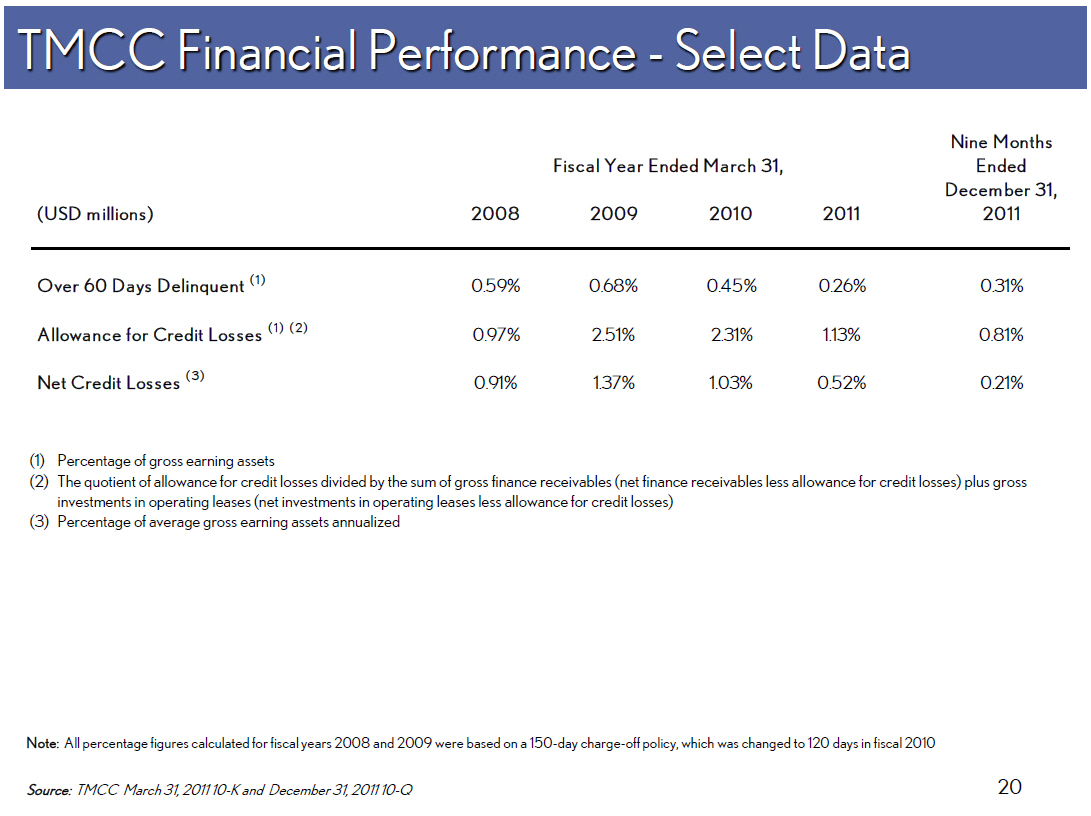 | ( U S D m i l l i o n s ) O v e r 6 0 D a y s D A l l o w a n c e f o r C N e t C r e d i t L o s s e (1) Percentage of gross earning assets (2) The quotient of allowance for credit losses divided by the sum of gross finance receivables (net finance receivables less allowance for credit losses) plus gross investments in operating leases (net investments in operating leases less allowance for credit losses) (3) Percentage of average gross earning assets annualized Note: All percentage figures calculated for fiscal years 2008 and 2009 were based on a 150-day charge-off policy, which was changed to 120 days in fiscal 2010 Source: TMCC March 31, 2011 10-K and December 31, 2011 10-Q 20 |
 | Core Strengths [] Dealer and customer relationships [] Data management and analytics [] Emphasis on innovation and execution excellence [] Tenured and highly engaged associate base and world class leadership team 21 |
 | TMCC Retail Loan Collateral and ABS Transactions 22 |
 | Credit Decisioning and Collections [] Major adjustments to credit decisioning implemented beginning in late 2007 -- Identification and minimization of least desirable segments [] Renewed focus on core Toyota and Lexus business [] Rededication of collections strategy and staff -- Re-trained staff and out-sourced high risk collections -- Emphasis on early intervention -- Optimization of staff and technology resources 23 |
 |
Cr 1

[]

1.00 %
--

-- 0.50%


Cu
          ---
    0.00%
          0


* Abbreviated for presentation purposes Source: Company reports

24
|
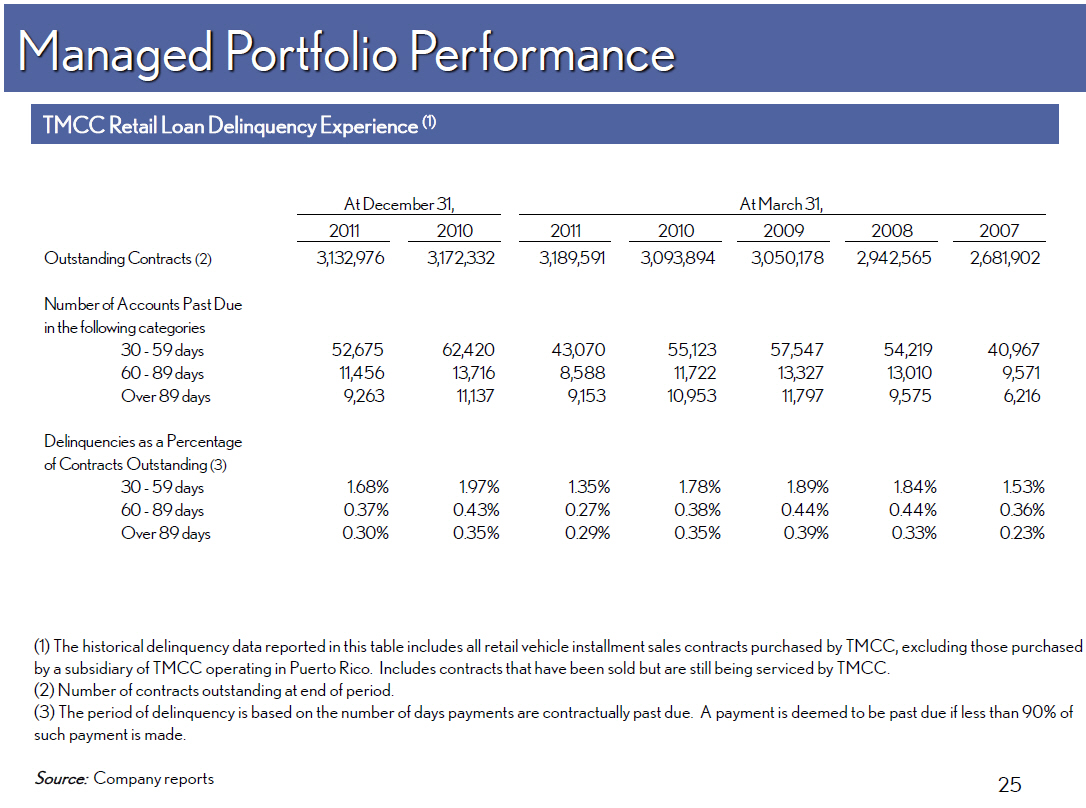 |
Managed Portfolio Performance6

TMCC Retail Loan Delinquency Experience (1)


Delinquencies     as a
of  Contracts Outsta
                                                                                              30 -   5 9
                                                                                              60 -   89
                                                                                              Over       89


(1) The historical delinquency data reported in this table includes all retail
vehicle installment sales contracts purchased by TMCC, excluding those
purchased by a subsidiary of TMCC operating in Puerto Rico. Includes contracts
that have been sold but are still being serviced by TMCC.
(2) Number of contracts outstanding at end of period.
(3) The period of delinquency is based on the number of days payments are
contractually past due. A payment is deemed to be past due if less than 90% of
such payment is made.

Source: Company reports

25
|
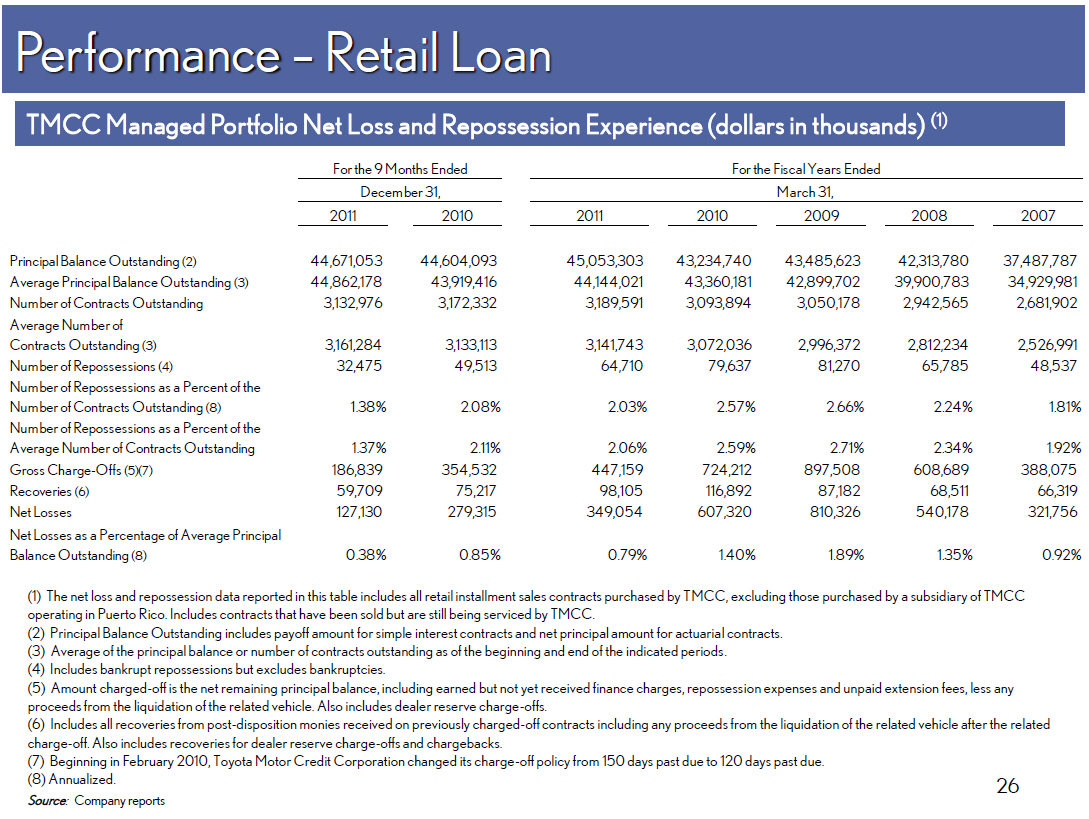 | PerformanceNum -- Retail Loanber o TMCC Average Num Managed Portfolio Net Loss and R possession Experience (dollars in thousands) ber (1) Gross Charge-Offs Recoveries (6) Net Losses Net Losses as a Per Balance Outstandi (1) The net loss and repossession data reported in this table includes all retail installment sales contracts purchased by TMCC, excluding those purchased by a subsidiary of TMCC operating in Puerto Rico. Includes contracts that have been sold but are still being serviced by TMCC. (2) Principal Balance Outstanding includes payoff amount for simple interest contracts and net principal amount for actuarial contracts. (3) Average of the principal balance or number of contracts outstanding as of the beginning and end of the indicated periods. (4) Includes bankrupt repossessions but excludes bankruptcies. (5) Amount charged-off is the net remaining principal balance, including earned but not yet received finance charges, repossession expenses and unpaid extension fees, less any proceeds from the liquidation of the related vehicle. Also includes dealer reserve charge-offs. (6) Includes all recoveries from post-disposition monies received on previously charged-off contracts including any proceeds from the liquidation of the related vehicle after the related charge-off. Also includes recoveries for dealer reserve charge-offs and chargebacks. (7) Beginning in February 2010, Toyota Motor Credit Corporation changed its charge-off policy from 150 days past due to 120 days past due. (8) Annualized. 26 Source: Company reports |
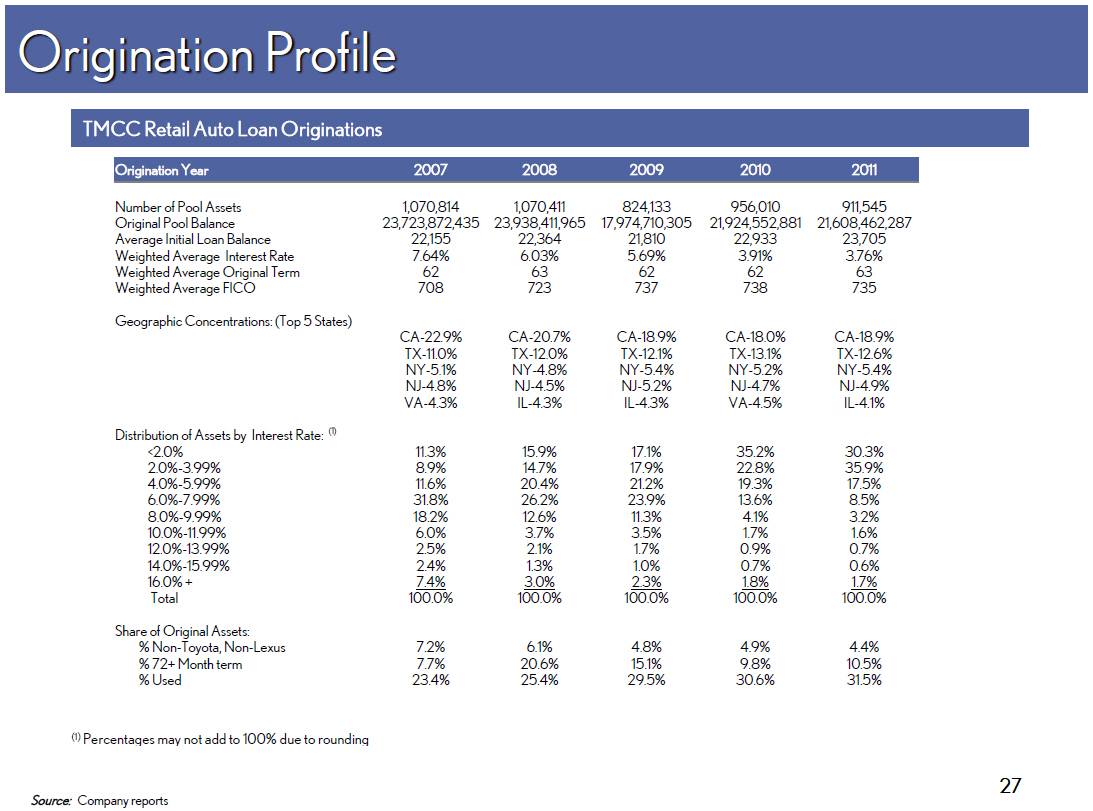 |
Origination Profile

TMCC Retail Auto Loan Originations

Share of Original
                                          % Non-
                                          % 72+ Month
                                          % Used


(1) Percentages may not add to 100% due to rounding

Source: Company reports

27
|
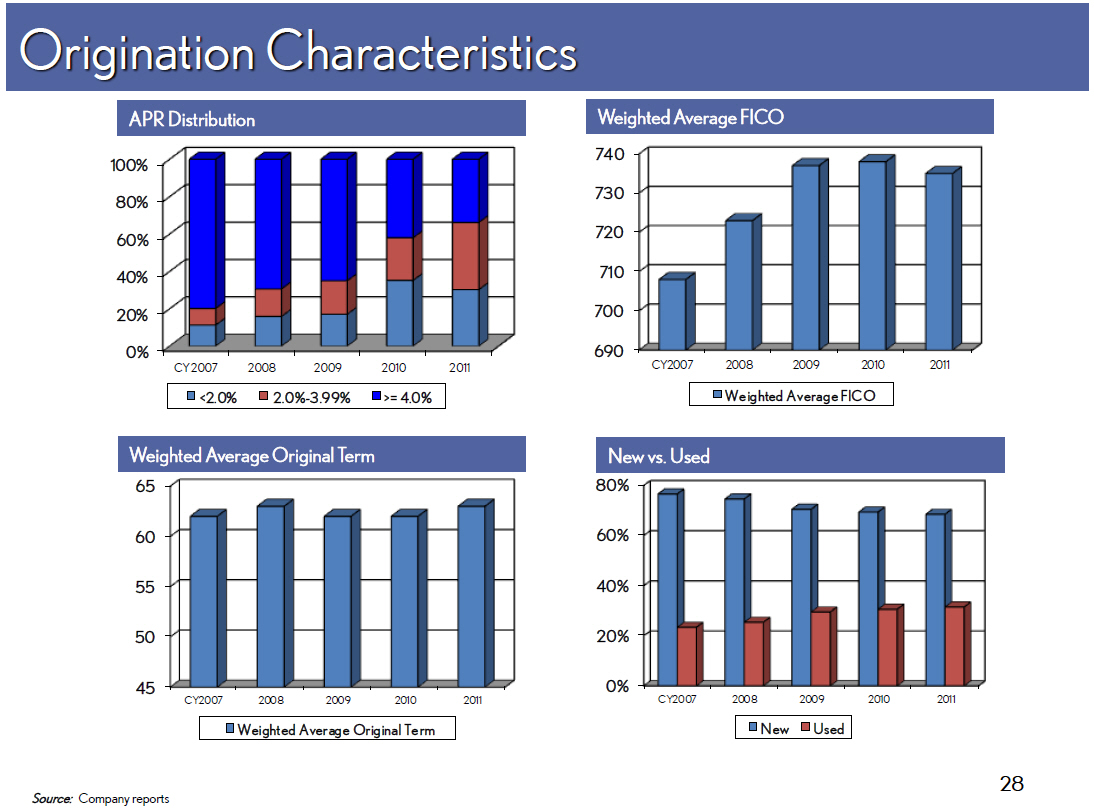 |
Origination 40% Characteristics
65

APR Distribution
                    20%
                     60
                           0%
                              CY
                     55

           Weighted Average FICO
                                 ---
     700
                                 ---
     60%
                                 ---
     690
2007              2008               CY2007
       <2.0% 40%                 2.0%-

Weighted Average Original Term
                      45
                               CY20

New vs. (Used)20%
                      0%
                        200 8 CY20
         Weighted Average


Source: Company reports

28
|
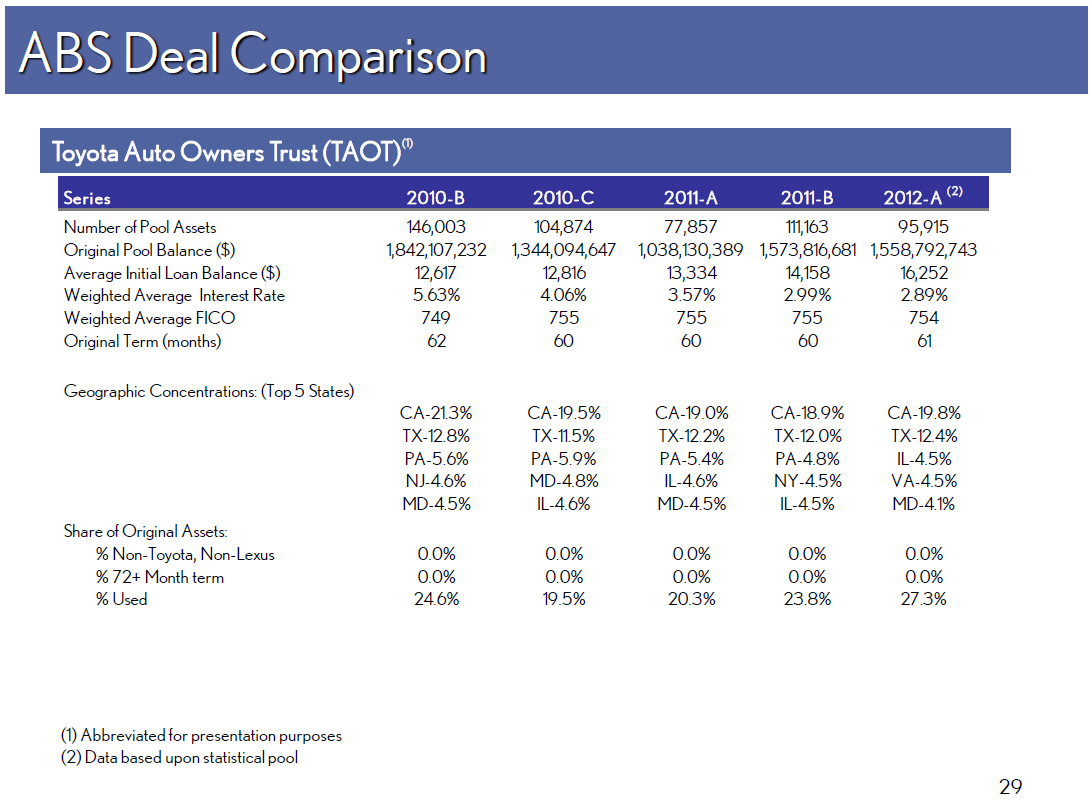 |
ABS Deal Comparison

Toyota Auto Owners Trust (TAOT)(1)


Share of Origina
                                                 % Non- Toy
                                                 % 72+ Mon
                                                 % Used


(1) Abbreviated for presentation purposes (2) Data based upon statistical pool


29
|
 |
TAOT Deal Performance

As of April 15, 2012 Payment Date


       0.50%

       0.45%

                        ---- ---- ---- ---- ---- ---- ---- ------ ---- ---- ---- ---- ---- ---- ---- ---- ---- --- --- ----- ----
 --- ---
       0.40%            T r a n s a c t i o n              M o o d y ' s         E L                S and P ' s        E L

                        ----------------------------- ---- --------------------- --------- ---- ------------------ --------- ----
 --- ---
                        TAOT 2010-A                        1.25% (1)                                1.70%          -   1.90%
  (
                        ---------------------------------- --------------------- ---- ---- ---- ------------------ ---
 -------------- ---
       0.35%            TAOT 2010-B                        1.25% (1)                                1.50%          -   1.70%
  (
                        ----------------------------- ---- --------------------- ---- ---- ---- ------------------ ---
 -------------- ---
                        TAOT 2010-C                        1.15%        (1)                         1.4 0%         -   1.60%
  (
                        ---------------------------------- ----------- --------- ---- ---- ---- ------------------ ---
 -------------- ---
       0.30%            TAOT 2011-A                        1.15%                                    1.4 0%         -   1.60%

                        ----------------------------- ==== ----------- ---- ==== ==== ==== ==== ------------------ ---
 -------------- ===
       0.25%            TAOT 2011-B                        0.85%                                    1.15%      - 1.35%

                        -----------------------------      ----------------                     --------------
 ----------------------
       0.20%

        0.15%

        0.10%

       0.05%

              ---- ---- ---- ---- ---- ==== ==== ---- ---- ------ ---- ---- ---- ---- ---- ---- ---- ---- ---- --- --- ----- ----
 --- ---
       0.00%

                1   2     3   4    5    6     7   8    9      10   11   12   13   14   15   16   17   18   19   20       21   22
 23
------------- ---- ---- ---- ---- ---- ---- ---- ---- ---- ------ ---- ---- ---- ---- ---- ---- ---- ---- ---- ------- ----- ----
 -------
TAOT 2010-A   0.00 0.01 0.04 0.06 0.07 0.10 0.12 0.15 0.18   0.20 0.21 0.22 0.23 0.25 0.26 0.27 0.28 0.29 0.29 0.31     0.32 0.32
 0.32
------------- ---- ---- ---- ---- ---- ---- ---- ---- ---- ------ ---- ---- ---- ---- ---- ---- ---- ---- ---- ------- ----- ----
 -------
TAOT 2010-B   0.00 0.00 0.00 0.02 0.06 0.08 0.11 0.13 0.14   0.15 0.16 0.17 0.18 0.20 0.21 0.22 0.22 0.23 0.23 0.23     0.23

------------- ---- ---- ---- ---- ---- ---- ---- ---- ---- ------ ---- ---- ---- ---- ---- ---- ---- ---- ---- ------- ----- ----
 --- ---
TAOT 2010-C   0.00 0.00 0.01 0.02 0.05 0.06 0.07 0.09 0.09 0.10   0.12 0.13 0.13 0.14 0.16 0.17 0.18 0.18 0.19

------------- ---- ---- ---- ---- ---- ---- ---- ---- ----------- ---- ---- ---- ---- ---- ---- ---- ---- ---- --- --- ----- ----
 --- ---
TAOT 2011-A   0.00 0.00 0.01 0.03 0.04 0.07 0.08 0.10 0.12   0.12 0.13 0.13 0.14 0.14

------------- ---- ---- ---- ---- ---- ---- ---- ---- ---- ------ ---- ---- ---- ---- ---- ---- ---- ---- ---- --- --- ----- ----
 --- ---
TAOT 2011-B   0.00 0.00 0.00 0.02 0.03 0.04 0.04

------------- ---- ---- ---- ---- ---- ---- ---- ---- ---- ------ ---- ---- ---- ---- ---- ---- ---- ---- ---- --- --- ----- ----
 --- ---

(1) Moody's cumulative net loss assumption at initial transaction rating. On September 15, 2011, Moody's announced that it had
 decreased the transaction CNL assumptions to
    0.45%-0.70% for 2010-A and 2010-B and 0.35%-0.60% for 2010-C.
(2) Standard and Poors cumulative net loss assumption at initial transaction rating. On January 17, 2012, Standard and Poors announced
 that it had decreased the transaction CNL
    assumptions to 0.45%-0.55% for 2010-A, 0.40%-0.50% for 2010-B and 0.35%-0.45% for 2010-C.


Source: Company reports

30
|
 | TMCC Funding Programs 31 |
 | Exceptional Liquidity [] A-1+/P-1 Direct Commercial Paper Program [] Backed by $ 13 billion multi-party back-stop credit facilities: $ 5 billion 364-day; $ 5 billion 3-year; $ 3 billion 5-year [] $ 10.2 billion Short-term Investment Portfolio (1) [] Over $ 50 billion in salable retail loan and lease receivables [] Access to various domestic and international term markets [] Billions of additional capacity in Global Benchmark Markets [] Inter-company lending infrastructure [] Credit Support Agreements: TMCC []TFSC [] TMC (1) Average balance for quarter ended December 31, 2011 Source:TMCC December 31,2011 10-Q 32 |
 | TMCC Funding Program Objectives [] TMCC is committed to: -- Maintaining funding diversity and exceptional liquidity -- Issuing into strong demand with attractive deals -- Identifying and developing new markets and investor relationships -- Responding quickly to opportunities with best-in-class execution 33 |
 | Diversity in Debt Offerings TMCC Term Debt Outstanding By Deal Type By Currency As of March 31, 2012 Source: Company Reports 34 |
 |
Funding Flexibility


Focus on More Diverse Maturities in USD Issuance(1)


       5% 3yr FY'09             FY'10              FY'11              FY'12
                                3yr                  1yr             10yr
        2yr                 2yr 15%            10yr  16%     2yr     16%     1yr
        19%                 8%                 24%           7%             37%
18 mth
 2%                                                              5yr
                                                         3yr     21%
                        1yr                1yr           17%
                                                 5yr
                       74%                77%                           3yr
                                                36%                    19%
                                                                              2yr
                                                                              7%


(1) Unsecured U.S. MTN issuance, excluding Structured Notes and Retail Notes.

Source: Company Reports

35
|
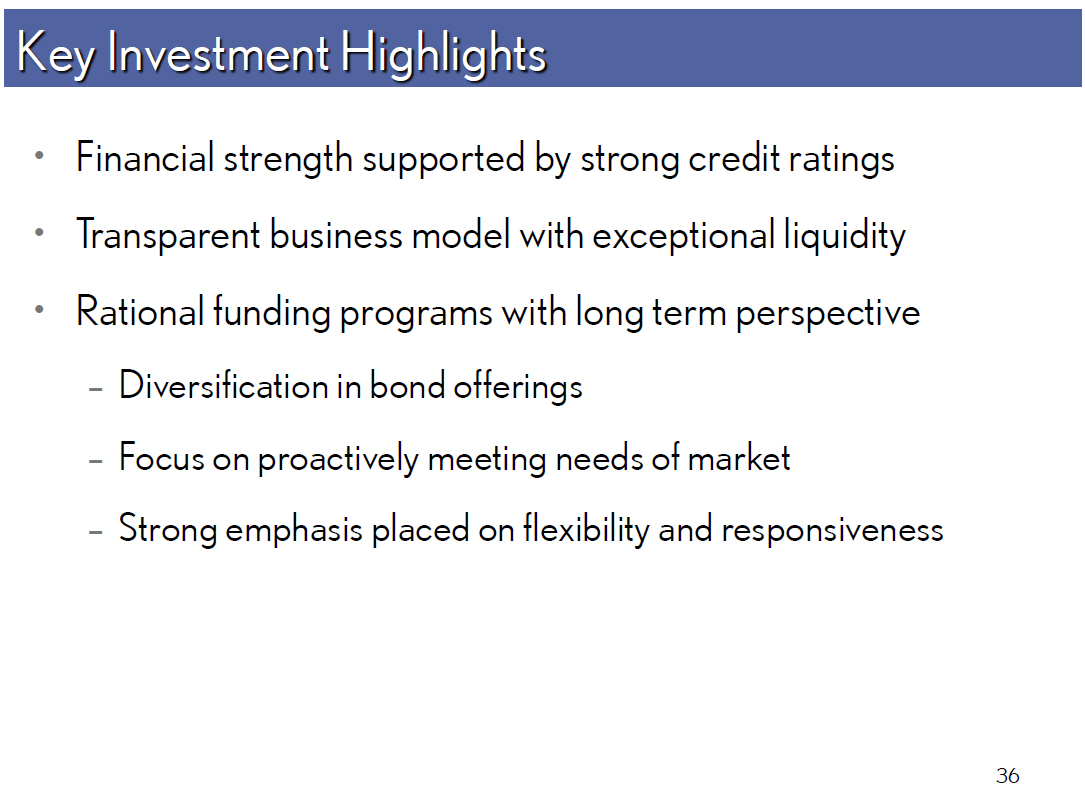 | Key Investment Highlights [] Financial strength supported by strong credit ratings [] Transparent business model with exceptional liquidity [] Rational funding programs with long term perspective -- Diversification in bond offerings -- Focus on proactively meeting needs of market -- Strong emphasis placed on flexibility and responsiveness 36 |
 |