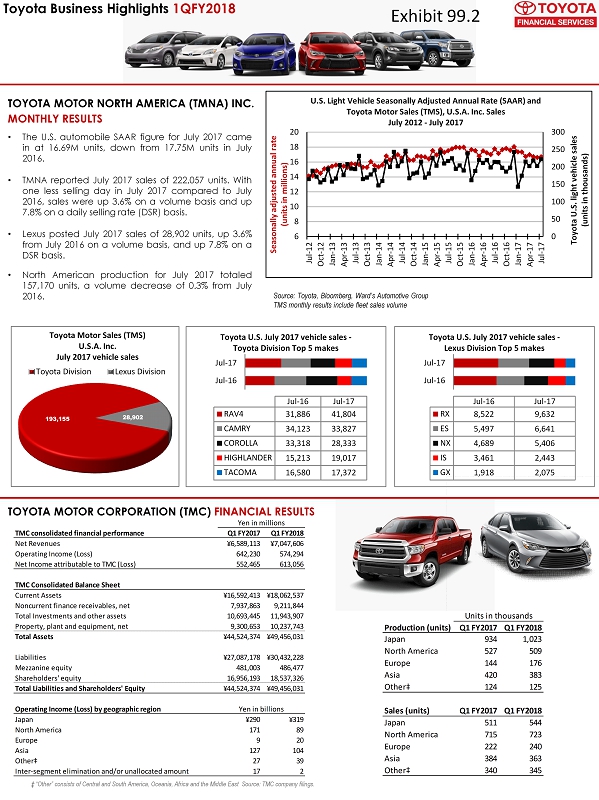
• The U . S . automobile SAAR figure for July 2017 came in at 16 . 69 M units, down from 17 . 75 M units in July 2016 . • TMNA reported July 2017 sales of 222 , 057 units . With one less selling day in July 2017 compared to July 2016 , sales were up 3 . 6 % on a volume basis and up 7 . 8 % on a daily selling rate (DSR) basis . • Lexus posted July 2017 sales of 28 , 902 units, up 3 . 6 % from July 2016 on a volume basis, and up 7 . 8 % on a DSR basis . • North American production for July 2017 totaled 157 , 170 units, a volume decrease of 0 . 3 % from July 2016 . Source: Toyota, Bloomberg, Ward’s Automotive Group TMS monthly results include fleet sales volume ‡ “Other” consists of Central and South America, Oceania, Africa and the Middle East Source : TMC company filings . TOYOTA MOTOR NORTH AMERICA (TMNA) INC . MONTHLY RESULTS TOYOTA MOTOR CORPORATION (TMC) FINANCIAL RESULTS Toyota Business Highlights 1QFY2018 Jul-16 Jul-17 Jul-16 Jul-17 RAV4 31,886 41,804 CAMRY 34,123 33,827 COROLLA 33,318 28,333 HIGHLANDER 15,213 19,017 TACOMA 16,580 17,372 Toyota U.S. July 2017 vehicle sales - Toyota Division Top 5 makes Jul-16 Jul-17 Jul-16 Jul-17 RX 8,522 9,632 ES 5,497 6,641 NX 4,689 5,406 IS 3,461 2,443 GX 1,918 2,075 Toyota U.S. July 2017 vehicle sales - Lexus Division Top 5 makes 0 50 100 150 200 250 300 6 8 10 12 14 16 18 20 Jul-12 Oct-12 Jan-13 Apr-13 Jul-13 Oct-13 Jan-14 Apr-14 Jul-14 Oct-14 Jan-15 Apr-15 Jul-15 Oct-15 Jan-16 Apr-16 Jul-16 Oct-16 Jan-17 Apr-17 Jul-17 Toyota U.S. light vehicle sales (units in thousands) Seasonally adjusted annual rate (units in millions) U.S. Light Vehicle Seasonally Adjusted Annual Rate (SAAR) and Toyota Motor Sales (TMS), U.S.A. Inc. Sales July 2012 - July 2017 TMC consolidated financial performance Q1 FY2017 Q1 FY2018 Net Revenues ¥6,589,113 ¥7,047,606 Operating Income (Loss) 642,230 574,294 Net Income attributable to TMC (Loss) 552,465 613,056 TMC Consolidated Balance Sheet Current Assets ¥16,592,413 ¥18,062,537 Noncurrent finance receivables, net 7,937,863 9,211,844 Total Investments and other assets 10,693,445 11,943,907 Property, plant and equipment, net 9,300,653 10,237,743 Total Assets ¥44,524,374 ¥49,456,031 Liabilities ¥27,087,178 ¥30,432,228 Mezzanine equity 481,003 486,477 Shareholders' equity 16,956,193 18,537,326 Total Liabilities and Shareholders' Equity ¥44,524,374 ¥49,456,031 Operating Income (Loss) by geographic region Japan ¥290 ¥319 North America 171 89 Europe 9 20 Asia 127 104 Other‡ 27 39 Inter-segment elimination and/or unallocated amount 17 2 Yen in millions Yen in billions Production (units) Q1 FY2017 Q1 FY2018 Japan 934 1,023 North America 527 509 Europe 144 176 Asia 420 383 Other‡ 124 125 Sales (units) Q1 FY2017 Q1 FY2018 Japan 511 544 North America 715 723 Europe 222 240 Asia 384 363 Other‡ 340 345 Units in thousands 193,155 28,902 Toyota Motor Sales ( TMS) U.S.A . Inc. July 2017 vehicle sales Toyota Division Lexus Division Exhibit 99.2
TOYOTA MOTOR CREDIT CORPORATION (TMCC) FINANCIAL RESULTS • Our consolidated net income was $ 165 million for the first quarter of fiscal 2018 compared to net income of $ 241 million for the same period of fiscal 2017 . The decrease in net income for the first quarter of fiscal 2018 compared to the same period in fiscal 2017 was primarily due to a $ 141 million increase in interest expense, a $ 92 million increase in depreciation on operating leases and a $ 33 million increase in provision for credit losses, partially offset by a $ 140 million increase in total financing revenues, and a $ 50 million decrease in provision for income taxes . • We recorded a provision for credit losses of $ 85 million for the first quarter of fiscal 2018 compared to $ 52 million for the same period in fiscal 2017 . Despite declines in delinquencies, default frequency and average loss severity in the current period, the increase in the provision for credit losses for the first quarter of fiscal 2018 was due to increasing trends in our credit loss experience over the last few years . Our provision for credit losses was further impacted by deterioration in the financial performance of certain dealers and an increase in the specific reserve for certain impaired dealers . • Our delinquencies were relatively consistent for the first quarter of fiscal 2018 compared to the same period in fiscal 2017 , but increased from 0 . 27 percent at March 31 , 2017 to 0 . 31 percent at June 30 , 2017 . Despite declines as compared to the same period in fiscal 2017 , we have seen increasing trends in delinquencies, default frequency, and average loss severity over the last few years . Changes in the economy that impact the consumer such as increasing interest rates, and a rise in the unemployment rate as well as higher debt balances, coupled with deterioration in actual and expected used vehicle values, could result in increases to our credit losses . 1 TFS market share represents the percentage of total domestic TMS sales of new Toyota and Lexus vehicles financed by us, excluding sales under dealer rental car and commercial fleet programs and sales of a private Toyota distributor * TMCC consumer portfolio includes TMCC and its consolidated subsidiaries SHORT - TERM FUNDING PROGRAMS • Toyota Motor Credit Corporation (TMCC ) ‡ , Toyota Credit de Puerto Rico Corp . (TCPR), Toyota Credit Canada Inc . (TCCI )†, Toyota Finance Australia Limited ( TFA) † and Toyota Motor Finance (Netherlands) B . V . ( TMFNL )† maintain direct relationships with institutional commercial paper investors through TMCC’s Sales & Trading team , providing each access to a variety of domestic and global markets through five, distinct 3 (a)( 3 ) programs . • TMCC ‡ commercial paper outstanding under our commercial paper programs ranged from approximately $ 26 . 5 billion to $ 28 . 5 billion during the quarter ended June 30 , 2017 , with an average outstanding balance of $ 27 . 4 billion . As of June 30 , 2017 , our commercial paper had a weighted average remaining maturity of 104 days . † TCCI, TFA, TMFNL and TMCC are subsidiaries of Toyota Financial Services Corporation, a wholly - owned subsidiary of Toyota Motor Corporation ‡ TMCC consolidated financial liabilities include TMCC and its consolidated subsidiaries, which includes TCPR LET’S GO PLACES • In July 2017 , Toyota Financial Services moved into its new state - of - the - art North American Headquarters in Plano , Texas and joined Toyota Motor North America, Inc . to pursue the One Toyota vision in North America . Please reference the Investor Relations section of toyotafinancial . com , for important information and filings . Forward looking statements are subject to risks and uncertainties that could cause actual results to fall short of current ex pec tations. Toyota and its affiliates discuss these risks and uncertainties in filings they make with the Securities and Exchan ge Commission. This presentation does not constitute an offer to purchase any securities. Any offer or sale of securities will be made only by means of a prospectus a nd related documentation . The Sales & Trading team engages in direct dialogue with institutional investors delivering a variety of fixed income products to meet our clients’ investment objectives and risk tolerances . We focus on providing simple, personal, and proactive service in the execution of all trades . Sales and Trading Contacts Jason Kelley | Region Manager (469) 486 - 5301 jason.kelley@toyota.com Norman Brem | Funding & Liquidity Analyst (469) 486 - 6760 norman.brem@toyota.com Peter Pang | Funding & Liquidity Analyst (469) 486 - 5244 peter.pang@toyota.com Nicholas Ro, CFA | National Manager (469) 786 - 8961 nicholas.ro@toyota.com Jeffrey DeSilva | Region Manager (469) 486 - 6759 jeffrey.desilva@toyota.com Andrew Huang, CFA | Funding & Liquidity Analyst (469) 786 - 8219 andrew.huang@toyota.com 62.2% 58.7% Q1 FY2017 Q1 FY2018 TFS - Market Share 1 Q1 FY2017 Q1 FY2018 63.2% 30.6% 84.2% 55.8% 30.9% 90.8% 0% 20% 40% 60% 80% 100% New retail contracts Used retail contracts Lease contracts TMCC - Percentage of Contracts Subvened Q1 FY2017 Q1 FY2018 144 72 152 147 68 131 0 100 200 New retail contracts Used retail contracts Lease contracts units in thousands TMCC - Vehicle Financing Volume Q1 FY2017 Q1 FY2018 0.00% 0.25% 0.50% Q1 FY2014 Q1 FY2015 Q1 FY2016 Q1 FY2017 Q1 FY2018 TMCC - Consumer Portfolio Credit Performance* Net charge-offs as a percentage of average gross earning assets Aggregate balances for accounts 60 or more days past due as a percentage of gross earning assets TMCC Financial Performance Q1 FY2017 Q1 FY2018 Total financing revenues $2,458 $2,598 Income before income taxes 387 261 Net Income 241 165 Debt-to-Equity Ratio 9.8x 10.2x U.S. dollars in millions 27.4 26.5 53.7 58.5 14.1 13.8 $0 $10 $20 $30 $40 $50 $60 $70 $80 $90 $100 $110 6/30/2016 6/30/2017 Amount ($billions) TMCC Consolidated Financial Liabilities Comparison Secured notes & loans payable Unsecured notes & loans payable Commercial Paper