
Toyota Business Highlights Q3FY2020 TOYOTA MOTOR NORTH AMERICA, INC. (Toyota U.S.) MONTHLY RESULTS • The U . S . automobile SAAR figure for January 2020 came in at 16 . 8 M units, up from January 2019 at 16 . 6 M units . • Toyota U . S . reported January 2020 sales of 165 , 865 units, a increase of 6 . 3 % on a volume basis and a increase of 6 . 3 % on a daily selling rate (DSR) basis versus January 2019 . • Lexus division posted January 2020 sales of 19 , 621 units, up 12 . 6 % on a volume basis and up 12 . 6 % on a DSR basis versus January 2019 . • North American production as a percentage of U . S . sales for January 2020 was 71 . 6 % , up from 69 . 9 % in January 2019 . Source: Toyota, Bloomberg, Ward’s Automotive Group Toyota U.S. monthly results include fleet sales volume TOYOTA MOTOR CORPORATION (TMC) FINANCIAL RESULTS ‡ “Other” consists of Central and South America, Oceania, Africa, Middle East and Other Source: TMC company filings. 0 50 100 150 200 250 300 6 8 10 12 14 16 18 20 Jan-15 Apr-15 Jul-15 Oct-15 Jan-16 Apr-16 Jul-16 Oct-16 Jan-17 Apr-17 Jul-17 Oct-17 Jan-18 Apr-18 Jul-18 Oct-18 Jan-19 Apr-19 Jul-19 Oct-19 Jan-20 Toyota U.S. Light Vehicle Sales (units in thousands) Seasonally Adjusted Annual Rate (units in millions) U.S. Light Vehicle Seasonally Adjusted Annual Rate (SAAR) and Toyota U.S. Sales January 2015 - January 2020 SAAR Toyota U.S. Sales 146,244 19,621 Toyota Division Lexus Division Toyota U.S. January 2020 Vehicle Sales Jan-20 Jan-19 Jan-20 Jan-19 RAV4 33,130 24,505 CAMRY 24,824 23,802 COROLLA 23,477 25,113 TACOMA 17,112 16,852 HIGHLANDER 17,009 14,413 Toyota U.S. January Vehicles Sales - Toyota Division Top 5 Models Jan-20 Jan-19 Jan-20 Jan-19 RX 7,377 5,508 NX 3,826 3,982 ES 3,037 3,144 GX 1,804 1,508 UX 1,504 791 Toyota U.S. January Vehicles Sales - Lexus Division Top 5 Models
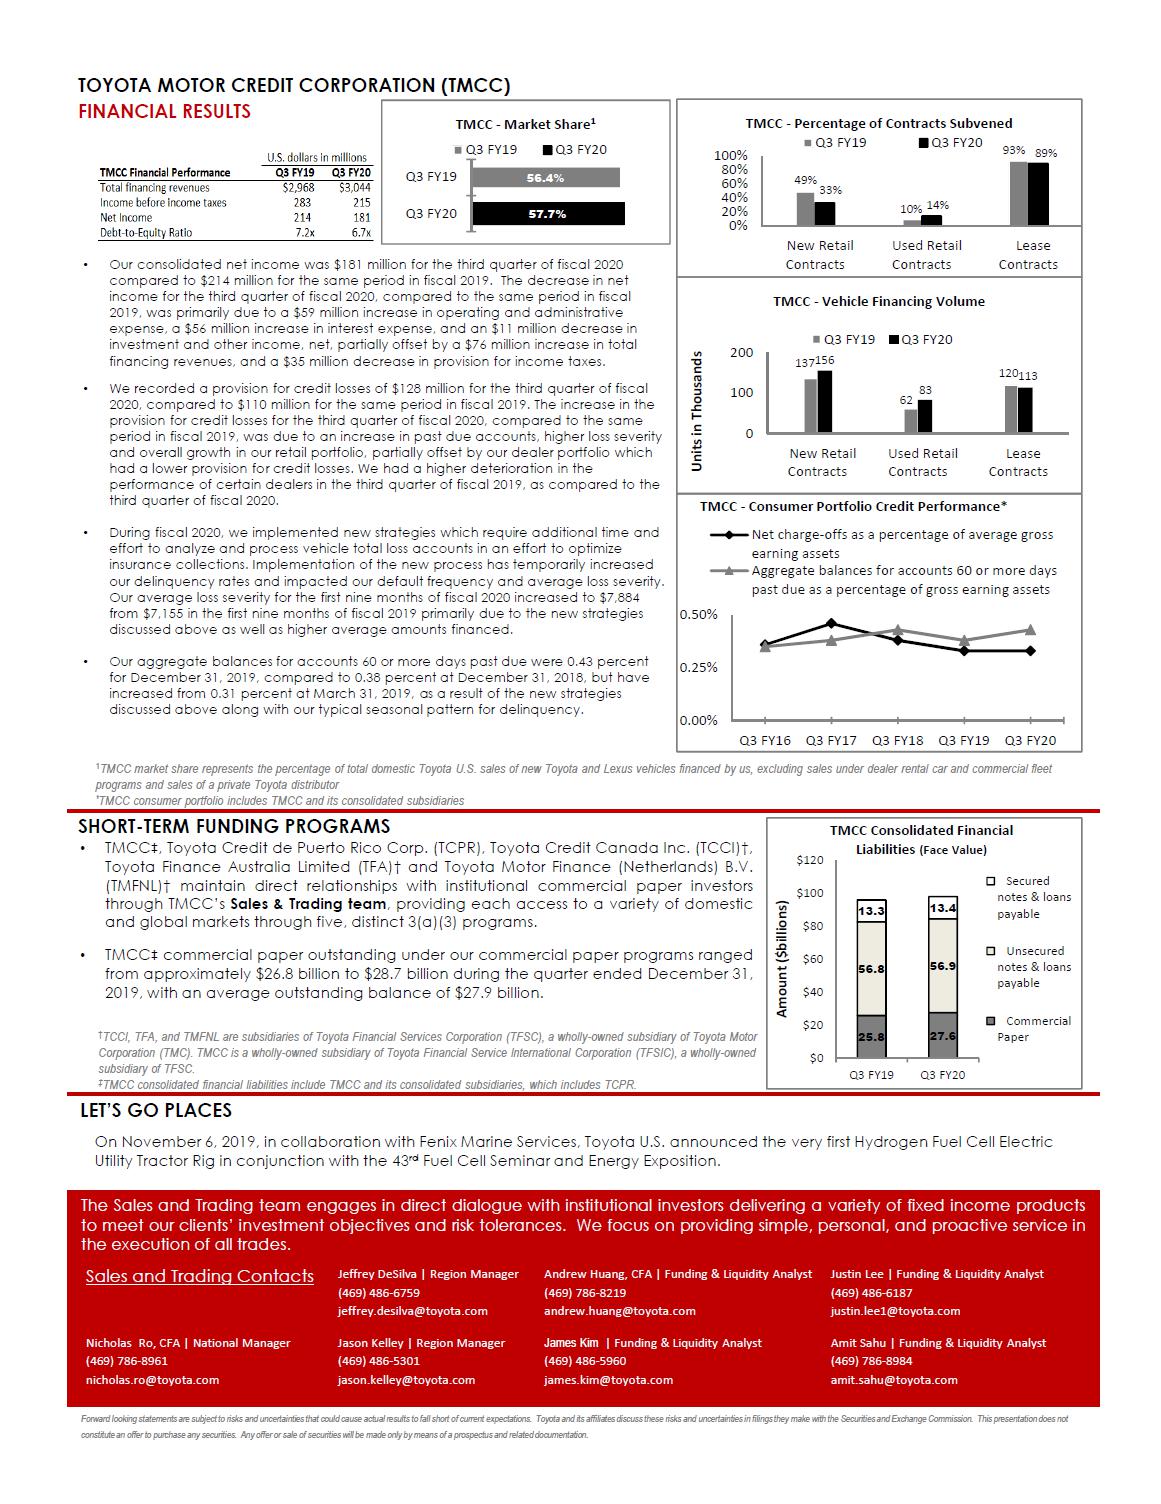
TOYOTA MOTOR CREDIT CORPORATION (TMCC) FINANCIAL RESULTS • Our consolidated net income was $181 million for the third quarter of fiscal 2020 compared to $214 million for the same period in fiscal 2019. The decrease in net income for the third quarter of fiscal 2020, compared to the same period in fiscal 2019, was primarily due to a $59 million increase in operating and administrative expense, a $56 million increase in interest expense, and an $11 million decrease in investment and other income, net, partially offset by a $76 million increase in total financing revenues, and a $35 million decrease in provision for income taxes. • We recorded a provision for credit losses of $128 million for the third quarter of fiscal 2020, compared to $110 million for the same period in fiscal 2019. The increase in the provision for credit losses for the third quarter of fiscal 2020, compared to the same period in fiscal 2019, was due to an increase in past due accounts, higher loss severity and overall growth in our retail portfolio, partially offset by our dealer portfolio which had a lower provision for credit losses. We had a higher deterioration in the performance of certain dealers in the third quarter of fiscal 2019, as compared to the third quarter of fiscal 2020. • During fiscal 2020, we implemented new strategies which require additional time and effort to analyze and process vehicle total loss accounts in an effort to optimize insurance collections. Implementation of the new process has temporarily increased our delinquency rates and impacted our default frequency and average loss severity. Our average loss severity for the first nine months of fiscal 2020 increased to $7,884 from $7,155 in the first nine months of fiscal 2019 primarily due to the new strategies discussed above as well as higher average amounts financed. • Our aggregate balances for accounts 60 or more days past due were 0.43 percent for December 31, 2019, compared to 0.38 percent at December 31, 2018, but have increased from 0.31 percent at March 31, 2019, as a result of the new strategies discussed above along with our typical seasonal pattern for delinquency. 1 TMCC market share represents the percentage of total domestic Toyota U.S. sales of new Toyota and Lexus vehicles financed by us, excluding sales under dealer rental car and commercial fleet programs and sales of a private Toyota distributor * TMCC consumer portfolio includes TMCC and its consolidated subsidiaries SHORT - TERM FUNDING PROGRAMS • TMCC ‡ , Toyota Credit de Puerto Rico Corp . (TCPR), Toyota Credit Canada Inc . (TCCI)†, Toyota Finance Australia Limited (TFA)† and Toyota Motor Finance (Netherlands) B . V . (TMFNL)† maintain direct relationships with institutional commercial paper investors through TMCC’s Sales & Trading team , providing each access to a variety of domestic and global markets through five, distinct 3 (a)( 3 ) programs . • TMCC ‡ c ommercial paper outstanding under our commercial paper programs ranged from approximately $ 26 . 8 billion to $ 28 . 7 billion during the quarter ended December 31 , 2019 , with an average outstanding balance of $ 27 . 9 billion . † TCCI, TFA, and TMFNL are subsidiaries of Toyota Financial Services Corporation (TFSC), a wholly - owned subsidiary of Toyota Motor Corporation (TMC). TMCC is a wholly - owned subsidiary of Toyota Financial Service International Corporation (TFSIC), a wholly - own ed subsidiary of TFSC. ‡ TMCC consolidated financial liabilities include TMCC and its consolidated subsidiaries, which includes TCPR. LET’S GO PLACES On November 6, 2019, in collaboration with Fenix Marine Services, Toyota U.S. announced the very first Hydrogen Fuel Cell Ele ctr ic Utility Tractor Rig in conjunction with the 43 rd Fuel Cell Seminar and Energy Exposition. The Sales and Trading team engages in direct dialogue with institutional investors delivering a variety of fixed income products to meet our clients’ investment objectives and risk tolerances . We focus on providing simple, personal, and proactive service in the execution of all trades . Sales and Trading Contacts Jeffrey DeSilva | Region Manager (469) 486 - 6759 jeffrey.desilva@toyota.com Andrew Huang, CFA | Funding & Liquidity Analyst (469) 786 - 8219 andrew.huang@toyota.com Justin Lee | Funding & Liquidity Analyst (469) 486 - 6187 justin.lee1@toyota.com Nicholas Ro, CFA | National Manager (469) 786 - 8961 nicholas.ro@toyota.com Jason Kelley | Region Manager (469) 486 - 5301 jason.kelley@toyota.com James Kim | Funding & Liquidity Analyst (469) 486 - 5960 james.kim@toyota.com Amit Sahu | Funding & Liquidity Analyst (469) 786 - 8984 amit.sahu@toyota.com Forward looking statements are subject to risks and uncertainties that could cause actual results to fall short of current ex pec tations. Toyota and its affiliates discuss these risks and uncertainties in filings they make with the Securities and Exchan ge Commission. This presentation does not constitute an offer to purchase any securities. Any offer or sale of securities will be made only by means of a prospectus a nd related documentation . 56.4% 57.7% Q3 FY19 Q3 FY20 TMCC - Market Share 1 Q3 FY19 Q3 FY20 49% 10% 93% 33% 14% 89% 0% 20% 40% 60% 80% 100% New Retail Contracts Used Retail Contracts Lease Contracts TMCC - Percentage of Contracts Subvened Q3 FY19 Q3 FY20 137 62 120 156 83 113 0 100 200 New Retail Contracts Used Retail Contracts Lease Contracts Units in Thousands TMCC - Vehicle Financing Volume Q3 FY19 Q3 FY20 0.00% 0.25% 0.50% Q3 FY16 Q3 FY17 Q3 FY18 Q3 FY19 Q3 FY20 TMCC - Consumer Portfolio Credit Performance* Net charge-offs as a percentage of average gross earning assets Aggregate balances for accounts 60 or more days past due as a percentage of gross earning assets 25.8 27.6 56.8 56.9 13.3 13.4 $0 $20 $40 $60 $80 $100 $120 Q3 FY19 Q3 FY20 Amount ($billions) TMCC Consolidated Financial Liabilities (Face Value) Secured notes & loans payable Unsecured notes & loans payable Commercial Paper