Exhibit 99.1
TOYOTA FINANCIAL SERVICES 1 Presentation Materials for Investors May 2023
TOYOTA FINANCIAL SERVICES 2 Disclaimer • This presentation includes certain “forward - looking statements” within the meaning of The U.S. Private Securities Litigation Reform Act of 1995. • These statements are based on current expectations and currently available information. • Actual results may differ materially from these expectations due to certain risks, uncertainties and other important factors, including the risk factors set forth in the most recent annual and periodic reports of Toyota Motor Corporation and Toyota Motor Credit Corporation. • We do not undertake to update the forward - looking statements to reflect actual results or changes in the factors affecting the forward - looking statements. • This presentation does not constitute an offer to sell or a solicitation of an offer to purchase any securities. Any offer or sale of securities will be made only by means of a prospectus and related documentation. • Investors and others should note that we announce material financial information using the investor relations section of our corporate website ( http://www.toyotafinancial.com ) and SEC filings. We use these channels, press releases, as well as social media to communicate with our investors, customers and the general public about our company, our services and other issues. While not all of the information that we post on social media is of a material nature, some information could be material. Therefore, we encourage investors, the media, and others interested in our company to review the information we post on the Toyota Motor Credit Corporation Twitter Feed ( http://www.twitter.com/toyotafinancial ). We may update our social media channels from time to time on the investor relations section of our corporate website.
TOYOTA FINANCIAL SERVICES 3 Disclaimer • This presentation includes certain “forward - looking statements” within the meaning of The U.S. Private Securities Litigation Ref orm Act of 1995. • These statements are based on current expectations and currently available information. • Actual results may differ materially from these expectations due to certain risks, uncertainties and other important factors, in cluding the risk factors set forth in the most recent annual and periodic reports of Toyota Motor Corporation and Toyota Motor Credit Corporation (“TMCC”). • We do not undertake to update the forward - looking statements to reflect actual results or changes in the factors affecting the f orward - looking statements. • This presentation does not constitute or form part of and should not be construed as, an offer to sell or issue or the solici tat ion of an offer to purchase or subscribe for securities of TMCC in any jurisdiction or an inducement to enter into investment activity in any jurisdiction. Neither this presentation nor any part thereof, nor t he fact of its distribution, shall form the basis of, or be relied on in connection with, any contract or commitment or investment decision whatsoever. Any offer or sale of securities by TMCC will be made only by m ean s of a prospectus and related documentation. • Investors and prospective investors in securities of TMCC are required to make their own independent investigation and apprai sal of the business and financial condition of TMCC and the nature of its securities. This presentation does not constitute a recommendation regarding securities of TMCC. Any prospective purchaser of se curities in TMCC is recommended to seek its own independent financial advice. • This presentation and its contents are directed only at and may only be communicated to (a) persons in member states of the E uro pean Economic Area who are “qualified investors” within the meaning of Article 2 of the Prospectus Regulation (EU) 2017/1129 and (b) persons in the United Kingdom who are “qualified investors” wit hin the meaning of Article 2 of the Prospectus Regulation (EU) 2017/1129 as it forms part of United Kingdom domestic law by virtue of the European Union (Withdrawal) Act 2018 (“EUWA”) who are ( i ) persons who have professional experience in matters relating to investments falling within Article 19(5) of the Financial Services and Markets Act 2000 (Financial Promotion) Order 2005 (the “Order”), o r ( ii) high net worth entities and other persons to whom it may lawfully be communicated, falling within Article 49(2)(a) to (d) of the Order, or (iii) other persons to whom it may otherwise lawfully b e c ommunicated (all such persons in (a) through (b) are collectively referred to as “Relevant Persons”); and in all cases are capable of being categorized as ( i ) in the European Economic Area, an eligible counterparty or a professional client, each as defined in Directive 2014/65/EU (as amended) or (ii) in the United Kingdom, an eligible counterparty (as defined in the FCA Handbook Conduct of Business Sour ceb ook) or a professional client (as defined in Regulation (EU) No 600/2014 as it forms part of United Kingdom domestic law by virtue of the EUWA) (such persons in ( i ) and (ii) being referred to as “Eligible Persons”). • This presentation must not be acted or relied on by persons who are not both Relevant Persons and Eligible Persons. Any inves tme nt or investment activity to which this presentation relates is available only to persons who are both Relevant Persons and Eligible Persons and will be engaged in only with persons who are both Rele van t Persons and Eligible Persons. • This presentation is an advertisement and not a prospectus and investors should not subscribe for or purchase any securities of TMCC referred to in this presentation or otherwise except on the basis of information in the Euro Medium Term Note Programme base prospectus of Toyota Motor Finance (Netherlands) B.V., Toyota Credit Canada Inc., Toyota Finance Australia Limited and T oy ota Motor Credit Corporation dated 16 September 2022, as supplemented from time to time (together, the “Prospectus”) together with the applica ble final terms which are or will be, as applicable, available on the website of the London Stock Exchange plc at https://www.londonstockexchange.com/news?tab=news - explorer. Investors should read the Prospectus before making an investment decision in order to fully understand the potential risks and rewards associated with the decision to invest in any securities of TMCC issued unde r t he Euro Medium Term Note Programme . Approval of the Prospectus by the Central Bank of Ireland and the Financial Conduct Authority should not be understood as an endorsement of securities issued b y T MCC under the Euro Medium Term Note Programme . • Investors and others should note that we announce material financial information using the investor relations section of our cor porate website ( http://www.toyotafinancial.com ) and SEC filings. We use these channels, press releases, as well as social media to communicate with our investors, customers and the general public a bou t our company, our services and other issues. While not all of the information that we post on social media is of a material nature, some information could be material. Therefore, we encourage in vestors, the media, and others interested in our company to review the information we post on the Toyota Motor Credit Corporation Twitter Feed ( http://www.twitter.com/toyotafinancial ). We may update our social media channels from time to time on the investor relations section of our corporate website.
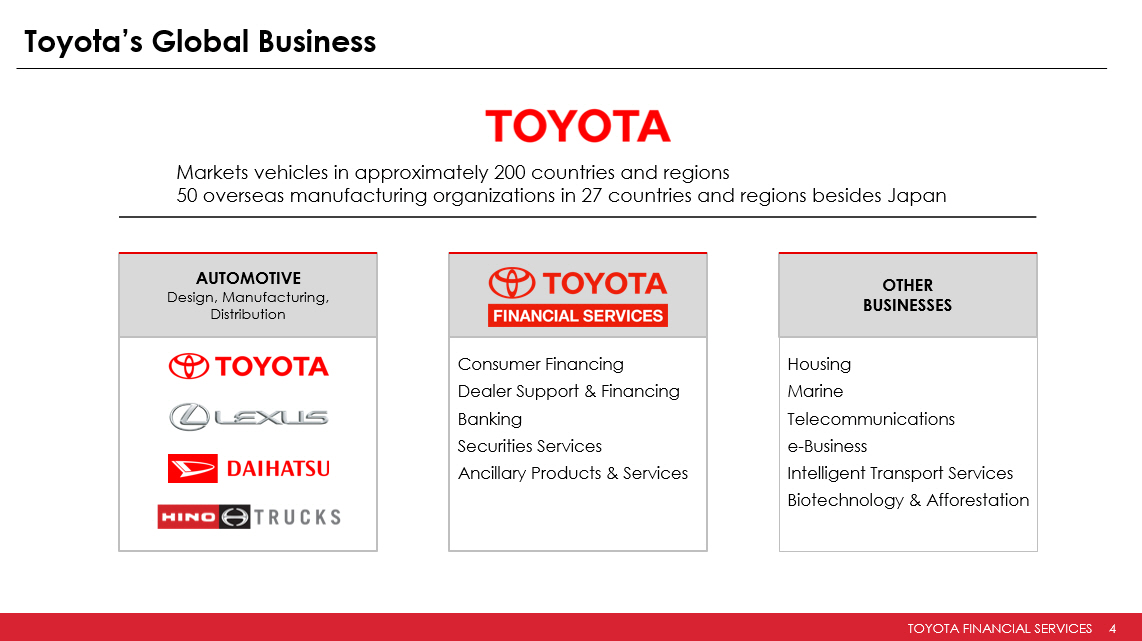
TOYOTA FINANCIAL SERVICES 4 Toyota’s Global Business Markets vehicles in approximately 200 countries and regions 50 overseas manufacturing organizations in 27 countries and regions besides Japan AUTOMOTIVE Design, Manufacturing, Distribution Consumer Financing Dealer Support & Financing Banking Securities Services Ancillary Products & Services OTHER BUSINESSES Housing Marine Telecommunications e - Business Intelligent Transport Services Biotechnology & Afforestation
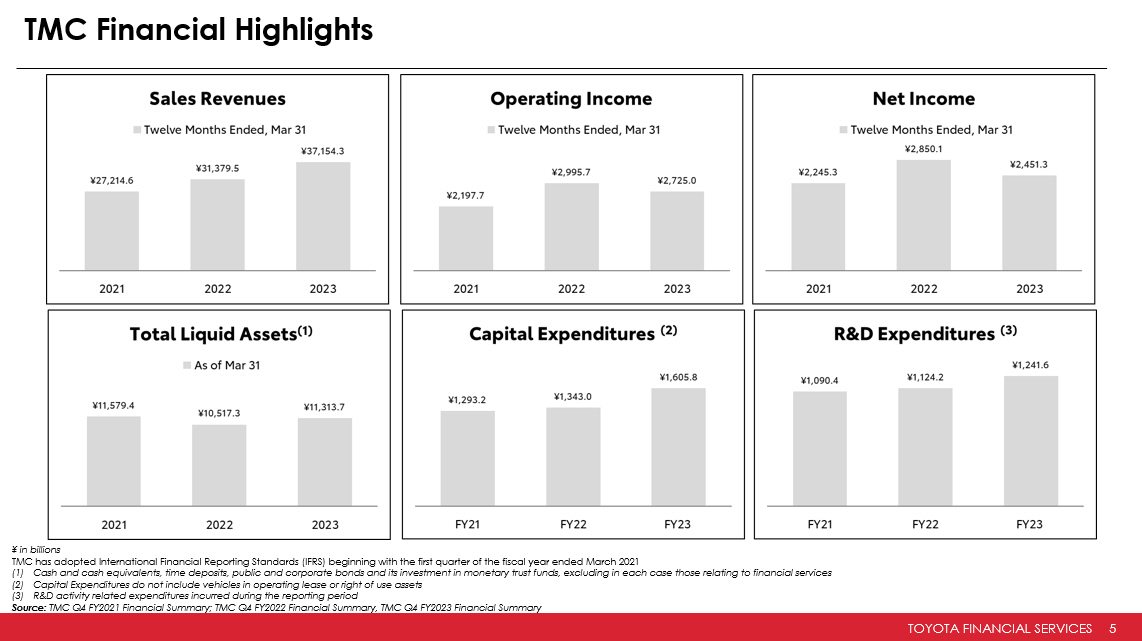
TOYOTA FINANCIAL SERVICES 5 TMC Financial Highlights ¥ in billions TMC has adopted International Financial Reporting Standards (IFRS) beginning with the first quarter of the fiscal year ended Mar ch 2021 (1) Cash and cash equivalents, time deposits, public and corporate bonds and its investment in monetary trust funds, excluding in ea ch case those relating to financial services (2) Capital Expenditures do not include vehicles in operating lease or right of use assets (3) R&D activity related expenditures incurred during the reporting period Source: TMC Q4 FY2021 Financial Summary; TMC Q4 FY2022 Financial Summary, TMC Q4 FY2023 Financial Summary
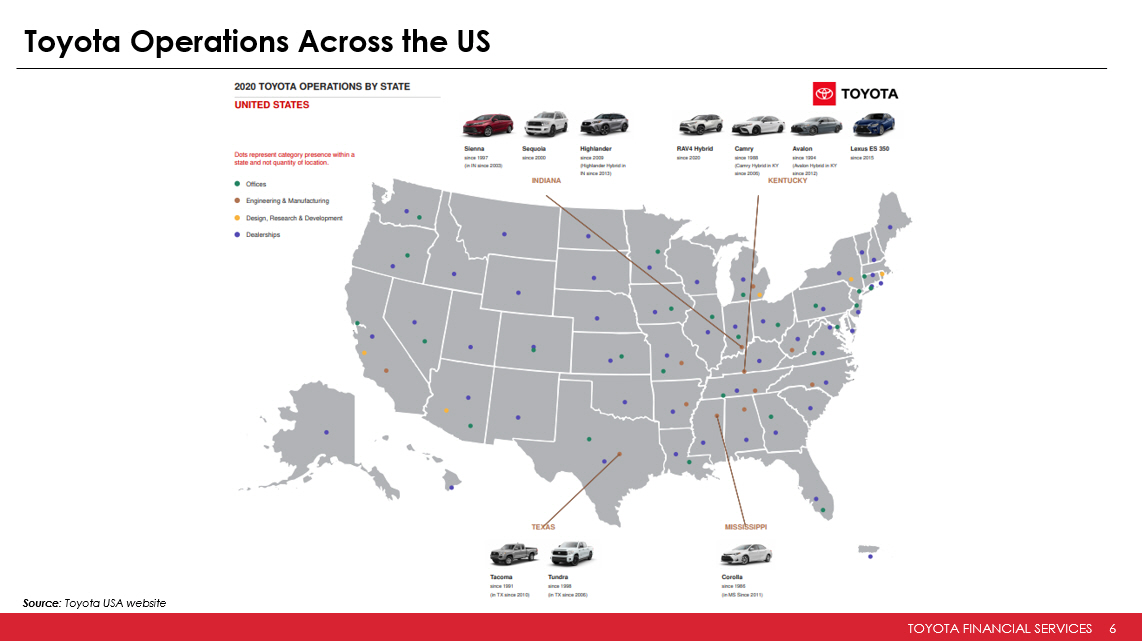
TOYOTA FINANCIAL SERVICES 6 Toyota Operations Across the US Source : Toyota USA website
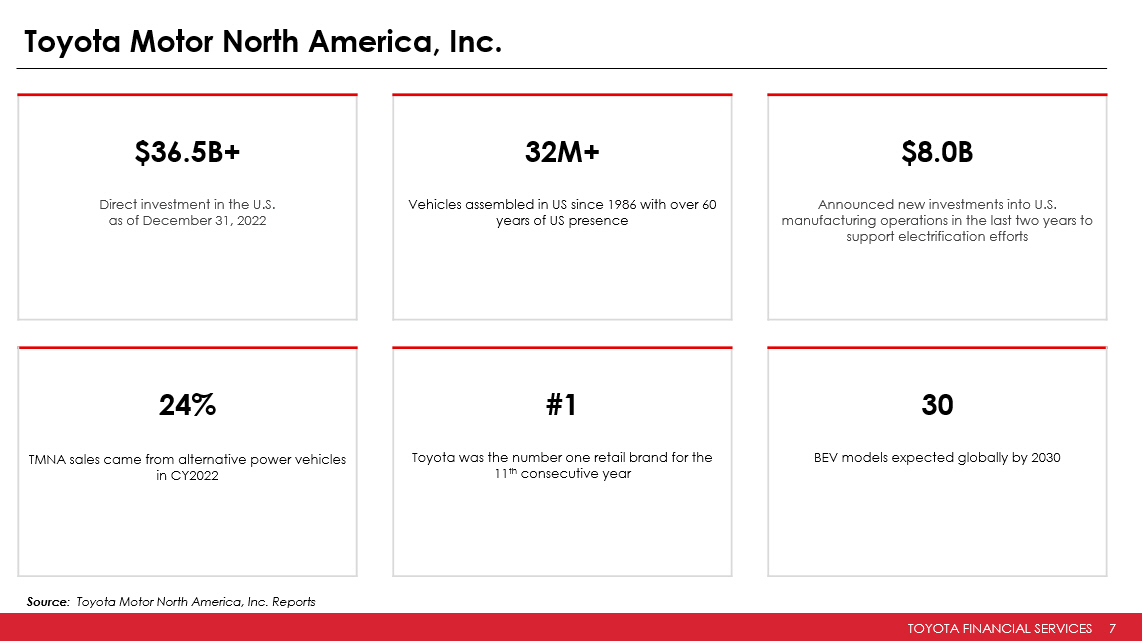
TOYOTA FINANCIAL SERVICES 7 Toyota Motor North America, Inc. $36.5B+ Direct investment in the U.S. as of December 31, 2022 32M+ Vehicles assembled in US since 1986 with over 60 years of US presence $8.0B Announced new investments into U.S. manufacturing operations in the last two years to support electrification efforts 24% TMNA sales came from alternative power vehicles in CY2022 #1 Toyota was the number one retail brand for the 11 th consecutive year 30 BEV models expected globally by 2030 Source : Toyota Motor North America, Inc. Reports

TOYOTA FINANCIAL SERVICES 8 Toyota and Lexus 3 rd Party Accolades Quality, dependability, safety and product appeal remain high as reflected by numerous 3 rd party accolades 2021 Fortune Toyota ranked one of the “World’s Most Admired Companies” and named the No. 1 Motor Vehicle company (7 th year running) 2022 IIHS Top Safety Pick Awards 12 qualifying Toyota models (8 pick+) 6 qualifying Lexus models (4 pick+) 2022 Kelley Blue Book Lowest 5 - Year Cost to Own Brand Toyota and Lexus 2022 J.D. Power and Associates Vehicle Dependability Survey Toyota tied for the most segment awards. Toyota listed as the brand with the fewest reported problems after three years of ownership. 2021 Kelley Blue Book Most Awarded Brands No. 1 on Kelley Blue Book’s 10 most Awarded Brands 2022 MY NHTSA 5 - Star Overall Rating 21 Toyota models 10 Lexus models 2022 U.S. News Best Cars for the Money Toyota Avalon winner of best large car; RAV4 Hybrid, Corolla, Camry and Camry Hybrid all finalists in their categories 2022 Kelley Blue Book Best Resale Value Brand Toyota/Lexus takes title with 5 category wins; Lexus with 3 category wins. May 2022 IIHS Used Vehicle List Best Choices for Teens 5 Toyota vehicles 1 Lexus vehicle US News: The 14 Cars with the Best Gas Mileage in 2022 5 Toyota models 2 Lexus models 2021 Interbrand Best Global Brands Toyota named world’s most valuable automotive brand 2022 U.S. News Best Cars for Families Highlander Hybrid winner for best hybrid & electric SUV; Avalon winner for best large car; Camry, Camry Hybrid, Avalon Hybrid and RAV4 are all finalists in their categories
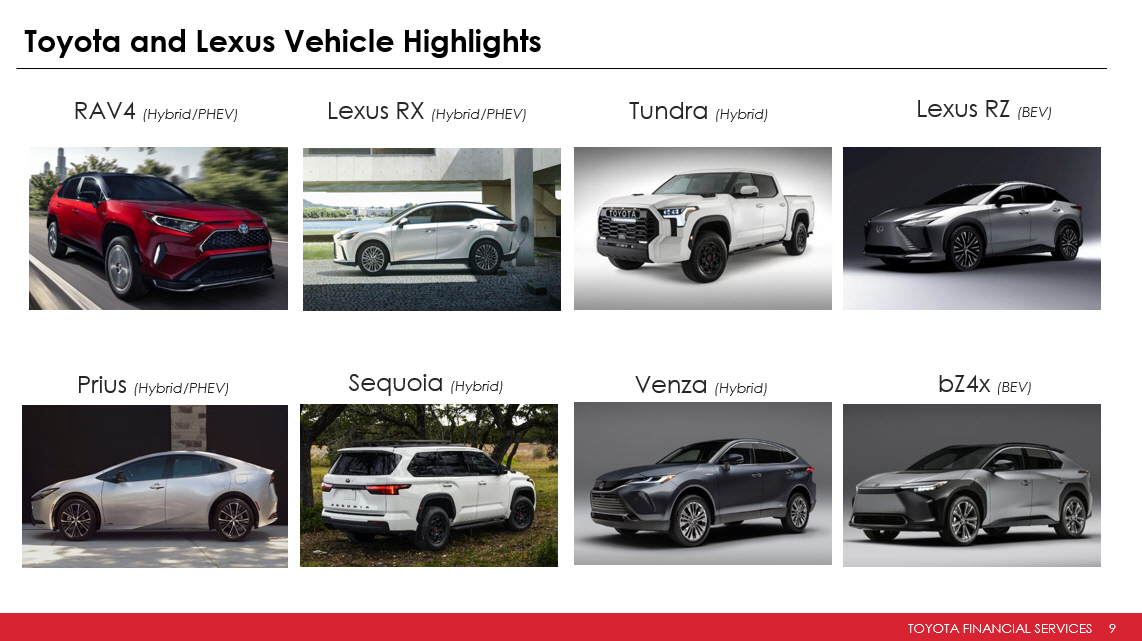
TOYOTA FINANCIAL SERVICES 9 Toyota and Lexus Vehicle Highlights RAV4 (Hybrid/PHEV) Lexus RX (Hybrid/PHEV) Tundra (Hybrid) Prius (Hybrid/PHEV) Sequoia (Hybrid) Venza (Hybrid) Lexus RZ (BEV) bZ4x (BEV)

TOYOTA FINANCIAL SERVICES 10 Battery EV Development Global Battery EV vehicles sales by 2030 Total BEVs 3.5 million Includes 1 million Lexus BEVs (Lexus 100% BEVs in N. America, Europe, and China) Toyota’s investment in electrification 1 (R&D and CAPEX) BEVs 4 trillion yen (incl. 2 trillion yen for batteries) HEVs PHEVs FCEVs 4 trillion yen Total 8 trillion yen (1) Investment amount from 2022 to 2030 (9 years) Source : Toyota Global Newsroom website (December 2021)

TOYOTA FINANCIAL SERVICES 11 Toyota Financial Services

TOYOTA FINANCIAL SERVICES 12 TFS Group Global Presence JAPAN REGION EUROPE/AFRICA REGION CHINA REGION ASIA/PACIFIC REGION AMERICAS OCEANIA REGION Finland Sweden Norway Denmark Vietnam Netherlands Ireland Germany UK France Czech Poland Slovakia Hungary Portugal Spain Italy Kazakhstan China Korea Japa n Taiwan India Thailand Russia Philippines Malaysia Indonesia South Africa Australia New Zealand Argentina Brazil Venezuela Mexico Puerto Rico Canad a U.S.A. Colombia
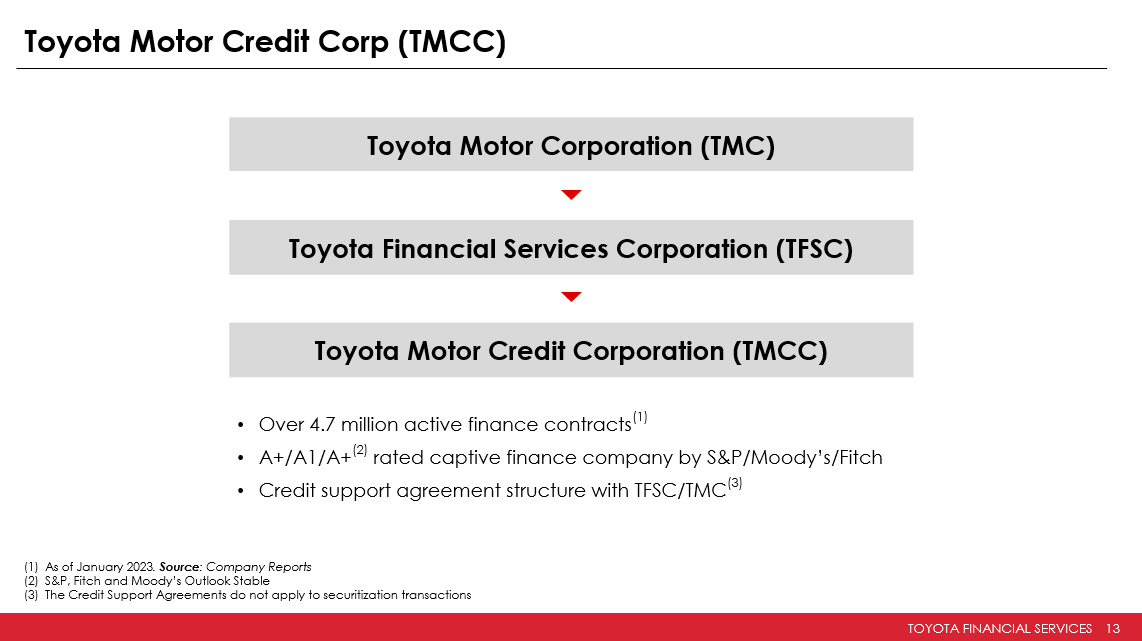
TOYOTA FINANCIAL SERVICES 13 Toyota Motor Credit Corp (TMCC) Toyota Motor Corporation (TMC) Toyota Financial Services Corporation (TFSC) Toyota Motor Credit Corporation (TMCC) • Over 4.7 million active finance contracts (1) • A+/A1/A+ (2) rated captive finance company by S&P/Moody’s/Fitch • Credit support agreement structure with TFSC/TMC (3) (1) As of January 2023 . Source : Company Reports (2) S&P, Fitch and Moody’s Outlook Stable (3) The Credit Support Agreements do not apply to securitization transactions
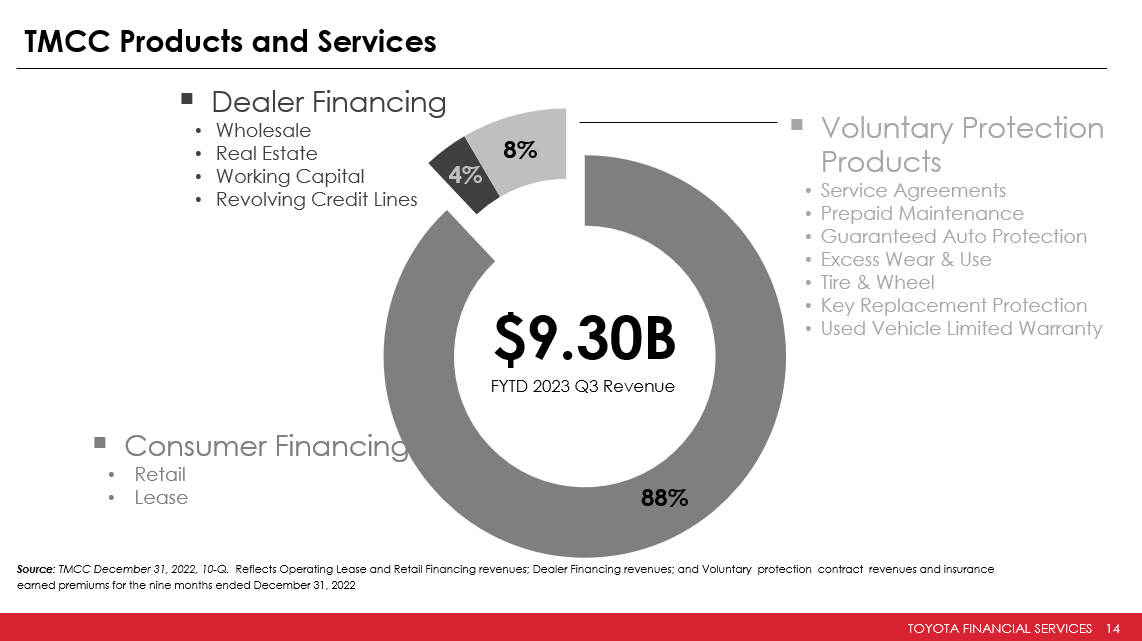
TOYOTA FINANCIAL SERVICES 14 ▪ Voluntary Protection Products • Service Agreements • Prepaid Maintenance • Guaranteed Auto Protection • Excess Wear & Use • Tire & Wheel • Key Replacement Protection • Used Vehicle Limited Warranty 88% 4% 8% $9.30B FYTD 2023 Q3 Revenue TMCC Products and Services ▪ Dealer Financing • Wholesale • Real Estate • Working Capital • Revolving Credit Lines ▪ Consumer Financing • Retail • Lease Source : TMCC December 31 , 2022, 10 - Q. Reflects Operating Lease and Retail Financing revenues; Dealer Financing revenues; and Voluntary protection contract revenues and insurance earned premiums for the nine months ended December 31 , 2022
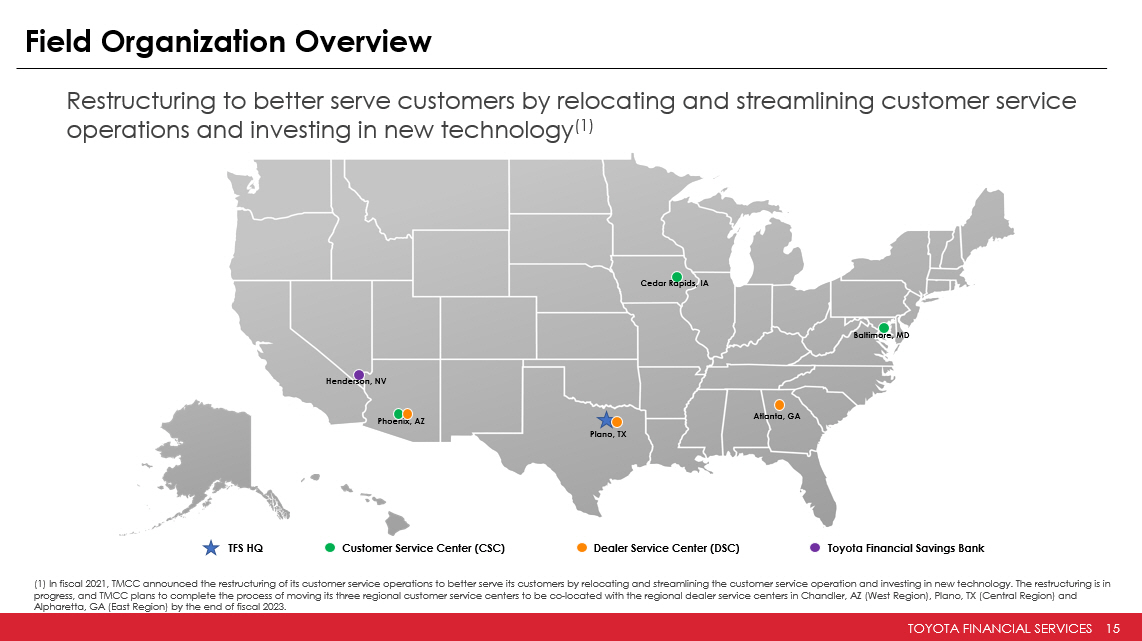
TOYOTA FINANCIAL SERVICES 15 Field Organization Overview TFS HQ Customer Service Center (CSC) Plano, TX Phoenix, AZ Cedar Rapids, IA Baltimore, MD Atlanta, GA Henderson, NV Dealer Service Center (DSC) Toyota Financial Savings Bank Restructuring to better serve customers by relocating and streamlining customer service operations and investing in new technology (1) (1) In fiscal 2021, TMCC announced the restructuring of its customer service operations to better serve its customers by relo cat ing and streamlining the customer service operation and investing in new technology. The restructuring is in progress, and TMCC plans to complete the process of moving its three regional customer service centers to be co - located with the regional dealer service centers in Chandler, AZ (West Region), Plano, TX (Central Region) and Alpharetta, GA (East Region) by the end of fiscal 2023.

TOYOTA FINANCIAL SERVICES 16 TMCC Financial Performance $ in millions (1) 60+ Days Delinquent, Allowance for Credit Losses, and Net Credit Losses : percentage of gross earning assets (2) Allowance for Credit Losses : the quotient of allowance for credit losses divided by the sum of gross finance receivables (finance receivables before all owa nce for credit losses). (3) Net Credit Losses : results are annualized and for Finance Receivables only Source: TMCC December 31, 2021 10 - Q & December 31, 2022 10 - Q $8,821 $9,022 $8,511 2020 2021 2022 Nine Months Ended, Dec 31 Total Financing Revenues $3,962 $4,564 $3,083 2020 2021 2022 Net Financing and Other Revenues Nine Months Ended, Dec 31 $1,697 $2,291 $653 2020 2021 2022 Net Income Nine Months Ended, Dec 31 0.38% 0.51% 0.72% 0.30% 0.28% 0.47% 2020 2021 2022 60+ Days Delinquent (1) Retail Lease As of Dec 31 1.50% 1.44% 1.63% 2020 2021 2022 As of Dec 31 Allowance for Credit Losses (1)(2) 0.32% 0.18% 0.46% 2020 2021 2022 Net Credit Losses (1)(3) Nine Months Ended, Dec 31
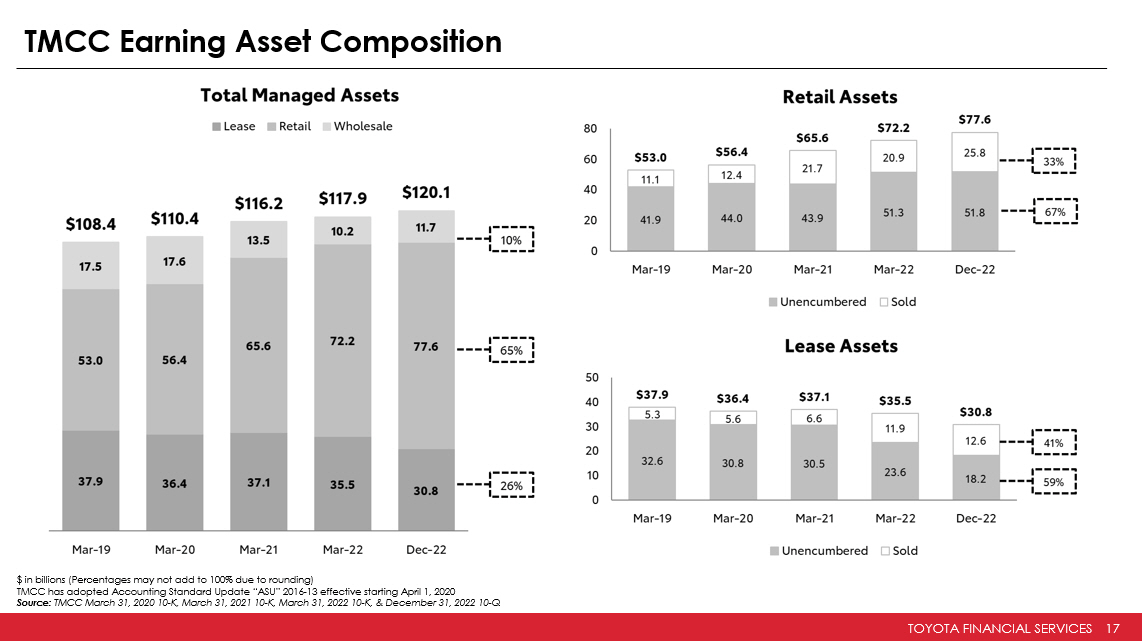
TOYOTA FINANCIAL SERVICES 17 TMCC Earning Asset Composition $ in billions (P ercentages may not add to 100% due to rounding) TMCC has adopted Accounting Standard Update “ASU” 2016 - 13 effective starting April 1, 2020 Source: TMCC March 31, 2020 10 - K, March 31, 2021 10 - K, March 31, 2022 10 - K, & December 31, 2022 10 - Q
TOYOTA FINANCIAL SERVICES 18 TMCC Funding Programs
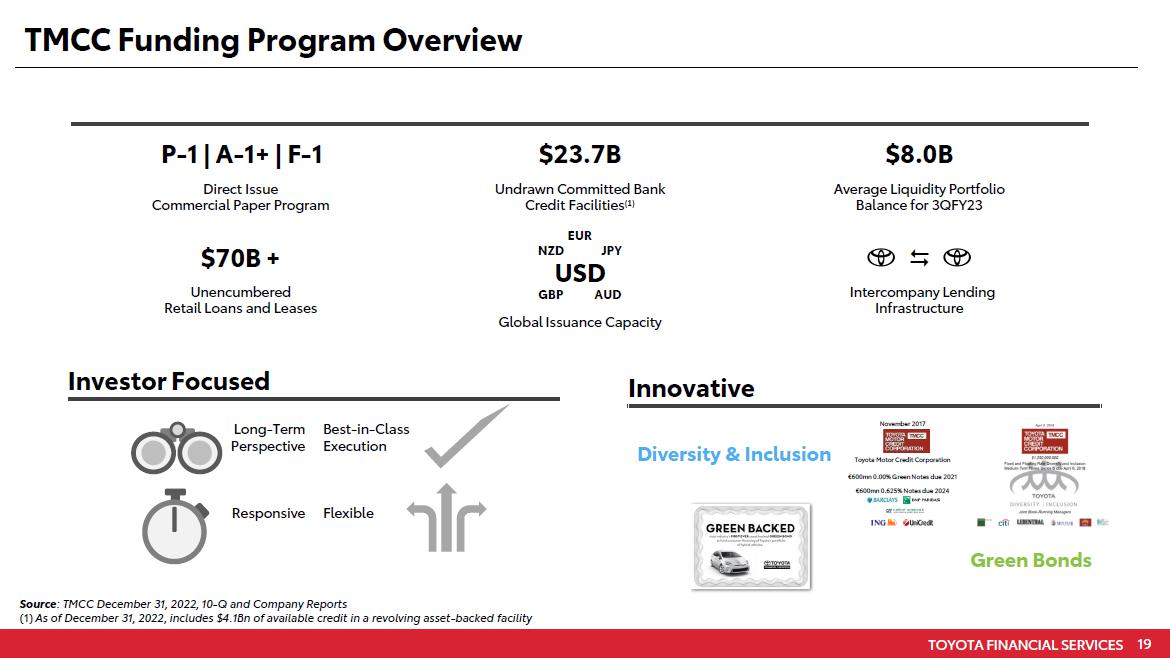
TOYOTA FINANCIAL SERVICES 19 TMCC Funding Program Overview Investor Focused Long - Term Perspective Best - in - Class Execution Responsive Flexible Innovative Diversity & Inclusion Green Bonds November 2017 Toyota Motor Credit Corporation €600mn 0.00% Green Notes due 2021 €600mn 0.625% Notes due 2024 Source : TMCC December 31, 2022, 10 - Q and Company Reports (1) As of December 31, 2022 , includes $4.1Bn of available credit in a revolving asset - backed facility P - 1 | A - 1+ | F - 1 . Direct Issue Commercial Paper Program $23.7B Undrawn Committed Bank Credit Facilities (1) $8.0B Average Liquidity Portfolio Balance for 3QFY23 $70B + Unencumbered Retail Loans and Leases EUR NZD JPY USD GBP AUD Global Issuance Capacity Intercompany Lending Infrastructure
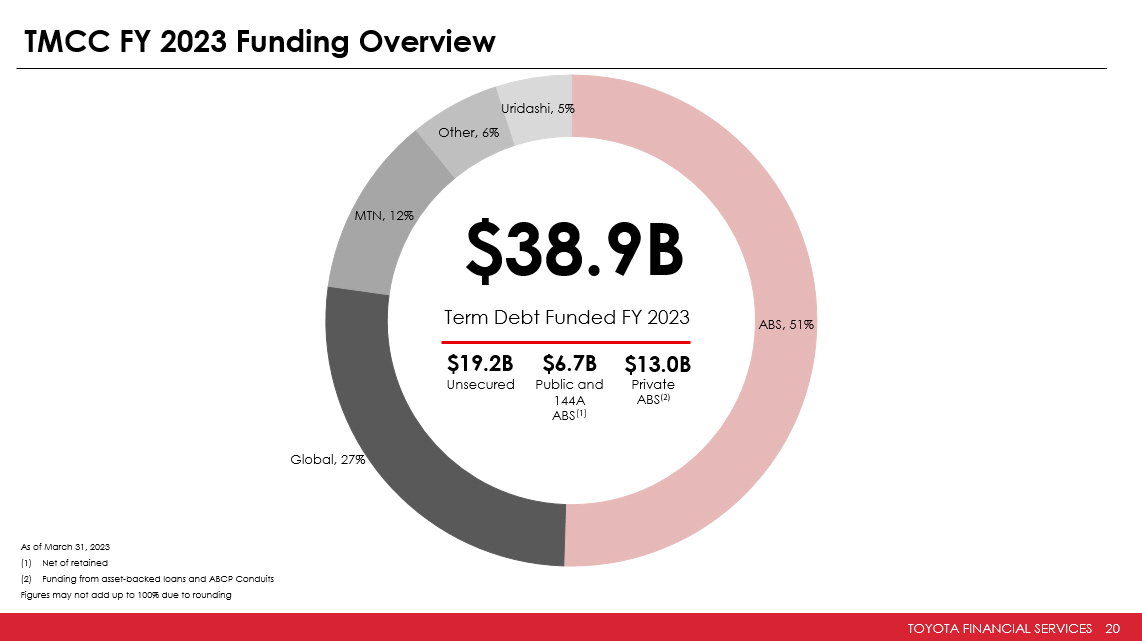
TOYOTA FINANCIAL SERVICES 20 TMCC FY 2023 Funding Overview As of March 31, 2023 (1) Net of retained (2) Funding from asset - backed loans and ABCP Conduits Figures may not add up to 100% due to rounding ABS , 51% Global , 27% MTN , 12% Other , 6% Uridashi , 5% $38.9B Term Debt Funded FY 2023 $19.2B $6.7B $13.0B Unsecured Public and 144A ABS (1) Private ABS (2)
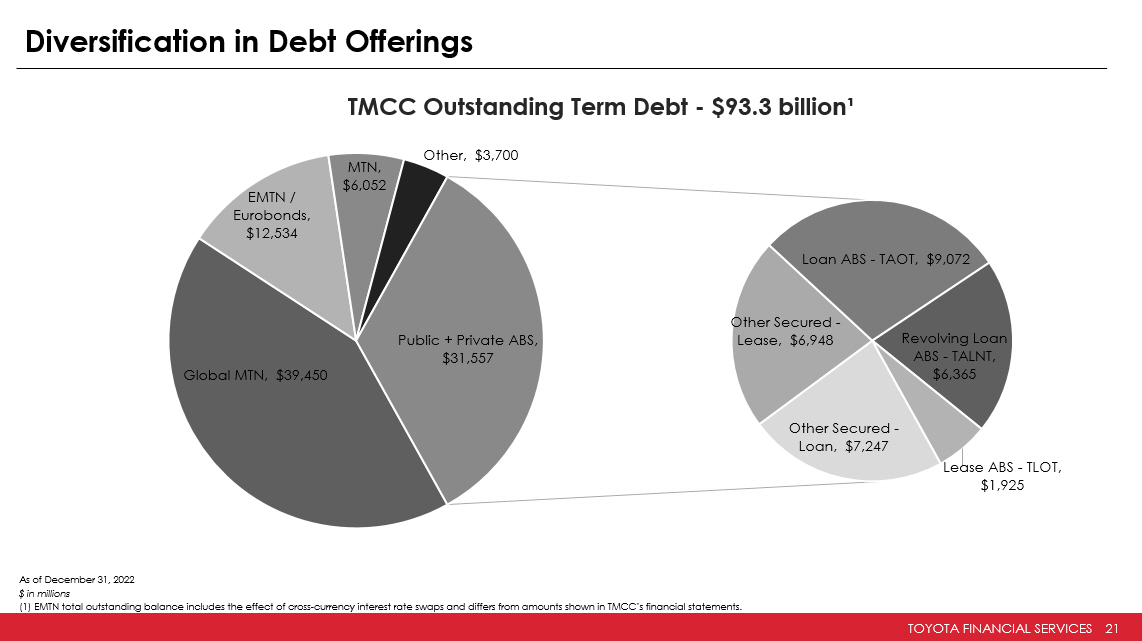
TOYOTA FINANCIAL SERVICES 21 Diversification in Debt Offerings As of December 31, 2022 $ in millions (1) EMTN total outstanding balance includes the effect of cross - currency interest rate swaps and differs from amounts shown in T MCC’s financial statements. Global MTN , $39,450 EMTN / Eurobonds , $12,534 MTN , $6,052 Other , $3,700 Other Secured - Loan , $7,247 Other Secured - Lease , $6,948 Loan ABS - TAOT , $9,072 Revolving Loan ABS - TALNT , $6,365 Lease ABS - TLOT , $1,925 Public + Private ABS, $31,557 TMCC Outstanding Term Debt - $93.3 billion¹

TOYOTA FINANCIAL SERVICES 22 Funding Flexibility and Responsiveness (1) Unsecured U.S. MTN issuances, excluding Structured Notes and Retail Demand Notes Percentages may not add to 100% due to rounding Source: Company Reports as of March 31, 2023 49% 73% 45% 47% 53% 38% 20% 45% 44% 38% 13% 8% 10% 10% 9% FY19 FY20 FY21 FY22 FY23 Diversification Across the USD Curve (1) <=2yrs 3-5yrs 7-10yrs
TOYOTA FINANCIAL SERVICES 23 Retail Loan and Lease Origination and Portfolio Performance

TOYOTA FINANCIAL SERVICES 24 Credit Decisioning & Collections Disciplined Underwriting Consistent and conservative underwriting standards designed to limit delinquencies and credit losses • Key mission is to support Toyota and Lexus brand and vehicle sales • Continued focus on prime originations • Proprietary credit scores that leverage TMCC’s extensive origination history • Regular statistical validations of predictive power Servicing Optimization Optimization of collections strategy and staff supports loss mitigation while enabling portfolio growth • Emphasis on early intervention • Reinforcement of strong compliance management system • Focus on analytics and technology to prioritize high risk accounts and manage loss severities

TOYOTA FINANCIAL SERVICES 25 Retail Loan: Cumulative Net Losses by Vintage Source : Company Reports as of December 31 , 2022 2015 0.0% 0.2% 0.4% 0.6% 0.8% 1.0% 1.2% 1.4% 1.6% 1 5 9 13 17 21 25 29 33 37 41 45 49 53 57 61 65 69 73 2012 2013 2014 2015 2016 2017 2018 2019 2020 2021
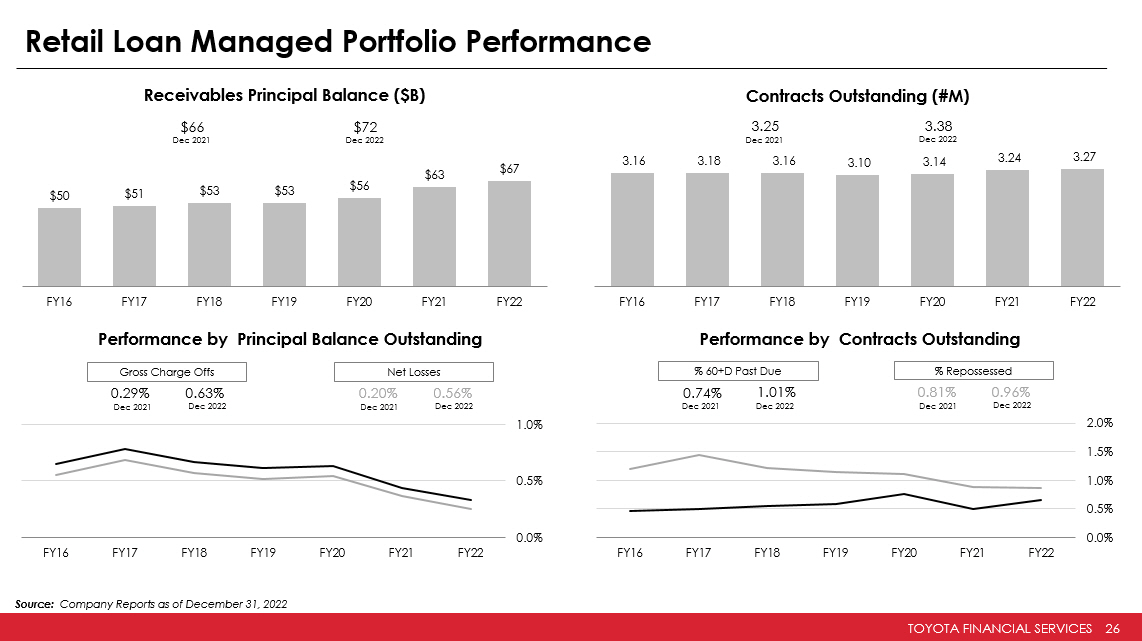
TOYOTA FINANCIAL SERVICES 26 Retail Loan Managed Portfolio Performance Source: Company Reports as of December 31, 2022 $67 $63 $56 $53 $53 $51 $50 FY22 FY21 FY20 FY19 FY18 FY17 FY16 Receivables Principal Balance ($B) $66 $72 Dec 2021 Dec 2022 3.27 3.24 3.14 3.10 3.16 3.18 3.16 FY22 FY21 FY20 FY19 FY18 FY17 FY16 Contracts Outstanding (#M) 3.25 3.38 Dec 2021 Dec 2022 0.0% 0.5% 1.0% FY22 FY21 FY20 FY19 FY18 FY17 FY16 0.29% 0.63% Dec 2021 Dec 2022 Gross Charge Offs 0.20% 0.56% Dec 2021 Dec 2022 Net Losses Performance by Principal Balance Outstanding 0.0% 0.5% 1.0% 1.5% 2.0% FY22 FY21 FY20 FY19 FY18 FY17 FY16 0.74% 1.01% 0.81% 0.96% Dec 2021 Dec 2022 Dec 2021 Dec 2022 % 60+D Past Due % Repossessed Performance by Contracts Outstanding
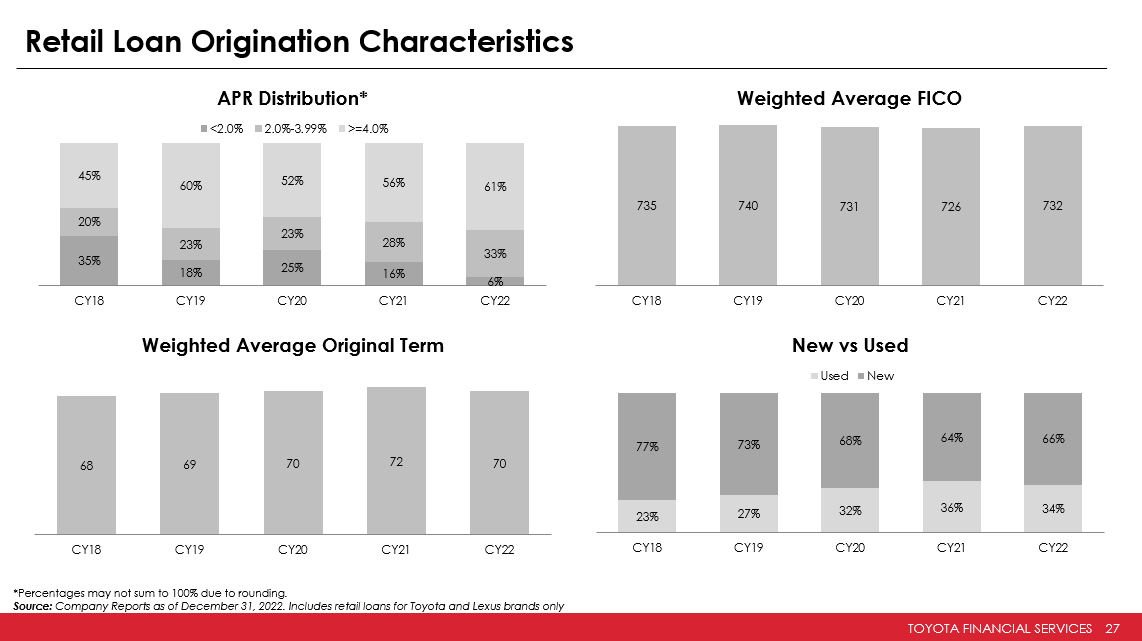
TOYOTA FINANCIAL SERVICES 27 Retail Loan Origination Characteristics *Percentages may not sum to 100% due to rounding . Source: Company Reports as of December 31, 2022. Includes retail loans for Toyota and Lexus brands only 35% 18% 25% 16% 6% 20% 23% 23% 28% 33% 45% 60% 52% 56% 61% CY18 CY19 CY20 CY21 CY22 APR Distribution* <2.0% 2.0%-3.99% >=4.0% 735 740 731 726 732 CY18 CY19 CY20 CY21 CY22 Weighted Average FICO 68 69 70 72 70 CY18 CY19 CY20 CY21 CY22 Weighted Average Original Term 23% 27% 32% 36% 34% 77% 73% 68% 64% 66% CY18 CY19 CY20 CY21 CY22 New vs Used Used New

TOYOTA FINANCIAL SERVICES 28 TAOT ABS Characteristics *Percentages may not sum to 100% due to rounding . Source: Company Reports as of March 31, 2023 761 766 2018-A 2023-A Weighted Average FICO $18,119 $26,149 2018-A 2023-A Average Principal Balance 65 66 50 56 15 10 2018-A 2023-A Original Term Remaining Term Seasoning Weighted Avg Orig and Rem Term (months) 51% 28% 49% 72% 2018-A 2023-A Receivables by Vehicle Type (%)* Sedans and Vans Trucks and SUVs
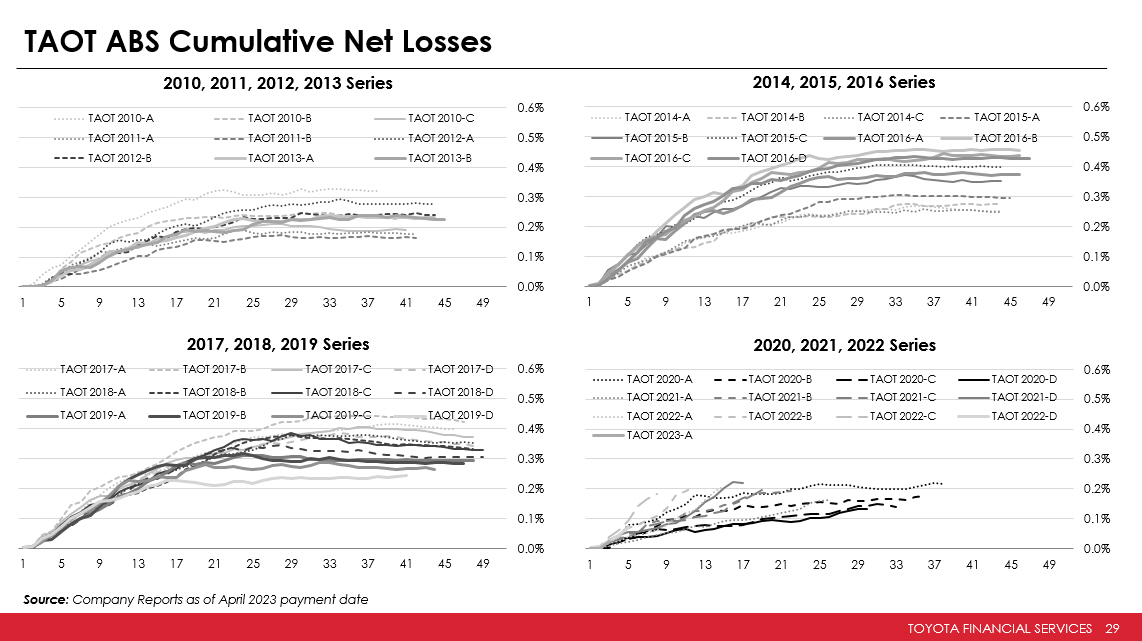
TOYOTA FINANCIAL SERVICES 29 TAOT ABS Cumulative Net Losses Source : Company Reports as of April 2023 payment date 0.0% 0.1% 0.2% 0.3% 0.4% 0.5% 0.6% 1 5 9 13 17 21 25 29 33 37 41 45 49 2010, 2011, 2012, 2013 Series TAOT 2010-A TAOT 2010-B TAOT 2010-C TAOT 2011-A TAOT 2011-B TAOT 2012-A TAOT 2012-B TAOT 2013-A TAOT 2013-B 0.0% 0.1% 0.2% 0.3% 0.4% 0.5% 0.6% 1 5 9 13 17 21 25 29 33 37 41 45 49 2014, 2015, 2016 Series TAOT 2014-A TAOT 2014-B TAOT 2014-C TAOT 2015-A TAOT 2015-B TAOT 2015-C TAOT 2016-A TAOT 2016-B TAOT 2016-C TAOT 2016-D 0.0% 0.1% 0.2% 0.3% 0.4% 0.5% 0.6% 1 5 9 13 17 21 25 29 33 37 41 45 49 2017, 2018, 2019 Series TAOT 2017-A TAOT 2017-B TAOT 2017-C TAOT 2017-D TAOT 2018-A TAOT 2018-B TAOT 2018-C TAOT 2018-D TAOT 2019-A TAOT 2019-B TAOT 2019-C TAOT 2019-D 0.0% 0.1% 0.2% 0.3% 0.4% 0.5% 0.6% 1 5 9 13 17 21 25 29 33 37 41 45 49 2020, 2021, 2022 Series TAOT 2020-A TAOT 2020-B TAOT 2020-C TAOT 2020-D TAOT 2021-A TAOT 2021-B TAOT 2021-C TAOT 2021-D TAOT 2022-A TAOT 2022-B TAOT 2022-C TAOT 2022-D TAOT 2023-A
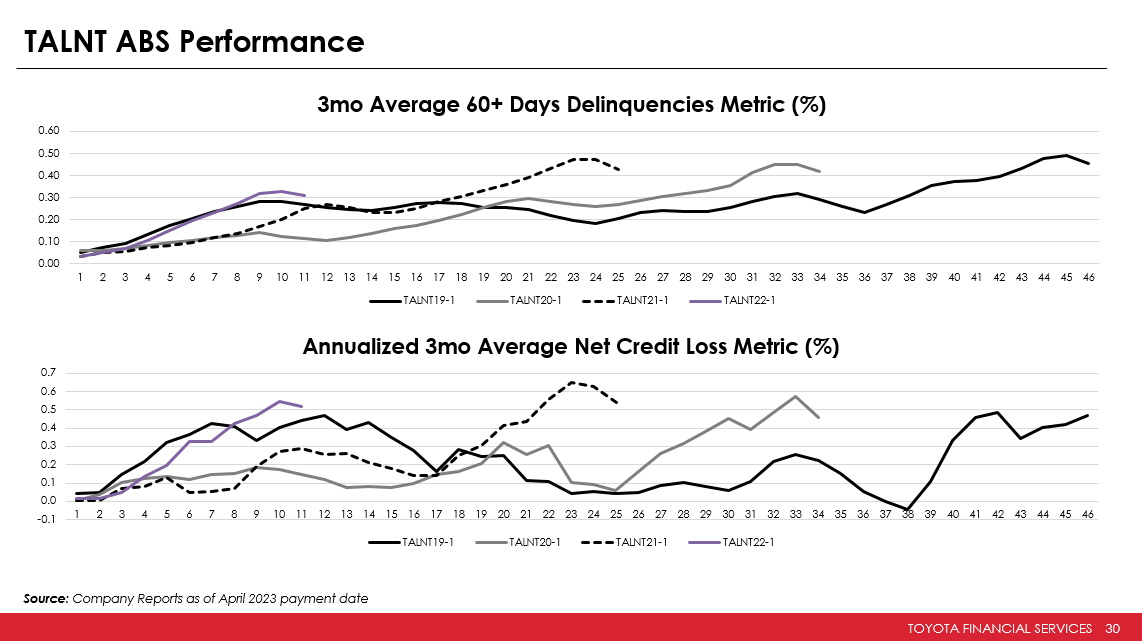
TOYOTA FINANCIAL SERVICES 30 TALNT ABS Performance Source : Company Reports as of April 2023 payment date 0.00 0.10 0.20 0.30 0.40 0.50 0.60 1 2 3 4 5 6 7 8 9 10 11 12 13 14 15 16 17 18 19 20 21 22 23 24 25 26 27 28 29 30 31 32 33 34 35 36 37 38 39 40 41 42 43 44 45 46 3mo Average 60+ Days Delinquencies Metric (%) TALNT19-1 TALNT20-1 TALNT21-1 TALNT22-1 -0.1 0.0 0.1 0.2 0.3 0.4 0.5 0.6 0.7 1 2 3 4 5 6 7 8 9 10 11 12 13 14 15 16 17 18 19 20 21 22 23 24 25 26 27 28 29 30 31 32 33 34 35 36 37 38 39 40 41 42 43 44 45 46 Annualized 3mo Average Net Credit Loss Metric (%) TALNT19-1 TALNT20-1 TALNT21-1 TALNT22-1
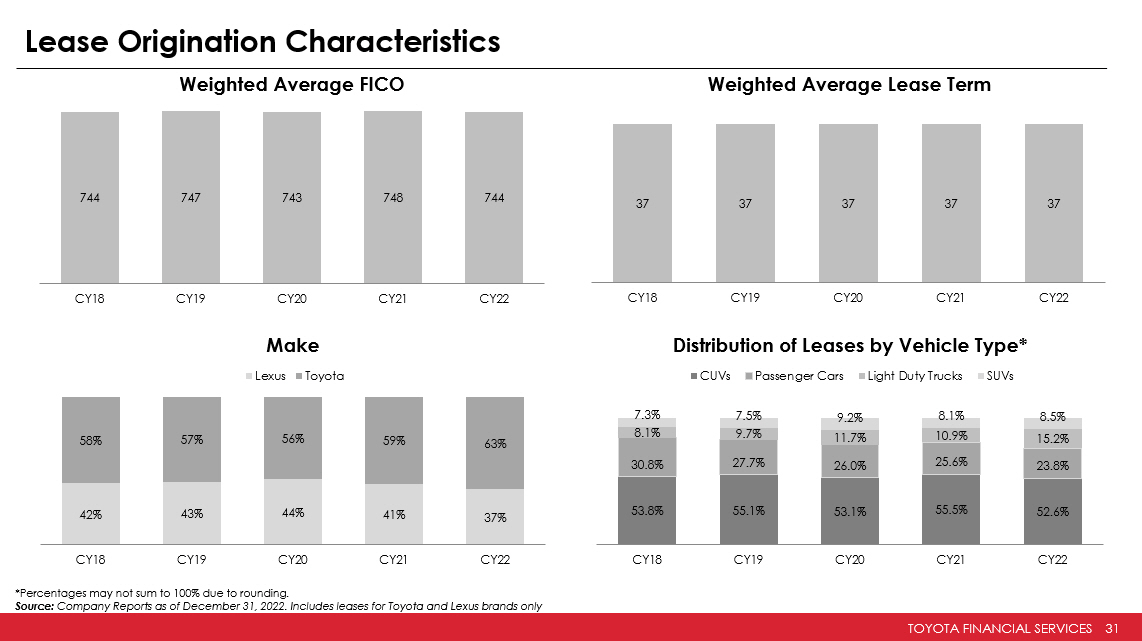
TOYOTA FINANCIAL SERVICES 31 Lease Origination Characteristics *Percentages may not sum to 100% due to rounding . Source: Company Reports as of December 31, 2022. Includes leases for Toyota and Lexus brands only 744 747 743 748 744 CY18 CY19 CY20 CY21 CY22 Weighted Average FICO 37 37 37 37 37 CY18 CY19 CY20 CY21 CY22 Weighted Average Lease Term 53.8% 55.1% 53.1% 55.5% 52.6% 30.8% 27.7% 26.0% 25.6% 23.8% 8.1% 9.7% 11.7% 10.9% 15.2% 7.3% 7.5% 9.2% 8.1% 8.5% CY18 CY19 CY20 CY21 CY22 Distribution of Leases by Vehicle Type* CUVs Passenger Cars Light Duty Trucks SUVs 42% 43% 44% 41% 37% 58% 57% 56% 59% 63% CY18 CY19 CY20 CY21 CY22 Make Lexus Toyota
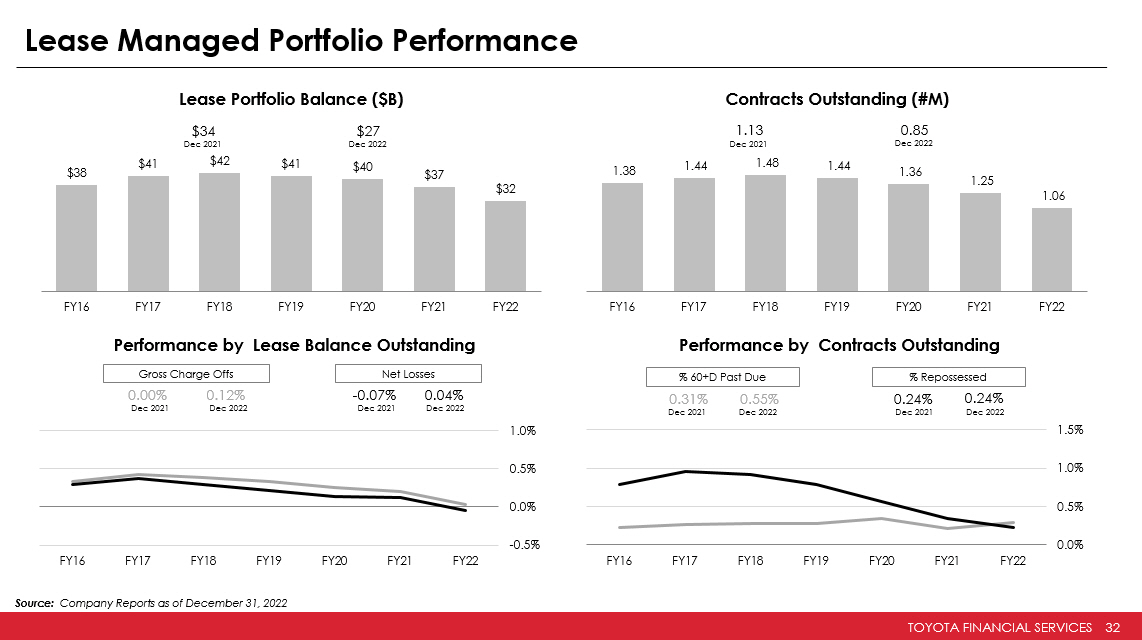
TOYOTA FINANCIAL SERVICES 32 Source: Company Reports as of December 31, 2022 Lease Managed Portfolio Performance $32 $37 $40 $41 $42 $41 $38 FY22 FY21 FY20 FY19 FY18 FY17 FY16 Lease Portfolio Balance ($B) $34 $27 Dec 2021 Dec 2022 1.06 1.25 1.36 1.44 1.48 1.44 1.38 FY22 FY21 FY20 FY19 FY18 FY17 FY16 Contracts Outstanding (#M) 1.13 0.85 Dec 2021 Dec 2022 -0.5% 0.0% 0.5% 1.0% FY22 FY21 FY20 FY19 FY18 FY17 FY16 0.00% 0.12% Dec 2021 Dec 2022 Gross Charge Offs - 0.07% 0.04% Dec 2021 Dec 2022 Net Losses Performance by Lease Balance Outstanding 0.0% 0.5% 1.0% 1.5% FY22 FY21 FY20 FY19 FY18 FY17 FY16 0.31% 0.55% 0.24% 0.24% Dec 2021 Dec 2022 Dec 2021 Dec 2022 % 60+D Past Due % Repossessed Performance by Contracts Outstanding
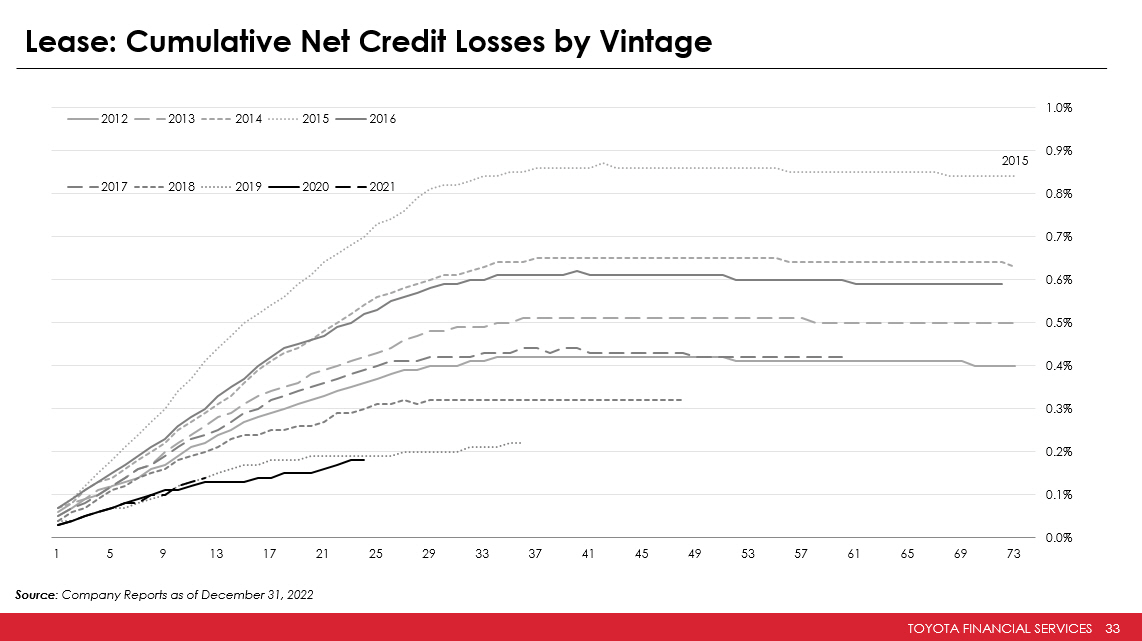
TOYOTA FINANCIAL SERVICES 33 Lease: Cumulative Net Credit Losses by Vintage Source : Company Reports as of December 31 , 2022 2015 0.0% 0.1% 0.2% 0.3% 0.4% 0.5% 0.6% 0.7% 0.8% 0.9% 1.0% 1 5 9 13 17 21 25 29 33 37 41 45 49 53 57 61 65 69 73 2012 2013 2014 2015 2016 2017 2018 2019 2020 2021

TOYOTA FINANCIAL SERVICES 34 TLOT ABS Characteristics *Percentages may not sum to 100% due to rounding Source: Company Reports as of April 30, 2023 773 772 772 772 2021-A 2021-B 2022-A 2023-A Weighted Average FICO 67.5% 69.2% 68.7% 72.6% 2021-A 2021-B 2022-A 2023-A Base Residual as % of Initial Securitization Value 38 38 38 37 28 27 28 27 10 11 11 10 2021-A 2021-B 2022-A 2023-A Original Term Remaining Payments Seasoning Weighted Avg Original and Remaining Payments 55.6% 55.0% 57.0% 55.6% 31.1% 29.5% 29.5% 25.4% 8.5% 9.1% 7.5% 8.8% 4.8% 6.3% 6.1% 10.2% 2021-A 2021-B 2022-A 2023-A CUVs Passenger Cars SUVs Light Duty Trucks Vehicle Type *

TOYOTA FINANCIAL SERVICES 35 TLOT Performance Source : Company Reports as of April 2023 payment date 0.00% 0.10% 0.20% 0.30% 0.40% 0.50% 1 2 3 4 5 6 7 8 9 10 11 12 13 14 15 16 17 18 19 20 21 22 23 24 Cumulative Net Loss TLOT2021-A TLOT2021-B TLOT2022-A 0.0% 1.0% 2.0% 3.0% 4.0% 5.0% 6.0% 7.0% 1 2 3 4 5 6 7 8 9 10 11 12 13 14 15 16 17 18 19 20 21 22 23 24 Cumulative Residual Gain (Loss) TLOT2021-A TLOT2021-B TLOT2022-A 0.00% 0.10% 0.20% 0.30% 0.40% 0.50% 1 2 3 4 5 6 7 8 9 10 11 12 13 14 15 16 17 18 19 20 21 22 23 24 60+ Days Delinquencies TLOT2021-A TLOT2021-B TLOT2022-A

TOYOTA FINANCIAL SERVICES 36 TMCC Managed Lease Portfolio Residual Loss Experience - Aggregate Portfolio (1)(2) TMCC Managed Lease Portfolio Residual Loss Experience - Aggregate Portfolio(1)(2) For the Calendar Years Ended December 31, 2022 2021 2020 2019 2018 Total Number of Vehicles Scheduled to Terminate 399,256 456,075 447,288 512,295 478,587 Total ALG Residuals on Vehicles Scheduled to Terminate $8,074,529,154 $8,708,633,563 $8,481,913,698 $9,454,199,686 $8,692,189,995 Number of Vehicles Returned to TMCC (3) 9,160 48,893 173,672 272,630 268,730 Number of Vehicles Going to Full Term (4) 188,198 238,456 273,229 305,965 271,132 Vehicles Returned to TMCC Ratio 2.3% 10.7% 38.8% 53.2% 56.2% Total Gain/(Loss) on ALG Residuals on Vehicles Returned to TMCC (5) $27,883,126 $175,597,275 $290,069,952 $410,323,395 $198,165,877 Average Gain/(Loss) on ALG Residuals on Vehicles Returned to TMCC (5) $3,044 $3,591 $1,670 $1,505 $737 Total ALG Residuals on Vehicles Returned to TMCC $174,624,797 $997,449,401 $3,424,893,778 $5,077,031,398 $4,924,842,497 Total Gain/(Loss) on ALG Residuals on Vehicles Returned to TMCC as a Percentage of ALG Residuals of Returned Vehicles sold by TMCC 16.0% 17.6% 8.5% 8.1% 4.0% Total Gain/(Loss) on ALG Residuals on Vehicles Returned to TMCC as a Percentage of ALG Residuals of Vehicles Scheduled to Terminate 0.3% 2.0% 3.4% 4.3% 2.3% Average Contract Residual Value as a Percentage of Adjusted MSRP (6) 57.4% 56.2% 58.5% 60.6% 60.5% Average ALG Residual as a Percentage of Adjusted MSRP (6) 51.7% 50.6% 51.2% 51.5% 51.8% Percentage Difference 5.8% 5.5% 7.3% 9.2% 8.6% (1) The residual value loss data reported in this table includes all lease contracts purchased by TMCC or the Titling Trust w ith FICO® scores of at least 620 and original terms between 24 and 48 months, excluding full Battery Electric and Hydrogen Fuel C el l Vehicles. The residual value loss data reported in this table also includes lease contracts that have been sold but are still being serviced by TMCC. (2) For purposes of this table, the “ALG Residual” for each leased vehicle is equal to the related residual value estimate pr odu ced by Automotive Lease Guide at the time of origination of the related lease with average condition and standard mileage (15 ,00 0 miles/year) or, if such estimate is unavailable, the related Contract Residual Value. (3) Excludes repossessions, charge - offs, and vehicles in inventory, but includes early terminations (4) Includes all vehicles terminating at scheduled maturity, terminating past scheduled maturity and terminating within 30 da ys prior to scheduled maturity. (5) Residual gain/(loss) is net of remarketing expenses, and excess wear and tear and excess mileage collections. (6) Adjusted MSRP includes value added vehicle adjustments. Source : Company Reports