Exhibit 99.2
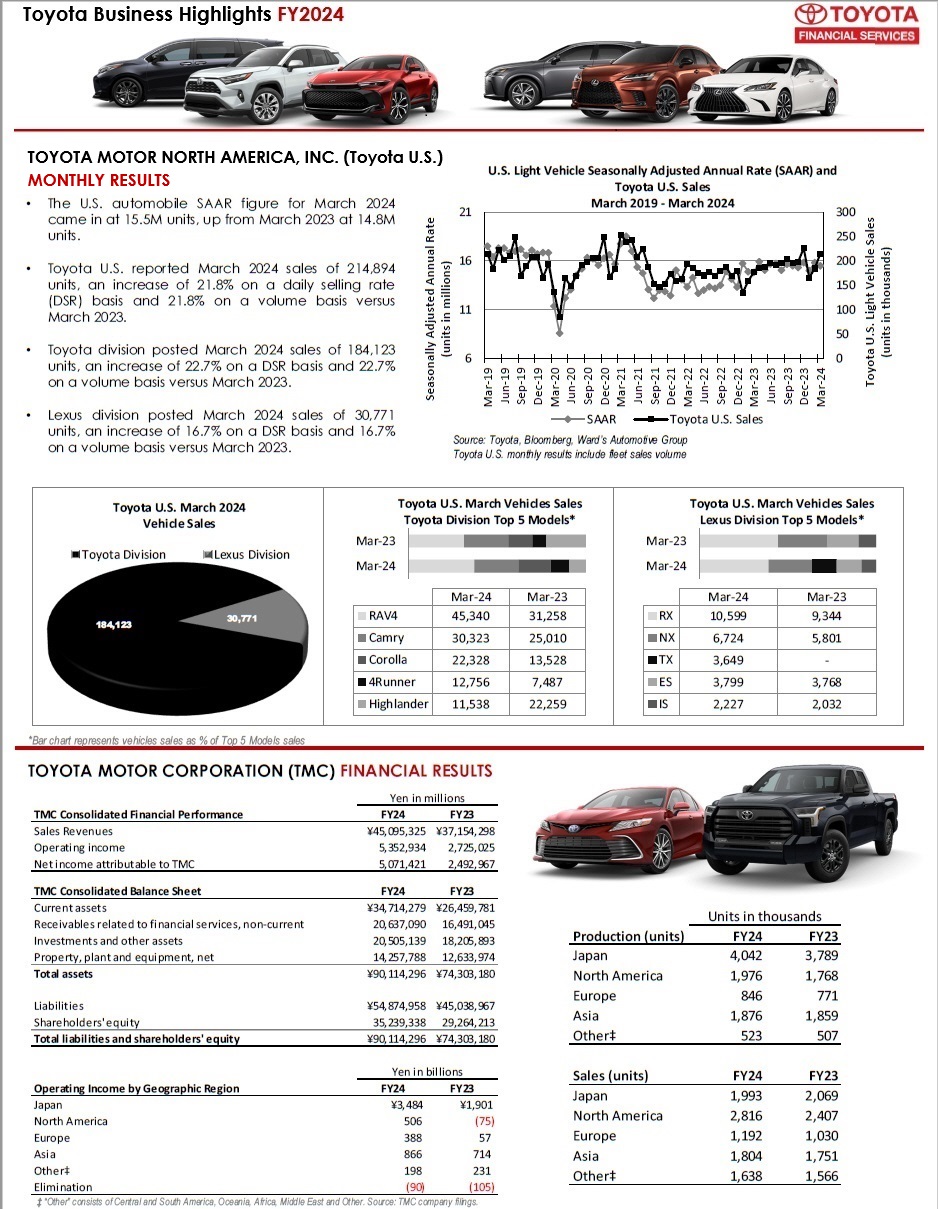
Toyota Business Highlights FY2024 TOYOTA MOTOR NORTH AMERICA, INC. (Toyota U.S.) MONTHLY RESULTS • The U . S . automobile SAAR figure for March 2024 came in at 15 . 5 M units, up from March 2023 at 14 . 8 M units . • Toyota U . S . reported March 2024 sales of 214 , 894 units, an increase of 21 . 8 % on a daily selling rate (DSR) basis and 21 . 8 % on a volume basis versus January 2023 . • Toyota division posted March 2024 sales of 184 , 123 units, an increase of 22 . 7 % on a DSR basis and 22 . 7 % on a volume basis versus March 2023 . • Lexus division posted March 2024 sales of 30 , 771 units, an increase of 16 . 7 % on a DSR basis and 16 . 7 % on a volume basis versus March 2023 . Source: Toyota, Bloomberg, Ward’s Automotive Group Toyota U.S. monthly results include fleet sales volume TOYOTA MOTOR CORPORATION (TMC) FINANCIAL RESULTS ‡ “Other” consists of Central and South America, Oceania, Africa, Middle East and Other. Source: TMC company filings. *Bar chart represents vehicles sales as % of Top 5 Models sales 184,123 30,771 Toyota Division Lexus Division Toyota U.S. March 2024 Vehicle Sales Mar-24 Mar-23 Mar-24 Mar-23 RAV4 45,340 31,258 Camry 30,323 25,010 Corolla 22,328 13,528 4Runner 12,756 7,487 Highlander 11,538 22,259 Toyota U.S. March Vehicles Sales Toyota Division Top 5 Models* Mar-24 Mar-23 Mar-24 Mar-23 RX 10,599 9,344 NX 6,724 5,801 TX 3,649 - ES 3,799 3,768 GX 583 2,472 Toyota U.S. March Vehicles Sales Lexus Division Top 5 Models* 0 50 100 150 200 250 300 6 11 16 21 Mar-19 Jun-19 Sep-19 Dec-19 Mar-20 Jun-20 Sep-20 Dec-20 Mar-21 Jun-21 Sep-21 Dec-21 Mar-22 Jun-22 Sep-22 Dec-22 Mar-23 Jun-23 Sep-23 Dec-23 Mar-24 Toyota U.S. Light Vehicle Sales (units in thousands) Seasonally Adjusted Annual Rate (units in millions) U.S. Light Vehicle Seasonally Adjusted Annual Rate (SAAR) and Toyota U.S. Sales March 2019 - March 2024 SAAR Toyota U.S. Sales TMC Consolidated Financial Performance FY24 FY23 Sales Revenues ¥45,095,325 ¥37,154,298 Operating income 5,352,934 2,725,025 Net income attributable to TMC 5,071,421 2,492,967 TMC Consolidated Balance Sheet FY24 FY23 Current assets ¥34,714,279 ¥26,459,781 Receivables related to financial services, non-current 20,637,090 16,491,045 Investments and other assets 20,505,139 18,205,893 Property, plant and equipment, net 14,257,788 12,633,974 Total assets ¥90,114,296 ¥74,303,180 Liabilities ¥54,874,958 ¥45,038,967 Shareholders' equity 35,239,338 29,264,213 Total liabilities and shareholders' equity ¥90,114,296 ¥74,303,180 Yen in billions Operating Income by Geographic Region FY24 FY23 Japan ¥3,484 ¥1,901 North America 506 (75) Europe 388 57 Asia 866 714 Other‡ 198 231 Elimination (90) (105) Yen in millions Production (units) FY24 FY23 Japan 4,042 3,789 North America 1,976 1,768 Europe 846 771 Asia 1,876 1,859 Other‡ 523 507 Sales (units) FY24 FY23 Japan 1,993 2,069 North America 2,816 2,407 Europe 1,192 1,030 Asia 1,804 1,751 Other‡ 1,638 1,566 Units in thousands

TOYOTA MOTOR CREDIT CORPORATION (TMCC) FINANCIAL RESULTS • Our consolidated net income was $1.5 billion in fiscal 2024, compared to $979 million in fiscal 2023. The increase in net income for fiscal 2024, compared to fiscal 2023, was primarily due to a $943 million decrease in depreciation on operating leases, a $851 million increase in total financing revenues, and a $776 million increase in investment and other income, net, partially offset by a $1.7 billion increase in interest expense, a $144 million increase in operating and administrative expense, a $126 million increase in provision for credit losses, a $122 million increase in voluntary protection contract expenses and insurance losses, and a $113 million increase in provision for income taxes. • We recorded a provision for credit losses of $839 million for fiscal 2024, compared to $713 million for fiscal 2023. The economic conditions have resulted in an increase in consumer delinquencies and charge - offs as well as higher than expected credit losses on both our consumer and dealer portfolios. These factors combined with the increase in size of our retail loan portfolio have led to an increase in the provisions for credit losses for fiscal 2024 compared to fiscal 2023. • Net charge - offs as a percentage of average finance receivables fiscal 2024 increased to 0.69 percent from 0.54 percent for fiscal 2023. Our default frequency as a percentage of outstanding finance receivable contracts increased to 1.25 percent for fiscal 2024, compared to 0.89 percent for fiscal 2023. Our average finance receivables loss severity per unit for fiscal 2024 increased to $14,113 from $12,425 in fiscal 2023. The increases in net charge - offs, default frequency, and loss severity per unit were due to an increase in full balance charge - offs, higher average amounts financed, and higher delinquencies. 1 TMCC market share represents the percentage of total domestic Toyota U.S. sales of new Toyota and Lexus vehicles financed by us, excluding sales under dealer rental car and commercial fleet programs, sales of a private Toyota distributors and private label vehicles financed. SHORT - TERM FUNDING PROGRAMS • TMCC ‡ , Toyota Credit de Puerto Rico Corp . (TCPR), Toyota Credit Canada Inc . (TCCI)†, Toyota Finance Australia Limited (TFA)† and Toyota Motor Finance (Netherlands) B . V . (TMFNL)† maintain direct relationships with institutional commercial paper investors through TMCC’s Sales & Trading team , providing each access to a variety of domestic and global markets through five, distinct 3 (a)( 3 ) programs . • Short - term funding needs are met through the issuance of commercial paper in the U . S . Commercial paper outstanding under our commercial paper programs ranged from approximately $ 16 . 6 billion to $ 18 . 1 billion during fiscal 2024 , with an average outstanding balance of $ 17 . 3 billion . † TCCI, TFA, and TMFNL are subsidiaries of Toyota Financial Services Corporation (TFSC), a wholly - owned subsidiary of Toyota Motor Corporation (TMC). TMCC is a wholly - owned subsidiary of Toyota Financial Service International Corporation (TFSIC), a wholly - own ed subsidiary of TFSC. ‡ TMCC consolidated financial liabilities include TMCC and its consolidated subsidiaries, which includes TCPR. LET’S GO PLACES On June 5, 2024, Toyota announced a $282 million investment growing its Huntsville plant production capabilities and adding more than 350 new, high - quality jobs with long - term stability, affirming its commitment to reinvesting profits in U.S. operations. The Sales and Trading team engages in direct dialogue with institutional investors delivering a variety of fixed income products to meet our clients’ investment objectives and risk tolerances . We focus on providing simple, personal, and proactive service in the execution of all trades . Chuan Qin, CFA| Funding & Liquidity Analyst (469) 486 - 6020 chuan.qin@toyota.com Bob Barish | Funding & Liquidity Analyst (469) 486 - 5598 bob.barish@toyota.com Jeffrey DeSilva | Region Manager (469) 486 - 6759 jeffrey.desilva@toyota.com Sales and Trading Contacts Vincent Rotariu | Funding & Liquidity Analyst (469) 486 - 6159 vincent.rotariu@toyota.com Justin Lee | Funding & Liquidity Analyst (469) 486 - 6187 justin.lee1@toyota.com Jason Kelley | Region Manager (469) 486 - 5301 jason.kelley@toyota.com Nicholas Ro, CFA | National Manager (469) 786 - 8961 nicholas.ro@toyota.com Forward looking statements are subject to risks and uncertainties that could cause actual results to fall short of current ex pec tations. Toyota and its affiliates discuss these risks and uncertainties in filings they make with the Securities and Exchan ge Commission. This presentation does not constitute an offer to purchase any securities. Any offer or sale of securities will be made only by means of a prospectus a nd related documentation . TMCC Financial Performance FY23 FY24 Total financing revenues $11,293 $12,144 Income before income taxes 1,308 1,902 Net Income 979 1,460 Debt-to-Equity Ratio 6.8x 7.2x U.S. dollars in millions 53.6% 54.4% FY23 FY24 TMCC - Market Share 1 446 48 148 392 59 222 0 100 200 300 400 500 New Retail Contracts Used Retail Contracts Lease Contracts Units In Thousands TMCC - Toyota U.S. Contracts Subvened FY23 FY24 718 406 258 840 390 343 0 500 1000 New Retail Contracts Used Retail Contracts Lease Contracts Units in Thousands TMCC - Vehicle Financing Volume FY23 FY24 0.22% 0.54% 0.69% 0.00% 0.25% 0.50% 0.75% FY22 FY23 FY24 Net Charge - offs as a Percentage of Average Finance Receivables 16.9 17.5 62.4 71.1 32.8 34.4 $0 $20 $40 $60 $80 $100 $120 $140 FY23 FY24 Amount ($billions) TMCC Consolidated Financial Liabilities Outstanding (Face Value) Secured notes & loans payable Unsecured notes & loans payable Commercial Paper