UNITED STATES
SECURITIES AND EXCHANGE COMMISSION
Washington, D.C. 20549
FORM N-CSR
CERTIFIED SHAREHOLDER REPORT OF REGISTERED MANAGEMENT
INVESTMENT COMPANIES
| | |
| Investment Company Act file number: | | 811-05594 |
| |
| Exact name of registrant as specified in charter: | | Prudential Short-Term Corporate |
| | Bond Fund, Inc. |
| |
| Address of principal executive offices: | | 655 Broad Street, 17th Floor |
| | Newark, New Jersey 07102 |
| |
| Name and address of agent for service: | | Deborah A. Docs |
| | 655 Broad Street, 17th Floor |
| | Newark, New Jersey 07102 |
| |
| Registrant’s telephone number, including area code: | | 800-225-1852 |
| |
| Date of fiscal year end: | | 12/31/2016 |
| |
| Date of reporting period: | | 12/31/2016 |
Item 1 – Reports to Stockholders
PRUDENTIAL INVESTMENTS, A PGIM BUSINESS | MUTUAL FUNDS
Prudential Short-Term Corporate Bond Fund, Inc.
| | |
| ANNUAL REPORT | | DECEMBER 31, 2016 |

| | |
To enroll in e-delivery, go to prudentialfunds.com/edelivery | |  |
|
| Objective: High current income consistent with the preservation of principal |
Highlights
PRUDENTIAL SHORT-TERM CORPORATE BOND FUND, INC.
| • | | Issue selection among investment-grade corporate bonds and collateralized loan obligations added to the Fund’s performance. (For a complete list of holdings, refer to the Portfolio of Investments section of this report.) |
| • | | The Fund benefited from its positioning in the upstream energy, automotive, consumer non-cyclical, and cable & satellite sectors. |
| • | | An underweight relative to the Bloomberg Barclays 1-5 Year US Credit Index in emerging markets debt detracted from returns. |
This report is not authorized for distribution to prospective investors unless preceded or accompanied by a current prospectus.
The views expressed in this report and information about the Fund’s portfolio holdings are for the period covered by this report and are subject to change thereafter.
Mutual funds are distributed by Prudential Investment Management Services LLC (PIMS), member SIPC. PGIM Fixed Income is a unit of PGIM, Inc. (PGIM), a registered investment adviser. PIMS and PGIM are Prudential Financial companies. © 2017 Prudential Financial, Inc. and its related entities. The Prudential logo and the Rock symbol are service marks of Prudential Financial, Inc. and its related entities, registered in many jurisdictions worldwide.
| | |
| 2 | | Visit our website at prudentialfunds.com |
Letter from the President

Dear Shareholder:
We hope you find the annual report for the Prudential Short-Term Corporate Bond Fund, Inc. informative and useful. The report covers performance for the 12-month period that ended December 31, 2016.
The reporting period was dominated by headline events. The most prominent was the surprising end to a dramatic US election season, as Donald Trump was elected 45th president of the United States. In the wake of the election, investor sentiment was positive for both the economy and the markets in anticipation of a more pro-business environment under a Trump-led administration. Another major headline event was Brexit—the term used to represent Britain’s decision to leave the European Union. This referendum raised further economic and political uncertainty over the future of existing trade and commerce agreements. Meanwhile, the US economy’s recovery continued to strengthen as labor markets tightened. However, questions arose over the new administration’s stance toward existing global trade agreements.
Equity markets in the US, especially financial stocks, experienced powerful gains after the US election, as equity investors appeared to believe that the new administration would quickly implement measures to boost growth. European stocks retreated for the reporting period overall as the eurozone economy continued to experience sluggish growth. Asian markets advanced moderately, and emerging markets were mixed.
In a move widely anticipated by the markets, the Federal Reserve raised its federal funds rate by 0.25% during its December policy meeting. Overall, US fixed income markets generated positive returns during the reporting period, though rising interest rates and concerns over potential inflation jolted bond markets near the end of the period.
Given the uncertainty in today’s investment environment, we believe that active professional portfolio management offers a potential advantage. Active managers often have the knowledge and flexibility to find the best investment opportunities in the most challenging markets.
Even so, it’s best if investment decisions are based on your long-term goals rather than on short-term market and economic developments. We also encourage you to work with an experienced financial advisor who can help you set goals, determine your tolerance for risk, build a diversified plan that’s right for you, and make adjustments when necessary.
By having Prudential Investments help you address your goals, you gain the advantage of asset managers that also manage money for many major corporations and pension funds around the world. That means you benefit from the same expertise, innovation, and attention to risk demanded by today’s most sophisticated investors.
Thank you for choosing our family of funds.
Sincerely,

Stuart S. Parker, President
Prudential Short-Term Corporate Bond Fund, Inc.
February 15, 2017
| | | | |
| Prudential Short-Term Corporate Bond Fund, Inc. | | | 3 | |
Your Fund’s Performance (unaudited)
Performance data quoted represent past performance. Past performance does not guarantee future results. The investment return and principal value of an investment will fluctuate, so that an investor’s shares, when redeemed, may be worth more or less than their original cost. Current performance may be lower or higher than the past performance data quoted. An investor may obtain performance data as of the most recent month-end by visiting our website at www.prudentialfunds.com or by calling (800) 225-1852.
| | | | | | | | | | | | | | | | |
| Cumulative Total Returns (Without Sales Charges) as of 12/31/16 | |
| | | One Year (%) | | | | Five Years (%) | | | | Ten Years (%) | | | | Since Inception (%) | |
| Class A | | | 2.50 | | | | 11.27 | | | | 45.25 | | | | — | |
| Class B | | | 1.73 | | | | 7.17 | | | | 34.69 | | | | — | |
| Class C | | | 1.73 | | | | 7.18 | | | | 36.01 | | | | — | |
| Class Q | | | 2.85 | | | | N/A | | | | N/A | | | | 10.97 (3/2/12) | |
| Class R | | | 2.24 | | | | 9.89 | | | | 41.70 | | | | — | |
| Class Z | | | 2.76 | | | | 12.78 | | | | 48.93 | | | | — | |
| Bloomberg Barclays 1–5 Year US Credit Index | | | 2.58 | | | | 12.90 | | | | 46.06 | | | | — | |
| Lipper Short/Intermediate Investment-Grade Debt Funds Average | | | 2.43 | | | | 9.63 | | | | 38.03 | | | | — | |
| | | | | | | | | | | | | | | | |
| Average Annual Total Returns (With Sales Charges) as of 12/31/16 | |
| | | One Year (%) | | | | Five Years (%) | | | | Ten Years (%) | | | | Since Inception (%) | |
| Class A | | | –0.83 | | | | 1.49 | | | | 3.46 | | | | — | |
| Class B | | | –1.27 | | | | 1.39 | | | | 3.02 | | | | — | |
| Class C | | | 0.73 | | | | 1.40 | | | | 3.12 | | | | — | |
| Class Q | | | 2.85 | | | | N/A | | | | N/A | | | | 2.18 (3/2/12) | |
| Class R | | | 2.24 | | | | 1.90 | | | | 3.55 | | | | — | |
| Class Z | | | 2.76 | | | | 2.44 | | | | 4.06 | | | | — | |
| Bloomberg Barclays 1–5 Year US Credit Index | | | 2.58 | | | | 2.46 | | | | 3.86 | | | | — | |
| Lipper Short/Intermediate Investment-Grade Debt Funds Average | | | 2.43 | | | | 1.84 | | | | 3.24 | | | | — | |
| | |
| 4 | | Visit our website at prudentialfunds.com |
| | | | | | | | |
| Average Annual Total Returns (Without Sales Charges) as of 12/31/16 |
| | One Year (%) | | Five Years (%) | | Ten Years (%) | | Since Inception (%) |
| Class A | | 2.50 | | 2.16 | | 3.80 | | — |
| Class B | | 1.73 | | 1.39 | | 3.02 | | — |
| Class C | | 1.73 | | 1.40 | | 3.12 | | — |
| Class Q | | 2.85 | | N/A | | N/A | | 2.18 (3/2/12) |
| Class R | | 2.24 | | 1.90 | | 3.55 | | — |
| Class Z | | 2.76 | | 2.44 | | 4.06 | | — |
| | | | |
| Prudential Short-Term Corporate Bond Fund, Inc. | | | 5 | |
Your Fund’s Performance (continued)
Growth of a $10,000 Investment
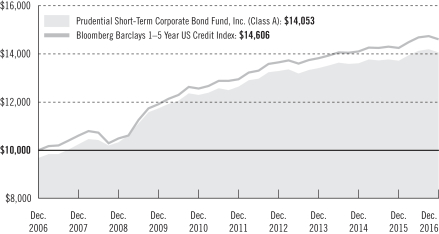
The graph compares a $10,000 investment in the Prudential Short-Term Corporate Bond Fund, Inc. (Class A shares) with a similar investment in the Bloomberg Barclays 1–5 Year US Credit Index by portraying the initial account values at the beginning of the 10-year period for Class A shares (December 31, 2006) and the account values at the end of the current fiscal year (December 31, 2016) as measured on a quarterly basis. For purposes of the graph, and unless otherwise indicated, it has been assumed that (a) the maximum applicable front-end sales charge was deducted from the initial $10,000 investment in Class A shares; (b) all recurring fees (including management fees) were deducted; and (c) all dividends and distributions were reinvested. The line graph provides information for Class A shares only. As indicated in the tables provided earlier, performance for Class B, C, Q, R, and Z shares will vary, due to the differing charges and expenses applicable to each share class (as indicated in the following paragraphs). Without waiver of fees and/or expense reimbursement, if any, the returns would have been lower.
Past performance does not predict future performance. Total returns and the ending account values in the graph include changes in share price and reinvestment of dividends and capital gains distributions in a hypothetical investment for the periods shown. The Fund’s total returns do not reflect the deduction of income taxes on an individual’s investment. Taxes may reduce your actual investment returns on income or gains paid by the Fund or any gains you may realize if you sell your shares.
| | |
| 6 | | Visit our website at prudentialfunds.com |
Source: Prudential Investments LLC and Lipper, Inc.
Inception returns are provided for any share class with less than 10 calendar years of returns.
The returns in the tables do not reflect the deduction of taxes that a shareholder would pay on Fund distributions or following the redemption of Fund shares. The average annual total returns take into account applicable sales charges, which are described for each share class in the table below.
| | | | | | | | | | | | |
| | | Class A | | Class B* | | Class C | | Class Q | | Class R | | Class Z |
| Maximum initial sales charge | | 3.25% of the public offering price | | None | | None | | None | | None | | None |
| Contingent deferred sales charge (CDSC) (as a percentage of the lower of original purchase price or net asset value at redemption) | | .50% on sales of $1 million or more made within 18 months of purchase | | 3% (Yr. 1) 2% (Yr. 2) 1% (Yr. 3) 1% (Yr. 4) 0% (Yr. 5) | | 1% on sales made within 12 months of purchase | | None | | None | | None |
| Annual distribution and service (12b-1) fees (shown as a percentage of average daily net assets) | | .25% | | 1% | | 1% | | None | | .75% (.50% currently) | | None |
*Class B shares are closed to all purchase activity and no additional Class B shares may be purchased or acquired except by exchange from Class B shares of another Fund or through dividend or capital gains reinvestment.
Benchmark Definitions
Bloomberg Barclays 1–5 Year US Credit Index—The Bloomberg Barclays 1–5 Year US Credit Index is an unmanaged index of publicly issued US corporate and specified foreign debentures and secured notes that meet specific maturity (between one and five years), liquidity, and quality requirements. It gives an indication of how short- and intermediate-term bonds have performed. The cumulative total return for the Index measured from the month-end closest to the inception date through 12/31/16 is 10.64% for Class Q shares. The average annual total return for the Index measured from the month-end closest to the inception date through 12/31/16 is 2.11% for Class Q shares.
Lipper Short/Intermediate Investment-Grade Debt Funds Average—The Lipper Short/Intermediate Investment-Grade Debt Funds Average (Lipper Average) is based on the average return of all funds in the Lipper Short/Intermediate Investment-Grade Debt Funds universe for the periods noted. Funds in the Lipper Average invest primarily in investment-grade debt issues (rated in the top four grades) with dollar-weighted average maturities of one to five years. The cumulative total return for the Lipper Average measured from the month-end closest to the inception date through 12/31/16 is 7.93% for Class Q shares. The average annual
| | | | |
| Prudential Short-Term Corporate Bond Fund, Inc. | | | 7 | |
Your Fund’s Performance (continued)
total return for the Lipper Average measured from the month-end closest to the inception date through 12/31/16 is 1.58% for Class Q shares.
Investors cannot invest directly in an index or average. The returns for the Index would be lower if they included the effects of sales charges, operating expenses of a mutual fund, or taxes. Returns for the Lipper Average reflect the deduction of operating expenses, but not sales charges or taxes. The Since Inception returns for the Index and the Lipper Average are measured from the closest month-end to inception date for the indicated share class.
| | | | | | |
| Distributions and Yields as of 12/31/16 |
| | Total Distributions
Paid for
12 Months ($) | | SEC 30-Day
Subsidized
Yield* (%) | | SEC 30-Day
Unsubsidized
Yield** (%) |
| Class A | | 0.26 | | 1.68 | | 1.68 |
| Class B | | 0.18 | | 0.99 | | 0.99 |
| Class C | | 0.18 | | 0.99 | | 0.99 |
| Class Q | | 0.30 | | 2.09 | | 2.09 |
| Class R | | 0.24 | | 1.49 | | 1.24 |
| Class Z | | 0.29 | | 1.97 | | 1.97 |
*SEC 30-Day Subsidized Yield (%)—A standardized yield calculation created by the Securities and Exchange Commission, it reflects the income earned during a 30-day period, after the deduction of the Fund’s net expenses (net of any expense waivers or reimbursements).
**SEC 30-Day Unsubsidized Yield (%)—A standardized yield calculation created by the Securities and Exchange Commission, it reflects the income earned during a 30-day period, after the deduction of the Fund’s gross expenses.
| | | | |
| Credit Quality expressed as a percentage of total investments as of 12/31/16 (%) | |
| AAA | | | 10.2 | |
| AA | | | 6.2 | |
| A | | | 39.3 | |
| BBB | | | 41.0 | |
| BB | | | 1.9 | |
| B | | | 0.1 | |
| Cash/Cash Equivalents | | | 1.4 | |
| Total Investments | | | 100.0 | |
Source: PGIM, Inc.
Credit ratings reflect the highest rating assigned by a nationally recognized statistical rating organization (NRSRO) such as Moody’s Investor Service, Inc. (Moody’s), Standard & Poor’s (S&P), or Fitch, Inc. (Fitch). Credit ratings reflect the common nomenclature used by both S&P and Fitch. Where applicable, ratings are converted to the comparable S&P/Fitch rating tier nomenclature. These rating agencies are independent and are widely used. The Not Rated category consists of securities that have not been rated by a NRSRO. Credit ratings are subject to change. Values may not sum to 100.0% due to rounding.
| | |
| 8 | | Visit our website at prudentialfunds.com |
Strategy and Performance Overview
How did the Fund perform?
The Prudential Short-Term Corporate Bond Fund’s Class A shares returned 2.50% for the 12-month period ended December 31, 2016, in line with the 2.58% return of the Bloomberg Barclays 1-5 Year US Credit Index (the Index) and the 2.43% return of the Lipper Short/Intermediate Investment-Grade Debt Funds Average.
What were market conditions?
| • | | The short-term investment-grade corporate bond market, as measured by the Index, posted a return of 2.58% during the reporting period, outperforming US Treasury securities by 148 basis points. (A basis point is 1/100th of a percent.) |
| • | | Short-term corporate bonds generated positive returns during the first quarter of 2016 but underperformed the broader corporate market. Credit spreads widened in January through mid-February amid uncertainty about the Federal Reserve’s (Fed) rate hiking schedule, the pace of US and global economic growth, fallout within the energy sector due to lower crude oil prices, the outlook for corporate earnings, and outsized issuance. (Credit spreads are the amount of extra yield that corporate bonds provide over similar-duration Treasuries.) Between mid-February and the end of March, credit spreads tightened as oil prices seemed to stabilize, US economic data improved, the Fed pushed back the timing and magnitude of its rate hikes, and China and the European Central Bank (ECB) increased their stimulus efforts. |
| • | | Short-term corporate bonds underperformed the broader corporate bond market in the second quarter, but recorded a positive return, benefiting from investors’ demand for yield amid steady, albeit modest, US economic growth. Fundamentals remained solid overall for US consumer-oriented sectors, which were boosted by US economic growth. Meanwhile, most commodity, energy, and metals & mining issuers sought to shore up their balance sheets. In other industrial sectors, the use of leverage increased as lower interest rates spurred mergers and acquisitions (M&A) activity and share buybacks. US financial issues came under pressure on fears that slower global growth and the Fed’s reluctance to raise rates might weigh on earnings. |
| • | | Short-term corporate bonds eked out a gain during the third quarter, but underperformed the broader corporate bond market. Overall, corporate bonds continued to benefit from modestly positive US economic growth and strong demand from global investors seeking yield against a backdrop of aggressive central bank monetary policies. These policies included negative interest rates in Europe and Japan, as well as the ECB’s corporate bond purchase program. The industrial and utility sectors outpaced the financial sector, which was hurt by concerns about ultra-low interest rates and the Fed’s continued reluctance to take monetary policy action. Although fundamentals in most consumer-oriented industries remained healthy, they weakened among high-quality industrial companies due to increased leverage for the financing of M&A and share-buyback activities. |
| | | | |
| Prudential Short-Term Corporate Bond Fund, Inc. | | | 9 | |
Strategy and Performance Overview (continued)
| • | | Short-term corporate bonds retreated during the fourth quarter, but outperformed the broader corporate bond market. Despite their negative returns, corporate bonds were supported overall by modestly improving US economic growth and still healthy credit fundamentals. While leverage continued to increase in the industrial sector, companies in most industries had positive free cash flows before share buybacks. In addition, revenue and earnings growth improved. Energy companies were generally stable, while metals & mining issuers continued to undergo balance sheet repair. |
| • | | At the end of the period, supply-and-demand conditions remained favorable, given the relatively higher yields of US corporate bonds versus those in other developed markets. Record issuance in 2016 was met with strong demand from both US and non-US investors, particularly investors from Japan and Europe where interest rates were anchored by aggressive central bank monetary policies. |
What worked?
| • | | The Fund benefited from security selection among investment-grade corporate bonds and collateralized loan obligations. Within corporate bonds, positioning in the upstream energy, automotive, consumer non-cyclical, and cable & satellite sectors added to relative performance. (For a complete list of holdings, refer to the Portfolio of Investments section of this report.) |
| • | | The Fund’s overall exposure to investment-grade corporate bonds contributed positively to results. |
| • | | PGIM Fixed Income continued to add modest allocations to non-Index fixed income sectors to diversify the Fund away from short-term investment-grade corporate bonds and to add incremental yield. During the period, non-Index exposure to short-duration BB-rated corporate bonds and high-quality commercial mortgage-backed securities added to returns. |
| • | | Overweights to Charter Communications (cable & satellite), Newell Brands (consumer non-cyclical), and General Motors (automotive) bolstered performance. An underweight to Wells Fargo (banking) also added value. |
What didn’t work?
| • | | The Fund was hurt by an underweight in emerging markets debt during the period. |
| • | | Within corporate bonds, the Fund’s positioning in the banking, metals & mining, and financial sectors detracted from performance. |
| • | | Overweight positions in the banking sector, including Bank of America, Citigroup, Morgan Stanley, and Goldman Sachs Group, hampered performance. The Fund’s underweights in metals & mining issuers, including Valepar and Freeport-McMoRan, also limited results. |
| | |
| 10 | | Visit our website at prudentialfunds.com |
Did the Fund use derivatives and how did they affect performance?
| • | | The Fund’s investment strategy does not heavily rely on derivative strategies, although it does employ certain instruments on a limited basis. |
| • | | Treasury futures are used to manage the Fund’s interest rate risk, which is more efficient than managing interest rate risk through the purchases and sales of cash corporate bonds. Credit default swaps are used sparingly to either add risk exposure to certain issuers, or to hedge credit risk imposed by certain issuers. |
| • | | During the reporting period, the use of Treasury futures and credit default swaps did not have a material impact on the Fund’s performance. |
Current outlook
| • | | Within investment-grade corporate bonds, PGIM Fixed Income continues to guard the Fund against event risk. PGIM Fixed Income favors financials, primarily US money center banks, over industrials. In PGIM Fixed Income’s view, financial issuers are less vulnerable to event risk and are subject to higher capital requirements, which should continue even if other post-financial crisis regulations are rolled back to some extent. |
| • | | Within industrials, PGIM Fixed Income prefers autos, chemicals, and paper. Also favored in other industries are select pharmaceuticals, as well as US-centric issuers with close ties to a growing US economy. |
| • | | PGIM Fixed Income favors electric utilities, and in the energy sector, continues to find select opportunities among issues that have already experienced an “event.” |
| • | | PGIM Fixed Income expects US credit spreads to tighten in the first quarter of 2017 given they were modestly attractive at the end of the period, with little to no sign of a US recession and on-going demand by overseas investors, driven by higher US interest rates and non-US central bank quantitative easing programs. |
| | | | |
| Prudential Short-Term Corporate Bond Fund, Inc. | | | 11 | |
Fees and Expenses (unaudited)
As a shareholder of the Fund, you incur two types of costs: (1) transaction costs, including sales charges (loads) on purchase payments and redemptions, as applicable, and (2) ongoing costs, including management fees, distribution and/or service (12b-1) fees, and other Fund expenses, as applicable. This example is intended to help you understand your ongoing costs (in dollars) of investing in the Fund and to compare these costs with the ongoing costs of investing in other mutual funds.
The example is based on an investment of $1,000 invested on July 1, 2016, at the beginning of the period, and held through the six-month period ended December 31, 2016. The example is for illustrative purposes only; you should consult the Prospectus for information on initial and subsequent minimum investment requirements.
Actual Expenses
The first line for each share class in the table on the following page provides information about actual account values and actual expenses. You may use the information on this line, together with the amount you invested, to estimate the expenses that you paid over the period. Simply divide your account value by $1,000 (for example, an $8,600 account value ÷ $1,000 = 8.6), then multiply the result by the number on the first line under the heading “Expenses Paid During the Six-Month Period” to estimate the expenses you paid on your account during this period.
Hypothetical Example for Comparison Purposes
The second line for each share class in the table on the following page provides information about hypothetical account values and hypothetical expenses based on the Fund’s actual expense ratio and an assumed rate of return of 5% per year before expenses, which is not the Fund’s actual return. The hypothetical account values and expenses may not be used to estimate the actual ending account balance or expenses you paid for the period. You may use this information to compare the ongoing costs of investing in the Fund and other funds. To do so, compare this 5% hypothetical example with the 5% hypothetical examples that appear in the shareholder reports of the other funds.
The Fund’s transfer agent may charge additional fees to holders of certain accounts that are not included in the expenses shown in the table on the following page. These fees apply to individual retirement accounts (IRAs) and Section 403(b) accounts. As of the close of the six-month period covered by the table, IRA fees included an annual maintenance fee of $15 per account (subject to a maximum annual maintenance fee of $25 for all accounts held by the same shareholder). Section 403(b) accounts are charged an annual $25 fiduciary maintenance fee. Some of the fees may vary in amount, or may be waived, based on your total account balance or the number of Prudential Investments funds, including the Fund, that you own. You should consider the additional fees that were charged to your
| | |
| 12 | | Visit our website at prudentialfunds.com |
Fund account over the six-month period when you estimate the total ongoing expenses paid over the period and the impact of these fees on your ending account value, as these additional expenses are not reflected in the information provided in the expense table. Additional fees have the effect of reducing investment returns.
Please note that the expenses shown in the table are meant to highlight your ongoing costs only and do not reflect any transactional costs such as sales charges (loads). Therefore, the second line for each share class in the table is useful in comparing ongoing costs only and will not help you determine the relative total costs of owning different funds. In addition, if these transactional costs were included, your costs would have been higher.
| | | | | | | | | | | | | | | | | | |
Prudential
Short-Term Corporate
Bond Fund, Inc. | | Beginning Account
Value
July 1, 2016 | | | Ending Account
Value
December 30, 2016 | | | Annualized
Expense Ratio
Based on the
Six-Month Period | | | Expenses Paid
During the
Six-Month Period* | |
| Class A | | Actual | | $ | 1,000.00 | | | $ | 995.50 | | | | 0.78 | % | | $ | 3.91 | |
| | Hypothetical | | $ | 1,000.00 | | | $ | 1,021.22 | | | | 0.78 | % | | $ | 3.96 | |
| Class B | | Actual | | $ | 1,000.00 | | | $ | 991.70 | | | | 1.53 | % | | $ | 7.66 | |
| | Hypothetical | | $ | 1,000.00 | | | $ | 1,017.44 | | | | 1.53 | % | | $ | 7.76 | |
| Class C | | Actual | | $ | 1,000.00 | | | $ | 991.80 | | | | 1.53 | % | | $ | 7.66 | |
| | Hypothetical | | $ | 1,000.00 | | | $ | 1,017.44 | | | | 1.53 | % | | $ | 7.76 | |
| Class Q | | Actual | | $ | 1,000.00 | | | $ | 998.10 | | | | 0.43 | % | | $ | 2.16 | |
| | Hypothetical | | $ | 1,000.00 | | | $ | 1,022.97 | | | | 0.43 | % | | $ | 2.19 | |
| Class R | | Actual | | $ | 1,000.00 | | | $ | 994.30 | | | | 1.03 | % | | $ | 5.16 | |
| | Hypothetical | | $ | 1,000.00 | | | $ | 1,019.96 | | | | 1.03 | % | | $ | 5.23 | |
| Class Z | | Actual | | $ | 1,000.00 | | | $ | 997.70 | | | | 0.53 | % | | $ | 2.66 | |
| | | Hypothetical | | $ | 1,000.00 | | | $ | 1,022.47 | | | | 0.53 | % | | $ | 2.69 | |
*Fund expenses (net of fee waivers or subsidies, if any) for each share class are equal to the annualized expense ratio for each share class (provided in the table), multiplied by the average account value over the period, multiplied by the 184 days in the six-month period ended December 31, 2016, and divided by the 366 days in the Fund’s fiscal year ended December 31, 2016 (to reflect the six-month period). Expenses presented in the table include the expenses of any underlying portfolios in which the Fund may invest.
| | | | |
| Prudential Short-Term Corporate Bond Fund, Inc. | | | 13 | |
Fees and Expenses (continued)
The Fund’s annual expense ratios for the 12-month period ended December 31, 2016, are as follows:
| | | | |
| Class | | Gross Operating Expenses (%) | | Net Operating Expenses (%) |
| A | | 0.77 | | 0.77 |
| B | | 1.52 | | 1.52 |
| C | | 1.52 | | 1.52 |
| Q | | 0.42 | | 0.42 |
| R | | 1.27 | | 1.02 |
| Z | | 0.52 | | 0.52 |
Net operating expenses shown above reflect fee waivers and/or expense reimbursements. Additional information on Fund expenses and any fee waivers and/or expense reimbursements can be found in the “Financial Highlights” tables in this report and in the Notes to the Financial Statements in this report.
| | |
| 14 | | Visit our website at prudentialfunds.com |
Portfolio of Investments
as of December 31, 2016
| | | | | | | | | | | | | | | | |
| Description | | Interest
Rate | | | Maturity
Date | | | Principal
Amount (000)# | | | Value (Note 2) | |
LONG-TERM INVESTMENTS 97.7% | |
|
ASSET-BACKED SECURITIES 5.8% | |
| | | | |
Collateralized Loan Obligations | | | | | | | | | | | | | | | | |
AIMCO CLO (Cayman Islands),
Series 2015-AA, Class A1, 144A | | | 2.580 | %(a) | | | 01/15/28 | | | | 25,000 | | | $ | 24,938,038 | |
ALM VIII Ltd. (Cayman Islands),
Series 2013-8A, Class A1R, 144A | | | 2.343 | (a) | | | 10/15/28 | | | | 20,000 | | | | 19,996,428 | |
Ares CLO Ltd. (Cayman Islands),
Series 2012-2A, Class AR, 144A | | | 2.164 | (a) | | | 10/12/23 | | | | 40,000 | | | | 40,005,356 | |
Ares XXVII CLO Ltd. (Cayman Islands),
Series 2013-2A, Class A2R, 144A | | | 2.240 | (a) | | | 07/28/25 | | | | 25,000 | | | | 25,058,562 | |
Atlas Senior Loan Fund V Ltd. (Cayman Islands),
Series 2014-1A, Class AR, 144A | | | 2.298 | (a) | | | 07/16/26 | | | | 10,000 | | | | 10,008,943 | |
Atrium X CLO (Cayman Islands),
Series 2015-10A, Class A, 144A | | | 2.000 | (a) | | | 07/16/25 | | | | 40,000 | | | | 39,892,164 | |
Ballyrock CLO Ltd. (Cayman Islands),
Series 2016-1A, Class A, 144A | | | 2.406 | (a) | | | 10/15/28 | | | | 10,000 | | | | 10,032,328 | |
Benefit Street Partners CLO VII Ltd. (Cayman Islands),
Series 2015-VIIA, Class A1A, 144A | | | 2.412 | (a) | | | 07/18/27 | | | | 11,500 | | | | 11,534,355 | |
Galaxy XVII CLO Ltd. (Cayman Islands),
Series 2014-17A, Class AR, 144A | | | 2.280 | (a) | | | 07/15/26 | | | | 10,000 | | | | 10,000,310 | |
Jefferson Mill CLO Ltd. (Cayman Islands),
Series 2015-1A, Class A1, 144A | | | 2.381 | (a) | | | 07/20/27 | | | | 45,000 | | | | 44,940,807 | |
Magnetite IX Ltd. (Cayman Islands),
Series 2014-9A, Class A1, 144A(b) | | | 2.302 | (a) | | | 07/25/26 | | | | 7,320 | | | | 7,332,096 | |
Marea CLO Ltd. (Cayman Islands),
Series 2012-1A, Class AR, 144A | | | 2.230 | (a) | | | 10/15/23 | | | | 25,000 | | | | 25,003,055 | |
Mill Creek CLO Ltd. (Cayman Islands),
Series 2016-1A, Class A, 144A | | | 2.631 | (a) | | | 04/20/28 | | | | 20,000 | | | | 20,035,430 | |
Mountain View CLO Ltd. (Cayman Islands),
Series 2014-1A, Class A, 144A | | | 2.390 | (a) | | | 10/15/26 | | | | 5,000 | | | | 4,991,843 | |
Series 2015-9A, Class A1A, 144A | | | 2.340 | (a) | | | 07/15/27 | | | | 26,000 | | | | 25,929,535 | |
OZLM Funding Ltd. (Cayman Islands),
Series 2012-1A, Class A1R, 144A | | | 2.402 | (a) | | | 07/22/27 | | | | 25,000 | | | | 25,004,072 | |
OZLM Funding II Ltd. (Cayman Islands),
Series 2012-2A, Class A1R, 144A | | | 2.308 | (a) | | | 10/30/27 | | | | 25,000 | | | | 25,005,400 | |
Palmer Square CLO Ltd. (Cayman Islands),
Series 2015-2A, Class A1A, 144A | | | 2.381 | (a) | | | 07/20/27 | | | | 35,000 | | | | 35,062,790 | |
Regatta VII Funding Ltd. (Cayman Islands),
Series 2016-1A, Class A1, 144A | | | 2.374 | (a) | | | 12/20/28 | | | | 20,000 | | | | 19,991,444 | |
See Notes to Financial Statements.
| | | | |
| Prudential Short-Term Corporate Bond Fund, Inc. | | | 15 | |
Portfolio of Investments (continued)
as of December 31, 2016
| | | | | | | | | | | | | | | | |
| Description | | Interest
Rate | | | Maturity
Date | | | Principal
Amount (000)# | | | Value (Note 2) | |
ASSET-BACKED SECURITIES (Continued) | |
| | | | |
Collateralized Loan Obligations (cont’d.) | | | | | | | | | | | | | | | | |
Silvermore CLO Ltd. (Cayman Islands),
Series 2014-1A, Class A1, 144A | | | 2.356 | %(a) | | | 05/15/26 | | | | 24,780 | | | $ | 24,745,873 | |
Sound Point CLO IX Ltd. (Cayman Islands),
Series 2015-2A, Class A, 144A | | | 2.401 | (a) | | | 07/20/27 | | | | 40,000 | | | | 40,040,512 | |
THL Credit Wind River CLO Ltd. (Cayman Islands),
Series 2014-1A, Class A, 144A | | | 2.402 | (a) | | | 04/18/26 | | | | 5,000 | | | | 5,013,537 | |
Series 2015-1A, Class A, 144A | | | 2.381 | (a) | | | 07/20/27 | | | | 45,000 | | | | 45,054,099 | |
Trinitas CLO V Ltd. (Cayman Islands),
Series 2016-5A, Class A, 144A | | | 2.434 | (a) | | | 10/25/28 | | | | 10,000 | | | | 9,997,748 | |
Wellfleet CLO Ltd. (Cayman Islands),
Series 2016-2A, Class A1, 144A | | | 2.507 | (a) | | | 10/20/28 | | | | 20,000 | | | | 20,117,106 | |
West CLO Ltd. (Cayman Islands),
Series 2013-1A, Class A1A, 144A | | | 2.281 | (a) | | | 11/07/25 | | | | 25,000 | | | | 25,002,432 | |
| | | | | | | | | | | | | | | | |
TOTAL ASSET-BACKED SECURITIES
(cost $593,099,955) | | | | | | | | | | | | | | | 594,734,263 | |
| | | | | | | | | | | | | | | | |
| | | | |
BANK LOAN 0.2% | | | | | | | | | | | | | | | | |
| | | | |
Technology | | | | | | | | | | | | | | | | |
Dell International LLC
(cost $19,449,511) | | | 2.998 | (a) | | | 12/31/18 | | | | 20,000 | | | | 19,968,760 | |
| | | | | | | | | | | | | | | | |
COMMERCIAL MORTGAGE-BACKED SECURITIES 3.8% | | | | | | | | | |
Banc of America Commercial Mortgage Trust,
Series 2007-2, Class A1A | | | 5.587 | (a) | | | 04/10/49 | | | | 11,687 | | | | 11,742,481 | |
Citigroup Commercial Mortgage Trust, | | | | | | | | | | | | | | | | |
Series 2015-GC27, Class A3 | | | 3.061 | | | | 02/10/48 | | | | 12,750 | | | | 12,944,752 | |
Series 2016-C2, Class A2 | | | 1.846 | | | | 08/10/49 | | | | 15,097 | | | | 14,737,439 | |
COMM Mortgage Trust, | | | | | | | | | | | | | | | | |
Series 2012-CR4, Class A2 | | | 1.801 | | | | 10/15/45 | | | | 3,200 | | | | 3,209,424 | |
Series 2014-CR18, Class A3 | | | 3.528 | | | | 07/15/47 | | | | 7,400 | | | | 7,722,974 | |
Series 2014-CR19, Class A3 | | | 3.530 | | | | 08/10/47 | | | | 14,824 | | | | 15,366,554 | |
Series 2015-CR22, Class A3 | | | 3.207 | | | | 03/10/48 | | | | 27,750 | | | | 28,111,660 | |
Series 2015-DC1, Class A3 | | | 3.219 | | | | 02/10/48 | | | | 20,000 | | | | 20,272,094 | |
GS Mortgage Securities Trust, | | | | | | | | | | | | | | | | |
Series 2013-GC14, Class A3 | | | 3.526 | | | | 08/10/46 | | | | 17,475 | | | | 18,195,104 | |
Series 2014-GC20, Class A3 | | | 3.680 | | | | 04/10/47 | | | | 19,000 | | | | 19,653,273 | |
Series 2014-GC22, Class A3 | | | 3.516 | | | | 06/10/47 | | | | 20,000 | | | | 20,595,806 | |
Series 2014-GC24, Class A3 | | | 3.342 | | | | 09/10/47 | | | | 10,000 | | | | 10,269,189 | |
Series 2015-GC28, Class A3 | | | 3.307 | | | | 02/10/48 | | | | 8,225 | | | | 8,416,687 | |
See Notes to Financial Statements.
| | | | | | | | | | | | | | | | |
| Description | | Interest
Rate | | | Maturity
Date | | | Principal
Amount (000)# | | | Value (Note 2) | |
COMMERCIAL MORTGAGE-BACKED SECURITIES (Continued) | | | | | | | | | |
JPMBB Commercial Mortgage Securities Trust, | | | | | | | | | | | | | | | | |
Series 2014-C21, Class A3 | | | 3.435 | % | | | 08/15/47 | | | | 15,000 | | | $ | 15,457,812 | |
Series 2015-C28, Class A2 | | | 2.773 | | | | 10/15/48 | | | | 19,754 | | | | 20,119,731 | |
JPMorgan Chase Commercial Mortgage Securities Trust, | | | | | | | | | | | | | | | | |
Series 2012-LC9, Class A3 | | | 2.475 | | | | 12/15/47 | | | | 7,000 | | | | 7,039,422 | |
Series 2013-C10, Class A3 | | | 2.682 | | | | 12/15/47 | | | | 22,445 | | | | 22,683,970 | |
Series 2013-C13, Class A3 | | | 3.525 | | | | 01/15/46 | | | | 10,000 | | | | 10,349,316 | |
Series 2013-C16, Class A2 | | | 3.070 | | | | 12/15/46 | | | | 10,755 | | | | 10,974,311 | |
Series 2014-C20, Class A3A1 | | | 3.472 | | | | 07/15/47 | | | | 20,000 | | | | 20,637,622 | |
Series 2016-JP3, Class A3 | | | 2.523 | | | | 08/15/49 | | | | 16,726 | | | | 16,173,109 | |
UBS-Barclays Commercial Mortgage Trust, | | | | | | | | | | | | | | | | |
Series 2012-C3, Class A4 | | | 3.091 | | | | 08/10/49 | | | | 90 | | | | 92,149 | |
Series 2012-C4, Class A3 | | | 2.533 | | | | 12/10/45 | | | | 31,000 | | | | 31,155,549 | |
Wachovia Bank Commercial Mortgage Trust,
Series 2007-C34, Class A1A | | | 5.608 | (a) | | | 05/15/46 | | | | 17,308 | | | | 17,576,412 | |
Wells Fargo Commercial Mortgage Trust, | | | | | | | | | | | | | | | | |
Series 2013-LC12, Class A2 | | | 3.531 | | | | 07/15/46 | | | | 10,000 | | | | 10,378,684 | |
Series 2015-LC20, Class A3 | | | 3.086 | | | | 04/15/50 | | | | 16,633 | | | | 16,885,915 | |
Series 2015-NXS1, Class A3 | | | 3.058 | | | | 05/15/48 | | | | 5,791 | | | | 5,826,377 | |
| | | | | | | | | | | | | | | | |
TOTAL COMMERCIAL MORTGAGE-BACKED SECURITIES
(cost $400,864,204) | | | | | | | | | | | | 396,587,816 | |
| | | | | | | | | | | | | | | | |
|
CORPORATE BONDS 86.8% | |
|
Aerospace/Defense 0.2% | |
BAE Systems PLC (United Kingdom),
Sr. Unsec’d. Notes, 144A | | | 4.750 | | | | 10/11/21 | | | | 5,936 | | | | 6,418,644 | |
Harris Corp., | | | | | | | | | | | | | | | | |
Sr. Unsec’d. Notes | | | 1.999 | | | | 04/27/18 | | | | 3,445 | | | | 3,447,098 | |
Sr. Unsec’d. Notes | | | 2.700 | | | | 04/27/20 | | | | 8,270 | | | | 8,260,903 | |
United Technologies Corp., Jr. Sub. Notes | | | 1.778 | (a) | | | 05/04/18 | | | | 5,055 | | | | 5,056,102 | |
| | | | | | | | | | | | | | | | |
| | | | | | | | | | | | | | | 23,182,747 | |
| | | | |
Agriculture 1.0% | | | | | | | | | | | | | | | | |
Altria Group, Inc., Gtd. Notes | | | 9.250 | | | | 08/06/19 | | | | 9,353 | | | | 11,036,278 | |
Imperial Brands Finance PLC (United Kingdom), Gtd. Notes, 144A | | | 2.050 | | | | 02/11/18 | | | | 26,140 | | | | 26,164,258 | |
Reynolds American, Inc., | | | | | | | | | | | | | | | | |
Gtd. Notes | | | 2.300 | | | | 08/21/17 | | | | 11,600 | | | | 11,657,095 | |
Gtd. Notes | | | 2.300 | | | | 06/12/18 | | | | 31,845 | | | | 32,046,866 | |
Gtd. Notes | | | 3.250 | | | | 06/12/20 | | | | 4,905 | | | | 5,025,977 | |
Gtd. Notes | | | 6.875 | | | | 05/01/20 | | | | 13,185 | | | | 14,972,688 | |
| | | | | | | | | | | | | | | | |
| | | | | | | | | | | | | | | 100,903,162 | |
See Notes to Financial Statements.
| | | | |
| Prudential Short-Term Corporate Bond Fund, Inc. | | | 17 | |
Portfolio of Investments (continued)
as of December 31, 2016
| | | | | | | | | | | | | | | | |
| Description | | Interest
Rate | | | Maturity
Date | | | Principal
Amount (000)# | | | Value (Note 2) | |
CORPORATE BONDS (Continued) | | | | | | | | | |
| | | | |
Airlines 1.0% | | | | | | | | | | | | | | | | |
American Airlines, | | | | | | | | | | | | | | | | |
Series 2013-1, Class A, Pass-Through Trust,
Pass-Through Certificates | | | 4.000 | % | | | 01/15/27 | | | | 2,339 | | | $ | 2,409,009 | |
Series 2013-2, Class A, Pass-Through Trust,
Pass-Through Certificates | | | 4.950 | | | | 07/15/24 | | | | 32,786 | | | | 34,958,125 | |
Continental Airlines, Inc., | | | | | | | | | | | | | | | | |
Series 1998-1, Class A, Pass-Through Trust, Pass-Through Certificates | | | 6.648 | | | | 03/15/19 | | | | 701 | | | | 710,857 | |
Series 1998-3, Class A-1, Pass-Through Trust, Pass-Through Certificates^ | | | 6.820 | | | | 11/01/19 | | | | 1,719 | | | | 1,778,648 | |
Series 1999-1, Class A, Pass-Through Trust,
Pass-Through Certificates | | | 6.545 | | | | 08/02/20 | | | | 1,980 | | | | 2,061,130 | |
Series 2001-1, Class A-1, Pass-Through Trust, Pass-Through Certificates | | | 6.703 | | | | 12/15/22 | | | | 73 | | | | 77,465 | |
Series 2007-1, Class A, Pass-Through Trust,
Pass-Through Certificates | | | 5.983 | | | | 10/19/23 | | | | 13,800 | | | | 15,248,584 | |
Series 2009-2, Class A, Pass-Through Trust,
Pass-Through Certificates | | | 7.250 | | | | 05/10/21 | | | | 10,108 | | | | 11,295,574 | |
Series 2010-1, Class A, Pass-Through Trust,
Pass-Through Certificates | | | 4.750 | | | | 07/12/22 | | | | 2,550 | | | | 2,690,127 | |
Delta Air Lines, Inc., | | | | | | | | | | | | | | | | |
Series 2007-1, Class A, Pass-Through Trust,
Pass-Through Certificates | | | 6.821 | | | | 02/10/24 | | | | 4,483 | | | | 5,155,354 | |
Series 2010-1, Class A, Pass-Through Trust,
Pass-Through Certificates | | | 6.200 | | | | 01/02/20 | | | | 2,691 | | | | 2,831,913 | |
Series 2010-2, Class A, Pass-Through Trust,
Pass-Through Certificates | | | 4.950 | | | | 11/23/20 | | | | 9,698 | | | | 10,163,089 | |
Series 2011-1, Class A, Pass-Through Trust,
Pass-Through Certificates | | | 5.300 | | | | 10/15/20 | | | | 1,147 | | | | 1,210,219 | |
Series 2012-1, Class A, Pass-Through Trust,
Pass-Through Certificates | | | 4.750 | | | | 11/07/21 | | | | 7,261 | | | | 7,587,290 | |
Southwest Airlines Co., Sr. Unsec’d. Notes | | | 2.650 | | | | 11/05/20 | | | | 7,235 | | | | 7,253,297 | |
| | | | | | | | | | | | | | | | |
| | | | | | | | | | | | | | | 105,430,681 | |
| | | | |
Apparel 0.1% | | | | | | | | | | | | | | | | |
VF Corp., Sr. Unsec’d. Notes | | | 5.950 | | | | 11/01/17 | | | | 5,915 | | | | 6,132,654 | |
| | | | |
Auto Manufacturers 4.4% | | | | | | | | | | | | | | | | |
BMW US Capital LLC (Germany), Gtd. Notes, 144A | | | 1.850 | | | | 09/15/21 | | | | 27,495 | | | | 26,549,969 | |
Daimler Finance North America LLC (Germany), | | | | | | | | | | | | | | | | |
Gtd. Notes, 144A | | | 1.875 | | | | 01/11/18 | | | | 6,802 | | | | 6,811,285 | |
Gtd. Notes, 144A | | | 2.250 | | | | 03/02/20 | | | | 10,125 | | | | 10,078,455 | |
See Notes to Financial Statements.
| | | | | | | | | | | | | | | | |
| Description | | Interest
Rate | | | Maturity
Date | | | Principal
Amount (000)# | | | Value (Note 2) | |
CORPORATE BONDS (Continued) | | | | | | | | | | | | | | | | |
| | | | |
Auto Manufacturers (cont’d.) | | | | | | | | | | | | | | | | |
Gtd. Notes, 144A | | | 2.375 | % | | | 08/01/18 | | | | 15,000 | | | $ | 15,112,875 | |
Gtd. Notes, 144A | | | 2.950 | | | | 01/11/17 | | | | 8,270 | | | | 8,272,622 | |
Ford Motor Credit Co. LLC, | | | | | | | | | | | | | | | | |
Sr. Unsec’d. Notes | | | 2.145 | | | | 01/09/18 | | | | 11,610 | | | | 11,626,811 | |
Sr. Unsec’d. Notes | | | 2.375 | | | | 01/16/18 | | | | 14,300 | | | | 14,363,849 | |
Sr. Unsec’d. Notes | | | 2.375 | | | | 03/12/19 | | | | 19,450 | | | | 19,438,466 | |
Sr. Unsec’d. Notes | | | 2.459 | | | | 03/27/20 | | | | 18,730 | | | | 18,489,507 | |
Sr. Unsec’d. Notes | | | 2.551 | | | | 10/05/18 | | | | 6,570 | | | | 6,606,950 | |
Sr. Unsec’d. Notes | | | 3.157 | | | | 08/04/20 | | | | 12,740 | | | | 12,834,709 | |
Sr. Unsec’d. Notes | | | 3.200 | | | | 01/15/21 | | | | 20,000 | | | | 20,029,180 | |
Sr. Unsec’d. Notes | | | 3.336 | | | | 03/18/21 | | | | 14,025 | | | | 14,122,319 | |
Sr. Unsec’d. Notes | | | 4.250 | | | | 02/03/17 | | | | 14,520 | | | | 14,548,590 | |
Sr. Unsec’d. Notes | | | 5.000 | | | | 05/15/18 | | | | 45,956 | | | | 47,758,854 | |
Sr. Unsec’d. Notes | | | 6.625 | | | | 08/15/17 | | | | 2,000 | | | | 2,060,864 | |
Sr. Unsec’d. Notes, MTN(c) | | | 2.943 | | | | 01/08/19 | | | | 19,740 | | | | 19,965,273 | |
General Motors Co., Sr. Unsec’d. Notes | | | 3.500 | | | | 10/02/18 | | | | 39,500 | | | | 40,286,089 | |
General Motors Financial Co., Inc., | | | | | | | | | | | | | | | | |
Gtd. Notes | | | 3.100 | | | | 01/15/19 | | | | 11,500 | | | | 11,622,049 | |
Gtd. Notes | | | 3.150 | | | | 01/15/20 | | | | 14,815 | | | | 14,907,905 | |
Gtd. Notes | | | 3.200 | | | | 07/13/20 | | | | 7,980 | | | | 8,004,004 | |
Gtd. Notes | | | 3.250 | | | | 05/15/18 | | | | 6,975 | | | | 7,066,386 | |
Gtd. Notes | | | 3.700 | | | | 11/24/20 | | | | 14,000 | | | | 14,241,500 | |
Gtd. Notes | | | 3.700 | | | | 05/09/23 | | | | 10,025 | | | | 9,864,470 | |
Gtd. Notes | | | 4.200 | | | | 03/01/21 | | | | 20,950 | | | | 21,615,100 | |
Gtd. Notes | | | 4.750 | | | | 08/15/17 | | | | 16,500 | | | | 16,812,972 | |
Harley-Davidson Financial Services, Inc., | | | | | | | | | | | | | | | | |
Gtd. Notes, 144A, MTN | | | 2.400 | | | | 09/15/19 | | | | 18,145 | | | | 18,256,356 | |
Gtd. Notes, 144A, MTN | | | 2.700 | | | | 03/15/17 | | | | 12,210 | | | | 12,238,523 | |
Volkswagen International Finance NV (Germany),
Gtd. Notes, 144A | | | 2.375 | | | | 03/22/17 | | | | 10,050 | | | | 10,072,613 | |
| | | | | | | | | | | | | | | | |
| | | | | | | | | | | | | | | 453,658,545 | |
| | | | |
Auto Parts & Equipment 0.4% | | | | | | | | | | | | | | | | |
Delphi Automotive PLC, Gtd. Notes | | | 3.150 | | | | 11/19/20 | | | | 16,465 | | | | 16,728,621 | |
ZF North America Capital, Inc. (Germany), | | | | | | | | | | | | | | | | |
Gtd. Notes, 144A(c) | | | 4.000 | | | | 04/29/20 | | | | 7,000 | | | | 7,280,000 | |
Gtd. Notes, 144A | | | 4.500 | | | | 04/29/22 | | | | 12,670 | | | | 13,065,938 | |
| | | | | | | | | | | | | | | | |
| | | | | | | | | | | | | | | 37,074,559 | |
| | | | |
Banks 23.1% | | | | | | | | | | | | | | | | |
Bank of America Corp.,
Jr. Sub. Notes, Series K | | | 8.000 | (a) | | | 07/29/49 | | | | 10,601 | | | | 10,892,528 | |
Jr. Sub. Notes, Series M | | | 8.125 | (a) | | | 12/29/49 | | | | 10,000 | | | | 10,387,500 | |
Jr. Sub. Notes, Series V(c) | | | 5.125 | (a) | | | 12/29/49 | | | | 15,000 | | | | 14,775,000 | |
See Notes to Financial Statements.
| | | | |
| Prudential Short-Term Corporate Bond Fund, Inc. | | | 19 | |
Portfolio of Investments (continued)
as of December 31, 2016
| | | | | | | | | | | | | | | | |
| Description | | Interest
Rate | | | Maturity
Date | | | Principal
Amount (000)# | | | Value (Note 2) | |
CORPORATE BONDS (Continued) | |
| | | | |
Banks (cont’d.) | | | | | | | | | | | | | | | | |
Sr. Unsec’d. Notes | | | 5.700 | % | | | 01/24/22 | | | | 5,000 | | | $ | 5,616,190 | |
Sr. Unsec’d. Notes | | | 5.750 | | | | 12/01/17 | | | | 30,860 | | | | 31,966,300 | |
Sr. Unsec’d. Notes | | | 6.000 | | | | 09/01/17 | | | | 47,395 | | | | 48,768,460 | |
Sr. Unsec’d. Notes, GMTN | | | 2.625 | | | | 04/19/21 | | | | 50,185 | | | | 49,840,631 | |
Sr. Unsec’d. Notes, MTN | | | 2.000 | | | | 01/11/18 | | | | 25,235 | | | | 25,293,066 | |
Sr. Unsec’d. Notes, MTN | | | 2.503 | | | | 10/21/22 | | | | 41,890 | | | | 40,512,950 | |
Sr. Unsec’d. Notes, MTN | | | 5.650 | | | | 05/01/18 | | | | 5,000 | | | | 5,238,810 | |
Sr. Unsec’d. Notes, MTN | | | 6.875 | | | | 04/25/18 | | | | 30,840 | | | | 32,780,144 | |
Sr. Unsec’d. Notes, Series L, MTN | | | 2.250 | | | | 04/21/20 | | | | 5,845 | | | | 5,810,924 | |
Sr. Unsec’d. Notes, Series L, MTN | | | 2.600 | | | | 01/15/19 | | | | 47,055 | | | | 47,457,226 | |
Sr. Unsec’d. Notes, Series L, MTN | | | 2.650 | | | | 04/01/19 | | | | 12,435 | | | | 12,566,363 | |
Bank of New York Mellon Corp. (The),
Sr. Unsec’d. Notes, MTN | | | 2.050 | | | | 05/03/21 | | | | 24,550 | | | | 24,095,850 | |
Bank of Tokyo-Mitsubishi UFJ Ltd. (The) (Japan),
Sr. Unsec’d. Notes, 144A | | | 2.300 | | | | 03/10/19 | | | | 20,200 | | | | 20,207,918 | |
Barclays PLC (United Kingdom), | | | | | | | | | | | | | | | | |
Sr. Unsec’d. Notes | | | 2.750 | | | | 11/08/19 | | | | 7,920 | | | | 7,899,091 | |
Sr. Unsec’d. Notes | | | 3.200 | | | | 08/10/21 | | | | 20,895 | | | | 20,652,430 | |
Sr. Unsec’d. Notes | | | 3.250 | | | | 01/12/21 | | | | 24,000 | | | | 24,023,376 | |
BPCE SA (France), Gtd. Notes, MTN | | | 2.500 | | | | 07/15/19 | | | | 10,000 | | | | 10,052,150 | |
Capital One Financial Corp., | | | | | | | | | | | | | | | | |
Sr. Unsec’d. Notes | | | 2.450 | | | | 04/24/19 | | | | 12,075 | | | | 12,151,459 | |
Sr. Unsec’d. Notes | | | 5.250 | | | | 02/21/17 | | | | 11,913 | | | | 11,970,206 | |
Sr. Unsec’d. Notes | | | 6.750 | | | | 09/15/17 | | | | 32,225 | | | | 33,376,077 | |
Capital One NA, | | | | | | | | | | | | | | | | |
Sr. Unsec’d. Notes | | | 2.250 | | | | 09/13/21 | | | | 48,890 | | | | 47,702,462 | |
Sr. Unsec’d. Notes | | | 2.400 | | | | 09/05/19 | | | | 12,135 | | | | 12,161,988 | |
Citigroup, Inc., | | | | | | | | | | | | | | | | |
Jr. Sub. Notes, Series Q | | | 5.950 | (a) | | | 12/29/49 | | | | 19,535 | | | | 19,827,048 | |
Jr. Sub. Notes, Series R(c) | | | 6.125 | (a) | | | 12/29/49 | | | | 6,810 | | | | 7,048,350 | |
Sr. Unsec’d. Notes | | | 1.700 | | | | 04/27/18 | | | | 20,000 | | | | 19,955,920 | |
Sr. Unsec’d. Notes | | | 2.350 | | | | 08/02/21 | | | | 18,000 | | | | 17,607,582 | |
Sr. Unsec’d. Notes | | | 2.500 | | | | 09/26/18 | | | | 10,245 | | | | 10,342,993 | |
Sr. Unsec’d. Notes | | | 2.500 | | | | 07/29/19 | | | | 19,810 | | | | 19,945,798 | |
Sr. Unsec’d. Notes | | | 2.550 | | | | 04/08/19 | | | | 23,100 | | | | 23,288,080 | |
Sr. Unsec’d. Notes | | | 2.700 | | | | 03/30/21 | | | | 78,185 | | | | 78,006,113 | |
Compass Bank, Sr. Unsec’d. Notes | | | 1.850 | | | | 09/29/17 | | | | 13,155 | | | | 13,125,138 | |
Credit Suisse AG (Switzerland), | | | | | | | | | | | | | | | | |
Sr. Unsec’d. Notes | | | 1.700 | | | | 04/27/18 | | | | 8,230 | | | | 8,211,861 | |
Sr. Unsec’d. Notes | | | 3.000 | | | | 10/29/21 | | | | 18,996 | | | | 19,177,507 | |
Sr. Unsec’d. Notes, GMTN | | | 1.375 | | | | 05/26/17 | | | | 4,800 | | | | 4,801,114 | |
Sr. Unsec’d. Notes, GMTN | | | 2.300 | | | | 05/28/19 | | | | 18,899 | | | | 18,945,246 | |
See Notes to Financial Statements.
| | | | | | | | | | | | | | | | |
| Description | | Interest
Rate | | | Maturity
Date | | | Principal
Amount (000)# | | | Value (Note 2) | |
CORPORATE BONDS (Continued) | |
| | | | |
Banks (cont’d.) | | | | | | | | | | | | | | | | |
Credit Suisse Group Funding Guernsey
Ltd. (Switzerland), | | | | | | | | | | | | | | | | |
Gtd. Notes | | | 2.750 | % | | | 03/26/20 | | | | 20,250 | | | $ | 20,074,230 | |
Gtd. Notes | | | 3.125 | | | | 12/10/20 | | | | 5,000 | | | | 4,984,370 | |
Gtd. Notes | | | 3.800 | | | | 06/09/23 | | | | 25,000 | | | | 24,972,450 | |
Danske Bank A/S (Denmark),
Sr. Unsec’d. Notes, 144A, MTN | | | 2.800 | | | | 03/10/21 | | | | 22,760 | | | | 22,921,437 | |
Deutsche Bank AG (Germany),
Sr. Unsec’d. Notes, GMTN | | | 3.375 | | | | 05/12/21 | | | | 26,505 | | | | 26,236,981 | |
Deutsche Bank AG London (Germany),
Sr. Unsec’d. Notes | | | 1.875 | | | | 02/13/18 | | | | 25,445 | | | | 25,298,997 | |
Discover Bank, Sr. Unsec’d. Notes | | | 2.000 | | | | 02/21/18 | | | | 28,905 | | | | 28,899,739 | |
Fifth Third Bancorp, Sub. Notes | | | 5.450 | | | | 01/15/17 | | | | 5,730 | | | | 5,737,867 | |
Fifth Third Bank, | | | | | | | | | | | | | | | | |
Sr. Unsec’d. Notes | | | 2.300 | | | | 03/15/19 | | | | 6,250 | | | | 6,292,156 | |
Sr. Unsec’d. Notes | | | 2.375 | | | | 04/25/19 | | | | 7,620 | | | | 7,677,287 | |
First Horizon National Corp., Sr. Unsec’d. Notes | | | 3.500 | | | | 12/15/20 | | | | 13,890 | | | | 14,016,510 | |
Goldman Sachs Group, Inc. (The), | | | | | | | | | | | | | | | | |
Jr. Sub. Notes, Series L | | | 5.700 | (a) | | | 12/29/49 | | | | 9,925 | | | | 10,171,140 | |
Jr. Sub. Notes, Series M | | | 5.375 | (a) | | | 12/29/49 | | | | 9,610 | | | | 9,706,100 | |
Sr. Unsec’d. Notes | | | 2.350 | | | | 11/15/21 | | | | 24,690 | | | | 23,987,816 | |
Sr. Unsec’d. Notes | | | 2.375 | | | | 01/22/18 | | | | 45,125 | | | | 45,393,268 | |
Sr. Unsec’d. Notes | | | 2.550 | | | | 10/23/19 | | | | 9,500 | | | | 9,569,749 | |
Sr. Unsec’d. Notes | | | 2.600 | | | | 04/23/20 | | | | 16,000 | | | | 16,016,768 | |
Sr. Unsec’d. Notes | | | 2.625 | | | | 01/31/19 | | | | 5,000 | | | | 5,053,760 | |
Sr. Unsec’d. Notes | | | 2.875 | | | | 02/25/21 | | | | 38,750 | | | | 38,929,180 | |
Sr. Unsec’d. Notes | | | 2.900 | | | | 07/19/18 | | | | 16,050 | | | | 16,271,650 | |
Sr. Unsec’d. Notes | | | 5.950 | | | | 01/18/18 | | | | 36,835 | | | | 38,372,567 | |
Sr. Unsec’d. Notes | | | 6.150 | | | | 04/01/18 | | | | 24,250 | | | | 25,508,939 | |
Sr. Unsec’d. Notes, GMTN | | | 5.375 | | | | 03/15/20 | | | | 10,000 | | | | 10,849,860 | |
Sr. Unsec’d. Notes, GMTN | | | 7.500 | | | | 02/15/19 | | | | 25,727 | | | | 28,520,463 | |
HSBC Bank PLC (United Kingdom),
Sr. Unsec’d. Notes, 144A | | | 1.500 | | | | 05/15/18 | | | | 5,000 | | | | 4,972,160 | |
HSBC Bank USA NA, Sub. Notes | | | 4.875 | | | | 08/24/20 | | | | 12,865 | | | | 13,638,495 | |
HSBC Holdings PLC (United Kingdom),
Sr. Unsec’d. Notes | | | 2.650 | | | | 01/05/22 | | | | 18,420 | | | | 17,982,728 | |
HSBC USA, Inc., Sr. Unsec’d. Notes | | | 2.625 | | | | 09/24/18 | | | | 9,855 | | | | 9,955,945 | |
Huntington Bancshares, Inc., Sr. Unsec’d. Notes(c) | | | 2.600 | | | | 08/02/18 | | | | 13,660 | | | | 13,793,062 | |
See Notes to Financial Statements.
| | | | |
| Prudential Short-Term Corporate Bond Fund, Inc. | | | 21 | |
Portfolio of Investments (continued)
as of December 31, 2016
| | | | | | | | | | | | | | | | |
| Description | | Interest
Rate | | | Maturity
Date | | | Principal
Amount (000)# | | | Value (Note 2) | |
CORPORATE BONDS (Continued) | |
| | | | |
Banks (cont’d.) | | | | | | | | | | | | | | | | |
JPMorgan Chase & Co., | | | | | | | | | | | | | | | | |
Jr. Sub. Notes | | | 7.900 | %(a) | | | 12/29/49 | | | | 14,000 | | | $ | 14,497,000 | |
Jr. Sub. Notes, Series Q | | | 5.150 | (a) | | | 12/29/49 | | | | 10,000 | | | | 9,564,000 | |
Jr. Sub. Notes, Series V | | | 5.000 | (a) | | | 12/29/49 | | | | 20,000 | | | | 19,950,000 | |
Sr. Unsec’d. Notes | | | 1.625 | | | | 05/15/18 | | | | 11,184 | | | | 11,169,651 | |
Sr. Unsec’d. Notes | | | 1.800 | | | | 01/25/18 | | | | 20,500 | | | | 20,522,673 | |
Sr. Unsec’d. Notes | | | 2.250 | | | | 01/23/20 | | | | 40,425 | | | | 40,329,840 | |
Sr. Unsec’d. Notes(c) | | | 2.400 | | | | 06/07/21 | | | | 29,670 | | | | 29,397,451 | |
Sr. Unsec’d. Notes | | | 2.550 | | | | 10/29/20 | | | | 15,090 | | | | 15,078,864 | |
Sr. Unsec’d. Notes | | | 6.000 | | | | 01/15/18 | | | | 40,000 | | | | 41,725,000 | |
Sr. Unsec’d. Notes | | | 6.300 | | | | 04/23/19 | | | | 65,200 | | | | 71,246,452 | |
KeyBank NA, Sr. Unsec’d. Notes | | | 2.500 | | | | 12/15/19 | | | | 16,025 | | | | 16,191,900 | |
Lloyds Bank PLC (United Kingdom), | | | | | | | | | | | | | | | | |
Gtd. Notes | | | 1.750 | | | | 03/16/18 | | | | 3,435 | | | | 3,430,098 | |
Gtd. Notes | | | 1.750 | | | | 05/14/18 | | | | 20,260 | | | | 20,233,014 | |
Gtd. Notes | | | 2.700 | | | �� | 08/17/20 | | | | 7,494 | | | | 7,548,879 | |
Gtd. Notes, 144A, MTN | | | 5.800 | | | | 01/13/20 | | | | 24,810 | | | | 27,054,809 | |
Manufacturers & Traders Trust Co., Sr. Unsec’d. Notes | | | 2.300 | | | | 01/30/19 | | | | 23,960 | | | | 24,136,753 | |
Mizuho Bank Ltd. (Japan), | | | | | | | | | | | | | | | | |
Gtd. Notes, 144A | | | 1.850 | | | | 03/21/18 | | | | 5,750 | | | | 5,739,984 | |
Gtd. Notes, 144A | | | 2.450 | | | | 04/16/19 | | | | 17,955 | | | | 18,031,111 | |
Morgan Stanley, | | | | | | | | | | | | | | | | |
Jr. Sub. Notes, Series H | | | 5.450 | (a) | | | 07/29/49 | | | | 17,375 | | | | 17,201,250 | |
Jr. Sub. Notes, Series J(c) | | | 5.550 | (a) | | | 12/29/49 | | | | 4,700 | | | | 4,752,875 | |
Sr. Unsec’d. Notes(c) | | | 1.875 | | | | 01/05/18 | | | | 17,140 | | | | 17,165,539 | |
Sr. Unsec’d. Notes | | | 2.650 | | | | 01/27/20 | | | | 19,700 | | | | 19,792,787 | |
Sr. Unsec’d. Notes | | | 2.800 | | | | 06/16/20 | | | | 25,800 | | | | 26,011,147 | |
Sr. Unsec’d. Notes, GMTN | | | 2.375 | | | | 07/23/19 | | | | 26,670 | | | | 26,745,983 | |
Sr. Unsec’d. Notes, GMTN | | | 2.450 | | | | 02/01/19 | | | | 9,430 | | | | 9,494,756 | |
Sr. Unsec’d. Notes, GMTN | | | 2.500 | | | | 04/21/21 | | | | 28,660 | | | | 28,348,408 | |
Sr. Unsec’d. Notes, GMTN | | | 5.500 | | | | 01/26/20 | | | | 14,765 | | | | 16,007,209 | |
Sr. Unsec’d. Notes, GMTN | | | 6.625 | | | | 04/01/18 | | | | 25,000 | | | | 26,438,200 | |
Sr. Unsec’d. Notes, MTN | | | 2.125 | | | | 04/25/18 | | | | 26,790 | | | | 26,896,731 | |
Sr. Unsec’d. Notes, MTN | | | 2.625 | | | | 11/17/21 | | | | 40,640 | | | | 40,150,776 | |
Sr. Unsec’d. Notes, MTN | | | 5.550 | | | | 04/27/17 | | | | 14,875 | | | | 15,071,871 | |
Sr. Unsec’d. Notes, MTN | | | 5.625 | | | | 09/23/19 | | | | 5,498 | | | | 5,959,612 | |
Sr. Unsec’d. Notes, MTN | | | 6.250 | | | | 08/28/17 | | | | 11,493 | | | | 11,841,916 | |
MUFG Union Bank NA, Sr. Unsec’d. Notes | | | 2.625 | | | | 09/26/18 | | | | 17,785 | | | | 17,979,390 | |
PNC Bank NA, Sr. Unsec’d. Notes | | | 2.200 | | | | 01/28/19 | | | | 15,425 | | | | 15,506,228 | |
Santander Bank NA, Sr. Unsec’d. Notes | | | 2.000 | | | | 01/12/18 | | | | 12,785 | | | | 12,779,656 | |
Santander UK Group Holdings PLC (United Kingdom), Sr. Unsec’d. Notes | | | 2.875 | | | | 10/16/20 | | | | 21,590 | | | | 21,395,496 | |
See Notes to Financial Statements.
| | | | | | | | | | | | | | | | |
| Description | | Interest
Rate | | | Maturity
Date | | | Principal
Amount (000)# | | | Value (Note 2) | |
CORPORATE BONDS (Continued) | | | | | | | | | | | | | | | | |
| | | | |
Banks (cont’d.) | | | | | | | | | | | | | | | | |
Skandinaviska Enskilda Banken AB (Sweden),
Sr. Unsec’d. Notes, 144A, MTN | | | 2.375 | % | | | 03/25/19 | | | | 44,760 | | | $ | 44,874,899 | |
Sumitomo Mitsui Banking Corp. (Japan), | | | | | | | | | | | | | | | | |
Gtd. Notes | | | 1.500 | | | | 01/18/18 | | | | 10,270 | | | | 10,218,537 | |
Gtd. Notes | | | 1.800 | | | | 07/18/17 | | | | 19,221 | | | | 19,265,727 | |
Gtd. Notes | | | 2.450 | | | | 01/10/19 | | | | 8,680 | | | | 8,727,514 | |
Gtd. Notes | | | 2.450 | | | | 01/16/20 | | | | 7,110 | | | | 7,080,586 | |
Sumitomo Mitsui Financial Group, Inc. (Japan),
Sr. Unsec’d. Notes | | | 2.442 | | | | 10/19/21 | | | | 14,330 | | | | 14,097,352 | |
SunTrust Banks, Inc., | | | | | | | | | | | | | | | | |
Sr. Unsec’d. Notes | | | 2.350 | | | | 11/01/18 | | | | 17,695 | | | | 17,851,795 | |
Sr. Unsec’d. Notes | | | 2.500 | | | | 05/01/19 | | | | 20,200 | | | | 20,372,245 | |
Sr. Unsec’d. Notes | | | 2.700 | | | | 01/27/22 | | | | 13,070 | | | | 13,075,555 | |
Svenska Handelsbanken AB (Sweden),
Gtd. Notes, MTN | | | 1.875 | | | | 09/07/21 | | | | 23,630 | | | | 22,819,845 | |
UBS AG (Switzerland), Sr. Unsec’d. Notes, GMTN | | | 2.375 | | | | 08/14/19 | | | | 25,410 | | | | 25,533,137 | |
UBS Group Funding Jersey Ltd. (Switzerland), | | | | | | | | | | | | | | | | |
Gtd. Notes, 144A | | | 2.650 | | | | 02/01/22 | | | | 28,325 | | | | 27,528,926 | |
Gtd. Notes, 144A | | | 2.950 | | | | 09/24/20 | | | | 13,750 | | | | 13,756,064 | |
Wells Fargo & Co., Jr. Sub. Notes, Series K | | | 7.980 | (a) | | | 03/29/49 | | | | 17,472 | | | | 18,258,240 | |
Wells Fargo Bank NA, Sub. Notes | | | 6.000 | | | | 11/15/17 | | | | 12,525 | | | | 12,998,345 | |
| | | | | | | | | | | | | | | | |
| | | | | | | | | | | | | | | 2,384,133,599 | |
| | | | |
Beverages 1.6% | | | | | | | | | | | | | | | | |
Anheuser-Busch InBev Finance, Inc. (Belgium), | | | | | | | | | | | | | | | | |
Gtd. Notes | | | 2.650 | | | | 02/01/21 | | | | 77,630 | | | | 78,075,984 | |
Gtd. Notes | | | 3.300 | | | | 02/01/23 | | | | 22,385 | | | | 22,781,931 | |
Anheuser-Busch InBev Worldwide, Inc. (Belgium),
Gtd. Notes | | | 5.375 | | | | 01/15/20 | | | | 10,000 | | | | 10,906,940 | |
Beam Suntory, Inc. (Japan), Gtd. Notes | | | 1.875 | | | | 05/15/17 | | | | 8,465 | | | | 8,477,113 | |
Coca-Cola Femsa SAB de CV (Mexico), Gtd. Notes | | | 2.375 | | | | 11/26/18 | | | | 25,500 | | | | 25,677,098 | |
Heineken NV (Netherlands), Sr. Unsec’d. Notes, 144A | | | 1.400 | | | | 10/01/17 | | | | 6,325 | | | | 6,327,549 | |
Molson Coors Brewing Co., Gtd. Notes | | | 2.000 | | | | 05/01/17 | | | | 10,975 | | | | 11,001,702 | |
| | | | | | | | | | | | | | | | |
| | | | | | | | | | | | | | | 163,248,317 | |
| | | | |
Biotechnology 1.8% | | | | | | | | | | | | | | | | |
Amgen, Inc., | | | | | | | | | | | | | | | | |
Sr. Unsec’d. Notes | | | 1.850 | | | | 08/19/21 | | | | 22,640 | | | | 21,770,986 | |
Sr. Unsec’d. Notes | | | 2.125 | | | | 05/15/17 | | | | 26,975 | | | | 27,062,993 | |
Sr. Unsec’d. Notes | | | 2.125 | | | | 05/01/20 | | | | 23,895 | | | | 23,671,176 | |
Sr. Unsec’d. Notes | | | 2.200 | | | | 05/22/19 | | | | 24,700 | | | | 24,890,659 | |
Sr. Unsec’d. Notes | | | 6.150 | | | | 06/01/18 | | | | 6,000 | | | | 6,363,282 | |
See Notes to Financial Statements.
| | | | |
| Prudential Short-Term Corporate Bond Fund, Inc. | | | 23 | |
Portfolio of Investments (continued)
as of December 31, 2016
| | | | | | | | | | | | | | | | |
| Description | | Interest
Rate | | | Maturity
Date | | | Principal
Amount (000)# | | | Value (Note 2) | |
CORPORATE BONDS (Continued) | |
| | | | |
Biotechnology (cont’d.) | | | | | | | | | | | | | | | | |
Biogen, Inc., Sr. Unsec’d. Notes | | | 2.900 | % | | | 09/15/20 | | | | 12,910 | | | $ | 13,074,654 | |
Celgene Corp., | | | | | | | | | | | | | | | | |
Sr. Unsec’d. Notes | | | 1.900 | | | | 08/15/17 | | | | 5,555 | | | | 5,572,765 | |
Sr. Unsec’d. Notes | | | 2.300 | | | | 08/15/18 | | | | 17,100 | | | | 17,204,532 | |
Sr. Unsec’d. Notes | | | 2.875 | | | | 08/15/20 | | | | 27,740 | | | | 28,057,762 | |
Gilead Sciences, Inc., | | | | | | | | | | | | | | | | |
Sr. Unsec’d. Notes | | | 2.500 | | | | 09/01/23 | | | | 9,365 | | | | 9,030,866 | |
Sr. Unsec’d. Notes | | | 2.550 | | | | 09/01/20 | | | | 9,620 | | | | 9,721,385 | |
| | | | | | | | | | | | | | | | |
| | | | | | | | | | | | | | | 186,421,060 | |
| | | | |
Building Materials 0.3% | | | | | | | | | | | | | | | | |
Fortune Brands Home & Security, Inc.,
Sr. Unsec’d. Notes | | | 3.000 | | | | 06/15/20 | | | | 11,225 | | | | 11,297,143 | |
Johnson Controls International PLC, Sr. Unsec’d. Notes | | | 3.750 | | | | 01/15/18 | | | | 6,652 | | | | 6,761,605 | |
Martin Marietta Materials, Inc., Sr. Unsec’d. Notes | | | 2.098 | (a) | | | 06/30/17 | | | | 13,885 | | | | 13,908,896 | |
| | | | | | | | | | | | | | | | |
| | | | | | | | | | | | | | | 31,967,644 | |
| | | | |
Chemicals 2.8% | | | | | | | | | | | | | | | | |
Ashland LLC, Gtd. Notes | | | 3.875 | | | | 04/15/18 | | | | 15,000 | | | | 15,393,750 | |
Cabot Corp., Sr. Unsec’d. Notes | | | 2.550 | | | | 01/15/18 | | | | 19,425 | | | | 19,502,545 | |
Celanese US Holdings LLC, Gtd. Notes | | | 4.625 | | | | 11/15/22 | | | | 8,900 | | | | 9,376,488 | |
CF Industries, Inc., Sr. Sec’d. Notes, 144A | | | 3.400 | | | | 12/01/21 | | | | 5,180 | | | | 5,125,553 | |
Chevron Phillips Chemical Co. LLC/Chevron Phillips Chemical Co. LP, Sr. Unsec’d. Notes, 144A(b) | | | 2.450 | | | | 05/01/20 | | | | 16,040 | | | | 15,929,051 | |
Dow Chemical Co. (The), | | | | | | | | | | | | | | | | |
Sr. Unsec’d. Notes | | | 4.125 | | | | 11/15/21 | | | | 24,913 | | | | 26,323,798 | |
Sr. Unsec’d. Notes | | | 8.550 | | | | 05/15/19 | | | | 15,000 | | | | 17,191,215 | |
Eastman Chemical Co., | | | | | | | | | | | | | | | | |
Sr. Unsec’d. Notes | | | 2.700 | | | | 01/15/20 | | | | 33,650 | | | | 33,846,853 | |
Sr. Unsec’d. Notes | | | 4.500 | | | | 01/15/21 | | | | 449 | | | | 474,197 | |
LyondellBasell Industries NV, | | | | | | | | | | | | | | | | |
Sr. Unsec’d. Notes | | | 5.000 | | | | 04/15/19 | | | | 41,595 | | | | 43,951,440 | |
Sr. Unsec’d. Notes | | | 6.000 | | | | 11/15/21 | | | | 19,935 | | | | 22,607,666 | |
Potash Corp of Saskatchewan, Inc. (Canada),
Sr. Unsec’d. Notes(c) | | | 4.875 | | | | 03/30/20 | | | | 19,415 | | | | 20,640,921 | |
Rohm & Haas Co., Gtd. Notes | | | 6.000 | | | | 09/15/17 | | | | 4,739 | | | | 4,886,857 | |
Sherwin-Williams Co. (The), Sr. Unsec’d. Notes | | | 1.350 | | | | 12/15/17 | | | | 5,000 | | | | 4,991,325 | |
Solvay Finance America LLC (Belgium),
Gtd. Notes,144A | | | 3.400 | | | | 12/03/20 | | | | 20,875 | | | | 21,240,166 | |
Westlake Chemical Corp., Gtd. Notes, 144A | | | 4.625 | | | | 02/15/21 | | | | 20,500 | | | | 21,217,500 | |
Yara International ASA (Norway),
Sr. Unsec’d. Notes, 144A | | | 7.875 | | | | 06/11/19 | | | | 7,933 | | | | 8,869,713 | |
| | | | | | | | | | | | | | | | |
| | | | | | | | | | | | | | | 291,569,038 | |
See Notes to Financial Statements.
| | | | | | | | | | | | | | | | |
| Description | | Interest
Rate | | | Maturity
Date | | | Principal
Amount (000)# | | | Value (Note 2) | |
CORPORATE BONDS (Continued) | |
| | | | |
Commercial Services 1.1% | | | | | | | | | | | | | | | | |
Ecolab, Inc., | | | | | | | | | | | | | | | | |
Sr. Unsec’d. Notes | | | 1.450 | % | | | 12/08/17 | | | | 15,600 | | | $ | 15,584,603 | |
Sr. Unsec’d. Notes | | | 2.250 | | | | 01/12/20 | | | | 4,215 | | | | 4,213,782 | |
Equifax, Inc., Sr. Unsec’d. Notes | | | 2.300 | | | | 06/01/21 | | | | 15,830 | | | | 15,513,352 | |
ERAC USA Finance LLC, | | | | | | | | | | | | | | | | |
Gtd. Notes, 144A(b) | | | 2.350 | | | | 10/15/19 | | | | 20,835 | | | | 20,816,498 | |
Gtd. Notes, 144A(b) | | | 2.600 | | | | 12/01/21 | | | | 25,000 | | | | 24,602,850 | |
Gtd. Notes, 144A(b) | | | 2.750 | | | | 03/15/17 | | | | 3,520 | | | | 3,529,434 | |
Gtd. Notes, 144A(b) | | | 2.800 | | | | 11/01/18 | | | | 2,050 | | | | 2,075,699 | |
Gtd. Notes, 144A(b) | | | 5.250 | | | | 10/01/20 | | | | 6,000 | | | | 6,538,194 | |
Gtd. Notes, 144A(b) | | | 6.375 | | | | 10/15/17 | | | | 4,461 | | | | 4,622,243 | |
Total System Services, Inc., Sr. Unsec’d. Notes | | | 3.800 | | | | 04/01/21 | | | | 11,178 | | | | 11,537,339 | |
| | | | | | | | | | | | | | | | |
| | | | | | | | | | | | | | | 109,033,994 | |
| | | | |
Computers 1.7% | | | | | | | | | | | | | | | | |
Apple, Inc., | | | | | | | | | | | | | | | | |
Sr. Unsec’d. Notes | | | 2.250 | | | | 02/23/21 | | | | 23,870 | | | | 23,850,140 | |
Sr. Unsec’d. Notes | | | 2.850 | | | | 05/06/21 | | | | 5,000 | | | | 5,103,730 | |
Diamond 1 Finance Corp./Diamond 2 Finance Corp., | | | | | | | | | | | | | | | | |
Sr. Sec’d. Notes, 144A | | | 3.480 | | | | 06/01/19 | | | | 41,740 | | | | 42,608,443 | |
Sr. Sec’d. Notes, 144A | | | 4.420 | | | | 06/15/21 | | | | 7,860 | | | | 8,133,096 | |
EMC Corp., Sr. Unsec’d. Notes | | | 1.875 | | | | 06/01/18 | | | | 32,460 | | | | 32,100,181 | |
Hewlett Packard Enterprise Co., | | | | | | | | | | | | | | | | |
Sr. Unsec’d. Notes | | | 2.450 | (a) | | | 10/05/17 | | | | 27,170 | | | | 27,321,065 | |
Sr. Unsec’d. Notes | | | 2.850 | (a) | | | 10/05/18 | | | | 24,090 | | | | 24,322,974 | |
Seagate HDD Cayman, Gtd. Notes | | | 3.750 | | | | 11/15/18 | | | | 13,195 | | | | 13,519,927 | |
| | | | | | | | | | | | | | | | |
| | | | | | | | | | | | | | | 176,959,556 | |
| | | | |
Diversified Financial Services 2.4% | | | | | | | | | | | | | | | | |
AerCap Ireland Capital Ltd./AerCap Global Aviation Trust (Netherlands), | | | | | | | | | | | | | | | | |
Gtd. Notes | | | 2.750 | | | | 05/15/17 | | | | 4,850 | | | | 4,856,062 | |
Gtd. Notes | | | 3.750 | | | | 05/15/19 | | | | 7,310 | | | | 7,447,062 | |
Air Lease Corp., Sr. Unsec’d. Notes | | | 5.625 | (a) | | | 04/01/17 | | | | 2,665 | | | | 2,688,319 | |
American Express Co., | | | | | | | | | | | | | | | | |
Sr. Unsec’d. Notes | | | 1.506 | (a) | | | 05/22/18 | | | | 2,000 | | | | 2,004,132 | |
Sr. Unsec’d. Notes | | | 7.000 | | | | 03/19/18 | | | | 19,920 | | | | 21,168,825 | |
American Express Credit Corp.,
Sr. Unsec’d. Notes, GMTN | | | 2.250 | | | | 08/15/19 | | | | 8,850 | | | | 8,899,250 | |
Capital One Bank USA NA, | | | | | | | | | | | | | | | | |
Sr. Unsec’d. Notes | | | 2.150 | | | | 11/21/18 | | | | 3,675 | | | | 3,681,641 | |
See Notes to Financial Statements.
| | | | |
| Prudential Short-Term Corporate Bond Fund, Inc. | | | 25 | |
Portfolio of Investments (continued)
as of December 31, 2016
| | | | | | | | | | | | | | | | |
| Description | | Interest
Rate | | | Maturity
Date | | | Principal
Amount (000)# | | | Value (Note 2) | |
CORPORATE BONDS (Continued) | |
| | | | |
Diversified Financial Services (cont’d.) | | | | | | | | | | | | | | | | |
Sr. Unsec’d. Notes | | | 2.300 | % | | | 06/05/19 | | | | 11,125 | | | $ | 11,151,889 | |
Sub. Notes | | | 8.800 | | | | 07/15/19 | | | | 7,995 | | | | 9,156,154 | |
Charles Schwab Corp. (The), Sr. Unsec’d. Notes | | | 2.200 | | | | 07/25/18 | | | | 3,950 | | | | 3,979,736 | |
CIT Group, Inc., Sr. Unsec’d. Notes | | | 3.875 | | | | 02/19/19 | | | | 20,000 | | | | 20,425,000 | |
Discover Financial Services, Sr. Unsec’d. Notes | | | 6.450 | | | | 06/12/17 | | | | 4,112 | | | | 4,196,288 | |
GE Capital International Funding Co. Unlimited Co.,
Gtd. Notes | | | 2.342 | | | | 11/15/20 | | | | 8,342 | | | | 8,338,021 | |
International Lease Finance Corp., | | | | | | | | | | | | | | | | |
Sr. Unsec’d. Notes | | | 3.875 | | | | 04/15/18 | | | | 16,644 | | | | 16,956,075 | |
Sr. Unsec’d. Notes | | | 8.750 | (a) | | | 03/15/17 | | | | 10,644 | | | | 10,790,355 | |
Lehman Brothers Holdings, Inc., | | | | | | | | | | | | | | | | |
Sr. Unsec’d. Notes(d) | | | 5.250 | (e) | | | 02/06/12 | | | | 1,520 | | | | 87,400 | |
Sr. Unsec’d. Notes(d) | | | 5.625 | (e) | | | 01/24/13 | | | | 1,000 | | | | 58,000 | |
Sr. Unsec’d. Notes(d) | | | 6.000 | (e) | | | 07/19/12 | | | | 900 | | | | 51,750 | |
Navient Corp., Sr. Unsec’d. Notes, MTN | | | 4.625 | | | | 09/25/17 | | | | 500 | | | | 508,125 | |
Nomura Holdings, Inc. (Japan),
Sr. Unsec’d. Notes, GMTN | | | 2.750 | | | | 03/19/19 | | | | 32,025 | | | | 32,328,085 | |
NYSE Holdings LLC, Gtd. Notes | | | 2.000 | | | | 10/05/17 | | | | 19,880 | | | | 19,985,493 | |
Synchrony Financial, | | | | | | | | | | | | | | | | |
Sr. Unsec’d. Notes | | | 1.875 | | | | 08/15/17 | | | | 7,025 | | | | 7,030,669 | |
Sr. Unsec’d. Notes | | | 2.600 | | | | 01/15/19 | | | | 26,850 | | | | 26,985,807 | |
Sr. Unsec’d. Notes | | | 2.700 | | | | 02/03/20 | | | | 17,625 | | | | 17,572,742 | |
Sr. Unsec’d. Notes | | | 3.000 | | | | 08/15/19 | | | | 10,115 | | | | 10,246,080 | |
| | | | | | | | | | | | | | | | |
| | | | | | | | | | | | | | | 250,592,960 | |
| | | | |
Electric 3.3% | | | | | | | | | | | | | | | | |
American Electric Power Co, Inc.,
Sr. Unsec’d. Notes, Series E | | | 1.650 | | | | 12/15/17 | | | | 19,295 | | | | 19,301,425 | |
Commonwealth Edison Co., First Mortgage | | | 2.150 | | | | 01/15/19 | | | | 5,375 | | | | 5,394,334 | |
Consolidated Edison, Inc., Sr. Unsec’d. Notes | | | 2.000 | | | | 05/15/21 | | | | 16,755 | | | | 16,375,080 | |
Dominion Resources, Inc., | | | | | | | | | | | | | | | | |
Jr. Sub. Notes | | | 2.962 | (a) | | | 07/01/19 | | | | 2,810 | | | | 2,844,864 | |
Jr. Sub. Notes | | | 4.104 | (a) | | | 04/01/21 | | | | 22,500 | | | | 23,437,530 | |
Sr. Unsec’d. Notes, Series B | | | 2.750 | | | | 09/15/22 | | | | 10,000 | | | | 9,840,730 | |
Sr. Unsec’d. Notes, Series C | | | 2.000 | | | | 08/15/21 | | | | 13,955 | | | | 13,533,224 | |
Duke Energy Corp., | | | | | | | | | | | | | | | | |
Sr. Unsec’d. Notes | | | 1.800 | | | | 09/01/21 | | | | 25,715 | | | | 24,771,337 | |
Sr. Unsec’d. Notes | | | 2.100 | | | | 06/15/18 | | | | 4,350 | | | | 4,368,501 | |
Emera US Finance LP (Canada), | | | | | | | | | | | | | | | | |
Gtd. Notes, 144A | | | 2.150 | | | | 06/15/19 | | | | 1,750 | | | | 1,747,107 | |
Gtd. Notes, 144A | | | 2.700 | | | | 06/15/21 | | | | 32,535 | | | | 32,204,542 | |
See Notes to Financial Statements.
| | | | | | | | | | | | | | | | |
| Description | | Interest
Rate | | | Maturity
Date | | | Principal
Amount (000)# | | | Value (Note 2) | |
CORPORATE BONDS (Continued) | |
| | | | |
Electric (cont’d.) | | | | | | | | | | | | | | | | |
Entergy Corp., Sr. Unsec’d. Notes | | | 5.125 | % | | | 09/15/20 | | | | 11,128 | | | $ | 11,995,472 | |
Exelon Corp., | | | | | | | | | | | | | | | | |
Sr. Unsec’d. Notes | | | 2.450 | | | | 04/15/21 | | | | 4,940 | | | | 4,880,631 | |
Sr. Unsec’d. Notes | | | 2.850 | | | | 06/15/20 | | | | 10,670 | | | | 10,783,902 | |
Exelon Generation Co. LLC, Sr. Unsec’d. Notes | | | 2.950 | | | | 01/15/20 | | | | 26,996 | | | | 27,317,036 | |
FirstEnergy Corp., Sr. Unsec’d. Notes, Series A | | | 2.750 | | | | 03/15/18 | | | | 10,850 | | | | 10,948,561 | |
Fortis, Inc. (Canada), Sr. Unsec’d. Notes, 144A | | | 2.100 | | | | 10/04/21 | | | | 13,335 | | | | 12,888,478 | |
Georgia Power Co., Sr. Unsec’d. Notes | | | 2.400 | | | | 04/01/21 | | | | 29,095 | | | | 28,908,705 | |
Kentucky Power Co., Sr. Unsec’d. Notes, 144A | | | 6.000 | | | | 09/15/17 | | | | 7,040 | | | | 7,236,838 | |
NextEra Energy Capital Holdings, Inc., | | | | | | | | | | | | | | | | |
Gtd. Notes | | | 1.586 | | | | 06/01/17 | | | | 4,770 | | | | 4,772,800 | |
Gtd. Notes | | | 1.649 | | | | 09/01/18 | | | | 14,030 | | | | 13,985,960 | |
Pacific Gas & Electric Co., Sr. Unsec’d. Notes | | | 3.250 | | | | 09/15/21 | | | | 5,290 | | | | 5,439,242 | |
PG&E Corp., Sr. Unsec’d. Notes | | | 2.400 | | | | 03/01/19 | | | | 18,060 | | | | 18,128,610 | |
PSEG Power LLC, Gtd. Notes(c) | | | 3.000 | | | | 06/15/21 | | | | 11,030 | | | | 11,063,884 | |
Southern Co. (The), | | | | | | | | | | | | | | | | |
Sr. Unsec’d. Notes | | | 2.450 | | | | 09/01/18 | | | | 7,050 | | | | 7,122,397 | |
Sr. Unsec’d. Notes | | | 2.750 | | | | 06/15/20 | | | | 12,818 | | | | 12,927,837 | |
TECO Finance, Inc., Gtd. Notes, MTN | | | 6.572 | | | | 11/01/17 | | | | 2,000 | | | | 2,076,160 | |
| | | | | | | | | | | | | | | | |
| | | | | | | | | | | | | | | 344,295,187 | |
| | | | |
Electronics 0.4% | | | | | | | | | | | | | | | | |
Arrow Electronics, Inc., Sr. Unsec’d. Notes | | | 3.000 | | | | 03/01/18 | | | | 5,425 | | | | 5,486,796 | |
FLIR Systems, Inc., Sr. Unsec’d. Notes | | | 3.125 | | | | 06/15/21 | | | | 18,569 | | | | 18,618,059 | |
Fortive Corp., Sr. Unsec’d. Notes, 144A | | | 2.350 | | | | 06/15/21 | | | | 7,845 | | | | 7,740,089 | |
Koninklijke Philips NV (Netherlands),
Sr. Unsec’d. Notes | | | 5.750 | | | | 03/11/18 | | | | 7,825 | | | | 8,200,811 | |
Tyco Electronics Group SA (Switzerland), Gtd. Notes | | | 2.350 | | | | 08/01/19 | | | | 3,455 | | | | 3,465,279 | |
| | | | | | | | | | | | | | | | |
| | | | | | | | | | | | | | | 43,511,034 | |
| | | | |
Food 1.7% | | | | | | | | | | | | | | | | |
JM Smucker Co. (The), | | | | | | | | | | | | | | | | |
Gtd. Notes | | | 1.750 | | | | 03/15/18 | | | | 5,965 | | | | 5,972,778 | |
Gtd. Notes | | | 2.500 | | | | 03/15/20 | | | | 14,625 | | | | 14,694,454 | |
Kraft Heinz Foods Co., | | | | | | | | | | | | | | | | |
Gtd. Notes | | | 2.250 | | | | 06/05/17 | | | | 10,720 | | | | 10,754,218 | |
Gtd. Notes | | | 2.800 | | | | 07/02/20 | | | | 38,045 | | | | 38,406,504 | |
Gtd. Notes | | | 6.125 | | | | 08/23/18 | | | | 11,431 | | | | 12,185,183 | |
Kroger Co. (The), | | | | | | | | | | | | | | | | |
Gtd. Notes | | | 6.400 | | | | 08/15/17 | | | | 9,800 | | | | 10,091,256 | |
Sr. Unsec’d. Notes | | | 2.300 | | | | 01/15/19 | | | | 4,125 | | | | 4,150,596 | |
See Notes to Financial Statements.
| | | | |
| Prudential Short-Term Corporate Bond Fund, Inc. | | | 27 | |
Portfolio of Investments (continued)
as of December 31, 2016
| | | | | | | | | | | | | | | | |
| Description | | Interest
Rate | | | Maturity
Date | | | Principal
Amount (000)# | | | Value (Note 2) | |
CORPORATE BONDS (Continued) | | | | | | | | | | | | | | | | |
| | | | |
Food (cont’d.) | | | | | | | | | | | | | | | | |
Mondelez International Holdings Netherlands BV,
Gtd. Notes, 144A | | | 2.000 | % | | | 10/28/21 | | | | 17,430 | | | $ | 16,698,637 | |
Sysco Corp., Gtd. Notes | | | 2.500 | | | | 07/15/21 | | | | 16,520 | | | | 16,343,699 | |
Tyson Foods, Inc., Gtd. Notes | | | 2.650 | | | | 08/15/19 | | | | 13,580 | | | | 13,709,445 | |
Wm. Wrigley Jr. Co., | | | | | | | | | | | | | | | | |
Sr. Unsec’d. Notes, 144A | | | 2.000 | | | | 10/20/17 | | | | 7,390 | | | | 7,427,164 | |
Sr. Unsec’d. Notes, 144A | | | 2.400 | | | | 10/21/18 | | | | 23,740 | | | | 23,952,402 | |
Sr. Unsec’d. Notes, 144A | | | 2.900 | | | | 10/21/19 | | | | 2,550 | | | | 2,594,528 | |
| | | | | | | | | | | | | | | | |
| | | | | | | | | | | | | | | 176,980,864 | |
| | | | |
Forest Products & Paper 0.5% | | | | | | | | | | | | | | | | |
Georgia-Pacific LLC, Gtd. Notes, 144A(b) | | | 5.400 | | | | 11/01/20 | | | | 13,600 | | | | 14,951,555 | |
International Paper Co., | | | | | | | | | | | | | | | | |
Sr. Unsec’d. Notes | | | 7.950 | | | | 06/15/18 | | | | 20,080 | | | | 21,796,378 | |
Sr. Unsec’d. Notes | | | 9.375 | | | | 05/15/19 | | | | 8,295 | | | | 9,633,091 | |
| | | | | | | | | | | | | | | | |
| | | | | | | | | | | | | | | 46,381,024 | |
| | | | |
Gas 0.6% | | | | | | | | | | | | | | | | |
CenterPoint Energy, Inc., Sr. Unsec’d. Notes | | | 5.950 | | | | 02/01/17 | | | | 12,400 | | | | 12,442,185 | |
Dominion Gas Holdings LLC, Sr. Unsec’d. Notes | | | 2.800 | | | | 11/15/20 | | | | 9,700 | | | | 9,788,270 | |
Sempra Energy, | | | | | | | | | | | | | | | | |
Sr. Unsec’d. Notes | | | 2.300 | | | | 04/01/17 | | | | 12,390 | | | | 12,414,284 | |
Sr. Unsec’d. Notes | | | 2.850 | | | | 11/15/20 | | | | 22,900 | | | | 23,076,376 | |
| | | | | | | | | | | | | | | | |
| | | | | | | | | | | | | | | 57,721,115 | |
| | | | |
Hand/Machine Tools 0.3% | | | | | | | | | | | | | | | | |
Stanley Black & Decker, Inc., | | | | | | | | | | | | | | | | |
Sub. Notes | | | 1.622 | | | | 11/17/18 | | | | 6,450 | | | | 6,410,287 | |
Sub. Notes | | | 2.451 | | | | 11/17/18 | | | | 22,195 | | | | 22,385,189 | |
| | | | | | | | | | | | | | | | |
| | | | | | | | | | | | | | | 28,795,476 | |
| | | | |
Healthcare-Products 2.1% | | | | | | | | | | | | | | | | |
Abbott Laboratories, Sr. Unsec’d. Notes | | | 2.900 | | | | 11/30/21 | | | | 31,245 | | | | 31,155,952 | |
Becton Dickinson and Co., Sr. Unsec’d. Notes | | | 2.675 | | | | 12/15/19 | | | | 15,444 | | | | 15,669,652 | |
Boston Scientific Corp., Sr. Unsec’d. Notes | | | 2.850 | | | | 05/15/20 | | | | 6,575 | | | | 6,673,053 | |
Edwards Lifesciences Corp., Sr. Unsec’d. Notes | | | 2.875 | | | | 10/15/18 | | | | 10,525 | | | | 10,683,085 | |
Medtronic, Inc., Gtd. Notes | | | 2.500 | | | | 03/15/20 | | | | 58,610 | | | | 59,265,904 | |
St. Jude Medical, Inc., Sr. Unsec’d. Notes | | | 2.800 | | | | 09/15/20 | | | | 25,260 | | | | 25,401,683 | |
Stryker Corp., Sr. Unsec’d. Notes | | | 2.625 | | | | 03/15/21 | | | | 17,460 | | | | 17,527,431 | |
Thermo Fisher Scientific, Inc., Sr. Unsec’d. Notes | | | 2.400 | | | | 02/01/19 | | | | 4,985 | | | | 5,022,896 | |
See Notes to Financial Statements.
| | | | | | | | | | | | | | | | |
| Description | | Interest
Rate | | | Maturity
Date | | | Principal
Amount (000)# | | | Value (Note 2) | |
CORPORATE BONDS (Continued) | |
| | | | |
Healthcare-Products (cont’d.) | | | | | | | | | | | | | | | | |
Zimmer Biomet Holdings, Inc., | | | | | | | | | | | | | | | | |
Sr. Unsec’d. Notes | | | 2.000 | % | | | 04/01/18 | | | | 13,075 | | | $ | 13,090,965 | |
Sr. Unsec’d. Notes | | | 2.700 | | | | 04/01/20 | | | | 15,435 | | | | 15,435,772 | |
Sr. Unsec’d. Notes | | | 3.150 | | | | 04/01/22 | | | | 13,499 | | | | 13,462,094 | |
| | | | | | | | | | | | | | | | |
| | | | | | | | | | | | | | | 213,388,487 | |
| | | | |
Healthcare-Services 2.9% | | | | | | | | | | | | | | | | |
Aetna, Inc., | | | | | | | | | | | | | | | | |
Sr. Unsec’d. Notes | | | 1.500 | | | | 11/15/17 | | | | 3,000 | | | | 2,997,597 | |
Sr. Unsec’d. Notes | | | 1.750 | | | | 05/15/17 | | | | 10,655 | | | | 10,664,643 | |
Sr. Unsec’d. Notes | | | 2.200 | | | | 03/15/19 | | | | 10,125 | | | | 10,150,525 | |
Sr. Unsec’d. Notes | | | 2.400 | | | | 06/15/21 | | | | 36,790 | | | | 36,623,415 | |
Anthem, Inc., | | | | | | | | | | | | | | | | |
Sr. Unsec’d. Notes | | | 1.875 | | | | 01/15/18 | | | | 41,195 | | | | 41,213,126 | |
Sr. Unsec’d. Notes | | | 2.250 | | | | 08/15/19 | | | | 23,940 | | | | 23,891,641 | |
Sr. Unsec’d. Notes | | | 2.300 | | | | 07/15/18 | | | | 9,875 | | | | 9,939,553 | |
Sr. Unsec’d. Notes | | | 3.700 | | | | 08/15/21 | | | | 14,150 | | | | 14,630,095 | |
Catholic Health Initiatives, | | | | | | | | | | | | | | | | |
Sec’d. Notes | | | 1.600 | | | | 11/01/17 | | | | 2,100 | | | | 2,109,188 | |
Unsec’d. Notes | | | 2.600 | | | | 08/01/18 | | | | 5,270 | | | | 5,321,541 | |
Coventry Health Care, Inc., | | | | | | | | | | | | | | | | |
Sr. Unsec’d. Notes | | | 5.450 | | | | 06/15/21 | | | | 1,416 | | | | 1,572,482 | |
Sr. Unsec’d. Notes | | | 5.950 | | | | 03/15/17 | | | | 19,180 | | | | 19,369,115 | |
Dignity Health, Sec’d. Notes | | | 2.637 | | | | 11/01/19 | | | | 8,900 | | | | 8,977,537 | |
Humana, Inc., Sr. Unsec’d. Notes | | | 2.625 | | | | 10/01/19 | | | | 9,010 | | | | 9,082,242 | |
Laboratory Corp. of America Holdings, | | | | | | | | | | | | | | | | |
Sr. Unsec’d. Notes | | | 2.200 | | | | 08/23/17 | | | | 14,785 | | | | 14,853,913 | |
Sr. Unsec’d. Notes | | | 2.500 | | | | 11/01/18 | | | | 8,100 | | | | 8,171,385 | |
Sr. Unsec’d. Notes | | | 2.625 | | | | 02/01/20 | | | | 3,640 | | | | 3,636,429 | |
Sr. Unsec’d. Notes(c) | | | 4.625 | | | | 11/15/20 | | | | 3,730 | | | | 3,998,802 | |
Quest Diagnostics, Inc., Sr. Unsec’d. Notes | | | 2.500 | | | | 03/30/20 | | | | 30,000 | | | | 29,978,970 | |
UnitedHealth Group, Inc., | | | | | | | | | | | | | | | | |
Sr. Unsec’d. Notes | | | 2.300 | | | | 12/15/19 | | | | 8,600 | | | | 8,664,543 | |
Sr. Unsec’d. Notes | | | 2.700 | | | | 07/15/20 | | | | 14,800 | | | | 15,022,666 | |
Sr. Unsec’d. Notes | | | 6.000 | | | | 02/15/18 | | | | 15,075 | | | | 15,806,303 | |
| | | | | | | | | | | | | | | | |
| | | | | | | | | | | | | | | 296,675,711 | |
| | | | |
Home Builders 0.2% | | | | | | | | | | | | | | | | |
D.R. Horton, Inc., Gtd. Notes(c) | | | 3.625 | | | | 02/15/18 | | | | 11,000 | | | | 11,110,000 | |
PulteGroup, Inc., Gtd. Notes | | | 4.250 | | | | 03/01/21 | | | | 5,143 | | | | 5,258,718 | |
Toll Brothers Finance Corp., Gtd. Notes | | | 4.000 | | | | 12/31/18 | | | | 8,050 | | | | 8,261,312 | |
| | | | | | | | | | | | | | | | |
| | | | | | | | | | | | | | | 24,630,030 | |
See Notes to Financial Statements.
| | | | |
| Prudential Short-Term Corporate Bond Fund, Inc. | | | 29 | |
Portfolio of Investments (continued)
as of December 31, 2016
| | | | | | | | | | | | | | | | |
| Description | | Interest
Rate | | | Maturity
Date | | | Principal
Amount (000)# | | | Value (Note 2) | |
CORPORATE BONDS (Continued) | |
| | | | |
Home Furnishings 0.1% | | | | | | | | | | | | | | | | |
Whirlpool Corp., Sr. Unsec’d. Notes | | | 2.400 | % | | | 03/01/19 | | | | 12,725 | | | $ | 12,774,093 | |
| | | | |
Housewares 0.7% | | | | | | | | | | | | | | | | |
Newell Brands, Inc., | | | | | | | | | | | | | | | | |
Sr. Unsec’d. Notes | | | 2.050 | | | | 12/01/17 | | | | 7,090 | | | | 7,113,482 | |
Sr. Unsec’d. Notes | | | 2.600 | | | | 03/29/19 | | | | 6,305 | | | | 6,374,185 | |
Sr. Unsec’d. Notes | | | 2.875 | | | | 12/01/19 | | | | 34,655 | | | | 35,272,830 | |
Sr. Unsec’d. Notes | | | 3.150 | | | | 04/01/21 | | | | 11,575 | | | | 11,779,831 | |
Sr. Unsec’d. Notes | | | 4.000 | | | | 06/15/22 | | | | 10,895 | | | | 11,291,044 | |
| | | | | | | | | | | | | | | | |
| | | | | | | | | | | | | | | 71,831,372 | |
| | | | |
Insurance 3.0% | | | | | | | | | | | | | | | | |
Allied World Assurance Co. Holdings Ltd., Gtd. Notes | | | 5.500 | | | | 11/15/20 | | | | 500 | | | | 539,364 | |
American International Group, Inc., | | | | | | | | | | | | | | | | |
Sr. Unsec’d. Notes | | | 2.300 | | | | 07/16/19 | | | | 29,190 | | | | 29,327,777 | |
Sr. Unsec’d. Notes | | | 3.300 | | | | 03/01/21 | | | | 15,095 | | | | 15,461,552 | |
AXIS Specialty Finance LLC, Gtd. Notes | | | 5.875 | | | | 06/01/20 | | | | 6,075 | | | | 6,658,965 | |
AXIS Specialty Finance PLC, Gtd. Notes | | | 2.650 | | | | 04/01/19 | | | | 9,160 | | | | 9,223,122 | |
Chubb INA Holdings, Inc., Gtd. Notes | | | 2.300 | | | | 11/03/20 | | | | 24,800 | | | | 24,794,321 | |
Liberty Mutual Group, Inc., Gtd. Notes, 144A(c) | | | 5.000 | | | | 06/01/21 | | | | 10,004 | | | | 10,884,052 | |
Markel Corp., Sr. Unsec’d. Notes | | | 7.125 | | | | 09/30/19 | | | | 14,001 | | | | 15,683,822 | |
Marsh & McLennan Cos., Inc., Sr. Unsec’d. Notes, MTN | | | 2.550 | | | | 10/15/18 | | | | 5,875 | | | | 5,930,237 | |
MetLife, Inc., Sr. Unsec’d. Notes | | | 1.756 | (a) | | | 12/15/17 | | | | 12,125 | | | | 12,145,188 | |
Metropolitan Life Global Funding I, | | | | | | | | | | | | | | | | |
Sec’d. Notes, 144A | | | 1.500 | | | | 01/10/18 | | | | 18,310 | | | | 18,313,003 | |
Sec’d. Notes, 144A | | | 2.300 | | | | 04/10/19 | | | | 50,000 | | | | 50,276,000 | |
New York Life Global Funding, Sec’d. Notes, 144A | | | 2.100 | | | | 01/02/19 | | | | 20,570 | | | | 20,655,139 | |
Principal Life Global Funding II, | | | | | | | | | | | | | | | | |
Sr. Sec’d. Notes, 144A | | | 1.500 | | | | 04/18/19 | | | | 3,570 | | | | 3,525,132 | |
Sr. Sec’d. Notes, 144A | | | 2.200 | | | | 04/08/20 | | | | 9,525 | | | | 9,453,686 | |
TIAA Asset Management Finance Co. LLC,
Sr. Unsec’d. Notes, 144A(b) | | | 2.950 | | | | 11/01/19 | | | | 23,585 | | | | 23,992,101 | |
Trinity Acquisition PLC, Gtd. Notes | | | 3.500 | | | | 09/15/21 | | | | 9,895 | | | | 9,991,565 | |
Unum Group, Sr. Unsec’d. Notes | | | 3.000 | | | | 05/15/21 | | | | 6,145 | | | | 6,127,050 | |
W.R. Berkley Corp., | | | | | | | | | | | | | | | | |
Sr. Unsec’d. Notes | | | 4.625 | | | | 03/15/22 | | | | 16,075 | | | | 17,194,495 | |
Sr. Unsec’d. Notes | | | 6.150 | | | | 08/15/19 | | | | 642 | | | | 699,336 | |
Sr. Unsec’d. Notes | | | 7.375 | | | | 09/15/19 | | | | 3,960 | | | | 4,441,615 | |
XLIT Ltd. (Ireland), Gtd. Notes | | | 2.300 | | | | 12/15/18 | | | | 9,251 | | | | 9,311,918 | |
| | | | | | | | | | | | | | | | |
| | | | | | | | | | | | | | | 304,629,440 | |
See Notes to Financial Statements.
| | | | | | | | | | | | | | | | |
| Description | | Interest
Rate | | | Maturity
Date | | | Principal
Amount (000)# | | | Value (Note 2) | |
CORPORATE BONDS (Continued) | |
| | | | |
Iron/Steel 0.1% | | | | | | | | | | | | | | | | |
Nucor Corp., Sr. Unsec’d. Notes | | | 5.850 | % | | | 06/01/18 | | | | 11,000 | | | $ | 11,589,083 | |
| | | | |
Leisure Time 0.3% | | | | | | | | | | | | | | | | |
Carnival Corp., Gtd. Notes | | | 1.875 | | | | 12/15/17 | | | | 30,705 | | | | 30,828,250 | |
| | | | |
Lodging 1.2% | | | | | | | | | | | | | | | | |
Marriott International, Inc., | | | | | | | | | | | | | | | | |
Sr. Unsec’d. Notes | | | 2.300 | | | | 01/15/22 | | | | 36,420 | | | | 35,329,112 | |
Sr. Unsec’d. Notes | | | 3.000 | | | | 03/01/19 | | | | 25,350 | | | | 25,793,549 | |
Sr. Unsec’d. Notes | | | 3.375 | | | | 10/15/20 | | | | 4,195 | | | | 4,303,529 | |
Sr. Unsec’d. Notes | | | 6.375 | | | | 06/15/17 | | | | 9,400 | | | | 9,604,159 | |
Sr. Unsec’d. Notes | | | 6.750 | | | | 05/15/18 | | | | 3,000 | | | | 3,198,045 | |
Sr. Unsec’d. Notes | | | 7.150 | | | | 12/01/19 | | | | 10,218 | | | | 11,514,858 | |
Wyndham Worldwide Corp., | | | | | | | | | | | | | | | | |
Sr. Unsec’d. Notes | | | 2.500 | | | | 03/01/18 | | | | 7,610 | | | | 7,674,061 | |
Sr. Unsec’d. Notes | | | 2.950 | | | | 03/01/17 | | | | 29,568 | | | | 29,597,745 | |
| | | | | | | | | | | | | | | | |
| | | | | | | | | | | | | | | 127,015,058 | |
| | | | |
Machinery-Construction & Mining | | | | | | | | | | | | | | | | |
Caterpillar Financial Services Corp.,
Sr. Unsec’d. Notes, GMTN | | | 1.700 | | | | 06/16/18 | | | | 500 | | | | 500,441 | |
| | | | |
Machinery-Diversified 0.2% | | | | | | | | | | | | | | | | |
CNH Industrial Capital LLC, Gtd. Notes | | | 3.250 | | | | 02/01/17 | | | | 13,125 | | | | 13,125,000 | |
Roper Technologies, Inc., Sr. Unsec’d. Notes | | | 1.850 | | | | 11/15/17 | | | | 6,770 | | | | 6,790,940 | |
| | | | | | | | | | | | | | | | |
| | | | | | | | | | | | | | | 19,915,940 | |
| | | | |
Media 2.7% | | | | | | | | | | | | | | | | |
21st Century Fox America, Inc., Gtd. Notes | | | 5.650 | | | | 08/15/20 | | | | 7,180 | | | | 7,935,889 | |
CBS Corp., Gtd. Notes | | | 1.950 | | | | 07/01/17 | | | | 7,702 | | | | 7,726,446 | |
CCO Holdings LLC/CCO Holdings Capital Corp.,
Sr. Unsec’d. Notes | | | 6.625 | | | | 01/31/22 | | | | 4,750 | | | | 4,922,188 | |
Charter Communications Operating LLC/Charter Communications Operating Capital,
Sr. Sec’d. Notes | | | 4.464 | | | | 07/23/22 | | | | 49,305 | | | | 51,525,254 | |
CSC Holdings LLC, Sr. Unsec’d. Notes | | | 7.625 | | | | 07/15/18 | | | | 4,698 | | | | 5,015,115 | |
DISH DBS Corp., Gtd. Notes | | | 4.250 | | | | 04/01/18 | | | | 10,000 | | | | 10,253,700 | |
NBCUniversal Enterprise, Inc., Gtd. Notes, 144A | | | 1.974 | | | | 04/15/19 | | | | 23,725 | | | | 23,810,695 | |
NBCUniversal Media LLC, Gtd. Notes | | | 4.375 | | | | 04/01/21 | | | | 5,355 | | | | 5,785,108 | |
Scripps Networks Interactive, Inc., | | | | | | | | | | | | | | | | |
Sr. Unsec’d. Notes | | | 2.800 | | | | 06/15/20 | | | | 500 | | | | 501,105 | |
Sr. Unsec’d. Notes | | | 3.500 | | | | 06/15/22 | | | | 30,770 | | | | 31,095,116 | |
See Notes to Financial Statements.
| | | | |
| Prudential Short-Term Corporate Bond Fund, Inc. | | | 31 | |
Portfolio of Investments (continued)
as of December 31, 2016
| | | | | | | | | | | | | | | | |
| Description | | Interest
Rate | | | Maturity
Date | | | Principal
Amount (000)# | | | Value (Note 2) | |
CORPORATE BONDS (Continued) | |
| | | | |
Media (cont’d.) | | | | | | | | | | | | | | | | |
Sky PLC (United Kingdom), | | | | | | | | | | | | | | | | |
Gtd. Notes, 144A | | | 2.625 | % | | | 09/16/19 | | | | 11,900 | | | $ | 11,948,493 | |
Gtd. Notes, 144A | | | 6.100 | | | | 02/15/18 | | | | 10,000 | | | | 10,433,820 | |
Thomson Reuters Corp., Sr. Unsec’d. Notes | | | 1.300 | | | | 02/23/17 | | | | 8,700 | | | | 8,700,365 | |
Time Warner Cable LLC, | | | | | | | | | | | | | | | | |
Sr. Sec’d. Notes | | | 5.850 | | | | 05/01/17 | | | | 6,068 | | | | 6,154,111 | |
Sr. Sec’d. Notes | | | 6.750 | | | | 07/01/18 | | | | 9,162 | | | | 9,781,534 | |
Sr. Sec’d. Notes | | | 8.250 | | | | 04/01/19 | | | | 9,759 | | | | 10,966,188 | |
Sr. Sec’d. Notes | | | 8.750 | | | | 02/14/19 | | | | 10,135 | | | | 11,421,577 | |
Time Warner, Inc., | | | | | | | | | | | | | | | | |
Gtd. Notes | | | 2.100 | | | | 06/01/19 | | | | 24,000 | | | | 23,985,504 | |
Gtd. Notes | | | 3.400 | | | | 06/15/22 | | | | 16,320 | | | | 16,415,423 | |
Viacom, Inc., | | | | | | | | | | | | | | | | |
Sr. Unsec’d. Notes | | | 2.250 | | | | 02/04/22 | | | | 12,500 | | | | 11,746,800 | |
Sr. Unsec’d. Notes | | | 2.500 | | | | 09/01/18 | | | | 6,290 | | | | 6,308,857 | |
| | | | | | | | | | | | | | | | |
| | | | | | | | | | | | | | | 276,433,288 | |
| | | | |
Mining 0.1% | | | | | | | | | | | | | | | | |
Barrick Gold Corp. (Canada), Sr. Unsec’d. Notes | | | 4.100 | | | | 05/01/23 | | | | 4,910 | | | | 5,036,879 | |
Barrick North America Finance LLC (Canada),
Gtd. Notes | | | 4.400 | | | | 05/30/21 | | | | 1,563 | | | | 1,642,487 | |
BHP Billiton Finance USA Ltd. (Australia),
Gtd. Notes, 144A(c) | | | 6.250 | (a) | | | 10/19/75 | | | | 7,870 | | | | 8,520,849 | |
| | | | | | | | | | | | | | | | |
| | | | | | | | | | | | | | | 15,200,215 | |
| | | | |
Miscellaneous Manufacturing 0.3% | | | | | | | | | | | | | | | | |
Bombardier, Inc. (Canada), Sr. Unsec’d. Notes, 144A | | | 4.750 | | | | 04/15/19 | | | | 7,150 | | | | 7,185,750 | |
Crane Co., Sr. Unsec’d. Notes | | | 2.750 | | | | 12/15/18 | | | | 9,500 | | | | 9,618,750 | |
Ingersoll-Rand Global Holding Co. Ltd., Gtd. Notes | | | 2.875 | | | | 01/15/19 | | | | 3,715 | | | | 3,781,517 | |
Koppers, Inc., Gtd. Notes | | | 7.875 | | | | 12/01/19 | | | | 4,000 | | | | 4,055,000 | |
Pentair Finance SA (United Kingdom), | | | | | | | | | | | | | | | | |
Gtd. Notes | | | 1.875 | | | | 09/15/17 | | | | 4,100 | | | | 4,106,117 | |
Gtd. Notes | | | 3.150 | | | | 09/15/22 | | | | 4,440 | | | | 4,348,230 | |
| | | | | | | | | | | | | | | | |
| | | | | | | | | | | | | | | 33,095,364 | |
| | | | |
Office/Business Equipment | | | | | | | | | | | | | | | | |
Xerox Corp., Sr. Unsec’d. Notes | | | 2.950 | | | | 03/15/17 | | | | 2,010 | | | | 2,016,056 | |
| | | | |
Oil & Gas 3.5% | | | | | | | | | | | | | | | | |
Anadarko Petroleum Corp., Sr. Unsec’d. Notes(c) | | | 4.850 | | | | 03/15/21 | | | | 35,825 | | | | 38,412,926 | |
Apache Corp., Sr. Unsec’d. Notes | | | 3.250 | | | | 04/15/22 | | | | 17,952 | | | | 18,234,008 | |
See Notes to Financial Statements.
| | | | | | | | | | | | | | | | |
| Description | | Interest
Rate | | | Maturity
Date | | | Principal
Amount (000)# | | | Value (Note 2) | |
CORPORATE BONDS (Continued) | |
| | | | |
Oil & Gas (cont’d.) | | | | | | | | | | | | | | | | |
BP Capital Markets PLC (United Kingdom), | | | | | | | | | | | | | | | | |
Gtd. Notes | | | 1.375 | % | | | 05/10/18 | | | | 15,300 | | | $ | 15,252,784 | |
Gtd. Notes(c) | | | 2.112 | | | | 09/16/21 | | | | 53,285 | | | | 52,280,578 | |
Canadian National Resources Ltd.(Canada),
Sr. Unsec’d. Notes(c) | | | 3.450 | | | | 11/15/21 | | | | 11,400 | | | | 11,653,445 | |
Cenovus Energy, Inc. (Canada), | | | | | | | | | | | | | | | | |
Sr. Unsec’d. Notes | | | 3.000 | | | | 08/15/22 | | | | 3,400 | | | | 3,287,042 | |
Sr. Unsec’d. Notes | | | 5.700 | | | | 10/15/19 | | | | 21,014 | | | | 22,479,516 | |
ConocoPhillips Co., Gtd. Notes(c) | | | 4.200 | | | | 03/15/21 | | | | 11,590 | | | | 12,311,141 | |
Devon Energy Corp., | | | | | | | | | | | | | | | | |
Sr. Unsec’d. Notes(c) | | | 3.250 | | | | 05/15/22 | | | | 6,930 | | | | 6,886,029 | |
Sr. Unsec’d. Notes | | | 4.000 | | | | 07/15/21 | | | | 4,691 | | | | 4,847,661 | |
EOG Resources, Inc., | | | | | | | | | | | | | | | | |
Sr. Unsec’d. Notes | | | 4.100 | | | | 02/01/21 | | | | 3,390 | | | | 3,572,606 | |
Sr. Unsec’d. Notes | | | 4.400 | | | | 06/01/20 | | | | 5,250 | | | | 5,569,216 | |
Exxon Mobil Corp., Sr. Unsec’d. Notes(c) | | | 2.222 | | | | 03/01/21 | | | | 20,925 | | | | 20,972,939 | |
Husky Energy, Inc. (Canada), | | | | | | | | | | | | | | | | |
Sr. Unsec’d. Notes | | | 6.150 | | | | 06/15/19 | | | | 4,305 | | | | 4,690,504 | |
Sr. Unsec’d. Notes | | | 7.250 | | | | 12/15/19 | | | | 15,291 | | | | 17,385,454 | |
Nabors Industries, Inc., Gtd. Notes | | | 6.150 | | | | 02/15/18 | | | | 15,755 | | | | 16,345,812 | |
Noble Energy, Inc., | | | | | | | | | | | | | | | | |
Sr. Unsec’d. Notes | | | 4.150 | | | | 12/15/21 | | | | 18,487 | | | | 19,239,181 | |
Sr. Unsec’d. Notes | | | 8.250 | | | | 03/01/19 | | | | 4,527 | | | | 5,085,202 | |
Noble Holding International Ltd. (United Kingdom), Gtd. Notes(c) | | | 2.500 | | | | 03/15/17 | | | | 3,095 | | | | 3,083,394 | |
Petroleos Mexicanos (Mexico), Gtd. Notes, 144A | | | 5.375 | | | | 03/13/22 | | | | 3,750 | | | | 3,839,925 | |
Phillips 66, Gtd. Notes | | | 2.950 | | | | 05/01/17 | | | | 6,430 | | | | 6,465,867 | |
Pioneer Natural Resources Co., | | | | | | | | | | | | | | | | |
Sr. Unsec’d. Notes | | | 6.650 | | | | 03/15/17 | | | | 5,250 | | | | 5,303,555 | |
Sr. Unsec’d. Notes | | | 6.875 | | | | 05/01/18 | | | | 19,140 | | | | 20,319,636 | |
Suncor Energy, Inc. (Canada), Sr. Unsec’d. Notes | | | 6.100 | | | | 06/01/18 | | | | 12,218 | | | | 12,935,624 | |
Tesoro Corp., Gtd. Notes, 144A | | | 4.750 | | | | 12/15/23 | | | | 15,000 | | | | 15,103,125 | |
Transocean, Inc., Gtd. Notes | | | 4.250 | (a) | | | 10/15/17 | | | | 9,600 | | | | 9,696,000 | |
| | | | | | | | | | | | | | | | |
| | | | | | | | | | | | | | | 355,253,170 | |
| | | | |
Oil & Gas Services 0.3% | | | | | | | | | | | | | | | | |
National Oilwell Varco, Inc., Sr. Unsec’d. Notes | | | 1.350 | | | | 12/01/17 | | | | 5,360 | | | | 5,339,107 | |
Schlumberger Holdings Corp., | | | | | | | | | | | | | | | | |
Sr. Unsec’d. Notes, 144A | | | 2.350 | | | | 12/21/18 | | | | 12,920 | | | | 13,026,577 | |
Sr. Unsec’d. Notes, 144A | | | 3.000 | | | | 12/21/20 | | | | 10,125 | | | | 10,339,174 | |
| | | | | | | | | | | | | | | | |
| | | | | | | | | | | | | | | 28,704,858 | |
See Notes to Financial Statements.
| | | | |
| Prudential Short-Term Corporate Bond Fund, Inc. | | | 33 | |
Portfolio of Investments (continued)
as of December 31, 2016
| | | | | | | | | | | | | | | | |
| Description | | Interest
Rate | | | Maturity
Date | | | Principal
Amount (000)# | | | Value (Note 2) | |
CORPORATE BONDS (Continued) | | | | | | | | | | | | | | | | |
| | | | |
Packaging & Containers 0.3% | | | | | | | | | | | | | | | | |
Ball Corp., Gtd. Notes | | | 4.375 | % | | | 12/15/20 | | | | 1,940 | | | $ | 2,027,300 | |
Bemis Co., Inc., Sr. Unsec’d. Notes | | | 6.800 | | | | 08/01/19 | | | | 1,879 | | | | 2,078,296 | |
WestRock RKT Co., | | | | | | | | | | | | | | | | |
Gtd. Notes | | | 3.500 | | | | 03/01/20 | | | | 13,815 | | | | 14,163,732 | |
Gtd. Notes | | | 4.450 | | | | 03/01/19 | | | | 12,675 | | | | 13,226,020 | |
| | | | | | | | | | | | | | | | |
| | | | | | | | | | | | | | | 31,495,348 | |
| | | | |
Pharmaceuticals 5.5% | | | | | | | | | | | | | | | | |
AbbVie, Inc., | | | | | | | | | | | | | | | | |
Sr. Unsec’d. Notes | | | 2.000 | | | | 11/06/18 | | | | 15,000 | | | | 15,009,210 | |
Sr. Unsec’d. Notes | | | 2.300 | | | | 05/14/21 | | | | 20,430 | | | | 20,017,028 | |
Sr. Unsec’d. Notes | | | 2.500 | | | | 05/14/20 | | | | 61,995 | | | | 62,011,181 | |
Actavis Funding SCS, | | | | | | | | | | | | | | | | |
Gtd. Notes | | | 2.450 | | | | 06/15/19 | | | | 6,530 | | | | 6,557,648 | |
Gtd. Notes | | | 3.000 | | | | 03/12/20 | | | | 73,525 | | | | 74,544,277 | |
Gtd. Notes | | | 3.450 | | | | 03/15/22 | | | | 6,180 | | | | 6,272,756 | |
Actavis, Inc., Gtd. Notes | | | 1.875 | | | | 10/01/17 | | | | 18,710 | | | | 18,745,755 | |
Baxalta, Inc., Gtd. Notes | | | 2.875 | | | | 06/23/20 | | | | 35,210 | | | | 35,201,197 | |
Bayer US Finance LLC (Germany), Gtd. Notes, 144A | | | 2.375 | | | | 10/08/19 | | | | 15,975 | | | | 16,003,292 | |
Cardinal Health, Inc., | | | | | | | | | | | | | | | | |
Sr. Unsec’d. Notes | | | 1.700 | | | | 03/15/18 | | | | 9,455 | | | | 9,445,507 | |
Sr. Unsec’d. Notes | | | 1.900 | | | | 06/15/17 | | | | 8,050 | | | | 8,072,065 | |
Express Scripts Holding Co., Gtd. Notes | | | 2.250 | | | | 06/15/19 | | | | 25,000 | | | | 24,997,175 | |
Forest Laboratories LLC, Gtd. Notes, 144A | | | 4.375 | | | | 02/01/19 | | | | 10,000 | | | | 10,391,380 | |
McKesson Corp., Sr. Unsec’d. Notes | | | 2.284 | | | | 03/15/19 | | | | 24,800 | | | | 24,892,876 | |
Mead Johnson Nutrition Co., Sr. Unsec’d. Notes | | | 3.000 | | | | 11/15/20 | | | | 17,255 | | | | 17,471,171 | |
Medco Health Solutions, Inc., Gtd. Notes | | | 4.125 | | | | 09/15/20 | | | | 2,000 | | | | 2,098,608 | |
Mylan, Inc., | | | | | | | | | | | | | | | | |
Gtd. Notes | | | 2.550 | | | | 03/28/19 | | | | 3,195 | | | | 3,188,140 | |
Gtd. Notes | | | 2.600 | | | | 06/24/18 | | | | 7,855 | | | | 7,900,472 | |
Mylan NV, | | | | | | | | | | | | | | | | |
Gtd. Notes, 144A | | | 2.500 | | | | 06/07/19 | | | | 13,010 | | | | 12,939,590 | |
Gtd. Notes, 144A | | | 3.000 | | | | 12/15/18 | | | | 4,090 | | | | 4,119,579 | |
Gtd. Notes, 144A | | | 3.150 | | | | 06/15/21 | | | | 18,210 | | | | 17,871,057 | |
Perrigo Co. PLC, Sr. Unsec’d. Notes | | | 2.300 | | | | 11/08/18 | | | | 8,350 | | | | 8,338,911 | |
Shire Acquisitions Investments Ireland DAC, | | | | | | | | | | | | | | | | |
Gtd. Notes | | | 1.900 | | | | 09/23/19 | | | | 17,540 | | | | 17,317,628 | |
Gtd. Notes | | | 2.400 | | | | 09/23/21 | | | | 57,645 | | | | 55,684,321 | |
Teva Pharmaceuticals Finance Netherlands III BV (Israel), Gtd. Notes(c) | | | 2.200 | | | | 07/21/21 | | | | 66,780 | | | | 63,887,558 | |
See Notes to Financial Statements.
| | | | | | | | | | | | | | | | |
| Description | | Interest
Rate | | | Maturity
Date | | | Principal
Amount (000)# | | | Value (Note 2) | |
CORPORATE BONDS (Continued) | | | | | | | | | | | | | | | | |
| | | | |
Pharmaceuticals (cont’d.) | | | | | | | | | | | | | | | | |
Zoetis, Inc., | | | | | | | | | | | | | | | | |
Sr. Unsec’d. Notes | | | 1.875 | % | | | 02/01/18 | | | | 10,650 | | | $ | 10,649,968 | |
Sr. Unsec’d. Notes | | | 3.450 | | | | 11/13/20 | | | | 15,455 | | | | 15,862,409 | |
| | | | | | | | | | | | | | | | |
| | | | | | | | | | | | | | | 569,490,759 | |
| | | | |
Pipelines 2.1% | | | | | | | | | | | | | | | | |
Buckeye Partners LP, Sr. Unsec’d. Notes | | | 2.650 | | | | 11/15/18 | | | | 5,610 | | | | 5,646,886 | |
Columbia Pipeline Group, Inc., Gtd. Notes | | | 2.450 | | | | 06/01/18 | | | | 8,745 | | | | 8,787,737 | |
DCP Midstream LLC, Sr. Unsec’d. Notes, 144A | | | 5.350 | | | | 03/15/20 | | | | 10,000 | | | | 10,375,000 | |
DCP Midstream Operating LP, | | | | | | | | | | | | | | | | |
Gtd. Notes | | | 2.500 | | | | 12/01/17 | | | | 8,990 | | | | 8,945,050 | |
Gtd. Notes | | | 2.700 | | | | 04/01/19 | | | | 4,560 | | | | 4,503,000 | |
Enable Midstream Partners LP,
Sr. Unsec’d. Notes | | | 2.400 | (a) | | | 05/15/19 | | | | 6,545 | | | | 6,425,868 | |
Enterprise Products Operating LLC, | | | | | | | | | | | | | | | | |
Gtd. Notes | | | 1.650 | | | | 05/07/18 | | | | 8,305 | | | | 8,281,671 | |
Gtd. Notes | | | 2.550 | | | | 10/15/19 | | | | 14,680 | | | | 14,829,809 | |
Gtd. Notes | | | 2.850 | | | | 04/15/21 | | | | 17,180 | | | | 17,310,688 | |
Gtd. Notes | | | 6.650 | | | | 04/15/18 | | | | 3,400 | | | | 3,605,289 | |
Kinder Morgan Energy Partners LP, | | | | | | | | | | | | | | | | |
Gtd. Notes | | | 2.650 | | | | 02/01/19 | | | | 8,300 | | | | 8,343,666 | |
Gtd. Notes | | | 5.000 | | | | 10/01/21 | | | | 29,692 | | | | 31,614,468 | |
Gtd. Notes | | | 6.000 | | | | 02/01/17 | | | | 4,900 | | | | 4,914,842 | |
Gtd. Notes | | | 6.500 | | | | 04/01/20 | | | | 5,000 | | | | 5,534,405 | |
Kinder Morgan, Inc., Gtd. Notes, 144A | | | 5.000 | | | | 02/15/21 | | | | 3,500 | | | | 3,728,116 | |
ONEOK Partners LP, | | | | | | | | | | | | | | | | |
Gtd. Notes | | | 2.000 | | | | 10/01/17 | | | | 13,030 | | | | 13,066,002 | |
Gtd. Notes | | | 3.200 | | | | 09/15/18 | | | | 9,185 | | | | 9,385,481 | |
Phillips 66 Partners LP, Sr. Unsec’d. Notes | | | 2.646 | | | | 02/15/20 | | | | 3,535 | | | | 3,524,123 | |
Spectra Energy Partners LP, Sr. Unsec’d. Notes | | | 2.950 | | | | 09/25/18 | | | | 20,415 | | | | 20,737,210 | |
Texas Eastern Transmission LP,
Sr. Unsec’d. Notes, 144A | | | 2.800 | | | | 10/15/22 | | | | 1,500 | | | | 1,460,035 | |
Western Gas Partners LP, Sr. Unsec’d. Notes | | | 2.600 | | | | 08/15/18 | | | | 7,142 | | | | 7,155,784 | |
Williams Partners LP, | | | | | | | | | | | | | | | | |
Sr. Unsec’d. Notes | | | 4.000 | | | | 11/15/21 | | | | 4,559 | | | | 4,679,066 | |
Sr. Unsec’d. Notes | | | 4.125 | | | | 11/15/20 | | | | 2,392 | | | | 2,486,850 | |
Sr. Unsec’d. Notes | | | 5.250 | | | | 03/15/20 | | | | 12,042 | | | | 12,865,902 | |
Williams Partners LP/Williams Partners Finance Corp., Sr. Unsec’d. Notes | | | 7.250 | | | | 02/01/17 | | | | 1,000 | | | | 1,003,906 | |
| | | | | | | | | | | | | | | | |
| | | | | | | | | | | | | | | 219,210,854 | |
See Notes to Financial Statements.
| | | | |
| Prudential Short-Term Corporate Bond Fund, Inc. | | | 35 | |
Portfolio of Investments (continued)
as of December 31, 2016
| | | | | | | | | | | | | | | | |
| Description | | Interest
Rate | | | Maturity
Date | | | Principal
Amount (000)# | | | Value (Note 2) | |
CORPORATE BONDS (Continued) | | | | | | | | | | | | | | | | |
| | | | |
Real Estate Investment Trusts (REITs) 2.7% | | | | | | | | | | | | | | | | |
AvalonBay Communities, Inc., Sr. Unsec’d. Notes, GMTN | | | 2.950 | % | | | 09/15/22 | | | | 10,258 | | | $ | 10,225,800 | |
Crown Castle International Corp., Sr. Unsec’d. Notes | | | 4.875 | | | | 04/15/22 | | | | 33,867 | | | | 36,061,582 | |
Digital Realty Trust LP, | | | | | | | | | | | | | | | | |
Gtd. Notes | | | 3.400 | | | | 10/01/20 | | | | 6,235 | | | | 6,342,323 | |
Gtd. Notes | | | 5.875 | | | | 02/01/20 | | | | 15,697 | | | | 17,107,783 | |
Equity Commonwealth, Sr. Unsec’d. Notes | | | 6.650 | | | | 01/15/18 | | | | 2,160 | | | | 2,214,739 | |
ERP Operating LP, Sr. Unsec’d. Notes | | | 2.375 | | | | 07/01/19 | | | | 11,370 | | | | 11,459,641 | |
Government Properties Income Trust,
Sr. Unsec’d. Notes | | | 3.750 | | | | 08/15/19 | | | | 5,100 | | | | 5,156,029 | |
Highwoods Realty LP, Sr. Unsec’d. Notes | | | 5.850 | | | | 03/15/17 | | | | 19,615 | | | | 19,780,845 | |
Liberty Property LP, Sr. Unsec’d. Notes | | | 4.750 | | | | 10/01/20 | | | | 6,000 | | | | 6,382,218 | |
Mack-Cali Realty LP, Sr. Unsec’d. Notes | | | 2.500 | | | | 12/15/17 | | | | 13,340 | | | | 13,381,261 | |
Realty Income Corp., | | | | | | | | | | | | | | | | |
Sr. Unsec’d. Notes | | | 2.000 | | | | 01/31/18 | | | | 7,800 | | | | 7,822,012 | |
Sr. Unsec’d. Notes | | | 6.750 | | | | 08/15/19 | | | | 4,585 | | | | 5,124,090 | |
Regency Centers LP, Gtd. Notes | | | 6.000 | | | | 06/15/20 | | | | 3,877 | | | | 4,288,334 | |
Scentre Group Trust 1/Scentre Group Trust 2 (Australia), Gtd. Notes, 144A | | | 2.375 | | | | 11/05/19 | | | | 9,100 | | | | 9,095,177 | |
Select Income REIT, Sr. Unsec’d. Notes | | | 2.850 | | | | 02/01/18 | | | | 11,821 | | | | 11,871,511 | |
Simon Property Group LP, Sr. Unsec’d. Notes | | | 2.200 | | | | 02/01/19 | | | | 12,200 | | | | 12,299,210 | |
Ventas Realty LP/Ventas Capital Corp., | | | | | | | | | | | | | | | | |
Gtd. Notes | | | 2.000 | | | | 02/15/18 | | | | 8,035 | | | | 8,051,536 | |
Gtd. Notes | | | 4.750 | | | | 06/01/21 | | | | 875 | | | | 940,799 | |
Vornado Realty LP, Sr. Unsec’d. Notes | | | 2.500 | | | | 06/30/19 | | | | 13,815 | | | | 13,863,946 | |
WEA Finance LLC/Westfield UK & Europe Finance PLC (Australia), | | | | | | | | | | | | | | | | |
Gtd. Notes, 144A | | | 1.750 | | | | 09/15/17 | | | | 16,900 | | | | 16,910,512 | |
Gtd. Notes, 144A | | | 2.700 | | | | 09/17/19 | | | | 5,400 | | | | 5,461,814 | |
Gtd. Notes, 144A | | | 3.250 | | | | 10/05/20 | | | | 13,485 | | | | 13,714,272 | |
Welltower, Inc., | | | | | | | | | | | | | | | | |
Sr. Unsec’d. Notes | | | 5.250 | | | | 01/15/22 | | | | 20,485 | | | | 22,566,317 | |
Sr. Unsec’d. Notes | | | 6.125 | | | | 04/15/20 | | | | 5,930 | | | | 6,582,454 | |
Weyerhaeuser Co., Sr. Unsec’d. Notes(c) | | | 7.375 | | | | 10/01/19 | | | | 7,607 | | | | 8,539,512 | |
| | | | | | | | | | | | | | | | |
| | | | | | | | | | | | | | | 275,243,717 | |
| | | | |
Retail 2.0% | | | | | | | | | | | | | | | | |
AutoZone, Inc., Sr. Unsec’d. Notes | | | 2.500 | | | | 04/15/21 | | | | 6,310 | | | | 6,239,101 | |
CVS Health Corp., | | | | | | | | | | | | | | | | |
Sr. Unsec’d. Notes | | | 2.125 | | | | 06/01/21 | | | | 5,000 | | | | 4,902,720 | |
Sr. Unsec’d. Notes | | | 2.250 | | | | 12/05/18 | | | | 24,250 | | | | 24,462,551 | |
See Notes to Financial Statements.
| | | | | | | | | | | | | | | | |
| Description | | Interest
Rate | | | Maturity
Date | | | Principal
Amount (000)# | | | Value (Note 2) | |
CORPORATE BONDS (Continued) | |
| | | | |
Retail (cont’d.) | | | | | | | | | | | | | | | | |
Sr. Unsec’d. Notes | | | 2.250 | % | | | 08/12/19 | | | | 20,350 | | | $ | 20,461,701 | |
Sr. Unsec’d. Notes | | | 2.800 | | | | 07/20/20 | | | | 59,833 | | | | 60,706,861 | |
Sr. Unsec’d. Notes | | | 4.750 | | | | 12/01/22 | | | | 7,796 | | | | 8,465,902 | |
Dollar General Corp., Sr. Unsec’d. Notes(c) | | | 1.875 | | | | 04/15/18 | | | | 26,920 | | | | 26,954,485 | |
Walgreens Boots Alliance, Inc., | | | | | | | | | | | | | | | | |
Sr. Unsec’d. Notes | | | 1.750 | | | | 11/17/17 | | | | 5,755 | | | | 5,769,359 | |
Sr. Unsec’d. Notes | | | 2.600 | | | | 06/01/21 | | | | 33,590 | | | | 33,379,088 | |
Sr. Unsec’d. Notes | | | 2.700 | | | | 11/18/19 | | | | 11,240 | | | | 11,389,099 | |
| | | | | | | | | | | | | | | | |
| | | | | | | | | | | | | | | 202,730,867 | |
| | | | |
Semiconductors 0.7% | | | | | | | | | | | | | | | | |
KLA-Tencor Corp., | | | | | | | | | | | | | | | | |
Sr. Unsec’d. Notes | | | 2.375 | | | | 11/01/17 | | | | 3,345 | | | | 3,365,040 | |
Sr. Unsec’d. Notes | | | 3.375 | | | | 11/01/19 | | | | 2,550 | | | | 2,610,585 | |
Maxim Integrated Products, Inc., Sr. Unsec’d. Notes | | | 2.500 | | | | 11/15/18 | | | | 13,825 | | | | 13,949,107 | |
NVIDIA Corp., Sr. Unsec’d. Notes | | | 2.200 | | | | 09/16/21 | | | | 34,535 | | | | 33,709,717 | |
NXP BV/NXP Funding LLC (Netherlands), | | | | | | | | | | | | | | | | |
Gtd. Notes, 144A | | | 3.750 | | | | 06/01/18 | | | | 8,825 | | | | 8,957,375 | |
Sr. Unsec’d. Notes, 144A | | | 3.875 | | | | 09/01/22 | | | | 10,000 | | | | 10,125,000 | |
| | | | | | | | | | | | | | | | |
| | | | | | | | | | | | | | | 72,716,824 | |
| | | | |
Software 1.3% | | | | | | | | | | | | | | | | |
CA, Inc., Sr. Unsec’d. Notes | | | 2.875 | | | | 08/15/18 | | | | 7,865 | | | | 7,975,951 | |
Electronic Arts, Inc., Sr. Unsec’d. Notes | | | 3.700 | | | | 03/01/21 | | | | 11,115 | | | | 11,491,521 | |
Fidelity National Information Services, Inc., | | | | | | | | | | | | | | | | |
Gtd. Notes | | | 1.450 | | | | 06/05/17 | | | | 2,090 | | | | 2,090,828 | |
Gtd. Notes | | | 2.000 | | | | 04/15/18 | | | | 7,500 | | | | 7,522,860 | |
Sr. Unsec’d. Notes | | | 2.250 | | | | 08/15/21 | | | | 15,425 | | | | 15,039,791 | |
Sr. Unsec’d. Notes | | | 2.850 | | | | 10/15/18 | | | | 7,180 | | | | 7,304,882 | |
Sr. Unsec’d. Notes | | | 3.625 | | | | 10/15/20 | | | | 13,570 | | | | 14,048,587 | |
Fiserv, Inc., Sr. Unsec’d. Notes | | | 2.700 | | | | 06/01/20 | | | | 15,210 | | | | 15,283,449 | |
Intuit, Inc., Sr. Unsec’d. Notes(c) | | | 5.750 | | | | 03/15/17 | | | | 4,537 | | | | 4,577,252 | |
Oracle Corp., | | | | | | | | | | | | | | | | |
Sr. Unsec’d. Notes | | | 1.900 | | | | 09/15/21 | | | | 33,460 | | | | 32,696,878 | |
Sr. Unsec’d. Notes | | | 2.375 | | | | 01/15/19 | | | | 17,340 | | | | 17,572,096 | |
| | | | | | | | | | | | | | | | |
| | | | | | | | | | | | | | | 135,604,095 | |
| | | | |
Telecommunications 5.3% | | | | | | | | | | | | | | | | |
America Movil SAB de CV (Mexico), Gtd. Notes | | | 5.000 | | | | 03/30/20 | | | | 11,400 | | | | 12,190,658 | |
AT&T, Inc., | | | | | | | | | | | | | | | | |
Sr. Unsec’d. Notes | | | 1.600 | | | | 02/15/17 | | | | 34,100 | | | | 34,109,173 | |
Sr. Unsec’d. Notes | | | 1.700 | | | | 06/01/17 | | | | 3,000 | | | | 3,004,110 | |
See Notes to Financial Statements.
| | | | |
| Prudential Short-Term Corporate Bond Fund, Inc. | | | 37 | |
Portfolio of Investments (continued)
as of December 31, 2016
| | | | | | | | | | | | | | | | |
| Description | | Interest
Rate | | | Maturity
Date | | | Principal
Amount (000)# | | | Value (Note 2) | |
CORPORATE BONDS (Continued) | |
| | | | |
Telecommunications (cont’d.) | | | | | | | | | | | | | | | | |
Sr. Unsec’d. Notes | | | 1.750 | % | | | 01/15/18 | | | | 14,900 | | | $ | 14,909,104 | |
Sr. Unsec’d. Notes | | | 2.400 | | | | 03/15/17 | | | | 14,850 | | | | 14,886,486 | |
Sr. Unsec’d. Notes(c) | | | 2.450 | | | | 06/30/20 | | | | 77,815 | | | | 77,272,785 | |
Sr. Unsec’d. Notes | | | 2.800 | | | | 02/17/21 | | | | 14,010 | | | | 13,898,718 | |
Sr. Unsec’d. Notes | | | 3.000 | | | | 06/30/22 | | | | 7,185 | | | | 7,052,868 | |
Sr. Unsec’d. Notes | | | 3.800 | | | | 03/15/22 | | | | 3,895 | | | | 3,992,916 | |
Sr. Unsec’d. Notes | | | 4.600 | | | | 02/15/21 | | | | 4,700 | | | | 4,971,087 | |
British Telecommunications PLC (United Kingdom), | | | | | | | | | | | | | | | | |
Sr. Unsec’d. Notes | | | 2.350 | | | | 02/14/19 | | | | 6,800 | | | | 6,839,658 | |
Sr. Unsec’d. Notes | | | 5.950 | | | | 01/15/18 | | | | 33,835 | | | | 35,262,905 | |
CenturyLink, Inc., Sr. Unsec’d. Notes, Series R | | | 5.150 | | | | 06/15/17 | | | | 10,450 | | | | 10,606,750 | |
Cisco Systems, Inc., Sr. Unsec’d. Notes | | | 1.850 | | | | 09/20/21 | | | | 5,265 | | | | 5,138,461 | |
Deutsche Telekom International Finance
BV (Germany), Gtd. Notes, 144A | | | 2.250 | | | | 03/06/17 | | | | 20,425 | | | | 20,453,983 | |
Nippon Telegraph & Telephone Corp. (Japan),
Sr. Sec’d. Notes | | | 1.400 | | | | 07/18/17 | | | | 8,720 | | | | 8,716,154 | |
Orange SA (France), | | | | | | | | | | | | | | | | |
Sr. Unsec’d. Notes | | | 2.750 | | | | 02/06/19 | | | | 21,115 | | | | 21,394,436 | |
Sr. Unsec’d. Notes | | | 5.375 | | | | 07/08/19 | | | | 4,828 | | | | 5,202,812 | |
Qwest Corp., Sr. Unsec’d. Notes | | | 6.500 | | | | 06/01/17 | | | | 8,500 | | | | 8,654,700 | |
Sprint Spectrum Co. LLC/Sprint Spectrum Co. II LLC/Sprint Spectrum Co. III LLC, Sr. Sec’d. Notes, 144A | | | 3.360 | | | | 03/20/23 | | | | 25,000 | | | | 25,046,750 | |
Telefonica Emisiones SAU (Spain), Gtd. Notes | | | 3.192 | | | | 04/27/18 | | | | 28,700 | | | | 29,112,735 | |
Telefonos de Mexico Sab de CV (Mexico), Gtd. Notes | | | 5.500 | | | | 11/15/19 | | | | 8,700 | | | | 9,397,018 | |
Verizon Communications, Inc., | | | | | | | | | | | | | | | | |
Sr. Unsec’d. Notes | | | 1.100 | | | | 11/01/17 | | | | 13,100 | | | | 13,069,097 | |
Sr. Unsec’d. Notes | | | 2.625 | | | | 02/21/20 | | | | 76,469 | | | | 77,202,644 | |
Sr. Unsec’d. Notes | | | 4.500 | | | | 09/15/20 | | | | 40,000 | | | | 42,804,520 | |
Vodafone Group PLC (United Kingdom), | | | | | | | | | | | | | | | | |
Sr. Unsec’d. Notes | | | 1.250 | | | | 09/26/17 | | | | 19,270 | | | | 19,234,254 | |
Sr. Unsec’d. Notes | | | 1.625 | | | | 03/20/17 | | | | 24,750 | | | | 24,754,876 | |
| | | | | | | | | | | | | | | | |
| | | | | | | | | | | | | | | 549,179,658 | |
| | | | |
Transportation 0.2% | | | | | | | | | | | | | | | | |
Federal Express Corp., Series 2012, Pass-Through Trust, Pass-Through Certificates, 144A | | | 2.625 | | | | 01/15/18 | | | | 2,881 | | | | 2,878,418 | |
Norfolk Southern Corp., Sr. Unsec’d. Notes | | | 7.700 | | | | 05/15/17 | | | | 6,810 | | | | 6,965,615 | |
Ryder System, Inc., Sr. Unsec’d. Notes, MTN | | | 2.650 | | | | 03/02/20 | | | | 7,480 | | | | 7,523,953 | |
| | | | | | | | | | | | | | | | |
| | | | | | | | | | | | | | | 17,367,986 | |
See Notes to Financial Statements.
| | | | | | | | | | | | | | | | |
| Description | | Interest
Rate | | | Maturity
Date | | | Principal
Amount (000)# | | | Value (Note 2) | |
CORPORATE BONDS (Continued) | |
| | | | |
Trucking & Leasing 0.3% | | | | | | | | | | | | | | | | |
Penske Truck Leasing Co. Lp/PTL Finance Corp., | | | | | | | | | | | | | | | | |
Sr. Unsec’d. Notes, 144A(b) | | | 2.500 | % | | | 06/15/19 | | | | 11,175 | | | $ | 11,202,066 | |
Sr. Unsec’d. Notes, 144A(b) | | | 3.200 | | | | 07/15/20 | | | | 17,770 | | | | 17,967,069 | |
Sr. Unsec’d. Notes, 144A(b) | | | 3.300 | | | | 04/01/21 | | | | 200 | | | | 202,248 | |
| | | | | | | | | | | | | | | | |
| | | | | | | | | | | | | | | 29,371,383 | |
| | | | | | | | | | | | | | | | |
TOTAL CORPORATE BONDS
(cost $8,939,004,502) | | | | | | | | | | | | | | | 8,944,885,563 | |
| | | | | | | | | | | | | | | | |
| | | | |
FOREIGN AGENCIES 0.9% | | | | | | | | | | | | | | | | |
CNOOC Finance 2013 Ltd. (China), Gtd. Notes | | | 1.750 | | | | 05/09/18 | | | | 8,450 | | | | 8,405,646 | |
Electricite de France SA (France), | | | | | | | | | | | | | | | | |
Sr. Unsec’d. Notes, 144A | | | 2.150 | | | | 01/22/19 | | | | 12,900 | | | | 12,928,819 | |
Sr. Unsec’d. Notes, 144A | | | 2.350 | | | | 10/13/20 | | | | 12,350 | | | | 12,231,909 | |
Korea Development Bank (The) (South Korea),
Sr. Unsec’d. Notes | | | 3.875 | | | | 05/04/17 | | | | 9,500 | | | | 9,567,925 | |
Sinopec Group Overseas Development 2014 Ltd. (China), Gtd. Notes, 144A | | | 1.750 | | | | 04/10/17 | | | | 46,030 | | | | 46,014,902 | |
| | | | | | | | | | | | | | | | |
TOTAL FOREIGN AGENCIES
(cost $89,063,699) | | | | | | | | | | | | | | | 89,149,201 | |
| | | | | | | | | | | | | | | | |
| | | | |
MUNICIPAL BOND 0.1% | | | | | | | | | | | | | | | | |
Alabama | | | | | | | | | | | | | | | | |
Alabama Economic Settlement Authority
(cost $5,150,000) | | | 3.163 | | | | 09/15/25 | | | | 5,150 | | | | 5,178,789 | |
| | | | | | | | | | | | | | | | |
| | | | |
U.S. TREASURY OBLIGATIONS 0.1% | | | | | | | | | | | | | | | | |
U.S. Treasury Notes | | | 1.375 | | | | 12/15/19 | | | | 5,110 | | | | 5,097,823 | |
U.S. Treasury Notes | | | 1.750 | | | | 11/30/21 | | | | 6,425 | | | | 6,377,063 | |
| | | | | | | | | | | | | | | | |
| | | | |
TOTAL U.S. TREASURY OBLIGATIONS
(cost $11,447,318) | | | | | | | | | | | | | | | 11,474,886 | |
| | | | | | | | | | | | | | | | |
| | | | |
| | | | | | | | | Shares | | | | |
PREFERRED STOCKS | | | | | | | | | | | | | | | | |
| | | | |
Banks | | | | | | | | | | | | | | | | |
Citigroup Capital XIII, 7.257% (Capital Security,
fixed to floating preferred)(a)
(cost $3,342,000) | | | | | | | | | | | 132,000 | | | | 3,408,240 | |
| | | | | | | | | | | | | | | | |
TOTAL LONG-TERM INVESTMENTS
(cost $10,061,421,189) | | | | | | | | | | | | | | | 10,065,387,518 | |
| | | | | | | | | | | | | | | | |
See Notes to Financial Statements.
| | | | |
| Prudential Short-Term Corporate Bond Fund, Inc. | | | 39 | |
Portfolio of Investments (continued)
as of December 31, 2016
| | | | | | | | | | | | | | | | |
| Description | | | | | | | |
Shares | | | Value (Note 2) | |
| | | | |
SHORT-TERM INVESTMENTS 2.6% | | | | | | | | | | | | | | | | |
| | | | |
AFFILIATED MUTUAL FUNDS | | | | | | | | | | | | | | | | |
Prudential Investment Portfolios 2 - Prudential Core Ultra Short Bond Fund(f) | | | | | | | | | | | 164,732,463 | | | $ | 164,732,463 | |
| | | | | | | | | | | | | | | | |
Prudential Investment Portfolios 2 - Prudential Institutional Money Market Fund
(cost $103,341,750; includes $103,281,718 of cash collateral for securities on loan)(f)(g) | | | | | | | | | | | 103,334,887 | | | | 103,355,554 | |
| | | | | | | | | | | | | | | | |
| | | | |
TOTAL SHORT-TERM INVESTMENTS
(cost $268,074,213)(Note 3) | | | | | | | | | | | | | | | 268,088,017 | |
| | | | | | | | | | | | | | | | |
| | | | |
TOTAL INVESTMENTS 100.3%
(cost $10,329,495,402)(Note 5) | | | | | | | | | | | | | | | 10,333,475,535 | |
Liabilities in excess of other assets(h) (0.3)% | | | | | | | | | | | | | | | (32,616,682 | ) |
| | | | | | | | | | | | | | | | |
NET ASSETS 100.0% | | | | | | | | | | | | | | $ | 10,300,858,853 | |
| | | | | | | | | | | | | | | | |
The following abbreviations are used in the annual report:
144A—Security was purchased pursuant to Rule 144A under the Securities Act of 1933 and may not be resold subject to that rule except to qualified institutional buyers. Unless otherwise noted, 144A securities are deemed to be liquid.
CDS—Credit Default Swap
CLO—Collateralized Loan Obligation
GMTN—Global Medium Term Note
LIBOR—London Interbank Offered Rate
MTN—Medium Term Note
OTC—Over-the-counter
REIT—Real Estate Investment Trust
| ^ | Indicates a Level 3 security. The aggregate value of Level 3 securities is $1,778,648 and 0.0% of net assets. |
| # | Principal and notional amount shown in U.S. dollars unless otherwise stated. |
| (a) | Variable rate instrument. The interest rate shown reflects the rate in effect at December 31, 2016. |
| (b) | Indicates a security or securities that have been deemed illiquid. (unaudited) |
| (c) | All or a portion of security is on loan. The aggregate market value of such securities, including those sold and pending settlement, is $101,128,962; cash collateral of $103,281,718 (included in liabilities) was received with which the Fund purchased highly liquid short-term investments. Securities on loan are subject to contractual netting arrangements. |
| (d) | Represents issuer in default on interest payments and or principal payment; non-income producing security. |
| (e) | Security is post-maturity. |
| (f) | Prudential Investments LLC, the manager of the Fund, also serves as manager of the Prudential Investment Portfolios 2 - Prudential Core Ultra Short Bond Fund and the Prudential Institutional Money Market Fund. |
| (g) | Represents security purchased with cash collateral received for securities on loan and includes dividend reinvestments. |
| (h) | Includes net unrealized appreciation (depreciation) on the following derivative contracts held at reporting period end: |
See Notes to Financial Statements.
Futures contracts outstanding at December 31, 2016:
| | | | | | | | | | | | | | | | | | | | |
Number of
Contracts | | | Type | | Expiration
Date | | | Value at
Trade Date | | | Value at
December 31,
2016 | | | Unrealized
Appreciation
(Depreciation) | |
| | | | Long Positions: | | | | | | | | | | | | | | | | |
| | 4,680 | | | 2 Year U.S. Treasury Notes | | | Mar. 2017 | | | $ | 1,014,433,036 | | | $ | 1,014,097,500 | | | $ | (335,536 | ) |
| | 728 | | | 5 Year U.S. Treasury Notes | | | Mar. 2017 | | | | 85,584,930 | | | | 85,659,438 | | | | 74,508 | |
| | | | | | | | | | | | | | | | | | | | |
| | | | | | | | | | | | | | | | | | | (261,028 | ) |
| | | | | | | | | | | | | | | | | | | | |
| | | | Short Position: | | | | | | | | | | | | | | | | |
| | 156 | | | 10 Year U.S. Treasury Notes | | | Mar. 2017 | | | | 19,203,591 | | | | 19,387,875 | | | | (184,284 | ) |
| | | | | | | | | | | | | | | | | | | | |
| | | | | | | | | | | | | | | | | | $ | (445,312 | ) |
| | | | | | | | | | | | | | | | | | | | |
Cash of $2,700,000 has been segregated with JPMorgan Chase to cover requirements for open futures contracts at December 31, 2016.
Credit default swap agreements outstanding at December 31, 2016:
| | | | | | | | | | | | | | | | | | | | | | | | | | | | |
Reference
Entity/
Obligation | | Termination
Date | | | Fixed
Rate | | | Notional
Amount
(000)#(3) | | Implied Credit
Spread at
December 31,
2016(5) | | | Fair
Value | | | Upfront
Premiums
Paid
(Received) | | | Unrealized
Appreciation
(Depreciation) | | | Counterparty |
OTC credit default swaps on corporate and/or sovereign issues—Sell Protection(2): |
Berkshire Hathaway, Inc. | | | 03/20/17 | | | | 1.000% | | | 15,000 | | | 0.136 | % | | $ | 33,738 | | | $ | (359,547 | ) | | $ | 393,285 | | | Credit Suisse First Boston Corp. |
| | | | | | | | | | | | | | | | | | | | | | | | | | | | |
The Fund entered into credit default swaps (“CDS”) to provide a measure of protection against defaults or to take an active long or short position with respect to the likelihood of a particular issuer’s default or the reference entity’s credit soundness. CDS contracts generally trade based on a spread which represents the cost a protection buyer has to pay the protection seller. The protection buyer is said to be short the credit as the value of the contract rises the more credit deteriorates. The value of the CDS contract increases for the protection buyer if the spread increases.
| (1) | If the Fund is a buyer of protection, it pays the fixed rate. When a credit event occurs, as defined under the terms of that particular swap agreement, the Fund will either (i) receive from the seller of protection an amount equal to the notional amount of the swap and make delivery of the referenced obligation or underlying securities comprising the referenced index or (ii) receive a net settlement amount in the form of cash or securities equal to the notional amount of the swap less the recovery value of the referenced obligation or underlying securities comprising the referenced index. |
| (2) | If the Fund is a seller of protection, it receives the fixed rate. When a credit event occurs, as defined under the terms of that particular swap agreement, the Fund will either (i) pay to the buyer of protection an amount equal to the notional amount of the swap and take delivery of the referenced obligation or underlying securities comprising the referenced index or (ii) pay a net settlement amount in the form of cash or securities equal to the notional amount of the swap less the recovery value of the referenced obligation or underlying securities comprising the referenced index. |
| (3) | Notional amount represents the maximum potential amount the Fund could be required to pay as a seller of credit protection or receive as a buyer of credit protection if a credit event occurs as defined under the terms of that particular swap agreement. |
| (4) | The fair value of credit default swap agreements on credit indices, asset-backed securities and centrally cleared corporate and/or sovereign issues serves as an indicator of the current status of the payment/performance risk and represents the likelihood of an expected liability (or profit) for the credit derivative should the notional amount of the |
See Notes to Financial Statements.
| | | | |
| Prudential Short-Term Corporate Bond Fund, Inc. | | | 41 | |
Portfolio of Investments (continued)
as of December 31, 2016
| | swap agreement be closed/sold as of the reporting date. Increasing fair value in absolute terms, when compared to the notional amount of the swap, represents a deterioration of the referenced entity’s credit soundness and a greater likelihood of risk of default or other credit event occurring as defined under the terms of the agreement. |
| (5) | Implied credit spreads, represented in absolute terms, utilized in determining the fair value of OTC credit default swap agreements on corporate issues or sovereign issues of an emerging country as of the reporting date serve as an indicator of the current status of the payment/performance risk and represent the likelihood of risk of default for the credit derivative. The implied credit spread of a particular referenced entity reflects the cost of buying/selling protection and may include up-front payments required to be made to enter into the agreement. Wider credit spreads represent a deterioration of the referenced entity’s credit soundness and a greater likelihood of risk of default or other credit event occurring as defined under the terms of the agreement. |
Various inputs are used in determining the value of the Fund’s investments. These inputs are summarized in the three broad levels listed below.
Level 1—quoted prices generally in active markets for identical securities.
Level 2—quoted prices for similar securities, interest rates and yield curves, prepayment speeds, foreign currency exchange rates and other observable inputs.
Level 3—unobservable inputs for securities valued in accordance with Board approved fair valuation procedures.
The following is a summary of the inputs used as of December 31, 2016 in valuing such portfolio securities:
| | | | | | | | | | | | |
| | | Level 1 | | | Level 2 | | | Level 3 | |
Investments in Securities | | | | | | | | | | | | |
Asset-Backed Securities | | | | | | | | | | | | |
Collateralized Loan Obligations | | $ | — | | | $ | 594,734,263 | | | $ | — | |
Bank Loan | | | — | | | | 19,968,760 | | | | — | |
Commercial Mortgage-Backed Securities | | | — | | | | 396,587,816 | | | | — | |
Corporate Bonds | | | — | | | | 8,943,106,915 | | | | 1,778,648 | |
Foreign Agencies | | | — | | | | 89,149,201 | | | | — | |
Municipal Bond | | | — | | | | 5,178,789 | | | | — | |
U.S. Treasury Obligations | | | — | | | | 11,474,886 | | | | — | |
Preferred Stocks | | | 3,408,240 | | | | — | | | | — | |
Affiliated Mutual Funds | | | 268,088,017 | | | | — | | | | — | |
Other Financial Instruments* | | | | | | | | | | | | |
Futures Contracts | | | (445,312 | ) | | | — | | | | — | |
Credit Default Swap Agreement | | | — | | | | 33,738 | | | | — | |
| | | | | | | | | | | | |
| Total | | $ | 271,050,945 | | | $ | 10,060,234,368 | | | $ | 1,778,648 | |
| | | | | | | | | | | | |
During the period, there were no transfers to between Level 1 and Level 2 to report.
| * | Other financial instruments are derivative instruments not reflected in the Portfolio of Investments, such as futures, forwards and centrally cleared swap contracts, which are recorded at the unrealized appreciation (depreciation) on the instrument, and OTC swap contracts which are recorded at fair value. |
See Notes to Financial Statements.
The industry classification of investments and liabilities in excess of other assets shown as a percentage of net assets as of December 31, 2016 were as follows (unaudited):
| | | | |
Banks | | | 23.1 | % |
Collateralized Loan Obligations | | | 5.8 | |
Pharmaceuticals | | | 5.5 | |
Telecommunications | | | 5.3 | |
Auto Manufacturers | | | 4.4 | |
Commercial Mortgage-Backed Securities | | | 3.8 | |
Oil & Gas | | | 3.5 | |
Electric | | | 3.3 | |
Insurance | | | 3.0 | |
Healthcare-Services | | | 2.9 | |
Chemicals | | | 2.8 | |
Media | | | 2.7 | |
Real Estate Investment Trusts (REITs) | | | 2.7 | |
Affiliated Mutual Funds (including 1.0% of collateral for securities on loan) | | | 2.6 | |
Diversified Financial Services | | | 2.4 | |
Pipelines | | | 2.1 | |
Healthcare-Products | | | 2.1 | |
Retail | | | 2.0 | |
Biotechnology | | | 1.8 | |
Food | | | 1.7 | |
Computers | | | 1.7 | |
Beverages | | | 1.6 | |
Software | | | 1.3 | |
Lodging | | | 1.2 | |
Commercial Services | | | 1.1 | |
Airlines | | | 1.0 | |
Agriculture | | | 1.0 | |
Foreign Agencies | | | 0.9 | |
Semiconductors | | | 0.7 | % |
Housewares | | | 0.7 | |
Gas | | | 0.6 | |
Forest Products & Paper | | | 0.5 | |
Electronics | | | 0.4 | |
Auto Parts & Equipment | | | 0.4 | |
Miscellaneous Manufacturing | | | 0.3 | |
Building Materials | | | 0.3 | |
Packaging & Containers | | | 0.3 | |
Leisure Time | | | 0.3 | |
Trucking & Leasing | | | 0.3 | |
Hand/Machine Tools | | | 0.3 | |
Oil & Gas Services | | | 0.3 | |
Home Builders | | | 0.2 | |
Aerospace/Defense | | | 0.2 | |
Technology | | | 0.2 | |
Machinery-Diversified | | | 0.2 | |
Transportation | | | 0.2 | |
Mining | | | 0.1 | |
Home Furnishings | | | 0.1 | |
Iron/Steel | | | 0.1 | |
U.S. Treasury Obligations | | | 0.1 | |
Apparel | | | 0.1 | |
Municipal Bond | | | 0.1 | |
| | | | |
| | | 100.3 | |
Liabilities in excess of other assets | | | (0.3 | ) |
| | | | |
| | | 100.0 | % |
| | | | |
See Notes to Financial Statements.
| | | | |
| Prudential Short-Term Corporate Bond Fund, Inc. | | | 43 | |
Portfolio of Investments (continued)
as of December 31, 2016
The Fund invested in derivative instruments during the reporting period. The primary types of risk associated with these derivative instruments are credit risk and interest rate risk. The effect of such derivative instruments on the Fund’s financial position and financial performance as reflected in the Statement of Assets and Liabilities and Statement of Operations is presented in the summary below.
Fair values of derivative instruments as of December 31, 2016 as presented in the Statement of Assets and Liabilities:
| | | | | | | | | | | | |
Derivatives not accounted for as hedging instruments,
carried at fair value | | Asset Derivatives | | | Liability Derivatives | |
| | Balance Sheet
Location | | Fair
Value | | | Balance Sheet
Location | | Fair
Value | |
| Credit contracts | | — | | $ | — | | | Premiums received for OTC swap agreements | | $ | 359,547 | |
| Credit contracts | | Unrealized appreciation on OTC swap agreements | | | 393,285 | | | — | | | — | |
| Interest rate contracts | | Due from/to broker—variation margin futures | | | 74,508 | * | | Due from/to broker—variation margin futures | | | 519,820 | * |
| | | | | | | | | | | | |
Total | | | | $ | 467,793 | | | | | $ | 879,367 | |
| | | | | | | | | | | | |
| * | Includes cumulative appreciation (depreciation) as reported in the schedule of open futures contracts. Only unsettled variation margin receivable (payable) is reported within the Statement of Assets and Liabilities. |
The effects of derivative instruments on the Statement of Operations for the year ended December 31, 2016 are as follows:
| | | | | | | | | | | | |
Amount of Realized Gain (Loss) on Derivatives Recognized in Income | |
Derivatives not accounted
for as hedging instruments,
carried at fair value | | Futures | | | Swaps | | | Total | |
Credit contracts | | $ | — | | | $ | (865,340 | ) | | $ | (865,340 | ) |
Interest rate contracts | | | (3,002,687 | ) | | | — | | | | (3,002,687 | ) |
| | | | | | | | | | | | |
Total | | $ | (3,002,687 | ) | | $ | (865,340 | ) | | $ | (3,868,027 | ) |
| | | | | | | | | | | | |
|
Change in Unrealized Appreciation (Depreciation) on Derivatives Recognized in Income | |
Derivatives not accounted
for as hedging instruments,
carried at fair value | | Futures | | | Swaps | | | Total | |
Credit contracts | | $ | — | | | $ | (834,707 | ) | | $ | (834,707 | ) |
Interest rate contracts | | | 1,328,954 | | | | — | | | | 1,328,954 | |
| | | | | | | | | | | | |
Total | | $ | 1,328,954 | | | $ | (834,707 | ) | | $ | 494,247 | |
| | | | | | | | | | | | |
See Notes to Financial Statements.
For the year ended December 31, 2016, the Fund’s average volume of derivative activities is as follows:
| | | | | | |
Futures Contracts—
Long Position(1) | | | Futures Contracts—
Short Positions(1) | |
| $ | 1,013,491,907 | | | $ | 128,532,451 | |
| |
Credit Default
Swap Agreements—
Buy Protection(2) | | | Credit Default
Swap Agreements—
Sell Protection(2) | |
| | $5,880,000 | | | | $15,000,000 | |
| (2) | Notional Amount in USD. |
The Fund invested in OTC derivatives and entered into other financial transactions during the reporting period that are either offset in accordance with current requirements or are subject to enforceable master netting arrangements or similar agreements that permit offsetting. The information about offsetting and related netting arrangements for OTC derivatives and other financial transactions, where the legal right to set-off exists, is presented in the summary below.
Offsetting of financial transaction assets and liabilities:
| | | | | | | | | | | | |
Description | | Gross
Amounts of
Recognized
Assets(3) | | | Collateral
Received | | | Net
Amount | |
Securities on Loan | | $ | 101,128,962 | | | $ | (101,128,962 | ) | | $ | — | |
| | | | | | | | | | | | |
See Notes to Financial Statements.
| | | | |
| Prudential Short-Term Corporate Bond Fund, Inc. | | | 45 | |
Portfolio of Investments (continued)
as of December 31, 2016
Offsetting of OTC derivative assets and liabilities:
| | | | | | | | | | | | | | | | |
Counterparty | | Gross
Amounts of
Recognized
Assets(1) | | | Gross
Amounts
Available
for Offset | | | Collateral
Received | | | Net
Amount | |
Credit Suisse First Boston Corp. | | $ | 393,285 | | | $ | (359,547 | ) | | $ | — | | | $ | 33,738 | |
| | | | | | | | | | | | | | | | |
| | | | |
Counterparty | | Gross
Amounts of
Recognized
Liabilities(2) | | | Gross
Amounts
Available
for Offset | | | Collateral
Pledged | | | Net
Amount | |
Credit Suisse First Boston Corp. | | $ | (359,547 | ) | | $ | 359,547 | | | $ | — | | | $ | — | |
| | | | | | | | | | | | | | | | |
| (1) | Includes unrealized appreciation on swaps and forwards, premiums paid on swap agreements and market value of purchased options. |
| (2) | Includes unrealized depreciation on swaps and forwards, premiums received on swap agreements and market value of written options. |
| (3) | Amount represents market value. |
See Notes to Financial Statements.
This Page Intentionally Left Blank
Statement of Assets & Liabilities
as of December 31, 2016
| | | | |
Assets | | | | |
Investments at value, including securities on loan of $101,128,962: | | | | |
Unaffiliated investments (cost $10,061,421,189) | | $ | 10,065,387,518 | |
Affiliated investments (cost $268,074,213) | | | 268,088,017 | |
Deposit with broker for futures | | | 2,700,000 | |
Dividends and interest receivable | | | 81,118,179 | |
Receivable for Fund shares sold | | | 58,802,876 | |
Unrealized appreciation on OTC swap agreements | | | 393,285 | |
Due from broker—variation margin futures | | | 270,146 | |
Tax reclaim receivable | | | 126,601 | |
Prepaid expenses | | | 75,597 | |
| | | | |
Total Assets | | | 10,476,962,219 | |
| | | | |
| |
Liabilities | | | | |
Payable to broker for collateral for securities on loan | | | 103,281,718 | |
Payable for Fund shares reacquired | | | 59,968,935 | |
Dividends payable | | | 5,451,207 | |
Management fee payable | | | 3,492,339 | |
Distribution fee payable | | | 1,729,623 | |
Accrued expenses and other liabilities | | | 1,648,663 | |
Premium received for OTC swap agreements | | | 359,547 | |
Payable for investments purchased | | | 92,740 | |
Affiliated transfer agent fee payable | | | 77,251 | |
Deferred directors’ fees | | | 1,343 | |
| | | | |
Total Liabilities | | | 176,103,366 | |
| | | | |
| |
Net Assets | | $ | 10,300,858,853 | |
| | | | |
| | | | | |
Net assets were comprised of: | | | | |
Common stock, at par | | $ | 9,337,618 | |
Paid-in capital in excess of par | | | 10,622,943,381 | |
| | | | |
| | | 10,632,280,999 | |
Undistributed net investment income | | | 4,494,205 | |
Accumulated net realized loss on investment transactions | | | (339,846,033 | ) |
Net unrealized appreciation on investments | | | 3,929,682 | |
| | | | |
Net assets, December 31, 2016 | | $ | 10,300,858,853 | |
| | | | |
See Notes to Financial Statements.
| | | | |
Class A | | | | |
Net asset value and redemption price per share
($1,861,163,073 ÷ 168,979,438 shares of common stock issued and outstanding) | | $ | 11.01 | |
Maximum sales charge (3.25% of offering price) | | | 0.37 | |
| | | | |
Maximum offering price to public | | $ | 11.38 | |
| | | | |
| |
Class B | | | | |
Net asset value, offering price and redemption price per share
($20,035,136 ÷ 1,819,086 shares of common stock issued and outstanding) | | $ | 11.01 | |
| | | | |
| |
Class C | | | | |
Net asset value, offering price and redemption price per share
($1,446,237,794 ÷ 131,310,046 shares of common stock issued and outstanding) | | $ | 11.01 | |
| | | | |
| |
Class Q | | | | |
Net asset value, offering price and redemption price per share
($116,542,649 ÷ 10,548,848 shares of common stock issued and outstanding) | | $ | 11.05 | |
| | | | |
| |
Class R | | | | |
Net asset value, offering price and redemption price per share
($174,661,141 ÷ 15,858,182 shares of common stock issued and outstanding) | | $ | 11.01 | |
| | | | |
| |
Class Z | | | | |
Net asset value, offering price and redemption price per share
($6,682,219,060 ÷ 605,246,220 shares of common stock issued and outstanding) | | $ | 11.04 | |
| | | | |
See Notes to Financial Statements.
| | | | |
| Prudential Short-Term Corporate Bond Fund, Inc. | | | 49 | |
Statement of Operations
Year Ended December 31, 2016
| | | | |
Net Investment Income (Loss) | | | | |
Income | | | | |
Interest income | | $ | 239,795,359 | |
Affiliated dividend income | | | 887,043 | |
Income from securities lending, net (including affiliated income of $480,144) | | | 542,726 | |
Unaffiliated dividend income | | | 233,940 | |
| | | | |
Total income | | | 241,459,068 | |
| | | | |
| |
Expenses | | | | |
Management fee | | | 38,660,720 | |
Distribution fee—Class A | | | 4,378,692 | |
Distribution fee—Class B | | | 250,088 | |
Distribution fee—Class C | | | 15,363,953 | |
Distribution fee—Class R | | | 1,253,765 | |
Transfer agent’s fees and expenses (including affiliated expense of $513,100) | | | 9,260,000 | |
Custodian and accounting fees (net of $58,500 fee credit) | | | 873,000 | |
Registration fees | | | 720,000 | |
Shareholders’ reports | | | 330,000 | |
Directors’ fees | | | 167,000 | |
Insurance expenses | | | 108,000 | |
Legal fees and expenses | | | 83,000 | |
Audit fee | | | 40,000 | |
Commitment fee on syndicated credit agreement | | | 12,000 | |
Miscellaneous | | | 32,805 | |
| | | | |
Total expenses | | | 71,533,023 | |
Less: Distribution fee waiver—Class R | | | (417,906 | ) |
| | | | |
Net expenses | | | 71,115,117 | |
| | | | |
Net investment income (loss) | | | 170,343,951 | |
| | | | |
| |
Realized And Unrealized Gain (Loss) On Investments | | | | |
Net realized gain (loss) on: | | | | |
Investment transactions (including affiliated of $672) | | | 8,856,299 | |
Futures transactions | | | (3,002,687 | ) |
Swap agreement transactions | | | (865,340 | ) |
| | | | |
| | | 4,988,272 | |
| | | | |
Net change in unrealized appreciation (depreciation) on: | | | | |
Investments (including affiliated of $13,804) | | | 52,367,101 | |
Futures | | | 1,328,954 | |
Swap agreements | | | (834,707 | ) |
| | | | |
| | | 52,861,348 | |
| | | | |
Net gain (loss) on investment transactions | | | 57,849,620 | |
| | | | |
Net Increase (Decrease) In Net Assets Resulting From Operations | | $ | 228,193,571 | |
| | | | |
See Notes to Financial Statements.
Statement of Changes in Net Assets
| | | | | | | | |
| | | Year Ended December 31, | |
| | | 2016 | | | 2015 | |
Increase (Decrease) in Net Assets | | | | | | | | |
Operations | | | | | | | | |
Net investment income (loss) | | $ | 170,343,951 | | | $ | 160,406,006 | |
Net realized gain (loss) on investment transactions | | | 4,988,272 | | | | 4,281,405 | |
Net change in unrealized appreciation (depreciation) on investments | | | 52,861,348 | | | | (87,745,875 | ) |
| | | | | | | | |
Net increase (decrease) in net assets resulting from operations | | | 228,193,571 | | | | 76,941,536 | |
| | | | | | | | |
Dividends from net investment income (Note 1) | | | | | | | | |
Class A | | | (41,668,427 | ) | | | (50,118,788 | ) |
Class B | | | (407,843 | ) | | | (620,519 | ) |
Class C | | | (25,055,609 | ) | | | (29,041,626 | ) |
Class Q | | | (3,916,100 | ) | | | (2,566,955 | ) |
Class R | | | (3,561,353 | ) | | | (3,407,152 | ) |
Class Z | | | (158,749,622 | ) | | | (147,619,513 | ) |
| | | | | | | | |
| | | (233,358,954 | ) | | | (233,374,553 | ) |
| | | | | | | | |
| | |
Fund share transactions (Net of share conversions) (Note 6) | | | | | | | | |
Net proceeds from shares sold | | | 4,724,506,926 | | | | 2,802,212,388 | |
Net asset value of shares issued in reinvestment of dividends
and distributions | | | 170,058,892 | | | | 166,315,034 | |
Cost of shares reacquired | | | (3,482,918,047 | ) | | | (3,419,363,933 | ) |
| | | | | | | | |
Net increase (decrease) in net assets from Fund share transactions | | | 1,411,647,771 | | | | (450,836,511 | ) |
| | | | | | | | |
Total increase (decrease) | | | 1,406,482,388 | | | | (607,269,528 | ) |
| | |
Net Assets: | | | | | | | | |
Beginning of year | | | 8,894,376,465 | | | | 9,501,645,993 | |
| | | | | | | | |
End of year(a) | | $ | 10,300,858,853 | | | $ | 8,894,376,465 | |
| | | | | | | | |
(a) Includes undistributed net investment income of: | | $ | 4,494,205 | | | $ | 4,267,321 | |
| | | | | | | | |
See Notes to Financial Statements.
| | | | |
| Prudential Short-Term Corporate Bond Fund, Inc. | | | 51 | |
Notes to Financial Statements
Prudential Short-Term Corporate Bond Fund, Inc. (the “Fund”), is an open-end management investment company, registered under the Investment Company Act of 1940, as amended, (“1940 Act”).
The Fund’s investment objective is high current income consistent with the preservation of principal.
Note 1. Accounting Policies
The Fund follows investment company accounting and reporting guidance of the Financial Accounting Standards Board (“FASB”) Accounting Standard Codification Topic 946 Financial Services—Investment Companies. The following accounting policies conform to U.S. generally accepted accounting principles. The Fund consistently follows such policies in the preparation of its financial statements.
Securities Valuation: The Fund holds securities and other assets that are fair valued at the close of each day (generally, 4:00 PM Eastern time) the New York Stock Exchange (“NYSE”) is open for trading. Fair value is the price that would be received to sell an asset or paid to transfer a liability in an orderly transaction between market participants on the measurement date. The Board of Directors (the “Board”) has adopted Valuation Procedures for security valuation under which fair valuation responsibilities have been delegated to Prudential Investments LLC (“PI” or “Manager”). Under the current Valuation Procedures, the established Valuation Committee is responsible for supervising the valuation of portfolio securities and other assets. The Valuation Procedures permit the Fund to utilize independent pricing vendor services, quotations from market makers, and alternative valuation methods when market quotations are either not readily available or not deemed representative of fair value. A record of the Valuation Committee’s actions is subject to the Board’s review, approval, and ratification at its next regularly-scheduled quarterly meeting.
Various inputs determine how the Fund’s investments are valued, all of which are categorized according to the three broad levels (Level 1, 2, or 3) detailed in the table following the Portfolio of Investments.
Investments in open-end, non-exchange-traded mutual funds are valued at their net asset values as of the close of the NYSE on the date of valuation. These securities are classified as Level 1 in the fair value hierarchy since they may be purchased or sold at their net asset values on the date of valuation.
Fixed income securities traded in the OTC market are generally valued at prices provided by approved independent pricing vendors. The pricing vendors provide these prices after
evaluating observable inputs including, but not limited to yield curves, yield spreads, credit ratings, deal terms, tranche level attributes, default rates, cash flows, prepayment speeds, broker/dealer quotations, and reported trades. Securities valued using such vendor prices are classified as Level 2 in the fair value hierarchy.
Bank loans are generally valued at prices provided by approved independent pricing vendors. The pricing vendors utilize broker/dealer quotations and provide prices based on the average of such quotations. Bank loans valued using such vendor pricing are generally classified as Level 2 in the fair value hierarchy.
OTC derivative instruments are generally valued using pricing vendor services, which derive the valuation based on inputs such as underlying asset prices, indices, spreads, interest rates, and exchange rates. These instruments are categorized as Level 2 in the fair value hierarchy.
Centrally cleared swaps listed or traded on a multilateral or trade facility platform, such as a registered exchange, are generally valued at the daily settlement price determined by the respective exchange. These securities are classified as Level 2 in the fair value hierarchy, as the daily settlement price is not public.
Securities and other assets that cannot be priced according to the methods described above are valued based on pricing methodologies approved by the Board. In the event that unobservable inputs are used when determining such valuations, the securities will be classified as Level 3 in the fair value hierarchy.
When determining the fair value of securities, some of the factors influencing the valuation include: the nature of any restrictions on disposition of the securities; assessment of the general liquidity of the securities; the issuer’s financial condition and the markets in which it does business; the cost of the investment; the size of the holding and the capitalization of the issuer; the prices of any recent transactions or bids/offers for such securities or any comparable securities; any available analyst media or other reports or information deemed reliable by the investment adviser regarding the issuer or the markets or industry in which it operates. Using fair value to price securities may result in a value that is different from a security’s most recent closing price and from the price used by other mutual funds to calculate their net asset values.
Restricted and Illiquid Securities: Subject to guidelines adopted by the Board, the Fund may invest up to 15% of its net assets in illiquid securities, including those which are restricted as to disposition under securities law (“restricted securities”). Restricted securities are valued pursuant to the valuation procedures noted above. Illiquid securities are those that, because of the absence of a readily available market or due to legal or contractual restrictions on resale, cannot be sold within seven days in the ordinary course of business at approximately the amount at which the Fund has valued the investment. Therefore, the Fund may find it difficult to sell illiquid securities at the time considered most advantageous by its Subadviser and may incur expenses that would not be incurred in the
| | | | |
| Prudential Short-Term Corporate Bond Fund, Inc. | | | 53 | |
Notes to Financial Statements (continued)
sale of securities that were freely marketable. Certain securities that would otherwise be considered illiquid because of legal restrictions on resale to the general public may be traded among qualified institutional buyers under Rule 144A of the Securities Act of 1933. These Rule 144A securities, as well as commercial paper that is sold in private placements under Section 4(2) of the Securities Act, may be deemed liquid by the Fund’s Subadviser under the guidelines adopted by the Fund. However, the liquidity of the Fund’s investments in Rule 144A securities could be impaired if trading does not develop or declines.
Concentration of Risk: The ability of debt securities issuers (other than those issued or guaranteed by the U.S. Government) held by the Fund to meet its obligations may be affected by the economic or political developments in a specific industry, region or country. Foreign security and currency transactions may involve certain considerations and risks not typically associated with those of domestic origin as a result of, among other factors, the possibility of political or economic instability or the level of governmental supervision and regulation of foreign securities markets.
Financial Futures Contracts: A financial futures contract is an agreement to purchase (long) or sell (short) an agreed amount of securities at a set price for delivery on a future date. Upon entering into a financial futures contract, the Fund is required to pledge to the broker an amount of cash and/or other assets equal to a certain percentage of the contract amount. This amount is known as the “initial margin.” Subsequent payments, known as “variation margin,” are made or received by the Fund each day, depending on the daily fluctuations in the value of the underlying security. Such variation margin is recorded for financial statement purposes on a daily basis as unrealized gain (loss). When the contract expires or is closed, the gain (loss) is realized and is presented in the Statement of Operations as net realized gain (loss) on futures transactions.
The Fund invested in financial futures contracts in order to hedge its existing portfolio securities, or securities the Fund intends to purchase, against fluctuation in value caused by changes in prevailing interest rates or foreign currency exchange rates. Should interest rates move unexpectedly, the Fund may not achieve the anticipated benefits of the financial futures contracts and may realize a loss. The use of futures transactions involves the risk of imperfect correlation in movements in the price of futures contracts, interest rates and the underlying hedged assets. With exchange-traded futures contracts, there is minimal counterparty credit risk to the Fund since the exchanges’ clearinghouse acts as counterparty to all exchange-traded futures and guarantees the futures contracts against default.
Swap Agreements: The Fund entered into credit default swap agreements. A swap agreement is an agreement to exchange the return generated by one instrument for the
return generated by another instrument. Swap agreements are negotiated in the OTC market and may be executed either directly with counterparty (“OTC-traded”) or through a central clearing facility, such as a registered commodities exchange. Swap agreements are valued daily at current market value and any change in value is included in the net unrealized appreciation or depreciation on investments. Centrally cleared swaps pay or receive an amount known as “variation margin”, based on daily changes in the valuation of the swap contract. Payments received or paid by the Fund are recorded as realized gains (losses) upon termination or maturity of the swap. Risk of loss may exceed amounts recognized on the Statements of Assets and Liabilities. Swap agreements outstanding at period end, if any, are listed on the Portfolio of Investments.
Credit Default Swaps: Credit default swaps (“CDS”) involve one party (the protection buyer) making a stream of payments to another party (the protection seller) in exchange for the right to receive a specified payment in the event of a default or as a result of a default (collectively a “credit event”) for the referenced entity (typically corporate issues or sovereign issues of an emerging country) on its obligation; or in the event of a write-down, principal shortfall, interest shortfall or default of all or part of the referenced entities comprising a credit index. The Fund is subject to credit risk in the normal course of pursuing its investment objectives. The Fund may enter into CDS contracts to provide a measure of protection against defaults or to take an active long or short position with respect to the likelihood of a particular issuer’s default or the reference entity’s credit soundness. CDS contracts generally trade based on a spread which represents the cost a protection buyer has to pay the protection seller. The protection buyer is said to be short the credit as the value of the contract rises the more the credit deteriorates. The value of the CDS contract increases for the protection buyer if the spread increases.
The Fund’s maximum risk of loss from counterparty credit risk for purchased credit default swaps is the inability of the counterparty to honor the contract up to the notional value due to a credit event.
As a seller of protection on credit default swap agreements, the Fund generally receives an agreed upon payment from the buyer of protection throughout the term of the swap, provided no credit event occurs. As the seller, the Fund effectively increases its investment risk because, in addition to its total net assets, the Fund may be subject to investment exposure on the notional amount of the swap.
The maximum amount of the payment that the Fund, as a seller of protection, could be required to make under a credit default swap agreement would be equal to the notional amount of the underlying security or index contract as a result of a credit event. This potential amount will be partially offset by any recovery values of the respective referenced obligations, or net amounts received from the settlement of buy protection credit default swap agreements which the Fund entered into for the same referenced entity or index. As a buyer of protection, the Fund generally receives an amount up to the notional value of the swap if a credit event occurs.
| | | | |
| Prudential Short-Term Corporate Bond Fund, Inc. | | | 55 | |
Notes to Financial Statements (continued)
Implied credit spreads, represented in absolute terms, utilized in determining the market value of credit default swap agreements on corporate or sovereign issues of an country as of period end are disclosed in the footnotes to the Portfolio of Investments, if applicable. These spreads serve as indicators of the current status of the payment/performance risk and represent the likelihood of default risk for the credit derivative. The implied credit spread of a particular referenced entity reflects the cost of buying/selling protection and may include upfront payments required to enter into the agreement. For credit default swap agreements on asset-backed securities and credit indices, the quoted market prices and resulting values serve as indicators of the current status of the payment/performance risk. Wider credit spreads and increased market value in absolute terms, when compared to the notional amount of the swap, represent a deterioration of the referenced entity’s credit soundness and a greater likelihood of risk of default or other credit event occurring as defined under the terms of the agreement.
Master Netting Arrangements: The Fund is subject to various Master Agreements, or netting arrangements, with select counterparties. These are agreements which a subadviser may have negotiated and entered into on behalf of the Fund. A master netting arrangement between the Fund and the counterparty permits the Fund to offset amounts payable by the Fund to the same counterparty against amounts to be received; and by the receipt of collateral from the counterparty by the Fund to cover the Fund’s exposure to the counterparty. However, there is no assurance that such mitigating factors are easily enforceable. In addition to master netting arrangements, the right to set-off exists when all the conditions are met such that each of the parties owes the other determinable amounts, the reporting party has the right to set-off the amount owed with the amount owed by the other party, the reporting party intends to set-off, and the right of set-off is enforceable by law. During the reporting period, there was no intention to settle on a net basis and all amounts are presented on a gross basis on the Statement of Assets and Liabilities.
The Fund is a party to ISDA (International Swaps and Derivatives Association, Inc.) Master Agreements with certain counterparties that govern OTC derivative and foreign exchange contracts entered into from time to time. The Master Agreements may contain provisions regarding, among other things, the parties’ general obligations, representations, agreements, collateral requirements, events of default and early termination. With respect to certain counterparties, in accordance with the terms of the Master Agreements, collateral posted to the Fund is held in a segregated account by the Fund’s custodian and with respect to those amounts which can be sold or re-pledged, is presented in the Portfolio of Investments. Collateral pledged by the Fund is segregated by the Fund’s custodian and
identified in the Portfolio of Investments. Collateral can be in the form of cash or debt securities issued by the U.S. Government or related agencies or other securities as agreed to by the Fund and the applicable counterparty. Collateral requirements are determined
based on the Fund’s net position with each counterparty. Termination events applicable to the Fund may occur upon a decline in the Fund’s net assets below a specified threshold over a certain period of time. Termination events applicable to counterparties may occur upon a decline in the counterparty’s long-term and short-term credit ratings below a specified level. In each case, upon occurrence, the other party may elect to terminate early and cause settlement of all derivative and foreign exchange contracts outstanding, including the payment of any losses and costs resulting from such early termination, as reasonably determined by the terminating party. Any decision by one or more of the Fund’s counterparties to elect early termination could impact the Fund’s future derivative activity.
In addition to each instrument’s primary underlying risk exposure (e.g. interest rate, credit, equity or foreign exchange, etc.), swap agreements involve, to varying degrees, elements of credit, market and documentation risk. Such risks involve the possibility that no liquid market for these agreements will exist, the counterparty to the agreement may default on its obligation to perform or disagree on the contractual terms of the agreement, and changes in net interest rates will be unfavorable. In connection with these agreements, securities in the portfolio may be identified or received as collateral from the counterparty in accordance with the terms of the respective swap agreements to provide or receive assets of value and to serve as recourse in the event of default or bankruptcy/insolvency of either party. Such OTC derivative agreements include conditions which, when materialized, give the counterparty the right to cause an early termination of the transactions under those agreements. Any election by the counterparty for early termination of the contract(s) may impact the amounts reported on financial statements.
As of December 31, 2016, the Fund has not met conditions under such agreements which give the counterparty the right to call for an early termination.
Forward currency contracts, written options, short sales, swaps and financial futures contracts involve elements of both market and credit risk in excess of the amounts reflected on the Statement of Assets and Liabilities. Such risks may be mitigated by engaging in master netting arrangements.
Securities Lending: The Fund may lend its portfolio securities to banks and broker-dealers. The loans are secured by collateral at least equal to the market value of the securities loaned. Collateral pledged by each borrower is invested in an affiliated money market fund and is marked to market daily, based on the previous day’s market value, such that the value of the collateral exceeds the value of the loaned securities. Pursuant to the repositioning of the money market fund as an ultra-short bond fund, for the period March 31, 2016 through July 18, 2016 the collateral was invested in an ultra-short bond fund. Loans are subject to termination at the option of the borrower or the Fund. Upon termination of the loan, the borrower will return to the Fund securities identical to the loaned securities. Should the borrower of the securities fail financially, the Fund has the right to repurchase the securities in the open market using the collateral. The Fund recognizes income, net of any rebate and securities lending agent fees, for lending its securities in the form of fees or interest on the investment of any cash received as collateral. The borrower receives all interest and dividends from the securities loaned and
| | | | |
| Prudential Short-Term Corporate Bond Fund, Inc. | | | 57 | |
Notes to Financial Statements (continued)
such payments are passed back to the lender in amounts equivalent thereto. The Fund also continues to recognize any unrealized gain (loss) in the market price of the securities loaned and on the change in the value of the collateral invested that may occur during the term of the loan. In addition, realized gain (loss) is recognized on changes in the value of the collateral invested that may occur during the term of the loan.
Securities Transactions and Net Investment Income: Securities transactions are recorded on the trade date. Realized gains (losses) from investment and currency transactions are calculated on the specific identification method. Dividend income is recorded on the ex-date. Interest income, including amortization of premium and accretion of discount on debt securities, as required, is recorded on an accrual basis. Expenses are recorded on an accrual basis, which may require the use of certain estimates by management that may differ from actual.
Net investment income or loss (other than distribution fees, which are charged directly to the respective class and transfer agency fees specific to Class Q shares which are charged to that share class) and unrealized and realized gains (losses) are allocated daily to each class of shares based upon the relative proportion of adjusted net assets of each class at the beginning of the day.
Dividends and Distributions: The Fund expects to pay dividends of net investment income monthly and distributions from net realized capital gains, if any, annually. Dividends and distributions to shareholders, which are determined in accordance with federal income tax regulations and which may differ from generally accepted accounting principles, are recorded on the ex-date. Permanent book/tax differences relating to income and gain (loss) are reclassified amongst undistributed net investment income, accumulated net realized gain (loss) and paid-in capital in excess of par, as appropriate.
Taxes: It is the Fund’s policy to continue to meet the requirements of the Internal Revenue Code applicable to regulated investment companies and to distribute all of its taxable net investment income and capital gains, if any, to its shareholders. Therefore, no federal income tax provision is required. Withholding taxes on foreign interest are recorded, net of reclaimable amounts, at the time the related income is earned.
Estimates: The preparation of financial statements requires management to make estimates and assumptions that affect the reported amounts and disclosures in the financial statements. Actual results could differ from those estimates.
Note 2. Agreements
The Fund has a management agreement with PI. Pursuant to this agreement, PI has responsibility for all investment advisory services and supervises the subadviser’s
performance of such services. PI has entered into a subadvisory agreement with PGIM, Inc., which provides subadvisory services to the Fund through its PGIM Fixed Income (“PFI”) unit. The subadvisory agreement provides that PFI will furnish investment advisory services in connection with the management of the Fund. In connection therewith, PFI is obligated to keep certain books and records of the Fund. PI pays for the services of PFI, the cost of compensation of officers of the Fund, occupancy and certain clerical and bookkeeping costs of the Fund. The Fund bears all other cost and expenses.
The management fee paid to PI is accrued daily and payable monthly, at an annual rate of .40% of the Fund’s average daily net assets up to $10 billion; and .39% of the Fund’s average daily net assets in excess of $10 billion. The effective management fee was .40% for the year ended December 31, 2016.
The Fund has a distribution agreement, pursuant to Rule 12b-1 under the 1940 Act, with Prudential Investment Management Services LLC (“PIMS”), which acts as the distributor of the Class A, Class B, Class C, Class Q, Class R, and Class Z shares. The Fund compensates PIMS for distributing and servicing the Fund’s Class A, Class B, Class C, and Class R shares pursuant to plans of distribution (the “Distribution Plans”), regardless of expenses actually incurred by PIMS. The distribution fees are accrued daily and payable monthly. No distribution or service fees are paid to PIMS as distributor of the Class Q or Class Z shares of the Fund.
Pursuant to the Distribution Plans, the Fund compensates PIMS for distribution-related activities at an annual rate of up to .25%, 1%, 1%, and .75% of the average daily net assets of the Class A, B, C, and R shares, respectively. PIMS contractually agreed through April 30, 2017 to limit such fees to .50% of the average daily net assets of Class R shares.
PIMS has advised the Fund that it received $2,866,948 in front-end sales charges resulting from sales of Class A shares during the year ended December 31, 2016. From these fees, PIMS paid such sales charges to affiliated broker-dealers, which in turn paid commissions to salespersons and incurred other distribution costs.
PIMS has advised the Fund that for the year ended December 31, 2016, it received $14,458, $16,114 and $197,132 in contingent deferred sales charges imposed upon redemptions by certain Class A, Class B and Class C shareholders, respectively.
PI, PGIM, Inc. and PIMS are indirect, wholly-owned subsidiaries of Prudential Financial, Inc. (“Prudential”).
Note 3. Other Transactions with Affiliates
Prudential Mutual Fund Services LLC (“PMFS”), an affiliate of PI and an indirect, wholly-owned subsidiary of Prudential, serves as the Fund’s transfer agent. The transfer agent’s fees and expenses in the Statement of Operations include certain out-of-pocket expenses paid to non-affiliates, where applicable.
| | | | |
| Prudential Short-Term Corporate Bond Fund, Inc. | | | 59 | |
Notes to Financial Statements (continued)
Prior to July 7, 2016, PGIM, Inc. was the Fund’s securities lending agent. Net earnings from securities lending are disclosed on the Statement of Operations as “Income from securities lending, net”. For the period January 1, 2016 through February 4, 2016, PGIM, Inc. had been compensated $8,996 for these services. At the June 2016 meeting of the Board, the Board approved compensation to PGIM, Inc. related to securities lending activities. The payment was for services provided from February 5, 2016 to July 5, 2016 and totaled $43,463. Prior to January 4, 2016, PGIM, Inc. was known as Prudential Investment Management, Inc. (“PIM”).
Effective July 7, 2016, the Board replaced PGIM, Inc. as securities lending agent with a third party agent (eSecLending).
The Fund may enter into certain securities purchase or sale transactions under Board approved Rule 17a-7 procedures. Rule 17a-7 is an exemptive rule under the 1940 Act, that permits purchase and sale transactions among affiliated investment companies, or between an investment company and a person that is affiliated solely by reason of having a common (or affiliated) investment adviser, common directors, and/or common officers. Such transactions are subject to ratification by the Board.
The Fund invests its overnight sweep cash in the Prudential Core Ultra Short Bond Fund (the “Core Fund”) and its securities lending cash collateral in the Prudential Institutional Money Market Fund (the “Money Market Fund”), each a portfolio of Prudential Investment Portfolios 2, registered under the 1940 Act and managed by PI. Earnings from the Core Fund and the Money Market Fund are disclosed on the Statement of Operations as “Affiliated dividend income” and “Income from securities lending, net”, respectively.
Note 4. Portfolio Securities
The cost of purchases and proceeds from sales of portfolio securities, other than short-term investments and U.S. Treasury securities, for the year ended December 31, 2016, were $3,601,182,196 and $2,231,687,148, respectively.
Note 5. Distribution and Tax Information
Distributions to shareholders, which are determined in accordance with federal income tax regulations and which may differ from generally accepted accounting principles, are recorded on the ex-date. In order to present undistributed net investment income, accumulated net realized loss on investment transactions and paid-in capital in excess of par on the Statement of Assets and Liabilities that more closely represent their tax character, certain adjustments have been made to undistributed net investment income and accumulated net realized loss on investment transactions. For the year ended December 31, 2016, the adjustments were to increase undistributed net investment income and increase accumulated net realized loss on investment transactions by
$63,241,887 due to differences in the treatment for book and tax purposes of accreting market discount and amortization of premiums, certain transactions involving swaps, paydown gains/losses and other book to tax adjustments. Net investment income, net realized gain (loss) on investment transactions and net assets were not affected by this change.
For the years ended December 31, 2016 and December 31, 2015, the tax character of dividends paid by the Fund was $233,358,954 and $233,374,553 of ordinary income, respectively.
As of December 31, 2016, the accumulated undistributed earnings on a tax basis was $4,500,559 of ordinary income. This differs from the amount shown on the Statement of Assets and Liabilities primarily due to cumulative timing differences between financial and tax reporting.
The United States federal income tax basis of the Fund’s investments and the net unrealized depreciation as of December 31, 2016 were as follows:
| | | | | | | | | | |
Tax Basis | | Appreciation | | Depreciation | | Net
Unrealized
Depreciation | | Other Cost Basis
Adjustments | | Total Net
Unrealized
Depreciation |
| $10,472,945,002 | | $51,918,210 | | $(191,387,677) | | $(139,469,467) | | $394,861 | | $(139,074,606) |
The difference between book basis and tax basis is primarily attributable to the differences in the treatment of accreting market discount and premium amortization for book and tax purposes and deferred losses on wash sales. Other cost basis adjustments are primarily attributable to unrealized appreciation on swaps.
Under the Regulated Investment Company Modernization Act of 2010 (the “Act”), the Fund is permitted to carryforward capital losses realized on or after January 1, 2011 (“post-enactment losses”) for an unlimited period. Post-enactment losses are required to be utilized before the utilization of losses incurred prior to the effective date of the Act. As a result of this ordering rule, capital loss carryforwards related to taxable years ending before December 31, 2011 (“pre-enactment losses”) may have an increased likelihood to expire unused. Additionally, post-enactment capital losses that are carried forward will retain their character as either short-term or long-term capital losses rather than being considered all short-term as under previous law. No capital gains distributions are expected to be paid to shareholders until net gains have been realized in excess of such losses. As of December 31, 2016, the pre and post-enactment losses were approximately:
| | | | |
Post-Enactment Losses: | | $ | 188,277,000 | |
| | | | |
Pre-Enactment Losses: | | | | |
Expiring 2018 | | $ | 1,604,000 | |
| | | | |
The Fund elected to treat post-October capital losses of approximately $6,961,000 as having been incurred in the following fiscal year (December 31, 2017).
| | | | |
| Prudential Short-Term Corporate Bond Fund, Inc. | | | 61 | |
Notes to Financial Statements (continued)
Management has analyzed the Fund’s tax positions taken on federal, state and local income tax returns for all open tax years and has concluded that no provision for income tax is required in the Fund’s financial statements for the current reporting period. The Fund’s federal, state and local income and federal excise tax returns for tax years for which the applicable statutes of limitations have not expired are subject to examination by the Internal Revenue Service and state departments of revenue.
Note 6. Capital
The Fund offers Class A, Class B, Class C, Class Q, Class R, and Class Z shares. Class A shares are sold with a front-end sales charge of up to 3.25%. All investors who purchased Class A shares in an amount of $1 million or more and sell these shares within 18 months of purchase are subject to a contingent deferred sales charge (“CDSC”) of .50%. The Class A CDSC is waived for purchases by certain retirement or benefit plans. Class B shares are sold with a CDSC of 3% which decreases by 1% annually to 1% in the third and fourth years and 0% in the fifth year. Class B shares automatically convert to Class A shares on a quarterly basis, approximately five years after purchase. Class B shares are closed to new purchases. Class C shares are sold with a CDSC of 1% on sales of shares made within 12 months of purchase. A special exchange privilege is also available for shareholders who qualify to purchase Class A shares at net asset value. Class R shares are available to certain retirement plans, clearing and settlement firms. Class Q, Class R and Class Z shares are not subject to any sales or redemption charge and are offered exclusively for sale to a limited group of investors.
Under certain circumstances, an exchange may be made from specified share classes of the Fund to one or more other share classes of the Fund as presented in the table of transactions in shares of common stock.
There are 2 billion shares of common stock authorized at $.01 par value per share, divided into six classes, designated Class A, Class B, Class C, Class Q, Class R, and Class Z common stock. Class A shares consists of 475 million authorized shares, Class B consists of 25 million authorized shares, Class C consists of 400 million authorized shares, Class Q and Class R shares each consist of 100 million authorized shares, and Class Z shares consist of 900 million authorized shares.
As of December 31, 2016, seven shareholders of record held 69% of the Fund’s outstanding shares on behalf of multiple beneficial owners.
Transactions in shares of common stock were as follows:
| | | | | | | | |
Class A | | Shares | | | Amount | |
Year ended December 31, 2016: | | | | | | | | |
Shares sold | | | 77,709,974 | | | $ | 864,194,268 | |
Shares issued in reinvestment of dividends and distributions | | | 3,051,962 | | | | 33,908,572 | |
Shares reacquired | | | (67,135,184 | ) | | | (743,490,955 | ) |
| | | | | | | | |
Net increase (decrease) in shares outstanding before conversion | | | 13,626,752 | | | | 154,611,885 | |
Shares issued upon conversion from other share class(es) | | | 2,407,403 | | | | 26,732,948 | |
Shares reacquired upon conversion into other share class(es) | | | (10,786,448 | ) | | | (119,692,790 | ) |
| | | | | | | | |
Net increase (decrease) in shares outstanding | | | 5,247,707 | | | $ | 61,652,043 | |
| | | | | | | | |
Year ended December 31, 2015: | | | | | | | | |
Shares sold | | | 45,385,148 | | | $ | 505,897,190 | |
Shares issued in reinvestment of dividends and distributions | | | 3,751,925 | | | | 41,881,155 | |
Shares reacquired | | | (80,153,940 | ) | | | (894,762,207 | ) |
| | | | | | | | |
Net increase (decrease) in shares outstanding before conversion | | | (31,016,867 | ) | | | (346,983,862 | ) |
Shares issued upon conversion from other share class(es) | | | 2,176,583 | | | | 24,265,801 | |
Shares reacquired upon conversion into other share class(es) | | | (3,501,679 | ) | | | (39,099,351 | ) |
| | | | | | | | |
Net increase (decrease) in shares outstanding | | | (32,341,963 | ) | | $ | (361,817,412 | ) |
| | | | | | | | |
Class B | | | | | | |
Year ended December 31, 2016: | | | | | | | | |
Shares sold | | | 210,796 | | | $ | 2,340,575 | |
Shares issued in reinvestment of dividends and distributions | | | 33,519 | | | | 372,342 | |
Shares reacquired | | | (443,118 | ) | | | (4,912,464 | ) |
| | | | | | | | |
Net increase (decrease) in shares outstanding before conversion | | | (198,803 | ) | | | (2,199,547 | ) |
Shares reacquired upon conversion into other share class(es) | | | (563,442 | ) | | | (6,243,578 | ) |
| | | | | | | | |
Net increase (decrease) in shares outstanding | | | (762,245 | ) | | $ | (8,443,125 | ) |
| | | | | | | | |
Year ended December 31, 2015: | | | | | | | | |
Shares sold | | | 300,452 | | | $ | 3,335,966 | |
Shares issued in reinvestment of dividends and distributions | | | 51,275 | | | | 572,567 | |
Shares reacquired | | | (742,127 | ) | | | (8,291,154 | ) |
| | | | | | | | |
Net increase (decrease) in shares outstanding before conversion | | | (390,400 | ) | | | (4,382,621 | ) |
Shares reacquired upon conversion into other share class(es) | | | (763,336 | ) | | | (8,492,131 | ) |
| | | | | | | | |
Net increase (decrease) in shares outstanding | | | (1,153,736 | ) | | $ | (12,874,752 | ) |
| | | | | | | | |
| | | | |
| Prudential Short-Term Corporate Bond Fund, Inc. | | | 63 | |
Notes to Financial Statements (continued)
| | | | | | | | |
Class C | | Shares | | | Amount | |
Year ended December 31, 2016: | | | | | | | | |
Shares sold | | | 25,294,185 | | | $ | 280,952,437 | |
Shares issued in reinvestment of dividends and distributions | | | 1,759,702 | | | | 19,551,628 | |
Shares reacquired | | | (30,903,507 | ) | | | (342,915,625 | ) |
| | | | | | | | |
Net increase (decrease) in shares outstanding before conversion | | | (3,849,620 | ) | | | (42,411,560 | ) |
Shares issued upon conversion from other share class(es) | | | 1,691 | | | | 18,788 | |
Shares reacquired upon conversion into other share class(es) | | | (4,412,300 | ) | | | (49,028,007 | ) |
| | | | | | | | |
Net increase (decrease) in shares outstanding | | | (8,260,229 | ) | | $ | (91,420,779 | ) |
| | | | | | | | |
Year ended December 31, 2015: | | | | | | | | |
Shares sold | | | 21,142,628 | | | $ | 235,734,688 | |
Shares issued in reinvestment of dividends and distributions | | | 1,997,541 | | | | 22,293,785 | |
Shares reacquired | | | (37,266,683 | ) | | | (415,934,634 | ) |
| | | | | | | | |
Net increase (decrease) in shares outstanding before conversion | | | (14,126,514 | ) | | | (157,906,161 | ) |
Shares issued upon conversion from other share class(es) | | | 4,991 | | | | 55,745 | |
Shares reacquired upon conversion into other share class(es) | | | (2,171,344 | ) | | | (24,253,030 | ) |
| | | | | | | | |
Net increase (decrease) in shares outstanding | | | (16,292,867 | ) | | $ | (182,103,446 | ) |
| | | | | | | | |
Class Q | | | | | | |
Year ended December 31, 2016: | | | | | | | | |
Shares sold | | | 4,852,805 | | | $ | 54,061,763 | |
Shares issued in reinvestment of dividends and distributions | | | 351,111 | | | | 3,914,595 | |
Shares reacquired | | | (7,651,340 | ) | | | (84,760,822 | ) |
| | | | | | | | |
Net increase (decrease) in shares outstanding before conversion | | | (2,447,424 | ) | | | (26,784,464 | ) |
Shares issued upon conversion from other share class(es) | | | 4,768,808 | | | | 52,743,019 | |
| | | | | | | | |
Net increase (decrease) in shares outstanding | | | 2,321,384 | | | $ | 25,958,555 | |
| | | | | | | | |
Year ended December 31, 2015: | | | | | | | | |
Shares sold | | | 1,391,222 | | | $ | 15,605,261 | |
Shares issued in reinvestment of dividends and distributions | | | 228,873 | | | | 2,561,734 | |
Shares reacquired | | | (1,371,221 | ) | | | (15,374,062 | ) |
| | | | | | | | |
Net increase (decrease) in shares outstanding | | | 248,874 | | | $ | 2,792,933 | |
| | | | | | | | |
Class R | | | | | | |
Year ended December 31, 2016: | | | | | | | | |
Shares sold | | | 3,885,887 | | | $ | 43,175,189 | |
Shares issued in reinvestment of dividends and distributions | | | 307,696 | | | | 3,418,712 | |
Shares reacquired | | | (2,621,015 | ) | | | (29,096,643 | ) |
| | | | | | | | |
Net increase (decrease) in shares outstanding before conversion | | | 1,572,568 | | | | 17,497,258 | |
Shares reacquired upon conversion into other share class(es) | | | (4,644 | ) | | | (51,219 | ) |
| | | | | | | | |
Net increase (decrease) in shares outstanding | | | 1,567,924 | | | $ | 17,446,039 | |
| | | | | | | | |
Year ended December 31, 2015: | | | | | | | | |
Shares sold | | | 3,656,004 | | | $ | 40,757,472 | |
Shares issued in reinvestment of dividends and distributions | | | 294,762 | | | | 3,288,209 | |
Shares reacquired | | | (2,389,282 | ) | | | (26,654,382 | ) |
| | | | | | | | |
Net increase (decrease) in shares outstanding before conversion | | | 1,561,484 | | | | 17,391,299 | |
Shares reacquired upon conversion into other share class(es) | | | (726 | ) | | | (8,005 | ) |
| | | | | | | | |
Net increase (decrease) in shares outstanding | | | 1,560,758 | | | $ | 17,383,294 | |
| | | | | | | | |
| | | | | | | | |
Class Z | | Shares | | | Amount | |
Year ended December 31, 2016: | | | | | | | | |
Shares sold | | | 312,866,236 | | | $ | 3,479,782,694 | |
Shares issued in reinvestment of dividends and distributions | | | 9,776,702 | | | | 108,893,043 | |
Shares reacquired | | | (204,890,532 | ) | | | (2,277,741,538 | ) |
| | | | | | | | |
Net increase (decrease) in shares outstanding before conversion | | | 117,752,406 | | | | 1,310,934,199 | |
Shares issued upon conversion from other share class(es) | | | 14,896,959 | | | | 165,730,386 | |
Shares reacquired upon conversion into other share class(es) | | | (6,342,176 | ) | | | (70,209,547 | ) |
| | | | | | | | |
Net increase (decrease) in shares outstanding | | | 126,307,189 | | | $ | 1,406,455,038 | |
| | | | | | | | |
Year ended December 31, 2015: | | | | | | | | |
Shares sold | | | 178,922,805 | | | $ | 2,000,881,811 | |
Shares issued in reinvestment of dividends and distributions | | | 8,558,737 | | | | 95,717,584 | |
Shares reacquired | | | (184,076,369 | ) | | | (2,058,347,494 | ) |
| | | | | | | | |
Net increase (decrease) in shares outstanding before conversion | | | 3,405,173 | | | | 38,251,901 | |
Shares issued upon conversion from other share class(es) | | | 5,610,430 | | | | 62,802,857 | |
Shares reacquired upon conversion into other share class(es) | | | (1,365,089 | ) | | | (15,271,886 | ) |
| | | | | | | | |
Net increase (decrease) in shares outstanding | | | 7,650,514 | | | $ | 85,782,872 | |
| | | | | | | | |
Note 7. Borrowings
The Fund, along with other affiliated registered investment companies (the “Funds”), is a party to a Syndicated Credit Agreement (“SCA”) with a group of banks. The purpose of the SCA is to provide an alternative source of temporary funding for capital share redemptions. The SCA provides for a commitment of $900 million for the period October 6, 2016 through October 5, 2017. The Funds pay an annualized commitment fee of .15% of the unused portion of the SCA. The interest rate on borrowings under the SCA is paid monthly and at a per annum rate based upon the higher of 0%, the effective federal funds rate, or the One-Month LIBOR rate, plus a contractual spread. Prior to October 6, 2016, the Funds had another SCA that provided a commitment of $900 million and the Funds paid an annualized commitment fee of .11% of the unused portion of the SCA. The interest rate on borrowings was substantially the same. The Fund’s portion of the commitment fee for the unused amount is accrued daily and paid quarterly.
The Fund did not utilize the SCA during the year ended December 31, 2016.
Note 8. Recent Accounting Pronouncements and Reporting Updates
In December 2016, the FASB released an Accounting Standards Update (“ASU”) that makes technical changes to various sections of the Accounting Standards Codification (“ASC”), including Topic 820, Fair Value Measurement. The changes to Topic 820 are intended to clarify the difference between a valuation approach and a valuation technique. The changes to ASC 820-10-50-2 require a reporting entity to disclose, for Level 2 and Level 3 fair value measurements, a change in either or both a valuation approach and a valuation technique and the reason(s) for the change. The changes to Topic 820 are effective for fiscal years, and interim periods within those fiscal years, beginning after
| | | | |
| Prudential Short-Term Corporate Bond Fund, Inc. | | | 65 | |
Notes to Financial Statements (continued)
December 15, 2016. At this time, management is evaluating the implications of the ASU and its impact on the financial statements and disclosures has not yet been determined.
On October 13, 2016, the Securities and Exchange Commission (the “SEC”) adopted new rules and forms and amended existing rules and forms which are intended to modernize and enhance the reporting and disclosure of information by registered investment companies and to improve the quality of information that funds provide to investors, including modifications to Regulation S-X which would require standardized, enhanced disclosure about derivatives in investment company financial statements. The new rules also enhance disclosure regarding fund liquidity and redemption practices. Also under the new rules, the SEC will permit open-end funds, with the exception of money market funds, to offer swing pricing, subject to board approval and review. The compliance dates of the modifications to Regulation S-X are August 1, 2017 and other amendments and rules are generally June 1, 2018 and December 1, 2018. Management is currently evaluating the impacts to the financial statement disclosures, if any.
Financial Highlights
| | | | | | | | | | | | | | | | | | | | |
| Class A Shares | | | | | | | | | | | | |
| | | Year Ended December 31, | |
| | | 2016 | | | 2015 | | | 2014 | | | 2013 | | | 2012 | |
| Per Share Operating Performance(a): | | | | | | | | | | | | | | | | | | | | |
| Net Asset Value, Beginning of Year | | | $11.00 | | | | $11.19 | | | | $11.33 | | | | $11.56 | | | | $11.35 | |
| Income (loss) from investment operations: | | | | | | | | | | | | | | | | | | | | |
| Net investment income (loss) | | | .19 | | | | .19 | | | | .20 | | | | .22 | | | | .26 | |
| Net realized and unrealized gain (loss) on investment transactions | | | .08 | | | | (.10 | ) | | | (.04 | ) | | | (.12 | ) | | | .33 | |
| Total from investment operations | | | .27 | | | | .09 | | | | .16 | | | | .10 | | | | .59 | |
| Less Dividends: | | | | | | | | | | | | | | | | | | | | |
| Dividends from net investment income | | | (.26 | ) | | | (.28 | ) | | | (.30 | ) | | | (.33 | ) | | | (.38 | ) |
| Net asset value, end of year | | | $11.01 | | | | $11.00 | | | | $11.19 | | | | $ 11.33 | | | | $11.56 | |
| Total Return(b): | | | 2.50% | | | | .81% | | | | 1.42% | | | | .89% | | | | 5.23% | |
| |
| Ratios/Supplemental Data: | |
| Net assets, end of year (000) | | | $1,861,163 | | | | $1,801,167 | | | | $2,194,768 | | | | $2,791,686 | | | | $2,596,682 | |
| Average net assets (000) | | | $1,751,490 | | | | $1,984,349 | | | | $2,686,658 | | | | $2,717,633 | | | | $2,125,935 | |
| Ratios to average net assets(c)(d): | | | | | | | | | | | | | | | | | | | | |
| Expenses after waivers and/or expense reimbursement | | | .77% | | | | .77% | | | | .78% | | | | .76% | | | | .78% | |
| Expenses before waivers and/or expense reimbursement | | | .77% | | | | .78% | | | | .83% | | | | .81% | | | | .83% | |
| Net investment income (loss) | | | 1.72% | | | | 1.73% | | | | 1.79% | | | | 1.91% | | | | 2.30% | |
| Portfolio turnover rate | | | 51% | | | | 49% | | | | 54% | | | | 65% | | | | 78% | |
| (a) | Calculated based on average shares outstanding during the year. |
| (b) | Total return does not consider the effects of sales loads. Total return is calculated assuming a purchase of a share on the first day and a sale on the last day of each year reported and includes reinvestment of dividends and distributions, if any. Total returns may reflect adjustments to conform to generally accepted accounting principles. |
| (c) | Does not include expenses of the underlying portfolio in which the Fund invests. |
| (d) | Effective March 9, 2015, the contractual distribution and service (12b-1) fees were reduced from .30% to .25% of the average daily net assets and the .05% contractual 12b-1 fee waiver was terminated. |
See Notes to Financial Statements.
| | | | |
| Prudential Short-Term Corporate Bond Fund, Inc. | | | 67 | |
Financial Highlights (continued)
| | | | | | | | | | | | | | | | | | | | |
| Class B Shares | |
| | | Year Ended December 31, | |
| | | 2016 | | | 2015 | | | 2014 | | | 2013 | | | 2012 | |
| Per Share Operating Performance(a): | | | | | | | | | | | | | | | | | | | | |
| Net Asset Value, Beginning of Year | | | $11.00 | | | | $11.19 | | | | $11.33 | | | | $11.56 | | | | $11.35 | |
| Income (loss) from investment operations: | | | | | | | | | | | | | | | | | | | | |
| Net investment income (loss) | | | .11 | | | | .11 | | | | .12 | | | | .13 | | | | .18 | |
Net realized and unrealized gain (loss) on
investment transactions | | | .08 | | | | (.10 | ) | | | (.04 | ) | | | (.11 | ) | | | .32 | |
| Total from investment operations | | | .19 | | | | .01 | | | | .08 | | | | .02 | | | | .50 | |
| Less Dividends: | | | | | | | | | | | | | | | | | | | | |
| Dividends from net investment income | | | (.18 | ) | | | (.20 | ) | | | (.22 | ) | | | (.25 | ) | | | (.29 | ) |
| Net asset value, end of year | | | $11.01 | | | | $11.00 | | | | $11.19 | | | | $11.33 | | | | $11.56 | |
| Total Return(b): | | | 1.73% | | | | .06% | | | | .66% | | | | .14% | | | | 4.44% | |
| |
| Ratios/Supplemental Data: | |
| Net assets, end of year (000) | | | $20,035 | | | | $28,396 | | | | $41,808 | | | | $57,649 | | | | $59,209 | |
| Average net assets (000) | | | $25,008 | | | | $34,875 | | | | $51,023 | | | | $59,969 | | | | $52,940 | |
| Ratios to average net assets(c): | | | | | | | | | | | | | | | | | | | | |
| Expenses after waivers and/or expense reimbursement | | | 1.52% | | | | 1.52% | | | | 1.53% | | | | 1.51% | | | | 1.53% | |
| Expenses before waivers and/or expense reimbursement | | | 1.52% | | | | 1.52% | | | | 1.53% | | | | 1.51% | | | | 1.53% | |
| Net investment income (loss) | | | .98% | | | | .99% | | | | 1.04% | | | | 1.16% | | | | 1.56% | |
| Portfolio turnover rate | | | 51% | | | | 49% | | | | 54% | | | | 65% | | | | 78% | |
| (a) | Calculated based on average shares outstanding during the year. |
| (b) | Total return does not consider the effects of sales loads. Total return is calculated assuming a purchase of a share on the first day and a sale on the last day of each year reported and includes reinvestment of dividends and distributions, if any. Total returns may reflect adjustments to conform to generally accepted accounting principles. |
| (c) | Does not include expenses of the underlying portfolio in which the Fund invests. |
See Notes to Financial Statements.
| | | | | | | | | | | | | | | | | | | | |
| Class C Shares | |
| | | Year Ended December 31, | |
| | | 2016 | | | 2015 | | | 2014 | | | 2013 | | | 2012 | |
| Per Share Operating Performance(a): | | | | | | | | | | | | | | | | | | | | |
| Net Asset Value, Beginning of Year | | | $11.00 | | | | $11.19 | | | | $11.33 | | | | $11.56 | | | | $11.35 | |
| Income (loss) from investment operations: | | | | | | | | | | | | | | | | | | | | |
| Net investment income (loss) | | | .11 | | | | .11 | | | | .12 | | | | .13 | | | | .18 | |
| Net realized and unrealized gain (loss) on investment transactions | | | .08 | | | | (.10 | ) | | | (.04 | ) | | | (.11 | ) | | | .32 | |
| Total from investment operations | | | .19 | | | | .01 | | | | .08 | | | | .02 | | | | .50 | |
| Less Dividends: | | | | | | | | | | | | | | | | | | | | |
| Dividends from net investment income | | | (.18 | ) | | | (.20 | ) | | | (.22 | ) | | | (.25 | ) | | | (.29 | ) |
| Net asset value, end of year | | | $11.01 | | | | $11.00 | | | | $11.19 | | | | $11.33 | | | | $11.56 | |
| Total Return(b): | | | 1.73% | | | | .06% | | | | .67% | | | | .14% | | | | 4.45% | |
| |
| Ratios/Supplemental Data: | |
| Net assets, end of year (000) | | | $1,446,238 | | | | $1,535,414 | | | | $1,744,748 | | | | $1,970,167 | | | | $2,135,745 | |
| Average net assets (000) | | | $1,536,399 | | | | $1,632,383 | | | | $1,861,288 | | | | $2,123,254 | | | | $1,842,751 | |
| Ratios to average net assets(c): | | | | | | | | | | | | | | | | | | | | |
| Expenses after waivers and/or expense reimbursement | | | 1.52% | | | | 1.52% | | | | 1.53% | | | | 1.51% | | | | 1.53% | |
| Expenses before waivers and/or expense reimbursement | | | 1.52% | | | | 1.52% | | | | 1.53% | | | | 1.51% | | | | 1.53% | |
| Net investment income (loss) | | | .98% | | | | .99% | | | | 1.04% | | | | 1.16% | | | | 1.55% | |
| Portfolio turnover rate | | | 51% | | | | 49% | | | | 54% | | | | 65% | | | | 78% | |
| (a) | Calculated based on average shares outstanding during the year. |
| (b) | Total return does not consider the effects of sales loads. Total return is calculated assuming a purchase of a share on the first day and a sale on the last day of each year reported and includes reinvestment of dividends and distributions, if any. Total returns may reflect adjustments to conform to generally accepted accounting principles. |
| (c) | Does not include expenses of the underlying portfolio in which the Fund invests. |
See Notes to Financial Statements.
| | | | |
| Prudential Short-Term Corporate Bond Fund, Inc. | | | 69 | |
Financial Highlights (continued)
| | | | | | | | | | | | | | | | | | | | | | | | |
| Class Q Shares | | | | | | | | | | | | | | | | | | |
| | | Year Ended December 31, | | | | | | March 2,
2012(a)
through
December 31, 2012 | |
| | | 2016 | | | 2015 | | | 2014 | | | 2013 | | | | | |
| Per Share Operating Performance(b): | | | | | | | | | | | | | | | | | | | | | | | | |
| Net Asset Value, Beginning of Period | | | $11.04 | | | | $11.23 | | | | $11.36 | | | | $11.59 | | | | | | | | $11.55 | |
| Income (loss) from investment operations: | | | | | | | | | | | | | | | | | | | | | | | | |
| Net investment income (loss) | | | .23 | | | | .23 | | | | .24 | | | | .26 | | | | | | | | .23 | |
| Net realized and unrealized gain (loss) on investment transactions | | | .08 | | | | (.10 | ) | | | (.02 | ) | | | (.12 | ) | | | | | | | .15 | |
| Total from investment operations | | | .31 | | | | .13 | | | | .22 | | | | .14 | | | | | | | | .38 | |
| Less Dividends: | | | | | | | | | | | | | | | | | | | | | | | | |
| Dividends from net investment income | | | (.30 | ) | | | (.32 | ) | | | (.35 | ) | | | (.37 | ) | | | | | | | (.34 | ) |
| Net asset value, end of period | | | $11.05 | | | | $11.04 | | | | $11.23 | | | | $11.36 | | | | | | | | $11.59 | |
| Total Return(c): | | | 2.85% | | | | 1.17% | | | | 1.94% | | | | 1.24% | | | | | | | | 3.34% | |
| |
| Ratios/Supplemental Data: | | | | | | | | | | | | | | | | | | |
| Net assets, end of period (000) | | | $116,543 | | | | $90,807 | | | | $89,604 | | | | $80,059 | | | | | | | | $57,217 | |
| Average net assets (000) | | | $143,488 | | | | $89,233 | | | | $43,439 | | | | $68,760 | | | | | | | | $54,722 | |
| Ratios to average net assets(d): | | | | | | | | | | | | | | | | | | | | | | | | |
| Expenses after waivers and/or expense reimbursement | | | .42% | | | | .42% | | | | .43% | | | | .42% | | | | | | | | .43% | (e) |
| Expenses before waivers and/or expense reimbursement | | | .42% | | | | .42% | | | | .43% | | | | .42% | | | | | | | | .43% | (e) |
| Net investment income (loss) | | | 2.08% | | | | 2.08% | | | | 2.14% | | | | 2.25% | | | | | | | | 2.43% | (e) |
| Portfolio turnover rate | | | 51% | | | | 49% | | | | 54% | | | | 65% | | | | | | | | 78% | (f) |
| (a) | Commencement of offering. |
| (b) | Calculated based on average shares outstanding during the period. |
| (c) | Total return is calculated assuming a purchase of a share on the first day and a sale on the last day of each period reported, and includes reinvestment of dividends and distributions, if any. Total returns may reflect adjustments to conform to generally accepted accounting principles. Total returns for periods of less than one full year are not annualized. |
| (d) | Does not include expenses of the underlying portfolio in which the Fund invests. |
See Notes to Financial Statements.
| | | | | | | | | | | | | | | | | | | | |
| Class R Shares | |
| | | Year Ended December 31, | |
| | | 2016 | | | 2015 | | | 2014 | | | 2013 | | | 2012 | |
| Per Share Operating Performance(a): | | | | | | | | | | | | | | | | | | | | |
| Net Asset Value, Beginning of Year | | | $11.00 | | | | $11.19 | | | | $11.33 | | | | $11.56 | | | | $11.35 | |
| Income (loss) from investment operations: | | | | | | | | | | | | | | | | | | | | |
| Net investment income (loss) | | | .16 | | | | .17 | | | | .17 | | | | .19 | | | | .23 | |
Net realized and unrealized gain (loss) on
investment transactions | | | .09 | | | | (.11 | ) | | | (.04 | ) | | | (.12 | ) | | | .33 | |
| Total from investment operations | | | .25 | | | | .06 | | | | .13 | | | | .07 | | | | .56 | |
| Less Dividends: | | | | | | | | | | | | | | | | | | | | |
| Dividends from net investment income | | | (.24 | ) | | | (.25 | ) | | | (.27 | ) | | | (.30 | ) | | | (.35 | ) |
| Net asset value, end of year | | | $11.01 | | | | $11.00 | | | | $11.19 | | | | $11.33 | | | | $11.56 | |
| Total Return(b): | | | 2.24% | | | | .57% | | | | 1.17% | | | | .65% | | | | 4.96% | |
| |
| Ratios/Supplemental Data: | |
| Net assets, end of year (000) | | | $174,661 | | | | $157,207 | | | | $142,496 | | | | $111,181 | | | | $46,706 | |
| Average net assets (000) | | | $167,164 | | | | $149,553 | | | | $129,408 | | | | $78,272 | | | | $29,321 | |
Ratios to average net assets(c): | | | | | | | | | | | | | | | | | | | | |
| Expenses after waivers and/or expense reimbursement | | | 1.02% | | | | 1.02% | | | | 1.03% | | | | 1.01% | | | | 1.03% | |
| Expenses before waivers and/or expense reimbursement | | | 1.27% | | | | 1.27% | | | | 1.28% | | | | 1.26% | | | | 1.28% | |
| Net investment income (loss) | | | 1.48% | | | | 1.48% | | | | 1.54% | | | | 1.67% | | | | 2.04% | |
| Portfolio turnover rate | | | 51% | | | | 49% | | | | 54% | | | | 65% | | | | 78% | |
| (a) | Calculated based on average shares outstanding during the year. |
| (b) | Total return is calculated assuming a purchase of a share on the first day and a sale on the last day of each year reported and includes reinvestment of dividends and distributions, if any. Total returns may reflect adjustments to conform to generally accepted accounting principles. |
| (c) | Does not include expenses of the underlying portfolio in which the Fund invests. |
See Notes to Financial Statements.
| | | | |
| Prudential Short-Term Corporate Bond Fund, Inc. | | | 71 | |
Financial Highlights (continued)
| | | | | | | | | | | | | | | | | | | | |
| Class Z Shares | |
| | | Year Ended December 31, | |
| | | 2016 | | | 2015 | | | 2014 | | | 2013 | | | 2012 | |
| Per Share Operating Performance(a): | | | | | | | | | | | | | | | | | | | | |
| Net Asset Value, Beginning of Year | | | $11.03 | | | | $11.22 | | | | $11.36 | | | | $11.59 | | | | $11.37 | |
| Income (loss) from investment operations: | | | | | | | | | | | | | | | | | | | | |
| Net investment income (loss) | | | .22 | | | | .22 | | | | .23 | | | | .25 | | | | .29 | |
| Net realized and unrealized gain (loss) on investment transactions | | | .08 | | | | (.10 | ) | | | (.04 | ) | | | (.12 | ) | | | .34 | |
| Total from investment operations | | | .30 | | | | .12 | | | | .19 | | | | .13 | | | | .63 | |
| Less Dividends: | | | | | | | | | | | | | | | | | | | | |
| Dividends from net investment income | | | (.29 | ) | | | (.31 | ) | | | (.33 | ) | | | (.36 | ) | | | (.41 | ) |
| Net asset value, end of year | | | $11.04 | | | | $11.03 | | | | $11.22 | | | | $11.36 | | | | $11.59 | |
| Total Return(b): | | | 2.76% | | | | 1.07% | | | | 1.68% | | | | 1.15% | | | | 5.58% | |
| |
| Ratios/Supplemental Data: | |
| Net assets, end of year (000) | | | $6,682,219 | | | | $5,281,386 | | | | $5,288,222 | | | | $4,310,734 | | | | $4,555,662 | |
| Average net assets (000) | | | $6,041,649 | | | | $5,313,632 | | | | $4,823,460 | | | | $4,440,951 | | | | $3,647,207 | |
| Ratios to average net assets(c): | | | | | | | | | | | | | | | | | | | | |
| Expenses after waivers and/or expense reimbursement | | | .52% | | | | .52% | | | | .53% | | | | .51% | | | | .53% | |
| Expenses before waivers and/or expense reimbursement | | | .52% | | | | .52% | | | | .53% | | | | .51% | | | | .53% | |
| Net investment income (loss) | | | 1.98% | | | | 1.99% | | | | 2.04% | | | | 2.16% | | | | 2.55% | |
| Portfolio turnover rate | | | 51% | | | | 49% | | | | 54% | | | | 65% | | | | 78% | |
| (a) | Calculated based on average shares outstanding during the year. |
| (b) | Total return is calculated assuming a purchase of a share on the first day and a sale on the last day of each year reported and includes reinvestment of dividends and distributions, if any. Total returns may reflect adjustments to conform to generally accepted accounting principles. |
| (c) | Does not include expenses of the underlying portfolio in which the Fund invests. |
See Notes to Financial Statements.
Report of Independent Registered Public
Accounting Firm
The Board of Directors and Shareholders
Prudential Short-Term Corporate Bond Fund, Inc.:
We have audited the accompanying statement of assets and liabilities of Prudential Short-Term Corporate Bond Fund, Inc. (the “Fund”), including the portfolio of investments, as of December 31, 2016, and the related statement of operations for the year then ended, the statements of changes in net assets for each of the years in the two-year period then ended, and the financial highlights for each of the years or periods in the five-year period then ended. These financial statements and financial highlights are the responsibility of the Fund’s management. Our responsibility is to express an opinion on these financial statements and financial highlights based on our audits.
We conducted our audits in accordance with the standards of the Public Company Accounting Oversight Board (United States). Those standards require that we plan and perform the audit to obtain reasonable assurance about whether the financial statements and financial highlights are free of material misstatement. An audit includes examining, on a test basis, evidence supporting the amounts and disclosures in the financial statements. Our procedures included confirmation of securities owned as of December 31, 2016, by correspondence with the custodian, transfer agent and brokers or by other appropriate auditing procedures when replies from brokers were not received. An audit also includes assessing the accounting principles used and significant estimates made by management, as well as evaluating the overall financial statement presentation. We believe that our audits provide a reasonable basis for our opinion.
In our opinion, the financial statements and financial highlights referred to above present fairly, in all material respects, the financial position of the Fund as of December 31, 2016, and the results of its operations, the changes in its net assets and the financial highlights for the periods described in the first paragraph above, in conformity with U.S. generally accepted accounting principles.

New York, New York
February 17, 2017
| | | | |
| Prudential Short-Term Corporate Bond Fund, Inc. | | | 73 | |
Federal Income Tax Information (unaudited)
For the year ended December 31, 2016, the Fund reports the maximum amount allowable but not less than 86.21% as interest related dividends in accordance with Sections 871(k)(1) and 881(e)(1) of the Internal Revenue Code.
INFORMATION ABOUT BOARD MEMBERS AND OFFICERS
(Unaudited)
Information about Board Members and Officers of the Fund is set forth below. Board Members who are not deemed to be “interested persons” of the Fund, as defined in the 1940 Act, are referred to as “Independent Board Members.” Board Members who are deemed to be “interested persons” of the Fund are referred to as “Interested Board Members.” The Board Members are responsible for the overall supervision of the operations of the Fund and perform the various duties imposed on the directors of investment companies by the 1940 Act. The Board in turn elects the Officers, who are responsible for administering the day-to-day operations of the Fund.
| | | | |
| Independent Board Members(1) |
Name, Address, Age Position(s) Portfolios Overseen | | Principal Occupation(s) During Past Five Years | | Other Directorships Held During Past Five Years |
Ellen S. Alberding (58) Board Member Portfolios Overseen: 88 | | President and Board Member, The Joyce Foundation (charitable foundation) (since 2002); Vice Chair, City Colleges of Chicago (community college system) (since 2011); Trustee, Skills for America’s Future (national initiative to connect employers to community colleges) (since 2011); Trustee, National Park Foundation (charitable foundation for national park system) (since 2009); Trustee, Economic Club of Chicago (since 2009). | | None. |
Kevin J. Bannon (64) Board Member Portfolios Overseen: 88 | | Managing Director (April 2008-May 2015) and Chief Investment Officer (October 2008-November 2013) of Highmount Capital LLC (registered investment adviser); formerly Executive Vice President and Chief Investment Officer (April 1993-August 2007) of Bank of New York Company; President (May 2003-May 2007) of BNY Hamilton Family of Mutual Funds. | | Director of Urstadt Biddle Properties (equity real estate investment trust) (since September 2008). |
Linda W. Bynoe (64) Board Member Portfolios Overseen: 88 | | President and Chief Executive Officer (since March 1995) and formerly Chief Operating Officer (December 1989-February 1995) of Telemat Ltd. (management consulting); formerly Vice President (January 1985-June 1989) at Morgan Stanley & Co. (broker-dealer). | | Director of Simon Property Group, Inc. (retail real estate) (May 2003-May 2012); Director of Anixter International, Inc. (communication products distributor) (since January 2006); Director of Northern Trust Corporation (financial services) (since April 2006); Trustee of Equity Residential (residential real estate) (since December 2009). |
Prudential Short-Term Corporate Bond Fund, Inc.
| | | | |
| Independent Board Members(1) |
Name, Address, Age Position(s) Portfolios Overseen | | Principal Occupation(s) During Past Five Years | | Other Directorships Held During Past Five Years |
Keith F. Hartstein (60) Board Member & Independent Chair Portfolios Overseen: 88 | | Retired; Member (since November 2014) of the Governing Council of the Independent Directors Council (organization of independent mutual fund directors); formerly President and Chief Executive Officer (2005-2012), Senior Vice President (2004-2005), Senior Vice President of Sales and Marketing (1997-2004), and various executive management positions (1990-1997), John Hancock Funds, LLC (asset management); Chairman, Investment Company Institute’s Sales Force Marketing Committee (2003-2008). | | None. |
Michael S. Hyland, CFA (71) Board Member Portfolios Overseen: 88 | | Retired (since February 2005); formerly Senior Managing Director (July 2001-February 2005) of Bear Stearns & Co, Inc.; Global Partner, INVESCO (1999-2001); Managing Director and President of Salomon Brothers Asset Management (1989-1999). | | None. |
Richard A. Redeker (73) Board Member & Independent Vice Chair Portfolios Overseen: 88 | | Retired Mutual Fund Senior Executive (47 years); Management Consultant; Director, Mutual Fund Directors Forum (since 2014); Independent Directors Council (organization of independent mutual fund directors)-Executive Committee, Chair of Policy Steering Committee, Governing Council. | | None. |
Stephen G. Stoneburn (73) Board Member Portfolios Overseen: 88 | | Chairman (since July 2011), President and Chief Executive Officer (since June 1996) of Frontline Medical Communications (publishing company); formerly President (June 1995-June 1996) of Argus Integrated Media, Inc.; Senior Vice President and Managing Director (January 1993-1995) of Cowles Business Media; Senior Vice President of Fairchild Publications, Inc. (1975-1989). | | None. |
Visit our website at prudentialfunds.com
| | | | |
| Interested Board Members(1) |
Name, Address, Age Position(s) Portfolios Overseen | | Principal Occupation(s) During Past Five Years | | Other Directorships Held During Past Five Years |
Stuart S. Parker (54) Board Member & President Portfolios Overseen: 88 | | President of Prudential Investments LLC (since January 2012); Executive Vice President of Prudential Investment Management Services LLC (since December 2012); Executive Vice President of Jennison Associates LLC and Head of Retail Distribution of Prudential Investments LLC (June 2005-December 2011). | | None. |
Scott E. Benjamin (43) Board Member & Vice President Portfolios Overseen: 88 | | Executive Vice President (since June 2009) of Prudential Investments LLC; Executive Vice President (June 2009-June 2012) and Vice President (since June 2012) of Prudential Investment Management Services LLC; Executive Vice President (since September 2009) of AST Investment Services, Inc.; Senior Vice President of Product Development and Marketing, Prudential Investments (since February 2006); Vice President of Product Development and Product Management, Prudential Investments (2003-2006). | | None. |
Grace C. Torres* (57) Board Member Portfolios Overseen: 86 | | Retired; formerly Treasurer and Principal Financial and Accounting Officer of the Prudential Investments Funds, Target Funds, Advanced Series Trust, Prudential Variable Contract Accounts and The Prudential Series Fund (1998-June 2014); Assistant Treasurer (March 1999-June 2014) and Senior Vice President (September 1999-June 2014) of Prudential Investments LLC; Assistant Treasurer (May 2003-June 2014) and Vice President (June 2005-June 2014) of AST Investment Services, Inc.; Senior Vice President and Assistant Treasurer (May 2003-June 2014) of Prudential Annuities Advisory Services, Inc. | | Director (since July 2015) of Sun Bancorp, Inc. N.A. |
| * | Note: Prior to her retirement in 2014, Ms. Torres was employed by Prudential Investments LLC. Due to her prior employment, she is considered to be an “interested person” under the 1940 Act. Ms. Torres is a Non-Management Interested Board Member. |
| (1) | The year that each Board Member joined the Fund’s Board is as follows: |
Ellen S. Alberding, 2013; Kevin J. Bannon, 2008; Linda W. Bynoe, 2005; Keith F. Hartstein, 2013; Michael S. Hyland, 2008; Richard A. Redeker, 1993; Stephen G. Stoneburn, 2003; Grace C. Torres, 2014; Stuart S. Parker, Board Member and President since 2012; Scott E. Benjamin, Board Member since 2010 and Vice President since 2009.
Prudential Short-Term Corporate Bond Fund, Inc.
| | | | |
| Fund Officers(a) |
Name, Address and Age Position with Fund | | Principal Occupation(s) During Past Five Years | | Length of Service as Fund Officer |
Raymond A. O’Hara (61) Chief Legal Officer | | Vice President and Corporate Counsel (since July 2010) of Prudential Insurance Company of America (Prudential); Vice President (March 2011-Present) of Pruco Life Insurance Company and Pruco Life Insurance Company of New Jersey; Vice President and Corporate Counsel (March 2011-Present) of Prudential Annuities Life Assurance Corporation; Chief Legal Officer of Prudential Investments LLC (since June 2012); Chief Legal Officer of Prudential Mutual Fund Services LLC (since June 2012) and Corporate Counsel of AST Investment Services, Inc. (since June 2012); formerly Assistant Vice President and Corporate Counsel (September 2008-July 2010) of The Hartford Financial Services Group, Inc.; formerly Associate (September 1980-December 1987) and Partner (January 1988-August 2008) of Blazzard & Hasenauer, P.C. (formerly, Blazzard, Grodd & Hasenauer, P.C.). | | Since 2012 |
Chad A. Earnst (41) Chief Compliance Officer | | Chief Compliance Officer (September 2014-Present) of Prudential Investments LLC; Chief Compliance Officer (September 2014-Present) of the Prudential Investments Funds, Target Funds, Advanced Series Trust, The Prudential Series Fund, Prudential’s Gibraltar Fund, Inc., Prudential Global Short Duration High Yield Income Fund, Inc., Prudential Short Duration High Yield Fund, Inc. and Prudential Jennison MLP Income Fund, Inc.; formerly Assistant Director (March 2010-August 2014) of the Asset Management Unit, Division of Enforcement, US Securities & Exchange Commission; Assistant Regional Director (January 2010-August 2014), Branch Chief (June 2006-December 2009) and Senior Counsel (April 2003-May 2006) of the Miami Regional Office, Division of Enforcement, US Securities & Exchange Commission. | | Since 2014 |
Deborah A. Docs (59) Secretary | | Vice President and Corporate Counsel (since January 2001) of Prudential; Vice President (since December 1996) and Assistant Secretary (since March 1999) of Prudential Investments LLC; formerly Vice President and Assistant Secretary (May 2003-June 2005) of AST Investment Services, Inc. | | Since 2004 |
Jonathan D. Shain (58) Assistant Secretary | | Vice President and Corporate Counsel (since August 1998) of Prudential; Vice President and Assistant Secretary (since May 2001) of Prudential Investments LLC; Vice President and Assistant Secretary (since February 2001) of Prudential Mutual Fund Services LLC; formerly Vice President and Assistant Secretary (May 2003-June 2005) of AST Investment Services, Inc. | | Since 2005 |
Visit our website at prudentialfunds.com
| | | | |
| Fund Officers(a) |
Name, Address and Age Position with Fund | | Principal Occupation(s) During Past Five Years | | Length of Service as Fund Officer |
Claudia DiGiacomo (42) Assistant Secretary | | Vice President and Corporate Counsel (since January 2005) of Prudential; Vice President and Assistant Secretary of Prudential Investments LLC (since December 2005); Associate at Sidley Austin Brown & Wood LLP (1999-2004). | | Since 2005 |
Andrew R. French (54) Assistant Secretary | | Vice President and Corporate Counsel (since February 2010) of Prudential; formerly Director and Corporate Counsel (2006-2010) of Prudential; Vice President and Assistant Secretary (since January 2007) of Prudential Investments LLC; Vice President and Assistant Secretary (since January 2007) of Prudential Mutual Fund Services LLC. | | Since 2006 |
Theresa C. Thompson (54) Deputy Chief Compliance Officer | | Vice President, Compliance, Prudential Investments LLC (since April 2004); and Director, Compliance, Prudential Investments LLC (2001-2004). | | Since 2008 |
Charles H. Smith (43) Anti-Money Laundering Compliance Officer | | Vice President, Corporate Compliance, Anti-Money Laundering Unit (since January 2015) of Prudential; committee member of the American Council of Life Insurers Anti-Money Laundering and Critical Infrastructure Committee (since January 2016); formerly Global Head of Economic Sanctions Compliance at AIG Property Casualty (February 2007-December 2014); Assistant Attorney General at the New York State Attorney General’s Office, Division of Public Advocacy. (August 1998-January 2007). | | Since 2016 |
M. Sadiq Peshimam (53) Treasurer and Principal Financial and Accounting Officer | | Vice President (since 2005) of Prudential Investments LLC; formerly Assistant Treasurer of funds in the Prudential Mutual Fund Complex (2006-2014). | | Since 2006 |
Peter Parrella (58) Assistant Treasurer | | Vice President (since 2007) and Director (2004-2007) within Prudential Mutual Fund Administration; formerly Tax Manager at SSB Citi Fund Management LLC (1997-2004). | | Since 2007 |
Lana Lomuti (49) Assistant Treasurer | | Vice President (since 2007) and Director (2005-2007), within Prudential Mutual Fund Administration; formerly Assistant Treasurer (December 2007-February 2014) of The Greater China Fund, Inc. | | Since 2014 |
Linda McMullin (55) Assistant Treasurer | | Vice President (since 2011) and Director (2008-2011) within Prudential Mutual Fund Administration. | | Since 2014 |
Kelly A. Coyne (48) Assistant Treasurer | | Director, Investment Operations of Prudential Mutual Fund Services LLC (since 2010). | | Since 2015 |
| (a) | Excludes Mr. Parker and Mr. Benjamin, interested Board Members who also serve as President and Vice President, respectively. |
Explanatory Notes to Tables:
| • | | Board Members are deemed to be “Interested,” as defined in the 1940 Act, by reason of their affiliation with Prudential Investments LLC and/or an affiliate of Prudential Investments LLC. |
| • | | Unless otherwise noted, the address of all Board Members and Officers is c/o Prudential Investments LLC, 655 Broad Street, Newark, New Jersey 07102-4410. |
Prudential Short-Term Corporate Bond Fund, Inc.
| • | | There is no set term of office for Board Members or Officers. The Board Members have adopted a retirement policy, which calls for the retirement of Board Members on December 31 of the year in which they reach the age of 75. |
| • | | “Other Directorships Held” includes only directorships of companies required to register or file reports with the SEC under the 1934 Act (that is, “public companies”) or other investment companies registered under the 1940 Act. |
| • | | “Portfolios Overseen” includes all investment companies managed by Prudential Investments LLC. The investment companies for which Prudential Investments LLC serves as manager include the Prudential Investments Mutual Funds, The Prudential Variable Contract Accounts, Target Mutual Funds, Prudential Short Duration High Yield Fund, Inc., Prudential Global Short Duration High Yield Fund, Inc., The Prudential Series Fund, Prudential’s Gibraltar Fund, Inc. and the Advanced Series Trust. |
Visit our website at prudentialfunds.com
| | | | |
| ∎ MAIL | | ∎ TELEPHONE | | ∎ WEBSITE |
655 Broad Street
Newark, NJ 07102 | | (800) 225-1852 | | www.prudentialfunds.com |
|
| PROXY VOTING |
| The Board of Directors of the Fund has delegated to the Fund’s investment subadviser the responsibility for voting any proxies and maintaining proxy recordkeeping with respect to the Fund. A description of these proxy voting policies and procedures is available without charge, upon request, by calling (800) 225-1852 or by visiting the Securities and Exchange Commission’s website at www.sec.gov. Information regarding how the Fund voted proxies relating to portfolio securities during the most recent 12-month period ended June 30 is available on the Fund’s website and on the Commission’s website. |
|
| DIRECTORS |
Ellen S. Alberding • Kevin J. Bannon • Scott E. Benjamin • Linda W. Bynoe • Keith F. Hartstein •
Michael S. Hyland • Stuart S. Parker • Richard A. Redeker • Stephen G. Stoneburn • Grace C. Torres |
|
| OFFICERS |
| Stuart S. Parker, President • Scott E. Benjamin, Vice President • M. Sadiq Peshimam, Treasurer and Principal Financial and Accounting Officer • Raymond A. O’Hara, Chief Legal Officer • Deborah A. Docs, Secretary • Chad A. Earnst, Chief Compliance Officer • Theresa C. Thompson, Deputy Chief Compliance Officer • Charles H. Smith, Anti-Money Laundering Compliance Officer • Jonathan D. Shain, Assistant Secretary • Claudia DiGiacomo, Assistant Secretary • Andrew R. French, Assistant Secretary • Peter Parrella, Assistant Treasurer • Lana Lomuti, Assistant Treasurer • Linda McMullin, Assistant Treasurer • Kelly A. Coyne, Assistant Treasurer |
| | | | |
| MANAGER | | Prudential Investments LLC | | 655 Broad Street Newark, NJ 07102 |
|
| INVESTMENT SUBADVISER | | PGIM Fixed Income | | 655 Broad Street Newark, NJ 07102 |
|
| DISTRIBUTOR | | Prudential Investment Management Services LLC | | 655 Broad Street Newark, NJ 07102 |
|
| CUSTODIAN | | The Bank of New York Mellon | | 225 Liberty Street New York, NY 10286 |
|
| TRANSFER AGENT | | Prudential Mutual Fund Services LLC | | PO Box 9658 Providence, RI 02940 |
|
INDEPENDENT REGISTERED
PUBLIC ACCOUNTING FIRM | | KPMG LLP | | 345 Park Avenue New York, NY 10154 |
|
| FUND COUNSEL | | Willkie Farr & Gallagher LLP | | 787 Seventh Avenue New York, NY 10019 |
|
|
| An investor should consider the investment objectives, risks, charges, and expenses of the Fund carefully before investing. The prospectus and summary prospectus contain this and other information about the Fund. An investor may obtain a prospectus and summary prospectus by visiting our website at www.prudentialfunds.com or by calling (800) 225-1852. The prospectus and summary prospectus should be read carefully before investing. |
|
| E-DELIVERY |
| To receive your mutual fund documents online, go to www.prudentialfunds.com/edelivery and enroll. Instead of receiving printed documents by mail, you will receive notification via email when new materials are available. You can cancel your enrollment or change your email address at any time by visiting the website address above. |
|
| SHAREHOLDER COMMUNICATIONS WITH DIRECTORS |
| Shareholders can communicate directly with the Board of Directors by writing to the Chair of the Board, Prudential Short-Term Corporate Bond Fund, Inc., Prudential Investments, Attn: Board of Directors, 655 Broad Street, Newark, NJ 07102. Shareholders can communicate directly with an individual Director by writing to the same address. Communications are not screened before being delivered to the addressee. |
|
| AVAILABILITY OF PORTFOLIO SCHEDULE |
| The Fund files its complete schedule of portfolio holdings with the Securities and Exchange Commission for the first and third quarters of each fiscal year on Form N-Q. The Fund’s Forms N-Q are available on the Commission’s website at www.sec.gov. The Fund’s Forms N-Q may also be reviewed and copied at the Commission’s Public Reference Room in Washington, D.C. Information on the operation and location of the Public Reference Room may be obtained by calling 1-800-SEC-0330. The Fund’s schedule of portfolio holdings is also available on the Fund’s website as of the end of each month no sooner than 15 days after the end of the month. |
|
| The Fund’s Statement of Additional Information contains additional information about the Fund’s Directors and is available without charge, upon request, by calling (800) 225-1852. |
Mutual Funds:
| | | | |
ARE NOT INSURED BY THE FDIC OR ANY
FEDERAL GOVERNMENT AGENCY | | MAY LOSE VALUE | | ARE NOT A DEPOSIT OF OR GUARANTEED
BY ANY BANK OR ANY BANK AFFILIATE |
PRUDENTIAL SHORT-TERM CORPORATE BOND FUND, INC.
| | | | | | | | | | | | |
| SHARE CLASS | | A | | B | | C | | Q | | R | | Z |
| NASDAQ | | PBSMX | | PSMBX | | PIFCX | | PSTQX | | JDTRX | | PIFZX |
| CUSIP | | 74441R102 | | 74441R201 | | 74441R300 | | 74441R607 | | 74441R409 | | 74441R508 |
MF140E
Item 2 – Code of Ethics – – See Exhibit (a)
As of the end of the period covered by this report, the registrant has adopted a code of ethics (the “Section 406 Standards for Investment Companies – Ethical Standards for Principal Executive and Financial Officers”) that applies to the registrant’s Principal Executive Officer and Principal Financial Officer; the registrant’s Principal Financial Officer also serves as the Principal Accounting Officer.
The registrant hereby undertakes to provide any person, without charge, upon request, a copy of the code of ethics. To request a copy of the code of ethics, contact the registrant 800-225-1852, and ask for a copy of the Section 406 Standards for Investment Companies - Ethical Standards for Principal Executive and Financial Officers.
Item 3 – Audit Committee Financial Expert –
The registrant’s Board has determined that Mr. Kevin J. Bannon, member of the Board’s Audit Committee is an “audit committee financial expert,” and that he is “independent,” for purposes of this Item.
Item 4 – Principal Accountant Fees and Services –
(a) Audit Fees
For the fiscal years ended December 31, 2016 and December 31, 2015, KPMG LLP (“KPMG”), the Registrant’s principal accountant, billed the Registrant $39,437 and $34,125, respectively, for professional services rendered for the audit of the Registrant’s annual financial statements or services that are normally provided in connection with statutory and regulatory filings. In addition to the above, $32,500 of audit fees billed by KPMG were paid by a service provider of the Registrant for the fiscal year ended December 31, 2016.
(b) Audit-Related Fees
For the fiscal years ended December 31, 2016 and December 31, 2015: none.
(c) Tax Fees
For the fiscal years ended December 31, 2016 and December 31, 2015: none.
(d) All Other Fees
For the fiscal years ended December 31, 2016 and December 31, 2015: none.
(e) (1) Audit Committee Pre-Approval Policies and Procedures
THE PRUDENTIAL MUTUAL FUNDS
AUDIT COMMITTEE POLICY
on
Pre-Approval of Services Provided by the Independent Accountants
The Audit Committee of each Prudential Mutual Fund is charged with the responsibility to monitor the independence of the Fund’s independent accountants. As part of this responsibility, the Audit Committee must pre-approve the independent accounting firm’s engagement to render audit and/or permissible non-audit services, as required by law. In evaluating a proposed engagement of the independent accountants, the Audit Committee will assess the effect that the engagement might reasonably be expected to have on the accountant’s independence. The Committee’s evaluation will be based on:
| | ● | | a review of the nature of the professional services expected to be provided, |
| | ● | | a review of the safeguards put into place by the accounting firm to safeguard independence, and |
| | ● | | periodic meetings with the accounting firm. |
Policy for Audit and Non-Audit Services Provided to the Funds
On an annual basis, the scope of audits for each Fund, audit fees and expenses, and audit-related and non-audit services (and fees proposed in respect thereof) proposed to be performed by the Fund’s independent accountants will be presented by the Treasurer and the independent accountants to the Audit Committee for review and, as appropriate, approval prior to the initiation of such services. Such presentation shall be accompanied by confirmation by both the Treasurer and the independent accountants that the proposed non-audit services will not adversely affect the independence of the independent accountants. Such proposed non-audit services shall be described in sufficient detail to enable the Audit Committee to assess the appropriateness of such services and fees, and the compatibility of the provision of such services with the auditor’s independence. The Committee shall receive periodic reports on the progress of the audit and other services which are approved by the Committee or by the Committee Chair pursuant to authority delegated in this Policy.
The categories of services enumerated under “Audit Services”, “Audit-related Services”, and “Tax Services” are intended to provide guidance to the Treasurer and the independent accountants as to those categories of services which the Committee believes are generally consistent with the independence of the independent accountants and which the Committee (or the Committee Chair) would expect upon the presentation of specific proposals to pre-approve. The enumerated categories are not intended as an exclusive list of audit, audit-related or tax services, which the Committee (or the Committee Chair) would consider for pre-approval.
Audit Services
The following categories of audit services are considered to be consistent with the role of the Fund’s independent accountants:
| | Ø | Annual Fund financial statement audits |
| | Ø | Seed audits (related to new product filings, as required) |
| | Ø | SEC and regulatory filings and consents |
Audit-related Services
The following categories of audit-related services are considered to be consistent with the role of the Fund’s independent accountants:
| | Ø | Accounting consultations |
| | Ø | Fund merger support services |
| | Ø | Agreed Upon Procedure Reports |
| | Ø | Other Internal Control Reports |
Individual audit-related services that fall within one of these categories (except for fund merger support services) and are not presented to the Audit Committee as part of the annual pre-approval process are subject to an authorized pre-approval by the Audit Committee so long as the estimated fee for those services does not exceed $30,000. Any services provided under such pre-approval will be reported to the Audit Committee at its next regular meeting. Should the amount of such services exceed $30,000 any additional fees will be subject to pre-approval by the Committee Chair (or any other Committee member on whom this responsibility has been delegated). Fees related to fund merger support services are subject to a separate authorized pre-approval by the Audit Committee with fees determined on a per occurrence and merger complexity basis.
Tax Services
The following categories of tax services are considered to be consistent with the role of the Fund’s independent accountants:
| | Ø | Tax compliance services related to the filing or amendment of the following: |
| | § | Federal, state and local income tax compliance; and, |
| | § | Sales and use tax compliance |
| | Ø | Timely RIC qualification reviews |
| | Ø | Tax distribution analysis and planning |
| | Ø | Tax authority examination services |
| | Ø | Tax appeals support services |
| | Ø | Accounting methods studies |
| | Ø | Fund merger support services |
| | Ø | Tax consulting services and related projects |
Individual tax services that fall within one of these categories and are not presented to the Audit Committee as part of the annual pre-approval process are subject to an authorized pre-approval by the Audit Committee so long as the estimated fee for those services does not exceed $30,000. Any services provided under such pre-approval will be reported to the Audit Committee at its next regular meeting. Should the amount of such services exceed $30,000 any additional fees will be subject to pre-approval by the Committee Chair (or any other Committee member on whom this responsibility has been delegated).
Other Non-Audit Services
Certain non-audit services that the independent accountants are legally permitted to render will be subject to pre-approval by the Committee or by one or more Committee members to whom the Committee has delegated this authority and who will report to the full Committee any pre-approval decisions made pursuant to this Policy. Non-audit services presented for pre-approval pursuant to this paragraph will be accompanied by a confirmation from both the Treasurer and the independent accountants that the proposed services will not adversely affect the independence of the independent accountants.
Proscribed Services
The Fund’s independent accountants will not render services in the following categories of non-audit services:
| | Ø | Bookkeeping or other services related to the accounting records or financial statements of the Fund |
| | Ø | Financial information systems design and implementation |
| | Ø | Appraisal or valuation services, fairness opinions, or contribution-in-kind reports |
| | Ø | Internal audit outsourcing services |
| | Ø | Management functions or human resources |
| | Ø | Broker or dealer, investment adviser, or investment banking services |
| | Ø | Legal services and expert services unrelated to the audit |
| | |
Ø | | Any other service that the Public Company Accounting Oversight Board determines, by regulation, is impermissible. |
Pre-approval of Non-Audit Services Provided to Other Entities Within the Prudential Fund Complex
Certain non-audit services provided to Prudential Investments LLC or any of its affiliates that also provide ongoing services to the Prudential Mutual Funds will be subject to pre-approval by the Audit Committee. The only non-audit services provided to these entities that will require pre-approval are those related directly to the operations and financial reporting of the Funds. Individual projects that are not presented to the Audit Committee as part of the annual pre-approval process will be subject to pre-approval by the Committee Chair (or any other Committee member on whom this responsibility has been delegated) so long as the estimated fee for those services does not exceed $30,000. Services presented for pre-approval pursuant to this paragraph will be accompanied by a confirmation from both the Treasurer and the independent accountants that the proposed services will not adversely affect the independence of the independent accountants.
Although the Audit Committee will not pre-approve all services provided to Prudential Investments LLC and its affiliates, the Committee will receive an annual report from the Fund’s independent accounting firm showing the aggregate fees for all services provided to Prudential Investments and its affiliates.
(e) (2) Percentage of services referred to in 4(b) – 4(d) that were approved by the audit committee –
For the fiscal years ended December 31, 2016 and December 31, 2015: none.
(f) Percentage of hours expended attributable to work performed by other than full time employees of principal accountant if greater than 50%.
The percentage of hours expended on the principal accountant’s engagement to audit the registrant’s financial statements for the most recent fiscal year that were attributed to work performed by persons other than the principal accountant’s full-time, permanent employees was 0%.
(g) Non-Audit Fees
The aggregate non-audit fees billed by KPMG for services rendered to the registrant’s investment adviser and any entity controlling, controlled by, or under common control with the investment adviser that provides ongoing services to the registrant for the fiscal years ended December 31, 2016 and December 31, 2015 was $0 and $0, respectively.
(h) Principal Accountant’s Independence
Not applicable as KPMG has not provided non-audit services to the registrant’s investment adviser and any entity controlling, controlled by, or under common control with the investment adviser that provides ongoing services to the registrant that were not pre-approved pursuant to Rule 2-01(c)(7)(ii) of Regulation S-X.
Item 5 – Audit Committee of Listed Registrants – Not applicable.
Item 6 – Schedule of Investments – The schedule is included as part of the report to shareholders filed under Item 1 of this Form.
Item 7 – Disclosure of Proxy Voting Policies and Procedures for Closed-End Management Investment Companies – Not applicable.
Item 8 – Portfolio Managers of Closed-End Management Investment Companies – Not applicable.
Item 9 – Purchases of Equity Securities by Closed-End Management Investment Company and Affiliated Purchasers – Not applicable.
Item 10 – Submission of Matters to a Vote of Security Holders – Not applicable.
Item 11 – Controls and Procedures
| | (a) | It is the conclusion of the registrant’s principal executive officer and principal financial officer that the effectiveness of the registrant’s current disclosure controls and procedures (such disclosure controls and procedures having been evaluated within 90 days of the date of this filing) provide reasonable assurance that the information required to be disclosed by the registrant has been recorded, processed, summarized and reported within the time period specified in the Commission’s rules and forms and that the information required to be disclosed by the registrant has been accumulated and communicated to the registrant’s principal executive officer and principal financial officer in order to allow timely decisions regarding required disclosure. |
| | (b) | There has been no significant change in the registrant’s internal control over financial reporting that occurred during the registrant’s most recent fiscal quarter of the period covered by this report that has materially affected, or is likely to materially affect, the registrant’s internal control over financial reporting. |
| | | | | | |
| Item 12 – Exhibits |
| | | |
| | (a) | | (1) | | Code of Ethics – Attached hereto as Exhibit EX-99.CODE-ETH |
| | | |
| | | | (2) | | Certifications pursuant to Section 302 of the Sarbanes-Oxley Act – Attached hereto as Exhibit EX-99.CERT. |
| | | |
| | | | (3) | | Any written solicitation to purchase securities under Rule 23c-1. – Not applicable. |
| | |
| | (b) | | Certifications pursuant to Section 906 of the Sarbanes-Oxley Act – Attached hereto as Exhibit EX-99.906CERT. |
SIGNATURES
Pursuant to the requirements of the Securities Exchange Act of 1934 and the Investment Company Act of 1940, the registrant has duly caused this report to be signed on its behalf by the undersigned, thereunto duly authorized.
| | |
Registrant: | | Prudential Short-Term Corporate Bond Fund, Inc. |
| | |
| |
By: | | /s/Deborah A. Docs |
| | Deborah A. Docs |
| | Secretary |
| |
Date: | | February 17, 2017 |
Pursuant to the requirements of the Securities Exchange Act of 1934 and the Investment Company Act of 1940, this report has been signed below by the following persons on behalf of the registrant and in the capacities and on the dates indicated.
| | |
By: | | /s/Stuart S. Parker |
| | Stuart S. Parker |
| | President and Principal Executive Officer |
| |
Date: | | February 17, 2017 |
| |
By: | | /s/M. Sadiq Peshimam |
| | M. Sadiq Peshimam |
| | Treasurer and Principal Financial and Accounting Officer |
| |
Date: | | February 17, 2017 |