UNITEDSTATES
SECURITIESANDEXCHANGECOMMISSION
Washington,D.C.20549
FORM N-CSRS
CERTIFIED SHAREHOLDER REPORT OF REGISTERED MANAGEMENT
INVESTMENT COMPANIES
Investment Company Act file number 811-05576
Name of Fund: BlackRock Global Allocation Fund, Inc.
Fund Address: 100 Bellevue Parkway, Wilmington, DE 19809
Name and address of agent for service: Anne F. Ackerley, Chief Executive Officer, BlackRock
Global Allocation Fund, Inc., 55 East 52nd Street, New York, NY 10055.
Registrant’s telephone number, including area code: (800) 441-7762
Date of fiscal year end: 10/31/2010
Date of reporting period: 04/30/2010
Item 1 – Report to Stockholders

BlackRock Global Allocation
Fund, Inc.
SEMI-ANNUAL REPORT
APRIL 30, 2010 I (UNAUDITED)
NOT FDIC INSURED
MAY LOSE VALUE
NO BANK GUARANTEE
| |
| Table of Contents | |
| | Page |
| Dear Shareholder | 3 |
| Semi-Annual Report: | |
| Fund Summary | 4 |
| About Fund Performance | 6 |
| Disclosure of Expenses | 6 |
| Portfolio Information | 7 |
| Financial Statements: | |
| Consolidated Schedule of Investments | 8 |
| Consolidated Statement of Assets and Liabilities | 24 |
| Consolidated Statement of Operations | 25 |
| Consolidated Statements of Changes in Net Assets | 26 |
| Financial Highlights | 27 |
| Notes to Consolidated Financial Statements | 32 |
| Officers and Directors | 42 |
| Additional Information | 43 |
| Mutual Fund Family | 46 |
2 BLACKROCK GLOBAL ALLOCATION FUND, INC.
APRIL 30, 2010
Dear Shareholder
Although overall global economic and financial conditions have generally improved over the past year, the period ended with high levels of market
volatility and diminishing investor confidence sparked by the sovereign debt crisis in Europe, concerns over the strength of the economic recovery
and uncertainty surrounding the future of interest rate policies. Additionally, as the period drew to a close, the increasing likelihood of more stringent
financial market regulations added to the overall sense of investment uncertainty. Despite the uneven nature of recent market conditions, we continue
to believe that the “Great Recession” likely ended at some point last summer, thanks primarily to massive fiscal and monetary stimulus, and that the
global economy remains in recovery mode.
Global equity markets bottomed in early 2009 and since that time have moved unevenly higher as investors were lured back into the markets by
depressed valuations, desire for higher yields and improvements in corporate earnings prospects. There have been several corrections along the way
and volatility levels have remained elevated — reflections of mixed economic data, lingering deflation issues (especially in Europe) and uncertainty
surrounding financial regulations. On balance, however, improving corporate revenues and profits and a positive macro backdrop helped push stock
prices higher over the last twelve and six months. From a geographic perspective, US equities have outpaced their international counterparts in recent
months, as the domestic economic recovery has been more pronounced and as credit-related issues have held European markets down.
Within fixed income markets, yields have been moving unevenly as improving economic conditions have been acting to push Treasury yields higher
(and prices correspondingly lower), while concerns over ongoing deflation threats have acted as a counterweight. As the period drew to a close,
Treasury yields were falling as investors flocked to the “safe haven” asset class in the face of escalating uncertainty. Over the course of the last twelve
and six months, however, Treasuries underperformed other areas of the bond market, particularly the high yield sector, which has been benefiting from
increased investor demand. Meanwhile, municipal bonds slightly outperformed taxable sectors over both the six- and twelve-month periods thanks to
continued high demand levels, but have continued to face the headwinds of ongoing state and local budget problems. As in the taxable arena, high
yield municipals have been outperforming the rest of the market.
Regarding cash investments, yields on money market securities remain near all-time lows (producing returns only marginally above zero percent), with
the Federal Open Market Committee reiterating that economic circumstances are likely to necessitate an accommodative interest rate stance for an
“extended period.”
| | |
| Against this backdrop, the major market averages posted the following returns: | | |
| Total Returns as of April 30, 2010 | 6-month | 12-month |
| US equities (S&P 500 Index) | 15.66% | 38.84% |
| Small cap US equities (Russell 2000 Index) | 28.17 | 48.95 |
| International equities (MSCI Europe, Australasia, Far East Index) | 2.48 | 34.43 |
| 3-month Treasury bill (BofA Merrill Lynch 3-Month Treasury Bill Index) | 0.04 | 0.15 |
| US Treasury securities (BofA Merrill Lynch 10-Year US Treasury Index) | (0.54) | (1.32) |
| Taxable fixed income (Barclays Capital US Aggregate Bond Index) | 2.54 | 8.30 |
| Tax-exempt fixed income (Barclays Capital Municipal Bond Index) | 3.68 | 8.85 |
| High yield bonds (Barclays Capital US Corporate High Yield 2% Issuer Capped Index) | 11.60 | 42.53 |
Past performance is no guarantee of future results. Index performance shown for illustrative purposes only. You cannot invest directly in an index.
Global financial markets continue to show signs of improvement, but questions about the strength and sustainability of the recovery abound. Through
periods of uncertainty, as ever, BlackRock’s full resources are dedicated to the management of our clients’ assets. For additional market perspective
and investment insight, visit www.blackrock.com/shareholdermagazine, where you’ll find the most recent issue of our award-winning Shareholder®
magazine, as well as its quarterly companion newsletter, Shareholder Perspectives. As always, we thank you for entrusting BlackRock with your
investments, and we look forward to your continued partnership in the months and years ahead.

THIS PAGE NOT PART OF YOUR FUND REPORT
3
Fund Summary as of April 30, 2010
Portfolio Management Commentary
How did the Fund perform?
• For the six-month period, the Fund’s Institutional, Investor A, Investor B
and Class R Shares outperformed its Reference Benchmark — which
comprises the S&P 500 Index (36%), FTSE World Index (ex-US) (24%),
BofA Merrill Lynch Current 5-Year US Treasury Index (24%), and Citigroup
Non-US Dollar World Government Bond Index (16%) — while Investor C
Shares performed in line with the benchmark. All share classes trailed
the broad-based all-equity benchmark, the FTSE World Index. The Fund
invests in both equities and bonds; therefore, the Reference Benchmark
provides a truer representation of the Fund’s composition and a more
meaningful comparison.
What factors influenced performance?
• Contributing favorably to the Fund’s performance relative to its Reference
Benchmark were its underweights in Spain, Italy, France and Australia.
The Fund also benefited from its stock selection in Japan and Russia.
From a sector perspective, underweights and stock selection in finan-
cials, consumer staples and utilities; stock selection in health care;
and an overweight in materials all contributed positively.
• In the fixed income portion, the Fund’s overweight in convertible bonds
contributed positively to relative performance.
• Detracting from the Fund’s relative performance was its underweight
and stock selection in the United States, as well as stock selection in
India, United Kingdom, Germany and China. From a sector perspective,
underweights and stock selection in the consumer discretionary and
industrials sectors, as well as an overweight and stock selection in
energy, detracted from relative performance.
Describe recent portfolio activity.
• During the period, the Fund’s overall equity allocation increased from
57% of net assets to 60%. Within equities, increases in the US, Asia,
Africa/Middle East and Latin America were modestly offset by a
decrease in Europe. On a sector basis, the Fund increased its weightings
in materials, information technology, consumer discretionary, financials,
industrials and energy, while reducing its weightings in utilities, consumer
staples, and health care.
• The Fund’s allocation to fixed income remained at 33% of net assets,
as increases in nominal US Treasuries and corporate bonds were offset
by decreases in US TIPS, Japanese government bonds and convertible
bonds. Reflecting the above changes, the Fund’s cash equivalent hold-
ings decreased from 10% of net assets to 7%.
Describe Fund positioning at period end.
• Relative to its Reference Benchmark, the Fund was neutral in equities,
underweight in fixed income and, consequently, overweight in cash
equivalents. Within the equity segment, the Fund was underweight in
Europe and the US, while being overweight in Asia and maintaining an
overweight position in Latin America.
• On a sector basis, the Fund was overweight in materials, telecommunica-
tion services, energy and health care, with underweights in consumer
discretionary, financials, consumer staples, utilities, information technol-
ogy and industrials.
• As for currency exposure, the Fund was underweight in the euro, the
British pound and the Australian dollar. The Fund had overweight posi-
tions in the US dollar, the Brazilian real and the Russian ruble, along
with several Asian currencies, including the Singapore dollar, the
Malaysian ringgit and the Indian rupee.
• The Fund’s period end cash position was 7%. Cash helped mitigate
portfolio volatility, served as a source of funds for new investments and
contributed to reducing the overall portfolio interest rate duration during
the period.
The views expressed reflect the opinions of BlackRock as of the date of this report and are subject to change based on changes in market, economic or other conditions.
These views are not intended to be a forecast of future events and are no guarantee of future results.
Derivative Financial Instruments
The Fund may invest in various derivative instruments, including financial
futures contracts, swaps, options and foreign currency exchange con-
tracts, as specified in Note 2 of the Notes to Consolidated Financials
Statements, which may constitute forms of economic leverage. Such
instruments are used to obtain exposure to a market without owning or
taking physical custody of securities or to hedge market, equity and/or
foreign currency exchange rate risks. Such derivative instruments involve
risks, including the imperfect correlation between the value of a deriva-
tive instrument and the underlying asset, possible default of the coun-
terparty to the transaction or illiquidity of the derivative instrument. The
Fund’s ability to successfully use a derivative instrument depends on the
investment advisor’s ability to accurately predict pertinent market move-
ments, which cannot be assured. The use of derivative instruments may
result in losses greater than if they had not been used, may require the
Fund to sell or purchase portfolio securities at inopportune times or for
distressed values, may limit the amount of appreciation the Fund can
realize on an investment or may cause the Fund to hold a security that it
might otherwise sell. The Fund’s investments in these instruments are
discussed in detail in the Notes to Consolidated Financial Statements.
4 BLACKROCK GLOBAL ALLOCATION FUND, INC.
APRIL 30, 2010
Total Return Based on a $10,000 Investment
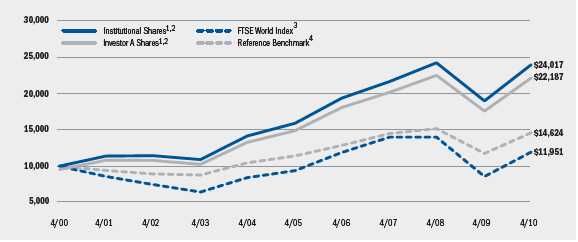
1 Assuming maximum sales charge, transaction costs and other operating expenses, including advisory fees, if any. Institutional Shares do not
have a sales charge.
2 The Fund invests in a portfolio of US and foreign equity securities, debt and money market securities, whose composition varies with respect to
types of securities and markets in response to changing market and economic trends.
3 This unmanaged capitalization-weighted index is comprised of 2,200 equities from 24 countries in 12 regions, including the United States.
4 The Reference Benchmark is an unmanaged weighted index comprised as follows: 36% of the S&P 500 Index; 24% FTSE World Index
(Excluding US); 24% BofA Merrill Lynch Current 5-Year US Treasury Index; and 16% Citigroup Non-US Dollar World Government Bond Index.
Descriptions of these indexes can be found in the footnotes below.
| | | | | | | |
| Performance Summary for the Period Ended April 30, 2010 | | | | | | |
| | | | | Average Annual Total Returns5 | | |
| | | 1 Year | | 5 Years | | 10 Years |
| | 6-Month | w/o sales | w/sales | w/o sales | w/sales | w/o sales | w/sales |
| | Total Returns | charge | charge | charge | charge | charge | charge |
| Institutional | 7.03% | 26.27% | N/A | 8.55% | N/A | 9.16% | N/A |
| Investor A | 6.88 | 25.96 | 19.35% | 8.27 | 7.11% | 8.88 | 8.30% |
| Investor B | 6.47 | 24.93 | 20.43 | 7.40 | 7.10 | 8.20 | 8.20 |
| Investor C | 6.44 | 25.07 | 24.07 | 7.44 | 7.44 | 8.05 | 8.05 |
| Class R | 6.76 | 25.58 | N/A | 7.93 | N/A | 8.62 | N/A |
| FTSE World Index | 9.88 | 39.33 | N/A | 4.95 | N/A | 1.80 | N/A |
| Reference Benchmark | 6.44 | 24.33 | N/A | 5.06 | N/A | 3.87 | N/A |
| US Stocks: S&P 500 Index6 | 15.66 | 38.84 | N/A | 2.63 | N/A | (0.19) | N/A |
| Non-US Stocks: FTSE World Index | | | | | | | |
| (Excluding US)7 | 5.42 | 39.67 | N/A | 6.73 | N/A | 3.78 | N/A |
| US Bonds: BofA Merrill Lynch Current | | | | | | | |
| 5-Year US Treasury Index8 | 1.71 | 2.14 | N/A | 5.40 | N/A | 6.18 | N/A |
| Non-US Bonds: Citigroup Non-US Dollar | | | | | | | |
| World Government Bond Index9 | (5.16) | 6.82 | N/A | 4.20 | N/A | 6.88 | N/A |
5 Assuming maximum sales charges, if any. Average annual total returns with and without sales charges reflect reductions for distribution and service fees. See “About Fund
Performance” on page 6 for a detailed description of share classes, including any related sales charges and fees.
6 This unmanaged index covers 500 industrial, utility, transportation and financial companies of the US markets (mostly New York Stock Exchange (“NYSE”) issues) representing
about 75% of NYSE market capitalization and 30% of NYSE issues.
7 This unmanaged capitalization-weighted index is comprised of 1,630 companies in 28 countries, excluding the United States.
8 This unmanaged index is designed to track the total return of the current coupon five-year U.S. Treasury bond.
9 This unmanaged market capitalization-weighted index tracks 10 government bond indexes, excluding the United States.
N/A — Not applicable as share class and index do not have a sales charge.
Past performance is not indicative of future results.
BLACKROCK GLOBAL ALLOCATION FUND, INC.
APRIL 30, 2010
5
About Fund Performance
• Institutional Shares are not subject to any sales charge. Institutional
Shares bear no ongoing distribution or service fees and are available only
to eligible investors.
• Investor A Shares incur a maximum initial sales charge (front-end load)
of 5.25% and a service fee of 0.25% per year (but no distribution fee).
• Investor B Shares are subject to a maximum contingent deferred sales
charge of 4.50% declining to 0% after six years. In addition, Investor B
Shares are subject to a distribution fee of 0.75% per year and a service
fee of 0.25% per year. These shares automatically convert to Investor A
Shares after approximately eight years. (There is no initial sales charge for
automatic share conversions.) All returns for periods greater than eight
years reflect this conversion. Investor B Shares are only available through
exchanges, dividend reinvestments by existing shareholders or for pur-
chase by certain qualified employee benefit plans.
• Investor C Shares are subject to a 1% contingent deferred sales charge
if redeemed within one year of purchase. In addition, Investor C Shares
are subject to a distribution fee of 0.75% per year and a service fee of
0.25% per year.
• Class R Shares do not incur a maximum initial sales charge (front-end
load) or deferred sales charge. These shares are subject to a distribution
fee of 0.25% per year and a service fee of 0.25% per year. Class R Shares
are available only to certain retirement plans. Prior to January 3, 2003
Class R Share performance results are those of Institutional Shares
(which have no distribution or service fees) restated to reflect Class R
Share fees.
Performance information reflects past performance and does not guaran-
tee future results. Current performance may be lower or higher than the
performance data quoted. Refer to www.blackrock.com/funds to obtain
performance data current to the most recent month-end. Performance
results do not reflect the deduction of taxes that a shareholder would
pay on fund distributions or the redemption of fund shares. The Fund
may charge a 2% redemption fee for sales or exchanges of shares within
30 days of purchase or exchange. Performance data does not reflect this
potential fee. Figures shown in the performance tables on the previous
page assume reinvestment of all dividends and capital gain distributions,
if any, at net asset value on the ex-dividend date. Investment return and
principal value of shares will fluctuate so that shares, when redeemed, may
be worth more or less than their original cost. Dividends paid to each class
of shares will vary because of the different levels of service, distribution
and transfer agency fees applicable to each class, which are deducted
from the income available to be paid to shareholders. The Fund’s invest-
ment advisor waived a portion of its fee. Without such waiver, the Fund’s
returns would have been lower.
Disclosure of Expenses
Shareholders of this Fund may incur the following charges: (a) expenses
related to transactions, including sales charges, redemption fees and
exchange fees; and (b) operating expenses including advisory fees, serv-
ice and distribution fees including 12b-1 fees and other Fund expenses.
The expense example below (which is based on a hypothetical investment
of $1,000 invested on November 1, 2009 and held through April 30,
2010) is intended to assist shareholders both in calculating expenses
based on an investment in the Fund and in comparing these expenses
with similar costs of investing in other mutual funds.
The table below provides information about actual account values and
actual expenses. In order to estimate the expenses a shareholder paid
during the period covered by this report, shareholders can divide their
account value by $1,000 and then multiply the result by the number cor-
responding to their share class under the heading entitled “Expenses Paid
During the Period.”
The table also provides information about hypothetical account values and
hypothetical expenses based on the Fund’s actual expense ratio and an
assumed rate of return of 5% per year before expenses. In order to assist
shareholders in comparing the ongoing expenses of investing in this Fund
and other funds, compare the 5% hypothetical example with the 5% hypo-
thetical examples that appear in other funds’ shareholder reports.
The expenses shown in the table are intended to highlight shareholders’
ongoing costs only and do not reflect any transactional expenses, such as
sales charges, redemption fees or exchange fees. Therefore, the hypotheti-
cal example is useful in comparing ongoing expenses only, and will not
help shareholders determine the relative total expenses of owning differ-
ent funds. If these transactional expenses were included, shareholder
expenses would have been higher.
| | | | | | |
| | | Actual | | | Hypothetical2 | |
| | Beginning | Ending | | Beginning | Ending | |
| | Account Value | Account Value | Expenses Paid | Account Value | Account Value | Expenses Paid |
| | November 1, 2009 | April 30, 2010 | During the Period1 | November 1, 2009 | April 30, 2010 | During the Period1 |
| Institutional | $1,000 | $1,070.30 | $4.11 | $1,000 | $1,020.83 | $4.01 |
| Investor A | $1,000 | $1,068.80 | $5.44 | $1,000 | $1,019.54 | $5.31 |
| Investor B | $1,000 | $1,064.70 | $9.68 | $1,000 | $1,015.43 | $9.44 |
| Investor C | $1,000 | $1,064.40 | $9.32 | $1,000 | $1,015.77 | $9.10 |
| Class R | $1,000 | $1,067.60 | $7.13 | $1,000 | $1,017.91 | $6.95 |
1 For each class of the Fund, expenses are equal to the annualized expense ratio for the class (0.80% for Institutional, 1.06% for Investor A, 1.89% for Investor B, 1.82% for
Investor C and 1.39% for Class R), multiplied by the average account value over the period, multiplied by 181/365 (to reflect the one-half year period shown).
2 Hypothetical 5% annual return before expenses are calculated by pro rating the number of days in the most recent fiscal half year divided by 365.
6 BLACKROCK GLOBAL ALLOCATION FUND, INC.
APRIL 30, 2010
| |
| Portfolio Information as of April 30, 2010 | |
| | Percent of |
| | Long-Term |
| Ten Largest Holdings (Equity Investments) | Investments |
| SPDR Gold Trust | 2% |
| Exxon Mobil Corp. | 1 |
| Microsoft Corp. | 1 |
| Petroleo Brasileiro SA — ADR | 1 |
| Bristol-Myers Squibb Co. | 1 |
| Apple, Inc. | 1 |
| International Business Machines Corp. | 1 |
| General Electric Co. | 1 |
| JPMorgan Chase & Co. | 1 |
| Wells Fargo & Co. | 1 |
| |
| | Percent of |
| | Long-Term |
| Geographic Allocation | Investments |
| United States | 55% |
| Japan | 8 |
| Canada | 4 |
| Brazil | 4 |
| Germany | 4 |
| United Kingdom | 3 |
| Singapore | 2 |
| China | 2 |
| South Korea | 2 |
| India | 2 |
| Malaysia | 2 |
| Russia | 2 |
| Other1 | 10 |
1 Other includes a 1% holding in each of the following countries: Hong Kong,
Luxembourg, Australia, Switzerland, Taiwan, France, United Arab Emirates,
Kazakhstan, Turkey and Mexico.
| | | |
| Overall Asset Exposure | | | |
| | Percent of Fund’s Net Assets | Reference Benchmark5 |
| | 4/30/10 | 10/31/09 | Percentages |
| US Equities | 322% | 30%2 | 36% |
| European Equities | 82 | 82 | 13 |
| Pacific Basin Equities | 122 | 132 | 8 |
| Other Equities | 8 | 6 | 3 |
| Total Equities | 603 | 573 | 60 |
| US Dollar Denominated Fixed Income Securities | 23 | 21 | 24 |
| US Issuers | 19 | 18 | — |
| Non-US Issuers | 4 | 3 | — |
| Non-US Dollar Denominated Fixed Income Securities | 10 | 12 | 16 |
| Total Fixed Income Securities | 33 | 33 | 40 |
| Cash & Short-Term Securities4 | 7 | 10 | — |
2 Includes value of financial futures contracts.
3 Includes Preferred Stock.
4 Cash & Short-Term Securities are reduced by the market (or nominal) value of long financial futures contracts.
5 The Reference Benchmark is an unmanaged weighted index comprised as follows: 36% of the S&P 500 Index; 24% FTSE World Index (Excluding US) Equities; 24% BofA
Merrill Lynch 5-Year US Treasury Bond Index; and 16% Citigroup World Government Bond Index (Excluding US). Descriptions of these indexes are found on page 5 of this
report to shareholders in the “Performance Summary” section.
BLACKROCK GLOBAL ALLOCATION FUND, INC.
APRIL 30, 2010
7
Consolidated Schedule of Investments April 30, 2010 (Unaudited)
(Percentages shown are based on Net Assets)
| | |
| Common Stocks | Shares | Value |
| Australia — 0.7% | | |
| BHP Billiton Ltd. | 3,557,951 | $ 130,065,328 |
| CSL Ltd. | 1,319,134 | 39,417,561 |
| Newcrest Mining Ltd. | 713,422 | 21,535,142 |
| Rio Tinto Ltd. | 304,357 | 19,886,731 |
| Telstra Corp. Ltd. | 7,614,267 | 22,308,977 |
| Woodside Petroleum Ltd. | 1,016,416 | 42,150,074 |
| | | 275,363,813 |
| Austria — 0.0% | | |
| Telekom Austria AG | 715,944 | 9,510,556 |
| Belgium — 0.1% | | |
| RHJ International (a) | 4,018,600 | 34,363,368 |
| RHJ International — ADR (a)(b) | 899,200 | 7,710,233 |
| | | 42,073,601 |
| Brazil — 2.3% | | |
| All America Latina Logistica SA | 1,967,160 | 17,597,778 |
| Banco Itau Holding Financeira SA | | |
| (Preference Shares) | 1,883,300 | 40,824,245 |
| Banco Santander Brasil SA | 1,605,400 | 18,573,044 |
| Cia Brasileira de Distribuicao Grupo Pao | | |
| de Acucar (Preference Shares) | 2,075,269 | 70,630,182 |
| Cia Energetica de Minas Gerais — ADR | 750,253 | 12,116,583 |
| Cosan Ltd. (a) | 3,326,600 | 35,328,492 |
| Cyrela Brazil Realty SA | 4,140,400 | 49,663,363 |
| Hypermarcas SA (a) | 7,636,800 | 104,606,477 |
| Mrv Engenharia e Participacoes SA | 3,671,300 | 25,703,852 |
| NET Servicos de Comunicacao SA (Preference | | |
| Shares) (a) | 1,683,600 | 19,884,544 |
| Petroleo Brasileiro SA — ADR | 8,656,500 | 328,427,610 |
| Petroleo Brasileiro SA — ADR | 750,410 | 31,839,896 |
| SLC Agricola SA | 3,248,300 | 30,497,487 |
| Usinas Siderurgicas de Minas Gerais SA | | |
| (Preference ‘A’ Shares) | 435,800 | 14,242,944 |
| Vale SA, Class A (Preference Shares) | 2,430,800 | 65,222,213 |
| Vivo Participacoes SA — ADR | 2,591,075 | 68,585,755 |
| | | 933,744,465 |
| Canada — 2.9% | | |
| Agrium, Inc. | 364,300 | 22,735,963 |
| Alamos Gold, Inc. | 2,562,000 | 38,059,244 |
| BCE, Inc. | 101,700 | 3,061,170 |
| Barrick Gold Corp. | 2,943,340 | 128,182,457 |
| Canadian Natural Resources Ltd. | 680,300 | 52,342,282 |
| Canadian Pacific Railway Ltd. | 617,326 | 36,335,808 |
| Canadian Pacific Railway Ltd. | 661,729 | 39,008,006 |
| Cenovus Energy, Inc. | 40,400 | 1,183,720 |
| Daylight Resources Trust | 3,433,600 | 37,858,161 |
| Eldorado Gold Corp. | 4,464,700 | 68,565,977 |
| EnCana Corp. | 40,400 | 1,336,028 |
| Goldcorp, Inc. | 3,480,600 | 150,466,338 |
| Golden Star Resources Ltd. (a) | 1,480,500 | 6,718,946 |
| IAMGOLD Corp. | 7,032,948 | 125,678,781 |
| | |
| Common Stocks | Shares | Value |
| Canada (concluded) | | |
| IAMGOLD, International African Mining Gold Corp. | 1,938,829 | $ 34,699,657 |
| Kinross Gold Corp. | 1,847,839 | 35,053,506 |
| Kinross Gold Corp. | 6,757,794 | 129,062,024 |
| New Gold, Inc. (a) | 345,500 | 2,023,750 |
| Potash Corp. of Saskatchewan, Inc. | 162,700 | 17,978,350 |
| Rogers Communications, Inc., Class B | 887,700 | 31,610,997 |
| Silver Wheaton Corp. (a) | 1,269,800 | 24,786,496 |
| Sino-Forest Corp. (a) | 2,458,600 | 43,711,672 |
| Suncor Energy, Inc. | 740,900 | 25,345,811 |
| TELUS Corp. | 327,200 | 12,104,918 |
| Talisman Energy, Inc. | 222,100 | 3,780,379 |
| Thomson Reuters Corp. | 46,900 | 1,682,772 |
| Vittera, Inc. (a) | 987,000 | 8,356,172 |
| Yamaha Gold, Inc. | 10,223,247 | 111,612,334 |
| | | 1,193,341,719 |
| Chile — 0.1% | | |
| Banco Santander Chile SA — ADR | 280,900 | 18,508,501 |
| Sociedad Quimica y Minera de Chile SA (c) | 419,900 | 15,116,400 |
| | | 33,624,901 |
| China — 1.5% | | |
| Beijing Enterprises Holdings Ltd. | 18,294,400 | 117,864,252 |
| Chaoda Modern Agriculture Holdings Ltd. | 68,410,408 | 78,214,153 |
| China BlueChemical Ltd. | 24,318,000 | 15,035,419 |
| China Communications Services Corp. Ltd. | 363,600 | 182,557 |
| China Huiyan Juice Group Ltd. | 5,886,000 | 4,471,765 |
| China Life Insurance Co. Ltd. | 6,459,100 | 29,740,902 |
| China Life Insurance Co. Ltd. — ADR | 448,966 | 30,345,612 |
| China Mobile Ltd. | 5,823,500 | 57,006,512 |
| China Pacific Insurance Group Co. Ltd. | 2,842,100 | 11,878,460 |
| China Shenhua Energy Co. Ltd., Class H | 13,222,000 | 56,737,188 |
| China South Locomotive and Rolling Corp. | 9,394,800 | 7,074,384 |
| China Telecom Corp., Ltd. | 31,090,700 | 14,264,111 |
| China Unicom Ltd. | 6,974,200 | 8,686,952 |
| Denway Motors Ltd. | 35,777,000 | 21,012,361 |
| Dongfeng Motor Group Co. Ltd. | 2,708,300 | 3,846,458 |
| Guangshen Railway Co. Ltd. | 37,814,700 | 14,700,831 |
| Jiangsu Express | 3,231,500 | 3,034,221 |
| Ping An Insurance Group Co. of China Ltd. | 1,910,800 | 16,358,070 |
| Shanghai Industrial Holdings Ltd. | 1,348,900 | 5,827,902 |
| Tianjin Development Holdings Ltd. (d) | 78,266,800 | 49,162,740 |
| Tianjin Port Development Holdings Ltd. | 124,907,400 | 35,127,398 |
| Xiamen International Port Co. Ltd. | 35,751,900 | 6,698,422 |
| Yanzhou Coal Mining Co. Ltd. | 296 | 823 |
| Zhongsheng Group Holdings Ltd. (a) | 5,925,800 | 8,242,839 |
| | | 595,514,332 |
| Egypt — 0.1% | | |
| Telecom Egypt | 10,449,481 | 34,719,873 |
| Finland — 0.0% | | |
| Fortum Oyj | 437,475 | 11,304,028 |
| | | | | | | |
| Portfolio Abbreviations | | | | | | |
| To simplify the listings of portfolio holdings in the | BRL | Brazilian Real | HOLDRS | Holding Company | SGD | Singapore Dollar |
| Consolidated Schedule of Investments, the names | CAD | Canadian Dollar | | Depositary Receipts | SPDR | Standard & Poor’s |
| and descriptions of many of the securities have | CHF | Swiss Frank | JPY | Japanese Yen | | Depositary Receipts |
| been abbreviated according to the following list: | CNY | Chinese Yuan | KRW | South Korean Won | THB | Thai Baht |
| | | ETF | Exchange-Traded Fund | MSCI | Morgan Stanley Capital | TRY | Turkish Lira |
| ADR | American Depositary Receipts | EUR | Euro | | International | TWD | Taiwan Dollar |
| AUD | Australian Dollar | GBP | British Pound | MYR | Malaysian Ringgit | USD | US Dollar |
| | | GDR | Global Depositary Receipts | NZD | New Zealand Dollar | ZAR | South African Rand |
| See Notes to Consolidated Financial Statements. | HKD | Hong Kong Dollar | PLN | Polish Zloty | | |
8 BLACKROCK GLOBAL ALLOCATION FUND, INC.
APRIL 30, 2010
Consolidated Schedule of Investments (continued)
(Percentages shown are based on Net Assets)
| | |
| Common Stocks | Shares | Value |
| France — 0.5% | | |
| AXA SA | 580,758 | $ 11,541,075 |
| AXA SA — ADR | 32,800 | 628,448 |
| Cie Generale d’Optique Essilor International SA | 984,960 | 60,043,089 |
| France Telecom SA | 2,320,680 | 50,803,596 |
| Sanofi-Aventis | 215,400 | 14,694,290 |
| Sanofi-Aventis — ADR | 31,400 | 1,071,054 |
| Thales SA | 267,700 | 9,969,496 |
| Total SA | 920,893 | 50,103,376 |
| | | 198,854,424 |
| Germany — 0.1% | | |
| Allianz AG, Registered Shares | 105,590 | 12,105,382 |
| Bayer AG | 343,935 | 21,969,596 |
| Bayer AG — ADR | 12,200 | 758,840 |
| Bayerische Motoren Werke AG | 134,420 | 6,648,018 |
| | | 41,481,836 |
| Hong Kong — 0.6% | | |
| Cheung Kong Holdings Ltd. | 2,304,700 | 28,421,219 |
| Cheung Kong Infrastructure Holdings Ltd. | 4,441,400 | 16,584,770 |
| China Dongxiang Group Co. | 22,262,700 | 15,110,984 |
| HSBC Holdings Plc, Hong Kong Registered | 2,372,000 | 24,222,327 |
| Hutchison Whampoa Ltd. | 4,021,397 | 27,599,269 |
| The Link Real Estate Investment Trust | 23,389,200 | 57,379,854 |
| Ports Design Ltd. | 90,500 | 221,608 |
| Shougang Concord International | | |
| Enterprises Co. Ltd. | 41,337,400 | 7,469,514 |
| Sinopharm Group Co. | 4,019,300 | 18,115,371 |
| Wharf Holdings Ltd. | 5,316,575 | 28,753,691 |
| | | 223,878,607 |
| India — 0.6% | | |
| Adani Power Ltd. (a) | 9,496,989 | 26,571,177 |
| Bharat Heavy Electricals Ltd. | 980,000 | 54,661,630 |
| Container Corp. of India | 302,200 | 8,802,105 |
| Hindustan Lever Ltd. | 2,534,200 | 13,668,849 |
| Housing Development Finance Corp. | 335,000 | 21,086,292 |
| Larsen & Toubro Ltd. | 687,300 | 24,820,939 |
| Reliance Industries Ltd. | 2,677,800 | 61,923,629 |
| State Bank of India Ltd. | 945,000 | 48,672,310 |
| | | 260,206,931 |
| Indonesia — 0.1% | | |
| Bumi Resources Tbk PT | 92,172,233 | 23,655,093 |
| Telekomunikasi Indonesia Tbk PT | 38,580,400 | 33,306,330 |
| | | 56,961,423 |
| Ireland — 0.1% | | |
| Accenture Plc | 62,700 | 2,736,228 |
| Covidien Plc | 611,425 | 29,342,286 |
| Ingersoll-Rand Plc | 80,900 | 2,991,682 |
| Warner Chilcott Plc, Class A (a) | 99,900 | 2,833,164 |
| | | 37,903,360 |
| Israel — 0.2% | | |
| AFI Development Plc — GDR (a) | 2,841,706 | 5,967,583 |
| Teva Pharmaceutical Industries Ltd. — ADR | 1,245,300 | 73,136,469 |
| | | 79,104,052 |
| Italy — 0.0% | | |
| Assicurazioni Generali SpA | 254,900 | 5,380,431 |
| Intesa Sanpaolo SpA | 3,624,100 | 11,944,743 |
| | | 17,325,174 |
| | |
| Common Stocks | Shares | Value |
| Japan — 6.1% | | |
| Astellas Pharma, Inc. | 588,200 | $ 20,595,786 |
| The Bank of Kyoto Ltd. | 2,206,500 | 19,387,252 |
| Canon, Inc. | 1,507,900 | 68,976,315 |
| Coca-Cola Central Japan Co., Ltd. | 605,107 | 7,805,265 |
| Coca-Cola West Holdings Co., Ltd. | 1,801,300 | 31,869,627 |
| Daihatsu Motor Co., Ltd. | 1,448,400 | 13,966,810 |
| Daikin Industries Ltd. | 140,300 | 5,290,750 |
| Daiwa House Industry Co., Ltd. | 2,185,600 | 23,516,434 |
| Denso Corp. | 881,400 | 25,722,072 |
| East Japan Railway Co. | 1,070,394 | 71,602,723 |
| Fanuc Ltd. | 200,900 | 23,723,452 |
| Fuji Heavy Industries Ltd. | 5,679,500 | 31,786,622 |
| Fujitsu Ltd. | 1,332,100 | 9,367,279 |
| Futaba Industrial Co., Ltd. | 1,795,900 | 14,509,992 |
| Hitachi Chemical Co., Ltd. | 1,286,100 | 27,930,721 |
| Hokkaido Coca-Cola Bottling Co., Ltd. | 514,300 | 2,565,825 |
| Honda Motor Co., Ltd. | 1,272,700 | 43,065,055 |
| Hoya Corp. | 2,212,900 | 61,206,527 |
| JGC Corp. | 2,433,700 | 42,023,272 |
| KDDI Corp. | 14,845 | 71,575,529 |
| Kinden Corp. | 1,864,500 | 16,545,393 |
| Kirin Holdings Co., Ltd. | 3,299,900 | 47,276,858 |
| Kubota Corp. | 7,774,500 | 68,285,235 |
| Kuraray Co., Ltd. | 1,552,400 | 20,322,527 |
| Kyowa Hakko Kirin Co. Ltd. | 2,045,700 | 21,464,768 |
| Mikuni Coca-Cola Bottling Co., Ltd. | 1,376,800 | 10,914,259 |
| Mitsubishi Corp. | 5,258,700 | 124,567,542 |
| Mitsubishi Tanabe Pharma Corp. | 994,900 | 13,163,423 |
| Mitsubishi UFJ Financial Group, Inc. | 8,675,400 | 45,207,808 |
| Mitsui & Co., Ltd. | 5,716,100 | 85,907,812 |
| Mitsui OSK Lines Ltd. | 3,085,800 | 23,069,999 |
| Mitsui Sumitomo Insurance Group Holdings, Inc. | 4,039,820 | 116,114,760 |
| Murata Manufacturing Co., Ltd. | 659,600 | 39,034,241 |
| NGK Insulators Ltd. | 785,300 | 15,476,670 |
| NKSJ Holdings, Inc. (a) | 8,096,670 | 58,784,574 |
| NTT DoCoMo, Inc. | 76,513 | 119,038,309 |
| NTT Urban Development Co. | 11,600 | 11,254,497 |
| Nintendo Co., Ltd. | 77,700 | 26,101,564 |
| Nippon Electric Glass Co. | 564,700 | 8,611,307 |
| Nippon Telegraph & Telephone Corp. | 974,000 | 39,645,282 |
| Nomura Holdings, Inc. | 3,999,900 | 27,647,766 |
| Okumura Corp. | 6,032,300 | 20,514,122 |
| Rinnai Corp. | 285,400 | 13,997,097 |
| Rohm Co., Ltd. | 401,400 | 29,747,767 |
| Sekisui House Ltd. | 5,630,400 | 53,669,384 |
| Seven & I Holdings Co., Ltd. | 2,586,600 | 66,142,190 |
| Shimachu Co., Ltd. | 326,400 | 6,787,147 |
| Shin-Etsu Chemical Co., Ltd. | 1,764,000 | 101,686,780 |
| Shionogi & Co., Ltd. | 1,205,600 | 21,763,368 |
| Sony Corp. — ADR | 73,100 | 2,501,482 |
| Sony Financial Holdings, Inc. | 2,855 | 10,296,345 |
| Sumitomo Chemical Co., Ltd. | 23,989,500 | 113,358,247 |
| Sumitomo Electric Industries Ltd. | 773,900 | 9,523,577 |
| Sumitomo Mitsui Financial Group, Inc. | 989,800 | 32,734,511 |
| Suzuki Motor Corp. | 3,635,800 | 76,423,647 |
| TDK Corp. | 342,400 | 21,913,840 |
| Tadano Ltd. | 623,100 | 3,365,426 |
| Terumo Corp. | 256,900 | 13,087,886 |
| Toda Corp. | 5,426,500 | 19,648,925 |
| Toho Co., Ltd. | 1,490,300 | 25,694,756 |
| Tokio Marine Holdings, Inc. | 4,307,700 | 128,242,894 |
| Tokyo Gas Co., Ltd. | 11,253,900 | 47,824,076 |
| Toyota Industries Corp. | 2,132,930 | 62,238,986 |
See Notes to Consolidated Financial Statements.
BLACKROCK GLOBAL ALLOCATION FUND, INC.
APRIL 30, 2010
9
Consolidated Schedule of Investments (continued)
(Percentages shown are based on Net Assets)
| | |
| Common Stocks | Shares | Value |
| Japan (concluded) | | |
| Toyota Motor Corp. | 949,900 | $ 36,702,199 |
| Ube Industries Ltd. | 9,213,400 | 23,288,046 |
| West Japan Railway Co. | 6,570 | 23,880,771 |
| | | 2,519,955,371 |
| Kazakhstan — 0.2% | | |
| KazMunaiGas Exploration Production — GDR | 3,335,200 | 82,045,920 |
| Luxembourg — 0.0% | | |
| Millicom International Cellular SA | 35,400 | 3,125,112 |
| Malaysia — 0.4% | | |
| Axiata Group Bhd (a) | 8,327,900 | 10,143,130 |
| British American Tobacco Malaysia Bhd | 1,116,300 | 15,364,722 |
| Genting Malaysia Bhd | 4,962,588 | 4,479,952 |
| IOI Corp. Bhd | 5,300,199 | 8,996,292 |
| PLUS Expressways Bhd | 28,203,461 | 30,336,343 |
| Telekom Malaysia Bhd | 5,774,000 | 6,266,644 |
| Tenaga Nasional Bhd | 9,129,244 | 24,266,672 |
| YTL Power International | 72,118,280 | 49,439,088 |
| | | 149,292,843 |
| Mexico — 0.2% | | |
| America Movil, SA de CV — ADR | 1,138,800 | 58,625,424 |
| Fomento Economico Mexicano, SA de CV — ADR | 275,400 | 13,034,682 |
| | | 71,660,106 |
| Netherlands — 0.1% | | |
| Koninklijke KPN NV | 1,413,691 | 21,209,601 |
| Koninklijke Philips Electronics NV | 745,000 | 25,016,484 |
| Koninklijke Philips Electronics NV, New York | | |
| Registered Shares | 156,000 | 5,201,040 |
| Unilever NV — ADR | 263,800 | 7,982,588 |
| | | 59,409,713 |
| Norway — 0.1% | | |
| DnB NOR ASA | 351,900 | 4,164,778 |
| Statoil ASA | 1,386,700 | 33,530,008 |
| | | 37,694,786 |
| Philippines — 0.0% | | |
| First Gen Corp. (a) | 1,836,047 | 417,546 |
| Philippine Long Distance Telephone Co. — ADR | 317,200 | 17,839,328 |
| | | 18,256,874 |
| Russia — 1.2% | | |
| Kuzbassrazrezugol (a) | 48,029,996 | 24,014,998 |
| LSR Group OJCS — GDR | 6,813,100 | 58,252,005 |
| MMC Norilsk Nickel — ADR | 2,810,574 | 53,963,021 |
| Novorossiysk Commercial Sea Port — GDR | 4,994,420 | 67,424,670 |
| OAO Rosnft Oil Co. — GDR | 1,978,400 | 16,044,824 |
| Polyus Gold Co. ZAO — ADR | 2,815,642 | 70,081,329 |
| RusHydro — ADR (a) | 19,330,960 | 112,119,568 |
| Sberbank | 25,942,300 | 70,044,210 |
| Surgutneftegaz — ADR | 1,404,700 | 13,428,932 |
| Uralkali — GDR | 87,200 | 1,879,160 |
| VimpelCom Ltd. — ADR (a) | 2,261,700 | 39,398,814 |
| | | 526,651,531 |
| Singapore — 0.8% | | |
| CapitaLand Ltd. | 1,089,100 | 2,941,903 |
| DBS Group Holdings Ltd. | 1,950,000 | 21,471,435 |
| Fraser and Neave Ltd. | 8,636,300 | 30,687,669 |
| Keppel Corp. Ltd. | 6,983,500 | 49,551,215 |
| MobileOne Ltd. | 10,659,700 | 16,535,433 |
| Noble Group Ltd. | 5,019,217 | 10,886,119 |
| | |
| Common Stocks | Shares | Value |
| Singapore (concluded) | | |
| Oversea-Chinese Banking Corp. | 8,213,100 | $ 52,160,605 |
| Parkway Holdings Ltd. | 13,622,885 | 33,345,490 |
| Parkway Life Real Estate Investment Trust | 444,195 | 428,966 |
| Sembcorp Marine Ltd. | 4,569,000 | 13,981,265 |
| Singapore Press Holdings Ltd. | 4,836,300 | 14,445,537 |
| Singapore Telecommunications Ltd. | 22,502,010 | 49,634,622 |
| United Overseas Bank Ltd. | 1,100,000 | 16,092,916 |
| | | 312,163,175 |
| South Africa — 0.1% | | |
| Anglo Platinum Ltd. | 86,098 | 9,343,323 |
| Gold Fields Ltd. — ADR | 552,700 | 7,428,288 |
| Impala Platinum Holdings Ltd. | 306,000 | 8,627,695 |
| Katanga Mining Ltd. (a) | 4,941,133 | 5,837,133 |
| Sasol Ltd. | 150,000 | 6,069,300 |
| | | 37,305,739 |
| South Korea — 0.9% | | |
| Cheil Industries, Inc. | 291,511 | 20,897,005 |
| KT Corp. — ADR | 2,190,500 | 49,505,300 |
| KT&G Corp. | 671,400 | 33,922,858 |
| Korean Reinsurance Co. | 332,322 | 2,897,836 |
| LG Corp. | 318,800 | 21,737,202 |
| LG Display Co. Ltd. | 628,500 | 26,729,144 |
| LS Corp. | 301,800 | 24,615,169 |
| Meritz Fire & Marine Insurance Co. Ltd. | 335,766 | 2,173,605 |
| POSCO | 58,830 | 26,381,335 |
| POSCO — ADR | 257,300 | 28,858,768 |
| Paradise Co. Ltd. | 1,984,226 | 5,775,022 |
| SK Telecom Co., Ltd. | 257,970 | 40,258,810 |
| Samsung Electronics Co., Ltd. | 104,900 | 79,759,545 |
| Samsung Fine Chemicals Co., Ltd. | 486,600 | 23,285,962 |
| | | 386,797,561 |
| Spain — 0.1% | | |
| Iberdrola Renovables | 1,298,100 | 5,032,508 |
| Telefonica SA | 1,345,573 | 30,457,379 |
| Telefonica SA — ADR (c) | 184,398 | 12,498,496 |
| | | 47,988,383 |
| Switzerland — 0.8% | | |
| Credit Suisse Group AG | 81,300 | 3,715,410 |
| Credit Suisse Group AG | 558,640 | 25,640,332 |
| Nestle SA, Registered Shares | 2,047,063 | 100,164,672 |
| Noble Corp. | 65,600 | 2,590,544 |
| Novartis AG, Registered Shares | 703,485 | 35,867,011 |
| Roche Holding AG | 244,915 | 38,669,430 |
| Transocean Ltd. (a) | 470,100 | 34,058,745 |
| Tyco Electronics Ltd. | 330,794 | 10,625,103 |
| Tyco International Ltd. | 324,946 | 12,604,656 |
| UBS AG | 1,809,100 | 28,026,905 |
| Weatherford International Ltd. (a) | 1,102,800 | 19,971,708 |
| Zurich Financial Services AG | 125,469 | 27,815,829 |
| | | 339,750,345 |
| Taiwan — 0.8% | | |
| Asustek Computer, Inc. | 7,539,646 | 14,538,119 |
| Catcher Technology Co. Ltd. | 2,314,400 | 6,105,943 |
| Cheng Shin Rubber Industry Co. Ltd. | 5,093,000 | 10,946,212 |
| Chunghwa Telecom Co., Ltd. | 10,994,967 | 21,584,180 |
| Chunghwa Telecom Co., Ltd. — ADR | 2,287,159 | 44,645,344 |
| Compal Electronics, Inc. | 5,328,000 | 7,404,766 |
| Delta Electronics, Inc. | 12,761,011 | 42,299,597 |
| Far EasTone Telecommunications Co., Ltd. | 15,692,000 | 19,099,023 |
| HON HAI Precision Industry Co., Ltd. | 5,339,375 | 25,065,846 |
See Notes to Consolidated Financial Statements.
10 BLACKROCK GLOBAL ALLOCATION FUND, INC.
APRIL 30, 2010
Consolidated Schedule of Investments (continued)
(Percentages shown are based on Net Assets)
| | |
| Common Stocks | Shares | Value |
| Taiwan (concluded) | | |
| HTC Corp. | 3,397,950 | $ 45,531,416 |
| MediaTek, Inc. | 1,118,000 | 18,930,022 |
| Taiwan Cement Corp. | 24,323,534 | 21,857,968 |
| Taiwan Semiconductor Manufacturing Co., Ltd. | 20,548,824 | 40,216,107 |
| | | 318,224,543 |
| Thailand — 0.2% | | |
| Hana Microelectronics Pcl | 10,790,310 | 7,937,239 |
| PTT Chemical PCL | 2,151,660 | 6,882,918 |
| PTT Public Company THB10 | 3,289,870 | 26,131,868 |
| Siam Commercial Bank Pcl | 12,829,483 | 32,514,839 |
| | | 73,466,864 |
| Turkey — 0.3% | | |
| BIM Birlesik Magazalar AS | 431,400 | 24,113,335 |
| Tupas Turkiye Petrol Rafine | 1,048,300 | 23,305,834 |
| Turk Telekomunikasyon AS | 5,908,400 | 22,028,497 |
| Turkcell Iletisim Hizmet AS | 2,541,700 | 16,473,914 |
| Turkiye Garanti Bankasi AS | 7,562,400 | 36,636,287 |
| | | 122,557,867 |
| United Kingdom — 1.5% | | |
| Anglo American Plc (a) | 1,353,100 | 57,474,183 |
| Antofagasta Plc | 1,623,800 | 24,619,875 |
| AstraZeneca Group Plc — ADR (c) | 96,100 | 4,250,503 |
| BG Group Plc | 1,210,900 | 20,467,478 |
| BP Plc | 5,703,291 | 49,743,741 |
| BP Plc — ADR | 178,800 | 9,324,420 |
| British American Tobacco Plc | 688,343 | 21,644,790 |
| Diageo Plc — ADR | 1,333,400 | 90,857,876 |
| Ensco International Plc — ADR | 68,700 | 3,241,266 |
| Guinness Peat Group Plc | 31,656,001 | 20,162,927 |
| HSBC Holdings Plc | 9,466,600 | 96,393,251 |
| HSBC Holdings Plc — ADR | 492,200 | 25,048,058 |
| Lloyds TSB Group Plc | 37,602,306 | 37,621,021 |
| Prudential Plc | 734,700 | 6,450,250 |
| Royal Dutch Shell Plc — ADR | 334,516 | 20,990,879 |
| Shire Pharmaceuticals Plc — ADR | 32,200 | 2,120,048 |
| Standard Chartered Plc | 873,407 | 23,297,785 |
| Unilever Plc | 663,206 | 19,929,522 |
| Unilever Plc — ADR | 414,100 | 12,464,410 |
| Vodafone Group Plc | 22,040,961 | 48,839,726 |
| Vodafone Group Plc — ADR | 1,470,386 | 32,642,569 |
| | | 627,584,578 |
| United States — 28.9% | | |
| 3M Co. | 754,900 | 66,936,983 |
| ACE Ltd. | 2,095,400 | 111,454,326 |
| The AES Corp. (a) | 164,000 | 1,892,560 |
| AOL, Inc. (a) | 51,803 | 1,210,118 |
| AT&T, Inc. | 9,383,570 | 244,535,834 |
| Abbott Laboratories | 1,919,400 | 98,196,504 |
| Advance Auto Parts, Inc. | 65,800 | 2,967,580 |
| Advanced Micro Devices, Inc. (a) | 2,280,000 | 20,656,800 |
| Aetna, Inc. | 2,100,400 | 62,066,820 |
| Alliance Resource Partners LP | 395,462 | 19,164,089 |
| The Allstate Corp. | 484,300 | 15,822,081 |
| Altria Group, Inc. | 1,860,300 | 39,419,757 |
| Amdocs Ltd. (a) | 96,200 | 3,072,628 |
| American Commercial Lines, Inc. (a)(d) | 705,245 | 14,386,998 |
| American Tower Corp., Class A (a) | 301,700 | 12,312,377 |
| American Water Works Co, Inc. | 434,200 | 9,456,876 |
| AmerisourceBergen Corp. | 663,700 | 20,475,145 |
| Amgen, Inc. (a) | 920,900 | 52,822,824 |
| | |
| Common Stocks | Shares | Value |
| United States (continued) | | |
| Amphenol Corp., Class A | 127,800 | $ 5,905,638 |
| Anadarko Petroleum Corp. | 915,800 | 56,926,128 |
| Analog Devices, Inc. | 222,800 | 6,668,404 |
| Apache Corp. | 575,100 | 58,522,176 |
| Apple, Inc. (a) | 1,095,300 | 286,004,736 |
| Arch Capital Group Ltd. (a) | 301,000 | 22,749,580 |
| Ascent Media Corp., Class A (a) | 3,255 | 96,088 |
| Axis Capital Holdings Ltd. | 19,200 | 598,464 |
| BMC Software, Inc. (a) | 140,500 | 5,530,080 |
| Bank of America Corp. | 12,528,016 | 223,374,525 |
| The Bank of New York Mellon Corp. | 3,967,448 | 123,506,656 |
| Baxter International, Inc. | 343,085 | 16,200,474 |
| Biogen Idec, Inc. (a) | 51,200 | 2,726,400 |
| Boeing Co. | 1,264,700 | 91,602,221 |
| Boston Scientific Corp. (a) | 2,639,200 | 18,157,696 |
| Bristol-Myers Squibb Co. | 11,621,477 | 293,907,153 |
| Broadcom Corp., Class A | 428,600 | 14,782,414 |
| Bunge Ltd. | 604,149 | 31,989,690 |
| CA, Inc. | 3,130,400 | 71,404,424 |
| CF Industries Holdings, Inc. | 721,300 | 60,351,171 |
| CMS Energy Corp. | 702,100 | 11,416,146 |
| CNA Financial Corp. (a) | 15,700 | 441,484 |
| CVS Caremark Corp. | 1,438,000 | 53,105,340 |
| Cablevision Systems Corp., Class A | 121,300 | 3,328,472 |
| Capital One Financial Corp. | 70,000 | 3,038,700 |
| Cardinal Health, Inc. | 82,800 | 2,872,332 |
| CareFusion Corp. (a) | 107,000 | 2,951,060 |
| CenturyTel, Inc. | 585,849 | 19,983,309 |
| Cephalon, Inc. (a) | 41,700 | 2,677,140 |
| Check Point Software Technologies Ltd. (a) | 83,800 | 2,984,956 |
| Chesapeake Energy Corp. | 771,500 | 18,361,700 |
| Chevron Corp. | 2,765,850 | 225,250,824 |
| Chubb Corp. | 783,900 | 41,444,793 |
| Cigna Corp. | 883,500 | 28,325,010 |
| Cisco Systems, Inc. (a) | 5,370,817 | 144,582,394 |
| Citigroup, Inc. (a)(c) | 27,728,523 | 121,173,646 |
| The Coca-Cola Co. | 553,400 | 29,579,230 |
| Cognizant Technology Solutions Corp. (a) | 219,300 | 11,223,774 |
| Colgate-Palmolive Co. | 650,800 | 54,732,280 |
| Comcast Corp., Class A | 6,232,163 | 123,022,898 |
| Comerica, Inc. | 83,200 | 3,494,400 |
| Complete Production Services, Inc. (a) | 1,257,600 | 18,977,184 |
| Computer Sciences Corp. (a) | 191,150 | 10,014,349 |
| Comverse Technology, Inc. (a) | 2,528,350 | 23,210,253 |
| ConAgra Foods, Inc. | 569,225 | 13,928,936 |
| ConocoPhillips | 2,131,100 | 126,139,809 |
| Consol Energy, Inc. | 3,004,047 | 134,220,820 |
| Constellation Brands, Inc., Class A (a) | 402,400 | 7,351,848 |
| Constellation Energy Group, Inc. | 81,600 | 2,884,560 |
| Corning, Inc. | 6,927,389 | 133,352,238 |
| Crown Holdings, Inc. (a) | 601,900 | 15,649,400 |
| DIRECTV, Class A (a) | 767 | 27,788 |
| DISH Network Corp. | 604,800 | 13,396,320 |
| DTE Energy Co. | 63,900 | 3,078,063 |
| Darden Restaurants, Inc. | 65,900 | 2,949,025 |
| DaVita, Inc. (a) | 545,600 | 34,061,808 |
| Dell, Inc. (a) | 4,781,019 | 77,356,887 |
| Devon Energy Corp. | 1,000,700 | 67,377,131 |
| Discover Financial Services, Inc. | 3,550 | 54,883 |
| Discovery Communications, Inc., Class A (a) | 32,150 | 1,244,205 |
| Discovery Communications, Inc., Class C (a) | 32,250 | 1,076,183 |
| The Dow Chemical Co. | 2,127,400 | 65,587,742 |
| Dr. Pepper Snapple Group, Inc. | 398,852 | 13,054,426 |
| E.I. du Pont de Nemours & Co. | 1,476,900 | 58,839,696 |
See Notes to Consolidated Financial Statements.
BLACKROCK GLOBAL ALLOCATION FUND, INC.
APRIL 30, 2010
11
Consolidated Schedule of Investments (continued)
(Percentages shown are based on Net Assets)
| | |
| Common Stocks | Shares | Value |
| United States (continued) | | |
| EMC Corp. (a) | 2,491,749 | $ 47,368,148 |
| EXCO Resources, Inc. | 2,152,800 | 39,934,440 |
| Eastman Chemical Co. | 43,100 | 2,884,252 |
| Eaton Corp. | 43,600 | 3,364,176 |
| eBay, Inc. (a) | 1,085,600 | 25,848,136 |
| El Paso Corp. | 6,858,216 | 82,984,414 |
| Electronic Arts, Inc. (a) | 1,745,200 | 33,804,524 |
| Eli Lilly & Co. | 693,400 | 24,248,198 |
| Endo Pharmaceuticals Holdings, Inc. (a) | 186,100 | 4,075,590 |
| Endurance Specialty Holdings Ltd. | 874,500 | 32,225,325 |
| Entergy Corp. | 467,500 | 38,003,075 |
| Everest Re Group Ltd. | 168,900 | 12,946,185 |
| Exelon Corp. | 707,300 | 30,831,207 |
| Expedia, Inc. | 120,500 | 2,845,005 |
| Extreme Networks, Inc. (a) | 68,041 | 226,577 |
| Exxon Mobil Corp. | 6,458,798 | 438,229,444 |
| FMC Corp. | 1,545,100 | 98,330,164 |
| FPL Group, Inc. | 1,131,200 | 58,878,960 |
| Family Dollar Stores, Inc. | 44,900 | 1,776,244 |
| Fidelity National Information Services, Inc. | 230,800 | 6,067,732 |
| Fidelity National Title Group, Inc., Class A | 3,735,950 | 56,711,721 |
| Fluor Corp. | 29,300 | 1,548,212 |
| Forest Laboratories, Inc. (a) | 273,200 | 7,447,432 |
| Freeport-McMoRan Copper & Gold, Inc., Class B | 649,713 | 49,072,823 |
| The Gap, Inc. | 126,900 | 3,138,237 |
| Garmin Ltd. (c) | 81,900 | 3,061,422 |
| General Communication, Inc., Class A (a) | 650,400 | 3,999,960 |
| General Electric Co. | 14,349,800 | 270,637,228 |
| General Mills, Inc. | 389,800 | 27,745,964 |
| Genzyme Corp. (a) | 955,000 | 50,844,200 |
| Gilead Sciences, Inc. (a) | 1,350,700 | 53,582,269 |
| Global Industries Ltd. (a) | 4,869,500 | 32,625,650 |
| Google, Inc., Class A (a)(c) | 249,529 | 131,112,518 |
| H.J. Heinz Co. | 393,098 | 18,424,503 |
| Halliburton Co. | 1,423,100 | 43,618,015 |
| Hanesbrands, Inc. (a) | 50,375 | 1,434,176 |
| Harris Corp. | 99,300 | 5,111,964 |
| Hartford Financial Services Group, Inc. | 495,400 | 14,153,578 |
| HealthSouth Corp. (a) | 862,875 | 17,654,423 |
| Hess Corp. | 630,900 | 40,093,695 |
| Hewitt Associates, Inc., Class A (a) | 67,100 | 2,750,429 |
| Hewlett-Packard Co. | 1,879,500 | 97,677,615 |
| Hologic, Inc. (a) | 3,999,600 | 71,472,852 |
| Hospira, Inc. (a) | 54,600 | 2,936,934 |
| Humana, Inc. (a) | 786,500 | 35,958,780 |
| ITT Corp. | 48,600 | 2,700,702 |
| Intel Corp. | 3,455,700 | 78,893,631 |
| International Business Machines Corp. | 2,105,090 | 271,556,610 |
| International Game Technology | 1,753,500 | 36,963,780 |
| International Paper Co. | 528,433 | 14,130,298 |
| Intuit, Inc. (a)(c) | 86,600 | 3,131,456 |
| JDS Uniphase Corp. (a) | 309,992 | 4,026,796 |
| JPMorgan Chase & Co. | 5,859,966 | 249,517,352 |
| Johnson & Johnson | 3,705,600 | 238,270,080 |
| KBR, Inc. | 800,000 | 17,664,000 |
| Kimberly-Clark Corp. | 40,000 | 2,450,400 |
| King Pharmaceuticals, Inc. (a) | 280,600 | 2,749,880 |
| Kraft Foods, Inc. | 2,987,568 | 88,432,013 |
| L-3 Communications Holdings, Inc. | 11,500 | 1,076,055 |
| LSI Corp. (a) | 217,928 | 1,311,927 |
| Lexmark International, Inc., Class A (a) | 806,800 | 29,891,940 |
| Liberty Media Corp., Series A (a) | 76 | 4,210 |
| Liberty Media Holding Corp. — Capital (a) | 192 | 8,500 |
| | |
| Common Stocks | Shares | Value |
| United States (continued) | | |
| Liberty Media Holding Corp. — Interactive (a) | 47,753 | $ 733,964 |
| Life Technologies Corp. (a) | 500,000 | 27,355,000 |
| Limited Brands, Inc. | 116,200 | 3,114,160 |
| Lockheed Martin Corp. | 897,700 | 76,205,753 |
| Lorillard, Inc. | 214,800 | 16,833,876 |
| Lubrizol Corp. | 34,200 | 3,089,628 |
| MEMC Electronic Materials, Inc. (a)(c) | 164,000 | 2,127,080 |
| Magnitogorsk Iron & Steel Works — ADR | 1,270,600 | 17,381,808 |
| Manpower, Inc. | 9,700 | 544,170 |
| Marathon Oil Corp. | 2,232,436 | 71,772,817 |
| Marco Polo Investment Holdings Ltd. | 4,274 | — |
| Mattel, Inc. | 1,390,300 | 32,046,415 |
| McDermott International, Inc. (a) | 3,025,800 | 82,937,178 |
| McDonald’s Corp. | 621,800 | 43,892,862 |
| The McGraw-Hill Cos., Inc. | 49,400 | 1,665,768 |
| McKesson Corp. | 571,100 | 37,012,991 |
| Mead Johnson Nutrition Co. | 1,232,455 | 63,607,003 |
| MeadWestvaco Corp. | 103,500 | 2,812,095 |
| Medco Health Solutions, Inc. (a) | 1,020,000 | 60,098,400 |
| Medtronic, Inc. | 2,421,000 | 105,773,490 |
| Merck & Co, Inc. | 4,518,558 | 158,330,272 |
| MetLife, Inc. | 620,375 | 28,276,692 |
| Mettler Toledo International, Inc. (a) | 125,400 | 15,735,192 |
| Microsoft Corp. | 12,870,650 | 393,069,651 |
| Molson Coors Brewing Co., Class B | 67,400 | 2,989,864 |
| Morgan Stanley | 1,906,700 | 57,620,474 |
| Motorola, Inc. (a) | 4,493,750 | 31,770,812 |
| Murphy Oil Corp. | 258,100 | 15,524,715 |
| Mylan, Inc. | 141,200 | 3,110,636 |
| NCB Holdings Ltd. (a) | 34,970 | — |
| NII Holdings, Inc. (a) | 84,500 | 3,584,490 |
| NRG Energy, Inc. (a) | 478,100 | 11,555,677 |
| Nabors Industries Ltd. (a) | 305,800 | 6,596,106 |
| National Oilwell Varco, Inc. | 1,411,300 | 62,139,539 |
| National Semiconductor Corp. | 189,400 | 2,799,332 |
| Newmont Mining Corp. | 2,435,968 | 136,609,085 |
| News Corp., Class A | 2,145,400 | 33,082,068 |
| Northern Trust Corp. | 1,519,474 | 83,540,681 |
| Northrop Grumman Corp. | 764,200 | 51,835,686 |
| Novell, Inc. (a) | 531,300 | 2,980,593 |
| Occidental Petroleum Corp. | 947,581 | 84,012,531 |
| Oracle Corp. | 4,929,200 | 127,370,528 |
| PPG Industries, Inc. | 42,000 | 2,955,540 |
| PPL Corp. | 612,200 | 15,158,072 |
| Pall Corp. | 200,000 | 7,798,000 |
| Parker Hannifin Corp. | 47,300 | 3,272,214 |
| PartnerRe Ltd. | 172,900 | 13,413,582 |
| PerkinElmer, Inc. | 688,877 | 17,256,369 |
| Perrigo Co. | 698,700 | 42,641,661 |
| Pfizer, Inc. | 11,924,716 | 199,381,252 |
| PharMerica Corp. (a) | 17,575 | 339,198 |
| Philip Morris International, Inc. | 1,160,600 | 56,962,248 |
| Pitney Bowes, Inc. | 117,100 | 2,974,340 |
| Platinum Underwriters Holdings Ltd. | 368,500 | 13,711,885 |
| Polo Ralph Lauren Corp. | 34,300 | 3,083,570 |
| Polycom, Inc. (a) | 1,721,600 | 56,038,080 |
| Praxair, Inc. | 269,300 | 22,559,261 |
| Precision Castparts Corp. | 390,300 | 50,091,102 |
| Pride International, Inc. (a) | 78,200 | 2,371,806 |
| Principal Financial Group, Inc. | 445,200 | 13,008,744 |
| The Procter & Gamble Co. | 2,562,859 | 159,307,315 |
| The Progressive Corp. | 1,038,300 | 20,859,447 |
| QUALCOMM, Inc. | 3,900,675 | 151,112,149 |
| Qwest Communications International, Inc. | 8,773,201 | 45,883,841 |
See Notes to Consolidated Financial Statements.
12 BLACKROCK GLOBAL ALLOCATION FUND, INC.
APRIL 30, 2010
Consolidated Schedule of Investments (continued)
(Percentages shown are based on Net Assets)
| | |
| Common Stocks | Shares | Value |
| United States (concluded) | | |
| R.R. Donnelley & Sons Co. | 116,800 | $ 2,510,032 |
| Ralcorp Holdings, Inc. (a) | 86,262 | 5,740,736 |
| Raytheon Co. | 455,300 | 26,543,990 |
| RenaissanceRe Holdings Ltd. | 369,500 | 20,673,525 |
| Reynolds American, Inc. | 19,500 | 1,041,690 |
| Ross Stores, Inc. | 59,600 | 3,337,600 |
| RusHydro | 63,635,122 | 3,595,384 |
| Ryder System, Inc. | 76,200 | 3,544,824 |
| SUPERVALU, Inc. | 201,876 | 3,007,952 |
| Safeway, Inc. | 121,000 | 2,855,600 |
| SanDisk Corp. (a) | 96,000 | 3,829,440 |
| Sara Lee Corp. | 4,325,500 | 61,508,610 |
| Schlumberger Ltd. | 1,238,288 | 88,438,529 |
| Seagate Technology Holdings (a) | 145,000 | 2,663,650 |
| Seahawk Drilling, Inc. (a) | 3,646 | 60,742 |
| Sears Holdings Corp. (a)(c) | 29,100 | 3,519,645 |
| Smith International, Inc. | 204,587 | 9,771,075 |
| Sohu.com, Inc. (a) | 121,000 | 5,826,150 |
| The Southern Co. | 238,900 | 8,256,384 |
| Spirit Aerosystems Holdings, Inc., Class A (a) | 2,511,500 | 55,705,070 |
| Sprint Nextel Corp. (a) | 3,443,800 | 14,636,150 |
| The St. Joe Co. (a)(c) | 1,174,800 | 38,815,392 |
| State Street Corp. | 1,261,500 | 54,875,250 |
| Stryker Corp. | 52,500 | 3,015,600 |
| TJX Cos., Inc. | 67,900 | 3,146,486 |
| Target Corp. | 56,200 | 3,196,094 |
| Tellabs, Inc. | 260,600 | 2,366,248 |
| Teradata Corp. (a) | 168,700 | 4,904,109 |
| Texas Instruments, Inc. | 1,589,200 | 41,335,092 |
| Thermo Fisher Scientific, Inc. (a) | 789,100 | 43,621,448 |
| Time Warner Cable, Inc. | 142,955 | 8,041,219 |
| Time Warner, Inc. | 569,333 | 18,833,536 |
| Total System Services, Inc. | 246,900 | 3,952,869 |
| Transatlantic Holdings, Inc. | 208,200 | 10,353,786 |
| The Travelers Cos., Inc. | 1,445,458 | 73,342,539 |
| URS Corp. (a) | 59,900 | 3,075,865 |
| U.S. Bancorp | 3,258,200 | 87,222,014 |
| Unifi, Inc. (a) | 1,607,511 | 6,156,767 |
| Union Pacific Corp. | 1,902,692 | 143,957,677 |
| United Technologies Corp. | 223,300 | 16,736,335 |
| UnitedHealth Group, Inc. | 2,410,200 | 73,053,162 |
| UnumProvident Corp. | 129,800 | 3,176,206 |
| Valero Energy Corp. | 1,131,300 | 23,519,727 |
| Validus Holdings Ltd. | 553,874 | 14,162,558 |
| VeriSign, Inc. (a) | 112,000 | 3,054,240 |
| Verizon Communications, Inc. | 6,364,718 | 183,876,703 |
| Viacom, Inc., Class B (a) | 2,256,700 | 79,729,211 |
| WABCO Holdings, Inc. (a) | 4,300 | 142,717 |
| Wal-Mart Stores, Inc. | 2,761,706 | 148,165,527 |
| Waters Corp. (a) | 515,300 | 37,096,447 |
| Watson Pharmaceuticals, Inc. (a) | 71,300 | 3,053,066 |
| WellPoint, Inc. (a) | 1,591,000 | 85,595,800 |
| Wells Fargo & Co. | 7,529,900 | 249,314,989 |
| Western Digital Corp. (a) | 281,041 | 11,547,975 |
| Whirlpool Corp. | 33,000 | 3,592,710 |
| Windstream Corp. | 506,166 | 5,593,134 |
| XL Capital Ltd., Class A | 5,388,166 | 95,909,355 |
| XTO Energy, Inc. | 752,900 | 35,777,808 |
| Xerox Corp. | 5,128,000 | 55,895,200 |
| Xilinx, Inc. | 111,400 | 2,871,892 |
| | | 11,857,006,175 |
| Total Common Stocks — 52.6% | | 21,635,850,581 |
| | | |
| Fixed Income Securities | | | |
| | | Par | |
| Asset-Backed Securities | | (000) | Value |
| United States — 0.0% | | | |
| Latitude CLO Ltd., Series 2005-1I, | | | |
| Class SUB, 0.41%, 12/15/17 | USD | 7,900 | $ 395,000 |
| Total Asset-Backed Securities — 0.0% | | | 395,000 |
| Corporate Bonds | | | |
| Brazil — 0.1% | | | |
| BES Investimento do Brasil SA, | | | |
| 5.63%, 3/25/15 (b) | | 9,784 | 9,701,989 |
| Banco Santander Brasil SA, | | | |
| 4.50%, 4/06/15 (b) | | 15,962 | 15,483,140 |
| Cosan Finance Ltd., 7.00%, 2/01/17 (b) | | 7,050 | 7,279,125 |
| | | | 32,464,254 |
| Canada — 0.5% | | | |
| Daylight Reources Trust, | | | |
| 6.25%, 12/31/14 (f) | CAD | 12,191 | 12,961,488 |
| PetroBakken Energy Ltd., | | | |
| 3.13%, 2/08/16 (f) | USD | 82,200 | 81,576,924 |
| Rogers Wireless Communications, Inc., | | | |
| 7.63%, 12/15/11 | CAD | 6,169 | 6,559,072 |
| Sino-Forest Corp. (b): | | | |
| 5.00%, 8/01/13 (f) | USD | 69,707 | 78,594,643 |
| 10.25%, 7/28/14 | | 25,000 | 27,625,000 |
| | | | 207,317,127 |
| China — 0.3% | | | |
| Celestial Nutrifoods Ltd., | | | |
| 53.57%, 6/12/11 (a)(e)(f) | SGD | 89,400 | 44,037,802 |
| China Petroleum & Chemical Corp., | | | |
| 5.95%, 4/24/14 (e)(f) | HKD | 306,660 | 43,446,610 |
| Pine Agritech Ltd., | | | |
| 27.64%, 7/27/12 (e)(f) | USD | 411,100 | 40,958,214 |
| | | | 128,442,626 |
| Europe — 0.3% | | | |
| European Investment Bank: | | | |
| 12.59%, 9/21/10 (b)(e) | BRL | 127,600 | 68,576,971 |
| 4.38%, 4/15/13 | EUR | 32,667 | 47,002,839 |
| Series 1158/0100, 3.63%, 10/15/11 | | 14,195 | 19,637,866 |
| | | | 135,217,676 |
| France — 0.0% | | | |
| Compagnie Generale des | | | |
| Etablissements Michelin, Series ML, | | | |
| 8.68%, 1/01/17 (e)(f) | | 9,251 | 13,627,346 |
| Germany — 0.0% | | | |
| Fresenius Finance Jersey Ltd., | | | |
| 5.63%, 8/14/11 (f) | | 6,700 | 10,348,041 |
| Hong Kong — 0.5% | | | |
| CITIC Resources Finance Ltd., | | | |
| 6.75%, 5/15/14 (b) | USD | 25,486 | 25,995,720 |
| FU JI Food and Catering | | | |
| Services Holdings Ltd., | | | |
| 47.99%, 10/18/10 (a)(e)(f)(g) | CNY | 190,300 | 5,018,754 |
| Hongkong Land CB 2005 Ltd., | | | |
| 2.75%, 12/21/12 (f) | USD | 7,400 | 10,609,750 |
See Notes to Consolidated Financial Statements.
BLACKROCK GLOBAL ALLOCATION FUND, INC.
APRIL 30, 2010
13
Consolidated Schedule of Investments (continued)
(Percentages shown are based on Net Assets)
| | | |
| | | Par | |
| Corporate Bonds | | (000) | Value |
| Hong Kong (concluded) | | | |
| Hutchison Whampoa International, Ltd.: | | | |
| 6.25%, 1/24/14 | USD | 12,497 | $ 13,758,022 |
| 4.63%, 9/11/15 | | 40,425 | 41,878,683 |
| 4.63%, 9/11/15 (b) | | 33,249 | 34,497,334 |
| 7.63%, 4/09/19 (b) | | 29,327 | 34,511,750 |
| 5.75%, 9/11/19 (b) | | 6,392 | 6,692,130 |
| Noble Group Ltd., 8.50%, 5/30/13 (b) | | 11,419 | 12,817,827 |
| | | | 185,779,970 |
| India — 1.0% | | | |
| Gujarat NRE Coke Ltd., | | | |
| 0.00%, 4/12/11 (e)(f) | | 10,000 | 18,000,000 |
| Housing Development Finance Corp., | | | |
| 0.00%, 9/27/10 (e)(f) | | 24,000 | 47,280,000 |
| Jaiprakash Associates Ltd., | | | |
| 0.00%, 9/12/12 (e)(f) | | 8,838 | 11,555,685 |
| Punj Lloyd Ltd., 0.00%, 4/08/11 (e)(f) | | 16,088 | 18,340,320 |
| REI Agro Ltd., 5.50%, 11/13/14 (b)(f) | | 46,977 | 48,621,195 |
| Reliance Communications Ltd. (e)(f): | | | |
| 0.00%, 5/10/11 | | 38,247 | 45,513,930 |
| 0.00%, 3/01/12 | | 115,900 | 132,464,776 |
| Suzlon Energy Ltd., 27.31%, 6/12/12 (e)(f) | | 24,650 | 26,029,414 |
| Tata Motors Ltd., 13.85%, 7/12/12 (e)(f) | | 4,300 | 5,479,038 |
| Tata Steel Ltd., 1.00%, 9/05/12 (f) | | 26,100 | 31,581,000 |
| | | | 384,865,358 |
| Japan — 0.1% | | | |
| The Mie Bank Ltd., 1.00%, 10/31/11 (f) | JPY | 374,000 | 3,929,307 |
| Nagoya Railroad Co. Ltd., | | | |
| 1.21%, 3/30/12 (e)(f) | | 154,000 | 1,705,009 |
| Suzuki Motor Corp., Series 9, | | | |
| 3.95% 3/29/13 (e)(f) | | 3,695,000 | 40,303,881 |
| | | | 45,938,197 |
| Kazakhstan — 0.3% | | | |
| KazMunaiGaz Finance Sub BV (b): | | | |
| 9.13%, 7/02/18 | USD | 87,610 | 103,160,775 |
| 7.00%, 5/05/20 (h) | | 32,152 | 31,587,089 |
| | | | 134,747,864 |
| Luxembourg — 0.9% | | | |
| Acergy SA, Series ACY, | | | |
| 2.25%, 10/11/13 (f) | | 11,100 | 12,037,972 |
| Actelion Finance SCA, | | | |
| 0.00%, 11/22/11 (e)(f) | CHF | 11,670 | 11,040,797 |
| Evraz Group SA: | | | |
| 8.88%, 4/24/13 (b) | USD | 11,550 | 12,069,750 |
| 8.25%, 11/10/15 | | 5,415 | 5,604,525 |
| 9.50%, 4/24/18 (b) | | 30,895 | 32,748,700 |
| Gaz Capital SA, 2.89%, 11/15/12 | JPY | 1,800,000 | 18,216,667 |
| TNK-BP Finance SA : | | | |
| 7.50%, 7/18/16 (b) | USD | 12,021 | 12,862,470 |
| 6.63%, 3/20/17 (b) | | 55,521 | 56,770,222 |
| 7.88%, 3/13/18 (b) | | 71,795 | 77,538,600 |
| Series 2, 7.50%, 7/18/16 | | 6,643 | 7,224,263 |
| UBS Luxembourg SA for OJSC Vimpel | | | |
| Communications: | | | |
| 8.25%, 5/23/16 | | 18,790 | 20,387,150 |
| 8.25%, 5/23/16 (b) | | 2,481 | 2,691,885 |
| VIP Finance Ireland Ltd. for OJSC Vimpel | | | |
| Communications, 9.13%, 4/30/18 (b) | | 91,544 | 104,245,730 |
| | | | 373,438,731 |
| | | |
| | | Par | |
| Corporate Bonds | | (000) | Value |
| Malaysia — 0.7% | | | |
| Berjaya Land Bhd, 8.00%, 8/15/11 (f) | MYR | 71,700 | $ 23,030,098 |
| Cherating Capital Ltd., | | | |
| 2.00%, 7/05/12 (f)(i) | USD | 36,500 | 41,564,375 |
| IOI Resources, 8.48%, 1/15/13 (e)(f) | | 48,610 | 49,703,725 |
| Johor Corp., Series P3, 1.00%, 7/31/12 | MYR | 179,132 | 65,813,924 |
| Rafflesia Capital Ltd., | | | |
| 1.25%, 10/04/11 (f)(i) | USD | 73,500 | 91,808,329 |
| | | | 271,920,451 |
| Mexico — 0.3% | | | |
| BBVA Bancomer SA/Texas, | | | |
| 7.25%, 4/22/20 (b) | | 38,464 | 39,031,152 |
| Petroles Mexicanos, 6.00%, 3/05/20 (b) | | 63,010 | 65,014,994 |
| | | | 104,046,146 |
| Netherlands — 0.1% | | | |
| ASM International NV (f): | | | |
| 4.25%, 12/06/11 | | 1,481 | 1,905,010 |
| 4.25%, 12/06/11 (b) | | 4,180 | 5,324,275 |
| Pargesa Netherlands NV, | | | |
| 1.75%, 6/15/14 (f) | CHF | 35,790 | 31,261,999 |
| | | | 38,491,284 |
| Norway — 0.2% | | | |
| Siem Industries, Inc., | | | |
| 0.00% 7/12/17 (e)(f) | USD | 34,000 | 34,918,000 |
| Subsea 7, Inc. (f): | | | |
| 2.80%, 6/06/11 | | 34,100 | 34,867,250 |
| 6.39%, 6/29/17 (e) | | 19,300 | 19,821,100 |
| | | | 89,606,350 |
| Philippines — 0.1% | | | |
| First Gen Corp., 2.50%, 2/11/13 (f) | | 23,500 | 26,966,250 |
| Singapore — 1.1% | | | |
| CapitaLand Ltd. (f): | | | |
| 2.10%, 11/15/16 | SGD | 64,750 | 46,561,360 |
| 3.13%, 3/05/18 | | 139,750 | 103,642,223 |
| 2.95%, 6/20/22 | | 178,250 | 116,666,401 |
| Keppel Land Ltd., 2.50%, 6/23/13 (f) | | 26,000 | 19,266,772 |
| Olam International Ltd., | | | |
| 6.00%, 10/15/16 (f) | USD | 37,000 | 42,246,600 |
| Wilmar International Ltd., | | | |
| 17.30%, 12/18/12 (e)(f) | | 30,400 | 43,373,808 |
| Yanlord Land Group Ltd., | | | |
| 5.85%, 7/13/14 (f) | SGD | 68,000 | 51,485,076 |
| Ying Li International Real Estate Ltd., | | | |
| 4.00%, 3/03/15 (f) | | 66,000 | 42,384,879 |
| | | | 465,627,119 |
| South Korea — 0.4% | | | |
| Hyundai Motor Manufacturing Czech sro, | | | |
| 4.50%, 4/15/15 (b) | USD | 32,993 | 33,296,503 |
| Korea Electric Power Corp.: | | | |
| 5.13%, 4/23/34 | | 38,562 | 40,460,176 |
| 7.59%, 4/01/96 (j) | | 31,040 | 20,176,000 |
| Zeus Cayman, 4.20%, 8/19/13 (e)(f) | JPY | 8,049,000 | 83,371,993 |
| | | | 177,304,672 |
| Spain — 0.1% | | | |
| Telvent GIT SA, 5.50%, 4/15/15 (b)(f) | USD | 32,544 | 36,021,001 |
| Sweden — 0.1% | | | |
| Svensk Exportkredit AB, | | | |
| 10.50%, 9/29/15 (i) | TRY | 31,190 | 19,890,189 |
See Notes to Consolidated Financial Statements.
14 BLACKROCK GLOBAL ALLOCATION FUND, INC.
APRIL 30, 2010
Consolidated Schedule of Investments (continued)
(Percentages shown are based on Net Assets)
| | | |
| | | Par | |
| Corporate Bonds | | (000) | Value |
| Trinidad — 0.0% | | | |
| Petroleum Co. of Trinidad & Tobago Ltd., | | | |
| 9.75%, 8/14/19 (b) | USD | 9,851 | $ 11,525,670 |
| United Arab Emirates — 0.5% | | | |
| Abu Dhabi National Energy Co., | | | |
| 6.50%, 10/27/36 | | 6,431 | 6,077,295 |
| Aldar Funding Ltd., 5.77%, 11/10/11 (f) | | 16,977 | 16,955,779 |
| Dana Gas Sukuk Ltd., 7.50%, 10/31/12 (f) | | 213,800 | 194,718,350 |
| | | | 217,751,424 |
| United Kingdom — 0.5% | | | |
| Lloyds TSB Bank Plc, 13.00% (k) | GBP | 46,296 | 81,460,899 |
| Petropavlovsk 2010 Ltd., | | | |
| 4.00%, 2/18/15 (f) | USD | 43,600 | 48,729,976 |
| Shire Plc, 2.75%, 5/09/14 (f) | | 84,592 | 84,645,885 |
| | | | 214,836,760 |
| United States — 6.2% | | | |
| The AES Corp., 8.38%, 3/01/11 | GBP | 3,349 | 5,252,268 |
| Advanced Micro Devices, Inc., | | | |
| 6.00%, 5/01/15 (f) | USD | 329,904 | 317,944,980 |
| Amgen, Inc., 0.38%, 2/01/13 (f) | | 118,176 | 118,914,600 |
| Amylin Pharmaceuticals, Inc., | | | |
| 3.00%, 6/15/14 (f) | | 42,182 | 37,120,160 |
| Archer-Daniels-Midland Co., | | | |
| 0.88%, 2/15/14 (f) | | 9,107 | 8,947,628 |
| Banco do Brasil SA, 4.50%, 1/22/15 (b) | | 19,181 | 19,217,762 |
| CF Industries, Inc., 7.13%, 5/01/20 | | 22,380 | 23,554,950 |
| Cell Genesys, Inc., 3.13%, 5/01/13 (f) | | 1,000 | 631,735 |
| Central European Distribution Corp., | | | |
| 3.00%, 3/15/13 (f) | | 4,843 | 4,358,700 |
| Chesapeake Energy Corp. (f): | | | |
| 2.50%, 5/15/37 | | 95,592 | 78,743,910 |
| 2.25%, 12/15/38 | | 115,709 | 85,480,024 |
| China Milk Products Group Ltd., | | | |
| 21.88%, 1/05/12 (e)(f) | | 39,800 | 17,986,695 |
| Cie de Financement Foncier, | | | |
| 2.13%, 4/22/13 (b) | | 89,700 | 90,307,090 |
| Consol Energy, Inc., 8.00%, 4/01/17 (b) | | 60,750 | 64,167,187 |
| Crown Cork & Seal Co., Inc., | | | |
| 7.50%, 12/15/96 | | 5,827 | 4,428,520 |
| Ford Motor Credit Co. LLC, 7.00%, 4/15/15 | | 16,811 | 17,095,795 |
| Gilead Sciences, Inc. (f): | | | |
| 0.50%, 5/01/11 | | 12,788 | 14,114,755 |
| 0.63%, 5/01/13 | | 22,379 | 26,295,325 |
| Hana Bank, 4.50%, 10/30/15 (b) | | 14,402 | 14,445,073 |
| Helix Energy Solutions Group, Inc., | | | |
| 3.25%, 12/15/25 (f) | | 15,252 | 13,974,645 |
| Hologic, Inc., 2.00%, 12/15/37 (f)(l) | | 156,135 | 140,521,500 |
| IOI Capital Bhd, Series IOI, | | | |
| 0.00% 12/18/11 (e)(f) | | 39,096 | 48,772,260 |
| Intel Corp. (f): | | | |
| 2.95%, 12/15/35 | | 69,940 | 70,814,250 |
| 3.25%, 8/01/39 (b) | | 90,939 | 111,286,601 |
| Kinetic Concepts, Inc., | | | |
| 3.25%, 4/15/15 (b)(f) | | 8,287 | 8,763,503 |
| King Pharmaceuticals, Inc., | | | |
| 1.25%, 4/01/26 (f) | | 15,913 | 14,242,135 |
| Kraft Foods, Inc.: | | | |
| 2.63%, 5/08/13 | | 44,194 | 45,186,199 |
| 4.13%, 2/09/16 | | 78,761 | 80,769,169 |
| LifePoint Hospitals, Inc. (f): | | | |
| 3.50%, 5/15/14 | | 5,911 | 6,132,663 |
| 3.25%, 8/15/25 | | 29,410 | 29,079,137 |
| | | |
| | | Par | |
| Corporate Bonds | | (000) | Value |
| United States (concluded) | | | |
| McMoRan Exploration Co. (f): | | | |
| 5.25%, 10/06/11 | USD | 11,129 | $ 11,337,669 |
| 5.25%, 10/06/11 (b) | | 6,342 | 6,460,913 |
| Medtronic, Inc. (f): | | | |
| 1.50%, 4/15/11 | | 7,909 | 7,988,090 |
| 1.63%, 4/15/13 | | 76,922 | 81,441,167 |
| Mylan, Inc., 1.25%, 3/15/12 (f) | | 68,827 | 76,225,902 |
| Omnicare, Inc., Series OCR, | | | |
| 3.25%, 12/15/35 (f) | | 29,982 | 25,672,087 |
| Omnicom Group, Inc. (e)(f): | | | |
| 0.04%, 7/31/32 | | 23,969 | 23,729,310 |
| 0.02%, 7/01/38 | | 16,249 | 16,228,689 |
| Paka Capital Ltd., 5.54%, 3/12/13 (e)(f) | | 20,000 | 20,525,000 |
| Pemex Project Funding Master Trust, | | | |
| 5.50%, 2/24/25 | EUR | 49,970 | 64,769,519 |
| Pontis Ltd., 6.25%, 7/20/10 (b) | USD | 5,474 | 5,473,562 |
| Preferred Term Securities XXIV, Ltd. (a)(b) | | 12,100 | 121 |
| Preferred Term Securities XXV, Ltd. (a) | | 12,150 | 122 |
| Preferred Term Securities XXVI, Ltd. (a) | | 9,900 | 99 |
| Preferred Term Securities XXVII, Ltd. (a) | | 7,100 | 71 |
| Ranbaxy Laboratories Ltd., | | | |
| 33.19%, 3/18/11 (e)(f) | | 19,863 | 24,045,611 |
| SBA Communications Corp. (f): | | | |
| 1.88%, 5/01/13 | | 21,355 | 22,342,669 |
| 4.00%, 10/01/14 (b) | | 13,464 | 17,957,610 |
| SanDisk Corp., 1.00%, 5/15/13 (f) | | 99,091 | 87,819,399 |
| Sino-Forest Corp., 5.00%, 8/01/13 (f) | | 3,578 | 4,075,771 |
| SonoSite, Inc., 3.75%, 7/15/14 (f) | | 12,479 | 13,539,715 |
| St. Mary Land & Exploration Co., | | | |
| 3.50%, 4/01/27 (f) | | 3,404 | 3,561,435 |
| Suzlon Energy Ltd. (e)(f): | | | |
| 17.71%, 10/11/12 | | 37,802 | 39,503,090 |
| 0.00%, 7/25/14 | | 35,295 | 32,270,254 |
| Tenet Healthcare Corp., 9.25%, 2/01/15 | | 9,870 | 10,560,900 |
| Thermo Fisher Scientific, Inc., | | | |
| 3.20%, 5/01/15 | | 20,459 | 20,580,158 |
| Transocean, Inc. (f): | | | |
| 1.50%, 12/15/37 | | 284,700 | 274,735,500 |
| Series A, 1.63%, 12/15/37 | | 73,343 | 71,967,819 |
| Series C, 1.50%, 12/15/37 | | 20,504 | 19,299,390 |
| Uno Restaurant Corp., | | | |
| 10.00%, 2/15/11 (a)(b)(g) | | 4,728 | 1,004,700 |
| Yanlord Land Group Ltd., | | | |
| 9.50%, 5/04/17 (b)(h) | | 32,038 | 31,964,736 |
| | | | 2,533,630,297 |
| Total Corporate Bonds — 14.3% | | | 5,859,804,803 |
| Floating Rate Loan Interests | | | |
| Indonesia — 0.2% | | | |
| PT Bumi Resources, Term Loan, | | | |
| 10.25%, 10/08/12 | | 42,000 | 42,000,000 |
| PT Multi Daerah Bersaing, Term Loan, | | | |
| 7.30%, 4/13/12 | | 41,700 | 41,700,000 |
| | | | 83,700,000 |
| Total Floating Rate Loan Interests — 0.2% | | | 83,700,000 |
See Notes to Consolidated Financial Statements.
BLACKROCK GLOBAL ALLOCATION FUND, INC.
APRIL 30, 2010
15
Consolidated Schedule of Investments (continued)
(Percentages shown are based on Net Assets)
| | | |
| | | Par | |
| Foreign Agency Obligations | | (000) | Value |
| Australian Government Bonds, | | | |
| 5.75%, 6/15/11 | AUD | 95,366 | $ 89,474,068 |
| Brazil Notas do Tesouro Nacional: | | | |
| Series B, 6.00%, 5/15/17 | BRL | 22,700 | 24,931,711 |
| Series F, 10.00%, 1/01/17 | | 697,929 | 359,171,247 |
| Series F, 10.00%, 1/01/21 | | 172,465 | 84,669,485 |
| Bundesrepublik Deutschland: | | | |
| 4.00%, 7/04/16 | EUR | 217,769 | 317,404,129 |
| 4.25%, 7/04/17 | | 135,609 | 200,372,922 |
| 3.50%, 7/04/19 | | 128,806 | 179,480,508 |
| Series 07, 4.00%, 1/04/18 | | 52,509 | 76,240,332 |
| Series 08, 4.25%, 7/04/18 | | 36,223 | 53,400,783 |
| Bundesschatzanweisungen, Series 1, | | | |
| 4.75%, 6/11/10 | | 111,850 | 149,579,605 |
| Caisse d’Amortissement de la Dette Sociale: | | | |
| 3.25%, 4/25/13 | | 21,650 | 30,192,246 |
| 4.00%, 10/25/14 | | 23,195 | 33,202,024 |
| Canadian Government Bond: | | | |
| 4.00%, 9/01/10 | CAD | 32,600 | 32,453,656 |
| 4.00%, 9/01/10 | | 3,672 | 3,655,516 |
| 4.00%, 6/01/16 | | 53,628 | 55,122,066 |
| Deutsche Bundesrepublik Inflation Linked, | | | |
| Series I/L, 1.50%, 4/15/16 | EUR | 29,692 | 41,825,790 |
| Export-Import Bank of Korea, | | | |
| 4.13%, 9/09/15 | USD | 73,100 | 73,915,138 |
| Federal Republic of Germany, | | | |
| 1.50%, 9/21/12 (b) | | 130,903 | 131,203,422 |
| Japanese Government CPI Linked Bond: | | | |
| Series 5, 0.80%, 9/10/15 | JPY | 5,789,432 | 60,640,040 |
| Series 6, 0.80%, 12/10/15 | | 5,913,954 | 61,740,889 |
| Series 7, 0.80%, 3/10/16 | | 8,875,870 | 92,474,875 |
| Series 8, 1.00%, 6/10/16 | | 2,531,311 | 26,459,727 |
| Series 16, 1.40%, 6/10/18 | | 4,291,279 | 44,896,034 |
| Japanese Government Two Year Bond, | | | |
| Series 272, 0.70%, 9/15/10 | | 5,685,650 | 60,653,571 |
| Korea Development Bank/Republic of | | | |
| Korea, 4.38%, 8/10/15 | USD | 78,956 | 80,755,012 |
| Kreditanstalt fuer Wiederaufbau, | | | |
| 3.25%, 6/27/13 (f) | EUR | 81,500 | 114,285,774 |
| Magyar Nemzeti Vagonkezel Zrt, | | | |
| 4.40%, 9/25/14 (f) | | 21,100 | 30,172,556 |
| Malaysia Government Bond: | | | |
| 3.76%, 4/28/11 | MYR | 215,109 | 68,332,790 |
| Series 0108, 3.46%, 7/31/13 | | 185,681 | 58,775,719 |
| Netherland Government Bond, | | | |
| 3.75%, 7/15/14 | EUR | 25,063 | 35,978,382 |
| New Zealand Government Bond, | | | |
| Series 216, 4.50%, 2/14/16 | NZD | 20,974 | 22,868,185 |
| Poland Government Bond, 3.00%, 8/24/16 | PLN | 180,055 | 60,182,874 |
| Socialist Republic of Vietnam, | | | |
| 6.75%, 1/29/20 | USD | 14,287 | 14,912,056 |
| Turkey Government Bond: | | | |
| 10.00%, 1/09/13 | TRY | 28,576 | 19,407,723 |
| 10.50%, 1/15/20 | | 46,031 | 30,875,960 |
| 4.00%, 4/01/20 | | 40,263 | 26,790,353 |
| Ukraine Government International Bond, | | | |
| 6.58%, 11/21/16 | USD | 3,550 | 3,436,755 |
| United Kingdom Gilt, 4.25%, 3/07/11 | GBP | 151,126 | 238,272,543 |
| Total Foreign Agency Obligations — 7.5% | | | 3,088,206,466 |
| | | |
| | | Par | |
| Structured Notes | | (000) | Value |
| Taiwan — 0.0% | | | |
| UBS AG (Total Return TWD Linked Notes), | | | |
| 0.26%, 12/01/10 (e) | USD | 3,106 | $ 3,112,191 |
| Total Structured Notes — 0.0% | | | 3,112,191 |
| U.S. Treasury Obligations | | | |
| U.S. Treasury Inflation Indexed Bonds: | | | |
| 2.50%, 7/15/16 (m) | | 219,483 | 244,003,825 |
| 2.38%, 1/15/17 | | 27,559 | 30,323,685 |
| 1.63%, 1/15/18 | | 64,099 | 67,058,426 |
| 2.38%, 1/15/27 | | 101,492 | 110,413,024 |
| U.S. Treasury Notes: | | | |
| 2.88%, 6/30/10 | | 174,006 | 174,754,005 |
| 2.75%, 7/31/10 | | 258,260 | 259,884,398 |
| 4.88%, 5/31/11 | | 223,396 | 233,920,067 |
| 0.88%, 1/31/12 | | 72,275 | 72,311,716 |
| 1.38%, 2/15/13 (m)(n) | | 666,758 | 666,237,262 |
| 1.38%, 3/15/13 | | 65,306 | 65,168,204 |
| 2.13%, 11/30/14 (n) | | 186,947 | 185,851,976 |
| 2.38%, 12/31/14 | | 375,210 | 380,721,490 |
| 2.25%, 1/31/15 | | 280,715 | 279,662,319 |
| 2.38%, 2/28/15 | | 368,163 | 368,394,943 |
| 2.38%, 3/31/15 | | 354,960 | 356,734,800 |
| 2.63%, 2/29/16 | | 93,233 | 92,504,366 |
| 2.75%, 2/15/19 | | 230,437 | 217,096,395 |
| 3.63%, 2/15/20 | | 129,851 | 129,465,472 |
| Total U.S. Treasury Obligations — 9.6% | | | 3,934,506,373 |
| Total Fixed Income Securities — 31.6% | | | 12,969,724,833 |
| Investment Companies | | Shares | |
| Brazil — 0.0% | | | |
| iShares MSCI Brazil (Free) Index Fund (o) | | 22,300 | 1,612,290 |
| South Korea — 0.0% | | | |
| iShares MSCI South Korea Index Fund (o) | | 24,900 | 1,293,057 |
| United States — 3.2% | | | |
| Consumer Staples Select Sector | | | |
| SPDR Fund (c) | | 1,413,300 | 39,049,479 |
| ETFS Palladium Trust (a) | | 100,710 | 5,518,908 |
| ETFS Platinum Trust (a)(d) | | 313,300 | 54,373,184 |
| Energy Select Sector SPDR Fund (c) | | 2,701,000 | 161,816,910 |
| Financial Select Sector SPDR Fund (c) | | 6,435,420 | 103,932,033 |
| Health Care Select Sector SPDR Fund (c) | | 1,414,500 | 43,750,485 |
| iShares Dow Jones U.S. Telecommunications | | | |
| Sector Index Fund (o) | | 787,500 | 16,049,250 |
| iShares Silver Trust (a)(o) | | 3,858,750 | 70,499,362 |
| SPDR Gold Trust (a) | | 5,285,405 | 609,830,029 |
| SPDR KBW Bank ETF (c) | | 260,000 | 7,191,600 |
| SPDR KBW Regional Banking ETF (c) | | 884,700 | 24,709,671 |
| Technology Select Sector SPDR Fund (c) | | 3,786,836 | 88,763,436 |
| Telecom HOLDRS Trust | | 177,700 | 4,257,692 |
| Utilities Select Sector SPDR Fund (c) | | 2,810,200 | 85,626,794 |
| Vanguard Telecommunication Services ETF | | 24,500 | 1,388,163 |
| | | | 1,316,756,996 |
See Notes to Consolidated Financial Statements.
16 BLACKROCK GLOBAL ALLOCATION FUND, INC.
APRIL 30, 2010
Consolidated Schedule of Investments (continued)
(Percentages shown are based on Net Assets)
| | | |
| Investment Companies | | Shares | Value |
| Vietnam — 0.1% | | | |
| Vietnam Enterprise Investments Ltd. — | | | |
| R Shares (a) | | 2,801,490 | $ 5,210,771 |
| Vinaland Ltd. (a) | | 14,489,260 | 13,764,797 |
| | | | 18,975,568 |
| Total Investment Companies — 3.3% | | | 1,338,637,911 |
| Preferred Securities | | | |
| | | Par | |
| Capital Trusts | | (000) | |
| Singapore — 0.0% | | | |
| DBS Capital Funding Corp., 7.66% (i)(k) | USD | 2,653 | 2,729,274 |
| Total Capital Trusts — 0.0% | | | 2,729,274 |
| Preferred Stocks | | Shares | |
| Brazil — 0.0% | | | |
| Cia Brasileira, Class B (a) | | 59,222 | 2,015,575 |
| Germany — 0.1% | | | |
| Volkswagen AG | | 373,450 | 36,080,186 |
| United States — 0.3% | | | |
| Bunge Ltd., 4.88% (f) | | 82,953 | 7,033,585 |
| El Paso Corp. (f): | | | |
| 4.99% | | 47,145 | 49,502,250 |
| 4.99% (b) | | 10,550 | 11,077,500 |
| Mylan, Inc., 6.50% (f) | | 43,646 | 56,593,586 |
| XL Capital Ltd., 10.75% (f) | | 261,357 | 7,006,981 |
| | | | 131,213,902 |
| Total Preferred Stocks — 0.4% | | | 169,309,663 |
| Total Preferred Securities — 0.4% | | | 172,038,937 |
| Rights | | | |
| United States — 0.0% | | | |
| Hydro-WGC (Expires 7/01/10) | 114,036,536 | 1,955,384 |
| Total Rights — 0.0% | | | 1,955,384 |
| Warrants (p) | | | |
| Brazil — 0.0% | | | |
| Cia Brasileirra de Distribuicao Grupo Pao | | | |
| de Acucar (Expires 6/02/10) | | 9,052 | — |
| Canada — 0.0% | | | |
| Kinross Gold Corp. (Expires 9/03/13) | | 560,413 | 1,837,149 |
| New Gold, Inc. (Expires 4/03/12) | | 1,727,300 | 68,017 |
| | | | 1,905,166 |
| | | |
| Warrants (p) | | Shares | Value |
| United States — 0.1% | | | |
| Bank of America Corp. (Expires 1/16/19) | | 2,675,600 $ | 26,729,244 |
| Ford Motor Co. (Expires 1/01/13) | | 3,710,415 | 19,368,366 |
| JPMorgan Chase & Co. (Expires 10/28/18) | | 958,700 | 13,316,344 |
| | | | 59,413,954 |
| Total Warrants — 0.1% | | | 61,319,120 |
| Total Long-Term Investments | | | |
| (Cost — $32,118,188,616) — 88.0% | | | 36,179,526,766 |
| Short-Term Securities | | | |
| Money Market Funds — 1.4% | | | |
| BlackRock Liquidity Funds, TempFund, | | | |
| Institutional Class, 0.13% (o)(q) | | 1,934,044 | 1,934,044 |
| | | Beneficial | |
| | | Interest | |
| | | (000) | |
| BlackRock Liquidity Series, LLC | | | |
| Money Market Series, 0.24% (o)(q)(r) | USD | 579,452 | 579,452,450 |
| Total Money Market Funds USD — 1.4% | | | 581,386,494 |
| | | Par | |
| Time Deposits | | (000) | |
| Japan — 0.0% | | | |
| Brown Brothers Harriman & Co., | | | |
| 0.01%, 5/01/10 | JPY | 13 | 137 |
| Singapore — 0.0% | | | |
| Brown Brothers Harriman & Co., | | | |
| 0.01%, 5/01/10 | SGD | 27 | 19,962 |
| United States — 0.1% | | | |
| Brown Brothers Harriman & Co., | | | |
| 0.01%, 5/01/10 | USD | 22,499 | 22,499,281 |
| Total Time Deposits — 0.1% | | | 22,519,380 |
| U.S. Treasury Obligations — 11.8% | | | |
| U.S. Treasury Bills (s): | | | |
| 0.08%, 5/06/10 | | 351,467 | 351,463,134 |
| 0.11%, 5/13/10 | | 350,500 | 350,488,083 |
| 0.08%, 5/20/10 | | 585,483 | 585,446,700 |
| 0.10%, 5/27/10 | | 278,738 | 278,712,913 |
| 0.13%, 6/03/10 | | 286,619 | 286,584,319 |
| 0.14%, 6/10/10 | | 525,025 | 524,944,671 |
| 0.16%, 6/17/10 | | 239,000 | 238,955,068 |
| 0.16%, 6/24/10 | | 338,000 | 337,921,922 |
| 0.14%, 7/01/10 | | 209,250 | 209,197,897 |
| 0.14%, 7/08/10 | | 481,135 | 481,000,763 |
| 0.15%, 7/15/10 | | 665,233 | 665,021,456 |
| 0.14%, 7/22/10 | | 234,087 | 234,005,304 |
| 0.15%, 7/29/10 | | 239,040 | 238,947,491 |
| 0.15%, 8/05/10 | | 69,314 | 69,285,027 |
| | | | 4,851,974,748 |
| Total Short-Term Securities | | | |
| (Cost — $5,455,859,653) — 13.3% | | | 5,455,880,622 |
See Notes to Consolidated Financial Statements.
BLACKROCK GLOBAL ALLOCATION FUND, INC.
APRIL 30, 2010
17
Consolidated Schedule of Investments (continued)
(Percentages shown are based on Net Assets)
| | |
| Options Purchased | Contracts | Value |
| Exchange-Traded Call Options — 0.0% | | |
| Apple, Inc.: | | |
| Strike Price USD 250, expires 7/17/10 | 830 | $ 1,902,775 |
| Strike Price USD 250, expires 10/16/10 | 415 | 1,308,288 |
| | | 3,211,063 |
| Total Options Purchased | | |
| (Cost — $1,951,161) — 0.0% | | 3,211,063 |
| Total Investments Before Investments | | |
| Sold Short and Outstanding Options | | |
| Written (Cost — $37,575,999,430*) — 101.3% | | 41,638,618,451 |
| Over-the-Counter Structured Options | Units | |
| Credit Suisse Euro Stoxx Index Link, | | |
| expires 9/30/10, Broker Credit Suisse | | |
| International (t) | 56,072 | (5,772,615) |
| Total Over-the-Counter Structured Options | | |
| (Premium Paid — $0) — 0.0% | | (5,772,615) |
| Investments Sold Short | Shares | |
| United States — 0.0% | | |
| D.R. Horton, Inc. | 575,663 | (8,456,489) |
| Total Investments Sold Short | | |
| (Proceeds — $5,272,413) — 0.0% | | (8,456,489) |
| Options Written | Contracts | |
| Exchange-Traded Call Options — (0.1)% | | |
| Advanced Micro Devices, Inc., | | |
| Strike Price USD 8, expires 7/17/10 | 22,800 | (3,306,000) |
| Agrium, Inc., Strike Price USD 60, expires 1/22/11 | 3,164 | (2,974,160) |
| Apple, Inc.: | | |
| Strike Price USD 280, expires 7/17/10 | 830 | (757,375) |
| Strike Price USD 290, expires 10/16/10 | 415 | (589,300) |
| CF Industries Holdings, Inc.: | | |
| Strike Price USD 85, expires 5/22/10 | 2,028 | (529,308) |
| Strike Price USD 90, expires 11/20/10 | 5,006 | (3,328,990) |
| Corning, Inc.: | | |
| Strike Price USD 16, expires 5/22/10 | 9,744 | (3,191,160) |
| Strike Price USD 19, expires 5/22/10 | 4,872 | (333,732) |
| Dell, Inc., Strike Price USD 15, expires 1/22/11 | 10,455 | (2,749,665) |
| JPMorgan Chase & Co., Strike Price USD 44, | | |
| expires 6/19/10 | 12,139 | (1,863,337) |
| Mattel, Inc., Strike Price USD 22.50, | | |
| expires 7/17/10 | 13,903 | (2,050,693) |
| MetLife, Inc., Strike Price USD 41, | | |
| expires 6/19/10 | 2,123 | (1,172,957) |
| Transocean Ltd., Strike Price USD 85, | | |
| expires 1/22/11 | 1,554 | (714,840) |
| UnitedHealth Group, Inc., Strike Price USD 30, | | |
| expires 6/19/10 | 9,870 | (1,638,420) |
| WellPoint, Inc., Strike Price USD 60, | | |
| expires 6/19/10 | 4,850 | (431,650) |
| | | (25,631,587) |
| | |
| Options Written | Contracts | Value |
| Exchange-Traded Put Options Written — 0.0% | | |
| Apple, Inc.: | | |
| Strike Price USD 240, expires 7/17/10 | 830 | $ (659,850) |
| Strike Price USD 230, expires 10/16/10 | 415 | (502,150) |
| | | (1,162,000) |
| Total Options Written | | |
| (Premiums Received — $28,993,953) — (0.1)% | | (26,793,587) |
| Total Investments, Net of Investments Sold Short | | |
| and Outstanding Options Written — 101.2% | | 41,597,595,760 |
| Liabilities in Excess of Other Assets — (1.2)% | | (506,243,697) |
| Net Assets — 100.0% | | $41,091,352,063 |
* The cost and unrealized appreciation (depreciation) of investments as of
April 30, 2010, as computed for federal income tax purposes, were as follows:
| |
| Aggregate cost | $37,771,369,707 |
| Gross unrealized appreciation | $ 5,035,982,879 |
| Gross unrealized depreciation | (1,168,734,135) |
| Net unrealized appreciation | $ 3,867,248,744 |
(a) Non-income producing security.
(b) Security exempt from registration under Rule 144A of the Securities Act of 1933.
These securities may be resold in transactions exempt from registration to
qualified institutional investors.
(c) Security, or a portion of security, is on loan.
See Notes to Consolidated Financial Statements.
18 BLACKROCK GLOBAL ALLOCATION FUND, INC.
APRIL 30, 2010
Consolidated Schedule of Investments (continued)
(d) Investments in companies whereby the Fund held 5% or more of the companies’ outstanding securities that are considered to be an affiliate of the Fund during the period, for
purposes of Section 2(a)(3) of the Investment Company Act of 1940, were as follows:
| | | | | | | |
| | Shares Held at | | | Shares Held at | Value at | | |
| | October 31, | Shares | Shares | April 30, | April 30, | Realized | |
| Affiliate | 2009 | Purchased | Sold | 2010 | 2010 | Gain | Income |
| American Commercial Lines, Inc. | 713,845 | 700 | 9,300 | 705,245 | $14,386,998 | $ 42,501 | — |
| ETFS Platinum Trust | — | 313,300 | — | 313,300 | $54,373,184 | — | — |
| Tianjin Development Holdings Ltd. | 77,828,800 | 1,449,300 | 1,011,300 | 78,266,800 | $49,162,740 | $485,920 | — |
(e) Represents a zero-coupon bond. Rate shown reflects the current yield as of
report date.
(f) Convertible security.
(g) Issuer filed for bankruptcy and/or is in default of interest payments.
(h) When-issued security. Unsettled when-issued transactions were as follows:
| | |
| | | Unrealized |
| Counterparty | Value | Depreciation |
| Citigroup Global Markets | $ 31,587,089 | — |
| HSBC Securities | $ 31,964,736 | $(73,264) |
(i) Variable rate security. Rate shown is as of report date.
(j) Represents a step-up bond that pays an initial coupon rate for the first period
and then a higher coupon rate for the following periods. Rate shown reflects the
current yield.
(k) Security is perpetual in nature and has no stated maturity date.
(l) Represents a step-down bond that pays an initial coupon rate for the first
period and then a lower coupon rate for the following periods. Rate shown as of
report date.
(m) All or a portion of security has been pledged as collateral in connection
with swaps.
(n) All or a portion of security has been pledged as collateral in connection with
open financial futures contracts.
(o) Investments in companies considered to be an affiliate of the Fund during the period, for purposes of Section 2(a)(3) of the Investment Company Act of 1940, were as follows:
| | | | | | | |
| | Shares/ | Shares/ | Shares/ | Shares/ | | | |
| | Beneficial | Beneficial | Beneficial | Beneficial | Value at | | |
| | Interest Held at | Interest | Interest | Interest Held at | April 30, | Realized | |
| Affiliate | October 31, 2009 | Purchased | Sold | April 30, 2010 | 2010 | Gain (Loss) | Income |
| BlackRock Liquidity Funds, TempFund | | | | | | | |
| Institutional Class | 1,801,967 | 132,0771 | — | 1,934,044 | $ 1,934,044 | — | $ 4,096 |
| BlackRock Liquidity Series, | | | | | | | |
| LLC Money Market Series | $138,379,650 $441,072,8001 | — $579,452,450 | $579,462,450 | — | $501,741 |
| iShares Dow Jones U.S. Telecommunications | | | | | | | |
| Sector Index Fund | 797,900 | — | (10,400) | 787,500 | $ 16,049,250 | $ (20,622) | $264,259 |
| iShares MSCI Brazil Index Fund | 22,600 | — | (300) | 22,300 | $ 1,612,290 | $ 9,702 | $ 51,462 |
| iShares MSCI South Korea Index Fund | 25,200 | — | (300) | 24,900 | $ 1,293,057 | $ 5,270 | $ 2,845 |
| iShares Silver Trust | 5,013,700 | 131,300 | (1,286,250) | 3,858,750 | $ 70,499,362 | $5,014,784 | — |
1 Represents net shares/beneficial interest purchased.
(p) Warrants entitle the Fund to purchase a predetermined number of shares
of common stock and are non-income producing. The purchase price and
number of shares are subject to adjustment under certain conditions until the
expiration date.
(q) Represents the current yield as of report date.
(r) Security was purchased with the cash collateral from loaned securities.
(s) Rates shown are discount rates or a range of discount rates paid at the time
of purchase.
(t) CSFB DJ EuroStoxx Structured Option is issued in units. Each unit represents
a structure based on the DJ EuroStoxx 50 Index, with an initial reference strike of
2,941.22. Each unit contains (a) one written put on the index at a strike price of
2,779.453 and (b) one call option on the index with a strike of 2,970.632. As of
April 30, 2010, the Fund held 56,072 units of the structure. On April 30, 2010,
the EuroStoxx 50 Index was 2,816.86. At this time, the value of the structured
option was ($5,772,615) based on a price of ($102.95) per unit. The option
expires on September 30, 2010.
See Notes to Consolidated Financial Statements.
BLACKROCK GLOBAL ALLOCATION FUND, INC.
APRIL 30, 2010
19
| | | | | | | |
| Consolidated Schedule of Investments (continued) | | |
| • | Foreign currency exchange contracts as of April 30, 2010 were as follows: | | |
| | | | | | | | Unrealized |
| | | | | | | Settlement | Appreciation |
| | Currency Purchased | | Currency Sold | Counterparty | Date | (Depreciation) |
| | CHF | 3,439,882 | USD | 3,171,567 | Barclays Bank Plc | 5/3/10 | $ 24,903 |
| | HKD | 24,810,296 | USD | 3,195,441 | Brown Brothers Harriman & Co. | 5/3/10 | 54 |
| | EUR | 1,229,031 | USD | 1,631,047 | Credit Suisse International | 5/4/10 | 5,348 |
| | THB | 58,202,263 | USD | 1,800,256 | Brown Brothers Harriman & Co. | 5/4/10 | (1,438) |
| | USD | 502,437 | BRL | 501,209 | Brown Brothers Harriman & Co. | 5/4/10 | 1,229 |
| | USD | 59,927 | THB | 1,937,430 | Brown Brothers Harriman & Co. | 5/4/10 | 48 |
| | EUR | 61,473,440 | USD | 82,223,184 | JPMorgan Chase Bank NA | 5/6/10 | (373,344) |
| | GBP | 10,902,036 | USD | 16,592,898 | Credit Suisse International | 5/6/10 | 87,411 |
| | USD | 85,024,361 | EUR | 63,859,910 | JPMorgan Chase Bank NA | 5/6/10 | (2,985) |
| | USD | 14,107,661 | JPY | 1,316,752,625 | Credit Suisse International | 5/6/10 | 89,264 |
| | USD | 864,865 | THB | 27,969,750 | Brown Brothers Harriman & Co. | 5/6/10 | 435 |
| | USD | 26,750,686 | ZAR | 195,464,590 | UBS AG | 5/6/10 | 315,884 |
| | EUR | 63,516,000 | USD | 84,828,794 | UBS AG | 5/7/10 | (259,192) |
| | EUR | 66,079,300 | USD | 88,251,879 | Deutsche Bank AG | 5/7/10 | (269,321) |
| | USD | 85,037,129 | EUR | 63,930,000 | Deutsche Bank AG | 5/7/10 | (83,702) |
| | USD | 84,413,399 | EUR | 63,516,000 | UBS AG | 5/7/10 | (156,203) |
| | USD | 13,304,375 | JPY | 1,249,679,926 | Brown Brothers Harriman & Co. | 5/7/10 | (64) |
| | KRW | 41,497,820 | USD | 36,919,769 | UBS AG | 5/10/10 | 509,564 |
| | KRW | 102,035,230 | USD | 90,803,718 | Deutsche Bank AG | 5/10/10 | 1,227,878 |
| | USD | 63,494,465 | JPY | 5,900,102,500 | JPMorgan Chase Bank NA | 5/13/10 | 676,667 |
| | CHF | 71,784,866 | EUR | 50,026,040 | UBS AG | 5/14/10 | 107,419 |
| | EUR | 18,834,450 | CHF | 27,030,073 | UBS AG | 5/14/10 | (43,768) |
| | EUR | 56,058,500 | USD | 76,440,810 | Barclays Bank Plc | 5/14/10 | (1,798,522) |
| | EUR | 63,581,600 | USD | 86,604,179 | UBS AG | 5/14/10 | (1,944,831) |
| | JPY | 5,676,140,364 | EUR | 44,588,691 | Barclays Bank Plc | 5/14/10 | 1,063,728 |
| | USD | 42,030,973 | EUR | 31,998,000 | Credit Suisse International | 5/14/10 | (574,590) |
| | EUR | 32,847,854 | USD | 43,444,900 | Credit Suisse International | 5/21/10 | 293,490 |
| | USD | 83,715,322 | EUR | 62,044,900 | UBS AG | 5/21/10 | 1,099,757 |
| | USD | 83,765,579 | EUR | 62,044,900 | Credit Suisse International | 5/21/10 | 1,150,014 |
| | USD | 29,901,078 | JPY | 2,808,309,268 | Credit Suisse International | 6/4/10 | (5,257) |
| | CNY | 210,443,800 | USD | 31,480,000 | JPMorgan Chase Bank NA | 10/13/10 | (345,883) |
| | Total | | | | | | $ 793,993 |
| | | | | | |
| • | Financial futures contracts purchased as of April 30, 2010 were as follows: | | |
| | | | | | | Unrealized |
| | | | | Expiration | Notional | Appreciation |
| | Contracts | Issue | Exchange | Date | Value | (Depreciation) |
| | 66 | H-Shares Index | Hong Kong | May 2010 | $ 5,104,044 | $ 15,873 |
| | 419 | S&P 500 Index | Chicago Mercantile | June 2010 | $124,394,842 | (433,692) |
| | 214 | S&P TSE 60 Index | Montreal | June 2010 | $ 29,543,988 | 548,314 |
| | 11,525 | DJ Euro Stoxx 50 | Eurex | June 2010 | $433,658,175 | (11,978,153) |
| | 1,474 | FTSE 100 Index | NYSE LIFFE — London | June 2010 | $126,278,715 | (2,067,767) |
| | 372 | Yen Denom Nikkei | Chicago Mercantile | June 2010 | $ 22,028,622 | (267,404) |
| | 50 | SPI 200 Index | Sydney | June 2010 | $ 5,666,014 | (92,235) |
| | 598 | DAX Index 25 Euro | Eurex | June 2010 | $118,731,593 | 3,297,239 |
| | 24 | TOPIX Index | Tokyo | June 2010 | $ 2,536,504 | (24,980) |
| | Total | | | | | $ (11,002,805) |
| | | | | | |
| • | Financial futures contracts sold as of April 30, 2010 were as follows: | | | |
| | | | | Expiration | Notional | Unrealized |
| | Contracts | Issue | Exchange | Date | Value | Appreciation |
| | 510 | IBEX 35 Plus Index | Meff Renta | | | |
| | | | Variable (Madrid) | May 2010 | $77,100,358 | $ 6,948,706 |
See Notes to Consolidated Financial Statements.
20 BLACKROCK GLOBAL ALLOCATION FUND, INC.
APRIL 30, 2010
Consolidated Schedule of Investments (continued)
| | | | | | |
| • | Total return swaps outstanding as of April 30, 2010 were as follows: | | | |
| | Interest | | | Notional | Unrealized |
| | Payable | | | Amount | Appreciation |
| | Rate | Counterparty | Expiration | (000) | (Depreciation) |
| | (0.60)%1 | BNP Paribas SA | September 2010 | USD | 177,260 | $ 4,782,2432 |
| | (0.47)%3 | Deutsche Bank AG | September 2010 | USD | 84,134 | 2,269,8132 |
| | (0.49)%4 | BNP Paribas SA | September 2010 | USD | 61,798 | 1,667,2142 |
| | 0.02%5 | BNP Paribas SA | September 2010 | USD | 99,683 | (1,227,904)6 |
| | 0.74%7 | JPMorgan Chase Bank NA | December 2010 | USD | 64,344 | 2,680,3108 |
| | 0.66%9 | BNP Paribas SA | January 2011 | USD | 58,283 | (1,026,834)8 |
| | (0.46)%10 | JPMorgan Chase Bank NA | February 2011 | USD | 99,266 | 2,717,4192 |
| | (0.46)%10 | JPMorgan Chase Bank NA | February 2011 | USD | 16,826 | (244,063)2 |
| | 0.30%11 | Citibank NA | April 2011 | USD | 11,400 | (472,595)12 |
| | Total | | | | | $ 11,145,603 |
1 Based on the 3-month LIBOR minus 0.85%.
2 Based on the return of the MSCI Daily Total Return Net Europe (excluding United Kingdom) USD Index.
3 Based on the 3-month LIBOR minus 0.72%.
4 Based on the 3-month LIBOR minus 0.74%.
5 Based on the 3-month LIBOR minus 0.24%.
6 Based on the return of the MSCI Daily Total Return Net EAFE USD Index.
7 Based on the 3-month LIBOR plus 0.48%.
8 Based on the return of the MSCI Daily Total Return Net Emerging Markets USD Index.
9 Based on the 3-month LIBOR plus 0.37%.
10 Based on the 3-month LIBOR minus 0.71%.
11 Based on the 3-month LIBOR minus 0.15%
12 Based on the return of the MSCi Daily Total Return All Country World USD Index.
• Fair Value Measurements — Various inputs are used in determining the fair value
of investments, which are as follows:
• Level 1 — price quotations in active markets/exchanges for identical assets
and liabilities
• Level 2 — other observable inputs (including, but not limited to: quoted prices
for similar assets or liabilities in markets that are active, quoted prices for
identical or similar assets or liabilities in markets that are not active, inputs
other than quoted prices that are observable for the assets or liabilities (such
as interest rates, yield curves, volatilities, prepayment speeds, loss severities,
credit risks and default rates) or other market-corroborated inputs)
• Level 3 — unobservable inputs based on the best information available in the
circumstances, to the extent observable inputs are not available (including the
Fund’s own assumptions used in determining the fair value of investments)
The inputs or methodologies used for valuing securities are not necessarily
an indication of the risk associated with investing in those securities. For
information about the Fund’s policy regarding valuation of investments and
other significant accounting policies, please refer to Note 1 of the Notes to
Consolidated Financial Statements.
See Notes to Consolidated Financial Statements.
BLACKROCK GLOBAL ALLOCATION FUND, INC.
APRIL 30, 2010
21
Consolidated Schedule of Investments (continued)
The following tables summarize the inputs used as of April 30, 2010 in determining the fair valuation of the
Fund’s investments:
| | | | |
| | | Investments in Securities | | |
| Valuation Inputs | Level 1 | Level 2 | Level 3 | Total |
| Assets: | | | | |
| Long-Term Investments: | | | | |
| Common Stocks | | | | |
| Australia | — | $ 275,363,813 | — | $ 275,363,813 |
| Austria | — | 9,510,556 | — | 9,510,556 |
| Belgium | $ 7,710,233 | 34,363,368 | — | 42,073,601 |
| Brazil | 933,744,465 | — | — | 933,744,465 |
| Canada | 1,193,341,719 | — | — | 1,193,341,719 |
| Chile | 33,624,901 | — | — | 33,624,901 |
| China | 101,220,174 | 494,294,158 | — | 595,514,332 |
| Egypt | — | 34,719,873 | — | 34,719,873 |
| Finland | — | 11,304,028 | — | 11,304,028 |
| France | 1,699,502 | 197,154,922 | — | 198,854,424 |
| Germany | 758,840 | 40,722,996 | — | 41,481,836 |
| Hong Kong | — | 223,878,607 | — | 223,878,607 |
| India | — | 260,206,931 | — | 260,206,931 |
| Indonesia | — | 56,961,423 | — | 56,961,423 |
| Ireland | 37,903,360 | — | — | 37,903,360 |
| Israel | 79,104,052 | — | — | 79,104,052 |
| Italy | — | 17,325,174 | — | 17,325,174 |
| Japan | 61,286,056 | 2,458,669,315 | — | 2,519,955,371 |
| Kazakhstan | 82,045,920 | — | — | 82,045,920 |
| Luxembourg | 3,125,112 | — | — | 3,125,112 |
| Malaysia | — | 149,292,843 | — | 149,292,843 |
| Mexico | 71,660,106 | — | — | 71,660,106 |
| Netherlands | 13,183,598 | 46,226,115 | — | 59,409,713 |
| Norway | — | 37,694,786 | — | 37,694,786 |
| Philippines | 17,839,328 | 417,546 | — | 18,256,874 |
| Russia | 526,651,531 | — | — | 526,651,531 |
| Singapore | — | 312,163,175 | — | 312,163,175 |
| South Africa | 13,265,421 | 24,040,318 | — | 37,305,739 |
| South Korea | 112,286,926 | 274,510,635 | — | 386,797,561 |
| Spain | 12,498,496 | 35,489,887 | — | 47,988,383 |
| Switzerland | 83,566,166 | 256,184,179 | — | 339,750,345 |
| Taiwan | 44,645,344 | 273,579,199 | — | 318,224,543 |
| Thailand | 73,466,864 | — | — | 73,466,864 |
| Turkey | 22,028,497 | 100,529,370 | — | 122,557,867 |
| United Kingdom | 200,940,029 | 426,644,549 | — | 627,584,578 |
| United States | 11,820,460,278 | 36,545,897 | — | 11,857,006,175 |
| Asset-Backed | | | | |
| Securities | — | — | $ 395,000 | 395,000 |
| Corporate Bonds | — | 5,088,208,863 | 771,595,940 | 5,859,804,803 |
| Floating Rate Loan | | | | |
| Interests | — | — | 83,700,000 | 83,700,000 |
| Foreign Agency | | | | |
| Obligations | — | 3,028,023,592 | 60,182,874 | 3,088,206,466 |
| Structured Notes | — | — | 3,112,191 | 3,112,191 |
| U.S. Treasury Obligations . | — | 3,934,506,373 | — | 3,934,506,373 |
| Investment Companies | 1,333,427,140 | 5,210,771 | — | 1,338,637,911 |
| Capital Trusts | — | 2,729,274 | — | 2,729,274 |
| Preferred Stocks | 70,634,152 | 96,659,936 | 2,015,575 | 169,309,663 |
| Rights | — | 1,955,384 | — | 1,955,384 |
| Warrants | 61,319,120 | — | — | 61,319,120 |
| Short-Term Securities: | | | | |
| Money Market Funds | 1,934,044 | 579,452,450 | — | 581,386,494 |
| Time Deposits | — | 22,519,380 | — | 22,519,380 |
| U.S. Treasury Obligations . | — | 4,851,974,748 | — | 4,851,974,748 |
| Liabilities: | | | | |
| Investments in Securities: | | | | |
| Investments Sold Short | (8,456,489) | — | — | (8,456,489) |
| Total | $17,006,914,885 | $23,699,034,434 | $921,001,580 | $41,626,950,899 |
| See Notes to Consolidated Financial Statements. | | | |
22 BLACKROCK GLOBAL ALLOCATION FUND, INC.
APRIL 30, 2010
Consolidated Schedule of Investments (concluded)
| | | | | |
| | Other Financial Instruments1 | | | |
| Valuation Inputs | Level 1 | Level 2 | Level 3 | | Total |
| Assets | $ 14,021,195 | $ 20,770,092 | — | | $ 34,791,287 |
| Liabilities | (41,657,818) | (14,603,111) | — | | (56,260,929) |
| Total | $ (27,636,623) | $ 6,166,981 | — | | $ (21,469,642) |
1 Other financial instruments are swaps, financial futures contracts, foreign currency exchange contracts and options.
Swaps, financial futures contracts and foreign currency exchange contracts are shown at the unrealized apprecia-
tion/depreciation on the instrument and options are shown at value.
The following table is a reconciliation of Level 3 investments for which significant unobservable inputs were used to determine fair value:
| | | | | | | | | |
| | | | | | Investments in Securities | | | |
| | | | | Floating | Foreign | | | | |
| | Asset-Backed Corporate | Rate Loan | Agency | Structured | Preferred | | |
| | Securities | Bonds | Interests | Obligations | Notes | Stocks | Warrants | Total |
| Balance, as of October 31, 2009 | $ 80,000 $866,416,734 $42,500,000 | $59,410,122 | $6,636,808 | $ 3,038,743 $ | 22,750 | $978,105,157 |
| Accrued discounts/premiums | 16,105 | 15,674,978 | — | (60,599) | 2,969 | — | — | 15,633,453 |
| Realized gain (loss) | (94,678) | 9,689,972 | — | 217,314 | 17,879 | 14 | — | 9,830,501 |
| Change in unrealized | | | | | | | | | |
| appreciation/depreciation2 | 395,573 | (922,188) | — | 1,437,555 | (17,257) | (141,565) | (22,750) | 729,368 |
| Net purchases (sales) | (2,000) (168,725,244) | (500,000) | (821,518) | (3,528,208) | (881,617) | — | (174,458,587) |
| Net transfers in/out of Level 3 | | — | 49,461,688 | 41,700,000 | — | — | — | — | 91,161,688 |
| Balance, as of April 30, 2010 | $ 395,000 $771,595,940 $83,700,000 | $60,182,874 | $3,112,191 | $ 2,015,575 | — | $921,001,580 |
| 2 The change in unrealized appreciation/depreciation on securities still held at April 30, 2010 was $17,075,070. | | | |
| | | Other Financial | | | | | | |
| | | Instruments4 | | | | | | |
| | | Liabilities | | | | | | |
| Balance, as of October 31, 2009 | $ 37,996,088 | | | | | | |
| Accrued discounts/premiums | | | — | | | | | | |
| Realized gain (loss) | | | 2,813,331 | | | | | | |
| Change in unrealized | | | | | | | | | |
| appreciation/depreciation | | | — | | | | | | |
| Net purchases (sales) | | (40,809,419) | | | | | | |
| Net transfers in/out of Level 3 | | | — | | | | | | |
| Balance, as of April 30, 2010 | | | — | | | | | | |
| 4 Other financial instruments are structured options. | | | | | | | | |
See Notes to Consolidated Financial Statements.
BLACKROCK GLOBAL ALLOCATION FUND, INC.
APRIL 30, 2010
23
| |
| Consolidated Statement of Assets and Liabilities | |
| April 30, 2010 (Unaudited) | |
| Assets | |
| Investments at value — unaffiliated (including securities loaned of $546,307,444) (cost — $36,792,773,340) | $40,849,855,076 |
| Investments at value — affiliated (cost — $783,226,090) | 788,763,375 |
| Cash | 1,770,580 |
| Foreign currency at value (cost — $67,235,120) | 68,154,303 |
| Unrealized appreciation on swaps | 14,116,999 |
| Unrealized appreciation on foreign currency exchange contracts | 6,653,093 |
| Capital shares sold receivable | 196,644,583 |
| Investments sold receivable | 171,461,990 |
| Interest receivable | 139,066,371 |
| Dividends receivable | 57,496,585 |
| Swap receivable | 308,204 |
| Securities lending income receivable — affiliated | 99,463 |
| Prepaid expenses | 768,909 |
| Total assets | 42,295,159,531 |
| Liabilities | |
| Collateral at value — securities loaned | 579,452,450 |
| Investments sold short at value (proceeds — $5,272,413) | 8,456,489 |
| Options written at value (premium received — $28,993,953) | 26,793,587 |
| Structured options at value (premiums paid — $0) | 5,772,615 |
| Unrealized depreciation on foreign currency exchange contracts | 5,859,100 |
| Unrealized depreciation on swaps | 2,971,396 |
| Investments purchased payable — unaffiliated | 362,925,915 |
| Capital shares redeemed payable | 111,124,684 |
| Investments purchased payable — affiliated | 39,932,460 |
| Investment advisory fees payable | 22,801,414 |
| Service and distribution fees payable | 15,844,419 |
| Margin variation payable | 7,259,804 |
| Deferred foreign capital gain tax | 5,255,237 |
| Other affiliates payable | 1,447,712 |
| Dividends on short sales payable | 130,561 |
| Officer's and Directors' fees payable | 87,835 |
| Other accrued expenses payable | 7,625,728 |
| Other liabilities | 66,062 |
| Total liabilities | 1,203,807,468 |
| Net Assets | $41,091,352,063 |
| Net Assets Consist of | |
| Paid-in capital | $38,018,583,348 |
| Distributions in excess of net investment income | (177,356,120) |
| Accumulated net realized loss | (807,182,831) |
| Net unrealized appreciation/depreciation | 4,057,307,666 |
| Net Assets | $41,091,352,063 |
| Net Asset Value | |
| Institutional — Based on net assets of $10,277,164,757 and 559,046,703 shares outstanding, 1 billion shares authorized, $0.10 per value | $ 18.38 |
| Investor A — Based on net assets of $14,742,822,418 and 805,872,965 shares outstanding, 2 billion shares authorized, $0.10 per value | $ 18.29 |
| Investor B — Based on net assets of $1,344,205,114 and 75,343,162 shares outstanding, 1.5 billion shares authorized, $0.10 per value | $ 17.84 |
| Investor C — Based on net assets of $13,955,328,052 and 817,358,083 shares outstanding, 1.5 billion shares authorized, $0.10 per value | $ 17.07 |
| Class R — Based on net assets of $771,831,722 and 43,563,587 shares outstanding, 2 billion shares authorized, $0.10 per value | $ 17.72 |
See Notes to Consolidated Financial Statements.
24 BLACKROCK GLOBAL ALLOCATION FUND, INC.
APRIL 30, 2010
| |
| Consolidated Statement of Operations | |
| Six Months Ended April 30, 2010 (Unaudited) | |
| Investment Income | |
| Interest | $ 259,828,834 |
| Dividends | 238,980,908 |
| Foreign taxes withheld | (8,753,461) |
| Securities lending — affiliated | 501,741 |
| Income — affiliated | 322,662 |
| Total income | 490,880,684 |
| Expenses | |
| Investment advisory | 138,962,066 |
| Service — Investor A | 16,580,748 |
| Service and Distribution — Investor B | 7,054,932 |
| Service and Distribution — Investor C | 63,124,321 |
| Service and Distribution — Class R | 1,704,966 |
| Transfer agent — Institutional | 3,463,466 |
| Transfer agent — Investor A | 5,782,337 |
| Transfer agent — Investor B | 1,168,533 |
| Transfer agent — Investor C | 6,188,219 |
| Transfer agent — Class R | 557,640 |
| Accounting services | 2,825,075 |
| Custodian | 2,815,116 |
| Registration | 606,445 |
| Printing | 463,950 |
| Officers and Directors | 391,559 |
| Professional | 338,278 |
| Miscellaneous | 499,427 |
| Total expenses excluding dividend expense | 252,527,078 |
| Dividend expenses on short sales | 708,360 |
| Total expenses | 253,235,438 |
| Less fees waived by advisor | (12,021,384) |
| Total expenses after fees waived | 241,214,054 |
| Net investment income | 249,666,630 |
| Realized and Unrealized Gain (Loss) | |
| Net realized gain (loss) from: | |
| Investments — unaffiliated | 132,491,044 |
| Investments — affiliated | 5,537,555 |
| In-kind redemptions | 109,117,858 |
| Financial futures contracts | (43,851,328) |
| Swaps | 1,577,275 |
| Short sales | (23,699,292) |
| Option written and structured options | 22,257,705 |
| Foreign currency transactions | (126,380,595) |
| | 77,050,222 |
| Net change in unrealized appreciation/depreciation on: | |
| Investments | 1,990,967,923 |
| Financial futures contracts | 9,607,528 |
| Swaps | (117,292) |
| Option written and structured options | 10,387,598 |
| Foreign currency transactions | 11,933,430 |
| Short sales | (2,605,297) |
| | 2,020,173,890 |
| Total realized and unrealized gain | 2,097,224,112 |
| Net Increase in Net Assets Resulting from Operations | $ 2,346,890,742 |
| See Notes to Consolidated Financial Statements. | |
BLACKROCK GLOBAL ALLOCATION FUND, INC.
APRIL 30, 2010
25
| | |
| Consolidated Statements of Changes in Net Assets | | |
| | Six Months | |
| | Ended | |
| | April 30, | Year Ended |
| | 2010 | October 31, |
| Increase (Decrease) in Net Assets: | (Unaudited) | 2009 |
| Operations | | |
| Net investment income | $ 249,666,630 | $ 456,828,495 |
| Net realized gain (loss) | 77,050,222 | (787,637,012) |
| Net change in unrealized appreciation/depreciation | 2,020,173,890 | 5,212,663,235 |
| Net increase in net assets resulting from operations | 2,346,890,742 | 4,881,854,718 |
| Dividends to Shareholders From | | |
| Net investment income: | | |
| Institutional | (117,814,754) | (251,914,635) |
| Investor A | (167,072,978) | (392,321,874) |
| Investor B | (13,142,613) | (55,746,986) |
| Investor C | (129,233,293) | (337,604,724) |
| Class R | (7,738,720) | (17,206,062) |
| Decrease in net assets resulting from dividends to shareholders | (435,002,358) | (1,054,794,281) |
| Capital Share Transactions | | |
| Net increase in net assets derived from capital share transactions | 5,997,361,208 | 5,830,930,035 |
| Redemption Fee | | |
| Redemption fee | 462,164 | 1,284,347 |
| Net Assets | | |
| Total increase in net assets | 7,909,711,756 | 9,659,274,819 |
| Beginning of period | 33,181,640,307 | 23,522,365,488 |
| End of period | $41,091,352,063 | $33,181,640,307 |
| Undistributed (distributions in excess of) net investment income | $ (177,356,120) $ 7,979,608 |
See Notes to Consolidated Financial Statements.
26 BLACKROCK GLOBAL ALLOCATION FUND, INC.
APRIL 30, 2010
| | | | | | | |
| Financial Highlights | | | | | | | |
| | | | Institutional | | | |
| Six Months |
| Ended |
| April 30, |
| | 2010 | | Year Ended October 31, | | |
| | (Consolidated) | 2009 | | | | | |
| | (Unaudited) | (Consolidated) | 2008 | 2007 | | 2006 | 2005 |
| Per Share Operating Performance | | | | | | | |
| Net asset value, beginning of period | $ 17.42 | $ 15.20 | $ 21.30 | $ 17.94 | $ 17.36 | $ 15.80 |
| Net investment income1 | 0.17 | 0.35 | 0.34 | 0.40 | | 0.38 | 0.34 |
| Net realized and unrealized gain (loss)2 | 1.05 | 2.61 | (5.10) | 3.60 | | 2.34 | 1.89 |
| Net increase (decrease) from investment operations | 1.22 | 2.96 | (4.76) | 4.00 | | 2.72 | 2.23 |
| Dividends and distributions from: | | | | | | | |
| Net investment income | (0.26) | (0.74) | (0.52) | (0.44) | | (0.44) | (0.49) |
| Net realized gain | — | — | (0.82) | (0.20) | | (1.70) | (0.18) |
| Total dividends and distributions | (0.26) | (0.74) | (1.34) | (0.64) | | (2.14) | (0.67) |
| Net asset value, end of period | $ 18.38 | $ 17.42 | $ 15.20 | $ 21.30 | $ 17.94 | $ 17.36 |
| Total Investment Return3 | | | | | | | |
| Based on net asset value | 7.03%4 | 20.43% | (23.73)% | 22.78% | | 16.65%5 | 14.41% |
| Ratios to Average Net Assets | | | | | | | |
| Total expenses | 0.87%6 | 0.91% | 0.95% | 0.88% | | 0.91% | 0.92% |
| Total expenses after fees waived and paid indirectly | 0.81%6 | 0.87% | 0.86% | 0.77% | | 0.82% | 0.84% |
| Total expenses after fees waived and paid indirectly and excluding | | | | | | | |
| dividend expense | 0.80%6 | 0.85% | 0.80% | 0.77% | | 0.82% | 0.84% |
| Net investment income | 1.85%6 | 2.26% | 1.78% | 2.08% | | 2.13% | 2.04% |
| Supplemental Data | | | | | | | |
| Net assets, end of period (000) | $10,277,165 | $8,066,571 | $5,091,181 | $4,858,867 | $3,506,452 | $2,574,791 |
| Portfolio turnover | 13% | 33% | 34% | 45% | | 40% | 49% |
1 Based on average shares outstanding.
2 Includes a redemption fee, which is less than $0.01 per share.
3 Where applicable, total investment returns exclude the effects of any sales charges and include the reinvestment of dividends and distributions.
4 Aggregate total investment return.
5 The previous investment advisor reimbursed the Fund in order to resolve a regulatory issue relating to an investment, which increased the total investment return by 0.02%.
6 Annualized.
See Notes to Consolidated Financial Statements.
BLACKROCK GLOBAL ALLOCATION FUND, INC.
APRIL 30, 2010
27
| | | | | | | | |
| Financial Highlights (continued) | | | | | | | | |
| | | | | Investor A | | | |
| Six Months |
| Ended |
| April 30, |
| | 2010 | | | Year Ended October 31, | | |
| | (Consolidated) | 2009 | | | | | |
| | (Unaudited) | (Consolidated) | 2008 | 2007 | | 2006 | 2005 |
| Per Share Operating Performance | | | | | | | | |
| Net asset value, beginning of period | $ 17.34 | $ 15.13 | $ 21.22 | $ 17.87 | $ 17.30 | $ 15.75 |
| Net investment income1 | 0.14 | | 0.31 | 0.29 | 0.35 | | 0.33 | 0.30 |
| Net realized and unrealized gain (loss)2 | 1.05 | | 2.60 | (5.09) | 3.60 | | 2.33 | 1.88 |
| Net increase (decrease) from investment operations | 1.19 | | 2.91 | (4.80) | 3.95 | | 2.66 | 2.18 |
| Dividends and distributions from: | | | | | | | | |
| Net investment income | (0.24) | | (0.70) | (0.47) | (0.40) | | (0.39) | (0.45) |
| Net realized gain | — | | — | (0.82) | (0.20) | | (1.70) | (0.18) |
| Total dividends and distributions | (0.24) | | (0.70) | (1.29) | (0.60) | | (2.09) | (0.63) |
| Net asset value, end of period | $ 18.29 | $ 17.34 | $ 15.13 | $ 21.22 | $ 17.87 | $ 17.30 |
| Total Investment Return3 | | | | | | | | |
| Based on net asset value | 6.88%4 | | 20.14% | (23.96)% | 22.56% | | 16.32%5 | 14.12% |
| Ratios to Average Net Assets | | | | | | | | |
| Total expenses | 1.13%6 | | 1.18% | 1.20% | 1.15% | | 1.16% | 1.17% |
| Total expenses after fees waived and paid indirectly | 1.07%6 | | 1.13% | 1.12% | 1.03% | | 1.07% | 1.09% |
| Total expenses after fees waived and paid indirectly and excluding | | | | | | | | |
| dividend expense | 1.06%6 | | 1.12% | 1.06% | 1.03% | | 1.07% | 1.09% |
| Net investment income | 1.58%6 | | 2.00% | 1.52% | 1.82% | | 1.88% | 1.79% |
| Supplemental Data | | | | | | | | |
| Net assets, end of period (000) | $14,742,822 | $11,844,981 | $8,387,965 | $8,266,581 | $5,833,059 | $4,482,210 |
| Portfolio turnover | 13% | | 33% | 34% | 45% | | 40% | 49% |
1 Based on average shares outstanding.
2 Includes a redemption fee, which is less than $0.01 per share.
3 Where applicable, total investment returns exclude the effects of any sales charges and include the reinvestment of dividends and distributions.
4 Aggregate total investment return.
5 The previous investment advisor reimbursed the Fund in order to resolve a regulatory issue relating to an investment, which increased the total investment return by 0.02%.
6 Annualized.
See Notes to Consolidated Financial Statements.
28 BLACKROCK GLOBAL ALLOCATION FUND, INC.
APRIL 30, 2010
| | | | | | | |
| Financial Highlights (continued) | | | | | | | |
| | | | Investor B | | | |
| Six Months |
| Ended |
| April 30, |
| | 2010 | | Year Ended October 31, | | |
| | (Consolidated) | 2009 | | | | | |
| | (Unaudited) | (Consolidated) | 2008 | 2007 | | 2006 | 2005 |
| Per Share Operating Performance | | | | | | | |
| Net asset value, beginning of period | $ 16.91 | $ 14.76 | $ 20.72 | $ 17.49 | $ 16.94 | $ 15.44 |
| Net investment income1 | 0.06 | 0.18 | 0.13 | 0.19 | | 0.19 | 0.17 |
| Net realized and unrealized gain (loss)2 | 1.03 | 2.53 | (4.97) | 3.51 | | 2.29 | 1.83 |
| Net increase (decrease) from investment operations | 1.09 | 2.71 | (4.84) | 3.70 | | 2.48 | 2.00 |
| Dividends and distributions from: | | | | | | | |
| Net investment income | (0.16) | (0.56) | (0.30) | (0.27) | | (0.23) | (0.32) |
| Net realized gain | — | — | (0.82) | (0.20) | | (1.70) | (0.18) |
| Total dividends and distributions | (0.16) | (0.56) | (1.12) | (0.47) | | (1.93) | (0.50) |
| Net asset value, end of period | $ 17.84 | $ 16.91 | $ 14.76 | $ 20.72 | $ 17.49 | $ 16.94 |
| Total Investment Return3 | | | | | | | |
| Based on net asset value | 6.47%4 | 19.15% | (24.57)% | 21.52% | | 15.49%5 | 13.19% |
| Ratios to Average Net Assets | | | | | | | |
| Total expenses | 1.96%6 | 2.00% | 2.01% | 1.95% | | 1.93% | 1.94% |
| Total expenses after fees waived and paid indirectly | 1.90%6 | 1.95% | 1.92% | 1.84% | | 1.83% | 1.86% |
| Total expenses after fees waived and paid indirectly and excluding | | | | | | | |
| dividend expense | 1.89%6 | 1.94% | 1.86% | 1.84% | | 1.83% | 1.86% |
| Net investment income | 0.72%6 | 1.17% | 0.70% | 1.03% | | 1.12% | 1.04% |
| Supplemental Data | | | | | | | |
| Net assets, end of period (000) | $ 1,344,205 | $1,442,397 | $1,514,668 | $2,141,544 | $2,020,699 | $2,060,638 |
| Portfolio turnover | 13% | 33% | 34% | 45% | | 40% | 49% |
1 Based on average shares outstanding.
2 Includes a redemption fee, which is less than $0.01 per share.
3 Where applicable, total investment returns exclude the effects of any sales charges and include the reinvestment of dividends and distributions.
4 Aggregate total investment return.
5 The previous investment advisor reimbursed the Fund in order to resolve a regulatory issue relating to an investment, which increased the total investment return by 0.02%.
6 Annualized.
See Notes to Consolidated Financial Statements.
BLACKROCK GLOBAL ALLOCATION FUND, INC.
APRIL 30, 2010
29
| | | | | | | | |
| Financial Highlights (continued) | | | | | | | | |
| | | | | Investor C | | | |
| Six Months |
| Ended |
| April 30, |
| | 2010 | | | Year Ended October 31, | | |
| | (Consolidated) | 2009 | | | | | |
| | (Unaudited) | (Consolidated) | 2008 | 2007 | | 2006 | 2005 |
| Per Share Operating Performance | | | | | | | | |
| Net asset value, beginning of period | $ 16.21 | $ 14.19 | $ 19.99 | $ 16.91 | $ 16.47 | $ 15.04 |
| Net investment income1 | 0.07 | | 0.18 | 0.14 | 0.19 | | 0.19 | 0.16 |
| Net realized and unrealized gain (loss)2 | 0.97 | | 2.43 | (4.78) | 3.39 | | 2.21 | 1.80 |
| Net increase (decrease) from investment operations | 1.04 | | 2.61 | (4.64) | 3.58 | | 2.40 | 1.96 |
| Dividends and distributions from: | | | | | | | | |
| Net investment income | (0.18) | | (0.59) | (0.34) | (0.30) | | (0.26) | (0.35) |
| Net realized gain | — | | — | (0.82) | (0.20) | | (1.70) | (0.18) |
| Total dividends and distributions | (0.18) | | (0.59) | (1.16) | (0.50) | | (1.96) | (0.53) |
| Net asset value, end of period | $ 17.07 | $ 16.21 | $ 14.19 | $ 19.99 | $ 16.91 | $ 16.47 |
| Total Investment Return3 | | | | | | | | |
| Based on net asset value | 6.44%4 | | 19.24% | (24.51)% | 21.54% | | 15.45%5 | 13.25% |
| Ratios to Average Net Assets | | | | | | | | |
| Total expenses | 1.89%6 | | 1.94% | 1.96% | 1.92% | | 1.93% | 1.94% |
| Total expenses after fees waived and paid indirectly | 1.83%6 | | 1.89% | 1.88% | 1.81% | | 1.83% | 1.86% |
| Total expenses after fees waived and paid indirectly and excluding | | | | | | | | |
| dividend expense | 1.82%6 | | 1.88% | 1.81% | 1.81% | | 1.83% | 1.86% |
| Net investment income | 0.82%6 | | 1.23% | 0.76% | 1.05% | | 1.11% | 1.01% |
| Supplemental Data | | | | | | | | |
| Net assets, end of period (000) | $13,955,328 | $11,251,502 | $8,157,355 | $7,425,397 | $4,585,172 | $2,841,071 |
| Portfolio turnover | 13% | | 33% | 34% | 45% | | 40% | 49% |
1 Based on average shares outstanding.
2 Includes a redemption fee, which is less than $0.01 per share.
3 Where applicable, total investment returns exclude the effects of any sales charges and include the reinvestment of dividends and distributions.
4 Aggregate total investment return.
5 The previous investment advisor reimbursed the Fund in order to resolve a regulatory issue relating to an investment, which increased the total investment return by 0.02%.
6 Annualized.
See Notes to Consolidated Financial Statements.
30 BLACKROCK GLOBAL ALLOCATION FUND, INC.
APRIL 30, 2010
| | | | | | | |
| Financial Highlights (concluded) | | | | | | | |
| | | | Class R | | | |
| Six Months |
| Ended |
| April 30, |
| | 2010 | | Year Ended October 31, | | |
| | (Consolidated) | 2009 | | | | | |
| | (Unaudited) | (Consolidated) | 2008 | 2007 | | 2006 | 2005 |
| Per Share Operating Performance | | | | | | | |
| Net asset value, beginning of period | $ 16.80 | $ 14.69 | $ 20.65 | $ 17.43 | $ 16.93 | $ 15.44 |
| Net investment income1 | 0.11 | 0.25 | 0.22 | 0.27 | | 0.28 | 0.25 |
| Net realized and unrealized gain (loss)2 | 1.02 | 2.51 | (4.94) | 3.51 | | 2.28 | 1.85 |
| Net increase (decrease) from investment operations | 1.13 | 2.76 | (4.72) | 3.78 | | 2.56 | 2.10 |
| Dividends and distributions from: | | | | | | | |
| Net investment income | (0.21) | (0.65) | (0.42) | (0.36) | | (0.36) | (0.43) |
| Net realized gain | — | — | (0.82) | (0.20) | | (1.70) | (0.18) |
| Total dividends and distributions | (0.21) | (0.65) | (1.24) | (0.56) | | (2.06) | (0.61) |
| Net asset value, end of period | $ 17.72 | $ 16.80 | $ 14.69 | $ 20.65 | $ 17.43 | $ 16.93 |
| Total Investment Return3 | | | | | | | |
| Based on net asset value | 6.76%4 | 19.67% | (24.21)% | 22.14% | | 16.02%5 | 13.87% |
| Ratios to Average Net Assets | | | | | | | |
| Total expenses | 1.46%6 | 1.54% | 1.55% | 1.47% | | 1.41% | 1.42% |
| Total expenses after fees waived and paid indirectly | 1.40%6 | 1.49% | 1.46% | 1.36% | | 1.32% | 1.35% |
| Total expenses after fees waived and paid indirectly and excluding | | | | | | | |
| dividend expense | 1.39%6 | 1.48% | 1.40% | 1.36% | | 1.32% | 1.35% |
| Net investment income | 1.26%6 | 1.65% | 1.18% | 1.47% | | 1.61% | 1.48% |
| Supplemental Data | | | | | | | |
| Net assets, end of period (000) | $ 771,832 | $576,189 | $371,196 | $306,367 | $148,232 | $ 61,531 |
| Portfolio turnover | 13% | 33% | 34% | 45% | | 40% | 49% |
1 Based on average shares outstanding.
2 Includes a redemption fee, which is less than $0.01 per share.
3 Where applicable, total investment returns include the reinvestment of dividends and distributions.
4 Aggregate total investment return.
5 The previous investment advisor reimbursed the Fund in order to resolve a regulatory issue relating to an investment, which increased the total investment return by 0.02%.
6 Annualized.
See Notes to Consolidated Financial Statements.
BLACKROCK GLOBAL ALLOCATION FUND, INC.
APRIL 30, 2010
31
Notes to Consolidated Financial Statements
1. Organization and Significant Accounting Policies:
BlackRock Global Allocation Fund, Inc. (the “Fund”) is registered under
the Investment Company Act of 1940, as amended (the “1940 Act”),
as a diversified, open-end management investment company. The Fund
is organized as a Maryland corporation. The Fund’s financial statements
are prepared in conformity with accounting principles generally accepted
in the United States of America (“US GAAP”), which may require the
use of management accruals and estimates. Actual results may differ
from these estimates. The Fund offers multiple classes of shares.
Institutional Shares are sold without a sales charge and only to certain
eligible investors. Investor A Shares are generally sold with a front-end
sales charge. Investor B and Investor C Shares may be subject to a con-
tingent deferred sales charge. Class R Shares are sold without a sales
charge and only to certain retirement and other similar plans. All classes
of shares have identical voting, dividend, liquidation and other rights
and the same terms and conditions, except that Investor A, Investor B,
Investor C and Class R Shares bear certain expenses related to the
shareholder servicing of such shares, and Investor B, Investor C and
Class R Shares also bear certain expenses related to the distribution
of such shares. Investor B Shares automatically convert to Investor A
Shares after approximately eight years. Investor B Shares are only
available through exchanges, dividend reinvestment by existing share-
holders or for purchase by certain qualified employee benefit plans.
Each class has exclusive voting rights with respect to matters relating
to its shareholder servicing and distribution expenditures (except that
Investor B shareholders may vote on material changes to the Investor A
distribution plan).
The following is a summary of significant accounting policies followed by
the Fund:
Basis of Consolidation: The accompanying consolidated financial
statements include the accounts of BlackRock Cayman Global Allocation
Fund I, Ltd. (the “Subsidiary”), a wholly owned subsidiary of the Fund,
which primarily invests in commodity-related instruments. The Fund may
invest up to 25% of its total assets in the Subsidiary. Intercompany
accounts and transactions have been eliminated.
Valuation: The Fund’s policy is to fair value its financial instruments
at market value using independent dealers or pricing services selected
under the supervision of the Board of Directors (the “Board”). Equity
investments traded on a recognized securities exchange or the NASDAQ
Global Market System are valued at the last reported sale price that day
or the NASDAQ official closing price, if applicable. For equity investments
traded on more than one exchange, the last reported sale price on the
exchange where the stock is primarily traded is used. Equity investments
traded on a recognized exchange for which there were no sales on that
day are valued at the last available bid (long positions) or ask (short
positions) price. If no bid or ask price is available, the prior day’s price
will be used, unless it is determined that such prior day’s price no longer
reflects the fair value of the security. Investments in open-end investment
(Unaudited)
companies are valued at net asset value each business day. Short-term
securities with remaining maturities of 60 days or less may be value at
amortized cost, which approximates fair value.
The Fund values its bond investments on the basis of last available
bid prices or current market quotations provided by dealers or pricing
services. Floating rate loan interests are valued at the mean of
the bid prices from one or more brokers or dealers as obtained from a
pricing service. In determining the value of a particular investment, pric-
ing services may use certain information with respect to transactions
in such investments, quotations from dealers, pricing matrixes, market
transactions in comparable investments, various relationships observed
in the market between investments and calculated yield measures based
on valuation technology commonly employed in the market for such
investments. Asset-backed and mortgage-backed securities are valued
by independent pricing services using models that consider estimated
cash flows of each tranche of the security, establish a benchmark yield
and develop an estimated tranche specific spread to the benchmark
yield based on the unique attributes of the tranche. Financial futures
contracts traded on exchanges are valued at their last sale price. Swap
agreements are valued utilizing quotes received daily by the Fund’s pric-
ing service or through brokers, which are derived using daily swap curves
and models that incorporate a number of market data factors, such
as discounted cash flows and trades and values of the underlying
reference securities.
The Fund values its investment in BlackRock Liquidity Series, LLC Money
Market Series (the “Money Market Series”) at fair value, which is ordinar-
ily based upon its pro rata ownership in the net assets of the underlying
fund. The Money Market Series seeks current income consistent with
maintaining liquidity and preserving capital. Although the Money Market
Series is not registered under the 1940 Act, its investments will follow
the parameters of investments by a money market fund that is subject
to Rule 2a-7 promulgated by the Securities and Exchange Commission
(the “SEC”) under the 1940 Act. The Fund may withdraw up to 25% of
its investment daily, although the manager of the Money Market Series,
in its sole discretion, may permit an investor to withdraw more than 25%
on any one day.
Securities and other assets and liabilities denominated in foreign curren-
cies are translated into US dollars using exchange rates determined
as of the close of business on the New York Stock Exchange (“NYSE”).
Foreign currency exchange contracts are valued at the mean between
the bid and ask prices and are determined as of the close of business
on the NYSE. Interpolated values are derived when the settlement date
of the contract is an interim date for which quotations are not available.
Exchange-traded options are valued at the mean between the last bid
and ask prices at the close of the options market in which the options
trade. An exchange-traded option for which there is no mean price is
valued at the last bid (long positions) or ask (short positions) price. If no
32 BLACKROCK GLOBAL ALLOCATION FUND, INC.
APRIL 30, 2010
Notes to Consolidated Financial Statements (continued)
bid or ask price is available, the prior day’s price will be used, unless it
is determined that the prior day’s price no longer reflects the fair value of
the option. Over-the-counter (“OTC”) options and swaptions are valued
by an independent pricing service using a mathematical model which
incorporates a number of market data factors, such as the trades and
prices of the underlying instruments.
In the event that application of these methods of valuation results in
a price for an investment which is deemed not to be representative of
the market value of such investment or is not available, the investment
will be valued by a method approved by the Board as reflecting fair
value (“Fair Value Assets”). When determining the price for Fair Value
Assets, the investment advisor and/or the sub-advisor seeks to deter-
mine the price that the Fund might reasonably expect to receive from
the current sale of that asset in an arm’s-length transaction. Fair value
determinations shall be based upon all available factors that the invest-
ment advisor and/or sub-advisor deems relevant. The pricing of all
Fair Value Assets is subsequently reported to the Board or a
committee thereof.
Generally, trading in foreign instruments is substantially completed
each day at various times prior to the close of business on the NYSE.
Occasionally, events affecting the values of such instruments may occur
between the foreign market close and the close of business on the NYSE
that may not be reflected in the computation of the Fund’s net assets.
If events (for example, a company announcement, market volatility or a
natural disaster) occur during such periods that are expected to materi-
ally affect the value of such instruments, those instruments may be Fair
Value Assets and be valued at their fair values, as determined in good
faith by the Board or by the investment advisor using a pricing service
and/or procedures approved by the Board. Each business day, the Fund
uses a pricing service selected under the supervision of the Fund’s
Board to assist with the valuation of certain foreign exchange-traded
equity securities and foreign exchange-traded and OTC options (the
“Systematic Fair Value Price”). Using current market factors, the
Systematic Fair Value Price is designed to value such foreign securities
and foreign options at fair value as of the close of business on the
NYSE, which follows the close of the local markets.
Foreign Currency Transactions: The Fund’s books and records are
maintained in US dollars. Foreign currency amounts are translated into
US dollars as follows: (i) market value of investment securities, assets
and liabilities at the current rate of exchange; and (ii) purchases and
sales of investment securities, income and expenses at the rates of
exchange prevailing on the respective dates of such transactions.
Generally, when the US dollar rises in value against foreign currency, the
Fund’s investments denominated in that currency will lose value because
its currency is worth fewer US dollars; the opposite effect occurs if the
US dollar falls in relative value.
The Fund reports foreign currency related transactions as components of
realized gain (loss) for financial reporting purposes, whereas such com-
ponents are treated as ordinary income for federal income tax purposes.
Asset Backed Securities: The Fund may invest in asset-backed securities.
Asset-backed securities are generally issued as pass-through certifi-
cates, which represent undivided fractional ownership interests in an
underlying pool of assets, or as debt instruments, which are also known
as collateralized obligations, and are generally issued as the debt of a
special purpose entity organized solely for the purpose of owning such
assets and issuing such debt. Asset-backed securities are often backed
by a pool of assets representing the obligations of a number of different
parties. The yield characteristics of certain asset-backed securities may
differ from traditional debt securities. One such major difference is that
all or a principal part of the obligations may be prepaid at any time
because the underlying assets (i.e., loans) may be prepaid at any time.
As a result, a decrease in interest rates in the market may result in
increases in the level of prepayments as borrowers, particularly mort-
gagors, refinance and repay their loans. An increased prepayment rate
with respect to an asset-backed security subject to such a prepayment
feature will have the effect of shortening the maturity of the security.
If the Fund has purchased such an asset-backed security at a premium,
a faster than anticipated prepayment rate could result in a loss of
principal to the extent of the premium paid. Changes in economic
conditions, including delinquencies and/or defaults on assets under-
lying these securities, can affect the value, income and/or liquidity of
such positions.
Capital Trusts: These securities are typically issued by corporations,
generally in the form of interest-bearing notes with preferred securities
characteristics, or by an affiliated business trust of a corporation, gener-
ally in the form of beneficial interests in subordinated debentures or
similarly structured securities. The securities can be structured as either
fixed or adjustable coupon securities that can have either a perpetual
or stated maturity date. Dividends can be deferred without creating an
event of default or acceleration, although maturity cannot take place
unless all cumulative payment obligations have been met. The deferral
of payments does not affect the purchase or sale of these securities in
the open market. Payments on these securities are treated as interest
rather than dividends for federal income tax purposes. These securities
can have a rating that is slightly below that of the issuing company’s
senior debt securities.
Floating Rate Loans: The Fund may invest in floating rate loan interests
that are issued to companies (the “borrower”) by banks, other financial
institutions, and privately and publicly offered corporations (the
“lender”). Floating rate loan interests are generally non-investment
grade, often involve borrowers whose financial condition is troubled or
BLACKROCK GLOBAL ALLOCATION FUND, INC.
APRIL 30, 2010
33
Notes to Consolidated Financial Statements (continued)
uncertain and companies that are highly levered. The Fund may invest
in obligations of borrowers who are in bankruptcy proceedings. Floating
rate loan interests may include fully funded term loans or revolving lines
of credit. Floating rate loan interests are typically senior in the corporate
capital structure of the issuer. Floating rate loan interests generally pay
interest at rates that are periodically determined by reference to a base
lending rate plus a premium. The base lending rates are generally the
lending rate offered by one or more European banks, such as LIBOR
(London Inter Bank Offered Rate), the prime rate offered by one or more
US banks or the certificate of deposit rate. Floating rate loan interests
may involve foreign borrowers, and investments may be denominated
in foreign currencies. The Fund considers these investments to be
investments in debt securities for purposes of their investment policies.
When a Fund buys a floating rate loan interest it may receive a facility
fee and when it sells a floating rate loan interest it may pay a facility
fee. On an ongoing basis, the Fund may receive a commitment fee
based on the undrawn portion of the underlying line of credit amount
of a floating rate loan interest. The Fund earns and/or pays facility and
other fees on floating rate loan interests, which are shown as facility
and other fees in the Consolidated Statement of Operations. Facility and
commitment fees are typically amortized to income over the term of the
loan or term of the commitment, respectively. Consent and amendment
fees are recorded to income as earned. Prepayment penalty fees, which
may be received by the Fund upon the prepayment of a floating rate
loan interest by a borrower, are recorded as realized gains. The Fund
may invest in multiple series or tranches of a loan. A different series or
tranche may have varying terms and carry different associated risks.
Floating rate loan interests are usually freely callable at the issuer’s
option. The Fund may invest in such loans in the form of participations
in loans (“Participations”) and assignments of all or a portion of loans
from third parties. Participations typically will result in the Fund having
a contractual relationship only with the lender, not with the borrower.
The Fund will have the right to receive payments of principal, interest
and any fees to which it is entitled only from the lender selling the
Participation and only upon receipt by the lender of the payments from
the borrower. In connection with purchasing Participations, the Fund
generally will have no right to enforce compliance by the borrower with
the terms of the loan agreement, nor any rights of offset against the
borrower, and the Fund may not benefit directly from any collateral sup-
porting the loan in which it has purchased the Participation. As a result,
the Fund will assume the credit risk of both the borrower and the lender
that is selling the Participation. The Fund’s investment in loan participa-
tion interests involves the risk of insolvency of the financial intermedi-
aries who are parties to the transactions. In the event of the insolvency
of the lender selling the Participation, the Fund may be treated as a
general creditor of the lender and may not benefit from any offset
between the lender and the borrower.
Inflation-Indexed Bonds: Inflation-indexed bonds are fixed income secu-
rities whose principal value is periodically adjusted according to the rate
of inflation. If the index measuring inflation rises or falls, the principal
value of inflation-indexed bonds will be adjusted upward or downward,
and consequently the interest payable on these securities (calculated
with respect to a smaller principal amount) will be increased or reduced,
respectively. Repayment of the original bond principal upon maturity (as
adjusted for inflation) is guaranteed in the case of US Treasury inflation-
indexed bonds. For bonds that do not provide a similar guarantee, the
adjusted principal value of the bond repaid at maturity may be less than
the original principal.
Preferred Stock: The Fund may invest in preferred stocks. Preferred
stock has a preference over common stock in liquidation (and generally
in receiving dividends as well) but is subordinated to the liabilities
of the issuer in all respects. As a general rule, the market value of
preferred stock with a fixed dividend rate and no conversion element
varies inversely with interest rates and perceived credit risk, while the
market price of convertible preferred stock generally also reflects some
element of conversion value. Because preferred stock is junior to debt
securities and other obligations of the issuer, deterioration in the credit
quality of the issuer will cause greater changes in the value of a pre-
ferred stock than in a more senior debt security with similar stated yield
characteristics. Unlike interest payments on debt securities, preferred
stock dividends are payable only if declared by the issuer’s board of
directors. Preferred stock also may be subject to optional or mandatory
redemption provisions.
Short Sales: When the Fund engages in a short sale, an amount equal
to the proceeds received by the Fund is reflected as an asset and an
equivalent liability. The amount of the liability is subsequently marked-
to-market to reflect the market value of the short sale. When the Fund
makes a short sale, it will borrow the security sold short and deliver it
to the counterparty to which it sold the security short. The Fund is
required to repay the counterparty any dividends received on the security
sold short, which is shown as dividend expense in the Consolidated
Statement of Operations. The Fund may pay a fee on the assets bor-
rowed from the counterparty, which is shown as stock loan fees in the
Consolidated Statement of Operations. The Fund maintains a segregated
account of securities as collateral for the short sales. The Fund is
exposed to market risk based on the amount, if any, that the market
value of the security increases beyond the market value at which the
position was sold. Thus, a short sale of a security involves the risk that
instead of declining, the price of the security sold short will rise. The
short sale of securities involves the possibility of a theoretically unlimited
loss since there is a theoretically unlimited potential for the market price
of the security sold short to increase. A gain, limited to the price at
which the Fund sold the security short, or a loss, unlimited as to the
dollar amount, will be recognized upon the termination of a short sale
34 BLACKROCK GLOBAL ALLOCATION FUND, INC.
APRIL 30, 2010
Notes to Consolidated Financial Statements (continued)
if the market price is greater or less than the proceeds originally
received. There is no assurance the Fund will be able to close out a
short position at a particular time or at an acceptable price.
Zero-Coupon Bonds: The Fund may invest in zero-coupon bonds, which
are normally issued at a significant discount from face value and do not
provide for periodic interest payments. Zero-coupon bonds may experi-
ence greater volatility in market value than similar maturity debt obliga-
tions which provide for regular interest payments.
Segregation and Collateralization: In cases in which the 1940 Act and
the interpretive positions of the SEC require that the Fund either delivers
collateral or segregates assets in connection with certain investments
(e.g., financial futures contracts, foreign currency exchange contracts,
swaps, short sales, structured options and written options), the Fund
will, consistent with SEC rules and/or certain interpretive letters issued
by the SEC, segregate collateral or designate on its books and records
cash or other liquid securities having a market value at least equal to
the amount that would otherwise be required to be physically segre-
gated. Furthermore, based on requirements and agreements with certain
exchanges and third party broker-dealers, each party has requirements
to deliver/deposit securities as collateral for certain investments.
Investment Transactions and Investment Income: For financial reporting
purposes, investment transactions are recorded on the dates the trans-
actions are entered into (the trade dates). Realized gains and losses
on investment transactions are determined on the identified cost basis.
Dividend income is recorded on the ex-dividend dates. Dividends from
foreign securities where the ex-dividend date may have passed are sub-
sequently recorded when the Fund has determined the ex-dividend date.
Under the applicable foreign tax laws, a withholding tax at various rates
may be imposed on capital gains, dividends and interest. Upon notifica-
tion from issuers, some of the dividend income received from a real
estate investment trust may be redesignated as a reduction of cost of
the related investment and/or realized gain. Interest income, including
amortization of premium and accretion of discount on debt securities,
is recognized on the accrual basis. Income and realized and unrealized
gains and losses are allocated daily to each class based on its relative
net assets. Consent fees are compensation for agreeing to changes in
the terms of debt instruments and are included in interest income in the
Consolidated Statement of Operations.
Dividends and Distributions: Dividends and distributions paid by the
Fund are recorded on ex-dividend dates. The amount and timing of
dividends and distributions are determined in accordance with federal
income tax regulations, which may differ from US GAAP.
Securities Lending: The Fund may lend securities to financial institutions
that provide cash as collateral, which will be maintained at all times in
an amount equal to at least 100% of the current market value of the
loaned securities. The market value of the loaned securities is deter-
mined at the close of business of the Fund and any additional required
collateral is delivered to the Fund on the next business day. Securities
lending income, as disclosed in the Consolidated Statement of
Operations, represents the income earned from the investment of the
cash collateral, net of rebates paid to, or fees paid by, borrowers and
less the fees paid to the securities lending agent. Loans of securities
are terminable at any time and the borrower, after notice, is required to
return borrowed securities within the standard time period for settlement
of securities transactions. In the event that the borrower defaults on its
obligation to return borrowed securities because of insolvency or for any
other reason, the Fund could experience delays and costs in gaining
access to the collateral. The Fund also could suffer a loss if the value
of an investment purchased with cash collateral falls below the market
value of loaned securities or if the value of an investment purchased
with cash collateral falls below the value of the original cash
collateral received.
Income Taxes: It is the Fund’s policy to comply with the requirements
of the Internal Revenue Code of 1986, as amended, applicable to
regulated investment companies and to distribute substantially all of
its taxable income to its shareholders. Therefore, no federal income tax
provision is required.
The Fund files US federal and various state and local tax returns.
No income tax returns are currently under examination. The statute of
limitations on the Fund’s US federal tax returns remains open for the
four years ended October 31, 2009. The statutes of limitations on the
Fund’s state and local tax returns may remain open for an additional
year depending upon the jurisdiction. There are no uncertain tax posi-
tions that require recognition of a tax liability.
Recent Accounting Standard: In January 2010, the Financial Accounting
Standards Board issued amended guidance to improve disclosure about
fair value measurements which will require additional disclosures about
transfers into and out of Levels 1 and 2 and separate disclosures about
purchases, sales, issuances and settlements in the reconciliation for fair
value measurements using significant unobservable inputs (Level 3). It
also clarifies existing disclosure requirements relating to the levels of
disaggregation for fair value measurement and inputs and valuation
techniques used to measure fair value. The amended guidance is effec-
tive for financial statements for fiscal years beginning after December
15, 2009, and interim periods within those fiscal years, except for
disclosures about purchases, sales, issuances and settlements in the
rollforward of activity in Level 3 fair value measurements, which are
effective for fiscal years beginning after December 15, 2010 and for
interim periods within those fiscal years. The impact of this guidance
on the Fund’s financial statements and disclosures is currently
being assessed.
BLACKROCK GLOBAL ALLOCATION FUND, INC.
APRIL 30, 2010
35
Notes to Consolidated Financial Statements (continued)
Other: Expenses directly related to the Fund or its classes are charged to
that Fund or class. Other operating expenses shared by several funds are
pro rated among those funds on the basis of relative net assets or other
appropriate methods. Other expenses of the Fund are allocated daily
to each class based on its relative net assets. The Fund has an arrange-
ment with the custodian whereby fees may be reduced by credits earned
on uninvested cash balances, which if applicable are shown as fees paid
indirectly in the Consolidated Statement of Operations. The custodian
imposes fees on overdrawn cash balances, which can be offset by accu-
mulated credits earned or may result in additional custody charges.
2. Derivative Financial Instruments:
The Fund may engage in various portfolio investment strategies both to
increase the returns of the Fund and to economically hedge, or protect,
its exposure to certain risks such as credit risk, equity risk, interest rate
risk and foreign currency exchange rate risk. Losses may arise if the
value of the contract decreases due to an unfavorable change in the
price of the underlying instrument or if the counterparty does not
perform under the contract. The Fund may mitigate counterparty risk
through master netting agreements included within an International
Swap and Derivatives Association, Inc. (“ISDA”) Master Agreement
between the Fund and separately each of its counterparties. The ISDA
Master Agreement allows the Fund to offset with its counterparty certain
derivative financial instrument’s payables and/or receivables with
collateral held with each separate counterparty. The amount of collateral
moved to/from applicable counterparties is based upon minimum trans-
fer amounts of up to $500,000. To the extent amounts due to the Fund
from its counterparties are not fully collateralized contractually or other-
wise, the Fund bears the risk of loss from counterparty non-performance.
See Note 1 “Segregation and Collateralization” for information with
respect to collateral practices. In addition, the Fund manages counter-
party risk by entering into agreements only with counterparties that it
believes have the financial resources to honor their obligations and by
monitoring the financial stability of those counterparties.
The Fund’s maximum risk of loss from counterparty credit risk on OTC
derivatives is generally the aggregate unrealized gain in excess of any
collateral pledged by the counterparty to the Fund. For OTC options
purchased, the Fund bears the risk of loss in the amount of the
premiums paid and change in market value of the options should the
counterparty not perform under the contracts. Options written by the
Fund do not give rise to counterparty credit risk, as options written
obligate the Fund to perform and not the counterparty. Certain ISDA
Master Agreements allow counterparties to OTC derivatives to terminate
derivative contracts prior to maturity in the event the Fund’s net assets
decline by a stated percentage or the Fund fails to meet the terms of
its ISDA Master Agreements, which would cause the Fund to accelerate
payment of any net liability owed to the counterparty. Counterparty risk
related to exchange-traded financial futures contracts and options is
minimal because of the protection against defaults provided by the
exchange on which they trade.
Financial Futures Contracts: The Fund may purchase or sell financial
futures contracts and options on financial futures contracts to gain expo-
sure to, or economically hedge against, changes in interest rates (inter-
est rate risk) or foreign currencies (foreign currency exchange rate risk).
Financial futures contracts are contracts for delayed delivery of securities
or currencies at a specific future date and at a specific price or yield.
Pursuant to the contract, the Fund agrees to receive from or pay to the
broker an amount of cash equal to the daily fluctuation in value of the
contract. Such receipts or payments are known as margin variation and
are recognized by the Fund as unrealized gains or losses. When the
contract is closed, the Fund records a realized gain or loss equal to the
difference between the value of the contract at the time it was opened
and the value at the time it was closed. The use of financial futures
transactions involves the risk of an imperfect correlation in the move-
ments in the price of financial futures contracts, interest rates and the
underlying assets.
Foreign Currency Exchange Contracts: The Fund may enter into foreign
currency exchange contracts as an economic hedge against either spe-
cific transactions or portfolio instruments or to gain exposure to foreign
currencies (foreign currency exchange rate risk). A foreign currency
exchange contract is an agreement between two parties to buy and sell
a currency at a set exchange rate on a future date. Foreign currency
exchange contracts, when used by the Fund, help to manage the overall
exposure to the currency backing some of the investments held by the
Fund. The contract is marked-to-market daily and the change in market
value is recorded by the Fund as an unrealized gain or loss. When the
contract is closed, the Fund records a realized gain or loss equal to the
difference between the value at the time it was opened and the value at
the time it was closed. The use of foreign currency exchange contracts
involves the risk that counterparties may not meet the terms of the
agreement or unfavorable movements in the value of a foreign currency
relative to the US dollar.
Options: The Fund may purchase and write call and put options to
increase or decrease its exposure to underlying instruments (equity risk)
and/or, in the case of options written, to generate gains from options
premiums. A call option gives the purchaser of the option the right
(but not the obligation) to buy, and obligates the seller to sell (when the
option is exercised), the underlying instrument at the exercise price at
any time or at a specified time during the option period. A put option
gives the holder the right to sell and obligates the writer to buy the
underlying instrument at the exercise price at any time or at a specified
time during the option period. When the Fund purchases (writes) an
option, an amount equal to the premium paid (received) by the Fund
is reflected as an asset (liability). The amount of the asset (liability) is
subsequently marked-to-market to reflect the current market value of
36 BLACKROCK GLOBAL ALLOCATION FUND, INC.
APRIL 30, 2010
Notes to Consolidated Financial Statements (continued)
the option purchased (written). When an instrument is purchased or sold
through an exercise of an option, the related premium paid (or received)
is added to (or deducted from) the basis of the instrument acquired or
deducted from (or added to) the proceeds of the instrument sold. When
an option expires (or the Fund enters into a closing transaction), the
Fund realizes a gain or loss on the option to the extent of the premiums
received or paid (or gain or loss to the extent the cost of the closing
transaction exceeds the premium received or paid). When the Fund
writes a call option, such option is “covered,” meaning that the Fund
holds the underlying instrument subject to being called by the option
counterparty, or cash in an amount sufficient to cover the obligation.
When the Fund writes a put option, such option is covered by cash in
an amount sufficient to cover the obligation.
In purchasing and writing options, the Fund bears the risk of an
unfavorable change in the value of the underlying instrument or the risk
that the Fund may not be able to enter into a closing transaction due
to an illiquid market. Exercise of an option written could result in the
Fund purchasing or selling a security at a price different from the
current market value. The Fund may execute transactions in both listed
and OTC options.
The Fund invests in structured options to increase or decrease its expo-
sure to an underlying index or group of securities (equity risk). These
structured options are European-Style Options and may consist of single
or multiple OTC options which are priced as a single security. European-
Style Options may only be exercised at the expiration date, but may be
transferred/sold prior to the expiration date. The value of a structured
option may either increase or decrease with the underlying index,
depending on the combination of options used. One type of structure
involves the combination of selling a put while buying a call on a
specific index. This option would rise in value as the underlying
index increases and fall in value as the underlying index decreases.
Alternatively, another structure involves the sale of a call and the
purchase of a put. This option structure would rise in value as the
underlying index decreases and fall in value as the underlying index
increases. Upon the exercise of the structured option, the Fund will
receive a payment from, or be required to remit a payment to the coun-
terparty, depending on the value of the underlying index at exercise.
Swaps: The Fund may enter into swap agreements, in which the Fund
and a counterparty agree to make periodic net payments on a specified
notional amount. These periodic payments received or made by the
Fund are recorded in the Consolidated Statement of Operations as
realized gains or losses, respectively. Any upfront fees paid are recorded
as assets and any upfront fees received are recorded as liabilities and
amortized over the term of the swap. Swaps are marked-to-market daily
and changes in value are recorded as unrealized appreciation (deprecia-
tion). When the swap is terminated, the Fund will record a realized gain
or loss equal to the difference between the proceeds from (or cost of)
the closing transaction and the Fund’s basis in the contract, if any.
Generally, the basis of the contracts is the premium received or paid.
Swap transactions involve, to varying degrees, elements of interest
rate, credit and market risk in excess of the amounts recognized in the
Consolidated Statement of Assets and Liabilities. Such risks involve
the possibility that there will be no liquid market for these agreements,
that the counterparty to the agreements may default on its obligation to
perform or disagree as to the meaning of the contractual terms in the
agreements, and that there may be unfavorable changes in interest rates
and/or market values associated with these transactions.
• Total return swaps — The Fund may enter into total return swaps to
obtain market exposure to a security or market without owning such
security or investing directly in that market or to transfer the risk/
return of one market (e.g., fixed income) to another market (e.g.,
equity) (equity risk and/or interest rate risk). Total return swaps are
agreements in which one party commits to pay interest in exchange
for the total return (coupons plus capital gains/losses) of an under-
lying asset. To the extent the total return of the security or index
underlying the transaction exceeds or falls short of the offsetting
interest rate obligation, the Fund will receive a payment from or
make a payment to the counterparty.
| | | | |
| Derivative Instruments Categorized by Risk Exposure: | | | |
| Fair Values of Derivative Instruments as of April 30, 2010 |
|
| | Asset Derivatives | | Liability Derivatives | |
| | Consolidated Statement of Assets | | Consolidated Statement of Assets | |
| | and Liabilities Location | Value | and Liabilities Location | Value |
| Foreign currency exchange contracts | Unrealized appreciation on foreign | | Unrealized depreciation on foreign | |
| | currency exchange contracts | $ 6,653,093 | currency exchange contracts | $ 5,859,100 |
| Equity contracts | Net unrealized appreciation/ | | Net unrealized appreciation/depreciation*; | |
| | appreciation*; Unrealized | | Unrealized depreciation on swaps; | |
| | appreciation on swaps; Investments | | Options written at value; | |
| | at value — unaffiliated** | 28,138,194 | Structured Options at value | 50,401,829 |
| Total | | $ 34,791,287 | | $ 56,260,929 |
* Includes cumulative unrealized appreciation/depreciation of financial futures contracts as reported in the Consolidated Schedule of Investments. Only current day’s margin
variation is reported within the Statement of Assets and Liabilities.
** Includes options purchased at value as reported in the Consolidated Schedule of Investments.
BLACKROCK GLOBAL ALLOCATION FUND, INC.
APRIL 30, 2010
37
| | | | | | |
| Notes to Consolidated Financial Statements (continued) | | | |
| The Effect of Derivative Instruments on the Consolidated Statement of Operations |
| Six Months Ended April 30, 2010 |
|
| Net Realized Gain (Loss) from |
|
| | Financial | | | | Foreign | |
| | Futures | | | | Currency | |
| | Contracts | | Swaps | Options*** | Transactions | Total |
| Foreign currency transactions | — | | — | $ (1,768,593) | $(126,487,683) | $(128,256,276) |
| Equity contracts | $ (43,851,328) | $ 1,577,275 | 9,170,494 | — | (33,103,559) |
| Total | $ (43,851,328) | $ 1,577,275 | $ 7,401,901 | $(126,487,683) | $(161,359,835) |
| Net Change in Unrealized Appreciation/Depreciation on |
|
| | Financial | | | | Foreign | |
| | Futures | | | | Currency | |
| | Contracts | | Swaps | Options*** | Transactions | Total |
| Foreign currency transactions | — | | — | $ 1,719,734 | $ 15,306,526 | $ 17,026,260 |
| Equity contracts | $ 9,607,528 | $ (117,292) | 19,638,076 | — | 29,128,312 |
| Total | $ 9,607,528 | $ (117,292) | $ 21,357,810 | $ 15,306,526 | $ 46,154,572 |
*** Options purchased are included in the net realized gain (loss) from investments and net change in unrealized appreciation/depreciation on investments.
For the six months ended April 30, 2010, the average quarterly balance
of outstanding derivative financial instruments was as follows:
| |
| Financial futures contracts: | |
| Average number of contracts purchased | 13,611 |
| Average number of contracts sold | 784 |
| Average notional value of contracts purchased | $ 768,992,711 |
| Average notional value of contracts sold | $ 92,379,522 |
| Foreign currency exchange contracts: | |
| Average number of contracts — US dollars purchased | 16 |
| Average number of contracts — US dollars sold | 27 |
| Average US dollar amounts purchased | $ 705,608,428 |
| Average US dollar amounts sold | $1,161,283,234 |
| Options: | |
| Average number of contracts purchased | 4,207 |
| Average number of contracts sold | 111,443 |
| Average notional value of contracts purchased | $ 53,194,500 |
| Average notional value of contracts written | $ 333,630,575 |
| Structured options: | |
| Average number of units | 67,947 |
| Average notional value | — |
| Total return swaps: | |
| Average number of contracts | 8 |
| Average notional value | $ 622,156,942 |
3. Investment Advisory Agreement and Other Transactions
with Affiliates:
The PNC Financial Services Group, Inc. ("PNC"), Bank of America
Corporation ("BAC") and Barclays Bank PLC ("Barclays") are the largest
stockholders of BlackRock, Inc. ("BlackRock"). Due to the ownership
structure, PNC is an affiliate of the Fund for 1940 Act purposes, but BAC
and Barclays are not.
The Fund entered into an Investment Advisory Agreement with BlackRock
Advisors, LLC (the “Manager”), the Fund's investment advisor, an indirect,
wholly owned subsidiary of BlackRock, to provide investment advisory
and administration services. The Manager is responsible for the manage-
ment of the Fund’s portfolio and provides the necessary personnel, facil-
ities, equipment and certain other services necessary to the operations
of the Fund. For such services, the Fund pays the Manager a monthly
fee at an annual rate of 0.75% of the Fund’s average daily net assets.
The Manager has voluntarily agreed to waive a portion of its fees payable
by the Fund, which is shown as fees waived by advisor in the Consoli-
dated Statement of Operations, so that such fee is reduced for average
daily net assets of the Fund as follows:
| | |
| | | Rate |
| In Excess of | Not Exceeding | Waived to |
| $10 billion | $15 billion | 0.69% |
| $15 billion | $20 billion | 0.68% |
| $20 billion | $25 billion | 0.67% |
| $25 billion | $30 billion | 0.65% |
| $30 billion | $40 billion | 0.63% |
| $40 billion | — | 0.62% |
For the six months ended April 30, 2010, the Manager waived
$12,018,612, which is included in fees waived by advisor in the
Consolidated Statement of Operations.
The Manager has voluntarily agreed to waive its advisory fees by the
amount of investment advisory fees the Fund pays to the Manager indi-
rectly through its investment in affiliated money market funds; however,
the Manager does not waive its advisory fees by the amount of invest-
ment advisory fees through its investment in other affiliated investment
companies, if any. This amount is included in fees waived by advisor in
the Consolidated Statement of Operations. For the six months ended
April 30, 2010, $2,772 was waived.
The Manager entered into a sub-advisory agreement with BlackRock
Investment Management, LLC (“BIM”) and BlackRock International
Limited, both affiliates of the Manager. The Manager pays the sub-advi-
sors for services they provide, a monthly fee that is a percentage of the
investment advisory fee paid by the Fund to the Manager.
For the six months ended April 30, 2010, the Fund reimbursed the
Manager $314,006 for certain accounting services, which is included
in accounting services in the Consolidated Statement of Operations.
The Fund entered into a Distribution Agreement and Distribution Plan
with BlackRock Investments, LLC (”BRIL“), an affiliate of BlackRock.
Pursuant to the Distribution Plan and in accordance with Rule 12b-1
38 BLACKROCK GLOBAL ALLOCATION FUND, INC.
APRIL 30, 2010
Notes to Consolidated Financial Statements (continued)
under the 1940 Act, the Fund pays BRIL ongoing service and distribution
fees. The fees are accrued daily and paid monthly at annual rates based
upon the average daily net assets of the shares of Fund, as follows:
| | |
| | Service | Distribution |
| | Fee | Fee |
| Investor A | 0.25% | — |
| Investor B | 0.25% | 0.75% |
| Investor C | 0.25% | 0.75% |
| Class R | 0.25% | 0.25% |
Pursuant to sub-agreements with BRIL, broker-dealers and BRIL
provide shareholder servicing and distribution services to the Fund.
The ongoing service and/or distribution fee compensates BRIL and
each broker-dealer for providing shareholder servicing and/or distribu-
tion related services to Investor A, Investor B and Investor C and
Class R shareholders.
For the six months ended April 30, 2010, affiliates earned underwriting
discounts, direct commissions and dealer concessions on sales of
the Fund’s Investor A Shares, which totaled $2,858,229. For the six
months ended April 30, 2010, affiliates received the following contin-
gent deferred sales charges relating to transactions in Investor B and
Investor C Shares.
| |
| Investor B | $866,003 |
| Investor C | $894,181 |
Furthermore, affiliates received contingent deferred sale charges of
$118,076 relating to transactions subject to front-end sales charge
waivers on Investor A Shares.
PNC Global Investment Servicing (U.S.) Inc., an indirect, wholly owned
subsidiary of PNC and an affiliate of the Manager, serves as transfer
agent and dividend disbursing agent. Transfer agency fees borne by
the Fund are comprised of those fees charged for all shareholder com-
munications including mailing of shareholder reports, dividend and
distribution notices, and proxy materials for shareholder meetings, as
well as per account and per transaction fees related to servicing and
maintenance of shareholder accounts, including the issuing, redeeming
and transferring of shares, check writing, anti-money laundering services,
and customer identification services.
The Manager maintains a call center, which is responsible for providing
certain shareholder services to the Fund, such as responding to share-
holder inquiries and processing transactions based upon instructions
from shareholders with respect to the subscription and redemption of
Fund shares. For the six months ended April 30, 2010, the Fund reim-
bursed the Manager the following amounts for costs incurred in running
the call center, which are included in transfer agent — class specific in
the Consolidated Statement of Operations.
| |
| | Call Center |
| | Fees |
| Institutional | $18,372 |
| Investor A | $89,164 |
| Investor B | $25,421 |
| Investor C | $83,293 |
| Class R | $ 1,757 |
The Fund has received an exemptive order from the SEC permitting it to,
among other things, pay an affiliated securities lending agent a fee
based on a share of the income derived from the securities lending
activities and has retained BIM as the securities lending agent. BIM
may, on behalf of the Fund, invest cash collateral received by the Fund
for such loans, among other things, in a private investment company
managed by the Manager or in registered money market funds advised
by the Manager or its affiliates. The market value of securities on loan
and the value of the related collateral are shown on the Consolidated
Statement of Assets and Liabilities as securities loaned and collateral
at value — securities loaned, respectively. The cash collateral invested
by BIM is disclosed in the Consolidated Schedule of Investments. The
share of income earned by the Fund on such investments is shown
as securities lending — affiliated in the Consolidated Statement of
Operations. For the six months ended April 30, 2010, BIM received
$127,190 in securities lending agent fees related to securities lending
activities for the Fund.
Certain officers and/or directors of the Fund are officers and/or directors
of BlackRock or its affiliates. The Fund reimburses the Manager for com-
pensation paid to the Fund's Chief Compliance Officer.
4. Investments:
Purchases and sales of investments including paydowns, excluding
short-term securities and US government securities, for the six months
ended April 30, 2010, were $7,004,844,846 and $2,605,274,265,
respectively.
Purchases and sales of US government securities for the six months
ended April 30, 2010, were $2,527,809,994 and $1,618,114,735,
respectively.
Transactions in options written for the six months ended April 30, 2010,
were as follows:
| | | |
| | | Calls | |
| | | | Premiums |
| | Contracts | | Received |
| Options outstanding at | | | |
| beginning of period | 150,366 | $ 45,490,237 |
| Options written | 129,715 | | 29,381,657 |
| Options exercised | (97,983) | | (30,367,131) |
| Options closed | (40,497) | | (13,433,169) |
| Options expired | (37,848) | | (3,596,705) |
| Options outstanding at end of period | 103,753 | $ 27,474,889 |
| | | Puts | |
| | | | Premiums |
| | Contracts | | Received |
| Options outstanding at | | | |
| beginning of period | 920 | $ 2,812,793 |
| Options written | 13,916 | | 13,939,373 |
| Options exercised | | | |
| Options closed | (12) | | (36,689) |
| Options expired | (13,579) | | (15,196,413) |
| Options outstanding at end of period | 1,245 | $ 1,519,064 |
As of April 30, 2010, the value of portfolio securities subject to covered
call options written was $337,496,843.
BLACKROCK GLOBAL ALLOCATION FUND, INC.
APRIL 30, 2010
39
Notes to Consolidated Financial Statements (continued)
5. Borrowings:
The Fund, along with certain other funds managed by the Manager and
its affiliates, is a party to a $500 million credit agreement with a group
of lenders, which was renewed until November 2010. The Fund may
borrow under the credit agreement to fund shareholder redemptions.
Prior to its renewal, the credit agreement had the following terms: 0.02%
upfront fee on the aggregate commitment amount which was allocated
to the Fund based on its net assets as of October 31, 2008; a commit-
ment fee of 0.08% per annum based on the Fund's pro rata share of
the unused portion of the credit agreement, which is included in miscel-
laneous in the Consolidated Statement of Operations, and interest at
a rate equal to the higher of the (a) federal funds effective rate and
(b) reserve adjusted one-month LIBOR, plus, in each case, the higher of
(i) 1.50% and (ii) 50% of the CDX Index (as defined in the credit agree-
ment) on amounts borrowed. Effective November 2009, the credit agree-
ment was renewed with the following terms: 0.02% upfront fee on the
aggregate commitment amount which was allocated to the Fund based
on its net assets as of October 31, 2009, a commitment fee of 0.10%
per annum based on the Fund's pro rata share of the unused portion of
the credit agreement and interest at a rate equal to the higher of (a) the
one-month LIBOR plus 1.25% per annum and (b) the Fed Funds rate
plus 1.25% per annum on amounts borrowed. The Fund did not borrow
under the credit agreement during the six months ended April 30, 2010.
6. Capital Loss CarryForwards:
As of October 31, 2009, the Fund had capital loss carryforwards
available to offset future realized capital gains through the indicated
expiration dates:
| |
| Expires October 31, | |
| 2010 | $ 3,257,086 |
| 2011 | 2,424,779 |
| 2016 | 8,995,345 |
| 2017 | 788,338,881 |
| Total | $ 803,016,091 |
7. Concentration, Market and Credit Risk:
In the normal course of business, the Fund invests in securities and
enters into transactions where risks exist due to fluctuations in the
market (market risk) or failure of the issuer of a security to meet all its
obligations (credit risk). The value of securities held by the Fund may
decline in response to certain events, including those directly involving
the issuers whose securities are owned by the Fund; conditions affecting
the general economy; overall market changes; local, regional or global
political, social or economic instability; and currency and interest rate
and price fluctuations. Similar to credit risk, the Fund may be exposed
to counterparty risk, or the risk that an entity with which the Fund has
unsettled or open transactions may default. The Fund manages counter-
party risk by entering into transactions only with counterparties that
it believes have the financial resources to honor their obligations and
by monitoring the financial stability of those counterparties. Financial
assets, which potentially expose the Fund to credit and counterparty
risks, consist principally of investments and cash due from counterpar-
ties. The extent of the Fund's exposure to credit and counterparty risks
with respect to these financial assets is generally approximated by their
value recorded in the Fund's Consolidated Statement of Assets and
Liabilities, less any collateral held by the Fund.
The Fund invests a substantial amount of its assets in issuers located
in a single country or a limited number of countries. When the Fund
concentrates its investments in this manner, it assumes the risk that
economic, political and social conditions in those countries may
have a significant impact on their investment performance. Please
see the Consolidated Schedule of Investments for concentrations in
specific countries.
As of April 30, 2010, the Fund had the following industry classifications:
| |
| | Percent of |
| | Long-Term |
| Industry | Investments |
| Oil, Gas & Consumable Fuels | 10% |
| Metals & Mining | 7 |
| Pharmaceuticals | 5 |
| Commercial Banks | 4 |
| Diversified Financial Services | 4 |
| Diversified Telecommunication Services | 4 |
| Insurance | 3 |
| Food Products | 3 |
| Industrial Conglomerates | 3 |
| Wireless Telecommunication Services | 2 |
| Semiconductors & Semiconductor Equipment | 2 |
| Energy Equipment & Services | 2 |
| Chemicals | 2 |
| Computers & Peripherals | 2 |
| Software | 2 |
| Real Estate Management & Development | 2 |
| Health Care Equipment & Supplies | 2 |
| Health Care Providers & Services | 2 |
| Capital Markets | 1 |
| Communications Equipment | 1 |
| Food & Staples Retailing | 1 |
| Biotechnology | 1 |
| Electric Utilities | 1 |
| Media | 1 |
| Electronic Equipment, Instruments & Components | 1 |
| Aerospace & Defense | 1 |
| Household Products | 1 |
| Road & Rail | 1 |
| IT Services | 1 |
| Automobiles | 1 |
| Beverages | 1 |
| Trading Companies & Distributors | 1 |
| Electrical Equipment | 1 |
| Tobacco | 1 |
| Paper & Forest Products | 1 |
| Internet Software & Services | 1 |
| Construction & Engineering | 1 |
| Life Sciences Tools & Services | 1 |
| Other* | 19 |
* Includes Asset-Backed Securities, US Treasury Obligations and Foreign
Government Obligations.
40 BLACKROCK GLOBAL ALLOCATION FUND, INC.
APRIL 30, 2010
| | | | | | |
| Notes to Consolidated Financial Statements (concluded) | | | |
| 8. Capital Share Transactions: | | | | | | |
| Transactions in capital shares for each class were as follows: | | | | | | |
| | Six Months Ended | Year Ended | |
| | April 30, 2010 | | October 31, 2009 |
| | Shares | | Amount | Shares | | Amount |
| Institutional | | | | | | |
| Shares sold | 157,412,988 | $ 2,845,673,648 | 224,084,151 | $ 3,530,088,787 |
| Shares issued to shareholders in reinvestment of dividends and distributions | 5,712,296 | | 101,727,996 | 15,049,003 | | 221,037,949 |
| Total issued | 163,125,284 | 2,947,401,644 | 239,133,154 | 3,751,126,736 |
| Shares redeemed | (67,070,508) | (1,220,817,500) | (111,052,531) | (1,690,232,537) |
| Net increase | 96,054,776 | $ 1,726,584,144 | 128,080,623 | $ 2,060,894,199 |
| Investor A | | | | | | |
| Shares sold and automatic conversion of shares | 172,739,026 | $ 3,114,091,841 | 238,010,540 | $ 3,745,731,393 |
| Shares issued to shareholders in reinvestment of dividends and distributions | 8,428,907 | | 149,527,772 | 23,940,344 | | 349,139,916 |
| Total issued | 181,167,933 | 3,263,619,613 | 261,950,884 | 4,094,871,309 |
| Shares redeemed | (58,344,694) | (1,050,282,888) | (133,181,127) | (2,016,408,935) |
| Net increase | 122,823,239 | $ 2,213,336,725 | 128,769,757 | $ 2,078,462,374 |
| Investor B | | | | | | |
| Shares sold | 1,964,737 | $ 34,489,037 | 12,702,879 | $ 186,933,426 |
| Shares issued to shareholders in reinvestment of dividends and distributions | 666,225 | | 11,558,938 | 3,481,967 | | 49,051,379 |
| Total issued | 2,630,962 | | 46,047,975 | 16,184,846 | | 235,984,805 |
| Shares redeemed and automatic conversion of shares | (12,566,732) | (221,208,373) | (33,498,343) | | (496,555,695) |
| Net decrease | (9,935,770) | $ (175,160,398) | (17,313,497) | $ (260,570,890) |
| Investor C | | | | | | |
| Shares sold | 164,893,800 | $ 2,775,937,331 | 222,113,983 | $ 3,273,646,648 |
| Shares issued to shareholders in reinvestment of dividends and distributions | 7,044,849 | | 116,943,088 | 22,540,904 | | 305,722,162 |
| Total issued | 171,938,649 | 2,892,880,419 | 244,654,887 | 3,579,368,810 |
| Shares redeemed | (48,859,787) | (821,916,833) | (125,252,461) | (1,764,227,714) |
| Net increase | 123,078,862 | $ 2,070,963,586 | 119,402,426 | $ 1,815,141,096 |
| Class R | | | | | | |
| Shares sold | 14,335,398 | $ 250,038,415 | 18,623,359 | $ 280,130,626 |
| Shares issued to shareholders in reinvestment of dividends and distributions | 449,457 | | 7,730,656 | 1,217,643 | | 17,189,054 |
| Total issued | 14,784,855 | | 257,769,071 | 19,841,002 | | 297,319,680 |
| Shares redeemed | (5,510,185) | | (96,131,920) | (10,817,247) | | (160,316,424) |
| Net increase | 9,274,670 | $ 161,637,151 | 9,023,755 | $ 137,003,256 |
There is a 2% redemption fee on shares redeemed or exchanged that have been held for 30 days or less. The redemption fees are collected and
retained by the Fund for the benefit of the remaining shareholders. The redemption fees are recorded as credit to paid-in-capital.
9. Subsequent Events:
Management has evaluated the impact of all subsequent events on the Fund through the date the financial statements were issued and has deter-
mined that there were no subsequent events requiring adjustment or additional disclosure in the financial statements.
BLACKROCK GLOBAL ALLOCATION FUND, INC.
APRIL 30, 2010
41
Officers and Directors
Robert M. Hernandez, Chairman of the Board, Director and Member
of the Audit Committee
Fred G. Weiss, Vice Chairman of the Board, Chairman of
the Audit Committee and Director
James H. Bodurtha, Director
Bruce R. Bond, Director
Donald W. Burton, Director
Richard S. Davis, Director
Honorable Stuart E. Eizenstat, Director
Laurence D. Fink, Director
Kenneth A. Froot, Director
Henry Gabbay, Director
John F. O’Brien, Director
Roberta Cooper Ramo, Director
David H. Walsh, Director
Richard R. West, Director and Member of the Audit Committee
Anne Ackerley, President and Chief Executive Officer
Jeffrey Holland, Vice President
Brendan Kyne, Vice President
Brian Schmidt, Vice President
Neal Andrews, Chief Financial Officer
Jay Fife, Treasurer
Brian Kindelan, Chief Compliance Officer
Howard Surloff, Secretary
Investment Advisor
BlackRock Advisors, LLC
Wilmington, DE 19809
Sub-Advisors
BlackRock Investment Management, LLC
Plainsboro, NJ 08536
BlackRock International Limited
Edinburgh, EH3 8JB,
United Kingdom
Custodian
Brown Brothers Harriman & Co.
Boston, MA 02109
Transfer Agent
PNC Global Investment Servicing (U.S.) Inc.
Wilmington, DE 19809
Accounting Agent
State Street Bank and Trust Company
Princeton, NJ 08540
Distributor
BlackRock Investments, LLC
New York, NY 10022
Independent Registered Public Accounting Firm
Deloitte & Touche LLP
Princeton, NJ 08540
Legal Counsel
Willkie Farr & Gallagher LLP
New York, NY 10019
Address of the Fund
100 Bellevue Parkway
Wilmington, DE 19809
42 BLACKROCK GLOBAL ALLOCATION FUND, INC.
APRIL 30, 2010
Additional Information
General Information
Electronic Delivery
Electronic copies of most financial reports and prospectuses are available
on the Fund’s website or shareholders can sign up for e-mail notifications
of quarterly statements, annual and semi-annual reports and prospec-
tuses by enrolling in the Fund’s electronic delivery program.
To enroll:
Shareholders Who Hold Accounts with Investment Advisors, Banks or
Brokerages:
Please contact your financial advisor. Please note that not all investment
advisors, banks or brokerages may offer this service.
Shareholders Who Hold Accounts Directly with BlackRock:
1) Access the BlackRock website at
http://www.blackrock.com/edelivery
2) Select “eDelivery” under the “More Information” section
3) Log into your account
Householding
The Fund will mail only one copy of shareholder documents, including
prospectuses, annual and semi-annual reports and proxy statements, to
shareholders with multiple accounts at the same address. This practice is
commonly called “householding” and is intended to reduce expenses and
eliminate duplicate mailings of shareholder documents. Mailings of your
shareholder documents may be householded indefinitely unless you
instruct us otherwise. If you do not want the mailing of these documents
to be combined with those for other members of your household, please
call (800) 441-7762.
Availability of Quarterly Portfolio Schedule of Investments
The Fund files its complete schedule of portfolio holdings with the
Securities and Exchange Commission (the “SEC”) for the first and third
quarters of each fiscal year on Form N-Q. The Fund’s Forms N-Q are
available on the SEC’s website at http://www.sec.gov and may also
be reviewed and copied at the SEC’s Public Reference Room in
Washington, D.C. Information on the operation of the Public Reference
Room may be obtained by calling (800) SEC-0330. The Fund’s Forms
N-Q may also be obtained upon request and without charge by
calling (800) 441-7762.
Availability of Proxy Voting Policies and Procedures
A description of the policies and procedures that the Fund uses to
determine how to vote proxies relating to portfolio securities is available
(1) without charge, upon request, by calling (800) 441-7762; (2) at
www.blackrock.com; and (3) on the SEC’s website at http://www.sec.gov.
Availability of Proxy Voting Record
Information about how the Fund voted proxies relating to securities held
in the Fund’s portfolio during the most recent 12-month period ended
June 30 is available upon request and without charge (1) at www.black-
rock.com or by calling (800) 441-7762 and (2) on the SEC’s website at
http://www.sec.gov.
BLACKROCK GLOBAL ALLOCATION FUND, INC.
APRIL 30, 2010
43
Additional Information (continued)
Shareholder Privileges
Account Information
Call us at (800) 441-7762 from 8:00 AM to 6:00 PM EST on any business
day to get information about your account balances, recent transactions and
share prices. You can also reach us on the Web at www.blackrock.com/funds.
Automatic Investment Plans
Investor Class shareholders who want to invest regularly can arrange to
have $50 or more automatically deducted from their checking or savings
account and invested in any of the BlackRock funds.
Systematic Withdrawal Plans
Investor Class shareholders can establish a systematic withdrawal plan
and receive periodic payments of $50 or more from their BlackRock
funds, as long as their account balance is at least $10,000.
Retirement Plans
Shareholders may make investments in conjunction with Traditional,
Rollover, Roth, Coverdell, Simple IRAs, SEP IRAs and 403(b) Plans.
44 BLACKROCK GLOBAL ALLOCATION FUND, INC.
APRIL 30, 2010
Additional Information (concluded)
BlackRock Privacy Principles
BlackRock is committed to maintaining the privacy of its current and
former fund investors and individual clients (collectively, “Clients”) and
to safeguarding their non-public personal information. The following
information is provided to help you understand what personal informa-
tion BlackRock collects, how we protect that information and why in cer-
tain cases we share such information with select parties.
If you are located in a jurisdiction where specific laws, rules or regula-
tions require BlackRock to provide you with additional or different
privacy-related rights beyond what is set forth below, then BlackRock
will comply with those specific laws, rules or regulations.
BlackRock obtains or verifies personal non-public information from and
about you from different sources, including the following: (i) information
we receive from you or, if applicable, your financial intermediary, on
applications, forms or other documents; (ii) information about your
transactions with us, our affiliates, or others; (iii) information we receive
from a consumer reporting agency; and (iv) from visits to our websites.
BlackRock does not sell or disclose to non-affiliated third parties any
non-public personal information about its Clients, except as permitted
by law or as is necessary to respond to regulatory requests or to service
Client accounts. These non-affiliated third parties are required to protect
the confidentiality and security of this information and to use it only for
its intended purpose.
We may share information with our affiliates to service your account or
to provide you with information about other BlackRock products or serv-
ices that may be of interest to you. In addition, BlackRock restricts
access to non-public personal information about its Clients to those
BlackRock employees with a legitimate business need for the informa-
tion. BlackRock maintains physical, electronic and procedural safeguards
that are designed to protect the non-public personal information of its
Clients, including procedures relating to the proper storage and disposal
of such information.
BLACKROCK GLOBAL ALLOCATION FUND, INC.
APRIL 30, 2010
45
A World-Class Mutual Fund Family
BlackRock offers a diverse lineup of open-end mutual funds crossing all investment styles and managed by experts in equity, fixed income and
tax-exempt investing.
| | | |
| Equity Funds | | | |
| BlackRock All-Cap Energy & Resources Portfolio | BlackRock Global Growth Fund | BlackRock Mid-Cap Value Equity Portfolio |
| BlackRock Asset Allocation Portfolio† | BlackRock Global Opportunities Portfolio | BlackRock Mid Cap Value Opportunities Fund |
| BlackRock Aurora Portfolio | BlackRock Global SmallCap Fund | BlackRock Natural Resources Trust |
| BlackRock Balanced Capital Fund† | BlackRock Health Sciences Opportunities Portfolio | BlackRock Pacific Fund |
| BlackRock Basic Value Fund | BlackRock Healthcare Fund | BlackRock Science & Technology |
| BlackRock Capital Appreciation Portfolio | BlackRock Index Equity Portfolio* | Opportunities Portfolio |
| BlackRock Energy & Resources Portfolio | BlackRock International Fund | BlackRock Small Cap Core Equity Portfolio |
| BlackRock Equity Dividend Fund | BlackRock International Index Fund | BlackRock Small Cap Growth Equity Portfolio |
| BlackRock EuroFund | BlackRock International Opportunities Portfolio | BlackRock Small Cap Growth Fund II |
| BlackRock Focus Growth Fund | BlackRock International Value Fund | BlackRock Small Cap Index Fund |
| BlackRock Focus Value Fund | BlackRock Large Cap Core Fund | BlackRock Small/Mid-Cap Growth Portfolio |
| BlackRock Fundamental Growth Fund | BlackRock Large Cap Core Plus Fund | BlackRock S&P 500 Index Fund |
| BlackRock Global Allocation Fund† | BlackRock Large Cap Growth Fund | BlackRock U.S. Opportunities Portfolio |
| BlackRock Global Dynamic Equity Fund | BlackRock Large Cap Value Fund | BlackRock Utilities and Telecommunications Fund |
| BlackRock Global Emerging Markets Fund | BlackRock Latin America Fund | BlackRock Value Opportunities Fund |
| BlackRock Global Financial Services Fund | BlackRock Mid-Cap Growth Equity Portfolio | BlackRock World Gold Fund |
| Fixed Income Funds | | | |
| BlackRock Bond Portfolio | BlackRock Inflation Protected Bond Portfolio | BlackRock Short-Term Bond Fund |
| BlackRock Emerging Market Debt Portfolio | BlackRock Intermediate Government | BlackRock Strategic Income |
| BlackRock GNMA Portfolio | Bond Portfolio | | Opportunities Portfolio |
| BlackRock Government Income Portfolio | BlackRock International Bond Portfolio | BlackRock Total Return Fund |
| BlackRock High Income Fund | BlackRock Long Duration Bond Portfolio | BlackRock Total Return Portfolio II |
| BlackRock High Yield Bond Portfolio | BlackRock Low Duration Bond Portfolio | BlackRock World Income Fund |
| BlackRock Income Portfolio† | BlackRock Managed Income Portfolio | |
| BlackRock Income Builder Portfolio† | BlackRock Multi-Sector Bond Portfolio | |
| Municipal Bond Funds | | | |
| BlackRock AMT-Free Municipal Bond Portfolio | BlackRock Kentucky Municipal Bond Portfolio | BlackRock New York Municipal Bond Fund |
| BlackRock California Municipal Bond Fund | BlackRock Municipal Insured Fund | BlackRock Ohio Municipal Bond Portfolio |
| BlackRock High Yield Municipal Fund | BlackRock National Municipal Fund | BlackRock Pennsylvania Municipal Bond Fund |
| BlackRock Intermediate Municipal Fund | BlackRock New Jersey Municipal Bond Fund | BlackRock Short-Term Municipal Fund |
| Target Risk & Target Date Funds† | | | |
| BlackRock Prepared Portfolios | BlackRock Lifecycle Prepared Portfolios | BlackRock LifePath Portfolios |
| Conservative Prepared Portfolio | 2010 | 2035 | Retirement |
| Moderate Prepared Portfolio | 2015 | 2040 | 2020 |
| Growth Prepared Portfolio | 2020 | 2045 | 2030 |
| Aggressive Growth Prepared Portfolio | 2025 | 2050 | 2040 |
| | 2030 | | 2050 |
* See the prospectus for information on specific limitations on investments in the fund.
† Mixed asset fund.
BlackRock mutual funds are currently distributed by BlackRock Investments, LLC. You should consider the investment objectives, risks, charges and
expenses of the funds under consideration carefully before investing. Each fund’s prospectus contains this and other information and is available at
www.blackrock.com or by calling (800) 441-7762 or from your financial advisor. The prospectus should be read carefully before investing.
46 BLACKROCK GLOBAL ALLOCATION FUND, INC.
APRIL 30, 2010

This report is not authorized for use as an offer of sale or a solic-
itation of an offer to buy shares of the Fund unless accompanied
or preceded by the Fund’s current prospectus. Past performance
results shown in this report should not be considered a repre-
sentation of future performance. Investment return and principal
value of shares will fluctuate so that shares, when redeemed,
may be worth more or less than their original cost. Statements
and other information herein are as dated and are subject to
change. Please see the Fund’s prospectus for a description of
risks associated with global investments.

Item 2 – Code of Ethics – Not Applicable to this semi-annual report
Item 3 – Audit Committee Financial Expert – Not Applicable to this semi-annual report
Item 4 – Principal Accountant Fees and Services – Not Applicable to this semi-annual report
Item 5 – Audit Committee of Listed Registrants – Not Applicable
Item 6 – Investments
(a) The registrant’s Schedule of Investments is included as part of the Report to
Stockholders filed under Item 1 of this form.
(b) Not Applicable due to no such divestments during the semi-annual period covered since
the previous Form N-CSR filing.
Item 7 – Disclosure of Proxy Voting Policies and Procedures for Closed-End Management
Investment Companies – Not Applicable
Item 8 – Portfolio Managers of Closed-End Management Investment Companies – Not Applicable
Item 9 – Purchases of Equity Securities by Closed-End Management Investment Company and
Affiliated Purchasers – Not Applicable
Item 10 – Submission of Matters to a Vote of Security Holders – The registrant’s Nominating and
Governance Committee will consider nominees to the board of directors recommended by
shareholders when a vacancy becomes available. Shareholders who wish to recommend a
nominee should send nominations that include biographical information and set forth the
qualifications of the proposed nominee to the registrant’s Secretary. There have been no
material changes to these procedures.
Item 11 – Controls and Procedures
11(a) – The registrant’s principal executive and principal financial officers or persons performing
similar functions have concluded that the registrant’s disclosure controls and procedures (as
defined in Rule 30a-3(c) under the Investment Company Act of 1940, as amended (the
“1940 Act”)) are effective as of a date within 90 days of the filing of this report based on the
evaluation of these controls and procedures required by Rule 30a-3(b) under the 1940 Act
and Rule 15(d)-15(b) under the Securities Exchange Act of 1934, as amended.
11(b) – There were no changes in the registrant’s internal control over financial reporting (as
defined in Rule 30a-3(d) under the 1940 Act) that occurred during the second fiscal quarter
of the period covered by this report that have materially affected, or are reasonably likely to
materially affect, the registrant’s internal control over financial reporting.
Item 12 – Exhibits attached hereto
12(a)(1) – Code of Ethics – Not Applicable to this semi-annual report
12(a)(2) – Certifications – Attached hereto
12(a)(3) – Not Applicable
12(b) – Certifications – Attached hereto
Pursuant to the requirements of the Securities Exchange Act of 1934 and the Investment
Company Act of 1940, the registrant has duly caused this report to be signed on its behalf by
the undersigned, thereunto duly authorized.
BlackRock Global Allocation Fund, Inc.
By: /s/ Anne F. Ackerley
Anne F. Ackerley
Chief Executive Officer of
BlackRock Global Allocation Fund, Inc.
Date: June 28, 2010
Pursuant to the requirements of the Securities Exchange Act of 1934 and the Investment
Company Act of 1940, this report has been signed below by the following persons on behalf
of the registrant and in the capacities and on the dates indicated.
By: /s/ Anne F. Ackerley
Anne F. Ackerley
Chief Executive Officer (principal executive officer) of
BlackRock Global Allocation Fund, Inc.
Date: June 28, 2010
By: /s/ Neal J. Andrews
Neal J. Andrews
Chief Financial Officer (principal financial officer) of
BlackRock Global Allocation Fund, Inc.
Date: June 28, 2010