
August - 2016

How to Build a Growth Companyin a Slow Growth World 2
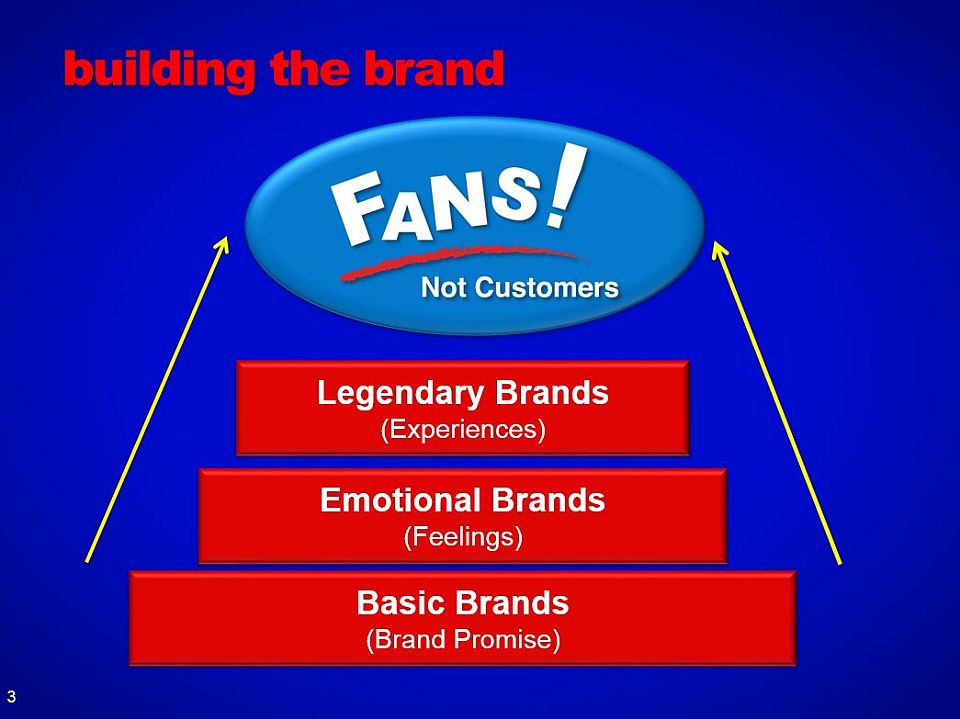
Basic Brands(Brand Promise) Emotional Brands(Feelings) Legendary Brands(Experiences) building the brand 3
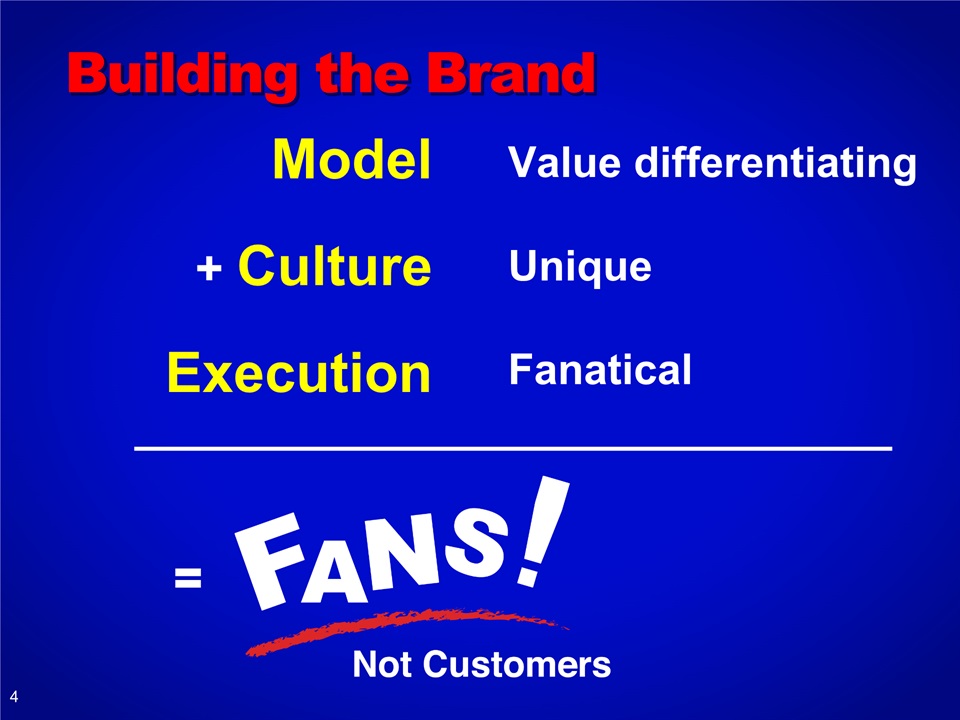
Value differentiatingUniqueFanatical Model+ Culture Execution = Building the Brand 4

Since the launch of our“Power of Red is Back”expansion plan . . . . 5
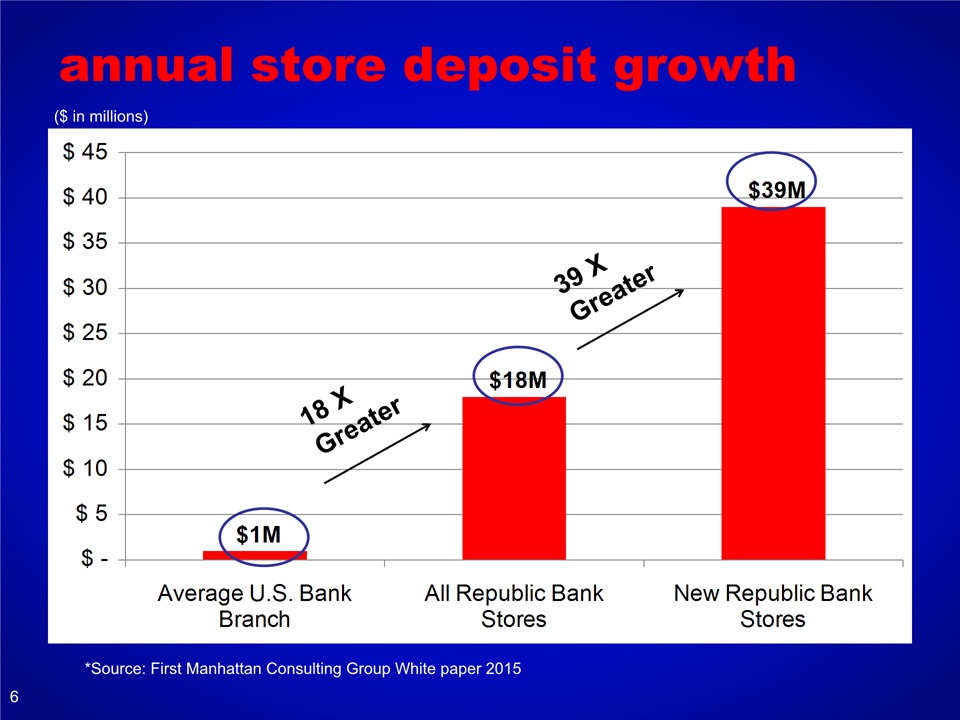
annual store deposit growth ($ in millions) 39 XGreater *Source: First Manhattan Consulting Group White paper 2015 6
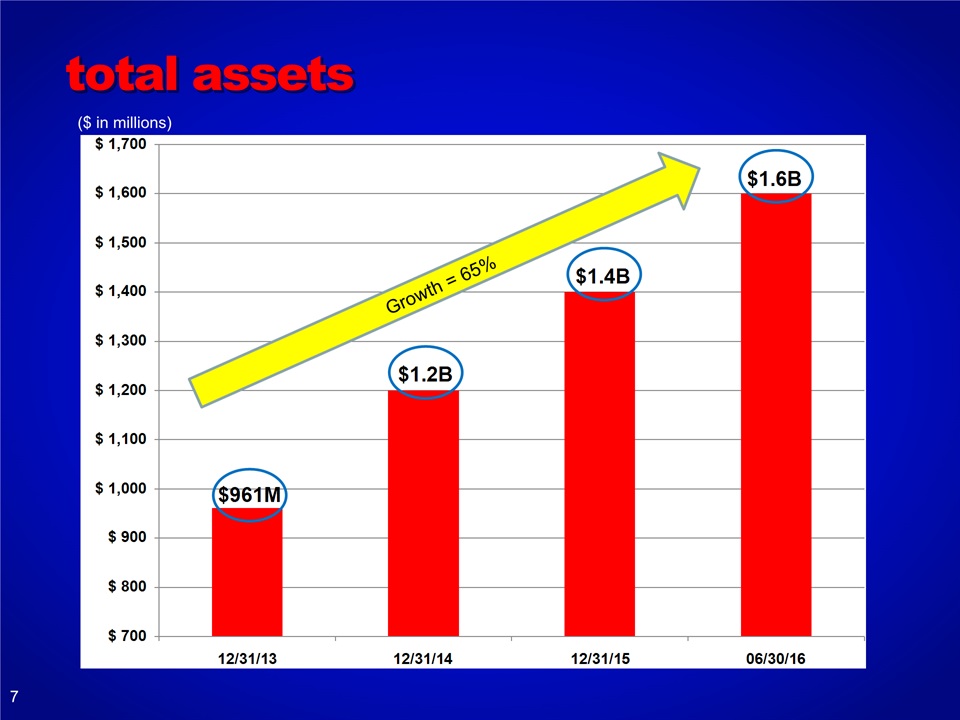
total assets ($ in millions) 7
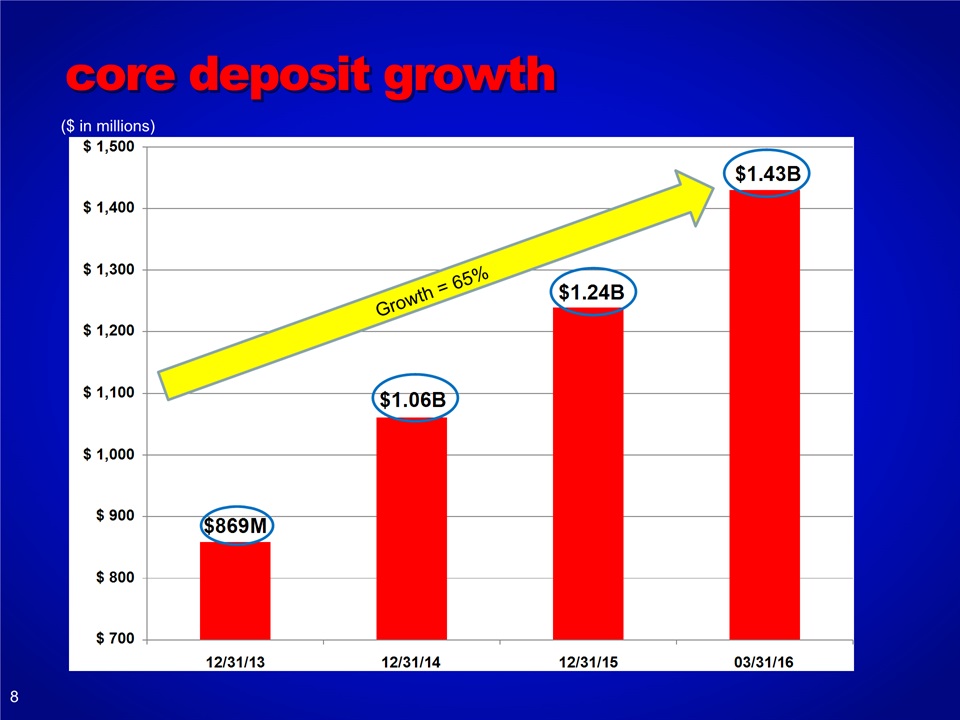
core deposit growth ($ in millions) 8
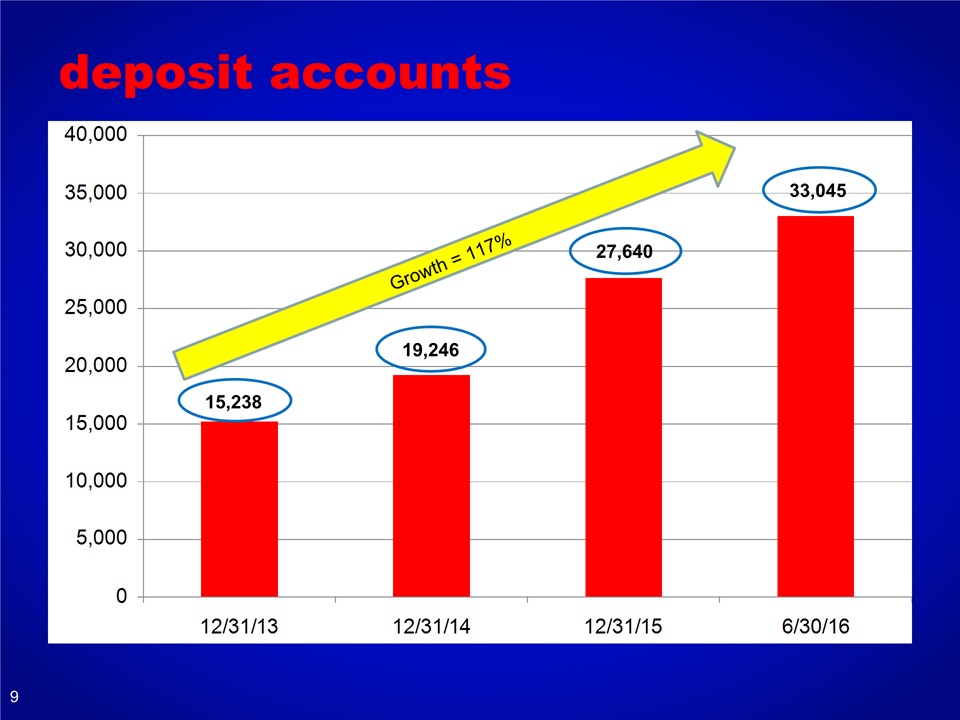
deposit accounts Growth = 117% 9
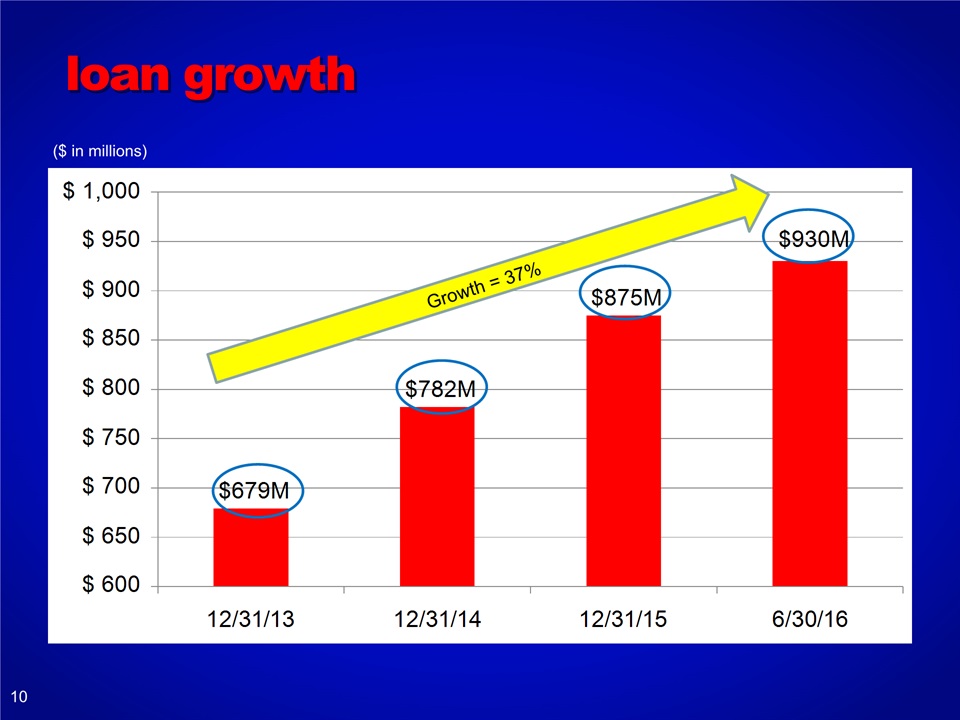
loan growth ($ in millions) 10
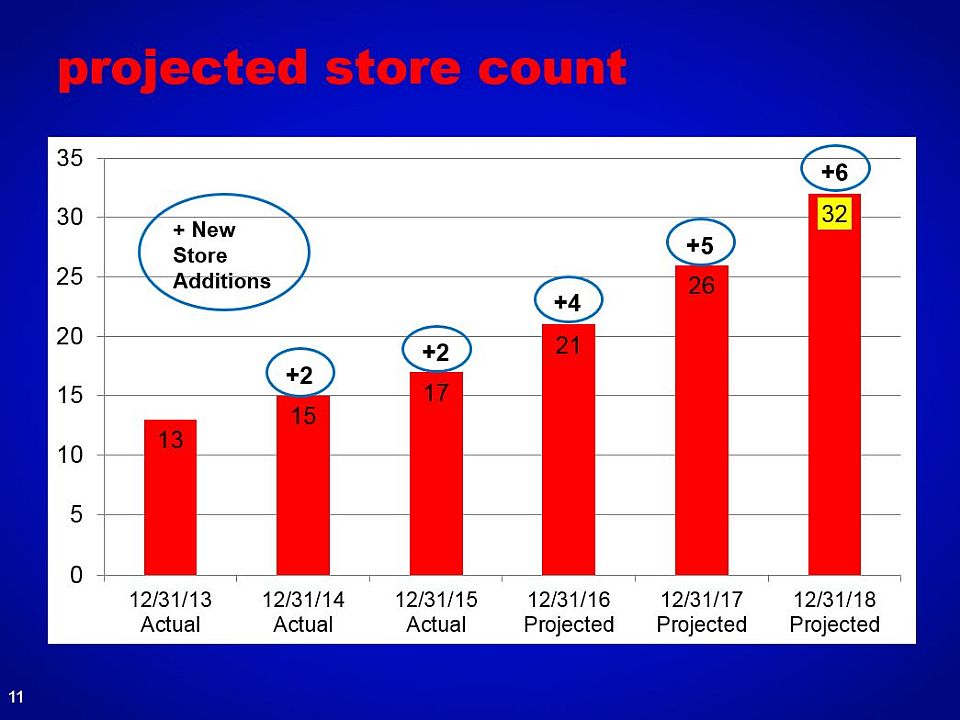
projected store count +2 +6 +4 +5 + New Store Additions 11
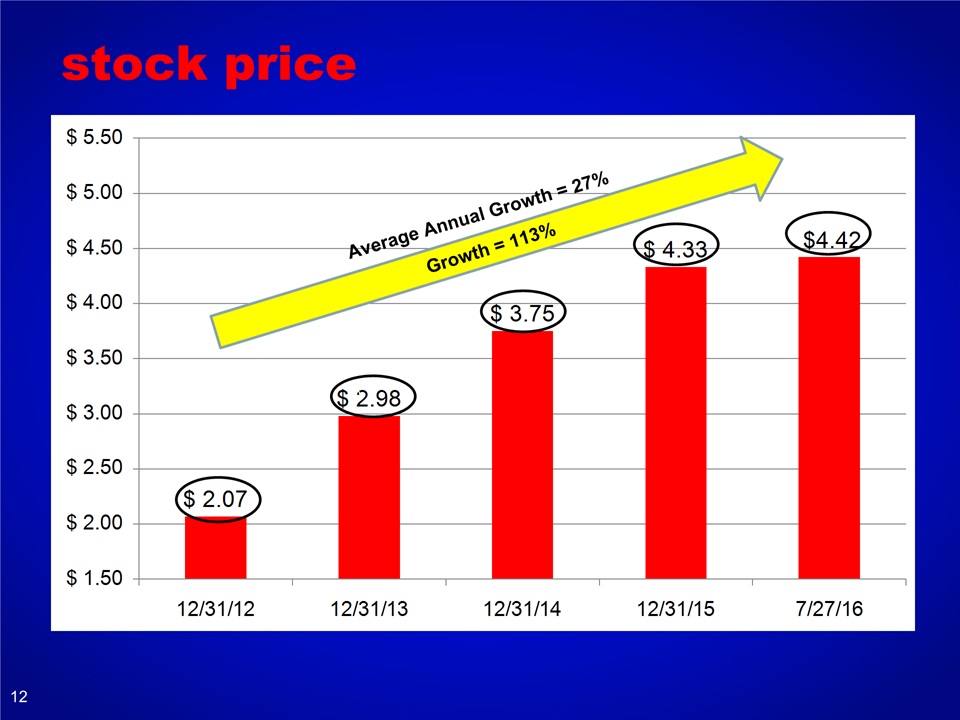
stock price 0 12

THE BEST OF EVERY CHANNELYOU CHOOSE in-store online mobile phone 13

our leadership team Tracie YoungChief Risk Officer Jay NeilonChief Credit Officer Frank CavallaroChief Financial Officer Harry D. MadonnaChairman,Chief Executive Officer Vernon W. Hill II Andrew J. LoguePresident,Chief Operating Officer Rhonda S. CostelloChief Retail Officer 14
mortgage company acquisition Announces acquisition of Oak Mortgage Company on 7/26/16. Residential mortgage originator located in Marlton, NJ.Closed more than $330 million in residential mortgages in 2015.Well known throughout our footprint. 15
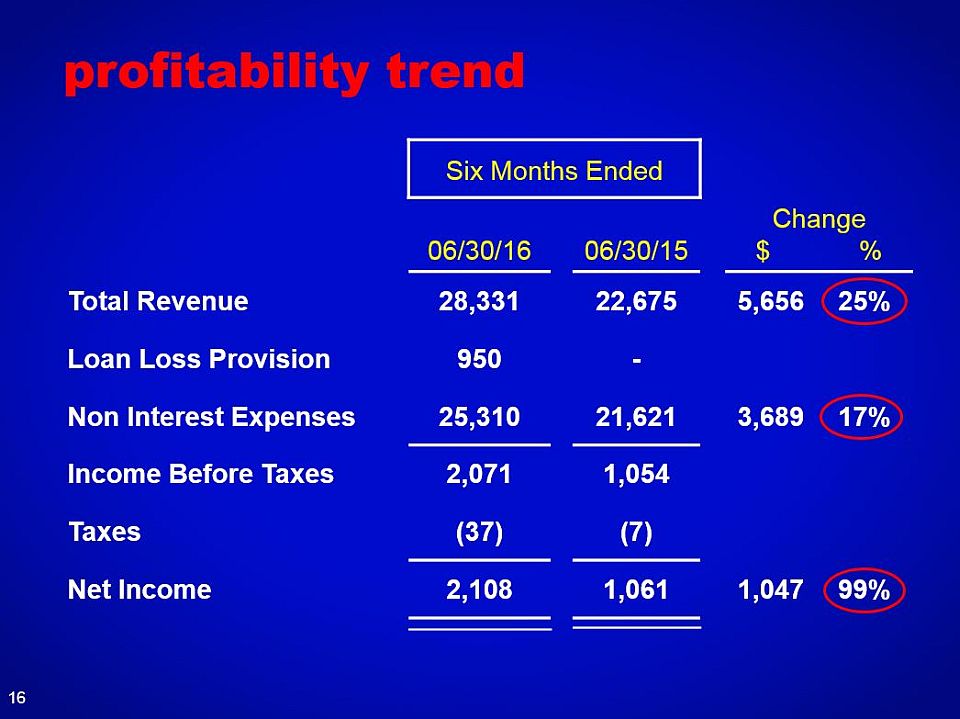
profitability trend Six Months Ended 06/30/16 06/30/15 Change $ % Total Revenue 28,331 22,675 5,656 25% Loan Loss Provision 950 - Non Interest Expenses 25,310 21,621 3,689 17% Income Before Taxes 2,071 1,054 Taxes (37) (7) Net Income 2,108 1,061 1,047 99% 16
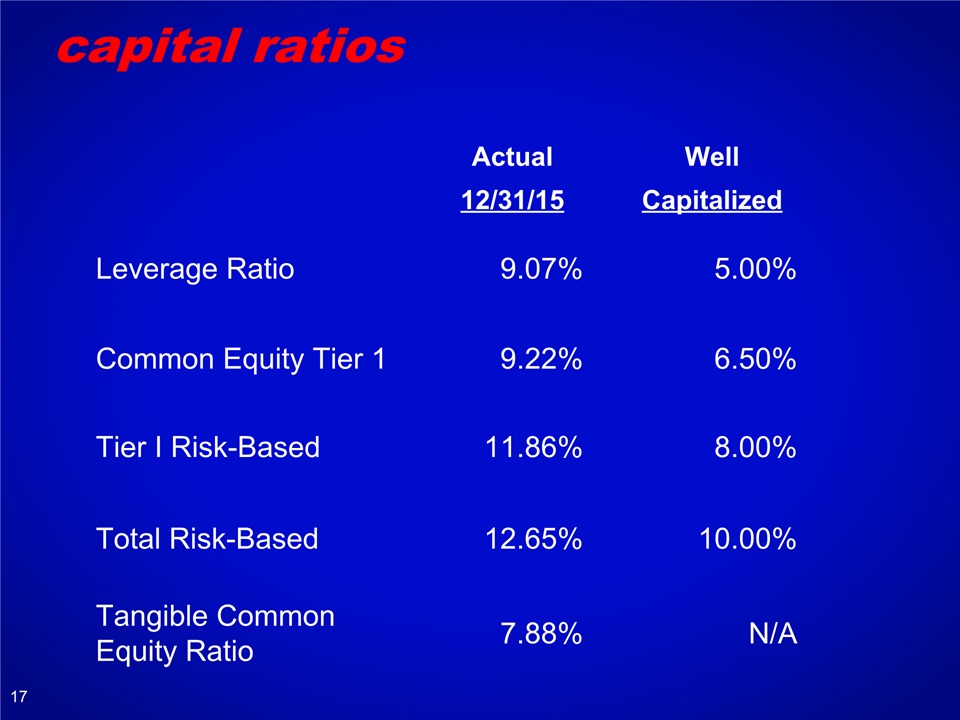
capital ratios Actual Well 12/31/15 Capitalized Leverage Ratio 9.07% 5.00% Common Equity Tier 1 9.22% 6.50% Tier I Risk-Based 11.86% 8.00% Total Risk-Based 12.65% 10.00% Tangible Common Equity Ratio 7.88% N/A 17
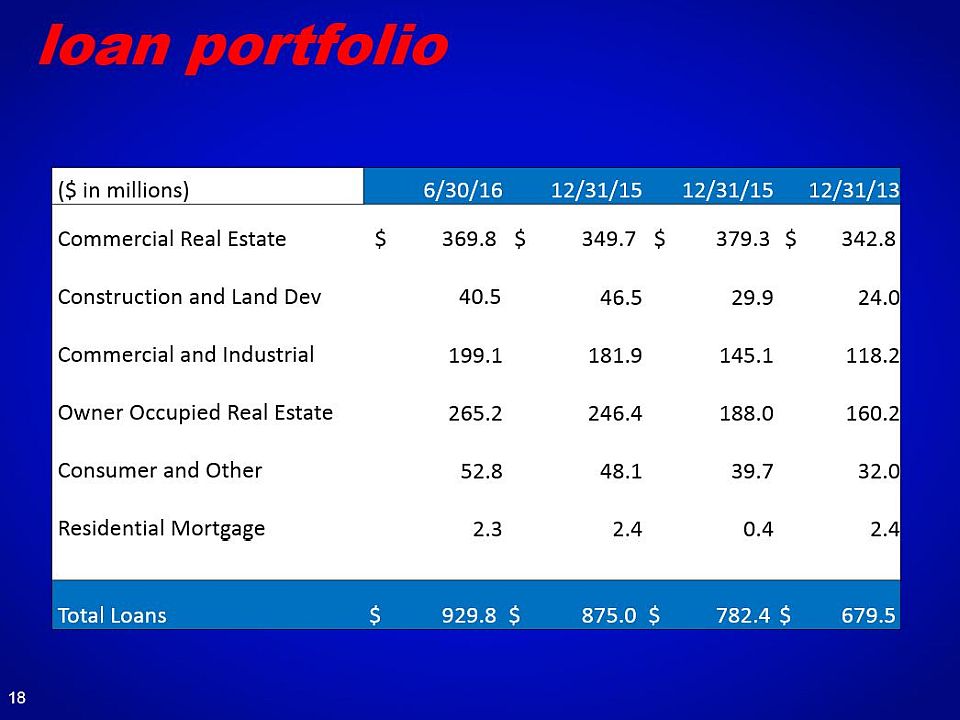
loan portfolio ($ in millions) 6/30/16 12/31/15 12/31/15 12/31/13 Commercial Real Estate $ 369.8 $ 349.7 $ 379.3 $ 342.8 Construction and Land Dev 40.5 46.5 29.9 24.0 Commercial and Industrial 199.1 181.9 145.1 118.2 Owner Occupied Real Estate 265.2 246.4 188.0 160.2 Consumer and Other 52.8 48.1 39.7 32.0 Residential Mortgage 2.3 2.4 0.4 2.4 Total Loans $ 929.8 $ 875.0 $ 782.4 $ 679.5 18
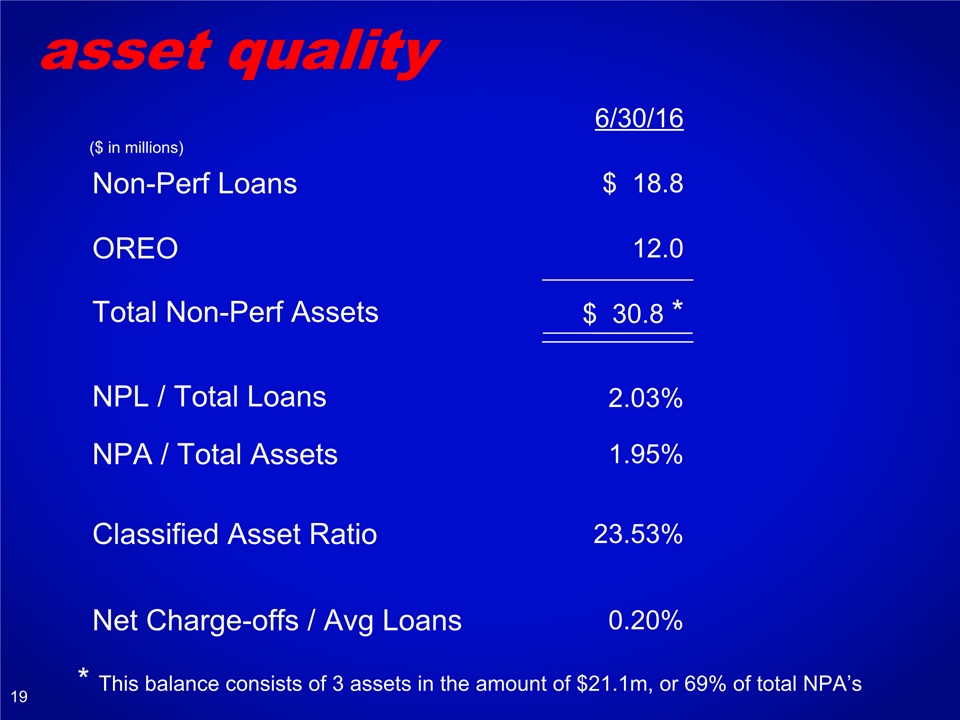
asset quality 6/30/16 Non-Perf Loans $ 18.8 OREO 12.0 Total Non-Perf Assets $ 30.8 * NPL / Total Loans 2.03% NPA / Total Assets 1.95% Classified Asset Ratio 23.53% Net Charge-offs / Avg Loans 0.20% ($ in millions) * This balance consists of 3 assets in the amount of $21.1m, or 69% of total NPA’s 19
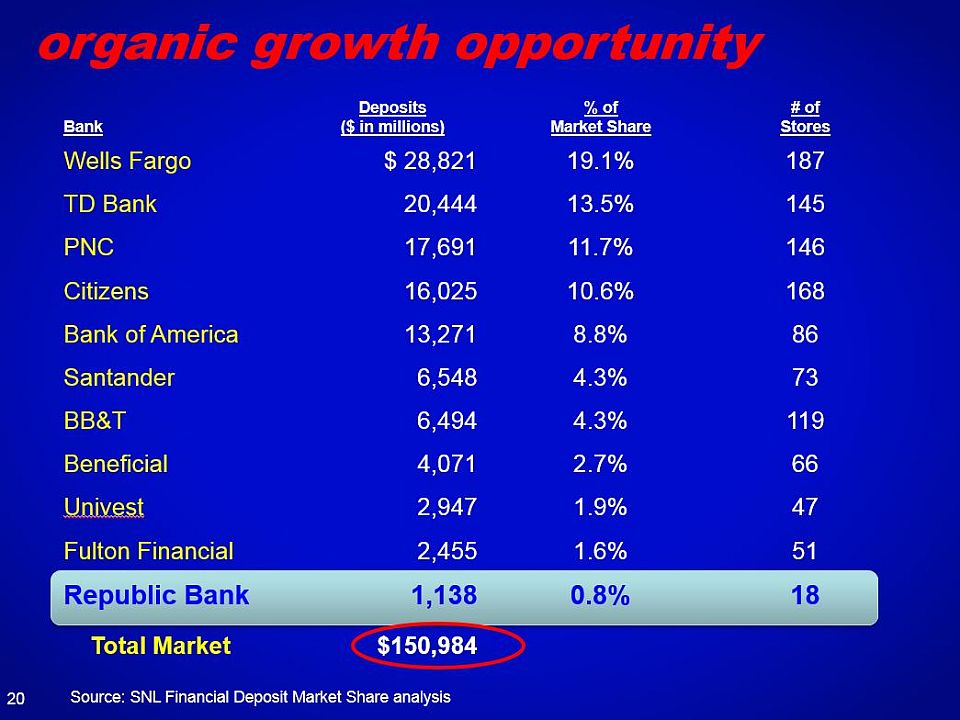
organic growth opportunity Source: SNL Financial Deposit Market Share analysis Bank Deposits ($ in millions) % of Market Share # of Stores Wells Fargo $ 28,821 19.1% 187 TD Bank 20,444 13.5% 145 PNC 17,691 11.7% 146 Citizens 16,025 10.6% 168 Bank of America 13,271 8.8% 86 Santander 6,548 4.3% 73 BB&T 6,494 4.3% 119 Beneficial 4,071 2.7% 66 Univest 2,947 1.9% 47 Fulton Financial 2,455 1.6% 51 Republic Bank 1,138 0.8% 18 Total Market $150,984 20

forward looking statements The Company may from time to time make written or oral "forward-looking statements", including statements contained in this presentation. The forward-looking statements contained herein are subject to certain risks and uncertainties that could cause actual results to differ materially from those projected in the forward-looking statements. For example, risks and uncertainties can arise with changes in: general economic conditions, including turmoil in the financial markets and related efforts of government agencies to stabilize the financial system; the adequacy of our allowance for loan losses and our methodology for determining such allowance; adverse changes in our loan portfolio and credit risk-related losses and expenses; concentrations within our loan portfolio, including our exposure to commercial real estate loans, and to our primary service area; changes in interest rates; our ability to identify, negotiate, secure and develop new store locations and renew, modify, or terminate leases or dispose of properties for existing store locations effectively; business conditions in the financial services industry, including competitive pressure among financial services companies, new service and product offerings by competitors, price pressures and similar items; deposit flows; loan demand; the regulatory environment, including evolving banking industry standards, changes in legislation or regulation; impact of the Dodd-Frank Wall Street Reform and Consumer Protection Act; our securities portfolio and the valuation of our securities; accounting principles, policies and guidelines as well as estimates and assumptions used in the preparation of our financial statements; rapidly changing technology; litigation liabilities, including costs, expenses, settlements and judgments; and other economic, competitive, governmental, regulatory and technological factors affecting our operations, pricing, products and services. You should carefully review the risk factors described in the Annual Report on Form 10-K for the year ended December 31, 2015 and other documents the Company files from time to time with the Securities and Exchange Commission. The words "would be," "could be," "should be," "probability," "risk," "target," "objective," "may," "will," "estimate," "project," "believe," "intend," "anticipate," "plan," "seek," "expect" and similar expressions or variations on such expressions are intended to identify forward-looking statements. All such statements are made in good faith by the Company pursuant to the "safe harbor" provisions of the U.S. Private Securities Litigation Reform Act of 1995. The Company does not undertake to update any forward-looking statement, whether written or oral, that may be made from time to time by or on behalf of the Company, except as may be required by applicable law or regulations. 22