Table of Contents
United States Securities and Exchange Commission
Washington, D.C. 2054
FORM 10-Q/A
(Amendment No. 1)
(Mark One)
| þ | Quarterly Report Pursuant To Section 13 Or 15(d) Of The Securities Exchange Act Of 1934 |
For the quarterly period ended June 30, 2008
or
| o | Transition report under section 13 or 15(d) of the securities exchange act of 1934 |
For the transition period from to .
Commission file number:001-31698
BROOKE CORPORATION
(Exact name of registrant as specified in its charter)
| Kansas | 48-1009756 | |
| (State or other jurisdiction of incorporation or organization) | (I.R.S. Employer Identification No.) |
8500 College Boulevard, Overland Park, Kansas 66210
(Address of principal executive offices) (Zip Code)
Registrant’s telephone number: (913) 383-9700
(Address of principal executive offices) (Zip Code)
Registrant’s telephone number: (913) 383-9700
Indicate by check mark whether the registrant (1) has filed all reports required to be filed by Section 13 or 15(d) of the Securities Exchange Act of 1934 during the preceding 12 months (or for such shorter period that the registrant was required to file such reports), and (2) has been subject to such filing requirements for the past 90 days. (Check One): Yesþ Noo
Indicate by check mark whether the registrant is a large accelerated filer, an accelerated filer, a non-accelerated filer, or a smaller reporting company. See the definitions of “large accelerated filer,” “accelerated filer” and “smaller reporting company” in Rule 12b-2 of the Exchange Act. (Check one):
| Large accelerated filero | Accelerated filerþ | Non-accelerated filero | Smaller reporting companyo | |||
| (Do not check if a smaller reporting company) |
Indicate by check mark whether the registrant is a shell company (as defined in Rule 12b-2 of the Exchange Act). Yeso Noþ
As of August 15, 2008, there were 14,519,001 shares of the registrant’s sole class of common stock outstanding.
Table of Contents
EXPLANATORY NOTE
This Form 10-Q/A-1 amends our Form 10-Q for the period ended June 30, 2008, which was filed with the Securities and Exchange Commission on August 18, 2008 (the “Original Filing”). We are filing this Form 10-Q/A-1 to add certain financial information and to correct typographical matters.
In addition, in connection with the filing of this Form 10-Q/A-1 and pursuant to Rules 13a-14(a) or 15d-14(a) under the Securities Exchange Act of 1934, we are including with this Form 10-Q/A-1 certain currently dated certifications.
This Amendment does not reflect events occurring after the Original Filing except as noted above. Except for the foregoing amended or added information, this Form 10-Q/A continues to speak as of the date of the Original Filing and the Company has not otherwise updated disclosures contained therein or herein to reflect events that occurred at a later date. For the convenience of the reader, this Form 10-Q/A-1 sets forth the Original Filing in its entirety as amended.
Table of Contents
PART I — FINANCIAL INFORMATION
Item 1. Financial Statements.
Brooke Corporation
Consolidated Balance Sheets
UNAUDITED
(in thousands, except share amounts)
Consolidated Balance Sheets
UNAUDITED
(in thousands, except share amounts)
ASSETS
| June 30, | December 31, | |||||||
| 2008 | 2007 | |||||||
Current Assets | ||||||||
| Cash | $ | 6,825 | $ | 4,699 | ||||
| Restricted cash | 388 | 454 | ||||||
| Investments | 86,609 | 32,020 | ||||||
| Accounts and notes receivable, net | 224,015 | 193,688 | ||||||
| Income tax receivable | 894 | 2,428 | ||||||
| Other receivables | 6,604 | 5,303 | ||||||
| Securities | 71,050 | 89,634 | ||||||
| Interest-only strip receivable | 7,072 | 7,749 | ||||||
| Security deposits | — | 221 | ||||||
| Prepaid expenses | 3,558 | 1,693 | ||||||
| Advertising supply inventory | 664 | 929 | ||||||
| Assets of discontinued operation, held for sale | 26,860 | 25,987 | ||||||
Total Current Assets | 434,539 | 364,805 | ||||||
Investment in Businesses | 951 | 9,413 | ||||||
Property and Equipment | ||||||||
| Cost | 22,890 | 23,755 | ||||||
| Less: Accumulated depreciation | (7,375 | ) | (7,008 | ) | ||||
Net Property and Equipment | 15,515 | 16,747 | ||||||
Other Assets | ||||||||
| Amortizable intangible assets | 12,738 | 9,709 | ||||||
| Less: Accumulated amortization | (2,424 | ) | (2,031 | ) | ||||
| Goodwill | 2,660 | 3,022 | ||||||
| Servicing asset | 5,226 | 6,025 | ||||||
| Deferred charges | 2,740 | 5,904 | ||||||
| Deferred tax asset | 23,776 | — | ||||||
| Other assets | 8,938 | 1,276 | ||||||
| Non-current assets of discontinued operation, held for sale | 8,196 | 8,124 | ||||||
Net Other Assets | 61,850 | 32,029 | ||||||
Total Assets | $ | 512,855 | $ | 422,994 | ||||
See accompanying summary of accounting policies and notes to financial statements.
1
Table of Contents
Brooke Corporation
Consolidated Balance Sheets
UNAUDITED
(in thousands, except share amounts)
Consolidated Balance Sheets
UNAUDITED
(in thousands, except share amounts)
LIABILITIES AND STOCKHOLDERS’ EQUITY
| June 30, | December 31, | |||||||
| 2008 | 2007 | |||||||
Current Liabilities | ||||||||
| Accounts payable | $ | 45,890 | $ | 18,912 | ||||
| Premiums payable to insurance companies | 5,963 | 7,621 | ||||||
| Deposits | 109,234 | 22,951 | ||||||
| Federal funds purchased | — | 9,522 | ||||||
| Payable under participation agreements | 60,301 | 39,452 | ||||||
| Accrued commission refunds | 491 | 570 | ||||||
| IBNR loss reserve | 5,957 | 8,440 | ||||||
| Unearned insurance premiums | 3,383 | 3,110 | ||||||
| Income tax payable | — | 826 | ||||||
| Deferred income tax payable | 1,801 | 1,715 | ||||||
| Warrant liability | 900 | 900 | ||||||
| Short-term debt | 73,665 | 43,536 | ||||||
| Current maturities of long-term debt | 51,456 | 52,465 | ||||||
| Liabilities of discontinued operation, held-for-sale | 28,076 | 26,643 | ||||||
Total Current Liabilities | 387,117 | 236,663 | ||||||
Non-current Liabilities | ||||||||
| Warrant liability | 2,354 | 2,354 | ||||||
| Deferred income tax payable | — | 6,402 | ||||||
| Servicing liability | 12 | 16 | ||||||
| Long-term debt less current maturities | 57,899 | 61,012 | ||||||
Total Liabilities | 447,382 | 306,447 | ||||||
Minority Interest in subsidiaries | 31,029 | 45,899 | ||||||
Stockholders’ Equity | ||||||||
| Common stock, $0.01 par value, 99,500,000 shares authorized, 14,524,456 and 14,224,021 shares issued and outstanding | 145 | 142 | ||||||
| Preferred stock series 2002 and 2002A, $25 par value, 110,000 shares authorized, 49,667 shares issued and outstanding | 1,242 | 1,242 | ||||||
| Preferred stock series 2002B, $32 par value, 34,375 authorized, 24,331 shares issued and outstanding | 779 | 779 | ||||||
| Preferred stock series 2006, $1 par value, 20,000 authorized, 20,000 shares issued and outstanding | 20 | 20 | ||||||
| Additional paid-in capital on preferred stock series 2006 | 18,576 | 18,576 | ||||||
| Discount on preferred stock series 2006 | (675 | ) | (2,025 | ) | ||||
| Additional paid-in capital | 55,869 | 55,424 | ||||||
| Accumulated deficit | (39,513 | ) | (6,889 | ) | ||||
| Accumulated other comprehensive income (loss) | (1,999 | ) | 3,379 | |||||
Total Stockholders’ Equity | 34,444 | 70,648 | ||||||
Total Liabilities and Stockholders’ Equity | $ | 512,855 | $ | 422,994 | ||||
See accompanying summary of accounting policies and notes to financial statements.
2
Table of Contents
Brooke Corporation
Consolidated Statements of Operations
UNAUDITED
(in thousands, except per share data)
Consolidated Statements of Operations
UNAUDITED
(in thousands, except per share data)
| For three months | For three months | |||||||
| Ended June 30, | Ended June 30, | |||||||
| 2008 | 2007 | |||||||
Operating Revenues | ||||||||
| Insurance commissions | $ | 27,967 | $ | 28,326 | ||||
| Interest income (net) | 7,263 | 6,191 | ||||||
| Consulting fees | 3 | 4,415 | ||||||
| Gain (loss) on sale of businesses | (3,631 | ) | 1,161 | |||||
| Initial franchise fees for basic services | — | 7,095 | ||||||
| Initial franchise fees for buyer assistance plans | — | 70 | ||||||
| Gain (loss) on sale of notes receivable | (1,728 | ) | 4,284 | |||||
| Insurance premiums earned | 2,544 | 3,191 | ||||||
| Policy fee income | 131 | 153 | ||||||
| Loss on sale of assets | (1,323 | ) | (15 | ) | ||||
| Other income | 595 | 283 | ||||||
Total Operating Revenues | 31,821 | 55,154 | ||||||
Operating Expenses | ||||||||
| Commissions expense | 22,466 | 22,260 | ||||||
| Payroll expense | 7,445 | 8,831 | ||||||
| Depreciation and amortization | 1,328 | 809 | ||||||
| Insurance loss and loss expense incurred | 1,111 | 2,227 | ||||||
| Provision for losses | 10,534 | 1,485 | ||||||
| Other operating expenses | 10,471 | 11,394 | ||||||
| Other operating interest expense | 652 | 368 | ||||||
Total Operating Expenses | 54,007 | 47,374 | ||||||
Income (loss) from Continuing Operations | (22,186 | ) | 7,780 | |||||
Other Expenses | ||||||||
| Interest expense | 2,500 | 2,730 | ||||||
| Minority interest in subsidiaries | (5,173 | ) | 760 | |||||
Total Other Expenses | (2,673 | ) | 3,490 | |||||
Income (loss) from Continuing Operations Before Income Taxes | (19,513 | ) | 4,290 | |||||
| Income tax expense (benefit) | (9,374 | ) | 1,800 | |||||
Net Income (loss) from Continuing Operations | (10,139 | ) | 2,490 | |||||
| Net income from discontinued operation | 56 | 216 | ||||||
Net Income (loss) | $ | (10,083 | ) | $ | 2,706 | |||
Net Income (loss) per Share: | ||||||||
| Basic and diluted | ||||||||
| Net income (loss) from continuing operations | $ | (.76 | ) | $ | 0.13 | |||
| Net income from discontinued operation | .01 | 0.02 | ||||||
| Net income (loss) | $ | (.75 | ) | $ | 0.15 | |||
See accompanying summary of accounting policies and notes to financial statements.
3
Table of Contents
Brooke Corporation
Consolidated Statements of Operations
UNAUDITED
(in thousands, except per share data)
Consolidated Statements of Operations
UNAUDITED
(in thousands, except per share data)
| For six months | For six months | |||||||
| Ended June 30, | Ended June 30, | |||||||
| 2008 | 2007 | |||||||
Operating Revenues | ||||||||
| Insurance commissions | $ | 62,280 | $ | 61,062 | ||||
| Interest income (net) | 15,399 | 14,244 | ||||||
| Consulting fees | 256 | 4,730 | ||||||
| Gain (loss) on sale of businesses | (4,477 | ) | 1,842 | |||||
| Initial franchise fees for basic services | 1,320 | 19,965 | ||||||
| Initial franchise fees for buyer assistance plans | — | 455 | ||||||
| Gain (loss) on sale of notes receivable | (1,629 | ) | 11,206 | |||||
| Insurance premiums earned | 5,212 | 3,266 | ||||||
| Policy fee income | 245 | 256 | ||||||
| Impairment loss | (11,763 | ) | — | |||||
| Loss on sale of assets | (1,323 | ) | (31 | ) | ||||
| Other income | 975 | 530 | ||||||
Total Operating Revenues | 66,495 | 117,525 | ||||||
Operating Expenses | ||||||||
| Commissions expense | 47,705 | 45,378 | ||||||
| Payroll expense | 16,901 | 16,597 | ||||||
| Depreciation and amortization | 2,712 | 1,616 | ||||||
| Insurance loss and loss expense incurred | 2,193 | 2,554 | ||||||
| Provision for losses | 23,424 | 5,202 | ||||||
| Other operating expenses | 27,957 | 22,751 | ||||||
| Other operating interest expense | 1,413 | 2,033 | ||||||
Total Operating Expenses | 122,305 | 96,131 | ||||||
Income (loss) from Continuing Operations | (55,810 | ) | 21,394 | |||||
Other Expenses | ||||||||
| Interest expense | 5,571 | 5,390 | ||||||
| Loss on extinguishment of debt | 8,210 | — | ||||||
| Minority interest in subsidiaries | (14,754 | ) | 724 | |||||
Total Other Expenses | (973 | ) | 6,114 | |||||
Income (loss) from Continuing Operations Before Income Taxes | (54,837 | ) | 15,280 | |||||
| Income tax expense (benefit) | (26,141 | ) | 5,988 | |||||
Net Income (loss) from Continuing Operations | (28,696 | ) | 9,292 | |||||
Net income from discontinued operation | 79 | 223 | ||||||
Net Income (loss) | $ | (28,617 | ) | $ | 9,515 | |||
Net Income (loss) per Share: | ||||||||
| Basic and diluted | ||||||||
| Net income from continuing operations | $ | (2.12 | ) | $ | 0.62 | |||
| Net income from discontinued operation | .01 | 0.01 | ||||||
| Net income (loss) | $ | (2.11 | ) | $ | 0.63 | |||
See accompanying summary of accounting policies and notes to financial statements.
4
Table of Contents
Brooke Corporation
Consolidated Statements of Changes in Stockholders’ Equity
UNAUDITED
(in thousands, except common shares)
Consolidated Statements of Changes in Stockholders’ Equity
UNAUDITED
(in thousands, except common shares)
| Accumulated | ||||||||||||||||||||||||||||||||||||
| Preferred | Preferred | Add’l | Other | |||||||||||||||||||||||||||||||||
| Common | Common | Preferred | Add’l | Stock | Paid-In | Retained | Comprehensive | |||||||||||||||||||||||||||||
| Shares | Stock | Stock | Capital | Discount | Capital | Earnings | Income | Total | ||||||||||||||||||||||||||||
Balances, December 31, 2006 | 12,553,726 | $ | 126 | $ | 2,041 | $ | 18,576 | $ | (4,725 | ) | $ | 36,139 | $ | 4,077 | $ | 294 | $ | 56,528 | ||||||||||||||||||
| Dividends paid | 2,700 | (12,561 | ) | (9,861 | ) | |||||||||||||||||||||||||||||||
| Equity issuance from plan awards | 170,810 | 1 | 425 | 426 | ||||||||||||||||||||||||||||||||
| Equity issuance | 1,500,000 | 15 | 18,860 | 18,875 | ||||||||||||||||||||||||||||||||
| Comprehensive income: | ||||||||||||||||||||||||||||||||||||
| Interest-only strip receivable, change in fair market value, net of income taxes | 2,885 | 2,885 | ||||||||||||||||||||||||||||||||||
| Currency translation adjustment, net of income taxes | 200 | 200 | ||||||||||||||||||||||||||||||||||
| Net income | 1,595 | 1,595 | ||||||||||||||||||||||||||||||||||
| Total comprehensive income | 4,680 | |||||||||||||||||||||||||||||||||||
Balances, December 31, 2007 | 14,224,536 | $ | 142 | $ | 2,041 | $ | 18,576 | $ | (2,025 | ) | $ | 55,424 | $ | (6,889 | ) | $ | 3,379 | $ | 70,648 | |||||||||||||||||
Balances, December 31, 2007 | 14,224,536 | $ | 142 | $ | 2,041 | $ | 18,576 | $ | (2,025 | ) | $ | 55,424 | $ | (6,889 | ) | $ | 3,379 | $ | 70,648 | |||||||||||||||||
| Dividends paid | 1,350 | (4,007 | ) | (2,657 | ) | |||||||||||||||||||||||||||||||
| Equity issuance from plan awards | 299,920 | 3 | 445 | 448 | ||||||||||||||||||||||||||||||||
| Comprehensive income (loss): | ||||||||||||||||||||||||||||||||||||
| Interest-only strip receivable, change in fair market value, net of income taxes | (5,328 | ) | (5,328 | ) | ||||||||||||||||||||||||||||||||
| Currency translation adjustment, net of income taxes | (50 | ) | (50 | ) | ||||||||||||||||||||||||||||||||
| Net loss | (28,617 | ) | (28,617 | ) | ||||||||||||||||||||||||||||||||
| Total comprehensive loss | (33,995 | ) | ||||||||||||||||||||||||||||||||||
Balances, June 30, 2008 | 14,524,456 | 145 | 2,041 | 18,576 | (675 | ) | 55,869 | (39,513 | ) | (1,999 | ) | 34,444 | ||||||||||||||||||||||||
See accompanying summary of accounting policies and notes to financial statements.
5
Table of Contents
Brooke Corporation
Consolidated Statements of Cash Flows
UNAUDITED
(in thousands)
Consolidated Statements of Cash Flows
UNAUDITED
(in thousands)
| For six months | For six months | |||||||
| Ended June 30, | Ended June 30, | |||||||
| 2008 | 2007 | |||||||
Cash flows from operating activities: | ||||||||
| Net income (loss) | $ | (28,617 | ) | $ | 9,515 | |||
| Net income from discontinued operation | 79 | 223 | ||||||
| Net income (loss) from continuing operations | (28,696 | ) | 9,292 | |||||
Adjustments to reconcile net income (loss) from continuing operations to net cash flows from operating activities: | ||||||||
| Depreciation | 1,166 | 797 | ||||||
| Amortization | 1,546 | 819 | ||||||
| (Gain) loss on sale of businesses | 4,477 | (1,842 | ) | |||||
| Deferred income tax expense | — | 1,137 | ||||||
| Write down to realizable value of inventory | — | 300 | ||||||
| (Gain) loss on sale of notes receivable | 1,629 | (11,586 | ) | |||||
| Loss on extinguishment of debt | 8,210 | — | ||||||
| Impairment loss | 11,763 | — | ||||||
| Provisions for stock awards | 782 | — | ||||||
| Minority interest | (14,870 | ) | 760 | |||||
| Loss on sale assets | 1,323 | |||||||
(Increase) decrease in assets: | ||||||||
| Accounts and notes receivable | (30,327 | ) | 83,612 | |||||
| Other receivables | (25,077 | ) | (1,477 | ) | ||||
| Prepaid expenses and other assets | 155 | 632 | ||||||
| Business inventory | 4,831 | (1,433 | ) | |||||
| Purchase of business inventory provided by sellers | 105 | 11,021 | ||||||
| Payments on seller notes for business inventory | (2,970 | ) | (4,790 | ) | ||||
Increase (decrease) in liabilities: | ||||||||
| Accounts and expenses payable | 26,978 | 9,319 | ||||||
| Other liabilities | 86,521 | (34 | ) | |||||
Net cash provided by operating activities | 47,546 | 96,527 | ||||||
Cash flows from investing activities: | ||||||||
| Cash payments for securities | (12,252 | ) | (41,083 | ) | ||||
| (Purchase) sale of investments | (54,589 | ) | 6,010 | |||||
| Cash payments for property and equipment | (1,480 | ) | (2,525 | ) | ||||
| Purchase of subsidiary and business assets | (8,291 | ) | (18,548 | ) | ||||
| Sale of subsidiary and business assets | — | 8,888 | ||||||
Net cash used in investing activities | (76,612 | ) | (47,258 | ) | ||||
Cash flows from financing activities: | ||||||||
| Dividends paid | (2,608 | ) | (4,647 | ) | ||||
| Cash proceeds from common stock issuance | — | 19,371 | ||||||
| Loan proceeds on debt | 46,213 | 9,564 | ||||||
| Payments on bond maturities | (45 | ) | (40 | ) | ||||
| Advances (payments) on short-term borrowing | 50,483 | 15,276 | ||||||
| Payments on long-term debt | (62,851 | ) | (85,936 | ) | ||||
Net cash provided by (used in) financing activities | 31,192 | (46,412 | ) | |||||
Net increase (decrease) in cash and cash equivalents | 2,126 | 2,857 | ||||||
Cash and cash equivalents, beginning of period | 4,699 | 19,225 | ||||||
Cash and cash equivalents, end of period | $ | 6,825 | $ | 22,082 | ||||
See accompanying summary of accounting policies and notes to financial statements.
6
Table of Contents
Brooke Corporation
Notes to Consolidated Financial Statements
UNAUDITED
Notes to Consolidated Financial Statements
UNAUDITED
1. Summary of Significant Accounting Policies
(a) Basis of Presentation
The consolidated financial statements include the accounts of the Company and its subsidiaries, except for the following qualifying special purpose entities formed for the purpose of acquiring loans from Aleritas Capital Corp. (“Aleritas”): Brooke Acceptance Company LLC, Brooke Captive Credit Company 2003, LLC, Brooke Capital Company, LLC, Brooke Securitization Company 2004A, LLC, Brooke Securitization Company V, LLC, Brooke Securitization 2006-1, LLC, all of which have issued asset-backed securities in which the Company is not obligated to repay, and Brooke Master Trust, LLC, a wholly-owned subsidiary of Brooke Warehouse Funding, LLC, which has secured senior debt in which the Company is not obligated to repay. Each is treated as its own separate and distinct entity. Qualifying special purpose entities are specifically excluded from consolidation under FIN 46(R), “Consolidation of Variable Interest Entities.”
The unaudited consolidated financial statements have been prepared in accordance with U.S. generally accepted accounting principles (GAAP) for interim financial reporting and with the instructions to Form 10-Q of Regulation S-X. Accordingly, they do not include all of the disclosures required by GAAP for complete financial statements and as such, should be read in conjunction with the Company’s annual report on Form 10-K for the year ended December 31, 2007. Management believes that the disclosures are adequate to make the information presented not misleading, and all normal and recurring adjustments necessary to present fairly the financial position at June 30, 2008 and the results of its operations for all periods presented have been made. The results of operations for any interim period are not necessarily indicative of the Company’s operating results for a full year.
Significant intercompany accounts and transactions have been eliminated in the consolidation of the financial statements.
A complete summary of significant accounting policies is included in Note 1 to the audited consolidated financial statements included in the Company’s annual report on Form 10-K for the year ended December 31, 2007.
On July 18, 2008, Brooke Capital Corporation entered into an agreement to sell its wholly-owned life insurance subsidiary, First Life America Corporation (“First Life” or “FLAC”) to First Trinity Financial Corporation. The sale is subject to customary regulatory approval by the Kansas Insurance Department. During the second quarter 2008, Brooke Capital had committed to a plan to sell First Life. Accordingly, as of June 30, 2008, First Life has been presented as a discontinued operation and its assets and liabilities being sold are presented as held-for-sale in the Company’s consolidated financial statements. All periods presented have been reclassified to reflect this discontinued operation. See additional information in Note 20.
(b) Cash Equivalents
For purposes of the statements of cash flows, the Company considers all cash on hand, cash in banks, amounts due from banks, short-term investments purchased with a maturity of three months or less, interest-bearing deposits with other banks due within three months, federal funds sold and overnight investments to be cash and cash equivalents. Restricted cash is not included in cash equivalents.
(c) Use of Accounting Estimates
The preparation of financial statements in conformity with generally accepted accounting principles requires management to make estimates and assumptions that affect the reported amounts of certain assets, liabilities and disclosures.
Accordingly, the actual amounts could differ from those estimates. Any adjustments applied to estimated amounts are recognized in the year in which such adjustments are determined.
It is at least reasonably possible these estimates will change in the near term.
7
Table of Contents
(d) Allowance for Doubtful Accounts
Generations Bank’s provision for loan losses on loans and accrued interest are charged to earnings when it is determined by management to be required. Management’s monthly evaluation of the adequacy of allowance accounts is based on past loss experience, known and inherent risks related to the assets, adverse situations that may affect a borrower’s ability to repay, estimated value of the underlying collateral, and current and prospective economic conditions.
The allowance for loan losses is maintained at a level believed to be appropriate by management to provide for probable loan losses inherent in the portfolio as of the balance sheet date. While management uses available information to recognize probable losses on loans in the portfolio, future additions to the allowances may be necessary based on changes in economic conditions. In addition, various regulatory agencies, as an integral part of their examination process, periodically review the allowance for loan losses. Such agencies may require Generations Bank to recognize additions to the allowance based on their judgments of information available to them at the time of their examination.
A loan is impaired when, based on current information and events, it is probable that all amounts due according to the contractual terms of the loan agreement will not be collected. Loan impairment is measured based on the present value of expected future cash flows discounted at the loan’s effective interest rate or, as a practical expedient, at the observable market price of the loan, or the fair value of the collateral if the loan is collateral dependent. Homogeneous loans are evaluated collectively for impairment.
The activity in the Generations Bank allowance for loan losses is summarized below:
| (in thousands) | 2008 | |||
| Balance at December 31, 2007 | $ | 190 | ||
| Provision for loan losses | 100 | |||
| Losses charged off | (4 | ) | ||
| Recoveries | — | |||
| Balance at June 30, 2008 | $ | 286 | ||
Impaired and nonaccruing loans at June 30, 2008 aggregated approximately $176,000 for Generations Bank for which an allowance of $40,000 has been established.
The Company estimates that a certain level of accounts receivable, primarily franchisee account balances, will be uncollectible; therefore, allowances of $6,700,000 and $1,114,000 at June 30, 2008 and December 31, 2007, respectively, have been established. Brooke Capital Corporation, the Company’s franchise subsidiary (“Brooke Capital”), has historically assisted its franchisees by providing commission advances during months when commissions are less than expected, but expects repayment of all such advances within four months. At June 30, 2008, the amount of allowance was determined after analysis of several specific factors, including franchise advances classified as “watch” status. Effective August 15, 2008, Brooke Capital will no longer provide commission advances.
Aleritas’ credit loss exposure is limited to on-balance sheet loans (other than loans sold to warehouse special purpose entities which are classified as on-balance sheet) and the retained interest in loans which have been sold to qualifying special purpose entities that have issued asset-backed securities or off-balance sheet bank debt. A credit loss assumption is inherent in the calculations of retained interest-only strip receivables resulting from loans that are sold. Prior to 2007, no reserve for credit losses has been made for on-balance sheet loans held in inventory for eventual sale for two reasons. First, these loans were typically held for six to nine months before being sold to investors and, therefore, had a short-term exposure to loss. Second, commissions received by Brooke Capital are typically distributed to Aleritas for loan payments prior to distribution of commissions to the franchisee borrower and most other creditors thereby reducing loan losses. Losses were written off to loan loss expense as they were identified.
However, given the rapid growth that Aleritas had experienced over the past two years, the seasoning of the loan portfolio, increased delinquencies of on-balance sheet loans and management’s expectation that loans will be held longer than previously (for nine to twelve months) before being sold, Aleritas established a reserve for potential loan losses on the on-balance sheet loans in the third quarter of 2007. The reserve for credit losses includes two key components: (1) loans that are impaired under SFAS No. 114, “Accounting by Creditors for Impairment of a Loan—an amendment of FASB Statements No. 5 and 15,” and (2) reserves for estimated losses inherent in the rest of the portfolio based upon historical and projected credit risk. In March 2008, Brooke Capital and the sole collateral preservation provider for loans to Brooke franchisees provided an analysis of credit loss exposure per agency based upon its estimates of the liquidation value of each agency.
This analysis followed a decision and disclosure by Brooke Capital in November 2007 that it would place less emphasis on rehabilitating poorly performing franchisees and more emphasis on terminating or liquidating poorly performing franchisees. Based on this plan and action, the loan loss reserve for on balance sheet loans was increased by $12,537,000 in the first quarter 2008 and $2,359,000 in the second quarter 2008 to reflect the increased potential losses resulting from the liquidation of several agencies as well as potential losses on other loans in the portfolio. A reserve of $14,896,000 and $1,655,000 was held at June 30, 2008, and December 31, 2007, respectively. Management will evaluate the adequacy of the reserve on an ongoing basis in the future utilizing the credit metrics underlying the reserve and input from its collateral preservation providers.
8
Table of Contents
The following schedule entitled “Valuation and Qualifying Accounts” summarizes the Allowance for Doubtful Accounts activity for the periods ended June 30, 2008 and December 31, 2007. Additions to the allowance for doubtful accounts are charged to expense.
Valuation and Qualifying Accounts
| Balance at | Balance at | |||||||||||||||
| Beginning of | Charges to | Write | End of | |||||||||||||
| (in thousands) | the Period | Expenses | Offs | the Period | ||||||||||||
| Allowance for Doubtful Accounts | ||||||||||||||||
| Year ended December 31, 2007 | 1,466 | 8,608 | 7,115 | 2,959 | ||||||||||||
| Period ended June 30, 2008 | $ | 2,959 | $ | 23,424 | $ | 2,177 | $ | 24,206 | ||||||||
The Company does not accrue interest on loans that are 90 days or more delinquent and payments received on all such loans are applied to principal. Loans and accounts receivables are written off when management determines that collection is unlikely. This determination is made based on management’s experience and evaluation of the debtor’s circumstances.
(e) Revenue Recognition
Commissions.The Company has estimated and accrued a liability for commission refunds of $491,000 and $570,000 at June 30, 2008 and December 31, 2007, respectively.
Interest income, net. The Company recognizes interest income when earned. A portion of the interest income that the Company receives on its loans is paid out to the holders of its participation interests and qualifying special purpose entities. A portion of the interest received on loans sold to qualifying special purpose entities is recognized as received. Payments to these holders are accounted for as participating interest expense, which is netted against gross interest income. Participating interest expense was $14,351,000 and $15,204,000, respectively, for the six-month periods ended June 30, 2008 and 2007.
(f) Amortizable Intangible Assets
Amortization was $203,000 and $214,000 for the six-month periods ended June 30, 2008 and 2007, respectively.
In connection with the Company’s acquisition of 100% of the outstanding ownership interests of CJD & Associates, L.L.C., additional payments of the purchase price have been made in the amount of $3,283,000 since the initial purchase in July of 2002 and recorded as Amortizable Intangible Assets.
As a result of the acquisition of CJD & Associates, L.L.C. on July 1, 2002, the Company recorded additional Amortizable Intangible Assets of $16,000 (net of accumulated amortization of $179,000).
(g) Investment in Businesses
The number of businesses purchased to hold in inventory for sale for the six-month periods ended June 30, 2008 and 2007 was two and 11, respectively. Correspondingly, the number of businesses sold from inventory for the six-month periods ended June 30, 2008 and 2007 was five and nine, respectively. At June 30, 2008 and December 31, 2007, the “Investment in Businesses” inventory consisted of three businesses and six businesses, respectively, with fair market values totaling $951,000 and $9,413,000, respectively.
(h) Deferred Charges
Net of amortization, the total balance of all deferred charges for the Company at June 30, 2008 and December 31, 2007 was $2,740,000 and $5,904,000, respectively.
Net of amortization, the balance of deferred charges associated with financings for Aleritas at June 30, 2008 and December 31, 2007 was $2,142,000 and $5,354,000, respectively. During the first quarter of 2007 there was an additional $349,000 in deferred charges primarily associated with the transaction by which Aleritas merged with Oakmont Acquisition Corp. (“Oakmont”). The previously deferred charges associated with the establishment of the Fifth Third Bank line of credit in 2006 of $388,000 were expensed during the period ended March 31, 2007, as closing costs associated with amending the Fifth Third facility. Deferred charges decreased during 2008 primarily due to the realization of $4.1 million of previously deferred financing costs associated with the early pay-off in March 2008 of Falcon Jordan notes issued on October 31, 2006.
9
Table of Contents
Commissions and other costs of acquiring life insurance, which vary with, and are primarily related to, the production of new business, have been deferred to the extent recoverable from future policy revenues and gross profits. The acquisition costs are being amortized over the premium paying period of the related policies using assumptions consistent with those used in computing policy reserves.
Commissions and other costs of acquiring property and casualty insurance, which vary with, and are primarily related to, the production of new business, have been deferred to the extent recoverable from future policy revenues and gross profits. The acquisition costs are being amortized over the premium paying period of the related policies using assumptions consistent with those used in computing policy reserves. Net of amortization, the balance was $599,000 and $550,000 at June 30, 2008 and December 31, 2007, respectively.
(i) Per Share Data
Basic net income per share is calculated by dividing net income, less preferred stock dividends declared in the period (whether or not paid) and the dividends accumulated for the period on cumulative preferred stock (whether or not earned), by the average number of shares of the Company’s common stock outstanding. Diluted net income per share is calculated by including the probable conversion of preferred stock to common stock, and then dividing net income, less preferred stock dividends declared on non-convertible stock during the period (whether or not paid) and the dividends accumulated for the period on non-convertible cumulative preferred stock (whether or not earned), by the adjusted average number of shares of the Company’s common stock outstanding. Total preferred stock dividends declared during the six-month periods ended June 30, 2008 and 2007 were $97,000 and $97,000, respectively. Basic and diluted net income per share from continuing operations for the six months periods ended June 30, 2008 and December 31, 2007, were determined as follows:
| (in thousands, except share and per share data) | June 30, 2008 | June 30, 2007 | ||||||
Basic Earnings Per Share | ||||||||
| Net Income (loss) from continuing operations | $ | (28,696 | ) | $ | 9,292 | |||
| Less: Preferred Stock Dividends | (1,447 | ) | (1,447 | ) | ||||
| Income (loss) Available to Common Stockholders | (30,143 | ) | 7,845 | |||||
| Average Common Stock Shares | 14,247 | 12,731 | ||||||
| Basic Earnings (loss) Per Share from continuing operations | $ | (2.12 | ) | $ | 0.62 | |||
| June 30, 2008 | June 30, 2007 | |||||||||||||||
Diluted Earnings Per Share | ||||||||||||||||
| Net Income (loss) from continuing operations | $ | (28,696 | ) | $ | 9,292 | |||||||||||
| Less: Preferred Stock Dividends on Non-Convertible Shares | (97 | ) | (97 | ) | ||||||||||||
| Income (loss) Available to Common Stockholders | (28,793 | ) | 9,195 | |||||||||||||
| Average Common Stock Shares | 14,247 | 12,731 | ||||||||||||||
| Plus: Assumed Exercise of 1,176,471 Preferred Stock | 1,176 | 1,176 | ||||||||||||||
| Plus: Assumed Exercise of 121,940 and 74,870 Stock Options | 122 | 15,545 | 75 | 13,982 | ||||||||||||
| Diluted Earnings (loss) Per Share from continuing operations | $ | (2.12 | ) | $ | 0.62 | |||||||||||
| * | The convertible preferred stock is anti-dilutive at June 30, 2008 and 2007. These shares are excluded from the dilution calculation and included as preferred stock dividend. |
(j) Advertising
Total advertising and marketing expense for the six-month periods ended June 30, 2008 and 2007 was $7,264,000 and $7,676,000, respectively.
10
Table of Contents
(k) Restricted Cash
In connection with Industrial Revenue Bonds, the amount of cash held at First National Bank of Phillipsburg at June 30, 2008 and December 31, 2007 was $72,000 and $73,000, respectively.
In connection with future loan payments of Brooke Acceptance Company LLC, Brooke Captive Credit Company 2003, LLC, Brooke Securitization Company 2004A, LLC, Brooke Capital Company, LLC, Brooke Securitization Company V, LLC and Brooke Securitization Company 2006-1, LLC, the amount of commissions held at June 30, 2008 and December 31, 2007 was $234,000 and $171,000, respectively.
The Company holds amounts in escrow in a cash account for certain borrowers for the purpose of paying debt service, property taxes and/or property insurance typically paid during the first year of the loan financing. The amount of escrowed cash held at June 30, 2008 and December 31, 2007 was $82,000 and $210,000, respectively.
(l) Accounts and Notes Receivable, Net
The net notes receivable included as part of the “Accounts and Notes Receivable, Net” asset category are available for sale and are carried at the lower of cost or market. Based on management’s experience, the carrying value approximates the fair value. Any changes in the net notes receivable balances are classified as an operating activity.
Generations Bank loan receivables are stated at unpaid principal balances, less unamortized discounts and premiums, the allowance for loan losses, and net deferred loan origination fees. Interest on loans is credited to income as earned. Interest accruals are discontinued when a loan becomes 90 days delinquent and all unpaid accrued interest is reversed. Interest income is subsequently recognized only to the extent cash payments are received. Interest accrual would be resumed if the loan was brought current prior to repossession or foreclosure. Loans receivable are charged off to the extent the receivable is deemed uncollectible.
Generations Bank loan origination fees received in excess of certain direct origination costs are deferred and amortized into income over the life of the loan using the interest method or recognized when the loan is sold.
Mortgage loans originated and intended for sale in the secondary market are carried at the lower of cost or estimated market value in the aggregate. Net unrealized losses are recognized through the statements of income. Generations Bank generally has commitments to sell mortgage loans held for sale in the secondary market. Gains or losses on sales are recognized upon delivery.
(m) Securities
The carrying values of securities were $71,050,000 and $89,634,000 at June 30, 2008 and December 31, 2007, respectively, and consisted primarily of three types of securities (or retained residual assets): interest-only strip receivables in loans sold; retained over-collateralization interests in loans sold; and cash reserves. The aggregate carrying values of the retained residual assets from the sale of loans was $69,179,000 and $87,763,000 at June 30, 2008 and December 31, 2007, respectively. The carrying value for the corresponding marketable securities approximates the fair value as calculated by the Company using reasonable assumptions. The value of the Company’s retained residual assets is subject to credit and prepayment risks on the transferred financial assets.
In March 2007, the Company purchased 748,000 shares of Northern Capital, Inc. Class B Convertible Preferred Stock at a price of $2.50 per share for a carrying value of $1,870,000. Northern Capital, Inc. is a managing general agent that owns a Florida insurance company. In June 2007, the Company purchased 850,000 shares of Oakmont Acquisition Corp. common stock at an average price per share of $5.76 for a carrying value of $4,894,000. In July of 2007, Oakmont merged with Brooke Credit Corporation.
When the Company sells notes receivable to qualifying special purpose entities, it retains an interest-only strip receivable or retained interest. The carrying values of the interest-only strip receivable in loans sold to qualifying special purpose entities were $26,619,000 and $28,144,000 at June 30, 2008 and December 31, 2007, respectively. The amount of gain or loss recorded on the sale of notes receivable to qualifying special purpose entities depends in part on the previous carrying amount of the financial assets involved in the transfer, allocated between the assets sold and the assets retained based on their relative fair value at the date of transfer. To initially obtain fair value of the retained interest-only strip receivable resulting from the sale of notes receivable to qualifying special purpose entities, quoted market prices are used, if available. However, quotes are generally not available for such retained residual assets. Therefore, the Company typically estimates fair value for these assets. The fair value of the interest-only strip receivables retained is based on the present value of future expected cash flows using management’s best estimates of key assumptions, credit losses (0.50% annually), prepayment speed (12.00% annually) and discount rates (11.00%) commensurate with the risks involved. The amount of unrealized gain (loss) on the retained residual assets was $0 and $(89,000) at June 30, 2008 and December 31, 2007, respectively. The interest-only strip receivables have varying dates of maturity ranging from the fourth quarter of 2015 to the second quarter of 2021.
11
Table of Contents
When the Company sells notes receivable to qualifying special purpose entities, it retains an over-collateralization interests in loans sold and cash reserves. The carrying values of retained over-collateralization interests were $41,710,000 and $63,507,000 at June 30, 2008 and December 31, 2007, respectively. The carrying values of cash reserves were $850,000 and $850,000 at June 30, 2008 and December 31, 2007, respectively. The fair value of the over-collateralization interest in the loans sold to qualifying special purpose entities that have issued asset-backed securities has been estimated at the par value of the underlying loans less the asset-backed securities sold. The fair value of the over-collateralization interest in the loans sold to qualifying special purpose entities that have secured bank debt, is based on the present value of future expected cash flows using management’s best estimates of key assumptions, credit losses (0.50% annually), prepayment speed (12.00% annually) and discount rates (11.00%) commensurate with the risks involved. The cash reserves do not represent credit enhancement reserves for benefit of the asset-backed security holders and creditors of the qualifying special purpose entities. These reserves are for the benefit of the third party trustee and servicer and if not used for excessive trustee and servicer expenses, the funds will be returned to the Company once the last note receivable held by the qualifying special purpose entity has matured. If excessive expenses are incurred by the trustee and servicer the Company will expense the reduction of the cash reserve. No excessive expenses have been incurred by the trustees and servicers to date. The fair value of the cash reserves has been estimated at the cash value of the reserve account.
The notes receivable sold in April 2003, November 2003, June 2004, March 2005, December 2005 and July 2006 involved the issuance of asset-backed securities by the following qualifying special purpose entities: Brooke Acceptance Company, LLC; Brooke Captive Credit Company 2003, LLC; Brooke Securitization Company 2004A, LLC; Brooke Capital Company, LLC; Brooke Securitization Company V, LLC; and Brooke Securitization Company 2006-1, LLC, respectively. In September 2006, Brooke Warehouse Funding, LLC entered into a receivables financing agreement with Fifth Third Bank which was classified as secured borrowings. However, in March 2007, Brooke Warehouse’s Fifth Third facility was paid off and replaced with a new off balance sheet facility through Brooke Warehouse Funding, LLC’s wholly-owned qualifying special purpose entity, Brooke Acceptance Company 2007-1, LLC. Therefore, the loans sold in March 2007 to Brooke Warehouse Funding, LLC, the Company’s special purpose entity, involved the incurrence of debt owed to Fifth Third Bank by Brooke Acceptance Company 2007-1, LLC, a wholly-owned qualifying special purpose entity subsidiary of the Brooke Warehouse Funding, LLC. Loans sold to Brooke Warehouse Funding, LLC are participated to Brooke Acceptance Company 2007-1, LLC which are then pledged to Fifth Third Bank for the off balance sheet debt. The purchase of loans by Brooke Warehouse Funding, LLC, the participation of those loans to Brooke Acceptance Company 2007-1, LLC and the pledge to Fifth Third Bank occurred simultaneously. In December 2007, Brooke Acceptance Company 2007-1, LLC was replaced by Brooke Master Trust, LLC. Loans now sold to Brooke Warehouse Funding, LLC are participated to Brooke Master Trust, LLC which are then pledged to Fifth Third Bank for the off-balance sheet debt.
Upon the sale of financial assets to qualifying special purpose entities, the unaffiliated trustees over the qualifying special purpose entities and the investors and lenders to the qualifying special purpose entities obtain full control over the assets and obtain the right to freely pledge or transfer the notes receivable. Servicing associated with the transferred assets is primarily the responsibility of unaffiliated servicing companies, which are compensated directly from cash flows generated from the transferred assets. The Company is retained as a secondary or sub-servicer. No servicing asset or servicing liability is recorded because servicing income is offset by servicing expense and represents the adequate compensation as determined by the market.
Although the Company does not provide recourse on the transferred notes and is not obligated to repay amounts due to investors and creditors of the qualifying special purpose entities, its retained assets are subject to loss, in part or in full, in the event credit losses exceed initial and ongoing management assumptions used in the fair market value calculation. Additionally, a partial loss of retained assets could occur in the event actual prepayments exceed management’s initial and ongoing assumptions used in the fair market calculation. In the first quarter of 2008, the Company wrote down the value of the securities balance by $11,763,000 due to expected credit losses on loans in its securitizations. As credit losses are realized they are expected to initiate provisions in the securitizations documents that result in the discontinuation of cash distributions from the qualifying special purpose entities until the financial ratios in the securitizations are brought back into compliance. In the fourth quarter of 2007, the Company wrote down the value of the securities balance by $5,517,000 due to expected credit losses on loans in its securitizations, actual prepayments exceeding assumed prepayments, and an increase in the prepayment assumption going forward.
Cash flows associated with the Company’s retained assets in the transferred assets are subordinate to cash flow distributions to the trustee over the transferred assets, servicer of the transferred loans, collateral preservation providers of the transferred loans, investors and creditors of the qualifying special purpose entities. Actual prepayments and credit losses will impact the amount and frequency of cash flow distributions to the Company from its retained assets. Although the Company expects to receive a certain level of cash flows over the life of the sold financial assets and the term of the asset-backed securities and senior debt secured by the qualifying special purpose entities, the Company will not receive full return of its retained assets until all obligations of the qualifying special purpose entities with respect to underlying loans are met.
12
Table of Contents
Subsequent to the initial calculation of the fair value of retained interest, the Company utilizes a fair market calculation methodology (utilizing the same methodology used to establish the initial fair value) to determine the ongoing fair market value of the retained interest. Ongoing fair value is calculated using the then current outstanding principal of the transferred notes receivable and the outstanding balances due unaffiliated purchasers, which are reflective of credit losses and prepayments prior to the fair value recalculation. Additionally, the Company completes an ongoing analysis of key assumptions used in the fair market value calculation to ensure that such assumptions used in the calculation are viable, based on current and historical prepayments and credit loss trends within similar asset types. Based upon this analysis and due to recent prepayment trends, the prepayment rate assumption used in the asset valuation was increased from 10% to 12% annually in the fourth quarter of 2007. All other assumptions remained the same. Management may make necessary adjustments to key assumptions based on current and historical trends, which may result in an immediate reduction or impairment loss in the fair market value of retained interest. During 2007 and 2006, the securitized pools of loans experienced an increase in the prepayment rate, and as a result, management determined that an “other than temporary” impairment occurred. The Company recorded an impairment losses related to the prepayment rate of $778,000 for the year ended December 31, 2007. Credit losses in the near term in the securitization portfolios are expected to be significantly higher than historical levels and higher than the 0.5% credit loss assumption. Management believes that this increase is directly attributable to market conditions which are cyclical such as the soft insurance marketplace and higher interest rates than when certain of the loans were originated. The 0.5% credit loss assumption determined by management is an average rate over the life of the portfolio. Management believes that during the remaining term of this portfolio, several cycles are likely to occur which could increase or decrease actual credit loss rates; however, management continues to believe the average rate assumption used is appropriate. Summarized in Note 2 is a sensitivity analysis or stress test on retained interests to determine the impact of a 10% and 20% variance in key assumptions currently used by management to calculate the fair value of retained interests.
Note 2 also contains a table summarizing the principal balances of loans managed by the Company. Included within the table are delinquency and net credit loss trends of managed receivables at June 30, 2008 and December 31, 2007.
The Company classifies the investment securities portfolios between those securities intended to be held to maturity, those securities available-for-sale, and those securities held for trading purposes.
Investment securities classified as held-to-maturity are those securities which the Company has the ability and positive intent to hold to maturity regardless of changes in market condition, liquidity needs, or changes in general economic conditions. These securities are stated at cost, adjusted for amortization of premiums and accretion of discounts, over the period to maturity using the interest method.
Investment securities classified as available-for-sale are those securities that the Company intends to hold for an indefinite period of time, but not necessarily to maturity. Any decision to sell a security classified as available-for-sale would be based on various factors, including significant movements in interest rates, liquidity needs, regulatory capital considerations, and other similar factors. These securities are carried at fair value with unrealized gains or losses reported as increases or decreases in accumulated other comprehensive income, net of the related deferred tax effect.
Trading securities are those securities that that may be purchased and held principally for the purpose of selling in the near term. Such securities are carried at fair value with unrealized gains or losses included in earnings. Realized gains or losses, determined on the basis of the cost of specific securities sold, are included in earnings. Unrealized losses for securities classified as held to maturity and available for sale judged to be other than temporary are charged to operations. As of June 30, 2008 and December 31, 2007, all investment securities within the Company’s portfolio were classified as available-for-sale.
(n) Insurance Losses and Loss Expenses
Insurance losses to be incurred and loss expenses to be paid by DB Indemnity, Ltd. and Delta Plus Holdings, Inc. are estimated and recorded when advised by the insured. Outstanding losses and loss expense adjustments represent the amounts needed to provide for the estimated ultimate cost of settling claims relating to insured events that have occurred before the balance sheet date. These amounts are based upon estimates of losses reported by the insureds plus an estimate for losses incurred but not reported.
Management believes that the provision for outstanding losses and loss expenses will be adequate to cover the ultimate net cost of losses incurred to the balance sheet date, but the provision is necessarily an estimate and may ultimately be settled for a significantly greater or lesser amount. It is at least reasonably possible that management will revise this estimate significantly in the near term. Any subsequent differences arising are recorded in the period in which they are determined.
13
Table of Contents
The Company has established an allowance of $5,357,000 at June 30, 2008 and $7,840,000 at December 31, 2007, respectively, for losses on property and casualty insurance policies issued by Traders Insurance Company. Reserves of $600,000 and $600,000 at June 30, 2008 and December 31, 2007, respectively, were established for claims on financial guaranty policies issued by DB Indemnity, Ltd. on loans originated by the Company’s finance subsidiary.
(o) Other Operating Interest Expense
Operating interest expense includes interest paid by the Company’s finance subsidiary to DZ BANK AG Deutsche Zentral-Genossenschaftsbank, Fifth Third Bank, and Home Federal Savings and Loan Association of Nebraska on line of credit loans for the purpose of originating insurance agency loans, originating funeral home loans and financing the over-collateralization portion of loans funded with the other lines of credit, and is, therefore, an operating expense. The interest paid and accrued for the six-month periods ending June 30, 2008 and 2007 was $1,413,000 and $2,033,000, respectively.
(p) Interest-only Strip Receivable
The aggregate carrying values of interest-only-strip receivables were $7,072,000 and $7,749,000 at June 30, 2008 and December 31, 2007, respectively. The amount of unrealized gain on the interest-only strip receivable was $248,000 at June 30, 2008 and $273,000 at December 31, 2007. The interest-only strip receivables have varying dates of maturities ranging from the third quarter of 2011 to the first quarter of 2027. The interest-only strip receivables have varying maturities ranging from the second quarter of 2010 to the fourth quarter of 2026.
(q)��Investments
At June 30, 2008 and December 31, 2007, the Company classified all of its fixed maturity and equity investments as available-for-sale securities and carried them at fair value with unrealized gains and losses, net of applicable income taxes, reported in other comprehensive income. Available-for-sale securities are those that the Company intends to hold for an indefinite period of time, but not necessarily to maturity. Any decision to sell a security classified as available-for-sale would be based on various factors, including significant movements in interest rates, liquidity needs, regulatory capital considerations and other similar factors.
Available-for-sale securities at June 30, 2008 and December 31, 2007 are summarized as follows:
| Gross | Gross | |||||||||||||||
| Amortized | Unrealized | Unrealized | Fair | |||||||||||||
| (in thousands) | Cost | Gains | Losses | Value | ||||||||||||
June 30, 2008: | ||||||||||||||||
| U.S. Treasury | $ | 2,057 | $ | 37 | $ | (9 | ) | $ | 2,085 | |||||||
| U.S. Government Agency | 62,012 | 21 | (1,562 | ) | 60,471 | |||||||||||
| Corporate bonds | 2,860 | 10 | (74 | ) | 2,796 | |||||||||||
| Total | $ | 66,929 | $ | 68 | $ | (1,645 | ) | $ | 65,352 | |||||||
| Equity securities | $ | 590 | $ | 68 | $ | (90 | ) | $ | 568 | |||||||
| Gross | Gross | |||||||||||||||
| Amortized | Unrealized | Unrealized | Fair | |||||||||||||
| (in thousands) | Cost | Gains | Losses | Value | ||||||||||||
December 31, 2007: | ||||||||||||||||
| U.S. Treasury | $ | 1,729 | $ | 30 | $ | — | $ | 1,759 | ||||||||
| U.S. Government Agency | 26,133 | 30 | (104 | ) | 26,059 | |||||||||||
| Corporate bonds | 3,584 | 15 | (50 | ) | 3,549 | |||||||||||
| Total | $ | 31,446 | $ | 75 | $ | (154 | ) | $ | 31,367 | |||||||
| Equity securities | $ | 590 | $ | 113 | $ | (50 | ) | $ | 653 | |||||||
The amortized cost and fair value of fixed maturities at June 30, 2008, by contractual maturity, are shown below. Actual maturities may differ from contractual maturities because certain borrowers may have the right to call or prepay obligations.
| June 30, 2008 | ||||||||
| (in thousands) | Amortized Cost | Fair Value | ||||||
| Due in one year or less | $ | 875 | $ | 878 | ||||
| Due after one year through five years | 3,192 | 3,185 | ||||||
| Due after five years through ten years | 1,949 | 1,934 | ||||||
| Due after ten years | 5,145 | 5,031 | ||||||
| Mortgage-backed bonds | 55,768 | 54,324 | ||||||
| $ | 66,929 | $ | 65,352 | |||||
14
Table of Contents
The fair values for investments in fixed maturities are based on quoted market prices.
Generations Bank has a blanket collateral agreement with the Federal Home Loan Bank in order to obtain advances. At June 30, 2008, no overnight advances were outstanding. However, the Bank has pledged qualifying mortgage-backed securities, with fair values of approximately $12,824,000 in connection with this advance agreement.
Included in investments are securities pledged to various state insurance departments. The fair value of these securities were $2,733,000 and $2,563,000 at June 30, 2008 and December 31, 2007, respectively.
Also included in investments at June 30, 2008, are certain interest bearing deposits and other short-term investments totaling $20,689,000.
Interest earned on investments is included in investment income as earned. Realized gains or losses on the sales of investments are recognized in operations on the specific identification basis. Impairments that are judged to be other than temporary are recognized as realized losses.
(r) Warrant Obligation
The warrant obligation consisted of the detachable warrants for Aleritas common stock issued in connection with Aleritas’ debt offering during the fourth quarter of 2006. The detachable noteholder warrants are within the scope of SFAS 150,“Accounting for Certain Financial Instruments with Characteristics of Both Liabilities and Equity.”SFAS 150 requires issuers to classify as liabilities (or assets under certain circumstances) free-standing financial instruments which, at inception, require or may require an issuer to settle an obligation by transferring assets.
SFAS 150 requires the detachable warrants issued to the noteholders to be classified as a liability since warrants incorporated a put option. The holders of these warrants could exercise their rights to force Aleritas to repurchase the warrants and/or warrant shares at the appraised value of the common stock, less the warrant exercise price of $0.01 per share. At each balance sheet date, any change in the calculated fair market value of the warrant obligation must be recorded as additional interest costs or financing income. Since the exercise price of the warrants is nominal, the change in the fair market value of the warrants represents the additional cost or income for the period.
Also in accordance with SFAS 150, the noteholder warrants were initially recorded as a discount to the notes based on the fair market value of the warrants at November 1, 2006, or approximately $2,737,000. The discount on the notes was to be amortized over the life of the notes using the effective interest method. During July 2007, the warrants were amended to remove the put option. The decrease in the market value of the liability from the beginning of 2007 through July 2007, $467,000, was recorded as a reduction of other interest expense. The amount of amortization resulting from discount accretion for the period ended June 30, 2008 and 2007 was $2,428,000 and $129,000, respectively. The unamortized balance of the discount on the notes, $2,381,000, was written off to repurchase of debt expense during the first quarter of 2008.
(s) Deposits
Deposits as of June 30, 2008 are summarized below:
| 2008 | ||||
| (in thousands) | Amount | |||
| Noninterest-bearing checking | $ | 2 | ||
| Savings | 218 | |||
| Interest-bearing checking | 6,685 | |||
| Money market | 14,117 | |||
| 21,022 | ||||
| Certificates of deposit | 79,242 | |||
| IRAs | 8,970 | |||
| $ | 109,234 | |||
15
Table of Contents
As of June 30, 2008, scheduled maturities of certificates of deposit and IRA accounts are shown below:
| (in thousands) | Amount | |||
| Within one year | $ | 79,886 | ||
| One to three years | 6,795 | |||
| Three to five years | 1,512 | |||
| Over five years | 19 | |||
| $ | 88,212 | |||
As of June 30, 2008, there were 143 certificate of deposit accounts of $100,000 or more totaling $21,366,000. These deposits are insured up to $100,000 by the Deposit Insurance Fund (DIF), which is administered by the Federal Deposit Insurance Corporation and is backed by the full faith and credit of the U. S. government.
Regulations of the Federal Reserve System require reserves to be maintained by all banking institutions according to the types and amounts of certain deposit liabilities. These requirements restrict usage of a portion of Generations Bank’s available cash balances from everyday usage in its operations. The minimum reserve requirements as of June 30, 2008 totaled $25,000.
Interest expense on deposits totaled approximately $1,994,000 for the six months ended June 30, 2008.
2. Notes Receivable
At June 30, 2008 and December 31, 2007, accounts and notes receivable consisted of the following:
| (in thousands) | 06/30/2008 | 12/31/2007 | ||||||
| Business loans | $ | 613,083 | $ | 606,596 | ||||
| Less: Business loans sold | (498,585 | ) | (517,743 | ) | ||||
| Commercial real estate loans | 103,543 | 96,024 | ||||||
| Less: Real estate loans sold | (66,599 | ) | (60,672 | ) | ||||
| Loans with subsidiaries | 18,821 | 19,786 | ||||||
| Less: Subsidiary loans sold | (18,821 | ) | (19,786 | ) | ||||
| Plus: Loans sold not classified as a true sale | 60,301 | 39,452 | ||||||
| Other Loans | 1,664 | 681 | ||||||
| Total notes receivable, net | 213,407 | 164,338 | ||||||
| Interest earned not collected on notes* | 7,950 | 7,132 | ||||||
| Customer receivables | 26,912 | 27,687 | ||||||
| Deferred loan fees | (48 | ) | (10 | ) | ||||
| Allowance for doubtful accounts | (24,206 | ) | (2,959 | ) | ||||
| Total accounts and notes receivable, net | $ | 224,015 | $ | 196,188 | ||||
| * | The Company has a corresponding liability for interest payable to participating lenders in the amounts of $2,058,000 and $1,609,000 at June 30, 2008 and December 31, 2007, respectively. |
Aleritas has loaned money to the Company and to other subsidiaries of the Company. These notes receivable have been eliminated in consolidation to the extent the notes receivable have not been sold to an unaffiliated third party. The sale of all or a portion of the intracompany notes receivable to an unaffiliated third party results in a notes payable, as discussed in Note 4.
Loan participations and loan securitizations represent the transfer of notes receivable, by sale, to “participating” lenders or asset-backed security investors. The Company receives consideration from the transfer of notes receivable, through retained interest and servicing assets. These transfers are accounted for by the criteria established by SFAS 140,“Accounting for Transfers and Servicing of Financial Assets and Extinguishments of Liabilities.”
The transfers that do not meet the criteria established by SFAS 140,“Accounting for Transfers and Servicing of Financial Assets and Extinguishments of Liabilities,”are classified as secured borrowings and the balances are recorded as both a note receivable asset and participation payable liability. At June 30, 2008 and December 31, 2007, secured borrowings totaled $60,301,000 and $39,452,000, respectively.
Of the notes receivable sold, at June 30, 2008 and December 31, 2007, $504,883,000 and $538,963,000, respectively, were accounted for as sales because the transfers meet the criteria established by SFAS 140,“Accounting for Transfers and Servicing of Financial Assets and Extinguishments of Liabilities.”
16
Table of Contents
The following provides details concerning notes receivable sold. Purchasers of these notes receivable obtained full control over the transferred assets (i.e. notes receivable) and obtained the right, free of conditions that constrain them from taking advantage of that right, to pledge or exchange the notes receivable. Furthermore, the agreements to transfer assets do not entitle, nor obligate, the Company to repurchase or redeem the notes receivable before their maturity, except in the event of an uncured breach of warranty.
| June 30, | December 31, | |||||||
| (in thousands) | 2008 | 2007 | ||||||
| Securitizations | $ | 118,527 | $ | 128,711 | ||||
| Participations | 211,390 | 229,159 | ||||||
| Off-balance sheet warehouse facility | 174,966 | 181,093 | ||||||
| Notes receivable sold | $ | 504,883 | $ | 538,963 | ||||
When the Company sells notes receivable, it generally retains interest income and servicing income. Gains or losses on sales of the notes receivable depend, in part, on the previous carrying amount of the financial assets involved in the transfer, allocated between the assets sold, the retained interest and the servicing assets based on their relative fair value at the date of transfer.
The Company is typically paid annual servicing fees ranging from 0.25% to 1.375% of the outstanding loan balance on loan participations. In those instances when annual service fees paid to the Company are less than the minimum cost of servicing, which is estimated at 0.25% of the outstanding balance, a servicing liability is recorded. Additionally, the Company often retains interest income. The Company’s right to interest income is not subordinate to the purchasers’ interests and Aleritas shares interest income with purchasers on a pro-rata basis. Although not subordinate to purchasers’ interests, the Company’s retained interest is subject to credit and prepayment risks on the transferred assets.
The Company is typically paid annual servicing fees ranging from 0.10% to 0.25% of the outstanding transferred loan balances on loans to qualifying special purpose entities that qualify for true sale. Additionally, the Company often retains interest income. The Company’s right to interest income is subordinate to the investor and lender’s interests. As such, the Company’s retained interest is subject to credit and prepayment risks on the transferred assets.
When the Company sells loans to a qualifying special-purpose entity an interest receivable is retained. The fair value of the difference between the loans sold and the securities issued to accredited investors, and the fair value of interest receivable is recorded as securities. A history of loans securitized follows:
| (in thousands) | Apr 2003 | Nov 2003 | Jun 2004 | Mar 2005 | Dec 2005 | Jul 2006 | ||||||||||||||||||
| Loans sold initially | $ | 15,825 | $ | 23,526 | $ | 24,832 | $ | 40,993 | $ | 64,111 | $ | 65,433 | ||||||||||||
| Asset-back securities | 13,350 | 18,500 | 20,000 | 32,000 | 51,500 | 52,346 | ||||||||||||||||||
| Securities retained at June 30, 2008: | ||||||||||||||||||||||||
| Interest-only strip receivables | $ | 47 | $ | 93 | $ | 258 | $ | 1,758 | $ | 2,556 | $ | 2,774 | ||||||||||||
| Over-collateralization interests | 164 | 1,007 | (862 | ) | (2,761 | ) | 2,384 | 426 | ||||||||||||||||
| Cash Reserves | 125 | 125 | 125 | 125 | 175 | 175 | ||||||||||||||||||
| Total | $ | 336 | $ | 1,225 | $ | (479 | ) | $ | (878 | ) | $ | 5,115 | $ | 3,375 | ||||||||||
| Securities retained at December 31, 2007 | $ | 1,054 | $ | 1,263 | $ | 2,837 | $ | 5,902 | $ | 9,285 | $ | 13,977 | ||||||||||||
| Service income, period ended: | ||||||||||||||||||||||||
| June 30, 2008 | — | 1 | 1 | 7 | 10 | 13 | ||||||||||||||||||
| June 30, 2007 | 2 | 2 | 3 | 15 | 24 | 31 | ||||||||||||||||||
In March 2007, Aleritas initiated a $150,000,000 facility to sell, on a revolving basis, a pool of its loans, while retaining residuals assets such as interest-only strip receivables and a subordinated over-collateralization interest in the receivables. The eligible receivables are sold to Brooke Warehouse Funding, LLC, a wholly owned bankruptcy-remote special purpose entity, without legal recourse to Aleritas. Brooke Warehouse Funding, LLC then entered into a participation agreement with Brooke Acceptance Company 2007-1, LLC to sell an undivided senior participation interest in all of the assets of Brooke Warehouse Funding, LLC. Brooke Acceptance Company 2007-1, LLC entered into an amended and restated receivables financing agreement with Fifth Third Bank which extended a credit facility to Brooke Acceptance Company 2007-1 LLC to provide funds to acquire such participation interests with a facility line of credit of $150,000,000. The facility qualifies for true sale treatment under SFAS 140. As of June 30, 2008, the outstanding balance of sold accounts receivable held by Brooke Warehouse Funding, LLC and participated to Brooke Master Trust, LLC totaled $180,050,000 which were removed from the consolidated balance sheet at that date. The fair value of the difference between loans sold and advanced portion on the facility, or the fair value of retained residual assets, were recorded on the Company’s books as a security with balances of $47,376,000 on June 30, 2008. This retained security is comprised of retained interest-only strip receivable totaling $19,133,000 and retained over-collateralization interests in the special purpose entity totaling $28,243,000.
17
Table of Contents
The Company received servicing income as sub-servicer of the facility of $176,000 and $36,000 for the periods ended June 30, 2008 and 2007, respectively. The facility contains the following financial covenants: minimum stockholders’ equity for Aleritas of $80 million, positive consolidated net income for the four fiscal quarter period then ending, maximum prepayment rate on the Aleritas’ loan portfolio of 20%; maximum loan loss rate of 1.5%; minimum fixed charge coverage ratio as scheduled; maximum cash leverage ratio as scheduled; and maximum total leverage ratio as scheduled. The facility contains other restrictions, including but not limited to: the incurrence of indebtedness and liens; the reorganization, transfer and merger of Aleritas; the disposal of its properties other than in the ordinary course of business; entering into transactions with affiliates or into material agreements other than in the ordinary course of business; entering into pledge and negative pledge agreements; and the declaration of dividends, except in limited circumstances.
At June 30, 2008, Aleritas was not in compliance with all of the terms and conditions of this facility and had an unresolved deficiency in the facility of $32,585,000. Fifth Third has issued a notice of default with respect to the facility and is in discussions with the Company’s management to address these issues. Management believes they will be able to come to an agreement with Fifth Third that will allow the facility to be in compliance with the Agreement. The facility is not available to fund new loans and it is unlikely the Aleritas will be able to fund loans into the facility in the future. There can be no assurance that Aleritas will reach a satisfactory resolution of the non-compliance. Failure to resolve the non-compliance may have a material adverse affect on the Company’s financial condition and results of operation.
The table below summarizes certain cash flows received from and paid to qualifying special purpose entities in connection with the Company’s off-balance sheet securitizations and credit facilities:
| Six Months Ended June 30, | ||||||||
| (in thousands) | 2008 | 2007 | ||||||
| Proceeds from new loan sales to qualifying special purpose entities* | $ | 5,826 | $ | 105,822 | ||||
Proceeds reinvested in qualifying special purpose entities(retained equity interest)** | 1,469 | 21,941 | ||||||
| Servicing fees received | 154 | 41 | ||||||
| Other cash flows received on retained interests*** | 3,925 | 3,919 | ||||||
| Proceeds from collections reinvested in (revolving-period) securitizations | — | — | ||||||
| * | This amount represents total loans sold by the Company to qualifying special purpose entities in connection with off-balance sheet securitizations and credit facilities. | |
| ** | This amount represents the Company’s retained equity interest in the securitization or credit facility qualifying special purpose entities. | |
| *** | This amount represents total cash flows received from retained interests by the Company other than servicing fees. Other cash flows include cash flows from interest-only strip receivables and cash above the minimum required level in cash collateral accounts. |
At June 30, 2008 and December 31, 2007, the Company had transferred assets with balances totaling $504,883,000 and $538,963,000, respectively, resulting in pre-tax gains for the six month periods ended June 30, 2008 and 2007 of $877,000 and $11,585,000, respectively before consideration of related securitization fees.
To obtain fair values of retained interests, quoted market prices are used, if available. However, quotes are generally not available for retained interests, so the Company typically estimates fair value based on the present value of future expected cash flows estimated using management’s best estimates of key assumptions, credit losses, prepayment speed and discount rates commensurate with the risks involved.
The value of the servicing asset or liability is calculated by estimating the net present value of net servicing income (or expense) on loans sold using the discount rate and prepayment speeds noted in the key economic assumptions table. Subsequent to the initial recording at fair value, the servicing asset is amortized in proportion to and over the period of estimated net servicing income.
18
Table of Contents
The following table provides the changes in the Company’s servicing asset and liability subsequently measured using the amortization method.
| June 30, 2008 | December 31, 2007 | |||||||||||||||
| Servicing | Servicing | Servicing | Servicing | |||||||||||||
| (in thousands) | Asset | Liability | Asset | Liability | ||||||||||||
| Carrying amount, beginning of year | $ | 6,025 | $ | 16 | $ | 4,512 | $ | 24 | ||||||||
| Additions: | ||||||||||||||||
| Servicing obligations that result from transfer of financial assets | 427 | — | 3,546 | — | ||||||||||||
| Subtractions: | ||||||||||||||||
| Disposals | (509 | ) | — | (703 | ) | — | ||||||||||
| Accumulated amortization | (717 | ) | (4 | ) | (1,330 | ) | (8 | ) | ||||||||
| Carrying amount, end of period | $ | 5,226 | $ | 12 | $ | 6,025 | $ | 16 | ||||||||
| Fair value as of: Beginning of year | $ | 6,870 | $ | 16 | $ | 5,176 | $ | 24 | ||||||||
| End of period | 7,771 | 14 | 6,870 | 16 | ||||||||||||
The dominant risk characteristics of the underlying loans of the Company’s retained interest-only strip receivables and servicing assets have been analyzed by management to identify how to stratify these assets for the purpose of evaluating and measuring impairment. The underlying loans are very similar in virtually all respects. Accordingly, the same key economic assumptions have been used when determining the fair value of retained interest and servicing assets for all loans. No valuation allowance has been established because the fair value for the adjustable-rate loan stratum is not less than the carrying amount of the servicing assets.
Although substantially all of the Company’s loans are adjustable, a discount rate has been applied to reflect the net present value of future revenue streams. As such, changes in the net present value rate, or discount rate, resulting from interest rate variations, could adversely affect the asset’s fair value. Impairment of retained interests and servicing assets are evaluated and measured annually. The impairment testing is performed by taking the current interest and servicing revenue stream and valuing the new revenue stream with the appropriate assumptions. The new revenue stream is based on the loan balances at the date the impairment test is completed, which will include all prepayments on loans and any credit losses for those loans. The new discounted revenue stream is then compared to the carrying value on the Company’s books and, if the new value is greater than the value on the books, no impairment has occurred. If the new discounted revenue stream is less than the value on the books, further analysis is performed to determine if an “other than temporary” impairment has occurred. If an “other than temporary” impairment has occurred, the Company writes the asset to the new discounted revenue stream. During 2007, the securitized pools of loans experienced increases in the prepayment rate and, as a result, management determined that an “other than temporary” impairment occurred. The Company recorded an impairment loss of $5,517,000 for the year. The Company believes that over the life of the securitizations the prepayment rate assumption used continues to be appropriate. Additional impairment of $11,763,000 was recognized for the six months ended June 30, 2008.
For the twelve months ended June 30, 2008, the Company’s loan portfolio experienced an annualized prepayment rate of 11.3%, which was higher than management’s assumption for both fixed and variable rate loans. Management believes that this increase is directly attributable to market conditions which are cyclical such as the softening insurance marketplace and the increasing interest rate environment. However, the assumed prepayment rate was increased to 12% in the fourth quarter of 2007 for both fixed and variable rate loans, from 8% and 10%, respectively, previously to reflect higher expected prepayment rates as the portfolio continues to season. The prepayment assumption is an average annual rate over the life of the Company’s portfolio. Management believes that during the remaining term of this portfolio, several cycles are likely to occur which could increase or decrease actual prepayment rates; however, management believes the revised average annual rate assumption is appropriate. Shorter term swings in prepayment rates typically occur because of cycles within a marketplace, such a softening and hardening of the insurance marketplace, changes in the death care rate for funeral homes and changes in the variable interest rate loans from key index rate changes. Longer term increases in prepayment rates typically result from long-term deterioration of the marketplace or increased lending competition.
At June 30, 2008 and December 31, 2007, the fair value of retained interest-only strip receivables recorded by the Company was $33,691,000 and $35,893,000, respectively. Of the totals at June 30, 2008, $7,072,000 was listed as interest-only strip receivable on the Company’s balance sheet and $26,619,000 in retained interest-only strip receivable carried in the Company’s securities. Of the totals at December 31, 2007, $7,749,000 was listed as interest-only strip receivable on the Company’s balance sheet and $28,144,000 in retained interest-only strip receivables carried in the Company’s securities.
At June 30, 2008 and December 31, 2007, the value of the servicing asset recorded by the Company was $5,226,000 and $6,025,000, respectively.
At June 30, 2008 and December 31, 2007, the value of the servicing liability recorded by the Company was $12,000 and $16,000, respectively.
19
Table of Contents
At June 30, 2008, key economic assumptions used in measuring the retained interest-only strip receivables and servicing assets when loans were sold during the year were as follows (rates per annum):
| Business Loans | ||||
| (Fixed & Adjustable Rate Stratum)* | ||||
| Prepayment speed | 12.00 | % | ||
Weighted average life(months) | 120 | |||
| Expected credit losses | 0.50 | % | ||
| Discount rate | 11.00 | % | ||
| * | During the fourth quarter of 2007, the prepayment speed assumption was changed from 10.00% to 12.00%. |
At June 30, 2008, key economic assumptions and the sensitivity of the current fair value of residual cash flows to immediate 10 percent and 20 percent adverse changes in those assumptions are as follows:
| Business Loans | ||||
| (in thousands except percentages) | (Fixed & Adjustable Rate Stratum) | |||
Prepayment speed (annual rate)** | 12.00 | % | ||
| Impact on fair value of 10% adverse change | $ | (2,034 | ) | |
| Impact on fair value of 20% adverse change | $ | (3,210 | ) | |
Expected credit losses (annual rate) | 0.50 | % | ||
| Impact on fair value of 10% adverse change | $ | (1,678 | ) | |
| Impact on fair value of 20% adverse change | $ | (2,030 | ) | |
Discount rate (annual)* | 11.00 | % | ||
| Impact on fair value of 10% adverse change | $ | (2,194 | ) | |
| Impact on fair value of 20% adverse change | $ | (3,125 | ) | |
| * | During the fourth quarter of 2007, the prepayment speed assumption was changed from 10.00% to 12.00%. |
These sensitivities are hypothetical and should be used with caution. The effect of a variation in a particular assumption on the value of the retained interest-only strip receivables and servicing assets is calculated without changing any other assumption; in reality, changes in one factor may result in changes in another, which might magnify or counteract the sensitivities.
The above adverse changes for prepayment speed and discount rate are calculated on the Company’s retained interest-only strip receivables and servicing assets on loans sold totaling $504,883,000. The above adverse changes for expected credit losses are calculated on the Company’s retained interest-only strip receivables in loans sold with recourse to participating lenders and loans sold to qualifying special purpose entities.
The following tables illustrate how the changes in fair values were calculated for 10% and 20% adverse changes in key economic assumptions.
Effect of Increases in Assumed Prepayment Speed on Servicing Asset
| Fixed & | ||||||||
| Adjustable Rate Stratum | ||||||||
| 10% | 20% | |||||||
| Prepayment | Prepayment | |||||||
| (in thousands) | Increase | Increase | ||||||
| Estimated cash flows from loan servicing fees | $ | 7,984 | $ | 7,769 | ||||
| Servicing expense | (1,414 | ) | (1,359 | ) | ||||
| Discount of estimated cash flows at 11.00% rate | (1,437 | ) | (1,375 | ) | ||||
| Carrying value of servicing asset after effect of increases | 5,133 | 5,035 | ||||||
| Carrying value of servicing asset before effect of increases | 5,226 | 5,226 | ||||||
| Decrease of carrying value due to increase in prepayments | $ | (93 | ) | $ | (191 | ) | ||
20
Table of Contents
Effect of Increases in Assumed Prepayment Speed on Retained Interest (Interest-Only Strip Receivable, including retained interest carried in Securities balance)
| Fixed & | ||||||||
| Adjustable Rate Stratum | ||||||||
| 10% | 20% | |||||||
| Prepayment | Prepayment | |||||||
| (in thousands) | Increase | Increase | ||||||
| Estimated cash flows from interest income | $ | 47,430 | $ | 45,357 | ||||
| Estimated credit losses | (4,908 | ) | (4,673 | ) | ||||
| Discount of estimated cash flows at 11.00% rate | (10,772 | ) | (10,012 | ) | ||||
| Carrying value of retained interests after effect of increases | 31,750 | 30,672 | ||||||
| Carrying value of retained interests before effect of increases | 33,691 | 33,691 | ||||||
| Decrease of carrying value due to increase in prepayments | $ | (1,941 | ) | $ | (3,019 | ) | ||
Effect of Increases in Assumed Credit Loss Rate on Retained Interest (Interest-Only Strip Receivable, including retained interest carried in Securities balance)
| Fixed & | ||||||||
| Adjustable Rate Stratum | ||||||||
| 10% | 20% | |||||||
| Credit Loss | Credit Loss | |||||||
| (in thousands) | Increase | Increase | ||||||
| Estimated cash flows from interest income | $ | 49,661 | $ | 49,661 | ||||
| Estimated credit losses | (5,675 | ) | (6,183 | ) | ||||
| Discount of estimated cash flows at 11.00% rate | (11,973 | ) | (11,817 | ) | ||||
| Carrying value of retained interests after effect of increases | 32,013 | 31,661 | ||||||
| Carrying value of retained interests before effect of increases | 33,691 | 33,691 | ||||||
| Decrease of carrying value due to increase in credit losses | $ | (1,678 | ) | $ | (2,030 | ) | ||
Effect of Increases in Assumed Discount Rate on Servicing Asset
| Fixed & | ||||||||
| Adjustable Rate Stratum | ||||||||
| 10% | 20% | |||||||
| Discount Rate | Discount Rate | |||||||
| (in thousands) | Increase | Increase | ||||||
| Estimated cash flows from loan servicing fees | $ | 8,212 | $ | 8,212 | ||||
| Servicing expense | (1,451 | ) | (1,451 | ) | ||||
| Discount of estimated cash flows | (1,729 | ) | (1,840 | ) | ||||
| Carrying value of servicing asset after effect of increases | 5,032 | 4,921 | ||||||
| Carrying value of servicing asset before effect of increases | 5,226 | 5,226 | ||||||
| Decrease of carrying value due to increase in discount rate | $ | (194 | ) | $ | (305 | ) | ||
Effect of Increases in Assumed Discount Rate on Retained Interest (Interest-Only Strip Receivable, including retained interest carried in Securities balance)
| Fixed & | ||||||||
| Adjustable Rate Stratum | ||||||||
| 10% | 20% | |||||||
| Discount Rate | Discount Rate | |||||||
| (in thousands) | Increase | Increase | ||||||
| Estimated cash flows from interest income | $ | 49,661 | $ | 49,661 | ||||
| Estimated credit losses | (5,154 | ) | (5,154 | ) | ||||
| Discount of estimated cash flows | (12,816 | ) | (13,636 | ) | ||||
| Carrying value of retained interests after effect of increases | 31,691 | 30,871 | ||||||
| Carrying value of retained interests before effect of increases | 33,691 | 33,691 | ||||||
| Decrease of carrying value due to increase in discount rate | $ | (2,000 | ) | $ | (2,820 | ) | ||
The following is an illustration of disclosure of static pool credit losses to the Company for loan participations sold with recourse and loans sold to qualifying special purpose entities. “Static pool credit loss” is an analytical tool that matches credit losses with the corresponding loans so that loan growth does not distort or minimize actual loss rates. The Company discloses static pool loss rates by measuring credit losses for loans originated in each of the last three years.
| Recourse & Securitized | ||||||||||||
| Loans Sold in | ||||||||||||
| 2008 | 2007* | 2006 | ||||||||||
Actual & Projected Credit Losses (%) at: | ||||||||||||
| June 30, 2008 | 0.00 | % | 0.00 | % | 1.52 | % | ||||||
| December 31, 2007 | 0.00 | 1.41 | ||||||||||
| December 31, 2006 | 1.95 | |||||||||||
| * | There were no loans sold in securitizations in 2007 and 2008 to date. |
21
Table of Contents
The following table presents quantitative information about the Company managed portfolio, including balances, delinquencies and net credit losses.
| Total Principal Amount of | Principal Amounts 60 or | Net Credit | ||||||||||||||||||||||
| Loans | More Days Past Due* | Losses** | ||||||||||||||||||||||
| June 30, | December 31, | June 30, | December 31, | June 30 | June 30, | |||||||||||||||||||
| (in thousands) | 2008 | 2007 | 2008 | 2007 | 2008 | 2007 | ||||||||||||||||||
Loan portfolio consists of: | ||||||||||||||||||||||||
| Loans on balance sheet**** | $ | 156,396 | $ | 144,131 | $ | 24,113 | $ | 13,319 | $ | 91 | $ | 151 | ||||||||||||
| Loans on balance sheet held in bankruptcy-remote warehouses | 57,011 | 20,207 | — | — | — | — | ||||||||||||||||||
| Off-balance sheet warehouse facility***** | 174,966 | 181,093 | — | — | — | — | ||||||||||||||||||
| Loans participated*** | 211,390 | 229,159 | 13,673 | 7,343 | 318 | — | ||||||||||||||||||
| Loans securitized | 118,527 | 128,711 | 1,852 | 1,898 | 1,096 | 668 | ||||||||||||||||||
| Total loans managed | $ | 718,290 | $ | 703,301 | $ | 39,638 | $ | 22,560 | $ | 1,505 | $ | 819 | ||||||||||||
| * | Loans 60 days or more past due are based on end of period loan balances. | |
| ** | Net credit losses are based on total loans outstanding. The net credit losses are net of recoveries, including recoveries from the proceeds of financial guaranty policies. | |
| *** | Loans participated represents true sale loan participations sold. | |
| **** | Loans on balance sheet exclude reserve for credit loss of $17,506,000 and $1,655,000 at June 30, 2008 and December 31, 2007. | |
| ***** | Net credit losses for loans in the off-balance sheet warehouse facility are accounted for through the valuation of the retained securities. |
3. Property and Equipment
A summary of property and equipment and depreciation is as follows:
| June 30, | December 31, | |||||||
| (in thousands) | 2008 | 2007 | ||||||
| Furniture and equipment | $ | 6,336 | $ | 6,893 | ||||
| Computer equipment | 4,909 | 5,310 | ||||||
| Automobiles and airplanes | 2,037 | 1,999 | ||||||
| Building and leasehold improvements | 8,520 | 8,465 | ||||||
| Land | 1,088 | 1,088 | ||||||
| 22,890 | 23,755 | |||||||
| Less: Accumulated depreciation | (7,375 | ) | (7,008 | ) | ||||
| Property and equipment, net | $ | 15,515 | $ | 16,747 | ||||
| Depreciation expense | $ | 1,166 | $ | 1,806 | ||||
4. Bank Loans, Notes Payable, and Other Long-Term Obligations
| June 30, | December 31, | |||||||
| (in thousands) | 2008 | 2007 | ||||||
Seller notes payable. These notes are payable to the seller of businesses that the Company has purchased and are collateralized by assets of the businesses purchased. Some of these notes have an interest rate of 0% and have been discounted at a rate of 5.50% to 9.75%. Interest rates on these notes range from 4.00% to 7.00% and maturities range from July 2008 to September 2015. | $ | 16,573 | $ | 19,581 | ||||
Valley View Bank line of credit. Maximum line of credit available of $4,000,000. Collateralized by notes receivable. Line of credit due was extended to August 2008. Interest rate is variable and was 7.25% at June 30, 2008, with interest and principal due monthly. | 3,989 | 3,989 | ||||||
Fifth Third Bank, Canadian Branch line of credit.New amounts available under the line were eliminated in the second quarter (Canadian dollars) | 4,822 | 8,967 | ||||||
Bank of Kansas City line of credit.Maximum line of credit available of $1,750,000. Collateralized by notes receivable. Line of credit due February, 2009. Interest rate is variable and was 5.25% at June 30, 2008. | 2,453 | — | ||||||
22
Table of Contents
| June 30, | December 31, | |||||||
| (in thousands) | 2008 | 2007 | ||||||
Home Federal Savings and Loan Association of Nebraska, line of credit.Maximum line of credit available of $7,500,000. Collateralized by cash flows of securities and other assets. Line of credit was paid off in March 2008. | — | 6,353 | ||||||
DZ BANK AG Deutsche Zentral-Genossenschaftsbank line of credit. New amounts available under the line were eliminated in the second quarter. Collateralized by new notes receivable. Line of credit due August 2009. Interest rate is variable and was at 4.25% at June 30, 2008, with interest due monthly. | 37,758 | 14,023 | ||||||
Columbian Bank and Trust Company,due July 2008. Interest rate is variable and was 5.00% at June 30, 2008. Interest and principal are due in one payment at maturity. Collateralized by accounts receivable. Columbian has agreed in principle to extend the maturity of this line of credit to January 2009. | 7,500 | — | ||||||
Citizens Bank and Trust Company,due August 2008. Interest rate is variable at Prime plus 3.00%, due quarterly with principal due at maturity. Interest rate was 8.00% at June 30, 2008. The Company pledged stock it owned in Aleritas and Brooke Capital Corporation. | 8,750 | 9,000 | ||||||
Participating Lenders, due December 2011. Interest rate is variable and was 9.50% at June 30, 2008. Principal payments are scheduled during the note’s term with unpaid balance due at maturity. Collateralized by stock in subsidiary and other assets. | 12,137 | 12,382 | ||||||
Bank Midwest, due February 2009. Interest rate is variable at Prime and was 5.00% at June 30, 2008. Interest due quarterly and principal due at maturity. Collateralized by stock in Generations Bank. | 5,000 | — | ||||||
Company debt with banks. These notes are payable to banks and collateralized by various assets of the Company. Interest rates on these notes range from 5.00% to 10.50%. Maturities range from July 2008 to September 2021. | 37,435 | 39,711 | ||||||
First State Bank secured term loan.Collateralized by substantially all of the Company’s assets. Minimum monthly payments of $875,000, with a final maturity in February 2013. Interest rate is variable and was 7.25% at June 30, 2008. | 46,213 | — | ||||||
Falcon Mezz. Partners II, LP, FMP II Co.-Investment, LLC and JZ Equity Partners PLC note payable.This $45,000,000 note had an associated discount of $2,499,000. Was collateralized by assets of the Company. Interest rate was fixed at 12.00%, with interest due quarterly. Repurchased in March 2008. | — | 42,572 | ||||||
| Total bank loans and notes payable | 182,630 | 156,578 | ||||||
| Capital lease obligation (See Note 5) | 390 | 435 | ||||||
| Total bank loans, notes payable and other long-term obligations | 183,020 | 157,013 | ||||||
| Less: Current maturities and short-term debt | (125,121 | ) | (96,001 | ) | ||||
| Total long-term debt | $ | 57,899 | $ | 61,012 | ||||
The renewal rights associated with the collateral interests of seller notes payable had estimated annual commissions of $37,332,000 and $47,457,000 at June 30, 2008 and December 31, 2007, respectively.
In connection with the outstanding loan and related debt agreements with Citizens Bank and Trust Company and various participating lenders, the Company has committed to certain covenants wherein the Company and certain of its subsidiaries will maintain certain benchmarks with respect to their: (1) regulatory status; (2) outstanding litigation; (3) liquidity; and (4) solvency as defined in the relevant agreement.
In addition, Brooke Capital has agreed to certain restrictions applicable to it and certain of its subsidiaries regarding, among other things: (1) investment in other affiliates; (2) payment of any dividends or distributions; (3) incurrence of additional debt; (4) pledging of certain assets; (5) reorganization and merger; and (6) disposition of assets.
On March 11, 2008, Keith Bouchey, then President and CEO of Brooke Corporation, resigned and on March 12, 2008, the stock price of Aleritas fell below the stated value in the loan covenants on the Citizens Bank and Trust note. During March 2008, the note was renegotiated with a maturity of May 30, 2008 and a new minimum stated value for Aleritas stock held as collateral. Since that time, the stock has traded below the current minimum stated value and the maturity date was extended to August 29, 2008. In connection with the recently announced sale of First Life, Brooke Capital has committed that it will apply the proceeds from this sale toward the ultimate retirement of this note. Accordingly, Citizens has agreed in principle to extend the note until the sale of First Life is consummated. The sale is subject to customary regulatory approval by the Kansas Insurance Department and is expected to close before the end of 2008.
The amount of note payable discount accretion for the period ended June 30, 2008 and 2007 was $2,428,000 and $129,000, respectively. The unamortized balance of the discount on the notes, $2,381,000, was written off to repurchase of debt expense during the first quarter of 2008.
Interest incurred on bank loans, notes payable and other long-term obligations for the periods ended June 30, 2008 and 2007 was $6,984,000 and $7,423,000, respectively.
23
Table of Contents
Bank loans, notes payable and other long-term obligations mature as follows:
| Twelve Months Ended June 30 | Bank Loans & | Capital | ||||||||||
| (in thousands) | Notes Payable | Lease | Total | |||||||||
| 2009 | $ | 125,121 | $ | 90 | $ | 125,211 | ||||||
| 2010 | 14,434 | 95 | 14,529 | |||||||||
| 2011 | 13,498 | 100 | 13,598 | |||||||||
| 2012 | 18,109 | 105 | 18,214 | |||||||||
| 2013 | 8,728 | — | 8,728 | |||||||||
| Thereafter | 2,740 | — | 2,740 | |||||||||
| $ | 182,630 | $ | 390 | $ | 183,020 | |||||||
5. Long-Term Debt, Capital Leases
Future capital lease payments and long-term operating lease payments are as follows:
| Capital | Operating | |||||||||||
| Twelve Months Ended June 30 | Real | Real | ||||||||||
| (in thousands) | Estate | Estate | Total | |||||||||
| 2009 | $ | 118 | $ | 8,729 | $ | 8,847 | ||||||
| 2010 | 117 | 5,810 | 5,927 | |||||||||
| 2011 | 114 | 2,563 | 2,677 | |||||||||
| 2012 | 111 | 798 | 909 | |||||||||
| 2013 | — | 279 | 279 | |||||||||
| 2014 and thereafter | — | 204 | 204 | |||||||||
| Total minimum lease payments | 460 | $ | 18,383 | $ | 18,843 | |||||||
| Less amount representing interest | (70 | ) | ||||||||||
| December 31, | ||||||||
| 2007 | ||||||||
| Total obligations under capital leases | $ | 390 | $ | 435 | ||||
| Less current maturities of obligations under capital leases | (90 | ) | (90 | ) | ||||
| Obligations under capital leases payable after one year | $ | 300 | $ | 345 | ||||
6. Income Taxes
Net income tax expense (benefit) is the tax calculated for the year based on the Company’s effective tax rate plus the change in deferred income taxes during the year. The elements of income tax expense (benefit) are as follows:
| June 30, | June 30, | |||||||
| (in thousands) | 2008 | 2007 | ||||||
| Current | $ | (894 | ) | $ | 1,321 | |||
| Deferred | (25,247 | ) | 4,667 | |||||
| $ | (26,141 | ) | $ | 5,988 | ||||
For the period ended June 30, 2008, income of $108,000 was earned in Bermuda and is included in the Company’s income tax calculation.
Reconciliation of the U.S. federal statutory tax rate to the Company’s effective tax rate on pretax income (loss), based on the dollar impact of this major component on the current income tax expense:
| June 30, | June 30, | |||||||
| 2008 | 2007 | |||||||
| U.S. federal statutory tax rate | (35 | )% | 35 | % | ||||
| State statutory tax rate | (4 | )% | 4 | % | ||||
| Miscellaneous* | 1 | % | (2 | )% | ||||
| Effective tax rate | (38 | )% | 37 | % | ||||
| * | The miscellaneous adjustment above includes the taxes of Brooke Capital Corporation which files a separate tax return. |
24
Table of Contents
Reconciliation of income tax receivable:
| June 30, | December 31, | |||||||
| (in thousands) | 2008 | 2007 | ||||||
| Income tax receivable—Beginning balance, January 1 | $ | 1,998 | $ | 480 | ||||
| Income tax payments over (under) current tax liability | (1,104 | ) | 1,518 | |||||
| Income tax receivable—Ending balance | $ | 894 | $ | 1,998 | ||||
Reconciliation of deferred tax asset:
| June 30, | December 31, | |||||||
| (in thousands) | 2008 | 2007 | ||||||
| Deferred tax asset—Beginning balance, January 1 | $ | — | $ | — | ||||
| Deferred tax asset over receivable | 23,776 | — | ||||||
| Deferred tax asset—Ending balance | $ | 23,776 | $ | — | ||||
Reconciliation of deferred tax liability:
| June 30, | December 31, | |||||||
| (in thousands) | 2008 | 2007 | ||||||
| Deferred income tax liability—Beginning balance, January 1 | $ | 8,117 | $ | 7,594 | ||||
| Accumulated other comprehensive income, unrealized gain (loss) on interest-only strip receivables | (5,318 | ) | 2,071 | |||||
| Accumulated other comprehensive income, currency exchange | — | — | ||||||
| Gain on sale of notes receivable | (938 | ) | (1,548 | ) | ||||
| Ending Balance | $ | 1,801 | $ | 8,117 | ||||
| June 30, | December 31, | |||||||
| (in thousands) | 2008 | 2007 | ||||||
| Deferred income tax liability—Current | $ | 1,801 | $ | 1,715 | ||||
| Deferred income tax liability—Long-term | — | 6,402 | ||||||
| Deferred income tax liability—Total | $ | 1,801 | $ | 8,117 | ||||
Deferred tax liabilities were recorded to recognize the future tax consequences of temporary differences between financial reporting amounts and the tax basis of existing assets and liabilities based on currently enacted tax laws and tax rates in effect for the years in which the differences are expected to reverse.
7. Employee Benefit Plans
The Company has a defined contribution retirement plan in which substantially all employees are eligible to participate. Employees may contribute up to the maximum amount allowed pursuant to the Internal Revenue Code, as amended. Effective January 1, 2007, the Company elected to match 50% of the employee’s contributions up to a maximum of 3% of compensation for the year, subject to a maximum contribution per individual of $3,000 for the plan year. The employer contribution of $164,000 and $175,000, respectively, were charged to expense for the six month periods ended June 30, 2008 and 2007.
Delta Plus Holdings, Inc. has a profit sharing/401-K plan for eligible employees. Participants may contribute up to the maximum amount allowed pursuant to the Internal Revenue Code, as amended. The Company matches 25% of the employee’s contributions up to a maximum of 8% of the employee’s respective compensation level.
8. Concentration of Credit and Deposit Risk
At June 30, 2008, the Company had account balances of $3,469,000 that exceeded the insurance limit of the Federal Deposit Insurance Corporation.
At June 30, 2008, the Company, through its qualifying special-purpose entity subsidiaries, had $141,383,000 in off-balance sheet debt outstanding to one financial institution, representing 61% of the total assets then sold through qualifying special-purpose entities. Aleritas had an additional $7,822,000 of on-balance sheet debt outstanding to this financial institution. Aleritas also had sold asset-backed securities totaling $49,747,000 to one financial institution, representing 22% of the total assets then sold through qualifying special purpose entities. At June 30, 2008, the Company had sold participation interests in loans totaling $97,780,000 to two financial institutions. This represents 33% of the participation interests then sold.
25
Table of Contents
Approximately 26% of Aleritas loans (both on and off-balance sheet) were located in Florida.
Approximately 13% of the total loans (both on and off-balance sheet) were to Allstate Agents.
Loans to the four largest obligors comprised 14% of Aleritas total loan portfolio excluding subsidiary loans.
As of June 30, 2008, approximately 64% of Generations Bank’s loan portfolio and current business activity is with customers located within the states of Missouri and Kansas.
9. Segment and Related Information
The Company had four reportable segments in 2008 and 2007. For the period ended June 30, 2008, the segments consisted of its Insurance Services Business, its Brokerage Business, its Lending Services Business and its Banking Services Business. For the period ended June 30, 2007, the segments consisted of its Franchise Services Business, its Brokerage Business, its Lending Services Business, and its Financial Services Business.
The Company assesses administrative fees to each business segment for legal, corporate and administrative services. Administrative fees for Insurance Services, Lending Services, Brokerage Business and Banking Services for the period ended June 30, 2008 totaled $900,000, $108,000, $30,000 and $15,000, respectively, and for the four segments existing during the period ended June 30, 2007 totaled $1,500,000, $1,125,000, $30,000 and $450,000, respectively.
Revenues, expenses, assets and liabilities that are not allocated to one of the four reportable segments are categorized as “Corporate.” Activities associated with Corporate include functions such as accounting, auditing, legal, human resources and investor relations. Activities associated with Corporate also include real estate ownership and corporate real estate management through Brooke Investments, Inc. and the operation of captive insurance companies that self-insure portions of the professional insurance agents’ liability exposure of Brooke Franchise Corporation, its affiliated companies and its franchisees and provide financial guaranty policies to Aleritas and its participating lenders.
Previously, the Company’s Insurance Services Business segment included the life insurance operations of First Life America Corporation. As of June 30, 2008, the related financial results of First Life are presented as a discontinued operation and the assets and liabilities of that business are presented as held-for-sale in the Company’s consolidated financial statements. All periods presented have been reclassified to reflect this discontinued operation. See Note 20 for additional information.
The tables below reflect summarized financial information concerning the Company’s reportable segments from its continuing operations for the three month and six month periods ended June 30, 2008 and 2007:
| Insurance | Lending | Elimination of | ||||||||||||||||||||||||||||||
| For the three months ended June 30, 2008 | Services | Brokerage | Services | Banking | Intersegment | Continuing | Discontinued | |||||||||||||||||||||||||
| (in thousands) | Business | Business | Business | Services | Corporate | Activity | Operations | Operation | ||||||||||||||||||||||||
| Insurance commissions | $ | 27,205 | $ | 762 | $ | — | $ | — | $ | — | $ | — | $ | 27,967 | — | |||||||||||||||||
| Policy fee income | — | 131 | — | — | — | — | 131 | — | ||||||||||||||||||||||||
| Insurance premiums earned | 2,544 | — | — | — | 157 | (157 | ) | 2,544 | 898 | |||||||||||||||||||||||
| Interest income | 173 | 3 | 5,527 | 1,377 | 100 | 83 | 7,263 | 408 | ||||||||||||||||||||||||
| Gain (loss) on sale of notes receivable | — | — | (1,756 | ) | — | — | 28 | (1,728 | ) | — | ||||||||||||||||||||||
| Consulting fees | 3 | — | — | — | — | — | 3 | — | ||||||||||||||||||||||||
| Initial franchise fees for basic services | — | — | — | — | — | — | — | — | ||||||||||||||||||||||||
| Initial franchise fees for buyers assistance plans | — | — | — | — | — | — | — | — | ||||||||||||||||||||||||
| Gain (loss) on sale of businesses | (3,631 | ) | — | — | — | — | — | (3,631 | ) | — | ||||||||||||||||||||||
| Impairment loss | — | — | — | — | — | — | — | — | ||||||||||||||||||||||||
| Loss on sale of assets | (1,323 | ) | — | — | — | — | — | (1,323 | ) | — | ||||||||||||||||||||||
| Other income | 3,795 | 11 | 93 | 268 | 41 | (3,613 | ) | 595 | 61 | |||||||||||||||||||||||
Total Operating Revenues | 28,766 | 907 | 3,864 | 1,645 | 298 | (3,659 | ) | 31,821 | 1,367 | |||||||||||||||||||||||
| Interest expense | 645 | 23 | 1,567 | 127 | 706 | 84 | 3,152 | — | ||||||||||||||||||||||||
| Commissions expense | 22,071 | 316 | — | 79 | — | — | 22,466 | 49 | ||||||||||||||||||||||||
| Payroll expense | 6,720 | 400 | (818 | ) | 277 | 866 | — | 7,445 | 134 | |||||||||||||||||||||||
26
Table of Contents
| Insurance | Lending | Elimination of | ||||||||||||||||||||||||||||||
| For the three months ended June 30, 2008 | Services | Brokerage | Services | Banking | Intersegment | Continuing | Discontinued | |||||||||||||||||||||||||
| (in thousands) | Business | Business | Business | Services | Corporate | Activity | Operations | Operation | ||||||||||||||||||||||||
| Insurance loss and loss expense incurred | 1,111 | — | — | — | — | — | 1,111 | — | ||||||||||||||||||||||||
| Depreciation and amortization | 716 | 110 | 353 | 113 | 36 | — | 1,328 | 195 | ||||||||||||||||||||||||
| Provision for losses | 8,076 | — | 2,358 | 100 | — | — | 10,534 | — | ||||||||||||||||||||||||
| Other operating expenses | 13,442 | 174 | (1,434 | ) | 1,257 | 802 | (3,770 | ) | 10,471 | 933 | ||||||||||||||||||||||
| Loss on extinguishment of debt | — | — | — | — | — | — | — | — | ||||||||||||||||||||||||
| Minority interest in subsidiary | (5,615 | ) | — | 442 | — | — | — | (5,173 | ) | — | ||||||||||||||||||||||
Income (loss) from Continuing Operations Before Income Taxes | (18,400 | ) | (116 | ) | 1,396 | (308 | ) | (2,112 | ) | 27 | (19,513 | ) | 56 | |||||||||||||||||||
| Segment assets | 84,490 | 12,329 | 292,719 | 130,153 | 90,257 | (132,093 | ) | 477,855 | 35,000 | |||||||||||||||||||||||
| Expenditures for segment assets | 581 | — | — | — | — | — | 581 | — | ||||||||||||||||||||||||
| Franchise | Lending | Elimination of | ||||||||||||||||||||||||||||||
| For the three months ended June 30, 2007 | Services | Brokerage | Services | Financial | Intersegment | Continuing | Discontinued | |||||||||||||||||||||||||
| (in thousands) | Business | Business | Business | Services | Corporate | Activity | Operations | Operation | ||||||||||||||||||||||||
| Insurance commissions | $ | 27,615 | $ | 711 | $ | — | $ | — | $ | — | $ | — | $ | 28,326 | — | |||||||||||||||||
| Policy fee income | — | 153 | — | — | — | — | 153 | — | ||||||||||||||||||||||||
| Insurance premiums earned | — | 3,156 | — | — | 283 | (248 | ) | 3,191 | 849 | |||||||||||||||||||||||
| Interest income | 95 | 122 | 5,371 | 671 | 166 | (234 | ) | 6,191 | 352 | |||||||||||||||||||||||
| Gain on sale of notes receivable | — | — | 4,282 | — | — | 2 | 4,284 | — | ||||||||||||||||||||||||
| Consulting fees | 1,113 | — | — | 3,990 | — | (688 | ) | 4,415 | — | |||||||||||||||||||||||
| Initial franchise fees for basic services | 7,095 | — | — | — | — | — | 7,095 | — | ||||||||||||||||||||||||
| Initial franchise fees for buyers assistance plans | 70 | — | — | — | — | — | 70 | — | ||||||||||||||||||||||||
| Gain on sale of businesses | 1,161 | — | — | — | — | — | 1,161 | — | ||||||||||||||||||||||||
| Loss on sale of assets | — | — | — | — | (15 | ) | — | (15 | ) | — | ||||||||||||||||||||||
| Other income | 696 | (18 | ) | 181 | 26 | 98 | (700 | ) | 283 | 60 | ||||||||||||||||||||||
Total Operating Revenues | 37,845 | 4,124 | 9,834 | 4,687 | 532 | (1,868 | ) | 55,154 | 1,261 | |||||||||||||||||||||||
| Interest expense | 705 | 47 | 1,838 | — | 741 | (233 | ) | 3,098 | — | |||||||||||||||||||||||
| Commissions expense | 22,126 | 134 | — | — | — | — | 22,260 | 50 | ||||||||||||||||||||||||
| Payroll expense | 5,423 | 1,134 | 611 | 977 | 686 | — | 8,831 | 116 | ||||||||||||||||||||||||
| Insurance loss and loss expense incurred | — | 2,002 | — | — | 225 | — | 2,227 | — | ||||||||||||||||||||||||
| Depreciation and amortization | 30 | 127 | 283 | 14 | 353 | 2 | 809 | 212 | ||||||||||||||||||||||||
| Provision for losses | 1,337 | — | 148 | — | — | — | 1,485 | — | ||||||||||||||||||||||||
| Other operating expenses | 8,950 | 981 | 1,280 | 1,206 | 613 | (1,636 | ) | 11,394 | 667 | |||||||||||||||||||||||
| Minority interest in subsidiary | — | — | — | 760 | — | — | 760 | — | ||||||||||||||||||||||||
Income (loss) from Continuing Operations Before Income Taxes | (726 | ) | (301 | ) | 5,674 | 1,730 | (2,086 | ) | (1 | ) | 4,290 | 216 | ||||||||||||||||||||
| Segment assets | 81,945 | 43,305 | 217,265 | 52,830 | 118,138 | (176,669 | ) | 336,814 | 31,000 | |||||||||||||||||||||||
| Expenditures for segment assets | — | — | 19,140 | (2,624 | ) | 780 | — | 17,296 | — | |||||||||||||||||||||||
| Insurance | Lending | Elimination of | ||||||||||||||||||||||||||||||
| For the six months ended June 30, 2008 | Services | Brokerage | Services | Banking | Intersegment | Continuing | Discontinued | |||||||||||||||||||||||||
| (in thousands) | Business | Business | Business | Services | Corporate | Activity | Operations | Operation | ||||||||||||||||||||||||
| Insurance commissions | $ | 60,823 | $ | 1,457 | $ | — | $ | — | $ | — | $ | — | $ | 62,280 | — | |||||||||||||||||
| Policy fee income | — | 245 | — | — | — | — | 245 | — | ||||||||||||||||||||||||
| Insurance premiums earned | 5,177 | — | — | — | 418 | (383 | ) | 5,212 | 2,000 | |||||||||||||||||||||||
| Interest income | 292 | 5 | 12,165 | 2,659 | 351 | (73 | ) | 15,399 | 805 | |||||||||||||||||||||||
| Gain (loss) on sale of notes receivable | — | — | (1,657 | ) | — | — | 28 | (1,629 | ) | — | ||||||||||||||||||||||
| Consulting fees | 256 | — | — | — | — | — | 256 | — | ||||||||||||||||||||||||
| Initial franchise fees for basic services | 1,320 | — | — | — | — | — | 1,320 | — | ||||||||||||||||||||||||
| Initial franchise fees for buyers assistance plans | — | — | — | — | — | — | — | — | ||||||||||||||||||||||||
| Gain (loss) on sale of businesses | (4,477 | ) | — | — | — | — | — | (4,477 | ) | — | ||||||||||||||||||||||
27
Table of Contents
| Insurance | Lending | Elimination of | ||||||||||||||||||||||||||||||
| For the six months ended June 30, 2008 | Services | Brokerage | Services | Banking | Intersegment | Continuing | Discontinued | |||||||||||||||||||||||||
| (in thousands) | Business | Business | Business | Services | Corporate | Activity | Operations | Operation | ||||||||||||||||||||||||
| Impairment loss | — | — | (11,763 | ) | — | — | — | (11,763 | ) | — | ||||||||||||||||||||||
| Loss on sale of assets | (1,323 | ) | — | — | — | — | — | (1,323 | ) | — | ||||||||||||||||||||||
| Other income | 9,716 | 10 | 240 | 301 | 93 | (9,385 | ) | 975 | 121 | |||||||||||||||||||||||
Total Operating Revenues | 71,784 | 1,717 | (1,015 | ) | 2,960 | 862 | (9,813 | ) | 66,495 | 2,926 | ||||||||||||||||||||||
| Interest expense | 1,646 | 49 | 3,899 | 127 | 1,337 | (74 | ) | 6,984 | — | |||||||||||||||||||||||
| Commissions expense | 46,981 | 579 | — | 145 | — | — | 47,705 | 104 | ||||||||||||||||||||||||
| Payroll expense | 13,516 | 820 | 705 | 464 | 1,396 | — | 16,901 | 312 | ||||||||||||||||||||||||
| Insurance loss and loss expense incurred | 1,790 | — | — | — | 403 | — | 2,193 | — | ||||||||||||||||||||||||
| Depreciation and amortization | 1,459 | 226 | 763 | 193 | 71 | — | 2,712 | 385 | ||||||||||||||||||||||||
| Provision for loan losses | 8,428 | — | 14,896 | 100 | — | — | 23,424 | — | ||||||||||||||||||||||||
| Other operating expenses | 26,166 | 317 | 6,784 | 2,441 | 2,014 | (9,765 | ) | 27,957 | 2,046 | |||||||||||||||||||||||
| Loss on extinguishment of debt | — | — | 8,210 | — | — | — | 8,210 | — | ||||||||||||||||||||||||
| Minority interest in subsidiary | (6,163 | ) | — | (8,591 | ) | — | — | — | (14,754 | ) | — | |||||||||||||||||||||
Income (loss) from Continuing Operations Before Income Taxes | (22,039 | ) | (274 | ) | (27,681 | ) | (510 | ) | (4,359 | ) | 26 | (54,837 | ) | 79 | ||||||||||||||||||
| Segment assets | 84,490 | 12,329 | 292,719 | 130,153 | 90,257 | (132,093 | ) | 477,855 | 35,000 | |||||||||||||||||||||||
| Expenditures for segment assets | 1,048 | — | 324 | 108 | — | — | 1,480 | 13 | ||||||||||||||||||||||||
| Franchise | Lending | Elimination of | ||||||||||||||||||||||||||||||
| For the six months ended June 30, 2007 | Services | Brokerage | Services | Financial | Intersegment | Consolidated | Discontinued | |||||||||||||||||||||||||
| (in thousands) | Business | Business | Business | Services | Corporate | Activity | Totals | Operation | ||||||||||||||||||||||||
| Insurance commissions | $ | 59,623 | $ | 1,439 | $ | — | $ | — | $ | — | $ | — | $ | 61,062 | — | |||||||||||||||||
| Policy fee income | — | 256 | — | — | — | — | 256 | — | ||||||||||||||||||||||||
| Insurance premiums earned | — | 3,156 | — | — | 549 | (439 | ) | 3,266 | 1,922 | |||||||||||||||||||||||
| Interest income | 173 | 132 | 12,798 | 1,270 | 361 | (490 | ) | 14,244 | 667 | |||||||||||||||||||||||
| Gain on sale of notes receivable | — | — | 11,203 | — | — | 3 | 11,206 | — | ||||||||||||||||||||||||
| Consulting fees | 1,427 | — | — | 4,245 | — | (942 | ) | 4,730 | — | |||||||||||||||||||||||
| Initial franchise fees for basic services | 19,965 | — | — | — | — | — | 19,965 | — | ||||||||||||||||||||||||
| Initial franchise fees for buyers assistance plans | 455 | — | — | — | — | — | 455 | — | ||||||||||||||||||||||||
| Gain on sale of businesses | 1,842 | — | — | — | — | — | 1,842 | — | ||||||||||||||||||||||||
| Loss on sale of assets | — | — | — | (16 | ) | (15 | ) | — | (31 | ) | — | |||||||||||||||||||||
| Other income | 1,335 | (18 | ) | 349 | 49 | 175 | (1,360 | ) | 530 | 124 | ||||||||||||||||||||||
Total Operating Revenues | 84,820 | 4,965 | 24,350 | 5,548 | 1,070 | (3,228 | ) | 117,525 | 2,713 | |||||||||||||||||||||||
| Interest expense | 1,258 | 83 | 5,174 | — | 1,397 | (489 | ) | 7,423 | — | |||||||||||||||||||||||
| Commissions expense | 44,967 | 411 | — | — | — | — | 45,378 | 109 | ||||||||||||||||||||||||
| Payroll expense | 10,985 | 1,643 | 1,125 | 1,330 | 1,514 | — | 16,597 | 240 | ||||||||||||||||||||||||
| Insurance loss and loss expense incurred | — | 2,003 | — | — | 551 | — | 2,554 | — | ||||||||||||||||||||||||
| Depreciation and amortization | 46 | 226 | 575 | 32 | 733 | 4 | 1,616 | 394 | ||||||||||||||||||||||||
| Provision for losses | 4,383 | — | 819 | — | — | — | 5,202 | — | ||||||||||||||||||||||||
| Other operating expenses | 19,394 | 1,172 | 3,034 | 1,634 | 260 | (2,743 | ) | 22,751 | 1,747 | |||||||||||||||||||||||
| Minority interest in subsidiary | — | — | — | 724 | — | — | 724 | — | ||||||||||||||||||||||||
Income (loss) from Continuing Operations Before Income Taxes | 3,787 | (573 | ) | 13,623 | 1,828 | (3,385 | ) | — | 15,280 | 223 | ||||||||||||||||||||||
| Segment assets | 81,945 | 43,305 | 217,265 | 52,830 | 118,138 | (176,669 | ) | 336,814 | 31,000 | |||||||||||||||||||||||
| Expenditures for segment assets | 482 | — | 41,083 | 7,911 | 2,525 | — | 52,001 | 2 | ||||||||||||||||||||||||
10. Related Party Information
Robert D. Orr, Chairman of the Board, and Leland G. Orr, Chief Executive Officer, own a controlling interest in Brooke Holdings, Inc. which owned 43% of the Company’s common stock at June 30, 2008.
Michael S. Lowry, Executive Vice President of Aleritas, is a co-member of First Financial Group, L.C. Kyle L. Garst, Chairman and Chief Executive Officer of Brooke Capital Corporation, is the sole manager and sole member of American Financial Group, L.L.C. In October 2001, First Financial Group, L.C. and American Financial Group, L.L.C. each guaranteed 50% of a Aleritas loan to The Wallace Agency, L.L.C. of Wanette, Oklahoma and each received a 7.50% profit interest in The Wallace Agency. The loan was originated on October 15, 2001 and is scheduled to mature on January 1, 2014. At June 30, 2008, the Company had a loss exposure of $274,000. First Financial Group, L.C. and American Financial Group, L.L.C. each sold its ownership interest in the Wallace Agency, L.L.C. back to the Wallace Agency, L.L.C. in March 2007.
28
Table of Contents
In January 2008, Aleritas entered into a Business Development and Finders Fee Agreement with Quantum Ventures of Michigan, LLC (“QVM”). This agreement was approved by the Aleritas’ directors and Governance Committee and then subsequently by the full Board of Directors (except that all related parties were excused from voting). One of the principals of QVM is Michael C. Azar, was a director of Aleritas until his resignation on April 1, 2008, and the former President of Oakmont Acquisition Corp., which merged with Brooke Credit Corporation (a Kansas corporation and predecessor-in-interest to Aleritas) on July 18, 2007. Pursuant to the agreement, the Company pays QVM $120,000 per annum, plus a percentage fee (which varies for each potential acquisition) for its work in bringing about an acquisition by the Company of another business entity through means such as a stock or asset purchase, or by merger or consolidation. This agreement was mutually terminated in the second quarter.
Anita F. Larson, former Executive Vice President of Aleritas, is married to John Arensberg, a partner in Arensberg Insurance of Overland Park, Kansas. Arensberg Insurance is a franchisee of Brooke Franchise Corporation pursuant to a standard form franchise agreement, and utilizes the administrative and processing services of Brooke Franchise Corporation’s service center employees pursuant to a standard form service center agreement. Brooke Franchise Corporation receives in excess of $135,000 in fees from the franchisee in connection with each of these agreements.
In December 2007, Brooke Holdings, Inc. purchased a 100% participation interest in a loan of $12,382,000 to Brooke Capital Corporation originated by Brooke Capital Advisors, Inc. (a wholly-owned subsidiary of Brooke Capital). Brooke Holdings, Inc. is controlled by Robert D. Orr and Leland G. Orr, who owned 74% and 22%, respectively, of its outstanding shares of stock as of August 15, 2008. The interest rate on the participation is variable, at 4.50% over the printed rate as published in the Wall Street Journal, and monthly payments of $222,000 are scheduled with a final payment of $5,910,000 due in December 2011. This loan is secured by the guaranty of the Company and by Brooke Capital’s pledge of its stock in First Life America Corporation. Upon the expected closing of the sale of First Life by Brooke Capital and the pay-off of the loan to Brooke Capital from Citizens Bank and Trust, the Company intends to secure its guaranty of this loan with the pledge of five million of its shares of Brooke Capital common stock as replacement collateral. Brooke Capital has also agreed to pledge its stock in Delta Plus Holdings, Inc. and certain Delta Plus subsidiaries, including Traders Insurance Company, upon the acquisition of Delta Plus from the Company pursuant to an Exchange Agreement entered into in November 2007. At June 30, 2008, all but $1,061,000 of the $12,137,000 amount outstanding has been sold to other participating lenders, and $6,554,000 remained payable to Brooke Holdings, Inc. and is reported as a part of accounts payable.
11. Acquisitions and Divestitures
In July 2002, the Company acquired 100% of the outstanding ownership interests of CJD & Associates, L.L.C. for an initial purchase price of $2,025,000. Additional payments of the purchase price in the amount of $3,283,000 have been made since the initial purchase.
On December 8, 2006, the Company closed on a Stock Purchase and Sale Agreement (“2006 Stock Purchase Agreement”) whereby the Company committed, through a series of steps, to acquire an approximate 55% interest in the outstanding shares of First American Capital Corporation (now Brooke Capital Corporation) in exchange for $3,000,000 in cash and execution of a Brokerage Agreement. At closing, the Company acquired an approximate 47% interest in First American’s then authorized, issued and outstanding common stock, for $2,552,000 and executed and delivered the Brokerage Agreement. As part of the closing, Brooke Capital issued Brooke Corporation a warrant to purchase the additional shares of common stock for $448,000, such shares to be authorized for issuance pursuant to forthcoming amendments to Brooke Capital’s articles of incorporation. Brooke Capital’s articles of incorporation were amended on January 31, 2007 and the Company exercised the warrant on the same day. On November 15, 2007, Brooke Capital completed a merger with Brooke Franchise Corporation (“Brooke Franchise”) which was then a wholly-owned subsidiary of the Company. Pursuant to the Merger Agreement, Brooke Franchise was merged with and into Brooke Capital, resulting in Brooke Capital being the survivor. The transaction was accounted for in accordance with the guidance under Statement of Financial Accounting Standards (SFAS) No. 141, “Business Combinations,” issued by the Financial Accounting Standards Board. Prior to the merger, the Company owned 100% of Brooke Franchise and 53% of Brooke Capital. As a result of the closing of the merger, the Company owned approximately 81% of Brooke Capital common stock. At June 30, 2008, the Company owned approximately 66% of Brooke Capital’s stock.
29
Table of Contents
As part of the consideration under the 2006 Stock Purchase Agreement, Brooke Capital Advisors, Inc., a subsidiary of Brooke Capital Corporation, and CJD & Associates, L.L.C. (“CJD”), the Company’s brokerage subsidiary, entered into an agreement by which, as of that date, Brooke Capital Advisors began transacting all new managing general agent loan brokerage business (formerly operated by CJD). CJD operated such a business prior to closing and, as part of the Brokerage Agreement, agreed not to engage in any new managing general agent loan brokerage business. Pursuant to the terms of the 2006 Stock Purchase Agreement, Brooke Corporation agreed to contribute funds to Brooke Capital Corporation as additional consideration, to the extent the pretax profits of Brooke Capital Advisors did not meet a three-year $6 million pretax profit goal in accordance with an agreed upon schedule set forth in the 2006 Stock Purchase Agreement. Brooke Capital Advisors reported pretax income of approximately $7,773,000 and $1,084,000 during 2007 and 2006, respectively. During the first six months of 2008, Brooke Capital Advisors reported a pretax loss of $1,705,000.
On January 8, 2007, the Company completed the acquisition of Generations Bank, a federal savings bank, by purchasing for $10.1 million in cash all of the issued and outstanding capital stock of the Bank from Kansas City Life Insurance Company pursuant to a Stock Purchase Agreement dated January 23, 2006. The Company assigned its rights and obligations under the agreement to its wholly-owned subsidiary, Brooke Bancshares, Inc. (formerly Brooke Brokerage Corporation), prior to closing. Accordingly, the Bank’s results of operations since January 8, 2007 are included in these consolidated financial statements.
The Bank operates under the name Generations Bank and its operations are conducted through contracted bank agents, who leverage existing relationships with Brooke franchisees and other independent insurance agents and professionals by providing additional products and services. The Bank’s main retail and administrative banking offices are located in Phillipsburg, Kansas.
An initial purchase premium of $1,900,000, along with other direct costs associated with the transaction, was allocated based on the fair values of the assets and liabilities acquired. The fair values of the major assets and liabilities acquired in this transaction were as follows (in thousands):
| At January 8, 2007 | ||||
| Investment securities | $ | 30,383 | ||
| Loans, net | 19,644 | |||
| Cash and other assets | 1,176 | |||
| Total assets | 51,203 | |||
| Deposits | 41,493 | |||
| Other borrowings | 1,289 | |||
| Other liabilities | 221 | |||
| Total liabilities | 43,003 | |||
| Net assets acquired | $ | 8,200 | ||
| Purchase premium recorded | 2,077 | |||
| Initial capitalization of the Bank | $ | 10,277 | ||
Effective July 18, 2007, pursuant to the Amended and Restated Agreement and Plan of Merger dated as of April 30, 2007 (the “Merger Agreement”) by and among Oakmont Acquisition Corp. (“Oakmont”), Brooke Credit Corporation (a Kansas corporation and predecessor-in-interest to Aleritas, “Brooke Kansas”) and the Company, Brooke Kansas was merged with and into Oakmont. In connection with the merger, Oakmont changed its name to Brooke Credit Corporation (a Delaware corporation, subsequently renamed as Aleritas Capital Corp. the “Surviving Corporation”). Pursuant to the Merger Agreement, each share of the issued and outstanding common stock of Oakmont was converted into one share of the validly issued, fully paid and non-assessable authorized share of common stock of the Surviving Corporation. The Company, along with seven other former Brooke Kansas equity holders, received aggregate merger consideration of 16,304,000 shares of the Surviving Corporation’s common stock, and the common stock of Brooke Kansas was cancelled. Shares of the Surviving Corporation’s common stock received by the Company along with shares of the Surviving Corporation purchased by the Company in the open market, Brooke Corporation owns approximately 62% of the Surviving Corporation’s issued and outstanding stock. An additional aggregate of 1,000,000 shares of the Surviving Corporation’s common stock will be issued to Brooke Corporation and the other former Brooke Kansas stockholders, or reserved for issuance pursuant to assumed warrants, in the event the Surviving Corporation achieves adjusted earnings of $19,000,000 in 2008.
In March 2007, the Company purchased 100% of the common stock of Delta Plus Holdings, Inc. for a total purchase price of $13,500,000, plus net tangible book value at closing.
During May 2007, Brooke Capital acquired a 100% interest in Brooke Investments, Inc., from Brooke Corporation. Brooke Investments acquires real estate for lease to franchisees, for corporate use and other purposes. See Note 5 for more information regarding the Company’s operating leases. Effective July 1, 2008, all franchise operations were transferred to Brooke Investments, Inc. and it became the named franchisor.
On September 28, 2007, Brooke Capital acquired 60 insurance agency locations from entities associated with Chicago-based J and P Holdings Inc. The agencies currently sell auto insurance under the trade names of Lone Star Auto, Insurance Xpress, Car Insurance Store, Hallberg Insurance Agency and Hallberg Xpress in Colorado, Illinois, Kansas, Missouri and Texas. The acquired agencies will be converted into Brooke franchises or merged into existing Brooke franchise locations. At June 30, 2008, 53 of the acquired agencies had been so converted or merged.
30
Table of Contents
On January 18, 2008, Generations Bank completed a transaction wherein it assumed approximately $100 million in deposits and $7.5 million in loans from Bank of the West. As part of the transaction, the Bank also acquired a network of 42 Kansas-based bank agents who refer deposit and loan business to the Bank. The Bank paid a deposit premium of approximately $2.9 million in connection with this transaction. To fund this purchase, the Bank received additional paid-in capital of $5 million from Brooke Bancshares, Inc., its immediate corporate parent. As a result of this transaction, the Bank reported total assets of approximately $141 million, total deposits of $125 million and total stockholders equity of $15.4 million as of January 31, 2008.
12. Stock-Based Compensation
The Company adopted SFAS 123R, “Share-Based Payment,” on January 1, 2006. The fair value of the options granted for the periods ended June 30, 2008 and 2007 is estimated on the date of grant using the binomial option pricing model. The weighted-average assumptions used and the estimated fair value are as follows:
| 2001 Plan | 2006 Plan | |||||||||||||||
| 2008 | 2007 | 2008 | 2007 | |||||||||||||
| Expected term (in years) | 3.3 | 4.8 | 4.7 | 5.7 | ||||||||||||
| Expected stock volatility | 10 | % | 10 | % | 10 | % | 10 | % | ||||||||
| Risk-free interest rate | 5 | % | 5 | % | 5 | % | 5 | % | ||||||||
| Dividend | 1 | % | 1 | % | 1 | % | 1 | % | ||||||||
| Fair value per share | $ | 0.17 | $ | 0.18 | $ | 1.09 | $ | 1.37 | ||||||||
At June 30, 2008, there were no additional shares available for the grant of stock options under the Brooke Corporation 2001 Compensatory Stock Option Plan (“2001 Plan”), as the 2001 Plan terminated on April 27, 2006, except with respect to stock options then outstanding, upon the adoption on that date by the Company’s shareholders of the 2006 Brooke Corporation Equity Incentive Plan (“2006 Plan”). The 2006 Plan includes stock options, incentive stock options, restricted shares, stock appreciation rights, performance shares, performance units and restricted share units as possible equity compensation awards. The 2006 Plan provides that a maximum of 500,000 shares of common stock may be issued pursuant to awards granted under such Plan. Awards of 308,107 restricted shares and incentive stock options to purchase 62,650 shares of common stock are outstanding under the 2006 Plan and accordingly, at June 30, 2008 there were 129,243 shares available for granting of stock-based awards under the 2006 Plan.
| 2001 Plan | 2006 Plan | |||||||||||||||
| Weighted | Weighted | |||||||||||||||
| Shares | Average | Shares | Average | |||||||||||||
| Under | Exercise | Under | Exercise | |||||||||||||
| Option | Price | Option | Price | |||||||||||||
| Outstanding December 31, 2006 | 228,650 | $ | 3.84 | — | $ | — | ||||||||||
| Granted | — | — | 90,000 | 12.45 | ||||||||||||
| Exercised | (158,660 | ) | 2.30 | — | — | |||||||||||
| Terminated and expired | (10,200 | ) | 23.49 | (25,250 | ) | 12.31 | ||||||||||
| Outstanding December 31, 2007 | 59,790 | 4.59 | 64,750 | 12.50 | ||||||||||||
| Granted | — | — | — | — | ||||||||||||
| Exercised | (— | ) | — | — | — | |||||||||||
| Terminated and expired | (500 | ) | 23.49 | (2,100 | ) | 12.31 | ||||||||||
| Outstanding June 30, 2008 | 59,290 | $ | 4.44 | 62,650 | $ | 12.51 | ||||||||||
65,240 options to purchase shares were exercisable at June 30, 2008. The following table summarizes information concerning outstanding and exercisable options at June 30, 2008.
| Options Outstanding | Options Exercisable | |||||||||||||||||||
| Remaining | Weighted | Weighted | ||||||||||||||||||
| Range of | Number | Contractual | Average | Number | Average | |||||||||||||||
| Exercisable Prices | Outstanding | Life in Years | Exercise Price | Exercisable | Exercise Price | |||||||||||||||
| 2001 Plan ($2.09 – $23.49) | 59,290 | 3.3 | $ | 4.44 | 52,290 | $ | 3.64 | |||||||||||||
| 2006 Plan ($12.31 – $13.54) | 62,650 | 4.7 | $ | 12.51 | 12,950 | $ | 12.50 | |||||||||||||
31
Table of Contents
13. Intangible Assets
In connection with its acquisitions of Generations Bank and Delta Plus Holdings, Inc., the Company recorded goodwill which is not being amortized but, rather, evaluated periodically for impairment. Goodwill had a value of $2,660,000 and $3,022,000 as of June 30, 2008 and December 31, 2007, respectively. There were no other intangible assets with indefinite useful lives as of June 30, 2008, and December 31, 2007. The intangible assets with definite useful lives had a value of $24,478,000 and $18,781,000 at June 30, 2008, and December 31, 2007, respectively. Of these assets, $5,226,000 and $6,025,000, respectively, were recorded as a servicing asset on the balance sheet. The remaining assets were included in “Other Assets” on the balance sheet. Amortization expense was $1,546,000 and $819,000 for the periods ended June 30, 2008 and 2007, respectively.
Amortization expense for amortizable intangible assets for the periods ended June 30, 2009, 2010, 2011, 2012 and 2013 is estimated to be $1,998,000, $1,784,000, $1,554,000, $1,368,000 and $1,194,000, respectively.
14. Supplemental Cash Flow Disclosures
| For the period | For the period | |||||||
| Ended June 30, | Ended June 30, | |||||||
| 2008 | 2007 | |||||||
Supplemental disclosures: (in thousands) | ||||||||
| Cash paid for interest | $ | 4,827 | $ | 2,829 | ||||
| Cash paid for income tax | $ | — | $ | 3,346 | ||||
Business inventory decreased from December 31, 2007 to June 30, 2008. During the periods ended June 30, 2008 and 2007, the statements of cash flows reflect the purchase of businesses into inventory provided by sellers totaling $0 and $11,021,000, the write down to realizable value of inventory of $3,631,000 and $300,000, respectively, and the change in inventory of $4,704,000 and $(1,433,000), respectively. Payments on seller notes were $4,750,000 and $4,790,000 in 2008 and 2007, respectively. Due to the lack of credit available in the second quarter to purchaser’s and the need for inventory liquidations, write downs were incurred to reduce inventory.
| For the period | For the period | |||||||
| Ended June 30, | Ended June 30, | |||||||
| (in thousands) | 2008 | 2007 | ||||||
| Purchase of business inventory | $ | — | $ | (18,439 | ) | |||
| Sale of business inventory | 1,073 | 27,727 | ||||||
| Net cash provided from sale of business inventory | 1,073 | 9,288 | ||||||
| Cash provided by sellers of business inventory | — | (11,021 | ) | |||||
| Write down to realizable value of inventory | 3,631 | 300 | ||||||
| (Increase) decrease in inventory on balance sheet | $ | 4,704 | $ | (1,433 | ) | |||
15. Statutory Requirements
At June 30, 2008, DB Indemnity, Ltd. was required to maintain a statutory capital and surplus of $120,000. Actual statutory capital and surplus was $2,849,000 and $2,737,000 at June 30, 2008 and December 31, 2007, respectively. Of the actual statutory capital, $120,000 and $120,000, respectively, is fully paid up share capital, and, accordingly, all of the retained earnings and contributed surplus were available for payment of dividends to shareholders.
DB Indemnity, Ltd. was required to maintain relevant assets of at least $3,138,000 and $3,123,000 at June 30, 2008 and December 31, 2007, respectively. At June 30, 2008 and December 31, 2007, relevant assets were $7,030,000 and $6,901,000, respectively. The minimum liquidity ratio was, therefore, met.
At June 30, 2008, The DB Group, Ltd. was required to maintain a statutory capital and surplus of $1,000,000. Actual statutory capital and surplus was $1,536,000 and $1,473,000 at June 30, 2008, and December 31, 2007, respectively. Of the actual statutory capital, $1,102,000 and $1,102,000, respectively, is fully paid up share capital and contributed surplus, and, accordingly, all of the retained earnings were available for payment of dividends to shareholders.
The DB Group, Ltd. was required to maintain relevant assets of at least $9,000 and $35,000 at June 30, 2008 and December 31, 2007, respectively. At June 30, 2008 and December 31, 2007, relevant assets were $1,548,000 and $1,520,000, respectively. The minimum liquidity ratio was, therefore, met.
32
Table of Contents
Traders Insurance Company is a Missouri domiciled property-casualty insurance company and prepares its statutory-basis financial statements in accordance with statutory accounting practices (“SAP”) prescribed or permitted by the Missouri Insurance Department (“MID”).
The Missouri Insurance Department recognizes only statutory accounting practices prescribed or permitted by the state of Missouri for determining and reporting the financial conditions and results of operation of an insurance company, for determining is solvency under the Missouri law. The National Association of Insurance Commissioners (“NAIC”) Accounting Practices and Procedures Manual version effective January 1, 2001 (“NAIC SAP”) has been adopted as a component of prescribed or permitted practices by the state of Missouri. The state has adopted certain prescribed accounting practices which differ from those found in NAIC SAP. Specifically, the practice which impacts Traders Insurance Company is that the state of Missouri does not allow for the admissibility of Electronic Data Processing Equipment unless the aggregate value exceeds $25,000. The Commissioner of Insurance has the right to permit other specific practices which deviate from prescribed practices.
The MID imposes on insurance enterprises minimum risk-based capital (“RBC”) requirements that were developed by the NAIC. Enterprises below specific trigger points or ratios are classified within certain levels, each of which requires specified corrective action. Management believes Traders Insurance Company meets the RBC requirements.
Generations Bank is subject to various regulatory capital requirements administered by the federal banking agencies. Failure to meet minimum capital requirements can initiate certain mandatory and possibly additional discretionary actions by regulators that, if undertaken, could have a direct material effect on the Bank’s financial statements. Under capital adequacy guidelines and the regulatory framework for prompt corrective action, the Bank must meet specific capital guidelines that involve quantitative measures of the Bank’s assets, liabilities, and certain off-balance sheet items as calculated under regulatory accounting practices. The capital amounts and classifications are also subject to qualitative judgments by the regulators about components, risk weightings, and other factors.
Quantitative measures established by regulation to ensure capital adequacy require the Bank to maintain minimum amounts and ratios of tangible capital (as defined in the regulations) to total tangible assets (as defined), total and Tier 1 capital (as defined) to risk-weighted assets (as defined) and of Tier 1 capital (as defined) to adjusted tangible assets (as defined).
Bank management believes that, as of June 30, 2008, the Bank meets all capital adequacy requirements to which it is subject.
33
Table of Contents
In connection with its recent acquisition of the Bank, the Company has committed to maintain the Bank as a “well capitalized” institution, as defined in the regulations promulgated by the Office of Thrift Supervision, for Prompt Corrective Action purposes for the three-year period immediately following the consummation of the acquisition of the Bank. As of June 30, 2008, Bank management believes that the Bank meets the requirements to be well capitalized under the regulatory framework for prompt corrective action. To be categorized as well capitalized, the Bank must maintain tangible capital, core (leverage) capital, and total (risk-based) capital ratios as set forth in the regulations As of December 31, 2007, the most recent notification from the Office of Thrift Supervision categorized the Bank as “well capitalized” under the regulatory framework for prompt corrective action. There are no conditions or events since that notification that management believes have changed the Bank’s category.
The bank’s actual capital amounts and ratios as of June 30, 2008 are presented in the following table:
| To be Well-Capitalized | ||||||||||||||||||||||||
| For Capital | Under Prompt Corrective | |||||||||||||||||||||||
| Actual | Adequacy Purposes | Action Provisions | ||||||||||||||||||||||
| Amount | Ratio | Amount | Ratio | Amount | Ratio | |||||||||||||||||||
| (dollars in thousands) | ||||||||||||||||||||||||
As of June 30, 2008: | ||||||||||||||||||||||||
| Total capital (to risk-weighted assets) | $ | 10,669 | 21.4 | % | $ | 3,985 | 8.0 | % | $ | 4,981 | 10.0 | % | ||||||||||||
| Tier 1 capital (to adjusted tangible assets) | 10,383 | 8.2 | 5,078 | 4.0 | 6,347 | 5.0 | ||||||||||||||||||
| Tangible capital (to tangible assets) | 10,383 | 8.2 | 2,539 | 2.0 | N/A | N/A | ||||||||||||||||||
| Tier 1 capital (to risk-weighted assets) | 10,383 | 20.8 | 1,993 | 4.0 | 2,989 | 6.0 | ||||||||||||||||||
34
Table of Contents
In connection with its acquisition on January 8, 2007, the Bank committed to operating within the parameters of a three-year business plan and submitting quarterly business variance plan reports to the OTS during that timeframe. That business plan presumes that no dividends will be declared during the three-year period.
In connection with the January 18, 2008 transaction with Bank of the West (see Note 11), the Bank committed to operating within the parameters of a revised three-year business plan which reflects the transaction and will continue to submit quarterly business variance plan reports to the OTS through the first quarter of 2010. The Bank also committed to maintaining a minimum Tier 1 (Core) Capital Ratio of 6.5% (which is higher than the 5% level necessary to be considered well-capitalized under prompt corrective action provisions).
The Bank’s management believes that with respect to the current regulations, the Bank will continue to meet its minimum capital requirements in the foreseeable future. However, events beyond the control of the Bank, such as significant changes in interest rates or a downturn in the economy in areas where the Bank has concentrations of loans, could adversely affect future earnings and, consequently, the ability of the Bank to meet its future minimum capital requirements.
The following table shows reconciliation between accounting principles generally accepted in the United States of America (GAAP) capital included in these financial statements and regulatory capital amounts as presented in the previous table (amounts in $1,000s):
| June 30, 2008 | ||||||||||||
| Tangible | Core | Total | ||||||||||
| Capital | Capital | Capital | ||||||||||
GAAP capital | $ | 14,162 | $ | 14,162 | $ | 14,162 | ||||||
| Plus: | ||||||||||||
| Allowance for loan losses | — | — | 286 | |||||||||
| Net unrealized loss on available-for-sale securities | 1,003 | 1,003 | 1,003 | |||||||||
| Less: | ||||||||||||
| Goodwill and core deposit intangible | (4,782 | ) | (4,782 | ) | (4,782 | ) | ||||||
| Regulatory capital | $ | 10,383 | $ | 10,383 | 10,669 | |||||||
In connection with its initial application to acquire the Bank, Brooke Corporation committed to meeting certain minimum consolidated capital-to-assets ratios during the five-year period following the Bank’s acquisition. More specifically, Brooke Corporation committed to maintain a minimum consolidated capital-to-assets ratio of 8% as of its most recent fiscal quarter end, provided that the minimum average consolidated capital-to-assets ratio for the preceding four fiscal quarter ends (including such most recent quarter end) shall not be less than 10%. For purposes of this commitment, both consolidated equity capital and total assets were to be reduced by certain amounts related to the Company’s: (1) intangible assets; (2) retained interests in loan securitizations and (3) interest-only strip receivables. As a result of losses reported by its non-banking subsidiaries during the first and second quarters of 2008, the Company’s consolidated capital-to-assets fell below the 8% minimum amount required as of March 31 and June 30, 2008.
35
Table of Contents
On July 25, 2008, the OTS presented a Memorandum of Understanding (“Memorandum”) for consideration and acceptance by the Boards of Directors of Brooke Corporation (“Brooke”) and Brooke Holdings, Inc. (“BHI”). The Memorandum reaffirmed certain commitments made by Brooke and BHI in connection with the original application for Brooke Bancshares, Inc. (“Bancshares”) to acquire the Bank including the minimum consolidated capital-to-assets ratios for Brooke Corporation discussed above and imposed other conditions. Significant conditions in the Memorandum that would require the prior written notice of non-objection of the OTS include: (1) any transactions involving the Bank and either Brooke or BHI and any subsidiaries of either of them; (2) any capital distribution or similar commitment by the Bank; (3) any dividend or other capital distribution by Brooke or BHI to their owner(s); (4) any purchase or redemption or commitment by either Brooke or BHI or their subsidiaries to purchase or redeem shares of stock and (5) the incurrence of any new debt or the increase or renewal of any existing debt of Brooke or BHI or any of its non-financial subsidiaries (including, but not limited to Bancshares). In addition, Brooke, BHI and Bancshares shall comply with existing regulations requiring the prior notification of the OTS with respect to any proposed appointments to their respective Boards of Directors as well as the employment of any individual as a senior executive officer and that any related employment agreements shall (also) comply with existing regulations.
The Memorandum will require Brooke’s Board of Directors to submit to the OTS for its review and non-objection, a Capital Plan designed to ensure that, by March 31, 2009, and thereafter, that Brooke shall have and maintain equity capital at least in the amount of: (1) 8% of total consolidated assets on a quarter-end basis and (2) 10% of total consolidated assets as an average of each of the last four quarter ends on a rolling basis. For purposes of meeting the capital requirements as of March 31, 2009 and thereafter, Brooke’s equity capital and total assets shall be calculated as reflected in the Company’s consolidated balance sheets and accompanying footnotes and shall be calculated in accordance with generally accepted accounting principles except that each shall be reduced by the sum of: (1) intangible assets, (2) 20% of retained interests in loan securitizations, and (3) 50% of interest-only strip receivables.
Coincident with our reporting as of March 31, 2009, Statement of Financial Accounting Standards (SFAS) No. 160,“Noncontrolling Interests in Consolidated Financial Statements”will become effective and will require presentation of noncontrolling (minority) interests as a part of consolidated stockholders’ equity. If SFAS No. 160 were effective as of June 30, 2008, minority interests of $31,029,000 would have been reported as a part of the Company’s total consolidated stockholders’ equity. Measured in this manner, Brooke’s adjusted equity capital would have represented 5.8% of its total adjusted consolidated assets as of June 30, 2008 and would have represented 13.4% of its total adjusted consolidated assets as an average of each of the last four quarters then ended (as compared to the 8% and 10% levels, respectively, that the Company will be required to meet at March 31, 2009 and thereafter).
Bancshares is subject to the conditions of a Supervisory Directive dated June 13, 2008 that includes restrictions similar to those imposed by the Memorandum presented to Brooke and BHI on July 25, 2008 with respect to: (1) transactions involving the Bank; (2) dividend or capital distributions by itself or the Bank; (3) purchases or redemptions of its stock; (4) the incurrence of any new debt or the increase or renewal of any existing debt and (5) the appointment of any new Directors or senior executive officers.
Brooke, Brooke Holdings and Bancshares are committed to meeting the conditions of the Memorandum and Supervisory Directive, as applicable, and are pursuing various initiatives including: (1) Brooke Corporation’s non-banking subsidiaries have made significant reductions in their respective work forces and taken other related steps to reduce their respective operating costs with the effect of these actions expected to become fully evident during the third and fourth quarters of 2008; (2) Brooke Corporation is actively attempting to sell certain of its insurance and brokerage interests and would use the proceeds from such sales to reduce short-term debt; (3) a shareholders’ “rights” offering is being considered by Brooke Corporation to increase capital and reduce debt; and (4) the sale of some or all of Brooke Corporation’s interest in Aleritas with the intent that Brooke Corporation would no longer control Aleritas (and, thus, would cease to include it in its consolidated reporting). The success and timing of any or all of these initiatives will likely be dependent on improvement in the credit markets that impact our various business lines.
The exclusion of Aleritas from Brooke’s consolidated reporting would eliminate certain assets from the Company’s consolidated balance sheet (i.e. retained interests in loan securitizations and interest-only strip receivables) that currently must be deducted from its consolidated equity capital for purposes of meeting the OTS’ minimum capital requirements for Brooke.
Failure to meet the conditions of the Memorandum or Supervisory Directive, including the capital levels of Brooke Corporation, could result in the OTS taking further regulatory actions, such as a supervisory agreement, cease-and-desist orders and civil monetary penalties. The OTS could also require us to sell assets, which could negatively impact our financial results. At this time, the financial impact, if any, of additional regulatory actions cannot be determined.
36
Table of Contents
16. Commitments and Contingencies
The financial statements do not reflect various commitments and contingencies which arise in the normal course of Generations Bank’s business. These commitments and contingencies which represent credit risk, interest rate risk, and liquidity risk, consist of commitments to extend credit, unsecured lending, and litigation arising in the normal course of business.
Commitments, which are disbursed subject to certain limitations, extend over periods of time with the majority of executed commitments disbursed within a twelve-month period. As of June 30, 2008, the Bank had no outstanding loan commitments to originate adjustable-rate loans.
Commitments to extend credit are agreements to lend to customers as long as there is no violation of any condition established in the contract. Commitments generally have fixed expiration dates or other termination clauses and may require payment of a fee. The Bank evaluates each customer’s creditworthiness on a case-by-case basis. The same credit policies are used in granting lines of credit as for on-balance sheet instruments. As of June 30, 2008 the Bank had commitments to lend to customers’ unused commercial and consumer lines of credit of approximately $1,617,000 and $1,379,000, respectively.
At June 30, 2008, there were no outstanding commitments to sell mortgage loans.
As discussed in Note 11, in December 2006, the Company closed on a Stock Purchase and Sale Agreement with Brooke Capital Corporation, pursuant to which, among other things, the Company acquired approximately 55% of Brooke Capital common stock then outstanding in exchange for $3 million in cash and the execution of a brokerage agreement. The 2006 Stock Purchase and Sale Agreement provides that the Company shall pay to Brooke Capital up to $6 million as additional consideration for such shares if $6 million of pretax profits are not generated over a three-year period by Brooke Capital Advisors, Inc. in accordance with the following schedule: (1) at least $1,500,000 of pretax profits during the twelve-months ended September 30, 2007; (2) at least $2,000,000 of pretax profits during the twelve-months ended September 30, 2008; and (3) at least $2,500,000 of pretax profits during the twelve-months ended September 30, 2009. Since acquiring a controlling interest in Brooke Capital in December 2006, Brooke Capital Advisors has reported $7,773,000 and $1,084,000 in pre-tax profits during 2007 and 2006, respectively. During the first six months of 2008, Brooke Capital Advisors reported a pretax loss of $905,000.
Various lawsuits have arisen in the ordinary course of the Company’s business. In each of the matters and collectively, the Company believes the ultimate resolution of such litigation will not result in any material adverse impact to the financial condition, operations or cash flows of the Company.
17. Foreign Currency Translation
In March 2005, the Company formed a New Brunswick, Canada subsidiary, Brooke Canada Funding, Inc. Until February 2006, the subsidiary conducted limited operations and did not own any assets. During February 2006, a $10,000,000(Canadian dollars)line of credit was established with the Canadian Branch of Fifth Third Bank, as disclosed in Note 4. The current operation of Brooke Canada Funding, Inc. consists of the funding of loans in Canada for the Company.
The financial position and results of operations of the Canadian subsidiary are determined using local currency, Canadian dollars, as the functional currency. Assets and liabilities of the subsidiary are translated at the exchange rate in effect at each period end. Income statement accounts are translated at the weighted average rate of exchange during the period. Translation adjustments arising from the use of different exchange rates from period to period are included in the cumulative translation adjustment included in accumulated other comprehensive income within shareholders’ equity as detailed below.
| Six Months Ended | ||||
| June 30, | ||||
| 2008 | ||||
| Gross translation adjustment | $ | (81 | ) | |
| Deferred taxes on the above | 31 | |||
| Net impact on accumulated other comprehensive income | $ | (50 | ) | |
18. New Accounting Standards
Fair Value Option and Fair Value Measurement- In September 2006, the Financial Accounting Standards Board (“FASB”) issued Statement No. 157,“Fair Value Measurements.”This statement defines fair value, establishes a framework for measuring fair value and expands disclosures about fair value measurements. The statement establishes a fair value hierarchy about the assumptions used to measure fair value and clarifies assumptions about risk and the effect of a restriction on the sale or use of an asset. The standard is effective for fiscal years beginning after November 15, 2007. In February 2008, the FASB issued FASB Staff Position (FSP) No. FAS 157-2,“Effective Date of FASB Statement No. 157.”This FSP delays the effective date of FAS 157 for all nonfinancial assets and nonfinancial liabilities, except those that are recognized or disclosed at fair value on a recurring basis (at least annually) to fiscal years beginning after November 15, 2008, and interim periods within those fiscal years. The impact of adoption was not material.
37
Table of Contents
Fair Value Measurement- Statement 157 defines fair value as the exchange price that would be received for an asset or paid to transfer a liability (an exit price) in the principal or most advantageous market for the asset or liability in an orderly transaction between market participants on the measurement date. Statement 157 also establishes a fair value hierarchy which requires an entity to maximize the use of observable inputs and minimize the use of unobservable inputs when measuring fair value. The standard describes three levels of inputs that may be used to measure fair value:
| • | Level 1:Quoted prices (unadjusted) or identical assets or liabilities in active markets that the entity has the ability to access as of the measurement date. |
| • | Level 2:Significant other observable inputs other than Level 1 prices, such as quoted prices for similar assets or liabilities, quoted prices in markets that are not active and other inputs that are observable or can be corroborated by observable market data. |
| • | Level 3:Significant unobservable inputs that reflect a company’s own assumptions about the assumptions that market participants would use in pricing an asset or liability. |
To estimate fair value of its available-for-sale Investment Securities, the Company obtains quoted prices provided by nationally recognized securities exchanges or matrix pricing, which is a mathematical technique used widely in the industry to value debt securities without relying exclusively on quoted prices for the specific securities, but rather by relying on the securities’ relationship to other benchmark quoted securities.
In August 2005, the FASB issued an exposure draft which amends Statement of Financial Accounting Standards No. 140, “Accounting for Transfers and Servicing of Financial Assets and Extinguishments of Liabilities.” This exposure draft seeks to clarify the derecognition requirements for financial assets and the initial measurement of interests related to transferred financial assets that are held by a transferor. The Company’s off-balance sheet transactions could be required to be reported consistent with the provisions of the exposure draft. Aleritas will continue to monitor the status of the exposure draft and consider what changes, if any, could be made to the structure of the securitizations and off-balance sheet financings to continue to exclude loans transferred to these qualifying special purpose entities.
In April 2008 the FASB decided to remove the qualifying special-purpose entity concept from Statement of Financial Accounting Standards No. 140,“Accounting for Transfers and Servicing of Financial Assets and Extinguishments of Liabilities”and simultaneously remove the QSPE exception from consolidation in FASB Interpretaion No. 46 (revised December 2003), “Consolidation of Variable Interest Entitites”.FASB also decided to amend Paragraph 9(a) to explicitly require preparers assessing legal isolation to consider all involvements with the transferred asset by entities within the consolidated group; and Paragraph 9(c) to prohibit sale accounting if the transferor has imposed a constraint on the transferee. The primary potential consequences of the tentative decision are that transferors would have to evaluate whether to consolidate any entity to which the assets are “sold” if the transferor retains an economic interest in the transferred assets, and that transfers would not be accounted for as sales if the transferor imposes a constraint on the transferee under any circumstances. An exposure draft of proposed requirements is planned by the end of June 2008, and a final Statement is planned to be effective for periods beginning after December 15, 2008. Aleritas will monitor the status of the exposure draft and consider what changes, if any, could be make to the structure of the securitizations and off-balance sheet financings to continue to exclude loans transferred to these qualifying special purpose entities. At June 30, 2008, the qualifying special purpose entities held loans totaling $307,117,000 which could be required to be shown on the financial statements depending on the outcome of the exposure draft.
38
Table of Contents
On February 20, 2008, the FASB issued Staff Position (FSP) 140-3, “Accounting for Transfers of Financial Assets and Repurchase Financing Transactions,” (“FSP 140-3”). The FSP focuses on the circumstances that would permit a transferor and a transferee to separately evaluate the accounting for a transfer of a financial asset and a repurchase financing under SFAS 140. The FSP states that a transfer of a financial asset and a repurchase agreement involving the transferred financial asset should be considered part of the same arrangement when the counterparties to the two transactions are the same unless certain criteria are met. The criteria in the FSP are intended to identify whether (1) there is a valid and distinct business or economic purpose for entering separately into the two transactions and (2) the repurchase financing does not result in the initial transferor regaining control over the previously transferred financial assets. Its purpose is to limit diversity of practice in accounting for these situations, resulting in more consistent financial reporting. Consequently, it is the FASB’s desire to have the FSP effective as soon as practicable. This FSP would be effective for financial statements issued for fiscal years beginning after November 15, 2008 and interim periods within those fiscal years. Early application is not permitted. The Company is in the process of evaluating the impact of the position on its financial statements.
In December 2007, the FASB issued SFAS No. 141 (revised 2007), “Business Combinations.” This statement establishes principles and requirements for how an acquirer recognizes and measures tangible assets acquired, liabilities assumed, goodwill and any noncontrolling interests and identifies related disclosure requirements for business combinations. Measurement requirements will result in all assets, liabilities, contingencies and contingent consideration being recorded at fair value on the acquisition date, with limited exceptions. Acquisition costs and restructuring costs will generally be expensed as incurred. This statement is effective for the Company for business combinations in which the acquisition date is on or after January 1, 2009. Management is currently assessing what impact, if any, the application of this standard could have on the Company’s results of operations and financial position.
In December 2007, the FASB issued SFAS No. 160, “Noncontrolling Interests in Consolidated Financial Statements.” This statement amends ARB 51 to establish accounting and reporting standards for the noncontrolling interest in a subsidiary and for the deconsolidation of a subsidiary. Minority interests will be recharacterized as noncontrolling interests and classified as a component of equity. This statement is effective for the Company beginning on January 1, 2009. It is not expected that adoption of this statement will have a material impact on the operating results or financial condition of the Company. However, if this statement were effective at June 30, 2008, the Company’s $31,029,000 in minority interests would be reclassified as a component of the Company’s stockholders’ equity.
19. Reclassifications
Certain accounts in the prior period financial statements have been reclassified for comparative purposes to conform with the presentation in the current year financial statements.
20. Discontinued Operation
On July 18, 2008, Brooke Capital entered into an agreement to sell its wholly owned life insurance subsidiary, First Life America Corporation (“First Life” or “FLAC”) to First Trinity Financial Corporation. During the second quarter 2008, Brooke Capital had committed to a plan to sell First Life. Accordingly, as of June 30, 2008, First Life has been presented as a discontinued operation and its assets and liabilities being sold are presented as held-for-sale in the Company’s consolidated financial statements. All periods presented have been reclassified to reflect this discontinued operation.
(a) Financial Statement Presentation
At June 30, 2008, no impairment charges have been required in connection with our assessment of the assets and liabilities of the discontinued operation. The Company’s reported results for the discontinued operation do not include the allocation of interest expense on debt that will be repaid as a result of the sale as such debt was not incurred for or otherwise used in connection with the life insurance subsidiary’s operation. No other consolidated interest expense was allocated to the discontinued operation for the periods ended June 30, 2008 and 2007.
The major classes of assets and liabilities reported as held-for-sale are as follows:
| (unaudited) | (unaudited) | |||||||
| June 30, 2008 | December 31, 2007 | |||||||
| Cash | $ | 1,210 | $ | 459 | ||||
| Investment securities available-for-sale | 18,675 | 18,867 | ||||||
| Other current assets | 6,975 | 6,661 | ||||||
Total Current Assets | 26,860 | 25,987 | ||||||
| Net Property and Equipment | 2,693 | 2,718 | ||||||
| Deferred charges, net | 5,503 | 5,406 | ||||||
Total Assets | 35,056 | 34,111 | ||||||
| Future annuity benefits | 19,565 | 18,735 | ||||||
| Future policy benefits | 7,580 | 7,035 | ||||||
| Other current liabilities | 931 | 873 | ||||||
Total Liabilities | 28,076 | 26,643 | ||||||
Net Assets | $ | 6,980 | $ | 7,468 | ||||
39
Table of Contents
The unaudited financial results of the discontinued operation are as follows (in thousands):
| 2008 | 2008 | |||||||||||||||||||||||
| Three Months | Three Months | % Increase | Six Months | Six Months | % Increase | |||||||||||||||||||
| Ended | Ended | (decrease) | Ended | Ended | (decrease) | |||||||||||||||||||
| June 30, 2008 | June 30, 2007 | over 2007 | June 30, 2008 | June 30, 2007 | over 2007 | |||||||||||||||||||
| (in thousands) | (in thousands) | |||||||||||||||||||||||
REVENUES | ||||||||||||||||||||||||
| Insurance premiums earned | $ | 898 | $ | 849 | 6 | % | $ | 2,000 | $ | 1,922 | 4 | % | ||||||||||||
| Interest income | 408 | 352 | 16 | 805 | 667 | 21 | ||||||||||||||||||
| Other income | 61 | 60 | 2 | 121 | 124 | (3 | ) | |||||||||||||||||
Total revenues | 1,367 | 1,261 | 8 | 2,926 | 2,713 | 8 | ||||||||||||||||||
EXPENSES | ||||||||||||||||||||||||
| Commission expense | 49 | 50 | (2 | ) | 104 | 109 | (5 | ) | ||||||||||||||||
| Payroll expense | 134 | 116 | 16 | 312 | 240 | 30 | ||||||||||||||||||
| Depreciation and amortization | 195 | 212 | (8 | ) | 385 | 394 | (2 | ) | ||||||||||||||||
| Other expenses | 933 | 667 | 40 | 2,046 | 1,747 | 17 | ||||||||||||||||||
Total expenses | 1,311 | 1,045 | 25 | 2,847 | 2,490 | 14 | ||||||||||||||||||
Income from discontinued operation | $ | 56 | 216 | (74 | ) | 79 | 223 | (65 | ) | |||||||||||||||
(b) Investments
First Life classifies all of its fixed maturity and equity investments as available-for-sale. Available-for-sale fixed maturities are carried at fair value with unrealized gains and losses, net of applicable taxes, reported in other comprehensive income. Equity securities are carried at fair value with unrealized gains and losses, net of applicable taxes, reported in other comprehensive income. Realized gains and losses on sales of investments are recognized in operations on the specific identification basis. Interest earned on investments is included in net investment income.
The amortized cost and fair value of investments at June 30, 2008 were $19,982,000 and $18,675,000, respectively. Gross unrealized gains and losses at that date were $79,000 and $1,386,000, respectively.
The amortized cost and fair value of investments at December 31, 2007 were $19,465,000 and $18,867,000, respectively. Gross unrealized gains and losses at that date were $157,000 and $755,000, respectively.
The fair values for investments in fixed maturities are based on quoted market prices.
Included in investments are securities, which have been pledged to various state insurance departments. The fair values of these securities were $2,292,000 and $2,279,000 at June 30, 2008 and December 31, 2007, respectively.
During the six-month period ended June 30, 2008, First Life had $1,000 in gross realized investment gains. During the six-month period ended June 30, 2007, First Life had no gross realized investment gains.
The components of other comprehensive loss and related tax effects during the six-month periods ended June 30, 2008 and 2007 are as follows (in thousands):
| Six-Month Periods Ended | ||||||||
| June 30, | ||||||||
| 2008 | 2007 | |||||||
| Unrealized holding losses on available-for-sale securities: | ||||||||
| Unrealized holding gains (losses) during the period | $ | (708 | ) | $ | (432 | ) | ||
| Less: Reclassification adjustment for gains included in net income | 1 | — | ||||||
| Tax benefit | 142 | 87 | ||||||
| Other comprehensive income (loss) | $ | (567 | ) | $ | (345 | ) | ||
40
Table of Contents
(c) Other Current Assets
First Life has purchased certain lottery prize cash flows, representing the assignments of the future payment rights from lottery winners at a discounted price. Payments on these cash flows will be made by state run lotteries and as such are backed by the general credit of the respective states. At June 30, 2008 and December 31, 2007, the carrying value of these other assets was approximately $3,816,000 and $3,527,000, respectively. Also included in other current assets are certain deposits and prepaid and other current amounts. The carrying values of these other assets approximates their fair values.
(d) Property and Equipment
Property and equipment represents the land, building and furniture, fixtures and equipment used in the discontinued operation’s location in Topeka, Kansas. Approximately 12,500 of the 20,000 square feet of space is leased to two tenants and those leases run through 2010 and 2011. Depreciation expense recorded was approximately $44,000 and $35,000, respectively, during the six month periods ended June 30, 2008 and 2007.
(e) Deferred Policy Acquisition Costs
Deferred policy acquisition costs at June 30, 2008 and December 31, 2007 were as follows (in thousands):
| June 30, 2008 | December 31, 2007 | |||||||
| Deferred policy acquisition costs | $ | 11,017 | $ | 10,579 | ||||
| Accumulated amortization | (5,514 | ) | (5,173 | ) | ||||
| Net | $ | 5,503 | $ | 5,406 | ||||
Deferred policy acquisition costs amortization of $341,000 and $359,000 was recorded during the six-month periods ended June 30, 2008 and 2007, respectively.
(f) Policy and Contract Liabilities
Annuity contract liabilities (future annuity benefits) are computed using the retrospective deposit method and consist of policy account balances before deduction of surrender charges, which accrue to the benefit of policyholders. Premiums received on annuity contracts are recognized as an increase in a liability rather than premium income. Interest credited on annuity contracts is recognized as an expense.
Traditional life insurance policy benefit liabilities (future policy benefits) are computed on a net level premium method using assumptions with respect to current yield, mortality, withdrawal rates and other assumptions deemed appropriate by First Life.
Policy claim liabilities represent the estimated liabilities for claims reported plus claims incurred but not yet reported. The liabilities are subject to the impact of actual payments and future changes in claim factors.
Policyholder premium deposits represent premiums received for payment of future premiums on existing policyholder contracts. The premium deposits are recognized as an increase in a liability rather than premium income. Interest credited on the premium deposits is recognized as an expense.
(g) Income Taxes
Deferred tax assets and liabilities are recorded to recognize the future tax consequences of temporary differences between financial reporting amounts and the tax basis of existing assets and liabilities based on currently enacted tax laws and tax rates in effect for the years in which the differences are expected to reverse. Significant components of First Life’s deferred taxes at June 30, 2008 would include a deferred tax liability of $920,000 related to its deferred policy acquisition costs and deferred tax assets of $155,000 and $261,000 related to its net operating loss carry forwards and net unrealized losses on available-for-sale investment securities, respectively.
41
Table of Contents
As of December 31, 2007, First Life had operating loss carryforwards of $833,000 from life insurance operations and were generated either during or subsequent to the base period for tax consolidation purposes. These loss carryforwards expire in 2022 through 2025. Capital loss carryforwards of $37,000 will expire in 2009 and 2010.
First Life was included in Brooke Capital’s consolidated federal income tax return for the year ended December 31, 2006 and would also be included for the period ended November 15, 2007 (the effective date of Brooke Capital’s merger with Brooke Franchise). First Life is taxed as a life insurance company under the provisions of the Internal Revenue Code and will be required to file a separate tax return for the five years following the November 15, 2007 merger transaction.
(h) Statutory Requirements
The discontinued operation, First Life America Corporation (“First Life”), prepares its statutory-basis financial statements in accordance with statutory accounting practices (“SAP”) prescribed or permitted by the Kansas Insurance Department (“KID”). Currently, “prescribed” statutory accounting practices include state insurance laws, regulations, and general administrative rules, as well as the National Association of Insurance Commissioners (“NAIC”) Accounting Practices and Procedures Manual and a variety of other NAIC publications. “Permitted” statutory accounting practices encompass all accounting practices that are not prescribed; such practices may differ from state to state, may differ from company to company within a state, and may change in the future. During 1998, the NAIC adopted codified statutory accounting principles (“Codification”). Codification replaced the NAIC Accounting Practices and Procedures Manual and was effective January 1, 2001. The impact of Codification was not material to First Life’s statutory-basis financial statements.
Principal differences between GAAP and SAP include: (a) costs of acquiring new policies are deferred and amortized for GAAP; (b) benefit reserves are calculated using more realistic investment, mortality and withdrawal assumptions for GAAP; (c) statutory asset valuation reserves are not required for GAAP; and (d) available-for-sale fixed maturity investments are reported at fair value with unrealized gains and losses reported as a separate component of shareholders’ equity for GAAP.
Statutory restrictions limit the amount of dividends, which may be paid by First Life to the Company. Generally, dividends during any year may not be paid without prior regulatory approval, in excess of the lesser of (a) 10% of statutory shareholders’ surplus as of the preceding December 31 or (b) statutory net operating income for the preceding year. In addition, First Life must maintain the minimum statutory capital and surplus required for life insurance companies in those states in which it is licensed to transact life insurance business.
The KID imposes on insurance enterprises minimum risk-based capital (“RBC”) requirements that were developed by the NAIC. The formulas for determining the amount of RBC specify various weighing factors that are applied to financial balances or various levels of activity based on the perceived degree of risk. Regulatory compliance is determined by ratio of the enterprises regulatory total adjusted capital, as defined by the NAIC, to its authorized control level RBC, as defined by the NAIC. Enterprises below specific trigger points or ratios are classified within certain levels, each of which requires specified corrective action. First Life has a ratio that is in excess of the minimum RBC requirements; accordingly, the Company’s management believes that First Life meets the RBC requirements.
(i) Reinsurance
In order to reduce the risk of financial exposure to adverse underwriting results, insurance companies reinsure a portion of their risks with other insurance companies. First Life has entered into agreements with Optimum Re Insurance Company (“Optimum Re”) of Dallas, Texas, and Wilton Reassurance Company (“Wilton Re”) of Wilton, CT, to reinsure portions of the life insurance risks it underwrites. Pursuant to the terms of the agreements, First Life retains a maximum coverage exposure of $50,000 on any one insured.
Pursuant to the terms of the agreement with Optimum Re, First Life generally pays no reinsurance premiums on first year individual business. However, SFAS No. 113, “Accounting and Reporting for Reinsurance of Short-Duration and Long-Duration Contracts,” requires the unpaid premium to be recognized as a first year expense and amortized over the estimated life of the reinsurance policies. First Life records this unpaid premium as “reinsurance premiums payable” in the accompanying balance sheet and as “reinsurance premiums ceded” in the accompanying income statement. To the extent that the reinsurance companies are unable to fulfill their obligations under the reinsurance agreements, First Life remains primarily liable for the entire amount at risk.
First Life is party to an Automatic Retrocession Pool Agreement (the “Reinsurance Pool”) with Optimum Re, Catholic Order of Foresters, American Home Life Insurance Company and Woodmen of the World. The agreement provides for automatic retrocession of coverage in excess of Optimum Re’s retention on business ceded to Optimum Re by the other parties to the Reinsurance Pool. First Life’s maximum exposure on any one insured under the Reinsurance Pool is $50,000.
42
Table of Contents
(j) Other Regulatory Matters
First Life is currently licensed to transact life and annuity business in the states of Kansas, Texas, Illinois, Oklahoma, North Dakota, Kentucky and Nebraska. Due to the varied processes of obtaining admission to write business in new states, management cannot reasonably estimate the time frame of expanding its marketing presence.
On May 3, 2007, First Life was released from its Memorandum of Understanding with the Ohio Department of Insurance. First Life’s license had been previously suspended as its statutory capital had fallen below the minimum required level in Ohio of $2,500,000. While the license had been reinstated during 2006, the Company had been prohibited from writing new business in that state while under the Memorandum. At December 31, 2007, First Life’s statutory basis capital and surplus was $3,801,000, which is in excess of the aforementioned minimum requirement.
21. Subsequent Event
On July 18, 2008, Brooke Capital entered into a Stock Purchase Agreement (the “Agreement”) to sell its wholly-owned life insurance subsidiary, First Life America Corporation, to First Trinity Financial Corporation for a purchase price not to exceed $8,000,000 in cash, as adjusted in accordance with the Agreement. The transaction is subject to approval by the Kansas Insurance Department. Proceeds from the sale will be used to reduce short-term debt. As of June 30, 2008, First Life has been presented as a discontinued operation and its assets and liabilities being sold are presented as held-for-sale in the Company’s consolidated financial statements. All periods presented have been reclassified to reflect this discontinued operation. See Note 20 for additional information.
43
Table of Contents
Item 2. Management’s Discussion and Analysis of Financial Condition and Results of Operations.
Amounts in this section have been rounded to the nearest thousand, except percentages, ratios, per share data, numbers of franchise locations and numbers of businesses. Unless otherwise indicated, or unless the context otherwise requires, references to years in this section mean our fiscal years ended December 31.
Forward-Looking Information
We caution you that this report on Form 10-Q for the six month period ended June 30, 2008 includes “forward-looking statements” within the meaning of the Private Securities Litigation Reform Act of 1995 and is subject to the safe harbor created by that Act. Among other things, these statements relate to our financial condition, results of operations and business. These forward-looking statements are generally identified by the words or phrases “will,” “will allow,” “will continue,” “would,” “would be,” “expect,” “expect to,” “intend,” “intend to,” “anticipate,” “is anticipated,” “foresee,” “estimate,” “plan,” “may,” “believe,” “implement,” “build,” “project” or similar expressions and references to strategies or plans. While we provide forward-looking statements to assist in the understanding of our anticipated future financial performance, we caution readers not to place undue reliance on any forward-looking statements, which speak only as of the date that we make them. Forward-looking statements are subject to significant risks and uncertainties, many of which are beyond our control. Although we believe that the assumptions underlying our forward-looking statements are reasonable, any of the assumptions could prove to be inaccurate. Actual results may differ materially from those contained in or implied by these forward-looking statements for a variety of reasons. These risks and uncertainties are discussed in more detail in our annual report on Form 10-K for the fiscal year ended December 31, 2007, in our other filings with the Securities and Exchange Commission and in this section of this report and include, but are not limited to:
| • | prevailing economic conditions, either nationally or locally in some or all areas in which we conduct business or conditions in the securities markets or the banking industry; | |
| • | changes in interest rates, deposit flows, loan demand, real estate values and competition, which can materially affect, among other things, consumer banking revenues, origination levels in our lending businesses and the level of defaults, losses and prepayments on loans made by us, whether held in portfolio or sold in the secondary markets; | |
| • | operational issues and/or capital spending necessitated by the potential need to adapt to industry changes in information technology systems, on which our banking segment is highly dependent; | |
| • | changes in accounting principles, policies, and guidelines; changes in any applicable law, rule, regulation or practice with respect to tax or legal issues; risks and uncertainties related to mergers and related integration and restructuring activities; conditions in the securities markets or the banking industry; | |
| • | our borrowers’ financial performance and their potential ability to repay amounts due to us; | |
| • | inability to fund our loans through sales to third parties; | |
| • | certain assumptions regarding the profitability of our securitizations, loan participations, warehouse lines of credit and other funding vehicles, which may not prove to be accurate; | |
| • | the value of the collateral securing our loans; | |
| • | potential litigation and regulatory proceedings regarding commissions, fees, contingency payments, profit sharing and other compensation paid to brokers or agents; | |
| • | dependence on key personnel; and |
44
Table of Contents
| • | the level of expenditures required to comply with the Sarbanes-Oxley Act and the potential material adverse effects of not complying with the Sarbanes-Oxley Act; |
| • | potential inability to accurately report our financial results or prevent fraud if we fail to maintain an effective system of internal controls; |
| • | potentially inadequate reserves for credit losses; |
| • | the maturity of significant liabilities during future months and uncertainties in the current economic environment may adversely affect our ability to repay, renew or extend those liabilities; |
| • | collateral values supporting loans to Brooke franchisees may deteriorate if Brooke Capital Corporation is not able to assist with management and liquidation of troubled insurance agencies; |
| • | potential inability of DB Indemnity to pay claims made on financial guaranty policies issued to affiliates; |
| • | failure to resolve potential breaches of our agreements and our affiliates agreements with Fifth Third Bank, First State Bank, DZ Bank and Textron; |
| • | potentially increased expenses or restrictions in our operations resulting from competition in highly regulated industries; |
| • | failure of pending transactions involving our subsidiaries to close or to close when expected; |
| • | changes in economic, political and regulatory environments, governmental policies, laws and regulations, including changes in accounting policies and standards and taxation requirements (such as new tax laws and new or revised tax law interpretations) that could materially adversely affect our operations and financial condition; |
| • | general credit market conditions and the share price of our publicly-traded subsidiaries, Aleritas Capital Corp. and Brooke Capital Corporation could make sales of our interests in those companies difficult or unacceptable, which would have a material and adverse affect on our ability to service our debt; and |
| • | general credit market conditions could prevent us from extending the maturities of our short term debt, which extension may be required if we are unable to sell assets or interests in our publicly-traded subsidiaries. |
We expressly disclaim any obligation to update or revise any of these forward-looking statements, whether because of future events, new information, a change in our views or expectations, or otherwise. We make no prediction or statement about the market performance of our shares of common stock.
General
We are a holding company focusing on investments in the insurance, banking and financial services industries with holdings in two public companies, Brooke Capital Corporation (AMEX: BCP) and Aleritas Capital Corp. (OTCBB: BRCR), and two wholly-owned private companies, Brooke Bancshares, Inc. and Brooke Brokerage Corporation.
Our operating expenses are paid from administrative and servicing fees paid by our subsidiaries. Our debt is serviced from the sale of assets, particularly the sale of stock in Aleritas and Brooke Capital.
Brooke Bancshares, Inc.Brooke Bancshares, a wholly-owned subsidiary, owns Generations Bank, formerly Brooke Savings Bank, which sells banking products and services primarily through contracted banker agents who are paid commissions for customer referrals.
Brooke Brokerage Corporation.Brooke Brokerage, a wholly-owned subsidiary, owns CJD & Associates, LLC which brokers hard-to-place property and casualty insurance policies and life insurance policies on a wholesale basis primarily through independent insurance agents.
Brooke Capital Corporation.Brooke Capital, a 66%-owned subsidiary, owns Brooke Investments, Inc. an independent insurance agency franchisor and Brooke Capital Advisors, Inc., a consultant to insurance agency borrowers.
Continued difficulty in the general credit markets has required the Company to forego committing capital for insurance company operations. Accordingly, the Company and Brooke Capital have been exploring strategic alternatives, including the potential sale of First Life and either the termination of an Exchange Agreement with Brooke Capital (for its acquisition of Delta Plus) or the sale of Delta Plus by Brooke Capital if the Exchange Agreement is completed. During the second quarter of 2008, Brooke Capital committed to a plan to sell First Life and, accordingly, it has been presented as a discontinued operation as discussed below.
45
Table of Contents
Aleritas Capital Corp.Aleritas, a 62%-owned subsidiary, is a finance company that lends to businesses that sell insurance and related services.
On July 18, 2008, Brooke Capital entered into an agreement to sell its wholly owned life insurance subsidiary, First Life America Corporation, to First Trinity Financial Corporation. At June 30, 2008, this part of our insurance segment has been presented as a discontinued operation and its assets and liabilities being sold are presented as held-for-sale in the Company’s consolidated financial statements. No impairment charges have been required in connection with our assessment of the assets and liabilities of the discontinued operation. That operation continues to conduct business as it has in the past, generating revenues from the issuance of life insurance and annuity policies sold by independent insurance agents through First Life America Corporation, a Kansas domiciled life insurance company subsidiary.
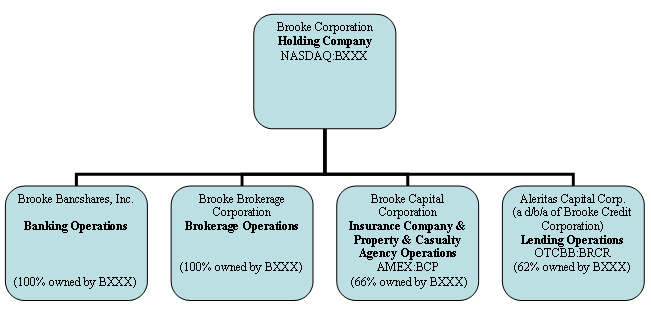
Results of Operations
Sometime during the remainder of 2008 we expect our 62% ownership interest in Aleritas and our 66% ownership interest in Brooke Capital to each be reduced to less than 50%. As a result of this and other circumstances, we expect to discontinue consolidating the financial results of Aleritas and Brooke Capital into our financial statements. This will result in a significant future reduction of recorded revenues, expenses, assets and liabilities. Thereafter our results of operations will likely be limited to banking operations, which are conducted by Generations Bank. However, the following table shows income and expenses (in thousands, except percentages and per share data) from continuing operations for the three months and six months ended June 30, 2008 and 2007, and the percentage change from period to period including 100% of the revenues, expenses, assets and liabilities of Aleritas and Brooke Capital. As separate public companies, separate filings have been made, and will be made, with the SEC by Aleritas and Brooke Capital.
| 2008 | 2008 | |||||||||||||||||||||||
| Three months | Three months | % Increase | Six months | Six months | % Increase | |||||||||||||||||||
| Ended | Ended | (decrease) | Ended | Ended | (decrease) | |||||||||||||||||||
| June 30, 2008 | June 30, 2007 | over 2007 | June 30, 2008 | June 30, 2007 | over 2007 | |||||||||||||||||||
Operating Revenues | ||||||||||||||||||||||||
| Insurance commissions | $ | 27,967 | $ | 28,326 | (1 | )% | $ | 62,280 | $ | 61,062 | 2 | % | ||||||||||||
| Interest income (net) | 7,263 | 6,191 | 17 | 15,399 | 14,244 | 8 | ||||||||||||||||||
| Consulting fees | 3 | 4,415 | (100 | ) | 256 | 4,730 | (95 | ) | ||||||||||||||||
| Gain on sale of businesses | (3,631 | ) | 1,161 | (413 | ) | (4,477 | ) | 1,842 | (343 | ) | ||||||||||||||
| Initial franchise fees for basic services | — | 7,095 | (100 | ) | 1,320 | 19,965 | (93 | ) | ||||||||||||||||
| Initial franchise fees for buyers assistance plans | — | 70 | (100 | ) | — | 455 | (100 | ) | ||||||||||||||||
| Gain on sale of notes receivable | (1,728 | ) | 4,284 | (140 | ) | (1,629 | ) | 11,206 | (115 | ) | ||||||||||||||
| Insurance premiums earned | 2,544 | 3,191 | (20 | ) | 5,212 | 3,266 | 60 | |||||||||||||||||
| Policy fee income | 131 | 153 | (14 | ) | 245 | 256 | — | |||||||||||||||||
| Impairment loss | — | — | — | (11,763 | ) | — | — | |||||||||||||||||
| Loss on sale of assets | (1,323 | ) | (15 | ) | 8,720 | (1,323 | ) | (31 | ) | 4,168 | ||||||||||||||
| Other income | 595 | 283 | 110 | 975 | 530 | 84 | ||||||||||||||||||
| Total operating revenues | 31,821 | 55,154 | (42 | ) | 66,495 | �� | 117,525 | (43 | ) | |||||||||||||||
Operating Expenses | ||||||||||||||||||||||||
| Commission expense | 22,466 | 22,260 | 1 | 47,705 | 45,378 | 5 | ||||||||||||||||||
| Payroll expenses | 7,445 | 8,831 | (16 | ) | 16,901 | 16,597 | 2 | |||||||||||||||||
| Depreciation and amortization expense | 1,328 | 809 | 64 | 2,712 | 1,616 | 68 | ||||||||||||||||||
| Insurance loss and loss expense | 1,111 | 2,227 | (50 | ) | 2,193 | 2,554 | (14 | ) | ||||||||||||||||
| Provision for losses | 10,534 | 1,485 | 609 | 23,424 | 5,202 | 351 | ||||||||||||||||||
46
Table of Contents
| 2008 | 2008 | ||||||||||||||||||||||||
| Three months | Three months | % Increase | Six months | Six months | % Increase | ||||||||||||||||||||
| Ended | Ended | (decrease) | Ended | Ended | (decrease) | ||||||||||||||||||||
| June 30, 2008 | June 30, 2007 | over 2007 | June 30, 2008 | June 30, 2007 | over 2007 | ||||||||||||||||||||
| Other operating expenses | 10,471 | 11,394 | (8 | ) | 27,957 | 22,751 | 23 | ||||||||||||||||||
| Other operating interest expense | 652 | 368 | 77 | 1,413 | 2,033 | (30 | ) | ||||||||||||||||||
| Total operating expenses | 54,007 | 47,374 | 14 | 122,305 | 96,131 | 27 | |||||||||||||||||||
Income (loss) from continuing operations | (22,186 | ) | 7,780 | (385 | ) | (55,810 | ) | 21,394 | (361 | ) | |||||||||||||||
| Interest expense | 2,500 | 2,730 | (8 | ) | 5,571 | 5,390 | 3 | ||||||||||||||||||
| Loss on extinguishment of debt | — | — | — | 8,210 | — | — | |||||||||||||||||||
| Minority interest in subsidiary | (5,173 | ) | 760 | (781 | ) | (14,754 | ) | 724 | (2138 | ) | |||||||||||||||
Income (loss) from continuing operations before income taxes | (19,513 | ) | 4,290 | (555 | ) | (54,837 | ) | 15,280 | (459 | ) | |||||||||||||||
| Income tax expenses | (9,374 | ) | 1,800 | (621 | ) | (26,141 | ) | 5,988 | (537 | ) | |||||||||||||||
Net income (loss) from continuing operations | $ | (10,139 | ) | $ | 2,490 | (507 | ) | $ | (28,696 | ) | $ | 9,292 | (409 | ) | |||||||||||
Net income from discontinued operation | 56 | 216 | (74 | )% | 79 | 223 | (65 | )% | |||||||||||||||||
Net income (loss) | $ | (10,083 | ) | 2,706 | (472 | ) | (28,617 | ) | 9,515 | (400 | ) | ||||||||||||||
| Basic and Diluted net income (loss) per share from continuing operations | $ | (.76 | ) | $ | 0.13 | (685 | )% | $ | (2.12 | ) | $ | 0.62 | (442 | )% | |||||||||||
| Basic and Diluted net income (loss) per share from discontinued operation | $ | .01 | $ | 0.02 | (50 | )% | $ | .01 | $ | 0..01 | — | % | |||||||||||||
We incurred a net loss in the second quarter of 2008 primarily as the result of recording our 66% share of losses incurred by Brooke Capital from shrinking its franchise operations.
Payroll expenses, which include wages, salaries, payroll taxes and compensated absences expenses increased primarily as a result of acquiring Generations Bank and Brooke Capital. Payroll expenses, as a percentage of total operating revenue, were approximately 23% and 16%, respectively, for the three months ended June 30, 2008 and 2007 and approximately 25 and 14%, respectively, for the six months ended June 30, 2008 and 2007.
Depreciation and amortization expense also increased primarily as a result of acquiring Delta Plus Holdings, Inc., Generations Bank and Brooke Capital.
Other operating expenses which include advertising, rent, travel, lodging and office supplies, also increased as the result of acquiring Delta Plus, Generations Bank and Brooke Capital. Other operating expenses, as a percentage of total operating revenue, were approximately 56% and 23%, respectively, for the three months ended June 30, 2008 and 2007 and approximately 54 and 24%, respectively, for the six months ended June 30, 2008 and 2007.
The following table shows selected assets and liabilities (in thousands, except percentages) as of June 30, 2008 and December 31, 2007, and the percentage change between those dates.
| 2008 | ||||||||||||
| % Increase | ||||||||||||
| As of | As of | (decrease) | ||||||||||
| June 30, 2008 | December 31, 2007 | over 2007 | ||||||||||
| Investments | $ | 86,609 | $ | 32,020 | 170 | % | ||||||
| Customer receivable | 26,912 | 27,687 | (3 | ) | ||||||||
| Notes receivable | 213,407 | 164,338 | 30 | |||||||||
| Interest earned not collected on notes | 7,950 | 7,132 | 11 | |||||||||
| Other receivables | 6,604 | 5,303 | 25 | |||||||||
| Securities | 71,050 | 89,634 | (21 | ) | ||||||||
| Deferred charges | 2,740 | 5,904 | (54 | ) | ||||||||
| Accounts payable | 45,890 | 18,912 | 142 | |||||||||
| Deposits | 109,234 | 22,951 | 376 | |||||||||
| Payable under participation agreements | 60,301 | 39,452 | 53 | |||||||||
| Premiums payable | 5,963 | 7,621 | (22 | ) | ||||||||
| Debt | 183,020 | 157,013 | 17 | |||||||||
| Minority interest in subsidiaries | 31,029 | 45,899 | (32 | ) | ||||||||
| Net assets of discontinued operations | 6,980 | 7,468 | (7 | ) | ||||||||
47
Table of Contents
Our acquisition of a controlling interest in Brooke Capital in December 2006 and January 2007 has resulted in a new asset category for investments and a new liability category for policy and contract liabilities to account for the life insurance and annuity operations of First Life America Corporation, Brooke Capital’s life insurance subsidiary. A balance sheet account has also been established to reflect the interests of Brooke Capital and Aleritas’ minority shareholders. The acquisition of Generations Bank in January 2007 has resulted in a new liability category for deposits, which are the bank’s primary source of funding.
Investments increased as the result of investments held by Generations Bank and Traders Insurance Company (Delta Plus Holdings, Inc. subsidiary) which were acquired during the first quarter of 2007. Generations Bank also purchased deposits from Bank of the West in January 2008 which increased investments.
Customer receivables primarily include amounts owed to Brooke Capital by its franchisees. A loss allowance exists for Brooke Capital’s credit loss exposure to these receivable balances from franchisees (SeeInsurance Services Segment, below).
Notes receivable include loans made by Aleritas. Notes receivable balances increased as a result of loans purchased by Generations Bank as well as loans originated by Aleritas. A loan loss reserve was established in 2007 which reduces the notes receivable balance.
Customer receivables, notes receivables, interest earned not collected on notes and allowance for doubtful accounts are the items that comprise our accounts and notes receivable, net, as shown on our consolidated balance sheet.
Other receivables, increased primarily from amounts due from franchisees for purchase of insurance agencies.
The securities balance result from loan sales activities to qualifying special purpose entities and primarily consist of three types of securities (or retained residual assets), interest-only strip receivables in the loans sold, retained over-collateralization interests in the loans sold, and cash reserves. When the Company sells notes receivables to qualifying special purpose entities it retains an over-collateralization interest in the loans sold and cash reserves. As cash is received for the interest-only strip receivable as well as the principal attributable to our over-collateralization retained interest, the securities balance declines.
Deferred charges include primarily the fees associated with the issuance of long-term debt by Aleritas. Upon the refinancing of the sub-debt by Aleritas, deferred charges associated with the old debt were expensed and deferred charges for the new debt were added.
Accounts payable, increased primarily as the result of an increase in payables to lenders by Aleritas. Accounts payable also increased as the result of acquiring Delta Plus, Generations Bank and Brooke Capital.
Payable under participation agreements is the amount we owe to funding institutions that have purchased participating interests in loans pursuant to transactions that do not meet the true sale test of SFAS 140,“Accounting for Transfers and Services of Financial Assets and Extinguishments of Liabilities.”Payable under participation agreements increased because we sold more loans pursuant to transactions that did not meet the true sale test.
The premiums payable liability category is comprised primarily of amounts due to insurance companies for premiums that are billed and collected by our franchisees. Premiums payable increased primarily from the continued expansion of our franchise operations, including the acquisition of Delta Plus, which resulted in an increase of premiums billed and collected by our franchisees. Premiums payable also increased from temporary fluctuations in agent billed activity.
48
Table of Contents
Income Taxes
For the six months ended June 30, 2008 and 2007, we recorded an income tax benefit of $9,374,000 and an income tax expense of $1,800,000, respectively, resulting in effective tax rates of 38% and 37%. As of June 30, 2008 and December 31, 2007, we had current income tax receivable of $894,000 and no current income tax liability, deferred income tax assets of $23,776,000 and deferred income tax liabilities of $1,801,000, respectively. The deferred tax asset is primarily due to the recognition of the impairment loss. The deferred tax liability is primarily due to the deferred recognition of revenues, for tax purposes, on loans sold until interest payments are actually received.
Analysis by Segment
Our four reportable segments are Banking, Brokerage, Insurance and Lending.
Revenues, expenses, assets and liabilities for reportable segments were extracted from financial statements prepared for Generations Bank (Banking Segment), CJD & Associates (Brokerage Segment), Brooke Capital Corporation and Delta Plus Holdings, Inc. (Insurance Segment) and Aleritas Capital Corp. (Lending Segment), and as such, consolidating entries are excluded.
The Banking Segment includes the sale of banking services by Generations Bank through independent agents. The Brokerage Segment includes the brokering of hard-to-place property and casualty insurance policies and life insurance policies on a wholesale basis by CJD & Associates through independent agents. The Lending Segment includes the lending activities of Aleritas.
All insurance company and retail insurance agency activities currently conducted, or expected to be conducted, by Brooke Capital are discussed in the Insurance Segment. These activities include non-standard auto insurance company activities (previously discussed in the Brokerage Segment), insurance agency franchise activities (previously discussed in the Franchise Segment) and life insurance company activities (previously discussed in the Financial Services Segments are now addressed as a “discontinued operations.”.
Each segment was assessed a shared services expense which is an internal allocation of legal, accounting, human resources and information technology expenses based on our estimate of usage. Because consolidating entries are excluded, the other operating expense category for reportable segments include internal allocations for shared services expense during the six month periods ended June 30, 2008 and 2007, of $15,000 and $15,000, respectively, for the Banking Segment, $30,000 and $30,000, respectively, for the Brokerage Segment, $900,000 and $1,935,000, respectively, for the Insurance Segment; and $108,000 and $1,125,000, respectively, for the Lending Segment.
Revenues, expenses, assets and liabilities that are not allocated to one of the four reportable segments are categorized as “Corporate.” Activities associated with Corporate include functions such as accounting, auditing, legal, human resources and investor relations. Activities associated with Corporate also include the operation of captive insurance companies that self-insure portions of the professional liability (errors and omissions) exposure of franchisee insurance agents and insurance agents employed by Brooke Capital and its affiliates and provide financial guaranty policies to Aleritas.
49
Table of Contents
Banking Segment
The following financial information relates to our Banking Segment and includes the financial information of the Generations Bank subsidiary of Brooke Bancshares, Inc. (in thousands, except percentages).
| 2008 | 2008 | |||||||||||||||||||||||
| Three months | Three months | % Increase | Six months | Six months | % Increase | |||||||||||||||||||
| Ended | Ended | (decrease) | Ended | Ended | (decrease) | |||||||||||||||||||
| June 30, 2008 | June 30, 2007 | Over 2007 | June 30, 2008 | June 30, 2007 | Over 2007 | |||||||||||||||||||
Operating Revenues | ||||||||||||||||||||||||
| Interest Income | $ | 1,377 | $ | 590 | 133 | % | $ | 2,659 | $ | 1,181 | 125 | % | ||||||||||||
| Other income | 268 | 25 | 972 | 301 | 38 | 692 | ||||||||||||||||||
Total operating revenues | 1,645 | 615 | 167 | 2,960 | 1,219 | 142 | ||||||||||||||||||
Operating Expenses | ||||||||||||||||||||||||
| Commission expense | 79 | — | 145 | — | ||||||||||||||||||||
| Payroll expense | 277 | 213 | 30 | 464 | 342 | 35 | ||||||||||||||||||
| Depreciation and amortization | 113 | 3 | 3657 | 193 | 5 | 3760 | ||||||||||||||||||
| Other operating expenses | 1,357 | 395 | 243 | 2,541 | 716 | 255 | ||||||||||||||||||
Total operating expenses | 1,826 | 611 | 199 | 3,343 | 1,063 | 214 | ||||||||||||||||||
Income from operations | $ | (181 | ) | $ | 4 | (4625 | )% | $ | (383 | ) | $ | 156 | (345 | )% | ||||||||||
| Interest expense | 127 | — | — | 127 | — | — | ||||||||||||||||||
Income (loss) before income taxes | (308 | ) | 4 | (7,800 | ) | (510 | ) | 156 | (427 | ) | ||||||||||||||
Total Assets (at period end) | $ | 130,153 | $ | 47,043 | 176 | $ | 130,153 | $ | 47,043 | 176 | ||||||||||||||
Generations Bank assets and liabilities have increased primarily as a result of the purchase of a network of 42 Kansas-based banker agents who refer deposit and loan business to Generations Bank.
Income Before Income Taxes.A loss was incurred primarily as the result of increase in deposits from the purchase of Bank of the West deposits. Generations Bank’s cost of funds increased with investment income increasing less due to the market conditions at the date of purchase. As a result of acquiring significantly more deposits liabilities than loan assets from the Bank of the West transaction, the banking segment is not expected to generate much, if any, earnings until the loan portfolio is increased in accordance with its business plans.
Brokerage Segment
The following financial information relates to our Brokerage Segment and includes the financial information of CJD & Associates, L.L.C., a wholly-owned subsidiary of Brooke Brokerage (in thousands, except percentages).
| 2008 | 2008 | |||||||||||||||||||||||
| Three months | Three months | % Increase | Six months | Six months | % Increase | |||||||||||||||||||
| Ended | Ended | (decrease) | Ended | Ended | (decrease) | |||||||||||||||||||
| June 30, 2008 | June 30, 2007 | Over 2007 | June 30, 2008 | June 30, 2007 | Over 2007 | |||||||||||||||||||
Operating Revenues | ||||||||||||||||||||||||
| Insurance commissions | $ | 762 | $ | 640 | 19 | % | $ | 1,457 | $ | 1,368 | 7 | % | ||||||||||||
| Policy fee income | 131 | 154 | (15 | ) | 245 | 256 | (4 | ) | ||||||||||||||||
| Interest income | 3 | 3 | — | 5 | 13 | (62 | ) | |||||||||||||||||
| Other income | 11 | — | — | 10 | — | — | ||||||||||||||||||
Total operating revenues | 907 | 797 | 14 | 1,717 | 1,637 | 5 | ||||||||||||||||||
Operating Expenses | ||||||||||||||||||||||||
| Commission expense | 316 | 293 | 8 | 579 | 570 | 2 | ||||||||||||||||||
| Payroll expense | 400 | 265 | 51 | 820 | 774 | 6 | ||||||||||||||||||
| Depreciation and amortization | 110 | 102 | 8 | 226 | 201 | 12 | ||||||||||||||||||
| Other operating expenses | 174 | 279 | (38 | ) | 317 | 470 | (33 | ) | ||||||||||||||||
Total operating expenses | 1,000 | 939 | 6 | 1,942 | 2,015 | (4 | ) | |||||||||||||||||
Income from operations | (93 | ) | (142 | ) | — | (225 | ) | (378 | ) | — | ||||||||||||||
| Interest expense | 23 | 35 | (34 | ) | 49 | 71 | (31 | ) | ||||||||||||||||
Income before income taxes | $ | (116 | ) | (177 | ) | — | % | $ | (274 | ) | (449 | ) | — | % | ||||||||||
Total assets (at period end) | $ | 12,329 | $ | 9,044 | 36 | % | $ | 12,329 | $ | 9,044 | 36 | % | ||||||||||||
Insurance.Brooke Brokerage, through its wholly-owned subsidiary, CJD & Associates, L.L.C., conducts insurance brokerage activities at its Overland Park, Kansas and Omaha, Nebraska underwriting offices under the Davidson-Babcock trade name. Insurance commission revenues and policy fee revenues decreased during the three months ended June 30, 2008 primarily as the result of the “soft” property and casualty insurance market, which is characterized by decreasing insurance premiums and increasing competition from standard insurance carriers for hard-to-place and niche property and casualty insurance policies.
50
Table of Contents
Commission expense represented approximately 41% and 46%, respectively, of Brooke Brokerage’s insurance commission revenue for the three month periods ended June 30, 2008 and 2007 and approximately 40% and 42%, respectively, for the six months ended June 30, 2008 and 2007. Policy fee income represented approximately 17% and 24%, respectively, of Brooke Brokerage’s insurance commissions for the three month periods ended June 30, 2008 and 2007 and approximately 17% and 19%, respectively, for the six months ended June 30, 2008 and 2007.
Net commission refund expense is our estimate of the amount of Brooke Brokerage’s share of wholesale commission refunds due to policyholders resulting from future policy cancellations. On June 30, 2008 and December 31, 2007, Brooke Brokerage recorded corresponding total commission refund liabilities of $87,000 and $89,000, respectively.
Income Before Income Taxes.Brooke Brokerage’s income before income taxes increased during in 2008 primarily as the result of reduction of operating expenses.
Insurance Segment
Brooke Franchise has merged into Brooke Capital and we expect all of the common stock of Delta Plus to be contributed to Brooke Capital upon closing of an exchange agreement. Assuming this transaction closes as planned; the companies discussed in this segment will include Brooke Capital and its wholly-owned subsidiaries and will correspond to the following chart of Brooke Capital’s primary companies.
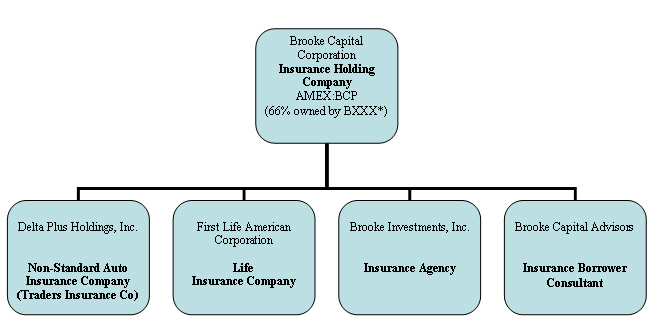
The following financial information relates to our Insurance Segment and includes the financial information of Brooke Capital and Delta Plus (in thousands, except percentages).
| 2008 | 2008 | |||||||||||||||||||||||
| Three months | Three months | % Increase | Six months | Six months | % Increase | |||||||||||||||||||
| Ended | Ended | (decrease) | Ended | Ended | (decrease) | |||||||||||||||||||
| June 30, 2008 | June 30, 2007 | over 2007 | June 30, 2008 | June 30, 2007 | over 2007 | |||||||||||||||||||
REVENUES | ||||||||||||||||||||||||
| Insurance commissions | $ | 27,205 | $ | 27,685 | (2 | )% | $ | 60,823 | $ | 59,694 | 2 | % | ||||||||||||
| Consulting fees | 3 | 5,103 | (100 | ) | 256 | 5,672 | (43 | ) | ||||||||||||||||
| Gain on sale of businesses | (3,631 | ) | 1,161 | (413 | ) | (4,477 | ) | 1,842 | (343 | ) | ||||||||||||||
| Initial franchise fees for basic services | — | 7,095 | (100 | ) | 1,320 | 19,965 | (93 | ) | ||||||||||||||||
| Initial franchise fees for buyers assistance plans | — | 70 | (100 | ) | — | 455 | (100 | ) | ||||||||||||||||
| Insurance premiums earned | 2,544 | 3,156 | (19 | ) | 5,177 | 3,156 | 64 | |||||||||||||||||
| Interest income | 173 | 296 | (42 | ) | 292 | 380 | (23 | ) | ||||||||||||||||
| Loss on sale of assets | (1,323 | ) | — | — | (1,323 | ) | — | |||||||||||||||||
| Other income | 3,795 | 635 | 498 | 9,716 | 1,313 | 640 | ||||||||||||||||||
Total operating revenues | 28,766 | 45,201 | (36 | ) | 71,784 | 92,477 | (22 | ) | ||||||||||||||||
EXPENSES | ||||||||||||||||||||||||
| Commission expense | $ | 22,071 | $ | 21,967 | — | % | $ | 46,982 | $ | 44,808 | 5 | % | ||||||||||||
| Payroll expense | 6,720 | 7,056 | (5 | ) | 13,516 | 12,842 | 5 | |||||||||||||||||
| Depreciation and amortization | 716 | 22 | 3155 | 1,459 | 98 | 1389 | ||||||||||||||||||
| Insurance loss and loss expense | 1,111 | 2,002 | (45 | ) | 1,790 | 2,002 | (11) | |||||||||||||||||
| Provision for losses | 8,076 | 1,337 | 504 | 8,428 | 4,383 | 92 | ||||||||||||||||||
| Other operating expenses | 13,442 | 10,443 | 29 | 26,166 | 21,013 | 25 | ||||||||||||||||||
Total operating expenses | 52,136 | 42,827 | 22 | 98,341 | 85,146 | 15 | ||||||||||||||||||
Income from operations | (23,370 | ) | 2,374 | (1084 | ) | (26,557 | ) | 7,331 | (462 | ) | ||||||||||||||
| Interest expense | 645 | 629 | (3 | ) | 1,646 | 1,271 | 30 | |||||||||||||||||
| Minority interest in subsidiary | (5,615 | ) | 760 | (839 | ) | (6,163 | ) | 724 | (951 | ) | ||||||||||||||
Income before income taxes | $ | (18,400 | ) | $ | 985 | (1968 | )% | $ | (22,039 | ) | $ | 5,336 | (513 | )% | ||||||||||
Total assets (at period end) | $ | 84,490 | $ | 139,465 | 39 | % | $ | 84,490 | $ | 139,465 | 39 | % | ||||||||||||
51
Table of Contents
Insurance Company Premium Revenues
Non-Standard Auto Insurance Company Premiums.Non-standard auto insurance policy premiums are currently generated entirely through Delta Plus’ insurance company subsidiary, Traders Insurance Company. Insurance premiums revenues generated by Delta Plus for the six month periods ended June 30, 2008 and 2007 totaled $5,177,000 and $5,079,000, respectively. The direct sale of non-standard auto insurance policies by Delta Plus is not expected to disrupt Brooke Capital’s relationship with the third-party independent insurance companies that are critical to the success of its franchise activities.
Capital Constraints on ExpansionStrategy. Continued difficulty in the general credit markets has restricted capital available for previously planned expansion of insurance company operations. As previously disclosed, we entered into an agreement on July 18, 2008 to sell our life insurance company, First Life. We are currently exploring strategic alternatives, including potential sales of First Life, Delta Plus and other insurance company operations in order to direct limited capital to our core businesses.
Insurance Company Expenses
Non-Standard Auto Insurance Company Expenses.Loss and loss adjustment expenses incurred by Delta Plus for the six month periods ended June 30, 2008 and 2007 totaled $1,790,000 and $2,003,000, respectively. General and administrative expenses incurred by Delta Plus for the six month periods ended June 30, 2008 and 2007 totaled $967,000 and $1,437,000, respectively.
Franchise Commission RevenuesBrooke Capital generates revenues primarily from sales commissions on policies sold by its franchisees that are written, or issued, by third-party insurance companies. Commission revenues typically represent a percentage of insurance premiums paid by policyholders. Premium amounts and commission percentage rates are established by independent insurance companies, so Brooke Capital has little or no control over the commission amount generated from the sale of a specific insurance policy written through a third-party insurance company. Brooke Capital primarily relies on the recruitment of additional franchisees to increase insurance commission revenues.
Retail insurance commissions have increased primarily as a result of Brooke Capital’s prior expansion of franchise operations. Brooke Capital also received commissions from the sale of investment securities that are not directly related to insurance sales. However, these revenues are not sufficient to be considered material and are, therefore, combined with insurance commission revenues.
Collateral preservation income is composed of initial, ongoing and special fees paid by the lender (Aleritas Capital (“Aleritas”)) for providing services such as underwriting, monitoring, rehabilitating, managing and liquidating insurance agencies. In January 2008, Brooke Capital began charging Aleritas for significant collateral preservation expenses that had previously been paid by us. For the six months ended June 30, 2008 and 2007, the special collateral preservation fees were $6,784,000 and $0, respectively.
Commission expense increased because insurance commission revenues increased and franchisees are typically paid a share of insurance commission revenue. Commission expense represented approximately 81% and 80%, respectively, of insurance commission revenue for the three month periods ended June 30, 2008 and 2007 and approximately 77% and 75%, respectively, for the six month periods ended June 30, 2008 and 2007.
Brooke Capital sometimes retains an additional share of franchisees’ commissions as payment for franchisees’ optional use of Brooke Capital’s service centers. However, we have discontinued providing this service.
52
Table of Contents
Profit sharing commissions, or Brooke Capital’s share of insurance company profits paid by insurance companies on policies written by franchisees, and other such performance compensation, were $351,000 for the three months ended June 30, 2008, as compared to $443,000 for the three months ended June 30, 2007. Profit sharing commissions were $4,034,000 for the six months ended June 30, 2008, as compared to $4,655,000 for the six months ended June 30, 2007. Profit sharing commissions represented approximately 1% and 2%, respectively, of Brooke Capital’s insurance commissions for the three month periods ended June 30, 2008 and 2007 and approximately 7% and 8%, respectively, for the six months ended June 30, 2008 and 2007. Franchisees do not receive any share of Brooke Capital’s profit sharing commissions although Brooke Capital typically pays annual advertising expenses for the benefit of franchisees in amounts no less than the amount of annual profit sharing received by Brooke Capital.
Net commission refund liability is our estimate of the amount of Brooke Capital’s share of retail commission refunds due to insurance companies resulting from future policy cancellations. As of June 30, 2008 and December 31, 2007, Brooke Capital recorded corresponding total commission refund liabilities of $404,000 and $481,000, respectively. Correspondingly, commission refund expense decreased in 2008 to reflect this lower estimate.
Franchise Operating Expenses.Payroll expense increased partially as the result of acquiring Delta Plus Holdings in March 2007. Payroll expense also increased partially as the result of the provision by Brooke Capital of additional collateral preservation assistance to franchisees coping with financial stress resulting from less commission revenues from reduction of premium rates by insurance companies.
Other operating expenses represented approximately 72% and 26%, respectively, of total revenues for the three month periods ended June 30, 2008 and 2007 and approximately 47% and 27%, respectively, for the six months ended June 30, 2008 and 2007. Other operating expenses increased at a faster rate than total operating revenues primarily as the result of the provision by Brooke Capital of additional collateral preservation assistance to franchisees coping with financial stress resulting from less commission revenues from reduction of premium rates by insurance companies.
The following table summarizes information relating to revenues and expenses associated with insurance agent relationships primarily as defined in the franchise agreement. Variances in expenses may be attributable to improved allocations of expenses among business units, which began in 2007 and continued in 2008.
Comparison of Net Commissions Breakdown to Corresponding Expenses Breakdown (in thousands)
| Recurring | ||||||||||||||||||||||||
| Franchise | Expenses Incurred | Profit Sharing | Expenses | |||||||||||||||||||||
| Royalties Collected | for Operation of | Service Center Fees | Expenses | Commissions | Incurred | |||||||||||||||||||
| from Franchisees | Phillipsburg | Collected from | Incurred | Collected | for Mass Media | |||||||||||||||||||
| for Support | Support Services | Franchisees for | for Operation of | from | & | |||||||||||||||||||
| Services | Campus | Service Centers | Service Centers | Insurance Cos | Logo Advertising | |||||||||||||||||||
Three months ended June 30, 2008 | $ | 2,045 | $ | 2,588 | $ | 663 | $ | 1,537 | $ | 351 | $ | 1,262 | ||||||||||||
Six months ended June 30, 2008 | $ | 4,245 | $ | 5,575 | $ | 1,284 | $ | 3,197 | $ | 4,034 | $ | 3,178 | ||||||||||||
Three months ended June 30, 2007 | $ | 3,058 | $ | 2,118 | $ | 861 | $ | 1,879 | $ | 443 | $ | 1,858 | ||||||||||||
Six months ended June 30, 2007 | $ | 5,868 | $ | 4,665 | $ | 1,763 | $ | 3,570 | $ | 4,655 | $ | 4,283 | ||||||||||||
53
Table of Contents
Initial Franchise Fees Revenue
Basic Services.A certain level of basic services is initially provided to all franchisees, whether they acquire an existing business and convert it into a Brooke franchise, start up a new Brooke franchise location or acquire a company developed franchise location. These basic services include services usually provided by other franchisors, including a business model, a license to use registered trademarks, access to suppliers and a license for an Internet-based information system. The amount of the initial franchise fees typically paid for basic services is currently $165,000.
Revenues from initial franchise fees for basic services are recognized as soon as Brooke Capital delivers the basic services to the new franchisee, such as access to Brooke Capital’s information and access to the Brooke Capital’s brand name. Upon completion of this commitment, Brooke Capital has no continuing obligation to the franchisee with regards to basic services.
We added one new franchise locations during the three months ended June 30, 2008, compared to 40 new franchise locations during the three month period ended June 30, 2007. We added two new franchise locations during the six month period ended June 30, 2008 compared to 130 new franchise locations during the six months ended June 30, 2007. The rate of new franchise location growth has slowed primarily as the result of the continuing restricted credit market environment and, in part, Brooke Capital’s “New Era” initiative beginning in the fourth quarter of 2007 to emphasize quality of franchisees over quantity of franchisees.
The following table summarizes information relating to initial franchise fees for basic services.
Summary of Initial Franchise Fees For Basic Services
and the Number of New Locations
(in thousands, except number of locations)
and the Number of New Locations
(in thousands, except number of locations)
| Start-up | ||||||||||||||||||||||||||||||||
| Related | Conversion | |||||||||||||||||||||||||||||||
| Initial | Related | Company | ||||||||||||||||||||||||||||||
| Franchise | Initial Franchise | Developed | Total Initial | |||||||||||||||||||||||||||||
| Fees | Fees | Initial Franchise | Franchise Fees | |||||||||||||||||||||||||||||
| for Basic | for Basic | Fees | For Basic | |||||||||||||||||||||||||||||
| Services | # | Services | # | for Basic Services | # | Services | # | |||||||||||||||||||||||||
| (Locations) | Loc | (Locations) | Loc | (Locations) | Loc | (Locations) | Loc | |||||||||||||||||||||||||
| Three months ended June 30, 2008 | $ | — | 1 | $ | — | — | $ | — | — | $ | — | 1 | ||||||||||||||||||||
| Six months ended June 30, 2008 | — | 1 | 1,320 | 1 | — | — | 1,320 | 2 | ||||||||||||||||||||||||
| Three months ended June 30, 2007 | 3,630 | 22 | 2,640 | 13 | 825 | 5 | 7,095 | 40 | ||||||||||||||||||||||||
| Six months ended June 30, 2007 | 10,395 | 63 | 7,260 | 55 | 2,310 | 12 | 19,965 | 130 | ||||||||||||||||||||||||
Buyers Assistance Plan Services.Buyer assistance plans provide assistance to franchisees for the initial acquisition and conversion of businesses. These services include, for example, compilation of an inspection report. The amount of the fee charged franchisees for these services typically varies based on the level of assistance, which in turn is largely determined by the size of the acquisition. We therefore typically base our fees for buyer assistance plans on the estimated revenues of the acquired business. All initial franchise fees (for both basic services and for buyer assistance plans) are paid to Brooke Capital when an acquisition closes. A significant part of Brooke Capital’s commission growth has come from such acquisitions of existing businesses that are subsequently converted into Brooke franchises.
54
Table of Contents
The total amount of initial fees paid by a franchisee is first allocated to basic services, and if the franchise is of an acquired and converted business, the excess of such fees over the amount allocated to basic services is allocated to buyer assistance plan services. The initial franchisee fee for basic services tends to be uniform among franchisees, and the total initial franchisee fees can be limited by competitive pressures. The decrease in initial franchise fees for buyer assistance plans is primarily attributable to an increase in the amount charged for initial franchise fees for basic services and the establishment of a cap, or maximum amount, on initial franchise fees for buyer assistance plans that are charged for each acquisition.
Brooke Capital performs substantially all of the buyer assistance plan services before an acquisition closes and, therefore, typically recognizes all of the initial franchise fee revenue for buyer assistance plan services at the time of closing.
Buyer assistance plan services are not applicable to the purchase by franchisees of company-developed or already-franchised businesses. In addition, buyer assistance plan services are not typically provided to franchisees selling to other franchisees and are not provided to franchisees purchasing businesses that were purchased by Brooke Capital in the preceding 24 months. Businesses that were converted into Brooke franchises and received buyer assistance plan services totaled 1 and 1, of new franchise locations for the three months ended June 30, 2008 and 2007, respectively, and 1 and 3, respectively of the new franchise locations for the six months ended June 30, 2008 and 2007.
Seller and Borrower-Related Revenues.Seller and borrower-related revenues typically are generated when an insurance agency is acquired by Brooke Capital for sale to a franchisee or when Brooke Capital assists an insurance business in securing a loan. Seller and borrower-related revenues include consulting fees paid directly by sellers and borrowers, gains on sale of businesses from deferred payments, gains on sale of businesses relating to company-owned stores, and gains on sale of businesses relating to inventory. All seller and borrower-related revenues are considered part of normal business operations and are classified on our income statement as operating revenue. Seller and borrower-related revenues decreased $8,532,000, or 174%, to $(3,631,000), for the three months ended June 30, 2008 from $4,900,000 for the three months ended June 30, 2007. Seller and borrower-related revenues decreased $10,799,000, or 164%, to $(4,227,000) for the six months ended June 30, 2008 from $6,572,000 for the six months ended June 30, 2007. The significant decrease in seller and borrower-related revenues from 2007 to 2008 is primarily attributable to a decrease in borrower consulting fees generated, due to the continuing restricted credit market environment.
Consulting Fees.Brooke Capital helps sellers prepare their insurance agency businesses for sale by developing business profiles, tabulating revenues, sharing its document library and general sale preparation. Brooke Capital also generates revenues from consulting with insurance agency borrowers and assisting them in securing loans. The scope of consulting engagements is largely determined by the size of the business being sold or the loan being originated. Consulting fees are typically based on the transaction value, are contingent upon closing of the transaction, and are paid at closing. Brooke Capital completes its consulting obligation at closing and is not required to perform any additional tasks for sellers or borrowers. Therefore, with no continuing obligation on the part of Brooke Capital, consulting fees paid directly by sellers or borrowers are immediately recognized as income by Brooke Capital.
Gains on Sale of Businesses from Deferred Payments.Our business includes the buying and selling of insurance agencies and occasionally holding them in inventory. When purchasing an agency, we typically defer a portion of the purchase price, at a low or zero interest rate, to encourage the seller to assist in the transition of the agency to one of our franchisees. We carry our liability to the seller at a discount to the nominal amount we owe, to reflect the below-market interest rate. When we sell an acquired business to a franchisee (typically on the same day it is acquired), we generally sell it for the full nominal price (i.e. before the discount) paid to the seller. When the sale price of the business exceeds the carrying value, the amount in excess of the carrying value is recognized as a gain. Gains on sale resulting primarily from discounted interest rates were zero for the three months ended June 30, 2008 from $443,000 for the three months ended June 30, 2007. Gains on discounted interest rates were $5,000 for the six months ended June 30, 2008 from $1,124,000 for the six months ended June 30, 2007. The decrease in gains from 2007 to 2008 was primarily due to the continuing restricted credit market environment and, in part, to Brooke Capital’s “New Era” initiative, beginning in the fourth quarter of 2007, to emphasize quality of franchisees over quantity of franchisees.
55
Table of Contents
We regularly negotiate below-market interest rates on the deferred portion of the purchase prices we pay sellers. We consider these below market interest rates to be a regular source of income related to the buying and selling of businesses. Although we have a continuing obligation to pay the deferred portion of the purchase price when due, we are not obligated to prepay the deferred portion of the purchase price or to otherwise diminish the benefit of the below-market interest rate upon which the reduced carrying value was based.
The calculation of the reduced carrying value, and the resulting gain on sale of businesses, is made by calculating the net present value of scheduled future payments to sellers at a current market interest rate. The following table provides information regarding the corresponding calculations:
Calculation of Seller Discounts Based On Reduced Carrying Values
(in thousands, except percentages and number of days)
(in thousands, except percentages and number of days)
| Interest Rate | ||||||||||||||||||||||||||||
| Used | Gain on Sale | |||||||||||||||||||||||||||
| Beginning | Weighted | Weighted | for Net | Full Nominal | Reduced | from | ||||||||||||||||||||||
| Principal | Average | Average | Present | Purchase | Carrying | Deferred | ||||||||||||||||||||||
| Balance | Rate | Maturity | Value | Price | Value | Payments | ||||||||||||||||||||||
| Three months ended June 30, 2008 | $ | — | — | % | — days | — | % | $ | — | $ | — | $ | — | |||||||||||||||
| Six months ended June 30, 2008 | 60 | 7.75 | % | 304 days | 7.75 | % | 65 | 60 | 5 | |||||||||||||||||||
| Three months ended June 30, 2007 | 3,683 | 9.75 | % | 602 days | 9.75 | % | 13,598 | 13,155 | 443 | |||||||||||||||||||
| Six months ended June 30, 2007 | 9,561 | 9.75 | % | 514 days | 9.75 | % | 23,982 | 22,858 | 1,124 | |||||||||||||||||||
Gains on Sale of Businesses—Company-Owned Stores. If we expect to own and operate businesses for more than one year, we consider these businesses to be company-owned stores and treat such transactions under purchase accounting principles, including booking intangible assets and recognizing the related amortization expense. By contrast, businesses purchased for resale to our franchisees (usually within one year) are carried at cost as business inventory, without the booking of intangible assets. There were no gains on sale resulting from the sale of company-owned stores for the three and six month periods ended June 30, 2008 and 2007.
Gains on Sale of Businesses—Inventoried Stores.As noted above, acquired businesses are typically sold on the same day as acquired for the same nominal price paid to the seller. However, this is not always the case and businesses are occasionally held in inventory. As such, gains and losses are recorded when an inventoried business is ultimately sold and carrying values of inventoried businesses are adjusted to estimated market value when market value is less than cost. Gains (losses) on sale resulting from the sale of inventoried stores were $(302,000) and $718,000 for the three months ended June 30, 2008 and 2007, respectively. Gains (losses) on sale resulting from the sale of inventoried stores were $(1,153,000 and $718,000, respectively, for the six months ended June 30, 2008 and 2007.
Franchise Collateral Preservation (CPA) Expenses- CPA activities are separated into two general categories. The first category of CPA activities consists primarily of support services provided by our Phillipsburg, Kansas campus personnel for all franchisees pursuant to a franchise agreement and the corresponding recurring expenses are paid from recurring franchise fees collected from franchisees and fees paid by lenders pursuant to Collateral Preservation Agreements (see above). Recurring franchise fee revenues totaled $2,045,000 and $3,058,000, respectively, during the three months ended June 30, 2008 and 2007. Recurring franchise fee revenues totaled $4,245,000 and $5,868,000, respectively, during the six months ended June 30, 2008 and 2007. Associated support services expenses totaled $2,558,000 and $2,118,000, respectively, during the three months ended June 30, 2008 and 2007. Associated support services expenses totaled $5,575,000 and $4,665,000, respectively, during the six months ended June 30, 2008 and 2007.
56
Table of Contents
The second category of CPA activities consists primarily of the extra monitoring and consulting with borrowers provided by national and regional personnel pursuant to collateral preservation agreements with lenders. Collateral preservation fee revenues totaled $5,396,000 and $2,440,000, respectively, during the three months ended June 30, 2008 and 2007. Collateral preservation fee revenues totaled $12,240,000 and $4,383,000, respectively, during the six months ended June 30, 2008 and 2007. Associated collateral preservation expenses totaled $14,076,000 and $7,763,000, respectively, during the three months ended June 30, 2008 and 2007. Associated collateral preservation expenses totaled $22,028,000 and $16,283,000, respectively, during the six months ended June 30, 2008 and 2007.
Franchise Recruitment Expenses- We believe that we have a good agent program and have improved our process for recruiting and identifying insurance agents who we believe have the personal attributes required to be successful at starting or operating an insurance agency business. Because not all agents have the personal attributes required for success as insurance agency owners, we continue to recruit to replace those less suited. Recruitment plays a critical role in assisting lenders in the preservation of collateral so that businesses on which the lender has foreclosed or exercised its private right of sale can be sold to new franchisees who may be more capable or more willing to successfully operate an insurance agency. Recruitment personnel expenses totaled $587,000 and $689,000, respectively, during the three months ended June 30, 2008 and 2007. Recruitment personnel expenses totaled $1,210,000 and $1,612,000, respectively, during the six months ended June 30, 2008 and 2007.
Income Before Income Taxes.We incurred losses before income taxes of $18,399,000 for the three months ended June 30, 2008 as compared to income before taxes of $1,092,000 for the three months ended June 30, 2007, a decrease of $19,491,000, or 1,785%. We incurred losses before income taxes of $22,039,000 for the six months ended June 30, 2008 as compared to income before taxes of $5,559,000 for the six months ended June 30, 2007, a decrease of $27,598,000, or 496%. The loss incurred during 2008 was primarily the result of shrinking the franchise network through closing, relocating or selling company-owned stores and establishing corresponding reserves for agency inventory write downs, lease buyouts and equipment write downs, producer development write downs and other restructuring expenses. The 2008 loss was also the result of a reduction in the amount of initial franchise fee revenues and other associated consulting fees due to the continuing restricted credit market environment, and, in part, to our “New Era” initiative beginning in the fourth quarter of 2007, to emphasize quality of franchisees over quantity of franchisees.
Company-Owned Stores.Because our franchising philosophy is predicated on local ownership and generating revenues from sales commissions paid to franchisees on the sale of insurance policies issued by third-party insurance companies, an increasing percentage of inventoried, managed, pending, franchisor-developed and franchisee-developed stores relative to franchisee-owned stores is generally undesirable from a franchising perspective. Accordingly, during the second quarter of 2008, we significantly reduced the number of company-owned stores by closing, relocating, selling or preparing to sell, 147 company-owned stores resulting in non typical expenses for associated reserves and write offs totaling $13,425,000.
We believe that we have a good agent program and have improved our process for recruiting and identifying insurance agents who we believe have the personal attributes required to be successful at starting or operating an insurance agency business. Because not all agents have the personal attributes required for success as insurance agency owners, we continue to recruit to replace those less suited.
57
Table of Contents
Same Store Sales. Revenue generation, primarily commissions from insurance sales, is an important factor in franchise financial performance and revenue generation is carefully analyzed by us. Twenty-four months after initial conversion of an acquired business, we consider a franchise “seasoned” and the comparison of current to prior year revenues a more reliable indicator of franchise performance. Combined same store sales of seasoned converted franchises and start up franchises for the twelve months ended June 30, 2008 and 2007 decreased 5.7% and increased 0.1%, respectively. The median annual revenue growth rates of seasoned converted franchises and qualifying start up franchises for the twelve months ended June 30, 2008 and 2007 were 2.0% and 3.4%. All same store calculations exclude profit sharing commissions. Same store calculations are based entirely on commissions allocated by us to franchisees’ monthly statements. We are unable to determine the impact, if any, on same store calculations resulting from commissions that franchisees receive but do not process through us as required by their franchise agreement.
Same store sales performance has been adversely affected by the “soft” property and casualty insurance market, which is characterized by a flattening or decreasing of premiums by insurance companies. Our franchisees predominately sell personal lines insurance, with more than 50% of our total commissions resulting from the sale of auto insurance policies, and we believe that the insurance market has been particularly soft with regards to premiums on personal lines insurance policies. We are beginning to see indications that the market may be “firming,” which may have an effect on same store sales performance in the future.
Franchise Balances. We categorize the balances owed by franchisees as either statement balances or non-statement balances. Statement balances are generally short-term and non-statement balances are generally longer term. We believe the most accurate analysis of franchise balances occurs immediately after settlement of franchisees’ monthly statements and before any additional entries are recorded to their account. Therefore, the following discussion of franchise balances is as of the settlement date that follows the corresponding commission month.
Statement Balances. We have historically assisted franchisees with short-term cash flow assistance by advancing commissions and granting temporary extensions of due dates for franchise statement balances owed by franchisees to us. Franchisees sometimes require short-term cash flow assistance because of cyclical fluctuations in commission receipts. Short-term cash flow assistance is also required when franchisees are required to pay us for insurance premiums due to insurance companies prior to receipt of the corresponding premiums from policyholders. The difference in these amounts has been identified as the “uncollected accounts balance” and this balance is calculated by identifying all charges to franchise statements for net premiums due insurance companies for which a corresponding deposit from policyholders into a premium trust account has not been recorded. Despite commission fluctuations and uncollected accounts balances, we expect franchisees to regularly pay their statement balances within a 30-day franchise statement cycle.
Any commission advance that remains unpaid after 120 days is placed on “watch” status. The increase in watch statement balances is partially attributable to financial stress resulting from less commission revenues due to reduction of premium rates by insurance companies. In early April 2008, we notified our franchisees that we will no longer provide commission advances after August 15, 2008 because they are expensive to administer and collect. Management believes that this change alone will not have an adverse effect on franchisees’ businesses, since sufficient notice has been provided, which allows franchisees to build funds internally or obtain outside credit.
The following table summarizes total statement balances, uncollected account balances and watch statement balances (in thousands) as of June 30, 2008 and December 31, 2007 (in thousands).
| As of | As of | |||||||
| June 30, 2008 | December 31, 2007 | |||||||
| Total Statement Balances | $ | 9,918 | $ | 9,662 | ||||
| Uncollected Accounts* (Included in Above Total Statement Balances) | $ | 2,773 | $ | 3,688 | ||||
| Watch Statement Balances (Included in Above Total Statement Balances) | $ | 9,652 | $ | 9,077 | ||||
| Watch Statement Uncollected Accounts** | $ | 1,941 | $ | 1,657 | ||||
| * | These amounts are limited to uncollected balances for franchisees with unpaid statement balances as of June 30, 2008 and December 31, 2007. | |
| ** | These amounts are limited to uncollected balances for franchisees with watch statement balances as of June 30, 2008 and December 31, 2007. |
58
Table of Contents
Non-statement Balances.Separate from short-term statement balances, Brooke Capital also extends credit to franchisees for long-term producer development, including hiring and training new franchise employees, and for other reasons not related to monthly fluctuations of revenues. These longer term non-statement balances are not reflected in the short-term statement balances referenced above and totaled $11,717,000 and $9,798,000, respectively, as of June 30, 2008 and December 31, 2007. Management intends to limit significantly the availability of non-statement balance funds.
Reserve for Doubtful Accounts. As part of the agreement to merge Brooke Franchise into Brooke Capital, Brooke Corporation continues to agree to guarantee the repayment of franchise balances outstanding as of June 30, 2007. The reserve increased significantly primarily to reflect the expected write offs of franchise balances related to producer development of closed, relocated or sold stores. The amount of our reserve for doubtful accounts was $6,700,000 as of June 30, 2008 and was $1,114,000 on December 31, 2007. Franchise balances outstanding as of June 30, 2008, and December 31, 2007 totaled $21,635,000 and $19,460,000, respectively.
The following table summarizes the Allowance for Doubtful Accounts activity for June 30, 2008 and December 31, 2007 (in thousands). Additions to the allowance for doubtful accounts are charged to expense. Write-offs in the table below are net of reimbursement from Brooke Corporation pursuant to our guaranty of franchise balances in connection with the merger.
Valuation and Qualifying Accounts
| Balance at | Write off | Write off | Balance at | |||||||||||||||||
| beginning | Charges to | statement | non-statement | end of | ||||||||||||||||
| of period | Expenses | balances | balances | period | ||||||||||||||||
| Allowance for Doubtful Accounts | ||||||||||||||||||||
| Year ended December 31, 2007 | $ | 1,466 | $ | 4,276 | $ | 961 | $ | 3,667 | $ | 1,114 | ||||||||||
| Six months ended June 30, 2008 | 1,114 | 6,645 | 421 | 638 | 6,700 | |||||||||||||||
Lending Services Segment
Aleritas is a specialty finance company that lends primarily to locally-owned businesses that sell insurance. The Company’s target market consists of retail insurance agencies, and managing general agencies, where the sale of insurance is their primary business. In addition, Aleritas loans money to funeral home owners, where the sale of insurance is often an important, although not primary, part of their business.
59
Table of Contents
Aleritas is focused on lending to small “main street businesses” across America, primarily in insurance-related industries which have historically been underserved by traditional lenders. The Company lends to four primary types of borrowers:
| • | Retail insurance agents and agencies that are franchisees of Brooke Capital Corporation (“Brooke Capital”), an affiliated company. | ||
| • | Retail insurance agents and agencies that are not franchisees of Brooke Capital. This lending program primarily includes loans made to captive retail insurance agents and agencies. | ||
| • | Managing general agencies, in which the sale of insurance is their primary business. | ||
| • | Independent funeral home owners, in which the sale of insurance is not their primary business but often an important part of their business (the sale of pre-need life insurance). |
Loan balances (excluding related party loans) in which Aleritas has retained interest and/or servicing rights follow:
| Average Loan Size | ||||||||||||||||
| June 30, | December 31, | June 30, | December 31, | |||||||||||||
| 2008 | 2007 | 2008 | 2007 | |||||||||||||
| Loan portfolio composition: | ||||||||||||||||
| On-balance sheet loans | $ | 169,967 | $ | 136,298 | ||||||||||||
| Off-balance sheet loans | 515,650 | 541,948 | ||||||||||||||
| Total | $ | 685,617 | $ | 678,246 | ||||||||||||
Loans(number and average loan size) | 1,272 | 1,313 | $ | 539 | $ | 517 | ||||||||||
Obligors(number and average loan size) | 865 | 843 | 793 | 805 | ||||||||||||
Weighted average seasoning(months) | 20 | 16 | ||||||||||||||
| Weighted average months to maturity | 122 | 125 | ||||||||||||||
| Variable loan portfolio’s average index over prime | 3.77 | % | 3.78 | % | ||||||||||||
On-balance sheet loans consist of (1) those loans held in inventory on the balance sheet, (2) those loans sold to participating lenders that do not qualify as true sales pursuant to the criteria established by SFAS No. 140, “Accounting for Transfers and Servicing of Financial Assets and Extinguishments of Liabilities” (“SFAS 140”), and (3) those loans sold to warehouse entities that do not qualify as true sales pursuant to the criteria established by SFAS 140. Off-balance sheet loans consist of (1) those loans sold to participating lenders that qualify as true sales pursuant to the criteria established by SFAS 140, and (2) those loans sold to qualifying special-purpose entities that qualify for a true sale pursuant to the criteria established by SFAS 140. All loan balances described above and portfolio statistics described below in this section exclude related party loans.
A majority of the loans are variable rate loans based on the New York Prime rate (“Prime”) as published in the Wall Street Journal. However, there are fixed rates on 0.9% of the portfolio. Typically the interest rate adjusts daily based on Prime; however, 99.1% of the portfolio adjusts annually and an immaterial amount of the loans adjust monthly.
The Company attempts to mitigate credit risk by retaining industry consultants and franchisors (“Collateral Preservation Providers”) to provide certain collateral preservation services, including assistance in the upfront analysis of a credit application, assistance with due diligence activities, assisting in ongoing surveillance of a borrower’s business and providing certain loss mitigation activities associated with distressed loans. Loss mitigation activities typically include marketing support, operational support, management services, rehabilitation services, and liquidation services. For these collateral preservation services, Aleritas shares a portion of the loan fee and interest income received on loan balances over the life of the loans and, in some instances, may be entitled to additional compensation and expense reimbursement, in excess of sharing in loan fees and interest income.
60
Table of Contents
| 2008 | 2008 | |||||||||||||||||||||||
| Three months | Three months | % Increase | Six months | Six months | % Increase | |||||||||||||||||||
| Ended | Ended | (decrease) | Ended | Ended | (decrease) | |||||||||||||||||||
| June 30, 2008 | June 30, 2007 | over 2007 | June 30, 2008 | June 30, 2007 | over 2007 | |||||||||||||||||||
Operating revenues | ||||||||||||||||||||||||
| Interest income | $ | 12,096 | $ | 13,239 | (9 | )% | $ | 26,646 | $ | 28,300 | (6 | )% | ||||||||||||
| Participating interest expense | (6,569 | ) | (7,869 | ) | — | (14,481 | ) | (15,503 | ) | — | ||||||||||||||
| Gain on sale of notes receivable | (1,756 | ) | 4,282 | (141 | ) | (1,657 | ) | 11,203 | (115 | ) | ||||||||||||||
| Impairment loss | — | — | (11,763 | ) | — | — | ||||||||||||||||||
| Other income | 93 | 181 | (49 | ) | 240 | 349 | (31 | ) | ||||||||||||||||
Total operating revenues | 3,864 | 9,833 | (61 | ) | (1,015 | ) | 24,349 | (104 | ) | |||||||||||||||
Operating expenses | ||||||||||||||||||||||||
| Other operating interest expense | 652 | 368 | 77 | 1,413 | 2,033 | (30 | ) | |||||||||||||||||
| Payroll expense | (818 | ) | 610 | (234 | ) | 705 | 1,124 | (37 | ) | |||||||||||||||
| Depreciation and amortization | 353 | 282 | 25 | 763 | 575 | (33 | ) | |||||||||||||||||
| Provision for loan losses | 2,358 | 148 | 1,493 | 14,896 | 819 | 1719 | ||||||||||||||||||
| Other operating expenses | (1,434 | ) | 1,281 | (212 | ) | 6,784 | 3,034 | 124 | ||||||||||||||||
Total operating expenses | 1,111 | 2,689 | 59 | 24,561 | 7,585 | 224 | ||||||||||||||||||
Income from operations | 2,753 | 7,144 | (61 | ) | (25,576 | ) | 16,764 | (253 | ) | |||||||||||||||
| Interest expense | 915 | 1,471 | (38 | ) | 2,486 | 3,141 | (21 | ) | ||||||||||||||||
| Loss on extinguishment of debt | — | — | 8,210 | — | ||||||||||||||||||||
| Minority interest | 442 | — | (8,591 | ) | — | |||||||||||||||||||
Income before income taxes | 1,396 | 5,673 | (75 | ) | (27,681 | ) | 13,623 | (303 | ) | |||||||||||||||
Total assets (at period end) | $ | 292,719 | $ | 217,265 | 35 | % | $ | 292,719 | $ | 217,265 | 35 | % | ||||||||||||
Interest Income.Aleritas typically sells most of the loans it originates to funding institutions as loan participations and to qualifying special purpose entities in which the loans are used to issue asset-backed securities and secure off balance sheet bank debt. Prior to either type of sale transaction, Aleritas typically holds these loans on its balance sheet and earns interest income during that time. After the loans are sold, Aleritas continues to earn interest income from the retained residual assets in theseoff-balance sheet loans. Net interest income, excluding credit losses provisions, for the six months ended June 30, 2008 was virtually unchanged from the same period in the previous.
Participating Interest Expense.A portion of the interest income that Aleritas receives on its loans is paid out to the purchasers of its loans, such as participating lenders and qualifying special purpose entities in which the loans are used to issue asset-backed securities and secure off-balance sheet bank debt. Payments to these holders are accounted for as participating interest expense, which is netted against interest income in the consolidated statements of operations. The amount of participating interest expense increased primarily as a result of an increased amount of loans sold to participating lenders and qualifying special purpose entities as compared to the comparable period. Participation interest expense represented approximately 54% and 59%, respectively, of Aleritas’ interest income for the three months ended June 30, 2008 and 2007. Participation interest expense represented approximately 54% and 55%, respectively, of Aleritas’ interest income for the six months ended June 30, 2008 and 2007.
Provision for Credit Losses.A loan loss reserve was established during the third quarter of 2007 and was increased by $14,896,000 during the six month period ended June 30, 2008. The significant increase in the loan loss reserve has resulted primarily because Aleritas believes that liquidation of troubled loans is less expensive that the associated collateral preservation expenses. The increase in loan loss reserves is also the result of increasing delinquencies in loan balances held on Aleritas’s balance sheet. Management will continue to evaluate the adequacy of the reserve on an ongoing basis in the future utilizing the credit metrics underlying the reserve and input from its collateral preservation providers.
61
Table of Contents
Gain on Sales of Notes Receivable.When the sale of a loan is classified as a true sale pursuant to the criteria established by SFAS 140, gains or losses are recognized, loans are removed from the balance sheet and residual assets, such as securities, interest-only strip receivables and servicing assets, are recorded. For residual assets resulting from loan participations, accounted for as a true sale, servicing assets andinterest-only strip receivables are typically recorded. For residual assets resulting from loans sold to QSPEs, accounted for as a true sale, securities are typically recorded consisting primarily of three types;interest-only strip receivables in loans sold, retained over-collateralization in interests in loans sold and cash reserves. Revenues from gain on sales of notes receivable decreased significantly in 2008 primarily because difficult credit market conditions has limited loan sales.
Aleritas estimates the value of interest-only strip receivables, servicing assets and interest-only strip receivables portion of securities balances by calculating the present value of the expected future cash flows from the interest and servicing spread, reduced by an estimate of credit losses and note receivable prepayments. The interest and servicing spread is the difference between the rate on the loans sold and the rate paid to participating lenders or the rate paid to investors and lenders to QSPEs. Over time, as cash is received from the payment of interest and servicing income, the value of the residual asset is reduced by writing down the interest asset and amortizing the servicing assets.
When the sale of a loan is not classified as a true sale pursuant to the criteria established by SFAS 140, the sale is classified as a secured borrowing, no gain on sale is recognized, and the note receivable and the corresponding payable remain on the balance sheet under a participation agreement.
In a true sale, the gain on sale of notes receivable consists of the gain associated with the ongoing servicing responsibilities and gains associated with interest income received.
When Aleritas sells loans to participating lenders that qualify as true sales under SFAS 140, a gain on sale is recognized when the notes receivable are sold. When Aleritas sells notes receivable to participating lenders, it typically retains interest and servicing rights. The component of the gain on sale of notes receivable to participating lenders is the gain on sale Aleritas records associated with the interest-only strip receivable and servicing assets, net of direct expenses, as described below. Unlike loans sold to QSPEs, Aleritas is the primary servicer of loans sold to participating lenders and as such servicing assets and liabilities are recorded.
The gain on sale of notes receivable has three components as detailed below.
| Six Months | ||||||||
| Ended June 30, | ||||||||
| 2008 | 2007 | |||||||
| Net gain from securitizations | $ | (153 | ) | $ | 8,442 | |||
| Net gain (loss) from true sale loan participations: | ||||||||
| Interest-only strip receivable benefit (loss) | (642 | ) | 1,606 | |||||
| Net gain (loss) from loan servicing | (82 | ) | 1,538 | |||||
| Subtotal | (877 | ) | 11,586 | |||||
| Losses from related party loan sales | (28 | ) | (3 | ) | ||||
| Gain on sale of notes receivable | (905 | ) | 11,583 | |||||
| Less: Securitization fee expense | (752 | ) | (380 | ) | ||||
| Gain on sale of notes receivable, net | $ | (1,657 | ) | $ | 11,203 | |||
The first component of the gain on sale of notes receivable is the gain on sale recorded associated with the over collateralization benefit based on a present value calculation of future expected cash flows from the retained portion of loans sold, net of prepayment and credit loss assumptions. Fluctuations in these gains, year-to-year, reflected the changing volume of loans sold to QSPEs. In addition, the spread for loans sold to QSPEs decreased from 4.13% in 2007 to 3.33% in 2008.
The second component of the gain on sale of notes receivable is the gain on sale recorded associated with the interest-only strip receivable benefit based on a present value calculation of future expected cash flows of the interest spread on the underlying participation loans sold, net of prepayment and credit loss assumptions. The spread associated with loan participations was approximately 2.08% in 2007 and 2008. However, due to tightening of credit markets, higher rates relative to the benchmark were required to be paid to the participating lenders. The spread percentages above exclude the spread associated with related party loans sold.
62
Table of Contents
The third component of the gain on sale of notes receivable is the gain associated with the ongoing servicing responsibilities. When loan participation is accounted for as a true sale, servicing responsibilities are retained for which Aleritas typically receives annual servicing fees ranging from 0.25% to 1.375% of the outstanding balance. A gain or loss is recognized immediately upon the sale of a loan participation based on whether the annual servicing fees are greater or less than the cost of servicing, which is estimated at 0.25% of the outstanding loan balance. The gain or loss associated with loan servicing is determined based on a present value calculation of future cash flows from servicing the underlying loans, net of servicing expenses and prepayment assumptions. The increase in net gains from loan servicing benefits for both 2007 and 2006 was primarily the result of more loans sold as true sale loan participations as a result of the growth of the loan portfolio. Additionally, the loan servicing fee was increased by .125% at the beginning of 2006.
When Aleritas sells loans to QSPEs that qualify as true sales under SFAS 140, a gain on sale is recognized when the notes receivable are sold. When Aleritas sells notes receivable to QSPEs, it typically retains interest rights. The component of the gain on sale of notes receivable to QSPEs is the gain on sale recorded associated with the interest-only strip receivable and retained interest benefit, net of direct expenses. Unlike participation sales, in loans sold to QSPEs an unaffiliated third party is the servicer and Aleritas is a secondary or sub-servicer. As such, no servicing asset or liability is recorded.
When Aleritas sells its loans to QSPEs in connection with securitizations, the net proceeds have historically approximated 75% to 85% of the loan balances sold to the special purpose entity. Unlike participation sales, in securitizations an unaffiliated third party is the servicer and Aleritas is a secondary or sub-servicer. No servicing asset or liability is recorded. The remaining amount is the retained interest (the over collateralization that is provided to enhance the credit of the asset-backed securities) or the interest-only strip receivable. The initial amount of this retained interest has historically ranged from 15% to 25% of the loan balances sold, with the calculation varying depending on such factors as the type of loans being securitized (e.g. retail insurance agency—franchise, retail insurance agency—non franchise and funeral home), the relative size of principal balances of individual loans, state concentrations, borrower concentrations and portfolio seasoning. For example, in Aleritas’ securitization that closed in July 2006, loans with balances totaling $65,433,000 were sold to a QSPE. Net proceeds of $52,346,000 were received by Aleritas. See the Off-Balance Sheet Arrangements section of this Form 10-Q below for the net proceeds associated with Aleritas’ other securitizations. With respect to loans sold as participations, the net proceeds received are generally 100% of the principal balance of the loans sold. In the event that Aleritas chooses to sell less than an entire loan to a participating lender, the net proceeds are generally 100% of the principal balance associated with the portion of the loan sold. Although when loans are sold pursuant to a true sale they are removed from the balance sheet, the fair value of the interest only strip receivable retained, the fair value of the difference between loans sold and securities issued to an investor (in the case of a securitization) and the fair value of cash reserves are recorded as the cash value of the reserve account.
Gains (losses) from servicing and interest benefits are typically non-cash gains (losses), as Aleritas receives cash equal to the carrying value of the loans sold. A corresponding adjustment has been made on the Statement of Cash Flows to reconcile net income to net cash flows from operating activities. Gain-on-sale accounting requires Aleritas to make assumptions regarding prepayment speeds and credit losses for loans sold which qualify as true sales pursuant to the criteria established by SFAS 140. The performances of these loans are monitored, and adjustments to these assumptions will be made if necessary. Underlying assumptions used in the initial determination of future cash flows on the participation loans and loans sold to qualifying special purpose entities accounted for as sales include the following:
| Business Loans | ||||
| (Fixed & Adjustable-Rate | ||||
| Stratum) | ||||
| Prepayment speed* | 12.00 | % | ||
| Weighted average life (months) | 120 | |||
| Expected credit losses* | 0.50 | % | ||
| Discount Rate* | 11.00 | % | ||
| * | Annual rates. |
63
Table of Contents
During the fourth quarter of 2005, the discount rate assumption was changed from 8.50% to 11.00%. Several factors were considered when determining the discount rate. As a starting point for analyzing this assumption, a range of the risk-free rate was used to determine a base discount rate. This base discount rate was then adjusted for various risk characteristics associated with the sold loans.
During the fourth quarter of 2007, the prepayment speed assumption was changed from 10.00% to 12.00%. Several factors were considered when determining the discount rate. As a starting point for analyzing this assumption, a range of the risk-free rate was used to determine a base discount rate. This base discount rate was then adjusted for various risk characteristics associated with the sold loans.
The most significant impact from the loans sold has been the removal of loans from Aleritas’s balance sheet that Aleritas continues to service. The balances of those off-balance sheet assets totaled:
| June 30, | December 31, | |||||||
| 2008 | 2007 | |||||||
| Off-balance sheet unaffiliated loans | $ | 515,650 | $ | 541,948 | ||||
Percent of the portfolio | 76 | % | 80 | % | ||||
| Related party loans off-balance sheet | 9,371 | 14,572 | ||||||
Loan Servicing Assets and Liabilities.When Aleritas recognizes non-cash gains for the servicing benefits of loan participation sales, it books that amount as a loan servicing asset on its balance sheet. This amount is equal to Aleritas’ estimate of the present value of future cash flows resulting from the servicing spread. Aleritas recognizes such assets only when the income allocated to its servicing responsibilities exceeds its cost of servicing, which Aleritas typically estimates at 0.25% of the loan value being serviced. Components of the servicing asset as of June 30, 2008 were as follows (in thousands):
| Estimated cash flows from loan servicing fees | $ | 8,212 | ||
| Less: | ||||
| Servicing Expense | (1,451 | ) | ||
| Discount to present value | (1,535 | ) | ||
| Carrying Value of Retained Servicing Interest in Loan Participations | $ | 5,226 | ||
In connection with the recognition of non-cash losses for the servicing liabilities of loan participation sales, the present value of future cash flows was recorded as a servicing liability. Components of the servicing liability as of June 30, 2008 were as follows (in thousands):
| Estimated cash flows from loan servicing fees | $ | — | ||
| Less: | ||||
| Servicing expense | 49 | |||
| Discount to present value | (37 | ) | ||
| Carrying Value of Retained Servicing Liability in Loan Participations | $ | 12 | ||
64
Table of Contents
Loan Participations-Interest-Only Strip Receivable Asset.To the extent that the difference between the rate paid by Aleritas to participating lenders and the rate received from its borrowers exceeds the maximum of 1.375% allocated to the servicing benefit, Aleritas recognizes a non-cash asset, called an “Interest-only strip receivable asset,” on its balance sheet. This amount is equal to Aleritas’ estimate of the present value of expected future cash flows resulting from this interest spread, net of credit loss (to the extent loans are sold to participating lenders with recourse to Aleritas) and prepayment assumptions. Components of the interest receivable asset as of June 30, 2008 were as follows (in thousands):
| Estimated cash flows from interest income | $ | 11,163 | ||
| Less: | ||||
| Estimated credit losses | — | |||
| Discount to present value | (4,091 | ) | ||
| Carrying Value of Retained Interest in Loan Participations | $ | 7,072 | ||
Loans Sold to Qualifying Special Purpose Entities — Interest-Only Strip Receivable Asset.The terms of Aleritas’ securitizations and off-balance sheet bank debt require the over-collateralization of the pool of loan assets that back the securities issued to investors and off-balance sheet debt secured. Aleritas retains ownership of the over-collateralization interests in loans sold, which is included in its securities balances, and has historically borrowed money from commercial banks to fund this investment. The fair value of the over-collateralization interest in the loans sold to qualifying special purpose entities that have issued asset-backed securities has been estimated at the par value of the underlying loans less the asset-backed securities sold. The fair value of the over-collateralization interest in the loans sold to qualifying special purpose entities that have secured bank debt, is based on the present value of future expected cash flows using management’s best estimates of key assumptions, credit losses (0.50% annually), prepayment speed (12.00% annually) and discount rates (11.00%) commensurate with the risks involved. The fair value of the cash reserves has been estimated at the cash value of the reserve account.
Additionally, Aleritas recognizes a non-cash gain from subordinate interest spread in the loans sold, in which Aleritas recognizes an interest-only strip receivable included within its securities balances. The amount of gain or loss recorded on the sale of notes receivable to qualifying special purpose entities depends in part on the previous carrying amount of the financial assets involved in the transfer, allocated between the assets sold and the assets retained based on their relative fair value at the date of transfer. To initially obtain fair value of retained interest-only strip receivable resulting from the sale of notes receivable to qualifying special purpose entities, quoted market prices are used, if available. However, quotes are generally not available for such retained residual assets. Therefore, Aleritas typically estimates fair value for these assets. The fair value of the interest-only strip receivables retained is based on the present value of future expected cash flows using management’s best estimates of key assumptions, credit losses (0.50% annually), prepayment speed (12.00% annually) and discount rates (11.00%) commensurate with the risks involved.
Although Aleritas does not provide recourse on the transferred notes and is not obligated to repay amounts due to investors and creditors of the QSPEs, the retained interest assets are subject to loss, in part or in full, in the event credit losses exceed initial and ongoing management assumptions used in the fair market value calculation. Additionally, a partial loss of retained assets could occur in the event actual prepayments exceed management’s initial and ongoing assumptions used in the fair market calculation.
The carrying values of securities, resulting from loan sale activities to QSPEs, follow:
| June 30, | December 31, | |||||||
| 2008 | 2007 | |||||||
| Interest-only strip receivables | $ | 26,619 | $ | 28,144 | ||||
| Retained over-collateralization interest in loans sold | 41,710 | 58,769 | ||||||
| Cash reserves | 850 | 850 | ||||||
| Securities resulting from sales to QSPEs | $ | 69,179 | $ | 87,763 | ||||
65
Table of Contents
Components of the interest receivable portion of securities follow:
| June 30, | ||||
| 2008 | ||||
| Estimated cash flows from interest income | $ | 38,498 | ||
| Less: | ||||
| Estimated credit losses | (5,154 | ) | ||
| Discount to present value | (6,725 | ) | ||
| Carrying value of interest receivable portion of securities | $ | 26,619 | ||
Compensation Expense.The significant decrease in compensation expense for the six months ended June 30, 2008, was primarily due to a decrease of restricted stock of $1,461,000 in the second quarter due to the expiration of previously granted stock based compensation prior to vesting. Compensation expense was lower due to staff reductions subsequent to the end of the first quarter.
Collateral Preservation Expense.Collateral preservation expense includes up-front, ongoing and special fees paid to collateral preservation providers to provide sourcing and underwriting assistance and ongoing loan monitoring and loss mitigation services. This expense decreased significantly for the six months ended June 30, 2008 because many of the fees paid by Aleritas to collateral preservation consultants during the first quarter of 2008 were billed to securitization trusts in the second quarter of 2008 as provided in the corresponding securitization trust documents.
Other General and Administrative Expenses.The increase in these expenses for the three months ended June 30, 2008, was primarily due to a decrease of loan origination fees which typically offset certain operating expenses.
Interest Expense.Interest expense decreased due to the refinancing of the private placement debt offering in the first quarter of 2008 with lower cost debt.
Income Tax Expense.Income tax expenses, effective tax rates and tax liabilities are detailed below.
| Six Months | ||||||||
| Ended June 30, | ||||||||
| 2008 | 2007 | |||||||
| Income tax expense (benefit) | $ | (13,784 | ) | $ | 5,177 | |||
| Effective tax rate | 38 | % | 38 | % | ||||
| June 30, | December 31, | |||||||
| 2008 | 2007 | |||||||
| Current income tax liabilities | $ | — | $ | 2,549 | ||||
| Deferred income tax liabilities (asset), net | 382 | 10,910 | ||||||
Aleritas historically filed a consolidated federal income tax return with Brooke Corporation. Effective with the Oakmont merger on July 18, 2007, Aleritas began filing separate tax returns which caused the effective tax rate to increase. Amounts that are deferred for tax purposes are deferred on Aleritas’ balance sheet as deferred income tax payables. In addition, Aleritas records amounts due to taxing authorities in future years for those amounts previously paid to Brooke Corporation; a corresponding receivable from Brooke Corporation is recorded. As a result, a significant deferred tax liability was recorded during 2006 for these amounts.
66
Table of Contents
Loan Quality
Credit losses incurred on the loan portfolio follow:
| Six Months Ended | ||||||||
| June 30, | ||||||||
| 2008 | 2007 | |||||||
| Credit losses on all loans | $ | 14,896 | $ | 819 | ||||
Summary of Credit Losses: | ||||||||
| Retail insurance agencies — franchise | $ | 1,504 | $ | — | ||||
| non-franchise | ||||||||
| Managing general agencies | ||||||||
| Funeral homes | ||||||||
| Related parties | ||||||||
| Total credit losses | $ | 1,504 | $ | — | ||||
Credit Loss Analysis: | ||||||||
| On-balance sheet loans: | ||||||||
| Loans charged off, net of recoveries | $ | 91 | $ | 3 | ||||
| Increase in the loan loss reserve | 14,896 | — | ||||||
| Total credit losses — on-balance sheet loans | $ | 14,987 | $ | 3 | ||||
| Percent of on-balance sheet loans | 8.8 | % | 0.0 | % | ||||
| Off-balance sheet loans: | ||||||||
| Credit losses incurred — warehouse facility* | $ | — | $ | — | ||||
| participations | 318 | — | ||||||
| securitizations | 1,096 | 668 | ||||||
| Total credit losses — off-balance sheet loans | $ | 1,414 | $ | 668 | ||||
| Annualized percent of off-balance sheet loans | 0.5 | % | 0.3 | % | ||||
| * | Net credit losses for loans in the off-balance sheet warehouse facility are accounted for through the valuation of the retained securities rather than charged to credit loss expense. |
Credit losses increased significantly in 2008 primarily because Aleritas believes that liquidation of troubled loans is less expensive than payment of collateral preservation expenses to assist troubled borrowers. The increase in loan loss reserves is also the result of increasing delinquencies in loan balances held on Aleritas’s balance sheet.
67
Table of Contents
Loan balances delinquent 60 days or more are detailed below.
| June 30, 2008 | December 31, 2007 | |||||||||||||||
| Amount | Percent of Loans | Amount | Percent of Loans | |||||||||||||
| On-balance sheet loans | $ | 24,113 | $ | 13,301 | ||||||||||||
| Off-balance sheet loans — warehouse facility | — | — | ||||||||||||||
| participations | 13,673 | 7,343 | ||||||||||||||
| securitizations | 1,852 | 1,898 | ||||||||||||||
| Total loan balances delinquent 60 days or more | $ | 39,638 | 5.8 | % | $ | 22,542 | 3.3 | % | ||||||||
| Percent of delinquent loans associated with: | ||||||||||||||||
| Retail agency loans — franchise | 77 | % | 91 | % | ||||||||||||
| non-franchise | 0 | % | 0 | % | ||||||||||||
| Independent funeral home owners | 13 | % | 9 | % | ||||||||||||
| Managing general agencies | 0 | % | 0 | % | ||||||||||||
| Other | 10 | % | ||||||||||||||
| Delinquent loans to related entities | $ | — | $ | — | 0 | % | ||||||||||
Loans to start-up franchisees of Brooke Capital mostly represent franchisees that did not meet the required commission threshold in order to quality for a longer amortizing franchise loan. Delinquencies associated with these start-up franchisee loans represented 53.3% of the total loan balances delinquent 60 days or more. As a result of this significant increase in start-up franchise loan delinquencies, Aleritas has restricted the funding of start-up franchise loans associated with non peer-to-peer financing transactions until these delinquencies are significantly reduced or eliminated.
Aleritas believes one important factor regarding credit quality for Aleritas, its participating lenders and investors, results from the cash management feature imposed by Aleritas on retail borrowers representing 64.2% and 64% of on and off-balance sheet loans at June 30, 2008, and December 31, 2007, respectively, excluding related party loans. Under this cash management feature, debt servicing associated with these loans are typically submitted directly by the insurance companies or deducted from commissions received by Brooke Capital prior to payment of commissions to the borrower and most other creditors. Aleritas believes that credit problems associated with retail agency loans are more likely to be identified when Aleritas monitors borrower revenues on a monthly or quarterly basis rather than by monitoring Aleritas’ loan delinquencies.
Aleritas believes another important factor regarding credit quality for Aleritas, its participating lender and purchasers of its loans, is utilization of Collateral Preservation Providers to perform collateral preservation services. These services assist the lender in monitoring borrower performance, advising borrowers and otherwise assisting Aleritas in the preservation of collateral and improvement of borrower financial performance.
The level of credit losses and payment delinquencies increased during 2007 and 2008. Aleritas believes that these increases were primarily attributable to increased strain placed on its borrowers resulting from conditions in which Aleritas had little or no control, such as a softening premium insurance market. Many of its borrowers are primarily engaged in insurance agency and brokerage activities and derive revenues from commissions paid by insurance companies, which commissions are based in large part on the amount of premiums paid by their customers to such insurance companies. Premium rates are determined by insurers based on a fluctuating market. Historically, property and casualty insurance premiums have been cyclical in nature, characterized by periods of severe price competition and excess underwriting capacity, or soft markets, which generally have an adverse effect upon the amount of commissions earned by insurance agency borrowers, followed by periods of high premium rates and shortages of underwriting capacity, or hard markets. The current insurance market generally may be characterized as “soft,” with a flattening or decreasing of premiums in most lines of insurance. As a result of the challenging insurance market and increasing interest rate environment of the last several years, collateral preservation providers have provided increased levels of collateral preservation and loss mitigation support. If conditions persist, Collateral Preservation Providers have demanded increased collateral preservation.
68
Table of Contents
Aleritas relies on the recruitment activities of Brooke Capital for the resale of franchise businesses, including start-up franchise businesses with little or no business revenues. Over the past three to six months, Aleritas believes Brooke Capital has experienced difficulty in its recruitment activities which has resulted in an increase in delinquent franchise loans and agencies under management by Brooke Capital. Declining recruitment activities on the part of Brooke Capital is expected to have a negative impact on its franchise portfolio and Aleritas is closely monitoring this situation and the impact it may have on its loan loss reserve.
Although Aleritas does not provide recourse on the transferred notes and is not obligated to repay amounts due to investors and creditors of the QSPEs, its retained assets are subject to loss, in part or in full, in the event credit losses exceed initial and ongoing management assumptions used in the fair market value calculation. Additionally, a partial loss of retained assets could occur in the event actual prepayments exceed calculation. Following a write down of the value and the securities balance by $5,517,000 in the fourth quarter of 2007, Aleritas further wrote down its securities balance by $11,763,000 in the first quarter of 2008 to reflect the expected losses associated with the liquidation of several underlying franchise agencies.
Perhaps a greater risk to Aleritas is the indirect exposure to credit losses that may be incurred by participating lenders and investors and lenders that provide funding to Aleritas’s QSPEs. In those cases in which Aleritas does not bear direct exposure to credit loss, if losses by participating lenders and investors and lenders that provide funding to its QSPEs reach unacceptable levels, then Aleritas may not be able to sell or fund loans in the future. Aleritas’s business model requires access to funding sources to originate new loans, so the inability to sell loans would have a significant adverse effect on Aleritas.
Corporate
Financial information not allocated to a reportable segment and relating primarily to Brooke Corporation’s corporate functions, The DB Group, Ltd. and DB Indemnity, Ltd. is as follows (in thousands, except percentages).
| 2008 | 2008 | |||||||||||||||||||||||
| Three months | Three months | % Increase | Six months | Six months | % Increase | |||||||||||||||||||
| Ended | Ended | (decrease) | Ended | Ended | (decrease) | |||||||||||||||||||
| June 30, 2008 | June 30, 2007 | over 2007 | June 30, 2008 | June 30, 2007 | over 2007 | |||||||||||||||||||
Operating Revenues | ||||||||||||||||||||||||
| Insurance premiums earned | $ | 157 | $ | 283 | (45 | )% | $ | 418 | $ | 549 | (24 | )% | ||||||||||||
| Interest income | 100 | 166 | (40 | ) | 351 | 361 | (3 | ) | ||||||||||||||||
| Other income | 41 | 83 | 49 | 93 | 160 | (42 | ) | |||||||||||||||||
Total operating revenues | 298 | 532 | (44 | ) | 862 | 1,070 | (19 | ) | ||||||||||||||||
Operating Expenses | ||||||||||||||||||||||||
| Payroll expense | 866 | 686 | 26 | 1,396 | 1,514 | (8 | ) | |||||||||||||||||
| Depreciation and amortization | 36 | 353 | (90 | ) | 71 | 733 | (90 | ) | ||||||||||||||||
| Insurance loss and loss expense | — | 225 | (100 | ) | 403 | 551 | (27 | ) | ||||||||||||||||
| Other operating expenses | 802 | 613 | 31 | 2,014 | 260 | 675 | ||||||||||||||||||
Total operating expenses | 1,704 | 1,877 | (9 | ) | 3,884 | 3,058 | 27 | |||||||||||||||||
Income from operations | (1,406 | ) | (1,345 | ) | (3,022 | ) | (1,988 | ) | ||||||||||||||||
| Interest expense | 706 | 741 | (5 | ) | 1,337 | 1,397 | (4 | ) | ||||||||||||||||
Income before income taxes | $ | (2,112 | ) | $ | (2,086 | ) | $ | (4,359 | ) | $ | (3,385 | ) | ||||||||||||
Total assets (at period end) | $ | 90,257 | $ | 118,138 | (24 | )% | $ | 90,257 | $ | 118,138 | (24 | )% | ||||||||||||
Shared Services Fees.An internal allocation of legal, accounting, human resources, information technology and facilities management expenses is made to each of the four reportable segments, based on our estimate of usage. These shared services fees totaled $481,000 and $1,785,000, respectively, for the three months ended June 30, 2008 and 2007, and $1,053,000 and 3,105,000, respectively, for the six months ended June 30, 2008 and 2007. These fees are recorded as a reduction of other operating expenses.
69
Table of Contents
The DB Group, Ltd.The DB Group insured a portion of the professional insurance agents’ liability exposure of Brooke Capital, its affiliated companies and its franchisees and did not have a policy in force on June 30, 2008. For the three months ended June 30, 2008, DB Group recorded total revenues of $16,000 and total operating expenses of $17,000, resulting in income before income taxes of $(1,000). For the six months ended June 30, 2008, DB Group recorded revenues of $104,000 and total operating expenses of $41,000, resulting in income before income taxes of $63,000. DB Group has not established reserves for claims.
DB Indemnity, Ltd.DB Indemnity issues financial guarantee policies to Aleritas and its participating lenders and had policies in force on June 30, 2008 covering principal loan balances totaling $241,608,000. For the three months ended June 30, 2008, DB Indemnity recorded total revenues of $224,000 and total operating expenses of $18,000, resulting in income before income taxes of $206,000. For the three months ended June 30, 2008 and 2007, respectively, DB Indemnity incurred $0 and $225,000 in claims or loss expense. For the six months ended June 30, 2008, DB Indemnity recorded total revenues of $552,000 and total operating expenses of $441,000, resulting in income before income taxes of $111,000. For the six months ended June 30, 2008 and 2007, respectively, DB Indemnity incurred $403,000 and $551,000 in claims or loss expense. DB Indemnity’s reserve for claims was $600,000 and $600,000, respectively, on June 30, 2008 and December 31, 2007. Claims are expected to increase because of increasing levels of troubled franchise borrowers.
Discontinued Operation
Life insurance policy premiums are currently generated entirely through First Life America Corporation.
| 2008 | 2008 | |||||||||||||||||||||||
| Three Months | Three Months | % Increase | Six Months | Six Months | % Increase | |||||||||||||||||||
| Ended | Ended | (decrease) | Ended | Ended | (decrease) | |||||||||||||||||||
| June 30, 2008 | June 30, 2007 | over 2007 | June 30, 2008 | June 30, 2007 | over 2007 | |||||||||||||||||||
| (in thousands) | (in thousands) | |||||||||||||||||||||||
REVENUES | ||||||||||||||||||||||||
| Insurance premiums earned | $ | 898 | $ | 849 | 6 | % | $ | 2,000 | $ | 1,922 | 4 | % | ||||||||||||
| Interest income | 408 | 352 | 16 | 805 | 667 | 21 | ||||||||||||||||||
| Other income | 61 | 60 | 2 | 121 | 124 | (3 | ) | |||||||||||||||||
Total revenues | 1,367 | 1,261 | 8 | 2,926 | 2,713 | 8 | ||||||||||||||||||
EXPENSES | ||||||||||||||||||||||||
| Commission expense | 49 | 50 | (2 | ) | 104 | 109 | (5 | ) | ||||||||||||||||
| Payroll expense | 134 | 116 | 16 | 312 | 240 | 30 | ||||||||||||||||||
| Depreciation and amortization | 195 | 212 | (8 | ) | 385 | 394 | (2 | ) | ||||||||||||||||
| Other expenses | 933 | 667 | (40 | ) | 2,046 | 1,747 | (17 | ) | ||||||||||||||||
Total expenses | 1,311 | 1,045 | 25 | 2,847 | 2,490 | 14 | ||||||||||||||||||
Income from discontinued operation | 56 | 216 | (74 | ) | 79 | 223 | (65 | ) | ||||||||||||||||
Total assets (at period end) | $ | 35,000 | $ | 31,000 | 13 | % | $ | 35,000 | $ | 31,000 | 13 | % | ||||||||||||
Net premium income increased from $849,000 during the three months ended June 30, 2007, to $898,000 for the three months ended June 30, 2008. Net premium income increased from $1,922,000 during the six months ended June 30, 2007, to $2,000,000 for the six months ended June 30, 2008.
Net interest income increased $56,000 or 16% for the three months ended June 30, 2008, compared to the same period for 2007 and increased $138,000 or 21% for the six months ended June 30, 2008, compared to the same period for 2007, due primarily to the increased size of our investment portfolio.
70
Table of Contents
Operating expenses totaled $1,311,000 and $1,045,000 for the three months ended June 30, 2008 and 2007, respectively. Included in total operating expenses were policy reserve increases of $249,000 and $152,000 for the three months ended June 30, 2008 and 2007, respectively. Operating expenses totaled $2,847,000 and $2,490,000 for the six months ended June 30, 2008 and 2007, respectively. Included in total operating expenses were policy reserve increases of $544,000 and $482,000 for the six months ended June 30, 2008 and 2007, respectively. Life insurance reserves are actuarially determined based on such factors as insured age, life expectancy, mortality and interest assumptions. As more life insurance is written and existing policies reach additional durations, policy reserve requirements will continue to increase.
Our death claims expense increased to $241,000 during the three months ended June 30, 2008 as compared to $104,000 during the same time period in 2007 and increased to $562,000 during the six months ended June 30, 2008 as compared to $417,000 during the same time period in 2007. Increases in death claims expense are reflective of the continued maturation of the final expense policies, which are generally purchased by consumers in their senior years.
Commission expense is based on a percentage of premiums and is determined in the product design. Additionally, higher percentage commissions are paid for first year business than renewal year. As our focus has shifted to marketing our life insurance products instead of our annuity products, gross and net commission expense has declined.
Policy acquisition costs deferred result from the capitalization of costs related to the sales of life insurance and include commissions on first year business, medical exam and inspection report fees, and salaries of employees directly involved in the marketing, underwriting and policy issuance functions. The level of these costs deferred has declined due to reduced levels of commission expense paid on issuance of annuity contracts in 2008 as compared to 2007. Amortization of deferred policy acquisition costs was $172,000 and $195,000 for the three month periods ended June 30, 2008 and 2007, respectively. Amortization of deferred policy acquisition costs was $341,000 and $359,000 for the six month periods ended June 30, 2008 and 2007, respectively. Management performs quarterly reviews of the recoverability of deferred acquisition costs based on current trends as to persistency, mortality and interest. These trends are compared to the assumptions used in the establishment of the original asset in order to assess the need for impairment. Based on the results of the aforementioned procedures performed by management, no impairments have been recorded against the balance of deferred acquisition costs.
Liquidity and Capital Resources
Our cash and cash equivalents were $6,825,000 and $4,699,000 as of June 30, 2008 and December 31, 2007, respectively. Our current ratios (current assets to current liabilities) were 1.12 and 1.53 at June 30, 2008 and December 31, 2007, respectively.
Our cash and cash equivalents increased a total of $2,126,000 from December 31, 2007 to June 30, 2008 primarily as a result of an increase in debt. During the second quarter of 2008, net cash of $47,546,000 was provided by operating activities, which resulted primarily from a $26,978,000 increase in account payable. Net cash of $76,612,000 was used in investing activities, which resulted primarily from our purchase of investments. Net cash of $31,192,000 was provided by financing activities, which resulted primarily from advances on our finance company lines of credit to fund loans.
Our cash and cash equivalents increase a total of $2,857,000 from December 31, 2006 to June 30, 2007. During 2007 net cash of $96,527,000 was provided by operating activities, which resulted primarily from a decrease in notes receivables from the sale of loans by Aleritas to an off balance sheet facility. Net cash of $47,258,000 was used in investing activities, which resulted primarily from the purchase of securities associated with Aleritas’ off balance sheet facility, the acquisition of Generations Bank, the acquisition of Delta Plus Holdings, Inc. and the exercise of warrants to acquire additional Brooke Capital stock. Net cash of $46,412,000 was used in financing activities which primarily resulted from long-term debt payments of $85,936,000 which was partially offset by net proceeds of $18,975,000 from the sale of 1,500,000 shares of common stock.
71
Table of Contents
Brooke Corporation.We have transitioned from primarily holding wholly-owned, privately-held subsidiaries to primarily holding partially-owned, publicly-traded subsidiaries (Aleritas and Brooke Capital). Our future primary source of revenues will likely be the sale of stock in Aleritas because revenues from shared services fees, income tax sharing arrangements and dividends previously received from our private company subsidiaries will decrease significantly. The primary source of repayment of our short term debt is the sale of our stock in Aleritas. If we cannot sell our stock in Aleritas, or if the market price is exceedingly low, then we may be forced to sell other assets to repay our short term debt.
Short Term Debt incurred by Brooke Corporation, the holding company, totals $25,000,000 and includes:
| • | $11,500,000 owed to Aleritas by Brooke Corporation, primarily sold to syndicate of banks, secured by Brooke Bancshares stock and matures July 2008 | ||
| • | $4,500,000 owed to Stockton National by Brooke Corporation, primarily sold to syndicate of banks, secured by Aleritas stock and matures November 2008. | ||
| • | $2,300,000 owed to Security State by Brooke Corporation, secured by Brooke Brokerage stock and matures July 2008 | ||
| • | $5,500,000 owed to NFC by Brooke Corporation, secured by CJD & Associates stock and other assets and matures September 2008. | ||
| • | $1,200,000 misc |
Disruption of the stock or credit markets may prohibit us from selling Aleritas or Brooke Capital stock or from issuing debt until stock is sold. We believe that revenues from the sale of stock in Aleritas will be sufficient to offset decreases in other sources of revenues and that the combined sources of revenues will be sufficient to fund our normal operations and pay our corporate expenses and income taxes. We do not anticipate paying dividends until market conditions improve and we have sold stock in Aleritas or Brooke Capital. Brooke Corporation has a contingent obligation to Spirit Bank to purchase approximately $7,500,000 in Aleritas loan balances if required by Spirit Bank. Brooke Corporation also has a contingent obligation to DZ bank for the guarantee of approximately $30,000,000 in loan receivable balances.
Brooke Capital.Brooke Capital is listed on the American Stock Exchange and has responsibility for meeting its requirements for capital without our assistance. The current credit environment has made it difficult to raise debt or equity to fund the expansion of insurance company operations. As such, Brooke Capital expects to sell the non-standard auto insurance company, Delta Plus and entered into an agreement for the sale of our life insurance subsidiary, First Life. Subject to lender and regulatory approvals, net proceeds from such sale will be used to repay short term bank debt. Brooke Capital has experienced occasional liquidity problems primarily as the result of uncertain market conditions, but expects the problems to be resolved when it receives past due servicing fees owed by securitization trusts.
Aleritas.Aleritas is traded on the over-the-counter bulletin board market and has responsibility for meeting its requirements for capital without assistance from us. Aleritas has experienced occasional liquidity problems primarily as the result of uncertain market conditions and refinancing of its subordinate debt obligations.
Brooke Bancshares.We contributed $10,000,000 to Brooke Bancshares’ equity in January 2007 to fund the purchase of Generations Bank. Generations Bank acquired a banker agent network in January, 2008 that significantly increased Generations Bank assets and which required an additional $5,000,000 capital contribution which was funded by issuance of debt by Brooke Bancshares. We have committed to the Office of Thrift Supervision that Generations Bank will meet certain minimum capital standards and additional capital contributions from us may be required for this purpose. Generations Bank.
72
Table of Contents
Subject to the above uncertainties, we believe that our existing cash, cash equivalents and funds generated from operating, investing and financing activities will be sufficient to satisfy our normal financial needs. Additionally, subject to the above, we believe that funds generated from future operating, investing and financing activities will be sufficient to satisfy our future financing needs, including the required annual principal payments of our long-term debt and any future tax liabilities.
Capital Commitments
The following summarizes our contractual obligations as of June 30, 2008 and the effect those obligations are expected to have on our liquidity and cash flow in future periods (in thousands):
| Payments Due by Period | ||||||||||||||||||||
| Less than | 1 to 3 | 3 to 5 | More than | |||||||||||||||||
| Contractual Obligations | Total | 1 year | years | years | 5 years | |||||||||||||||
| Short-term borrowings | $ | 73,665 | $ | 73,665 | $ | — | $ | — | $ | — | ||||||||||
| Long-term debt | 108,965 | 51,456 | 27,932 | 26,837 | 2,740 | |||||||||||||||
| Interest payments* | 14,099 | 7,489 | 4,914 | 991 | 705 | |||||||||||||||
| Operating leases (facilities) | 18,383 | 8,729 | 8,373 | 1,077 | 204 | |||||||||||||||
| Capital leases (facilities) | 390 | 90 | 195 | 105 | — | |||||||||||||||
| Total from continuing operations | $ | 215,502 | $ | 141,429 | $ | 41,414 | $ | 29,010 | $ | 3,649 | ||||||||||
| Discontinued operations | $ | 27,145 | 2,443 | 5,429 | 6,243 | 13,030 | ||||||||||||||
| * | Includes interest on short-term and long-term borrowings. For additional information on the debt associated with these interest payments see Notes 4 and 5 to our consolidated financial statements. |
Our principal capital commitments consist of bank lines of credit, term loans, deferred payments to business sellers and obligations under leases for our facilities. We have entered into enforceable, legally binding agreements that specify all significant terms with respect to the contractual commitment amounts in the table above.
Capital commitments of our discontinued operations represent future annuity and policy benefits. While annuity contracts have scheduled payments, the timing of cash flows associated with life insurance policies is uncertain and can vary significantly.
Critical Accounting Policies
Our established accounting policies are summarized in Notes 1 and 2 to our consolidated financial statements for the years ended December 31, 2007 and 2006, and the three-month periods ended June 30, 2008 and 2007. As part of our oversight responsibilities, we continually evaluate the propriety of our accounting methods as new events occur. We believe that our policies are applied in a manner that is intended to provide the user of our financial statements with a current, accurate and complete presentation of information in accordance with generally accepted accounting principles.
We believe that the following accounting policies are critical. These accounting policies are more fully explained in the referenced Note 1 to our consolidated financial statements for the years ended December 31, 2007 and 2006, and thethree-month periods ended June 30, 2008 and 2007.
The preparation of our financial statements requires us to make estimates and judgments that affect the reported amounts of our assets, liabilities, revenues and expenses. The following discussions summarize how we identify critical accounting estimates, the historical accuracy of these estimates, sensitivity to changes in key assumptions, and the likelihood of changes in the future. The following discussions also indicate the uncertainties in applying these critical accounting estimates and the related variability that is likely to result during the remainder of 2008.
73
Table of Contents
Franchisees’ Share of Undistributed Commissions.We are obligated to pay franchisees a share of all commissions we receive. Prior to allocation of commissions to a specific policy, we cannot identify the policy owner and do not know the corresponding share (percentage) of commissions to be paid. We estimate the franchisee’s share of commissions to determine the approximate amount of undistributed commissions that we owe to franchisees.
An estimate of franchisees’ shares of undistributed commissions is made based on historical rates of commission payout, management’s experience and the trends in actual and forecasted commission payout rates. Although commission payout rates will vary, we do not expect significant variances from year to year. We regularly analyze and, if necessary, immediately change the estimated commission payout rates based on the actual average commission payout rates. The commission payout rate used in 2008 to estimate franchisees’ share of undistributed commissions was 85% and the actual average commission payout rate to franchisees (net of profit sharing commissions) was 82% for the three months ended June 30, 2008. We believe that these estimates will not change substantially during the remainder of 2008.
Reserve for Doubtful Accounts.Our allowance for doubtful accounts is comprised primarily of allowance for estimated losses related to amounts owed to us by franchisees for short-term credit advances, which are recorded as monthly statement balances, and longer-term credit advances, which are recorded as non-statement balances. Losses from advances to franchisees are estimated by analyzing all advances recorded to franchise statements that had not been repaid within the previous four months; all advances recorded as non-statement balances for producers who are in the first three months of development, total franchise statement balances; total non-statement balances; historical loss rates; loss rate trends; potential for recoveries; and management’s experience. Loss rates will vary and significant growth in our franchise network could accelerate those variances. The effect of any such variances can be significant. The estimated allowance for doubtful accounts as of June 30, 2008 was $6,700,000. The estimated allowance was approximately 144% of the actual amount of losses from advances made to franchisees for the twelve months ended June 30, 2008, approximately 31 of the actual total combined franchise statement and non-statement balances as of June 30, 2008, and approximately 69% of the actual combined advances recorded to franchise statements that had not been repaid during the four-month period ended June 30, 2008 and recorded as non-statement balances for producers in the first three months of development.
Reserves for Insurance Claims.Reserves for Insurance Claims are comprised of amounts set aside for claims on DB Indemnity, Ltd. and Traders Insurance Company insurance policies. DB Indemnity is a captive insurance company that issues financial guaranty policies covering loans originated by Aleritas. Traders Insurance Company is a domestic insurance company that issues auto insurance policies. Reserves for claims on DB Indemnity insurance policies are estimated by analyzing historical claim payments, the amount delinquent loans, the amount of loans in which default has been declared, the amount of loans in which an obligor’s business revenues have experienced a significant decline resulting in inadequate repayment ability and/or collateral support, the amount of loans in which a material change in an obligor’s or guarantor’s financial condition has occurred or is expected to occur, the amount of start up franchise loans that have matured and the borrower has not achieved the required minimum monthly commission benchmark, and management’s experience. Reserves for claims on Traders Insurance Company insurance policies are estimated based on historical experience, management’s experience, industry analysis and consultation with an independent actuarial firm. Claim payments will vary and significant growth in the issuance of insurance policies or changes in policy underwriting could accelerate those variances. The effect of any such variances can be significant. The estimated reserve for insurance claims as of June 30, 2008 was $600,000 for DB Indemnity. We have also established an allowance of $5,357,000 as of June 30, 2008 for losses on property and casualty insurance policies issued by Traders Insurance Company.
Discount, Prepayment and Credit Loss Rates Used to Record Loan Participation Sales and Loan Sales to Qualifying Special Purpose Entities.We regularly sell the loans that we originate to banks, finance companies and qualifying special purpose entities. Accounting for the sale of these loans and the subsequent tests for impairment are summarized in Note 2 to our consolidated financial statements for the years ended December 31, 2007, 2006 and 2005.
74
Table of Contents
Loan participations and the sale of loans to qualifying special-purpose entities represent the transfer of notes receivable, by sale, to participating lenders or qualifying special-purpose entities. The fair value of retained interests and servicing assets resulting from the transferred loans are recorded in accordance with SFAS 140. Most of our loans are adjustable rate loans. When we sell notes receivable to qualifying special-purpose entities, it retains all over-collateralization interest in loans sold and cash reserves. The fair value of the over-collateralization interests in loans sold to qualifying special purpose entities that have issued asset-backed securities has been estimated at the par value (carrying value) of the underlying loans less the asset-backed securities sold. The fair value of the over-collateralization interests in loans sold to qualifying special purpose entities that have secured bank debt is based on the present value of future expected cash flows using management’s best estimates of key assumptions, which at June 30, 2008, were: credit losses (0.50% annually), prepayment speed (12.00% annually) and discount rate (11.00%) commensurate with the risk involved. The fair value of the cash reserves is estimated at the cash value of the reserve account.
These assumptions regarding discount rate, prepayment rate and credit loss are based on historical comparisons, management’s experience and the trends in actual and forecasted portfolio prepayment speeds, portfolio credit losses, risk-free interest rates and market interest rates. The accuracy of these assumptions is monitored and changes made as necessary. It is important to note that our loan portfolio experienced an annualized prepayment rate of 12.8% over the twelve month period ended June 30, 2008. Management believes that this increase during 2008 is directly attributable to market conditions which are cyclical such as the softening insurance marketplace and the increasing interest rate environment. The prepayment assumption determined by management is an average annual rate over the life of our portfolio. Management believes that during the remaining term of this portfolio, several cycles are likely to occur which could increase or decrease actual prepayment rates; however, due to recent prepayment and interest rate trends, the prepayment rate assumption was increased from 10% to 12% annually in 2007’s fourth quarter. Shorter-term swings in prepayment rates typically occur because of cycles within a marketplace, such as a softening and hardening of the insurance marketplace, changes in the death care rate for funeral homes and changes in the variable interest rate loans from key index rate changes. Longer term increases in prepayment rates typically result from long-term deterioration of the marketplace or increased lending competition.
We tested retained interests for impairment as of December 31, 2007. The securitized pools of loans experienced an increase in the prepayment rate, and as a result, management determined that an “other than temporary” impairment occurred. An impairment loss of $778,000 was recorded for the year then ended. During 2006, the securitized pools of loans experienced an increase in the prepayment rate as well and an impairment loss of $329,000 was recorded for the year. The effect of variances in the assumptions can be significant and the impact of changes in these estimates is discussed in Note 2 to the consolidated financial statements for the years ended December 31, 2007 and 2006.
Subsequent to the initial calculation of the fair value of retained interest, we utilize a fair market methodology to determine the ongoing fair market value of the retained interest. Ongoing fair value is calculated using the then current outstanding principal of the transferred notes receivable and the outstanding balances due unaffiliated purchasers, which are reflective of credit losses and prepayments prior to the fair value recalculation. The rates of write down of the retained interest are based on the current interest revenue stream. This revenue stream is based on the loan balances at the date the impairment test is completed, which will include all prepayments on loans and any credit losses for those loans. However, due to the impairment of the collateral supporting certain loans an additional impairment loss of $11,763,000 was recorded which reduced the securities balance.
As of December 31, 2007 and 2006, as a result of the above mentioned increased payment speeds and reduction in collateral value, the fair value of the retained interests declined resulting in the impairment losses noted above. The total impairment losses above represented 1.0% and 0.1% of the off-balance sheet loans as of December 31, 2007 and 2006, respectively.
75
Table of Contents
Provision for Credit Losses.Our credit loss exposure is limited to on-balance sheet loans (other than loans sold to warehouse qualifying special-purpose entities which are classified as on-balance sheet) and the our retained interest in loans that are sold to qualifying special-purpose entities that have issued asset-backed securities or off-balance sheet bank debt. A credit loss assumption is inherent in the calculations of retained interest-only strip receivables resulting from loans that are sold. Historically, no reserve for credit losses had been made for on-balance sheet loans held in inventory for eventual sale for two reasons. First, these loans were typically held for six to nine months before being sold to investors and, therefore, had a short-term exposure to loss. Second, commissions received by Brooke Capital, are typically distributed to Aleritas for loan payments prior to distribution of commissions to the franchisee borrower and most other creditors.
However, given the rapid growth that we have experienced over the past two years, the seasoning of the loan portfolio, an increase in delinquencies of on-balance sheet loans and management’s expectation that loans will be held longer than previously (for nine to twelve months) before being sold; we established a reserve for potential loan losses on the on-balance sheet loans in the third quarter of 2007. The reserve for credit losses includes two key components: (1) loans that are impaired under SFAS No. 114, “Accounting by Creditors for Impairment of a Loan — an amendment of FASB Statements No. 5 and 15” and (2) reserves for estimated losses inherent in the rest of the portfolio based upon historical and projected credit risk. A reserve of $14,896,000 was established with an offsetting charge to credit loss expense. Management will evaluate the adequacy of the reserve on an ongoing basis in the future utilizing the credit metrics underlying the reserve.
Amortization and Useful Lives.We acquire insurance agencies and other businesses that we intend to hold for more than one year. We record these acquisitions as Amortizable intangible assets. Accounting for Amortizable intangible assets, and the subsequent tests for impairment are summarized in Note 1(g) to our consolidated financial statements for the years ended December 31, 2007 and 2006. The rates of amortization of Amortizable intangible assets are based on our estimate of the useful lives of the renewal rights of customer and insurance contracts purchased. We estimate the useful lives of these assets based on historical renewal rights information, management’s experience, industry standards, and trends in actual and forecasted commission payout rates. The rates of amortization are calculated on an accelerated method (150% declining balance) based on a 15-year life. As of December 31, 2007, we tested Amortizable intangible assets for impairment and the resulting analysis indicated that our assumptions were historically accurate and that the useful lives of these assets exceeded the amortization rate. The Amortizable intangible assets have a relatively stable life and unless unforeseen circumstances occur, the life is not expected to change in the foreseeable future. Because of the relatively large remaining asset balance, changes in our estimates could significantly impact our results.
The rates of amortization of servicing assets are based on our estimate of repayment rates, and the resulting estimated maturity dates, of the loans that we service. Loan repayment rates are determined using assumptions about credit losses, prepayment speed and discount rates as outlined in the discussion above about the fair values of servicing assets. As of December 31, 2007, an analysis of prepayment speeds and credit losses indicated that our assumptions were historically accurate and the maturity date estimates were reasonable. Although significant changes in estimates are not expected, because of the relatively large remaining asset balance, changes in our estimates that significantly shorten the estimated maturity dates could significantly impact our results.
Loan Origination Expenses.Aleritas typically sells loans soon after origination and retains responsibility for loan servicing. However, most of Aleritas’ operating expenses are associated with loan origination. We analyze our lending activities to estimate how much of Aleritas’ operating expenses should be allocated to loan origination activities and, therefore, matched, or offset, with the corresponding loan origination fees collected from borrowers at loan closing. The estimated allocations of payroll and operating expenses to loan origination activities are based on management’s observations and experience; job descriptions and other employment records; and payroll records. Although not expected, significant changes in our estimate of expense allocations could significantly impact our results, because loan fees amounts are significant to us.
76
Table of Contents
Income Tax Expense.An estimate of income tax expense is based primarily on historical rates of actual income tax payments. The estimated effective income tax rate used for the six months ended June 30, 2008 to calculate income tax expense was 38%. Although not expected, significant changes in our estimated tax rate could significantly impact our results. We believe this estimate will not change significantly during the remained of 2008.
Revenue Recognition Policies.Revenue recognition is summarized in Note 1(e) to our consolidated financial statements for the years ended December 31, 2007 and 2006.
With respect to the previously described critical accounting policies, we believe that the application of judgments and assumptions is consistently applied and produces financial information which fairly depicts the results of operations for all years presented.
Off Balance Sheet Arrangements
In General.Other than the below listed off-balance sheet transaction which occurred during March of 2007, there have been no material changes in our off balance sheet financing arrangements from those reported in our annual report on Form 10-K for the year ended December 31, 2007.
Asset Securitizations
In recent years, Aleritas has relied on securitizations to fund a large portion of the loan portfolio. No asset-backed securities were issued in 2008 and 2007. Based on recent developments in the credit markets, especially as they relate to asset securitizations, the buying pool of prospective purchasers has been significantly reduced. As a result of this market condition, Aleritas may be required to provide increased credit enhancement with reduced interest spreads in order to entice prospective purchasers to participate in asset securitizations completed by Aleritas in the future, if there is a market at all. If the market for these securities is such that this is not possible, then Aleritas will attempt to partially offset the impact with the sale of more loan participations through the lender network but that may not be possible.
Off-Balance Sheet Bank Debt
During the first quarter of 2007, Aleritas structured an off-balance sheet transaction, involving the sale of loans to Brooke Warehouse Funding, in which loans were used by Brooke Warehouse Funding, LLC to secure bank debt, through its wholly owned subsidiary, from Fifth Third Bank, in which Aleritas is not obligated to repay. Previously, Brooke Warehouse Funding secured bank debt directly from Fifth Third Bank, which was categorized as on-balance sheet bank debt to Aleritas. As of June 30, 2008, the outstanding balance of sold accounts receivable held by Brooke Warehouse Funding, LLC and participated to Brooke Master Trust 2007-1, LLC totaled $174,966,000. Based on recent developments in the credit markets, especially as they relate to off-balance sheet bank debt, the pool of prospective lenders of such off-balance sheet debt has been significantly reduced. As a result of this market condition, Aleritas may be required to provide increased credit enhancement with reduced interest spreads in order to entice prospective lenders to extend such credit in the future, if there is a market at all. If the market for such debt is such that this is not possible, then Aleritas believes that the funding shortfall can be partially offset with the sale of more loan participations through the lender network and with increased borrowing from on-balance sheet bank lines of credit. Although mostly offset by amounts owed by Fifth Third for collateral preservation fees, Aleritas has $2,846,000 of funds that it has received and not remitted to Fifth Third. Fifth Third has not issued a notice of default with respect to the facility and is in discussions with Aleritas’s management. Management believes they will be able to come to an agreement with Fifth Third regarding collateral preservation fees and that will allow the facility to be in compliance with the Agreement although there can be no assurance that Aleritas will reach a satisfactory resolution.
77
Table of Contents
Although entirely offset by amounts owed by off-balance sheet entities for collateral preservation fees, Aleritas has $794,000 of funds that it has received and not remitted to other off-balance sheet entities. These other off-balance sheet entities have not issued a notice of default and they are in discussions with Aleritas’s management. Management believes they will be able to come to an agreement with these off-balance sheet entities regarding collateral preservation fees and that will allow the entities to be in compliance although there can be no assurance that Aleritas will reach a satisfactory resolution.
Proposed Accounting Changes.In April 2008 the Financial Accounting Standards Board (“FASB”) decided to remove the qualifying special-purpose entity concept from Statement of Financial Accounting Standards No. 140,“Accounting for Transfers and Servicing of Financial Assets and Extinguishments of Liabilities”and simultaneously remove the QSPE exception from consolidation in FASB Interpretaion No. 46 (revised December 2003), “Consolidation of Variable Interest Entitites”. FASB also decided to amend Paragraph 9(a) to explicitly require preparers assessing legal isolation to consider all involvements with the transferred asset by entities within the consolidated group; and Paragraph 9(c) to prohibit sale accounting if the transferor has imposed a constraint on the transferee. The primary potential consequences of the tentative decision are that transferors would have to evaluate whether to consolidate any entity to which the assets are “sold” if the transferor retains an economic interest in the transferred assets, and that transfers would not be accounted for as sales if the transferor imposes a constraint on the transferee under any circumstances. An exposure draft of proposed requirements is planned by the end of June 2008, and a final Statement is planned to be effective for periods beginning after December 15, 2008. Aleritas will monitor the status of the exposure draft and consider what changes, if any, could be made to the structure of the securitizations and off-balance sheet financings to continue to exclude loans transferred to these QSPE’s. At June 30, 2008, the QSPE’s held loans totaling $307,117,000 which could be required to be shown on the financial statements depending on the outcome of the exposure draft.
Recently Issued Accounting Pronouncements
See Note 18 to our consolidated financial statements for a discussion of the effects of the adoption of new accounting standards.
Related Party Transactions
See Note 10 to our consolidated financial statements for information about related party transactions.
Impact of Inflation and General Economic Conditions
There have been no material changes to the description of the impact of inflation and general economic conditions reported in our annual report on Form 10-K for the year ended December 31, 2007.
The level of credit losses for Aleritas and payment delinquencies increased during 2007 and continued to increase during 2008 due, in part, to higher interest rates and a softening insurance market. Aleritas expects increased levels of delinquencies, defaults and credit losses as the full impact of these market conditions are felt by Aleritas borrowers.
The actual annualized prepayment rate on Aleritas loans has increased to approximately 11% during the twelve-month period ended June 30, 2008, primarily due to increased asset ownership transfers to other borrowers within our portfolio, new loan documents being executed on existing loans to improve security interests and the increasing interest rate environment. We expect that, over the remaining life of the Aleritas loan portfolio, several cycles of increasing and decreasing prepayment rates will likely occur, primarily resulting from fluctuations in key interest rates and changes in the insurance marketplace.
All other schedules have been omitted because they are either inapplicable or the required information has been provided in the consolidated financial statements or the notes thereto.
78
Table of Contents
Item 3. Quantitative and Qualitative Disclosures About Market Risk
There have been no material changes in the description of our market risks from those reported at December 31, 2007 in our Annual Report on Form 10-K.
Although credit performance has been favorable for Aleritas and the purchasers of its loans, the level of credit losses for Aleritas and payment delinquencies increased during 2007 and continued to increase during the first half of 2008 due, in part, to increasing interest rates and a softening premium insurance market. We do expect increased levels of delinquencies, defaults and credit losses as the full impact of these market conditions are felt by Aleritas borrowers.
The actual annualized prepayment rate on Aleritas loans has increased to approximately [12.8]% during the twelve-month period ending June 30, 2008, primarily due to increased asset ownership transfers to other borrowers within our portfolio, new loan documents being executed on existing loans to improve security interests and the increasing interest rate environment. We expect that, over the remaining life of the Aleritas loan portfolio, several cycles of increasing and decreasing prepayment rates will likely occur, primarily resulting from fluctuations in key interest rates and changes in the insurance marketplace.
Item 4. Controls and Procedures
Evaluation of Disclosure Controls and Procedures
We have adopted and maintain disclosure controls and procedures (as such term is defined in Rules 13a-15(e) and 15d-15(e) under the Exchange Act), that are designed to ensure that information required to be disclosed in our reports under the Exchange Act, is recorded, processed, summarized and reported within the time periods required under the Securities and Exchange Commission’s rules and forms and that the information is gathered and communicated to our management, including our Chief Executive Officer and Chief Financial Officer, as appropriate, to allow for timely decisions regarding required disclosure. In designing and evaluating the disclosure controls and procedures, management recognizes that any controls and procedures, no matter how well designed and operated, can provide only reasonable assurance of achieving the desired control objectives, and management is required to apply its judgment in evaluating the cost-benefit relationship of possible controls and procedures.
As of the end of the period covered by this report, we have carried out an evaluation, under the supervision and with the participation of management, including our Chief Executive Officer and Chief Financial Officer, of the effectiveness of the design and operation of our disclosure controls and procedures. Based on the foregoing, our Chief Executive Officer and Chief Financial Officer concluded that our disclosure controls and procedures were effective at the reasonable assurance level. In conducting our evaluation, we considered that the Company restated the presentation of its cash flow statements for years ended December 31, 2005, 2006 and 2007 as well as for the three months ended March 31, 2008 to record activity on securitization-related bank lines of credit as financing activities instead of operating activities. Correction of this accounting error resulted in no changes in our net cash flows, net income, assets, liabilities, retained earnings, or earnings per share. We do not believe this restatement indicates a material weakness in our internal controls. However, we have established specific controls related to arrangements that are within the scope of SFAS 95 to provide a written analysis of the appropriate accounting for other similar arrangements and to review our conclusions with qualified internal accounting personnel or third party accounting experts. In addition, we will provide our accounting staff with additional training related to generally accepted accounting principles and financial statement reporting matters with respect to SFAS 95.
Changes in Internal Control over Financial Reporting
There have been no changes in our internal controls over financial reporting (as defined in Rule 13(a) or Rule 15d-15(f) of the Exchange Act) during the quarter covered by this report that have materially affected, or are reasonably likely to materially affect, our internal controls over financial reporting.
79
Table of Contents
PART II — OTHER INFORMATION
Item 1. Legal Proceedings
We and our subsidiaries have from time to time been parties to claims and lawsuits that are incidental to our business operations. While ultimate liability with respect to these claims and litigation is difficult to predict, we believe that the amount, if any, that we are required to pay in the discharge of liabilities or settlements in these matters will not have a material adverse effect on our consolidated results of operations or financial position.
Item 1A. Risk Factors
In addition to the other information set forth in this report, you should carefully consider the factors discussed in Part I, “Item 1A. Risk Factors” in our Annual Report on Form 10-K for the year ended December 31, 2007, which could materially affect your business, financial condition, or future results. There have been no material changes to the risk factors described in that report. However, the risks described in our Annual Report are not the only risks facing the Company. Additional risks and uncertainties not currently known to us or that we currently deem to be immaterial also may materially adversely affect our business, financial condition and/or operating results.
Item 4. Submission of Matters to a Vote of Security Holders
The Company held its Annual Meeting of Shareholders on May 15, 2008. The following proposals were submitted to a vote of shareholders at such meeting:
PROPOSAL NO. 1
Election of the following five directors to serve until the next Annual Meeting of Shareholders or until their successors are duly elected and qualified:
| For | Against | |||||||
| Robert D. Orr | 11,514,466 | 403,342 | ||||||
| Leland G. Orr | 11,509,551 | 408,256 | ||||||
| John L. Allen | 11,818,279 | 99,529 | ||||||
| Joe. L. Barnes | 11,815,296 | 102,511 | ||||||
| Mitchell G. Holthus | 11,817,576 | 100,231 | ||||||
PROPOSAL NO. 2
Ratification of the appointment of Summers, Spencer & Callison, CPAs, Chartered as the independent registered public accounting firm of the Company:
| For | Against | Abstain | ||||||
| 11,840,035 | 77,773 | 0 | ||||||
Item 6. Exhibits
The following exhibits are filed as part of this report. Exhibit numbers correspond to the numbers in the exhibit table in Item 601 of Regulation S-K:
| 31.1 | Certification of Chief Executive Officer pursuant to Section 302 of the Sarbanes-Oxley Act of 2002. | ||
| 31.2 | Certification of Chief Financial Officer pursuant to Section 302 of the Sarbanes-Oxley Act of 2002. | ||
| 32.1 | Certification of Chief Executive Officer pursuant to 18 U.S.C. Section 1350, as adopted pursuant to Section 906 of the Sarbanes-Oxley Act of 2002. | ||
| 32.2 | Certification of Chief Financial Officer pursuant to 18 U.S.C. Section 1350, as adopted pursuant to Section 906 of the Sarbanes-Oxley Act of 2002. |
80
Table of Contents
SIGNATURES
In accordance with requirements of the Securities Exchange Act of 1934, the registrant caused this report to be signed on its behalf by the undersigned, thereunto duly authorized.
| Date: August 20, 2008 | BROOKE CORPORATION | |||||
| By: | /s/ Leland G. Orr | |||||
| By: | /s/ Travis W. Vrbas | |||||
81
Table of Contents
INDEX TO EXHIBITS
| Exhibit No. | Description | |||
| 31.1 | Certification of Chief Executive Officer pursuant to Section 302 of the Sarbanes-Oxley Act of 2002.1 | |||
| 31.2 | Certification of Chief Financial Officer pursuant to Section 302 of the Sarbanes-Oxley Act of 2002.1 | |||
| 32.1 | Certification of Chief Executive Officer pursuant to 18 U.S.C. Section 1350, as adopted pursuant to Section 906 of the Sarbanes-Oxley Act of 2002.1 | |||
| 32.2 | Certification of Chief Financial Officer pursuant to 18 U.S.C. Section 1350, as adopted pursuant to Section 906 of the Sarbanes-Oxley Act of 2002.1 | |||
| 1 | Filed herewith. |
82