UNITED STATES
SECURITIES AND EXCHANGE COMMISSION
Washington, D.C. 20549
FORM N-CSR
CERTIFIED SHAREHOLDER REPORT OF REGISTERED
MANAGEMENT INVESTMENT COMPANIES
Investment Company Act File Number: 811-02215-99
T. Rowe Price Small-Cap Value Fund, Inc.
(Exact name of registrant as specified in charter)
100 East Pratt Street, Baltimore, MD 21202
(Address of principal executive offices)
David Oestreicher
100 East Pratt Street, Baltimore, MD 21202
(Name and address of agent for service)
Registrant’s telephone number, including area code: (410) 345-2000
Date of fiscal year end: December 31
Date of reporting period: December 31, 2024
Item 1. Reports to Shareholders
(a) Report pursuant to Rule 30e-1
Annual Shareholder Report
December 31, 2024
This annual shareholder report contains important information about Small-Cap Value Fund (the "fund") for the period of January 1, 2024 to December 31, 2024. You can find the fund’s prospectus, financial information on Form N‑CSR (which includes required tax information for dividends), holdings, proxy voting information, and other information atwww.troweprice.com/prospectus. You can also request this information without charge by contacting T. Rowe Price at 1‑800‑638‑5660 or info@troweprice.com or contacting your intermediary.
What were the fund costs for the last year? (based on a hypothetical $10,000 investment)
| | Costs of a $10,000 investment | Costs paid as a percentage of a $10,000 investment |
|---|
| Small-Cap Value Fund - Investor Class | $81 | 0.77% |
|---|
What drove fund performance during the past 12 months?
U.S. equities posted strong returns, lifted by favorable economic data and corporate earnings reports, easing inflationary pressures, and short-term interest rate reductions by the Federal Reserve. The results of the U.S. presidential election ended a lengthy period of uncertainty, boosting stocks further in the fourth quarter. Small-cap stocks significantly lagged large-cap peers, and growth outperformed value across all market capitalizations.
Versus the style-specific Russell 2000 Value Index, stock selection in the consumer discretionary sector was the leading contributor to relative performance. Shares of Cava, the largest Mediterranean restaurant company in the U.S., advanced on industry-leading traffic growth. Stock choices in energy also added value. Shares of TechnipFMC, a global offshore oil field service and equipment company, benefited from strong performance in its subsea segment.
Conversely, stock selection in health care detracted from relative results. Health care diagnostics company QuidelOrtho was a key detractor due to headwinds from a “COVID-off” overhang and execution issues that ultimately led to a change in management. Stock choices in materials also hindered performance. Weak end markets and tightening aluminum scrap spreads pressured downstream aluminum mining company Constellium.
The fund adheres to a contrarian, bottom-up investing approach and seeks to identify under-followed companies that we believe are inefficiently priced. Fundamental research, anchored by face-to-face meetings with company management, is critical to uncovering successful investment opportunities, and a long-term orientation allows for full exploitation of valuation anomalies.
How has the fund performed?
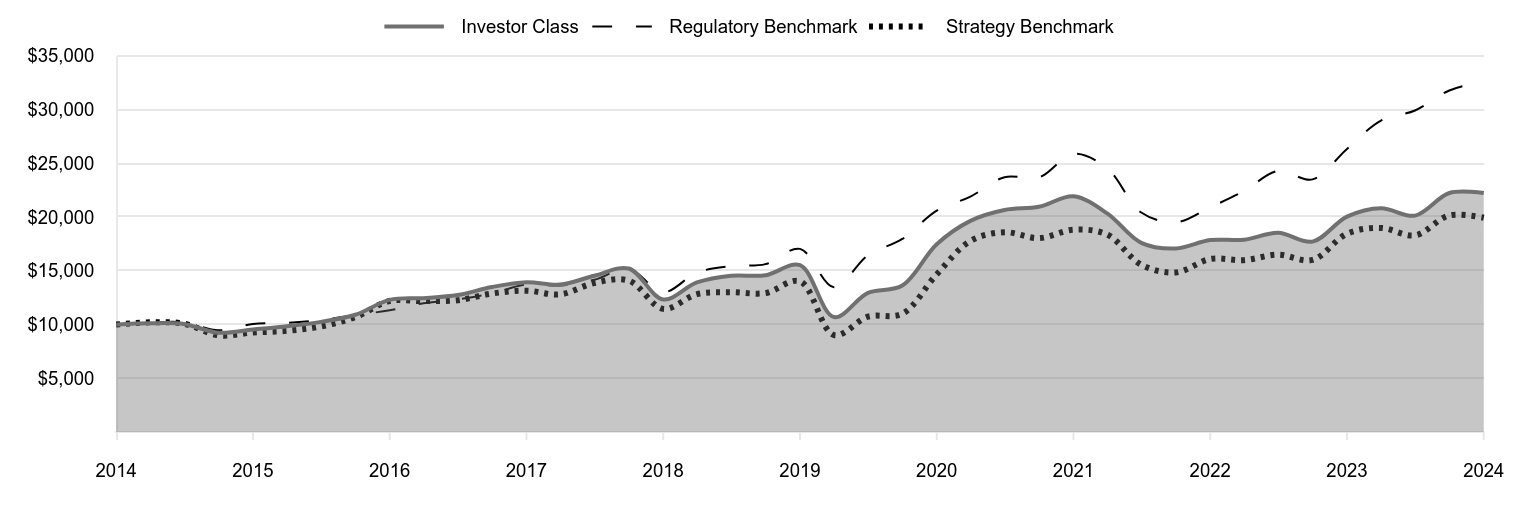
Cumulative Returns of a Hypothetical $10,000 Investment as of December 31, 2024
| Investor Class | Regulatory Benchmark | Strategy Benchmark |
|---|
| 2014 | 10,000 | 10,000 | 10,000 |
|---|
| 2015 | 10,113 | 10,180 | 10,198 |
|---|
| 2015 | 10,051 | 10,194 | 10,076 |
|---|
| 2015 | 9,233 | 9,455 | 8,994 |
|---|
| 2015 | 9,530 | 10,048 | 9,253 |
|---|
| 2016 | 9,832 | 10,145 | 9,411 |
|---|
| 2016 | 10,244 | 10,412 | 9,816 |
|---|
| 2016 | 10,905 | 10,870 | 10,686 |
|---|
| 2016 | 12,291 | 11,327 | 12,190 |
|---|
| 2017 | 12,452 | 11,978 | 12,174 |
|---|
| 2017 | 12,738 | 12,339 | 12,256 |
|---|
| 2017 | 13,490 | 12,903 | 12,882 |
|---|
| 2017 | 13,935 | 13,721 | 13,146 |
|---|
| 2018 | 13,710 | 13,633 | 12,799 |
|---|
| 2018 | 14,534 | 14,163 | 13,861 |
|---|
| 2018 | 15,204 | 15,172 | 14,084 |
|---|
| 2018 | 12,333 | 13,002 | 11,455 |
|---|
| 2019 | 13,909 | 14,828 | 12,821 |
|---|
| 2019 | 14,537 | 15,435 | 12,997 |
|---|
| 2019 | 14,580 | 15,614 | 12,923 |
|---|
| 2019 | 15,520 | 17,035 | 14,020 |
|---|
| 2020 | 10,690 | 13,475 | 9,020 |
|---|
| 2020 | 12,941 | 16,443 | 10,726 |
|---|
| 2020 | 13,622 | 17,957 | 11,000 |
|---|
| 2020 | 17,460 | 20,593 | 14,669 |
|---|
| 2021 | 19,639 | 21,900 | 17,775 |
|---|
| 2021 | 20,651 | 23,705 | 18,585 |
|---|
| 2021 | 20,949 | 23,681 | 18,031 |
|---|
| 2021 | 21,919 | 25,877 | 18,816 |
|---|
| 2022 | 20,333 | 24,512 | 18,365 |
|---|
| 2022 | 17,595 | 20,418 | 15,559 |
|---|
| 2022 | 17,070 | 19,506 | 14,842 |
|---|
| 2022 | 17,854 | 20,907 | 16,091 |
|---|
| 2023 | 17,880 | 22,408 | 15,986 |
|---|
| 2023 | 18,532 | 24,288 | 16,494 |
|---|
| 2023 | 17,708 | 23,497 | 16,006 |
|---|
| 2023 | 20,035 | 26,334 | 18,448 |
|---|
| 2024 | 20,817 | 28,973 | 18,983 |
|---|
| 2024 | 20,127 | 29,904 | 18,291 |
|---|
| 2024 | 22,231 | 31,767 | 20,148 |
|---|
| 2024 | 22,226 | 32,604 | 19,934 |
|---|
202501-4140694, 202502-4108906
Average Annual Total Returns
| | 1 Year | 5 Years | 10 Years |
|---|
| Small-Cap Value Fund (Investor Class) | 10.93% | 7.45% | 8.31% |
|---|
| Russell 3000 Index (Regulatory Benchmark) | 23.81 | 13.86 | 12.55 |
|---|
| Russell 2000 Value Index (Strategy Benchmark) | 8.05 | 7.29 | 7.14 |
|---|
The preceding line graph shows the value of a hypothetical $10,000 investment in the fund over the past 10 fiscal year periods or since inception (for funds lacking 10-year records). The fund’s performance information included in the line graph and table above is compared with a regulatory required index that represents an overall securities market (Regulatory Benchmark). In addition, the line graph and table may also include one or more indexes that more closely aligns to the fund's investment strategy (Strategy Benchmark(s)). Due to new SEC Rules on shareholder reporting the fund adopted a new broad-based securities market index, referred to as the Regulatory Benchmark. Market index returns do not include expenses, which are deducted from fund returns. The fund's total return figures reflect the reinvestment of dividends and capital gains, if any.Neither the fund’s returns nor the index returns reflect the deduction of taxes that a shareholder would pay on fund distributions or redemptions of fund shares.The fund’s past performance is not a good predictor of the fund’s future performance.Updated performance information can be found at www.troweprice.com.
What are some fund statistics?
- Total Net Assets (000s)$10,472,939
- Number of Portfolio Holdings381
- Investment Advisory Fees Paid (000s)$46,994
- Portfolio Turnover Rate32.4%
What did the fund invest in?
Sector Allocation (as a % of Net Assets)
| Financials | 28.1% |
| Industrials & Business Services | 14.4 |
| Real Estate | 10.5 |
| Consumer Discretionary | 9.7 |
| Health Care | 8.5 |
| Energy | 7.8 |
| Information Technology | 6.7 |
| Utilities | 5.2 |
| Materials | 4.4 |
| Other | 4.7 |
Top Ten Holdings (as a % of Net Assets)
| Pinnacle Financial Partners | 1.6% |
| PennyMac Financial Services | 1.4 |
| TechnipFMC | 1.3 |
| Columbia Banking System | 1.3 |
| Matador Resources | 1.2 |
| SouthState | 1.2 |
| Houlihan Lokey | 1.1 |
| East West Bancorp | 1.0 |
| Terreno Realty | 0.9 |
| TXNM Energy | 0.9 |
If you invest directly with T. Rowe Price, you can elect to receive future shareholder reports or other important documents through electronic delivery by enrolling at www.troweprice.com/paperless. If you invest through a financial intermediary such as an investment advisor, a bank, retirement plan sponsor or a brokerage firm, please contact that organization and ask if it can provide electronic delivery.
Frank Russell Company "LSE" does not accept any liability for any errors or omissions in the indexes or data, and hereby expressly disclaim all warranties of originality, accuracy, completeness, timeliness, merchantability and fitness for a particular purpose. No party may rely on any indexes or data contained in this communication. Visit www.troweprice.com/en/us/market-data-disclosures for additional legal notices & disclaimers.
Small-Cap Value Fund
Investor Class (PRSVX)
T. Rowe Price Investment Services, Inc.
100 East Pratt Street
Baltimore, MD 21202
Annual Shareholder Report
December 31, 2024
This annual shareholder report contains important information about Small-Cap Value Fund (the "fund") for the period of January 1, 2024 to December 31, 2024. You can find the fund’s prospectus, financial information on Form N‑CSR (which includes required tax information for dividends), holdings, proxy voting information, and other information atwww.troweprice.com/prospectus. You can also request this information without charge by contacting T. Rowe Price at 1‑800‑638‑5660 or info@troweprice.com or contacting your intermediary.
What were the fund costs for the last year? (based on a hypothetical $10,000 investment)
| | Costs of a $10,000 investment | Costs paid as a percentage of a $10,000 investment |
|---|
| Small-Cap Value Fund - Advisor Class | $122 | 1.16% |
|---|
What drove fund performance during the past 12 months?
U.S. equities posted strong returns, lifted by favorable economic data and corporate earnings reports, easing inflationary pressures, and short-term interest rate reductions by the Federal Reserve. The results of the U.S. presidential election ended a lengthy period of uncertainty, boosting stocks further in the fourth quarter. Small-cap stocks significantly lagged large-cap peers, and growth outperformed value across all market capitalizations.
Versus the style-specific Russell 2000 Value Index, stock selection in the consumer discretionary sector was the leading contributor to relative performance. Shares of Cava, the largest Mediterranean restaurant company in the U.S., advanced on industry-leading traffic growth. Stock choices in energy also added value. Shares of TechnipFMC, a global offshore oil field service and equipment company, benefited from strong performance in its subsea segment.
Conversely, stock selection in health care detracted from relative results. Health care diagnostics company QuidelOrtho was a key detractor due to headwinds from a “COVID-off” overhang and execution issues that ultimately led to a change in management. Stock choices in materials also hindered performance. Weak end markets and tightening aluminum scrap spreads pressured downstream aluminum mining company Constellium.
The fund adheres to a contrarian, bottom-up investing approach and seeks to identify under-followed companies that we believe are inefficiently priced. Fundamental research, anchored by face-to-face meetings with company management, is critical to uncovering successful investment opportunities, and a long-term orientation allows for full exploitation of valuation anomalies.
How has the fund performed?
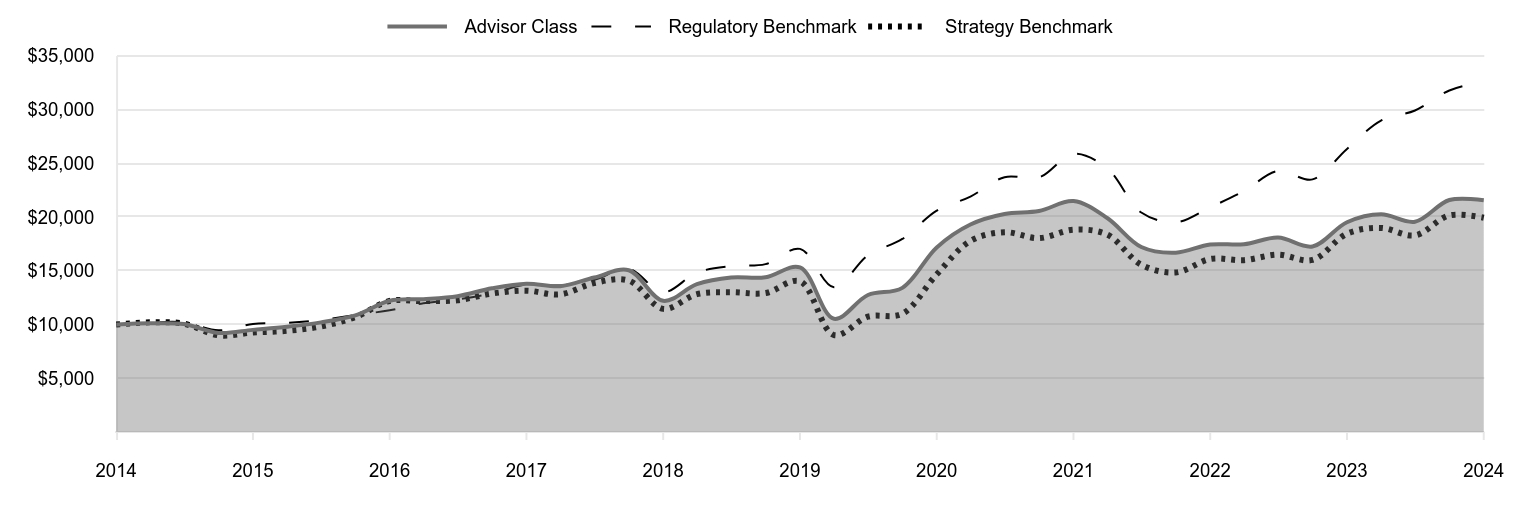
Cumulative Returns of a Hypothetical $10,000 Investment as of December 31, 2024
| Advisor Class | Regulatory Benchmark | Strategy Benchmark |
|---|
| 2014 | 10,000 | 10,000 | 10,000 |
|---|
| 2015 | 10,105 | 10,180 | 10,198 |
|---|
| 2015 | 10,037 | 10,194 | 10,076 |
|---|
| 2015 | 9,213 | 9,455 | 8,994 |
|---|
| 2015 | 9,500 | 10,048 | 9,253 |
|---|
| 2016 | 9,794 | 10,145 | 9,411 |
|---|
| 2016 | 10,196 | 10,412 | 9,816 |
|---|
| 2016 | 10,845 | 10,870 | 10,686 |
|---|
| 2016 | 12,209 | 11,327 | 12,190 |
|---|
| 2017 | 12,359 | 11,978 | 12,174 |
|---|
| 2017 | 12,633 | 12,339 | 12,256 |
|---|
| 2017 | 13,368 | 12,903 | 12,882 |
|---|
| 2017 | 13,798 | 13,721 | 13,146 |
|---|
| 2018 | 13,560 | 13,633 | 12,799 |
|---|
| 2018 | 14,369 | 14,163 | 13,861 |
|---|
| 2018 | 15,047 | 15,172 | 14,084 |
|---|
| 2018 | 12,201 | 13,002 | 11,455 |
|---|
| 2019 | 13,751 | 14,828 | 12,821 |
|---|
| 2019 | 14,362 | 15,435 | 12,997 |
|---|
| 2019 | 14,389 | 15,614 | 12,923 |
|---|
| 2019 | 15,308 | 17,035 | 14,020 |
|---|
| 2020 | 10,533 | 13,475 | 9,020 |
|---|
| 2020 | 12,743 | 16,443 | 10,726 |
|---|
| 2020 | 13,406 | 17,957 | 11,000 |
|---|
| 2020 | 17,166 | 20,593 | 14,669 |
|---|
| 2021 | 19,296 | 21,900 | 17,775 |
|---|
| 2021 | 20,274 | 23,705 | 18,585 |
|---|
| 2021 | 20,551 | 23,681 | 18,031 |
|---|
| 2021 | 21,478 | 25,877 | 18,816 |
|---|
| 2022 | 19,906 | 24,512 | 18,365 |
|---|
| 2022 | 17,211 | 20,418 | 15,559 |
|---|
| 2022 | 16,684 | 19,506 | 14,842 |
|---|
| 2022 | 17,439 | 20,907 | 16,091 |
|---|
| 2023 | 17,461 | 22,408 | 15,986 |
|---|
| 2023 | 18,082 | 24,288 | 16,494 |
|---|
| 2023 | 17,260 | 23,497 | 16,006 |
|---|
| 2023 | 19,509 | 26,334 | 18,448 |
|---|
| 2024 | 20,250 | 28,973 | 18,983 |
|---|
| 2024 | 19,562 | 29,904 | 18,291 |
|---|
| 2024 | 21,581 | 31,767 | 20,148 |
|---|
| 2024 | 21,557 | 32,604 | 19,934 |
|---|
202501-4140694, 202502-4108906
Average Annual Total Returns
| | 1 Year | 5 Years | 10 Years |
|---|
| Small-Cap Value Fund (Advisor Class) | 10.49% | 7.09% | 7.98% |
|---|
| Russell 3000 Index (Regulatory Benchmark) | 23.81 | 13.86 | 12.55 |
|---|
| Russell 2000 Value Index (Strategy Benchmark) | 8.05 | 7.29 | 7.14 |
|---|
The preceding line graph shows the value of a hypothetical $10,000 investment in the fund over the past 10 fiscal year periods or since inception (for funds lacking 10-year records). The fund’s performance information included in the line graph and table above is compared with a regulatory required index that represents an overall securities market (Regulatory Benchmark). In addition, the line graph and table may also include one or more indexes that more closely aligns to the fund's investment strategy (Strategy Benchmark(s)). Due to new SEC Rules on shareholder reporting the fund adopted a new broad-based securities market index, referred to as the Regulatory Benchmark. Market index returns do not include expenses, which are deducted from fund returns. The fund's total return figures reflect the reinvestment of dividends and capital gains, if any.Neither the fund’s returns nor the index returns reflect the deduction of taxes that a shareholder would pay on fund distributions or redemptions of fund shares.The fund’s past performance is not a good predictor of the fund’s future performance.Updated performance information can be found at www.troweprice.com.
What are some fund statistics?
- Total Net Assets (000s)$10,472,939
- Number of Portfolio Holdings381
- Investment Advisory Fees Paid (000s)$46,994
- Portfolio Turnover Rate32.4%
What did the fund invest in?
Sector Allocation (as a % of Net Assets)
| Financials | 28.1% |
| Industrials & Business Services | 14.4 |
| Real Estate | 10.5 |
| Consumer Discretionary | 9.7 |
| Health Care | 8.5 |
| Energy | 7.8 |
| Information Technology | 6.7 |
| Utilities | 5.2 |
| Materials | 4.4 |
| Other | 4.7 |
Top Ten Holdings (as a % of Net Assets)
| Pinnacle Financial Partners | 1.6% |
| PennyMac Financial Services | 1.4 |
| TechnipFMC | 1.3 |
| Columbia Banking System | 1.3 |
| Matador Resources | 1.2 |
| SouthState | 1.2 |
| Houlihan Lokey | 1.1 |
| East West Bancorp | 1.0 |
| Terreno Realty | 0.9 |
| TXNM Energy | 0.9 |
If you invest directly with T. Rowe Price, you can elect to receive future shareholder reports or other important documents through electronic delivery by enrolling at www.troweprice.com/paperless. If you invest through a financial intermediary such as an investment advisor, a bank, retirement plan sponsor or a brokerage firm, please contact that organization and ask if it can provide electronic delivery.
Frank Russell Company "LSE" does not accept any liability for any errors or omissions in the indexes or data, and hereby expressly disclaim all warranties of originality, accuracy, completeness, timeliness, merchantability and fitness for a particular purpose. No party may rely on any indexes or data contained in this communication. Visit www.troweprice.com/en/us/market-data-disclosures for additional legal notices & disclaimers.
Small-Cap Value Fund
Advisor Class (PASVX)
T. Rowe Price Investment Services, Inc.
100 East Pratt Street
Baltimore, MD 21202
Annual Shareholder Report
December 31, 2024
This annual shareholder report contains important information about Small-Cap Value Fund (the "fund") for the period of January 1, 2024 to December 31, 2024. You can find the fund’s prospectus, financial information on Form N‑CSR (which includes required tax information for dividends), holdings, proxy voting information, and other information atwww.troweprice.com/prospectus. You can also request this information without charge by contacting T. Rowe Price at 1‑800‑638‑5660 or info@troweprice.com or contacting your intermediary.
What were the fund costs for the last year? (based on a hypothetical $10,000 investment)
| | Costs of a $10,000 investment | Costs paid as a percentage of a $10,000 investment |
|---|
| Small-Cap Value Fund - I Class | $70 | 0.66% |
|---|
What drove fund performance during the past 12 months?
U.S. equities posted strong returns, lifted by favorable economic data and corporate earnings reports, easing inflationary pressures, and short-term interest rate reductions by the Federal Reserve. The results of the U.S. presidential election ended a lengthy period of uncertainty, boosting stocks further in the fourth quarter. Small-cap stocks significantly lagged large-cap peers, and growth outperformed value across all market capitalizations.
Versus the style-specific Russell 2000 Value Index, stock selection in the consumer discretionary sector was the leading contributor to relative performance. Shares of Cava, the largest Mediterranean restaurant company in the U.S., advanced on industry-leading traffic growth. Stock choices in energy also added value. Shares of TechnipFMC, a global offshore oil field service and equipment company, benefited from strong performance in its subsea segment.
Conversely, stock selection in health care detracted from relative results. Health care diagnostics company QuidelOrtho was a key detractor due to headwinds from a “COVID-off” overhang and execution issues that ultimately led to a change in management. Stock choices in materials also hindered performance. Weak end markets and tightening aluminum scrap spreads pressured downstream aluminum mining company Constellium.
The fund adheres to a contrarian, bottom-up investing approach and seeks to identify under-followed companies that we believe are inefficiently priced. Fundamental research, anchored by face-to-face meetings with company management, is critical to uncovering successful investment opportunities, and a long-term orientation allows for full exploitation of valuation anomalies.
How has the fund performed?
Cumulative Returns of a Hypothetical $500,000 Investment as of December 31, 2024
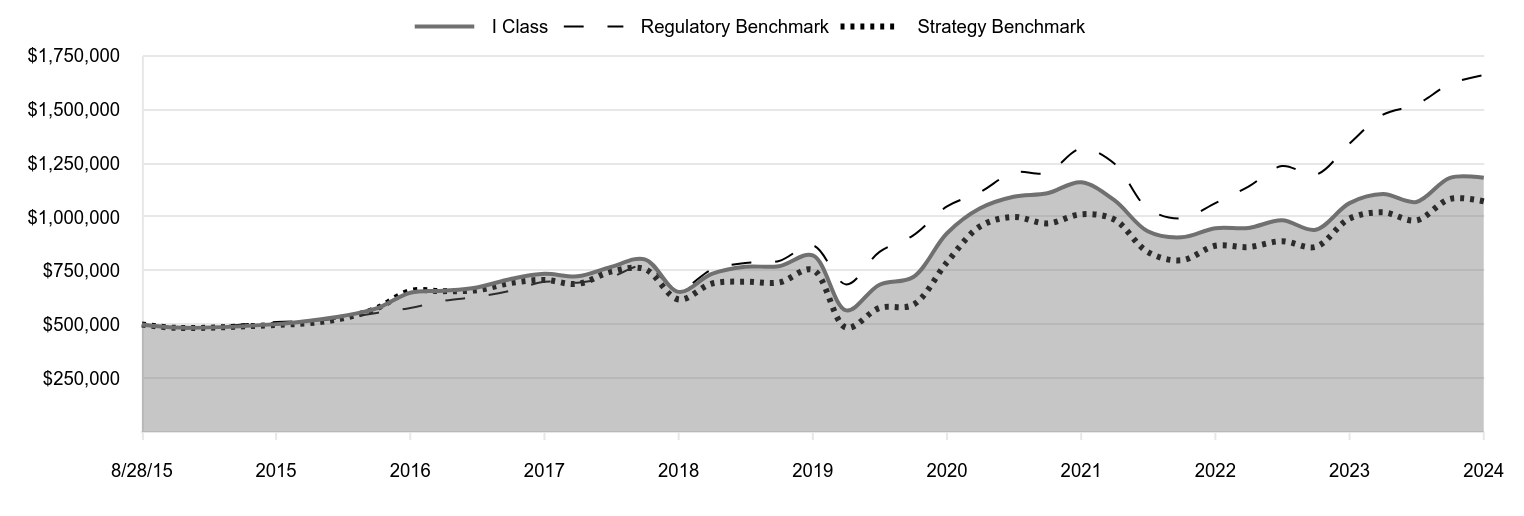
| I Class | Regulatory Benchmark | Strategy Benchmark |
|---|
| 8/28/15 | 500,000 | 500,000 | 500,000 |
|---|
| 9/30/15 | 486,055 | 481,606 | 484,012 |
|---|
| 12/31/15 | 501,703 | 511,802 | 497,933 |
|---|
| 3/31/16 | 517,731 | 516,758 | 506,411 |
|---|
| 6/30/16 | 539,562 | 530,351 | 528,219 |
|---|
| 9/30/16 | 574,658 | 553,674 | 575,051 |
|---|
| 12/31/16 | 647,786 | 576,980 | 655,981 |
|---|
| 3/31/17 | 656,544 | 610,118 | 655,128 |
|---|
| 6/30/17 | 671,905 | 628,516 | 659,518 |
|---|
| 9/30/17 | 711,674 | 657,248 | 693,215 |
|---|
| 12/31/17 | 735,592 | 698,900 | 707,396 |
|---|
| 3/31/18 | 723,897 | 694,395 | 688,721 |
|---|
| 6/30/18 | 767,678 | 721,399 | 745,910 |
|---|
| 9/30/18 | 803,214 | 772,791 | 757,879 |
|---|
| 12/31/18 | 651,758 | 662,265 | 616,396 |
|---|
| 3/31/19 | 735,190 | 755,270 | 689,913 |
|---|
| 6/30/19 | 768,564 | 786,199 | 699,399 |
|---|
| 9/30/19 | 771,181 | 795,339 | 695,393 |
|---|
| 12/31/19 | 821,035 | 867,693 | 754,432 |
|---|
| 3/31/20 | 565,758 | 686,348 | 485,398 |
|---|
| 6/30/20 | 684,910 | 837,534 | 577,165 |
|---|
| 9/30/20 | 721,084 | 914,650 | 591,917 |
|---|
| 12/31/20 | 924,415 | 1,048,935 | 789,395 |
|---|
| 3/31/21 | 1,040,229 | 1,115,510 | 956,493 |
|---|
| 6/30/21 | 1,094,019 | 1,207,426 | 1,000,110 |
|---|
| 9/30/21 | 1,110,139 | 1,206,198 | 970,296 |
|---|
| 12/31/21 | 1,161,758 | 1,318,104 | 1,012,560 |
|---|
| 3/31/22 | 1,078,183 | 1,248,528 | 988,267 |
|---|
| 6/30/22 | 933,434 | 1,040,009 | 837,287 |
|---|
| 9/30/22 | 905,576 | 993,577 | 798,687 |
|---|
| 12/31/22 | 947,646 | 1,064,936 | 865,907 |
|---|
| 3/31/23 | 949,232 | 1,141,402 | 860,219 |
|---|
| 6/30/23 | 984,323 | 1,237,129 | 887,588 |
|---|
| 9/30/23 | 940,708 | 1,196,875 | 861,323 |
|---|
| 12/31/23 | 1,064,525 | 1,341,360 | 992,733 |
|---|
| 3/31/24 | 1,106,392 | 1,475,756 | 1,021,530 |
|---|
| 6/30/24 | 1,070,066 | 1,523,216 | 984,297 |
|---|
| 9/30/24 | 1,182,121 | 1,618,099 | 1,084,220 |
|---|
| 12/31/24 | 1,182,189 | 1,660,708 | 1,072,694 |
|---|
202501-4140694, 202502-4108906
Average Annual Total Returns
| | 1 Year | 5 Years | Since Inception 8/28/15 |
|---|
| Small-Cap Value Fund (I Class) | 11.05% | 7.56% | 9.65% |
|---|
| Russell 3000 Index (Regulatory Benchmark) | 23.81 | 13.86 | 13.71 |
|---|
| Russell 2000 Value Index (Strategy Benchmark) | 8.05 | 7.29 | 8.51 |
|---|
The preceding line graph shows the value of a hypothetical $500,000 investment in the fund over the past 10 fiscal year periods or since inception (for funds lacking 10-year records). The fund’s performance information included in the line graph and table above is compared with a regulatory required index that represents an overall securities market (Regulatory Benchmark). In addition, the line graph and table may also include one or more indexes that more closely aligns to the fund's investment strategy (Strategy Benchmark(s)). Due to new SEC Rules on shareholder reporting the fund adopted a new broad-based securities market index, referred to as the Regulatory Benchmark. Market index returns do not include expenses, which are deducted from fund returns. The fund's total return figures reflect the reinvestment of dividends and capital gains, if any.Neither the fund’s returns nor the index returns reflect the deduction of taxes that a shareholder would pay on fund distributions or redemptions of fund shares.The fund’s past performance is not a good predictor of the fund’s future performance.Updated performance information can be found at www.troweprice.com.
What are some fund statistics?
- Total Net Assets (000s)$10,472,939
- Number of Portfolio Holdings381
- Investment Advisory Fees Paid (000s)$46,994
- Portfolio Turnover Rate32.4%
What did the fund invest in?
Sector Allocation (as a % of Net Assets)
| Financials | 28.1% |
| Industrials & Business Services | 14.4 |
| Real Estate | 10.5 |
| Consumer Discretionary | 9.7 |
| Health Care | 8.5 |
| Energy | 7.8 |
| Information Technology | 6.7 |
| Utilities | 5.2 |
| Materials | 4.4 |
| Other | 4.7 |
Top Ten Holdings (as a % of Net Assets)
| Pinnacle Financial Partners | 1.6% |
| PennyMac Financial Services | 1.4 |
| TechnipFMC | 1.3 |
| Columbia Banking System | 1.3 |
| Matador Resources | 1.2 |
| SouthState | 1.2 |
| Houlihan Lokey | 1.1 |
| East West Bancorp | 1.0 |
| Terreno Realty | 0.9 |
| TXNM Energy | 0.9 |
If you invest directly with T. Rowe Price, you can elect to receive future shareholder reports or other important documents through electronic delivery by enrolling at www.troweprice.com/paperless. If you invest through a financial intermediary such as an investment advisor, a bank, retirement plan sponsor or a brokerage firm, please contact that organization and ask if it can provide electronic delivery.
Frank Russell Company "LSE" does not accept any liability for any errors or omissions in the indexes or data, and hereby expressly disclaim all warranties of originality, accuracy, completeness, timeliness, merchantability and fitness for a particular purpose. No party may rely on any indexes or data contained in this communication. Visit www.troweprice.com/en/us/market-data-disclosures for additional legal notices & disclaimers.
Small-Cap Value Fund
I Class (PRVIX)
T. Rowe Price Investment Services, Inc.
100 East Pratt Street
Baltimore, MD 21202
Annual Shareholder Report
December 31, 2024
This annual shareholder report contains important information about Small-Cap Value Fund (the "fund") for the period of January 1, 2024 to December 31, 2024. You can find the fund’s prospectus, financial information on Form N‑CSR (which includes required tax information for dividends), holdings, proxy voting information, and other information atwww.troweprice.com/prospectus. You can also request this information without charge by contacting T. Rowe Price at 1‑800‑638‑5660 or info@troweprice.com or contacting your intermediary.
What were the fund costs for the last year? (based on a hypothetical $10,000 investment)
| | Costs of a $10,000 investment | Costs paid as a percentage of a $10,000 investment |
|---|
| Small-Cap Value Fund - Z Class | $0 | 0.00% |
|---|
What drove fund performance during the past 12 months?
U.S. equities posted strong returns, lifted by favorable economic data and corporate earnings reports, easing inflationary pressures, and short-term interest rate reductions by the Federal Reserve. The results of the U.S. presidential election ended a lengthy period of uncertainty, boosting stocks further in the fourth quarter. Small-cap stocks significantly lagged large-cap peers, and growth outperformed value across all market capitalizations.
Versus the style-specific Russell 2000 Value Index, stock selection in the consumer discretionary sector was the leading contributor to relative performance. Shares of Cava, the largest Mediterranean restaurant company in the U.S., advanced on industry-leading traffic growth. Stock choices in energy also added value. Shares of TechnipFMC, a global offshore oil field service and equipment company, benefited from strong performance in its subsea segment.
Conversely, stock selection in health care detracted from relative results. Health care diagnostics company QuidelOrtho was a key detractor due to headwinds from a “COVID-off” overhang and execution issues that ultimately led to a change in management. Stock choices in materials also hindered performance. Weak end markets and tightening aluminum scrap spreads pressured downstream aluminum mining company Constellium.
The fund adheres to a contrarian, bottom-up investing approach and seeks to identify under-followed companies that we believe are inefficiently priced. Fundamental research, anchored by face-to-face meetings with company management, is critical to uncovering successful investment opportunities, and a long-term orientation allows for full exploitation of valuation anomalies.
How has the fund performed?
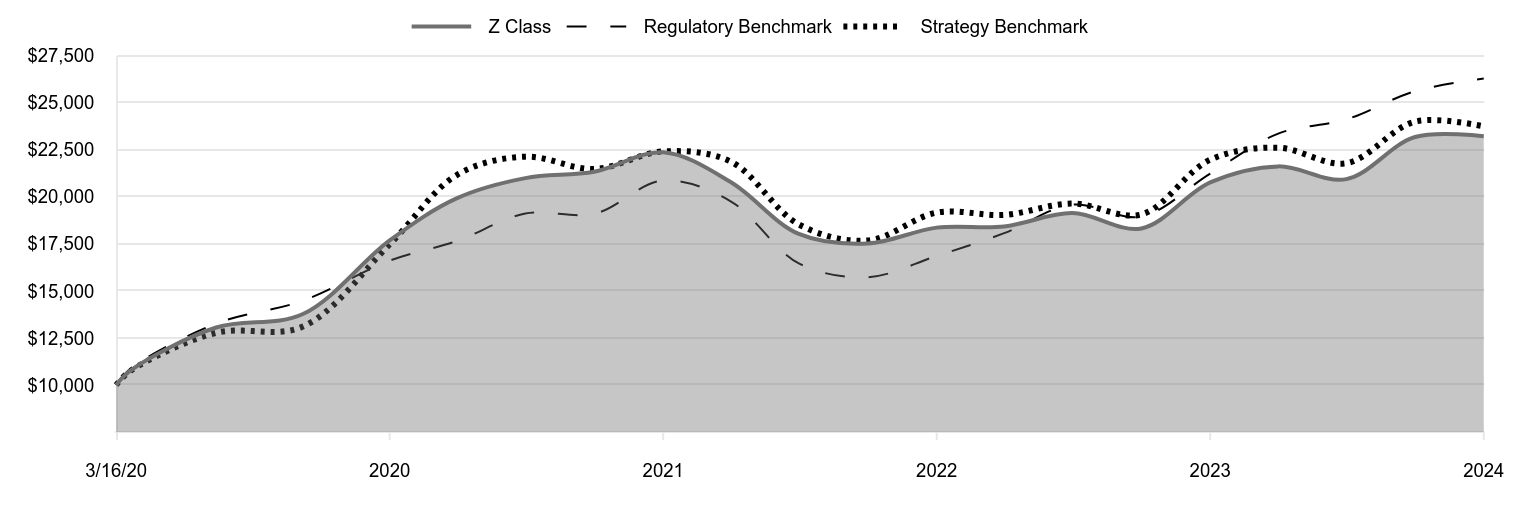
Cumulative Returns of a Hypothetical $10,000 Investment as of December 31, 2024
| Z Class | Regulatory Benchmark | Strategy Benchmark |
|---|
| 3/16/20 | 10,000 | 10,000 | 10,000 |
|---|
| 3/31/20 | 10,766 | 10,865 | 10,744 |
|---|
| 6/30/20 | 13,056 | 13,259 | 12,775 |
|---|
| 9/30/20 | 13,770 | 14,480 | 13,102 |
|---|
| 12/31/20 | 17,684 | 16,606 | 17,473 |
|---|
| 3/31/21 | 19,930 | 17,659 | 21,172 |
|---|
| 6/30/21 | 20,994 | 19,115 | 22,137 |
|---|
| 9/30/21 | 21,336 | 19,095 | 21,477 |
|---|
| 12/31/21 | 22,367 | 20,867 | 22,413 |
|---|
| 3/31/22 | 20,788 | 19,765 | 21,875 |
|---|
| 6/30/22 | 18,026 | 16,464 | 18,533 |
|---|
| 9/30/22 | 17,520 | 15,729 | 17,679 |
|---|
| 12/31/22 | 18,364 | 16,859 | 19,166 |
|---|
| 3/31/23 | 18,425 | 18,069 | 19,041 |
|---|
| 6/30/23 | 19,137 | 19,585 | 19,646 |
|---|
| 9/30/23 | 18,321 | 18,948 | 19,065 |
|---|
| 12/31/23 | 20,766 | 21,235 | 21,974 |
|---|
| 3/31/24 | 21,619 | 23,362 | 22,611 |
|---|
| 6/30/24 | 20,941 | 24,114 | 21,787 |
|---|
| 9/30/24 | 23,179 | 25,616 | 23,999 |
|---|
| 12/31/24 | 23,217 | 26,290 | 23,744 |
|---|
202501-4140694, 202502-4108906
Average Annual Total Returns
| | 1 Year | Since Inception 3/16/20 |
|---|
| Small-Cap Value Fund (Z Class) | 11.81% | 19.20% |
|---|
| Russell 3000 Index (Regulatory Benchmark) | 23.81 | 22.33 |
|---|
| Russell 2000 Value Index (Strategy Benchmark) | 8.05 | 19.76 |
|---|
The preceding line graph shows the value of a hypothetical $10,000 investment in the fund over the past 10 fiscal year periods or since inception (for funds lacking 10-year records). The fund’s performance information included in the line graph and table above is compared with a regulatory required index that represents an overall securities market (Regulatory Benchmark). In addition, the line graph and table may also include one or more indexes that more closely aligns to the fund's investment strategy (Strategy Benchmark(s)). Due to new SEC Rules on shareholder reporting the fund adopted a new broad-based securities market index, referred to as the Regulatory Benchmark. Market index returns do not include expenses, which are deducted from fund returns. The fund's total return figures reflect the reinvestment of dividends and capital gains, if any.Neither the fund’s returns nor the index returns reflect the deduction of taxes that a shareholder would pay on fund distributions or redemptions of fund shares.The fund’s past performance is not a good predictor of the fund’s future performance.Updated performance information can be found at www.troweprice.com.
What are some fund statistics?
- Total Net Assets (000s)$10,472,939
- Number of Portfolio Holdings381
- Investment Advisory Fees Paid (000s)$46,994
- Portfolio Turnover Rate32.4%
What did the fund invest in?
Sector Allocation (as a % of Net Assets)
| Financials | 28.1% |
| Industrials & Business Services | 14.4 |
| Real Estate | 10.5 |
| Consumer Discretionary | 9.7 |
| Health Care | 8.5 |
| Energy | 7.8 |
| Information Technology | 6.7 |
| Utilities | 5.2 |
| Materials | 4.4 |
| Other | 4.7 |
Top Ten Holdings (as a % of Net Assets)
| Pinnacle Financial Partners | 1.6% |
| PennyMac Financial Services | 1.4 |
| TechnipFMC | 1.3 |
| Columbia Banking System | 1.3 |
| Matador Resources | 1.2 |
| SouthState | 1.2 |
| Houlihan Lokey | 1.1 |
| East West Bancorp | 1.0 |
| Terreno Realty | 0.9 |
| TXNM Energy | 0.9 |
If you invest directly with T. Rowe Price, you can elect to receive future shareholder reports or other important documents through electronic delivery by enrolling at www.troweprice.com/paperless. If you invest through a financial intermediary such as an investment advisor, a bank, retirement plan sponsor or a brokerage firm, please contact that organization and ask if it can provide electronic delivery.
Frank Russell Company "LSE" does not accept any liability for any errors or omissions in the indexes or data, and hereby expressly disclaim all warranties of originality, accuracy, completeness, timeliness, merchantability and fitness for a particular purpose. No party may rely on any indexes or data contained in this communication. Visit www.troweprice.com/en/us/market-data-disclosures for additional legal notices & disclaimers.
Small-Cap Value Fund
Z Class (TRZVX)
T. Rowe Price Investment Services, Inc.
100 East Pratt Street
Baltimore, MD 21202
Item 1. (b) Notice pursuant to Rule 30e-3.
Not applicable.
Item 2. Code of Ethics.
The registrant has adopted a code of ethics, as defined in Item 2 of Form N-CSR, applicable to its principal executive officer, principal financial officer, principal accounting officer or controller, or persons performing similar functions. A copy of this code of ethics is filed as an exhibit to this Form N-CSR. No substantive amendments were approved or waivers were granted to this code of ethics during the period covered by this report.
Item 3. Audit Committee Financial Expert.
The registrant’s Board of Directors has determined that Mr. Paul F. McBride qualifies as an audit committee financial expert, as defined in Item 3 of Form N-CSR. Mr. McBride is considered independent for purposes of Item 3 of Form N-CSR.
Item 4. Principal Accountant Fees and Services.
(a) – (d) Aggregate fees billed for the last two fiscal years for professional services rendered to, or on behalf of, the registrant by the registrant’s principal accountant were as follows:
| | | | | | | | | | | | | | |
| | | | 2024 | | | | | | 2023 | |
| | Audit Fees | | | $46,029 | | | | | | | | $46,733 | |
| | Audit-Related Fees | | | - | | | | | | | | - | |
| | Tax Fees | | | 9,200 | | | | | | | | 15,809 | |
| | All Other Fees | | | - | | | | | | | | - | |
Audit fees include amounts related to the audit of the registrant’s annual financial statements and services normally provided by the accountant in connection with statutory and regulatory filings. Audit-related fees include amounts reasonably related to the performance of the audit of the registrant’s financial statements and specifically include the issuance of a report on internal controls and, if applicable, agreed-upon procedures related to fund acquisitions. Tax fees include amounts related to services for tax compliance, tax planning, and tax advice. The nature of these services specifically includes the review of distribution calculations and the preparation of Federal, state, and excise tax returns. All other fees include the registrant’s pro-rata share of amounts for agreed-upon procedures in conjunction with service contract approvals by the registrant’s Board of Directors/Trustees.
(e)(1) The registrant’s audit committee has adopted a policy whereby audit and non-audit services performed by the registrant’s principal accountant for the registrant, its investment adviser, and any entity controlling, controlled by, or under common control with the investment adviser that provides ongoing services to the registrant require pre-approval in advance at regularly scheduled audit committee meetings. If such a service is required between regularly scheduled audit committee meetings, pre-approval may be authorized by one audit committee member with ratification at the next scheduled audit committee meeting. Waiver of pre-approval for audit or non-audit services requiring fees of a de minimis amount is not permitted.
(2) No services included in (b) – (d) above were approved pursuant to paragraph (c)(7)(i)(C) of Rule 2-01 of Regulation S-X.
(f) Less than 50 percent of the hours expended on the principal accountant’s engagement to audit the registrant’s financial statements for the most recent fiscal year were attributed to work performed by persons other than the principal accountant’s full-time, permanent employees.
(g) The aggregate fees billed for the most recent fiscal year and the preceding fiscal year by the registrant’s principal accountant for non-audit services rendered to the registrant, its investment adviser, and any entity controlling, controlled by, or under common control with the investment adviser that provides ongoing services to the registrant were $1,262,000 and $1,524,000, respectively.
(h) All non-audit services rendered in (g) above were pre-approved by the registrant’s audit committee. Accordingly, these services were considered by the registrant’s audit committee in maintaining the principal accountant’s independence.
(i) Not applicable.
(j) Not applicable.
Item 5. Audit Committee of Listed Registrants.
Not applicable.
Item 6. Investments.
(a) Not applicable. The complete schedule of investments is included in Item 7 of this Form N-CSR.
(b) Not applicable.
Item 7. Financial Statements and Financial Highlights for Open-End Management Investment Companies.
(a – b) Report pursuant to Regulation S-X.
Financial
Highlights
Portfolio
of
Investments
Financial
Statements
and
Notes
Additional
Fund
Information
Financial
Statements
and
Other
Information
For
more
insights
from
T.
Rowe
Price
investment
professionals,
go
to
troweprice.com
.
T.
ROWE
PRICE
PRSVX
Small-Cap
Value
Fund
PASVX
Small-Cap
Value
Fund–
.
Advisor Class
PRVIX
Small-Cap
Value
Fund–
.
I Class
TRZVX
Small-Cap
Value
Fund–
.
Z Class
T.
ROWE
PRICE
Small-Cap
Value
Fund
For
a
share
outstanding
throughout
each
period
The
accompanying
notes
are
an
integral
part
of
these
financial
statements.
Investor
Class
..
Year
..
..
Ended
.
12/31/24
12/31/23
12/31/22
12/31/21
12/31/20
NET
ASSET
VALUE
Beginning
of
period
$
51
.99
$
47
.90
$
61
.79
$
52
.79
$
47
.91
Investment
activities
Net
investment
income
(1)(2)
0
.38
0
.36
0
.20
0
.18
0
.23
Net
realized
and
unrealized
gain/loss
5
.58
5
.43
(
11
.56
)
13
.13
5
.72
Total
from
investment
activities
5
.96
5
.79
(
11
.36
)
13
.31
5
.95
Distributions
Net
investment
income
(
0
.48
)
(
0
.33
)
(
0
.18
)
(
0
.21
)
(
0
.19
)
Net
realized
gain
(
4
.68
)
(
1
.37
)
(
2
.35
)
(
4
.10
)
(
0
.88
)
Total
distributions
(
5
.16
)
(
1
.70
)
(
2
.53
)
(
4
.31
)
(
1
.07
)
NET
ASSET
VALUE
End
of
period
$
52
.79
$
51
.99
$
47
.90
$
61
.79
$
52
.79
Ratios/Supplemental
Data
Total
return
(2)(3)
10
.93
%
12
.22
%
(
18
.55
)
%
25
.54
%
12
.50
%
Ratios
to
average
net
assets:
(2)
Gross
expenses
before
waivers/payments
by
Price
Associates
0
.77
%
0
.78
%
0
.79
%
0
.75
%
0
.76
%
Net
expenses
after
waivers/
payments
by
Price
Associates
0
.77
%
0
.78
%
0
.79
%
0
.75
%
0
.76
%
Net
investment
income
0
.70
%
0
.74
%
0
.37
%
0
.29
%
0
.53
%
Portfolio
turnover
rate
32
.4
%
27
.5
%
20
.7
%
25
.1
%
28
.0
%
Net
assets,
end
of
period
(in
millions)
$4,225
$4,532
$4,565
$7,722
$6,301
0
%
0
%
0
%
0
%
0
%
(1)
Per
share
amounts
calculated
using
average
shares
outstanding
method.
(2)
Includes
the
impact
of
expense-related
arrangements
with
Price
Associates.
(3)
Total
return
reflects
the
rate
that
an
investor
would
have
earned
on
an
investment
in
the
fund
during
each
period,
assuming
reinvestment
of
all
distributions,
and
payment
of
no
redemption
or
account
fees,
if
applicable.
T.
ROWE
PRICE
Small-Cap
Value
Fund
For
a
share
outstanding
throughout
each
period
The
accompanying
notes
are
an
integral
part
of
these
financial
statements.
Advisor
Class
..
Year
..
..
Ended
.
12/31/24
12/31/23
12/31/22
12/31/21
12/31/20
NET
ASSET
VALUE
Beginning
of
period
$
51
.88
$
47
.76
$
61
.60
$
52
.64
$
47
.80
Investment
activities
Net
investment
income
(loss)
(1)(2)
0
.17
0
.22
0
.02
(
0
.02
)
0
.11
Net
realized
and
unrealized
gain/loss
5
.53
5
.39
(
11
.51
)
13
.08
5
.66
Total
from
investment
activities
5
.70
5
.61
(
11
.49
)
13
.06
5
.77
Distributions
Net
investment
income
(
0
.19
)
(
0
.12
)
—
—
(
0
.05
)
Net
realized
gain
(
4
.68
)
(
1
.37
)
(
2
.35
)
(
4
.10
)
(
0
.88
)
Total
distributions
(
4
.87
)
(
1
.49
)
(
2
.35
)
(
4
.10
)
(
0
.93
)
NET
ASSET
VALUE
End
of
period
$
52
.71
$
51
.88
$
47
.76
$
61
.60
$
52
.64
Ratios/Supplemental
Data
Total
return
(2)(3)
10
.49
%
11
.87
%
(
18
.81
)
%
25
.12
%
12
.14
%
Ratios
to
average
net
assets:
(2)
Gross
expenses
before
waivers/payments
by
Price
Associates
1
.16
%
1
.08
%
1
.14
%
1
.08
%
1
.06
%
Net
expenses
after
waivers/
payments
by
Price
Associates
1
.16
%
1
.08
%
1
.14
%
1
.08
%
1
.06
%
Net
investment
income
(loss)
0
.32
%
0
.44
%
0
.03
%
(
0
.04
)
%
0
.25
%
Portfolio
turnover
rate
32
.4
%
27
.5
%
20
.7
%
25
.1
%
28
.0
%
Net
assets,
end
of
period
(in
millions)
$49
$65
$77
$105
$97
0
%
0
%
0
%
0
%
0
%
(1)
Per
share
amounts
calculated
using
average
shares
outstanding
method.
(2)
Includes
the
impact
of
expense-related
arrangements
with
Price
Associates.
(3)
Total
return
reflects
the
rate
that
an
investor
would
have
earned
on
an
investment
in
the
fund
during
each
period,
assuming
reinvestment
of
all
distributions,
and
payment
of
no
redemption
or
account
fees,
if
applicable.
T.
ROWE
PRICE
Small-Cap
Value
Fund
For
a
share
outstanding
throughout
each
period
The
accompanying
notes
are
an
integral
part
of
these
financial
statements.
I
Class
..
Year
..
..
Ended
.
12/31/24
12/31/23
12/31/22
12/31/21
12/31/20
NET
ASSET
VALUE
Beginning
of
period
$
51
.87
$
47
.80
$
61
.72
$
52
.76
$
47
.89
Investment
activities
Net
investment
income
(1)(2)
0
.44
0
.42
0
.28
0
.25
0
.27
Net
realized
and
unrealized
gain/loss
5
.57
5
.41
(
11
.55
)
13
.12
5
.72
Total
from
investment
activities
6
.01
5
.83
(
11
.27
)
13
.37
5
.99
Distributions
Net
investment
income
(
0
.56
)
(
0
.39
)
(
0
.30
)
(
0
.31
)
(
0
.24
)
Net
realized
gain
(
4
.68
)
(
1
.37
)
(
2
.35
)
(
4
.10
)
(
0
.88
)
Total
distributions
(
5
.24
)
(
1
.76
)
(
2
.65
)
(
4
.41
)
(
1
.12
)
NET
ASSET
VALUE
End
of
period
$
52
.64
$
51
.87
$
47
.80
$
61
.72
$
52
.76
Ratios/Supplemental
Data
Total
return
(2)(3)
11
.05
%
12
.33
%
(
18
.43
)
%
25
.67
%
12
.59
%
Ratios
to
average
net
assets:
(2)
Gross
expenses
before
waivers/payments
by
Price
Associates
0
.66
%
0
.67
%
0
.67
%
0
.65
%
0
.66
%
Net
expenses
after
waivers/payments
by
Price
Associates
0
.66
%
0
.67
%
0
.67
%
0
.65
%
0
.66
%
Net
investment
income
0
.81
%
0
.86
%
0
.52
%
0
.40
%
0
.63
%
Portfolio
turnover
rate
32
.4
%
27
.5
%
20
.7
%
25
.1
%
28
.0
%
Net
assets,
end
of
period
(in
millions)
$3,025
$2,975
$2,900
$2,388
$1,507
0
%
0
%
0
%
0
%
0
%
(1)
Per
share
amounts
calculated
using
average
shares
outstanding
method.
(2)
Includes
the
impact
of
expense-related
arrangements
with
Price
Associates.
(3)
Total
return
reflects
the
rate
that
an
investor
would
have
earned
on
an
investment
in
the
fund
during
each
period,
assuming
reinvestment
of
all
distributions,
and
payment
of
no
redemption
or
account
fees,
if
applicable.
T.
ROWE
PRICE
Small-Cap
Value
Fund
For
a
share
outstanding
throughout
each
period
The
accompanying
notes
are
an
integral
part
of
these
financial
statements.
Z
Class
(1)
..
Year
..
..
Ended
.
3/16/20
(1)
Through
12/31/20
12/31/24
12/31/23
12/31/22
12/31/21
NET
ASSET
VALUE
Beginning
of
period
$
52
.06
$
47
.95
$
61
.88
$
52
.83
$
30
.66
Investment
activities
Net
investment
income
(2)(3)
0
.81
0
.75
0
.63
0
.64
0
.43
Net
realized
and
unrealized
gain/loss
5
.63
5
.44
(
11
.59
)
13
.16
23
.08
Total
from
investment
activities
6
.44
6
.19
(
10
.96
)
13
.80
23
.51
Distributions
Net
investment
income
(
0
.91
)
(
0
.71
)
(
0
.62
)
(
0
.65
)
(
0
.46
)
Net
realized
gain
(
4
.68
)
(
1
.37
)
(
2
.35
)
(
4
.10
)
(
0
.88
)
Total
distributions
(
5
.59
)
(
2
.08
)
(
2
.97
)
(
4
.75
)
(
1
.34
)
NET
ASSET
VALUE
End
of
period
$
52
.91
$
52
.06
$
47
.95
$
61
.88
$
52
.83
Ratios/Supplemental
Data
Total
return
(3)(4)
11
.81
%
13
.08
%
(
17
.90
)
%
26
.48
%
76
.84
%
Ratios
to
average
net
assets:
(3)
Gross
expenses
before
waivers/payments
by
Price
Associates
0
.64
%
0
.65
%
0
.65
%
0
.64
%
0
.64
%
(5)
Net
expenses
after
waivers/
payments
by
Price
Associates
0
.00
%
0
.00
%
0
.00
%
0
.00
%
0
.00
%
(5)
Net
investment
income
1
.48
%
1
.53
%
1
.17
%
1
.04
%
1
.26
%
(5)
Portfolio
turnover
rate
32
.4
%
27
.5
%
20
.7
%
25
.1
%
28
.0
%
Net
assets,
end
of
period
(in
millions)
$3,174
$3,004
$2,754
$4,046
$3,420
0
%
0
%
0
%
0
%
0
%
(1)
Inception
date
(2)
Per
share
amounts
calculated
using
average
shares
outstanding
method.
(3)
Includes
the
impact
of
expense-related
arrangements
with
Price
Associates.
(4)
Total
return
reflects
the
rate
that
an
investor
would
have
earned
on
an
investment
in
the
fund
during
each
period,
assuming
reinvestment
of
all
distributions,
and
payment
of
no
redemption
or
account
fees,
if
applicable.
Total
return
is
not
annualized
for
periods
less
than
one
year.
(5)
Annualized
T.
ROWE
PRICE
Small-Cap
Value
Fund
December
31,
2024
Shares/Par
$
Value
(Cost
and
value
in
$000s)
‡
COMMON
STOCKS
96.7%
COMMUNICATION
SERVICES
1.7%
Diversified
Telecommunication
Services
0.2%
AST
SpaceMobile (1)(2)
1,082,844
22,848
GCI
Liberty,
Class
A,
EC (2)(3)
399,039
—
22,848
Entertainment
0.7%
Liberty
Media
Corp-Liberty
Live,
Class
C (2)
665,183
45,272
Madison
Square
Garden
Sports (2)
111,078
25,068
70,340
Media
0.8%
Advantage
Solutions (1)(2)
5,550,809
16,208
Advantage
Solutions,
Warrants,
12/31/26 (2)
400,000
5
New
York
Times,
Class
A
1,390,572
72,379
88,592
Total
Communication
Services
181,780
CONSUMER
DISCRETIONARY
9.6%
Automobile
Components
1.0%
Dorman
Products (2)
358,869
46,491
LCI
Industries
169,912
17,567
Modine
Manufacturing (2)
155,072
17,978
Visteon (2)
228,869
20,305
102,341
Broadline
Retail
0.3%
Etsy (2)
993
53
Ollie's
Bargain
Outlet
Holdings (2)
153,602
16,855
Savers
Value
Village (1)(2)
1,492,046
15,293
32,201
Distributors
0.1%
Pool
Corp
39,451
13,450
13,450
Diversified
Consumer
Services
0.9%
Grand
Canyon
Education (2)
67,664
11,084
Strategic
Education
927,084
86,608
97,692
Hotels,
Restaurants
&
Leisure
1.4%
Cava
Group (2)
30,048
3,390
Dutch
Bros,
Class
A (2)
581,413
30,454
Marriott
Vacations
Worldwide
454,421
40,807
T.
ROWE
PRICE
Small-Cap
Value
Fund
Shares/Par
$
Value
(Cost
and
value
in
$000s)
‡
Papa
John's
International (1)
941,001
38,647
Torchys
Holdings,
Class
A,
Acquisition
Date:
11/13/20,
Cost $12,311 (2)(3)(4)(5)
1,439,856
5,356
United
Parks
&
Resorts (2)
85,743
4,818
Wyndham
Hotels
&
Resorts
271,128
27,327
150,799
Household
Durables
0.9%
Champion
Homes (2)
373,331
32,890
Meritage
Homes
296,428
45,597
Taylor
Morrison
Home (2)
222,411
13,614
92,101
Leisure
Products
0.7%
Peloton
Interactive,
Class
A (1)(2)
7,769,013
67,591
Rad
Power
Bikes,
Class
A,
Acquisition
Date:
1/22/21
-
9/16/21,
Cost $21,320 (2)(3)(5)
3,355,939
671
68,262
Specialty
Retail
3.2%
Abercrombie
&
Fitch,
Class
A (2)
132,236
19,765
Asbury
Automotive
Group (2)
149,237
36,269
Boot
Barn
Holdings (1)(2)
102,034
15,491
Carvana (2)
396,797
80,693
Chewy,
Class
A (2)
327,468
10,967
Floor
&
Decor
Holdings,
Class
A (2)
563
56
Framebridge
Expense
Fund
Payment,
EC,
Acquisition
Date:
5/19/20,
Cost $9 (2)(3)(5)
9,353
9
Group
1
Automotive (1)
122,931
51,813
Monro (6)
1,582,537
39,247
RH (2)
39,878
15,695
Urban
Outfitters (2)
512,458
28,124
Victoria's
Secret (2)
917,932
38,021
336,150
Textiles,
Apparel
&
Luxury
Goods
1.1%
Bombas,
Acquisition
Date:
2/12/21,
Cost $14,601 (2)(3)(5)
3,303,766
9,977
Figs,
Class
A (1)(2)
6,198,149
38,367
Kontoor
Brands
138,195
11,803
Steven
Madden
734,887
31,247
Under
Armour,
Class
A (1)(2)
1,976,047
16,362
VF
582,819
12,507
120,263
Total
Consumer
Discretionary
1,013,259
T.
ROWE
PRICE
Small-Cap
Value
Fund
Shares/Par
$
Value
(Cost
and
value
in
$000s)
‡
CONSUMER
STAPLES
2.2%
Beverages
0.0%
Boston
Beer,
Class
A (2)
7,306
2,192
Coca-Cola
Consolidated
518
653
Primo
Brands
38,979
1,199
4,044
Consumer
Staples
Distribution
&
Retail
0.0%
Grocery
Outlet
Holding (1)(2)
121,500
1,897
1,897
Food
Products
1.5%
Farmers
Business
Network,
Warrants,
9/29/33,
Acquisition
Date:
9/29/23,
Cost $— (2)(3)(5)
10,691,000
9,087
Nomad
Foods
2,300,990
38,611
Post
Holdings (2)
463,369
53,037
Simply
Good
Foods (2)
463,075
18,051
TreeHouse
Foods (2)
749,112
26,316
Utz
Brands (1)
926,800
14,514
159,616
Personal
Care
Products
0.7%
BellRing
Brands (2)
943,894
71,113
Olaplex
Holdings (1)(2)
4,005,848
6,930
78,043
Total
Consumer
Staples
243,600
ENERGY
7.8%
Energy
Equipment
&
Services
3.4%
Cactus,
Class
A
1,024,497
59,790
ChampionX
686,766
18,673
Enerflex
(CAD) (1)
5,988,755
59,619
Energy
Reservoir
Holdings,
Class
A-1,
Acquisition
Date:
4/30/19,
Cost $20,874 (2)(3)(4)(5)(6)
20,874,541
11,272
Expro
Group
Holdings (2)
2,939,936
36,661
Liberty
Energy,
Class
A (1)
1,094,432
21,768
Solaris
Energy
Infrastructure (1)
467,181
13,445
TechnipFMC
4,722,174
136,660
357,888
Oil,
Gas
&
Consumable
Fuels
4.4%
Advantage
Energy
(CAD) (1)(2)
2,754,108
18,892
Expand
Energy
828,398
82,467
Gulfport
Energy (2)
168,959
31,122
Magnolia
Oil
&
Gas,
Class
A
2,492,371
58,272
T.
ROWE
PRICE
Small-Cap
Value
Fund
Shares/Par
$
Value
(Cost
and
value
in
$000s)
‡
Matador
Resources
2,185,272
122,943
PBF
Energy,
Class
A (1)
752,829
19,988
Permian
Resources
3,965,370
57,022
Range
Resources
2,019,933
72,677
463,383
Total
Energy
821,271
FINANCIALS
27.8%
Banks
19.4%
Banc
of
California
3,320,430
51,334
BankUnited
1,319,570
50,368
Blue
Foundry
Bancorp (2)
876,891
8,602
Cadence
Bank
901,366
31,052
Cathay
General
Bancorp
702,719
33,457
Coastal
Financial (2)(6)
759,737
64,509
Columbia
Banking
System
5,045,220
136,271
Columbia
Financial (1)(2)
763,875
12,077
CRB
Group,
Acquisition
Date:
4/14/22,
Cost $3,215 (2)(3)(5)
30,579
1,935
CrossFirst
Bankshares,
Class
A (2)
877,019
13,287
Dogwood
State
Bank,
Voting
Shares,
Acquisition
Date:
5/6/19
-
4/5/24,
Cost $4,795 (2)(3)(5)
479,510
7,658
East
West
Bancorp
1,093,588
104,722
Eastern
Bankshares
3,414,069
58,893
FB
Financial
1,556,941
80,198
Flagstar
Financial (1)
1,723,600
16,081
FS
Bancorp (6)
655,496
26,915
Grasshopper
Bancorp,
Acquisition
Date:
10/12/18
-
5/2/19,
Cost $5,034 (2)(3)(5)
503,404
2,265
Grasshopper
Bancorp,
Warrants,
10/12/28,
Acquisition
Date:
10/12/18,
Cost $— (2)(3)(5)
100,220
68
HarborOne
Bancorp
1,729,121
20,456
Home
BancShares
2,837,501
80,301
John
Marshall
Bancorp (6)
1,240,165
24,903
Live
Oak
Bancshares (6)
2,448,316
96,831
National
Bank
Holdings,
Class
A
1,304,539
56,173
Origin
Bancorp
632,073
21,042
Pacific
Premier
Bancorp
1,683,706
41,958
Pinnacle
Financial
Partners
1,494,118
170,912
Ponce
Financial
Group (1)(2)(6)
1,541,212
20,036
Popular
806,868
75,894
Preferred
Bank
658,020
56,840
Prosperity
Bancshares
820,827
61,849
Southern
First
Bancshares (2)(6)
473,013
18,802
SouthState
1,226,202
121,983
T.
ROWE
PRICE
Small-Cap
Value
Fund
Shares/Par
$
Value
(Cost
and
value
in
$000s)
‡
Synovus
Financial
495,740
25,397
Texas
Capital
Bancshares (2)
1,171,527
91,613
Towne
Bank
2,524,818
85,995
Webster
Financial
1,709,330
94,389
Western
Alliance
Bancorp
1,147,523
95,864
WSFS
Financial
1,329,856
70,655
2,031,585
Capital
Markets
2.0%
Hamilton
Lane,
Class
A
190,869
28,258
Houlihan
Lokey
640,388
111,210
OTC
Markets
Group,
Class
A
397,176
20,341
Sprott
105,056
4,430
StepStone
Group,
Class
A
499,760
28,926
StoneX
Group (2)
206,882
20,268
213,433
Consumer
Finance
0.2%
PRA
Group (2)
1,073,279
22,421
22,421
Financial
Services
3.1%
Flywire (2)
558,367
11,514
HA
Sustainable
Infrastructure
Capital (1)
2,730,425
73,257
Marqeta,
Class
A (2)
4,702,176
17,821
PennyMac
Financial
Services
1,404,615
143,467
Stash
Financial,
Acquisition
Date:
1/6/21
-
1/26/21,
Cost $1,244 (2)(3)(5)
38,630
185
Voya
Financial
82,761
5,697
Walker
&
Dunlop
696,496
67,706
319,647
Insurance
2.7%
Baldwin
Insurance
Group (1)(2)
456,105
17,679
Coalition,
Series
A,
Acquisition
Date:
9/13/21,
Cost $357 (2)(3)
(5)
21,587
190
First
American
Financial
174,945
10,924
Goosehead
Insurance,
Class
A (1)(2)
298,085
31,961
Hanover
Insurance
Group
134,166
20,750
James
River
Group
Holdings (6)
2,452,007
11,941
Primerica
92,635
25,143
ProAssurance (2)
2,321,562
36,936
RLI
84,366
13,906
Root,
Class
A (1)(2)
178,922
12,988
Ryan
Specialty
Holdings,
Class
A (1)
1,015,719
65,168
Selective
Insurance
Group
147,891
13,831
T.
ROWE
PRICE
Small-Cap
Value
Fund
Shares/Par
$
Value
(Cost
and
value
in
$000s)
‡
TWFG (2)
185,789
5,722
White
Mountains
Insurance
Group
9,353
18,192
285,331
Mortgage
Real
Estate
Investment
Trusts
0.4%
PennyMac
Mortgage
Investment
Trust,
REIT (1)
3,444,164
43,362
43,362
Total
Financials
2,915,779
HEALTH
CARE
7.9%
Biotechnology
2.8%
ACELYRIN (1)(2)
2,838,233
8,912
Akero
Therapeutics (2)
108,495
3,018
Applied
Therapeutics (1)(2)
3,384,666
2,898
Arcellx (2)
37,484
2,875
Arrowhead
Pharmaceuticals (2)
432,899
8,139
Ascendis
Pharma,
ADR (2)
81,836
11,266
Black
Diamond
Therapeutics (1)(2)
2,424,301
5,188
Blueprint
Medicines (2)
30,384
2,650
Cabaletta
Bio (1)(2)
1,933,017
4,388
Celldex
Therapeutics (2)
258,223
6,525
Centessa
Pharmaceuticals,
ADR (1)(2)
657,169
11,008
CRISPR
Therapeutics (1)(2)
122,135
4,807
Cytokinetics (1)(2)
1,296,448
60,985
Erasca (2)
4,191,151
10,520
Icosavax,
CVR (2)(3)
1,240,955
—
Immatics (1)(2)
2,864,376
20,366
Immunocore
Holdings,
ADR (1)(2)
1,258,246
37,118
Immunome (1)(2)
705,181
7,489
Immunovant (1)(2)
288,943
7,157
Ionis
Pharmaceuticals (2)
540,307
18,889
Iovance
Biotherapeutics (1)(2)
1,015,996
7,519
Jasper
Therapeutics (2)
51,600
1,103
Merus (2)
74,750
3,143
Nurix
Therapeutics (2)
507,479
9,561
Prime
Medicine (1)(2)
1,300,100
3,796
Tango
Therapeutics (1)(2)
1,664,754
5,144
Vaxcyte (2)
41,240
3,376
Vera
Therapeutics (1)(2)
76,875
3,251
Verve
Therapeutics (1)(2)
1,175,491
6,630
Xenon
Pharmaceuticals (2)
317,954
12,464
290,185
Health
Care
Equipment
&
Supplies
1.4%
Avanos
Medical (2)
1,741,891
27,731
T.
ROWE
PRICE
Small-Cap
Value
Fund
Shares/Par
$
Value
(Cost
and
value
in
$000s)
‡
DENTSPLY
SIRONA
453,340
8,604
Lantheus
Holdings (2)
413,025
36,949
Neogen (1)(2)
1,014,555
12,317
Novocure (2)
150,010
4,470
Pax
Labs,
Class
A,
Acquisition
Date:
4/18/19,
Cost $9,910 (2)
(3)(5)
2,631,808
1,079
QuidelOrtho (2)
1,257,933
56,041
147,191
Health
Care
Providers
&
Services
2.3%
Alignment
Healthcare (2)
1,766,279
19,871
Capsule,
Acquisition
Date:
4/7/21,
Cost $3,065 (2)(3)(5)
211,518
273
Concentra
Group
Holdings
Parent
3,095,687
61,233
Ensign
Group
389,530
51,753
Innovage
Holding (2)
3,254,017
12,788
NeoGenomics (2)
128,100
2,111
Oscar
Health,
Class
A (1)(2)
2,239,242
30,095
Pennant
Group (2)
378,871
10,048
Privia
Health
Group (1)(2)
401,118
7,842
Select
Medical
Holdings
2,532,021
47,728
243,742
Health
Care
Technology
0.5%
Doximity,
Class
A (2)
670,485
35,797
Phreesia (2)
532,827
13,406
49,203
Life
Sciences
Tools
&
Services
0.2%
Pacific
Biosciences
of
California (1)(2)
3,079,647
5,636
Sotera
Health (1)(2)
1,357,459
18,570
24,206
Pharmaceuticals
0.7%
Arvinas (2)
344,587
6,606
Elanco
Animal
Health (2)
3,043,139
36,852
Neumora
Therapeutics (1)(2)
1,295,999
13,738
Rapport
Therapeutics (2)
382,487
6,785
Third
Harmonic
Bio (1)(2)
873,133
8,985
72,966
Total
Health
Care
827,493
INDUSTRIALS
&
BUSINESS
SERVICES
13.9%
Aerospace
&
Defense
1.2%
BWX
Technologies
135,049
15,043
Leonardo
DRS (2)
1,236,957
39,966
Loar
Holdings (2)
119,320
8,819
T.
ROWE
PRICE
Small-Cap
Value
Fund
Shares/Par
$
Value
(Cost
and
value
in
$000s)
‡
MDA
Space
(CAD) (2)
302,836
6,221
Moog,
Class
A
271,481
53,439
123,488
Building
Products
1.1%
AZZ
212,144
17,379
UFP
Industries
529,446
59,642
Zurn
Elkay
Water
Solutions (1)
1,044,947
38,976
115,997
Commercial
Services
&
Supplies
1.8%
Brady,
Class
A
568,675
41,997
BrightView
Holdings (2)
1,389,267
22,214
Casella
Waste
Systems,
Class
A (2)
359,677
38,058
MSA
Safety
172,409
28,580
Tetra
Tech
594,901
23,701
UniFirst
23,594
4,037
VSE (1)
350,287
33,312
191,899
Construction
&
Engineering
0.9%
Arcosa
327,382
31,671
MYR
Group (2)
97,812
14,552
Valmont
Industries
82,357
25,256
WillScot
Holdings (2)
567,321
18,977
90,456
Electrical
Equipment
0.3%
Thermon
Group
Holdings (2)
969,300
27,887
27,887
Ground
Transportation
0.7%
Covenant
Logistics
Group
101,704
5,544
Landstar
System
368,112
63,264
68,808
Machinery
3.4%
AGCO
100
9
Alamo
Group
55,342
10,289
Crane
228,194
34,628
Douglas
Dynamics
576,060
13,612
Enpro
173,370
29,898
Esab
590,271
70,797
ESCO
Technologies
190,299
25,350
Federal
Signal
58,378
5,394
Helios
Technologies
350,876
15,663
Hillman
Solutions (2)
1,117,086
10,880
T.
ROWE
PRICE
Small-Cap
Value
Fund
Shares/Par
$
Value
(Cost
and
value
in
$000s)
‡
John
Bean
Technologies (1)
294,343
37,411
RBC
Bearings (2)
215,538
64,476
Shyft
Group (6)
1,869,947
21,953
SPX
Technologies (2)
101,778
14,811
355,171
Marine
Transportation
0.3%
Matson
216,077
29,136
29,136
Passenger
Airlines
0.6%
Allegiant
Travel (1)
523,041
49,228
Sun
Country
Airlines
Holdings (2)
1,174,752
17,128
66,356
Professional
Services
1.9%
Checkr,
Acquisition
Date:
6/29/18,
Cost $866 (2)(3)(5)
211,422
1,298
Conduent (2)
2,700,092
10,908
First
Advantage (2)
566,444
10,610
FTI
Consulting (2)
245,539
46,930
Parsons (1)(2)
272,940
25,179
Paycor
HCM (2)
1,900,099
35,285
Robert
Half
14,800
1,043
UL
Solutions,
Class
A
635,109
31,679
Upwork (2)
1,874,695
30,651
193,583
Trading
Companies
&
Distributors
1.7%
Air
Lease (1)
437,159
21,075
Beacon
Roofing
Supply (2)
523,066
53,133
Custom
Truck
One
Source (1)(2)
1,868,544
8,988
Herc
Holdings
239,595
45,363
McGrath
RentCorp
75,345
8,425
Rush
Enterprises,
Class
A
683,705
37,460
SiteOne
Landscape
Supply (2)
100
13
174,457
Total
Industrials
&
Business
Services
1,437,238
INFORMATION
TECHNOLOGY
6.2%
Communications
Equipment
0.6%
Viavi
Solutions (2)
6,121,241
61,824
61,824
Electronic
Equipment,
Instruments
&
Components
1.8%
Cognex
100
4
FARO
Technologies (2)
268,579
6,811
T.
ROWE
PRICE
Small-Cap
Value
Fund
Shares/Par
$
Value
(Cost
and
value
in
$000s)
‡
Insight
Enterprises (2)
34,042
5,178
Littelfuse
194,645
45,868
Mirion
Technologies (2)
4,747,181
82,838
PAR
Technology (1)(2)
576,334
41,882
Vontier
281,929
10,282
192,863
IT
Services
0.7%
ASGN (2)
114,938
9,579
Endava,
ADR (1)(2)
1,479,589
45,719
Grid
Dynamics
Holdings (2)
438,590
9,754
Themis
Solutions,
Acquisition
Date:
4/14/21,
Cost $3,039 (2)
(3)(5)
135,360
4,711
69,763
Semiconductors
&
Semiconductor
Equipment
1.3%
Allegro
MicroSystems (1)(2)
1,183,216
25,865
Entegris
88,322
8,749
Lattice
Semiconductor (2)
578,486
32,771
MACOM
Technology
Solutions
Holdings (2)
418,195
54,328
Onto
Innovation (2)
67,614
11,269
132,982
Software
1.8%
Alarm.com
Holdings (2)
258,798
15,735
Apiture,
Acquisition
Date:
11/6/23,
Cost $252 (2)(3)(5)
15,000
327
Apiture,
Acquisition
Date:
7/1/20
-
11/6/23,
Cost $11,099 (2)(3)
(5)
687,865
14,982
Aurora
Innovation (2)
3,311,670
20,864
Braze,
Class
A (2)
387,570
16,232
Enfusion,
Class
A (2)
738,846
7,610
Gusto,
Acquisition
Date:
8/18/20
-
11/9/20,
Cost $7,474 (2)(3)
(5)
559,515
10,401
Intapp (2)
455,397
29,186
nCino (1)(2)
784,179
26,333
Onestream (2)
251,932
7,185
SimilarWeb (2)
421,900
5,978
Socure,
Acquisition
Date:
12/22/21,
Cost $2,410 (2)(3)(5)
149,990
624
Workiva (2)
342,779
37,534
192,991
Total
Information
Technology
650,423
MATERIALS
3.9%
Chemicals
1.5%
Cabot
148,353
13,546
Element
Solutions
2,466,317
62,718
T.
ROWE
PRICE
Small-Cap
Value
Fund
Shares/Par
$
Value
(Cost
and
value
in
$000s)
‡
HB
Fuller
414,824
27,992
Orion
753,747
11,902
PureCycle
Technologies (1)(2)
849,045
8,703
Quaker
Chemical
219,776
30,936
155,797
Construction
Materials
0.2%
Knife
River (2)
154,133
15,666
15,666
Metals
&
Mining
2.0%
Capstone
Copper
(CAD) (1)(2)
3,937,924
24,354
Carpenter
Technology
29,910
5,076
Constellium (2)
5,861,474
60,197
Hudbay
Minerals (1)
1,300,626
10,535
Reliance
276,396
74,423
Warrior
Met
Coal
646,172
35,048
209,633
Paper
&
Forest
Products
0.2%
Louisiana-Pacific
24,304
2,517
West
Fraser
Timber
(CAD) (1)
145,263
12,586
West
Fraser
Timber (1)
59,795
5,175
20,278
Total
Materials
401,374
MISCELLANEOUS
0.0%
Miscellaneous
0.0%
Helix
Acquisition
Corp.
II (2)
259,509
2,725
Total
Miscellaneous
2,725
REAL
ESTATE
10.5%
Diversified
Real
Estate
Investment
Trusts
1.2%
American
Assets
Trust,
REIT
1,126,626
29,586
Empire
State
Realty
Trust,
Class
A,
REIT
1,074,242
11,086
Essential
Properties
Realty
Trust,
REIT
2,831,655
88,574
129,246
Hotel
&
Resort
Real
Estate
Investment
Trusts
1.2%
Apple
Hospitality,
REIT
3,461,028
53,127
Pebblebrook
Hotel
Trust,
REIT
4,186,670
56,729
Ryman
Hospitality
Properties,
REIT
105,753
11,034
120,890
Industrial
Real
Estate
Investment
Trusts
1.7%
EastGroup
Properties,
REIT
465,614
74,726
T.
ROWE
PRICE
Small-Cap
Value
Fund
Shares/Par
$
Value
(Cost
and
value
in
$000s)
‡
Terreno
Realty,
REIT
1,661,522
98,263
172,989
Office
Real
Estate
Investment
Trusts
1.3%
Highwoods
Properties,
REIT
1,846,741
56,474
IQHQ,
Class
A-1,
REIT,
Acquisition
Date:
10/30/19
-
8/21/20,
Cost $13,130 (2)(3)(5)
866,287
8,940
Kilroy
Realty,
REIT
1,727,892
69,893
135,307
Real
Estate
Management
&
Development
0.9%
Colliers
International
Group (1)
178,815
24,313
FirstService
214,344
38,801
Opendoor
Technologies,
Class
A (1)(2)
10,320,224
16,512
St.
Joe
315,872
14,192
93,818
Residential
Real
Estate
Investment
Trusts
1.5%
Apartment
Investment
&
Management,
Class
A,
REIT (2)
1,752,369
15,929
Independence
Realty
Trust,
REIT
4,236,584
84,054
UMH
Properties,
REIT
3,042,728
57,447
157,430
Retail
Real
Estate
Investment
Trusts
1.6%
Curbline
Properties,
REIT
1,299,892
30,184
Macerich,
REIT
2,529,991
50,397
NETSTREIT,
REIT (1)
3,952,874
55,933
Saul
Centers,
REIT
709,724
27,537
164,051
Specialized
Real
Estate
Investment
Trusts
1.1%
CubeSmart,
REIT
1,563,891
67,013
Safehold,
REIT (1)
2,473,225
45,705
112,718
Total
Real
Estate
1,086,449
UTILITIES
5.2%
Electric
Utilities
2.8%
Hawaiian
Electric
Industries (1)(2)
3,187,277
31,012
IDACORP
585,772
64,013
MGE
Energy (1)
508,742
47,801
OGE
Energy
1,329,624
54,847
TXNM
Energy
1,990,314
97,864
295,537
Gas
Utilities
1.6%
Chesapeake
Utilities
636,371
77,224
T.
ROWE
PRICE
Small-Cap
Value
Fund
Shares/Par
$
Value
(Cost
and
value
in
$000s)
‡
ONE
Gas
1,239,285
85,820
163,044
Independent
Power
&
Renewable
Electricity
Producers
0.0%
Talen
Energy (1)(2)
5,279
1,064
1,064
Water
Utilities
0.8%
Artesian
Resources,
Class
A (6)
536,213
16,955
California
Water
Service
Group
906,920
41,111
Middlesex
Water
427,672
22,508
80,574
Total
Utilities
540,219
Total
Common
Stocks
(Cost
$7,147,815)
10,121,610
CONVERTIBLE
BONDS
0.2%
Farmers
Business
Network,
15.00%,
9/29/25,
Acquisition
Date:
9/29/23,
Cost $10,691 (2)(3)(5)
10,691,000
10,691
Stash
Financial,
5.00%,
3/23/26,
Acquisition
Date:
9/8/23,
Cost $9,400 (2)(3)(5)
9,400,000
9,903
Total
Convertible
Bonds
(Cost
$20,091)
20,594
CONVERTIBLE
PREFERRED
STOCKS
2.4%
CONSUMER
DISCRETIONARY
0.1%
Hotels,
Restaurants
&
Leisure
0.0%
Torchys
Holdings,
Acquisition
Date:
11/13/20,
Cost $2,539 (2)
(3)(4)(5)
282,711
1,052
1,052
Specialty
Retail
0.1%
1661,
Series
F,
Acquisition
Date:
5/28/21,
Cost $12,383 (2)(3)
(5)
2,127,647
1,894
Minted,
Series
E,
Acquisition
Date:
10/30/18,
Cost $5,471 (2)
(3)(5)
406,249
4,314
6,208
Total
Consumer
Discretionary
7,260
CONSUMER
STAPLES
0.0%
Food
Products
0.0%
Farmers
Business
Network,
Series
D,
Acquisition
Date:
11/3/17,
Cost $15,529 (2)(3)(5)
841,026
2,944
T.
ROWE
PRICE
Small-Cap
Value
Fund
Shares/Par
$
Value
(Cost
and
value
in
$000s)
‡
Farmers
Business
Network,
Series
E,
Acquisition
Date:
2/11/19,
Cost $3,362 (2)(3)(5)
144,247
505
Farmers
Business
Network,
Series
F,
Acquisition
Date:
7/31/20,
Cost $881 (2)(3)(5)
26,661
93
Total
Consumer
Staples
3,542
FINANCIALS
0.2%
Banks
0.1%
CRB
Group,
Series
D,
Acquisition
Date:
1/28/22,
Cost $11,470 (2)(3)(5)
109,095
6,903
6,903
Financial
Services
0.0%
Stash
Financial,
Series
F,
Acquisition
Date:
4/24/20,
Cost $11,157 (2)(3)(5)
445,224
2,133
Stash
Financial,
Series
G,
Acquisition
Date:
1/26/21,
Cost $12,559 (2)(3)(5)
335,107
1,605
3,738
Insurance
0.1%
Coalition,
Series
E,
Acquisition
Date:
9/7/21,
Cost $21,422 (2)
(3)(5)
1,296,510
11,409
11,409
Total
Financials
22,050
HEALTH
CARE
0.6%
Biotechnology
0.0%
Laronde,
Series
B,
Acquisition
Date:
7/28/21,
Cost $9,269 (2)
(3)(5)
331,043
728
728
Health
Care
Providers
&
Services
0.1%
Capsule,
Series
1-D,
Acquisition
Date:
4/7/21,
Cost $3,065 (2)
(3)(5)
211,518
273
Honor
Technology,
Series
D,
Acquisition
Date:
10/16/20,
Cost $8,981 (2)(3)(5)
3,729,550
6,377
Honor
Technology,
Series
E,
Acquisition
Date:
9/29/21,
Cost $10,347 (2)(3)(5)
3,272,913
5,597
12,247
Life
Sciences
Tools
&
Services
0.5%
Cleerly,
Series
C,
Acquisition
Date:
7/8/22,
Cost $11,917 (2)(3)
(5)
1,011,567
11,916
National
Resilience,
Series
B,
Acquisition
Date:
10/23/20,
Cost $6,453 (2)(3)(5)
472,388
21,952
T.
ROWE
PRICE
Small-Cap
Value
Fund
Shares/Par
$
Value
(Cost
and
value
in
$000s)
‡
National
Resilience,
Series
C,
Acquisition
Date:
6/9/21,
Cost $13,636 (2)(3)(5)
307,043
14,268
48,136
Total
Health
Care
61,111
INDUSTRIALS
&
BUSINESS
SERVICES
0.5%
Aerospace
&
Defense
0.1%
ABL
Space
Systems,
Series
A-8,
Acquisition
Date:
3/24/21,
Cost $14,587 (2)(3)(5)
367,537
257
Epirus,
Series
C-2,
Acquisition
Date:
1/28/22,
Cost $14,645 (2)
(3)(5)
2,622,728
7,240
7,497
Electrical
Equipment
0.3%
CELLINK,
Series
D,
Acquisition
Date:
1/20/22,
Cost $12,776 (2)
(3)(5)
613,518
1,215
Tonian
Holdings,
Series
A,
Non-Voting
Shares,
Acquisition
Date:
1/15/21
-
7/20/21,
Cost $8,392 (2)(3)(5)(6)
8,531,194
11,091
Tonian
Holdings,
Series
A,
Voting
Shares,
Acquisition
Date:
1/15/21
-
1/26/22,
Cost $15,325 (2)(3)(5)(6)
15,050,275
19,565
31,871
Professional
Services
0.1%
Checkr,
Series
C,
Acquisition
Date:
4/10/18,
Cost $4,046 (2)(3)
(5)
889,080
5,459
5,459
Total
Industrials
&
Business
Services
44,827
INFORMATION
TECHNOLOGY
0.5%
IT
Services
0.0%
Themis
Solutions,
Series
AA,
Acquisition
Date:
4/14/21,
Cost $684 (2)(3)(5)
30,470
1,060
Themis
Solutions,
Series
AB,
Acquisition
Date:
4/14/21,
Cost $68 (2)(3)(5)
3,030
106
Themis
Solutions,
Series
B,
Acquisition
Date:
4/14/21,
Cost $75 (2)(3)(5)
3,310
115
Themis
Solutions,
Series
E,
Acquisition
Date:
4/14/21,
Cost $2,437 (2)(3)(5)
108,552
3,778
5,059
Software
0.5%
Gusto,
Series
B,
Acquisition
Date:
8/18/20,
Cost $1,746 (2)(3)
(5)
129,187
2,402
Gusto,
Series
B-2,
Acquisition
Date:
8/18/20,
Cost $3,259 (2)
(3)(5)
241,168
4,483
Gusto,
Series
C,
Acquisition
Date:
7/16/18,
Cost $5,412 (2)(3)
(5)
711,894
13,234
T.
ROWE
PRICE
Small-Cap
Value
Fund
Shares/Par
$
Value
(Cost
and
value
in
$000s)
‡
Gusto,
Series
D,
Acquisition
Date:
7/16/19,
Cost $7,227 (2)(3)
(5)
542,859
10,092
Nuro,
Series
C,
Acquisition
Date:
10/30/20
-
3/2/21,
Cost $11,195 (2)(3)(5)
857,551
6,123
Nuro,
Series
D,
Acquisition
Date:
10/29/21,
Cost $6,458 (2)(3)
(5)
309,802
2,212
SecurityScorecard,
Series
E,
Acquisition
Date:
3/5/21,
Cost $9,505 (2)(3)(5)
1,881,753
9,917
Socure,
Series
A,
Acquisition
Date:
12/22/21,
Cost $2,929 (2)
(3)(5)
182,290
758
Socure,
Series
A-1,
Acquisition
Date:
12/22/21,
Cost $2,404 (2)
(3)(5)
149,613
622
Socure,
Series
B,
Acquisition
Date:
12/22/21,
Cost $43 (2)(3)(5)
2,706
11
Socure,
Series
E,
Acquisition
Date:
10/27/21,
Cost $5,572 (2)
(3)(5)
346,775
1,443
51,297
Total
Information
Technology
56,356
MATERIALS
0.5%
Chemicals
0.1%
Sila
Nano,
Series
F,
Acquisition
Date:
1/7/21,
Cost $11,381 (2)
(3)(5)
275,749
5,392
5,392
Metals
&
Mining
0.4%
Kobold
Metals,
Series
B-1,
Acquisition
Date:
1/10/22,
Cost $14,318 (2)(3)(5)
522,347
44,375
44,375
Total
Materials
49,767
Total
Convertible
Preferred
Stocks
(Cost
$314,925)
244,913
PREFERRED
STOCKS
0.0%
ENERGY
0.0%
Energy
Equipment
&
Services
0.0%
Energy
Reservoir
Holdings,
Class
A-3,
Acquisition
Date:
11/30/22,
Cost $144 (2)(3)(4)(5)(6)
143,910
164
Energy
Reservoir
Holdings,
Class
A-3,
Acquisition
Date:
5/3/21
-
9/29/21,
Cost $1,287 (2)(3)(4)(5)(6)
1,286,870
1,673
Total
Energy
1,837
Total
Preferred
Stocks
(Cost
$1,431)
1,837
T.
ROWE
PRICE
Small-Cap
Value
Fund
Shares/Par
$
Value
(Cost
and
value
in
$000s)
‡
SHORT-TERM
INVESTMENTS
0.9%
Money
Market
Funds
0.9%
T.
Rowe
Price
Government
Reserve
Fund,
4.53% (6)(7)
97,250,361
97,250
Total
Short-Term
Investments
(Cost
$97,250)
97,250
SECURITIES
LENDING
COLLATERAL
3.0%
INVESTMENTS
IN
A
POOLED
ACCOUNT
THROUGH
SECURITIES
LENDING
PROGRAM
WITH
JPMORGAN
CHASE
BANK 0.0%
Money
Market
Funds 0.0%
T.
Rowe
Price
Government
Reserve
Fund,
4.53% (6)(7)
4,427,176
4,427
Total
Investments
in
a
Pooled
Account
through
Securities
Lending
Program
with
JPMorgan
Chase
Bank
4,427
INVESTMENTS
IN
A
POOLED
ACCOUNT
THROUGH
SECURITIES
LENDING
PROGRAM
WITH
STATE
STREET
BANK
AND
TRUST
COMPANY 3.0%
Money
Market
Funds 3.0%
T.
Rowe
Price
Government
Reserve
Fund,
4.53% (6)(7)
312,323,905
312,324
Total
Investments
in
a
Pooled
Account
through
Securities
Lending
Program
with
State
Street
Bank
and
Trust
Company
312,324
Total
Securities
Lending
Collateral
(Cost
$316,751)
316,751
Total
Investments
in
Securities
103.2%
of
Net
Assets
(Cost
$7,898,263)
$
10,802,955
‡
Shares/Par
are
denominated
in
U.S.
dollars
unless
otherwise
noted.
(1)
See
Note
3.
All
or
a
portion
of
this
security
is
on
loan
at
December
31,
2024.
(2)
Non-income
producing
(3)
See
Note
2.
Level
3
in
fair
value
hierarchy.
(4)
Investment
in
a
partnership
held
indirectly
through
a
limited
liability
company
that
is
owned
by
the
fund
and
treated
as
a
corporation
for
U.S.
tax
purposes.
T.
ROWE
PRICE
Small-Cap
Value
Fund
.
.
.
.
.
.
.
.
.
.
(5)
Security
cannot
be
offered
for
public
resale
without
first
being
registered
under
the
Securities
Act
of
1933
and
related
rules
("restricted
security").
Acquisition
date
represents
the
day
on
which
an
enforceable
right
to
acquire
such
security
is
obtained
and
is
presented
along
with
related
cost
in
the
security
description.
The
fund
may
have
registration
rights
for
certain
restricted
securities.
Any
costs
related
to
such
registration
are
generally
borne
by
the
issuer.
The
aggregate
value
of
restricted
securities
(excluding
144A
holdings)
at
period
end
amounts
to
$358,652
and
represents
3.4%
of
net
assets.
(6)
Affiliated
Companies
(7)
Seven-day
yield
ADR
American
Depositary
Receipts
CAD
Canadian
Dollar
CVR
Contingent
Value
Rights
EC
Escrow
CUSIP;
represents
a
beneficial
interest
in
a
residual
pool
of
assets;
the
amount
and
timing
of
future
distributions,
if
any,
is
uncertain;
when
presented,
interest
rate
and
maturity
date
are
those
of
the
original
security.
REIT
A
domestic
Real
Estate
Investment
Trust
whose
distributions
pass-through
with
original
tax
character
to
the
shareholder
T.
ROWE
PRICE
Small-Cap
Value
Fund
AFFILIATED
COMPANIES
($000s)
The
fund
may
invest
in
certain
securities
that
are
considered
affiliated
companies.
As
defined
by
the
1940
Act,
an
affiliated
company
is
one
in
which
the
fund
owns
5%
or
more
of
the
outstanding
voting
securities,
or
a
company
that
is
under
common
ownership
or
control.
The
following
securities
were
considered
affiliated
companies
for
all
or
some
portion
of
the
year
ended
December
31,
2024.
Net
realized
gain
(loss),
investment
income,
change
in
net
unrealized
gain/loss,
and
purchase
and
sales
cost
reflect
all
activity
for
the
period
then
ended.
Affiliate
Net
Realized
Gain
(Loss)
Change
in
Net
Unrealized
Gain/Loss
Investment
Income
Artesian
Resources,
Class
A
$
(
24
)
$
(
5,046
)
$
594
CELLINK,
Series
D
—
(
521
)
—
Coastal
Financial
59
25,907
—
Dogwood
State
Bank,
Voting
Shares
—
1,779
—
Energy
Reservoir
Holdings,
Class
A-1
—
(
834
)
—
Energy
Reservoir
Holdings,
Class
A-3
—
13
—
Energy
Reservoir
Holdings,
Class
A-3
—
142
—
FS
Bancorp
176
2,546
702
James
River
Group
Holdings
(
18
)
(
9,147
)
325
John
Marshall
Bancorp
51
(
2,753
)
269
Live
Oak
Bancshares
494
(
15,169
)
295
Monro
(
2,174
)
(
4,251
)
1,698
Ponce
Financial
Group
(
49
)
5,225
—
ProAssurance
(
449
)
6,498
—
Saul
Centers,
REIT
(
2,150
)
1,601
4,626
Shyft
Group
(
8
)
(
2,593
)
198
Southern
First
Bancshares
(
66
)
1,327
—
Tonian
Holdings,
Series
A,
Non-Voting
Shares
—
853
—
Tonian
Holdings,
Series
A,
Voting
Shares
—
1,505
—
T.
Rowe
Price
Government
Reserve
Fund,
4.53%
—
—
5,959
++
Affiliates
not
held
at
period
end
(
11,362
)
2,024
—
Totals
$
(
15,520
)
#
$
9,106
$
14,666
+
T.
ROWE
PRICE
Small-Cap
Value
Fund
AFFILIATED
COMPANIES
(CONTINUED)
($000s)
Supplementary
Investment
Schedule
Affiliate
Value
12/31/23
Purchase
Cost
Sales
Cost
Value
12/31/24
Artesian
Resources,
Class
A
$
*
$
2,139
$
161
$
16,955
CELLINK,
Series
D
*
—
—
*
Coastal
Financial
*
13,117
420
64,509
Dogwood
State
Bank,
Non-
Voting
Shares
5,130
436
3,359
—
Dogwood
State
Bank,
Voting
Shares
2,520
3,359
—
*
Dogwood
State
Bank,
Warrants,
5/6/24
342
—
—
—
Energy
Reservoir
Holdings,
Class
A-1
12,107
—
1
11,272
Energy
Reservoir
Holdings,
Class
A-3
1,531
—
—
1,673
Energy
Reservoir
Holdings,
Class
A-3
151
—
—
164
FS
Bancorp
24,636
—
267
26,915
James
River
Group
Holdings
*
4,629
136
11,941
John
Marshall
Bancorp
23,951
3,815
110
24,903
Live
Oak
Bancshares
112,264
—
264
96,831
Metropolitan
Bank
Holding
32,044
—
37,142
—
Monro
*
4,165
3,843
39,247
Ponce
Financial
Group
*
—
2,372
20,036
ProAssurance
*
3,232
7,580
*
Saul
Centers,
REIT
51,774
—
25,838
*
Shyft
Group
*
16,786
91
21,953
Southern
First
Bancshares
16,766
1,024
315
18,802
Strattec
Security
5,881
—
5,356
—
Tonian
Holdings,
Series
A,
Non-Voting
Shares
10,238
—
—
11,091
Tonian
Holdings,
Series
A,
Voting
Shares
18,060
—
—
19,565
T.
Rowe
Price
Government
Reserve
Fund,
4.53%
296,346
¤
¤
414,001
Total
$
799,858
^
T.
ROWE
PRICE
Small-Cap
Value
Fund
The
accompanying
notes
are
an
integral
part
of
these
financial
statements.
#
Capital
gain
distributions
from
underlying
Price
funds
represented
$0
of
the
net
realized
gain
(loss).
++
Excludes
earnings
on
securities
lending
collateral,
which
are
subject
to
rebates
and
fees
as
described
in
Note
3.
+
Investment
income
comprised
$14,666
of
dividend
income
and
$0
of
interest
income.
¤
Purchase
and
sale
information
not
shown
for
cash
management
funds.
^
The
cost
basis
of
investments
in
affiliated
companies
was
$822,194.
*
On
the
date
indicated,
issuer
was
held
but
not
considered
an
affiliated
company.
T.
ROWE
PRICE
Small-Cap
Value
Fund
December
31,
2024
Statement
of
Assets
and
Liabilities
($000s,
except
shares
and
per
share
amounts)
Assets
Investments
in
securities,
at
value
(cost
$7,898,263)
$
10,802,955
Dividends
and
interest
receivable
11,793
Receivable
for
shares
sold
3,593
Due
from
affiliates
1,482
Receivable
for
investment
securities
sold
745
Cash
1
Other
assets
177
Total
assets
10,820,746
Liabilities
Obligation
to
return
securities
lending
collateral
316,751
Payable
for
shares
redeemed
24,247
Investment
management
fees
payable
5,884
Payable
for
investment
securities
purchased
299
Payable
to
directors
8
Other
liabilities
618
Total
liabilities
347,807
NET
ASSETS
$
10,472,939
T.
ROWE
PRICE
Small-Cap
Value
Fund
December
31,
2024
Statement
of
Assets
and
Liabilities
($000s,
except
shares
and
per
share
amounts)
The
accompanying
notes
are
an
integral
part
of
these
financial
statements.
Net
Assets
Consist
of:
Total
distributable
earnings
(loss)
$
3,074,252
Paid-in
capital
applicable
to
198,409,765
shares
of
$0.01
par
value
capital
stock
outstanding;
1,000,000,000
shares
authorized
7,398,687
NET
ASSETS
$
10,472,939
NET
ASSET
VALUE
PER
SHARE
Investor
Class
(Net
assets:
$4,224,688;
Shares
outstanding:
80,028,493)
$
52.79
Advisor
Class
(Net
assets:
$49,106;
Shares
outstanding:
931,634)
$
52.71
I
Class
(Net
assets:
$3,024,723;
Shares
outstanding:
57,456,431)
$
52.64
Z
Class
(Net
assets:
$3,174,422;
Shares
outstanding:
59,993,207)
$
52.91
T.
ROWE
PRICE
Small-Cap
Value
Fund
Year
Ended
12/31/24
Investment
Income
(Loss)
Income
Dividend
(net
of
foreign
taxes
of
$462)
$
154,519
Securities
lending
904
.
Interest
116
Other
21
Total
income
155,560
Expenses
Investment
management
66,776
Shareholder
servicing
Investor
Class
$
5,704
Advisor
Class
153
I
Class
650
6,507
Rule
12b-1
fees
Advisor
Class
139
Prospectus
and
shareholder
reports
Investor
Class
157
Advisor
Class
3
I
Class
74
Z
Class
2
236
Custody
and
accounting
383
Registration
108
Legal
and
audit
58
Directors
35
Miscellaneous
62
Waived
/
paid
by
Price
Associates
(
19,782
)
Total
expenses
54,522
Net
investment
income
101,038
T.
ROWE
PRICE
Small-Cap
Value
Fund
The
accompanying
notes
are
an
integral
part
of
these
financial
statements.
Year
Ended
12/31/24
Realized
and
Unrealized
Gain
/
Loss
–
Net
realized
gain
(loss)
Securities
1,221,054
Foreign
currency
transactions
(
23
)
Net
realized
gain
1,221,031
Change
in
net
unrealized
gain
/
loss
Securities
(
200,752
)
Other
assets
and
liabilities
denominated
in
foreign
currencies
(
9
)
Change
in
net
unrealized
gain
/
loss
(
200,761
)
Net
realized
and
unrealized
gain
/
loss
1,020,270
INCREASE
IN
NET
ASSETS
FROM
OPERATIONS
$
1,121,308
T.
ROWE
PRICE
Small-Cap
Value
Fund
Statement
of
Changes
in
Net
Assets
Year
.
.
.
.
.
.
.
.
.
.
.
.
.
.
Ended
.
.
.
.
.
.
.
.
.
.
.
.
.
.
12/31/24
12/31/23
Increase
(Decrease)
in
Net
Assets
Operations
Net
investment
income
$
101,038
$
100,734
Net
realized
gain
1,221,031
370,249
Change
in
net
unrealized
gain
/
loss
(
200,761
)
726,043
Increase
in
net
assets
from
operations
1,121,308
1,197,026
Distributions
to
shareholders
Net
earnings
Investor
Class
(
382,934
)
(
145,187
)
Advisor
Class
(
4,223
)
(
1,833
)
I
Class
(
279,911
)
(
98,724
)
Z
Class
(
306,975
)
(
116,548
)
Decrease
in
net
assets
from
distributions
(
974,043
)
(
362,292
)
Capital
share
transactions
*
Shares
sold
Investor
Class
448,799
547,659
Advisor
Class
5,840
7,438
I
Class
386,986
321,543
Z
Class
216,427
246,502
Distributions
reinvested
Investor
Class
370,678
140,718
Advisor
Class
4,106
1,794
I
Class
252,343
90,127
Z
Class
306,975
116,548
Shares
redeemed
Investor
Class
(
1,203,060
)
(
1,080,475
)
Advisor
Class
(
26,779
)
(
27,564
)
I
Class
(
621,206
)
(
569,394
)
Z
Class
(
391,426
)
(
349,654
)
Decrease
in
net
assets
from
capital
share
transactions
(
250,317
)
(
554,758
)
T.
ROWE
PRICE
Small-Cap
Value
Fund
Statement
of
Changes
in
Net
Assets
The
accompanying
notes
are
an
integral
part
of
these
financial
statements.
Year
.
.
.
.
.
.
.
.
.
.
.
.
.
.
Ended
.
.
.
.
.
.
.
.
.
.
.
.
.
.
12/31/24
12/31/23
Net
Assets
Increase
(decrease)
during
period
(
103,052
)
279,976
Beginning
of
period
10,575,991
10,296,015
End
of
period
$
10,472,939
$
10,575,991
*Share
information
(000s)
Shares
sold
Investor
Class
8,272
11,165
Advisor
Class
108
151
I
Class
7,053
6,560
Z
Class
4,084
5,003
Distributions
reinvested
Investor
Class
6,650
2,804
Advisor
Class
74
36
I
Class
4,540
1,800
Z
Class
5,496
2,319
Shares
redeemed
Investor
Class
(
22,068
)
(
22,084
)
Advisor
Class
(
498
)
(
554
)
I
Class
(
11,488
)
(
11,680
)
Z
Class
(
7,296
)
(
7,053
)
Decrease
in
shares
outstanding
(
5,073
)
(
11,533
)
T.
ROWE
PRICE
Small-Cap
Value
Fund
NOTES
TO
FINANCIAL
STATEMENTS
T.
Rowe
Price
Small-Cap
Value
Fund,
Inc. (the
fund) is
registered
under
the
Investment
Company
Act
of
1940
(the
1940
Act)
as a
diversified, open-
end
management
investment
company. The
fund
seeks long-term
capital
growth
by
investing
primarily
in
small
companies
whose
common
stocks
are
believed
to
be
undervalued.
The
fund
has four classes
of
shares:
the
Small-
Cap
Value
Fund
(Investor
Class),
the
Small-Cap
Value
Fund–Advisor
Class
(Advisor
Class),
the
Small-Cap
Value
Fund–I
Class
(I
Class)
and
the
Small-Cap
Value
Fund–Z
Class
(Z
Class).
Advisor
Class
shares
are
sold
only
through
various
brokers
and
other
financial
intermediaries.
I
Class
shares
require
a
$500,000
initial
investment
minimum,
although
the
minimum
generally
is
waived
or
reduced
for
financial
intermediaries,
eligible
retirement
plans,
and
certain
other
accounts.
The
Z
Class
is
only
available
to
funds
advised
by
T.
Rowe
Price
Associates,
Inc.
and
its
affiliates
and
other
clients
that
are
subject
to
a
contractual
fee
for
investment
management
services.
The
Advisor
Class
operates
under
a
Board-approved
Rule
12b-1
plan
pursuant
to
which
the
class
compensates
financial
intermediaries
for
distribution,
shareholder
servicing,
and/
or
certain
administrative
services;
the
Investor,
I
and
Z
Classes
do
not
pay
Rule
12b-1
fees. Each
class
has
exclusive
voting
rights
on
matters
related
solely
to
that
class;
separate
voting
rights
on
matters
that
relate
to
all
classes;
and,
in
all
other
respects,
the
same
rights
and
obligations
as
the
other
classes.
NOTE
1
-
SIGNIFICANT
ACCOUNTING
POLICIES
Basis
of
Preparation
The fund
is
an
investment
company
and
follows
accounting
and
reporting
guidance
in
the
Financial
Accounting
Standards
Board
(FASB)
Accounting
Standards
Codification
Topic
946
(ASC
946).
The
accompanying
financial
statements
were
prepared
in
accordance
with
accounting
principles
generally
accepted
in
the
United
States
of
America
(GAAP),
including,
but
not
limited
to,
ASC
946.
GAAP
requires
the
use
of
estimates
made
by
management.
Management
believes
that
estimates
and
valuations
are
appropriate;
however,
actual
results
may
differ
from
those
estimates,
and
the
valuations
reflected
in
the
accompanying
financial
statements
may
differ
from
the
value
ultimately
realized
upon
sale
or
maturity.
Investment
Transactions,
Investment
Income,
and
Distributions
Investment
transactions
are
accounted
for
on
the
trade
date
basis.
Income
and
expenses
are
recorded
on
the
accrual
basis.
Realized
gains
and
losses
are
reported
on
the
identified
cost
basis. Premiums
and
discounts
on
debt
securities
are
T.
ROWE
PRICE
Small-Cap
Value
Fund
amortized
for
financial
reporting
purposes. Income
tax-related
interest
and
penalties,
if
incurred,
are
recorded
as
income
tax
expense. Dividends
received
from other
investment
companies are
reflected
as
dividend income;
capital
gain
distributions
are
reflected
as
realized
gain/loss. Dividend
income and
capital
gain
distributions
are
recorded
on
the
ex-dividend
date. Distributions
from
REITs
are
initially
recorded
as
dividend
income
and,
to
the
extent
such
represent
a
return
of
capital
or
capital
gain
for
tax
purposes,
are
reclassified
when
such
information
becomes
available. Non-cash
dividends,
if
any,
are
recorded
at
the
fair
market
value
of
the
asset
received. Proceeds
from
litigation
payments,
if
any,
are
included
in
either
net
realized
gain
(loss)
or
change
in
net
unrealized
gain/loss
from
securities. Distributions
to
shareholders
are
recorded
on
the
ex-dividend
date. Income
distributions,
if
any,
are
declared
and
paid
by
each
class annually. A
capital
gain
distribution,
if
any, may
also
be
declared
and
paid
by
the
fund
annually.
Currency
Translation
Assets,
including
investments,
and
liabilities
denominated
in
foreign
currencies
are
translated
into
U.S.
dollar
values
each
day
at
the
prevailing
exchange
rate,
using
the
mean
of
the
bid
and
asked
prices
of
such
currencies
against
U.S.
dollars
as
provided
by
an
outside
pricing
service.
Purchases
and
sales
of
securities,
income,
and
expenses
are
translated
into
U.S.
dollars
at
the
prevailing
exchange
rate
on
the
respective
date
of
such
transaction.
The
effect
of
changes
in
foreign
currency
exchange
rates
on
realized
and
unrealized
security
gains
and
losses
is
not
bifurcated
from
the
portion
attributable
to
changes
in
market
prices.
Class
Accounting
Shareholder
servicing,
prospectus,
and
shareholder
report
expenses
incurred
by
each
class
are
charged
directly
to
the
class
to
which
they
relate.
Expenses
common
to
all
classes,
investment
income,
and
realized
and
unrealized
gains
and
losses
are
allocated
to
the
classes
based
upon
the
relative
daily
net
assets
of
each
class.
The
Advisor
Class
pays
Rule
12b-1
fees,
in
an
amount
not
exceeding
0.25%
of
the
class’s
average
daily
net
assets.
In-Kind
Redemptions
In
accordance
with
guidelines
described
in
the
fund’s
prospectus,
and
when
considered
to
be
in
the
best
interest
of
all
shareholders,
the
fund
may
distribute
portfolio
securities
rather
than
cash
as
payment
for
a
redemption
of
fund
shares
(in-kind
redemption).
Gains
and
losses
realized
on
in-kind
redemptions
are
not
recognized
for
tax
purposes
and
are
reclassified
from
undistributed
realized
gain
(loss)
to
paid-in
capital.
During
the
year ended
December
31,
2024,
the
fund
realized
$36,712,000 of
net
gain
on
$76,205,000
of
in-kind
redemptions.
T.
ROWE
PRICE
Small-Cap
Value
Fund
Capital
Transactions
Each
investor’s
interest
in
the
net
assets
of the
fund
is
represented
by
fund
shares. The
fund’s
net
asset
value
(NAV)
per
share
is
computed
at
the
close
of
the
New
York
Stock
Exchange
(NYSE),
normally
4
p.m.
Eastern
time,
each
day
the
NYSE
is
open
for
business.
However,
the
NAV
per
share
may
be
calculated
at
a
time
other
than
the
normal
close
of
the
NYSE
if
trading
on
the
NYSE
is
restricted,
if
the
NYSE
closes
earlier,
or
as
may
be
permitted
by
the
SEC.
Purchases
and
redemptions
of
fund
shares
are
transacted
at
the
next-computed
NAV
per
share,
after
receipt
of
the
transaction
order
by
T.
Rowe
Price
Associates,
Inc.,
or
its
agents.
New
Accounting
Guidance
In December
2023,
the
FASB
issued
Accounting
Standards
Update
(ASU),
ASU
2023-09,
Income
Taxes
(Topic
740)
–
Improvements
to
Income
Taxes
Disclosures,
which
enhances
the
transparency
of
income
tax
disclosures.
The
ASU
requires
public
entities,
on
an
annual
basis,
to
provide
disclosure
of
specific
categories
in
the
rate
reconciliation,
as
well
as
disclosure
of
income
taxes
paid
disaggregated
by
jurisdiction.
The
amendments
under
this
ASU
are
required
to
be
applied
prospectively
and
are
effective
for
fiscal
years
beginning
after
December
15,
2024.
Management
expects
that
adoption
of
the
guidance
will
not
have
a
material
impact
on
the
fund’s
financial
statements.
Indemnification
In
the
normal
course
of
business, the
fund
may
provide
indemnification
in
connection
with
its
officers
and
directors,
service
providers,
and/or
private
company
investments. The
fund’s
maximum
exposure
under
these
arrangements
is
unknown;
however,
the
risk
of
material
loss
is
currently
considered
to
be
remote.
NOTE
2
-
VALUATION
Fair
Value
The
fund’s
financial
instruments
are
valued
at
the
close
of
the
NYSE
and
are
reported
at
fair
value,
which
GAAP
defines
as
the
price
that
would
be
received
to
sell
an
asset
or
paid
to
transfer
a
liability
in
an
orderly
transaction
between
market
participants
at
the
measurement
date. The fund’s
Board
of
Directors
(the
Board)
has
designated
T.
Rowe
Price
Associates,
Inc.
as
the
fund’s
valuation
designee
(Valuation
Designee).
Subject
to
oversight
by
the
Board,
the
Valuation
Designee
performs
the
following
functions
in
performing
fair
value
determinations:
assesses
and
manages
valuation
risks;
establishes
and
applies
fair
value
methodologies;
tests
fair
value
methodologies;
and
evaluates
pricing
vendors
and
pricing
agents.
The
duties
T.
ROWE
PRICE
Small-Cap
Value
Fund
and
responsibilities
of
the
Valuation
Designee
are
performed
by
its
Valuation
Committee. The
Valuation
Designee provides
periodic
reporting
to
the
Board
on
valuation
matters.
Various
valuation
techniques
and
inputs
are
used
to
determine
the
fair
value
of
financial
instruments.
GAAP
establishes
the
following
fair
value
hierarchy
that
categorizes
the
inputs
used
to
measure
fair
value:
Level
1
–
quoted
prices
(unadjusted)
in
active
markets
for
identical
financial
instruments
that
the
fund
can
access
at
the
reporting
date
Level
2
–
inputs
other
than
Level
1
quoted
prices
that
are
observable,
either
directly
or
indirectly
(including,
but
not
limited
to,
quoted
prices
for
similar
financial
instruments
in
active
markets,
quoted
prices
for
identical
or
similar
financial
instruments
in
inactive
markets,
interest
rates
and
yield
curves,
implied
volatilities,
and
credit
spreads)
Level
3
–
unobservable
inputs
(including
the Valuation
Designee’s assumptions
in
determining
fair
value)
Observable
inputs
are
developed
using
market
data,
such
as
publicly
available
information
about
actual
events
or
transactions,
and
reflect
the
assumptions
that
market
participants
would
use
to
price
the
financial
instrument.
Unobservable
inputs
are
those
for
which
market
data
are
not
available
and
are
developed
using
the
best
information
available
about
the
assumptions
that
market
participants
would
use
to
price
the
financial
instrument.
GAAP
requires
valuation
techniques
to
maximize
the
use
of
relevant
observable
inputs
and
minimize
the
use
of
unobservable
inputs.
When
multiple
inputs
are
used
to
derive
fair
value,
the
financial
instrument
is
assigned
to
the
level
within
the
fair
value
hierarchy
based
on
the
lowest-level
input
that
is
significant
to
the
fair
value
of
the
financial
instrument.
Input
levels
are
not
necessarily
an
indication
of
the
risk
or
liquidity
associated
with
financial
instruments
at
that
level
but
rather
the
degree
of
judgment
used
in
determining
those
values.
Valuation
Techniques
Equity
securities,
including
exchange-traded
funds, listed
or
regularly
traded
on
a
securities
exchange
or
in
the
over-the-
counter
(OTC)
market
are
valued
at
the
last
quoted
sale
price
or,
for
certain
markets,
the
official
closing
price
at
the
time
the
valuations
are
made.
OTC
Bulletin
Board
securities
are
valued
at
the
mean
of
the
closing
bid
and
asked
prices.
A
security
that
is
listed
or
traded
on
more
than
one
exchange
is
valued
at
the
quotation
on
the
exchange
determined
to
be
the
primary
market
for
such
T.
ROWE
PRICE
Small-Cap
Value
Fund
security.
Listed
securities
not
traded
on
a
particular
day
are
valued
at
the
mean
of
the
closing
bid
and
asked
prices
for
domestic
securities
and
the
last
quoted
sale
or
closing
price
for
international
securities.
The
last
quoted
prices
of
non-U.S.
equity
securities
may
be
adjusted
to
reflect
the
fair
value
of
such
securities
at
the
close
of
the
NYSE,
if
the Valuation
Designee
determines
that
developments
between
the
close
of
a
foreign
market
and
the
close
of
the
NYSE
will
affect
the
value
of
some
or
all
of
the
fund’s portfolio
securities.
Each
business
day,
the
Valuation
Designee uses
information
from
outside
pricing
services
to
evaluate
the
quoted
prices
of
portfolio
securities
and,
if
appropriate,
decide whether
it
is
necessary
to
adjust
quoted
prices
to
reflect
fair
value
by
reviewing
a
variety
of
factors,
including
developments
in
foreign
markets,
the
performance
of
U.S.
securities
markets,
and
the
performance
of
instruments
trading
in
U.S.
markets
that
represent
foreign
securities
and
baskets
of
foreign
securities. The Valuation
Designee
uses
outside
pricing
services
to
provide
it
with
quoted
prices
and
information
to
evaluate
or
adjust
those
prices.
The Valuation
Designee
cannot
predict
how
often
it
will
use
quoted
prices
and
how
often
it
will
determine
it
necessary
to
adjust
those
prices
to
reflect
fair
value.
Debt
securities
generally
are
traded
in
the over-the-counter
(OTC)
market
and
are
valued
at
prices
furnished
by
independent
pricing
services
or
by
broker
dealers
who
make
markets
in
such
securities.
When
valuing
securities,
the
independent
pricing
services
consider
factors
such
as,
but
not
limited
to,
the
yield
or
price
of
bonds
of
comparable
quality,
coupon,
maturity,
and
type,
as
well
as
prices
quoted
by
dealers
who
make
markets
in
such
securities.
Investments
in
mutual
funds
are
valued
at
the
mutual
fund’s
closing
NAV
per
share
on
the
day
of
valuation.
Assets
and
liabilities
other
than
financial
instruments,
including
short-term
receivables
and
payables,
are
carried
at
cost,
or
estimated
realizable
value,
if
less,
which
approximates
fair
value.
Investments
for
which
market
quotations are
not
readily
available
or
deemed
unreliable
are
valued
at
fair
value
as
determined
in
good
faith
by
the
Valuation
Designee.
The
Valuation
Designee
has
adopted
methodologies
for
determining
the
fair
value
of
investments
for
which
market
quotations
are
not
readily
available
or
deemed
unreliable,
including
the
use
of
other
pricing
sources.
Factors
used
in
determining
fair
value
vary
by
type
of
investment
and
may
include
market
or
investment
specific
considerations.
The
Valuation
Designee typically
will
afford
greatest
weight
to
actual
prices
in
arm’s
length
transactions,
to
the
extent
they
represent
orderly
transactions
between
market
participants,
transaction
information
can
be
reliably
obtained,
and
prices
are
T.
ROWE
PRICE
Small-Cap
Value
Fund
deemed
representative
of
fair
value.
However,
the
Valuation
Designee may
also
consider
other
valuation
methods
such
as
market-based
valuation
multiples;
a
discount
or
premium
from
market
value
of
a
similar,
freely
traded
security
of
the
same
issuer;
discounted
cash
flows;
yield
to
maturity;
or
some
combination.
Fair
value
determinations
are
reviewed
on
a
regular
basis.
Because
any
fair
value
determination
involves
a
significant
amount
of
judgment,
there
is
a
degree
of
subjectivity
inherent
in
such
pricing
decisions. Fair
value
prices
determined
by
the
Valuation
Designee could
differ
from
those
of
other
market
participants,
and
it
is
possible
that
the
fair
value
determined
for
a
security
may
be
materially
different
from
the
value
that
could
be
realized
upon
the
sale
of
that
security.
Valuation
Inputs
The
following
table
summarizes
the
fund’s
financial
instruments,
based
on
the
inputs
used
to
determine
their
fair
values
on
December
31,
2024
(for
further
detail
by
category,
please
refer
to
the
accompanying
Portfolio
of
Investments):
($000s)
Level
1
Level
2
Level
3
Total
Value
Assets
Common
Stocks
$
9,908,630
$
121,672
$
91,308
$
10,121,610
Convertible
Bonds
—
—
20,594
20,594
Convertible
Preferred
Stocks
—
—
244,913
244,913
Preferred
Stocks
—
—
1,837
1,837
Short-Term
Investments
97,250
—
—
97,250
Securities
Lending
Collateral
316,751
—
—
316,751
Total
$
10,322,631
$
121,672
$
358,652
$
10,802,955
T.
ROWE
PRICE
Small-Cap
Value
Fund
Following
is
a
reconciliation
of
the
fund’s
Level
3
holdings
for
the
year ended
December
31,
2024.
Gain
(loss)
reflects
both
realized
and
change
in
unrealized
gain/loss
on
Level
3
holdings
during
the
period,
if
any,
and
is
included
on
the
accompanying
Statement
of
Operations.
The
change
in
unrealized
gain/loss
on
Level
3
instruments
held
at
December
31,
2024,
totaled $8,191,000 for
the
year ended
December
31,
2024.
Additionally,
during
the
period,
transfers
into
and/or
out
of
Level
3
include
securities
acquired
or
exchanged
as
a
result
of
a
corporate
action.
In
accordance
with
GAAP,
the
following
table
provides
quantitative
information
about
significant
unobservable
inputs
used
to
determine
the
fair
valuations
of
the
fund’s
Level
3
assets,
by
class
of
financial
instrument.
Because
the
Valuation
Designee considers
a
wide
variety
of
factors
and
($000s)
Beginning
Balance
12/31/23
Gain
(Loss)
During
Period
Total
Purchases
Total
Sales
Transfer
Into
Level 3
Transfer
Out
of
Level
3
Ending
Balance
12/31/24
Investment
in
Securities
Common
Stocks
$
86,206
$
4,666
$
3,805
$
(3,369)
$
—
$
—
$
91,308
Convertible
Bonds
20,091
503
—
—
—
—
20,594
Convertible
Preferred
Stocks
248,004
6,367
—
(9,458)
14,587
(14,587)
244,913
Preferred
Stocks
1,682
155
—
—
—
—
1,837
Total
$
355,983
$
11,691
$
3,805
$
(12,827)
$
14,587
$
(14,587)
$
358,652
T.
ROWE
PRICE
Small-Cap
Value
Fund
inputs,
both
observable
and
unobservable,
in
determining
fair
values,
the
unobservable
inputs
presented
do
not
reflect
all
inputs
significant
to
the
fair
value
determination.
Investments
in
Securities
Value
(000s)
Valuation
Technique(s)+
Significant
Unobservable
Input(s)
Value
or
Range
of
Input(s)
Weighted
Average
of
Input(s)*
Impact
to
Valuation
from
an
Increase
in
Input**
Common
Stocks
$91,308
Recent
comparable
transaction
price(s)
—#
—#
—#
—#
Private
company
valuation
—#
—#
—#
Discount
for
uncertainty
5%
-
100%
10%
Decrease
Market
comparable
Private
company
valuation
—#
—#
—#
Probability
for
potential
outcome
20%
-
40%
24%
Increase
Enterprise
value
to
sales
multiple
1.4x
-
8.9x
4.6x
Increase
Sales
growth
rate
5%
-
24%
21%
Increase
Enterprise
value
to
gross
profit
multiple
3.4x
-
15.0x
10.0x
Increase
Gross
profit
growth
rate
25%
25%
Increase
Enterprise
value
to
EBITDA
multiple
7.8x
-
20.4x
13.0x
Increase
T.
ROWE
PRICE
Small-Cap
Value
Fund
Investments
in
Securities
Value
(000s)
Valuation
Technique(s)+
Significant
Unobservable
Input(s)
Value
or
Range
of
Input(s)
Weighted
Average
of
Input(s)*
Impact
to
Valuation
from
an
Increase
in
Input**
Enterprise
value
to
gross
written
premiums
multiple
2.2x
-
2.8x
2.5x
Increase
Gross
written
premiums
growth
rate
7%
7%
Increase
Price
to
tangible
book
value
multiple
2.0x
-
2.3x
2.2x
Increase
Tangible
book
value
growth
rate
7%
7%
Increase
Discount
for
liquidation
preference
—#
—#
—#
Discount
to
NAV
30%
30%
Decrease
Discount
to
public
company
multiples
39%
-
52%
41%
Decrease
Discount
for
uncertainty
100%
100%
Decrease
Discount
for
lack
of
marketability
10%
10%
Decrease
Options
pricing
Model
Private
company
valuation
—#
—#
—#
Risk-free
rate
4%
4%
Increase
Volatility
42%
42%
Increase
Convertible
Bonds
$20,594
Recent
comparable
transaction
price(s)
—#
—#
—#
—#
T.
ROWE
PRICE
Small-Cap
Value
Fund
Investments
in
Securities
Value
(000s)
Valuation
Technique(s)+
Significant
Unobservable
Input(s)
Value
or
Range
of
Input(s)
Weighted
Average
of
Input(s)*
Impact
to
Valuation
from
an
Increase
in
Input**
Private
company
valuation
—#
—#
—#
Discount
for
uncertainty
10%
10%
Decrease
Convertible
Preferred
Stocks
$244,913
Recent
comparable
transaction
price(s)
—#
—#
—#
—#
Conversion
ratio
—#
—#
—#
Private
company
valuation
—#
—#
—#
Discount
for
uncertainty
10%
10%
Decrease
Market
comparable
Premium
for
liquidation
preference
—#
—#
—#
Premium
to
public
company
multiples
59%
-
147%
102%
Increase
Probability
for
potential
outcome
20%
-
60%
33%
Increase
Enterprise
value
to
sales
multiple
1.1x
-
10.2x
6.8x
Increase
Projected
enterprise
value
to
sales
multiple
3.1x
-
8.7x
7.8x
Increase
Sales
growth
rate
4%
-
136%
49%
Increase
T.
ROWE
PRICE
Small-Cap
Value
Fund
Investments
in
Securities
Value
(000s)
Valuation
Technique(s)+
Significant
Unobservable
Input(s)
Value
or
Range
of
Input(s)
Weighted
Average
of
Input(s)*
Impact
to
Valuation
from
an
Increase
in
Input**
Enterprise
value
to
gross
profit
multiple
1.5x
-
21.6x
13.0x
Increase
Projected
enterprise
value
to
gross
profit
multiple
21.6x
21.6x
Increase
Gross
profit
growth
rate
6%
-
171%
64%
Increase
Enterprise
value
to
EBITDA
multiple
8.2x
-
20.4x
12.6x
Increase
Projected
enterprise
value
to
EBITDA
multiple
37.6x
37.6x
Increase
EBITDA
growth
rate
56%
56%
Increase
Enterprise
value
to
gross
written
premiums
multiple
2.2x
-
2.8x
2.5x
Increase
Gross
written
premiums
growth
rate
7%
7%
Increase
Price
to
tangible
book
value
multiple
2.0x
-
2.3x
2.2x
Increase
Tangible
book
value
growth
rate
7%
7%
Increase
Discount
for
dilution
43%
43%
Decrease
T.
ROWE
PRICE
Small-Cap
Value
Fund
+
Valuation
techniques
may
change
in
order
to
reflect the
Valuation
Designee’s
judgment
of
current
market
participant
assumptions.
*
Unobservable
inputs
were
weighted
by
the
relative
fair
value
of
the
instruments.
**
Represents
the
directional
change
in
the
fair
value
of
the
Level
3
investment(s)
that
would
have
resulted
from
an
increase
in
the
corresponding
input
at
period
end.
A
decrease
in
the
unobservable
input
would
have
had
the
opposite
effect.
Significant
increases
and
decreases
in
these
inputs
in
isolation
could
result
in
significantly
higher
or
lower
fair
value
measurements.
#
No
quantitative
unobservable
inputs
significant
to
the
valuation
technique
were
created
by
the
Valuation
Designee.
NOTE
3
-
OTHER
INVESTMENT
TRANSACTIONS
Consistent
with
its
investment
objective, the
fund
engages
in
the
following
practices
to
manage
exposure
to
certain
risks
and/or
to
enhance
performance.
The
investment
objective,
policies,
program,
and
risk
factors
of the
fund
are
described
more
fully
in the
fund’s prospectus
and
Statement
of
Additional
Information.
Investments
in
Securities
Value
(000s)
Valuation
Technique(s)+
Significant
Unobservable
Input(s)
Value
or
Range
of
Input(s)
Weighted
Average
of
Input(s)*
Impact
to
Valuation
from
an
Increase
in
Input**
Discount
to
public
company
multiples
43%
-
52%
48%
Decrease
Discount
rate
for
cost
of
capital
10%
-
45%
18%
Decrease
Discount
for
uncertainty
100%
100%
Decrease
Discount
for
lack
of
marketability
10%
10%
Decrease
Preferred
Stocks
$1,837
Recent
comparable
transaction
price(s)
Discount
for
uncertainty
5%
5%
Decrease
T.
ROWE
PRICE
Small-Cap
Value
Fund
Restricted
Securities
The
fund
invests
in
securities
that
are
subject
to
legal
or
contractual
restrictions
on
resale.
Prompt
sale
of
such
securities
at
an
acceptable
price
may
be
difficult
and
may
involve
substantial
delays
and
additional
costs.
Securities
Lending
The fund
may
lend
its
securities
to
approved
borrowers
to
earn
additional
income.
Its
securities
lending
activities
are
administered
by
a
lending
agent
in
accordance
with
a
securities
lending
agreement.
Security
loans
generally
do
not
have
stated
maturity
dates,
and
the
fund
may
recall
a
security
at
any
time.
The
fund
receives
collateral
in
the
form
of
cash
or
U.S.
government
securities.
Collateral
is
maintained
over
the
life
of
the
loan
in
an
amount
not
less
than
the
value
of
loaned
securities;
any
additional
collateral
required
due
to
changes
in
security
values
is
delivered
to
the
fund
the
next
business
day.
Cash
collateral
is
invested
in
accordance
with
investment
guidelines
approved
by
fund
management.
Additionally,
the
lending
agent
indemnifies
the
fund
against
losses
resulting
from
borrower
default.
Although
risk
is
mitigated
by
the
collateral
and
indemnification,
the
fund
could
experience
a
delay
in
recovering
its
securities
and
a
possible
loss
of
income
or
value
if
the
borrower
fails
to
return
the
securities,
collateral
investments
decline
in
value,
and
the
lending
agent
fails
to
perform.
Securities
lending
revenue
consists
of
earnings
on
invested
collateral
and
borrowing
fees,
net
of
any
rebates
to
the
borrower,
compensation
to
the
lending
agent,
and
other
administrative
costs.
In
accordance
with
GAAP,
investments
made
with
cash
collateral
are
reflected
in
the
accompanying
financial
statements,
but
collateral
received
in
the
form
of
securities
is
not.
At
December
31,
2024,
the
value
of
loaned
securities
was
$301,842,000;
the
value
of
cash
collateral
and
related
investments
was
$316,751,000.
Other
Purchases
and
sales
of
portfolio
securities
other
than
in-kind
transactions,
if
any,
and short-term securities
aggregated $3,387,624,000 and
$4,365,549,000,
respectively,
for
the
year ended
December
31,
2024.
NOTE
4
-
FEDERAL
INCOME
TAXES
Generally,
no
provision
for
federal
income
taxes
is
required
since
the
fund
intends
to continue
to
qualify
as
a
regulated
investment
company
under
Subchapter
M
of
the
Internal
Revenue
Code
and
distribute
to
shareholders
all
of
its taxable
income
and
gains.
Distributions
determined
in
accordance
with
federal
income
tax
regulations
may
differ
in
amount
or
character
from
net
investment
income
and
realized
gains
for
financial
reporting
purposes.
T.
ROWE
PRICE
Small-Cap
Value
Fund
The
fund
files
U.S.
federal,
state,
and
local
tax
returns
as
required.
The
fund’s
tax
returns
are
subject
to
examination
by
the
relevant
tax
authorities
until
expiration
of
the
applicable
statute
of
limitations,
which
is
generally
three
years
after
the
filing
of
the
tax
return
but
which
can
be
extended
to
six
years
in
certain
circumstances.
Tax
returns
for
open
years
have
incorporated
no
uncertain
tax
positions
that
require
a
provision
for
income
taxes.
Capital
accounts
within
the
financial
reporting
records
are
adjusted
for
permanent
book/tax
differences
to
reflect
tax
character
but
are
not
adjusted
for
temporary
differences.
The
permanent
book/tax
adjustments,
if
any,
have
no
impact
on
results
of
operations
or
net
assets.
The
permanent
book/tax
adjustments
relate
primarily
to
redemptions
in
kind,
deemed
distributions
on
shareholder
redemptions
and
the
character
of
income
on
passive
foreign
investment
companies.
The
tax
character
of
distributions
paid
for
the
periods
presented
was
as
follows:
At
December
31,
2024,
the
tax-basis
cost
of
investments
(including
derivatives,
if
any)
and
gross
unrealized
appreciation
and
depreciation
were as
follows:
($000s)
December
31,
2024
December
31,
2023
Ordinary
income
(including
short-term
capital
gains,
if
any)
$
172,584
$
89,589
Long-term
capital
gain
801,459
272,703
Total
distributions
$
974,043
$
362,292
($000s)
Cost
of
investments
$
7,911,418
Unrealized
appreciation
$
3,677,197
Unrealized
depreciation
(785,665)
Net
unrealized
appreciation
(depreciation)
$
2,891,532
T.
ROWE
PRICE
Small-Cap
Value
Fund
At
December
31,
2024,
the
tax-basis
components
of
accumulated
net
earnings
(loss)
were
as
follows:
Temporary
differences
between
book-basis
and
tax-basis
components
of
total
distributable
earnings
(loss)
arise
when
certain
items
of
income,
gain,
or
loss
are
recognized
in
different
periods
for
financial
statement
purposes
versus
for
tax
purposes;
these
differences
will
reverse
in
a
subsequent
reporting
period.
The
temporary
differences
relate
primarily
to
the
deferral
of
losses
from
wash
sales.
Other
temporary
differences
relate
primarily
to
deferral
of
REIT
income.
NOTE
5
-
FOREIGN TAXES
The
fund
is
subject
to
foreign
income
taxes
imposed
by
certain
countries
in
which
it
invests.
Additionally,
capital
gains
realized
upon
disposition
of
securities
issued
in
or
by
certain
foreign
countries
are
subject
to
capital
gains
tax
imposed
by
those
countries.
All
taxes
are
computed
in
accordance
with
the
applicable
foreign
tax
law,
and,
to
the
extent
permitted,
capital
losses
are
used
to
offset
capital
gains.
Taxes
attributable
to
income
are
accrued
by
the
fund
as
a
reduction
of
income.
Current
and
deferred
tax
expense
attributable
to
capital
gains
is
reflected
as
a
component
of
realized
or
change
in
unrealized
gain/
loss
on
securities
in
the
accompanying
financial
statements.
To
the
extent
that
the
fund
has
country
specific
capital
loss
carryforwards,
such
carryforwards
are
applied
against
net
unrealized
gains
when
determining
the
deferred
tax
liability.
Any
deferred
tax
liability
incurred
by
the
fund
is
included
in
either
Other
liabilities
or
Deferred
tax
liability
on
the
accompanying
Statement
of
Assets
and
Liabilities.
($000s)
Undistributed
long-term
capital
gain
$
181,047
Net
unrealized
appreciation
(depreciation)
2,891,532
Other
temporary
differences
1,673
Total
distributable
earnings
(loss)
$
3,074,252
T.
ROWE
PRICE
Small-Cap
Value
Fund
NOTE
6
-
RELATED
PARTY
TRANSACTIONS
The
fund
is
managed
by
T.
Rowe
Price
Associates,
Inc.
(Price
Associates),
a
wholly
owned
subsidiary
of
T.
Rowe
Price
Group,
Inc.
(Price
Group). Price
Associates
has
entered
into
a
sub-advisory
agreement(s)
with
one
or
more
of
its
wholly
owned
subsidiaries,
to
provide
investment
advisory
services
to
the
fund.
The
investment
management
agreement
between
the
fund
and
Price
Associates
provides
for
an
annual
investment
management
fee,
which
is
computed
daily
and
paid
monthly. The
fee
consists
of
an
individual
fund
fee,
equal
to
0.35%
of
the
fund’s
average
daily
net
assets,
and
a
group
fee.
The
group
fee
rate
is
calculated
based
on
the
combined
net
assets
of
certain
mutual
funds
sponsored
by
Price
Associates
(the
group)
applied
to
a
graduated
fee
schedule,
with
rates
ranging
from
0.48%
for
the
first
$1
billion
of
assets
to
0.260%
for
assets
in
excess
of
$845
billion.
The
fund’s
group
fee
is
determined
by
applying
the
group
fee
rate
to
the
fund’s
average
daily
net
assets. At
December
31,
2024,
the
effective
annual
group
fee
rate
was
0.28%.
The Investor
Class and Advisor
Class are
each
subject
to
a
contractual
expense
limitation
through
the
expense
limitation
dates
indicated
in
the
table
below.
This
agreement
will
continue
through
the
expense
limitation
dates
indicated
in
the
table
below,
and
may
be
renewed,
revised,
or
revoked
only
with
approval
of
the
fund’s
Board.
During
the
limitation
period,
Price
Associates
is required
to
waive
or
pay
any
expenses
(excluding
interest;
expenses
related
to
borrowings,
taxes,
and
brokerage;
non-recurring,
extraordinary
expenses;
and
acquired
fund
fees
and
expenses)
that
would
otherwise
cause
the class’s ratio
of
annualized
total
expenses
to
average
net
assets
(net
expense
ratio)
to
exceed
its
expense
limitation.
Each
class
is
required
to
repay
Price
Associates
for
expenses
previously
waived/paid
to
the
extent
the
class’s net
assets
grow
or
expenses
decline
sufficiently
to
allow
repayment
without
causing
the class’s net
expense
ratio
(after
the
repayment
is
taken
into
account)
to
exceed
the
lesser
of:
(1)
the
expense
limitation
in
place
at
the
time
such
amounts
were
waived;
or
(2)
the class’s
current
expense
limitation.
However,
no
repayment
will
be
made
more
than
three
years
after
the
date
of
a
payment
or
waiver.
The
I
Class
is
also
subject
to
an
operating
expense
limitation
(I
Class
Limit)
pursuant
to
which
Price
Associates
is
contractually
required
to
pay
all
operating
expenses
of
the
I
Class,
excluding
management
fees;
interest;
expenses
related
to
borrowings,
taxes,
and
brokerage; non-recurring,
extraordinary expenses; and
acquired
fund
fees
and
expenses, to
the
extent
such
operating
expenses,
on
an
annualized
basis,
exceed
the
I
Class
Limit. This
agreement
will
continue
through
the
expense
limitation
date
indicated
in
the
table
below,
and
may
T.
ROWE
PRICE
Small-Cap
Value
Fund
be
renewed,
revised,
or
revoked
only
with
approval
of
the
fund’s
Board.
The
I
Class
is
required
to
repay
Price
Associates
for
expenses
previously
paid
to
the
extent
the
class’s
net
assets
grow
or
expenses
decline
sufficiently
to
allow
repayment
without
causing
the
class’s
operating
expenses
(after
the
repayment
is
taken
into
account)
to
exceed
the
lesser
of:
(1)
the
I
Class
Limit
in
place
at
the
time
such
amounts
were
paid;
or
(2)
the
current
I
Class
Limit.
However,
no
repayment
will
be
made
more
than
three
years
after
the
date
of
a
payment
or
waiver.
The
Z
Class
is
also
subject
to
a
contractual
expense
limitation
agreement
whereby
Price
Associates
has
agreed
to
waive
and/or
bear
all
of
the
Z
Class’
expenses
(excluding
interest;
expenses
related
to
borrowings,
taxes,
and
brokerage;
non-recurring,
extraordinary
expenses;
and
acquired
fund
fees
and
expenses)
in
their
entirety.
This
fee
waiver
and/or
expense
reimbursement
arrangement
is
expected
to
remain
in
place
indefinitely,
and
the
agreement
may
only
be
amended
or
terminated
with
approval
by
the
fund’s
Board.
Expenses
of
the
fund
waived/paid
by
the
manager
are
not
subject
to
later
repayment
by
the
fund.
Pursuant
to
these
agreements,
expenses
were waived/paid
by
and/or
repaid
to
Price
Associates
during
the year
ended December
31,
2024 as
indicated
in
the
table
below.
At
December
31,
2024,
there
were
no
amounts
subject
to
repayment
by
the
fund. Any
repayment
of
expenses
previously
waived/
paid
by
Price
Associates
during
the
period
would
be
included
in
the
net
investment
income
and
expense
ratios
presented
on
the
accompanying
Financial
Highlights.
In
addition,
the
fund
has
entered
into
service
agreements
with
Price
Associates
and
two
wholly
owned
subsidiaries
of
Price
Associates,
each
an
affiliate
of
the
fund
(collectively,
Price).
Price
Associates
provides
certain
accounting
and
administrative
services
to
the
fund.
T.
Rowe
Price
Services,
Inc.
provides
shareholder
and
administrative
services
in
its
capacity
as
the
fund’s
transfer
and
dividend-disbursing
agent.
T.
Rowe
Price
Retirement
Plan
Services,
Inc.
Investor
Class
Advisor
Class
I
Class
Z
Class
Expense
limitation/I
Class
Limit
0.99%
1.24%
0.05%
0.00%
Expense
limitation
date
04/30/26
04/30/26
04/30/26
N/A
(Waived)/repaid
during
the
period
($000s)
$—
$—
$—
$(19,782)
T.
ROWE
PRICE
Small-Cap
Value
Fund
provides
subaccounting
and
recordkeeping
services
for
certain
retirement
accounts
invested
in
the
Investor
Class
and
Advisor
Class.
For
the
year
ended
December
31,
2024,
expenses
incurred
pursuant
to
these
service
agreements
were
$117,000
for
Price
Associates;
$2,466,000
for
T.
Rowe
Price
Services,
Inc.;
and
$516,000
for
T.
Rowe
Price
Retirement
Plan
Services,
Inc.
All
amounts
due
to
and
due
from
Price,
exclusive
of
investment
management
fees
payable,
are
presented
net
on
the
accompanying
Statement
of
Assets
and
Liabilities.
T.
Rowe
Price
Investment
Services,
Inc.
(Investment
Services)
serves
as
distributor
to
the
fund.
Pursuant
to
an
underwriting
agreement,
no
compensation
for
any
distribution
services
provided
is
paid
to
Investment
Services
by
the
fund
(except
for
12b-1
fees
under
a
Board-approved
Rule
12b-1
plan).
Mutual
funds,
trusts,
and
other
accounts
managed
by
Price
Associates
or
its
affiliates
(collectively,
Price
Funds
and
accounts)
may
invest
in
the
fund.
No
Price
fund
or
account
may
invest
for
the
purpose
of
exercising
management
or
control
over
the
fund.
At
December
31,
2024, 100%
of
the
Z
Class's
outstanding
shares
were
held
by
Price
Funds
and
accounts.
The fund
may
invest
its
cash
reserves
in
certain
open-end
management
investment
companies
managed
by
Price
Associates
and
considered
affiliates
of
the
fund:
the
T.
Rowe
Price
Government
Reserve
Fund
or
the
T.
Rowe
Price
Treasury
Reserve
Fund,
organized
as
money
market
funds
(together,
the
Price
Reserve
Funds).
The
Price
Reserve
Funds
are
offered
as
short-term
investment
options
to
mutual
funds,
trusts,
and
other
accounts
managed
by
Price
Associates
or
its
affiliates
and
are
not
available
for
direct
purchase
by
members
of
the
public.
Cash
collateral
from
securities
lending,
if
any,
is
invested
in
the
T.
Rowe
Price
Government
Reserve Fund. The
Price
Reserve
Funds
pay
no
investment
management
fees.
The fund may
participate
in
securities
purchase
and
sale
transactions
with
other
funds
or
accounts
advised
by
Price
Associates
(cross
trades),
in
accordance
with
procedures
adopted
by the
fund’s
Board
and
Securities
and
Exchange
Commission
rules,
which
require,
among
other
things,
that
such
purchase
and
sale
cross
trades
be
effected
at
the
independent
current
market
price
of
the
security.
During
the
year
ended
December
31,
2024,
the
aggregate
value
of
purchases
and
sales
cross
trades
with
other
funds
or
accounts
advised
by
Price
Associates
was
less
than
1%
of
the
fund’s
net
assets
as
of
December
31,
2024.
Price
Associates
has voluntarily
agreed
to
reimburse
the
fund
from
its
own
resources
on
a
monthly
basis
for
the
cost
of
brokerage
commissions
embedded
in
the
cost
of
the
fund’s
foreign
currency
transactions. This
agreement
may
T.
ROWE
PRICE
Small-Cap
Value
Fund
be
rescinded
at
any
time. For
the
year ended
December
31,
2024,
this
reimbursement
amounted
to
$21,000,
which
is
included
in
Net
realized
gain
(loss)
on
Securities
in
the
Statement
of
Operations.
NOTE
7
-
SEGMENT
REPORTING
Operating
segments
are
defined
as
components
of
a
company
that
engage
in
business
activities
and
for
which
discrete
financial
information
is
available
and
regularly
reviewed
by
the
chief
operating
decision
maker
(CODM)
in
deciding
how
to
allocate
resources
and
assess
performance.
The
Management
Committee
of
Price
Associates
acts
as
the
fund’s
CODM.
The
fund
makes
investments
in
accordance
with
its
investment
objective
as
outlined
in
the
Prospectus
and
is
considered
one
reportable
segment
because
the
CODM
allocates
resources
and
assesses
the
operating
results
of
the
fund
on
the
whole.
The
fund’s
revenue
is
derived
from
investments
in
portfolio
of
securities.
The
CODM
allocates
resources
and
assesses
performance
based
on
the
operating
results
of
the
fund,
which
is
consistent
with
the
results
presented
in
the
statement
of
operations,
statement
of
changes
in
net
assets
and
financial
highlights.
The
CODM
compares
the
fund’s
performance
to
its
benchmark
index
and
evaluates
the
positioning
of
the
fund
in
relation
to
its
investment
objective.
The
measure
of
segment
assets
is
net
assets
of
the
fund
which
is
disclosed
in
the
statement
of
assets
and
liabilities.
The
accounting
policies
of
the
segment
are
the
same
as
those
described
in
the
summary
of
significant
accounting
policies.
The
financial
statements
include
all
details
of
the
segment
assets,
segment
revenue
and
expenses;
and
reflect
the
financial
results
of
the
segment.
NOTE
8
-
OTHER
MATTERS
Unpredictable environmental,
political,
social
and
economic
events,
including
but
not
limited
to,
environmental
or
natural
disasters,
war
and
conflict
(including
Russia’s
military
invasion
of
Ukraine
and
the
conflict
in
Israel,
Gaza
and
surrounding
areas),
terrorism,
geopolitical
developments
(including
trading
and
tariff
arrangements,
sanctions
and
cybersecurity
attacks),
and
public
health
epidemics
(including
the
global
outbreak
of
COVID-19)
and
similar
public
health
threats,
may
significantly
affect
the
economy
and
the
markets
and
issuers
in
which
a
fund
invests.
The
extent
and
duration
of
such
events
and
resulting
T.
ROWE
PRICE
Small-Cap
Value
Fund
market
disruptions
cannot
be
predicted.
These
and
other
similar
events
may
cause
instability
across
global
markets,
including
reduced
liquidity
and
disruptions
in
trading
markets,
while
some
events
may
affect
certain
geographic
regions,
countries,
sectors,
and
industries
more
significantly
than
others,
and
exacerbate
other
pre-existing
political,
social,
and
economic
risks.
The
fund’s
performance
could
be
negatively
impacted
if
the
value
of
a
portfolio
holding
were
harmed
by
these
or
such
events.
Management
actively
monitors
the
risks
and
financial
impacts
arising
from
such
events.
T.
ROWE
PRICE
Small-Cap
Value
Fund
REPORT
OF
INDEPENDENT
REGISTERED
PUBLIC
ACCOUNTING
FIRM
To
the
Board
of
Directors
and
Shareholders
of
T.
Rowe
Price
Small-Cap
Value
Fund,
Inc.
Opinion
on
the
Financial
Statements
We
have
audited
the
accompanying
statement
of
assets
and
liabilities,
including
the
portfolio
of
investments,
of
T.
Rowe
Price
Small-Cap
Value
Fund,
Inc.
(the
"Fund")
as
of
December
31,
2024,
the
related
statement
of
operations
for
the
year
ended
December
31,
2024,
the
statement
of
changes
in
net
assets
for
each
of
the
two
years
in
the
period
ended
December
31,
2024,
including
the
related
notes,
and
the
financial
highlights
for
each
of
the
periods
indicated
therein
(collectively
referred
to
as
the
“financial
statements”).
In
our
opinion,
the
financial
statements
present
fairly,
in
all
material
respects,
the
financial
position
of
the
Fund
as
of
December
31,
2024,
the
results
of
its
operations
for
the
year
then
ended,
the
changes
in
its
net
assets
for
each
of
the
two
years
in
the
period
ended
December
31,
2024
and
the
financial
highlights
for
each
of
the
periods
indicated
therein,
in
conformity
with
accounting
principles
generally
accepted
in
the
United
States
of
America.
Basis
for
Opinion
These
financial
statements
are
the
responsibility
of
the
Fund’s
management.
Our
responsibility
is
to
express
an
opinion
on
the
Fund’s
financial
statements
based
on
our
audits.
We
are
a
public
accounting
firm
registered
with
the
Public
Company
Accounting
Oversight
Board
(United
States)
(PCAOB)
and
are
required
to
be
independent
with
respect
to
the
Fund
in
accordance
with
the
U.S.
federal
securities
laws
and
the
applicable
rules
and
regulations
of
the
Securities
and
Exchange
Commission
and
the
PCAOB.
We
conducted
our
audits
of
these
financial
statements
in
accordance
with
the
standards
of
the
PCAOB.
Those
standards
require
that
we
plan
and
perform
the
audit
to
obtain
reasonable
assurance
about
whether
the
financial
statements
are
free
of
material
misstatement,
whether
due
to
error
or
fraud.
T.
ROWE
PRICE
Small-Cap
Value
Fund
Our
audits
included
performing
procedures
to
assess
the
risks
of
material
misstatement
of
the
financial
statements,
whether
due
to
error
or
fraud,
and
performing
procedures
that
respond
to
those
risks.
Such
procedures
included
examining,
on
a
test
basis,
evidence
regarding
the
amounts
and
disclosures
in
the
financial
statements.
Our
audits
also
included
evaluating
the
accounting
principles
used
and
significant
estimates
made
by
management,
as
well
as
evaluating
the
overall
presentation
of
the
financial
statements.
Our
procedures
included
confirmation
of
securities
owned
as
of
December
31,
2024
by
correspondence
with
the
custodians,
transfer
agent
and
brokers;
when
replies
were
not
received
from
brokers,
we
performed
other
auditing
procedures.
We
believe
that
our
audits
provide
a
reasonable
basis
for
our
opinion.
/s/
PricewaterhouseCoopers
LLP
Baltimore,
Maryland
February
20,
2025
We
have
served
as
the
auditor
of
one
or
more
investment
companies
in
the
T.
Rowe
Price
group
of
investment
companies
since
1973.
REPORT
OF
INDEPENDENT
REGISTERED
PUBLIC
ACCOUNTING
FIRM
(continued)
T.
ROWE
PRICE
Small-Cap
Value
Fund
TAX
INFORMATION
(UNAUDITED)
FOR
THE
TAX
YEAR
ENDED 12/31/24
We
are
providing
this
information
as
required
by
the
Internal
Revenue
Code.
The
amounts
shown
may
differ
from
those
elsewhere
in
this
report
because
of
differences
between
tax
and
financial
reporting
requirements.
The
fund’s
distributions
to
shareholders
included:
$937,532,000
from
long-term
capital
gains,
subject
to
a
long-term
capital
gains
tax
rate
of
not
greater
than
20%
For
nonresident
alien
shareholders,
100%
of
short-term
capital
gain
dividends
distributed
by
the
fund
for
the
fiscal
year
are
qualified
short-term
capital
gains.
For
taxable
non-corporate
shareholders,
$113,909,000
of
the
fund's
income
represents
qualified
dividend
income
subject
to
a
long-term
capital
gains
tax
rate
of
not
greater
than
20%.
For
corporate
shareholders,
$107,307,000
of
the
fund's
income
qualifies
for
the
dividends-received
deduction.
For
individuals
and
certain
trusts
and
estates
which
are
entitled
to
claim
a
deduction
of
up
to
20%
of
their
combined
qualified
real
estate
investment
trust
(REIT)
dividends,
$15,719,000
of
the
fund's
income
qualifies
as
qualified
real
estate
investment
trust
(REIT)
dividends.
100
East
Pratt
Street
Baltimore,
MD
21202
T.
Rowe
Price
Investment
Services,
Inc.
Call
1-800-225-5132
to
request
a
prospectus
or
summary
prospectus;
each
includes
investment
objectives,
risks,
fees,
expenses,
and
other
information
that
you
should
read
and
consider
carefully
before
investing.
F46-050
2/25
Item 8. Changes in and Disagreements with Accountants for Open-End Management Investment Companies.
Not applicable.
Item 9. Proxy Disclosures for Open-End Management Investment Companies.
Not applicable.
Item 10. Remuneration Paid to Directors, Officers, and Others of Open-End Management Investment Companies.
Remuneration paid to Directors is included in Item 7 of this Form N-CSR.
Item 11. Statement Regarding Basis for Approval of Investment Advisory Contract.
If applicable, see Item 7.
Item 12. Disclosure of Proxy Voting Policies and Procedures for Closed-End Management Investment Companies.
Not applicable.
Item 13. Portfolio Managers of Closed-End Management Investment Companies.
Not applicable.
Item 14. Purchases of Equity Securities by Closed-End Management Investment Company and Affiliated Purchasers.
Not applicable.
Item 15. Submission of Matters to a Vote of Security Holders.
There has been no change to the procedures by which shareholders may recommend nominees to the registrant’s board of directors.
Item 16. Controls and Procedures.
(a) The registrant’s principal executive officer and principal financial officer have evaluated the registrant’s disclosure controls and procedures within 90 days of this filing and have concluded that the registrant’s disclosure controls and procedures were effective, as of that date, in ensuring that information required to be disclosed by the registrant in this Form N-CSR was recorded, processed, summarized, and reported timely.
(b) The registrant’s principal executive officer and principal financial officer are aware of no change in the registrant’s internal control over financial reporting that occurred during the period covered by this report that has materially affected, or is reasonably likely to materially affect, the registrant’s internal control over financial reporting.
Item 17. Disclosure of Securities Lending Activities for Closed-End Management Investment Companies.
Not applicable.
Item 18. Recovery of Erroneously Awarded Compensation.
Not applicable.
Item 19. Exhibits.
SIGNATURES
Pursuant to the requirements of the Securities Exchange Act of 1934 and the Investment Company Act of 1940, the registrant has duly caused this report to be signed on its behalf by the undersigned, thereunto duly authorized.
| | | | |
T. Rowe Price Small-Cap Value Fund, Inc. |
| By | | /s/ David Oestreicher | | |
| | David Oestreicher | | |
| | Principal Executive Officer | | |
| | |
| Date | | February 20, 2025 | | |
Pursuant to the requirements of the Securities Exchange Act of 1934 and the Investment Company Act of 1940, this report has been signed below by the following persons on behalf of the registrant and in the capacities and on the dates indicated.
| | | | |
| By | | /s/ David Oestreicher | | |
| | David Oestreicher | | |
| | Principal Executive Officer | | |
| | |
| Date | | February 20, 2025 | | |
| | | | |
| By | | /s/ Alan S. Dupski | | |
| | Alan S. Dupski | | |
| | Principal Financial Officer | | |
| | |
| Date | | February 20, 2025 | | |