UNITED STATES
SECURITIES AND EXCHANGE COMMISSION
WASHINGTON, D.C. 20549
FORM 6-K
Report of Foreign Private Issuer
Pursuant to Rule 13a-16 or 15d-16 of the
Securities Exchange Act of 1934
30 January 2024
Commission File Number 1-10691
DIAGEO plc
(Translation of registrant’s name into English)
16 Great Marlborough Street, London W1F 7HS, England
(Address of principal executive offices)
Indicate by check mark whether the registrant files or will file annual reports under cover Form 20-F or Form 40-F.
Form 20-F x Form 40-F ¨
This report on Form 6-K shall be deemed to be filed and incorporated by reference in the registration statement on
Form F-3 (File No. 333-269929) and registration statements on Form S-8 (File Nos. 333-223071, 333-206290, 333-169934,
333-162490, 333-153481, and 333-182315) and to be a part thereof from the date on which this report is furnished, to the
extent not superseded by documents or reports subsequently filed or furnished.
INTRODUCTION
Diageo plc is a public limited company incorporated under the laws of England and Wales. As used herein, except as the
context otherwise requires, the term ‘company’ refers to Diageo plc and the terms ‘group’ and ‘Diageo’ refer to the company
and its consolidated subsidiaries. References used herein to ‘shares’ and ‘ordinary shares’ are, except where otherwise
specified, to Diageo plc’s ordinary shares.
PRESENTATION OF FINANCIAL INFORMATION
The unaudited condensed consolidated interim financial statements starting on page F-1 have been prepared in accordance with
UK adopted IAS 34 ‘Interim Financial Reporting’, IAS 34 ‘Interim Financial Reporting’ as issued by the International
Accounting Standards Board (‘IASB’) and The Disclosure Guidance and Transparency Rules sourcebook of the UK’s Financial
Conduct Authority. These financial statements should be read in conjunction with the company’s published consolidated
financial statements for the year ended 30 June 2023, which were prepared in accordance with IFRS® Accounting Standards
adopted by the UK and IFRS Accounting Standards issued by IASB, including interpretations issued by the IFRS
Interpretations Committee. IFRS Accounting Standards as adopted by the UK differs in certain respects from IFRS Accounting
Standards as issued by the IASB, but the differences have no impact on the group’s consolidated financial statements for the
periods presented. The consolidated financial statements are prepared on a going concern basis under the historical cost
convention, unless stated otherwise.
In preparing these condensed consolidated interim financial statements, the significant judgements made by management when
applying the group’s accounting policies and the significant areas where estimates were required were the same as those that
applied to the consolidated financial statements for the year ended 30 June 2023, with the exception of changes in estimates
disclosed in note 3 Exceptional items and note 12 Contingent liabilities and legal proceedings. These condensed consolidated
interim financial statements were approved for issue on 29 January 2024.
The financial statements for Diageo plc for the year ending 30 June 2024 will be prepared in accordance with IFRS Accounting
Standards as adopted by the UK and IFRS Accounting Standards as issued by the IASB, including interpretations issued by the
IFRS Interpretations Committee.
The business review and financial information included in this document for the six months ended 31 December 2023 and 31
December 2022 have been derived from the Diageo interim condensed consolidated financial information.
The principal executive office of the company is located at 16 Great Marlborough Street, London W1F 7HS, England and its
telephone number is +44 (0) 20 7947 9100.
3
MARKET DATA
The market data and competitive set classifications are taken from independent industry sources in the markets in which Diageo
operates.
4
Cautionary statement concerning forward-looking statements
This document contains ‘forward-looking’ statements. These statements can be identified by the fact that they do not relate only
to historical or current facts. In particular, forward-looking statements include all statements that express forecasts,
expectations, plans, outlook, objectives and projections with respect to future matters, including the statements set forth in the
'Fiscal 24 outlook', and any other statements with respect to trends in results of operations, margins, growth rates, overall
market trends, the impact of changes in interest or exchange rates, the availability or cost of financing to Diageo, anticipated
cost savings or synergies, anticipated productivity savings, expected investments, expected inventory levels, the completion of
any strategic transactions or restructuring programmes, anticipated tax rates, changes in the international tax environment,
expected cash payments, outcomes of litigation or regulatory enquiries, anticipated changes in the value of assets and liabilities
related to pension schemes and general economic conditions. By their nature, forward-looking statements involve risk and
uncertainty because they relate to events and depend on circumstances that will occur in the future. There are a number of
factors that could cause actual results and developments to differ materially from those expressed or implied by these forward-
looking statements, including factors that are outside Diageo's control.
These factors include, but are not limited to: (i) economic, political, social or other developments in countries and markets in
which Diageo operates, including elevated geopolitical instability as a result of conflict in the Middle East and macroeconomic
events that may affect Diageo’s customers, suppliers and/or financial counterparties; (ii) the effects of climate change, or legal,
regulatory or market measures intended to address climate change; (iii) changes in consumer preferences and tastes, including
as a result of disruptive market forces, changes in demographics and evolving social trends (including any shifts in consumer
tastes towards at-home occasions, premiumisation, small-batch craft alcohol, or lower or no alcohol products and/or
developments in e-commerce); (iv) changes in the domestic and international tax environment that could lead to uncertainty
around the application of existing and new tax laws and unexpected tax exposures; (v) changes in the cost of production,
including as a result of increases in the cost of commodities, labour and/or energy due to inflation and/or supply chain
disruptions; (vi) any litigation or other similar proceedings (including with tax, customs, competition, environmental, anti-
corruption or other regulatory authorities); (vii) legal and regulatory developments, including changes in regulations relating to
environmental issues and/or e-commerce; (viii) the consequences of any failure of internal controls; (ix) the consequences of
any failure by Diageo or its associates to comply with anti-corruption, sanctions, trade restrictions or similar laws and
regulations, or any failure of Diageo’s related internal policies and procedures to comply with applicable law or regulation; (x)
Diageo’s ability to make sufficient progress against or achieve its ESG ambitions; (xi) cyber-attacks and IT threats or any other
disruptions to core business operations; (xii) contamination, counterfeiting or other circumstances which could harm the level
of customer support for Diageo’s brands and adversely impact its sales; (xiii) Diageo’s ability to maintain its brand image and
corporate reputation or to adapt to a changing media environment; (xiv) fluctuations in exchange rates and/or interest rates; (xv)
Diageo’s ability to derive the expected benefits from its business strategies, including Diageo’s investments in e-commerce and
its luxury portfolio; (xvi) increased competitive product and pricing pressures, including as a result of introductions of new
products or categories that are competitive with Diageo’s products and consolidations by competitors and retailers; (xvii)
increased costs for, or shortages of, talent, as well as labour strikes or disputes; (xviii) movements in the value of the assets and
liabilities related to Diageo’s pension plans; (xix) Diageo’s ability to renew supply, distribution, manufacturing or licence
agreements (or related rights) and licences on favourable terms, or at all, when they expire; or (xx) any failure by Diageo to
protect its intellectual property rights.
All oral and written forward-looking statements made on or after the date of this document and attributable to Diageo are
expressly qualified in their entirety by the above cautionary factors, by the ‘Risk Factors’ section immediately preceding those
and by the ‘Risk Factors’ included in Diageo’s Annual Report on Form 20-F for the year ended 30 June 2023 filed with the US
Securities and Exchange Commission. Any forward-looking statements made by or on behalf of Diageo speak only as of the
date they are made. Diageo does not undertake to update forward-looking statements to reflect any changes in Diageo's
expectations with regard thereto or any changes in events, conditions or circumstances on which any such statement is based.
This document includes names of Diageo’s products, which constitute trademarks or trade names which Diageo owns, or which
others own and license to Diageo for use. All rights reserved. © Diageo plc 2024.
5
CAPITALISATION AND INDEBTEDNESS
The following table sets out on an IFRS basis the unaudited capitalisation and indebtedness and the unaudited cash and cash
equivalents of Diageo as at 31 December 2023.
31 December 2023 | |
$ million | |
Indebtedness | |
Short-term borrowings and bank overdrafts | 2,004 |
Long-term borrowings | 19,476 |
Lease liabilities | 572 |
Total indebtedness | 22,052 |
Capitalisation | |
Share capital | 893 |
Share premium | 1,703 |
Capital redemption reserve | 4,076 |
Hedging and exchange reserve | (3,574) |
Own shares | (2,256) |
Other retained earnings | 8,949 |
Equity attributable to the equity shareholders of the parent company | 9,791 |
Non-controlling interests | 1,933 |
Total equity | 11,724 |
Total capitalisation and indebtedness | 33,776 |
Cash and cash equivalents | 1,529 |
Notes
(1)At 31 December 2023, 2,447 million ordinary shares of 28101/108 pence each were issued, all of which were fully paid,
including shares issued, shares issued and held in employee share trusts and those held as treasury shares.
current return of capital programme, approved by the Board on 31 July 2023, seeks to return up to $1.0 billion to
shareholders and is expected to be completed no later than 26 June 2024. The current programme follows the successful
completion of Diageo's additional return of capital programme that ended on 2 June 2023, in which $0.6 billion of
capital (announced as up to £0.5 billion on 26 January 2023) was returned to shareholders. In the six months ended 31
December 2023, the company purchased 12.9 million ordinary shares (2022 – 14.8 million) at a cost of $480 million
(including transaction costs of $2 million) (2022 – $655 million including transaction costs of $8 million). All shares
purchased under the share buyback programme were cancelled. The remaining contractual amount of $522 million is
expected to be purchased by 26 June 2024. As the share buyback programme cannot be cancelled during closed periods,
a financial liability of $497 million (including transaction costs) was accrued in line with contractual terms at 31
December 2023 (2022 – $259 million) equivalent to 13.6 million shares (2022 – 5.9 million shares) that represents the
maximum potential purchase value by 31 January 2024.
(2)There have been no material changes to performance guarantees or indemnities in respect of liabilities of third parties
from those reported in Diageo’s Annual Report on Form 20-F for the year ended 30 June 2023.
(3)At 31 December 2023, none of the group’s net borrowings were secured on assets of the group.
(4)An interim dividend of 40.50 cents per share will be paid to holders of ordinary shares and ADRs on the register as of 1
March 2024.
(5)Other than those disclosed above, there has been no material change since 31 December 2023 in the group’s net
borrowings, performance guarantees, indemnities and capitalisation.
6
BUSINESS REVIEW
INFORMATION PRESENTED
Diageo is one of the world’s leading premium drinks businesses and operates on an international scale selling all types of
beverage alcohol. It is one of a small number of premium drinks companies that operate globally across spirits and beer.
The following discussion is based on Diageo’s results for the six months ended 31 December 2023 compared with the six
months ended 31 December 2022.
This section contains certain non-GAAP measures, including organic movements, growth on a constant basis, organic growth
excluding Travel Retail and Guinness, free cash flow, return on average invested capital, adjusted net borrowings to adjusted
EBITDA and tax rate before exceptional items. These non-GAAP measures should be viewed as complementary to, and not
replacements for, the comparable GAAP measures and reported movements therein. Organic movements and organic operating
profit presented in this section are before exceptional items. Share, unless otherwise stated, refers to value share. See
‘Definitions and reconciliations of non-GAAP measures to GAAP measures’ for an explanation of non-GAAP measures on
pages 36 to 45.
7
OPERATING RESULTS FOR THE SIX MONTHS ENDED 31 DECEMBER 2023 COMPARED WITH THE SIX
MONTHS ENDED 31 DECEMBER 2022
Financial highlights
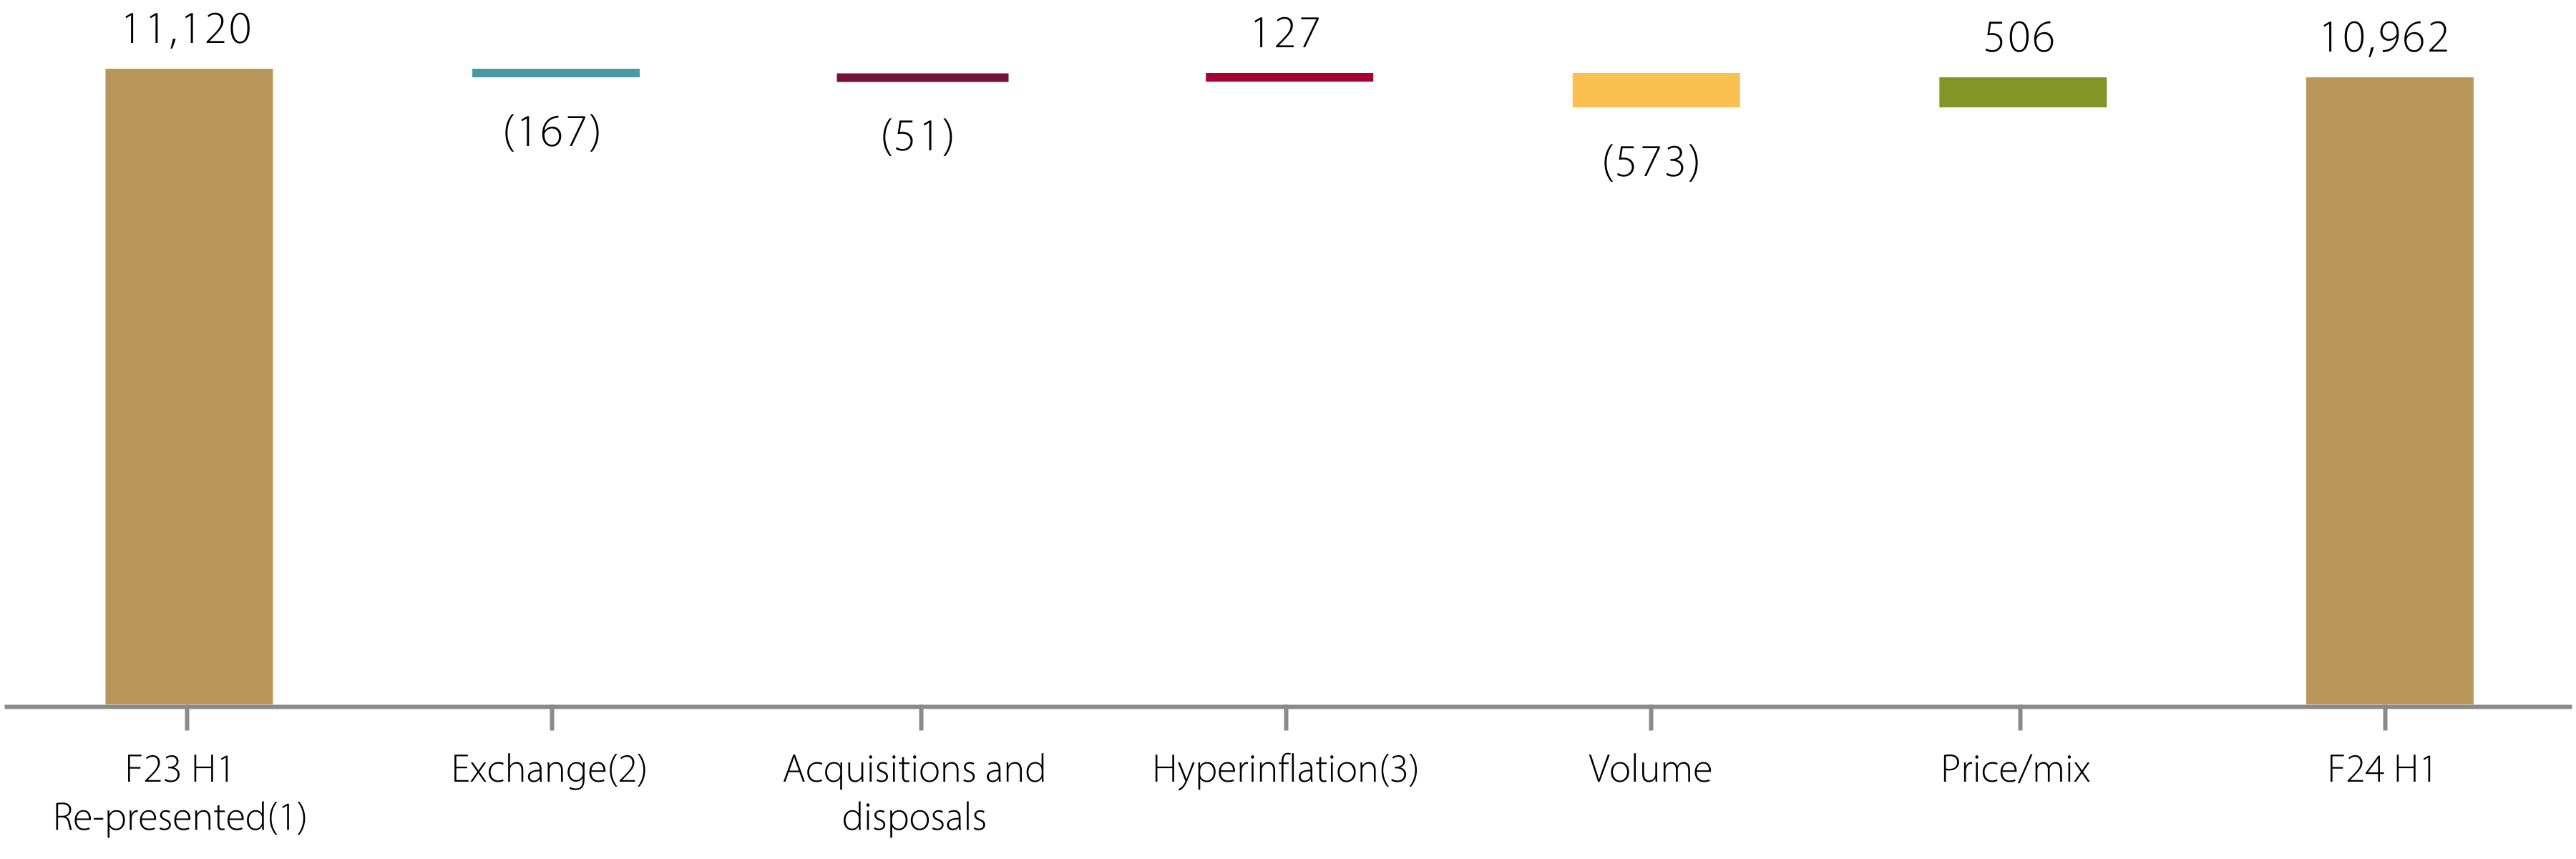
◦Reported net sales of $11.0 billion declined 1.4% or $158 million, due to a $167 million unfavourable foreign exchange
impact and an organic net sales decline of $67 million or 0.6%, driven by a $310 million or 23% decline in Latin America
and Caribbean (LAC).
◦Excluding the impact of LAC, reported net sales grew $72 million or 0.7%, and organic net sales grew $243 million or
2.5%, driven by Asia Pacific, Africa and Europe, partially offset by a $64 million or 1.5% decline in North America which
improved sequentially from the second half of fiscal 23.
◦The decline in LAC was driven by a strong double-digit net sales growth comparator as well as lower consumption and
consumer downtrading due to macroeconomic pressures in the region.
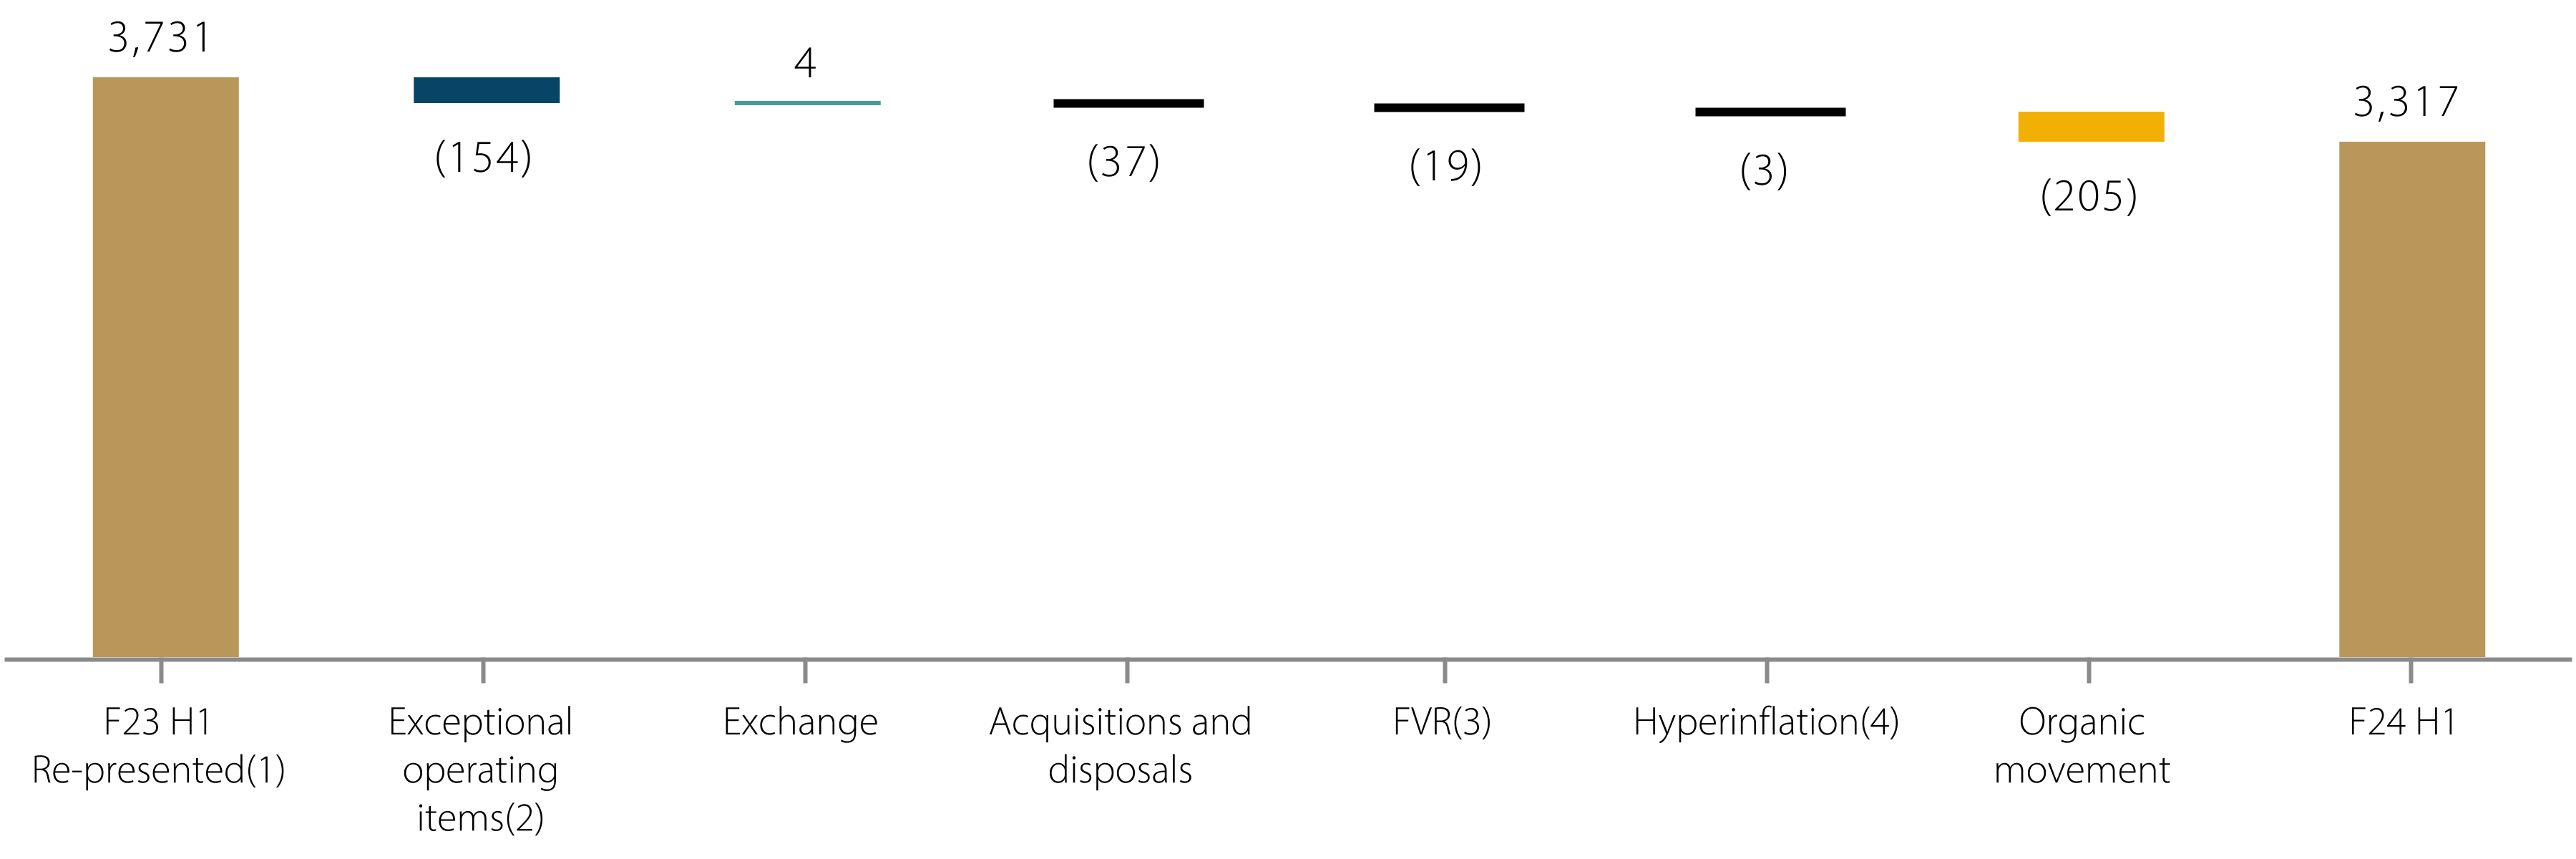
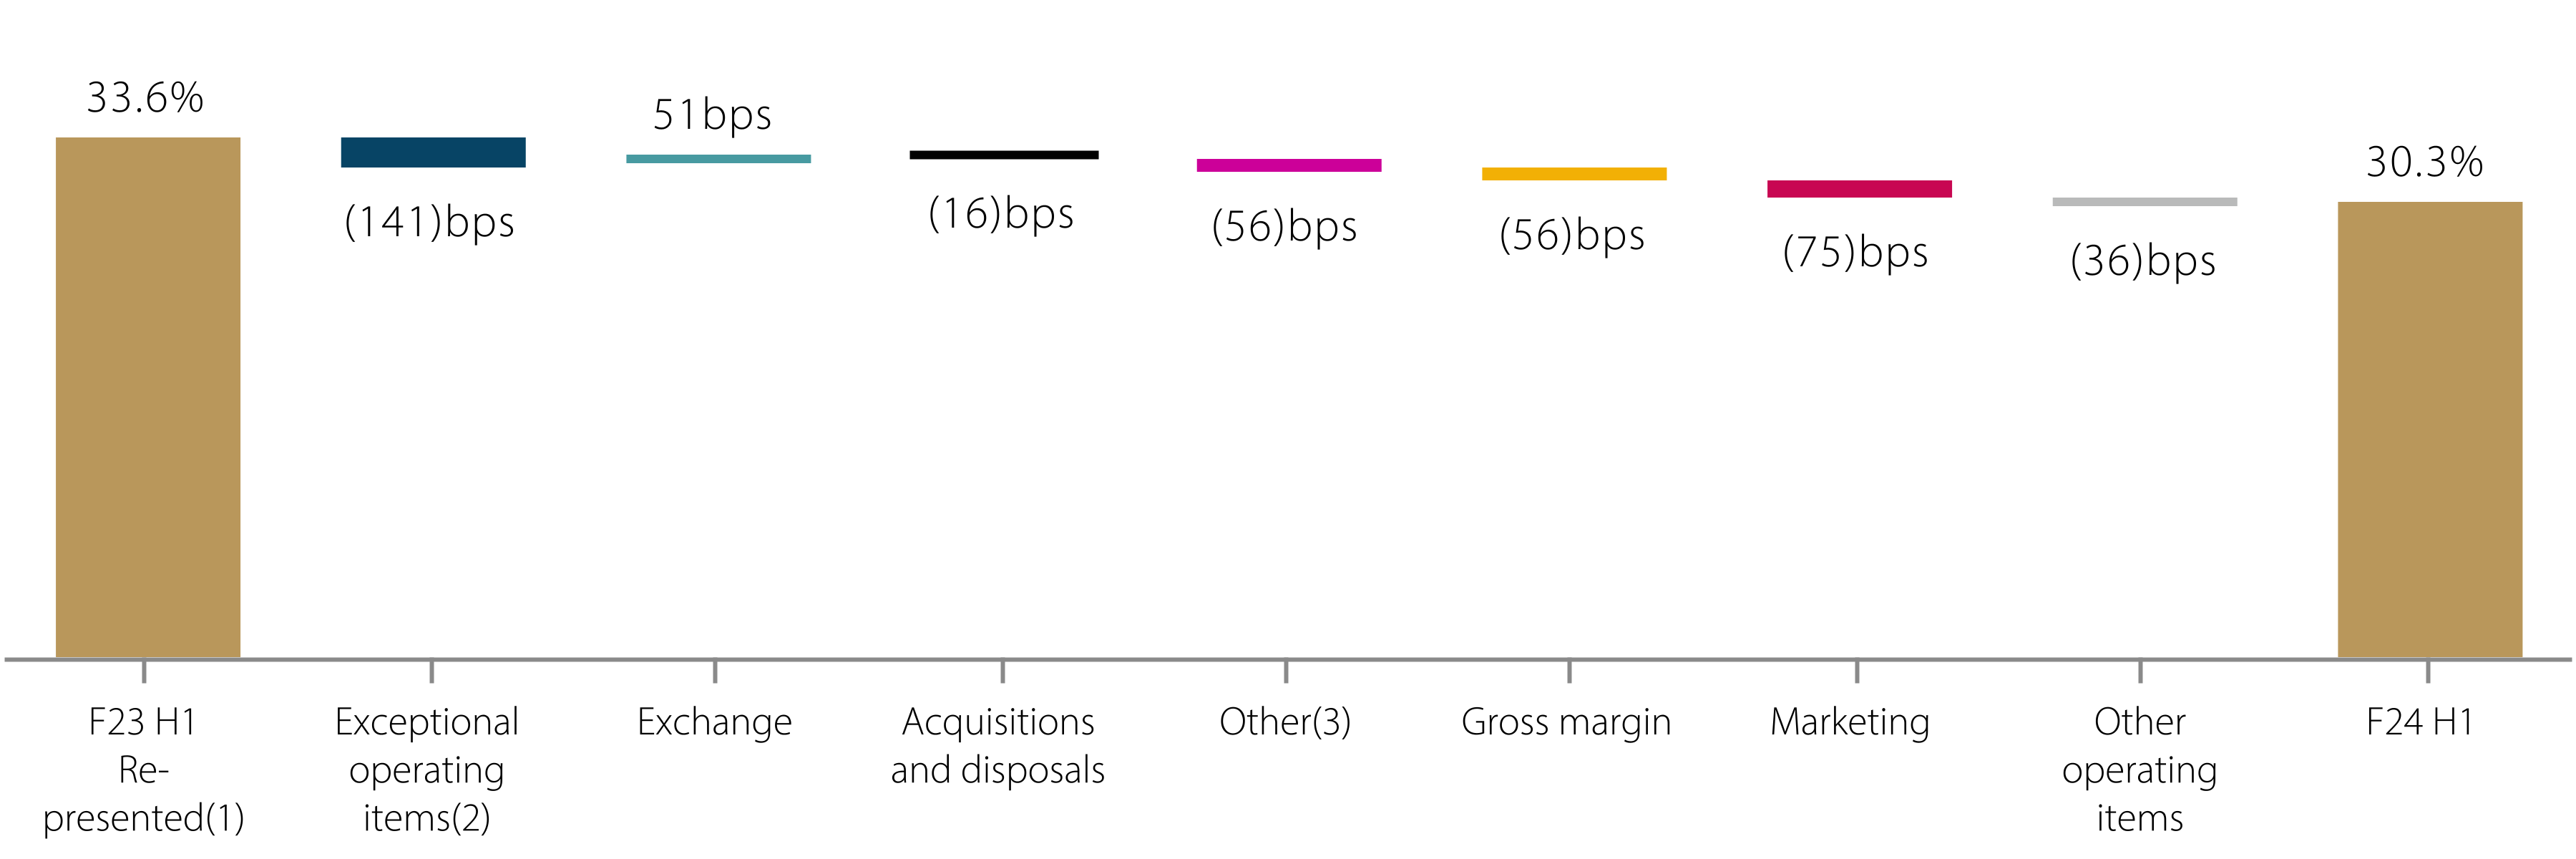
◦Reported operating profit declined 11.1% to $3.3 billion, and reported operating profit margin contracted 329bps due to
lower organic operating margin and a negative impact from exceptional operating items.
��Organic operating profit declined by $205 million or 5.4%, of which $234 million was attributable to LAC, organic
operating margin contracted 167bps.
◦Excluding the impact of LAC, organic operating profit grew by $29 million or 0.9%, and organic operating margin
contracted 53bps, driven by increased marketing investment.
◦Net cash flow from operating activities increased by $0.7 billion to $2.1 billion. Free cash flow increased by $0.5 billion to
$1.5 billion, driven by disciplined working capital management and the positive impact of lapping one-off cash tax
payments from the prior year.
◦Declared interim dividend increased by 5% to 40.50 cents per share. Completed $0.5 billion of share buybacks as part of the
return of capital programme announced on 1 August 2023.
RECENT TRENDS
Debra Crew, Chief Executive of Diageo, commenting on the six months ended 31 December 2023 said:
The first half of fiscal 24 was challenging for Diageo and our sector, particularly as we lapped strong growth in the prior year
and faced an uneven global consumer environment. Excluding LAC, our group organic net sales grew 2.5%, driven by good
growth in Europe, Asia Pacific and Africa. While North America delivered sequential improvement in line with our
expectations, we are focused on returning to high-quality share growth as consumer behaviour continues to normalise in our
largest region.
As previously announced in November 2023, materially weaker performance in LAC, driven by fast-changing consumer
sentiment and high inventory levels, significantly impacted total business performance. Having conducted a review of inventory
levels and monitored performance in the critical holiday season, we have taken action and have further plans to reduce
inventory to more appropriate levels for the current consumer environment in the region by the end of fiscal 24. This is a key
priority.
With a strong focus on execution, we delivered an improved free cash flow of $1.5 billion, and our pipeline of productivity
initiatives in the first half of fiscal 24 drove $335 million of savings, helping us to sustain investment in brand building. During
the half, we returned $0.5 billion to shareholders via share buybacks as part of our commitment to return up to $1.0 billion of
capital to shareholders in fiscal 24. We declared an interim dividend increase to 40.50 cents per share, reflecting our
commitment to a progressive dividend policy.
Looking ahead to the second half of fiscal 24, despite continued global economic volatility, we expect to deliver improvement
in organic net sales and organic operating profit growth at the group level, compared to the first half. While the macro
environment will continue to present challenges, I am confident that we remain well-positioned and resilient for the long term.
We are diversified by category, price point and region and will continue to invest behind our iconic brands to maintain our
position as an industry leader in total beverage alcohol, an attractive sector with a long runway for growth.
See page 36 for an explanation and reconciliation of non-GAAP measures, including organic net sales, organic marketing investment, organic operating profit,
free cash flow, eps before exceptionals, adjusted net debt, adjusted EBITDA and tax rate before exceptional items.
Unless otherwise stated, movements in results are for the six months ended 31 December 2023 compared to the six months ended 31 December 2022.
8
Summary financial information | F24 H1 | F23 H1 Re-presented(1) | Organic growth % | Reported growth % | |
Volume | EUm | 124.6 | 136.8 | (5) | (9) |
Net sales | $ million | 10,962 | 11,120 | (1) | (1) |
Marketing | $ million | 1,952 | 1,861 | 4 | 5 |
Operating profit before exceptional items | $ million | 3,510 | 3,770 | (5) | (7) |
Exceptional operating items(2) | $ million | (193) | (39) | ||
Operating profit | $ million | 3,317 | 3,731 | (11) | |
Share of associate and joint venture profit after tax | $ million | 253 | 202 | 25 | |
Non-operating exceptional items(2) | $ million | (60) | 19 | ||
Net finance charges | $ million | (431) | (345) | ||
Exceptional taxation credit(2) | $ million | 42 | 84 | ||
Tax rate including exceptional items | % | 23.9 | 21.2 | 13 | |
Tax rate before exceptional items | % | 23.4 | 23.4 | — | |
Profit attributable to parent company’s shareholders | $ million | 2,210 | 2,709 | (18) | |
Basic earnings per share | cents | 98.6 | 119.1 | (17) | |
Basic earnings per share before exceptional items | cents | 108.1 | 116.4 | (7) | |
Interim dividend | cents | 40.50 | 38.57 | 5 |
(1)See page F-7 for an explanation under Basis of preparation.
(2) For further details on exceptional items see pages 15 and F-11-F-13.
Fiscal 24 outlook
Organic net sales growth
Overall, for the group, we expect our organic net sales growth rate in the second half to gradually improve compared to the
growth rate in the first half.
In North America, in the second half of fiscal 24, we expect to drive gradual improvement in organic net sales performance,
despite uncertainty in the consumer environment. We will continue to invest in our brands and innovations as we work towards
the delivery of high-quality market share improvement as the consumer environment continues to normalise.
In the second half of fiscal 24, we expect macroeconomic pressures will persist in LAC and impact progress in reducing
inventory levels. As a result, we expect organic net sales in LAC to decline between the range of -10% to -20% in the second
half of fiscal 24, compared to the second half of fiscal 23. However, we expect to close fiscal 24 with a more appropriate level
of inventory for the current consumer environment.
In Europe, Asia Pacific and Africa, we expect continued growth in the second half recognising that macroeconomic volatility
and consumer uncertainty will likely persist.
Organic operating profit growth
In the second half of fiscal 24, we expect an organic operating profit decline compared to the prior year, but we expect the rate
of decline to improve compared to the first half of fiscal 24. While we expect headwinds to persist from continued inflation and
relatively low operating leverage as we reduce inventory in LAC, we will continue to focus on delivering strong productivity
and leveraging revenue growth management capabilities, while remaining invested in marketing.
Taxation
We expect the tax rate before exceptional items for fiscal 24 to be in the region of 23% mainly as a result of profit mix.
Effective interest rate
We expect the effective interest rate to reduce slightly for the full year from the first half of fiscal 24 which was reported at
4.4%, given current market conditions.
9
Productivity
At the end of fiscal 24, we will complete a three-year period over which we committed to deliver $1.5 billion of productivity
benefits and we expect to exceed this target.
At our Capital Markets Event in November 2023, we announced a new productivity commitment to deliver $2.0 billion of
productivity savings over the three years, from fiscal 25 to fiscal 27. We plan to deliver this accelerated productivity
commitment across cost of goods, marketing spend and overheads. This acceleration will be supported by investments,
including our supply chain agility programme, which was announced in July 2022. We expect benefits from our supply chain
agility programme to increase from fiscal 25 and accelerate in the following years.
Capital expenditure and free cash flow
In fiscal 24, we continue to expect capital expenditure for the full year to be in the range of $1.3-1.5 billion. We expect broadly
this level of spend to continue in the coming years, but then normalise to historical levels as a percentage of net sales starting in
fiscal 27. We expect cash flow to grow organically through the second half of fiscal 24, while we continue to invest in capital
expenditure and maturing stock.
Foreign exchange guidance
We are not providing specific guidance in relation to foreign exchange for fiscal 24. However, using the first half experienced
foreign exchange impact and spot exchange rates of $1=£0.79 and $1=€0.90 as at 31 December 2023 for the second half and
applying them to a representative income statement profile, for operating profit we would see a positive exchange impact of
approximately $210 million and a negative impact on net sales of approximately $90 million.
Functional and presentation currency
Commencing with the interim dividend declared in January 2024, Diageo's dividends will be declared in US dollars and remain
in line with the group's existing progressive dividend policy. Holders of ordinary shares will continue to receive their dividends
in sterling, but will have the option to elect to receive their dividends in US dollars instead. Holders of American Depositary
Receipts (ADRs) will continue to receive dividends in US dollars.
Unaudited recast full primary financial information and selected financial information as of and for the years ended 30 June
2021, 30 June 2022 and 30 June 2023 will be re-presented in US dollars and made available later today to reflect the change in
the presentation currency of Diageo from sterling to US dollars.
Notes to the business and financial review
Unless otherwise stated:
–movements in results are for the six months ended 31 December 2023 compared to the six months ended 31 December
2022;
–commentary below refers to organic movements unless stated as reported;
–volume is in millions of equivalent units (EUm);
–net sales are sales after deducting excise duties;
–percentage movements are organic movements unless stated as reported;
–growth is organic net sales movement; and
–market share refers to value share, except for India which is volume share.
Following a review of our interim performance metrics, we have made the decision to report return on average invested capital
only on a full-year basis at year end going forward.
See page 36 for an explanation of the calculation and use of non-GAAP measures.
10
Key performance indicators
Net sales ($ million)
Reported net sales declined 1.4%
Organic net sales declined 0.6%
Reported net sales declined 1.4%, driven by unfavourable foreign exchange impacts, organic net sales decline and a
negative impact from acquisitions and disposals, partially offset by hyperinflation adjustments.
Organic net sales decline of 0.6% was primarily attributable to weak performance in LAC driven by a strong double-digit net
sales growth comparator, as well as lower consumption and consumer downtrading due to macroeconomic pressures in the
region. These impacts materially contributed to the group’s organic volume decline of 5.2% which was partially offset by
positive price/mix of 4.6% delivered across all other regions, and mainly driven by positive pricing. Excluding LAC, organic
net sales grew 2.5%.
Organic movement

(i
(i
(1)See page F-7 for an explanation under Basis of preparation.
(2)Exchange rate movements reflect the adjustment to recalculate the reported results as if they had been generated at the prior period weighted average
exchange rates.
(3)See pages F-15 and 37-40 for details on hyperinflation adjustments.
11
Operating profit ($ million)
Reported operating profit declined 11.1%
Organic operating profit declined 5.4%
Reported operating profit declined 11.1%, primarily driven by a decrease in organic operating profit and negative exceptional
operating items.
Organic operating profit declined 5.4%, ahead of the organic net sales decline, primarily driven by a $234 million operating
profit decline in LAC.
(1)See page F-7 for explanation under Basis of preparation.
(2)For further details on exceptional operating items see pages 15 and F-11-F-13.
(3)Fair value remeasurements. For further details see page 15.
(4)See pages F-15 and 37-40 for details on hyperinflation adjustments.
Operating margin (%)
Reported operating margin declined by 329bps
Organic operating margin declined by 167bps
Reported operating margin declined by 329bps, primarily driven by a decrease in organic operating margin and the negative
impact of exceptional operating items.
Organic operating margin declined by 167bps, predominantly due to weak performance in LAC. Excluding LAC, organic
operating margin declined 53bps. The decline was driven by an increase in marketing, partially offset by the favourable impact
from other operating items and a positive gross margin.
At the group level, including LAC, the impact on gross margin from price increases and productivity initiatives more than
offset cost inflation in absolute terms.
Organic movement
(167)bps
(1)See page F-7 for an explanation under Basis of preparation.
(2)For further details on exceptional operating items see pages 15 and F-11-F-13.
(3)Fair value remeasurements and hyperinflation adjustments. For further details on fair value remeasurements see page 15. See pages F-15 and 37-40 for
details on hyperinflation adjustments.
12
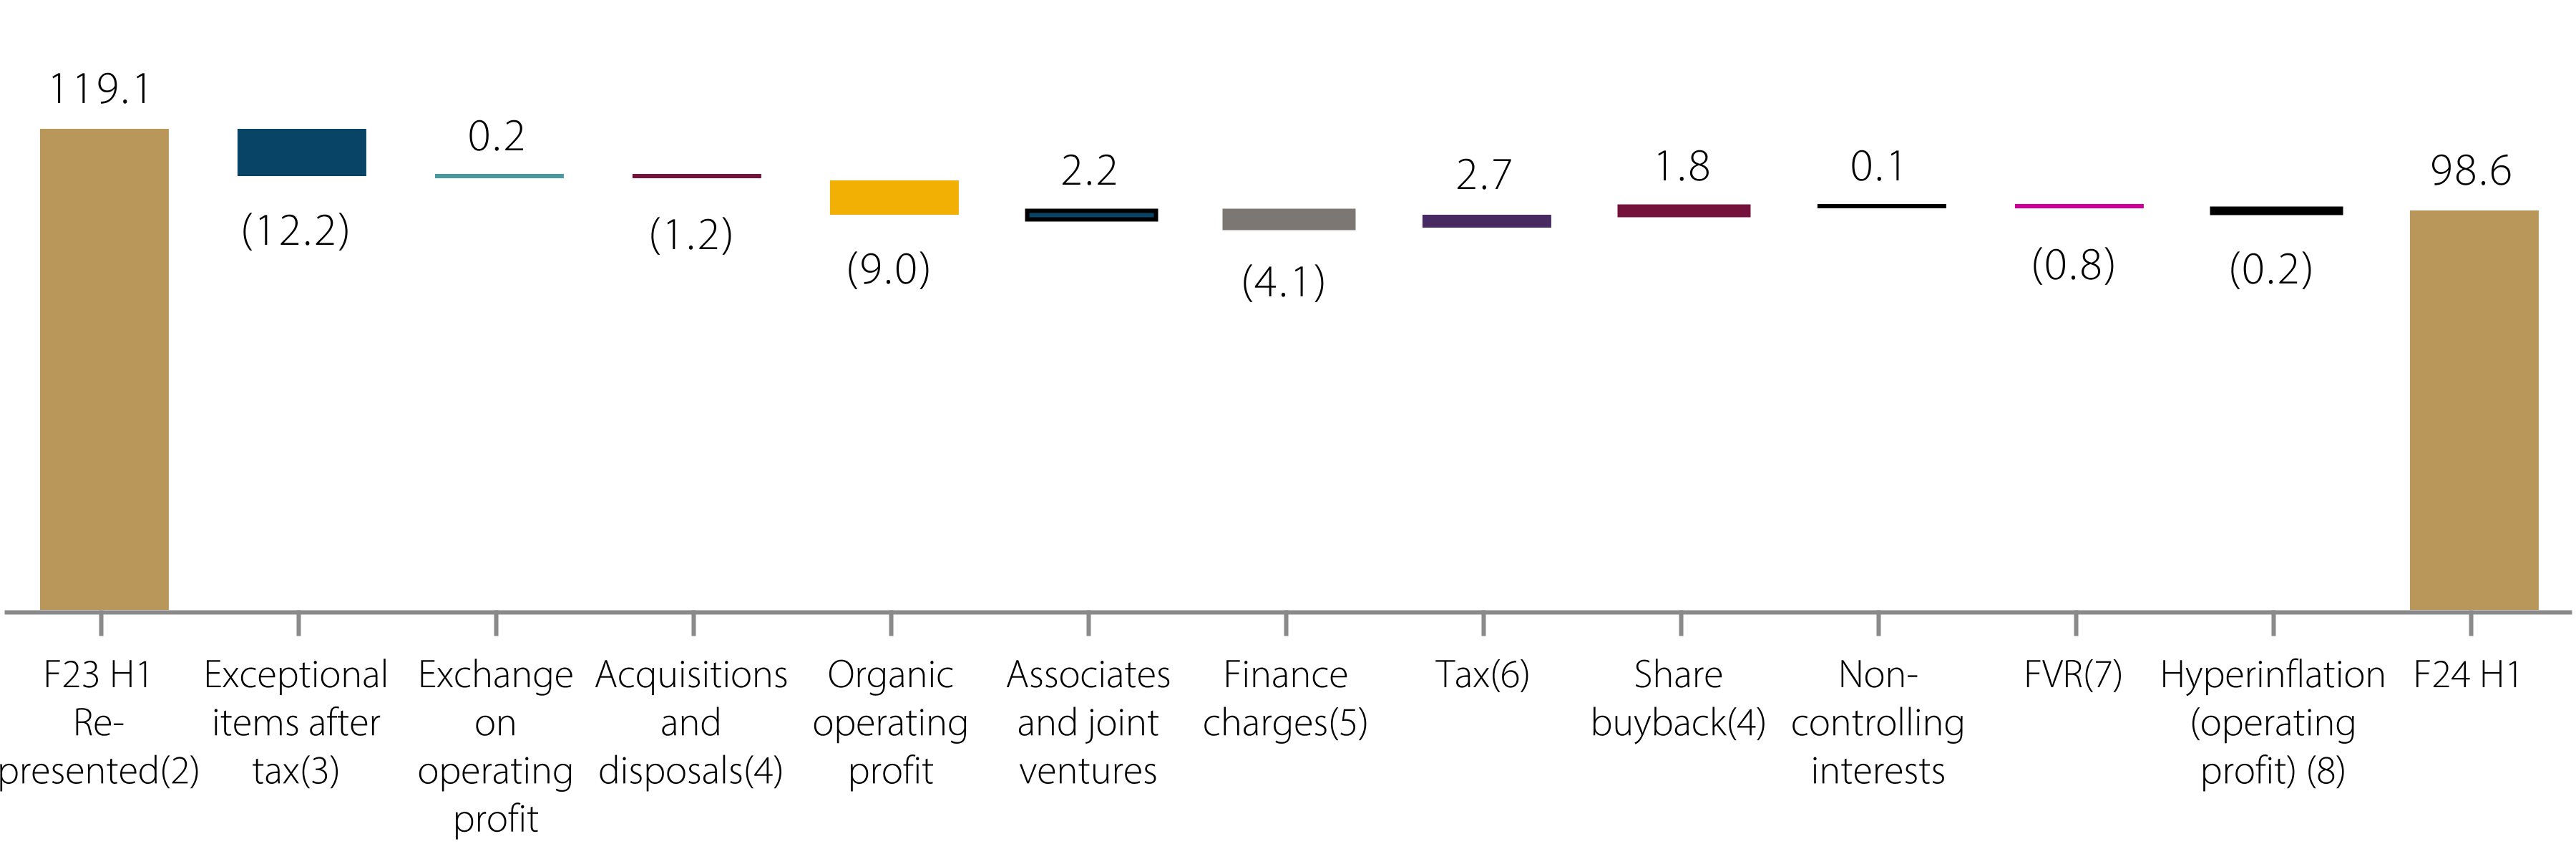
Basic earnings per share (cents)
Basic eps decreased 17.2% from 119.1 cents to 98.6 cents
Basic eps before exceptional items(1) decreased 7.1% from 116.4 cents to 108.1 cents
Basic eps decreased 20.5 cents, mainly driven by exceptional items, lower organic operating profit and higher finance charges,
partially offset by lower tax, higher income from associates and joint ventures, and the impact of share buybacks.
Basic eps before exceptional items decreased 8.3 cents.(i(i
(1)See page 36 for an explanation of the calculation and use of non-GAAP measures.
(2)See page F-7 for an explanation under Basis of preparation.
(3)For further details on exceptional items see pages 15 and F-11-F-13.
(4) Includes finance charges net of tax.
(5)Excludes finance charges related to acquisitions, disposals, share buybacks and includes finance charges related to hyperinflation adjustments.
(6)Excludes tax related to acquisitions, disposals and share buybacks.
(7)Fair value remeasurements. For further details see page 15.
(8)Operating profit hyperinflation adjustments movement was $(3) million compared to the first half of fiscal 23 (F24 H1 – $(12) million; F23 H1 – $(9)
million).
Net cash from operating activities and free cash flow ($ million)
Generated $2,146 million net cash from operating activities(1) and $1,462 million free cash flow
Net cash from operating activities was $2,146 million, an increase of $674 million compared to the first half of fiscal 23. Free
cash flow grew by $498 million to $1,462 million.
Free cash flow growth was driven by strong working capital management interventions and the positive impact of lapping one-
off cash tax payments from the prior year. These favourable factors more than offset the negative impacts of lower operating
profit and increased interest payments, attributable to the current higher interest rate environment. The increase in capital
expenditure (capex) demonstrates our commitment to investments for long-term sustainable growth.
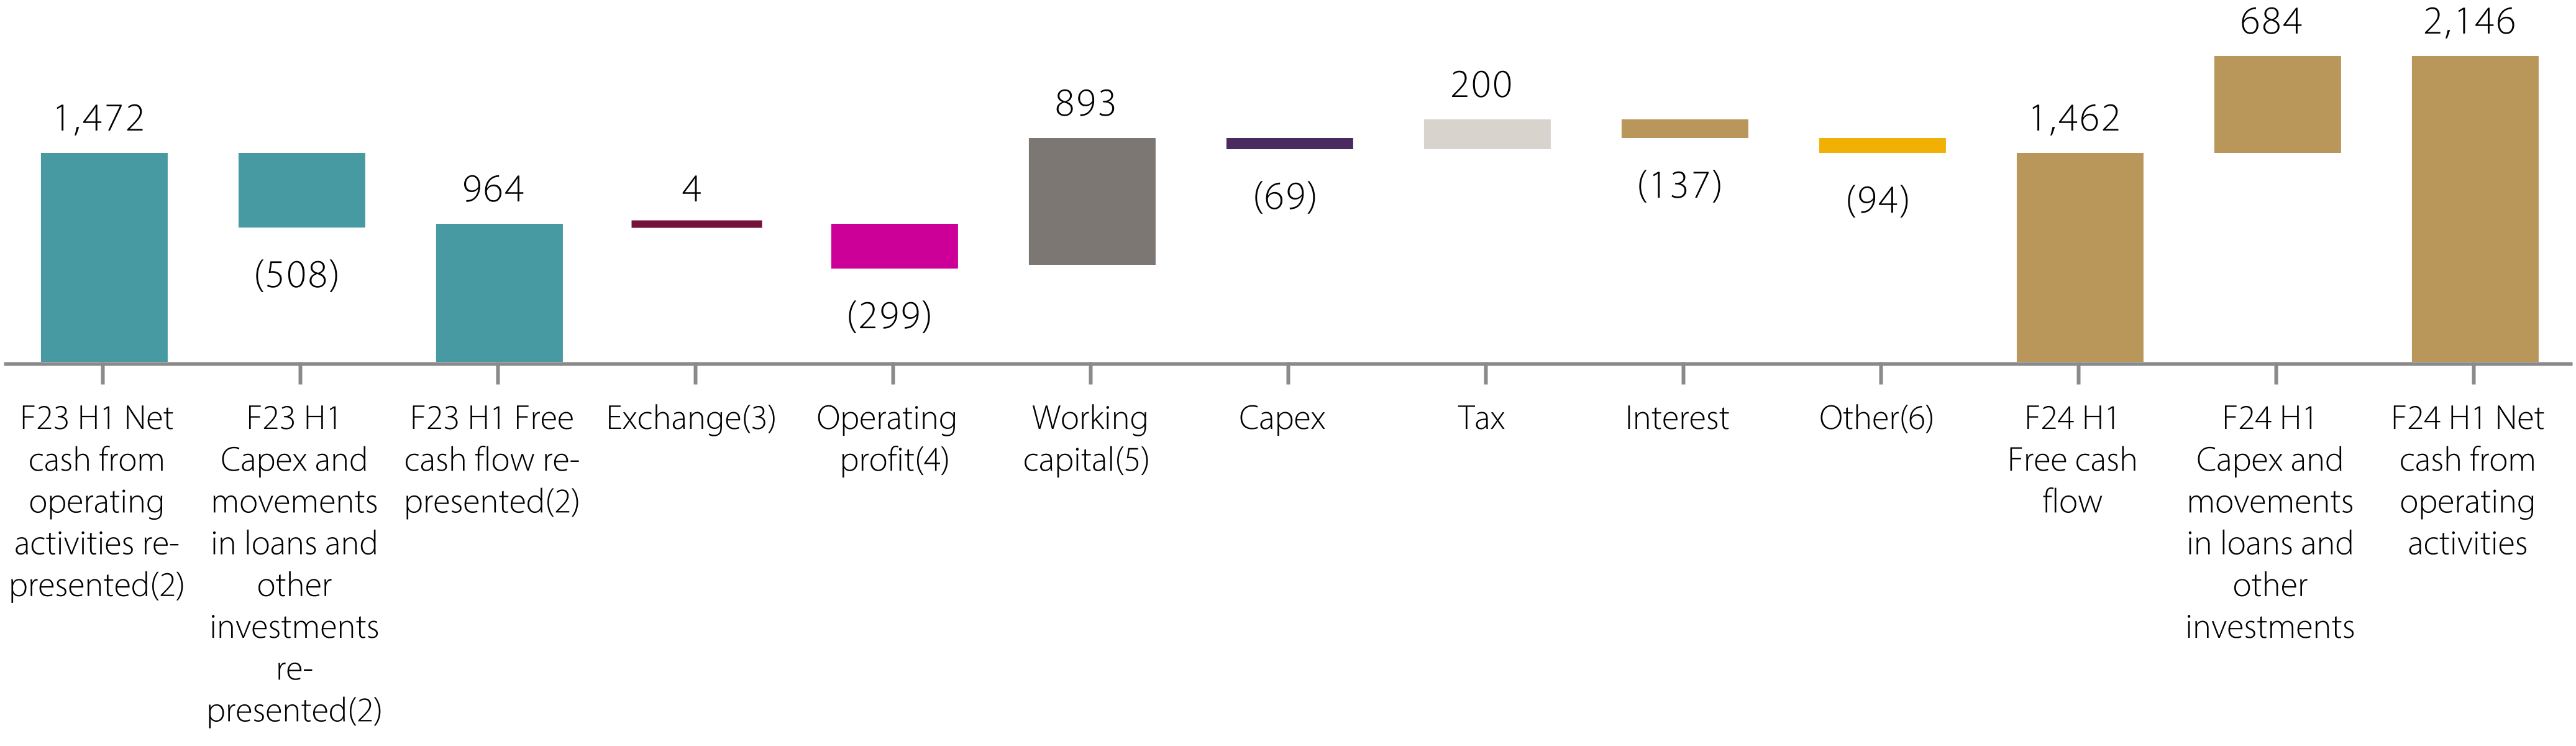
(1)Net cash from operating activities excludes net capex (F24 H1 – $(575) million; F23 H1 – $(506) million) and movements in loans and other investments.
(2) See page F-7 for an explanation under Basis of preparation.
(3)Exchange on operating profit before exceptional items.
(4)Operating profit excludes exchange, depreciation and amortisation, post employment charges of $(10) million and other non-cash items.
(5)Working capital movement includes maturing inventory.
(6)Other items include dividends received from associates and joint ventures, movements in loans and other investments and post employment payments.
13
Additional financial information
Summary income statement
31 December 2022 | Exchange (a) | Acquisitions and disposals (b) | Organic movement(2) | Fair value remeasure -ment (d) | Reclassifi- cation | Hyper- inflation(2) | 31 December 2023 | |
Re- presented(1) $ million | $ million | $ million | $ million | $ million | $ million | $ million | $ million | |
Sales | 15,611 | (353) | (328) | 152 | — | — | 99 | 15,181 |
Excise duties | (4,491) | 186 | 277 | (219) | — | — | 28 | (4,219) |
Net sales | 11,120 | (167) | (51) | (67) | — | — | 127 | 10,962 |
Cost of sales | (4,248) | 156 | 25 | (36) | (24) | — | (86) | (4,213) |
Gross profit | 6,872 | (11) | (26) | (103) | (24) | — | 41 | 6,749 |
Marketing | (1,861) | 1 | (15) | (70) | — | 7 | (14) | (1,952) |
Other operating items | (1,241) | 14 | 4 | (32) | 5 | (7) | (30) | (1,287) |
Operating profit before exceptional items | 3,770 | 4 | (37) | (205) | (19) | — | (3) | 3,510 |
Exceptional operating items (c) | (39) | (193) | ||||||
Operating profit | 3,731 | 3,317 | ||||||
Non-operating items (c) | 19 | (60) | ||||||
Net finance charges | (345) | (431) | ||||||
Share of after tax results of associates and joint ventures | 202 | 253 | ||||||
Profit before taxation | 3,607 | 3,079 | ||||||
Taxation (e) | (766) | (737) | ||||||
Profit for the period | 2,841 | 2,342 |
(1)See page F-7 for an explanation under Basis of preparation.
(2)For the definition of organic movement and hyperinflation see pages 37-40.
14
(a) Exchange
The impact of movements in exchange rates on reported figures for operating profit was principally in respect of the favourable
exchange impact of the strengthening of the Mexican peso and sterling against the US dollar, partially offset by the weakening of
the Nigerian naira, Kenyan shilling and the Turkish lira.
The effect of movements in exchange rates and other movements on profit before exceptional items and taxation for the six
months ended 31 December 2023 is set out in the table below.
Gains/(losses) | ||
$ million | ||
Translation impact | (9) | |
Transaction impact | 13 | |
Operating profit before exceptional items | 4 | |
Net finance charges – translation impact | (7) | |
Net finance charges – transaction impact | (6) | |
Net finance charges | (13) | |
Associates – translation impact | 14 | |
Profit before exceptional items and taxation | 5 | |
Six months ended 31 December 2023 | Six months ended 31 December 2022 | |
Exchange rates | ||
Translation $1 = | £0.80 | £0.85 |
Transaction $1 = | £0.79 | £0.78 |
Translation $1 = | €0.92 | €0.98 |
(b) Acquisitions and disposals
The acquisitions and disposals movement in the six months ended 31 December 2023 was primarily attributable to the disposal of
the United Spirits Limited (USL) Popular brands and Guinness Cameroun S.A.
See pages 17, 36-41 and F-19 for further details.
(c) Exceptional items
In the six months ended 31 December 2023, exceptional operating items were a loss of $193 million (2022 – a loss of $39
million), mainly due to various dispute and litigation matters ($108 million) and charges in respect of brand impairment ($54
million) and the supply chain agility programme ($31 million).
In the six months ended 31 December 2023, exceptional non-operating items were a loss of $60 million (2022 – a gain of $19
million), mainly driven by the loss on the sale of the Windsor business in Korea ($53 million).
See pages F-11-F-13 for further details.
(d) Fair value remeasurement
The adjustment to cost of sales reflects the elimination of fair value changes for biological assets in respect of growing agave
plants of $24 million loss for the six months ended 31 December 2023 and $nil for the six months ended 31 December 2022. The
adjustments to marketing and other operating expenses were the elimination of fair value changes to contingent consideration
liabilities and earn-out arrangements in respect of prior year acquisitions of $23 million gain for the six months ended 31
December 2023 and $18 million gain for the six months ended 31 December 2022.
15
(e) Taxation
The reported tax rate for the six months ended 31 December 2023 was 23.9% compared with 21.2% for the six months ended 31
December 2022.
For the six months ended 31 December 2023, income tax expense was recognised based on management’s best estimate of the
weighted average annual income tax rate expected for the full financial year applied to the pre-tax income of the interim period in
line with the relevant accounting standard.
Included in the tax charge of $737 million in the six months ended 31 December 2023 is a net exceptional tax credit of $42
million, including an exceptional tax credit of $23 million in respect of various dispute and litigation matters in North America
and Europe and $13 million in respect of brand impairments in the US ready to drink portfolio.
The tax rate before exceptional items for the six months ended 31 December 2023 was 23.4% compared with 23.4% for the six
months ended 31 December 2022.
We expect the tax rate before exceptional items for the year ending 30 June 2024 to be in the region of 23%.
A reconciliation of the forward-looking non-GAAP financial measure ‘tax rate before exceptional items’ to its most directly
comparable GAAP financial measure, ‘tax rate after exceptional items’, is not provided because it is not possible to predict,
without unreasonable effort, with reasonable certainty, exceptional items which by their nature are material or not in the normal
course of business. These exceptional items are uncertain, depend on various factors, and could be material to our consolidated
results.
(f) Dividend
The group aims to increase the dividend each year. The decision in respect of the dividend is made with reference to the dividend
cover as well as current performance trends, including sales and profit after tax together with cash generation. Diageo targets
dividend cover (the ratio of basic earnings per share before exceptional items to dividend per share) within the range of 1.8-2.2
times. For the year ended 30 June 2023, dividend cover was 2.0 times on a re-presented basis. The group will keep future returns
of capital, including dividends, under review through the year ending 30 June 2024 to ensure Diageo’s capital is allocated in the
best way to maximise value for the business and its stakeholders.
An interim dividend of 40.50 cents per share will be paid to holders of ordinary shares and US ADRs on register as of 1 March
2024. The ex-dividend date is 29 February 2024. This represents an increase of 5% on last year’s interim dividend. The interim
dividend will be paid to holders of ordinary shares and US ADRs on 17 April 2024. Holders of ordinary shares will receive their
dividends in sterling unless they elect to receive their dividends in US dollars by 15 March 2024. The dividend per share in pence
to be paid to ordinary shareholders will be announced approximately two weeks prior to the payment date and will be determined
by the actual foreign exchange rates achieved by Diageo buying forward contracts, entered into during the three days preceding
the announcement. A dividend reinvestment plan is available to holders of ordinary shares in respect of the interim dividend and
the plan notice date is 15 March 2024.
(g) Return of capital
Diageo’s current return of capital programme, approved by the Board on 31 July 2023, seeks to return up to $1.0 billion to
shareholders and is expected to be completed no later than 26 June 2024. The current programme follows the successful
completion of Diageo's additional return of capital programme that ended on 2 June 2023, in which $0.6 billion of capital
(announced as up to £0.5 billion on 26 January 2023) was returned to shareholders.
In the six months ended 31 December 2023, the company purchased 12.9 million ordinary shares (2022 – 14.8 million) at a cost
of $480 million (including transaction costs of $2 million) (2022 – $655 million including transaction costs of $8 million). All
shares purchased under the share buyback programme were cancelled. The remaining contractual amount of $522 million is
expected to be purchased by 26 June 2024. As the share buyback programme cannot be cancelled during closed periods, a
financial liability of $497 million (including transaction costs) was accrued in line with contractual terms at 31 December 2023
(2022 – $259 million) equivalent to 13.6 million shares (2022 – 5.9 million shares) that represents the maximum potential
purchase value by 31 January 2024.
16
Movements in net borrowings
2023 | 2022 | |
$ million | Re-presented(1) $ million | |
Net borrowings at 30 June | (19,582) | (17,107) |
Free cash flow (2) | 1,462 | 964 |
Acquisitions (3) | (3) | (129) |
Investment in associates | (51) | (38) |
Sale of businesses and brands (4) | 18 | 111 |
Share buyback programme (5) | (480) | (655) |
Net sale of own shares for share schemes (6) | 5 | 12 |
Dividends paid to non-controlling interests | (71) | (94) |
Net movements in bonds (7) | 558 | 1,689 |
Net movements in other borrowings (8) | (331) | (33) |
Equity dividend paid | (1,348) | (1,194) |
Net (decrease)/increase in cash and cash equivalents | (241) | 633 |
Net increase in bonds and other borrowings | (227) | (1,658) |
Exchange differences (9) | (399) | 4 |
Other non-cash items (10) | (34) | (75) |
Net borrowings at 31 December | (20,483) | (18,203) |
(1)See page F-7 for an explanation under Basis of preparation.
(2) See page 42-43 for the analysis of free cash flow.
(3) In the six months ended 31 December 2023, Diageo paid $3 million in respect of prior year acquisitions. Diageo completed
two acquisitions in the six months ended 31 December 2022: (i) on 29 September 2022, the acquisition of the remaining issued
share capital of Mr Black Spirits Pty Ltd, owner of Mr Black, the Australian premium cold brew coffee liqueur, that it did not
already own; and (ii) on 2 November 2022, the acquisition of the entire issued share capital of Balcones Distilling, a Texas craft
distiller and one of the leading producers of American single malt whiskey in the United States. In the six months ended 31
December 2022, Diageo also paid $22 million in respect of prior year acquisitions.
(4) In the six months ended 31 December 2023, sale of businesses and brands included a net cash consideration of $17 million
for the disposal of Windsor Global Co., Ltd. In the six months ended 31 December 2022, sale of businesses and brands
represents the disposal of the USL Popular brands and the Archers brand net of transaction costs.
(5) See page 16 for details of Diageo's return of capital programmes.
(6) Net sale of own shares comprised receipts from employees on the exercise of share options of $21 million (2022 – $34
million) less purchase of own shares for the future settlement of obligations under the employee share option schemes of
$16 million (2022 – $22 million).
(7) In the six months ended 31 December 2023, the group issued bonds of $1,700 million ($1,690 million - net of discount and
fee) and repaid bonds of $500 million and €600 million ($632 million). In the six months ended 31 December 2022, the group
issued bonds of $2,000 million (cash flow includes related discount and fee) and repaid bonds of $300 million.
(8) In the six months ended 31 December 2023, the net movements in other borrowings principally arose from the decrease in
commercial paper, collateral and bank loan balances, cash outflows of foreign currency swaps and forwards, and repayment of
lease liabilities. In the six months ended 31 December 2022, the net movements in other borrowings principally arose from cash
movement of foreign currency swaps and forwards and repayment of lease liabilities offset by the increase in bank loans.
(9) In the six months ended 31 December 2023, exchange losses arising on net borrowings of $399 million were primarily
driven by unfavourable exchange movements on sterling and euro denominated borrowings and unfavourable exchange
movements on cash and cash equivalents, foreign currency swaps and forwards and interest rate instruments. In the six months
ended 31 December 2022, exchange gains arising on net borrowings of $4 million were primarily driven by favourable
17
exchange movements on euro and sterling denominated borrowings and unfavourable exchange movements on cash and cash
equivalents partially offset by favourable movements on foreign currency swaps and forwards.
(10) In the six months ended 31 December 2023, other non-cash items were principally in respect of additional leases entered
into during the period partially offset by fair value movements of interest rate hedging instruments. In the six months ended 31
December 2022, other non-cash items were principally in respect of the reclassification of cash and cash equivalents in
Guinness Cameroun S.A. to assets and liabilities held for sale.
Movements in equity
2023 | 2022 | |
$ million | Re-presented(1) $ million | |
Equity at 30 June | 11,709 | 11,511 |
Adjustment to 2023 closing equity in respect of hyperinflation in Ghana (2) | 51 | — |
Adjusted equity at the beginning of the period | 11,760 | 11,511 |
Profit for the period | 2,342 | 2,841 |
Exchange adjustments (3) | (189) | (249) |
Remeasurement of post employment benefit plans net of taxation | (109) | (451) |
Hyperinflation adjustments net of taxation (2) | 192 | 103 |
Associates' transactions with non-controlling interests | — | (14) |
Dividend declared to non-controlling interests | (53) | (75) |
Equity dividend declared | (1,349) | (1,200) |
Share buyback programme (4) | (977) | (775) |
Other reserve movements | 107 | 148 |
Equity at 31 December | 11,724 | 11,839 |
(1) See page F-7 for an explanation under Basis of preparation.
(2) See pages F-15 and 37-40 for details on hyperinflation adjustments.
(3) Exchange movements in the six months ended 31 December 2023 primarily arose from exchange loss driven by the Turkish
lira, sterling and Indian rupee. Exchange movements in the six months ended 31 December 2022 primarily arose from exchange
loss driven by Indian rupee and Turkish lira, partially offset by the gain in euro.
(4) See page 16 for details of Diageo's return of capital programmes.
Post employment benefit plans
The net surplus of the group’s post employment benefit plans decreased by $92 million from $739 million at 30 June 2023 to
$647 million at 31 December 2023. The decrease in net surplus was predominantly attributable to the unfavourable change in
the discount rate assumptions in the United Kingdom due to the decrease in returns from ‘AA’ rated corporate bonds used to
calculate the discount rates on the liabilities of the post employment plans (from 5.2% to 4.5%) that was partially offset by the
favourable actual change in the market value of assets held by the post employment benefit plans in the United Kingdom, and
the change in inflation rate assumptions in the United Kingdom (from 3.2% to 2.9%).
Total cash contributions by the group to all post employment benefit plans in the year ending 30 June 2024 are estimated to be
approximately $90 million.
18
Analysis by reporting segments
The reported and organic movements for volume, net sales, marketing spend, operating profit and operating profit before
exceptional items by reporting segments for the six months ended 31 December 2023 were as follows:
Volume | Net sales | Marketing | Operating profit before exceptional items | Operating profit | ||||||
Reported growth by region | % | EUm | % | $ million | % | $ million | % | $ million | % | $ million |
North America | (3) | (0.7) | (2) | (65) | 2 | 15 | 2 | 35 | (7) | (116) |
Europe | (3) | (0.9) | 10 | 226 | 19 | 72 | (3) | (23) | (6) | (51) |
Asia Pacific | (15) | (6.9) | 2 | 37 | 14 | 50 | (2) | (15) | 1 | 10 |
Latin America and Caribbean | (19) | (3.0) | (18) | (230) | (12) | (25) | (41) | (222) | (41) | (222) |
Africa | (4) | (0.7) | (12) | (138) | (20) | (27) | (40) | (85) | (40) | (85) |
Corporate | — | — | 24 | 12 | 67 | 6 | 25 | 50 | 25 | 50 |
Diageo | (9) | (12.2) | (1) | (158) | 5 | 91 | (7) | (260) | (11) | (414) |
Volume | Net sales | Marketing | Operating profit before exceptional items | |||||
Organic growth by region | % | EUm | % | $ million | % | $ million | % | $ million |
North America | (3) | (0.8) | (2) | (64) | 2 | 12 | (1) | (21) |
Europe | (4) | (1.1) | 3 | 78 | 9 | 35 | (4) | (34) |
Asia Pacific | (2) | (0.8) | 6 | 125 | 15 | 53 | 3 | 23 |
Latin America and Caribbean | (19) | (3.0) | (23) | (310) | (19) | (40) | (41) | (234) |
Africa | (6) | (1.1) | 9 | 95 | 6 | 7 | 9 | 21 |
Corporate | — | — | 17 | 9 | 27 | 3 | 22 | 40 |
Diageo | (5) | (6.8) | (1) | (67) | 4 | 70 | (5) | (205) |
See page 36 for an explanation and reconciliation of non-GAAP measures.
19
North America
•Reported net sales declined 2%, due to weaker organic performance.
•Organic net sales declined 2%, due to weaker performance in US Spirits and Canada, partially offset by growth from Diageo
Beer Company (DBC USA).
•Price/mix grew 1% and was more than offset by a 3% decline in volume, mainly in vodka and rum.
•US Spirits net sales declined 2%, lapping strong double-digit growth in tequila, US whiskey and spirits-based ready to drink
products. Depletion growth was approximately one percentage point ahead of shipment growth in the first half of fiscal 24,
with some variation across brands. Overall inventory levels at distributors at the end of the first half of fiscal 24 remained in
line with historical levels.
•DBC USA net sales grew 5%, reflecting strong growth in Guinness and Smirnoff flavoured malt beverages.
•Organic operating margin increased by 12bps, driven by gross margin expansion, partially offset by increased marketing
investment. Gross margin improvement was driven by productivity savings, supply efficiencies and pricing actions which
more than offset adverse mix and inflation.
•Marketing investment grew 2% as we invested in key categories and brands.
US Spirits highlights(1):
•Tequila net sales declined 5%, primarily due to a 14% decline in Casamigos lapping double-digit growth as distributors
replenished inventory in the prior year. Don Julio net sales increased 2%, driven by aged liquid variants including
Reposado, partially offset by some destocking of Don Julio 1942. Both Casamigos and Don Julio depletions were
significantly ahead of shipments. Diageo's tequila portfolio continues to grow share of the total US spirits industry,
primarily driven by Don Julio.
•Crown Royal whisky net sales decreased 2%, primarily due to Crown Royal Deluxe and Crown Royal Peach, partially
offset by the strength of broader flavours, led by Crown Royal Salted Caramel and Crown Royal Regal Apple, as well as
premium variants.
•Vodka net sales declined 4%, primarily due to Cîroc, which declined 21% as consumers shifted into other spirits categories,
partially offset by 2% growth in Smirnoff, driven by flavoured variants. Ketel One net sales declined 4% driven by Ketel
One Botanicals. Ketel One held share of spirits and grew share of the vodka category supported by our 'Made to Cocktail'
media campaign.
•Johnnie Walker net sales declined 13%, due to continued normalisation of demand for luxury variant Johnnie Walker Blue
Label. Johnnie Walker gained share of the scotch category in the first half of fiscal 24.
•Captain Morgan net sales declined 2%, primarily due to Captain Morgan Original Spiced.
•Bulleit whiskey net sales increased 19%, significantly ahead of depletions growth as inventory levels continue to normalise.
Bulleit held share of the spirits industry.
•Buchanan's net sales increased 36%, primarily driven by the continued success of Buchanan’s Pineapple. Buchanan's
trademark also gained share of the spirits industry.
•Single Malts net sales declined 27%, due to the lapping of the launch of luxury innovation Lagavulin 11YO Charred Oak
Cask.
•Spirits-based cocktails net sales increased 33%, driven by the expansion of our cocktail collection Ketel One Espresso
Martini, Ketel One Cosmopolitan, and Tanqueray Negroni.
F23 H1 Re-presented(2) | Exchange | Acquisitions and disposals | Organic movement | Other(3) | F24 H1 | Reported movement | |||
Key financials: North America | $ million | $ million | $ million | $ million | $ million | $ million | % | ||
Net sales | 4,149 | (3) | 2 | (64) | — | 4,084 | (2) | ||
Marketing | 767 | (1) | 4 | 12 | — | 782 | 2 | ||
Operating profit before exceptional items | 1,690 | 62 | (11) | (21) | 5 | 1,725 | 2 | ||
Exceptional operating items(4) | (31) | (182) | |||||||
Operating profit | 1,659 | 1,543 | (7) |
(1) Spirits brands excluding cocktails, which includes ready to drink, ready-to-serve and non-alcoholic variants.
(2) See page F-7 for an explanation under Basis of preparation.
(3)Fair value remeasurements. For further details see page 15.
(4)For further details on exceptional operating items see pages 15 and F-11-F-13.
20
Markets: | Organic volume movement | Reported volume movement | Organic net sales movement | Reported net sales movement |
Markets and categories: | % | % | % | % |
North America(1) | (3) | (3) | (2) | (2) |
US Spirits(1) | (3) | (2) | (2) | (2) |
DBC USA(2) | 2 | 2 | 5 | 5 |
Canada | (7) | (7) | (5) | (7) |
Spirits(1) | (4) | (3) | (3) | (3) |
Beer | 3 | 3 | 6 | 6 |
Ready to drink | (6) | (6) | 7 | 6 |
Organic volume movement(4) | Organic net sales movement | Reported net sales movement | |
Key brands(3): | % | % | % |
Crown Royal | (3) | (2) | (2) |
Don Julio | 19 | 2 | 2 |
Smirnoff | (5) | 2 | 1 |
Casamigos(5) | (9) | (14) | (14) |
Johnnie Walker | (6) | (13) | (13) |
Captain Morgan | (7) | (1) | (1) |
Baileys | — | 5 | 4 |
Ketel One(6) | (5) | (5) | (5) |
Bulleit whiskey(7) | 13 | 19 | 19 |
Guinness | 2 | 5 | 5 |
Buchanan's | 50 | 35 | 35 |
(1)Reported volume movement includes impacts from acquisitions and/or disposals. For further details see pages 38-41.
(2)Certain spirits-based ready to drink products in certain states are distributed through DBC USA and those net sales are captured within DBC USA.
(3)Spirits brands excluding cocktails, which includes ready to drink, ready- to-serve and non-alcoholic variants.
(4)Organic equals reported volume movement.
(5)Casamigos trademark includes both tequila and mezcal.
(6)Ketel One includes Ketel One vodka and Ketel One Botanicals.
(7)Bulleit whiskey excludes Bulleit Crafted Cocktails.
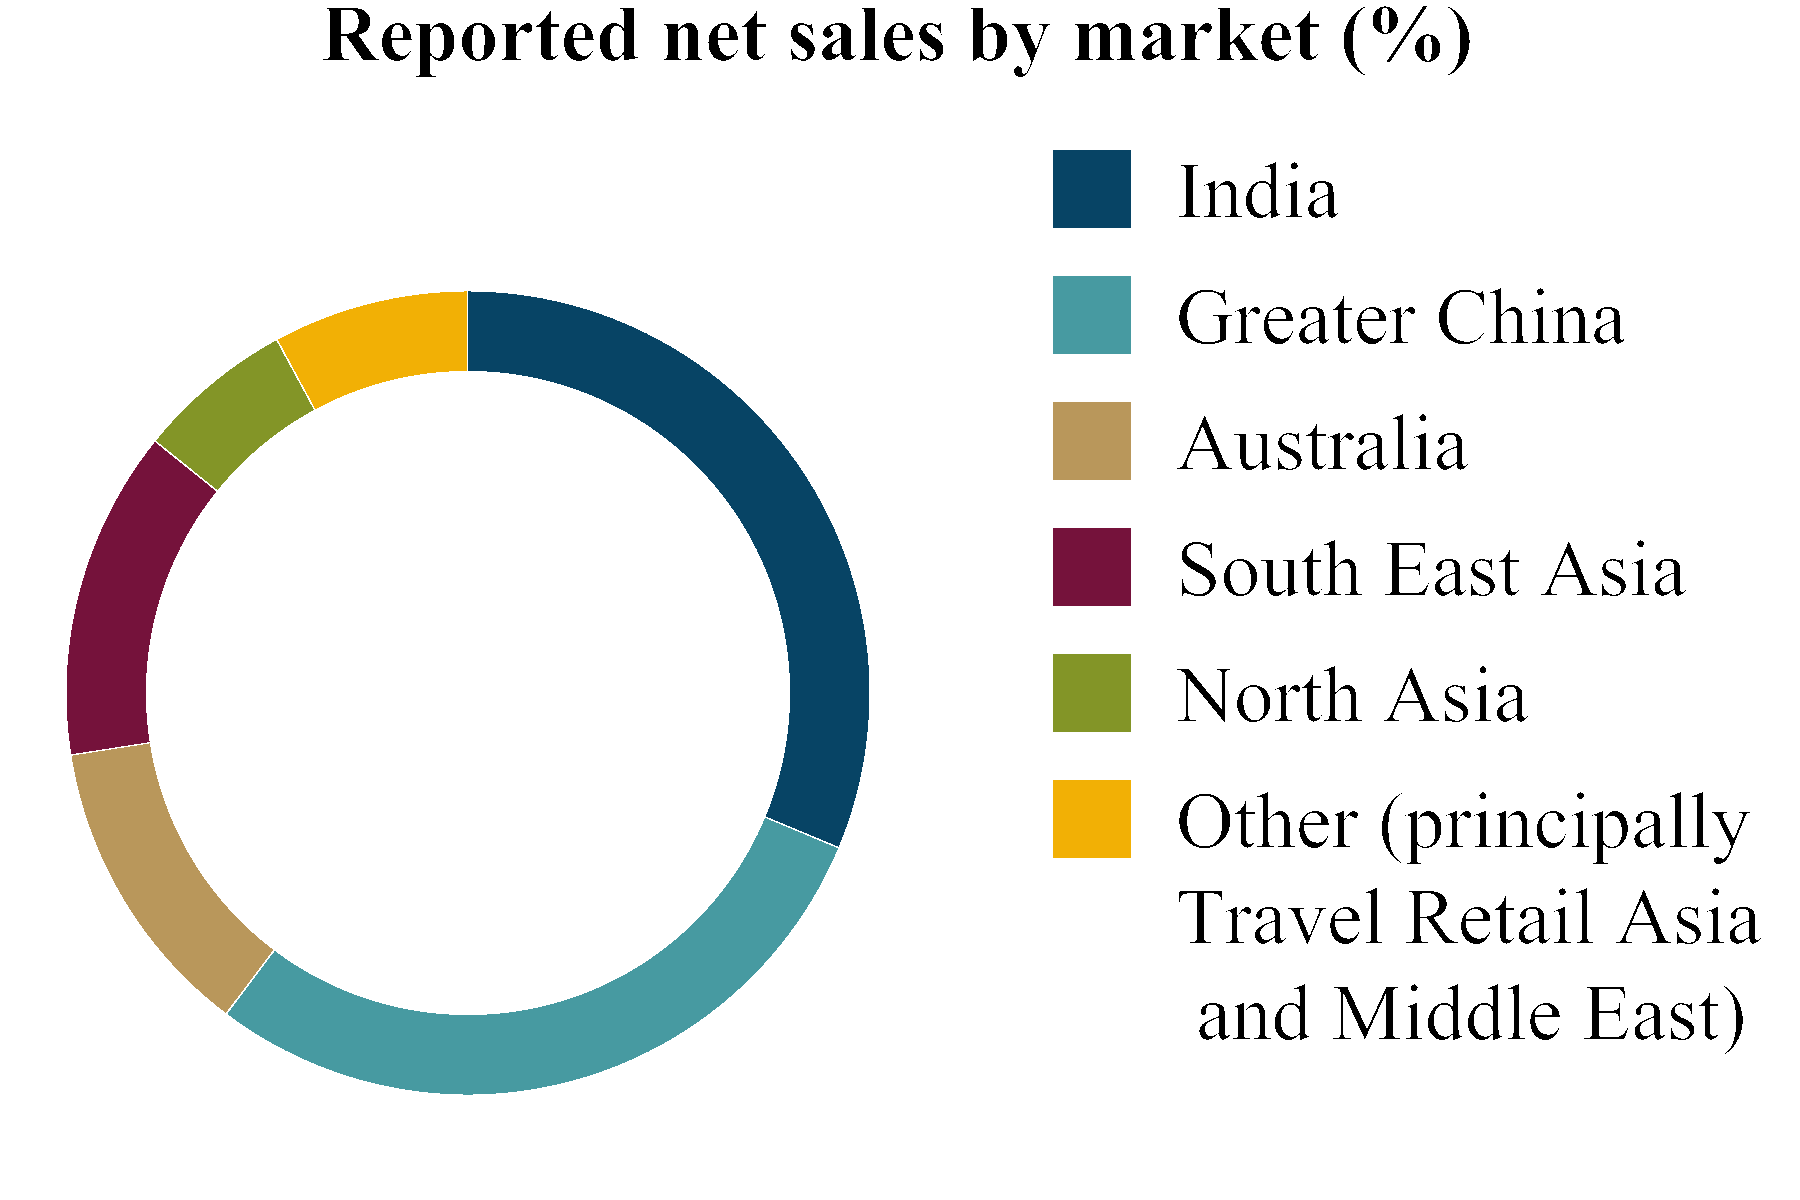
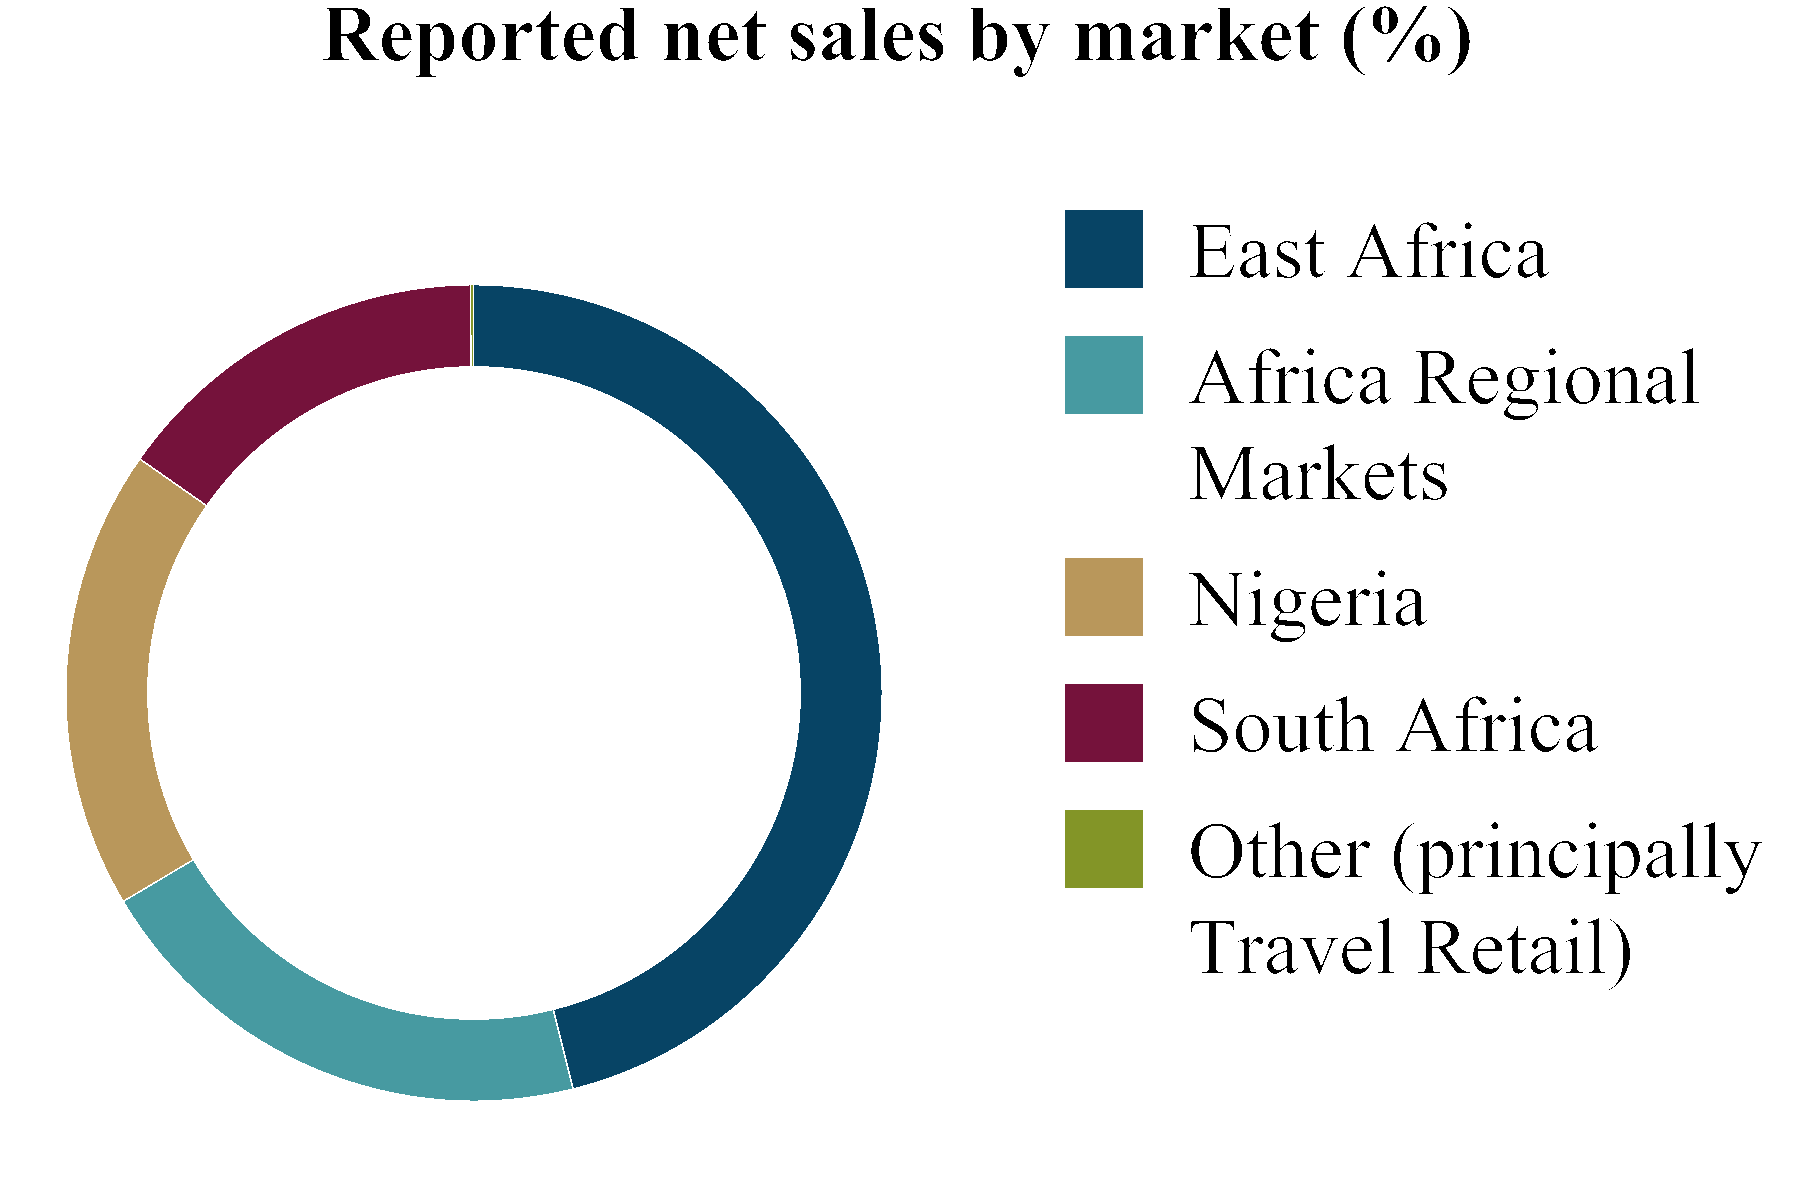
North America contributed | North America organic net sales declined | |
37% of Diageo reported net sales in first half of fiscal 24 | 2% in first half of fiscal 24 |

21
Europe
•Reported net sales grew 10%, primarily driven by a hyperinflation adjustment(1) related to Turkey and organic growth.
•Organic net sales grew 3%, primarily driven by double-digit growth in Turkey and high single-digit growth in Great Britain
and Ireland. This was significantly offset by declines in Eastern Europe, primarily due to lapping final sales of inventories in
Russia following the previously announced winding down of operations in fiscal 23. Excluding the impact of lapping the
final sales of inventories in Russia, organic net sales grew 6%.
•Price/mix grew 7%, driven by price increases across all markets, with Guinness growth driving particularly strong price/mix
in Great Britain and Ireland. Volume declined by 4%, primarily in the standard price tier.
•Spirits net sales were flat, with high double-digit growth in tequila, primarily Don Julio, offset by declines in other
categories, mainly rum and gin. Excluding the effect of lapping final sales of inventories in Russia, spirits net sales grew
3%.
•Beer net sales grew 20%, driven by both positive volume and price/mix. Guinness net sales grew 24%, gaining share in the
on-trade in both Ireland and Great Britain.
•Organic operating margin declined by 257bps. Strong strategic price increases were more than offset by cost inflation and
increased marketing investment.
•Marketing investment increased 9%, driven primarily by investment in Johnnie Walker, Don Julio and Tanqueray 0.0.
Market highlights:
•Great Britain net sales grew 9%, primarily driven by strong performance in Guinness, which gained share in both the on-
trade and off-trade.
•Southern Europe net sales were 1% lower, due to declines in rum and J&B more than offsetting strong growth in Johnnie
Walker Red Label and Johnnie Walker Black Label. Southern Europe delivered double-digit basis point market share gains
in the whisky category.
•Northern Europe net sales were 4% lower, due to declines in Talisker, Lagavulin and ready to drink (RTD) cocktails more
than offsetting double digit-growth in Johnnie Walker Red Label.
•Ireland net sales grew 10%, primarily driven by double-digit growth in Guinness and strong share gains in the on-trade.
•Eastern Europe net sales declined 16%, primarily driven by lapping the final sales of inventories in Russia in the first half of
the prior year. Excluding Russia, net sales grew 5% driven by Guinness and Don Julio.
•Turkey net sales grew 30%, with volume growth of 3%, primarily reflecting the impact of price increases in response to
inflation and increased excise duties. Growth was mostly driven by strong performance in Johnnie Walker Red Label and
Johnnie Walker Black Label, with share gains in whisky.
F23 H1 Re-presented(2) | Exchange | Acquisitions and disposals | Organic movement | Hyperinflation(1) | F24 H1 | Reported movement | |
Key financials: Europe | $ million | $ million | $ million | $ million | $ million | $ million | % |
Net sales | 2,339 | 5 | 20 | 78 | 123 | 2,565 | 10 |
Marketing | 387 | 7 | 16 | 35 | 14 | 459 | 19 |
Operating profit before exceptional items | 820 | 13 | (9) | (34) | 7 | 797 | (3) |
Exceptional operating items(3) | 17 | (11) | |||||
Operating profit | 837 | 786 | (6) |
(1) See pages F-15 and 37-40 for details on hyperinflation adjustments.
(2)See page F-7 for an explanation under Basis of preparation.
(3) For further details on exceptional operating items see pages 15 and F-11-F-13.
22
Markets: | Organic volume movement | Reported volume movement | Organic net sales movement | Reported net sales movement |
Markets and categories: | % | % | % | % |
Europe(1) | (4) | (3) | 3 | 10 |
Great Britain(1) | (1) | (2) | 9 | 15 |
Southern Europe(1) | (5) | (5) | (1) | 5 |
Northern Europe(1) | (7) | (7) | (4) | 2 |
Ireland(1) | (1) | (2) | 10 | 17 |
Eastern Europe(1) | (15) | (15) | (16) | (15) |
Turkey(1) | 3 | 3 | 30 | 25 |
Spirits(1) | (4) | (4) | — | 6 |
Beer | 7 | 7 | 20 | 28 |
Ready to drink(1) | (14) | (15) | (8) | (4) |
Organic volume movement(3) | Organic net sales movement | Reported net sales movement | |
Key brands(2): | % | % | % |
Guinness | 9 | 24 | 32 |
Johnnie Walker | 8 | 12 | 17 |
Baileys | — | 2 | 8 |
Smirnoff | (3) | 3 | 9 |
Captain Morgan | (10) | (7) | (3) |
Gordon's | (11) | (5) | — |
Tanqueray | (10) | (6) | (1) |
JεB | (7) | (11) | (6) |
(1)Reported volume movement includes impacts from acquisitions and/or disposals. For further details see pages 38-41.
(2)Spirits brands excluding ready to drink and non-alcoholic variants.
(3)Organic equals reported volume movement.
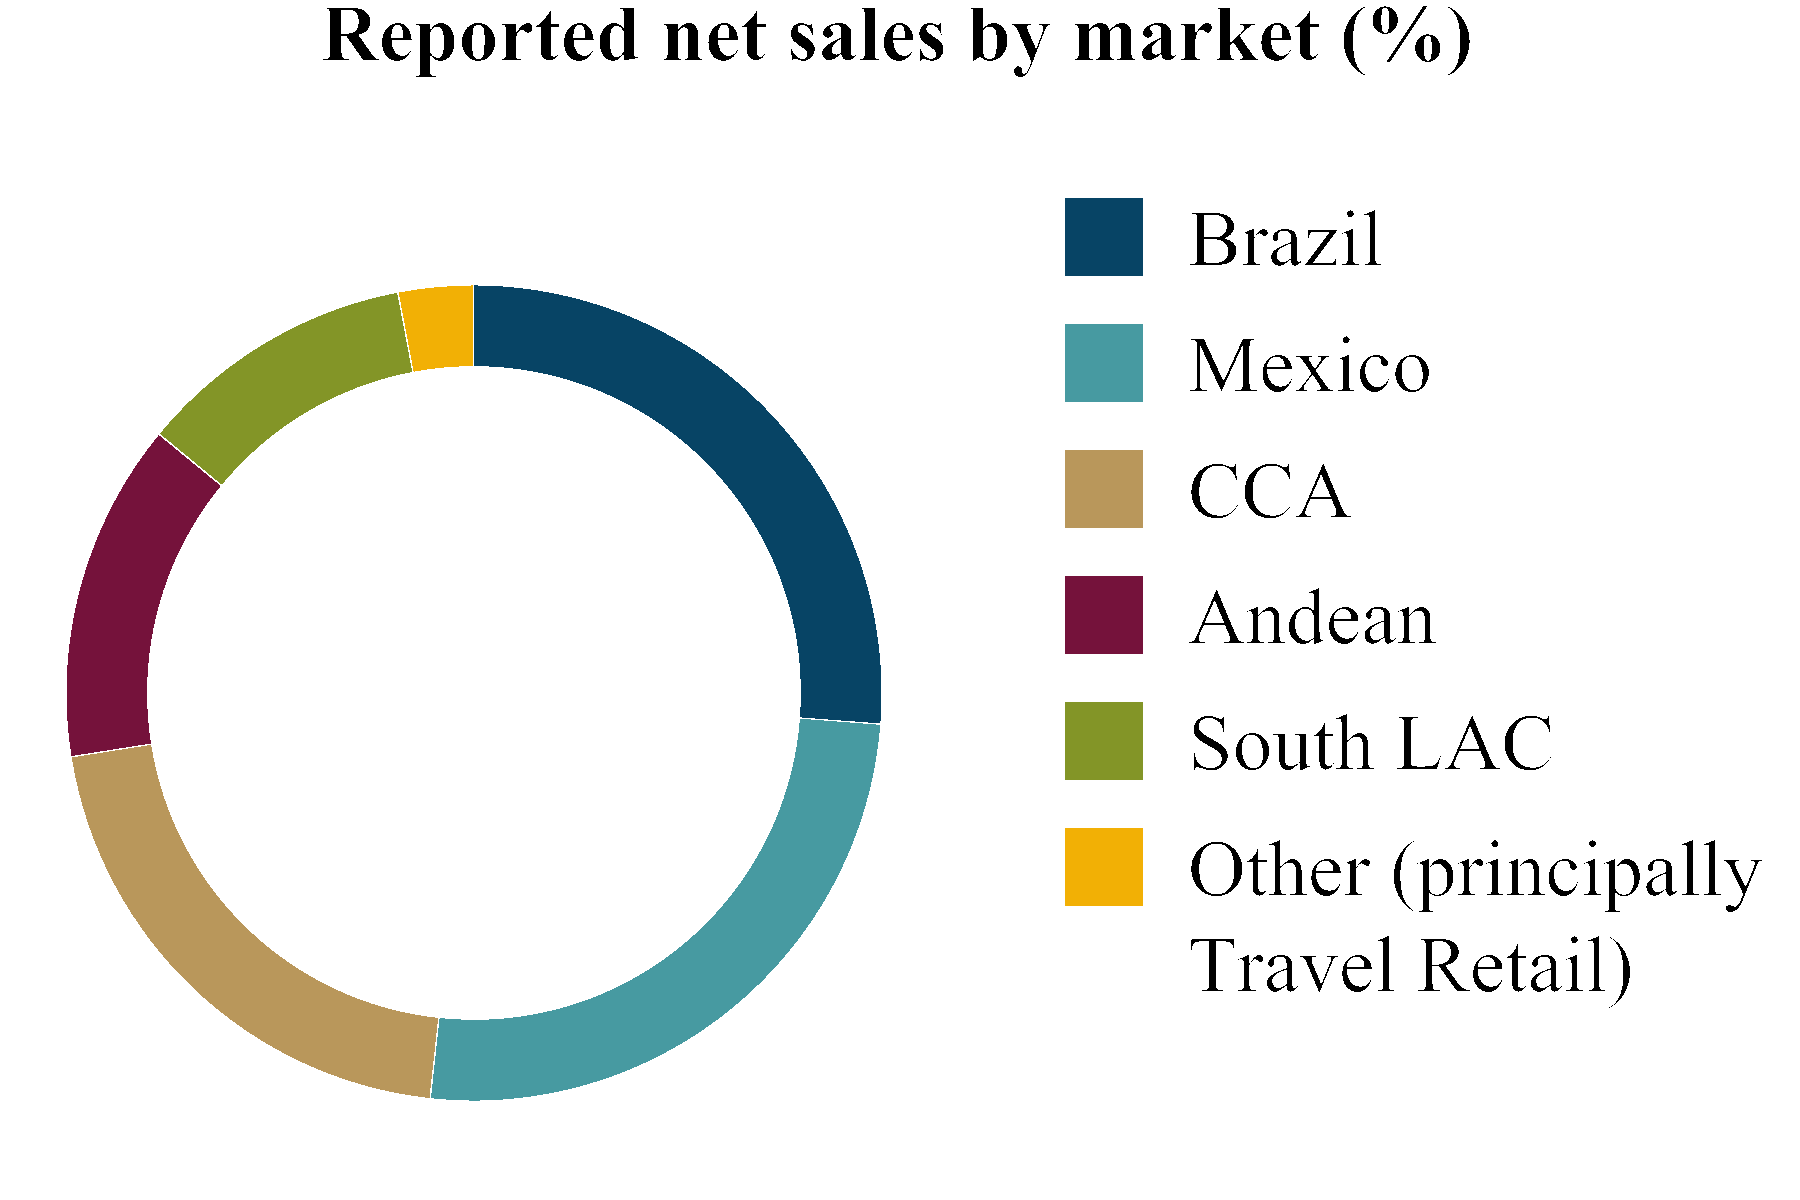
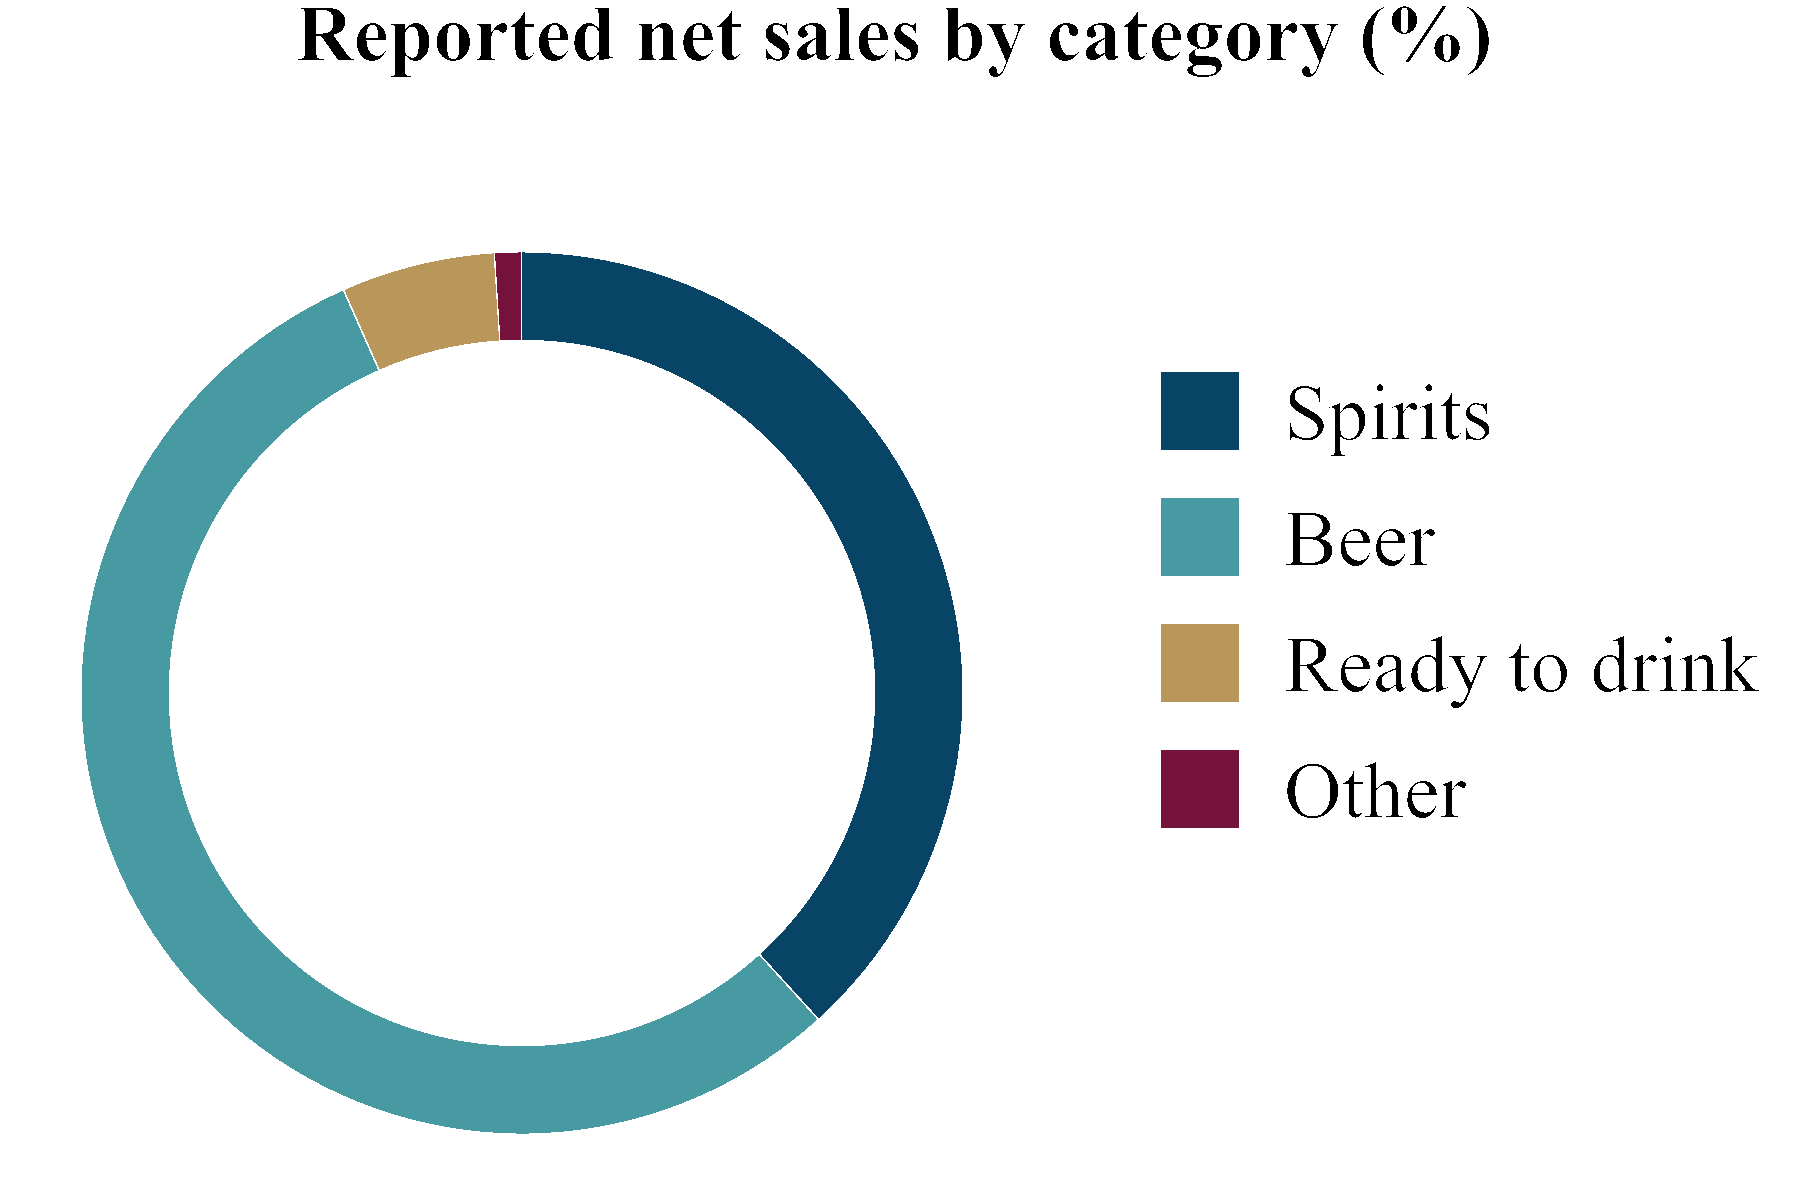
Europe contributed | Europe organic net sales grew | |
23% of Diageo reported net sales in first half of fiscal 24 | 3% in first half of fiscal 24 |
23
Asia Pacific
•Reported net sales grew 2%, driven by organic growth, partially offset by the disposal of Windsor and the negative impact
of foreign exchange.
•Organic net sales grew 6%, driven by double-digit growth in Greater China, lapping low single-digit growth in the prior
year, and high single-digit growth in India. This was partially offset by declines in markets lapping on-trade recovery,
mainly North Asia and South East Asia, as well as a decline in Australia.
•Price/mix of 8% was driven by price increases and the growth of ultra-premium and super-premium price tiers, led by
Chinese white spirits, scotch and tequila.
•Spirits net sales grew 8%, primarily driven by strong double-digit growth in Chinese white spirits; IMFL whisky(1) and The
Singleton also grew double-digits. Tequila delivered triple-digit growth, primarily in South East Asia and Travel Retail,
albeit on a smaller base.
•Organic operating margin declined by 84bps. Positive mix, attributable to growth in Chinese white spirits in Greater China,
as well as favourable product mix in India driving positive gross margin, was more than offset by marketing investment.
•Marketing investment grew 15%, mainly driven by incremental investment in Chinese white spirits, as well as Don Julio
1942 and single malts across almost all markets.
Market highlights:
•India net sales grew 9%, driven by double-digit growth in IMFL whisky and scotch. Scotch growth was driven by Johnnie
Walker and Black & White.
•Greater China net sales grew 18%, primarily driven by strong growth in Chinese white spirits, reflecting the recovery of the
on-trade following the easing of Covid-19 restrictions.
•Australia net sales declined 6%, primarily driven by RTD cocktails.
•South East Asia net sales declined 5%, lapping strong double-digit growth in the prior period. Growth across the region,
mainly in Don Julio and The Singleton, was more than offset by double-digit declines in Vietnam, particularly impacting
Johnnie Walker.
•North Asia (Korea and Japan) net sales declined 6%, lapping strong growth in the prior period driven by the recovery of the
on-trade. The decline was attributable to scotch, primarily Johnnie Walker Black Label and White Horse.
•Travel Retail Asia and Middle East net sales grew 4%, primarily driven by Don Julio 1942.
F23 H1 Re-presented(2) | Exchange | Acquisitions and disposals | Organic movement | F24 H1 | Reported movement | |
Key financials: Asia Pacific | $ million | $ million | $ million | $ million | $ million | % |
Net sales | 2,169 | (23) | (65) | 125 | 2,206 | 2 |
Marketing | 356 | — | (3) | 53 | 406 | 14 |
Operating profit before exceptional items | 704 | (24) | (14) | 23 | 689 | (2) |
Exceptional operating items(3) | (25) | — | ||||
Operating profit | 679 | 689 | 1 |
(1) Indian-Made Foreign Liquor (IMFL) whisky.
(2) See page F-7 for an explanation under Basis of preparation.
(3)For further details on exceptional operating items see pages 15 and F-11-F-13.
24
Organic volume movement | Reported volume movement | Organic net sales movement | Reported net sales movement | |
Markets and categories: | % | % | % | % |
Asia Pacific(1) | (2) | (15) | 6 | 2 |
India(1) | — | (16) | 9 | (1) |
Greater China | 20 | 20 | 18 | 14 |
Australia | (10) | (10) | (6) | (8) |
South East Asia(1) | (15) | (15) | (5) | — |
North Asia | (27) | (27) | (6) | (18) |
Travel Retail Asia and Middle East | (18) | (18) | 4 | 12 |
Spirits(1)(2) | (2) | (14) | 8 | 3 |
Beer | (11) | (11) | (8) | (6) |
Ready to drink | (17) | (17) | (12) | (14) |
Organic volume movement(3) | Organic net sales movement | Reported net sales movement | |
Key brands(2): | % | % | % |
Johnnie Walker | (11) | 1 | 5 |
Shui Jing Fang(4) | 44 | 32 | 27 |
McDowell's | (5) | 3 | (1) |
The Singleton | 28 | 22 | 20 |
Smirnoff | (2) | (1) | (5) |
Royal Challenge | 13 | 20 | 17 |
Guinness | (11) | (9) | (7) |
Black & White | 17 | 22 | 19 |
(1)Reported volume movement includes impacts from acquisitions and/or disposals. For further details see pages 38-41.
(2)Spirits brands excluding ready to drink and non-alcoholic variants.
(3) Organic equals reported volume movement.
(4)Growth figures represent total Chinese white spirits of which Shui Jing Fang is the principal brand.
Asia Pacific contributed | Asia Pacific organic net sales grew | |
20% of Diageo reported net sales in first half of fiscal 24 | 6% in first half of fiscal 24 |
25
Latin America and Caribbean
•Reported net sales declined 18%, reflecting weaker organic performance partially offset by a favourable impact from
foreign exchange, mainly due to a strengthening of various major regional currencies.
•Organic net sales declined 23%, driven by softening consumer demand across LAC markets and lapping strong double-digit
growth. Despite depletions running ahead of shipments during the period, inventory levels in the channel remained elevated
at the end of the first half of fiscal 24.
•Price/mix declined 4%, reflecting higher trade investment to manage inventory towards appropriate levels for the current
macroeconomic environment, and consumer downtrading.
•Spirits net sales declined 25%, primarily led by a double-digit decline in scotch, particularly Buchanan's, Johnnie Walker
Black Label and Old Parr, as well as a strong double-digit decline in Don Julio.
•Organic operating margin declined by 994bps, driven by lower operating leverage, increased trade investment and cost
inflation.
•Marketing investment declined 19%, slightly behind the organic net sales decline, in response to the softening consumer
environment.
Market highlights:
•Brazil net sales declined 27%, primarily driven by a strong double-digit decline in scotch across all brands, while winning
market share in the scotch, vodka and gin categories.
•Mexico net sales declined 28%, primarily driven by strong double-digit declines in tequila, led by Don Julio, and scotch.
•Central America and Caribbean (CCA) net sales declined 29%, primarily due to strong double-digit declines in scotch and
tequila, which more than offset strong triple-digit growth in Smirnoff Ice flavoured malt beverages.
•Andean (Colombia and Venezuela) net sales declined 22%, with positive price/mix more than offset by lower volume.
Scotch contracted 25%, primarily driven by strong double-digit declines in Buchanan’s and Johnnie Walker, and a double-
digit decline in Old Parr.
•South LAC (Argentina, Bolivia, Chile, Ecuador, Paraguay, Peru and Uruguay) net sales grew 4%, driven by strong price/
mix, partially offset by a decline in volume.
F23 H1 Re-presented(1) | Exchange | Organic movement | Other(2) | F24 H1 | Reported movement | |
Key financials: Latin America and Caribbean | $ million | $ million | $ million | $ million | $ million | % |
Net sales | 1,299 | 80 | (310) | — | 1,069 | (18) |
Marketing | 209 | 15 | (40) | — | 184 | (12) |
Operating profit | 538 | 36 | (234) | (24) | 316 | (41) |
(1)See page F-7 for an explanation under Basis of preparation.
(2)Fair value remeasurements. For further details see page 15.
26
Organic volume movement | Reported volume movement | Organic net sales movement | Reported net sales movement | |
Markets and categories: | % | % | % | % |
Latin America and Caribbean | (19) | (19) | (23) | (18) |
Brazil | (15) | (15) | (27) | (23) |
Mexico | (21) | (21) | (28) | (18) |
CCA | (22) | (22) | (29) | (26) |
South LAC | (19) | (19) | 4 | (13) |
Andean | (27) | (27) | (22) | 6 |
Spirits | (19) | (19) | (25) | (19) |
Beer | 12 | 12 | 45 | 51 |
Ready to drink | (13) | (13) | (13) | (10) |
Organic volume movement(2) | Organic net sales movement | Reported net sales movement | |
Key brands(1): | % | % | % |
Johnnie Walker | (14) | (18) | (16) |
Buchanan’s | (24) | (32) | (20) |
Don Julio | (28) | (36) | (29) |
Old Parr | (20) | (30) | (20) |
Smirnoff | (17) | (16) | (16) |
Black & White | (25) | (32) | (24) |
Baileys | (25) | (18) | (14) |
White Horse | (17) | (31) | (26) |
(1)Spirits brands excluding ready to drink and non-alcoholic variants.
(2)Organic equals reported volume movement.
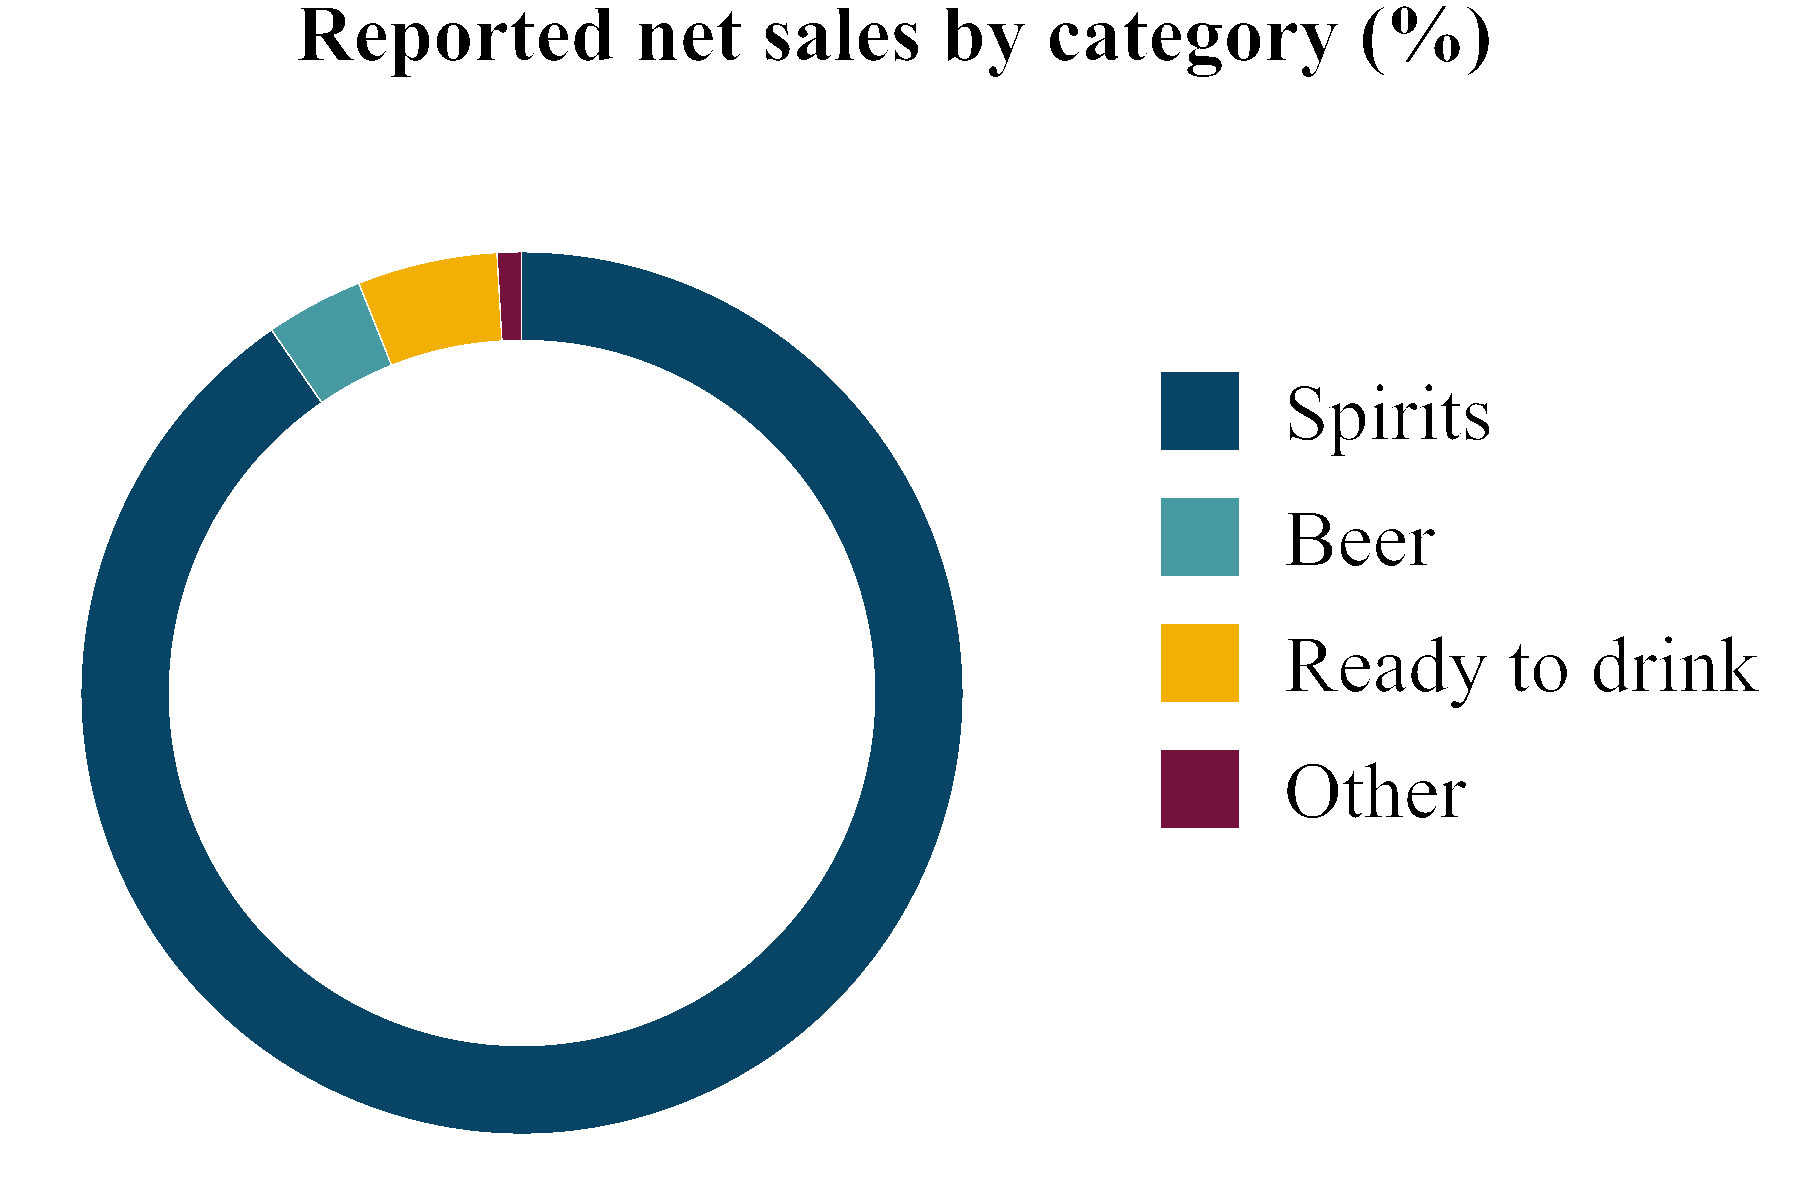
Latin America and Caribbean contributed | Latin America and Caribbean organic net sales declined | |
10% of Diageo reported net sales in first half of fiscal 24 | 23% in first half of fiscal 24 |
27
Africa
•Reported net sales declined 12%, reflecting an unfavourable impact from foreign exchange, mainly due to a weakening
Nigerian naira and Kenyan shilling, partially offset by organic growth.
•Organic net sales grew 9%, with growth across all markets except South Africa. Growth was driven by price increases,
partially offset by a 6% decline in volume.
•Price/mix grew 16%, mainly due to broad-based price increases in Nigeria, Africa Regional Markets and East Africa.
Volume declines were driven by spirits, mainly vodka and scotch, primarily in the value and standard price tiers.
•Spirits net sales declined 4%, driven by a 14% volume decrease, mainly in international spirits led by Smirnoff 1818 and
Johnnie Walker Red Label. Chrome and Orijin also contributed to the volume decline.
•Beer net sales grew 17%, with strong growth in all main beer markets, Nigeria, East Africa and Africa Regional Markets.
The increase was primarily driven by Malta Guinness, Senator and Guinness, each delivering double digit growth. Net sales
benefitted from price increases and volume growth of 3%.
•Organic operating margin increased by 2bps, as price increases and productivity savings more than offset cost inflation.
•Marketing investment grew 6%, focused on supporting spirits premiumisation, Guinness and tequila penetration.
Market highlights:
•East Africa net sales increased 9%, lapping a softer comparator and driven by price increases and 2% volume growth. The
increase was primarily driven by beer, mainly Senator. Spirits also contributed to the improvement led by gin, rum and
scotch, followed by RTD, particularly Smirnoff Ice.
•Nigeria net sales grew 20%, driven by strong price/mix supported by price increases across all categories. Growth was
partially offset by a decline in volume.
•Africa Regional Markets net sales grew 11%, led by growth in beer, primarily driven by Malta Guinness and Guinness,
supported by price increases. The growth was partially offset by a decline in spirits particularly in Johnnie Walker. Strong
price/mix more than offset a volume decline of 10%.
•South Africa net sales declined 15%, primarily driven by lower volume of 21%, reflecting declines in Johnnie Walker Black
Label and Smirnoff 1818.
F23 H1 Re-presented(1) | Exchange | Reclassifi- cation | Acquisitions and disposals | Organic movement | Hyper- inflation(2) | F24 H1 | Reported movement | |
Key financials: Africa | $ million | $ million | $ million | $ million | $ million | $ million | $ million | % |
Net sales | 1,113 | (229) | — | (8) | 95 | 4 | 975 | (12) |
Marketing | 133 | (25) | (7) | (2) | 7 | — | 106 | (20) |
Operating profit | 215 | (93) | — | (3) | 21 | (10) | 130 | (40) |
(1)See page F-7 for an explanation under Basis of preparation.
(2)See pages F15 and 37-40 for details on hyperinflation adjustments.
28
Markets: | Organic volume movement | Reported volume movement | Organic net sales movement | Reported net sales movement |
Markets and categories: | % | % | % | % |
Africa(1) | (6) | (4) | 9 | (12) |
East Africa | 2 | 2 | 9 | (5) |
Nigeria | (15) | (15) | 20 | (35) |
Africa Regional Markets(1) | (10) | (13) | 11 | (17) |
South Africa | (21) | 5 | (15) | 17 |
Spirits(1) | (14) | (8) | (4) | (8) |
Beer(1) | 3 | 3 | 17 | (14) |
Ready to drink(1) | (2) | (28) | 28 | (24) |
Organic volume movement(3) | Organic net sales movement | Reported net sales movement | |
Key brands(2): | % | % | % |
Guinness | (12) | 11 | (32) |
Malta Guinness | 4 | 47 | (4) |
Senator | 31 | 34 | 11 |
Johnnie Walker | (22) | (11) | (18) |
Smirnoff | (19) | (11) | (25) |
Tusker | (3) | 3 | (9) |
Serengeti | (12) | (3) | (9) |
(1)Reported volume movement includes impacts from acquisitions and/or disposals. For further details see pages 38-41.
(2)Spirits brands excluding ready to drink and non-alcoholic variants.
(3)Organic equals reported volume movement, except for Guinness which had reported volume movement of (10)%.
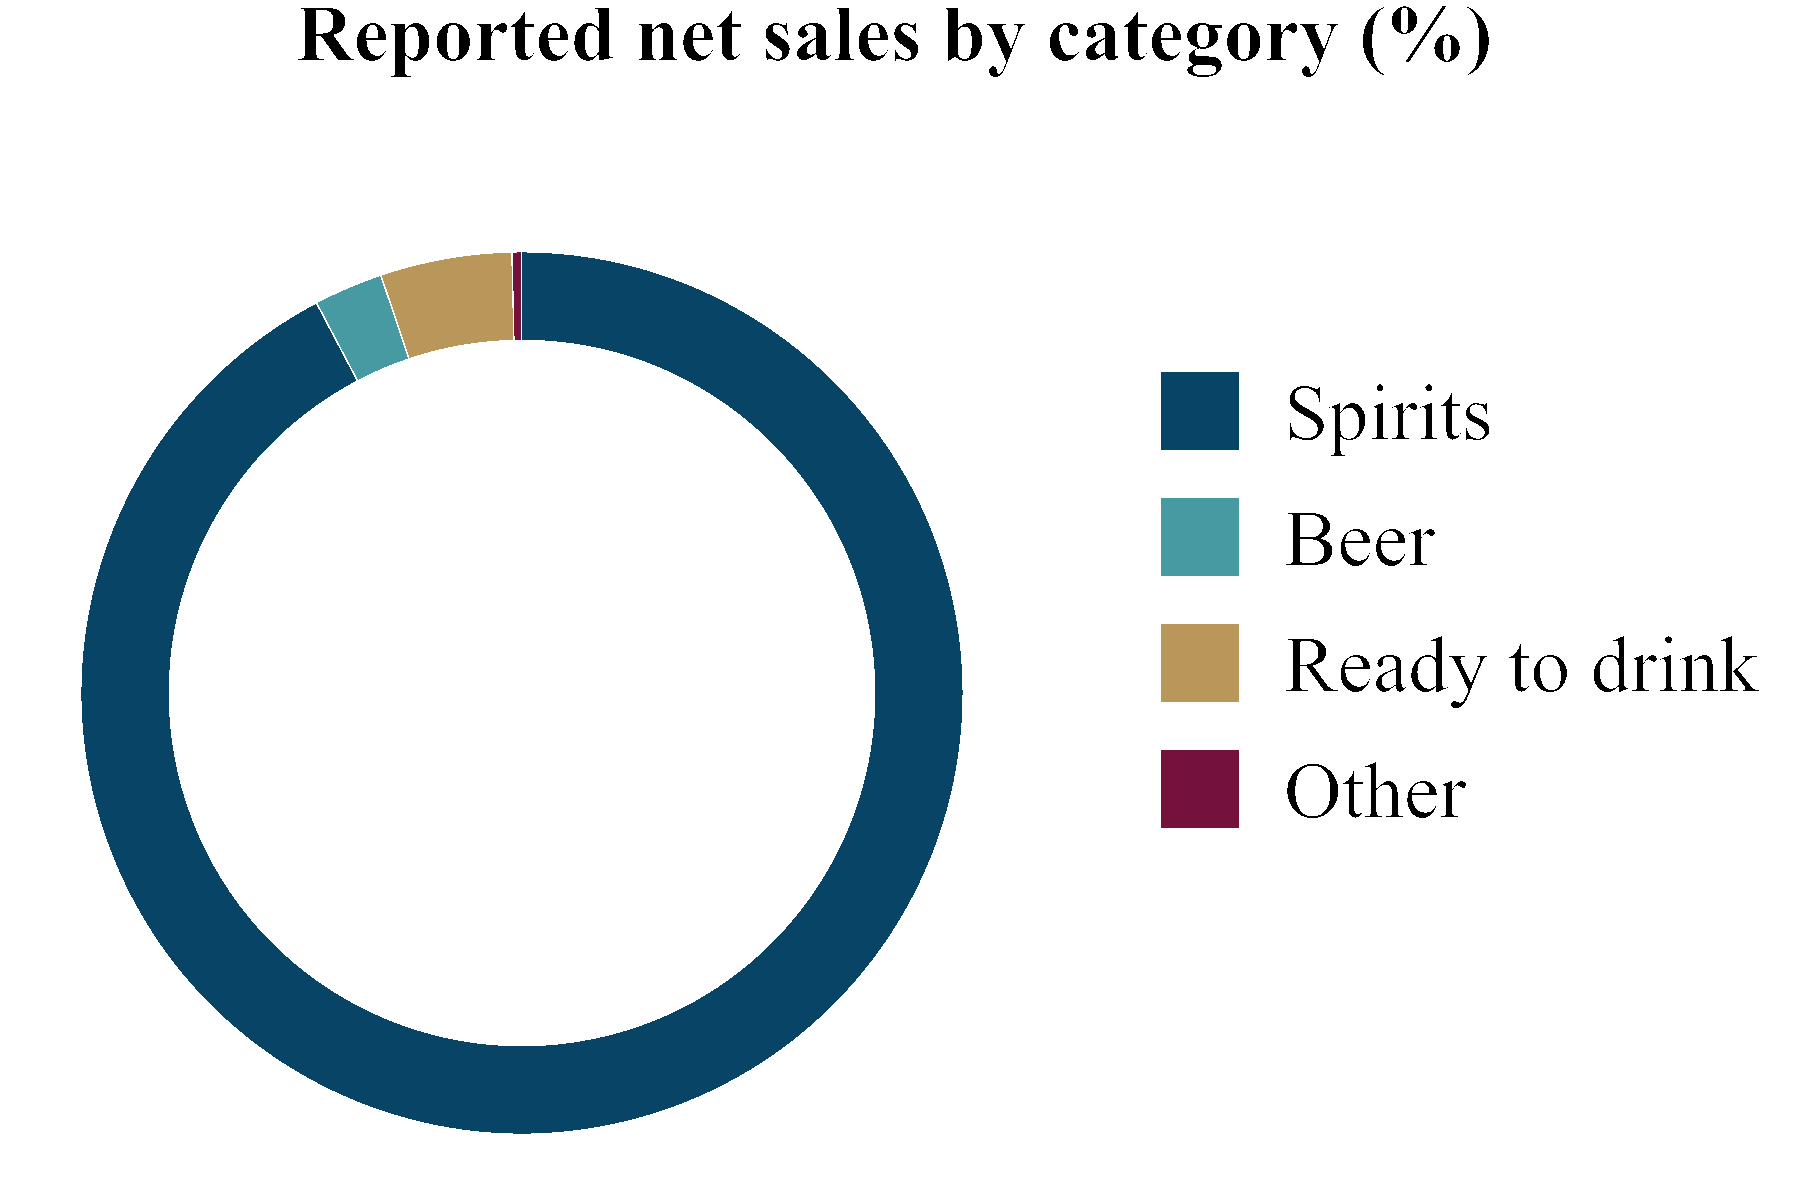
Africa contributed | Africa organic net sales grew | |
9% of Diageo reported net sales in first half of fiscal 24 | 9% in first half of fiscal 24 |
29
Corporate
Net sales
Corporate net sales principally arise from visitor centres and the global licensing of Diageo brands and trademarks. Corporate
net sales were $63 million in the six months ended 31 December 2023, an increase of $12 million compared to the six months
ended 31 December 2022. Net sales were favourably impacted by an organic increase of $9 million and $3 million exchange
rate movement gain.
Operating profit
Corporate operating costs comprise central costs, including finance, marketing, corporate relations, human resources and legal,
as well as certain information systems, facilities and employee costs that are not allocated to the geographical segments or to the
Supply Chain and Procurement segment. Operating costs were $147 million in the six months ended 31 December 2023, a
decrease of $50 million compared to the six months ended 31 December 2022. The $50 million decrease in costs in the six
months ended 31 December 2023 mainly originates from overhead accrual benefits, further affected by favourable transactional
exchange rate impact of $10 million primarily due to the strengthening of sterling against the US dollar.
30
Category and brand review
•Scotch net sales declined 10%, primarily due to LAC. Excluding LAC scotch net sales declined 5%.
◦Johnnie Walker declined 5%, led by LAC, followed by North America, partially offset by growth in Europe.
◦Buchanan's, excluding Buchanan's Pineapple(1), declined 29% due to lower volume of 21% mainly led by LAC.
North America also contributed to the decline.
◦Scotch malts declined 12%, led by Europe and North America lapping the launch of innovations including Lagavulin
11YO Charred Oak Cask.
•Tequila net sales declined 6%, attributable to declines in North America and LAC, partially offset by strong growth in Europe,
APAC, and Africa, reflecting the global expansion of Don Julio.
•Vodka net sales declined 5%, primarily due to lower volume, mainly driven by Cîroc in North America and Europe.
•Rum net sales declined 5%, led by Europe, with volumes declining across all regions.
•Liqueurs net sales declined 1%, primarily driven by Baileys in LAC, APAC and Africa, largely offset by growth in North
America.
•Beer net sales grew 14%, with strong growth in all regions except APAC. Growth was led by strong performance of Guinness
in Europe, Africa, and North America as well as Malta and Senator in Africa. Beer volume grew 3%.
•Ready to drink net sales declined 3%, driven by APAC, Europe and LAC, partially offset by growth in Africa and North
America.
•Total trade market share grew or held in 30%(2) of total net sales value in measured markets. This compares to 75% in the first
half of fiscal 23. The decline was primarily driven by a 17bps share loss in North America, which represents 39% of the total
net sales value in measured markets in the first half of fiscal 24.
Key categories: | Organic volume movement(3) % | Organic net sales movement % | Reported net sales movement % | Reported net sales by category % |
Spirits(4) | (6) | (3) | (2) | 80 |
Scotch | (10) | (10) | (8) | 26 |
Tequila | — | (6) | (5) | 11 |
Vodka(5)(6) | (9) | (5) | (5) | 9 |
Canadian whisky(7) | (4) | (2) | (2) | 6 |
Rum(6) | (16) | (5) | — | 5 |
Liqueurs | (6) | (1) | 2 | 6 |
Gin(6) | (10) | (6) | 3 | 5 |
IMFL whisky(7) | 4 | 10 | (4) | 4 |
Chinese white spirits(7) | 44 | 32 | 27 | 4 |
US whiskey(7) | (1) | 6 | 6 | 2 |
Beer | 3 | 14 | 4 | 15 |
Ready to drink | (11) | (3) | (10) | 4 |
(1)Buchanan's Pineapple is not classified as a scotch.
(2)Internal estimates incorporating Nielsen, Association of Canadian Distillers, Dichter & Neira, Frontline, INTAGE, IRI, ISCAM, NABCA, State Monopolies,
TRAC, IPSOS and other third-party providers. All analysis of data has been applied with a tolerance of +/- 3 bps. Percentages represent percent of markets by
total Diageo net sales contribution that have held or gained total trade share fiscal year to date. Measured markets indicate a market where we have purchased
any market share data. Market share data may include beer, wine, spirits or other elements. Measured market net sales value sums to 89% of total Diageo net
sales value in the first half of fiscal 24.
(3)Organic equals reported volume movement except for spirits (10)%, vodka (10)%, liqueurs (5)%, gin (3)%, IMFL whisky (15)%,and ready to drink (18)%.
(4)Spirits brands excluding ready to drink and non-alcoholic variants.
(5)Vodka includes Ketel One Botanical.
(6)Vodka, rum and gin include IMFL variants.
(7)See pages 20-21 for details of Canadian whisky, US whiskey and pages 24-25 for details of IMFL whisky and Chinese white spirits.
31
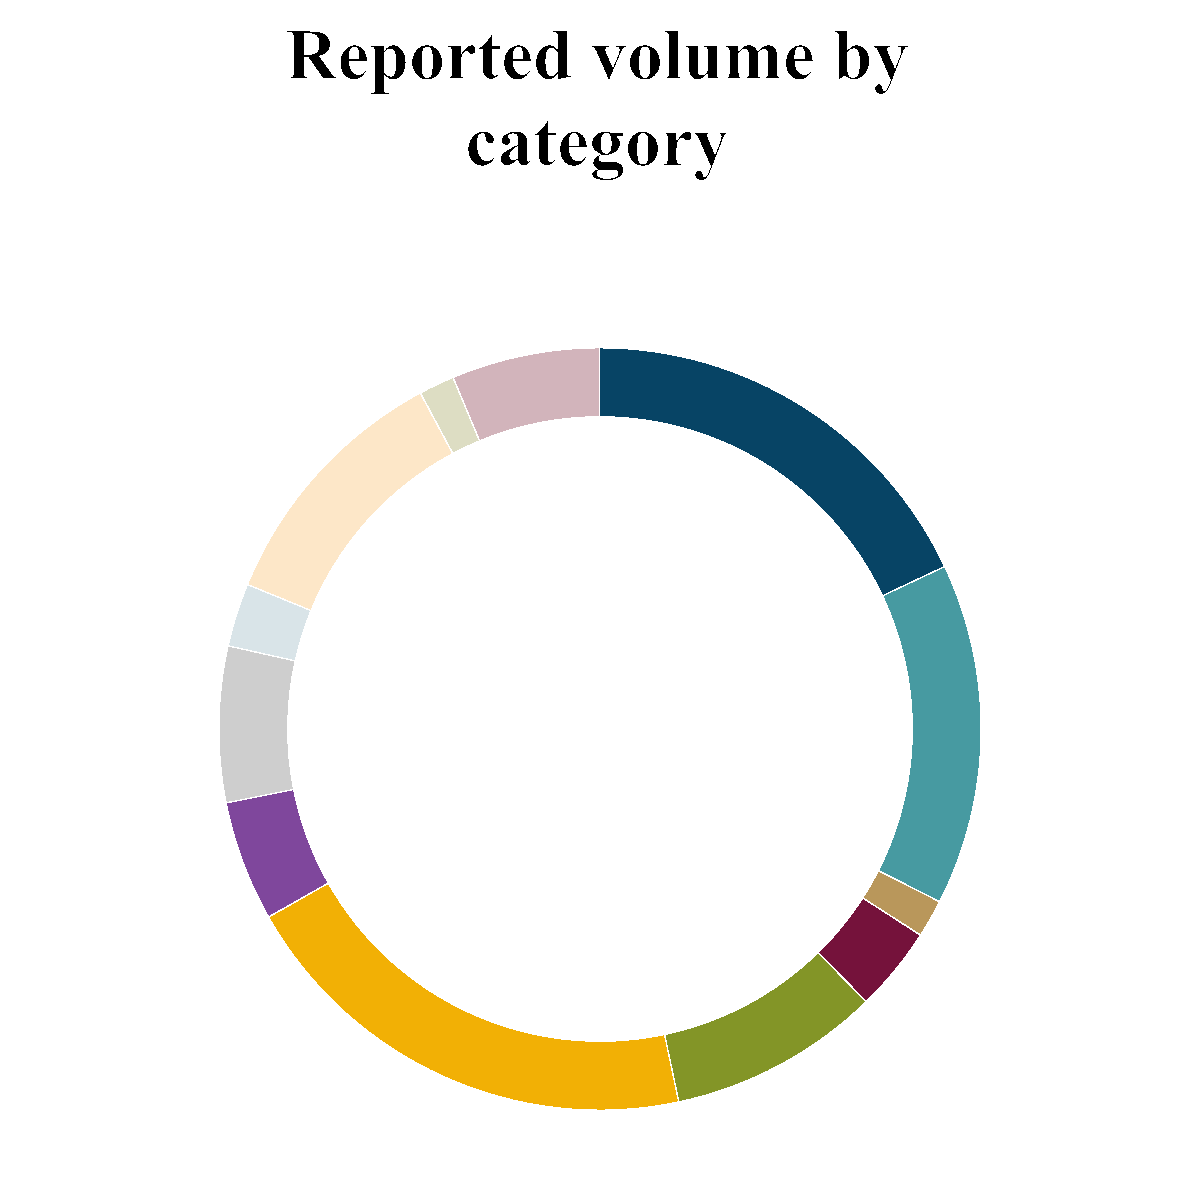
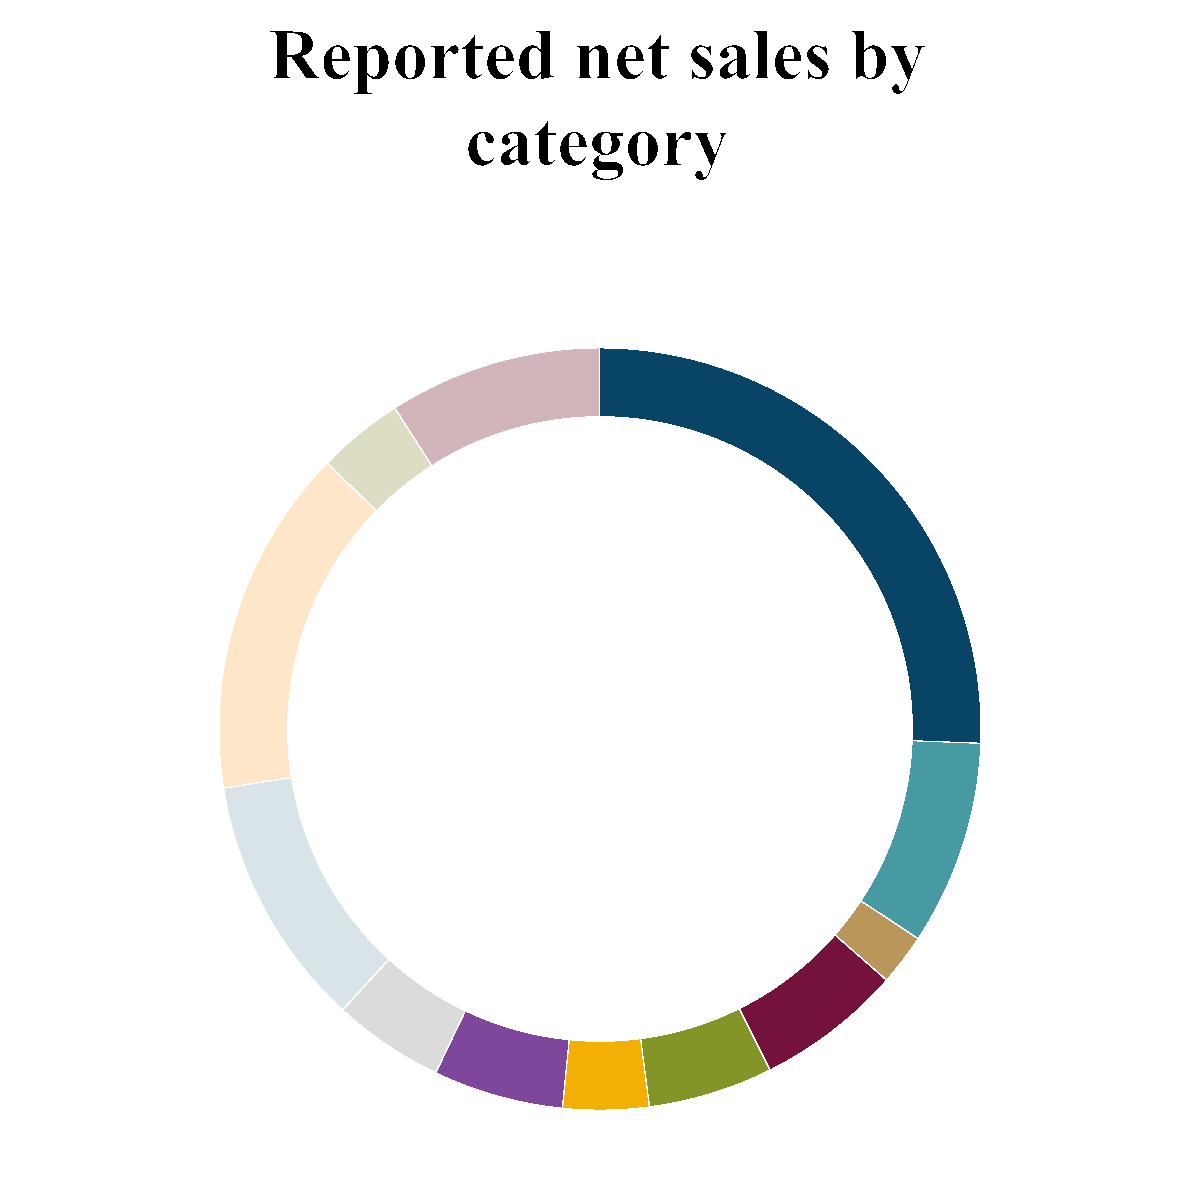
n | Scotch | n | Vodka | n | US whiskey | n | Canadian whisky | n | Rum | n | IMFL whisky |
n | Liqueurs | n | Gin | n | Tequila | n | Beer | n | Ready to drink | n | Other |
Key brands(1): | Organic volume movement(2) % | Organic net sales movement % | Reported net sales movement % |
Johnnie Walker | (7) | (5) | (3) |
Guinness | (1) | 14 | 6 |
Smirnoff | (8) | (1) | (1) |
Don Julio | 7 | (1) | 1 |
Crown Royal | (3) | (2) | (2) |
Baileys | (5) | — | 2 |
Casamigos(3) | (8) | (13) | (13) |
Shui Jing Fang(4) | 44 | 32 | 27 |
Captain Morgan | (9) | (3) | (2) |
Scotch malts | (6) | (12) | (11) |
Buchanan’s | (6) | (11) | (2) |
McDowell's | (5) | 2 | (1) |
Gordon's | (13) | (4) | 19 |
Tanqueray | (12) | (10) | (10) |
Bulleit whiskey(5) | (20) | (22) | (21) |
Ketel One(6) | (6) | (5) | (5) |
Cîroc vodka | (22) | (23) | (22) |
Old Parr | (18) | (25) | (17) |
Black & White | (13) | (12) | (9) |
Yenì Raki | (4) | (6) | 11 |
JεB | (12) | (17) | (13) |
Bundaberg | (5) | (1) | (4) |
(1)Brands excluding ready to drink, non-alcoholic variants and beer except Guinness.
(2)Organic equals reported volume movement, except for Gordon's which had reported volume movement of 1%.
(3)Casamigos trademark includes both tequila and mezcal.
(4)Growth figures represent total Chinese white spirits of which Shui Jing Fang is the principal brand.
(5)Bulleit whiskey excludes Bulleit Crafted Cocktails.
(6)Ketel One includes Ketel One vodka and Ketel One Botanical.
32
LIQUIDITY AND CAPITAL RESOURCES
1. Sources and uses of liquidity
The primary source of the group’s liquidity over the last three financial years has been cash generated from operations. These
funds have generally been used to pay interest, taxes and dividends, and to fund capital expenditure and acquisitions, and,
together with the group’s current strong cash position, are expected to continue to fund future operating and capital needs. The
group also issues short-term commercial paper regularly in order to finance its day-to-day operations.
The table below sets forth the group’s available undrawn committed bank facilities as at 31 December 2023.
31 December 2023 | |
$ million | |
Expiring within one year | 125 |
Expiring between one and two years | 625 |
Expiring after two years | 2,625 |
3,375 |
The facilities can be used for general corporate purposes and, together with cash and cash equivalents, support the group’s
commercial paper programmes.
There are no financial covenants on the group’s material short- and long-term borrowings. Certain of these borrowings contain
cross default provisions and negative pledges.
The committed bank facilities are subject to a single financial covenant, being minimum interest cover ratio of two times
(defined as the ratio of operating profit before exceptional items, aggregated with share of after tax results of associates and
joint ventures, to net interest charges). They are also subject to pari passu ranking and negative pledge covenants.
Any non-compliance with covenants underlying Diageo’s financing arrangements could, if not waived, constitute an event of
default with respect to any such arrangements, and any non-compliance with covenants may, in particular circumstances, lead
to an acceleration of maturity on certain borrowings and the inability to access committed facilities. Diageo was in full
compliance with its financial, pari passu ranking and negative pledge covenants in respect of its material short- and long-term
borrowings throughout each of the years presented.
Management believe that it has sufficient funding for its working capital requirements.
2. Analysis of cash flows
The table below sets forth the group’s cash flows as at 31 December 2023.
31 December 2023 | |
$ million | |
Net cash inflow from operating activities | 2,146 |
Net cash outflow from investing activities | (720) |
Net cash outflow from financing activities | (1,667) |
Net decrease in net cash and cash equivalents | (241) |
Exchange differences | (45) |
Net cash and cash equivalents at beginning of period | 1,768 |
Net cash and cash equivalents at end of the period | 1,482 |
Net cash inflow from operating activities was $2,146 million, an increase of $674 million compared to the first half of fiscal 23,
primarily driven by strong working capital management and lapping one-off cash tax payments in the prior period, which was
partially offset by the decline in operating profit and increased interest payments.
Net cash outflow from investing activities was $720 million, an increase of $156 million compared to the first half of fiscal 23,
mainly driven by an increased capital investment, which was partially offset by business acquisitions ($54 million) and sale of
business ($18 million).
33
Net cash outflow from financing activities was $1,667 million, an increase of $1,392 million compared to the first half of fiscal
23. This change was largely driven by $558 million net inflow in relation to bond issuances and repayments (2022 – $1,689
million net inflow).
The operating, investing and financing activities described above resulted in a decrease in net cash and cash equivalents of $286
million, from $1,768 million at 30 June 2023 to $1,482 million at 31 December 2023.
3. Analysis of borrowings
The group policy with regard to the expected maturity profile of borrowings of group finance companies is to limit the
proportion of such borrowings maturing within 12 months to 50% of gross borrowings less money market demand deposits, and
the level of commercial paper to 30% of gross borrowings less money market demand deposits. In addition, it is group policy to
maintain backstop facility terms from relationship banks to support commercial paper obligations.
The group’s gross borrowings and net borrowings are measured at amortised cost with the exception of borrowings designated
in fair value hedge relationships, interest rate hedging instruments and foreign currency swaps and forwards. For borrowings
designated in fair value hedge relationships, Diageo recognises a fair value adjustment for the risk being hedged in the balance
sheet, whereas interest rate hedging instruments and foreign currency swaps and forwards are measured at fair value.
The table below sets forth the group’s gross borrowings and net borrowings as at 31 December 2023.
31 December 2023 | 30 June 2023 | |
$ million | Re-presented $ million | |
Overdrafts | (47) | (45) |
Other borrowings due within one year | (1,957) | (2,097) |
Borrowings due within one year | (2,004) | (2,142) |
Borrowings due between one and three years | (4,807) | (4,437) |
Borrowings due between three and five years | (3,826) | (3,620) |
Borrowings due after five years | (10,843) | (10,592) |
Fair value of foreign currency forwards and swaps | 406 | 436 |
Fair value of interest rate hedging instruments | (366) | (476) |
Lease liabilities | (572) | (564) |
Gross borrowings | (22,012) | (21,395) |
Offset by: | ||
Cash and cash equivalents | 1,529 | 1,813 |
Net borrowings | (20,483) | (19,582) |
The table below sets forth the percentage of the group’s gross borrowings and cash and cash equivalents by currency as at 31
December 2023.
Total $ million | US dollar % | Sterling % | Euro % | Indian rupee % | Nigerian naira % | Russian rouble % | Chinese yuan % | Other % | |
Gross borrowings | (22,012) | 51% | 18% | 23% | —% | —% | —% | 3% | 5% |
Cash and cash equivalents | 1,529 | 17% | 4% | 5% | 5% | 7% | —% | 27% | 35% |
Based on average monthly net borrowings and net interest charge, the effective interest rate for the six months ended 31
December 2023 was 4.4%. For this calculation, net interest charge excludes fair value adjustments to derivative financial
instruments and borrowings and average monthly net borrowings include the impact of interest rate swaps that are no longer in
a hedge relationship but exclude the market value adjustment for cross currency interest rate swaps.
For the six months ended 31 December 2023, the group issued bonds of $1,700 million ($1,690 million - net of discount and
fee) and repaid bonds of $500 million and €600 million ($632 million). In the six months ended 31 December 2022, the group
issued bonds of $2,000 million (cash flow includes related discount and fee) and repaid bonds of $300 million.
34
In the six months ended 31 December 2023, the net movements in other borrowings principally arose from the decrease in
commercial paper, collateral and bank loan balances, cash outflows of foreign currency swaps and forwards, and repayment of
lease liabilities. In the six months ended 31 December 2022, the net movements in other borrowings principally arose from cash
movement of foreign currency swaps and forwards and repayment of lease liabilities offset by the increase in bank loans.
The group’s management is committed to enhancing shareholder value in the long-term, both by investing in the business and
brands so as to deliver continued improvement in the return from those investments and by managing the capital structure.
Diageo manages its capital structure to achieve capital efficiency, provide flexibility to invest through the economic cycle and
give efficient access to debt markets at attractive cost levels. This is achieved by targeting an adjusted net borrowings (net
borrowings aggregated with post employment benefit liabilities) to adjusted EBITDA leverage of 2.5 - 3.0 times, this range for
Diageo being currently broadly consistent with an A band credit rating. Diageo would consider operating outside of this range
in order to effect strategic initiatives within its stated goals, which could have an impact on its rating. If Diageo’s leverage was
to be negatively impacted by the financing of an acquisition, it would seek over time to return to the range of 2.5 – 3.0 times.
The group regularly assesses its debt and equity capital levels against its stated policy for capital structure. As at 31 December
2023, the adjusted net borrowings ($20,954 million) to adjusted EBITDA ratio was 2.9 times. For this calculation, net
borrowings are adjusted by post employment benefit liabilities before tax ($471 million) whilst adjusted EBITDA ($7,195
million) comprises operating profit excluding exceptional operating items and depreciation, amortisation and impairment and
includes share of after tax results of associates and joint ventures.
The group’s funding, liquidity and exposure to foreign currency, interest rate risks, financial credit risk and commodity price
risk are conducted within a framework of board approved policies and guidelines. The group purchases insurance for
commercial or, where required, for legal or contractual reasons. In addition, the group retains some insurable risk where
external insurance is not considered to be an economic means of mitigating this risk. Loan, trade and other receivables
exposures are managed locally in the operating units where they arise and credit limits are established as deemed appropriate
for the customer.
b) The following bonds were issued and repaid:
31 December 2023 | 31 December 2022 | |
$ million | Re-presented $ million | |
Issued | ||
$ denominated | 1,690 | 1,989 |
Repaid | ||
€ denominated | (632) | — |
$ denominated | (500) | (300) |
558 | 1,689 |
4. Capital repayments
Authorisation was given by shareholders on 28 September 2023 to purchase a maximum of 224,704,974 ordinary shares at a
minimum price of 28101/108 pence and a maximum price of higher of (a) 105% of the average market value of the company's
ordinary shares for the five business days prior to the day the purchase is made and (b) the higher of the price of the last
independent trade and the highest current independent bid on the trading venue where the purchase is carried out. The
programme expires at the conclusion of the next Annual General Meeting or on 27 December 2024, if earlier.
35
DEFINITIONS AND RECONCILIATION OF NON-GAAP MEASURES TO GAAP MEASURES
Diageo’s strategic planning process is based on certain non-GAAP measures, including organic movements. These non-GAAP
measures are chosen for planning and reporting, and some of them are used for incentive purposes. The group’s management
believes that these measures provide valuable additional information for users of the financial statements in understanding the
group’s performance. These non-GAAP measures should be viewed as complementary to, and not replacements for, the
comparable GAAP measures and reported movements therein.
It is not possible to reconcile the forecast tax rate before exceptional items, forecast organic net sales growth and forecast
organic operating profit growth to the most comparable GAAP measure as it is not possible to predict, without unreasonable
effort, with reasonable certainty, the future impact of changes in exchange rates, acquisitions and disposals and potential
exceptional items.
Volume
Volume is a performance indicator that is measured on an equivalent units basis to nine-litre cases of spirits. An equivalent unit
represents one nine-litre case of spirits, which is approximately 272 servings. A serving comprises 33ml of spirits, 165ml of
wine, or 330ml of ready to drink or beer. Therefore, to convert volume of products other than spirits to equivalent units, the
following guide has been used: beer in hectolitres, divide by 0.9; wine in nine-litre cases, divide by five; ready to drink and
certain pre-mixed products that are classified as ready to drink in nine-litre cases, divide by ten.
Organic movements
Organic information is presented using US dollar amounts on a constant currency basis excluding the impact of exceptional
items, certain fair value remeasurement, hyperinflation and acquisitions and disposals. Organic measures enable users to focus
on the performance of the business which is common to both years and which represents those measures that local managers are
most directly able to influence.
Calculation of organic movements
The organic movement percentage is the amount in the row titled ‘Organic movement’ in the tables below, expressed as a
percentage of the relevant absolute amount in the row titled ‘Six months ended 31 December 2022 adjusted’. Organic operating
margin is calculated by dividing operating profit before exceptional items by net sales after excluding the impact of exchange
rate movements, certain fair value remeasurements, hyperinflation and acquisitions and disposals.
(a) Exchange rates
Exchange in the organic movement calculation reflects the adjustment to recalculate the reported results as if they had been
generated at the prior period weighted average exchange rates.
Exchange impacts in respect of the external hedging of intergroup sales by the markets in a currency other than their functional
currency and the intergroup recharging of services are also translated at prior period weighted average exchange rates and are
allocated to the geographical segment to which they relate. Residual exchange impacts are reported as part of the Corporate
segment. Results from hyperinflationary economies are translated at forward-looking rates.
(b) Acquisitions and disposals
For acquisitions in the current period, the post-acquisition results are excluded from the organic movement calculations. For
acquisitions in the prior period, post-acquisition results are included in full in the prior period but are included in the organic
movement calculation from the anniversary of the acquisition date in the current period. The acquisition row also eliminates the
impact of transaction costs that have been charged to operating profit in the current or prior period in respect of acquisitions
that, in management’s judgement, are expected to be completed.
Where a business, brand, brand distribution right or agency agreement was disposed of or terminated in the reporting period, the
group, in the organic movement calculations, excludes the results for that business from the current and prior period. In the
calculation of operating profit, the overheads included in disposals are only those directly attributable to the businesses disposed
of, and do not result from subjective judgements of management.
36
(c) Exceptional items
Exceptional items are those that in management’s judgement need to be disclosed separately. Such items are included within the
income statement caption to which they relate, and are excluded from the organic movement calculations. Management believes
that separate disclosure of exceptional items and the classification between operating and non-operating items further helps
investors to understand the performance of the group. Changes in estimates and reversals in relation to items previously
recognised as exceptional are presented consistently as exceptional in the current year.
Exceptional operating items are those that are considered to be material and unusual or non-recurring in nature and are part of
the operating activities of the group, such as one-off global restructuring programmes which can be multi-year, impairment of
intangible assets and fixed assets, indirect tax settlements, property disposals and changes in post employment plans.
Gains and losses on the sale or directly attributable to a prospective sale of businesses, brands or distribution rights, step up
gains and losses that arise when an investment becomes an associate or an associate becomes a subsidiary and other material,
unusual non-recurring items that are not in respect of the production, marketing and distribution of premium drinks, are
disclosed as exceptional non-operating items below operating profit in the income statement.
Exceptional current and deferred tax items comprise material and unusual or non-recurring items that impact taxation.
Examples include direct tax provisions and settlements in respect of prior years and the remeasurement of deferred tax assets
and liabilities following tax rate changes.
(d) Fair value remeasurement
Fair value remeasurement in the organic movement calculation reflects an adjustment to eliminate the impact of fair value
changes in biological assets, earn-out arrangements that are accounted for as remuneration and fair value changes relating to
contingent consideration liabilities and equity options that arose on acquisitions recognised in the income statement.
Adjustment in respect of hyperinflation
The group's experience is that hyperinflationary conditions result in price increases that include both normal pricing actions
reflecting changes in demand, commodity and other input costs or considerations to drive commercial competitiveness, as well
as hyperinflationary elements and that for the calculation of organic movements, the distortion from hyperinflationary elements
should be excluded.
Cumulative inflation over 100% (2% per month compounded) over three years is one of the key indicators within IAS 29 to
assess whether an economy is deemed to be hyperinflationary. As a result, the definition of 'Organic movements' includes price
growth in markets deemed to be hyperinflationary economies, up to a maximum of 2% per month while also being on a
constant currency basis. Corresponding adjustments have been made to all income statement related lines in the organic
movement calculations.
In the tables presenting the calculation of organic movements, 'hyperinflation' is included as a reconciling item between
reported and organic movements and that also includes the relevant IAS 29 adjustments.
37
Organic movement calculations for the six months ended 31 December 2023 were as follows:
North America million | Europe million | Asia Pacific million | Latin America and Caribbean million | Africa million | Corporate million | Total million | |
Volume (equivalent units) | |||||||
Six months ended 31 December 2022 reported | 27.0 | 29.2 | 47.1 | 15.8 | 17.7 | — | 136.8 |
Disposals(2) | — | — | (6.1) | — | (0.7) | — | (6.8) |
Six months ended 31 December 2022 adjusted | 27.0 | 29.2 | 41.0 | 15.8 | 17.0 | — | 130.0 |
Organic movement | (0.8) | (1.1) | (0.8) | (3.0) | (1.1) | — | (6.8) |
Acquisitions and disposals(2) | 0.1 | 0.2 | — | — | 1.1 | — | 1.4 |
Six months ended 31 December 2023 reported | 26.3 | 28.3 | 40.2 | 12.8 | 17.0 | — | 124.6 |
Organic movement % | (3) | (4) | (2) | (19) | (6) | — | (5) |
North America $ million | Europe $ million | Asia Pacific $ million | Latin America and Caribbean $ million | Africa $ million | Corporate $ million | Total $ million | |
Sales | |||||||
Six months ended 31 December 2022 reported (re-presented) | 4,540 | 4,055 | 3,741 | 1,646 | 1,578 | 51 | 15,611 |
Exchange | (2) | (80) | 17 | 26 | (26) | 1 | (64) |
Disposals(2) | — | (7) | (333) | — | (110) | — | (450) |
Hyperinflation | — | (45) | — | — | — | — | (45) |
Six months ended 31 December 2022 adjusted | 4,538 | 3,923 | 3,425 | 1,672 | 1,442 | 52 | 15,052 |
Organic movement | (128) | 311 | 188 | (328) | 100 | 9 | 152 |
Acquisitions and disposals(2) | 3 | 25 | 29 | — | 65 | — | 122 |
Exchange | (2) | (50) | (78) | 98 | (259) | 2 | (289) |
Hyperinflation | — | 140 | — | — | 4 | — | 144 |
Six months ended 31 December 2023 reported | 4,411 | 4,349 | 3,564 | 1,442 | 1,352 | 63 | 15,181 |
Organic movement % | (3) | 8 | 5 | (20) | 7 | 17 | 1 |
38
North America $ million | Europe $ million | Asia Pacific $ million | Latin America and Caribbean $ million | Africa $ million | Corporate $ million | Total $ million | |
Net sales | |||||||
Six months ended 31 December 2022 reported (re-presented) | 4,149 | 2,339 | 2,169 | 1,299 | 1,113 | 51 | 11,120 |
Exchange | (1) | (6) | 27 | 21 | (18) | 1 | 24 |
Disposals(2) | — | (5) | (89) | — | (73) | — | (167) |
Hyperinflation | — | (16) | — | — | — | — | (16) |
Six months ended 31 December 2022 adjusted | 4,148 | 2,312 | 2,107 | 1,320 | 1,022 | 52 | 10,961 |
Organic movement | (64) | 78 | 125 | (310) | 95 | 9 | (67) |
Acquisitions and disposals(2) | 2 | 25 | 24 | — | 65 | — | 116 |
Exchange | (2) | 11 | (50) | 59 | (211) | 2 | (191) |
Hyperinflation | — | 139 | — | — | 4 | — | 143 |
Six months ended 31 December 2023 reported | 4,084 | 2,565 | 2,206 | 1,069 | 975 | 63 | 10,962 |
Organic movement % | (2) | 3 | 6 | (23) | 9 | 17 | (1) |
North America $ million | Europe $ million | Asia Pacific $ million | Latin America and Caribbean $ million | Africa $ million | Corporate $ million | Total $ million | |
Marketing | |||||||
Six months ended 31 December 2022 reported (re-presented) | 767 | 387 | 356 | 209 | 133 | 9 | 1,861 |
Exchange | (2) | 3 | 3 | 2 | (5) | 2 | 3 |
Reclassification | — | — | — | — | (7) | — | (7) |
Disposals(2) | — | — | (8) | — | (3) | — | (11) |
Hyperinflation | — | (2) | — | — | — | — | (2) |
Six months ended 31 December 2022 adjusted | 765 | 388 | 351 | 211 | 118 | 11 | 1,844 |
Organic movement | 12 | 35 | 53 | (40) | 7 | 3 | 70 |
Acquisitions and disposals(2) | 4 | 16 | 5 | — | 1 | — | 26 |
Exchange | 1 | 4 | (3) | 13 | (20) | 1 | (4) |
Hyperinflation | — | 16 | — | — | — | — | 16 |
Six months ended 31 December 2023 reported | 782 | 459 | 406 | 184 | 106 | 15 | 1,952 |
Organic movement % | 2 | 9 | 15 | (19) | 6 | 27 | 4 |
39
North America $ million | Europe $ million | Asia Pacific $ million | Latin America and Caribbean $ million | Africa $ million | Corporate $ million | Total $ million | |
Operating profit before exceptional items | |||||||
Six months ended 31 December 2022 reported (re-presented) | 1,690 | 820 | 704 | 538 | 215 | (197) | 3,770 |
Exchange(1) | 13 | (12) | 22 | 31 | 27 | 13 | 94 |
Fair value remeasurement of contingent considerations, equity option and earn-out arrangements | (18) | — | — | — | — | — | (18) |
Acquisitions and disposals(2) | 1 | (3) | (21) | — | (18) | — | (41) |
Hyperinflation | — | 9 | — | — | — | — | 9 |
Six months ended 31 December 2022 adjusted | 1,686 | 814 | 705 | 569 | 224 | (184) | 3,814 |
Organic movement | (21) | (34) | 23 | (234) | 21 | 40 | (205) |
Acquisitions and disposals(2) | (12) | (6) | 7 | — | 15 | — | 4 |
Fair value remeasurement of contingent considerations, equity option and earn-out arrangements | 23 | — | — | — | — | — | 23 |
Fair value remeasurement of biological assets | — | — | — | (24) | — | — | (24) |
Exchange(1) | 49 | 25 | (46) | 5 | (120) | (3) | (90) |
Hyperinflation | — | (2) | — | — | (10) | — | (12) |
Six months ended 31 December 2023 reported | 1,725 | 797 | 689 | 316 | 130 | (147) | 3,510 |
Organic movement % | (1) | (4) | 3 | (41) | 9 | 22 | (5) |
Organic operating margin % (3) | |||||||
Six months ended 31 December 2023 | 40.8 | 32.6 | 32.6 | 33.2 | 21.9 | n/a | 33.1 |
Six months ended 31 December 2022 | 40.6 | 35.2 | 33.5 | 43.1 | 21.9 | n/a | 34.8 |
Organic operating margin movement (bps) | 12 | (257) | (84) | (994) | 2 | n/a | (167) |
(1)The impact of movements in exchange rates on reported figures for operating profit was principally in respect of the favourable exchange impact of the
strengthening of the Mexican peso and sterling against the US dollar, partially offset by the weakening of the Nigerian naira, Kenyan shilling and the
Turkish lira.
(2)Acquisitions and disposals that had an effect on organic volume, sales, net sales, marketing and operating profit growth in the six months ended 31
December 2023, are detailed on page 41.
(3)Organic operating margin calculated by dividing Operating profit before exceptional items by net sales.
(i)For the reconciliation of sales to net sales, see page 14.
(ii)Percentages and margin movements are calculated on rounded figures.
40
In the six months ended 31 December 2023, the acquisitions and disposals that affected volume, sales, net sales, marketing and
operating profit were as follows, as per footnote (2) on the previous page:
Volume | Sales | Net sales | Marketing | Operating profit | |
EUm | $ million | $ million | $ million | $ million | |
Six months ended 31 December 2022 (re-presented) | |||||
Acquisitions | |||||
Lone River Ranch Water | — | — | — | — | 1 |
— | — | — | — | 1 | |
Disposals | |||||
USL Popular brands | (5.9) | (276) | (43) | — | (6) |
Archers brand | — | (7) | (5) | — | (3) |
Windsor | (0.2) | (57) | (46) | (8) | (15) |
Guinness Cameroun S.A. | (0.7) | (110) | (73) | (3) | (18) |
(6.8) | (450) | (167) | (11) | (42) | |
Acquisitions and disposals | (6.8) | (450) | (167) | (11) | (41) |
Six months ended 31 December 2023 | |||||
Acquisitions | |||||
Mr Black | 0.1 | 3 | 2 | 1 | (4) |
Balcones Distilling | — | — | — | 3 | (8) |
Gordon's | 0.5 | 52 | 52 | 1 | 5 |
Don Papa Rum | 0.2 | 25 | 25 | 16 | (6) |
0.8 | 80 | 79 | 21 | (13) | |
Disposals | |||||
Windsor | — | 29 | 24 | 5 | 7 |
Guinness Cameroun S.A. | 0.6 | 13 | 13 | — | 10 |
0.6 | 42 | 37 | 5 | 17 | |
Acquisitions and disposals | 1.4 | 122 | 116 | 26 | 4 |
41
Earnings per share before exceptional items
Earnings per share before exceptional items is calculated by dividing profit attributable to equity shareholders of the parent
company before exceptional items by the weighted average number of shares in issue.
Earnings per share before exceptional items for the six months ended 31 December 2023 and 31 December 2022 are set out in
the table below:
2023 | 2022 | |
$ million | Re-presented $ million | |
Profit attributable to equity shareholders of the parent company | 2,210 | 2,709 |
Exceptional operating and non-operating items | 253 | 20 |
Exceptional tax items and tax in respect of exceptional operating and non-operating items | (42) | (84) |
Exceptional items attributable to non-controlling interests | 2 | 1 |
Profit attributable to equity shareholders of the parent company before exceptional items | 2,423 | 2,646 |
Weighted average number of shares | million | million |
Shares in issue excluding own shares | 2,242 | 2,274 |
Dilutive potential ordinary shares | 5 | 7 |
Diluted shares in issue excluding own shares | 2,247 | 2,281 |
cents | Re-presented cents | |
Basic earnings per share before exceptional items | 108.1 | 116.4 |
Diluted earnings per share before exceptional items | 107.8 | 116.0 |
Free cash flow
Free cash flow comprises the net cash flow from operating activities aggregated with the net cash received/paid for working
capital loans receivable, cash paid or received for investments and the net cash expenditure paid for property, plant and
equipment and computer software that are included in net cash flow from investing activities.
The remaining components of net cash flow from investing activities that do not form part of free cash flow, as defined by the
group’s management, are in respect of the acquisition and sale of businesses and non-working capital loans to and from
associates.
The group’s management regards a portion of the purchase and disposal of property, plant and equipment and computer
software as ultimately non-discretionary since ongoing investment in plant, machinery and technology is required to support the
day-to-day operations, whereas acquisition and sale of businesses are discretionary.
Where appropriate, separate explanations are given for the impacts of acquisition and sale of businesses, dividends paid and the
purchase of own shares, each of which arises from decisions that are independent from the running of the ongoing underlying
business.
42
Free cash flow reconciliations for the six months ended 31 December 2023 and 31 December 2022 are set out in the table
below:
2023 | 2022 | |
$ million | Re-presented $ million | |
Net cash inflow from operating activities | 2,146 | 1,472 |
Disposal of property, plant and equipment and computer software | 7 | 8 |
Purchase of property, plant and equipment and computer software | (582) | (514) |
Movements in loans and other investments | (109) | (2) |
Free cash flow | 1,462 | 964 |
Adjusted net borrowings to adjusted EBITDA
Diageo manages its capital structure with the aim of achieving capital efficiency, providing flexibility to invest through the
economic cycle and giving efficient access to debt markets at attractive cost levels. The group regularly assesses its debt and
equity capital levels to enhance its capital structure by reviewing the ratio of adjusted net borrowings (net borrowings
aggregated with post employment benefit liabilities before tax) to adjusted EBITDA (earnings before exceptional operating
items, non-operating items, interest, tax, depreciation, amortisation and impairment).
Calculations for the ratio of adjusted net borrowings to adjusted EBITDA for the six months ended 31 December 2023 and 31
December 2022 are set out in the table below:
2023 | 2022 | |
$ million | Re-presented $ million | |
Borrowings due within one year | 2,004 | 2,767 |
Borrowings due after one year | 19,476 | 18,365 |
Fair value of foreign currency derivatives and interest rate hedging instruments | (40) | (136) |
Lease liabilities | 572 | 526 |
Less: Cash and cash equivalents | (1,529) | (3,319) |
Net borrowings | 20,483 | 18,203 |
Post employment benefit liabilities before tax | 471 | 457 |
Adjusted net borrowings | 20,954 | 18,660 |
Profit for the year | 3,980 | 4,412 |
Taxation | 1,134 | 1,302 |
Net finance charges | 798 | 656 |
Depreciation, amortisation and impairment (excluding exceptional impairment) | 648 | 631 |
Exceptional impairment | 728 | 409 |
EBITDA(1) | 7,288 | 7,410 |
Exceptional operating items (excluding impairment) | 192 | 107 |
Non-operating items | (285) | 27 |
Adjusted EBITDA(1) | 7,195 | 7,544 |
Adjusted net borrowings to adjusted EBITDA | 2.9 | 2.5 |
(1) EBITDA and adjusted EBITDA are calculated based on the last 12 months.
1) EBITDA and adjusted EBITDA are calculated based on the last 12 month
43
Tax rate before exceptional items
Tax rate before exceptional items is calculated by dividing the total tax charge before tax charges and credits in respect of
exceptional items, by profit before taxation adjusted to exclude the impact of exceptional operating and non-operating items,
expressed as a percentage. The measure is used by management to assess the rate of tax applied to the group’s operations before
tax on exceptional items.
The tax rates from operations before exceptional and after exceptional items for the six months ended 31 December 2023 and
31 December 2022 are set out in the table below:
2023 | 2022 | |
$ million | Re-presented $ million | |
Taxation on profit (a) | 737 | 766 |
Tax in respect of exceptional items | 42 | 16 |
Exceptional tax credit | — | 68 |
Tax before exceptional items (b) | 779 | 850 |
Profit before taxation (c) | 3,079 | 3,607 |
Non-operating items | 60 | (19) |
Exceptional operating items | 193 | 39 |
Profit before taxation and exceptional items (d) | 3,332 | 3,627 |
Tax rate after exceptional items (a/c) | 23.9% | 21.2% |
Tax rate before exceptional items (b/d) | 23.4% | 23.4% |
Other definitions
Volume share is a brand’s retail volume expressed as a percentage of the retail volume of all brands in its segment. Value share
is a brand’s retail sales value expressed as a percentage of the retail sales value of all brands in its segment. Unless otherwise
stated, share refers to value share.
Net sales are sales less excise duties. Diageo incurs excise duties throughout the world. In the majority of countries, excise
duties are effectively a production tax which becomes payable when the product is removed from bonded premises and is not
directly related to the value of sales. It is generally not included as a separate item on external invoices; increases in excise
duties are not always passed on to the customer and where a customer fails to pay for a product received, the group cannot
reclaim the excise duty. The group therefore recognises excise duty as a cost to the group.
Price/mix is the number of percentage points difference between the organic movement in net sales and the organic movement
in volume. The difference arises because of changes in the composition of sales between higher and lower priced variants/
markets or as price changes are implemented.
Shipments comprise the volume of products sold to Diageo’s immediate (first tier) customers. Depletions are the estimated
volume of the onward sales made by Diageo's immediate customers. Both shipments and depletions are measured on an
equivalent units basis.
References to emerging markets include Poland, Eastern Europe, Turkey, Latin America and Caribbean, Africa and Asia
Pacific (excluding Australia, Korea and Japan).
References to reserve brands include, but are not limited to, Johnnie Walker Blue Label, Johnnie Walker Green Label, Johnnie
Walker Gold Label Reserve, Johnnie Walker Aged 18 Years, John Walker & Sons Collection and other Johnnie Walker super
and ultra-premium brands; The Singleton, Talisker, Lagavulin, Mortlach, Oban and other malt brands; Buchanan’s Special
Reserve, Buchanan’s Red Seal; Crown Royal Special Reserve, Crown Royal XR and Haig Club whisky; Bulleit 10 Years
Bourbon; Orphan Barrel whiskey; Balcones whisky and rum; Tanqueray No. TEN; Aviation, Jinzu and Villa Ascenti gin; Cîroc
vodka; Don Julio, Casamigos and DeLeón tequila; Mezcal Unión and Pierde Almas mezcal; Zacapa, Bundaberg Master
Distillers' Collection, Pampero Aniversario and Don Papa rum; Shui Jing Fang and Seedlip.
44
References to ready to drink also include ready to serve products, such as pre-mixed cans in some markets.
References to beer include cider, flavoured malt beverages and some non-alcoholic products such as Malta Guinness. The
results of Hop House 13 Lager are included in the Guinness figures.
There is no industry-agreed definition for price tiers and for data providers such as IWSR, definitions can vary by market.
Diageo bases price tier definitions on a methodology that uses external metrics (including market pricing data from Nielsen, IRI
etc., as well as the IWSR segmentation) for benchmarking and internal pricing metrics for a consistent segmentation.
References to the disposal of the USL Popular brands include non-exhaustively the Haywards, Old Tavern, White Mischief,
Honey Bee, Green Label and Romanov brands.
References to the group include Diageo plc and its consolidated subsidiaries.
45
INDEX TO THE UNAUDITED CONDENSED FINANCIAL INFORMATION
FOR THE SIX MONTHS ENDED 31 DECEMBER 2023 AND 31 DECEMBER 2022
The unaudited condensed consolidated financial information was approved by the Board of Directors on 26 January 2024.
F- 1
UNAUDITED CONDENSED CONSOLIDATED INCOME STATEMENT
Six months ended 31 December 2023 | Six months ended 31 December 2022 | ||
Notes | $ million | Re-presented(1) $ million | |
Sales | 2 | 15,181 | 15,611 |
Excise duties | (4,219) | (4,491) | |
Net sales | 2 | 10,962 | 11,120 |
Cost of sales | (4,241) | (4,279) | |
Gross profit | 6,721 | 6,841 | |
Marketing | (1,952) | (1,861) | |
Other operating items | (1,452) | (1,249) | |
Operating profit | 2 | 3,317 | 3,731 |
Non-operating items | 3 | (60) | 19 |
Finance income | 4 | 287 | 303 |
Finance charges | 4 | (718) | (648) |
Share of after tax results of associates and joint ventures | 253 | 202 | |
Profit before taxation | 3,079 | 3,607 | |
Taxation | 5 | (737) | (766) |
Profit for the period | 2,342 | 2,841 | |
Attributable to: | |||
Equity shareholders of the parent company | 2,210 | 2,709 | |
Non-controlling interests | 132 | 132 | |
2,342 | 2,841 | ||
million | million | ||
Weighted average number of shares | |||
Shares in issue excluding own shares | 2,242 | 2,274 | |
Dilutive potential ordinary shares | 5 | 7 | |
2,247 | 2,281 | ||
cents | cents | ||
Basic earnings per share | 98.6 | 119.1 | |
Diluted earnings per share | 98.4 | 118.8 |
(1)See page F-7 for an explanation under Basis of preparation.
F- 2
UNAUDITED CONDENSED CONSOLIDATED STATEMENT OF COMPREHENSIVE INCOME
Six months ended 31 December 2023 | Six months ended 31 December 2022 | |
$ million | Re-presented(2) $ million | |
Other comprehensive income | ||
Items that will not be recycled subsequently to the income statement | ||
Net remeasurement of post employment benefit plans | ||
Group | (138) | (622) |
Associates and joint ventures | (2) | 12 |
Non-controlling interests | (1) | — |
Tax on post employment benefit plans | 32 | 159 |
Changes in the fair value of equity investments at fair value through other comprehensive income | — | (4) |
(109) | (455) | |
Items that may be recycled subsequently to the income statement | ||
Exchange differences on translation of foreign operations | ||
Group | (18) | (244) |
Associates and joint ventures | 106 | 75 |
Non-controlling interests | (8) | (61) |
Net investment hedges | (295) | (21) |
Exchange loss recycled to the income statement | ||
On disposal of foreign operations | 26 | — |
On step acquisitions | — | 2 |
Tax on exchange differences - group | 36 | (2) |
Effective portion of changes in fair value of cash flow hedges | ||
Hedge of foreign currency debt of the group | 39 | 72 |
Transaction exposure hedging of the group | 90 | 176 |
Hedges by associates and joint ventures | 1 | 16 |
Commodity price risk hedging of the group | (11) | (8) |
Recycled to income statement - hedge of foreign currency debt of the group | 52 | (35) |
Recycled to income statement - transaction exposure hedging of the group | (125) | (77) |
Recycled to income statement - commodity price risk hedging of the group | 20 | (41) |
Cost of hedging | (48) | — |
Recycled to income statement - cost of hedging | (12) | — |
Tax on effective portion of changes in fair value of cash flow hedges | (29) | (20) |
Hyperinflation adjustments | 290 | 129 |
Tax on hyperinflation adjustments(1) | (98) | (26) |
16 | (65) | |
Other comprehensive (loss) net of tax, for the period | (93) | (520) |
Profit for the period | 2,342 | 2,841 |
Total comprehensive income for the period | 2,249 | 2,321 |
Attributable to: | ||
Equity shareholders of the parent company | 2,126 | 2,250 |
Non-controlling interests | 123 | 71 |
Total comprehensive income for the period | 2,249 | 2,321 |
(1) Tax on hyperinflation adjustments $(64) million and tax rate change on hyperinflation adjustments $(34) million.
(2) See page F-7 for an explanation under Basis of preparation.
F- 3
UNAUDITED CONDENSED CONSOLIDATED BALANCE SHEET
31 December 2023 | 30 June 2023 | 31 December 2022 | |||||
Notes | $ million | $ million | Re-presented(1) $ million | Re-presented(1) $ million | Re-presented(1) $ million | Re-presented(1) $ million | |
Non-current assets | |||||||
Intangible assets | 14,496 | 14,506 | 14,556 | ||||
Property, plant and equipment | 8,212 | 7,738 | 7,168 | ||||
Biological assets | 194 | 197 | 143 | ||||
Investments in associates and joint ventures | 5,229 | 4,825 | 4,710 | ||||
Other investments | 96 | 71 | 50 | ||||
Other receivables | 32 | 39 | 33 | ||||
Other financial assets | 430 | 497 | 479 | ||||
Deferred tax assets | 171 | 178 | 127 | ||||
Post employment benefit assets | 1,118 | 1,210 | 1,272 | ||||
29,978 | 29,261 | 28,538 | |||||
Current assets | |||||||
Inventories | 6 | 9,840 | 9,653 | 9,062 | |||
Trade and other receivables | 4,580 | 3,427 | 4,648 | ||||
Assets held for sale | — | — | 220 | ||||
Corporate tax receivables | 5 | 274 | 292 | 199 | |||
Other financial assets | 564 | 437 | 479 | ||||
Cash and cash equivalents | 7 | 1,529 | 1,813 | 3,319 | |||
16,787 | 15,622 | 17,927 | |||||
Total assets | 46,765 | 44,883 | 46,465 | ||||
Current liabilities | |||||||
Borrowings and bank overdrafts | 7 | (2,004) | (2,142) | (2,767) | |||
Other financial liabilities | (371) | (453) | (524) | ||||
Share buyback liability | (497) | — | (259) | ||||
Trade and other payables | (7,292) | (6,678) | (7,332) | ||||
Liabilities held for sale | — | — | (92) | ||||
Corporate tax payables | 5 | (253) | (170) | (319) | |||
Provisions | (213) | (150) | (135) | ||||
(10,630) | (9,593) | (11,428) | |||||
Non-current liabilities | |||||||
Borrowings | 7 | (19,476) | (18,649) | (18,365) | |||
Other financial liabilities | (865) | (941) | (925) | ||||
Other payables | (447) | (463) | (424) | ||||
Provisions | (313) | (306) | (319) | ||||
Deferred tax liabilities | (2,839) | (2,751) | (2,708) | ||||
Post employment benefit liabilities | (471) | (471) | (457) | ||||
(24,411) | (23,581) | (23,198) | |||||
Total liabilities | (35,041) | (33,174) | (34,626) | ||||
Net assets | 11,724 | 11,709 | 11,839 | ||||
Equity | |||||||
Share capital | 893 | 898 | 863 | ||||
Share premium | 1,703 | 1,703 | 1,621 | ||||
Other reserves | 502 | 665 | 560 | ||||
Retained earnings | 6,693 | 6,590 | 6,722 | ||||
Equity attributable to equity shareholders of the parent company | 9,791 | 9,856 | 9,766 | ||||
Non-controlling interests | 1,933 | 1,853 | 2,073 | ||||
Total equity | 11,724 | 11,709 | 11,839 | ||||
(1) See page F-7 for an explanation under Basis of preparation.
F- 4
UNAUDITED CONDENSED CONSOLIDATED STATEMENT OF CHANGES IN EQUITY
Retained earnings/(deficit) | Equity attributable to parent company shareholders $ million | ||||||||
Share capital $ million | Share premium $ million | Other reserves $ million | Own shares $ million | Other retained earnings $ million | Total $ million | Non- controlling interests $ million | Total equity $ million | ||
At 30 June 2022 (re-presented1) | 875 | 1,635 | 658 | (2,223) | 8,490 | 6,267 | 9,435 | 2,076 | 11,511 |
Other(2) | (7) | (14) | 4 | 17 | — | 17 | — | — | — |
Profit for the period | — | — | — | — | 2,709 | 2,709 | 2,709 | 132 | 2,841 |
Other comprehensive loss | — | — | (107) | — | (352) | (352) | (459) | (61) | (520) |
Total comprehensive (loss)/income for the period | — | — | (107) | — | 2,357 | 2,357 | 2,250 | 71 | 2,321 |
Employee share schemes | — | — | — | 22 | 17 | 39 | 39 | — | 39 |
Share-based incentive plans | — | — | — | — | 31 | 31 | 31 | — | 31 |
Share-based incentive plans in respect of associates | — | — | — | — | 3 | 3 | 3 | — | 3 |
Share-based payments and purchase of own shares in respect of subsidiaries | — | — | — | — | 1 | 1 | 1 | 1 | 2 |
Associates' transactions with non- controlling interests | — | — | — | — | (14) | (14) | (14) | — | (14) |
Unclaimed dividend | — | — | — | — | 1 | 1 | 1 | — | 1 |
Change in fair value of put option | — | — | — | — | (5) | (5) | (5) | — | (5) |
Share buyback programme | (5) | — | 5 | — | (775) | (775) | (775) | — | (775) |
Dividend declared in the period | — | — | — | — | (1,200) | (1,200) | (1,200) | (75) | (1,275) |
At 31 December 2022 (re-presented1) | 863 | 1,621 | 560 | (2,184) | 8,906 | 6,722 | 9,766 | 2,073 | 11,839 |
At 30 June 2023 (re-presented1) | 898 | 1,703 | 665 | (2,286) | 8,876 | 6,590 | 9,856 | 1,853 | 11,709 |
Adjustment to 2023 closing equity in respect of hyperinflation in Ghana | — | — | — | — | 41 | 41 | 41 | 10 | 51 |
Adjusted opening balance | 898 | 1,703 | 665 | (2,286) | 8,917 | 6,631 | 9,897 | 1,863 | 11,760 |
Profit for the period | — | — | — | — | 2,210 | 2,210 | 2,210 | 132 | 2,342 |
Other comprehensive (loss)/income | — | — | (168) | — | 84 | 84 | (84) | (9) | (93) |
Total comprehensive (loss)/income for the period | — | — | (168) | — | 2,294 | 2,294 | 2,126 | 123 | 2,249 |
Employee share schemes | — | — | — | 30 | 4 | 34 | 34 | — | 34 |
Share-based incentive plans | — | — | — | — | 24 | 24 | 24 | — | 24 |
Share-based incentive plans in respect of associates | — | — | — | — | 2 | 2 | 2 | — | 2 |
Tax on share-based incentive plans | — | — | — | — | (7) | (7) | (7) | — | (7) |
Unclaimed dividend | — | — | — | — | 1 | 1 | 1 | — | 1 |
Change in fair value of put option | — | — | — | — | 40 | 40 | 40 | — | 40 |
Share buyback programme | (5) | — | 5 | — | (977) | (977) | (977) | — | (977) |
Dividend declared in the period | — | — | — | — | (1,349) | (1,349) | (1,349) | (53) | (1,402) |
At 31 December 2023 | 893 | 1,703 | 502 | (2,256) | 8,949 | 6,693 | 9,791 | 1,933 | 11,724 |
(1) See page F-7 for an explanation under Basis of preparation.
(2) Includes amounts relating to foreign translation differences arising from the retranslation of reserves due to the change in the group’s presentation currency.
F- 5
UNAUDITED CONDENSED CONSOLIDATED STATEMENT OF CASH FLOWS
Six months ended 31 December 2023 | Six months ended 31 December 2022 | |||
$ million | $ million | Re- presented(1) $ million | Re- presented(1) $ million | |
Cash flows from operating activities | ||||
Profit for the period | 2,342 | 2,841 | ||
Taxation | 737 | 766 | ||
Share of after tax results of associates and joint ventures | (253) | (202) | ||
Net finance charges | 431 | 345 | ||
Non-operating items | 60 | (19) | ||
Operating profit | 3,317 | 3,731 | ||
Increase in inventories | (82) | (552) | ||
Increase in trade and other receivables | (1,106) | (1,191) | ||
Increase in trade and other payables and provisions | 469 | 131 | ||
Net increase in working capital | (719) | (1,612) | ||
Depreciation, amortisation and impairment | 411 | 332 | ||
Dividends received | 5 | 5 | ||
Post employment payments less amounts included in operating profit | (24) | (27) | ||
Other items | 59 | 9 | ||
451 | 319 | |||
Cash generated from operations | 3,049 | 2,438 | ||
Interest received | 91 | 78 | ||
Interest paid | (443) | (293) | ||
Taxation paid | (551) | (751) | ||
(903) | (966) | |||
Net cash inflow from operating activities | 2,146 | 1,472 | ||
Cash flows from investing activities | ||||
Disposal of property, plant and equipment and computer software | 7 | 8 | ||
Purchase of property, plant and equipment and computer software | (582) | (514) | ||
Movements in loans and other investments | (109) | (2) | ||
Sale of businesses and brands | 18 | 111 | ||
Acquisition of subsidiaries | (3) | (129) | ||
Investment in associates and joint ventures | (51) | (38) | ||
Net cash outflow from investing activities | (720) | (564) | ||
Cash flows from financing activities | ||||
Share buyback programme | (480) | (655) | ||
Net sale of own shares for share schemes | 5 | 12 | ||
Dividends paid to non-controlling interests | (71) | (94) | ||
Proceeds from bonds | 1,690 | 1,989 | ||
Repayment of bonds | (1,132) | (300) | ||
Cash inflow from other borrowings | 470 | 173 | ||
Cash outflow from other borrowings | (801) | (206) | ||
Equity dividend paid | (1,348) | (1,194) | ||
Net cash outflow from financing activities | (1,667) | (275) | ||
Net (decrease)/increase in net cash and cash equivalents | (241) | 633 | ||
Exchange differences | (45) | (25) | ||
Reclassification to assets held for sale | — | (57) | ||
Net cash and cash equivalents at beginning of the period | 1,768 | 2,675 | ||
Net cash and cash equivalents at end of the period | 1,482 | 3,226 | ||
Net cash and cash equivalents consist of: | ||||
Cash and cash equivalents | 1,529 | 3,319 | ||
Bank overdrafts | (47) | (93) | ||
1,482 | 3,226 | |||
(1) See page F-7 for an explanation under Basis of preparation.
F- 6
NOTES
1. Basis of preparation
These unaudited condensed consolidated interim financial statements have been prepared in accordance with UK adopted IAS
34 ‘Interim Financial Reporting’, IAS 34 ‘Interim Financial Reporting’ as issued by the International Accounting Standards
Board (‘IASB’) and The Disclosure Guidance and Transparency Rules sourcebook of the UK’s Financial Conduct Authority.
These financial statements should be read in conjunction with the company’s published consolidated financial statements for
the year ended 30 June 2023, which were prepared in accordance with IFRS® Accounting Standards adopted by the UK and
IFRS Accounting Standards issued by IASB, including interpretations issued by the IFRS Interpretations Committee. IFRS
Accounting Standards as adopted by the UK differs in certain respects from IFRS Accounting Standards as issued by the IASB,
but the differences have no impact on the group’s consolidated financial statements for the periods presented. The consolidated
financial statements are prepared on a going concern basis under the historical cost convention, unless stated otherwise.
In preparing these condensed consolidated interim financial statements, the significant judgements made by management when
applying the group’s accounting policies and the significant areas where estimates were required were the same as those that
applied to the consolidated financial statements for the year ended 30 June 2023, with the exception of changes in estimates
disclosed in note 3 Exceptional items and note 12 Contingent liabilities and legal proceedings. These condensed consolidated
interim financial statements were approved for issue on 29 January 2024.
The financial statements for Diageo plc for the year ending 30 June 2024 will be prepared in accordance with IFRS Accounting
Standards as adopted by the UK and IFRS Accounting Standards as issued by the IASB, including interpretations issued by the
IFRS Interpretations Committee.
Going concern
Management prepared cash flow forecasts which were also sensitised to reflect severe but plausible downside scenarios taking
into consideration the group's principal risks. In the base case scenario, management included assumptions for mid-single digit
net sales growth, flat operating margin and global TBA market share growth. In light of the ongoing geopolitical volatility, the
base case outlook and severe but plausible downside scenarios incorporated considerations for a prolonged global recession,
supply chain disruptions, higher inflation and further geopolitical deterioration. Even under these scenarios, the group’s
liquidity is still expected to remain strong. Mitigating actions, should they be required, are all within management’s control and
could include reductions in discretionary spending such as acquisitions and capital expenditure, as well as a temporary
suspension of the share buyback programme and dividend payments in the next 12 months, or drawdowns on committed
facilities. Having considered the outcome of these assessments, the Directors are comfortable that the company is a going
concern for at least 12 months from the date of signing the group's condensed consolidated interim financial statements.
Foreign currencies
Starting 1 July 2023, in line with reporting requirements, the functional currency of Diageo plc changed from sterling to US
dollars which is applied prospectively. This is because the group's share of net sales and expenses in the US and other countries
whose currencies correlate closely with the US dollar has been increasing over the years, and that trend is expected to continue
in line with the group's strategic focus. Diageo also decided to change its presentation currency to US dollars with effect from 1
July 2023, applied retrospectively, as it believes that this change will provide better alignment of the reporting of performance
with its business exposures.
The comparative financial information included in these condensed consolidated interim financial statements of Diageo as of
and for the six months ended 31 December 2023 was re-presented in US dollars following the translation methodology in IAS
21 - The Effects of Changes in Foreign Exchange Rates:
–assets and liabilities were translated into US dollars at the closing exchange rate prevailing at the relevant balance
sheet date;
–the consolidated income statement and the consolidated statement of cash flows of non US dollar entities were
translated into US dollars at weighted average exchange rates for the relevant period, which is consistent with the
requirements of IAS21; except for subsidiaries in hyperinflationary economies that were translated with the closing
rate at the end of the relevant period and for substantial transactions that are translated at the rate on the date of the
transaction (including acquisitions, disposals, impairment write off, dividends received and paid);
–share capital, share premium, capital redemption reserve included in other reserves and own shares in the statement of
changes in equity were translated into US dollars at the closing exchange rate at the relevant balance sheet date;
exchange differences arising on the retranslation to closing rates were taken to the exchange reserve; and
–the cumulative foreign exchange translation reserve was set to zero on 1 July 2004, the date of transition to IFRS and
this reserve was re-presented as if the group reported in US dollars since that date.
F- 7
As results of the functional and presentation currency change, the group has rebalanced its net investment hedging portfolio in
line with the shifted currency exposure. Diageo has re-designated its buy US dollar sell sterling cross currency interest swaps in
net investment hedge relationships previously used in cash flow hedging foreign currency debt of the group.
Weighted average exchange rates used in the translation of income statements were sterling – $1 = £0.80 (2022 – $1 = £0.85)
and euro – $1 = €0.92 (2022 – $1 = €0.98). Exchange rates used to translate assets and liabilities at the balance sheet date were
sterling – $1 = £0.79 (31 December 2022 – $1 = £0.83; 30 June 2023 – $1 = £0.79) and euro – $1 = €0.90 (31 December 2022 –
$1 = €0.94; 30 June 2023 – $1 = €0.93). The group uses foreign exchange transaction hedges to mitigate the effect of exchange
rate movements.
New accounting standards and interpretations
The following standard amendments to the Accounting Standards, issued by the IASB and endorsed by the UK, were adopted
by the group from 1 July 2023 with no material impact on the group’s consolidated results, financial position or disclosures:
–IFRS 17 – Insurance Contracts
–Amendments to IAS 12 Income Taxes – Deferred Tax related to Assets and Liabilities arising from a Single
Transaction
–Amendments to IAS 1, 8 – Definition of Accounting Estimates
–Amendments to IAS 1 Disclosure Initiative – Accounting Policies.
The following amendments issued by the IASB have been endorsed by the UK and have not been adopted by the group:
–Amendments to IAS 1 – Classification of Liabilities and Non-current Liabilities with Covenants (effective from the
year ending 30 June 2025)
–Amendments to IFRS 16 – Lease Liability in a Sale and Leaseback (effective from the year ending 30 June 2025)
–Amendments to IAS 7 and IFRS 7 – Supplier Finance Arrangements (effective from the year ending 30 June 2025).
There are a number of other amendments and clarifications to IFRS Accounting Standards effective in future years, which are
not expected to significantly impact the group’s consolidated results or financial position.
2. Segmental information
The segmental information presented is consistent with management reporting provided to the Executive Committee (the chief
operating decision maker).
The Executive Committee considers the business principally from a geographical perspective based on the location of third-
party sales and the business analysis is presented by geographical segment. In addition to these geographical selling segments, a
further segment reviewed by the Executive Committee is the Supply Chain and Procurement (SC&P) segment, which
manufactures products for other group companies and includes production sites in the United Kingdom, Ireland, Italy,
Guatemala and Mexico, and comprises the global procurement function.
The group's operations also include the Corporate segment. Corporate costs are in respect of central costs, including finance,
marketing, corporate relations, human resources and legal, as well as certain information systems, facilities and employee costs
that are not allocable to the geographical segments or to the SC&P.
Diageo uses shared services operations to deliver transaction processing activities for markets and operational entities. These
centres are located in India, Hungary, Colombia and the Philippines. These captive business service centres also perform certain
central finance activities, including elements of financial planning and reporting, treasury and HR services. The costs of shared
services operations are recharged to the regions.
For planning and management reporting purposes, Diageo uses budgeted exchange rates that are set at the prior year's weighted
average exchange rate. In order to ensure a consistent basis on which performance is measured through the year, prior period
results are also restated to the budgeted exchange rate. Segmental information for net sales and operating profit before
exceptional items are reported on a consistent basis with management reporting. The adjustments required to retranslate the
segmental information to actual exchange rates and to reconcile it to the group’s reported results are shown in the tables below.
The comparative segmental information, prior to retranslation, has not been restated at the current year’s budgeted exchange
rates but is presented at the budgeted rates for the respective year.
F- 8
In addition, for management reporting purposes, Diageo presents the result of acquisitions and disposals completed in the
current and prior year separately from the results of the geographical segments. The impact of acquisitions and disposals on net
sales and operating profit is disclosed under the appropriate geographical segments in the tables below at budgeted exchange
rates.
(a) Segmental information for the consolidated income statement
North America | Europe | Asia Pacific | Latin America and Caribbean | Africa | SC&P | Eliminate inter- segment sales | Total operating segments | Corporate and other | Total | |
Six months ended 31 December 2023 | $ million | $ million | $ million | $ million | $ million | $ million | $ million | $ million | $ million | $ million |
Sales | 4,411 | 4,349 | 3,564 | 1,442 | 1,352 | 1,842 | (1,842) | 15,118 | 63 | 15,181 |
Net sales | ||||||||||
At budgeted exchange rates(1) | 4,077 | 2,356 | 2,226 | 1,004 | 1,115 | 1,797 | (1,742) | 10,833 | 61 | 10,894 |
Acquisitions and disposals | 2 | 25 | 24 | — | 65 | — | — | 116 | — | 116 |
SC&P allocation | 7 | 34 | 6 | 6 | 2 | (55) | — | — | — | — |
Retranslation to actual exchange rates | (2) | 11 | (50) | 59 | (211) | 100 | (100) | (193) | 2 | (191) |
Hyperinflation | — | 139 | — | — | 4 | — | — | 143 | — | 143 |
Net sales | 4,084 | 2,565 | 2,206 | 1,069 | 975 | 1,842 | (1,842) | 10,899 | 63 | 10,962 |
Operating profit/(loss) | ||||||||||
At budgeted exchange rates(1) | 1,672 | 784 | 729 | 337 | 245 | (14) | — | 3,753 | (144) | 3,609 |
Acquisitions and disposals | (12) | (6) | 7 | — | 15 | — | — | 4 | — | 4 |
SC&P allocation | (7) | (4) | (1) | (2) | — | 14 | — | — | — | — |
Fair value remeasurements | 23 | — | — | (24) | — | — | — | (1) | — | (1) |
Retranslation to actual exchange rates | 49 | 25 | (46) | 5 | (120) | — | — | (87) | (3) | (90) |
Hyperinflation | — | (2) | — | — | (10) | — | — | (12) | — | (12) |
Operating profit/(loss) before exceptional items | 1,725 | 797 | 689 | 316 | 130 | — | — | 3,657 | (147) | 3,510 |
Exceptional operating items | (182) | (11) | — | — | — | — | — | (193) | — | (193) |
Operating profit/(loss) | 1,543 | 786 | 689 | 316 | 130 | — | — | 3,464 | (147) | 3,317 |
Non-operating items | (60) | |||||||||
Net finance charges | (431) | |||||||||
Share of after tax results of associates and joint ventures | 253 | |||||||||
Profit before taxation | 3,079 |
F- 9
North America | Europe | Asia Pacific | Latin America and Caribbean | Africa | SC&P | Eliminate inter- segment sales | Total operating segments | Corporate and other | Total | |
Six months ended 31 December 2022 | Re- presented $ million | Re- presented $ million | Re- presented $ million | Re- presented $ million | Re- presented $ million | Re- presented $ million | Re- presented $ million | Re- presented $ million | Re- presented $ million | Re- presented $ million |
Sales | 4,540 | 4,055 | 3,741 | 1,646 | 1,578 | 1,939 | (1,939) | 15,560 | 51 | 15,611 |
Net sales | ||||||||||
At budgeted exchange rates(1) | 4,144 | 2,432 | 2,310 | 1,332 | 1,228 | 2,125 | (2,086) | 11,485 | 58 | 11,543 |
Acquisitions and disposals | 17 | 9 | 47 | 4 | — | — | — | 77 | — | 77 |
SC&P allocation | 4 | 25 | 4 | 5 | 1 | (39) | — | — | — | — |
Retranslation to actual exchange rates | (16) | (241) | (192) | (42) | (116) | (147) | 147 | (607) | (7) | (614) |
Hyperinflation | — | 114 | — | — | — | — | — | 114 | — | 114 |
Net sales | 4,149 | 2,339 | 2,169 | 1,299 | 1,113 | 1,939 | (1,939) | 11,069 | 51 | 11,120 |
Operating profit/(loss) | ||||||||||
At budgeted exchange rates(1) | 1,687 | 845 | 747 | 545 | 284 | 52 | — | 4,160 | (211) | 3,949 |
Acquisitions and disposals | (9) | 3 | 7 | — | — | — | — | 1 | — | 1 |
SC&P allocation | 12 | 29 | 3 | 7 | 1 | (52) | — | — | — | — |
Fair value remeasurements | 18 | (1) | — | — | — | — | — | 17 | — | 17 |
Retranslation to actual exchange rates | (18) | (83) | (53) | (14) | (70) | — | — | (238) | 14 | (224) |
Hyperinflation | — | 27 | — | — | — | — | — | 27 | — | 27 |
Operating profit/(loss) before exceptional items | 1,690 | 820 | 704 | 538 | 215 | — | — | 3,967 | (197) | 3,770 |
Exceptional operating items | (31) | 17 | (25) | — | — | — | — | (39) | — | (39) |
Operating profit/(loss) | 1,659 | 837 | 679 | 538 | 215 | — | — | 3,928 | (197) | 3,731 |
Non-operating items | 19 | |||||||||
Net finance charges | (345) | |||||||||
Share of after tax results of associates and joint ventures | 202 | |||||||||
Profit before taxation | 3,607 |
(1)These items represent the IFRS 8 performance measures for the geographical and SC&P segments.
(i)The net sales figures for SC&P reported to the Executive Committee primarily comprise inter-segment sales and these are eliminated in a separate column
in the above segmental analysis. Apart from sales by the SC&P segment to the geographical segments, inter-segment sales are not material.
(ii)Approximately 36% of calendar year net sales occurred in the last four months of 2023.
(b) Category and geographical analysis
Category analysis | Geographical analysis | |||||||||
Spirits $ million | Beer $ million | Ready to drink $ million | Other $ million | Total $ million | United States $ million | India $ million | Great Britain $ million | Rest of world $ million | Total $ million | |
Six months ended 31 December 2023 | ||||||||||
Sales(1) | 12,409 | 2,063 | 496 | 213 | 15,181 | 4,158 | 1,687 | 1,571 | 7,765 | 15,181 |
Six months ended 31 December 2022 | ||||||||||
Sales(1) (re-presented) | 12,904 | 2,008 | 564 | 135 | 15,611 | 4,268 | 1,886 | 1,373 | 8,084 | 15,611 |
(1)The geographical analysis of sales is based on the location of third-party sales.
F- 10
3. Exceptional items
Exceptional items are those that in management’s judgement need to be disclosed separately. Such items are included within the
income statement caption to which they relate. Management believes that that separate disclosure of exceptional items and the
classification between operating and non-operating items further helps investors to understand the performance of the group.
Changes in estimates and reversals in relation to items previously recognised as exceptional are presented consistently as
exceptional in the current year.
Exceptional operating items are those that are considered to be material and unusual or non-recurring in nature and are part of
the operating activities of the group, such as one-off global restructuring programmes which can be multi-year, impairment of
intangible assets and fixed assets, indirect tax settlements, property disposals and changes in post employment plans.
Gains and losses on the sale or directly attributable to a prospective sale of businesses, brands or distribution rights, step up
gains and losses that arise when an investment becomes an associate or an associate becomes a subsidiary and other material,
unusual non-recurring items that are not in respect of the production, marketing and distribution of premium drinks, are
disclosed as exceptional non-operating items below operating profit in the income statement.
Exceptional current and deferred tax items comprise material and unusual or non-recurring items that impact taxation.
Examples include direct tax provisions and settlements in respect of prior years and the remeasurement of deferred tax assets
and liabilities following tax rate changes.
F- 11
Six months ended 31 December 2023 | Six months ended 31 December 2022 | |
$ million | Re-presented $ million | |
Exceptional operating items | ||
Brand impairment (1) | (54) | — |
Supply chain agility programme (2) | (31) | (56) |
Various dispute and litigation matters (3) | (108) | — |
Winding down Russian operations (4) | — | 17 |
(193) | (39) | |
Non-operating items | ||
Sale of businesses and brands | ||
Windsor business (5) | (53) | — |
Guinness Cameroun S.A. (6) | (11) | (2) |
USL Popular brands (7) | 4 | 5 |
Archers brand (8) | — | 23 |
United National Breweries (9) | — | 3 |
Step acquisition - Mr Black (10) | — | (10) |
(60) | 19 | |
Exceptional items before taxation | (253) | (20) |
Items included in taxation | ||
Tax on exceptional operating items | 43 | 14 |
Tax on exceptional non-operating items | (1) | 2 |
Exceptional taxation (11) | — | 68 |
42 | 84 | |
Total exceptional items | (211) | 64 |
Attributable to: | ||
Equity shareholders of the parent company | (213) | 63 |
Non-controlling interests | 2 | 1 |
Total exceptional items | (211) | 64 |
(1) In the six months ended 31 December 2023, an impairment charge of $54 million in respect of certain brands in the US
ready to drink portfolio was recognised in exceptional operating items. The charge is mainly driven by the reduction in forecast
cash flow assumptions due to the reprioritisation of the portfolio and the more challenging macroeconomic environment. A pre-
tax discount rate of 10% (2022 – 9%) for North America has been used to calculate the net present value of the future cash
flows expected to be generated by these brands. The brand impairment reduced the deferred tax liability by $13 million
resulting in a net exceptional loss of $41 million.
(2) In the six months ended 31 December 2023, an exceptional charge of $31 million was accounted for in respect of the supply
chain agility programme (2022 – $56 million). With this five-year spanning programme launched in July 2022, Diageo expects
to strengthen its supply chain, improve its resilience and agility, drive efficiencies, deliver additional productivity savings and
make its supply operations more sustainable. Total implementation cost of the programme is expected to be up to $600 million
over the five-year period, which will comprise non‐cash items and one‐off expenses, the majority of which are expected to be
recognised as exceptional operating items. The exceptional charge for the six months ended 31 December 2023 was primarily
in respect of accelerated depreciation in North America, being additional depreciation of assets in the period directly
F- 12
attributable to the programme. Restructuring cash expenditure was $11 million in the six months ended 31 December 2023
(2022 – $nil).
(3) In the six months ended 31 December 2023, $108 million was recorded as an exceptional operating item in respect of
various dispute and litigation matters in North America and Europe, including certain costs and expenses associated therewith.
(4) In the six months ended 31 December 2022, Diageo released unutilised provisions of $17 million from the $64 million
exceptional charge taken in the year ended 30 June 2022 in respect of winding down its operations in Russia.
(5) On 27 October 2023, Diageo completed the sale of Windsor Global Co., Ltd. to PT W Co., Ltd., a Korean company
sponsored by Pine Tree Investment & Management Co., Ltd. for a total consideration of KRW 206 billion ($152 million). The
transaction resulted in a loss of $53 million in the six months ended 31 December 2023, which was recognised as a non-
operating item attributable to the sale, including cumulative translation losses of $26 million recycled to the income statement.
(6) On 26 May 2023, Diageo completed the sale of its wholly owned subsidiary, Guinness Cameroun S.A., its brewery in
Cameroon, to Castel Group. In the six months ended 31 December 2023, $11 million charges directly attributable to the
disposal have been accounted for. Transaction costs relating to the prospective sale in the six months ended 31 December 2022
amounted to $2 million.
(7) On 30 September 2022, Diageo completed the sale of the Popular brands of its USL business. The aggregate consideration
for the disposal was $97 million, the disposed net assets included $34 million net working capital and $23 million brand, and
$19 million goodwill was derecognised. In the six months ended 31 December 2022, the transaction resulted in an exceptional
gain of $5 million. $4 million of the purchase price, that was subject to administrative actions within 12 months and considered
uncertain at the time of the transaction, was paid to Diageo in the six months ended 31 December 2023 and recognised as
exceptional gain.
(8) On 8 September 2022, Diageo announced the sale of its Archers brand. The transaction resulted in an exceptional gain of
$23 million.
(9) In the six months ended 31 December 2022, ZAR 46 million ($3 million) of deferred consideration was paid to Diageo in
respect of the sale of United National Breweries, the full amount of which represented a non-operating gain.
(10) On 29 September 2022, the group acquired the part of the entire issued share capital of Mr Black Spirits Pty Ltd, owner of
the Mr Black Australian premium cold brew coffee liqueur, that it did not already own. As a result of Mr Black becoming a
subsidiary of the group, in the six months ended 31 December 2022, a loss of $10 million arose, being the difference between
the book value of the associate prior to the transaction and its fair value plus transaction costs.
(11) Exceptional tax credits of $84 million in the six months ended 31 December 2022 include tax credits of $68 million in
respect of the deductibility of fees paid to Diageo plc for guaranteeing externally issued debt of US group entities.
F- 13
4. Finance income and charges
Six months ended 31 December 2023 | Six months ended 31 December 2022 | |
$ million | Re-presented $ million | |
Interest income | 106 | 101 |
Fair value gain on financial instruments | 110 | 167 |
Total interest income | 216 | 268 |
Interest charge on bonds, commercial paper, bank loans and overdrafts | (324) | (277) |
Interest charge on finance leases | (10) | (9) |
Other interest charges | (223) | (148) |
Fair value loss on financial instruments | (113) | (167) |
Total interest charges | (670) | (601) |
Net interest charges | (454) | (333) |
Net finance income in respect of post employment plans in surplus | 28 | 35 |
Hyperinflation adjustment in respect of Turkey (1) | 22 | — |
Hyperinflation adjustment in respect of Ghana (1) | 6 | — |
Hyperinflation adjustment in respect of Venezuela (1) | 4 | — |
Interest income in respect of direct and indirect tax | 3 | — |
Change in financial liability (Level 3) | 8 | — |
Total other finance income | 71 | 35 |
Net finance charge in respect of post employment plans in deficit | (10) | (9) |
Hyperinflation adjustment in respect of Turkey (1) | — | (7) |
Interest charge in respect of direct and indirect tax | (17) | (20) |
Unwinding of discounts | (11) | (7) |
Other finance charges | (10) | (4) |
Total other finance charges | (48) | (47) |
Net other finance income/(charges) | 23 | (12) |
F- 14
(1) Hyperinflationary adjustments
The group applied hyperinflationary accounting for its operations in Turkey, Ghana and Venezuela.
The group applies hyperinflationary accounting for its operations in Ghana starting from 1 July 2023. Hyperinflationary
accounting needs to be applied as if Ghana had always been a hyperinflationary economy, hence, as per Diageo’s accounting
policy choice, the differences between equity at 30 June 2023 as reported and the equity after the restatement of the non-
monetary items to the measuring unit current at 30 June 2023 were recognised in retained earnings.
The group’s consolidated financial statements include the results and financial position of its operations in hyperinflationary
economies restated to the measuring unit current at the end of each period, with hyperinflationary gains and losses in respect of
monetary items being reported in finance income and charges. Comparative amounts presented in the consolidated financial
statements were not restated. When applying IAS 29 on an ongoing basis, comparatives in stable currency are not restated and
the effect of inflating opening net assets to the measuring unit current at the end of the reporting period is presented in other
comprehensive income. The movement in the publicly available official price index for the six months ended 31 December
2023 was 38% (2022 – 15%) in Turkey and 9% in Ghana. The inflation rate used by the group in the case of Venezuela is
provided by an independent valuer because no reliable, officially published rate is available. Movement in the price index for
the six months ended 31 December 2023 was 54% (2022 – 105%) in Venezuela.
Recent developments in Venezuela led management to change its estimate for the exchange rate of VES/$ to be the official
exchange rate published by Bloomberg. Figures for the six months ended 31 December 2023 show the results of the
Venezuelan operation consolidated at the official closing exchange rate.
5. Taxation
For the six months ended 31 December 2023, the tax charge of $737 million (2022 – $766 million) comprises a UK tax charge
of $116 million (2022 – $144 million) and a foreign tax charge of $621 million (2022 – $622 million).
For the six months ended 31 December 2023, income tax expense was recognised based on management’s best estimate of the
weighted average annual income tax rate expected for the full financial year applied to the pre-tax income of the interim period
in line with the relevant accounting standard.
Included in the tax charge of $737 million in the six months ended 31 December 2023 is a net exceptional tax credit of $42
million, including an exceptional tax credit of $23 million in respect of various dispute and litigation matters in North America
and Europe and $13 million in respect of brand impairments in the US ready to drink portfolio.
The group has a number of ongoing tax audits worldwide for which provisions are recognised in line with the relevant
international accounting standard, taking into account best estimates and management’s judgements concerning the ultimate
outcome of the tax audits. For the six months ended 31 December 2023, ongoing audits that are provided for individually are
not expected to result in a material tax liability. The current tax asset of $274 million (30 June 2023 – $292 million) and tax
liability of $253 million (30 June 2023 – $170 million) include $213 million (30 June 2023 – $218 million) of provisions for tax
uncertainties.
In December 2021, the OECD released a framework for Pillar Two Model Rules which will introduce a global minimum
corporate tax rate of 15% applicable to multinational enterprise groups with global revenue over €750 million. The legislation
implementing the rules in the UK was substantively enacted on 20 June 2023 and will apply to Diageo from the financial year
ending 30 June 2025 onwards. Diageo is reviewing this legislation and also monitoring the status of implementation of the
model rules outside of the UK to understand the potential impact on the group. Diageo has applied the temporary exception
under IAS 12 in relation to the accounting for deferred taxes arising from the implementation of the Pillar Two rules.
The tax rate before exceptional items for the six months ended 31 December 2023 was 23.4% compared with 23.4% for the six
months ended 31 December 2022.
F- 15
6. Inventories
31 December 2023 | 30 June 2023 | 31 December 2022 | |
$ million | Re-presented $ million | Re-presented $ million | |
Raw materials and consumables | 730 | 684 | 718 |
Work in progress | 156 | 166 | 200 |
Maturing inventories | 7,697 | 7,300 | 6,572 |
Finished goods and goods for resale | 1,257 | 1,503 | 1,572 |
9,840 | 9,653 | 9,062 |
7. Net borrowings
31 December 2023 | 30 June 2023 | 31 December 2022 | |
$ million | Re-presented $ million | Re-presented $ million | |
Borrowings due within one year and bank overdrafts | (2,004) | (2,142) | (2,767) |
Borrowings due after one year | (19,476) | (18,649) | (18,365) |
Fair value of foreign currency forwards and swaps | 406 | 436 | 643 |
Fair value of interest rate hedging instruments | (366) | (476) | (507) |
Lease liabilities | (572) | (564) | (526) |
(22,012) | (21,395) | (21,522) | |
Cash and cash equivalents | 1,529 | 1,813 | 3,319 |
(20,483) | (19,582) | (18,203) |
8. Reconciliation of movement in net borrowings
Six months ended 31 December 2023 | Six months ended 31 December 2022 | |
$ million | Re-presented $ million | |
Net (decrease)/increase in cash and cash equivalents before exchange | (241) | 633 |
Net increase in bonds and other borrowings(1) | (227) | (1,658) |
Net increase in net borrowings from cash flows | (468) | (1,025) |
Exchange differences on net borrowings | (399) | 4 |
Other non-cash items(2) | (34) | (75) |
Net borrowings at beginning of the period | (19,582) | (17,107) |
Net borrowings at end of the period | (20,483) | (18,203) |
(1)In the six months ended 31 December 2023, net increase in bonds and other borrowings excludes $nil cash outflow in respect of derivatives designated in
forward point hedges (2022 – $(2) million).
(2)In the six months ended 31 December 2023, other non-cash items were principally in respect of additional leases entered into during the period partially
offset by fair value movements of interest rate hedging instruments. In the six months ended 31 December 2022, other non-cash items were principally in
respect of the reclassification of cash and cash equivalents in Guinness Cameroun S.A. to assets and liabilities held for sale.
In the six months ended 31 December 2023, the group issued bonds of $1,700 million ($1,690 million - net of discount and fee)
consisting of $800 million 5.375% fixed rate notes due 2026 and $900 million 5.625% fixed rate notes due 2033, and repaid
bonds of $500 million and €600 million ($632 million). In the six months ended 31 December 2022, the group issued bonds of
$2,000 million ($1,989 million - net of discount and fee) consisting of $500 million 5.2% fixed rate notes due 2025,
$750 million 5.3% fixed rate notes due 2027 and $750 million 5.5% fixed rate notes due 2033, and repaid bonds of
$300 million.
All bonds and commercial paper issued by Diageo plc's wholly owned subsidiaries are fully and unconditionally guaranteed by
Diageo plc.
F- 16
9. Financial instruments
Fair value measurements of financial instruments are presented through the use of a three-level fair value hierarchy that
prioritises the valuation techniques used in fair value calculations.
The group maintains policies and procedures to value instruments using the most relevant data available. If multiple inputs that
fall into different levels of the hierarchy are used in the valuation of an instrument, the instrument is categorised on the basis of
the most subjective input.
Foreign currency forwards and swaps, cross currency swaps and interest rate swaps are valued using discounted cash flow
techniques. These techniques incorporate inputs at levels 1 and 2, such as foreign exchange rates and interest rates. These
market inputs are used in the discounted cash flow calculation incorporating the instrument’s term, notional amount and
discount rate, and taking credit risk into account. As significant inputs to the valuation are observable in active markets, these
instruments are categorised as level 2 in the hierarchy.
Other financial liabilities include a put option, which does not have an expiry date, held by Industrias Licoreras de Guatemala
(ILG) to sell the remaining 50% equity stake in Rum Creation & Products Inc., the owner of the Zacapa rum brand, to Diageo.
The liability is fair valued using the discounted cash flow method and as at 31 December 2023, an amount of $224 million (30
June 2023 – $274 million) is recognised as a liability with changes in the fair value of the put option included in retained
earnings. As the valuation of this option uses assumptions not observable in the market, it is categorised as level 3 in the
hierarchy. As at 31 December 2023, because it is unknown when or if ILG will exercise the option, the liability is measured as
if the exercise date is on the last day of the current financial year considering forecast future performance. The option is
sensitive to reasonably possible changes in assumptions; if the option were to be exercised as at 30 June 2025, the fair value of
the liability would decrease by approximately $37 million.
Included in other financial liabilities, the contingent consideration on acquisition of businesses represents the present value of
payments up to $507 million, which are expected to be paid over the next eight years. Contingent considerations linked to
certain volume targets at 31 December 2023 included $144 million in respect of the acquisition of Aviation American Gin and
Davos Brands (30 June 2023 – $142 million) and $76 million in respect of the acquisition of 21Seeds (30 June 2023 – $75
million). Contingent consideration of $93 million in respect of the acquisition of Don Papa Rum (30 June 2023 – $89 million) is
linked to certain financial performance targets. Contingent considerations are fair valued based on a discounted cash flow
method using assumptions not observable in the market. Contingent considerations are sensitive to possible changes in
assumptions; a 10% increase or decrease in volume would increase or decrease the fair value of contingent considerations
linked to certain volume targets by approximately $40 million, and a 10% increase or decrease in cash flows would increase or
decrease the fair value of contingent considerations linked to certain financial performance targets by approximately
$30 million.
There were no significant changes in the measurement and valuation techniques, or significant transfers between the levels of
the financial assets and liabilities in the six months ended 31 December 2023.
The group’s financial assets and liabilities measured at fair value are categorised as follows:
31 December 2023 | 30 June 2023 | 31 December 2022 | |
$ million | Re-presented $ million | Re-presented $ million | |
Derivative assets | 703 | 748 | 820 |
Derivative liabilities | (440) | (556) | (663) |
Valuation techniques based on observable market input (Level 2) | 263 | 192 | 157 |
Financial assets - other | 281 | 249 | 208 |
Financial liabilities - other | (599) | (665) | (690) |
Valuation techniques based on unobservable market input (Level 3) | (318) | (416) | (482) |
In the six months ended 31 December 2023 and 31 December 2022, the increase in financial assets - other of $32 million (2022
– the decrease in financial asset - other of $17 million) is principally in respect of acquisitions.
F- 17
The movements in level 3 instruments, measured on a recurring basis, are as follows:
Zacapa financial liability | Contingent consideration recognised on acquisition of businesses | Zacapa financial liability | Contingent consideration recognised on acquisition of businesses | |
Six months ended 31 December 2023 | Six months ended 31 December 2023 | Six months ended 31 December 2022 | Six months ended 31 December 2022 | |
$ million | $ million | Re-presented $ million | Re-presented $ million | |
At the beginning of the period | (274) | (391) | (261) | (449) |
Net gains included in the income statement | 8 | 15 | — | 15 |
Net losses included in exchange in other comprehensive income | — | — | (1) | — |
Net gains/(losses) included in retained earnings | 40 | — | (5) | — |
Acquisitions | — | — | — | (5) |
Settlement of liabilities | 2 | 1 | 7 | 9 |
At the end of the period | (224) | (375) | (260) | (430) |
The carrying amount of the group’s financial assets and liabilities is generally the same as their fair value apart from
borrowings. At 31 December 2023, the fair value of gross borrowings (excluding lease liabilities and the fair value of derivative
instruments) was $21,001 million and the carrying value was $21,480 million (30 June 2023 – $19,707 million and $20,791
million, respectively).
10. Dividends and other reserves
Six months ended 31 December 2023 | Six months ended 31 December 2022 | |
Amounts recognised as distributions to equity shareholders | $ million | Re-presented $ million |
Final dividend for the year ended 30 June 2023 of 59.98 cents per share (2022 - 52.71 cents)(1) | 1,349 | 1,200 |
(1)Re-presented at declaration date's rate.
An interim dividend of 40.50 cents per share (2022 – 38.57 cents) was approved by a duly authorised committee of the Board of
Directors on 29 January 2024. As the approval was after the balance sheet date, it was not included as a liability. The change in
functional currency from sterling to US dollars does not significantly impact Diageo plc's retained earnings that are available
for the payment of dividends or purchases of own shares.
Other reserves of $502 million at 31 December 2023 (2022 – $560 million) include a capital redemption reserve of
$4,076 million (2022 – $3,869 million), a hedging reserve surplus of $270 million (2022 – $115 million surplus) and an
exchange reserve deficit of $3,844 million (2022 – $3,424 million deficit). Out of the total hedging reserves $60 million
represents the cost of hedging arising from cross currency interest rate swaps in net investment hedges.
F- 18
11. Sale of businesses and brands
Cash consideration received and net assets disposed of in respect of sale of businesses and brands in the six months ended 31
December 2023 were as follows:
Windsor business $ million | Other $ million | Total $ million | |
Sale consideration | |||
Cash received in the period | 37 | 4 | 41 |
Cash disposed of | (20) | — | (20) |
Transaction and other directly attributable costs paid | — | (3) | (3) |
Net cash received | 17 | 1 | 18 |
Deferred consideration receivable | 107 | — | 107 |
Transaction and other directly attributable costs payable | (12) | (8) | (20) |
112 | (7) | 105 | |
Net assets disposed of | |||
Brands | (167) | — | (167) |
Other non-current assets | (3) | — | (3) |
Inventories | (11) | — | (11) |
Other working capital | 3 | — | 3 |
Corporate tax | 2 | — | 2 |
Deferred tax | 37 | — | 37 |
(139) | — | (139) | |
Exchange recycled from other comprehensive income | (26) | — | (26) |
Loss on disposal before taxation | (53) | (7) | (60) |
Taxation | (1) | — | (1) |
Loss on disposal after taxation | (54) | (7) | (61) |
On 30 September 2022, Diageo announced the completion of the sale of Popular brands of its USL business. Payment of
$4 million of the purchase price that was subject to administrative actions within 12 months and considered uncertain at the
time of the transaction, was made to Diageo in the six months ended 31 December 2023.
On 26 May 2023, Diageo completed the sale of Guinness Cameroun S.A., its brewery in Cameroon, to Castel Group. In the six
months ended 31 December 2023, $11 million costs directly attributable to the disposal have been accounted for.
On 27 October 2023, Diageo completed the sale of Windsor Global Co., Ltd. to PT W Co., Ltd., a Korean company sponsored
by Pine Tree Investment & Management Co., Ltd. for a total consideration of KRW 206 billion ($152 million). The transaction
resulted in a loss of $53 million in the six months ended 31 December 2023, which was recognised as a non-operating item
attributable to the sale, including cumulative translation losses in the amount of $26 million recycled to the income statement.
Deferred consideration of KRW 102 billion ($75 million) was received after balance sheet closing date, on 25 January 2024.
12. Contingent liabilities and legal proceedings
(a) Guarantees and related matters
As of 31 December 2023, the group has no material unprovided guarantees or indemnities in respect of liabilities of third
parties.
(b) Acquisition of USL shares from UBHL and related proceedings in relation to the USL transaction
On 4 July 2013, Diageo completed its acquisition, under a share purchase agreement with United Breweries (Holdings) Limited
(UBHL) and various other sellers (the SPA), of shares representing 14.98% in USL, including shares representing 6.98% from
UBHL. The SPA was signed on 9 November 2012 as part of the transaction announced by Diageo in relation to USL on that
F- 19
day (the Original USL Transaction). Following a series of further transactions, as of 31 December 2023, Diageo has a 55.88%
investment in USL (excluding 2.38% owned by the USL Benefit Trust).
Prior to the acquisition from UBHL on 4 July 2013, the High Court of Karnataka (High Court) had granted leave to UBHL
under the Indian Companies Act 1956 (the Leave Order) to enable the sale by UBHL to Diageo to take place (the UBHL Share
Sale) notwithstanding the continued existence of certain winding-up petitions that were pending against UBHL on the date of
the SPA. At the time of the completion of the UBHL Share Sale, the Leave Order remained subject to review on appeal.
However, as stated by Diageo at the time of closing, it was considered unlikely that any appeal process in respect of the Leave
Order would definitively conclude on a timely basis and, accordingly, Diageo waived the conditionality under the SPA relating
to the absence of insolvency proceedings in relation to UBHL and acquired the 6.98% stake in USL from UBHL at that time.
Following appeal and counter-appeal in respect of the Leave Order, this matter is now before the Supreme Court of India which
has issued an order that the status quo be maintained with regard to the UBHL Share Sale pending a hearing on the matter
before it. Following a number of adjournments, the next date for a substantive hearing is yet to be fixed.
In separate proceedings, the High Court passed a winding-up order against UBHL on 7 February 2017, and appeals filed by
UBHL against that order have since been dismissed, initially by a division bench of the High Court and subsequently by the
Supreme Court of India.
Diageo continues to believe that the acquisition price of INR 1,440 per share paid to UBHL for the USL shares is fair and
reasonable as regards UBHL, UBHL’s shareholders and UBHL’s secured and unsecured creditors. However, adverse results for
Diageo in the proceedings referred to above could, absent leave or relief in other proceedings, ultimately result in Diageo losing
title to the 6.98% stake in USL acquired from UBHL. Diageo believes, including by reason of its rights under USL’s articles of
association to nominate USL’s CEO and CFO and the right to appoint, through USL, a majority of the directors on the boards
of USL’s subsidiaries as well as its ability as promoter to nominate for appointment up to two-thirds of USL’s directors for so
long as the chairperson of USL is an independent director, that it would remain in control of USL and would continue to be able
to consolidate USL as a subsidiary for accounting purposes regardless of the outcome of this litigation.
There can be no certainty as to the outcome of the existing or any further related legal proceedings or the time frame within
which they would be concluded.
(c) Continuing matters relating to Dr Vijay Mallya and affiliates
On 25 February 2016, Diageo and USL each announced that they had entered into arrangements with Dr Mallya under which
he had agreed to resign from his position as a director and as chairman of USL and from his positions in USL’s subsidiaries.
Diageo’s agreement with Dr Mallya (the February 2016 Agreement) provided for a payment of $75 million to Dr Mallya over a
five-year period of which $40 million was paid on signing of the February 2016 Agreement with the balance being payable in
equal instalments of $7 million a year over five years (2017-2021). All payments were subject to and conditional on Dr
Mallya’s compliance with the agreement. The February 2016 Agreement also provided for the release of Dr Mallya’s personal
obligations to indemnify Diageo Holdings Netherlands B.V. (DHN) in respect of its earlier liability ($141 million) under a
backstop guarantee of certain borrowings of Watson Limited (Watson) (a company affiliated with Dr Mallya).
On account of various breaches and other provisions of agreements between Dr Mallya and persons connected with him and
Diageo and/or USL, Diageo did not make the five instalment payments due during the five-year period between 2017 and 2021.
In addition, Diageo has also demanded that Dr Mallya repay the $40 million paid by Diageo in February 2016 and sought
compensation for various losses incurred by the relevant members of the Diageo group.
On 16 November 2017, Diageo and other relevant members of the Diageo group commenced claims in the High Court of
Justice in England and Wales (the English High Court) against Dr Mallya in relation to these matters. At the same time DHN
also commenced claims in the English High Court against Dr Mallya, his son Sidhartha Mallya, Watson and Continental
Administration Services Limited (CASL) (a company affiliated with Dr Mallya and understood to hold assets on trust for him
and certain persons affiliated with him) for in excess of $142 million (plus interest) in relation to Watson’s liability to DHN in
respect of its borrowings referred to above and the breach of associated security documents. Dr Mallya, Sidhartha Mallya and
the relevant affiliated companies filed a defence to these claims, and Dr Mallya also filed a counterclaim for payment of the two
instalment payments that had by that time been withheld as described above.
Diageo continues to prosecute its claims and to defend the counterclaim. As part of these proceedings, Diageo and the other
relevant members of its group filed an application for strike out and/or summary judgement in respect of certain aspects of the
defence filed by Dr Mallya and the other defendants, including their defence in relation to Watson and CASL’s liability to repay
DHN. The application was successful resulting in Watson being ordered to pay approximately $135 million plus various
F- 20
amounts in respect of interest to DHN, with CASL being held liable as co-surety for 50% of any such amount unpaid by
Watson. These amounts were, contrary to the relevant orders, not paid by the relevant deadlines and Watson and CASL’s
remaining defences in the proceedings were struck out. Diageo and DHN have accordingly sought asset disclosure and are
considering further enforcement steps against Watson and CASL, both in the United Kingdom and in other jurisdictions where
they are present or hold assets.
A trial of the remaining elements of these claims was due to commence on 21 November 2022. However, on 26 July 2021 Dr
Mallya was declared bankrupt by the English High Court pursuant to a bankruptcy petition presented by a consortium of Indian
banks. Diageo and the relevant members of its group have informed the Trustee in Bankruptcy of their position as creditors in
the bankruptcy and have engaged with the Trustee regarding their claims and the status of the current proceedings. An appeal
by Dr Mallya against his bankruptcy (and an appeal by the bank consortium against orders made in the course of the bankruptcy
proceedings) are pending. In light of the uncertainty posed by the ongoing bankruptcy proceedings, the trial of Diageo’s claim
was initially relisted to take place in February 2024. However, Dr Mallya’s appeal against his bankruptcy and the banks’ cross
appeal is not expected to be heard until April 2024. Accordingly, the Court has rescheduled the trial of Diageo’s claim for
March 2025.
At this stage, it is not possible to assess the extent to which the various ongoing proceedings related to the bankruptcy will
affect the remaining elements of the claims by Diageo and the relevant members of its group.
Upon completion of an initial inquiry in April 2015 into past improper transactions which identified references to certain
additional parties and matters, USL carried out an additional inquiry into these transactions (Additional Inquiry) which was
completed in July 2016. The Additional Inquiry, prima facie, identified transactions indicating actual and potential diversion of
funds from USL and its Indian and overseas subsidiaries to, in most cases, entities that appeared to be affiliated or associated
with Dr Mallya. All amounts identified in the Additional Inquiry have been provided for or expensed in the financial statements
of USL or its subsidiaries in the respective prior periods. USL has filed recovery suits against relevant parties identified
pursuant to the Additional Inquiry.
Further, at this stage, it is not possible for the management of USL to estimate the financial impact on USL, if any, arising out
of potential non-compliance with applicable laws in relation to such fund diversions.
(d) Other matters in relation to USL
In respect of the Watson backstop guarantee arrangements, the Securities and Exchange Board of India (SEBI) issued a notice
to Diageo on 16 June 2016 that if there is any net liability incurred by Diageo (after any recovery under relevant security or
other arrangements, which matters remain pending) on account of the Watson backstop guarantee, such liability, if any, would
be considered to be part of the price paid for the acquisition of USL shares under the SPA which formed part of the Original
USL Transaction and that, in that case, additional equivalent payments would be required to be made to those shareholders
(representing 0.04% of the shares in USL) who tendered in the open offer made as part of the Original USL Transaction.
Diageo believes that the Watson backstop guarantee arrangements were not part of the price paid or agreed to be paid for any
USL shares under the Original USL Transaction and that therefore SEBI's decision was not consistent with applicable law, and
Diageo appealed against it before the Securities Appellate Tribunal, Mumbai (SAT). On 1 November 2017, SAT issued an
order in respect of Diageo’s appeal in which, amongst other things, it observed that the relevant officer at SEBI had neither
considered Diageo’s earlier reply nor provided Diageo with an opportunity to be heard, and accordingly directed SEBI to pass a
fresh order after giving Diageo an opportunity to be heard. Following SAT’s order, Diageo made its further submissions in the
matter, including at a personal hearing before a Deputy General Manager of SEBI. On 26 June 2019, SEBI issued an order
reiterating the directions contained in its previous notice dated 16 June 2016. As with the previous SEBI notice, Diageo
believes that SEBI's latest order is not consistent with applicable law. Diageo appealed against this order before SAT and, after
a hearing in March 2023, SAT allowed Diageo’s appeal on 26 July 2023. Accordingly, SEBI’s order dated 26 June 2019 stands
quashed. Under applicable law, SEBI has filed an appeal against SAT’s order before the Supreme Court of India. However,
there can be no certainty as to its outcome or the timeframe within which any such appeal would be concluded.
(e) USL’s dispute with IDBI Bank Limited
Prior to the acquisition by Diageo of a controlling interest in USL, USL had prepaid a term loan of INR 6,280 million ($76
million) taken through IDBI Bank Limited (IDBI), an Indian bank, which was secured on certain fixed assets and brands of
USL, as well as by a pledge of certain shares in USL held by the USL Benefit Trust (of which USL is the sole beneficiary). The
maturity date of the loan was 31 March 2015. IDBI disputed the prepayment, following which USL filed a writ petition in
November 2013 before the High Court of Karnataka (the High Court) challenging the bank’s actions.
Following the original maturity date of the loan, USL received notices from IDBI seeking to recall the loan, demanding a
further sum of INR 459 million ($6 million) on account of the outstanding principal, accrued interest and other amounts, and
also threatening to enforce the security in the event that USL did not make these further payments. Pursuant to an application
filed by USL before the High Court in the writ proceedings, the High Court directed that, subject to USL depositing such
F- 21
further amount with the bank (which amount was duly deposited by USL), the bank should hold the amount in a suspense
account and not deal with any of the secured assets including the shares until disposal of the original writ petition filed by USL
before the High Court.
On 27 June 2019, a single judge bench of the High Court issued an order dismissing the writ petition filed by USL, amongst
other things, on the basis that the matter involved an issue of breach of contract by USL and was therefore not maintainable in
exercise of the court’s writ jurisdiction. USL filed an appeal against this order before a division bench of the High Court, which
on 30 July 2019 issued an interim order directing the bank to not deal with any of the secured assets until the next date of
hearing. On 13 January 2020, the division bench of the High Court admitted the writ appeal and extended the interim stay. This
appeal is currently pending. Based on the assessment of USL’s management supported by external legal opinions, USL
continues to believe that it has a strong case on the merits and therefore continues to believe that the secured assets will be
released to USL and the aforesaid amount of INR 459 million ($6 million) remains recoverable from IDBI.
(f) Tax
The international tax environment has seen increased scrutiny and rapid change over recent years bringing with it greater
uncertainty for multinationals. Against this backdrop, Diageo has been monitoring developments and continues to engage
transparently with the tax authorities in the countries where Diageo operates to ensure that the group manages its arrangements
on a sustainable basis.
The group operates in a large number of markets with complex tax and legislative regimes that are open to subjective
interpretation. In the context of these operations, it is possible that tax exposures which have not yet materialised (including
those which could arise as a result of tax assessments) may result in losses to the group. In the circumstances where tax
authorities have raised assessments, challenging interpretations which may lead to a possible material outflow, these have been
included as contingent liabilities. Where the potential tax exposures are known to us and have not been assessed, the group
considers disclosure of such matters taking into account their size and nature, relevant regulatory requirements and potential
prejudice of the future resolution or assessment thereof.
Diageo has a large number of ongoing tax cases in Brazil and India. Since assessing an accurate value of contingent liabilities in
these markets requires a high degree of judgement, contingent liabilities are disclosed on the basis of the current known
possible exposure from tax assessment values. While not all of these cases are individually significant, the current aggregate
known possible exposure from tax assessment values is up to approximately $934 million for Brazil and up to approximately
$115 million for India. The group believes that the likelihood that the tax authorities will ultimately prevail is lower than
probable but higher than remote. Due to the fiscal environment in Brazil and in India, the possibility of further tax assessments
related to the same matters cannot be ruled out and the judicial processes may take extended periods to conclude. Based on its
current assessment, Diageo believes that no provision is required in respect of these issues.
Payments were made under protest in India in respect of the periods 1 April 2006 to 31 March 2019 in relation to tax
assessments where the risk is considered to be remote or possible. These payments have to be made in order to be able to
challenge the assessments and as such have been recognised as a receivable in the group's balance sheet. The total amount of
payments under protest recognised as a receivable as at 31 December 2023 is $149 million (corporate tax payments of $137
million and indirect tax payments of $12 million).
(g) Other
The group has extensive international operations and routinely makes judgements on a range of legal, customs and tax matters
which are incidental to the group's operations. Some of these judgements are or may become the subject of challenges and
involve proceedings, the outcome of which cannot be foreseen. In particular, the group is currently a defendant in various
customs proceedings that challenge the declared customs value of products imported by certain Diageo companies. Diageo
continues to defend its position vigorously in these proceedings.
Save as disclosed above, neither Diageo, nor any member of the Diageo group, is or has been engaged in, nor (so far as Diageo
is aware) is there pending or threatened by or against it, any legal or arbitration proceedings which may have a significant effect
on the financial position of the Diageo group.
F- 22
13. Related party transactions
The group’s significant related parties are its associates, joint ventures, key management personnel and post employment
benefit plans.
There were no transactions with these related parties during the six months ended 31 December 2023 on terms other than those
that prevail in arm’s length transactions.
14. Post balance sheet events
On 16 January 2024, Diageo agreed with Combs Wine and Spirits LLC to purchase the 50% of the share capital of DeLeon
Holdco LLC that Diageo North America, Inc did not already own, for a total consideration of approximately $200 million. In
connection with this acquisition, the previously outstanding disputes between the shareholders were resolved and Diageo is now
the 100% owner of the DeLeón brand.
F- 23
SIGNATURE
Pursuant to the requirements of the Securities Exchange Act of 1934, the registrant has duly caused this report to be signed on
its behalf by the undersigned, thereunto duly authorised.
Diageo plc
(Registrant)
/s/ Lavanya Chandrashekar |
Name: Lavanya Chandrashekar |
Title: Chief Financial Officer |
30 January 2024 |