Table of Contents
UNITED STATES
SECURITIES AND EXCHANGE COMMISSION
Washington, D.C. 20549
FORM N-CSR
CERTIFIED SHAREHOLDER REPORT OF REGISTERED MANAGEMENT
INVESTMENT COMPANIES
Investment Company Act File Number 811-05601
SEI Institutional International Trust
(Exact name of registrant as specified in charter)
c/o CT Corporation
101 Federal Street
Boston, MA 02110
(Address of principal executive offices) (Zip code)
SEI Investments
One Freedom Valley Drive
Oaks, PA 19456
(Name and address of agent for service)
Registrant’s telephone number, including area code: 1-800-342-5734
Date of fiscal year end: September 30, 2009
Date of reporting period: September 30, 2009
Table of Contents
| Item 1. | Reports to Stockholders. |
Table of Contents

SEI Institutional International Trust
Annual Report as of September 30, 2009
International Equity Fund
Emerging Markets Equity Fund
International Fixed Income Fund
Emerging Markets Debt Fund
Table of Contents
| 1 | ||
| 6 | ||
| 29 | ||
| 30 | ||
| 31 | ||
| 33 | ||
| 34 | ||
| 45 | ||
| 46 | ||
| 49 | ||
Board of Trustees Considerations in Approving | 50 | |
| 53 | ||
The Trust files its complete schedule of portfolio holdings with the Securities and Exchange Commission for the first and third quarters of each fiscal year on Form N-Q within sixty days after the end of the period. The Trust’s Form N-Q is available on the Commission’s website at http://www.sec.gov, and may be reviewed and copied at the Commission’s Public Reference Room in Washington, DC. Information on the operation of the Public Reference Room may be obtained by calling 1-800-SEC-0330.
A description of the policies and procedures that the Trust uses to determine how to vote proxies relating to portfolio securities, as well as information relating to how a Fund voted proxies relating to portfolio securities during the most recent 12-month period ended June 30, is available (i) without charge, upon request, by calling 1-800-DIAL-SEI; and (ii) on the Commission’s website at http://www.sec.gov.
Table of Contents
MANAGEMENT’S DISCUSSION AND ANALYSIS OF FUND PERFORMANCE
SEI INSTITUTIONAL INTERNATIONAL TRUST — SEPTEMBER 30, 2009
International Equity Fund
I. Objective and Strategy
The International Equity Fund (“the Fund”) seeks to provide long-term capital appreciation by investing in equity securities of foreign companies.
II. Multi-Manager Approach
The Fund uses a multi-manager approach, relying upon a number of sub-advisors with differing investment philosophies to manage portions of the Fund’s portfolio under the general supervision of SEI Investments Management Corporation. The Fund utilized the following sub-advisors as of September 30, 2009: Acadian Asset Management, Inc., AXA Rosenberg Investment Management LLC, Declaration Management & Research LLC, INTECH Investment Management, LLC, McKinley Capital Management, Inc., Principal Global Investors, LLC, Quantitative Management Associates LLC and Wellington Management Company, LLC. For the year ended September 30, 2009, Acadian Asset Management, Inc., Declaration Management & Research LLC, INTECH Investment Management, LLC and Wellington Management Company, LLP were added to the Fund; AllianceBernstein L.P., Record Currency Management Limited and Smith Breeden Associates, Inc. were terminated.
III. Market Commentary
The global economic crisis continued to work its way through major economies such as the U.S., UK, Europe and Japan in the latter half of 2008 and the beginning of 2009. Equity markets were characterized by steep declines, sharp reversals and increased volatility. This was especially apparent in the Financials, Energy and Materials sectors. In early March 2009, global markets began a powerful rally. Strong fiscal and monetary stimulus plans from governments around the world seemed to positively impact the fight against recession. In general, equity markets delivered sizable gains by the end of September; however, continued high unemployment, further potential bank losses and mixed economic results have remained risks to a rapid recovery.
Asia Pacific ex-Japan was the strongest performing region during the year, as it benefited from global credit markets, increasing commodity prices and stronger economic conditions relative to its peers. Japan and Europe lagged with mixed economic data for the fiscal year. The fourth quarter of 2008 and early 2009 were characterized by extreme risk aversion and a preference for more defensive sectors. In contrast, cyclical sectors such as Financials and Materials led the market rally in the second and third quarters of 2009.
IV. Return vs. Benchmark
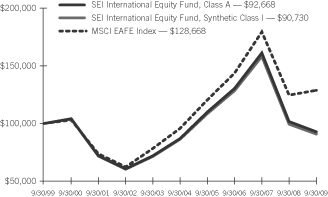
For the year ended September 30, 2009, the Fund underperformed the MSCI EAFE Index (the “Index”), returning (8.73%) versus the Index return of 3.23%.
V. Fund Attribution
Fund performance was primarily driven by stock selection. Holdings in the Financials sector detracted from performance, as the sector experienced dramatic reversals during the year. The Financials sector went from concerns over survival and unprecedented government intervention to a soaring rally by the end of the third quarter 2009. These extreme inflection points in the Financials sector made stock selection difficult. Commodities also experienced significant changes in momentum, which resulted in mixed performance for the Fund’s positions in the Materials sector. Stock selection in Telecommunications and Consumer Staples positively contributed to performance. Regionally, the Fund’s overweight allocation to emerging markets benefitted performance, as emerging markets outpaced developed regions during the time period. Stock selection in Japan and Europe detracted from performance, especially in cyclical sectors such as Financials, Materials and Industrials.
International Equity Fund
AVERAGE ANNUAL TOTAL RETURN1
| One Year Return | Annualized 3 Year Return | Annualized 5 Year Return | Annualized 10 Year Return | Annualized Inception to Date | ||||||
| Class A | (8.73)% | (10.75)% | 1.25% | (0.76)% | 2.89% | |||||
| Class I | (8.80)% | (10.93)% | 1.00% | (0.97)% | 2.65% |
Comparison of Change in the Value of a $100,000 Investment in the International Equity Fund, Class A and Class I, versus the Morgan Stanley MSCI EAFE Index
| 1 | For the period ended September 30, 2009. Past performance is no indication of future performance. Class I Shares were offered beginning on January 4, 2002. Class A Shares were offered beginning December 20, 1989. Class I Shares performance for the period prior to January 4, 2002 is performance derived from the performance of the Class A Shares. The performance of Class I Shares may be lower than the performance of Class A Shares because of different distribution fees paid by Class I shareholders. Returns shown do not reflect the deduction of taxes that a shareholder would pay on fund distributions or the redemption of fund shares. The returns for certain periods reflect fee waivers and/or reimbursements in effect for that period; absent fee waivers and reimbursements, performance would have been lower. |
| SEI Institutional International Trust / Annual Report / September 30, 2009 | 1 |
Table of Contents
MANAGEMENT’S DISCUSSION AND ANALYSIS OF FUND PERFORMANCE
SEI INSTITUTIONAL INTERNATIONAL TRUST — SEPTEMBER 30, 2009
Emerging Markets Equity Fund
I. Objective and Strategy
The Emerging Markets Equity Fund (the “Fund”) seeks to provide capital appreciation by investing in emerging-market companies.
II. Multi-Manager Approach
The Fund uses a multi-manager approach, relying upon a number of sub-advisors with differing investment philosophies to manage portions of the Fund’s portfolio under the general supervision of SEI Investments Management Corporation. The Fund utilized the following sub-advisors as of September 30, 2009: AllianceBernstein L.P., Artisan Partners Limited Partnership, AXA Rosenberg Investment Management LLC, PanAgora Asset Management, Inc., Rexiter Capital Management Limited and The Boston Company Asset Management LLC. No manager changes were made during the fiscal year ended September 30, 2009.
III. Market Commentary
Towards the end of 2008, emerging-markets equities witnessed some of the steepest quarterly declines on record. Significant downward pressure on commodities, a slowdown in global demand and investor risk aversion contributed to the negative market performance. However, starting in the first quarter of 2009, emerging markets decoupled from their developed counterparts and soared in the second quarter. Investor exuberance was driven by anticipation that emerging markets would benefit from global stimulus packages, domestic demand and increasing prices in commodity markets. Emerging Asia, especially China, had strong performance, which was generated in part by significant government stimulus. Eastern Europe lagged emerging peers as it struggled to weather the economic crisis.
IV. Return vs. Benchmark
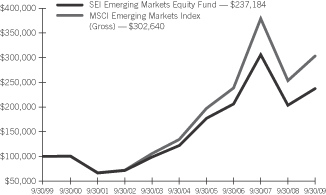
For the year ended September 30, 2009, the Fund underperformed the MSCI Emerging Markets Index (Gross) (the “Index”), returning 16.40% versus the Index return of 19.44%.
V. Fund Attribution
For the fiscal year, the Fund had negative relative performance from stock selection. Stock selection in Consumer Discretionary, especially automobiles and components, was strong. In contrast, the Fund’s underweight allocation to the Financials and Materials sectors ultimately detracted from performance for the fiscal year.
Stock selection in Russia and an allocation to Brazil, which are markets heavily influenced by commodities, posted positive returns for the Fund. However, holdings in Asia and the Pacific Rim detracted the most from Fund performance. In particular, stock selection in India was impaired by negative performance in Information Technology services.
Emerging Markets Equity Fund
AVERAGE ANNUAL TOTAL RETURN1
| One Year Return | Annualized 3 Year Return | Annualized 5 Year Return | Annualized 10 Year Return | Annualized Inception to Date | ||||||
| Class A | 16.40% | 4.79% | 14.16% | 9.02% | 5.48% |
Comparison of Change in the Value of a $100,000 Investment in the
Emerging Markets Equity Fund, versus the MSCI Emerging Markets Index (Gross)
| 1 | For the period ended September 30, 2009. Past performance is no indication of future performance. Class A Shares were offered beginning January 17, 1995. Returns shown do not reflect the deduction of taxes that a shareholder would pay on fund distributions or the redemption of fund shares. The returns for certain periods reflect fee waivers and/or reimbursements in effect for that period; absent fee waivers and reimbursements, performance would have been lower. |
| 2 | SEI Institutional International Trust / Annual Report / September 30, 2009 |
Table of Contents
MANAGEMENT’S DISCUSSION AND ANALYSIS OF FUND PERFORMANCE
SEI INSTITUTIONAL INTERNATIONAL TRUST — SEPTEMBER 30, 2009
International Fixed Income Fund
I. Objective and Strategy
The International Fixed Income Fund (“the Fund”) seeks to provide capital appreciation and current income by investing in investment-grade fixed-income securities of foreign government and corporate issuers.
II. Multi-Manager Approach
The Fund uses a multi-manager approach, relying upon a number of sub-advisors with differing investment philosophies to manage portions of the Fund’s portfolio under the general supervision of SEI Investments Management Corporation. The Fund utilized the following sub-advisers as of September 30, 2009: AllianceBernstein L.P., BlackRock Financial Management, Inc., Fidelity International Investment Advisors (UK) Limited, UBS Global Asset Management (Americas) Inc. and Wellington Management Company, LLP. For the year ended September 30, 2009, Wellington Management Company, LLP was added to the Fund; BlackRock Financial Management Inc. and Record Currency Management Limited were terminated.
III. Market Commentary
The fiscal year began with a worldwide economic contraction led by developed markets. Global manufacturing sank to a record low, and orders and inventory also fell rapidly. Spreads widened dramatically as a result of a massive flight to-quality, and liquidity seized up. Central banks around the globe began to coordinate efforts to fight this massive downturn, cutting interest rates and enacting government stimulus plans to provide liquidity to the market. Responses to the crisis were not in vain; during the second half of the fiscal year, the economies of several different countries began a recovery process and global consumption increased. This turnaround sparked a massive rally in early March 2009, as investors increased their risk appetites and funded new investments with cash that had previously been on the sidelines. The third quarter brought about a more tempered view of the situation, as concerns remained regarding global de-leveraging, the health of the financial system and the unwinding of government stimulus. Global labor markets remain under pressure, and global manufacturing activity has recently stalled. Although the period ended with conditions being markedly better than they were last year, we believe it will take some time before normalcy completely returns to the market.
IV. Return vs. Benchmark
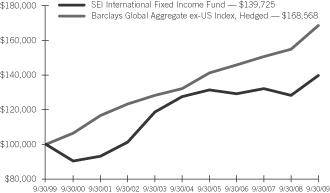
For the year ended September 30, 2009, the Fund slightly underperformed the Barclays Global Aggregate ex-US Index, Hedged, returning 8.85% versus the index return of 8.86%.
V. Fund Attribution
As spreads widened in the fourth quarter of 2008, the Fund’s overweight to Financials detracted from performance. Overweights to commercial mortgage-backed securities (“CMBS”) and mortgage-backed securities (“MBS”) also performed poorly during this period. However, during the early part of 2009, spreads began to tighten, and performance for CMBS and other loans improved. During the second and third quarters of 2009, the Fund benefited from its exposure to Financials, MBS and CMBS, as all of these securities staged massive rallies. Currency management was slightly positive over the fiscal year. An overweight to inflation-linked bonds was also slightly positive for this time period.
International Fixed Income Fund
AVERAGE ANNUAL TOTAL RETURN1
| One Year Return | Annualized 3 Year Return | Annualized 5 Year Return | Annualized 10 Year Return | Annualized Inception to Date | ||||||
| Class A | 8.85% | 2.65% | 1.85% | 3.40% | 4.59% |
Comparison of Change in the Value of a $100,000 Investment in the International Fixed Income Fund, versus the Barclays Global Aggregate ex-U.S. Index, Hedged
| 1 | For the period ended September 30, 2009. Past performance is no indication of future performance. Class A Shares were offered beginning September 1, 1993. Returns shown do not reflect the deduction of taxes that a shareholder would pay on fund distributions or the redemption of fund shares. The returns for certain periods reflect fee waivers and/or reimbursements in effect for that period; absent fee waivers and reimbursements, performance would have been lower. |
| SEI Institutional International Trust / Annual Report / September 30, 2009 | 3 |
Table of Contents
MANAGEMENT’S DISCUSSION AND ANALYSIS OF FUND PERFORMANCE
SEI INSTITUTIONAL INTERNATIONAL TRUST — SEPTEMBER 30, 2009
Emerging Markets Debt Fund
I. Objective and Strategy
The Emerging Markets Debt Fund (the “Fund”) invests in U.S.-dollar-denominated debt securities of government, government-rated and corporate issuers of emerging-market countries, as well as entities organized to restructure the outstanding debt of such issuers, with the goal of maximizing total return.
II. Multi-Manager Approach
The Fund uses a multi-manager approach, relying on a number of sub-advisors with differing investment philosophies to manage portions of the Fund’s portfolio under the general supervision of SEI Investments Management Corporation. The Fund utilized the following sub-advisers as of September 30, 2009: Ashmore Investment Management Limited, ING Investment Management Advisors, B.V. and Stone Harbor Investment Partners LP. There were no manager changes made during the fiscal year.
III. Market Commentary
There was upward momentum in emerging-markets debt as an asset class over the fiscal year, as investor risk appetite drove returns higher. With spreads reaching 900 basis points during the peak of the financial crisis, investors fled from lower-quality assets such as emerging-markets debt and moved to higher-quality assets. However, as risk in emerging markets appeared to be overpriced and spread valuations widened to a six-year high, asset prices began to climb and investor sentiment slowly improved. Additionally, market support came from the International Monetary Fund (“IMF”), which became active in lending financial support to nations in financial distress and providing much-needed liquidity to the market. Decreased financing costs resulted in a surge of new issuance from higher-quality sovereigns and corporates, followed by mid-to lower-quality countries and credits. Probably the most significant impact on emerging markets was when world leaders at the G-20 summit pledged over $1.1 trillion of additional resources to the IMF to help support the global economy. As countries slowly climbed out of recession, investor risk appetite continued to increase and inflows into emerging-market assets began to rise, providing further support.
The global economic downturn’s negative impact on emerging markets was immediate, as issuance came to a halt at the beginning
of the fiscal year. Ecuador voluntarily defaulted on its interest payments in the fourth quarter of 2008, sending additional shockwaves through the asset class. Emerging-markets debt also experienced significant investor outflows during the first half of the period, and it wasn’t until the global rally began in March that sentiment slowly began to return and technicals turned positive due to increased issuance. After delivering several downgrades to emerging nations, credit-rating agencies reversed the trend in the third quarter of 2009 and issued five upgrades and only one downgrade due to the stability of emerging economies and their ability to avoid the significant deterioration experienced in the developed world. Continued IMF support, rising commodity prices, supportive levels of reserves and a plethora of front-loaded rate cuts helped emerging economies return to equilibrium, bringing the value of the asset class to levels witnessed prior to the collapse of Lehman Brothers. Even the corporate bond sector of emerging markets, which was expected to struggle given its significant amount of leverage, was able to outperform external debt, which is owed to creditors outside the country, for the period. Gross-domestic-product growth for emerging markets during the fiscal year beat that of the developed world, and we believe emerging markets will lead the global recovery into 2010.
IV. Return vs. Benchmark
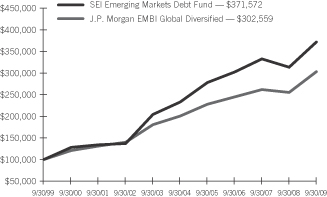
For the year ended September 30, 2009, the Fund underperformed the J.P. Morgan EMBI Global Diversified Index (the “Index”) returning 18.62% versus the Index return of 18.69%.
V. Fund Attribution
During the period, the Fund added to relative performance in Brazil through an overweight as well as security selection to local-currency-denominated assets. The real was one of the stronger performing currencies in emerging markets versus the dollar, and Brazil continues to benefit from strong fundamentals, an improving banking system and rising domestic demand. Security selection in Venezuela benefited performance as bonds were supported by higher oil prices and expectations from market participants that President Chavez would hold true to his plans to reform the broader economy. Ecuador’s choice to default on its issuance caused bonds to plummet, and our underweight position added to performance.
| 4 | SEI Institutional International Trust / Annual Report / September 30, 2009 |
Table of Contents
MANAGEMENT’S DISCUSSION AND ANALYSIS OF FUND PERFORMANCE
SEI INSTITUTIONAL INTERNATIONAL TRUST — SEPTEMBER 30, 2009
Emerging Markets Debt Fund (Concluded)
The Fund’s overweight to off-benchmark corporate debt hurt performance. Prices dropped on concerns that the corporate sector would struggle to meet refinancing needs and that depreciating currencies would make it more costly to service outstanding debt. Security selection in Russia, especially the banking sector, detracted from performance as the country experienced investor outflows and witnessed a 40% reduction in its international reserves to help prop up a depreciating ruble. Security selection in Mexico subtracted from relative performance as the country experienced significant fiscal deterioration due to its high correlation with the U.S. economy, which struggled for the better part of the period. A shift in the political landscape has created uncertainty over the country’s fiscal position, and a decrease in oil production at PEMEX, the country’s state-run oil company, negatively impacted government revenues.
Emerging Markets Debt Fund
AVERAGE ANNUAL TOTAL RETURN1
| One Year Return | Annualized 3 Year Return | Annualized 5 Year Return | Annualized 10 Year Return | Annualized Inception to Date | ||||||
| Class A | 18.62% | 7.16% | 9.80% | 14.03% | 10.52% |
Comparison of Change in the Value of a $100,000 Investment in the Emerging Markets Debt Fund, versus the J.P. Morgan EMBI Global Diversified Index
| 1 | For the period ended September 30, 2009. Past performance is no indication of future performance. Class A Shares were offered beginning June 26, 1997. Returns shown do not reflect the deduction of taxes that a shareholder would pay on fund distributions or the redemption of fund shares. The returns for certain periods reflect fee waivers and/or reimbursements in effect for that period; absent fee waivers and reimbursements, performance would have been lower. |
| SEI Institutional International Trust / Annual Report / September 30, 2009 | 5 |
Table of Contents
SUMMARY SCHEDULE OF INVESTMENTS
International Equity Fund
September 30, 2009

| Description | Percentage of Net Assets (%) | Shares | Market Value ($ Thousands) | |||||||
COMMON STOCK — 88.8% |
| |||||||||
Argentina — 0.0% |
| |||||||||
Other Securities | 0.0 | % | $ | 575 | ||||||
Australia — 4.9% | ||||||||||
BHP Billiton | 0.7 | 430,742 | 14,343 | |||||||
Other Securities | 4.2 | 85,818 | ||||||||
| 100,161 | ||||||||||
Austria — 0.2% | ||||||||||
Other Securities | 0.2 | 4,824 | ||||||||
Belgium — 1.2% | ||||||||||
Other Securities | 1.2 | 24,496 | ||||||||
Brazil — 0.5% | ||||||||||
Other Securities | 0.5 | 10,941 | ||||||||
Canada — 1.6% | ||||||||||
Other Securities | 1.6 | 31,992 | ||||||||
Chile — 0.1% | ||||||||||
Banco Santander Chile ADR | 0.1 | 23,200 | 1,335 | |||||||
Other Securities | 0.0 | 291 | ||||||||
| 1,626 | ||||||||||
China — 0.8% | ||||||||||
Other Securities | 0.8 | 15,786 | ||||||||
Cyprus — 0.0% | ||||||||||
Other Securities | 0.0 | 229 | ||||||||
Denmark — 0.8% | ||||||||||
Other Securities | 0.8 | 16,423 | ||||||||
| Description | Percentage of Net Assets (%) | Shares | Market Value ($ Thousands) | |||||||
Finland — 0.7% | ||||||||||
Other Securities | 0.7 | % | $ | 15,273 | ||||||
France — 6.8% | ||||||||||
BNP Paribas (A) | 0.7 | 180,227 | 14,384 | |||||||
Sanofi-Aventis | 1.2 | 336,731 | 24,684 | |||||||
Societe Generale | 0.6 | 156,768 | 12,603 | |||||||
Total (A) | 0.7 | 224,102 | 13,301 | |||||||
Other Securities | 3.6 | 75,381 | ||||||||
| 140,353 | ||||||||||
Germany — 6.6% | ||||||||||
Allianz | 0.6 | 95,443 | 11,910 | |||||||
Bayer | 0.5 | 158,633 | 10,979 | |||||||
Deutsche Bank | 0.5 | 123,995 | 9,505 | |||||||
E.ON | 0.4 | 215,684 | 9,137 | |||||||
Siemens | 0.8 | 179,896 | 16,640 | |||||||
Other Securities | 3.8 | 78,597 | ||||||||
| 136,768 | ||||||||||
Greece — 0.7% | ||||||||||
Other Securities | 0.7 | 14,748 | ||||||||
Hong Kong — 3.2% |
| |||||||||
Hang Seng Bank | 0.1 | 92,400 | 1,332 | |||||||
Sun Hung Kai Properties | 0.6 | 857,000 | 12,628 | |||||||
Other Securities | 2.5 | 51,897 | ||||||||
| 65,857 | ||||||||||
India — 0.7% | ||||||||||
Other Securities | 0.7 | 13,713 | ||||||||
Indonesia — 0.1% |
| |||||||||
Other Securities | 0.1 | 2,405 | ||||||||
Ireland — 0.3% | ||||||||||
Other Securities | 0.3 | 6,191 | ||||||||
Israel — 0.3% | ||||||||||
Other Securities | 0.3 | 7,107 | ||||||||
Italy — 2.6% | ||||||||||
Enel | 0.5 | 1,586,211 | 10,057 | |||||||
Other Securities | 2.1 | 44,129 | ||||||||
| 54,186 | ||||||||||
Japan — 18.6% | ||||||||||
Astellas Pharma | 0.4 | 197,500 | 8,140 | |||||||
Canon | 0.7 | 350,800 | 14,222 | |||||||
East Japan Railway | 0.4 | 120,500 | 8,694 | |||||||
Honda Motor | 0.8 | 541,900 | 16,735 | |||||||
Mitsubishi | 0.6 | 622,300 | 12,622 | |||||||
| 6 | SEI Institutional International Trust / Annual Report / September 30, 2009 |
Table of Contents
| Description | Percentage of Net Assets (%) | Shares | Market Value ($ Thousands) | |||||||
Nippon Telegraph & Telephone | 0.5 | % | 221,800 | $ | 10,305 | |||||
Nissan Motor | 0.4 | 1,213,900 | 8,230 | |||||||
Sumitomo Mitsui Financial Group (A) | 0.4 | 236,800 | 8,278 | |||||||
Toyota Motor | 0.4 | 224,100 | 8,935 | |||||||
Other Securities | 14.0 | 287,867 | ||||||||
| 384,028 | ||||||||||
Jersey — 0.0% | ||||||||||
Other Securities | 0.0 | 799 | ||||||||
Malta — 0.0% | ||||||||||
Other Securities | 0.0 | — | ||||||||
Mauritius — 0.1% | ||||||||||
Other Securities | 0.1 | 975 | ||||||||
Mexico — 0.0% | ||||||||||
Other Securities | 0.0 | 271 | ||||||||
Netherlands — 4.5% |
| |||||||||
Royal Dutch Shell, Cl A | 1.0 | 756,178 | 21,597 | |||||||
Royal Dutch Shell, Cl B | 0.5 | 386,633 | 10,735 | |||||||
Unilever | 0.5 | 381,815 | 10,992 | |||||||
Other Securities | 2.5 | 48,707 | ||||||||
| 92,031 | ||||||||||
New Zealand — 0.1% |
| |||||||||
Other Securities | 0.1 | 2,669 | ||||||||
Norway — 0.7% | ||||||||||
Other Securities | 0.7 | 14,681 | ||||||||
Papua New Guinea — 0.0% |
| |||||||||
Other Securities | 0.0 | 552 | ||||||||
Portugal — 0.5% |
| |||||||||
Other Securities | 0.5 | 9,471 | ||||||||
Russia — 0.4% |
| |||||||||
Other Securities | 0.4 | 8,719 | ||||||||
Singapore — 1.4% |
| |||||||||
Wilmar International (A) | 0.4 | 1,844,000 | 8,271 | |||||||
Other Securities | 1.0 | 20,183 | ||||||||
| 28,454 | ||||||||||
South Africa — 0.2% |
| |||||||||
Other Securities | 0.2 | 3,054 | ||||||||
South Korea — 0.2% |
| |||||||||
Other Securities | 0.2 | 4,150 | ||||||||
Spain — 3.8% |
| |||||||||
Banco Bilbao Vizcaya Argentaria (A) | 0.5 | 566,652 | 10,047 | |||||||
| Description | Percentage of Net Assets (%) | Shares/ Face Amount (Thousands) (1) | Market Value ($ Thousands) | |||||||
Banco Santander Central Hispano | 0.9 | % | 1,188,325 | $ | 19,107 | |||||
Telefonica (A) | 1.3 | 955,149 | 26,324 | |||||||
Other Securities | 1.1 | 22,413 | ||||||||
| 77,891 | ||||||||||
Sweden — 1.6% |
| |||||||||
Other Securities | 1.6 | 33,172 | ||||||||
Switzerland — 7.6% |
| |||||||||
Credit Suisse Group | 0.9 | 318,180 | 17,632 | |||||||
Nestle | 1.3 | 640,927 | 27,276 | |||||||
Novartis | 1.1 | 438,826 | 21,928 | |||||||
Roche Holding | 0.8 | 98,060 | 15,829 | |||||||
UBS | 0.4 | 458,387 | 8,380 | |||||||
Xstrata | 0.5 | 620,018 | 9,148 | |||||||
Zurich Financial Services | 0.7 | 56,710 | 13,472 | |||||||
Other Securities | 1.9 | 42,814 | ||||||||
| 156,479 | ||||||||||
Taiwan — 0.8% |
| |||||||||
Other Securities | 0.8 | 15,621 | ||||||||
Turkey — 0.1% |
| |||||||||
Other Securities | 0.1 | 2,477 | ||||||||
United Kingdom — 15.6% |
| |||||||||
AstraZeneca | 0.9 | 394,014 | 17,670 | |||||||
Barclays | 0.6 | 1,988,437 | 11,767 | |||||||
BG Group | 0.4 | 484,545 | 8,424 | |||||||
BHP Billiton | 0.6 | 451,274 | 12,327 | |||||||
BP | 1.4 | 3,285,633 | 29,060 | |||||||
British American Tobacco | 0.7 | 435,903 | 13,685 | |||||||
GlaxoSmithKline | 0.6 | 668,037 | 13,136 | |||||||
HSBC Holdings | 1.1 | 2,006,864 | 22,981 | |||||||
Rio Tinto | 0.5 | 218,036 | 9,306 | |||||||
Standard Chartered | 0.8 | 672,608 | 16,588 | |||||||
Vodafone Group | 0.9 | 7,916,006 | 17,750 | |||||||
Other Securities | 7.1 | 148,392 | ||||||||
| 321,086 | ||||||||||
United States — 0.5% |
| |||||||||
Other Securities | 0.5 | 10,043 | ||||||||
Total Common Stock | 1,830,277 | |||||||||
MORTGAGE-BACKED SECURITIES — 3.7% | ||||||||||
Agency Mortgage-Backed Obligations — 1.8% | ||||||||||
FNMA | ||||||||||
6.000%, 07/01/37 | 0.0 | 869 | 919 | |||||||
FNMA 15 Year TBA | ||||||||||
6.000%, 10/20/21 | 0.2 | 4,000 | 4,260 | |||||||
| SEI Institutional International Trust / Annual Report / September 30, 2009 | 7 |
Table of Contents
SUMMARY SCHEDULE OF INVESTMENTS
International Equity Fund (Continued)
September 30, 2009
| Description | Percentage of Net Assets (%) | Face Amount (Thousands) (1)/ Shares | Market Value ($ Thousands) | |||||||
FNMA 30 Year TBA | ||||||||||
6.500%, 10/01/37 | 0.6 | % | 10,650 | $ | 11,382 | |||||
6.000%, 10/01/37 | 0.6 | 12,100 | 12,765 | |||||||
FNMA ARM | ||||||||||
5.128%, 10/01/35 (D) | 0.1 | 1,319 | 1,376 | |||||||
4.504%, 05/01/35 (D) | 0.1 | 1,027 | 1,067 | |||||||
FNMA CMO STRIPS, Ser 369, Cl 1, IO | ||||||||||
5.000%, 03/01/36 | 0.0 | 1,283 | 168 | |||||||
Other Securities | 0.2 | 4,734 | ||||||||
| 36,671 | ||||||||||
Non-Agency Mortgage-Backed Obligations — 1.9% | ||||||||||
Other Securities | 1.9 | 39,393 | ||||||||
Total Mortgage-Backed Securities |
| 76,064 | ||||||||
ASSET-BACKED SECURITIES — 1.4% | ||||||||||
Automotive — 0.3% | ||||||||||
Other Securities | 0.3 | 5,090 | ||||||||
Credit Card — 0.7% | ||||||||||
Other Securities | 0.7 | 15,228 | ||||||||
Mortgage-Related — 0.4% |
| |||||||||
Other Securities | 0.4 | 8,418 | ||||||||
Total Asset-Backed Securities | 28,736 | |||||||||
PREFERRED STOCK — 0.5% | ||||||||||
Brazil — 0.4% | ||||||||||
Other Securities | 0.4 | 7,787 | ||||||||
France — 0.0% | ||||||||||
Other Securities | 0.0 | 497 | ||||||||
Germany — 0.1% |
| |||||||||
Other Securities | 0.1 | 2,603 | ||||||||
Total Preferred Stock | 10,887 | |||||||||
CORPORATE OBLIGATION — 0.1% | ||||||||||
United States — 0.1% | ||||||||||
Other Securities | 0.1 | 914 | ||||||||
Total Corporate Obligation | 914 | |||||||||
| Description | Percentage of Net Assets (%) | Shares/ Face Amount (Thousands) (1) | Market Value ($ Thousands) | |||||||
WARRANTS — 0.0% | ||||||||||
Italy — 0.0% | ||||||||||
Other Securities | 0.0 | % | $ | 7 | ||||||
Singapore — 0.0% |
| |||||||||
Other Securities | 0.0 | 30 | ||||||||
Total Warrants | 37 | |||||||||
RIGHTS — 0.0% |
| |||||||||
Australia — 0.0% |
| |||||||||
Other Securities | 0.0 | 33 | ||||||||
Belgium — 0.0% |
| |||||||||
Other Securities | 0.0 | — | ||||||||
France — 0.0% |
| |||||||||
Other Securities | 0.0 | 396 | ||||||||
Hong Kong — 0.0% |
| |||||||||
Other Securities | 0.0 | 77 | ||||||||
Sweden — 0.0% |
| |||||||||
Other Securities | 0.0 | 97 | ||||||||
Total Rights | 603 | |||||||||
CASH EQUIVALENT — 3.9% | ||||||||||
United States — 3.9% |
| |||||||||
SEI Daily Income Trust, Prime Obligation Fund, Cl A, 0.110%†* | 3.9 | 80,443,128 | 80,443 | |||||||
Total Cash Equivalent | ||||||||||
U.S. TREASURY OBLIGATIONS — 0.7% | ||||||||||
U.S. Treasury Bills | ||||||||||
0.233%, 12/03/09 (B) (C) | 0.6 | 12,364 | 12,362 | |||||||
Other Obligations | 0.1 | 2,350 | ||||||||
Total U.S. Treasury Obligations | 14,712 | |||||||||
AFFILIATED PARTNERSHIP — 7.9% | ||||||||||
United States — 7.9% |
| |||||||||
SEI Liquidity Fund, L.P., 0.400%†* (D) | 7.9 | 165,342,282 | 163,007 | |||||||
Total Affiliated Partnership | 163,007 | |||||||||
| 8 | SEI Institutional International Trust / Annual Report / September 30, 2009 |
Table of Contents
| Description | Percentage of Net Assets (%) | Face Amount (Thousands) (1) | Market Value ($ Thousands) | |||||||||
TIME DEPOSITS — 2.0% | ||||||||||||
United States — 2.0% |
| |||||||||||
Brown Brothers Harriman | ||||||||||||
5.950%, 10/01/09 | 0.0 | % | ZAR | 3 | $ | — | ||||||
2.174%, 10/01/09 | 0.0 | AUD | 531 | 469 | ||||||||
1.500%, 10/01/09 | 0.0 | NZD | 100 | 72 | ||||||||
0.382%, 10/01/09 | 0.0 | NOK | 185 | 32 | ||||||||
0.125%, 10/01/09 | 0.0 | EUR | 85 | 124 | ||||||||
0.100%, 10/01/09 | 0.0 | DKK | 3,539 | 695 | ||||||||
0.088%, 10/01/09 | 0.0 | GBP | 321 | 513 | ||||||||
0.060%, 10/01/09 | 0.0 | CAD | 3 | 2 | ||||||||
0.030%, 10/01/09 | 1.9 | 38,281 | 38,281 | |||||||||
0.020%, 10/01/09 | 0.0 | CHF | 454 | 438 | ||||||||
0.010%, 10/01/09 | 0.0 | HKD | 693 | 89 | ||||||||
0.010%, 10/01/09 | 0.1 | JPY | 71,757 | 801 | ||||||||
0.010%, 10/01/09 | 0.0 | SEK | 1,438 | 206 | ||||||||
0.005%, 10/01/09 | 0.0 | SGD | 53 | 38 | ||||||||
Total Time Deposits | 41,760 | |||||||||||
Total Investments — 109.0% | $ | 2,247,440 | ||||||||||
A summary of the outstanding forward foreign currency contracts held by the Fund at September 30, 2009, is as follows:
| Settlement Date | Currency to Deliver (Thousands) | Currency to Receive (Thousands) | Unrealized Appreciation (Depreciation) ($ Thousands) | |||||||||
10/1/09-10/21/09 | JPY | 3,376,515 | USD | 36,750 | $ | (971 | ) | |||||
10/1/09-10/21/09 | USD | 37,114 | JPY | 3,376,515 | 607 | |||||||
10/2/09-10/21/09 | AUD | 53,713 | USD | 46,813 | (506 | ) | ||||||
10/2/09-10/21/09 | CAD | 25,266 | USD | 23,760 | 214 | |||||||
10/5/09-10/21/09 | HKD | 313,704 | USD | 40,483 | — | |||||||
10/5/09-10/21/09 | USD | 76,835 | GBP | 46,440 | (2,575 | ) | ||||||
10/6/09-10/21/09 | USD | 46,832 | AUD | 53,682 | 460 | |||||||
10/21/09 | AUD | 2,537 | CHF | 2,100 | (210 | ) | ||||||
10/21/09 | CHF | 2,100 | AUD | 2,568 | 238 | |||||||
10/21/09 | CHF | 4,400 | GBP | 2,560 | (148 | ) | ||||||
10/21/09 | CHF | 9,218 | USD | 8,708 | (179 | ) | ||||||
10/21/09 | GBP | 2,569 | CHF | 4,400 | 134 | |||||||
10/21/09 | MXP | 3,461 | USD | 261 | 6 | |||||||
10/21/09 | NOK | 9,412 | USD | 1,610 | (12 | ) | ||||||
10/21/09 | SEK | 92,083 | USD | 13,486 | 313 | |||||||
10/21/09 | SGD | 2,711 | USD | 1,918 | (6 | ) | ||||||
10/21/09 | USD | 23,614 | CAD | 25,266 | (68 | ) | ||||||
10/21/09 | USD | 8,787 | CHF | 9,218 | 99 | |||||||
10/21/09 | USD | 76,695 | EUR | 52,051 | (619 | ) | ||||||
10/21/09 | USD | 40,484 | HKD | 313,704 | (1 | ) | ||||||
10/21/09 | USD | 260 | MXP | 3,461 | (4 | ) | ||||||
10/21/09 | USD | 391 | NZD | 542 | 1 | |||||||
10/21/09 | USD | 13,435 | SEK | 92,083 | (261 | ) | ||||||
10/21/09 | USD | 1,920 | SGD | 2,711 | 4 | |||||||
10/21/09 | USD | 1,592 | ZAR | 11,915 | (24 | ) | ||||||
10/21/09 | ZAR | 11,915 | USD | 1,616 | 48 | |||||||
10/21/09-11/20/09 | EUR | 52,083 | USD | 77,049 | 928 | |||||||
10/21/09-11/20/09 | GBP | 2,448 | JPY | 378,000 | 310 | |||||||
10/21/09-11/20/09 | GBP | 1,204 | SGD | 2,800 | 62 | |||||||
10/21/09-11/20/09 | GBP | 46,576 | USD | 76,063 | 1,585 | |||||||
10/21/09-11/20/09 | JPY | 378,000 | GBP | 2,570 | (115 | ) | ||||||
10/21/09-11/20/09 | JPY | 189,000 | NZD | 3,263 | 243 | |||||||
10/21/09-11/20/09 | NZD | 3,147 | JPY | 189,000 | (159 | ) | ||||||
10/21/09-11/20/09 | NZD | 659 | USD | 460 | (16 | ) | ||||||
| Settlement Date | Currency to Deliver (Thousands) | Currency to Receive (Thousands) | Unrealized Appreciation (Depreciation) ($ Thousands) | |||||||||
10/21/09-11/20/09 | SGD | 2,800 | GBP | 1,227 | $ | (26 | ) | |||||
10/21/09-11/20/09 | USD | 1,629 | NOK | 9,526 | 12 | |||||||
11/20/09 | CHF | 2,100 | EUR | 1,391 | 7 | |||||||
11/20/09 | CHF | 1,000 | NOK | 5,854 | 43 | |||||||
11/20/09 | EUR | 1,393 | CHF | 2,100 | (10 | ) | ||||||
11/20/09 | EUR | 1,397 | JPY | 188,000 | 59 | |||||||
11/20/09 | JPY | 188,000 | EUR | 1,431 | (10 | ) | ||||||
11/20/09 | NOK | 5,968 | CHF | 1,000 | (63 | ) | ||||||
| $ | (610 | ) | ||||||||||
A summary of the open futures contracts held by the Fund at September 30, 2009, is as follows:
| Type of Contract | Number of Contracts Long (Short) | Expiration Date | Unrealized Appreciation (Depreciation) ($ Thousands) | ||||||
DJ Euro Stoxx 50 Index | 932 | Dec-2009 | $ | 494 | |||||
FTSE 100 Index | 278 | Dec-2009 | 520 | ||||||
Hang Seng Index | 16 | Oct-2009 | 7 | ||||||
MSCI EAFE Index E-MINI | 88 | Dec-2009 | 133 | ||||||
Nikkei 225 Index | 20 | Dec-2009 | (24 | ) | |||||
SPI 200 Index | 66 | Dec-2009 | 220 | ||||||
Topix Index | 244 | Dec-2009 | (1,094 | ) | |||||
U.S. 10-Year Treasury Note | (14 | ) | Dec-2009 | (20 | ) | ||||
U.S. 5-Year Treasury Note | (14 | ) | Dec-2009 | (13 | ) | ||||
| $ | 223 | ||||||||
For the year ended September 30, 2009, The total amount of all open futures contracts, as presented in the table above, are representative of the volume of activity for this derivative type during the period.
| SEI Institutional International Trust / Annual Report / September 30, 2009 | 9 |
Table of Contents
SUMMARY SCHEDULE OF INVESTMENTS
International Equity Fund (Concluded)
September 30, 2009
A summary of outstanding swap agreements held by the Fund at September 30, 2009, is as follows:
| Total Return Swap | ||||||||||||||
| Counterparty | Reference Entity/Obligation | Fund Pays | Fund Receives | Termination Date | Notional Amount (Thousands) | Net Unrealized Depreciation ($ Thousands) | ||||||||
| Morgan Stanley | MSCI Daily TR Net EAFE USD Market Index | 3-Month LIBOR | Price Return | 01/13/10 | 95,310 | $ | (1,341 | ) | ||||||
| Credit Default Swaps | ||||||||||||||
| Counterparty | Reference Entity/Obligation | Buy/Sell Protection | (Pays)/ Receives Rate | Termination Date | Notional Amount (Thousands) | Net Unrealized Appreciation ($ Thousands) | ||||||||
| Bank of America | Radian Group Inc., 7.750%, 06/01/11 | BUY | (0.39 | ) | 12/20/13 | 2,500 | $ | 920 | ||||||
| JPMorgan Chase Bank | Radian Group Inc., 7.750%, 06/01/11 | BUY | (0.39 | ) | 12/20/13 | 2,500 | 921 | |||||||
| $ | 1,841 | |||||||||||||
The following is a summary of the inputs used as of September 30, 2009 in valuing the Fund’s investments carried at value ($ Thousands):
| Investments in Securities | Level 1 | Level 2 | Level 3 | Total | ||||||||
Common Stock | $ | 1,830,277 | $ | — | $ | — | $ | 1,830,277 | ||||
Mortgage-Backed Securities | — | 76,064 | — | 76,064 | ||||||||
Asset-Backed Securities | — | 28,736 | — | 28,736 | ||||||||
Preferred Stock | 10,887 | — | — | 10,887 | ||||||||
Corporate Obligation | — | 914 | — | 914 | ||||||||
Warrants | 37 | — | — | 37 | ||||||||
Rights | — | 603 | — | 603 | ||||||||
Cash Equivalent | 80,443 | — | — | 80,443 | ||||||||
U.S. Treasury Obligations | — | 14,712 | — | 14,712 | ||||||||
Affiliated Partnership | — | 163,007 | — | 163,007 | ||||||||
Time Deposits | — | 41,760 | — | 41,760 | ||||||||
Total Investments in Securities | $ | 1,921,644 | $ | 325,796 | $ | — | $ | 2,247,440 | ||||
| Other Financial Instruments* | Level 1 | Level 2 | Level 3 | Total | ||||||||||
Futures | $ | 223 | $ | — | $ | — | $ | 223 | ||||||
Forwards | — | (610 | ) | — | (610 | ) | ||||||||
Credit Default Swaps | — | 1,841 | — | 1,841 | ||||||||||
Total Return Swaps | — | (1,341 | ) | — | (1,341 | ) | ||||||||
Total Other Financial Instruments | $ | 223 | $ | (110 | ) | $ | — | $ | 113 | |||||
| * | Other Financial Instruments are valued at unrealized appreciation/depreciation. |
For more information on valuation inputs, see Note 2 — Significant Accounting Policies in Notes to Financial Statements.
The accompanying notes are an integral part of the financial statements.
Percentages are based on a Net Assets of $2,061,808 ($ Thousands).
| * | Rate shown is the 7-day effective yield as of September 30, 2009. |
| (1) | In U.S. dollars unless otherwise indicated. |
| † | Affiliated security. |
| (A) | This security or a partial position of this security is on loan at September 30, 2009. The total market value of securities on loan at September 30, 2009 was $155,229 ($ Thousands) (See Note 9). |
| (B) | Zero coupon security. The rate reported on the Summary Schedule of Investments is the effective yield at time of purchase. |
| (C) | Security, or portion thereof, has been pledged as collateral on open futures contracts. |
| (D) | This security was purchased with cash collateral held from securities on loan (see Note 9). The total value of such securities as of September 30, 2009 was $163,007 ($ Thousands). |
ARM — Adjustable Rate Mortgage
AUD — Australian Dollar
CAD — Canadian Dollar
CHF — Swiss Franc
Cl — Class
CMO — Collateralized Mortgage Obligation
DKK — Danish Krone
EAFE — Europe, Australasia and Far East
EUR — Euro
FNMA — Federal National Mortgage Association
GBP — British Pound Sterling
HKD — Hong Kong Dollar
IO — Interest Only
JPY — Japanese Yen
LIBOR — London Interbank Offered Rate
L.P. — Limited Partnership
MSCI — Morgan Stanley Capital International
MXP — Mexican Peso
NOK — Norwegian Krone
NZD — New Zealand Dollar
SEK — Swedish Krona
SER — Series
SGD — Singapore Dollar
STRIPS — Separate Trading of Registered Interest and Principal of Securities
TBA — To Be Announced
USD — U.S. Dollar
ZAR — South African Rand
Amounts designated as “—” are $O or have been rounded to $O.
The Summary Schedule of Investments does not reflect the complete portfolio holdings. It includes the Fund’s 50 largest holdings and each investment in any issuer that exceeds 1% of the Fund’s net assets. “Other Securities” represent all issues not required to be disclosed under the rules adopted by the U.S. Securities and Exchange Commission (“SEC”). Footnotes above may apply to securities that are included in “other securities.” For further detail, the complete schedule of portfolio holdings is available (i) without charge, upon request, by calling (800) 342-5734; and (ii) on the SEC’s website at http://www.sec.gov.
| 10 | SEI Institutional International Trust / Annual Report / September 30, 2009 |
Table of Contents
SUMMARY SCHEDULE OF INVESTMENTS
Emerging Markets Equity Fund
September 30, 2009

| Description | Percentage of Net Assets (%) | Shares | Market Value ($ Thousands) | |||||
COMMON STOCK — 86.7% | ||||||||
Argentina — 0.4% | ||||||||
Other Securities | 0.4 | % | $ | 3,323 | ||||
Brazil — 7.8% | ||||||||
Banco do Brasil | 0.3 | 161,654 | 2,848 | |||||
Centrais Eletricas Brasileiras | 0.1 | 54,180 | 838 | |||||
Cia de Saneamento Basico do Estado de Sao Paulo | 0.2 | 101,469 | 1,920 | |||||
Cia de Saneamento Basico do Estado de Sao Paulo ADR | 0.0 | 610 | 23 | |||||
Itau Unibanco Holding ADR | 0.6 | 287,329 | 5,790 | |||||
Petroleo Brasileiro | 0.9 | 347,229 | 7,936 | |||||
Petroleo Brasileiro ADR | 0.3 | 49,934 | 2,292 | |||||
Redecard | 0.4 | 239,703 | 3,685 | |||||
Usinas Siderurgicas de Minas Gerais | 0.4 | 142,800 | 3,647 | |||||
Vale | 0.3 | 136,800 | 3,157 | |||||
Vale ADR, Cl B | 0.6 | 252,970 | 5,851 | |||||
Other Securities | 3.7 | 33,374 | ||||||
| 71,361 | ||||||||
Chile — 1.2% | ||||||||
Enersis ADR | 0.4 | 205,191 | 3,786 | |||||
Other Securities | 0.8 | 7,429 | ||||||
| 11,215 | ||||||||
China — 9.6% | ||||||||
Bank of China | 0.8 | 14,479,000 | 7,622 | |||||
China Citic Bank | 0.1 | 1,009,000 | 665 | |||||
China Construction Bank | 1.3 | 15,222,250 | 12,158 | |||||
China Shenhua Energy | 0.0 | 36,000 | 157 | |||||
Industrial & Commercial Bank of China (A) | 1.2 | 14,633,000 | 11,027 | |||||
| Description | Percentage of Net Assets (%) | Shares | Market Value ($ Thousands) | |||||
PetroChina | 0.4 | % | 3,469,023 | $ | 3,921 | |||
PetroChina ADR | 0.1 | 11,290 | 1,284 | |||||
Other Securities | 5.7 | 51,382 | ||||||
| 88,216 | ||||||||
Czech Republic — 0.5% | ||||||||
Other Securities | 0.5 | 4,550 | ||||||
Egypt — 0.4% | ||||||||
Other Securities | 0.4 | 4,074 | ||||||
Hong Kong — 6.2% | ||||||||
China Foods | 0.0 | 148,000 | 102 | |||||
China Mobile | 1.5 | 1,453,715 | 14,181 | |||||
China Mobile ADR | 0.3 | 48,070 | 2,361 | |||||
China Overseas Land & Investment | 0.2 | 806,800 | 1,745 | |||||
China Resources Power Holdings | 0.2 | 734,800 | 1,708 | |||||
CNOOC | 0.7 | 4,828,448 | 6,492 | |||||
CNOOC ADR | 0.1 | 3,510 | 475 | |||||
CNPC Hong Kong | 0.1 | 1,172,836 | 929 | |||||
Industrial and Commercial Bank of China Asia | 0.1 | 293,000 | 663 | |||||
Other Securities | 3.0 | 28,139 | ||||||
| 56,795 | ||||||||
Hungary — 0.2% | ||||||||
Other Securities | 0.2 | 1,535 | ||||||
India — 6.9% | ||||||||
Tata Consultancy Services | 0.5 | 336,788 | 4,348 | |||||
Other Securities | 6.4 | 59,121 | ||||||
| 63,469 | ||||||||
Indonesia — 1.7% | ||||||||
Bank Mandiri | 0.4 | 7,908,592 | 3,846 | |||||
Telekomunikasi Indonesia | 0.4 | 4,293,100 | 3,842 | |||||
Other Securities | 0.9 | 8,232 | ||||||
| 15,920 | ||||||||
Israel — 1.7% | ||||||||
Teva Pharmaceutical Industries | 0.4 | 73,554 | 3,683 | |||||
Teva Pharmaceutical Industries ADR | 0.5 | 84,356 | 4,265 | |||||
Other Securities | 0.8 | 7,631 | ||||||
| 15,579 | ||||||||
Kazakhstan — 0.2% |
| |||||||
Other Securities | 0.2 | % | 1,873 | |||||
| SEI Institutional International Trust / Annual Report / September 30, 2009 | 11 |
Table of Contents
SUMMARY SCHEDULE OF INVESTMENTS
Emerging Markets Equity Fund (Continued)
September 30, 2009
| Description | Percentage of Net Assets (%) | Shares | Market Value ($ Thousands) | |||||
Malaysia — 1.9% | ||||||||
Malayan Banking | 0.4 | % | 1,851,067 | $ | 3,557 | |||
Other Securities | 1.5 | 14,019 | ||||||
| 17,576 | ||||||||
Mexico — 4.1% | ||||||||
America Movil, Ser L | 0.6 | 2,408,459 | 5,270 | |||||
America Movil ADR, Ser L | 0.7 | 147,706 | 6,474 | |||||
Other Securities | 2.8 | 26,173 | ||||||
| 37,917 | ||||||||
Netherlands — 0.1% |
| |||||||
Other Securities | 0.1 | 1,042 | ||||||
Pakistan — 0.1% | ||||||||
Other Securities | 0.1 | 1,189 | ||||||
Panama — 0.1% | ||||||||
Other Securities | 0.1 | 1,174 | ||||||
Peru — 0.2% | ||||||||
Other Securities | 0.2 | 1,973 | ||||||
Philippines — 0.4% | ||||||||
Other Securities | 0.4 | 3,360 | ||||||
Poland — 0.7% | ||||||||
Other Securities | 0.7 | 6,382 | ||||||
Russia — 6.0% | ||||||||
Lukoil ADR | 1.3 | 217,888 | 11,951 | |||||
Lukoil OAO ADR | 0.2 | 37,300 | 2,022 | |||||
OAO Gazprom ADR | 1.8 | 722,532 | 16,799 | |||||
Rosneft Oil GDR | 0.5 | 658,529 | 4,952 | |||||
Other Securities | 2.2 | 18,950 | ||||||
| 54,674 | ||||||||
South Africa — 6.8% | ||||||||
ABSA Group | 0.3 | 150,030 | 2,376 | |||||
FirstRand | 0.4 | 1,869,984 | 4,074 | |||||
Gold Fields | 0.4 | 271,744 | 3,640 | |||||
MTN Group | 0.7 | 390,818 | 6,300 | |||||
Sasol | 0.5 | 116,007 | 4,323 | |||||
Other Securities | 4.5 | 41,314 | ||||||
| 62,027 | ||||||||
South Korea — 12.9% | ||||||||
Hyundai Motor | 0.5 | 46,878 | 4,436 | |||||
Korea Electric Power | 0.4 | 122,970 | 3,736 | |||||
LG | 0.3 | 41,054 | 2,753 | |||||
LG Electronics | 0.7 | 58,280 | 6,208 | |||||
LG Philips LCD | 0.5 | 170,970 | 4,919 | |||||
POSCO | 0.7 | 15,149 | 6,262 | |||||
| Description | Percentage of Net Assets (%) | Shares | Market Value ($ Thousands) | |||||
Samsung Electronics | 3.2 | % | 42,310 | $ | 29,266 | |||
Shinhan Financial Group | 0.9 | 203,930 | 8,135 | |||||
Other Securities | 5.7 | 52,374 | ||||||
| 118,089 | ||||||||
Sweden — 0.1% | ||||||||
Other Securities | 0.1 | 996 | ||||||
Taiwan — 10.9% | ||||||||
Chinatrust Financial Holding | 0.5 | 6,844,862 | 4,439 | |||||
Compal Electronics | 0.6 | 4,376,281 | 5,098 | |||||
HON HAI Precision Industry | 1.4 | 3,247,934 | 13,033 | |||||
MediaTek | 0.8 | 458,023 | 7,637 | |||||
Taiwan Fertilizer | 0.4 | 1,007,000 | 3,602 | |||||
Taiwan Semiconductor Manufacturing | 1.4 | 6,509,456 | 13,060 | |||||
Taiwan Semiconductor Manufacturing ADR | 0.2 | 164,386 | 1,802 | |||||
United Microelectronics | 0.6 | 11,392,312 | 5,581 | |||||
Other Securities | 5.0 | 45,599 | ||||||
| 99,851 | ||||||||
Thailand — 2.7% | ||||||||
Other Securities | 2.7 | 24,249 | ||||||
Turkey — 2.6% | ||||||||
Tupras Turkiye Petrol Rafine | 0.4 | 235,733 | 3,902 | |||||
Other Securities | 2.2 | 19,559 | ||||||
| 23,461 | ||||||||
United Arab Emirates — 0.0% | ||||||||
Other Securities | 0.0 | 16 | ||||||
United Kingdom — 0.3% | ||||||||
Other Securities | 0.3 | 2,932 | ||||||
Total Common Stock | 794,818 | |||||||
PREFERRED STOCK — 8.1% | ||||||||
Brazil — 8.1% | ||||||||
Centrais Eletricas Brasileiras | 0.2 | 112,246 | 1,566 | |||||
Investimentos Itau | 0.6 | 917,435 | 5,520 | |||||
Itau Unibanco Holding | 0.6 | 263,562 | 5,296 | |||||
Petroleo Brasileiro | 1.3 | 596,442 | 11,680 | |||||
Petroleo Brasileiro Sponsored ADR, Cl A | 1.5 | 351,510 | 13,818 | |||||
Vale, Cl A | 0.7 | 322,331 | 6,625 | |||||
Vale ADR, Cl B | 0.4 | 183,376 | 3,761 | |||||
Other Securities | 2.8 | 26,113 | ||||||
Total Preferred Stock | 74,379 | |||||||
| 12 | SEI Institutional International Trust / Annual Report / September 30, 2009 |
Table of Contents
| Description | Percentage of Net Assets (%) | Shares/ Face Amount | Market Value ($ Thousands) | |||||
DEBENTURE BOND — 0.0% | ||||||||
Brazil — 0.0% | ||||||||
Vale, Ser 1997 | ||||||||
0.000%, 09/30/49* | 0.0 | % | 8 | $ | — | |||
Total Debenture Bond | — | |||||||
EQUITY-LINKED WARRANTS — 0.1% | ||||||||
Russia — 0.1% | ||||||||
Other Securities | 0.1 | 769 | ||||||
United Arab Emirates — 0.0% | ||||||||
Other Securities | 0.0 | 564 | ||||||
Total Equity-Linked Warrants | 1,333 | |||||||
EXCHANGE TRADED FUND — 0.7% | ||||||||
United States — 0.7% | ||||||||
iShares MSCI Emerging Markets Index Fund | 0.7 | 165,068 | 6,423 | |||||
Total Exchange Traded Fund | 6,423 | |||||||
CASH EQUIVALENT — 0.4% | ||||||||
United States — 0.4% | ||||||||
SEI Daily Income Trust, Prime Obligation Fund, Cl A, 0.110%†** | 0.4 | 3,454,719 | 3,455 | |||||
Total Cash Equivalent | 3,455 | |||||||
AFFILIATED PARTNERSHIP — 3.9% | ||||||||
United States — 3.9% | ||||||||
SEI Liquidity Fund, L.P., | ||||||||
0.400%†** (B) | 3.9 | 36,294,960 | 35,307 | |||||
Total Affiliated Partnership | 35,307 | |||||||
TIME DEPOSITS — 1.1% | ||||||||
United States — 1.1% | ||||||||
Brown Brothers Harriman | ||||||||
5.950%, 10/01/09 | 0.0 | ZAR 3,094 | 408 | |||||
0.125%, 10/01/09 | 0.0 | EUR 76 | 111 | |||||
0.088%, 10/01/09 | 0.0 | GBP 6 | 10 | |||||
0.030%, 10/01/09 | 1.0 | 9,451 | 9,451 | |||||
| Description | Percentage of | Face Amount (Thousands) (1) | Market Value ($ Thousands) | |||||
0.010%, 10/01/09 | 0.1 | % | HKD 4,162 | $ | 537 | |||
0.005%, 10/01/09 | 0.0 | SGD 2 | 2 | |||||
Total Time Deposits | 10,519 | |||||||
Total Investments — 101.0% | $ | 926,234 | ||||||
Percentages are based on a Net Assets of $916,780 ($ Thousands).
| * | Non-Income producing security. |
| ** | Rate shown is the 7-day effective yield as of September 30, 2009. |
| (1) | In U.S. dollars unless otherwise indicated. |
| † | Affiliated security. |
| (A) | This security or a partial position of this security is on loan at September 30, 2009. The total market value of securities on loan at September 30, 2009 was $34,648 ($ Thousands) (See Note 9). |
| (B) | This security was purchased with cash collateral held from securities on loan (see Note 9). The total value of such securities as of September 30, 2009 was $35,307 ($ Thousands). |
ADR — American Depositary Receipt
Cl — Class
EUR — Euro
GBP — British Pound Sterling
GDR — Global Depositary Receipt
HKD — Hong Kong Dollar
L.P. — Limited Partnership
MSCI — Morgan Stanley Capital International
Ser — Series
SGD — Singapore Dollar
USD — U.S. Dollar
ZAR — South African Rand
Amounts designated as “—” are $O or have been rounded to $O.
The Summary Schedule of Investments does not reflect the complete portfolio holdings. It includes the Fund’s 50 largest holdings and each investment in any issuer that exceeds 1% of the Fund’s net assets. “Other Securities” represent all issues not required to be disclosed under the rules adopted by the U.S. Securities and Exchange Commission (“SEC”). Footnotes above may apply to securities that are included in “Other Securities.” For further detail, the complete schedule of portfolio holdings is available (i) without charge, upon request, by calling (800) 342-5734; and (ii) on the SEC’s website at http://www.sec.gov.
The following is a summary of the inputs used as of September 30, 2009 in valuing the Fund’s investments carried at value ($ Thousands):
| Investments in Securities | Level 1 | Level 2 | Level 3 | Total | ||||||||
Common Stock | $ | 794,811 | $ | — | $ | 7 | $ | 794,818 | ||||
Preferred Stock | 74,379 | — | — | 74,379 | ||||||||
Debenture Bond | — | — | — | — | ||||||||
Equity-Linked Warrants | — | 1,333 | — | 1,333 | ||||||||
Exchange Traded Fund | 6,423 | — | — | 6,423 | ||||||||
Cash Equivalent | 3,455 | — | — | 3,455 | ||||||||
Affiliated Partnership | — | 35,307 | — | 35,307 | ||||||||
Time Deposits | — | 10,519 | — | 10,519 | ||||||||
Total Investments in Securities | $ | 879,068 | $ | 47,159 | $ | 7 | $ | 926,234 | ||||
| SEI Institutional International Trust / Annual Report / September 30, 2009 | 13 |
Table of Contents
SUMMARY SCHEDULE OF INVESTMENTS
Emerging Markets Equity Fund (Concluded)
September 30, 2009
The following is a reconciliation of the investments is which significant unobservable inputs (Level 3) were used in determining value ($ Thousands):
| Common Stock | |||
Beginning balance as of October 1, 2008 | $ | — | |
Accrued discounts/premiums | — | ||
Realized gain/(loss) | — | ||
Change in unrealized appreciation/(depreciation) | — | ||
Net purchases/sales | — | ||
Net transfer in and/or out of Level 3 | 7 | ||
Ending balance as of September 30, 2009 | $ | 7 | |
| Changes in unrealized gains/(losses) included in earnings related to securities still held at reporting date. | $ | — | |
For more information on valuation inputs, see Note 2 — Significant Accounting Policies in Notes to Financial Statements.
The accompanying notes are an integral part of the financial statements.
| 14 | SEI Institutional International Trust / Annual Report / September 30, 2009 |
Table of Contents
SUMMARY SCHEDULE OF INVESTMENTS
International Fixed Income Fund
September 30, 2009
| Description | Percentage of Net Assets (%) | Face Amount (Thousands) (1) | Market Value ($ Thousands) | |||||||
GLOBAL BONDS — 73.2% |
| |||||||||
Australia — 1.6% | ||||||||||
Other Securities | 1.6 | % | $ | 8,720 | ||||||
Austria — 0.1% | ||||||||||
Other Securities | 0.1 | 616 | ||||||||
Belgium — 1.6% | ||||||||||
Kingdom of Belgium, Ser 31 | ||||||||||
5.500%, 03/28/28 | 0.9 | 2,872 | 4,871 | |||||||
Kingdom of Belgium, Ser 48 | ||||||||||
4.000%, 03/28/22 | 0.6 | 2,100 | 3,089 | |||||||
Other Securities | 0.2 | 819 | ||||||||
| 8,779 | ||||||||||
Brazil — 0.5% | ||||||||||
Federal Republic of Brazil | ||||||||||
12.500%, 01/05/16 | 0.3 | 3,080 | 1,899 | |||||||
Other Securities | 0.2 | 863 | ||||||||
| 2,762 | ||||||||||
Canada — 3.8% | ||||||||||
Export Development Canada MTN | ||||||||||
2.375%, 03/19/12 | 0.2 | 800 | 817 | |||||||
Government of Canada | ||||||||||
5.000%, 06/01/14 | 0.2 | 1,000 | 1,035 | |||||||
5.000%, 06/01/37 | 0.9 | 4,200 | 4,679 | |||||||
4.250%, 06/01/18 | 0.3 | 1,525 | 1,538 | |||||||
3.750%, 06/01/19 | 0.1 | 630 | 608 | |||||||
3.750%, 06/01/12 | 0.9 | 4,960 | 4,863 | |||||||
Province of Ontario Canada | ||||||||||
4.200%, 03/08/18 | 0.3 | 1,950 | 1,885 | |||||||
Other Securities | 0.9 | 5,216 | ||||||||
| 20,641 | ||||||||||
| Description | Percentage of Net Assets (%) | Face Amount (Thousands) (1) | Market Value ($ Thousands) | |||||||
Chile — 0.1% | ||||||||||
Other Securities | 0.1 | % | $ | 662 | ||||||
Colombia — 0.1% | ||||||||||
Other Securities | 0.1 | 260 | ||||||||
Denmark — 1.7% | ||||||||||
Dong Energy MTN | ||||||||||
4.875%, 05/07/14 | 0.0 | 100 | 153 | |||||||
Kingdom of Denmark MTN | ||||||||||
4.000%, 11/15/12 | 0.8 | 20,391 | 4,198 | |||||||
4.000%, 11/15/17 | 0.2 | 4,450 | 912 | |||||||
3.125%, 03/17/14 | 0.1 | 500 | 748 | |||||||
Other Securities | 0.6 | 3,158 | ||||||||
| 9,169 | ||||||||||
France — 5.6% | ||||||||||
EDF MTN | ||||||||||
6.875%, 12/12/22 | 0.1 | 300 | 561 | |||||||
6.125%, 06/02/34 | 0.0 | 100 | 182 | |||||||
Government of France | ||||||||||
4.750%, 04/25/35 | 0.7 | 2,465 | 3,970 | |||||||
4.250%, 04/25/19 | 1.3 | 4,670 | 7,260 | |||||||
3.750%, 10/25/19 | 0.0 | 100 | 149 | |||||||
3.750%, 04/25/21 | 0.6 | 2,300 | 3,379 | |||||||
3.500%, 04/25/15 | 0.2 | 535 | 813 | |||||||
Other Securities | 2.7 | 13,551 | ||||||||
| 29,865 | ||||||||||
Germany — 9.1% | ||||||||||
Bundesrepublik Deutschland, | ||||||||||
5.000%, 01/04/12 | 0.1 | 500 | 788 | |||||||
Bundesrepublik Deutschland, | ||||||||||
4.750%, 07/04/34 | 0.7 | 2,460 | 3,991 | |||||||
4.250%, 01/04/14 | 0.4 | 1,425 | 2,249 | |||||||
Bundesrepublik Deutschland, | ||||||||||
3.750%, 01/04/17 | 1.0 | 3,600 | 5,554 | |||||||
Bundesrepublik Deutschland, | ||||||||||
4.250%, 07/04/39 | 1.1 | 3,740 | 5,764 | |||||||
4.000%, 01/04/18 | 0.4 | 1,260 | 1,963 | |||||||
Bundesrepublik Deutschland, | ||||||||||
4.750%, 07/04/40 | 1.9 | 6,255 | 10,421 | |||||||
Bundesrepublik Deutschland, | ||||||||||
3.500%, 07/04/19 | 1.2 | 4,331 | 6,476 | |||||||
| SEI Institutional International Trust / Annual Report / September 30, 2009 | 15 |
Table of Contents
SUMMARY SCHEDULE OF INVESTMENTS
International Fixed Income Fund (Continued)
September 30, 2009
| Description | Percentage of Net Assets (%) | Face Amount (Thousands) (1) | Market Value ($ Thousands) | |||||||
Bundesschatzanweisungen, | ||||||||||
1.250%, 09/16/11 | 0.9 | % | 3,300 | $ | 4,822 | |||||
KFW | ||||||||||
4.700%, 06/02/37 | 0.3 | CAD | 2,080 | 1,788 | ||||||
3.875%, 01/21/19 | 0.1 | 325 | 487 | |||||||
3.500%, 03/10/14 (A) | 0.3 | 1,675 | 1,743 | |||||||
Other Securities | 0.6 | 3,064 | ||||||||
| 49,110 | ||||||||||
Greece — 0.5% | ||||||||||
Hellenic Republic 30 Year Government Bond | ||||||||||
4.600%, 09/20/40 | 0.5 | 2,000 | 2,657 | |||||||
Hungary — 0.3% | ||||||||||
Other Securities | 0.3 | 1,775 | ||||||||
Ireland — 0.8% | ||||||||||
Other Securities | 0.8 | 4,045 | ||||||||
Italy — 3.8% | ||||||||||
Buoni Poliennali Del Tesoro | ||||||||||
5.750%, 02/01/33 | 1.3 | 4,170 | 6,914 | |||||||
Intesa Sanpaolo MTN | ||||||||||
6.375%, 04/06/10 | 0.6 | 2,150 | 3,203 | |||||||
Italy Buoni Poliennali Del Tesoro | ||||||||||
4.250%, 03/01/20 | 0.1 | 195 | 289 | |||||||
3.500%, 06/01/14 | 0.8 | 2,900 | 4,354 | |||||||
Unicredito Italiano MTN | ||||||||||
4.500%, 09/22/19 | 0.4 | 1,300 | 1,916 | |||||||
Other Securities | 0.7 | 4,020 | ||||||||
| 20,696 | ||||||||||
Japan — 13.5% | ||||||||||
Government of Japan 10 Year Bond, Ser 284 | ||||||||||
1.700%, 12/20/16 | 1.3 | 568,400 | 6,714 | |||||||
Government of Japan 10 Year Bond, Ser 288 | ||||||||||
1.700%, 09/20/17 | 3.8 | 1,729,950 | 20,386 | |||||||
Government of Japan 10 Year Bond, Ser 296 | ||||||||||
1.500%, 09/20/18 | 0.9 | 427,000 | 4,914 | |||||||
Government of Japan 10 Year Bond, Ser 301 | ||||||||||
1.500%, 06/20/19 | 0.5 | 235,300 | 2,685 | |||||||
Government of Japan 15 Year Bond, Ser 35 | ||||||||||
0.410%, 07/20/20 (B) | 0.3 | 170,500 | 1,811 | |||||||
| Description | Percentage of Net Assets (%) | Face Amount (Thousands) (1) | Market Value ($ Thousands) | |||||||
Government of Japan 20 Year Bond, Ser 109 | ||||||||||
1.900%, 03/20/29 | 0.5 | % | 256,000 | $ | 2,799 | |||||
Government of Japan 20 Year Bond, Ser 48 | ||||||||||
2.500%, 12/21/20 | 0.7 | 289,450 | 3,570 | |||||||
Government of Japan 20 Year Bond, Ser 99 | ||||||||||
2.100%, 12/20/27 | 2.3 | 1,075,900 | 12,241 | |||||||
Government of Japan CPI Linked Bond, Ser 13 | ||||||||||
1.300%, 09/10/17 | 0.2 | 111,712 | 1,170 | |||||||
Government of Japan CPI Linked Bond, Ser 15 | ||||||||||
1.400%, 03/10/18 | 0.2 | 92,647 | 974 | |||||||
Government of Japan CPI Linked Bond, Ser 5 | ||||||||||
0.800%, 09/10/15 | 1.0 | 499,982 | 5,208 | |||||||
Japan Finance for Municipal Enterprises | ||||||||||
2.000%, 05/09/16 | 1.2 | 540,000 | 6,363 | |||||||
Other Securities | 0.6 | 3,530 | ||||||||
| 72,365 | ||||||||||
Jersey — 0.1% | ||||||||||
Other Securities | 0.1 | 340 | ||||||||
Mexico — 0.1% | ||||||||||
Other Securities | 0.1 | 789 | ||||||||
Netherlands — 5.5% | ||||||||||
Government of Netherlands | ||||||||||
7.500%, 01/15/23 | 0.8 | 2,228 | 4,497 | |||||||
4.500%, 07/15/17 | 0.4 | 1,500 | 2,379 | |||||||
4.000%, 07/15/16 | 0.5 | 1,700 | 2,628 | |||||||
Rabobank Nederland MTN | ||||||||||
4.125%, 04/04/12 | 0.4 | 1,250 | 1,918 | |||||||
Other Securities | 3.3 | 18,087 | ||||||||
| 29,509 | ||||||||||
New Zealand — 0.1% |
| |||||||||
Other Securities | 0.1 | 492 | ||||||||
Norway — 0.6% | ||||||||||
Other Securities | 0.6 | 3,150 | ||||||||
Peru — 0.2% | ||||||||||
Other Securities | 0.2 | 1,103 | ||||||||
Poland — 0.3% | ||||||||||
Other Securities | 0.3 | 1,652 | ||||||||
Portugal — 0.1% | ||||||||||
Other Securities | 0.1 | 734 | ||||||||
| 16 | SEI Institutional International Trust / Annual Report / September 30, 2009 |
Table of Contents
| Description | Percentage of Net Assets (%) | Face Amount (Thousands) (1) | Market Value ($ Thousands) | ||||||||||
Russia — 0.6% | |||||||||||||
Other Securities | 0.6 | % | $ | 3,288 | |||||||||
Singapore — 0.0% | |||||||||||||
Other Securities | 0.0 | 137 | |||||||||||
South Africa — 0.1% | |||||||||||||
Other Securities | 0.1 | 449 | |||||||||||
Spain — 1.0% | |||||||||||||
Other Securities | 1.0 | 5,114 | |||||||||||
Supra-National — 3.6% | |||||||||||||
European Investment Bank MTN | |||||||||||||
6.000%, 08/14/13 | 0.1 | AUD | 700 | 624 | |||||||||
3.500%, 04/15/16 | 0.7 | 2,525 | 3,761 | ||||||||||
1.400%, 06/20/17 | 2.4 | JPY | 1,138,000 | 12,907 | |||||||||
Other Securities | 0.4 | 2,209 | |||||||||||
| 19,501 | |||||||||||||
Sweden — 1.2% | |||||||||||||
Kingdom of Sweden, | |||||||||||||
4.500%, 08/12/15 | 0.6 | 21,900 | 3,389 | ||||||||||
Other Securities | 0.6 | �� | 3,115 | ||||||||||
| 6,504 | |||||||||||||
Switzerland — 0.9% | |||||||||||||
Other Securities | 0.9 | 4,771 | |||||||||||
United Arab Emirates — 0.1% | |||||||||||||
Other Securities | 0.1 | 605 | |||||||||||
United Kingdom — 7.9% | |||||||||||||
Abbey National Treasury Services MTN | |||||||||||||
4.250%, 04/12/21 | 0.4 | 1,350 | 1,923 | ||||||||||
Anglian Water Services Financing MTN | |||||||||||||
4.625%, 10/07/13 | 0.4 | 1,450 | 2,204 | ||||||||||
Barclays Bank MTN | |||||||||||||
14.000%, 06/15/19 (B) | 0.0 | 100 | 206 | ||||||||||
10.000%, 05/21/21 | 0.1 | 304 | 620 | ||||||||||
6.750%, 01/16/23 (B) | 0.1 | 350 | 564 | ||||||||||
5.000%, 09/22/16 | 0.1 | 330 | 334 | ||||||||||
4.500%, 03/04/19 (B) | 0.0 | 125 | 172 | ||||||||||
Chester Asset Receivables, Ser A | |||||||||||||
6.125%, 10/15/10 | 0.6 | EUR | 2,160 | 3,156 | |||||||||
Royal Bank of Scotland MTN | |||||||||||||
6.934%, 04/09/18 | 0.1 | 300 | 435 | ||||||||||
5.750%, 05/21/14 | 0.1 | 250 | 389 | ||||||||||
| Description | Percentage of Net Assets (%) | Face Amount (Thousands) (1) | Market Value ($ Thousands) | |||||||||
United Kingdom Treasury | ||||||||||||
4.750%, 12/07/38 | 0.2 | % | 665 | $ | 1,183 | |||||||
4.750%, 09/07/15 | 0.3 | 910 | 1,611 | |||||||||
4.500%, 03/07/19 | 0.1 | 195 | 334 | |||||||||
4.500%, 12/07/42 | 0.1 | 335 | 575 | |||||||||
4.250%, 12/07/49 | 0.0 | 85 | 141 | |||||||||
4.250%, 09/07/39 | 0.1 | 325 | 532 | |||||||||
4.000%, 09/07/16 | 0.1 | 350 | 594 | |||||||||
2.250%, 03/07/14 | 0.1 | 355 | 560 | |||||||||
Other Securities | 5.0 | 26,865 | ||||||||||
| 42,398 | ||||||||||||
United States — 7.7% | ||||||||||||
BA Covered Bond Issuer MTN | ||||||||||||
4.125%, 04/05/12 | 0.9 | EUR | 3,100 | 4,622 | ||||||||
Citigroup | ||||||||||||
5.500%, 04/11/13 | 0.2 | 995 | 1,018 | |||||||||
4.750%, 02/10/19 (B) | 0.2 | EUR | 1,000 | 1,198 | ||||||||
4.625%, 08/03/10 | 0.1 | 400 | 409 | |||||||||
4.250%, 02/25/30 (B) | 0.1 | 450 | 454 | |||||||||
Citigroup Funding | ||||||||||||
2.250%, 12/10/12 | 0.1 | 550 | 557 | |||||||||
Other Securities | 6.1 | 33,107 | ||||||||||
| 41,365 | ||||||||||||
Total Global Bonds |
| 394,023 | ||||||||||
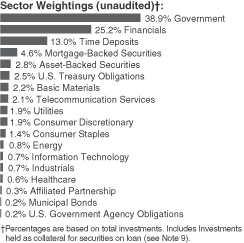
MORTGAGE-BACKED SECURITIES — 4.6% | ||||||||||||
Non-Agency Mortgage-Backed Obligation — 4.6% | ||||||||||||
Beluga Master Issuer, | ||||||||||||
1.051%, 04/28/99 (A) | 0.5 | 2,200 | 2,951 | |||||||||
Citigroup Commercial Mortgage Trust, Ser 2007-C6, Cl A4 | ||||||||||||
5.888%, 06/10/17 (A) | 0.2 | 1,140 | 992 | |||||||||
Citigroup Commercial Mortgage Trust, Ser 2008-C7, Cl A4 | ||||||||||||
6.299%, 05/01/38 (A) | 0.1 | 405 | 365 | |||||||||
Citigroup Mortgage Loan Trust, | ||||||||||||
5.110%, 05/25/35 (A) | 0.3 | 2,003 | 1,658 | |||||||||
Gracechurch Mortgage Financing, Ser 2006-1, Cl C3 | ||||||||||||
1.129%, 11/20/56 (A) (B) | 0.0 | 250 | 277 | |||||||||
Gracechurch Mortgage Financing, Ser 2007-1X, Cl 3A2 | ||||||||||||
0.959%, 11/20/56 (A) | 0.5 | 2,000 | 2,836 | |||||||||
| SEI Institutional International Trust / Annual Report / September 30, 2009 | 17 |
Table of Contents
SUMMARY SCHEDULE OF INVESTMENTS
International Fixed Income Fund (Continued)
September 30, 2009
| Description | Percentage of Net Assets (%) | Face Amount (Thousands) (1) | Market Value ($ Thousands) | |||||||||
Gracechurch Mortgage Financing, Ser 2007-1X, Cl 2D2 | ||||||||||||
1.259%, 11/20/56 (A) (B) | 0.1 | % | 400 | $ | 519 | |||||||
Salomon Brothers Mortgage Securities, Ser 2000-C1, Cl A2 | ||||||||||||
7.520%, 12/18/32 (A) | 0.1 | 630 | 631 | |||||||||
Other Securities | 2.8 | 14,636 | ||||||||||
Total Mortgage-Backed Securities | 24,865 | |||||||||||
CORPORATE OBLIGATIONS — 3.8% | ||||||||||||
United States — 3.8% | ||||||||||||
Other Securities | 3.8 | 20,308 | ||||||||||
Total Corporate Obligations | 20,308 | |||||||||||
ASSET-BACKED SECURITIES — 2.8% | ||||||||||||
Automotive — 0.8% | ||||||||||||
Other Securities | 0.8 | 4,393 | ||||||||||
Credit Card — 0.5% | ||||||||||||
Citibank Credit Card Issuance Trust, | ||||||||||||
5.375%, 04/11/11 | 0.5 | EUR | 1900 | 2,727 | ||||||||
Mortgage-Related — 0.3% |
| |||||||||||
Other Securities | 0.3 | 1,760 | ||||||||||
Other Asset-Backed Securities — 1.2% | ||||||||||||
Lambda Finance, Ser 2005-1X, Cl A2 | ||||||||||||
1.113%, 11/15/29 (A) (B) | 0.2 | 844 | 1,135 | |||||||||
Other Securities | 1.0 | 5,131 | ||||||||||
| 6,266 | ||||||||||||
Total Asset-Backed Securities | 15,146 | |||||||||||
U.S. TREASURY OBLIGATIONS — 2.5% | ||||||||||||
U.S. Treasury Bonds | ||||||||||||
3.500%, 02/15/39 | 0.0 | 75 | 68 | |||||||||
4.250%, 05/15/39 | 0.2 | 960 | 993 | |||||||||
U.S. Treasury Notes | ||||||||||||
1.375%, 04/15/12 | 0.5 | 2,500 | 2,511 | |||||||||
2.000%, 11/30/13 | 0.8 | 4,300 | 4,307 | |||||||||
2.625%, 07/31/14 | 0.1 | 700 | 711 | |||||||||
4.500%, 11/15/15 | 0.2 | 1,100 | 1,213 | |||||||||
2.750%, 02/15/19 | 0.1 | 660 | 630 | |||||||||
| Description | Percentage of Net Assets (%) | Face Amount (Thousands) (1)/ Shares | Market Value ($ Thousands) | |||||||||
U.S. Treasury Inflationary Index Note | ||||||||||||
3.000%, 07/15/12 | 0.6 | % | 2,575 | $ | 3,279 | |||||||
Total U.S. Treasury Obligations (Cost $13,623) ($ Thousands) |
| 13,712 | ||||||||||
U.S. GOVERNMENT AGENCY OBLIGATION — 0.2% | ||||||||||||
Other Securities | 0.2 | 878 | ||||||||||
Total U.S. Government Agency Obligation | 878 | |||||||||||
MUNICIPAL BONDS — 0.2% | ||||||||||||
Other Securities | 0.2 | 1,234 | ||||||||||
Total Municipal Bonds | 1,234 | |||||||||||
TIME DEPOSITS — 13.1% | ||||||||||||
United States — 13.1% | ||||||||||||
Brown Brothers Harriman | ||||||||||||
5.950%, 10/01/09 | 0.0 | ZAR | 45 | 6 | ||||||||
2.174%, 10/01/09 | 0.0 | AUD | 79 | 70 | ||||||||
1.500%, 10/01/09 | 0.0 | NZD | 10 | 7 | ||||||||
0.382%, 10/01/09 | 0.0 | NOK | 5 | 1 | ||||||||
0.125%, 10/01/09 | 0.1 | EUR | 125 | 183 | ||||||||
0.088%, 10/01/09 | 0.1 | GBP | 383 | 613 | ||||||||
0.060%, 10/01/09 | 0.2 | CAD | 1,272 | 1,185 | ||||||||
0.030%, 10/01/09 | 12.6 | 67,494 | 67,495 | |||||||||
0.010%, 10/01/09 | 0.0 | HKD | 2 | — | ||||||||
0.010%, 10/01/09 | 0.1 | JPY | 52,493 | 586 | ||||||||
0.010%, 10/01/09 | 0.0 | SEK | 998 | 143 | ||||||||
0.005%, 10/01/09 | 0.0 | SGD | 1 | — | ||||||||
Total Time Deposits | 70,289 | |||||||||||
AFFILIATED PARTNERSHIP — 0.3% | ||||||||||||
United States — 0.3% | ||||||||||||
SEI Liquidity Fund, L.P., | ||||||||||||
0.400%†* (C) | 0.3 | 1,712,483 | 1,704 | |||||||||
Total Affiliated Partnership | 1,704 | |||||||||||
Total Investments — 100.7% | $ | 542,159 | ||||||||||
| 18 | SEI Institutional International Trust / Annual Report / September 30, 2009 |
Table of Contents
A summary of the outstanding forward foreign currency contracts held by the Fund at September 30, 2009, is as follows:
| Settlement Date | Currency to Deliver (Thousands) | Currency to Receive (Thousands) | Unrealized (Depreciation) | |||||||
10/1/09 | USD | 5,088 | CHF | 5,281 | $ | 2 | ||||
10/1/09-11/9/09 | USD | 23,957 | GBP | 14,920 | (95 | ) | ||||
10/1/09-12/4/09 | CHF | 34,081 | USD | 32,175 | (690 | ) | ||||
10/2/09 | USD | 3,675 | DKK | 18,764 | 9 | |||||
10/6/09 | USD | 733 | MXP | 9,904 | — | |||||
10/6/09 | USD | 1,414 | SEK | 9,887 | — | |||||
10/6/09-10/28/09 | USD | 9,518 | CAD | 10,237 | 21 | |||||
10/6/09-11/5/09 | JPY | 10,117,167 | USD | 109,296 | (3,736 | ) | ||||
10/6/09-11/5/09 | MXP | 19,808 | USD | 1,474 | 11 | |||||
10/6/09-11/5/09 | NOK | 3,278 | USD | 555 | (10 | ) | ||||
10/6/09-11/9/09 | GBP | 39,063 | USD | 63,496 | 1,032 | |||||
10/6/09-11/27/09 | CAD | 63,846 | USD | 58,622 | (882 | ) | ||||
10/6/09-11/27/09 | USD | 120,548 | EUR | 82,496 | 34 | |||||
10/6/09-11/27/09 | USD | 31,237 | JPY | 2,813,453 | 190 | |||||
10/6/09-11/27/09 | USD | 33,576 | NOK | 203,357 | 1,429 | |||||
10/6/09-12/2/09 | SEK | 44,384 | USD | 6,339 | (12 | ) | ||||
10/6/09-12/16/09 | EUR | 246,360 | USD | 357,608 | (2,450 | ) | ||||
10/13/09 | USD | 4,233 | AUD | 5,051 | 220 | |||||
10/19/09 | JPY | 147,033 | KRW | 1,988,696 | 47 | |||||
10/22/09-10/28/09 | DKK | 31,475 | USD | 6,104 | (75 | ) | ||||
10/27/09 | PLN | 2,522 | USD | 876 | 7 | |||||
10/28/09 | AUD | 4,349 | USD | 3,599 | (230 | ) | ||||
11/4/09 | GBP | 512 | EUR | 580 | 29 | |||||
11/17/09 | HUF | 145,058 | USD | 767 | (12 | ) | ||||
11/24/09 | HUF | 158,903 | PLN | 2,425 | (19 | ) | ||||
11/25/09 | EUR | 1,121 | PLN | 4,658 | (37 | ) | ||||
11/27/09 | SEK | 77,404 | EUR | 7,580 | — | |||||
| $ | (5,217 | ) | ||||||||
A summary of the open futures contracts held by the Fund at September 30, 2009, is as follows:
| Type of Contract | Number of Contracts Long (Short) | Expiration Date | Unrealized Appreciation (Depreciation) ($ Thousands) | ||||||
30-Day FED Fund | (1 | ) | Oct-2009 | $ | — | ||||
Australian 10-Year Bond | 5 | Dec-2009 | — | ||||||
Australian 3-Year Bond | 178 | Dec-2009 | (80 | ) | |||||
Canadian 10-Year Bond | 39 | Dec-2009 | 58 | ||||||
Euro-Bobl | 132 | Dec-2009 | 115 | ||||||
Euro-Bund | 27 | Dec-2009 | 11 | ||||||
Euro-Schatz | 36 | Dec-2009 | 33 | ||||||
Japanese 10-Year Bond | 1 | Dec-2009 | 8 | ||||||
Long Gilt 10-Year Bond | 36 | Dec-2009 | 43 | ||||||
U.S. 10-Year Treasury Note | (208 | ) | Dec-2009 | (346 | ) | ||||
U.S. 2-Year Treasury Note | (136 | ) | Dec-2009 | (140 | ) | ||||
U.S. 5-Year Treasury Note | (130 | ) | Dec-2009 | (182 | ) | ||||
U.S. Long Treasury Bond | (54 | ) | Dec-2009 | (117 | ) | ||||
| $ | (597 | ) | |||||||
For the year ended September 30, 2009, the total amount of all open futures contracts, as presented in the table above, are representative of the volume of activity for this derivative type during the period.
| SEI Institutional International Trust / Annual Report / September 30, 2009 | 19 |
Table of Contents
SUMMARY SCHEDULE OF INVESTMENTS
International Fixed Income Fund (Continued)
September 30, 2009
A summary of outstanding swap agreements held by the Fund at September 30, 2009, is as follows:
| Credit Default Swaps | |||||||||||||||||
| Counterparty | Reference Entity/Obligation | Buy/Sell Protection | (Pays)/ Receives Rate | Termination Date | Notional Amount (Thousands) | Net Unrealized Appreciation (Depreciation) ($ Thousands) | |||||||||||
| Deutsche Bank | Wolters Kluwer NV, 5.125% 01/27/14 | BUY | (0.90 | ) | 03/20/14 | EUR | 1,400 | $ | (40 | ) | |||||||
| HSBC | Autozone Inc., 5.500% 11/15/15 | BUY | (1.00 | ) | 03/20/15 | 650 | 3 | ||||||||||
| JPMorgan Chase Bank | iTraxx Europe Crossover Series 9 Version 3 | SELL | 6.50 | 06/20/13 | EUR | (4,800 | ) | 153 | |||||||||
| Morgan Stanley | Prudential Financial 4.500% 07/15/13 | SELL | 5.00 | 09/20/14 | (350 | ) | 45 | ||||||||||
| Morgan Stanley | Spanish Government, 5.500% 07/30/17 | BUY | (1.00 | ) | 09/20/14 | USD | 4,100 | (16 | ) | ||||||||
| $ | 145 | ||||||||||||||||
| Interest Rate Swaps | |||||||||||||
| Counterparty | Fund Pays | Fund Receives | Termination Date | Notional Amount (Thousands) | Net Unrealized Appreciation (Depreciation) ($ Thousands) | ||||||||
| Citigroup | 3.79% | 6-Month GBP LIBOR | 05/19/19 | GBP | 2,500,000 | $ | (7 | ) | |||||
| Deutsche Bank | 6-Month EURIBOR | 4.17% | 03/28/13 | EUR | 7,000,000 | 868 | |||||||
| Deutsche Bank | 4.31% | 6-Month EURIBOR | 04/07/10 | EUR | 6,500,000 | (282 | ) | ||||||
| JPMorgan Chase Bank | 6-Month JPY LIBOR | 2.22% | 03/26/27 | JPY | 750,000,000 | 384 | |||||||
| JPMorgan Chase Bank | 6-Month EURIBOR | 4.38% | 01/07/13 | EUR | 5,400,000 | 760 | |||||||
| JPMorgan Chase Bank | 4.20% | 6-Month EURIBOR | 03/30/12 | EUR | 3,000,000 | (338 | ) | ||||||
| JPMorgan Chase Bank | 6-Month JPY LIBOR | 1.29% | 03/26/12 | JPY | 1,300,000,000 | 246 | |||||||
| JPMorgan Chase Bank | 3.91% | 6-Month EURIBOR | 03/13/10 | EUR | 6,500,000 | (327 | ) | ||||||
| $ | 1,304 | ||||||||||||
Percentages are based on a Net Assets of $538,159 ($ Thousands).
| * | Rate shown is the 7-day effective yield as of September 30, 2009. |
| † | Affiliated security. |
| (1) | In local currency unless otherwise indicated. |
| (A) | This security or a partial position of this security is on loan at September 30, 2009. The total market value of securities on loan at September 30, 2009 was $1,666 ($ Thousands) (See Note 9). |
| (B) | Variable Rate Security — The rate reported on the Summary Schedule of Investments is the rate in effect as of September 30, 2009. |
| (C) | This security was purchased with cash collateral held from securities on loan (see Note 9). The total value of such securities as of September 30, 2009 was $1,704 ($ Thousands). |
AUD — Australian Dollar
CAD — Canadian Dollar
CHF — Swiss Franc
Cl — Class
CPI — Consumer Price Index
DKK — Danish Krone
EUR — Euro
EURIBOR — Euro London Interbank Offered Rate
GBP — British Pound Sterling
HKD — Hong Kong Dollar
HUF — Hungarian Forint
JPY — Japanese Yen
KRW — Korean Won
LIBOR — London Interbank Offered Rate
L. P. — Limited Partnership
MTN — Medium Term Note
MXP — Mexican Peso
NOK — Norwegian Krone
NZD — New Zealand Dollar
PLN — Polish Zloty
SEK — Swedish Krona
Ser — Series
SGD — Singapore Dollar
USD — U.S. Dollar
ZAR — South African Rand
Amounts designated as “—” are $O or have been rounded to $O.
The Summary Schedule of Investments does not reflect the complete portfolio holdings. It includes the Fund’s 50 largest holdings and each investment of any issuer that exceeds 1% of the Fund’s net assets. “Other Securities” represent all issues not required to be disclosed under the rules adopted by the U.S. Securities and Exchange Commission (“SEC”). Footnotes above may apply to securities that are included in “other securities.” For further detail, the complete schedule of portfolio holdings is available (i) without charge, upon request, by calling (800) 342-5734; and (ii) on the SEC’s website at http://www.sec.gov.
The following is a summary of the inputs used as of September 30, 2009 in valuing the Fund’s investments carried at value ($ Thousands):
| Investments in Securities | Level 1 | Level 2 | Level 3 | Total | ||||||||
Global Bonds | $ | — | $ | 394,018 | $ | 5 | $ | 394,023 | ||||
Mortgage-Backed Securities | — | 24,865 | — | 24,865 | ||||||||
Corporate Obligations | — | 20,308 | — | 20,308 | ||||||||
Asset-Backed Securities | — | 15,146 | — | 15,146 | ||||||||
U.S. Treasury Obligations | — | 13,712 | — | 13,712 | ||||||||
U.S. Government Agency Obligation | — | 878 | — | 878 | ||||||||
Municipal Bonds | — | 1,234 | — | 1,234 | ||||||||
Time Deposits | — | 70,289 | — | 70,289 | ||||||||
Affiliated Partnership | — | 1,704 | — | 1,704 | ||||||||
Total Investments in Securities | $ | — | $ | 542,154 | $ | 5 | $ | 542,159 | ||||
| Other Financial Instruments* | Level 1 | Level 2 | Level 3 | Total | |||||||||||
Futures | $ | (597 | ) | $ | — | $ | — | $ | (597 | ) | |||||
Forwards | — | (5,217 | ) | — | (5,217 | ) | |||||||||
Credit Default Swaps | — | 145 | — | 145 | |||||||||||
Interest Rate Swaps | — | 1,304 | — | 1,304 | |||||||||||
Total Other Financial Instruments | $ | (597 | ) | $ | (3,768 | ) | $ | — | $ | (4,365 | ) | ||||
| * | Other Financial Instruments are valued at unrealized appreciation/depreciation. |
| 20 | SEI Institutional International Trust / Annual Report / September 30, 2009 |
Table of Contents
The following is a reconciliation of the investments is which significant unobservable inputs (Level 3) were used in determining value ($ Thousands):
| Global Bonds | Swap Contracts | |||||||
Beginning balance as of October 1, 2008 | $ | 5 | $ | 112 | ||||
Accrued discounts/premiums | 1 | — | ||||||
Realized gain/(loss) | — | — | ||||||
Change in unrealized appreciation/(depreciation) | (1 | ) | — | |||||
Net purchases/sales | — | — | ||||||
Net transfer in and/or out of Level 3 | — | (112 | ) | |||||
Ending balance as of September 30, 2009 | $ | 5 | $ | — | ||||
| Changes in unrealized gains/(losses) included in earnings related to securities still held at reporting date. | $ | (1 | ) | $ | — | |||
For more information on valuation inputs, see Note 2 — Significant Accounting Policies in Notes to Financial Statements.
The accompanying notes are an integral part of the financial statements.
| SEI Institutional International Trust / Annual Report / September 30, 2009 | 21 |
Table of Contents
SUMMARY SCHEDULE OF INVESTMENTS
Emerging Markets Debt Fund
September 30, 2009
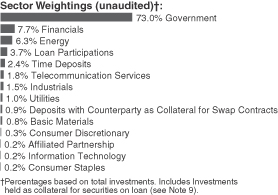
| Description | Percentage of Net Assets (%) | Face Amount ( Thousands) (1) | Market Value ($ Thousands) | |||||||
GLOBAL BONDS — 91.4% |
| |||||||||
Argentina — 5.9% |
| |||||||||
Republic of Argentina | ||||||||||
12.000%, 09/19/16 (A) | 0.0 | % | 1,000 | $ | 230 | |||||
11.750%, 05/20/11 (A) | 0.1 | 2,554 | 608 | |||||||
10.139%, 12/15/35 (B) (C) | 0.0 | 3,655 | 226 | |||||||
10.000%, 01/03/07 (A) | 0.1 | ITL 3,000,000 | 713 | |||||||
9.750%, 09/19/27 (A) | 0.1 | 2,150 | 688 | |||||||
9.250%, 07/20/04 (A) | 0.1 | 1,375 | 623 | |||||||
9.000%, 05/26/49 (A) | 0.1 | 2,650 | 1,147 | |||||||
9.000%, 05/24/49 (A) | 0.1 | 1,400 | 653 | |||||||
8.750%, 02/04/49 (A) | 0.1 | 1,375 | 610 | |||||||
8.500%, 07/01/49 (A) | 0.0 | 775 | 351 | |||||||
8.500%, 07/30/10 (A) | 0.1 | 2,000 | 833 | |||||||
8.280%, 12/31/33 | 0.5 | 6,278 | 4,238 | |||||||
8.125%, 04/21/49 (A) | 0.2 | 4,200 | 1,820 | |||||||
8.000%, 02/26/08 (A) | 0.1 | 1,000 | 464 | |||||||
8.000%, 02/25/32 (A) | 0.1 | 864 | 391 | |||||||
7.820%, 12/31/33 | 0.1 | 734 | 601 | |||||||
7.625%, 03/31/05 (A) | 0.1 | 1,120 | 370 | |||||||
7.625%, 08/11/07 (A) | 0.1 | ITL 2,325,000 | 522 | |||||||
7.000%, 03/18/49 (A) | 0.0 | ITL 1,475,000 | 340 | |||||||
7.000%, 09/12/13 | 0.1 | 1,200 | 930 | |||||||
7.000%, 10/03/15 | 1.8 | 20,140 | 14,493 | |||||||
2.500%, 03/31/19 (D) | 0.6 | 12,990 | 4,352 | |||||||
2.280%, 12/15/35 (B) | 0.1 | 7,705 | 512 | |||||||
0.943%, 08/03/12 (B) | 0.8 | 21,115 | 6,429 | |||||||
0.000%, 07/13/49 (A) | 0.1 | ITL 3,245,000 | 717 | |||||||
Other Securities | 0.4 | 3,599 | ||||||||
| 46,460 | ||||||||||
Bahrain — 0.1% |
| |||||||||
Other Securities | 0.1 | 432 | ||||||||
Belize — 0.0% |
| |||||||||
Other Securities | 0.0 | 220 | ||||||||
| Description | Percentage of Net Assets (%) | Face Amount (Thousands) (1) | Market Value ($ Thousands) | |||||||
Bosnia and Herzegovina — 0.1% |
| |||||||||
Other Securities | 0.1 | % | $ | 1,092 | ||||||
Brazil — 9.1% |
| |||||||||
Banco Nacional de Desenvolvimento Economico e Social | ||||||||||
6.500%, 06/10/19 (E) | 0.3 | 2,325 | 2,470 | |||||||
Federal Republic of Brazil | ||||||||||
12.250%, 03/06/30 | 0.0 | 175 | 304 | |||||||
11.000%, 08/17/40 | 2.2 | 12,957 | 17,427 | |||||||
10.125%, 05/15/27 | 0.9 | 4,735 | 7,008 | |||||||
8.875%, 04/15/24 | 0.4 | 2,470 | 3,273 | |||||||
8.750%, 02/04/25 | 0.5 | 2,735 | 3,610 | |||||||
8.500%, 09/24/12 | 0.1 | 460 | 768 | |||||||
8.250%, 01/20/34 | 0.9 | 5,290 | 6,975 | |||||||
8.000%, 01/15/18 | 0.6 | 4,212 | 4,878 | |||||||
7.875%, 03/07/15 | 0.1 | 690 | 814 | |||||||
7.125%, 01/20/37 | 0.8 | 5,335 | 6,362 | |||||||
6.000%, 01/17/17 | 0.1 | 1,100 | 1,190 | |||||||
5.875%, 01/15/19 | 0.1 | 1,100 | 1,182 | |||||||
Nota Do Tesouro Nacional | ||||||||||
10.000%, 01/01/17 | 1.6 | 25,476 | 12,881 | |||||||
Other Securities | 0.5 | 2,791 | ||||||||
| 71,933 | ||||||||||
Chile — 0.2% |
| |||||||||
Other Securities | 0.2 | 1,686 | ||||||||
Colombia — 4.5% |
| |||||||||
Republic of Colombia | ||||||||||
11.750%, 02/25/20 | 0.4 | 2,345 | 3,412 | |||||||
10.375%, 01/28/33 | 0.1 | 450 | 657 | |||||||
9.850%, 06/28/27 | 0.0 | COP 302,000 | 166 | |||||||
8.125%, 05/21/24 | 0.5 | 3,150 | 3,780 | |||||||
7.375%, 03/18/19 | 0.8 | 5,545 | 6,341 | |||||||
7.375%, 09/18/37 | 1.5 | 10,225 | 11,554 | |||||||
7.375%, 01/27/17 | 0.6 | 4,410 | 5,054 | |||||||
Other Securities | 0.6 | 4,918 | ||||||||
| 35,882 | ||||||||||
Croatia — 0.2% |
| |||||||||
Other Securities | 0.2 | 1,252 | ||||||||
Czech Republic — 0.1% |
| |||||||||
Other Securities | 0.1 | 676 | ||||||||
Dominican Republic — 0.1% |
| |||||||||
Other Securities | 0.1 | 531 | ||||||||
Ecuador — 0.1% |
| |||||||||
Other Securities | 0.1 | 957 | ||||||||
| 22 | SEI Institutional International Trust / Annual Report / September 30, 2009 |
Table of Contents
| Description | Percentage of Net Assets (%) | Face Amount (Thousands) (1) | Market Value ($ Thousands) | |||||||
El Salvador — 0.9% |
| |||||||||
Republic of El Salvador | ||||||||||
7.650%, 06/15/35 | 0.7 | % | 5,811 | $ | 5,811 | |||||
Other Securities | 0.2 | 1,119 | ||||||||
| 6,930 | ||||||||||
Gabon — 0.2% |
| |||||||||
Other Securities | 0.2 | 1,826 | ||||||||
Georgia — 0.5% |
| |||||||||
Other Securities | 0.5 | 4,112 | ||||||||
Ghana — 0.2% |
| |||||||||
Other Securities | 0.2 | 1,675 | ||||||||
India — 0.5% |
| |||||||||
Other Securities | 0.5 | 3,827 | ||||||||
Indonesia — 6.7% |
| |||||||||
Majapahit Holding | ||||||||||
8.000%, 08/07/19 (E) | 0.2 | 1,320 | 1,409 | |||||||
7.875%, 06/29/37 (E) (F) | 0.0 | 355 | 351 | |||||||
7.750%, 10/17/16 | 0.2 | 1,100 | 1,157 | |||||||
7.250%, 10/17/11 | 0.1 | 650 | 674 | |||||||
Republic of Indonesia | ||||||||||
11.625%, 03/04/19 | 0.3 | 1,400 | 1,949 | |||||||
11.625%, 03/04/19 (E) | 0.8 | 4,585 | 6,453 | |||||||
10.375%, 05/04/14 (E) | 0.0 | 200 | 243 | |||||||
10.375%, 05/04/14 | 0.0 | 300 | 364 | |||||||
8.500%, 10/12/35 | 0.5 | 3,550 | 4,278 | |||||||
7.750%, 01/17/38 | 2.7 | 19,391 | 21,427 | |||||||
7.500%, 01/15/16 | 0.3 | 2,100 | 2,316 | |||||||
7.250%, 04/20/15 | 0.2 | 1,480 | 1,618 | |||||||
6.875%, 01/17/18 | 0.3 | 2,330 | 2,505 | |||||||
6.875%, 03/09/17 | 0.1 | 370 | 395 | |||||||
6.750%, 03/10/14 | 0.1 | 700 | 746 | |||||||
6.750%, 03/10/14 (E) | 0.2 | 1,300 | 1,401 | |||||||
6.625%, 02/17/37 | 0.3 | 2,350 | 2,293 | |||||||
6.625%, 02/17/37 (E) | 0.0 | 300 | 295 | |||||||
Other Securities | 0.4 | 3,391 | ||||||||
| 53,265 | ||||||||||
Iraq — 1.1% |
| |||||||||
Republic of Iraq | ||||||||||
5.800%, 01/15/28 | 1.1 | 11,550 | 8,662 | |||||||
Ivory Coast — 0.0% |
| |||||||||
Other Securities | 0.0 | 374 | ||||||||
Jamaica — 0.1% |
| |||||||||
Other Securities | 0.1 | 511 | ||||||||
Kazakhstan — 2.9% |
| |||||||||
KazMunaiGaz Finance Sub MTN | ||||||||||
11.750%, 01/23/15 (E) | 0.5 | 3,130 | 3,701 | |||||||
| Description | Percentage of Net Assets (%) | Face Amount (Thousands) (1) | Market Value ($ Thousands) | |||||||||
9.125%, 07/02/18 (E) | 0.6 | % | 4,505 | $ | 4,888 | |||||||
9.125%, 07/02/18 | 0.5 | 3,550 | 3,834 | |||||||||
8.375%, 07/02/13 | 0.4 | 2,735 | 2,896 | |||||||||
Other Securities | 0.9 | 7,452 | ||||||||||
| 22,771 | ||||||||||||
Lebanon — 0.0% |
| |||||||||||
Other Securities | 0.0 | 266 | ||||||||||
Malaysia — 2.7% |
| |||||||||||
Government of Malaysia | ||||||||||||
4.378%, 11/29/19 | 0.4 | 10,580 | 3,097 | |||||||||
Petroliam Nasional | ||||||||||||
7.750%, 08/15/15 | 0.1 | 705 | 833 | |||||||||
7.625%, 10/15/26 | 0.1 | 395 | 471 | |||||||||
Petronas Capital | ||||||||||||
7.875%, 05/22/22 | 1.0 | 6,255 | 7,649 | |||||||||
7.875%, 05/22/22 (B) | 0.1 | 400 | 492 | |||||||||
7.875%, 05/22/22 | 0.1 | 1,000 | 1,223 | |||||||||
5.250%, 08/12/19 | 0.9 | 7,250 | 7,319 | |||||||||
| 21,084 | ||||||||||||
Mexico — 8.0% |
| |||||||||||
Mexican Bonos | ||||||||||||
7.500%, 06/03/27 | 0.2 | MXP | 23,150 | 1,569 | ||||||||
Mexican Bonos, Ser M10 | ||||||||||||
7.750%, 12/14/17 | 0.4 | MXP | 39,035 | 2,873 | ||||||||
Pemex Project Funding Master Trust | ||||||||||||
6.625%, 06/15/35 | 0.0 | 450 | 435 | |||||||||
5.750%, 03/01/18 | 0.2 | 1,505 | 1,488 | |||||||||
United Mexican States | ||||||||||||
8.300%, 08/15/31 | 1.6 | 10,185 | 13,037 | |||||||||
8.125%, 12/30/19 (G) | 0.4 | 2,415 | 2,943 | |||||||||
7.500%, 04/08/33 | 0.5 | 3,665 | 4,352 | |||||||||
6.625%, 03/03/15 | 0.4 | 2,600 | 2,870 | |||||||||
6.050%, 01/11/40 | 1.0 | 8,084 | 8,064 | |||||||||
5.950%, 03/19/19 | 0.7 | 5,608 | 5,888 | |||||||||
5.875%, 02/17/14 | 0.1 | 450 | 482 | |||||||||
5.625%, 01/15/17 | 0.7 | 5,284 | 5,485 | |||||||||
United Mexican States, Ser A MTN | ||||||||||||
6.750%, 09/27/34 | 0.8 | 5,583 | 6,141 | |||||||||
Other Securities | 1.0 | 7,369 | ||||||||||
| 62,996 | ||||||||||||
Nigeria — 0.2% |
| |||||||||||
Other Securities | 0.2 | 1,413 | ||||||||||
Oman — 0.1% |
| |||||||||||
Other Securities | 0.1 | 1,024 | ||||||||||
Pakistan — 0.6% |
| |||||||||||
Other Securities | 0.6 | 4,933 | ||||||||||
| SEI Institutional International Trust / Annual Report / September 30, 2009 | 23 |
Table of Contents
SUMMARY SCHEDULE OF INVESTMENTS
Emerging Markets Debt Fund (Continued)
September 30, 2009
| Description | Percentage of Net Assets (%) | Face Amount (Thousands) (1) | Market Value ($ Thousands) | |||||||
Panama — 2.3% |
| |||||||||
Republic of Panama | ||||||||||
9.375%, 04/01/29 | 1.0 | % | 5,932 | $ | 8,097 | |||||
9.375%, 01/16/23 | 0.1 | 560 | 717 | |||||||
8.875%, 09/30/27 | 0.1 | 450 | 594 | |||||||
8.125%, 04/28/34 | 0.1 | 720 | 879 | |||||||
7.250%, 03/15/15 | 0.7 | 4,865 | 5,558 | |||||||
6.700%, 01/26/36 | 0.3 | 1,860 | 2,055 | |||||||
| 17,900 | ||||||||||
Peru — 3.0% |
| |||||||||
Republic of Peru | ||||||||||
8.750%, 11/21/33 | 0.2 | 1,155 | 1,542 | |||||||
8.375%, 05/03/16 | 0.3 | 1,650 | 2,009 | |||||||
7.350%, 07/21/25 | 1.2 | 8,045 | 9,393 | |||||||
7.125%, 03/30/19 | 0.4 | 2,625 | 3,028 | |||||||
6.550%, 03/14/37 | 0.8 | 5,555 | 6,027 | |||||||
Other Securities | 0.1 | 1,998 | ||||||||
| 23,997 | ||||||||||
Philippines — 5.7% |
| |||||||||
Republic of Philippines | 0.6 | 3,435 | 4,822 | |||||||
9.500%, 02/02/30 | 0.6 | 3,670 | 4,872 | |||||||
9.375%, 01/18/17 | 0.1 | 200 | 247 | |||||||
8.875%, 03/17/15 | 0.1 | 450 | 541 | |||||||
8.375%, 06/17/19 | 0.4 | 2,645 | 3,220 | |||||||
8.250%, 01/15/14 | 0.1 | 600 | 691 | |||||||
8.000%, 01/15/16 | 0.6 | 4,200 | 4,851 | |||||||
7.750%, 01/14/31 | 0.9 | 6,323 | 7,185 | |||||||
7.500%, 09/25/24 | 2.0 | 14,006 | 15,792 | |||||||
Other Securities | 0.3 | 2,508 | ||||||||
| 44,729 | ||||||||||
Poland — 1.6% | ||||||||||
Republic of Poland | ||||||||||
6.375%, 07/15/19 | 1.6 | 11,565 | 12,992 | |||||||
Qatar — 0.2% | ||||||||||
Other Securities | 0.2 | 1,954 | ||||||||
Russia — 10.7% | ||||||||||
Gaz Capital MTN | ||||||||||
9.625%, 03/01/13 | 0.2 | 1,200 | 1,338 | |||||||
8.625%, 04/28/34 | 0.1 | 920 | 1,005 | |||||||
6.510%, 03/07/22 | 0.0 | 215 | 198 | |||||||
6.212%, 11/22/16 | 0.1 | 600 | 576 | |||||||
RSHB Capital | ||||||||||
9.000%, 06/11/14 (E) | 0.2 | 1,100 | 1,205 | |||||||
7.750%, 05/29/18 | 0.1 | 650 | 670 | |||||||
6.299%, 05/15/17 | 0.0 | 300 | 287 | |||||||
| Description | Percentage of Net Assets (%) | Face Amount (Thousands) (1) | Market Value ($ Thousands) | |||||||
Russian Federation Registered | ||||||||||
12.750%, 06/24/28 | 1.1 | % | 5,010 | $ | 8,342 | |||||
7.500%, 03/31/30 (D) | 7.0 | 51,092 | 55,466 | |||||||
VTB Capital | ||||||||||
6.875%, 05/29/18 | 0.7 | 5,900 | 5,826 | |||||||
6.609%, 10/31/12 (E) | 0.4 | 3,200 | 3,200 | |||||||
Other Securities | 0.8 | 6,457 | ||||||||
| 84,570 | ||||||||||
Singapore — 0.2% | ||||||||||
Other Securities | 0.2 | 1,430 | ||||||||
South Africa — 1.5% |
| |||||||||
Republic of South Africa | ||||||||||
8.500%, 06/23/17 | 0.1 | 860 | 1,041 | |||||||
6.875%, 05/27/19 | 0.3 | 2,130 | 2,375 | |||||||
6.500%, 06/02/14 | 0.4 | 2,945 | 3,225 | |||||||
5.875%, 05/30/22 | 0.3 | 2,400 | 2,460 | |||||||
Other Securities | 0.4 | 2,633 | ||||||||
| 11,734 | ||||||||||
South Korea — 1.3% |
| |||||||||
Export-Import Bank of Korea | ||||||||||
8.125%, 01/21/14 | 0.6 | 3,820 | 4,376 | |||||||
5.875%, 01/14/15 | 0.1 | 995 | 1,049 | |||||||
Korea Development Bank | ||||||||||
8.000%, 01/23/14 | 0.3 | 2,115 | 2,417 | |||||||
Republic of Korea | ||||||||||
7.125%, 04/16/19 | 0.1 | 900 | 1,055 | |||||||
Other Securities | 0.2 | 1,075 | ||||||||
| 9,972 | ||||||||||
Supra-National — 0.1% |
| |||||||||
Other Securities | 0.1 | 1,145 | ||||||||
Thailand — 0.1% | ||||||||||
Other Securities | 0.2 | 1,181 | ||||||||
Trinidad & Tobago — 0.4% |
| |||||||||
Other Securities | 0.4 | 3,090 | ||||||||
Tunisia — 0.2% | ||||||||||
Other Securities | 0.2 | 1,889 | ||||||||
Turkey — 5.8% | ||||||||||
Republic of Turkey | ||||||||||
11.875%, 01/15/30 | 0.1 | 450 | 726 | |||||||
9.500%, 01/15/14 | 0.1 | 750 | 880 | |||||||
8.000%, 02/14/34 | 0.3 | 2,200 | 2,500 | |||||||
7.635%, 02/02/11 (C) | 0.3 | 3,900 | 2,354 | |||||||
7.500%, 11/07/19 | 0.3 | 2,190 | 2,414 | |||||||
7.500%, 07/14/17 | 0.2 | 1,350 | 1,488 | |||||||
7.375%, 02/05/25 | 0.5 | 3,820 | 4,119 | |||||||
| 24 | SEI Institutional International Trust / Annual Report / September 30, 2009 |
Table of Contents
| Description | Percentage of Net Assets (%) | Face Amount (Thousands) (1) | Market Value ($ Thousands) | |||||||
7.250%, 03/05/38 | 0.7 | % | 5,530 | $ | 5,751 | |||||
7.250%, 03/15/15 | 1.3 | 9,460 | 10,311 | |||||||
7.000%, 09/26/16 | 0.2 | 1,500 | 1,614 | |||||||
7.000%, 06/05/20 | 0.0 | 200 | 213 | |||||||
7.000%, 03/11/19 | 0.3 | 1,800 | 1,922 | |||||||
6.875%, 03/17/36 | 0.8 | 6,220 | 6,220 | |||||||
6.750%, 04/03/18 | 0.6 | 4,750 | 5,006 | |||||||
Other Securities | 0.1 | 415 | ||||||||
| 45,933 | ||||||||||
Ukraine — 2.1% | ||||||||||
Government of Ukraine | ||||||||||
7.650%, 06/11/13 | 0.5 | 4,330 | 3,908 | |||||||
6.875%, 03/04/11 (E) | 0.5 | 4,475 | 4,151 | |||||||
6.580%, 11/21/16 (E) | 0.2 | 2,390 | 1,864 | |||||||
6.580%, 11/21/16 | 0.1 | 500 | 390 | |||||||
Other Securities | 0.8 | 5,977 | ||||||||
| 16,290 | ||||||||||
United Arab Emirates — 2.3% | ||||||||||
Jafz Sukuk | ||||||||||
4.169%, 11/27/12 (B) | 1.0 | AED 31,500 | 7,676 | |||||||
Nakheel Development | ||||||||||
3.173%, 12/14/09 | 0.8 | 5,800 | 5,916 | |||||||
Other Securities | 0.5 | 4,523 | ||||||||
| 18,115 | ||||||||||
Uruguay — 2.9% | ||||||||||
Republic of Uruguay PIK | ||||||||||
7.875%, 01/15/33 | 0.4 | 2,863 | 3,104 | |||||||
Republic of Uruguay | ||||||||||
9.250%, 05/17/17 | 0.5 | 3,475 | 4,187 | |||||||
8.000%, 11/18/22 | 1.5 | 10,870 | 12,175 | |||||||
7.625%, 03/21/36 | 0.4 | 2,600 | 2,743 | |||||||
6.875%, 09/28/25 | 0.1 | 601 | 616 | |||||||
| 22,825 | ||||||||||
Venezuela — 5.6% | ||||||||||
Government of Venezuela | ||||||||||
13.625%, 08/15/18 | 0.1 | 600 | 618 | |||||||
9.375%, 01/13/34 | 0.3 | 3,330 | 2,564 | |||||||
9.250%, 05/07/28 | 0.6 | 6,330 | 4,795 | |||||||
9.250%, 09/15/27 | 0.1 | 1,070 | 861 | |||||||
9.000%, 05/07/23 | 0.6 | 5,770 | 4,385 | |||||||
8.500%, 10/08/14 | 0.1 | 916 | 815 | |||||||
7.650%, 04/21/25 | 1.0 | 12,125 | 8,033 | |||||||
7.000%, 03/31/38 | 0.0 | 100 | 60 | |||||||
6.000%, 12/09/20 | 0.2 | 2,020 | 1,237 | |||||||
5.750%, 02/26/16 | 0.2 | 2,000 | 1,470 | |||||||
1.505%, 04/20/11 (B) | 1.9 | 17,006 | 15,221 | |||||||
Petroleos De Venezuela | ||||||||||
5.375%, 04/12/27 | 0.2 | 3,555 | 1,698 | |||||||
5.250%, 04/12/17 | 0.3 | 3,585 | 2,196 | |||||||
| 43,953 | ||||||||||
| Description | Percentage of Net Assets (%) | Face Amount (Thousands) (1)/ Shares | Market Value ($ Thousands) | |||||
Vietnam — 0.2% | ||||||||||
Other Securities | 0.2 | % | $ | 1,703 | ||||||
Yemen — 0.1% | ||||||||||
Other Securities | 0.1 | 725 | ||||||||
Total Global Bonds |
| 722,917 | ||||||||
LOAN PARTICIPATIONS — 3.7% |
| |||||||||
Connect International PIK | ||||||||||
0.000%, 01/01/10* (A) (F) | 1.1 | 9,501 | 8,354 | |||||||
Other Securities | 2.5 | 20,487 | ||||||||
Total Loan Participations | 28,841 | |||||||||
COMMON STOCK — 0.6% |
| |||||||||
GVT Holding* (F) | 0.6 | 199,627 | 4,547 | |||||||
Total Common Stock | 4,547 | |||||||||
CONVERTIBLE BONDS — 0.4% |
| |||||||||
Other Securities | 0.4 | 3,091 | ||||||||
Total Convertible Bonds |
| 3,091 | ||||||||
WARRANTS — 0.0% | ||||||||||
Russia — 0.0% | ||||||||||
Other Securities | 0.0 | — | ||||||||
Total Warrants | — | |||||||||
DEPOSITS WITH COUNTERPARTY AS COLLATERAL FOR SWAP CONTRACTS (H) — 0.9% | ||||||||||
United States — 0.9% |
| |||||||||
Other Securities | 0.9 | 7,414 | ||||||||
Total Deposits with Counterparty as Collateral for Swap Contracts | 7,414 | |||||||||
AFFILIATED PARTNERSHIP — 0.2% | ||||||||||
United States — 0.2% |
| |||||||||
SEI Liquidity Fund, L.P., | 0.2 | 2,060,348 | 1,806 | |||||||
Total Affiliated Partnership |
| 1,806 | ||||||||
| SEI Institutional International Trust / Annual Report / September 30, 2009 | 25 |
Table of Contents
SUMMARY SCHEDULE OF INVESTMENTS
Emerging Markets Debt Fund (Continued)
September 30, 2009
| Description | Percentage of Net Assets (%) | Face Amount (Thousands) (1) | Market Value ($ Thousands) | ||||||||
TIME DEPOSITS — 2.4% |
| ||||||||||
United States — 2.4% |
| ||||||||||
Brown Brothers Harriman | |||||||||||
0.125%, 10/01/09 | 0.0 | % | EUR | 99 | $ | 144 | |||||
0.030%, 10/01/09 | 2.4 | 18,603 | 18,603 | ||||||||
Total Time Deposits |
| 18,747 | |||||||||
Total Investments — 99.6% |
| $ | 787,363 | ||||||||
A summary of the outstanding forward foreign currency contracts held by the Fund at September 30, 2009, is as follows:
| Settlement Date | Currency to Deliver | Currency to Receive (Thousands) | Unrealized Appreciation (Depreciation) ($ Thousands) | |||||||||
10/2/09 | BRL | 22,602 | USD | 12,348 | $ | (339 | ) | |||||
10/2/09-11/4/09 | USD | 19,354 | BRL | 35,896 | 758 | |||||||
10/9/09 | USD | 3,036 | KRW | 3,782,350 | 176 | |||||||
10/9/09-11/23/09 | USD | 4,183 | TRY | 6,238 | 3 | |||||||
10/21/09 | MXP | 14,792 | USD | 1,090 | (2 | ) | ||||||
10/21/09 | USD | 1,130 | MXP | 14,792 | (38 | ) | ||||||
10/26/09-10/28/09 | EUR | 14,544 | USD | 21,391 | 134 | |||||||
| $ | 692 | |||||||||||
A summary of the open futures contracts held by the Fund at September 30, 2009, is as follows:
| Type of Contract | Number of Contracts Long | Expiration Date | Unrealized Appreciation ($ Thousands) | ||||
U.S. Long Treasury Bond | 7 | Dec-2009 | $ | 20 | |||
U.S. Long Treasury Note | 20 | Dec-2009 | 34 | ||||
| $ | 54 | ||||||
For the year ended September 30, 2009, the total amount of all open futures contracts, as presented in the table above, are representative of the volume of activity for this derivative type during the period.
| 26 | SEI Institutional International Trust / Annual Report / September 30, 2009 |
Table of Contents
A summary of outstanding swap agreements held by the Fund at September 30, 2009, is as follows:
| Total Return Swaps | ||||||||||||||||
| Counterparty | Reference Entity/Obligation | Fund Pays | Fund Receives | Termination Date | Notional Amount (Thousands) | Net Unrealized Depreciation ($ Thousands) | ||||||||||
| Merrill Lynch | Solar Gardens Ltd Term Loan Credit Facility | Cash Deposit Of Notional Amount | Price Return | 12/30/09 | NGN | 288,900 | $ | (263 | ) | |||||||
| Merrill Lynch | Zaporozh Term Loan, 9.784% 12/31/17 | Cash Deposit Of Notional Amount | Price Return | 12/31/17 | 1,136 | (475 | ) | |||||||||
| $ | (738 | ) | ||||||||||||||
| Credit Default Swaps | |||||||||||||||
| Counterparty | Reference Entity/Obligation | Buy/Sell Protection | (Pays)/ Receives Rate | Termination Date | Notional Amount (Thousands) | Net Unrealized Appreciation (Depreciation) ($ Thousands) | |||||||||
| Credit Suisse | Naftogaz Ukrainy, 8.125% 09/30/09 | SELL | 5.20 | 12/20/11 | (750 | ) | $ | (147 | ) | ||||||
| Credit Suisse | Naftogaz Ukrainy, 8.125% 09/30/09 | SELL | 5.75 | 12/20/09 | (3,600 | ) | (439 | ) | |||||||
| Credit Suisse | Republic of Kazakhstan | SELL | 14.25 | 02/20/10 | (550 | ) | 37 | ||||||||
| $ | (549 | ) | |||||||||||||
Percentages are based on a Net Assets of $790,597 ($ Thousands).
| * | Rate shown is the 7-day effective yield as of September 30, 2009. |
| † | Affiliated security. |
| (1) | In U.S. dollars unless otherwise indicated. |
| (A) | Security in default on interest payments. |
| (B) | Variable Rate Security — The rate reported on the Summary Schedule of Investments is the rate in effect as of September 30, 2009. |
| (C) | Zero coupon security. The rate reported on the Summary Schedule of Investments is the effective yield at time of purchase. |
| (D) | Step Bonds — The rate reflected on the Schedule of Investments is the effective yield on September 30, 2009. The coupon on a step bond changes on a specified date. |
| (E) | Securities sold within terms of a private placement memorandum, exempt from registration under Section 144A of the Securities Act of 1933, as amended, and may be sold only to dealers in that program or other “accredited investors.” These securities have been determined to be liquid under guidelines established by the board of Trustees. |
| (F) | Securities considered illiquid. The total market value of such securities as of September 30, 2009 was $47,263($ Thousands) and represented 6.0% of Net Assets. |
| (G) | This security or a partial position of this security is on loan at September 30, 2009. The total market value of securities on loan at September 30, 2009 was $1,975 ($ Thousands) (See Note 9). |
| (H) | Cash on deposit with swap counterparty as collateral for outstanding swap contracts. |
| (I) | This security was purchased with cash collateral held from securities on loan (see Note 9). The total value of such securities as of September 30, 2009 was $1,806 ($ Thousands). |
AED — United Arab Emirates Dirham
BRL — Brazilian Real
COP — Colombian Peso
EUR — Euro
ITL — Italian Lira
KRW — Korean Won
L.P. — Limited Partnership
MTN — Medium Term Note
MXP — Mexican Peso
NGN — Nigerian Naira
PIK — Payment-in-Kind
Ser — Series
TRY — New Turkish Lira
USD — U.S. Dollar
Amounts designated as “—” are $O or have been rounded to $O.
The Summary Schedule of Investments does not reflect the complete portfolio holdings. It includes the Fund’s 50 largest holdings and each investment of any issuer that exceeds 1% of the Fund’s net assets. “Other Securities” represent all issues not required to be disclosed under the rules adopted by the U.S. Securities and Exchange Commission (“SEC”). Footnotes above may apply to securities that are included in “other securities.” For further detail, the complete schedule of portfolio holdings is available (H) without charge, upon request, by calling (800) 342-5734; and (ii) on the SEC’s website at http://www.sec.gov.
The following is a summary of the inputs used as of September 30, 2009 in valuing the Fund’s investments carried at value ($ Thousands):
| Investments in Securities | Level 1 | Level 2 | Level 3 | Total | ||||||||
Global Bonds | $ | — | $ | 722,917 | $ | — | $ | 722,917 | ||||
Loan Participations | — | 2,211 | 26,630 | 28,841 | ||||||||
Common Stock | 4,547 | — | — | 4,547 | ||||||||
Convertible Bonds | — | 3,091 | — | 3,091 | ||||||||
Warrants | — | — | — | — | ||||||||
Deposit with Counterparty as | ||||||||||||
Collateral for Swap Contracts | — | 7,414 | — | 7,414 | ||||||||
Affiliated Partnership | — | 1,806 | — | 1,806 | ||||||||
Time Deposits | — | 18,747 | — | 18,747 | ||||||||
Total Investments in Securities | $ | 4,547 | $ | 756,186 | $ | 26,630 | $ | 787,363 | ||||
| Other Financial Instruments* | Level 1 | Level 2 | Level 3 | Total | |||||||||||
Futures | $ | 54 | $ | — | $ | — | $ | 54 | |||||||
Forwards | — | 692 | — | 692 | |||||||||||
Total Return Swaps | — | — | (738 | ) | (738 | ) | |||||||||
Credit Default Swaps | — | (549 | ) | — | (549 | ) | |||||||||
Total Other Financial Instruments | $ | 54 | $ | 143 | $ | (738 | ) | $ | (541 | ) | |||||
| * | Other Financial Instruments are valued at unrealized appreciation/depreciation. |
| SEI Institutional International Trust / Annual Report / September 30, 2009 | 27 |
Table of Contents
SUMMARY SCHEDULE OF INVESTMENTS
Emerging Markets Debt Fund (Concluded)
September 30, 2009
The following is a reconciliation of the investments is which significant unobservable inputs (Level 3) were used in determining value ($ Thousands):
| Loan Participations | Swap Contracts | |||||||
Beginning balance as of October 1, 2008 | $ | 36,055 | $ | (31 | ) | |||
Accrued discounts/premiums | 23 | — | ||||||
Realized gain/(loss) | 222 | 361 | ||||||
Change in unrealized appreciation/(depreciation) | (13,038 | ) | (707 | ) | ||||
Net purchases/sales | 3,368 | (361 | ) | |||||
Net transfer in and/or out of Level 3 | — | — | ||||||
Ending balance as of September 30, 2009 | $ | 26,630 | $ | (738 | ) | |||
| Changes in unrealized gains/(losses) included in earnings related to securities still held at reporting date. | $ | (12,935 | ) | $ | (707 | ) | ||
For more information on valuation inputs, see Note 2 — Significant Accounting Policies in Notes to Financial Statements.
The accompanying notes are an integral part of the financial statements.
| 28 | SEI Institutional International Trust / Annual Report / September 30, 2009 |
Table of Contents
Statements of Assets and Liabilities ($ Thousands)
September 30, 2009
| International Equity Fund | Emerging Markets Equity Fund | International Fixed Income Fund | Emerging Markets Debt Fund | |||||||||||||
ASSETS: | ||||||||||||||||
Investments, at value (Cost $1,778,902, $735,326, $518,049 and $728,083, respectively)(1) | $ | 2,003,990 | $ | 887,472 | $ | 540,455 | $ | 785,557 | ||||||||
Affiliated investments, at value (Cost $245,785, $39,750, $1,712 and $2,060, respectively) | 243,450 | 38,762 | 1,704 | 1,806 | ||||||||||||
Cash | 39,749 | 11,255 | 67,155 | 17,633 | ||||||||||||
Foreign currency, at value (Cost $7,677, $4,609, $2,793 and $168, respectively) | 7,698 | 4,637 | 2,814 | 168 | ||||||||||||
Cash pledged as collateral for forward foreign currency contracts, futures contracts or swap contracts | — | — | 625 | 2,655 | ||||||||||||
Receivable for investment securities sold | 31,204 | 31,697 | 1,881 | 2,620 | ||||||||||||
Unrealized gain on forward foreign currency contracts | 5,373 | — | 3,031 | 1,071 | ||||||||||||
Receivable for fund shares sold | 2,864 | 1,608 | 856 | 1,827 | ||||||||||||
Dividends and interest receivable | 4,604 | 2,033 | 6,679 | 11,864 | ||||||||||||
Variation margin receivable | 175 | — | 51 | 3 | ||||||||||||
Foreign tax reclaim receivable | 2,055 | 148 | — | — | ||||||||||||
Margin Deposit | — | — | 153 | — | ||||||||||||
Unrealized gain on foreign currency spot contracts | 194 | — | — | — | ||||||||||||
Receivable for swap contracts terminated | — | — | 119 | — | ||||||||||||
Swap contracts, at value (Premiums paid $0, $0, $(48) and $0, respectively) | 1,841 | — | 2,408 | 37 | ||||||||||||
Total Assets | 2,343,197 | 977,612 | 627,931 | 825,241 | ||||||||||||
LIABILITIES: | ||||||||||||||||
Payable for investment securities purchased | 103,032 | 14,600 | 77,129 | 25,954 | ||||||||||||
Payable upon return of securities loaned | 165,342 | 36,295 | 1,712 | 2,060 | ||||||||||||
Unrealized loss on forward foreign currency contracts | 5,983 | — | 8,248 | 379 | ||||||||||||
Payable for fund shares redeemed | 2,740 | 7,257 | 1,000 | 4,000 | ||||||||||||
Swap contracts, at value (Premiums received $0, $0, $73 And $0, respectively) | 1,341 | — | 1,080 | 1,324 | ||||||||||||
Variation margin payable | 638 | — | 108 | 2 | ||||||||||||
Unrealized loss on foreign currency spot contracts | 23 | 1 | — | — | ||||||||||||
Administration fees payable | 759 | 480 | 263 | 409 | ||||||||||||
Investment advisory fees payable | 701 | 695 | 66 | 272 | ||||||||||||
Shareholder servicing fees payable | 421 | 185 | 99 | 157 | ||||||||||||
Trustees’ fees | 5 | 2 | 1 | 2 | ||||||||||||
Chief compliance officer fees payable | 3 | 1 | 1 | 1 | ||||||||||||
Administration servicing fees payable | 2 | — | — | — | ||||||||||||
Other accrued expenses | 399 | 303 | 65 | 84 | ||||||||||||
Accrued foreign capital gains tax on appreciated securities | — | 1,013 | — | — | ||||||||||||
Total Liabilities | 281,389 | 60,832 | 89,772 | 34,644 | ||||||||||||
Net Assets | $ | 2,061,808 | $ | 916,780 | $ | 538,159 | $ | 790,597 | ||||||||
NET ASSETS: | ||||||||||||||||
Paid in Capital (unlimited authorization — no par value) | $ | 3,134,211 | $ | 1,045,404 | $ | 582,005 | $ | 814,879 | ||||||||
Undistributed (Distributions in excess of) net investment income | (2,486 | ) | 3,367 | (33,391 | ) | 187 | ||||||||||
Accumulated net realized loss on investments, futures contracts, option contracts, foreign currency contracts and swap contracts | (1,293,069 | ) | (282,268 | ) | (28,087 | ) | (81,160 | ) | ||||||||
Net unrealized appreciation on investments | 222,753 | 151,158 | 22,398 | 57,220 | ||||||||||||
Net unrealized appreciation (depreciation) on futures contracts | 223 | — | (597 | ) | 54 | |||||||||||
Net unrealized appreciation (depreciation) on swap contracts | 500 | — | 1,449 | (1,287 | ) | |||||||||||
Net unrealized appreciation (depreciation) on foreign currency contracts, foreign currencies and translation of other assets and liabilities denominated in foreign currencies | (324 | ) | 132 | (5,618 | ) | 704 | ||||||||||
Accumulated foreign capital gains tax on appreciated securities | — | (1,013 | ) | — | — | |||||||||||
Net Assets | $ | 2,061,808 | $ | 916,780 | $ | 538,159 | $ | 790,597 | ||||||||
Net Asset Value, Offering and Redemption Price Per Share — Class A ($2,053,410,569 ÷ 260,442,943 shares, $916,779,989 ÷ 95,147,546 shares, $538,159,277 ÷ 52,723,777 shares, $790,597,127 ÷ 77,196,426 shares, respectively.) | $7.88 | $9.64 | $10.21 | $10.24 | ||||||||||||
Net Asset Value, Offering and Redemption Price Per Share — Class I ($8,396,973 ÷ 1,064,683 shares) | $7.89 | N/A | N/A | N/A | ||||||||||||
| (1) | Included in “Investments, at value” is the market value of securities on loan in the amounts of $155,229, $34,648, $1,666 and $1,975, ($Thousands), respectively. |
Amounts designated as “—” are $0 or have been rounded to $0.
The accompanying notes are an integral part of the financial statements.
| SEI Institutional International Trust / Annual Report / September 30, 2009 | 29 |
Table of Contents
Statements of Operations ($ Thousands)
For the year ended September 30, 2009
| International Equity Fund | Emerging Markets Equity Fund | International Fixed Income Fund | Emerging Markets Debt Fund | |||||||||||||
Investment Income: | ||||||||||||||||
Dividends | $ | 54,898 | $ | 22,121 | $ | 4 | $ | — | ||||||||
Dividends from Affiliated Securities(1) | 449 | 29 | — | — | ||||||||||||
Interest | 3,481 | 86 | 20,599 | 66,007 | ||||||||||||
Security Lending Income — Net(2) | 2,620 | 774 | 3 | 104 | ||||||||||||
Less: Foreign Taxes Withheld | (4,475 | ) | (1,969 | ) | — | (10 | ) | |||||||||
Total Investment Income | 56,973 | 21,041 | 20,606 | 66,101 | ||||||||||||
Expenses: | ||||||||||||||||
Investment Advisory Fees | 8,743 | 7,236 | 796 | 5,706 | ||||||||||||
Administration Fees | 7,791 | 4,479 | 3,185 | 4,363 | ||||||||||||
Shareholder Servicing Fees — Class A | 4,313 | 1,723 | 1,327 | 1,678 | ||||||||||||
Shareholder Servicing Fees — Class I | 15 | — | — | — | ||||||||||||
Admin Servicing Fees — Class I | 15 | — | — | — | ||||||||||||
Trustees’ Fees | 35 | 14 | 11 | 14 | ||||||||||||
Chief Compliance Officer Fees | 14 | 5 | 4 | 6 | ||||||||||||
Custodian/Wire Agent Fees | 756 | 644 | 74 | 64 | ||||||||||||
Printing Fees | 227 | 89 | 79 | 93 | ||||||||||||
Professional Fees | 187 | 226 | 56 | 68 | ||||||||||||
Overdraft Fees | 83 | 68 | 35 | 66 | ||||||||||||
Interest Expense on Reverse Repurchase Agreements | 52 | — | — | — | ||||||||||||
Registration Fees | 49 | 20 | 14 | 18 | ||||||||||||
Other Expenses | 145 | 66 | 59 | 52 | ||||||||||||
Total Expenses | 22,425 | 14,570 | 5,640 | 12,128 | ||||||||||||
Less: | ||||||||||||||||
Waiver of Investment Advisory Fees | (150 | ) | (997 | ) | — | (2,927 | ) | |||||||||
Waiver of Shareholder Servicing Fees — Class A | — | — | (243 | ) | — | |||||||||||
Fees Paid Indirectly(1) | (69 | ) | — | — | — | |||||||||||
Net Expenses | 22,206 | 13,573 | 5,397 | 9,201 | ||||||||||||
Net Investment Income | 34,767 | 7,468 | 15,209 | 56,900 | ||||||||||||
Net Realized and Unrealized Gain (Loss): | ||||||||||||||||
Net Realized Gain (Loss) from: | ||||||||||||||||
Investments | (879,403 | ) | (260,714 | ) | (22,920 | ) | (74,861 | ) | ||||||||
Futures Contracts | (55,325 | ) | — | 942 | 1,054 | |||||||||||
Written Options | — | — | — | 266 | ||||||||||||
Swap Contracts | (69,214 | ) | — | (937 | ) | 3,252 | ||||||||||
Foreign Currency Transactions | (13,765 | ) | (612 | ) | 8,926 | (6,197 | ) | |||||||||
Net Change in Unrealized Appreciation (Depreciation) on: | ||||||||||||||||
Investments | 662,317 | 322,929 | 63,427 | 117,778 | ||||||||||||
Affiliated Investments | (341 | ) | (43 | ) | (8 | ) | 28 | |||||||||
Futures Contracts | 6,424 | — | (1,454 | ) | 33 | |||||||||||
Written Options | — | — | — | (254 | ) | |||||||||||
Swap Contracts | 20,467 | — | 1,524 | (4,018 | ) | |||||||||||
Foreign Capital Gains Tax on Appreciated Securities | — | (991 | ) | — | — | |||||||||||
Foreign Currency Transactions | 13,255 | 223 | (25,944 | ) | (993 | ) | ||||||||||
Net Realized and Unrealized Gain (Loss) | (315,585 | ) | 60,792 | 23,556 | 36,088 | |||||||||||
Net Increase (Decrease) in Net Assets Resulting from Operations | $ | (280,818 | ) | $ | 68,260 | $ | 38,765 | $ | 92,988 | |||||||
| (1) | See Note 5 in Notes to Financial Statements. |
| (2) | Income is from the investment of collateral in an affiliated security. |
Amounts designated as “—” are $0 or have been rounded to $0.
The accompanying notes are an integral part of the financial statements.
| 30 | SEI Institutional International Trust / Annual Report / September 30, 2009 |
Table of Contents
Statements of Changes in Net Assets ($ Thousands)
For the years ended September 30,
| International Equity Fund | Emerging Markets Equity Fund | |||||||||||||||
| 2009 | 2008 | 2009 | 2008 | |||||||||||||
Operations: | ||||||||||||||||
Net Investment Income | $ | 34,767 | $ | 72,670 | $ | 7,468 | $ | 12,423 | ||||||||
Net Realized Gain (Loss) from Investments, Affiliated Investments, Futures Contracts, Written Options and Swap Contracts | (1,003,942 | ) | (258,698 | ) | (260,714 | ) | 215,399 | |||||||||
Net Realized Gain (Loss) on Forward Foreign Currency Contracts and Foreign Currency Transactions | (13,765 | ) | (5,623 | ) | (612 | ) | (1,094 | ) | ||||||||
Net Change in Unrealized Appreciation (Depreciation) on Investments, Affiliated Investments, Futures Contracts, Written Options and Swap Contracts | 688,867 | (1,203,717 | ) | 322,886 | (726,733 | ) | ||||||||||
Net Change in Unrealized Appreciation (Depreciation) on Foreign Capital Tax Gains on Appreciated Securities | — | 66 | (991 | ) | 2,322 | |||||||||||
Net Change in Unrealized Appreciation (Depreciation) on Forward Foreign Currency Contracts, Foreign Currencies, and Translation of Other Assets and Liabilities Denominated in Foreign Currencies | 13,255 | (15,772 | ) | 223 | (470 | ) | ||||||||||
Net Increase (Decrease) in Net Assets Resulting from Operations | (280,818 | ) | (1,411,074 | ) | 68,260 | (498,153 | ) | |||||||||
Dividends and Distributions from: | ||||||||||||||||
Net Investment Income: | ||||||||||||||||
Class A | (41,196 | ) | (93,239 | ) | (10,169 | ) | (6,962 | ) | ||||||||
Class I | (89 | ) | (335 | ) | — | — | ||||||||||
Net Realized Gains: | ||||||||||||||||
Class A | — | (423,708 | ) | (154,334 | ) | (337,463 | ) | |||||||||
Class I | — | (1,715 | ) | — | — | |||||||||||
Total Dividends and Distributions | (41,285 | ) | (518,997 | ) | (164,503 | ) | (344,425 | ) | ||||||||
Capital Share Transactions: | ||||||||||||||||
Class A: | ||||||||||||||||
Proceeds from Shares Issued | 1,137,018 | 769,174 | 318,878 | 345,735 | ||||||||||||
Reinvestment of Dividends & Distributions | 39,508 | 492,950 | 157,509 | 331,075 | ||||||||||||
Cost of Shares Redeemed | (1,130,315 | ) | (1,041,575 | ) | (429,094 | ) | (645,731 | ) | ||||||||
Increase in Net Assets Derived from Class A Transactions | 46,211 | 220,549 | 47,293 | 31,079 | ||||||||||||
Class I: | ||||||||||||||||
Proceeds from Shares Issued | 4,670 | 4,758 | — | — | ||||||||||||
Reinvestment of Dividends & Distributions | 89 | 2,016 | — | — | ||||||||||||
Cost of Shares Redeemed | (3,101 | ) | (10,601 | ) | — | — | ||||||||||
Increase (Decrease) in Net Assets Derived from Class I Transactions | 1,658 | (3,827 | ) | — | — | |||||||||||
Increase in Net Assets Derived from Capital Share Transactions | 47,869 | 216,722 | 47,293 | 31,079 | ||||||||||||
Net Decrease in Net Assets | (274,234 | ) | (1,713,349 | ) | (48,950 | ) | (811,499 | ) | ||||||||
Net Assets: | ||||||||||||||||
Beginning of Year | 2,336,042 | 4,049,391 | 965,730 | 1,777,229 | ||||||||||||
End of Year | $ | 2,061,808 | $ | 2,336,042 | $ | 916,780 | $ | 965,730 | ||||||||
Undistributed Net Investment Income Included in Net Assets at End of Year | $ | (2,486 | ) | $ | 15,358 | $ | 3,367 | $ | 6,621 | |||||||
Share Transactions: | ||||||||||||||||
Class A: | ||||||||||||||||
Shares Issued | 170,747 | 62,451 | 44,440 | 20,424 | ||||||||||||
Reinvestment of Distributions | 6,291 | 35,290 | 28,647 | 18,345 | ||||||||||||
Shares Redeemed | (179,952 | ) | (83,663 | ) | (62,439 | ) | (36,985 | ) | ||||||||
Total Class A Transactions | (2,914 | ) | 14,078 | 10,648 | 1,784 | |||||||||||
Class I: | ||||||||||||||||
Shares Issued | 789 | 357 | — | — | ||||||||||||
Reinvestment of Distributions | 14 | 145 | — | — | ||||||||||||
Shares Redeemed | (479 | ) | (824 | ) | — | — | ||||||||||
Total Class I Transactions | 324 | (322 | ) | — | — | |||||||||||
Net Increase (Decrease) in Shares Outstanding From Share Transactions | (2,590 | ) | 13,756 | 10,648 | 1,784 | |||||||||||
Amounts designated as “—” are $0 or have been rounded to $0.
The accompanying notes are an integral part of the financial statements.
| SEI Institutional International Trust / Annual Report / September 30, 2009 | 31 |
Table of Contents
Statements of Changes in Net Assets ($ Thousands)
For the years ended September 30,
| International Fixed Income Fund | Emerging Markets Debt Fund | |||||||||||||||
| 2009 | 2008 | 2009 | 2008 | |||||||||||||
Operations: | ||||||||||||||||
Net Investment Income | $ | 15,209 | $ | 26,802 | $ | 56,900 | $ | 59,866 | ||||||||
Net Realized Gain (Loss) from Investments, Affiliated Investments, Futures Contracts, Written Options and Swap Contracts | (22,915 | ) | (3,078 | ) | (70,289 | ) | 5,401 | |||||||||
Net Realized Gain (Loss) on Forward Foreign Currency Contracts and Foreign Currency Transactions | 8,926 | (17,617 | ) | (6,197 | ) | 1,170 | ||||||||||
Net Change in Unrealized Appreciation (Depreciation) on Investments, Affiliated Investments, Futures Contracts, Written Options and Swap Contracts | 63,489 | (62,704 | ) | 113,567 | (123,294 | ) | ||||||||||
Net Change in Unrealized Appreciation (Depreciation) on Forward Foreign Currency Contracts, Foreign Currencies, and Translation of Other Assets and Liabilities Denominated in Foreign Currencies | (25,944 | ) | 35,566 | (993 | ) | 2,312 | ||||||||||
Net Increase (Decrease) in Net Assets Resulting from Operations | 38,765 | (21,031 | ) | 92,988 | (54,545 | ) | ||||||||||
Dividends and Distributions from: | ||||||||||||||||
Net Investment Income: | ||||||||||||||||
Class A | (57,885 | ) | (10,040 | ) | (60,833 | ) | (70,236 | ) | ||||||||
Net Realized Gains: | ||||||||||||||||
Class A | — | — | — | (28,377 | ) | |||||||||||
Total Dividends and Distributions | (57,885 | ) | (10,040 | ) | (60,833 | ) | (98,613 | ) | ||||||||
Capital Share Transactions: | ||||||||||||||||
Class A: | ||||||||||||||||
Proceeds from Shares Issued | 160,142 | 179,908 | 363,248 | 282,654 | ||||||||||||
Reinvestment of Dividends & Distributions | 55,164 | 9,540 | 55,708 | 93,090 | ||||||||||||
Cost of Shares Redeemed | (361,351 | ) | (263,795 | ) | (537,868 | ) | (347,834 | ) | ||||||||
Increase in Net Assets Derived from Capital Share Transactions | (146,045 | ) | (74,347 | ) | (118,912 | ) | 27,910 | |||||||||
Net Decrease in Net Assets | (165,165 | ) | (105,418 | ) | (86,757 | ) | (125,248 | ) | ||||||||
Net Assets: | ||||||||||||||||
Beginning of Year | 703,324 | 808,742 | 877,354 | 1,002,602 | ||||||||||||
End of Year | $ | 538,159 | $ | 703,324 | $ | 790,597 | $ | 877,354 | ||||||||
Undistributed (Distributions in excess of) Net Investment Income Included in Net Assets at End of Year | $ | (33,391 | ) | $ | 745 | $ | 187 | $ | 10,250 | |||||||
Share Transactions: | ||||||||||||||||
Class A: | ||||||||||||||||
Shares Issued | 16,650 | 16,595 | 43,772 | 27,097 | ||||||||||||
Reinvestment of Distributions | 6,009 | 882 | 6,654 | 8,865 | ||||||||||||
Shares Redeemed | (37,149 | ) | (24,385 | ) | (66,241 | ) | (33,787 | ) | ||||||||
Total Class A Transactions | (14,490 | ) | (6,908 | ) | (15,815 | ) | 2,175 | |||||||||
The accompanying notes are an integral part of the financial statements.
| 32 | SEI Institutional International Trust / Annual Report / September 30, 2009 |
Table of Contents
For the years ended September 30, (unless otherwise indicated)
For a Share Outstanding Throughout Each Year
| Net Asset Value, Beginning of Period | Net Investment Income (Loss)(1) | Net Realized and Unrealized Gains (Losses) on Securities(1) | Total from Operations | Dividends from Net Investment Income | Distributions from Realized Capital Gains | Total Dividends and Distributions | Net Asset Value, End of Period | Total Return† | Net Assets End of Period ($ Thousands) | Ratio of Expenses to Average Net Assets* | Ratio of Expenses to Average Net Assets (Excluding Fees Paid Indirectly)** | Ratio of Expenses to Average Net Assets (Excluding Waivers and Fees Paid Indirectly)** | Ratio of Net Investment Income (Loss) to Average Net Assets | Portfolio Turnover Rate† | ||||||||||||||||||||||||||||||||||||
International Equity Fund |
| |||||||||||||||||||||||||||||||||||||||||||||||||
Class A |
| |||||||||||||||||||||||||||||||||||||||||||||||||
2009 | $ | 8.85 | $ | 0.13 | $ | (0.94 | ) | $ | (0.81 | ) | $ | (0.16 | ) | $ | — | $ | (0.16 | ) | $ | 7.88 | (8.73 | )% | $ | 2,053,411 | 1.28 | %(2)(3) | 1.28 | %(2)(3) | 1.29 | % | 2.01 | % | 154 | % | ||||||||||||||||
2008 | 16.18 | 0.27 | (5.52 | ) | (5.25 | ) | (0.34 | ) | (1.74 | ) | (2.08 | ) | 8.85 | (36.96 | ) | 2,329,504 | 1.25 | (2)(3) | 1.26 | (2)(3) | 1.26 | (2) | 2.15 | 218 | ||||||||||||||||||||||||||
2007 | 14.07 | 0.28 | 2.89 | 3.17 | (0.47 | ) | (0.59 | ) | (1.06 | ) | 16.18 | 23.56 | 4,032,236 | 1.32 | (2)(3) | 1.33 | (2)(3) | 1.33 | (2) | 1.85 | 172 | |||||||||||||||||||||||||||||
2006 | 12.14 | 0.24 | 1.97 | 2.21 | (0.28 | ) | — | (0.28 | ) | 14.07 | 18.50 | 3,491,007 | 1.32 | (2) | 1.33 | (2) | 1.33 | (2) | 1.85 | 118 | ||||||||||||||||||||||||||||||
2005 | 9.81 | 0.16 | 2.40 | 2.56 | (0.23 | ) | — | (0.23 | ) | 12.14 | 26.33 | 3,227,258 | 1.24 | 1.24 | 1.24 | 1.50 | 80 | |||||||||||||||||||||||||||||||||
Class I |
| |||||||||||||||||||||||||||||||||||||||||||||||||
2009 | $ | 8.82 | $ | 0.13 | $ | (0.94 | ) | $ | (0.81 | ) | $ | (0.12 | ) | $ | — | $ | (0.12 | ) | $ | 7.89 | (8.80 | )% | $ | 8,397 | 1.53 | %(2)(3) | 1.53 | %(2)(3) | 1.54 | % | 1.97 | % | 154 | % | ||||||||||||||||
2008 | 16.13 | 0.22 | (5.49 | ) | (5.27 | ) | (0.30 | ) | (1.74 | ) | (2.04 | ) | 8.82 | (37.14 | ) | 6,538 | 1.50 | (2)(3) | 1.51 | (2)(3) | 1.51 | (2) | 1.72 | 218 | ||||||||||||||||||||||||||
2007 | 14.04 | 0.25 | 2.88 | 3.13 | (0.45 | ) | (0.59 | ) | (1.04 | ) | 16.13 | 23.25 | 17,155 | 1.57 | (2)(3) | 1.58 | (2)(3) | 1.58 | (2) | 1.66 | 172 | |||||||||||||||||||||||||||||
2006 | 12.12 | 0.23 | 1.94 | 2.17 | (0.25 | ) | — | (0.25 | ) | 14.04 | 18.20 | 13,401 | 1.59 | (2) | 1.59 | (2) | 1.59 | (2) | 1.77 | 118 | ||||||||||||||||||||||||||||||
2005 | 9.81 | 0.14 | 2.38 | 2.52 | (0.21 | ) | — | (0.21 | ) | 12.12 | 25.86 | 7,952 | 1.49 | 1.49 | 1.49 | 1.28 | 80 | |||||||||||||||||||||||||||||||||
Emerging Markets Equity Fund |
| |||||||||||||||||||||||||||||||||||||||||||||||||
Class A |
| |||||||||||||||||||||||||||||||||||||||||||||||||
2009 | $ | 11.43 | $ | 0.08 | $ | 0.18 | $ | 0.26 | $ | (0.10 | ) | $ | (1.95 | ) | $ | (2.05 | ) | $ | 9.64 | 16.40 | % | $ | 916,780 | 1.97 | %(4) | 1.97 | %(4) | 2.11 | % | 1.08 | % | 80 | % | |||||||||||||||||
2008 | 21.49 | 0.14 | (5.64 | ) | (5.50 | ) | (0.08 | ) | (4.48 | ) | (4.56 | ) | 11.43 | (33.33 | ) | 965,730 | 1.99 | (4) | 1.99 | (4) | 2.08 | 0.85 | 94 | |||||||||||||||||||||||||||
2007 | 16.67 | 0.08 | 7.22 | 7.30 | (0.08 | ) | (2.40 | ) | (2.48 | ) | 21.49 | 48.27 | 1,777,229 | 1.97 | (4) | 1.97 | (4) | 2.05 | 0.44 | 79 | ||||||||||||||||||||||||||||||
2006 | 15.94 | 0.11 | 2.32 | 2.43 | (0.10 | ) | (1.60 | ) | (1.70 | ) | 16.67 | 16.46 | 1,336,574 | 1.96 | 1.97 | 2.06 | 0.65 | 65 | ||||||||||||||||||||||||||||||||
2005 | 11.10 | 0.14 | 4.80 | 4.94 | (0.10 | ) | — | (0.10 | ) | 15.94 | 44.68 | 1,354,502 | 1.95 | 1.96 | 2.05 | 1.05 | 69 | |||||||||||||||||||||||||||||||||
International Fixed Income Fund |
| |||||||||||||||||||||||||||||||||||||||||||||||||
Class A |
| |||||||||||||||||||||||||||||||||||||||||||||||||
2009 | $ | 10.46 | $ | 0.28 | $ | 0.53 | $ | 0.81 | $ | (1.06 | ) | $ | — | $ | (1.06 | ) | $ | 10.21 | 8.85 | % | $ | 538,159 | 1.02 | %(5) | 1.02 | %(5) | 1.06 | % | 2.86 | % | 170 | % | ||||||||||||||||||
2008 | 10.91 | 0.37 | (0.68 | ) | (0.31 | ) | (0.14 | ) | — | (0.14 | ) | 10.46 | (2.89 | ) | 703,324 | 1.02 | (5) | 1.02 | (5) | 1.04 | 3.45 | 147 | ||||||||||||||||||||||||||||
2007 | 10.86 | 0.36 | (0.11 | ) | 0.25 | (0.20 | ) | — | (0.20 | ) | 10.91 | 2.34 | 808,742 | 1.02 | (5) | 1.02 | (5) | 1.04 | 3.29 | 215 | ||||||||||||||||||||||||||||||
2006 | 11.72 | 0.28 | (0.49 | ) | (0.21 | ) | (0.34 | ) | (0.31 | ) | (0.65 | ) | 10.86 | (1.64 | ) | 841,903 | 1.01 | 1.01 | 1.03 | 2.61 | 194 | |||||||||||||||||||||||||||||
2005 | 12.22 | 0.28 | 0.15 | 0.43 | (0.89 | ) | (0.04 | ) | (0.93 | ) | 11.72 | 3.01 | 880,923 | 1.00 | 1.00 | 1.04 | 2.24 | 145 | ||||||||||||||||||||||||||||||||
Emerging Markets Debt Fund |
| |||||||||||||||||||||||||||||||||||||||||||||||||
Class A |
| |||||||||||||||||||||||||||||||||||||||||||||||||
2009 | $ | 9.43 | $ | 0.71 | $ | 0.85 | $ | 1.56 | $ | (0.75 | ) | $ | — | $ | (0.75 | ) | $ | 10.24 | 18.62 | % | $ | 790,597 | 1.37 | %(6) | 1.37 | %(6) | 1.81 | % | 8.47 | % | 73 | % | ||||||||||||||||||
2008 | 11.04 | 0.62 | (1.18 | ) | (0.56 | ) | (0.74 | ) | (0.31 | ) | (1.05 | ) | 9.43 | (5.71 | ) | 877,354 | 1.37 | (6) | 1.37 | (6) | 1.79 | 5.94 | 83 | |||||||||||||||||||||||||||
2007 | 11.28 | 0.60 | 0.47 | 1.07 | (0.65 | ) | (0.66 | ) | (1.31 | ) | 11.04 | 10.03 | 1,002,602 | 1.37 | (6) | 1.37 | (6) | 1.79 | 5.47 | 81 | ||||||||||||||||||||||||||||||
2006 | 11.81 | 0.56 | 0.34 | 0.90 | (0.80 | ) | (0.63 | ) | (1.43 | ) | 11.28 | 8.68 | 828,343 | 1.36 | 1.36 | 1.78 | 5.03 | 108 | ||||||||||||||||||||||||||||||||
2005 | 10.74 | 0.66 | 1.31 | 1.97 | (0.63 | ) | (0.27 | ) | (0.90 | ) | 11.81 | 19.34 | 1,143,845 | 1.35 | 1.35 | 1.79 | 6.03 | 85 | ||||||||||||||||||||||||||||||||
| * | Includes Fees Paid Indirectly. See Note 5 in Notes to Financial Statements. |
| ** | See Note 5 in Notes to Financial Statements. |
| † | Returns and portfolio turnover rates are for the period indicated and have not been annualized. Returns do not reflect the deduction of taxes that a shareholder would pay on fund distributions or the redemption of fund shares. |
| (1) | Per share net investment income (loss) and net realized and unrealized gains/(losses) calculated using average shares. |
| (2) | The expense ratio includes interest expense on reverse repurchase agreements. Had this expense been excluded, the ratios for Class A and I shares would have been 1.28% and 1.53%, respectively, for 2009 and 2008, and 1.24% and 1.49%, respectively, for 2007 and 2006. |
| (3) | The expense ratio includes overdraft fees. Had this expense been excluded, the ratios for Class A and I shares would have been 1.28% and 1.53%, respectively for 2009, 1.25% and 1.50%, respectively for 2008 and 1.32% and 1.57%, respectively for 2007. |
| (4) | The expense ratio includes overdraft fees. Had this expense been excluded, the ratios would have been 1.96% for 2009, 2008 and 2007. |
| (5) | The expense ratio includes overdraft fees. Had this expense been excluded, the ratios would have been 1.01%, 1.02% and 1.01%, for 2009, 2008 and 2007, respectively. |
| (6) | The expense ratio includes overdraft fees. Had this expense been excluded, the ratios would have been 1.36% for 2009, 2008 and 2007. |
Amounts designated as “—” are either $0 or have been rounded to $0.
The accompanying notes are an integral part of the financial statements.
| SEI Institutional International Trust / Annual Report / September 30, 2009 | 33 |
Table of Contents
September 30, 2009
1. ORGANIZATION
SEI Institutional International Trust (the “Trust”) was organized as a Massachusetts business trust under a Declaration of Trust dated June 30, 1988. The operations of the Trust commenced on December 20, 1989.
The Trust is registered under the Investment Company Act of 1940, as amended, as an open-end investment company with five funds: the International Equity Fund, the Tax-Managed International Equity Fund, the Emerging Markets Equity Fund, the International Fixed Income Fund and the Emerging Markets Debt Fund (together the “Funds”). The Trust’s prospectuses provide a description of each Fund’s investment objectives, policies, and strategies. The Trust is registered to offer Class A shares of each of the Funds and the International Equity Fund is registered to offer Class I shares.
As of September 30, 2009, the Tax-Managed International Equity Fund had not yet commenced operations.
2. SIGNIFICANT ACCOUNTING POLICIES
The following is a summary of significant accounting policies consistently followed by the Funds.
Financial Accounting Standards Board (“FASB”) Launches Accounting Standards Codification — The FASB previously issued FASB ASC 105 (formerly FASB Statement No. 168), The “FASB Accounting Standards CodificationTM” and the Hierarchy of Generally Accepted Accounting Principles (“ASC 105”). ASC 105 established the FASB Accounting Standards CodificationTM (“Codification” or “ASC”) as the single source of authoritative U.S. generally accepted accounting principles (“GAAP”) recognized by the FASB to be applied by nongovernmental entities. Rules and interpretive releases of the Securities and Exchange Commission (“SEC”) under authority of federal securities laws are also sources of authoritative GAAP for SEC registrants. The Codification supersedes all existing non-SEC accounting and reporting standards. All other non-grandfathered, non-SEC accounting literature not included in the Codification have become non-authoritative.
Following the Codification, the FASB will not issue new standards in the form of Statements, FASB Staff Positions or Emerging Issues Task Force Abstracts. Instead, it will issue Accounting Standards Updates, which will serve to update the Codification, provide background information about the guidance and provide the basis for conclusions on the changes to the Codification.
GAAP was not intended to be changed as a result of the FASB’s Codification project, but it has changed the way the guidance is organized and presented. As a result, these changes have had an impact on how companies reference GAAP in their financial statements and in their accounting policies for financial statements issued for interim and annual periods ending after September 15, 2009. The Trust has implemented the Codification as of September 30, 2009.
Use of Estimates — The preparation of financial statements, in conformity with U.S. generally accepted accounting principles, requires
management to make estimates and assumptions that affect the reported amounts of assets and liabilities and disclosure of contingent assets and liabilities at the date of the financial statements, and the reported amounts of increases and decreases in net assets from operations during the reporting period. Actual results could differ from those estimates.
Security Valuation — Securities listed on a securities exchange, market or automated quotation system for which quotations are readily available are valued at the last quoted sale price on the primary exchange or market (foreign or domestic) on which they are traded, or, if there is no such reported sale, at the most recent quoted bid price. Debt securities are priced based upon valuations provided by independent, third-party pricing agents, if available. Such values generally reflect the last reported sales price if the security is actively traded. The third-party pricing agents may also value debt securities at an evaluated bid price by employing methodologies that utilize actual market transactions, broker-supplied valuations, or other methodologies designed to identify the market value for such securities. Debt obligations with remaining maturities of sixty days or less may be valued at their amortized cost, which approximates market value. The prices for foreign securities are reported in local currency and converted to U.S. dollars using currency exchange rates. Prices for most securities held in the Funds are provided daily by recognized independent pricing agents. If a security price cannot be obtained from an independent, third-party pricing agent, the Funds seek to obtain a bid price from at least one independent broker.
Securities for which market prices are not “readily available” are valued in accordance with Fair Value Procedures established by the Trust’s Board of Trustees (the “Board”). The Trust’s Fair Value Procedures are implemented through a Fair Value Committee (the “Committee”) designated by the Board. Some of the more common reasons that may necessitate that a security be valued using Fair Value Procedures include: the security’s trading has been halted or suspended; the security has been de-listed from a national exchange; the security’s primary trading market is temporarily closed at a time when, under normal conditions, it would be open; or the security’s primary pricing source is not able or willing to provide a price. When a security is valued in accordance with the Fair Value Procedures, the Committee will determine the value after taking into consideration relevant information reasonably available to the Committee.
For securities that principally trade on a foreign market or exchange, a significant gap in time can exist between the time of a particular security’s last trade and the time at which a Fund calculates its net asset value. The closing prices of such securities may no longer reflect their market value at the time the Fund calculates net asset value if an event that could materially affect the value of those securities (a “Significant Event”) has occurred between the time of the security’s last close and the time that the Fund calculates net asset value. A Significant Event may relate to a single issuer or to an entire market sector. If the adviser or sub-adviser of a Fund becomes aware of a
| 34 | SEI Institutional International Trust / Annual Report / September 30, 2009 |
Table of Contents
Significant Event that has occurred with respect to a security or group of securities after the closing of the exchange or market on which the security or securities principally trade, but before the time at which the Fund calculates net asset value, it may request that a Committee Meeting be called. In addition, the Fund’s administrator monitors price movements among certain selected indices, securities and/or baskets of securities that may be an indicator that the closing prices received earlier from foreign exchanges or markets may not reflect market value at the time the Fund calculates net asset value. If price movements in a monitored index or security exceed levels established by the administrator, the administrator notifies the adviser or sub-adviser for any Fund holding the relevant securities that such limits have been exceeded. In such event, the adviser or sub-adviser makes the determination whether a Committee Meeting should be called based on the information provided.
The International Equity Fund and Emerging Markets Equity Fund also use a third-party fair valuation vendor. The vendor provides a fair value for foreign securities held by these Funds based on certain factors and methodologies (involving, generally, tracking valuation correlations between the U.S. market and each non-U.S. security). Values from the fair value vendor are applied in the event that there is a movement in the U.S. market that exceeds a specific threshold that has been established by the Committee. The Committee has also established a “confidence interval” which is used to determine the level of historical correlation between the value of a specific foreign security and movements in the U.S. market before a particular security will be fair valued when the threshold is exceeded. In the event that the threshold established by the Committee is exceeded on a specific day, the International Equity Fund and Emerging Markets Equity Fund will value the non-U.S. securities in their portfolios that exceed the applicable “confidence interval” based upon the adjusted prices provided by the fair valuation vendor.
In accordance with U.S. generally accepted accounting principles, Fair Value is defined as the price that the Fund would receive upon selling an investment in a timely transaction to an independent buyer in the principal or most advantageous market of the investment. A three-tier hierarchy has been established to maximize the use of the observable market data and minimize the use of unobservable inputs and to establish classification of the fair value measurements for disclosure purposes. Inputs refer broadly to the assumptions that market participants would use in pricing an asset. Inputs may be observable or unobservable. Observable inputs are inputs that reflect the assumptions market participants would use in pricing the asset or liability developed based on market data obtained from sources independent of the reporting entity. Unobservable inputs are inputs that reflect the reporting entity’s own assumptions about the assumptions market participants would use in pricing the asset or liability developed based on the best information available in the circumstances.
The three-tier hierarchy of inputs is summarized in the three broad Levels listed below:
Level 1 — quoted prices in active markets for identical investments
Level 2 — other significant observable inputs (including quoted prices for similar investments, interest rates, prepayment speeds, credit risks, etc.)
Level 3 — significant unobservable inputs (including the Fund’s own assumptions in determining the fair value of investments)
The valuation techniques used by the Funds to measure fair value during the year ended September 30, 2009 maximized the use of observable inputs and minimized the use of unobservable inputs. For the year ended September 30, 2009, there have been no significant changes to the inputs or the Trust’s fair valuation methodologies.
Reverse Repurchase Agreements — The International Equity and Emerging Markets Equity Funds may issue reverse repurchase agreements. A reverse repurchase agreement involves the sale of portfolio assets together with an agreement to repurchase the same assets later at a fixed price. Additional assets are maintained in an account with the broker. The segregated assets may consist of cash, U.S. Government securities, or other liquid securities at least equal in value to the obligations under the reverse repurchase agreements. In the event the buyer of securities under a reverse repurchase agreement files for bankruptcy or becomes insolvent, the Fund’s use of the proceeds under the agreement may be restricted pending a determination by the other party, or its trustee or receiver, whether to enforce the obligation to repurchase the securities. During the year ended September 30, 2009, the International Equity Fund entered into reverse repurchase agreements that had an average daily balance outstanding of $3,195,246, with an average interest rate of 1.64% and paid interest of $51,785. At September 30, 2009, there were no open reverse repurchase agreements.
Foreign Currency Translation — The books and records of the Funds investing in international securities are maintained in U.S. dollars on the following basis:
(I) market value of investment securities, assets and liabilities at the current rate of exchange; and
(II) purchases and sales of investment securities, income and expenses at the relevant rates of exchange prevailing on the respective dates of such transactions.
The Funds do not isolate that portion of gains and losses on investments in equity securities that is due to changes in the foreign exchange rates from that which is due to changes in market prices of equity securities.
The Funds report certain foreign-currency-related transactions as components of realized gains for financial reporting purposes, whereas such components are treated as ordinary income for Federal income tax purposes.
Forward Foreign Currency Contracts — A Fund may enter into forward foreign currency contracts as hedges against either specific transactions, fund positions or anticipated fund positions. All commitments are “marked-to-market” daily at the applicable foreign exchange rate, and any resulting unrealized gains or losses are recorded currently. The Fund realizes gains and losses at the time
| SEI Institutional International Trust / Annual Report / September 30, 2009 | 35 |
Table of Contents
Notes to Financial Statements (Continued)
September 30, 2009
forward contracts are extinguished. Unrealized gains or losses on outstanding positions in forward foreign currency contracts held at the close of the year are recognized as ordinary income or loss for federal income tax purposes. The Fund could be exposed to risk if the counterparties to the contracts are unable to meet the terms of the contract and from unanticipated movements in the value of a foreign currency relative to the U.S. dollar.
Finally, the risk exists that losses could exceed amounts disclosed on the Statement of Assets and Liabilities.
Futures Contracts — The International Equity Fund, the International Fixed Income Fund and the Emerging Markets Debt Fund utilized futures contracts during the year ended September 30, 2009. The Funds may purchase future contracts to gain exposure to market changes, which may be more efficient or cost effective than actually buying the securities. The Funds utilize futures contracts for tactical hedging purposes as well as to enhance the Funds’ returns. Upon entering into such a contract, a Fund is required to deposit and maintain as collateral such initial margin as required by the exchange on which the contract is held. The contracts are marked to market daily and the resulting changes in value are accounted for as unrealized gains and losses. Variation margin payments are paid or received, depending upon whether unrealized losses or gains are incurred. When the contract is closed, the Funds record a realized gain or loss equal to the difference between the proceeds from (or cost of) the closing transaction and the amount invested in the contract.
Risks of entering into futures contracts include the possibility that there will be an imperfect price correlation between the futures and the underlying securities. Second, it is possible that a lack of liquidity for futures contracts could exist in the secondary market, resulting in an inability to close a position prior to its maturity date. Third, the futures contract involves the risk that a Fund could lose more than the original margin deposit required to initiate a futures transaction.
Finally, the risk exists that losses could exceed amounts disclosed on the Statement of Assets and Liabilities.
Equity-Linked Warrants — The International Equity and Emerging Markets Equity Funds each may invest in equity-linked warrants. These Funds purchase the equity-linked warrants from a broker, who in turn purchases shares in the local market and issues a call warrant hedged on the underlying holding. If the Fund exercises its call and closes its position, the shares are sold and the warrant redeemed with the proceeds. Each warrant represents one share of the underlying stocks, therefore the price, performance and liquidity of the warrant are all directly linked to the underlying stock. The warrants can be redeemed for 100% of the value of the underlying stock, less transaction costs. In addition to the market risk of the underlying holding, these Funds bear additional counterparty risk to the issuing broker. There is currently no active trading market for equity-linked warrants.
Swap Agreements — A Fund’s investments in swap contracts is mainly used as an efficient means to take and manage risk in the portfolio, including interest rate risk, credit risk and overall yield sensitivity. A swap agreement is a two-party contract under which an agreement is
made to exchange returns from predetermined investments or instruments, including a particular interest rate, foreign currency, or “basket” of securities representing a particular index. Credit default swaps involve the periodic payment by a Fund or counterparty of interest based on a specified rate multiplied by a notional amount assigned to an underlying debt instrument or group of debt instruments in exchange for the assumption of credit risk on the same instruments. In the event of a credit event, usually in the form of a credit rating downgrade, the party receiving periodic payments (i.e. floating rate payer) must pay the other party (i.e. fixed rate payer) an amount equal to the outstanding principal of the downgraded debt instrument. Total return swaps allow an investor to benefit from the cash flow without ever actually owning the underlying security. The receiver must pay any decline in value to the payer at the end of the total return swap. However, the investor does not need to make a payment if there is no decline in price. Payments can be made on various indices, bonds (i.e. mortgage backed securities, bank debt and corporate), loans or commodities. The value of a total return swap is equal to the change in value of the underlying asset versus the accrued income payment based on LIBOR (London Interbank Offered Rate) or some other form of index on the notional amount. Interest rate swaps involve the exchange by a Fund with another party of their respective commitments to pay or receive interest (e.g., an exchange of floating rate payments for fixed rate payments) with respect to a notional amount of principal to manage a Fund’s exposure to interest rates. Payments received or made are recorded as realized gains or losses. A Fund could be exposed to credit or market risk due to unfavorable changes in the fluctuation of interest rates or if the counterparty defaults on its obligation to perform. Risk of loss may exceed amounts recognized on the statement of assets and liabilities. In connection with swap agreements, securities/cash may be set aside as collateral by the Fund’s custodian. A Fund may enter into swap agreements in order to, among other things, change the maturity or duration of the investment portfolio; protect a Fund’s value from changes in interest rates; or expose a Fund to a different security or market.
Swaps are marked-to-market daily based upon quotations from market makers and the resulting changes in market values, if any, are recorded as unrealized gains or losses in the Statement of Operations. Net payments of interest are recorded as realized gains or losses. Entering into swap agreements involves, to varying degrees, elements of credit and market risk in excess of the amounts recognized on the Schedule of Investments or the Statement of Assets and Liabilities. Such risks involve the possibility that there will be no liquid market for these agreements, that the counterparty to the agreement may default on its obligation to perform and that there may be unfavorable changes in the fluctuation of interest rates. Risks also arise from potential losses from adverse market movements.
Counterparty risk is mitigated by having a master netting arrangement between a Fund and the counterparty and by having the counterparty post collateral to cover a Fund’s exposure to the counterparty. In connection with outstanding credit-default swaps as of September 30, 2009, the Emerging Markets Debt Fund has deposits in the amount of $7,414,292 with the counterparty as collateral.
| 36 | SEI Institutional International Trust / Annual Report / September 30, 2009 |
Table of Contents
Options Written/Purchased — A Fund may invest in financial options contracts to add return or to hedge their existing portfolio securities, or securities that the Fund intends to purchase, against fluctuations in fair value caused by changes in prevailing market interest rates. When the Fund writes or purchases an option, an amount equal to the premium received or paid by the Fund is recorded as a liability or an asset and is subsequently adjusted to the current market value of the option written or purchased. Premiums received or paid from purchasing or writing options which expire unexercised are treated by the Fund on the expiration date as realized gains or losses. The difference between the premium and the amount paid or received on effecting a closing purchase or sale transaction, including brokerage commissions, is also treated as a realized gain or loss. If an option is exercised, the premium paid or received is added to the cost of the purchase or proceeds from the sale in determining whether the Fund has realized a gain or a loss.
The risk in writing a call option is that the Fund gives up the opportunity for profit if the market price of the security increases. The risk in writing a put option is that the Fund may incur a loss if the market price of the security decreases and the option is exercised. The risk in purchasing an option is that the Fund pays a premium whether or not the option is exercised. The Fund also has the additional risk of being unable to enter into a closing transaction at an acceptable price if a liquid secondary market does not exist. Option contracts also involve the risk that they may not work as intended due to unanticipated developments in market conditions or other causes.
Finally, the risk exists that losses could exceed amounts disclosed on the Statement of Assets and Liabilities.
Delayed Delivery Transactions — A Fund may purchase or sell securities on a when-issued or delayed delivery basis. These transactions involve a commitment by the Fund to purchase or sell securities for a predetermined price or yield, with payment and delivery taking place beyond the customary settlement period. When delayed delivery purchases are outstanding, the Fund will set aside liquid assets in an amount sufficient to meet the purchase price. When purchasing a security on a delayed delivery basis, the Fund assumes the rights and risks of ownership of the security, including the risk of price and yield fluctuations, and takes such fluctuations into account when determining its net asset value. The Fund may dispose of or renegotiate a delayed delivery transaction after it is entered into, and may sell when-issued securities before they are delivered, which may result in a capital gain or loss. When the Fund has sold a security on a delayed delivery basis, the Fund does not participate in future gains and losses with respect to the security.
Loan Participations and Brady Bonds — The Emerging Markets Debt Fund invests in U.S. dollar-denominated fixed- and floating-rate loans (“Loans”) arranged through private negotiations between a foreign sovereign entity and one or more financial institutions (“Lenders”). The Fund invests in such Loans in the form of participations in Loans
(“Participations”) or assignments of all or a portion of Loans from third parties. Participations typically result in this Fund having a contractual relationship only with the Lenders, not with the sovereign borrowers. This Fund has the right to receive payments of principal, interest and any fees to which it is entitled from the Lender selling the Participation and only upon receipt by the Lender of the payments from the borrower. In connection with purchasing Participations, the Fund generally has no right to enforce compliance by the borrower with the terms of the loan agreement relating to the Loan, nor any rights of set-off against the borrower, and the Fund will not benefit directly from any collateral supporting the Loan in which it has purchased the Participation. As a result, the Fund assumes the credit risk of both the borrower and the Lender that is selling the Participation.
Certain debt obligations, customarily referred to as “Brady Bonds,” are created through the exchange of existing commercial bank loans to foreign entities for new obligations in connection with debt restructuring under a plan introduced by former U.S. Secretary of the Treasury Nicholas F. Brady. Brady Bonds have only been issued since 1989, and, accordingly, do not have a long payment history. They are issued by governments that may have previously defaulted on the loans being restructured by the Brady Bonds, so they are subject to the risk of default by the issuer. They may be fully or partially collateralized or uncollateralized and issued in various currencies.
Illiquid Securities — A security is considered illiquid if it cannot be sold or disposed of in the ordinary course of business within seven days or less for its approximate carrying value on the books of the Funds. Valuations of illiquid securities may differ significantly from the values that would have been used had an active market value for these securities existed.
Classes — Class-specific expenses are borne by that class. Income, non-class specific expenses, and realized and unrealized gains/losses are allocated to the respective classes on the basis of relative daily net assets.
Expenses — Expenses that are directly related to one of the Funds are charged directly to that Fund. Other operating expenses of the Trust are prorated to the Funds on the basis of relative daily net assets.
Dividends and Distributions to Shareholders — The International Equity, Emerging Markets Equity and International Fixed Income Funds will distribute substantially all of their net investment income and all net realized capital gains, if any, at least annually. The Emerging Markets Debt Fund will distribute substantially all of its net investment income, if any, at least quarterly and all net realized gains, if any, at least annually. All dividends and distributions are recorded on ex-dividend date.
Security Transactions and Investment Income — Security transactions are recorded on the trade date. Cost used in determining net realized capital gains and losses on the sale of securities is determined on the basis of specific identification. Dividend income and expense is
| SEI Institutional International Trust / Annual Report / September 30, 2009 | 37 |
Table of Contents
Notes to Financial Statements (Continued)
September 30, 2009
recognized on the ex-dividend date, and interest income or expense is recognized using the accrual basis of accounting.
Amortization and accretion is calculated using the scientific interest method, which approximates the effective interest method over the holding period of the security. Amortization of premiums and discounts is included in interest income.
Investments in Real Estate Investment Trusts (“REITs”) — Dividend income is recorded based on the income included in distributions received from the REIT investments using published REIT reclassifications including some management estimates when actual amounts are not available. Distributions received in excess of this estimated amount are recorded as a reduction of the cost of investments or reclassified to capital gains. The actual amounts of income, return of capital, and capital gains are only determined by each REIT after its fiscal year-end, and may differ from the estimated amounts.
3. CREDIT DERIVATIVES
A Fund enters into credit default swaps to simulate long and short bond positions that are either unavailable or considered to be less attractively priced in the bond market. A Fund uses these swaps to reduce risk where a Fund has exposure to the issuer, or to take an active long or short position with respect to the likelihood of an event of default. The reference obligation of the swap can be a single issuer, a “basket” of issuers, or an index. The underlying referenced assets are corporate debt, sovereign debt and asset backed securities.
The buyer of a credit default swap is generally obligated to pay the seller a periodic stream of payments over the term of the contract in return for a contingent payment upon the occurrence of a credit event with respect to an underlying reference obligation. Generally, a credit event for corporate or sovereign reference obligations means bankruptcy, failure to pay, obligation acceleration, repudiation/moratorium or restructuring. For credit default swaps on asset-backed securities, a
credit event may be triggered by events such as failure to pay principal, maturity extension, rating downgrade or write-down.
If a Fund is a seller of protection, and a credit event occurs, as defined under the terms of that particular swap agreement, a Fund will generally either (i) pay to the buyer an amount equal to the notional amount of the swap and take delivery of the referenced obligation, other deliverable obligations, or underlying securities comprising a referenced index or (ii) pay a net settlement amount in the form of cash or securities equal to the notional amount of the swap less the recovery value of the referenced obligation or underlying securities comprising a referenced index.
If a Fund is a buyer of protection and a credit event occurs, as defined under the terms of that particular swap agreement, a Fund will either (i) receive from the seller of protection an amount equal to the notional amount of the swap and deliver the referenced obligation, other deliverable obligations or underlying securities comprising the referenced index or (ii) receive a net settlement amount in the form of cash or securities equal to the notional amount of the swap less the recovery value of the referenced obligation or underlying securities comprising the referenced index. Recovery values are assumed by market makers considering either industry standard recovery rates or entity specific factors and considerations until a credit event occurs. If a credit event has occurred, the recovery value is determined by a facilitated auction whereby a minimum number of allowable broker bids, together with a specified valuation method, are used to calculate the settlement value.
Certain Funds are party to International Swap Dealers Association, Inc. Master Agreements (“ISDA Master Agreements”). These agreements are with select counterparties and they govern transactions, including certain over-the counter derivative and foreign exchange contracts, entered into by the Trust on behalf of a Fund and the counterparty.
As of September 30, 2009, the International Fixed Income and the Emerging Markets Debt Funds are the buyers (“receiving protection”) on a total notional amount of $6.2 million and $0.0 million, respectively and are the sellers (“providing protection”) on a total notional amount of $7.4 million and $4.9 million, respectively. The notional amounts of the swaps are not recorded in the financial statements. The notional amount does approximate the maximum potential amount of future payments that the Funds could be required to make if the Funds were the sellers of protection and a credit event were to occur. Those credit default swaps (“CDS”) for which the Funds are providing protection at balance sheet date are summarized as follows:
| INTERNATIONAL FIXED INCOME FUND WRITTEN CREDIT DERIVATIVE CONTRACTS | SINGLE NAME CDS | CDS ON AN INDEX | |||||||||||||
| REFERENCE ASSET | CORP US$ | SOVEREIGN US$ | ABS US$ | CORP US$ | Total | ||||||||||
Fair value of written credit derivatives | $ | 43,629 | $ | — | $ | — | $ | 106,860 | $ | 150,489 | |||||
Maximum potential amount of future payments | $ | 350,000 | $ | — | $ | — | $ | 7,016,210 | $ | 7,366,210 | |||||
Recourse provisions with third parties to recover any amounts paid under the credit derivative (including any purchased credit protection)1 | $ | — | $ | — | $ | — | $ | — | $ | — | |||||
Collateral held by the Fund or other third parties which the Fund can obtain upon occurrence of a triggering event | $ | — | $ | — | $ | — | $ | 50,820 | $ | 50,820 | |||||
| 1 | Potential recoveries would include purchased credit derivatives to the extent they offset written credit derivatives which have an identical underlying, or a netting arrangement or credit support annex with the counterparty. There may be other potential recoveries from recourse provisions where agreements cover multiple derivative arrangements but those amounts have not been included. |
| 38 | SEI Institutional International Trust / Annual Report / September 30, 2009 |
Table of Contents
| MAXIMUM POTENTIAL AMOUNT OF FUTURE PAYMENTS BY CONTRACT TERM | ||||||||||||||||||
| INTERNATIONAL FIXED INCOME FUND | 0-6 MONTHS | 6-12 MONTHS | 1-5 YEARS | 5-10 YEARS | > 10 YEARS | Total | ||||||||||||
Current credit spread* on underlying (in basis points)1 | ||||||||||||||||||
0-100 | $ | — | $ | — | $ | — | $ | — | $ | — | $ | — | ||||||
101-250 | $ | — | $ | — | $ | 350,000 | $ | — | $ | — | $ | 350,000 | ||||||
251-500 | $ | — | $ | — | $ | — | $ | — | $ | — | $ | — | ||||||
501-1,000 | $ | — | $ | — | $ | 7,016,210 | $ | — | $ | — | $ | 7,016,210 | ||||||
> than 1,000 | $ | — | $ | — | $ | — | $ | — | $ | — | $ | — | ||||||
Total | $ | — | $ | — | $ | 7,366,210 | $ | — | $ | — | $ | 7,366,210 | ||||||
| * | The credit spread on the underlying asset is generally indicative of the current status of the underlying risk of the Fund having to perform. The spread also reflects the cost of buying/selling protection and may include upfront payments required to be made to enter into a contract. Higher credit spreads with a shorter contract term is indicative of a higher likelihood of performance by the Fund. |
The credit spread disclosed above for each reference obligation where the Fund is the seller of protection is a representation of the current payment/performance risk of the swap
| EMERGING MARKETS DEBT FUND WRITTEN CREDIT DERIVATIVE CONTRACTS | SINGLE NAME CDS | CDS ON AN INDEX | |||||||||||||||
| REFERENCE ASSET | CORP US$ | SOVEREIGN US$ | ABS US$ | CORP US$ | Total | ||||||||||||
Fair value of written credit derivatives | $ | — | $ | (549,351 | ) | $ | — | $ | — | $ | (549,351 | ) | |||||
Maximum potential amount of future payments | $ | — | $ | 4,900,000 | $ | — | $ | — | $ | 4,900,000 | |||||||
Recourse provisions with third parties to recover any amounts paid under the credit derivative (including any purchased credit protection)1 | $ | — | $ | — | $ | — | $ | — | $ | — | |||||||
Collateral held by the Fund or other third parties which the Fund can obtain upon occurrence of a triggering event | $ | — | $ | 4,350,000 | $ | — | $ | — | $ | 4,350,000 | |||||||
| 1 | Potential recoveries would include purchased credit derivatives to the extent they offset written credit derivatives which have an identical underlying, or a netting arrangement or credit support annex with the counterparty. There may be other potential recoveries from recourse provisions where agreements cover multiple derivative arrangements but those amounts have not been included. |
| MAXIMUM POTENTIAL AMOUNT OF FUTURE PAYMENTS BY CONTRACT TERM | ||||||||||||||||||
| EMERGING MARKETS DEBT FUND | 0-6 MONTHS | 6-12 MONTHS | 1-5 YEARS | 5-10 YEARS | > 10 YEARS | Total | ||||||||||||
Current credit spread* on underlying (in basis points)1 | ||||||||||||||||||
0-500 | $ | 550,000 | $ | — | $ | — | $ | — | $ | — | $ | 550,000 | ||||||
501-8,000 | $ | — | $ | — | $ | — | $ | — | $ | — | $ | — | ||||||
8,001-9,000 | $ | — | $ | — | $ | 750,000 | $ | — | $ | — | $ | 750,000 | ||||||
9,001-10,000 | $ | 3,600,000 | $ | — | $ | — | $ | — | $ | — | $ | 3,600,000 | ||||||
> than 10,000 | $ | — | $ | — | $ | — | $ | — | $ | — | $ | — | ||||||
Total | $ | 4,150,000 | $ | — | $ | 750,000 | $ | — | $ | — | $ | 4,900,000 | ||||||
| * | The credit spread on the underlying asset is generally indicative of the current status of the underlying risk of the Fund having to perform. The spread also reflects the cost of buying/selling protection and may include upfront payments required to be made to enter into a contract. Higher credit spreads with a shorter contract term is indicative of a higher likelihood of performance by the Fund. |
4. DERIVATIVE TRANSACTIONS
The fair value of derivative instruments as of September 30, 2009 was as follows:
| Asset Derivatives | Liability Derivatives | |||||||||||
| Year ended September 30, 2009 ($ Thousands) | Year ended September 30, 2009 ($ Thousands) | |||||||||||
| Contract Type | Statements of Assets & Liabilities Location | Fair Value | Statements of Assets & Liabilities Location | Fair Value | ||||||||
Derivatives not accounted for as hedging instruments: |
| |||||||||||
| International Equity Fund | ||||||||||||
Interest rate contracts | Net Assets — Unrealized appreciation on futures contracts | $ | — | * | Net Assets — Unrealized depreciation on futures contracts | $ | 33 | * | ||||
Foreign exchange contracts | Unrealized gain on forward foreign currency contracts | 5,373 | Unrealized loss on forward foreign currency contracts | 5,983 | ||||||||
Credit contracts | Net Assets — Unrealized appreciation on swap contracts | 1,841 | Net Assets — Unrealized depreciation on swap contracts | — | ||||||||
Equity contracts | Net Assets — Unrealized appreciation on futures contracts | 1,374 | * | Net Assets — Unrealized depreciation on futures contracts | 1,118 | * | ||||||
Net Assets — Unrealized appreciation on swap contracts | — | Net Assets — Unrealized depreciation on swap contracts | 1,341 | |||||||||
Total Derivatives not accounted for as hedging instruments | $ | 8,588 | $ | 8,475 | ||||||||
| SEI Institutional International Trust / Annual Report / September 30, 2009 | 39 |
Table of Contents
Notes to Financial Statements (Continued)
September 30, 2009
| Asset Derivatives | Liability Derivatives | |||||||||||
| Year ended September 30, 2009 ($ Thousands) | Year ended September 30, 2009 ($ Thousands) | |||||||||||
| Contract Type | Statements of Assets & Liabilities Location | Fair Value | Statements of Assets & Liabilities Location | Fair Value | ||||||||
| International Fixed Income Fund | ||||||||||||
Interest rate contracts | Net Assets — Unrealized appreciation on futures contracts | $ | 268 | * | Net Assets — Unrealized depreciation on futures contracts | $ | 865 | * | ||||
Net Assets — Unrealized appreciation on swap contracts | 2,258 | Net Assets — Unrealized depreciation on swap contracts | 954 | |||||||||
Foreign exchange contracts | Unrealized gain on forward foreign currency contracts | 3,031 | Unrealized loss on forward foreign currency contracts | 8,248 | ||||||||
Credit contracts | Net Assets — Unrealized appreciation on swap contracts | 201 | Net Assets — Unrealized depreciation on swap contracts | 56 | ||||||||
Total Derivatives not accounted for as hedging instruments | $ | 5,758 | $ | 10,123 | ||||||||
| Emerging Markets Debt Fund | ||||||||||||
Interest rate contracts | Net Assets — Unrealized appreciation on futures contracts | $ | 54 | * | Net Assets — Unrealized depreciation on futures contracts | $ | — | * | ||||
Foreign exchange contracts | Unrealized gain on forward foreign currency contracts | 1,071 | Unrealized loss on forward foreign currency contracts | 379 | ||||||||
Credit contracts | Net Assets — Unrealized appreciation on swap contracts | 37 | Net Assets — Unrealized depreciation on swap contracts | 1,324 | ||||||||
Total Derivatives not accounted for as hedging instruments | $ | 1,162 | $ | 1,703 | ||||||||
| * | Includes cumulative appreciation/depreciation of futures contracts as reported in the Schedules of Investments. Only current day’s variation margin is reported within the Statements of Assets & Liabilities. |
| † | Includes cumulative appreciation/depreciation of swap contracts as reported in the Schedules of Investments. Market Value is reported within the Statements of Assets & Liabilities for swap contracts that have paid premiums. |
The effect of derivative instruments on the Statements of Operations for the year ended September 30, 2009 is as follows:
Amount of realized Gain or (Loss) on Derivatives Recognized in Income ($ Thousands):
| Derivatives Not Accounted for as Hedging Instruments | Options | Futures | Forward Currency Contracts | Swaps | Total | ||||||||||
| International Equity Fund | |||||||||||||||
Interest rate contracts | $ | — | $ | (1,381) | $ | — | $ | — | $ | (1,381) | |||||
Foreign exchange contracts | — | — | (14,888) | — | (14,888) | ||||||||||
Credit contracts | — | — | — | (58,078) | (58,078) | ||||||||||
Equity contracts | — | (53,944) | — | (11,136) | (65,080) | ||||||||||
Total | $ | — | $ | (55,325) | $ | (14,888) | $ | (69,214) | $ | (139,427) | |||||
| International Fixed Income Fund | |||||||||||||||
Interest rate contracts | $ | — | $ | 942 | $ | — | $ | (355) | $ | 587 | |||||
Foreign exchange contracts | 91 | — | 9,227 | — | 9,318 | ||||||||||
Credit contracts | — | — | — | (582) | (582) | ||||||||||
Total | $ | 91 | $ | 942 | $ | 9,227 | $ | (937) | $ | 9,323 | |||||
| Emerging Markets Debt Fund | |||||||||||||||
Interest rate contracts | $ | 361 | $ | 1,054 | $ | — | $ | (446) | $ | 969 | |||||
Foreign exchange contracts | — | — | 5,258 | — | 5,258 | ||||||||||
Credit contracts | — | — | — | 3,698 | 3,698 | ||||||||||
Total | $ | 361 | $ | 1,054 | $ | 5,258 | $ | 3,252 | $ | 9,925 | |||||
Change in Unrealized Appreciation or (Depreciation) on Derivatives Recognized in Income ($ Thousands):
| Derivatives Not Accounted for as Hedging Instruments | Options | Futures | Forward Currency Contracts | Swaps | Total | ||||||||||
| International Equity Fund | |||||||||||||||
Interest rate contracts | $ | — | $ | (1,402) | $ | — | $ | — | $ | (1,402) | |||||
Foreign exchange contracts | — | — | 12,428 | — | 12,428 | ||||||||||
Credit contracts | — | — | — | 9,259 | 9,259 | ||||||||||
Equity contracts | — | 7,826 | — | 11,208 | 19,034 | ||||||||||
Total | $ | — | $ | 6,424 | $ | 12,428 | $ | 20,467 | $ | 39,319 | |||||
| International Fixed Income Fund | |||||||||||||||
Interest rate contracts | $ | — | $ | (1,454) | $ | — | $ | 1,398 | $ | (56) | |||||
Foreign exchange contracts | (23) | — | (26,102) | — | (26,125) | ||||||||||
Credit contracts | — | — | — | 126 | 126 | ||||||||||
Total | $ | (23) | $ | (1,454) | $ | (26,102) | $ | 1,524 | $ | (26,055) | |||||
| 40 | SEI Institutional International Trust / Annual Report / September 30, 2009 |
Table of Contents
| Derivatives Not Accounted for as Hedging Instruments | Options | Futures | Forward Currency Contracts | Swaps | Total | |||||||||||
| Emerging Markets Debt Fund | ||||||||||||||||
Interest rate contracts | $ | (150 | ) | $ | 33 | $ | — | $ | (948) | $ | (1,065) | |||||
Foreign exchange contracts | 155 | — | (1,454) | — | (1,299) | |||||||||||
Credit contracts | — | — | — | (3,070) | (3,070) | |||||||||||
Total | $ | 5 | $ | 33 | $ | (1,454) | $ | (4,018) | $ | (5,434) | ||||||
The ISDA Master Agreements maintain provisions for general obligations, representations, agreements, collateral, and events of default or termination. The occurrence of a specified event of termination may give a counterparty the right to terminate all of its contracts and affect settlement of all outstanding transactions under the applicable ISDA Master Agreement.
Written options transactions for the year ended September 30, 2009 are summarized as follows:
| Emerging Markets Debt Fund | |||||||
| Number of Contracts | Premium Received ($ Thousands) | ||||||
| Balance at the beginning of year | 40,669,200 | $ | 266 | ||||
| Written | — | — | |||||
| Expired | (40,669,200 | ) | (266 | ) | |||
| Closing buys | — | — | |||||
| Balance at the end of year | — | $ | — | ||||
5. ADMINISTRATION, INVESTMENT ADVISORY AND DISTRIBUTION AGREEMENTS AND OTHER TRANSACTIONS WITH AFFILIATES
Administration & Transfer Agency Agreement — The Trust and SEI Investments Global Funds Services (the “Administrator”) are parties to an amended and restated Administration and Transfer Agency Agreement dated December 10, 2003 under which the Administrator provides administrative and transfer agency services to the Funds for annual fees, based on the average daily net assets of the respective funds, as presented below:
| International Equity Fund | 0.45 | % | |
| Emerging Markets Equity Fund | 0.65 | % | |
| International Fixed Income Fund | 0.60 | % | |
| Emerging Markets Debt Fund | 0.65 | % |
However, the Administrator has voluntarily agreed to waive its fee so that the total annual expenses of each Fund will not exceed certain expense limitations adopted by the Administrator as presented below. In the event that the total annual expenses of a Fund, after reflecting a waiver of all fees by the Administrator, exceed the specific limitation, the Administrator has agreed to bear such excess. Any such waiver is voluntary and may be terminated at any time at the Administrator’s sole discretion. At September 30, 2009, there were no such waivers in each Fund.
International Fund | Emerging Markets Equity Fund | International Fixed Income Fund | Emerging Markets Debt Fund | |||||||||
Class A | 1.28 | %*† | 1.96 | %† | 1.02 | %† | 1.36 | %† | ||||
Class I | 1.53 | %*† | — | — | — |
* The expense cap excludes interest expense on reverse repurchase agreements.
† The expense cap excludes overdraft fees.
Investment Advisory Agreement —SEI Investments Management Corporation (“SIMC”) acts as the Investment Adviser for the Funds under an amended and restated Investment Advisory Agreement dated December 17, 2002 under which SIMC receives annual fees, based on the average daily net assets of the respective funds, as presented below:
| International Equity Fund | 0.505 | % | |
| Emerging Markets Equity Fund | 1.050 | % | |
| International Fixed Income Fund | 0.150 | % | |
| Emerging Markets Debt Fund | 0.850 | % |
However, SIMC has also voluntarily agreed to waive its fee so that the total annual expenses of each Fund will not exceed certain expense limitations adopted by the Adviser as presented above.
As of September 30, 2009, SIMC has entered into Investment Sub-Advisory Agreements with the following parties:
| Investment Sub-Adviser |
International Equity Fund |
Acadian Asset Management, Inc. |
AXA Rosenberg Investment Management LLC |
Declaration Management & Research LLC |
INTECH Investment Management, LLC |
McKinley Capital Management, Inc. |
Principal Global Investors, LLC |
Quantitative Management Associates LLC |
Wellington Management Company, LLP |
Emerging Markets Equity Fund |
AllianceBernstein L.P. |
Artisan Partners Limited Partnership |
AXA Rosenberg Investment Management LLC |
PanAgora Asset Management, Inc. |
Rexiter Capital Management Limited |
The Boston Company Asset Management LLC |
International Fixed Income Fund |
AllianceBernstein L.P. |
BlackRock Financial Management, Inc. |
Fidelity International Investment Advisors (UK) Limited (delegates to Fidelity International Investment Advisors) |
UBS Global Asset Management (Americas) Inc. |
Wellington Management Company, LLP |
Emerging Markets Debt Fund |
Ashmore Investment Management Limited |
ING Investment Management Advisors, B.V. |
Stone Harbor Investment Partners LP |
| SEI Institutional International Trust / Annual Report / September 30, 2009 | 41 |
Table of Contents
Notes to Financial Statements (Continued)
September 30, 2009
Under the investment sub-advisory agreements, each party receives an annual fee, paid by SIMC.
Distribution Agreement — SEI Investments Distribution Co. (the “Distributor”), a wholly owned subsidiary of SEI Investments Company (“SEI”) and a registered broker-dealer, acts as the Distributor of the shares of the Trust under an amended and restated Distribution Agreement dated September 16, 2002. The Trust has adopted plans under which firms, including the Distributor, that provide shareholder and administrative services may receive compensation therefrom. Such plans provide fees payable to the Distributor equal to the following amounts, calculated as a percentage of the average daily net assets attributable to each particular class of each respective fund.
| Shareholder Servicing Fees | Administrative Servicing Fees | |||||
International Equity Fund | ||||||
Class A | 0.25 | % | — | |||
Class I | 0.25 | % | 0.25 | % | ||
Emerging Markets Equity Fund | ||||||
Class A | 0.25 | % | — | |||
International Fixed Income Fund | ||||||
Class A | 0.25 | % | — | |||
Emerging Markets Debt Fund | ||||||
Class A | 0.25 | % | — |
The Distribution Agreement between the Distributor and the Trust provides that the Distributor may receive compensation on fund transactions effected for the Trust in accordance with the rules of the Securities and Exchange Commission (“SEC”). Accordingly, it is expected that fund transactions may result in brokerage commissions being paid to the Distributor. The SEC rules require that such commissions not exceed usual and customary commissions. For the year ended September 30, 2009, the Distributor received no brokerage commissions.
Under both the Shareholder Servicing Plan and Administrative Service Plan, the Distributor may retain as profit any difference between the fee it receives and the amount it pays to third parties.
However, the Distributor has also voluntarily agreed to waive its fee so that the total annual expenses of each Fund will not exceed certain expense limitations as agreed upon by the Distributor as presented above.
For the year ended September 30, 2009, the Distributor retained 100% of both shareholder servicing fees, less the waiver, and administration servicing fees.
Investment in Affiliated Securities — The Funds may invest excess cash in the SEI Daily Income Trust Prime Obligation Fund, an affiliated money market fund. Additionally, the Funds may invest cash collateral from the securities lending program in the SEI Liquidity Fund L.P., also an affiliated fund.
Payment to Affiliates — Certain Officers and Trustees of the Trust are also Officers and/or Trustees of the Administrator or the Distributor, a wholly owned subsidiary of SEI. The Trust pays each unaffiliated Trustee an annual fee for attendance at quarterly, interim, and committee meetings.
The Administrator or the Distributor pays compensation of Officers and affiliated Trustees.
A portion of the services provided by the Chief Compliance Officer (“CCO”) and his staff, whom are employees of the Administrator, are paid for by the Trust as incurred. The services include regulatory oversight of the Trust’s Adviser, sub-advisers and service providers as required by SEC regulations. The CCO’s services have been approved by and are reviewed annually by the Board.
Fees Paid Indirectly — The Funds may direct certain fund trades to the Distributor who pays a portion of the Fund’s expenses. Accordingly, the expenses reduced, which were used to pay third party expenses, and the effect on the Fund’s expense ratio, as a percentage of the Fund’s average daily net assets for the year ended September 30, 2009, can be found on the Statement of Operations and Financial Highlights, respectively.
6. INVESTMENT TRANSACTIONS
The cost of security purchases and the proceeds from the sale and maturity of securities, other than short-term investments, during the year ended September 30, 2009, were as follows:
| Purchases ($ Thousands) | Sales and Maturities ($ Thousands) | |||||
| International Equity Fund | ||||||
US Government | $ | 555,209 | $ | 846,642 | ||
Other | 2,011,948 | 2,052,700 | ||||
| Emerging Markets Equity Fund | ||||||
US Government | — | — | ||||
Other | 558,291 | 676,202 | ||||
| International Fixed Income Fund | ||||||
US Government | 114,712 | 143,546 | ||||
Other | 626,224 | 737,335 | ||||
| Emerging Markets Debt Fund | ||||||
US Government | — | — | ||||
Other | 441,453 | 558,139 | ||||
7. FEDERAL TAX INFORMATION:
It is each Fund’s intention to continue to qualify as a regulated investment company under Subchapter M of the Internal Revenue Code and distribute all of its taxable income (including net capital gains). Accordingly, no provision for Federal income taxes is required.
The Funds may be subject to taxes imposed by countries in which they invest with respect to their investments in issuers existing or operating in such countries. Such taxes are generally based on income earned. The Funds accrue such taxes when the related income is earned.
| 42 | SEI Institutional International Trust / Annual Report / September 30, 2009 |
Table of Contents
Dividends from net investment income and distributions from net realized capital gains are determined in accordance with U.S. Federal income tax regulations, which may differ from those amounts determined under accounting principles generally accepted in the United States of America. These differences, which may result in distribution reclassifications, are primarily due to paydown reclassifications, foreign currency transactions, net investment losses, investment in partnerships, swaps, passive foreign investment companies and municipal bonds. These book/tax differences are either temporary or permanent in nature. To the extent these differences are permanent, they are charged or credited to paid-in capital, undistributed net investment income or accumulated net realized gain, as appropriate, in the period that the differences arise.
Accordingly, the following permanent differences have been reclassified to/from the following accounts as of September 30, 2009:
| Undistributed Net Investment Income/(Loss) ($ Thousands) | Accumulated Realized Gain/ (Loss) ($ Thousands) | Paid-in- Capital ($ Thousands) | ||||||||||
International Equity Fund | $ | (11,326 | ) | $ | 13,631 | $ | (2,305 | ) | ||||
Emerging Markets Equity Fund | (553 | ) | 553 | — | ||||||||
International Fixed Income Fund | 8,540 | (8,562 | ) | 22 | ||||||||
Emerging Markets Debt Fund | (6,130 | ) | 6,130 | — | ||||||||
These reclassifications had no impact on the net assets or net asset value per share of the Funds.
The tax character of dividends and distributions declared during the last two years were as follows:
| Ordinary Income ($ Thousands) | Long-Term Capital Gain ($ Thousands) | Totals ($ Thousands) | |||||||||
International Equity Fund | 2009 | $ | 41,285 | $ | — | $ | 41,285 | ||||
| 2008 | 266,737 | 252,260 | 518,997 | ||||||||
Emerging Markets Equity Fund | 2009 | 10,171 | 154,332 | 164,503 | |||||||
| 2008 | 91,523 | 252,902 | 344,425 | ||||||||
International Fixed Income Fund | 2009 | 57,885 | — | 57,885 | |||||||
| 2008 | 10,040 | — | 10,040 | ||||||||
Emerging Markets Debt Fund | 2009 | 60,833 | — | 60,833 | |||||||
| 2008 | 81,803 | 16,810 | 98,613 | ||||||||
As of September 30, 2009, the components of Accumulated Losses were as follows:
| Undistributed Ordinary Income ($ Thousands) | Undistributed Long-Term Capital Gain ($ Thousands) | Capital Loss Carryforwards ($ Thousands) | Post October Losses ($ Thousands) | |||||||||||
International Equity Fund | $ | — | $ | — | $ | (432,652 | ) | $ | (747,423 | ) | ||||
Emerging Markets Equity Fund | 5,455 | — | (33,118 | ) | (202,302 | ) | ||||||||
International Fixed Income Fund | 5,034 | — | (5,360 | ) | (23,329 | ) | ||||||||
Emerging Markets Debt Fund | 23,593 | — | (14,696 | ) | (60,401 | ) | ||||||||
| Post October Currency Losses ($ Thousands) | Unrealized Appreciation ($ Thousands) | Other Temporary Differences ($ Thousands) | Total Accumulated Losses ($ Thousands) | ||||||||||||
International Equity Fund | $ | — | $ | 107,235 | $ | 437 | $ | (1,072,403 | ) | ||||||
Emerging Markets Equity Fund | — | 101,341 | — | (128,624 | ) | ||||||||||
International Fixed Income Fund | (34,460 | ) | 18,236 | (3,967 | ) | (43,846 | ) | ||||||||
Emerging Markets Debt Fund | — | 50,635 | (23,413 | ) | (24,282 | ) | |||||||||
Post-October losses represent losses realized on investment transactions from November 1, 2008 through September 30, 2009, that, in accordance with Federal income tax regulations, the Funds defer and treat as having arisen in the following fiscal year. For Federal income tax purposes, capital carryforwards may be carried forward and applied against future capital gains as follows:
| Expires 2015 ($ Thousands) | Expires 2017 ($ Thousands) | Total Capital Loss Carryforward 09/30/09 ($ Thousands) | |||||||
International Equity Fund | $ | — | $ | 432,652 | $ | 432,652 | |||
Emerging Markets Equity Fund | — | 33,118 | 33,118 | ||||||
International Fixed Income Fund | 3,797 | 1,563 | 5,360 | ||||||
Emerging Markets Debt Fund | — | 14,696 | 14,696 | ||||||
For tax purposes, the losses in the Funds can be carried forward for a maximum of eight years to offset any net realized capital gains.
The Federal tax cost, aggregate gross unrealized appreciation and depreciation on investments, at September 30, 2009 for each Fund is as follows:
Federal ($ Thousands) | Aggregate ($ Thousands) | Aggregate ($ Thousands) | Net ($ Thousands) | ||||||||||
International Equity Fund | $ | 2,140,527 | $ | 272,518 | $ | (165,605 | ) | $ | 106,913 | ||||
Emerging Markets Equity Fund | 824,012 | 188,244 | (86,022 | ) | 102,222 | ||||||||
International Fixed Income Fund | 519,884 | 34,214 | (11,939 | ) | 22,275 | ||||||||
Emerging Markets Debt Fund | 736,145 | 86,199 | (34,981 | ) | 51,218 | ||||||||
Management has analyzed the Funds’ tax position taken on federal income tax returns for all open tax years and has concluded that as of September 30, 2009, no provision for income tax would be required in the Funds’ financial statements. The Funds’ federal and state income and federal excise tax returns for tax years for which the applicable statutes of limitations have not expired are subject to examination by the Internal Revenue Service and state departments of revenue.
8. CONCENTRATION/RISKS
Each Fund invests in securities of foreign issuers in various countries. These investments may involve certain considerations and risks not typically associated with investments in the United States, as a result of, among other factors, the possibility of future political and economic developments and the level of governmental supervision and regulation of securities markets in the respective countries. The
| SEI Institutional International Trust / Annual Report / September 30, 2009 | 43 |
Table of Contents
Notes to Financial Statements (Concluded)
September 30, 2009
International Fixed Income Fund and Emerging Markets Debt Fund invest in debt securities, the market value of which may change in response to interest rate changes. Also, the ability of the issuers of debt securities held by the International Fixed Income Fund and Emerging Markets Debt Fund to meet their obligations may be affected by economic and political developments in a specific country, industry or region.
Certain securities held by the Funds are valued on the basis of a price provided by a principal market maker. The prices provided by the principal market makers are estimates that may differ from the value that would be realized if the securities were sold. At September 30, 2009, the total value of these securities represented approximately 4% of the net assets of the Emerging Markets Debt Fund.
In the normal course of business, the Funds enter into contracts that provide general indemnifications by the Fund to the counterparty to the contract. The Funds’ maximum exposure under these arrangements is dependent on future claims that may be made against the Funds and, therefore, cannot be established; however, Management believes that based on experience, the risk of loss from such claims is considered remote.
9. SECURITIES LENDING
A Fund may lend portfolio securities to brokers, dealers and other financial organizations that meet capital and other credit requirements or other criteria established by the Trust’s Board of Trustees. These loans may not exceed 33 1/3% of the total asset value of a Fund (including the loan collateral). No Fund will lend portfolio securities to its Adviser, sub-adviser or their affiliates unless it has applied for and received specific authority to do so from the SEC. Loans of portfolio securities will be fully collateralized by cash. Collateral will be maintained in an amount equal to at least 100% of the current market
value of the loaned securities by marking to market daily, although the borrower will be required to deliver collateral between 102% and 105% of the market value of borrowed securities for domestic and foreign securities, respectively. However, due to market fluctuations during the day, the value of securities loaned on a particular day may, during the course of the day, exceed the value of collateral. On each business day, the amount of collateral is adjusted based on the prior day’s market fluctuations and the current day’s lending activity. Income from lending activity is determined by the amount of interest earned on collateral, less any amounts payable to the borrowers of the securities and the lending agent. Lending securities involves certain risks, including the risk that a Fund may be delayed or prevented from recovering the collateral if the borrower fails to return the securities.
Cash collateral received in connection with securities lending is invested in short-term investments by the lending agent. These investments may include the SEI Liquidity Fund L.P., and the Fund bears all of the gains and losses on such investment. There is no guarantee that these investments will not lose value.
10. SUBSEQUENT EVENTS
Management has evaluated the need for disclosures and/or adjustments resulting from subsequent events through November 30, 2009, the date the financial statements were issued. This evaluation did not result in any subsequent events that necessitated disclosures and/or adjustments.
11. OTHER MATTERS (Unaudited)
Due to volatility in the fixed income and equity markets, the market value of some of the Fund’s holdings may currently be lower than shown in the Summary Schedules of Investments (“SOI”). The values shown in the SOI’s were the market values as of September 30, 2009 and do not reflect any market events after September 30, 2009.
| 44 | SEI Institutional International Trust / Annual Report / September 30, 2009 |
Table of Contents
Report of Independent Registered Public Accounting Firm
To the Board of Trustees and Shareholders
SEI Institutional International Trust:
We have audited the accompanying statements of assets and liabilities, including the summary schedules of investments, of the SEI Institutional International Trust comprising the International Equity Fund, Emerging Markets Equity Fund, International Fixed Income Fund and Emerging Markets Debt Fund (collectively, the “Funds”) as of September 30, 2009, and the related statements of operations for the year then ended, the statements of changes in net assets for each of the years in the two-year period then ended, and the financial highlights for each of the years in the four-year period then ended. These financial statements and financial highlights are the responsibility of the Funds’ management. Our responsibility is to express an opinion on these financial statements and financial highlights based on our audits. The financial highlights for the year or period ended September 30, 2005, were audited by other auditors, whose report dated November 29, 2005 expressed an unqualified opinion thereon.
We conducted our audits in accordance with the standards of the Public Company Accounting Oversight Board (United States). Those standards require that we plan and perform the audit to obtain reasonable assurance about whether the financial statements and financial highlights are free of material misstatement. An audit includes examining, on a test basis, evidence supporting the amounts and disclosures in the financial statements. Our procedures included confirmation of securities owned as of September 30, 2009, by correspondence with the custodian and brokers or other appropriate auditing procedures. An audit also includes assessing the accounting principles used and significant estimates made by management, as well as evaluating the overall financial statement presentation. We believe that our audits provide a reasonable basis for our opinion.
In our opinion, the financial statements and financial highlights referred to above present fairly, in all material respects, the financial position of each of the funds comprising SEI Institutional International Trust as of September 30, 2009, the results of their operations for the year then ended, the changes in their net assets for each of the years in the two-year period then ended, and the financial highlights for each of the years in the four-year period then ended, in conformity with U.S. generally accepted accounting principles.
Philadelphia, Pennsylvania
November 30, 2009
| SEI Institutional International Trust / Annual Report / September 30, 2009 | 45 |
Table of Contents
TRUSTEES AND OFFICERS OF THE TRUST (Unaudited)
The following chart lists Trustees and Officers as of September 30, 2009.
Set forth below are the names, addresses, ages, position with the Trust, Term of Office and Length of Time Served, the principal occupations for the last five years, number of portfolios in fund complex overseen by trustee, and other directorships outside the fund complex of each of the persons currently serving as Trustees and Officers of the Trust. The Trust’s Statement of Additional Information (“SAI”) includes additional information about the Trustees and Officers. The SAI may be obtained without charge by calling 1-800-342-5734.
| Name Address, and Age | Position(s) Held with Trusts | Term of Office and Length of Time Served1 | Principal Occupation(s) During Past Five Years | Number of Portfolios in Fund Complex Overseen by Trustee2 | Other Directorships Held by Trustee | |||||
| INTERESTED TRUSTEES | ||||||||||
| Robert A. Nesher One Freedom Valley Drive, Oaks, PA 19456 63 yrs. old | Chairman of the Board of Trustees* | since 1982 | Currently performs various services on behalf of SEI Investments for which Mr. Nesher is compensated. | 80 | Trustee of The Advisors’ Inner Circle Fund, The Advisors’ Inner Circle Fund II, Bishop Street Funds, Director of SEI Global Master Fund, plc, SEI Global Assets Fund, plc, SEI Global Investments Fund, plc, SEI Investments Global, Limited, SEI Investments — Global Fund Services, Limited, SEI Investments (Europe), Limited, SEI Investments — Unit Trust Management (UK), Limited, SEI Global Nominee Ltd., SEI Structured Credit Fund, L.P., and SEI Multi-Strategy Funds plc. | |||||
| William M. Doran 1701 Market Street Philadelphia, PA 19103 69 yrs. old | Trustee* | since 1982 | Self-employed consultant since 2003. Partner, Morgan, Lewis & Bockius LLP (law firm) from 1976 to 2003, counsel to the Trust, SEI, SIMC, the Administrator and the Distributor. Secretary of SEI since 1978. | 80 | Trustee of The Advisors’ Inner Circle Fund, The Advisors’ Inner Circle Fund II, Bishop Street Funds, Director of SEI since 1974. Director of the Distributor since 2003. Director of SEI Investments — Global Fund Services, Limited, SEI Investments Global, Limited, SEI Investments (Europe), Limited, SEI Investments (Asia), Limited and SEI Asset Korea Co., Ltd. | |||||
| TRUSTEES | ||||||||||
| James M. Storey One Freedom Valley Drive, Oaks, PA 19456 78 yrs. old | Trustee | since 1995 | Attorney, sole practitioner since 1994. Partner, Dechert Price & Rhoads, September 1987- December 1993. | 80 | Trustee of The Advisors’ Inner Circle Fund, The Advisors’ Inner Circle Fund II, Bishop Street Funds, and U.S. Charitable Gift Trust. |
| *Messrs. | Nesher and Doran are Trustees who may be deemed as “interested” persons of the Trust as that term is defined in the 1940 Act by virtue of their affiliation with SIMC and the Trust’s Distributor. |
| 1Each | trustee shall hold office during the lifetime of this Trust until the election and qualification of his or her successor, or until he or she sooner dies, resigns or is removed in accordance with the Trust’s Declaration of Trust. |
| 2The | Fund Complex includes the following Trusts: SEI Asset Allocation Trust, SEI Daily Income Trust, SEI Institutional Investments Trust, SEI Institutional International Trust, SEI Institutional Managed Trust, SEI Liquid Asset Trust, SEI Tax Exempt Trust and SEI Alpha Strategy Portfolios, L.P. |
| 46 | SEI Institutional International Trust / Annual Report / September 30, 2009 |
Table of Contents
| Name Address, and Age | Position(s) Held with Trusts | Term of Office and Length of Time Served1 | Principal Occupation(s) During Past Five Years | Number of Portfolios in Fund Complex Overseen by Trustee2 | Other Directorships Held by Trustee | |||||
| TRUSTEES (continued) | ||||||||||
George J. Sullivan, Jr. One Freedom | Trustee | since 1996 | Self-Employed Consultant, Newfound Consultants Inc. since April 1997. | 80 | Trustee of The Advisors’ Inner Circle Fund, The Advisors’ Inner Circle Fund II, Bishop Street Funds, State Street Navigator Securities Lending Trust, and SEI Structured Credit Fund, L.P. member of the independent review committee for SEI’s Canadian registered mutual funds. | |||||
Rosemarie B. Greco One Freedom | Trustee | since 1999 | Director, Governor’s Office of Health Care Reform, Commonwealth of Pennsylvania since 2003. Founder and Principal, Grecoventures Ltd. from 1999 to 2002. | 80 | Director, Sonoco, Inc.; Director, Exelon Corporation; Trustee, Pennsylvania Real Estate Investment Trust. | |||||
| Nina Lesavoy One Freedom Valley Drive, Oaks, PA 19456 52 yrs. old | Trustee | since 2003 | Founder and Managing Director, Avec Capital since 2008. Managing Director, Cue Capital from March 2002-March 2008. | 80 | Director of SEI Structured Credit Fund, L.P. | |||||
James M. Williams One Freedom | Trustee | since 2004 | Vice President and Chief Investment Officer, J. Paul Getty Trust, Non-Profit Foundation for Visual Arts, since December 2002. President, Harbor Capital Advisors and Harbor Mutual Funds, 2000-2002. | 80 | Trustee/Director of Ariel Mutual Funds, and SEI Structured Credit Fund, L.P. | |||||
Mitchell A. Johnson One Freedom | Trustee | since 2007 | Private Investor since 1994. | 80 | Trustee of the Advisors’ Inner Circle Fund, The Advisor’s Inner Circle Fund II, and Bishop Street Funds. | |||||
Hubert L. Harris, Jr. One Freedom | Trustee | since 2008 | Retired since December 2005. Chief Executive Officer and Chair of the Board of Directors, AMVESCAP Retirement, Inc., 1997-December 2005. Chief Executive Officer, INVESCO North America, September 2003-December 2005. | 80 | Director of Colonial BancGroup, Inc. and Chair of the Board of Trustees, Georgia Tech Foundation, Inc. (nonprofit corporation). | |||||
| OFFICERS | ||||||||||
Robert A. Nesher One Freedom | President & CEO | since 2005 | Currently performs various services on behalf of SEI for which Mr. Nesher is compensated. | N/A | N/A | |||||
Stephen F. Panner One Freedom Valley Drive, | Controller and Chief Financial Officer | since 2005 | Fund Accounting Director of the Administrator since 2005. Fund Administration Manager, Old Mutual Fund Services, 2000-2005. Chief Financial Officer, Controller and Treasurer, PBHG Funds and PBHG Insurance Series Fund, 2004-2005. Assistant Treasurer, PBHG Funds and PBHG Insurance Series Fund, 2000-2004. Assistant Treasurer, Old Mutual Advisors Fund, 2004-2005. | N/A | N/A |
| SEI Institutional International Trust / Annual Report / September 30, 2009 | 47 |
Table of Contents
TRUSTEES AND OFFICERS OF THE TRUST (Unaudited)
| Name Address, and Age | Position(s) Held with Trusts | Term of Office and Length of Time Served1 | Principal Occupation(s) During Past Five Years | Number of Portfolios in Fund Complex Overseen by Trustee2 | Other Directorships Held by Trustee | |||||
| OFFICERS (continued) | ||||||||||
| Russell Emery One Freedom Valley Drive Oaks, PA 19456 46 yrs. old | Chief Compliance Officer | since 2006 | Chief Compliance Officer of SEI Institutional Managed Trust, SEI Asset Allocation Trust, SEI Institutional International Trust, SEI Liquid Asset Trust, SEI Daily Income Trust, SEI Tax Exempt Trust, SEI Institutional Investments Trust, The Advisors’ Inner Circle Fund, The Advisors’ Inner Circle Fund II, and Bishop Street Funds, since March 2006. Chief Compliance Officer of SEI Structural Credit Fund, LP and SEI Alpha Strategy Portfolio, LP since June 2007. Director of Investment Product Management and Development of SIMC, February 2003-March 2006. | N/A | N/A | |||||
Timothy D. Barto One Freedom | Vice President and Secretary | since 2002 | General Counsel, Vice President and Secretary of SIMC and the Administrator since 2004. Vice President and Assistant Secretary of SEI since 2001. Vice President of SIMC and the Administrator since 1999. Assistant Secretary of SIMC, the Administrator and the Distributor and Vice President of the Distributor, 1999-2003. | N/A | N/A | |||||
| James Ndiaye One Freedom Valley Drive Oaks, PA 19456 41 yrs. old | Vice President and Assistant Secretary | since 2005 | Vice President and Assistant Secretary of SIMC since 2005. Vice President, Deutsche Asset Management (2003-2004). Associate, Morgan, Lewis & Bockius LLP (2000-2003). | N/A | N/A | |||||
| Michael T. Pang One Freedom Valley Drive Oaks, PA 19456 37 yrs. old | Vice President and Assistant Secretary | since 2005 | Vice President and Assistant Secretary of SIMC since 2005. Counsel, Caledonian Bank & Trust’s Mutual Funds Group (2004). Counsel, Permal Asset Management (2001-2004). | N/A | N/A | |||||
| Aaron Buser One Freedom Valley Drive Oaks, PA 19456 38 yrs. old | Vice President and Assistant Secretary | since 2008 | Vice President and Assistant Secretary of SIMC since 2007. Associate at Stark & Stark (2004-2007). Associate at Flaster/Greenberg, P.C. (2000-2004). | N/A | N/A | |||||
| David F. McCann One Freedom Valley Drive Oaks, PA 19456 33 yrs. Old | Vice President and Assistant Secretary | since 2009 | Vice President and Assistant Secretary of SIMC since 2008. Attorney, Drinker Biddle & Reath, LLP (law firm), May 2005-October 2008. Attorney, Pepper Hamilton, LLP (law firm), September 2001-May 2005. | N/A | N/A | |||||
| John J. McCue One Freedom Valley Drive Oaks, PA 19456 46 yrs. old | Vice President | since 2004 | Director of Portfolio Implementations for SIMC since 1995. Managing Director of Money Market Investments for SIMC since 2003. | N/A | N/A | |||||
| Andrew S. Decker One Freedom Valley Drive Oaks, PA 19456 46 yrs. old | Anti-Money Laundering Compliance Officer | since 2008 | Compliance Officer and Product Manager, SEI 2005-2008. Vice President, Old Mutual Capital, 2000-2005. | N/A | N/A | |||||
| 1Each | trustee shall hold office during the lifetime of this Trust until the election and qualification of his or her successor, or until he or she sooner dies, resigns or is removed in accordance with the Trust’s Declaration of Trust. |
| 2The | Fund Complex includes the following Trusts: SEI Asset Allocation Trust, SEI Daily Income Trust, SEI Institutional Investments Trust, SEI Institutional International Trust, SEI Institutional Managed Trust, SEI Liquid Asset Trust, SEI Tax Exempt Trust and SEI Alpha Strategy Portfolios, L.P. |
| 48 | SEI Institutional International Trust / Annual Report / September 30, 2009 |
Table of Contents
Disclosure of Fund Expenses (Unaudited)
All mutual funds have operating expenses. As a shareholder of a fund, your investment is affected by these ongoing costs, which include (among others) costs for portfolio management, administrative services, and shareholder reports like this one. It is important for you to understand the impact of these costs on your investment returns.
Operating expenses such as these are deducted from the fund’s gross income and directly reduce your final investment return. These expenses are expressed as a percentage of the fund’s average net assets; this percentage is known as the fund’s expense ratio.
The following examples use the expense ratio and are intended to help you understand the ongoing costs (in dollars) of investing in your fund and to compare these costs with those of other mutual funds. The examples are based on an investment of $1,000 made at the beginning of the period shown and held for the entire period.
The table on this page illustrates your fund’s costs in two ways:
Actual fund return. This section helps you to estimate the actual expenses after fee waivers that your Fund incurred over the period. The “Expenses Paid During Period” column shows the actual dollar expense cost incurred by a $1,000 investment in the Fund, and the “Ending Account Value” number is derived from deducting that expense cost from the Fund’s gross investment return.
You can use this information, together with the actual amount you invested in the Fund, to estimate the expenses you paid over that period. Simply divide your actual account value by $1,000 to arrive at a ratio (for example, an $8,600 account value divided by $1,000 = 8.6), then multiply that ratio by the number shown for your Fund under “Expenses Paid During Period.”
Hypothetical 5% return. This section helps you compare your Fund’s costs with those of other mutual funds. It assumes that the fund had an annual 5% return before expenses during the year, but that the expense ratio (Column 3) for the period is unchanged. This example is useful in making comparisons because the Securities and Exchange Commission requires all mutual funds to make this 5% calculation. You can assess your Fund’s comparative cost by comparing the hypothetical result for your Fund in the “Expense Paid During Period” column with those that appear in the same charts in the shareholder reports for other funds.
NOTE: Because the return is set at 5% for comparison purposes — NOT your Fund’s actual return — the account values shown may not apply to your specific investment.
Beginning 4/1/09 | Ending Account Value 9/30/09 | Annualized Expense Ratios | Expenses Paid During Period* | |||||||||
International Equity Fund | ||||||||||||
Actual Fund Return | ||||||||||||
Class A | $ | 1,000.00 | $ | 1,448.50 | 1.27 | % | $ | 7.82 | ||||
Class I | $ | 1,000.00 | $ | 1,447.70 | 1.52 | % | $ | 9.35 | ||||
Hypothetical 5% Return | ||||||||||||
Class A | $ | 1,000.00 | $ | 1,018.68 | 1.27 | % | $ | 6.45 | ||||
Class I | $ | 1,000.00 | $ | 1,017.43 | 1.52 | % | $ | 7.70 | ||||
Emerging Markets Equity Fund | ||||||||||||
Actual Fund Return | ||||||||||||
Class A | $ | 1,000.00 | $ | 1,625.60 | 1.97 | % | $ | 12.96 | ||||
Hypothetical 5% Return | ||||||||||||
Class A | $ | 1,000.00 | $ | 1,015.20 | 1.97 | % | $ | 9.95 | ||||
| Beginning Account Value 4/1/09 | Ending Account Value 9/30/09 | Annualized Expense Ratios | Expenses Paid During Period* | |||||||||
International Fixed Income Fund | ||||||||||||
Actual Fund Return | ||||||||||||
Class A | $ | 1,000.00 | $ | 1,113.40 | 1.01 | % | $ | 5.37 | ||||
Hypothetical 5% Return | ||||||||||||
Class A | $ | 1,000.00 | $ | 1,019.99 | 1.01 | % | $ | 5.13 | ||||
Emerging Markets Debt Fund | ||||||||||||
Actual Fund Return | ||||||||||||
Class A | $ | 1,000.00 | $ | 1,314.70 | 1.37 | % | $ | 7.95 | ||||
Hypothetical 5% Return | ||||||||||||
Class A | $ | 1,000.00 | $ | 1,018.20 | 1.37 | % | $ | 6.93 | ||||
| * | Expenses are equal to the Fund’s annualized expense ratio multiplied by the average account value over the period, multiplied by 183/365 (to reflect the one-half year period shown). |
| SEI Institutional International Trust / Annual Report / September 30, 2009 | 49 |
Table of Contents
Board of Trustees Considerations in Approving the Advisory and Sub-Advisory Agreements (Unaudited)
SEI Institutional International Trust (the “Trust”) and SEI Investments Management Corporation (“SIMC”) have entered into an investment advisory agreement (the “Advisory Agreement”). Pursuant to the Advisory Agreement, SIMC oversees the investment advisory services provided to the series of the Trust (the “Funds”) and may manage the cash portion of the Funds’ assets. Pursuant to separate sub-advisory agreements (the “Sub-Advisory Agreements” and, together with the Advisory Agreement, the “Investment Advisory Agreements”) with SIMC, and under the supervision of SIMC and the Trust’s Board of Trustees (the “Board”), the Sub-Advisers are responsible for the day-to-day investment management of all or a discrete portion of the assets of the Funds. The Sub-Advisers also are responsible for managing their employees who provide services to these Funds. The Sub-Advisers are selected based primarily upon the research and recommendations of SIMC, which evaluates quantitatively and qualitatively the Sub-Advisers’ skills and investment results in managing assets for specific asset classes, investment styles and strategies.
The Investment Company Act of 1940, as amended (the “1940 Act”) requires that the initial approval of, as well as the continuation of, the Funds’ Investment Advisory Agreements must be specifically approved: (i) by the vote of the Board of Trustees or by a vote of the shareholders of the Funds; and (ii) by the vote of a majority of the Trustees who are not parties to the Investment Advisory Agreements or “interested persons” of any party (the “Independent Trustees”), cast in person at a meeting called for the purpose of voting on such approval. In connection with their consideration of such approvals, the Funds’ Trustees must request and evaluate, and SIMC and the Sub-Advisers are required to furnish, such information as may be reasonably necessary to evaluate the terms of the Investment Advisory Agreements. In addition, the Securities and Exchange Commission (“SEC”) takes the position that, as part of their fiduciary duties with respect to a mutual fund’s fees, mutual fund boards are required to evaluate the material factors applicable to a decision to approve an Investment Advisory Agreement.
Consistent with these responsibilities, the Trust’s Board of Trustees calls and holds meetings each year that are dedicated to considering whether to renew the Investment Advisory Agreements between the Trust and SIMC and SIMC and the Sub-Advisers with respect to the Funds of the Trust. In preparation for these meetings, the Board requests and reviews a wide variety of materials provided by SIMC and the Sub-Advisers, including information about SIMC’s and the Sub-Advisers’ affiliates, personnel and operations. The Board also receives extensive data provided by third parties. This information is in addition to the detailed information about the Funds that the Board reviews during the course of each year, including information that relates to Fund operations and Fund performance. The Trustees also receive a memorandum from Fund counsel and independent counsel to the Independent Trustees regarding the responsibilities of Trustees in connection with their consideration of whether to approve the Trust’s Investment Advisory Agreements. Finally, the Independent Trustees receive advice from independent counsel to the Independent Trustees, meet in executive session outside the presence of Fund management and participate in question and answer sessions with representatives of SIMC and the Sub-Advisers.
Specifically, the Board requested and received written materials from SIMC and the Sub-Advisers regarding: (a) the quality of SIMC’s and the Sub-Advisers’ investment management and other services; (b) SIMC’s and the Sub-Advisers’ investment management personnel; (c) SIMC’s and the Sub-Advisers’ operations and financial condition; (d) SIMC’s and the Sub-Advisers’ brokerage practices (including any soft dollar arrangements) and investment strategies; (e) the level of the advisory fees that SIMC and the Sub-Advisers charge the Funds compared with the fees each charge to comparable mutual funds; (f) the Funds’ overall fees and operating expenses compared with similar mutual funds; (g) the level of SIMC’s and the Sub-Advisers’ profitability from their Fund-related operations; (h) SIMC’s and the Sub-Advisers’ compliance systems; (i) SIMC’s and the Sub-Advisers’ policies on and compliance procedures for personal securities transactions; (j) SIMC’s and the Sub-Advisers’ reputation, expertise and resources in domestic and/or international financial markets; and (k) the Funds’ performance compared with similar mutual funds.
At the June 24, 2009 and September 17, 2009 meetings of the Board of Trustees, the Trustees, including a majority of the Independent Trustees, approved the Investment Advisory Agreements and approved the selection of SIMC and the Sub-Advisers to act in their respective capacities for the Funds. Additionally, during the September 17, 2009 meeting, the Board, including the Independent Trustees, also considered a proposal to amend the Advisory Agreement, which would increase the management fee
| 50 | SEI Institutional International Trust / Annual Report / September 30, 2009 |
Table of Contents
that the International Fixed Income Fund pays to SIMC (the “Proposal”). SIMC requested an increase in its management fee because SIMC believed it was necessary to ensure that SIMC is able to retain and/or attract qualified sub-advisers to provide sub-advisory services for the International Fixed Income Fund. The Board, including all of the Independent Trustees, unanimously approved this Proposal, subject to the approval of the International Fixed Income Fund’s shareholders. The Board concluded, in the exercise of its reasonable judgment that the Proposal was fair and reasonable in relation to the services expected to be provided to the International Fixed Income Fund and that approval of the Proposal would be in the best interests of the shareholders of the International Fixed Income Fund. The Board also determined that the basis for the renewal of the Advisory Agreement would remain the basis for the Board’s approval of the Proposal, subject to the new consideration of the proposed higher management fee rate. The Board’s approval of both the Proposal and the Investment Advisory Agreements was based on its consideration and evaluation of a variety of specific factors discussed at the meetings and at prior meetings, including:
| • | the nature, extent and quality of the services provided to the Funds under the Investment Advisory Agreements, including the resources of SIMC and the Sub-Advisers and their affiliates dedicated to the Funds; |
| • | the Funds’ investment performance and how it compared to that of other comparable mutual funds; |
| • | the Funds’ expenses under each Investment Advisory Agreement and how those expenses compared to those of other comparable mutual funds; |
| • | the profitability of SIMC and the Sub-Advisers and their affiliates with respect to the Funds, including both direct and indirect benefits accruing to SIMC and the Sub-Advisers and their affiliates; and |
| • | the extent to which economies of scale would be realized as the Funds grow and whether fee levels in the Investment Advisory Agreements reflect those economies of scale for the benefit of Fund investors. |
Nature, Extent and Quality of Services. The Board of Trustees considered the nature, extent and quality of the services provided by SIMC and the Sub-Advisers to the Funds and the resources of SIMC and the Sub-Advisers and their affiliates dedicated to the Funds. In this regard, the Trustees evaluated, among other things, SIMC’s and the Sub-Advisers’ personnel, experience, track record and compliance program. The Trustees found the level of SIMC’s professional staff and culture of compliance satisfactory. Following evaluation, the Board concluded that, within the context of its full deliberations, the nature, extent and quality of services provided by SIMC and the Sub-Advisers to the Funds and the resources of SIMC and the Sub-Advisers and their affiliates dedicated to the Funds supported renewal of the Investment Advisory Agreements.
Fund Performance. The Board of Trustees considered Fund performance in determining whether to renew the Investment Advisory Agreements. Specifically, the Trustees considered the Funds’ performance relative to their peer groups and appropriate indices/benchmarks, in light of total return, yield and market trends. As part of this review, the Trustees considered the composition of each peer group and selection criteria. In evaluating performance, the Trustees considered both market risk and shareholder risk expectations for the Funds. The Trustees found Fund performance satisfactory, and where performance was below the benchmark, the Trustees were satisfied that appropriate steps were being taken. Following evaluation, the Board concluded that, within the context of its full deliberations, the performance of the Funds supported renewal of the Investment Advisory Agreements.
Fund Expenses. With respect to the Funds’ expenses under the Investment Advisory Agreements, the Trustees considered the rate of compensation called for by the Investment Advisory Agreements and the Funds’ net operating expense ratio in comparison to those of other comparable mutual funds. The Trustees also considered information about average expense ratios of comparable mutual funds in the Funds’ respective peer groups. The Trustees further considered the fact that the comparative fee analysis either showed that the various fees were below average or that there was a reasonable basis for the fee level. Finally, the Trustees considered the effects of SIMC’s voluntary waiver of management and other fees and the Sub-Advisers’ fees to prevent total Fund expenses from exceeding a specified cap and that SIMC and the Sub-Advisers, through waivers, have maintained the
| SEI Institutional International Trust / Annual Report / September 30, 2009 | 51 |
Table of Contents
Board of Trustees Considerations in Approving the Advisory and Sub-Advisory Agreements (Unaudited) (Concluded)
Funds’ net operating expenses at competitive levels for their respective distribution channels. Following evaluation, the Board concluded that, within the context of its full deliberations, the expenses of the Funds are reasonable and supported renewal of the Investment Advisory Agreements.
Profitability. With regard to profitability, the Trustees considered all compensation flowing to SIMC and the Sub-Adviser and their affiliates, directly or indirectly. The Trustees considered whether the varied levels of compensation and profitability under the Investment Advisory Agreements and other service agreements were reasonable and justified in light of the quality of all services rendered to the Funds by SIMC and the Sub-Advisers and their affiliates. The Trustees found that profitability was reasonable and that the margin was not increasing despite growth in assets. When considering the profitability of the Sub-Advisers, the Board took into account the fact that the Sub-Advisers are compensated by SIMC, and not by the Funds directly, and such compensation with respect to any Sub-Adviser reflects an arms-length negotiation between the Sub-Adviser and SIMC. Based on this evaluation, the Board concluded that, within the context of its full deliberations, the profitability of SIMC and the Sub-Advisers are reasonable and supported renewal of the Investment Advisory Agreements.
Economies of Scale. The Trustees considered the existence of any economies of scale and whether those were passed along to the Funds’ shareholders through a graduated investment advisory fee schedule or other means, including any fee waivers by SIMC and its affiliates. Based on this evaluation, the Board concluded that, within the context of its full deliberations, the Funds obtain reasonable benefit from economies of scale.
Based on the Trustees’ deliberation and their evaluation of the information described above, the Board, including all of the Independent Trustees, unanimously approved the continuation of the Investment Advisory Agreements and concluded that the compensation under the Investment Advisory Agreements is fair and reasonable in light of such services and expenses and such other matters as the Trustees considered to be relevant in the exercise of their reasonable judgment. In the course of their deliberations, the Trustees did not identify any particular information that was all-important or controlling.
| 52 | SEI Institutional International Trust / Annual Report / September 30, 2009 |
Table of Contents
Notice to Shareholders (Unaudited)
For shareholders that do not have a September 30, 2009 taxable year end, this notice is for informational purposes only. For shareholders with a September 30, 2009 taxable year end, please consult your tax advisor as to the pertinence of this notice.
For the fiscal year ended September 30, 2009 the Funds of the SEI Institutional International Trust are designating the following items with regard to distributions paid during the year:
| Fund | (A) Long-Term Capital Gain Distributions (Tax Basis) | (B) Ordinary Income Distributions (Tax Basis) | (C) Total | (D) Dividends Received Deduction (1) | (E) Qualifying Dividend Income (15% Tax Rate for QDI) (2) | (F) U.S. Government Interest (3) | (G) Interest Related Dividends (4) | (H) Short-Term Capital Gain Dividends (5) | ||||||||||||||||
| International Equity | 0.00 | % | 100.00 | % | 100.00 | % | 0.00 | % | 96.18 | % | 0.12 | % | 5.61 | % | 0.00 | % | ||||||||
| Emerging Markets Equity | 92.61 | % | 7.39 | % | 100.00 | % | 0.00 | % | 64.42 | % | 0.00 | % | 0.79 | % | 0.00 | % | ||||||||
| International Fixed Income | 0.00 | % | 100.00 | % | 100.00 | % | 0.00 | % | 0.00 | % | 0.21 | % | 3.78 | % | 0.00 | % | ||||||||
| Emerging Markets Debt | 0.00 | % | 100.00 | % | 100.00 | % | 0.00 | % | 0.00 | % | 0.00 | % | 11.29 | % | 0.00 | % |
The Funds intend to pass through foreign tax credit to shareholders. For the fiscal year ended September 30, 2008, the amount of foreign source income and foreign tax credit are as follows:
| Fund | Foreign Source Income | Foreign Tax Credit Pass Through | ||||
Emerging Markets Equity | $ | 6,442,261 | $ | 2,146,929 | ||
| (1) | “Dividends Received Deduction” represent dividends which qualify for the corporate dividends received deduction. |
| (2) | “Qualifying Dividend Income” represent qualifying dividends as created by the Jobs and Growth Tax Relief Reconciliation Act of 2003. It is the intention of the Fund to designate the max amount permitted by law. |
| (3) | “U.S. Government Interest” represent the amount of interest that was derived from direct U.S. Government obligations and distributed during the fiscal year. Generally, interest from direct U.S. Government obligations is exempt from state income tax. However, for shareholders who are residents of California, Connecticut or New York, the statutory threshold requirements were not satisfied to permit exemption of these amounts from state income. |
| (4) | “Interest Related Dividends” represent qualifying interest that is exempt from U.S. withholding tax when paid to foreign investors as created by the American Jobs Creation Act of 2004. This provision of the IRC will be expiring for years beginning after January 1, 2010. |
| (5) | “Short-Term Capital Gain Dividends” represent qualifying short-term capital gain that is exempt from U.S. withholding tax when paid to foreign investors as created by the American Jobs Creation Act of 2004. This provision of the IRC will be expiring for years beginning after January 1, 2010. |
Items (A), (B) and (C) are based on the percentage of each fund’s total distribution.
Items (D) and (E) are based on the percentage of “Ordinary Income Distributions.”
Item (F) is based on the percentage of gross income of each Fund.
Item (G) is based on the percentage of net investment income distributions.
Item (H) is based on the percentage of short-term capital gains distributions.
Please consult your tax adviser for proper treatment of this information. This notification should be kept with your permanent tax records.
| SEI Institutional International Trust / Annual Report / September 30, 2009 | 53 |
Table of Contents
SEI INSTITUTIONAL INTERNATIONAL TRUST ANNUAL REPORT SEPTEMBER 30, 2009
Robert A. Nesher, Chairman
Trustees
William M. Doran
James M. Storey
George J. Sullivan, Jr.
Rosemarie B. Greco
Nina Lesavoy
James M. Williams
Mitchell A. Johnson
Hubert L. Harris, Jr.
Officers
Robert A. Nesher
President and Chief Executive Officer
Stephen F. Panner
Controller and Chief Financial Officer
Russell Emery
Chief Compliance Officer
Timothy D. Barto
Vice President, Secretary
James Ndiaye
Vice President, Assistant Secretary
Michael T. Pang
Vice President, Assistant Secretary
Aaron Buser
Vice President, Assistant Secretary
David F. McCann
Vice President, Assistant Secretary
John J. McCue
Vice President
Andrew S. Decker
Anti-Money Laundering Compliance Officer
Investment Adviser
SEI Investments Management Corporation
Administrator
SEI Investments Global Funds Services
Distributor
SEI Investments Distribution Co.
Legal Counsel
Morgan, Lewis & Bockius LLP
Independent Registered Public Accounting Firm
KMPG LLP
This report and the financial statements contained herein are submitted for the general information of the shareholders of the Trust and must be preceded or accompanied by a current prospectus. Shares of the SEI Funds are not deposits or obligations of, or guaranteed or endorsed by, any bank. The shares are not federally insured by the Federal Deposit Insurance Corporation (FDIC), the Federal Reserve Board, or any other government agency. Investment in the shares involves risk, including the possible loss of principal.
For more information call
1 800 DIAL SEI
(1 800 342 5734)
Table of Contents
SEI Investments Distribution Co.
Oaks, PA 19456 1.800.DIAL.SEI (1.800.342.5734)
SEI-F-018 (9/09)
Table of Contents
| Item 2. | Code of Ethics. |
The Registrant has adopted a code of ethics that applies to the Registrant’s principal executive officer, principal financial officer, comptroller or principal accounting officer.
| Item 3. | Audit Committee Financial Expert. |
(a)(1) The Registrant’s board of trustees has determined that the Registrant has one audit committee financial expert serving on the audit committee.
(a)(2) The audit committee financial experts are George J. Sullivan, Jr. and Hubert L. Harris, Jr. Mrrs. Sullivan and Harris are independent as defined in Form N-CSR Item 3(a)(2).
| Item 4. | Principal Accountant Fees and Services. |
Fees billed by KPMG LLP (KPMG) related to the Registrant.
KPMG billed the Registrant aggregate fees for the services redered to the Registrant for fiscal year 2009 and for fiscal year 2008 as follows:
| Fiscal Year 2009 | Fiscal Year 2008 | |||||||||||||||
| All fees and services to the Registrant that were pre-approved | All fees and | All other fees and services to | All fees and services to the Registrant that were pre-approved | All fees and service affiliates | All other fees and services to affiliates that did not require | |||||||||||
(a) | Audit Fees(1) | $ | 159,000 | N/A | $0 | $ | 150,000 | N/A | $0 | |||||||
(b) | Audit-Related Fees | $ | 0 | $0 | N/A | $ | 0 | $0 | N/A | |||||||
(c) | Tax Fees(2) | $ | 25,400 | N/A | $0 | $ | 26,800 | N/A | $0 | |||||||
(d) | All Other Fees(3) | $ | 244,500 | $0 | $0 | $ | 248,500 | $0 | $0 | |||||||
Notes:
| (1) | Audit fees include amounts related to the audit of the Registrant’s annual financial statements and services normally provided by the accountant in connection with statutory and regulatory filings. |
| (2) | Review of federal income tax returns of the Registrant. |
| (3) | See Section (g)(1) |
Table of Contents
(e)(1) All requests or applications for services to be provided by the independent auditor shall be submitted to the Chief Financial Officer (“CFO”) of the Registrant and must include a detailed description of the services proposed to be rendered. The Registrant ‘s CFO will determine whether such services (1) require specific pre-approval, (2) are included within the list of services that have received the general pre-approval of the audit committee or (3) have been previously pre-approved in connection with the independent auditor’s annual engagement letter for the applicable year or otherwise.
Requests or applications to provide services that require specific pre-approval by the audit committee will be submitted to the audit committee by the CFO. The audit committee will be informed by the CFO on a quarterly basis of all services rendered by the independent auditor. The audit committee has delegated specific pre-approval authority to either the audit committee chair or financial experts, provided that the estimated fee for any such proposed pre-approved service does not exceed $100,000 and any pre-approval decisions are reported to the audit committee at its next regularly scheduled meeting.
All services to be provided by the independent auditor shall be provided pursuant to a signed written engagement letter with the Registrant, the investment advisor or applicable control affiliate (except that matters as to which an engagement letter would be impractical because of timing issues or because the matter is small may not be the subject of an engagement letter) that sets forth both the services to be provided by the independent auditor and the total fees to be paid to the independent auditor for those services.
In addition, the audit committee has determined to take additional measures on an annual basis to meet its responsibility to oversee the work of the independent auditor and to assure the auditor’s independence from the Registrant, such as reviewing a formal written statement from the independent auditor delineating all relationships between the independent auditor and the Registrant, and discussing with the independent auditor its methods and procedures for ensuring independence.
(e)(2) Percentage of fees billed applicable to non-audit services pursuant to waiver of pre-approval requirement were as follows:
| FYE 2009 | FYE 2008 | |||||
Audit-Related Fees | 0 | % | 0 | % | ||
Tax Fees | 0 | % | 0 | % | ||
All Other Fees | 0 | % | 0 | % |
(f) Not Applicable.
(g)(1) The aggregate non-audit fees and services billed by KPMG for the fiscal years 2009 and 2008 were $244,500 and $248,500, respectively. Non-audit fees consist of SAS No. 70 review of fund accounting and administration operations, attestation report in accordance with Rule 17 Ad-13, agreed upon procedures report over certain internal controls related to compliance with federal securities laws and regulations and tax consulting services for various service affiliates of the Registrant.
(h) During the past fiscal year, Registrant’s principal accountant provided certain non-audit services to Registrant’s investment adviser or to entities controlling, controlled by, or under common control with Registrant’s investment adviser that provide ongoing services to Registrant that were not subject to pre-approval pursuant to paragraph (c)(7)(ii) of Rule 2-01 of Regulation S-X. The audit committee of Registrant’s board of trustees reviewed and considered these non-audit services provided by Registrant’s principal accountant to Registrant’s affiliates, including whether the provision of these non-audit services is compatible with maintaining the principal accountant’s independence.
| Item 5. | Audit Committee of Listed Registrants. |
Not applicable.
Table of Contents
| Item 6. | Schedule of Investments |
The Schedules of Investments in securities of unaffiliated issuers as of the close of the reporting period for the International Equity Fund, the Emerging Markets Equity Fund, the International Fixed Income Fund and the Emerging Markets Debt Fund are listed below.
SCHEDULE OF INVESTMENTS
International Equity Fund
September 30, 2009
Description | Shares | Market Value ($ Thousands) | |||
COMMON STOCK — 88.8% | |||||
Argentina — 0.0% | |||||
Banco Macro ADR | 15,100 | $ | 365 | ||
Grupo Financiero Galicia ADR* | 16,900 | 79 | |||
Telecom Argentina ADR* | 8,200 | 131 | |||
| 575 | |||||
Australia — 4.9% | |||||
AGL Energy | 88,189 | 1,064 | |||
AJ Lucas Group | 278 | 1 | |||
Alumina | 965,020 | 1,559 | |||
Amcor | 107,796 | 521 | |||
AMP | 8,619 | 50 | |||
Arrow Energy* | 106,165 | 401 | |||
Asciano Group | 194,269 | 284 | |||
Australia & New Zealand Banking Group | 162,840 | 3,505 | |||
Australian Stock Exchange | 26,286 | 817 | |||
AWB(A) | 131,337 | 148 | |||
AXA Asia Pacific Holdings | 23,750 | 92 | |||
Beach Petroleum | 535,481 | 354 | |||
Bendigo and Adelaide Bank | 10,981 | 91 | |||
BHP Billiton | 430,742 | 14,343 | |||
Billabong International | 7,490 | 79 | |||
Biota Holdings* | 5,300 | 13 | |||
BlueScope Steel | 1,082,933 | 2,800 | |||
Boral(A) | 22,131 | 119 | |||
Brambles(A) | 238,612 | 1,702 | |||
Caltex Australia | 37,554 | 401 | |||
CFS Retail Property Trust(B) | 58,433 | 104 | |||
Coca-Cola Amatil | 210,318 | 1,821 | |||
Cochlear | 4,708 | 277 | |||
Commonwealth Bank of Australia | 118,691 | 5,421 | |||
Computershare | 227,460 | 2,240 | |||
Crown | 99,926 | 788 | |||
CSL | 78,711 | 2,324 | |||
CSR | 29,494 | 49 | |||
David Jones | 58,100 | 299 | |||
Dexus Property Group(B) | 115,600 | 86 | |||
Downer EDI | 34,676 | 251 | |||
Energy Resources of Australia | 35,397 | 788 | |||
Extract Resources* | 20,638 | 166 | |||
Fortescue Metals Group* | 39,478 | 133 | |||
Foster’s Group | 183,087 | 897 | |||
Goodman Fielder | 672,980 | 992 | |||
Goodman Group(B) | 85,783 | 50 | |||
GPT Group(B) | 198,683 | 120 | |||
GrainCorp | 12,373 | 99 | |||
Harvey Norman Holdings | 401,837 | 1,525 | |||
Incitec Pivot | 143,547 | 358 | |||
Insurance Australia Group | 114,876 | 383 | |||
JB Hi-Fi | 45,330 | 794 | |||
John Fairfax Holdings | 60,771 | 92 | |||
Kingsgate Consolidated | 3,700 | 27 | |||
Leighton Holdings | 17,580 | 561 | |||
Lend Lease | 16,735 | 157 | |||
Lion Nathan | 101,221 | 1,023 | |||
Macquarie Airports | 31,273 | 78 | |||
Macquarie Group | 84,663 | 4,393 | |||
Macquarie Infrastructure Group | 992,232 | 1,292 | |||
Metcash | 201,108 | 799 | |||
Description | Shares | Market Value ($ Thousands) | |||
National Australia Bank | 162,546 | $ | 4,413 | ||
Newcrest Mining | 8,682 | 244 | |||
OneSteel | 408,939 | 1,094 | |||
Orica | 76,106 | 1,578 | |||
Origin Energy | 44,011 | 634 | |||
OZ Minerals | 344,272 | 346 | |||
Pacific Brands | 379,743 | 402 | |||
Paladin Energy*(A) | 88,370 | 351 | |||
Primary Health Care | 18,400 | 101 | |||
Qantas Airways | 352,114 | 889 | |||
QBE Insurance Group | 40,255 | 855 | |||
Rio Tinto | 89,918 | 4,701 | |||
Santos | 365,055 | 4,897 | |||
Sims Group | 19,228 | 387 | |||
Sonic Healthcare | 10,553 | 132 | |||
SP AusNet, Cl Miscellaneous | 46,456 | 36 | |||
Straits Resources | 85,569 | 124 | |||
Suncorp-Metway | 139,090 | 1,090 | |||
Super Cheap Auto Group | 11,099 | 58 | |||
TABCORP Holdings | 194,126 | 1,222 | |||
Tatts Group | 638,844 | 1,432 | |||
Telstra | 305,331 | 881 | |||
Toll Holdings | 20,807 | 157 | |||
United Group | 14,500 | 190 | |||
Washington H Soul Pattinson | 700 | 8 | |||
Wesfarmers | 132,057 | 3,089 | |||
Westfield Group(B) | 246,090 | 3,019 | |||
Westpac Banking | 225,275 | 5,219 | |||
Woodside Petroleum | 31,979 | 1,471 | |||
Woolworths | 157,310 | 4,061 | |||
WorleyParsons | 13,315 | 349 | |||
| 100,161 | |||||
Austria — 0.2% | |||||
Erste Group Bank | 36,995 | 1,651 | |||
EVN | 2,222 | 44 | |||
Mayr Melnhof Karton | 600 | 61 | |||
Oesterreichische Elektrizitaetswirtschafts, Cl A | 1,753 | 89 | |||
OMV | 60,971 | 2,457 | |||
Strabag | 6,871 | 222 | |||
Vienna Insurance Group | 5,259 | 300 | |||
| 4,824 | |||||
Belgium — 1.2% | |||||
Banque Nationale de Belgique | 3 | 15 | |||
Colruyt | 284 | 67 | |||
Delhaize Group | 83,306 | 5,777 | |||
Dexia | 265,396 | 2,444 | |||
D’ieteren | 375 | 138 | |||
Euronav | 2,720 | 58 | |||
Fortis | 114,367 | 535 | |||
Groupe Bruxelles Lambert | 15,172 | 1,400 | |||
InBev | 152,604 | 6,961 | |||
KBC Groep | 3,586 | 180 | |||
Mobistar | 326 | 22 | |||
Nationale A Portefeuille | 6,350 | 345 | |||
Solvay | 15,900 | 1,649 | |||
Telenet Group Holding | 27,791 | 733 | |||
UCB | 79,108 | 3,335 | |||
Umicore | 27,989 | 837 | |||
| 24,496 | |||||
| 1 | SEI Institutional International Trust / Annual Holdings / September 30, 2009 |
Table of Contents
Description | Shares | Market Value ($ Thousands) | |||
Brazil — 0.5% | |||||
Brasil Telecom Participacoes ADR | 29,600 | $ | 1,578 | ||
BRF - Brasil Foods* | 89,800 | 2,369 | |||
Centrais Eletricas Brasileiras ADR | 62,600 | 968 | |||
Cia de Saneamento Basico do Estado de Sao Paulo ADR | 38,600 | 1,464 | |||
Cia Energetica de Minas Gerais ADR | 157,350 | 2,392 | |||
Cyrela Brazil Realty | 74,200 | 966 | |||
Redecard | 74,800 | 1,150 | |||
Telegraph Norte Leste Participacoes ADR | 2,900 | 54 | |||
| 10,941 | |||||
Canada — 1.6% | |||||
Agrium | 70,000 | 3,485 | |||
Bank of Montreal | 17,700 | 893 | |||
Barrick Gold | 57,800 | 2,191 | |||
Canadian National Railway | 60,880 | 2,991 | |||
Canadian Natural Resources | 21,500 | 1,448 | |||
Cascades | 13,400 | 98 | |||
CGI Group, Cl A* | 4,700 | 55 | |||
EnCana | 82,590 | 4,760 | |||
Gildan Activewear* | 29,900 | 589 | |||
Goldcorp | 125,880 | 5,082 | |||
Husky Energy | 27,000 | 758 | |||
IAMGOLD | 65,076 | 917 | |||
Inmet Mining | 18,900 | 1,056 | |||
Kinross Gold | 114,000 | 2,474 | |||
Nexen | 0 | — | |||
Pacific Rubiales Energy*(A) | 58,500 | 723 | |||
QLT* | 10,800 | 40 | |||
Royal Bank of Canada | 11,500 | 617 | |||
Sino-Forest* | 162,900 | 2,567 | |||
Teck Cominco, Cl B | 45,400 | 1,248 | |||
TELUS, Cl A | 1 | — | |||
| 31,992 | |||||
Chile — 0.1% | |||||
Banco Santander Chile ADR | 23,200 | 1,335 | |||
Enersis ADR | 15,800 | 291 | |||
| 1,626 | |||||
China — 0.8% | |||||
Bank of China | 5,447,000 | 2,867 | |||
China Citic Bank | 286,000 | 189 | |||
China Life Insurance | 886,900 | 3,862 | |||
China Railway Group* | 2,078,000 | 1,786 | |||
Dongfeng Motor Group | 2,070,000 | 2,201 | |||
Industrial & Commercial Bank of China | 6,478,000 | 4,881 | |||
| 15,786 | |||||
Cyprus — 0.0% | |||||
Bank of Cyprus Public | 30,067 | 229 | |||
Denmark — 0.8% | |||||
A P Moller - Maersk, Cl A | 162 | 1,081 | |||
Carlsberg, Cl B | 68,628 | 4,965 | |||
Danisco | 11,102 | 673 | |||
Description | Shares | Market Value ($ Thousands) | |||
Danske Bank | 186,172 | $ | 4,871 | ||
Novo Nordisk, Cl B | 54,746 | 3,424 | |||
Novozymes, Cl B | 595 | 56 | |||
Sydbank | 8,916 | 233 | |||
Topdanmark* | 3,655 | 552 | |||
Vestas Wind Systems* | 716 | 52 | |||
William Demant Holding* | 6,949 | 516 | |||
| 16,423 | |||||
Finland — 0.7% | |||||
Citycon | 70,439 | 299 | |||
Fortum | 5,227 | 134 | |||
Huhtamaki | 19,572 | 249 | |||
Kesko, Cl B | 7,958 | 266 | |||
Kone, Cl B | 124,936 | 4,587 | |||
Metso | 7,297 | 205 | |||
Nokia | 97,826 | 1,437 | |||
Nokian Renkaat | 6,031 | 140 | |||
Outokumpu | 24,966 | 469 | |||
Rautaruukki | 8,411 | 202 | |||
Sampo, Cl A | 119,210 | 2,999 | |||
Sanoma* | 5,388 | 119 | |||
Stora Enso, Cl R | 221,271 | 1,540 | |||
UPM-Kymmene | 35,557 | 426 | |||
Wartsila, Cl B | 54,997 | 2,201 | |||
| 15,273 | |||||
France — 6.8% | |||||
Accor | 48,952 | 2,722 | |||
Aeroports de Paris(A) | 2,927 | 263 | |||
Air France-KLM(A) | 36,000 | 654 | |||
Air Liquide | 2,187 | 249 | |||
Alcatel-Lucent(A) | 86,283 | 386 | |||
Alstom(A) | 34,858 | 2,541 | |||
Arkema(A) | 16,054 | 565 | |||
Atos Origin | 6,804 | 343 | |||
AXA(A) | 93,125 | 2,518 | |||
BNP Paribas(A) | 180,227 | 14,384 | |||
Bouygues(A) | 39,915 | 2,027 | |||
Capital Gemini(A) | 33,794 | 1,768 | |||
Carrefour | 6,900 | 313 | |||
Casino Guichard Perrachon(A) | 7,635 | 605 | |||
Christian Dior(A) | 16,363 | 1,614 | |||
Cie Generale d’Optique Essilor International | 6,731 | 383 | |||
Ciments Francais(A) | 953 | 107 | |||
Club Mediterranee* | 6,051 | 143 | |||
CNP Assurances(A) | 29,664 | 3,019 | |||
Compagnie Generale des Etablissements Michelin, Cl B | 21,141 | 1,657 | |||
Credit Agricole | 50,444 | 1,053 | |||
Dassault Systemes(A) | 3,493 | 194 | |||
EDF | 44,048 | 2,610 | |||
Eiffage(A) | 10,821 | 689 | |||
Eutelsat Communications | 49,631 | 1,507 | |||
Fonciere Des Regions(B) | 5,118 | 595 | |||
France Telecom(A) | 283,123 | 7,534 | |||
GDF Suez | 13,127 | 582 | |||
Gecina(B) | 5,105 | 608 | |||
Gemalto*(A) | 15,609 | 727 | |||
Groupe Steria SCA | 3,103 | 110 | |||
Havas(A) | 135,416 | 574 | |||
| SEI Institutional International Trust / Annual Holdings / September 30, 2009 | 2 |
Table of Contents
SCHEDULE OF INVESTMENTS
International Equity Fund
September 30, 2009
Description | Shares | Market Value ($ Thousands) | |||
Hermes International(A) | 1,098 | $ | 162 | ||
ICADE(A)(B) | 1,819 | 195 | |||
Iliad | 2,585 | 291 | |||
Ipsen(A) | 2,105 | 115 | |||
Klepierre(B) | 2,926 | 116 | |||
Lafarge(A) | 22,159 | 1,981 | |||
Legrand(A) | 11,985 | 333 | |||
LVMH Moet Hennessy Louis Vuitton(A) | 6,259 | 629 | |||
Metropole Television(A) | 33,234 | 873 | |||
Natixis(A) | 30,250 | 182 | |||
Neopost | 4,270 | 383 | |||
Nexity(A) | 5,180 | 206 | |||
Peugeot(A) | 49,062 | 1,494 | |||
PPR(A) | 48,404 | 6,197 | |||
Publicis Groupe(A) | 74,055 | 2,967 | |||
Safran | 84,110 | 1,574 | |||
Sanofi-Aventis | 336,731 | 24,684 | |||
Schneider Electric(A) | 13,424 | 1,359 | |||
SCOR(A) | 52,262 | 1,427 | |||
SES | 55,800 | 1,264 | |||
Societe BIC | 1,703 | 121 | |||
Societe Des Autoroutes Paris- Rhin-Rhone | 3,467 | 264 | |||
Societe Generale | 156,768 | 12,603 | |||
Sodexho Alliance(A) | 2,622 | 157 | |||
Technip | 74,754 | 4,770 | |||
Thales(A) | 1,307 | 65 | |||
Total(A) | 224,102 | 13,301 | |||
Unibail(A)(B) | 16,401 | 3,403 | |||
Valeo(A) | 33,564 | 882 | |||
Veolia Environnement(A) | 6,669 | 255 | |||
Vinci | 49,523 | 2,799 | |||
Vivendi | 65,826 | 2,035 | |||
Zodiac Aerospace(A) | 5,608 | 222 | |||
| 140,353 | |||||
Germany — 6.6% | |||||
Aixtron | 58,318 | 1,587 | |||
Allianz | 95,443 | 11,910 | |||
BASF | 151,323 | 8,009 | |||
Bayer | 158,633 | 10,979 | |||
Bayerische Motoren Werke | 152,660 | 7,353 | |||
Bilfinger Berger | 8,000 | 553 | |||
Continental | 839 | 45 | |||
DaimlerChrysler | 149,452 | 7,516 | |||
Deutsche Bank | 123,995 | 9,505 | |||
Deutsche Boerse | 27,465 | 2,242 | |||
Deutsche Lufthansa | 303,254 | 5,368 | |||
Deutsche Post | 312,082 | 5,839 | |||
Deutsche Postbank | 4,965 | 175 | |||
Deutsche Telekom | 58,952 | 804 | |||
E.ON | 215,684 | 9,137 | |||
GAGFAH | 39,114 | 433 | |||
Hannover Rueckversicherung | 121,697 | 5,573 | |||
HeidelbergCement | 38,509 | 2,490 | |||
Henkel KGaA | 3,413 | 124 | |||
Hochtief | 24,638 | 1,875 | |||
Infineon Technologies* | 326,793 | 1,842 | |||
Lanxess | 592 | 20 | |||
Linde | 10,922 | 1,183 | |||
MAN | 2,984 | 246 | |||
Description | Shares | Market Value ($ Thousands) | |||
Merck KGaA | 2,768 | $ | 275 | ||
Metro | 7,166 | 405 | |||
MTU Aero Engines Holding | 11,480 | 543 | |||
Muenchener Rueckversicherungs | 37,088 | 5,911 | |||
RWE | 74,114 | 6,876 | |||
Salzgitter | 521 | 50 | |||
SAP | 112,023 | 5,449 | |||
Siemens | 179,896 | 16,640 | |||
Software | 996 | 84 | |||
Suedzucker | 76,147 | 1,542 | |||
ThyssenKrupp | 16,626 | 572 | |||
Tipp24 | 1,677 | 63 | |||
TUI | 167,608 | 1,727 | |||
United Internet | 76,035 | 1,146 | |||
Volkswagen(A) | 3,739 | 614 | |||
Wacker Chemie | 404 | 63 | |||
| 136,768 | |||||
Greece — 0.7% | |||||
Alpha Bank AE | 118,377 | 2,180 | |||
Coca Cola Hellenic Bottling | 33,301 | 885 | |||
EFG Eurobank Ergasias* | 8,659 | 136 | |||
Marfin Investment Group | 74,930 | 322 | |||
National Bank of Greece | 92,247 | 3,304 | |||
OPAP | 45,562 | 1,174 | |||
Piraeus Bank* | 26,496 | 491 | |||
Public Power | 274,505 | 6,103 | |||
Titan Cement | 4,440 | 153 | |||
| 14,748 | |||||
Hong Kong — 3.2% | |||||
ASM Pacific Technology | 30,900 | 219 | |||
Bank of East Asia | 108,600 | 392 | |||
BOC Hong Kong Holdings | 2,702,200 | 5,927 | |||
Cathay Pacific Airways(A) | 220,000 | 347 | |||
Champion Technology Holdings | 942,000 | 33 | |||
Cheung Kong Holdings | 146,000 | 1,853 | |||
China Overseas Land & Investment | 1,424,000 | 3,080 | |||
China Sci-Tech Holdings* | 2,272,000 | 70 | |||
Chinese Estates Holdings | 186,500 | 315 | |||
CLP Holdings | 358,500 | 2,433 | |||
Dairy Farm International Holdings | 12,500 | 75 | |||
Dickson Concepts International | 145,000 | 71 | |||
DMX Technologies Group* | 475,000 | 160 | |||
Esprit Holdings | 463,000 | 3,107 | |||
First Pacific | 293,000 | 196 | |||
Geely Automobile Holdings(A) | 450,000 | 123 | |||
Genting Singapore*(A) | 1,720,000 | 1,367 | |||
Guoco Group | 5,000 | 53 | |||
Hang Lung Group | 151,000 | 756 | |||
Hang Lung Properties | 627,000 | 2,310 | |||
Hang Seng Bank | 92,400 | 1,332 | |||
Henderson Land Development | 124,000 | 816 | |||
Hengan International Group | 136,000 | 822 | |||
Hong Kong & China Gas | 57,000 | 144 | |||
Hong Kong Exchanges and Clearing | 196,800 | 3,568 | |||
Hongkong & Shanghai Hotels | 7,000 | 9 | |||
HongKong Electric Holdings | 60,000 | 329 | |||
Hongkong Land Holdings | 227,000 | 987 | |||
Hopewell Holdings | 228,000 | 716 | |||
| 3 | SEI Institutional International Trust / Annual Holdings / September 30, 2009 |
Table of Contents
Description | Shares | Market Value ($ Thousands) | |||
Huabao International Holdings | 2,744,000 | $ | 2,942 | ||
Hutchison Harbour Ring | 506,000 | 37 | |||
Hutchison Telecommunications Hong Kong Holdings | 802,000 | 135 | |||
Hutchison Telecommunications International | 802,000 | 166 | |||
Hutchison Whampoa | 439,300 | 3,171 | |||
Hysan Development | 301,000 | 754 | |||
Jardine Matheson Holdings | 26,400 | 803 | |||
Jardine Strategic Holdings(A) | 25,000 | 424 | |||
Kerry Properties | 129,000 | 690 | |||
Lai Sun Development* | 3,850,000 | 64 | |||
Li & Fung | 62,000 | 250 | |||
Lifestyle International Holdings | 28,500 | 43 | |||
Link REIT(B) | 61,000 | 134 | |||
MTR(A) | 127,500 | 443 | |||
New World Development | 1,160,000 | 2,497 | |||
Noble Group(A) | 1,231,000 | 2,140 | |||
Orient Overseas International(A) | 17,500 | 89 | |||
Pacific Basin Shipping | 165,000 | 109 | |||
Pacific Century Premium Developments | 326,000 | 87 | |||
RCG Holdings* | 42,943 | 57 | |||
SIM Technology Group | 424,000 | 45 | |||
Sino Land | 150,000 | 269 | |||
Sun Hung Kai Properties | 857,000 | 12,628 | |||
Swire Pacific, Cl A | 97,000 | 1,140 | |||
Television Broadcasts | 44,000 | 190 | |||
Texwinca Holdings | 4,000 | 3 | |||
VTech Holdings | 56,000 | 482 | |||
Wharf Holdings | 628,000 | 3,335 | |||
Wheelock | 62,000 | 203 | |||
Wing Hang Bank | 11,000 | 108 | |||
Yue Yuen Industrial Holdings | 291,690 | 809 | |||
| 65,857 | |||||
India — 0.7% | |||||
Bharti Airtel | 205,090 | 1,785 | |||
HDFC Bank | 87,580 | 3,005 | |||
Infosys Technologies | 42,830 | 2,053 | |||
Larsen & Toubro | 59,790 | 2,100 | |||
Reliance Industries GDR*(C) | 27,309 | 2,515 | |||
State Bank of India GDR | 5,794 | 527 | |||
Sterlite Industries India | 107,100 | 1,728 | |||
| 13,713 | |||||
Indonesia — 0.1% | |||||
Astra International | 345,500 | 1,192 | |||
Indo Tambangraya Megah | 483,500 | 1,213 | |||
| 2,405 | |||||
Ireland — 0.3% | |||||
CRH | 58,587 | 1,619 | |||
DCC | 3,000 | 77 | |||
Experian | 182,339 | 1,535 | |||
Irish Life & Permanent | 70,230 | 577 | |||
Kerry Group, Cl A | 2,366 | 68 | |||
Ryanair Holdings ADR* | 79,700 | 2,315 | |||
| 6,191 | |||||
Description | Shares | Market Value ($ Thousands) | |||
Israel — 0.3% | |||||
Check Point Software Technologies* | 43,080 | $ | 1,222 | ||
Teva Pharmaceutical Industries ADR | 116,400 | 5,885 | |||
| 7,107 | |||||
Italy — 2.6% | |||||
ACEA | 53,887 | 705 | |||
Alleanza Assicurazioni | 4,059 | 37 | |||
Amplifon | 37,257 | 150 | |||
Atlantia | 73,823 | 1,788 | |||
Autogrill | 1,987 | 24 | |||
Banca Carige | 46,459 | 138 | |||
Banca Monte dei Paschi di Siena | 321,734 | 687 | |||
Banca Popolare di Milano Scarl | 59,714 | 454 | |||
Benetton Group | 33,254 | 336 | |||
CIR-Compagnie Industriali Riunite | 19,575 | 44 | |||
Edison | 241,666 | 419 | |||
Enel | 1,586,211 | 10,057 | |||
Engineering Ingegneria Informatica* | 2,148 | 76 | |||
ENI | 293,467 | 7,327 | |||
Exor | 6,310 | 117 | |||
Fastweb* | 160 | 4 | |||
Fiat | 94,711 | 1,217 | |||
Finmeccanica | 87,700 | 1,549 | |||
Intesa Sanpaolo | 1,656,301 | 7,050 | |||
Iride | 29,209 | 57 | |||
Italcementi | 40,495 | 623 | |||
Luxottica Group | 2,499 | 65 | |||
Maire Tecnimont | 30,916 | 150 | |||
Mediaset | 74,864 | 523 | |||
Mediobanca | 100,626 | 1,374 | |||
Mediolanum | 46,957 | 326 | |||
Milano Assicurazioni | 87,809 | 311 | |||
Parmalat | 375,927 | 1,038 | |||
Piccolo Credito Valtellinese Scarl | 14,987 | 154 | |||
Pirelli & C | 161,203 | 86 | |||
Saipem | 5,901 | 177 | |||
Saras | 981,080 | 3,782 | |||
Snam Rete Gas | 10,801 | 52 | |||
Societa Iniziative Autostradali e Servizi | 4,913 | 43 | |||
Telecom Italia | 4,908,964 | 8,035 | |||
Terna Rete Elettrica Nazionale | 283,190 | 1,103 | |||
UniCredito Italiano | 958,712 | 3,742 | |||
Unipol Gruppo Finanziario | 241,523 | 366 | |||
| 54,186 | |||||
Japan — 18.6% | |||||
77 Bank | 87,000 | 498 | |||
Aderans | 1,500 | 21 | |||
Advantest | 4,800 | 133 | |||
Aeon | 81,800 | 785 | |||
Aeon Credit Service | 6,800 | 69 | |||
Aichi Bank | 1,200 | 108 | |||
Aida Engineering(A) | 6,000 | 20 | |||
Aioi Insurance | 28,000 | 143 | |||
Aisan Industry | 5,700 | 41 | |||
Aisin Seiki | 50,400 | 1,233 | |||
| SEI Institutional International Trust / Annual Holdings / September 30, 2009 | 4 |
Table of Contents
SCHEDULE OF INVESTMENTS
International Equity Fund
September 30, 2009
Description | Shares | Market Value ($ Thousands) | |||
Ajinomoto | 90,000 | $ | 904 | ||
Alfresa Holdings(A) | 5,400 | 221 | |||
Alpen | 4,100 | 75 | |||
Alpine Electronics | 29,700 | 279 | |||
Alps Electric | 95,600 | 553 | |||
Amada | 113,000 | 762 | |||
AOKI Holdings | 3,800 | 43 | |||
Aoyama Trading | 11,600 | 200 | |||
Arnest One | 9,500 | 87 | |||
Asahi Breweries | 65,700 | 1,205 | |||
Asahi Glass | 655,000 | 5,304 | |||
Asahi Kasei | 170,000 | 868 | |||
Asics | 20,000 | 187 | |||
Asset Managers Holdings | 760 | 69 | |||
Astellas Pharma | 197,500 | 8,140 | |||
Bank of Kyoto | 20,000 | 184 | |||
Bank of Nagoya | 19,000 | 82 | |||
Belluna | 5,200 | 22 | |||
Benesse | 45,600 | 2,241 | |||
Best Denki | 8,000 | 38 | |||
BML | 2,400 | 70 | |||
Bridgestone | 34,000 | 612 | |||
Canon | 350,800 | 14,222 | |||
Canon Finetech | 1,000 | 13 | |||
Canon Marketing Japan | 63,500 | 1,127 | |||
Casio Computer | 25,500 | 209 | |||
Cawachi | 3,100 | 71 | |||
Central Japan Railway | 293 | 2,111 | |||
Century Tokyo Leasing | 15,700 | 172 | |||
Chiba Bank | 200,000 | 1,242 | |||
Chiba Kogyo Bank* | 5,500 | 45 | |||
Chubu Electric Power | 400 | 10 | |||
Chuetsu Pulp & Paper | 18,000 | 44 | |||
Chugai Pharmaceutical | 69,500 | 1,441 | |||
Chugoku Bank | 5,000 | 63 | |||
Chuo Denki Kogyo | 10,000 | 80 | |||
Circle K Sunkus | 9,200 | 139 | |||
Coca-Cola Central Japan | 9,100 | 127 | |||
Corona | 1,900 | 26 | |||
Cosmo Oil | 427,000 | 1,192 | |||
CREATE SD HOLDINGS | 2,000 | 46 | |||
Crescendo Investment, Cl A(B) | 22 | 34 | |||
Dai Nippon Printing | 182,000 | 2,512 | |||
Daicel Chemical Industries | 318,000 | 1,925 | |||
Daihatsu Motor | 86,000 | 881 | |||
Daiichi Sankyo | 128,000 | 2,649 | |||
Daiichikosho | 19,100 | 246 | |||
Daikin Industries | 1,900 | 69 | |||
Daikoku Denki | 2,600 | 59 | |||
Daimei Telecom Engineering | 2,000 | 20 | |||
Dainippon Ink and Chemicals | 101,000 | 144 | |||
Dainippon Screen Manufacturing | 194,000 | 737 | |||
Dainippon Sumitomo Pharma | 95,400 | 1,043 | |||
Daishi Bank | 36,000 | 146 | |||
Daito Trust Construction | 1,100 | 48 | |||
Daiwa House Industry | 132,000 | 1,386 | |||
Daiwa Securities Group | 719,000 | 3,718 | |||
DCM Japan Holdings | 17,000 | 116 | |||
Denki Kagaku Kogyo | 122,000 | 504 | |||
Denso | 156,300 | 4,609 | |||
Dentsu(A) | 49,500 | 1,155 | |||
Dowa Mining | 3,000 | 18 | |||
Description | Shares | Market Value ($ Thousands) | |||
Duskin | 3,900 | $ | 73 | ||
eAccess | 35 | 25 | |||
East Japan Railway | 120,500 | 8,694 | |||
Eisai | 2,600 | 98 | |||
Electric Power Development | 18,500 | 588 | |||
Elpida Memory* | 7,800 | 103 | |||
FamilyMart | 10,900 | 352 | |||
Fancl*(C) | 1,300 | 21 | |||
Fanuc(A) | 41,200 | 3,704 | |||
Fast Retailing | 15,200 | 1,929 | |||
Fuji Film Holdings | 105,600 | 3,173 | |||
Fuji Heavy Industries | 100,000 | 390 | |||
Fuji Media Holdings | 1,586 | 2,604 | |||
Fujikura | 18,000 | 88 | |||
Fujishoji | 42 | 57 | |||
Fujitec | 6,000 | 34 | |||
Fujitsu | 819,000 | 5,369 | |||
Fukuda Denshi | 300 | 9 | |||
Fukuoka Financial Group | 398,000 | 1,658 | |||
Furuno Electric | 3,500 | 20 | |||
Goldwin* | 28,000 | 60 | |||
GS Yuasa(A) | 62,000 | 568 | |||
H2O Retailing(A) | 18,000 | 113 | |||
Hachijuni Bank | 39,000 | 218 | |||
Hakuhodo DY Holdings | 8,250 | 451 | |||
Heiwa | 23,000 | 254 | |||
Heiwado | 6,200 | 86 | |||
Higashi-Nippon Bank | 19,000 | 40 | |||
Higo Bank | 17,000 | 101 | |||
Hikari Tsushin | 1,700 | 37 | |||
HI-LEX | 4,600 | 44 | |||
Hino Motors | 566,000 | 2,156 | |||
Hirose Electric | 1,900 | 215 | |||
Hiroshima Bank | 19,000 | 79 | |||
Hisamitsu Pharmaceutical | 3,400 | 138 | |||
Hitachi | 341,000 | 1,051 | |||
Hitachi Cable | 72,000 | 211 | |||
Hitachi Chemical | 14,600 | 299 | |||
Hitachi Metals | 10,000 | 103 | |||
Hokuhoku Financial Group | 205,000 | 481 | |||
Honda Motor | 541,900 | 16,735 | |||
Hosiden | 21,900 | 298 | |||
House Foods | 10,200 | 171 | |||
Hoya | 10,800 | 256 | |||
Hyakugo Bank | 28,000 | 144 | |||
Hyakujushi Bank | 24,000 | 109 | |||
Ibiden | 37,600 | 1,403 | |||
Idemitsu Kosan | 9,300 | 770 | |||
IHI | 163,000 | 331 | |||
Inabata | 9,100 | 38 | |||
Inpex Holdings | 3 | 26 | |||
Isetan Mitsukoshi Holdings(A) | 56,200 | 647 | |||
Isuzu Motors | 19,000 | 40 | |||
IT Holdings | 6,900 | 95 | |||
Ito En | 3,700 | 69 | |||
Itochu | 433,000 | 2,877 | |||
Itochu Enex | 28,900 | 169 | |||
Itochu Techno-Solutions | 6,400 | 198 | |||
Itochu-Shokuhin | 1,300 | 46 | |||
Izumiya | 8,000 | 44 | |||
J Front Retailing | 20,000 | 121 | |||
Japan Digital Laboratory | 500 | 7 | |||
| 5 | SEI Institutional International Trust / Annual Holdings / September 30, 2009 |
Table of Contents
Description | Shares | Market Value ($ Thousands) | |||
Japan Petroleum Exploration | 1,300 | $ | 66 | ||
Japan Prime Realty Investment, Cl A(B) | 15 | 37 | |||
Japan Retail Fund Investment, Cl A(B) | 33 | 179 | |||
Japan Steel Works(A) | 17,360 | 200 | |||
Japan Tobacco | 2,057 | 7,076 | |||
JFE Holdings | 144,600 | 4,974 | |||
JFE Shoji Holdings | 26,000 | 95 | |||
JGC | 9,000 | 185 | |||
Joyo Bank | 9,000 | 44 | |||
JS Group | 15,500 | 273 | |||
JSR | 44,500 | 915 | |||
Jupiter Telecommunications | 1,153 | 1,118 | |||
Kagawa Bank | 7,000 | 28 | |||
Kagoshima Bank | 5,000 | 40 | |||
Kajima | 23,000 | 59 | |||
Kamigumi | 115,000 | 941 | |||
Kaneka | 133,000 | 958 | |||
Kansai Electric Power | 91,100 | 2,208 | |||
Kansai Paint | 37,000 | 289 | |||
Kanto Auto Works | 4,600 | 46 | |||
Kanto Natural Gas Development | 6,000 | 42 | |||
Kato Sangyo | 900 | 15 | |||
Kawasaki Heavy Industries(A) | 176,000 | 448 | |||
KDDI | 606 | 3,425 | |||
Keihin Electric Express Railway | 4,000 | 34 | |||
Keio | 78,000 | 534 | |||
Keisei Electric Railway | 53,000 | 353 | |||
Keyence | 1,000 | 214 | |||
Kikkoman | 25,000 | 312 | |||
Kinden | 21,000 | 176 | |||
Kintetsu(A) | 82,000 | 318 | |||
Kirin Brewery | 217,000 | 3,335 | |||
Kobe Steel | 4,000 | 7 | |||
Kohnan Shoji | 3,500 | 40 | |||
Konica Minolta Holdings | 64,500 | 613 | |||
Kose | 5,900 | 144 | |||
K’s Holdings | 5,700 | 192 | |||
Kubota | 280,000 | 2,336 | |||
Kuraray | 105,000 | 1,149 | |||
Kurita Water Industries | 600 | 22 | |||
Kyocera | 38,200 | 3,554 | |||
Kyoei Steel | 7,400 | 178 | |||
Kyorin | 39,000 | 664 | |||
Kyowa Hakko Kirin | 88,000 | 1,118 | |||
Kyudenko | 9,000 | 57 | |||
Kyushu Electric Power | 39,800 | 905 | |||
Lintec | 5,000 | 95 | |||
Mabuchi Motor | 8,800 | 449 | |||
Maeda | 19,000 | 61 | |||
Maeda Road Construction | 7,000 | 63 | |||
Makino Milling Machine | 11,000 | 43 | |||
Makita | 1,000 | 32 | |||
Marubeni | 621,000 | 3,142 | |||
Marudai Food | 14,000 | 44 | |||
Marui | 58,200 | 418 | |||
Maruzen Showa Unyu | 9,000 | 31 | |||
Matsui Securities(A) | 25,300 | 207 | |||
Matsumotokiyoshi Holdings | 6,400 | 160 | |||
Matsushita Electric Industrial | 223,500 | 3,303 | |||
Matsushita Electric Works | 20,000 | 240 | |||
Description | Shares | Market Value ($ Thousands) | |||
Maxvalu Nishinihon | 2,300 | $ | 35 | ||
Mazda Motor | 380,000 | 853 | |||
McDonald’s Holdings Japan | 3,400 | 68 | |||
Mediceo Paltac Holdings | 53,900 | 760 | |||
MEIJI Holdings | 7,700 | 329 | |||
Mie Bank | 18,000 | 60 | |||
Mikuni Coca-Cola Bottling | 3,400 | 30 | |||
Millea Holdings | 64,700 | 1,879 | |||
Minebea | 24,000 | 110 | |||
Ministop | 8,000 | 127 | |||
Miraca Holdings | 38,400 | 1,257 | |||
Mitsubishi | 622,300 | 12,622 | |||
Mitsubishi Chemical Holdings | 158,000 | 658 | |||
Mitsubishi Electric | 257,000 | 1,952 | |||
Mitsubishi Estate | 91,000 | 1,435 | |||
Mitsubishi Gas Chemical | 126,000 | 687 | |||
Mitsubishi Logistics | 3,000 | 36 | |||
Mitsubishi Materials | 69,000 | 191 | |||
Mitsubishi Motors*(A) | 351,000 | 580 | |||
Mitsubishi Rayon | 49,000 | 169 | |||
Mitsubishi Steel Manufacturing | 39,000 | 80 | |||
Mitsubishi UFJ Financial Group | 1,009,100 | 5,432 | |||
Mitsubishi UFJ Lease & Finance | 6,950 | 210 | |||
Mitsui | 259,800 | 3,407 | |||
Mitsui Chemicals | 65,000 | 232 | |||
Mitsui Engineering & Shipbuilding(A) | 161,000 | 419 | |||
Mitsui Fudosan | 2,000 | 34 | |||
Mitsui Home | 9,000 | 52 | |||
Mitsui Mining & Smelting | 112,000 | 288 | |||
Mitsui Sumitomo Insurance Group Holdings | 41,100 | 1,136 | |||
Mitsumi Electric | 35,400 | 766 | |||
Mizuho Financial Group | 62,200 | 124 | |||
Morinaga Milk Industry | 61,000 | 305 | |||
Murata Manufacturing | 63,100 | 3,002 | |||
Nafco | 3,700 | 69 | |||
Nagase | 19,000 | 236 | |||
Nakanishi | 400 | 35 | |||
Namco Bandai Holdings(A) | 31,100 | 319 | |||
NEC(A) | 1,280,000 | 4,031 | |||
NEC Fielding | 600 | 9 | |||
NEC Networks & System Integration | 15,800 | 216 | |||
NET One Systems | 48 | 72 | |||
NGK Insulators | 47,000 | 1,092 | |||
NGK Spark Plug | 5,000 | 64 | |||
NHK Spring | 69,000 | 571 | |||
Nichii Gakkan | 700 | 7 | |||
Nidec | 24,000 | 1,954 | |||
Nintendo | 17,000 | 4,367 | |||
Nippon Beet Sugar Manufacturing | 4,000 | 11 | |||
Nippon Building Fund, Cl A(B) | 11 | 98 | |||
Nippon Densetsu Kogyo | 18,000 | 170 | |||
Nippon Electric Glass | 280,000 | 2,561 | |||
Nippon Express | 61,000 | 249 | |||
Nippon Flour Mills | 8,000 | 44 | |||
Nippon Konpo Unyu Soko | 6,000 | 72 | |||
Nippon Meat Packers | 30,000 | 387 | |||
Nippon Mining Holdings | 763,500 | 3,769 | |||
Nippon Oil | 557,000 | 3,135 | |||
Nippon Paper Group(A) | 17,800 | 515 | |||
| SEI Institutional International Trust / Annual Holdings / September 30, 2009 | 6 |
Table of Contents
SCHEDULE OF INVESTMENTS
International Equity Fund
September 30, 2009
Description | Shares | Market Value ($ Thousands) | |||
Nippon Seiki | 5,000 | $ | 57 | ||
Nippon Soda | 90,000 | 381 | |||
Nippon Steel | 47,000 | 172 | |||
Nippon Steel Trading | 7,000 | 12 | |||
Nippon Telegraph & Telephone | 221,800 | 10,305 | |||
Nipponkoa Insurance | 91,000 | 571 | |||
Nipro | 4,600 | 108 | |||
Nishi-Nippon City Bank | 133,000 | 337 | |||
Nissan Chemical Industries | 25,000 | 361 | |||
Nissan Motor | 1,213,900 | 8,230 | |||
Nissan Shatai | 6,000 | 48 | |||
Nisshin Seifun Group | 8,000 | 112 | |||
Nisshin Steel | 57,000 | 102 | |||
Nisshinbo Industries | 42,000 | 448 | |||
Nissin Healthcare Food Service | 100 | 1 | |||
Nitori | 26,611 | 2,274 | |||
Nitto Denko | 23,600 | 725 | |||
NOK | 19,900 | 297 | |||
Nomura Real Estate Office Fund, Cl A(B) | 7 | 47 | |||
Nomura Research Institute | 8,900 | 212 | |||
Noritake | 1,000 | 3 | |||
Noritsu Koki | 6,500 | 59 | |||
Noritz | 200 | 3 | |||
NTT Data | 200 | 642 | |||
NTT DoCoMo | 2,998 | 4,802 | |||
Obic | 1,010 | 171 | |||
Odakyu Electric Railway | 50,000 | 452 | |||
Ohsho Food Service | 5,000 | 151 | |||
OJI Paper | 28,000 | 127 | |||
Okaya | 500 | 5 | |||
Okumura | 7,000 | 26 | |||
Okuwa | 5,000 | 55 | |||
Omron | 34,200 | 647 | |||
Ono Pharmaceutical | 12,700 | 662 | |||
Onward Holdings(A) | 29,000 | 216 | |||
ORIX | 10,900 | 667 | |||
Osaka Gas | 442,000 | 1,555 | |||
Osaka Steel | 9,100 | 160 | |||
Pioneer | 20,400 | 49 | |||
Plenus | 100 | 1 | |||
QP | 13,600 | 156 | |||
Raito Kogyo | 26,000 | 61 | |||
Rakuten | 4,075 | 2,722 | |||
Resona Holdings | 59,100 | 762 | |||
Ricoh | 37,000 | 541 | |||
Ricoh Leasing | 3,100 | 68 | |||
Rinnai | 3,500 | 166 | |||
Rohm | 44,500 | 3,121 | |||
Roland | 2,200 | 25 | |||
San-Ai Oil | 8,000 | 40 | |||
San-In Godo Bank | 17,000 | 145 | |||
Sanki Engineering | 26,000 | 219 | |||
Sankyo | 11,200 | 703 | |||
Santen Pharmaceutical | 21,800 | 803 | |||
Sanyo Chemical Industries | 9,000 | 53 | |||
Sanyo Electric*(A) | 166,000 | 395 | |||
Sapporo Hokuyo Holdings | 258,900 | 922 | |||
Sawai Pharmaceutical(A) | 1,900 | 110 | |||
Sazaby League | 1,700 | 26 | |||
SBI Holdings | 2,044 | 405 | |||
Secom | 25,900 | 1,308 | |||
Description | Shares | Market Value ($ Thousands) | |||
Sega Sammy Holdings | 21,900 | $ | 286 | ||
Seiko Epson(A) | 37,100 | 558 | |||
Seino Transportation | 62,000 | 538 | |||
Sekisui Chemical | 9,000 | 52 | |||
Sekisui House | 46,000 | 416 | |||
Seven & I Holdings | 77,000 | 1,849 | |||
Sharp | 189,000 | 2,107 | |||
Shikoku Electric Power | 2,000 | 61 | |||
Shimamura | 2,700 | 266 | |||
Shimano | 4,700 | 204 | |||
Shin-Etsu Chemical | 54,100 | 3,335 | |||
Shinko Electric Industries | 68,800 | 1,229 | |||
Shinko Securities | 141,000 | 515 | |||
Shinmaywa Industries | 18,000 | 71 | |||
Shinsei Bank(A) | 785,000 | 1,210 | |||
Shionogi | 174,000 | 4,130 | |||
Shizuoka Bank | 10,000 | 106 | |||
Showa | 3,000 | 18 | |||
Showa Shell Sekiyu | 38,600 | 423 | |||
Sinanen | 2,000 | 11 | |||
Sintokogio | 16,500 | 126 | |||
SMC | 1,500 | 185 | |||
Softbank | 18,800 | 414 | |||
Sohgo Security Services | 5,400 | 64 | |||
Sojitz | 51,100 | 98 | |||
Sony | 206,100 | 6,112 | |||
SRI Sports | 29 | 29 | |||
Stanley Electric | 76,500 | 1,555 | |||
Sumco | 27,200 | 620 | |||
Sumikin Bussan | 21,000 | 48 | |||
Sumisho Computer Systems | 300 | 5 | |||
Sumitomo | 218,000 | 2,252 | |||
Sumitomo Chemical | 189,000 | 789 | |||
Sumitomo Electric Industries | 330,500 | 4,334 | |||
Sumitomo Metal Mining | 136,000 | 2,239 | |||
Sumitomo Mitsui Financial Group(A) | 236,800 | 8,278 | |||
Sumitomo Realty & Development | 5,000 | 92 | |||
Sumitomo Rubber Industries | 17,600 | 166 | |||
Sumitomo Trust & Banking | 11,000 | 59 | |||
Suzuken | 12,500 | 433 | |||
Suzuki Motor | 67,100 | 1,570 | |||
T&D Holdings | 21,650 | 588 | |||
Tadano | 13,000 | 64 | |||
Taiheiyo Cement | 43,000 | 58 | |||
Taisei | 22,000 | 44 | |||
Taisho Pharmaceutical | 26,000 | 527 | |||
Taiyo Nippon Sanso | 57,000 | 681 | |||
Taiyo Yuden | 47,300 | 559 | |||
Takashimaya | 27,000 | 217 | |||
Takeda Pharmaceutical | 77,600 | 3,241 | |||
Takeuchi Manufacturing | 100 | 1 | |||
Tanabe Seiyaku | 6,000 | 80 | |||
TDK | 37,100 | 2,151 | |||
Teijin | 173,000 | 541 | |||
Temp Holdings | 1,200 | 11 | |||
Terumo | 13,400 | 739 | |||
THK | 9,300 | 183 | |||
TKC | 2,700 | 59 | |||
Tobu Railway | 65,000 | 398 | |||
Toda | 14,000 | 50 | |||
Toho Holdings | 7,800 | 108 | |||
| 7 | SEI Institutional International Trust / Annual Holdings / September 30, 2009 |
Table of Contents
Description | Shares | Market Value ($ Thousands) | |||
Tohokushinsha Film | 5,200 | $ | 30 | ||
Tokyo Electric Power | 44,900 | 1,181 | |||
Tokyo Electron | 24,700 | 1,581 | |||
Tokyo Energy & Systems | 6,000 | 49 | |||
Tokyo Steel Manufacturing | 102,195 | 1,256 | |||
Tokyo Style | 5,000 | 43 | |||
Tokyo Tatemono | 22,000 | 108 | |||
Tokyo Tekko | 24,000 | 83 | |||
Tokyu | 26,000 | 125 | |||
Tokyu Land | 44,000 | 176 | |||
TonenGeneral Sekiyu | 34,000 | 333 | |||
Toppan Forms | 2,400 | 33 | |||
Toppan Printing | 318,000 | 3,019 | |||
Topre | 700 | 7 | |||
Topy Industries | 10,615 | 23 | |||
Toray Industries | 7,000 | 43 | |||
Toshiba | 738,000 | 3,882 | |||
Toshiba TEC | 74,000 | 347 | |||
Tosoh | 57,000 | 145 | |||
Totetsu Kogyo | 9,000 | 64 | |||
TOTO(A) | 10,000 | 63 | |||
Toyo Kohan | 10,000 | 44 | |||
Toyo Securities | 37,000 | 77 | |||
Toyo Seikan Kaisha | 44,300 | 854 | |||
Toyo Suisan Kaisha | 41,000 | 1,113 | |||
Toyo Tire & Rubber | 29,000 | 70 | |||
Toyoda Gosei | 14,200 | 416 | |||
Toyota Boshoku(A) | 10,300 | 204 | |||
Toyota Industries | 33,100 | 911 | |||
Toyota Motor | 224,100 | 8,935 | |||
Toyota Tsusho | 80,600 | 1,219 | |||
Trend Micro | 6,800 | 254 | |||
Tsumura | 3,100 | 112 | |||
TV Asahi | 91 | 154 | |||
Ube Industries | 5,000 | 13 | |||
Unicharm | 1,600 | 152 | |||
UNY | 2,000 | 15 | |||
USS | 1,740 | 104 | |||
Valor | 5,400 | 49 | |||
Vital KSK Holdings | 2,200 | 13 | |||
Warabeya Nichiyo | 5,200 | 68 | |||
Watabe Wedding | 7,400 | 106 | |||
West Japan Railway | 226 | 858 | |||
Yahoo! Japan | 2,375 | 809 | |||
Yamada Denki | 36,920 | 2,507 | |||
Yamaguchi Financial Group | 61,000 | 634 | |||
Yamaha | 1,100 | 13 | |||
Yamaha Motor | 38,200 | 472 | |||
Yamato Kogyo | 30,300 | 856 | |||
Yamato Transport | 175,000 | 2,883 | |||
Yamazaki Baking | 25,000 | 340 | |||
Yaskawa Electric | 33,000 | 239 | |||
Yodogawa Steel Works | 12,000 | 51 | |||
Yokogawa Electric | 25,300 | 225 | |||
Yonekyu | 3,000 | 31 | |||
Yurtec | 2,000 | 13 | |||
| 384,028 | |||||
Jersey — 0.0% | |||||
Randgold Resources | 6,210 | 435 | |||
Regus | 227,254 | 364 | |||
| 799 | |||||
Description | Shares | Market Value ($ Thousands) | |||
Malta — 0.0% | |||||
BGP Holdings* | 198,683 | $ | — | ||
Mauritius — 0.1% | |||||
Golden Agri-Resources | 3,195,623 | 975 | |||
Mexico — 0.0% | |||||
America Movil, Ser L | 124,000 | 271 | |||
Netherlands — 4.5% | |||||
Accell Group | 1,107 | 53 | |||
Aegon | 142,591 | 1,209 | |||
Akzo Nobel | 102,717 | 6,356 | |||
ArcelorMittal | 86,912 | 3,246 | |||
ASML Holding(A) | 75,951 | 2,231 | |||
Corio(B) | 2,455 | 169 | |||
European Aeronautic Defence and Space | 309,758 | 6,948 | |||
Fugro | 1,995 | 115 | |||
Heineken | 9,368 | 431 | |||
Heineken Holding | 24,358 | 992 | |||
Imtech | 25,229 | 643 | |||
ING Groep | 278,973 | 4,975 | |||
James Hardie Industries | 51,047 | 354 | |||
Koninklijke Ahold | 242,177 | 2,910 | |||
Koninklijke DSM | 102,727 | 4,287 | |||
Koninklijke KPN | 286,450 | 4,746 | |||
Koninklijke Philips Electronics | 103,800 | 2,525 | |||
Koninklijke Vopak* | 21,489 | 1,393 | |||
Ordina | 12,662 | 79 | |||
QIAGEN*(A) | 20,952 | 444 | |||
Randstad Holding(A) | 45,600 | 1,967 | |||
Royal Dutch Shell, Cl A | 756,178 | 21,597 | |||
Royal Dutch Shell, Cl B | 386,633 | 10,735 | |||
Smit Internationale | 1,798 | 139 | |||
TNT | 91,283 | 2,447 | |||
Unilever | 381,815 | 10,992 | |||
Wavin | 21,975 | 48 | |||
| 92,031 | |||||
New Zealand — 0.1% | |||||
Air New Zealand | 110,300 | 97 | |||
Fletcher Building | 93,876 | 567 | |||
Telecom of New Zealand | 1,012,472 | 1,948 | |||
Vector | 41,730 | 57 | |||
| 2,669 | |||||
Norway — 0.7% | |||||
Aker Solutions | 204,200 | 2,289 | |||
DnB | 376,264 | 4,338 | |||
Marine Harvest* | 1,512,000 | 1,093 | |||
Norsk Hydro | 167,200 | 1,108 | |||
Seadrill | 6,800 | 141 | |||
Statoil | 107,630 | 2,410 | |||
Telenor | 286,400 | 3,302 | |||
| 14,681 | |||||
| SEI Institutional International Trust / Annual Holdings / September 30, 2009 | 8 |
Table of Contents
SCHEDULE OF INVESTMENTS
International Equity Fund
September 30, 2009
Description | Shares | Market Value ($ Thousands) | |||
Papua New Guinea — 0.0% | |||||
Lihir Gold* | 223,330 | $ | 552 | ||
Portugal — 0.5% | |||||
Banco Comercial Portugues(A) | 629,561 | 930 | |||
Banco Espirito Santo(A) | 90,538 | 642 | |||
Cimpor Cimentos de Portugal(A) | 47,920 | 395 | |||
Energias de Portugal | 915,537 | 4,189 | |||
Galp Energia SGPS, Cl B | 1,907 | 33 | |||
Jeronimo Martins SGPS | 60,150 | 526 | |||
Portugal Telecom SGPS | 247,883 | 2,621 | |||
REN - Redes Energeticas Nacionais | 30,708 | 135 | |||
| 9,471 | |||||
Russia — 0.4% | |||||
Mobile Telesystems ADR | 53,400 | 2,578 | |||
OAO Gazprom ADR | 160,664 | 3,735 | |||
Surgutneftegaz ADR | 8,414 | 72 | |||
Vimpel-Communications ADR | 124,800 | 2,334 | |||
| 8,719 | |||||
Singapore — 1.4% | |||||
CapitaCommercial Trust(B) | 929,000 | 686 | |||
CapitaLand(A) | 179,000 | 472 | |||
CapitaMall Trust(B) | 554,000 | 727 | |||
Chemoil Energy | 80,000 | 45 | |||
City Developments(A) | 52,000 | 381 | |||
DBS Group Holdings | 489,000 | 4,609 | |||
Fraser and Neave | 259,000 | 730 | |||
Jardine Cycle & Carriage | 45,000 | 776 | |||
Keppel | 49,000 | 282 | |||
NatSteel | 2,000 | 2 | |||
Olam International* | 485,000 | 860 | |||
Oversea-Chinese Banking | 639,000 | 3,560 | |||
SembCorp Industries | 138,000 | 332 | |||
SembCorp Marine | 43,000 | 97 | |||
SIA Engineering | 121,000 | 221 | |||
Singapore Airlines | 5,000 | 49 | |||
Singapore Exchange | 161,000 | 962 | |||
Singapore Technologies Engineering | 33,000 | 64 | |||
Singapore Telecommunications | 1,069,000 | 2,466 | |||
United Industrial(A) | 86,000 | 112 | |||
United Overseas Bank | 191,000 | 2,274 | |||
UOB-Kay Hian Holdings | 77,000 | 82 | |||
UOL Group | 79,000 | 193 | |||
Venture | 2,000 | 13 | |||
Wilmar International(A) | 1,844,000 | 8,271 | |||
Wing Tai Holdings | 57,000 | 68 | |||
Yangzijiang Shipbuilding Holdings | 175,000 | 120 | |||
| 28,454 | |||||
South Africa — 0.2% | |||||
Impala Platinum Holdings | 132,242 | 3,054 | |||
South Korea — 0.2% | |||||
Samsung Electronics | 6,000 | 4,150 | |||
Description | Shares | Market Value ($ Thousands) | |||
Spain — 3.8% | |||||
Abengoa | 2,010 | $ | 58 | ||
Abertis Infraestructuras(A) | 30,462 | 691 | |||
Acerinox(A) | 25,922 | 557 | |||
ACS Actividades de Construcciony Servicios(A) | 44,230 | 2,304 | |||
Banco Bilbao Vizcaya Argentaria(A) | 566,652 | 10,047 | |||
Banco de Sabadell(A) | 9,279 | 69 | |||
Banco de Valencia(A) | 9,199 | 86 | |||
Banco Popular Espanol(A) | 57,608 | 577 | |||
Banco Santander Central Hispano | 1,188,325 | 19,107 | |||
Bankinter(A) | 65,336 | 824 | |||
Construcciones y Auxiliar de Ferrocarriles | 39 | 20 | |||
Criteria Caixacorp | 74,637 | 383 | |||
EDP Renovaveis* | 46,712 | 513 | |||
Enagas | 22,778 | 475 | |||
Financiera Alba(A) | 4,789 | 273 | |||
Fomento de Construcciones y Contratas(A) | 8,743 | 409 | |||
Gas Natural | 80,889 | 1,785 | |||
Iberdrola | 198,500 | 1,945 | |||
Iberdrola Renovables | 17,922 | 87 | |||
Inditex(A) | 15,662 | 898 | |||
Mapfre(D) | 205,092 | 916 | |||
Obrascon Huarte Lain | 10,567 | 294 | |||
Red Electrica(A) | 51,443 | 2,630 | |||
Repsol(A) | 210,277 | 5,714 | |||
Sacyr Vallehermoso(A) | 20,301 | 384 | |||
Telefonica(A) | 955,149 | 26,324 | |||
Zardoya Otis(A) | 24,032 | 521 | |||
| 77,891 | |||||
Sweden — 1.6% | |||||
Alliance Oil* | 20,011 | 247 | |||
Assa Abloy, Cl B | 29,076 | 471 | |||
Atlas Copco, Cl A | 56,666 | 728 | |||
Atlas Copco, Cl B | 10,077 | 115 | |||
Boliden | 54,000 | 578 | |||
Electrolux, Ser B | 204,163 | 4,657 | |||
Eniro | 17,910 | 93 | |||
Hennes & Mauritz, Cl B | 36,584 | 2,048 | |||
Holmen, Cl B | 14,063 | 386 | |||
Investor AB, Cl B | 20,998 | 382 | |||
Lundin Petroleum* | 57,558 | 465 | |||
Millicom International Cellular* | 1,305 | 95 | |||
Nordea Bank | 372,824 | 3,743 | |||
Scania, Cl B | 7,579 | 94 | |||
Securitas, Cl B | 25,582 | 246 | |||
Skanska, Cl B | 32,545 | 476 | |||
SKF, Cl B | 32,725 | 512 | |||
Svenska Cellulosa, Cl B | 460,404 | 6,222 | |||
Svenska Cellulosa, Cl A | 8,393 | 113 | |||
Svenska Handelsbanken, Cl A | 41,450 | 1,055 | |||
Swedbank | 49,500 | 471 | |||
Swedish Match | 68,267 | 1,367 | |||
Tele2, Cl B | 18,109 | 240 | |||
Telefonaktiebolaget LM Ericsson, Cl B | 717,571 | 7,183 | |||
TeliaSonera | 158,813 | 1,040 | |||
| 9 | SEI Institutional International Trust / Annual Holdings / September 30, 2009 |
Table of Contents
Description | Shares | Market Value ($ Thousands) | |||
Volvo, Cl A | 6,100 | $ | 54 | ||
Volvo, Cl B | 9,836 | 91 | |||
| 33,172 | |||||
Switzerland — 7.6% | |||||
ABB | 294,310 | 5,900 | |||
ACE | 47,700 | 2,550 | |||
Actelion* | 22,726 | 1,409 | |||
Adecco | 12,347 | 656 | |||
Advanced Digital Broadcast Holdings* | 480 | 26 | |||
Baloise Holding | 35,084 | 3,347 | |||
Banque Cantonale Vaudoise | 1,647 | 678 | |||
Clariant | 54,000 | 491 | |||
Credit Suisse Group | 318,180 | 17,632 | |||
Elektrizitaets-Gesellschaft Laufenburg | 56 | 59 | |||
Geberit | 4,009 | 615 | |||
Helvetia Holding | 1,890 | 634 | |||
Holcim* | 65,076 | 4,459 | |||
Julius Baer Group | 98,265 | 4,901 | |||
Kuehne + Nagel International | 14,110 | 1,224 | |||
Lindt & Spruengli | 348 | 844 | |||
Lonza Group | 210 | 23 | |||
Nestle | 640,927 | 27,276 | |||
Nobel Biocare Holding | 5,403 | 179 | |||
Novartis | 438,826 | 21,928 | |||
Roche Holding | 98,060 | 15,829 | |||
Schindler Holding | 8,582 | 594 | |||
SGS | 405 | 544 | |||
Sonova Holding | 8,498 | 856 | |||
Straumann Holding | 689 | 178 | |||
Sulzer | 2,629 | 227 | |||
Swatch Group | 41,392 | 3,621 | |||
Swiss Life Holding | 7,246 | 856 | |||
Swiss Reinsurance | 23,915 | 1,078 | |||
Swisscom | 12,842 | 4,588 | |||
Syngenta | 8,500 | 1,950 | |||
UBS | 458,387 | 8,380 | |||
Valora Holding | 365 | 87 | |||
Vontobel Holding | 7,207 | 240 | |||
Xstrata | 620,018 | 9,148 | |||
Zurich Financial Services | 56,710 | 13,472 | |||
| 156,479 | |||||
Taiwan — 0.8% | |||||
AU Optronics ADR | 162,470 | 1,573 | |||
Chunghwa Telecom | 1,592,031 | 2,867 | |||
HON HAI Precision Industry GDR | 234,702 | 1,898 | |||
MediaTek | 106,000 | 1,767 | |||
Taishin Financial Holding | 2,533,000 | 1,103 | |||
Taiwan Semiconductor Manufacturing | 1,653,954 | 3,318 | |||
United Microelectronics ADR* | 814,400 | 3,095 | |||
| 15,621 | |||||
Turkey — 0.1% | |||||
Turkiye Garanti Bankasi | 657,550 | 2,477 | |||
United Kingdom — 15.6% | |||||
3i Group | 199,319 | 920 | |||
Description | Shares | Market Value ($ Thousands) | |||
Aegis Group | 228,480 | $ | 409 | ||
AMEC | 268,901 | 3,247 | |||
Amlin | 109,960 | 674 | |||
Anglo American | 93,607 | 2,984 | |||
Antofagasta | 324,443 | 3,941 | |||
Arriva | 22,460 | 180 | |||
Associated British Foods | 18,517 | 251 | |||
AstraZeneca | 394,014 | 17,670 | |||
Autonomy* | 167,320 | 4,359 | |||
Aviva | 767,037 | 5,497 | |||
Avocet Mining* | 30,221 | 36 | |||
Babcock International Group | 97,954 | 891 | |||
BAE Systems | 399,058 | 2,229 | |||
Balfour Beatty | 363,928 | 1,874 | |||
Barclays | 1,988,437 | 11,767 | |||
Berkeley Group Holdings* | 20,195 | 286 | |||
BG Group | 484,545 | 8,424 | |||
BHP Billiton | 451,274 | 12,327 | |||
BP | 3,285,633 | 29,060 | |||
Brit Insurance Holdings | 23,358 | 76 | |||
British American Tobacco | 435,903 | 13,685 | |||
British Sky Broadcasting Group | 43,955 | 402 | |||
BT Group, Cl A | 1,128,477 | 2,346 | |||
Burberry Group | 69,541 | 560 | |||
Cadbury | 473,955 | 6,087 | |||
Cairn Energy* | 3,749 | 167 | |||
Cape* | 51,033 | 209 | |||
Capita Group | 16,141 | 187 | |||
Carillion | 72,213 | 318 | |||
Carnival | 26,955 | 919 | |||
Carphone Warehouse Group | 103,544 | 317 | |||
Catlin Group | 146,296 | 822 | |||
Centrica | 1,154,000 | 4,644 | |||
Close Brothers Group | 27,086 | 345 | |||
Compass Group | 57,860 | 354 | |||
Computacenter | 11,100 | 57 | |||
Daily Mail & General Trust, Cl A | 46,458 | 341 | |||
Debenhams | 208,782 | 254 | |||
Devro | 35,193 | 77 | |||
Diageo | 241,674 | 3,711 | |||
Dimension Data Holdings | 315,424 | 319 | |||
DS Smith | 83,389 | 143 | |||
easyJet* | 444,501 | 2,696 | |||
Eurasian Natural Resources | 44,867 | 629 | |||
Firstgroup | 106,622 | 705 | |||
Fresnillo | 104,253 | 1,287 | |||
Friends Provident Group | 1,795,547 | 2,389 | |||
GlaxoSmithKline | 668,037 | 13,136 | |||
Greggs | 6,095 | 39 | |||
Group 4 Securicor | 74,018 | 261 | |||
Halfords Group | 13,610 | 77 | |||
Hamworthy | 16,122 | 68 | |||
Healthcare Locums | 40,124 | 167 | |||
Hiscox | 82,000 | 452 | |||
Home Retail Group | 528,576 | 2,299 | |||
HSBC Holdings | 2,006,864 | 22,981 | |||
ICAP | 270,271 | 1,827 | |||
Imperial Tobacco Group | 132,493 | 3,831 | |||
Inchcape | 3,639,184 | 1,638 | |||
Intercontinental Hotels Group | 25,164 | 327 | |||
International Power | 436,745 | 2,019 | |||
Invensys | 298,269 | 1,389 | |||
| SEI Institutional International Trust / Annual Holdings / September 30, 2009 | 10 |
Table of Contents
SCHEDULE OF INVESTMENTS
International Equity Fund
September 30, 2009
Description | Shares | Market Value ($ Thousands) | |||
Investec | 299,736 | $ | 2,196 | ||
J Sainsbury | 6,682 | 35 | |||
Johnson Matthey | 7,561 | 168 | |||
Kazakhmys | 120,383 | 2,068 | |||
Kingfisher | 1,022,117 | 3,480 | |||
Legal & General Group | 2,949,989 | 4,142 | |||
Logica | 297,882 | 620 | |||
London Stock Exchange Group | 8,750 | 120 | |||
Marks & Spencer Group | 652,705 | 3,780 | |||
Meggitt | 170,369 | 635 | |||
Millennium & Copthorne Hotels | 43,480 | 259 | |||
Mondi | 2,310 | 11 | |||
National Express Group | 24,220 | 185 | |||
National Grid | 340,347 | 3,288 | |||
Next | 103,115 | 2,955 | |||
Northumbrian Water Group | 19,830 | 78 | |||
Old Mutual | 2,831,710 | 4,529 | |||
Pearson | 90,448 | 1,115 | |||
Persimmon | 116,055 | 847 | |||
Petrofac | 118,386 | 1,870 | |||
Petropavlovsk | 82,501 | 1,195 | |||
Prudential | 139,387 | 1,341 | |||
Reckitt Benckiser Group | 130,102 | 6,363 | |||
Rexam | 579,346 | 2,418 | |||
Rio Tinto | 218,036 | 9,306 | |||
Rolls-Royce Group | 489,745 | 3,688 | |||
Royal & Sun Alliance Insurance Group | 729,016 | 1,560 | |||
Royal Bank of Scotland Group | 677,332 | 574 | |||
SABMiller | 38,326 | 925 | |||
Sage Group | 705,878 | 2,635 | |||
Schroders | 8,088 | 141 | |||
Scottish & Southern Energy | 26,688 | 501 | |||
Serco Group | 151,416 | 1,223 | |||
Severn Trent | 29,399 | 456 | |||
Shire | 70,195 | 1,217 | |||
Standard Chartered | 672,608 | 16,588 | |||
Standard Life | 22,528 | 79 | |||
Tate & Lyle | 92,000 | 622 | |||
Taylor Woodrow | 1,036,137 | 698 | |||
Tesco | 590,723 | 3,775 | |||
Thomas Cook Group | 143,477 | 533 | |||
Tomkins | 85,924 | 259 | |||
Travis Perkins | 107,718 | 1,435 | |||
TUI Travel | 16,339 | 67 | |||
Tullett Prebon | 103,954 | 650 | |||
Tullow Oil | 144,211 | 2,602 | |||
Unilever | 78,928 | 2,244 | |||
Vedanta Resources | 20,439 | 622 | |||
Vodafone Group | 7,916,006 | 17,750 | |||
WM Morrison Supermarkets | 447,134 | 1,983 | |||
WPP | 427,526 | 3,672 | |||
| 321,086 | |||||
United States — 0.5% | |||||
A Schulman | 903 | 18 | |||
Air Transport Services Group* | 17,100 | 59 | |||
American Equity Investment Life Holding | 8,100 | 57 | |||
Capital One Financial | 3,900 | 139 | |||
Clearwater Paper* | 5,500 | 227 | |||
Computer Sciences* | 6,000 | 316 | |||
Description | Shares/Face Amount (Thousands) (1) | Market Value ($ Thousands) | |||
Earthlink | 34,300 | $ | 289 | ||
EW Scripps, Cl A | 20,000 | 150 | |||
FBL Financial Group, Cl A | 3,100 | 60 | |||
Glatfelter | 18,800 | 216 | |||
Hawkins | 6,900 | 161 | |||
HSN* | 7,500 | 122 | |||
International Business Machines | 16,000 | 1,914 | |||
Journal Communications, Cl A | 11,000 | 41 | |||
M&F Worldwide* | 2,300 | 47 | |||
Macquarie Infrastructure | 6,800 | 61 | |||
McClatchy, Cl A | 22,400 | 57 | |||
Media General, Cl A | 10,900 | 93 | |||
Noble | 25,085 | 952 | |||
PS Business Parks(B) | 17,444 | 895 | |||
Rayonier(B) | 9,900 | 405 | |||
Schweitzer-Mauduit International | 11,500 | 625 | |||
State Street | 19,100 | 1,005 | |||
Synthes | 7,342 | 884 | |||
Thomson Reuters | 34,203 | 1,144 | |||
Wausau Paper | 10,600 | 106 | |||
| 10,043 | |||||
Total Common Stock | 1,830,277 | ||||
MORTGAGE-BACKED SECURITIES — 3.7% | |||||
Agency Mortgage-Backed Obligation — 1.8% | |||||
FHLMC ARM (E) | |||||
5.838%, 03/01/36 | 990 | 1,035 | |||
5.262%, 10/01/35 | 810 | 846 | |||
4.776%, 06/01/35 | 923 | 947 | |||
FHLMC CMO STRIPS, Ser 231, Cl IO, IO | |||||
5.500%, 08/01/35 | 1,639 | 284 | |||
FHLMC CMO STRIPS, Ser 245, Cl IO, IO | |||||
5.000%, 05/15/37 | 2,257 | 394 | |||
FHLMC CMO, Ser 3346, Cl FA | |||||
0.473%, 02/15/19 (E) | 1,238 | 1,228 | |||
FNMA | |||||
6.000%, 07/01/37 | 869 | 919 | |||
FNMA 15 Year TBA | |||||
6.000%, 10/20/21 | 4,000 | 4,260 | |||
FNMA 30 Year TBA | |||||
6.500%, 10/01/37 | 10,650 | 11,382 | |||
6.000%, 10/01/37 | 12,100 | 12,765 | |||
FNMA ARM | |||||
5.128%, 10/01/35 (E) | 1,319 | 1,376 | |||
4.504%, 05/01/35 (E) | 1,027 | 1,067 | |||
FNMA CMO STRIPS, Ser 369, Cl 1, IO | |||||
5.000%, 03/01/36 | 1,283 | 168 | |||
| 36,671 | |||||
Non-Agency Mortgage-Backed Obligation — 1.9% | |||||
Adjustable Rate Mortgage Trust, Ser 2005-5, Cl 1A1 | |||||
4.163%, 09/25/35 (E) | 1,114 | 646 | |||
American Home Mortgage | |||||
Investment Trust, Ser 2004-3, Cl 3A | |||||
3.003%, 10/25/34 (E) | 1,008 | 642 | |||
| 11 | SEI Institutional International Trust / Annual Holdings / September 30, 2009 |
Table of Contents
Description | Face Amount (Thousands) (1) | Market Value ($ Thousands) | |||
Banc of America Commercial Mortgage, Ser 2006-5, Cl A1 | |||||
5.185%, 09/10/47 | 562 | $ | 571 | ||
Banc of America Funding, Ser 2006-A, Cl 2A2 | |||||
4.973%, 02/20/36 (E) | 371 | 75 | |||
Banc of America Mortgage Securities, Ser 2003-9, Cl 1A12 | |||||
0.696%, 12/25/33 (E) | 536 | 509 | |||
BCAP Trust, Ser 2006-RR1, Cl PA | |||||
5.000%, 11/25/36 | 749 | 747 | |||
Bear Stearns Adjustable Rate Mortgage Trust, Ser 2004-7, Cl 1A1 | |||||
4.350%, 10/25/34 (E) | 443 | 332 | |||
Chase Mortgage Finance, Ser 2007-A1, Cl 7A1 | |||||
4.601%, 02/25/37 (E) | 777 | 737 | |||
Countrywide Home Loan Mortgage Pass-Through Trust, Ser 2003- 13, Cl 2A17 | |||||
5.750%, 08/25/34 | 560 | 559 | |||
Countrywide Home Loan Mortgage Pass-Through Trust, Ser 2003- 34, Cl A3 | |||||
5.000%, 09/25/33 | 458 | 459 | |||
Countrywide Home Loan Mortgage Pass-Through Trust, Ser 2004- 22, Cl A1 | |||||
4.946%, 11/25/34 (E) | 1,329 | 986 | |||
Countrywide Home Loan Mortgage Pass-Through Trust, Ser 2007- HYB1, Cl 1A1 | |||||
5.410%, 03/25/37 (E) | 1,735 | 833 | |||
CS First Boston Mortgage Securities, Ser 2001-CF2, Cl A4 | |||||
6.505%, 02/15/34 | 752 | 775 | |||
CS First Boston Mortgage Securities, Ser 2003-C3, Cl A3 | |||||
3.382%, 05/15/38 | 181 | 181 | |||
CS First Boston Mortgage Securities, Ser 2005-C1, Cl A2 | |||||
4.609%, 02/15/38 | 464 | 467 | |||
CS First Boston Mortgage Securities, Ser 2005-C4, Cl A2 | |||||
5.017%, 08/15/38 | 685 | 689 | |||
Deutsche Alternative Securities Mortgage Loan Trust, Ser 2006- AB3, Cl A1 | |||||
6.250%, 07/25/36 (E) | 1,516 | 1,094 | |||
DLJ Commercial Mortgage, Ser 2000-CF1, Cl A1B | |||||
7.620%, 06/10/33 | 485 | 494 | |||
DLJ Commercial Mortgage, Ser 2000-CKP1, Cl A1B | |||||
7.180%, 11/10/33 | 1,038 | 1,068 | |||
First Horizon Alternative Mortgage Trust, Ser 2005-AA3, Cl 3A1 | |||||
5.365%, 05/25/35 (E) | 733 | 553 | |||
Description | Face Amount (Thousands) (1) | Market Value ($ Thousands) | |||
First Horizon Mortgage Pass- Through Trust, Ser 2003-9, Cl 1A3 | |||||
5.500%, 11/25/33 | 1,373 | $ | 1,353 | ||
First Horizon Mortgage Pass- Through Trust, Ser 2006-AR3, Cl 1A1 | |||||
5.641%, 11/25/36 (E) | 2,051 | 1,613 | |||
First Union National Bank Commercial Mortgage, Ser 2000-C1, Cl A2 | |||||
7.841%, 05/17/32 | 111 | 112 | |||
GMAC Commercial Mortgage Securities, Ser 2004-C2, Cl A2 | |||||
4.760%, 08/10/38 | 569 | 579 | |||
GMAC Mortgage Loan Trust, Ser 2004-J1, Cl A2 | |||||
5.250%, 04/25/34 | 1,044 | 1,038 | |||
GMAC Mortgage Loan Trust, Ser 2004-J4, Cl A1 | |||||
5.500%, 09/25/34 | 619 | 616 | |||
Indymac Mortgage Loan Trust, Ser 2004-AR6, Cl 1A | |||||
3.845%, 10/25/34 (E) | 225 | 143 | |||
JP Morgan Commercial Mortgage Finance, Ser 2000-C10, Cl A2 | |||||
7.371%, 08/15/32 (E) | 420 | 423 | |||
JP Morgan Mortgage Trust, Ser 2004-A5, Cl 4A2 | |||||
4.818%, 12/25/34 (E) | 429 | 416 | |||
LB-UBS Commercial Mortgage Trust, Ser 2000-C4, Cl A2 | |||||
7.370%, 08/15/26 | 200 | 205 | |||
LB-UBS Commercial Mortgage Trust, Ser 2000-C5, Cl A2 | |||||
6.510%, 12/15/26 | 613 | 633 | |||
LB-UBS Commercial Mortgage Trust, Ser 2001-WM, Cl A2 | |||||
6.530%, 07/14/16 (C) | 620 | 655 | |||
LB-UBS Commercial Mortgage Trust, Ser 2003-C7, Cl A2 | |||||
4.064%, 09/15/27 (E) | 548 | 552 | |||
Master Adjustable Rate Mortgages, Ser 2005-2, Cl 3A1 | |||||
4.146%, 03/25/35 (E) | 1,399 | 854 | |||
Master Alternative Loans Trust, Ser 2003-6, Cl 3A2 | |||||
5.750%, 09/25/33 | 574 | 573 | |||
Merrill Lynch Mortgage Investors, Ser 2005-A4, Cl 1A | |||||
4.212%, 07/25/35 (E) | 302 | 190 | |||
MLCC Mortgage Investors, Ser 2006-1, Cl 1A1 | |||||
3.798%, 02/25/36 (E) | 3,072 | 1,536 | |||
Morgan Stanley Capital I, Ser 2005-HQ5, Cl A2 | |||||
4.809%, 01/14/42 | 1,005 | 1,011 | |||
Nomura Asset Acceptance, Ser 2004-R1, Cl A1 | |||||
6.500%, 03/25/34 (C) | 1,141 | 1,014 | |||
| SEI Institutional International Trust / Annual Holdings / September 30, 2009 | 12 |
Table of Contents
SCHEDULE OF INVESTMENTS
International Equity Fund
September 30, 2009
Description | Face Amount (Thousands) (1) | Market Value ($ Thousands) | |||
Nomura Asset Acceptance, Ser 2004-R2, Cl A1 | |||||
6.500%, 10/25/34 (C)(E) | 1,193 | $ | 1,030 | ||
PNC Mortgage Acceptance, Ser 2000-C2, Cl A2 | |||||
7.300%, 10/12/33 | 633 | 653 | |||
PNC Mortgage Acceptance, Ser 2001-C1, Cl A2 | |||||
7.610%, 03/15/33 | 303 | 305 | |||
Residential Asset Securitization Trust, Ser 2003-A, Cl A2 | |||||
0.746%, 03/25/33 (E) | 366 | 326 | |||
Residential Asset Securitization Trust, Ser 2004-IP2, Cl 3A1 | |||||
4.258%, 12/25/34 (E) | 3,110 | 2,395 | |||
Residential Funding Mortgage Securities I, Ser 2004-S2, Cl A4 | |||||
5.500%, 03/25/34 | 1,513 | 1,513 | |||
Residential Funding Mortgage Securities I, Ser 2006-S5, Cl A11 | |||||
6.000%, 06/25/36 | 1,176 | 1,137 | |||
Salomon Brothers Mortgage Securities, Ser 2000-C1, Cl A2 | |||||
7.520%, 02/18/32 (E) | 600 | 602 | |||
Thornburg Mortgage Securities Trust, Ser 2006-5, Cl A1 | |||||
0.366%, 09/25/46 (E) | 2,268 | 2,171 | |||
Wachovia Bank Commercial Mortgage Trust, Ser 2005-C17, Cl A2 | |||||
4.782%, 03/15/42 | 950 | 950 | |||
WaMu Mortgage Pass-Through Certificates, Ser 2003-S4, Cl 2A5 | |||||
4.500%, 06/25/33 | 736 | 737 | |||
WaMu Mortgage Pass-Through Certificates, Ser 2004-AR9, Cl A6 | |||||
2.954%, 08/25/34 (E) | 234 | 225 | |||
WaMu Mortgage Pass-Through Certificates, Ser 2004-S2, Cl 2A1 | |||||
5.500%, 06/25/34 | 730 | 728 | |||
Wells Fargo Mortgage Backed Securities Trust, Ser 2004-6, Cl A13 | |||||
0.696%, 06/25/34 (E) | 504 | 484 | |||
Wells Fargo Mortgage Backed Securities Trust, Ser 2004-I, Cl B1 | |||||
4.167%, 07/25/34 (E) | 127 | 46 | |||
Wells Fargo Mortgage Backed Securities Trust, Ser 2004-N, Cl A5 | |||||
3.221%, 08/25/34 (E) | 163 | 158 | |||
| 39,393 | |||||
Total Mortgage-Backed Securities | 76,064 | ||||
Description | Face Amount (Thousands) (1) | Market Value ($ Thousands) | |||
ASSET-BACKED SECURITIES — 1.4% | |||||
Automotive — 0.3% | |||||
Bank of America Auto Trust, Ser 2009-2A, Cl A3 | |||||
2.130%, 09/15/13 (C) | 1,150 | $ | 1,152 | ||
BMW Floorplan Master Owner Trust, Ser 2009-1A, Cl A | |||||
1.395%, 09/15/14 (C)(E) | 285 | 285 | |||
Honda Auto Receivables Owner Trust, Ser 2008-1, Cl A3 | |||||
4.470%, 01/18/12 | 545 | 560 | |||
Honda Auto Receivables Owner Trust, Ser 2009-2, Cl A2 | |||||
2.220%, 08/15/11 | 1,035 | 1,045 | |||
Honda Auto Receivables Owner Trust, Ser 2009-3, Cl A3 | |||||
2.310%, 05/15/13 | 685 | 696 | |||
Mercedes-Benz Auto Receivables Trust, Ser 2009-1, Cl A3 | |||||
1.670%, 01/15/14 | 240 | 240 | |||
USAA Auto Owner Trust, Ser 2009-1, Cl A2 | |||||
2.640%, 08/15/11 | 1,100 | 1,112 | |||
| 5,090 | |||||
Credit Card — 0.7% | |||||
American Express Credit Account Master Trust, Ser 2009-1, Cl A | |||||
1.593%, 12/15/14 (E) | 3,295 | 3,334 | |||
Bank of America Credit Card Trust, Ser 2006-A6, Cl A6 | |||||
0.273%, 11/15/13 (E) | 620 | 612 | |||
Capital One Multi-Asset Execution Trust, Ser 2008-A5, Cl A5 | |||||
4.850%, 02/18/14 | 1,075 | 1,131 | |||
Capital One Multi-Asset Execution Trust, Ser 2009-A1, Cl A1 | |||||
1.343%, 04/15/13 (E) | 600 | 602 | |||
Chase Issuance Trust, Ser 2007- A10, Cl A10 | |||||
0.283%, 06/16/14 (E) | 620 | 609 | |||
Chase Issuance Trust, Ser 2009- A4, Cl A4 | |||||
0.993%, 06/15/12 (E) | 1,100 | 1,104 | |||
Chase Issuance Trust, Ser 2009- A6, Cl A6 | |||||
1.093%, 07/16/12 (E) | 1,550 | 1,557 | |||
Citibank Credit Card Issuance Trust, Ser 2004-A7, Cl A7 | |||||
0.497%, 11/25/13 (E) | 1,430 | 1,412 | |||
Citibank Credit Card Issuance Trust, Ser 2005-A7, Cl A7 | |||||
4.750%, 10/22/12 | 295 | 306 | |||
Citibank Credit Card Issuance Trust, Ser 2009-A1, Cl A1 | |||||
1.993%, 03/17/14 (E) | 645 | 661 | |||
MBNA Credit Card Master Note Trust, Ser 2003-A4, Cl A4 | |||||
0.463%, 09/17/12 (E) | 1,760 | 1,757 | |||
| 13 | SEI Institutional International Trust / Annual Holdings / September 30, 2009 |
Table of Contents
Description | Face Amount (Thousands) (1)/Shares | Market Value ($ Thousands) | |||
MBNA Credit Card Master Note Trust, Ser 2003-A8, Cl A8 | |||||
0.433%, 12/17/12 (E) | 2,150 | $ | 2,143 | ||
| 15,228 | |||||
Mortgage Related — 0.4% | |||||
ACE Securities, Ser 2003-NC1, Cl M1 | |||||
1.416%, 07/25/33 (E) | 2,100 | 1,194 | |||
Ameriquest Mortgage Securities, Ser 2005-R9, Cl AF3 | |||||
5.098%, 11/25/35 | 452 | 443 | |||
Citicorp Residential Mortgage Securities, Ser 2006-2, Cl A4 | |||||
5.775%, 09/25/36 | 1,245 | 1,044 | |||
CNH Equipment Trust, Ser 2009- A, Cl A2 | |||||
4.060%, 10/17/11 | 450 | 456 | |||
CNH Equipment Trust, Ser 2009- B, Cl A2 | |||||
2.400%, 05/16/11 | 1,555 | 1,560 | |||
GSAMP Trust, Ser 2005-HE3, Cl M1 | |||||
0.716%, 06/25/35 (E) | 355 | 338 | |||
Master Asset Backed Securities Trust, Ser 2003-WMC2, Cl M1 | |||||
1.296%, 08/25/33 (E) | 316 | 264 | |||
Merrill Lynch Mortgage Investors, Ser 2003-HE1, Cl M2 | |||||
1.896%, 07/25/34 (E) | 135 | 29 | |||
Morgan Stanley Capital I, Ser 2003-NC8, Cl M1 | |||||
1.296%, 09/25/33 (E) | 1,631 | 1,111 | |||
Residential Asset Mortgage Products, Ser 2003-RS11, Cl Mll1 | |||||
1.341%, 12/25/33 (E) | 188 | 111 | |||
Resmae Mortgage Loan Trust, Ser 2006-1, Cl A2B | |||||
0.396%, 02/25/36 (C)(E) | 4,058 | 1,793 | |||
Terwin Mortgage Trust, Ser 2006- 2, Cl 2A1 | |||||
4.500%, 06/25/36 | 727 | 75 | |||
| 8,418 | |||||
Total Asset-Backed Securities | 28,736 | ||||
PREFERRED STOCK — 0.5% | |||||
Brazil — 0.4% | |||||
Banco Bradesco | 184,300 | 3,657 | |||
Petroleo Brasileiro | 210,900 | 4,130 | |||
| 7,787 | |||||
France — 0.0% | |||||
Bureau Veritas | 8,814 | 497 | |||
Germany — 0.1% | |||||
Bayerische Motoren Werke | 3,127 | 104 | |||
Draegerwerk | 2,624 | 100 | |||
Jungheinrich | 2,620 | 53 | |||
RWE | 13,432 | 1,105 | |||
Description | Shares/Face Amount (Thousands) (1) | Market Value ($ Thousands) | |||
Volkswagen | 10,672 | $ | 1,241 | ||
| 2,603 | |||||
Total Preferred Stock | 10,887 | ||||
CORPORATE OBLIGATION — 0.1% | |||||
United States — 0.1% | |||||
Shinsei Finance Cayman | |||||
6.418%, 01/29/49(C)(E) | 1,740 | 914 | |||
Total Corporate Obligation | 914 | ||||
| Number Of Warrants | |||||
WARRANTS — 0.0% | |||||
Italy — 0.0% | |||||
Mediobanca, Expires 03/20/11 * | 95,834 | 7 | |||
Unione di Banche Italiane , Expires 06/30/11 * | 34,013 | — | |||
| 7 | |||||
Singapore — 0.0% | |||||
Golden Agri-Resources, | |||||
Expires 05/29/12 * | 172,793 | 30 | |||
Total Warrants (Cost $0) | 37 | ||||
| Number Of Rights | |||||
RIGHTS — 0.0% | |||||
Australia — 0.0% | |||||
AWB Limited, Expires 10/23/09* | 131 | 32 | |||
Sigma Pharm, Expires 10/20/09* | 34 | 1 | |||
| 33 | |||||
Belgium — 0.0% | |||||
Fortis, Expires 07/01/14* | 423 | — | |||
France — 0.0% | |||||
BNP Paribas, Expires 10/15/09* | 183 | 396 | |||
Hong Kong — 0.0% | |||||
Genting Singapore, Expires 10/14/09*(A) | 344 | 77 | |||
Sweden — 0.0% | |||||
Swedbank, Expires 10/06/09* | 50 | 97 | |||
Total Rights (Cost $96) | 603 | ||||
| SEI Institutional International Trust / Annual Holdings / September 30, 2009 | 14 |
Table of Contents
SCHEDULE OF INVESTMENTS
International Equity Fund
September 30, 2009
Description | Shares/Face Amount (Thousands) (1) | Market Value ($ Thousands) | ||||
CASH EQUIVALENT — 3.9% | ||||||
United States — 3.9% | ||||||
SEI Daily Income Trust, Prime Obligation Fund, Cl A, 0.110%†** | 80,443,128 | $ | 80,443 | |||
Total Cash Equivalent | 80,443 | |||||
U.S. TREASURY OBLIGATIONS (F) (G) (F) — 0.7% | ||||||
U.S. Treasury Bills | ||||||
0.291%, 12/17/09 | 850 | 850 | ||||
0.233%, 12/03/09 | 12,364 | 12,362 | ||||
0.150%, 11/19/09 | 1,500 | 1,500 | ||||
Total U.S. Treasury Obligations | 14,712 | |||||
AFFILIATED PARTNERSHIP — 7.9% | ||||||
United States — 7.9% | ||||||
SEI Liquidity Fund, L.P., 0.400%†**(H) | 165,342,282 | 163,007 | ||||
Total Affiliated Partnership | 163,007 | |||||
TIME DEPOSITS — 2.0% | ||||||
United States — 2.0% | ||||||
Brown Brothers Harriman | ||||||
5.950%, 10/01/09 | ZAR | 3 | — | |||
2.174%, 10/01/09 | AUD | 531 | 469 | |||
1.500%, 10/01/09 | NZD | 100 | 72 | |||
0.382%, 10/01/09 | NOK | 185 | 32 | |||
0.125%, 10/01/09 | EUR | 85 | 124 | |||
0.100%, 10/01/09 | DKK | 3,539 | 695 | |||
0.088%, 10/01/09 | GBP | 321 | 513 | |||
0.060%, 10/01/09 | CAD | 3 | 2 | |||
0.030%, 10/01/09 | 38,281 | 38,281 | ||||
0.020%, 10/01/09 | CHF | 454 | 438 | |||
0.010%, 10/01/09 | HKD | 693 | 89 | |||
0.010%, 10/01/09 | JPY | 71,757 | 801 | |||
0.010%, 10/01/09 | SEK | 1,438 | 206 | |||
0.005%, 10/01/09 | SGD | 53 | 38 | |||
Total Time Deposits | 41,760 | |||||
Total Investments — 109.0% | $ | 2,247,440 | ||||
| 15 | SEI Institutional International Trust / Annual Holdings / September 30, 2009 |
Table of Contents
A summary of the outstanding forward foreign currency contracts held by the Fund at September 30, 2009, is as follows:
Settlement Date | Currency to Deliver (Thousands) | Currency to Receive (Thousands) | Unrealized Appreciation (Depreciation) ($ Thousands) | |||||||
10/1/09-10/21/09 | JPY | 3,376,515 | USD | 36,750 | $ | (971 | ) | |||
10/1/09-10/21/09 | USD | 37,114 | JPY | 3,376,515 | 607 | |||||
10/2/09-10/21/09 | AUD | 53,713 | USD | 46,813 | (506 | ) | ||||
10/2/09-10/21/09 | CAD | 25,266 | USD | 23,760 | 214 | |||||
10/5/09-10/21/09 | HKD | 313,704 | USD | 40,483 | — | |||||
10/5/09-10/21/09 | USD | 76,835 | GBP | 46,440 | (2,575 | ) | ||||
10/6/09-10/21/09 | USD | 46,832 | AUD | 53,682 | 460 | |||||
10/21/09 | AUD | 2,537 | CHF | 2,100 | (210 | ) | ||||
10/21/09 | CHF | 2,100 | AUD | 2,568 | 238 | |||||
10/21/09 | CHF | 4,400 | GBP | 2,560 | (148 | ) | ||||
10/21/09 | CHF | 9,218 | USD | 8,708 | (179 | ) | ||||
10/21/09 | GBP | 2,569 | CHF | 4,400 | 134 | |||||
10/21/09 | MXP | 3,461 | USD | 261 | 6 | |||||
10/21/09 | NOK | 9,412 | USD | 1,610 | (12 | ) | ||||
10/21/09 | SEK | 92,083 | USD | 13,486 | 313 | |||||
10/21/09 | SGD | 2,711 | USD | 1,918 | (6 | ) | ||||
10/21/09 | USD | 23,614 | CAD | 25,266 | (68 | ) | ||||
10/21/09 | USD | 8,787 | CHF | 9,218 | 99 | |||||
10/21/09 | USD | 76,695 | EUR | 52,051 | (619 | ) | ||||
10/21/09 | USD | 40,484 | HKD | 313,704 | (1 | ) | ||||
10/21/09 | USD | 260 | MXP | 3,461 | (4 | ) | ||||
10/21/09 | USD | 391 | NZD | 542 | 1 | |||||
10/21/09 | USD | 13,435 | SEK | 92,083 | (261 | ) | ||||
10/21/09 | USD | 1,920 | SGD | 2,711 | 4 | |||||
10/21/09 | USD | 1,592 | ZAR | 11,915 | (24 | ) | ||||
10/21/09 | ZAR | 11,915 | USD | 1,616 | 48 | |||||
10/21/09-11/20/09 | EUR | 52,083 | USD | 77,049 | 928 | |||||
10/21/09-11/20/09 | GBP | 2,448 | JPY | 378,000 | 310 | |||||
10/21/09-11/20/09 | GBP | 1,204 | SGD | 2,800 | 62 | |||||
10/21/09-11/20/09 | GBP | 46,576 | USD | 76,063 | 1,585 | |||||
10/21/09-11/20/09 | JPY | 378,000 | GBP | 2,570 | (115 | ) | ||||
10/21/09-11/20/09 | JPY | 189,000 | NZD | 3,263 | 243 | |||||
10/21/09-11/20/09 | NZD | 3,147 | JPY | 189,000 | (159 | ) | ||||
10/21/09-11/20/09 | NZD | 659 | USD | 460 | (16 | ) | ||||
10/21/09-11/20/09 | SGD | 2,800 | GBP | 1,227 | (26 | ) | ||||
10/21/09-11/20/09 | USD | 1,629 | NOK | 9,526 | 12 | |||||
11/20/09 | CHF | 2,100 | EUR | 1,391 | 7 | |||||
11/20/09 | CHF | 1,000 | NOK | 5,854 | 43 | |||||
11/20/09 | EUR | 1,393 | CHF | 2,100 | (10 | ) | ||||
11/20/09 | EUR | 1,397 | JPY | 188,000 | 59 | |||||
11/20/09 | JPY | 188,000 | EUR | 1,431 | (10 | ) | ||||
11/20/09 | NOK | 5,968 | CHF | 1,000 | (63 | ) | ||||
| $ | (610 | ) | ||||||||
A summary of the open futures contracts held by the Fund at September 30, 2009, is as follows:
Type of Contract | Number of Contracts Long (Short) | Expiration Date | Unrealized Appreciation (Depreciation) ($ Thousands) | ||||||
DJ Euro Stoxx 50 Index | 932 | Dec-2009 | $ | 494 | |||||
FTSE 100 Index | 278 | Dec-2009 | 520 | ||||||
Hang Seng Index | 16 | Oct-2009 | 7 | ||||||
MSCI EAFE Index E-MINI | 88 | Dec-2009 | 133 | ||||||
Nikkei 225 Index | 20 | Dec-2009 | (24 | ) | |||||
SPI 200 Index | 66 | Dec-2009 | 220 | ||||||
Topix Index | 244 | Dec-2009 | (1,094 | ) | |||||
U.S. 10-Year Treasury Note | (14 | ) | Dec-2009 | (20 | ) | ||||
U.S. 5-Year Treasury Note | (14 | ) | Dec-2009 | (13 | ) | ||||
| $ | 223 | ||||||||
For the year ended September 30, 2009, the total amount of all open futures contracts, as presented in the table above, are representative of the volume of activity for this derivative type during the period.
| SEI Institutional International Trust / Annual Holdings / September 30, 2009 | 16 |
Table of Contents
SCHEDULE OF INVESTMENTS
International Equity Fund
September 30, 2009
A summary of outstanding swap agreements held by the Fund at September 30, 2009, is as follows:
Total Return Swap
Counterparty | Reference Entity/Obligation | Fund Pays | Fund Receives | Termination Date | Notional Amount (Thousands) | Net Unrealized Depreciation ($Thousands) | ||||||||
Morgan Stanley | MSCI Daily TR Net EAFE USD Market Index | 3-Month LIBOR | Price Return | 01/13/10 | 95,310 | $ | (1,341 | ) | ||||||
Credit Default Swaps
Counterparty | Reference Entity/Obligation | Buy/Sell Protection | (Pays)/Receives Rate | Termination Date | Notional Amount (Thousands) | Net Unrealized Appreciation ($Thousands) | ||||||||
Bank of America | Radian Group Inc., 7.750%, 06/01/11 | BUY | (0.39 | ) | 12/20/13 | 2,500 | $ | 920 | ||||||
JPMorgan Chase Bank | Radian Group Inc., 7.750%, 06/01/11 | BUY | (0.39 | ) | 12/20/13 | 2,500 | 921 | |||||||
| $ | 1,841 | |||||||||||||
Percentages are based on a Net Assets of $2,061,808
($ Thousands).
| * | Non-income producing security |
| ** | Rate shown is the 7-day effective yield as of September 30, 2009. |
| † | Affiliated security |
| (1) | In U.S. dollars unless otherwise noted. |
| (A) | This security or a partial position of this security is on loan at September 30, 2009. The total market value of securities on loan at September 30, 2009 was$155,229 (Thousands) (See Note 9). |
| (B) | Real Estate Investment Trust |
| (C) | Securities sold within terms of a private placement memorandum, exempt from registration under Section 144A of the Securities Act of 1933, as amended, and may be sold only to dealers in that program or other “accredited investors.” These securities have been determined to be liquid under guidelines established by the Board of Trustees. |
| (D) | Security fair valued using methods determined in good faith by the Valuation Committee of the Board of Trustees. The total market value of such securities as of September 30, 2009 was $916 (Thousands) and represented 0.0% of Net Assets. |
| (E) | Variable Rate Security - The rate reported on the Schedule of Investments is the rate in effect as of September 30, 2009. |
| (F) | Zero coupon security. The rate reported on the Schedule of Investments is the effective yield at time of purchase. |
| (G) | Security, or portion thereof, has been pledged as collateral on open futures contracts. |
| (H) | This security was purchased with cash collateral held from securities on loan (see Note 9). The total value of such securities as of September 30, 2009 was $163,007 (Thousands). |
ADR — American Depositary Receipt
ARM — Adjustable Rate Mortgage
AUD — Australian Dollar
CAD — Canadian Dollar
CHF — Swiss Franc
Cl — Class
CMO — Collateralized Mortgage Obligation
DKK — Danish Krone
EAFE — Europe, Australasia and Far East
EURIBOR — Euro London Interbank Offered Rate
EUR — Euro
FHLMC — Federal Home Loan Mortgage Corporation
FNMA — Federal National Mortgage Association
GBP — British Pound Sterling
GDR — Global Depositary Receipt
HKD — Hong Kong Dollar
IO — Interest Only - face amount represents notional amount
JPY — Japanese Yen
LIBOR — London Interbank Offered Rate
L.P. — Limited Partnership
MSCI — Morgan Stanley Capital International
MXP — Mexican Peso
NOK — Norwegian Krone
NZD — New Zealand Dollar
SEK — Swedish Krona
Ser — Series
SGD — Singapore Dollar
STRIPS — Separately Traded Registered Interest and Principal Securities
TBA — To Be Announced
USD — U.S. Dollar
ZAR — South African Rand
Amounts designated as “—” are $0 or have been rounded to $0.
The accompanying notes are an integral part of the financial statements.
| 17 | SEI Institutional International Trust / Annual Holdings / September 30, 2009 |
Table of Contents
SCHEDULE OF INVESTMENTS
Emerging Markets Equity Fund
September 30, 2009
Description | Shares | Market Value ($ Thousands) | |||
COMMON STOCK — 86.7% | |||||
Argentina — 0.4% | |||||
Tenaris ADR | 71,458 | $ | 2,545 | ||
Ternium ADR(A) | 29,250 | 778 | |||
| 3,323 | |||||
Brazil — 7.8% | |||||
All America Latina Logistica | 134,000 | 1,035 | |||
Amil Participacoes | 166,900 | 913 | |||
Banco do Brasil | 161,654 | 2,848 | |||
Banestes Banco do Estado do Espirito Santo | 4,800 | 20 | |||
BM&F BOVESPA | 67,100 | 493 | |||
BR Malls Participacoes* | 74,500 | 875 | |||
Centrais Eletricas Brasileiras | 54,180 | 838 | |||
Cia de Saneamento Basico do Estado de Sao Paulo | 101,469 | 1,920 | |||
Cia de Saneamento Basico do Estado de Sao Paulo ADR | 610 | 23 | |||
Cia de Saneamento de Minas Gerais | 84,600 | 1,419 | |||
Cia Energetica de Minas Gerais ADR(A) | 62,163 | 945 | |||
Cia Siderurgica Nacional ADR | 9,800 | 300 | |||
Companhia Brasileira de Meios de Pagamento | 34,477 | 340 | |||
Dufry South America | 61,000 | 1,025 | |||
EDP - Energias do Brasil | 99,302 | 1,623 | |||
Empresa Brasileira de Aeronautica* | 186,300 | 1,067 | |||
Empresa Brasileira de Aeronautica ADR* | 22,380 | 513 | |||
Eternit | 26,655 | 111 | |||
Gerdau | 88,900 | 924 | |||
Gerdau ADR | 76,104 | 1,023 | |||
Grendene | 309,324 | 1,450 | |||
GVT Holding*(B) | 20,200 | 460 | |||
Hypermarcas* | 106,250 | 2,087 | |||
Itau Unibanco Holding ADR | 287,329 | 5,790 | |||
Klabin Segall* | 19,700 | 57 | |||
Light | 41,852 | 580 | |||
Localiza Rent A Car | 196,800 | 1,961 | |||
Lojas Renner | 93,249 | 1,614 | |||
Marfrig Alimentos* | 42,400 | 402 | |||
Medial Saude* | 147,800 | 900 | |||
Multiplan Empreendimentos Imobiliarios | 8,500 | 132 | |||
OGX Petroleo e Gas Participacoes | 2,784 | 2,114 | |||
PDG Realty Empreendimentos e Participacoes | 82,400 | 680 | |||
Petroleo Brasileiro | 347,229 | 7,936 | |||
Petroleo Brasileiro ADR | 49,934 | 2,292 | |||
Porto Seguro | 26,600 | 269 | |||
Redecard | 239,703 | 3,685 | |||
Rodobens Negocios Imobiliarios | 85,150 | 854 | |||
Santos Brasil Participacoes | 41,581 | 329 | |||
Sistema Educacional Brasileiro | 87,900 | 862 | |||
SLC Agricola | 61,520 | 525 | |||
Souza Cruz | 12,806 | 453 | |||
Telegraph Norte Leste Participacoes ADR | 111,007 | 2,086 | |||
Description | Shares | Market Value ($ Thousands) | |||
Telegraph Norte Leste Participacoes | 41,900 | $ | 940 | ||
Tractebel Energia | 60,770 | 716 | |||
Usinas Siderurgicas de Minas Gerais | 142,800 | 3,647 | |||
Vale | 136,800 | 3,157 | |||
Vale ADR, Cl B | 252,970 | 5,851 | |||
Vivo Participacoes ADR | 2,959 | 75 | |||
Votorantim Celulose e Papel ADR* | 8,000 | 131 | |||
Votorantim Celulose e Papel* | 4,100 | 67 | |||
Wilson Sons, Cl BDR, BDR | 73,605 | 1,004 | |||
| 71,361 | |||||
Chile — 1.2% | |||||
Banco de Chile ADR | 16,814 | 799 | |||
Banco Santander Chile ADR | 25,761 | 1,482 | |||
Centros Comerciales Sudamericanos | 109,425 | 299 | |||
Cia Cervecerias Unidas | 167,128 | 1,139 | |||
Cia Cervecerias Unidas ADR | 23,094 | 793 | |||
CorpBanca ADR | 13,600 | 441 | |||
Embotelladora Andina ADR, Cl B | 32,078 | 576 | |||
Empresa Nacional de Electricidad ADR | 19,700 | 923 | |||
Empresa Nacional de Telecomunicaciones | 49,589 | 645 | |||
Enersis ADR | 205,191 | 3,786 | |||
Multiexport Foods* | 144,140 | 27 | |||
Sociedad Quimica y Minera de Chile ADR(A) | 7,800 | 305 | |||
| 11,215 | |||||
China — 9.6% | |||||
AirMedia Group ADR* | 103,742 | 762 | |||
Ajisen China Holdings | 1,181,897 | 1,052 | |||
Anhui Conch Cement | 220,882 | 1,472 | |||
Anhui Expressway | 854,000 | 505 | |||
Asia Cement China Holdings | 148,000 | 94 | |||
Bank of China | 14,479,000 | 7,622 | |||
Bank of Communications(A) | 1,189,000 | 1,448 | |||
Beauty China Holdings(B)(C) | 70,000 | 7 | |||
Bosideng International Holdings | 6,640,000 | 1,071 | |||
Central China Real Estate | 25,000 | 7 | |||
China Citic Bank | 1,009,000 | 665 | |||
China Coal Energy | 707,000 | 925 | |||
China Communications Services | 610,000 | 334 | |||
China Construction Bank | 15,222,250 | 12,158 | |||
China Dongxiang Group | 2,254,500 | 1,504 | |||
China Life Insurance | 604,516 | 2,633 | |||
China Molybdenum | 1,145,991 | 918 | |||
China Petroleum & Chemical | 910,000 | 774 | |||
China Railway Construction(A) | 1,480,500 | 1,968 | |||
China Shenhua Energy | 36,000 | 157 | |||
China Shineway Pharmaceutical Group | 86,000 | 92 | |||
China Shipping Development | 1,144,000 | 1,447 | |||
China Telecom | 3,630,000 | 1,714 | |||
China Zhongwang Holdings*(A) | 882,800 | 868 | |||
Chongqing Changan Automobile, Cl B | 927,400 | 544 | |||
Ctrip.com International ADR* | 52,100 | 3,063 | |||
Dongfeng Motor Group | 1,937,555 | 2,060 | |||
| 1 | SEI Institutional International Trust / Annual Holdings / September 30, 2009 |
Table of Contents
Description | Shares | Market Value ($ Thousands) | |||
Epure International | 2,543,500 | $ | 1,029 | ||
Fosun International | 1,101,500 | 769 | |||
Golden Eagle Retail Group(A) | 459,215 | 770 | |||
Great Wall Motor | 524,000 | 472 | |||
Great Wall Technology | 358,000 | 103 | |||
Guangzhou R&F Properties | 556,400 | 978 | |||
Huaneng Power International | 1,184,800 | 784 | |||
Huaneng Power International ADR | 4,040 | 108 | |||
Industrial & Commercial Bank of China(A) | 14,633,000 | 11,027 | |||
Jiangling Motors, Cl B | 453,400 | 569 | |||
Jiangsu Expressway(A) | 338,000 | 277 | |||
Mindray Medical International ADR | 38,678 | 1,262 | |||
New Oriental Education & Technology Group ADR* | 8,248 | 664 | |||
PetroChina | 3,469,023 | 3,921 | |||
PetroChina ADR | 11,290 | 1,284 | |||
Ping An Insurance Group of China | 214,000 | 1,698 | |||
Renhe Commercial Holdings | 10,682,000 | 2,150 | |||
Shanda Games ADR* | 33,800 | 395 | |||
Shanda Interactive Entertainment ADR*(A) | 2,400 | 123 | |||
Shandong Chenming Paper Holdings, Cl B | 842,100 | 594 | |||
Shandong Molong Petroleum Machinery | 1,358,813 | 142 | |||
Shanghai Mechanical and Electrical Industry, Cl B | 170,265 | 174 | |||
Shenzhou International Group Holdings | 369,000 | 370 | |||
Sinopharm Group* | 80,400 | 204 | |||
Sinotrans | 4,378,000 | 1,034 | |||
Sinotrans Shipping | 1,293,500 | 521 | |||
Soho China | 1,957,500 | 1,048 | |||
Tencent Holdings | 195,200 | 3,176 | |||
Tingyi Cayman Islands Holding | 628,000 | 1,296 | |||
Travelsky Technology | 96,000 | 74 | |||
Weiqiao Textile | 1,721,400 | 1,066 | |||
Yangzijiang Shipbuilding Holdings(A) | 1,658,102 | 1,136 | |||
Yanzhou Coal Mining | 536,000 | 773 | |||
Zhejiang Expressway | 1,293,162 | 1,133 | |||
Zhuzhou CSR Times Electric | 706,000 | 1,228 | |||
| 88,216 | |||||
Czech Republic — 0.5% | |||||
CEZ | 57,746 | 3,068 | |||
Komercni Banka | 4,037 | 802 | |||
Philip Morris CR | 560 | 284 | |||
Telefonica O2 Czech Republic | 16,046 | 396 | |||
| 4,550 | |||||
Egypt — 0.4% | |||||
Commercial International Bank | 127,289 | 1,328 | |||
Egyptian Financial Group-Hermes Holding | 220,924 | 1,206 | |||
National Societe Generale Bank | 12,100 | 63 | |||
Orascom Construction Industries GDR*(A)(D) | 14,078 | 591 | |||
Suez Cement | 29,826 | 223 | |||
Description | Shares | Market Value ($ Thousands) | |||
Telecom Egypt | 205,500 | $ | 663 | ||
| 4,074 | |||||
Hong Kong — 6.2% | |||||
Beijing Enterprises Holdings | 424,362 | 2,248 | |||
Chaoda Modern Agriculture(A) | 2,859,400 | 1,727 | |||
Cheung Kong Holdings | 26,000 | 330 | |||
China BlueChemical | 1,293,337 | 701 | |||
China Foods | 148,000 | 102 | |||
China Mengniu Dairy | 443,000 | 1,134 | |||
China Mobile | 1,453,715 | 14,181 | |||
China Mobile ADR | 48,070 | 2,361 | |||
China Overseas Land & Investment | 806,800 | 1,745 | |||
China Pharmaceutical Group | 1,552,000 | 873 | |||
China Power International Development(A) | 4,175,200 | 1,196 | |||
China Resources Power Holdings | 734,800 | 1,708 | |||
China Unicom | 1,057,682 | 1,498 | |||
CNOOC | 4,828,448 | 6,492 | |||
CNOOC ADR | 3,510 | 475 | |||
CNPC Hong Kong | 1,172,836 | 929 | |||
COSCO Pacific | 1,825,015 | 2,619 | |||
Denway Motors | 3,484,000 | 1,551 | |||
Digital China Holdings | 292,000 | 278 | |||
Geely Automobile Holdings(A) | 2,615,000 | 712 | |||
Global Bio-Chemical Technology Group | 3,957,500 | 1,001 | |||
GOME Electrical Appliances Holdings | 5,286,740 | 1,412 | |||
Great Eagle Holdings | 153,668 | 379 | |||
Guangdong Investment | 872,000 | 430 | |||
GZI Real Estate Investment Trust(E) | 706,065 | 260 | |||
Hengan International Group | 114,000 | 689 | |||
Hopewell Holdings | 163,779 | 515 | |||
Huabao International Holdings | 2,448,809 | 2,626 | |||
Industrial and Commercial Bank of China Asia | 293,000 | 663 | |||
NWS Holdings | 205,226 | 397 | |||
Samson Holding(A) | 5,549,000 | 1,146 | |||
Shanghai Industrial Holdings | 314,985 | 1,420 | |||
Sino Biopharmaceutical | 1,011,000 | 233 | |||
Sinolink Worldwide Holdings | 1,936,000 | 487 | |||
Skyworth Digital Holdings | 1,802,000 | 835 | |||
Texwinca Holdings | 224,600 | 177 | |||
TPV Technology | 2,041,890 | 1,265 | |||
| 56,795 | |||||
Hungary — 0.2% | |||||
Egis Gyogyszergyar | 2,000 | 212 | |||
Magyar Telekom | 53,194 | 232 | |||
MOL Hungarian Oil and Gas | 13,125 | 1,091 | |||
| 1,535 | |||||
India — 6.9% | |||||
Allahabad Bank | 111,286 | 276 | |||
Andhra Bank | 365,655 | 806 | |||
Bank | 10,693 | 94 | |||
Bank of Baroda | 125,937 | 1,261 | |||
Bank of India | 254,564 | 2,196 | |||
Bank of Maharashtra | 111,285 | 109 | |||
| SEI Institutional International Trust / Annual Holdings / September 30, 2009 | 2 |
Table of Contents
SCHEDULE OF INVESTMENTS
Emerging Markets Equity Fund
September 30, 2009
Description | Shares | Market Value ($ Thousands) | |||
Bharat Electronics | 8,329 | $ | 266 | ||
Bharat Heavy Electricals | 28,180 | 1,364 | |||
Bharat Petroleum | 78,222 | 933 | |||
Bharti Airtel | 335,679 | 2,922 | |||
Birla | 25,717 | 160 | |||
Cairn India* | 457,047 | 2,488 | |||
Canara Bank | 95,549 | 640 | |||
Container of India | 1,300 | 32 | |||
Dena Bank | 42,104 | 59 | |||
Federal Bank | 55,489 | 291 | |||
GAIL India | 359,718 | 2,686 | |||
Glenmark Pharmaceuticals | 49,990 | 247 | |||
Grasim Industries | 20,666 | 1,192 | |||
Gujarat Alkalies & Chemicals | 23,460 | 58 | |||
Gujarat Narmada Valley Fertilizers | 142,723 | 302 | |||
Gujarat State Fertilisers & Chemicals | 21,870 | 80 | |||
HCL Technologies | 115,942 | 821 | |||
Hero Honda Motors | 29,240 | 1,017 | |||
Hindalco Industries | 130,002 | 349 | |||
Hindustan Petroleum | 102,740 | 858 | |||
Hindustan Unilever | 18,952 | 103 | |||
Hindustan Zinc | 53,580 | 921 | |||
Housing Development Finance | 56,038 | 3,250 | |||
India Cements | 709,260 | 1,982 | |||
Indian Bank | 138,611 | 472 | |||
Indian Overseas Bank | 51,626 | 136 | |||
Industrial Development Bank of India | 315,589 | 836 | |||
Infosys Technologies | 59,691 | 2,862 | |||
Infosys Technologies ADR | 5,730 | 278 | |||
ITC | 74,869 | 363 | |||
Jet Airways India | 40,750 | 279 | |||
Jindal Steel & Power | 19,380 | 236 | |||
Mahanagar Telephone Nigam | 507,220 | 965 | |||
Mahindra & Mahindra | 30,000 | 551 | |||
Mangalore Refinery & Petrochemicals | 439,380 | 834 | |||
Maruti Udyog | 31,436 | 1,112 | |||
Mphasis | 10,058 | 139 | |||
Oil & Natural Gas | 111,225 | 2,710 | |||
Oriental Bank of Commerce | 72,499 | 359 | |||
Patni Computer Systems | 167,378 | 1,601 | |||
Piramal Healthcare | 121,378 | 967 | |||
Power Finance | 195,805 | 932 | |||
Punjab National Bank | 44,931 | 745 | |||
Reliance Industries* | 41,890 | 1,917 | |||
Sesa GOA*(F) | 148,274 | 819 | |||
Shipping of India | 40,912 | 120 | |||
State Bank of India | 51,796 | 2,363 | |||
State Bank of India GDR(D) | 25,100 | 2,282 | |||
Steel Authority of India | 589,610 | 2,095 | |||
Sterlite Industries India ADR | 23,650 | 378 | |||
Sterlite Industries India | 71,582 | 1,155 | |||
Syndicate Bank | 114,759 | 223 | |||
Tata Consultancy Services | 336,788 | 4,348 | |||
Tata Power | 9,356 | 256 | |||
Tata Steel | 150,736 | 1,596 | |||
Ultratech Cement | 2,160 | 36 | |||
Union Bank of India | 53,345 | 266 | |||
Zee Entertainment Enterprises | 297,096 | 1,475 | |||
| 63,469 | |||||
Description | Shares | Market Value ($ Thousands) | |||
Indonesia — 1.7% | |||||
Astra International | 392,351 | $ | 1,354 | ||
Bank Central Asia | 2,547,500 | 1,219 | |||
Bank Mandiri | 7,908,592 | 3,846 | |||
Bank Rakyat Indonesia | 2,187,000 | 1,697 | |||
Gudang Garam | 480,570 | 741 | |||
Indocement Tunggal Prakarsa | 1,062,305 | 1,165 | |||
Indosat | 1,091,500 | 615 | |||
Kalbe Farma | 1,539,800 | 212 | |||
Semen Gresik Persero | 458,000 | 299 | |||
Tambang Batubara Bukit Asam | 209,000 | 305 | |||
Telekomunikasi Indonesia | 4,293,100 | 3,842 | |||
Unilever Indonesia | 254,093 | 281 | |||
United Tractors | 213,000 | 344 | |||
| 15,920 | |||||
Israel — 1.7% | |||||
Bank Hapoalim* | 243,750 | 865 | |||
Bezeq Israeli Telecommunication | 1,443,402 | 3,096 | |||
Delek Automotive Systems | 2,517 | 30 | |||
Delek Group | 1,038 | 174 | |||
Discount Investment | 8,366 | 188 | |||
First International Bank of Israel* | 51,020 | 709 | |||
Israel Chemicals | 25,182 | 288 | |||
Israel Discount Bank, Cl A | 177,274 | 334 | |||
Makhteshim-Agan Industries | 76,735 | 346 | |||
Mizrahi Tefahot Bank* | 92,000 | 781 | |||
Partner Communications | 38,041 | 717 | |||
Teva Pharmaceutical Industries | 73,554 | 3,683 | |||
Teva Pharmaceutical Industries ADR | 84,356 | 4,265 | |||
Union Bank of Israel* | 21,090 | 103 | |||
| 15,579 | |||||
Kazakhstan — 0.2% | |||||
KazMunaiGas Exploration Production GDR | 83,682 | 1,873 | |||
Malaysia — 1.9% | |||||
Berjaya Sports Toto | 286,975 | 367 | |||
BIMB Holdings | 36,000 | 11 | |||
British American Tobacco Malaysia | 55,400 | 705 | |||
CIMB Group Holdings | 742,200 | 2,380 | |||
Gamuda | 962,900 | 882 | |||
Genting Malaysia | 3,265,340 | 2,585 | |||
Hong Leong Bank | 368,411 | 699 | |||
KLCC Property Holdings | 97,600 | 94 | |||
Lafarge Malayan Cement | 57,100 | 103 | |||
Malayan Banking | 1,851,067 | 3,557 | |||
Malaysian Bulk Carriers | 349,191 | 307 | |||
PPB Group | 202,000 | 899 | |||
Proton Holdings | 167,000 | 195 | |||
Public Bank | 158,653 | 468 | |||
Public Bank (Foreign Market) | 87,400 | 258 | |||
RHB Capital | 46,280 | 68 | |||
Sime Darby | 440,300 | 1,081 | |||
Telekom Malaysia | 166,000 | 147 | |||
Tenaga Nasional | 1,046,935 | 2,477 | |||
| 3 | SEI Institutional International Trust / Annual Holdings / September 30, 2009 |
Table of Contents
Description | Shares | Market Value ($ Thousands) | |||
UMW Holdings | 161,066 | $ | 293 | ||
| 17,576 | |||||
Mexico — 4.1% | |||||
Alfa, Cl A | 131,688 | 629 | |||
America Movil ADR, Ser L | 147,706 | 6,474 | |||
America Movil, Ser L | 2,408,459 | 5,270 | |||
Banco Compartamos(A) | 83,343 | 304 | |||
Bolsa Mexicana de Valores* | 573,228 | 709 | |||
Cemex ADR* | 19,800 | 256 | |||
Coca-Cola Femsa ADR | 12,640 | 608 | |||
Coca-Cola Femsa | 107,800 | 517 | |||
Consorcio ARA(A) | 960,600 | 576 | |||
Desarrolladora Homex ADR*(A) | 41,543 | 1,569 | |||
Embotelladoras Arca | 595,309 | 1,471 | |||
Empresas ICA* | 24,500 | 58 | |||
Fomento Economico Mexicano ADR | 22,346 | 850 | |||
Fomento Economico Mexicano | 272,255 | 1,036 | |||
Gruma, Cl B* | 220,756 | 387 | |||
Grupo Bimbo, Ser A | 77,320 | 430 | |||
Grupo Carso, Ser A1(A) | 64,749 | 209 | |||
Grupo Casa Saba ADR | 4,500 | 86 | |||
Grupo Continental(B) | 644,000 | 1,288 | |||
Grupo Financiero Banorte, Cl O(A) | 767,116 | 2,565 | |||
Grupo Mexico, Ser B* | 1,186,581 | 2,186 | |||
Grupo Modelo | 201,900 | 751 | |||
Grupo Simec, Cl B* | 150,000 | 398 | |||
Grupo Televisa ADR | 124,415 | 2,313 | |||
Grupo Televisa | 328,395 | 1,214 | |||
Industrias, Cl B* | 157,544 | 552 | |||
Kimberly-Clark de Mexico, Cl A(A) | 278,900 | 1,157 | |||
Megacable Holdings* | 73,000 | 138 | |||
Urbi Desarrollos Urbanos* | 1,605,241 | 3,252 | |||
Wal-Mart de Mexico, Ser V(A) | 191,700 | 664 | |||
| 37,917 | |||||
Netherlands — 0.1% | |||||
Plaza Centers | 496,174 | 1,042 | |||
Pakistan — 0.1% | |||||
Oil & Gas Development | 920,472 | 1,189 | |||
Panama — 0.1% | |||||
Copa Holdings, Cl A | 26,400 | 1,174 | |||
Peru — 0.2% | |||||
Cia de Minas Buenaventura ADR | 8,329 | 293 | |||
Credicorp | 21,600 | 1,680 | |||
| 1,973 | |||||
Philippines — 0.4% | |||||
ABS-CBN Holdings(B) | 131,700 | 83 | |||
Bank of the Philippine Islands | 437,171 | 415 | |||
Globe Telecom | 1,376 | 29 | |||
Metropolitan Bank & Trust | 273,300 | 222 | |||
Philippine Long Distance Telephone | 15,200 | 773 | |||
Description | Shares | Market Value ($ Thousands) | |||
Philippine Long Distance Telephone ADR | 23,779 | $ | 1,222 | ||
SM Investments | 48,580 | 333 | |||
Union Bank of Philippines | 446,600 | 283 | |||
| 3,360 | |||||
Poland — 0.7% | |||||
Asseco Poland | 22,140 | 472 | |||
Bank Pekao | 7,490 | 393 | |||
Cyfrowy Polsat | 121,890 | 626 | |||
Gant Development* | 6,000 | 42 | |||
Getin Holding* | 50,000 | 157 | |||
KGHM Polska Miedz | 28,431 | 847 | |||
Polish Oil & Gas | 58,200 | 72 | |||
Polski Koncern Naftowy Orlen | 148,036 | 1,519 | |||
Powszechna Kasa Oszczednosci Bank Polski | 57,677 | 668 | |||
Telekomunikacja Polska | 290,860 | 1,586 | |||
| 6,382 | |||||
Russia — 6.0% | |||||
Comstar United Telesystems GDR | 204,027 | 1,071 | |||
Evraz Group GDR | 59,903 | 1,564 | |||
Globaltrans Investment GDR* | 172,656 | 1,278 | |||
LUKOIL ADR | 217,888 | 11,951 | |||
Lukoil OAO ADR | 37,300 | 2,022 | |||
MMC Norilsk Nickel ADR | 288,449 | 3,577 | |||
Mobile Telesystems ADR | 73,485 | 3,547 | |||
Novolipetsk Steel GDR* | 33,848 | 861 | |||
OAO Gazprom ADR | 722,532 | 16,799 | |||
Pharmstandard GDR* | 33,038 | 595 | |||
Rosneft Oil GDR | 658,529 | 4,952 | |||
Sberbank GDR | 6,200 | 1,373 | |||
Severstal GDR | 54,223 | 418 | |||
Sistema GDR | 5,176 | 76 | |||
Surgutneftegaz ADR | 152,598 | 1,335 | |||
Tatneft ADR | 41,892 | 1,037 | |||
TMK OAO GDR | 267 | 4 | |||
Uralkali GDR | 66,738 | 1,261 | |||
X5 Retail Group GDR* | 39,206 | 953 | |||
| 54,674 | |||||
South Africa — 6.8% | |||||
ABSA Group | 150,030 | 2,376 | |||
African Bank Investments | 353,391 | 1,376 | |||
Anglo Platinum | 11,960 | 1,053 | |||
AngloGold Ashanti | 43,936 | 1,748 | |||
AngloGold Ashanti ADR(A) | 43,719 | 1,782 | |||
ArcelorMittal South Africa | 126,026 | 1,996 | |||
Aspen Pharmacare Holdings | 49,518 | 404 | |||
Assore | 1,435 | 119 | |||
Aveng | 187,961 | 1,073 | |||
Barloworld | 269,112 | 1,740 | |||
Bidvest Group | 64,930 | 1,016 | |||
DataTec | 45,000 | 144 | |||
FirstRand | 1,869,984 | 4,074 | |||
Gold Fields ADR | 39,510 | 545 | |||
Gold Fields | 271,744 | 3,640 | |||
Grindrod | 453,355 | 951 | |||
Harmony Gold Mining(A) | 155,431 | 1,641 | |||
Hyprop Investments | 10,729 | 60 | |||
Impala Platinum Holdings | 152,824 | 3,529 | |||
| SEI Institutional International Trust / Annual Holdings / September 30, 2009 | 4 |
Table of Contents
SCHEDULE OF INVESTMENTS
Emerging Markets Equity Fund
September 30, 2009
Description | Shares | Market Value ($ Thousands) | |||
Imperial Holdings | 70,843 | $ | 746 | ||
Investec | 184,600 | 1,392 | |||
JD Group | 75,760 | 446 | |||
Kumba Iron Ore | 25,330 | 829 | |||
Medi-Clinic | 94,478 | 278 | |||
Metropolitan Holdings | 485,749 | 820 | |||
Mondi | 239,626 | 1,233 | |||
Mr Price Group | 138,736 | 623 | |||
MTN Group | 390,818 | 6,300 | |||
Murray & Roberts Holdings | 38,220 | 299 | |||
Nampak | 536,152 | 1,203 | |||
Naspers, Cl N | 46,829 | 1,586 | |||
Nedbank Group(A) | 153,288 | 2,417 | |||
Remgro | 60,722 | 710 | |||
Reunert | 98,221 | 726 | |||
Sanlam | 783,451 | 2,121 | |||
Sappi | 633,483 | 2,366 | |||
Sasol | 116,007 | 4,323 | |||
Sasol ADR | 9,070 | 346 | |||
Shoprite Holdings | 72,817 | 596 | |||
Standard Bank Group | 154,030 | 1,975 | |||
Steinhoff International Holdings | 300,000 | 653 | |||
Telkom(A) | 83,070 | 474 | |||
Vodacom Group Pty* | 23,072 | 171 | |||
Woolworths Holdings | 59,575 | 127 | |||
| 62,027 | |||||
South Korea — 12.9% | |||||
CJ CheilJedang | 4,134 | 728 | |||
Daegu Bank | 54,400 | 780 | |||
Daewoo Securities | 6,050 | 111 | |||
Daewoo Shipbuilding & Marine Engineering | 77,210 | 1,127 | |||
Daishin Securities | 26,860 | 369 | |||
Dongbu Insurance | 21,523 | 660 | |||
Doosan | 3,680 | 278 | |||
GS Engineering & Construction | 26,891 | 2,104 | |||
GS Holdings | 18,010 | 499 | |||
GS Home Shopping | 1,898 | 115 | |||
Hana Financial Group | 17,980 | 620 | |||
Hanwha Chemical | 89,740 | 975 | |||
Hyundai Department Store | 4,125 | 385 | |||
Hyundai Development | 45,350 | 1,647 | |||
Hyundai Heavy Industries | 5,805 | 887 | |||
Hyundai Mipo Dockyard | 2,849 | 301 | |||
Hyundai Mobis | 10,460 | 1,469 | |||
Hyundai Motor | 46,878 | 4,436 | |||
Kangwon Land | 127,010 | 1,876 | |||
KB Financial Group | 65,994 | 3,389 | |||
KCC | 531 | 160 | |||
KISWIRE | 2,750 | 98 | |||
Korea Development Financing | 1,930 | 52 | |||
Korea Electric Power | 122,970 | 3,736 | |||
Korea Plant Service & Engineering | 13,254 | 365 | |||
Korea Zinc | 9,254 | 1,378 | |||
Korean Reinsurance | 32,480 | 327 | |||
KT | 52,850 | 1,814 | |||
KT ADR | 80,800 | 1,404 | |||
KT&G | 29,347 | 1,778 | |||
LG | 41,054 | 2,753 | |||
LG Chemical | 18,948 | 3,522 | |||
LG Electronics | 58,280 | 6,208 | |||
Description | Shares | Market Value ($ Thousands) | |||
LG Philips LCD | 170,970 | $ | 4,919 | ||
Lotte Chilsung Beverage | 138 | 94 | |||
Lotte Confectionery | 510 | 536 | |||
Lotte Shopping | 10,426 | 2,810 | |||
LS Industrial Systems | 9,912 | 782 | |||
MegaStudy | 5,492 | 1,130 | |||
Namyang Dairy Products | 196 | 93 | |||
Pacific | 85 | 11 | |||
POSCO | 15,149 | 6,262 | |||
POSCO ADR | 9,120 | 948 | |||
Pusan Bank | 74,870 | 832 | |||
Samsung Electro-Mechanics | 1,640 | 141 | |||
Samsung Electronics | 42,310 | 29,266 | |||
Samsung Fire & Marine Insurance | 13,538 | 2,769 | |||
Samsung Heavy Industries | 35,440 | 770 | |||
SeAH Holdings | 66 | 3 | |||
Shinhan Financial Group | 203,930 | 8,135 | |||
Shinsegae | 6,951 | 3,510 | |||
SK Holdings | 17,341 | 1,656 | |||
SK Telecom | 13,799 | 2,137 | |||
SK Telecom ADR | 107,780 | 1,881 | |||
S-Oil | 23,454 | 1,240 | |||
Woori Investment & Securities | 59,840 | 851 | |||
Youngone Holdings | 3,508 | 67 | |||
Yuhan | 5,533 | 895 | |||
| 118,089 | |||||
Sweden — 0.1% | |||||
Alliance Oil*(A) | 80,770 | 996 | |||
Taiwan — 10.9% | |||||
Ability Enterprise | 178,039 | 349 | |||
Acer | 1,088,371 | 2,776 | |||
Advanced Semiconductor Engineering ADR | 88,998 | 368 | |||
Advanced Semiconductor Engineering | 3,747,404 | 3,083 | |||
Asustek Computer | 1,267,931 | 2,177 | |||
AU Optronics | 1,372,418 | 1,334 | |||
Cathay Financial Holding | 1,554,200 | 2,582 | |||
Cheng Loong | 318,000 | 110 | |||
Chi Mei Optoelectronics | 683,000 | 359 | |||
China Bills Finance* | 461,000 | 131 | |||
China Steel | 1,137,819 | 1,058 | |||
Chinatrust Financial Holding | 6,844,862 | 4,439 | |||
Chunghwa Telecom | 978,777 | 1,763 | |||
Compal Electronics | 4,376,281 | 5,098 | |||
CTCI | 187,396 | 182 | |||
Far Eastern Textile | 946,539 | 1,110 | |||
Far EasTone Telecommunications | 538,000 | 629 | |||
First Financial Holding | 1,892,192 | 1,180 | |||
Formosa Plastics | 230,165 | 469 | |||
Foxconn Technology | 312,300 | 886 | |||
Gigabyte Technology | 174,000 | 147 | |||
HannStar Display* | 477,838 | 105 | |||
High Tech Computer | 187,100 | 2,054 | |||
HON HAI Precision Industry | 3,247,934 | 13,033 | |||
KGI Securities | 579,000 | 312 | |||
Lite-On Technology | 1,281,118 | 1,680 | |||
Macronix International | 1,192,687 | 657 | |||
MediaTek | 458,023 | 7,637 | |||
| 5 | SEI Institutional International Trust / Annual Holdings / September 30, 2009 |
Table of Contents
Description | Shares | Market Value ($ Thousands) | |||
Mega Financial Holding | 3,535,000 | $ | 2,238 | ||
Nan Ya Plastics | 5,040 | 8 | |||
Nan Ya Printed Circuit Board | 344,967 | 1,196 | |||
Nien Hsing Textile | 241,000 | 124 | |||
Novatek Microelectronics | 227,860 | 539 | |||
Pou Chen | 887,200 | 574 | |||
Quanta Computer | 1,654,592 | 3,474 | |||
Siliconware Precision Industries | 1,235,002 | 1,744 | |||
SinoPac Financial Holdings | 4,673,230 | 1,919 | |||
Taishin Financial Holding | 1,645,000 | 716 | |||
Taiwan Cooperative Bank | 1,577,661 | 972 | |||
Taiwan Fertilizer | 1,007,000 | 3,602 | |||
Taiwan Semiconductor Manufacturing | 6,509,456 | 13,060 | |||
Taiwan Semiconductor Manufacturing ADR | 164,386 | 1,802 | |||
Tatung GDR* | 315,600 | 1,247 | |||
U-Ming Marine Transport | 115,000 | 194 | |||
United Microelectronics | 11,392,312 | 5,581 | |||
Universal Scientific Industrial | 296,000 | 138 | |||
Walsin Lihwa | 154,000 | 53 | |||
Wistron | 981,000 | 1,825 | |||
Yageo | 2,647,440 | 742 | |||
Yuanta Financial Holding | 3,235,000 | 2,395 | |||
| 99,851 | |||||
Thailand — 2.7% | |||||
Advanced Info Service | 384,700 | 1,085 | |||
Airports of Thailand | 428,000 | 541 | |||
Bangkok Bank | 292,600 | 1,077 | |||
Bangkok Bank NVDR(A) | 830,700 | 3,009 | |||
Bumrungrad Hospital | 843,850 | 732 | |||
Charoen Pokphand Foods | 2,679,100 | 638 | |||
Electricity Generating | 43,101 | 99 | |||
Glow Energy | 383,300 | 376 | |||
Kasikornbank(A) | 1,523,433 | 3,884 | |||
Krung Thai Bank | 5,262,440 | 1,426 | |||
PTT | 150,644 | 1,181 | |||
PTT Exploration & Production | 224,619 | 971 | |||
PTT NVDR | 39,900 | 313 | |||
Ratchaburi Electricity Generating Holding | 35,600 | 40 | |||
Siam Cement (A) | 389,454 | 2,589 | |||
Siam Commercial Bank | 1,908,688 | 4,781 | |||
Thai Airways International* | 315,680 | 211 | |||
Thai Union Frozen Products | 613,100 | 473 | |||
Thanachart Capital | 362,000 | 189 | |||
Total Access Communication | 502,600 | 608 | |||
Total Access Communication NVDR | 20,100 | 26 | |||
| 24,249 | |||||
Turkey — 2.6% | |||||
Akenerji Elektrik Uretim | 11,347 | 106 | |||
Anadolu Efes Biracilik Ve Malt Sanayii | 80,993 | 883 | |||
Cimsa Cimento Sanayi VE Tica | 239,742 | 1,056 | |||
Eczacibasi Ilac Sanayi | 175,000 | 187 | |||
Ford Otomotiv Sanayi | 147,528 | 923 | |||
Haci Omer Sabanci Holding | 219,555 | 849 | |||
Hurriyet Gazetecilik* | 274,740 | 248 | |||
KOC Holding* | 152,000 | 399 | |||
Description | Shares | Market Value ($ Thousands) | |||
Petrol Ofisi* | 51,450 | $ | 251 | ||
Tekfen Holding* | 228,463 | 658 | |||
Tupras Turkiye Petrol Rafine | 235,733 | 3,902 | |||
Turk Hava Yollari | 1,039,413 | 2,699 | |||
Turk Sise ve Cam Fabrikalari | 1,022,232 | 1,087 | |||
Turkcell Iletisim Hizmet ADR | 27,970 | 500 | |||
Turkcell Iletisim Hizmet | 420,298 | 2,997 | |||
Turkiye Garanti Bankasi | 591,897 | 2,230 | |||
Turkiye Halk Bankasi | 127,691 | 756 | |||
Turkiye Is Bankasi, Cl C | 469,416 | 1,832 | |||
Turkiye Sinai Kalkinma Bankasi* | 1,192,188 | 1,179 | |||
Turkiye Vakiflar Bankasi Tao, Cl D | 314,240 | 719 | |||
| 23,461 | |||||
United Arab Emirates — 0.0% | |||||
DP World | 30,000 | 16 | |||
United Kingdom — 0.3% | |||||
Anglo American | 81,211 | 2,578 | |||
JKX Oil & Gas | 79,730 | 354 | |||
| 2,932 | |||||
Total Common Stock | 794,818 | ||||
PREFERRED STOCK — 8.1% | |||||
Brazil — 8.1% | |||||
Banco Bradesco | 89,700 | 1,780 | |||
Banco Daycoval | 25,700 | 124 | |||
Brasil Telecom | 29,046 | 254 | |||
Brasil Telecom Participacoes | 89,418 | 946 | |||
Braskem | 224,600 | 1,412 | |||
Centrais Eletricas Brasileiras | 112,246 | 1,566 | |||
Cia Brasileira de Distribuicao Grupo Pao de Acucar, Cl Preference | 24,484 | 687 | |||
Cia de Bebidas das Americas | 24,000 | 1,967 | |||
Cia de Bebidas das Americas ADR | 16,093 | 1,324 | |||
Cia de Tecidos do Norte de Minas - Coteminas | 175,532 | 580 | |||
Cia Energetica de Minas Gerais | 135,901 | 2,044 | |||
Cia Paranaense de Energia | 113,353 | 1,985 | |||
Construtora Sultepa | 600 | 2 | |||
Eletropaulo Metropolitana Eletricidade de Sao Paulo | 110,640 | 2,266 | |||
Gerdau | 53,100 | 711 | |||
Investimentos Itau | 917,435 | 5,520 | |||
Itau Unibanco Holding | 263,562 | 5,296 | |||
Marcopolo | 245,400 | 828 | |||
Metalurgica Gerdau, Cl A | 61,599 | 1,029 | |||
NET Servicos de Comunicacao* | 244,800 | 2,828 | |||
Petroleo Brasileiro | 596,442 | 11,680 | |||
Petroleo Brasileiro Sponsored ADR, Cl A | 351,510 | 13,818 | |||
Randon Participacoes | 117,200 | 872 | |||
Telecomunicacoes de Sao Paulo | 67,166 | 1,689 | |||
Telemar Norte Leste | 20,927 | 687 | |||
Tim Participacoes | 525,600 | 1,289 | |||
Ultrapar Participacoes | 17,900 | 715 | |||
Universo Online | 20,000 | 94 | |||
Vale, Cl A | 322,331 | 6,625 | |||
| SEI Institutional International Trust / Annual Holdings / September 30, 2009 | 6 |
Table of Contents
SCHEDULE OF INVESTMENTS
Emerging Markets Equity Fund
September 30, 2009
Description | Shares/Face Amount (Thousands) (1) | Market Value ($ Thousands) | |||
Vale ADR, Cl B | 183,376 | $ | 3,761 | ||
Total Preferred Stock | 74,379 | ||||
DEBENTURE BOND — 0.0% | |||||
Brazil — 0.0% | |||||
Vale, Ser 1997 | |||||
0.000%, 09/30/49* | 8 | — | |||
Total Debenture Bond | — | ||||
| Number Of Warrants | |||||
EQUITY-LINKED WARRANTS — 0.1% | |||||
Russia — 0.1% | |||||
Sberbank, Expires 02/28/18 * | 112,700 | 232 | |||
Sberbank, Expires 02/23/10 * | 270,000 | 537 | |||
| 769 | |||||
United Arab Emirates —0.0% | |||||
Air Arabia, Expires 08/13/10 * | 769,900 | 239 | |||
Dana Gas PJSC, Expires 12/06/10 * | 1,001,800 | 325 | |||
| 564 | |||||
Total Equity-Linked Warrants | 1,333 | ||||
EXCHANGE TRADED FUND — 0.7% | |||||
United States — 0.7% | |||||
iShares MSCI Emerging Markets Index Fund | 165,068 | 6,423 | |||
Total Exchange Traded Fund | 6,423 | ||||
CASH EQUIVALENT — 0.4% | |||||
United States — 0.4% | |||||
SEI Daily Income Trust, Prime Obligation Fund, Cl A, 0.110%†** | 3,454,719 | 3,455 | |||
Total Cash Equivalent | 3,455 | ||||
AFFILIATED PARTNERSHIP — 3.9% | |||||
United States — 3.9% | |||||
SEI Liquidity Fund, L.P., 0.400%†**(G) | 36,294,960 | 35,307 | |||
Total Affiliated Partnership | $ | 35,307 | |||
Description | Face Amount (Thousands) (1) | Market Value ($ Thousands) | ||||
TIME DEPOSITS — 1.1% | ||||||
United States — 1.1% | ||||||
Brown Brothers Harriman | ||||||
5.950%, 10/01/09 | ZAR | 3,094 | 408 | |||
0.125%, 10/01/09 | EUR | 76 | 111 | |||
0.088%, 10/01/09 | GBP | 6 | 10 | |||
0.030%, 10/01/09 | 9,451 | 9,451 | ||||
0.010%, 10/01/09 | HKD | 4,162 | 537 | |||
0.005%, 10/01/09 | SGD | 2 | 2 | |||
Total Time Deposits | 10,519 | |||||
Total Investments — 101.0% | $ | 926,234 | ||||
Percentages are based on a Net Assets of $916,780
($ Thousands).
| * | Non-income producing security |
| ** | Rate shown is the 7-day effective yield as of September 30, 2009. |
| (1) | In U.S. dollars unless otherwise indicated. |
| † | Affiliated security |
| (A) | This security or a partial position of this security is on loan at September 30, 2009. The total market value of securities on loan at September 30, 2009 was $34,645 ($ Thousands) (See Note 9). |
| (B) | Securities considered illiquid. The total market value of such securities as of September 30, 2009 was $1,838 ($ Thousands) and represented 0.2% of Net Assets. |
| (C) | Security fair valued using methods determined in good faith by the Valuation Committee of the Board of Trustees. The total market value of such securities as of September 30, 2009 was $7 ($ Thousands) and represented 0.0%of Net Assets. |
| (D) | Securities sold within terms of a private placement memorandum, exempt from registration under Section 144A of the Securities Act of 1933, as amended, and may be sold only to dealers in that program or other “accredited investors.” These securities have been determined to be liquid under guidelines established by the Board of Trustees. |
| (E) | Real Estate Investments Trust |
| (F) | Zero coupon security. The rate reported on the Schedule of Investments is the effective yield at time of purchase. |
| (G) | This security was purchased with cash collateral held from securities on loan (see Note 9). The total value of such securities as of September 30, 2009 was $35,307 ($ Thousands). |
ABS — Asset-Based Security
ADR — American Depositary Receipt
BDR — Brazilian Depositary Receipt
Cl — Class
EUR — Euro
GBP — British Pound Sterling
GDR — Global Depositary Receipt
HKD — Hong Kong Dollar
LIBOR — London Interbank Offered Rate
L.P. — Limited Partnership
MSCI — Morgan Stanley Capital International
NVDR — Non-Voting Depositary Receipt
Ser — Series
SGD — Singapore Dollar
USD — U.S. Dollar
ZAR — South African Rand
Amounts designated as “—” are $0 or have been rounded to $0.
The accompanying notes are an integral part of the financial statements.
| 7 | SEI Institutional International Trust / Annual Holdings / September 30, 2009 |
Table of Contents
SCHEDULE OF INVESTMENTS
International Fixed Income Fund
September 30, 2009
Description | Face Amount (Thousands) (1) | Market Value ($ Thousands) | ||||
GLOBAL BONDS — 73.2% | ||||||
Australia — 1.6% | ||||||
Australia & New Zealand Banking Group MTN | ||||||
5.125%, 09/10/19 | 200 | $ | 294 | |||
Australia Government Bond | ||||||
3.000%, 09/20/25 | 640 | 563 | ||||
Commonwealth Bank of Australia MTN | ||||||
5.875%, 07/29/11 | 273 | 425 | ||||
5.500%, 08/06/19 | 650 | 984 | ||||
0.920%, 03/17/15(A) | 100 | 142 | ||||
Fairfax Med | ||||||
5.250%, 06/15/12 | 250 | 354 | ||||
Macquarie Bank MTN | ||||||
5.500%, 09/19/16(A) | GBP | 336 | 453 | |||
New South Wales Treasury | ||||||
6.000%, 04/01/19 | 300 | 265 | ||||
5.250%, 05/01/13 | 980 | 860 | ||||
QBE Insurance Group MTN | ||||||
6.125%, 09/28/15 | 250 | 408 | ||||
Queensland Treasury | ||||||
6.000%, 09/14/17 | 1,630 | 1,452 | ||||
Rio Tinto Finance USA | ||||||
5.875%, 07/15/13 | 795 | 857 | ||||
St. George Bank MTN | ||||||
1.038%, 03/11/15(A)(B) | 500 | 695 | ||||
Westpac Banking MTN | ||||||
4.250%, 09/22/16 | 350 | 513 | ||||
4.250%, 01/25/12 | 300 | 455 | ||||
| 8,720 | ||||||
Austria — 0.1% | ||||||
Telekom Finanzmanagement MTN | ||||||
5.000%, 07/22/13 | 401 | 616 | ||||
Belgium — 1.6% | ||||||
Dexia Funding | ||||||
4.892%, 11/30/49(A) | 336 | 245 | ||||
Fortis Bank | ||||||
4.625%, 10/24/49(A) | 200 | 212 | ||||
Inbev | ||||||
8.625%, 01/30/17 | 200 | 362 | ||||
Kingdom of Belgium, Ser 31 | ||||||
5.500%, 03/28/28 | 2,872 | 4,871 | ||||
Kingdom of Belgium, Ser 48 | ||||||
4.000%, 03/28/22 | 2,100 | 3,089 | ||||
| 8,779 | ||||||
Brazil — 0.5% | ||||||
Federal Republic of Brazil | ||||||
12.500%, 01/05/16 | 3,080 | 1,899 | ||||
10.250%, 01/10/28 | 1,010 | 551 | ||||
Vale Overseas | ||||||
6.875%, 11/21/36 | 301 | 312 | ||||
| 2,762 | ||||||
Description | Face Amount (Thousands) (1) | Market Value ($ Thousands) | |||
Canada — 3.8% | |||||
Bell Canada MTN | |||||
5.000%, 02/15/17 | 270 | $ | 257 | ||
Canadian Natural Resources | |||||
5.150%, 02/01/13 | 175 | 186 | |||
Canadian Pacific Railway | |||||
6.500%, 05/15/18 | 99 | 108 | |||
Export Development Canada MTN | |||||
2.375%, 03/19/12 | 800 | 817 | |||
Government of Canada | |||||
5.000%, 06/01/14 | 1,000 | 1,035 | |||
5.000%, 06/01/37 | 4,200 | 4,679 | |||
4.250%, 06/01/18 | 1,525 | 1,538 | |||
3.750%, 06/01/19 | 630 | 608 | |||
3.750%, 06/01/12 | 4,960 | 4,863 | |||
Province of Ontario Canada | |||||
4.750%, 06/02/13 | 1,430 | 1,439 | |||
4.200%, 03/08/18 | 1,950 | 1,885 | |||
4.100%, 06/16/14 | 550 | 581 | |||
Province of Quebec Canada | |||||
5.250%, 10/01/13 | 1,274 | 1,307 | |||
Royal Bank of Canada MTN | |||||
4.625%, 01/22/18 | 252 | 385 | |||
Teck Resources | |||||
9.750%, 05/15/14(C) | 95 | 105 | |||
Xstrata Finance Canada MTN | |||||
5.250%, 06/13/17 | 200 | 281 | |||
YPG Holdings MTN | |||||
5.250%, 02/15/16 | 665 | 567 | |||
| 20,641 | |||||
Chile — 0.1% | |||||
Nacional del Cobre de Chile - CODELCO | |||||
6.150%, 10/24/36(C) | 640 | 662 | |||
Colombia — 0.1% | |||||
Ecopetrol | |||||
7.625%, 07/23/19 | 237 | 260 | |||
Denmark — 1.7% | |||||
Carlsgerg Breweries | |||||
7.250%, 11/28/16 | 150 | 266 | |||
Danica Pension | |||||
4.350%, 10/29/49(A) | 755 | 964 | |||
Danske Bank MTN | |||||
4.875%, 06/11/13 | 150 | 235 | |||
Dong Energy MTN | |||||
4.875%, 05/07/14 | 100 | 153 | |||
Kingdom of Denmark MTN | |||||
4.000%, 11/15/12 | 20,391 | 4,198 | |||
4.000%, 11/15/17 | 4,450 | 912 | |||
3.125%, 03/17/14 | 500 | 748 | |||
Nykredit | |||||
4.858%, 10/01/38(A) | 9,039 | 1,693 | |||
| 9,169 | |||||
| 1 | SEI Institutional International Trust / Annual Holdings / September 30, 2009 |
Table of Contents
Description | Face Amount (Thousands) (1) | Market Value ($ Thousands) | |||
France — 5.6% | |||||
Areva | |||||
4.875%, 09/23/24 | 150 | $ | 222 | ||
3.875%, 09/23/16 | 100 | 147 | |||
AXA MTN | |||||
5.777%, 07/29/49(A) | 1,100 | 1,362 | |||
BNP Paribas | |||||
8.667%, 09/29/49(A) | 100 | 152 | |||
BNP Paribas Home Loan Covered Bonds MTN | |||||
4.750%, 05/28/13 | 100 | 158 | |||
BNP Paribas Public Sector SCF MTN | |||||
3.625%, 06/16/14 | 100 | 150 | |||
BPCE MTN | |||||
6.117%, 10/29/49(A) | 100 | 104 | |||
Caisse Refinancement de l’Habitat | |||||
4.250%, 10/25/14 | 332 | 512 | |||
Cie de Saint-Gobain MTN | |||||
6.000%, 05/20/13 | 50 | 78 | |||
CIE Financement Foncier | |||||
4.625%, 09/23/17(B) | 515 | 802 | |||
Compagnie de Financement Foncier | |||||
4.500%, 01/09/13 | 290 | 450 | |||
3.750%, 01/24/17 | 189 | 280 | |||
Compagnie De St Gobain MTN | |||||
1.268%, 04/11/12(A) | 350 | 489 | |||
Credit Agricole | |||||
4.130%, 11/29/49(A) | 150 | 178 | |||
Credit Agricole Covered Bonds MTN | |||||
3.500%, 07/21/14 | 450 | 674 | |||
Credit Logement | |||||
4.604%, 03/29/49(A)(B) | 350 | 414 | |||
1.373%, 12/15/49(A)(B) | 150 | 157 | |||
Dexia Credit Local | |||||
2.375%, 09/23/11(C) | 500 | 507 | |||
EDF MTN | |||||
6.875%, 12/12/22 | 300 | 561 | |||
6.125%, 06/02/34 | 100 | 182 | |||
Government of France | |||||
4.750%, 04/25/35 | 2,465 | 3,970 | |||
4.250%, 04/25/19 | 4,670 | 7,260 | |||
3.750%, 10/25/19 | 100 | 149 | |||
3.750%, 04/25/21 | 2,300 | 3,379 | |||
3.500%, 04/25/15 | 535 | 813 | |||
HSBC France MTN | |||||
4.875%, 01/15/14 | 250 | 390 | |||
Lafarge MTN | |||||
8.750%, 05/30/17 | 250 | 444 | |||
7.625%, 05/27/14 | 200 | 324 | |||
6.150%, 07/15/11 | 800 | 833 | |||
Natixis MTN | |||||
1.177%, 01/26/17(A) | 300 | 381 | |||
Societe Financement de l’Economie Francaise | |||||
3.375%, 05/05/14(C) | 905 | 929 | |||
2.125%, 01/30/12(C) | 955 | 968 | |||
Description | Face Amount (Thousands) (1) | Market Value ($ Thousands) | ||||
Societe Generale MTN | ||||||
0.984%, 06/07/17(A) | 200 | $ | 268 | |||
Societe Generale Societe de Credit Fonciere MTN | ||||||
4.000%, 07/07/16 | 650 | 984 | ||||
TPSA Eurofinance France MTN | ||||||
6.000%, 05/22/14 | 150 | 238 | ||||
Veolia Environnement | ||||||
6.125%, 10/29/37 | GBP | 200 | 343 | |||
5.250%, 06/03/13 | 585 | 613 | ||||
| 29,865 | ||||||
Germany — 9.1% | ||||||
Bayer MTN | ||||||
5.625%, 05/23/18 | GBP | 150 | 250 | |||
5.000%, 07/29/05(A) | 218 | 296 | ||||
Bayerische Landesbank MTN | ||||||
4.500%, 02/07/19(A) | 350 | 423 | ||||
Bundesrepublik Deutschland, Ser 02 | ||||||
5.000%, 01/04/12 | 500 | 788 | ||||
Bundesrepublik Deutschland, Ser 03 | ||||||
4.750%, 07/04/34 | 2,460 | 3,991 | ||||
4.250%, 01/04/14 | 1,425 | 2,249 | ||||
Bundesrepublik Deutschland, Ser 06 | ||||||
3.750%, 01/04/17 | 3,600 | 5,554 | ||||
Bundesrepublik Deutschland, Ser 07 | ||||||
4.250%, 07/04/39 | 3,740 | 5,764 | ||||
4.000%, 01/04/18 | 1,260 | 1,963 | ||||
Bundesrepublik Deutschland, Ser 08 | ||||||
4.750%, 07/04/40 | 6,255 | 10,421 | ||||
Bundesrepublik Deutschland, Ser 09 | ||||||
3.500%, 07/04/19 | 4,331 | 6,476 | ||||
Bundesschatzanweisungen, Ser 1 | ||||||
1.250%, 09/16/11 | 3,300 | 4,822 | ||||
Commerzbank MTN | ||||||
5.625%, 11/29/17(A) | 150 | 208 | ||||
4.125%, 09/13/16(A) | 400 | 532 | ||||
Deutsche Bank | ||||||
4.875%, 05/20/13 | 381 | 406 | ||||
Deutsche Boerse | ||||||
7.500%, 06/13/38(A) | 250 | 361 | ||||
Dexia Kommunalbank Deutschland MTN | ||||||
3.500%, 06/05/14 | 390 | 588 | ||||
KFW | ||||||
4.700%, 06/02/37 | CAD | 2,080 | 1,788 | |||
3.875%, 01/21/19 | 325 | 487 | ||||
3.500%, 03/10/14(D) | 1,675 | 1,743 | ||||
| 49,110 | ||||||
Greece — 0.5% | ||||||
Hellenic Republic 30 Year Government Bond | ||||||
4.600%, 09/20/40 | 2,000 | 2,657 | ||||
| SEI Institutional International Trust / Annual Holdings / September 30, 2009 | 2 |
Table of Contents
SCHEDULE OF INVESTMENTS
International Fixed Income Fund
September 30, 2009
Description | Face Amount (Thousands) (1) | Market Value ($ Thousands) | ||||
Hungary — 0.3% | ||||||
Government of Hungary | ||||||
6.750%, 02/24/17 | 175,000 | $ | 890 | |||
6.750%, 11/24/17 | 175,000 | 885 | ||||
| 1,775 | ||||||
Ireland — 0.8% | ||||||
Allied Irish Banks | ||||||
12.500%, 06/25/19 | 97 | 160 | ||||
5.250%, 03/10/25(A) | 220 | 229 | ||||
Ardagh Glass Finance | ||||||
7.125%, 06/15/17 | 125 | 164 | ||||
Ardagh Glass Group PIK | ||||||
10.750%, 03/01/15 | 325 | 389 | ||||
Bank of Ireland MTN | ||||||
4.625%, 04/08/13 | 169 | 246 | ||||
Bord Gais Eireann MTN | ||||||
5.750%, 06/16/14 | 250 | 389 | ||||
Depfa ACS Bank MTN | ||||||
4.250%, 12/15/09(B) | 210 | 308 | ||||
GE Capital European Funding MTN | ||||||
4.375%, 03/30/11 | 400 | 600 | ||||
TransCapit (Transneft) Registered | ||||||
7.700%, 08/07/13 | 1,124 | 1,187 | ||||
UT2 Funding | ||||||
5.321%, 06/30/16(B) | 390 | 373 | ||||
| 4,045 | ||||||
Italy — 3.8% | ||||||
Assicurazioni Generali MTN | ||||||
5.125%, 09/16/24 | 350 | 513 | ||||
Banca Italease MTN | ||||||
1.099%, 02/02/10(A) | 150 | 216 | ||||
Banco Popolare Scarl MTN | ||||||
1.233%, 02/08/17(A) | 550 | 688 | ||||
Buoni Poliennali Del Tesoro | ||||||
5.750%, 02/01/33 | 4,170 | 6,914 | ||||
Enel Finance International MTN | ||||||
5.750%, 09/14/40 | 300 | 480 | ||||
5.000%, 09/14/22 | 250 | 366 | ||||
Intesa Sanpaolo MTN | ||||||
6.375%, 11/12/17(A) | GBP | 300 | 493 | |||
6.375%, 04/06/10 | 2,150 | 3,203 | ||||
5.000%, 09/23/19 | 400 | 587 | ||||
Italy Buoni Poliennali Del Tesoro | ||||||
4.250%, 03/01/20 | 195 | 289 | ||||
3.500%, 06/01/14 | 2,900 | 4,354 | ||||
Telecom Italia MTN | ||||||
8.250%, 03/21/16 | 250 | 437 | ||||
6.750%, 03/21/13 | 150 | 240 | ||||
Unicredito Italiano MTN | ||||||
4.500%, 09/22/19 | 1,300 | 1,916 | ||||
| 20,696 | ||||||
Japan — 13.5% | ||||||
Aiful | ||||||
6.000%, 12/12/11(C) | 534 | 214 | ||||
East Japan Railway MTN | ||||||
4.750%, 12/08/31 | GBP | 350 | 544 | |||
Description | Face Amount (Thousands) (1) | Market Value ($ Thousands) | ||||
Fukoku Mutual Life Insurance | ||||||
4.500%, 09/28/25(A) | EUR | 500 | $ | 477 | ||
Government of Japan 10 Year Bond, Ser 284 | ||||||
1.700%, 12/20/16 | 568,400 | 6,714 | ||||
Government of Japan 10 Year Bond, Ser 288 | ||||||
1.700%, 09/20/17 | 1,729,950 | 20,386 | ||||
Government of Japan 10 Year Bond, Ser 296 | ||||||
1.500%, 09/20/18 | 427,000 | 4,914 | ||||
Government of Japan 10 Year Bond, Ser 301 | ||||||
1.500%, 06/20/19 | 235,300 | 2,685 | ||||
Government of Japan 15 Year Bond, Ser 35 | ||||||
0.410%, 07/20/20(A) | 170,500 | 1,811 | ||||
Government of Japan 20 Year Bond, Ser 109 | ||||||
1.900%, 03/20/29 | 256,000 | 2,799 | ||||
Government of Japan 20 Year Bond, Ser 48 | ||||||
2.500%, 12/21/20 | 289,450 | 3,570 | ||||
Government of Japan 20 Year Bond, Ser 99 | ||||||
2.100%, 12/20/27 | 1,075,900 | 12,241 | ||||
Government of Japan CPI Linked Bond, Ser 13 | ||||||
1.300%, 09/10/17 | 111,712 | 1,170 | ||||
Government of Japan CPI Linked Bond, Ser 15 | ||||||
1.400%, 03/10/18 | 92,647 | 974 | ||||
Government of Japan CPI Linked Bond, Ser 5 | ||||||
0.800%, 09/10/15 | 499,982 | 5,208 | ||||
Japan Finance for Municipal Enterprises | ||||||
2.000%, 05/09/16 | 540,000 | 6,363 | ||||
Sumitomo Mitsui Banking | ||||||
6.164%, 09/16/24(A) | 400 | 513 | ||||
4.375%, 10/27/14(A) | EUR | 830 | 1,210 | |||
4.375%, 10/15/15(A) | EUR | 460 | 572 | |||
| 72,365 | ||||||
Jersey — 0.1% | ||||||
WPP MTN | ||||||
6.625%, 05/12/16 | 225 | 340 | ||||
Mexico — 0.1% | ||||||
Mexican Bonos, Ser MI10 | ||||||
9.000%, 12/20/12 | 10,000 | 789 | ||||
Netherlands — 5.5% | ||||||
ABN Amro Bank MTN | ||||||
3.750%, 07/15/14 | 750 | 1,129 | ||||
Adecco International Financial Services | ||||||
4.500%, 04/25/13 | 500 | 743 | ||||
Aegon | ||||||
4.750%, 06/01/13 | 250 | 251 | ||||
| 3 | SEI Institutional International Trust / Annual Holdings / September 30, 2009 |
Table of Contents
Description | Face Amount (Thousands) (1) | Market Value ($ Thousands) | ||||
Allianz Finance II | ||||||
6.125%, 05/31/22(A) | 1,000 | $ | 1,512 | |||
4.750%, 07/22/19 | 150 | 226 | ||||
ArcelorMittal | ||||||
5.375%, 06/01/13(C) | 800 | 818 | ||||
ASML Holding | ||||||
5.750%, 06/13/17 | 400 | 558 | ||||
Bayer MTN | ||||||
4.625%, 09/26/14 | 375 | 579 | ||||
BMW Finance MTN | ||||||
5.000%, 08/06/18 | 133 | 200 | ||||
Boats Investments MTN | ||||||
11.000%, 03/31/17 | 310 | 313 | ||||
CRH Finance MTN | ||||||
7.375%, 05/28/14 | 430 | 696 | ||||
Deutsche Telekom International Finance BV MTN | ||||||
6.500%, 04/08/22 | 680 | 1,164 | ||||
E.ON International Finance MTN | ||||||
6.750%, 01/27/39 | 200 | 386 | ||||
Enbw International Finance MTN | ||||||
6.125%, 07/07/39 | 100 | 160 | ||||
Eureko MTN | ||||||
7.375%, 06/16/14 | 340 | 549 | ||||
5.125%, 06/24/15(A) | 650 | 637 | ||||
Generali Finance | ||||||
5.479%, 02/28/49(A) | 450 | 572 | ||||
Government of Netherlands | ||||||
7.500%, 01/15/23 | 2,228 | 4,497 | ||||
4.500%, 07/15/17 | 1,500 | 2,379 | ||||
4.000%, 07/15/16 | 1,700 | 2,628 | ||||
Heineken | ||||||
7.250%, 03/10/15 | 335 | 586 | ||||
ING Bank MTN | ||||||
4.750%, 05/27/19 | 800 | 1,249 | ||||
ING Verzekeringen | ||||||
6.250%, 06/21/21(A) | 1,310 | 1,652 | ||||
KBC Internationale Financieringsmaatschappij MTN | ||||||
4.500%, 09/17/14 | 350 | 512 | ||||
Koninklijke KPN MTN | ||||||
7.500%, 02/04/19 | 150 | 263 | ||||
5.750%, 09/17/29 | 350 | 557 | ||||
Linde Finance | ||||||
7.375%, 07/14/66(A) | 300 | 448 | ||||
Philips Electronics | ||||||
5.750%, 03/11/18 | 395 | 425 | ||||
Rabobank Nederland MTN | ||||||
5.875%, 05/20/19 | 300 | 481 | ||||
4.125%, 04/04/12 | 1,250 | 1,918 | ||||
1.046%, 07/28/15(A) | 250 | 358 | ||||
RWE Finance BV MTN | ||||||
6.625%, 01/31/19 | 150 | 258 | ||||
Siemens Financieringsmat | ||||||
6.125%, 09/14/66(A) | GBP | 275 | 418 | |||
Volkswagen | ||||||
5.625%, 02/09/12 | 250 | 387 | ||||
| 29,509 | ||||||
Description | Face Amount (Thousands) (1) | Market Value ($ Thousands) | ||||
New Zealand — 0.1% | ||||||
ANZ National International | ||||||
6.200%, 07/19/13 | 450 | $ | 492 | |||
Norway — 0.6% | ||||||
DnB Bank MTN | ||||||
4.500%, 05/29/14 | 200 | 306 | ||||
Eksportfinans MTN | ||||||
4.375%, 09/20/10 | EUR | 625 | 939 | |||
Kommunalbanken MTN | ||||||
2.875%, 06/22/12 | 1,250 | 1,275 | ||||
MPU Offshore Lift | ||||||
11.285%, 12/22/11(B)(E) | 1,500 | 5 | ||||
Norske Skogindustrier | ||||||
7.000%, 06/26/17 | 275 | 253 | ||||
Petrolia Drilling | ||||||
12.000%, 06/20/12(B) | 1,000 | 86 | ||||
Sevan Drilling | ||||||
7.410%, 12/07/12(A) | 2,000 | 286 | ||||
| 3,150 | ||||||
Peru — 0.2% | ||||||
Republic of Peru | ||||||
9.875%, 02/06/15 | 625 | 793 | ||||
8.375%, 05/03/16 | 255 | 310 | ||||
| 1,103 | ||||||
Poland — 0.3% | ||||||
Republic of Poland | ||||||
6.375%, 07/15/19 | 730 | 820 | ||||
5.500%, 10/25/19 | 2,535 | 832 | ||||
| 1,652 | ||||||
Portugal — 0.1% | ||||||
Banco Comercial Portugues | ||||||
3.750%, 10/08/16 | 500 | 734 | ||||
Russia — 0.6% | ||||||
Gazprom | ||||||
9.625%, 03/01/13 | 470 | 524 | ||||
6.580%, 10/31/13 | GBP | 150 | 239 | |||
6.212%, 11/22/16(C) | 230 | 222 | ||||
RSHB Capital for Russian Agricultural Bank | ||||||
7.750%, 05/29/18(C) | 1,095 | 1,126 | ||||
7.750%, 05/29/18 | 617 | 636 | ||||
Steel Capital (Severstal) | ||||||
9.750%, 07/29/13(B)(C) | 540 | 541 | ||||
| 3,288 | ||||||
Singapore — 0.0% | ||||||
Flextronics International | ||||||
6.500%, 05/15/13 | 140 | 137 | ||||
| SEI Institutional International Trust / Annual Holdings / September 30, 2009 | 4 |
Table of Contents
SCHEDULE OF INVESTMENTS
International Fixed Income Fund
September 30, 2009
Description | Face Amount (Thousands) (1) | Market Value ($ Thousands) | ||||
South Africa — 0.1% | ||||||
Foodcorp Registered | ||||||
8.875%, 06/15/12 | EUR | 330 | $ | 449 | ||
Spain — 1.0% | ||||||
Banco Santander | ||||||
3.875%, 05/27/14 | 400 | 607 | ||||
Government of Spain | ||||||
4.600%, 07/30/19 | 935 | 1,458 | ||||
3.800%, 01/31/17 | 955 | 1,437 | ||||
Mapfre | ||||||
5.921%, 07/24/37(A) | 500 | 616 | ||||
Santander Issuances MTN | ||||||
1.302%, 07/25/17(A) | 250 | 341 | ||||
Santander Issuances, Ser 24 | ||||||
7.300%, 07/27/19(A) | 200 | 341 | ||||
Telefonica Emisiones SAU MTN | ||||||
5.431%, 02/03/14 | 200 | 314 | ||||
| 5,114 | ||||||
Supra-National — 3.6% | ||||||
European Investment Bank MTN | ||||||
6.000%, 08/14/13 | AUD | 700 | 624 | |||
3.500%, 04/15/16 | 2,525 | 3,761 | ||||
1.400%, 06/20/17 | JPY | 1,138,000 | 12,907 | |||
Inter-American Development Bank | ||||||
9.750%, 05/15/15 | 750 | 1,577 | ||||
WT Finance | ||||||
3.625%, 06/27/12 | EUR | 450 | 632 | |||
| 19,501 | ||||||
Sweden — 1.2% | ||||||
Kingdom of Sweden, Ser 1046 | ||||||
5.500%, 10/08/12 | 9,550 | 1,501 | ||||
Kingdom of Sweden, Ser 1049 | ||||||
4.500%, 08/12/15 | 21,900 | 3,389 | ||||
Stadshypotek MTN | ||||||
3.750%, 12/12/13 | 150 | 226 | ||||
Svenska Handelsbanken | ||||||
5.500%, 05/26/16 | 350 | 586 | ||||
1.169%, 10/19/17(A) | EUR | 500 | 657 | |||
Volvo Treasury | ||||||
5.950%, 04/01/15 | 145 | 145 | ||||
| 6,504 | ||||||
Switzerland — 0.9% | ||||||
Credit Suisse MTN | ||||||
4.750%, 08/05/19 | 400 | 594 | ||||
UBS MTN | ||||||
6.625%, 04/11/18 | GBP | 150 | 263 | |||
6.250%, 09/03/13 | EUR | 200 | 317 | |||
5.875%, 12/20/17 | 800 | 819 | ||||
5.625%, 05/19/14 | 700 | 1,088 | ||||
3.000%, 10/06/14 | 200 | 292 | ||||
1.023%, 11/17/15(A) | EUR | 784 | 1,054 | |||
Weatherford International | ||||||
9.625%, 03/01/19 | 275 | 344 | ||||
| 4,771 | ||||||
Description | Face Amount (Thousands) (1) | Market Value ($ Thousands) | ||||
United Arab Emirates — 0.1% | ||||||
National Bank of Abu Dhabi MTN | ||||||
5.875%, 02/27/12 | GBP | 365 | $ | 605 | ||
United Kingdom — 7.9% | ||||||
3I Group | ||||||
1.003%, 06/08/12 | 350 | 424 | ||||
Abbey National Treasury Services MTN | ||||||
4.250%, 04/12/21 | 1,350 | 1,923 | ||||
Anglian Water Services Financing MTN | ||||||
5.250%, 10/30/15 | 280 | 466 | ||||
4.625%, 10/07/13 | 1,450 | 2,204 | ||||
Anglian Water Services Financing, Ser A5 MTN | ||||||
6.293%, 07/30/30 | 500 | 870 | ||||
Bank of Scotland MTN | ||||||
4.750%, 06/08/22 | 1,275 | 1,818 | ||||
Barclays Bank MTN | ||||||
14.000%, 06/15/19(A) | 100 | 206 | ||||
10.000%, 05/21/21 | 304 | 620 | ||||
6.750%, 01/16/23(A) | 350 | 564 | ||||
5.000%, 09/22/16 | 330 | 334 | ||||
4.500%, 03/04/19(A) | 125 | 172 | ||||
BAT International Finance MTN | ||||||
5.875%, 03/12/15 | 200 | 319 | ||||
BG Energy Capital | ||||||
3.375%, 07/15/13 | 200 | 295 | ||||
British Telecommunications MTN | ||||||
6.500%, 07/07/15 | 400 | 627 | ||||
5.750%, 12/07/28 | 111 | 152 | ||||
Centrica MTN | ||||||
7.000%, 09/19/33 | 300 | 572 | ||||
Chester Asset Receivables, Ser A | ||||||
6.125%, 10/15/10 | EUR | 2,160 | 3,156 | |||
Enterprise Inns | ||||||
6.500%, 12/06/18 | 140 | 179 | ||||
ENW Finance MTN | ||||||
6.125%, 07/21/21 | 350 | 581 | ||||
GlaxoSmithKline Capital MTN | ||||||
3.875%, 07/06/15 | 500 | 748 | ||||
Group 4 Securicor | ||||||
7.750%, 05/13/19 | 100 | 181 | ||||
Hammerson | ||||||
5.250%, 12/15/16(F) | 280 | 416 | ||||
HBOS MTN | ||||||
5.125%, 10/29/49(A)(B) | EUR | 386 | 322 | |||
Holcim US Finance Sarl & Cie SCS | ||||||
6.000%, 12/30/19(C) | 25 | 25 | ||||
HSBC Holdings MTN | ||||||
6.500%, 05/20/24 | 250 | 455 | ||||
Imperial Tobacco Finance MTN | ||||||
8.375%, 02/17/16 | 700 | 1,201 | ||||
7.250%, 09/15/14 | 150 | 244 | ||||
Ineo’s Group Holdings | ||||||
7.875%, 02/15/16 | EUR | 111 | 79 | |||
Legal & General Group MTN | ||||||
4.000%, 06/08/25(A) | 200 | 240 | ||||
| 5 | SEI Institutional International Trust / Annual Holdings / September 30, 2009 |
Table of Contents
Description | Face Amount (Thousands) (1) | Market Value ($ Thousands) | |||
Lloyds TSB Bank MTN | |||||
13.000%, 01/29/49(A) | 100 | $ | 160 | ||
6.375%, 04/15/14 | 725 | 1,230 | |||
6.350%, 10/29/49(A) | 181 | 180 | |||
6.250%, 04/15/14 | 150 | 238 | |||
4.385%, 05/29/49(A)(B) | 200 | 172 | |||
Marks & Spencer MTN | |||||
5.625%, 03/24/14 | 268 | 439 | |||
Motability Operations Group MTN | |||||
5.250%, 09/28/16 | 250 | 403 | |||
National Westminster Bank | |||||
6.500%, 09/07/21 | 220 | 314 | |||
Nationwide Building Society MTN | |||||
3.375%, 08/17/15(A) | 580 | 794 | |||
3.125%, 01/26/10 | 352 | 515 | |||
Network Rail Infrastructure Finance MTN | |||||
4.875%, 11/27/15 | 950 | 1,639 | |||
Northern Rock | |||||
5.625%, 01/13/15(A)(B) | 50 | 26 | |||
5.625%, 06/22/17(C) | 1,750 | 1,657 | |||
Northumbrian Water Finance | |||||
6.000%, 10/11/17 | 500 | 873 | |||
Old Mutual MTN | |||||
4.500%, 01/18/17(A)(B) | 250 | 300 | |||
Prudential MTN | |||||
6.125%, 12/19/31 | 120 | 170 | |||
Rexam MTN | |||||
4.375%, 03/15/13 | 600 | 870 | |||
Rolls-Royce | |||||
6.750%, 04/30/19 | 100 | 177 | |||
Royal Bank of Scotland MTN | |||||
6.934%, 04/09/18 | 300 | 435 | |||
5.750%, 05/21/14 | 250 | 389 | |||
Scottish & Southern Energy MTN | |||||
6.250%, 08/27/38 | 150 | 265 | |||
5.750%, 02/05/14 | 245 | 415 | |||
Scottish Widows | |||||
5.125%, 09/24/49(A) | 100 | 93 | |||
Society of Lloyds | |||||
6.875%, 11/17/25 | 250 | 402 | |||
Southern Gas Networks, Ser A1 MTN | |||||
1.194%, 10/21/10(A)(B) | 300 | 428 | |||
SOV Housing Capital | |||||
5.705%, 09/10/39 | 250 | 409 | |||
Standard Chartered Bank MTN | |||||
5.875%, 09/26/17 | 700 | 1,058 | |||
Tesco | |||||
6.052%, 10/13/39 | 350 | 573 | |||
5.125%, 02/24/15 | 200 | 313 | |||
Thames Water Utilities Cayman Finance MTN | |||||
6.125%, 02/04/13 | 200 | 313 | |||
Description | Face Amount (Thousands) (1) | Market Value ($ Thousands) | ||||
United Kingdom Treasury | ||||||
4.750%, 12/07/38 | 665 | $ | 1,183 | |||
4.750%, 09/07/15 | 910 | 1,611 | ||||
4.500%, 03/07/19 | 195 | 334 | ||||
4.500%, 12/07/42 | 335 | 575 | ||||
4.250%, 12/07/49 | 85 | 141 | ||||
4.250%, 09/07/39 | 325 | 532 | ||||
4.000%, 09/07/16 | 350 | 594 | ||||
2.250%, 03/07/14 | 355 | 560 | ||||
Vodafone Group MTN | ||||||
6.250%, 01/15/16 | 150 | 245 | ||||
5.900%, 11/26/32 | 276 | 464 | ||||
4.625%, 09/08/14 | 100 | 163 | ||||
W&DB Issuer, Ser B1 | ||||||
5.641%, 07/15/35(A)(B) | 60 | 68 | ||||
Yorkshire Power Finance | ||||||
7.250%, 08/04/28 | 408 | 736 | ||||
Yorkshire Water Services Bradford Finance | ||||||
6.375%, 08/19/39 | 100 | 177 | ||||
Zurich Finance MTN | ||||||
6.625%, 10/30/49(A) | 260 | 372 | ||||
| 42,398 | ||||||
United States — 7.7% | ||||||
AES | ||||||
7.750%, 10/15/15 | 55 | 55 | ||||
Alcoa | ||||||
5.375%, 01/15/13 | 314 | 322 | ||||
Altria Group | ||||||
9.250%, 08/06/19 | 325 | 397 | ||||
American Express Credit MTN | ||||||
5.375%, 10/01/14 | 250 | 401 | ||||
American Honda Finance | ||||||
6.250%, 07/16/13 | 250 | 398 | ||||
American International Group, Ser A3 | ||||||
4.875%, 03/15/67(A) | EUR | 400 | 260 | |||
AT&T | ||||||
5.875%, 04/28/17 | 200 | 343 | ||||
5.600%, 05/15/18 | 415 | 436 | ||||
BA Covered Bond Issuer MTN | ||||||
4.125%, 04/05/12 | EUR | 3,100 | 4,622 | |||
Bank of America MTN | ||||||
6.125%, 09/15/21 | 350 | 568 | ||||
5.650%, 05/01/18 | 350 | 346 | ||||
4.750%, 05/06/19(A) | 250 | 323 | ||||
BNP Paribas Capital Trust III | ||||||
6.625%, 12/29/49(A) | 1,000 | 1,389 | ||||
Cablevision Systems, Ser B | ||||||
8.000%, 04/15/12 | 235 | 245 | ||||
Case New Holland | ||||||
7.125%, 03/01/14 | 80 | 78 | ||||
CBS | ||||||
7.700%, 07/30/10 | 440 | 457 | ||||
CIT Group MTN | ||||||
5.125%, 09/30/14 | GBP | 75 | 48 | |||
| SEI Institutional International Trust / Annual Holdings / September 30, 2009 | 6 |
Table of Contents
SCHEDULE OF INVESTMENTS
International Fixed Income Fund
September 30, 2009
Description | Face Amount (Thousands) (1) | Market Value ($ Thousands) | ||||
Citigroup | ||||||
5.500%, 04/11/13 | 995 | $ | 1,018 | |||
4.750%, 02/10/19(A) | EUR | 1,000 | 1,198 | |||
4.625%, 08/03/10 | 400 | 409 | ||||
4.250%, 02/25/30(A) | 450 | 454 | ||||
Citigroup Funding | ||||||
2.250%, 12/10/12 | 550 | 557 | ||||
Commerzbank Capital Funding Trust I | ||||||
5.012%, 03/29/49(A) | EUR | 200 | 158 | |||
Computer Sciences | ||||||
5.500%, 03/15/13(C) | 605 | 639 | ||||
ConocoPhillips | ||||||
5.750%, 02/01/19 | 400 | 436 | ||||
Countrywide Financial MTN | ||||||
5.800%, 06/07/12 | 507 | 535 | ||||
Countrywide Home Loan, Ser L MTN | ||||||
4.000%, 03/22/11 | 9 | 9 | ||||
Dell | ||||||
5.625%, 04/15/14 | 245 | 271 | ||||
Dow Chemical | ||||||
8.550%, 05/15/19 | 288 | 324 | ||||
Duke Energy | ||||||
6.300%, 02/01/14 | 375 | 415 | ||||
Dynegy Holdings | ||||||
8.375%, 05/01/16 | 230 | 215 | ||||
Electronic Data Systems, Ser B | ||||||
6.500%, 08/01/13 | 474 | 529 | ||||
Fisher Scientific International | ||||||
6.125%, 07/01/15 | 71 | 74 | ||||
General Electric Capital | ||||||
5.625%, 05/01/18 | 580 | 578 | ||||
Genworth Financial | ||||||
1.600%, 06/20/11 | JPY | 89,000 | 879 | |||
Glencore Finance Europe MTN | ||||||
7.125%, 04/23/15 | 300 | 448 | ||||
6.500%, 02/27/19 | GBP | 400 | 596 | |||
Goldman Sachs Group | ||||||
4.750%, 01/28/14 | 396 | 593 | ||||
4.250%, 08/04/10 | 200 | 296 | ||||
1.193%, 02/04/13(A) | EUR | 450 | 625 | |||
Goodyear | ||||||
9.000%, 07/01/15 | 155 | 161 | ||||
Hertz | ||||||
8.875%, 01/01/14 | 221 | 223 | ||||
HSBC Finance MTN | ||||||
7.000%, 03/27/12 | 285 | 487 | ||||
HVB Funding Trust VIII | ||||||
7.055%, 03/29/49(A) | 1,600 | 1,848 | ||||
Ingersoll-Rand Global Holding | ||||||
9.500%, 04/15/14 | 213 | 252 | ||||
International Paper | ||||||
7.950%, 06/15/18 | 260 | 282 | ||||
JPMorgan Chase Bank | ||||||
4.625%, 05/31/17(A) | EUR | 250 | 368 | |||
Key Bank | ||||||
1.053%, 02/09/12 | 220 | 240 | ||||
0.979%, 11/21/11 | 50 | 59 | ||||
Kraft Foods | ||||||
6.125%, 08/23/18 | 735 | 780 | ||||
5.750%, 03/20/12 | 200 | 310 | ||||
Description | Face Amount (Thousands) (1) | Market Value ($ Thousands) | ||||
Merrill Lynch MTN | ||||||
6.750%, 05/21/13 | 150 | $ | 236 | |||
4.625%, 10/02/13 | EUR | 261 | 383 | |||
Morgan Stanley MTN | ||||||
6.000%, 04/28/15 | 630 | 667 | ||||
3.750%, 03/01/13 | 1,000 | 1,448 | ||||
Oracle | ||||||
5.750%, 04/15/18 | 752 | 829 | ||||
Owens Corning | ||||||
6.500%, 12/01/16 | 670 | 654 | ||||
Pemex Project Funding Master Trust | ||||||
5.500%, 02/24/25 | 300 | 372 | ||||
Pfizer | ||||||
5.750%, 06/03/21 | 150 | 245 | ||||
3.625%, 06/03/13 | 150 | 226 | ||||
1.800%, 02/22/16 | JPY | 70,000 | 744 | |||
Philip Morris International | ||||||
4.875%, 05/16/13 | 345 | 367 | ||||
Pregis | ||||||
5.996%, 04/15/13 | 50 | 69 | ||||
Qwest | ||||||
7.625%, 06/15/15 | 560 | 567 | ||||
Qwest Communications International | ||||||
7.500%, 02/15/14 | 335 | 331 | ||||
Reynolds American | ||||||
7.625%, 06/01/16 | 377 | 403 | ||||
7.300%, 07/15/15 | 195 | 203 | ||||
7.250%, 06/01/12 | 572 | 614 | ||||
SES | ||||||
4.875%, 07/09/14 | 150 | 228 | ||||
SLM MTN | ||||||
0.973%, 12/15/10(A) | EUR | 300 | 395 | |||
Tesoro | ||||||
6.500%, 06/01/17 | 280 | 253 | ||||
Toyota Motor Credit Corp | ||||||
5.250%, 02/03/12 | 250 | 389 | ||||
Tyco International Group | ||||||
6.000%, 11/15/13 | 331 | 355 | ||||
United Health Group | ||||||
6.000%, 02/15/18 | 135 | 142 | ||||
US Bank | ||||||
4.375%, 02/28/17 | 900 | 1,223 | ||||
Verizon Communications | ||||||
5.250%, 04/15/13 | 315 | 341 | ||||
Wal-Mart Stores | ||||||
4.875%, 01/19/39 | GBP | 238 | 366 | |||
Wellpoint | ||||||
5.875%, 06/15/17 | 20 | 21 | ||||
Western Union | ||||||
5.930%, 10/01/16 | 888 | 962 | ||||
Windstream | ||||||
8.625%, 08/01/16 | 220 | 225 | ||||
WM Covered Bond Program MTN | ||||||
4.375%, 05/19/14 | 100 | 148 | ||||
3.875%, 09/27/11 | 250 | 372 | ||||
Wyndham Worldwide | ||||||
6.000%, 12/01/16 | 242 | 218 | ||||
| 7 | SEI Institutional International Trust / Annual Holdings / September 30, 2009 |
Table of Contents
Description | Face Amount (Thousands) (1) | Market Value ($ Thousands) | |||
Zurich Finance USA MTN | |||||
6.500%, 10/14/15 | 250 | $ | 415 | ||
| 41,365 | |||||
Total Global Bonds | 394,023 | ||||
MORTGAGE-BACKED SECURITIES — 4.6% | |||||
Non-Agency Mortgage-Backed Obligation — 4.6% | |||||
Arkle Master Issuer, Ser 2006-1X, Cl 5M1 | |||||
1.143%, 02/17/52 (B) | 150 | 162 | |||
Arran Residential Mortgages Funding, Ser 2006-1X, Cl BC | |||||
1.158%, 04/12/56 (A)(B) | 432 | 418 | |||
Banc of America Commercial Mortgage, Ser 2007-5, Cl A4 | |||||
5.492%, 02/10/51 | 1,200 | 978 | |||
Bear Stearns Adjustable Rate Mortgage Trust, Ser 2004-6, Cl 3A | |||||
5.431%, 09/25/34 (A) | 404 | 376 | |||
Beluga Master Issuer, Ser 2006-1, Cl A2 | |||||
1.051%, 04/28/99 (A) | 2,200 | 2,951 | |||
Canary Wharf Finance, Ser II, Cl C2 | |||||
1.487%, 10/22/37 (A)(B) | 200 | 96 | |||
Citigroup Commercial Mortgage Trust, Ser 2007-C6, Cl A4 | |||||
5.888%, 06/10/17 (A) | 1,140 | 992 | |||
Citigroup Commercial Mortgage Trust, Ser 2008-C7, Cl A4 | |||||
6.299%, 05/01/38 (A) | 405 | 365 | |||
Citigroup Mortgage Loan Trust, Ser 2005-2, Cl 1A4 | |||||
5.110%, 05/25/35 (A) | 2,003 | 1,658 | |||
Commercial Mortgage Asset Trust, Ser 1999-C1, Cl A3 | |||||
6.640%, 01/17/32 | 330 | 331 | |||
Credit Suisse First Boston Mortgage Securities, Ser 2003- CKS4, Cl A1 | |||||
4.485%, 11/15/36 | 1,277 | 1,302 | |||
Credit Suisse Mortgage Capital Certificates, Ser 2006-C3, Cl A3 | |||||
6.020%, 06/15/38 (A) | 1,250 | 1,060 | |||
Credit Suisse Mortgage Capital Certificates, Ser 2006-C5, Cl A3 | |||||
5.311%, 12/15/39 | 1,215 | 986 | |||
Eddystone Finance, Ser 2006-1, Cl B | |||||
1.328%, 04/19/21 (A)(B) | 100 | 107 | |||
Eddystone Finance, Ser 2006-1, Cl C | |||||
1.528%, 04/19/21 (A)(B) | 100 | 98 | |||
Gracechurch Mortgage Financing, Ser 2006-1, Cl C3 | |||||
1.129%, 11/20/56 (A)(B) | 250 | 277 | |||
Description | Face Amount (Thousands) (1) | Market Value ($ Thousands) | |||
Gracechurch Mortgage Financing, Ser 2007-1X, Cl 3A2 | |||||
0.959%, 11/20/56 (A) | 2,000 | $ | 2,836 | ||
Gracechurch Mortgage Financing, Ser 2007-1X, Cl 2D2 | |||||
1.259%, 11/20/56 (A)(B) | 400 | 519 | |||
Granite Master Issuer, Ser 2006-2, Cl A5 | |||||
0.551%, 12/20/54 (A)(B) | 729 | 917 | |||
GSR Mortgage Loan Trust, Ser 2005-AR1, Cl 4A1 | |||||
5.134%, 01/25/35 (A) | 559 | 483 | |||
Holmes Master Issuer, Ser 2007- 1, Cl 3C2 | |||||
1.416%, 07/15/40 (A)(B) | 150 | 192 | |||
Immeo Residential Finance, Ser 2, Cl A | |||||
0.933%, 12/15/16 (A) | 470 | 481 | |||
JLOC, Ser 37X, Cl B1 | |||||
0.826%, 01/15/15 (A)(B)(G) | 13,362 | 127 | |||
JP Morgan Chase Commercial Mortgage Securities, Ser 2006- CB17, Cl A4 | |||||
5.429%, 12/12/43 | 840 | 777 | |||
JP Morgan Chase Commercial Mortgage Securities, Ser 2007- CB18, Cl A4 | |||||
5.440%, 06/12/47 | 880 | 756 | |||
JP Morgan Mortgage Trust, Ser 2004-A5, Cl 3A1 | |||||
5.309%, 12/25/34 (A) | 487 | 468 | |||
Keybank, Ser 2000-C1, Cl A2 | |||||
7.727%, 05/17/32 (A) | 1,124 | 1,135 | |||
Leek Finance, Ser 15X, Cl BA | |||||
0.913%, 03/21/37 (A)(B) | 100 | 43 | |||
London and Regional Debt Securitisation, Ser 1, Cl A | |||||
1.202%, 10/15/14 (A)(B) | 150 | 191 | |||
Permanent Financing, Ser 7, Cl 3B | |||||
0.908%, 06/10/42 (A)(B) | 850 | 1,154 | |||
Salomon Brothers Mortgage Securities, Ser 2000-C1, Cl A2 | |||||
7.520%, 12/18/32 (A) | 630 | 631 | |||
Skyline, Ser 2007-1, Cl D | |||||
1.754%, 07/22/43 (A)(B) | 200 | 127 | |||
Storm, Ser 2006-1, Cl A2 | |||||
1.054%, 04/22/48 (A) | 1,268 | 1,764 | |||
Talisman Finance, Ser 7, Cl H | |||||
3.246%, 04/22/17 (A)(B) | 487 | 107 | |||
| 24,865 | |||||
Total Mortgage-Backed Securities | 24,865 | ||||
| SEI Institutional International Trust / Annual Holdings / September 30, 2009 | 8 |
Table of Contents
SCHEDULE OF INVESTMENTS
International Fixed Income Fund
September 30, 2009
Description | Face Amount (Thousands) (1) | Market Value ($ Thousands) | |||
CORPORATE OBLIGATIONS — 3.8% | |||||
United States — 3.8% | |||||
AES | |||||
7.750%, 03/01/14 | 110 | $ | 111 | ||
American Express | |||||
7.250%, 05/20/14 | 375 | 421 | |||
AT&T | |||||
6.500%, 09/01/37 | 650 | 698 | |||
AutoNation | |||||
2.284%, 04/15/13(A)(C) | 44 | 41 | |||
Autozone | |||||
5.750%, 01/15/15 | 650 | 692 | |||
Bear Stearns MTN | |||||
6.950%, 08/10/12 | 363 | 404 | |||
Caterpillar Financial Services MTN | |||||
6.200%, 09/30/13 | 810 | 897 | |||
Cellco Partners/Verizon Wireless | |||||
3.750%, 05/20/11(C) | 650 | 671 | |||
Countrywide Financial | |||||
6.250%, 05/15/16 | 132 | 132 | |||
DirecTV Holdings | |||||
5.875%, 10/01/19(C) | 550 | 547 | |||
Dominion Resources | |||||
6.400%, 06/15/18 | 400 | 448 | |||
Embarq | |||||
7.082%, 06/01/16 | 1,283 | 1,394 | |||
Federated Retail Holding | |||||
5.350%, 03/15/12 | 505 | 492 | |||
Fisher Scientific International | |||||
6.750%, 08/15/14 | 107 | 111 | |||
Freeport-McMoRan Copper & Gold | |||||
8.250%, 04/01/15 | 300 | 319 | |||
General Mills | |||||
5.250%, 08/15/13 | 300 | 326 | |||
Humana | |||||
7.200%, 06/15/18 | 280 | 283 | |||
6.450%, 06/01/16 | 40 | 40 | |||
6.300%, 08/01/18 | 50 | 48 | |||
ILFC E-Capital Trust I | |||||
5.900%, 12/21/65(A)(C) | 150 | 76 | |||
Liberty Mutual Group | |||||
7.800%, 03/15/37(C) | 315 | 239 | |||
Limited Brands | |||||
5.250%, 11/01/14 | 585 | 543 | |||
Lincoln National | |||||
8.750%, 07/01/19 | 128 | 148 | |||
Masco | |||||
6.125%, 10/03/16 | 500 | 474 | |||
McGraw-Hill | |||||
5.900%, 11/15/17 | 325 | 333 | |||
McKesson | |||||
5.250%, 03/01/13 | 615 | 650 | |||
Merrill Lynch | |||||
6.050%, 05/16/16 | 200 | 200 | |||
Mirant Americas Generation | |||||
8.500%, 10/01/21(C) | 399 | 347 | |||
Mohawk Industries | |||||
6.875%, 01/15/16 | 500 | 498 | |||
Description | Face Amount (Thousands) (1) | Market Value ($ Thousands) | |||
Motorola | |||||
7.500%, 05/15/25 | 85 | $ | 77 | ||
6.500%, 09/01/25 | 531 | 449 | |||
Nisource Finance | |||||
6.800%, 01/15/19 | 710 | 727 | |||
NRG Energy | |||||
7.375%, 02/01/16 | 225 | 218 | |||
Principal Financial Group | |||||
7.875%, 05/15/14 | 290 | 320 | |||
Progress Energy | |||||
6.050%, 03/15/14 | 160 | 175 | |||
RRI Energy | |||||
7.875%, 06/15/17 | 225 | 220 | |||
7.625%, 06/15/14 | 175 | 172 | |||
Sara Lee | |||||
6.250%, 09/15/11 | 448 | 484 | |||
SLM MTN | |||||
5.050%, 11/14/14 | 1,000 | 735 | |||
Starwood Hotels & Resorts Worldwide | |||||
7.375%, 11/15/15 | 644 | 634 | |||
Time Warner Cable | |||||
9.125%, 01/15/13 | 720 | 836 | |||
7.500%, 04/01/14 | 385 | 442 | |||
Union Bank MTN | |||||
5.950%, 05/11/16 | 392 | 390 | |||
Union Carbide | |||||
7.750%, 10/01/96 | 535 | 401 | |||
United States Steel | |||||
6.050%, 06/01/17 | 615 | 574 | |||
Valero Energy | |||||
9.375%, 03/15/19 | 345 | 402 | |||
Wachovia MTN | |||||
5.500%, 05/01/13 | 415 | 444 | |||
5.350%, 03/15/11 | 150 | 156 | |||
Wachovia Capital Trust III | |||||
5.800%, 03/15/11(A) | 385 | 266 | |||
Wellpoint | |||||
7.000%, 02/15/19 | 90 | 102 | |||
Whirlpool MTN | |||||
8.600%, 05/01/14 | 148 | 166 | |||
Williams | |||||
7.875%, 09/01/21 | 110 | 119 | |||
Xerox | |||||
7.625%, 06/15/13 | 210 | 216 | |||
| 20,308 | |||||
Total Corporate Obligations | 20,308 | ||||
ASSET-BACKED SECURITIES — 2.8% | |||||
Automotive — 0.8% | |||||
Auto Compartiment, Ser 2006-1, Cl B | |||||
1.177%, 07/25/17(A) | 500 | 559 | |||
Auto Compartiment, Ser 2007-1, Cl A | |||||
0.959%, 02/25/19(A) | 1,000 | 1,384 | |||
Ford Credit Auto Owner Trust, Ser 2006-C, Cl A3 | |||||
5.160%, 11/15/10 | 324 | 325 | |||
FTA Santander Auto, Ser 1, Cl A | |||||
0.908%, 11/25/21(A) | 450 | 647 | |||
| 9 | SEI Institutional International Trust / Annual Holdings / September 30, 2009 |
Table of Contents
Description | Face Amount (Thousands) (1) | Market Value ($ Thousands) | ||||
Hyundai Auto Receivables Trust, Ser 2009-A, Cl A2 | ||||||
1.110%, 02/15/12 | 1,020 | $ | 1,020 | |||
Santander Consumer Finance, Ser 2007-1, Cl A | ||||||
0.916%, 09/20/22 (B) | 324 | 458 | ||||
| 4,393 | ||||||
Credit Card — 0.5% | ||||||
Citibank Credit Card Issuance Trust, Ser A4, Cl A4 | ||||||
5.375%, 04/11/11 | EUR | 1,900 | 2,727 | |||
Mortgage Related Securities — 0.3% | ||||||
Countrywide Asset-Backed Certificates, Ser 2007-2, Cl 2A1 | ||||||
0.296%, 08/25/37 (A) | 1,164 | 1,057 | ||||
Soundview Home Equity Loan Trust, Ser 2007-NS1, Cl A1 | ||||||
0.366%, 01/25/37 (A) | 822 | 703 | ||||
| 1,760 | ||||||
Other Asset-Backed Securities — 1.2% | ||||||
Amstel Corporate Loan Offering, Ser 2007-1, Cl A2 | ||||||
0.929%, 03/25/17 (A)(B) | 917 | 938 | ||||
COMIT, Ser 1, Cl C | ||||||
1.041%, 06/29/13 (A)(B) | 79 | 57 | ||||
Lambda Finance, Ser 2005-1X, Cl A2 | ||||||
1.113%, 11/15/29 (A)(B) | 844 | 1,135 | ||||
Mermaid Secured Finance, Ser 2007-1, Cl C | ||||||
1.408%, 01/30/40 (A)(B) | 100 | 135 | ||||
Mermaid Secured Finance, Ser 2007-1, Cl D | ||||||
1.208%, 01/30/40 (A)(B) | 100 | 138 | ||||
Prime Bricks, Ser 2007-1, Cl C | ||||||
1.408%, 01/30/40 (A)(B) | 100 | 135 | ||||
Prime Bricks, Ser 2007-1, Cl B | ||||||
1.208%, 01/30/40 (A)(B) | 350 | 482 | ||||
SLM Student Loan Trust, Ser 2004-2, Cl A5 | ||||||
1.107%, 01/25/24 (A) | 1,000 | 1,269 | ||||
SLM Student Loan Trust, Ser 2008-5, Cl A3 | ||||||
1.804%, 01/25/18 | 900 | 922 | ||||
SLM Student Loan Trust, Ser 2008-5, Cl A4 | ||||||
2.204%, 07/25/23 | 200 | 207 | ||||
1.604%, 10/25/16 | 800 | 813 | ||||
Description | Face Amount (Thousands) (1) | Market Value ($ Thousands) | ||||
Whinstone Capital Management, Ser 1X, Cl B1 | ||||||
6.596%, 10/25/45 (A)(B) | 140 | $ | 35 | |||
| 6,266 | ||||||
Total Asset-Backed Securities | 15,146 | |||||
U.S. TREASURY OBLIGATIONS — 2.5% | ||||||
U.S. Treasury Bonds | ||||||
4.250%, 05/15/39 | 960 | 993 | ||||
3.500%, 02/15/39 | 75 | 68 | ||||
U.S. Treasury Notes | ||||||
4.500%, 11/15/15 | 1,100 | 1,213 | ||||
2.750%, 02/15/19 | 660 | 630 | ||||
2.625%, 07/31/14 | 700 | 711 | ||||
2.000%, 11/30/13 | 4,300 | 4,307 | ||||
1.375%, 04/15/12 | 2,500 | 2,511 | ||||
United States Treasury Inflation Index Note | ||||||
3.000%, 07/15/12 | 2,575 | 3,279 | ||||
Total U.S. Treasury Obligations | 13,712 | |||||
U.S. GOVERNMENT AGENCY OBLIGATION — 0.2% | ||||||
FHLB | ||||||
1.750%, 08/22/12 | 875 | 878 | ||||
Total U.S. Government Agency Obligation | 878 | |||||
MUNICIPAL BONDS — 0.2% | ||||||
Metropolitan Transportation Authority, RB | ||||||
7.336%, 11/15/39 | 305 | 377 | ||||
State of California, GO | ||||||
5.250%, 04/01/14 | 825 | 857 | ||||
| 1,234 | ||||||
Total Municipal Bonds | 1,234 | |||||
TIME DEPOSITS — 13.1% | ||||||
United States — 13.1% | ||||||
Brown Brothers Harriman | ||||||
5.950%, 10/01/09 | ZAR | 45 | 6 | |||
2.174%, 10/01/09 | AUD | 79 | 70 | |||
1.500%, 10/01/09 | NZD | 10 | 7 | |||
0.382%, 10/01/09 | NOK | 5 | 1 | |||
0.125%, 10/01/09 | EUR | 125 | 183 | |||
0.088%, 10/01/09 | GBP | 383 | 613 | |||
0.060%, 10/01/09 | CAD | 1,272 | 1,185 | |||
0.030%, 10/01/09 | 67,494 | 67,495 | ||||
| SEI Institutional International Trust / Annual Holdings / September 30, 2009 | 10 |
Table of Contents
SCHEDULE OF INVESTMENTS
International Fixed Income Fund
September 30, 2009
Description | Face Amount (Thousands) (1)/Shares | Market Value ($ Thousands) | ||||
0.010%, 10/01/09 | HKD | 2 | $ | — | ||
0.010%, 10/01/09 | JPY | 52,493 | 586 | |||
1.500%, 10/01/09 | SEK | 998 | 143 | |||
0.005%, 10/01/09 | SGD | 1 | — | |||
Total Time Deposits | 70,289 | |||||
AFFILIATED PARTNERSHIP — 0.3% | ||||||
United States — 0.3% | ||||||
SEI Liquidity Fund, L.P., 0.400%†*(H) | 1,712,483 | 1,704 | ||||
Total Affiliated Partnership | 1,704 | |||||
Total Investments — 100.7% | $ | 542,159 | ||||
A summary of the outstanding forward foreign currency contracts held by the Fund at September 30, 2009, is as follows:
Settlement Date | Currency to Deliver (Thousands) | Currency to Receive (Thousands) | Unrealized Appreciation (Depreciation) ($ Thousands) | |||||||
10/1/09 | USD | 5,088 | CHF | 5,281 | $ | 2 | ||||
10/1/09-11/9/09 | USD | 23,957 | GBP | 14,920 | (95 | ) | ||||
10/1/09-12/4/09 | CHF | 34,081 | USD | 32,175 | (690 | ) | ||||
10/2/09 | USD | 3,675 | DKK | 18,764 | 9 | |||||
10/6/09 | USD | 733 | MXP | 9,904 | — | |||||
10/6/09 | USD | 1,414 | SEK | 9,887 | — | |||||
10/6/09-10/28/09 | USD | 9,518 | CAD | 10,237 | 21 | |||||
10/6/09-11/5/09 | JPY | 10,117,167 | USD | 109,296 | (3,736 | ) | ||||
10/6/09-11/5/09 | MXP | 19,808 | USD | 1,474 | 11 | |||||
10/6/09-11/5/09 | NOK | 3,278 | USD | 555 | (10 | ) | ||||
10/6/09-11/9/09 | GBP | 39,063 | USD | 63,496 | 1,032 | |||||
10/6/09-11/27/09 | CAD | 63,846 | USD | 58,622 | (882 | ) | ||||
10/6/09-11/27/09 | USD | 120,548 | EUR | 82,496 | 34 | |||||
10/6/09-11/27/09 | USD | 31,237 | JPY | 2,813,453 | 190 | |||||
10/6/09-11/27/09 | USD | 33,576 | NOK | 203,357 | 1,429 | |||||
10/6/09-12/2/09 | SEK | 44,384 | USD | 6,339 | (12 | ) | ||||
10/6/09-12/16/09 | EUR | 246,360 | USD | 357,608 | (2,450 | ) | ||||
10/13/09 | USD | 4,233 | AUD | 5,051 | 220 | |||||
10/19/09 | JPY | 147,033 | KRW | 1,988,696 | 47 | |||||
10/22/09-10/28/09 | DKK | 31,475 | USD | 6,104 | (75 | ) | ||||
10/27/09 | PLN | 2,522 | USD | 876 | 7 | |||||
10/28/09 | AUD | 4,349 | USD | 3,599 | (230 | ) | ||||
11/4/09 | GBP | 512 | EUR | 580 | 29 | |||||
11/17/09 | HUF | 145,058 | USD | 767 | (12 | ) | ||||
11/24/09 | HUF | 158,903 | PLN | 2,425 | (19 | ) | ||||
11/25/09 | EUR | 1,121 | PLN | 4,658 | (37 | ) | ||||
11/27/09 | SEK | 77,404 | EUR | 7,580 | — | |||||
| $ | (5,217 | ) | ||||||||
| 11 | SEI Institutional International Trust / Annual Holdings / September 30, 2009 |
Table of Contents
A summary of the open futures contracts held by the Fund at September 30, 2009, is as follows:
Type of Contract | Number of Contracts Long (Short) | Expiration Date | Unrealized Appreciation (Depreciation) ($ Thousands) | ||||||
30-Day FED Fund | (1 | ) | Oct-2009 | $ | — | ||||
Australian 10-Year Bond | 5 | Dec-2009 | 0 | ||||||
Australian 3-Year Bond | 178 | Dec-2009 | (80 | ) | |||||
Canadian 10-Year Bond | 39 | Dec-2009 | 58 | ||||||
Euro-Bobl | 132 | Dec-2009 | 115 | ||||||
Euro-Bund | 27 | Dec-2009 | 11 | ||||||
Euro-Schatz | 36 | Dec-2009 | 34 | ||||||
Japanese 10-Year Bond | 1 | Dec-2009 | 8 | ||||||
Long Gilt 10-Year Bond | 36 | Dec-2009 | 42 | ||||||
U.S. 10-Year Treasury Note | (208 | ) | Dec-2009 | (346 | ) | ||||
U.S. 2-Year Treasury Note | (136 | ) | Dec-2009 | (140 | ) | ||||
U.S. 5-Year Treasury Note | (130 | ) | Dec-2009 | (182 | ) | ||||
U.S. Long Treasury Bond | (54 | ) | Dec-2009 | (117 | ) | ||||
| $ | (597 | ) | |||||||
For the year ended September 30, 2009, the total amount of all open futures contracts, as presented in the table above, are representative of the volume of activity for this derviative type during the period.
A summary of outstanding swap agreements held by the Fund at September 30, 2009, is as follows:
Credit Default Swaps
Counterparty | Reference Entity/Obligation | Buy/Sell Protection | (Pays)/Receives Rate | Termination Date | Notional Amount (Thousands) | Net Unrealized Appreciation (Depreciation) ($Thousands) | |||||||||||
| Deutsche Bank | Wolters Kluwer NV, 5.125% 01/27/14 | BUY | (0.90 | ) | 03/20/14 | EUR | 1,400 | $ | (40 | ) | |||||||
| HSBC | Autozone Inc., 5.500% 11/15/15 | BUY | (1.00 | ) | 03/20/15 | 650 | 3 | ||||||||||
| JPMorgan Chase Bank | iTraxx Europe Crossover Series 9 Version 3 | SELL | 6.50 | 06/20/13 | EUR | (4,800 | ) | 153 | |||||||||
| Morgan Stanley | Prudential Financial 4.500% 07/15/13 | SELL | 5.00 | 09/20/14 | (350 | ) | 45 | ||||||||||
| Morgan Stanley | Spanish Government, 5.500% 07/30/17 | BUY | (1.00 | ) | 09/20/14 | USD | 4,100 | (16 | ) | ||||||||
| $ | 145 | ||||||||||||||||
Interest Rate Swaps
Counterparty | Fund Pays | Fund Receives | Termination Date | Notional Amount (Thousands) | Net Unrealized Appreciation (Depreciation) ($Thousands) | ||||||||
Citigroup | 3.79% | 6-Month GBP LIBOR | 05/19/19 | GBP | 2,500,000 | $ | (7 | ) | |||||
Deutsche Bank | 6-Month EURIBOR | 4.17% | 03/28/13 | EUR | 7,000,000 | 868 | |||||||
Deutsche Bank | 4.31% | 6-Month EURIBOR | 04/07/10 | EUR | 6,500,000 | (282 | ) | ||||||
JPMorgan Chase Bank | 6-Month JPY LIBOR | 2.22% | 03/26/27 | JPY | 750,000,000 | 384 | |||||||
JPMorgan Chase Bank | 6-Month EURIBOR | 4.38% | 01/07/13 | EUR | 5,400,000 | 760 | |||||||
JPMorgan Chase Bank | 4.20% | 6-Month EURIBOR | 03/30/12 | EUR | 3,000,000 | (338 | ) | ||||||
JPMorgan Chase Bank | 6-Month JPY LIBOR | 1.29% | 03/26/12 | JPY | 1,300,000,000 | 246 | |||||||
JPMorgan Chase Bank | 3.91% | 6-Month EURIBOR | 03/13/10 | EUR | 6,500,000 | (327 | ) | ||||||
| $ | 1,304 | ||||||||||||
| SEI Institutional International Trust / Annual Holdings / September 30, 2009 | 12 |
Table of Contents
SCHEDULE OF INVESTMENTS
International Fixed Income Fund
September 30, 2009
| Percentages are based on a Net Assets of $538,159 ($ Thousands). |
| * | Rate shown is the 7-day effective yield as of September 30, 2009. |
| † | Affiliated security |
| (1) | In local currency unless otherwise indicated. |
| (A) | Variable Rate Security - The rate reported on the Schedule of Investments is the rate in effect as of September 30, 2009. |
| (B) | Securities considered illiquid. The total market value of such securities as of September 30, 2009 was $12,744 ($ Thousands) and represented 2.4% of Net Assets. |
| (C) | Securities sold within terms of a private placement memorandum, exempt from registration under Section 144A of the Securities Act of 1933, as amended, and may be sold only to dealers in that program or other “accredited investors.” These securities have been determined to be liquid under guidelines established by the Board of Trustees. |
| (D) | This security or a partial position of this security is on loan at September 30, 2009. The total market value of securities on loan at September 30, 2009 was $1,666 ($ Thousands) (See Note 9). |
| (E) | Security in default on interest payments. |
| (F) | Real Estate Investments Trust |
| (G) | Security fair valued using methods determined in good faith by the Valuation Committee of the Board of Trustees. The total market value of such securities as of September 30, 2009 was $127 ($ Thousands) and represented 0.0% of Net Assets. |
| (H) | This security was purchased with cash collateral held from securities on loan (see Note 9). The total value of such securities as of September 30, 2009 was $1,704 ($ Thousands). |
AUD — Australian Dollar
CAD — Canadian Dollar
CHF — Swiss Franc
Cl — Class
CPI — Consumer Price Index
DKK — Danish Krone
EURIBOR — Euro London Interbank Offered Rate (check manually)
EUR — Euro
FHLB — Federal Home Loan Bank
GBP — British Pound Sterling
HKD — Hong Kong Dollar
HUF — Hungarian Forint
JPY — Japanese Yen
KRW — Korean Won
LIBOR — London Interbank Offered Rate
L.P. — Limited Partnership
MTN — Medium Term Note
MXP — Mexican Peso
NOK — Norwegian Krone
NZD — New Zealand Dollar
PLN — Polish Zloty
SEK — Swedish Krona
Ser — Series
SGD — Singapore Dollar
USD — U.S. Dollar
ZAR — South African Rand
Amounts designated as “—” are $0 or have been rounded to $0.
The accompanying notes are an integral part of the financial statements.
| 13 | SEI Institutional International Trust / Annual Holdings / September 30, 2009 |
Table of Contents
SCHEDULE OF INVESTMENTS
Emerging Markets Debt Fund
September 30, 2009
Description | Face Amount (Thousands) (1) | Market Value ($ Thousands) | ||||
GLOBAL BONDS — 91.4% | ||||||
Argentina — 5.9% | ||||||
Alto Parana | ||||||
6.375%, 06/09/17(A)(B) | 440 | $ | 449 | |||
Province of Buenos Aires | ||||||
9.625%, 04/18/28(A) | 695 | 375 | ||||
9.625%, 04/18/28(A)(B) | 1,605 | 867 | ||||
9.375%, 09/14/18(A) | 470 | 269 | ||||
3.000%, 05/15/35(A)(C) | 1,200 | 360 | ||||
Province of Medoza | ||||||
5.500%, 09/04/18(A) | 370 | 233 | ||||
Provincia Del Neuquen | ||||||
8.656%, 10/18/14(A)(B) | 195 | 196 | ||||
Republic of Argentina | ||||||
12.000%, 09/19/16(D) | 1,000 | 230 | ||||
11.750%, 05/20/11(D) | 2,554 | 608 | ||||
10.139%, 12/15/35(E)(F) | 3,655 | 226 | ||||
10.000%, 01/03/07(D) ITL | 3,000,000 | 713 | ||||
9.750%, 09/19/27(D) | 2,150 | 688 | ||||
9.250%, 07/20/04(D) | 1,375 | 623 | ||||
9.000%, 05/26/49(D) | 2,650 | 1,147 | ||||
9.000%, 05/24/49(D) | 1,400 | 653 | ||||
9.000%, 07/01/11(D) | 1,125 | 512 | ||||
8.750%, 02/04/49(D) | 1,375 | 610 | ||||
8.500%, 07/30/10(D) | 2,000 | 833 | ||||
8.500%, 07/01/49(D) | 775 | 351 | ||||
8.280%, 12/31/33 | 6,278 | 4,238 | ||||
8.125%, 04/21/49(D) | 4,200 | 1,820 | ||||
8.000%, 02/25/32(D) | 864 | 391 | ||||
8.000%, 02/26/08(D) | 1,000 | 464 | ||||
7.820%, 12/31/33 | 734 | 601 | ||||
7.625%, 03/31/05(D) | 1,120 | 370 | ||||
7.625%, 08/11/07(D) | ITL | 2,325,000 | 522 | |||
7.000%, 03/18/49(D) | ITL | 1,475,000 | 340 | |||
7.000%, 09/12/13 | 1,200 | 930 | ||||
7.000%, 10/03/15 | 20,140 | 14,493 | ||||
2.500%, 03/31/19(C) | 12,990 | 4,352 | ||||
2.280%, 12/15/35(E) | 7,705 | 512 | ||||
0.943%, 08/03/12(E) | 21,115 | 6,429 | ||||
0.000%, 07/13/49(D) | ITL | 3,245,000 | 717 | |||
Transportadora Gas Norte | ||||||
7.500%, 12/31/12(A)(B)(C)(D) | 260 | 88 | ||||
7.500%, 12/31/12(A)(C)(D) | 130 | 44 | ||||
7.500%, 12/31/12(D) | 420 | 143 | ||||
6.500%, 12/31/12(A)(C)(D) | 72 | 25 | ||||
6.500%, 12/31/12(A)(B)(C)(D) | 30 | 10 | ||||
6.500%, 12/31/12(A)(C)(D) | 81 | 28 | ||||
| 46,460 | ||||||
Description | Face Amount (Thousands) (1) | Market Value ($ Thousands) | ||||
Bahrain — 0.1% | ||||||
CBB International Sukuk | ||||||
6.247%, 06/17/14 | 400 | $ | 432 | |||
Belize — 0.0% | ||||||
Government of Belize | ||||||
4.250%, 02/20/29(A) | 400 | 220 | ||||
Bosnia and Herzegovina — 0.1% | ||||||
Republic of Bosnia & Herzegovina | ||||||
0.000%, 12/11/17(A)(F) | DEM | 2,300 | 1,092 | |||
Brazil — 9.1% | ||||||
Banco Bradesco | ||||||
6.750%, 09/29/19(B) | 585 | 603 | ||||
Banco Nacional de Desenvolvimento Economico e Social | ||||||
6.500%, 06/10/19(B) | 2,325 | 2,470 | ||||
Banco Safra MTN | ||||||
10.875%, 04/03/17(A)(B) | BRL | 919 | 483 | |||
Federal Republic of Brazil | ||||||
12.250%, 03/06/30 | 175 | 304 | ||||
11.000%, 08/17/40 | 12,957 | 17,427 | ||||
10.125%, 05/15/27 | 4,735 | 7,008 | ||||
8.875%, 04/15/24 | 2,470 | 3,273 | ||||
8.750%, 02/04/25 | 2,735 | 3,610 | ||||
8.500%, 09/24/12 | 460 | 768 | ||||
8.250%, 01/20/34 | 5,290 | 6,975 | ||||
8.000%, 01/15/18 | 4,212 | 4,878 | ||||
7.875%, 03/07/15 | 690 | 814 | ||||
7.125%, 01/20/37 | 5,335 | 6,362 | ||||
6.000%, 01/17/17 | 1,100 | 1,190 | ||||
5.875%, 01/15/19 | 1,100 | 1,182 | ||||
Nota Do Tesouro Nacional | ||||||
10.000%, 01/01/17 | 25,476 | 12,881 | ||||
Petrobras | ||||||
7.875%, 03/15/19 | 1,055 | 1,217 | ||||
Voto-Votorantim | ||||||
6.625%, 09/25/19(B) | 490 | 488 | ||||
| 71,933 | ||||||
Chile — 0.2% | ||||||
Empresa Nacional del Petroleo | ||||||
6.250%, 07/08/19(B) | 900 | 961 | ||||
Nacional del Cobre de Chile | ||||||
7.500%, 01/15/19 | 600 | 725 | ||||
| 1,686 | ||||||
Colombia — 4.5% | ||||||
Bogota Distrio Capital | ||||||
9.750%, 07/26/28(B) | COP | 9,241,000 | 4,371 | |||
Ecopetrol | ||||||
7.625%, 07/23/19 | 500 | 547 | ||||
| 1 | SEI Institutional International Trust / Annual Holdings / September 30, 2009 |
Table of Contents
Description | Face Amount (Thousands) (1) | Market Value ($ Thousands) | ||||
Republic of Colombia | ||||||
11.750%, 02/25/20 | 2,345 | $ | 3,412 | |||
10.375%, 01/28/33 | 450 | 657 | ||||
9.850%, 06/28/27 | COP | 302,000 | 166 | |||
8.125%, 05/21/24 | 3,150 | 3,780 | ||||
7.375%, 03/18/19 | 5,545 | 6,341 | ||||
7.375%, 09/18/37 | 10,225 | 11,554 | ||||
7.375%, 01/27/17 | 4,410 | 5,054 | ||||
| 35,882 | ||||||
Croatia — 0.2% | ||||||
Zagrebacki Holding | ||||||
5.500%, 07/10/17 | 1,100 | 1,252 | ||||
Czech Republic — 0.1% | ||||||
Central European Media Enterprises | ||||||
11.625%, 09/15/16(B) | 450 | 676 | ||||
Dominican Republic — 0.1% | ||||||
Republic of Dominican Republic | ||||||
9.040%, 01/23/18 | 71 | 75 | ||||
8.625%, 04/20/27 | 480 | 456 | ||||
| 531 | ||||||
Ecuador — 0.1% | ||||||
Republic of Ecuador Registered | ||||||
9.375%, 12/15/15 | 1,100 | 957 | ||||
El Salvador — 0.9% | ||||||
Republic of El Salvador | ||||||
8.250%, 04/10/32 | 455 | 482 | ||||
7.750%, 01/24/23 | 595 | 637 | ||||
7.650%, 06/15/35 | 5,811 | 5,811 | ||||
| 6,930 | ||||||
Gabon — 0.2% | ||||||
Republic of Gabon | ||||||
8.200%, 12/12/17(B) | 1,747 | 1,826 | ||||
Georgia — 0.5% | ||||||
BG Finance for JSC Bank of Georgia | ||||||
9.000%, 02/08/12 | 1,850 | 1,748 | ||||
Republic of Georgia | ||||||
7.500%, 04/15/13 | 2,400 | 2,364 | ||||
| 4,112 | ||||||
Ghana — 0.2% | ||||||
Republic of Ghana | ||||||
8.500%, 10/04/17(B) | 720 | 720 | ||||
8.500%, 10/04/17 | 950 | 955 | ||||
| 1,675 | ||||||
Description | Face Amount (Thousands) (1) | Market Value ($ Thousands) | ||||
India — 0.5% | ||||||
Vedanta Resources | ||||||
9.500%, 07/18/18(B) | 3,885 | $ | 3,827 | |||
Indonesia — 6.7% | ||||||
JPMorgan Chase Bank MTN | ||||||
12.800%, 06/17/21(E) | IDR | 26,200,000 | 3,202 | |||
Majapahit Holding | ||||||
8.000%, 08/07/19(B) | 1,320 | 1,409 | ||||
7.875%, 06/29/37(A)(B) | 355 | 351 | ||||
7.750%, 10/17/16(A) | 180 | 189 | ||||
7.750%, 10/17/16 | 1,100 | 1,157 | ||||
7.250%, 10/17/11 | 650 | 674 | ||||
Republic of Indonesia | ||||||
11.625%, 03/04/19 | 1,400 | 1,949 | ||||
11.625%, 03/04/19(B) | 4,585 | 6,453 | ||||
10.375%, 05/04/14 | 300 | 364 | ||||
10.375%, 05/04/14(B) | 200 | 243 | ||||
8.500%, 10/12/35 | 3,550 | 4,278 | ||||
7.750%, 01/17/38 | 19,391 | 21,427 | ||||
7.500%, 01/15/16 | 2,100 | 2,316 | ||||
7.250%, 04/20/15 | 1,480 | 1,618 | ||||
6.875%, 01/17/18 | 2,330 | 2,505 | ||||
6.875%, 03/09/17 | 370 | 395 | ||||
6.750%, 03/10/14 | 700 | 746 | ||||
6.750%, 03/10/14(B) | 1,300 | 1,401 | ||||
6.625%, 02/17/37 | 2,350 | 2,293 | ||||
6.625%, 02/17/37(B) | 300 | 295 | ||||
| 53,265 | ||||||
Iraq — 1.1% | ||||||
Republic of Iraq | ||||||
5.800%, 01/15/28 | 11,550 | 8,662 | ||||
Ivory Coast — 0.0% | ||||||
Republic of Ivory Coast | ||||||
4.000%, 03/30/18(D) | 4,300 | 374 | ||||
Jamaica — 0.1% | ||||||
Digicel Group | ||||||
8.875%, 01/15/15(B) | 550 | 511 | ||||
Kazakhstan — 2.9% | ||||||
CenterCredit International | ||||||
8.625%, 01/30/14 | 1,250 | 1,100 | ||||
Citigroup Global Markets for JSC Kazkommertsbank | ||||||
7.375%, 04/07/14(E) | 1,300 | 910 | ||||
HSBK Europe | ||||||
9.250%, 10/16/13 | 675 | 661 | ||||
7.750%, 05/13/13 | 150 | 142 | ||||
7.250%, 05/03/17 | 460 | 384 | ||||
| SEI Institutional International Trust / Annual Holdings / September 30, 2009 | 2 |
Table of Contents
SCHEDULE OF INVESTMENTS
Emerging Markets Debt Fund
September 30, 2009
Description | Face Amount (Thousands) (1) | Market Value ($ Thousands) | ||||
Kazkommerts International | ||||||
8.500%, 04/16/13 | 550 | $ | 465 | |||
8.000%, 11/03/15 | 1,550 | 1,255 | ||||
7.875%, 04/07/14 | 400 | 326 | ||||
7.500%, 11/29/16(A) | 1,700 | 1,318 | ||||
6.875%, 02/13/17 | 450 | 503 | ||||
KazMunaiGaz Finance Sub | ||||||
11.750%, 01/23/15(B) | 3,130 | 3,701 | ||||
9.125%, 07/02/18(B) | 4,505 | 4,888 | ||||
9.125%, 07/02/18 | 3,550 | 3,834 | ||||
8.375%, 07/02/13 | 2,735 | 2,896 | ||||
Tengizchevroil Finance | ||||||
6.124%, 11/15/14 | 393 | 388 | ||||
| 22,771 | ||||||
Lebanon — 0.0% | ||||||
Republic of Lebanon MTN | ||||||
8.250%, 04/12/21 | 250 | 266 | ||||
Malaysia — 2.7% | ||||||
Government of Malaysia | ||||||
4.378%, 11/29/19 | 10,580 | 3,097 | ||||
Petroliam Nasional | ||||||
7.750%, 08/15/15 | 705 | 833 | ||||
7.625%, 10/15/26 | 395 | 471 | ||||
Petronas Capital | ||||||
7.875%, 05/22/22 | 6,255 | 7,649 | ||||
7.875%, 05/22/22(B) | 400 | 492 | ||||
7.875%, 05/22/22 | 1,000 | 1,223 | ||||
5.250%, 08/12/19 | 7,250 | 7,319 | ||||
| 21,084 | ||||||
Mexico — 8.0% | ||||||
EUR Capital | ||||||
6.277%, 05/09/49(E) | 1,350 | 1,460 | ||||
Grupo Senda | ||||||
10.500%, 10/03/15 | 2,015 | 1,617 | ||||
Mexican Bonos | ||||||
7.500%, 06/03/27 | MXP | 23,150 | 1,569 | |||
Mexican Bonos, Ser M10 | ||||||
7.750%, 12/14/17 | MXP | 39,035 | 2,873 | |||
NII Capital | ||||||
10.000%, 08/15/16 | 3,700 | 3,737 | ||||
Oceanografia | ||||||
11.250%, 07/15/15 | 1,029 | 555 | ||||
Pemex Project Funding Master Trust | ||||||
6.625%, 06/15/35 | 450 | 435 | ||||
5.750%, 03/01/18 | 1,505 | 1,488 | ||||
United Mexican States | ||||||
8.300%, 08/15/31 | 10,185 | 13,037 | ||||
8.125%, 12/30/19(G) | 2,415 | 2,943 | ||||
7.500%, 04/08/33 | 3,665 | 4,352 | ||||
6.625%, 03/03/15 | 2,600 | 2,870 | ||||
6.050%, 01/11/40 | 8,084 | 8,064 | ||||
5.950%, 03/19/19 | 5,608 | 5,888 | ||||
5.875%, 02/17/14 | 450 | 482 | ||||
5.625%, 01/15/17 | 5,284 | 5,485 | ||||
Description | Face Amount (Thousands) (1) | Market Value ($ Thousands) | |||
United Mexican States, Ser A MTN | |||||
6.750%, 09/27/34 | 5,583 | $ | 6,141 | ||
| 62,996 | |||||
Nigeria — 0.2% | |||||
GTB Finance | |||||
8.500%, 01/29/12 | 800 | 764 | |||
UBS | |||||
0.000%, 09/04/17(A)(B)(E) | 750 | 649 | |||
| 1,413 | |||||
Oman — 0.1% | |||||
Blue City Investments | |||||
13.750%, 11/07/13(A) | 2,250 | 900 | |||
4.264%, 11/07/13(E) | 250 | 124 | |||
| 1,024 | |||||
Pakistan — 0.6% | |||||
Republic of Pakistan | |||||
7.125%, 03/31/16 | 2,850 | 2,505 | |||
6.875%, 06/01/17 | 2,840 | 2,428 | |||
| 4,933 | |||||
Panama — 2.3% | |||||
Republic of Panama | |||||
9.375%, 04/01/29 | 5,932 | 8,097 | |||
9.375%, 01/16/23 | 560 | 717 | |||
8.875%, 09/30/27 | 450 | 594 | |||
8.125%, 04/28/34 | 720 | 879 | |||
7.250%, 03/15/15 | 4,865 | 5,558 | |||
6.700%, 01/26/36 | 1,860 | 2,055 | |||
| 17,900 | |||||
Peru — 3.0% | |||||
Interoceanica IV Finance | |||||
3.930%, 11/30/25(A)(B)(F)(F) | 952 | 365 | |||
3.930%, 11/30/18(A)(B)(F)(F) | 450 | 270 | |||
Peru Enhanced Pass-Through Finance | |||||
6.637%, 06/02/25(B)(F)(F) | 320 | 123 | |||
3.999%, 05/31/18(F)(F) | 233 | 177 | |||
3.987%, 05/31/18(A)(B)(F)(F) | 1,398 | 1,063 | |||
Republic of Peru | |||||
8.750%, 11/21/33 | 1,155 | 1,542 | |||
8.375%, 05/03/16 | 1,650 | 2,009 | |||
7.350%, 07/21/25 | 8,045 | 9,393 | |||
7.125%, 03/30/19 | 2,625 | 3,028 | |||
6.550%, 03/14/37 | 5,555 | 6,027 | |||
| 23,997 | |||||
| 3 | SEI Institutional International Trust / Annual Holdings / September 30, 2009 |
Table of Contents
Description | Face Amount (Thousands) (1) | Market Value ($ Thousands) | |||
Philippines — 5.7% | |||||
National Power | |||||
9.625%, 05/15/28(A) | 1,400 | $ | 1,645 | ||
Power Sector | |||||
7.250%, 05/27/19 | 810 | 863 | |||
Republic of Philippines | |||||
10.625%, 03/16/25 | 3,435 | 4,822 | |||
9.500%, 02/02/30 | 3,670 | 4,872 | |||
9.375%, 01/18/17 | 200 | 247 | |||
8.875%, 03/17/15 | 450 | 541 | |||
8.375%, 06/17/19 | 2,645 | 3,220 | |||
8.250%, 01/15/14 | 600 | 691 | |||
8.000%, 01/15/16 | 4,200 | 4,851 | |||
7.750%, 01/14/31 | 6,323 | 7,185 | |||
7.500%, 09/25/24 | 14,006 | 15,792 | |||
| 44,729 | |||||
Poland — 1.6% | |||||
Republic of Poland | |||||
6.375%, 07/15/19 | 11,565 | 12,992 | |||
Qatar — 0.2% | |||||
Government of Qatar | |||||
9.750%, 06/15/30 | 425 | 608 | |||
Qtel International Finance MTN | |||||
7.875%, 06/10/19 | 700 | 800 | |||
6.500%, 06/10/14(B) | 500 | 546 | |||
| 1,954 | |||||
Russia — 10.7% | |||||
Alfa Diversified Payment Rights Finance MTN | |||||
2.199%, 12/15/11(B)(E) | 252 | 214 | |||
Alfa Invest MTN | |||||
9.250%, 06/24/13(A)(B) | 750 | 731 | |||
Bank of Moscow | |||||
7.500%, 11/25/15(A)(E) | 1,200 | 1,149 | |||
Gaz Capital MTN | |||||
9.625%, 03/01/13 | 1,200 | 1,338 | |||
8.625%, 04/28/34 | 920 | 1,005 | |||
6.510%, 03/07/22 | 215 | 198 | |||
6.212%, 11/22/16 | 600 | 576 | |||
RSHB Capital | |||||
9.000%, 06/11/14(B) | 1,100 | 1,205 | |||
7.750%, 05/29/18 | 650 | 670 | |||
7.175%, 05/16/13 | 100 | 103 | |||
6.299%, 05/15/17 | 300 | 287 | |||
Russian Federation Registered | |||||
12.750%, 06/24/28 | 5,010 | 8,342 | |||
7.500%, 03/31/30(C) | 51,092 | 55,466 | |||
Teorema | |||||
11.000%, 10/27/09 | 3,400 | 170 | |||
Transneft | |||||
8.700%, 08/07/18(B) | 775 | 846 | |||
7.700%, 08/07/13(B) | 150 | 159 | |||
Description | Face Amount (Thousands) (1) | Market Value ($ Thousands) | |||
Vimpel Communications | |||||
9.125%, 04/30/18(A)(B) | 1,155 | $ | 1,208 | ||
9.125%, 04/30/18 | 350 | 368 | |||
8.375%, 04/30/13(B) | 900 | 936 | |||
8.250%, 05/23/16 | 570 | 573 | |||
VTB Capital | |||||
6.875%, 05/29/18 | 5,900 | 5,826 | |||
6.609%, 10/31/12(B) | 3,200 | 3,200 | |||
| 84,570 | |||||
Singapore — 0.2% | |||||
Sea Product | |||||
4.700%, 02/14/12(A) | 2,200 | 1,430 | |||
South Africa — 1.5% | |||||
Edcon Proprietary | |||||
4.023%, 06/15/14(E) | 1,800 | 1,881 | |||
PE Paper | |||||
12.000%, 08/01/14 | 700 | 752 | |||
Republic of South Africa | |||||
8.500%, 06/23/17 | 860 | 1,041 | |||
6.875%, 05/27/19 | 2,130 | 2,375 | |||
6.500%, 06/02/14 | 2,945 | 3,225 | |||
5.875%, 05/30/22 | 2,400 | 2,460 | |||
| 11,734 | |||||
South Korea — 1.3% | |||||
Export-Import Bank of Korea | |||||
8.125%, 01/21/14 | 3,820 | 4,376 | |||
5.875%, 01/14/15 | 995 | 1,049 | |||
Korea Development Bank | |||||
8.000%, 01/23/14 | 2,115 | 2,417 | |||
Korea Power | |||||
6.250%, 06/17/14 | 750 | 798 | |||
POSCO | |||||
8.750%, 03/26/14(B) | 240 | 277 | |||
Republic of Korea | |||||
7.125%, 04/16/19 | 900 | 1,055 | |||
| 9,972 | |||||
Supra-National — 0.1% | |||||
Andina de Fomento | |||||
8.125%, 06/04/19 | 485 | 563 | |||
Central American Bank for Economic Integration | |||||
5.375%, 09/24/14(B) | 300 | 299 | |||
Eurasian Development Bank MTN | |||||
7.375%, 09/29/14(B) | 275 | 283 | |||
| 1,145 | |||||
Thailand — 0.1% | |||||
True Move | |||||
10.750%, 12/16/13(A)(B) | 1,250 | 1,181 | |||
| SEI Institutional International Trust / Annual Holdings / September 30, 2009 | 4 |
Table of Contents
SCHEDULE OF INVESTMENTS
Emerging Markets Debt Fund
September 30, 2009
Description | Face Amount (Thousands) (1) | Market Value ($ Thousands) | |||
Trinidad & Tobago — 0.4% | |||||
Petroleum of Trinidad & Tobago | |||||
6.000%, 05/08/22(A) | 1,955 | $ | 1,799 | ||
6.000%, 05/08/22(B) | 800 | 736 | |||
Petrotrin | |||||
9.750%, 08/14/19 | 490 | 555 | |||
| 3,090 | |||||
Tunisia — 0.2% | |||||
Banque Centrale de Tunisie | |||||
8.250%, 09/19/27 | 800 | 938 | |||
7.375%, 04/25/12 | 865 | 951 | |||
| 1,889 | |||||
Turkey — 5.8% | |||||
Globus Capital Finance | |||||
8.500%, 03/05/12 | 500 | 415 | |||
Republic of Turkey | |||||
11.875%, 01/15/30 | 450 | 726 | |||
9.500%, 01/15/14 | 750 | 880 | |||
8.000%, 02/14/34 | 2,200 | 2,500 | |||
7.635%, 02/02/11(F) | 3,900 | 2,354 | |||
7.500%, 11/07/19 | 2,190 | 2,414 | |||
7.500%, 07/14/17 | 1,350 | 1,488 | |||
7.375%, 02/05/25 | 3,820 | 4,119 | |||
7.250%, 03/05/38 | 5,530 | 5,751 | |||
7.250%, 03/15/15 | 9,460 | 10,311 | |||
7.000%, 09/26/16 | 1,500 | 1,614 | |||
7.000%, 06/05/20 | 200 | 213 | |||
7.000%, 03/11/19 | 1,800 | 1,922 | |||
6.875%, 03/17/36 | 6,220 | 6,220 | |||
6.750%, 04/03/18 | 4,750 | 5,006 | |||
| 45,933 | |||||
Ukraine — 2.1% | |||||
Credit Suisse First Boston International (Export/Import - Ukraine) | |||||
8.000%, 11/06/15(A) | 750 | 499 | |||
6.800%, 10/04/12(A) | 600 | 507 | |||
Credit Suisse International for JSC Bank for Social Development Ukrsotsbank | |||||
8.000%, 02/22/10 | 1,600 | 1,568 | |||
Government of Ukraine | |||||
7.650%, 06/11/13 | 4,330 | 3,908 | |||
6.875%, 03/04/11(B) | 4,475 | 4,151 | |||
6.580%, 11/21/16(B) | 2,390 | 1,864 | |||
6.580%, 11/21/16 | 500 | 390 | |||
JSC Commercial Bank | |||||
8.000%, 02/06/12 | 2,000 | 1,500 | |||
MHP | |||||
10.250%, 11/30/11 | 1,250 | 1,141 | |||
Naftogaz | |||||
8.130%, 09/30/09 | 700 | 612 | |||
Springvale Holdings | |||||
9.181%, 09/07/09(A)(D)(E) | 1,000 | 150 | |||
| 16,290 | |||||
Description | Face Amount (Thousands) (1) | Market Value ($ Thousands) | ||||
United Arab Emirates — 2.3% | ||||||
Dolphin Energy | ||||||
5.888%, 06/15/19(B) | 350 | $ | 354 | |||
Dubai Holding Commercial Operations MTN | ||||||
4.750%, 01/30/14 | 1,400 | 1,739 | ||||
Emirate of Abu Dhabi | ||||||
6.750%, 04/08/19(B) | 970 | 1,083 | ||||
Jafz Sukuk | ||||||
4.169%, 11/27/12(E) | AED | 31,500 | 7,676 | |||
MDC-GMTN | ||||||
7.625%, 05/06/19 | 500 | 568 | ||||
Nakheel Development | ||||||
3.173%, 12/14/09 | 5,800 | 5,916 | ||||
2.750%, 01/16/11 | 950 | 779 | ||||
| 18,115 | ||||||
Uruguay — 2.9% | ||||||
Republic of Uruguay PIK | ||||||
7.875%, 01/15/33 | 2,863 | 3,104 | ||||
Republic of Uruguay | ||||||
9.250%, 05/17/17 | 3,475 | 4,187 | ||||
8.000%, 11/18/22 | 10,870 | 12,175 | ||||
7.625%, 03/21/36 | 2,600 | 2,743 | ||||
6.875%, 09/28/25 | 601 | 616 | ||||
| 22,825 | ||||||
Venezuela — 5.6% | ||||||
Government of Venezuela | ||||||
13.625%, 08/15/18 | 600 | 618 | ||||
9.375%, 01/13/34 | 3,330 | 2,564 | ||||
9.250%, 09/15/27 | 1,070 | 861 | ||||
9.250%, 05/07/28 | 6,330 | 4,795 | ||||
9.000%, 05/07/23 | 5,770 | 4,385 | ||||
8.500%, 10/08/14 | 916 | 815 | ||||
7.650%, 04/21/25 | 12,125 | 8,033 | ||||
7.000%, 03/31/38 | 100 | 60 | ||||
6.000%, 12/09/20 | 2,020 | 1,237 | ||||
5.750%, 02/26/16 | 2,000 | 1,470 | ||||
1.505%, 04/20/11(E) | 17,006 | 15,221 | ||||
Petroleos De Venezuela | ||||||
5.375%, 04/12/27 | 3,555 | 1,698 | ||||
5.250%, 04/12/17 | 3,585 | 2,196 | ||||
| 43,953 | ||||||
Vietnam — 0.2% | ||||||
Republic of Vietnam | ||||||
6.875%, 01/15/16 | 1,615 | 1,703 | ||||
Yemen — 0.1% | ||||||
Pemberley MTN | ||||||
11.500%, 02/19/14(A)(B) | 1,250 | 725 | ||||
0.000%, 02/25/20(A)(B)(E) | 1,250 | — | ||||
| 725 | ||||||
Total Global Bonds | 722,917 | |||||
| 5 | SEI Institutional International Trust / Annual Holdings / September 30, 2009 |
Table of Contents
Description | Face Amount (Thousands) (1) | Market Value ($ Thousands) | ||||
LOAN PARTICIPATIONS — 3.7% | ||||||
Angola — 0.2% | ||||||
Republic of Angola | ||||||
3.472%, 04/30/16 | EUR | 1,300 | $ | 1,463 | ||
Georgia — 0.0% | ||||||
Ashmore Cayman | ||||||
0.000%, 04/16/14 (F) | 221 | 119 | ||||
Indonesia — 0.7% | ||||||
Indonesia Standby Loan 94 | ||||||
1.250%, 12/31/49 | 2,457 | 2,211 | ||||
Star Energy | ||||||
19.000%, 01/13/10 | 3,200 | 3,200 | ||||
| 5,411 | ||||||
Mexico — 0.3% | ||||||
Altos Hornos Promissory Note # 5 | ||||||
0.000%, 04/29/99 (A)(D) | 2,500 | 362 | ||||
Altos Hornos Promissory Note # 6 | ||||||
0.000%, 04/29/99 (A)(D) | 2,500 | 363 | ||||
Altos Hornos Promissory Note | ||||||
0.000%, 12/31/49 (A)(D) | 4,500 | 653 | ||||
Altos Hornos Tranche A | ||||||
0.000%, 04/11/04 (A)(D) | 6,540 | 948 | ||||
| 2,326 | ||||||
Nigeria — 0.3% | ||||||
Oando | ||||||
13.900%, 03/02/10 (A) | 229,710 | 1,324 | ||||
13.900%, 02/23/10 (A) | 229,710 | 1,324 | ||||
| 2,648 | ||||||
Russia — 0.3% | ||||||
Snegri | ||||||
10.500%, 04/21/10 (A) | 2,550 | 2,040 | ||||
Singapore — 1.5% | ||||||
Connect International PIK | ||||||
0.000%, 01/01/10 (A)(D) | 9,501 | 8,354 | ||||
Morton Bay | ||||||
6.243%, 12/30/09 (A) | 3,193 | 3,193 | ||||
| 11,547 | ||||||
Description | Face Amount (Thousands) (1) /Shares | Market Value ($ Thousands) | ||||
Turkey — 0.4% | ||||||
Cukurova, Ser B | ||||||
9.170%, 05/01/12 (A) | 4,109 | $ | 3,287 | |||
Total Loan Participations | 28,841 | |||||
COMMON STOCK — 0.6% | ||||||
GVT Holding *(A) | 199,627 | 4,547 | ||||
Total Common Stock | 4,547 | |||||
CONVERTIBLE BONDS — 0.4% | ||||||
Firstsource CV to 42,549.14 | ||||||
5.962%, 12/04/12 (F)(F) | 1,800 | 1,676 | ||||
Suzlon Energy | ||||||
1.835%, 06/12/12 (F) | 1,404 | 1,415 | ||||
Total Convertible Bonds | 3,091 | |||||
| Number Of Warrants | ||||||
WARRANTS — 0.0% | ||||||
Russia — 0.0% | ||||||
Teorema Holding A, Expires 10/27/11 (A)* | 226 | — | ||||
Teorema Holding B, Expires 10/27/11 (A)* | 452 | — | ||||
Total Warrants | — | |||||
DEPOSIT WITH COUNTERPARTY AS COLLATERAL FOR SWAP CONTRACTS(H) — 0.9% | ||||||
United States — 0.9% | ||||||
Deposits with Credit Suisse First Boston as Collateral for Swap Contracts Outstanding | 750 | 750 | ||||
Deposits with Credit Suisse First Boston as Collateral for Swap Contracts Outstanding | 3,600 | 3,600 | ||||
Deposits with Merrill | 1,136 | 1,136 | ||||
Deposits with Merrill | IDR | 288,900 | 1,928 | |||
| 7,414 | ||||||
Total Deposit with Counterparty as Collateral for Swap Contracts (Cost $7,934) ($ Thousands) | 7,414 | |||||
| SEI Institutional International Trust / Annual Holdings / September 30, 2009 | 6 |
Table of Contents
SCHEDULE OF INVESTMENTS
Emerging Markets Debt Fund
September 30, 2009
Description | Face Amount (Thousands) (1) | Market Value ($ Thousands) | ||||
AFFILIATED PARTNERSHIP — 0.2% | ||||||
United States — 0.2% | ||||||
SEI Liquidity Fund, L.P., | ||||||
0.400%**(I) | 2,060,348 | $ | 1,806 | |||
Total Affiliated Partnership | 1,806 | |||||
TIME DEPOSITS — 2.4% | ||||||
United States — 2.4% | ||||||
Brown Brothers Harriman | ||||||
0.125%, 10/01/09 | EUR | 99 | 144 | |||
0.030%, 10/01/09 | 18,603 | 18,603 | ||||
Total Time Deposits | 18,747 | |||||
Total Investments — 99.6% | $ | 787,363 | ||||
A summary of the outstanding forward foreign currency contracts held by the Fund at September 30, 2009, is as follows:
Settlement Date | Currency to Deliver (Thousands) | Currency to Receive (Thousands) | Unrealized Appreciation (Depreciation) ($ Thousands) | |||||||
10/2/09 | BRL | 22,602 | USD | 12,348 | $ | (339 | ) | |||
10/2/09-11/4/09 | USD | 19,354 | BRL | 35,896 | 758 | |||||
10/9/09 | USD | 3,036 | KRW | 3,782,350 | 176 | |||||
10/9/09-11/23/09 | USD | 4,183 | TRY | 6,238 | 3 | |||||
10/21/09 | MXP | 14,792 | USD | 1,090 | (2 | ) | ||||
10/21/09 | USD | 1,130 | MXP | 14,792 | (38 | ) | ||||
10/26/09-10/28/09 | EUR | 14,544 | USD | 21,391 | 134 | |||||
| $ | 692 | |||||||||
A summary of the open futures contracts held by the Fund at September 30, 2009, is as follows:
Type of Contract | Number of Contracts Long | Expiration Date | Unrealized Appreciation ($ Thousands) | ||||
U.S. Long Treasury Bond | 7 | Dec-2009 | $ | 20 | |||
U.S. Long Treasury Note | 20 | Dec-2009 | 34 | ||||
| $ | 54 | ||||||
For the year ended September 30, 2009, the total amount of all open futures contracts, as presented in the table above, are representative of the volume of activity for this derivative type during the period.
| 7 | SEI Institutional International Trust / Annual Holdings / September 30, 2009 |
Table of Contents
A summary of outstanding swap agreements held by the fund at September 31, 2009, is as follows:
Total Return Swaps
Counterparty | Reference Entity/Obligation | Fund Pays | Fund Receives | Termination Date | Notional Amount (Thousands) | Net Unrealized Depreciation ($Thousands) | |||||||||
Merrill Lynch | Solar Gardens Ltd Term Loan Credit Facility | Cash Deposit Of Notional Amount | Price Return | 12/30/09 | NGN | 288,900 | $ | (263 | ) | ||||||
Merrill Lynch | Zaporozh Term Loan, 9.784% 12/31/17 | Cash Deposit Of Notional Amount | Price Return | 12/31/17 | 1,136 | (475 | ) | ||||||||
| $ | (738 | ) | |||||||||||||
Credit Default Swaps
Counterparty | Reference Entity/Obligation | Buy/Sell Protection | (Pays)/Receives Rate | Termination Date | Notional Amount (Thousands) | Net Unrealized Appreciation (Depreciation) ($Thousands) | |||||||||
Credit Suisse | Naftogaz Ukrainy, 8.125% 09/30/09 | SELL | 5.20 | 12/20/11 | (750 | ) | $ | (147 | ) | ||||||
Credit Suisse | Naftogaz Ukrainy, 8.125% 09/30/09 | SELL | 5.75 | 12/20/09 | (3,600 | ) | (439 | ) | |||||||
Credit Suisse | Republic of Kazakhstan | SELL | 14.25 | 02/20/10 | (550 | ) | 37 | ||||||||
| $ | (549 | ) | |||||||||||||
| Percentages are based on a Net Assets of $790,597 ($ Thousands). |
| * | Non-income producing security |
| ** | Rate shown is the 7-day effective yield as of September 30, 2009. |
| (1) | In U.S. dollars unless otherwise indicated. |
| (A) | Securities considered illiquid. The total market value of such securities as of September 30, 2009 was $47,263 ($ Thousands) and represented 6.0% of Net Assets. |
| (B) | Securities sold within terms of a private placement memorandum, exempt from registration under Section 144A of the Securities Act of 1933, as amended, and may be sold only to dealers in that program or other “accredited investors.” These securities have been determined to be liquid under guidelines established by the Board of Trustees. |
| (C) | Step Bonds - The rate reflected on the Schedule of Investments is the effective yield on September 30, 2009. The coupon on a step bond changes on a specified date. (D) Security in default on interest payments. |
| (E) | Variable Rate Security - The rate reported on the Schedule of Investments is the rate in effect as of September 30, 2009. |
| (F) | Zero coupon security. The rate reported on the Schedule of Investments is the effective yield at time of purchase. |
| (G) | This security or a partial position of this security is on loan at September 30, 2009. The total market value of securities on loan at September 30, 2009 was $1,975 ($ Thousands) (See Note 9). |
| (H) | Cash on loan to swap counterparty as collateral for outstanding swap contracts. |
| (I) | This security was purchased with cash collateral held from securities on loan (see Note 9). The total value of such securities as of September 30, 2009 was $1,806 ($ Thousands). |
AED — United Arab Emirates Dirham
BRL — Brazilian Real
COP — Colombian Peso
CV — Convertible Security
DEM — German Mark
EURIBOR — Euro London Interbank Offered Rate
EUR — Euro
IDR — Indonesian Rupiah
ITL — Italian Lira
KRW — Korean Won
LIBOR — London Interbank Offered Rate
L.P. — Limited Partnership
MTN — Medium Term Note
MXP — Mexican Peso
NGN — Nigerian Naira
PIK — Payment-in-Kind
Ser — Series
TRY — New Turkish Lira
USD — U.S. Dollar
Amounts designated as “—” are $O or have been rounded to $O.
The accompanying notes are an integral part of the financial statements.
| SEI Institutional International Trust / Annual Holdings / September 30, 2009 | 8 |
Table of Contents
| Item 6. | Auditor Opinion |
Report of Independent Registered Public Accounting Firm
To the Board of Trustees and Shareholders
SEI Institutional International Trust:
We have audited, in accordance with the standards of the Public Company Accounting Oversight Board (United States), the financial statements of SEI Institutional International Trust, comprising the International Equity Fund, Emerging Markets Equity Fund, International Fixed Income Fund and Emerging Markets Debt Fund (collectively, the “Funds”), as of and for the year or period ended September 30, 2009, and have issued our report thereon dated November 30, 2009 (which report and financial statements are included in Item 1 of this Certified Shareholder Report on Form N-CSR). Our audits included an audit of the Funds’ schedules of investments in securities (the “Schedules”) as of September 30, 2009 appearing in Item 6 of this Form N-CSR. These Schedules are the responsibility of the Funds’ management. Our responsibility is to express an opinion on these Schedules based on our audits.
In our opinion, the Schedules referred to above, when read in conjunction with the financial statements of the Funds referred to above, present fairly, in all material respects, the information set forth therein.
Philadelphia, Pennsylvania
November 30, 2009
| Item 7. | Disclosure of Proxy Voting Policies and Procedures for Closed-End Management Investment Companies. |
Not applicable.
| Item 8. | Portfolio Managers of Closed-End Management Investment Companies |
Not applicable.
| Item 9. | Purchases of Equity Securities by Closed-End Management Company and Affiliated Purchasers. |
Not applicable.
| Item 10. | Submission of Matters to a Vote of Security Holders. |
The Registrant has a standing nominating committee (the “Committee”) currently consisting of the independent trustees. The Committee is responsible for evaluating and recommending nominees for election to the Registrant’s board of trustees (the “Board”). Pursuant to the Committee’s charter, adopted on June 18, 2004 and as amended, the Committee will review all shareholder recommendations for nominations to fill vacancies on the Board if such recommendations are submitted in writing and addressed to the Committee at the Registrant’s office.
| Item 11. | Controls and Procedures. |
(a) The registrant’s principal executive and principal financial officers, or persons performing similar functions, have concluded that the Registrant’s disclosure controls and procedures (as defined in Rule 30a-3(c) under the Investment Company Act of 1940 (the “1940 Act”)) are effective, based on the evaluation of these controls and procedures required by Rule 30a-3(b) under the 1940 Act and Rules 13a-15(b) or 15d-15(b) under the Securities Exchange Act of 1934 as of a date within 90 days of the filing date of this report.
(b) There were no changes in the Registrant’s internal control over financial reporting (as defined in Rule 30a-3(d) under the 1940 Act) that occurred during the second fiscal quarter of the period covered by this report that have materially affected, or are reasonably likely to materially affect, the Registrants internal control over financial reporting.
| Items 12. | Exhibits. |
(a)(1) Code of Ethics attached hereto.
(a)(2) A separate certification for the principal executive officer and the principal financial officer of the Registrant as required by Rule 30a-2(a) under the Investment Company Act of 1940, as amended (17 CFR 270.30a-2(a)), are filed herewith.
(b) Officer certifications as required by Rule 30a-2(b) under the Investment Company Act of 1940, as amended (17 CFR 270.30a-2(b)) also accompany this filing as an exhibit.
Table of Contents
SIGNATURES
Pursuant to the requirements of the securities Exchange Act of 1934 and the Investment Company Act of 1940, the Registrant has duly caused this report to be signed on its behalf by the undersigned, thereunto duly authorized.
| (Registrant) | SEI Institutional International Trust | |||
| By (Signature and Title) | /s/ ROBERT A. NESHER. | |||
| Robert A. Nesher | ||||
| President & CEO | ||||
Date: November 30, 2009
Pursuant to the requirements of the Securities Exchange Act of 1934 and the Investment Company Act of 1940, this report has been signed below by the following persons on behalf of the Registrant and in the capacities and on the dates indicated.
| By (Signature and Title) | /s/ ROBERT A. NESHER. | |||
| Robert A. Nesher | ||||
| President & CEO | ||||
| Date: November 30, 2009 | ||||
| By (Signature and Title) | /s/ STEPHEN F. PANNER. | |||
| Stephen F. Panner, | ||||
| Controller & CFO | ||||
Date: November 30, 2009