Table of Contents
UNITED STATES
SECURITIES AND EXCHANGE COMMISSION
Washington, D.C. 20549
FORM N-CSRS
CERTIFIED SHAREHOLDER REPORT OF REGISTERED
MANAGEMENT INVESTMENT COMPANIES
Investment Company Act File Number 811-05601
SEI Institutional International Trust
SEI Investments
One Freedom Valley Drive
Oaks, PA 19456
c/o CT Corporation
155 Federal Street
Boston, MA 02110
Registrant’s telephone number, including area code: 1-800-342-5734
Date of fiscal year end: September 30, 2014
Date of reporting period: March 31, 2014
Table of Contents
Item 1. Reports to Stockholders.
Table of Contents

March 31, 2014
SEMI-ANNUAL REPORT
SEI Institutional International Trust
† International Equity Fund
† Emerging Markets Equity Fund
† International Fixed Income Fund
† Emerging Markets Debt Fund

Table of Contents
| 1 | ||||
| 49 | ||||
| 50 | ||||
| 51 | ||||
| 53 | ||||
| 54 | ||||
| 65 | ||||
Board of Trustees Considerations in Approving | 66 | |||
The Trust files its complete schedule of portfolio holdings with the Securities and Exchange Commission for the first and third quarters of each fiscal year on Form N-Q within sixty days after the end of the period. The Trust’s Form N-Q is available on the Commission’s website at http://www.sec.gov, and may be reviewed and copied at the Commission’s Public Reference Room in Washington, DC. Information on the operation of the Public Reference Room may be obtained by calling 1-800-SEC-0330.
A description of the policies and procedures that the Trust uses to determine how to vote proxies relating to portfolio securities, as well as information relating to how a Fund voted proxies relating to portfolio securities during the most recent 12-month period ended June 30, is available (i) without charge, upon request, by calling 1-800-DIAL-SEI; and (ii) on the Commission’s website at http://www.sec.gov.
Table of Contents
SCHEDULE OF INVESTMENTS (Unaudited)
International Equity Fund
March 31, 2014
| Description | Shares | Market Value ($ Thousands) | ||||||
COMMON STOCK — 91.8% |
| |||||||
Argentina — 0.0% | ||||||||
Ternium ADR | 10,297 | $ | 305 | |||||
|
| |||||||
Australia — 1.7% | ||||||||
Amcor | 63,520 | 612 | ||||||
APA Group (A) | 3,515 | 21 | ||||||
Arrium | 137,692 | 172 | ||||||
Asciano Group | 8,698 | 42 | ||||||
Australia & New Zealand Banking Group (A) | 155,295 | 4,759 | ||||||
Bank of Queensland | 40,764 | 486 | ||||||
BC Iron | 117,343 | 516 | ||||||
Bendigo and Adelaide Bank | 716 | 8 | ||||||
Brambles | 1,435,351 | 12,319 | ||||||
Centamin* | 344,234 | 291 | ||||||
Challenger | 153,768 | 912 | ||||||
Commonwealth Bank of Australia | 112,320 | 8,062 | ||||||
Crown Resorts | 48,147 | 742 | ||||||
CSL | 71,102 | 4,584 | ||||||
Dexus Property Group (B) | 15,481 | 15 | ||||||
Downer EDI | 71,192 | 331 | ||||||
Flight Centre Travel Group | 9,460 | 460 | ||||||
Fortescue Metals Group | 162,302 | 790 | ||||||
Iluka Resources (A) | 293,245 | 2,693 | ||||||
Insurance Australia Group | 266,239 | 1,374 | ||||||
Macquarie Group | 15,380 | 826 | ||||||
Mount Gibson Iron | 338,252 | 285 | ||||||
Ramsay Health Care | 2,274 | 101 | ||||||
RCR Tomlinson | 41,735 | 108 | ||||||
REA Group | 3,860 | 174 | ||||||
Roc Oil* | 155,859 | 67 | ||||||
Seek | 15,556 | 253 | ||||||
Sonic Healthcare | 12,138 | 194 | ||||||
Suncorp Group | 86,910 | 1,037 | ||||||
Tatts Group | 9,162 | 25 | ||||||
Telstra | 343,272 | 1,616 | ||||||
Wesfarmers | 542 | 21 | ||||||
Westpac Banking | 24,557 | 787 | ||||||
|
| |||||||
| 44,683 | ||||||||
|
| |||||||
| Description | Shares | Market Value ($ Thousands) | ||||||
Austria — 0.4% | ||||||||
Andritz | 92,250 | $ | 5,703 | |||||
Erste Group Bank | 725 | 25 | ||||||
Flughafen Wien | 849 | 84 | ||||||
OMV | 64,763 | 2,940 | ||||||
Raiffeisen International Bank Holding | 8,447 | 282 | ||||||
Telekom Austria | 3,703 | 37 | ||||||
Voestalpine | 26,707 | 1,174 | ||||||
|
| |||||||
| 10,245 | ||||||||
|
| |||||||
Belgium — 1.6% | ||||||||
Ageas | 213,316 | 9,510 | ||||||
Anheuser-Busch InBev | 30,685 | 3,218 | ||||||
Belgacom | 206,434 | 6,467 | ||||||
Colruyt | 89,281 | 4,922 | ||||||
Delhaize Group | 20,426 | 1,493 | ||||||
Groupe Bruxelles Lambert | 40,293 | 4,025 | ||||||
KBC Groep | 124,223 | 7,645 | ||||||
Telenet Group Holding | 8,757 | 540 | ||||||
UCB | 63,928 | 5,121 | ||||||
|
| |||||||
| 42,941 | ||||||||
|
| |||||||
Brazil — 0.5% | ||||||||
Banco Santander Brasil ADR | 876,197 | 4,881 | ||||||
Braskem ADR* | 45,883 | 717 | ||||||
Centrais Eletricas Brasileiras | 147,600 | 429 | ||||||
Centrais Eletricas Brasileiras ADR (A) | 1,065,969 | 3,027 | ||||||
Cia Energetica de Minas Gerais | 393,389 | 2,675 | ||||||
Cia Paranaense de Energia ADR (A) | 13,961 | 183 | ||||||
Gerdau ADR | 196,252 | 1,258 | ||||||
Oi ADR (A) | 411,409 | 547 | ||||||
|
| |||||||
| 13,717 | ||||||||
|
| |||||||
Canada — 3.3% | ||||||||
Aecon Group | 5,100 | 80 | ||||||
Agrium | 92,826 | 9,052 | ||||||
Alimentation Couche Tard, Cl B | 49,400 | 4,002 | ||||||
Altus Group | 4,119 | 67 | ||||||
Bank of Nova Scotia | 56,971 | 3,305 | ||||||
Bankers Petroleum* | 18,400 | 90 | ||||||
Barrick Gold | 396,461 | 7,069 | ||||||
Cameco | 231,696 | 5,306 | ||||||
Canadian Natural Resources | 43,500 | 1,670 | ||||||
Canadian Pacific Railway | 35,265 | 5,293 | ||||||
Canfor* | 7,800 | 184 | ||||||
Celestica* | 6,200 | 68 | ||||||
Cenovus Energy | 86,998 | 2,520 | ||||||
Empire, Cl A | 4,262 | 261 | ||||||
Ensign Energy Services | 15,800 | 234 | ||||||
Imperial Oil | 172,100 | 8,027 | ||||||
Jean Coutu Group PJC, Cl A | 37,900 | 750 | ||||||
Kinross Gold | 1,448,771 | 5,998 | ||||||
Linamar | 13,900 | 642 | ||||||
| SEI Institutional International Trust / Semi-Annual Report / March 31, 2014 | 1 |
Table of Contents
SCHEDULE OF INVESTMENTS (Unaudited)
International Equity Fund (Continued)
March 31, 2014
| Description | Shares | Market Value ($ Thousands) | ||||||
Magna International, Cl A | 48,000 | $ | 4,622 | |||||
Mullen Group | 23,600 | 593 | ||||||
New Gold* | 499,100 | 2,473 | ||||||
Quebecor, Cl B | 11,000 | 269 | ||||||
ShawCor | 99,100 | 4,139 | ||||||
Silver Wheaton | 160,400 | 3,645 | ||||||
Suncor Energy | 75,300 | 2,634 | ||||||
Talisman Energy | 554,181 | 5,531 | ||||||
Toronto-Dominion Bank | 179,494 | 8,429 | ||||||
Transcontinental, Cl A | 17,100 | 248 | ||||||
Trinidad Drilling | 22,000 | 231 | ||||||
Western Forest Products | 38,500 | 84 | ||||||
|
| |||||||
| 87,516 | ||||||||
|
| |||||||
China — 0.1% | ||||||||
Lihua International* | 14,953 | 73 | ||||||
PICC Property & Casualty | 1,686,000 | 2,308 | ||||||
Yangzijiang Shipbuilding Holdings | 435,000 | 374 | ||||||
|
| |||||||
| 2,755 | ||||||||
|
| |||||||
Denmark — 0.8% | ||||||||
AP Moeller - Maersk, Cl A (A) | 33 | 381 | ||||||
AP Moeller - Maersk, Cl B (A) | 404 | 4,848 | ||||||
Carlsberg, Cl B | 473 | 47 | ||||||
Coloplast, Cl B | 3,852 | 312 | ||||||
Danske Bank | 21,799 | 608 | ||||||
DSV | 26,069 | 842 | ||||||
Jyske Bank* | 89,881 | 4,941 | ||||||
Novo Nordisk, Cl B | 88,520 | 4,033 | ||||||
Rockwool International, Cl B | 1,230 | 239 | ||||||
TDC | 129,790 | 1,200 | ||||||
Tryg | 28,778 | 2,847 | ||||||
William Demant Holding* | 1,093 | 93 | ||||||
|
| |||||||
| 20,391 | ||||||||
|
| |||||||
Finland — 0.8% | ||||||||
Elisa, Cl A | 12,686 | 365 | ||||||
Fortum | 1,958 | 44 | ||||||
Huhtamaki | 7,436 | 204 | ||||||
Kone, Cl B | 1,615 | 68 | ||||||
Neste Oil | 10,395 | 212 | ||||||
Nokia | 1,660,259 | 12,334 | ||||||
Pohjola Bank, Cl A | 34 | 1 | ||||||
Sampo, Cl A | 63,784 | 3,310 | ||||||
Stora Enso, Cl R | 287,796 | 3,080 | ||||||
Tieto | 15,404 | 396 | ||||||
UPM-Kymmene | 53,765 | 919 | ||||||
|
| |||||||
| 20,933 | ||||||||
|
| |||||||
France — 10.9% | ||||||||
Accor | 14,933 | 765 | ||||||
Aeroports de Paris | 4,954 | 618 | ||||||
Air Liquide | 1,198 | 162 | ||||||
| Description | Shares | Market Value ($ Thousands) | ||||||
Alcatel-Lucent* | 414,584 | $ | 1,635 | |||||
Alstom | 211,723 | 5,784 | ||||||
Arkema | 117,415 | 13,302 | ||||||
AtoS | 8,258 | 747 | ||||||
AXA | 316,833 | 8,238 | ||||||
BNP Paribas | 342,201 | 26,407 | ||||||
Boiron | 1,900 | 154 | ||||||
Bouygues | 2,011 | 84 | ||||||
Bureau Veritas | 3,425 | 105 | ||||||
Cap Gemini | 15,955 | 1,208 | ||||||
Carrefour | 265,477 | 10,280 | ||||||
Cie de St.-Gobain | 24,217 | 1,464 | ||||||
Cie Generale des Etablissements- Michelin, Cl B | 1,433 | 179 | ||||||
CNP Assurances | 20,896 | 443 | ||||||
Credit Agricole | 315,343 | 4,974 | ||||||
Dassault Systemes | 3,546 | 416 | ||||||
Electricite de France | 209,723 | 8,300 | ||||||
Essilor International | 43,454 | 4,384 | ||||||
Eurazeo | 5,595 | 503 | ||||||
Eutelsat Communications | 160,889 | 5,466 | ||||||
France Telecom | 72,868 | 1,077 | ||||||
GDF Suez | 221,392 | 6,060 | ||||||
Gecina (B) | 524 | 70 | ||||||
Iliad | 3,126 | 902 | ||||||
Interparfums | 1,425 | 67 | ||||||
JC Decaux | 12,538 | 549 | ||||||
Kering | 30,255 | 6,173 | ||||||
Klepierre (B) | 1,336 | 60 | ||||||
Lafarge | 5,168 | 404 | ||||||
Lagardere | 17,896 | 711 | ||||||
Legrand | 197,494 | 12,275 | ||||||
L’Oreal | 36,819 | 6,074 | ||||||
Metropole Television | 10,297 | 224 | ||||||
Natixis | 133,741 | 983 | ||||||
Nexity | 8,567 | 368 | ||||||
Pernod Ricard | 28,450 | 3,313 | ||||||
Peugeot | 205,653 | 3,882 | ||||||
Publicis Groupe | 80,466 | 7,273 | ||||||
Renault | 4,298 | 418 | ||||||
Rexel | 372,761 | 9,784 | ||||||
Safran | 238,529 | 16,533 | ||||||
Sanofi | 421,181 | 43,932 | ||||||
Schneider Electric | 232,334 | 20,606 | ||||||
SCOR | 28,478 | 997 | ||||||
Societe Generale | 26,263 | 1,618 | ||||||
Sodexo | 89,709 | 9,413 | ||||||
Suez Environnement | 39,934 | 811 | ||||||
Technip | 98,213 | 10,140 | ||||||
Teleperformance | 4,248 | 246 | ||||||
Thales | 112,759 | 7,480 | ||||||
Total | 109,551 | 7,187 | ||||||
Valeo | 28,131 | 3,964 | ||||||
Vallourec | 127,113 | 6,903 | ||||||
| 2 | SEI Institutional International Trust / Semi-Annual Report / March 31, 2014 |
Table of Contents
| Description | Shares | Market Value ($ Thousands) | ||||||
Veolia Environnement | 38,938 | $ | 771 | |||||
Vetoquinol* | 1,345 | 70 | ||||||
Vinci | 3,640 | 270 | ||||||
Vivendi | 9,907 | 276 | ||||||
Wendel | 5,451 | 848 | ||||||
Zodiac Aerospace | 29,079 | 1,028 | ||||||
|
| |||||||
| 289,378 | ||||||||
|
| |||||||
Germany — 8.0% | ||||||||
Adidas | 75,068 | 8,126 | ||||||
Allianz | 8,935 | 1,511 | ||||||
Amadeus Fire | 973 | 85 | ||||||
Axel Springer | 1,409 | 90 | ||||||
Bayer | 137,223 | 18,568 | ||||||
Bayerische Motoren Werke | 65,159 | 8,228 | ||||||
Borussia Dortmund GmbH & KGaA | 22,765 | 123 | ||||||
Brenntag | 46,739 | 8,674 | ||||||
Commerzbank* | 32,532 | 598 | ||||||
Continental | 99,831 | 23,927 | ||||||
Daimler | 167,958 | 15,878 | ||||||
Deutsche Boerse | 121,427 | 9,668 | ||||||
Deutsche Lufthansa | 189,702 | 4,972 | ||||||
Deutsche Post | 117,021 | 4,350 | ||||||
Deutsche Telekom | 46,969 | 759 | ||||||
Deutz* | 13,983 | 118 | ||||||
E.ON | 232,699 | 4,551 | ||||||
Fraport Frankfurt Airport Services Worldwide | 6,553 | 490 | ||||||
Fresenius | 1,447 | 227 | ||||||
GEA Group | 147,641 | 6,752 | ||||||
Gerresheimer | 3,486 | 226 | ||||||
Grammer | 6,818 | 334 | ||||||
HeidelbergCement | 96,112 | 8,241 | ||||||
Henkel | 17,301 | 1,739 | ||||||
Hochtief | 12,955 | 1,177 | ||||||
Hugo Boss | 5,356 | 713 | ||||||
Kabel Deutschland Holding | 4,589 | 631 | ||||||
Linde | 59,358 | 11,879 | ||||||
MAN | 1,530 | 195 | ||||||
Merck | 30,478 | 5,135 | ||||||
Metro | 20,552 | 839 | ||||||
Muenchener Rueckversicherungs | 23,618 | 5,163 | ||||||
RTL Group | 5,524 | 629 | ||||||
RWE | 104,979 | 4,262 | ||||||
SAP | 183,719 | 14,879 | ||||||
SAP ADR | 71,300 | 5,797 | ||||||
Siemens | 177,880 | 23,952 | ||||||
Sky Deutschland | 15,826 | 136 | ||||||
Suedzucker | 40,762 | 1,161 | ||||||
ThyssenKrupp | 249,827 | 6,702 | ||||||
TUI | 32,267 | 538 | ||||||
United Internet | 20,729 | 974 | ||||||
Volkswagen | 306 | 78 | ||||||
|
| |||||||
| 213,075 | ||||||||
|
| |||||||
| Description | Shares | Market Value ($ Thousands) | ||||||
Guernsey — 0.1% | ||||||||
Resolution | 300,250 | $ | 1,496 | |||||
|
| |||||||
Hong Kong — 2.6% | ||||||||
AIA Group | 2,144,800 | 10,175 | ||||||
Cathay Pacific Airways | 170,000 | 317 | ||||||
Chaoda Modern Agriculture* (C) (D) | 2,440,000 | — | ||||||
Cheung Kong Holdings | 4,000 | 66 | ||||||
Cheung Kong Infrastructure Holdings | 43,000 | 274 | ||||||
China Merchants Holdings International | 1,144,000 | 3,930 | ||||||
China Mobile | 103,451 | 947 | ||||||
China Mobile ADR (A) | 147,100 | 6,706 | ||||||
CNOOC | 6,417,000 | 9,646 | ||||||
Digital China Holdings | 2,890,000 | 2,914 | ||||||
Galaxy Entertainment Group* | 386,000 | 3,356 | ||||||
Henderson Land Development | 1,099 | 6 | ||||||
Hong Kong & China Gas | 660 | 2 | ||||||
Hongkong Land Holdings | 836,000 | 5,409 | ||||||
Hutchison Whampoa | 222,500 | 2,946 | ||||||
Jardine Matheson Holdings | 88,242 | 5,566 | ||||||
Jardine Strategic Holdings | 246,110 | 8,826 | ||||||
Link (B) | 781,500 | 3,844 | ||||||
MGM China Holdings | 195,200 | 688 | ||||||
Power Assets Holdings | 5,000 | 43 | ||||||
Sands China | 146,800 | 1,097 | ||||||
SJM Holdings | 148,000 | 416 | ||||||
Wharf Holdings | 84,000 | 537 | ||||||
Wheelock | 6,000 | 23 | ||||||
|
| |||||||
| 67,734 | ||||||||
|
| |||||||
India — 0.4% | ||||||||
Idea Cellular | 3,312,978 | 7,625 | ||||||
Infosys ADR (A) | 65,884 | 3,569 | ||||||
Tata Motors ADR | 1,973 | 70 | ||||||
Wipro ADR (A) | 26,293 | 352 | ||||||
|
| |||||||
| 11,616 | ||||||||
|
| |||||||
Ireland — 0.3% | ||||||||
Bank of Ireland* | 3,745,518 | 1,590 | ||||||
CRH | 1,180 | 33 | ||||||
Experian | 16,659 | 300 | ||||||
Kerry Group, Cl A | 3,796 | 290 | ||||||
Ryanair Holdings* | 33,800 | 1,988 | ||||||
Smurfit Kappa Group | 118,008 | 2,859 | ||||||
|
| |||||||
| 7,060 | ||||||||
|
| |||||||
Israel — 1.5% | ||||||||
Bank Hapoalim | 171,721 | 979 | ||||||
Bank Leumi Le-Israel* | 1,744 | 7 | ||||||
Bezeq Israeli Telecommunication | 4,908,756 | 8,736 | ||||||
Check Point Software Technologies* | 261,573 | 17,690 | ||||||
NICE Systems | 4,462 | 197 | ||||||
Teva Pharmaceutical Industries | 220,385 | 11,645 | ||||||
|
| |||||||
| 39,254 | ||||||||
|
| |||||||
| SEI Institutional International Trust / Semi-Annual Report / March 31, 2014 | 3 |
Table of Contents
SCHEDULE OF INVESTMENTS (Unaudited)
International Equity Fund (Continued)
March 31, 2014
| Description | Shares | Market Value ($ Thousands) | ||||||
Italy — 1.5% | ||||||||
AEM | 309,551 | $ | 402 | |||||
Assicurazioni Generali | 17,821 | 397 | ||||||
Atlantia | 50,852 | 1,307 | ||||||
Buzzi Unicem* | 17,341 | 324 | ||||||
CNH Industrial* | 10,576 | 122 | ||||||
Enel | 42,423 | 240 | ||||||
ERG | 248,064 | 4,017 | ||||||
Exor | 101,035 | 4,537 | ||||||
Fiat | 202,794 | 2,362 | ||||||
Finmeccanica | 6,186 | 61 | ||||||
Gtech Spa | 7,261 | 221 | ||||||
Intesa Sanpaolo | 2,902,150 | 9,840 | ||||||
Iren | 94,742 | 171 | ||||||
Italcementi | 9,012 | 111 | ||||||
Luxottica Group | 13,777 | 797 | ||||||
Mediobanca | 40,746 | 466 | ||||||
Pirelli & C | 42,418 | 667 | ||||||
Prysmian | 4,569 | 114 | ||||||
Safilo Group* | 9,105 | 192 | ||||||
Snam Rete Gas | 25,630 | 150 | ||||||
Telecom Italia RNC | 10,564,365 | 9,886 | ||||||
Terna Rete Elettrica Nazionale | 137,050 | 734 | ||||||
UniCredit | 105,699 | 966 | ||||||
Unione di Banche Italiane | 43,083 | 406 | ||||||
UnipolSai* | 67,598 | 259 | ||||||
|
| |||||||
| 38,749 | ||||||||
|
| |||||||
Japan — 15.9% | ||||||||
Aeon | 1,500 | 17 | ||||||
AEON Financial Service | 1,200 | 27 | ||||||
Aisin Seiki | 600 | 22 | ||||||
Alfresa Holdings | 24,800 | 1,621 | ||||||
Alpen | 14,700 | 266 | ||||||
Amada | 15,000 | 106 | ||||||
Aoyama Trading | 8,400 | 221 | ||||||
Arcland Sakamoto | 12,800 | 244 | ||||||
Asahi Kasei | 197,000 | 1,343 | ||||||
Astellas Pharma | 537,000 | 6,382 | ||||||
Bandai Namco Holdings | 65,700 | 1,559 | ||||||
Belluna | 13,600 | 68 | ||||||
Bridgestone | 3,500 | 124 | ||||||
Calbee | 2,200 | 52 | ||||||
Calsonic Kansei | 121,000 | 563 | ||||||
Canon Marketing Japan | 15,200 | 209 | ||||||
Casio Computer | 4,600 | 55 | ||||||
Central Japan Railway | 32,900 | 3,853 | ||||||
Chiyoda | 6,000 | 78 | ||||||
Citizen Holdings | 7,400 | 56 | ||||||
Coca-Cola West | 17,900 | 313 | ||||||
Dai Nippon Printing (A) | 682,000 | 6,549 | ||||||
Daicel | 48,000 | 394 | ||||||
Daiichi Sankyo | 178,500 | 3,012 | ||||||
| Description | Shares | Market Value ($ Thousands) | ||||||
Daikin Industries | 44,000 | $ | 2,470 | |||||
Daikyo | 175,000 | 352 | ||||||
Daito Trust Construction | 39,700 | 3,682 | ||||||
Daiwa House Industry | 174,000 | 2,958 | ||||||
Daiwa Securities Group | 513,000 | 4,473 | ||||||
Denso | 33,700 | 1,619 | ||||||
Don Quijote Holdings | 9,500 | 492 | ||||||
Doutor Nichires Holdings | 6,200 | 109 | ||||||
Dydo Drinco | 11,900 | 497 | ||||||
Dynam Japan Holdings | 30,400 | 91 | ||||||
East Japan Railway | 83,000 | 6,130 | ||||||
Electric Power Development | 3,500 | 99 | ||||||
Fanuc | 50,500 | 8,927 | ||||||
Fuji Film Holdings | 199,800 | 5,376 | ||||||
Fuji Heavy Industries | 99,200 | 2,689 | ||||||
Fuji Soft | 7,600 | 162 | ||||||
Fujitsu | 140,000 | 848 | ||||||
Geo Holdings | 20,000 | 177 | ||||||
GungHo Online Entertainment (A) | 15,900 | 87 | ||||||
Hino Motors | 120,100 | 1,785 | ||||||
Hirose Electric | 1,100 | 151 | ||||||
Hitachi | 2,388,000 | 17,669 | ||||||
Hitachi Metals | 38,000 | 542 | ||||||
Hokuhoku Financial Group | 37,000 | 71 | ||||||
Hokuriku Electric Power | 14,600 | 190 | ||||||
Hoya | 44,200 | 1,379 | ||||||
Hulic | 53,700 | 737 | ||||||
IHI | 186,000 | 784 | ||||||
Isetan Mitsukoshi Holdings | 11,000 | 136 | ||||||
IT Holdings | 56,400 | 928 | ||||||
Iyo Bank | 26,400 | 253 | ||||||
J Front Retailing | 22,000 | 152 | ||||||
Japan Airlines | 30,900 | 1,524 | ||||||
Japan Exchange Group | 7,400 | 181 | ||||||
Japan Prime Realty Investment, Cl A (B) | 24 | 78 | ||||||
JGC | 170,000 | 5,926 | ||||||
JTEKT | 35,700 | 532 | ||||||
Kajima | 17,000 | 60 | ||||||
Kakaku.com | 23,800 | 388 | ||||||
Kandenko (A) | 40,000 | 203 | ||||||
Kaneka | 41,000 | 249 | ||||||
Kanematsu | 158,000 | 245 | ||||||
Kansai Paint | 659,600 | 9,447 | ||||||
Kawasaki Heavy Industries | 59,000 | 218 | ||||||
KDDI | 307,000 | 17,815 | ||||||
Keyence | 29,900 | 12,360 | ||||||
Kikkoman | 8,000 | 151 | ||||||
Koito Manufacturing | 8,000 | 136 | ||||||
Komatsu | 104,600 | 2,172 | ||||||
Konica Minolta | 56,500 | 528 | ||||||
Kubota | 5,000 | 66 | ||||||
Kyocera | 900 | 41 | ||||||
Lawson | 47,900 | 3,395 | ||||||
| 4 | SEI Institutional International Trust / Semi-Annual Report / March 31, 2014 |
Table of Contents
| Description | Shares | Market Value ($ Thousands) | ||||||
M3 | 22,200 | $ | 365 | |||||
Mabuchi Motor | 108,100 | 7,096 | ||||||
Maeda Road Construction | 4,000 | 56 | ||||||
Makita | 2,000 | 110 | ||||||
Mazda Motor | 433,000 | 1,926 | ||||||
McDonald’s Holdings Japan | 3,500 | 94 | ||||||
Medipal Holdings | 40,000 | 613 | ||||||
MEIJI Holdings | 7,200 | 455 | ||||||
Miraca Holdings | 74,300 | 3,261 | ||||||
Misawa Homes (A) | 24,600 | 317 | ||||||
Mitsubishi Estate | 16,000 | 380 | ||||||
Mitsubishi Gas Chemical | 26,000 | 147 | ||||||
Mitsubishi Materials | 1,000 | 3 | ||||||
Mitsubishi Tanabe Pharma | 289,800 | 4,061 | ||||||
Mitsui Fudosan | 43,000 | 1,315 | ||||||
Mitsui OSK Lines | 105,000 | 410 | ||||||
MS&AD Insurance Group Holdings | 357,200 | 8,199 | ||||||
Murata Manufacturing | 15,400 | 1,456 | ||||||
Nabtesco | 398,700 | 9,191 | ||||||
NGK Insulators | 24,000 | 501 | ||||||
NGK Spark Plug | 35,000 | 788 | ||||||
NHK Spring | 2,200 | 20 | ||||||
Nichireki | 6,289 | 63 | ||||||
Nidec | 28,300 | 1,725 | ||||||
Nikon (A) | 605,200 | 9,767 | ||||||
Nippon Express | 28,000 | 137 | ||||||
Nippon Paint | 29,000 | 440 | ||||||
Nippon Signal | 13,000 | 114 | ||||||
Nippon Steel & Sumitomo Metal | 164,000 | 449 | ||||||
Nippon Telegraph & Telephone | 82,600 | 4,507 | ||||||
Nippon Telegraph & Telephone ADR | 353,432 | 9,628 | ||||||
Nippon Yusen | 105,000 | 306 | ||||||
Nissan Motor | 1,035,500 | 9,250 | ||||||
Nissan Tokyo Sales Holdings | 20,000 | 71 | ||||||
Nisshin Fudosan | 26,400 | 98 | ||||||
Nitori Holdings | 12,700 | 552 | ||||||
Nitto Denko | 23,400 | 1,123 | ||||||
Nomura Holdings | 272,100 | 1,749 | ||||||
Nomura Real Estate Holdings | 67,100 | 1,284 | ||||||
Nomura Research Institute | 21,900 | 693 | ||||||
North Pacific Bank | 243,200 | 989 | ||||||
NSK | 63,000 | 650 | ||||||
NTT DOCOMO | 99,000 | 1,565 | ||||||
Oita Bank | 16,000 | 62 | ||||||
Oji Holdings (A) | 131,000 | 588 | ||||||
Olympus | 2,900 | 93 | ||||||
Omron | 32,400 | 1,340 | ||||||
Oriental Land | 4,200 | 640 | ||||||
Otsuka | 1,700 | 223 | ||||||
Otsuka Holdings | 97,500 | 2,923 | ||||||
Panasonic | 312,600 | 3,561 | ||||||
Rakuten | 75,900 | 1,015 | ||||||
Resona Holdings | 87,500 | 424 | ||||||
Ricoh | 6,500 | 75 | ||||||
| Description | Shares | Market Value ($ Thousands) | ||||||
Rohm | 117,000 | $ | 5,232 | |||||
Sanrio (A) | 128,400 | 4,339 | ||||||
Santen Pharmaceutical | 93,600 | 4,163 | ||||||
Secom | 4,800 | 277 | ||||||
Sega Sammy Holdings | 800 | 18 | ||||||
Seiko Epson | 1,300 | 41 | ||||||
Seino Holdings | 124,000 | 1,184 | ||||||
Sekisui Chemical | 843,000 | 8,783 | ||||||
Sekisui House | 471,300 | 5,862 | ||||||
Sekisui Jushi | 5,000 | 68 | ||||||
Seven & I Holdings | 147,600 | 5,653 | ||||||
Shimadzu | 38,000 | 338 | ||||||
Shimano | 700 | 70 | ||||||
Shimizu | 91,000 | 473 | ||||||
Shin-Etsu Chemical | 171,100 | 9,799 | ||||||
Shionogi | 4,000 | 74 | ||||||
Shiseido | 446,900 | 7,880 | ||||||
Showa | 25,500 | 281 | ||||||
Showa Shell Sekiyu | 36,600 | 328 | ||||||
SKY Perfect JSAT Holdings | 19,600 | 105 | ||||||
SMC | 89,900 | 23,766 | ||||||
SoftBank | 141,500 | 10,717 | ||||||
Sojitz | 370,700 | 634 | ||||||
Sony (A) | 48,800 | 934 | ||||||
Sony Financial Holdings | 10,500 | 172 | ||||||
Stanley Electric | 20,400 | 454 | ||||||
Sugi Holdings | 92,100 | 4,100 | ||||||
Sumitomo Chemical | 182,000 | 673 | ||||||
Sumitomo Electric Industries | 5,800 | 87 | ||||||
Sumitomo Forestry | 15,700 | 158 | ||||||
Sumitomo Heavy Industries | 8,000 | 33 | ||||||
Sumitomo Mitsui Financial Group | 469,400 | 20,096 | ||||||
Sumitomo Mitsui Trust Holdings | 1,676,220 | 7,585 | ||||||
Sumitomo Realty & Development | 29,000 | 1,138 | ||||||
Sumitomo Rubber Industries | 3,200 | 41 | ||||||
Suruga Bank | 2,000 | 35 | ||||||
Suzuken | 30,700 | 1,191 | ||||||
Suzuki Motor | 277,500 | 7,259 | ||||||
Sysmex | 2,000 | 64 | ||||||
Taiheiyo Cement | 238,000 | 860 | ||||||
Taisei (A) | 168,000 | 752 | ||||||
TDK | 7,800 | 326 | ||||||
Terumo | 2,800 | 61 | ||||||
Toho Holdings | 48,300 | 1,024 | ||||||
Tokai | 2,800 | 80 | ||||||
Tokyo Tatemono | 26,000 | 223 | ||||||
Tokyu | 34,000 | 208 | ||||||
Toppan Printing | 83,000 | 596 | ||||||
Toshiba | 26,000 | 110 | ||||||
TOTO | 52,000 | 723 | ||||||
Toyo Seikan Group Holdings | 22,800 | 371 | ||||||
Toyoda Gosei | 5,800 | 111 | ||||||
| SEI Institutional International Trust / Semi-Annual Report / March 31, 2014 | 5 |
Table of Contents
SCHEDULE OF INVESTMENTS (Unaudited)
International Equity Fund (Continued)
March 31, 2014
| Description | Shares | Market Value ($ Thousands) | ||||||
Toyota Industries | 11,500 | $ | 554 | |||||
Toyota Motor | 402,074 | 25,566 | ||||||
Toyota Tsusho | 1,300 | 33 | ||||||
Trend Micro | 11,500 | 357 | ||||||
United Urban Investment (B) | 43 | 63 | ||||||
USS | 20,700 | 291 | ||||||
Wacoal Holdings | 532,704 | 5,447 | ||||||
Warabeya Nichiyo | 13,300 | 252 | ||||||
Watabe Wedding | 6,395 | 42 | ||||||
Yahoo Japan | 73,100 | 359 | ||||||
Yamaha | 31,600 | 408 | ||||||
Yamato Holdings | 79,300 | 1,713 | ||||||
Yamazaki Baking | 10,000 | 119 | ||||||
Yaskawa Electric | 22,000 | 305 | ||||||
Yellow Hat | 12,500 | 250 | ||||||
Yokogawa Electric | 29,300 | 474 | ||||||
Yokohama Rubber | 2,000 | 19 | ||||||
Yuasa Trading | 38,000 | 78 | ||||||
|
| |||||||
| 421,612 | ||||||||
|
| |||||||
Malta — 0.0% | ||||||||
BGP Holdings* (D) | 198,683 | — | ||||||
|
| |||||||
Mexico — 0.1% | ||||||||
Gruma, Cl B* | 27,044 | 224 | ||||||
Grupo Financiero Banorte, Cl O | 539,012 | 3,647 | ||||||
Industrias Bachoco ADR | 1,349 | 59 | ||||||
|
| |||||||
| 3,930 | ||||||||
|
| |||||||
Netherlands — 6.6% | ||||||||
Aegon | 631,951 | 5,803 | ||||||
Airbus Group | 140,652 | 10,078 | ||||||
Akzo Nobel | 337,019 | 27,512 | ||||||
ASML Holding | 113,052 | 10,475 | ||||||
BinckBank | 10,024 | 119 | ||||||
Boskalis Westminster | 10,918 | 601 | ||||||
Delta Lloyd | 20,943 | 581 | ||||||
Fugro | 3,982 | 245 | ||||||
Gemalto | 8,758 | 1,020 | ||||||
Heineken Holding | 7,917 | 511 | ||||||
ING Groep* | 557,095 | 7,889 | ||||||
Koninklijke Ahold | 525,084 | 10,551 | ||||||
Koninklijke DSM | 105,481 | 7,242 | ||||||
Koninklijke KPN | 14,481 | 51 | ||||||
Koninklijke Philips | 14,638 | 515 | ||||||
OCI* | 7,070 | 321 | ||||||
PostNL | 954,622 | 4,358 | ||||||
Randstad Holding | 30,890 | 1,810 | ||||||
Reed Elsevier | 904,606 | 19,556 | ||||||
Royal Dutch Shell, Cl A | 742,290 | 27,126 | ||||||
Royal Dutch Shell ADR, Cl B | 116,152 | 9,073 | ||||||
STMicroelectronics | 4,535 | 42 | ||||||
TNT Express | 621,602 | 6,108 | ||||||
Unilever | 385,303 | 15,844 | ||||||
| Description | Shares | Market Value ($ Thousands) | ||||||
Wolters Kluwer | 229,423 | $ | 6,476 | |||||
Ziggo | 2,702 | 120 | ||||||
|
| |||||||
| 174,027 | ||||||||
|
| |||||||
New Zealand — 0.0% | ||||||||
Air New Zealand | 50,141 | 89 | ||||||
Fletcher Building | 34,789 | 287 | ||||||
Ryman Healthcare | 31,587 | 240 | ||||||
|
| |||||||
| 616 | ||||||||
|
| |||||||
Norway — 1.3% | ||||||||
DnB | 1,067,608 | 18,563 | ||||||
Seadrill | 47,250 | 1,668 | ||||||
Statoil | 459,249 | 12,964 | ||||||
Telenor | 117,202 | 2,598 | ||||||
|
| |||||||
| 35,793 | ||||||||
|
| |||||||
Poland — 0.0% | ||||||||
Tauron Polska Energia | 59,269 | 103 | ||||||
|
| |||||||
Portugal — 0.1% | ||||||||
Energias de Portugal (A) | 239,844 | 1,114 | ||||||
Portucel | 16,095 | 73 | ||||||
Sonae SGPS* | 211,509 | 398 | ||||||
|
| |||||||
| 1,585 | ||||||||
|
| |||||||
Puerto Rico — 0.0% | ||||||||
Triple-S Management, Cl B* | 7,516 | 121 | ||||||
|
| |||||||
Russia — 0.6% | ||||||||
Gazprom ADR | 854,460 | 6,579 | ||||||
Sberbank of Russia ADR | 824,621 | 8,057 | ||||||
Surgutneftegas ADR | 8,414 | 62 | ||||||
|
| |||||||
| 14,698 | ||||||||
|
| |||||||
Singapore — 1.2% | ||||||||
City Developments | 472,000 | 3,791 | ||||||
ComfortDelgro | 84,000 | 133 | ||||||
DBS Group Holdings | 946,000 | 12,164 | ||||||
Flextronics International* | 212,293 | 1,962 | ||||||
Keppel | 25,110 | 217 | ||||||
Sembcorp Industries | 969,000 | 4,230 | ||||||
Sembcorp Marine (A) | 1,240,000 | 3,993 | ||||||
Singapore Technologies Engineering | 251,000 | 762 | ||||||
STATS ChipPAC* (A) | 236,000 | 67 | ||||||
United Overseas Bank | 207,600 | 3,574 | ||||||
|
| |||||||
| 30,893 | ||||||||
|
| |||||||
South Africa — 0.0% | ||||||||
ArcelorMittal | 63,922 | 1,030 | ||||||
Net 1 UEPS Technologies* | 20,521 | 204 | ||||||
|
| |||||||
| 1,234 | ||||||||
|
| |||||||
| 6 | SEI Institutional International Trust / Semi-Annual Report / March 31, 2014 |
Table of Contents
| Description | Shares | Market Value ($ Thousands) | ||||||
South Korea — 1.9% | ||||||||
KB Financial Group | 132,141 | $ | 4,645 | |||||
Korea Electric Power | 184,270 | 6,310 | ||||||
KT&G | 114,702 | 8,621 | ||||||
LG Display ADR (A) | 83,576 | 1,045 | ||||||
Meritz Financial Group | 22,180 | 163 | ||||||
Samsung Electronics | 11,005 | 13,885 | ||||||
SK Telecom | 47,103 | 9,536 | ||||||
SK Telecom ADR (A) | 332,272 | 7,499 | ||||||
|
| |||||||
| 51,704 | ||||||||
|
| |||||||
Spain — 0.9% | ||||||||
Abertis Infraestructuras (A) | 37,465 | 856 | ||||||
ACS Actividades de Construccion y Servicios (A) | 51,591 | 2,028 | ||||||
Amadeus IT Holding, Cl A (A) | 97,210 | 4,039 | ||||||
Banco Bilbao Vizcaya Argentaria | 38,614 | 464 | ||||||
Banco Popular Espanol (A) | 63,503 | 480 | ||||||
Banco Santander | 108,301 | 1,033 | ||||||
CaixaBank | 205,038 | 1,320 | ||||||
Distribuidora Internacional de Alimentacion (A) | 118,107 | 1,080 | ||||||
Enagas | 1,703 | 52 | ||||||
Endesa | 8,158 | 294 | ||||||
Ferrovial | 47,052 | 1,020 | ||||||
Gamesa Tecnologica* | 10,518 | 114 | ||||||
Gas Natural | 57,565 | 1,619 | ||||||
Grifols (A) | 12,026 | 659 | ||||||
Iberdrola | 97,126 | 679 | ||||||
Inditex (A) | 2,339 | 351 | ||||||
Mapfre | 11,184 | 47 | ||||||
Red Electrica | 2,248 | 183 | ||||||
Repsol | 1,657 | 42 | ||||||
Tecnicas Reunidas (A) | 116,473 | 6,582 | ||||||
Telefonica (A) | 26,577 | 421 | ||||||
Zardoya Otis (A) | 28,710 | 489 | ||||||
|
| |||||||
| 23,852 | ||||||||
|
| |||||||
Sweden — 2.4% | ||||||||
AarhusKarlshamn | 1,988 | 130 | ||||||
Assa Abloy, Cl B | 24,060 | 1,279 | ||||||
Elekta, Cl B (A) | 211,612 | 2,815 | ||||||
Getinge, Cl B | 1,410 | 39 | ||||||
Hexagon, Cl B | 2,004 | 68 | ||||||
Holmen, Cl B | 1,832 | 67 | ||||||
Investor, Cl B | 16,171 | 584 | ||||||
Kinnevik Investment, Cl B | 35,794 | 1,320 | ||||||
NCC, Cl B | 13,500 | 488 | ||||||
Nordea Bank | 1,091,482 | 15,454 | ||||||
Securitas, Cl B | 20,521 | 237 | ||||||
Skandinaviska Enskilda Banken, Cl A | 832,299 | 11,406 | ||||||
SKF, Cl B | 30 | 1 | ||||||
Svenska Cellulosa, Cl B | 269,427 | 7,916 | ||||||
| Description | Shares | Market Value ($ Thousands) | ||||||
Svenska Handelsbanken, Cl A | 7,634 | $ | 382 | |||||
Swedbank, Cl A | 208,113 | 5,576 | ||||||
Swedish Match | 2,939 | 96 | ||||||
Tele2, Cl B | 407 | 5 | ||||||
Telefonaktiebolaget LM Ericsson | 595,657 | 7,940 | ||||||
Telefonaktiebolaget LM Ericsson, Cl B | 513,398 | 6,826 | ||||||
|
| |||||||
| 62,629 | ||||||||
|
| |||||||
Switzerland — 10.0% | ||||||||
ABB | 290,038 | 7,486 | ||||||
Actelion | 18,244 | 1,729 | ||||||
Adecco | 108,254 | 9,013 | ||||||
Aryzta | 4,521 | 400 | ||||||
Autoneum Holding | 609 | 140 | ||||||
Baloise Holding | 9,656 | 1,215 | ||||||
Clariant | 156,234 | 3,038 | ||||||
Credit Suisse Group | 452,643 | 14,650 | ||||||
EMS-Chemie Holding | 2,060 | 778 | ||||||
Geberit | 2,258 | 740 | ||||||
Georg Fischer | 857 | 665 | ||||||
Givaudan | 12,488 | 19,325 | ||||||
Julius Baer Group | 118,418 | 5,259 | ||||||
Kuehne & Nagel International | 1,176 | 165 | ||||||
Lindt & Spruengli | 86 | 1,020 | ||||||
Lonza Group | 17,204 | 1,756 | ||||||
Nestle | 198,800 | 14,977 | ||||||
Novartis | 311,747 | 26,469 | ||||||
OC Oerlikon | 157,324 | 2,654 | ||||||
Pargesa Holding | 1,646 | 143 | ||||||
Partners Group Holding | 20,256 | 5,696 | ||||||
Roche Holding | 144,836 | 43,450 | ||||||
SGS (A) | 4,664 | 11,505 | ||||||
Siegfried Holding | 717 | 136 | ||||||
Sika | 3,081 | 12,612 | ||||||
Sonova Holding | 32,826 | 4,801 | ||||||
Sulzer | 40,629 | 5,588 | ||||||
Swiss Life Holding | 16,749 | 4,114 | ||||||
Swiss Re | 62,735 | 5,820 | ||||||
Swisscom | 47 | 29 | ||||||
Syngenta | 21,987 | 8,321 | ||||||
UBS | 433,428 | 8,981 | ||||||
UBS Registered | 927,053 | 19,163 | ||||||
Weatherford International* | 285,459 | 4,956 | ||||||
Zurich Insurance Group | 54,767 | 16,827 | ||||||
|
| |||||||
| 263,621 | ||||||||
|
| |||||||
Taiwan — 0.1% | ||||||||
Taiwan Semiconductor | 35,057 | 702 | ||||||
United Microelectronics ADR (A) | 398,752 | 829 | ||||||
|
| |||||||
| 1,531 | ||||||||
|
| |||||||
United Arab Emirates — 0.1% | ||||||||
Dragon Oil | 238,205 | 2,244 | ||||||
|
| |||||||
| SEI Institutional International Trust / Semi-Annual Report / March 31, 2014 | 7 |
Table of Contents
SCHEDULE OF INVESTMENTS (Unaudited)
International Equity Fund (Continued)
March 31, 2014
| Description | Shares | Market Value ($ Thousands) | ||||||
United Kingdom — 15.0% | ||||||||
3i Group | 92,734 | $ | 615 | |||||
Admiral Group | 5,275 | 126 | ||||||
AMEC | 14,935 | 279 | ||||||
Amlin | 1,120,309 | 9,045 | ||||||
Aon | 72,800 | 6,136 | ||||||
ASOS* | 982 | 85 | ||||||
Associated British Foods | 155,437 | 7,207 | ||||||
AstraZeneca | 241,860 | 15,631 | ||||||
Aviva | 1,256,639 | 9,993 | ||||||
Babcock International Group | 12,862 | 289 | ||||||
BAE Systems | 277,042 | 1,913 | ||||||
Balfour Beatty | 773,027 | 3,861 | ||||||
Barclays | 4,933,190 | 19,196 | ||||||
Berendsen | 36,341 | 677 | ||||||
BG Group | 916,108 | 17,067 | ||||||
BHP Billiton | 286,272 | 8,801 | ||||||
BP | 357,219 | 2,859 | ||||||
BP ADR | 84,383 | 4,059 | ||||||
British American Tobacco | 286,170 | 15,913 | ||||||
British Sky Broadcasting Group | 4,213 | 64 | ||||||
BT Group, Cl A | 1,389,827 | 8,793 | ||||||
Bunzl | 416,939 | 11,094 | ||||||
Burberry Group | 174 | 4 | ||||||
Capita | 452,527 | 8,269 | ||||||
Carnival | 139,018 | 5,293 | ||||||
Catlin Group | 589,801 | 5,290 | ||||||
Centrica | 114,411 | 629 | ||||||
Cobham | 78,383 | 391 | ||||||
Compass Group | 136,199 | 2,078 | ||||||
Dairy Crest Group | 16,069 | 130 | ||||||
Diageo | 407,773 | 12,651 | ||||||
easyJet | 17,549 | 502 | ||||||
EnQuest* | 47,528 | 98 | ||||||
G4S | 22,169 | 89 | ||||||
GKN | 256,404 | 1,668 | ||||||
GlaxoSmithKline | 267,725 | 7,103 | ||||||
Hargreaves Lansdown | 33,878 | 823 | ||||||
Hikma Pharmaceuticals | 27,007 | 748 | ||||||
Home Retail Group | 2,003,303 | 7,234 | ||||||
Howden Joinery Group | 459,800 | 2,852 | ||||||
HSBC Holdings | 2,918,250 | 29,554 | ||||||
ICAP | 403,915 | 2,543 | ||||||
IMI | 17,950 | 436 | ||||||
Inmarsat | 1,406 | 17 | ||||||
InterContinental Hotels Group | 10,973 | 353 | ||||||
International Consolidated Airlines Group* | 1,504,332 | 10,466 | ||||||
Intertek Group | 1,975 | 101 | ||||||
ITV | 741,582 | 2,368 | ||||||
J Sainsbury | 57,527 | 303 | ||||||
Johnson Matthey | 25,502 | 1,391 | ||||||
Keller Group | 5,152 | 92 | ||||||
Kingfisher | 283,935 | 1,995 | ||||||
| Description | Shares | Market Value ($ Thousands) | ||||||
Land Securities Group (B) | 10,160 | $ | 173 | |||||
Legal & General Group | 764,713 | 2,610 | ||||||
Lloyds Banking Group* | 11,675,673 | 14,531 | ||||||
London Stock Exchange Group | 16,756 | 550 | ||||||
Marks & Spencer Group | 61,186 | 461 | ||||||
Meggitt | 141,782 | 1,134 | ||||||
Melrose Industries | 56,855 | 281 | ||||||
Michael Page International | 679,442 | 5,559 | ||||||
Mondi | 107,590 | 1,882 | ||||||
Next | 27,003 | 2,971 | ||||||
Pearson | 340 | 6 | ||||||
Persimmon | 42,357 | 950 | ||||||
Premier Oil | 869,520 | 4,275 | ||||||
Prudential | 713,993 | 15,099 | ||||||
QinetiQ Group | 261,900 | 986 | ||||||
Reckitt Benckiser Group | 6,849 | 558 | ||||||
Reed Elsevier | 754,859 | 11,527 | ||||||
Rexam | 799,639 | 6,490 | ||||||
Rio Tinto | 88,496 | 4,924 | ||||||
Rolls-Royce Holdings | 40,607 | 727 | ||||||
SABMiller | 154,688 | 7,724 | ||||||
Schroders | 21,968 | 952 | ||||||
Segro (B) | 116,190 | 643 | ||||||
Shire | 251,774 | 12,361 | ||||||
Smiths Group | 6,291 | 133 | ||||||
SSE | 14,067 | 345 | ||||||
Standard Life | 5,279 | 33 | ||||||
Synthomer | 32,850 | 155 | ||||||
TalkTalk Telecom Group | 869,700 | 4,644 | ||||||
Tate & Lyle | 5,696 | 63 | ||||||
Tesco | 2,631,124 | 12,958 | ||||||
Travis Perkins | 148,527 | 4,668 | ||||||
TUI Travel | 139,811 | 1,021 | ||||||
Tullow Oil | 252,880 | 3,156 | ||||||
Verizon Communications | 408 | 19 | ||||||
Vodafone Group | 3,497,768 | 12,846 | ||||||
Whitbread | 27,223 | 1,889 | ||||||
William Hill | 764 | 4 | ||||||
WM Morrison Supermarkets | 85,873 | 305 | ||||||
Wolseley | 499 | 28 | ||||||
WPP | 419,797 | 8,657 | ||||||
Xchanging | 57,394 | 159 | ||||||
|
| |||||||
| 397,631 | ||||||||
|
| |||||||
United States — 1.1% | ||||||||
1-800-Flowers.com, Cl A* | 18,877 | 106 | ||||||
Alliance HealthCare Services* | 7,648 | 256 | ||||||
Alon USA Energy | 28,918 | 432 | ||||||
Andersons | 13,543 | 802 | ||||||
Argan | 4,574 | 136 | ||||||
Axis Capital Holdings | 166,449 | 7,632 | ||||||
Broadwind Energy* | 6,300 | 77 | ||||||
Cambrex* | 3,417 | 64 | ||||||
Capella Education | 1,346 | 85 | ||||||
| 8 | SEI Institutional International Trust / Semi-Annual Report / March 31, 2014 |
Table of Contents
| Description | Shares/Face Amount (1) (Thousands) | Market Value ($ Thousands) | ||||||||
Cascade Microtech* | 6,858 | $ | 69 | |||||||
Century Casinos* | 15,165 | 109 | ||||||||
Christopher & Banks* | 10,635 | 70 | ||||||||
Computer Sciences | 51,450 | 3,129 | ||||||||
Constellium, Cl A* | 20,076 | 589 | ||||||||
Cross Country Healthcare* | 44,445 | 359 | ||||||||
Engility Holdings* | 4,031 | 182 | ||||||||
FBR* | 2,328 | 60 | ||||||||
Forest Oil* | 35,862 | 69 | ||||||||
Inteliquent | 5,284 | 77 | ||||||||
Intersections | 9,969 | 59 | ||||||||
Malibu Boats, Cl A* | 2,378 | 53 | ||||||||
Manpowergroup | 60,399 | 4,761 | ||||||||
Midcoast Energy Partners | 8,592 | 177 | ||||||||
Nielsen Holdings | 147,000 | 6,561 | ||||||||
NN | 18,207 | 359 | ||||||||
PharMerica* | 14,739 | 412 | ||||||||
Phoenix* | 1,995 | 103 | ||||||||
Providence Service* | 2,445 | 69 | ||||||||
Provident Financial Holdings | 5,496 | 85 | ||||||||
Renewable Energy Group* | 28,868 | 346 | ||||||||
Repligen* | 5,809 | 75 | ||||||||
Republic Airways Holdings* | 26,872 | 246 | ||||||||
RPX* | 10,803 | 176 | ||||||||
Skullcandy* | 72,700 | 667 | ||||||||
Taro Pharmaceutical Industries* | 1,163 | 129 | ||||||||
United Community Banks* | 13,511 | 263 | ||||||||
US Concrete* | 2,364 | 56 | ||||||||
Valero Energy | 9,285 | 493 | ||||||||
Warren Resources* | 61,957 | 297 | ||||||||
Xerium Technologies* | 8,322 | 134 | ||||||||
|
| |||||||||
| 29,824 | ||||||||||
|
| |||||||||
Total Common Stock | 2,429,496 | |||||||||
|
| |||||||||
PREFERRED STOCK — 0.8% |
| |||||||||
Germany — 0.8% | ||||||||||
Bayerische Motoren Werke | 9,374 | 886 | ||||||||
Draegerwerk | 2,624 | 322 | ||||||||
Fuchs Petrolub | 1,082 | 109 | ||||||||
Henkel | 97,561 | 10,504 | ||||||||
Porsche | 236 | 24 | ||||||||
ProSiebenSat.1 Media | 32,045 | 1,467 | ||||||||
STO SE & Co KGaA | 314 | 65 | ||||||||
Volkswagen | 27,954 | 7,247 | ||||||||
| �� | |||||||||
Total Preferred Stock | 20,624 | |||||||||
|
| |||||||||
U.S. TREASURY OBLIGATION (E) (F) — 0.3% |
| |||||||||
U.S. Treasury Bills | 7,520 | 7,519 | ||||||||
|
| |||||||||
Total U.S. Treasury Obligation | 7,519 | |||||||||
|
| |||||||||
| Description | Number Of Rights/ Shares/Face Amount (1) (Thousands) | Market Value ($ Thousands) | ||||||||||
RIGHTS — 0.0% | ||||||||||||
Hong Kong — 0.0% | ||||||||||||
New World Hotel Investment ††* | 6 | $ | — | |||||||||
|
| |||||||||||
Spain — 0.0% | ||||||||||||
Banco Bilbao Vizcaya Argentaria, Expires 04/14/14* | 39 | 9 | ||||||||||
|
| |||||||||||
Total Rights |
| 9 | ||||||||||
|
| |||||||||||
AFFILIATED PARTNERSHIP — 2.8% |
| |||||||||||
SEI Liquidity Fund, L.P. | 75,032,710 | 75,033 | ||||||||||
|
| |||||||||||
Total Affiliated Partnership |
| 75,033 | ||||||||||
|
| |||||||||||
CASH EQUIVALENT — 4.5% |
| |||||||||||
SEI Daily Income Trust, Prime Obligation Fund, Cl A 0.010% †** | 120,368,874 | 120,369 | ||||||||||
|
| |||||||||||
Total Cash Equivalent |
| 120,369 | ||||||||||
|
| |||||||||||
TIME DEPOSITS — 2.4% |
| |||||||||||
Brown Brothers Harriman | ||||||||||||
4.350%, 04/01/2014 | ZAR | 16 | 2 | |||||||||
1.950%, 04/01/2014 | NZD | 5 | 4 | |||||||||
1.929%, 04/01/2014 | AUD | 161 | 150 | |||||||||
0.550%, 04/01/2014 | NOK | 42 | 7 | |||||||||
0.278%, 04/01/2014 | CAD | 13 | 12 | |||||||||
0.100%, 04/01/2014 | SEK | 1,358 | 209 | |||||||||
0.076%, 04/01/2014 | EUR | 1,521 | 2,096 | |||||||||
0.048%, 04/01/2014 | GBP | 344 | 573 | |||||||||
0.030%, 04/01/2014 | 61,056 | 61,056 | ||||||||||
0.005%, 04/01/2014 | SGD | 108 | 86 | |||||||||
0.005%, 04/01/2014 | HKD | 205 | 26 | |||||||||
0.005%, 04/01/2014 | JPY | 11,504 | 112 | |||||||||
0.001%, 04/01/2014 | CHF | 209 | 236 | |||||||||
(0.100)%, 04/01/2014 | DKK | 37 | 7 | |||||||||
|
| |||||||||||
Total Time Deposits |
| 64,576 | ||||||||||
|
| |||||||||||
Total Investments — 102.6% |
| $ | 2,717,626 | |||||||||
|
| |||||||||||
| SEI Institutional International Trust / Semi-Annual Report / March 31, 2014 | 9 |
Table of Contents
SCHEDULE OF INVESTMENTS (Unaudited)
International Equity Fund (Concluded)
March 31, 2014
A list of the open futures contracts held by the Fund at March 31, 2014, is as follows:
| Type of Contract | Number of Contracts Long | Expiration Date | Unrealized Appreciation (Depreciation) ($ Thousands) | |||||||||
DJ Euro Stoxx 50 Index | 1,054 | Jun-2014 | $ | 1,449 | ||||||||
FTSE 100 Index | 341 | Jun-2014 | 340 | |||||||||
Hang Seng Index | 43 | Apr-2014 | 59 | |||||||||
SPI 200 Index | 95 | Jun-2014 | 131 | |||||||||
Topix Index | 236 | Jun-2014 | (295 | ) | ||||||||
|
| |||||||||||
| $ | 1,684 | |||||||||||
|
| |||||||||||
For the six months ended March 31, 2014, the total amount of all open futures contracts, as presented in the table above, are representative of the volume of activity for this derivative type during the six months.
Percentages are based on a Net Assets of $2,648,288 ($ Thousands).
| * | Non-income producing security. |
| ** | Rate shown is the 7-day effective yield as of March 31, 2014. |
| † | Investment in Affiliated Security. |
| †† | Expiration date is unavailable. |
| (1) | In U.S. dollars unless otherwise indicated. |
| (A) | This security or a partial position of this security is on loan at March 31, 2014. The total market value of securities on loan at March 31, 2014 was $71,887 ($ Thousands) (See Note 8). |
| (B) | Real Estate Investment Trust. |
| (C) | Security fair valued using methods determined in good faith by the Valuation Committee of the Board of Trustees. The total market value of such securities as of March 31, 2014 was $0 ($ Thousands) and represented 0.0% of Net Assets. |
| (D) | Securities considered illiquid. The total market value of such securities as of March 31, 2014 was $0 ($ Thousands) and represented 0.0% of Net Assets. |
| (E) | Security, or portion thereof, has been pledged as collateral on open futures contracts. |
| (F) | The rate reported is the effective yield at time of purchase. |
| (G) | This security was purchased with cash collateral held from securities on loan (see Note 8). The total value of such securities as of March 31, 2014 was $75,033 ($ Thousands). |
ADR — American Depositary Receipt
AUD — Australian Dollar
CAD — Canadian Dollar
CHF — Swiss Franc
Cl — Class
DJ — Dow Jones
DKK — Danish Krone
EUR — Euro
FTSE — Financial Times and the London Stock Exchange
GBP — British Pound Sterling
HKD — Hong Kong Dollar
JPY — Japanese Yen
L.P. — Limited Partnership
NOK — Norwegian Krone
NZD — New Zealand Dollar
SEK — Swedish Krone
SGD — Singapore Dollar
SPI — Share Price Index
ZAR — South African Rand
The following is a summary of the level of inputs used as of March 31, 2014, in valuing the Fund’s investments and other financial instruments carried at value ($ Thousands):
| Investments in Securities | Level 1 | Level 2 | Level 3 | Total | ||||||||||||
Common Stock | $ | 2,429,496 | $ | — | $ | — | $ | 2,429,496 | ||||||||
Preferred Stock | 20,624 | — | — | 20,624 | ||||||||||||
U.S. Treasury Obligation | — | 7,519 | — | 7,519 | ||||||||||||
Rights | 9 | — | — | 9 | ||||||||||||
Affiliated Partnership | — | 75,033 | — | 75,033 | ||||||||||||
Cash Equivalent | 120,369 | — | — | 120,369 | ||||||||||||
Time Deposits | — | 64,576 | — | 64,576 | ||||||||||||
|
|
|
|
|
|
|
| |||||||||
Total Investments in Securities | $ | 2,570,498 | $ | 147,128 | $ | — | $ | 2,717,626 | ||||||||
|
|
|
|
|
|
|
| |||||||||
| Other Financial Instruments | Level 1 | Level 2 | Level 3 | Total | ||||||||||||
Futures Contracts * | ||||||||||||||||
Unrealized Appreciation | $ | 1,979 | $ | — | $ | — | $ | 1,979 | ||||||||
Unrealized Depreciation | (295 | ) | — | — | (295 | ) | ||||||||||
|
|
|
|
|
|
|
| |||||||||
Total Other Financial Instruments | $ | 1,684 | $ | — | $ | — | $ | 1,684 | ||||||||
|
|
|
|
|
|
|
| |||||||||
| * | Futures contracts are valued at the unrealized appreciation/(depreciation) on the instrument. |
For the six months ended March 31, 2014, there were no transfers between Level 1 and Level 2 assets and liabilities.
For the six months ended March 31, 2014, there were no transfers from Level 2 into Level 3 assets and liabilities.
Amounts designated as “—” are $0 or have been rounded to $0.
The accompanying notes are an integral part of the financial statements.
| 10 | SEI Institutional International Trust / Semi-Annual Report / March 31, 2014 |
Table of Contents
SCHEDULE OF INVESTMENTS (Unaudited)
Emerging Markets Equity Fund
March 31, 2014
| Description | Shares | Market Value ($ Thousands) | ||||||
COMMON STOCK — 89.5% | ||||||||
Argentina — 0.4% | ||||||||
Arcos Dorados Holdings, Cl A (A) | 310,500 | $ | 3,130 | |||||
Tenaris ADR | 44,100 | 1,951 | ||||||
YPF ADR (A) | 50,800 | 1,583 | ||||||
|
| |||||||
| 6,664 | ||||||||
|
| |||||||
Austria — 0.2% | ||||||||
Erste Group Bank (A) | 61,148 | 2,090 | ||||||
IMMOFINANZ (A) | 339,978 | 1,594 | ||||||
|
| |||||||
| 3,684 | ||||||||
|
| |||||||
Belgium — 0.1% | ||||||||
KBC Groep | 19,105 | 1,176 | ||||||
|
| |||||||
Brazil — 8.7% | ||||||||
ALL—America Latina Logistica | 394,961 | 1,316 | ||||||
AMBEV | 521,300 | 3,900 | ||||||
AMBEV ADR | 768,290 | 5,693 | ||||||
Arezzo Industria e Comercio | 45,982 | 564 | ||||||
Arteris | 44,900 | 362 | ||||||
B2W Cia Digital* | 382,400 | 4,655 | ||||||
Banco Bradesco (A) | 421,096 | 5,756 | ||||||
Banco do Brasil | 407,180 | 4,094 | ||||||
Banco Santander Brasil ADR (A) | 484,515 | 2,699 | ||||||
BB Seguridade Participacoes | 369,500 | 4,079 | ||||||
BM&FBovespa | 709,717 | 3,542 | ||||||
BR Malls Participacoes | 584,000 | 5,044 | ||||||
BR Properties | 296,500 | 2,444 | ||||||
Brasil Insurance Participacoes e Administracao | 373,100 | 1,901 | ||||||
Braskem ADR* (A) | 229,769 | 3,589 | ||||||
BRF ADR | 227,975 | 4,555 | ||||||
CCR | 59,700 | 457 | ||||||
Cia Energetica de Minas Gerais ADR | 75,435 | 513 | ||||||
Cia Hering | 48,700 | 594 | ||||||
Cia Paranaense de Energia ADR (A) | 14,934 | 196 | ||||||
Cielo | 148,220 | 4,725 | ||||||
| Description | Shares | Market Value ($ Thousands) | ||||||
Cyrela Brazil Realty Empreendimentos e Participacoes | 1,165,967 | $ | 7,105 | |||||
EcoRodovias Infraestrutura e Logistica | 351,600 | 2,110 | ||||||
EDP—Energias do Brasil | 462,300 | 2,088 | ||||||
Estacio Participacoes | 823,500 | 8,357 | ||||||
Even Construtora e Incorporadora | 456,300 | 1,521 | ||||||
Fibria Celulose ADR* | 326,285 | 3,609 | ||||||
Gerdau ADR | 1,033,826 | 6,627 | ||||||
Gol Linhas Aereas Inteligentes | 340,245 | 1,654 | ||||||
Grendene | 32,600 | 226 | ||||||
Helbor Empreendimentos | 127,613 | 446 | ||||||
Hypermarcas | 634,060 | 4,620 | ||||||
JBS | 627,100 | 2,151 | ||||||
Kroton Educacional | 123,462 | 2,695 | ||||||
Localiza Rent a Car | 159,332 | 2,326 | ||||||
Lojas Renner | 64,300 | 1,831 | ||||||
Mahle-Metal Leve Industria e Comercio | 22,600 | 239 | ||||||
MRV Engenharia e Participacoes | 223,600 | 795 | ||||||
Petroleo Brasileiro | 103,622 | 687 | ||||||
Petroleo Brasileiro ADR (A) | 602,065 | 7,917 | ||||||
Porto Seguro | 61,300 | 855 | ||||||
Qualicorp* | 296,000 | 2,993 | ||||||
Santos Brasil Participacoes | 74,220 | 553 | ||||||
Sao Martinho | 17,200 | 236 | ||||||
Souza Cruz | 45,400 | 413 | ||||||
Sul America | 109,682 | 732 | ||||||
Telefonica Brasil ADR (A) | 126,700 | 2,691 | ||||||
Tim Participacoes | 136,600 | 713 | ||||||
Tim Participacoes ADR | 502,600 | 13,047 | ||||||
Totvs | 126,120 | 1,966 | ||||||
Vale | 56,186 | 783 | ||||||
Vale ADR, Cl B (A) | 511,461 | 7,074 | ||||||
Valid Solucoes e Servicos de Seguranca em Meios de Pagamento e Identificacao S.A | 131,300 | 2,031 | ||||||
Via Varejo* | 236,800 | 2,487 | ||||||
|
| |||||||
| 154,256 | ||||||||
|
| |||||||
Canada — 0.9% | ||||||||
Africa Oil* | 207,644 | 1,394 | ||||||
Alamos Gold | 211,000 | 1,910 | ||||||
Pacific Rubiales Energy | 603,876 | 10,893 | ||||||
SEMAFO | 368,493 | 1,302 | ||||||
|
| |||||||
| 15,499 | ||||||||
|
| |||||||
Chile — 0.9% | ||||||||
Banco de Chile | 15,274,225 | 1,919 | ||||||
Banco Santander Chile | 80,574,985 | 4,711 | ||||||
Cia Cervecerias Unidas ADR (A) | 156,191 | 3,496 | ||||||
SACI Falabella | 204,350 | 1,798 | ||||||
Sociedad Quimica y Minera de Chile ADR | 130,469 | 4,141 | ||||||
|
| |||||||
| 16,065 | ||||||||
|
| |||||||
| SEI Institutional International Trust / Semi-Annual Report / March 31, 2014 | 11 |
Table of Contents
SCHEDULE OF INVESTMENTS (Unaudited)
Emerging Markets Equity Fund (Continued)
March 31, 2014
| Description | Shares | Market Value ($ Thousands) | ||||||
China — 13.6% | ||||||||
AAC Technologies Holdings (A) | 1,517,980 | $ | 7,857 | |||||
Agricultural Bank of China | 26,344,732 | 11,479 | ||||||
Anhui Conch Cement (A) | 1,405,000 | 6,022 | ||||||
ANTA Sports Products (A) | 2,791,000 | 4,656 | ||||||
Anton Oilfield Services Group (A) | 7,042,000 | 4,476 | ||||||
Baidu* | 125,788 | 19,168 | ||||||
Bank of China | 24,664,105 | 10,938 | ||||||
BYD Electronic International | 695,000 | 407 | ||||||
Changyou.com ADR*(A) | 92,700 | 2,737 | ||||||
China BlueChemical | 1,742,000 | 898 | ||||||
China CITIC Bank | 1,486,000 | 856 | ||||||
China Communications Services | 1,394,000 | 645 | ||||||
China Construction Bank | 25,185,993 | 17,630 | ||||||
China Lesso Group Holdings | 2,376,200 | 1,317 | ||||||
China Life Insurance | 197,000 | 557 | ||||||
China Merchants Bank | 2,154,076 | 3,904 | ||||||
China National Materials | 9,461,438 | 1,695 | ||||||
China Oilfield Services | 1,468,000 | 3,444 | ||||||
China Pacific Insurance Group | 149,000 | 532 | ||||||
China Petroleum & Chemical | 9,377,839 | 8,390 | ||||||
China Petroleum & Chemical ADR (A) | 24,400 | 2,184 | ||||||
China Shenhua Energy | 701,000 | 2,024 | ||||||
China Telecom (A) | 3,650,000 | 1,689 | ||||||
China Vanke, Cl B | 3,201,724 | 5,324 | ||||||
Chongqing Rural Commercial Bank | 2,726,612 | 1,195 | ||||||
CITIC Securities | 610,500 | 1,273 | ||||||
Coolpad Group (A) | 3,740,000 | 1,837 | ||||||
Country Garden Holdings | 2,059,305 | 860 | ||||||
Evergrande Real Estate Group (A) | 2,021,000 | 954 | ||||||
Fosun International* (A) | 802,500 | 1,009 | ||||||
Giant Interactive Group ADR | 242,600 | 2,807 | ||||||
Great Wall Motor | 212,500 | 1,066 | ||||||
Guangzhou R&F Properties | 1,312,400 | 1,892 | ||||||
Industrial & Commercial Bank of China | 31,459,168 | 19,345 | ||||||
Jiangsu Expressway (A) | 1,754,000 | 1,999 | ||||||
Jiangxi Copper | 1,271,000 | 2,137 | ||||||
KWG Property Holding | 1,737,370 | 954 | ||||||
Mindray Medical International | 56,254 | 1,820 | ||||||
NetEase ADR | 13,025 | 877 | ||||||
New Oriental Education & Technology Group | 322,500 | 9,465 | ||||||
PetroChina ADR | 39,961 | 4,336 | ||||||
Phoenix New Media ADR* | 86,258 | 894 | ||||||
PICC Property & Casualty | 1,927,800 | 2,639 | ||||||
Ping An Insurance Group of China | 761,500 | 6,312 | ||||||
Prince Frog International Holdings (A) | 5,784,100 | 1,708 | ||||||
SINA* | 57,400 | 3,468 | ||||||
Sinopec Engineering Group (A) | 3,967,000 | 4,296 | ||||||
SOHO China | 2,946,028 | 2,423 | ||||||
Sohu.com* | 89,800 | 5,845 | ||||||
Tencent Holdings | 202,147 | 14,059 | ||||||
| Description | Shares | Market Value ($ Thousands) | ||||||
Tingyi Cayman Islands Holding (A) | 1,262,000 | $ | 3,620 | |||||
Tsingtao Brewery (A) | 436,000 | 3,190 | ||||||
Uni-President China Holdings (A) | 3,579,000 | 3,008 | ||||||
Want Want China Holdings | 339,000 | 506 | ||||||
Weichai Power (A) | 390,000 | 1,476 | ||||||
WuXi PharmaTech Cayman ADR* | 70,313 | 2,592 | ||||||
Zhejiang Expressway (A) | 3,232,000 | 2,946 | ||||||
Zhuzhou CSR Times Electric | 2,635,600 | 8,885 | ||||||
|
| |||||||
| 240,522 | ||||||||
|
| |||||||
Colombia — 0.4% | ||||||||
Bancolombia ADR, Cl R | 93,100 | 5,258 | ||||||
Cementos Argos | 114,600 | 587 | ||||||
Ecopetrol | 839,218 | 1,718 | ||||||
Grupo Nutresa | 17,719 | 246 | ||||||
|
| |||||||
| 7,809 | ||||||||
|
| |||||||
Czech Republic — 0.6% | ||||||||
CEZ | 140,311 | 4,025 | ||||||
Komercni Banka | 24,222 | 5,793 | ||||||
|
| |||||||
| 9,818 | ||||||||
|
| |||||||
Egypt — 0.0% | ||||||||
Commercial International Bank Egypt GDR | 134,789 | 655 | ||||||
|
| |||||||
Greece — 0.1% | ||||||||
Alpha Bank AE* | 513,233 | 506 | ||||||
OPAP | 119,258 | 1,923 | ||||||
|
| |||||||
| 2,429 | ||||||||
|
| |||||||
Hong Kong — 6.2% | ||||||||
Anxin-China Holdings | 1,212,000 | 187 | ||||||
Bolina Holding (A) | 4,549,300 | 1,759 | ||||||
Chaoda Modern Agriculture* (B) (C) | 2,056,181 | — | ||||||
China Everbright International | 5,041,000 | 6,902 | ||||||
China High Precision Automation Group (B) (C) | 1,385,624 | 221 | ||||||
China Medical System Holdings | 2,496,500 | 2,826 | ||||||
China Mengniu Dairy (A) | 1,894,915 | 9,490 | ||||||
China Minsheng Banking | 1,163,500 | 1,167 | ||||||
China Mobile | 1,758,741 | 16,098 | ||||||
China Mobile ADR (A) | 59,740 | 2,724 | ||||||
China Modern Dairy Holdings* (A) | 2,949,000 | 1,266 | ||||||
China Power International Development (A) | 1,229,000 | 426 | ||||||
China State Construction International Holdings | 5,546,784 | 9,396 | ||||||
China Taiping Insurance Holdings* | 1,263,200 | 2,260 | ||||||
China Unicom Hong Kong ADR (A) | 135,090 | 1,778 | ||||||
CNOOC | 4,050,407 | 6,088 | ||||||
CNOOC ADR (A) | 16,410 | 2,491 | ||||||
COSCO Pacific | 5,275 | 7 | ||||||
Far East Horizon | 1,197,000 | 880 | ||||||
| 12 | SEI Institutional International Trust / Semi-Annual Report / March 31, 2014 |
Table of Contents
| Description | Shares | Market Value ($ Thousands) | ||||||
Geely Automobile Holdings | 4,370,000 | $ | 1,718 | |||||
GOME Electrical Appliances Holding | 9,371,000 | 1,583 | ||||||
Guangdong Investment (A) | 1,448,000 | 1,383 | ||||||
Haier Electronics Group | 2,352,000 | 6,367 | ||||||
Nine Dragons Paper Holdings | 1,982,500 | 1,544 | ||||||
Samsonite International (A) | 463,552 | 1,434 | ||||||
Sands China | 740,500 | 5,532 | ||||||
Shanghai Industrial Holdings (A) | 107,000 | 357 | ||||||
Shenzhen Investment | 960,000 | 311 | ||||||
Shougang Fushan Resources | 4,204,000 | 1,279 | ||||||
Sino Biopharmaceutical | 3,276,000 | 2,792 | ||||||
SJM Holdings | 571,405 | 1,606 | ||||||
Sunac China Holdings | 708,000 | 411 | ||||||
Sunny Optical Technology Group (A) | 5,383,807 | 5,240 | ||||||
Techtronic Industries | 2,623,000 | 7,304 | ||||||
Xinyi Glass Holdings (A) | 2,458,944 | 2,000 | ||||||
Zoomlion Heavy Industry Science and Technology (A) | 3,698,060 | 2,574 | ||||||
|
| |||||||
| 109,401 | ||||||||
|
| |||||||
Hungary — 0.1% | ||||||||
Richter Gedeon Nyrt | 59,370 | 1,035 | ||||||
|
| |||||||
India — 7.3% | ||||||||
Aurobindo Pharma | 865,780 | 7,415 | ||||||
Axis Bank | 179,288 | 4,385 | ||||||
Bank of Baroda | 276,395 | 3,336 | ||||||
Biocon | 96,261 | 684 | ||||||
Cairn India | 2,612,710 | 14,568 | ||||||
Crompton Greaves | 949,206 | 2,549 | ||||||
Cummins India | 420,725 | 4,204 | ||||||
Dabur India | 985,792 | 2,965 | ||||||
Dena Bank | 141,420 | 143 | ||||||
Glenmark Pharmaceuticals | 257,705 | 2,439 | ||||||
Godrej Consumer Products | 142,073 | 2,044 | ||||||
HCL Technologies | 110,111 | 2,564 | ||||||
HDFC Bank ADR | 129,118 | 5,298 | ||||||
Hexaware Technologies | 296,384 | 747 | ||||||
Housing Development Finance | 64,749 | 958 | ||||||
ICICI Bank ADR | 282,654 | 12,380 | ||||||
Indiabulls Housing Finance | 215,603 | 858 | ||||||
Infosys ADR (A) | 22,797 | 1,235 | ||||||
ITC | 638,003 | 3,770 | ||||||
Larsen & Toubro | 209,342 | 4,458 | ||||||
Mahindra & Mahindra GDR | 169,628 | 2,786 | ||||||
Maruti Udyog | 5,417 | 179 | ||||||
Oil & Natural Gas | 455,516 | 2,431 | ||||||
Oil India | 59,070 | 479 | ||||||
Power Grid Corp of India | 1,483,424 | 2,608 | ||||||
Punjab National Bank* | 17,291 | 215 | ||||||
Reliance Industries | 298,567 | 4,653 | ||||||
Reliance Industries GDR (D) | 402,302 | 12,472 | ||||||
Rural Electrification | 470,890 | 1,811 | ||||||
| Description | Shares | Market Value ($ Thousands) | ||||||
Shriram Transport Finance | 435,451 | $ | 5,596 | |||||
Syndicate Bank | 165,516 | 266 | ||||||
Tata Consultancy Services | 17,686 | 632 | ||||||
Tata Global Beverages | 1,181,170 | 2,968 | ||||||
Tata Motors ADR | 174,000 | 6,161 | ||||||
UPL | 493,884 | 1,525 | ||||||
Wipro ADR (A) | 142,168 | 1,905 | ||||||
WNS Holdings ADR* | 11,629 | 209 | ||||||
Yes Bank | 469,960 | 3,257 | ||||||
Zee Entertainment Enterprises | 454,997 | 2,067 | ||||||
|
| |||||||
| 129,220 | ||||||||
|
| |||||||
Indonesia (B) — 2.0% | ||||||||
AKR Corporindo | 5,506,300 | 2,362 | ||||||
Bank Bukopin | 5,292,948 | 299 | ||||||
Bank Mandiri | 2,369,700 | 1,996 | ||||||
Bank Rakyat Indonesia Persero | 11,162,651 | 9,490 | ||||||
Gudang Garam | 478,900 | 2,096 | ||||||
Kalbe Farma | 7,605,600 | 987 | ||||||
Matahari Department Store* | 2,327,300 | 2,861 | ||||||
Perusahaan Gas Negara Persero | 5,013,100 | 2,275 | ||||||
Semen Indonesia Persero | 2,979,500 | 4,188 | ||||||
Surya Semesta Internusa | 2,847,000 | 242 | ||||||
Tambang Batubara Bukit Asam | 1,345,000 | 1,111 | ||||||
Telekomunikasi Indonesia Persero | 33,038,680 | 6,458 | ||||||
United Tractors | 701,681 | 1,289 | ||||||
|
| |||||||
| 35,654 | ||||||||
|
| |||||||
Israel — 0.9% | ||||||||
Check Point Software Technologies* | 29,412 | 1,989 | ||||||
Teva Pharmaceutical Industries | 250,800 | 13,252 | ||||||
|
| |||||||
| 15,241 | ||||||||
|
| |||||||
Malaysia — 1.9% | ||||||||
Affin Holdings | 96,100 | 114 | ||||||
Alliance Financial Group | 1,247,900 | 1,685 | ||||||
AMMB Holdings | 695,600 | 1,529 | ||||||
Axiata Group | 2,268,736 | 4,634 | ||||||
Berjaya Sports Toto | 220,201 | 268 | ||||||
British American Tobacco Malaysia | 41,451 | 750 | ||||||
Bursa Malaysia | 214,300 | 495 | ||||||
Genting Malaysia | 291,956 | 376 | ||||||
Hong Leong Financial Group | 56,400 | 271 | ||||||
IOI | 513,100 | 754 | ||||||
IOI Properties Group* | 256,549 | 209 | ||||||
Kulim Malaysia* | 245,800 | 253 | ||||||
Malayan Banking | 1,837,300 | 5,446 | ||||||
Malaysia Building Society | 671,427 | 448 | ||||||
Media Prima | 589,247 | 426 | ||||||
Parkson Holdings | 138,918 | 128 | ||||||
Petronas Chemicals Group | 1,548,200 | 3,276 | ||||||
Sapurakencana Petroleum* | 1,100,600 | 1,517 | ||||||
Telekom Malaysia | 360,876 | 651 | ||||||
Tenaga Nasional | 428,700 | 1,570 | ||||||
| SEI Institutional International Trust / Semi-Annual Report / March 31, 2014 | 13 |
Table of Contents
SCHEDULE OF INVESTMENTS (Unaudited)
Emerging Markets Equity Fund (Continued)
March 31, 2014
| Description | Shares | Market Value ($ Thousands) | ||||||
Top Glove | 1,963,928 | $ | 2,977 | |||||
UEM Sunrise | 3,492,395 | 2,353 | ||||||
UMW Holdings | 904,983 | 3,043 | ||||||
|
| |||||||
| 33,173 | ||||||||
|
| |||||||
Mexico — 5.2% | ||||||||
Alfa, Cl A | 316,300 | 800 | ||||||
America Movil, Ser L | 2,114,974 | 2,110 | ||||||
America Movil ADR, Ser L | 299,475 | 5,954 | ||||||
Arca Continental | 521,100 | 3,111 | ||||||
Cemex ADR* (A) | 513,021 | 6,480 | ||||||
Compartamos* | 940,700 | 1,722 | ||||||
Controladora Comercial Mexicana | 109,200 | 453 | ||||||
Empresas ICA ADR* (A) | 237,380 | 1,564 | ||||||
Fibra Uno Administracion (E) | 629,800 | 2,039 | ||||||
Fomento Economico Mexicano | 106,200 | 991 | ||||||
Fomento Economico Mexicano ADR | 72,370 | 6,748 | ||||||
Genomma Lab Internacional, | 4,169,339 | 10,733 | ||||||
Gruma, Cl B* | 154,532 | 1,279 | ||||||
Grupo Carso, Ser A1 | 141,600 | 743 | ||||||
Grupo Financiero Banorte, Cl O | 1,865,819 | 12,624 | ||||||
Grupo Financiero Inbursa, Cl O | 297,200 | 768 | ||||||
Grupo Financiero Santander | 196,678 | 2,417 | ||||||
Grupo Herdez | 32,875 | 98 | ||||||
Grupo Mexico, Ser B | 1,711,124 | 5,403 | ||||||
Grupo Televisa | 376,031 | 12,518 | ||||||
Industrias Penoles | 53,730 | 1,400 | ||||||
Inmobiliaria Vesta | 1,429,300 | 2,887 | ||||||
Kimberly-Clark de Mexico, Cl A | 1,789,500 | 4,779 | ||||||
Wal-Mart de Mexico, Ser V | 1,619,998 | 3,861 | ||||||
|
| |||||||
| 91,482 | ||||||||
|
| |||||||
Netherlands — 0.6% | ||||||||
Yandex, Cl A* | 365,700 | 11,041 | ||||||
|
| |||||||
Peru — 0.6% | ||||||||
Credicorp | 71,700 | 9,889 | ||||||
|
| |||||||
Philippines — 1.0% | ||||||||
Aboitiz Equity Ventures | 892,900 | 1,115 | ||||||
Aboitiz Power | 1,003,000 | 832 | ||||||
Alliance Global Group | 1,204,488 | 766 | ||||||
Ayala | 157,670 | 2,032 | ||||||
BDO Unibank | 1,066,883 | 2,022 | ||||||
International Container Terminal Services | 1,452,004 | 3,497 | ||||||
Manila Electric | 33,470 | 212 | ||||||
RFM | 10,303,200 | 1,339 | ||||||
Semirara Mining, Cl A | 102,840 | 940 | ||||||
SM Investments | 238,426 | 3,748 | ||||||
SM Prime Holdings | 2,333,600 | 760 | ||||||
|
| |||||||
| 17,263 | ||||||||
|
| |||||||
| Description | Shares | Market Value ($ Thousands) | ||||||
Poland — 0.9% | ||||||||
Asseco Poland | 33,224 | $ | 516 | |||||
Bank Handlowy w Warszawie | 5,496 | 206 | ||||||
Energa* | 208,496 | 1,232 | ||||||
Eurocash | 163,387 | 2,163 | ||||||
KGHM Polska Miedz | 27,366 | 986 | ||||||
PGE | 281,646 | 1,762 | ||||||
Polski Koncern Naftowy Orlen | 93,779 | 1,341 | ||||||
Powszechna Kasa Oszczednosci Bank Polski | 400,655 | 5,633 | ||||||
Powszechny Zaklad Ubezpieczen | 14,467 | 2,057 | ||||||
Tauron Polska Energia | 554,595 | 964 | ||||||
|
| |||||||
| 16,860 | ||||||||
|
| |||||||
Russia — 5.0% | ||||||||
Etalon Group GDR* | 56,800 | 221 | ||||||
Eurasia Drilling GDR | 82,118 | 2,105 | ||||||
Gazprom ADR | 861,355 | 6,658 | ||||||
Globaltrans Investment GDR | 586,883 | 6,772 | ||||||
Lukoil ADR | 172,939 | 9,665 | ||||||
Magnit GDR | 112,217 | 6,149 | ||||||
Mail.ru Group GDR* | 38,649 | 1,370 | ||||||
MegaFon GDR | 111,186 | 3,130 | ||||||
MMC Norilsk Nickel ADR | 163,218 | 2,715 | ||||||
Mobile Telesystems | 214,425 | 3,750 | ||||||
NovaTek GDR | 62,107 | 6,832 | ||||||
QIWI ADR | 62,100 | 2,152 | ||||||
Rosneft GDR | 537,626 | 3,580 | ||||||
Sberbank of Russia ADR | 1,836,131 | 17,851 | ||||||
Severstal GDR | 174,931 | 1,324 | ||||||
Sistema GDR | 55,343 | 1,246 | ||||||
Surgutneftegas ADR | 146,322 | 1,065 | ||||||
Tatneft ADR | 91,754 | 3,143 | ||||||
TMK GDR | 388,600 | 3,400 | ||||||
Uralkali GDR | 15,707 | 373 | ||||||
X5 Retail Group GDR* | 342,511 | 5,367 | ||||||
|
| |||||||
| 88,868 | ||||||||
|
| |||||||
Singapore — 0.3% | ||||||||
Asian Pay Television Trust | 6,247,500 | 3,676 | ||||||
China Yuchai International | 27,469 | 582 | ||||||
Wilmar International | 475,000 | 1,307 | ||||||
|
| |||||||
| 5,565 | ||||||||
|
| |||||||
South Africa — 5.2% | ||||||||
Anglo American Platinum | 25,931 | 1,168 | ||||||
AngloGold Ashanti ADR | 130,153 | 2,223 | ||||||
ArcelorMittal South Africa* | 159,732 | 509 | ||||||
AVI (A) | 82,892 | 446 | ||||||
Barclays Africa Group (A) | 94,202 | 1,334 | ||||||
Bidvest Group | 142,844 | 3,781 | ||||||
Exxaro Resources (A) | 228,514 | 3,042 | ||||||
FirstRand | 890,986 | 3,058 | ||||||
Foschini Group | 76,016 | 774 | ||||||
Impala Platinum Holdings | 50,285 | 574 | ||||||
| 14 | SEI Institutional International Trust / Semi-Annual Report / March 31, 2014 |
Table of Contents
| Description | Shares | Market Value ($ Thousands) | ||||||
Imperial Holdings | 138,454 | $ | 2,481 | |||||
Investec | 186,414 | 1,504 | ||||||
Kumba Iron Ore | 46,914 | 1,686 | ||||||
Liberty Holdings | 100,951 | 1,194 | ||||||
Life Healthcare Group Holdings | 1,112,911 | 4,075 | ||||||
Mondi | 91,891 | 1,615 | ||||||
MTN Group | 579,853 | 11,883 | ||||||
Murray & Roberts Holdings* | 239,957 | 561 | ||||||
Nampak | 131,113 | 448 | ||||||
Naspers, Cl N | 66,562 | 7,349 | ||||||
Netcare | 381,601 | 847 | ||||||
Remgro | 151,966 | 2,961 | ||||||
Reunert | 231,967 | 1,423 | ||||||
RMB Holdings | 194,887 | 889 | ||||||
Sasol | 194,087 | 10,869 | ||||||
Shoprite Holdings | 230,405 | 3,487 | ||||||
SPAR Group | 113,941 | 1,316 | ||||||
Standard Bank Group | 579,968 | 7,654 | ||||||
Steinhoff International Holdings | 360,079 | 1,746 | ||||||
Telkom* | 107,522 | 344 | ||||||
Tongaat Hulett | 19,087 | 206 | ||||||
Truworths International | 104,454 | 767 | ||||||
Vodacom Group (A) | 383,011 | 4,734 | ||||||
Woolworths Holdings | 687,369 | 4,796 | ||||||
|
| |||||||
| 91,744 | ||||||||
|
| |||||||
South Korea — 11.9% | ||||||||
Chong Kun Dang Pharmaceutical | 7,416 | 549 | ||||||
Chongkundang Holdings | 1,449 | 77 | ||||||
Coway | 102,950 | 7,225 | ||||||
Daelim Industrial | 24,045 | 1,958 | ||||||
Daewoong Pharmaceutical | 7,044 | 464 | ||||||
Dongbu Insurance | 71,513 | 3,708 | ||||||
Dongkuk Steel Mill | 39,970 | 467 | ||||||
Grand Korea Leisure | 25,294 | 1,040 | ||||||
GS Home Shopping | 5,417 | 1,206 | ||||||
Halla Visteon Climate Control | 57,200 | 2,612 | ||||||
Hankook Tire | 63,754 | 3,618 | ||||||
Hankook Tire Worldwide | 17,490 | 346 | ||||||
Hite Jinro | 52,840 | 1,167 | ||||||
Hyosung | 11,642 | 840 | ||||||
Hyundai Development* | 52,270 | 1,473 | ||||||
Hyundai Home Shopping Network | 2,667 | 392 | ||||||
Hyundai Marine & Fire Insurance | 84,103 | 2,426 | ||||||
Hyundai Mobis | 3,009 | 890 | ||||||
Hyundai Motor | 42,025 | 9,910 | ||||||
Industrial Bank of Korea | 271,650 | 3,445 | ||||||
Interpark | 105,156 | 1,205 | ||||||
Kangwon Land | 70,740 | 2,060 | ||||||
KB Financial Group | 158,225 | 5,559 | ||||||
KCC | 19,284 | 9,873 | ||||||
Kia Motors | 121,522 | 6,770 | ||||||
Korea Aerospace Industries | 96,660 | 3,083 | ||||||
Korean Reinsurance | 40,647 | 393 | ||||||
| Description | Shares | Market Value ($ Thousands) | ||||||
KT | 26,140 | $ | 726 | |||||
KT ADR | 214,890 | 2,985 | ||||||
KT&G | 54,426 | 4,090 | ||||||
LG | 33,556 | 1,825 | ||||||
LG Chem | 1,294 | 309 | ||||||
LG Display ADR (A) | 208,140 | 2,602 | ||||||
LG Electronics | 32,971 | 2,010 | ||||||
Lock & Lock | 141,830 | 2,119 | ||||||
Lotte Chilsung Beverage | 2,972 | 4,166 | ||||||
Lotte Confectionery | 2,463 | 4,218 | ||||||
Meritz Fire & Marine Insurance | 31,080 | 434 | ||||||
Mirae Asset Securities | 33,890 | 1,315 | ||||||
NAVER | 3,768 | 2,740 | ||||||
OCI | 8,994 | 1,500 | ||||||
POSCO | 4,692 | 1,305 | ||||||
S-1, Cl 1 | 22,661 | 1,895 | ||||||
Samsung Electronics | 43,661 | 55,086 | ||||||
Samsung Engineering* | 35,800 | 2,411 | ||||||
Samsung Fire & Marine Insurance | 6,459 | 1,453 | ||||||
Samsung Heavy Industries | 61,980 | 1,855 | ||||||
Samsung Life Insurance | 30,555 | 2,885 | ||||||
SFA Engineering | 68,663 | 2,835 | ||||||
Shinhan Financial Group | 187,714 | 8,288 | ||||||
SK C&C* | 14,664 | 2,059 | ||||||
SK Holdings | 5,252 | 952 | ||||||
SK Hynix | 106,081 | 3,588 | ||||||
SK Telecom | 10,785 | 2,183 | ||||||
SK Telecom ADR (A) | 653,159 | 14,742 | ||||||
Soulbrain | 9,800 | 353 | ||||||
Sung Kwang Bend | 124,412 | 2,712 | ||||||
Sungwoo Hitech | 45,849 | 728 | ||||||
Vieworks | 46,332 | 1,145 | ||||||
Wonik IPS* | 106,062 | 889 | ||||||
|
| |||||||
| 211,159 | ||||||||
|
| |||||||
Spain — 0.4% | ||||||||
Cemex Latam Holdings* | 940,272 | 7,844 | ||||||
|
| |||||||
Taiwan — 8.8% | ||||||||
Airtac International Group | 127,895 | 1,325 | ||||||
Asustek Computer | 268,000 | 2,653 | ||||||
Catcher Technology | 301,000 | 2,179 | ||||||
Cathay Financial Holding | 1,337,226 | 1,950 | ||||||
Chailease Holding | 279,200 | 670 | ||||||
Chicony Electronics | 186,992 | 485 | ||||||
China Motor | 1,319,000 | 1,178 | ||||||
China Steel Chemical | 373,800 | 2,136 | ||||||
Chong Hong Construction | 116,000 | 352 | ||||||
CTBC Financial Holding | 3,085,000 | 1,930 | ||||||
CTCI | 995,000 | 1,492 | ||||||
Delta Electronics | 351,000 | 2,167 | ||||||
eMemory Technology* | 110,000 | 751 | ||||||
Everlight Electronics | 844,000 | 2,140 | ||||||
Far Eastern New Century | 556,000 | 591 | ||||||
Farglory Land Development | 1,437,043 | 2,449 | ||||||
| SEI Institutional International Trust / Semi-Annual Report / March 31, 2014 | 15 |
Table of Contents
SCHEDULE OF INVESTMENTS (Unaudited)
Emerging Markets Equity Fund (Continued)
March 31, 2014
| Description | Shares | Market Value ($ Thousands) | ||||||
Formosa Taffeta | 88,000 | $ | 98 | |||||
Fubon Financial Holding | 2,836,000 | 3,846 | ||||||
Giga Solar Materials | 54,785 | 1,193 | ||||||
Hermes Microvision | 30,300 | 1,214 | ||||||
Hermes Microvision GDR* (D) | 46,900 | 1,878 | ||||||
Hiwin Technologies | 419,270 | 4,062 | ||||||
Hon Hai Precision Industry | 2,485,828 | 7,045 | ||||||
Inventec | 868,000 | 855 | ||||||
King Yuan Electronics | 616,000 | 511 | ||||||
King’s Town Bank | 692,000 | 642 | ||||||
Kinsus Interconnect Technology | 625,000 | 2,319 | ||||||
Lite-On Technology | 2,034,120 | 3,033 | ||||||
MediaTek | 1,293,500 | 19,093 | ||||||
Mega Financial Holding | 362,000 | 280 | ||||||
Merry Electronics | 283,440 | 1,550 | ||||||
MPI* | 280,000 | 907 | ||||||
Novatek Microelectronics | 644,300 | 2,951 | ||||||
Phison Electronics | 455,000 | 2,928 | ||||||
Pou Chen | 1,598,000 | 2,254 | ||||||
Powertech Technology | 353,000 | 534 | ||||||
President Chain Store | 318,652 | 2,250 | ||||||
Quanta Computer | 1,038,000 | 2,795 | ||||||
Radiant Opto-Electronics | 883,050 | 3,567 | ||||||
Realtek Semiconductor | 1,259,173 | 3,796 | ||||||
Shin Kong Financial Holding | 6,154,118 | 1,944 | ||||||
Taishin Financial Holding | 4,456,030 | 2,019 | ||||||
Taiwan Cement | 3,536,000 | 5,457 | ||||||
Taiwan Semiconductor Manufacturing | 8,551,595 | 40,433 | ||||||
Teco Electric and Machinery | 2,716,000 | 3,028 | ||||||
Transcend Information | 593,000 | 1,928 | ||||||
Uni-President Enterprises | 1,066,700 | 1,856 | ||||||
United Microelectronics | 1,488,000 | 628 | ||||||
United Microelectronics ADR (A) | 1,432,100 | 2,979 | ||||||
Vanguard International Semiconductor | 490,000 | 730 | ||||||
Wistron NeWeb | 195,000 | 439 | ||||||
|
| |||||||
| 155,490 | ||||||||
|
| |||||||
Thailand — 1.6% | ||||||||
Advanced Info Service | 170,200 | 1,186 | ||||||
Bangchak Petroleum | 257,500 | 248 | ||||||
Bangkok Bank | 375,554 | 2,066 | ||||||
Bangkok Bank Foreign (A) | 521,200 | 2,884 | ||||||
Bangkok Dusit Medical Services | 271,000 | 1,111 | ||||||
Bangkok Expressway | 148,400 | 151 | ||||||
CP ALL | 1,809,400 | 2,426 | ||||||
CP Seven Eleven PCL | 345,900 | 464 | ||||||
Delta Electronics Thailand | 183,700 | 334 | ||||||
Kiatnakin Bank | 948,544 | 1,243 | ||||||
PTT | 605,050 | 5,577 | ||||||
PTT Global Chemical | 1,835,600 | 4,089 | ||||||
Ratchaburi Electricity Generating Holding | 269,800 | 430 | ||||||
Siam Commercial Bank | 297,700 | 1,445 | ||||||
Thai Oil | 1,016,700 | 1,661 | ||||||
Thanachart Capital | 1,825,200 | 2,026 | ||||||
VGI Global Media | 4,724,424 | 1,660 | ||||||
|
| |||||||
| 29,001 | ||||||||
|
| |||||||
| Description | Shares | Market Value ($ Thousands) | ||||||
Turkey — 1.8% | ||||||||
Anadolu Efes Biracilik Ve Malt Sanayii | 343,171 | $ | 3,818 | |||||
Arcelik | 125,102 | 699 | ||||||
Aselsan Elektronik Sanayi Ve Ticaret | 835,919 | 3,364 | ||||||
EIS Eczacibasi Ilac ve Sinai ve Finansal Yatirimlar Sanayi ve Ticaret | 158,566 | 159 | ||||||
Emlak Konut Gayrimenkul Yatirim Ortakligi (E) | 5,591,063 | 6,586 | ||||||
Enka Insaat ve Sanayi | 301,658 | 901 | ||||||
Eregli Demir ve Celik Fabrikalari | 1,619,632 | 2,090 | ||||||
Koza Altin Isletmeleri | 30,742 | 267 | ||||||
TAV Havalimanlari Holding | 563,813 | 4,533 | ||||||
Tofas Turk Otomobil Fabrikasi | 315,043 | 1,789 | ||||||
Turk Hava Yollari | 227,992 | 702 | ||||||
Turk Telekomunikasyon | 641,301 | 1,784 | ||||||
Turkcell Iletisim Hizmetleri* (A) | 165,335 | 2,277 | ||||||
Turkiye Garanti Bankasi | 441,780 | 1,512 | ||||||
Turkiye Halk Bankasi | 196,572 | 1,218 | ||||||
Turkiye Sise ve Cam Fabrikalari | 887,267 | 962 | ||||||
|
| |||||||
| 32,661 | ||||||||
|
| |||||||
United Arab Emirates — 0.2% | ||||||||
Dragon Oil | 405,068 | 3,816 | ||||||
|
| |||||||
United Kingdom — 1.1% | ||||||||
Afren* | 2,383,371 | 5,610 | ||||||
Anglo American ADR | 82,040 | 1,043 | ||||||
BG Group | 145,770 | 2,716 | ||||||
Hikma Pharmaceuticals | 131,620 | 3,645 | ||||||
Old Mutual | 760,742 | 2,550 | ||||||
SABMiller | 91,655 | 4,583 | ||||||
|
| |||||||
| 20,147 | ||||||||
|
| |||||||
United States — 0.6% | ||||||||
Avon Products | 133,700 | 1,957 | ||||||
First Cash Financial Services* | 68,900 | 3,477 | ||||||
Freeport-McMoRan Copper & Gold | 62,700 | 2,073 | ||||||
Yahoo! * | 68,900 | 2,474 | ||||||
|
| |||||||
| 9,981 | ||||||||
|
| |||||||
Total Common Stock | ||||||||
(Cost $1,524,215) ($ Thousands) | 1,585,112 | |||||||
|
| |||||||
EXCHANGE TRADED FUNDS — 4.6% |
| |||||||
United States — 4.6% | ||||||||
iPath MSCI India Index ETN (A) | 196,225 | 11,897 | ||||||
iShares MSCI Emerging Markets ETF | 1,712,128 | 70,180 | ||||||
|
| |||||||
Total Exchange Traded Funds | 82,077 | |||||||
|
| |||||||
| 16 | SEI Institutional International Trust / Semi-Annual Report / March 31, 2014 |
Table of Contents
| Description | Shares/Face Amount (1) (Thousands) | Market Value ($ Thousands) | ||||||||||
PREFERRED STOCK — 3.3% |
| |||||||||||
Brazil — 3.0% | ||||||||||||
Banco do Estado do Rio Grandedo Sul | 663,302 | $ | 3,821 | |||||||||
Bradespar, Cl Preference | 189,000 | 1,657 | ||||||||||
Cia Brasileira de Distribuicao Grupo Pao de Acucar ADR | 126,867 | 5,552 | ||||||||||
Cia Energetica de Sao Paulo, Cl B | 239,300 | 2,815 | ||||||||||
Cia Paranaense de Energia | 85,100 | 1,124 | ||||||||||
Itau Unibanco Holding | 124,039 | 1,860 | ||||||||||
Itau Unibanco Holding ADR | 334,996 | 4,978 | ||||||||||
Itausa—Investimentos Itau | 706,990 | 2,892 | ||||||||||
Klabin | 1,133,000 | 1,180 | ||||||||||
Marcopolo | 3,014,200 | 6,078 | ||||||||||
Metalurgica Gerdau, Cl A | 213,260 | 1,633 | ||||||||||
Petroleo Brasileiro, Cl Preference | 291,716 | 2,030 | ||||||||||
Petroleo Brasileiro ADR, Cl A | 578,743 | 8,027 | ||||||||||
Vale, Cl A | 64,785 | 812 | ||||||||||
Vale ADR, Cl B | 664,762 | 8,276 | ||||||||||
|
| |||||||||||
| 52,735 | ||||||||||||
|
| |||||||||||
Chile — 0.0% | ||||||||||||
Sociedad Quimica y Minera de Chile, Cl B | 15,754 | 497 | ||||||||||
|
| |||||||||||
Colombia — 0.2% |
| |||||||||||
Banco Davivienda, Cl Preference | 68,232 | 883 | ||||||||||
Bancolombia, Cl Preference | 146,619 | 2,032 | ||||||||||
|
| |||||||||||
| 2,915 | ||||||||||||
|
| |||||||||||
South Korea — 0.1% | ||||||||||||
Samsung Electronics | 929 | 923 | ||||||||||
|
| |||||||||||
Total Preferred Stock |
| 57,070 | ||||||||||
|
| |||||||||||
Number Of | ||||||||||||
RIGHTS — 0.0% | ||||||||||||
Taiwan — 0.0% | ||||||||||||
Taishin Financial Holdings, Expires 04/05/2014* | 225 | 13 | ||||||||||
|
| |||||||||||
Total Rights |
| 13 | ||||||||||
|
| |||||||||||
DEBENTURE BOND — 0.0% |
| |||||||||||
Brazil — 0.0% | ||||||||||||
Vale, Ser 1997 | BRL | 8 | — | |||||||||
|
| |||||||||||
Total Debenture Bond | — | |||||||||||
|
| |||||||||||
| Description | Shares/Face Amount (1) (Thousands) | Market Value ($ Thousands) | ||||||||||
AFFILIATED PARTNERSHIP — 6.1% |
| |||||||||||
SEI Liquidity Fund, L.P. | 107,208,474 | $ | 107,208 | |||||||||
|
| |||||||||||
Total Affiliated Partnership |
| 107,208 | ||||||||||
|
| |||||||||||
CASH EQUIVALENT — 0.6% |
| |||||||||||
SEI Daily Income Trust, Prime Obligation Fund, Cl A | 11,351,693 | 11,352 | ||||||||||
|
| |||||||||||
Total Cash Equivalent |
| 11,352 | ||||||||||
|
| |||||||||||
TIME DEPOSITS — 1.8% |
| |||||||||||
Brown Brothers Harriman | ||||||||||||
4.350%, 04/01/2014 | ZAR | 2,201 | 209 | |||||||||
0.550%, 04/01/2014 | NOK | — | — | |||||||||
0.278%, 04/01/2014 | CAD | 22 | 20 | |||||||||
0.100%, 04/01/2014 | SEK | 1 | — | |||||||||
0.076%, 04/01/2014 | EUR | 28 | 38 | |||||||||
0.048%, 04/01/2014 | GBP | — | — | |||||||||
0.030%, 04/01/2014 | 31,737 | 31,737 | ||||||||||
0.005%, 04/01/2014 | HKD | 1,035 | 134 | |||||||||
0.005%, 04/01/2014 | SGD | 259 | 206 | |||||||||
|
| |||||||||||
Total Time Deposits |
| 32,344 | ||||||||||
|
| |||||||||||
Total Investments — 105.9% |
| $ | 1,875,176 | |||||||||
|
| |||||||||||
Percentages are based on a Net Assets of $1,770,581 ($ Thousands).
| * | Non-income producing security. |
| ** | Rate shown is the 7-day effective yield as of March 31, 2014. |
| † | Investment in Affiliated Security. |
| (1) | In U.S. dollars unless otherwise indicated. |
| (A) | This security or a partial position of this security is on loan at March 31, 2014. The total market value of securities on loan at March 31, 2014 was $103,025 ($ Thousands) (See Note 8). |
| (B) | Security fair valued using methods determined in good faith by the Valuation Committee of the Board of Trustees. The total market value of such securities as of March 31, 2014 was $35,875 ($ Thousands) and represented 2.03% of Net Assets. |
| (C) | Securities considered illiquid. The total market value of such securities as of March 31, 2014 was $221 ($ Thousands) and represented 0.00% of Net Assets. |
| (D) | Securities sold within terms of a private placement memorandum, exempt from registration under Section 144A of the Securities Act of 1933, as amended, and may be sold only to dealers in that program or other “accredited investors.” These securities have been determined to be liquid under guidelines established by the Board of Trustees. |
| (E) | Real Estate Investment Trust. |
| (F) | Variable Rate Security—The rate reported on the Schedule of Investments is the rate in effect as of March 31, 2014. |
| (G) | This security was purchased with cash collateral held from securities on loan (see Note 8). The total value of such securities as of March 31, 2014 was $107,208 ($ Thousands). |
| ADR | — American Depositary Receipt |
| BRL | — Brazilian Real |
| CAD | — Canadian Dollar |
| Cl | — Class |
| ETF | — Exchange Traded Fund |
| ETN | — Exchange Traded Note |
| EUR | — Euro |
| GBP | — British Pound Sterling |
| GDR | — Global Depositary Receipt |
| HKD | — Hong Kong Dollar |
| L.P. | — Limited Partnership |
| MSCI | — Morgan Stanley Capital International |
| NOK | — Norwegian Krone |
| SEK | — Swedish Krona |
| SEI Institutional International Trust / Semi-Annual Report / March 31, 2014 | 17 |
Table of Contents
SCHEDULE OF INVESTMENTS (Unaudited)
Emerging Markets Equity Fund (Concluded)
March 31, 2014
| Ser | — Series |
| SGD | — Singapore Dollar |
| ZAR | — South African Rand |
The following is a summary of the level of inputs used as of March 31, 2014, in valuing the Fund’s investments carried at value ($ Thousands):
| Investments in Securities | Level 1 | Level 2 | Level 3 (1) | Total | ||||||||||||
Common Stock | $ | 1,549,237 | $ | 35,654 | $ | 221 | $ | 1,585,112 | ||||||||
Exchange Traded Funds | 82,077 | — | — | 82,077 | ||||||||||||
Preferred Stock | 57,070 | — | — | 57,070 | ||||||||||||
Rights | 13 | — | — | 13 | ||||||||||||
Debenture Bond | — | — | — | — | ||||||||||||
Affiliated Partnership | — | 107,208 | — | 107,208 | ||||||||||||
Cash Equivalent | 11,352 | — | — | 11,352 | ||||||||||||
Time Deposits | — | 32,344 | — | 32,344 | ||||||||||||
|
|
|
|
|
|
|
| |||||||||
Total Investments in Securities | $ | 1,699,749 | $ | 175,206 | $ | 221 | $ | 1,875,176 | ||||||||
|
|
|
|
|
|
|
| |||||||||
(1) A reconciliation of Level 3 investments and disclosures of significant unobservable inputs are presented when the Fund has a significant amount of Level 3 investments at the beginning and/or end of the period in relation to net assets. Management has concluded that Level 3 investments are not material in relation to net assets.
For the six months ended March 31, 2014, there were transfers between Level 1 and Level 2 assets and liabilities. The primary reason for changes in the classifications between Level 1 and Level 2 occurs when foreign equity securities are fair valued using other observable market-based inputs in place of the closing exchange price due to events occurring after the close of the exchange or market on which the investment is principally traded (See Note 2).
For the six months ended March 31, 2014, there were no transfers between Level 2 and Level 3 assets and liabilities.
Amounts designated as “—” are $0 or have been rounded to $0.
The accompanying notes are an integral part of the financial statements.
| 18 | SEI Institutional International Trust / Semi-Annual Report / March 31, 2014 |
Table of Contents
SCHEDULE OF INVESTMENTS (Unaudited)
International Fixed Income Fund
March 31, 2014
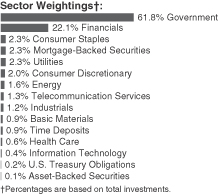
| Description | Face Amount (1) (Thousands) | Market Value ($ Thousands) | ||||||||||
GLOBAL BONDS — 93.9% |
| |||||||||||
Australia — 3.5% | ||||||||||||
Australia & New Zealand Banking Group MTN | ||||||||||||
3.625%, 07/18/2022 | EUR | 300 | $ | 470 | ||||||||
Commonwealth Bank of Australia | ||||||||||||
1.375%, 01/22/2019 | EUR | 560 | 781 | |||||||||
Government of Australia | ||||||||||||
6.000%, 02/15/2017 | 2,060 | 2,066 | ||||||||||
5.750%, 07/15/2022 | 2,750 | 2,876 | ||||||||||
5.500%, 04/21/2023 | 160 | 165 | ||||||||||
4.250%, 07/21/2017 | 1,350 | 1,295 | ||||||||||
2.750%, 04/21/2024 | 2,165 | 1,786 | ||||||||||
Government of Australia, | ||||||||||||
5.250%, 03/15/2019 | 2,720 | 2,727 | ||||||||||
Government of Australia, | ||||||||||||
5.750%, 05/15/2021 | 1,900 | 1,977 | ||||||||||
Macquarie Bank MTN | ||||||||||||
3.500%, 12/18/2020 | GBP | 221 | 368 | |||||||||
National Australia Bank MTN | ||||||||||||
1.875%, 01/13/2023 | EUR | 220 | 301 | |||||||||
Queensland Treasury, Ser 17 | ||||||||||||
6.000%, 09/14/2017 | 780 | 787 | ||||||||||
Rio Tinto Finance | ||||||||||||
3.500%, 03/22/2022 | USD | 55 | 55 | |||||||||
Suncorp-Metway | ||||||||||||
5.125%, 10/27/2014 | GBP | 235 | 400 | |||||||||
Westpac Banking MTN | ||||||||||||
1.500%, 03/24/2021 | EUR | 220 | 301 | |||||||||
1.375%, 04/17/2020 | EUR | 230 | 317 | |||||||||
|
| |||||||||||
| 16,672 | ||||||||||||
|
| |||||||||||
Austria — 1.0% |
| |||||||||||
Republic of Austria | ||||||||||||
3.900%, 07/15/2020 | 1,500 | 2,408 | ||||||||||
| Description | Face Amount (1) (Thousands) | Market Value ($ Thousands) | ||||||||||
3.650%, 04/20/2022 | 290 | $ | 463 | |||||||||
3.200%, 02/20/2017 | 600 | 894 | ||||||||||
3.150%, 06/20/2044 | 55 | 83 | ||||||||||
1.750%, 10/20/2023 | 380 | 520 | ||||||||||
Republic of Austria, | ||||||||||||
6.250%, 07/15/2027 | 225 | 454 | ||||||||||
|
| |||||||||||
| 4,822 | ||||||||||||
|
| |||||||||||
Belgium — 1.6% |
| |||||||||||
Anheuser-Busch InBev MTN | ||||||||||||
8.625%, 01/30/2017 | 200 | 335 | ||||||||||
2.875%, 09/25/2024 | 650 | 929 | ||||||||||
Kingdom of Belgium | ||||||||||||
3.750%, 06/22/2045 | 183 | 281 | ||||||||||
2.600%, 06/22/2024 | 240 | 342 | ||||||||||
Kingdom of Belgium, Ser 44 | ||||||||||||
5.000%, 03/28/2035 | 500 | 908 | ||||||||||
Kingdom of Belgium, Ser 47 | ||||||||||||
3.250%, 09/28/2016 | 900 | 1,330 | ||||||||||
Kingdom of Belgium, Ser 49 | ||||||||||||
4.000%, 03/28/2017 | 230 | 350 | ||||||||||
Kingdom of Belgium, Ser 58 | ||||||||||||
3.750%, 09/28/2020 | 231 | 366 | ||||||||||
Kingdom of Belgium, Ser 67 | ||||||||||||
3.000%, 09/28/2019 | 1,020 | 1,547 | ||||||||||
Kingdom of Belgium, Ser 69 | ||||||||||||
1.250%, 06/22/2018 | 545 | 765 | ||||||||||
|
| |||||||||||
| 7,153 | ||||||||||||
|
| |||||||||||
Brazil — 0.7% | ||||||||||||
Braskem Finance | ||||||||||||
6.450%, 02/03/2024 | 300 | 307 | ||||||||||
Brazil Notas do Tesouro Nacional | ||||||||||||
10.000%, 01/01/2017 | 3,800 | 1,594 | ||||||||||
BRF | ||||||||||||
3.950%, 05/22/2023 (A) | USD | 410 | 366 | |||||||||
Cosan | ||||||||||||
5.000%, 03/14/2023 (A) | USD | 240 | 226 | |||||||||
Gerdau Trade | ||||||||||||
5.750%, 01/30/2021 (A) | USD | 101 | 103 | |||||||||
4.750%, 04/15/2023 (A) | USD | 200 | 186 | |||||||||
Raizen Energy Finance | ||||||||||||
7.000%, 02/01/2017 (A) | USD | 270 | 297 | |||||||||
Samarco Mineracao | ||||||||||||
4.125%, 11/01/2022 (A) | USD | 430 | 396 | |||||||||
|
| |||||||||||
| 3,475 | ||||||||||||
|
| |||||||||||
Canada — 4.5% | ||||||||||||
Bank of Nova Scotia MTN | ||||||||||||
1.000%, 04/02/2019 (B) | EUR | 259 | 356 | |||||||||
Bell Canada MTN | ||||||||||||
5.000%, 02/15/2017 | 270 | 264 | ||||||||||
| SEI Institutional International Trust / Semi-Annual Report / March 31, 2014 | 19 |
Table of Contents
SCHEDULE OF INVESTMENTS (Unaudited)
International Fixed Income Fund (Continued)
March 31, 2014
| Description | Face Amount (1) (Thousands) | Market Value ($ Thousands) | ||||||||||
Bombardier | ||||||||||||
6.000%, 10/15/2022 | 310 | $ | 310 | |||||||||
Canada Housing Trust No. 1 | ||||||||||||
4.100%, 12/15/2018 | 1,390 | 1,382 | ||||||||||
2.050%, 06/15/2017 | 2,470 | 2,275 | ||||||||||
CDP Financial | ||||||||||||
4.400%, 11/25/2019 (A) | USD | 850 | 938 | |||||||||
Government of Canada | ||||||||||||
5.750%, 06/01/2033 | 485 | 624 | ||||||||||
5.000%, 06/01/2037 | 1,300 | 1,583 | ||||||||||
4.000%, 06/01/2041 | 545 | 587 | ||||||||||
2.750%, 06/01/2022 | 2,750 | 2,586 | ||||||||||
1.750%, 03/01/2019 | 2,180 | 1,978 | ||||||||||
1.500%, 08/01/2015 | 1,750 | 1,596 | ||||||||||
1.250%, 02/01/2016 | 895 | 813 | ||||||||||
Muskrat Falls | ||||||||||||
3.630%, 06/01/2029 | 340 | 323 | ||||||||||
National Bank of Canada | ||||||||||||
1.500%, 03/25/2021 | 257 | 353 | ||||||||||
Province of British Columbia | ||||||||||||
3.250%, 12/18/2021 | EUR | 1,150 | 1,079 | |||||||||
Province of Manitoba Canada | ||||||||||||
3.850%, 12/01/2021 | 710 | 689 | ||||||||||
Province of Ontario Canada | ||||||||||||
8.100%, 09/08/2023 | 700 | 888 | ||||||||||
3.450%, 06/02/2045 | 245 | 204 | ||||||||||
3.150%, 06/02/2022 | 2,000 | 1,833 | ||||||||||
Province of Quebec Canada | ||||||||||||
3.500%, 12/01/2045 | 145 | 119 | ||||||||||
3.000%, 09/01/2023 | 500 | 443 | ||||||||||
Quebecor Media | ||||||||||||
5.750%, 01/15/2023 | USD | 128 | 128 | |||||||||
Royal Bank of Canada | ||||||||||||
1.625%, 08/04/2020 | EUR | 190 | 265 | |||||||||
TransCanada PipeLines | ||||||||||||
2.500%, 08/01/2022 | USD | 300 | 281 | |||||||||
|
| |||||||||||
| 21,897 | ||||||||||||
|
| |||||||||||
Chile — 0.2% | ||||||||||||
Empresa de Transporte de Pasajeros Metro | ||||||||||||
4.750%, 02/04/2024 (A) | USD | 390 | 405 | |||||||||
ENTEL Chile | ||||||||||||
4.875%, 10/30/2024 | USD | 380 | 387 | |||||||||
|
| |||||||||||
| 792 | ||||||||||||
|
| |||||||||||
China — 0.1% | ||||||||||||
Talent Yield Investments | ||||||||||||
4.500%, 04/25/2022 (A) | USD | 310 | 309 | |||||||||
|
| |||||||||||
Colombia — 0.0% | ||||||||||||
Pacific Rubiales Energy | ||||||||||||
5.125%, 03/28/2023 (A) | USD | 123 | 120 | |||||||||
|
| |||||||||||
| Description | Face Amount (1) (Thousands) | Market Value ($ Thousands) | ||||||||||
Czech Republic — 0.1% | ||||||||||||
Government of Czech Republic, Ser 51 | ||||||||||||
4.000%, 04/11/2017 | 8,050 | $ | 446 | |||||||||
|
| |||||||||||
Denmark — 1.3% | ||||||||||||
Danske Bank | ||||||||||||
5.375%, 09/29/2021 (C) | GBP | 170 | 296 | |||||||||
3.875%, 10/04/2023 (C) | EUR | 150 | 218 | |||||||||
3.500%, 04/16/2018 | EUR | 155 | 236 | |||||||||
DONG Energy MTN | ||||||||||||
5.750%, 04/09/2040 | GBP | 200 | 378 | |||||||||
Kingdom of Denmark | ||||||||||||
4.500%, 11/15/2039 | 1,300 | 335 | ||||||||||
4.000%, 11/15/2017 | 1,600 | 333 | ||||||||||
3.000%, 11/15/2021 | 21,800 | 4,528 | ||||||||||
|
| |||||||||||
| 6,324 | ||||||||||||
|
| |||||||||||
Finland — 1.0% | ||||||||||||
Elisa MTN | ||||||||||||
2.250%, 10/04/2019 | 300 | 420 | ||||||||||
Government of Finland | ||||||||||||
3.375%, 04/15/2020 | 2,080 | 3,250 | ||||||||||
1.500%, 04/15/2023 | 340 | 461 | ||||||||||
Nordea Bank Finland MTN | ||||||||||||
2.375%, 07/17/2017 | 190 | 276 | ||||||||||
2.250%, 05/03/2019 | 170 | 248 | ||||||||||
|
| |||||||||||
| 4,655 | ||||||||||||
|
| |||||||||||
France — 6.2% | ||||||||||||
Accor | ||||||||||||
2.500%, 03/21/2019 | 300 | 425 | ||||||||||
ALD International MTN | ||||||||||||
2.000%, 05/26/2017 | 500 | 697 | ||||||||||
Arkema | ||||||||||||
3.850%, 04/30/2020 | 200 | 305 | ||||||||||
AXA MTN | ||||||||||||
5.625%, 01/16/2054 (C) | GBP | 302 | 499 | |||||||||
Banque Federative du Credit Mutuel MTN | ||||||||||||
2.000%, 09/19/2019 | 400 | 559 | ||||||||||
Banque PSA Finance MTN | ||||||||||||
4.875%, 09/25/2015 | 450 | 649 | ||||||||||
BNP Paribas | ||||||||||||
4.730%, 04/12/2049 (C) | 300 | 431 | ||||||||||
BNP Paribas Home Loan SFH MTN | ||||||||||||
3.125%, 03/22/2022 | 200 | 306 | ||||||||||
BPCE | ||||||||||||
5.700%, 10/22/2023 | USD | 380 | 395 | |||||||||
BPCE SFH MTN | ||||||||||||
1.750%, 11/29/2019 | 600 | 851 | ||||||||||
1.500%, 01/30/2020 | 400 | 557 | ||||||||||
| 20 | SEI Institutional International Trust / Semi-Annual Report / March 31, 2014 |
Table of Contents
| Description | Face Amount (1) (Thousands) | Market Value ($ Thousands) | ||||||||||
Caisse d’Amortissement de la Dette Sociale MTN | ||||||||||||
1.125%, 05/25/2019 | 363 | $ | 502 | |||||||||
Caisse Francaise de Financement Local MTN | ||||||||||||
4.500%, 04/27/2015 | 380 | 546 | ||||||||||
3.750%, 05/18/2016 | 225 | 331 | ||||||||||
Carrefour Banque | ||||||||||||
1.032%, 03/21/2018 (C) | 177 | 245 | ||||||||||
Casino Guichard Perracho MTN | ||||||||||||
4.726%, 05/26/2021 | 300 | 474 | ||||||||||
Cie de Financement Foncier MTN | ||||||||||||
4.625%, 09/23/2017 | 575 | 897 | ||||||||||
4.250%, 01/19/2022 | 300 | 489 | ||||||||||
Cie de St. Gobain MTN | ||||||||||||
3.625%, 03/28/2022 | 120 | 180 | ||||||||||
Coface | ||||||||||||
4.125%, 03/27/2024 | 200 | 279 | ||||||||||
Credit Agricole MTN | ||||||||||||
2.375%, 11/27/2020 | 600 | 844 | ||||||||||
Credit Agricole Home Loan SFH MTN | ||||||||||||
2.875%, 09/09/2016 | 300 | 437 | ||||||||||
Dexia Credit Local MTN | ||||||||||||
2.000%, 01/22/2021 | 200 | 280 | ||||||||||
1.625%, 10/29/2018 | 565 | 795 | ||||||||||
1.375%, 09/18/2019 | 500 | 688 | ||||||||||
1.250%, 10/18/2016 (A) | USD | 449 | 449 | |||||||||
Electricite de France MTN | ||||||||||||
6.500%, 01/26/2019 (A) | USD | 250 | 296 | |||||||||
5.500%, 10/17/2041 | GBP | 200 | 365 | |||||||||
5.375%, 12/12/2049 (C) | 100 | 147 | ||||||||||
5.250%, 12/29/2049 (C) | USD | 120 | 120 | |||||||||
Eutelsat | ||||||||||||
2.625%, 01/13/2020 | 200 | 284 | ||||||||||
French Treasury Note | ||||||||||||
1.000%, 07/25/2017 | 235 | 330 | ||||||||||
Gecina MTN | ||||||||||||
2.875%, 05/30/2023 (D) | 500 | 687 | ||||||||||
Government of France | ||||||||||||
5.750%, 10/25/2032 | 545 | 1,076 | ||||||||||
5.000%, 10/25/2016 | 1,240 | 1,914 | ||||||||||
4.750%, 04/25/2035 | 60 | 107 | ||||||||||
4.500%, 04/25/2041 | 805 | 1,414 | ||||||||||
4.250%, 10/25/2023 | 85 | 141 | ||||||||||
3.250%, 05/25/2045 | 440 | 623 | ||||||||||
3.000%, 04/25/2022 | 640 | 974 | ||||||||||
2.250%, 05/25/2024 | 315 | 440 | ||||||||||
1.000%, 05/25/2018 | 140 | 195 | ||||||||||
1.000%, 11/25/2018 | 1,390 | 1,930 | ||||||||||
1.000%, 05/25/2019 | 340 | 469 | ||||||||||
HSBC SFH France MTN | ||||||||||||
2.000%, 10/16/2023 | 700 | 971 | ||||||||||
| Description | Face Amount (1) (Thousands) | Market Value ($ Thousands) | ||||||||||
Iliand | ||||||||||||
4.875%, 06/01/2016 | 300 | $ | 442 | |||||||||
RCI Banque | ||||||||||||
3.400%, 04/11/2014 (A) | USD | 250 | 250 | |||||||||
Renault MTN | ||||||||||||
3.625%, 09/19/2018 | 450 | 654 | ||||||||||
Sanofi MTN | ||||||||||||
2.500%, 11/14/2023 | 200 | 282 | ||||||||||
Societe Generale MTN | ||||||||||||
5.750%, 04/20/2016 (A) | USD | 111 | 120 | |||||||||
5.200%, 04/15/2021 (A) | USD | 225 | 250 | |||||||||
5.000%, 01/17/2024 (A) | USD | 250 | 249 | |||||||||
3.875%, 12/17/2015 | GBP | 100 | 173 | |||||||||
Societe Generale SFH MTN | ||||||||||||
3.250%, 06/06/2016 | 400 | 585 | ||||||||||
Unibail-Rodamco MTN | ||||||||||||
2.375%, 02/25/2021 (D) | 500 | 706 | ||||||||||
Veolia Environnement MTN | ||||||||||||
6.125%, 11/25/2033 | 270 | 479 | ||||||||||
4.625%, 03/30/2027 | 200 | 313 | ||||||||||
|
| |||||||||||
| 30,096 | ||||||||||||
|
| |||||||||||
Germany — 8.7% | ||||||||||||
Allianz Finance II MTN | ||||||||||||
3.500%, 02/14/2022 | 100 | 153 | ||||||||||
Bayer MTN | ||||||||||||
1.875%, 01/25/2021 | 93 | 130 | ||||||||||
Bundesobligation | ||||||||||||
1.000%, 10/12/2018 | 250 | 352 | ||||||||||
Bundesobligation, Ser 159 | ||||||||||||
2.000%, 02/26/2016 | 1,500 | 2,141 | ||||||||||
Bundesrepublik Deutschland | ||||||||||||
4.750%, 09/20/2033 | 190 | 349 | ||||||||||
2.500%, 07/04/2044 | 3,325 | 4,651 | ||||||||||
1.750%, 02/15/2024 (G) | 3,600 | 5,042 | ||||||||||
1.500%, 09/04/2022 | 450 | 629 | ||||||||||
Bundesrepublik Deutschland, Ser 00 | ||||||||||||
5.500%, 01/04/2031 | 550 | 1,102 | ||||||||||
Bundesrepublik Deutschland, Ser 03 | ||||||||||||
4.750%, 07/04/2034 | 450 | 860 | ||||||||||
Bundesschatzanweisungen | ||||||||||||
2.875%, 09/11/2015 | 323 | 307 | ||||||||||
Continental MTN | ||||||||||||
3.125%, 09/09/2020 | 600 | 881 | ||||||||||
Deutsche Bank MTN | ||||||||||||
1.411%, 12/15/2015 (C) | GBP | 280 | 464 | |||||||||
Deutsche Bundesrepublik | ||||||||||||
4.000%, 01/04/2037 | 110 | 194 | ||||||||||
Deutsche Telekom International Finance MTN | ||||||||||||
8.875%, 11/27/2028 | GBP | 160 | 390 | |||||||||
7.375%, 12/04/2019 | GBP | 200 | 409 | |||||||||
| SEI Institutional International Trust / Semi-Annual Report / March 31, 2014 | 21 |
Table of Contents
SCHEDULE OF INVESTMENTS (Unaudited)
International Fixed Income Fund (Continued)
March 31, 2014
| Description | Face Amount (1) (Thousands) | Market Value ($ Thousands) | ||||||||||
Deutschland Inflation Linked Bond | ||||||||||||
1.500%, 04/15/2016 | 3,218 | $ | 4,633 | |||||||||
E.ON International Finance MTN | ||||||||||||
6.000%, 10/30/2019 | GBP | 300 | 578 | |||||||||
Euro Zone Inflation Linked Bond | ||||||||||||
0.750%, 04/15/2018 | 6,804 | 9,889 | ||||||||||
Evonik Industries MTN | ||||||||||||
1.875%, 04/08/2020 | 600 | 835 | ||||||||||
FMS Wertmanagement | ||||||||||||
3.000%, 08/03/2018 | 500 | 755 | ||||||||||
1.125%, 09/03/2018 | 900 | 1,258 | ||||||||||
Hypothekenbank Frankfurt MTN | ||||||||||||
2.875%, 01/19/2016 | 160 | 230 | ||||||||||
KFW | ||||||||||||
4.750%, 08/12/2015 | SEK | 6,000 | 972 | |||||||||
3.875%, 01/21/2019 | 1,325 | 2,088 | ||||||||||
3.375%, 08/30/2017 | CHF | 370 | 465 | |||||||||
1.125%, 10/16/2018 | 250 | 350 | ||||||||||
Linde Finance MTN | ||||||||||||
3.875%, 06/01/2021 | 450 | 707 | ||||||||||
Muenchener Rueckversicherungs MTN | ||||||||||||
6.250%, 05/26/2042 (C) | 200 | 333 | ||||||||||
RWE | ||||||||||||
7.000%, 10/12/2072 (C) | USD | 224 | 245 | |||||||||
Vier Gas Transport Gmbh MTN | ||||||||||||
3.125%, 07/10/2023 | 250 | 365 | ||||||||||
2.875%, 06/12/2025 | 200 | 281 | ||||||||||
|
| |||||||||||
| 42,038 | ||||||||||||
|
| |||||||||||
Guatemala — 0.0% | ||||||||||||
Comcel Trust | ||||||||||||
6.875%, 02/06/2024 | USD | 230 | 241 | |||||||||
|
| |||||||||||
Ireland — 1.1% | ||||||||||||
AIB Mortgage Bank MTN | ||||||||||||
2.625%, 07/29/2016 | 400 | 569 | ||||||||||
Allied Irish Banks MTN | ||||||||||||
2.875%, 11/28/2016 | 400 | 562 | ||||||||||
Aquarius and Investments for Zurich Insurance MTN | ||||||||||||
4.250%, 10/02/2043 (C) | 100 | 146 | ||||||||||
Bank of Ireland MTN | ||||||||||||
4.000%, 01/28/2015 | 250 | 353 | ||||||||||
2.054%, 09/22/2015 (A) (C) | CAD | 205 | 177 | |||||||||
CRH Finland Services MTN | ||||||||||||
2.750%, 10/15/2020 | 350 | 501 | ||||||||||
GE Capital UK Funding MTN | ||||||||||||
4.375%, 07/31/2019 | GBP | 810 | 1,452 | |||||||||
| Description | Face Amount (1) (Thousands) | Market Value ($ Thousands) | ||||||||||
Ireland Government Bond | ||||||||||||
5.400%, 03/13/2025 | 260 | $ | 430 | |||||||||
4.500%, 10/18/2018 | 345 | 539 | ||||||||||
3.900%, 03/20/2023 | 200 | 300 | ||||||||||
|
| |||||||||||
| 5,029 | ||||||||||||
|
| |||||||||||
Israel — 0.2% | ||||||||||||
Israel Government Bond MTN | ||||||||||||
4.250%, 03/31/2023 | 750 | 231 | ||||||||||
2.875%, 01/29/2024 | EUR | 650 | 918 | |||||||||
|
| |||||||||||
| 1,149 | ||||||||||||
|
| |||||||||||
Italy — 7.6% | ||||||||||||
Assicurazioni Generali MTN | ||||||||||||
2.875%, 01/14/2020 | 250 | 355 | ||||||||||
Banca Monte dei Paschi di Siena | ||||||||||||
5.000%, 02/09/2018 | 230 | 349 | ||||||||||
4.875%, 09/15/2016 | 700 | 1,036 | ||||||||||
Banco Popolare SC MTN | ||||||||||||
3.500%, 03/14/2019 | 350 | 488 | ||||||||||
Edison MTN | ||||||||||||
3.875%, 11/10/2017 | 600 | 903 | ||||||||||
Enel Finance International MTN | ||||||||||||
4.875%, 03/11/2020 | 100 | 158 | ||||||||||
4.875%, 04/17/2023 | 290 | 463 | ||||||||||
3.875%, 10/07/2014 (A) | USD | 350 | 355 | |||||||||
Eni MTN | ||||||||||||
3.625%, 01/29/2029 | 600 | 870 | ||||||||||
Intesa Sanpaolo MTN | ||||||||||||
4.875%, 07/10/2015 | 300 | 434 | ||||||||||
4.000%, 11/09/2017 | 368 | 550 | ||||||||||
Italy Buoni Poliennali Del Tesoro | ||||||||||||
6.500%, 11/01/2027 | 305 | 548 | ||||||||||
6.000%, 05/01/2031 | 1,045 | 1,814 | ||||||||||
5.500%, 09/01/2022 | 410 | 668 | ||||||||||
5.500%, 11/01/2022 | 150 | 245 | ||||||||||
5.000%, 03/01/2025 | 960 | 1,510 | ||||||||||
5.000%, 09/01/2040 | 755 | 1,174 | ||||||||||
4.750%, 05/01/2017 | 1,780 | 2,709 | ||||||||||
4.750%, 09/01/2021 | 3,250 | 5,087 | ||||||||||
4.750%, 09/01/2044 | 355 | 529 | ||||||||||
4.500%, 03/01/2019 | 675 | 1,045 | ||||||||||
4.500%, 02/01/2020 | 570 | 883 | ||||||||||
4.500%, 05/01/2023 | 210 | 320 | ||||||||||
4.500%, 03/01/2024 | 3,000 | 4,560 | ||||||||||
3.500%, 11/01/2017 | 4,440 | 6,553 | ||||||||||
3.500%, 06/01/2018 | 300 | 443 | ||||||||||
2.250%, 04/22/2017 | 1,106 | 1,571 | ||||||||||
TeamSystem Holding | ||||||||||||
7.375%, 05/15/2020 | 220 | 323 | ||||||||||
| 22 | SEI Institutional International Trust / Semi-Annual Report / March 31, 2014 |
Table of Contents
| Description | Face Amount (1) (Thousands) | Market Value ($ Thousands) | ||||||||
Telecom Italia MTN | ||||||||||
4.500%, 01/25/2021 | 400 | $ | 567 | |||||||
Unione di Banche Italiane MTN | ||||||||||
4.500%, 02/22/2016 | 200 | 294 | ||||||||
|
| |||||||||
| 36,804 | ||||||||||
|
| |||||||||
Japan — 17.9% | ||||||||||
Government of Japan 5 Year Bond | ||||||||||
0.300%, 03/20/2017 | 443,900 | 4,334 | ||||||||
0.300%, 09/20/2018 | 364,850 | 3,562 | ||||||||
Government of Japan 5 Year Bond, Ser 106 | ||||||||||
0.200%, 09/20/2017 | 850,000 | 8,273 | ||||||||
Government of Japan 5 Year Bond, Ser 109 | ||||||||||
0.100%, 03/20/2018 | 37,900 | 367 | ||||||||
Government of Japan 10 Year Bond | ||||||||||
0.800%, 09/20/2023 | 104,000 | 1,028 | ||||||||
0.600%, 12/20/2023 | 265,600 | 2,573 | ||||||||
0.600%, 03/20/2024 | 48,350 | 467 | ||||||||
Government of Japan 10 Year Bond, Ser 298 | ||||||||||
1.300%, 12/20/2018 | 254,550 | 2,600 | ||||||||
Government of Japan 10 Year Bond, Ser 301 | ||||||||||
1.500%, 06/20/2019 | 759,550 | 7,864 | ||||||||
Government of Japan 10 Year Bond, Ser 303 | ||||||||||
1.400%, 09/20/2019 | 489,100 | 5,049 | ||||||||
Government of Japan 10 Year Bond, Ser 308 | ||||||||||
1.300%, 06/20/2020 | 1,151,000 | 11,870 | ||||||||
Government of Japan 10 Year Bond, Ser 313 | ||||||||||
1.300%, 03/20/2021 | 750,000 | 7,752 | ||||||||
Government of Japan 10 Year Bond, Ser 316 | ||||||||||
1.100%, 06/20/2021 | 240,550 | 2,454 | ||||||||
Government of Japan 20 Year Bond | ||||||||||
1.700%, 06/20/2033 | 102,050 | 1,032 | ||||||||
Government of Japan 20 Year Bond, Ser 106 | ||||||||||
2.200%, 09/20/2028 | 40,650 | 458 | ||||||||
Government of Japan 20 Year Bond, Ser 112 | ||||||||||
2.100%, 06/20/2029 | 325,000 | 3,612 | ||||||||
Government of Japan 20 Year Bond, Ser 128 | ||||||||||
1.900%, 06/20/2031 | 55,000 | 586 | ||||||||
Government of Japan 20 Year Bond, Ser 140 | ||||||||||
1.700%, 09/20/2032 | 34,850 | 356 | ||||||||
Government of Japan 20 Year Bond, Ser 143 | ||||||||||
1.600%, 03/20/2033 | 412,450 | 4,117 | ||||||||
| Description | Face Amount (1) (Thousands) | Market Value ($ Thousands) | ||||||||||
Government of Japan 20 Year Bond, Ser 144 | ||||||||||||
1.500%, 03/20/2033 | 63,050 | $ | 619 | |||||||||
Government of Japan 20 Year Bond, Ser 55 | ||||||||||||
2.000%, 03/21/2022 | 257,000 | 2,793 | ||||||||||
Government of Japan 20 Year Bond, Ser 99 | ||||||||||||
2.100%, 12/20/2027 | 506,400 | 5,655 | ||||||||||
Government of Japan 30 Year Bond | ||||||||||||
1.800%, 03/20/2043 | 109,500 | 1,087 | ||||||||||
Government of Japan 30 Year Bond, Ser 30 | ||||||||||||
2.300%, 03/20/2039 | 322,500 | 3,539 | ||||||||||
Government of Japan 30 Year Bond, Ser 33 | ||||||||||||
2.000%, 09/20/2040 | 267,000 | 2,771 | ||||||||||
Government of Japan 30 Year Bond, Ser 34 | ||||||||||||
2.200%, 03/20/2041 | 30,000 | 324 | ||||||||||
Government of Japan 30 Year Bond, Ser 36 | ||||||||||||
2.000%, 03/20/2042 | 15,000 | 156 | ||||||||||
Government of Japan 30 Year Bond, Ser 37 | ||||||||||||
1.900%, 09/20/2042 | 40,400 | 410 | ||||||||||
Japan Finance Organization for Municipalities | ||||||||||||
4.500%, 05/27/2014 | EUR | 450 | 623 | |||||||||
Mizuho Financial Group Cayman 3 | ||||||||||||
4.600%, 03/27/2024 | USD | 306 | 308 | |||||||||
ORIX | ||||||||||||
4.710%, 04/27/2015 | USD | 135 | 141 | |||||||||
|
| |||||||||||
| 86,780 | ||||||||||||
|
| |||||||||||
Malaysia — 0.5% | ||||||||||||
Bank Negara Malaysia Monetary Notes | ||||||||||||
2.841%, 05/27/2014 (E) | 1,275 | 389 | ||||||||||
2.756%, 09/09/2014 (E) | 3,860 | 1,167 | ||||||||||
Malaysia Government Bond | ||||||||||||
5.734%, 07/30/2019 | 900 | 301 | ||||||||||
3.418%, 08/15/2022 | 445 | 130 | ||||||||||
Petronas Capital | ||||||||||||
5.250%, 08/12/2019 | USD | 410 | 461 | |||||||||
|
| |||||||||||
| 2,448 | ||||||||||||
|
| |||||||||||
Mexico — 0.6% | ||||||||||||
Grupo KUO De | ||||||||||||
6.250%, 12/04/2022 (A) | USD | 300 | 306 | |||||||||
| SEI Institutional International Trust / Semi-Annual Report / March 31, 2014 | 23 |
Table of Contents
SCHEDULE OF INVESTMENTS (Unaudited)
International Fixed Income Fund (Continued)
March 31, 2014
| Description | Face Amount (1) (Thousands) | Market Value ($ Thousands) | ||||||||||
Mexican Bonos | ||||||||||||
8.000%, 06/11/2020 | 12,606 | $ | 1,089 | |||||||||
7.750%, 11/13/2042 | 9,100 | 746 | ||||||||||
7.000%, 06/19/2014 | 5,537 | 427 | ||||||||||
Petroleos Mexicanos | ||||||||||||
3.500%, 01/30/2023 | 425 | 400 | ||||||||||
|
| |||||||||||
| 2,968 | ||||||||||||
|
| |||||||||||
Netherlands — 4.2% | ||||||||||||
ABN AMRO Bank MTN | ||||||||||||
6.375%, 04/27/2021 | 245 | 402 | ||||||||||
3.750%, 07/15/2014 | 750 | 1,044 | ||||||||||
Achmea BV MTN | ||||||||||||
2.500%, 11/19/2020 | 400 | 559 | ||||||||||
Achmea Hypotheekbank MTN | ||||||||||||
2.750%, 02/18/2021 | 150 | 210 | ||||||||||
2.375%, 02/08/2016 | 275 | 388 | ||||||||||
Akzo Nobel MTN | ||||||||||||
8.000%, 04/06/2016 | GBP | 205 | 384 | |||||||||
ASML Holding | ||||||||||||
3.375%, 09/19/2023 | 450 | 647 | ||||||||||
Coco-Cola HBC Finance | ||||||||||||
2.375%, 06/18/2020 | 350 | 491 | ||||||||||
Heineken MTN | ||||||||||||
2.125%, 08/04/2020 | 300 | 420 | ||||||||||
ING Bank | ||||||||||||
6.125%, 05/29/2023 (C) | 145 | 226 | ||||||||||
5.800%, 09/25/2023 (A) | USD | 375 | 400 | |||||||||
3.625%, 02/25/2026 (C) | 180 | 250 | ||||||||||
3.375%, 03/23/2017 | 125 | 186 | ||||||||||
Kingdom of Netherlands | ||||||||||||
4.000%, 07/15/2016 | 630 | 943 | ||||||||||
4.000%, 07/15/2018 | 185 | 291 | ||||||||||
4.000%, 01/15/2037 | 300 | 520 | ||||||||||
2.500%, 01/15/2033 | 365 | 506 | ||||||||||
2.250%, 07/15/2022 | 1,255 | 1,823 | ||||||||||
1.750%, 07/15/2023 | 4,250 | 5,860 | ||||||||||
1.750%, 07/15/2023 | 655 | 903 | ||||||||||
1.250%, 01/15/2018 | 345 | 488 | ||||||||||
1.250%, 01/15/2019 | 475 | 668 | ||||||||||
Koninklijke KPN | ||||||||||||
3.250%, 02/01/2021 | 200 | 288 | ||||||||||
Petrobras Global Finance BV | ||||||||||||
4.750%, 01/14/2025 | 310 | 430 | ||||||||||
Robert Bosch Investment Nederland MTN | ||||||||||||
2.979%, 05/27/2033 | 200 | 276 | ||||||||||
Shell International Finance | ||||||||||||
2.250%, 01/06/2023 | USD | 825 | 763 | |||||||||
TenneT Holding | ||||||||||||
2.125%, 11/01/2020 | 350 | 491 | ||||||||||
UPCB Finance | ||||||||||||
7.625%, 01/15/2020 | 250 | 370 | ||||||||||
| Description | Face Amount (1) (Thousands) | Market Value ($ Thousands) | ||||||||||
Wuerth Finance International MTN | ||||||||||||
1.750%, 05/21/2020 | 150 | $ | 208 | |||||||||
|
| |||||||||||
| 20,435 | ||||||||||||
|
| |||||||||||
New Zealand — 0.9% | ||||||||||||
BNZ International Funding MTN | ||||||||||||
1.250%, 05/23/2018 | EUR | 156 | 214 | |||||||||
Government of New Zealand | ||||||||||||
5.500%, 04/15/2023 | 320 | 296 | ||||||||||
5.000%, 03/15/2019 | 435 | 391 | ||||||||||
2.000%, 09/20/2025 | 4,157 | 3,432 | ||||||||||
|
| |||||||||||
| 4,333 | ||||||||||||
|
| |||||||||||
Norway — 0.5% | ||||||||||||
DnB Bank MTN | ||||||||||||
4.750%, 03/08/2022 (C) | EUR | 120 | 179 | |||||||||
3.000%, 09/26/2023 (C) | EUR | 170 | 243 | |||||||||
Eksportfinans | ||||||||||||
2.375%, 05/25/2016 | USD | 200 | 198 | |||||||||
2.000%, 09/15/2015 | USD | 20 | 20 | |||||||||
Government of Norway | ||||||||||||
4.500%, 05/22/2019 | 1,150 | 214 | ||||||||||
2.000%, 05/24/2023 | 645 | 101 | ||||||||||
Kommunalbanken MTN | ||||||||||||
1.000%, 03/15/2018 (A) | USD | 800 | 781 | |||||||||
Sparebank 1 Boligkreditt MTN | ||||||||||||
2.375%, 11/22/2016 | EUR | 170 | 245 | |||||||||
Yara International | ||||||||||||
7.875%, 06/11/2019 (A) | USD | 185 | 225 | |||||||||
|
| |||||||||||
| 2,206 | ||||||||||||
|
| |||||||||||
Peru — 0.0% | ||||||||||||
Minsur | ||||||||||||
6.250%, 02/07/2024 | USD | 230 | 242 | |||||||||
|
| |||||||||||
Poland — 0.5% | ||||||||||||
Republic of Poland | ||||||||||||
5.125%, 04/21/2021 | USD | 135 | 149 | |||||||||
4.000%, 10/25/2023 | 300 | 98 | ||||||||||
2.500%, 07/25/2018 | 1,945 | 617 | ||||||||||
Republic of Poland, Ser 1019 | ||||||||||||
5.500%, 10/25/2019 | 1,475 | 530 | ||||||||||
Republic of Poland, Ser 1021 | ||||||||||||
5.750%, 10/25/2021 | 3,490 | 1,278 | ||||||||||
Republic of Poland, Ser E MTN | ||||||||||||
4.200%, 04/15/2020 | EUR | 100 | 159 | |||||||||
|
| |||||||||||
| 2,831 | ||||||||||||
|
| |||||||||||
Portugal — 0.1% | ||||||||||||
Caixa Geral de Depositos MTN | ||||||||||||
3.000%, 01/15/2019 | 300 | 428 | ||||||||||
|
| |||||||||||
| 24 | SEI Institutional International Trust / Semi-Annual Report / March 31, 2014 |
Table of Contents
| Description | Face Amount (1) (Thousands) | Market Value ($ Thousands) | ||||||||||
Qatar — 0.1% | ||||||||||||
State of Qatar | ||||||||||||
4.500%, 01/20/2022 (A) | USD | 390 | $ | 424 | ||||||||
|
| |||||||||||
Russia — 0.3% | ||||||||||||
Gazprom OAO Via Gaz Capital MTN | ||||||||||||
3.600%, 02/26/2021 | EUR | 900 | 1,219 | |||||||||
Severstal OAO Via Steel Capital MTN | ||||||||||||
4.450%, 03/19/2018 (A) | USD | 320 | 311 | |||||||||
|
| |||||||||||
| 1,530 | ||||||||||||
|
| |||||||||||
Singapore — 0.2% | ||||||||||||
Government of Singapore | ||||||||||||
4.000%, 09/01/2018 | 495 | 440 | ||||||||||
3.125%, 09/01/2022 | 275 | 230 | ||||||||||
Temasek Financial I MTN | ||||||||||||
2.375%, 01/23/2023 (A) | USD | 495 | 456 | |||||||||
|
| |||||||||||
| 1,126 | ||||||||||||
|
| |||||||||||
South Africa — 0.3% | ||||||||||||
Gold Fields Orogen Holding | ||||||||||||
4.875%, 10/07/2020 | USD | 400 | 346 | |||||||||
Republic of South Africa | ||||||||||||
10.500%, 12/21/2026 | 2,500 | 276 | ||||||||||
8.250%, 09/15/2017 | 6,600 | 640 | ||||||||||
|
| |||||||||||
| 1,262 | ||||||||||||
|
| |||||||||||
South Korea — 0.6% | ||||||||||||
Korea National Oil | ||||||||||||
3.125%, 04/03/2017 (A) | USD | 540 | 563 | |||||||||
Korea Treasury Bond | ||||||||||||
4.250%, 06/10/2021 | 1,009,870 | 1,001 | ||||||||||
4.000%, 12/10/2031 | 350,000 | 341 | ||||||||||
3.500%, 09/10/2016 | 973,960 | 928 | ||||||||||
|
| |||||||||||
| 2,833 | ||||||||||||
|
| |||||||||||
Spain — 4.2% | ||||||||||||
Ayt Cedulas Cajas Global | ||||||||||||
3.750%, 12/14/2022 | 200 | 285 | ||||||||||
Ayt Cedulas Cajas X Fondo de Titulizacion | ||||||||||||
0.383%, 06/30/2015 (C) | 200 | 273 | ||||||||||
Banco de Sabadell | ||||||||||||
3.375%, 01/23/2018 | 100 | 147 | ||||||||||
Banco Popular Espanol | ||||||||||||
4.000%, 10/18/2016 | 100 | 147 | ||||||||||
3.750%, 01/22/2019 | 100 | 148 | ||||||||||
Bankia | ||||||||||||
4.000%, 02/03/2025 | 300 | 440 | ||||||||||
| Description | Face Amount (1) (Thousands) | Market Value ($ Thousands) | ||||||||||
Ferrovial Emisiones MTN | ||||||||||||
3.375%, 06/07/2021 | 475 | $ | 687 | |||||||||
Fondo de Amortizaciondel Deficit Electrico | ||||||||||||
4.125%, 03/17/2017 | 200 | 298 | ||||||||||
2.250%, 12/17/2016 | 700 | 992 | ||||||||||
Government of Spain | ||||||||||||
6.000%, 01/31/2029 | 465 | 803 | ||||||||||
5.850%, 01/31/2022 | 110 | 184 | ||||||||||
5.500%, 07/30/2017 | 315 | 493 | ||||||||||
5.500%, 04/30/2021 | 1,980 | 3,242 | ||||||||||
4.850%, 10/31/2020 | 1,740 | 2,751 | ||||||||||
4.700%, 07/30/2041 | 230 | 345 | ||||||||||
4.500%, 01/31/2018 | 2,680 | 4,105 | ||||||||||
4.100%, 07/30/2018 | 150 | 228 | ||||||||||
4.000%, 04/30/2020 | 100 | 152 | ||||||||||
3.800%, 04/30/2024 | 1,000 | 1,444 | ||||||||||
3.300%, 10/31/2014 | 475 | 665 | ||||||||||
3.150%, 01/31/2016 | 600 | 863 | ||||||||||
Santander Consumer Finance | ||||||||||||
3.875%, 03/23/2016 | 200 | 291 | ||||||||||
Santander International Debt MTN | ||||||||||||
4.625%, 03/21/2016 | 700 | 1,029 | ||||||||||
Telefonica Emisiones MTN | ||||||||||||
5.597%, 03/12/2020 | GBP | 100 | 182 | |||||||||
|
| |||||||||||
| 20,194 | ||||||||||||
|
| |||||||||||
Supra-National — 1.4% | ||||||||||||
European Financial Stability Facility | ||||||||||||
1.625%, 07/17/2020 | 1,700 | 2,380 | ||||||||||
European Investment Bank MTN | ||||||||||||
4.250%, 04/15/2019 | 740 | 1,185 | ||||||||||
2.750%, 09/15/2021 | 1,000 | 1,497 | ||||||||||
1.375%, 09/15/2021 | 575 | 784 | ||||||||||
European Stability Mechanism MTN | ||||||||||||
1.375%, 03/04/2021 | 850 | 1,169 | ||||||||||
|
| |||||||||||
| 7,015 | ||||||||||||
|
| |||||||||||
Sweden — 2.1% | ||||||||||||
Akzo Nobel Sweden Finance MTN | ||||||||||||
2.625%, 07/27/2022 | EUR | 150 | 211 | |||||||||
Kingdom of Sweden, Ser 1050 | ||||||||||||
3.000%, 07/12/2016 | 4,000 | 647 | ||||||||||
Kingdom of Sweden, Ser 1051 | ||||||||||||
3.750%, 08/12/2017 | 4,870 | 817 | ||||||||||
Kingdom of Sweden, Ser 1052 | ||||||||||||
4.250%, 03/12/2019 | 21,035 | 3,679 | ||||||||||
| SEI Institutional International Trust / Semi-Annual Report / March 31, 2014 | 25 |
Table of Contents
SCHEDULE OF INVESTMENTS (Unaudited)
International Fixed Income Fund (Continued)
March 31, 2014
| Description | Face Amount (1) (Thousands) | Market Value ($ Thousands) | ||||||||||
Kingdom of Sweden, Ser 1054 | ||||||||||||
3.500%, 06/01/2022 | 5,835 | $ | 1,004 | |||||||||
Kingdom of Sweden, Ser 3105 | ||||||||||||
3.500%, 12/01/2015 | 4,183 | 690 | ||||||||||
Nordea Bank MTN | ||||||||||||
4.500%, 03/26/2020 | EUR | 225 | 350 | |||||||||
4.000%, 03/29/2021 | EUR | 255 | 386 | |||||||||
Skandinaviska Enskilda Banken MTN | ||||||||||||
4.000%, 09/12/2022 (C) | EUR | 190 | 281 | |||||||||
1.875%, 11/14/2019 | EUR | 175 | 244 | |||||||||
1.375%, 05/29/2018 (A) | USD | 300 | 294 | |||||||||
Svenska Handelsbanken | ||||||||||||
2.656%, 01/15/2024 (C) | EUR | 651 | 913 | |||||||||
Swedbank Hypotek | ||||||||||||
1.125%, 05/07/2020 | EUR | 100 | 137 | |||||||||
Telefonaktiebolaget LM Ericsson | ||||||||||||
4.125%, 05/15/2022 | USD | 465 | 475 | |||||||||
|
| |||||||||||
| 10,128 | ||||||||||||
|
| |||||||||||
Switzerland — 0.8% | ||||||||||||
Credit Suisse MTN | ||||||||||||
5.750%, 09/18/2025 (C) | EUR | 250 | 376 | |||||||||
4.750%, 08/05/2019 | EUR | 400 | 639 | |||||||||
Government of Switzerland | ||||||||||||
2.000%, 04/28/2021 | 1,070 | 1,336 | ||||||||||
1.500%, 04/30/2042 | 120 | 136 | ||||||||||
UBS MTN | ||||||||||||
6.625%, 04/11/2018 | GBP | 150 | 292 | |||||||||
6.375%, 07/20/2016 | GBP | 160 | 295 | |||||||||
4.750%, 02/12/2026 (C) | EUR | 500 | 707 | |||||||||
4.280%, 04/29/2049 (C) | EUR | 200 | 280 | |||||||||
|
| |||||||||||
| 4,061 | ||||||||||||
|
| |||||||||||
Thailand — 0.1% | ||||||||||||
Thailand Government Bond | ||||||||||||
3.650%, 12/17/2021 | THB | 16,020 | 497 | |||||||||
|
| |||||||||||
Turkey — 0.1% | ||||||||||||
Akbank | ||||||||||||
3.875%, 10/24/2017 (A) | USD | 380 | 376 | |||||||||
Republic of Turkey | ||||||||||||
7.500%, 11/07/2019 | USD | 275 | 315 | |||||||||
Turkey Government International Bond | ||||||||||||
5.500%, 02/16/2017 | EUR | 50 | 75 | |||||||||
|
| |||||||||||
| 766 | ||||||||||||
|
| |||||||||||
United Arab Emirates — 0.2% | ||||||||||||
Abu Dhabi National Energy | ||||||||||||
3.625%, 01/12/2023 (A) | USD | 400 | 392 | |||||||||
| Description | Face Amount (1) (Thousands) | Market Value ($ Thousands) | ||||||||||
IPIC GMTN MTN | ||||||||||||
6.875%, 03/14/2026 | GBP | 100 | $ | 208 | ||||||||
5.875%, 03/14/2021 | EUR | 125 | 211 | |||||||||
|
| |||||||||||
| 811 | ||||||||||||
|
| |||||||||||
United Kingdom —14.5% | ||||||||||||
AA Bond | ||||||||||||
4.720%, 07/02/2043 | 500 | 872 | ||||||||||
Abbey National Treasury Services MTN | ||||||||||||
5.500%, 06/18/2014 | 775 | 1,304 | ||||||||||
5.250%, 02/16/2029 | 450 | 864 | ||||||||||
5.125%, 04/14/2021 | 300 | 565 | ||||||||||
4.250%, 04/12/2021 | EUR | 350 | 569 | |||||||||
3.625%, 09/08/2016 | EUR | 300 | 444 | |||||||||
3.375%, 06/08/2015 | EUR | 500 | 713 | |||||||||
2.000%, 01/14/2019 | EUR | 400 | 558 | |||||||||
1.750%, 01/15/2018 | EUR | 525 | 733 | |||||||||
Aviva MTN | ||||||||||||
6.875%, 05/22/2038 (C) | EUR | 195 | 310 | |||||||||
6.125%, 07/05/2043 (C) | EUR | 225 | 356 | |||||||||
Bank of Scotland MTN | ||||||||||||
4.750%, 06/08/2022 | EUR | 290 | 492 | |||||||||
4.625%, 06/08/2017 | EUR | 275 | 426 | |||||||||
Barclays Bank MTN | ||||||||||||
6.750%, 01/16/2023 (C) | 350 | 642 | ||||||||||
6.625%, 03/30/2022 | EUR | 200 | 335 | |||||||||
4.250%, 01/12/2022 | 250 | 448 | ||||||||||
Barclays Bank, Ser E MTN | ||||||||||||
6.000%, 01/23/2018 | EUR | 150 | 236 | |||||||||
BAT International Finance MTN | ||||||||||||
7.250%, 03/12/2024 | 250 | 531 | ||||||||||
5.375%, 06/29/2017 | EUR | 425 | 666 | |||||||||
Bishopsgate Asset Finance | ||||||||||||
4.808%, 08/14/2044 | 186 | 286 | ||||||||||
BP Capital Markets MTN | ||||||||||||
3.830%, 10/06/2017 | EUR | 350 | 528 | |||||||||
2.994%, 02/18/2019 | EUR | 162 | 239 | |||||||||
2.972%, 02/27/2026 | EUR | 300 | 417 | |||||||||
2.500%, 11/06/2022 | USD | 400 | 373 | |||||||||
2.177%, 09/28/2021 | EUR | 545 | 753 | |||||||||
British American Tobacco Holdings MTN | ||||||||||||
4.000%, 07/07/2020 | 100 | 156 | ||||||||||
British Telecommunications MTN | ||||||||||||
6.375%, 06/23/2037 | 120 | 242 | ||||||||||
5.750%, 12/07/2028 | 111 | 209 | ||||||||||
Channel Link Enterprises Finance | ||||||||||||
3.643%, 06/30/2050 (C) | EUR | 700 | 943 | |||||||||
Coventry Building Society MTN | ||||||||||||
4.625%, 04/19/2018 | 230 | 419 | ||||||||||
| 26 | SEI Institutional International Trust / Semi-Annual Report / March 31, 2014 |
Table of Contents
| Description | Face Amount (1) (Thousands) | Market Value ($ Thousands) | ||||||||||
Direct Line Insurance Group | ||||||||||||
9.250%, 04/27/2042 (C) | 100 | $ | 211 | |||||||||
Eastern Power Networks MTN | ||||||||||||
6.250%, 11/12/2036 | 160 | 323 | ||||||||||
ENW Finance MTN | ||||||||||||
6.125%, 07/21/2021 | 350 | 678 | ||||||||||
Eversholt Funding MTN | ||||||||||||
5.831%, 12/02/2020 | 100 | 189 | ||||||||||
Experian Finance MTN | ||||||||||||
4.750%, 02/04/2020 | EUR | 425 | 678 | |||||||||
FCE Bank MTN | ||||||||||||
5.125%, 11/16/2015 | 200 | 352 | ||||||||||
4.825%, 02/15/2017 | 200 | 357 | ||||||||||
1.875%, 05/12/2016 | EUR | 250 | 350 | |||||||||
1.625%, 09/09/2016 | EUR | 100 | 139 | |||||||||
First Hydro Finance | ||||||||||||
9.000%, 07/31/2021 | 220 | 480 | ||||||||||
Gatwick Funding MTN | ||||||||||||
5.750%, 01/23/2037 | 250 | 467 | ||||||||||
Great Rolling Stock MTN | ||||||||||||
6.250%, 07/27/2020 | 300 | 575 | ||||||||||
Heathrow Funding MTN | ||||||||||||
7.125%, 02/14/2024 | 150 | 299 | ||||||||||
HJ Heinz Finance UK | ||||||||||||
6.250%, 02/18/2030 | 115 | 194 | ||||||||||
HSBC Bank MTN | ||||||||||||
4.750%, 09/29/2020 (C) | 225 | 386 | ||||||||||
4.125%, 08/12/2020 | USD | 375 | 397 | |||||||||
HSBC Holdings MTN | ||||||||||||
6.500%, 05/20/2024 | 250 | 509 | ||||||||||
Imperial Tobacco Finance MTN | ||||||||||||
8.375%, 02/17/2016 | EUR | 575 | 901 | |||||||||
7.750%, 06/24/2019 | 600 | 1,216 | ||||||||||
7.250%, 09/15/2014 | EUR | 150 | 213 | |||||||||
3.375%, 02/26/2026 | EUR | 400 | 556 | |||||||||
2.250%, 02/26/2021 | EUR | 400 | 549 | |||||||||
Intu SGS Finance MTN | ||||||||||||
3.875%, 03/17/2023 (D) | 250 | 410 | ||||||||||
Lloyds TSB Bank MTN | ||||||||||||
6.500%, 03/24/2020 | EUR | 275 | 454 | |||||||||
4.625%, 02/02/2017 | EUR | 420 | 638 | |||||||||
Mondi Finance MTN | ||||||||||||
3.375%, 09/28/2020 | EUR | 400 | 581 | |||||||||
Motability Operations Group MTN | ||||||||||||
3.750%, 11/29/2017 | EUR | 300 | 451 | |||||||||
National Westminster Bank | ||||||||||||
6.500%, 09/07/2021 | 220 | 400 | ||||||||||
Nationwide Building Society | ||||||||||||
4.625%, 02/08/2021 | EUR | 550 | 918 | |||||||||
4.125%, 03/20/2023 (C) | EUR | 1,200 | 1,744 | |||||||||
3.125%, 10/13/2016 | EUR | 175 | 257 | |||||||||
Network Rail Infrastructure Finance MTN | ||||||||||||
4.400%, 03/06/2016 | CAD | 690 | 660 | |||||||||
| Description | Face Amount (1) (Thousands) | Market Value ($ Thousands) | ||||||||||
Northern Rock | ||||||||||||
5.625%, 06/22/2017 (A) | USD | 1,750 | $ | 1,958 | ||||||||
Northumbrian Water Finance | ||||||||||||
6.875%, 02/06/2023 | 190 | 385 | ||||||||||
6.000%, 10/11/2017 | 500 | 940 | ||||||||||
RL Finance Bonds No. 2 | ||||||||||||
6.125%, 11/30/2043 (C) | 100 | 168 | ||||||||||
Rolls-Royce | ||||||||||||
6.750%, 04/30/2019 | 100 | 198 | ||||||||||
Royal Bank of Scotland | ||||||||||||
9.500%, 03/16/2022 (C) | USD | 200 | 234 | |||||||||
6.934%, 04/09/2018 | EUR | 300 | 472 | |||||||||
5.500%, 03/23/2020 | EUR | 200 | 325 | |||||||||
5.125%, 01/13/2024 | 400 | 756 | ||||||||||
Severn Trent Utilities Finance | ||||||||||||
6.125%, 02/26/2024 | 195 | 382 | ||||||||||
Southern Gas Networks MTN | ||||||||||||
4.875%, 10/05/2023 | 215 | 384 | ||||||||||
Standard Chartered MTN | ||||||||||||
4.000%, 07/12/2022 (C) | USD | 390 | 397 | |||||||||
Standard Life MTN | ||||||||||||
5.500%, 12/04/2042 (C) | 250 | 435 | ||||||||||
5.314%, 01/06/2049 (C) | EUR | 230 | 322 | |||||||||
Tesco MTN | ||||||||||||
6.125%, 02/24/2022 | 300 | 569 | ||||||||||
United Kingdom Gilt | ||||||||||||
4.500%, 12/07/2042 | 1,900 | 3,757 | ||||||||||
4.250%, 06/07/2032 | 180 | 339 | ||||||||||
4.250%, 12/07/2055 | 280 | 548 | ||||||||||
3.250%, 01/22/2044 | 390 | 618 | ||||||||||
2.250%, 09/07/2023 | 980 | 1,567 | ||||||||||
1.750%, 07/22/2019 | 400 | 560 | ||||||||||
1.750%, 09/07/2022 | 1,135 | 1,772 | ||||||||||
1.250%, 07/22/2018 | 735 | 1,203 | ||||||||||
1.000%, 09/07/2017 | 575 | 947 | ||||||||||
United Kingdom Treasury | ||||||||||||
4.750%, 12/07/2030 | 1,240 | 2,469 | ||||||||||
4.250%, 03/07/2036 | 875 | 1,644 | ||||||||||
4.250%, 09/07/2039 | 720 | 1,359 | ||||||||||
4.000%, 03/07/2022 | 3,900 | 7,227 | ||||||||||
2.000%, 01/22/2016 | 533 | 909 | ||||||||||
1.750%, 01/22/2017 | 1,670 | 2,833 | ||||||||||
Voyage Care Bondco | ||||||||||||
6.500%, 08/01/2018 | 150 | 261 | ||||||||||
Wales & West Utilities Finance MTN | ||||||||||||
6.750%, 12/17/2036 (C) | 200 | 381 | ||||||||||
Western Power Distribution South West | ||||||||||||
5.750%, 03/23/2040 | 200 | 381 | ||||||||||
Western Power Distribution West Midlands | ||||||||||||
3.875%, 10/17/2024 | 230 | 377 | ||||||||||
WPP Finance MTN | ||||||||||||
3.000%, 11/20/2023 | EUR | 123 | 175 | |||||||||
| SEI Institutional International Trust / Semi-Annual Report / March 31, 2014 | 27 |
Table of Contents
SCHEDULE OF INVESTMENTS (Unaudited)
International Fixed Income Fund (Continued)
March 31, 2014
| Description | Face Amount (1) (Thousands) | Market Value ($ Thousands) | ||||||||||
Yorkshire Power Finance | ||||||||||||
7.250%, 08/04/2028 | 208 | $ | 434 | |||||||||
Yorkshire Water Services Bradford Finance | ||||||||||||
6.375%, 08/19/2039 | 100 | 207 | ||||||||||
|
| |||||||||||
| 70,054 | ||||||||||||
|
| |||||||||||
United States — 6.0% | ||||||||||||
21st Century Fox America | ||||||||||||
4.500%, 02/15/2021 | 75 | 81 | ||||||||||
4.000%, 10/01/2023 | 59 | 60 | ||||||||||
3.000%, 09/15/2022 | 111 | 107 | ||||||||||
AbbVie | ||||||||||||
4.400%, 11/06/2042 | 90 | 88 | ||||||||||
2.900%, 11/06/2022 | 255 | 245 | ||||||||||
1.750%, 11/06/2017 | 49 | 49 | ||||||||||
Aetna | ||||||||||||
2.750%, 11/15/2022 | 165 | 155 | ||||||||||
Altria Group | ||||||||||||
4.750%, 05/05/2021 | 180 | 196 | ||||||||||
4.250%, 08/09/2042 | 265 | 235 | ||||||||||
American Equity Investment Life Holding | ||||||||||||
6.625%, 07/15/2021 | 144 | 154 | ||||||||||
American International Group | ||||||||||||
8.175%, 05/15/2058 (C) | 240 | 315 | ||||||||||
5.850%, 01/16/2018 | 245 | 280 | ||||||||||
American Tower | ||||||||||||
3.400%, 02/15/2019 (D) | 390 | 400 | ||||||||||
AT&T | ||||||||||||
5.875%, 04/28/2017 | GBP | 200 | 370 | |||||||||
4.875%, 06/01/2044 | GBP | 230 | 374 | |||||||||
Bank of America MTN | ||||||||||||
1.875%, 01/10/2019 | 280 | 390 | ||||||||||
Barrick North America Finance | ||||||||||||
4.400%, 05/30/2021 | 189 | 190 | ||||||||||
Bristol-Myers Squibb | ||||||||||||
2.000%, 08/01/2022 | 670 | 609 | ||||||||||
Chevron | ||||||||||||
2.355%, 12/05/2022 | 810 | 761 | ||||||||||
Citigroup | ||||||||||||
5.000%, 08/02/2019 | EUR | 230 | 369 | |||||||||
4.450%, 01/10/2017 | 250 | 270 | ||||||||||
Denbury Resources | ||||||||||||
4.625%, 07/15/2023 | 78 | 73 | ||||||||||
Discovery Communications | ||||||||||||
2.375%, 03/07/2022 | 350 | 480 | ||||||||||
DISH DBS | ||||||||||||
5.000%, 03/15/2023 | 150 | 151 | ||||||||||
Dollar General | ||||||||||||
3.250%, 04/15/2023 | 400 | 378 | ||||||||||
Dover MTN | ||||||||||||
2.125%, 12/01/2020 | 250 | 348 | ||||||||||
| Description | Face Amount (1) (Thousands) | Market Value ($ Thousands) | ||||||||||
General Electric | ||||||||||||
2.700%, 10/09/2022 | 320 | $ | 310 | |||||||||
General Electric Capital MTN | ||||||||||||
5.500%, 01/08/2020 | 305 | 351 | ||||||||||
5.300%, 02/11/2021 | 205 | 231 | ||||||||||
4.625%, 01/07/2021 | 750 | 826 | ||||||||||
Glencore Funding | ||||||||||||
4.125%, 05/30/2023 (A) | 250 | 239 | ||||||||||
Goldman Sachs Group MTN | ||||||||||||
4.250%, 01/29/2026 | 190 | 318 | ||||||||||
2.625%, 08/19/2020 | EUR | 350 | 494 | |||||||||
Intelsat Jackson Holdings | ||||||||||||
5.500%, 08/01/2023 (A) | 240 | 235 | ||||||||||
International Business Machines MTN | ||||||||||||
1.375%, 11/19/2019 | EUR | 250 | 344 | |||||||||
John Deere Bank MTN | ||||||||||||
1.500%, 07/16/2018 | 250 | 349 | ||||||||||
JPMorgan Chase Bank | ||||||||||||
0.997%, 05/31/2017 (C) | EUR | 1,250 | 1,704 | |||||||||
JPMorgan Chase MTN | ||||||||||||
0.682%, 10/12/2015 (C) | EUR | 350 | 479 | |||||||||
Kroger | ||||||||||||
3.400%, 04/15/2022 | 33 | 33 | ||||||||||
Macy’s Retail Holdings | ||||||||||||
3.875%, 01/15/2022 | 164 | 169 | ||||||||||
MCE Finance | ||||||||||||
5.000%, 02/15/2021 (A) | 250 | 250 | ||||||||||
Merrill Lynch MTN | ||||||||||||
0.854%, 09/14/2018 (C) | EUR | 375 | 496 | |||||||||
Metropolitan Life Global Funding I MTN | ||||||||||||
4.625%, 05/16/2017 | EUR | 200 | 305 | |||||||||
Mondelez International | ||||||||||||
2.375%, 01/26/2021 | 400 | 557 | ||||||||||
1.125%, 01/26/2017 | 650 | 897 | ||||||||||
Morgan Stanley MTN | ||||||||||||
5.375%, 08/10/2020 | EUR | 150 | 245 | |||||||||
3.750%, 09/21/2017 | EUR | 350 | 521 | |||||||||
2.375%, 03/31/2021 | 1,250 | 1,723 | ||||||||||
Motorola Solutions | ||||||||||||
3.500%, 03/01/2023 | 178 | 170 | ||||||||||
Nissan Motor Acceptance | ||||||||||||
2.350%, 03/04/2019 (A) | 540 | 535 | ||||||||||
Nabors Industries | ||||||||||||
5.100%, 09/15/2023 (A) | 280 | 290 | ||||||||||
Noble Holding International | ||||||||||||
4.900%, 08/01/2020 | 25 | 27 | ||||||||||
Offshore Group Investment | ||||||||||||
7.125%, 04/01/2023 | 218 | 222 | ||||||||||
Owens Corning | ||||||||||||
6.500%, 12/01/2016 | 145 | 160 | ||||||||||
Philip Morris International MTN | ||||||||||||
2.900%, 11/15/2021 | 325 | 321 | ||||||||||
| 28 | SEI Institutional International Trust / Semi-Annual Report / March 31, 2014 |
Table of Contents
| Description | Face Amount (1) Thousands) | Market Value ($ Thousands) | ||||||||||
2.875%, 05/30/2024 | EUR | 100 | $ | 142 | ||||||||
2.875%, 03/03/2026 | 435 | 598 | ||||||||||
2.125%, 05/30/2019 | EUR | 100 | 142 | |||||||||
PNC Funding | ||||||||||||
5.125%, 02/08/2020 | �� | 300 | 338 | |||||||||
3.300%, 03/08/2022 | 150 | 151 | ||||||||||
Principal Financial Group | ||||||||||||
1.850%, 11/15/2017 | 175 | 176 | ||||||||||
Procter & Gamble | ||||||||||||
2.000%, 11/05/2021 | 150 | 209 | ||||||||||
Prologis | ||||||||||||
3.375%, 02/20/2024 | 300 | 423 | ||||||||||
3.000%, 01/18/2022 | 450 | 634 | ||||||||||
Prologis International | ||||||||||||
2.875%, 04/04/2022 (B) | 220 | 302 | ||||||||||
Prudential Financial | ||||||||||||
5.625%, 06/15/2043 (C) | 545 | 556 | ||||||||||
Rabobank Capital Funding Trust IV | ||||||||||||
5.556%, 12/31/2019 (C) | GBP | 153 | 267 | |||||||||
Regency Energy Partners | ||||||||||||
4.500%, 11/01/2023 | 72 | 67 | ||||||||||
Republic Services | ||||||||||||
4.750%, 05/15/2023 | 155 | 165 | ||||||||||
Reynolds American | ||||||||||||
3.250%, 11/01/2022 | 361 | 340 | ||||||||||
Ryder System MTN | ||||||||||||
5.850%, 11/01/2016 | 116 | 129 | ||||||||||
Simon Property Group | ||||||||||||
2.375%, 10/02/2020 (B) (D) | EUR | 400 | 564 | |||||||||
Sirius XM Radio | ||||||||||||
4.625%, 05/15/2023 (A) | 254 | 239 | ||||||||||
Societe Generale | ||||||||||||
5.922%, 04/05/2017 (A) (C) | 180 | 191 | ||||||||||
Sprint | ||||||||||||
7.875%, 09/15/2023 (A) | 187 | 206 | ||||||||||
Sun Merger Sub | ||||||||||||
5.875%, 08/01/2021 (A) | 153 | 159 | ||||||||||
Time Warner Cable | ||||||||||||
5.750%, 06/02/2031 | 250 | 448 | ||||||||||
5.250%, 07/15/2042 | 400 | 668 | ||||||||||
T-Mobile USA | ||||||||||||
6.625%, 04/01/2023 | 230 | 244 | ||||||||||
Transocean | ||||||||||||
2.500%, 10/15/2017 | 173 | 174 | ||||||||||
UBS MTN | ||||||||||||
5.875%, 12/20/2017 | USD | 247 | 283 | |||||||||
United Technologies | ||||||||||||
1.800%, 06/01/2017 | 201 | 204 | ||||||||||
UnitedHealth Group | ||||||||||||
2.750%, 02/15/2023 | 120 | 113 | ||||||||||
Verizon Communications | ||||||||||||
6.550%, 09/15/2043 | 200 | 243 | ||||||||||
| Description | Face Amount (1) Thousands) | Market Value ($ Thousands) | ||||||||
Viacom | ||||||||||
3.875%, 04/01/2024 | 148 | $ | 148 | |||||||
WellPoint | ||||||||||
4.650%, 01/15/2043 | 110 | 107 | ||||||||
2.300%, 07/15/2018 | 150 | 150 | ||||||||
Wells Fargo MTN | ||||||||||
4.600%, 04/01/2021 | 75 | 83 | ||||||||
3.500%, 03/08/2022 | 235 | 240 | ||||||||
Williams Partners | ||||||||||
5.250%, 03/15/2020 | 89 | 98 | ||||||||
Windstream | ||||||||||
7.500%, 04/01/2023 | 255 | 268 | ||||||||
|
| |||||||||
| 29,398 | ||||||||||
|
| |||||||||
Total Global Bonds | 454,792 | |||||||||
|
| |||||||||
MORTGAGE-BACKED SECURITIES — 2.2% |
| |||||||||
Agency Mortgage-Backed Obligation — 0.0% |
| |||||||||
FHLMC, Ser K501, Cl X1A, IO | ||||||||||
1.741%, 08/25/2016 (C) (F) | 317 | 9 | ||||||||
|
| |||||||||
Non-Agency Mortgage-Backed Obligation — 2.2% |
| |||||||||
BB-UBS Trust, | ||||||||||
3.430%, 11/05/2036 (A) | 100 | 96 | ||||||||
Bear Stearns Adjustable Rate Mortgage Trust, Ser 2004-6, Cl 3A | ||||||||||
5.205%, 09/25/2034 (A) (C) | 103 | 101 | ||||||||
Bear Stearns Commercial Mortgage | ||||||||||
5.405%, 12/11/2040 (C) | 175 | 184 | ||||||||
Bear Stearns Commercial Mortgage | ||||||||||
4.674%, 06/11/2041 | 48 | 50 | ||||||||
Bear Stearns Commercial Mortgage | ||||||||||
4.871%, 09/11/2042 | 25 | 26 | ||||||||
Bear Stearns Commercial Mortgage | ||||||||||
5.138%, 10/12/2042 (C) | 40 | 42 | ||||||||
Bear Stearns Commercial Mortgage | ||||||||||
5.577%, 04/12/2038 (C) | 124 | 133 | ||||||||
Bear Stearns Commercial Mortgage | ||||||||||
5.537%, 10/12/2041 | 223 | 243 | ||||||||
Bear Stearns Commercial Mortgage | ||||||||||
5.716%, 06/11/2040 (C) | 241 | 269 | ||||||||
Bear Stearns Commercial Mortgage | ||||||||||
5.694%, 06/11/2050 (C) | 110 | 123 | ||||||||
Bear Stearns Commercial Mortgage | ||||||||||
5.471%, 01/12/2045 (C) | 66 | 73 | ||||||||
| SEI Institutional International Trust / Semi-Annual Report / March 31, 2014 | 29 |
Table of Contents
SCHEDULE OF INVESTMENTS (Unaudited)
International Fixed Income Fund (Continued)
March 31, 2014
| Description | Face Amount (1) (Thousands) | Market Value ($ Thousands) | ||||||||
CD Mortgage Trust, | ||||||||||
5.886%, 11/15/2044 (C) | 112 | $ | 126 | |||||||
Citigroup Commercial Mortgage | ||||||||||
5.784%, 03/15/2049 (C) | 155 | 168 | ||||||||
Citigroup Commercial Mortgage | ||||||||||
6.136%, 12/10/2049 (C) | 570 | 641 | ||||||||
Citigroup Commercial Mortgage | ||||||||||
4.371%, 09/10/2046 (C) | 115 | 122 | ||||||||
Citigroup Mortgage Loan Trust, | ||||||||||
2.614%, 05/25/2035 (A) (C) | 644 | 620 | ||||||||
COMM Mortgage Trust, | ||||||||||
5.768%, 06/10/2046 (C) | 129 | 140 | ||||||||
COMM Mortgage Trust, | ||||||||||
4.237%, 07/10/2045 (C) | 35 | 37 | ||||||||
COMM Mortgage Trust, | ||||||||||
3.213%, 03/10/2046 | 90 | 88 | ||||||||
COMM Mortgage Trust, | ||||||||||
3.334%, 06/10/2046 | 130 | 128 | ||||||||
COMM Mortgage Trust, | ||||||||||
4.022%, 07/10/2045 | 50 | 52 | ||||||||
COMM Mortgage Trust, | ||||||||||
3.955%, 02/10/2047 | 70 | 72 | ||||||||
Commercial Mortgage Loan Trust, | ||||||||||
6.009%, 12/10/2049 (C) | 170 | 188 | ||||||||
Credit Suisse First Boston Mortgage | ||||||||||
4.877%, 04/15/2037 | 85 | 86 | ||||||||
CW Capital Cobalt, | ||||||||||
5.223%, 08/15/2048 | 50 | 53 | ||||||||
Eddystone Finance, | ||||||||||
1.045%, 04/19/2021 (C) (F) | 133 | 219 | ||||||||
FNMA Connecticut Avenue Securities, Ser 2013-C01, Cl M1 | ||||||||||
2.154%, 10/25/2023 (A) (C) | 141 | 144 | ||||||||
FNMA Connecticut Avenue Securities, Ser 2014-C01, Cl M1 | ||||||||||
1.754%, 01/25/2024(A) (C) | 359 | 362 | ||||||||
| Description | Face Amount (1) (Thousands) | Market Value ($ Thousands) | ||||||||||
Fosse Master Issuer, | ||||||||||||
1.920%, 10/18/2054(A) (C) | 202 | $ | 337 | |||||||||
GE Capital Commercial Mortgage, | ||||||||||||
5.309%, 11/10/2045 (C) | 55 | 58 | ||||||||||
GMAC Commercial Mortgage Securities Trust, | ||||||||||||
5.238%, 11/10/2045 (C) | 101 | 105 | ||||||||||
Goldman Sachs Mortgage Securities Trust, | ||||||||||||
4.866%, 04/10/2047 (B) | 80 | 73 | ||||||||||
Granite Master Issuer, | ||||||||||||
0.414%, 12/20/2054 (A) (C) (F) | EUR | 121 | 165 | |||||||||
Granite Master Issuer, | ||||||||||||
0.434%, 12/20/2054 (A) (C) (F) | EUR | 238 | 325 | |||||||||
Greenwich Capital Commercial Funding, Ser 2006-GG7, Cl A4 | ||||||||||||
5.820%, 07/10/2038 (C) | 143 | 155 | ||||||||||
Greenwich Capital Commercial Funding, Ser 2007-GG11, Cl A4 | ||||||||||||
5.736%, 12/10/2049 | 165 | 184 | ||||||||||
Greenwich Capital Commercial Funding, Ser 2007-GG9, Cl AM | ||||||||||||
5.475%, 03/10/2039 | 370 | 398 | ||||||||||
GS Mortgage Securities II, | ||||||||||||
5.366%, 05/03/2032 (A) | 50 | 56 | ||||||||||
GS Mortgage Securities II, | ||||||||||||
3.377%, 05/10/2045 | 60 | 61 | ||||||||||
GS Mortgage Securities II, | ||||||||||||
2.773%, 11/10/2045 | 125 | 119 | ||||||||||
GSR Mortgage Loan Trust, | ||||||||||||
4.853%, 01/25/2035 (A) (C) | 193 | 194 | ||||||||||
JPMorgan Chase Commercial Mortgage Securities, | ||||||||||||
5.244%, 01/12/2043 (C) | 85 | 90 | ||||||||||
JPMorgan Chase Commercial Mortgage Securities, | ||||||||||||
5.399%, 05/15/2045 | 79 | 86 | ||||||||||
| 30 | SEI Institutional International Trust / Semi-Annual Report / March 31, 2014 |
Table of Contents
| Description | Face Amount (1) (Thousands) | Market Value ($ Thousands) | ||||||||
JPMorgan Chase Commercial Mortgage Securities, | ||||||||||
5.698%, 02/12/2049 (C) | 145 | $ | 161 | |||||||
JPMorgan Chase Commercial Mortgage Securities, | ||||||||||
1.655%, 02/12/2051 (C) | 220 | 212 | ||||||||
JPMorgan Chase Commercial Mortgage Securities, | ||||||||||
2.829%, 10/15/2045 | 90 | 86 | ||||||||
JPMorgan Chase Commercial Mortgage Securities, | ||||||||||
4.668%, 10/15/2045 (A) (C) | 100 | 94 | ||||||||
JPMorgan Chase Commercial Mortgage Securities, | ||||||||||
5.009%, 12/15/2046 (A) (C) | 100 | 92 | ||||||||
JPMorgan Mortgage Trust, | ||||||||||
4.855%, 12/25/2034 (A) (C) | 129 | 130 | ||||||||
LB-UBS Commercial Mortgage Trust, Ser 2005-C5, Cl A4 | ||||||||||
4.954%, 09/15/2030 | 31 | 32 | ||||||||
LB-UBS Commercial Mortgage Trust, Ser 2007-C2, Cl A3 | ||||||||||
5.430%, 02/15/2040 | 87 | 95 | ||||||||
LB-UBS Commercial Mortgage Trust, Ser 2007-C6, Cl A4 | ||||||||||
5.858%, 07/15/2040 (C) | 179 | 191 | ||||||||
LB-UBS Commercial Mortgage Trust, Ser 2007-C7, Cl A3 | ||||||||||
5.866%, 09/15/2045 (C) | 64 | 73 | ||||||||
LB-UBS Commercial Mortgage Trust, Ser 2008-C1, Cl A2 | ||||||||||
6.157%, 04/15/2041 (C) | 51 | 58 | ||||||||
Merrill Lynch Mortgage Trust, | ||||||||||
5.047%, 07/12/2038 (C) | 125 | 131 | ||||||||
Merrill Lynch Mortgage Trust, | ||||||||||
5.282%, 11/12/2037 (C) | 112 | 118 | ||||||||
Merrill Lynch Mortgage Trust, | ||||||||||
5.291%, 01/12/2044 (C) | 88 | 94 | ||||||||
ML-CFC Commercial Mortgage Trust, Ser 2007-5, Cl A4 | ||||||||||
5.378%, 08/12/2048 | 114 | 123 | ||||||||
Morgan Stanley Capital I Trust, | ||||||||||
4.989%, 08/13/2042 | 166 | 171 | ||||||||
| Description | Face Amount (1) (Thousands) | Market Value ($ Thousands) | ||||||||
Morgan Stanley Capital I Trust, | ||||||||||
5.162%, 10/12/2052 (C) | 175 | $ | 185 | |||||||
Morgan Stanley Capital I Trust, | ||||||||||
5.692%, 04/15/2049 (C) | 65 | 72 | ||||||||
Morgan Stanley Capital I, | ||||||||||
5.809%, 12/12/2049 | 75 | 84 | ||||||||
Morgan Stanley Re-REMIC Trust, Ser 2010-GG10, Cl A4A | ||||||||||
5.806%, 08/15/2045 (A) (C) | 88 | 97 | ||||||||
Silverstone Master Issuer, | ||||||||||
1.970%, 01/21/2055 (A) (C) | 300 | 504 | ||||||||
UBS-Barclays Commercial Mortgage Trust, Ser 2013-C5, Cl D | ||||||||||
4.095%, 03/10/2046 (A) (C) | 35 | 31 | ||||||||
UBS-Barclays Commercial Mortgage Trust, Ser 2013-C5, Cl A4 | ||||||||||
3.185%, 03/10/2046 | 220 | 214 | ||||||||
UBS-Barclays Commercial Mortgage Trust, Ser 2013-C6, Cl A3 | ||||||||||
2.971%, 04/10/2046 | 70 | 67 | ||||||||
VNO Mortgage Trust, | ||||||||||
2.996%, 11/15/2030 (A) | 105 | 101 | ||||||||
Wachovia Bank Commercial Mortgage Trust, | ||||||||||
5.418%, 01/15/2045 (C) | 26 | 28 | ||||||||
Wells Fargo Commercial Mortgage Trust, Ser 2012-LC5, Cl D | ||||||||||
4.779%, 10/15/2045 (A) (C) | 10 | 9 | ||||||||
WFRBS Commercial Mortgage Trust, Ser 2011-C4, Cl A4 | ||||||||||
4.902%, 06/15/2044 (A) (C) | 175 | 193 | ||||||||
WFRBS Commercial Mortgage Trust, Ser 2013-C12, Cl A4 | ||||||||||
3.198%, 03/15/2048 | 60 | 59 | ||||||||
WFRBS Commerical Mortgage Trust, Ser 2013-C15, Cl A3 | ||||||||||
3.881%, 08/15/2046 | 70 | 72 | ||||||||
|
| |||||||||
| 10,569 | ||||||||||
|
| |||||||||
Total Mortgage-Backed Securities |
| 10,578 | ||||||||
|
| |||||||||
CORPORATE OBLIGATIONS — 1.2% |
| |||||||||
United States — 1.2% | ||||||||||
Anadarko Petroleum | ||||||||||
6.375%, 09/15/2017 | 330 | 378 | ||||||||
Bank of America MTN | ||||||||||
5.000%, 05/13/2021 | 175 | 193 | ||||||||
| SEI Institutional International Trust / Semi-Annual Report / March 31, 2014 | 31 |
Table of Contents
SCHEDULE OF INVESTMENTS (Unaudited)
International Fixed Income Fund (Continued)
March 31, 2014
| Description | Face Amount (1) (Thousands) | Market Value ($ Thousands) | ||||||||
CMS Energy | ||||||||||
5.050%, 03/15/2022 | 140 | $ | 156 | |||||||
CNA Financial | ||||||||||
7.250%, 11/15/2023 | 110 | 135 | ||||||||
6.500%, 08/15/2016 | 40 | 45 | ||||||||
Duke Realty | ||||||||||
6.750%, 03/15/2020 (D) | 140 | 163 | ||||||||
Enterprise Products Operating | ||||||||||
5.950%, 02/01/2041 | 100 | 114 | ||||||||
General Electric Capital MTN | ||||||||||
5.550%, 05/04/2020 | 45 | 52 | ||||||||
2.375%, 06/30/2015 | 150 | 153 | ||||||||
Humana | ||||||||||
7.200%, 06/15/2018 | 280 | 333 | ||||||||
Kinder Morgan Energy Partners | ||||||||||
6.850%, 02/15/2020 | 104 | 122 | ||||||||
3.500%, 09/01/2023 | 171 | 161 | ||||||||
2.650%, 02/01/2019 | 86 | 86 | ||||||||
Lincoln National | ||||||||||
8.750%, 07/01/2019 | 128 | 165 | ||||||||
McGraw Hill Financial | ||||||||||
5.900%, 11/15/2017 | 325 | 360 | ||||||||
Morgan Stanley | ||||||||||
3.450%, 11/02/2015 | 125 | 130 | ||||||||
Motorola Solutions | ||||||||||
7.500%, 05/15/2025 | 85 | 103 | ||||||||
Noble Energy | ||||||||||
8.250%, 03/01/2019 | 250 | 311 | ||||||||
PNC Bank | ||||||||||
2.700%, 11/01/2022 | 445 | 418 | ||||||||
Prudential Financial MTN | ||||||||||
6.100%, 06/15/2017 | 125 | 142 | ||||||||
Ryder System MTN | ||||||||||
7.200%, 09/01/2015 | 108 | 117 | ||||||||
SLM MTN | ||||||||||
5.500%, 01/15/2019 | 433 | 458 | ||||||||
Smithfield Foods | ||||||||||
6.625%, 08/15/2022 | 44 | 48 | ||||||||
Time Warner | ||||||||||
4.875%, 03/15/2020 | 150 | 165 | ||||||||
Time Warner Cable | ||||||||||
7.500%, 04/01/2014 | 385 | 385 | ||||||||
Total System Services | ||||||||||
2.375%, 06/01/2018 | 236 | 233 | ||||||||
Union Electric | ||||||||||
6.700%, 02/01/2019 | 45 | 54 | ||||||||
Viacom | ||||||||||
6.125%, 10/05/2017 | 325 | 373 | ||||||||
Williams Partners | ||||||||||
4.000%, 11/15/2021 | 150 | 153 | ||||||||
|
| |||||||||
Total Corporate Obligations |
| 5,706 | ||||||||
|
| |||||||||
ASSET-BACKED SECURITIES — 0.3% |
| |||||||||
Automotive — 0.2% | ||||||||||
Bavarian Sky, | ||||||||||
0.474%, 06/20/2020 (C) | 524 | 722 | ||||||||
|
| |||||||||
| Description | Face Amount (2) (Thousands) | Market Value ($ Thousands) | ||||||||||
Other Asset-Backed Securities — 0.1% |
| |||||||||||
Volta Electricity Receivables, | ||||||||||||
4.172%, 02/16/2017 | 242 | $ | 340 | |||||||||
|
| |||||||||||
Total Asset-Backed Securities |
| 1,062 | ||||||||||
|
| |||||||||||
U.S. TREASURY OBLIGATIONS — 0.2% |
| |||||||||||
U.S. Treasury Notes | ||||||||||||
2.000%, 02/15/2022 | 760 | 735 | ||||||||||
U.S. Treasury Bonds | ||||||||||||
3.125%, 02/15/2043 | 180 | 165 | ||||||||||
|
| |||||||||||
Total U.S. Treasury Obligations |
| 900 | ||||||||||
|
| |||||||||||
TIME DEPOSITS — 0.8% |
| |||||||||||
Brown Brothers Harriman | ||||||||||||
4.350%, 04/01/2014 | ZAR | 1 | — | |||||||||
1.950%, 04/01/2014 | NZD | 83 | 72 | |||||||||
1.929%, 04/01/2014 | AUD | 168 | 156 | |||||||||
0.550%, 04/01/2014 | NOK | 136 | 23 | |||||||||
0.278%, 04/01/2014 | CAD | 110 | 99 | |||||||||
0.100%, 04/01/2014 | SEK | 101 | 16 | |||||||||
0.076%, 04/01/2014 | EUR | 436 | 600 | |||||||||
0.048%, 04/01/2014 | GBP | 16 | 27 | |||||||||
0.030%, 04/01/2014 | 2,999 | 2,999 | ||||||||||
0.005%, 04/01/2014 | SGD | 1 | — | |||||||||
0.005%, 04/01/2014 | HKD | 2 | — | |||||||||
0.005%, 04/01/2014 | JPY | 9,349 | 91 | |||||||||
0.001%, 04/01/2014 | CHF | — | — | |||||||||
(0.100)%, 04/01/2014 | DKK | 12 | 2 | |||||||||
|
| |||||||||||
Total Time Deposits |
| 4,085 | ||||||||||
|
| |||||||||||
Total Investments — 98.6% |
| $ | 477,123 | |||||||||
|
| |||||||||||
A list of the open futures contracts held by the Fund at March 31, 2014, is as follows:
| Type of Contract | Number of Contracts Long (Short) | Expiration Date | Unrealized Appreciation (Depreciation) ($ Thousands) | |||||||||
10-YR MINI JGB | 2 | Jun-2014 | $ | — | ||||||||
Australian 10-Year Bond | 3 | Jun-2014 | 2 | |||||||||
Australian 3-Year Bond | 40 | Jun-2014 | (5 | ) | ||||||||
Canadian 10-Year Bond | (2 | ) | Jun-2014 | (1 | ) | |||||||
Canadian 10-Year Bond | 23 | Jun-2014 | 9 | |||||||||
Euro-Bobl | (59 | ) | Jun-2014 | (27 | ) | |||||||
Euro-BTP | 12 | Jun-2014 | 11 | |||||||||
Euro-Bund | 24 | Jun-2014 | 14 | |||||||||
Euro-Buxl 30 Year Bond | 22 | Jun-2014 | 29 | |||||||||
Euro-OAT | 11 | Jun-2014 | 17 | |||||||||
Euro-Schatz | 40 | Jun-2014 | (6 | ) | ||||||||
Japanese 10-Year Bond | 4 | Jun-2014 | (6 | ) | ||||||||
Long Gilt 10-Year Bond | 48 | Jun-2014 | 31 | |||||||||
U.S. 10-Year Treasury Note | (280 | ) | Jun-2014 | 105 | ||||||||
U.S. 2-Year Treasury Note | (65 | ) | Jun-2014 | 17 | ||||||||
U.S. 5-Year Treasury Note | 14 | Jun-2014 | (11 | ) | ||||||||
U.S. 5-Year Treasury Note | (43 | ) | Jun-2014 | (2 | ) | |||||||
U.S. Long Treasury Bond | (29 | ) | Jun-2014 | (32 | ) | |||||||
U.S. Ultra Long Treasury Bond | (5 | ) | Jun-2014 | (14 | ) | |||||||
|
| |||||||||||
| $ | 131 | |||||||||||
|
| |||||||||||
For the six months ended March 31, 2014, the total amount of all open futures contracts, as presented in the table above, are representative of the volume of activity for this derivative type during the six months.
| 32 | SEI Institutional International Trust / Semi-Annual Report / March 31, 2014 |
Table of Contents
A list of the open forward foreign currency contracts held by the Fund at March 31, 2014, is as follows:
| Settlement Date | Currency to Deliver (Thousands) | Currency to Receive (Thousands) | Unrealized Appreciation (Depreciation) ($Thousands) | |||||||||||||||||
04/02/2014-05/05/2014 | BRL | 7,215 | USD | 3,036 | $ | (148 | ) | |||||||||||||
04/02/2014-05/05/2014 | USD | 2,313 | BRL | 5,415 | 80 | |||||||||||||||
04/03/2014 | USD | 4,426 | DKK | 23,974 | — | |||||||||||||||
04/03/2014 | USD | 530 | SEK | 3,434 | — | |||||||||||||||
04/03/2014-04/30/2014 | PLN | 15,821 | USD | 5,211 | (23 | ) | ||||||||||||||
04/03/2014-04/30/2014 | USD | 3,558 | AUD | 3,849 | 8 | |||||||||||||||
04/03/2014-04/30/2014 | USD | 4,917 | CAD | 5,439 | 10 | |||||||||||||||
04/03/2014-04/30/2014 | USD | 108,999 | EUR | 79,065 | (30 | ) | ||||||||||||||
04/03/2014-04/30/2014 | USD | 25,896 | GBP | 15,535 | 2 | |||||||||||||||
04/03/2014-04/30/2014 | USD | 35,226 | JPY | 3,626,593 | (10 | ) | ||||||||||||||
04/03/2014-04/30/2014 | USD | 3,758 | NZD | 4,332 | (1 | ) | ||||||||||||||
04/03/2014-05/07/2014 | AUD | 20,583 | USD | 18,507 | (544 | ) | ||||||||||||||
04/03/2014-05/07/2014 | CAD | 27,536 | USD | 24,776 | (163 | ) | ||||||||||||||
04/03/2014-05/07/2014 | DKK | 51,573 | USD | 9,540 | 18 | |||||||||||||||
04/03/2014-05/07/2014 | EUR | 236,538 | USD | 326,576 | 604 | |||||||||||||||
04/03/2014-05/07/2014 | JPY | 12,707,678 | USD | 124,003 | 587 | |||||||||||||||
04/03/2014-05/07/2014 | SEK | 63,445 | USD | 9,873 | 89 | |||||||||||||||
04/03/2014-05/08/2014 | GBP | 49,762 | USD | 82,860 | (76 | ) | ||||||||||||||
04/03/2014-05/08/2014 | NZD | 8,933 | USD | 7,607 | (131 | ) | ||||||||||||||
04/11/2014 | IDR | 4,613,397 | USD | 402 | (3 | ) | ||||||||||||||
04/11/2014-06/11/2014 | USD | 782 | IDR | 9,226,795 | 24 | |||||||||||||||
04/21/2014 | USD | 769 | PEI | 2,170 | 1 | |||||||||||||||
04/30/2014 | CHF | 2,428 | USD | 2,774 | 24 | |||||||||||||||
04/30/2014 | CZK | 8,436 | USD | 427 | 3 | |||||||||||||||
04/30/2014 | ILS | 777 | USD | 224 | 2 | |||||||||||||||
04/30/2014 | KRW | 3,111,655 | USD | 2,887 | (37 | ) | ||||||||||||||
04/30/2014 | MYR | 1,470 | USD | 445 | (5 | ) | ||||||||||||||
04/30/2014 | NOK | 1,884 | USD | 311 | (4 | ) | ||||||||||||||
04/30/2014 | SGD | 1,746 | USD | 1,379 | (10 | ) | ||||||||||||||
04/30/2014 | THB | 16,305 | USD | 506 | 4 | |||||||||||||||
04/30/2014 | USD | 120 | MXN | 1,572 | 1 | |||||||||||||||
04/30/2014 | USD | 80 | NOK | 480 | — | |||||||||||||||
04/30/2014 | USD | 160 | ZAR | 1,710 | 1 | |||||||||||||||
04/30/2014 | ZAR | 12,546 | USD | 1,159 | (29 | ) | ||||||||||||||
04/30/2014-06/24/2014 | MXN | 37,192 | USD | 2,811 | (31 | ) | ||||||||||||||
|
| |||||||||||||||||||
| $ | 213 | |||||||||||||||||||
|
| |||||||||||||||||||
A list of the counterparties for the open forward foreign currency contracts held by the Fund at March 31, 2014, is as follows:
| Counterparty | Currency to Deliver ($Thousands) | Currency to Receive ($Thousands) | Unrealized Appreciation (Depreciation) ($Thousands) | |||||||||
| Bank of America | (198 | ) | 196 | $ | (2 | ) | ||||||
| Barclays PLC | (18,092 | ) | 17,960 | (132 | ) | |||||||
| BNP Paribas | (14,858 | ) | 14,783 | (75 | ) | |||||||
| Brown Brothers Harriman | (182,199 | ) | 182,541 | 342 | ||||||||
| Citigroup | (404,294 | ) | 404,720 | 426 | ||||||||
| Commonwealth Associates | (26,880 | ) | 27,019 | 139 | ||||||||
| Credit Suisse First Boston | (156 | ) | 155 | (1 | ) | |||||||
| Deutsche Bank | (28,604 | ) | 28,575 | (29 | ) | |||||||
| Goldman Sachs | (1,596 | ) | 1,614 | 18 | ||||||||
| HSBC | (8,042 | ) | 8,042 | — | ||||||||
| JPMorgan Chase Bank | (31,115 | ) | 31,123 | 8 | ||||||||
| National Australia Bank | (4,261 | ) | 4,145 | (116 | ) | |||||||
| RBC | (24,893 | ) | 24,759 | (134 | ) | |||||||
| Royal Bank of Scotland | (28,459 | ) | 28,634 | 175 | ||||||||
| Standard Bank | (449 | ) | 444 | (5 | ) | |||||||
| State Street | (15,558 | ) | 15,539 | (19 | ) | |||||||
| UBS | (11,431 | ) | 11,069 | (362 | ) | |||||||
| Westpac Banking | (15,640 | ) | 15,620 | (20 | ) | |||||||
|
| |||||||||||
| $ | 213 | |||||||||||
|
| |||||||||||
For the six months ended March 31, 2014, the total amount of all open forward foreign currency contracts, as presented in the table above, are representative of the volume of activity for this derivative type during the six months.
A list of the open OTC swap agreements held by the Fund at March 31, 2014, is as follows:
Interest Rate Swaps | ||||||||||||||||||||
| Counterparty | Fund Pays | Fund Receives | Termination Date | Currency | Notional Amount (Thousands) | Net Unrealized Depreciation ($ Thousands) | ||||||||||||||
| Citibank | 2.83% | 3 Month USD LIBOR | 08/08/2023 | USD | 6,000 | $ | (60 | ) | ||||||||||||
| Citigroup | 3.79% | 6-Month GBP LIBOR | 05/19/2019 | GBP | 2,500 | (405 | ) | |||||||||||||
|
| |||||||||||||||||||
| $ | (465 | ) | ||||||||||||||||||
|
| |||||||||||||||||||
A list of the open centrally cleared swap agreements held by the Fund at March 31, 2014, is as follows:
Interest Rate Swaps | ||||||||||||||||||||
| Counterparty | Fund Pays | Fund Receives | Termination Date | Currency | Notional Amount (Thousands) | Net Unrealized Depreciation ($ Thousands) | ||||||||||||||
| Citibank | 3.34% | 6-Month GBP LIBOR | 01/17/2044 | GBP | 1,000 | $ | (19 | ) | ||||||||||||
| JPMorgan Chase Bank | 6-Month EURIBOR | 1.56% | 11/28/2033 | EUR | 600,000 | (33 | ) | |||||||||||||
| JPMorgan Chase Bank | 1.90% | 6-Month EUR EURIBOR | 03/24/2024 | EUR | 2,200 | (33 | ) | |||||||||||||
| JPMorgan Chase Bank | 2.87% | 6-Month GBP LIBOR | 02/14/2024 | GBP | 250 | (3 | ) | |||||||||||||
| JPMorgan Chase Bank | 1.49% | 6-Month EUR EURIBOR | 11/21/2023 | EUR | 5,500 | (190 | ) | |||||||||||||
| JPMorgan Chase Bank | 1.49% | 6-Month EUR EURIBOR | 09/12/2018 | EUR | 7,000 | (268 | ) | |||||||||||||
|
| |||||||||||||||||||
| $ | (546 | ) | ||||||||||||||||||
|
| |||||||||||||||||||
For the six months ended March 31, 2014, the total amount of all swap agreements, as presented in the table above, are representative of the volume of activity for this derivative type during the six months.
| SEI Institutional International Trust / Semi-Annual Report / March 31, 2014 | 33 |
Table of Contents
SCHEDULE OF INVESTMENTS (Unaudited)
International Fixed Income Fund (Concluded)
March 31, 2014
Percentages are based on a Net Assets of $484,058 ($ Thousands).
| (1) | In local currency unless otherwise indicated. |
| (2) | In U.S. Dollar unless otherwise indicated. |
| (A) | Securities sold within terms of a private placement memorandum, exempt from registration under Section 144A of the Securities Act of 1933, as amended, and may be sold only to dealers in that program or other “accredited investors.” These securities have been determined to be liquid under guidelines established by the board of Trustees. |
| (B) | Security is when-issued. |
| (C) | Variable Rate Security — The rate reported on the Schedule of Investments is the rate in effect as of March 31, 2014. |
| (D) | Real Estate Investment Trust. |
| (E) | Zero coupon security. The rate reported on the Schedule of Investments is the effective yield at time of purchase. |
| (F) | Securities considered illiquid. The total market value of such securities as of March 31, 2014 was $718 ($ Thousands) and represented 0.15% of Net Assets. |
| (G) | Security, or portion thereof, has been pledged as collateral on open swap agreements. |
AUD — Australian Dollar
BRL — Brazilian Real
CAD — Canadian Dollar
CHF — Swiss Franc
CZK — Czech Koruna
Cl — Class
DKK — Danish Krone
EUR — Euro
EURIBOR — Euro London Interbank Offered Rate
FHLMC — Federal Home Loan Mortgage Corporation
FNMA — Federal National Mortgage Association
GBP — British Pound Sterling
HKD — Hong Kong Dollar
IDR — Indonesia Rupian
ILS — Israeli Shekel
IO — Interest Only
JGB — Japanese Government Bond
JPY — Japanese Yen
KRW — Korean Won
LIBOR — London Interbank Offered Rate
MTN — Medium Term Note
MXN — Mexican Peso
MYR — Malaysian Ringgit
NOK — Norwegian Krone
NZD — New Zealand Dollar
PEI — Peruvian Inca
PLC — Public Limited Company
PLN — Polish Zlotty
SEK — Swedish Krone
Ser — Series
SGD — Singapore Dollar
THB — Thai Baht
USD — U.S. Dollar
ZAR— South African Rand
The following is a summary of the level of inputs used as of March 31, 2014, in valuing the Fund’s investments and other financial instruments carried at value ($Thousands):
| Investments in Securities | Level 1 | Level 2 | Level 3 | Total | ||||||||||||
Global Bonds | $ | — | $ | 454,792 | $ | — | $ | 454,792 | ||||||||
Mortgage-Backed Securities | — | 10,578 | — | 10,578 | ||||||||||||
Corporate Obligations | — | 5,706 | — | 5,706 | ||||||||||||
Asset-Backed Securities | — | 1,062 | — | 1,062 | ||||||||||||
U.S. Treasury Obligations | — | 900 | — | 900 | ||||||||||||
Time Deposits | — | 4,085 | — | 4,085 | ||||||||||||
|
|
|
|
|
|
|
| |||||||||
Total Investments in Securities | $ | — | $ | 477,123 | $ | — | $ | 477,123 | ||||||||
|
|
|
|
|
|
|
| |||||||||
| Other Financial Instruments | Level 1 | Level 2 | Level 3 | Total | ||||||||||||
Futures Contracts* | $ | 235 | $ | — | $ | — | $ | 235 | ||||||||
Unrealized Depreciation | (104 | ) | — | — | (104 | ) | ||||||||||
Forwards Contracts* | — | 1,458 | — | 1,458 | ||||||||||||
Unrealized Depreciation | — | (1,245 | ) | — | (1,245 | ) | ||||||||||
OTC Swaps | ||||||||||||||||
Interest Rate Swaps* | ||||||||||||||||
Unrealized Depreciation | — | (465 | ) | — | (465 | ) | ||||||||||
Centrally Cleared Swaps | ||||||||||||||||
Interest Rate Swaps* | ||||||||||||||||
Unrealized Depreciation | — | (546 | ) | — | (546 | ) | ||||||||||
|
|
|
|
|
|
|
| |||||||||
Total Other Financial Instruments | $ | 131 | $ | (798 | ) | $ | — | $ | (667 | ) | ||||||
|
|
|
|
|
|
|
| |||||||||
| * | Futures contracts, forwards contracts, and swap contracts are valued at the net unrealized appreciation/(depreciation) on the instrument. |
For the six months ended March 31, 2014, there were no transfers between Level 1 and Level 2 assets and liabilities.
For the six months ended March 31, 2014, there were no transfers between Level 2 and Level 3 assets and liabilities.
Amounts designated as “—” are $0 or have been rounded to $0.
The accompanying notes are an integral part of the financial statements.
| 34 | SEI Institutional International Trust / Semi-Annual Report / March 31, 2014 |
Table of Contents
SCHEDULE OF INVESTMENTS (Unaudited)
Emerging Markets Debt Fund
March 31, 2014
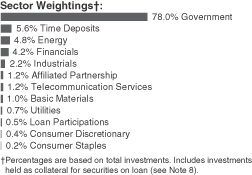
| Description | Face Amount (1) (Thousands) | Market Value ($ Thousands) | ||||||||
GLOBAL BONDS — 92.8% |
| |||||||||
Argentina — 0.7% | ||||||||||
City of Buenos Aires Argentina | ||||||||||
9.950%, 03/01/2017 (A) (B) | 2,350 | $ | 2,338 | |||||||
Republic of Argentina | ||||||||||
7.000%, 10/03/2015 | 1,125 | 1,095 | ||||||||
7.000%, 04/17/2017 | 4,200 | 3,885 | ||||||||
2.500%, 03/31/2019 (C) | 4,072 | 1,710 | ||||||||
|
| |||||||||
| 9,028 | ||||||||||
|
| |||||||||
Armenia — 0.1% | ||||||||||
Republic of Armenia | ||||||||||
6.000%, 09/30/2020 | 1,500 | 1,553 | ||||||||
|
| |||||||||
Azerbaijan — 0.4% | ||||||||||
Republic of Azerbaijan International Bond | ||||||||||
4.750%, 03/18/2024 (B) | 2,547 | 2,571 | ||||||||
State Oil of the Azerbaijan Republic | ||||||||||
5.450%, 02/09/2017 | 1,312 | 1,381 | ||||||||
4.750%, 03/13/2023 | 1,356 | 1,293 | ||||||||
|
| |||||||||
| 5,245 | ||||||||||
|
| |||||||||
Barbados — 0.1% | ||||||||||
Columbus International | ||||||||||
7.375%, 03/30/2021 (B) | 1,213 | 1,249 | ||||||||
|
| |||||||||
Belarus — 0.4% | ||||||||||
Republic of Belarus | ||||||||||
8.950%, 01/26/2018 | 3,260 | 3,342 | ||||||||
8.750%, 08/03/2015 | 1,130 | 1,144 | ||||||||
|
| |||||||||
| 4,486 | ||||||||||
|
| |||||||||
Belize — 0.2% | ||||||||||
Belize Government International Bond | ||||||||||
5.000%, 08/20/2017 (C) | 3,250 | 2,263 | ||||||||
|
| |||||||||
| Description | Face Amount (1) (Thousands) | Market Value ($ Thousands) | ||||||||||
Bermuda — 0.2% | ||||||||||||
Government of Bermuda | ||||||||||||
4.854%, 02/06/2024 | 1,680 | $ | 1,714 | |||||||||
4.138%, 01/03/2023 (B) | 820 | 804 | ||||||||||
|
| |||||||||||
| 2,518 | ||||||||||||
|
| |||||||||||
Bolivia — 0.3% | ||||||||||||
Government of Bolivia | ||||||||||||
5.950%, 08/22/2023 | 3,135 | 3,276 | ||||||||||
4.875%, 10/29/2022 (B) | 250 | 248 | ||||||||||
|
| |||||||||||
| 3,524 | ||||||||||||
|
| |||||||||||
Bosnia and Herzegovina — 0.1% | ||||||||||||
Republic of Bosnia & Herzegovina | ||||||||||||
2.063%, 12/11/2017 (A) (D) | DEM | 1,200 | 685 | |||||||||
|
| |||||||||||
Brazil — 9.4% | ||||||||||||
Banco Nacional de Desenvolvimento Economico e Social | ||||||||||||
6.500%, 06/10/2019 (B) | 660 | 746 | ||||||||||
5.750%, 09/26/2023 | 280 | 293 | ||||||||||
5.500%, 07/12/2020 (B) | 400 | 428 | ||||||||||
BR Malls International Finance | ||||||||||||
8.500%, 12/31/2049 (B) | 33 | 34 | ||||||||||
Brazil Letras do Tesouro Nacional (E) | ||||||||||||
10.821%, 01/01/2015 | BRL | 7,890 | 3,223 | |||||||||
10.789%, 01/01/2016 | BRL | 33,605 | 12,175 | |||||||||
10.345%, 01/01/2017 | BRL | 54,969 | 17,613 | |||||||||
9.453%, 01/01/2018 | BRL | 21,700 | 6,133 | |||||||||
Brazil Loan Trust 1 | ||||||||||||
5.477%, 07/24/2023 (B) | 2,344 | 2,379 | ||||||||||
5.477%, 07/24/2023 | 351 | 355 | ||||||||||
Brazil Notas do Tesouro Nacional, Ser B | ||||||||||||
10.442%, 08/15/2020 | BRL | 4,385 | 4,618 | |||||||||
Brazil Notas do Tesouro Nacional | ||||||||||||
10.000%, 01/01/2017 | BRL | 26,484 | 11,111 | |||||||||
Brazil Notas do Tesouro Nacional, Serie F | ||||||||||||
10.000%, 01/01/2018 | BRL | 8,530 | 3,508 | |||||||||
10.000%, 01/01/2021 | BRL | 7,513 | 2,951 | |||||||||
10.000%, 01/01/2023 | BRL | 16,170 | 6,187 | |||||||||
Caixa Economica Federal | ||||||||||||
4.500%, 10/03/2018 | 250 | 254 | ||||||||||
Cosan | ||||||||||||
5.000%, 03/14/2023 (B) | 300 | 282 | ||||||||||
ESAL GmbH | ||||||||||||
6.250%, 02/05/2023 (B) | 350 | 331 | ||||||||||
Federal Republic of Brazil | ||||||||||||
10.125%, 05/15/2027 | 850 | 1,288 | ||||||||||
| SEI Institutional International Trust / Semi-Annual Report / March 31, 2014 | 35 |
Table of Contents
SCHEDULE OF INVESTMENTS (Unaudited)
Emerging Markets Debt Fund (Continued)
March 31, 2014
| Description | Face Amount (1) (Thousands) | Market Value ($ Thousands) | ||||||||||
10.125%, 05/15/2027 | 2,292 | $ | 3,472 | |||||||||
8.875%, 04/15/2024 | 400 | 538 | ||||||||||
8.250%, 01/20/2034 | 4,767 | 6,316 | ||||||||||
7.125%, 01/20/2037 | 8,634 | 10,350 | ||||||||||
5.875%, 01/15/2019 | 369 | 415 | ||||||||||
4.875%, 01/22/2021 | 1,909 | 2,029 | ||||||||||
4.250%, 01/07/2025 | 6,696 | 6,478 | ||||||||||
2.625%, 01/05/2023 (F) | 9,822 | 8,692 | ||||||||||
Itau Unibanco Holding | ||||||||||||
5.650%, 03/19/2022 (B) | 300 | 302 | ||||||||||
JBS Finance II | ||||||||||||
8.250%, 01/29/2018 | 370 | 396 | ||||||||||
8.250%, 01/29/2018 (B) | 350 | 374 | ||||||||||
Marfrig Overseas | ||||||||||||
9.500%, 05/04/2020 (B) | 835 | 838 | ||||||||||
Minerva Luxembourg | ||||||||||||
12.250%, 02/10/2022 (B) | 650 | 725 | ||||||||||
7.750%, 01/31/2023 | 300 | 307 | ||||||||||
Odebrecht Drilling Norbe VIII/IX | ||||||||||||
6.350%, 06/30/2021 | 113 | 117 | ||||||||||
6.350%, 06/30/2021 (B) | 18 | 19 | ||||||||||
Odebrecht Finance | ||||||||||||
5.125%, 06/26/2022 (B) | 350 | 349 | ||||||||||
Odebrecht Offshore Drilling Finance | ||||||||||||
6.750%, 10/01/2022 (B) | 195 | 202 | ||||||||||
Samarco Mineracao | ||||||||||||
4.125%, 11/01/2022 (B) | 238 | 219 | ||||||||||
Schahin II Finance | ||||||||||||
5.875%, 09/25/2022 (B) | 84 | 81 | ||||||||||
|
| |||||||||||
| 116,128 | ||||||||||||
|
| |||||||||||
Chile — 1.3% | ||||||||||||
Banco del Estado de Chile | ||||||||||||
4.125%,10/07/2020 | 30 | 31 | ||||||||||
3.875%, 02/08/2022 (B) | 230 | 227 | ||||||||||
BancoEstado | ||||||||||||
4.125%, 10/07/2020 (B) | 270 | 279 | ||||||||||
Bonos de la Tesoreria de la Republica en pesos | ||||||||||||
6.000%, 01/01/2018 | CLP | 240,000 | 463 | |||||||||
6.000%, 01/01/2020 | CLP | 245,000 | 478 | |||||||||
6.000%, 01/01/2022 | CLP | 90,000 | 176 | |||||||||
Cencosud | ||||||||||||
5.500%, 01/20/2021 (B) | 200 | 206 | ||||||||||
4.875%, 01/20/2023 (B) | 405 | 392 | ||||||||||
Empresa Nacional del Petroleo | ||||||||||||
6.250%, 07/08/2019 (B) | 100 | 112 | ||||||||||
6.250%, 07/08/2019 | 50 | 56 | ||||||||||
5.250%, 08/10/2020 | 100 | 106 | ||||||||||
5.250%, 08/10/2020 (B) | 240 | 253 | ||||||||||
Nacional del Cobre de Chile | ||||||||||||
7.500%, 01/15/2019 | 170 | 204 | ||||||||||
6.150%, 10/24/2036 | 1,748 | 1,928 | ||||||||||
| Description | Face Amount (1) (Thousands) | Market Value ($ Thousands) | ||||||||||
5.625%, 09/21/2035 | 880 | $ | 911 | |||||||||
5.625%, 10/18/2043 | 250 | 256 | ||||||||||
4.500%, 08/13/2023 (B) | 1,799 | 1,854 | ||||||||||
4.250%, 07/17/2042 (B) | 654 | 556 | ||||||||||
3.875%, 11/03/2021 (B) | 403 | 405 | ||||||||||
3.000%, 07/17/2022 (B) | 1,923 | 1,794 | ||||||||||
Republic of Chile | ||||||||||||
5.500%, 08/05/2020 | CLP | 323,000 | 590 | |||||||||
3.875%, 08/05/2020 | 3,083 | 3,276 | ||||||||||
2.250%, 10/30/2022 | 1,316 | 1,204 | ||||||||||
Telefonica Moviles Chile | ||||||||||||
2.875%, 11/09/2015 | 100 | 102 | ||||||||||
VTR Finance BV | ||||||||||||
6.875%, 01/15/2024 (B) | 266 | 277 | ||||||||||
|
| |||||||||||
| 16,136 | ||||||||||||
|
| |||||||||||
China — 1.7% | ||||||||||||
Amber Circle Funding | ||||||||||||
3.250%, 12/04/2022 | 850 | 783 | ||||||||||
Central China Real Estate | ||||||||||||
8.000%, 01/28/2020 | 400 | 365 | ||||||||||
Central China Real Estate MTN | ||||||||||||
6.500%, 06/04/2018 | 900 | 819 | ||||||||||
China Overseas Finance | ||||||||||||
3.950%, 11/15/2022 | 200 | 180 | ||||||||||
China SCE Property Holdings | ||||||||||||
11.500%, 11/14/2017 | 800 | 824 | ||||||||||
China Shanshui Cement Group | ||||||||||||
10.500%, 04/27/2017 (B) | 650 | 692 | ||||||||||
10.500%, 04/27/2017 | 200 | 213 | ||||||||||
Country Garden Holdings | ||||||||||||
11.250%, 04/22/2017 | 825 | 869 | ||||||||||
11.125%, 02/23/2018 | 275 | 298 | ||||||||||
7.500%, 01/10/2023 | 1,653 | 1,537 | ||||||||||
Franshion Development | ||||||||||||
6.750%, 04/15/2021 (B) | 320 | 321 | ||||||||||
Kaisa Group Holdings | ||||||||||||
8.875%, 03/19/2018 (B) | 150 | 145 | ||||||||||
Sinochem Overseas Capital | ||||||||||||
6.300%, 11/12/2040 | 250 | 270 | ||||||||||
4.500%, 11/12/2020 (B) | 4,021 | 4,153 | ||||||||||
4.500%, 11/12/2020 | 4,863 | 5,022 | ||||||||||
Sinopec Capital | ||||||||||||
3.125%, 04/24/2023 (B) | 1,219 | 1,111 | ||||||||||
Sinopec Group Overseas Development | ||||||||||||
4.875%, 05/17/2042 (B) | 300 | 293 | ||||||||||
Sunac China Holdings | ||||||||||||
12.500%, 10/16/2017 | 300 | 322 | ||||||||||
9.375%, 04/05/2018 | 1,600 | 1,556 | ||||||||||
Talent Yield Investments | ||||||||||||
4.500%, 04/25/2022 | 1,282 | 1,280 | ||||||||||
|
| |||||||||||
| 21,053 | ||||||||||||
|
| |||||||||||
| 36 | SEI Institutional International Trust / Semi-Annual Report / March 31, 2014 |
Table of Contents
| Description | Face Amount (1) (Thousands) | Market Value ($ Thousands) | ||||||||||
Colombia — 4.8% | ||||||||||||
Bancolombia | ||||||||||||
5.125%, 09/11/2022 | 328 | $ | 320 | |||||||||
Bogota Distrito Capital | ||||||||||||
9.750%, 07/26/2028 (B) | COP | 8,820,000 | 5,041 | |||||||||
9.750%, 07/26/2028 | COP | 370,000 | 211 | |||||||||
Citigroup Funding, CLN (Republic of Colombia) | ||||||||||||
11.000%, 07/27/2020 | COP | 7,940,000 | 5,027 | |||||||||
Colombia Government International Bond | ||||||||||||
5.625%, 02/26/2044 | 1,277 | 1,333 | ||||||||||
Colombian TES | ||||||||||||
11.250%, 10/24/2018 | COP | 69,800 | 43 | |||||||||
10.000%, 07/24/2024 | COP | 5,020,800 | 3,198 | |||||||||
7.500%, 08/26/2026 | COP | 517,300 | 270 | |||||||||
7.000%, 09/11/2019 | COP | 14,000,000 | 7,454 | |||||||||
7.000%, 05/04/2022 | COP | 2,990,000 | 1,577 | |||||||||
7.000%, 05/04/2022 | COP | 4,742,500 | 2,501 | |||||||||
7.000%, 05/04/2022 | COP | 864,000 | 456 | |||||||||
6.000%, 04/28/2028 | COP | 687,900 | 322 | |||||||||
5.000%, 11/21/2018 | COP | 4,884,800 | 2,429 | |||||||||
Emgesa ESP | ||||||||||||
8.750%, 01/25/2021 | COP | 870,000 | 469 | |||||||||
Empresas Publicas de Medellin ESP | ||||||||||||
8.375%, 02/01/2021 | COP | 310,000 | 164 | |||||||||
Grupo Aval | ||||||||||||
4.750%, 09/26/2022 (B) | 222 | 214 | ||||||||||
JPMorgan, CLN (Republic of Columbia) | ||||||||||||
7.000%, 05/04/2022 | COP | 2,087,000 | 1,101 | |||||||||
Pacific Rubiales Energy | ||||||||||||
7.250%, 12/12/2021 | 1,621 | 1,779 | ||||||||||
5.125%, 03/28/2023 (B) | 506 | 492 | ||||||||||
Republic of Colombia | ||||||||||||
12.000%, 10/22/2015 | COP | 374,000 | 211 | |||||||||
11.750%, 02/25/2020 | 1,587 | 2,293 | ||||||||||
10.375%, 01/28/2033 | 360 | 545 | ||||||||||
9.850%, 06/28/2027 | COP | 3,584,000 | 2,369 | |||||||||
8.125%, 05/21/2024 | 1,190 | 1,547 | ||||||||||
7.750%, 04/14/2021 | COP | 1,734,000 | 987 | |||||||||
7.375%, 03/18/2019 | 2,046 | 2,460 | ||||||||||
7.375%, 09/18/2037 | 6,479 | 8,293 | ||||||||||
6.125%, 01/18/2041 | 1,485 | 1,663 | ||||||||||
4.375%, 07/12/2021 | 3,565 | 3,708 | ||||||||||
4.375%, 03/21/2023 | COP | 135,000 | 62 | |||||||||
4.000%, 02/26/2024 | 1,419 | 1,405 | ||||||||||
Transportadora de Gas Internacional ESP | ||||||||||||
5.700%, 03/20/2022 (B) | 200 | 208 | ||||||||||
|
| |||||||||||
| 60,152 | ||||||||||||
|
| |||||||||||
| Description | Face Amount (1) (Thousands) | Market Value ($ Thousands) | ||||||||||
Costa Rica — 0.3% | ||||||||||||
Banco de Costa Rica | ||||||||||||
5.250%, 08/12/2018 | 340 | $ | 345 | |||||||||
Banco Nacional de Costa Rica | ||||||||||||
6.250%, 11/01/2023 (B) | 240 | 237 | ||||||||||
4.875%, 11/01/2018 | 641 | 647 | ||||||||||
Costa Rica Government International Bond | ||||||||||||
5.625%, 04/30/2043 | 260 | 224 | ||||||||||
4.375%, 04/30/2025 (B) | 525 | 470 | ||||||||||
4.375%, 04/30/2025 | 260 | 233 | ||||||||||
4.250%, 01/26/2023 | 1,198 | 1,108 | ||||||||||
Instituto Costarricense de Electricidad | ||||||||||||
6.950%, 11/10/2021 | 400 | 424 | ||||||||||
6.375%, 05/15/2043 | 250 | 214 | ||||||||||
|
| |||||||||||
| 3,902 | ||||||||||||
|
| |||||||||||
Croatia — 1.6% | ||||||||||||
Government of Croatia | ||||||||||||
6.750%, 11/05/2019 | 3,140 | 3,458 | ||||||||||
6.625%, 07/14/2020 (B) | 170 | 186 | ||||||||||
6.625%, 07/14/2020 | 3,101 | 3,393 | ||||||||||
6.375%, 03/24/2021 | 810 | 873 | ||||||||||
6.375%, 03/24/2021 (B) | 1,532 | 1,651 | ||||||||||
6.250%, 04/27/2017 (B) | 630 | 676 | ||||||||||
6.000%, 01/26/2024 (B) | 6,835 | 7,108 | ||||||||||
6.000%, 01/26/2024 | 1,500 | 1,560 | ||||||||||
5.875%, 07/09/2018 | EUR | 150 | 225 | |||||||||
5.500%, 04/04/2023 | 1,458 | 1,473 | ||||||||||
|
| |||||||||||
| 20,603 | ||||||||||||
|
| |||||||||||
Czech Republic — 0.2% | ||||||||||||
Czech Republic Government Bond | ||||||||||||
2.500%, 08/25/2028 | CZK | 50,630 | 2,448 | |||||||||
|
| |||||||||||
Dominican Republic — 0.6% | ||||||||||||
Dominican Republic | ||||||||||||
9.040%, 01/23/2018 | 967 | 1,064 | ||||||||||
7.500%, 05/06/2021 | 2,270 | 2,531 | ||||||||||
7.500%, 05/06/2021 (B) | 1,830 | 2,040 | ||||||||||
6.600%, 01/28/2024 (B) | 230 | 236 | ||||||||||
5.875%, 04/18/2024 | 710 | 699 | ||||||||||
5.875%, 04/18/2024 (B) | 770 | 764 | ||||||||||
|
| |||||||||||
| 7,334 | ||||||||||||
|
| |||||||||||
Ecuador — 0.1% | ||||||||||||
Republic of Ecuador | ||||||||||||
9.375%, 12/15/2015 | 1,218 | 1,289 | ||||||||||
|
| |||||||||||
Egypt — 0.2% | ||||||||||||
Government of Egypt | ||||||||||||
6.875%, 04/30/2040 | 1,434 | 1,291 | ||||||||||
| SEI Institutional International Trust / Semi-Annual Report / March 31, 2014 | 37 |
Table of Contents
SCHEDULE OF INVESTMENTS (Unaudited)
Emerging Markets Debt Fund (Continued)
March 31, 2014
| Description | Face Amount (1) (Thousands) | Market Value ($ Thousands) | ||||||||||
5.750%, 04/29/2020 | 450 | $ | 461 | |||||||||
5.750%, 04/29/2020 (B) | 100 | 102 | ||||||||||
|
| |||||||||||
| 1,854 | ||||||||||||
|
| |||||||||||
El Salvador — 0.7% | ||||||||||||
Republic of El Salvador | ||||||||||||
8.250%, 04/10/2032 | 407 | 431 | ||||||||||
8.250%, 04/10/2032 | 480 | 509 | ||||||||||
7.750%, 01/24/2023 | 708 | 759 | ||||||||||
7.750%, 01/24/2023 | 680 | 729 | ||||||||||
7.650%, 06/15/2035 | 650 | 647 | ||||||||||
7.625%, 02/01/2041 (B) | 150 | 146 | ||||||||||
7.625%, 02/01/2041 | 599 | 584 | ||||||||||
7.375%, 12/01/2019 | 570 | 607 | ||||||||||
5.875%, 01/30/2025 | 2,785 | 2,618 | ||||||||||
5.875%, 01/30/2025 (A) (B) | 1,257 | 1,181 | ||||||||||
Telemovil Finance | ||||||||||||
8.000%, 10/01/2017 | 800 | 855 | ||||||||||
|
| |||||||||||
| 9,066 | ||||||||||||
|
| |||||||||||
Gabon — 0.0% | ||||||||||||
Gabonese Republic | ||||||||||||
8.200%, 12/12/2017 | 490 | 559 | ||||||||||
|
| |||||||||||
Georgia — 0.3% | ||||||||||||
Georgian Railway JSC | ||||||||||||
7.750%, 07/11/2022 | 3,190 | 3,410 | ||||||||||
7.750%, 07/11/2022 (B) | 390 | 417 | ||||||||||
|
| |||||||||||
| 3,827 | ||||||||||||
|
| |||||||||||
Ghana — 0.1% | ||||||||||||
Republic of Ghana | ||||||||||||
8.500%, 10/04/2017 | 1,189 | 1,205 | ||||||||||
8.500%, 10/04/2017 (B) | 300 | 304 | ||||||||||
7.875%, 08/07/2023 | 660 | 606 | ||||||||||
|
| |||||||||||
| 2,115 | ||||||||||||
|
| |||||||||||
Guatemala — 0.1% | ||||||||||||
Comcel Trust | ||||||||||||
6.875%, 02/06/2024 (B) | 1,090 | 1,140 | ||||||||||
Guatemala Government Bond | ||||||||||||
4.875%, 02/13/2028 | 509 | 491 | ||||||||||
|
| |||||||||||
| 1,631 | ||||||||||||
|
| |||||||||||
Hungary — 3.8% | ||||||||||||
Republic of Hungary | ||||||||||||
8.000%, 02/12/2015 | HUF | 230,000 | 1,073 | |||||||||
7.750%, 08/24/2015 | HUF | 281,700 | 1,338 | |||||||||
7.625%, 03/29/2041 | 3,890 | 4,483 | ||||||||||
7.000%, 06/24/2022 | HUF | 972,300 | 4,822 | |||||||||
6.750%, 02/24/2017 | HUF | 164,010 | 788 | |||||||||
| Description | Face Amount (1) (Thousands) | Market Value ($ Thousands) | ||||||||||
6.750%, 11/24/2017 | HUF | 793,420 | $ | 3,834 | ||||||||
6.500%, 06/24/2019 | HUF | 298,490 | 1,437 | |||||||||
6.375%, 03/29/2021 | 920 | 1,006 | ||||||||||
6.250%, 01/29/2020 | 770 | 840 | ||||||||||
6.000%, 01/11/2019 | EUR | 982 | 1,515 | |||||||||
6.000%, 11/24/2023 | HUF | 730,380 | 3,411 | |||||||||
5.750%, 11/22/2023 | 5,546 | 5,726 | ||||||||||
5.500%, 12/22/2016 | HUF | 510,620 | 2,374 | |||||||||
5.500%, 12/20/2018 | HUF | 485,330 | 2,252 | |||||||||
5.375%, 02/21/2023 | 3,528 | 3,577 | ||||||||||
5.375%, 03/25/2024 | 1,120 | 1,122 | ||||||||||
5.000%, 03/30/2016 | GBP | 227 | 389 | |||||||||
4.125%, 02/19/2018 | 4,248 | 4,312 | ||||||||||
4.000%, 03/25/2019 | 636 | 632 | ||||||||||
|
| |||||||||||
| 44,931 | ||||||||||||
|
| |||||||||||
India — 0.1% | ||||||||||||
Bharti Airtel International Netherlands | ||||||||||||
5.125%, 03/11/2023 (B) | 439 | 436 | ||||||||||
Export-Import Bank of India MTN | ||||||||||||
4.000%, 08/07/2017 | 200 | 208 | ||||||||||
Vedanta Resources | ||||||||||||
7.125%, 05/31/2023 (B) | 160 | 160 | ||||||||||
6.750%, 06/07/2016 | 125 | 131 | ||||||||||
6.000%, 01/31/2019 (B) | 273 | 273 | ||||||||||
|
| |||||||||||
| 1,208 | ||||||||||||
|
| |||||||||||
Indonesia — 7.3% | ||||||||||||
Adaro Indonesia | ||||||||||||
7.625%, 10/22/2019 | 300 | 319 | ||||||||||
Deutsche Bank, CLN (Republic of Indonesia) | ||||||||||||
7.000%, 05/15/2022 | IDR | 2,300,000 | 190 | |||||||||
7.000%, 05/15/2027 | IDR | 2,300,000 | 178 | |||||||||
6.625%, 05/15/2033 | IDR | 2,300,000 | 164 | |||||||||
Indo Energy Finance | ||||||||||||
7.000%, 05/07/2018 | 200 | 194 | ||||||||||
Indo Energy Finance II | ||||||||||||
6.375%, 01/24/2023 | 1,179 | 937 | ||||||||||
6.375%, 01/24/2023 (B) | 200 | 159 | ||||||||||
Indonesia Treasury Bond | ||||||||||||
8.375%, 03/15/2034 | IDR | 16,000,000 | 1,389 | |||||||||
7.875%, 04/15/2019 | IDR | 41,620,000 | 3,692 | |||||||||
Indosat Palapa | ||||||||||||
7.375%, 07/29/2020 (B) | 200 | 217 | ||||||||||
JPMorgan, CLN | ||||||||||||
7.000%, 05/15/2022 | IDR | 105,300,000 | 8,713 | |||||||||
6.625%, 05/15/2033 | IDR | 3,100,000 | 221 | |||||||||
| 38 | SEI Institutional International Trust / Semi-Annual Report / March 31, 2014 |
Table of Contents
| Description | Face Amount (1) (Thousands) | Market Value ($ Thousands) | ||||||||||
Listrindo Capital BV | ||||||||||||
6.950%, 02/21/2019 (B) |
| 200 | $ | 211 | ||||||||
Majapahit Holding | ||||||||||||
8.000%, 08/07/2019 | 470 | 547 | ||||||||||
7.875%, 06/29/2037 (B) | 205 | 226 | ||||||||||
7.750%, 10/17/2016 | 370 | 417 | ||||||||||
7.750%, 01/20/2020 | 894 | 1,026 | ||||||||||
Pertamina Persero MTN | ||||||||||||
6.500%, 05/27/2041 (B) | 380 | 359 | ||||||||||
6.000%, 05/03/2042 | 340 | 301 | ||||||||||
6.000%, 05/03/2042 (B) | 935 | 827 | ||||||||||
5.625%, 05/20/2043 | 3,882 | 3,285 | ||||||||||
5.250%, 05/23/2021 (B) |
| 500 | 501 | |||||||||
4.875%, 05/03/2022 (B) |
| 220 | 211 | |||||||||
Perusahaan Penerbit | ||||||||||||
6.125%, 03/15/2019 | 460 | 503 | ||||||||||
Republic of Indonesia | ||||||||||||
11.625%, 03/04/2019 | 1,674 | 2,266 | ||||||||||
11.625%, 03/04/2019 | 4,254 | 5,759 | ||||||||||
11.625%, 03/04/2019 (B) |
| 975 | 1,320 | |||||||||
11.000%, 09/15/2025 | IDR | 3,200,000 | 336 | |||||||||
9.000%, 03/15/2029 | IDR | 82,636,000 | 7,569 | |||||||||
8.500%, 10/12/2035 | 1,000 | 1,275 | ||||||||||
8.500%, 10/12/2035 | 1,140 | 1,453 | ||||||||||
8.375%, 03/15/2024 | IDR | 78,156,000 | 7,071 | |||||||||
8.375%, 03/15/2034 | IDR | 55,920,000 | 4,854 | |||||||||
8.250%, 06/15/2032 | IDR | 17,369,000 | 1,479 | |||||||||
7.750%, 01/17/2038 | 1,478 | 1,762 | ||||||||||
7.750%, 01/17/2038 | 5,989 | 7,142 | ||||||||||
7.000%, 05/15/2022 | IDR | 59,080,000 | 4,889 | |||||||||
6.875%, 01/17/2018 | 2,004 | 2,277 | ||||||||||
6.750%, 01/15/2044 (B) | 1,650 | 1,805 | ||||||||||
6.625%, 05/15/2033 | IDR | 30,078,000 | 2,145 | |||||||||
6.625%, 02/17/2037 | 676 | 717 | ||||||||||
6.625%, 02/17/2037 | 484 | 513 | ||||||||||
6.125%, 05/15/2028 | IDR | 26,020,000 | 1,844 | |||||||||
5.875%, 03/13/2020 | 460 | 503 | ||||||||||
5.875%, 03/13/2020 (B) | 864 | 944 | ||||||||||
5.625%, 05/15/2023 | IDR | 38,571,000 | 2,869 | |||||||||
5.375%, 10/17/2023 | 300 | 311 | ||||||||||
5.250%, 01/17/2042 | 1,029 | 933 | ||||||||||
4.875%, 05/05/2021 | 2,600 | 2,665 | ||||||||||
4.875%, 05/05/2021 (B) | 850 | 871 | ||||||||||
3.375%, 04/15/2023 (B) | 1,339 | 1,195 | ||||||||||
Tullow Oil | ||||||||||||
6.000%, 11/01/2020 (B) | 170 | 173 | ||||||||||
|
| |||||||||||
| 91,727 | ||||||||||||
|
| |||||||||||
Iraq — 0.8% | ||||||||||||
Republic of Iraq | ||||||||||||
5.800%, 01/15/2028 | 10,897 | 9,589 | ||||||||||
|
| |||||||||||
| Description | Face Amount (1) (Thousands) | Market Value ($ Thousands) | ||||||||||
Israel — 0.1% | ||||||||||||
Altice Financing | ||||||||||||
8.000%, 12/15/2019 | EUR | 400 | $ | 610 | ||||||||
7.875%, 12/15/2019 (A) | 400 | 437 | ||||||||||
Altice Finco | ||||||||||||
9.875%, 12/15/2020 (A) | 300 | 342 | ||||||||||
|
| |||||||||||
| 1,389 | ||||||||||||
|
| |||||||||||
Ivory Coast — 0.8% | ||||||||||||
Ivory Coast Government Bond | ||||||||||||
7.774%, 12/31/2032 | 3,413 | 3,200 | ||||||||||
7.774%, 12/31/2032 (A) (G) |
| 6,777 | 6,353 | |||||||||
|
| |||||||||||
| 9,553 | ||||||||||||
|
| |||||||||||
Jamaica — 0.2% | ||||||||||||
Digicel Group | ||||||||||||
10.500%, 04/15/2018 | 400 | 424 | ||||||||||
8.250%, 09/30/2020 | 2,200 | 2,349 | ||||||||||
|
| |||||||||||
| 2,773 | ||||||||||||
|
| |||||||||||
Kazakhstan — 2.0% | ||||||||||||
Development Bank of Kazakhstan | ||||||||||||
4.125%, 12/10/2022 | 770 | 695 | ||||||||||
Halyk Savings Bank of Kazakhstan | ||||||||||||
7.250%, 01/28/2021 (B) | 400 | 420 | ||||||||||
7.250%, 01/28/2021 | 200 | 210 | ||||||||||
KazAgro National Management Holding | ||||||||||||
4.625%, 05/24/2023 | 370 | 342 | ||||||||||
Kazakhstan Temir Zholy Finance | ||||||||||||
6.950%, 07/10/2042 | 400 | 408 | ||||||||||
6.950%, 07/10/2042 (B) | 250 | 255 | ||||||||||
Kazatomprom Natsionalnaya Atomnaya Kompaniya | ||||||||||||
6.250%, 05/20/2015 (B) | 450 | 466 | ||||||||||
6.250%, 05/20/2015 | 100 | 103 | ||||||||||
KazMunayGas National MTN | ||||||||||||
11.750%, 01/23/2015 | 1,611 | 1,728 | ||||||||||
9.125%, 07/02/2018 | 1,458 | 1,750 | ||||||||||
9.125%, 07/02/2018 (B) | 2,819 | 3,383 | ||||||||||
7.000%, 05/05/2020 | 100 | 113 | ||||||||||
7.000%, 05/05/2020 (B) | 1,426 | 1,608 | ||||||||||
6.375%, 04/09/2021 | 1,069 | 1,165 | ||||||||||
6.375%, 04/09/2021 (B) | 3,827 | 4,171 | ||||||||||
5.750%, 04/30/2043 | 3,240 | 2,916 | ||||||||||
5.750%, 04/30/2043 (B) | 781 | 703 | ||||||||||
4.400%, 04/30/2023 | 1,342 | 1,265 | ||||||||||
4.400%, 04/30/2023 (B) | 523 | 494 | ||||||||||
Republic of Kazakhstan | ||||||||||||
6.375%, 10/06/2020 (B) | 600 | 654 | ||||||||||
| SEI Institutional International Trust / Semi-Annual Report / March 31, 2014 | 39 |
Table of Contents
SCHEDULE OF INVESTMENTS (Unaudited)
Emerging Markets Debt Fund (Continued)
March 31, 2014
| Description | Face Amount (1) (Thousands) | Market Value ($ Thousands) | ||||||||||
Samruk-Energy JSC MTN | ||||||||||||
3.750%, 12/20/2017 | 1,000 | $ | 974 | |||||||||
Zhaikmunai Via Zhaikmunai International | ||||||||||||
7.125%, 11/13/2019 | 600 | 622 | ||||||||||
7.125%, 11/13/2019 (A) (B) | 425 | 441 | ||||||||||
|
| |||||||||||
| 24,886 | ||||||||||||
|
| |||||||||||
Kenya — 0.2% |
| |||||||||||
Kenya Infrastructure Bond | ||||||||||||
11.000%, 09/15/2025 | KES | 180,000 | 2,096 | |||||||||
|
| |||||||||||
Latvia — 0.1% |
| |||||||||||
Republic of Latvia | ||||||||||||
2.750%, 01/12/2020 (A) | 670 | 643 | ||||||||||
|
| |||||||||||
Lithuania — 0.3% |
| |||||||||||
Republic of Lithuania | ||||||||||||
6.625%, 02/01/2022 | 1,112 | 1,313 | ||||||||||
6.125%, 03/09/2021 (B) | 1,424 | 1,627 | ||||||||||
5.125%, 09/14/2017 (B) | 310 | 339 | ||||||||||
5.125%, 09/14/2017 (F) | 200 | 218 | ||||||||||
|
| |||||||||||
| 3,497 | ||||||||||||
|
| |||||||||||
Malaysia — 4.0% |
| |||||||||||
Malaysia Government Bond | ||||||||||||
5.248%, 09/15/2028 (B) | MYR | 1,050 | 346 | |||||||||
4.392%, 04/15/2026 | MYR | 8,720 | 2,673 | |||||||||
4.378%, 11/29/2019 | MYR | 1,353 | 425 | |||||||||
4.262%, 09/15/2016 | MYR | 10,260 | 3,208 | |||||||||
4.181%, 07/15/2024 | MYR | 10,439 | 3,209 | |||||||||
4.160%, 07/15/2021 | MYR | 3,879 | 1,198 | |||||||||
4.048%, 09/30/2021 | MYR | 3,380 | 1,036 | |||||||||
4.012%, 09/15/2017 | MYR | 13,780 | 4,279 | |||||||||
3.892%, 03/15/2027 | MYR | 578 | 167 | |||||||||
3.889%, 07/31/2020 | MYR | 6,983 | 2,127 | |||||||||
3.844%, 04/15/2033 | MYR | 1,770 | 488 | |||||||||
3.835%, 08/12/2015 | MYR | 3,161 | 977 | |||||||||
3.741%, 02/27/2015 | MYR | 400 | 123 | |||||||||
3.580%, 09/28/2018 | MYR | 2,047 | 624 | |||||||||
3.502%, 05/31/2027 | MYR | 1,050 | 291 | |||||||||
3.492%, 03/31/2020 | MYR | 17,579 | 5,259 | |||||||||
3.480%, 03/15/2023 | MYR | 14,448 | 4,215 | |||||||||
3.418%, 08/15/2022 | MYR | 8,399 | 2,459 | |||||||||
3.394%, 03/15/2017 | MYR | 2,150 | 658 | |||||||||
3.314%, 10/31/2017 | MYR | 21,610 | 6,557 | |||||||||
3.260%, 03/01/2018 | MYR | 12,400 | 3,742 | |||||||||
3.197%, 10/15/2015 | MYR | 2,971 | 911 | |||||||||
3.172%, 07/15/2016 | MYR | 2,800 | 854 | |||||||||
Petronas Capital | ||||||||||||
7.875%, 05/22/2022 | 1,648 | 2,153 | ||||||||||
Wakala Global Sukuk | ||||||||||||
4.646%, 07/06/2021 (B) | 390 | 420 | ||||||||||
|
| |||||||||||
| 48,399 | ||||||||||||
|
| |||||||||||
| Description | Face Amount (1) (Thousands) | Market Value ($ Thousands) | ||||||||||
Mexico — 7.1% |
| |||||||||||
Alfa | ||||||||||||
6.875%, 03/25/2044 (B) | 1,395 | $ | 1,435 | |||||||||
5.250%, 03/25/2024 (B) | 925 | 948 | ||||||||||
BBVA Bancomer | ||||||||||||
6.750%, 09/30/2022 (B) | 500 | 547 | ||||||||||
Cemex | ||||||||||||
9.250%, 05/12/2020 | 58 | 64 | ||||||||||
9.000%, 01/11/2018 (B) | 306 | 333 | ||||||||||
6.500%, 12/10/2019 | 550 | 586 | ||||||||||
Cemex Espana | ||||||||||||
9.250%, 05/12/2020 (B) | 800 | 878 | ||||||||||
Cemex Espana Luxembourg | ||||||||||||
9.875%, 04/30/2019 | 950 | 1,102 | ||||||||||
Cemex Finance | ||||||||||||
9.375%, 10/12/2022 (B) | 350 | 411 | ||||||||||
Comision Federal de Electricidad | ||||||||||||
5.750%, 02/14/2042 (B) | 500 | 487 | ||||||||||
4.875%, 05/26/2021 (B) | 400 | 417 | ||||||||||
4.875%, 01/15/2024 (B) | 637 | 647 | ||||||||||
Fresnillo | ||||||||||||
5.500%, 11/13/2023 (B) | 300 | 302 | ||||||||||
Metalsa | ||||||||||||
4.900%, 04/24/2023 (B) | 212 | 196 | ||||||||||
Mexican Bonos | ||||||||||||
8.000%, 06/11/2020 | MXN | 14 | 1 | |||||||||
7.500%, 06/03/2027 | MXN | 49,800 | 4,150 | |||||||||
6.500%, 06/09/2022 | MXN | 62,305 | 4,921 | |||||||||
6.250%, 06/16/2016 | MXN | 768 | 62 | |||||||||
6.000%, 06/18/2015 | MXN | 5,099 | 401 | |||||||||
5.000%, 06/15/2017 | MXN | 14,891 | 1,162 | |||||||||
4.750%, 06/14/2018 | MXN | 23,500 | 1,786 | |||||||||
Mexican Bonos, Ser M | ||||||||||||
6.500%, 06/10/2021 | MXN | 96,797 | 7,736 | |||||||||
Mexican Bonos, Ser M10 | ||||||||||||
8.500%, 12/13/2018 | MXN | 10,450 | 914 | |||||||||
7.750%, 12/14/2017 | MXN | 25,184 | 2,127 | |||||||||
7.250%, 12/15/2016 | MXN | 38,196 | 3,150 | |||||||||
Mexican Bonos, Ser M20 | ||||||||||||
10.000%, 12/05/2024 | MXN | 19,220 | 1,906 | |||||||||
8.500%, 05/31/2029 | MXN | 4,810 | 431 | |||||||||
8.000%, 12/07/2023 | MXN | 81,363 | 7,056 | |||||||||
7.750%, 05/29/2031 | MXN | 91,577 | 7,656 | |||||||||
Mexican Bonos, Ser M30 | ||||||||||||
8.500%, 11/18/2038 | MXN | 38,121 | 3,390 | |||||||||
Mexican Bonos, Ser MI10 | ||||||||||||
9.500%, 12/18/2014 | MXN | 68,227 | 5,442 | |||||||||
Pemex Project Funding Master Trust | ||||||||||||
6.625%, 06/15/2035 | 2,800 | 3,108 | ||||||||||
5.750%, 03/01/2018 | 290 | 322 | ||||||||||
Petroleos Mexicanos | ||||||||||||
8.000%, 05/03/2019 | 390 | 476 | ||||||||||
| 40 | SEI Institutional International Trust / Semi-Annual Report / March 31, 2014 |
Table of Contents
| Description | Face Amount (1) (Thousands) | Market Value ($ Thousands) | ||||||||||
7.190%, 09/12/2024 | MXN | 35,570 | $ | 2,648 | ||||||||
6.500%, 06/02/2041 | 572 | 626 | ||||||||||
6.375%, 01/23/2045 (B) | 806 | 869 | ||||||||||
6.000%, 03/05/2020 | 180 | 203 | ||||||||||
6.000%, 03/05/2020 (B) | 60 | 68 | ||||||||||
5.500%, 06/27/2044 | 70 | 68 | ||||||||||
5.500%, 06/27/2044 (B) | 150 | 145 | ||||||||||
3.500%, 01/30/2023 (B) | 185 | 174 | ||||||||||
Trust F | ||||||||||||
5.250%, 12/15/2024 (B) (H) | 1,080 | 1,077 | ||||||||||
United Mexican States MTN | ||||||||||||
6.050%, 01/11/2040 | 2,270 | 2,593 | ||||||||||
5.950%, 03/19/2019 | 572 | 665 | ||||||||||
5.750%, 10/12/2110 | 2,038 | 2,002 | ||||||||||
5.550%, 01/21/2045 | 4,913 | 5,220 | ||||||||||
4.750%, 03/08/2044 | 1,782 | 1,693 | ||||||||||
4.000%, 10/02/2023 | 3,298 | 3,331 | ||||||||||
United Mexican States, | ||||||||||||
6.750%, 09/27/2034 | 1,885 | 2,300 | ||||||||||
|
| |||||||||||
| 88,232 | ||||||||||||
|
| |||||||||||
Mongolia — 0.4% | ||||||||||||
Development Bank of | ||||||||||||
5.750%, 03/21/2017 | 902 | 839 | ||||||||||
5.125%, 12/05/2022 | 1,540 | 1,238 | ||||||||||
4.125%, 01/05/2018 | 2,100 | 1,890 | ||||||||||
|
| |||||||||||
| 3,967 | ||||||||||||
|
| |||||||||||
Morocco — 0.3% | ||||||||||||
Kingdom of Morocco | ||||||||||||
5.500%, 12/11/2042 (A) | 1,527 | 1,416 | ||||||||||
5.500%, 12/11/2042 (B) | 200 | 186 | ||||||||||
4.250%, 12/11/2022 (A) (B) | 230 | 223 | ||||||||||
4.250%, 12/11/2022 | 2,122 | 2,058 | ||||||||||
|
| |||||||||||
| 3,883 | ||||||||||||
|
| |||||||||||
Mozambique — 0.1% | ||||||||||||
EMATUM Via Mozambique EMATUM Finance 2020 | ||||||||||||
6.305%, 09/11/2020 | 845 | 807 | ||||||||||
|
| |||||||||||
Netherlands — 0.0% | ||||||||||||
Nostrum Oil & Gas Finance BV | ||||||||||||
6.375%, 02/14/2019 (B) | 353 | 360 | ||||||||||
|
| |||||||||||
Nigeria — 0.8% | ||||||||||||
Afren | ||||||||||||
10.250%, 04/08/2019 (B) | 563 | 641 | ||||||||||
6.625%, 12/09/2020 (B) | 600 | 612 | ||||||||||
Nigeria Treasury Bill | ||||||||||||
12.706%, 05/22/2014 (E) | NGN | 31,370 | 187 | |||||||||
12.392%, 05/08/2014 (E) | NGN | 50,000 | 299 | |||||||||
12.387%, 04/10/2014 (E) | NGN | 137,000 | 828 | |||||||||
| Description | Face Amount (1) (Thousands) | Market Value ($ Thousands) | ||||||||||
Republic of Nigeria | ||||||||||||
16.390%, 01/27/2022 | NGN | 292,310 | $ | 1,974 | ||||||||
16.000%, 06/29/2019 | NGN | 241,298 | 1,571 | |||||||||
16.000%, 06/29/2019 | NGN | 169,000 | 1,100 | |||||||||
15.100%, 04/27/2017 | NGN | 23,192 | 145 | |||||||||
14.200%, 03/14/2024 | NGN | 69,650 | 428 | |||||||||
6.750%, 01/28/2021 (B) | 550 | 587 | ||||||||||
6.750%, 01/28/2021 | 1,043 | 1,114 | ||||||||||
6.375%, 07/12/2023 | 596 | 616 | ||||||||||
6.375%, 07/12/2023 (B) | 551 | 570 | ||||||||||
|
| |||||||||||
| 10,672 | ||||||||||||
|
| |||||||||||
Pakistan — 0.1% | ||||||||||||
Republic of Pakistan | ||||||||||||
7.125%, 03/31/2016 | 500 | 511 | ||||||||||
6.875%, 06/01/2017 | 430 | 436 | ||||||||||
6.875%, 06/01/2017 | 100 | 102 | ||||||||||
|
| |||||||||||
| 1,049 | ||||||||||||
|
| |||||||||||
Panama — 0.7% | ||||||||||||
Republic of Panama | ||||||||||||
9.375%, 01/16/2023 | 560 | 743 | ||||||||||
9.375%, 04/01/2029 | 2,331 | 3,305 | ||||||||||
8.875%, 09/30/2027 | 270 | 373 | ||||||||||
8.125%, 04/28/2034 | 2,128 | 2,692 | ||||||||||
7.125%, 01/29/2026 | 100 | 124 | ||||||||||
6.700%, 01/26/2036 | 760 | 893 | ||||||||||
5.200%, 01/30/2020 | 138 | 153 | ||||||||||
4.300%, 04/29/2053 | 130 | 107 | ||||||||||
|
| |||||||||||
| 8,390 | ||||||||||||
|
| |||||||||||
Paraguay — 0.1% | ||||||||||||
Republic of Paraguay | ||||||||||||
4.625%, 01/25/2023 | 300 | 297 | ||||||||||
Telefonica Celular del Paraguay | ||||||||||||
6.750%, 12/13/2022 | 200 | 211 | ||||||||||
6.750%, 12/13/2022 (A) | 200 | 211 | ||||||||||
|
| |||||||||||
| 719 | ||||||||||||
|
| |||||||||||
Peru — 1.2% | ||||||||||||
Cementos Pacasmayo SAA | ||||||||||||
4.500%, 02/08/2023 (B) | 200 | 188 | ||||||||||
Cia Minera Ares SAC | ||||||||||||
7.750%, 01/23/2021 (B) | 209 | 215 | ||||||||||
Inkia Energy | ||||||||||||
8.375%, 04/04/2021 (B) | 200 | 216 | ||||||||||
Peru Enhanced Pass-Through Finance | ||||||||||||
4.507%, 06/02/2025 (A) (B) (E) | 1,000 | 670 | ||||||||||
2.505%, 05/31/2018 (A) (B) (E) | 327 | 304 | ||||||||||
2.494%, 05/31/2018 (E) | 121 | 113 | ||||||||||
| SEI Institutional International Trust / Semi-Annual Report / March 31, 2014 | 41 |
Table of Contents
SCHEDULE OF INVESTMENTS (Unaudited)
Emerging Markets Debt Fund (Continued)
March 31, 2014
| Description | Face Amount (1) (Thousands) | Market Value ($ Thousands) | ||||||||||
Republic of Peru | ||||||||||||
9.910%, 05/05/2015 | PEI | 675 | $ | 256 | ||||||||
8.750%, 11/21/2033 | 5,103 | 7,450 | ||||||||||
8.200%, 08/12/2026 | PEI | 4,246 | 1,742 | |||||||||
7.840%, 08/12/2020 | PEI | 2,312 | 914 | |||||||||
7.350%, 07/21/2025 | 510 | 656 | ||||||||||
6.950%, 08/12/2031 | PEI | 200 | 72 | |||||||||
6.950%, 08/12/2031 | PEI | 2,188 | 785 | |||||||||
6.900%, 08/12/2037 | PEI | 1,997 | 703 | |||||||||
6.850%, 02/12/2042 | PEI | 613 | 211 | |||||||||
6.550%, 03/14/2037 | 465 | 559 | ||||||||||
Volcan Cia Minera | ||||||||||||
5.375%, 02/02/2022 (B) | 18 | 17 | ||||||||||
|
| |||||||||||
| 15,071 | ||||||||||||
|
| |||||||||||
Philippines — 0.9% | ||||||||||||
Development Bank of Philippines | ||||||||||||
5.500%, 03/25/2021 | 330 | 355 | ||||||||||
National Power | ||||||||||||
9.625%, 05/15/2028 (A) | 1,100 | 1,564 | ||||||||||
Power Sector Assets & Liabilities Management | ||||||||||||
7.390%, 12/02/2024 (B) | 820 | 1,030 | ||||||||||
7.250%, 05/27/2019 | 170 | 204 | ||||||||||
Republic of Philippines | ||||||||||||
10.625%, 03/16/2025 | 405 | 630 | ||||||||||
9.500%, 02/02/2030 | 1,226 | 1,908 | ||||||||||
8.375%, 06/17/2019 | 160 | 203 | ||||||||||
7.750%, 01/14/2031 | 1,994 | 2,727 | ||||||||||
5.500%, 03/30/2026 | 500 | 564 | ||||||||||
4.200%, 01/21/2024 | 300 | 310 | ||||||||||
4.000%, 01/15/2021 | 1,116 | 1,173 | ||||||||||
3.900%, 11/26/2022 | PHP | 45,000 | 958 | |||||||||
|
| |||||||||||
| 11,626 | ||||||||||||
|
| |||||||||||
Poland — 4.7% | ||||||||||||
Republic of Poland | ||||||||||||
6.375%, 07/15/2019 | 4,765 | 5,590 | ||||||||||
6.250%, 10/24/2015 | PLN | 1,490 | 519 | |||||||||
5.750%, 04/25/2029 | PLN | 3,450 | 1,283 | |||||||||
5.000%, 04/25/2016 | PLN | 1,113 | 383 | |||||||||
4.750%, 10/25/2016 | PLN | 3,810 | 1,311 | |||||||||
4.750%, 04/25/2017 | PLN | 965 | 333 | |||||||||
4.000%, 10/25/2023 | PLN | 9,250 | 3,006 | |||||||||
4.000%, 01/22/2024 | 3,575 | 3,594 | ||||||||||
3.750%, 04/25/2018 | PLN | 7,127 | 2,381 | |||||||||
3.000%, 08/24/2016 | PLN | 9,236 | 3,191 | |||||||||
3.000%, 03/17/2023 | 1,470 | 1,374 | ||||||||||
2.881%, 01/25/2016 (E) | PLN | 21,930 | 6,884 | |||||||||
2.750%, 08/25/2023 | PLN | 3,068 | 1,055 | |||||||||
2.500%, 07/25/2018 | PLN | 2,890 | 917 | |||||||||
1.239%, 07/25/2016 (E) | PLN | 4,810 | 1,485 | |||||||||
| Description | Face Amount (1) (Thousands) | Market Value ($ Thousands) | ||||||||||
Republic of Poland, Ser 0415 | ||||||||||||
5.500%, 04/25/2015 | PLN | 2,600 | $ | 885 | ||||||||
Republic of Poland, Ser 0922 | ||||||||||||
5.750%, 09/23/2022 | PLN | 30,526 | 11,225 | |||||||||
Republic of Poland, Ser 1017 | ||||||||||||
5.250%, 10/25/2017 | PLN | 17,235 | 6,063 | |||||||||
Republic of Poland, Ser 1019 | ||||||||||||
5.500%, 10/25/2019 | PLN | 9,680 | 3,479 | |||||||||
Republic of Poland, Ser 1021 | ||||||||||||
5.750%, 10/25/2021 | PLN | 3,292 | 1,206 | |||||||||
|
| |||||||||||
| 56,164 | ||||||||||||
|
| |||||||||||
Qatar — 0.2% | ||||||||||||
Qtel International Finance | ||||||||||||
7.875%, 06/10/2019 | 665 | 826 | ||||||||||
State of Qatar | ||||||||||||
9.750%, 06/15/2030 | 647 | 1,003 | ||||||||||
6.400%, 01/20/2040 (B) | 377 | 448 | ||||||||||
6.400%, 01/20/2040 | 220 | 261 | ||||||||||
|
| |||||||||||
| 2,538 | ||||||||||||
|
| |||||||||||
Romania — 1.4% | ||||||||||||
Government of Romania MTN | ||||||||||||
6.750%, 02/07/2022 | 4,344 | 5,061 | ||||||||||
6.750%, 02/07/2022 (B) | 350 | 408 | ||||||||||
6.125%, 01/22/2044 | 1,366 | 1,443 | ||||||||||
5.950%, 06/11/2021 | RON | 1,680 | 541 | |||||||||
5.850%, 07/28/2014 | RON | 1,920 | 599 | |||||||||
5.850%, 04/26/2023 | RON | 3,050 | 979 | |||||||||
5.750%, 04/29/2020 | RON | 1,260 | 404 | |||||||||
4.875%, 01/22/2024 (B) | 1,616 | 1,644 | ||||||||||
4.875%, 01/22/2024 (B) | 3,136 | 3,191 | ||||||||||
4.750%, 06/24/2019 | RON | 1,940 | 597 | |||||||||
4.375%, 08/22/2023 | 3,476 | 3,411 | ||||||||||
|
| |||||||||||
| 18,278 | ||||||||||||
|
| |||||||||||
Russia — 7.6% | ||||||||||||
Alfa Bank Via Alfa Bond Issuance | ||||||||||||
7.750%, 04/28/2021 | 500 | 509 | ||||||||||
7.500%, 09/26/2019 | 750 | 746 | ||||||||||
7.500%, 09/26/2019 (B) | 260 | 259 | ||||||||||
Credit Bank of Moscow Via CBOM Finance | ||||||||||||
7.700%, 02/01/2018 | 1,000 | 966 | ||||||||||
EuroChem Mineral & Chemical Via EuroChem GI | ||||||||||||
5.125%, 12/12/2017 (B) | 175 | 171 | ||||||||||
Far East Capital | ||||||||||||
8.000%, 05/02/2018 (B) | 200 | 163 | ||||||||||
Gazprom Neft OAO Via GPN | ||||||||||||
Capital | ||||||||||||
6.000%, 11/27/2023 (B) | 480 | 470 | ||||||||||
| 42 | SEI Institutional International Trust / Semi-Annual Report / March 31, 2014 |
Table of Contents
| Description | Face Amount (1) (Thousands) | Market Value ($ Thousands) | ||||||||||
4.375%, 09/19/2022 | 730 | $ | 648 | |||||||||
Gazprom OAO Via Gaz Capital | ||||||||||||
9.250%, 04/23/2019 | 414 | 489 | ||||||||||
6.510%, 03/07/2022 | 470 | 484 | ||||||||||
Metalloinvest Finance | ||||||||||||
5.625%, 04/17/2020 (B) | 275 | 258 | ||||||||||
Mobile Telesystems Via MTS International Funding | ||||||||||||
8.625%, 06/22/2020 | 900 | 1,026 | ||||||||||
8.625%, 06/22/2020 (B) | 800 | 912 | ||||||||||
Ritekro | ||||||||||||
12.613%, 11/07/2022 (A) (I) | 914 | 339 | ||||||||||
Rosneft Oil Via Rosneft International Finance | ||||||||||||
4.199%, 03/06/2022 | 500 | 442 | ||||||||||
Russian Agricultural Bank Via RSHB Capital | ||||||||||||
5.298%, 12/27/2017 (B) | 415 | 411 | ||||||||||
Russian Federal Bond - OFZ | ||||||||||||
8.150%, 02/03/2027 | RUB | 183,888 | 4,987 | |||||||||
7.600%, 04/14/2021 | RUB | 403,132 | 10,865 | |||||||||
7.600%, 07/20/2022 | RUB | 141,856 | 3,765 | |||||||||
7.500%, 03/15/2018 | RUB | 82,202 | 2,274 | |||||||||
7.500%, 02/27/2019 | RUB | 99,755 | 2,736 | |||||||||
7.400%, 04/19/2017 | RUB | 118,436 | 3,308 | |||||||||
7.400%, 06/14/2017 | RUB | 38,980 | 1,085 | |||||||||
7.350%, 01/20/2016 | RUB | 80,000 | 2,253 | |||||||||
7.050%, 01/19/2028 | RUB | 72,624 | 1,792 | |||||||||
7.000%, 12/03/2014 (C) | RUB | 32,430 | 812 | |||||||||
7.000%, 01/25/2023 | RUB | 189,188 | 4,843 | |||||||||
7.000%, 08/16/2023 | RUB | 105,405 | 2,676 | |||||||||
6.900%, 08/03/2016 | RUB | 48,434 | 1,351 | |||||||||
6.800%, 12/11/2019 | RUB | 137,154 | 3,620 | |||||||||
6.700%, 05/15/2019 | RUB | 7,370 | 193 | |||||||||
6.200%, 01/31/2018 | RUB | 116,650 | 3,121 | |||||||||
Russian Foreign | ||||||||||||
7.850%, 03/10/2018 | RUB | 160,000 | 4,484 | |||||||||
7.500%, 03/31/2030 | 13,509 | 15,366 | ||||||||||
5.625%, 04/04/2042 | 1,600 | 1,548 | ||||||||||
4.875%, 09/16/2023 (B) | 800 | 791 | ||||||||||
4.875%, 09/16/2023 | 1,600 | 1,582 | ||||||||||
Russian Railways Via RZD Capital | ||||||||||||
5.700%, 04/05/2022 | 398 | 389 | ||||||||||
Sberbank of Russia Via SB Capital | ||||||||||||
5.717%, 06/16/2021 | 400 | 405 | ||||||||||
5.500%, 02/26/2024 (B) (D) | 1,488 | 1,393 | ||||||||||
5.250%, 05/23/2023 | 850 | 788 | ||||||||||
SCF Capital | ||||||||||||
5.375%, 10/27/2017 (B) | 350 | 329 | ||||||||||
TMK Capital | ||||||||||||
7.750%, 01/27/2018 | 1,400 | 1,348 | ||||||||||
| Description | Face Amount (1) (Thousands) | Market Value ($ Thousands) | ||||||||
TMK OAO Via TMK Capital | ||||||||||
6.750%, 04/03/2020 | 1,300 | $ | 1,141 | |||||||
VEB-Leasing Via VEB Leasing Investment | ||||||||||
5.125%, 05/27/2016 | 320 | 321 | ||||||||
Vimpel Communications Via VIP Finance Ireland | ||||||||||
7.748%, 02/02/2021 (B) | 800 | 819 | ||||||||
7.748%, 02/02/2021 | 450 | 461 | ||||||||
VimpelCom Holdings | ||||||||||
7.504%, 03/01/2022 | 870 | 882 | ||||||||
7.504%, 03/01/2022 (B) | 400 | 405 | ||||||||
5.200%, 02/13/2019 (B) | 200 | 189 | ||||||||
VimpelCom Holdings BV | ||||||||||
5.950%, 02/13/2023 (B) | 200 | 183 | ||||||||
Vnesheconombank Via VEB Finance | ||||||||||
6.902%, 07/09/2020 | 1,310 | 1,371 | ||||||||
6.800%, 11/22/2025 | 580 | 574 | ||||||||
6.800%, 11/22/2025 (B) | 150 | 148 | ||||||||
5.450%, 11/22/2017 (B) | 400 | 408 | ||||||||
VTB Bank Via VTB Capital | ||||||||||
6.950%, 10/17/2022 | 200 | 199 | ||||||||
6.875%, 05/29/2018 | 600 | 638 | ||||||||
6.315%, 02/22/2018 | 762 | 794 | ||||||||
6.250%, 06/30/2035 | 357 | 367 | ||||||||
|
| |||||||||
| 95,297 | ||||||||||
|
| |||||||||
Senegal — 0.1% | ||||||||||
Republic of Senegal | ||||||||||
8.750%, 05/13/2021 (B) | 540 | 614 | ||||||||
8.750%, 05/13/2021 | 200 | 227 | ||||||||
|
| |||||||||
| 841 | ||||||||||
|
| |||||||||
Serbia — 0.6% | ||||||||||
Republic of Serbia | ||||||||||
7.250%, 09/28/2021 | 2,820 | 3,159 | ||||||||
7.250%, 09/28/2021 (B) | 200 | 224 | ||||||||
5.875%, 12/03/2018 | 2,783 | 2,943 | ||||||||
5.875%, 12/03/2018 (B) | 530 | 560 | ||||||||
5.250%, 11/21/2017 (B) | 1,203 | 1,248 | ||||||||
4.875%, 02/25/2020 | 200 | 200 | ||||||||
|
| |||||||||
| 8,334 | ||||||||||
|
| |||||||||
Singapore — 0.2% | ||||||||||
Sea Production | ||||||||||
10.239%, 02/14/2014 (D) | 1,463 | 1,243 | ||||||||
STATS ChipPAC | ||||||||||
4.500%, 03/20/2018 (B) | 200 | 201 | ||||||||
Yanlord Land Group | ||||||||||
9.500%, 05/04/2017 | 980 | 1,017 | ||||||||
|
| |||||||||
| 2,461 | ||||||||||
|
| |||||||||
| SEI Institutional International Trust / Semi-Annual Report / March 31, 2014 | 43 |
Table of Contents
SCHEDULE OF INVESTMENTS (Unaudited)
Emerging Markets Debt Fund (Continued)
March 31, 2014
| Description | Face Amount (1) (Thousands) | Market Value ($ Thousands) | ||||||||||
Slovak Republic — 0.1% | ||||||||||||
Republic of Slovak | ||||||||||||
4.375%, 05/21/2022 (B) | 1,546 | $ | 1,638 | |||||||||
|
| |||||||||||
Slovenia — 0.2% | ||||||||||||
Slovenia Government International Bond | ||||||||||||
5.850%, 05/10/2023 | 691 | 753 | ||||||||||
5.850%, 05/10/2023 | 444 | 484 | ||||||||||
5.250%, 02/18/2024 (B) | 1,493 | 1,549 | ||||||||||
|
| |||||||||||
| 2,786 | ||||||||||||
|
| |||||||||||
South Africa — 5.8% | ||||||||||||
Eskom Holdings | ||||||||||||
6.750%, 08/06/2023 (B) | 1,289 | 1,348 | ||||||||||
5.750%, 01/26/2021 | 400 | 408 | ||||||||||
Republic of South Africa | ||||||||||||
13.500%, 09/15/2015 | ZAR | 40,000 | 4,147 | |||||||||
10.500%, 12/21/2026 | ZAR | 52,596 | 5,798 | |||||||||
8.750%, 02/28/2048 | ZAR | 27,993 | 2,573 | |||||||||
8.500%, 06/23/2017 (F) | 860 | 1,014 | ||||||||||
8.500%, 01/31/2037 | ZAR | 38,618 | 3,512 | |||||||||
8.250%, 09/15/2017 | ZAR | 34,992 | 3,392 | |||||||||
8.000%, 12/21/2018 | ZAR | 87,550 | 8,381 | |||||||||
8.000%, 01/31/2030 | ZAR | 31,571 | 2,798 | |||||||||
7.750%, 02/28/2023 | ZAR | 49,342 | 4,531 | |||||||||
7.250%, 01/15/2020 | ZAR | 52,428 | 4,801 | |||||||||
7.000%, 02/28/2031 | ZAR | 200 | 16 | |||||||||
7.000%, 02/28/2031 | ZAR | 46,569 | 3,741 | |||||||||
6.875%, 05/27/2019 | 2,043 | 2,355 | ||||||||||
6.750%, 03/31/2021 | ZAR | 17,610 | 1,547 | |||||||||
6.500%, 02/28/2041 | ZAR | 3,435 | 245 | |||||||||
6.250%, 03/31/2036 | ZAR | 22,890 | 1,622 | |||||||||
5.875%, 05/30/2022 | 770 | 845 | ||||||||||
5.875%, 09/16/2025 | 11,133 | 11,968 | ||||||||||
5.500%, 03/09/2020 | 1,340 | 1,455 | ||||||||||
4.665%, 01/17/2024 | 1,123 | 1,112 | ||||||||||
Transnet SOC | ||||||||||||
9.500%, 05/13/2021 (B) | ZAR | 13,360 | 1,235 | |||||||||
4.000%, 07/26/2022 | 2,100 | 1,931 | ||||||||||
4.000%, 07/26/2022 (B) | 1,119 | 1,029 | ||||||||||
|
| |||||||||||
| 71,804 | ||||||||||||
|
| |||||||||||
Sri Lanka — 0.5% | ||||||||||||
Bank of Ceylon | ||||||||||||
6.875%, 05/03/2017 (B) | 320 | 335 | ||||||||||
Republic of Sri Lanka | ||||||||||||
6.250%, 10/04/2020 (B) | 249 | 261 | ||||||||||
6.250%, 07/27/2021 (B) | 1,400 | 1,457 | ||||||||||
6.250%, 07/27/2021 | 729 | 759 | ||||||||||
5.875%, 07/25/2022 | 2,585 | 2,598 | ||||||||||
|
| |||||||||||
| 5,410 | ||||||||||||
|
| |||||||||||
| Description | Face Amount (1) (Thousands) | Market Value ($ Thousands) | ||||||||||
Thailand — 3.1% | ||||||||||||
Thailand Government Bond | ||||||||||||
5.670%, 03/13/2028 | THB | 3,000 | $ | 109 | ||||||||
4.875%, 06/22/2029 | THB | 22,410 | 753 | |||||||||
3.875%, 06/13/2019 | THB | 468,000 | 14,908 | |||||||||
3.650%, 12/17/2021 | THB | 198,400 | 6,152 | |||||||||
3.625%, 06/16/2023 | THB | 342,076 | 10,508 | |||||||||
3.580%, 12/17/2027 | THB | 53,033 | 1,569 | |||||||||
3.250%, 06/16/2017 | THB | 35,200 | 1,104 | |||||||||
1.200%, 07/14/2021 | THB | 127,325 | 3,737 | |||||||||
|
| |||||||||||
| 38,840 | ||||||||||||
|
| |||||||||||
Trinidad & Tobago — 0.1% | ||||||||||||
Republic of Trinidad & Tobago | ||||||||||||
4.375%, 01/16/2024 (B) | 1,305 | 1,365 | ||||||||||
|
| |||||||||||
Turkey — 6.7% | ||||||||||||
Akbank | ||||||||||||
5.000%, 10/24/2022 | 225 | 213 | ||||||||||
Export Credit Bank of Turkey | ||||||||||||
5.875%, 04/24/2019 (B) | 200 | 208 | ||||||||||
KOC Holding | ||||||||||||
3.500%, 04/24/2020 (B) | 125 | 114 | ||||||||||
Republic of Turkey | ||||||||||||
11.875%, 01/15/2030 | 600 | 963 | ||||||||||
10.500%, 01/15/2020 | TRY | 3,041 | 1,448 | |||||||||
9.500%, 01/12/2022 | TRY | 9,517 | 4,293 | |||||||||
9.000%, 01/27/2016 | TRY | 2,200 | 1,005 | |||||||||
9.000%, 03/08/2017 | TRY | 12,842 | 5,832 | |||||||||
8.800%, 11/14/2018 | TRY | 2,501 | 1,111 | |||||||||
8.800%, 09/27/2023 | TRY | 1,419 | 611 | |||||||||
8.500%, 09/14/2022 | TRY | 21,342 | 9,104 | |||||||||
8.300%, 10/07/2015 | TRY | 10,108 | 4,588 | |||||||||
8.300%, 06/20/2018 | TRY | 2,500 | 1,096 | |||||||||
8.300%, 06/20/2018 | TRY | 15,534 | 6,811 | |||||||||
8.000%, 02/14/2034 | 1,550 | 1,879 | ||||||||||
7.500%, 07/14/2017 | 1,037 | 1,166 | ||||||||||
7.500%, 11/07/2019 | 3,849 | 4,409 | ||||||||||
7.375%, 02/05/2025 | 3,878 | 4,448 | ||||||||||
7.250%, 03/05/2038 | 200 | 226 | ||||||||||
7.100%, 03/08/2023 | TRY | 1,120 | 432 | |||||||||
7.100%, 03/08/2023 | TRY | 13,406 | 5,170 | |||||||||
7.000%, 09/26/2016 | 838 | 919 | ||||||||||
7.000%, 03/11/2019 | 240 | 268 | ||||||||||
7.000%, 06/05/2020 | 2,592 | 2,914 | ||||||||||
6.875%, 03/17/2036 | 1,360 | 1,474 | ||||||||||
6.750%, 04/03/2018 | 2,938 | 3,238 | ||||||||||
6.750%, 05/30/2040 | 375 | 401 | ||||||||||
6.500%, 01/07/2015 | TRY | 5,864 | 2,652 | |||||||||
6.300%, 02/14/2018 | TRY | 11,800 | 4,854 | |||||||||
6.250%, 09/26/2022 | 1,207 | 1,297 | ||||||||||
6.000%, 01/14/2041 | 1,780 | 1,749 | ||||||||||
5.625%, 03/30/2021 | 2,760 | 2,879 | ||||||||||
| 44 | SEI Institutional International Trust / Semi-Annual Report / March 31, 2014 |
Table of Contents
| Description | Face Amount (1) (Thousands) | Market Value ($ Thousands) | ||||||||
5.125%, 03/25/2022 | 2,288 | $ | 2,293 | |||||||
3.250%, 03/23/2023 | 1,289 | 1,127 | ||||||||
Turkiye Garanti Bankasi | ||||||||||
5.250%, 09/13/2022 (B) | 500 | 477 | ||||||||
4.000%, 09/13/2017 (B) | 200 | 199 | ||||||||
|
| |||||||||
| 81,868 | ||||||||||
|
| |||||||||
Ukraine — 1.6% | ||||||||||
Ferrexpo Finance | ||||||||||
7.875%, 04/07/2016 (B) | 88 | 84 | ||||||||
Government of Ukraine | ||||||||||
9.250%, 07/24/2017 | 11,320 | 11,094 | ||||||||
9.250%, 07/24/2017 (B) | 403 | 394 | ||||||||
7.950%, 02/23/2021 (B) | 250 | 235 | ||||||||
7.950%, 02/23/2021 (F) | 1,700 | 1,598 | ||||||||
7.800%, 11/28/2022 (B) | 300 | 278 | ||||||||
7.500%, 04/17/2023 | 555 | 513 | ||||||||
7.500%, 04/17/2023 (B) | 1,049 | 970 | ||||||||
6.875%, 09/23/2015 (F) | 2,249 | 2,137 | ||||||||
6.750%, 11/14/2017 | 276 | 254 | ||||||||
6.580%, 11/21/2016 | 403 | 379 | ||||||||
Ukraine Railways Via Shortline | ||||||||||
9.500%, 05/21/2018 | 200 | 164 | ||||||||
Ukreximbank Via Biz Finance | ||||||||||
8.750%, 01/22/2018 | 670 | 566 | ||||||||
8.375%, 04/27/2015 | 593 | 528 | ||||||||
|
| |||||||||
| 19,194 | ||||||||||
|
| |||||||||
United Arab Emirates — 0.0% | ||||||||||
MAF Global Securities | ||||||||||
7.125%, 10/29/2049 (D) | 200 | 214 | ||||||||
|
| |||||||||
Uruguay — 0.6% | ||||||||||
Republic of Uruguay PIK | ||||||||||
7.875%, 01/15/2033 | 1,662 | 2,177 | ||||||||
Republic of Uruguay | ||||||||||
8.000%, 11/18/2022 | 1,183 | 1,499 | ||||||||
7.625%, 03/21/2036 | 2,076 | 2,657 | ||||||||
4.500%, 08/14/2024 | 932 | 956 | ||||||||
|
| |||||||||
| 7,289 | ||||||||||
|
| |||||||||
Venezuela — 3.7% | ||||||||||
Petroleos de Venezuela | ||||||||||
12.750%, 02/17/2022 | 290 | 263 | ||||||||
9.000%, 11/17/2021 | 1,050 | 782 | ||||||||
8.500%, 11/02/2017 | 1,289 | 1,080 | ||||||||
8.500%, 11/02/2017 | 8,430 | 7,060 | ||||||||
5.500%, 04/12/2037 | 250 | 129 | ||||||||
5.375%, 04/12/2027 | 390 | 207 | ||||||||
5.250%, 04/12/2017 | 1,408 | 1,052 | ||||||||
5.000%, 10/28/2015 | 3,855 | 3,315 | ||||||||
Republic of Venezuela | ||||||||||
13.625%, 08/15/2018 | 1,716 | 1,707 | ||||||||
13.625%, 08/15/2018 | 144 | 139 | ||||||||
12.750%, 08/23/2022 | 12,292 | 11,309 | ||||||||
11.950%, 08/05/2031 | 2,578 | 2,192 | ||||||||
| Description | Face Amount (1) (Thousands)/Shares | Market Value ($ Thousands) | ||||||||||
11.750%, 10/21/2026 | 2,515 | $ | 2,144 | |||||||||
9.375%, 01/13/2034 | 1,861 | 1,365 | ||||||||||
9.250%, 09/15/2027 | 1,793 | 1,336 | ||||||||||
9.250%, 05/07/2028 | 2,445 | 1,785 | ||||||||||
9.000%, 05/07/2023 | 881 | 654 | ||||||||||
9.000%, 05/07/2023 | 20 | 15 | ||||||||||
8.500%, 10/08/2014 | 780 | 766 | ||||||||||
8.250%, 10/13/2024 | 500 | 348 | ||||||||||
7.750%, 10/13/2019 | 3,825 | 2,907 | ||||||||||
7.650%, 04/21/2025 | 290 | 194 | ||||||||||
6.000%, 12/09/2020 | 1,087 | 737 | ||||||||||
5.750%, 02/26/2016 (F) |
| 4,350 | 3,779 | |||||||||
|
| |||||||||||
| 45,265 | ||||||||||||
|
| |||||||||||
Vietnam — 0.1% | ||||||||||||
Republic of Vietnam | ||||||||||||
6.875%, 01/15/2016 | 360 | 387 | ||||||||||
6.750%, 01/29/2020 | 1,099 | 1,227 | ||||||||||
|
| |||||||||||
| 1,614 | ||||||||||||
|
| |||||||||||
Zambia — 0.2% | ||||||||||||
Republic of Zambia | ||||||||||||
5.375%, 09/20/2022 | 2,360 | 2,015 | ||||||||||
|
| |||||||||||
Total Global Bonds |
| 1,147,330 | ||||||||||
|
| |||||||||||
LOAN PARTICIPATIONS — 0.5% |
| |||||||||||
Singapore — 0.5% |
| |||||||||||
Ashmore Cayman SPC, No. 1 |
| |||||||||||
0.000%, 08/31/2011 (A) (G) (I) |
| 9,161 | 4,289 | |||||||||
Morton Bay | ||||||||||||
6.220%, 12/31/2013 (A) (I) |
| 3,158 | 2,314 | |||||||||
|
| |||||||||||
Total Loan Participations |
| 6,603 | ||||||||||
|
| |||||||||||
AFFILIATED PARTNERSHIP — 1.2% |
| |||||||||||
SEI Liquidity Fund, L.P. 0.070% †* (J) | 15,421,402 | 15,421 | ||||||||||
|
| |||||||||||
Total Affiliated Partnership |
| 15,421 | ||||||||||
|
| |||||||||||
TIME DEPOSITS — 5.6% |
| |||||||||||
Brown Brothers Harriman | ||||||||||||
4.350%, 04/01/2014 | ZAR | 1,386 | 132 | |||||||||
0.076%, 04/01/2014 | EUR | 138 | 191 | |||||||||
0.048%, 04/01/2014 | GBP | — | — | |||||||||
0.030%, 04/01/2014 | 68,731 | 68,731 | ||||||||||
0.005%, 04/01/2014 | SGD | 1 | — | |||||||||
|
| |||||||||||
Total Time Deposits |
| 69,054 | ||||||||||
|
| |||||||||||
Total Investments — 100.1% |
| $ | 1,238,408 | |||||||||
|
| |||||||||||
| SEI Institutional International Trust / Semi-Annual Report / March 31, 2014 | 45 |
Table of Contents
SCHEDULE OF INVESTMENTS (Unaudited)
Emerging Markets Debt Fund (Continued)
March 31, 2014
A list of the open futures contracts held by the Fund at March 31, 2014, is as follows:
| Type of Contract | Number of Contracts Long (Short) | Expiration Date | Unrealized Appreciation (Depreciation) ($ Thousands) | |||||||||
Euro-Bund | (18 | ) | Jun-2014 | $ | (32 | ) | ||||||
U.S. 10-Year Treasury Note | (26 | ) | Jun-2014 | 1 | ||||||||
U.S. 2-Year Treasury Note | 55 | Jun-2014 | (15 | ) | ||||||||
U.S. 5-Year Treasury Note | 9 | Jul-2014 | – | |||||||||
U.S. 5-Year Treasury Note | (65 | ) | Jul-2014 | (17 | ) | |||||||
U.S. Long Treasury Bond | 27 | Jun-2014 | 24 | |||||||||
|
| |||||||||||
| $ | (39 | ) | ||||||||||
|
| |||||||||||
For the six months ended March 31, 2014, the total amount of all open future contracts, as presented in the table above, are representative of the volume of activity for this derivative type during the six months.
A list of the open forward foreign currency contracts held by the Fund at March 31, 2014, is as follows:
| Settlement Date | Currency | Currency | Unrealized Appreciation (Depreciation) ($ Thousands) | |||||||||||||||||
04/01/2014-05/19/2014 | BRL | 37,928 | USD | 15,884 | $ | (809 | ) | |||||||||||||
04/02/2014-05/19/2014 | USD | 8,160 | BRL | 19,311 | 332 | |||||||||||||||
04/03/2014-04/21/2014 | PHP | 93,828 | USD | 2,091 | (2 | ) | ||||||||||||||
04/03/2014-05/05/2014 | USD | 41,446 | EUR | 30,210 | 188 | |||||||||||||||
04/03/2014-05/05/2014 | USD | 10,917 | PHP | 489,197 | (7 | ) | ||||||||||||||
04/03/2014-06/18/2014 | EUR | 13,216 | PLN | 55,418 | 90 | |||||||||||||||
04/03/2014-06/18/2014 | EUR | 31,576 | USD | 43,411 | (104 | ) | ||||||||||||||
04/03/2014-06/18/2014 | USD | 4,976 | HUF | 1,121,241 | 43 | |||||||||||||||
04/03/2014-06/18/2014 | USD | 23,057 | MXN | 307,845 | 485 | |||||||||||||||
04/03/2014-06/18/2014 | USD | 10,138 | ZAR | 111,774 | 424 | |||||||||||||||
04/03/2014-06/30/2014 | USD | 32,041 | TRY | 72,156 | 1,377 | |||||||||||||||
04/04/2014 | KRW | 4,130,000 | USD | 3,860 | (20 | ) | ||||||||||||||
04/04/2014-06/18/2014 | USD | 8,666 | THB | 287,477 | 183 | |||||||||||||||
04/04/2014-06/30/2014 | TRY | 41,280 | USD | 18,502 | (676 | ) | ||||||||||||||
04/04/2014-06/30/2014 | USD | 12,111 | KRW | 13,033,089 | 128 | |||||||||||||||
04/07/2014 | MXN | 82,058 | USD | 6,167 | (119 | ) | ||||||||||||||
04/07/2014-04/22/2014 | EUR | 1,614 | RON | 7,222 | 7 | |||||||||||||||
04/07/2014-06/26/2014 | USD | 5,064 | PEI | 14,328 | 8 | |||||||||||||||
04/09/2014-05/21/2014 | THB | 556,455 | USD | 17,027 | (112 | ) | ||||||||||||||
04/15/2014-06/18/2014 | USD | 22,717 | MYR | 75,505 | 369 | |||||||||||||||
04/16/2014 | TWD | 141,145 | USD | 4,644 | 7 | |||||||||||||||
04/16/2014 | USD | 4,661 | TWD | 141,063 | (27 | ) | ||||||||||||||
04/16/2014-04/30/2014 | MYR | 10,392 | USD | 3,124 | (55 | ) | ||||||||||||||
04/16/2014-05/19/2014 | CLP | 5,890,373 | USD | 10,750 | 76 | |||||||||||||||
04/16/2014-05/19/2014 | USD | 15,248 | CLP | 8,568,735 | 278 | |||||||||||||||
04/16/2014-07/16/2014 | NGN | 297,897 | USD | 1,787 | 1 | |||||||||||||||
04/16/2014-07/16/2014 | USD | 6,391 | NGN | 1,105,261 | 154 | |||||||||||||||
04/22/2014-05/05/2014 | EUR | 10,741 | HUF | 3,331,119 | 119 | |||||||||||||||
04/22/2014-05/05/2014 | HUF | 2,705,167 | EUR | 8,679 | (156 | ) | ||||||||||||||
04/22/014-06/18/2014 | ILS | 45,109 | USD | 12,913 | (9 | ) | ||||||||||||||
04/22/014-06/18/2014 | RON | 9,152 | EUR | 2,032 | (22 | ) | ||||||||||||||
04/22/2014-07/17/2015 | CNH | 270,068 | USD | 41,464 | (1,875 | ) | ||||||||||||||
04/22/2014-07/17/2015 | USD | 41,533 | CNH | 270,068 | 1,805 | |||||||||||||||
04/25/2014 | GBP | 617 | USD | 1,031 | 4 | |||||||||||||||
04/25/2014 | USD | 609 | GBP | 370 | 7 | |||||||||||||||
05/05/2014 | PLN | 12,571 | EUR | 2,950 | (89 | ) | ||||||||||||||
05/05/2014-07/16/2014 | RUB | 584,015 | USD | 16,063 | (318 | ) | ||||||||||||||
05/05/2014-07/16/2014 | USD | 15,856 | RUB | 580,304 | 415 | |||||||||||||||
05/12/2014-06/18/2014 | ZAR | 66,232 | USD | 6,106 | (137 | ) | ||||||||||||||
05/12/2014-06/26/2014 | COP | 18,750,326 | USD | 9,275 | (208 | ) | ||||||||||||||
05/12/2014-07/16/2014 | USD | 11,813 | COP | 24,022,549 | 315 | |||||||||||||||
05/30/2014-06/18/2014 | USD | 4,261 | INR | 267,877 | 161 | |||||||||||||||
06/12/2014-12/08/2014 | USD | 13,928 | IDR | 164,354,561 | 242 | |||||||||||||||
06/17/2014-06/18/2014 | CZK | 129,947 | EUR | 4,746 | 3 | |||||||||||||||
06/18/2014 | CZK | 49,015 | USD | 2,487 | 21 | |||||||||||||||
06/18/2014 | HUF | 202,880 | USD | 901 | (5 | ) | ||||||||||||||
06/18/2014 | RON | 3,920 | USD | 1,200 | (8 | ) | ||||||||||||||
06/18/2014 | SGD | 9,966 | USD | 7,867 | (61 | ) | ||||||||||||||
06/18/2014 | USD | 152 | ILS | 533 | – | |||||||||||||||
06/18/2014 | USD | 7,499 | PLN | 22,970 | 70 | |||||||||||||||
| Settlement Date | Currency | Currency | Unrealized Appreciation (Depreciation) ($ Thousands) | |||||||||||||||||
06/18/2014 | USD | 2,641 | RON | 8,635 | $ | 20 | ||||||||||||||
07/16/2014 | PEI | 8,223 | USD | 2,881 | (7 | ) | ||||||||||||||
12/08/2014 | IDR | 25,000,000 | USD | 2,050 | (61 | ) | ||||||||||||||
|
| |||||||||||||||||||
| $ | 2,445 | |||||||||||||||||||
|
| |||||||||||||||||||
A list of the counterparties for the open forward foreign currency contracts held by the Fund at March 31, 2014, is as follows:
| Counterparty | Currency to Deliver ($ Thousands) | Currency to Receive ($ Thousands) | Unrealized Appreciation (Depreciation) ($ Thousands) | |||||||
| Barclays PLC | (2,002) | 1,989 | $ | (13 | ) | |||||
| Citigroup | (113,715) | 114,680 | 965 | |||||||
| Goldman Sachs | (174,599) | 175,063 | 464 | |||||||
| HSBC | (87,013) | 87,251 | 238 | |||||||
| JPMorgan Chase Bank | (223,385) | 224,176 | 791 | |||||||
|
| |||||||||
| $ | 2,445 | |||||||||
|
| |||||||||
For the six months ended March 31, 2014, the total amount of all open forward foreign currency contracts, as presented in the table above, are representative of the volume of activity for this derivative type during the six months.
| 46 | SEI Institutional International Trust / Semi-Annual Report / March 31, 2014 |
Table of Contents
A list of the open OTC swap agreements held by the Fund at March 31, 2014, is as follows:
Interest Rate Swaps | ||||||||||||||||||||
| Counterparty | Fund Pays | Fund Receives | Termination Date | Currency | Notional Amount (Thousands) | Net Unrealized Appreciation (Depreciation) ($ Thousands) | ||||||||||||||
| Goldman Sachs | 3-Month ZAR JIBAR | 8.76% | 01/16/2029 | ZAR | 52,000 | $ | 102 | |||||||||||||
| Goldman Sachs | 3-Month ZAR JIBAR | 8.30% | 01/16/2024 | ZAR | 23,000 | 1 | ||||||||||||||
| Goldman Sachs | 28-Day MXN TIIE | 6.87% | 01/10/2024 | MXN | 60,000 | 106 | ||||||||||||||
| Goldman Sachs | 3-Month ZAR JIBAR | 8.19% | 12/20/2023 | ZAR | 10,000 | (12 | ) | |||||||||||||
| Goldman Sachs | 28-Day MXN TIIE | 6.68% | 12/12/2023 | MXN | 36,000 | 25 | ||||||||||||||
| Goldman Sachs | 7-Day China Fixing Repo Rate | 4.40% | 03/25/2019 | CNY | 58,000 | (352 | ) | |||||||||||||
| Goldman Sachs | 3-Month ILS TELBOR | 2.29% | 12/24/2018 | ILS | 14,000 | 81 | ||||||||||||||
| Goldman Sachs | 1-Year BRL CDI | 12.26% | 01/02/2018 | BRL | 13,563 | (80 | ) | |||||||||||||
| Goldman Sachs | 0.95% | 3-Month ILS TELBOR | 04/02/2016 | ILS | 6,000 | — | ||||||||||||||
| Goldman Sachs | 1.21% | 3-Month ILS TELBOR | 02/14/2016 | ILS | 8,000 | (14 | ) | |||||||||||||
| Goldman Sachs | 3.31% | 6-Month PLN WIBOR | 02/03/2016 | PLN | 30,000 | (69 | ) | |||||||||||||
| Goldman Sachs | 3-Month ZAR JIBAR | 6.85% | 01/22/2016 | ZAR | 25,000 | (8 | ) | |||||||||||||
| Goldman Sachs | 1.20% | 3-Month ILS TELBOR | 01/16/2016 | ILS | 34,383 | (62 | ) | |||||||||||||
| Goldman Sachs | 1-Year BRL CDI | 11.59% | 01/04/2016 | BRL | 5,024 | (17 | ) | |||||||||||||
| Goldman Sachs | 3-Month ZAR JIBAR | 6.81% | 12/31/2015 | ZAR | 60,000 | (17 | ) | |||||||||||||
| Goldman Sachs | 1.18% | 3-Month ILS TELBOR | 12/24/2015 | ILS | 33,000 | (82 | ) | |||||||||||||
| Goldman Sachs | 3-Month ZAR JIBAR | 6.75% | 12/22/2015 | ZAR | 80,000 | (24 | ) | |||||||||||||
|
| |||||||||||||||||||
| $ | (422 | ) | ||||||||||||||||||
|
| |||||||||||||||||||
For the six months ended March 31, 2014, the total number of all open swap agreements, as presented in the table above, are representative of the volume of activity for this derivative type during the six months.
Percentages are based on a Net Assets of $1,237,503 ($ Thousands).
| * | Rate shown is the 7-day effective yield as of March 31, 2014. |
| † | Investment in Affiliated Security. |
| (1) | In U.S. dollars unless otherwise indicated. |
| (A) | Securities considered illiquid. The total market value of such securities as of March 31, 2014 was $23,750 ($ Thousands) and represented 1.92% of Net Assets. |
| (B) | Securities sold within terms of a private placement memorandum, exempt from registration under Section 144A of the Securities Act of 1933, as amended, and may be sold only to dealers in that program or other “accredited investors.” These securities have been determined to be liquid under guidelines established by the board of Trustees. |
| (C) | Step Bonds — The rate reflected on the Schedule of Investments is the effective yield on March 31, 2014. The coupon on a step bond changes on a specified date. |
| (D) | Variable Rate Security — The rate reported on the Schedule of Investments is the rate in effect as of March 31, 2014. |
| (E) | Zero coupon security. The rate reported on the Schedule of Investments is the effective yield at time of purchase. |
| (F) | This security or a partial position of this security is on loan at March 31, 2014. The total market value of securities on loan at March 31, 2014 was $14,846 ($ Thousands) (See Note 8). |
| (G) | Security in default on interest payments. |
| (H) | Real Estate Investment Trust. |
| (I) | Security fair valued using methods determined in good faith by the Valuation Committee of the Board of Trustees. The total market value of such securities as of March 31, 2014 was $6,942 ($ Thousands) and represented 0.56% of Net Assets. |
| (J) | This security was purchased with cash collateral held from securities on loan (see Note 8). The total value of such securities as of March 31, 2014 was $15,421 ($ Thousands). |
BRL — Brazilian Real
CDI — Average One - Day Interbank Deposit
CLN — Credit Linked Note
CLP — Chilean Peso
CNH — Chinese Yuen (Offshore)
CNY — Chinese Renminbi
COP — Colombian Peso
CZK — Czech Koruna
DEM — German Mark
EUR — Euro
GBP — British Pound Sterling
HUF — Hungarian Forint
IDR — Indonesia Rupiah
ILS — Israeli Shekel
INR — India Rupee
JIBAR — Johannesburg Interbank Agreed Rate
KES — Kenyan Shilling
KRW — Korean Won
MTN — Medium Term Note
MXN — Mexican Peso
MYR — Malaysian Ringgit
NGN — Nigerian Naira
PEI — Peruvian Inca
PHP — Philippine Peso
PIK — Payment-in-Kind
PLC — Public Limited Company
PLN —Polish Zlotty
RON — Romanian Leu
RUB — Russian Ruble
Ser — Series
SGD — Singapore Dollar
SPC — Segregated Portfolio Company
TELBOR — Tel Aviv Interbank Offered Rate
THB — Thai Baht
TIIE — Equilibrium Interbank Interest Rate
TRY — Turkish Lira
TWD — Taiwanese Dollar
USD — U.S. Dollar
WIBOR — Warsaw Interbank Offered Rate
ZAR — South African Rand
The following is a summary of the level of inputs used as of March 31, 2014, in valuing the Fund’s investments and other financial instruments carried at value ($ Thousands):
| Investments in Securities | Level 1 | Level 2 | Level 3 (1) | Total | ||||||||||||
Global Bonds | $ | — | $ | 1,147,330 | $ | — | $ | 1,147,330 | ||||||||
Loan Participations | — | — | 6,603 | 6,603 | ||||||||||||
Affiliated Partnership | — | 15,421 | — | 15,421 | ||||||||||||
Time Deposits | — | 69,054 | — | 69,054 | ||||||||||||
|
|
|
|
|
|
|
| |||||||||
Total Investments in Securities | $ | — | $ | 1,231,805 | $ | 6,603 | $ | 1,238,408 | ||||||||
|
|
|
|
|
|
|
| |||||||||
| Other Financial Instruments | Level 1 | Level 2 | Level 3 | Total | ||||||||||||
Futures Contracts* | $ | 25 | $ | — | $ | — | $ | 25 | ||||||||
Unrealized Depreciation | (64 | ) | — | — | (64 | ) | ||||||||||
Forwards Contracts* | — | 7,332 | — | 7,332 | ||||||||||||
Unrealized Depreciation | — | (4,887 | ) | — | (4,887 | ) | ||||||||||
OTC Swaps | ||||||||||||||||
Interest Rate Swaps * | ||||||||||||||||
Unrealized Appreciation | — | 315 | — | 315 | ||||||||||||
Unrealized Depreciation | — | (737 | ) | — | (737 | ) | ||||||||||
|
|
|
|
|
|
|
| |||||||||
Total Other Financial Instruments | $ | (39 | ) | $ | 2,023 | $ | — | $ | 1,984 | |||||||
|
|
|
|
|
|
|
| |||||||||
| SEI Institutional International Trust / Semi-Annual Report / March 31, 2014 | 47 |
Table of Contents
SCHEDULE OF INVESTMENTS (Unaudited)
Emerging Markets Debt Fund (Concluded)
March 31, 2014
| (1) | Of the $6,603 ($ Thousands) in Level 3 securities as of March 31, 2014, $6,603 ($ Thousands) or 0.53% are not valued via third party pricing vendors and broker quotes. If significant, the disclosure of the unobservable inputs and the interrelationships and sensitivity between these inputs are required for those Level 3 securities that are no valued by third party pricing vendors or broker quotes. |
| * | Futures contracts, forwards contracts and swaps are valued at the unrealized appreciation/(depreciation) on the instrument. |
For the six months ended March 31, 2014, there were no transfers between Level 1 and Level 2 assets and liabilities.
For the six months ended March 31, 2014, there were no transfers between Level 2 and Level 3 assets and liabilities.
Amounts designated as “—” are $0 or have been rounded to $0.
The accompanying notes are an integral part of the financial statements.
| 48 | SEI Institutional International Trust / Semi-Annual Report / March 31, 2014 |
Table of Contents
Statements of Assets and Liabilities ($ Thousands) (Unaudited)
March 31, 2014
| International Equity Fund | Emerging Markets Equity Fund | International Fixed Income Fund | Emerging Markets Debt Fund | |||||||||||||
ASSETS: | ||||||||||||||||
Investments, at value (Cost $2,199,619, $1,702,883, $467,497 and $1,239,258, respectively)(1) | $ | 2,522,224 | $ | 1,756,616 | $ | 477,123 | $ | 1,222,987 | ||||||||
Affiliated investments, at value (Cost $195,402, $118,560, $0 and $15,421, respectively) | 195,402 | 118,560 | — | 15,421 | ||||||||||||
Cash | — | 288 | 1,448 | — | ||||||||||||
Foreign currency, at value (Cost $1,518, $1,807, $0 and $2,240, respectively) | 1,527 | 1,814 | — | 2,220 | ||||||||||||
Cash pledged as collateral for forward foreign currency contracts, futures contracts or swap contracts | — | — | 1,169 | 176 | ||||||||||||
Receivable for investment securities sold | 18,738 | 10,731 | 10,893 | 22,939 | ||||||||||||
Unrealized gain on forward foreign currency contracts | — | — | 1,458 | 7,332 | ||||||||||||
Receivable for fund shares sold | 2,472 | 26,963 | 218 | 1,143 | ||||||||||||
Dividends and interest receivable | 8,169 | 2,396 | 4,797 | 18,290 | ||||||||||||
Variation margin receivable | 437 | — | 109 | 10 | ||||||||||||
Foreign tax reclaim receivable | 2,930 | 182 | — | — | ||||||||||||
Unrealized gain on foreign spot currency contracts | 15 | 11 | — | — | ||||||||||||
Swap contracts, at value (Premiums paid $0, $0, $0 and $0, respectively) | — | — | — | 315 | ||||||||||||
Total Assets | 2,751,914 | 1,917,561 | 497,215 | 1,290,833 | ||||||||||||
LIABILITIES: | ||||||||||||||||
Payable for investment securities purchased | 22,856 | 33,265 | 8,682 | 26,882 | ||||||||||||
Payable upon return of securities loaned | 75,033 | 107,208 | — | 15,421 | ||||||||||||
Payable to custodian | 900 | — | — | 2,911 | ||||||||||||
Foreign currency payable, at value (Proceeds $0, $0, $1,794 and $0, respectively) | — | — | 1,794 | — | ||||||||||||
Unrealized loss on forward foreign currency contracts | — | — | 1,245 | 4,887 | ||||||||||||
Swap contracts, at value (Premiums received $0, $0, $0 and $0, respectively) | — | — | 465 | 737 | ||||||||||||
Payable for fund shares redeemed | 1,664 | 2,375 | 335 | 888 | ||||||||||||
Variation margin payable | 124 | — | 156 | 12 | ||||||||||||
Unrealized loss on foreign spot currency contracts | 40 | 8 | 3 | — | ||||||||||||
Investment advisory fees payable | 1,124 | 1,505 | 123 | 400 | ||||||||||||
Administration fees payable | 1,001 | 931 | 246 | 669 | ||||||||||||
Shareholder servicing fees payable | 559 | 358 | 31 | 257 | ||||||||||||
Trustees’ fees | 10 | 5 | 2 | 5 | ||||||||||||
Chief compliance officer fees payable | 8 | 5 | 2 | 4 | ||||||||||||
Administration servicing fees payable | 4 | — | — | — | ||||||||||||
Other accrued expenses | 299 | 113 | 73 | 257 | ||||||||||||
Accrued foreign capital gains tax on appreciated securities | 4 | 1,207 | — | — | ||||||||||||
Total Liabilities | 103,626 | 146,980 | 13,157 | 53,330 | ||||||||||||
Net Assets | $ | 2,648,288 | $ | 1,770,581 | $ | 484,058 | $ | 1,237,503 | ||||||||
NET ASSETS: | ||||||||||||||||
Paid in Capital — (unlimited authorization — no par value) | $ | 3,182,491 | $ | 1,806,388 | $ | 484,555 | $ | 1,297,578 | ||||||||
Undistributed (Distributions in excess of) net investment income | 18,345 | (8,750 | ) | 3,495 | 5,852 | |||||||||||
Accumulated net realized loss on investments, futures contracts, foreign currency contracts and swap contracts | (876,918 | ) | (79,611 | ) | (12,190 | ) | (51,746 | ) | ||||||||
Net unrealized appreciation (depreciation) on investments | 322,605 | 53,733 | 9,626 | (16,271 | ) | |||||||||||
Net unrealized appreciation (depreciation) on futures contracts | 1,684 | — | 131 | (39 | ) | |||||||||||
Net unrealized deprecation on swap contracts | — | — | (1,011 | ) | (422 | ) | ||||||||||
Net unrealized appreciation (depreciation) on forward foreign currency contracts, foreign currencies and translation of other assets and liabilities denominated in foreign currencies | 85 | 28 | (548 | ) | 2,551 | |||||||||||
Accumulated foreign capital gains tax on appreciated securities | (4 | ) | (1,207 | ) | — | — | ||||||||||
Net Assets | $ | 2,648,288 | $ | 1,770,581 | $ | 484,058 | $ | 1,237,503 | ||||||||
Net Asset Value, Offering and Redemption Price Per Share — Class A ($2,642,485,080 ÷ 258,502,407 shares, $1,770,580,991 ÷ 167,703,966 shares, $484,058,302 ÷ 45,604,799 shares, $1,237,502,850 ÷ 120,488,504 shares, respectively.) | $10.22 | $10.56 | $10.61 | $10.27 | ||||||||||||
Net Asset Value, Offering and Redemption Price Per Share — Class I ($5,802,578 ÷ 567,841 shares) | $10.22 | N/A | N/A | N/A | ||||||||||||
| (1) | Included in “Investments, at value” is the market value of securities on loan in the amounts of $71,887, $103,025, $0 and $14,846, ($ Thousands), respectively. |
N/A — Not applicable. Share classes currently not offered.
Amounts designated as “—” are $0 or have been rounded to $0.
The accompanying notes are an integral part of the financial statements.
| SEI Institutional International Trust / Semi-Annual Report / March 31, 2014 | 49 |
Table of Contents
Statements of Operations ($ Thousands) (Unaudited)
For the six months ended March 31, 2014
| International Equity Fund | Emerging Markets Equity Fund | International Fixed Income Fund | Emerging Markets Debt Fund | |||||||||||||
Investment Income: | ||||||||||||||||
Dividends | $ | 37,195 | $ | 11,235 | $ | — | $ | — | ||||||||
Dividends from Affiliated Security(1)(2) | 4 | 1 | — | — | ||||||||||||
Interest | 10 | — | 5,799 | 36,940 | ||||||||||||
Security Lending Income — Net(1) | 629 | 660 | — | 15 | ||||||||||||
Less: Foreign Taxes Withheld | (1,852 | ) | (1,012 | ) | (7 | ) | (131 | ) | ||||||||
Total Investment Income | 35,986 | 10,884 | 5,792 | 36,824 | ||||||||||||
Expenses: | ||||||||||||||||
Investment Advisory Fees | 6,301 | 8,301 | 711 | 5,022 | ||||||||||||
Administration Fees | 5,615 | 5,139 | 1,422 | 3,840 | ||||||||||||
Shareholder Servicing Fees — Class A | 3,112 | 1,976 | 592 | 1,477 | ||||||||||||
Shareholder Servicing Fees — Class I | 8 | — | — | — | ||||||||||||
Administrative Servicing Fees — Class I | 8 | — | — | — | ||||||||||||
Trustees’ Fees | 17 | 10 | 3 | 8 | ||||||||||||
Chief Compliance Officer Fees | 8 | 4 | 2 | 4 | ||||||||||||
Custodian/Wire Agent Fees | 168 | 304 | 35 | 185 | ||||||||||||
Printing Fees | 107 | 61 | 22 | 53 | ||||||||||||
Overdraft Fees | 2 | 2 | 5 | 7 | ||||||||||||
Professional Fees | 77 | 79 | 16 | 48 | ||||||||||||
Registration Fees | 25 | 13 | 6 | 15 | ||||||||||||
Other Expenses | 65 | 42 | 31 | 44 | ||||||||||||
Total Expenses | 15,513 | 15,931 | 2,845 | 10,703 | ||||||||||||
Less: | ||||||||||||||||
Waiver of Investment Advisory Fees | — | (419 | ) | — | (2,660 | ) | ||||||||||
Waiver of Shareholder Servicing Fees — Class A | — | — | (424 | ) | — | |||||||||||
Fees Paid Indirectly | — | (7 | ) | — | — | |||||||||||
Net Expenses | 15,513 | 15,505 | 2,421 | 8,043 | ||||||||||||
Net Investment Income (Loss) | 20,473 | (4,621 | ) | 3,371 | 28,781 | |||||||||||
Net Realized and Unrealized Gain (Loss) on Investments, Option Contracts, Futures Contracts, Swap Contracts and Foreign Currency Transactions: | ||||||||||||||||
Net Realized Gain (Loss) from: | ||||||||||||||||
Investments | 102,111 | 25,429 | 3,772 | (12,403 | ) | |||||||||||
Futures Contracts | 2,633 | — | (147 | ) | (81 | ) | ||||||||||
Option Contracts | — | — | — | (365 | ) | |||||||||||
Swap Contracts | — | — | 1,455 | (5,437 | ) | |||||||||||
Foreign Currency Transactions | (147 | ) | (294 | ) | (7,140 | ) | (29,044 | ) | ||||||||
Net Change in Unrealized Appreciation (Depreciation) on: | ||||||||||||||||
Investments | 30,132 | (10,546 | ) | 4,994 | 26,901 | |||||||||||
Futures Contracts | 2,056 | — | 512 | (9 | ) | |||||||||||
Option Contracts | — | — | — | 361 | ||||||||||||
Swap Contracts | — | — | (1,931 | ) | 4,715 | |||||||||||
Foreign Capital Gains Tax on Appreciated Securities | (4 | ) | (1,059 | ) | — | — | ||||||||||
Foreign Currency Transactions | (39 | ) | 12 | 6,674 | 4,539 | |||||||||||
Net Realized and Unrealized Gain (Loss) on Investments, Option Contracts, Futures Contracts, Swap Contracts and Foreign Currency Transactions | 136,742 | 13,542 | 8,189 | (10,823 | ) | |||||||||||
Net Increase in Net Assets Resulting from Operations | $ | 157,215 | $ | 8,921 | $ | 11,560 | $ | 17,958 | ||||||||
| (1) | Income is from the investment of collateral in an affiliated security. |
| (2) | See Note 4 in Notes to Financial Statements. |
Amounts designated as “—” are $0 or have been rounded to $0.
The accompanying notes are an integral part of the financial statements.
| 50 | SEI Institutional International Trust / Semi-Annual Report / March 31, 2014 |
Table of Contents
Statements of Changes in Net Assets ($ Thousands)
For the six months ended March 31, 2014 (Unaudited) and the year ended September 30, 2013
| International Equity Fund | Emerging Markets Equity Fund | |||||||||||||||
| 2014 | 2013 | 2014 | 2013 | |||||||||||||
Operations: | ||||||||||||||||
Net Investment Income (Loss) | $ | 20,473 | $ | 30,536 | $ | (4,621 | ) | $ | 5,287 | |||||||
Net Realized Gain from Investments and Futures Contracts | 104,744 | 81,432 | 25,429 | 9,079 | ||||||||||||
Net Realized Loss on Forward Foreign Currency Contracts and Foreign Currency Transactions | (147 | ) | (2,172 | ) | (294 | ) | (1,531 | ) | ||||||||
Net Change in Unrealized Appreciation (Depreciation) on Investments and Futures Contracts | 32,188 | 273,430 | (10,546 | ) | 28,776 | |||||||||||
Net Change in Unrealized Appreciation (Depreciation) on Foreign Capital Tax Gains on Appreciated Securities | (4 | ) | — | (1,059 | ) | 147 | ||||||||||
Net Change in Unrealized Appreciation (Depreciation) on Forward Foreign Currency Contracts, Foreign Currencies, and Translation of Other Assets and Liabilities Denominated in Foreign Currencies | (39 | ) | 441 | 12 | (30 | ) | ||||||||||
Net Increase in Net Assets Resulting from Operations | 157,215 | 383,667 | 8,921 | 41,728 | ||||||||||||
Dividends From: | ||||||||||||||||
Net Investment Income: | ||||||||||||||||
Class A | (31,558 | ) | (29,890 | ) | (7,645 | ) | (4,998 | ) | ||||||||
Class I | (64 | ) | (72 | ) | N/A | N/A | ||||||||||
Total Dividends | (31,622 | ) | (29,962 | ) | (7,645 | ) | (4,998 | ) | ||||||||
Capital Share Transactions: | ||||||||||||||||
Class A: | ||||||||||||||||
Proceeds from Shares Issued | 354,209 | 563,306 | 511,774 | 724,981 | ||||||||||||
Reinvestment of Dividends & Distributions | 28,743 | 27,440 | 7,072 | 4,533 | ||||||||||||
Cost of Shares Redeemed | (215,947 | ) | (436,142 | ) | (163,224 | ) | (252,291 | ) | ||||||||
Increase in Net Assets Derived from Class A Transactions | 167,005 | 154,604 | 355,622 | 477,223 | ||||||||||||
Class I: | ||||||||||||||||
Proceeds from Shares Issued | 613 | 1,323 | N/A | N/A | ||||||||||||
Reinvestment of Dividends & Distributions | 45 | 47 | N/A | N/A | ||||||||||||
Cost of Shares Redeemed | (1,122 | ) | (1,647 | ) | N/A | N/A | ||||||||||
Decrease in Net Assets Derived from Class I Transactions | (464 | ) | (277 | ) | N/A | N/A | ||||||||||
Increase in Net Assets Derived from Capital Share Transactions | 166,541 | 154,327 | 355,622 | 477,223 | ||||||||||||
Net Increase in Net Assets | 292,134 | 508,032 | 356,898 | 513,953 | ||||||||||||
Net Assets: | ||||||||||||||||
Beginning of Period | 2,356,154 | 1,848,122 | 1,413,683 | 899,730 | ||||||||||||
End of Period | $ | 2,648,288 | $ | 2,356,154 | $ | 1,770,581 | $ | 1,413,683 | ||||||||
Undistributed (Distributions in excess of) Net Investment Income Included in Net Assets at End of Period | $ | 18,345 | $ | 29,494 | $ | (8,750 | ) | $ | 3,516 | |||||||
Share Transactions: | ||||||||||||||||
Class A: | ||||||||||||||||
Shares Issued | 35,370 | 63,540 | 48,437 | 70,166 | ||||||||||||
Reinvestment of Distributions | 2,851 | 3,244 | 667 | 426 | ||||||||||||
Shares Redeemed | (21,639 | ) | (49,907 | ) | (15,658 | ) | (24,132 | ) | ||||||||
Total Class A Transactions | 16,582 | 16,877 | 33,446 | 46,460 | ||||||||||||
Class I: | ||||||||||||||||
Shares Issued | 61 | 148 | N/A | N/A | ||||||||||||
Reinvestment of Distributions | 4 | 6 | N/A | N/A | ||||||||||||
Shares Redeemed | (111 | ) | (185 | ) | N/A | N/A | ||||||||||
Total Class I Transactions | (46 | ) | (31 | ) | N/A | N/A | ||||||||||
Net Increase in Shares Outstanding from Share Transactions | 16,536 | 16,846 | 33,446 | 46,460 | ||||||||||||
N/A — Not applicable. Share classes currently not offered.
Amounts designated as “—” are $0 or have been rounded to $0.
The accompanying notes are an integral part of the financial statements.
| SEI Institutional International Trust / Semi-Annual Report / March 31, 2014 | 51 |
Table of Contents
Statements of Changes in Net Assets ($ Thousands) (Continued)
For the six months ended March 31, 2014 (Unaudited) and the year ended September 30, 2013
| International Fixed Income Fund | Emerging Markets Debt Fund | |||||||||||||||
| 2014 | 2013 | 2014 | 2013 | |||||||||||||
Operations: | ||||||||||||||||
Net Investment Income | $ | 3,371 | $ | 6,789 | $ | 28,781 | $ | 50,806 | ||||||||
Net Realized Gain (Loss) from Investments, Futures Contracts, Option Contracts and Swap Contracts | 5,080 | 6,287 | (18,286 | ) | 11,840 | |||||||||||
Net Realized Gain (Loss) on Forward Foreign Currency Contracts and Foreign Currency Transactions | (7,140 | ) | 17,142 | (29,044 | ) | 2,913 | ||||||||||
Net Change in Unrealized Appreciation (Depreciation) on Investments, Futures Contracts, Option Contracts and Swap Contracts | 3,575 | (21,948 | ) | 31,968 | (124,707 | ) | ||||||||||
Net Change in Unrealized Appreciation (Depreciation) on Forward Foreign Currency Contracts, Foreign Currencies, and Translation of Other Assets and Liabilities Denominated in Foreign Currencies | 6,674 | (4,510 | ) | 4,539 | (4,978 | ) | ||||||||||
Net Increase (Decrease) in Net Assets Resulting from Operations | 11,560 | 3,760 | 17,958 | (64,126 | ) | |||||||||||
Dividends and Distributions from: | ||||||||||||||||
Net Investment Income: | ||||||||||||||||
Class A | (2,598 | ) | (17,902 | ) | (20,857 | ) | (70,620 | ) | ||||||||
Net Realized Gains: | ||||||||||||||||
Class A | — | — | (7,466 | ) | (45,779 | ) | ||||||||||
Return of Capital: | ||||||||||||||||
Class A | — | (4,024 | ) | — | — | |||||||||||
Total Dividends and Distributions | (2,598 | ) | (21,926 | ) | (28,323 | ) | (116,399 | ) | ||||||||
Capital Share Transactions: | ||||||||||||||||
Class A: | ||||||||||||||||
Proceeds from Shares Issued | 56,950 | 119,934 | 232,887 | 470,901 | ||||||||||||
Reinvestment of Dividends & Distributions | 2,293 | 19,825 | 24,669 | 101,418 | ||||||||||||
Cost of Shares Redeemed | (57,529 | ) | (140,004 | ) | (191,984 | ) | (374,600 | ) | ||||||||
Increase (Decrease) in Net Assets Derived from Capital Share Transactions | 1,714 | (245 | ) | 65,572 | 197,719 | |||||||||||
Net Increase (Decrease) in Net Assets | 10,676 | (18,411 | ) | 55,207 | 17,194 | |||||||||||
Net Assets: | ||||||||||||||||
Beginning of Period | 473,382 | 491,793 | 1,182,296 | 1,165,102 | ||||||||||||
End of Period | $ | 484,058 | $ | 473,382 | $ | 1,237,503 | $ | 1,182,296 | ||||||||
Undistributed (Distributions in excess of) Net Investment Income Included in Net Assets at End of Period | $ | 3,495 | $ | 2,722 | $ | 5,852 | $ | (2,072 | ) | |||||||
Share Transactions: | ||||||||||||||||
Class A: | ||||||||||||||||
Shares Issued | 5,427 | 11,333 | 23,008 | 41,939 | ||||||||||||
Reinvestment of Distributions | 220 | 1,897 | 2,427 | 8,776 | ||||||||||||
Shares Redeemed | (5,479 | ) | (13,265 | ) | (18,898 | ) | (33,284 | ) | ||||||||
Total Class A Transactions | 168 | (35 | ) | 6,537 | 17,431 | |||||||||||
Amounts designated as “—” are either $0 or have been rounded to $0.
The accompanying notes are an integral part of the financial statements.
| 52 | SEI Institutional International Trust / Semi-Annual Report / March 31, 2014 |
Table of Contents
For the six months ended March 31, 2014 (Unaudited) and the years ended September 30,
For a Share Outstanding Throughout Each Period
| Net Asset Value, Beginning of Period | Net Investment Income (Loss)(1) | Net Realized and Unrealized Gains (Losses) on Securities(1) | Total from Operations | Dividends from Net Investment Income | Distributions from Realized Capital Gains | Total Dividends and Distributions and Return of Capital | Net Asset Value, End of Period | Total Return† | Net Assets End of Period (Thousands) | Ratio of Expenses to Average Net Assets* | Ratio of Expenses to Average Net Assets (Excluding Fees Paid Indirectly)** | Ratio of Expenses to Average Net Assets (Excluding Waivers and Fees Paid Indirectly)** | Ratio of Net Investment Income to Average Net Assets | Portfolio Turnover Rate | ||||||||||||||||||||||||||||||||||||||||||||||
International Equity Fund |
| |||||||||||||||||||||||||||||||||||||||||||||||||||||||||||
Class A |
| |||||||||||||||||||||||||||||||||||||||||||||||||||||||||||
2014*** | $ | 9.71 | $ | 0.08 | $ | 0.56 | $ | 0.64 | $ | (0.13 | ) | $ | — | $ | (0.13 | ) | $ | 10.22 | 6.58 | % | $ | 2,642,485 | 1.24 | %(3) | 1.24 | %(3) | 1.24 | %(3) | 1.64 | % | 30 | % | ||||||||||||||||||||||||||||
2013 | 8.19 | 0.13 | 1.53 | 1.66 | (0.14 | ) | — | (0.14 | ) | 9.71 | 20.47 | 2,350,201 | 1.25 | (3) | 1.25 | (3) | 1.25 | (3) | 1.50 | 47 | ||||||||||||||||||||||||||||||||||||||||
2012 | 7.29 | 0.14 | 0.92 | 1.06 | (0.16 | ) | — | (0.16 | ) | 8.19 | 14.76 | 1,842,851 | 1.26 | (3) | 1.26 | (3) | 1.26 | (3) | 1.75 | 56 | ||||||||||||||||||||||||||||||||||||||||
2011 | 8.34 | 0.16 | (1.08 | ) | (0.92 | ) | (0.13 | ) | — | (0.13 | ) | 7.29 | (11.34 | ) | 1,566,893 | 1.27 | (3) | 1.27 | (3) | 1.27 | (3) | 1.88 | 98 | |||||||||||||||||||||||||||||||||||||
2010 | 7.88 | 0.10 | 0.36 | 0.46 | — | — | — | 8.34 | 5.84 | 1,898,206 | 1.27 | (3) | 1.27 | (3) | 1.28 | (11) | 1.26 | 144 | ||||||||||||||||||||||||||||||||||||||||||
2009 | 8.85 | 0.13 | (0.94 | ) | (0.81 | ) | (0.16 | ) | — | (0.16 | ) | 7.88 | (8.73 | ) | 2,053,411 | 1.28 | (2)(3) | 1.28 | (2)(3) | 1.29 | (11) | 2.01 | 154 | |||||||||||||||||||||||||||||||||||||
Class I |
| |||||||||||||||||||||||||||||||||||||||||||||||||||||||||||
2014*** | $ | 9.70 | $ | 0.06 | $ | 0.56 | $ | 0.62 | $ | (0.10 | ) | $ | — | $ | (0.10 | ) | $ | 10.22 | 6.45 | % | $ | 5,803 | 1.49 | %(3) | 1.49 | %(3) | 1.49 | %(3) | 1.28 | % | 30 | % | ||||||||||||||||||||||||||||
2013 | 8.18 | 0.11 | 1.52 | 1.63 | (0.11 | ) | — | (0.11 | ) | 9.70 | 20.19 | 5,953 | 1.50 | (3) | 1.50 | (3) | 1.50 | (3) | 1.21 | 47 | ||||||||||||||||||||||||||||||||||||||||
2012 | 7.28 | 0.12 | 0.91 | 1.03 | (0.13 | ) | — | (0.13 | ) | 8.18 | 14.37 | 5,271 | 1.51 | (3) | 1.51 | (3) | 1.51 | (3) | 1.48 | 56 | ||||||||||||||||||||||||||||||||||||||||
2011 | 8.32 | 0.13 | (1.06 | ) | (0.93 | ) | (0.11 | ) | — | (0.11 | ) | 7.28 | (11.44 | ) | 5,265 | 1.52 | (3) | 1.52 | (3) | 1.52 | (3) | 1.54 | 98 | |||||||||||||||||||||||||||||||||||||
2010 | 7.89 | 0.08 | 0.35 | 0.43 | — | — | — | 8.32 | 5.45 | 8,455 | 1.52 | (3) | 1.52 | (3) | 1.53 | (11) | 1.00 | 144 | ||||||||||||||||||||||||||||||||||||||||||
2009 | 8.82 | 0.13 | (0.94 | ) | (0.81 | ) | (0.12 | ) | — | (0.12 | ) | 7.89 | (8.80 | ) | 8,397 | 1.53 | (2)(3) | 1.53 | (2)(3) | 1.54 | (11) | 1.97 | 154 | |||||||||||||||||||||||||||||||||||||
Emerging Markets Equity Fund |
| |||||||||||||||||||||||||||||||||||||||||||||||||||||||||||
Class A |
| |||||||||||||||||||||||||||||||||||||||||||||||||||||||||||
2014*** | $ | 10.53 | $ | (0.03 | ) | $ | 0.11 | $ | 0.08 | $ | (0.05 | ) | $ | — | $ | (0.05 | ) | $ | 10.56 | 0.77 | % | $ | 1,770,581 | 1.96 | %(4) | 1.96 | %(4) | 2.01 | %(12) | 0.58 | % | 29 | % | |||||||||||||||||||||||||||
2013 | 10.25 | 0.06 | 0.28 | 0.34 | (0.06 | ) | — | (0.06 | ) | 10.53 | 3.29 | 1,413,683 | 1.96 | (4) | 1.96 | (4) | 2.04 | (12) | 0.52 | 78 | ||||||||||||||||||||||||||||||||||||||||
2012 | 9.00 | 0.05 | 1.23 | 1.28 | (0.03 | ) | — | (0.03 | ) | 10.25 | 14.21 | 899,730 | 1.97 | (4) | 1.97 | (4) | 2.07 | (12) | 0.49 | 93 | ||||||||||||||||||||||||||||||||||||||||
2011 | 11.40 | 0.05 | (2.35 | ) | (2.30 | ) | (0.10 | ) | — | (0.10 | ) | 9.00 | (20.38 | ) | 695,498 | 1.96 | (4) | 1.96 | (4) | 2.09 | (12) | 0.44 | 98 | |||||||||||||||||||||||||||||||||||||
2010 | 9.64 | 0.04 | 1.78 | 1.82 | (0.06 | ) | — | (0.06 | ) | 11.40 | 18.93 | 935,583 | 1.96 | (4) | 1.96 | (4) | 2.09 | (12) | 0.38 | 81 | ||||||||||||||||||||||||||||||||||||||||
2009 | 11.43 | 0.08 | 0.18 | 0.26 | (0.10 | ) | (1.95 | ) | (2.05 | ) | 9.64 | 16.40 | 916,780 | 1.97 | (4) | 1.97 | (4) | 2.11 | (12) | 1.08 | 80 | |||||||||||||||||||||||||||||||||||||||
International Fixed Income Fund |
| |||||||||||||||||||||||||||||||||||||||||||||||||||||||||||
Class A |
| |||||||||||||||||||||||||||||||||||||||||||||||||||||||||||
2014*** | $ | 10.42 | $ | 0.07 | $ | 0.18 | $ | 0.25 | $ | (0.06 | ) | $ | — | $ | (0.06 | ) | $ | 10.61 | 2.39 | % | $ | 484,058 | 1.02 | %(5) | 1.02 | %(5) | 1.20 | %(13) | 1.42 | % | 52 | % | ||||||||||||||||||||||||||||
2013 | 10.82 | 0.14 | (0.06 | ) | 0.08 | (0.48 | )(10) | — | (0.48 | ) | 10.42 | 0.77 | 473,382 | 1.02 | (5) | 1.02 | (5) | 1.20 | (13) | 1.37 | 86 | |||||||||||||||||||||||||||||||||||||||
2012 | 10.44 | 0.17 | 0.48 | 0.65 | (0.27 | ) | — | (0.27 | ) | 10.82 | 6.34 | 491,793 | 1.02 | (5) | 1.02 | (5) | 1.21 | (13) | 1.60 | 103 | ||||||||||||||||||||||||||||||||||||||||
2011 | 10.92 | 0.25 | (0.22 | ) | 0.03 | (0.51 | )(9) | — | (0.51 | ) | 10.44 | 0.41 | 488,929 | 1.02 | (5) | 1.02 | (5) | 1.21 | (13) | 2.40 | 119 | |||||||||||||||||||||||||||||||||||||||
2010 | 10.21 | 0.24 | 0.57 | 0.81 | (0.10 | )(8) | — | (0.10 | ) | 10.92 | 7.97 | 505,081 | 1.07 | (7) | 1.07 | (7) | 1.21 | (13) | 2.33 | 135 | ||||||||||||||||||||||||||||||||||||||||
2009 | 10.46 | 0.28 | 0.53 | 0.81 | (1.06 | ) | — | (1.06 | ) | 10.21 | 8.85 | 538,159 | 1.02 | (5) | 1.02 | (5) | 1.06 | (13) | 2.86 | 170 | ||||||||||||||||||||||||||||||||||||||||
Emerging Markets Debt Fund |
| |||||||||||||||||||||||||||||||||||||||||||||||||||||||||||
Class A |
| |||||||||||||||||||||||||||||||||||||||||||||||||||||||||||
2014*** | $ | 10.38 | $ | 0.25 | $ | (0.11 | ) | $ | 0.14 | $ | (0.18 | ) | $ | (0.07 | ) | $ | (0.25 | ) | $ | 10.27 | 1.37 | % | $ | 1,237,503 | 1.36 | %(6) | 1.36 | %(6) | 1.81 | %(14) | 4.87 | % | 51 | % | ||||||||||||||||||||||||||
2013 | 12.07 | 0.47 | (1.02 | ) | (0.55 | ) | (0.68 | ) | (0.46 | ) | (1.14 | ) | 10.38 | (5.19 | ) | 1,182,296 | 1.36 | (6) | 1.36 | (6) | 1.81 | (14) | 4.20 | 90 | ||||||||||||||||||||||||||||||||||||
2012 | 10.81 | 0.55 | 1.36 | 1.91 | (0.63 | ) | (0.02 | ) | (0.65 | ) | 12.07 | 18.48 | 1,165,102 | 1.36 | (6) | 1.36 | (6) | 1.80 | (14) | 4.85 | 102 | |||||||||||||||||||||||||||||||||||||||
2011 | 11.19 | 0.63 | (0.70 | ) | (0.07 | ) | (0.31 | ) | — | (0.31 | ) | 10.81 | (0.71 | ) | 876,396 | 1.36 | (6) | 1.36 | (6) | 1.80 | (14) | 5.58 | 59 | |||||||||||||||||||||||||||||||||||||
2010 | 10.24 | 0.67 | 1.14 | 1.81 | (0.86 | ) | — | (0.86 | ) | 11.19 | 18.78 | 931,865 | 1.36 | (6) | 1.36 | (6) | 1.79 | (14) | 6.41 | 70 | ||||||||||||||||||||||||||||||||||||||||
2009 | 9.43 | 0.71 | 0.85 | 1.56 | (0.75 | ) | — | (0.75 | ) | 10.24 | 18.62 | 790,597 | 1.37 | (6) | 1.37 | (6) | 1.81 | (14) | 8.47 | 73 | ||||||||||||||||||||||||||||||||||||||||
| * | Includes Fees Paid Indirectly, if applicable. See Note 4 in Notes to Financial Statements. |
| ** | See Note 4 in Notes to Financial Statements. |
| *** | For the six months ended March 31, 2014. All ratios have been annualized. Total Return and Portfolio Turnover Rate have not been annualized. |
| † | Returns do not reflect the deduction of taxes that a shareholder would pay on fund distributions or the redemption of fund shares. |
| (1) | Per share net investment income/(loss) and net realized and unrealized gains/(losses) calculated using average shares. |
| (2) | The expense ratio includes interest expense on reverse repurchase agreements. Had this expense been excluded, the ratios for Class A and I shares would have been 1.28% for 2009. |
| (3) | The expense ratio includes overdraft fees. Had this expense been excluded, the ratios for Class A and I shares would have been 1.24% and 1.49%, respectively for 2014, 1.25% and 1.50%, respectively for 2013, 1.26% and 1.51%, respectively for 2012, 1.27% and 1.52%, respectively for 2011 and 2010 and 1.28% and 1.53%, respectively for 2009. |
| (4) | The expense ratio includes overdraft fees. Had this expense been excluded, the ratios would have been 1.96% for 2014, 2013, 2012, 2011, 2010 and 2009. |
| (5) | The expense ratio includes overdraft fees. Had this expense been excluded, the ratios would have been 1.02%, 1.02%, 1.02%, 1.02%, 1.01% and 1.02% for 2014, 2013, 2012, 2011 and 2009, respectively. |
| (6) | The expense ratio includes overdraft fees. Had this expense been excluded, the ratios would have been 1.36% for 2014, 2013, 2012, 2011, 2010 and 2009. |
| (7) | The expense ratio includes proxy and overdraft fees. Had these expenses been excluded, the ratio would have been 1.01% for 2010. |
| (8) | Includes a return of capital of less than $0.01. |
| (9) | Includes a return of capital of $0.01 per share. |
| (10) | Includes a return of capital of $0.09 per share. |
| (11) | The expense ratio includes overdraft fees. Had this expense been excluded, the ratios for Class A and I shares would have been 1.28% and 1.53%, respectively for 2010 and 1.29% and 1.54%, respectively for 2009. |
| (12) | The expense ratio includes overdraft fees. Had this expense been excluded the ratios would have been 2.02%, 2.04%, 2.06%, 2.09%, 2.09% and 2.10% for 2014, 2013, 2012, 2011, 2010 and 2009. |
| (13) | The expense ratio includes overdraft fees. Had this expense been excluded the ratios would have been 1.20%, 1.20%, 1.21%, 1.21%, 1.15% and 1.06% for 2014, 2013, 2012, 2011, 2010 and 2009. |
| (14) | The expense ratio includes overdraft fees. Had this expense been excluded the ratios would have been 1.81%, 1.81%, 1.80%, 1.80%, 1.79% and 1.80% for 2014, 2013, 2012, 2011, 2010 and 2009. |
Amounts designated as “—” are either $0 or have been rounded to $0.
The accompanying notes are an integral part of the financial statements.
| SEI Institutional International Trust / Semi-Annual Report / March 31, 2014 | 53 |
Table of Contents
March 31, 2014 (Unaudited)
1. ORGANIZATION
SEI Institutional International Trust (the “Trust”) was organized as a Massachusetts business trust under a Declaration of Trust dated June 30, 1988. The operations of the Trust commenced on December 20, 1989.
The Trust is registered under the Investment Company Act of 1940, as amended, as an open-end investment company with four funds: International Equity Fund, Emerging Markets Equity Fund, International Fixed Income Fund and Emerging Markets Debt Fund (together the “Funds”). The Trust’s prospectuses provide a description of each Fund’s investment goal, principal strategies and risks. The Trust is registered to offer Class A shares of each of the Funds and Class I shares of the International Equity Fund.
2. SIGNIFICANT ACCOUNTING POLICIES
The following is a summary of significant accounting policies consistently followed by the Funds.
Use of Estimates — The preparation of financial statements, in conformity with U.S. generally accepted accounting principles (“U.S. GAAP”), requires management to make estimates and assumptions that affect the reported amounts of assets and liabilities and disclosure of contingent assets and liabilities as of the date of the financial statements, and the reported amounts of increases and decreases in net assets from operations during the reporting period. Actual results could differ from those estimates.
Security Valuation — Securities listed on a securities exchange, market or automated quotation system for which quotations are readily available are valued at the last quoted sale price on the primary exchange or market (foreign or domestic) on which they are traded, or, if there is no such reported sale, at the most recent quoted bid price. Debt securities are priced based upon valuations provided by independent, third-party pricing agents, if available. Such values generally reflect the last reported sales price if the security is actively traded. The third-party pricing agents may also value debt securities at an evaluated bid price by employing methodologies that utilize actual market transactions, broker-supplied valuations, or other methodologies designed to identify the market value for such securities. Debt obligations with remaining maturities of sixty days or less may be valued at their amortized cost, which approximates market value. The prices for foreign securities are reported in local currency and converted to U.S. dollars using currency exchange rates. Prices for most securities held in the Funds are provided daily by recognized independent pricing agents. SEI Investments Management Corporation (“SIMC”) or a sub-adviser, as applicable, reasonably believes that prices provided by independent pricing agents are reliable. However, there can be no assurance that such pricing service’s prices will be reliable. SIMC or a sub-adviser, as applicable, continuously monitors the reliability of prices obtained from any pricing service and will notify the Funds’ administrator if it believes that a particular
pricing service is no longer a reliable source of prices. The Funds’ administrator, in turn, will notify the Trust’s Fair Value Committee if it receives such notification from SIMC or a sub-adviser, as applicable, or if the Funds’ administrator reasonably believes that a particular pricing service is no longer a reliable source for prices. If a security price cannot be obtained from an independent, third-party pricing agent, the Funds seek to obtain a bid price from at least one independent broker.
Securities for which market prices are not “readily available” are determined to be unreliable or can not be valued using methodologies described above are valued in accordance with Fair Value Procedures established by the Trust’s Board of Trustees (the “Board”). The Trust’s Fair Value Procedures are implemented through a Fair Value Committee (the “Committee”) designated by the Board. The Committee is currently composed of two members of the Board of Trustees, as well as representatives from SIMC and its affiliates. The Committee provides regular reports to the Board concerning investments for which market prices are not readily available or may be unreliable. Some of the more common reasons that may necessitate that a security be valued using Fair Value Procedures include: the security’s trading has been halted or suspended; the security has been de-listed from a national exchange; the security’s primary trading market is temporarily closed at a time when, under normal conditions, it would be open; or the security’s primary pricing source is not able or willing to provide a price. When a security is valued in accordance with the Fair Value Procedures, the Committee will determine the value after taking into consideration relevant information reasonably available to the Committee. Examples of factors the Committee may consider are: (i) the facts giving rise to the need to fair value; (ii) the last trade price; (iii) the performance of the market or the issuer’s industry; (iv) the liquidity of the security; (v) the size of the holding in a Fund; or (vi) any other appropriate information. The determination of a security’s fair value price often involves the consideration of a number of subjective factors and is therefore subject to the unavoidable risk that the value assigned to a security may be higher or lower than the security’s value would be if a reliable market quotation for the security was readily available.
For securities that principally trade on a foreign market or exchange, a significant gap in time can exist between the time of a particular security’s last trade and the time at which a Fund calculates its net asset value. The closing prices of such securities may no longer reflect their market value at the time the Fund calculates net asset value if an event that could materially affect the value of those securities (a “Significant Event”) has occurred between the time of the security’s last close and the time that the Fund calculates net asset value. A Significant Event may relate to a single issuer or to an entire market sector. If the adviser or sub-adviser of a Fund becomes aware of a Significant Event that has occurred with respect to a security or group of securities after the closing of the exchange or market on which the security or securities principally trade, but before the time at which
| 54 | SEI Institutional International Trust / Semi-Annual Report / March 31, 2014 |
Table of Contents
the Fund calculates net asset value, it may request that a Committee meeting be called. In addition, the Fund’s administrator monitors price movements among certain selected indices, securities and/or baskets of securities that may be an indicator that the closing prices received earlier from foreign exchanges or markets may not reflect market value at the time the Fund calculates net asset value. If price movements in a monitored index or security exceed levels established by the administrator, the administrator notifies the adviser or sub-adviser for any Fund holding the relevant securities that such limits have been exceeded. In such event, the adviser or sub-adviser makes the determination whether a Committee Meeting should be called based on the information provided.
The International Equity Fund and Emerging Markets Equity Fund also use a third-party fair valuation vendor. The vendor provides a fair value for foreign securities held by these Funds based on certain factors and methodologies (involving, generally, tracking valuation correlations between the U.S. market and each non-U.S. security). Values from the fair value vendor are applied in the event that there is a movement in the U.S. market that exceeds a specific threshold that has been established by the Committee. The Committee has also established a “confidence interval” which is used to determine the level of historical correlation between the value of a specific foreign security and movements in the U.S. market before a particular security will be fair valued when the threshold is exceeded. In the event that the threshold established by the Committee is exceeded on a specific day, the International Equity Fund and Emerging Markets Equity Fund will value the non-U.S. securities in their portfolios that exceed the applicable “confidence interval” based upon the adjusted prices provided by the fair valuation vendor.
In accordance with U.S. GAAP, fair value is defined as the price that the Fund would receive upon selling an investment in an orderly transaction to an independent buyer in the principal or most advantageous market of the investment. A three-tier hierarchy has been established to maximize the use of the observable market data and minimize the use of unobservable inputs and to establish classification of the fair value measurements for disclosure purposes. Inputs refer broadly to the assumptions that market participants would use in pricing an asset. Inputs may be observable or unobservable. Observable inputs are inputs that reflect the assumptions market participants would use in pricing the asset or liability developed based on market data obtained from sources independent of the reporting entity. Unobservable inputs are inputs that reflect the reporting entity’s own assumptions about the assumptions market participants would use in pricing the asset or liability developed based on the best information available in the circumstances.
The three-tier hierarchy of inputs is summarized in the three broad Levels listed below:
Level 1 — quoted prices in active markets for identical investments
Level 2 — other significant observable inputs (including quoted prices for similar investments, interest rates, prepayment speeds, credit risks, etc.)
Level 3 — significant unobservable inputs (including the Fund’s own assumptions in determining the fair value of investments)
Investments are classified within the level of the lowest significant input considered in determining fair value. Investments classified within Level 3 whose fair value measurement considers several inputs may include Level 1 or Level 2 inputs as components of the overall fair value measurement.
The valuation techniques used by the Funds to measure fair value during the six months ended March 31, 2014 maximized the use of observable inputs and minimized the use of unobservable inputs.
For the six months ended March 31, 2014, there have been no significant changes to the inputs or the Trust’s fair valuation methodologies.
Security Transactions and Investment Income — Security transactions are recorded on the trade date. Cost used in determining net realized capital gains and losses on the sale of securities is determined on the basis of specific identification. Dividend income and expense is recognized on the ex-dividend date, and interest income or expense is recognized using the accrual basis of accounting.
Distributions received on securities that represent a return of capital or capital gain are recorded as a reduction of cost of investments and/ or as a realized gain. The Trust estimates the components of distributions received that may be considered nontaxable distributions or capital gain distributions.
Amortization and accretion is calculated using the scientific interest method, which approximates the effective interest method over the holding period of the security, which is not materially different from the effective interest method. Amortization of premiums and discounts is included in interest income.
Expenses — Expenses that are directly related to one of the Funds are charged directly to that Fund. Other operating expenses of the Trust are prorated to the Funds on the basis of relative daily net assets.
Classes — Class-specific expenses are borne by that class. Income, non-class specific expenses, and realized and unrealized gains/losses are allocated to the respective classes on the basis of relative daily net assets.
Foreign Currency Translation — The books and records of the Funds investing in international securities are maintained in U.S. dollars on the following basis:
(i) market value of investment securities, assets and liabilities at the current rate of exchange; and
(ii) purchases and sales of investment securities, income and expenses at the relevant rates of exchange prevailing on the respective dates of such transactions.
| SEI Institutional International Trust / Semi-Annual Report / March 31, 2014 | 55 |
Table of Contents
Notes to Financial Statements (Continued)
March 31, 2014 (Unaudited)
The Funds do not isolate that portion of gains and losses on investments in equity securities that is due to changes in the foreign exchange rates from that which is due to changes in market prices of equity securities.
The Funds report certain foreign-currency-related transactions as components of realized gains for financial reporting purposes, whereas such components are treated as ordinary income for Federal income tax purposes.
Forward Foreign Currency Contracts — To the extent consistent with its Investment Objective and Strategies, a Fund may enter into forward foreign currency contracts as hedges against either specific transactions, fund positions, speculative purposes or anticipated fund positions. All commitments are “marked-to-market” daily at the applicable foreign exchange rate, and any resulting unrealized gains or losses are recorded currently. The Fund realizes gains and losses at the time forward contracts are extinguished. Unrealized gains or losses on outstanding positions in forward foreign currency contracts held at the close of the year are recognized as ordinary income or loss for federal income tax purposes. The Fund could be exposed to risk if the counterparties to the contracts are unable to meet the terms of the contract and from unanticipated movements in the value of a foreign currency relative to the U.S. dollar.
Finally, the risk exists that losses could exceed amounts disclosed on the Statement of Assets and Liabilities. Refer to each Fund’s Schedule of Investments for details regarding open forward foreign currency contracts as of March 31, 2014, if applicable.
Futures Contracts — To the extent consistent with its Investment Objective and Strategies, the Funds may purchase futures contracts to gain exposure to market changes, which may be more efficient or cost effective than actually buying the securities. To the extent consistent with its Investment Objective and Strategies, a Fund may utilize futures contracts for tactical hedging purposes as well as to enhance the Funds’ returns and may also utilize futures contracts to efficiently assist in managing the Funds’ duration and yield curve exposure. Upon entering into such a contract, a Fund is required to deposit and maintain as collateral such initial margin as required by the exchange on which the contract is held. The contracts are marked to market daily and the resulting changes in value are accounted for as unrealized gains and losses. Variation margin payments are paid or received, depending upon whether unrealized losses or gains are incurred. When the contract is closed, the Funds record a realized gain or loss equal to the difference between the proceeds from (or cost of) the closing transaction and the amount invested in the contract.
Risks of entering into futures contracts include the possibility that there will be an imperfect price correlation between the futures and the underlying securities. Second, it is possible that a lack of liquidity for futures contracts could exist in the secondary market, resulting in an inability to close a position prior to its maturity date. Third, the
futures contract involves the risk that a Fund could lose more than the original margin deposit required to initiate a futures transaction.
Finally, the risk exists that losses could exceed amounts disclosed on the Statement of Assets and Liabilities. Refer to each Fund’s Schedule of Investments for details regarding open futures contracts as of March 31, 2014, if applicable.
Options/Swaptions Writing/Purchasing — To the extent consistent with its investment objective and strategies, a Fund may invest in financial options/swaptions contracts for the purpose of hedging its existing portfolio securities, or securities that a Fund intends to purchase, against fluctuations in fair market value caused by changes in prevailing market interest rates. A Fund may also invest in financial option/swaption contracts to enhance its returns. When the Fund writes or purchases an option/swaption, an amount equal to the premium received or paid by the Fund is recorded as a liability or an asset and is subsequently adjusted to the current market value of the option/swaption written or purchased. Premiums received or paid from writing or purchasing options/ swaptions which expire unexercised are treated by the Fund on the expiration date as realized gains or losses. The difference between the premium and the amount paid or received on effecting a closing purchase or sale transaction, including brokerage commissions, is also treated as a realized gain or loss. If an option/swaption is exercised, the premium paid or received is added to the cost of the purchase or proceeds from the sale in determining whether the Fund has realized a gain or a loss.
The risk in writing a call option/swaption is a Fund may give up the opportunity for profit if the market price of the security increases. The risk in writing a put option/swaption is a Fund may incur a loss if the market price of the security decreases and the option/swaption is exercised. The risk in purchasing an option/swaption is a Fund may pay a premium whether or not the option/swaption is exercised. The Funds also have the additional risk of being unable to enter into a closing transaction at an acceptable price if a liquid secondary market does not exist. Option/swaption contracts also involve the risk that they may not work as intended due to unanticipated developments in market conditions or other causes.
Finally, the risk exists that losses on written options could exceed amounts disclosed on the Statements of Assets and Liabilities. Refer to each Fund’s Schedule of Investments for details regarding open option/swaption contracts as of March 31, 2014, if applicable.
Swap Agreements — To the extent consistent with its Investment Objective and Strategies, a Fund may invest in swap contracts as an efficient means to take and manage risk in the portfolio, including interest rate risk, credit risk and overall yield sensitivity. A swap agreement is a two-party contract under which an agreement is made to exchange returns from predetermined investments or instruments, including a particular interest rate, foreign currency, or “basket” of
| 56 | SEI Institutional International Trust / Semi-Annual Report / March 31, 2014 |
Table of Contents
securities representing a particular index. Swap agreements are privately negotiated in the over-the-counter market (“OTC swaps”) or may be executed in a multilateral or other trade facility platform, such as a registered commodities exchange (“Centrally Cleared swaps”). Interest rate swaps involve the exchange by a Fund with another party of their respective commitments to pay or receive interest (e.g., an exchange of floating rate payments for fixed rate payments) with respect to a notional amount of principal. Credit default swaps involve the periodic payment by a Fund or counterparty of interest based on a specified rate multiplied by a notional amount assigned to an underlying debt instrument or group of debt instruments in exchange for the assumption of credit risk on the same instruments. In the event of a credit event, usually in the form of a credit rating downgrade, the party receiving periodic payments (i.e. floating rate payer) must pay the other party (i.e. fixed rate payer) an amount equal to the outstanding principal of the downgraded debt instrument. Total return swaps allow an investor to benefit from the cash flow without ever actually owning the underlying security. The receiver must pay any decline in value to the payer at the end of the total return swap. However, the investor does not need to make a payment if there is no decline in price. Payments can be made on various indices, bonds (i.e. mortgage backed securities, bank debt and corporate), loans or commodities. The value of a total return swap is equal to the change in value of the underlying asset versus the accrued income payment based on LIBOR (London Interbank Offered Rate) or some other form of index on the notional amount. Interest rate swaps involve the exchange by a Fund with another party of their respective commitments to pay or receive interest (e.g., an exchange of floating rate payments for fixed rate payments) with respect to a notional amount of principal to manage a Fund’s exposure to interest rates. Payments received or made are recorded as realized gains or losses. A Fund could be exposed to credit or market risk due to unfavorable changes in the fluctuation of interest rates or if the counterparty defaults on its obligation to perform. Risk of loss may exceed amounts recognized on the statement of assets and liabilities. In connection with swap agreements, securities/cash may be set aside as collateral by the Fund’s custodian. A Fund may enter into swap agreements in order to, among other things, change the maturity or duration of the investment portfolio; protect a Fund’s value from changes in interest rates; or expose a Fund to a different security or market.
Swaps are marked-to-market daily based upon quotations from market makers and the resulting changes in market values, if any, are recorded as unrealized gains or losses in the Statement of Operations. Net payments of interest are recorded as realized gains or losses. Daily changes in valuation of Centrally Cleared swaps, if any, are recorded as a receivable or payable for the change in value as appropriate (“variation margin”) on the Statements of Assets and Liabilities.
Entering into swap agreements involves, to varying degrees, elements of credit and market risk in excess of the amounts recognized on the Schedule of Investments or the Statement of Assets and Liabilities.
Such risks involve the possibility that there will be no liquid market for these agreements, that the counterparty to the agreement may default on its obligation to perform and that there may be unfavorable changes in the fluctuation of interest rates. Risks also arise from potential losses from adverse market movements.
Counterparty risk may be mitigated by having a master netting arrangement between a Fund and the counterparty and by having the counterparty post collateral to cover a Fund’s exposure to the counterparty. Refer to each Fund’s Schedule of Investments for details regarding open swap contracts as of March 31, 2014, if applicable.
Delayed Delivery Transactions — A Fund may purchase or sell securities on a when-issued or delayed delivery basis. These transactions involve a commitment by the Fund to purchase or sell securities for a predetermined price or yield, with payment and delivery taking place beyond the customary settlement period. When delayed delivery purchases are outstanding, the Fund will set aside liquid assets in an amount sufficient to meet the purchase price. When purchasing a security on a delayed delivery basis, the Fund assumes the rights and risks of ownership of the security, including the risk of price and yield fluctuations, and takes such fluctuations into account when determining its net asset value. The Fund may dispose of or renegotiate a delayed delivery transaction after it is entered into, and may sell when-issued securities before they are delivered, which may result in a capital gain or loss. When the Fund has sold a security on a delayed delivery basis, the Fund does not participate in future gains and losses with respect to the security.
Loan Participations and Brady Bonds — To the extent consistent with its Investment Goal and Strategies, a Fund may invest in U.S. dollar-denominated fixed- and floating-rate loans (“Loans”) arranged through private negotiations between a foreign sovereign entity and one or more financial institutions (“Lenders”). The Fund invests in such Loans in the form of participations in Loans (“Participations”) or assignments of all or a portion of Loans from third parties. Participations typically result in a Fund having a contractual relationship only with the Lenders, not with the sovereign borrowers. This Fund has the right to receive payments of principal, interest and any fees to which it is entitled from the Lender selling the Participation and only upon receipt by the Lender of the payments from the borrower. In connection with purchasing Participations, the Fund generally has no right to enforce compliance by the borrower with the terms of the loan agreement relating to the Loan, nor any rights of set-off against the borrower, and the Fund will not benefit directly from any collateral supporting the Loan in which it has purchased the Participation. As a result, the Fund assumes the credit risk of both the borrower and the Lender that is selling the Participation.
Certain debt obligations, customarily referred to as “Brady Bonds,” are created through the exchange of existing commercial bank loans to foreign entities for new obligations in connection with debt
| SEI Institutional International Trust / Semi-Annual Report / March 31, 2014 | 57 |
Table of Contents
Notes to Financial Statements (Continued)
March 31, 2014 (Unaudited)
restructuring under a plan introduced by former U.S. Secretary of the Treasury Nicholas F. Brady. Brady Bonds have only been issued since 1989, and, accordingly, do not have a long payment history. They are issued by governments that may have previously defaulted on the loans being restructured by the Brady Bonds, so they are subject to the risk of default by the issuer. They may be fully or partially collateralized or uncollateralized and issued in various currencies.
Illiquid Securities — A security is considered illiquid if it cannot be sold or disposed of in the ordinary course of business within seven days or less for its approximate carrying value on the books of the Funds. Valuations of illiquid securities may differ significantly from the values that would have been used had an active market value for these securities existed.
Dividends and Distributions to Shareholders — The International Equity, Emerging Markets Equity and International Fixed Income Funds will distribute substantially all of their net investment income and all net realized capital gains, if any, at least annually. The Emerging Markets Debt Fund will distribute substantially all of its net investment income, if any, at least quarterly and all net realized gains, if any, at least annually. All dividends and distributions are recorded on ex-dividend date.
Investments in Real Estate Investment Trusts (“REITs”) — Dividend income is recorded based on the income included in distributions received from the REIT investments using published REIT reclassifications including some management estimates when actual amounts are not available. Distributions received in excess of this estimated amount are recorded as a reduction of the cost of investments or reclassified to capital gains. The actual amounts of income, return of capital, and capital gains are only determined by each REIT after its fiscal year-end, and may differ from the estimated amounts.
Redemption Fees — The Funds charge a redemption fee based on a redemption, or a series of redemptions from a single identifiable source that in the aggregate exceed a specific dollar threshold within any thirty day period, as presented below:
| Dollar Threshold ($ Thousands) | Redemption Fee | |||||||
| International Equity Fund | $ | 50,000 | 0.75 | % | ||||
| Emerging Markets Equity Fund | 25,000 | 1.25 | ||||||
| International Fixed Income Fund | 25,000 | 1.00 | ||||||
| Emerging Markets Debt Fund | 25,000 | 1.00 | ||||||
For the six months ended March 31, 2014, the Funds did not charge any redemption fees. Such fees, if any, are retained by the Funds for the benefit of the remaining shareholders.
3. DERIVATIVE TRANSACTIONS
The following tables include only Funds that had exposure to more than one type of risk on derivatives held throughout the six month period. For Funds that held derivatives throughout the six month period with only one type of risk exposure, additional information can be found on the Schedules of Investments and the Statements of Operations. The fair value of derivative instruments as of March 31, 2014 was as follows:
| Asset Derivatives | Liability Derivatives | |||||||||||
| Six month period ended March 31, 2014 ($ Thousands) | Six month period ended March 31, 2014 ($ Thousands) | |||||||||||
| Statement of Assets and Liabilities Location | Fair Value | Statement of Assets and Liabilities Location | Fair Value | |||||||||
International Fixed Income Fund | ||||||||||||
Interest rate contracts | Net Assets — Unrealized appreciation on futures contracts | $ | 235 | * | Net Assets — Unrealized depreciation on futures contracts | $ | 104 | * | ||||
Net Assets — Unrealized appreciation on swap contracts | — | † | Net Assets — Unrealized depreciation on swap contracts | 1,011 | † | |||||||
Foreign exchange contracts | Unrealized gain on forward foreign currency contracts | 1,458 | Unrealized loss on forward foreign currency contracts | 1,245 | ||||||||
|
|
|
| |||||||||
Total Derivatives not accounted for as hedging instruments | $ | 1,693 | $ | 2,360 | ||||||||
|
|
|
| |||||||||
Emerging Markets Debt Fund | ||||||||||||
Interest rate contracts | Net Assets — Unrealized appreciation on futures contracts | $ | 25 | * | Net Assets — Unrealized depreciation on futures contracts | $ | 64 | * | ||||
Net Assets — Unrealized appreciation on swap contracts | 315 | † | Net Assets — Unrealized depreciation on swap contracts | 737 | † | |||||||
Foreign exchange contracts | Unrealized gain on forward foreign currency contracts | 7,332 | Unrealized loss on forward foreign currency contracts | 4,887 | ||||||||
|
|
|
| |||||||||
Total Derivatives not accounted for as hedging instruments | $ | 7,672 | $ | 5,688 | ||||||||
|
|
|
| |||||||||
| * | Includes cumulative appreciation/depreciation of futures contracts as reported in the Schedules of Investments. Only current day’s variation margin is reported within the Statements of Assets & Liabilities. |
| † | Includes cumulative appreciation/depreciation of swap contracts as reported in the Schedules of Investments. Market Value is reported within the Statements of Assets & Liabilities for OTC swap contracts that have paid premiums. For centrally cleared swap contracts current days variation margin is reported within the Statements of Assets & Liabilities. |
| 58 | SEI Institutional International Trust / Semi-Annual Report / March 31, 2014 |
Table of Contents
The effect of derivative instruments on the Statements of Operations for the six months ended March 31, 2014.
Amount of realized gain or (loss) on derivatives recognized in income ($ Thousands):
| Derivatives Not Accounted for as Hedging Instruments | Options | Futures | Forward Currency Contracts | Swaps | Total | |||||||||||||||
| International Fixed Income Fund | ||||||||||||||||||||
Interest rate contracts | $ | — | $ | (147 | ) | $ | — | $ | 1,456 | $ | 1,309 | |||||||||
Credit Contracts | — | — | — | (26 | ) | (26 | ) | |||||||||||||
Equity Contracts | — | — | — | 25 | 25 | |||||||||||||||
Foreign exchange contracts | — | — | (5,707 | ) | — | (5,707 | ) | |||||||||||||
Total | $ | — | $ | (147 | ) | $ | (5,707 | ) | $ | 1,455 | $ | (4,399 | ) | |||||||
| Emerging Markets Debt Fund | ||||||||||||||||||||
Interest rate contracts | $ | — | $ | (81 | ) | $ | — | $ | (20 | ) | $ | (101 | ) | |||||||
Foreign exchange contracts | — | — | (4,676 | ) | — | (4,676 | ) | |||||||||||||
Equity contracts | (365 | ) | — | — | (5,417 | ) | (5,782 | ) | ||||||||||||
Total | $ | (365 | ) | $ | (81 | ) | $ | (4,676 | ) | $ | (5,437 | ) | $ | (10,559 | ) | |||||
Change in unrealized appreciation or (depreciation) on derivatives recognized in income ($ Thousands):
| Derivatives Not Accounted for as Hedging Instruments | Options | Futures | Forward Currency Contracts | Swaps | Total | |||||||||||||||
| International Fixed Income Fund | ||||||||||||||||||||
Interest rate contracts | $ | — | $ | 512 | $ | — | $ | (1,931 | ) | $ | (1,419 | ) | ||||||||
Foreign exchange contracts | — | — | 6,713 | — | 6,713 | |||||||||||||||
Total | $ | — | $ | 512 | $ | 6,713 | $ | (1,931 | ) | $ | 5,294 | |||||||||
| Emerging Markets Debt Fund | ||||||||||||||||||||
Interest rate contracts | $ | 361 | $ | (9 | ) | $ | — | $ | (326 | ) | $ | 26 | ||||||||
Foreign exchange contracts | — | — | 4,768 | — | 4,768 | |||||||||||||||
Equity contracts | — | — | — | 5,041 | 5,041 | |||||||||||||||
Total | $ | 361 | $ | (9 | ) | $ | 4,768 | $ | 4,715 | $ | 9,835 | |||||||||
Certain Funds are party to International Swap Dealers Association, Inc. Master Agreements (“ISDA Master Agreements”). These agreements are with select counterparties and they govern transactions, including certain over-the counter derivative and foreign exchange contracts, entered into by the Trust on behalf of a Fund and the counterparty.
The ISDA Master Agreements maintain provisions for general obligations, representations, agreements, collateral, and events of default or termination. The occurrence of a specified event of termination may give a counterparty the right to terminate all of its contracts and affect settlement of all outstanding transactions under the applicable ISDA Master Agreement.
To reduce counterparty risk with respect to OTC transactions, the Funds may enter into master netting arrangements, established within the Fund’s ISDA Master Agreements, which allow the Funds to make (or to have an entitlement to receive) a single net payment in the event of default (close-out netting) for outstanding payables and receivables with respect to certain OTC positions in swaps for each individual counterparty. In addition, the Funds may require that certain counterparties post cash and/or securities in collateral accounts to cover their net payment obligations for those derivative contracts subject to ISDA Master Agreements. If the counterparty fails to perform under these contracts and agreements, the cash and/or secu rities will be made available to the Funds.
For financial reporting purposes, the Funds do not offset derivative assets and derivative liabilities that are subject to netting arrangements in the Statement of Assets and Liabilities. Bankruptcy or insolvency laws of a particular jurisdiction may impose restrictions on or prohibitions against the right of offset in bankruptcy, insolvency or other events.
Collateral terms are contract specific for OTC derivatives. For derivatives traded under an ISDA master agreement, the collateral requirements are typically calculated by netting the mark to market amount of each transaction under such agreement and comparing that amount to the value of any collateral currently pledged by the Funds or the counterparty.
For financial reporting purposes, cash collateral that has been pledged to cover obligations of the Funds, if any, is reported separately on the Statement of Assets and Liabilities as cash pledged as collateral. Non-cash collateral pledged by the Funds, if any, is noted in the Schedules of Investments. Generally, the amount of collateral due from or to a party must exceed a minimum transfer amount threshold before a transfer has to be made. To the extent amounts due to the Funds from its counterparties are not fully collateralized, contractually or otherwise, the Funds bear the risk of loss from counterparty nonperformance.
| SEI Institutional International Trust / Semi-Annual Report / March 31, 2014 | 59 |
Table of Contents
Notes to Financial Statements (Continued)
March 31, 2014 (Unaudited)
The following table presents by derivative type the Funds’ derivatives net of the related collateral posted for the benefit of the Funds at March 31, 2014:
| Portfolio | Derivative Type | Value of Asset | Value of Liability | Net Amount Due (to)/from Counterparty | Collateral Pledged (Received) by Fund | Net Exposure After Collateral | ||||||||||||||||
| International Equity Fund | Variation margin Futures contracts | $ | 437 | $ | (124 | ) | $ | 313 | $ | 7,519 | $ | 7,832 | ||||||||||
| Security lending | 75,033 | (75,033 | ) | — | — | — | ||||||||||||||||
|
| |||||||||||||||||||||
| 75,470 | (75,157 | ) | 313 | 7,519 | 7,832 | |||||||||||||||||
|
| |||||||||||||||||||||
| Emerging Markets Equity Fund | Security lending | 107,208 | (107,208 | ) | — | — | — | |||||||||||||||
|
| |||||||||||||||||||||
| 107,208 | (107,208 | ) | — | — | — | |||||||||||||||||
|
| |||||||||||||||||||||
| International Fixed Income Fund | Variation margin Futures contracts | 499 | — | 499 | 1,169 | 1,668 | ||||||||||||||||
Variation margin Centrally cleared swaps | — | (546 | ) | (546 | ) | — | (546 | ) | ||||||||||||||
| Forwards contracts | 1,458 | (1,245 | ) | 213 | — | 213 | ||||||||||||||||
| OTC swaps | — | (465 | ) | (465 | ) | 1,942 | 1,477 | |||||||||||||||
|
| |||||||||||||||||||||
| 1,957 | (2,256 | ) | (299 | ) | 3,111 | 2,812 | ||||||||||||||||
|
| |||||||||||||||||||||
| Emerging Markets Debt | Variation margin Futures contracts | 10 | (12 | ) | (2 | ) | 176 | 174 | ||||||||||||||
| Security lending | 15,421 | (15,421 | ) | — | — | — | ||||||||||||||||
| Forwards contracts | 7,332 | (4,887 | ) | 2,445 | — | 2,445 | ||||||||||||||||
| OTC swaps | 315 | (737 | ) | (422 | ) | — | (422 | ) | ||||||||||||||
|
| |||||||||||||||||||||
| 23,078 | (21,057 | ) | 2,021 | 176 | 2,197 | |||||||||||||||||
|
| |||||||||||||||||||||
4. INVESTMENT ADVISORY, ADMINISTRATION AND DISTRIBUTION AGREEMENTS, INVESTMENT SUB-ADVISORY AGREEMENTS AND OTHER TRANSACTIONS WITH AFFILIATES
Investment Advisory, Administration and Distribution Agreements — SIMC serves as investment adviser (the “Adviser”) to each Fund. In connection with serving as Adviser, SIMC is entitled to a fee, which is calculated daily and paid monthly, based on the average daily net assets of each fund.
SEI Investments Global Funds Services (the “Administrator”) provides administrative and transfer agency services to the Funds for annual fees, based on the average daily net assets of each fund.
SEI Investments Distribution Co. (the “Distributor”), a wholly owned subsidiary of SEI Investments Company (“SEI”), serves as each Fund’s Distributor. The Trust has adopted plans under which firms,
including the Distributor, that provide shareholder and administrative services may receive compensation therefrom.
Such plans provide fees payable to the Distributor, calculated as a percentage of the average daily net assets attributable to each particular class of each respective fund. Under both the Shareholder Servicing Plan and Administrative Service Plan, the Distributor may retain as profit any difference between the fee it receives and the amount it pays to third parties.
The Adviser, Administrator and/or Distributor have voluntarily agreed to waive a portion of their fees in order to keep total direct operating expenses (exclusive of interest from borrowings, brokerage commissions, taxes, Trustees fees and extraordinary expenses not incurred in the ordinary course of the Funds’ business) at a specified level. The voluntary waivers by the Funds’ Adviser, Administrator and/or Distributor are limited to the Funds’ direct operating expenses and, therefore, do not apply to indirect expenses incurred by the Funds, such as acquired fund fees and expenses (AFFE). The waivers are voluntarily and the Funds’ Adviser, Administrator and/or Distributor may discontinue all or part of any of these waivers at any time.
The following is a summary of annual fees payable to the Adviser, Administrator and Distributor and the voluntary expense limitations for each Fund:
| Advisory Fee | Administration Fee | Shareholder Servicing Fee | Administrative Servicing Fee | Voluntary Expense Limitations | ||||||||||||||||
International Equity Fund | ||||||||||||||||||||
Class A | 0.505 | % | 0.45 | % | 0.25 | % | — | 1.25 | % | |||||||||||
Class I | 0.505 | % | 0.45 | % | 0.25 | % | 0.25 | % | 1.50 | % | ||||||||||
Emerging Markets Equity Fund | ||||||||||||||||||||
Class A | 1.05 | % | 0.65 | % | 0.25 | % | — | 1.96 | % | |||||||||||
International Fixed Income Fund | ||||||||||||||||||||
Class A | 0.30 | % | 0.60 | % | 0.25 | % | — | 1.02 | % | |||||||||||
Emerging Markets Debt Fund | ||||||||||||||||||||
Class A | 0.85 | % | 0.65 | % | 0.25 | % | — | 1.36 | % | |||||||||||
| 60 | SEI Institutional International Trust / Semi-Annual Report / March 31, 2014 |
Table of Contents
For the six months ended March 31, 2014, the Distributor retained 100% of both shareholder servicing fees and administrative servicing fees, less the waiver.
Investment Sub-Advisory Agreements — As of March 31, 2014, SIMC has entered into Investment Sub-Advisory Agreements with the following parties:
| Investment Sub-Adviser |
| International Equity Fund |
| Acadian Asset Management LLC |
Causeway Capital Management LLC |
| INTECH Investment Management LLC |
| Neuberger Berman Management LLC |
| Schroder Investment Management North America, Inc. |
| Tradewinds Global Investors LLC |
| Emerging Markets Equity Fund |
| Delaware Investment Fund Advisers |
| JO Hambro Capital Management Limited |
| Kleinwort Benson Investors International Ltd. |
| Lazard Asset Management LLC |
| Neuberger Berman Management LLC |
| PanAgora Asset Management, Inc. |
| International Fixed Income Fund |
| AllianceBernstein L.P. |
| FIL Investment Advisors |
| Wellington Management Company, LLP |
| Emerging Markets Debt Fund |
| Investec Asset Management Ltd. |
| Neuberger Berman Management LLC |
| Stone Harbor Investment Partners LP |
Under the investment sub-advisory agreements, each sub-adviser receives an annual fee, paid by SIMC.
Brokerage Commissions Paid to Affiliates — The Distribution Agreement between the Distributor and the Trust provides that the Distributor may receive compensation on fund transactions effected for the Trust in accordance with the rules of the Securities and Exchange Commission (“SEC”). Accordingly, it is expected that fund transactions may result in brokerage commissions being paid to the Distributor. The
SEC rules require that such commissions not exceed usual and customary commissions. There were no such commissions for the six months ended March 31, 2014.
Fees Paid Indirectly — The Funds may direct certain fund trades to the Distributor who pays a portion of the Fund’s expenses. Accordingly, the expenses reduced, which were used to pay third party expenses, and the effect on the Fund’s expense ratio, as a percentage of the Fund’s average daily net assets for the six months ended March 31, 2014, can be found on the Statement of Operations and Financial Highlights, if applicable.
Investment in Affiliated Securities — The Funds may invest excess cash in the SEI Daily Income Trust Prime Obligation Fund, an affiliated money market fund. Additionally, the Funds may invest cash collateral from the securities lending program in the SEI Liquidity Fund L.P., also an affiliated fund.
The following is summary of the transactions with affiliates for the six month period ended March 31, 2014 ($ Thousands):
| SEI Liquidity Fund | Value 9/30/2013 | Purchases at Cost | Proceeds from Sales | Value 3/31/2014 | Dividend Income | |||||||||||||||
International Equity Fund | $ | 96,733 | $ | 333,776 | $ | (355,476 | ) | $ | 75,033 | $ | 629 | |||||||||
Emerging Markets Equity Fund | 77,907 | 188,209 | (158,908 | ) | 107,208 | 660 | ||||||||||||||
Emerging Markets Debt Fund | 4,924 | 17,113 | (6,616 | ) | 15,421 | 15 | ||||||||||||||
| SDIT Prime Obligation | ||||||||||||||||||||
International Equity Fund | 72,641 | 158,395 | (110,667 | ) | $ | 120,369 | 4 | |||||||||||||
Emerging Markets Equity Fund | 7,821 | 193,131 | (189,600 | ) | 11,352 | 1 | ||||||||||||||
Payment to Affiliates — Certain Officers and Trustees of the Trust are also Officers and/or Directors of the Administrator, Adviser and/or the Distributor.
The Trust pays each unaffiliated Trustee an annual fee for attendance at quarterly, interim, and committee meetings. The Administrator or the Distributor pays compensation of Officers and affiliated Trustees.
A portion of the services provided by the Chief Compliance Officer (“CCO”) and his staff, whom are employees of the Administrator, are paid for by the Trust as incurred. The services include regulatory oversight of the Trust’s Adviser, sub-advisers and service providers as required by SEC regulations. The CCO’s services have been approved by and are reviewed annually by the Board.
Interfund Lending — The SEC has granted an exemption that permits the Trust to participate in an interfund lending program (“the
Program”) with existing or future investment companies registered under the 1940 Act that are advised by SIMC (the “SEI Funds”). The Program allows the SEI Funds to lend money to and borrow money from each other for temporary or emergency purposes. Participation in the Program is voluntary for both borrowing and lending funds. Interfund loans may be made only when the rate of interest to be charged is more favorable to the lending fund than an investment in overnight repurchase agreements (“Repo Rate”), and more favorable to the borrowing fund than the rate of interest that would be charged by a bank for short-term borrowings (“Bank Loan Rate”). The Bank Loan Rate will be determined using a formula reviewed annually by the SEI Funds’ Board of Trustees. The interest rate imposed on interfund loans is the average of the Repo Rate and the Bank Loan Rate. For the six months ended March 31, 2014, the Trust had not participated in the Program.
| SEI Institutional International Trust / Semi-Annual Report / March 31, 2014 | 61 |
Table of Contents
Notes to Financial Statements (Continued)
March 31, 2014 (Unaudited)
5. INVESTMENT TRANSACTIONS
The cost of security purchases and the proceeds from the sale of securities, other than temporary cash investments and futures, during the six months ended March 31, 2014, were as follows:
| Purchases ($ Thousands) | Sales and Maturities ($ Thousands) | |||||||
International Equity Fund | ||||||||
US Government | $ | — | $ | — | ||||
Other | 799,872 | 706,928 | ||||||
Emerging Markets Equity Fund | ||||||||
US Government | — | — | ||||||
Other | 783,868 | 456,394 | ||||||
International Fixed Income Fund | ||||||||
US Government | 1,461 | 2,862 | ||||||
Other | 232,626 | 229,976 | ||||||
Emerging Markets Debt Fund | ||||||||
US Government | — | — | ||||||
Other | 596,493 | 545,979 | ||||||
6. FEDERAL TAX INFORMATION:
It is each Fund’s intention to continue to qualify as a regulated investment company under Subchapter M of the Internal Revenue Code and distribute all of its taxable income (including net capital gains). Accordingly, no provision for Federal income taxes is required.
The Funds may be subject to taxes imposed by countries in which they invest with respect to their investments in issuers existing or operating in such countries. Such taxes are generally based on income earned. The Funds accrue such taxes when the related income is earned.
Dividends from net investment income and distributions from net realized capital gains are determined in accordance with U.S. Federal income tax regulations, which may differ from those amounts determined under U.S. GAAP. These differences, which may result in distribution reclassifications, are primarily due to paydown reclassifications, foreign currency transactions, net investment losses, investment in partnerships, swaps and passive foreign investment companies. These book/tax differences are either temporary or permanent in nature. To the extent these differences are permanent, they are charged or credited to paid-in capital, undistributed net investment income or accumulated net realized gain, as appropriate, in the period that the differences arise.
The tax character of dividends and distributions declared during the last two years were as follows:
| Ordinary Income ($ Thousands) | Long-Term Capital Gain ($ Thousands) | Return of Capital ($ Thousands) | Totals ($ Thousands) | |||||||||||||||||
International Equity Fund | 2013 | $ | 29,962 | $ | — | — | $ | 29,962 | ||||||||||||
| 2012 | 34,761 | — | — | 34,761 | ||||||||||||||||
Emerging Markets Equity Fund | 2013 | 4,998 | — | — | 4,998 | |||||||||||||||
| 2012 | 2,183 | — | — | 2,183 | ||||||||||||||||
International Fixed Income Fund | 2013 | 17,902 | — | 4,024 | 21,926 | |||||||||||||||
| 2012 | 12,225 | — | — | 12,225 | ||||||||||||||||
Emerging Markets Debt Fund | 2013 | 79,157 | 37,242 | — | 116,399 | |||||||||||||||
| 2012 | 53,538 | 2,001 | — | 55,539 | ||||||||||||||||
As of September 30, 2013, the components of Distributable Earnings (Accumulated Losses) were as follows:
| Undistributed Ordinary Income ($ Thousands) | Undistributed Long-Term Capital Gain ($ Thousands) | Capital Loss Carryforwards ($ Thousands) | Post October | |||||||||||||
International Equity Fund | $ | 31,585 | $ | — | $ | (966,949 | ) | $ | — | |||||||
Emerging Markets Equity Fund | 6,503 | — | (81,766 | ) | — | |||||||||||
International Fixed Income Fund | — | — | (10,538 | ) | — | |||||||||||
Emerging Markets Debt Fund | 5,739 | 8,019 | — | (552 | ) | |||||||||||
| Unrealized Appreciation (Depreciation) ($ Thousands) | Other Temporary Differences ($ Thousands) | Total Accumulated Gains (Losses) ($ Thousands) | ||||||||||
International Equity Fund | $ | 275,108 | $ | 460 | $ | (659,796 | ) | |||||
Emerging Markets Equity Fund | 38,175 | 5 | (37,083 | ) | ||||||||
International Fixed Income Fund | (2,000 | ) | 3,079 | (9,459 | ) | |||||||
Emerging Markets Debt Fund | (50,214 | ) | (12,702 | ) | (49,710 | ) | ||||||
Post-October losses represent losses realized on investment transactions from November 1, 2012 through September 30, 2013, that, in accordance with Federal income tax regulations, the Funds defer and treat as having arisen in the following fiscal year. For Federal income tax purposes, capital carryforwards may be carried forward and applied against future capital gains as follows:
| Expires 2017 ($ Thousands) | Expires 2018 ($ Thousands) | Total Capital Loss Carryforward 09/30/13 ($ Thousands) | ||||||||||
International Equity Fund | $ | 276,592 | $ | 690,357 | $ | 966,949 | ||||||
Emerging Markets Equity Fund | — | 19,246 | 19,246 | |||||||||
International Fixed Income Fund | — | 10,538 | 10,538 | |||||||||
Under the recently enacted Regulated Investment Company Modernization Act of 2010, Funds will be permitted to carry forward capital losses incurred in taxable years beginning after December 22, 2010 for an unlimited period. However, any losses incurred during those future taxable years will be required to be utilized prior to the losses incurred in pre-enactment taxable years. As a result of this ordering rule, pre-enactment capital loss carryforwards may be more likely to expire unused. Additionally, post-enactment capital losses that are carried forward will retain their character as either short-term or long-term capital losses rather than being considered all short-term as under previous law. Losses carried forward under these new provisions are as follows:
| Short-Term Loss | Long-Term Loss | Total* | ||||||||||
Emerging Markets Equity Fund | $ | 33,049 | $ | 29,471 | $ | 62,520 | ||||||
| * | This table should be used in conjunction with the capital loss carryforwards table. |
During the year ended September 30, 2013, the following Funds utilized capital loss carryforwards to offset capital gains:
| Amount utilized ($ Thousands) | ||||
International Equity Fund | $ | 38,493 | ||
International Fixed Income Fund | 5,369 | |||
| 62 | SEI Institutional International Trust / Semi-Annual Report / March 31, 2014 |
Table of Contents
For Federal income tax purposes, the cost of securities owned at March 31, 2014, and the net realized gains or losses on securities sold for the period were not materially different from amounts reported for financial reporting purposes. These differences are primarily due to investments in partnerships, passive foreign investment companies, defaulted bonds and wash sales which cannot be used for Federal income tax purposes in the current year and have been deferred for use in future years. The aggregate gross unrealized appreciation and depreciation on total investments, excluding options purchased, held by the Funds at March 31, 2014, was as follows:
| Federal Tax Cost ($ Thousands) | Aggregate Gross Unrealized Appreciation ($ Thousands) | Aggregate Gross Unrealized Depreciation ($ Thousands) | Net Unrealized Appreciation ($ Thousands) | |||||||||||||
International Equity Fund | $ | 2,395,021 | $ | 400,121 | (77,516 | ) | $ | 322,605 | ||||||||
Emerging Markets Equity Fund | 1,821,443 | 155,845 | (102,112 | ) | 53,733 | |||||||||||
International Fixed Income Fund | 467,497 | 20,984 | (11,358 | ) | 9,626 | |||||||||||
Emerging Markets Debt Fund | 1,254,679 | 34,690 | (50,961 | ) | (16,271 | ) | ||||||||||
Management has analyzed the Funds’ tax positions taken on federal income tax returns for all open tax years and has concluded that as of September 30, 2013, no provision for income tax would be required in the Funds’ financial statements. The Funds’ federal and state income and federal excise tax returns for tax years for which the applicable statutes of limitations have not expired are subject to examination by the Internal Revenue Service and state departments of revenue.
7. CONCENTRATION/RISKS
In the normal course of business, the Trust enters into contracts that provide general indemnifications by the Trust to the counterparty to the contract. The Trust’s maximum exposure under these arrangements is dependent on future claims that may be made against the Trust and, therefore, cannot be estimated; however, management believes that, based on experience, the risk of loss from such claims is considered remote.
The following descriptions provide additional information about some of the risks of investing in the Funds:
Asset-Backed Securities Risk — Payment of principal and interest on asset-backed securities is dependent largely on the cash flows generated by the assets backing the securities, and asset-backed securities may not have the benefit of any security interest in the related assets.
Credit Risk — The risk that the issuer of a security or the counterparty to a contract will default or otherwise become unable to honor a financial obligation.
Currency Risk — To the extent a Fund takes positions in currencies, it will be subject to the risk that currency exchange rates may fluctuate in response to, among other things, changes in interest rates, intervention (or failure to intervene) by U.S. or foreign governments, central banks
or supranational entities, or by the imposition of currency controls or other political developments in the United States or abroad.
Fixed Income Market Risk — The prices of a Fund’s fixed income securities respond to economic developments, particularly interest rate changes, as well as to perceptions about the creditworthiness of individual issuers, including governments and their agencies. Generally, the Fund’s fixed income securities will decrease in value if interest rates rise and vice versa. In the case of foreign securities, price fluctuations will reflect international economic and political events, as well as changes in currency valuations relative to the U.S. dollar.
Foreign Investment/Emerging Markets Risk — The risk that non-U.S. securities may be subject to additional risks due to, among other things, political, social and economic developments abroad, currency movements, and different legal, regulatory and tax environments. These additional risks may be heightened with respect to emerging market countries since political turmoil and rapid changes in economic conditions are more likely to occur in these countries.
Interest Rate Risk — The risk that a rise in interest rates will cause a fall in the value of fixed income securities, including U.S. Government Securities, in which the Fund invests. Although U.S. Government securities are considered to be among the safest investments, they are not guaranteed against price movements due to changing interest rates. A low interest rate environment may present greater interest rate risk, because there may be a greater likelihood of rates increasing and rates may increase more rapidly.
Mortgage-Backed Securities Risk — Mortgage-backed securities are affected by, among other things, interest rate changes and the possibility of prepayment of the underlying mortgage loans. Mortgage-backed securities are also subject to the risk that underlying borrowers will be unable to meet their obligations.
Please refer to each Funds current prospectus for additional disclosure regarding the risks associated with investing in the Funds. The foregoing is not intended to be a complete discussion of the risks associated with the investment strategies of the Funds.
8. SECURITIES LENDING
A Fund may lend portfolio securities to brokers, dealers and other financial organizations that meet capital and other credit requirements or other criteria established by the Trust’s Board of Trustees. These loans may not exceed 33 1/3% of the total asset value of a Fund (including the loan collateral). No Fund will lend portfolio securities to its Adviser, sub-adviser or their affiliates unless it has applied for and received specific authority to do so from the SEC. Loans of portfolio securities will be fully collateralized by cash. Collateral will be maintained in an amount equal to at least 100% of the current market value of the loaned securities by marking to market daily, although the borrower will be required to deliver collateral between 102% and 105% of the market value of borrowed securities for domestic and foreign securities, respectively. However, due to market fluctuations
| SEI Institutional International Trust / Semi-Annual Report / March 31, 2014 | 63 |
Table of Contents
Notes to Financial Statements (Concluded)
March 31, 2014 (Unaudited)
during the day, the value of securities loaned on a particular day may, during the course of the day, exceed the value of collateral. On each business day, the amount of collateral is adjusted based on the prior day’s market fluctuations and the current day’s lending activity. Income from lending activity is determined by the amount of interest earned on collateral, less any amounts payable to the borrowers of the securities and the lending agent. Lending securities involves certain
risks, including the risk that a Fund may be delayed or prevented from recovering the collateral if the borrower fails to return the securities.
Cash collateral received in connection with securities lending is invested in short-term investments by the lending agent. These
investments may include the SEI Liquidity Fund L.P., and the Fund bears all of the gains and losses on such investment. There is no guarantee that these investments will not lose value.
9. SUBSEQUENT EVENTS
Management has evaluated the need for disclosures and/or adjustments resulting from subsequent events. Based on this evaluation, no disclosures and/or adjustments were required to the financial statements as of March 31, 2014.
| 64 | SEI Institutional International Trust / Semi-Annual Report / March 31, 2014 |
Table of Contents
Disclosure of Fund Expenses (Unaudited)
All mutual funds have operating expenses. As a shareholder of a fund, your investment is affected by these ongoing costs, which include (among others) costs for portfolio management, administrative services, and shareholder reports like this one. It is important for you to understand the impact of these costs on your investment returns.
Operating expenses such as these are deducted from the fund’s gross income and directly reduce your final investment return. These expenses are expressed as a percentage of the fund’s average net assets; this percentage is known as the fund’s expense ratio.
The following examples use the expense ratio and are intended to help you understand the ongoing costs (in dollars) of investing in your fund and to compare these costs with those of other mutual funds. The examples are based on an investment of $1,000 made at the beginning of the period shown and held for the entire period.
The table on this page illustrates your fund’s costs in two ways:
Actual Fund return. This section helps you to estimate the actual expenses after fee waivers that your Fund incurred over the period. The “Expenses Paid During Period” column shows the actual dollar expense cost incurred by a $1,000 investment in the Fund, and the “Ending Account Value” number is derived from deducting that expense cost from the Fund’s gross investment return.
You can use this information, together with the actual amount you invested in the Fund, to estimate the expenses you paid over that period. Simply divide your actual account value by $1,000 to arrive at a ratio (for example, an $8,600 account value divided by $1,000 = 8.6), then multiply that ratio by the number shown for your Fund under “Expenses Paid During Period.”
Hypothetical 5% return. This section helps you compare your Fund’s costs with those of other mutual funds. It assumes that the fund had an annual 5% return before expenses during the year, but that the expense ratio (Column 3) for the period is unchanged. This example is useful in making comparisons because the Securities and Exchange Commission requires all mutual funds to make this 5% calculation. You can assess your Fund’s comparative cost by comparing the hypothetical result for your Fund in the “Expense Paid During Period” column with those that appear in the same charts in the shareholder reports for other funds.
NOTE: Because the return is set at 5% for comparison purposes — NOT your Fund’s actual return — the account values shown may not apply to your specific investment.
Beginning 10/1/13 | Ending Account Value 3/31/14 | Annualized Expense Ratios | Expenses Paid During Period* | |||||||||||||
International Equity Fund |
| |||||||||||||||
Actual Fund Return | ||||||||||||||||
Class A | $ | 1,000.00 | $ | 1,065.80 | 1.24 | % | $ | 6.40 | ||||||||
Class I | 1,000.00 | 1,064.50 | 1.49 | 7.68 | ||||||||||||
Hypothetical 5% Return |
| |||||||||||||||
Class A | $ | 1,000.00 | $ | 1,018.73 | 1.24 | % | $ | 6.26 | ||||||||
Class I | 1,000.00 | 1,017.49 | 1.49 | 7.50 | ||||||||||||
Emerging Markets Equity Fund |
| |||||||||||||||
Actual Fund Return | ||||||||||||||||
Class A | $ | 1,000.00 | $ | 1,007.70 | 1.96 | % | $ | 9.83 | ||||||||
Hypothetical 5% Return |
| |||||||||||||||
Class A | $ | 1,000.00 | $ | 1,015.14 | 1.96 | % | $ | 9.87 | ||||||||
| Beginning Account Value 10/1/13 | Ending Account Value 3/31/14 | Annualized Expense Ratios | Expenses Paid During Period* | |||||||||||||
International Fixed Income Fund |
| |||||||||||||||
Actual Fund Return | ||||||||||||||||
Class A | $ | 1,000.00 | $ | 1,024.90 | 1.02 | % | $ | 5.16 | ||||||||
Hypothetical 5% Return |
| |||||||||||||||
Class A | $ | 1,000.00 | $ | 1,019.84 | 1.02 | % | $ | 5.14 | ||||||||
Emerging Markets Debt Fund |
| |||||||||||||||
Actual Fund Return | ||||||||||||||||
Class A | $ | 1,000.00 | $ | 1,013.70 | 1.36 | % | $ | 6.83 | ||||||||
Hypothetical 5% Return |
| |||||||||||||||
Class A | $ | 1,000.00 | $ | 1,018.14 | 1.36 | % | $ | 6.85 | ||||||||
| * | Expenses are equal to the Fund’s annualized expense ratio multiplied by the average account value over the period, multiplied by 182/365 (to reflect the one-half year period shown). |
| SEI Institutional International Trust / Semi-Annual Report / March 31, 2014 | 65 |
Table of Contents
Board of Trustees Considerations in Approving the Funds’ Investment Advisory and Sub-Advisory Agreements (Unaudited)
SEI Institutional International Trust (the “Trust”) and SEI Investments Management Corporation (“SIMC”) have entered into an investment advisory agreement (the “Advisory Agreement”). Pursuant to the Advisory Agreement, SIMC oversees the investment advisory services provided to the series of the Trust (the “Funds”) and may manage the cash portion of the Funds’ assets. Pursuant to separate sub-advisory agreements (the “Sub-Advisory Agreements” and, together with the Advisory Agreement, the “Investment Advisory Agreements”) with SIMC, and under the supervision of SIMC and the Trust’s Board of Trustees (the “Board”), the sub-advisers (each, a “Sub-Adviser” and collectively, the “Sub-Advisers”) are responsible for the day-to-day investment management of all or a discrete portion of the assets of the Funds. The Sub-Advisers are also responsible for managing their employees who provide services to these Funds. The Sub-Advisers are selected based primarily upon the research and recommendations of SIMC, which evaluates quantitatively and qualitatively the Sub-Advisers’ skills and investment results in managing assets for specific asset classes, investment styles and strategies.
The Investment Company Act of 1940, as amended (the “1940 Act”) requires that the initial approval of, as well as the continuation of, the Funds’ Investment Advisory Agreements must be specifically approved: (i) by the vote of the Board or by a vote of the shareholders of the Funds; and (ii) by the vote of a majority of the Trustees who are not parties to the Investment Advisory Agreements or “interested persons” of any party (the “Independent Trustees”), cast in person at a meeting called for the purpose of voting on such approval(s). In connection with their consideration of such approval(s), the Funds’ Trustees must request and evaluate, and SIMC and the Sub-Advisers are required to furnish, such information as may be reasonably necessary to evaluate the terms of the Investment Advisory Agreements. In addition, the Securities and Exchange Commission takes the position that, as part of their fiduciary duties with respect to a mutual fund’s fees, mutual fund boards are required to evaluate the material factors applicable to a decision to approve an Investment Advisory Agreement.
Consistent with these responsibilities, the Board calls and holds meetings each year that are dedicated to considering whether to approve new and terminate or renew existing Investment Advisory Agreements between the Trust and SIMC and SIMC and the Sub-Advisers with respect to the Funds of the Trust. In preparation for these meetings, the Board requests and reviews a wide variety of materials provided by SIMC and the Sub-Advisers, including information about SIMC’s and the Sub-Advisers’ affiliates, personnel and operations. The Board also receives extensive data from third parties. This information is provided in addition to the detailed information about the Funds that the Board reviews during the course of each year, including information that relates to Fund operations and Fund performance. The Trustees also receive a memorandum from counsel regarding the responsibilities of Trustees in connection with their consideration of whether to approve the Trust’s Investment Advisory Agreements. Finally, the Independent Trustees receive advice from independent counsel to the Independent Trustees, meet in executive sessions outside the presence of Fund management and participate in question and answer sessions with representatives of SIMC and the Sub-Advisers.
Specifically, during the course of the Trust’s fiscal year, the Board requested and received written materials from SIMC and the Sub-Advisers regarding: (i) the quality of SIMC’s and the Sub-Advisers’ investment management and other services; (ii) SIMC’s and the Sub-Advisers’ investment management personnel; (iii) SIMC’s and the Sub-Advisers’ operations and financial condition; (iv) SIMC’s and the Sub-Advisers’ brokerage practices (including any soft dollar arrangements) and investment strategies; (v) the level of the advisory fees that SIMC charges the Funds and the level of the sub-advisory fees that SIMC pays the Sub-Advisers compared with the fees each charge to comparable mutual funds; (vi) the Funds’ overall fees and operating expenses compared with similar mutual funds; (vii) the level of SIMC’s and the Sub-Advisers’ profitability from their Fund-related operations; (viii) SIMC’s and the Sub-Advisers’ compliance systems; (ix) SIMC’s and the Sub-Advisers’ policies on and compliance procedures for personal securities transactions; (x) SIMC’s and the Sub-Advisers’ reputation, expertise and resources in domestic and/or international financial markets; and (xi) the Funds’ performance compared with similar mutual funds.
At the December 10-11, 2013 and the March 25-26, 2014 meetings of the Board of Trustees, the Trustees, including a majority of the Independent Trustees, approved the Investment Advisory Agreements and approved the selection of SIMC and
| 66 | SEI Institutional International Trust / Semi-Annual Report / March 31, 2014 |
Table of Contents
Board of Trustees Considerations in Approving the Funds’ Investment Advisory and Sub-Advisory Agreements (Unaudited) (Continued)
certain Sub-Advisers to act in their respective capacities for the Funds. The Board’s approval was based on its consideration and evaluation of a variety of specific factors discussed at the meetings and at prior meetings, including:
| • | the nature, extent and quality of the services provided to the Funds under the Investment Advisory Agreements, including the resources of SIMC and the Sub-Advisers and their affiliates dedicated to the Funds; |
| • | the Funds’ investment performance and how it compared to that of other comparable mutual funds; |
| • | the Funds’ expenses under each Investment Advisory Agreement and how those expenses compared to those of other comparable mutual funds; |
| • | the profitability of SIMC and the Sub-Advisers and their affiliates with respect to the Funds, including both direct and indirect benefits accruing to SIMC and the Sub-Advisers and their affiliates; and |
| • | the extent to which economies of scale would be realized as the Funds grow and whether fee levels in the Investment Advisory Agreements reflect those economies of scale for the benefit of Fund investors. |
Nature, Extent and Quality of Services. The Board considered the nature, extent and quality of the services provided by SIMC and the Sub-Advisers to the Funds and the resources of SIMC and the Sub-Advisers and their affiliates dedicated to the Funds. In this regard, the Trustees evaluated, among other things, SIMC’s and each Sub-Adviser’s personnel, experience, track record and compliance program. The Trustees found the level of SIMC’s and each Sub-Adviser’s professional staff and culture of compliance satisfactory. Following evaluation, the Board concluded that, within the context of its full deliberations, the nature, extent and quality of services provided by SIMC and the Sub-Advisers to the Funds and the resources of SIMC and the Sub-Advisers and their affiliates dedicated to the Funds supported renewal of the Investment Advisory Agreements.
Fund Performance. The Board considered Fund performance in determining whether to approve new and terminate or renew existing Investment Advisory Agreements. Specifically, the Trustees considered the Funds’ performance relative to their peer groups and appropriate indices/benchmarks in light of total return, yield and market trends. As part of this review, the Trustees considered the composition of each peer group and selection criteria. In evaluating performance, the Trustees considered both market risk and shareholder risk expectations for the Funds. The Trustees found Fund performance satisfactory, and, where performance was below the benchmark, the Trustees were satisfied that appropriate steps were being taken. Following evaluation, the Board concluded that, within the context of its full deliberations, the performance of the Funds supported renewal of the Investment Advisory Agreements.
Fund Expenses. With respect to the Funds’ expenses under the Investment Advisory Agreements, the Trustees considered the rate of compensation called for by the Investment Advisory Agreements and the Funds’ net operating expense ratio in comparison to those of other comparable mutual funds. The Trustees also considered information about average expense ratios of comparable mutual funds in the Funds’ respective peer groups. The Trustees further considered the fact that the comparative fee analysis either showed that the various fees were below average or that there was a reasonable basis for the fee level. Finally, the Trustees considered the effects of SIMC’s voluntary waiver of management and other fees to prevent total Fund expenses from exceeding a specified cap and concluded that SIMC, through waivers, has maintained the Funds’ net operating expenses at competitive levels for its distribution channels. Following evaluation, the Board concluded that, within the context of its full deliberations, the expenses of the Funds are reasonable and supported renewal of the Investment Advisory Agreements.
Profitability. With regard to profitability, the Trustees considered all compensation flowing to SIMC and the Sub-Advisers and their affiliates, directly or indirectly. The Trustees considered whether the varied levels of compensation and profitability under the Investment Advisory Agreements and other service agreements were reasonable and justified in light of the quality of all services rendered to the Funds by SIMC and the Sub-Advisers and their affiliates. The Trustees found that profitability was reasonable. When considering the profitability of the Sub-Advisers, the Board took into account the fact that the Sub-Advisers are compensated by SIMC and not by the Funds directly, and such compensation with respect to any Sub-Adviser reflects an arms-
| SEI Institutional International Trust / Semi-Annual Report / March 31, 2014 | 67 |
Table of Contents
length negotiation between the Sub-Adviser and SIMC. Based on this evaluation, the Board concluded that, within the context of its full deliberations, the profitability of each of SIMC and the Sub-Advisers is reasonable and supported renewal of the Investment Advisory Agreements.
Economies of Scale. The Trustees considered the existence of any economies of scale and whether those were passed along to the Funds’ shareholders through a graduated investment advisory fee schedule or other means, including any fee waivers by SIMC and its affiliates. Based on this evaluation, the Board concluded that, within the context of its full deliberations, the Funds obtain reasonable benefit from economies of scale.
Based on the Trustees’ deliberation and their evaluation of the information described above, the Board, including all of the Independent Trustees, unanimously approved the continuation of the Investment Advisory Agreements and concluded that the compensation under the Investment Advisory Agreements is fair and reasonable in light of such services and expenses and such other matters as the Trustees considered to be relevant in the exercise of their reasonable judgment. In the course of their deliberations, the Trustees did not identify any particular information that was all-important or controlling.
| 68 | SEI Institutional International Trust / Semi-Annual Report / March 31, 2014 |
Table of Contents
SEI INSTITUTIONAL INTERNATIONAL TRUST SEMI-ANNUAL REPORT MARCH 31, 2014
Robert A. Nesher, Chairman
Trustees
William M. Doran
George J. Sullivan, Jr.
Nina Lesavoy
James M. Williams
Mitchell A. Johnson
Hubert L. Harris, Jr.
Officers
Robert A. Nesher
President and Chief Executive Officer
Peter A. Rodriguez
Controller and Chief Financial Officer
Russell Emery
Chief Compliance Officer
Timothy D. Barto
Vice President, Secretary
Aaron Buser
Vice President, Assistant Secretary
David F. McCann
Vice President, Assistant Secretary
Stephen G. MacRae
Vice President
Edward McCusker
Anti-Money Laundering Compliance Officer
Privacy Officer
Investment Adviser
SEI Investments Management Corporation
Administrator
SEI Investments Global Funds Services
Distributor
SEI Investments Distribution Co.
Legal Counsel
Morgan, Lewis & Bockius LLP
Independent Registered Public Accounting Firm
KPMG LLP
This report and the financial statements contained herein are submitted for the general information of the shareholders of the Trust and must be preceded or accompanied by a current prospectus. Shares of the SEI Funds are not deposits or obligations of, or guaranteed or endorsed by, any bank. The shares are not federally insured by the Federal Deposit Insurance Corporation (FDIC), the Federal Reserve Board, or any other government agency. Investment in the shares involves risk, including the possible loss of principal.
For more information call
1 800 DIAL SEI
(1 800 342 5734)
Table of Contents

SEI Investments Distribution Co.
Oaks, PA 19456 1.800.DIAL SEI (1.800.342.5734)
SEI-F-031 (3/14)
Table of Contents
Item 2. Code of Ethics.
Not applicable for semi-annual report.
Item 3. Audit Committee Financial Expert.
Not applicable for semi-annual report.
Item 4. Principal Accountant Fees and Services.
Not applicable for semi-annual report.
Item 5. Audit Committee of Listed Registrants.
Not applicable.
Item 6. Schedule of Investments.
The Schedules of Investments in securities of unaffiliated issuers as of the close of the reporting period for the International Equity Fund, the Emerging Markets Equity Fund, the International Fixed Income Fund and the Emerging Markets Debt Fund are included as part of the report to shareholders filed under Item 1 of this form.
Item 7. Disclosure of Proxy Voting Policies and Procedures for Closed-End Management Investment Companies.
Not applicable.
Item 8. Portfolio Managers of Closed-End Management Investment Companies.
Not applicable.
Item 9. Purchases of Equity Securities by Closed-End Management Company and Affiliated Purchasers.
Not applicable.
Item 10. Submission of Matters to a Vote of Security Holders.
The Registrant has a standing Governance Committee (the “Committee”) currently consisting of the independent trustees. The Committee is responsible for evaluating and recommending nominees for election to the Registrant’s Board of Trustees (the “Board”). Pursuant to the Committee’s Charter, adopted on June 18, 2004, the Committee will review all shareholder recommendations for nominations to fill vacancies on the Board if such recommendations are submitted in writing and addressed to the Committee at the Registrant’s office.
Item 11. Controls and Procedures.
(a) The Registrant’s principal executive and principal financial officers, or persons performing similar functions, have concluded that the Registrant’s disclosure controls and procedures (as defined in Rule 30a-3(c) under the Investment Company Act of 1940 (the “1940 Act”)) are effective, based on the evaluation of these controls and procedures required by Rule 30a-3(b) under the 1940 Act and Rules 13a-15(b) or 15d-15(b) under the Securities Exchange Act of 1934 as of a date within 90 days of the filing date of this report.
(b) There were no changes in the Registrant’s internal control over financial reporting (as defined in Rule 30a-3(d) under the 1940 Act) that occurred during the second fiscal quarter of the period covered by this report that have materially affected, or are reasonably likely to materially affect, the Registrant’s internal control over financial reporting.
Items 12. Exhibits.
(a)(1) Not applicable for semi-annual report.
(a)(2) A separate certification for the principal executive officer and the principal financial officer of the Registrant as required by
Rule 30a-2(a) under the Investment Company Act of 1940, as amended (17 CFR 270.30a-2(a)), are filed herewith.
(b) Officer certifications as required by Rule 30a-2(b) under the Investment Company Act of 1940, as amended (17 CFR 270.30a-2(b)), also accompany this filing as an exhibit.
Table of Contents
SIGNATURES
Pursuant to the requirements of the Securities Exchange Act of 1934 and the Investment Company Act of 1940, the registrant has duly caused this report to be signed on its behalf by the undersigned, thereunto duly authorized.
| SEI Institutional International Trust | ||||||
By | /s/ Robert A. Nesher | |||||
Robert A. Nesher, President & CEO | ||||||
Date: June 4, 2014 | ||||||
Pursuant to the requirements of the Securities Exchange Act of 1934 and the Investment Company Act of 1940, this report has been signed below by the following persons on behalf of the registrant and in the capacities and on the dates indicated.
| By | /s/ Robert A. Nesher | |||||
| Robert A. Nesher, President & CEO | ||||||
| Date: June 4, 2014 | ||||||
| By | /s/ Peter A. Rodriguez | |||||
| Peter A. Rodriguez, Controller & CFO | ||||||
| Date: June 4, 2014 | ||||||