Exhibit 99.6
September Budget Update
2005/06 – 2007/08
September 14, 2005

www.gov.bc.ca
National Library of Canada Cataloguing in Publication Data
British Columbia.
Budget and fiscal plan. — 2002/03/2004/05/2005/06/2007/08-
Annual
Also available on the Internet.
Continues: British Columbia. Ministry of Finance and
Corporate Relations. Budget ... reports. ISSN 1207-5841
ISSN 1705-6071 = Budget and fiscal plan — British Columbia.
1. Budget — British Columbia — Periodicals. 2. British
Columbia — Appropriations and expenditures — Periodicals.
I. British Columbia. Ministry of Finance. II. Title.
HJ12.B742 | | 352.48’09711’05 | | C2003-960048-3 |
TABLE OF CONTENTS | | |
| | |
September Budget Update 2005/06 — 2007/08 | | September 14, 2005 |
September Budget Update – 2005/06 to 2007/08

September 14, 2005
As required by Section 7(d) of the Budget Transparency and Accountability Act (BTAA), I am confirming that this September Budget Update contains the following elements in support of the forthcoming Estimates debate:
• The fiscal and economic forecasts for 2005/06, which are detailed in Part 1 and Part 3.
• All material economic, demographic, taxation, accounting policy and other assumptions underlying the 2005/06 economic, revenue, expenditure, surplus and debt forecasts are also disclosed. We have disclosed key assumptions regarding ongoing or anticipated negotiations. In particular:
• For budget planning purposes the status quo is assumed to prevail in the U.S. lumber dispute;
• No equalization revenues have been assumed beyond 2005/06. The federal government has indicated they will determine a new mechanism for allocating equalization funding among provinces by March 2006, based on the advice of an independent panel. Given the uncertainty, government made a prudent assumption that there would be no equalization revenues in 2006/07 or 2007/08; and
• The current compensation mandate that has been in place since January 2002 will remain unchanged until March 31, 2006. As the next mandate is still under development, no compensation increase has been assumed in the fiscal plan. Details of the next wage mandate that commences April 1, 2006, will be released by the next budget in February 2006. The forecast allowances included in this fiscal plan cover the potential costs of future public sector wage settlements, in addition to revenue risks such as a sudden fall in energy prices, or the costs of natural disasters.
These and other major areas of risk to the plan known at this time are disclosed in the risks section in Part 1 and in the material assumption tables in the appendix.
• The report on the current advice of the Minister’s Economic Forecast Council on economic growth, including the range of forecasts for 2005 and 2006. This is found at the end of Part 3.
The September Budget Update reflects the ministry responsibilities announced on June 16, 2005, including the assignment of Land and Water BC activities among various government ministries effective September 30, 2005. BC Buildings Corporation will be converted to ministry status in 2006/07. Therefore, BC Buildings Corporation has been incorporated in the budget update on a status quo basis, as plans for its integration have not yet been finalized.
Some post-secondary institutions have forecast deficits. Government has not approved these forecasts since a funding review is currently underway and will be completed later this fall. Upon completion, it is expected that revised forecasts with balanced budgets will be submitted by the institutions reflecting the results of this review. These forecasts will be included in Budget 2006.
The accounting policies followed in the September Budget Update comply, in all material respects, with generally accepted accounting principles (GAAP) for senior governments as prescribed by the Public Sector Accounting Board (PSAB).
As required under section 7(e) of the BTAA, the forecast allowance, which is an adjustment to the most likely forecast of the 2005/06 surplus, is also disclosed.
I would like to thank staff in all government ministries, Crown corporations and the SUCH sector for their work in developing the plans and preparing these multi-year economic and financial forecasts. I would like to especially acknowledge the hard work and dedication of my colleagues in the Ministry of Finance for their efforts in preparing this updated fiscal plan and a second set of Estimates for the 2005/06 fiscal year.
| | /s/ Tamara Vrooman | |
| | TAMARA VROOMAN | |
| | Deputy Minister and | |
| | Secretary to Treasury Board | |
Ministry of | | Office of the | | Mailing Address: | | Location Address: |
Finance | | Deputy Minister | | PO Box 9417 Stn Prov Govt | | Room 109 |
| | | | Victoria BC V8W 9V1 | | 617 Government Street |
| | | | www.gov.bc.ca/fin | | Victoria BC |
Summary: BUDGET AND FISCAL PLAN – 2005/06 TO 2007/08
Fiscal Plan Summary – 2005/06 to 2007/08
| | | | | | Budget | | | | | |
| | Budget | | Actual | | Estimate | | Plan | | Plan | |
($ millions) | | 2004/05 | | 2004/05 | | 2005/06 | | 2006/07 | | 2007/08 | |
Revenue | | 30,492 | | 33,233 | | 34,476 | | 34,398 | | 35,131 | |
Expense | | (30,292 | ) | (30,658 | ) | (32,876 | ) | (33,198 | ) | (33,831 | ) |
Surplus before forecast allowance | | 200 | | 2,575 | | 1,600 | | 1,200 | | 1,300 | |
Forecast allowance | | (100 | ) | — | | (300 | ) | (600 | ) | (900 | ) |
Surplus | | 100 | | 2,575 | | 1,300 | | 600 | | 400 | |
Capital spending: | | | | | | | | | | | |
Taxpayer-supported capital spending | | 1,943 | | 2,322 | | 3,038 | | 2,938 | | 2,443 | |
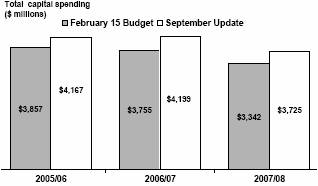
Total capital spending | | 2,934 | | 3,182 | | 4,167 | | 4,199 | | 3,725 | |
Provincial Debt: | | | | | | | | | | | |
Provincial government direct operating debt | | 16,558 | | 14,481 | | 12,871 | | 12,180 | | 11,003 | |
Taxpayer-supported debt | | 32,115 | | 28,657 | | 28,274 | | 28,906 | | 28,740 | |
Total debt | | 39,395 | | 35,826 | | 35,910 | | 37,350 | | 38,033 | |
Provincial government direct operating | | 11.3 | % | 9.3 | % | 7.8 | % | 7.0 | % | 6.1 | % |
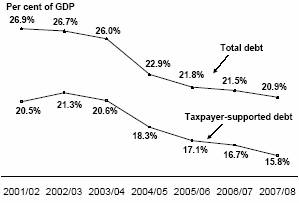
Taxpayer-supported debt to GDP ratio | | 21.8 | % | 18.3 | % | 17.1 | % | 16.7 | % | 15.8 | % |
Total debt to GDP ratio | | 26.8 | % | 22.9 | % | 21.8 | % | 21.5 | % | 20.9 | % |
BC’s fiscal position improves
Driven by stronger economic performance, the fiscal outlook of the BC government has improved since the February 15 budget. This has allowed:
• program enhancements for seniors ($242 million over three years); and
• a commitment to help build a new relationship with First Nations and Aboriginal communities ($100 million in 2005/06).
In addition to the small business threshold adjustment, the personal income tax reduction and medical service plan premium assistance enhancements for BC’s low and modest income earners, announced in the February 15 budget, two new competitiveness measures are included in the September Update:
• a reduction in the general corporate income tax rate to 12 per cent from 13.5 per cent; and
• a tax refund for the commercialization of intellectual property in the form of life science related patents.

Since the February 15 budget, the province has also negotiated funding agreements with the federal government that enable expansion of key childhood development programs and programs in the forest sector:
• expansion of early learning and child care services ($329 million over three years); and
• support for the Mountain Pine Beetle Action Plan ($100 million over three years).
The September Update also reconfirms the spending and revenue initiatives tabled with the February 15 budget.
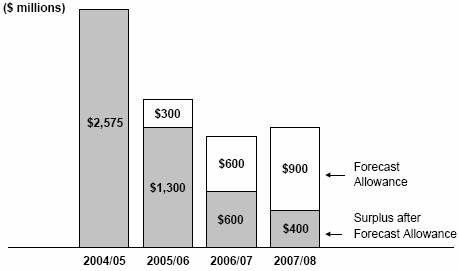
Budget plan remains prudent
With the September Update, government continues its legislated commitment to balanced budgets. The updated fiscal plan includes a forecast surplus of $1.3 billion for 2005/06, and surpluses of $600 million in 2006/07 and $400 million in 2007/08. The updated fiscal plan includes forecast allowances of $300 million in 2005/06, $600 million in 2006/07 and $900 million in 2007/08. These provisions protect the fiscal plan from revenue risks such as a sudden fall in energy prices, natural disasters and other unexpected spending requirements.
The forecast allowances must also cover potential wage and benefit increases arising from the next round of public sector bargaining, as no compensation increases have been included in this fiscal plan. Details of the next wage mandate will be released by the next budget in February 2006.
Surplus allocated to reduce borrowing requirements
To meet the transportation, health and education infrastructure needs of a growing economy, significant capital project investments are planned in the coming years for health care facilities, universities, colleges and highways. This leads to increases in debt over the course of the three-year plan, reflecting the borrowing requirements for planned capital projects. The three-year fiscal plan assumes that funds from the operating surplus are applied to reduce these borrowing requirements.
Debt to remain affordable
Government is committed to keeping debt affordable for future generations of British Columbians. Government will monitor the borrowing requirements for capital projects to ensure that debt does not grow faster than the overall economy. Consistent with this commitment, both total debt and taxpayer-supported debt are forecast to decline as a per cent of GDP in each of the next three years.
Debt-to-GDP ratio to decline
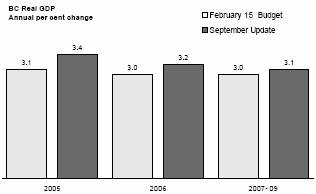
A strong economic foundation
The BC economy performed impressively in 2004, posting a real GDP growth rate of 3.9 per cent. Momentum continues in employment, consumer spending, home construction and non-residential investment, maintaining high levels of consumer and business confidence. This broadly based economic growth is expected to continue in 2005 and 2006. The Ministry of Finance forecasts economic growth of 3.4 per cent for 2005 and 3.2 per cent in 2006, up from the forecast in the February 15 budget.
The revenue outlook has similarly improved since February primarily due to higher taxation and energy revenues consistent with the updated economic forecast, as well as new federal government transfer payments. A strong economy and an improved financial position provide the underpinnings for continued enhancement of priority program areas, and for maintaining a competitive economic environment.
BC economic growth forecast improved
Seniors first to share in new benefits
The new commitments in this September Update incorporate initiatives to improve the lives of senior citizens. These include funds for:
• the renewal of the Seniors’ Supplement for those with lower incomes;
• increased ceilings for eligibility under the Shelter Aid for Elderly Renters (SAFER) rent subsidy program; and
• strengthening and modernizing the full range of health care services for seniors.
Building a new First Nations relationship
The provincial government is committed to building a new relationship with First Nations and Aboriginal communities. In 2005/06, the provincial government plans to invest $100 million of one-time funding to help First Nations and Aboriginal communities build appropriate capacity to provide effective input and participate in the management of lands, resources and social programs. This will assist First Nations and Aboriginal communities in becoming active, supporting partners in relationships with government, business and other organizations.
3
Spending Initiatives
($ millions) | | 2005/06 | | 2006/07 | | 2007/08 | |
September Update | | | | | | | |
Enhanced services for seniors | | 93 | | 112 | | 37 | |
First Nations New Relationships fund | | 100 | | — | | — | |
Other changes | | 54 | | 104 | | 66 | |
| | 247 | | 216 | | 103 | |
Funded by new federal transfers | | | | | | | |
Early learning and child care | | 55 | | 122 | | 152 | |
Mountain pine beetle | | 27 | | 37 | | 36 | |
September Update sub-total | | 329 | | 375 | | 291 | |
| | | | | | | |
February 15 Budget | | | | | | | |
Health services | | 624 | | 555 | | 848 | |
K-12 and post-secondary education | | 108 | | 19 | | 119 | |
Services to children | | 75 | | 82 | | 87 | |
Community services | | 155 | | 158 | | 210 | |
Safety | | 57 | | 68 | | 73 | |
Economic development and job creation | | 367 | | 89 | | 116 | |
Olympics funding | | — | | — | | 40 | |
Environment | | 41 | | 40 | | 42 | |
February 15 budget sub-total | | 1,427 | | 1,011 | | 1,535 | |
Total spending initiatives | | 1,756 | | 1,386 | | 1,826 | |
Early learning and child care
Additional revenues from a five-year agreement with the federal government will allow for expansion of the Child Care Subsidy program and creation of new child care spaces.
Mountain pine beetle
In addition to the $89 million provincial funding increase in the February 15 budget, a further $100 million received from the federal government will support the province’s Mountain Pine Beetle Action Plan, and help respond to the increasing devastation of the pine forest in BC’s interior.
Other changes
Other changes since the February 15 budget include a $50 million annual increase in the contingency vote to allow for unexpected costs or new initiatives. The contingency vote is now set at approximately 1 per cent of total government expense.
Maintaining a competitive environment
In addition to the tax relief measures in the February 15 budget, and already passed into law, the September Update includes measures to enhance BC as a competitive location for new business investment and to support job creation. The September Update includes a reduction in the general corporate income tax rate and a tax incentive to help keep intellectual property within the province.
Tax reductions
($ millions) | | 2005/06 | | 2006/07 | | 2007/08 | |
September Update | | | | | | | |
General corporate income tax rate reduction to 12% from 13.5% | | 71 | | 143 | | 143 | |
Intellectual property | | — | | 20 | | 20 | |
September Update sub-total | | 71 | | 163 | | 163 | |
| | | | | | | |
February 15 Budget | | | | | | | |
BC tax reduction for low and modest income earners | | 120 | | 122 | | 124 | |
Social service tax reduction | | 270 | | 288 | | 298 | |
First time home buyers’ property transfer tax exemption | | 15 | | 15 | | 15 | |
Enhanced MSP premium assistance | | 30 | | 40 | | 40 | |
Small business income tax threshold | | 10 | | 10 | | 10 | |
Other | | 42 | | 21 | | 14 | |
February 15 budget sub-total | | 487 | | 496 | | 501 | |
Total tax reductions | | 558 | | 659 | | 664 | |
Expanded capital plan
The September Update includes a capital plan for ministries and Crown corporations, reflecting a three-year increase of $1.1 billion compared to the February 15 budget. This is mainly due to higher planned capital outlays by the post-secondary sector and health authorities based on updated plans from these sectors. Plan changes also include the increase for the Vancouver Convention Centre Expansion Project.
Expanded capital plan reflects demand for new infrastructure
4
Infrastructure is costly to build, operate and maintain. But it is long-lived and delivers benefits across generations. Today’s British Columbians are reaping the benefits of infrastructure investments made by their parents and grandparents. Infrastructure is clearly important to all British Columbians. Careful planning and budgeting is important so government can build new infrastructure, overhaul and update existing infrastructure and avoid bottlenecks, so that the province is left in good order for future generations.
Given the recent rise in construction material and labour prices, government will bring increased focus on capital spending proposals during the annual budget priority setting process, and will continue to monitor its infrastructure plan to ensure that all planned projects are managed within a declining debt-to-GDP track.
First Quarterly Report
In addition to the updated fiscal plan and its underlying assumptions, the September Update includes financial results for the April-to-June quarter of the 2005/06 fiscal year. These show a three-month surplus of $469 million mainly due to lower-than-expected spending in the first three months of the fiscal year.
2006/07 budget process
Due to the timing of the September Update, the debate on the 2005/06 Estimates will occur at the same time that the budget development process for 2006/07 gets underway. The Minister of Finance has released the 2006/07 Budget Consultation Paper with the September Update. This paper stands referred to a Select Standing Committee of the Legislative Assembly, which will seek public input on the February 2006 budget and hold public meetings in selected communities around British Columbia during late September and October.
5
Part 1: THREE-YEAR FISCAL PLAN
Table 1.1 Three Year Fiscal Plan – Operating Statement
| | 2004/05 | | Budget | | | | | |
| | Budget | | | | Estimate | | Plan | | Plan | |
($ millions) | | Estimate | | Actual | | 2005/06 | | 2006/07 | | 2007/08 | |
Taxpayer-supported programs and agencies: | | | | | | | | | | | |
Revenue | | 28,420 | | 30,821 | | 32,202 | | 32,139 | | 32,934 | |
Expense | | (30,292 | ) | (30,658 | ) | (32,876 | ) | (33,198 | ) | (33,831 | ) |
Taxpayer-supported balance | | (1,872 | ) | 163 | | (674 | ) | (1,059 | ) | (897 | ) |
Commercial Crown corporation income | | 2,072 | | 2,412 | | 2,274 | | 2,259 | | 2,197 | |
Surplus before forecast allowance | | 200 | | 2,575 | | 1,600 | | 1,200 | | 1,300 | |
Forecast allowance | | (100 | ) | — | | (300 | ) | (600 | ) | (900 | ) |
Surplus | | 100 | | 2,575 | | 1,300 | | 600 | | 400 | |
Introduction
The September Update continues government’s legislated commitment to balance the provincial budget. Following a record surplus of $2.6 billion in 2004/05, the updated fiscal plan forecasts a surplus of $1.3 billion for 2005/06, and surpluses of $600 million in 2006/07 and $400 million for 2007/08.
Chart 1.1 Revenue gains improve fiscal outlook
Since the February 15 budget, the surplus outlook has improved by $1.1 billion in 2005/06, $400 million in 2006/07 and by $200 million in 2007/08, driven by a stronger economic performance. This allows for new funding for government initiatives in priority areas including:
• program enhancements for seniors ($242 million over three years); and
• a commitment to help build a new relationship with First Nations and Aboriginal communities ($100 million in 2005/06).
In addition, since the February 15 budget the province has negotiated funding agreements with the federal government that fund the following initiatives:
• expansion of early learning and child care ($329 million over three years); and
6
• support for the Mountain Pine Beetle Action Plan ($100 million over three years).
The September Update includes an infrastructure plan to meet the needs of a growing economy and demands for new and upgraded health care and educational facilities. Total infrastructure spending for ministries and taxpayer-supported agencies is higher than the February 15 budget, and funds an additional $243 million in 2005/06, $430 million in 2006/07 and $371 million in 2007/08. This mainly reflects needed infrastructure in the colleges and universities and for health care facilities. More information on the capital spending forecast is found on page 37.
Following a record $1.9 billion reduction in provincial debt in 2004/05, debt is forecast to increase slightly in 2005/06 to total $35.9 billion, and is forecast to rise to $38.0 billion by 2007/08. The increase in debt reflects borrowing needed to support planned infrastructure spending including health facilities, post-secondary institutions, and highways.
Government is committed to keeping debt affordable for future generations of British Columbians. Consistent with this commitment, both the total debt to GDP and the taxpayer-supported debt to GDP ratios continue to fall over the three-year fiscal plan. Additional information on the debt outlook is found starting on page 41 and in the topic box on page 58.
The September Update is prepared on the basis of the ministry and Cabinet structure announced on June 16, 2005. The responsibilities for Land and Water BC (LWBC) are being formally transferred to eight government ministries effective September 30, 2005. Increases to those ministries’ budgets are offset by the elimination of LWBC spending over the three-year plan.
To cover potential ministry pressures relating to the reorganization, $20 million has been notionally set aside within the contingencies vote in 2005/06.
The budget plan for BC Buildings Corporation is included in the September Update on a status-quo basis, as details for its incorporation into government have not yet been finalized.
The government revenue forecast is based on income growth, demand, commodity prices, the exchange rate and other related assumptions included in the economic forecast. Revenue also includes forecasts submitted by Crown corporations, and organizations in the SUCH sector (school districts; universities, colleges and university colleges and institutes; and health authorities and hospital societies).
By comparison to the February 15 budget, revenues (before tax measures) are forecast to have increased by $1.5 billion in 2005/06, and by $1.1 billion in 2006/07 and 2007/08. These increases reflect the improved economic outlook, higher commodity prices, additional federal funding and the better than expected results in 2004/05. After deducting the impact of new tax measures in this budget, the change in revenues becomes $1.4 billion in 2005/06, $901 million in 2006/07 and $887 million in 2007/08 (as shown in Table 1.2).
7
Table 1.2 Three-Year Fiscal Plan Update – Changes from February 15 Budget
($ millions) | | 2005/06 | | 2006/07 | | 2007/08 | |
February 15 Budget | | 220 | | 200 | | 200 | |
Revenue changes: | | | | | | | |
Taxation | | 824 | | 796 | | 620 | |
Natural resources | | 488 | | 122 | | 228 | |
Other taxpayer-supported revenue | | 84 | | 6 | | (23 | ) |
Federal transfers | | 131 | | 133 | | 158 | |
Commercial Crown corporation operating results | | (56 | ) | 7 | | 67 | |
Total revenue changes before tax measures | | 1,471 | | 1,064 | | 1,050 | |
Less : tax measures | | (71 | ) | (163 | ) | (163 | ) |
Total revenue changes after tax measures | | 1,400 | | 901 | | 887 | |
Less : expense increases (decreases): | | | | | | | |
Consolidated revenue fund (CRF) increases: | | | | | | | |
Ministry of Health (Seniors) | | 75 | | 75 | | — | |
Ministry of Advanced Education (tuition policy/seat growth) | | 15 | | — | | — | |
Ministry of Attorney General (Crown prosecutors) | | — | | 10 | | 11 | |
Ministry of Children and Family Development (Community Living BC) | | 4 | | 2 | | 2 | |
Ministry of Children and Family Development (Early Learning and Child Care) (1) | | 55 | | 122 | | 152 | |
Ministry of Employment and Income Assistance (seniors supplement) | | 10 | | 20 | | 20 | |
Ministry of Forests and Range (housing) | | 8 | | 17 | | 17 | |
Ministry of Forests and Range (BC timber sales) | | (18 | ) | — | | — | |
Ministry of Forests and Range (mountain pine beetle) (1) | | 27 | | 37 | | 36 | |
Ministry of Tourism, Sport and the Arts (Vancouver Convention Centre Expansion) | | — | | 39 | | — | |
Other spending changes (including contingency vote increase) | | 53 | | 53 | | 53 | |
Subtotal | | 229 | | 375 | | 291 | |
Transfer from Land and Water BC (various ministries) | | 19 | | 38 | | 38 | |
Reduction in MOPD debt servicing costs | | (46 | ) | (36 | ) | (73 | ) |
First Nations New Relationships Fund | | 100 | | — | | — | |
Net increase in CRF spending | | 302 | | 377 | | 256 | |
Change in expenses recovered from external entities | | (21 | ) | (38 | ) | (32 | ) |
Land and Water BC – transfer to ministries | | (19 | ) | (38 | ) | (38 | ) |
Other taxpayer-supported Crown agencies – net spending | | 36 | | (21 | ) | 22 | |
SUCH sector – net spending | | 122 | | 71 | | 129 | |
Total expense increases | | 420 | | 351 | | 337 | |
Net changes before forecast allowance adjustment | | 980 | | 550 | | 550 | |
Forecast allowance (increase)/decreases | | 100 | | (150 | ) | (350 | ) |
Total changes | | 1,080 | | 400 | | 200 | |
September Update Updated Fiscal Plan | | 1,300 | | 600 | | 400 | |
(1) Funded through increases in federal transfers.
The revenue forecast is described starting on page 31. The revenue forecast also includes the effect of new revenue measures since the February 15 budget totaling $71 million in 2005/06 and $163 million in 2006/07 and 2007/08. These revenue policy changes are detailed in Part 2: Revenue Measures.
The fiscal plan is based on the Ministry of Finance’s economic forecast that projects economic growth of 3.4 per cent for 2005, 3.2 per cent in 2006 and 3.1 per cent in 2007, slightly less than the independent Economic Forecast Council average. Full details of the economic forecast are found in Part 3: British Columbia Economic Review and Outlook.
8
Chart 1.2 Revenue and spending trends
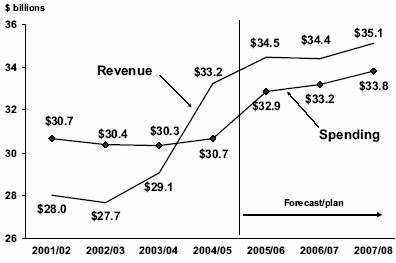
Based on projections for the economy and for commodity prices, total revenues are expected to increase by 3.7 per cent in 2005/06, followed by growth of 0.9 per cent per year on average for the next two years.
The spending plan confirms the spending initiatives tabled with the February 15 budget and provides new funding for government priorities including key program enhancements for seniors. Overall spending is forecast to increase by 7.2 per cent between 2004/05 and 2005/06, as funding is increased in most ministry budgets. Further information on the spending forecast, including the consolidated revenue fund (CRF) spending plan, follows on page 12.
The main risks to the government fiscal plan include economic fluctuations such as exchange rate or sudden commodity price changes, as well as wage and service demand pressures on the expenditure side. These and other risks are more fully described starting on page 44.
A $300 million forecast allowance is provided in 2005/06 to protect the bottom line against unanticipated revenue shortfalls or spending pressures that may arise before the end of the fiscal year. The fiscal plan also includes forecast allowances of $600 million in 2006/07, and $900 million in 2007/08, to protect the fiscal plan from revenue risks such as sudden changes in energy prices and from unexpected spending pressures such as natural disasters. The forecast allowances also cover the potential costs of future public sector wage settlements.
The three-year fiscal plan conforms to the standards set by the accounting profession for senior governments in Canada referred to as generally accepted accounting principles or “GAAP”. As with the February 15 budget and Budget 2004, this budget integrates financial forecasts for the SUCH sector into government’s revenue, spending and balance sheet projections.
9
Table 1.3 Revenue by Source(1)
| | 2004/05 | | Budget | | | | | |
| | Budget | | | | Estimate | | Plan | | Plan | |
($ millions) | | Estimate | | Actual | | 2005/06 | | 2006/07 | | 2007/08 | |
Taxation revenue | | | | | | | | | | | |
Personal income | | 5,005 | | 5,050 | | 5,484 | | 5,674 | | 6,008 | |
Corporate income | | 893 | | 1,255 | | 1,215 | | 1,223 | | 1,099 | |
Social service | | 4,156 | | 4,156 | | 4,213 | | 4,427 | | 4,649 | |
Fuel | | 891 | | 904 | | 915 | | 947 | | 979 | |
Tobacco | | 676 | | 699 | | 690 | | 690 | | 690 | |
Property | | 1,655 | | 1,661 | | 1,717 | | 1,789 | | 1,859 | |
Property transfer | | 432 | | 604 | | 650 | | 600 | | 550 | |
Other | | 477 | | 588 | | 561 | | 546 | | 556 | |
| | 14,185 | | 14,917 | | 15,445 | | 15,896 | | 16,390 | |
Natural resource revenue | | | | | | | | | | | |
Natural gas royalties | | 1,213 | | 1,439 | | 1,754 | | 1,714 | | 1,764 | |
Columbia River Treaty | | 215 | | 258 | | 305 | | 285 | | 265 | |
Other energy and minerals | | 603 | | 612 | | 775 | | 796 | | 731 | |
Forests | | 999 | | 1,363 | | 1,246 | | 1,007 | | 1,008 | |
Water and other resources | | 402 | | 301 | | 326 | | 380 | | 384 | |
| | 3,432 | | 3,973 | | 4,406 | | 4,182 | | 4,152 | |
Other revenue | | | | | | | | | | | |
Medical Services Plan premiums | | 1,398 | | 1,465 | | 1,438 | | 1,437 | | 1,444 | |
Post secondary education fees | | 763 | | 836 | | 904 | | 935 | | 974 | |
Other healthcare-related fees | | 195 | | 189 | | 179 | | 173 | | 173 | |
Motor vehicle licences and permits | | 370 | | 381 | | 398 | | 410 | | 424 | |
Other fees and licences | | 852 | | 750 | | 746 | | 700 | | 665 | |
Investment earnings | | 889 | | 833 | | 818 | | 836 | | 885 | |
Sales of goods and services | | 681 | | 741 | | 655 | | 673 | | 703 | |
Miscellaneous | | 1,309 | | 1,505 | | 1,590 | | 1,535 | | 1,545 | |
| | 6,457 | | 6,700 | | 6,728 | | 6,699 | | 6,813 | |
Contributions from the federal government | | | | | | | | | | | |
Health and social transfers | | 3,224 | | 3,421 | | 4,180 | | 4,545 | | 4,860 | |
Equalization | | 402 | | 979 | | 590 | | — | | — | |
Other cost-shared agreements | | 720 | | 831 | | 853 | | 817 | | 719 | |
| | 4,346 | | 5,231 | | 5,623 | | 5,362 | | 5,579 | |
Taxpayer-supported programs and agencies | | 28,420 | | 30,821 | | 32,202 | | 32,139 | | 32,934 | |
Commercial Crown corporation income | | | | | | | | | | | |
BC Hydro (before regulatory transfers) | | 388 | | 240 | | 329 | | 333 | | 256 | |
Liquor Distribution Branch | | 760 | | 779 | | 779 | | 794 | | 809 | |
BC Lotteries (net of payments to federal government) | | 842 | | 811 | | 892 | | 942 | | 1,021 | |
BC Rail (2) | | 29 | | 178 | | 39 | | 46 | | 26 | |
ICBC (3) | | 52 | | 399 | | 224 | | 125 | | 61 | |
Other | | 1 | | 5 | | 11 | | 19 | | 24 | |
| | 2,072 | | 2,412 | | 2,274 | | 2,259 | | 2,197 | |
Total revenue | | 30,492 | | 33,233 | | 34,476 | | 34,398 | | 35,131 | |
(1) | The 2004/05 budget estimate and actual results have been restated to reflect government’s current accounting policies. |
(2) | BC Rail’s fiscal plan projections represent their earnings during government’s fiscal year. On BC Rail’s fiscal year basis (December), the outlook is – 2004 (budget): $211 million; 2004 (actual): $195 million; 2005: $39 million; 2006: $46 million; 2007:$26 million. |
(3) | ICBC’s fiscal plan projections represent their earnings during government’s fiscal year. On ICBC’s fiscal year basis (December), the outlook is – 2004 (budget): $52 million; 2004 (actual): $389 million; 2005: $285 million; 2006: $125 million; 2007:$61 million. |
10
Table 1.4 Expense by Ministry, Program and Agency(1)
| | 2004/05 | | Budget | | | | | |
| | Budget | | | | Estimate | | Plan | | Plan | |
($ millions) | | Estimate | | Actual | | 2005/06 | | 2006/07 | | 2007/08 | |
Advanced Education | | 1,828 | | 1,827 | | 1,898 | | 1,948 | | 2,024 | |
Education | | 4,922 | | 4,919 | | 5,074 | | 5,166 | | 5,190 | |
Health | | 10,545 | | 10,589 | | 11,470 | | 11,870 | | 12,089 | |
Subtotal | | 17,295 | | 17,335 | | 18,442 | | 18,984 | | 19,303 | |
Office of the Premier | | 9 | | 8 | | 11 | | 12 | | 12 | |
Aboriginal Relations and Reconciliation | | 39 | | 35 | | 34 | | 33 | | 32 | |
Agriculture and Lands | | 314 | | 227 | | 294 | | 255 | | 221 | |
Attorney General | | 445 | | 446 | | 459 | | 481 | | 483 | |
Children and Family Development | | 1,498 | | 1,467 | | 1,637 | | 1,735 | | 1,789 | |
Community Services | | 190 | | 178 | | 261 | | 247 | | 221 | |
Economic Development | | 104 | | 83 | | 444 | | 155 | | 149 | |
Employment and Income Assistance | | 1,262 | | 1,259 | | 1,355 | | 1,367 | | 1,395 | |
Energy, Mines and Petroleum Resources | | 59 | | 71 | | 72 | | 72 | | 70 | |
Environment | | 149 | | 128 | | 175 | | 219 | | 220 | |
Finance | | 78 | | 81 | | 81 | | 81 | | 81 | |
Forests and Range | | 709 | | 785 | | 856 | | 922 | | 955 | |
Labour and Citizen’s Services | | 190 | | 234 | | 193 | | 192 | | 179 | |
Public Safety and Solicitor General | | 480 | | 488 | | 525 | | 528 | | 531 | |
Small Business and Revenue | | 44 | | 36 | | 44 | | 43 | | 43 | |
Tourism, Sport and the Arts | | 133 | | 166 | | 180 | | 190 | | 113 | |
Transportation | | 828 | | 834 | | 829 | | 830 | | 830 | |
Total ministries and Office of the Premier | | 23,826 | | 23,861 | | 25,892 | | 26,346 | | 26,627 | |
Legislation | | 46 | | 42 | | 51 | | 47 | | 47 | |
Officers of the Legislature | | 27 | | 27 | | 46 | | 21 | | 21 | |
BC Family Bonus | | 59 | | 57 | | 39 | | 32 | | 32 | |
Management of Public Funds and Debt | | 800 | | 677 | | 684 | | 711 | | 698 | |
Contingencies (All Ministries) and New Programs | | 191 | | — | | 320 | | 320 | | 360 | |
Other Appropriations | | 8 | | 8 | | 6 | | 6 | | 6 | |
Subtotal | | 24,957 | | 24,672 | | 27,038 | | 27,483 | | 27,791 | |
First Nations New Relationships Fund | | — | | — | | 100 | | — | | — | |
Priority initiatives | | — | | 452 | | — | | — | | — | |
Transportation infrastructure funding | | — | | 750 | | — | | — | | — | |
Disbursement of BC Rail Partnership gain | | — | | 169 | | — | | — | | — | |
Consolidated revenue fund expense | | 24,957 | | 26,043 | | 27,138 | | 27,483 | | 27,791 | |
Expenses recovered from external entities | | 1,632 | | 1,705 | | 1,674 | | 1,689 | | 1,662 | |
Grants to agencies and other internal transfers: | | | | | | | | | | | |
Taxpayer-supported Crown agencies | | (735 | ) | (1,752 | ) | (974 | ) | (1,000 | ) | (933 | ) |
School districts | | (4,267 | ) | (4,262 | ) | (4,438 | ) | (4,486 | ) | (4,514 | ) |
Universities | | (818 | ) | (893 | ) | (981 | ) | (993 | ) | (1,021 | ) |
Colleges, university colleges, and institutes | | (778 | ) | (848 | ) | (741 | ) | (757 | ) | (770 | ) |
Health authorities and hospital societies | | (6,912 | ) | (7,198 | ) | (7,583 | ) | (7,700 | ) | (7,785 | ) |
Children and Family Development governance authorities | | — | | (1 | ) | (395 | ) | (592 | ) | (1,140 | ) |
| | (13,510 | ) | (14,954 | ) | (15,112 | ) | (15,528 | ) | (16,163 | ) |
Taxpayer-supported Crown agencies | | 1,904 | | 2,130 | | 2,137 | | 2,046 | | 2,210 | |
SUCH sector and regional authorities: | | | | | | | | | | | |
School districts | | 4,451 | | 4,533 | | 4,781 | | 4,829 | | 4,846 | |
Universities | | 1,936 | | 2,073 | | 2,454 | | 2,574 | | 2,682 | |
Colleges, university colleges, and institutes | | 1,324 | | 1,345 | | 1,258 | | 1,280 | | 1,323 | |
Health authorities and hospital societies (2) | | 7,598 | | 7,782 | | 8,159 | | 8,241 | | 8,347 | |
Children and Family Development governance authorities | | — | | 1 | | 387 | | 584 | | 1,133 | |
| | 17,213 | | 17,864 | | 19,176 | | 19,554 | | 20,541 | |
Net spending of Crown agencies and the SUCH sector | | 3,703 | | 2,910 | | 4,064 | | 4,026 | | 4,378 | |
Total taxpayer-supported expense | | 30,292 | | 30,658 | | 32,876 | | 33,198 | | 33,831 | |
(1) | The 2004/05 budget estimate and actual results have been restated to reflect government’s current organization and accounting policies. |
(2) | Excludes inter-entity transactions between health authorities and hospital societies. |
11
Consolidated Revenue Fund Spending
Consolidated Revenue Fund (CRF) spending will increase from an initial estimate of $25.0 billion in 2004/05 to $27.8 billion by 2007/08 – an 11.3 per cent increase.
This budget confirms government’s commitment to health care and education as government’s funding priority areas, while taking advantage of the new choices provided by increased revenues to provide additional support to BC’s seniors, children, First Nations and the mountain pine beetle response.
Chart 1.3 Consolidated Revenue Fund spending (1)
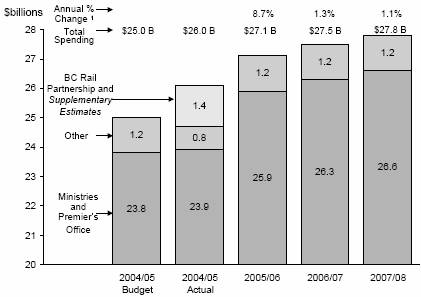
(1) Change from prior year budget.
Seniors
The September Update builds on government’s ongoing commitment for a system of supports for seniors by providing an additional $242 million over three years to assist low-income seniors with the increased cost of living and housing and to strengthen and modernize the full range of services for seniors.
The Ministry of Employment and Income Assistance budget includes an additional $50 million over three years for the Senior’s Supplement. Effective in October 2005, eligible seniors receiving the federal guaranteed income supplement will receive a provincial monthly supplement of up to a maximum of $49 per single senior or up to $60 per partner in a married couple. An estimated 39,500 low-income seniors will benefit from this provincial supplement.
Table 1.5 Enhancing Services to Seniors
($ millions) | | 2005/06 | | 2006/07 | | 2007/08 | | Total | |
September Update | | | | | | | | | |
Seniors’ supplement | | 10 | | 20 | | 20 | | 50 | |
SAFER | | 8 | | 17 | | 17 | | 42 | |
Transition support/Seniors care | | 75 | | 75 | | — | | 150 | |
Total changes | | 93 | | 112 | | 37 | | 242 | |
12
The September Update also provides an additional $42 million over three years to fund rent ceiling increases to the Shelter Aid for Elderly Renters (SAFER). The maximum monthly rent ceiling under SAFER will increase by $90 in low cost areas and $180 in high cost areas effective in October 2005 and the program will be expanded to include owners of manufactured homes paying pad rental. These significant rent ceiling increases are the first since 1990, and coupled with the inclusion of owners of manufactured homes, are expected to increase the number of eligible program participants from 12,000 to 19,200 – a 60 per cent increase.
The Ministry of Health will achieve the commitment to add 5,000 new residential, Assisted Living and Supportive Housing beds by 2008. However, many facilities also need to be modernized and updated. The September Update provides an additional $150 million over two years to strengthen and modernize the full range of services for seniors, to support a smooth transition as new beds come on stream and to ensure seniors can age in place where appropriate. This funding will be used to benefit seniors in a number of ways, including:
• the purchase of equipment, such as beds and lifts for improved patient care and comfort, and to reduce strain and injuries for health care providers;
• facility improvements to accommodate higher levels of care; and
• training of case managers in the use of new assessment tools;
Of this new funding, $40 million will be invested directly in services provided by partners such as SUCCESS, Kiwanis and the Salvation Army.
More information on programs for seniors is provided in the topic box on page 51.
Health Care
The September Update reconfirms the investment of growing provincial revenues in British Columbia’s funding priorities for health care. Over three years, health care will receive the largest share of funding increases.
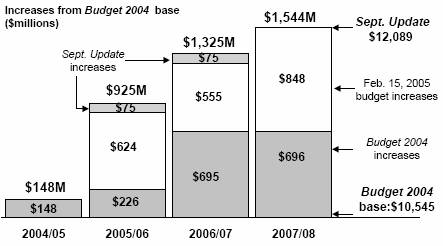
Chart 1.4 Ministry of Health budget increases
13
Table 1.6 Continued Commitment to Health Care
($ millions) | | 2005/06 | | 2006/07 | | 2007/08 | | Total | |
Lifts in Budget 2004 | | 226 | | 695 | | 696 | | 1,617 | |
| | | | | | | | | |
Post Budget 2004 | | | | | | | | | |
Additional 2004/05 Health Accord funding | | 148 | | 18 | | 130 | | 296 | |
Federal funding adjustment – population and equipment | | 17 | | (4 | ) | (1 | ) | 12 | |
Abbotsford Regional Hospital and Cancer Centre | | — | | — | | 3 | | 3 | |
Net health changes 2004 | | 391 | | 709 | | 828 | | 1,928 | |
| | | | | | | | | |
February 15, 2005 Budget | | | | | | | | | |
New 10-year federal health agreement | | 444 | | 523 | | 544 | | 1,511 | |
New provincial funding | | 15 | | 18 | | 172 | | 205 | |
September Update | | | | | | | | | |
Transition support/Seniors care | | 75 | | 75 | | — | | 150 | |
Total changes | | 925 | | 1,325 | | 1,544 | | 3,794 | |
Per cent increase from Budget 2004 base | | 8.8 | % | 12.6 | % | 14.6 | % | | |
By 2007/08, the Ministry of Health budget will increase by over 14.6 per cent or $1.5 billion since Budget 2004 was delivered on February 17, 2004. This is a result of additional new provincial funding and government’s continued commitment to reinvest every new federal dollar from the First Ministers’ Accord on Health Care Renewal funding and the new federal health funding agreement.
The $1.5 billion increase from 2004/05 to 2007/08 has been allocated to the following major program areas:
Regional Health Sector ($1,041 million) for services such as:
• effective health promotion, disease prevention and other public health services;
• enhancing primary care;
• cancer treatment, heart surgeries, diagnostic imaging, joint replacement, sight restoration services, renal care and palliative care;
• delivering effective community and home-based services;
• increasing options for frail seniors in the assisted living and residential care sector;
• increasing the supply and training of health care professionals; and
• patient safety initiatives.
Medical Services Plan ($120 million):
• To provide for increased volume related to population growth and aging.
PharmaCare ($254 million):
• For new drugs and anticipated volume and price increases for prescription drugs.
Debt Service and Amortization ($64 million):
• To support new provincial capital investment of $735 million over three years in the health sector.
14
Emergency Health Services (BC Ambulance) ($47 million):
• Additional capacity for emergency transport services.
Examples of spending initiatives that will increase access and services for the public, include:
• $10 million over three years for screening mammography;
• $14 million over three years for children and youth with special needs to provide additional diagnosis and assessment services for children who have developmental behavioural conditions including fetal alcohol syndrome disorder;
• $70 million is the Ministry of Health’s portion of the $73 million for Early Childhood Screening initiatives targeted at children below the age of six. Funding is provided for dental screening and services, hearing screening (A Sound Start), and vision screening;
• $77 million over 3 years for recruitment, training and retention of nurses;
• $100 million over three years for public health initiatives including ActNow BC, which promotes healthy lifestyles including physical activity, healthy eating, living tobacco free and healthy choices during pregnancy; and expanding public health capacity including prevention activities such as immunization programs, drinking water and food safety, and health emergency preparedness;
• $75 million in 2005/06 and 2006/07 to strengthen and modernize the full range of health care services for seniors;
• $70 million budgeted in 2007/08 for the Michael Smith Health Research Foundation which, when combined with the $30 million provided in 2004/05, completes government’s commitment of $100 million for the Michael Smith Foundation. This funding will support health system research including strategies to attract and keep health researchers and trainees in BC and to leverage research funding from other sources; and
• $125 million over three years for life supporting drugs and services for cancer, cardiac, renal and transplant patients.
Education: K–12
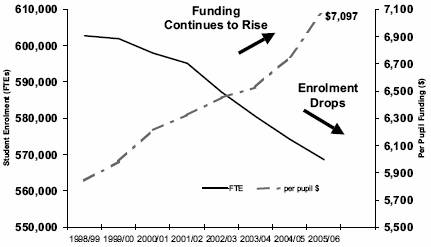
The September Update builds on government’s ongoing commitment to education. Annual funding for K–12 will increase $268 million by 2007/08 compared to 2004/05 funding in Budget 2004. This represents 5.4 per cent growth in annual funding by 2007/08.
Per pupil funding for 2005/06 is estimated at $7,097 per student, a 5.1 per cent increase over 2004/05. This represents a $150 million increase in funding for the 2005/06 school year. Per pupil funding continues to grow to support student achievement despite declining enrolment projections.
This increased funding for K–12 students is linked to locally developed plans that will ensure every student has access to:
• school libraries and quality learning resources;
• music and arts programs; and
• improved services to support every special needs student.
15
Chart 1.5 K–12 budget increases

* Public library funding resulting from the government reorganization after the February 15 budget.
These plans indicate that school districts will use this funding to hire 1,600 more staff, including 630 teachers and 507 educational assistants. Further information on how individual school districts will be spending these funds is available on the Ministry of Education website at: www.bced.gov.bc.ca.
Chart 1.6 Student enrolment and per pupil funding (public schools)
In addition to increased per pupil funding, the September Update provides funding for a $1.5 billion seismic mitigation program to upgrade all at-risk schools within 15 years. A long-term plan for the program will be established with school boards and the Ministry of Education.
The September Update also reflects the transfer of public library funding to the Ministry of Education, including $12 million in new funding announced in the February 15 budget to provide broadband internet access to every branch, operating a 24-hour virtual reference desk and setting up a one-card system to give the public access to books from any library in the province.
16
Post-Secondary Education
The September Update builds on government’s ongoing commitment to increasing access to post-secondary education. Annual funding for post-secondary education will increase by $196 million by 2007/08 compared to 2004/05 funding in Budget 2004. This represents 10.7 per cent growth in annual funding by 2007/08.
Chart 1.7 Post-secondary education budget increases
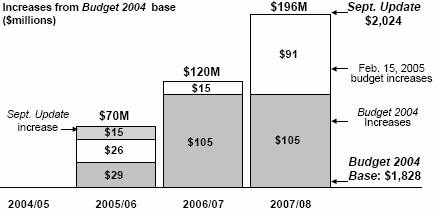
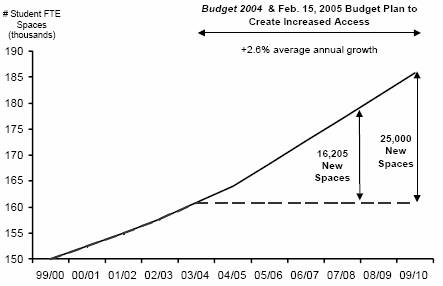
In partnership with the post-secondary sector, 25,000 new student spaces will be created by 2010. This represents average seat growth of 2.6 per cent annually. By the end of 2007/08, there will be 16,205 new seats in the post-secondary system. Through the September Update the province will fund these new seats at an average of $9,200 per space.
Chart 1.8 Public post-secondary student spaces increase
In the February 2005 throne speech, government committed to limit future tuition increases to the rate of inflation, effective September 2005. Recognizing this change will impact the ability of some institutions to raise revenues, and to ensure that provincial seat growth targets continue to be met, the September Update includes $15 million in new funding for universities in 2005/06. Government is continuing to work with post-secondary institutions to ensure that appropriate funding is available to meet government’s seat growth targets for 2005/06 and beyond.
17
In addition to providing funding for the annual costs for seat growth, the province is also providing almost $800 million in capital funding for infrastructure to accommodate seat growth, replace existing infrastructure and facilitate research activities throughout the post-secondary system.
The province provides over $300 million annually for loans to post-secondary students. As part of a comprehensive student financial assistance system, the September Update also provides over $450 million over three years in funding for loan reductions, targeting funds towards students who are most in need, grants for students with disabilities, debt relief programs and a loan-forgiveness program that encourages doctors, nurses and other health professionals to practice in under-served regions.
Children
Government will spend an additional $573 million over three years to enhance programs and services for children and their families.
Table 1.7 Enhancing Services to Children
($ millions) | | 2005/06 | | 2006/07 | | 2007/08 | | Total | |
September Update | | | | | | | | | |
Early Learning and Child Care | | 55 | | 122 | | 152 | | 329 | |
| | | | | | | | | |
February 15, 2005 Budget | | | | | | | | | |
Increased access to childcare | | 4 | | 1 | | — | | 5 | |
Children in care and family development | | 8 | | 9 | | 9 | | 26 | |
Early childhood screening | | 21 | | 25 | | 27 | | 73 | |
Children and youth with special needs | | | | | | | | | |
• Assessments | | 3 | | 5 | | 6 | | 14 | |
• Reduced waitlists | | 11 | | 14 | | 17 | | 42 | |
• Services for school-aged children | | 28 | | 28 | | 28 | | 84 | |
Total changes | | 130 | | 204 | | 239 | | 573 | |
The September Update includes an additional $329 million over three years for Early Learning and Child Care (ELCC). In the 2005 Federal Budget, the Government of Canada committed $5 billion over 5 years to ELCC. The provincial government is investing every dollar of BC’s share, estimated at $633 million over five years, in regulated early learning and child care for children under 6 years of age. The new ELCC funding will be targeted to improve access to quality child care programs and services, for groups such as lower income families, aboriginal people and children with special needs.
The province will develop and release in November 2005 an Action Plan on ELCC covering the five years of federal funding. The federal government and the province have committed to conclude a detailed multi-year funding agreement, for the period 2006/07 to 2009/10, by December 15, 2005.
This funding will enable the provincial government to help more families meet the challenge of affording quality child care in BC. This will be done by increasing child care subsidy rates and increasing the income exemption for parents with children under six in regulated child care. The province will also be addressing child care operating funding grants to providers as well as capital grants. More information will be available with the release of the Action Plan in November 2005.
18
The September Update reconfirms $73 million over three years to implement an integrated strategy for infant and early childhood screening programs as one method for improving early childhood development. Programs will focus on newborn hearing screening (A Sound Start), dental screening for infants and preschoolers, and a population health-based case finding approach to identify preschool children with vision impairments. This strategy will involve service providers in the health, school and community social services sectors.
The September Update reconfirms $140 million over three years to enhance programs and services for children and youth with special needs and their families. This includes $14 million for enhanced diagnostic and assessment services for children who have developmental behavioral conditions (including Fetal Alcohol Syndrome Disorder (FASD)); $42 million to provide new intervention and support services for children affected by FASD; for reducing waitlists in direct intervention services and key family support services; and $84 million for enhanced services to children and youth with special needs in the education system.
Communities
The September Update reconfirms the investment of growing provincial revenues in services and programs that support BC’s communities. Communities benefit from the additional funding that the September Update provides to persons with disabilities, people who are homeless, and recent immigrants to increase their self-reliance and maximize involvement in their local communities, as well as from the expansion of local arts, literacy and cultural initiatives.
Table 1.8 Enhancing Services to Communities(1)
($ millions) | | 2005/06 | | 2006/07 | | 2007/08 | | Total | |
September Update | | | | | | | | | |
Community Living BC - capital grants | | 4 | | 2 | | 2 | | 8 | |
| | | | | | | | | |
February 15, 2005 Budget | | | | | | | | | |
Income assistance caseload | | 8 | | 24 | | 46 | | 78 | |
Persons with disabilities | | 56 | | 58 | | 62 | | 176 | |
Adult community living services | | 22 | | 28 | | 41 | | 91 | |
Homelessness | | 15 | | 8 | | 17 | | 40 | |
Social housing | | 12 | | 10 | | 14 | | 36 | |
Family law funding | | 5 | | 5 | | 5 | | 15 | |
Traffic fine revenue sharing | | 29 | | 17 | | 17 | | 63 | |
Arts funding | | 3 | | 3 | | 3 | | 9 | |
BC Skills Connect for immigrants | | 5 | | 5 | | 5 | | 15 | |
Total changes | | 159 | | 160 | | 212 | | 531 | |
(1) As a result of the government reorganization, funding for public libraries announced in the February 15 budget is now included in the Ministry of Education.
The September Update invests in services that assist individuals and families in need, and includes $78 million over three years to fund increased costs due to growth and changes in the composition of the income assistance caseload.
19
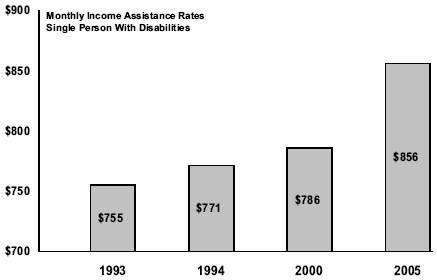
For the past three years, the Ministry of Employment and Income Assistance has been focusing on programs and services designed to assist persons with disabilities to enhance their self-reliance. Effective December 22, 2004, income assistance rates for persons with disabilities were increased by $70 per month or 9 per cent for a single person with disabilities. This is the third highest support rate for persons with disabilities in Canada. The September Update provides $176 million to fund the cost of the rate increase.
Income assistance rates for persons with disabilities were last increased in August 2000, when a general increase of 2 per cent was provided. Since the time of this rate increase, the cost of living has increased 7.4 per cent. For a single person with disabilities, the $70 per month increase is the largest support rate increase in the past 30 years and the largest percentage increase since 1981.
Chart 1.9 Persons with disabilities – monthly income assistance rates
The number of adults with developmental disabilities accessing residential and day support services and their acuity of need are increasing as a result of demographic trends and advancing technologies. An additional $91 million has been provided in the Ministry of Children and Family Development over three years to manage this expected caseload growth.
On July 1, 2005, Community Living BC (CLBC) was established as a Crown agency with the mandate to provide community-based services to individuals with developmental disabilities. Prior to July 1, the Ministry of Children and Family Development (MCFD) delivered adult community living services with program services funded through the ministry’s operating and capital budgets. Government transfers through the Adult Community Living Services (ALCS) vote wholly fund CLBC’s annual operating budget. In addition, MCFD received a budget increase to the ALCS vote to cover the capital requirements of CLBC. As the additional funding will be used for capital spending, there is no net impact to government’s bottom line.
The September Update provides $40 million over three years for emergency shelter programs, housing and support services for people who are homeless.
20
The Minister Responsible for Housing will provide an additional $15 million through community organizations to provide year-round emergency shelter beds, food and other services in BC communities for people with basic safety, comfort, nutrition and hygiene needs. The Ministry of Children and Family Development will provide an additional $1 million for youth beds. An additional $24 million is also being provided through the BC Housing Management Commission (BCHMC) for transition and supportive housing projects that focus on moving people into stable housing arrangements, while related health and other support services will be provided by health authorities and the Ministries of Employment and Income Assistance and Children and Family Development.
The September Update includes $31 million in funding for BCHMC to provide operating subsidies for independent living spaces provided through Independent Living BC. BCHMC will also receive an additional $5 million, which will leverage additional funding from federal programs to upgrade public housing.
The Ministry of Attorney General has piloted several successful family law initiatives designed to balance the needs of citizens with the capacity of the legal system. The September Update reconfirms the provision of an additional $15 million to ensure these programs continue for the next three years. The funding enhances current services where domestic violence is involved; the Family Duty Counsel programs (Provincial and Supreme Court) that assist self-represented litigants in family matters; and the Supreme Court Family referral program that assists unrepresented parties who must access the Supreme Court in complex matters to resolve a family justice matter.
Beginning in 2005/06, the province is committing $5 million annually to BC Skills Connect for assisting skilled immigrants to obtain accreditation and employment that better matches their training, skills and experience.
The September Update provides for 100 per cent of net traffic fine revenue to be returned to municipalities for community policing, crime prevention and other initiatives to help make communities safer.
The September Update confirms that the BC Arts Council will receive an additional $3 million in annual funding beginning in 2005/06.
Safety
The September Update invests growing provincial revenues to help prevent violence against women, and to protect communities from crime.
The September Update reconfirms the investment of significant funding over three years to help keep communities safe. This investment includes $93 million in policing to provide 215 new RCMP positions to be allocated to detachment policing, first nations policing, major and serious crime investigations, cyber crime, an Indo-Canadian task force, and other policing initiatives.
21
Table 1.9 Commitment to Safety
($ millions) | | 2005/06 | | 2006/07 | | 2007/08 | | Total | |
September Update | | | | | | | | | |
Crown prosecutor wages | | — | | 10 | | 11 | | 21 | |
| | | | | | | | | |
February 15, 2005 Budget | | | | | | | | | |
Policing strategy (215 additional RCMP officers) | | 35 | | 42 | | 45 | | 122 | |
Corrections (workload and safety) and Attorney General capacity | | 9 | | 14 | | 16 | | 39 | |
Personal safety for women | | 13 | | 12 | | 12 | | 37 | |
Total changes | | 57 | | 78 | | 84 | | 219 | |
This increased level of policing is anticipated to create additional demands on the legal system; this will be addressed by adding $25 million to the Ministry of Attorney General for the processing of new cases and $4 million to the Ministry of Public Safety and Solicitor General for the related pressures in the correction system. Funding will provide additional capacity in the system by adding prosecutors, sheriffs, and corrections related costs over three years. The September Update also provides $21 million to fund wage increases for crown counsel in accordance with the provisions contained in the Crown Counsel Agreement Continuation Act (Bill 21).
The Corrections Branch houses persons sentenced or remanded into custody until trial. Additional funding of $32 million over three years has been allocated to address trends in inmate population and to enhance safety in both the community corrections programs and the province’s correctional facilities. The Ministry of Attorney General has been allocated $7 million over three years to accommodate the impact on the justice system of hiring additional police.
The September Update reconfirms an additional $37 million to increase personal safety for women and girls through increased funding for transition house services, outreach programs, support services for traumatized children, additional counseling and initiatives to prevent violence.
Economic Development
The September Update reconfirms significant initiatives targeting economic development throughout the province.
Agriculture and Aquaculture Initiatives
The September Update provides $8 million for initiatives aimed at enhancing the province’s agricultural and aquaculture industries, and protecting food safety:
• $2 million for enhanced surveillance and testing, as part of the provincial response to BSE and avian flu.
• $6 million for fisheries initiatives including inspection, monitoring and improvements in aquatic animal health.
22
Table 1.10 Economic Development Initiatives
($ millions) | | 2005/06 | | 2006/07 | | 2007/08 | | Total | |
September Update | | | | | | | | | |
Mountain pine beetle response | | 27 | | 37 | | 36 | | 100 | |
First Nations New Relationships Fund | | 100 | | — | | — | | 100 | |
| | | | | | | | | |
February 15, 2005 Budget | | | | | | | | | |
Agriculture and aquaculture | | 4 | | 2 | | 2 | | 8 | |
Forestry | | | | | | | | | |
• Beetle response and reforestation | | 31 | | 7 | | 51 | | 89 | |
• Filmon response and fuel management | | 20 | | 12 | | 12 | | 44 | |
• Rural access | | 10 | | — | | — | | 10 | |
Oil & Gas, Mining | | | | | | | | | |
• Heartlands oil and gas roads | | 32 | | — | | — | | 32 | |
• Mining plan, data acquisition | | 6 | | 5 | | 5 | | 16 | |
• Oil and gas initiatives | | 7 | | 6 | | 4 | | 17 | |
Infrastructure | | | | | | | | | |
• Municipal infrastructure | | 5 | | — | | — | | 5 | |
• Major regional sports facilities | | 50 | | — | | — | | 50 | |
• Post-secondary sports training facilities | | 20 | | 27 | | 13 | | 60 | |
Tourism | | 24 | | 22 | | 21 | | 67 | |
Peace River, North East BC | | 8 | | 8 | | 8 | | 24 | |
Regional development trusts | | 150 | | — | | — | | 150 | |
Total economic development initiatives | | 494 | | 126 | | 152 | | 772 | |
As part of the government re-organization announced on June 16, 2005 the functions and staff of Land and Water British Columbia (LWBC) will transfer to various ministries effective September 30, 2005. Most of these functions and staff are being transferred to the Ministries of Agriculture and Lands and Environment. The expense by ministry, program and agency shown in Table 1.4, reflects the transfers of LWBC functions and staff to the respective ministries.
Forestry
The September Update includes $243 million in funding for initiatives to address the economic impacts of the mountain pine beetle outbreak and forest fires, while providing new opportunities to industry and communities.
• $189 million is allocated for incremental manufacturing and economic diversification planning in communities impacted by the mountain pine beetle outbreak. A major reforestation program targeting areas of the province impacted by the mountain pine beetle outbreak and forest fires is also included.
This spending includes $100 million of funding announced by the federal government in March 2005 to be dedicated to costs arising from the mountain pine beetle outbreak. The province continues to pursue additional federal funding for these forestry initiatives in recognition of the potential impact of the mountain pine beetle and forest fires on communities and industry, the need for adjustments in this sector and the continuing contribution of a sustainable provincial forest to Canada’s climate change initiatives.
23
Further information on the province’s initiatives to address the mountain pine beetle outbreak can be found in the topic box on page 56.
• $44 million for fuel management and the commitment to fully implement the recommendations of the Filmon Report. This includes the addition of two air tankers, hiring seven additional unit crews and funding for Community Wildfire Protection Plans.
• $10 million to replace bridges providing access to remote communities.
Oil and Gas, Mining
The September Update provides $65 million for initiatives to facilitate exploration and continued development of the provincial oil and gas and mining sectors:
• $32 million investment in the heartlands oil and gas road rehabilitation strategy, to upgrade roads and lengthen the winter drilling season. This investment will be funded through the transportation investment plan.
• $16 million to implement the mining plan, including measures to improve mine safety and safety of workers and improved services to the mining sector.
• $17 million for additional oil and gas initiatives, including community and stakeholder engagement.
Infrastructure
The September Update provides $115 million in funding for community infrastructure across the province:
• $5 million in 2005/06 for the new BC Community Water Improvement Program in the Ministry of Community Services targeting projects to improve drinking water and waste management.
• $50 million for major regional sports facilities funded through the Ministry of Economic Development.
• $60 million for major post-secondary sports training facilities funded through the Ministry of Economic Development.
Combined with the $150 million of provincial funding to be provided through existing infrastructure programs from 2005/06 to 2007/08, provincial funding for community infrastructure in the September Update will total $265 million. This provincial funding will leverage additional investments in municipal and regional infrastructure from other levels of government and the private sector.
On April 15, 2005 the province, federal government and the Union of BC Municipalities (UBCM) signed an Agreement in Principle to share a portion of federal gas tax revenues with local municipalities. Between 2005/06 and 2009/10, $636 million in federal funding will flow directly to the UBCM to support environmentally sustainable municipal infrastructure and improvements to transportation infrastructure. As this funding is not flowing through the province, it is not included in either the revenues or expenses of the province.
24
Tourism
The September Update provides $67 million over three years for Tourism BC, supporting the objective of doubling the tourism industry by 2015. This funding, combined with revenues allocated from the provincial hotel room tax, will allow Tourism BC to double its marketing budget to $50 million per year.
Peace River Regional District Memorandum of Understanding
The September Update provides $24 million in new funding for a new memorandum of understanding with the Peace River Regional District (PRRD). The province has budgeted $20 million annually from 2005/06 to 2007/08 for grants to the PRRD, an increase of $8 million per year.
Regional Development Trusts
The September Update provides $150 million in one-time funding for three $50 million trust contributions to support investments in natural resource, tourism and economic development in the north, southern interior and north island coastal regions. This includes additional funding of $30 million to assist northern communities respond to the pine beetle infestation.
First Nations New Relationships Fund
The provincial government is committed to building a new relationship with First Nations and Aboriginal communities. In 2005/06 the provincial government plans to invest $100 million of one-time funding to help First Nations and Aboriginal communities build appropriate capacity to provide effective input and participate in the management of lands, resources and social programs. This will assist First Nations and Aboriginal communities in becoming active, supporting partners in relationships with government, business and other organizations. Further information is provided in the topic box on page 54.
2010 Olympic and Paralympic Winter Games (2010 Olympics)
The province has committed $600 million toward the 2010 Olympics. This includes funding for venues, an endowment to support the ongoing operation of certain venues, medical and security costs, legacies for sports, First Nations and municipalities, and a contingency allocation of $140 million to protect against unbudgeted costs.
Table 1.11 2010 Olympics Funding
($ millions) | | 2003/04 | | 2004/05 | | 2005/06 | | 2006/07 | | 2007/08 | | Total | |
| | | | | | | | | | | | | |
February 15, 2005 Budget | | | | | | | | | | | | | |
Venues | | 51 | | 30 | | 96 | | 12 | | 18 | | 207 | |
Venues endowment | | 55 | | — | | — | | — | | — | | 55 | |
Medical and security | | — | | — | | 2 | | 2 | | 5 | | 9 | |
First Nations and municipal legacies | | 3 | | — | | 18 | | 13 | | 4 | | 38 | |
Total contribution to provincial commitment | | 109 | | 30 | | 116 | | 27 | | 27 | | 309 | |
Olympic contingency allocations (1) | | — | | — | | — | | — | | 40 | | | |
(1) Notionally allocated within the contingencies vote.
25
As a prudent planning assumption the province has allocated $40 million of the Olympic contingency to the government contingencies vote in 2007/08, for unforeseen expenditures associated with the Olympic funding envelope. Treasury Board maintains control over access to the Olympic contingency funding.
Through the September Update, the province will have funded $309 million of its $600 million commitment to the 2010 Olympics by 2007/08.
Further details on the provincial commitment to the 2010 Olympics can be found in the British Columbia Olympic and Paralympic Winter Games Secretariat Progress Report at www.sbed.gov.bc.ca/2010secretariat/
Vancouver Convention Centre Expansion Project (VCCEP)
The province has approved an increase in the total project budget for the VCCEP from $565 million to $615 million. This increases the total provincial funding commitment to $272.5 million, including an increase of up to $39.4 million in the provincial contribution in 2006/07, and $3.1 million in-kind contribution from the transfer of pipe for pilings from the windup of the Vancouver Trade and Convention Center Authority in 2004/05.
Other sources of funding for the project include $222.5 million from the federal government, $90 million from Tourism Vancouver, and $30 million in commercial revenues. The provincial contribution may be reduced if up-front payments from commercial revenues exceed $30 million.
Further information on the VCCEP can be found on the VCCEP Ltd. website at www.vccep.bc.ca
Table 1.12 Vancouver Convention Centre Expansion Project Funding
($ millions) | | 2003/04 | | 2004/05 | | 2005/06 | | 2006/07 | | 2007/08 | | Total | |
Funding Sources | | | | | | | | | | | | | |
Provincial contribution | | 67 | | 65 | (1) | 70 | | 71 | | — | | 273 | |
Contribution funded on behalf of Tourism Vancouver | | — | | 9 | | 19 | | 30 | | 25 | | 83 | |
Total funding by province (Ministry of Tourism, Sport and the Arts) | | 67 | | 74 | | 89 | | 101 | | 25 | | 356 | |
(1) Includes $3.1 million of steel pipe transferred on windup of the Vancouver Trade and Convention Centre Authority.
Transportation Investment Plan
The September Update updates the next three years of the transportation investment plan to reflect current estimates. The plan continues to be based on the following principles:
• the province will dedicate revenue or funding sources to finance its contributions;
• federal cost-sharing will be secured on all eligible projects and programs;
• additional transportation investment will be leveraged through partnerships with private partners; and
• the taxpayer-supported debt limit of the BC Transportation Financing Authority (BCTFA) is set at $3.4 billion.
26
Table 1.13 Transportation Investment Plan
($ millions) | | 2005/06 | | 2006/07 | | 2007/08 | | Total | |
New fuel tax revenues | | 222 | | 228 | | 235 | | 685 | |
Additional provincial investments: | | | | | | | | | |
• Rehabilitation | | 146 | | 146 | | 146 | | 438 | |
• Interior and rural side roads | | 75 | | 75 | | 75 | | 225 | |
• Airports and ports | | 12 | | 10 | | 10 | | 32 | |
• Border crossing infrastructure | | 50 | | 26 | | 15 | | 91 | |
• William R. Bennett Bridge and east approach | | 8 | | 2 | | 2 | | 12 | |
• Okanagan Valley corridor | | 14 | | 10 | | 29 | | 53 | |
• Highway 1 – Kicking Horse Canyon | | 16 | | 11 | | 5 | | 32 | |
• Gateway initiatives | | 50 | | 143 | | 96 | | 289 | |
• Sea-to-Sky highway | | 68 | | 133 | | 56 | | 257 | |
• Cariboo connector program | | 16 | | 28 | | 21 | | 65 | |
• Oil and gas roads | | 32 | | — | | — | | 32 | |
• Other highway corridors and projects | | 140 | | 96 | | 46 | | 282 | |
• Richmond-Airport-Vancouver Rapid Transit Project | | 82 | | — | | 118 | | 200 | |
Total provincial investment | | 709 | | 680 | | 619 | | 2,008 | |
Investments funded through contributions from other partners | | | | | | | | | |
• Richmond-Airport-Vancouver Rapid Transit Project (contributions from the federal government; Greater Vancouver Transportation Authority; Vancouver Airport Authority; and private sector partner | | 305 | | 596 | | 524 | | 1,425 | |
• Border crossing infrastructure (federal contribution) | | 23 | | 16 | | 16 | | 55 | |
• Other contributions to projects (federal contributions) | | 23 | | 21 | | 26 | | 70 | |
Total investments funded through contributions from other partners | | 351 | | 633 | | 566 | | 1,550 | |
The updated transportation plan provides:
• $2 billion of provincial investment in transportation infrastructure between 2005/06 and 2007/08; and
• $1.6 billion of investment leveraged through federal cost-sharing and partnerships with private partners, local governments and other agencies.
Environment
The September Update reconfirms $123 million for initiatives aimed at environmental protection and land use certainty to facilitate sustainable economic development.
• $16 million to increase the number of park rangers and conservation officers, as well as to provide seasonal employment opportunities for youth and training for potential future employment opportunities in the field of environmental management through the BC Conservation Corps.
• $66 million for the investigation and remediation of contaminated sites on Crown land.
• $8 million to implement the Drinking Water Protection Act, including research into the protection of surface and ground water from contaminated sites.
• $5 million to increase the capacity of the Environmental Assessment Office to address environmental assessments throughout the province.
27
Table 1.14 Environment
($ millions) | | 2005/06 | | 2006/07 | | 2007/08 | | Total | |
February 15, 2005 Budget | | | | | | | | | |
BC Conservation Corps and park services | | 5 | | 5 | | 6 | | 16 | |
Investigation and remediation of contaminated sites | | 21 | | 22 | | 23 | | 66 | |
Drinking water action plan | | 2 | | 3 | | 3 | | 8 | |
Environmental Assessment Office capacity | | 1 | | 2 | | 2 | | 5 | |
Land-use planning | | 12 | | 8 | | 8 | | 28 | |
Total environment initiatives | | 41 | | 40 | | 42 | | 123 | |
• $28 million for cross-government land use planning activities including completion and implementation of Land and Resource Management Plans. This will result in increased certainty for communities, First Nations and industry by confirming environmental, economic and cultural objectives on provincial lands.
Other changes
The contingency vote has been increased by $50 million annually to allow for unexpected costs or new initiatives. The contingency vote is now set at approximately 1 per cent of total government expense. The September Update also includes $6.3 million over three years for cross-government strategic policy support. This provides for formalization of the Deputy Ministers’ Policy Secretariat and inclusion of social priorities, and coordination and management of government’s corporate planning process. Since 2004, the Secretariat has been a shared resource for natural resource ministries to work on inter-ministry issues, reporting to participating ministries through a Deputy Ministers’ committee. The September Update also includes $1.3 million over three years for communications, research, issues management and policy coordination support for the Office of the Premier.
Public Sector Compensation
The current compensation mandate that has been in place since January 2002 will remain unchanged until March 31, 2006. The majority of public sector unions have settled under this mandate. The remaining groups will continue to be bound by the current mandate.
Collective agreements for almost 90 per cent of public sector employees will be up for renegotiation over the next nine months. The Minister of Finance, as Chair of the Public Sector Employers’ Council, is working with public sector employers to create a new bargaining mandate that will succeed the current mandate and will be effective April 1, 2006. That mandate will continue to balance a number of priorities including the need to recruit and retain employees while allowing flexibility to innovate and improve services to British Columbians. Any compensation increase must be sustainable and affordable for taxpayers over the long-term. As the next mandate is still under development, no compensation increase has been assumed in this fiscal plan. Details of the next mandate will be released by the next budget in February 2006.
28
About 52 per cent of the current BC budget goes towards wages and benefits for public sector workers. To put this in perspective, a 1 per cent increase in wages and benefits costs taxpayers approximately $160 million per year. For example, a 1 per cent increase each year for three years costs about $160 million in year one, $320 million in year two, and $480 million in year three.
Chart 1.10 Public sector compensation
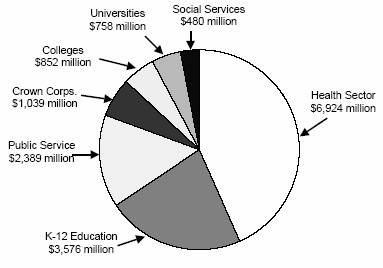
Taxpayer-supported Crown Agencies Expenses
Taxpayer-supported Crown corporations and agencies provide a number of services to the public. These agencies are primarily funded by the provincial government, but may also have outside sources of revenue. Some of the services provided by taxpayer-supported Crown agencies are highway construction (BC Transportation Financing Authority), property assessment, (BC Assessment Authority), social housing (BC Housing Management Commission), transit services (BC Transit), and legal services (Legal Services Society).
As the taxpayer-supported Crown agencies receive most of their funding from ministry budgets, their impact on total government spending is the amount by which their total spending exceeds any grants and transfers made to these entities by the ministries and special offices.
At $1,163 million, net spending forecast by taxpayer-supported Crown agencies for 2005/06 in the September Update is $17 million higher than the projection in the February 15 budget, and $6 million less than the forecast in the Budget 2004 fiscal plan. The increase, compared to the February 15 budget, reflects an increase in operating costs for the BC Transportation Financing Authority (BCTFA). Other forecast spending increases are offset by increased transfers from the CRF.
Revenue and spending of taxpayer-supported Crown agencies are combined with CRF revenue and expenses in Tables 1.3 and 1.4. Revenues and expenses for individual taxpayer-supported Crown agencies are provided in Appendix Table A9.
29
SUCH Sector Expenses
The SUCH sector is comprised of the school districts; universities, colleges, university colleges and institutes; and the health authorities and hospital societies. The government funds these organizations that in turn deliver education and health care services to British Columbians on the government’s behalf.
For some of these organizations, such as the school districts and health authorities, government transfers and fees cover most of their operating costs. For other organizations, such as universities and colleges, their operating costs are only partially funded by government, with the remaining revenues raised from outside sources, including fees and federal government grants. Revenue and spending of the SUCH Sector entities are combined with CRF revenue and expenses in Tables 1.3 and 1.4. However, revenues and expenses for the individual sectors are detailed in Appendix Table A9.
SUCH sector expenses in excess of government transfers are forecast to be $2.9 billion in 2005/06. This amount is offset by the SUCH sector’s own source revenue in determining the bottom line impact of the SUCH sector.
• Projected total spending by school districts for 2005/06 is $85 million higher than in the February 15 budget and $291 million higher than the Budget 2004 fiscal plan. The increase is primarily due to salaries for increased support levels for special needs students, pay equity benefits, costs associated with school generated funds and facilities maintenance. The increased spending will be partially offset by additional provincial contributions, school generated funds and other miscellaneous revenue.
• Projected total spending by universities and colleges for 2005/06 is $89 million higher than in the February 15 budget and $347 million higher than the Budget 2004 fiscal plan. Government’s planned seat expansion will result in increased staff hiring, additional operating costs and higher amortization expense due to increased capital expenditures.
Some post-secondary institutions have forecast deficits for 2006/07 and 2007/08. Government has not approved these forecasts since a funding review is currently underway and will be completed this fall. Upon completion, it is expected that revised forecasts with balanced budgets will be submitted by the institutions reflecting the results of this review. These forecasts will be included in Budget 2006.
• Projected total spending by health authorities and hospital societies for 2005/06 is $158 million higher than in the February 15 budget and $561 million higher than the Budget 2004 fiscal plan. The increase is primarily due to increased provincial contributions and new federal health care funding.
Regional Authority Expenses
The Ministry of Children and Family Development continues the transition to establishing new governance authorities for adult community living services and child and family development services. Community Living BC assumed control over services to adults and children with developmental disabilities on July 1, 2005. The establishment of regional aboriginal authorities is expected
30
to occur in 2006/07, followed by regional authorities for non-aboriginal child and family services in 2007/08. The authorities will be considered established when they assume responsibility under legislation for the delivery of some or all services.
Revenue
Government revenue includes the combined revenues of the CRF, taxpayer-supported Crown agencies, the SUCH sector, and the net income of commercial Crown corporations. Following rapid growth of 14.4 per cent in 2004/05, revenue is forecast to total $34,472 million in 2005/06, up 3.7 per cent over 2004/05 (see Table 1.3).
Chart 1.11 Revenue forecast

The 2005/06 forecast includes the effects of 5.5 per cent nominal GDP growth in 2005 and higher revenues from energy, coal and federal transfer payments. These improvements are partially offset by lower forest revenues and the effect of revenue measures announced since Budget 2004.
In 2006/07, revenue is forecast to decline 0.2 per cent reflecting an assumed zero equalization entitlement, lower lumber prices and harvest volumes, reduced ICBC net income, anticipated moderation in housing market activity resulting in lower property transfer tax revenue and moderating energy prices. These are partially offset by the impact of 5.1 per cent nominal GDP growth and increased health and social transfers from the federal government.
In 2007/08, revenue is projected to increase 2.1 per cent incorporating the effects of 4.9 per cent nominal GDP growth and 4.0 per cent higher federal government transfers. These increases are partially offset by declining corporate income tax revenue due to lags in the federal government’s collection and instalment payment systems, continued moderation in property transfer tax revenue and the effects of falling coal and metal prices.
Key assumptions and sensitivities relating to revenue are provided in Appendix Table A10.
31
Revenue changes since February 15 budget
Compared to the February 15 budget, revenue is forecast to be $1.4 billion higher in 2005/06, up $901 million in 2006/07 and $887 million higher in 2007/08 reflecting an improved economic outlook, higher commodity prices, particularly natural gas, and better than expected 2004/05 year end results. The main areas of change are:
Chart 1.12 Revenue changes from February 15 budget
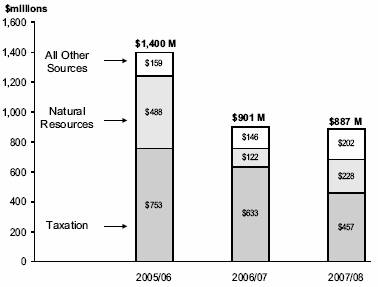
• Personal income tax – up $282 million in 2005/06 including a one-time prior-year adjustment due to higher 2004 revenues than anticipated when the 2004/05 books were closed. This, combined with improved personal and labour income growth, results in a $135 million base adjustment in 2005/06, rising to $180 million by 2007/08.
• Corporate income tax – up $140 million and $143 million in 2005/06 and 2006/07 as higher instalments from the federal government and a stronger corporate profits outlook in 2004 and 2005 are partially offset by the effects of reducing the general tax rate to 12.0 per cent from 13.5 per cent.
• Social service tax – up $100 million in 2005/06, rising to $118 million by 2007/08 mainly due to a $90 million improvement in 2004/05 results and stronger economic growth beginning in 2005.
• Property transfer tax – up $190 million in 2005/06 due to the very strong housing market year to date. The reduced improvement in 2007/08 of $130 million reflects moderation in sales activity.
• Energy and minerals – Natural gas royalties are forecast to be up $199 million, $30 million and $175 million since the February 15 plan reflecting higher natural gas prices. The revenue increase is less in 2006/07 mainly due to the changes in the natural gas price forecasts – up $0.83 per gigajoule in 2005/06, $0.40 in 2006/07 and $0.83 in 2007/08. The revenue forecast from other energy and mineral sources is up $117 million, $153 million and $109 million in the revised three year plan due to higher expected electricity and metal prices, and increased bonus bid revenues.
32
Table 1.15 Assumptions Underlying Main Revenue Changes
| | February 15, 2005 | | September 14, 2005 | |
| | 2004 | | 2005 | | 2006 | | 2007 | | 2004 | | 2005 | | 2006 | | 2007 | |
| | | | | | | | | | | | | | | | | |
Personal income | | 4.1 | % | 4.5 | % | 4.5 | % | 4.4 | % | 4.1 | % | 4.9 | % | 4.8 | % | 4.5 | % |
Labour income | | 4.2 | % | 4.5 | % | 4.6 | % | 4.7 | % | 4.5 | % | 5.2 | % | 4.9 | % | 4.9 | % |
Corporate profits | | 19.9 | % | 5.7 | % | 5.2 | % | 3.5 | % | 32.9 | % | 6.8 | % | 5.0 | % | 6.0 | % |
Retail sales | | 6.5 | % | 5.2 | % | 4.9 | % | 4.8 | % | 6.3 | % | 5.7 | % | 5.2 | % | 4.9 | % |
Nominal GDP | | 6.6 | % | 4.7 | % | 4.5 | % | 4.5 | % | 7.5 | % | 5.5 | % | 5.1 | % | 4.9 | % |
SPF 2X4 price
($US/1000 bd ft) | | $ | 393 | | $ | 319 | | $ | 300 | | $ | 300 | | $ | 393 | | $ | 360 | | $ | 300 | | $ | 300 | |
| | | | | | | | | | | | | | | | | |
Hemlock price
($US/1000 bd ft) | | $ | 615 | | $ | 588 | | $ | 600 | | $ | 600 | | $ | 615 | | $ | 534 | | $ | 538 | | $ | 550 | |
| | 2004/05 | | 2005/06 | | 2006/07 | | 2007/08 | | 2004/05 | | 2005/06 | | 2006/07 | | 2007/08 | |
| | | | | | | | | | | | | | | | | |
Natural gas price
($Cdn/gigajoule, plant inlet) | | $ | 5.52 | | $ | 5.71 | | $ | 5.75 | | $ | 5.28 | | $ | 5.62 | | $ | 6.51 | | $ | 6.15 | | $ | 6.11 | |
Electricity price
(Mid-Columbia, $US/mega-watt hour) | | $ | 47 | | $ | 50 | | $ | 48 | | $ | 47 | | $ | 46 | | $ | 59 | | $ | 61 | | $ | 59 | |
Crown harvest volumes
(million cubic metres) | | 69.3 | | 67.5 | | 66.0 | | 66.0 | | 70.5 | | 68.5 | | 66.0 | | 66.0 | |
• Forests – up $166 million in 2005/06 reflecting higher spruce-pine-fir prices and harvest volumes, due in part to stronger US demand. Revenue is expected to be down about $60 million in the next two years reflecting the outlook for Coastal log prices at $83 per cubic metre, compared to $91 in 2004/05 and lower hemlock and pulp prices compared to the February 15 plan.
• Federal government contributions – up $131 million, $133 million and $158 million from the February 15, 2005 forecast reflecting increased funding for Early Learning and Child Care announced in the federal government’s 2005 budget, assistance to combat the mountain pine beetle infestation, and in support of post-secondary institutions, health authorities and school districts program costs. These increases offset reduced health and social transfers due to improved personal and corporate income tax revenues.
Table 1.16 September Update – Changes from February 15 Budget
($ millions) | | 2005/06 | | 2006/07 | | 2007/08 | |
Revenue changes: | | | | | | | |
Personal income tax prior-year adjustment | | 147 | | — | | — | |
Personal income tax base | | 135 | | 165 | | 180 | |
Corporate income tax | | 140 | | 143 | | 3 | |
Social service tax | | 100 | | 108 | | 118 | |
Property transfer tax | | 190 | | 190 | | 130 | |
Energy and minerals | | 316 | | 183 | | 284 | |
Forests | | 166 | | (62 | ) | (60 | ) |
Federal transfers (non Equalization) | | 131 | | 133 | | 158 | |
Other sources | | 75 | | 41 | | 74 | |
Total revenue changes | | 1,400 | | 901 | | 887 | |
33
Commercial Crown Corporations Income
• British Columbia Hydro and Power Authority – At $329 million, BC Hydro’s income forecast for 2005/06 in the September Update is $66 million less than the projection in the February 15 budget, mainly due to higher energy costs from increased market purchases. BC Hydro income before regulatory transfers for 2005/06 is $119 million less than the forecast in the Budget 2004 fiscal plan.
The forecast reflects the 4.85 per cent rate increase confirmed by the BC Utilities Commission in November 2004. As well, energy costs have increased since Budget 2004 primarily due to increased purchases for electricity trade purposes and to meet domestic demand. These downward pressures are partially offset by reduced finance charges, due to lower debt levels and interest rates, and lower amortization costs reflecting BCUC decisions on amortization rates.
Water inflows to reservoirs, which determine the amount of low-cost hydro generation available to BC Hydro, are forecast to be 95 per cent of normal (based on the August 2005 water inflow estimates) – slightly lower than the Budget 2004 plan, which assumed normal water inflows.
• British Columbia Liquor Distribution Branch (LDB) – At $779 million, LDB’s projected net income for 2005/06 is unchanged from the February 15 budget and $14 million less than the forecast in the Budget 2004 fiscal plan. Product costs and discounts to licensee retail stores are increasing at a faster rate than sales, resulting in lower margins. As well, increased operating costs reflect LDB’s retail marketing plan, including credit card use and improvements to its retail outlets.
• British Columbia Lottery Corporation – BC Lotteries’ total transfers to the government (after distribution to the federal government) are projected at $892 million for 2005/06, unchanged from the February 15 budget, but $50 million less than the Budget 2004 forecast. Lottery and bingo revenue projections have declined due to lower participation in lottery games and a slower than projected introduction of community bingo gaming centres. This is partially offset by an increase in the casino gaming revenue forecast.
A large portion of BC Lotteries’ transfers to government is redistributed to charities and local governments. For 2005/06, the government forecasts that it will distribute $215 million of gaming revenue to these entities – $137 million to charities, $63 million to local governments, $9 million in development assistance contributions, and $6 million for horseracing purse enhancement. The net proceeds after distributions will be $677 million, of which $147 million is allocated to the Health Special Account and $530 million will go into general revenue to fund other government priorities, including education and social services.
34
• British Columbia Railway Company – At $39 million, BC Rail’s forecast earnings for government’s 2005/06 fiscal year are $37 million lower than the projection presented in the February 15 budget, and $12 million lower than the Budget 2004 outlook. The decrease reflects an extended timeframe for the disposal of Vancouver Wharves and the Port Subdivision.
• Insurance Corporation of British Columbia – ICBC’s outlook for the government’s 2005/06 fiscal year is projected at $224 million, a $48 million improvement over the outlook in the February 15 budget. The outlook reflects the premium rate changes announced by ICBC in June 2005. The improvement is due to increased premium revenue from higher sales volumes and higher investment income, partially offset by higher claims costs, including an adjustment to prior year claims estimates, and increased operating costs.
The current outlook for 2005/06 is $227 million higher than the projection in Budget 2004, primarily due to higher investment income and a reduction in projected claims costs. ICBC projects declining net income for 2006/07 and 2007/08 due to rising claims costs, mainly in the area of personal injury claims.
Full-Time Equivalents (FTEs)
Taxpayer-supported FTEs, including ministries and special offices (CRF), taxpayer-supported Crown agencies and regional authorities, is projected at 31,271 in 2005/06. This is 51 FTEs higher than the February 15 budget, due to the formalization of the Deputy Ministers’ Policy Secretariat and changes in taxpayer-supported Crown agencies.
By 2007/08, FTEs are projected to increase a further 237 to total 31,508 FTEs. Table 1.17 provides details of changes from the February 15 budget. FTEs of the SUCH sector are not included in these forecasts.
Ministries and special offices (CRF)
The 2005/06 FTEs projection for ministries and special offices is 27,259 FTEs – a net increase of 109 FTEs from the February 15 budget. The increase mainly reflects the transfer of FTEs from Land and Water BC. (LWBC) as part of the recent government reorganization. The increase in ministries due to LWBC is offset by a corresponding reduction in taxpayer-supported Crown corporation FTEs. Ministry FTE’s have been restated for the government reorganization announced June 16, 2005.
Approximately 3,000 FTEs within the Ministry of Children and Family Development were to be transferred to new governance authorities by 2006/07. Community Living BC assumed full control over services to adults and children with developmental disabilities effective July 1, 2005. The establishment of regional Aboriginal authorities is expected to occur in 2006/07, followed by regional authorities for non-aboriginal child and family services in 2007/08. The authorities will be considered established when they assume responsibility under legislation for the delivery of some or all services. Further information is available in the ministry’s service plan.
35
Taxpayer-supported Crown agencies
The 2005/06 taxpayer-supported Crown agencies FTE projection is 3,790 – a decrease of 135 FTEs from the February 15 budget. As noted previously, the reduction is primarily due to the transfer of LWBC-related FTE’s to various ministries.
Table 1.17 Full-Time Equivalents (FTEs) – Changes from February 15 Budget
FTEs | | 2005/06 | | 2006/07 | | 2007/08 | |
Ministries and special offices (CRF): | | | | | | | |
February 15 budget | | 27,150 | | 26,990 | | 24,530 | |
| | | | | | | |
Changes: | | | | | | | |
Agriculture and Lands (LWBC transfer) | | 99 | | 199 | | 199 | |
Environment (LWBC transfer) | | 41 | | 81 | | 81 | |
Tourism, Sports and the Arts (LWBC transfer) | | 15 | | 31 | | 31 | |
Other ministry changes (mainly LWBC transfers) | | 6 | | 12 | | 11 | |
Children and Family Development (governance authorities) | | (77 | ) | (7 | ) | (4 | ) |
Other ministry changes | | 25 | | 25 | | 25 | |
| | 109 | | 341 | | 343 | |
September Update Updated Fiscal Plan | | 27,259 | | 27,331 | | 24,873 | |
| | | | | | | |
Taxpayer-supported Crown corporations and agencies: | | | | | | | |
February 15 budget | | 3,925 | | 3,885 | | 3,895 | |
Changes: | | | | | | | |
Land & Water BC (transfer to ministries) | | (161 | ) | (322 | ) | (322 | ) |
Other changes (net) | | 26 | | 27 | | 8 | |
| | (135) | | (295 | ) | (314 | ) |
September Update Updated Fiscal Plan | | 3,790 | | 3,590 | | 3,581 | |
| | | | | | | |
Children and Family Development Regional authorities: | | | | | | | |
February 15 budget | | 145 | | 540 | | 3,050 | |
| | | | | | | |
Changes: | | | | | | | |
Children and Family Development governance authorities | | 77 | | 7 | | 4 | |
September Update Updated Fiscal Plan | | 222 | | 547 | | 3,054 | |
| | | | | | | |
Summary: | | | | | | | |
Ministries and special offices (CRF) | | 27,259 | | 27,331 | | 24,873 | |
Taxpayer-supported Crown corporations and agencies | | 3,790 | | 3,590 | | 3,581 | |
Regional authorities | | 222 | | 547 | | 3,054 | |
September Update Updated Fiscal Plan | | 31,271 | | 31,468 | | 31,508 | |
36
Capital Spending (1)
In addition to funding municipal and regional infrastructure delivered by local governments, the province also invests directly in capital infrastructure to provide services to the public and facilitate economic development. Provincial capital infrastructure investments are made through school districts, health authorities, post-secondary institutions, Crown agencies and ministries.
Table 1.18 Capital Spending
| | 2004/05 | | Budget | | | | | |
| | Budget | | | | Estimate | | Plan | | Plan | |
($ millions) | | Estimate | | Actual | | 2005/06 | | 2006/07 | | 2007/08 | |
Taxpayer-supported | | | | | | | | | | | |
Education | | | | | | | | | | | |
Schools (K–12) | | 196 | | 239 | | 293 | | 244 | | 284 | |
Post-secondary | | 408 | | 695 | | 723 | | 604 | | 518 | |
Health | | 326 | | 568 | | 756 | | 803 | | 703 | |
BC Transportation Financing Authority | | 500 | | 513 | | 629 | | 665 | | 467 | |
Vancouver Convention Centre Expansion Project | | 70 | | 50 | | 119 | | 187 | | 147 | |
Columbia River power projects (1) | | 90 | | — | | — | | — | | — | |
Government operating (ministries) | | 257 | | 175 | | 401 | | 339 | | 255 | |
Other (2) | | 96 | | 82 | | 117 | | 96 | | 69 | |
Total taxpayer-supported | | 1,943 | | 2,322 | | 3,038 | | 2,938 | | 2,443 | |
| | | | | | | | | | | |
Self-supported | | | | | | | | | | | |
BC Hydro | | 821 | | 612 | | 829 | | 1,008 | | 993 | |
BC Transmission Corporation | | — | | — | | 49 | | 80 | | 29 | |
Columbia River power projects (1) | | — | | 84 | | 40 | | 34 | | 143 | |
BC Rail | | 17 | | 30 | | 21 | | 11 | | 15 | |
ICBC (3) | | 66 | | 31 | | 60 | | 41 | | 30 | |
BC Lotteries | | 75 | | 93 | | 100 | | 60 | | 60 | |
Liquor Distribution Branch | | 12 | | 10 | | 30 | | 27 | | 12 | |
Total self-supported commercial | | 991 | | 860 | | 1,129 | | 1,261 | | 1,282 | |
Total capital spending | | 2,934 | | 3,182 | | 4,167 | | 4,199 | | 3,725 | |
(1) Joint ventures of the Columbia Power Corporation (CPC) and Columbia Basin Trust (CBT).
(2) Includes BC Housing Management Commission, Provincial Rental Housing Corporation, BC Buildings Corporation, Ministry of Attorney General, Ministry of Public Safety and Solicitor General, Ministry of Children and Family Development, Rapid Transit Project 2000, and BC Transit.
(3) Includes ICBC Properties Ltd.
Taxpayer-supported capital spending
Taxpayer-supported capital spending forecasts include capital infrastructure for school districts, health authorities, post-secondary institutions, taxpayer-supported Crown agencies, and ministries.
Taxpayer-supported capital spending is projected to range from $3.0 billion in 2005/06 to $2.4 billion in 2007/08. Significant elements of this projected spending include the following:
• A $1.5 billion program to seismically upgrade all at-risk schools in the province over fifteen years. This program will cover both structural and non-structural upgrading of school facilities. A long-term plan for the program will be established with school boards and the Ministry of Education.
(1) Capital investments are not included in the government’s annual surplus or deficit. In accordance with generally accepted accounting principles (GAAP), annual amortization expenses that recognize the estimated wear and tear of capital assets during the fiscal year are included in the government’s annual expenses instead of recording the full capital costs as they occur.
37
• In addition to funding annual costs for post-secondary seat growth, the province is also providing almost $800 million in capital funding for infrastructure to accommodate this growth, replace existing infrastructure and facilitate research activities throughout the post-secondary system. Examples of post-secondary projects included in projected capital spending are a new Kwantlen University College Trades Campus in Cloverdale, a University of British Columbia Centre for International Collaboration On Repair Discovery (ICORD), the Selkirk College Castlegar Aviation Centre and the Thompson Rivers University Williams Lake campus replacement. Post-secondary institutions utilize own-source revenues in addition to provincial funding to finance capital infrastructure.
• The Ministry of Health will also provide $735 million (including federal equipment funding) in capital grants to health authorities for new major construction and upgrading of existing health facilities, equipment, and clinical information systems over the next three years.
The ministry will be investing $66 million over three years to further the implementation of the Electronic Health Record. This includes leveraged funding of $30 million from Canada Health Infoway. Examples of major capital/equipment projects currently underway include: Abbotsford Regional Hospital and Cancer Centre; Nanaimo Regional General Hospital – expansion to improve access to patient care, maternal programs and surgical services on Central Vancouver Island; Vancouver Cancer Centre – radiation therapy annex to accommodate two new and two replacement Linear Accelerators; Academic and Ambulatory Care Centre at Vancouver General Hospital; new academic space in teaching hospitals around BC including Prince George Regional Hospital, Victoria General Hospital and Royal Jubilee Hospital; Bulkley Valley District Hospital – Emergency Department and Diagnostic Imaging renovation; Whistler Health Centre – Emergency Department renovations; purchase of a new mobile magnetic resonance imaging machine (MRI) to serve Cranbrook, Trail and Penticton hospitals; and Picture Archiving Communication Systems in Northern, Interior and Fraser Health Authorities which allow digital images to be shared between hospitals/regions and radiologists. Some of these projects receive funding from various funding partners including Regional Hospital Districts and Foundations.
• Continued implementation of the transportation investment plan which will provide over $3 billion of public and private sector investment over the next three years. Under the plan, provincial capital spending for 2005/06 to 2007/08 includes initiatives such as the Sea-to-Sky Highway improvements, border crossing infrastructure, the William R. Bennett Bridge and funding for Gateway initiatives. Additional details on the Transportation Investment Plan are provided in Table 1.13.
• The Vancouver Convention Centre Expansion Project (VCCEP) – capital spending shown in Table 1.18 is based on the project’s total capital cost, reflecting funding provided by all partners (the province, Canada and Tourism Vancouver). Table 1.19 shows the capital expenditures for VCCEP associated with provincial financing only, which totals $273 million.
38
Table 1.12 provides the timing and amount of provincial funding grants provided to VCCEP. These grants are eliminated in the summary financial statements, so that only the total capital expenditures of VCCEP are reported in the government financial statements.
Provincial capital infrastructure spending is financed through a combination of sources:
• operating surpluses;
• cash balances;
• cost-sharing with partners (such as federal or municipal governments);
• partnerships with the private sector (public-private-partnerships); and/or
• borrowing (debt-financing).
Debt-financing continues to represent a significant source of financing for provincial capital spending, so the level of capital spending has a significant impact on projected provincial debt (see the topic box on page 58).
Self-supported capital spending
Total capital spending includes capital infrastructure for self-supported commercial Crown corporations.
Self-supported capital spending is projected to range from $1.1 billion in 2005/06 to $1.3 billion in 2007/08. The majority of this capital spending is for electrical generation, transmission and distribution projects carried out through BC Hydro and BC Transmission Corporation to enhance reliability, public safety and growing demand. In addition to the projects shown on Table 1.19, other examples of electrical generation, transmission and distribution projects included in self-supported capital spending are new substations in Maple Ridge and Langley, redevelopment of the Aberfeldie generating station, and seismic upgrades of the Coquitlam and Stave Falls dams.
Further details on provincial capital investments are shown in the service plans of ministries and Crown corporations.
Projects over $50 million
As required under the Budget Transparency and Accountability Act, major capital projects with multi-year budgets totaling $50 million or more are shown in Table 1.19. Annual allocations of the full budget for these projects are included as part of the provincial government’s capital investment spending shown in Table 1.18.
Over the next three years over $1.2 billion of provincial funding will be spent on major capital investments (greater than $50 million) including:
• $400 million for health care facilities including Vancouver General Hospital, the Academic Ambulatory Care Centre, and the Abbotsford Regional Hospital and Cancer Centre.
39
• $305 million for major transportation capital infrastructure. In addition, the Ministry of Transportation is investigating financial and project delivery options through P3s for improvements to Lower Mainland infrastructure and the Trans Canada Highway in the Kicking Horse Canyon. Since the
Table 1.19 Capital Expenditure Projects Greater Than $50 million(1)
Note: Information in bold type denotes changes from the February 15 budget.
| | | | | | Estimated | | | | | |
| | | | Forecast | | Cumulative | | | | | | | | Cumulative | | | | | |
| | Start | | Completion | | Spending at | | Spending | | Spending | | Spending | | Spending at | | Total Project | |
($ millions) | | Date | | Date | | Mar. 31, 2005(2) + | | 2005/06+ | | 2006/07+ | | 2007/08 | | = Mar. 31, 2008 | | Budget(3) | | Forecast (3) | |
| | | | | | | | | | | | | | | | | | | |
Advanced Education facilities (4) | | | | | | | | | | | | | | | | | | | |
SFU – Surrey Central City Campus | | Mar. 2004 | | Sept. 2007 | | 40 | | 13 | | 13 | | 4 | | 70 | | 70 | | 70 | |
Health facilities (4) | | | | | | | | | | | | | | | | | | | |
Vancouver General Hospital, redevelopment project | | Sept. 2000 | | Jan. 2007 (5) | | 96 | | 25 | | 33 | | 2 | | 156 | | 156 | | 156 | |
Academic Ambulatory Care Centre | | Fall 2004 | | Summer/06 | | 12 | | 66 | | 17 | | — | | 95 | | 95 | | 95 | |
Abbotsford Regional Hospital and Cancer Centre | | Fall 2004 | | Summer/08 | | 39 | | 112 | | 126 | | 19 | | 296 | | 316 | | 316 | |
| | | | | | | | | | | | | | | | | | | |
Total health facilities | | | | | | 147 | | 203 | | 176 | | 21 | | 547 | | 567 | | 567 | |
Transportation | | | | | | | | | | | | | | | | | | | |
Trans Canada Highway - 5 Mile (Yoho) Bridge | | May 1999 | | Fall 2006 | | 33 | | 6 | | 5 | | — | | 44 | | 44 | (6) | 44 | (6) |
Nisga’a Highway | | Aug. 1998 | | Fall 2005 | | 42 | | 10 | | — | | — | | 52 | | 52 | | 52 | |
Sea-to-Sky Highway | | April 2003 | | Winter 2009 | | 67 | | 65 | | 128 | | 52 | | 312 | | 600 | | 600 | |
William R. Bennett Bridge | | Mar. 2005 | | July 2008 | | 6 | | 6 | | 2 | | 2 | | 16 | | 144 | | 144 | |
SkyTrain extension - phase 1 | | Sept. 1998 | | June 2006 | | 1,077 | | 13 | | 16 | | — | | 1,106 | | 1,167 | | 1,106 | |
Total transportation | | | | | | 1,225 | | 100 | | 151 | | 54 | | 1,530 | | 2,007 | | 1,946 | |
Power generation | | | | | | | | | | | | | | | | | | | |
BC Hydro | | | | | | | | | | | | | | | | | | | |
• Seven Mile Dam safety improvements | | June 1999 | | Sept. 2005 | | 62 | | 2 | | — | | — | | 64 | | 100 | | 64 | |
• Mica Dam – generator stator replacement | | Feb. 2004 | | Oct. 2010 | | 6 | | 12 | | 16 | | 18 | | 52 | | 78 | | 78 | |
• Peace Canyon Dam – generator stator replacement and rotor modification | | Feb. 2004 | | Mar. 2010 | | 1 | | 8 | | 15 | | 16 | | 40 | | 64 | | 63 | |
BC Transmission Corporation | | | | | | | | | | | | | | | | | | | |
• System control centre modernization project | | Feb. 2005 | | June 2008 | | 2 | | 34 | | 74 | | 23 | | 133 | | 134 | | 134 | |
Brilliant Expansion Power Corporation (7) | | | | | | | | | | | | | | | | | | | |
• Brilliant Dam power expansion | | Oct. 2002 | | Aug. 2006 | | 158 | | 28 | | 19 | | — | | 205 | | 205 | | 205 | |
Total power generation | | | | | | 229 | | 84 | | 124 | | 57 | | 494 | | 581 | | 544 | |
Other | | | | | | | | | | | | | | | | | | | |
ICBC Properties Ltd. | | | | | | | | | | | | | | | | | | | |
• Surrey Central City Mall Ltd. | | Sept. 1999 | | Mar. 2007 | (8) | 243 | | 30 | | 11 | | — | | 284 | | 312 | | 284 | |
Vancouver Convention Centre Expansion Project | | 2003 | | 2008 | | 57 | | 58 | | 90 | | 68 | | 273 | | 273 | | 273 | (9) |
Total other | | | | | | 300 | | 88 | | 101 | | 68 | | 557 | | 585 | | 557 | |
(1) Only projects that have been approved by Treasury Board and/or Crown corporation boards are included in this table. Ministry service plans may include projects that still require final approval. Only the provincial share of funding is presented. Total costs for some of these projects could be higher as they are cost-shared with the federal government, municipal authorities or the private sector.
(2) Total expenditures since commencement of each project.
(3) Represents sum of annual budgeted expenditures to complete each project.
(4) Amounts shown exclude interest costs incurred during construction.
(5) Individual components were completed starting in December 2000 and will continue to be completed before the end of the overall project.
(6) Amount represents the provincial portion of this cost-shared project with the federal government. Total project budget is $65 million.
(7) A joint venture of the Columbia Power Corporation and the Columbia Basin Trust.
(8) The base building was substantially completed in January 2003; however, work to prepare space for new tenants is still required.
(9) Amount represents the provincial portion of this cost-shared project with the federal government and the tourism industry.
40
Richmond-Airport-Vancouver rapid transit project (RAV) is not part of government, provincial funding for RAV is not included in the province’s capital spending. However provincial grants to RAV are detailed in the Transportation Investment Plan (Table 1.13).
• $265 million for power generation and transmission capital projects by BC Hydro, BC Transmission Corporation and the Brilliant Expansion Power Corporation.
• $257 million for other projects including the Vancouver Convention Centre Expansion Project and tenant improvements for Surrey Central City Mall (ICBC Properties Ltd.).
Table 1.19 identifies the provincial share of funding for major capital projects (over $50 million). However, total costs for some of these projects are higher as they are cost-shared with the federal government, municipal authorities or the private sector.
Provincial Debt
In 2005/06, total provincial debt is forecast at $35.9 billion, up $84 million from 2004/05. The 2005/06 change reflects:
• a $1.6 billion decrease in government direct operating debt (resulting from the CRF surplus and improved cash flows);
• a $1.2 billion increase in taxpayer-supported debt mainly to finance net capital requirements;
• a $167 million increase in commercial Crown corporation debt, mainly to fund power generation and transmission capital projects by BC Hydro and BC Transmission; and
• a $300 million forecast allowance to mirror the income statement forecast allowance.
Over the following two years, government direct operating debt is forecast to decrease $1.9 billion reflecting continued surpluses of the CRF. Other taxpayer-supported debt will increase $2.3 billion to finance capital requirements. Self-supported debt will increase $1.1 billion, mainly to fund power generation and transmission projects.
The debt forecast includes forecast allowances of $300 million in 2005/06, $600 million in 2006/07 and $900 million in 2007/08. Projected debt levels under the fiscal plan would be lower by the amount of the forecast allowance for each year should the government not require this allowance. In addition, government has not included the cost of wage settlements in the fiscal forecast, as the wage mandate has not been established. When wage costs are known, this will be reflected in higher taxpayer-supported debt.
The government direct operating debt to GDP ratio is forecast to steadily decline to 6.1 per cent by 2007/08 from 9.3 per cent in 2004/05, reflecting on-going surpluses over the three year fiscal plan. The debt forecast assumes that the expected surpluses will be fully applied to debt reduction. However, should the revenues be lower than forecast or if government allocates some of these surpluses to other areas, the debt forecast would change accordingly.
41
Table 1.20 Provincial Debt Summary (1)
| | | | Budget | | | | | |
| | 2004/05 | | Estimate | | Plan | | Plan | |
($ millions unless otherwise indicated) | | Budget | | Actual | | 2005/06 | | 2006/07 | | 2007/08 | |
Taxpayer-supported debt | | | | | | | | | | | |
Provincial government direct operating debt | | 16,558 | | 14,481 | | 12,871 | | 12,180 | | 11,003 | |
Other taxpayer-supported debt (mainly capital) | | | | | | | | | | | |
Education (2) | | 6,901 | | 6,809 | | 7,305 | | 7,831 | | 8,300 | |
Health (2) | | 2,479 | | 2,112 | | 2,566 | | 2,920 | | 3,128 | |
Highways and public transit | | 5,018 | | 4,593 | | 4,848 | | 5,240 | | 5,532 | |
Other (3) | | 1,159 | | 662 | | 684 | | 735 | | 777 | |
Total other taxpayer-supported debt | | 15,557 | | 14,176 | | 15,403 | | 16,726 | | 17,737 | |
Total taxpayer-supported debt | | 32,115 | | 28,657 | | 28,274 | | 28,906 | | 28,740 | |
Self-supported commercial Crown corporations debt | | 7,180 | | 7,169 | | 7,336 | | 7,844 | | 8,393 | |
Total debt before forecast allowance | | 39,295 | | 35,826 | | 35,610 | | 36,750 | | 37,133 | |
Forecast allowance (4) | | 100 | | — | | 300 | | 600 | | 900 | |
Total provincial debt | | 39,395 | | 35,826 | | 35,910 | | 37,350 | | 38,033 | |
| | | | | | | | | | | |
Debt as a per cent of GDP | | | | | | | | | | | |
Provincial government direct operating | | 11.3 | % | 9.3 | % | 7.8 | % | 7.0 | % | 6.1 | % |
Taxpayer-supported | | 21.8 | % | 18.3 | % | 17.1 | % | 16.7 | % | 15.8 | % |
Total provincial | | 26.8 | % | 22.9 | % | 21.8 | % | 21.5 | % | 20.9 | % |
Taxpayer-supported debt per capita ($) | | 7,674 | | 6,830 | | 6,667 | | 6,741 | | 6,625 | |
Taxpayer-supported interest bite (cents per dollar of revenue) | | 6.4 | | 5.0 | | 5.0 | | 5.4 | | 5.4 | |
(1) Debt is after deduction of sinking funds and unamortized discounts, and excludes accrued interest. Government direct and fiscal agency accrued interest is reported in the government’s accounts as an accounts payable.
(2) Includes debt and guarantees incurred by the government on behalf of school districts, universities, colleges and health authorities/hospital societies (SUCH), and debt directly incurred by these entities.
(3) Includes taxpayer-supported Crown corporations and agencies, other fiscal agency loans, student assistance loan guarantees, loan guarantees to agricultural producers, guarantees issued under economic development and home mortgage assistance programs, and loan guarantee provisions.
(4) Reflects the operating statement forecast allowance for each year (amounts are not cumulative). Since it is unknown as to which agency would require this debt, the borrowing allowance is shown as a separate item over the plan.
The ratio of taxpayer-supported debt to GDP, which excludes commercial Crown corporations and the forecast allowance, is a key measure used by financial analysts and investors to assess a province’s ability to repay debt. Consistent with government’s commitment, the taxpayer-supported debt to GDP ratio falls over the three year plan, keeping debt affordable for future generations of British Columbians.
Chart 1.13 Debt to GDP ratios decline
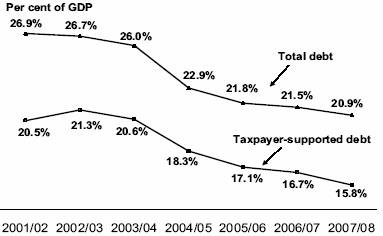
42
The taxpayer-supported debt to GDP ratio is forecast to decrease to 17.1 per cent in 2005/06, 16.7 per cent in 2006/07 and 15.8 per cent in 2007/08. The change from the February 2005 budget forecast reflects a $1.3 billion improvement in taxpayer-supported debt for 2005/06 that is carried forward into subsequent years, and higher GDP forecasts. Taxpayer-supported interest costs are expected to rise to 5.4 cents per dollar of revenue by 2007/08, due to higher interest rates and increased taxpayer-supported capital debt.
The total provincial debt to GDP ratio is forecast to drop to 20.9 per cent in 2007/08 from 22.9 per cent in 2004/05. Total debt includes commercial Crown corporations and the debt forecast allowance.
Table 1.21 Provincial Financing
| | | | | | Actual | | | | | | | | Estimated | |
| | Debt (1) | | | | Debt (1) | | | | | | | | Debt (1) | |
| | Outstanding | | 2004/05 | | Outstanding | | 2005/06 Transactions | | Outstanding | |
| | at March 31, | | Debt | | at March 31, | | New | | Retirement | | Net | | at March 31, | |
($ millions) | | 2004 | | Change | | 2005 | | Borrowing (2) | | Provision (3) | | Change | | 2006 | |
| | | | | | | | | | | | | | | |
Taxpayer-supported debt | | | | | | | | | | | | | | | |
Provincial government direct operating | | 15,694 | | (1,213 | ) | 14,481 | | — | | 1,610 | | (1,610 | ) | 12,871 | |
Education (4) | | 6,521 | | 288 | | 6,809 | | 837 | | 341 | | 496 | | 7,305 | |
Health (4) | | 2,215 | | (103 | ) | 2,112 | | 567 | | 113 | | 454 | | 2,566 | |
Highways and public transit | | 4,880 | | (287 | ) | 4,593 | | 822 | | 567 | | 255 | | 4,848 | |
Other debt (5) | | 718 | | (56 | ) | 662 | | 102 | | 80 | | 22 | | 684 | |
Total taxpayer-supported debt | | 30,028 | | (1,371 | ) | 28,657 | | 2,328 | | 2,711 | | (383 | ) | 28,274 | |
Self-supported commercial Crown corporations debt | | 7,739 | | (570 | ) | 7,169 | | 762 | | 595 | | 167 | | 7,336 | |
Forecast allowance | | — | | — | | — | | 300 | | — | | 300 | | 300 | |
Total provincial debt | | 37,767 | | (1,941 | ) | 35,826 | | 3,390 | | 3,306 | | 84 | | 35,910 | |
(1) Debt is after deduction of sinking funds and unamortized discounts, and excludes accrued interest. Government direct and fiscal agency accrued interest is reported in the government’s accounts as an accounts payable.
(2) New long-term borrowing plus net change in short-term debt.
(3) Sinking fund contributions, sinking fund earnings and net maturities of long-term debt (after deduction of sinking fund balances for maturing issues).
(4) Includes debt and guarantees incurred by the government on behalf of school districts, universities, colleges and health authorities/hospital societies (SUCH), and debt directly incurred by these entities.
(5) Includes taxpayer-supported Crown corporations and agencies, other fiscal agency loans, student assistance loans, loan guarantees to agricultural producers, guarantees issued under economic development and home mortgage assistance programs, and loan guarantee provisions.
Table 1.21 summarizes the provincial financing plan for 2005/06.
• New borrowing for government operating purposes will not be required as the CRF surplus and improved cash flows will facilitate a $1.6 billion debt retirement.
• New borrowing of $2.3 billion is anticipated for other taxpayer-supported entities, of which $1.1 billion will be used to replace maturing debt and $1.2 billion will be used for capital financing requirements.
• Self-supported entities are expected to borrow $762 million to refinance $595 million of maturing debt and to fund capital projects.
• A forecast allowance of $300 million is included as new borrowing to mirror the operating statement allowance.
Further information on financing capital infrastructure through provincial debt can be found in the topic box on page 58. Additional details on the debt outstanding for government, Crown corporations and agencies are provided in Appendix Tables A15 and A16.
43
Risks to the Fiscal Plan
The risks to the fiscal plan stem mainly from changes in factors that government does not directly control. These include:
• Assumptions underlying revenue and Crown corporation and agency forecasts such as economic factors, commodity prices and weather conditions.
• The outcome of litigation, arbitrations, and negotiations with third parties, such as the federal government and for the softwood lumber dispute.
• Utilization rates for government services such as health care, children and family services, or employment assistance.
In addition, changes in accounting treatment or revised interpretations of generally accepted accounting principles (GAAP) could have material impacts on the bottom line.
Table 1.22 summarizes the approximate effect of changes in some of the key variables on the surplus. However, individual circumstances and interrelationships between the variables may cause the actual variances to be higher or lower than the estimates shown in the table. For example, a decrease in natural resource revenues may be offset by an increase in commercial Crown corporation incomes; or as occurred in 2003/04, an increase in the US/Cdn exchange rate can be largely offset by higher commodity prices.
Table 1.22 Key Fiscal Sensitivities
| | | | Fiscal Impact | |
Variable | | Increases of: | | ($ millions) | |
Nominal GDP | | 1% | | $150 – $250 | |
Lumber prices
(US$/thousand board feet) | | $50 | | $80 – $140 | |
Natural gas prices
(Cdn$/gigajoule) | | 50 cents | | $130 – $170 | |
Wage and compensation rates | | 1% | | -$160 | |
US exchange rate
(US cent/Cdn $) | | 1 cent | | -$25 to -$40 | |
Interest rates | | 1 percentage point | | -$110 | |
Debt | | $500 million | | -$25 | |
The experience of the 2003/04 fiscal year also demonstrated the tendency for negative fiscal shocks – forest fires, floods, BSE, equalization revenue losses – to be offset by positive variances in other areas – commercial Crown corporation incomes, taxation and energy revenues, and other improvements. In 2003/04, the $500 million forecast allowance was not needed, as the positive effects more than offset the negative fiscal shocks.
44
By contrast, the 2001/02 fiscal year saw an unexpectedly sharp decline in the economy, as the US went into recession and travel between nations was severely impacted by the aftermath of September 11. In this year, government would have missed its fiscal targets, had it not used a portion of the forecast allowance.
The potential economic impact of Hurricane Katrina in the U.S. gulf coast is continuing to be evaluated. Expectations vary as to the overall economic impact. It is uncertain how much the positive impact of the massive reconstruction efforts will counter the negative impacts of higher oil, gasoline and natural gas prices, or loss of infrastructure on the overall economy. Spikes in commodity prices such as natural gas and lumber may have a positive effect on natural resource revenues in the near-term, until supply-demand imbalances level out.
Contingency Vote
A $320 million contingency vote is included in each of the 2005/06 and 2006/07 fiscal years, representing roughly 1 per cent of overall government expense. The contingency vote is increased to $360 million in 2007/08 reflecting a $40 million allocation of the $140 million 2010 Olympics contingency budget.
The increased allocation to contingencies is a prudent budgeting measure that protects the three-year fiscal plan from:
• unforeseen and unbudgeted costs that may arise (such as the provincial contribution to tsunami relief in Southeast Asia in 2004/05, or unexpected environmental remediation costs); and
• pressures for costs that are currently budgeted based on estimates whose final value are impacted by external events or prices (such as payments made under the Vancouver Island Gas Pipeline Assistance Agreement that are directly linked to natural gas prices).
Table 1.23 outlines cost pressures that government has notionally allocated to the contingency vote across the three-year fiscal plan.
Table 1.23 Notional Allocations to Contingency Vote
($ millions) | | 2005/06 | | 2006/07 | | 2007/08 | |
Vancouver Island Gas Pipeline Assistance Agreement –
potential natural gas price changes | | 10 | | 10 | | 10 | |
Traffic fines revenue sharing – potential changes in estimates | | 5 | | 5 | | 5 | |
Government restructuring | | 20 | | — | | — | |
2010 Olympics – preliminary allocation of contingency amount | | — | | — | | 40 | |
Sub-total notional allocations | | 35 | | 15 | | 55 | |
Unallocated contingencies | | 285 | | 305 | | 305 | |
Total contingencies | | 320 | | 320 | | 360 | |
In addition to these specific items, corporate pressures such as the valuation of employer contributions to pension plans or leave liability costs may also impact the contingency vote.
45
Forecast Allowance
In 2005/06, the government continues to build a forecast allowance into the bottom-line to act as a cushion against possible deterioration in revenue or spending forecasts, and thus increase the certainty of meeting the surplus targets established in the fiscal plan.
A forecast allowance of $300 million for 2005/06 is included in the September Update. This is $100 million lower than in the February 15 budget, reflecting reduced risk as there are only six months remaining in the fiscal year. This forecast allowance has the explicit effect of reducing the expected surplus from the government’s most likely forecast of $1.6 billion in 2005/06 to a more conservative budget surplus of $1.3 billion. The explicit nature of the adjustment to the surplus flows from the Budget Transparency and Accountability Act that requires disclosure of adjustments to the more likely fiscal result.
A corresponding $300 million borrowing allowance has also been included in the provincial debt forecast for 2005/06, increasing the total debt forecast by $300 million compared to the most likely forecast.
Forecast allowances for the 2006/07 and 2007/08 fiscal years are now set at $600 million for 2006/07 and $900 million for 2007/08. The higher forecast allowances reflect increased risks to the surplus arising from continued high energy prices, and from spending pressures from future public sector wage settlements.
SUCH Sector
SUCH sector forecasts have been provided by management of the various organizations based on broad policy assumptions provided by the Ministries of Health and Advanced Education. Forecasts for the combined school districts have been compiled by the Ministry of Education based on the requirements of the School Act and the amounts of block funding included in the budget. Every effort has been made to ensure that the financial information is compiled in a manner consistent with GAAP as financial information is converted from that provided by the sectors to align with the accounting policies of the government reporting entity. While the lead financial officers and chairs of the board for the health authorities, universities, colleges and institutions have signed off on these forecasts, final plans are still subject to formal approval of their boards, as well as approval by School District boards. Final approved plans may therefore differ from the management forecasts included in the budget.
Some post-secondary institutions have forecast deficits for 2006/07 and 2007/08. Government has not approved these forecasts since a funding review is currently underway and will be completed this fall. Upon completion, it is expected that revised forecasts with balanced budgets will be submitted by the institutions reflecting the results of this review. These forecasts will be included in Budget 2006.
46
Revenue
The revenue forecast contained in the fiscal plan is based on the economic forecast detailed in Part 3: British Columbia Economic Review and Outlook. Details on major assumptions and sensitivities resulting from changes to those assumptions are shown in Appendix Table A10.
The main areas that may affect the revenue forecast are:
• BC’s overall economic performance;
• exchange rate and commodity prices, especially natural gas, lumber, and electricity prices;
• the outcome of the softwood lumber dispute with the US;
• water levels in the BC Hydro system; and
• finalization of the mechanism for allocating fixed annual amounts of federal equalization transfers among provinces. The federal government has established an independent panel to advise on allocation mechanisms. The federal government is expected to finalize the apportionment between provinces before March 31, 2006. Depending on the mechanism used, BC may receive a portion of these transfers in 2006/07 and 2007/08.
Crown corporations and agencies have provided their own forecasts that were used to prepare the fiscal plan, as well as their statements of assumptions. The boards of those corporations and agencies have included these forecasts, along with further details on assumptions and risks, in the service plans being released with the budget.
The fiscal plan does not assume or make allowance for extraordinary adjustments other than those noted in the assumptions provided by the Crown corporations and agencies. Factors such as electricity prices, water inflows into the BC Hydro system, accident trends, interest/exchange rates, decisions of an independent regulator, or pending litigation could significantly change actual financial results over the forecast period.
New decisions or directions by Crown corporation or agency boards of directors may result in changes to costs and revenues due to restructuring, valuation allowances and asset write-downs, or gains and losses on disposals of businesses or assets (for example BCBC, LWBC and Columbia Basin Trust).
In situations where revenue could benefit as a result of a negotiated or litigated settlement, no revenue increases have been assumed except where a published agreement is available. Specifically no assumptions have been made as to potential benefits from a resolution of the softwood lumber dispute with the US. Further, no assumptions have been made as to potential federal funding for immigration and training, additional funding for the Pacific Gateway or additional funding for post-secondary education.
47
Spending
The spending forecast contained in the fiscal plan is based on ministry and taxpayer-supported Crown corporation and agency spending plans and strategies, as well as SUCH sector forecasts. Details on major assumptions and sensitivities resulting from changes to those assumptions are shown in Appendix Table A11 and in ministry service plans. The main spending issues follow.
Public Sector Compensation
Collective agreements for almost 90 per cent of public sector employees are up for renegotiation over the next nine months. As the next mandate is still under development, no specific compensation increase has been included in the fiscal plan, placing a potential pressure on forecast allowance in 2006/07 and 2007/08.
About 52 per cent of the current BC budget goes towards wages and benefits for public sector workers. To put this in perspective, a 1 per cent increase in wages and benefits costs taxpayers approximately $160 million per year. For example, a 1 per cent increase each year for three years costs about $160 million in year one, $320 million in year two, and $480 million in year three.
Demand-driven Programs
The government funds a number of demand-driven programs such as PharmaCare, K-12 education, student financial assistance and income assistance. The budgets for these programs reflect the best estimate of demand and other factors such as price inflation. If demand is higher than estimated, this will result in a spending pressure to be managed.
Public Sector Program Delivery
The vast majority of government-funded services are delivered through third party delivery agencies that provide programs such as acute and continuing health care, K-12 education, post-secondary education, and community social services. All of these sectors face cost pressures in the form of program demand and non-wage inflation.
Treaty Negotiations
The government is committed to negotiating affordable, working treaties with First Nations that provide certainty regarding ownership and use of provincial Crown land and resources. The province has concluded Agreements-in-Principle with the Lheidli T’enneh, Maa-nulth, Sliammon, Snuneymuxw, Yekooche, and Tsawwassen First Nations. The province is seeking to reach Final Agreements with First Nations and the federal government. The province will therefore focus resources on key opportunities in order to reach final treaty settlements with First Nations and Canada. Outcomes of negotiations may ultimately affect the economic outlook and the fiscal plan when settlements are concluded.
48
Capital Risks
The capital spending forecasts assumed in the fiscal plan may be affected by various factors including:
• weather and geotechnical conditions causing project delays or unusual costs;
• changes in market conditions, including service demand, inflation, borrowing costs and wage settlements;
• the outcome of environmental impact studies;
• the accuracy of capital project forecasts;
• the successful negotiation of cost-sharing agreements with other jurisdictions; and
• the success of public-private sector partnership negotiations.
Unfunded Liabilities
The College, Public Service, Teachers and Municipal Pension Plans – the four major public service plans – are joint trusteeship plans. In the event that a plan deficit is determined by an actuarial evaluation, the pension boards are required to address the shortfall by contribution adjustments or other means. Any unfunded liabilities (funding basis) are therefore expected to be short term in nature. For example, the most recent actuarial valuation of the Municipal Pension Plan indicated a $789 million liability (funding basis), which was addressed by an increase to contribution rates of 1.98 per cent to be shared equally by members and employers effective July 1, 2005. The next major actuarial valuation report (for the Public Service Pension Plan) is expected by March 2006.
Catastrophes and Disasters
The spending plans for the Ministries of Forests and Range and Public Safety and Solicitor General include amounts to fight forest fires and deal with other emergencies such as floods and blizzards. These amounts are based on historical averages of actual spending and on conditions of normal to moderate severity. Extreme occurrences may affect expenses in these ministries and those of other ministries.
49
Pending Litigation
The spending plan for the Ministry of Attorney General contains provisions for payments under the Crown Proceeding Act based on estimates of expected claims and related costs of settlements likely to be incurred. These estimates are based on a historical ten-year average of actual spending. Litigation developments may occur that are beyond the assumptions used in the plan (for example, higher-than-expected volumes, or size of claim amounts and timing of settlements). Various legal actions may also establish precedents requiring minimum service levels in various areas of provincial jurisdiction. These developments may also affect expenditures in other ministries.
One-time Write-downs and Other Adjustments
Ministry budgets provide for anticipated levels of asset or loan write-downs where estimates can be reasonably predicted. The overall spending forecast does not make allowance for extraordinary items other than the amount provided in the contingency vote.
50
Caring for Seniors
Seniors are an important part of British Columbia’s social and economic fabric. Today’s seniors are more physically active and better educated than ever before. They are more likely to volunteer their time, and through their knowledge and experience contribute in many valuable ways to their communities.
British Columbia has one of the fastest growing seniors population in the country. The province is currently home to approximately 588,000 seniors. By the year 2031, the seniors population will more than double and make up approximately 23 per cent of the provincial total.
British Columbia Population Aged 65 and Over

Government is committed to ensuring that BC’s seniors share in the success of the province. In the 2005 throne speech, the provincial government recognized the challenges associated with meeting the needs of a growing seniors population and committed to establishing a new Premier’s Council on Aging and Seniors’ Issues.
The mandate of the Council is to ensure the best quality of life for BC’s seniors by focusing on the following areas:
• demographic and social economic changes;
• a vision for 2020 with regards to the province’s seniors population; and
• pressing needs and opportunities to improve seniors’ independence and quality of living, including, but not limited to:
• healthy lifestyles and nutrition;
• independence and quality of life;
• housing options and home care;
• seniors’ services; and
• mandatory retirement.
The Council will provide an interim report on its findings and will provide preliminary directions by May 31, 2006 and recommendations for the future by September 30, 2006.
The September Update continues to build on government’s commitment to seniors by allocating additional resources to assist low-income seniors with the cost of living and by improving care. These new initiatives include:
• Renewing the Senior’s Supplement – eligible seniors receiving the federal guaranteed income supplement will automatically receive a provincial monthly supplement of up to a maximum of $49 per single senior or up to $60 per partner in a married couple. An estimated 39,500 low-income seniors will benefit from this provincial supplement. Payments will be received by the end of October.
• Increasing the Shelter Aid for Elderly Renters (SAFER) maximum rental ceiling by $90 in low cost areas and $180 in high cost areas effective in October 2005. The program will be expanded to include owners of manufactured homes paying pad rental. These significant rent ceiling increases are the first since 1990, and coupled with the inclusion of owners of manufactured homes, are expected to increase the number of eligible program participants from 12,000 to 19,200 – a 60 per cent increase.
51
SAFER provides financial assistance to residents of British Columbia who pay more than 30 per cent of their gross monthly income for rent, and:
• are age 65 or older and entitled to Old Age Security;
• are age 60 to 64 and are either a Canadian Citizen or a landed immigrant;
• have lived in BC a full 12 months prior to applying; and
• have lived continuously in Canada for at least 10 years as an adult.
• Adding an additional 5,000 new residential, Assisted Living and Supportive housing beds by 2008. The September Update provides an additional $150 million over two years to strengthen and modernize the full range of services for seniors to support a smooth transition as new beds come on stream and to ensure seniors can age in place where appropriate. This will be done through purchasing equipment, such as beds and lifts; infrastructure improvements to facilitate higher levels of care; and training for improved care management and assessment. Of this new funding, $40 million will be invested directly in services provided by partners such as SUCCESS, Kiwanis and the Salvation Army.
Programs and services
Government is committed to providing a network of services and programs for seniors. Not only do several ministries offer programs specifically for seniors, there is also a Minister Responsible for Seniors’ and Women’s Issues to coordinate policy and provide information on issues facing seniors. Current programs and services impacting seniors include:
Income
• Elimination of the provincial income tax for all people earning less than $15,500, including seniors.
• An increase in the refundable sales tax credit for low income seniors by 50 per cent.
Health
• Medical Services Plan (MSP) – Persons who are 65 years of age or more and enrolled in MSP, will automatically receive a BC Gold CareCard. The BC Gold CareCard is useful as proof of age and residence for discounts offered by certain government programs and many businesses.
• MSP premiums have been reduced for lower income seniors and families.
• Prescription costs have been reduced for lower income citizens through Fair PharmaCare – 82 per cent of all registrants now pay the same or less for all prescriptions.
• Independent Living BC – is a housing-for-health program that meets the needs of seniors with low to moderate incomes and people with disabilities who require additional support to remain independent but do not require 24-hour residential health care.
Housing
• Home Owner Grant for Seniors – reduces the amount of property taxes for eligible seniors.
• Property Tax Deferment – homeowners aged 60 years and over may defer the payment of annual property taxes on their principal residence.
• Affordable Housing for Seniors – seniors who are able to live without any support services or who can continue to live independently with the assistance of home care, can apply for seniors affordable housing developments managed by BC Housing or non-profit and co-op housing providers.
52
Recreation
• Hunting and Angling Licences for Seniors – these programs allow seniors 65 years of age or over, who are BC residents and Canadian Citizens, to buy hunting and angling licences at a reduced rate. Seniors save $25 on a basic hunting licence and $31 on a non-tidal angling licence.
• Camping Subsidy – individuals residing in BC who are 65 years or older and have a BC PharmaCare card may camp for half the full campsite fee after Labour Day to June 14. This discount applies to the senior and his/her spouse.
• Royal BC Museum – seniors pay reduced admission fees at the Royal BC Museum in Victoria.
Transportation
• Bus Pass Program – provides affordable transportation to low-income senior citizens and persons who are disabled.
• Senior citizen automobile insurance and driver licence discounts are available with the Insurance Corporation of British Columbia.
• BC Ferries – seniors with acceptable I.D. (e.g. the BC Gold CareCard) enjoy free travel on southern routes sailing Monday through Thursday, except on holidays.
Resources
In a continuing effort to support BC’s seniors, the following resources are available:
• Health and Seniors’ Information Line – the toll-free 1-800 telephone line offers seniors a single source for information about government services, including information about health programs, services and initiatives. The information line is available Monday to Friday, 8:30 AM to 4:30 PM.
Toll free in BC: | | 1 800 465-4911 |
Victoria: | | 250 952-1742 |
• BC Seniors Online Website – the BC Seniors Online website provides access to client-centred information, services and other programs for seniors, from provincial and federal governments. Seniors, their families, caregivers and supporting service organizations can access reliable, consistent and up-to-date information on topics such as:
• Health Services;
• Housing;
• Recreation; and
• Finance.
The BC Seniors Online website is found at www.mcaws.gov.bc.ca/seniors
53
A New Relationship With First Nations
Support for the New Relationship with First Nations
First Nations and other Aboriginal people play a vital role in the social, economic and cultural life of BC. The provincial government is committed to working in partnership with First Nations and others to help ensure that the five great goals for the next decade are also achieved for Aboriginal British Columbians. To achieve this vision, the province is building a new relationship based on respect, recognition of Aboriginal rights and title, and reconciliation.
Over the past several years, there has been progress in building this relationship and in creating new economic and social opportunities for First Nations and Aboriginal communities.
• Within the British Columbia Treaty Commission process, five Agreements-in-Principle have been signed, each of which will form the basis of a final treaty.
• More than 300 individual agreements have been made in areas such as land use planning, economic development, forestry, oil and gas, parks, agriculture and aquaculture.
• $135 million in revenue sharing has been committed over four years for First Nation communities interested in forestry, as well as access to 9 million cubic metres of dedicated timber harvest.
• A $15 million First Nations Benefits Trust was set up in 2004 to support initiatives for Aboriginal communities along the BC Rail corridor.
• Aboriginal groups have been directly involved with planning and benefit sharing for the 2010 Olympic and Paralympic Winter Games.
• An agreement with Aboriginal leaders has been signed to reduce the number of Aboriginal children coming into government care and return children to their communities when appropriate.
• A variety of other actions have been taken in economic and social areas such as dedicated funding for Aboriginal housing, educational cultural development, business development, training and employment opportunities and participation in the treaty negotiations process.
While the provincial government regards these examples as significant achievements, it also recognizes that in order for progress to continue in building a new relationship, First Nations and other Aboriginal communities require further support to build their capacity to actively participate in the social and economic development of British Columbia, and to be effective partners in consultations concerning land and resources.
First Nations New Relationship Fund
While progress has been made in building capacity, it is acknowledged that a more systematic and focused way is needed to build capacity within First Nations and Aboriginal communities. Ideally, building capacity should be targeted at training and other related activities that help First Nations and others build the internal capacity to respond to consultations and assumed responsibilities while improving the economic and social well-being of Aboriginal communities.
In 2005/06, the provincial government will invest $100 million of one-time funding to help First Nations and Aboriginal communities build appropriate capacity to provide effective input and participate in the management of lands, resources and social programs. This will assist First Nations and Aboriginal communities in becoming active, supporting partners in relationships with government, business and other organizations.
54
Between now and Spring 2006, the provincial government will engage First Nations and Aboriginal communities, as well as other interested groups, including the federal government, to invite their views and participation on the most appropriate strategies and structures for achieving this important step.
An update on this initiative, along with an appropriate funding appropriation, will be provided when the government presents its next budget in February 2006.
Principled Approach to Building Capacity
The provincial government believes that the commitment of public resources to help First Nations and Aboriginal people build capacity should be guided by the following principles:
• Inclusive – available to all First Nations and other Aboriginal communities engaged with the provincial government. Informed by best practices and experiences from local government, the business community and other jurisdictions.
• Building Self-Reliance – targeted to reducing or eliminating reliance on procuring ongoing outside expert advice, where it makes better sense for First Nations and Aboriginal communities to internally develop these resources for themselves.
• Outcome Based – targeted and linked to specific beneficial outcomes and the processes needed to achieve those outcomes. This should flow from a clear set of plans as to what is needed to be done, by whom, and framed within specific time lines that ultimately lead to those outcomes.
• Simple, Efficient and Flexible – approaches that are not complicated or cumbersome to create or maintain; avoid duplication of efforts; support common interests through the creation of economies of scale; and be flexible to reflect evolving new relationship priorities.
• Affordable and Accountable – publicly affordable and lead to new opportunities that create strengthened economic and social conditions in First Nations and Aboriginal communities, which in turn will benefit all British Columbians. Establish clear responsibilities that lead to clear accountabilities for outcomes.
• Jurisdictional Recognition – reflects the accountabilities of the parties involved. The Government of Canada, local governments, as well as the private sector each have responsibilities and roles to play in helping to build capacity with First Nations and Aboriginal people.
55
Mountain Pine Beetle
British Columbia is currently experiencing the largest recorded mountain pine beetle outbreak in North America. BC has 12 million hectares of lodgepole pine forest primarily in the Interior, of which approximately 7 million hectares has been affected by the beetle. Projections suggest that approximately 80 per cent of the 12 million hectares will be killed by 2014.
The outbreak continues to kill mature pine trees in the Central Interior and is well established in the Thompson-Okanagan and Kootenay regions. Infestations are now appearing in the Peace River Region.
Since 1999, several factors have come together to create the conditions for the current mountain pine beetle outbreak:
• BC has a large supply of mature and old lodgepole pine forests, which are highly susceptible to insect attacks;
• the province has been experiencing relatively warm winters in recent years, conditions under which the beetle thrives; and
• the lodgepole pine forest has extended further south into areas where severe cold is rare.
Climate is an important factor, because the pine beetle cannot survive in cold climates. A sudden cold snap (-25 degrees Celsius) in early fall or late spring, or sustained frigid winter temperatures (-40 degrees Celsius)
Map 1 - Mountain Pine Beetle Spread
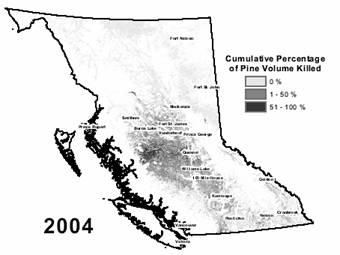
can eliminate beetle populations over a wide area and is the most effective natural control. However, BC has not experienced such conditions in recent years, and this has made the situation worse.
Economic Impacts
In the short term, the outbreak is expected to create an increase in economic activity as dead trees are harvested before they decay and lose their commercial value. This short-term surplus of harvestable timber will be followed by a reduction in the cut as the outbreak runs its course and dead trees reach the end of their economic usefulness. The loss of future timber supply presents a challenge to the communities affected and the province as a whole. About 25 to 30 per cent of the province’s timber harvesting land base is pine. In large portions of the Interior region, pine makes up over 50 per cent of the harvestable timber.
Provincial Government Response
The province is committed to action that will mitigate the impacts of this unprecedented outbreak on BC’s forests, communities and the provincial economy in the short-term, and ensure sustainability of the forest resource in the long-term. This action is outlined in British Columbia’s Mountain Pine Beetle Action Plan 2005-2010 released earlier this year.
Map 2 - Mountain Pine Beetle Spread
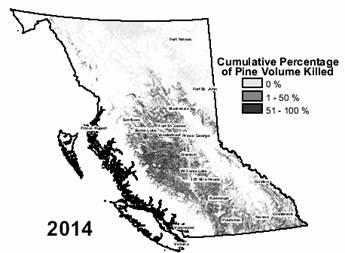
56
Consistent with the action plan, in the February 15 budget the province committed $101 million to address the mountain pine beetle outbreak. In 2004/05, $12 million was spent on reforestation initiatives in areas affected by the beetle as part of the Forests for Tomorrow program. This long-term, large-scale program will speed the recovery of forest from natural disasters. Over the next three years, the province will spend $89 million on various initiatives including:
• Economic diversification – the short term accelerated salvage of beetle killed pine provides an opportunity for communities and industries in the affected areas to benefit from diversification into other types of forest products manufacturing. Funding will be provided to take advantage of this opportunity through the development of forest roads to access damaged stands and to handle the increased flow of wood to mills and communities. Funding is also provided to establish a forest fertilization program to accelerate the growth rate of surviving stands towards replacing some of the wood supply lost to the beetle.
• Incremental manufacturing – this refers to tendering forest licences to utilize beetle infested wood in non-lumber products such as oriented strand board (OSB), pellets, bio fuels, power generation, fibre panels etc. So far, a number of licences are being considered for OSB mills and industrial pellets manufacturing plants.
• Reforestation – activities under the Forests for Tomorrow program are being implemented to reforest destroyed areas as quickly and efficiently as is economically viable.
Mountain Pine Beetle Response
($ millions) | | 2005/06 | | 2006/07 | | 2007/08 | | Total | |
September Update | | | | | | | | | |
Federal funding | | 27 | | 37 | | 36 | | 100 | |
February 15 budget | | | | | | | | | |
Provincial funding | �� | 31 | | 7 | | 51 | | 89 | |
Total | | 58 | | 44 | | 87 | | 189 | |
The province will also provide an additional $50 million in funding for the Northern Development Initiative in 2005/06, $30 million of which will be dedicated to help communities respond to the mountain pine beetle infestation.
Recognizing the seriousness of the situation, in March 2005, BC and Alberta agreed to work together and share costs in managing mountain pine beetle populations in BC’s Peace Forest District to minimize the potential for beetle infestations moving eastward into forested areas of Alberta. The provinces signed a 5-year renewable Memorandum of Agreement (MOA) to share a one-year cost of $1.65 million for beetle control and mitigation, with BC contributing approximately $900,000. BC will invest its share this winter in fall-and-burn management strategies and ongoing monitoring of attacked trees in the southern half of the Peace Forest District.
In addition to the province’s funding plan, BC received a commitment of $100 million from the federal government in March 2005 to help meet costs to combat the pine beetle spread and mitigate damage. Over the next three years the province plans to spend funds on community diversification and stability, spread control, fuel management, inventory planning and data collection, and research for new wood products. The province continues to work with First Nations, local communities and advisory boards to shape priorities and delivery. The province is also pursuing additional federal funding for these forestry initiatives in recognition of the impact of the mountain pine beetle on BC and the potential impact on the rest of Canada.
Mitigating the impacts of this unprecedented bark beetle outbreak will require a coordinated effort by governments and the forest industry in cooperation with communities, First Nations and others. Further information is provided on the government website at www.for.gov.bc.ca/ hfp/mountain_pine_beetle.
57
Provincial Debt and Capital Investments
Infrastructure is costly to build, operate and maintain, but it is long-lived and delivers benefits across generations. Today’s British Columbians are reaping the benefits of infrastructure investments made by their parents and grandparents. Infrastructure is clearly important to all British Columbians as it exists throughout the province to enable economic and social systems to work well.
Careful planning and budgeting is important so government can build new infrastructure, overhaul and update existing infrastructure, and avoid bottlenecks, so that the province is left in good order for future generations. Funding for infrastructure is mainly derived from government revenue. When revenues are not sufficient to offset the cost of its initiatives, government obtains financing from outside sources, mainly through debt issuances that are to be repaid on future dates.
Borrowing for operations may be required to meet other working capital requirements such as loans and advances, or changes in accounts receivable/payable. This type of debt (government direct operating debt) typically declines with surpluses. There is not a dollar for dollar relationship between changes in direct operating debt and the surplus because of changes in other balance sheet items, such as cash balances, loan receivables and other accounts receivables/payables.
Borrowing for capital projects finances the building of schools, hospitals, roads and other social and economic assets. As these investments provide essential services over several years, the government, like the private sector, borrows to fund these projects and amortizes the costs over the assets’ useful life.
Chart 1 shows that debt levels have risen sharply over the past decade mainly to finance deficits and capital spending. In 2004/05, a record surplus facilitated a $1.9 billion pay-down of debt. Although the government is forecasting continued operating surpluses that will be used to offset borrowing requirements, absolute debt levels will rise to finance capital projects through March 31, 2008.
Chart 1 Historical debt track
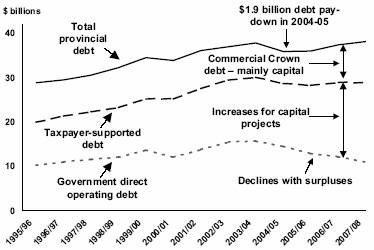
Reconciliation of surplus to change in debt
In general, the change in debt will not equal the surplus as:
• debt is required to finance capital spending in excess of non-cash amortization costs included in the surplus; and
• due to other working capital sources/requirements that represent changes in balance sheet items (such as cash balances, loan receivables and other accounts receivables/payables), but do not form part of the surplus.
Table 1 reconciles forecast surpluses with changes in debt. In the updated fiscal plan, debt rises despite expected surpluses mainly due to the impact of capital spending in excess of amortization, and higher commercial Crown corporation debt incurred for capital investments.
Table 1 Reconciliation of Surplus to Change in Total Provincial Debt
| | 2005/06 | | 2006/07 | | 2007/08 | |
Surplus before forecast allowance | | 1,600 | | 1,200 | | 1,300 | |
Taxpayer-supported capital spending | | (3,038 | ) | (2,938 | ) | (2,443 | ) |
Add back: non-cash amortization included in surplus | | 1,392 | | 1,420 | | 1,457 | |
Net increase in taxpayer-supported capital assets | | (1,646 | ) | (1,518 | ) | (986 | ) |
Other sources/(requirements) (eg: cash, accounts receivables/payables) | | 429 | | (314 | ) | (148 | ) |
Decrease/(increase) in taxpayer-supported debt | | 383 | | (632 | ) | 166 | |
Net increase in commercial Crown debt
(mainly for capital purposes) | | (167 | ) | (508 | ) | (549 | ) |
Increase in forecast allowance | | (300 | ) | (300 | ) | (300 | ) |
Annual increase in total provincial debt | | (84 | ) | (1,440 | ) | (683 | ) |
Financing capital investments
Significant capital investments are planned over the coming years to meet the transportation, health and education infrastructure needs
58
of a growing economy, and to replace and upgrade existing infrastructure. Financing for these capital investments is provided through a combination of sources:
• operating surpluses;
• cash balances;
• cost-sharing with partners (such as federal or municipal governments);
• partnerships with the private sector (public-private partnerships); and/or
• borrowing (debt-financing).
As shown in Chart 2, debt financing continues to represent a significant portion of financing for provincial capital spending, so the level of capital expenditures has a significant impact on projected provincial debt.
Chart 2 Taxpayer-supported capital financed through debt
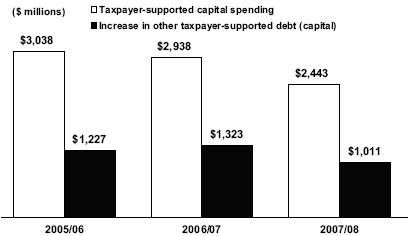
As the financial implications of capital infrastructure spending extend significantly beyond the three-year fiscal plan, government has established a long-term focus on both the need for, and affordability of, capital infrastructure spending.
To incorporate this long-term view into government’s fiscal planning and budgeting process, taxpayer-supported and self-supported government agencies have prepared 10-year capital forecasts that will help guide government decisions regarding capital spending priorities for the 2006/07 budget and beyond.
Government’s updated three-year capital plan, including priorities and financial information for 2006/07 to 2008/09, will be reflected in Budget 2006.
Debt remains affordable
With forecast surpluses, government direct operating debt (the debt resulting from cumulative historical deficits) is forecast to steadily decline over the next three years. Although capital investments will result in additional debt, they provide essential social and economic benefits and fit within the overall government strategic objective of lowering the taxpayer-supported debt to GDP ratio each year. This ensures that the necessary investments are made in an affordable, sustainable manner.
Chart 3 shows that the government direct operating debt, taxpayer-supported debt and total provincial debt to GDP ratios decline over the three-year plan and that the debt burden remains affordable.
Chart 3 Debt remains affordable
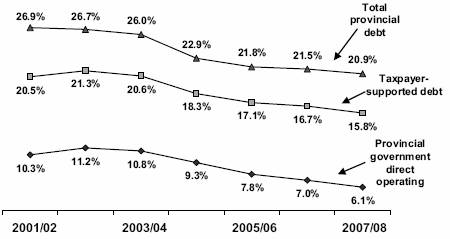
Looking forward
Government will continue its focus on effective and affordable debt management through the following measures:
1. Continued use of surpluses to reduce borrowing requirements and debt.
2. Continued use of forecast allowances and the contingency vote to ensure that fiscal targets are met.
3. Review of cash management practices to minimize the need for borrowing.
4. On-going review and diligent management of capital spending to ensure the appropriate utilization of capital resources, and to establish a sustainable relationship between operating and capital budgets.
59
Oil and Gas Prices
Increases in crude oil and natural gas prices have generated some substitution to other energy sources – like coal or electricity – but not all consumers can easily or efficiently switch. Coal and electricity prices have also increased over the last three years, influenced by the interdependence among energy sources. For example, as an increasing amount of electricity supply is generated from natural gas fired plants, electricity prices will be influenced by natural gas price swings.
The impacts of Hurricane Katrina on the medium-term outlook for energy prices and North American economic growth are uncertain. Due to the massive disruption in production, refining and distribution, oil and natural gas prices can be expected to remain high and volatile in the short-term. The duration of restricted supplies and higher prices depends on how quickly the damaged infrastructure can be repaired or replaced. The natural gas price forecast underlying the September Update natural gas royalty projections was prepared in late July and therefore does not include any effects on prices and markets due to Hurricane Katrina.
Natural gas prices are forecast to average over C$6.00 per gigajoule (plant inlet) in the three-year plan.
Government revenue from energy and mineral sources is forecast to be about $2.8 billion annually in the 2005/06 to 2007/08 period as the forecast assumes continued tight supply and strong demand, resulting in higher prices over the forecast horizon.
BC royalty revenues are very sensitive to natural gas prices. A price change of C$0.50 per gigajoule results in a $130 million to $170 million revenue change. The Ministry of Energy and Mines uses private and public organizations as well as internal analysis to forecast natural gas prices. As shown in the attached table, BC’s royalty price forecast is based on averages of private sector forecasts, adjusted for:
• conversion from market hub to Canadian dollars per gigajoule at plant inlet; and
• conversion from calendar year basis to fiscal year basis.
The ministry’s forecast is selected to be in line with these averages.
Natural Gas Price Forecasts
| | | | | | | | Adjusted to fiscal years and | |
| | | | | | | | $C/gigajoule at plant inlet | |
Private sector forecasts (calendar year) | | 2005 | | 2006 | | 2007 | | 2005/06 | | 2006/07 | | 2007/08 | |
GLJ HH US$/MMBtu (Jul 05) | | 7.00 | | 7.25 | | 6.80 | | 6.79 | | 6.30 | | 5.82 | |
Sproule HH US$/MMBtu (Jul 05) | | 7.00 | | 7.76 | | 7.05 | | 7.04 | | 6.80 | | 5.95 | |
GLJ Alberta AECO-C Spot CDN$/MMBtu (Jul 05) | | 7.40 | | 7.75 | | 7.35 | | 6.95 | | 6.69 | | 6.35 | |
Sproule Alberta AECO-C Spot CDN$/MMBtu (Jul 05) | | 7.60 | | 8.42 | | 7.55 | | 7.28 | | 7.20 | | 6.36 | |
GLJ Sumas Spot US$/MMBtu (Jul 05) | | 6.15 | | 6.55 | | 6.20 | | 6.65 | | 6.35 | | 6.00 | |
Sproule Sumas Spot CDN$/MMBtu (Jul 05) | | 7.72 | | 8.58 | | 7.81 | | 6.97 | | 6.93 | | 6.16 | |
GLJ BC Spot Plant Gate CDN$/MMBtu (Jul 05) | | 7.10 | | 7.50 | | 7.10 | | 6.61 | | 6.41 | | 6.07 | |
Sproule BC Plant Inlet CDN$/MMBtu (Jul 05) | | 6.93 | | 7.82 | | 7.05 | | 7.11 | | 7.21 | | 6.43 | |
GLJ Midwest Chicago US$/MMBtu (Jul 05) | | 6.90 | | 7.35 | | 6.95 | | 6.92 | | 6.57 | | 6.12 | |
Sproule Alliance Plant Gate CDN$/MMBtu (Jul 05) | | 7.26 | | 8.12 | | 7.25 | | 6.95 | | 6.92 | | 6.08 | |
EIA US$/MMBtu Henry Hub (Jul 05) | | 7.21 | | 7.41 | | — | | 6.80 | | 5.99 | | — | |
TD Economics HH FuturesUS$/MMBtu (Jun 05) | | 6.53 | | 6.19 | | — | | 5.93 | | 4.94 | | — | |
Scotiabank Group HH US$/MMBtu (Jun 05) | | 6.65 | | 6.10 | | — | | 6.04 | | 4.84 | | — | |
BMO Alberta Empress US$/MMBtu (Jun 05) | | 5.90 | | 5.50 | | — | | 6.28 | | 5.30 | | — | |
RBC Financial Group HH US$/MMBtu (Jun 05) | | 6.62 | | — | | — | | 5.96 | | — | | — | |
Exports Development Canada HH US$/MMBtu (May 05) | | 5.75 | | 5.50 | | — | | 4.80 | | 4.19 | | — | |
NYMEX Forward Market converted to Plant Inlet CDN$/GJ (Jul 05) | | | | | | | | 7.54 | | 7.56 | | 7.04 | |
Average all minus high/low | | | | | | | | 6.64 | | 6.25 | | 6.14 | |
Average one forecast per consultant minus high/low | | | | | | | | 6.38 | | 5.72 | | 6.08 | |
Natural Gas Royalty Price Forecast | | | | | | | | 6.51 | | 6.15 | | 6.11 | |
GLJ: Gilbert Laustsen Jung Associates Ltd | | US EIA: Energy Information Administration |
60
Part 2: REVENUE MEASURES
Table 2.1 Summary of Revenue Measures
| | Effective | | Taxpayer Impacts | |
| | Date | | 2005/06 | | 2006/07 | |
| | | | ($ millions) | |
September Update | | | | | | | |
| | | | | | | |
Income Tax Act | | | | | | | |
• | Reduce the general corporate income tax rate to 12 per cent from 13.5 per cent | | July 1, 2005 | | (71 | ) | (143 | ) |
| | | | | | | | |
International Financial Activity Act | | | | | | | |
• | Provide tax refunds for the commercialization of life science related patents | | January 1, 2006 | | — | | (20 | ) |
| | | | | | | | |
February 15, 2005 Budget (1) | | | | | | | |
| | | | | | | |
Income Tax Act | | | | | | | |
• | Introduce the BC Tax Reduction, a non-refundable personal income tax credit | | January 1, 2005 | | (120 | ) | (122 | ) |
• | Extend the Mining Exploration Tax Credit to 2016 | | August 1, 2006 | | — | | — | |
• | Increase the Film Incentive BC and Production Services tax credit rates | | January 1, 2005 | | (30 | ) | (8 | ) |
• | Increase corporate income tax small business threshold to $400,000 from $300,000 | | January 1, 2005 | | (10 | ) | (10 | ) |
| | | | | | | | |
Social Service Tax Act | | | | | | | |
• | Reduce provincial sales tax rate to 7 per cent from 7.5 per cent | | October 21, 2004 | | (270 | ) | (270 | ) |
• | Increase incentive for purchases of hybrid passenger vehicles on a time-limited basis | | February 16, 2005 | | (1 | ) | (2 | ) |
• | Provide time-limited exemption for ENERGY STAR residential heating equipment | | February 16, 2005 | | (2 | ) | (2 | ) |
• | Increase vehicle surtax threshold for passenger vehicles to $49,000 from $47,000 | | February 16, 2005 | | (5 | ) | (5 | ) |
| | | | | | | | |
Property Transfer Tax Act | | | | | | | |
• | Increase thresholds for First Time Home Buyers’ exemption | | February 16, 2005 | | (15 | ) | (15 | ) |
| | | | | | | | |
Medicare Protection Act | | | | | | | |
• | Enhance Medical Services Plan premium assistance (2) | | July 1, 2005 | | (30 | ) | (40 | ) |
| | | | | | | | |
Home Owner Grant Act | | | | | | | |
• | Increase threshold for Home Owner Grant phase-out and reduce phase out rate | | 2005 tax year | | (3 | ) | (3 | ) |
| | | | | | | | |
School Act | | | | | | | |
• | Exempt specified improvements of eligible hydroelectric projects | | 2005 tax year | | (1 | ) | (1 | ) |
| Total | | | | (558 | ) | (641 | ) |
(1) | Legislation implementing these measures was passed during the spring 2005 Legislative session. |
(2) | The province was able to implement this change effective July 1, 2005 rather than August 1, 2005 as originally announced in the February 2005 budget. |
61
Revenue Measures — Supplementary Information
For more details on tax changes see Ministry of Small Business and Revenue website at:
www.sbr.gov.bc.ca/budget/budget.htm
September Update
Income Tax Act | |
| |
| General Corporate Income Tax Rate |
| |
| Effective July 1, 2005, the general corporate income tax rate is reduced to 12 per cent from 13.5 per cent. The general corporate income tax rate applies to investment income, income of public and non-Canadian-controlled private corporations, income of Canadian-controlled private corporations with paid up capital in excess of $10 million and active business income of Canadian-controlled private corporations in excess of $400,000. |
| |
International Financial Activity Act |
| |
| Tax Refunds for the Commercialization of Life Science Related Patents |
| |
| As announced on July 20, 2005, the International Financial Activity (IFA) program is expanded effective January 1, 2006, to include refunds of provincial corporate income taxes on income from the commercialization of intellectual property in the form of life science related patents. |
| |
| The IFA provides refunds of corporate income taxes paid on eligible income from international financial activities. Eligible corporations must be incorporated in Canada, have a permanent establishment in BC, and be registered with the International Financial Centre British Columbia Society. This program is expanded to include a partial refund of corporate income tax paid on income from the international commercialization of life science related patents. |
| |
| Life sciences encompass all living organisms and their surrounding ecosystems. As such, life science related patents include inventions that have a living or biological component, certain medical devices as well as methods for investigating or analyzing living matter. The key sectors of the economy that develop life science patents are biomedicine, forestry, agriculture, ocean sciences and mining. |
| |
| The IFA refund for the commercialization of life science related patents is limited to 75 per cent of corporate income tax paid up to a maximum of $8 million per year per taxpayer or associated group of taxpayers. In any one taxation year, corporations can claim a refund for the commercialization of patents, or a refund for their other international financial activities, but not both. |
62
February 15, 2005 Budget |
| |
Income Tax Act | |
| |
| BC Tax Reduction |
| |
| Effective for the 2005 taxation year a non-refundable personal income tax credit is introduced. The BC Tax Reduction is targeted to low and modest income taxpayers and will be calculated as $360 less 3.6 per cent of net income in excess of $16,000. The credit is used to reduce BC personal income taxes payable and will benefit taxpayers with net incomes of $26,000 or less in 2005. The total personal income taxes paid by BC residents at different income levels are shown in Table 2.2. |
| |
Table 2.2 | Interprovincial Comparisons of Provincial Personal Income Taxes Payable(1) – 2005
(Rates known as of September 1, 2005) |
| | |
| | | | | | | | | | | | | | | | | | Prince | | | |
| | British | | | | Saskat- | | | | | | | | New | | Nova | | Edward | | New- | |
Taxable income (2) | | Columbia(2) | | Alberta | | chewan | | Manitoba | | Ontario | | Quebec(3) | | Brunswick | | Scotia | | Island | | foundland | |
| | Annual provincial taxes payable (4) ($) | |
| | | | | | | | | | | | | | | | | | | | | |
$ | 10,000 | | 0 | | 0 | | 119 | | 77 | | 0 | | (35 | ) | 154 | | 0 | | 0 | | 219 | |
$ | 20,000 | | 396 | | 427 | | 1,143 | | 1,191 | | 641 | | 898 | | 1,056 | | 966 | | 1,115 | | 1,203 | |
$ | 30,000 | | 1,175 | | 1,358 | | 2,167 | | 2,231 | | 1,504 | | 2,450 | | 1,957 | | 1,858 | | 2,028 | | 2,210 | |
$ | 50,000 | | 2,867 | | 3,286 | | 4,552 | | 4,935 | | 3,466 | | 5,940 | | 4,710 | | 4,713 | | 4,687 | | 5,366 | |
$ | 80,000 | | 6,047 | | 6,286 | | 8,452 | | 9,645 | | 7,309 | | 11,972 | | 9,403 | | 9,523 | | 9,779 | | 10,922 | |
(1) | Calculated for a single individual with wage income and claiming credits for Canada Pension Plan and Quebec Pension Plan contributions, Employment Insurance premiums and the basic personal amount. |
(2) | Taxable income, total income less allowable deductions, is defined by federal legislation in all provinces except Quebec. In the table, it is assumed that federally defined taxable income is equal to Quebec taxable income. |
(3) | Quebec residents pay federal tax less an abatement of 16.5 per cent of federal tax. In the table, the Quebec abatement has been used to reduce Quebec provincial personal income tax for comparative purposes. |
(4) | Includes provincial low income reductions in British Columbia, Manitoba, Ontario, Nova Scotia and Prince Edward Island, provincial surtaxes payable in Ontario, Nova Scotia, Prince Edward Island and Newfoundland and contributions to the Health Services Fund in Quebec. Excludes credits for sales and property taxes. |
| The BC Tax Reduction will reduce or eliminate taxes for about 730,000 BC taxpayers at a cost of $120 million in 2005. The maximum credit of $360 and the $16,000 net income threshold will be indexed to provincial inflation starting in 2006. |
| |
| Table 2.3 BC Tax Reduction – 2005 Tax Year* |
| |
| Income | | BC tax before credit | | Maximum credit | | Net BC tax | | |
| $ | 9,000 | | $ | 0 | | $ | 360 | | $ | 0 | | |
| $ | 12,000 | | $ | 161 | | $ | 360 | | $ | 0 | | |
| $ | 16,000 | | $ | 387 | | $ | 360 | | $ | 27 | | |
| $ | 20,000 | | $ | 612 | | $ | 216 | | $ | 396 | | |
| $ | 24,000 | | $ | 837 | | $ | 72 | | $ | 765 | | |
| $ | 26,000 | | $ | 950 | | $ | 0 | | $ | 950 | | |
| * Calculated for a single taxpayer with wage income, no deductions and claiming the basic personal credit and credits for Canada Pension Plan contributions and Employment Insurance premiums only. |
63
| Mining Exploration Tax Credit |
| |
| The Mining Exploration Tax Credit is extended for an additional ten years to 2016. The credit is available to both individuals and corporations that undertake mining exploration in the province. The credit is calculated as 20 per cent of eligible BC mining exploration expenditures. The credit was scheduled to expire in August 2006 but will be extended to December 31, 2016. |
| |
| Film Incentive BC and Production Services Tax Credits |
| |
| As announced on January 20, 2005, the province’s tax credit rates for film and television productions are increased effective January 1, 2005 to March 31, 2006. The basic Film Incentive BC tax credit rate is increased to 30 per cent from 20 per cent and the basic Production Services Tax Credit is increased to 18 per cent from 11 per cent. |
| |
| The higher rates will apply to productions that start principal photography in the period from January 1, 2005 to March 31, 2006. Pre-production costs incurred prior to January 1, 2005 are not eligible for the higher rates. |
| |
| For productions that consist of episodes of a Canadian television series that are eligible for the basic Film Incentive BC tax credit, the 30 per cent rate will apply to each episode of the production where principal photography of that episode begins after January 1, 2005. In addition, for productions that start principal photography before April 2006 and conclude filming after March 31, 2006, transition rules will apply. |
| |
| Small Business Threshold |
| |
| The maximum amount of taxable income to which the small business corporate income tax rate may be applied, or the “business limit”, is increased to $400,000 from $300,000 effective January 1, 2005. |
| |
| Corporations will pro-rate their business limits based on the number of days in the taxation year before and after January 1, 2005. When allocating the business limit among associated corporations, the provincial business limit will continue to be allocated in the same proportion as the federal business limit. |
| |
Social Service Tax Act |
| |
| Provincial Sales Tax Rate |
| |
| The provincial sales tax rate was reduced to 7 per cent from 7.5 per cent effective October 21, 2004. |
| |
| Alternative Fuel Vehicles |
| |
| Effective February 16, 2005, provincial sales tax relief for qualifying alternative fuel vehicles will be provided as a point of sale tax reduction rather than a refund. In addition, changes have been made to: |
| |
| • the definition of “hybrid electric vehicle”; and |
| |
| • the amount of sales tax relief. |
64
| New Definition of Hybrid Electric Vehicle |
| |
| The definition of “hybrid electric vehicle” is expanded to reflect technological developments. To qualify under the new definition the motor vehicle must be manufactured with both an internal combustion engine and an electric motor and must be: |
| |
| • capable of being propelled simultaneously by both the electric motor and the internal combustion engine, or solely by the electric motor operating on electricity generated by the internal combustion engine; |
| |
| • designed to automatically shut off the internal combustion engine when idling, braking or coasting (commonly referred to as “idle stop”); and |
| |
| • designed to capture and store electricity generated during braking (referred to as “regenerative braking”). |
| |
| Amount and Calculation of Tax Reductions |
| |
| Existing provincial sales tax relief for alternative fuel vehicles is enhanced and the maximum benefit for hybrid passenger vehicles is increased on a temporary basis. |
| |
| Under the previous refund program, refunds were calculated as 30 per cent of sales tax paid up to a maximum of $1,000, $5,000, or $10,000 depending on whether the vehicle was a passenger vehicle, a shuttle bus, or a passenger bus. Under the new program: |
| |
| • Hybrid electric passenger vehicles are eligible for a 100 per cent reduction of sales tax up to a maximum of $2,000 from February 16, 2005 to March 31, 2008; the maximum tax relief is reduced to $1000 from April 1, 2008 to March 31, 2009 and is eliminated after March 31, 2009; |
| |
| • Alternative fuel vehicles that are not hybrid electric passenger vehicles, passenger buses or shuttle buses, are eligible for a tax reduction of 50 per cent of the sales tax payable to a maximum of $1,000; |
| |
| • Shuttle buses are eligible for a tax reduction of 50 per cent of sales tax payable to a maximum of $5,000; and |
| |
| • Passenger buses are eligible for a tax reduction of 50 per cent of sales tax payable to a maximum of $10,000. |
| |
| The tax reductions for alternative fuel vehicles other than hybrid electric passenger vehicles are not phased out. |
| |
| Energy Efficient Residential Heating Equipment Exemption |
| |
| Effective from February 16, 2005 until March 31, 2007, the following heating equipment is exempt from provincial sales tax when purchased or leased for residential purposes: |
| |
| • Gas fired forced-air furnaces, boilers, air-source heat pumps and ground source heat pumps that are listed as being “ENERGY STAR Qualified” by the Office of Energy Efficiency, Natural Resources Canada; and |
65
• Oil-fired forced-air furnaces that have a Seasonal Energy Utilization Efficiency rating (SEUE) of at least 85 per cent as established under the federal Energy Efficiency Act.
To be designated as “ENERGY STAR Qualified”, products must meet or exceed technical specifications designed to ensure that they are among the most energy efficient in the marketplace.
Vehicle Surtax Thresholds for Passenger Vehicles Increased
Effective February 16, 2005, the threshold for the surtax on passenger vehicles is increased from $47,000 to $49,000. Tax rates will apply as follows:
• 7 per cent on passenger vehicles valued at less than $49,000;
• 8 per cent on passenger vehicles valued at $49,000 or more, but less than $50,000;
• 9 per cent on passenger vehicles valued at $50,000 or more, but less than $51,000; and
• 10 per cent on passenger vehicles valued at $51,000 or more.
The new thresholds apply to all passenger vehicles purchased after February 15, 2005. For leased passenger vehicles, the new vehicle surtax thresholds apply to the first lease payment due after February 15, 2005.
Property Transfer Tax Act
Fair Market Value Threshold for Eligibility under the First-Time Home Buyers’ Exemption Program
Effective for registrations after February 15, 2005, the fair market value threshold for eligible residential property under the First-Time Home Buyers’ exemption program is increased by about 18 per cent to $325,000 from $275,000 in the Greater Vancouver Regional District, the Capital Regional District and the Fraser Valley Regional District and to $265,000 from $225,000 in the rest of the province. A proportional exemption is provided for residences that have a fair market value up to $25,000 above the new thresholds.
Effective for registrations after February 15, 2005 the mortgage pay down limits are increased. The pay down limit is the maximum that a mortgage can be paid down in the first year without losing eligibility for the First-Time Home Buyers’ Exemption. The limit is calculated as the greater of the amount required to pay the mortgage down to 70 per cent of fair market value or a specified amount. For qualifying properties in the Capital Regional District, the Greater Vancouver Regional District and the Fraser Valley Regional District the specified amount is increased to $13,000 from $11,000. For other parts of British Columbia the amount is increased to $10,600 from $9,000.
66
Medicare Protection Act
Medical Services Plan Premium Assistance
Effective July 1, 2005, the Medical Services Plan premium assistance program is enhanced to reduce or eliminate monthly premiums for about 215,000 people. The changes will reduce premium revenue by $40 million annually. (The province was able to implement this measure one month earlier than the planned date of August 1, 2005 as announced in the February 2005 budget.)
Premium assistance is enhanced by increasing the adjusted net family income thresholds by $4,000 each (see Table 2.4).
Table 2.4 Medical Service Plan Premium Assistance Changes
(Effective July 1, 2005)
| | Per cent of | | | | | |
Level of | | premiums | | Adjusted net family income range* | |
assistance | | payable | | Before changes | | After changes | |
1 | | 0 | | $16,000 or less | | $20,000 or less | |
2 | | 20 | | $16,001 to $18,000 | | $20,001 to $22,000 | |
3 | | 40 | | $18,001 to $20,000 | | $22,001 to $24,000 | |
4 | | 60 | | $20,001 to $22,000 | | $24,001 to $26,000 | |
5 | | 80 | | $22,001 to $24,000 | | $26,001 to $28,000 | |
* Adjusted net family income is used to determine the level of assistance and is defined as net income from an applicant’s (and spouse’s) income tax return, less $3,000, for each dependant (reduced by child care expenses claimed), $3,000 for each person in the family over age 65 and $3,000 for each person in the family who is disabled.
Table 2.5 shows the impact of these changes for a single person, a senior couple and a family of four at various income levels. For example, the adjusted net income of a senior couple with $34,000 annual income is $25,000. This couple will be eligible for the 60 per cent level of assistance and pay monthly premiums of $57.60 per month, or $691.20 annually; a reduction of $460.80 per year.
Home Owner Grant Act
Increase in Threshold for Home Owner Grant Phase-out
Effective for the 2005 tax year, the threshold for the phase-out of the home owner grant is increased to $685,000 from $585,000. For properties with assessed values exceeding the threshold amount, the home owner grant will be phased out. Effective for the 2005 tax year, the rate at which the grant is phased out is reduced to $5 from $10 for each $1,000 of assessed value above the threshold. Recipients of the basic home owner grant will continue to receive some grant for properties with values up to $779,000. For seniors and other home owners receiving the additional grant a partial grant will be available for properties with values up to $834,000.
The increase to the threshold will, on average, offset the increase of sharply rising assessed values on higher-priced properties over the past year. As was the case last year, approximately 95.5 per cent of eligible homeowners will receive the full home owner grant.
67
| Table 2.5 Examples of Medical Service Plan Premium Changes | |
(Effective July 1, 2005)
| | Annual | | Annual | | | |
| | premiums | | premiums | | | |
| | before | | after | | | |
Annual net family income | | changes | | changes | | (Decrease) | |
| | | | | | | |
Single | | | | | | | |
$16,000 or less | | $ | 0.00 | | $ | 0.00 | | $ | 0.00 | |
$16,001 to $18,000 | | $ | 129.60 | | $ | 0.00 | | $ | (129.60 | ) |
$18,001 to $20,000 | | $ | 259.20 | | $ | 0.00 | | $ | (259.20 | ) |
$20,001 to $22,000 | | $ | 388.80 | | $ | 129.60 | | $ | (259.20 | ) |
$22,001 to $24,000 | | $ | 518.40 | | $ | 259.20 | | $ | (259.20 | ) |
$24,001 to $26,000 | | $ | 648.00 | | $ | 388.80 | | $ | (259.20 | ) |
$26,001 to $28,000 | | $ | 648.00 | | $ | 518.40 | | $ | (129.60 | ) |
Over $28,000 | | $ | 648.00 | | $ | 648.00 | | $ | 0.00 | |
Senior Couple | | | | | | | |
$25,000 or less | | $ | 0.00 | | $ | 0.00 | | $ | 0.00 | |
$25,001 to $27,000 | | $ | 230.40 | | $ | 0.00 | | $ | (230.40 | ) |
$27,001 to $29,000 | | $ | 460.80 | | $ | 0.00 | | $ | (460.80 | ) |
$29,001 to $31,000 | | $ | 691.20 | | $ | 230.40 | | $ | (460.80 | ) |
$31,001 to $33,000 | | $ | 921.60 | | $ | 460.80 | | $ | (460.80 | ) |
$33,001 to $35,000 | | $ | 1,152.00 | | $ | 691.20 | | $ | (460.80 | ) |
$35,001 to $37,000 | | $ | 1,152.00 | | $ | 921.60 | | $ | (230.40 | ) |
Over $37,000 | | $ | 1,152.00 | | $ | 1,152.00 | | $ | 0.00 | |
Family of Four | | | | | | | |
$25,000 or less | | $ | 0.00 | | $ | 0.00 | | $ | 0.00 | |
$25,001 to $27,000 | | $ | 259.20 | | $ | 0.00 | | (259.20 | ) |
$27,001 to $29,000 | | $ | 518.40 | | $ | 0.00 | | (518.40 | ) |
$29,001 to $31,000 | | $ | 777.60 | | $ | 259.20 | | (518.40 | ) |
$31,001 to $33,000 | | $ | 1,036.80 | | $ | 518.40 | | (518.40 | ) |
$33,001 to $35,000 | | $ | 1,296.00 | | $ | 777.60 | | (518.40 | ) |
$35,001 to $37,000 | | $ | 1,296.00 | | $ | 1,036.80 | | (259.20 | ) |
Over $37,000 | | $ | 1,296.00 | | $ | 1,296.00 | | $ | 0.00 | |
School Act
School Tax Exemption for Alternative Energy Power Projects
Effective for the 2005 tax year, government is introducing an exemption from school tax for specified improvements of eligible hydroelectric projects that first began production after December 31, 2001.
Run-of-river projects that have long-term energy purchase agreements with BC Hydro signed before January 1, 2005 are eligible for the exemption. Run-of-river projects that do not have long-term energy purchase agreements with BC Hydro and hydroelectric storage projects are eligible for the exemption if they are certified to use the Ecologo trademark under the federal Environmental Choice Program.
For projects requiring Ecologo certification to qualify for the exemption, a refund of school tax paid on the qualifying improvements is available for the three years prior to the first year they become exempt.
The exemption is for intake facilities, including trash racks, penstocks and their foundations and support structures, tunnels and tunnel linings. Weirs are exempt when part of a run-of-river project. Dams do not qualify for the exemption.
68
Table 2.6 Summary of Administrative Measures (1)
| | Effective |
| | Date |
Income Tax Act | | |
• | Replace medical expense notch provision for expenses claimed for dependants | | January 1, 2004 |
• | Clarify that the determination of a refundable tax credit constitutes an assessment | | January 1, 2000 |
• | Confirm practice of not charging taxpayers interest when account is paid on time and parallel federal Act regarding a series of transactions for anti-avoidance purposes | | July 1, 2003 and
Royal Assent |
• | Ensure that penalties can apply to false claims and omissions when claiming tax credits | | October 1, 2002 |
• | Limit the foreign tax credit that can be claimed by corporations | | January 1, 2006 |
• | Exclude expenses incurred for purposes of the BC Mining Flow-through Share Tax Credit from eligible expenses for purposes of the Mining Exploration Tax Credit | | January 1, 2005 |
| | |
Corporation Capital Tax Act | | |
• | Require financial corporations to retain records for specified time | | Royal Assent |
• | Add a definition of salaries and wages for determining paid up capital of financial corporations allocated to other jurisdictions | | February 16, 2005 |
• | Require financial corporations to have the same year end when claiming an investment allowance | | April 1, 2005 |
| | |
Social Service Tax Act | | |
• | Provide additional exemptions for bona fideaquaculturists | | February 16, 2005 |
• | Provide additional exemptions for bona fidefarmers | | February 16, 2005 |
• | Expand exemption for safety helmets | | February 16, 2005 |
• | Increase maximum price for self-contained smoke alarms | | February 16, 2005 |
• | Expand exemption for penstock piping and related equipment | | February 16, 2005 |
• | Require remittance of all amounts collected as tire and battery levies | | February 16, 2005 |
• | Provide exemption for recordings of moving picture and audio productions when used for specified purposes | | August 1, 1996 and
February 16, 2005 |
| | |
Motor Fuel Tax Act | | |
• | Improve the enforcement of coloured fuel use | | February 16, 2005 |
• | Clarify coloured fuel use authorized in all unlicensed farm vehicles for farming purposes | | February 16, 2005 |
| | |
Tobacco Tax Act | | |
• | Provide authority to seize stolen product | | Royal Assent |
• | Revise the definition of “package” | | February 16, 2005 |
| | |
School Act | | |
• | Based on the provincial residential property tax rate formula, set rate so that the tax on the average home increases by the provincial rate of inflation | | January 1, 2005 |
• | Rates adjusted so that the change in total non-residential school tax revenue is limited to inflation plus new construction | | January 1, 2005 |
| | |
Taxation (Rural Area) Act | | |
• | Reduce the rural non-residential property tax rate so that the change in total non-residential rural area tax revenue is limited to inflation plus new construction | | January 1, 2005 |
| | |
Insurance Premium Tax Act | | |
• | Introduce an exemption for out-of-province non-profit health insurers | | January 1, 1997 |
• | Provide authority to inspect tax related records | | Royal Assent |
• | Clarify the definition of taxpayer | | Royal Assent |
• | Provide an exemption for real estate insurance organizations | | September 15, 1990 |
| | |
International Financial Activity Act | | |
• | Clarify that registration date and registration refusal can be appealed | | September 1, 2004 |
• | Change the international financial centre society’s name | | Royal Assent |
| | |
Hotel Room Tax | | |
• | Provide an exemption for industrial camps | | February 16, 2005 |
| | |
Health Authorities Act | | |
• | Clarify property tax exemptions for public hospitals and public-private partnerships | | Royal Assent |
(1) Legislation implementing these measures was passed during the spring 2005 Legislative session.
69
Administrative Measures — Supplementary Information
For more details on tax changes see Ministry of Small Business and Revenue website at:
www.sbr.gov.bc.ca/budget/budget.htm
Income Tax Act
Medical Expense Tax Credit
Effective for the 2004 taxation year, changes are made to the medical expense tax credit to allow more expenses that are incurred on behalf of dependants to be claimed. These changes parallel similar ones made to the federal medical expense tax credit in 2004.
Medical expenses paid for dependent relatives (e.g., child, grandparent, niece, nephew, etc.) have been subject to “notch” provisions. That is, the expenses were reduced if they exceeded the basic personal credit amount.
Under the new provisions:
• Medical expenses made on behalf of minor children will be pooled with the medical expenses of the taxpayer and his or her spouse or common-law partner, subject to the taxpayer’s minimum expense threshold (the lesser of three per cent of the taxpayer’s net income and $1,722 for 2004), without regard to the income of the minor child.
• For medical expenses paid on behalf of other dependent relatives, taxpayers will be able to claim qualifying medical expenses paid on behalf of such a dependant that exceed the lesser of 3 per cent of the dependant’s net income and $1,722 (that is, the threshold for the credit that would apply if the dependant claimed the expenses on their own). The maximum eligible amount that can be claimed on behalf of each dependent relative other than minor children will be $5,000.
Assessments
The Act is amended to clarify that the determination of refundable tax credits constitutes an assessment of income tax. This amendment is required because the date of assessment is used to determine various timeframes under the Act, such as statue-barring dates, interest and penalties, and the filing of notices of objections or appeals.
Measures to Harmonize with Federal Act
Effective July 1, 2003, the Act is amended to confirm the existing practice to not charge taxpayers interest if their account is paid in full by the date specified in their notice. In addition, the Act is amended to parallel the federal Income Tax Act regarding a series of transactions for purposes of the province’s anti-avoidance provision.
Refundable Taxes
The Act is amended to ensure that penalties may apply to various provincial refundable tax credits. In particular, the amendments will ensure that penalties
70
can apply to persons who knowingly make false statements or omissions when claiming tax credits, or who claim a refund to which they are not entitled.
Limit the Foreign Tax Credit
Both the federal and provincial governments provide a corporate foreign tax credit on income taxes paid to foreign jurisdictions on non-business income earned in the year. The provincial foreign tax credit is computed on a country-by-country basis and is limited to the foreign income taxes paid in excess of the federal foreign tax credit deducted for that year.
The Act is amended to ensure that a corporation is deemed to have claimed the maximum federal foreign tax credit per country before a provincial foreign tax credit is allowed. The amendments remove the unintended result that would allow a corporation to reduce its provincial taxes before claiming a full federal credit. This change is consistent with the treatment of foreign taxes paid by individuals. The change is made applicable for corporate taxation years beginning on or after January 1, 2006.
Mining Exploration Tax Credit
British Columbia has two tax credit programs to support mining exploration in the province, the Mining Exploration Tax Credit and the BC Mining Flow-Through Share Tax Credit. Both programs allow a tax credit based on specific exploration expenses incurred. The BC Mining Flow-Through Share Tax Credit is harmonized with an equivalent federal program.
In 2004, the province and the federal government announced extensions to their mining flow-through share tax credit programs to December 31, 2005. As a result of the extension to the federal and provincial programs, the definition of excluded expenses in the Mining Exploration Tax Credit program is updated to exclude expenses incurred and claimed for purposes of the mining flow-through share tax credit programs.
Corporation Capital Tax Act
Retention of Records
The Corporation Capital Tax Act is amended to clarify how long a financial corporation must retain its records. A financial corporation will be required to keep records related to, or relevant to, a taxation year for the later of:
• 7 years after the delivery of the return;
• during the period a waiver is in effect;
• 9 months after revoking a waiver; and
• until all appeals have been exhausted.
These requirements are consistent with those of other provincial taxation statutes.
71
Definition of Salaries and Wages
For purposes of determining the net paid up capital of a bank or credit union allocated to jurisdictions outside BC, a formula comprising salaries and wages and loans and deposits is used. A definition of salaries and wages is added to ensure consistency with the definitions used in other jurisdictions.
Investment Allowance
The Corporation Capital Tax Act provides an investment allowance deduction for financial corporations that own shares in another financial corporation that has a permanent establishment in BC. The Act is amended to limit the investment allowance deduction to shares in a financial corporation only if that corporation has the same taxation year-end as the financial corporation claiming the deduction.
Social Service Tax Act
Bona Fide Aquaculturists
Effective February 16, 2005:
• pearl nets, mussel socking and other netting used for shellfish seed and grow outs are added to the list of items that can be purchased or leased exempt from provincial sales tax by bona fide aquaculturists for an aquaculture purpose; and
• the maximum length of boats that may be purchased exempt by bona fide aquaculturists for an aquaculture purpose is increased from 11 metres to 20 metres.
Bona Fide Farmers
Effective February 16, 2005, the following are added to the list of items that can be purchased or leased exempt from provincial sales tax by bona fide farmers for a farm purpose:
• disinfectant mats; and
• tapeners (hand-held devices used to attach plants to plant supports).
Safety Equipment Exemption Expanded
Safety Helmets
Effective February 16, 2005, the exemption for safety helmets is expanded to include all safety helmets for use in sport, recreation and transportation. Previously, the exemption applied only to bicycle helmets, motorcycle helmets and work related safety helmets and caps, which included helmets for professional sport. With the expansion of the exemption, all safety helmets, including skateboarding, snowboarding, baseball, hockey and boxing helmets, are exempt.
72
Smoke and Fire Alarms
Effective February 16, 2005, the exemption for self-contained smoke and fire alarms for residential use is amended to increase the qualifying per unit price from $50 to $250.
Exemption for Penstock Systems Expanded
Effective February 16, 2005, the provincial sales tax exemption for penstock piping and related equipment is expanded to include penstock and related equipment for any hydroelectric power generating facility that is validly licensed under the Water Act.
Previously, penstock was exempt in either of two ways – as machinery or equipment if located on a hydroelectric manufacturing site, or because it was part of a run-of-river hydroelectric facility that held a valid water license for power production purposes under the Water Act. The expansion of the exemption means it will now apply to hydroelectric storage projects where the penstock is located, in part, outside of the manufacturing site, provided the facility has a valid power production license under the Water Act.
The expanded exemption is effective for purchases of penstock and related equipment made after February 15, 2005.
Environmental Levies
Effective February 16, 2005, the Act is amended to require all amounts collected as environmental levies on tires and batteries to be remitted to Government. This harmonizes the collection and remittance of environmental levies with that of the provincial sales tax. Tire and battery levies are deposited in the Sustainable Environment Fund and are used to fund provincial environmental protection and renewal initiatives.
Programming Acquired for Public Broadcast or for Making Copies for Sale or Lease
Effective August 1, 1996, an exemption is provided for recordings of visual and audio productions such as TV and radio programs and movies acquired for the purpose of:
• public broadcast by a licensed radio or television broadcaster; or
• making copies of such productions for public broadcast by licensed broadcasters, for public exhibition (subject to payment of tax by the exhibitor) or for sale or lease.
Visual and Audio Productions Acquired for Copying into Other Productions
Effective February 16, 2005, an exemption is provided for recordings of visual and audio productions, such as film clips and soundtracks, acquired by film or television producers for the purpose of being copied into a second production such as a motion picture, or TV show where the second production is for:
• public broadcast by a licensed radio or television broadcaster;
73
• exhibition in a movie theatre or similar venue; or
• sale or lease.
Motor Fuel Tax Act
Penalty for Unauthorized Uses of Coloured Fuel
Effective February 16, 2005, persons who purchase or use coloured fuel for an unauthorized purpose are subject to a penalty equal to three times the clear fuel tax that would have been paid had the fuel not been coloured. This penalty is in addition to an assessment for the difference between the coloured fuel tax paid and the tax that would have been paid had the fuel not been coloured.
The penalty does not apply to the use of coloured fuel to operate unlicensed motor vehicles used in logging or mineral mining operations while operating off highway. Coloured fuel used in such vehicles is allowed under the Act provided the difference between the coloured fuel tax paid and the tax that would have been paid for clear fuel is remitted to the province.
Clarify Uses of Coloured Fuel for Farmers
Effective February 16, 2005 the Act is amended to clarify that farmers may use coloured fuel in any unlicensed vehicle provided the vehicle is operated:
• on land classified as a farm under the Assessment Act; and
• operated by or on behalf of a farmer for farm purposes.
Coloured fuel may also be used when a farm vehicle is proceeding to or returning from a farm location where the use of coloured fuel is otherwise authorized under the Act.
The authorization applies to any unlicensed farm vehicles, such as threshers, combines, loaders, ATVs and snowmobiles as long as they are operated under the conditions outlined above.
Tobacco Tax Act
Provide the Authority to Seize Stolen Tobacco Products
The Act is amended to provide appropriate officials with the authority to seize tobacco products that were not purchased from an authorized wholesaler. The quantity of seized products can be up to a maximum of 1,000 grams (50 cartons).
This authority parallels the existing authority to seize tobacco that does not bear the province’s mark, that bears the mark of another jurisdiction or was marked by a person authorized to do so by the director.
The amendment comes into force on Royal Assent.
74
Revise the Definition of Package
The Tobacco Tax Act Regulations are amended to revise the definition of “package” in relation to fine cut (loose) cigarette tobacco to increase the container size to 500 grams from 300 grams.
Increasing the package size ensures that packages up to 500 grams are required to be appropriately marked. The marking program provides a means of identifying tobacco acquired through the legitimate wholesale/retail chain and assists in curtailing tax losses from illicit tobacco trade.
School Act
Provincial Residential School Property Tax Rates
In general, a separate residential tax rate is set for each school district. For the 2005 calendar year, average residential school property taxes before application of the home owner grant will be increased by the provincial inflation rate from the previous year. For 2005 the increase will be 2.0 per cent. This follows the policy announced in Budget 2003 and continued in Budget 2004.
Residential tax rates will be set in April when revised assessment roll data are available to calculate the rates according to the provincial residential school tax rate formula. Tax rates will fall in almost every school district in response to rising average assessed values. Even though the average residential school tax is increased by the rate of inflation, the change in individual tax bills will vary. Some homeowners will experience an increase in their school taxes, while others will have reductions. The variation in individual tax bills will occur because changes in the assessed value of any individual property are likely to differ from changes in average provincial and school district assessed values.
Provincial Non-Residential School Property Tax Rates
A single, province-wide rate is set for each of the seven non-residential property classes. These tax rates have remained unchanged since 1999.
In response to increases in assessed values, the rates for 2005 will be adjusted so that the change in total non-residential school tax revenues will be limited to inflation plus new construction. This adjustment to rates may differ by property class to reflect differences in relative changes in assessed values by class. The rates will be set when revised assessment roll data are available.
Taxation (Rural Area) Act
Provincial Rural Property Tax Rates
A single provincial rural residential tax rate applies province-wide. For the 2005 calendar year, the provincial rural residential tax rate will fall in response to rising average assessed values consistent with policy introduced in Budget 2003; average residential provincial rural area taxes will increase by the provincial inflation rate of 2.0 per cent.
75
Non-residential provincial rural tax rates will be adjusted so that the change in total non-residential rural area tax revenues will be limited to inflation plus new construction.
Insurance Premium Tax Act
Exemption for Out-of-Province Non-Profit Health Insurers
The Insurance Premium Tax Act and Regulations are amended to provide a tax exemption for health care premiums received by non-profit extra-provincial health insurance corporations for medical service and health care plans contracted with BC residents. For the premiums to be exempt, non-profit extra–provincial health insurers must be licensed to carry on insurance business in BC under the Financial Institutions Act. The exemption is retroactive to January 1, 1997.
Power to Inspect Records
The Act is amended to provide the Commissioner of Income Tax, or other authorized officer of the Ministry of Small Business and Revenue, with the authority to access books or records of taxpayers and insurance agents. In addition, authority is provided to make inquiries of any person regarding a specific taxpayer for the purpose of administering or enforcing the tax. The Commissioner may also request information from a person relating to an unnamed taxpayer if the person is an insurance agent or insurance sales person or if a court order has been granted.
In addition, the Act is amended to provide the Commissioner or authorized officer of the Ministry of Small Business and Revenue with the authority to:
• require taxpayers and insurance agents to keep adequate records;
• specify what records taxpayers and insurance agents must keep; and
• attend a place of business to inspect the books and records to verify a return required under the Act.
Definition of Taxpayer
Effective February 15, 2005, the Act is amended to clarify that, for the purposes of the definition of a “taxpayer”, a corporation or partnership is resident in British Columbia if the corporation or partnership has a permanent establishment in the province at the time the premium for a contract of insurance with an unlicensed insurer becomes payable. Permanent establishment under the Act has the same meaning as the Income Tax Act (Canada). This ensures that insurance premiums relating to risks in respect of persons resident or property located in the province are subject to tax.
Exemption for Real Estate Insurance Organizations
The Act is amended to clarify that persons who are licensees under the Real Estate Services Act pay no tax on:
• insurance premiums paid under an insurance contract with the Real Estate Errors and Omissions Insurance Corporation; or
76
• assessments levied for the Real Estate Special Compensation Fund by the Real Estate Compensation Fund Corporation.
International Financial Activity Act
Expansion of Appeal Provisions to Include Registration Date and Registration Refusal
The International Financial Activity Act (IFA) is amended to clarify that a corporation or specialist has the right to appeal the commissioner’s decision to refuse registration of the corporation or specialist under the international financial activity tax refund program (IFP). Under the IFP, a corporation or specialist must obtain registration to qualify for an income tax refund.
The Act is also amended to clarify that a corporation or specialist can appeal the effective date of registration. The registration date is important because a claimant can only earn an income tax refund under the program from the date of registration. As such, if a claimant does not agree with the registration date that the Ministry of Small Business and Revenue determines, they may appeal.
Change of Name for IFC Society
Effective February 16, 2005, the definition of “society” is amended to change the name “IFC International Financial Centre Society of Vancouver” to “International Financial Centre British Columbia Society” to reflect the recent change in the society’s name.
Hotel Room Tax Act
Exemption for Industrial Camps
Effective February 16, 2005, lodging in industrial camps is exempt from tax.
Industrial camps are facilities that provide accommodation in bunkhouses, trailers or other structures that:
• are operated by or on behalf of an employer or by a person under contract with an employer, and
• are operated for the purpose of providing lodging exclusively (more than 90 per cent) to employees or other persons engaged by the employer when those persons are performing work or services for the employer.
Industrial camps are generally located in remote areas and may occasionally provide lodging to backpackers or other transient tourists. Tax does not apply to the charge on such accommodation provided that over 90 per cent of the time the camp is used to provide lodging to persons performing work for the employer.
The exemption does not apply where an employer rents rooms for employees in hotels, motels, resorts or other accommodation facilities.
77
Health Authorities Act
Property Tax Exemptions For Public Hospitals Managed Directly or as a Public-Private Partnership
The Act is amended to clarify that property tax exemptions apply to public hospitals managed directly or as a public-private partnership in the following situations:
• property held or occupied for future hospital use;
• space occupied by organizations on behalf of the Health Authority that is used for Health Authority purposes;
• space occupied by not-for-profit organizations that would be exempt under another act if they were the owner; and
• space occupied and used for teaching purposes by physicians who have academic appointments with the medical faculty of the University of British Columbia and are credentialed members of the teaching hospital.
78
Part 3: BRITISH COLUMBIA ECONOMIC REVIEW AND OUTLOOK(1)
Highlights
Following growth of 3.9 per cent in 2004, the British Columbia economy is forecast to grow 3.4 per cent in 2005 and 3.2 per cent in 2006. This is somewhat higher than the economic forecast in the February 15 budget of 3.1 per cent in 2005 and 3.0 per cent in 2006.
Chart 3.1 Ministry of Finance economic outlook for BC
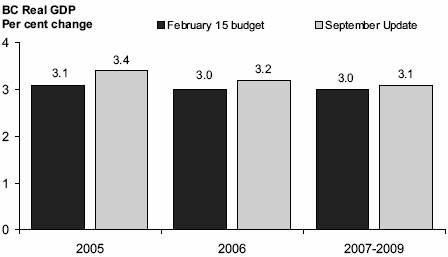
The Economic Forecast Council, a group of private sector economists who provide independent advice to the Minister of Finance on the provincial economic outlook, has also upgraded their average outlook for the BC economy in a survey conducted in July 2005. The Council now forecasts growth in British Columbia of 3.6 per cent in 2005 and 3.4 per cent in 2006, compared to 3.3 per cent in 2005 and 3.1 per cent in 2006 in January.
Chart 3.2 Economic Forecast Council upgrades BC forecast for 2005
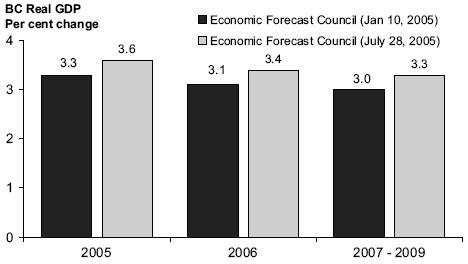
(1) Reflects information available as of August 31, 2005. All annual and quarterly references are for the calendar year.
79
Over the 2007 to 2009 period, the Economic Forecast Council expects the British Columbia economy to grow 3.3 per cent per year while the Ministry of Finance forecast calls for growth averaging 3.1 per cent per year.
Economic Forecast Council members upgraded their forecasts for BC in July for a variety of reasons, including strength in the domestic economy. In particular, retail sales, non-residential investment and employment growth were all performing better than expected in January. Council members also noted that the outlook for net migration to BC had improved since January. Council members also upgraded their outlook for the trade sector since their January surveys. Stronger commodity prices and a less severe than anticipated impact from the high Canadian dollar on BC exports have resulted in higher expectations for net exports over the forecast period.
Chart 3.3 British Columbia economic outlook
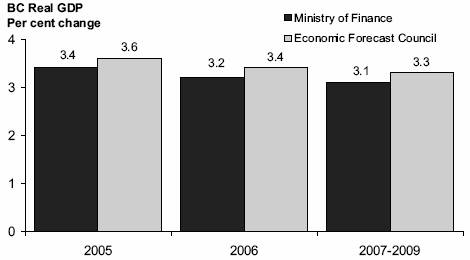
As has been the practice, the Ministry of Finance forecast is slightly more conservative than that of the Economic Forecast Council (see Table 3.1). A topic box at the end of Part Three reports on the consultation with the Economic Forecast Council.
Table 3.1 British Columbia Economic Outlook
| | Forecast | |
| | 2005 | | 2006 | | 2007 | | 2008 | | 2009 | |
| | Per cent change in real GDP | |
| | | | | | | | | | | |
Ministry of Finance Economic Forecast | | 3.4 | | 3.2 | | 3.1 | | 3.1 | | 3.1 | |
Economic Forecast Council (1) | | 3.6 | | 3.4 | | 3.3 | | 3.3 | | 3.3 | |
(1) Average of the thirteen members who provided forecasts. (The Council provided a single average annual growth rate for 2007 through 2009.)
Recent Developments
The performance of key BC economic indicators in recent quarters is presented in Table 3.2.
80
Table 3.2 British Columbia Economic Indicators
| | First Quarter | | Second Quarter | | Year-to-Date | |
| | Jan. to Mar. 2005 | | Apr. to June 2005 | | Jan. to June 2005 | |
| | change from | | change from | | change from | |
All data seasonally adjusted | | Oct. to Dec. 2004 | | Jan. to Mar. 2005 | | Jan. to June 2004 | |
| | Per cent change | |
Employment | | +0.7 | | +1.3 | | +3.2 | |
Manufacturing Shipments | | -0.5 | | -1.1 | | +4.9 | |
Exports | | +1.6 | | +3.1 | | +6.4 | |
Retail Sales | | +1.4 | | +1.4 | | +5.8 | |
Housing Starts | | -0.3 | | +1.3 | | -3.0 | |
Non-Residential Building Permits | | +39.0 | | +10.8 | | +78.8 | |
Source: Statistics Canada; BC Stats
Employment in BC has shown continued strong gains over the first two calendar quarters of 2005, increasing 3.2 per cent over the same period last year. The unemployment rate hit 5.7 per cent in May of this year, its lowest point since January of 1981. In June and July the unemployment rate rose, and so far this year has averaged 6.3 per cent.
Supported by continued low interest rates, housing starts remain at high levels, and increased in the April to June quarter after declining in the previous quarter. Over the first six months of this year, housing starts were down 3.0 per cent relative to the same period of 2004. Retail sales posted robust growth in the first quarter, but declined slightly in May and June. For the January to June period, retail sales are up 5.8 per cent compared to the same period last year.
Exports have risen 6.4 per cent during the first six months in 2005, over the same period last year. The negative impact on exports of the high Canadian dollar has been offset by strong commodity prices and a robust U.S. housing sector. Manufacturing shipments fell in both the first and second quarters of 2005 due to large declines in wood shipments. However, shipments are up 4.9 per cent year-to-date to June due to weakness at the beginning of 2004.
Non-residential building permits have increased strongly so far this year, rising 78.8 per cent in the first six months of 2005 relative to the same period a year ago. Growth was seen in all three areas of non-residential building permits, institutional and government, commercial and industrial.
The Outlook for the External Environment
The U.S. economy posted strong growth over the first half of 2005, with real GDP increasing at an annual rate of 3.8 per cent in the first quarter and 3.3 per cent in the second quarter. Real consumer spending continued to be one of the main growth drivers, rising 3.0 per cent on an annualized basis in the second quarter. Investment in both residential and non-residential structures rose in the second quarter with investment increasing an annualized 8.9 per cent overall. The trade sector contributed positively to growth as exports saw substantial growth of 13.2 per cent (annual rate) in the second quarter.
81
In the second half of this year, many analysts expect U.S. growth to moderate due to the impact of high oil prices, rising interest rates and slowing consumer spending growth. Housing starts have continued to post record levels so far in 2005, with demand sustained by continued low interest rates. Most analysts expect the housing sector to cool later this year and into 2006 due to rising house prices, higher interest rates and saturated demand. Cooling of the housing sector and high debt loads are also expected to moderate consumer spending in the second half of 2005.
After the 4.2 per cent growth seen in 2004, the August Consensus Economics survey of private sector economists expects U.S. real GDP growth of 3.6 per cent in 2005 and 3.3 per cent in 2006. Forecasters have raised their expectations for U.S. growth mainly because of the strong growth seen in the first half of this year. Even with moderating growth for the second half of 2005, the strong start to the year will result in a robust performance overall in 2005 for the U.S. economy.
Chart 3.4 Consensus outlook for the U.S. remains strong
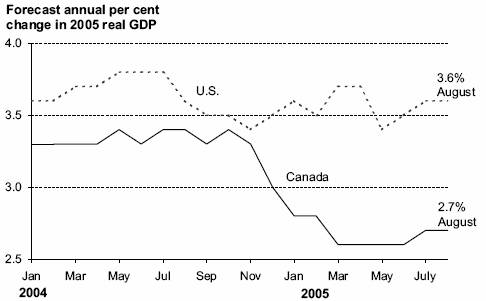
Source: Consensus Economics
The chart above represents forecasts for real GDP growth in 2005 as polled on specific dates. For example, forecasters surveyed on August 8, 2005 had an average U.S. growth forecast of 3.6 per cent.
In order to reflect the risks surrounding the U.S. economic outlook, the Ministry of Finance’s growth assumptions are somewhat lower than the consensus. In 2005, the Ministry of Finance assumes U.S. economic growth of 3.4 per cent, compared to the current 3.6 per cent consensus. U.S. growth is expected to moderate to 2.9 per cent in the Ministry of Finance forecast for 2006, while the August consensus survey predicts more robust growth of 3.3 per cent for the year. Over the medium-term, the Ministry of Finance assumes that the U.S. economy will grow at a rate of about 3.0 per cent per year. The risks surrounding the U.S. growth outlook include the impact of high oil prices, slowing housing and consumer spending and the fiscal and current account deficits.
82
Growth in the Canadian economy continues to be dampened by the impacts of the rapid appreciation of the Canadian dollar relative to the U.S. dollar seen in 2003 and 2004. However, the domestic side of the economy has shown robust growth, which has helped to offset weakness in the trade sector. Robust job creation, strong housing prices, low interest rates and rising incomes are driving an expansion in consumer spending and the housing market. Real GDP growth was 2.1 per cent in the first quarter of 2005, strengthening to 3.2 per cent in the second quarter. The main drivers of growth in the Canadian economy so far this year, were consumer spending and both residential and machinery and equipment investment. Export growth, however, remains modest, rising 2.1 per cent over the first two quarters of this year relative to the same period in 2004.
In their July survey, Consensus Economics raised their 2005 Canadian growth expectations after four consecutive months with no change. Recent positive economic data releases such as retail sales, employment and strong April GDP growth were cited as factors in the upgraded outlook. The August survey calls for growth of 2.7 per cent for 2005 and 2.9 per cent for 2006. The Ministry of Finance forecast is somewhat conservative relative to the consensus, and assumes that the Canadian economy will grow by 2.5 per cent in 2005 and 2.6 per cent in 2006.
Table 3.3 September Update Economic Forecast: Key Assumptions*
| | 2005 | | 2006 | |
| | Feb. 15 budget | | September | | Feb. 15 budget | | September | |
| | Forecast | | Update | | Forecast | | Update | |
| | Annual per cent change unless otherwise noted | |
Canada Real GDP | | 2.7 | | 2.5 | | 2.7 | | 2.6 | |
U.S. Real GDP | | 3.2 | | 3.4 | | 3.0 | | 2.9 | |
Japan Real GDP | | 0.8 | | 1.2 | | 1.5 | | 1.5 | |
Europe Real GDP | | 1.5 | | 1.0 | | 1.8 | | 1.5 | |
U.S. Housing Starts | | -12.7 | | -1.0 | | -2.9 | | -9.3 | |
Canada 3-month Treasury Bill Rate | | 2.7 | | 2.6 | | 3.4 | | 3.3 | |
US cents / Canadian $ | | 84.4 | | 81.4 | | 83.0 | | 83.0 | |
* More details on the five-year outlook are available in Tables 3.8.1 through 3.8.4 at the end of Part Three.
The economic recovery in Japan has been supported by a turnaround in domestic demand, although consumer activity is still not strong. Japan is a major oil importer and the adverse impact of higher oil prices on the Japanese economy combined with the potential slowing of their trading partners, including China and the U.S., indicates further difficulty for the trade sector. The August Consensus Economics survey predicts economic growth in Japan of 1.6 per cent for 2005 and 1.5 per cent for 2006. The Ministry of Finance is assuming slightly lower growth of 1.2 per cent in 2005, rising to 1.5 per cent in 2006.
Germany’s economy has been showing signs of improvement recently with rising business sentiment and stronger foreign demand. However, the outlook for growth prospects for Europe remains muted in the near-term. The Consensus Economics survey in August predicted growth of 1.3 per cent in Europe for 2005 and 1.7 per cent in 2006. The Ministry of Finance forecasts growth of 1.0 per cent in 2005 and 1.5 per cent in 2006 for Europe.
83
China saw substantial GDP growth in 2004 of 9.5 per cent, driven by strong exports and investment. In July of 2005, China delinked its currency from the U.S. dollar, resulting in a revaluation of 2.1 per cent. The Chinese Yuan now will float within a very narrow band against a basket of currencies from the country’s major trading partners. The banking sector remains a key concern in terms of economic stability in China, as the ratio of problem loans has been rising. Blue Chip Economic Indicators, a monthly survey of about 50 leading business economists, was forecasting growth in China of 9.1 per cent in 2005 and 8.0 per cent in 2006 in their August survey.
Financial Markets
The Federal Reserve Board has raised the federal funds rate 25 basis points at each of its’ past ten meetings, bringing the key interest rate to 3.50 per cent. The committee stated that monetary policy continues to be accommodative and that this stimulus can be “removed at a measured pace.”
The Bank of Canada has left the target overnight rate unchanged at 2.50 per cent since October of 2004. In their July 12th interest rate announcement the Bank of Canada signaled that interest rates might soon be rising since they believe the Canadian economy is operating close to its production capacity. Therefore, some reduction in monetary stimulus will be required in the near-term.
Chart 3.5 Short-term interest rates to rise in both the U.S. and Canada

Sources: Bank of Canada and U.S. Federal Reserve Bank, Ministry of Finance forecasts.
Outlook
The Ministry of Finance assumes that the U.S. federal funds rate will rise at a measured pace in order to remove monetary stimulus from the economy, consistent with the private sector average. The average of private sector forecasts predicts that the Federal Reserve will move to the sidelines in 2006 as inflationary pressures ease and growth moderates.
84
The private sector average expects the Bank of Canada to begin raising the overnight target rate this fall and into 2006. The Bank of Canada’s statement that they believe the Canadian economy is operating near capacity supports the view that they will raise interest rates until monetary stimulus is removed.
The Canadian three-month treasury bill rate is expected to average 2.6 per cent in 2005, rising to 3.3 per cent in 2006. Ten-year government of Canada bonds are forecast to average 4.1 per cent this year and 4.6 per cent in 2006. The Ministry of Finance outlook is based on the average of six private sector forecasts as of July 25, 2005.
Table 3.4 Private Sector Canadian Three Month Treasury Bill Interest Rate Forecasts
Average annual interest rate (per cent) | | 2005 | | 2006 | |
| | | | | |
Global Insight | | 2.5 | | 3.1 | |
BMO | | 2.6 | | 3.5 | |
Nesbitt Burns | | 2.6 | | 3.6 | |
Scotiabank | | 2.6 | | 2.8 | |
TD Economics | | 2.6 | | 3.6 | |
RBC Capital Markets | | 2.6 | | 3.5 | |
Average (as of July 25, 2005) | | 2.6 | | 3.3 | |
February 15 budget Forecast (as of January 5, 2005) | | 2.7 | | 3.4 | |
The Canadian dollar averaged 76.8 cents US in 2004, and appreciated strongly in the second half of the year. So far in 2005, the Canadian dollar has remained at high levels, averaging 81.3 cents US over the January to August period.
Outlook
The U.S. dollar is expected to resume a modest weakening trend in 2006, as the imbalances in the U.S. economy become more of a concern. In addition, high energy prices are expected to provide support to the Canadian dollar. However, gains in the Canadian dollar from U.S. currency weakness could be limited by softening non-energy commodity prices and lower interest rates in Canada relative to the U.S.
Chart 3.6 Canadian dollar to remain above 80 cents
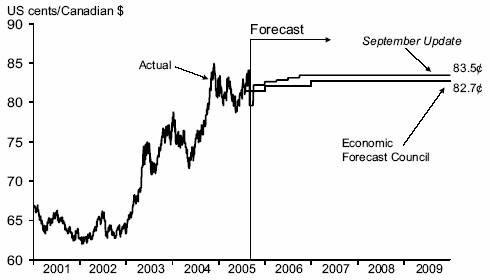
85
The private sector forecast of the Canadian dollar in 2005 averages 81.4 cents US, rising to 83.0 cents US in 2006. The Ministry of Finance exchange rate outlook is based on these private sector averages (see Table 3.5). The Canadian dollar is expected to level out at 83.5 cents US for the 2007 to 2009 period.
Table 3.5 Private Sector Exchange Rate Forecasts
Average annual exchange rate (US cents/Can $) | | 2005 | | 2006 | |
| | | | | |
Global Insight | | 81.7 | | 85.4 | |
BMO | | 81.4 | | 82.7 | |
Nesbitt Burns | | 81.5 | | 82.2 | |
Scotiabank | | 81.6 | | 86.4 | |
TD Economics | | 81.2 | | 82.5 | |
RBC Capital Markets | | 81.0 | | 78.7 | |
Average (as of July 25, 2005) | | 81.4 | | 83.0 | |
February 15 budget Forecast (as of January 5, 2005) | | 84.4 | | 83.0 | |
The British Columbia Outlook
After strong growth in 2004, the Ministry of Finance expects economic growth in British Columbia, at 3.4 per cent, to outperform Canadian growth in 2005. Over the medium-term, economic growth in BC of 3.1 per cent is expected, reflecting continuing robust investment, consumers spending and export growth.
Table 3.6 summarizes the Ministry of Finance’s outlook for key economic indicators relative to the February 15 budget forecast. Additional detail on the current economic forecast can be found in tables 3.8.1 to 3.8.4 at the end of Part 3.
Table 3.6 September Update Forecast: Key Indicators
| | 2005 | | 2006 | |
| | Feb. 15 budget | | September | | Feb. 15 budget | | September | |
| | Forecast | | Update | | Forecast | | Update | |
| | Annual per cent change unless otherwise noted | |
Real GDP | | 3.1 | | 3.4 | | 3.0 | | 3.2 | |
Nominal GDP | | 4.7 | | 5.5 | | 4.5 | | 5.1 | |
Employment | | 1.9 | | 2.7 | | 1.9 | | 2.0 | |
Unemployment Rate | | 7.2 | | 6.5 | | 7.2 | | 6.4 | |
Net In-Migration (‘000 persons) | | 34.1 | | 38.2 | | 38.7 | | 40.7 | |
Personal Income | | 4.5 | | 4.9 | | 4.5 | | 4.8 | |
Corporate Pre-tax Profits | | 5.7 | | 6.8 | | 5.2 | | 5.0 | |
Housing Starts (‘000s) | | 32.0 | | 32.2 | | 31.7 | | 30.8 | |
Retail Sales | | 5.2 | | 5.7 | | 4.9 | | 5.2 | |
The Labour Market
Employment growth in British Columbia was robust in 2004 averaging 2,059,700 persons employed, an increase of 2.3 per cent from 2003. The British Columbia economy has continued to generate substantial employment opportunities in 2005. Over the first seven months of this year 64,114 jobs were created compared to the same period of 2004. An increase in full-time employment of 69,286 jobs was offset by a decline in part-time employment
86
of 5,200 jobs year-to-date to July. Job growth in British Columbia was broadly based, with both goods and services sectors expanding in the first seven months of 2005.
Chart 3.7 Employment growth remains robust in 2005
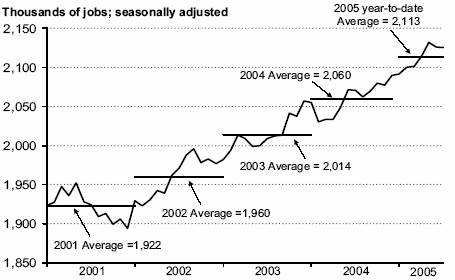
Source: Statistics Canada
The unemployment rate in British Columbia averaged 6.3 per cent in the January to July period of 2005, down from 7.5 per cent in the same period of 2004. The drop in the unemployment rate over the first seven months of this year is a result of stronger growth in employment than in the labour force.
Outlook
Employment is forecast to increase by 2.7 per cent in 2005, adding about 55,000 jobs to the BC economy. In 2006, an additional 42,000 jobs are expected to be created in BC, an increase of 2.0 per cent. Job creation is expected to be strong in the construction, energy, mining, transportation and service sectors of the BC economy, while the outlook for job growth in the forest sector continues to be weak.
Chart 3.8 Unemployment rate forecast to decline
Unemployment rate; per cent
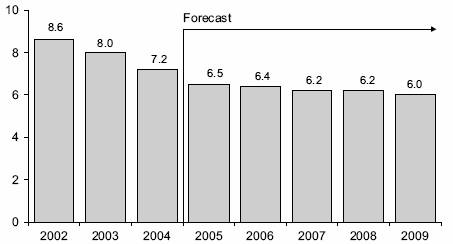
Sources: Statistics Canada and BC Ministry of Finance forecast
87
The labour force is expected to grow at about 1.9 per cent in both 2005 and 2006. As the labour force is expected to grow at a slower pace than employment for 2005 and 2006, the unemployment rate is forecast to fall to 6.5 per cent in 2005 and 6.4 per cent in 2006. Over the medium-term, the unemployment rate is forecast to continue this gradual decline.
Domestic Demand
Consumer Spending and Housing
Retail sales are on track to post another year of strong growth after an increase of 6.3 per cent in 2004. Over the first six months of this year, the value of retail sales has risen 5.8 per cent compared to the same period of last year. The increase has largely being driven by the strong housing market as much of the strength was seen in furniture, home electronics and appliances as well as home improvement stores. In addition to furniture and home-related purchases, the value of fuel sales increased substantially over the first half of 2005, reflecting higher market prices for gasoline.
Chart 3.9 Retail sales remain strong in 2005

Source: Statistics Canada
Low mortgage rates, increased migration and robust job creation continue to support strong housing starts in 2005. British Columbia’s housing starts totaled 32,386 units in the first seven months of 2005, a 0.2 per cent increase over the same period the previous year.
Outlook
The forecast for inflation-adjusted consumer spending on goods and services calls for growth of 3.5 per cent in 2005. Increased job opportunities and rising incomes in British Columbia will support consumer demand for goods and services this year. In 2006, further growth of 3.6 per cent is expected in real consumer spending, followed by growth of about 2.9 per cent on average over the medium-term. Retail sales are forecast to rise 5.7 per cent in 2005, followed by growth of 5.2 per cent in 2006.
88
The outlook for consumer spending growth remains robust over the forecast period. However, higher interest rates, housing starts leveling off and high debt loads of consumers are expected to slow growth in consumer spending over the medium-term.
Chart 3.10 Housing starts to stay at high levels
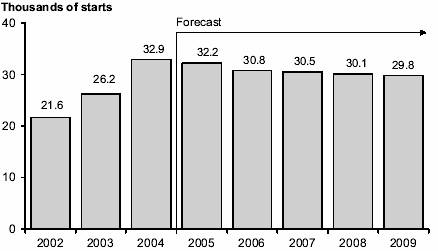
Sources: Canada Mortgage and Housing Corporation actuals and BC Ministry of Finance forecast
Rising interest rates, saturated demand and rising house prices are expected to cool housing starts growth in British Columbia over the forecast period, although the level of housing starts will remain high. Housing starts are forecast to total about 32,200 units in 2005, falling to around 30,800 units in 2006. Over the medium-term housing starts are forecast to remain at a robust level of around 30,000 units per year.
External Trade and Commodity Markets
The value of BC’s merchandise exports rose 6.4 per cent in the first six months of 2005, relative to the same period of 2004. A jump in the market price for coal and natural gas, combined with higher coal export volumes, has led to strong growth in the energy sector. Energy exports rose 29.3 per cent during the six months of 2005 compared to the same period the previous year. Overall, the value of merchandise exports excluding forestry increased 14.8 per cent year-to-date to June, reflecting strength in other export commodities such as industrial goods.
Lower spruce-pine-fir prices, and the continued effect of a higher Canadian dollar, have contributed to a 3.2 per cent decline in forestry exports year-to-date to June. For the January to August period the spruce-pine-fir price averaged US$367. This compared to an average US$412 observed during the same period of 2004. The price of hemlock baby squares has fallen 14.3 per cent year-to-date to August. The average price of hemlock baby squares over the January to August period was US$538 compared to US$627 during the same period of 2004.
89
The value of softwood lumber exports to the U.S. has risen 5.7 per cent year-to-date to June, reflecting strength in the Interior of the province. Conversely, softwood lumber exports from the Coastal industry are mainly destined for Japan and have fallen 23.8 per cent over the first half of this year.
Chart 3.11 Natural gas price outlook up since February
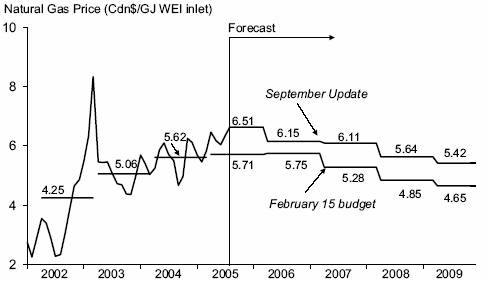
Source: BC Ministry of Energy and Mines
Canadian natural gas prices continued to be volatile over the course of 2005, with the highest monthly price of $6.5C/GJ occurring in April shortly after a low of $5.5C/GJ in February. On average through the month of July 2005, the natural gas price has increased 7.5 per cent compared to the first seven months of 2004. The impact of hurricane Katrina on oil and natural gas markets remains unclear. How high oil and natural gas prices reach and how long they stay elevated depends in large part on how quickly refinery production and distribution can get back to normal operations.
Chart 3.12 Exports slow in 2005; rebound thereafter
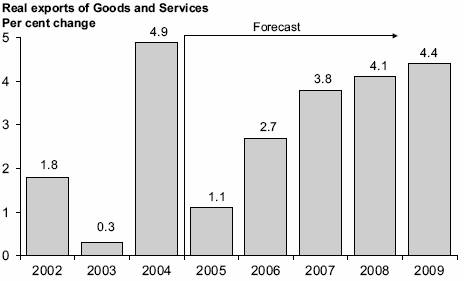
Sources: Statistics Canada and BC Ministry of Finance forecast
90
Coal prices have been very strong so far this year, driven largely by China’s rapid economic growth and resulting import demand. Increased demand for steel in turn raised demand for coal, supporting higher coal prices.
Outlook
Real exports of goods and services are expected to increase 1.1 per cent in 2005. This is somewhat lower growth than the 4.9 per cent seen in 2004, reflecting the higher Canadian dollar and easing external demand. Real export growth is forecast to improve after 2006, consistent with economic growth in BC’s trading partners and improving export prices. Over the 2006 to 2009 period, export growth is expected to pick-up, rising 3.8 per cent per year on average. The improvement in export performance over the medium-term is forecast to come largely from the energy and high-tech sectors as well as service exports related to the 2010 Olympics.
The average price of British Columbia goods and services exports is forecast to rise just 0.2 per cent in 2005, as the strength in energy prices are largely offset by a decline in the price of lumber, BC’s largest export. Export prices are expected to decline in 2006, led by lumber prices returning to their medium-term levels. Natural gas prices are forecast to decline gradually, reaching C$5.42/GJ by 2009/10. Spruce-pine-fir prices are expected to average US$360 per thousand board feet in 2005 and US$300 through the remainder of the forecast period. The average export price is expected to pick up moderately over the medium-term as commodity prices stabilize and the Canadian dollar remains around 83.5 cents US.
Business and Government
Business investment (including residential) adjusted for inflation expanded by 11.7 per cent in 2004, building on robust growth of 7.4 per cent in 2003. While much of the growth in business investment was driven by strong residential investment, which is estimated to have increased 14.8 per cent in 2004, investment in machinery and equipment also saw robust growth. Business confidence in BC remained strong in 2004, remaining above Canada as a whole.
Chart 3.13 Business confidence in BC above the Canadian average in 2005
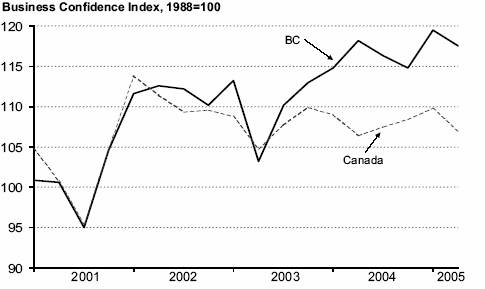
Source: Canadian Federation of Independent Business
91
Machinery and equipment investment benefited from the higher Canadian dollar, rising an estimated 20.0 per cent in 2004, as costs were lower for industries importing equipment from the U.S. Non-residential construction saw a decline of 4.2 per cent compared to the level achieved in 2003. Over the first six months of 2005, non-residential building permits have increased strongly, indicating a pick-up in non-residential construction for this year. Corporate profits in British Columbia jumped 32.9 per cent in 2004, following a strong 11.2 per cent gain in 2003. The strong growth in corporate profits provides further momentum to reinvest in plant and equipment.
Local, provincial and federal government combined spending in BC is estimated to have increased 1.1 per cent in 2004 in inflation-adjusted terms.
Outlook
Total investment in British Columbia is forecast to grow 6.7 per cent in 2005 and 5.2 per cent in 2006. This growth reflects public sector investment in capital projects as well as strength in machinery and equipment and non-residential investment. Over the medium-term, total investment in British Columbia is expected to grow around 4.2 per cent per year on average. Strong investment in non-residential construction is expected to be a significant growth driver over the medium-term, rising 7.1 per cent per year on average from 2007 to 2009. Investment in machinery and equipment is also forecast to post strong growth over the medium-term, as firms take advantage of the higher Canadian dollar to import equipment from the U.S. at a lower cost and re-invest profits.
Combined spending by the three levels of government in inflation-adjusted terms is expected to grow 5.9 per cent in 2005 as the provincial government increases spending commitments for health care, education, and priority initiatives for children, communities, safety, economic development, culture and the environment. Over the medium-term, inflation-adjusted government spending is forecast to rise 2.3 per cent on average per year.
Inflation
Consumer price inflation in both BC and Canada began 2004 quite low, but rising fuel prices drove up inflation over the summer months and into the winter before falling in December. In Canada, overall consumer price inflation averaged 1.9 per cent in 2004, a significant decrease from the 2.8 per cent rate of inflation seen in 2003. The slowdown in the average annual rate of inflation in 2004 was due mainly to a much smaller increase in automotive vehicle insurance premiums during the year, as well as a decline in natural gas and computer equipment and supplies prices. British Columbia experienced similar consumer price inflation to Canada as a whole in 2004; inflation averaged 2.0 per cent for the year.
So far in 2005, Canadian consumer price inflation has averaged 2.0 per cent, while in BC the rate is slightly lower at 1.9 per cent. Higher gasoline and other energy prices have been a leading factor in inflation so far this year. Removing the energy component of the index, consumer prices in BC are up by 1.6 per cent when compared to the first half of 2004.
92
Outlook
Consumer price inflation in British Columbia and Canada is expected to continue to average 2.0 per cent per year over the forecast period, in line with the Bank of Canada’s inflation target.
Risks to the Economic Outlook
The economic outlook has risks on both the upside and downside. The most significant risks to the British Columbia outlook remain the volatility of the Canadian dollar and sustainability of the U.S. economic recovery.
The British Columbia economy could grow faster than forecast if:
• The Canadian dollar falls significantly below the current forecast.
• The U.S. economy resumes a higher growth path.
• A lasting resolution to the softwood lumber dispute is reached; alongside growing U.S. demand, this would provide an opportunity for further growth in British Columbia’s forest industry.
• British Columbia business confidence and investment strengthen further; this would provide a base for stronger economic growth in the province.
• Interprovincial net in-migration strengthens further; this would generate additional demand for goods and services and boost economic growth.
• Visitors to BC increase more than expected as Vancouver gains further international recognition as a tourism destination through promotion of the 2010 Winter Olympics.
Alternatively, the British Columbia economy could grow slower than forecast if:
• The Canadian dollar movements become increasingly volatile or the dollar appreciates rapidly above the current forecast.
• Oil prices rise and are sustained at a high level, dampening North American growth prospects.
• Interest rates in the U.S. and Canada rise more quickly than forecast.
• Commodity prices decline more sharply than forecast or become more volatile.
• The recent monetary tightening, as well as the effects of high oil prices on China, slows the Chinese economy significantly.
• Geopolitical uncertainty accelerates due to events in the Middle East or further terrorist attacks.
93
Table 3.7 Current Economic Statistics
| | | | | | Year-to-Date
Average | |
| | Latest Period | | 2004 | | 2005 | | Change | |
BRITISH COLUMBIA | | | | | | | | | | | |
LABOUR MARKET | | | | | | | | | | | |
Employment (s.a. (1), thousands) | | July | | 2,125 | | 2,049 | | 2,113 | | 3.1 | % |
Unemployment rate (s.a., per cent) | | July | | 6.2 | | 7.5 | | 6.3 | | -1.2 | |
Total net in-migration (persons) | | Jan.-Mar. | | 10,836 | | 7,407 | | 10,836 | | 3,429 | |
Interprovincial (persons) | | Jan.-Mar. | | 1,073 | | (250 | ) | 1,073 | | 1,323 | |
International (persons) | | Jan.-Mar. | | 9,763 | | 7,657 | | 9,763 | | 2,106 | |
Wages and salaries (s.a. $ millions) | | June | | 6,008 | | 5,622 | | 5,903 | | 5.0 | % |
Average weekly wage rate | | July | | 698 | | 679 | | 701 | | 3.3 | % |
| | | | | | | | | | | |
CONSUMER SECTOR | | | | | | | | | | | |
Retail sales (s.a., $ million) | | June | | 4,122 | | 3,871 | | 4,098 | | 5.8 | % |
Car and truck sales (s.a., units) | | June | | 16,173 | | 14,911 | | 15,430 | | 3.5 | % |
Housing starts (all areas, s.a., annual rate) | | July | | 35,500 | | 32,314 | | 32,386 | | 0.2 | % |
Existing home sales (s.a.) | | July | | 9,370 | | 8,336 | | 8,785 | | 5.4 | % |
Building permits (s.a., $ millions) | | June | | 899 | | 673 | | 821 | | 22.0 | % |
B.C. consumer price index (annual per cent change) | | July | | 1.9 | | 1.9 | | 1.9 | | 0.0 | |
| | | | | | | | | | | |
INDUSTRIAL ACTIVITY | | | | | | | | | | | |
Foreign merchandise exports (s.a., $ million) | | June | | 2,858 | | 2,525 | | 2,687 | | 6.4 | % |
Manufacturing shipments (s.a., $ million) | | June | | 3,551 | | 3,397 | | 3,565 | | 4.9 | % |
Lumber production (thousand cubic metres) | | June | | 3,450 | | 3,251 | | 3,429 | | 5.5 | % |
Pulp and paper shipments (thousand tonnes) | | June | | 660 | | 634 | | 635 | | 0.2 | % |
Copper production (million kg) | | June | | 23.7 | | 18.6 | | 22.8 | | 22.3 | % |
| | | | | | | | | | | |
TOURISM | | | | | | | | | | | |
Entries of U.S. and overseas residents (thousands) | | June | | 624.6 | | 617.9 | | 606.1 | | -1.9 | % |
BC ferry passengers to/from Vancouver Island (thousands) | | July | | 1,433 | | 888 | | 887 | | -0.1 | % |
| | | | | | | | | | | |
COMMODITY PRICES | | | | | | | | | | | |
Lumber (U.S.$/thousand board feet) | | Aug | | 301 | | 412 | | 367 | | -11.0 | % |
Pulp (U.S. $/tonne) | | July | | 594 | | 617 | | 625 | | 1.2 | % |
Newsprint (U.S.$/tonne) | | July | | 607 | | 542 | | 592 | | 9.3 | % |
Copper (U.S.$/lb.) | | July | | 1.64 | | 1.24 | | 1.53 | | 22.8 | % |
| | | | | | | | | | | |
FINANCIAL DATA | | | | | | | | | | | |
Canadian dollar (U.S. cents) | | Aug | | 83.1 | | 75.0 | | 81.3 | | 6.3 | |
Canadian prime rate (per cent) | | Aug | | 4.25 | | 3.91 | | 4.25 | | 0.34 | |
Canadian treasury bills (per cent) | | Aug | | 2.76 | | 2.08 | | 2.52 | | 0.45 | |
Treasury bill spread - Canada minus U.S. (per cent) | | Aug | | -0.63 | | 1.03 | | -0.25 | | -1.28 | |
(1) s.a. - seasonally adjusted
94
Table 3.8.1 Gross Domestic Product: British Columbia
| | | | | | Forecast | |
| | 2003 | | 2004 | | 2005 | | 2006 | | 2007 | | 2008 | | 2009 | |
| | | | | | | | | | | | | | | |
BRITISH COLUMBIA: | | | | | | | | | | | | | | | |
Gross Domestic Product at Market Prices: | | | | | | | | | | | | | | | |
• Real (1997 $ billion; chain-weighted) | | 133.6 | | 138.8 | | 143.5 | | 148.0 | | 152.5 | | 157.3 | | 162.2 | |
(% change) | | 2.5 | | 3.9 | | 3.4 | | 3.2 | | 3.1 | | 3.1 | | 3.1 | |
| | | | | | | | | | | | | | | |
• Current Dollar ($ billion) | | 145.5 | | 156.5 | | 165.0 | | 173.4 | | 181.8 | | 190.7 | | 200.0 | |
(% change) | | 5.2 | | 7.5 | | 5.5 | | 5.1 | | 4.9 | | 4.9 | | 4.9 | |
| | | | | | | | | | | | | | | |
• GDP Price Deflator (1997 = 100) | | 108.9 | | 112.8 | | 115.0 | | 117.1 | | 119.2 | | 121.3 | | 123.3 | |
(% change) | | 2.6 | | 3.6 | | 2.0 | | 1.9 | | 1.7 | | 1.7 | | 1.7 | |
| | | | | | | | | | | | | | | |
Real GDP Per Person | | | | | | | | | | | | | | | |
(1997 $; chain-weighted) | | 32,175 | | 33,072 | | 33,830 | | 34,511 | | 35,164 | | 35,847 | | 36,529 | |
(% change) | | 1.6 | | 2.8 | | 2.3 | | 2.0 | | 1.9 | | 1.9 | | 1.9 | |
| | | | | | | | | | | | | | | |
Real GDP Per Employed Person | | | | | | | | | | | | | | | |
(% change) | | -0.3 | | 1.6 | | 0.7 | | 1.1 | | 1.1 | | 1.2 | | 1.2 | |
| | | | | | | | | | | | | | | |
Unit Labour Cost(1) (% change) | | 0.8 | | 0.6 | | 1.7 | | 1.7 | | 1.7 | | 1.7 | | 1.6 | |
| | | | | | | | | | | | | | | |
Components of British Columbia Real GDP at Market Prices ($1997 billions; chain-weighted) | | | | | | | | | | | | | | | |
| | | | | | | | | | | | | | | |
Personal Expenditure on Goods and Services | | 85.2 | | 88.7 | | 91.9 | | 95.2 | | 98.1 | | 100.8 | | 103.5 | |
(% change) | | 3.3 | | 4.1 | | 3.5 | | 3.6 | | 3.1 | | 2.8 | | 2.7 | |
| | | | | | | | | | | | | | | |
• Goods | | 36.6 | | 38.1 | | 39.7 | | 41.2 | | 42.3 | | 43.4 | | 44.6 | |
(% change) | | 1.4 | | 4.0 | | 4.3 | | 3.6 | | 2.8 | | 2.7 | | 2.5 | |
| | | | | | | | | | | | | | | |
• Services | | 48.6 | | 50.7 | | 52.2 | | 54.0 | | 55.8 | | 57.4 | | 59.0 | |
(% change) | | 4.7 | | 4.1 | | 3.0 | | 3.6 | | 3.3 | | 2.8 | | 2.8 | |
| | | | | | | | | | | | | | | |
Government Current Expenditures on Goods and Services | | 25.7 | | 26.0 | | 27.5 | | 27.8 | | 28.3 | | 29.0 | | 29.8 | |
(% change) | | 2.0 | | 1.1 | | 5.9 | | 1.0 | | 1.6 | | 2.6 | | 2.7 | |
| | | | | | | | | | | | | | | |
Investment in Fixed Capital | | 27.4 | | 30.6 | | 32.7 | | 34.4 | | 35.7 | | 37.3 | | 38.9 | |
(% change) | | 7.3 | | 11.7 | | 6.7 | | 5.2 | | 3.8 | | 4.6 | | 4.3 | |
| | | | | | | | | | | | | | | |
Final Domestic Demand | | 138.2 | | 145.0 | | 151.6 | | 156.9 | | 161.5 | | 166.5 | | 171.5 | |
(% change) | | 3.7 | | 4.9 | | 4.6 | | 3.5 | | 2.9 | | 3.1 | | 3.0 | |
| | | | | | | | | | | | | | | |
Exports Goods & Services | | 60.3 | | 63.3 | | 64.0 | | 65.7 | | 68.3 | | 71.1 | | 74.2 | |
(% change) | | 0.3 | | 4.9 | | 1.1 | | 2.7 | | 3.8 | | 4.1 | | 4.4 | |
| | | | | | | | | | | | | | | |
Imports Goods & Services | | 65.9 | | 70.2 | | 72.9 | | 75.0 | | 77.2 | | 79.6 | | 82.3 | |
(% change) | | 3.7 | | 6.4 | | 3.9 | | 3.0 | | 2.9 | | 3.2 | | 3.4 | |
| | | | | | | | | | | | | | | |
Inventory Change | | 0.8 | | 1.0 | | 1.0 | | 0.9 | | 0.9 | | 0.6 | | 0.5 | |
| | | | | | | | | | | | | | | |
Statistical Discrepancy | | 0.2 | | -0.3 | | -0.3 | | -0.3 | | -0.3 | | -0.3 | | -0.3 | |
| | | | | | | | | | | | | | | |
Real GDP at Market Prices | | 133.6 | | 138.8 | | 143.5 | | 148.0 | | 152.5 | | 157.3 | | 162.2 | |
(% change) | | 2.5 | | 3.9 | | 3.4 | | 3.2 | | 3.1 | | 3.1 | | 3.1 | |
(1) Unit labour cost is the nominal cost of labour incurred to produce one unit of real output.
95
Table 3.8.2 Components of Nominal Income and Expenditure
| | | | | | Forecast | |
| | 2003 | | 2004 | | 2005 | | 2006 | | 2007 | | 2008 | | 2009 | |
| | | | | | | | | | | | | | | |
Labour Income(1) ($ million) | | 75,141 | | 78,509 | | 82,583 | | 86,632 | | 90,836 | | 95,224 | | 99,796 | |
(% change) | | 3.2 | | 4.5 | | 5.2 | | 4.9 | | 4.9 | | 4.8 | | 4.8 | |
| | | | | | | | | | | | | | | |
Personal Income ($ million) | | 116,125 | | 120,907 | | 126,779 | | 132,870 | | 138,895 | | 145,165 | | 151,643 | |
(% change) | | 2.7 | | 4.1 | | 4.9 | | 4.8 | | 4.5 | | 4.5 | | 4.5 | |
| | | | | | | | | | | | | | | |
Corporate Profits Before Taxes ($ million) | | 12,568 | | 16,703 | | 17,844 | | 18,735 | | 19,838 | | 21,016 | | 22,197 | |
(% change) | | 11.2 | | 32.9 | | 6.8 | | 5.0 | | 5.9 | | 5.9 | | 5.6 | |
| | | | | | | | | | | | | | | |
Retail Sales ($ million) | | 44,421 | | 47,217 | | 49,910 | | 52,491 | | 55,087 | | 57,690 | | 60,412 | |
(% change) | | 2.7 | | 6.3 | | 5.7 | | 5.2 | | 4.9 | | 4.7 | | 4.7 | |
| | | | | | | | | | | | | | | |
Housing Starts | | 26,174 | | 32,925 | | 32,226 | | 30,805 | | 30,511 | | 30,100 | | 29,808 | |
(% change) | | 21.0 | | 25.8 | | -2.1 | | -4.4 | | -1.0 | | -1.3 | | -1.0 | |
| | | | | | | | | | | | | | | |
Residential Investment(2) ($ million) | | 10,694 | | 13,148 | | 13,958 | | 14,676 | | 15,440 | | 16,254 | | 17,113 | |
(% change) | | 19.6 | | 22.9 | | 6.2 | | 5.1 | | 5.2 | | 5.3 | | 5.3 | |
| | | | | | | | | | | | | | | |
B.C. Consumer Price Index (1992 = 100) | | 120.4 | | 122.8 | | 125.3 | | 127.9 | | 130.4 | | 133.1 | | 135.8 | |
(% change) | | 2.1 | | 2.0 | | 2.1 | | 2.0 | | 2.0 | | 2.0 | | 2.0 | |
(1) Domestic basis; wages, salaries and supplementary labour income.
(2) Includes renovations and improvements.
Table 3.8.3 Labour Market Indicators
| | | | | | Forecast | |
| | 2003 | | 2004 | | 2005 | | 2006 | | 2007 | | 2008 | | 2009 | |
| | | | | | | | | | | | | | | |
Population (on July 1) (000’s) | | 4,152 | | 4,196 | | 4,241 | | 4,288 | | 4,338 | | 4,387 | | 4,439 | |
(% change) | | 0.9 | | 1.1 | | 1.1 | | 1.1 | | 1.1 | | 1.1 | | 1.2 | |
| | | | | | | | | | | | | | | |
Labour Force Population, 15+ Years (000’s) | | 3,341 | | 3,389 | | 3,447 | | 3,500 | | 3,554 | | 3,608 | | 3,663 | |
(% change) | | 1.2 | | 1.5 | | 1.7 | | 1.5 | | 1.6 | | 1.5 | | 1.5 | |
| | | | | | | | | | | | | | | |
Net In-Migration | | | | | | | | | | | | | | | |
| | | | | | | | | | | | | | | |
• International(1) | | 27,913 | | 28,476 | | 28,156 | | 27,601 | | 28,996 | | 30,286 | | 31,185 | |
| | | | | | | | | | | | | | | |
• Interprovincial | | 3,747 | | 7,080 | | 10,000 | | 13,100 | | 13,300 | | 15,000 | | 16,000 | |
| | | | | | | | | | | | | | | |
• Total | | 31,660 | | 35,556 | | 38,156 | | 40,701 | | 42,296 | | 45,286 | | 47,185 | |
| | | | | | | | | | | | | | | |
Participation Rate(2) (%) | | 65.6 | | 65.5 | | 65.6 | | 65.8 | | 66.0 | | 66.2 | | 66.3 | |
| | | | | | | | | | | | | | | |
Labour Force (000’s) | | 2,191 | | 2,219 | | 2,261 | | 2,304 | | 2,345 | | 2,390 | | 2,430 | |
(% change) | | 2.2 | | 1.3 | | 1.9 | | 1.9 | | 1.8 | | 1.9 | | 1.7 | |
| | | | | | | | | | | | | | | |
Employment (000’s) | | 2,014 | | 2,060 | | 2,115 | | 2,157 | | 2,199 | | 2,241 | | 2,284 | |
(% change) | | 2.8 | | 2.3 | | 2.7 | | 2.0 | | 1.9 | | 1.9 | | 1.9 | |
| | | | | | | | | | | | | | | |
• Goods Sector Employment (000’s) | | 401 | | 422 | | 436 | | 449 | | 464 | | 478 | | 492 | |
(% change) | | 5.1 | | 5.3 | | 3.2 | | 3.1 | | 3.2 | | 3.1 | | 3.0 | |
| | | | | | | | | | | | | | | |
• Service Sector Employment (000’s) | | 1,614 | | 1,638 | | 1,679 | | 1,708 | | 1,735 | | 1,763 | | 1,792 | |
(% change) | | 2.2 | | 1.5 | | 2.5 | | 1.7 | | 1.6 | | 1.6 | | 1.6 | |
| | | | | | | | | | | | | | | |
Unemployment Rate (%) | | 8.0 | | 7.2 | | 6.5 | | 6.4 | | 6.2 | | 6.2 | | 6.0 | |
(1) International migration includes net non-permanent residents and returning emigrants less net temporary residents abroad.
(2) Percentage of the population 15 years of age and over in the labour force.
96
Table 3.8.4 Major Economic Assumptions
| | | | | | Forecast | |
| | 2003 | | 2004 | | 2005 | | 2006 | | 2007 | | 2008 | | 2009 | |
| | | | | | | | | | | | | | | |
GDP (billions) | | | | | | | | | | | | | | | |
Canada Real (1997 $; chain-weighted) | | 1,092 | | 1,124 | | 1,153 | | 1,183 | | 1,219 | | 1,256 | | 1,294 | |
(% change) | | 2.0 | | 2.9 | | 2.5 | | 2.6 | | 3.0 | | 3.0 | | 3.0 | |
| | | | | | | | | | | | | | | |
Canada Current Dollar ($ billion) | | 1,216 | | 1,290 | | 1,353 | | 1,414 | | 1,479 | | 1,548 | | 1,621 | |
(% change) | | 5.4 | | 6.1 | | 4.9 | | 4.5 | | 4.6 | | 4.7 | | 4.7 | |
| | | | | | | | | | | | | | | |
Canada GDP Price Deflator
(1997 = 100) | | 111.3 | | 114.7 | | 117.4 | | 119.6 | | 121.4 | | 123.3 | | 125.3 | |
(% change) | | 3.3 | | 3.1 | | 2.3 | | 1.9 | | 1.5 | | 1.6 | | 1.7 | |
| | | | | | | | | | | | | | | |
U.S.A. Real (1996 U.S.$; chain-weighted | | 10,321 | | 10,756 | | 11,116 | | 11,434 | | 11,782 | | 12,132 | | 12,499 | |
(% change) | | 2.7 | | 4.2 | | 3.4 | | 2.9 | | 3.0 | | 3.0 | | 3.0 | |
| | | | | | | | | | | | | | | |
Japan Real (2000 Yen; chain-weighted) | | 519,311 | | 533,042 | | 539,675 | | 547,901 | | 556,371 | | 564,651 | | 573,054 | |
(% change) | | 1.4 | | 2.6 | | 1.2 | | 1.5 | | 1.5 | | 1.5 | | 1.5 | |
| | | | | | | | | | | | | | | |
Europe Real(1) (% change) | | 0.7 | | 1.7 | | 1.0 | | 1.5 | | 1.8 | | 2.0 | | 2.0 | |
| | | | | | | | | | | | | | | |
Housing Starts(2) (000’s) | | | | | | | | | | | | | | | |
Canada | | 218 | | 233 | | 210 | | 185 | | 185 | | 185 | | 185 | |
(% change) | | 6.5 | | 6.9 | | -10.0 | | -11.9 | | 0.0 | | 0.0 | | 0.0 | |
| | | | | | | | | | | | | | | |
U.S.A | | 1,854 | | 1,950 | | 1,930 | | 1,750 | | 1,700 | | 1,600 | | 1,600 | |
(% change) | | 8.4 | | 5.2 | | -1.0 | | -9.3 | | -2.9 | | -5.9 | | 0.0 | |
| | | | | | | | | | | | | | | |
Japan | | 1,160 | | 1,189 | | 1,170 | | 1,150 | | 1,150 | | 1,150 | | 1,150 | |
(% change) | | 0.8 | | 2.5 | | -1.6 | | -1.7 | | 0.0 | | 0.0 | | 0.0 | |
| | | | | | | | | | | | | | | |
Consumer Price Index | | | | | | | | | | | | | | | |
Canada (1992=100) | | 122.3 | | 124.6 | | 127.2 | | 129.7 | | 132.3 | | 134.9 | | 137.6 | |
(% change) | | 2.8 | | 1.9 | | 2.1 | | 2.0 | | 2.0 | | 2.0 | | 2.0 | |
| | | | | | | | | | | | | | | |
Canadian Interest Rates (%) | | | | | | | | | | | | | | | |
3-Month Treasury Bills | | 2.9 | | 2.2 | | 2.6 | | 3.3 | | 4.1 | | 4.9 | | 5.0 | |
10-year Government Bonds | | 4.8 | | 4.6 | | 4.1 | | 4.6 | | 5.1 | | 5.9 | | 6.0 | |
| | | | | | | | | | | | | | | |
United States Interest Rates (%) | | | | | | | | | | | | | | | |
3-Month Treasury Bills | | 1.0 | | 1.4 | | 3.1 | | 3.9 | | 4.4 | | 5.0 | | 5.0 | |
10-year Government Bonds | | 4.0 | | 4.3 | | 4.3 | | 4.7 | | 5.1 | | 5.9 | | 6.0 | |
| | | | | | | | | | | | | | | |
Exchange Rate (U.S. cents / Canadian $) | | 71.4 | | 76.8 | | 81.4 | | 83.0 | | 83.5 | | 83.5 | | 83.5 | |
| | | | | | | | | | | | | | | |
British Columbia Goods and Services
Export Price Deflator (% change) | | -1.0 | | 3.4 | | 0.2 | | -2.0 | | 0.6 | | 1.0 | | 1.3 | |
(1) | Euro zone (12) is Austria, Belgium, Finland, France, Germany, Greece, Ireland, Italy, Luxembourg, Netherlands, Portugal and Spain. |
(2) | British Columbia housing starts appear in Table 3.8.2 |
97
The Economic Forecast Council, 2005
Introduction
Prior to the annual budget, the Minister of Finance seeks the advice of the Economic Forecast Council (the Council) on the outlook for the provincial economy and presents the forecasts with the budget. This consultation process is a requirement of the Budget Transparency and Accountability Act.
Prior to the February 15, 2005 budget, the Minister had met with the Council on December 3, 2004 to discuss their estimates for 2004 and the economic outlook for 2005 and beyond.
The Economic Forecast Council has been resurveyed on July 28, 2005 for the September Budget Update. The underlying forecast details from these surveys are summarized in the table at the end of the topic box.
Chart 1 – Economic Forecast Council Outlook for the BC Economy

Note: BC real GDP per cent change represents the average of the Economic Forecast Council’s forecasts
Overview
Following growth in the British Columbia economy of 3.9 per cent in 2004, the average of the Council’s forecasts now call for growth of 3.6 per cent in 2005, 3.4 per cent in 2006 and 3.3 per cent for the 2007 to 2009 period. All Council members expected growth in the BC economy to outpace that of Canada for 2005. For BC, the solid domestic outlook was expected to be partially offset by the drag of net exports on growth this year, while the outlook for job creation remained robust. In the medium-term, Council members noted that non-residential construction related to the 2010 Olympics and a strong domestic economy supported by higher migration would sustain strong growth rates in that sector. In addition, growing trade with Asia and improved (provincial government) fiscal flexibility was expected to result in overall robust growth over the medium-term.
Forecast risks identified by the Council included labour shortages and resulting upward pressures on prices related to infrastructure projects for the 2010 Olympics, the strength of the Canadian dollar, slowing North American housing markets, and the potential for weakening global economic growth.
International Outlook
On average, the Economic Forecast Council expected growth of 3.6 per cent in the U.S. economy for 2005. The Council’s average forecast was for U.S. growth of 3.2 per cent in 2006 and 3.1 per cent for the 2007 to 2009 period.
Several Council members cited a slowdown in U.S. growth as a risk to the outlook, particularly in terms of a slowing housing sector. The housing sector’s contribution to growth was expected to moderate as higher interest rates and high levels of consumer indebtedness dampen housing activity. Slowing of the North American housing sector would have a negative impact on BC’s exports of forest products.
The Council mentioned that growth in China was expected to moderate; contributing, along with the U.S., to an overall cooling of world GDP growth. The strength of the Japanese economic recovery remained an issue of concern for the Council. While growth in Japan currently appears more sustainable, decelerating growth in China could derail Japan’s economic growth expectations.
98
The Canadian Economy
The Canadian economy is still working through the impacts of the rapid appreciation of the Canadian dollar seen in 2003 and 2004. Council members noted that the higher Canadian dollar and weaker external demand, combined with softening commodity prices, could result in Canadian economic growth below potential.
For 2005, Canadian growth was forecast to be 2.7 per cent on average, climbing to an average forecast of 2.9 per cent in 2006 and 2007 through 2009.
The risks to the Canadian outlook cited by Council members included a renewed appreciation of the Canadian dollar, slowing global demand and a more rapid downturn in commodity prices.
Financial Markets
Most Council members expected the Federal Reserve to slow the pace of tightening at the end of this year and into 2006, due to the sensitivity of the U.S. economy to higher interest rates. The higher federal funds rate (1) was expected to dampen the U.S. housing market, which could negatively impact BC’s forestry exports.
The intended federal funds rate was projected to be 3.2 per cent on average in 2005, rising to 3.9 per cent in 2006 on average. Over the 2007 to 2009 period forecasts of the intended federal funds rate averaged 4.2 per cent.
In Canada, the Council generally felt that, with contained inflation and modest growth expectations, the Bank of Canada would remain on the sidelines or tighten modestly through the end of 2005. The overnight target rate (2) was expected to average 2.6 per cent for 2005. For the most part, Council members expected the Bank of Canada to raise rates at a measured pace through 2006, resulting in an average forecast for the overnight target rate of 3.3 per cent in 2006. A few Council members expected the Bank of Canada to move to the sidelines after one rate hike in 2006. Over the medium-term, the overnight target rate was forecast to average 3.8 per cent over the 2007 to 2009 period.
The Council’s average forecast for the Canadian exchange rate was 81.6 cents US in 2005, and
(1) The federal funds rate is the interest rate at which depository institutions lend balances at the Federal Reserve to other depository institutions overnight.
(2) The overnight target rate is the midpoint of the Bank of Canada’s operating band for overnight financing.
British Columbia Economic Forecast Council: Summary of Forecasts
July 28, 2005 Survey
| | | | | | | | 2007-2009 | |
Participant | | Organization | | 2005 | | 2006 | | Average | |
| | | | Per cent change in real GDP | |
Marie-Christine Bernard | | Conference Board | | 3.0 | | 2.9 | | 2.8 | |
Jock Finlayson | | BC Business Council | | 3.5 | | 3.5 | | 3.5 | |
Rick Egelton | | Bank of Montreal | | 3.5 | | 3.8 | | 3.6 | |
Warren Lovely | | CIBC | | 3.5 | | 3.2 | | 3.2 | |
Ernie Stokes | | Stokes Economic Consulting | | 3.5 | | 3.6 | | 3.0 | |
Don Drummond | | TD Bank | | 3.6 | | 3.3 | | 3.5 | |
Warren Jestin | | Scotiabank | | 3.6 | | 3.5 | | 3.5 | |
Craig Wright | | RBC Financial Group | | 3.6 | | 3.6 | | 3.5 | |
Dale Orr | | Global Insight | | 3.7 | | 3.1 | | 3.1 | |
Helmut Pastrick | | Credit Union Central of BC | | 3.7 | | 3.9 | | 3.6 | |
William Tharp | | M. Murenbeeld & Associates | | 3.9 | | 2.9 | | 2.7 | |
David Baxter | | Urban Futures Institute | | 4.0 | | 3.8 | | 3.6 | |
Carl Sonnen | | Informetrica | | 4.2 | | 3.5 | | 2.7 | |
Average | | | | 3.6 | | 3.4 | | 3.3 | |
99
ranged from a low of 80.2 cents up to a high of 83.0 cents. In 2006, the average of Council members’ exchange rate forecasts was 82.1 cents US with the majority expecting a steady or appreciating Canadian dollar. On average, the Council expects the Canadian dollar to stabilize over the medium-term at 82.7 cents US for 2007 to 2009. Council members continued to have divergent views on the level of the Canadian dollar over the medium-term. For the 2007 to 2009 period, the range of Council members forecasts of the Canadian dollar was from 79.0 cents US up to 87.0 cents US.
Chart 2 – Economic Forecast Council Outlook for the Exchange Rate
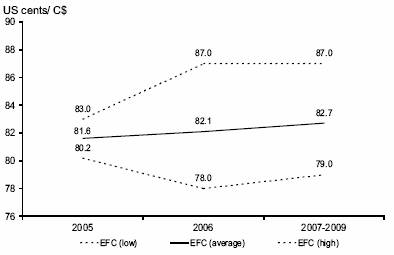
The potential for further Canadian dollar appreciation was seen as one of the largest risks to the outlook. Further increases in the exchange rate bring renewed risks to growth in Canada and BC, particularly without the offset of higher commodity prices seen in 2004. Potentially negative impacts of the higher Canadian dollar would be lower exports of goods as well as tourism activity. A potential benefit of the stronger dollar mentioned by Council members was productivity enhancement through increased investment in machinery and equipment from the U.S.
British Columbia Forecast
On average, Council members expected BC’s economy to post growth of 3.6 per cent in 2005, 3.4 per cent in 2006 and 3.3 per cent during the 2007 to 2009 period. Forecasts for BC economic growth in 2005 ranged from 3.0 per cent up to 4.2 per cent. All of the Council members forecast BC to outperform Canada in 2005, and almost all of the Council expected this to continue through the forecast period.
Chart 3 – Economic Forecast Council Outlook for BC and Canada
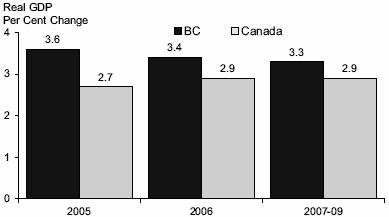
Note: Real GDP per cent change for BC and Canada represent the average of the Economic Forecast Council’s forecasts
Council members cited BC’s positive net interprovincial migration, sound fiscal policy, strong consumer spending and investment growth, the robust North American housing market and increased shipments through the BC transportation infrastructure, as reasons for BC’s strong performance.
Chart 4 – Economic Growth Forecast 2005
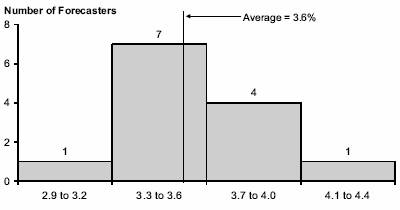
As shown in Charts 4 and 5, Council members views were relatively convergent on their BC growth forecasts for 2005 and 2006.
Over the medium-term, the Council noted that BC’s economy would benefit from strong non-residential construction and increased trade with rapidly expanding Pacific Rim countries.
100
Chart 5 – Economic Growth Forecast 2006
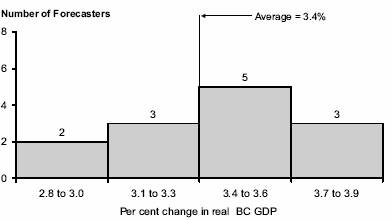
The BC outlook for the 2007-09 period showed a divergence of views among Council members. A large group (seven members) expected growth of 3.5 per cent or higher and a somewhat smaller group (five members) predicted growth of 3.1 per cent or less for 2007 to 2009 (see Chart 6).
Chart 6 – Economic Growth Forecast 2007-09
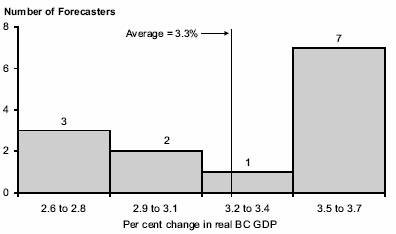
External Issues
The Council noted the risk of a slowing global economic outlook, including growth of BC’s trading partners such as the U.S., Japan and China. The trade and savings deficits in the U.S. as well as imbalances in Asia could lead to sizeable economic and currency adjustments. While BC’s economy has a diversified export market, the U.S. is still the province’s major trading partner and a downturn in the U.S. economy would have a negative impact on BC.
The Council recognized British Columbia’s opportunity for significant long-term growth due to our position as a gateway to rapidly expanding Asian markets. However, several Council members stressed the importance of developing the necessary infrastructure (including improvements to ports, railways and border crossings) quickly in order to capitalize on this opportunity as soon as possible.
The potential resolution of the softwood lumber dispute with the U.S. was also mentioned by the Council as a positive factor for the BC outlook. While forestry in BC was expected to continue to benefit from a strong U.S. housing sector in 2005, all of the Council members forecast the U.S. housing market to slow in 2006. The effects of the pine beetle epidemic in BC on the forest industry was also mentioned by several Council members as a medium-term issue.
Sectoral Issues
In terms of the domestic economy, the Council discussed the areas of housing, immigration, tourism and energy sector development.
The Council on average expected the housing sector in BC to be robust in 2005, supported by low interest rates and increased migration from both international and interprovincial sources. The Council on average saw housing starts easing somewhat from the high levels seen in 2004 but remaining robust with an average of 32,367 units in 2005. There was a wide range of forecasts of housing starts in 2005, from 26,000 units up to 36,000 units. Over the 2007 to 2009 period, housing starts were expected to average 29,728 units with forecasts ranging from 22,000 units up to 39,000 units.
Total net migration to BC was expected to increase in 2005, relative to the level seen in 2004, with the Council’s forecasts averaging 36,820 people for 2005 compared to 35,556 people in 2004. The range of forecasts for total net migration was quite wide, with a low of 30,000 people and a high of 45,000 people in 2005. Forecasts for total net migration also showed divergence over the medium-term. Total net migration was forecast to average 43,390 people over the 2007 to 2009 period, with a low forecast of 20,000 people and a high forecast of 70,000 people.
101
Tourism in BC has been negatively impacted by the higher Canadian dollar as well as security concerns. Council members noted that while these concerns may continue to dampen tourism in the near term, the outlook for tourism was brighter post-2006. In addition to the expected boost to tourism from the 2010 Olympics, Canada has been added to China’s list of approved destinations, which should provide support to tourism in BC over the medium-term.
Several Council members mentioned high energy prices, particularly oil prices, as having both positive and negative impacts for the BC economy. High prices for oil and natural gas encourage exploration and the development of the increasingly important oil and gas industry in BC. However, the Council also noted that the high level of energy prices was a drag on external demand, which in addition to the potentially negative impact on non-energy commodity prices, would negatively impact BC’s non-energy exports. Over the medium-term, development of the natural gas industry in Northeast BC was cited by the Council as a positive driver of economic growth.
Government
Council members also mentioned the improved fiscal position of government and a positive business climate as strengths in BC. The robust economic outlook for BC provides improved fiscal flexibility for the provincial government. In addition, the Council noted that the government has more flexibility to maintain a competitive tax regime and invest in infrastructure.
The top medium-term issue raised by Council members was the 2010 Olympics and potential labour constraints resulting in rising construction costs. Infrastructure projects planned for the 2010 Olympics represent a significant investment in infrastructure, and Council members expected the BC economy to benefit from the rise in non-residential construction through the medium-term. Cost pressures on materials and labour for all types of construction projects were raised as an important issue by the Council. Stronger migration to BC may help alleviate some labour shortages, but also puts further pressure on the housing market. Another labour market issue raised by some Council members was the perception of unionized labour in BC as costly and potentially disruptive.
Changes since the February 15, 2005 budget
The Economic Forecast Council has upgraded their average outlook for the BC economy from 2005 through 2009. The Council forecasts growth in British Columbia of 3.6 per cent in 2005 and 3.4 per cent in 2006, compared to 3.3 per cent in 2005 and 3.1 per cent in 2006 in January. Over the 2007 to 2009 period the Economic Forecast Council expects the British Columbia economy to grow 3.3 per cent per year.
Chart 7 – Average Growth Forecast Upgraded
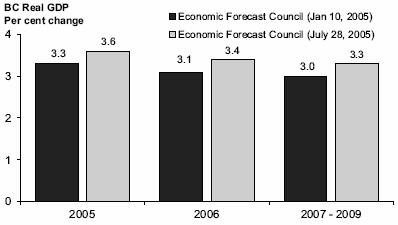
Economic forecast council members upgraded their forecasts for BC in July for a variety of reasons. There was a general view that the BC economy has positive momentum from the strong 2004 performance and robust year-to-date data for 2005. Strong growth on the domestic side of the economy was cited by council members as one of the main reasons for upgrading their 2005 outlook. In particular, retail sales, non-residential investment and employment growth were all performing better than expected in January. Council members also noted that the outlook for net migration to BC had improved since January.
102
Council members also upgraded their outlook for the trade sector since their January surveys. Stronger commodity prices and a less severe than anticipated impact from the high Canadian dollar on BC exports have resulted in higher expectations for net exports over the forecast period. In addition, investment in some commodity sectors, such as mining, was expected to perform better than previously thought.
Forecast Survey — Participants’ Opinions
All figures are based | | 2005 | | 2006 | | 2007 to 2009 | |
on annual averages | | Range | | Average(1) | | Range | | Average(1) | | Range | | Average(2) | |
United States | | | | | | | | | | | | | |
Real GDP (% change) | | 3.4 - 3.7 | | 3.6 | (13) | 2.5 - 3.7 | | 3.2 | (13) | 2.5 - 3.6 | | 3.1 | (12) |
Intended Federal Funds rate (%) | | 3.00 - 3.50 | | 3.22 | (13) | 3.50 - 4.25 | | 3.95 | (12) | 2.50 - 5.00 | | 4.21 | (11) |
Housing starts (million units) | | 1.91 - 2.02 | | 1.99 | (12) | 1.46 - 1.90 | | 1.78 | (12) | 1.50 - 1.80 | | 1.70 | (11) |
Canada | | | | | | | | | | | | | |
Real GDP (% change) | | 2.5 - 3.0 | | 2.7 | (13) | 2.5 - 3.4 | | 2.9 | (13) | 2.4 - 3.2 | | 2.9 | (13) |
Bank of Canada Overnight Target rate (%) | | 2.50 - 2.88 | | 2.65 | (12) | 2.60 - 3.94 | | 3.30 | (12) | 2.30 - 5.23 | | 3.80 | (11) |
Exchange rate (US cents/C$) | | 80.2 - 83.0 | | 81.6 | (13) | 78.0 - 87.0 | | 82.1 | (13) | 79.0 - 87.0 | | 82.7 | (12) |
Consumer price index (% chg) | | 1.8 - 2.3 | | 2.0 | (13) | 1.3 - 2.3 | | 1.9 | (13) | 1.3 - 2.0 | | 1.9 | (12) |
British Columbia | | | | | | | | | | | | | |
Real GDP (% change) | | 3.0 - 4.2 | | 3.6 | (13) | 2.9 - 3.9 | | 3.4 | (13) | 2.7 - 3.6 | | 3.3 | (13) |
Nominal GDP (% change) | | 4.7 - 7.8 | | 5.8 | (11) | 3.9 - 7.4 | | 5.4 | (11) | 4.2 - 7.0 | | 5.2 | (10) |
Personal Income (% change) | | 2.9 - 6.2 | | 5.3 | (10) | 3.0 - 6.0 | | 5.0 | (10) | 2.9 - 6.0 | | 4.5 | (9) |
Net Migration (thousand persons) | | 30.0 - 45.0 | | 36.8 | (11) | 28.0 - 56.0 | | 40.4 | (11) | 20.0 - 70.0 | | 43.4 | (10) |
Employment (% change) | | 2.2 - 3.6 | | 2.9 | (12) | 1.2 - 3.1 | | 2.0 | (12) | 1.0 - 2.8 | | 1.9 | (12) |
Unemployment rate (%) | | 5.5 - 6.5 | | 6.1 | (13) | 5.5 - 6.3 | | 5.9 | (13) | 5.2 - 6.4 | | 5.9 | (13) |
Corporate pre-tax profits (% change) | | -4.1 - 12.0 | | 7.5 | (6) | -1.1 - 7.0 | | 5.2 | (6) | 4.0 - 8.0 | | 6.0 | (6) |
Housing starts (thousand units) | | 26.0 - 36.0 | | 32.4 | (13) | 24.0 - 37.0 | | 31.0 | (13) | 22.0 - 39.0 | | 29.7 | (12) |
Retail sales (% change) | | 4.7 - 7.6 | | 6.0 | (13) | 3.1 - 7.8 | | 5.4 | (13) | 3.2 - 6.7 | | 4.9 | (12) |
Consumer price index (% chg) | | 1.4 - 2.5 | | 2.0 | (13) | 1.3 - 2.9 | | 2.0 | (13) | 1.3 - 3.0 | | 2.0 | (13) |
(1) Based on responses from participants providing forecasts.
(2) Participants provided an average forecast for 2007 to 2009.
(3) Number of respondents shown in parenthesis.
103
Part 4: 2005/06 FIRST QUARTERLY REPORT
2005/06 Results to June 30, 2005
The quarterly results for the April to June 2005 period show a surplus of $469 million, $641 million higher than the year-to-date budget.
For the first three months of the fiscal year revenues were up $235 million from budget. This reflects higher than expected taxpayer-supported revenues of $162 million, mainly due to higher property transfer tax revenues reflecting strong year-to-date housing sales, and higher than expected forestry revenues, mainly due to improved harvest volumes for the first three months of the fiscal year. Commercial crown net earnings were up $73 million reflecting stronger results for BC Lotteries and ICBC.
Government expenses for the April to June period were $406 million lower than forecast. This reflects lower than expected spending in most ministries ($152 million), and lower ministry expenses recovered from external entities ($97 million) – this is in part due to delayed spending pending the anticipated government reorganization announced in June 2005. In addition, net spending by taxpayer-supported crown corporations and the SUCH sector was $157 million lower than forecast.
Capital spending totaled $765 million for the quarter ended June 30, 2005, $198 million lower than forecast. This is primarily due to lower than forecast spending by government ministries (in part due to spending delays pending the government reorganization), lower health capital spending and lower capital spending by BC Hydro. Provincial debt was $35.9 billion at June 30, 2005, $235 million lower than budget. Taxpayer supported debt totaled $28.4 billion at June 30, 2005, $532 million lower than budget as a result of lower capital spending and the improved surplus. Self-supported debt stood at $7.5 billion, $297 million higher than budget, due mainly to accelerated timing of BC Hydro requirements.
The following tables provide further details on quarterly results for the April to June 2005 period.
104
Table 4.1 2005/06 Operating Statement
| | Year-to-Date to June 30 | |
| | 2005/06 | | Actual | |
($ millions) | | Budget | | Actual | | Variance | | 2004/05 | |
Taxpayer-supported programs and agencies: | | | | | | | | | |
Revenue | | 7,440 | | 7,602 | | 162 | | 7,305 | |
Expense | | (8,023 | ) | (7,617 | ) | 406 | | (7,520 | ) |
Taxpayer-supported balance | | (583 | ) | (15 | ) | 568 | | (215 | ) |
Commercial Crown corporation net earnings | | 411 | | 484 | | 73 | | 485 | |
Surplus (deficit) | | (172 | ) | 469 | | 641 | | 270 | |
105
Table 4.2 2005/06 Revenue by Source
| | Year-to-Date to June 30 | |
| | 2005/06 | | Actual | |
($ millions) | | Budget | | Actual | | Variance | | 2004/05 | |
Taxation | | | | | | | | | |
Personal income | | 1,278 | | 1,276 | | (2 | ) | 1,223 | |
Corporation income | | 281 | | 281 | | — | | 238 | |
Social service | | 1,040 | | 1,057 | | 17 | | 1,061 | |
Fuel | | 225 | | 223 | | (2 | ) | 220 | |
Tobacco | | 183 | | 181 | | (2 | ) | 179 | |
Property | | 425 | | 420 | | (5 | ) | 409 | |
Property transfer | | 122 | | 221 | | 99 | | 173 | |
Other | | 137 | | 140 | | 3 | | 153 | |
| | 3,691 | | 3,799 | | 108 | | 3,656 | |
Natural resources | | | | | | | | | |
Natural gas royalties | | 406 | | 405 | | (1 | ) | 389 | |
Columbia River Treaty | | 53 | | 53 | | — | | 63 | |
Other energy and minerals | | 180 | | 178 | | (2 | ) | 148 | |
Forests | | 137 | | 209 | | 72 | | 162 | |
Water and other resources | | 79 | | 76 | | (3 | ) | 75 | |
| | 855 | | 921 | | 66 | | 837 | |
Other revenue | | | | | | | | | |
Medical Services Plan premiums | | 359 | | 371 | | 12 | | 349 | |
Post-secondary education fees | | 143 | | 131 | | (12 | ) | 135 | |
Other health care-related fees | | 49 | | 46 | | (3 | ) | 47 | |
Motor vehicle licences and permits | | 97 | | 102 | | 5 | | 95 | |
Other fees and licences | | 168 | | 166 | | (2 | ) | 280 | |
Investment earnings | | 213 | | 190 | | (23 | ) | 216 | |
Sales of goods and services | | 141 | | 144 | | 3 | | 124 | |
Miscellaneous | | 366 | | 407 | | 41 | | 466 | |
| | 1,536 | | 1,557 | | 21 | | 1,712 | |
Contributions from the federal government | | | | | | | | | |
Health and social transfers | | 1,036 | | 1,032 | | (4 | ) | 841 | |
Equalization | | 148 | | 147 | | (1 | ) | 111 | |
Other federal contributions | | 174 | | 146 | | (28 | ) | 148 | |
| | 1,358 | | 1,325 | | (33 | ) | 1,100 | |
Taxpayer-supported programs and agencies | | 7,440 | | 7,602 | | 162 | | 7,305 | |
Commercial Crown corporation operating results | | | | | | | | | |
BC Hydro (before regulatory transfers | | (15 | ) | (15 | ) | — | | 8 | |
Liquor Distribution Branch | | 179 | | 185 | | 6 | | 189 | |
BC Lotteries (net of payments to the federal government) | | 200 | | 227 | | 27 | | 176 | |
BC Rail (1) | | 2 | | 4 | | 2 | | 27 | |
ICBC (2) | | 42 | | 72 | | 30 | | 85 | |
Other | | 3 | | 11 | | 8 | | — | |
| | 411 | | 484 | | 73 | | 485 | |
Total revenue | | 7,851 | | 8,086 | | 235 | | 7,790 | |
(1) The year to date figures reflect BC Rail’s budget and results for the April to June period.
(2) The year to date figures reflect ICBC’s budget and results for the April to June period.
106
Table 4.3 2005/06 Expense by Ministry, Program and Agency
| | Year-to-Date to June 30 | |
| | 2005/06 | | Actual | |
($ millions) | | Budget (1) | | Actual | | Variance | | 2004/05 (2) | |
Advanced Education | | 430 | | 426 | | (4 | ) | 432 | |
Education | | 1,420 | | 1,416 | | (4 | ) | 1,409 | |
Health Services | | 2,866 | | 2,804 | | (62 | ) | 2,733 | |
Subtotal | | 4,716 | | 4,646 | | (70 | ) | 4,574 | |
Office of the Premier | | 2 | | 2 | | — | | 2 | |
Aboriginal Relations and Reconciliation | | 8 | | 7 | | (1 | ) | 9 | |
Agriculture and Lands | | 23 | | 21 | | (2 | ) | 102 | |
Attorney General | | 121 | | 116 | | (5 | ) | 118 | |
Children and Family Development | | 390 | | 379 | | (11 | ) | 360 | |
Community Services | | 121 | | 122 | | 1 | | 17 | |
Economic Development | | 54 | | 50 | | (4 | ) | 37 | |
Employment and Income Assistance | | 332 | | 317 | | (15 | ) | 314 | |
Energy, Mines and Petroleum Resources | | 18 | | 17 | | (1 | ) | 13 | |
Environment | | 30 | | 32 | | 2 | | 29 | |
Finance | | 21 | | 16 | | (5 | ) | 14 | |
Forests and Range | | 189 | | 176 | | (13 | ) | 169 | |
Labour and Citizens’ Services | | 48 | | 43 | | (5 | ) | 52 | |
Public Safety and Solicitor General | | 130 | | 128 | | (2 | ) | 118 | |
Small Business and Revenue | | 10 | | 8 | | (2 | ) | 8 | |
Tourism, Sports and the Arts | | 95 | | 89 | | (6 | ) | 76 | |
Transportation | | 204 | | 199 | | (5 | ) | 197 | |
Total ministries and Office of the Premier | | 6,512 | | 6,368 | | (144 | ) | 6,209 | |
Legislation | | 13 | | 10 | | (3 | ) | 10 | |
Officers of the Legislature | | 24 | | 20 | | (4 | ) | 5 | |
BC Family Bonus | | 13 | | 13 | | — | | 19 | |
Management of public funds and debt | | 165 | | 163 | | (2 | ) | 175 | |
Contingencies and new programs | | — | | — | | — | | — | |
Other appropriations | | (18 | ) | (17 | ) | 1 | | 7 | |
Consolidated revenue fund expense | | 6,709 | | 6,557 | | (152 | ) | 6,425 | |
Expenses recovered from external entities | | 424 | | 327 | | (97 | ) | 391 | |
Grants to agencies and other internal transfers: | | | | | | | | | |
Taxpayer-supported Crown agencies | | (232 | ) | (281 | ) | (49 | ) | (269 | ) |
School districts | | (1,263 | ) | (1,292 | ) | (29 | ) | (1,113 | ) |
Universities | | (225 | ) | (242 | ) | (17 | ) | (271 | ) |
Colleges, university colleges and institutes | | (201 | ) | (187 | ) | 14 | | (200 | ) |
Health authorities and hospital societies | | (1,797 | ) | (2,019 | ) | (222 | ) | (2,046 | ) |
Children and Family Development governance authorities | | (66 | ) | — | | 66 | | (1 | ) |
| | (3,784 | ) | (4,021 | ) | (237 | ) | (3,900 | ) |
Taxpayer-supported Crown agencies | | 518 | | 465 | | (53 | ) | 464 | |
SUCH sector and regional authorities: | | | | | | | | | |
School districts | | 1,285 | | 1,364 | | 79 | | 1,233 | |
Universities | | 536 | | 550 | | 14 | | 541 | |
Colleges, university colleges and institutes | | 329 | | 295 | | (34 | ) | 307 | |
Health authorities and hospital societies | | 1,940 | | 2,080 | | 140 | | 2,058 | |
Children and Family Development governance authorities | | 66 | | — | | (66 | ) | 1 | |
| | 4,674 | | 4,754 | | 80 | | 4,604 | |
Net spending of Crown agencies and the SUCH sector | | 890 | | 733 | | (157 | ) | 704 | |
Total taxpayer-supported expense | | 8,023 | | 7,617 | | (406 | ) | 7,520 | |
(1) | Budget amounts and prior year comparative figures have been restated to reflect government’s current organization and accounting policies. |
(2) | The 2004/05 consolidated revenue fund results have been restated to reflect the current government organization. |
107
Table 4.4 2005/06 Expense By Function
| | Year-to-Date to June 30 | |
| | 2005/06 | | Actual | |
($ millions) | | Budget | | Actual | | Variance | | 2004/05 | |
Health | | 3,170 | | 2,997 | | (173 | ) | 2,854 | |
Education | | 2,369 | | 2,389 | | 20 | | 2,417 | |
Social services | | 711 | | 652 | | (59 | ) | 646 | |
Protection of persons and property | | 299 | | 286 | | (13 | ) | 292 | |
Transportation | | 399 | | 302 | | (97 | ) | 303 | |
Natural resources and economic development | | 199 | | 255 | | 56 | | 331 | |
Other | | 385 | | 265 | | (120 | ) | 169 | |
General government | | 157 | | 137 | | (20 | ) | 126 | |
Debt servicing | | 334 | | 334 | | — | | 382 | |
Total taxpayer-supported expense | | 8,023 | | 7,617 | | (406 | ) | 7,520 | |
Table 4.5 2005/06 Capital Spending
| | Year-to-Date to June 30 | |
| | 2005/06 | | Actual | |
($ millions) | | Budget | | Actual | | Variance | | 2004/05 | |
Taxpayer-supported | | | | | | | | | |
Education | | | | | | | | | |
Schools (K-12) | | 81 | | 81 | | — | | 75 | |
Post-secondary | | 146 | | 146 | | — | | 166 | |
Health | | 188 | | 119 | | (69 | ) | 86 | |
BC Transportation Financing Authority | | 145 | | 173 | | 28 | | 114 | |
Vancouver Convention Centre Expansion Project | | 31 | | 22 | | (9 | ) | 3 | |
Government operating (ministries) | | 91 | | 25 | | (66 | ) | 9 | |
Other (1) | | 29 | | 26 | | (3 | ) | 20 | |
Total taxpayer-supported | | 711 | | 592 | | (119 | ) | 473 | |
Self-supported | | | | | | | | | |
BC Hydro | | 174 | | 133 | | (41 | ) | 140 | |
BC Transmission Corporation | | 17 | | 2 | | (15 | ) | — | |
Columbia River power projects (2) | | 10 | | 8 | | (2 | ) | 14 | |
BC Rail | | 5 | | 3 | | (2 | ) | 11 | |
ICBC (3) | | 14 | | 6 | | (8 | ) | 7 | |
BC Lotteries | | 25 | | 19 | | (6 | ) | 17 | |
Liquor Distribution Branch | | 7 | | 2 | | (5 | ) | — | |
Total self-supported | | 252 | | 173 | | (79 | ) | 189 | |
Total capital expenditures | | 963 | | 765 | | (198 | ) | 662 | |
(1) Includes BC Housing Management Commission, Provincial Rental Housing Corporation, BC Buildings Corporation, Ministry of Attorney General, Ministry of Public Safety and Solicitor General, Ministry of Children and Family Development, Rapid Transit Project 2000, and BC Transit.
(2) Joint ventures of the Columbia Power Corporation (CPC) and Columbia Basin Trust (CBT).
(3) Includes ICBC Properties Ltd.
108
Table 4.6 2005/06 Capital Expenditure Projects Greater Than $50 million(1)
Note: Information in bold type denotes changes from the February 15 budget.
| | | | Forecast | | Cumulative | | Spending | | Cumulative | | Total | | Total | |
| | Start | | Completion | | Spending at | | April 1 to | | Spending at | | Project | | Project | |
($ millions) | | Date | | Date | | Mar. 31, 2005(2) + | | June 30 | | = June 30, 2005 | | Budget(3) | | Forecast (3) | |
Advanced Education facilities (4) | | | | | | | | | | | | | | | |
SFU – Surrey Central City Campus | | Mar. 2004 | | Sept. 2007 | | 40 | | — | | 40 | | 70 | | 70 | |
Health facilities (4) | | | | | | | | | | | | | | | |
Vancouver General Hospital, redevelopment project | | Sept. 2000 | | Jan. 2007 | (5) | 96 | | 8 | | 104 | | 156 | | 156 | |
Academic Ambulatory Care Centre | | Fall 2004 | | Summer/06 | | 12 | | 17 | | 29 | | 95 | | 95 | |
Abbotsford Regional Hospital and Cancer Centre | | Fall 2004 | | Summer/08 | | 39 | | 29 | | 68 | | 316 | | 316 | |
Total health facilities | | | | | | 147 | | 54 | | 201 | | 567 | | 567 | |
Transportation | | | | | | | | | | | | | | | |
Trans Canada Highway — 5 Mile (Yoho) Bridge | | May 1999 | | Fall 2006 | | 33 | | 2 | | 35 | | 44 | (6) | 44 | (6) |
Niaga’a Highway | | Aug. 1998 | | Fall 2005 | | 42 | | 2 | | 44 | | 52 | | 52 | |
Sea-to-Sky Highway | | April 2003 | | Winter 2009 | | 67 | | 15 | | 82 | | 600 | | 600 | |
William R. Bennett Bridge | | Mar. 2005 | | July 2008 | | 6 | | — | | 6 | | 144 | | 144 | |
SkyTrain extension — phase 1 | | Sept. 1998 | | June 2006 | | 1,077 | | 2 | | 1,079 | | 1,167 | | 1,106 | |
Total transportation | | | | | | 1,225 | | 21 | | 1,246 | | 2,007 | | 1,946 | |
Power generation | | | | | | | | | | | | | | | |
BC Hydro | | | | | | | | | | | | | | | |
• Seven Mile Dam safety improvements | | June 1999 | | Sept. 2005 | | 62 | | — | | 62 | | 100 | | 64 | |
• Mica Dam — generator stator replacement | | Feb. 2004 | | Oct. 2010 | | 6 | | 1 | | 7 | | 78 | | 78 | |
• Peace Canyon Dam — generator stator replacement and rotor modification | | Feb. 2004 | | Mar. 2010 | | 1 | | — | | 1 | | 64 | | 63 | |
BC Transmission Corporation | | | | | | | | | | | | | | | |
• System control centre modernization project | | Feb. 2005 | | June 2008 | | 2 | | — | | 2 | | 134 | | 134 | |
Brilliant Expansion Power Corporation (7) | | | | | | | | | | | | | | | |
• Brilliant Dam power expansion | | Oct. 2002 | | Aug. 2006 | | 158 | | 6 | | 164 | | 205 | | 205 | |
Total power generation | | | | | | 229 | | 7 | | 236 | | 581 | | 544 | |
Other | | | | | | | | | | | | | | | |
ICBC Properties Ltd. | | | | | | | | | | | | | | | |
• Surrey Central City Mall Ltd | | Sept. 1999 | | Mar. 2007 | (8) | 243 | | 5 | | 248 | | 312 | | 284 | |
Vancouver Convention Centre Expansion Project | | 2003 | | 2008 | | 57 | | 9 | | 66 | | 273 | | 273 | (9) |
Total other | | | | | | 300 | | 14 | | 314 | | 585 | | 557 | |
(1) | Only projects that have been approved by Treasury Board and/or Crown corporation boards are included in this table. Ministry service plans may include projects that still require final approval. |
(2) | Total expenditures since commencement of each project. |
(3) | Represents sum of annual budgeted expenditures to complete each project. |
(4) | Amounts shown exclude interest costs incurred during construction. |
(5) | Individual components were completed starting in December 2000 and will continue to be completed before the end of the overall project. |
(6) | Amount represents the provincial portion of this cost-shared project with the federal government. Total project budget is $65 million. |
(7) | A joint venture of the Columbia Power Corporation and the Columbia Basin Trust. |
(8) | The base building was substantially completed in January 2003; however, work to prepare space for new tenants is still required. |
(9) | Amount represents the provincial portion of this cost-shared project with the federal government and the tourism industry. |
109
Table 4.7 2005/06 Provincial Debt (1)
| | Balance | | Balance at June 30, 2005 | |
| | March 31, | | Net | | Debt Outstanding | | | |
($ millions) | | 2005 | | Change (2) | | Actual | | Budget | | Variance | |
Taxpayer-supported debt | | | | | | | | | | | |
Provincial government operating | | 14,481 | | (344 | ) | 14,137 | | 14,206 | | (69 | ) |
Other taxpayer-supported debt (mainly capital) | | | | | | | | | | | |
Education facilities | | | | | | | | | | | |
Schools | | 4,483 | | 15 | | 4,498 | | 4,523 | | (25 | ) |
Post-secondary institutions | | 2,326 | | 48 | | 2,374 | | 2,413 | | (39 | ) |
| | 6,809 | | 63 | | 6,872 | | 6,936 | | (64 | ) |
Health facilities | | 2,112 | | 57 | | 2,169 | | 2,482 | | (313 | ) |
Highways and public transit | | | | | | | | | | | |
BC Transportation Financing Authority | | 2,474 | | (50 | ) | 2,424 | | 2,479 | | (55 | ) |
BC Transit | | 78 | | (2 | ) | 76 | | 84 | | (8 | ) |
Public transit | | 906 | | (4 | ) | 902 | | 897 | | 5 | |
SkyTrain extension | | 1,135 | | 3 | | 1,138 | | 1,142 | | (4 | ) |
| | 4,593 | | (53 | ) | 4,540 | | 4,602 | | (62 | ) |
Other | | | | | | | | | | | |
BC Buildings | | 241 | | 17 | | 258 | | 234 | | 24 | |
Social housing (3) | | 133 | | 5 | | 138 | | 178 | | (40 | ) |
Homeowner Protection Office | | 130 | | (15 | ) | 115 | | 149 | | (34 | ) |
Other (4) | | 158 | | 25 | | 183 | | 157 | | 26 | |
| | 662 | | 32 | | 694 | | 718 | | (24 | ) |
Total other taxpayer-supported debt | | 14,176 | | 99 | | 14,275 | | 14,738 | | (463 | ) |
Total taxpayer-supported debt | | 28,657 | | (245 | ) | 28,412 | | 28,944 | | (532 | ) |
Self-supported debt | | | | | | | | | | | |
Commercial Crown corporations | | | | | | | | | | | |
BC Hydro | | 6,906 | | 302 | | 7,208 | | 6,923 | | 285 | |
BC Transmission Corporation | | — | | 30 | | 30 | | 16 | | 14 | |
Columbia River power projects (5) | | 257 | | (5 | ) | 252 | | 254 | | (2 | ) |
Liquor Distribution Branch | | 6 | | — | | 6 | | 6 | | — | |
| | 7,169 | | 327 | | 7,496 | | 7,199 | | 297 | |
Warehouse borrowing program | | — | | — | | — | | — | | — | |
Total self-supported debt | | 7,169 | | 327 | | 7,496 | | 7,199 | | 297 | |
Total provincial debt | | 35,826 | | 82 | | 35,908 | | 36,143 | | (235 | ) |
(1) | Debt includes provincial government direct debt, fiscal agency loans, other debt that has been guaranteed by the provincial government, and certain other debt that is not provincially guaranteed. |
(2) | Gross new long-term borrowing plus net change in short-term debt outstanding, less sinking fund contributions, sinking fund earnings and net maturities of long-term debt (after deduction of sinking fund balances for maturing issues). |
(3) | Includes the BC Housing Management Commission and the Provincial Rental Housing Corporation. |
(4) | Includes other taxpayer-supported Crown corporations and agencies, student loan guarantees, loan guarantees to agricultural producers, guarantees issued under economic development and home mortgage assistance programs, and loan guarantee provisions. |
(5) | Joint ventures of the Columbia Power Corporation (CPC) and Columbia Basin Trust (CBT). |
110
Table 4.8 2005/06 Statement of Financial Position
| | Actual | | Year-to-date | |
| | March 31, | | June 30, | |
($ millions) | | 2005 | | 2005 | |
Financial assets | | | | | |
Cash and temporary investments | | 3,568 | | 3,154 | |
Other financial assets | | 6,676 | | 6,578 | |
Sinking funds | | 4,516 | | 4,473 | |
Investments in commercial Crown corporations | | | | | |
Retained earnings | | 3,219 | | 3,291 | |
Recoverable capital loans | | 6,901 | | 7,233 | |
| | 10,120 | | 10,524 | |
Warehouse borrowing program assets | | — | | — | |
| | 24,880 | | 24,729 | |
Liabilities | | | | | |
Accounts payable & accrued liabilities | | 6,583 | | 5,976 | |
Deferred revenue | | 5,181 | | 5,306 | |
Debt: | | | | | |
Taxpayer-supported debt | | 28,657 | | 28,412 | |
Self-supported debt | | 7,169 | | 7,496 | |
Total provincial debt | | 35,826 | | 35,908 | |
Add: sinking fund investments presented as assets | | 4,516 | | 4,473 | |
Less : guarantees and non-guaranteed debt | | (421 | ) | (381 | ) |
Financial statement debt | | 39,921 | | 40,000 | |
| | 51,685 | | 51,282 | |
Net liabilities | | (26,805 | ) | (26,553 | ) |
Capital and other assets | | | | | |
Tangible capital assets | | 23,117 | | 23,356 | |
Other assets | | 613 | | 591 | |
| | 23,730 | | 23,947 | |
Accumulated surplus (deficit) | | (3,075 | ) | (2,606 | ) |
Table 4.8a 2005/06 Changes in Financial Position
| | Year-to-date | |
| | June 30, | |
($ millions) | | 2005 | |
(Surplus) deficit for the period: | | (469 | ) |
Capital asset changes: | | | |
Increase in taxpayer-supported capital investments | | 592 | |
Less: amortization and other accounting changes | | (375 | ) |
| | 217 | |
Increase (decrease) in net liabilities | | (252 | ) |
Investment and working capital changes: | | | |
Increase (reduction) in cash and temporary investments | | (414 | ) |
Increase (decrease) in warehouse borrowing investments | | — | |
Increase in total investment in commercial Crown corporations | | 245 | |
Add: net loan issues and other accounting changes | | 159 | |
| | 404 | |
Other working capital changes | | 341 | |
| | 331 | |
Increase (decrease) in financial statement debt | | 79 | |
(Increase) decrease in sinking fund debt | | 43 | |
Increase (decrease) in guarantees and non-guaranteed debt | | (40 | ) |
Increase (decrease) in total provincial debt | | 82 | |
111
APPENDICES
A1 Tax Expenditures
Introduction
A tax expenditure is the reduction in revenues from delivering government programs or benefits through the tax system rather than through voted budget appropriations. Tax expenditures are usually made by offering special tax rates, exemptions, or tax credits. Governments introduce tax expenditures primarily to achieve social policy objectives such as transfers to lower income families or to promote economic development and job creation.
Reporting tax expenditures improves government accountability by providing a more complete picture of government activities. The tax expenditure appendix outlines major tax expenditures for the 2004/05 fiscal year. It does not include tax expenditures introduced or expanded in the February 15 budget or the September Update. These are described in Part Two: Revenue Measures.
The Role of Tax Expenditure Programs
Using the tax system to deliver programs can reduce administration costs and compliance costs for recipients. In certain situations, the tax system allows intended beneficiaries to be readily identified from information that is already collected. In these cases setting up a separate expenditure program would result in costly overlap and duplication of effort. An example is the provincial sales tax credit, which is delivered through the income tax system. If this were a direct provincial expenditure program, a provincial agency or office would have to be established to duplicate much of the work already done by the Canada Revenue Agency. In addition, it would require individuals to undertake a separate, time-consuming application process in order to qualify for the benefit.
There are, however, several potential drawbacks to tax expenditure programs. First, their overall cost often receives less public scrutiny than is the case for spending programs because annual budget appropriations by the legislature are not typically required. Second, tax expenditure programs do not always effectively target those who are intended to benefit from them. Some expenditure programs that are intended to provide tax relief for low income earners may, in reality, confer the greatest benefit on high income earners who pay the most taxes. Sales tax exemptions, for example, often provide a greater absolute benefit to those with higher incomes because they have more to spend on consumer products. Finally, costs are often more difficult to control under a tax expenditure program because the benefits tend to be more open ended and enforcement is often more difficult than for spending programs.
112
Tax Expenditure Reporting
Not all tax reductions, credits and exemptions are classed as tax expenditures. Three criteria were used to choose those features of the tax system that should be reported as tax expenditures.
First, the emphasis is on tax reductions, exemptions and refunds that are close equivalents to spending programs. By implication, the list does not include tax measures designed to meet broad tax policy objectives such as improving fairness in the tax system, or measures designed to simplify the administration of the tax. The list also does not include items that are generally excluded from a particular tax base. For example, most services are excluded from provincial sales taxes, which are primarily designed to apply to purchases of goods.
Second, revenues raised under provincial government authority that are turned over to agencies outside of government are not reported as tax expenditures in this appendix. This includes, for example, the hotel room tax revenues transferred to Tourism BC.
Third, smaller items of less than $2 million are not included. Where practical, smaller items have been presented together as an aggregate figure.
British Columbia Tax Expenditure Programs
The following tables report 2004/05 tax expenditure estimates.
For presentation purposes, British Columbia tax expenditures have been broken into three broad categories.
• Social and Income Transfer Programs (Table A1.1): These include tax expenditures that are offered as part of government’s mix of health, education, housing, income transfer and family related programs. Examples include the BC Family Bonus, the home owner grant, the sales tax exemption for children’s clothing and the income tax credit for medical expenses.
• Economic Development and Business Assistance Programs (Table A1.2): This category includes tax preferences for small businesses and measures to encourage new private sector investment.
• Environmental Protection Programs (Table A1.3): There are relatively few tax expenditures in this category because environmental protection is now generally based on the principle of “polluter pay”, such as the tire tax and battery levies. However, environmental tax expenditures include, for example, a sales tax exemption for bicycles and a fuel tax exemption for certain alternative fuels.
Each category has its own table of tax expenditure estimates. Within each table, the list of tax expenditures delivered through the income tax system has been separated into two sub-categories.
• Provincial Measures: This includes all major tax expenditures that are under provincial policy control.
113
• Federal Measures: British Columbia shares the cost of some federal income tax expenditure programs because, under the tax collection agreement between British Columbia and the federal government, the province has agreed to maintain a consistent income tax base with the federal government in the interest of reducing administrative and compliance costs.
The cost of individual tax expenditures cannot be added together to reach a total tax expenditure figure for two reasons:
• in some cases the programs interact with one another so that eliminating one program could increase or decrease the cost of another; and
• eliminating certain tax expenditure programs could change the choices taxpayers make, which in turn would affect the cost estimates.
The estimates for each tax expenditure are based on a static analysis of the costs and do not take into account any behavioural changes which could change the cost over time.
114
Table A1.1 Social and Income Transfer Programs – Tax Expenditure
| | | | 2004/05 | |
| | | | Estimated Cost | |
| | | | ($ millions) | |
Provincial Sales Tax (1) | | | | | |
Exemptions for the following items: | | | | | |
• Food (basic groceries, snack foods, candies, soft drinks and restaurant meals) | | | | 788 | |
• Residential fuels (electricity, natural gas, fuel oil, etc.) | | | | 164 | |
• Prescription and non-prescription drugs, vitamins and certain other health care products and appliances | | | | 86 | |
• Children’s clothing and footwear | | | | 23 | |
• Clothing patterns, fabrics and notions | | | | 6 | |
• Specified school supplies | | | | 48 | |
• Books, magazines and newspapers | | | | 58 | |
• Basic telephone and cable service | | | | 57 | |
• “1-800” and equivalent telephone services | | | | 8 | |
• Specified safety equipment | | | | 10 | |
• Labour to repair major household appliances, clothing and footwear | | | | 7 | |
• Miscellaneous consumer exemptions (e.g. used clothing under $100) | | | | 4 | |
• Livestock for human consumption and feed, seed and fertilizer | | | | 39 | |
| | | | | |
Personal Income Tax | | | | | |
Provincial Measures | | | | | |
BC Family Bonus (2) | | | | 52 | |
Sales tax credit | | | | 62 | |
Political contributions tax credit | | | | 2 | |
Provincial Non-Refundable Credits: (3) | | | | | |
• Charitable donations tax credit | | | | 116 | |
• Tax credits for tuition and education | | | | 44 | |
• Tax credits for disabilities and medical expenses | | | | 51 | |
• Pension income tax credit | | | | 21 | |
• Credit for persons older than 65 years | | | | 63 | |
• Married and equivalent-to-married credits | | | | 85 | |
• Tax credit for Canada Pension Plan contributions | | | | 118 | |
• Tax credit for Employment Insurance premiums paid | | | | 48 | |
| | | | | |
Federal Measures (4) | | | | | |
• Deduction and inclusion of alimony and child support payments | | | | 5 | |
• Child care expense deduction | | | | 27 | |
• Exemption from capital gains up to $500,000 for small businesses and family farms | | | | 32 | |
• Deduction for residents of northern and isolated areas | | | | 7 | |
• Non-taxation of employer-paid insurance premiums for group private health and welfare plans | | | | 114 | |
• Registered Retirement Savings Plans: (5) | | | | | |
• exemption for | – contributions | | 347 | | | |
| – investment earnings | | 258 | | | |
• taxation of | – withdrawals | | (231 | ) | | |
| Total | | | | 374 | |
• Registered Pension Plans: (5) | | | | | |
• exemption for | – contributions | | 260 | | | |
| – investment earnings | | 408 | | | |
• taxation of | – withdrawals | | (367 | ) | | |
| Total | | | | 301 | |
115
| | 2004/05 | |
| | Estimated Cost | |
| | ($ millions) | |
Corporation Income Tax (6) | | | |
Charitable donations deduction | | 15 | |
| | | |
School and Rural Area Property Tax (7) | | | |
Home Owner Grant | | 519 | |
Exemption for places of worship | | 9 | |
| | | |
Property Transfer Tax | | | |
Exemption for first-time home buyers | | 41 | |
Exemptions for the following: | | | |
| | | |
• Property transfers between related individuals | | 33 | |
• Property transfers to municipalities, regional districts, hospital districts, library boards, school boards, water districts and educational institutions | | 4 | |
• Property transfers to charities registered under the Income Tax Act (Canada) | | 9 | |
(1) Estimates of the cost of sales tax measures are based on last year’s estimates adjusted to reflect increases in the consumer price index and population growth.
(2) The $52 million represents the tax expenditure portion of the program’s cost. The tax expenditure portion represents family bonus payments that effectively reduce the recipient’s personal income tax. The remaining cost of the program, including recoveries and administration costs, of $59 million for 2004/05, is presented in the BC Benefits Vote because it represents payments to families which exceed their provincial income tax liabilities. In 2004/05, the total program cost was $111 million.
(3) Provincial non-refundable credits are generally based on estimates of credit claims by British Columbia residents.
(4) The estimates show provincial revenue losses only. They are based on estimates of projected federal losses contained in Government of Canada: Tax Expenditures and Evaluations, 2004. British Columbia personal income tax expenditures for the federal measures are based on the amounts claimed by British Columbia residents for the measure and the relevant provincial tax rates for the period. (Prior to 1997 federal tax expenditure reports did not include projections; previous estimates of provincial revenue losses were based on historical federal estimates.) Certain tax expenditure items have been excluded where no data were available or the amounts were immaterial.
(5) Registered retirement savings plans and registered pension plans are treated in the same way as in the federal tax expenditure report. The tax expenditure associated with these schemes is presented as the amount of tax that would otherwise be paid in the year of deferral, were the deferral not available. However, this type of estimate overstates the true costs of these preferences because taxes are eventually paid, including tax on investment earnings. An estimate that does not overstate these costs would, however, be difficult to develop and would require some largely speculative assumptions.
(6) The deduction offered for corporate charitable donations is a federal measure, but the estimate shows only the provincial revenue loss. This is calculated from the federal revenue loss by applying British Columbia’s share of corporate taxable income and the relevant tax rates to the federal estimate.
(7) The property tax estimate is for the 2004 calendar year, and includes only school and rural area property taxes levied by the province. Home Owner Grant cost is shown for the 2004/05 fiscal year.
116
Table A1.2 Economic Development and Business Assistance Programs – Tax Expenditure
| | 2004/05 | |
| | Estimated Cost | |
| | ($ millions) | |
Fuel Tax | | | |
Tax exemption for international flights carrying cargo | | 2 | |
Tax exemption for family farm trucks (on road) | | 3 | |
Tax reduction for compressor fuel used to transmit natural gas from wellhead to processing plant | | 13 | |
| | | |
Personal Income Tax | | | |
Venture capital tax credit | | 24 | |
Employee venture capital tax credit | | 5 | |
| | | |
Corporation Income Tax | | | |
Provincial Measures | | | |
Film and video tax credit | | 27 | |
Production services tax credit | | 43 | |
International financial business tax refund (1) | | 7 | |
Scientific Research and Experimental Development Tax Credit | | 95 | |
Mining Exploration Tax Credit | | 3 | |
| | | |
School and Rural Area Property Taxation (2) | | | |
Assessment exemption of $10,000 for industrial and business properties | | 9 | |
Overnight tourist accommodation assessment relief | | 3 | |
Exemption for property used for pollution abatement (3) | | 6 | |
(1) | Includes employee income tax refunds. |
(2) | Estimates are for the 2004 calendar year and include only school and rural area property taxes levied by the province. |
(3) | The property tax exemption for most land and improvements used in pollution abatement equipment was removed for 1997, but existing properties which were exempt in 1996 remain exempt under grandparenting provisions. |
Table A1.3 Environmental Protection Programs – Tax Expenditure
| | 2004/05 | |
| | Estimated Cost | |
| | ($ millions) | |
Provincial Sales Tax | | | |
Exemptions for the following items: | | | |
• Bicycles | | 8 | |
• Specified energy conservation equipment | | 12 | |
| | | |
Fuel Tax | | | |
Tax exemption for alternative fuels | | 17 | |
117
Table A2 Interprovincial Comparisons of Tax Rates – 2005
(Rates known as of September 1, 2005) (1)
| | | | | | | | | | | | | | | | | | Prince | | | |
| | British | | | | Saskat- | | | | | | | | New | | Nova | | Edward | | New- | |
Tax | | Columbia(2) | | Alberta | | chewan | | Manitoba | | Ontario | | Quebec | | Brunswick | | Scotia | | Island | | foundland | |
Corporation income tax (per cent of taxable income) (3) | | | | | | | | | | | | | | | | | | | | | |
General Rate | | 12 | | 11.5 | | 17 | | 15 | | 14 | | 8.9/16.25 | | 13 | | 16 | | 16 | | 14 | |
Manufacturing Rate | | 12 | | 11.5 | | 10 | | 15 | | 12 | | 8.9 | | 13 | | 16 | | 7.5 | | 5 | |
Small Business Rate | | 4.5 | | 3 | | 5 | | 5 | | 5.5 | | 8.9 | | 2.5 | | 5 | | 7.5 | | 5 | |
Small Business Threshold
($000s) | | 400 | | 400 | | 300 | | 400 | | 400 | | n/a | | 425 | | 300 | | 300 | | 300 | |
| | | | | | | | | | | | | | | | | | | | | |
Corporation Capital Tax (4) | | | | | | | | | | | | | | | | | | | | | |
Non-financial | | Nil | | Nil | | .6 | | .3/.5 | | .3 | | .6 | | .3 | | .3 | | Nil | | Nil | |
Financial | | 1.0/3.0 | | Nil | | .7/3.25 | | 3.0 | | .6/.72/.9 | | 1.2 | | 3.0 | | 4.0 | | 5.0 | | 4.0 | |
| | | | | | | | | | | | | | | | | | | | | |
Health Care Premiums (5) | | | | | | | | | | | | | | | | | | | | | |
Individual/family | | 54/108 | | 44/88 | | Nil | | Nil | | Nil | | Nil | | Nil | | Nil | | Nil | | Nil | |
| | | | | | | | | | | | | | | | | | | | | |
Payroll tax (6) (per cent) | | Nil | | Nil | | Nil | | 2.15 | | 1.95 | | 4.26 | | Nil | | Nil | | Nil | | 2.0 | |
| | | | | | | | | | | | | | | | | | | | | |
Insurance premium tax
(per cent) (7) | | 2-4.4 | | 2-3 | | 3-4 | | 2-3 | | 2-3.5 | | 2-3 | | 2-3 | | 3-4 | | 3.5 | | 4 | |
| | | | | | | | | | | | | | | | | | | | | |
Fuel tax (cents per litre)(8) | | | | | | | | | | | | | | | | | | | | | |
Gasoline | | 14.5 | | 9.0 | | 15.0 | | 11.5 | | 14.7 | | 22.5 | | 21.5 | | 23.0 | | 22.5 | | 24.0 | |
Diesel | | 15.0 | | 9.0 | | 15.0 | | 11.5 | | 14.3 | | 23.0 | | 24.0 | | 22.0 | | 21.5 | | 24.0 | |
| | | | | | | | | | | | | | | | | | | | | |
Sales tax (per cent) | | | | | | | | | | | | | | | | | | | | | |
General rate | | 7 | | Nil | | 7 | | 7 | | 8 | | 7.5 | | 8 | | 8 | | 10 | | 8 | |
Liquor | | 10 | | Nil | | 10 | | 7 | | 12 | | 7.5 | | 8 | | 8 | | 37.5 | | 8 | |
Meals | | Nil | | Nil | | Nil | | 7 | | 8 | | 7.5 | | 8 | | 8 | | 10 | | 8 | |
Accommodation | | 8 | | 5 | | 7 | | 7 | | 5 | | 7.5 | | 8 | | 8 | | 10 | | 8 | |
| | | | | | | | | | | | | | | | | | | | | |
Tobacco tax (dollars per carton of 200 cigarettes) (9) | | 35.80 | | 32.00 | | 39.20 | | 39.90 | | 23.45 | | 20.60 | | 28.10 | | 36.30 | | 34.90 | | 39.50 | |
(1) Rates shown are those known as of September 1, 2005 and that are in effect for 2005.
(2) British Columbia rates are those announced in the September 14, 2005 Budget update.
(3) Manitoba has announced a reduction in its small business rate to 4.5 per cent and its general rate to 14.5 per cent in 2006.
(4) Ontario has a deduction of $5 million for all corporations; Manitoba has a $5 million deduction and the higher rate applies to corporations with taxable capital in excess of $10 million; Saskatchewan has a $10 million deduction with up to an additional $7.5 million proportional to wages and salaries paid in the province; Quebec has a $600,000 deduction.
Large Saskatchewan resource corporations are assessed a surcharge on the value of Saskatchewan resource sales. Ontario and Quebec have an additional surcharge or compensation tax on financial institutions.
(5) British Columbia has a two-person rate of $96. British Columbia and Alberta offer premium assistance in the form of lower rates or an exemption from premiums for lower income individuals and families. Ontario and Quebec levy health care contributions as additions to provincial personal income taxes payable.
(6) Provinces with payroll taxes provide payroll tax relief for small businesses.
(7) The lower rate applies to premiums for life, sickness and accident insurance; the higher rate applies to premiums for property insurance including automobile insurance. In Ontario, Quebec and Newfoundland specific sales taxes also apply to insurance premiums, except those related to individual life and health.
(8) Tax rate is for regular fuel used on highways. The British Columbia rate includes 6.75 cents per litre dedicated to the BC Transportation Financing Authority. The rates do not include regional taxes. The tax rates for Quebec, New Brunswick, Nova Scotia and Newfoundland include provincial sales tax based on current pump prices. The rate for PEI includes a 10% tax on the estimated wholesale price.
(9) Includes estimated provincial sales tax where applicable.
118
Table A3 Comparison of Provincial and Federal Taxes by Province – 2005
| | | | | | | | | | | | | | | | | | | Prince | | | |
| | | British | | | | Saskat- | | | | | | | | New | | Nova | | Edward | | New- | |
Tax | | Columbia | | Alberta | | chewan | | Manitoba | | Ontario | | Quebec | | Brunswick | | Scotia | | Island | | foundland | |
| | | ($) | |
Two Income Family of Four - $90,000 | | | | | | | | | | | | | | | | | | | | | |
1. | Provincial Income Tax | | 4,190 | | 4,867 | | 6,310 | | 7,119 | | 4,963 | | 9,336 | | 6,892 | | 6,935 | | 7,019 | | 7,974 | |
| Net Child Benefits | | 0 | | 154 | | 0 | | — | | 0 | | (2,350 | ) | 0 | | 0 | | — | | 0 | |
2. | Property Tax | - Gross | | 2,210 | | 2,087 | | 3,138 | | 4,907 | | 3,276 | | 2,946 | | 2,451 | | 2,410 | | 1,658 | | 1,700 | |
| | - Net | | 1,740 | | 2,087 | | 3,138 | | 4,507 | | 3,276 | | 2,946 | | 2,451 | | 2,410 | | 1,658 | | 1,700 | |
3. | Sales Tax | | 1,154 | | 14 | | 1,181 | | 1,258 | | 1,613 | | 1,998 | | 1,790 | | 1,788 | | 1,859 | | 1,745 | |
4. | Fuel Tax | | 218 | | 135 | | 225 | | 173 | | 221 | | 338 | | 323 | | 345 | | 338 | | 360 | |
5. | Provincial Direct Taxes | | 7,302 | | 7,257 | | 10,854 | | 13,057 | | 10,073 | | 12,268 | | 11,456 | | 11,478 | | 10,874 | | 11,779 | |
6. | Health Care Premiums/Payroll Tax | | 1,296 | | 1,056 | | — | | 1,935 | | 1,755 | | 3,834 | | — | | — | | — | | 1,800 | |
7. | Total Provincial Tax | | 8,598 | | 8,313 | | 10,854 | | 14,992 | | 11,828 | | 16,102 | | 11,456 | | 11,478 | | 10,874 | | 13,579 | |
8. | Federal Income Tax | | 10,529 | | 10,529 | | 10,529 | | 10,529 | | 10,529 | | 10,529 | | 10,529 | | 10,529 | | 10,529 | | 10,529 | |
9. | Net Federal GST | | 1,662 | | 1,739 | | 1,629 | | 1,592 | | 1,661 | | 1,679 | | 1,566 | | 1,565 | | 1,678 | | 1,527 | |
10. | Total Tax | | 20,789 | | 20,581 | | 23,012 | | 27,113 | | 24,018 | | 28,310 | | 23,551 | | 23,572 | | 23,081 | | 25,635 | |
| | | | | | | | | | | | | | | | | | | | | |
Two Income Family of Four - $60,000 | | | | | | | | | | | | | | | | | | | | | |
1. | Provincial Income Tax | | 1,990 | | 2,308 | | 3,307 | | 3,717 | | 2,460 | | 4,905 | | 3,723 | | 3,723 | | 3,893 | | 4,341 | |
| Net Child Benefits | | 0 | | 154 | | 0 | | — | | 0 | | (3,450 | ) | 0 | | 0 | | — | | 0 | |
2. | Property Tax | - Gross | | 2,111 | | 1,853 | | 2,605 | | 3,568 | | 2,395 | | 2,577 | | 1,287 | | 1,928 | | 1,425 | | 1,594 | |
| | - Net | | 1,641 | | 1,853 | | 2,605 | | 3,168 | | 2,395 | | 2,577 | | 1,287 | | 1,928 | | 1,425 | | 1,594 | |
3. | Sales Tax | | 898 | | 11 | | 937 | | 1,003 | | 1,273 | | 1,700 | | 1,421 | | 1,421 | | 1,472 | | 1,394 | |
4. | Fuel Tax | | 218 | | 135 | | 225 | | 173 | | 221 | | 338 | | 323 | | 345 | | 338 | | 360 | |
5. | Provincial Direct Taxes | | 4,747 | | 4,461 | | 7,074 | | 8,061 | | 6,349 | | 6,070 | | 6,754 | | 7,417 | | 7,128 | | 7,689 | |
6. | Health Care Premiums/Payroll Tax | | 1,296 | | 1,056 | | — | | 1,290 | | 1,170 | | 2,556 | | — | | — | | — | | 1,200 | |
7. | Total Provincial Tax | | 6,043 | | 5,517 | | 7,074 | | 9,351 | | 7,519 | | 8,626 | | 6,754 | | 7,417 | | 7,128 | | 8,889 | |
8. | Federal Income Tax | | 5,799 | | 5,799 | | 5,799 | | 5,799 | | 5,799 | | 5,799 | | 5,799 | | 5,799 | | 5,799 | | 5,799 | |
9. | Net Federal GST | | 1,295 | | 1,414 | | 1,292 | | 1,270 | | 1,311 | | 1,429 | | 1,243 | | 1,243 | | 1,329 | | 1,219 | |
10. | Total Tax | | 13,137 | | 12,730 | | 14,165 | | 16,420 | | 14,629 | | 15,854 | | 13,796 | | 14,459 | | 14,256 | | 15,907 | |
| | | | | | | | | | | | | | | | | | | | | |
Two Income Family of Four - $30,000 | | | | | | | | | | | | | | | | | | | | | |
1. | Provincial Income Tax | | 0 | | 0 | | 574 | | 432 | | 393 | | (179 | ) | 1,109 | | 891 | | 1,014 | | 1,312 | |
| Net Child Benefits | | 0 | | (712 | ) | 0 | | — | | (383 | ) | (4,160 | ) | (52 | ) | 0 | | — | | 0 | |
2. | Property Tax | - Gross | | 2,111 | | 1,853 | | 2,605 | | 3,568 | | 2,395 | | 2,577 | | 1,287 | | 1,928 | | 1,425 | | 1,594 | |
| | - Net | | 1,641 | | 1,853 | | 2,605 | | 3,168 | | 2,395 | | 2,577 | | 1,287 | | 1,928 | | 1,425 | | 1,594 | |
3. | Sales Tax | | 666 | | 9 | | 680 | | 740 | | 919 | | 1,405 | | 1,020 | | 1,028 | | 1,065 | | 1,009 | |
4. | Fuel Tax | | 145 | | 90 | | 150 | | 115 | | 147 | | 225 | | 215 | | 230 | | 225 | | 240 | |
5. | Provincial Direct Taxes | | 2,452 | | 1,240 | | 4,009 | | 4,455 | | 3,471 | | (132 | ) | 3,579 | | 4,077 | | 3,729 | | 4,155 | |
6. | Health Care Premiums/Payroll Tax | | 0 | | 263 | | — | | 645 | | 585 | | 1,278 | | — | | — | | — | | 600 | |
7. | Total Provincial Tax | | 2,452 | | 1,503 | | 4,009 | | 5,100 | | 4,056 | | 1,146 | | 3,579 | | 4,077 | | 3,729 | | 4,755 | |
8. | Federal Income Tax | | 1,750 | | 1,750 | | 1,750 | | 1,750 | | 1,750 | | 1,750 | | 1,750 | | 1,750 | | 1,750 | | 1,750 | |
9. | Net Federal GST | | 265 | | 432 | | 243 | | 243 | | 253 | | 487 | | 199 | | 205 | | 267 | | 189 | |
10. | Total Tax | | 4,467 | | 3,685 | | 6,002 | | 7,093 | | 6,059 | | 3,383 | | 5,528 | | 6,032 | | 5,746 | | 6,694 | |
| | | | | | | | | | | | | | | | | | | | | |
Unattached Individual - $25,000 | | | | | | | | | | | | | | | | | | | | | |
1. | Provincial Income Tax | | 737 | | 758 | | 1,506 | | 1,138 | | 1,024 | | 1,042 | | 1,376 | | 1,307 | | 1,439 | | 1,553 | |
2. | Property Tax | | — | | — | | — | | — | | — | | — | | — | | — | | — | | — | |
3. | Sales Tax | | 376 | | 4 | | 397 | | 449 | | 552 | | 730 | | 645 | | 649 | | 702 | | 637 | |
4. | Fuel Tax | | 145 | | 90 | | 150 | | 115 | | 147 | | 225 | | 215 | | 230 | | 225 | | 240 | |
5. | Provincial Direct Taxes | | 1,258 | | 852 | | 2,053 | | 1,702 | | 1,723 | | 1,997 | | 2,236 | | 2,186 | | 2,366 | | 2,430 | |
6. | Health Care Premiums/Payroll Tax | | 259 | | 528 | | — | | 538 | | 488 | | 1,065 | | — | | — | | — | | 500 | |
7. | Total Provincial Tax | | 1,517 | | 1,380 | | 2,053 | | 2,240 | | 2,211 | | 3,062 | | 2,236 | | 2,186 | | 2,366 | | 2,930 | |
8. | Federal Income Tax | | 2,232 | | 2,232 | | 2,232 | | 2,232 | | 2,232 | | 2,232 | | 2,232 | | 2,232 | | 2,232 | | 2,232 | |
9. | Net Federal GST | | 252 | | 263 | | 231 | | 241 | | 242 | | 274 | | 218 | | 220 | | 257 | | 210 | |
10. | Total Tax | | 4,001 | | 3,875 | | 4,516 | | 4,713 | | 4,685 | | 5,568 | | 4,686 | | 4,638 | | 4,855 | | 5,372 | |
| | | | | | | | | | | | | | | | | | | | | | | | | |
119
| | | | | | | | | | | | | | | | | | | Prince | | | |
| | | British | | | | Saskat- | | | | | | | | New | | Nova | | Edward | | New- | |
Tax | | Columbia | | Alberta | | chewan | | Manitoba | | Ontario | | Quebec | | Brunswick | | Scotia | | Island | | foundland | |
| | | ($ ) | |
Unattached Individual - $80,000 | | | | | | | | | | | | | | | | | | | | | |
1. | Provincial Income Tax | | 5,238 | | 5,656 | | 7,633 | | 8,549 | | 6,212 | | 10,940 | | 8,363 | | 8,473 | | 8,622 | | 9,685 | |
2. | Property Tax | - Gross | | 1,453 | | 1,830 | | 2,036 | | 3,119 | | 2,293 | | 2,578 | | 977 | | 2,041 | | 1,300 | | 1,300 | |
| | - Net | | 983 | | 1,830 | | 2,036 | | 2,719 | | 2,293 | | 2,578 | | 977 | | 2,041 | | 1,300 | | 1,300 | |
3. | Sales Tax | | 973 | | 11 | | 1,007 | | 1,087 | | 1,415 | | 1,632 | | 1,598 | | 1,593 | | 1,732 | | 1,536 | |
4. | Fuel Tax | | 218 | | 135 | | 225 | | 173 | | 221 | | 338 | | 323 | | 345 | | 338 | | 360 | |
5. | Provincial Direct Taxes | | 7,412 | | 7,632 | | 10,901 | | 12,528 | | 10,141 | | 15,488 | | 11,261 | | 12,452 | | 11,992 | | 12,881 | |
6. | Health Care Premiums/Payroll Tax | | 648 | | 528 | | — | | 1,720 | | 1,560 | | 3,408 | | — | | — | | — | | 1,600 | |
7. | Total Provincial Tax | | 8,060 | | 8,160 | | 10,901 | | 14,248 | | 11,701 | | 18,896 | | 11,261 | | 12,452 | | 11,992 | | 14,481 | |
8. | Federal Income Tax | | 12,456 | | 12,456 | | 12,456 | | 12,456 | | 12,456 | | 12,456 | | 12,456 | | 12,456 | | 12,456 | | 12,456 | |
9. | Net Federal GST | | 1,547 | | 1,596 | | 1,468 | | 1,423 | | 1,510 | | 1,389 | | 1,398 | | 1,393 | | 1,490 | | 1,344 | |
10. | Total Tax | | 22,063 | | 22,212 | | 24,825 | | 28,127 | | 25,667 | | 32,741 | | 25,115 | | 26,301 | | 25,938 | | 28,281 | |
| | | | | | | | | | | | | | | | | |
Senior Couple with Equal Pension Incomes - $30,000 | | | | | | | | | | | | | | | | | |
1. | Provincial Income Tax | | 0 | | 0 | | 125 | | (400 | ) | (418 | ) | (300 | ) | 438 | | 569 | | 582 | | 657 | |
2. | Property Tax | - Gross | | 2,111 | | 1,853 | | 2,605 | | 3,568 | | 2,395 | | 2,577 | | 1,287 | | 1,928 | | 1,425 | | 1,594 | |
| | - Net | | 1,366 | | 1,853 | | 2,605 | | 3,168 | | 2,395 | | 2,577 | | 1,287 | | 1,928 | | 1,425 | | 1,594 | |
3. | Sales Tax | | 717 | | 8 | | 730 | | 762 | | 980 | | 1,350 | | 1,213 | | 1,209 | | 1,259 | | 1,237 | |
4. | Fuel Tax | | 145 | | 90 | | 150 | | 115 | | 147 | | 225 | | 215 | | 230 | | 225 | | 240 | |
5. | Provincial Direct Taxes | | 2,228 | | 1,951 | | 3,610 | | 3,645 | | 3,104 | | 3,852 | | 3,153 | | 3,936 | | 3,491 | | 3,728 | |
6. | Health Care Premiums/Payroll Tax | | 230 | | 0 | | — | | — | | — | | — | | — | | — | | — | | — | |
7. | Total Provincial Tax | | 2,458 | | 1,951 | | 3,610 | | 3,645 | | 3,104 | | 3,852 | | 3,153 | | 3,936 | | 3,491 | | 3,728 | |
8. | Federal Income Tax | | 599 | | 599 | | 599 | | 599 | | 599 | | 599 | | 599 | | 599 | | 599 | | 599 | |
9. | Net Federal GST | | 697 | | 694 | | 644 | | 604 | | 648 | | 715 | | 627 | | 623 | | 732 | | 648 | |
10. | Total Tax | | 3,754 | | 3,244 | | 4,853 | | 4,848 | | 4,351 | | 5,166 | | 4,379 | | 5,158 | | 4,822 | | 4,975 | |
| | | | | | | | | | | | | | | | | | | | | | | | |
Personal Income Tax
• Income tax is based on basic personal credits, applicable provincial credits, and typical major deductions at each income level. Quebec residents pay federal income tax less an abatement of 16.5 per cent of basic federal tax. This abatement has been used to reduce Quebec provincial tax rather than federal tax, for comparative purposes. The two income family of four with $60,000 annual income is assumed to have one spouse earning $40,000 and the other $20,000, the family with $90,000 income is assumed to have one spouse earning $50,000 and the other $40,000, the family with $30,000 is assumed to have each spouse earning $15,000 and each senior is assumed to receive $15,000. All representative families are assumed to have employment income except the senior couple. Contributions to the Quebec Health Services Fund are included in Quebec personal income tax.
Net Child Benefits
• Net child benefits are provincial measures affecting payments to families with children. Provincial child benefit measures are available in British Columbia (BC Family Bonus), Alberta (Family Employment Credit), Saskatchewan (Child Benefit), Ontario (Child Care Supplement for Working Families), Quebec (Integrated Child Allowance), New Brunswick (Child Tax Benefit), Nova Scotia (Child Benefit) and Newfoundland (Child Benefit). In addition, the Alberta government has chosen to vary the amount of the basic federal child tax benefit that its residents receive (shown as a net amount).
Property Tax
• Estimates of property taxes are from a survey of Royal LePage’s on-line listings of residential properties for sale conducted in 2004. It is assumed that the individual at $25,000 rents accommodation; the family at $30,000 and at $55,000 and the senior couple own bungalows; the family at $90,000 owns a two-story executive style home; and the single at $80,000 owns a luxury condominium, in a major city for each province. Net local and provincial property taxes are estimated as taxes owing after credits provided through the property tax system are subtracted.
Sales and Fuel Tax Estimates
• Includes sales tax on meals, liquor and accommodation. Estimates are based on expenditure patterns from the Survey of Household Spending in 2001. In estimating individual and family taxable consumption, disposable income is reduced by 20 per cent to reflect housing (mortgage and property taxes or rent) costs. The senior couple is assumed to own their home and have no mortgage costs. For each province, disposable income is further reduced by estimated federal income taxes, estimated provincial income taxes and health care premiums if applicable. In addition, the single individual with $80,000 annual income and the family with $90,000 annual income are assumed to have savings equal to 5 per cent of their disposable income. For each family, disposable income is distributed among expenditures using the consumption pattern of a typical family with the relevant characteristics as estimated by the family expenditure survey. The provincial retail sales tax and the federal goods and services tax (GST) components of these expenditures are then calculated. GST estimates have been reduced by the GST credit, where applicable.
• Fuel tax is based on annual consumption: 1,000 litres of unleaded fuel for the single at $25,000, the family at $30,000 and the senior couple; others are assumed to consume 1,500 litres.
Health Care Premiums/Payroll Tax
• Health care premiums are levied in British Columbia and Alberta only. Approximately 50 per cent of British Columbia premiums are paid by employers on behalf of their employees with the remainder paid by individuals, either by employees or by residents who are not employed. Payroll taxes, in the four provinces that levy them, are paid by the employer. The cost to employers of payroll taxes and health care premiums paid on behalf of employees is generally reflected in reduced wages.
Effective Tax Rates
• British Columbia taxes have been calculated using rates in effect for 2005. Taxes for other provinces were calculated using rates that were announced prior to September 1, 2005, and that come into effect during 2005.
120
Table A4 | | Interprovincial Comparisons of Provincial Personal Income Taxes Payable(1) – 2005 |
| | (Rates known as of September 1, 2005) |
| | | | | | | | | | | | | | | | | | Prince | | | |
| | British | | | | Saskat- | | | | | | | | New | | Nova | | Edward | | New- | |
Taxable income (2) | | Columbia | | Alberta | | chewan | | Manitoba | | Ontario | | Quebec(3) | | Brunswick | | Scotia | | Island | | foundland | |
| | Annual provincial taxes payable(4) ($) |
$ | 10,000 | | 0 | | 0 | | 119 | | 77 | | 0 | | (35 | ) | 154 | | 0 | | 0 | | 219 | |
$ | 20,000 | | 396 | | 427 | | 1,143 | | 1,191 | | 641 | | 898 | | 1,056 | | 966 | | 1,115 | | 1,203 | |
$ | 30,000 | | 1,175 | | 1,358 | | 2,167 | | 2,231 | | 1,504 | | 2,450 | | 1,957 | | 1,858 | | 2,028 | | 2,210 | |
$ | 40,000 | | 1,955 | | 2,291 | | 3,258 | | 3,541 | | 2,405 | | 4,312 | | 3,234 | | 3,259 | | 3,312 | | 3,755 | |
$ | 50,000 | | 2,867 | | 3,286 | | 4,552 | | 4,935 | | 3,466 | | 5,940 | | 4,710 | | 4,713 | | 4,687 | | 5,366 | |
$ | 60,000 | | 3,782 | | 4,286 | | 5,852 | | 6,335 | | 4,381 | | 7,776 | | 6,192 | | 6,189 | | 6,153 | | 6,997 | |
$ | 70,000 | | 4,795 | | 5,286 | | 7,152 | | 7,905 | | 5,497 | | 9,903 | | 7,751 | | 7,856 | | 7,942 | | 8,958 | |
$ | 80,000 | | 6,047 | | 6,286 | | 8,452 | | 9,645 | | 7,309 | | 11,972 | | 9,403 | | 9,523 | | 9,779 | | 10,922 | |
$ | 100,000 | | 8,865 | | 8,286 | | 11,052 | | 13,125 | | 10,791 | | 16,084 | | 12,707 | | 13,206 | | 13,453 | | 14,850 | |
$ | 125,000 | | 12,540 | | 10,786 | | 14,701 | | 17,475 | | 15,143 | | 21,176 | | 17,083 | | 18,019 | | 18,046 | | 19,761 | |
$ | 150,000 | | 16,215 | | 13,286 | | 18,451 | | 21,825 | | 19,496 | | 26,105 | | 21,543 | | 22,831 | | 22,638 | | 24,671 | |
| | Provincial personal income taxes as a per cent of taxable income (%) |
$ | 10,000 | | 0.0 | | 0.0 | | 1.2 | | 0.8 | | 0.0 | | (0.4 | ) | 1.5 | | 0.0 | | 0.0 | | 2.2 | |
$ | 20,000 | | 2.0 | | 2.1 | | 5.7 | | 6.0 | | 3.2 | | 4.5 | | 5.3 | | 4.8 | | 5.6 | | 6.0 | |
$ | 30,000 | | 3.9 | | 4.5 | | 7.2 | | 7.4 | | 5.0 | | 8.2 | | 6.5 | | 6.2 | | 6.8 | | 7.4 | |
$ | 40,000 | | 4.9 | | 5.7 | | 8.1 | | 8.9 | | 6.0 | | 10.8 | | 8.1 | | 8.1 | | 8.3 | | 9.4 | |
$ | 50,000 | | 5.7 | | 6.6 | | 9.1 | | 9.9 | | 6.9 | | 11.9 | | 9.4 | | 9.4 | | 9.4 | | 10.7 | |
$ | 60,000 | | 6.3 | | 7.1 | | 9.8 | | 10.6 | | 7.3 | | 13.0 | | 10.3 | | 10.3 | | 10.3 | | 11.7 | |
$ | 70,000 | | 6.9 | | 7.6 | | 10.2 | | 11.3 | | 7.9 | | 14.1 | | 11.1 | | 11.2 | | 11.3 | | 12.8 | |
$ | 80,000 | | 7.6 | | 7.9 | | 10.6 | | 12.1 | | 9.1 | | 15.0 | | 11.8 | | 11.9 | | 12.2 | | 13.7 | |
$ | 100,000 | | 8.9 | | 8.3 | | 11.1 | | 13.1 | | 10.8 | | 16.1 | | 12.7 | | 13.2 | | 13.5 | | 14.9 | |
$ | 125,000 | | 10.0 | | 8.6 | | 11.8 | | 14.0 | | 12.1 | | 16.9 | | 13.7 | | 14.4 | | 14.4 | | 15.8 | |
$ | 150,000 | | 10.8 | | 8.9 | | 12.3 | | 14.6 | | 13.0 | | 17.4 | | 14.4 | | 15.2 | | 15.1 | | 16.4 | |
(1) Calculated for a single individual with wage income and claiming credits for Canada Pension Plan and Quebec Pension Plan contributions, Employment Insurance premiums and the basic personal amount.
(2) Taxable income, total income less allowable deductions, is defined by federal legislation in all provinces except Quebec. In the table, it is assumed that federally defined taxable income is equal to Quebec taxable income.
(3) Quebec residents pay federal tax less an abatement of 16.5 per cent of federal tax. In the table, the Quebec abatement has been used to reduce Quebec provincial personal income tax for comparative purposes.
(4) Includes provincial low income reductions in British Columbia, Manitoba, Ontario, Nova Scotia and Prince Edward Island, provincial surtaxes payable in Ontario, Nova Scotia, Prince Edward Island and Newfoundland and contributions to the Health Services Fund in Quebec. Excludes credits for sales and property taxes.
121
Table A5 Summary of Revenue Measures from July 30, 2001 to September 14, 2005 (1)
| | Effective Date | |
July 30, 2001 Economic and Fiscal Update | | | |
Income Tax | | | |
• | 25 per cent personal income tax cut | | January 1, 2001 | |
• | Dividend tax credit rates reduced | | January 1, 2001 | |
• | General corporate income tax rate reduced to 13.5 per cent from 16.5 per cent | | January 1, 2002 | |
• | Manufacturing and processing tax credit repealed | | July 31, 2001 | |
Corporation Capital Tax | | | |
• | Tax phased-out for general corporations | | September 1, 2001 | |
Social Service Tax | | | |
• | Tax exemption for production machinery equipment | | July 31, 2001 | |
• | Vehicle surtax threshold for passenger vehicles increased | | July 31, 2001 | |
Motor Fuel Tax | | | |
• | Tax exemption provided for marine bunker fuel | | August 1, 2001 | |
• | Domestic jet fuel and aviation fuel tax rates reduced to 2 cents/litre | | August 1, 2001 | |
Budget 2002 | | | |
Income Tax | | | |
• | Increase sales tax credit | | January 1, 2002 | |
• | Adjust BC Family Bonus | | July 1, 2002 | |
• | Raise small business threshold to $300,000 | | April 1, 2002 | |
Medical Services Plan Premiums | | | |
• | Increase premiums and enhance premium assistance | | May 1, 2002 | |
Social Service Tax | | | |
• | Increase provincial sales tax rate to 7.5 per cent from 7 per cent | | February 20, 2002 | |
• | Expand machinery and equipment tax exemption to include repair parts | | February 20, 2002 | |
Tobacco Tax | | | |
• | Increase tobacco tax rate to $30 from $22 per carton | | February 20, 2002 | |
School and Rural Area Property Taxes | | | |
• | Increase average gross residential rural and school property taxes by 2 per cent | | January 1, 2002 | |
Miscellaneous measures | | | |
• | Disability credits; sales tax exemptions for farmers and refunds to Parent Advisory Councils | | various | |
Budget 2003 | | | |
Income Tax | | | |
• | Increase budget for labour sponsored venture capital tax credits | | April 1, 2003 | |
• | Introduce an equity tax credit for new media | | April 1, 2003 | |
• | Provide an enhanced regional incentive for film credits | | April 1, 2003 | |
• | Introduce a Digital Animation or Visual Effects tax credit | | April 1, 2003 | |
• | Extend the BC Mining Flow-Through Share Tax Credit | | January 1, 2004 | |
• | Extend the Mining Exploration Tax Credit for three years | | August 1, 2003 | |
• | Introduce a book publishing tax credit | | October 1, 2002 | |
Corporation Capital Tax | | | |
• | Increase the capital tax exemption threshold for small financial institutions to $10 million from $5 million | | April 1, 2003 | |
Motor Fuel Tax | | | |
• | Provide exemption for marine gas oil used in gas turbine powered commercial vessels | | February 19, 2003 | |
BC Transportation Financing Authority Revenue | | | |
• | Increase the clear fuel tax rate levied on behalf of BC Transportation Financing Authority by 3.5 cents/litre | | March 1, 2003 | |
Tobacco Tax | | | |
• | Increase the tobacco tax rate to $32 from $30 per carton and to 16 cents from 15 cents per gram of fine-cut tobacco | | February 19, 2003 | |
School and Rural Area Property Taxes | | | |
• | Increase average gross residential rural and school property taxes by inflation | | January 1, 2003 | |
122
| | | Effective Date | |
Insurance Premium Tax | | | |
• | Increase tax on property insurance to 4.4 per cent from 4 per cent to offset forest fire suppression costs | | January 1, 2004 | |
• | Clarify the definition of taxable insurers | | February 19, 2003 | |
Property Transfer Tax | | | |
• | Enhance fairness and effectiveness of First-Time Home Buyers’ exemption | | February 19, 2003 | |
Budget 2004 | | | |
Income Tax | | | |
• | Reduce BC Family Bonus and BC Earned Income amounts | | July 1, 2004 | |
• | Extend Scientific Research and Experimental Development Tax Credit | | September 1, 2004 | |
International Financial Business Tax Refund | | | |
• | Allow non-financial institutions to register, expand the list of qualifying activities and eliminate the employee tax refund | | September 1, 2004 | |
Tobacco Tax | | | |
• | Increase tobacco tax rate to $35.80 from $32.00 per carton and to 17.9 cents per gram for fine-cut tobacco | | December 20, 2003 | |
Home Owner Grant Act | | | |
• | Increase the threshold for the home owner grant phase-out to $585,000 from $525,000 | | January 1, 2004 | |
Ports Property Tax Act | | | |
• | Reduce property taxes on major BC port facilities and provide compensation to affected municipalities | | January 1, 2004 | |
Budget 2005 – February 15, 2005 | | | |
Income Tax | | | |
• | Introduce the BC Tax Reduction, a non-refundable personal income tax credit | | January 1, 2005 | |
• | Extend the Mining Exploration Tax Credit to 2016 | | August 1, 2006 | |
• | Increase the Film Incentive BC and Production Services tax credit rates | | January 1, 2005 | |
• | Increase corporate income tax small business threshold to $400,000 from $300,000 | | January 1, 2005 | |
Social Service Tax | | | |
• | Reduce provincial sales tax rate to 7 per cent from 7.5 per cent | | October 21, 2004 | |
• | Increase incentives for purchases of hybrid passenger vehicles on a time-limited basis | | February 16, 2005 | |
• | Provide time-limited exemption for ENERGY STAR residential heating equipment | | February 16, 2005 | |
• | Increase vehicle surtax threshold for passenger vehicles to $49,000 from $47,000 | | February 16, 2005 | |
Property Transfer Tax | | | |
• | Increase thresholds for First-Time Home Buyers’ program | | February 16, 2005 | |
Medicare Protection Act | | | |
• | Enhance Medical Services Plan premium assistance | | July 1, 2005 | |
Home Owner Grant Act | | | |
• | Increase threshold for Home Owner Grant phase-out and reduce reduction rate | | 2005 tax year | |
School Act | | | |
• | Exempt specified improvements of eligible hydroelectric projects | | 2005 tax year | |
September Update (September 14, 2005) | | | |
Income Tax | | | |
• | Reduce the general corporate income tax rate to 12 per cent from 13.5 per cent | | July 1, 2005 | |
International Financial Activity Act | | | |
• | Provide tax refunds for the commercialization of life science related patents | | January 1, 2006 | |
(1) Measures with no material revenue impact are excluded. For details of these measures see the revenue measures section of each publication.
123
Table A6 Operating Statement – 2001/02 to 2007/08
| | | | | | | | | | Budget | | | | | |
| | Actual | | Actual | | Actual | | Actual | | Estimate | | Plan | | Plan | |
($ millions) | | 2001/02 | | 2002/03 | | 2003/04 | | 2004/05 | | 2005/06 | | 2006/07 | | 2007/08 | |
Taxpayer-supported programs and agencies: | | | | | | | | | | | | | | | |
Revenue | | 26,935 | | 25,893 | | 27,176 | | 30,821 | | 32,202 | | 32,139 | | 32,934 | |
Expense | | (30,668 | ) | (30,396 | ) | (30,335 | ) | (30,658 | ) | (32,876 | ) | (33,198 | ) | (33,831 | ) |
Taxpayer-supported balance | | (3,733 | ) | (4,503 | ) | (3,159 | ) | 163 | | (674 | ) | (1,059 | ) | (897 | ) |
Commercial Crown corporation income | | 1,085 | | 1,766 | | 1,884 | | 2,412 | | 2,274 | | 2,259 | | 2,197 | |
Surplus/(deficit) before joint trusteeship and forecast allowance | | (2,648 | ) | (2,737 | ) | (1,275 | ) | 2,575 | | 1,600 | | 1,200 | | 1,300 | |
Joint trusteeship | | 1,464 | | — | | — | | — | | — | | — | | — | |
Forecast allowance | | — | | — | | — | | — | | (300 | ) | (600 | ) | (900 | ) |
Surplus/(deficit) | | (1,184 | ) | (2,737 | ) | (1,275 | ) | 2,575 | | 1,300 | | 600 | | 400 | |
124
Table A7 Revenue by Source(1) – 2001/02 to 2007/08
| | | | | | | | | | Budget | | | | | |
| | Actual | | Actual | | Actual | | Actual | | Estimate | | Plan | | Plan | |
($ millions) | | 2001/02 | | 2002/03 | | 2003/04 | | 2004/05 | | 2005/06 | | 2006/07 | | 2007/08 | |
Taxation revenue | | | | | | | | | | | | | | | |
Personal income | | 5,366 | | 4,150 | | 4,877 | | 5,050 | | 5,484 | | 5,674 | | 6,008 | |
Corporate income | | 1,522 | | 612 | | 775 | | 1,255 | | 1,215 | | 1,223 | | 1,099 | |
Social service | | 3,552 | | 3,794 | | 4,024 | | 4,156 | | 4,213 | | 4,427 | | 4,649 | |
Fuel | | 659 | | 687 | | 875 | | 904 | | 915 | | 947 | | 979 | |
Tobacco | | 499 | | 606 | | 647 | | 699 | | 690 | | 690 | | 690 | |
Property | | 1,481 | | 1,541 | | 1,574 | | 1,661 | | 1,717 | | 1,789 | | 1,859 | |
Property transfer | | 303 | | 407 | | 518 | | 604 | | 650 | | 600 | | 550 | |
Other (2) | | 728 | | 555 | | 540 | | 588 | | 561 | | 546 | | 556 | |
| | 14,110 | | 12,352 | | 13,830 | | 14,917 | | 15,445 | | 15,896 | | 16,390 | |
Natural resource revenue | | | | | | | | | | | | | | | |
Natural gas royalties | | 836 | | 1,056 | | 1,230 | | 1,439 | | 1,754 | | 1,714 | | 1,764 | |
Columbia River Treaty | | 360 | | 100 | | 230 | | 258 | | 305 | | 285 | | 265 | |
Other energy and minerals | | 430 | | 473 | | 535 | | 612 | | 775 | | 796 | | 731 | |
Forests | | 1,253 | | 1,323 | | 1,014 | | 1,363 | | 1,246 | | 1,007 | | 1,008 | |
Other resources | | 298 | | 270 | | 300 | | 301 | | 326 | | 380 | | 384 | |
| | 3,177 | | 3,222 | | 3,309 | | 3,973 | | 4,406 | | 4,182 | | 4,152 | |
Other revenue | | | | | | | | | | | | | | | |
Medical Services Plan premiums | | 954 | | 1,355 | | 1,447 | | 1,465 | | 1,438 | | 1,437 | | 1,444 | |
Post secondary fees | | 452 | | 580 | | 781 | | 836 | | 904 | | 935 | | 974 | |
Other healthcare-related fees | | 221 | | 217 | | 225 | | 189 | | 179 | | 173 | | 173 | |
Motor vehicle licences and permits | | 342 | | 351 | | 363 | | 381 | | 398 | | 410 | | 424 | |
Other fees and licences | | 1,073 | | 1,056 | | 715 | | 750 | | 746 | | 700 | | 665 | |
Investment earnings | | 1,274 | | 1,024 | | 950 | | 833 | | 818 | | 836 | | 885 | |
Sales of goods and services | | 1,006 | | 986 | | 714 | | 741 | | 655 | | 673 | | 703 | |
Miscellaneous (3) | | 1,006 | | 927 | | 1,223 | | 1,505 | | 1,590 | | 1,535 | | 1,545 | |
| | 6,328 | | 6,496 | | 6,418 | | 6,700 | | 6,728 | | 6,699 | | 6,813 | |
Contributions from the federal government | | | | | | | | | | | | | | | |
Health and social transfers | | 2,445 | | 2,606 | | 3,044 | | 3,421 | | 4,180 | | 4,545 | | 4,860 | |
Equalization | | 158 | | 543 | | (330 | ) | 979 | | 590 | | — | | — | |
Other cost shared agreements (4) | | 717 | | 674 | | 905 | | 831 | | 853 | | 817 | | 719 | |
| | 3,320 | | 3,823 | | 3,619 | | 5,231 | | 5,623 | | 5,362 | | 5,579 | |
Taxpayer-supported programs and agencies | | 26,935 | | 25,893 | | 27,176 | | 30,821 | | 32,202 | | 32,139 | | 32,934 | |
Commercial Crown corporations | | | | | | | | | | | | | | | |
BC Hydro (before regulatory transfers) | | 258 | | 352 | | 90 | | 240 | | 329 | | 333 | | 256 | |
Liquor Distribution Branch | | 637 | | 654 | | 724 | | 779 | | 779 | | 794 | | 809 | |
BC Lotteries (net of payments to the federal government) | | 598 | | 663 | | 719 | | 811 | | 892 | | 942 | | 1,021 | |
BC Rail (5) | | (166 | ) | 4 | | 41 | | 178 | | 39 | | 46 | | 26 | |
ICBC (5) | | (242 | ) | 80 | | 302 | | 399 | | 224 | | 125 | | 61 | |
Other | | — | | 13 | | 8 | | 5 | | 11 | | 19 | | 24 | |
| | 1,085 | | 1,766 | | 1,884 | | 2,412 | | 2,274 | | 2,259 | | 2,197 | |
Total revenue | | 28,020 | | 27,659 | | 29,060 | | 33,233 | | 34,476 | | 34,398 | | 35,131 | |
(1) In order to comply with generally accepted accounting principles, revenue of school districts, post-secondary institutions and regional health authorities/societies is included in the government’s reporting entity beginning in 2004/05. To conform with this presentation, prior years have been restated based on unaudited financial information in the Public Accounts .
(2) Includes revenue from corporation capital, insurance premium and hotel room taxes.
(3) Includes asset dispositions, reimbursements for health care and other services provided to external agencies, and other recoveries.
(4) Includes contributions for health, education, housing and social service programs, for transportation projects, and for coastal ferry services.
(5) Amounts represent earnings during government’s fiscal year.
125
Table A8 Expense By Function (1) – 2001/02 to 2007/08
| | | | | | | | | | Budget | | | | | |
| | Actual | | Actual | | Actual | | Actual | | Estimate | | Plan | | Plan | |
($ millions) | | 2001/02 | | 2002/03 | | 2003/04 | | 2004/05 | | 2005/06 | | 2006/07 | | 2007/08 | |
Health | | 10,694 | | 11,080 | | 11,365 | | 11,633 | | 12,651 | | 13,019 | | 13,264 | |
Social services | | 3,484 | | 3,151 | | 2,819 | | 2,665 | | 2,842 | | 2,935 | | 2,986 | |
Education | | 8,273 | | 8,445 | | 8,764 | | 9,022 | | 9,515 | | 9,766 | | 9,992 | |
Protection of persons and property | | 1,216 | | 1,248 | | 1,365 | | 1,215 | | 1,349 | | 1,267 | | 1,254 | |
Transportation | | 1,702 | | 1,898 | | 1,430 | | 1,603 | | 1,523 | | 1,472 | | 1,621 | |
Natural resources and economic development | | 1,847 | | 1,533 | | 1,486 | | 1,670 | | 1,649 | | 1,497 | | 1,478 | |
Other | | 814 | | 821 | | 1,074 | | 1,028 | | 1,111 | | 988 | | 934 | |
Government restructuring | | 347 | | 172 | | 123 | | — | | — | | — | | — | |
Contingencies (2) | | — | | — | | — | | — | | 320 | | 320 | | 360 | |
General government | | 564 | | 539 | | 489 | | 505 | | 634 | | 609 | | 590 | |
Debt servicing | | 1,727 | | 1,509 | | 1,420 | | 1,317 | | 1,282 | | 1,325 | | 1,352 | |
Total expense | | 30,668 | | 30,396 | | 30,335 | | 30,658 | | 32,876 | | 33,198 | | 33,831 | |
(1) In order to comply with generally accepted accounting principles, the expenses of school districts, post-secondary institutes and regional health authorities/societies are included in the government’s reporting entity beginning in 2004/05. To conform with this presentation, prior years have been restated based on unaudited financial information in the Public Accounts.
(2) The Contingencies vote is allocated to functions according to actual results for 2001/02 to 2004/05.
126
Table A9 Taxpayer-supported Entity Operating Statements (1) – 2001/02 to 2007/08
| | | | | | | | | | Budget | | | | | |
| | Actual | | Actual | | Actual | | Actual | | Estimate | | Plan | | Plan | |
($ millions) | | 2001/02 | | 2002/03 | | 2003/04 | | 2004/05 | | 2005/06 | | 2006/07 | | 2007/08 | |
| | | | | | | | | | | | | | | |
Taxpayer-supported Crown Agencies: | | | | | | | | | | | | | | | |
| | | | | | | | | | | | | | | |
BC Transportation Financing Authority | | | | | | | | | | | | | | | |
Revenue | | 466 | | 419 | | 622 | | 1,383 | | 631 | | 634 | | 636 | |
Expense | | (466 | ) | (439 | ) | (497 | ) | (578 | ) | (600 | ) | (546 | ) | (697 | ) |
| | — | | (20 | ) | 125 | | 805 | | 31 | | 88 | | (61 | ) |
Accounting adjustments | | (185 | ) | (179 | ) | (177 | ) | (172 | ) | (165 | ) | (155 | ) | (145 | ) |
Net impact | | (185 | ) | (199 | ) | (52 | ) | 633 | | (134 | ) | (67 | ) | (206 | ) |
| | | | | | | | | | | | | | | |
British Columbia Buildings Corporation | | | | | | | | | | | | | | | |
Revenue | | 465 | | 485 | | 515 | | 447 | | 412 | | 387 | | 382 | |
Expense | | (428 | ) | (433 | ) | (468 | ) | (396 | ) | (370 | ) | (342 | ) | (340 | ) |
| | 37 | | 52 | | 47 | | 51 | | 42 | | 45 | | 42 | |
Accounting adjustments | | 16 | | 12 | | (4 | ) | (4 | ) | (2 | ) | (2 | ) | (2 | ) |
Net impact | | 53 | | 64 | | 43 | | 47 | | 40 | | 43 | | 40 | |
| | | | | | | | | | | | | | | |
British Columbia Housing Management Commission | | | | | | | | | | | | | | | |
Revenue | | 260 | | 263 | | 279 | | 284 | | 333 | | 329 | | 329 | |
Expense | | (260 | ) | (263 | ) | (279 | ) | (284 | ) | (333 | ) | (329 | ) | (329 | ) |
| | — | | — | | — | | — | | — | | — | | — | |
Accounting adjustments | | | | 1 | | 7 | | 4 | | — | | — | | — | |
Net impact | | — | | 1 | | 7 | | 4 | | — | | — | | — | |
| | | | | | | | | | | | | | | |
British Columbia Transit | | | | | | | | | | | | | | | |
Revenue | | 118 | | 136 | | 138 | | 146 | | 155 | | 160 | | 163 | |
Expense | | (119 | ) | (136 | ) | (138 | ) | (148 | ) | (155 | ) | (160 | ) | (163 | ) |
| | (1 | ) | — | | — | | (2 | ) | — | | — | | — | |
Accounting adjustments | | (9 | ) | | | (3 | ) | (1 | ) | (1 | ) | | | | |
Net impact | | (10 | ) | — | | (3 | ) | (3 | ) | (1 | ) | — | | — | |
| | | | | | | | | | | | | | | |
Tourism British Columbia | | | | | | | | | | | | | | | |
Revenue | | 35 | | 34 | | 33 | | 45 | | 58 | | 58 | | 58 | |
Expense | | (36 | ) | (34 | ) | (37 | ) | (45 | ) | (57 | ) | (58 | ) | (58 | ) |
| | (1 | ) | — | | (4 | ) | — | | 1 | | — | | — | |
Accounting adjustments | | (2 | ) | 1 | | | | 5 | | — | | | | | |
Net impact | | (3 | ) | 1 | | (4 | ) | 5 | | 1 | | — | | — | |
| | | | | | | | | | | | | | | |
Other taxpayer-supported Crown agencies | | | | | | | | | | | | | | | |
Revenue | | 1,601 | | 1,213 | | 693 | | 736 | | 622 | | 627 | | 636 | |
Expense | | (1,826 | ) | (1,236 | ) | (661 | ) | (679 | ) | (622 | ) | (611 | ) | (623 | ) |
| | (225 | ) | (23 | ) | 32 | | 57 | | — | | 16 | | 13 | |
Accounting adjustments | | 175 | | (62 | ) | 65 | | 43 | | 82 | | 108 | | 41 | |
Net impact | | (50 | ) | (85 | ) | 97 | | 100 | | 82 | | 124 | | 54 | |
| | | | | | | | | | | | | | | |
Total net impact | | (195 | ) | (218 | ) | 88 | | 786 | | (12 | ) | 100 | | (112 | ) |
127
| | | | | | | | | | Budget | | | | | |
| | Actual | | Actual | | Actual | | Actual | | Estimate | | Plan | | Plan | |
($ millions) | | 2001/02 | | 2002/03 | | 2003/04 | | 2004/05 | | 2005/06 | | 2006/07 | | 2007/08 | |
| | | | | | | | | | | | | | | |
SUCH Sector and Regional Authorities: | | | | | | | | | | | | | | | |
| | | | | | | | | | | | | | | |
School Districts | | | | | | | | | | | | | | | |
Revenue | | 4,308 | | 4,417 | | 4,569 | | 4,666 | | 4,852 | | 4,871 | | 4,900 | |
Expense | | (4,277 | ) | (4,230 | ) | (4,471 | ) | (4,533 | ) | (4,781 | ) | (4,829 | ) | (4,847 | ) |
| | 31 | | 187 | | 98 | | 133 | | 71 | | 42 | | 53 | |
Accounting adjustments | | 11 | | (37 | ) | 51 | | 44 | | 39 | | 44 | | 47 | |
Net impact | | 42 | | 150 | | 149 | | 177 | | 110 | | 86 | | 100 | |
| | | | | | | | | | | | | | | |
Universities | | | | | | | | | | | | | | | |
Revenue | | 1,720 | | 1,828 | | 1,991 | | 2,158 | | 2,470 | | 2,543 | | 2,633 | |
Expense | | (1,612 | ) | (1,712 | ) | (1,905 | ) | (2,073 | ) | (2,454 | ) | (2,574 | ) | (2,682 | ) |
| | 108 | | 116 | | 86 | | 85 | | 16 | | (31 | ) | (49 | ) |
Accounting adjustments | | 31 | | 70 | | 32 | | 38 | | — | | (5 | ) | (1 | ) |
Net impact | | 139 | | 186 | | 118 | | 123 | | 16 | | (36 | ) | (50 | ) |
| | | | | | | | | | | | | | | |
Colleges, University Colleges, and Institutes | | | | | | | | | | | | | | | |
Revenue | | 1,215 | | 1,290 | | 1,362 | | 1,400 | | 1,257 | | 1,258 | | 1,293 | |
Expense | | (1,212 | ) | (1,257 | ) | (1,298 | ) | (1,345 | ) | (1,258 | ) | (1,279 | ) | (1,323 | ) |
| | 3 | | 33 | | 64 | | 55 | | (1 | ) | (21 | ) | (30 | ) |
Accounting adjustments | | 51 | | 14 | | 10 | | 13 | | 8 | | 16 | | 7 | |
Net impact | | 54 | | 47 | | 74 | | 68 | | 7 | | (5 | ) | (23 | ) |
| | | | | | | | | | | | | | | |
Health Authorities | | | | | | | | | | | | | | | |
Revenue | | 6,432 | | 7,127 | | 7,538 | | 7,667 | | 7,973 | | 8,050 | | 8,147 | |
Expense | | (6,486 | ) | (7,125 | ) | (7,589 | ) | (7,602 | ) | (7,973 | ) | (8,050 | ) | (8,147 | ) |
| | (54 | ) | 2 | | (51 | ) | 65 | | — | | — | | — | |
Accounting adjustments | | (12 | ) | 155 | | 102 | | (40 | ) | 26 | | 43 | | 29 | |
Net impact | | (66 | ) | 157 | | 51 | | 25 | | 26 | | 43 | | 29 | |
| | | | | | | | | | | | | | | |
Hospital Societies | | | | | | | | | | | | | | | |
Revenue | | 558 | | 594 | | 649 | | 648 | | 645 | | 646 | | 650 | |
Expense | | (559 | ) | (598 | ) | (665 | ) | (646 | ) | (648 | ) | (649 | ) | (654 | ) |
| | (1 | ) | (4 | ) | (16 | ) | 2 | | (3 | ) | (3 | ) | (4 | ) |
Accounting adjustments | | 8 | | (1 | ) | (25 | ) | — | | — | | (6 | ) | (5 | ) |
Net impact | | 7 | | (5 | ) | (41 | ) | 2 | | (3 | ) | (9 | ) | (9 | ) |
| | | | | | | | | | | | | | | |
Children and Family Development Governance Authorities2 | | | | | | | | | | | | | | | |
Revenue | | — | | 2 | | 4 | | 1 | | 387 | | 584 | | 1,133 | |
Expense | | — | | (1 | ) | (3 | ) | (1 | ) | (387 | ) | (584 | ) | (1,133 | ) |
| | — | | 1 | | 1 | | — | | — | | — | | — | |
Accounting adjustments | | — | | 1 | | — | | — | | 8 | | 8 | | 7 | |
Net impact | | — | | 2 | | 1 | | — | | 8 | | 8 | | 7 | |
| | | | | | | | | | | | | | | |
Total net impact | | 176 | | 537 | | 352 | | 395 | | 164 | | 87 | | 54 | |
128
| | | | | | | | | | Budget | | | | | |
| | Actual | | Actual | | Actual | | Actual | | Estimate | | Plan | | Plan | |
($ millions) | | 2001/02 | | 2002/03 | | 2003/04 | | 2004/05 | | 2005/06 | | 2006/07 | | 2007/08 | |
| | | | | | | | | | | | | | | |
Net operating statements of taxpayer-supported Crown agencies | | | | | | | | | | | | | | | |
Revenue | | 2,945 | | 2,550 | | 2,280 | | 3,041 | | 2,211 | | 2,195 | | 2,204 | |
Accounting adjustments | | (175 | ) | (147 | ) | (119 | ) | (113 | ) | (92 | ) | (64 | ) | (133 | ) |
Net revenue | | 2,770 | | 2,403 | | 2,161 | | 2,928 | | 2,119 | | 2,131 | | 2,071 | |
Expense | | (3,135 | ) | (2,541 | ) | (2,080 | ) | (2,130 | ) | (2,137 | ) | (2,046 | ) | (2,210 | ) |
Accounting adjustments | | 170 | | (80 | ) | 7 | | (12 | ) | 6 | | 15 | | 27 | |
Net expense | | (2,965 | ) | (2,621 | ) | (2,073 | ) | (2,142 | ) | (2,131 | ) | (2,031 | ) | (2,183 | ) |
Net fiscal plan impact | | (195 | ) | (218 | ) | 88 | | 786 | | (12 | ) | 100 | | (112 | ) |
| | | | | | | | | | | | | | | |
Net operating statements of SUCH sector and regional authorities | | | | | | | | | | | | | | | |
Revenue | | 14,233 | | 15,258 | | 16,113 | | 16,540 | | 17,584 | | 17,952 | | 18,756 | |
Accounting adjustments | | (157 | ) | (334 | ) | (478 | ) | (466 | ) | (487 | ) | (532 | ) | (513 | ) |
Net revenue | | 14,076 | | 14,924 | | 15,635 | | 16,074 | | 17,097 | | 17,420 | | 18,243 | |
Expense | | (14,146 | ) | (14,923 | ) | (15,931 | ) | (16,200 | ) | (17,501 | ) | (17,965 | ) | (18,786 | ) |
Accounting adjustments | | 246 | | 536 | | 648 | | 521 | | 568 | | 632 | | 597 | |
Net expense | | (13,900 | ) | (14,387 | ) | (15,283 | ) | (15,679 | ) | (16,933 | ) | (17,333 | ) | (18,189 | ) |
Net fiscal plan impact | | 176 | | 537 | | 352 | | 395 | | 164 | | 87 | | 54 | |
| | | | | | | | | | | | | | | |
Total net operating statements of taxpayer-supported entities | | | | | | | | | | | | | | | |
Revenue | | 17,178 | | 17,808 | | 18,393 | | 19,581 | | 19,795 | | 20,147 | | 20,960 | |
Accounting adjustments | | (332 | ) | (481 | ) | (597 | ) | (579 | ) | (579 | ) | (596 | ) | (646 | ) |
Net revenue | | 16,846 | | 17,327 | | 17,796 | | 19,002 | | 19,216 | | 19,551 | | 20,314 | |
Expense | | (17,281 | ) | (17,464 | ) | (18,011 | ) | (18,330 | ) | (19,638 | ) | (20,011 | ) | (20,996 | ) |
Accounting adjustments | | 416 | | 456 | | 655 | | 509 | | 574 | | 647 | | 624 | |
Net expense | | (16,865 | ) | (17,008 | ) | (17,356 | ) | (17,821 | ) | (19,064 | ) | (19,364 | ) | (20,372 | ) |
Net fiscal plan impact | | (19 | ) | 319 | | 440 | | 1,181 | | 152 | | 187 | | (58 | ) |
(1) Revenue and expense are shown as reported in the entity financial statements and service plans, before consolidation and accounting adjustments.
(2) The amount of funding to be transferred, and the timing of the transfer, will be based on an assessment of Authority readiness.
129
Table A10 Material Assumptions – Revenue
| | Budget | | | | September | | | | | | |
Revenue Source | | Estimate | | Actual | | Update | | Plan | | Plan | | Sensitivities |
and Assumptions | | 2004/05 | | 2005/06 | | 2006/07 | | 2007/08 | | 2005/06 |
| | ($ millions) | | |
Personal Income Tax | | $ | 5,005 | | $ | 5,050 | | $ | 5,484 | | $ | 5,674 | | $ | 6,008 | | |
BC personal income growth | | 4.0 | % | 4.1 | % | 4.9 | % | 4.8 | % | 4.5 | % | |
BC tax base growth | | 4.7 | % | 4.7 | % | 5.4 | % | 5.3 | % | 5.0 | % | +/- 1% change in 2005 BC personal income growth equals +/- $50 to $100 million |
Average tax yield | | 5.50 | % | 5.48 | % | 5.60 | % | 5.64 | % | 5.68 | % |
Tax credits and BC Tax Reduction | | $ | -125 | | $ | -165 | | $ | -255 | | $ | -257 | | $ | -259 | |
Prior-year adjustment | | $ | 0 | | $ | 69 | | $ | 147 | | $ | 0 | | $ | 0 | |
| | | | | | | | | | | | |
2004 Tax-year | | 2004 Factors | | | | | | | | +/- 1% change in 2004 BC personal or taxable income growth equals +/- $50 to $100 million one-time effect (prior-year adjustment) and could result in an additional +/- $50 to $100 million base change in 2005/06 |
BC personal income growth | | 4.0 | % | 4.1 | % | 4.1 | % | | | | |
BC tax base growth | | 4.7 | % | 4.7 | % | 5.5 | % | | | | |
Average 2004 tax yield | | 5.50 | % | 5.48 | % | 5.56 | % | | | | |
Gross 2004 tax | | $ | 4,821 | | $ | 4,847 | | $ | 4,955 | | | | | |
| | | | | | | | | | | |
2003 Tax-year | | 2003 Factors | | | | | | | |
BC personal income growth | | 2.9 | % | 2.7 | % | | | | | | |
BC tax base growth | | 3.4 | % | 4.4 | % | | | | | | |
Average 2003 tax yield | | 5.46 | % | 5.44 | % | | | | | | |
Gross 2003 tax | | $ | 4,570 | | $ | 4,597 | | | | | | | | |
Prior year assessments, tax credits and other | | $ | 165 | | $ | 153 | | | | | | | | |
Corporate Income Tax | | $ | 893 | | $ | 1,255 | | $ | 1,215 | | $ | 1,223 | | $ | 1,099 | | |
National tax base ($ billions) | | $ | 129.9 | | $ | 143.6 | | $ | 149.2 | | $ | 156.5 | | $ | 157.3 | | +/- 1% change in the 2005 national tax base equals +/- $10 to $15 million in 2005/06 |
BC instalment share | | 8.74 | % | 8.74 | % | 9.08 | % | 9.85 | % | 9.68 | % |
Prior-year adjustments | | $ | -49 | | $ | 167 | | $ | 150 | | $ | 90 | | $ | -17 | |
Tax credits | | $ | -172 | | $ | -172 | | $ | -206 | | $ | -199 | | $ | -191 | |
International Financial Activity Act refunds | | $ | -9 | | $ | -3 | | $ | -10 | | $ | -30 | | $ | -30 | |
BC tax base ($ billions) | | $ | 10.1 | | $ | 13.5 | | $ | 14.4 | | $ | 15.2 | | $ | 16.1 | | |
BC tax base growth | | 7.0 | % | 26.0 | % | 7.0 | % | 5.0 | % | 6.0 | % | +/- 1% change in the 2004 BC tax base equals +/- $10 to $15 million in 2005/06 |
BC corporate profits growth | | 6.8 | % | 32.9 | % | 6.8 | % | 5.0 | % | 5.9 | % |
| | 2003 Factors | | | | | | | |
BC corporate profits growth | | 1.1 | % | 11.2 | % | | | | | | |
BC tax base growth | | 1.0 | % | 14.3 | % | | | | | | | |
National tax base growth | | 12.5 | % | 10.0 | % | | | | | | | |
BC share of national tax base | | 7.79 | % | 9.08 | % | | | | | | | |
2002 and prior-years revenue | | $ | 0 | | $ | 26 | | | | | | | | |
Tax credits | | $ | -199 | | $ | -133 | | | | | | | | |
Revenue is recorded on a cash basis. Due to lags in the federal collection and instalment systems, changes to the BC corporate profits and tax base forecasts affect revenue in the succeeding year. For example, 2005/06 instalments from the federal government are based on BC’s share of the national tax base for the 2003 tax-year (assessed as of December 31, 2004) and a forecast of the 2005 national tax base. Cash adjustments for any under/over payments from the federal government in respect of 2004 will be received/paid on March 31, 2006. | | |
Social Service Tax | | $ | 4,156 | | $ | 4,156 | | $ | 4,213 | | $ | 4,427 | | $ | 4,649 | | |
Consumer expenditure growth | | 4.8 | % | 5.7 | % | 5.6 | % | 5.7 | % | 5.2 | % | +/- 1% change in 2005 growth equals up to +/- $25 million
+/- 1% change in 2005 growth equals up to +/- $10 million
+/- 1% change in 2005 growth equals up to +/- $10 million |
| | | | | | | | | | | |
Business investment growth | | 5.7 | % | 6.9 | % | 6.7 | % | 11.2 | % | 9.0 | % |
| | | | | | | | | | | |
Other expenditure growth | | 3.0 | % | 9.9 | % | 3.3 | % | 1.1 | % | 3.7 | % |
| | | | | | | | | | | |
Social service tax base growth | | 5.3 | % | 6.3 | % | 5.3 | % | 5.1 | % | 5.1 | % |
Fuel Tax | | $ | 891 | | $ | 904 | | $ | 915 | | $ | 947 | | $ | 979 | | |
Real GDP growth | | 2.8 | % | 3.9 | % | 3.4 | % | 3.2 | % | 3.1 | % | +/- 1% change in real GDP equals up to +/- $10 million |
| | | | | | | | | | | |
| | | | | | | | | | | |
130
| | Budget | | | | September | | | | | | | |
Revenue Source | | Estimate | | Actual | | Update | | Plan | | Plan | | Sensitivities | |
and Assumptions | | 2004/05 | | 2005/06 | | 2006/07 | | 2007/08 | | 2005/06 | |
| | ($ millions) | | | |
Property Tax | | $ | 1,655 | | $ | 1,661 | | $ | 1,717 | | $ | 1,789 | | $ | 1,859 | | | |
BC Consumer Price Inflation | | 1.6 | % | 2.0 | % | 2.1 | % | 2.0 | % | 2.0 | % | +/- 1% change in new con-struction and inflation equals up to +/- $5 million in residential property taxation revenue | |
Housing Starts | | 26,949 | | 32,925 | | 32,226 | | 30,805 | | 30,511 | | |
| | | | | | | | | | | | |
Residential (school purpose) | | $ | 628 | | $ | 624 | | $ | 655 | | $ | 695 | | $ | 736 | | |
Non-residential (school purpose) | | $ | 869 | | $ | 879 | | $ | 897 | | $ | 924 | | $ | 950 | | |
Rural Area | | $ | 73 | | $ | 75 | | $ | 75 | | $ | 77 | | $ | 80 | | | |
Other* | | $ | 85 | | $ | 83 | | $ | 90 | | $ | 93 | | $ | 93 | | +/- 1% change in non- residential assessed values equals up to +/- $5 million | |
| | | | | | | | | | | | |
* Other includes BC Assessment Authority taxation revenue, municipal contributions to BC Transit and commissions paid to municipalities for the collection of provincial (residential school purpose) property taxes.
Petroleum, natural gas, minerals and Columbia River Treaty export electricity sales | | $ | 2,031 | | $ | 2,309 | | $ | 2,834 | | $ | 2,795 | | $ | 2,760 | | | |
Natural gas price ($Cdn/gigajoule at plant inlet) | | $ | 4.65 | | $ | 5.62 | | $ | 6.51 | | $ | 6.15 | | $ | 6.11 | | +/- $0.50 change in the natural gas price equals +/- $130 to $170 million +/- 1% change in natural gas volumes equals +/- $15 to $20 million | |
Natural gas volumes (annual per cent change) | | 8.1 | % | 3.8 | % | 2.9 | % | 3.1 | % | 3.0 | % | |
| | | | | | | | | | | | |
Oil price ($US/bbl at Cushing, OK) | | $ | 27.75 | | $ | 44.99 | | $ | 51.21 | | $ | 47.99 | | $ | 50.32 | | |
Auctioned land base (000 hectares) | | 954 | | 552 | | 567 | | 600 | | 620 | | | |
| | | | | | | | | | | | | |
Average bid price/hectare ($) | | $ | 400 | | $ | 507 | | $ | 644 | | $ | 500 | | $ | 500 | | | |
Metallurgical coal price ($US/tonne, fob west coast) | | $ | 48 | | $ | 50 | | $ | 120 | | $ | 115 | | $ | 100 | | | |
| | | | | | | | | | | | | |
Columbia River Treaty sales | | | | | | | | | | | | | |
Annual quantity set by treaty
(million mega-watt hours) | | 4.5 | | 4.5 | | 4.5 | | 4.3 | | 4.1 | | +/- 10% change in the average Mid-Columbia electricity price equals +/- $25 to $30 million | |
Mid- Columbia electricity price
($US/mega-watt hour) | | $ | 41 | | $ | 46 | | $ | 59 | | $ | 61 | | $ | 59 | | |
| | | | | | | | | | | | | |
Components of revenue | | | | | | | | | | | | Based on a recommendation from the Auditor General to be consistent with generally accepted accounting principles, bonus bid revenue recognition reflects eight-year deferral of cash receipts from the sale of oil and gas drilling rights | |
Natural gas royalties | | $ | 1,213 | | $ | 1,439 | | $ | 1,754 | | $ | 1,714 | | $ | 1,764 | | |
Bonus bids, permits and fees | | $ | 435 | | $ | 355 | | $ | 382 | | $ | 408 | | $ | 421 | | |
Petroleum royalties | | $ | 77 | | $ | 112 | | $ | 111 | | $ | 100 | | $ | 104 | | |
Columbia River Treaty sales | | $ | 215 | | $ | 258 | | $ | 305 | | $ | 285 | | $ | 265 | | |
Coal | | $ | 25 | | $ | 19 | | $ | 139 | | $ | 209 | | $ | 160 | | |
Metals and other | | $ | 41 | | $ | 101 | | $ | 117 | | $ | 52 | | $ | 18 | | |
Oil and Gas Commission fees | | $ | 25 | | $ | 25 | | $ | 26 | | $ | 27 | | $ | 28 | | |
Forests | | $ | 999 | | $ | 1,363 | | $ | 1,246 | | $ | 1,007 | | $ | 1,008 | | | |
Prices (calendar year average) | | | | | | | | | | | | +/- US$50 change in SPF price equals +/- $75 to $125 million
+/- US$100 change in hemlock price equals +/- $15 to $30 million
+/- US$50 change in pulp price equals +/-$5 to $10 million
+/- Cdn$10 change in log price equals +/-$130 to $140 million |
SPF 2x4 price ($US/1000 bd ft) | | $ | 300 | | $ | 393 | | $ | 360 | | $ | 300 | | $ | 300 | |
Hemlock price ($US/1000 bd ft) | | $ | 563 | | $ | 615 | | $ | 534 | | $ | 538 | | $ | 550 | |
Pulp ($US/tonne) | | $ | 574 | | $ | 616 | | $ | 615 | | $ | 600 | | $ | 600 | |
Average Coast Log Price
($Cdn/cubic metre)
(Vancouver Log Market, fiscal year) | |
n/a
| |
$
|
91
| |
$
|
84
| |
$
|
83
| |
$
|
83
| |
131
| | Budget | | | | September | | | | | | | |
Revenue Source | | Estimate | | Actual | | Update | | Plan | | Plan | | Sensitivities | |
and Assumptions | | 2004/05 | | 2005/06 | | 2006/07 | | 2007/08 | | 2005/06 | |
| | ($ millions) | | | |
Forests – continued | | | | | | | | | | | | | |
Crown harvest volumes (million cubic metres) | | | | | | | | | | | | +/- 10% change in Interior harvest volumes equals +/- $50 to $75 million +/- 10% change in Coastal harvest volumes equals +/- $15 to $20 million | |
Interior | | 48.5 | | 52.3 | | 51.5 | | 48.6 | | 48.6 | | |
Coast | | 15.0 | | 18.2 | | 17.0 | | 17.4 | | 17.4 | | |
Total | | 63.5 | | 70.5 | | 68.5 | | 66.0 | | 66.0 | | |
BC Timber Sales (included in above) | | 11.5 | | 9.8 | | 12.9 | | 15.0 | | 15.5 | | |
| | | | | | | | | | | | |
Components of revenue | | | | | | | | | | | | | |
Tenures | | $ | 708 | | $ | 1,021 | | $ | 857 | | $ | 611 | | $ | 602 | | | |
BC Timber Sales | | $ | 253 | | $ | 266 | | $ | 302 | | $ | 334 | | $ | 344 | | | |
Logging Tax | | $ | 20 | | $ | 31 | | $ | 65 | | $ | 40 | | $ | 40 | | | |
Other | | $ | 18 | | $ | 45 | | $ | 22 | | $ | 22 | | $ | 22 | | | |
Health and social transfers | | $ | 3,224 | | $ | 3,421 | | $ | 4,180 | | $ | 4,545 | | $ | 4,860 | | | |
National Canada Health Transfer (CHT) cash excluding Trusts, Early Learning and Child Care (ELCC), Health Reform Transfer (HRT), September 2004 First Ministers’ Meeting (FMM), and prior-year adjustments | | $ | 12,650 | | $ | 12,650 | | $ | 13,000 | | $ | 13,400 | | $ | 13,750 | | | |
National HRT cash | | $ | 1,500 | | $ | 1,500 | | $ | 0 | | $ | 0 | | $ | 0 | | | |
National FMM base cash (absorbs HRT) | | $ | 0 | | $ | 1,000 | | $ | 6,000 | | $ | 6,740 | | $ | 7,598 | | | |
National Wait Times cash | | $ | 0 | | $ | 4,250 | | $ | 0 | | $ | 0 | | $ | 0 | | | |
National FMM Capital cash | | $ | 0 | | $ | 500 | | $ | 0 | | $ | 0 | | $ | 0 | | | |
National Canada Social Transfer (CST) cash | | $ | 7,750 | | $ | 7,750 | | $ | 8,000 | | $ | 8,200 | | $ | 8,450 | | | |
National ELCC cash | | $ | 75 | | $ | 150 | | $ | 225 | | $ | 300 | | $ | 350 | | | |
National ELCC Federal Budget 2005 cash | | $ | 0 | | $ | 700 | | $ | 0 | | $ | 650 | | $ | 1,150 | | | |
National basic federal tax ($ billions) | | $ | 98.8 | | $ | 99.3 | | $ | 107.0 | | $ | 113.5 | | $ | 121.1 | | +/- 0.1% change in BC’s population share equals +/- $25 to $35 million | |
BC basic federal tax ($ billions) | | $ | 11.9 | | $ | 12.1 | | $ | 12.9 | | $ | 13.6 | | $ | 14.2 | | |
BC share of national population | | 13.1 | % | 13.1 | % | 13.2 | % | 13.2 | % | 13.2 | % | |
BC health and social transfers revenue | | | | | | | | | | | | | |
CHT | | $ | 1,778 | | $ | 1,772 | | $ | 1,820 | | $ | 2,005 | | $ | 2,089 | | | |
HRT | | $ | 195 | | $ | 197 | | $ | 0 | | $ | 0 | | $ | 0 | | | |
FMM Base Funding (absorbs HRT) | | $ | 0 | | $ | 131 | | $ | 789 | | $ | 887 | | $ | 1,002 | | | |
FMM Wait Times | | $ | 0 | | $ | 560 | | $ | 0 | | $ | 0 | | $ | 0 | | | |
FMM Deferral (Base and Wait Times) | | $ | 0 | | $ | -691 | | $ | 116 | | $ | 228 | | $ | 267 | | | |
FMM Capital Equipment Funding | | $ | 0 | | $ | 0 | | $ | 0 | | $ | 0 | | $ | 4 | | | |
CST | | $ | 1,089 | | $ | 1,086 | | $ | 1,120 | | $ | 1,228 | | $ | 1,283 | | | |
ELCC | | $ | 10 | | $ | 20 | | $ | 30 | | $ | 40 | | $ | 46 | | | |
ELCC Federal Budget 2005 | | $ | 0 | | $ | 0 | | $ | 92 | | $ | 85 | | $ | 152 | | | |
ELCC Deferral | | $ | 0 | | $ | 0 | | $ | -37 | | $ | 37 | | $ | 0 | | | |
Prior-year adjustments | | $ | 0 | | $ | 48 | | $ | -2 | | $ | 0 | | $ | 0 | | | |
2003 CHST Supplement | | | | | | | | | | | | | |
Trust ($333 million) | | $ | 133 | | $ | 133 | | $ | 71 | | $ | 0 | | $ | 0 | | | |
2003 Medical Equipment | | | | | | | | | | | | | |
Trust ($200 million) | | $ | 19 | | $ | 17 | | $ | 33 | | $ | 17 | | $ | 17 | | | |
2004 CHST Supplement | | | | | | | | | | | | | |
Trust ($262 million) | | $ | 0 | | $ | 131 | | $ | 131 | | $ | 0 | | $ | 0 | | | |
2004 Public Immunization | | | | | | | | | | | | | |
Trust ($52 million) | | $ | 0 | | $ | 17 | | $ | 17 | | $ | 18 | | $ | 0 | | | |
The Ministry of Health and the Ministry of Children and Family Development developed plans to defer bridging, multi-year and capital/equipment cash advances received from the federal government in 2004/05 and 2005/06 and recognize revenue with matching expense over the three-year plan. The Office of the Auditor General has reviewed these plans and supports, subject to further review and/or accounting policy changes, that these revenue deferrals are consistent with GAAP.
132
| | Budget | | | | September | | | | | | | |
Revenue Source | | Estimate | | Actual | | Update | | Plan | | Plan | | Sensitivities | |
and Assumptions | | 2004/05 | | 2005/06 | | 2006/07 | | 2007/08 | | 2005/06 | |
| | ($ millions) | | | |
Equalization | | $ | 402 | | $ | 979 | | $ | 590 | | $ | 0 | | $ | 0 | | | |
Components of Equalization revenue ($millions) | | | | | | | | | | | | | |
Current-year base (new framework) | | $ | 402 | | $ | 682 | | $ | 590 | | $ | 0 | | $ | 0 | | | |
One-time | | $ | 0 | | $ | 38 | | $ | 0 | | $ | 0 | | $ | 0 | | | |
Prior years | | $ | 0 | | $ | 259 | | $ | 0 | | $ | 0 | | $ | 0 | | | |
SUCH sector direct revenue | | $ | 2,606 | | $ | 2,927 | | $ | 3,065 | | $ | 3,067 | | $ | 3,155 | | | |
School Districts | | $ | 193 | | $ | 448 | | $ | 453 | | $ | 429 | | $ | 432 | | Management forecasts based on policy assumptions provided by the relevant ministries – subject to final approval by the boards of these organizations | |
Universities | | $ | 1,171 | | $ | 1,303 | | $ | 1,489 | | $ | 1,545 | | $ | 1,611 | | |
Colleges, University Colleges and Institutes | | $ | 545 | | $ | 565 | | $ | 524 | | $ | 518 | | $ | 530 | | |
Health Authorities and Hospital Societies | | $ | 697 | | $ | 611 | | $ | 599 | | $ | 575 | | $ | 582 | | |
| | | | | | | | | | | | |
Commercial Crown corporation income | | $ | 2,072 | | $ | 2,412 | | $ | 2,274 | | $ | 2,259 | | $ | 2,197 | | | |
| | | | | | | | | | | | | | | | | | |
| | The forecast sensitivities of individual Crown corporations are disclosed in their service plans. The main sensitivities are disclosed below. | |
| | | | | | | | | | | | | | | | | | |
BC Hydro (before deferral account transfers) | | $ | 388 | | $ | 240 | | $ | 329 | | $ | 333 | | $ | 256 | | | |
reservoir water inflows | | 94 | % | 94 | % | 95 | % | 100 | % | 100 | % | +/-1% in hydro generation | |
(August 2005 forecast) | | | | | | | | | | | | = +/-$25 million | |
mean gas price | | 5.09 | | 5.36 | | 6.80 | | 6.90 | | 6.50 | | +/-10% = -/+$20 million | |
(Sumas, $US/MMbtu) | | | | | | | | | | | | | |
electricity prices | | 37.44 | | 43.97 | | 54.10 | | 53.90 | | 54.10 | | +/-$1 MWh in electricity trade margins = +/-$35 | |
(Mid-C, $US/MWh) | | | | | | | | | | | | Million | |
rate increase | | 7.23 | % | 4.85 | % | nil | | nil | | nil | | | |
ICBC | | $ | 52 | | $ | 399 | | $ | 224 | | $ | 125 | | $ | 61 | | | |
investment income | | $ | 330 | | $ | 395 | | $ | 500 | | $ | 394 | | $ | 413 | | +/-1% return = +/-$71 | |
| | | | | | | | | | | | to $79 million | |
adjustment to prior-year claims | | — | | $ | 46 | | $ | -66 | | — | | — | | +/-1% in costs = -/+$47 | |
| | | | | | | | | | | | to $50 million | |
premium revenue trend | | +3.6 | % | +6.1 | % | +1.6 | % | +0.2 | % | +2.0 | % | +/-1% = +/-$30-31 million | |
claims-incurred trend | | +6.2 | % | +2.7 | % | +3.6 | % | +4.9 | % | +4.9 | % | +/-1% = -/+$22-26 million | |
133
Table A11 Material Assumptions – Expense | | | | |
| | Budget | | | | Budget | | | | | | | |
Ministry Programs | | Estimate | | Actual | | Estimate | | Plan | | Plan | | Sensitivities | |
and Assumptions | | 2004/05 | | 2005/06 | | 2006/07 | | 2007/08 | | 2005/06 | |
| | ($ millions unless otherwise specified) | | | |
Advanced Education | | 1,828 | | 1,827 | | 1,898 | | 1,948 | | 2,024 | | The number of student spaces may vary depending on the financial and other policies of post secondary institutions. | |
| | | | | | | | | | | | |
Student spaces – (# of FTEs) | | 164,065 | | 161,681 | | 168,265 | | 172,659 | | 177,053 | | |
| | | | | | | | | | | | | |
Attorney General | | 445 | | 446 | | 459 | | 481 | | 483 | | The number of recommended criminal cases brought forward by the various police departments, resulting in charges being laid by the Crown, and the number of civil litigation cases. | |
| | | | | | | | | | | | |
New cases filed/processed
(# for all courts) | | n/a | | 338,000 | | 318,000 | | 318,000 | | 318,000 | | |
| | | | | | | | | | | | | |
Crown Proceeding Act (CPA) | | 28 | | 21 | | 28 | | 28 | | 28 | | The number and size of litigation brought against the province. | |
| | | | | | Funding based on an historical ten-year average. | | |
* Excludes CPA budget and expentitures and includes contingency access
Children and Family Development | | 1,498 | | 1,467 | | 1,637 | | 1,735 | | 1,789 | | | |
Average children-in-care
caseload (#) | | 9,300 | | 9,108 | | 9,000 | | 9,000 | | 9,000 | | A 1% increase in the average child-in- care caseload or the average cost per case will affect expenditures by approximately $2.5 million. | |
Average annual residential
cost per child in care ($) | | 25,900 | | 26,500 | | 26,500 | | 26,500 | | 26,500 | | |
| | | | | | | | | | | | | |
Adult Community Living: | | | | | | | | | | | | | |
Residential Services: | | | | | | | | | | | | | |
| | | | | | | | | | | | The adult community living caseload is sensitive to the pressures of an aging population and increased community awareness of services offered through the creation of the new Crown Agency. A 1 % increase in the average residential services caseload will cost approximately $3.5 million. A 1% increase in the average day programs caseload will cost approximately $1 million. |
Average caseload (#) | | 4,940 | | 5,002 | | 5,173 | | 5,350 | | 5,533 | |
| | | | | | | | | | | |
Average cost per client ($) | | 70,735 | | 63,065 | | 63,065 | | 63,065 | | 63,065 | |
| | | | | | | | | | | |
Day Programs: | | | | | | | | | | | |
| | | | | | | | | | | |
Average caseload (#) | | 9,340 | | 9,441 | | 9,740 | | 10,040 | | 10,340 | |
Average cost per client ($) | | 12,900 | | 12,700 | | 12,705 | | 12,751 | | 12,807 | |
* operated by Community Living BC | | | | | | | | | | | | |
Education | | 4,922 | | 4,919 | | 5,074 | | 5,166 | | 5,190 | | |
Student Enrolment (# of FTEs) | | 574,219 | | 574,230 | | 568,591 | | 563,009 | | 559,141 | | |
Employment and Income Assistance | | 1,262 | | 1,259 | | 1,355 | | 1,367 | | 1,395 | | |
Supplementary Estimates | | | | 10 | | | | | | | | |
Temporary Assistance
annual average caseload (#) | | 56,200 | | 54,000 | | 50,550 | | 48,900 | | 48,300 | | The expected-to-work caseload is sensitive to fluctuations in economic and employment trends in the service sector. A 1% change in the Temporary Assistance annual average caseload or average cost per case will affect expenditures from $3 to $4 million annually. |
134
| | Budget | | | | Budget | | | | | | |
Ministry Programs | | Estimate | | Actual | | Estimate | | Plan | | Plan | | Sensitivities |
and Assumptions | | 2004/05 | | 2005/06 | | 2006/07 | | 2007/08 | | 2005/06 |
| | ($ millions unless otherwise specified) | | |
Employment and Income Assistance – continued | | | | | | | | | | | | |
Disability Assistance
annual average caseload (#) | | 52,500 | | 53,700 | | 57,050 | | 60,050 | | 63,050 | | The caseload for persons with disabilities is sensitive to the aging of the population and overall health needs. The average cost per case is sensitive to the composition of the caseload. A 1% change in the Disability Assistance annual average caseload or average cost per case will affect expenditures from $5 to $6 million annually. |
| | | | | | | | | | | | |
Total annual average caseload (#) | | 108,700 | | 107,700 | | 107,600 | | 108,950 | | 111,350 | | The average cost per case is sensitive to the composition of the caseload, and reported income. A 1% change in the annual caseload or average cost per case will affect expenditures from $8 million to $10 million annually. |
| | | | | | | | | | | | |
Forests and Range | | 709 | | 785 | | 856 | | 922 | | 955 | | |
Supplementary Estimates | | | | 113 | | | | | | | | |
Direct Fire Fighting | | 55 | | 55 | | 55 | | 55 | | 55 | | |
Statutory Spending Authority | | | | 109 | | Funding based on a 10 year | | |
| | | | 164 | | historical average (1993-2002) | | |
BC Timber Sales | | 132 | | 116 | | 148 | | 229 | | 230 | | |
| | | | | | * Increase in capitalized expenditures as 2005/06 is the first year in which labour costs, which have been capitalized into inventory, are expensed as part of cost of goods sold. | | |
Health | | 10,545 | | 10,589 | | 11,470 | | 11,870 | | 12,089 | | |
| | | | | | | | | | | | |
Pharmacare | | 830 | | 793 | | 890 | | 982 | | 1,084 | | +/- 1% change in utilization or drug prices affects costs by approximately $9 million |
Demand/cost growth
(per cent change) | | | | | | 7.2 | % | 10.3 | % | 10.4 | % |
| | | | | | | | | | | | |
Medical Services Plan (MSP) | | 2,522 | | 2,546 | | 2,627 | | 2,642 | | 2,642 | | a 1% increase in volume of services provided by fee-for-service physicians affects costs by approximately $20 million |
| | | | | | | | | | | | a 1% increase in population growth costs approximately $65 million |
Regional Health Sector Funding | | 6,542 | | 6,665 | | 7,240 | | 7,496 | | 7,583 | | |
135
| | Budget | | | | Budget | | | | | | |
Ministry Programs | | Estimate | | Actual | | Estimate | | Plan | | Plan | | Sensitivities |
and Assumptions | | 2004/05 | | 2005/06 | | 2006/07 | | 2007/08 | | 2005/06 |
| | ($ millions unless otherwise specified) | | | |
| | | | | | | | | | | | Volume and severity of criminal activity, the number of inmate beds occupied and the number of investigations and audits based on the volume of gaming activity. | |
Public Safety and Solicitor General | | 480 | | 488 | | 525 | | 528 | | 531 | | |
| | | | | | | | | | | | |
Supplementary Estimates | | | | 3 | | | | | | | | |
| | | | | | | | | | | | | |
Emergency Program Act (EPA) | | 16 | | 16 | | 16 | | 16 | | 16 | | The number and severity of natural disasters. | |
Statutory Spending Authority | | | | 6
22 | | Funding based on historical average. | | | |
Management of Public Funds and Debt | | 800 | | 677 | | 684 | | 711 | | 698 | | | |
Interest rates for | | | | | | | | | | | | | |
new provincial borrowing: | | | | | | | | | | | | Full year impact on MoPD on interest costs of a 1% change in interest rates equals $67 million; $100 million increase in debt level equals $5 million. | |
Short-term | | 2.81 | % | 2.43 | % | 2.96 | % | 3.75 | % | 4.63 | % | |
Long-term | | 5.68 | % | 5.15 | % | 4.86 | % | 5.36 | % | 6.00 | % | |
CDN/US exchange rate (cents) | | 79.4 | | 78.2 | | 81.7 | | 83.2 | | 83.5 | | |
| | | | | | | | | | | | | |
Government-Wide Issues | | | | | | | | | | | | | |
| | | | | | | | | | | | | |
Compensation | | | | | | | | | | | | A new bargaining mandate is under development. A 1% increase in wages and benefits costs approximately $160 million per year. For example, a 1% increase each year for three years costs about $160 million in year one, $320 million in year two, and $480 million in year three. | |
| | | | | | | | | | | | | |
Taxpayer-supported Crown agencies net spending | | 1,169 | | 378 | | 1,163 | | 1,046 | | 1,277 | | The forecast sensitivities of individual Crown corporations and agencies are disclosed in their service plans. | |
| | | | | | | | | | | | | |
SUCH sector and regional authorities expenses in excess of grant funding | | 2,534 | | 2,532 | | 2,901 | | 2,980 | | 3,101 | | | |
School Districts | | 184 | | 271 | | 343 | | 343 | | 332 | | Management forecasts based on broad policy assumptions provided by the responsible ministries - subject to final review and approval by the various boards of these organizations. | |
Universities | | 1,118 | | 1,180 | | 1,473 | | 1,581 | | 1,661 | | |
Colleges, University Colleges and Institutes | | 546 | | 497 | | 517 | | 523 | | 553 | | |
Health Authorities and Hospital Societies | | 686 | | 584 | | 576 | | 541 | | 562 | | | |
CFD Regional Authorities | | — | | — | | (8 | ) | (8 | ) | (7 | ) | | |
136
Table A12 Full-Time Equivalents (FTEs) (1),(2) – 2001/02 to 2007/08 | | | | |
| | | | | | | | | | Budget | | | | | |
| | Actual | | Actual | | Actual | | Actual | | Estimate | | Plan | | Plan | |
| | 2001/02 | | 2002/03 | | 2003/04 | | 2004/05 | | 2005/06 | | 2006/07 | | 2007/08 | |
| | | | | | | | | | | | | | | |
Ministries and special offices (CRF) | | 33,495 | | 29,751 | | 28,684 | | 26,859 | | 27,259 | | 27,331 | | 24,873 | |
Taxpayer-supported Crown agencies | | 8,447 | | 7,814 | | 4,570 | | 3,822 | | 3,790 | | 3,590 | | 3,581 | |
Regional authorities (3) | | — | | — | | — | | — | | 222 | | 547 | | 3,054 | |
Total FTEs | | 41,942 | | 37,565 | | 33,254 | | 30,681 | | 31,271 | | 31,468 | | 31,508 | |
(1) Full-time equivalents (FTEs) are a measure of staff employment. FTEs are calculated by dividing the total hours of employment paid for in a given period by the number of hours an individual, full-time person would normally work in that period. This does not equate to the physical number of employees. For example, two half-time employees would equal one FTE, or alternatively, three FTEs may represent two full-time employees who have worked sufficient overtime hours to equal an additional FTE.
(2) FTE amounts do not include SUCH sector staff employment.
(3) Number of FTEs to be transferred and the timing of the transfers will be based on an assessment of authority readiness.
Table A13 Capital Spending – 2001/02 to 2007/08 | | | | | | |
| | | | | | | | | | Budget | | | | | |
| | Actual | | Actual | | Actual | | Actual | | Estimate | | Plan | | Plan | |
($ millions) | | 2001/02 | | 2002/03 | | 2003/04 | | 2004/05 | | 2005/06 | | 2006/07 | | 2007/08 | |
Taxpayer-supported | | | | | | | | | | | | | | | |
Education | | | | | | | | | | | | | | | |
Schools (K–12) | | 459 | | 383 | | 313 | | 239 | | 293 | | 244 | | 284 | |
Post-secondary | | 391 | | 412 | | 605 | | 695 | | 723 | | 604 | | 518 | |
Health | | 275 | | 422 | | 420 | | 568 | | 756 | | 803 | | 703 | |
BC Transportation Financing Authority | | 344 | | 275 | | 436 | | 513 | | 629 | | 665 | | 467 | |
Rapid Transit Project 2000 | | 210 | | 35 | | 14 | | 15 | | 13 | | 16 | | — | |
BC Ferries | | 55 | | 58 | | — | | — | | — | | — | | — | |
Vancouver Convention Centre Expansion Project | | — | | — | | 56 | | 50 | | 119 | | 187 | | 147 | |
Government operating (ministries) | | 203 | | 183 | | 185 | | 175 | | 401 | | 339 | | 255 | |
Other (1) | | 133 | | 108 | | 16 | | 67 | | 104 | | 80 | | 69 | |
Total taxpayer-supported | | 2,070 | | 1,876 | | 2,045 | | 2,322 | | 3,038 | | 2,938 | | 2,443 | |
| | | | | | | | | | | | | | | |
Self-supported | | | | | | | | | | | | | | | |
BC Hydro | | 545 | | 741 | | 636 | | 612 | | 829 | | 1,008 | | 993 | |
BC Transmission Corporation | | — | | — | | — | | — | | 49 | | 80 | | 29 | |
Columbia River power projects (2) | | 118 | | 54 | | 100 | | 84 | | 40 | | 34 | | 143 | |
BC Rail | | 78 | | 52 | | 33 | | 30 | | 21 | | 11 | | 15 | |
ICBC (3) | | 107 | | 41 | | 26 | | 31 | | 60 | | 41 | | 30 | |
BC Lotteries | | 20 | | 30 | | 49 | | 93 | | 100 | | 60 | | 60 | |
Liquor Distribution Branch | | 26 | | 9 | | 2 | | 10 | | 30 | | 27 | | 12 | |
Total self-supported commercial | | 894 | | 927 | | 846 | | 860 | | 1,129 | | 1,261 | | 1,282 | |
Total capital spending | | 2,964 | | 2,803 | | 2,891 | | 3,182 | | 4,167 | | 4,199 | | 3,725 | |
(1) Includes BC Housing Management Commission, Provincial Rental Housing Corporation, BC Buildings Corporation, Ministry of Attorney General, Ministry of Public Safety and Solicitor General, Ministry of Children and Family Development, and BC Transit.
(2) Joint ventures of the Columbia Power Corporation and Columbia Basin Trust.
(3) Includes ICBC Properties Ltd.
137
Table A14 Statement of Financial Position – 2001/02 to 2007/08 (1) | | | | |
| | | | | | | | | | Budget | | | | | |
| | Actual | | Actual | | Actual | | Actual | | Estimate | | Plan | | Plan | |
($ millions) | | 2001/02 | | 2002/03 | | 2003/04 | | 2004/05 | | 2005/06 | | 2006/07 | | 2007/08 | |
Financial assets | | | | | | | | | | | | | | | |
Cash and temporary investments | | 2,452 | | 2,617 | | 2,690 | | 3,568 | | 3,012 | | 2,891 | | 2,680 | |
Other financial assets | | 5,663 | | 5,373 | | 6,339 | | 6,676 | | 7,029 | | 7,100 | | 7,172 | |
Sinking funds | | 5,518 | | 5,074 | | 4,619 | | 4,516 | | 3,984 | | 3,749 | | 3,515 | |
Investments in commercial Crown corporations | | | | | | | | | | | | | | | |
Retained earnings | | 2,520 | | 2,858 | | 3,221 | | 3,219 | | 3,518 | | 3,765 | | 3,920 | |
Recoverable capital loans | | 7,246 | | 7,231 | | 7,512 | | 6,901 | | 7,073 | | 7,592 | | 7,995 | |
| | 9,766 | | 10,089 | | 10,733 | | 10,120 | | 10,591 | | 11,357 | | 11,915 | |
Warehouse borrowing program assets | | 1,067 | | — | | — | | — | | — | | — | | — | |
| | 24,466 | | 23,153 | | 24,381 | | 24,880 | | 24,616 | | 25,097 | | 25,282 | |
Liabilities | | | | | | | | | | | | | | | |
Accounts payable & accrued lliabilities | | 5,361 | | 5,961 | | 6,826 | | 6,583 | | 6,840 | | 7,168 | | 7,837 | |
Deferred revenue | | 2,274 | | 2,968 | | 4,012 | | 5,181 | | 5,678 | | 5,539 | | 5,343 | |
Debt: | | | | | | | | | | | | | | | |
Taxpayer-supported debt | | 27,534 | | 29,425 | | 30,028 | | 28,657 | | 28,274 | | 28,906 | | 28,740 | |
Self-supported debt | | 8,548 | | 7,452 | | 7,739 | | 7,169 | | 7,336 | | 7,844 | | 8,393 | |
Forecast allowance | | | | | | | | | | 300 | | 600 | | 900 | |
Total provincial debt | | 36,082 | | 36,877 | | 37,767 | | 35,826 | | 35,910 | | 37,350 | | 38,033 | |
Add: | sinking fund investments presented as assets | | 5,518 | | 5,074 | | 4,619 | | 4,516 | | 3,984 | | 3,749 | | 3,515 | |
Less : | guarantees and non-guaranteed debt | | (464 | ) | (415 | ) | (399 | ) | (421 | ) | (419 | ) | (414 | ) | (567 | ) |
Financial statement debt | | 41,136 | | 41,536 | | 41,987 | | 39,921 | | 39,475 | | 40,685 | | 40,981 | |
| | 48,771 | | 50,465 | | 52,825 | | 51,685 | | 51,993 | | 53,392 | | 54,161 | |
Net liabilities | | (24,305 | ) | (27,312 | ) | (28,444 | ) | (26,805 | ) | (27,377 | ) | (28,295 | ) | (28,879 | ) |
Capital and other assets | | | | | | | | | | | | | | | |
Tangible capital assets | | 22,135 | | 22,413 | | 22,255 | | 23,117 | | 24,763 | | 26,281 | | 27,267 | |
Other assets | | 532 | | 524 | | 539 | | 613 | | 839 | | 839 | | 837 | |
| | 22,667 | | 22,937 | | 22,794 | | 23,730 | | 25,602 | | 27,120 | | 28,104 | |
Accumulated surplus (deficit) | | (1,638 | ) | (4,375 | ) | (5,650 | ) | (3,075 | ) | (1,775 | ) | (1,175 | ) | (775 | ) |
(1) Comparative figures have been restated to reflect government’s accounting policies in effect at March 31, 2005.
138
Table A14a Changes in Financial Position – 2001/02 to 2007/08 | | | | |
| | | | | | | | | | Budget | | | | | |
| | Actual | | Actual | | Actual | | Actual | | Estimate | | Plan | | Plan | |
($ millions) | | 2001/02 | | 2002/03 | | 2003/04 | | 2004/05 | | 2005/06 | | 2006/07 | | 2007/08 | |
| | | | | | | | | | | | | | | |
(Surplus) deficit for the year: | | 1,184 | | 2,737 | | 1,275 | | (2,575 | ) | (1,300 | ) | (600 | ) | (400 | ) |
| | | | | | | | | | | | | | | |
Capital and other asset changes: | | | | | | | | | | | | | | | |
Increase in taxpayer-supported capital investments | | 2,070 | | 1,876 | | 2,045 | | 2,322 | | 3,038 | | 2,938 | | 2,443 | |
Less : amortization and other accounting changes | | (1,422 | ) | (1,598 | ) | (2,203 | ) | (1,460 | ) | (1,392 | ) | (1,420 | ) | (1,457 | ) |
Change in net capital assets | | 648 | | 278 | | (158 | ) | 862 | | 1,646 | | 1,518 | | 986 | |
Increase (decrease) in other assets | | (23 | ) | (8 | ) | 15 | | 74 | | 226 | | — | | (2 | ) |
| | 625 | | 270 | | (143 | ) | 936 | | 1,872 | | 1,518 | | 984 | |
Increase (decrease) in net liabilities | | 1,809 | | 3,007 | | 1,132 | | (1,639 | ) | 572 | | 918 | | 584 | |
Investment and working capital changes: | | | | | | | | | | | | | | | |
Increase (reduction) in cash and temporary investments | | 517 | | 165 | | 73 | | 878 | | (556 | ) | (121 | ) | (211 | ) |
Increase (decrease) in warehouse borrowing investments | | (245 | ) | (1,067 | ) | — | | — | | — | | — | | — | |
Increase in total investment in commercial Crown corporations | | 410 | | 1,036 | | 1,189 | | 1,016 | | 1,428 | | 1,508 | | 1,437 | |
Less: loan repayments and other accounting changes | | (756 | ) | (713 | ) | (545 | ) | (1,629 | ) | (957 | ) | (742 | ) | (879 | ) |
| | (346 | ) | 323 | | 644 | | (613 | ) | 471 | | 766 | | 558 | |
Other working capital changes | | 210 | | (2,028 | ) | (1,398 | ) | (692 | ) | (933 | ) | (353 | ) | (635 | ) |
| | 136 | | (2,607 | ) | (681 | ) | (427 | ) | (1,018 | ) | 292 | | (288 | ) |
Increase (decrease) in financial statement debt | | 1,945 | | 400 | | 451 | | (2,066 | ) | (446 | ) | 1,210 | | 296 | |
(Increase) decrease in sinking fund debt | | 482 | | 444 | | 455 | | 103 | | 532 | | 235 | | 234 | |
Increase (decrease) in guarantees and non-guaranteed debt | | (133 | ) | (49 | ) | (16 | ) | 22 | | (2 | ) | (5 | ) | 153 | |
Increase (decrease) in total provincial debt | | 2,294 | | 795 | | 890 | | (1,941 | ) | 84 | | 1,440 | | 683 | |
139
Table A15 Debt Summary – 2001/02 to 2007/08 (1), (2) | | | | | | | | |
| | | | | | | | | | Budget | | | | | |
| | Actual | | Actual | | Actual | | Actual | | Estimate | | Plan | | Plan | |
($ millions unless otherwise indicated) | | 2001/02 | | 2002/03 | | 2003/04 | | 2004/05 | | 2005/06 | | 2006/07 | | 2007/08 | |
Taxpayer-supported debt | | | | | | | | | | | | | | | |
Provincial government direct operating | | 13,779 | | 15,447 | | 15,694 | | 14,481 | | 12,871 | | 12,180 | | 11,003 | |
Other taxpayer-supported debt (mainly capital) | | | | | | | | | | | | | | | |
Education | | | | | | | | | | | | | | | |
Schools (2) | | 4,126 | | 4,333 | | 4,409 | | 4,483 | | 4,619 | | 4,762 | | 4,946 | |
Post-secondary institutions (2) | | 1,717 | | 1,791 | | 2,112 | | 2,326 | | 2,686 | | 3,069 | | 3,354 | |
| | 5,843 | | 6,124 | | 6,521 | | 6,809 | | 7,305 | | 7,831 | | 8,300 | |
Health (2) | | 2,075 | | 2,146 | | 2,215 | | 2,112 | | 2,566 | | 2,920 | | 3,128 | |
Highways, ferries and public transit | | | | | | | | | | | | | | | |
BC Transportation Financing Authority | | 2,514 | | 2,661 | | 2,764 | | 2,474 | | 2,708 | | 3,092 | | 3,388 | |
BC Transit | | 79 | | 87 | | 83 | | 78 | | 83 | | 77 | | 69 | |
Public transit | | 936 | | 930 | | 914 | | 906 | | 908 | | 906 | | 909 | |
SkyTrain extension | | 1,044 | | 1,105 | | 1,119 | | 1,135 | | 1,149 | | 1,165 | | 1,166 | |
Rapid Transit Project 2000 Ltd | | 47 | | 3 | | — | | — | | — | | — | | — | |
BC Ferries | | 19 | | — | (3) | — | | — | | — | | — | | — | |
| | 4,639 | | 4,786 | | 4,880 | | 4,593 | | 4,848 | | 5,240 | | 5,532 | |
Other | | | | | | | | | | | | | | | |
BC Buildings | | 596 | | 456 | | 317 | | 241 | | 185 | | 168 | | 152 | |
Social housing (4) | | 299 | | 161 | | 156 | | 133 | | 146 | | 151 | | 145 | |
Homeowner Protection Office | | 113 | | 123 | | 129 | | 130 | | 154 | | 180 | | 200 | |
Other (5) | | 190 | | 182 | | 116 | | 158 | | 199 | | 236 | | 280 | |
| | 1,198 | | 922 | | 718 | | 662 | | 684 | | 735 | | 777 | |
Total other taxpayer-supported debt | | 13,755 | | 13,978 | | 14,334 | | 14,176 | | 15,403 | | 16,726 | | 17,737 | |
Total taxpayer-supported debt | | 27,534 | | 29,425 | | 30,028 | | 28,657 | | 28,274 | | 28,906 | | 28,740 | |
Self-supported debt | | | | | | | | | | | | | | | |
Commercial Crown corporations | | | | | | | | | | | | | | | |
BC Hydro | | 6,670 | | 6,784 | | 7,040 | | 6,906 | | 7,021 | | 7,485 | | 7,879 | |
BC Transmission Corporation | | — | | — | | — | | — | | 64 | | 120 | | 129 | |
Columbia River power projects (6) | | 184 | | 165 | | 215 | | 257 | | 247 | | 236 | | 383 | |
BC Rail | | 614 | | 494 | | 477 | | — | (7) | — | | — | | — | |
Liquor Distribution Branch | | 13 | | 9 | | 7 | | 6 | | 4 | | 3 | | 2 | |
| | 7,481 | | 7,452 | | 7,739 | | 7,169 | | 7,336 | | 7,844 | | 8,393 | |
Warehouse borrowing program | | 1,067 | | — | | — | | — | | — | | — | | — | |
Total self-supported debt | | 8,548 | | 7,452 | | 7,739 | | 7,169 | | 7,336 | | 7,844 | | 8,393 | |
Total debt before forecast allowance | | 36,082 | | 36,877 | | 37,767 | | 35,826 | | 35,610 | | 36,750 | | 37,133 | |
Forecast allowance | | — | | — | | — | | — | | 300 | | 600 | | 900 | |
Total provincial debt | | 36,082 | | 36,877 | | 37,767 | | 35,826 | | 35,910 | | 37,350 | | 38,033 | |
| | | | | | | | | | | | | | | |
Debt as a per cent of GDP | | | | | | | | | | | | | | | |
Provincial government direct operating | | 10.3 | % | 11.2 | % | 10.8 | % | 9.3 | % | 7.8 | % | 7.0 | % | 6.1 | % |
Taxpayer-supported | | 20.5 | % | 21.3 | % | 20.6 | % | 18.3 | % | 17.1 | % | 16.7 | % | 15.8 | % |
Total provincial | | 26.9 | % | 26.7 | % | 26.0 | % | 22.9 | % | 21.8 | % | 21.5 | % | 20.9 | % |
(1) Debt is after deduction of sinking funds and unamortized discounts, and excludes accrued interest. Government direct and fiscal agency accrued interest is reported in the government’s accounts as an accounts payable.
(2) Includes debt and guarantees incurred by the government on behalf of school districts, universities, colleges and health authorities/hospital societies (SUCH), and debt directly incurred by these entities.
(3) Effective April 1, 2003, the provincial coastal ferry system became independently operated by BC Ferry Services.
(4) Includes the BC Housing Management Commission and the Provincial Rental Housing Corporation.
(5) Includes other taxpayer-supported Crown corporations and agencies, student loan guarantees, loan guarantees to agricultural producers, guarantees issued under economic development and home mortgage assistance programs and loan guarantee provisions.
(6) A joint venture of the Columbia Power Corporation (CPC) and Columbia Basin Trust (CBT).
(7) BC Rail debt was repaid after completion of the BC Rail investment partnership.
140
Table A16 Key Debt Indicators – 2001/02 to 2007/08 (1) | | | | | |
| | | | | | | | | | Budget | | | | | |
| | Actual | | Actual | | Actual | | Actual | | Estimate | | Plan | | Plan | |
| | 2001/02 | | 2002/03 | | 2003/04 | | 2004/05 | | 2005/06 | | 2006/07 | | 2007/08 | |
Debt to revenue (per cent) | | | | | | | | | | | | | | | |
Total provincial | | 92.2 | | 104.7 | | 100.8 | | 85.2 | | 82.9 | | 85.8 | | 85.2 | |
Taxpayer-supported | | 100.3 | | 110.3 | | 107.4 | | 88.4 | | 84.3 | | 86.2 | | 83.8 | |
Debt per capita ($) (2) | | | | | | | | | | | | | | | |
Total provincial | | 8,848 | | 8,962 | | 9,096 | | 8,538 | | 8,467 | | 8,710 | | 8,767 | |
Taxpayer-supported | | 6,752 | | 7,151 | | 7,232 | | 6,830 | | 6,667 | | 6,741 | | 6,625 | |
Debt to GDP (per cent) (3) | | | | | | | | | | | | | | | |
Total provincial | | 26.9 | | 26.7 | | 26.0 | | 22.9 | | 21.8 | | 21.5 | | 20.9 | |
Taxpayer-supported | | 20.5 | | 21.3 | | 20.6 | | 18.3 | | 17.1 | | 16.7 | | 15.8 | |
Interest bite (cents per dollar of revenue) (4) | | | | | | | | | | | | | | | |
Total provincial | | 6.2 | | 6.3 | | 5.9 | | 5.0 | | 5.0 | | 5.3 | | 5.4 | |
Taxpayer-supported | | 6.3 | | 6.3 | | 6.0 | | 5.0 | | 5.0 | | 5.4 | | 5.4 | |
Interest costs ($ millions) | | | | | | | | | | | | | | | |
Total provincial | | 2,432 | | 2,237 | | 2,207 | | 2,119 | | 2,179 | | 2,322 | | 2,406 | |
Taxpayer-supported | | 1,734 | | 1,669 | | 1,682 | | 1,624 | | 1,691 | | 1,800 | | 1,837 | |
Interest rate (per cent) (5) | | | | | | | | | | | | | | | |
Taxpayer-supported | | 6.6 | | 5.9 | | 5.7 | | 5.5 | | 6.1 | | 6.3 | | 6.4 | |
| | | | | | | | | | | | | | | |
Background Information: | | | | | | | | | | | | | | | |
Revenue ($ millions) | | | | | | | | | | | | | | | |
Total provincial (6) | | 39,126 | | 35,232 | | 37,464 | | 42,058 | | 43,337 | | 43,520 | | 44,621 | |
Taxpayer-supported (7) | | 27,455 | | 26,680 | | 27,966 | | 32,407 | | 33,552 | | 33,517 | | 34,298 | |
Debt ($ millions) | | | | | | | | | | | | | | | |
Total provincial | | 36,082 | | 36,877 | | 37,767 | | 35,826 | | 35,910 | | 37,350 | | 38,033 | |
Taxpayer-supported (8) | | 27,534 | | 29,425 | | 30,028 | | 28,657 | | 28,274 | | 28,906 | | 28,740 | |
Provincial GDP ( $millions) (9) | | 134,060 | | 138,368 | | 145,500 | | 156,481 | | 165,022 | | 173,375 | | 181,789 | |
Population (thousands at July 1) (10) | | 4,078 | | 4,115 | | 4,152 | | 4,196 | | 4,241 | | 4,288 | | 4,338 | |
(1) Includes fiscal data of school districts, post-secondary institutions and regional health authorities/societies (SUCH).
(2) The ratio of debt to population (e.g. 2005/06 debt divided by population at July 1, 2005).
(3) The ratio of debt outstanding at fiscal year end to provincial nominal gross domestic product (GDP) for the calendar year ending in the fiscal year (e.g. 2005/06 debt divided by 2005 GDP).
(4) The ratio of interest costs (less sinking fund interest) to revenue. Figures include capitalized interest expense in order to provide a more comparable measure to outstanding debt.
(5) Weighted average of all outstanding debt issues.
(6) Includes revenue of the consolidated revenue fund (excluding dividends from enterprises) plus revenue of all government organizations and enterprises.
(7) Excludes revenue of government enterprises, but includes dividends from enterprises paid to the consolidated revenue fund.
(8) Excludes debt of commercial Crown corporations and agencies and funds held under the province’s warehouse borrowing program.
(9) GDP for the calendar year ending in the fiscal year (e.g. GDP for 2005 is used for the fiscal year ended March 31, 2006).
(10) Population at July 1st within the fiscal year (e.g. population at July 1, 2005 is used for the fiscal year ended March 31, 2006).
141