Exhibit 99.6
First Quarterly Report
on the Economy, Fiscal Situation, and Outlook
Fiscal Year 2007/08
Three Months
April – June 2007

British Columbia Cataloguing in Publication Data |
|
British Columbia. Ministry of Finance. |
Quarterly report on the economy, fiscal situation and Crown corporations. — ongoing– |
|
Quarterly. |
Title on cover: Quarterly report. |
Continues: British Columbia. Ministry of Finance. |
Quarterly financial report. ISSN 0833-1375. |
ISSN 1192-2176 — Quarterly Report on the economy, fiscal situation and Crown corporations. |
|
1. Finance, Public — British Columbia — Accounting — Periodicals. 2. British Columbia — Economic conditions — 1945 – — Periodicals.* |
3. Corporations, Government — British Columbia — Accounting — Periodicals. I. Title. |
|
HJ13.B77 | 354.711’007231’05 |
TABLE OF CONTENTS | |
| |
2007/08 First Quarterly Report | September 14, 2007 |
Summary | 3 |
Part One — Updated Financial Forecast | |
| |
Introduction | 5 |
| |
Revenue | 7 |
Changes from Budget 2007 | 7 |
First Quarterly Report plan | 10 |
| |
Commercial Crown corporations income | 15 |
| |
Expense | 16 |
Consolidated revenue fund expense | 16 |
Contingencies | 17 |
Service delivery agency expenses | 18 |
| |
Full-time equivalents (FTE’s) | 19 |
| |
Provincial capital spending | 19 |
| |
Provincial debt | 23 |
Taxpayer-supported debt | 25 |
Self-supported debt | 25 |
| |
Risks to the fiscal plan | 25 |
| |
Tables: | |
1.1 | Fiscal Plan Update – Changes from Budget 2007 | 6 |
1.2 | Revenue by Source: 2006/07 – 2009/10 | 8 |
1.3 | Expense by Ministry, Program and Agency: 2006/07 – 2009/10 | 9 |
1.4 | Assumptions Underlying Main Revenue Changes | 10 |
1.5 | Personal Income Tax Revenue | 11 |
1.6 | Corporate Income Tax Revenue | 11 |
1.7 | Social Service Tax Revenue | 12 |
1.8 | Forests Revenue | 13 |
1.9 | Health and Social Transfers | 14 |
1.10 | Notional Allocations to Contingencies | 17 |
1.11 | Capital Spending – Changes from Budget 2007 | 19 |
1.12 | Capital Spending: 2006/07 – 2009/10 | 20 |
1.13 | Capital Expenditure Projects Greater Than $50 Million | 22 |
1.14 | Debt Summary – Changes from Budget 2007 | 23 |
1.15 | Debt Summary: 2006/07 – 2009/10 | 24 |
| | |
Part Two — Economic Review and Outlook | |
| |
Summary | 27 |
| |
Comparison to private sector forecasts | 27 |
| |
Recent economic developments | 28 |
| |
External environment | 29 |
United States | 29 |
Canada | 31 |
First Quarterly Report 2007/08
Table of Contents
Europe | 32 |
Japan | 32 |
China | 33 |
Financial markets | 33 |
Commodity markets | 36 |
| |
British Columbia economic forecast | 37 |
External trade | 37 |
Labour market | 38 |
Demographic developments | 39 |
Domestic demand | 40 |
| |
Medium-term outlook | 43 |
| |
Risks to the forecast | 43 |
| |
Tables: | |
2.1 | British Columbia Economic Indicators | 29 |
2.2 | First Quarterly Economic Forecast: Key Assumptions | 32 |
2.3 | Private Sector Canadian Three Month Treasury Bill Interest Rate Forecasts | 33 |
2.4 | Private Sector Exchange Rate Forecasts | 35 |
2.5 | First Quarterly Economic Forecast: Key Indicators | 37 |
2.6 | Current Economic Statistics | 45 |
2.7.1 | Gross Domestic Product: British Columbia | 46 |
2.7.2 | Components of Nominal Income and Expenditure | 47 |
2.7.3 | Labour Market Indicators | 47 |
2.7.4 | Major Economic Assumptions | 48 |
| | |
Topic Box: | |
The US Subprime Mortgage Market | 49 |
| |
Appendix | |
| |
Financial Results: Three Months Ended June 30, 2007 and 2007/08 Full-Year Forecast | |
| |
Tables: | |
A.1 | Operating Statement | 56 |
A.2 | Revenue by Source | 57 |
A.3 | Expense by Ministry, Program and Agency | 58 |
A.4 | Expense by Function | 59 |
A.5 | Capital Spending | 60 |
A.6 | Provincial Debt | 61 |
| |
Updated Financial Plan: 2007/08 - 2009/10 | |
A.7 | Revenue Assumptions | 62 |
A.8 | Natural Gas Price Forecasts | 66 |
A.9 | Expense Assumptions | 67 |
A.10 | Expense by Function | 68 |
A.11 | Service Delivery Agency Operating Results | 69 |
A.12 | Full-Time Equivalents | 71 |
A.13 | Statement of Financial Position | 72 |
| | | |
2
SUMMARY | | |
| | |
2007/08 First Quarterly Report | | September 14, 2007 |
| | | | 2007/08 | | | | | |
| | 2006/07 | | | | Updated | | Updated Plan | |
($ millions) | | Actual | | Budget | | Forecast | | 2008/09 | | 2009/10 | |
Revenue | | 38,504 | | 37,390 | | 38,530 | | 38,580 | | 39,850 | |
Expense | | (34,184 | ) | (36,240 | ) | (36,430 | ) | (36,830 | ) | (37,975 | ) |
Negotiating Framework incentive payments | | (264 | ) | — | | — | | — | | — | |
Surplus before forecast allowance | | 4,056 | | 1,150 | | 2,100 | | 1,750 | | 1,875 | |
Forecast allowance | | — | | (750 | ) | (500 | ) | (1,000 | ) | (1,050 | ) |
Surplus | | 4,056 | | 400 | | 1,600 | | 750 | | 825 | |
| | | | | | | | | | | |
Capital spending: | | | | | | | | | | | |
Taxpayer-supported capital spending | | 3,366 | | 3,864 | | 4,257 | | 3,590 | | 2,867 | |
Total capital spending | | 4,349 | | 5,156 | | 5,598 | | 5,328 | | 4,633 | |
Provincial Debt: | | | | | | | | | | | |
Taxpayer-supported debt | | 25,874 | | 27,803 | | 26,231 | | 26,781 | | 26,490 | |
Total debt | | 33,347 | | 36,837 | | 34,760 | | 36,802 | | 37,463 | |
Taxpayer-supported debt-to-GDP ratio | | 14.4 | % | 14.8 | % | 13.8 | % | 13.4 | % | 12.6 | % |
Total debt-to GDP ratio | | 18.6 | % | 19.6 | % | 18.3 | % | 18.5 | % | 17.8 | % |
3-year moving average | | | | | | | | | | | |
Taxpayer-supported debt-to-GDP ratio | | 16.2 | % | 15.2 | % | 14.8 | % | 13.9 | % | 13.3 | % |
Total debt-to GDP ratio | | 20.6 | % | 19.7 | % | 19.1 | % | 18.4 | % | 18.2 | % |
Fiscal position improves
• BC’s fiscal outlook has improved since budget. The surplus for 2007/08 is now forecast to be $1.6 billion, up from the $400 million expected at budget.
Fiscal outlook improved

• The improved fiscal outlook offers government the flexibility to address some additional priority items this fiscal year. Updates on these items, including their impact on the surplus and debt projections will be provided in the second Quarterly Report and in Budget 2008.
• Improved surpluses are also expected in 2008/09 and 2009/10. Significant forecast allowances are retained in the updated fiscal plan in recognition of risks to the economic forecast, volatile natural resource revenues and the interim nature of health spending allocations for 2008/09 and 2009/10.
Updated economic forecast remains robust
Source: BC Ministry of Finance
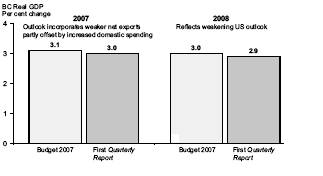
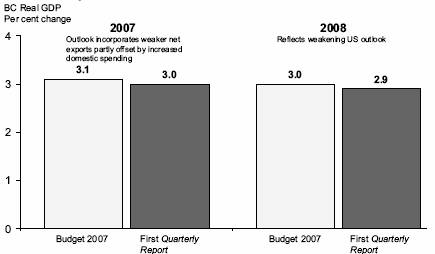
• Economic growth is expected to remain robust at 3.0 per cent in 2007, down from the 3.1 per cent forecast at budget. This revision reflects weakness in lumber and natural gas markets and lower US economic growth, but is partially offset by stronger domestic demand and continued strength in retail trade. For 2008, BC’s economic growth forecast is revised to 2.9 per cent, down from the 3.0 per cent forecast at budget time, recognizing increased risks to the outlook posed by continued deterioration of the US economy and a weakening US housing market, recent instability in financial markets and the higher than expected Canadian dollar.
• The main revenue improvements arise from increased taxation revenue forecasts, higher federal transfers, including one-time trusts in 2007/08, and higher net income for ICBC.
3
Summary
These improvements are partially offset by reduced natural gas revenues.
• Updated spending forecasts include fire fighting and flood related costs, additional child care spending (funded through federal transfers), and recent changes to MLA compensation and pensions, partially offset by lower interest expense forecasts.
• Taxpayer-supported capital spending is up $691 million across the three-year plan, reflecting new health projects in Victoria, Kelowna and Vernon, and additional investments in the education sector and social housing. The forecast also reflects the carry-over of slower than expected capital spending in 2006/07 for roads and post secondary projects and the updated budget for the Vancouver Convention Centre expansion project. The increased spending is being financed through allocations from the capital contingencies, use of accumulated cash balances and cost sharing with partners, rather than additional borrowing.
• Government remains committed to ensuring its infrastructure spending is affordable. Consistent with this commitment the updated capital spending plan remains within the three year debt allocations established in Budget 2007. The taxpayer-supported
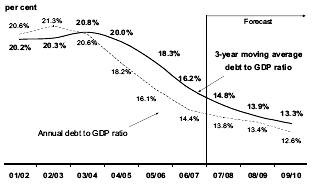
debt-to-GDP ratio, a key measure of fiscal sustainability, is forecast to continue its downward trend by falling from 14.4 per cent at March 31, 2007 to 12.6 per cent by the end of 2009/10, assuming the projected surpluses are applied to debt reduction. However, should government allocate some of these surpluses to other areas, the debt forecast would change accordingly.
Taxpayer debt to GDP ratio trends down
Risks remain
• Although economic growth is forecast to remain robust, the fiscal plan continues to face uncertainty relating to factors the government does not directly control.
• These risks include, but are not limited to, a further deterioration in the US economy beyond that assumed in the quarterly forecast, caused by a worse than expected performance in the US housing sector and continuing instability in financial markets.
US housing market continues to weaken
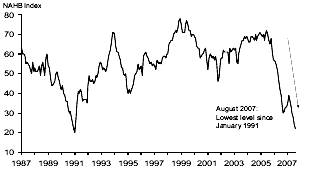
Source: National Assoication of Home Builders
• The volatility of natural resource revenues continues to pose risks to the fiscal plan. Although natural gas prices have been reduced in the forecast, further risk exists should prices fall further.
• The main potential changes to spending include the impacts of natural disasters, changing caseloads and demands for health care.
2008 Budget Consultation
• Increased surpluses provide choices for British Columbians. These include ways to encourage environmentally responsible choices for consumers, businesses and government; increased spending for health care and other government programs; and lower taxes or reduced debt. However, commitments to these areas must be affordable today as well as being sustainable in the years ahead.
• A committee of the Legislative Assembly will be seeking public input to the February 2008 budget and will be holding public meetings in selected communities throughout BC beginning in late September through to October. The committee will issue a report on its findings to the Legislature no later than November 15, 2007.
4
PART ONE — UPDATED FINANCIAL FORECAST (1) | | |
| | |
2007/08 First Quarterly Report | | September 14, 2007 |
Introduction
Higher surpluses are forecast in the three year fiscal plan, reflecting improved revenues. The surplus for 2007/08 is forecast to be $1.6 billion, up from the $400 million expected at budget. Improved surpluses are also expected for 2008/09 and 2009/10.
The improved fiscal outlook offers government the flexibility to address some additional priority items this fiscal year. Updates on these items, including their impact on the surplus and debt projections, will be provided in the second Quarterly Report and in Budget 2008.
Compared to budget, total revenues are up $1.1 billion in 2007/08, $710 million in 2008/09 and $775 million in 2009/10. Higher taxation revenues, higher federal transfers (including one-time trusts in 2007/08), and improved net income from ICBC are expected in all three years of the fiscal plan. These increases are partially offset by reductions in natural gas revenues.
Total government spending is now forecast to be $190 million higher than budget in 2007/08, due to higher forest fire and flood related costs, inclusion of additional child care spending (funded through additional federal transfers), the impact of recent changes to MLA compensation and pensions, and ministry expenses recovered from the federal government primarily for post-secondary assistance programs including the Millennium Scholarship Fund. This additional spending is partially offset by reduced interest costs due to lower than forecast debt levels.
Updated taxpayer-supported capital spending is $691 million higher than budget over the three years, reflecting additional investments in health facilities, the education sector and social housing. The forecast also reflects changes in timing of capital spending for roads, post-secondary facilities and the updated budget for the Vancouver Convention Centre expansion project. These investments are financed through allocations from the capital contingency, use of accumulated cash balances and cost-sharing with partners rather than additional borrowing.
Government continues its commitment to ensuring capital spending for schools, roads and hospitals is affordable, as the updated capital plan is within the three-year debt allocations established in Budget 2007. The debt forecast is lower than budget in each of the next three years, and the key taxpayer-supported debt to GDP ratio is projected to decline from 14.4 per cent at March 31, 2007 to 12.6 per cent by the end of 2009/10, assuming the projected surpluses are applied to debt reduction. However, should government allocate some of these surpluses to other areas, the debt forecast would change accordingly.
(1) Reflects information available and government policy as at August 31, 2007.
5
Table 1.1 Fiscal Plan Update – Changes from Budget 2007
($ millions) | | 2007/08 | | 2008/09 | | 2009/10 | |
Budget 2007 Fiscal Plan (February 20, 2007) | | 400 | | 150 | | 150 | |
First Quarterly Report Forecast Updates: | | | | | | | |
Revenue increases (decreases): | | | | | | | |
Personal income tax: | | | | | | | |
Base – improved economic growth and continuation of robust earnings from higher-income taxpayers in 2007 | | 124 | | 129 | | 133 | |
Prior-year adjustment – weaker 2006 tax assessments | | (75 | ) | | | | |
Corporate income tax – improved 2006 corporate profits and tax assessments including higher impact of duty deposit refunds on forest firms’ income | | 377 | | 46 | | 93 | |
Social service tax – higher 2006/07 results and stronger 2007 sales growth | | 200 | | 208 | | 219 | |
Property tax – lower than expected property tax base | | (69 | ) | (63 | ) | (58 | ) |
Property transfer tax – strong year-to-date results and improved short-term outlook | | 96 | | 171 | | 221 | |
Natural gas royalties – lower natural gas prices and volumes | | (369 | ) | (420 | ) | (413 | ) |
Coal, metals and other minerals – higher coal and metal prices | | 1 | | 40 | | 118 | |
Other energy and sales of Crown land leases – offsetting effects of higher Canadian dollar and stronger electricity and oil prices | | (31 | ) | (5 | ) | 4 | |
Forest revenue – lower harvest volumes, lower price in 2008, higher Canadian dollar, offset by higher Softwood Lumber Agreement border tax collections in 2008/09 | | (99 | ) | 98 | | (29 | ) |
Medical Services Plan premiums – higher 2006/07 results and a change in accounting treatment | | 53 | | 55 | | 61 | |
Federal transfers: | | | | | | | |
Health Transfers: | | | | | | | |
One-time trusts: HPV immunization and Patient wait times guarantee | | 116 | | — | | — | |
Mainly higher national tax points, partially offset by higher BC tax point deductions | | 60 | | 43 | | 53 | |
Canada Social Transfer – mainly federal budget impact of higher national base with equal per capita cash funding (elimination of tax point transfers) | | 50 | | 94 | | 132 | |
Other transfers – one-time eco-Trust, multiculturalism and immigration funding, Millennium Scholarship Fund and direct post-secondary research grant funding | | 368 | | 77 | | 78 | |
All other taxpayer supported changes | | 84 | | 68 | | 71 | |
Commercial Crown corporation net income: | | | | | | | |
Liquor Distribution Branch – lower operating costs | | 12 | | 14 | | 15 | |
BC Rail – timing of asset dispositions | | (13 | ) | 80 | | (3 | ) |
ICBC – primarily higher premium revenue and, in 2007/08, the sale of Surrey Central City Mall | | 259 | | 74 | | 78 | |
Other Crown corporation changes – mainly timing of BCRC asset dispositions | | (4 | ) | 1 | | 2 | |
Total revenue changes | | 1,140 | | 710 | | 775 | |
Less: expense increases (decreases): | | | | | | | |
Forest fire costs | | 57 | | — | | — | |
Children and Family Development – federal child care funding (2007/08 amount shown as a recovery) | | — | | 33 | | 33 | |
Forests and Range – increase in BC Timber Sales costs | | 15 | | 10 | | 10 | |
Public Safety and Solicitor General – flood costs and disaster assistance | | 53 | | — | | — | |
Tourism, Sport and the Arts – additional construction funding for VCCEP | | — | | 268 | | — | |
Changes to MLA compensation and pensions | | 43 | | 9 | | 9 | |
Interest costs – mainly reduced operating debt levels | | (23 | ) | (61 | ) | (95 | ) |
CRF expense changes | | 145 | | 259 | | (43 | ) |
Increased ministry expenditures recoverable mainly from the federal government | | 114 | | 45 | | 49 | |
Service delivery agency net spending changes: | | | | | | | |
School districts – additional grants/timing of grants in 2007/08 and increased operating costs for the out-years | | (29 | ) | 33 | | 12 | |
Post-secondary institutions – additional grants in 2007/08 in part for Aboriginal programs and increased faculty and operating costs for out-years | | (22 | ) | 54 | | 93 | |
Health authorities – implementation of efficiency/cost saving strategies | | (33 | ) | — | | — | |
Other service delivery agencies – in 2008/09, primarily the impact of VCCEP funding | | 15 | | (281 | ) | (11 | ) |
Total expense changes | | 190 | | 110 | | 100 | |
Subtotal | | 950 | | 600 | | 675 | |
Forecast allowance decrease | | 250 | | — | | — | |
Total changes to Fiscal Plan | | 1,200 | | 600 | | 675 | |
Updated Fiscal Plan | | 1,600 | | 750 | | 825 | |
6
Despite a robust economy and improved fiscal outlook, there are a number of risks and pressures to the fiscal plan, including economic fluctuations such as exchange rate movements, or sudden natural gas or other commodity price changes. In addition, the forecast allowances in 2008/09 and 2009/10 continue to recognize the interim nature of the health spending allocations for 2008/09 and 2009/10. Significant forecast allowances have been retained within the fiscal plan to help ensure fiscal plan targets continue to be met.
The main changes to the fiscal plan are summarized in Table 1.1.
Financial results for the April to June quarter show a $912 million surplus for the period, $790 million higher than expected. Revenues were $539 million ahead of forecast, and spending $251 million less than expected for the three-month period. Details are found in Tables A.1 to A.6.
Revenue
The revised revenue forecast incorporates updated economic and commodity price forecasts since the Budget 2007 projections, final results for 2006/07 released in the Public Accounts on July 11, 2007 and actual revenue results recorded for the April to June 2007 period. The updated forecast also incorporates federal government budget announcements (March 19, 2007) unavailable at the time of the BC Budget 2007 release – including $315 million of new trusts and the decision to fund the Canada Social Transfer on an equal per capita basis. In addition, the forecast includes the effects of new 2006 tax assessment information provided by the federal government since the Budget 2007 release.
Changes from Budget 2007
Government revenue is expected to be $1,140 million, $710 million and $775 million higher than the budget forecast over the 2007/08 to 2009/10 period reflecting:
• the one-time effect in 2007/08 of federal government trusts to support initiatives to reduce wait times and to protect women and girls from cervical cancer, and projects to reduce air pollutant and greenhouse gas emissions (announced in the federal budget on March 19, 2007);
• the effects on tax and other own-source revenues (excluding natural resources) of robust economic growth over the next two years;
• the impact of changes in lumber prices and Crown harvest volumes on stumpage revenue, partly offset by changes in border tax collections;
• improved revenue from coal, metals and other mineral sources mainly due to stronger prices for these commodities; and
• higher commercial Crown corporation net income mainly attributable to improved outlooks for BC Rail (BCRC) in 2007/08 and ICBC and LDB during the plan period.
These improvements are partially offset by lower natural gas royalties due to lower price and volume projections.
7
Table 1.2 Revenue by Source: 2006/07 – 2009/10
| | Actual | | Forecast | | Updated Plan | |
($ millions) | | 2006/07 | | 2007/08 | | 2008/09 | | 2009/10 | |
Taxation: | | | | | | | | | |
Personal income | | 6,905 | | 6,438 | | 6,706 | | 7,126 | |
Corporate income | | 1,538 | | 1,772 | | 1,438 | | 1,544 | |
Social service | | 4,714 | | 5,090 | | 5,337 | | 5,625 | |
Fuel | | 901 | | 919 | | 937 | | 958 | |
Tobacco | | 726 | | 705 | | 705 | | 705 | |
Property | | 1,732 | | 1,794 | | 1,880 | | 1,966 | |
Property transfer | | 914 | | 1,000 | | 1,050 | | 1,050 | |
Other (1) | | 588 | | 615 | | 633 | | 655 | |
| | 18,018 | | 18,333 | | 18,686 | | 19,629 | |
Natural Resources: | | | | | | | | | |
Natural gas royalties | | 1,207 | | 1,330 | | 1,358 | | 1,324 | |
Columbia River Treaty | | 223 | | 270 | | 285 | | 325 | |
Other energy, metals and minerals | | 935 | | 887 | | 833 | | 837 | |
Forests | | 1,276 | | 1,296 | | 1,372 | | 1,282 | |
Water and other resources | | 341 | | 341 | | 391 | | 398 | |
| | 3,982 | | 4,124 | | 4,239 | | 4,166 | |
Other Revenue | | | | | | | | | |
Medical Services Plan premiums | | 1,524 | | 1,550 | | 1,567 | | 1,586 | |
Post-secondary education fees | | 928 | | 957 | | 994 | | 1,029 | |
Other health-care related fees | | 216 | | 225 | | 219 | | 219 | |
Motor vehicle licences and permits | | 424 | | 433 | | 445 | | 456 | |
Other fees and licences | | 699 | | 780 | | 739 | | 723 | |
Investment earnings | | 1,032 | | 898 | | 934 | | 986 | |
Sales of goods and services | | 693 | | 672 | | 716 | | 765 | |
Miscellaneous (2) | | 1,917 | | 1,664 | | 1,625 | | 1,653 | |
| | 7,433 | | 7,179 | | 7,239 | | 7,417 | |
Contributions from the federal government | | | | | | | | | |
Health and social transfers | | 4,473 | | 4,870 | | 4,787 | | 4,996 | |
Equalization | | 459 | | — | | — | | — | |
Other federal contributions (3) | | 1,454 | | 1,267 | | 947 | | 983 | |
| | 6,386 | | 6,137 | | 5,734 | | 5,979 | |
Taxpayer-supported programs and agencies | | 35,819 | | 35,773 | | 35,898 | | 37,191 | |
Commercial Crown corporation net income | | | | | | | | | |
BC Hydro | | 407 | | 365 | | 401 | | 420 | |
Liquor Distribution Branch | | 840 | | 822 | | 842 | | 854 | |
BC Lotteries (net of payments to the federal government) | | 1,011 | | 1,024 | | 1,078 | | 1,133 | |
BCRC (4) | | 29 | | 47 | | 85 | | 2 | |
ICBC (5) | | 381 | | 484 | | 257 | | 228 | |
Other | | 17 | | 15 | | 19 | | 22 | |
| | 2,685 | | 2,757 | | 2,682 | | 2,659 | |
Total revenue | | 38,504 | | 38,530 | | 38,580 | | 39,850 | |
(1) | Composed of revenue from corporation capital tax, insurance premium tax and hotel room tax. |
(2) | Includes asset dispositions, reimbursements for health care and other services provided to external agencies, and other recoveries. |
(3) | Includes contributions for health, education, housing and social service programs, and transportation projects. |
(4) | The 2007/08 forecast represents BCRC’s projected earnings during government’s fiscal year. On BCRC’s fiscal year basis (December), the outlook for 2007 is also $47 million. For 2008/09 and 2009/10, the fiscal year and calendar year projections are assumed to be the same. |
(5) | The 2007/08 forecast represents ICBC’s projected earnings during government’s fiscal year. On ICBC’s fiscal year basis (December), the outlook for 2007 is $526 million. For 2008/09 and 2009/10, the fiscal year and calendar year projections are assumed to be the same. |
8
Table 1.3 Expense by Ministry, Program and Agency: 2006/07 – 2009/10
| | Actual | | Forecast | | Updated Plan | |
($ millions) | | 2006/07 | | 2007/08 | | 2008/09 | | 2009/10 | |
Advanced Education | | 2,027 | | 2,151 | | 2,243 | | 2,336 | |
Education | | 5,312 | | 5,494 | | 5,637 | | 5,747 | |
Health | | 12,124 | | 12,967 | | 13,358 | | 13,798 | |
Contingencies – Health Innovation Fund | | — | | 100 | | — | | — | |
Subtotal | | 19,463 | | 20,712 | | 21,238 | | 21,881 | |
Office of the Premier | | 12 | | 14 | | 14 | | 14 | |
Aboriginal Relations and Reconciliation | | 43 | | 55 | | 61 | | 49 | |
Agriculture and Lands | | 238 | | 270 | | 240 | | 242 | |
Attorney General | | 485 | | 520 | | 525 | | 530 | |
Children and Family Development | | 1,852 | | 1,867 | | 1,967 | | 2,015 | |
Community Services | | 267 | | 274 | | 296 | | 298 | |
Economic Development | | 282 | | 266 | | 199 | | 240 | |
Employment and Income Assistance | | 1,358 | | 1,480 | | 1,509 | | 1,551 | |
Energy, Mines and Petroleum Resources | | 75 | | 77 | | 78 | | 78 | |
Environment | | 193 | | 223 | | 245 | | 252 | |
Finance | | 75 | | 91 | | 92 | | 94 | |
Forests and Range | | 1,000 | | 1,150 | | 1,157 | | 1,126 | |
Labour and Citizen’s Services | | 210 | | 97 | | 92 | | 95 | |
Public Safety and Solicitor General | | 594 | | 656 | | 618 | | 632 | |
Small Business and Revenue | | 45 | | 60 | | 61 | | 62 | |
Tourism, Sport and the Arts | | 214 | | 130 | | 354 | | 76 | |
Transportation | | 842 | | 882 | | 884 | | 909 | |
Total ministries and Office of the Premier | | 27,248 | | 28,824 | | 29,630 | | 30,144 | |
Legislation | | 49 | | 101 | | 68 | | 70 | |
Officers of the Legislature | | 24 | | 34 | | 33 | | 33 | |
BC Family Bonus | | 23 | | 17 | | 15 | | 13 | |
Management of public funds and debt | | 544 | | 535 | | 454 | | 395 | |
Contingencies – new programs | | 53 | | 360 | | 365 | | 375 | |
Contingencies – Negotiating Framework | | — | | 39 | | 77 | | 142 | |
Other appropriations | | 4 | | 10 | | 6 | | 6 | |
Consolidated revenue fund expense before Negotiating Framework incentive payments | | 27,945 | | 29,920 | | 30,648 | | 31,178 | |
Negotiating Framework incentive payments | | 264 | | — | | — | | — | |
Consolidated revenue fund total expense | | 28,209 | | 29,920 | | 30,648 | | 31,178 | |
Expenses recovered from external entities | | 2,117 | | 1,941 | | 1,855 | | 1,933 | |
Grants to service delivery agencies and other internal transfers: | | | | | | | | | |
School districts | | (4,677 | ) | (4,774 | ) | (4,888 | ) | (4,990 | ) |
Universities | | (1,109 | ) | (1,239 | ) | (1,282 | ) | (1,353 | ) |
Colleges, university colleges and institutes | | (842 | ) | (847 | ) | (851 | ) | (876 | ) |
Health authorities and hospital societies | | (8,132 | ) | (8,730 | ) | (8,783 | ) | (8,982 | ) |
Children and family development agencies | | (629 | ) | (684 | ) | (715 | ) | (742 | ) |
Other service delivery agencies | | (913 | ) | (763 | ) | (1,092 | ) | (749 | ) |
| | (16,302) | | (17,037 | ) | (17,611 | ) | (17,692 | ) |
Service delivery agency expense: | | | | | | | | | |
School districts | | 5,041 | | 5,151 | | 5,283 | | 5,361 | |
Universities | | 2,593 | | 2,826 | | 2,984 | | 3,132 | |
Colleges, university colleges and institutes | | 1,310 | | 1,373 | | 1,420 | | 1,465 | |
Health authorities and hospital societies | | 8,892 | | 9,437 | | 9,395 | | 9,600 | |
Children and family development agencies | | 631 | | 687 | | 716 | | 744 | |
Other service delivery agencies | | 1,957 | | 2,132 | | 2,140 | | 2,254 | |
| | 20,424 | | 21,606 | | 21,938 | | 22,556 | |
Net spending of service delivery agencies | | 4,122 | | 4,569 | | 4,327 | | 4,864 | |
Total taxpayer-supported expense | | 34,448 | | 36,430 | | 36,830 | | 37,975 | |
9
Table 1.4 Assumptions Underlying Main Revenue Changes
Annual per cent change unless otherwise indicated
| | Budget 2007 | | First Quarterly Report Forecast | |
| | 2006 | | 2007 | | 2008 | | 2009 | | 2006 | | 2007 | | 2008 | | 2009 | |
Personal income | | 6.5 | % | 4.2 | % | 4.6 | % | 4.7 | % | 7.2 | % | 4.7 | % | 4.6 | % | 4.7 | % |
Labour income | | 7.8 | % | 4.1 | % | 5.1 | % | 5.2 | % | 8.2 | % | 5.6 | % | 5.1 | % | 5.2 | % |
Corporate profits | | 1.9 | % | 5.2 | % | 4.7 | % | 4.6 | % | 8.3 | % | 5.0 | % | 2.8 | % | 7.1 | % |
Personal consumption | | 6.0 | % | 5.2 | % | 5.1 | % | 5.2 | % | 6.7 | % | 6.1 | % | 5.4 | % | 5.3 | % |
Investment | | 11.0 | % | 5.8 | % | 5.2 | % | 6.6 | % | 12.4 | % | 10.0 | % | 4.5 | % | 5.6 | % |
Housing starts | | 4.9 | % | -7.7 | % | -6.1 | % | -0.7 | % | 5.1 | % | 0.2 | % | -8.4 | % | -4.3 | % |
Nominal GDP | | 5.9 | % | 5.0 | % | 4.9 | % | 5.0 | % | 6.4 | % | 5.7 | % | 4.9 | % | 5.5 | % |
Real GDP | | 3.9 | % | 3.1 | % | 3.0 | % | 3.1 | % | 3.6 | % | 3.0 | % | 2.9 | % | 3.1 | % |
Employment | | 3.1 | % | 1.9 | % | 1.9 | % | 1.9 | % | 3.1 | % | 2.9 | % | 1.7 | % | 1.9 | % |
Population | | 1.2 | % | 1.1 | % | 1.1 | % | 1.2 | % | 1.2 | % | 1.3 | % | 1.2 | % | 1.2 | % |
Exchange rate | | 88.2 | | 86.9 | | 88.1 | | 88.5 | | 88.2 | | 92.0 | | 94.6 | | 93.5 | |
SPF 2X4 price
($US/1000 bd ft) | | $ | 296 | | $ | 269 | | $ | 294 | | $ | 300 | | $ | 296 | | $ | 265 | | $ | 275 | | $ | 300 | |
Pulp price ($US/tonne) | | $ | 674 | | $ | 713 | | $ | 700 | | $ | 700 | | $ | 674 | | $ | 776 | | $ | 731 | | $ | 725 | |
| | | | | | | | | | | | | | | | | | | | | | | | | | | | | | | | | |
| | 2006/07 | | 2007/08 | | 2008/09 | | 2009/10 | | 2006/07 | | 2007/08 | | 2008/09 | | 2009/10 | |
| | | | | | | | | | | | | | | | | |
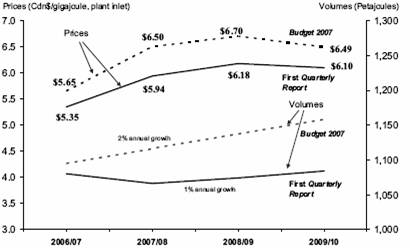
Natural gas price
($Cdn/gigajoule, plant inlet) | | $ | 5.65 | | $ | 6.50 | | $ | 6.70 | | $ | 6.49 | | $ | 5.35 | | $ | 5.94 | | $ | 6.18 | | $ | 6.10 | |
Natural gas volumes | | | | | | | | | | | | | | | | | |
Petajoules | | 1,095 | | 1,116 | | 1,137 | | 1,158 | | 1,080 | | 1,066 | | 1,074 | | 1,084 | |
Annual per cent change | | 1.2 | % | 1.9 | % | 1.9 | % | 1.8 | % | -0.2 | % | -1.3 | % | 0.8 | % | 0.9 | % |
| | | | | | | | | | | | | | | | | |
Electricity price
(Mid-Columbia, $US/mega-watt hour) | | $ | 53 | | $ | 65 | | $ | 67 | | $ | 65 | | $ | 50 | | $ | 66 | | $ | 72 | | $ | 71 | |
Metallurgical coal price
($US/tonne, fob west coast) | | $ | 105 | | $ | 90 | | $ | 85 | | $ | 75 | | $ | 108 | | $ | 92 | | $ | 95 | | $ | 95 | |
Copper price ($US/lb) | | $ | 3.20 | | $ | 2.55 | | $ | 1.85 | | $ | 1.45 | | $ | 3.17 | | $ | 3.15 | | $ | 2.40 | | $ | 2.15 | |
Molybdenum ($US/lb) | | $ | 26.00 | | $ | 22.00 | | $ | 12.50 | | $ | 7.00 | | $ | 25.39 | | $ | 28.00 | | $ | 19.25 | | $ | 13.75 | |
Crown harvest volumes (million cubic metres) | | | | | | | | | | | | | | | | | |
Interior | | 54.0 | | 52.0 | | 53.0 | | 55.0 | | 53.6 | | 51.0 | | 51.0 | | 53.0 | |
Coast | | 15.0 | | 14.0 | | 15.0 | | 16.0 | | 14.6 | | 12.8 | | 15.0 | | 16.0 | |
Total | | 69.0 | | 66.0 | | 68.0 | | 71.0 | | 68.2 | | 63.8 | | 66.0 | | 69.0 | |
| | | | | | | | | | | | | | | | | | | | | | | | | | | | | | | | | |
First Quarterly Report plan
The updated revenue forecast is expected to increase 0.1 per cent in 2007/08 over 2006/07 as higher revenues from taxation, natural resources and commercial Crown corporation net incomes are offset by the loss of equalization entitlement, lower trust funds established by the federal government and the effects on personal income tax revenue of tax cuts introduced in Budget 2007 and lower prior-year adjustments.
Revenue growth continues to be relatively flat in 2008/09 as the effects of 4.9 per cent nominal GDP growth are partially offset by:
• the second stage of personal income tax cuts introduced in Budget 2007;
• lower corporate income tax revenue mainly reflecting the one-time impact recorded in 2007/08 of the receipt of duty deposit refunds by forest-sector firms;
• the effects of falling metal prices; and
• reduced federal government contributions as no additional trust funding is assumed beyond 2007/08.
10
In 2009/10, revenue growth of 3.3 per cent or $1,270 million incorporates the impacts of 5.5 per cent nominal GDP growth and the partially offsetting impacts of falling natural resource revenues and commercial Crown corporation net income. Forest revenues are expected to decline reflecting lower federal government border tax collections on softwood lumber exports as lumber prices are forecast to rise resulting in lower export tax rates applied to US lumber shipments. All other natural resource revenues are forecast to be relatively flat in 2009/10 reflecting energy and metal price projections.
Key assumptions and sensitivities relating to revenue are provided in Appendix Table A.7. The major revenue components are:
• After accounting for tax measures and prior year adjustments, personal income tax base revenue is forecast to average 6.3 per cent growth over the next three years consistent with personal and labour income growth assumptions. The updated forecast also incorporates the continuation of strong earnings from higher income individuals in 2007.
Table 1.5 Personal Income Tax Revenue
| | | | | | | | | | Average | |
| | | | | | | | | | Annual | |
($ millions) | | 2006/07 | | 2007/08 | | 2008/09 | | 2009/10 | | Growth (1) | |
Personal Income tax revenue | | 6,905 | | 6,438 | | 6,706 | | 7,126 | | | |
Tax Measures: | | | | | | | | | | | |
Budget 2007 | | 63 | | 321 | | 547 | | 575 | | | |
Announced prior to budget | | | | | | | | | | | |
(dividend and training tax credits) | | 64 | | 75 | | 75 | | 75 | | | |
Federal government measures (income splitting) | | — | | 40 | | 40 | | 40 | | | |
Prior-year adjustment | | (491 | ) | 75 | | — | | — | | | |
Other one-time adjustments | | (33 | ) | — | | — | | — | | | |
Base revenue | | 6,508 | | 6,949 | | 7,368 | | 7,816 | | 6.3 | % |
Annual growth | | 10.3 | % | 6.8 | % | 6.0 | % | 6.1 | % | | |
Personal income growth (calendar year basis) | | 7.2 | % | 4.7 | % | 4.6 | % | 4.7 | % | 4.7 | % |
Labour income growth (calendar year basis) | | 8.2 | % | 5.6 | % | 5.1 | % | 5.2 | % | 5.3 | % |
(1) Average annual growth between 2006/07 and 2009/10.
• Strong corporate income tax revenue growth in 2007/08 mainly reflects the one-time impact of duty deposit refunds received by the forest sector firms in 2006. Preliminary tax return information indicates that 2006 tax entitlement will be higher than assumed at budget, consistent with updated 2006 corporate profits growth. Revenue returns to more normal levels over the next two years as instalments rise and adjustments for prior years decline.
Table 1.6 Corporate Income Tax Revenue
($ millions) | | 2006/07 | | 2007/08 | | 2008/09 | | 2009/10 | |
Advance instalments: | | | | | | | | | |
Base | | 1,237 | | 1,342 | | 1,411 | | 1,567 | |
Softwood lumber duty deposits refunds | | 25 | | 13 | | — | | — | |
Total advances | | 1,262 | | 1,355 | | 1,411 | | 1,567 | |
International Financial Activity Act refunds | | (2 | ) | (25 | ) | (25 | ) | (25 | ) |
| | 2005 | | 2006 | | 2007 | | 2008 | |
Prior-year adjustment: | | | | | | | | | |
Base year | | 207 | | 92 | | 35 | | 2 | |
Duty deposits refunds | | — | | 275 | | 17 | | — | |
Prior years | | 71 | | 75 | | — | | — | |
| | 278 | | 442 | | 52 | | 2 | |
Corporate income tax revenue | | 1,538 | | 1,772 | | 1,438 | | 1,544 | |
11
• In 2007/08 social service tax revenue growth, forecast at 8 per cent, reflects strong year-to-date collections. Over the next two years, average annual growth is expected to be 5.1 per cent, consistent with consumer expenditure, business investment and overall economic growth.
Table 1.7 Social Service Tax Revenue
($ millions) | | 2006/07 | | 2007/08 | | 2008/09 | | 2009/10 | |
Social service tax revenue | | 4,714 | | 5,090 | | 5,337 | | 5,625 | |
Annual Per Cent Change | | 7.9 | % | 8.0 | % | 4.9 | % | 5.4 | % |
Annual per cent change (calendar year basis) | | | | | | | | | |
Personal Consumption | | 6.7 | % | 6.1 | % | 5.4 | % | 5.3 | % |
Investment | | 12.4 | % | 10.0 | % | 4.5 | % | 5.6 | % |
Nominal GDP | | 6.4 | % | 5.7 | % | 4.9 | % | 5.5 | % |
• Property transfer tax revenue is forecast to grow 9.4 per cent in 2007/08 reflecting year-to-date sales. Over the next two years, growth in this revenue source is expected to moderate as the effects of higher interest rates in 2007 and 2008 and high prices slow market sales compared to recent years.
Chart 1.1 Property transfer tax revenue growth expected to moderate
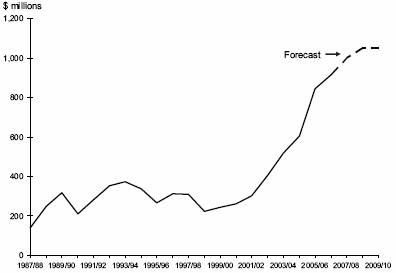
• Natural gas royalties are forecast to rise 10 per cent in 2007/08 over 2006/07 as higher natural gas prices are partially offset by declining volumes. Revenue is expected to remain relatively flat over the next two years reflecting a stable price outlook and moderate volume growth.
See Appendix Tables A.7 and A.8 for more details regarding natural gas price forecasts and a comparison of 2007 storage inventory with historical levels.
As Chart 1.2 shows, the updated forecast assumes lower price and volume projections compared to the budget forecast, illustrating the volatility associated with natural gas royalties.
12
Chart 1.2 Lower natural gas prices and volumes
Source: Ministry of Energy, Mines and Petroleum Resources
• Revenue from sales of electricity under the Columbia River Treaty increases each year over the plan due to higher electricity prices in the first two years and higher volumes in the third year of the plan. Other energy and mineral revenue is expected to fall in 2007/08 mainly due to the impact of a higher Canadian dollar on mining profits. Revenue continues to decline in 2008/09 mainly due to weaker metal prices and is relatively flat in 2009/10 as higher revenue from coal and sales of Crown land drilling rights are offset by impacts of declining oil and metal prices.
• Forests revenue is up slightly in 2007/08 as higher softwood lumber border tax collections are partially offset by lower stumpage and logging tax revenues due to lower harvest volumes.
Over the next two years, stumpage revenue is expected to increase reflecting rising harvest volumes and moderate price growth. However, the assumption of rising prices has an offsetting impact on border tax collections revenue as prices are expected to rise to US $300 per thousand board feet by early 2009 and the export tax rate to fall to 5 per cent from the current 15 per cent level. Over the medium term, assuming flat prices, interior stumpage rates are expected to decline, reflecting reduced log values and higher handling costs due to the effects of the mountain pine beetle infestation.
Table 1.8 Forests Revenue
($ millions) | | 2006/07 | | 2007/08 | | 2008/09 | | 2009/10 | |
Stumpage | | 1,002 | | 947 | | 1,057 | | 1,085 | |
Softwood Lumber Agreement – border tax | | 156 | | 305 | | 270 | | 142 | |
Logging tax | | 98 | | 20 | | 20 | | 30 | |
Other | | 20 | | 24 | | 25 | | 25 | |
Forest Revenue | | 1,276 | | 1,296 | | 1,372 | | 1,282 | |
Average export tax rate | | 15.0 | % | 12.5 | % | 11.2 | % | 5.0 | % |
Total Crown harvest volumes (million cubic metres) | | 68.2 | | 63.8 | | 66.0 | | 69.0 | |
Spruce-pine-fir 2X4 prices ($US/1000 bd ft) | | 273 | | 270 | | 281 | | 300 | |
13
• Revenue from health and social transfers is expected to rise $397 million in 2007/08 reflecting normal base growth and $116 million of new trust money established by the federal government. These additional funds are intended to support initiatives to reduce wait times and the purchase of the human papillomavirus vaccine with the goal of protecting women and girls from cervical cancer.
Table 1.9 Health and Social Transfers
($ millions) | | 2006/07 | | 2007/08 | | 2008/09 | | 2009/10 | |
Canada Health Transfer | | 2,808 | | 3,098 | | 3,281 | | 3,488 | |
Wait times (1) | | 158 | | 158 | | 79 | | 33 | |
2007 trusts | | — | | 116 | | — | | — | |
Health deferral | | 104 | | 130 | | 24 | | 24 | |
Canada Social Transfer | | 1,213 | | 1,311 | | 1,403 | | 1,451 | |
Early learning and childcare | | 148 | | — | | — | | — | |
2007 Child care spaces funding | | — | | 33 | | — | | — | |
Prior-year adjustments | | 42 | | 25 | | — | | — | |
Total Health and Social Transfers | | 4,473 | | 4,870 | | 4,787 | | 4,996 | |
(1) Due to lump sum payment by the federal government, the 2006/07 to 2008/09 wait time revenue represents deferred revenue.
Revenue continues to decline in 2008/09 as base growth is offset by the loss of one-time trust funding and lower recognition of deferred funding from federal government advances. Revenue growth returns to normal in 2009/10 as one-time funding for specific purposes is reduced to a relatively small level recognizing the depreciation of capital assets.
The forecast incorporates the federal budget measure to fund the Canada Social Transfer on an equal per capita basis (elimination of tax point transfers).
• In 2007/08, other federal transfers include a one-time $199 million eco-Trust funding for reducing air pollutant and greenhouse gas emissions, $25 million for multiculturalism and immigration, and $17 million in disaster financial assistance.
Chart 1.3 Federal government contributions

14
In 2008/09, other transfers decline reflecting support that is one-time in nature, as well as uncertainty of federal government commitment or the timing of some funding sources expected in 2007/08. This includes funding in support of combating the mountain pine beetle infestation, the Pan-Canadian health surveillance, providing services for immigrants, and grants to local governments through the Canada Infrastructure Program.
Commercial Crown corporations income
• BC Hydro’s three year earnings projections are virtually unchanged from Budget 2007, as fluctuations in operating results are offset by changes to regulatory account transfers. A $155 million improvement in operating results for 2007/08 is primarily due to higher than expected inflows to reservoirs (109 per cent of normal), and enabled a $114 million transfer to the regulatory accounts to help offset future rate increases. Operating results for 2008/09 and 2009/10 are slightly lower than the projections in Budget 2007, primarily due to higher than expected operations and maintenance costs. These reductions will be offset by additional transfers from the regulatory accounts. The regulatory accounts and their use are subject to ongoing review by the BC Utilities Commission.
• LDB has improved its annual net income projections by an average $14 million per year over the forecast period. The improvement is due to lower operating costs, primarily resulting from the implementation of the new Beverage Container Stewardship Program. This reflects a shift of the responsibility for beverage containers from the LDB to industry stakeholders.
• BC Lottery Corporation’s projections are unchanged from Budget 2007. BCLC is currently developing strategies for implementing the recommendations from the May 2007 Ombudsman Report, and for addressing the impact of the smoking ban in public buildings beginning in January 2008. BCLC will revise its projections once the strategies are finalized.
• BCRC’s earnings forecast continues to show a certain degree of volatility due to the uncertainty in forecasting both the timing and gain from asset disposals, which are primarily property sales. The current projections reflect a shift of asset disposals from 2007/08 to 2008/09, and an increase in estimated value.
• ICBC’s impact on the government’s bottom line is expected to improve by $259 million in 2007/08, by $74 million in 2008/09, and by $78 million in 2009/10. The improvement in 2007/08 is mainly due to income from the sale of Surrey Central City Mall (an ICBC Properties Ltd. investment), and a $105 million reduction to expected claims costs. Claims incurred costs have moderated from the Budget 2007 projections, and a re-estimation of the current value of unpaid claims has resulted in a positive prior years’ claims adjustment. The improvements to 2008/09 and 2009/10 are primarily due to increases in projected premium revenue resulting from higher optional insurance sales.
15
Expense
Government expense includes spending for ministries and other programs of the Consolidated Revenue Fund (CRF), combined with the expense of service delivery agencies, including the SUCH sector (schools, universities, colleges and health authorities/hospital societies).
Total expenses are now forecast to total $36.4 billion in 2007/08, $36.8 billion in 2008/09 and $38.0 billion in 2009/10.
Total expense for 2007/08 is up $190 million from Budget 2007, due to:
• higher than expected forest fire fighting and other natural disaster costs ($110 million);
• the impact of changes to MLA compensation and pensions ($43 million); and
• increased spending funded by one-time recoveries, primarily from the federal government ($114 million). Included in this amount is the initial year of an annual $33 million lift to federal child care funding.
Other spending changes in 2007/08 include higher costs for the BC Timber Sales program ($15 million). The above increases are partially offset by reduced interest costs ($23 million) and a reduction in spending by service delivery agencies ($69 million).
Total expense for 2008/09 and 2009/10 is up $110 million and $100 million, respectively. The increases are due to higher child care funding by the federal government, increased BC Timber Sales program costs, the impact of changes to MLA compensation, and higher spending by service delivery agencies in the education sector, partially offset by lower interest costs.
Consolidated revenue fund expense
The updated forecast for 2007/08 includes $113 million for forest fire fighting costs, $57 million above budget. BC Timber Sales expenses are projected at $200 million, $15 million above budget primarily due to a write-down of inventory. Full-year flood-related costs under the Emergency Program Act are projected at $53 million above budget, including expenses for mitigation work and response and recovery costs. Legislature expenses are $43 million above budget related to recent changes to MLA compensation and pensions and assumes that all MLAs purchase past pensionable service in 2007/08. Funding for forest fire fighting, BC Timber Sales, Emergency Program Act and MLA compensation and pension related costs is statutorily provided for and does not require additional approval of the legislature.
All other ministries are forecast to be on budget for 2007/08.
16
Subsequent to Budget 2007, the three year spending plan has been increased by $52 million in each of 2008/09 and 2009/10, due to the following changes:
• Ministry of Children and Family Development – spending targets have been increased by $33 million in each of 2008/09 and 2009/10 due to increased funding from the federal government for child care.
• Legislature – spending targets have been increased by $9 million in each of 2008/09 and 2009/10 to reflect increases in MLA compensation.
• Ministry of Forests and Range and Minister Responsible for Housing – spending targets have been increased by $10 million in each of 2008/09 and 2009/10 as a result of BC Timber Sales expenses related to a write-down of inventory.
• The spending plan also includes a $268 million allocation to the Vancouver Convention Centre expansion project in 2008/09 to fund additional construction costs identified earlier this year. As this is a grant to VCCEP, there is no impact on total expense in 2008/09 as it relates to increased capital spending.
Contingencies
General program spending commitments and pressures totaling $28 million in 2007/08, $25 million in 2008/09 and $54 million in 2008/09 have been notionally allocated to the contingencies vote. These allocations include:
Table 1.10 Notional Allocations to Contingencies
($ millions) | | 2007/08 | | 2008/09 | | 2009/10 | |
2010 Olympics – preliminary allocation of contingency amount | | — | | 20 | | 49 | |
Corrections caseload and safety issues | | 13 | | — | | — | |
Major trials | | 8 | | — | | — | |
Norman B. Keevil Institute of Mining Engineering at UBC | | 5 | | — | | — | |
Traffic fines revenue sharing – potential changes in estimates | | — | | 5 | | 5 | |
Enhanced driver’s license pilot program | | 2 | | — | | — | |
Subtotal notional allocations | | 28 | | 25 | | 54 | |
Unallocated contingencies | | 332 | | 340 | | 321 | |
Total contingencies | | 360 | | 365 | | 375 | |
• Up to $20 million in 2008/09 and $49 million in 2009/10 has been allocated for the 2010 Olympic and Paralympic Winter Games (2010 Olympics), unchanged from budget. The provincial contingency allocation is included in the province’s $600 million commitment to the 2010 Olympics.
• Up to $13 million in 2007/08 to address caseload and safety issues within correctional facilities in BC.
• Up to $8 million for expected costs related to the Pickton trial and other major trials in 2007/08.
• Up to $5 million in 2007/08 for the Norman B. Keevil Institute of Mining Engineering at UBC to create a global centre of excellence in mining science and engineering to support BC’s mining industry.
• Up to $5 million in 2008/09 and 2009/10 for potential changes in estimates for traffic fine revenue sharing.
• Up to $2 million in 2007/08 for the Enhanced Driver’s License pilot program.
17
Negotiating Framework
Budget 2007 included $39 million in 2007/08, $77 million in 2008/09, and $142 million in 2009/10 for the wage and benefit impacts of agreements yet to be concluded. These amounts continue to be held in contingencies and will be distributed by the Minister of Finance once settlements are reached.
Health Innovation Fund
Budget 2007 also included a $100 million Health Innovation Fund, open to health authorities for proposals to promote innovation and facilitate improvements in patient care within the public health-care system. Based on proposals submitted by health authorities, $85 million has been approved for 29 pilot projects and $15 million for smaller, short-term projects.
Service delivery agency expenses
Service delivery agency net spending (i.e. expenses in excess of government transfers) is forecast to decrease by $69 million in 2007/08 and $194 million in 2008/09, and increase by $94 million in 2009/10 compared to the projections in Budget 2007.
Projected net spending by school districts is down $29 million in 2007/08, and up $33 million and $12 million in 2008/09 and 2009/10 respectively. The decrease in net spending in 2007/08 in part reflects additional grants and the timing of grants. The net spending increases in 2008/09 and 2009/10 are due to increased operating cost forecasts.
Projected net spending by health authorities and hospital societies is down $33 million in 2007/08, reflecting efficiency and cost saving strategies being implemented by the health authorities.
This forecast update only reflects updated projections for 2007/08 from health authorities and hospital societies. Health authorities have projected lower deficits totaling $55 million in 2007/08 (Vancouver Coastal Health Authority, including Providence $35 million; Fraser Health Authority $20 million) compared to $119 million as presented in Budget 2007 (Vancouver Coastal Health Authority $54 million; Fraser Health Authority $65 million).
To alleviate the forecast deficits, health authorities have assumed in their updated projections a number of revenue growth and efficiency/cost savings measures to be implemented in 2007/08. Some of these measures will be funded by the $100 million Health Innovation Fund announced by the government in Budget 2007.
The 2008/09 and 2009/10 projections from these health organizations have not been updated from Budget 2007, pending the outcome of the Conversation on Health initiative. The Ministry of Health will continue to work with the health authorities on their financial plans in the context of this initiative as part of the budget process.
To ensure that the Province’s three-year fiscal plan remains balanced, the forecast allowances for 2008/09 and 2009/10 will continue to recognize the interim nature of the health spending allocations and can accommodate some additional growth in health funding.
18
Projected net spending (spending net of government grants) by universities and colleges is down $22 million in 2007/08, and up $54 million and $93 million in 2008/09 and 2009/10 respectively. The decrease in net spending in 2007/08 reflects additional funding grants to support Aboriginal post-secondary education and an increase in annual capital allowance funding for facility upgrades. Funding is provided by the Ministry of Advanced Education through allocations within its existing budget. The net spending increases in 2008/09 and 2009/10 reflects additional faculty and operating cost forecasts.
Full-time equivalents (FTEs)
The updated projection for taxpayer-supported FTEs – including ministries, special offices, and service delivery agencies (excluding the SUCH sector) – is unchanged from Budget 2007 (see Appendix Table A.12).
Provincial capital spending
Capital spending is needed to build, acquire or replace assets such as roads, schools, post-secondary facilities, hospitals and related major equipment.
Capital spending is not directly counted in the government’s annual surplus or deficit. Instead, generally accepted accounting principles require capital costs to be spread out over the useful lives of the related assets through annual amortization expenses. These amortization expenses are charged annually against the surplus. However, the cash requirements for capital projects have an immediate impact on debt, except where cash balances can be drawn down or new revenue sources applied.
Table 1.11 Capital Spending – Changes from Budget 2007
($ millions) | | 2007/08 | | 2008/09 | | 2009/10 | |
Budget 2007 capital spending | | 5,156 | | 4,916 | | 4,567 | |
| | | | | | | |
Taxpayer-supported changes: | | | | | | | |
Education – computer, furniture and equipment and vehicle purchases financed from cash balances | | 57 | | — | | — | |
Post-secondary education – mainly carry-over of slower-than-expected 2006/07 capital spending | | 103 | | 52 | | (32 | ) |
Health – mainly priority spending for Victoria Royal Jubilee Hospital, Kelowna General Hospital and Vernon Jubilee Hospital | | 135 | | 213 | | 209 | |
BCTFA – mainly timing of capital spending | | 151 | | 14 | | 1 | |
Vancouver Convention Centre expansion project – updated project budget | | 84 | | 147 | | 22 | |
Social housing – acquisition of single room occupancy hotels for social housing | | 49 | | 5 | | 5 | |
Capital spending contingencies – mainly reflects reallocation for health priority projects and the Vancouver Convention Centre expansion project | | (190 | ) | (150 | ) | (190 | ) |
Other | | 4 | | 1 | | 1 | |
Total taxpayer-supported | | 393 | | 282 | | 16 | |
| | | | | | | |
Self-supported changes: | | | | | | | |
BC Hydro – mainly higher costs to strengthen the power system from extreme weather, support for independent power producers and transmission system upgrades | | 68 | | 123 | | 34 | |
Other | | (19 | ) | 7 | | 16 | |
Total self-supported | | 49 | | 130 | | 50 | |
Total Changes | | 442 | | 412 | | 66 | |
Updated capital spending | | 5,598 | | 5,328 | | 4,633 | |
19
Table 1.12 Capital Spending: 2006/07 – 2009/10
| | Actual | | Forecast | | Updated Plan | |
($ millions) | | 2006/07 | | 2007/08 | | 2008/09 | | 2009/10 | |
| | | | | | | | | |
Taxpayer-supported | | | | | | | | | |
Education | | | | | | | | | |
Schools (K–12) | | 322 | | 422 | | 411 | | 411 | |
Post-secondary | | 874 | | 960 | | 642 | | 443 | |
Health | | 760 | | 954 | | 882 | | 858 | |
BC Transportation Financing Authority | | 821 | | 1,073 | | 830 | | 634 | |
Vancouver Convention Centre expansion project | | 108 | | 290 | | 290 | | 37 | |
Government operating (ministries) | | 309 | | 325 | | 257 | | 256 | |
Other (1) | | 172 | | 128 | | 98 | | 88 | |
Capital spending contingencies (2.5% of total taxpayer-supported capital spending in 2007/08, 5% in 2008/09 and 2009/10) | | — | | 105 | | 180 | | 140 | |
Total taxpayer-supported | | 3,366 | | 4,257 | | 3,590 | | 2,867 | |
| | | | | | | | | |
Self-supported | | | | | | | | | |
BC Hydro | | 807 | | 1,063 | | 1,419 | | 1,407 | |
BC Transmission Corporation | | 50 | | 85 | | 16 | | 8 | |
Columbia River power projects (2) | | 19 | | 29 | | 148 | | 198 | |
BC Rail | | 19 | | 33 | | 24 | | 9 | |
ICBC (3) | | 22 | | 29 | | 30 | | 45 | |
BC Lotteries | | 44 | | 84 | | 80 | | 80 | |
Liquor Distribution Branch | | 22 | | 18 | | 21 | | 19 | |
Total self-supported | | 983 | | 1,341 | | 1,738 | | 1,766 | |
Total capital spending | | 4,349 | | 5,598 | | 5,328 | | 4,633 | |
(1) | Includes BC Housing Management Commission, Provincial Rental Housing Corporation, Rapid Transit Project 2000, BC Transit and other service delivery agencies. |
| |
(2) | Joint ventures of the Columbia Power Corporation and Columbia Basin Trust. |
| |
(3) | Includes ICBC Properties Ltd. |
Total capital spending is forecast to be $5.6 billion in 2007/08, $5.3 billion in 2008/09 and $4.6 billion in 2009/10. These amounts are $442 million, $412 million and $66 million higher than the Budget 2007 projections (see Tables 1.11 and 1.12).
Taxpayer-supported capital spending is forecast to be $393 million higher than budget in 2007/08, $282 million higher in 2008/09 and $16 million higher in 2009/10. The increases include:
• priority investments in the health sector including the Victoria Royal Jubilee Hospital, Kelowna General Hospital and Vernon Jubilee Hospital (approvals in principle for the projects were made in Budget 2007, and funds were set aside in capital contingencies);
• higher spending for computers, furniture and equipments, and vehicles in K–12 schools;
• post-secondary projects carried over from slower-than-expected spending in 2006/7;
• highway infrastructure improvements throughout the province, and projects carried over from slower-than-expected spending in 2006/07;
20
• revised estimates for the Vancouver Convention Center expansion project; and
• acquisition of single room occupancy hotels for social housing.
These investments are mainly being financed through a combination of cash balances or own source revenues (such as donations), and are being made without further increases in taxpayer-supported debt.
Self-supported commercial Crown corporation capital spending is forecast to be $49 million higher than budget in 2007/08, $130 million higher in 2008/09 and $50 million higher in 2009/10. These forecasts mainly reflect additional BC Hydro costs to strengthen the power system from extreme weather conditions, support for independent power producers and transmission system upgrades.
Significant capital projects (those with multi-year budgets totaling $50 million or more) are shown in Table 1.13. Total spending for these projects over the next three years is forecast at $1.9 billion, up $630 million from the Budget 2007 projections. The higher forecast mainly reflects the addition of the Victoria Royal Jubilee, Kelowna General and Vernon Jubilee hospitals; addition of BC Hydro’s Revelstoke Dam Unit 5 project; and revised estimates for the Vancouver Convention Centre expansion project.
21
Table 1.13 Capital Expenditure Projects Greater Than $50 million (1)
Note: Information in bold type denotes changes from 2006/07 Public Accounts.
| | | | | | Estimated | | | | | |
| | | | Forecast | | Cumulative | | | | | | | | Cumulative | | | | | |
| | Start | | Completion | | Spending at | | Spending | | Spending | | Spending | | Spending at | | Total Project | |
($ millions) | | Date | | Date | | Mar. 31, 2007(2) + | | 2007/08 + | | 2008/09 + | | 2009/10 | | = Mar. 31, 2010 | | Budget(3) | | Forecast (3) | |
| | | | | | | | | | | | | | | | | | | |
Health facilities (4) | | | | | | | | | | | | | | | | | | | |
Vancouver General Hospital, redevelopment project | | Sept. 2000 | | Fall 2007 | | 155 | | 1 | | — | | — | | 156 | | 156 | | 156 | |
Abbotsford Regional Hospital and Cancer Centre | | Fall 2004 | | Summer/08 | | 182 | | 119 | | 15 | | — | | 316 | | 316 | | 316 | |
Surrey Outpatient Facility | | Spring 2006 | | Spring/10 | | 2 | | 5 | | 74 | | 61 | | 142 | | 151 | | 151 | |
Victoria Royal Jubilee Hospital inpatient facility | | Spring/07 | | Spring/10 | | — | | 20 | | 67 | | 56 | | 143 | | 150 | | 150 | |
Kelowna General Hospital Ambulatory Care Centre and Emergency Department | | Spring/07 | | Spring/10 | | — | | 1 | | 20 | | 22 | | 43 | | 61 | | 61 | |
Vernon Jubilee Hospital Diagnostic and Treatment Building | | Spring/07 | | Spring/10 | | — | | 2 | | 15 | | 16 | | 33 | | 49 | | 49 | |
Total health facilities | | | | | | 339 | | 148 | | 191 | | 155 | | 833 | | 883 | | 883 | |
| | | | | | | | | | | | | | | | | | | |
Transportation | | | | | | | | | | | | | | | | | | | |
Trans Canada Highway – 10 Mile (Park) Bridge | | Oct. 2005 | | Jan. 2008 | | 54 | | 14 | | — | | — | | 68 | | 68 | (6) | 68 | (6) |
Pitt River Bridge (5) | | Feb. 2006 | | Fall 2009 | | 20 | | 30 | | 42 | | 16 | | 108 | | 108 | (6) | 108 | (6) |
Sea-to-Sky Highway (5) | | April 2003 | | July 2009 | | 356 | | 142 | | 73 | | 29 | | 600 | | 600 | | 600 | (7) |
William R. Bennett Bridge (5) | | Mar. 2005 | | July 2008 | | 83 | | 46 | | 15 | | — | | 144 | | 144 | | 144 | |
Total transportation | | | | | | 513 | | 232 | | 130 | | 45 | | 920 | | 920 | | 920 | |
| | | | | | | | | | | | | | | | | | | |
Power generation | | | | | | | | | | | | | | | | | | | |
BC Hydro | | | | | | | | | | | | | | | | | | | |
– Mica Dam – generator stator replacement | | Feb. 2004 | | Mar. 2011 | | 37 | | 16 | | 17 | | 6 | | 76 | | 76 | | 76 | |
– Peace Canyon Dam – generator stator replacement and rotor modification | | Feb. 2004 | | Oct. 2009 | | 28 | | 14 | | 14 | | 11 | | 67 | | 67 | | 67 | |
– Coquitlam Dam seismic upgrade | | Oct. 2003 | | Aug. 2007 | | 42 | | 16 | | — | | — | | 58 | | 58 | | 58 | |
– Aberfeldie redevelopment | | Apr. 2005 | | Aug. 2008 | | 13 | | 54 | | 25 | | — | | 92 | | 92 | | 92 | |
– GM Shrum G2–G4 stator replacement | | Sept. 2004 | | Aug. 2010 | | 16 | | 18 | | 22 | | 10 | | 66 | | 66 | | 66 | |
– Peace Canyon G1–G4 turbine overhaul | | Oct. 2005 | | Oct. 2009 | | 9 | | 14 | | 16 | | 16 | | 55 | | 55 | | 55 | |
– Revelstoke Unit 5 project | | May 2005 | | Oct. 2011 | | 8 | | 22 | | 42 | | 92 | | 164 | | 330 | | 330 | |
BC Transmission Corporation | | | | | | | | | | | | | | | | | | | |
– System control centre modernization project | | Feb. 2005 | | Oct. 2008 | | 57 | | 75 | | 2 | | — | | 134 | | 133 | | 134 | |
Brilliant Expansion Power Corporation (8) | | | | | | | | | | | | | | | | | | | |
– Brilliant Dam power expansion | | Oct. 2002 | | Aug. 2007 | | 191 | | 14 | | — | | — | | 205 | | 205 | | 205 | |
Total power generation | | | | | | 401 | | 243 | | 138 | | 135 | | 917 | | 1,082 | | 1,083 | |
| | | | | | | | | | | | | | | | | | | |
Other | | | | | | | | | | | | | | | | | | | |
ICBC Properties Ltd. | | | | | | | | | | | | | | | | | | | |
– Surrey City Centre Mall Ltd. | | Sept. 1999 | | July 2007 | (9) | 270 | | 5 | | — | | — | | 275 | | 312 | | 275 | |
Vancouver Convention Centre expansion project | | 2003 | | 2009 | | 112 | | 162 | | 229 | | 38 | | 541 | | 541 | | 541 | (10) |
Total other | | | | | | 382 | | 167 | | 229 | | 38 | | 816 | | 853 | | 816 | |
(1) | Only projects that have been approved by Treasury Board and/or Crown corporation boards are included in this table. Ministry service plans may include projects that still require final approval. Only the provincial share of funding is presented. Total costs for some of these projects could be higher as they are cost-shared with the federal government, municipal authorities or the private sector. |
| |
(2) | Total expenditures since commencement of each project. |
| |
(3) | Represents sum of annual budgeted expenditures to complete each project. |
| |
(4) | Amounts shown may include cost of construction, equipment, deferred development costs and land, less funding contributed by Regional Hospital Districts, and exclude interest costs incurred during construction. |
| |
(5) | Amounts shown exclude interest costs incurred during construction. |
| |
(6) | Amount represents the provincial portion of this cost-shared project with the federal government. |
| |
(7) | Represents capital construction costs before the addition of enhanced rehabilitation and safety features. The total estimated outlays (including both capital construction and operating activities) for the project over 25 years is $1.983 billion, which assumes 2 per cent inflation per year and maximum performance payments. |
| |
(8) | A joint venture of the Columbia Power Corporation and the Columbia Basin Trust. |
| |
(9) | The base building was substantially completed in January 2003; however, work to prepare space for new tenants is still required. Effective August 1, 2007, ownership of the Central City development was transferred to a consortium of Canadian pension funds. |
| |
(10) | Amount represents the provincial portion of this cost-shared project with the federal government and the tourism industry. The total project forecast (including federal and private sector partners) has been revised to $883 million following a review of the impact of higher than expected construction costs. |
22
Provincial debt
The government and its Crown corporations borrow to finance construction of capital projects or other investments, to refinance maturing debt and to finance working capital needs.
Total provincial debt is projected to total $34.8 billion at March 31, 2008 (18.3 per cent of provincial GDP), $36.8 billion at March 31, 2009 (18.5 per cent of GDP) and $37.5 billion at March 31, 2010 (17.8 per cent of GDP). These amounts are significantly lower than the Budget 2007 projections (see Tables 1.14 and 1.15), reflecting higher expected revenues over the next three years and a $1.0 billion lower than expected debt balance at March 31, 2007.
Table 1.14 Debt Summary – Changes from Budget 2007
($ millions) | | 2007/08 | | 2008/09 | | 2009/10 | |
Budget 2007 total debt | | 36,837 | | 38,681 | | 39,981 | |
Taxpayer-supported debt changes: | | | | | | | |
Government operating – mainly opening cash and revenue improvements | | (1,404 | ) | (1,820 | ) | (2,587 | ) |
Education facilities – mainly impact of capital spending changes offset by use of cash balances and own source revenues, and reclassification of post-secondary institutions’ subsidiaries debt to self-supported | | (107 | ) | (112 | ) | (124 | ) |
Health facilities – mainly priority health projects offset by lower than expected debt at March 31, 2007 | | (48 | ) | 70 | | 96 | |
Transportation – mainly impact of capital spending changes | | 69 | | 19 | | (15 | ) |
Social housing – mainly impact of lower than expected debt at April 1, 2007 | | (59 | ) | (45 | ) | (30 | ) |
Other changes | | (23 | ) | (23 | ) | (21 | ) |
Total taxpayer-supported | | (1,572 | ) | (1,911 | ) | (2,681 | ) |
| | | | | | | |
Self-supported debt changes: | | | | | | | |
BC Hydro – mainly impact of improved cash flows from operations | | (154 | ) | (9 | ) | 74 | |
BC Transmission Corporation – mainly impact of stronger cash flows from operations | | 3 | | (16 | ) | (14 | ) |
Columbia River power projects – timing of borrowing for Waneta Dam expansion | | (157 | ) | 4 | | 50 | |
Post-secondary institutions’ subsidiaries – reclassification from taxpayer-supported | | 53 | | 53 | | 53 | |
Total self-supported | | (255 | ) | 32 | | 163 | |
Forecast allowance changes: (1) | | | | | | | |
Adjustment to mirror operating statement forecast allowance change | | (250 | ) | — | | — | |
Total changes | | (2,077 | ) | (1,879 | ) | (2,518 | ) |
Updated total debt | | 34,760 | | 36,802 | | 37,463 | |
(1) Forecast allowance is not cumulative – only the relevant year forecast allowance is included in the debt forecast for each of the fiscal years.
Total provincial debt includes an allowance to mirror the operating statement forecast allowance. The forecast allowance has been reduced from the original budgeted $750 million in 2007/08 to $500 million, reflecting reduced risks in the natural gas price forecast and assessment of other risks to the end of the fiscal year. The forecast allowances of $1,000 million in 2008/09, and $1,050 million in 2009/10 remain unchanged from budget. This forecast allowance is not cumulative – only the relevant year forecast allowance is included in the debt forecast for each of the fiscal years.
23
Table 1.15 Debt Summary (1): 2006/07 – 2009/10
| | Actual | | Forecast | | Updated Plan | |
($ millions) | | 2006/07 | | 2007/08 | | 2008/09 | | 2009/10 | |
Taxpayer-supported debt | | | | | | | | | |
Provincial government direct operating | | 9,505 | | 7,721 | | 6,595 | | 4,840 | |
Other taxpayer-supported debt (mainly capital) | | | | | | | | | |
Education facilities (2) | | | | | | | | | |
Schools | | 4,724 | | 4,956 | | 5,232 | | 5,510 | |
Post-secondary institutions | | 2,909 | | 3,336 | | 3,532 | | 3,839 | |
| | 7,633 | | 8,292 | | 8,764 | | 9,349 | |
Health facilities (2) | | 2,813 | | 3,300 | | 3,809 | | 4,184 | |
Highways and public transit | | | | | | | | | |
BC Transportation Financing Authority | | 3,237 | | 4,115 | | 4,715 | | 5,167 | |
Public transit | | 892 | | 915 | | 946 | | 993 | |
Sky Train extension | | 1,153 | | 1,150 | | 1,150 | | 1,150 | |
BC Transit | | 96 | | 91 | | 102 | | 103 | |
| | 5,378 | | 6,271 | | 6,913 | | 7,413 | |
Other | | | | | | | | | |
Social housing (3) | | 216 | | 213 | | 211 | | 209 | |
Homeowner Protection Office | | 110 | | 148 | | 159 | | 166 | |
Other (4) | | 219 | | 286 | | 330 | | 329 | |
| | 545 | | 647 | | 700 | | 704 | |
Total other taxpayer-supported debt | | 16,369 | | 18,510 | | 20,186 | | 21,650 | |
Total taxpayer-supported debt | | 25,874 | | 26,231 | | 26,781 | | 26,490 | |
Self-supported debt | | | | | | | | | |
Commercial Crown corporations and agencies | | | | | | | | | |
BC Hydro | | 7,144 | | 7,652 | | 8,494 | | 9,320 | |
BC Transmission Corporation | | 37 | | 98 | | 78 | | 63 | |
Columbia River power projects (5) | | 236 | | 224 | | 395 | | 486 | |
Liquor Distribution Branch | | 3 | | 2 | | 1 | | 1 | |
Post-secondary institutions’ subsidiaries | | 53 | | 53 | | 53 | | 53 | |
Total self-supported debt | | 7,473 | | 8,029 | | 9,021 | | 9,923 | |
Total debt before forecast allowance | | 33,347 | | 34,260 | | 35,802 | | 36,413 | |
Forecast allowance | | — | | 500 | | 1,000 | | 1,050 | |
Total provincial debt | | 33,347 | | 34,760 | | 36,802 | | 37,463 | |
Debt as a per cent of GDP | | | | | | | | | |
Taxpayer-supported | | 14.4 | % | 13.8 | % | 13.4 | % | 12.6 | % |
Total provincial debt | | 18.6 | % | 18.3 | % | 18.5 | % | 17.8 | % |
(1) | Debt is after deduction of sinking funds and unamortized discounts, and excludes accrued interest. Government direct and fiscal agency accrued interest is reported in the government’s accounts as an accounts payable. |
| |
(2) | Includes debt and guarantees incurred by the government on behalf of school districts, universities, colleges, and health authorities/hospital societies (SUCH), as well as debt directly incurred by these entities. |
| |
(3) | Includes the BC Housing Management Commission and the Provincial Rental Housing Corporation. |
| |
(4) | Includes debt of other taxpayer-supported Crown corporations and agencies and fiscal agency loans to local governments. Also includes student loan guarantees, loan guarantees to agricultural producers, guarantees under economic development and home mortgage assistance programs, and loan guarantee provisions. |
| |
(5) | A joint venture of the Columbia Power Corporation and Columbia Basin Trust. |
24
Taxpayer-supported debt
Taxpayer-supported debt is projected to total $26.2 billion at March 31, 2008 (down $1.6 billion from budget), $26.8 billion at March 31, 2009 (down $1.9 billion from budget), and $26.5 billion at March 31, 2010 (down $2.7 billion from budget). These projections reflect the impacts of stronger taxation and increased federal contributions, and lower than forecast debt balances at the end of the 2006/07 fiscal year.
The debt forecast incorporates the updated capital spending plan and assumes that the expected surpluses will be fully applied to debt reduction. However, should the government allocate some of these surpluses to other areas, the debt forecast would change accordingly.
Based on these assumptions, taxpayer-supported debt is projected at 13.8 per cent of GDP at the end of 2007/08, 13.4 per cent of GDP at the end of 2008/09 and 12.6 per cent of GDP at the end of 2009/10.
Self-supported debt
Self-supported debt is incurred mainly to finance power generation and distribution projects throughout the province. Self-supported debt is projected to total $8.0 billion at March 31, 2008 (down $255 million from budget), $9.0 billion at March 31, 2009 (up $32 million from budget), and $9.9 billion at March 31, 2010 (up $163 million from budget).
The lower projection for 2007/08 is mainly due to delayed borrowing for the Waneta Dam power project and reduced working capital requirements for BC Hydro. Higher debt in the next two fiscal years mainly reflect the impact of higher capital spending and the reclassification of debt related to post-secondary institutions’ subsidiaries to the self-supported category.
Risks to the fiscal plan
The major risks to the fiscal plan include, but are not limited to, changes to economic variables, including the economic growth of BC’s trading partners, commodity prices (especially natural gas, lumber and electricity), instability in financial markets and exchange rate fluctuations.
The main changes to the three year fiscal plan risk profile described in Budget 2007 are summarized below.
Further deterioration in the US economy in line with further weakness in the US housing market poses risk to the economic outlook for both BC and Canada.
Although the fiscal plan incorporates significant reductions in projected natural gas revenues across the three year plan, the risk of further revenue declines has been reduced but not eliminated.
25
The forecast incorporates reduced forest sector activity due to the labour disruption in the coastal forest industry. The more prolonged the strike, the greater would be the downside risk, with additional challenges to industry regarding an insufficient supply of logs for lumber mills and chips for pulp mills.
The spending forecast contained in the fiscal plan is based on ministry and taxpayer-supported Crown corporation and agency spending plans and strategies. Changes to planned assumptions, such as utilization or demand rates for government services represent a spending risk. In particular, health spending plans have only been established for 2007/08. The 2008/09 and 2009/10 are interim allocations, which only include funding to cover negotiating framework costs.
In addition, changes in accounting treatment or revised interpretations of generally accepted accounting principles could have impacts on the bottom line. For example, the accounting treatment for resource roads is under review and could result in changes to the fiscal plan forecast.
Natural disasters are also a continued risk to the plan.
26
PART TWO — ECONOMIC REVIEW AND OUTLOOK (1) |
| |
2007/08 First Quarterly Report | September 14, 2007 |
Summary
Chart 2.1 Updated BC forecast remains robust
Source: BC Ministry of Finance
• Economic growth in British Columbia is expected to remain solid in 2007, fuelled by steady gains in employment, strong domestic demand and continued strength in retail trade.
• The updated BC forecast incorporates the ongoing weakness in lumber and natural gas markets, as well as lower US economic growth caused by declines in the US housing market and recent instability in financial markets. These factors are largely offset by stronger domestic demand, led by personal consumption and residential investment, with little change resulting in the overall forecast.
• Going forward, risks to the forecast include, but are not limited to, further deterioration in the US economy (caused by a worse than expected performance in the US housing sector) and continuing instability in financial markets.
Comparison to private sector forecasts
Most revised private sector forecasts for BC in 2007 have been downgraded since the Budget, largely due to growing concerns about the strength of the faltering US economy. The average estimate for BC real GDP growth among seven private sector forecasters is now 3.1 per cent for 2007, compared to 3.2 per cent at Budget time. The Ministry of Finance forecast for 2007 has also declined from 3.1 per cent growth at Budget time to 3.0 per cent for the first Quarterly Report.
On average, the seven private sector forecasters’ view of BC’s real GDP growth in 2008 is 3.3 per cent – the same as forecast at Budget time. However, the Ministry of Finance recognizes the increased risk to the outlook posed
(1) Reflects information available as of August 29, 2007.
27
Chart 2.2 Current private sector and Ministry of Finance forecasts
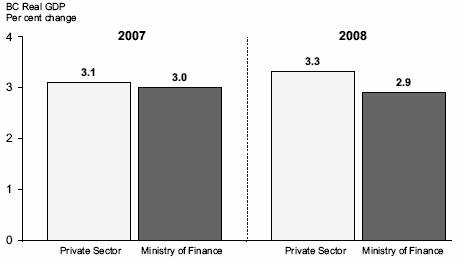
Source: BC Ministry of Finance and various private sector financial institutions
by the continued deterioration of the US economy, the recent instability in financial markets and the higher than expected Canadian dollar. As a result, the Ministry’s forecast for BC’s real GDP growth in 2008 is now 2.9 per cent, as opposed to the 3.0 per cent forecast at Budget time.
Recent economic developments
Indicators of economic performance so far in 2007 reveal that British Columbia is experiencing steady growth this year. Weakness in export markets is in part offset by a very strong domestic economy. The six major indicators outlined in Table 2.1 offer a general outline of BC’s economic performance in the first six months of 2007 compared to the same period a year ago. Employment continued to grow steadily year-to-date to June, rising 3.3 per cent relative to the first half of 2006. This places BC third in job growth among Canadian provinces for this period, behind only Alberta and Saskatchewan.
Exports, however, fell 2.7 per cent year-to-date to June from the same period in 2006, due largely to the declining values of lumber and natural gas exports. As a result, it is no surprise that BC’s year-to-date export performance is the weakest among provinces.
Manufacturing shipments are also down year-to-date to June 2007, dropping 0.6 per cent compared to the first six months of 2006. Growth in shipments in 2007 has been pulled down by a decline in shipments of wood products.
Retail sales have shown robust growth during the first half of this year, as the 7.4 per cent increase year-to-date reflects robust consumer confidence among British Columbians relative to the rest of Canada. Housing starts held steady over the January to June period, rising 0.3 per cent compared to the same period in 2006. Although housing starts are not increasing at the same rapid pace as in recent years, they remained at a high level for the first half of 2007.
28
Non-residential building permits rose 20.4 per cent in the first half of 2007 compared to the same period in 2006. The growth was spurred by a 47.2 per cent surge in commercial permits, which has more than offset declines in both industrial and institutional permits.
Table 2.1 British Columbia Economic Indicators
All data seasonally adjusted | | Jan. to Mar. 2007
change from
Oct. to Dec. 2006 | | Apr. to Jun. 2007
change from
Jan. to Mar. 2007 | | Year-to-Date
Jan. to Jun. 2007
change from
Jan. to Jun. 2006 | |
| | Per cent change | |
Employment | | +1.9 | | +0.1 | | +3.3 | |
Manufacturing shipments | | -0.2 | | +1.9 | | -0.6 | |
Exports | | +1.4 | | +0.3 | | -2.7 | |
Retail sales | | +3.2 | | +2.8 | | +7.4 | |
Housing starts | | +4.8 | | -1.3 | | +0.3 | |
Non-residential building permits | | -12.3 | | +16.7 | | +20.4 | |
External environment
United States
In the United States, according to preliminary estimates, real GDP increased at an annualized pace of 4.0 per cent in the April to June quarter. This was up from 0.6 per cent in the January to March quarter, and was due to stronger business investment, government spending and exports coupled with a decline in imports. However, there were signs of weakness in the April to June quarter, as residential investment remained a significant drag on growth and consumer spending, which makes up over two-thirds of economic activity and has been a key driver of economic growth, slowed.
As for the labour market, the US economy created a relatively weak 92,000 jobs in July, fewer than the average monthly increase of approximately 138,000 jobs over the first six months of 2007. Further, the unemployment rate rose 0.1 percentage points in July to reach 4.6 per cent. Consumer confidence fell in August to a one-year low, according to preliminary data from the University of Michigan. There are several drags on confidence going forward including high consumer debt, the declining US housing market, financial instability and high gasoline and energy prices.
The US housing market continued its rapid decline through 2007, as housing starts dropped 25.9 per cent to average 1,451,000 annualized units in the first seven months of 2007 compared to the same period a year ago, with analysts predicting further deterioration. In August, the National Association of Home Builders (NAHB) housing market index, an indicator of homebuilder optimism, reached 22 points, a 14 point drop since March and its lowest level since January 1991. Given further declines in all sub-indices, the bottoming-out of the housing market may not occur this year.
29
Chart 2.3 US housing market weakens further

Source: National Association of Home Builders
A number of soft economic data releases in recent months, along with recent credit problems in financial markets, have led analysts to downgrade their expectations for 2007 US GDP growth since the start of the year. As a result, the Consensus Economics average outlook has declined from 2.7 per cent in February to 1.9 per cent in August.
Chart 2.4 Consensus outlook for US in 2007 and 2008 downgraded
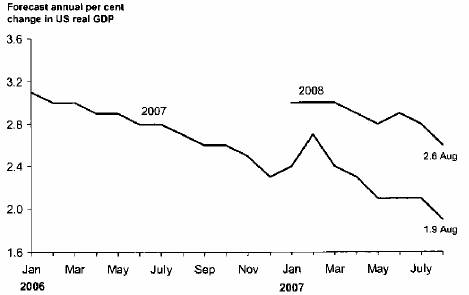
Source: Consensus Economics
The chart above represents forecasts for real GDP growth in 2007and 2008 as polled on specific dates. For example, forecasters surveyed on August 13, 2007 had an average 2007 U.S. growth forecast of 1.9 per cent, while in January they forecast 2007 U.S. growth at 2.4 per cent.
The August estimate for 2007 GDP growth is 0.8 points lower than the 2.7 per cent growth expected in February. Additionally, high oil prices and higher unit labour costs are causing doubt among analysts that the Federal Reserve will reduce interest rates this year, in spite of the recent financial instability.
Estimates for 2008 US real GDP growth have also been downgraded since earlier this year, dropping 0.4 points from the 3.0 per cent growth anticipated in the February Consensus survey. Consensus analysts now anticipate that
30
the US economy will grow by 2.6 per cent on the year. This renewed growth will be driven primarily by strength in industrial production and business investment.
The Ministry of Finance forecast is consistent with the downward view seen in the Consensus publication, assuming 1.8 per cent US real GDP growth for 2007 and 2.3 per cent for 2008. This is more prudent than the Consensus estimate of 1.9 per cent and 2.6 per cent for 2007 and 2008, respectively. This reflects the Ministry’s view of the balance of risks to the US outlook.
Canada
Canada’s economy has managed to grow steadily despite the downturn in the United States. Jobs in Canada have increased by 362,500 year-to-date to July, the majority of which being full-time positions. The national unemployment rate has dropped to 6.1 per cent year-to-date to July 2007, compared to 6.3 per cent over the same period in 2006.
Unlike the large decline in the US housing sector in 2007, the Canadian housing market has slipped marginally, with housing starts down 5.4 per cent in the first seven months of this year relative to the same period last year. However, building permits – a precursor to new building activity – have increased year-to-date to June by a remarkable 18.2 per cent over the same period in 2006. This jump in new permits was driven by surging growth in both non-residential and residential permits, which increased by 29.1 per cent and 11.8 per cent, respectively. Consumer spending in Canada has also shown strength this year with retail sales to June 2007 up 6.3 per cent compared to the same period a year ago. Meanwhile, Canadian exports were up 5.3 per cent in the January to June period compared to last year, mainly due to strong foreign demand for oil products and consumer and industrial goods.
Canadian real GDP grew a robust 3.9 per cent on an annualized basis in the January to March quarter of this year. In the April to June quarter, Canada posted strong growth again with an annualized 3.4 per cent gain in real GDP.
Chart 2.5 Consensus outlook for Canada in 2008 downgraded
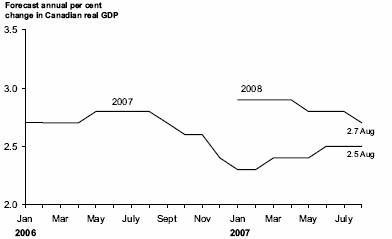
Source: Consensus Economics
The chart above represents forecasts for real GDP growth in 2007as polled on specific dates. For example, forecasters surveyed on August 13, 2007 had an average 2007 Canadian growth forecast of 2.5 per cent, while in January they forecast 2007 Canadian growth at 2.3 per cent.
31
Throughout the first eight months of 2007, forecasters have slightly raised their outlooks for the Canadian economy this year. Against a backdrop of solid consumer spending and employment growth, overall economic growth expectations for 2007 have risen, with Consensus Economics now pegging this year’s real GDP growth at 2.5 per cent in its August survey. This compares to 2.3 per cent in the February survey.
For 2008, the Consensus view for Canada has dropped from 2.9 per cent in February to 2.7 per cent in the August survey.
The Ministry of Finance forecast for Canadian real GDP growth is 2.3 per cent for 2007 and 2.5 per cent for 2008. This difference from the Consensus is recognition of the increased risk to the outlook posed by the continued deterioration of the US housing market, the recent instability in financial markets and the higher than expected Canadian dollar.
Table 2.2 First Quarterly Economic Forecast: Key Assumptions (1)
| | 2007 | | 2008 | |
| | Budget | | First Quarterly | | Budget | | First Quarterly | |
| | Forecast | | Forecast | | Forecast | | Forecast | |
| | Annual per cent change unless otherwise noted | |
US real GDP | | 2.1 | | 1.8 | | 2.8 | | 2.3 | |
Canada real GDP | | 2.0 | | 2.3 | | 2.7 | | 2.5 | |
Japan real GDP | | 1.7 | | 2.2 | | 1.9 | | 1.8 | |
Europe real GDP | | 1.8 | | 2.6 | | 1.9 | | 2.1 | |
US housing starts | | -23.0 | | -23.8 | | 10.7 | | -3.7 | |
Canada 3-month Treasury Bill rate | | 4.0 | | 4.4 | | 4.1 | | 4.8 | |
Canada 10-year government bonds | | 4.1 | | 4.5 | | 4.5 | | 5.1 | |
US cents / Canadian $ | | 86.9 | | 92.0 | | 88.1 | | 94.6 | |
(1) More details on the five-year outlook are available in Tables 2.7.1 through 2.7.4 at the end of Part Two.
Europe
Europe’s outlook has been upgraded since the beginning of 2007 due to strong investment activity and growth in industrial production. The outlook for the German economy is showing continued improvement, particularly with respect to industrial production and investments in machinery and equipment. The August Consensus Economics survey is forecasting Euro zone growth of 2.7 per cent in 2007 and 2.3 per cent in 2008. The Ministry of Finance forecasts slightly lower growth for Europe of 2.6 per cent in 2007 and 2.1 per cent in 2008.
Japan
The 2007 economic outlook for Japan has also been revised upward since the start of the year, due to gains in retail sales and industrial production. However, concerns remain over Japan’s tightening labour market and slow overall private consumption growth. The Consensus Economics August survey is predicting Japanese economic growth to be 2.4 per cent in 2007, followed by 2.1 per cent in 2008. The Ministry of Finance forecasts slightly lower growth for Japan of 2.2 per cent and 1.8 per cent in 2007 and 2008, respectively.
32
China
Prospects for China’s economic growth remain very strong, with the August Blue Chip Economic Indicators survey forecasting real GDP growth of 10.7 per cent in 2007 followed by 9.9 per cent in 2008. These gains have China on pace to become the third largest economy in the world by the end of this year, supplanting Germany.
Financial markets
Interest rates
After holding its key target overnight rate constant for a year, the Bank of Canada raised this rate by 25 basis points at its latest meeting in July 2007. The target overnight rate now sits at 4.5 per cent. There are varying sentiments among analysts with respect to the Bank of Canada’s rate decisions in the near-term.
Table 2.3 Private Sector Canadian Three Month Treasury Bill
Interest Rate Forecasts
Average annual interest rate (per cent) | | 2007 | | 2008 | |
| | | | | |
Global Insight | | 4.3 | | 4.5 | |
CIBC | | 4.4 | | 4.4 | |
Nesbitt Burns | | 4.5 | | 4.8 | |
Scotiabank | | 4.4 | | 4.9 | |
TD Economics | | 4.4 | | 4.7 | |
RBC Capital Markets | | 4.5 | | 5.2 | |
Average (as of July 24, 2007) | | 4.4 | | 4.8 | |
First Quarterly Report Forecast | | 4.4 | | 4.8 | |
The US Federal Reserve Board has held its key interest rate constant at 5.25 per cent since June 2006. At its latest meeting on August 7, 2007, the Federal Reserve kept the target for the federal funds rate unchanged, marking the ninth consecutive meeting where the Fed has opted not to change rates. The Fed noted at this meeting that a sustained moderation in inflationary pressures has yet to be convincingly demonstrated and that its primary policy concern remained the risk that inflation will fail to moderate as expected.
However, on August 17, 2007, in a bid to stabilize worsening financial markets, the Federal Reserve cut its discount rate—the rate it charges banks for emergency loans—from 6.25 per cent to 5.75 per cent.(2) In a separate statement, the Fed said the downside risks to economic growth had “increased appreciably” and that they were “prepared to act as needed” to prevent financial turmoil from hurting the US economy.
(2) See the topic box at the end of this chapter for a discussion of the current US subprime mortgage market.
33
Outlook
Consistent with most private sector forecasts as of July 24, 2007, the Ministry of Finance outlook assumes that the Bank of Canada will slightly raise its overnight target rate in the third quarter of 2007 from 4.5 per cent to 4.75 per cent, and maintain this rate for the duration of 2008. Some forecasters now expect the Bank of Canada not to raise rates on September 5, 2007, but see a rate hike in either the fourth quarter of 2007 or the first quarter of 2008. Over the medium-term, the Ministry of Finance assumes that the target for the overnight rate will rise to 5.0 per cent. Table 2.3 and Chart 2.6 show the Ministry of Finance interest rate outlook, based on the average of six private sector forecasts.
The Ministry of Finance assumes the US Federal Reserve Board will hold its federal funds rate at 5.25 per cent through 2008. Interest rates are eventually expected to drop slightly to 5.0 per cent in early 2009, and remain at that level over the medium-term.
Chart 2.6 Interest rates are forecast to remain stable

Source: Bank of Canada and U.S. Federal Reserve Bank, Ministry of Finance forecasts
In recent weeks, the US Federal Reserve has provided significant liquidity, leading to speculation that the next move by the Fed on September 18, 2007 will be a rate reduction. The Ministry of Finance assumed no rate reduction, based on the average of private sector forecasts on July 24, 2007.
Generally, the interest rate assumptions made on July 24, 2007 remain in-line with the average of private sector views. As events in global financial markets may overtake current views on interest rates, the BC Ministry of Finance will continue to monitor closely both financial markets and the private sector outlook going forward.
Exchange rate
The Canadian dollar continued to appreciate in 2007, averaging 89.9 cents US in the first eight months of the year, which is up 1.9 per cent from the same period a year ago. A number of factors have contributed to the loonie’s strength including robust Canadian economic growth, merger and acquisition activity, a weak US dollar and ongoing concerns regarding the US budget and
34
current account deficits. While most analysts expect the Canadian dollar to remain strong, some are concerned about possible negative economic impacts such as lower revenues from exports and tourism.
Chart 2.7 Canadian dollar forecast raised

Source: Bank of Canada, BC Ministry of Finance forecast
Due to recent volatility in global financial markets, there has been a shift out of smaller financial markets into government bonds of major global economies like Japan and the US. The resulting tumult has caused significant volatility for currencies of smaller economies like Canada and Australia. The noon spot rate for the Canadian dollar has swung from a high of 96.41 US cents on July 26, 2007 to 92.98 US cents on August 16, 2007.
Outlook
The strength of the Canadian economy is expected to support a higher dollar going forward, with the loonie averaging 92.0 US cents in 2007. The dollar is expected to rise again in 2008 to 94.6 US cents. Table 2.4 shows the average of six private sector forecasts upon which the Ministry of Finance exchange rate outlook is based.
The outlook on the Canadian dollar is dependent on many factors including interest rate movements, demand for Canadian goods by foreign trading partners, commodity prices, financial investment flows and the stability of financial markets. For further information on the current global financial turmoil, see the topic box on page 49.
Table 2.4 Private Sector Exchange Rate Forecasts
Average annual exchange rate (US cents/Can $) | | 2007 | | 2008 | |
Global Insight | | 92.1 | | 93.1 | |
CIBC | | 92.4 | | 97.1 | |
Nesbitt Burns | | 92.0 | | 92.9 | |
Scotiabank | | 92.1 | | 98.9 | |
TD Economics | | 91.8 | | 94.1 | |
RBC Capital Markets | | 91.7 | | 91.8 | |
Average (as of July 24, 2007) | | 92.0 | | 94.6 | |
First Quarterly Report forecast | | 92.0 | | 94.6 | |
35
Commodity markets
A mixture of activity in commodity prices has been seen so far in 2007, with strong oil, metal and mineral prices counteracting weaker lumber and natural gas prices. In particular, prices for lumber are substantially lower this year, reaching a low of $228 US in early May before rebounding to around $265 US by the end of August. Lumber prices averaged $258 US for the first eight months of 2007, down $60 US compared to the same period a year ago.
Natural gas prices have fallen since the end of last year and averaged C$4.52 per gigajoule in July 2007, down 30 per cent from C$6.46 per gigajoule in December 2006. A number of factors have contributed to lower natural gas prices including higher storage levels of natural gas and weaker demand due to milder weather and an appreciating Canadian dollar. Oil prices have been very high due to supply concerns and instability in the Middle East, but this has not translated into higher natural gas prices. The West Texas Intermediate oil price averaged $63.32 US per barrel in the first seven months of this year.
Meanwhile, metal and mineral prices are recording strong growth so far in 2007. Copper prices have continued to appreciate, averaging $3.16 US per pound in the first seven months of 2007, 10 per cent higher than the same period a year ago. Prices for gold, silver and aluminum have all seen remarkable growth relative to last year, while the average price of lead has nearly doubled.
Outlook
The average price of British Columbia’s exports of goods and services is expected to rise by 0.3 per cent in 2007. This relatively weak price growth in 2007 is mainly due to lower natural gas and lumber prices.
Chart 2.8 Lumber prices weaker since Budget 2007
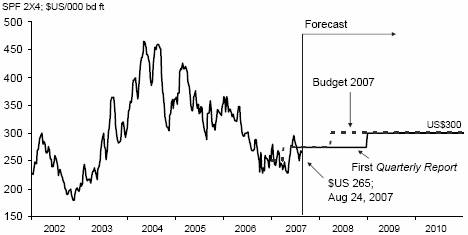
Source: Madison’s Lumber Reporter; Ministry of Finance; Ministry of Forests and Range
For 2008, the export price of goods and services is forecast to decline by 1.1 per cent due primarily to lower prices for minerals and paper.
36
Chart 2.9 Natural gas prices also weaken
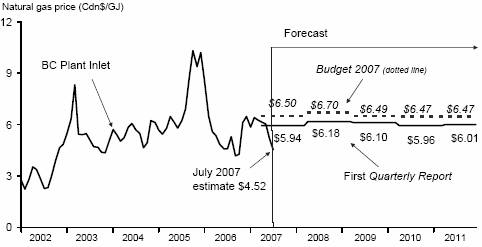
Source: BC Ministry of Energy, Mines and Petroleum Resources; Ministry of Finance
British Columbia economic forecast
The British Columbia economy is forecast to grow 3.0 per cent this year and 2.9 per cent in 2008. Investment and consumer spending are expected to drive economic growth, while growth in exports is forecast to be more than offset by solid gains in imports.
Table 2.5 First Quarterly Economic Forecast: Key Indicators (1)
| | 2007 | | 2008 | |
| | Budget 2007 | | First Quarterly | | Budget 2008 | | First Quarterly | |
| | Forecast | | Forecast | | Forecast | | Forecast | |
| | Annual per cent change unless otherwise noted | |
Real GDP | | 3.1 | | 3.0 | | 3.0 | | 2.9 | |
Nominal GDP | | 5.0 | | 5.7 | | 4.9 | | 4.9 | |
Employment | | 1.9 | | 2.9 | | 1.9 | | 1.7 | |
Unemployment rate | | 4.8 | | 4.3 | | 4.8 | | 4.6 | |
Net in-migration ('000 persons) | | 39.8 | | 43.7 | | 43.9 | | 45.0 | |
Corporate pre-tax profits | | 5.2 | | 5.0 | | 4.7 | | 2.8 | |
Housing starts ('000s) | | 33.6 | | 36.5 | | 31.6 | | 33.4 | |
Retail sales | | 5.4 | | 6.6 | | 5.2 | | 5.5 | |
(1) More details on the five-year outlook are available in Tables 2.7.1 through 2.7.4 at the end of Part Two.
External trade
The value of British Columbia’s exports has declined considerably since the beginning of 2007, due to the appreciating Canadian dollar and weakening in some commodity prices, notably lumber and natural gas. The total value of international merchandise exports from British Columbia to the rest of the world was down 2.7 per cent year-to-date through June compared to the same period in 2006. Forestry was the main contributor to the decline in export growth for the first half of this year, as forestry exports dropped 5.9 per cent relative to the first six months of 2006, reflecting both lower prices and slowing lumber production. Slower demand from a faltering US housing market is a major driving force behind these declines. The value of energy exports also
37
contracted from January to June 2007, dipping 6.2 per cent from the same period a year ago. Declines were observed in exports of both natural gas and coal. Exports of agriculture and fish products rose 7.9 per cent year-to-date to June.
Outlook
The outlook for the rest of 2007 is for modest growth in exports. Steady global demand is expected to outweigh the negative forces of a rising Canadian dollar and softening commodity prices. Real exports from British Columbia are forecast to rise 0.7 per cent this year and 3.4 per cent in 2008.
Chart 2.10 Exports trends impacted by lumber and energy prices
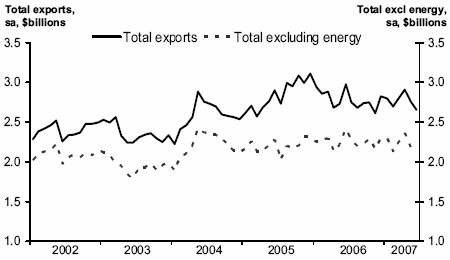
Source: BC STATS
Labour market
Employment in BC grew 3.2 per cent over the first seven months of 2007, as almost 71,000 jobs were added to the provincial economy. Gains occurred in both full-time employment, up 59,000 jobs year-to-date to July, and part-time employment, up almost 12,000 jobs.
Job gains over the first seven months of this year were concentrated in areas such as construction, utilities, health and social services, and the finance, insurance and real estate sectors.
While posting a 30-year low of 3.9 per cent in March, the unemployment rate averaged a very low 4.2 per cent in the January to July period, down 0.5 percentage points from the same period in 2006. The fall in the unemployment rate occurred due to employment growth outpacing labour force growth.
Wages and salaries in BC rose 6.4 per cent in the first six months of 2007 relative to the same period last year. This is slightly less than the year-to-date growth for Canadian wages and salaries to June of 6.6 per cent. Wage rate growth in BC for the first seven months of 2007 was modest compared to other provinces, with average weekly wage rates up 3.2 per cent compared to the same period a year ago.
38
Outlook
Employment in British Columbia is forecast to grow 2.9 per cent for 2007, equivalent to 65,000 jobs. Much of the strength this year is expected to be in the construction and other goods sectors of the economy. For 2008, the economy is expected to generate about 38,000 new jobs, a 1.7 per cent increase in employment. The unemployment rate is expected to average 4.3 per cent in 2007, then rise to 4.6 per cent in 2008 as more people enter the labour market.
Chart 2.11 Employment gains pause, but levels remain strong

Source: Statistics Canada
Demographic developments
BC’s population grew 1.3 per cent in the January to March period of 2007, compared to the same quarter of last year, mainly due to in-migration. The natural increase in BC’s population, measured as births minus deaths, is on a downward trend. In 2006, BC had a natural increase of 11,048 people, down from an annual natural increase of 21,635 people in 1991.
British Columbia saw a net inflow of 2,502 people from other provinces in the January to March quarter of 2007. Following a net inflow of 5,696 people from other countries in the final three months of 2006, net international migration to BC was up by 10,269 people through the January to March period of 2007. BC experienced an overall net migration gain of 12,771 people in the first quarter of this year.
Outlook
The forecast calls for British Columbia to gain 43,700 people in 2007 from net migration. In 2008, net migration is expected to rise to 45,000 people.
39
Domestic demand
Consumer spending and housing
Retail sales have performed well for most of 2007, with year-to-date sales up 7.4 per cent through June. Strong gains have been made this year in several categories including home and hardware stores, building materials and garden centres, as well as home electronics and appliance stores.
Chart 2.12 Retail sales activity strong
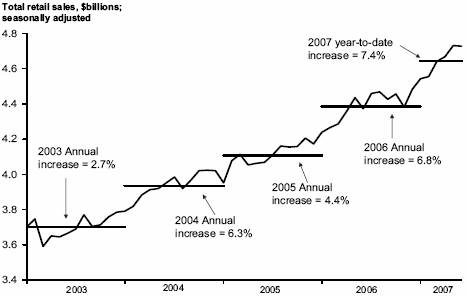
Source: Statistics Canada
Housing starts in BC began strong in 2007, as an annualized 40,500 units were initiated in January of this year. However, housing starts declined by 2.3 per cent over the first seven months of 2007 compared to the same period in 2006, with monthly starts averaging an annualized 36,800 units this year.
Outlook
Retail sales are forecast to grow rapidly over the next two years, increasing 6.6 per cent in 2007 and 5.5 per cent in 2008, supported by continued consumer confidence and growing personal income. Housing starts are forecast to total 36,500 units for 2007, moderating to a still high 33,440 units in 2008. Lower demand and rising home prices are expected to slow the pace of housing starts next year.
40
Chart 2.13 Housing starts remain high
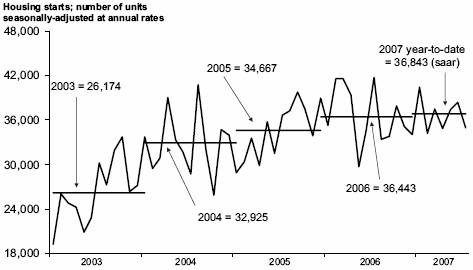
Source: Canada Mortgage and Housing Corporation
Business and government activity
Business investment in British Columbia has been growing steadily along with provincial economic growth. Corporate profits have posted very strong growth since 2003, and rose 8.3 per cent in 2006. Non-residential building permits surged 20.4 per cent in the first half of 2007 compared to the same period in 2006. Business bankruptcies continued their decline through the first six months of 2007, falling 29.3 per cent compared to the same period in 2006. However, business incorporations dropped slightly in the January to July period of this year, falling 0.1 per cent relative to the first seven months of 2006.
Chart 2.14 Non-residential construction strengthening
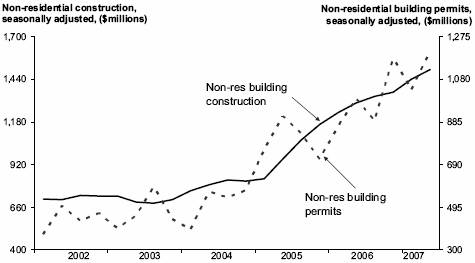
Source: Statistics Canada; quarterly data
41
Rapid growth in non-residential construction over the last few years, coupled with the strong residential construction market, has led to concerns over skilled labour shortages and escalating construction costs. Statistics Canada’s overall construction price index for non-residential buildings in Vancouver increased 13.7 per cent in the first half of 2007 compared to the first six months of 2006. This follows annual non-residential construction price growth of 7.3 per cent in 2005 and 10.3 per cent in 2006.
Wages – a large component of overall construction costs – have also increased since 2006, as average hourly earnings in the province’s construction sector rose 5.0 per cent in the first six months of 2007 compared to the same period last year, according to Statistics Canada’s Survey of Employment, Payroll and Hours. Wage growth in the construction sector is not evenly distributed, with certain jobs experiencing higher wage inflation than others. For example, average wages for jobs in the utility system construction area were up 18.5 per cent year-to-date to June, while highway, street and bridge construction workers saw a decline of 6.8 per cent in their wages.
Outlook
Corporate pre-tax profits are forecast to grow 5.0 per cent in 2007, and a more modest 2.8 per cent in 2008, reflecting further commodity price declines. Total real investment in British Columbia is expected to increase 6.7 per cent this year and by 2.6 per cent in 2008.
Chart 2.15 Non-residential construction prices in Vancouver

Source: Statistics Canada
Real (inflation-adjusted) government expenditures for all levels of government (federal, provincial and local) are forecast to rise 4.7 per cent in 2007 and 1.7 per cent in 2008. Over the medium-term, growth in government spending is expected to average around 2.3 per cent.
42
Inflation
Consumer price inflation averaged 1.9 per cent in the first seven months of 2007. Lower prices for durables and semi-durables were offset by higher prices in the non-durables sector (reflecting higher energy prices) and the services sector. In the January to July period of 2007, British Columbia had the fourth highest rate of inflation among the provinces, as its Consumer Price Index averaged 1.9 per cent year-to-date to July. This rate is slightly lower than Canada’s 2.0 per cent average rate of inflation over the same period.
Outlook
Inflation for BC is expected to average 2.0 per cent this year as higher prices for non-durables (driven by climbing oil prices) and services are expected to be offset by lower prices for semi-durables. In 2008 and over the medium-term inflation is forecast to average about 2.1 per cent per year.
Medium-term outlook
The US economy is expected to grow around 3.0 per cent per year over the medium-term, while the Canadian economy is expected to grow at a slightly slower pace, at 2.8 per cent per year. The Japanese economy is expected to grow at an annual rate of 1.5 per cent over the medium-term, while Europe is expected to grow 2.0 per cent per year.
Economic growth in British Columbia is forecast to grow by 3.1 per cent in 2009, 3.3 per cent in 2010 and 3.1 per cent in 2011. This reflects the economic strength of the province’s major trading partners and continued growth in domestic economic activity leading up to and during the 2010 Winter Olympics.
British Columbia’s population is forecast to grow about 1.2 per cent per year over the medium-term, as more people are expected to enter the province from other parts of Canada and from other countries.
Detailed tables of the five-year outlook are provided at the end of Part Two (see Tables 2.7.1 through 2.7.4).
Risks to the forecast
The economic outlook has both upside and downside risks associated with it. The most significant risks to the British Columbia economic outlook remain a further deterioration in the US economy, caused by a worse than expected performance in the US housing market, and increased turmoil in financial markets.
The British Columbia economy could grow faster than forecast if:
• The US housing market recovers from its current state of decline and demand from this sector is stronger than anticipated. This would provide an opportunity for further growth in British Columbia’s forest industry.
• The value of the Canadian dollar falls significantly below the current forecast.
43
• Commodity prices, in particular lumber prices and natural gas prices rise to levels higher than the current forecast.
• British Columbia business confidence and investment continue to strengthen, providing a base for stronger economic growth in the province.
• The US economy performs better than anticipated.
• Interprovincial net migration increases substantially, creating additional demand for goods and services to boost economic growth.
• Visitors to BC increase more than expected as Vancouver gains further international recognition as a tourism destination through promotion of the 2010 Winter Olympics.
Alternatively, the British Columbia economy could grow slower than forecast if:
• The US housing market deteriorates further than expected.
• The recent credit crisis broadens in scope and affects economic growth across North America.
• Commodity prices decline more sharply than forecast or become more volatile.
• The Canadian dollar movements become increasingly volatile or the dollar continues its rapid appreciation.
• The escalation in construction sector costs continues and shortages of skilled labour are worse than expected.
• Oil prices rise even further and are sustained at a higher level, dampening North American growth prospects.
• The mountain pine beetle outbreak is more widespread than anticipated.
• Geopolitical uncertainty accelerates due to events in the Middle East and terrorist threats.
• Tourism in British Columbia slows, for example due to tighter border security in the US, further appreciation of the Canadian dollar, or fears of an Avian Flu or Pandemic Influenza outbreak.
44
Table 2.6 Current Economic Statistics
| | | | | | Year-to-Date | |
| | | | Average | |
| | Latest Period | | 2006 | | 2007 | | Change | |
BRITISH COLUMBIA | | | | | | | | | | | |
| | | | | | | | | | | |
LABOUR MARKET | | | | | | | | | | | |
Employment (s.a.(1), thousands) | | July | | 2,258 | | 2,186 | | 2,257 | | 3.2 | % |
Unemployment rate (s.a., per cent) | | July | | 4.1 | | 4.6 | | 4.2 | | -0.5 | |
Total net in-migration (persons) | | Jan -Mar. | | 12,771 | | 10,365 | | 12,771 | | 2,406 | |
Interprovincial (persons) | | Jan -Mar. | | 2,502 | | 654 | | 2,502 | | 1,848 | |
International (persons) | | Jan -Mar. | | 10,269 | | 9,711 | | 10,269 | | 558 | |
Wages and salaries (s.a. $millions) | | June | | 7,202 | | 6,635 | | 7,057 | | 6.4 | % |
Average weekly wage rate | | July | | 744 | | 720 | | 743 | | 3.2 | % |
| | | | | | | | | | | |
CONSUMER SECTOR | | | | | | | | | | | |
Retail sales (s.a., $ million) | | June | | 4,729 | | 4,325 | | 4,644 | | 7.4 | % |
Car and truck sales (s.a., units) | | June | | 16,936 | | 15,996 | | 17,013 | | 6.4 | % |
Housing starts (all areas, s.a., annual rate) | | July | | 35,000 | | 37,714 | | 36,843 | | -2.3 | % |
Existing home sales (s.a.) | | July | | 9,234 | | 8,444 | | 8,559 | | 1.4 | % |
Building permits (s.a., $ millions) | | June | | 1,305 | | 898 | | 1,099 | | 22.4 | % |
BC consumer price index (annual per cent change) | | July | | 1.0 | | 1.9 | | 1.9 | | 0.0 | |
| | | | | | | | | | | |
INDUSTRIAL ACTIVITY | | | | | | | | | | | |
Foreign merchandise exports (s.a., $ million) | | June | | 2,653 | | 2,845 | | 2,768 | | -2.7 | % |
Manufacturing shipments (s.a., $ million) | | June | | 3,496 | | 3,517 | | 3,495 | | -0.6 | % |
Lumber production (thousand cubic metres) | | June | | 3,225 | | 3,577 | | 3,318 | | -7.2 | % |
Pulp and paper shipments (thousand tonnes) | | June | | 596 | | 658 | | 633 | | -3.9 | % |
Copper production (million kg) | | June | | 20.8 | | 23.4 | | 21.7 | | -7.3 | % |
| | | | | | | | | | | |
TOURISM | | | | | | | | | | | |
Entries of U.S. and overseas residents (thousands) | | June | | 561.1 | | 576.5 | | 562.4 | | -2.5 | % |
BC ferry passengers to/from Vancouver Island (thousands) | | July | | 1,426 | | 886 | | 895 | | 1.1 | % |
| | | | | | | | | | | |
COMMODITY PRICES | | | | | | | | | | | |
Lumber (US $/thousand board feet) | | July | | 271 | | 325 | | 257 | | -20.8 | % |
Pulp (US $/tonne) | | July | | 799 | | 642 | | 768 | | 19.7 | % |
Newsprint (US $/tonne) | | July | | 583 | | 664 | | 617 | | -7.1 | % |
Copper (US $/lb.) | | July | | 3.62 | | 2.88 | | 3.16 | | 10.0 | % |
| | | | | | | | | | | |
FINANCIAL DATA | | | | | | | | | | | |
Canadian dollar (US cents) | | July | | 95.2 | | 88.0 | | 89.2 | | 1.3 | |
Canadian prime rate (per cent) | | July | | 6.25 | | 5.68 | | 6.04 | | 0.36 | |
Canadian treasury bills (per cent) | | July | | 4.56 | | 3.94 | | 4.28 | | 0.34 | |
Treasury bill spread – Canada minus US (per cent) | | July | | -0.26 | | -0.66 | | -0.58 | | 0.09 | |
(1) | | s.a. - seasonally adjusted. |
45
Table 2.7.1 Gross Domestic Product: British Columbia
| | | | | | Forecast | |
| | 2005 | | 2006 | | 2007 | | 2008 | | 2009 | | 2010 | | 2011 | |
BRITISH COLUMBIA: | | | | | | | | | | | | | | | |
| | | | | | | | | | | | | | | |
Gross Domestic Product at Market Prices: | | | | | | | | | | | | | | | |
– Real (1997 $ billion; chain-weighted) | | 145.5 | | 150.7 | | 155.3 | | 159.7 | | 164.7 | | 170.3 | | 175.5 | |
(% change) | | 3.7 | | 3.6 | | 3.0 | | 2.9 | | 3.1 | | 3.3 | | 3.1 | |
– Current dollar ($ billion) | | 168.9 | | 179.7 | | 189.9 | | 199.2 | | 210.3 | | 221.5 | | 232.6 | |
(% change) | | 7.2 | | 6.4 | | 5.7 | | 4.9 | | 5.5 | | 5.3 | | 5.0 | |
– GDP price deflator (1997 = 100) | | 116.1 | | 119.2 | | 122.3 | | 124.7 | | 127.6 | | 130.1 | | 132.6 | |
(% change) | | 3.4 | | 2.7 | | 2.6 | | 2.0 | | 2.3 | | 1.9 | | 1.9 | |
Real GDP per person | | | | | | | | | | | | | | | |
(1997 $; chain-weighted) | | 34,173 | | 34,971 | | 35,574 | | 36,156 | | 36,843 | | 37,608 | | 38,285 | |
(% change) | | 2.4 | | 2.3 | | 1.7 | | 1.6 | | 1.9 | | 2.1 | | 1.8 | |
Real GDP per employed person | | | | | | | | | | | | | | | |
(% change) | | 0.4 | | 0.5 | | 0.1 | | 1.2 | | 1.3 | | 1.4 | | 1.1 | |
Unit labour cost(1) (% change) | | 2.7 | | 4.5 | | 2.6 | | 2.1 | | 2.0 | | 1.8 | | 2.1 | |
| | | | | | | | | | | | | | | |
Components of British Columbia Real GDP at
Market Prices ($1997 billions; chain-weighted) | |
| | | | | | | | | | | | | | | |
Personal expenditure on Goods and services | | 92.3 | | 97.2 | | 101.2 | | 104.6 | | 108.0 | | 111.6 | | 115.3 | |
| (% change) | | 4.4 | | 5.3 | | 4.1 | | 3.3 | | 3.3 | | 3.4 | | 3.3 | |
– | Goods | | 39.5 | | 41.5 | | 43.8 | | 45.3 | | 46.9 | | 48.5 | | 50.2 | |
| (% change) | | 3.4 | | 5.1 | | 5.4 | | 3.5 | | 3.4 | | 3.5 | | 3.5 | |
– | Services | | 52.8 | | 55.7 | | 57.4 | | 59.3 | | 61.1 | | 63.1 | | 65.1 | |
| (% change) | | 5.1 | | 5.4 | | 3.2 | | 3.2 | | 3.1 | | 3.3 | | 3.1 | |
Government current expenditures on Goods and services | | 25.9 | | 26.6 | | 27.8 | | 28.3 | | 29.0 | | 29.7 | | 30.3 | |
(% change) | | 1.5 | | 2.8 | | 4.7 | | 1.7 | | 2.4 | | 2.5 | | 2.1 | |
Investment in fixed capital | | 33.8 | | 37.0 | | 39.5 | | 40.5 | | 42.1 | | 43.9 | | 46.0 | |
(% change) | | 8.1 | | 9.5 | | 6.7 | | 2.6 | | 3.7 | | 4.5 | | 4.8 | |
| | | | | | | | | | | | | | | |
Final domestic demand | | 151.3 | | 159.9 | | 167.5 | | 172.3 | | 177.9 | | 184.1 | | 190.3 | |
(% change) | | 4.5 | | 5.6 | | 4.8 | | 2.9 | | 3.2 | | 3.5 | | 3.4 | |
| | | | | | | | | | | | | | | |
Exports goods and services | | 67.5 | | 69.1 | | 69.6 | | 72.0 | | 74.9 | | 77.8 | | 80.2 | |
(% change) | | 2.9 | | 2.4 | | 0.7 | | 3.4 | | 4.0 | | 3.9 | | 3.1 | |
Imports goods and services | | 75.1 | | 79.8 | | 82.7 | | 85.0 | | 87.8 | | 91.0 | | 94.2 | |
(% change) | | 5.7 | | 6.3 | | 3.6 | | 2.8 | | 3.3 | | 3.6 | | 3.5 | |
Inventory change | | 1.7 | | 1.4 | | 0.9 | | 1.0 | | 0.8 | | 0.8 | | 0.8 | |
Statistical discrepancy | | 0.0 | | -0.1 | | -0.1 | | -0.1 | | -0.1 | | -0.1 | | -0.1 | |
| | | | | | | | | | | | | | | |
Real GDP at market prices | | 145.5 | | 150.7 | | 155.3 | | 159.7 | | 164.7 | | 170.3 | | 175.5 | |
(% change) | | 3.7 | | 3.6 | | 3.0 | | 2.9 | | 3.1 | | 3.3 | | 3.1 | |
(1) | | Unit labour cost is the nominal cost of labour incurred to produce one unit of real output. |
46
Table 2.7.2 Components of Nominal Income and Expenditure
| | | | | | Forecast | |
| | 2005 | | 2006 | | 2007 | | 2008 | | 2009 | | 2010 | | 2011 | |
Labour income(1) ($ million) | | 85,402 | | 92,434 | | 97,645 | | 102,576 | | 107,885 | | 113,460 | | 119,391 | |
(% change) | | 6.5 | | 8.2 | | 5.6 | | 5.1 | | 5.2 | | 5.2 | | 5.2 | |
Personal income ($ million) | | 130,481 | | 139,867 | | 146,437 | | 153,149 | | 160,348 | | 167,847 | | 175,740 | |
(% change) | | 5.7 | | 7.2 | | 4.7 | | 4.6 | | 4.7 | | 4.7 | | 4.7 | |
Corporate profits before taxes ($ million) | | 20,011 | | 21,673 | | 22,478 | | 23,388 | | 25,054 | | 26,418 | | 27,690 | |
(% change) | | 17.6 | | 8.3 | | 5.0 | | 2.8 | | 7.1 | | 5.4 | | 4.8 | |
Retail sales ($ million) | | 49,286 | | 52,627 | | 56,075 | | 59,173 | | 62,375 | | 65,787 | | 69,399 | |
(% change) | | 4.4 | | 6.8 | | 6.6 | | 5.5 | | 5.4 | | 5.5 | | 5.5 | |
Housing starts | | 34,667 | | 36,443 | | 36,500 | | 33,440 | | 32,004 | | 31,069 | | 30,262 | |
(% change) | | 5.3 | | 5.1 | | 0.2 | | -8.4 | | -4.3 | | -2.8 | | -2.7 | |
Residential investment(2) ($ million) | | 14,602 | | 16,835 | | 18,354 | | 19,229 | | 20,169 | | 21,214 | | 22,406 | |
(% change) | | 12.7 | | 15.3 | | 9.0 | | 4.8 | | 4.9 | | 5.2 | | 5.6 | |
BC consumer price index (2001 = 100) | | 106.3 | | 108.1 | | 110.3 | | 112.6 | | 115.0 | | 117.4 | | 119.9 | |
(% change) | | 2.0 | | 1.7 | | 2.0 | | 2.1 | | 2.1 | | 2.1 | | 2.1 | |
(1) | Domestic basis; wages, salaries and supplementary labour income. |
| |
(2) | Includes renovations and improvements. |
Table 2.7.3 Labour Market Indicators
| | | | | | Forecast | |
| | 2005 | | 2006 | | 2007 | | 2008 | | 2009 | | 2010 | | 2011 | |
Population (on July 1) (000’s) | | 4,258 | | 4,310 | | 4,365 | | 4,418 | | 4,472 | | 4,527 | | 4,583 | |
(% change) | | 1.3 | | 1.2 | | 1.3 | | 1.2 | | 1.2 | | 1.2 | | 1.2 | |
Labour force population, 15+ Years (000’s) | | 3,448 | | 3,511 | | 3,569 | | 3,624 | | 3,680 | | 3,736 | | 3,792 | |
(% change) | | 1.7 | | 1.8 | | 1.6 | | 1.6 | | 1.5 | | 1.5 | | 1.5 | |
Net in-migration | | | | | | | | | | | | | | | |
– International(1) | | 38,843 | | 36,224 | | 33,735 | | 33,048 | | 33,838 | | 33,187 | | 33,454 | |
– Interprovincial | | 4,811 | | 7,823 | | 9,999 | | 12,000 | | 12,500 | | 15,500 | | 16,000 | |
– Total | | 43,654 | | 44,047 | | 43,734 | | 45,048 | | 46,338 | | 48,687 | | 49,454 | |
Participation rate(2) (%) | | 65.6 | | 65.7 | | 66.2 | | 66.5 | | 66.8 | | 67.1 | | 67.4 | |
Labour force (000’s) | | 2,263 | | 2,305 | | 2,361 | | 2,409 | | 2,460 | | 2,507 | | 2,555 | |
(% change) | | 1.9 | | 1.8 | | 2.4 | | 2.0 | | 2.1 | | 1.9 | | 1.9 | |
Employment (000’s) | | 2,131 | | 2,196 | | 2,260 | | 2,298 | | 2,341 | | 2,387 | | 2,433 | |
(% change) | | 3.3 | | 3.1 | | 2.9 | | 1.7 | | 1.9 | | 2.0 | | 1.9 | |
– Goods sector employment (000’s)(3) | | 442 | | 455 | | 479 | | 488 | | 501 | | 514 | | 527 | |
(% change) | | 3.4 | | 2.9 | | 5.3 | | 1.8 | | 2.6 | | 2.7 | | 2.5 | |
– Service sector employment (000’s)(3) | | 1,688 | | 1,740 | | 1,781 | | 1,810 | | 1,840 | | 1,872 | | 1,906 | |
(% change) | | 3.3 | | 3.1 | | 2.3 | | 1.6 | | 1.7 | | 1.7 | | 1.8 | |
Unemployment rate (%) | | 5.9 | | 4.8 | | 4.3 | | 4.6 | | 4.8 | | 4.8 | | 4.8 | |
(1) | | International migration includes net non-permanent residents and returning emigrants less net temporary residents abroad. |
| | |
(2) | | Percentage of the population 15 years of age and over in the labour force. |
| | |
(3) | | Components may not sum to total due to rounding. |
47
Table 2.7.4 Major Economic Assumptions
| | | | | | Forecast | |
| | 2005 | | 2006 | | 2007 | | 2008 | | 2009 | | 2010 | | 2011 | |
GDP (billions) | | | | | | | | | | | | | | | |
Canada real (2002 $; chain-weighted) | | 1,248 | | 1,282 | | 1,312 | | 1,346 | | 1,383 | | 1,422 | | 1,462 | |
(% change) | | 3.1 | | 2.8 | | 2.3 | | 2.5 | | 2.8 | | 2.8 | | 2.8 | |
US real (1996 US$; chain-weighted) | | 11,004 | | 11,319 | | 11,522 | | 11,787 | | 12,145 | | 12,507 | | 12,877 | |
(% change) | | 3.1 | | 2.9 | | 1.8 | | 2.3 | | 3.0 | | 3.0 | | 3.0 | |
Japan real (2000 Yen; chain-weighted) | | 537,214 | | 548,921 | | 560,758 | | 571,048 | | 579,588 | | 588,306 | | 597,415 | |
(% change) | | 1.9 | | 2.2 | | 2.2 | | 1.8 | | 1.5 | | 1.5 | | 1.5 | |
Europe real(1) (% change) | | 1.6 | | 2.9 | | 2.6 | | 2.1 | | 2.0 | | 2.0 | | 2.0 | |
| | | | | | | | | | | | | | | |
Industrial production index | | | | | | | | | | | | | | | |
US (2002 = 100) | | 106.9 | | 111.2 | | 113.2 | | 116.0 | | 119.5 | | 123.1 | | 126.7 | |
(% change) | | 3.2 | | 4.0 | | 1.8 | | 2.5 | | 3.0 | | 3.0 | | 3.0 | |
Japan (2000 = 100) | | 101.9 | | 106.3 | | 108.7 | | 111.4 | | 113.6 | | 115.8 | | 118.1 | |
(% change) | | 1.6 | | 4.3 | | 2.2 | | 2.5 | | 2.0 | | 2.0 | | 2.0 | |
Europe(1) (2000 = 100) | | 103.8 | | 107.9 | | 110.6 | | 113.0 | | 115.2 | | 117.5 | | 119.9 | |
(% change) | | 1.3 | | 4.0 | | 2.5 | | 2.1 | | 2.0 | | 2.0 | | 2.0 | |
| | | | | | | | | | | | | | | |
Housing starts(2) (000’s) | | | | | | | | | | | | | | | |
Canada | | 225 | | 227 | | 215 | | 190 | | 185 | | 185 | | 185 | |
(% change) | | -3.4 | | 0.8 | | -5.6 | | -11.5 | | -2.6 | | 0.0 | | 0.0 | |
US | | 2,073 | | 1,812 | | 1,381 | | 1,330 | | 1,450 | | 1,500 | | 1,600 | |
(% change) | | 6.3 | | -12.6 | | -23.8 | | -3.7 | | 9.0 | | 3.4 | | 6.7 | |
Japan | | 1,236 | | 1,290 | | 1,273 | | 1,254 | | 1,200 | | 1,150 | | 1,150 | |
(% change) | | 4.0 | | 4.4 | | -1.3 | | -1.5 | | -4.3 | | -4.2 | | 0.0 | |
| | | | | | | | | | | | | | | |
Consumer price index | | | | | | | | | | | | | | | |
Canada (2001 = 100) | | 107.0 | | 109.1 | | 111.7 | | 114.2 | | 116.5 | | 118.9 | | 121.2 | |
(% change) | | 2.2 | | 2.0 | | 2.4 | | 2.3 | | 2.0 | | 2.0 | | 2.0 | |
| | | | | | | | | | | | | | | |
Canadian interest rates (%) | | | | | | | | | | | | | | | |
3-Month treasury bills | | 2.7 | | 4.0 | | 4.4 | | 4.8 | | 5.0 | | 5.0 | | 5.0 | |
10-year government bonds | | 4.1 | | 4.2 | | 4.5 | | 5.1 | | 5.4 | | 5.8 | | 6.0 | |
| | | | | | | | | | | | | | | |
United States interest rates (%) | | | | | | | | | | | | | | | |
3-Month treasury bills | | 3.1 | | 4.7 | | 4.9 | | 5.0 | | 5.0 | | 5.0 | | 5.0 | |
10-year government bonds | | 4.3 | | 4.8 | | 5.0 | | 5.5 | | 5.8 | | 5.9 | | 6.0 | |
| | | | | | | | | | | | | | | |
Exchange rate (US cents / Canadian $) | | 82.5 | | 88.2 | | 92.0 | | 94.6 | | 93.5 | | 92.4 | | 91.8 | |
| | | | | | | | | | | | | | | |
British Columbia goods and services Export price deflator (% change) | | 3.7 | | 0.0 | | 0.3 | | -1.1 | | 1.8 | | 1.2 | | 1.1 | |
(1) | | Euro zone (12) is Austria, Belgium, Finland, France, Germany, Greece, Ireland, Italy, Luxembourg, Netherlands, Portugal and Spain. |
| | |
(2) | | British Columbia housing starts appear in Table 2.7.2. |
48
The US Subprime Mortgage Market
Summary
Over the last few years, a vibrant US economy has led to steady job growth, healthy increases in personal income and a surging housing market in the US. Americans’ desires to invest heavily in real estate during this period (fuelled partially by low interest rates) led to widespread lending of subprime mortgages to homebuyers. These mortgages, generally offered at higher rates, are loans to riskier borrowers.
Facing substantial increases in the demand for riskier mortgages, lenders sought to offload a substantial amount of the loans by packaging them together and selling them to large investment banks and other financial institutions throughout the world. Packaging subprime loans as mortgage-backed securities (MBS) allowed financial institutions to reduce their liquidity risks and subsequently increase the amount of lending in the subprime market. Unfortunately, new types of lending instruments (e.g. collateralized debt obligations or CDOs) made it very difficult for buyers of these subprime-backed securities to observe the quality of the underlying loans. As a result, there was a mispricing of risk associated with many subprime loans.
In 2004 and 2005 the volume of subprime mortgages exploded along with the booming housing market. Investors all over the globe were more than eager to jump into the MBS market, and homebuyers took on more and more high-risk mortgages with confidence that increasing home values would allow them to refinance or sell if necessary. By the time the housing market began to cool in 2006, a much larger than expected increase in subprime defaults caught financial markets by surprise. The mispricing of risk in the subprime sector came to a head in August 2007, as financial markets lost billions due to a massive decrease in confidence among investors. Rapidly spreading concerns over the erosion of the subprime sector in recent weeks have resulted in reduced liquidity in financial markets, as investors have tightened up their willingness to lend money and markets struggle to re-price the risk of investments.
Like other provinces, British Columbia bond spreads have also been adversely affected since the subprime crash, although not as negatively impacted as Canadian corporate bond spreads in which there has been significant widening.
Subprime mortgage market
At the heart of the recent liquidity crisis is the rapid erosion of the subprime mortgage market in the US. Subprime lending refers to the practice of making loans to high-risk borrowers. Subprime lending is risky for both lenders and borrowers due to the combination of high interest rates, poor credit history and weaker financial situations often associated with subprime applicants.
The US subprime mortgage sector has grown dramatically in recent years, with a surging domestic housing market (fuelled by low interest rates and a rapidly growing supply) causing a large increase in the demand for mortgages. Lenders eager to grant mortgages to risky borrowers offered them more exotic lending instruments, combined with little or no requirement for downpayment. One example of a popular subprime loan is the 2/28 hybrid, which combines features of the adjustable-rate mortgage (ARM) and fixed-rate mortgage (FRM). The 2/28 has a fixed, low rate for the first two years (a “teaser” rate) and then becomes adjustable semi-annually for the next 28 years as the rate resets to the value of a pre-determined index plus a margin. Other subprime products include negatively amortizing mortgages (NegAms), interest-only mortgages (lOs) and NINJA loans (no job, no income, and no assets).(1)
(1) | | NegAms are mortgages with payment schedules in which the borrower pays back less than the full amount of interest to the lender on a scheduled payment, and the remainder is added to the principal. As long as house prices rise, the lender has security, but if prices fall, the risks of non-payment increase. An IO mortgage requires the borrower to pay only the interest for a set period of time. Once the IO period ends, the borrower must pay down the principal in addition to interest. NINJA loans are granted without documented proof of income, employment or assets required from borrowers. |
49
During the period 2004–2006, approximately 45 per cent of subprime mortgages were ARMs or hybrids, 25 per cent were FRMs, 10 per cent allowed negative amortization and 20 per cent were IOs.(2)
Events preceding the subprime instability
The recent crisis has its beginnings in a global financial market flooded with cash. Following the stock market decline in 2000, the US Federal Reserve cut short-term interest rates to historic lows to incite consumer spending and fend off recession. This plan proved effective, as US economic strength continued despite its slumping stock market. As the US and world economies continued to grow, global liquidity was drawn to the US economy, as investors and central banks from around the world purchased US financial instruments.
Chart 1 – US GDP growth recovers after 2001
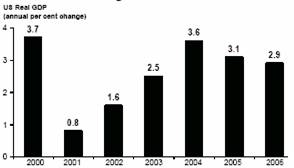
Source: US Census Bureau
The result of this flurry of financial activity was a global economy with low inflation, strong corporate profits and steady growth for investors. Confidence among investors continued to increase, as risk premiums – the additional yield that investors demand for holding riskier assets such as mortgage bonds and low-rated corporate debt – began to shrink. With the cost of loans falling, private equity firms also began borrowing large sums of money to purchase struggling companies, streamlining their operations and selling them publicly.
(2) NERA (2007). The Subprime Meltdown: A Primer.
At the same time, extremely low interest rates helped to push the US housing market into overdrive, as new construction, new and existing homes sales, and real estate prices all reached historically high levels. The low cost of mortgages – and banks’ willingness to grant them to high-risk borrowers – allowed homebuyers to purchase bigger and better homes, with the confidence that even when their finances were stretched, the increase in home values provided the option to refinance or sell instead of going into delinquency.
Chart 2 – Growth of the US subprime mortgage market
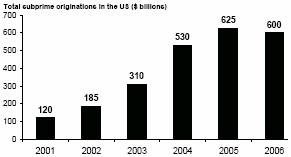
Source. NERA Economic Consulting
New Financial Innovations
Large investment banks and other financial institutions were able to increase the amount of lending in the subprime market through securitization. Securitization is the process of turning pools of home loans into bonds, which are referred to as mortgage-backed securities (MBSs), or sometimes into more complex debt instruments, such as collateralized debt obligations (CDOs).(3)
These sorts of financial innovations have helped to increase the volume of credit available to borrowers, and to improve the liquidity of the mortgage market. However, these instruments are not without their drawbacks. For example. MBSs and CDOs are difficult to price accurately. These instruments do not reduce risk, but simply transfer it, and the purchaser of these instruments is often unable to accurately price the risk.
(3) TD Economics. (August 20, 2007). The Grey Anatomy of the Current Credit Crunch.
50
In financial markets, lenders generally reduce the risks associated with issuing loans by pooling a large number of loans. Over a long period of time and with a large enough number of loans issued, investors will usually be able to predict approximately how many borrowers will default. This process allows lenders, and subsequently the investors that purchase asset-backed securities, to accurately price the risk involved in their investments.
Unfortunately, these new financial innovations interacted with previous financial innovations in ways that were not fully appreciated at the time the transactions took place. For example, subprime loans requiring limited documentation (NINJA loans) were originally created to make it easier for self-employed people to receive approval for mortgages. By packaging off their loans, the incentives and abilities of borrowers and lenders were impaired. The individual buying the subprime-backed CDO, for example, could not observe the credit quality of the underlying loans. An investor’s analysis simply assumed that in large enough amounts, the subprime loans will reach an average, and predictable, historical default rate. The lender, of course, is not concerned about the credit quality of the borrower, since the lender effectively transfers the subprime mortgage and all associated risks through the CDO. As such, these mortgages meet the goals of lenders to continue lending, but also increase the risk that future defaults will be higher than in the past.
Current subprime and financial market difficulties
Between 2001 and 2006, years of growth in the housing market had meant that even when a subprime borrower was struggling with payments, the increase in home values provided the option to refinance or sell property instead of facing delinquency. However, the increase in short-term interest rates since 2004, along with the cooling of the US housing market starting in 2006 caused a marked increase in the number of defaults on subprime loans. The delinquency rate on subprime mortgages that originated in 2005 peaked at about twice the rate of those originated over 2002–2004, while the delinquency rate on the 2006 vintage of subprime mortgages looks likely to peak at about twice that of the 2005 vintage. Where these loans had been allocated to MBS or CDOs, this has led to more defaults in these investments.
Chart 3 – Decline in US housing starts since 2006
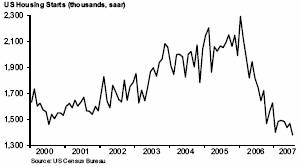
Source: US Census Bureau
This steep rise in the rate of subprime delinquencies caused a large number of subprime mortgage lenders to file for bankruptcy, including New Century Financial Corporation, the second largest subprime lender in the US. As delinquencies increased, a number of hedge funds ran into trouble because they were deeply invested in thinly traded CDOs with declining values. Some investors have had to sell assets at discounts, and the amount of sales has led to price declines. These incidents have sparked concern over market contagion as they have prompted markdowns of similar assets in other portfolios.
The problem has already spread to the asset-backed commercial paper market (ABCP).(4) Investors have become increasingly hesitant to buy ABCP backed by assets such as mortgages with the housing market in such a poor state. As a result, many issuers of ABCP cannot find buyers, leaving them without liquidity in the short-term.
(4) Asset backed commercial paper (ABCP) is a term for trusts set up by financial institutions that issue paper (short-term debt) backed by car loans, mortgages and credit card receivables.
51
Money markets have seized up in recent weeks, with banks and investors gripped by fear after defaults linked to US mortgages caused massive losses for banks in the US, Germany and elsewhere. Interest charged on loans that banks once made to each other as a matter of routine have skyrocketed due to concerns over exposure to US subprime mortgages and complex credit finds.
In Canada, firms such as Coventree Inc. have been unable to renew billions of dollars worth of ABCP. Germany’s government was forced to bail out one of its banks, American Home Mortgage closed and the Dow-Jones Industrial Average had dropped by over 1,000 points by mid-August. Central banks in the US, Japan, Canada and several European nations injected billions of dollars in liquidity into financial markets in order to encourage more lending. Further, on August 17, 2007, the US Federal Reserve lowered its discount rate – the rate it charges qualified lenders. mainly banks, for temporary loans – to 5.75 per cent for 30 days to further calm financial markets. The Fed did not, however, change its more closely-watched federal funds rate, which affects credit cards, home equity lines of credit, car loans and other consumer loan rates. Banks, investors, foreign governments and analysts will certainly be watching with anticipation when members of the Fed next meet on September 18, 2007 to evaluate again whether or not it will adjust the intended Fed funds rate.
The aftermath – what is expected now?
As of September, significant uncertainty still remained in global financial markets and losses on the mortgage-backed
securities at the heart of the crisis were still being revealed. Financial analysts report a substantial amount of uncertainty as a major factor currently driving markets, and the potential definitely exists for further declines. So far, Chair of the US Federal Reserve Ben Bernanke estimates the value of non-recoverable defaults on subprime mortgages in the US to be US $100 billion (the total value of the subprime market is over $1 trillion).
Members of the US Federal Reserve now see significant downside risks to US economic growth, but expect a return to more normal market conditions after some time. Private sector analysts generally agree with this prediction, and some have argued that the cut to the discount rate, combined with the injection of billions of dollars of cash into the banking system in recent weeks, have helped to stabilize financial markets for the time being. Most investors still expect the Fed to cut its intended funds rate when it next meets on September 18, 2007.
Most Canadian analysts suggest that the impact of the liquidity crisis will be felt to a far lesser extent in Canada than in the US. CIBC World Markets argues that strong growth in corporate profits as well as steady economic activity remain highly supportive for Canadian equities and corporate credit quality. BMO Capital Markets points to Canada’s strong second quarter GDP growth of 3.4 per cent, a jobless rate that sits at a 33-year low and a very strong Canadian dollar. Further, TD Economics notes that liquidity squeezes over the last 20 years have not led to recessions in Canada or the US.
British Columbia’s exposure
As for British Columbia, the deterioration of the US housing market since early 2006 has certainly hurt BC’s lumber industry, lowering demand for exports of its lumber products. Demand from the US will likely continue to decrease until its housing market finally bottoms out and begins to rebuild.
Like other provinces, British Columbia bond spreads have also been adversely affected since the subprime crash, although not as negatively impacted as Canadian corporate bond spreads in which there has been significant widening. Investors have recognized provincial bonds as somewhat more of a ‘safe haven’ than corporate bonds during this credit crisis. Since the subprime issue became a factor in Canada, BC bond spreads have widened to 34 basis
52
points over the Government of Canada benchmark bond in 10 years from 22 over prior. In 30-year bonds, BC’s credit spread has widened to 48 basis points over their Canadian counterparts from 34 over before the subprime crisis. The volatility in credit markets throughout this past year has at times made it difficult to access the bond market for funding. However, BC has continued to fund its program this year through a combination of private financings and public bond offerings done during some brief windows of market stability.
Conclusion
At this stage of the credit crisis, there are divergent views among analysts as to the final impact of the financial turmoil. Merrill Lynch chief economist David Rosenberg pegs the probability of US recession at 70 per cent (as of September 7, 2007). This compares to views of other chief economists, such as those at TD and CIBC, who argue that the credit contagion is not severe enough to push US economic growth off track.
Views among decision makers and analysts continue to fluctuate. For example, Fed chairman Ben Bernanke who was initially criticized for appearing indifferent to the credit crisis, has since met with President Bush and made statements suggesting that the Fed intends to help calm financial markets and bolster the US economy in the coming months.
Meanwhile, markets continue to be highly volatile, as investors are constantly adjusting their portfolios to avoid exposure to the subprime contagion.
53
APPENDIX: | FINANCIAL RESULTS |
| For the Three Months Ended June 30, 2007 |
| |
| UPDATED FINANCIAL PLAN |
| For the Three Years 2007/08 – 2009/10 |
| | |
2007/08 First Quarterly Report | | September 14, 2007 |
| | | |
| | Three Months Ended June 30, 2007 and 2007/08 Full-Year Forecast |
| | |
Table A.1 | | Operating Statement |
Table A.2 | | Revenue by Source |
Table A.3 | | Expense by Ministry, Program and Agency |
Table A.4 | | Expense by Function |
Table A.5 | | Capital Spending |
Table A.6 | | Provincial Debt |
| | |
| | Updated Financial Plan: 2007/08–2009/10 |
| | |
Table A.7 | | Revenue Assumptions |
Table A.8 | | Natural Gas Price Forecasts |
Table A.9 | | Expense Assumptions |
Table A.10 | | Expense by Function |
Table A.11 | | Service Delivery Agency Operating Results |
Table A.12 | | Full-Time Equivalents |
Table A.13 | | Statement of Financial Position |
Appendix
Table A.1 2007/08 Operating Statement
| | Year-to-Date to June 30 | | Full Year | |
| | 2007/08 | | Actual | | 2007/08 | | Actual | |
($ millions) | | Budget | | Actual | | Variance | | 2006/07 | | Budget | | Forecast | | Variance | | 2006/07 | |
Taxpayer-supported programs and agencies: | | | | | | | | | | | | | | | | | |
Revenue | | 8,292 | | 8,694 | | 402 | | 7,924 | | 34,887 | | 35,773 | | 886 | | 35,819 | |
Expense | | (8,673 | ) | (8,422 | ) | 251 | | (7,962 | ) | (36,240 | ) | (36,430 | ) | (190 | ) | (34,184 | ) |
Negotiating Framework incentive payments | | — | | — | | — | | (34 | ) | — | | — | | — | | (264 | ) |
Taxpayer-supported balance | | (381 | ) | 272 | | 653 | | (72 | ) | (1,353 | ) | (657 | ) | 696 | | 1,371 | |
Commercial Crown corporation income | | 503 | | 640 | | 137 | | 504 | | 2,503 | | 2,757 | | 254 | | 2,685 | |
Surplus before forecast allowance | | 122 | | 912 | | 790 | | 432 | | 1,150 | | 2,100 | | 950 | | 4,056 | |
Forecast allowance | | — | | — | | — | | — | | (750 | ) | (500 | ) | 250 | | — | |
Surplus | | 122 | | 912 | | 790 | | 432 | | 400 | | 1,600 | | 1,200 | | 4,056 | |
56
Table A.2 2007/08 Revenue by Source
| | Year-to-Date to June 30 | | Full Year | |
| | 2007/08 | | Actual | | 2007/08 | | Actual | |
($ millions) | | Budget | | Actual | | Variance | | 2006/07 | | Budget | | Forecast | | Variance | | 2006/07 | |
Taxation | | | | | | | | | | | | | | | | | |
Personal income | | 1,589 | | 1,601 | | 12 | | 1,457 | | 6,389 | | 6,438 | | 49 | | 6,905 | |
Corporate income | | 322 | | 323 | | 1 | | 330 | | 1,395 | | 1,772 | | 377 | | 1,538 | |
Social service | | 1,214 | | 1,227 | | 13 | | 1,113 | | 4,890 | | 5,090 | | 200 | | 4,714 | |
Fuel | | 227 | | 229 | | 2 | | 226 | | 919 | | 919 | | — | | 901 | |
Tobacco | | 186 | | 186 | | — | | 184 | | 705 | | 705 | | — | | 726 | |
Property | | 462 | | 455 | | (7 | ) | 426 | | 1,863 | | 1,794 | | (69 | ) | 1,732 | |
Property transfer | | 245 | | 295 | | 50 | | 257 | | 904 | | 1,000 | | 96 | | 914 | |
Other | | 155 | | 155 | | — | | 165 | | 606 | | 615 | | 9 | | 588 | |
| | 4,400 | | 4,471 | | 71 | | 4,158 | | 17,671 | | 18,333 | | 662 | | 18,018 | |
Natural resources | | | | | | | | | | | | | | | | | |
Natural gas royalties | | 390 | | 309 | | (81 | ) | 286 | | 1,699 | | 1,330 | | (369 | ) | 1,207 | |
Columbia River Treaty | | 71 | | 56 | | (15 | ) | 43 | | 285 | | 270 | | (15 | ) | 223 | |
Other energy, metals and minerals | | 218 | | 151 | | (67 | ) | 256 | | 902 | | 887 | | (15 | ) | 935 | |
Forests | | 146 | | 217 | | 71 | | 120 | | 1,395 | | 1,296 | | (99 | ) | 1,276 | |
Water and other resources | | 83 | | 136 | | 53 | | 86 | | 347 | | 341 | | (6 | ) | 341 | |
| | 908 | | 869 | | (39 | ) | 791 | | 4,628 | | 4,124 | | (504 | ) | 3,982 | |
Other revenue | | | | | | | | | | | | | | | | | |
Medical Services Plan premiums | | 369 | | 386 | | 17 | | 377 | | 1,497 | | 1,550 | | 53 | | 1,524 | |
Post-secondary education fees | | 144 | | 188 | | 44 | | 171 | | 964 | | 957 | | (7 | ) | 928 | |
Other health-care related fees | | 55 | | 55 | | — | | 54 | | 219 | | 225 | | 6 | | 216 | |
Motor vehicle licences and permits | | 111 | | 110 | | (1 | ) | 104 | | 435 | | 433 | | (2 | ) | 424 | |
Other fees and licences | | 149 | | 165 | | 16 | | 146 | | 756 | | 780 | | 24 | | 699 | |
Investment earnings | | 185 | | 204 | | 19 | | 205 | | 914 | | 898 | | (16 | ) | 1,032 | |
Sales of goods and services | | 175 | | 145 | | (30 | ) | 140 | | 706 | | 672 | | (34 | ) | 693 | |
Miscellaneous | | 412 | | 461 | | 49 | | 431 | | 1,554 | | 1,664 | | 110 | | 1,917 | |
| | 1,600 | | 1,714 | | 114 | | 1,628 | | 7,045 | | 7,179 | | 134 | | 7,433 | |
Contributions from the federal government | | | | | | | | | | | | | | | | | |
Health and social transfers | | 1,156 | | 1,268 | | 112 | | 1,068 | | 4,644 | | 4,870 | | 226 | | 4,473 | |
Equalization | | — | | — | | — | | 115 | | — | | — | | — | | 459 | |
Other federal contributions | | 228 | | 372 | | 144 | | 164 | | 899 | | 1,267 | | 368 | | 1,454 | |
| | 1,384 | | 1,640 | | 256 | | 1,347 | | 5,543 | | 6,137 | | 594 | | 6,386 | |
Taxpayer-supported programs and agencies | | 8,292 | | 8,694 | | 402 | | 7,924 | | 34,887 | | 35,773 | | 886 | | 35,819 | |
Commercial Crown corporation net income | | | | | | | | | | | | | | | | | |
BC Hydro | | (25 | ) | 5 | | 30 | | — | | 365 | | 365 | | — | | 407 | |
Liquor Distribution Branch | | 202 | | 210 | | 8 | | 201 | | 810 | | 822 | | 12 | | 840 | |
BC Lotteries (net of payments to the federal government) | | 238 | | 259 | | 21 | | 251 | | 1,024 | | 1,024 | | — | | 1,011 | |
BCRC (1) | | 29 | | 15 | | (14 | ) | 17 | | 60 | | 47 | | (13 | ) | 29 | |
ICBC (2) | | 54 | | 145 | | 91 | | 25 | | 225 | | 484 | | 259 | | 381 | |
Other | | 5 | | 6 | | 1 | | 10 | | 19 | | 15 | | (4 | ) | 17 | |
| | 503 | | 640 | | 137 | | 504 | | 2,503 | | 2,757 | | 254 | | 2,685 | |
Total revenue | | 8,795 | | 9,334 | | 539 | | 8,428 | | 37,390 | | 38,530 | | 1,140 | | 38,504 | |
(1) | | The year to date figures reflect BCRC’s budget and results for the April to June period. The full year forecast represents BCRC’s earnings during government’s fiscal year. On BCRC’s fiscal year basis (December), the outlook is – 2007 (budget): $79 million; 2007 (forecast): $47 million. |
(2) | | The year to date figures reflect ICBC’s budget and results for the April to June period. The full-year forecast represents ICBC’s earnings during government’s fiscal year. On ICBC’s fiscal year basis (December), the outlook is – 2007 (budget): $225 million; 2007 (forecast): $526 million. |
57
Table A.3 2007/08 Expense by Ministry, Program and Agency
| | Year-to-Date to June 30 | | Full Year | |
| | 2007/08 | | Actual | | 2007/08 | | Actual | |
($ millions) | | Budget | | Actual | | Variance | | 2006/07 | | Budget | | Forecast | | Variance | | 2006/07 | |
Advanced Education | | 525 | | 523 | | (2 | ) | 455 | | 2,151 | | 2,151 | | — | | 2,027 | |
Education | | 1,541 | | 1,552 | | 11 | | 1,469 | | 5,494 | | 5,494 | | — | | 5,312 | |
Health | | 3,040 | | 2,993 | | (47 | ) | 2,761 | | 12,967 | | 12,967 | | — | | 12,124 | |
Contingencies – Health Innovation Fund | | — | | — | | — | | — | | 100 | | 100 | | — | | — | |
Subtotal | | 5,106 | | 5,068 | | (38 | ) | 4,685 | | 20,712 | | 20,712 | | — | | 19,463 | |
Office of the Premier | | 3 | | 3 | | — | | 2 | | 14 | | 14 | | — | | 12 | |
Aboriginal Relations and Reconciliation | | 13 | | 13 | | — | | 8 | | 55 | | 55 | | — | | 43 | |
Agriculture and Lands | | 36 | | 36 | | — | | 29 | | 270 | | 270 | | — | | 238 | |
Attorney General | | 128 | | 134 | | 6 | | 132 | | 520 | | 520 | | — | | 485 | |
Children and Family Development | | 465 | | 461 | | (4 | ) | 423 | | 1,867 | | 1,867 | | — | | 1,852 | |
Community Services | | 142 | | 94 | | (48 | ) | 103 | | 274 | | 274 | | — | | 267 | |
Economic Development | | 36 | | 35 | | (1 | ) | 62 | | 266 | | 266 | | — | | 282 | |
Employment and Income Assistance | | 361 | | 349 | | (12 | ) | 321 | | 1,480 | | 1,480 | | — | | 1,358 | |
Energy, Mines and Petroleum Resources | | 19 | | 17 | | (2 | ) | 27 | | 77 | | 77 | | — | | 75 | |
Environment | | 49 | | 46 | | (3 | ) | 41 | | 223 | | 223 | | — | | 193 | |
Finance | | 25 | | 21 | | (4 | ) | 22 | | 91 | | 91 | | — | | 75 | |
Forests and Range | | 217 | | 224 | | 7 | | 168 | | 1,078 | | 1,150 | | 72 | | 1,000 | |
Labour and Citizen’s Services | | 21 | | 20 | | (1 | ) | 3 | | 97 | | 97 | | — | | 210 | |
Public Safety and Solicitor General | | 139 | | 152 | | 13 | | 140 | | 603 | | 656 | | 53 | | 594 | |
Small Business and Revenue | | 14 | | 13 | | (1 | ) | 7 | | 60 | | 60 | | — | | 45 | |
Tourism, Sport and the Arts | | 30 | | 31 | | 1 | | 70 | | 130 | | 130 | | — | | 214 | |
Transportation | | 221 | | 204 | | (17 | ) | 233 | | 882 | | 882 | | — | | 842 | |
Total ministries and Office of the Premier | | 7,025 | | 6,921 | | (104 | ) | 6,476 | | 28,699 | | 28,824 | | 125 | | 27,248 | |
Legislation | | 15 | | 14 | | (1 | ) | 12 | | 58 | | 101 | | 43 | | 49 | |
Officers of the Legislature | | 8 | | 7 | | (1 | ) | 6 | | 34 | | 34 | | — | | 24 | |
BC Family Bonus | | 5 | | 5 | | — | | 8 | | 17 | | 17 | | — | | 23 | |
Management of public funds and debt | | 139 | | 131 | | (8 | ) | 145 | | 558 | | 535 | | (23 | ) | 544 | |
Contingencies – new programs | | 125 | | — | | (125 | ) | — | | 360 | | 360 | | — | | 53 | |
Contingencies – Negotiating Framework | | — | | — | | — | | — | | 39 | | 39 | | — | | — | |
Other appropriations | | 10 | | 6 | | (4 | ) | 7 | | 10 | | 10 | | — | | 4 | |
Consolidated revenue fund expense before Negotiating Framework incentive payments | | 7,327 | | 7,084 | | (243 | ) | 6,654 | | 29,775 | | 29,920 | | 145 | | 27,945 | |
Negotiating Framework incentive payments | | — | | — | | — | | 34 | | — | | — | | — | | 264 | |
Total consolidated revenue fund expense | | 7,327 | | 7,084 | | (243 | ) | 6,688 | | 29,775 | | 29,920 | | 145 | | 28,209 | |
Expenses recovered from external entities | | 324 | | 381 | | 57 | | 365 | | 1,827 | | 1,941 | | 114 | | 2,117 | |
Grants to service delivery agencies and other internal transfers: | | | | | | | | | | | | | | | | | |
School districts | | (1,366 | ) | (1,366 | ) | — | | (1,302 | ) | (4,743 | ) | (4,774 | ) | (31 | ) | (4,677 | ) |
Universities | | (284 | ) | (283 | ) | 1 | | (275 | ) | (1,204 | ) | (1,239 | ) | (35 | ) | (1,109 | ) |
Colleges, university colleges, and institutes | | (192 | ) | (215 | ) | (23 | ) | (208 | ) | (808 | ) | (847 | ) | (39 | ) | (842 | ) |
Health authorities and hospital societies | | (2,143 | ) | (2,168 | ) | (25 | ) | (1,942 | ) | (8,605 | ) | (8,730 | ) | (125 | ) | (8,132 | ) |
Children and family development agencies | | (164 | ) | (162 | ) | 2 | | (151 | ) | (684 | ) | (684 | ) | — | | (629 | ) |
Other service delivery agencies | | (188 | ) | (210 | ) | (22 | ) | (183 | ) | (776 | ) | (763 | ) | 13 | | (913 | ) |
| | (4,337 | ) | (4,404 | ) | (67 | ) | (4,061 | ) | (16,820 | ) | (17,037 | ) | (217 | ) | (16,302 | ) |
Service delivery agency expense: | | | | | | | | | | | | | | | | | |
School districts | | 1,495 | | 1,468 | | (27 | ) | 1,436 | | 5,149 | | 5,151 | | 2 | | 5,041 | |
Universities | | 633 | | 634 | | 1 | | 592 | | 2,794 | | 2,826 | | 32 | | 2,593 | |
Colleges, university colleges, and institutes | | 326 | | 325 | | (1 | ) | 323 | | 1,353 | | 1,373 | | 20 | | 1,310 | |
Health authorities and hospital societies | | 2,304 | | 2,324 | | 20 | | 2,120 | | 9,345 | | 9,437 | | 92 | | 8,892 | |
Children and family development agencies | | 161 | | 169 | | 8 | | 148 | | 687 | | 687 | | — | | 631 | |
Other service delivery agencies | | 440 | | 441 | | 1 | | 385 | | 2,130 | | 2,132 | | 2 | | 1,957 | |
| | 5,359 | | 5,361 | | 2 | | 5,004 | | 21,458 | | 21,606 | | 148 | | 20,424 | |
Net spending of service delivery agencies | | 1,022 | | 957 | | (65 | ) | 943 | | 4,638 | | 4,569 | | (69 | ) | 4,122 | |
Total taxpayer-supported expense | | 8,673 | | 8,422 | | (251 | ) | 7,996 | | 36,240 | | 36,430 | | 190 | | 34,448 | |
58
Table A.4 2007/08 Expense By Function
| | Year-to-Date to June 30 | | Full Year | |
| | 2007/08 | | Actual | | 2007/08 | | Actual | |
($ millions) | | Budget | | Actual | | Variance | | 2006/07 | | Budget | | Forecast | | Variance | | 2006/07 | |
Health: | | | | | | | | | | | | | | | | | |
Medical Services Plan | | 789 | | 789 | | — | | 716 | | 3,154 | | 3,160 | | 6 | | 2,969 | |
Pharmacare | | 239 | | 226 | | (13 | ) | 213 | | 1,023 | | 1,023 | | — | | 914 | |
Regional services | | 2,035 | | 2,018 | | (17 | ) | 1,894 | | 9,048 | | 9,023 | | (25 | ) | 8,500 | |
Other healthcare expenses | | 177 | | 185 | | 8 | | 177 | | 890 | | 905 | | 15 | | 867 | |
Health Innovation Fund | | — | | — | | — | | — | | 100 | | 100 | | — | | — | |
| | 3,240 | | 3,218 | | (22 | ) | 3,000 | | 14,215 | | 14,211 | | (4 | ) | 13,250 | |
Education: | | | | | | | | | | | | | | | | | |
Elementary and secondary | | 1,571 | | 1,555 | | (16 | ) | 1,514 | | 5,545 | | 5,516 | | (29 | ) | 5,272 | |
Post-secondary | | 1,022 | | 968 | | (54 | ) | 922 | | 4,123 | | 4,161 | | 38 | | 4,088 | |
Other education expenses | | 32 | | 38 | | 6 | | 56 | | 169 | | 169 | | — | | 159 | |
| | 2,625 | | 2,561 | | (64 | ) | 2,492 | | 9,837 | | 9,846 | | 9 | | 9,519 | |
Social services: | | | | | | | | | | | | | | | | | |
Social assistance | | 449 | | 438 | | (11 | ) | 402 | | 1,912 | | 1,912 | | — | | 1,713 | |
Childcare services | | 238 | | 260 | | 22 | | 234 | | 1,106 | | 1,139 | | 33 | | 1,085 | |
Other social services expenses | | 22 | | 28 | | 6 | | 33 | | 88 | | 90 | | 2 | | 94 | |
| | 709 | | 726 | | 17 | | 669 | | 3,106 | | 3,141 | | 35 | | 2,892 | |
Protection of persons and property | | 317 | | 333 | | 16 | | 308 | | 1,418 | | 1,499 | | 81 | | 1,329 | |
Transportation | | 305 | | 295 | | (10 | ) | 312 | | 1,351 | | 1,331 | | (20 | ) | 1,251 | |
Natural resources and economic development | | 293 | | 300 | | 7 | | 275 | | 1,566 | | 1,697 | | 131 | | 1,663 | |
Other | | 293 | | 285 | | (8 | ) | 182 | | 1,335 | | 1,345 | | 10 | | 1,278 | |
Contingencies – new programs | | 120 | | | | (120 | ) | — | | 360 | | 360 | | — | | — | |
Contingencies – Negotiating Framework | | 5 | | | | (5 | ) | — | | 39 | | 39 | | — | | — | |
General government | | 179 | | 167 | | (12 | ) | 186 | | 668 | | 685 | | 17 | | 768 | |
Interest | | 587 | | 537 | | (50 | ) | 538 | | 2,345 | | 2,276 | | (69 | ) | 2,234 | |
Subtotal | | 8,673 | | 8,422 | | (251 | ) | 7,962 | | 36,240 | | 36,430 | | 190 | | 34,184 | |
Negotiating framework incentive payments | | — | | — | | — | | 34 | | — | | — | | — | | 264 | |
Total expense | | 8,673 | | 8,422 | | (251 | ) | 7,996 | | 36,240 | | 36,430 | | 190 | | 34,448 | |
59
Table A.5 2007/08 Capital Spending
| | Year-to-Date to June 30 | | Full Year | |
| | 2007/08 | | Actual | | 2007/08 | | Actual | |
($ millions) | | Budget | | Actual | | Variance | | 2006/07 | | Budget | | Forecast | | Variance | | 2006/07 | |
Taxpayer-supported | | | | | | | | | | | | | | | | | |
Education | | | | | | | | | | | | | | | | | |
Schools (K–12) | | 71 | | 92 | | 21 | | 101 | | 365 | | 422 | | 57 | | 322 | |
Post-secondary | | 68 | | 139 | | 71 | | 137 | | 857 | | 960 | | 103 | | 874 | |
Health | | 135 | | 130 | | (5 | ) | 135 | | 819 | | 954 | | 135 | | 760 | |
BC Transportation Financing Authority | | 230 | | 215 | | (15 | ) | 203 | | 922 | | 1,073 | | 151 | | 821 | |
Vancouver Convention Centre expansion project | | 43 | | 58 | | 15 | | 30 | | 206 | | 290 | | 84 | | 108 | |
Government operating (ministries) | | 74 | | 17 | | (57 | ) | 20 | | 325 | | 325 | | — | | 309 | |
Other (1) | | 19 | | 48 | | 29 | | 17 | | 75 | | 128 | | 53 | | 172 | |
Capital spending contingencies | | — | | — | | — | | — | | 295 | | 105 | | (190 | ) | — | |
Total taxpayer-supported | | 640 | | 699 | | 59 | | 643 | | 3,864 | | 4,257 | | 393 | | 3,366 | |
Self-supported | | | | | | | | | | | | | | | | | |
BC Hydro | | 246 | | 216 | | (30 | ) | 158 | | 995 | | 1,063 | | 68 | | 807 | |
BC Transmission Corporation | | 23 | | 22 | | (1 | ) | 8 | | 68 | | 85 | | 17 | | 50 | |
Columbia River power projects (2) | | 8 | | 4 | | (4 | ) | 16 | | 30 | | 29 | | (1 | ) | 19 | |
BC Rail | | 17 | | 3 | | (14 | ) | 3 | | 66 | | 33 | | (33 | ) | 19 | |
ICBC (3) | | 2 | | 4 | | 2 | | 5 | | 30 | | 29 | | (1 | ) | 22 | |
BC Lotteries | | 21 | | 11 | | (10 | ) | 10 | | 85 | | 84 | | (1 | ) | 44 | |
Liquor Distribution Branch | | 3 | | 1 | | (2 | ) | 2 | | 18 | | 18 | | — | | 22 | |
Total self-supported | | 320 | | 261 | | (59 | ) | 202 | | 1,292 | | 1,341 | | 49 | | 983 | |
Total capital spending | | 960 | | 960 | | — | | 845 | | 5,156 | | 5,598 | | 442 | | 4,349 | |
(1) | Includes BC Housing Management Commission, Provincial Rental Housing Corporation, Rapid Transit Project 2000, BC Transit and other service delivery agencies. |
(2) | Joint ventures of the Columbia Power Corporation and Columbia Basin Trust. |
(3) | Includes ICBC Properties Ltd. |
60
Table A.6 2007/08 Provincial Debt (1)
| | Balance | | Balance at June 30, 2007 | | Forecast at March 31, 2008 | |
| | March 31, | | Net | | Debt Outstanding | | | | Net | | Debt Outstanding | | | |
($ millions) | | 2007 | | Change (2) | | Actual | | Budget | | Variance | | Change (2) | | Forecast | | Budget | | Variance | |
Taxpayer-supported debt | | | | | | | | | | | | | | | | | | | |
Provincial government operating | | 9,505 | | 800 | | 10,305 | | 9,637 | | 668 | | (1,784 | ) | 7,721 | | 9,125 | | (1,404 | ) |
Other taxpayer-supported debt (mainly capital) | | | | | | | | | | | | | | | | | | | |
Education (3) | | | | | | | | | | | | | | | | | | | |
Schools | | 4,724 | | 36 | | 4,760 | | 4,791 | | (31 | ) | 232 | | 4,956 | | 4,961 | | (5 | ) |
Post-secondary institutions | | 2,909 | | 23 | | 2,932 | | 3,087 | | (155 | ) | 427 | | 3,336 | | 3,438 | | (102 | ) |
| | 7,633 | | 59 | | 7,692 | | 7,878 | | (186 | ) | 659 | | 8,292 | | 8,399 | | (107 | ) |
Health (3) | | 2,813 | | 42 | | 2,855 | | 2,986 | | (131 | ) | 487 | | 3,300 | | 3,348 | | (48 | ) |
Highways and public transit | | | | | | | | | | | | | | | | | | | |
BC Transportation Financing Authority | | 3,237 | | 144 | | 3,381 | | 3,536 | | (155 | ) | 878 | | 4,115 | | 4,058 | | 57 | |
Public transit | | 892 | | 11 | | 903 | | 904 | | (1 | ) | 23 | | 915 | | 916 | | (1 | ) |
Sky Train extension | | 1,153 | | — | | 1,153 | | 1,150 | | 3 | | (3 | ) | 1,150 | | 1,150 | | — | |
BC Transit | | 96 | | (2 | ) | 94 | | 82 | | 12 | | (5 | ) | 91 | | 78 | | 13 | |
| | 5,378 | | 153 | | 5,531 | | 5,672 | | (141 | ) | 893 | | 6,271 | | 6,202 | | 69 | |
Other | | | | | | | | | | | | | | | | | | | |
Social housing (4) | | 216 | | (4 | ) | 212 | | 290 | | (78 | ) | (3 | ) | 213 | | 272 | | (59 | ) |
Homeowner Protection Office | | 110 | | 5 | | 115 | | 130 | | (15 | ) | 38 | | 148 | | 148 | | — | |
Other (5) | | 219 | | 38 | | 257 | | 257 | | — | | 67 | | 286 | | 309 | | (23 | ) |
| | 545 | | 39 | | 584 | | 677 | | (93 | ) | 102 | | 647 | | 729 | | (82 | ) |
Total other taxpayer-supported | | 16,369 | | 293 | | 16,662 | | 17,213 | | (551 | ) | 2,141 | | 18,510 | | 18,678 | | (168 | ) |
Provision for compensation agreements | | — | | — | | — | | — | | — | | — | | — | | — | | — | |
Total taxpayer-supported debt | | 25,874 | | 1,093 | | 26,967 | | 26,850 | | 117 | | 357 | | 26,231 | | 27,803 | | (1,572 | ) |
Self-supported debt | | | | | | | | | | | | | | | | | | | |
Commercial Crown corporations | | | | | | | | | | | | | | | | | | | |
BC Hydro | | 7,144 | | 488 | | 7,632 | | 7,282 | | 350 | | 508 | | 7,652 | | 7,806 | | (154 | ) |
BC Transmission Corporation | | 37 | | 40 | | 77 | | 59 | | 18 | | 61 | | 98 | | 95 | | 3 | |
Columbia River power projects (6) | | 236 | | (6 | ) | 230 | | 276 | | (46 | ) | (12 | ) | 224 | | 381 | | (157 | ) |
Liquor Distribution Branch | | 3 | | — | | 3 | | 3 | | — | | (1 | ) | 2 | | 2 | | — | |
Post-secondary institutions’ subsidiaries | | 53 | | — | | 53 | | — | | 53 | | — | | 53 | | — | | 53 | |
| | 7,473 | | 522 | | 7,995 | | 7,620 | | 375 | | 556 | | 8,029 | | 8,284 | | (255 | ) |
Total self-supported debt | | 7,473 | | 522 | | 7,995 | | 7,620 | | 375 | | 556 | | 8,029 | | 8,284 | | (255 | ) |
Forecast allowance | | — | | — | | — | | — | | — | | 500 | | 500 | | 750 | | (250 | ) |
Total provincial debt | | 33,347 | | 1,615 | | 34,962 | | 34,470 | | 492 | | 1,413 | | 34,760 | | 36,837 | | (2,077 | ) |
(1) | Debt is after deduction of sinking funds and unamortized discounts, and excludes accrued interest. Government direct and fiscal agency accrued interest is reported in the government’s accounts as an accounts payable. |
(2) | Gross new long-term borrowing plus net change in short-term debt outstanding, less sinking fund contributions, sinking fund earnings and net maturities of long-term debt (after deduction of sinking fund balances for maturing issues). |
(3) | Includes debt and guarantees incurred by the government on behalf of school districts, universities, colleges and health authorities/hospital societies (SUCH), and debt directly incurred by these entities. |
(4) | Includes the BC Housing Management Commission and the Provincial Rental Housing Corporation. |
(5) | Includes debt of other taxpayer-supported Crown corporations and agencies and fiscal agency loans to local governments. Also includes student loan guarantees, loan guarantees to agricultural producers, guarantees under economic development and home mortgage assistance programs, and loan guarantee provisions. |
(6) | Joint ventures of the Columbia Power Corporation and Columbia Basin Trust. |
61
Table A.7 Revenue Assumptions: 2007/08 – 2009/10
Revenue Source and Assumptions | | Forecast | | Updated Plan | |
($ millions unless otherwise specified) | | 2007/08 | | 2008/09 | | 2009/10 | |
Personal income tax | | $ | 6,438 | | $ | 6,706 | | $ | 7,126 | |
Tax Year | | | | | | | |
BC personal income growth | | 4.7 | % | 4.6 | % | 4.7 | % |
BC tax base growth | | 5.5 | % | 5.2 | % | 5.3 | % |
Average tax yield | | 5.64 | % | 5.46 | % | 5.50 | % |
Gross current-year tax | | $ | 6,373 | | $ | 6,488 | | $ | 6,884 | |
BC Tax credits | | $ | -142 | | $ | -139 | | $ | -136 | |
BC Tax Reduction | | $ | -110 | | $ | -113 | | $ | -115 | |
Prior-year adjustment (fiscal year) | | $ | -75 | | $ | 0 | | $ | 0 | |
Family Bonus offset (fiscal year) | | $ | -17 | | $ | -15 | | $ | -13 | |
| | | | | | | |
Prior Tax Years | | 2006 Factors | | | | | |
BC personal income growth | | 7.2 | % | | | | |
BC tax base growth | | 9.2 | % | | | | |
Average 2006 tax yield | | 5.84 | % | | | | |
Gross 2006 tax | | $ | 6,249 | | | | | |
2005 and prior years tax | | $ | 320 | | | | | |
BC Tax credits | | $ | -130 | | | | | |
BC Tax Reduction | | $ | -108 | | | | | |
| | | | | | | |
Corporate income tax | | $ | 1,772 | | $ | 1,438 | | $ | 1,544 | |
Tax Year | | | | | | | |
National tax base ($ billions) | | $ | 181.5 | | $ | 191.7 | | $ | 201.7 | |
BC general corporate rate | | 12.0 | % | 12.0 | % | 12.0 | % |
BC small business corporate rate | | 4.5 | % | 4.5 | % | 4.5 | % |
International Financial Activity Act refunds | | $ | -25 | | $ | -25 | | $ | -25 | |
BC tax base ($ billions) | | $ | 18.9 | | $ | 19.2 | | $ | 20.6 | |
BC tax base growth | | 5.0 | % | 3.0 | % | 7.0 | % |
BC corporate profits growth | | 5.0 | % | 2.8 | % | 7.1 | % |
BC instalment share | | 10.18 | % | 10.05 | % | 10.42 | % |
Prior-year adjustments | | $ | 442 | | $ | 52 | | $ | 2 | |
BC Tax credits | | | | | | | |
Film, Television and Production Services | | $ | -150 | | $ | -160 | | $ | -140 | |
Scientific Research and Experimental Development | | $ | -150 | | $ | -160 | | $ | -170 | |
Other | | $ | -45 | | $ | -45 | | $ | -45 | |
Total BC Tax Credits | | $ | -345 | | $ | -365 | | $ | -355 | |
Advance instalments (fiscal year) | | $ | 1,355 | | $ | 1,411 | | $ | 1,567 | |
| | | | | | | |
Prior Tax Years | | 2006 Factors | | | | | |
Entitlement excluding duty deposits refunds | | | | | | | |
BC tax base ($ billions) | | $ | 17.8 | | | | | |
BC tax base growth | | 11.9 | % | | | | |
BC corporate profits growth | | 8.3 | % | | | | |
BC tax base entitlement from duty deposit refunds ($ billions) | | $ | 2.5 | | | | | |
National tax base growth | | 12.6 | % | | | | |
BC share of national tax base | | 11.5 | % | | | | |
Gross 2006 tax excluding duty deposit refunds | | $ | 1,636 | | | | | |
Revenue from softwood lumber duty deposit refunds | | $ | 300 | | | | | |
2005 and prior-years revenue | | $ | 75 | | | | | |
BC Tax credits | | | | | | | |
Film, Television and Production Services | | $ | -140 | | | | | |
Scientific Research and Experimental Development | | $ | -140 | | | | | |
Other | | $ | -20 | | | | | |
Total BC Tax Credits | | $ | -300 | | | | | |
Revenue is recorded on a cash basis. Due to lags in the federal collection and instalment systems, changes to the BC corporate profits and tax base forecasts affect revenue in the succeeding year. For example, 2007/08 instalments from the federal government are based on BC’s share of the national tax base for the 2005 tax year (assessed as of December 31, 2006) and a forecast of the 2007 national tax base. Cash adjustments for any under/over payments from the federal government in respect of 2006 will be received/paid on March 31, 2008.
62
Revenue Source and Assumptions | | Forecast | | Updated Plan | |
($ millions unless otherwise specified) | | 2007/08 | | 2008/09 | | 2009/10 | |
Social service tax | | $ | 5,090 | | $ | 5,337 | | $ | 5,625 | |
Consumer expenditure growth (calendar year) | | 6.1 | % | 5.4 | % | 5.3 | % |
Business investment growth (calendar year) | | 8.3 | % | 9.1 | % | 9.8 | % |
Other expenditure growth (calendar year) | | 3.8 | % | 2.1 | % | 4.8 | % |
Social service tax base growth (fiscal year) | | 8.0 | % | 4.9 | % | 5.5 | % |
| | | | | | | |
Components of revenue | | | | | | | |
Consolidated Revenue Fund (net of Commissions) | | $ | 5,021 | | $ | 5,268 | | $ | 5,552 | |
BC Transportation Financing Authority | | $ | 12 | | $ | 12 | | $ | 12 | |
Recoveries | | $ | 57 | | $ | 57 | | $ | 61 | |
| | | | | | | |
Fuel tax | | $ | 919 | | $ | 937 | | $ | 958 | |
Real GDP growth (calendar year) | | 3.0 | % | 2.9 | % | 3.1 | % |
Gasoline and diesel assumed volume growth (calendar year) | | 2.0 | % | 2.0 | % | 2.0 | % |
| | | | | | | |
Components of revenue | | | | | | | |
Gasoline and diesel: | | | | | | | |
Consolidated Revenue Fund | | $ | 360 | | $ | 367 | | $ | 374 | |
BC Transit | | $ | 8 | | $ | 8 | | $ | 8 | |
BC Transportation Financing Authority | | $ | 419 | | $ | 427 | | $ | 436 | |
Other fuel sources | | $ | 132 | | $ | 135 | | $ | 140 | |
| | | | | | | |
Property tax | | $ | 1,794 | | $ | 1,880 | | $ | 1,966 | |
BC Consumer Price Index (calendar year) | | 2.0 | % | 2.1 | % | 2.1 | % |
Housing Starts (calendar year) | | 36,500 | | 33,440 | | 32,004 | |
Home Owner Grants (fiscal year) | | $ | -663 | | $ | -683 | | $ | -704 | |
| | | | | | | |
Components of revenue | | | | | | | |
Residential (school purpose) | | $ | 602 | | $ | 638 | | $ | 673 | |
Non-residential (school purpose) | | $ | 984 | | $ | 1,024 | | $ | 1,065 | |
Rural Area | | $ | 88 | | $ | 92 | | $ | 95 | |
Police | | $ | 19 | | $ | 19 | | $ | 19 | |
Other* | | $ | 101 | | $ | 107 | | $ | 114 | |
| * | Other includes BC Assessment Authority taxation revenue, municipal contributions to BC Transit and commissions paid to municipalities for the collection of provincial (residential school purpose) property taxes. |
Other taxes | | $ | 2,320 | | $ | 2,388 | | $ | 2,410 | |
Calendar Year | | | | | | | |
Population | | 1.3 | % | 1.2 | % | 1.2 | % |
BC Consumer Price Index | | 2.0 | % | 2.1 | % | 2.1 | % |
Housing Starts | | 36,500 | | 33,440 | | 32,004 | |
Nominal GDP | | 5.7 | % | 4.9 | % | 5.5 | % |
Real GDP | | 3.0 | % | 2.9 | % | 3.1 | % |
| | | | | | | |
Components of revenue | | | | | | | |
Property transfer | | $ | 1,000 | | $ | 1,050 | | $ | 1,050 | |
Tobacco | | $ | 705 | | $ | 705 | | $ | 705 | |
Corporation capital | | $ | 105 | | $ | 105 | | $ | 110 | |
Insurance premium | | $ | 362 | | $ | 372 | | $ | 381 | |
Hotel room | | $ | 148 | | $ | 156 | | $ | 164 | |
Consolidated Revenue Fund | | $ | 116 | | $ | 94 | | $ | 99 | |
Tourism BC | | $ | 32 | | $ | 62 | | $ | 65 | |
63
Revenue Source and Assumptions | | Forecast | | Updated Plan | |
($ millions unless otherwise specified) | | 2007/08 | | 2008/09 | | 2009/10 | |
Petroleum, natural gas, minerals and Columbia River Treaty export electricity sales | | $ | 2,487 | | $ | 2,476 | | $ | 2,486 | |
Natural gas price ($Cdn/gigajoule at plant inlet) | | $ | 5.94 | | $ | 6.18 | | $ | 6.10 | |
Natural gas volumes (petajoules) | | 1,066 | | 1,074 | | 1,084 | |
Annual per cent change | | -1.3 | % | 0.8 | % | 0.9 | % |
Oil price ($US/bbl at Cushing, Ok) | | $ | 65.57 | | $ | 67.18 | | $ | 63.67 | |
Auctioned land base (000 hectares) | | 404 | | 642 | | 623 | |
Average bid price/hectare ($) | | $ | 858 | | $ | 710 | | $ | 614 | |
Metallurgical coal price ($US/tonne,fob west coast) | | $ | 92 | | $ | 95 | | $ | 95 | |
Copper price ($US/lb) | | $ | 3.15 | | $ | 2.40 | | $ | 2.15 | |
| | | | | | | |
Columbia River Treaty sales | | | | | | | |
Annual quantity set by treaty (million mega-watt hours) | | 4.1 | | 4.0 | | 4.5 | |
Mid-Columbia electricity price ($US/mega-watt hour) | | $ | 66 | | $ | 72 | | $ | 71 | |
| | | | | | | |
Components of revenue | | | | | | | |
Natural gas royalties | | $ | 1,330 | | $ | 1,358 | | $ | 1,324 | |
Bonus bids, permits and fees | | $ | 496 | | $ | 501 | | $ | 510 | |
Petroleum royalties | | $ | 100 | | $ | 97 | | $ | 87 | |
Columbia River Treaty electricity sales | | $ | 270 | | $ | 285 | | $ | 325 | |
Coal | | $ | 93 | | $ | 102 | | $ | 119 | |
Minerals, metals and other | | $ | 167 | | $ | 101 | | $ | 88 | |
Oil and Gas Commission fees | | $ | 31 | | $ | 32 | | $ | 33 | |
Royalty Programs and Infrastructure credits | | | | | | | |
Summer drilling | | $ | -46 | | $ | -51 | | $ | -55 | |
Deep drilling | | $ | -59 | | $ | -66 | | $ | -71 | |
Marginal, Low Production and Ultramarginal | | $ | -121 | | $ | -135 | | $ | -147 | |
Road infrastructure | | $ | -37 | | $ | -47 | | $ | -23 | |
Pipeline infrastructure | | $ | -10 | | $ | 0 | | $ | 0 | |
Total credits | | $ | -273 | | $ | -299 | | $ | -296 | |
| | | | | | | |
Implicit royalty rate | | 21.0 | % | 20.5 | % | 20.0 | % |
| | | | | | | |
Royalty program (marginal, low production and ultra marginal drilling) adjustments reflect reduced royalty rates. | |
| | | | | | | |
Forests | | $ | 1,296 | | $ | 1,372 | | $ | 1,282 | |
Prices (calendar year average) | | | | | | | |
SPF 2x4 ($US/1000 bd ft) | | $ | 265 | | $ | 275 | | $ | 300 | |
Random Lengths Composite ($US/thousand board feet) | | $ | 300 | | $ | 310 | | $ | 335 | |
Hemlock price ($US/1000 bd ft) | | $ | 600 | | $ | 600 | | $ | 600 | |
Pulp ($US/tonne) | | $ | 776 | | $ | 731 | | $ | 725 | |
Coastal log($Cdn/cubic metre)(Vancouver Log Market, fiscal year) | | $ | 104 | | $ | 105 | | $ | 105 | |
Fiscal Year Trade Assumptions | | | | | | | |
Export tax rate | | 12.5 | % | 11.2 | % | 5.0 | % |
SPF 2x4 ($US/1000 bd ft) | | $ | 270 | | $ | 281 | | $ | 300 | |
Random Lengths Composite price ($US/thousand board feet) | | $ | 306 | | $ | 316 | | $ | 335 | |
Lumber shipments and consumption (billion board feet) | | | | | | | |
BC lumber exports to U.S. | | 9.7 | | 9.3 | | 10.3 | |
Crown harvest volumes (million cubic metres) | | | | | | | |
Interior | | 51.0 | | 51.0 | | 53.0 | |
Coast | | 12.8 | | 15.0 | | 16.0 | |
Total | | 63.8 | | 66.0 | | 69.0 | |
BC Timber Sales (included in above) | | 12.5 | | 12.6 | | 12.6 | |
Components of revenue | | | | | | | |
Tenures | | $ | 644 | | $ | 752 | | $ | 780 | |
BC Timber Sales | | $ | 303 | | $ | 305 | | $ | 305 | |
Softwood Lumber Agreement 2006 border tax | | $ | 305 | | $ | 270 | | $ | 142 | |
Logging tax | | $ | 20 | | $ | 20 | | $ | 30 | |
Other | | $ | 24 | | $ | 25 | | $ | 25 | |
64
Revenue Source and Assumptions | | Forecast | | Updated Plan | |
($ millions unless otherwise specified) | | 2007/08 | | 2008/09 | | 2009/10 | |
Health and social transfers | | $ | 4,870 | | $ | 4,787 | | $ | 4,996 | |
| | | | | | | | | | |
National Cash Transfers | | | | | | | |
Canada Health Transfer (CHT) excluding Trusts, September 2004 First Ministers’ Meeting (FMM) and prior-year adjustments | | $ | 13,750 | | $ | 14,100 | | $ | 14,400 | |
FMM | | $ | 7,598 | | $ | 8,529 | | $ | 9,587 | |
Canada Social Transfer (CST) | | $ | 9,487 | | $ | 10,537 | | $ | 10,853 | |
National basic federal tax ($ billions) | | $ | 122.0 | | $ | 128.7 | | $ | 136.6 | |
BC basic federal tax ($ billions) | | $ | 15.3 | | $ | 16.2 | | $ | 17.1 | |
BC share of national population (calendar year) | | 13.27 | % | 13.32 | % | 13.37 | % |
| | | | | | | |
BC health and social transfers revenue | | | | | | | |
CHT | | $ | 2,091 | | $ | 2,145 | | $ | 2,207 | |
FMM | | $ | 1,008 | | $ | 1,136 | | $ | 1,282 | |
Wait Times | | $ | 0 | | $ | 0 | | $ | 33 | |
Human Papillomavirus Immunization Trust | | $ | 40 | | $ | 0 | | $ | 0 | |
Patient Wait Times Guarantee Trust | | $ | 76 | | $ | 0 | | $ | 0 | |
2003 Medical Equipment ($200 million) | | $ | 16 | | $ | 16 | | $ | 16 | |
FMM Capital Equipment Funding | | $ | 4 | | $ | 7 | | $ | 7 | |
FMM Deferral (Base and Wait Times) | | $ | 267 | | $ | 79 | | $ | 0 | |
CST | | $ | 1,311 | | $ | 1,404 | | $ | 1,451 | |
2007/08 Child care spaces funding (one time) | | $ | 33 | | $ | 0 | | $ | 0 | |
Prior-year adjustments | | $ | 24 | | $ | 0 | | $ | 0 | |
| | | | | | | |
Service delivery agency direct revenue | | $ | 4,551 | | $ | 4,635 | | $ | 4,785 | |
School districts | | $ | 484 | | $ | 482 | | $ | 484 | |
Universities | | $ | 1,726 | | $ | 1,801 | | $ | 1,861 | |
Colleges, university colleges, and institutes | | $ | 545 | | $ | 559 | | $ | 573 | |
Health authorities and hospital societies | | $ | 650 | | $ | 601 | | $ | 604 | |
Children and family development agencies | | $ | 2 | | $ | 2 | | $ | 2 | |
BC Transportation Financing Authority | | $ | 466 | | $ | 475 | | $ | 486 | |
Other service delivery agencies | | $ | 678 | | $ | 715 | | $ | 775 | |
| | | | | | | |
Commercial Crown corporation net income | | $ | 2,757 | | $ | 2,682 | | $ | 2,659 | |
| | | | | | | |
BC Hydro | | $ | 365 | | $ | 401 | | $ | 420 | |
reservoir water inflows (per cent of normal)
(August 2006 forecast) | | 109 | % | 100 | % | 100 | % |
mean gas price
(Sumas, $US/Mmbtu – BC Hydro forecast based on NYMEX forward selling prices) | | 7.65 | | 8.46 | | 8.20 | |
electricity prices
(Mid-C, $US/MWh) | | 59.05 | | 66.00 | | 65.02 | |
rate increases | | 2.10 | % | 6.07 | % | 7.30 | % |
| | | | | | | |
ICBC (projected earnings during government’s fiscal year) | | $ | 484 | | $ | 257 | | $ | 228 | |
vehicle growth | | +2.5 | % | +2.6 | % | +2.5 | % |
claims cost trend | | +4.0 | % | +6.1 | % | +5.3 | % |
investment return (calculated on investment assets at cost) | | 7.3 | % | 5.7 | % | 5.4 | % |
loss ratio | | 85.2 | % | 89.0 | % | 89.8 | % |
| | | | | | | | | | | | | |
65
Table A.8 Natural Gas Price Forecasts: 2007/08 – 2009/10
| | | | | | | | Adjusted to fiscal years and | |
| | | | | | | | $C/gigajoule at plant inlet | |
Private sector forecasts (calendar year) | | 2007 | | 2008 | | 2009 | | 2007/08 | | 2008/09 | | 2009/10 | |
GLJ Henry Hub US$/MMBtu (July 2007) | | 7.37 | | 7.50 | | 7.50 | | 5.81 | | 5.66 | | 5.72 | |
Sproule Henry Hub US$/MMBtu (July 2007) | | 7.12 | | 8.31 | | 8.17 | | 5.76 | | 6.44 | | 6.26 | |
GLJ Alberta AECO-C Spot CDN$/MMBtu (July 07) | | 7.11 | | 7.17 | | 7.28 | | 6.10 | | 6.09 | | 6.17 | |
Sproule Alberta AECO-C Spot CDN$/MMBtu (July 2007) | | 6.94 | | 7.99 | | 7.83 | | 6.24 | | 6.79 | | 6.54 | |
GLJ Sumas Spot US$/MMBtu (July 2007) | | 6.73 | | 6.85 | | 6.85 | | 5.76 | | 5.71 | | 5.76 | |
Sproule Sumas Spot CDN$/MMBtu (July 2007) | | 7.08 | | 7.99 | | 7.83 | | 5.95 | | 6.32 | | 6.07 | |
GLJ BC Spot Plant Gate CDN$/MMBtu (July 2007) | | 6.76 | | 6.80 | | 6.91 | | 5.90 | | 5.84 | | 5.92 | |
Sproule BC Plant Inlet CDN$/MMBtu (July 2007) | | 6.00 | | 6.94 | | 6.78 | | 6.08 | | 6.53 | | 6.29 | |
GLJ Midwest Chicago US$/MMBtu (July 2007) | | 7.21 | | 7.45 | | 7.50 | | 5.93 | | 5.94 | | 6.06 | |
Sproule Alliance Plant Gate CDN$/MMBtu (July 2007) | | 6.43 | | 7.69 | | 7.56 | | 5.92 | | 6.52 | | 6.29 | |
US EIA US$/MMBtu Henry Hub (Aug 2007) | | 7.24 | | 7.82 | | — | | 5.58 | | — | | — | |
TD Economics Henry Hub Futures US$/MMBtu (July 07) | | 7.17 | | 7.00 | | — | | 5.26 | | — | | — | |
Scotiabank Group Henry Hub US$/MMBtu (July 2007) | | 7.50 | | 8.25 | | — | | 5.93 | | — | | — | |
BMO Alberta Empress US$/MMBtu (July 2007) | | 6.74 | | 7.90 | | — | | 6.23 | | — | | — | |
RBC Financial Henry Hub US$/MMBtu (July 2007) | | 7.03 | | — | | — | | — | | — | | — | |
Exports Development Canada Henry Hub US$/MMBtu (July 2007) | | 7.60 | | 7.70 | | — | | 5.82 | | — | | — | |
Tristone Capital Henry Hub US$/MMBtu (Jun 2007) | | 7.75 | | 8.50 | | — | | 6.12 | | — | | — | |
Petro-Canada AECO-C Spot CDN$/Mcf (July 2007) | | 7.50 | | — | | — | | — | | — | | — | |
NYMEX Forward Market converted to Plant Inlet CDN$/GJ (Aug 2007) | | | | | | | | 5.45 | | 6.61 | | 6.79 | |
| | | | | | | | | | | | | |
Average all minus high/low | | | | | | | | 5.92 | | 6.17 | | 6.10 | |
| | | | | | | | | | | | | |
Average one forecast per consultant minus high/low | | | | | | | | 5.95 | | 6.19 | | 6.10 | |
| | | | | | | | | | | | | |
Natural Gas Royalty Price Forecast | | | | | | | | 5.94 | | 6.18 | | 6.10 | |
GLJ: Gilbert Laustsen Jung Associates Ltd. US EIA: US Energy Information Administration AECO: Alberta Energy Company
U.S. Natural Gas Storage Levels
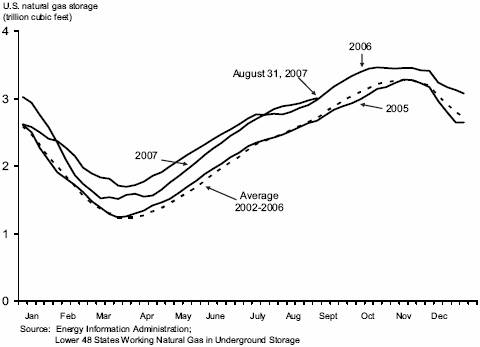
Source: Energy Information Administration;
Lower 48 States Working Natural Gas in Underground Storage
66
Table A.9 Expense Assumptions: 2007/08 – 2009/10
Ministry Programs and Assumptions | | Forecast | | Updated Plan | |
($ millions unless otherwise specified) | | 2007/08 | | 2008/09 | | 2009/10 | |
| | | | | | | |
Advanced Education | | 2,151 | | 2,243 | | 2,336 | |
Student spaces (# of FTEs) | | 190,442 | | 194,600 | | 198,626 | |
| | | | | | | |
Attorney General | | 520 | | 525 | | 530 | |
New cases filed/processed (# for all courts) | | 295,000 | | 295,000 | | 295,000 | |
Crown Proceeding Act | | 28 | | 28 | | 28 | |
| | | | | | | |
Children and Family Development | | 1,867 | | 1,967 | | 2,015 | |
Average children-in-care caseload (#) | | 9,200 | | 9,100 | | 9,000 | |
| | | | | | | |
Adult Community Living: | | | | | | | |
Residential Services: | | | | | | | |
Average caseload (#) | | 5,486 | | 5,688 | | 5,899 | |
Average cost per client ($) | | 65,300 | | 64,400 | | 63,900 | |
Day Programs: | | | | | | | |
Average caseload (#) | | 10,496 | | 10,887 | | 11,300 | |
Average cost per client ($) | | 17,000 | | 17,100 | | 17,200 | |
| | | | | | | |
Education | | 5,494 | | 5,637 | | 5,747 | |
Student enrolment (# of FTEs) | | 549,304 | | 544,361 | | 538,917 | |
| | | | | | | |
Employment and Income Assistance | | 1,480 | | 1,509 | | 1,551 | |
Average annual temporary assistance caseload (#) | | 41,870 | | 42,280 | | 43,770 | |
Average annual disability assistance caseload (#) | | 64,000 | | 67,000 | | 70,000 | |
Average annual total assistance caseload (#) | | 105,870 | | 109,280 | | 113,770 | |
| | | | | | | |
Forests and Range | | 1,150 | | 1,157 | | 1,126 | |
Direct fire fighting | | 113 | | 56 | | 56 | |
BC timber sales | | 200 | | 206 | | 226 | |
| | | | | | | |
Health | | 12,967 | | 13,358 | | 13,978 | |
Pharmacare demand/cost growth (per cent of change) | | 7.3 | % | 3.7 | % | 3.7 | % |
Medical Services Plan (MSP) | | 3,057 | | 3,167 | | 3,282 | |
Regional health sector funding | | 8,047 | | 8,215 | | 8,442 | |
| | | | | | | |
Public Safety and Solicitor General | | 656 | | 618 | | 632 | |
Emergency Program Act | | 53 | | 16 | | 16 | |
| | | | | | | |
Management of public funds and debt | | 535 | | 454 | | 395 | |
Interest rates for new provincial borrowing: | | | | | | | |
Short-term | | 4.80 | % | 5.08 | % | 5.25 | % |
Long-term | | 5.42 | % | 5.85 | % | 6.20 | % |
CDN/US exchange rate (cents) | | 94.7 | | 94.0 | | 93.2 | |
| | | | | | | |
Service delivery agency net spending | | 4,569 | | 4,327 | | 4,864 | |
School districts | | 377 | | 395 | | 371 | |
Universities | | 1,587 | | 1,702 | | 1,779 | |
Colleges, university colleges, and institutes | | 526 | | 569 | | 589 | |
Health authorities and hospital societies | | 707 | | 612 | | 618 | |
Children and family development agencies | | 3 | | 1 | | 2 | |
BC Transportation Financing Authority | | 719 | | 645 | | 730 | |
Other service delivery agencies | | 650 | | 403 | | 775 | |
67
Table A.10 Expense By Function(1): 2006/07 – 2009/10
| | Actual | | Forecast | | Updated Plan | |
($millions) | | 2006/07 | | 2007/08 | | 2008/09 | | 2009/10 | |
Health: | | | | | | | | | |
Medical Services Plan | | 2,969 | | 3,160 | | 3,270 | | 3,385 | |
Pharmacare | | 914 | | 1,023 | | 1,061 | | 1,100 | |
Regional services | | 8,500 | | 9,023 | | 9,229 | | 9,477 | |
Other healthcare expenses | | 867 | | 905 | | 850 | | 904 | |
Health Innovation Fund | | — | | 100 | | — | | — | |
| | 13,250 | | 14,211 | | 14,410 | | 14,866 | |
Education: | | | | | | | | | |
Elementary and secondary | | 5,272 | | 5,516 | | 5,657 | | 5,737 | |
Post-secondary | | 4,088 | | 4,161 | | 4,385 | | 4,561 | |
Other education expenses | | 159 | | 169 | | 174 | | 180 | |
| | 9,519 | | 9,846 | | 10,216 | | 10,478 | |
Social services: | | | | | | | | | |
Social assistance | | 1,713 | | 1,912 | | 1,957 | | 2,021 | |
Childcare services | | 1,085 | | 1,139 | | 1,159 | | 1,170 | |
Other social services expenses | | 94 | | 90 | | 92 | | 91 | |
| | 2,892 | | 3,141 | | 3,208 | | 3,282 | |
Protection of persons and property | | 1,329 | | 1,499 | | 1,448 | | 1,458 | |
Transportation | | 1,251 | | 1,331 | | 1,258 | | 1,324 | |
Natural resources and economic development | | 1,663 | | 1,697 | | 1,572 | | 1,660 | |
Other | | 1,278 | | 1,345 | | 1,310 | | 1,307 | |
Contingencies – new programs | | — | | 360 | | 365 | | 375 | |
Contingencies – Negotiating Framework | | — | | 39 | | 77 | | 142 | |
General government | | 768 | | 685 | | 648 | | 666 | |
Interest | | 2,234 | | 2,276 | | 2,318 | | 2,417 | |
Expense before negotiating framework incentive payments | | 34,184 | | 36,430 | | 36,830 | | 37,975 | |
Negotiating framework incentive payments | | 264 | | — | | — | | — | |
Total expense | | 34,448 | | 36,430 | | 36,830 | | 37,975 | |
(1) Amounts have been restated to reflect government’s accounting policies in effect at March 31, 2007.
68
Table A.11 Service Delivery Agency Operating Results(1): 2006/07 – 2009/10
| | Actual | | Forecast | | Updated Plan | |
($ millions) | | 2006/07 | | 2007/08 | | 2008/09 | | 2009/10 | |
| | | | | | | | | |
School districts | | | | | | | | | |
| | | | | | | | | |
Revenue | | 5,178 | | 5,221 | | 5,348 | | 5,433 | |
Expense | | (5,041 | ) | (5,151 | ) | (5,283 | ) | (5,361 | ) |
| | 137 | | 70 | | 65 | | 72 | |
Accounting adjustments | | 61 | | 37 | | 22 | | 41 | |
Net impact | | 198 | | 107 | | 87 | | 113 | |
| | | | | | | | | |
Universities | | | | | | | | | |
| | | | | | | | | |
Revenue | | 2,751 | | 2,921 | | 3,063 | | 3,194 | |
Expense | | (2,593 | ) | (2,826 | ) | (2,984 | ) | (3,132 | ) |
| | 158 | | 95 | | 79 | | 62 | |
Accounting adjustments | | 95 | | 44 | | 20 | | 20 | |
Net impact | | 253 | | 139 | | 99 | | 82 | |
| | | | | | | | | |
Colleges, university colleges, and institutes | | | | | | | | | |
| | | | | | | | | |
Revenue | | 1,378 | | 1,373 | | 1,403 | | 1,441 | |
Expense | | (1,310 | ) | (1,373 | ) | (1,420 | ) | (1,465 | ) |
| | 68 | | — | | (17 | ) | (24 | ) |
Accounting adjustments | | 22 | | 19 | | 7 | | 8 | |
Net impact | | 90 | | 19 | | (10 | ) | (16 | ) |
| | | | | | | | | |
Health authorities and hospital societies | | | | | | | | | |
| | | | | | | | | |
Revenue | | 8,857 | | 9,382 | | 9,395 | | 9,600 | |
Expense | | (8,892 | ) | (9,437 | ) | (9,395 | ) | (9,600 | ) |
| | (35 | ) | (55 | ) | — | | — | |
Accounting adjustments | | (88 | ) | (2 | ) | (11 | ) | (15 | ) |
Net impact | | (123 | ) | (57 | ) | (11 | ) | (15 | ) |
| | | | | | | | | |
Children and family development agencies | | | | | | | | | |
| | | | | | | | | |
Revenue | | 631 | | 687 | | 716 | | 744 | |
Expense | | (631 | ) | (687 | ) | (716 | ) | (744 | ) |
| | — | | — | | — | | — | |
Accounting adjustments | | 1 | | (1 | ) | 1 | | — | |
Net impact | | 1 | | (1 | ) | 1 | | — | |
| | | | | | | | | |
BC Transportation Financing Authority | | | | | | | | | |
| | | | | | | | | |
Revenue | | 618 | | 611 | | 612 | | 617 | |
Expense | | (585 | ) | (719 | ) | (645 | ) | (730 | ) |
| | 33 | | (108 | ) | (33 | ) | (113 | ) |
Accounting adjustments | | (155 | ) | (145 | ) | (137 | ) | (130 | ) |
Net impact | | (122 | ) | (253 | ) | (170 | ) | (243 | ) |
69
| | Actual | | Forecast | | Updated Plan | |
($ millions) | | 2006/07 | | 2007/08 | | 2008/09 | | 2009/10 | |
| | | | | | | | | |
British Columbia Housing Management Commission | | | | | | | | | |
| | | | | | | | | |
Revenue | | 497 | | 505 | | 523 | | 469 | |
Expense | | (497 | ) | (505 | ) | (523 | ) | (469 | ) |
| | — | | — | | — | | — | |
Accounting adjustments | | (15 | ) | (5 | ) | — | | — | |
Net impact | | (15 | ) | (5 | ) | — | | — | |
| | | | | | | | | |
British Columbia Transit | | | | | | | | | |
| | | | | | | | | |
Revenue | | 165 | | 187 | | 218 | | 229 | |
Expense | | (167 | ) | (187 | ) | (218 | ) | (229 | ) |
| | (2 | ) | — | | — | | — | |
Accounting adjustments | | — | | (6 | ) | (1 | ) | (1 | ) |
Net impact | | (2 | ) | (6 | ) | (1 | ) | (1 | ) |
| | | | | | | | | |
Tourism British Columbia | | | | | | | | | |
| | | | | | | | | |
Revenue | | 60 | | 58 | | 70 | | 74 | |
Expense | | (59 | ) | (58 | ) | (70 | ) | (74 | ) |
| | 1 | | — | | — | | — | |
Accounting adjustments | | 7 | | — | | — | | — | |
Net impact | | 8 | | — | | — | | — | |
| | | | | | | | | |
Vancouver Convention Centre Expansion Project Ltd. | | | | | | | | | |
| | | | | | | | | |
Revenue | | — | | — | | — | | 23 | |
Expense | | — | | — | | — | | (22 | ) |
| | — | | — | | — | | 1 | |
Accounting adjustments | | 107 | | 36 | | 295 | | (17 | ) |
Net impact | | 107 | | 36 | | 295 | | (16 | ) |
| | | | | | | | | |
Other service delivery agencies | | | | | | | | | |
| | | | | | | | | |
Revenue | | 722 | | 706 | | 702 | | 749 | |
Expense | | (649 | ) | (663 | ) | (684 | ) | (730 | ) |
| | 73 | | 43 | | 18 | | 19 | |
Accounting adjustments | | 48 | | (40 | ) | — | | (2 | ) |
Net impact | | 121 | | 3 | | 18 | | 17 | |
| | | | | | | | | |
Total net fiscal plan impact | | 516 | | (18 | ) | 308 | | (79 | ) |
| | | | | | | | | |
Total service delivery agencies operating results | | | | | | | | | |
Revenue | | 20,857 | | 21,651 | | 22,050 | | 22,573 | |
Accounting adjustments | | 73 | | (75 | ) | 176 | | (95 | ) |
Net revenue | | 20,930 | | 21,576 | | 22,226 | | 22,478 | |
Expense | | (20,424 | ) | (21,606 | ) | (21,938 | ) | (22,556 | ) |
Accounting adjustments | | 10 | | 12 | | 20 | | (1 | ) |
Net expense | | (20,414 | ) | (21,594 | ) | (21,918 | ) | (22,557 | ) |
Total net impact | | 516 | | (18 | ) | 308 | | (79 | ) |
(1) | Revenue and expense are shown as reported in the entity financial statements and service plans, before consolidation and accounting adjustments. |
70
Table A.12 Full-Time Equivalents (FTEs)(1): 2006/07 – 2009/10
| | Actual | | Forecast | | Updated Plan | |
FTEs | | 2006/07 | | 2007/08 | | 2008/09 | | 2009/10 | |
Ministries and special offices (CRF) | | 28,647 | | 30,416 | | 30,581 | | 30,717 | |
Service delivery agencies (2) | | 3,917 | | 3,975 | | 3,985 | | 3,990 | |
Total FTEs | | 32,564 | | 34,391 | | 34,566 | | 34,707 | |
(1) | Full-time equivalents (FTEs) are a measure of staff employment. FTEs are calculated by dividing the total hours of employment paid for in a given period by the number of hours an individual, full-time person would normally work in that period. This does not equate to the physical number of employees. For example, two half-time employees would equal one FTE, or alternatively, three FTEs may represent two full-time employees who have worked sufficient overtime hours to equal an additional FTE. |
(2) | Service delivery agencies FTE amounts do not include SUCH sector staff employment. |
71
Table A.13 Statement of Financial Position: 2006/07 – 2009/10
| | Actual | | Year-to-date | | Forecast | | Updated Plan | |
| | March 31 | | June 30 | | March 31 | | March 31 | | March 31 | |
($ millions) | | 2007 | | 2007 | | 2008 | | 2009 | | 2010 | |
Financial assets | | | | | | | | | | | |
Cash and temporary investments | | 3,367 | | 4,374 | | 2,657 | | 2,613 | | 2,784 | |
Other financial assets | | 7,854 | | 7,561 | | 8,266 | | 8,601 | | 8,890 | |
Sinking funds | | 3,798 | | 3,496 | | 3,516 | | 3,411 | | 3,264 | |
Investments in commercial Crown corporations: | | | | | | | | | | | |
Retained earnings | | 4,396 | | 4,449 | | 5,015 | | 5,465 | | 5,813 | |
Recoverable capital loans | | 7,170 | | 7,708 | | 7,749 | | 8,571 | | 9,494 | |
| | 11,566 | | 12,157 | | 12,764 | | 14,036 | | 15,307 | |
| | 26,585 | | 27,588 | | 27,203 | | 28,661 | | 30,245 | |
Liabilities | | | | | | | | | | | |
Accounts payable and accrued liabilities | | 7,094 | | 6,427 | | 7,561 | | 8,019 | | 9,047 | |
Deferred revenue | | 5,986 | | 5,853 | | 6,115 | | 6,473 | | 6,725 | |
Debt: | | | | | | | | | | | |
Taxpayer-supported debt | | 25,874 | | 26,967 | | 26,231 | | 26,781 | | 26,490 | |
Self-supported debt | | 7,473 | | 7,995 | | 8,029 | | 9,021 | | 9,923 | |
Forecast allowance | | — | | — | | 500 | | 1,000 | | 1,050 | |
Total provincial debt | | 33,347 | | 34,962 | | 34,760 | | 36,802 | | 37,463 | |
Add: debt offset by sinking funds | | 3,798 | | 3,496 | | 3,516 | | 3,411 | | 3,264 | |
Less: guarantees and non-guaranteed debt | | (407 | ) | (406 | ) | (423 | ) | (595 | ) | (576 | ) |
Financial statement debt | | 36,738 | | 38,052 | | 37,853 | | 39,618 | | 40,151 | |
| | 49,818 | | 50,332 | | 51,529 | | 54,110 | | 55,923 | |
Net liabilities | | (23,233 | ) | (22,744 | ) | (24,326 | ) | (25,449 | ) | (25,678 | ) |
Capital and other non-financial assets | | | | | | | | | | | |
Tangible capital assets | | 26,626 | | 26,910 | | 29,316 | | 31,205 | | 32,261 | |
Other non-financial assets | | 943 | | 965 | | 946 | | 930 | | 928 | |
| | 27,569 | | 27,875 | | 30,262 | | 32,135 | | 33,189 | |
Accumulated surplus | | 4,336 | | 5,131 | | 5,936 | | 6,686 | | 7,511 | |
Changes in Financial Position: 2006/07 – 2009/10
| | Year-to-date | | Forecast | | Updated Plan | |
| | June 30 | | March 31 | | March 31 | | March 31 | |
($ millions) | | 2007 | | 2008 | | 2009 | | 2010 | |
| | | | | | | | | |
Change in accumulated surplus | | (795 | ) | (1,600 | ) | (750 | ) | (825 | ) |
Change in comprehensive income | | (117 | ) | — | | — | | — | |
Surplus for the period | | (912 | ) | (1,600 | ) | (750 | ) | (825 | ) |
Capital and other non-financial asset changes: | | | | | | | | | |
Increase in taxpayer-supported capital investments | | 699 | | 4,257 | | 3,590 | | 2,867 | |
Less: amortization and other accounting changes | | (415 | ) | (1,567 | ) | (1,701 | ) | (1,811 | ) |
Change in net capital assets | | 284 | | 2,690 | | 1,889 | | 1,056 | |
Increase (decrease) in other non-financial assets | | 22 | | 3 | | (16 | ) | (2 | ) |
| | 306 | | 2,693 | | 1,873 | | 1,054 | |
Increase (decrease) in net liabilities | | (606 | ) | 1,093 | | 1,123 | | 229 | |
Investment and working capital changes: | | | | | | | | | |
Increase (reduction) in cash and temporary investments | | 1,007 | | (710 | ) | (44 | ) | 171 | |
Increase in total investment in commercial Crown corporations: | | | | | | | | | |
Increase (decrease) in retained earnings | | 53 | | 619 | | 450 | | 348 | |
Less: change in comprehensive income | | 117 | | — | | — | | — | |
Self-supported capital investments | | 261 | | 1,341 | | 1,738 | | 1,766 | |
Less: loan repayments and other accounting changes | | 394 | | (762 | ) | (916 | ) | (843 | ) |
| | 708 | | 1,198 | | 1,272 | | 1,271 | |
Other working capital changes | | 205 | | (466 | ) | (586 | ) | (1,138 | ) |
| | 1,920 | | 22 | | 642 | | 304 | |
Increase (decrease) in financial statement debt | | 1,314 | | 1,115 | | 1,765 | | 533 | |
(Increase) decrease in sinking fund debt | | 302 | | 282 | | 105 | | 147 | |
Increase (decrease) in guarantees and non-guaranteed debt | | (1 | ) | 16 | | 172 | | (19 | ) |
Increase (decrease) in total provincial debt | | 1,615 | | 1,413 | | 2,042 | | 661 | |
72