Exhibit 99.9
Budget and Fiscal Plan
2008/09 – 2010/11
February 19, 2008

National Library of Canada Cataloguing in Publication Data
British Columbia.
Budget and fiscal plan. — 2002/03/2004/05-
Annual
Also available on the Internet.
Continues: British Columbia. Ministry of Finance and
Corporate Relations. Budget ... reports. ISSN 1207-5841
ISSN 1705-6071 = Budget and fiscal plan — British Columbia.
1. Budget — British Columbia — Periodicals. 2. British
Columbia — Appropriations and expenditures — Periodicals.
I. British Columbia. Ministry of Finance. II. Title.
HJ12.B742 352.48’09711’05 C2003-960048-3
TABLE OF CONTENTS |
|
Budget and Fiscal Plan 2008/09 – 2010/11 | February 19, 2008 |
Attestation by the Secretary to Treasury Board | | |
| | |
Summary | | 1 |
| | |
Part One: A Budget for Climate Action | | |
| | |
Summary | | 7 |
| | |
Carbon Tax and Revenue Recycling | | 11 |
Introduction | | 11 |
Principles | | 11 |
How does the tax work? | | 12 |
Revenue Recycling | | 14 |
Carbon Tax Implications | | 16 |
Carbon Tax Conclusions | | 22 |
| | |
Existing Climate Action and Related Initiatves in BC: A Track Record of Action | | 22 |
The 2007 Throne Speech and Budget 2007: Ramping up to Address Climate Change | | 22 |
2007 Energy Plan: Continued Actions for Conservation and Greener Energy | | 25 |
Results of Public Consultations to Prepare for Budget 2008 | | 26 |
| | |
Budget 2008: Expenditures to Support Climate Action | | 27 |
Total Climate Action Expenditures and the Federal Ecotrust Contribution | | 34 |
Environmental, Economic and Health Implications | | 35 |
| | |
Looking Ahead | | 36 |
| | |
Tables: | | |
1.1 | Rate per Tonne of CO2-equivalent | | 12 |
1.2 | Selected Carbon Tax Rates by Fuel Type | | 14 |
1.3 | British Columbia Tax Cut – Impact on Taxpayers | | 16 |
1.4 | Annual Carbon Tax Cost for Gasoline Fueled Vehicles | | 17 |
1.5 | Annual Carbon Tax Cost for Diesel Fueled Vehicles | | 17 |
1.6 | Annual Carbon Tax Cost of Home Fuel Use | | 17 |
1.7 | Revenue Neutral Climate Action Measures – Impact on Taxpayers | | 18 |
1.8 | Carbon Tax Cost of Selected Late Model Vehicles at $10 per tonne | | 19 |
1.9 | Additional Budget 2008 Climate Action Tax Initiatives | | 20 |
1.10 | A Track Record of Action on Energy and Climate Issues | | 23 |
1.11 | Key 2007 Throne Speech Directions: Strengthening the Commitment to Climate Action | | 26 |
1.12 | Key 2007 Energy Plan Initiatives that Support Climate Action | | 26 |
1.13 | Budget 2008: Total Climate Action Expenditure Initiatives | | 27 |
1.14 | LiveSmartBC – Efficiency Incentive Program | | 29 |
| | |
Topic Boxes: | | |
A Climate Change Backgrounder | | 8 |
What is Taxed – the Carbon Tax Base | | 13 |
A Revenue Neutral Carbon Tax Plan | | 15 |
What Can I Do to Reduce Carbon Emissions? | | 21 |
“Cap and Trade” System for Large Emitters | | 38 |
BC as a Climate Action Leader: A Comparison with Other Jurisdictions | | 40 |
| | | | | |
Budget and Fiscal Plan – 2008/09 to 2010/11
| | |
Part Two: Three-Year Fiscal Plan | | |
| | |
Introduction | | 43 |
Consolidated Revenue Fund Spending | | 48 |
Climate Action | | 48 |
New Investments in the Economy and Communities | | 49 |
Vancouver Convention Centre Expansion Project | | 54 |
2010 Olympic and Paralympic Winter Games | | 55 |
Provincial Transportation Investments | | 55 |
K–12 Education | | 56 |
Enhancing Health Care | | 57 |
Strengthening Social Services | | 59 |
Justice and Public Safety | | 62 |
Expenses Recovered from External Entities | | 63 |
Service Delivery Agency Expenses | | 63 |
Revenue | | 64 |
Budget 2008 Plan | | 64 |
Commercial Crown Corporation Income | | 70 |
Full-Time Equivalents | | 71 |
Capital Spending | | 72 |
Projects over $50 million | | 76 |
Provincial Debt | | 78 |
Risks to the Fiscal Plan | | 81 |
| | |
Tables: | | |
2.1 | Three-Year Fiscal Plan – Operating Statement | | 43 |
2.2 | Three-Year Fiscal Plan Update – Changes from Budget 2007 | | 44 |
2.3 | Revenue by Source | | 46 |
2.4 | Expense by Ministry, Program and Agency | | 47 |
2.5 | New Investments in the Economy and Communities (in addition to Climate Action) | | 49 |
2.6 | Vancouver Convention Centre Expansion Project Funding | | 54 |
2.7 | 2010 Olympics Funding | | 55 |
2.8 | Provincial Transportation Investments | | 56 |
2.9 | Enhancing Health Care | | 59 |
2.10 | Strengthening Social Services | | 60 |
2.11 | Reducing Homelessness | | 60 |
2.12 | Justice and Public Safety | | 62 |
2.13 | Budget 2008 Tax Measures – 2007/08 to 2010/11 | | 65 |
2.14 | Personal income tax revenue | | 66 |
2.15 | Corporate income tax revenue | | 66 |
2.16 | Social service tax revenue | | 67 |
2.17 | Health and social transfers | | 70 |
2.18 | Full-Time Equivalents (FTE’s) – Changes from Budget 2007 | | 72 |
2.19 | Capital Spending | | 73 |
2.20 | Capital Expenditure Projects Greater Than $50 million | | 77 |
2.21 | Provincial Debt Summary | | 79 |
2.22 | Reconciliation of Summary Surpluses to Provincial Debt Changes | | 80 |
2.23 | Provincial Financing | | 80 |
2.24 | Key Fiscal Sensitivities | | 81 |
2.25 | Notional Allocations to Contingencies | | 84 |
| | | |
Topic Boxes: | | |
Capital Financing and Debt Management | | 88 |
Building on British Columbia’s Strengths | | 92 |
Budget and Fiscal Plan – 2008/09 to 2010/11
ii
Part Three: Tax Measures | | |
| | |
Tax Measures – Supplementary Information | | 102 |
Revenue Neutral Climate Action Initatives | | 102 |
Other Climate Action Initiatives | | 106 |
Other Revenue Measures | | 110 |
Victoria Regional Transit Commission Tax Increased by 1 Cent Per Litre | 118 |
| |
Tables: | | |
3.1 | Summary of Tax Measures | | 100 |
3.2 | British Columbia Personal Income Tax Brackets and Rates | 104 |
3.3 | British Columbia Tax Cut – Impact on Taxpayers | 104 |
3.4 | British Columbia Personal Income Taxes Payable | |
| Before 2001 and After 2009 Tax Cuts | | 105 |
3.5 | Tax Reductions for Fuel Efficient Vehicles | 107 |
3.6 | Corporation Capital Tax Rates | | 111 |
| | | |
Topic Box: | | |
Provincial Sales Tax Review | | 119 |
| | | |
Part Four: British Columbia Economic Review and Outlook | |
| |
Summary | | 121 |
Recent Developments | | 122 |
The Outlook for the External Environment | | 123 |
Financial Markets | | 128 |
The British Columbia Economic Outlook | | 131 |
Risks to the Economic Outlook | | 139 |
| | |
Tables: | | | |
4.1 | British Columbia Economic Indicators | 122 |
4.2 | Ministry of Finance Economic Forecast: | Key Assumptions | 128 |
4.3 | Private Sector Canadian Three Month Treasury Bill Interest Rate Forecasts | 129 |
4.4 | Private Sector Canadian 10-year Government Bond Interest Rate Forecasts | 130 |
4.5 | Private Sector Exchange Rate Forecasts | | 131 |
4.6 | British Columbia Economic Outlook | | 131 |
4.7 | Ministry of Finance Economic Forecast: Key Economic Indicators | 132 |
4.8 | British Columbia Economic Review | | 140 |
4.9.1 | Gross Domestic Product: British Columbia | 141 |
4.9.2 | Components of Nominal Income and Expenditure | 142 |
4.9.3 | Labour Market Indicators | | 142 |
4.9.4 | Major Economic Assumptions | | 143 |
| | | |
Topic Box: | | |
The Economic Forecast Council, 2008 | | 144 |
| | | | | | |
Budget and Fiscal Plan – 2008/09 to 2010/11
iii
Part Five: 2007/08 Updated Financial Forecast (Third Quarterly Report) | |
| |
2007/08 Fiscal Year in Review | 151 |
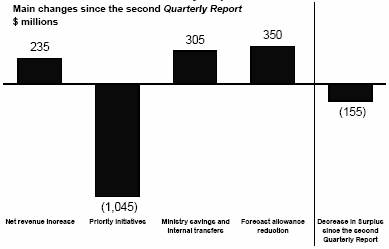
Changes since the Second Quarterly Report | 152 |
Capital Spending and Provincial Debt | 157 |
| |
Tables: | |
5.1 | Budget 2007 and Quarterly Updates – Operating Statement | 151 |
5.2 | Operating Statement Update Since the Second Quarterly Report | 153 |
5.3 | 2007/08 Priority Initiatives | 154 |
5.4 | 2007/08 Notional Allocations to Contingencies | 156 |
5.5 | Budget 2007 and Quarterly Updates – Capital Spending and Provincial Debt | 157 |
5.6 | Capital Spending and Provincial Debt Update Since the Second Quarterly Report | 158 |
5.7 | 2007/08 Operating Statement | 159 |
5.8 | 2007/08 Forecast Update – Changes from Budget 2007 | 160 |
5.9 | 2007/08 Revenue by Source | 161 |
5.10 | 2007/08 Expense by Ministry, Program and Agency | 162 |
5.11 | 2007/08 Expense by Function | 163 |
5.12 | 2007/08 Service Delivery Agency Operating Results | 164 |
5.13 | 2007/08 Capital Spending | 166 |
5.14 | 2007/08 Provincial Debt | 167 |
5.15 | 2007/08 Statement of Financial Position | 168 |
| |
Appendices | | 169 |
| | | |
Budget and Fiscal Plan – 2008/09 to 2010/11
iv

| February 19, 2008 |
As required by Section 7(d) of the Budget Transparency and Accountability Act (BTAA), I am confirming that the Budget and Fiscal Plan contains the following elements:
· The fiscal and economic forecasts for 2008/09 and future years, which are detailed in Part 2 and Part 4.
· All material economic, demographic, taxation, accounting policy and other assumptions underlying the 2008/09 economic, revenue, expenditure, surplus and debt forecasts are also disclosed. In particular:
· The status quo policy is assumed for federal government transfer revenues. No revenues or expenditures have been included in this budget either for the recently legislated federal Community Development Trust, or for the transfer of labour market programs from the federal government which was still being finalized when the budget went to press. These will be included in future fiscal updates as detailed agreements are complete and accounting treatments confirmed. While both initiatives will result in increased revenue and expenditure, the net impact on the three-year fiscal plan is expected to be small;
· Similarly, no assumptions have been made regarding measures that may be included in the federal budget expected to be tabled on February 26, 2008; and
· Many of the wage agreements reached in the last round of public sector negotiations expire by the end of the 2009/10. In 2010/11, Ministry of Health funding growth is maintained at the same rate as for the previous year to accommodate wage increases in that sector; an increased contingency vote allocation has been provided for other sectors.
· The report on the advice received from the Minister’s Economic Forecast Council on the economic growth outlook for British Columbia, including the range of forecasts for 2008 and 2009.
· The major areas of risk to the plan known at this time are disclosed in the risks section in Part 2, and in the material assumptions tables in the Appendix.
Government continues to work towards providing funding information to health authorities and post-secondary institutions sufficiently early in the fiscal year for them to develop board approved plans for the budget; however, this was not possible for Budget 2008. As a result, the financial forecasts for school districts, universities, colleges and health authorities (the SUCH sector) have all been developed by the Ministries of Health, Advanced Education and Education on an aggregate basis for their respective sectors. Individual organizational plans for health authorities and post-secondary institutions will be developed over the coming months and reflected in the updated fiscal plan in the first Quarterly Report.
The accounting policies followed in the Budget and Fiscal Plan comply, in all material respects, with generally accepted accounting principles (GAAP) for senior governments.
As required under section 7(e) of the BTAA, the forecast allowance, which is an adjustment to the most likely forecast of the 2008/09 surplus, is also disclosed. The 2008/09 to 2010/11 forecast allowances help to mitigate against revenue risks arising from a worse-than-expected economic slowdown in the US and in particular its housing sector, unexpected costs such as natural disasters, changes in key commodity prices or out-year funding pressures.
I would like to recognize staff in government ministries and agencies for their contribution to this document. I would like to especially acknowledge staff in the Ministry of Finance, whose professionalism, commitment and expertise were essential to the completion of this budget.
| 
|
| Chris Trumpy |
| Deputy Minister and
Secretary to Treasury Board |
Ministry of
Finance | | Office of the
Deputy Minister | | Mailing Address:
PO Box 9417 Stn Prov Govt
Victoria BC V8W 9V1
www.gov.bc.ca/fin | | Location Address:
Room 109
617 Government Street
Victoria BC |
Summary: BUDGET AND FISCAL PLAN – 2008/09 to 2010/11
| | 2007/08 | | Budget | | | | | |
($ millions) | | Budget | | Updated | | Estimate | | Plan | | Plan | |
| | Forecast | | 2008/09 | | 2009/10 | | 2010/11 | |
Revenue | | 37,390 | | 39,400 | | 38,490 | | 39,925 | | 41,525 | |
Expense | | (36,240 | ) | (37,280 | ) | (37,690 | ) | (39,100 | ) | (40,700 | ) |
Surplus before forecast allowance | | 1,150 | | 2,120 | | 800 | | 825 | | 825 | |
Forecast allowance | | (750 | ) | (150 | ) | (750 | ) | (675 | ) | (675 | ) |
Surplus | | 400 | | 1,970 | | 50 | | 150 | | 150 | |
Capital spending: | | | | | | | | | | | |
Taxpayer-supported capital spending | | 3,864 | | 4,149 | | 3,859 | | 3,370 | | 3,051 | |
Total capital spending | | 5,156 | | 5,525 | | 5,766 | | 5,479 | | 5,440 | |
Provincial Debt: | | | | | | | | | | | |
Government direct operating debt | | 9,125 | | 8,246 | | 7,408 | | 6,880 | | 6,452 | |
Taxpayer-supported debt | | 27,803 | | 26,792 | | 27,741 | | 28,973 | | 30,044 | |
Total debt | | 36,837 | | 35,003 | | 37,741 | | 39,980 | | 42,473 | |
Government direct operating debt-to-GDP ratio | | 4.9 | % | 4.3 | % | 3.7 | % | 3.3 | % | 2.9 | % |
Taxpayer-supported debt-to-GDP ratio | | 14.8 | % | 14.1 | % | 14.0 | % | 13.9 | % | 13.7 | % |
Total debt-to GDP ratio | | 19.6 | % | 18.4 | % | 19.0 | % | 19.1 | % | 19.4 | % |
A BUDGET FOR CLIMATE ACTION
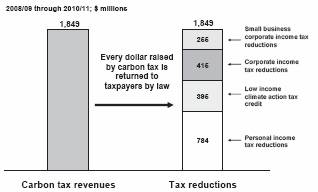
Budget 2008 supports and adds momentum to government’s plan to reduce greenhouse gas emissions by providing the fiscal framework to implement government’s climate action initiatives. At the same time, BC maintains its commitment to a strong, vibrant and competitive economy that promotes investment, innovation and job creation. Consistent with these two objectives, government intends to introduce legislation to implement a new carbon tax effective July 1, 2008. Under a three year revenue neutral carbon tax plan, 100 per cent of revenues from the tax will be returned to British Columbians through offsetting tax reductions.
Revenue Neutral Carbon Tax
The carbon tax will initially be based on a rate of $10 per tonne of greenhouse gas (GHG) emissions, and will increase to $30 per tonne by 2012.
To return the revenues from the carbon tax back into the economy, government is:
· introducing a new low income refundable Climate Action Tax Credit of $100 per adult and $30 per child for low income families, which will be paid quarterly;
· reducing personal income taxes by 5 per cent on the first $70,000 of income by 2009;
· lowering the general corporate income tax rate to 11 per cent from 12 per cent and the small business rate to 3.5 per cent from 4.5 per cent; and
· introducing additional increases to the Climate Action Tax Credit and reductions to personal and corporate income taxes. The goal is to lower the general corporate income tax rate to 10 per cent and the small business rate to 2.5 per cent by 2011.
Revenue Neutral Carbon Tax Plan
($ millions) | | 2008/09 | | 2009/10 | | 2010/11 | | Total | |
Carbon tax revenue | | 338 | | 631 | | 880 | | 1,849 | |
Low income climate action tax credit | | 104 | | 145 | | 146 | | 395 | |
Personal income tax reductions | | 113 | | 270 | | 401 | | 784 | |
General corporate income tax cuts | | 75 | | 134 | | 206 | | 415 | |
Small business corporate income tax cuts | | 46 | | 82 | | 127 | | 255 | |
Total tax reductions | | 338 | | 631 | | 880 | | 1,849 | |
In total, carbon tax revenues of $1.85 billion over three years will be returned to taxpayers through offsetting tax cuts and tax credits.
By taxing all of the fossil fuel combustion emissions in BC that are included in the national emissions inventory, the province is taking responsibility for its own emissions and providing a key tool to meet its GHG reduction targets.
Budget and Fiscal Plan – 2008/09 to 2010/11
Summary
The tax is initially being set at a relatively low rate and being increased over five years to give people and businesses an opportunity to adjust.

Climate Action Dividend
To help British Columbians make lifestyle changes to reduce their use of fossil fuels, each resident will receive a Climate Action Dividend payment of $100 in June 2008, paid out of the 2007/08 surplus. The total value of these benefits is $440 million.
Personal income tax reductions since 2001

Significant tax reductions since 2001
The latest personal income tax cut of 5 per cent on the first $70,000 in income builds on the 25 percent tax cut in 2001, the BC Tax Reduction in 2005 and the 10 per cent tax cut on the first $100,000 in income in 2007. As a result of these changes, 250,000 people no longer pay BC personal income taxes and all taxpayers have received substantial cuts. More than 85 per cent of taxpayers with incomes of $70,000 or less have received tax cuts of at least 37 per cent.
The general corporate income tax rate has been cut by a third to 11 per cent from 16.5 per cent in 2001, while the small business rate has been reduced by more than 20 per cent to 3.5 per cent from 4.5 per cent in 2001.
Corporate income tax reductions since 2001

Over $ 1 billion additional commitments to support Climate Action
In addition to the carbon tax and offsetting tax reductions, Budget 2008 also includes a further $64 million of tax measures and $986 million of spending commitments for climate action initiatives.
Other Climate Action Tax Measures
($ millions) | | 2008/09 | | 2009/10 | | 2010/11 | | Total | |
Increase equity capital tax credits for clean technology | | 5 | | 5 | | 5 | | 15 | |
Tax relief for conventional fuel efficient vehicles | | 11 | | 11 | | 11 | | 33 | |
PST exemption for ENERGY STAR® appliances | | 5 | | 5 | | — | | 10 | |
Other climate action measures | | 3 | | 3 | | — | | 6 | |
Total other climate action measures | | 24 | | 24 | | 16 | | 64 | |
Budget 2008 includes further tax measures to promote climate action for a total three year revenue commitment of $64 million. These comprise:
· Small Business Venture Capital Act tax credit budget increased by $5 million annually and allocating $7.5 million to clean technology businesses;
· tax relief for fuel efficient conventional vehicles qualifying for the federal ecoAuto rebate, equal to the federal rebate. This is in addition to the existing tax relief for hybrid and alternative fuel vehicles; and
· provincial sales tax exemptions for a variety of energy efficient goods, including washing machines, refrigerators and freezers as well as electric power-assisted bicycles and tricycles and electric motorcycles.
On the spending side, $690 million of operating expenditures over four years are committed to support greater energy efficiency and reduce carbon emissions, to promote research into new energy efficient technologies, expand public transit and to help achieve a carbon-neutral government by 2010. These include:
Budget and Fiscal Plan – 2008/09 to 2010/11
2
Summary
· $60 million for the LiveSmartBC incentives to households for energy audits and retrofits; and energy assessments for small businesses;
· $33 million for the BC Green Ports Initiative to help reduce emissions from short-haul trucks servicing BC ports, and to fund port electrification to allow ships to turn their engines off while in port; and to reduce truck emissions at inspection stations; and
· up to $10 million for incentives to encourage biodiesel production.
Funding for Climate Action Initiatives
($ millions) | | 2007/08 | | 2008/09 | | 2009/10 | | 2010/11 | | Total | |
Throne Speech 2007 & Energy Plan | | — | | 3 | | 3 | | 3 | | 9 | |
Individuals, families, communities | | 19 | | 23 | | 28 | | 28 | | 98 | |
Provincial Transit Plan | | 52 | | 20 | | 23 | | 56 | | 151 | |
Other transportation initiatives | | 0.3 | | 12 | | 11 | | 10 | | 33 | |
Bioenergy and alternative energy | | 30 | | 18 | | 4 | | 5 | | 57 | |
Research into climate change solutions | | 98 | | — | | — | | — | | 98 | |
Improving BC’s ability to adapt | | — | | 14 | | 16 | | 17 | | 47 | |
Policy development and outreach | | — | | 39 | | 37 | | 35 | | 111 | |
Carbon neutral public sector | | 24 | | 9 | | 10 | | 12 | | 55 | |
Managing BC’s forests in a changing climate | | 29 | | 0.6 | | 0.6 | | 0.6 | | 31 | |
Transit and public sector capital outlays | | — | | 47 | | 93 | | 156 | | 296 | |
Total | | 252 | | 186 | | 226 | | 322 | | 986 | |
In addition, government has committed to $296 million of capital spending that includes:
· $219 million for public transit projects including three new rapid transit lines in the Lower Mainland, RapidBus expansion, and additional buses for use in many BC communities; and
· $75 million towards energy efficient retrofits for public sector buildings.
The total spending commitment is $986 million.
In total, these tax reductions and spending commitments exceed $1 billion over four years.
Domestic economy remained strong in 2007
British Columbia Economic Indicators
(annual per cent change) | | Year-to-date
Jan to Dec 2007/
Jan to Dec 2006 | |
Employment | | +3.2 | |
Retail sales | | +7.1 | * |
Housing starts | | +7.6 | |
Non-residential building permits | | +0.2 | |
Manufacturing shipments | | -2.4 | * |
Exports | | -5.1 | * |
Note: * data available to November only
The government is committed to maintaining both a strong, competitive economy and a robust, affordable fiscal framework. This budget will be the fifth consecutive balanced budget.
Through 2007, the domestic economy posted a fourth consecutive year of strong growth led by high employment, retail sales, and housing construction. However, exports and manufacturing declined reflecting weakness largely due to the high Canadian dollar and a significant slowing in the US housing market, related in large part to the sub-prime mortgage market.
US housing market in decline
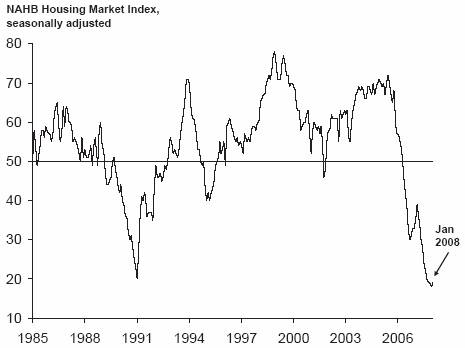
Source: National Association of Home Builders
Growth to pick up after slowing in 2008
Looking ahead, significantly slower growth is expected in the US for 2008, with US housing starts falling well below trend. This results in some slowing of economic growth in BC, with BC real gross domestic product expected to grow by 2.4 per cent. In the medium term, growth is expected to pick up to average 2.8 per cent.
BC to outperform Canada
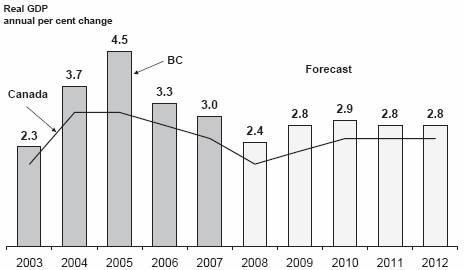
Sources: Statistics Canada, BC Ministry of Finance
Budget and Fiscal Plan – 2008/09 to 2010/11
3
Summary
Prudence remains important to achieving a balanced budget plan
The main risks to the fiscal plan lie in the potential for a larger than expected slowdown in the US economy and the US housing sector, particularly in 2008/09. The volatility of natural gas, lumber prices and the Canadian dollar also pose significant risks. To help manage the higher level of risk in 2008/09, government is continuing its prudent fiscal planning practices by:
· using economic planning assumptions that are generally lower than forecasts provided by external experts;
· maintaining a $375 million contingency vote, equivalent to 1 per cent of operating expenditures;
· retaining a $750 million forecast allowance to protect the bottom line from revenue declines and unexpected natural disaster costs;
· targeting a surplus of $50 million in 2008/09, returning to $150 million in subsequent years as economic conditions improve; and
· maintaining a $200 million capital contingency in 2008/09 or 5 per cent of taxpayer-supported capital outlays.
Balanced budgets supported by prudent forecast allowances

Debt remains affordable
Government is committed to a significant capital spending program over the next three years, to build much needed hospitals, roads, transit facilities, and bridges. Taxpayer-supported capital spending is forecast to total $10.3 billion over the next three years. As a result, taxpayer-supported debt is forecast to grow by $3.3 billion over the next three fiscal years to $30 billion in 2010/11. However, government continues to manage its capital spending plan to ensure that the growth in taxpayer-supported debt is less than the growth in the overall economy.
As a result, the taxpayer-supported debt to GDP ratio, a key measure of fiscal sustainability used by credit rating agencies, is forecast to decline over the next three years.
Taxpayer-supported debt to GDP ratio trends down
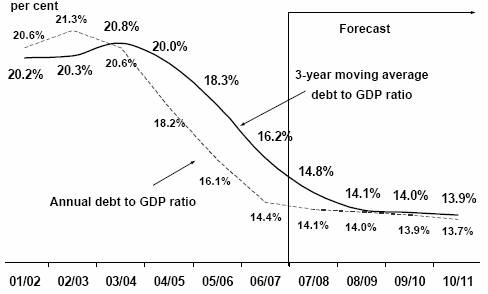
Government intends to continue its commitment to maintaining this downward trend in the taxpayer-supported debt to GDP ratio. Consistent with the recommendations of the Economic Forecast Council, a moving average is used to track the debt to GDP ratio trend. This strategy keeps debt affordable for future generations of British Columbians.
Additional Competitiveness Tax Measures
($ millions) | | 2008/09 | | 2009/10 | | 2010/11 | | Total | |
Increase film tax credit rates and enhance regional credits | | 47 | | 47 | | 18 | | 112 | |
Reduce school property tax rates for major industry | | 12 | | 24 | | 24 | | 60 | |
Expand international financial activity program | | 2 | | 2 | | 2 | | 6 | |
Phase out capital tax for financial institutions | | 36 | | 74 | | 110 | | 220 | |
PST review measures | | 3 | | 3 | | 3 | | 9 | |
Total tax reductions | | 100 | | 150 | | 157 | | 407 | |
Building on BC’s economic strengths
To ensure British Columbia’s economy remains strong and competitive, further tax reductions totaling $407 million over three years are introduced in Budget 2008. The changes include ensuring the film sector remains competitive with other jurisdictions, addressing the competitive pressures facing BC’s export-oriented businesses, and promoting BC as an attractive location for financial services:
Budget and Fiscal Plan – 2008/09 to 2010/11
4
Summary
· the basic Film Incentive tax credit rate and the basic Production Services tax credit rate are increased and the regional film tax credit rate is increased for production activities that are distant from the Lower Mainland and Southern Vancouver Island;
· the school property tax rate for major industrial property is reduced over two years to equal the business class rate in 2009, providing relief to export-related industries including the forest sector;
· to enhance Vancouver’s attractiveness as an International Financial Centre, eligible activities under the International Financial Activity Act will be expanded; and
· the capital tax on financial institutions is phased-out over three years, and then replaced by a minimum tax.
In addition, to ease pressures faced by first time home buyers, the First Time Home Buyers’ exemption threshold is increased to $425,000 from $375,000 and first time buyers are no longer required to have a mortgage of at least 70 per cent.
Tax reductions provided to British Columbians in Budget 2008 total $2.3 billion over three years, of which $1.85 billion is recycled from the carbon tax.
In addition to tax reductions, spending initiatives that stimulate economic growth remain a vital component of the province’s fiscal plan. New investments totaling $346 million over four years are included in this budget supporting environmentally responsible resource development, engagement with Aboriginal peoples regarding land and resource activities, post-secondary research opportunities and community development.
New Investments in the Economy and Communities
(in addition to Climate Action)
($ millions) | | 2007/08 | | 2008/09 | | 2009/10 | | 2010/11 | | Total | |
Economic development | | 12 | | 29 | | 29 | | 39 | | 109 | |
Education, research & a skilled workforce | | 60 | | 6 | | 2 | | 4 | | 72 | |
Developing community infrastructure | | — | | 16 | | 7 | | 37 | | 60 | |
Expanding community arts & culture | | 78 | | 9 | | 10 | | 8 | | 105 | |
Total | | 150 | | 60 | | 48 | | 88 | | 346 | |
Sustaining and strengthening social services
Budget 2008 also commits funding to sustaining and enhancing education and other key services upon which British Columbians depend. Budget 2008 provides:
· $144 million over three years for K-12 education, despite declining enrolments. This funding enables the opening of up to 400 Strong Start centres by 2010; and
· $787 million over four years invested in programs that reduce homelessness; support adults and children at risk; implementation of a positive aging action plan; maintain justice and public safety; and sustain a wide range of supports for those in need.
Strengthening Social Services
($ millions) | | 2007/08 | | 2008/09 | | 2009/10 | | 2010/11 | | Total | |
Reducing homelessness | | 3 | | 39 | | 31 | | 31 | | 104 | |
Childcare spaces/subsidies (federal) | | 33 | | 33 | | 34 | | 35 | | 135 | |
Children at risk and with special needs | | — | | 14 | | 14 | | 27 | | 55 | |
Persons with developmental disabilities | | — | | 8 | | 14 | | 20 | | 42 | |
Income assistance supplements | | — | | 10 | | 10 | | 11 | | 31 | |
Action plan for positive aging | | — | | 5 | | 8 | | 10 | | 23 | |
Services to victims of crime | | — | | 5 | | 6 | | 6 | | 17 | |
Other service enhancements | | — | | 11 | | 10 | | 10 | | 31 | |
Justice and public safety | | 16 | | 44 | | 48 | | 57 | | 165 | |
Improvements to BC driver licences | | — | | 6 | | 7 | | 7 | | 20 | |
Increased capacity in correctional centres | | 7 | | 22 | | 79 | | 56 | | 164 | |
Total | | 59 | | 197 | | 261 | | 270 | | 787 | |
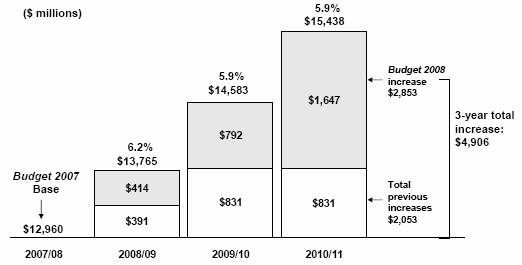
$2.9 billion to support health care
Budget 2008 commits $2.9 billion in new funding to health care to provide a sustainable growth track averaging six per cent a year. The new funding accounts for about two-thirds of the consolidated revenue fund budget increases allocated in Budget 2008. Included in this funding is a $300 million Transformation Fund to help implement a broad package of changes impacting many areas of the system, as well as the recently announced range of legislative and regulatory initiatives. An Innovation and Integration fund totaling $75 million is set aside in the contingencies vote to:
· support patient focused service enhancement and best practices;
· facilitate innovation; and
· improve integration and coordination of health service delivery.
Budget and Fiscal Plan – 2008/09 to 2010/11
5
Government is also supporting major new health projects in Victoria, Kelowna, Vernon and Fort St John with $543 million over four years contributed to those projects, and new projects at the planning stage at the BC Children’s Hospital and in Prince George.
Health Budget increases
Conclusion
In summary, Budget 2008:
· introduces a revenue neutral carbon tax as a key climate action tool;
· provides the fiscal resources to support the development and implementation of the climate action plan;
· commits to additional tax cuts for business and individuals to support climate action and enhance competitiveness;
· makes continued investments to strengthen competitiveness and promote economic growth;
· includes significant prudence in face of the economic risks in the US; and
· provides new funding to sustain health care and other key public services in the years ahead.
Budget and Fiscal Plan – 2008/09 to 2010/11
6
Part 1: A BUDGET FOR CLIMATE ACTION
Section 1.1: Summary
· There is considerable evidence that global temperatures are warming and that there are more frequent severe weather events causing increased economic and related damage. The overwhelming scientific consensus is that the main cause is the creation of greenhouse gases (GHGs) due to extensive use of fossil fuels by humans.
· BC has a clear track record of climate action initiatives going back several years, including the 2002 Energy Plan, the 2004 “Weather, Climate, and the Future: BC’s Plan,” and additional targeted measures.
· The 2007 Throne Speech signaled that even more efforts are needed. Also over the past year, the 2007 Energy Plan was released, the Greenhouse Gas Reduction Targets Act was legislated, and work has continued on the development of effective climate change actions.
· Budget 2008 provides the fiscal tools to meet the climate challenge. Its cornerstone is government’s intention to introduce a revenue neutral carbon tax effective July 1, 2008.
· The carbon tax has a broad base, so that it will affect emissions throughout the provincial economy, but it is being introduced gradually to give individuals and businesses time to adjust. All of the revenue raised will be offset by cutting other taxes; none of the revenue will be used to fund government programs. As part of the revenue recycling, a refundable tax credit will help offset the tax for low income individuals and families.
· In 2008, a Climate Action Dividend of $100 for all BC residents will help British Columbians make adjustments to begin to move towards a lower carbon lifestyle.
· Budget 2008 also provides for almost $1 billion of new operating and capital expenditures on climate action over four years to create incentives to change behavior, implement new regulatory requirements, undertake cutting-edge research, and make needed “low carbon” investments.
· These actions place BC among the most progressive jurisdictions in the world in terms of climate action policies.
· The climate action challenge cannot be confronted in isolation from what other governments are doing. BC will continue to work with its partners in other jurisdictions on cooperative solutions, through mechanisms such as the Western Climate Initiative.
· Key next steps include implementation of: enhanced tailpipe emission standards for new passenger vehicles; a “cap and trade” system for large emitters; emission reductions from landfills; fuel standards that increase use of biomass fuels; and planning for more sustainable community development.
· In summary, Budget 2008 introduces a carbon tax as a key climate action tool and provides the needed fiscal resources to support the development and implementation of the climate action plan.
Budget and Fiscal Plan – 2008/09 to 2010/11
7
A Budget for Climate Action
A Climate Change Backgrounder
What is the problem?
There is considerable evidence that the climate is changing, that it is being caused by human activities, and its effects will worsen if no action is taken. Virtually all of the world’s top scientific experts in the subject area agree with these conclusions, drawn from the most recent report(1) by the Intergovernmental Panel on Climate Change (IPCC). The IPCC concludes that 11 of the last 12 years (1995–2006) rank among the warmest since 1850. It has also concluded that atmospheric carbon dioxide equivalent (CO2-equivalent) concentrations increased from a relatively stable 280 parts per million (ppm) to 380 ppm over the past 150 years, as shown in Chart 1, and that current concentrations are the highest on record for 650,000 years according to analysis of ice cores.
These increases are primarily due to fossil fuel combustion and land use changes, releasing increased amounts of carbon dioxide, methane, and nitrous oxide into the atmosphere. These gases act to trap more solar heat within the earth’s atmosphere than was the case in pre-industrial times, much like a greenhouse, hence the term “greenhouse gases.” The likely key global effects of these atmospheric changes as described by the IPCC, if no action is taken, include:
· estimated global warming of 1.8 to 4.0 degrees Celsius by 2100 (average annual best estimate) is projected, with the higher value refl ecting the impact of higher emissions;
· rising sea levels, decreased snowpacks, and glacial melting;
· increased heat waves and drought occurrences; and
· increased tropical storm intensities and frequency of extreme precipitation events, leading to increased flood risks.
Chart 1 shows the close correlation between CO2-equivalent concentrations and average world temperature since the 1850s.
Chart 1 – Global carbon dioxide concentration and temperatures 1856-2004
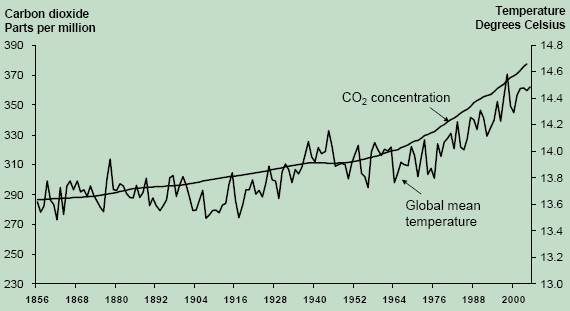
Source: Pacific Climate Impacts Consortium
(1) Intergovernmental Panel and Climate Change, Fourth Assessment Report: Climate Change 2007: Synthesis Report, November 17, 2007. See http://www.ipcc.ch.
Budget and Fiscal Plan – 2008/09 to 2010/11
8
A Budget for Climate Action
What is the Intergovernmental Panel on Climate Change?
The IPCC was established by the World Meteorological Organization (WMO) and United Nations Environment Programme (UNEP) in 1988 to evaluate climate change science, impacts and options for adaptation and mitigation. The IPCC is open to all member countries of WMO and UNEP. The IPCC has coordinated four major assessments of climate change, published in 1990, 1995, 2001 and 2007.
The drafting and review process for the most recent assessment involved 450 lead authors working with 800 contributors and 2,500 expert reviewers from 130 countries. Hundreds of scientists all over the world contribute to the work of the IPCC as authors, contributors and reviewers. Over 25 of those collaborating on the fourth assessment report (2007) are Canadians from leading universities, government, and other organizations, and 11 of these work in British Columbia.
Why should we be concerned?
Changes in climate affect everything from food production, the abundance of water resources, the frequency of catastrophic weather events, forest health, and recreational activities. For North America, the IPCC concludes that there will be:
· lower snowpacks in the western mountainous areas, with more winter flooding and competition for already over-allocated water resources;
· challenges for crops that are already susceptible to warm weather events or depend on highly-utilized water resources; and
· more extreme heat waves, causing increased health problems in cities.
On a world-wide basis, the IPCC also concludes that there are increased risks of:
· extinction for approximately 20 to 30 per cent of plant and animal species; and
· decreases in global food production if local average annual warming exceeds the 1 to 3 degrees Celsius range.
Global average temperature increases greater than 2 degrees Celsius (relative to pre-industrial temperatures) are generally viewed by scientists as leading to impacts in many regions that may be beyond society’s capacity to adapt.(2) The 2007 IPCC report concludes that based on the current understanding of the sensitivity of the global climate system to greenhouse gas emissions, avoiding a global increase greater than 2.0-2.4 degrees Celsius above pre-industrial levels requires that emissions by 2050 be reduced by 50-85 per cent relative to 2000 levels. This implies stabilization of atmospheric concentrations of greenhouse gases at 445-490 ppm CO2 -equivalent.
However, it is not only scientists and governments that are concerned. A recent report by Lloyd’s, the world’s leading insurer, states that “The frequency and magnitude of catastrophes – especially weather related catastrophes – has increased significantly in recent years. Climate change is expected to exacerbate this further, and by 2050 mega-catastrophes like Hurricane Katrina, which used to occur every 100 years, are predicted to happen every 25 years. Businesses need to prepare for the prospect of growing natural hazard risks now.”(3)
How is all this relevant to British Columbia?
The Pacific Climate Impacts Consortium (PCIC) at the University of Victoria concludes that BC’s climate has also changed over the last 50-100 years, with the data showing temperatures up by an average 0.6 to 1.7 degrees, depending on the region. Winters have warmed faster than summers.
(2) Based on IPCC Working Group 2 “Impacts, Adaptation, and Vulnerability” Report (2007) and reports submitted to the Exeter “Avoiding Dangerous Climate Change” conference (2005).
(3) See www.lloyds.com/360.
Budget and Fiscal Plan – 2008/09 to 2010/11
9
A Budget for Climate Action
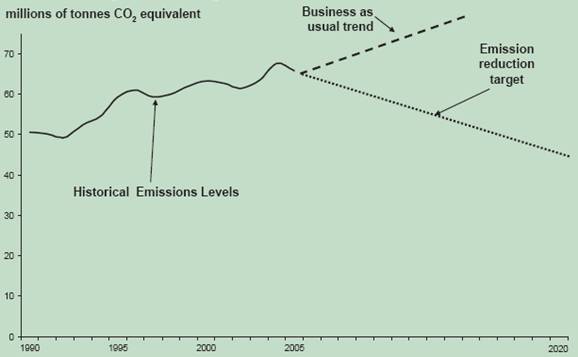
Chart 2 – BC greenhouse gas emissions
While this increase seems small, it has been enough to contribute to large losses in snowpack (-25 per cent to -50 per cent in lower elevations) during the past 50 years. In addition this warming is causing spring snowmelt events to occur 10 to 30 days earlier. While there are regional variations, total province-wide annual precipitation has increased roughly 20 per cent across the province over the last 100 years.
Warmer winters are also a contributing factor to the Mountain Pine Beetle epidemic that is devastating much of the BC interior’s pine forests. There are also growing concerns about summer water shortages in the agriculturally-significant Okanagan region and the risks to electricity generation in the Columbia-Kootenays due to the decline in snowmelt runoff and the impending loss of glaciers.
What are the main sources of emissions and what is the trend if we do nothing?
In BC, 65.9 million tonnes of CO2-equivalent were released in 2005. Under a “business as usual” scenario, emissions are anticipated to continue to rise as they have in the past. However, government is legally committed to reducing 2020 emissions to 33 per cent below the 2007 level, as indicated in Chart 2.
In order to design effective strategies to reduce emissions, it is important to know which types of human activities generate greenhouse gases. Because fossil fuels play such an important role in providing energy for most industries and for our daily activities, emissions originate from a variety of sectors as shown in Chart 3.
Chart 3 – BC greenhouse gas emissions by sector (2005)

Source: Environment Canada, 1990-2005 National Inventory Report
Budget and Fiscal Plan – 2008/09 to 2010/11
10
A Budget for Climate Action
Section 1.2: Carbon Tax and Revenue Recycling
Introduction
The government of British Columbia intends to introduce legislation to implement a revenue neutral carbon tax based on GHG emissions from fossil fuel combustion effective July 1, 2008.
A rare consensus has formed in BC among individuals, certain business interests, environmental organizations, and economists that a carbon tax is a key and necessary tool in the move to reduce GHG emissions, with one significant proviso. With few exceptions, the advice of all these groups has been “if there is a new tax, the additional revenue must be recycled to taxpayers through reductions to other taxes”.
A carbon tax is usually defined as a tax based on GHG emissions generated from the burning of fossil fuels within a jurisdiction.(1) It puts a price on each tonne of GHG emitted, sending a price signal that will, over time, elicit a powerful market response across the entire economy resulting in reduced emissions. It has the advantage of providing an incentive without favouring any one way of reducing emissions over another. Businesses and individuals will be free to choose whether to pay the tax or to avoid it by reducing usage, increasing efficiency, changing fuels, adopting new technology or any combination of these approaches.
The National Roundtable on the Environment and the Economy (NRTEE) in its January 7, 2008 report, Getting to 2050 – Canada’s Transition to a Low Carbon Future(2), provides a compelling argument as to why putting a price on GHG emissions is important and how a carbon tax is an important element of an effective climate action strategy, along with other types of measures that will be facilitated by Budget 2008.
Principles
The British Columbia carbon tax is based on the following principles:
· All carbon tax revenue will be recycled through tax reductions – The government intends to introduce legislation that includes a legal requirement to present an annual three year plan to the legislature demonstrating how all of the carbon tax revenue will be returned to taxpayers through tax reductions. The money will not be used to fund government programs.
· The tax rate will start low and increase gradually – Starting low gives individuals and businesses time to make adjustments and respects decisions made prior to the announcement of the tax. There is also certainty about rates for the first five years.
· Low income individuals and families will be protected – A refundable Climate Action Tax Credit will ensure that those with lower incomes are compensated for the tax, and that most will be better off.
(1) Some experts have suggested that a carbon tax should also include the GHG emissions generated by industrial processes and all fugitive emissions. The government will consider expanding the tax base in the future to include these GHG sources.
(2) http://www.nrtee-trnee.ca/eng/publications/getting-to-2050/intro-page-getting-to-2050-eng.html.
Budget and Fiscal Plan – 2008/09 to 2010/11
11
A Budget for Climate Action
· The tax will have the broadest possible base – All emissions from fossil fuel combustion in BC captured in Environment Canada’s National Inventory Report will be taxed, with no exemptions except those required for integration with other climate action policies in the future and for efficient administration.
· The tax will be integrated with other measures – The carbon tax will not, on its own, meet BC’s emission reduction targets but it is a key element in the strategy. To avoid unfairness and what might effectively be double taxation, the carbon tax and complementary measures such as the “cap and trade” system will be integrated as these other measures are designed and implemented.
How does the tax work?
The carbon tax applies to the purchase or use of fossil fuel within the province. The amount of GHGs emitted when a unit of fossil fuel is burned depends fundamentally on the chemical makeup of the fuel, particularly on the amount of carbon in the fuel. That fact allows for a relatively simple administrative principle for applying the carbon tax.
Administratively, the carbon tax will be applied and collected at the wholesale level in essentially the same way that motor fuel taxes are currently applied and collected. This minimizes the cost of administration to government and the compliance cost to those collecting the tax on government’s behalf. Even though the carbon tax applies to a broader range of fuels and fuel uses than existing motor fuel taxes, with few exceptions, the same mechanism and administrative infrastructure can be used for both purposes. See the accompanying Topic Box for more detail on the tax base.
The tax rates starting on July 1, 2008 are based on $10 per tonne of CO2-equivalent(3) emissions, increasing by $5 per tonne each year for the next four years to $30 per tonne in 2012 (see Table 1.1). Some environmentalists and economists have suggested starting with a higher level of tax, arguing that a low initial tax rate will have little immediate effect. However, allowing this relatively long phase-in period up to the $30 per tonne level is intended to give people and business time to adjust their habits and purchasing patterns, and to respect decisions taken before the tax was announced, such as vehicle purchases.
Table 1.1 Rate per Tonne of CO2-equivalent
Effective Date | | Rate
$/tonne of CO2-e | |
July 1, 2008 | | $ | 10 | |
July 1, 2009 | | $ | 15 | |
July 1, 2010 | | $ | 20 | |
July 1, 2011 | | $ | 25 | |
July 1, 2012 | | $ | 30 | |
(3) There are several greenhouse gases, three of which are produced by fossil fuel combustion - CO2, methane and nitrous oxide. Both methane and nitrous oxide have a greater impact per tonne on the greenhouse effect than CO2. CO2-equivalent is a measure of the total greenhouse effect created from all GHG emissions, with the non-CO2 emission levels adjusted to a CO2-equivalent basis. See the National Inventory Report, 1990-2005, Environment Canada, Section 1.1, page 18. (http://www.ec.gc.ca/pdb/ghg/inventory_report/2005_report/tdm-toc_eng.cfm)
Budget and Fiscal Plan – 2008/09 to 2010/11
12
A Budget for Climate Action
What is Taxed – the Carbon Tax Base
The tax base is made up of those items that are subject to tax. For the carbon tax, the purpose is to effectively tax all of the GHG emissions in BC from the combustion of fossil fuels that are captured in the National Inventory Report.(1) In practice, this means that the tax base includes all of the fossil fuels:
· purchased for use in the province, or
· used by those importing or producing the fuel.
The tax base includes fossil fuels used for transportation by individuals and in all industries, including the combustion of natural gas to operate pipelines, as well as road, rail, marine and air transportation. As well, the tax base includes fuel used to create heat for households and industrial processes, such as producing cement and drying coal.
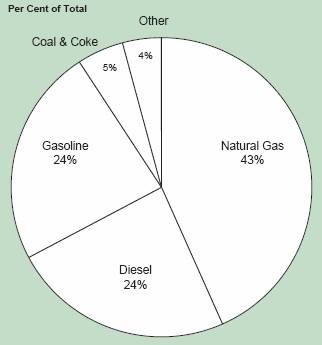
There are some exemptions to minimize administrative and compliance costs, such as small sealed containers of fuel. The chart shows the 2007 GHG emissions resulting from the burning of the main types of fossil fuel used in British Columbia. Natural gas, gasoline, diesel fuel and coal and coke account for 96 per cent of emissions from the combustion of fossil fuels in British Columbia. Other fossil fuels include propane, light and heavy fuel oil, aviation gasoline, aviation turbo fuel and kerosene.
The only fuel types not included in the tax base are those that are not “fossil fuels.” These are generally referred to as biomass fuels or biofuels, which include firewood, wood-waste, ethanol, bio-diesel and bio-heating oil.(2) Under the international protocol used for the National Inventory Report, the CO2 produced from the combustion of biomass is not included in the inventory because the carbon released by combustion was first drawn from the atmosphere by the plants through photosynthesis. Fuels that include both fossil fuel and biomass fuel, such as blended gasoline and ethanol, will only be subject to tax on the fossil fuel content of the fuel.
GHG emissions from fossil fuels
Certain fuel uses are not subject to tax. These exemptions, such as for inter-jurisdictional commercial marine and aviation purposes and fuel to be exported, are needed to ensure that the tax applies only to combustion and thus emissions produced in BC. The province is taking responsibility for the emissions in our province that are included in the inventory but recognizes that other jurisdictions will need to introduce their own GHG reduction policies. Thus, neither the emissions released elsewhere to produce fuel imported to BC or the emissions released elsewhere from burning fuel exported from BC are included in the tax base. The intention is to effectively tax the emissions from burning fossil fuels within the province.
The fossil fuels included in the tax base account for about 70 per cent of British Columbia’s total current GHG emissions. Other emissions, including those resulting from industrial processes such as production of oil, gas, aluminum and cement, as well as emissions from landfills and other sources, will not be subject to the tax initially. More work is needed to determine whether emissions from other sources should be subject to the carbon tax. There are technical measurement issues with these other GHG emissions, many of which are created during the production process and vary considerably from facility to facility. Also, many of these emissions will be subject to the cap and trade system or other GHG reduction measures under development. Further work will be needed to ensure the carbon tax is appropriately integrated with these other measures.
(1) A full description of what emissions are measured under the Kyoto Protocol is found in the National Inventory Report, 1990-2005: Greenhouse Gas Sources and Sinks in Canada, November, 2007
(http://www.ec.gc.ca/pdb/ghg/inventory_report/2005_report/tdm-toc_eng.cfm)
(2) Hydrogen is another potential fuel that is neither a fossil fuel or a biomass fuel. When and if hydrogen becomes generally used as a fuel type, it will not be subject to the carbon tax because its use does not generate any GHGs.
Budget and Fiscal Plan – 2008/09 to 2010/11
13
A Budget for Climate Action
Since different fuels generate different amounts of GHG when burned, $10 per tonne of CO2-equivalent must be translated into tax rates for each specific type of fuel. Table 1.2 shows the per unit rates for selected fossil fuels in 2008. For example, in 2008 the rate for gasoline will be 2.41 cents per litre. The tax rate for diesel used for road transportation will be slightly higher at 2.76 cents per litre due to the higher carbon content of the fuel while the tax on propane will be lower on a per litre basis.
Table 1.2 Selected Carbon Tax Rates by Fuel Type
| | Units for
Tax Rates | | Tax Rate
July 1, 2008 | |
Gasoline | | ¢/litre | | 2.41 | |
Diesel | | ¢/litre | | 2.76 | |
Jet fuel | | ¢/litre | | 2.62 | |
Natural gas | | ¢/gigajoule | | 49.88 | |
Propane | | ¢/litre | | 1.53 | |
Coal - Canadian bituminous | | $/tonne | | 20.79 | |
Coal - sub-bituminous | | $/tonne | | 17.72 | |
Revenue Recycling
A key principle, reinforced in legislation, is that all the revenue generated by the carbon tax will be recycled through tax reductions. None of the carbon tax revenue will be used to increase spending.
In addition, Budget 2008 includes a Climate Action Dividend, an initial payment of $440 million to all British Columbians to help begin the transition to a lower carbon lifestyle. This payment is not part of the 2008 revenue recycling and is being paid out of the 2007/08 surplus.
Accountability for full revenue recycling will be achieved primarily through a legislated requirement that each year the budget include a three-year plan for carbon tax revenue recycling. The first plan is included in the Revenue Neutral Carbon Tax Plan topic box. It shows that for 2008, the revenue will be recycled through a refundable tax credit, the Climate Action Tax Credit, as well as reductions in personal and corporation income tax rates. The legislation implementing the recycling tax cuts for 2008 and 2009 is tabled with Budget 2008. Failure to table a revenue neutral plan will mean that the Minister of Finance is ineligible to receive the 10 per cent salary holdback.
There will also be annual reporting on the actual amount of carbon tax collected and revised estimates of revenue reductions due to the revenue recycling measures. In next year’s budget, a revised estimate for 2008/09 will be provided based on results for the first three fiscal quarters. In future years, the report will also include year end amounts as reported in the Public Accounts.
By necessity, the revenue recycling plan in the budget must be based on estimates and the actual carbon tax revenue and revenue recycling costs may vary from those estimates for a number of reasons. If the actual amount of revenue recycled is less than the amount of carbon tax revenue collected for a given year, the plan will also show how the government intends to return the excess to taxpayers through additional tax reductions. This ensures that there will be full, transparent, ongoing revenue recycling.
Budget and Fiscal Plan – 2008/09 to 2010/11
14
A Budget for Climate Action
A Revenue Neutral Carbon Tax Plan
The table below contains the first plan that demonstrates how the carbon tax will be recycled. In future years this plan will be a legislated requirement. Revenue neutrality means that there must be tax reductions that fully recycle the estimated revenue from the carbon tax in a given fiscal year. The plan shows estimated revenue from the tax for the next three fiscal years and tax measures that will recycle at least that amount of revenue in each year.
In the future, the plan will also show how any excess carbon tax revenue collected in earlier years will be returned to taxpayers.
Revenue Neutral Carbon Tax Plan
($ millions) | | 2008/09 | | 2009/10 | | 2010/11 | |
Carbon tax revenue (amount to be returned to taxpayers) | | (338 | ) | (631 | ) | (880 | ) |
| | | | | | | |
Personal Tax Cuts | | | | | | | |
– Low income refundable tax credit * | | 104 | | 145 | | 146 | |
– Reduce bottom two tax bracket rates by 2 per cent for 2008and by 5 per cent for 2009 and subsequent years * | | 113 | | 230 | | 244 | |
– Additional personal income tax rate cuts | | — | | 40 | | 157 | |
Total tax cuts for individuals | | 217 | | 415 | | 547 | |
| | | | | | | |
Business Tax Cuts | | | | | | | |
– Reduce general corporate rate to 11 per cent July 1, 2008 * | | 75 | | 128 | | 133 | |
– Reduce general corporate rate to 10.5 per cent January 1, 2010 and to 10 per cent January 1, 2011 | | — | | 6 | | 73 | |
– Reduce small business corporate income tax rate to 3.5 per cent July 1, 2008 * | | 46 | | 79 | | 82 | |
– Reduce small business corporate income tax rate to 3 per cent January 1, 2010 and to 2.5 per cent January 1, 2011 | | — | | 3 | | 45 | |
Total tax cuts for businesses | | 121 | | 216 | | 333 | |
| | | | | | | |
Total tax cuts | | 338 | | 631 | | 880 | |
* Legislation introduced with Budget 2008 .
Budget and Fiscal Plan – 2008/09 to 2010/11
15
A Budget for Climate Action
Table 1.3 shows the impact of the personal income tax revenue recycling reductions on various taxpayers. It also demonstrates how the Climate Action Tax Credit will assist those with low incomes. This refundable tax credit will be paid quarterly, along with the GST Tax Credit, ensuring that low income earners do not have to wait until they file their tax returns to receive the benefit.
The tax reductions apply regardless of how much carbon tax an individual pays. This will allow individuals and families to make their own choices about how to adjust to a lower carbon lifestyle.
Table 1.3 British Columbia Tax Cut – Impact on Taxpayers*
| | | | 2008 | | 2009 | |
Family Type | | Income | | Low income
Climate Action
Credit | | Personal
Income Tax
cut | | Total | | Low income
Climate Action
Credit | | Personal
Income Tax
cut | | Total | |
Single | | $ | 20,000 | | $ | 50 | | $ | 11 | | $ | 61 | | $ | 103 | | $ | 28 | | $ | 131 | |
| | $ | 60,000 | | $ | 0 | | $ | 68 | | $ | 68 | | $ | 0 | | $ | 179 | | $ | 179 | |
| | | | | | | | | | | | | | | | | | | | | | |
Senior couple | | $ | 30,000 | | $ | 100 | | $ | 0 | | $ | 100 | | $ | 205 | | $ | 0 | | $ | 205 | |
| | | | | | | | | | | | | | | |
Single parent - one child | | $ | 35,000 | | $ | 100 | | $ | 17 | | $ | 117 | | $ | 205 | | $ | 46 | | $ | 251 | |
| | | | | | | | | | | | | | | |
Two earner family of four | | $ | 40,000 | | $ | 65 | | $ | 22 | | $ | 87 | | $ | 152 | | $ | 56 | | $ | 208 | |
| | | | | | | | | | | | | | | |
| | $ | 90,000 | | $ | 0 | | $ | 85 | | $ | 85 | | $ | 0 | | $ | 224 | | $ | 224 | |
* Calculated for taxpayers with wage income and claiming basic credits.
Carbon Tax Implications
Carbon Tax Impact on Individuals
The main impacts of the carbon tax on individuals are related to their transportation and heating costs.
For those who use private vehicles for transportation, the impact of the tax will depend on four factors – distance driven, fuel efficiency of the vehicle, the type of fuel used, and driving habits. All of these can be adjusted over time to reduce the impact of the tax. For example, in the near term by careful planning, trips can be combined to reduce kilometers driven. In the first year, driving roughly 10 km less per week would reduce fuel cost by enough to offset the impact of the carbon tax.
Tables 1.4 and 1.5 show the annual carbon tax cost based on $10 and $30 per tonne of GHG for a variety of fuel efficiency and annual distance driven for gasoline and diesel vehicles. Table 1.8 shows the carbon tax cost for select late model vehicles.
The amount of carbon tax associated with heating and cooling of residential buildings and domestic hot water depend on the type of energy used, the energy efficiency of the equipment, the outside temperature, the level at which the thermostat is set and the energy efficiency of the building. Table 1.6 outlines the carbon tax costs that would result from various energy sources based on provincial averages.
Budget and Fiscal Plan – 2008/09 to 2010/11
16
A Budget for Climate Action
Table 1.4 Annual Carbon Tax Cost for Gasoline Fueled Vehicles
| | Fuel Efficiency | |
Litres/100 km | | 5.0 | | 7.5 | | 10.0 | | 12.5 | | 15.0 | |
| | | | | | | | | | | |
$10 per tonne | | | | | | | | | | | |
10,000 km | | $ | 12.05 | | $ | 18.08 | | $ | 24.10 | | $ | 30.13 | | $ | 36.15 | |
20,000 km | | $ | 24.10 | | $ | 36.15 | | $ | 48.20 | | $ | 60.25 | | $ | 72.30 | |
30,000 km | | $ | 36.15 | | $ | 54.23 | | $ | 72.30 | | $ | 90.38 | | $ | 108.45 | |
40,000 km | | $ | 48.20 | | $ | 72.30 | | $ | 96.40 | | $ | 120.50 | | $ | 144.60 | |
| | | | | | | | | | | |
$30 per tonne | | | | | | | | | | | |
10,000 km | | $ | 36.15 | | $ | 54.23 | | $ | 72.30 | | $ | 90.38 | | $ | 108.45 | |
20,000 km | | $ | 72.30 | | $ | 108.45 | | $ | 144.60 | | $ | 180.75 | | $ | 216.90 | |
30,000 km | | $ | 108.45 | | $ | 162.68 | | $ | 216.90 | | $ | 271.13 | | $ | 325.35 | |
40,000 km | | $ | 144.60 | | $ | 216.90 | | $ | 289.20 | | $ | 361.50 | | $ | 433.80 | |
Table 1.5 Annual Carbon Tax Cost for Diesel Fueled Vehicles
| | Fuel Efficiency | |
Litres/100 km | | 5.0 | | 7.5 | | 10.0 | | 12.5 | | 15.0 | |
| | | | | | | | | | | |
$10 per tonne | | | | | | | | | | | |
10,000 km | | $ | 13.80 | | $ | 20.70 | | $ | 27.60 | | $ | 34.50 | | $ | 41.40 | |
20,000 km | | $ | 27.60 | | $ | 41.40 | | $ | 55.20 | | $ | 69.00 | | $ | 82.80 | |
30,000 km | | $ | 41.40 | | $ | 62.10 | | $ | 82.80 | | $ | 103.50 | | $ | 124.20 | |
40,000 km | | $ | 55.20 | | $ | 82.80 | | $ | 110.40 | | $ | 138.00 | | $ | 165.60 | |
| | | | | | | | | | | |
$30 per tonne | | | | | | | | | | | |
10,000 km | | $ | 41.40 | | $ | 62.10 | | $ | 82.80 | | $ | 103.50 | | $ | 124.20 | |
20,000 km | | $ | 82.80 | | $ | 124.20 | | $ | 165.60 | | $ | 207.00 | | $ | 248.40 | |
30,000 km | | $ | 124.20 | | $ | 186.30 | | $ | 248.40 | | $ | 310.50 | | $ | 372.60 | |
40,000 km | | $ | 165.60 | | $ | 248.40 | | $ | 331.20 | | $ | 414.00 | | $ | 496.80 | |
Table 1.6 Annual Carbon Tax Cost of Home Fuel Use
| | $ 10 per tonne | | $ 30 per tonne | |
Home Heating | | | | | |
– Electricity | | $ | 0 | | $ | 0 | |
– Fuel oil | | $ | 47 | | $ | 141 | |
– Standard efficiency gas | | $ | 35 | | $ | 105 | |
– Mid-efficiency gas | | $ | 29 | | $ | 86 | |
– Highest-efficiency gas | | $ | 24 | | $ | 72 | |
| | | | | |
Domestic Hot Water | | | | | |
– Electricity | | $ | 0 | | $ | 0 | |
– Standard efficiency gas | | $ | 11 | | $ | 32 | |
– Mid-efficiency gas | | $ | 10 | | $ | 29 | |
– Highest-efficiency gas | | $ | 7 | | $ | 21 | |
Note: Based on average household consumption across mainland British Columbia.
Source: BC Hydro
Budget and Fiscal Plan – 2008/09 to 2010/11
17
A Budget for Climate Action
Table 1.7 shows the net impact of the carbon tax and the associated tax cuts in 2008 and 2009 for two representative family types. It demonstrates that for many typical families the tax cuts will exceed the cost of the carbon tax.
Table 1.7 Revenue Neutral Climate Action Measures - Impact on Taxpayers
| | Tax (Benefit) | |
| | 2008* | | 2009 | |
Double earner family of four with $60,000/year income | | | | | |
– Van – 10 L/100km fuel efficiency driving 20,000 km/year | | 24 | | 60 | |
– Natural gas heat and hot water | | 21 | | 53 | |
– Personal income tax reduction | | (45 | ) | (118 | ) |
Net impact | | 0 | | (5 | ) |
| | | | | |
Senior couple with $30,000/year income | | | | | |
– Gas guzzler – 12 L/100km fuel efficiency driving 7,000 km/year | | 10 | | 25 | |
– Oil furnace using 2000 litres of heating oil per year | | 28 | | 70 | |
– Personal income tax reduction (Climate Action Tax Credit) | | (100 | ) | (105 | ) |
Net impact | | (62 | ) | (10 | ) |
*July 1, to December 31, 2008
Carbon Tax Impact on Business
Every business or other organization that purchases or uses fossil fuel for combustion in British Columbia will be subject to the carbon tax. The main uses of the fuel are for transportation, heating of buildings and providing heat for industrial processes.
The relative amount of tax paid and the impact on the business will depend on many things, including the industry, the particular configuration of each facility, the ability to use alternative fuel sources, and to make new investments to reduce the use of fossil fuels. As with individuals, in both the near term and further into the future, businesses will have choices that can be made in terms of how things are shipped, how much business travel is undertaken and what equipment and fuel is used, all of which will affect the amount of tax that will be paid.
The low initial tax rate is not expected to significantly affect the business community and the five year phase-in will allow time for businesses to adjust. The province hopes that other jurisdictions will also put effective mechanisms in place that put a reasonable price on GHG emissions. The cap and trade system, which will be implemented across a number of western jurisdictions will be an important step in that direction. Much of the carbon tax revenue will be recycled to business, initially through significant corporation income tax reductions, mitigating the net impact on the business community. In addition, the reduction to school property tax rates for the major industrial class announced in Budget 2008, while not a revenue recycling measure, will provide important tax relief to industrial facilities across the province and will help improve their competitiveness.
Impact on GHG Emissions
The carbon tax is purposely being started at a low rate compared to the rates at which some experts have suggested will ultimately be required to encourage significant changes in behavior. Even at $30 per tonne in 2012, some experts
Budget and Fiscal Plan – 2008/09 to 2010/11
18
A Budget for Climate Action
Table 1.8 Carbon Tax Cost of Selected Late Model Vehicles at $10 per tonne
Top 5 Most Fuel Efficient Passenger Cars – 2008 Model
Rank | | Manufacturer | | Model | | Class | | Engine Size | | Transmission | | Vehicles
Sold | | Average
L/100km | | Annual
Carbon Tax
Cost ($) | |
#1 | | Toyota | | Prius Hybrid | | C | | 1.5L | | V | | N/A | | 4.1 | | 20 | |
#2 | | Honda | | Civic Hybrid | | C | | 1.3L | | V | | N/A | | 4.5 | | 22 | |
#3 | | Smart | | ForTwo | | SC | | 1.5L | | S5 | | N/A | | 5.4 | | 26 | |
#4 | | Toyota | | Camry Hybrid | | INT | | 2.4L | | V | | N/A | | 5.7 | | 27 | |
#5 | | Nissan | | Altima Hybrid | | INT | | 2.5L | | V | | N/A | | 5.8 | | 28 | |
Top 5 Most Fuel Efficient Light Trucks – 2008 Model
Rank | | Manufacturer | | Model | | Class | | Engine Size | | Transmission | | Vehicles
Sold | | Average
L/100km | | Annual
Carbon Tax
Cost ($) | |
#1 | | Ford | | Escape Hybrid AWD | | CSU | | 2.3L | | V | | N/A | | 7.0 | | 34 | |
#2 | | Saturn | | VUE Hybrid | | ISU | | 2.4L | | E4 | | N/A | | 7.3 | | 35 | |
#3 | | Toyota | | Highlander Hybrid 4WD | | ISU | | 3.3L | | V | | N/A | | 7.9 | | 38 | |
#4 | | Jeep | | Compass/Patriot | | CSU | | 2.4L | | M5 | | N/A | | 8.1 | | 39 | |
#5 | | Lexus | | RX 400H | | LSU | | 3.3L | | V | | N/A | | 8.1 | | 39 | |
Top 10 BC Passenger Car Sales – 2006
Rank | | Manufacturer | | Model | | Class | | Vehicles
Sold | | Average
L/100km | | Annual
Carbon Tax
Cost ($) | |
#1 | | Honda | | Civic Sedan/Coupe | | C | | 9543 | | 6.8 | | 33 | |
#2 | | Mazda | | Mazda3 | | C | | 5661 | | 7.9 | | 38 | |
#3 | | Toyota | | Corolla | | C | | 5450 | | 7.0 | | 34 | |
#4 | | Toyota | | Yaris | | SC | | 4582 | | 6.4 | | 31 | |
#5 | | Toyota | | Matrix | | C | | 3673 | | 7.7 | | 37 | |
#6 | | Toyota | | Camry | | INT | | 3394 | | 9.1 | | 44 | |
#7 | | Ford | | Focus | | C | | 3021 | | 8.2 | | 39 | |
#8 | | Chevrolet | | Cobalt | | C | | 2755 | | 8.2 | | 40 | |
#9 | | Honda | | Accord | | INT | | 2580 | | 8.7 | | 42 | |
#10 | | Volkswagen | | Jetta | | C | | 2524 | | 8.8 | | 42 | |
Top 10 BC Light Truck Sales – 2006
Rank | | Manufacturer | | Model | | Class | | Vehicles
Sold | | Average
L/100km | | Annual
Carbon Tax
Cost ($) | |
#1 | | Ford | | F-Series Pick-Up | | LP | | 10361 | | 14.0 | | 68 | |
#2 | | Dodge | | Ram Pickup | | LP | | 5269 | | 14.1 | | 68 | |
#3 | | Chevrolet | | Silverado | | LP | | 4948 | | 13.8 | | 67 | |
#4 | | Dodge | | Caravan | | SV | | 4802 | | 10.5 | | 51 | |
#5 | | GMC | | Sierra | | LP | | 4415 | | 14.0 | | 67 | |
#6 | | Ford | | Ranger | | SP | | 3272 | | 11.6 | | 56 | |
#7 | | Ford | | Escape | | CSU | | 3217 | | 9.2 | | 44 | |
#8 | | Honda | | CR-V | | CSU | | 2646 | | 9.7 | | 47 | |
#9 | | Toyota | | RAV4 | | CSU | | 2249 | | 9.3 | | 45 | |
#10 | | Honda | | Odyssey | | SV | | 2069 | | 10.4 | | 50 | |
Notes: | 1. Assumes 55% city and 45% highway driving to calculate average fuel consumption. |
| |
| 2. Assumes 20,000 km per year, $10 per tonne carbon tax rate. |
Legend | | | | |
| | | | |
1.Transmission | | | | |
| | | | |
E - Electronic automatic | | | | |
M - Manual | | | | |
S - Automatic with manual mode | | | | |
V - Continuously variable | | | | |
| | | | |
2. Class | | | | |
| | | | |
C - Compact | | | | |
SC - SubCompact | | | | |
INT - Intermediate | | | | |
CSU - Compact Sport Utility | | | | |
ISU - Intermediate Sport Utility | | | | |
LSU - Luxury Sport Utility | | | | |
LP - Large Pickup | | | | |
SP - Small Pickup | | | | |
SV - Small Van | | | | |
Budget and Fiscal Plan – 2008/09 to 2010/11
19
A Budget for Climate Action
argue that a higher price will ultimately be required. As noted above, this phase-in is intended to provide individuals and businesses with time to adjust and to provide certainty about initial rates.
After being phased-in, further tax rate changes will depend on a number of factors including:
· whether BC is meeting its emissions targets;
· the expected future impact on emissions of other policies such as cap and trade and low carbon fuel standards;
· the actions taken by other governments to reduce their GHG emissions and to set a price on carbon; and
· the advice of the Climate Action Team.
A preliminary estimate by M. K. Jaccard and Associates suggests that in the absence of other GHG reduction policies, the carbon tax could reduce BC’s GHG emissions in 2020 by up to 3 million tonnes of CO2 -equivalent annually. This is based on introducing the tax, increasing it to $30 per tonne of CO2 -equivalent over 4 years, and then leaving tax rates unchanged thereafter. When formally assessed in combination with the other GHG reduction policies being implemented, the impact of the carbon tax will be somewhat lower.
Other Climate Action Tax Initiatives
To help families with the transition to a lower carbon lifestyle, the government is also introducing new incentives through the tax system totaling $64 million over three years. These measures are described in Table 1.9
Table 1.9 Additional Budget 2008 Climate Action Tax Initiatives
· | PST reduction for certain conventional fuel efficient vehicles that meet the fuel efficiency criteria set out in the federal government’s ecoAuto rebate program. The tax reduction is $1,000, $1,500, or $2,000, and is based on fuel efficiency and vehicle type.* |
| |
· | PST exemption for ENERGY STAR qualified residential refrigerators, clothes washers and freezers (expires March 31, 2010). |
| |
· | PST exemption for energy efficient residential gas-fired water heaters with an energy factor of 0.80 or greater (expires December 31, 2009). |
| |
· | PST exemption for production machinery and equipment for local governments for power production and cogeneration. |
| |
· | Exemption from passenger vehicle rental tax for rentals of eight hours or less. |
| |
· | PST exemption for electric power-assisted two and three wheel cycles* and non-motorized adult-sized tricycles. |
| |
· | PST reduction for hydrogen fuel cell buses of 50% of the tax payable to a maximum of $10,000.* |
| |
· | PST reduction for electric motorcycles of 50% of the tax payable to a maximum of $1,000.* |
| |
· | PST exemption for insulation designed to prevent heat or cold loss from hot water tanks, hot and cold water pipes, and ductwork. |
| |
· | PST exemption for biodiesel fuel, including the portion of biodiesel fuel used in a furnace oil blend, when used for heating or other non-motive uses. |
| |
· | PST exemption for certain aerodynamic devices purchased for use on commercial motor vehicles. |
| |
· | PST applied to coal and coke, except when purchased for use in a residential dwelling unit. |
| |
· | Biodiesel and ethanol classified as alternative motor fuels for all purposes and are exempt from tax. |
| |
· | Eligible intellectual property expanded to include green-related patents (patents with World Patent Office classifications related to power generation using forces of nature such as wind, solar and tidal). |
| |
· | Equity tax credit budget increased by $5 million per year, with $7.5 million of tax credit budget dedicated to clean technology. |
* Measures have a sunset date of March 31, 2011.
Budget and Fiscal Plan – 2008/09 to 2010/11
20
A Budget for Climate Action
What Can I Do to Reduce Carbon Emissions?
One of the most common questions people have about climate change is “What can I do to reduce greenhouse gas emissions?”
The table below provides examples of the emissions reductions and financial savings that can result from some specific choices.
Savings from Carbon Emission Reductions
| | | | Carbon Tax Rate | |
| | Source of savings | | $10 | | $15 | | $20 | | $25 | | $30 | |
| | | | dollars | |
Regularly tune up vehicle: tune and maintain proper tire inflation can reduce fuel consumption by 10%: vehicle with fuel efficiency of 10 L/100km. | | Fuel | | 200 | | 200 | | 200 | | 200 | | 200 | |
| Carbon tax | | 5 | | 7 | | 10 | | 12 | | 14 | |
| | | | | | | | | | | | |
| Total | | 205 | | 207 | | 210 | | 212 | | 214 | |
| | | | | | | | | | | | | |
Drive one day less per week: vehicle with fuel efficiency of 8 L/100km. | | Fuel | | 228 | | 228 | | 228 | | 228 | | 228 | |
| Carbon tax | | 5 | | 8 | | 11 | | 14 | | 16 | |
| | | | | | | | | | | | |
| Total | | 233 | | 236 | | 239 | | 242 | | 244 | |
| | | | | | | | | | | | | |
Walk to work: 5 kilometre commute and vehicle with fuel efficiency of 8 L/100km. | | Fuel | | 192 | | 192 | | 192 | | 192 | | 192 | |
| Carbon tax | | 5 | | 7 | | 9 | | 12 | | 14 | |
| | | | | | | | | | | | |
| Total | | 197 | | 199 | | 201 | | 204 | | 206 | |
| | | | | | | | | | | | | |
Switch to transit: assumes distance to work is 25km, vehicle with fuel efficiency of 10 L/100km and a two zone transit pass at $87 per month | | Fuel | | 1,200 | | 1,200 | | 1,200 | | 1,200 | | 1,200 | |
| Carbon tax | | 29 | | 43 | | 58 | | 72 | | 87 | |
| Total | | 1,229 | | 1,243 | | 1,258 | | 1,272 | | 1,287 | |
| Less transit cost | | (1,044 | ) | (1,044 | ) | (1,044 | ) | (1,044 | ) | (1,044 | ) |
| Net savings | | 185 | | 199 | | 214 | | 228 | | 243 | |
| | | | | | | | | | | | | |
Replace inefficient vehicle: 20,000 km per year and replace vehicle with fuel efficiency of 12 L/100km with 10 L/100km efficiency | | Fuel | | 400 | | 400 | | 400 | | 400 | | 400 | |
| Carbon tax | | 10 | | 14 | | 19 | | 24 | | 29 | |
| | | | | | | | | | | | |
| Total | | 410 | | 414 | | 419 | | 424 | | 429 | |
| | | | | | | | | | | | | |
Weatherize windows and doors: Weatherizing all windows and doors can reduce space heating costs by 5%. | | Fuel | | 42 | | 42 | | 42 | | 42 | | 42 | |
| Carbon tax | | 2 | | 3 | | 4 | | 5 | | 6 | |
| | | | | | | | | | | | |
| Total | | 44 | | 45 | | 46 | | 47 | | 48 | |
| | | | | | | | | | | | | |
Install programmable thermostat: A 5° celsius reduction for 8 hours per day reduces heating costs by 10%. | | Fuel | | 85 | | 85 | | 85 | | 85 | | 85 | |
| Carbon tax | | 4 | | 6 | | 8 | | 10 | | 12 | |
| | | | | | | | | | | | |
| Total | | 89 | | 91 | | 93 | | 95 | | 97 | |
| | | | | | | | | | | | | |
Replace gas furnace: Replace a 65% efficient with a 95% efficient gas furnace. | | Fuel | | 254 | | 254 | | 254 | | 254 | | 254 | |
| Carbon tax | | 12 | | 17 | | 23 | | 29 | | 35 | |
| | | | | | | | | | | | |
| Total | | 266 | | 271 | | 277 | | 283 | | 289 | |
Assumptions:
· Gasoline price of $1 per litre and natural gas at $11 per gigajoule (not including fixed monthly charges).
· Carbon tax is levied at the equivalent of $10 per tonne July 1, 2008 rising by $5 per tonne each year.
· Vehicles driven 20,000 kilometres per year.
· Heating costs before changes assumes 77 gigajoules per year.
· Not included are savings in insurance costs due to vehicle replacement and change of use, parking and the federal income tax credit for transit.
Budget and Fiscal Plan – 2008/09 to 2010/11
21
A Budget for Climate Action
Carbon Tax Conclusions
When implemented effective July 1, 2008, the carbon tax will provide British Columbia with an important climate action tool. By phasing in the tax based on an initial rate of $10 per tonne of GHG to $30 per tonne over five years, individuals and businesses will have time to make adjustments before the tax becomes more significant and recent purchase decisions will be respected. The revenue from the tax will be fully and transparently recycled by reducing other taxes, including the Climate Action Tax Credit specifically designed to help lower income families. The carbon tax will apply as broadly as possible to fossil fuel purchases and use by both individuals and businesses in BC, effectively putting a price on 70 per cent of provincial emissions.
Section 1.3: Existing Climate Action and Related Initiatives in BC: A Track Record of Action
Significant public attention has only recently been focused on climate change and energy conservation issues. However, the provincial government has been responding for some time now. Early in its first mandate the government recognized the importance of developing and using BC’s energy resources efficiently and in a more environmentally responsible manner, as evident in Energy for our Future: A Plan for BC, released in 2002. Then, in December 2004, the government released its first climate strategy, Weather, Climate, and the Future: BC’s Plan. Complementing these early actions have been a series of additional energy efficiency, clean power, alternative energy, transportation, and related forestry initiatives. This extensive record is documented in Table 1.10.
The 2007 Throne Speech and Budget 2007: Ramping up to Address Climate Change
While past actions were moving BC towards a lower carbon economy, it became clear that more needed to be done. That is why last year’s Throne Speech, delivered on February 13, 2007, committed to a 33 per cent decrease in GHG emissions by 2020 compared to the current level. This target, along with the 80 per cent reduction target for 2050, was enshrined in the Greenhouse Gas Reduction Targets Act in the fall of 2007. However, targets are only effective if there are actions to meet them. The key measures proposed in the Throne Speech to begin the process for meeting the targets are noted in Table 1.11.
Subsequent to the Throne Speech, Budget 2007 was tabled. In that document, the government began the work on its renewed climate action agenda by undertaking several measures. Among them, both the social service tax exemption for home heating equipment that is “ENERGY STAR Qualified” and the maximum $2,000 sales tax rebate on purchases of hybrid electric passenger vehicles were extended, biodiesel fuel was exempted from the Motor Fuel Tax Act, $10 million was provided to purchase hybrid vehicles for the provincial fleet, and $4 million was allocated to establish the Climate Action Secretariat.
Budget and Fiscal Plan – 2008/09 to 2010/11
22
A Budget for Climate Action
Table 1.10 A Track Record of Action on Energy and Climate Issues
Initiative | | Details |
| | |
Key Early Actions: 2002 Energy Plan | | |
| | |
Commitment to update the province’s Energy Efficiency Act. | | Fulfilled in 2006 with updated energy efficiency regulations for a number of consumer products, such as furnaces, commercial boilers, gas fireplaces and included North America’s most comprehensive regulation for heat loss from windows. |
| | |
Promote energy efficiency | | Exempted from the Social Services Tax a range of products: EnergyStar® windows; doors and skylights; residential furnaces, boilers and heat pumps; and alternative energy sources such as wind, solar, and micro-hydro. |
| | |
Improve energy efficiency in buildings | | Voluntary and cost-effective efficiency targets for new and existing buildings were set. |
| | |
New rate structures to encourage large consumers to pursue energy efficiencies | | New stepped and time of use rates implemented in 2006. |
| | |
Net Metering Program | | Allows customers with small power generating facilities to produce electricity and sell any surplus back to BC Hydro. |
| | |
Amend Utilities Commission Act to remove a disincentive for energy distributors to invest in conservation | | The Act was amended in 2003 to remove the disincentive. |
| | |
Voluntary goal to acquire 50% of new supply from BC Clean Electricity Sources | | In April 2004, the Province released the BC Clean Electricity Guidelines, and revised them in September 2005. All new supply resources delivered to BC Hydro from within BC met this criterion, which refers to alternative energy technologies that result in net environmental improvements relative to existing sources. |
| | |
Key Early Actions: Weather, Climate, and the Future: BC’s Plan (2004) |
|
Support for Hydrogen and Fuel Cell technology development | | Since 2002, BC has spent over $3 million in support of this work. Over $110 million in investment in hydrogen and fuel cells has been announced in BC, including $30 million in federal funding. |
| | |
Enhancing Energy Conservation | | Since 2001, BC Hydro’s PowerSmart Program has spent $325 million on incentives to replace less efficient appliances and building materials and to increase conservation awareness. PowerSmart’s Product Incentive Program for businesses has also helped reduce energy requirements. The energy savings amount to almost 2,700 gigawatt-hours per year, enough to power about 265,000 homes. |
| | |
Incorporating Climate Change into Transportation Planning | | In Budget 2007 , $9.4 million over three years was devoted to expanding transit in 25 communities. Also the $1.9 billion ($2003) Vancouver to Richmond “Canada Line” was started in 2005, and will enable reduced use of private passenger vehicles. |
| | |
Encouraging Local Government Actions | | The Province supported the development of the Greenhouse Gas Action Guide, a “best practices” blueprint for communities. Also, under the “Green Cities Project,” $40 million over four years was allocated to build bike paths, walkways, and other initiatives to encourage reduced use of automobiles, and the new Green City Awards program encourages the exchange of best practices by communities. |
| | |
Green Buildings BC | | Since 2000, government has delivered the Green Buildings BC Retrofit Program for public sector buildings, which has resulted in energy efficiency investments estimated at $133 million and projected annual energy savings of $14.4 million. |
| | |
Support for Applied Climate Change Research | | The Province was a founding partner in the Pacific Climate Impacts Consortium at the University of Victoria, contributing $0.6 million by 2007/08. |
| | |
Assistance to Communities at Risk from Climate Change | | These efforts have consisted of the provision of a $2 million Drought Planning Fund, completion of a survey of the province’s 300 dikes, and $3 million to UBCM for improved fire protection measures. |
Budget and Fiscal Plan – 2008/09 to 2010/11
23
A Budget for Climate Action
Table 1.10 A Track Record of Action on Energy and Climate Issues – Continued
Initiative | | Details |
| | |
Key Early Actions: Energy Efficiency | | |
| | |
Energy Efficient Buildings: A Plan for BC | | This 2005 plan aimed to reduce energy consumption and greenhouse gas emissions in homes and buildings. In partnership with the federal government beginning in 2006, $11 million was allocated to a large number of projects in support of the Plan. This resulted in $100 million of combined investment with other partners and saved enough energy to power 89,000 homes for one year. |
| | |
Community Action on Energy Efficiency Program | | Promoted community leadership to achieve energy efficiency improvements in buildings and provides direct policy and technical support to local governments. So far, $1.6 million has been allocated to assist 52 BC communities with developing energy efficiency programs specific to their needs. |
| | |
Towns for Tomorrow | | In 2006/07, $21 million in capital funding over three years was allocated to energy improvement projects in communities with under 5,000 population, including for local government buildings. |
| | |
Smart Development Partnership Program | | Government has been providing as much as 50% of a local government’s costs up to a $50,000 maximum to encourage communities to adopt more sustainable land use planning practices. |
| | |
BC Local Government Grants Program | | Offers $10,000 each for local government projects that support community energy planning and climate action. |
| | |
Key Early Actions: Clean Power | | |
| | |
First Nations and Remote Community Clean Energy Program | | This $3.9 million pilot program began in 2006, and provides financial incentives to assist these communities adopt lower emission and more efficient electricity supply options. It has provided support to 10 First Nations communities. |
| | |
Additional Hydro Generation from the Kootenays | | Columbia Power Corporation, a crown entity, completed three significant, hydro-electric power projects in the Columbia Basin between 2002 and 2007, using existing dam infrastructure: The Brilliant Upgrades, Arrow Lakes Generating Station, and the Brilliant Expansion. An additional project, the Waneta Expansion, is currently in the planning stage. |
| | |
Key Early Actions: Alternative Energy | | |
| | |
Participation Rent Policy for Wind Power | | For wind projects on Crown land, this 2005 pricing policy provides more certainty to proceed with new investments, by allowing for zero payment of participation rents for the first 10 years of commercial operations. |
| | |
Tidal Power | | BC Hydro has supported a feasibility study for tidal energy on Haida Gwaii and government has provided operational funding for a tidal pilot project at Race Rocks, near Victoria. |
| | |
BC Solar For Schools Project | | Three BC educational institutions have participated in this pilot. These schools are now using clean, renewable solar energy to supplement their grid-powered energy requirements. |
| | |
Key Early Actions: Cleaner Transportation | | |
| | |
Hydrogen Highway | | This initiative was announced in 2005. By 2009, 20 new BC Transit fuel cell buses will be based in Whistler as part of public transportation for the 2010 Games. The total cost for the hydrogen bus fleet is $89 million, cost shared with the federal government. |
| | |
Hybrid Vehicles in Government | | In 2006, government changed its procurement policy, with some minor exceptions based on local conditions, to ensure that new vehicles purchased or leased are to utilize hybrid technology. As of Fall 2007, government had procured over 450 hybrid vehicles in the government fleet – a 10-fold increase from 2005. The Province also initiated a plug-in hybrid electric vehicle demonstration project to investigate the increased utilization of the grid as a source of power. |
| | |
Gateway Program | | Includes $50 million for the development of cycling and pedestrian paths in the Lower Mainland. |
| | |
Cycling Infrastructure Partnerships | | This program began in 2006 in partnership with local government to encourage new cycling infrastructure. |
Budget and Fiscal Plan – 2008/09 to 2010/11
24
A Budget for Climate Action
Table 1.10 A Track Record of Action on Energy and Climate Issues – Continued
Initiative | | Details |
| | |
Key Early Actions : Forestry Mitigation and Adaptation |
| | |
Mountain Pine Beetle Action Plan | | The mountain pine beetle has affected 40 per cent of the pine forests in BC. Since 2001 the government has committed about $620 million for mitigating future impacts of the infestation and economic diversification, including steps to use pine fibre for bioenergy production. In addition, the federal government has invested $340 million in BC since 2002. |
| | |
Future Forest Ecosystems Initiative | | The Ministry of Forests is working to adapt BC’s forest and range management framework to a changing climate. Its key objective is to help maintain and enhance the resilience of BC’s forest and rangeland ecosystems to ecological changes associated with climate change. |
| | |
Key Early Actions: Existing Tax Incentives Supporting Climate Action |
| | |
Provincial Sales Tax Incentives for Vehicles | | PST reduction for: hybrid electric vehicles of 100% of the tax payable to a maximum of $2,000; for other eligible alternative fuel vehicles (e.g. operate on ethanol, natural gas or propane) of 50% of the tax payable to a maximum of $1,000; and for 50% of the tax payable to a maximum of $5,000 for alternative fuel shuttle buses and $10,000 for alternative fuel passenger buses; PST exemption for purchase of and charges to install kits to convert motor vehicles to operate on natural gas or propane, or to operate exclusively on electricity; PST refund on parts and labour to convert shuttle buses and passenger buses to operate as hybrid electric vehicles or to operate on HCNG (a blend of hydrogen and compressed natural gas). |
| | |
Provincial Sales Tax Incentives for Households | | PST exemptions for: ENERGY STAR qualified windows, doors and skylights; for insulation designed to prevent loss of heat from a building, including weather stripping and caulking and window insulating systems; for eligible wind powered, solar powered, or micro-hydro powered generating equipment, including solar photovoltaic collector panels (can also be used for heating/hot water); and for ENERGY STAR qualified home heating equipment, including oil-fired forced-air furnaces, boilers, air-source heat pumps, and ground-source heat pumps. |
| | |
Other Provincial Sales Tax Incentives | | PST exemption for non-motorized two wheel bicycles and for penstock equipment used for hydroelectric power generation. |
| | |
Motor Fuel Tax | | Exemptions for: natural gas and alcohol-based fuels (blends of gasoline or diesel fuel and at least 85% ethanol or methanol) when purchased to propel a motor vehicle; the ethanol portion, including denaturant, of an ethanol/gasoline or ethanol/diesel blend if the ethanol portion is not less than 5% or more than 25% of the volume of the blend; biodiesel, including the biodiesel portion of any blend of biodiesel fuel and diesel fuel and pure biodiesel (the latter two exemptions do not apply to coloured fuel, locomotive fuel, marine diesel fuel, jet fuel or aviation fuel). Also, a preferential tax rate (2.7¢/litre) for propane purchased for use in operating a motor vehicle or stationary engine. |
| | |
Property Tax | | Property (School) tax exemption for specified improvements to eligible wind power or hydroelectric power projects. |
2007 Energy Plan: Continued Actions for Conservation and Greener Energy
On February 27, 2007, the government released The BC Energy Plan: A Vision for Clean Energy Leadership, updated from the 2002 version. This document contains a total of 55 policy initiatives, many of which will act to reduce fossil fuel consumption and therefore GHG emissions. The main components that will directly contribute to emission reductions are outlined in Table 1.12.
Budget and Fiscal Plan – 2008/09 to 2010/11
25
A Budget for Climate Action
Table 1.11 Key 2007 Throne Speech Directions: Strengthening the Commitment to Climate Action
· | Limits on emissions for large industry emitters and development of a system to register and trade carbon offsets and carbon credits (“cap & trade” system) |
| |
· | Limits on tailpipe emissions from new vehicles sold in BC |
| |
· | Limits on emissions from landfills |
| |
· | Investments in forest carbon sinks |
| |
· | Create a new “Green Building Code” by 2008 |
| |
· | By 2012, installation of electrical “smart meters” for all BC Hydro customers so that residents can monitor usage and make energy-saving adjustments in real time |
| |
· | A “Citizen’s Conservation Council,” comprised of leading British Columbians, to help guide the public in making positive contributions to climate action initiatives |
| |
· | A “Climate Action Team” of experts to advise on realistic, economically viable strategies to reduce emissions and set interim emission targets for 2012 and 2016 |
| |
· | Initiatives to retrofit existing homes |
| |
· | New regional transit options |
| |
· | Creation of electrified truck stops and anti-idling measures for heavy vehicles |
| |
· | Seek federal cooperation for port electrification |
| |
· | Government operations to be “carbon-neutral” by 2010 |
| |
Table 1.12 Key 2007 Energy Plan Initiatives that Support Climate Action |
| |
· | All new electricity generating facilities must have net zero GHG emissions and all existing thermal generation power plants will have net zero GHG emissions by 2016 |
| |
· | Clean or renewable electricity generation to account for 90% of total generation |
| |
· | Acquire 50% of BC Hydro’s incremental resource needs through conservation by 2020 |
| |
· | Implementation of a 5 per cent renewable fuel content standard for diesel and a 5 per cent ethanol content of gasoline by 2010. |
| |
· | A new industrial energy efficiency program, in which government will work with industry to encourage more efficient and greener alternatives for power needs |
| |
· | A “bio-energy strategy” to spur quicker development of energy from wood residue, agricultural waste, and municipal solid waste |
| |
· | Electricity procurement to recognize the value of intermittent resources (e.g., wind, solar, small hydro, and tidal) |
| |
· | A new pilot project for energy performance labeling |
| |
· | A new BC Hydro “Standing Offer” to encourage clean electricity projects under 10 mega-watts to allow smaller facilities to sell power at a fixed price with standard contract terms and conditions |
| |
· | Eliminate routine flaring from oil and gas producing wells and other facilities by 2016 |
| |
· | BC Hydro to issue a call for proposals to produce power from wood fibre (e.g., beetle-kill timber and sawmill residue) |
| |
· | A $25 million, Innovative Clean Energy (ICE) Fund, financed by a surcharge on energy sales, to promote cleaner energy sources |
Results of Public Consultations to Prepare for Budget 2008
Prior to each budget, the Select Standing Committee on Finance and Government Services travels the province to consult with British Columbians on their fiscal priorities. Based on what the Committee heard regarding the climate action issue in Fall 2007, its report advised that the government should:
· | take decisive action on climate change by providing clear and concise information on programs and measures available to individuals and businesses to change behaviors; |
Budget and Fiscal Plan – 2008/09 to 2010/11
26
A Budget for Climate Action
· | expedite the construction of rapid transit; |
| |
· | promote energy-efficient households; |
| |
· | provide incentives to support BC’s growing biofuels industry; |
| |
· | support the trucking industry’s green transition; and |
| |
· | given the potential for government to implement a carbon tax, mitigate the impacts of such a tax on lower and middle-income families. |
Although there is additional work to be done, Budget 2008 addresses all of these suggestions and goes even further.
Section 1.4: Budget 2008: Expenditures to Support Climate Action
The government has now had one year to begin to fulfill the commitments made in 2007. Many of these measures are complex or will require negotiations with stakeholders, and therefore will take more time to fully implement. However, Budget 2008 provides the foundation to assure British Columbians that the emission reductions required will be achieved. Table 1.13 summarizes the government’s operating and capital expenditure initiatives over four years, which total almost $1 billion. The following section provides the details as to how that amount is allocated to the various climate action initiatives funded by Budget 2008.
Table 1.13 Budget 2008 : Total Climate Action Expenditure Initiatives
| | | | | | | | | | 4 Year | |
$ millions | | 2007/08 | | 2008/09 | | 2009/10 | | 2010/11 | | Total | |
Operating expenditures | | | | | | | | | | | |
Throne Speech 2007 legislative commitments | | — | | 2 | | 2 | | 2 | | 6 | |
Energy Plan climate change policy initiatives | | — | | 1 | | 1 | | 1 | | 3 | |
Individuals, families, communities | | 19 | | 23 | | 28 | | 28 | | 98 | |
Provincial Transit Plan | | 52 | | 20 | | 23 | | 56 | | 151 | |
Additional transportation initiatives | | 0.3 | | 12 | | 11 | | 10 | | 33 | |
Bioenergy & alternative energy solutions | | 30 | | 18 | | 4 | | 5 | | 57 | |
Researching solutions to the climate challenge | | 98 | | — | | — | | — | | 98 | |
Improving BC’s ability to adapt | | — | | 14 | | 16 | | 17 | | 47 | |
Policy development and public outreach (incl. contingencies) | | — | | 39 | | 37 | | 35 | | 111 | |
Carbon neutral public sector | | 24 | | 9 | | 10 | | 12 | | 55 | |
Managing BC’s forests in a changing climate | | 29 | | 0.6 | | 0.6 | | 0.6 | | 31 | |
| | | | | | | | | | | |
Total operating expenditures | | 252 | | 139 | | 133 | | 166 | | 690 | |
| | | | | | | | | | | |
Capital expenditures | | | | | | | | | | | |
Provincial Transit Plan | | | | | | | | | | | |
– Provincial bus fleet expansion | | — | | 2 | | 22 | | 9 | | 33 | |
– RapidBus (Lower Mainland, Capital Region, Kelowna) | | — | | 17 | | 16 | | 11 | | 44 | |
– Rapid Transit (Evergreen, UBC, & Expo Lines) | | — | | 2 | | 29 | | 111 | | 142 | |
Sub-total: Provincial Transit Plan | | — | | 21 | | 67 | | 131 | | 219 | |
Public sector building energy efficiency retrofits | | — | | 25 | | 25 | | 25 | | 75 | |
Upgrade climate/hydrometric monitoring networks | | — | | 0.5 | | 0.5 | | 0.5 | | 2 | |
| | | | | | | | | | | |
Total capital expenditures | | — | | 47 | | 93 | | 156 | | 296 | |
| | | | | | | | | | | |
Overall climate action expenditure total | | | | | | | | | | 986 | |
Budget and Fiscal Plan – 2008/09 to 2010/11
27
A Budget for Climate Action
Funding for Key 2007 Throne Speech Legislative Commitments
Government must be creative in managing an issue as complex as climate change, and has to use all the levers it has available, i.e. expenditure programs, regulations, and tax initiatives. Budget 2008 contains measures to reduce emissions utilizing all these tools, in part by providing almost $6 million in funding for the following legislative measures announced in Throne Speech 2007:
· | Limits on GHGs by large emitters – Greenhouse gases from these sources, which includes fossil fuel production and other industries, comprise 36 per cent of total BC emissions. Budget 2008 will fund the development of a regulatory “cap and trade” system for large emitters. See the “Cap and Trade System for Large Emitters” topic box for an explanation of this market-based mechanism. |
| |
· | Limits on GHGs from new vehicles sold in BC – Of the 38 per cent of BC emissions attributable to the transportation sector, over one-third of those are from passenger vehicles. Budget 2008 provides the resources to develop emission standards for new motor vehicles sold in BC. These standards will be phased in over time. |
| |
· | Limits on GHGs from landfills – Organic waste in BC landfills decomposes to create methane, a greenhouse gas that is 21 times more damaging than CO2 and it comprises 8 per cent of provincial emissions. The problem is caused by the 30-40 per cent of the waste stream that is compostable. New standards will result in increased capturing of methane on site. The fiscal plan will fund the development of criteria and standards in support of these goals, working closely with local governments. |
| |
· | Development of a “Green Building Code” that will introduce the highest energy efficiency standards in Canada – Incremental funding is allocated to develop and implement the new Code, in consultation with industry, professional, and community representatives. The new “green requirements” will mean every new home and building will conserve more energy and water, reducing the environmental impacts and resulting in long term cost savings. |
Funding for 2007 Energy Plan Initiatives supporting Climate Action
Budget 2008 allocates $3 million over 3 years to fund the further development of many of the climate action-related commitments in the 2007 Energy Plan (see Table 1.12). In addition, Budget 2008 provides for an exemption on royalties for gas that would otherwise be flared at producing wells. The value of the royalties is estimated to be $1 million annually, but the initiative is revenue neutral since royalties would not be collected under the status quo.
Initiatives to assist individuals, families, and communities
BC’s 1.8 million households contribute almost 20 million tonnes in CO2-equivalent emissions annually for an average of 11.1 tonnes per household. The sources of these emissions are shown in Chart 1.1.
In 2008 Throne Speech, government outlined a new LiveSmartBC strategy to reward smart choices that will save energy, water, fuel, time and money.
Budget and Fiscal Plan – 2008/09 to 2010/11
28
A Budget for Climate Action
| Chart 1.1 – Household greenhouse gas emissions in BC (2005) |
|
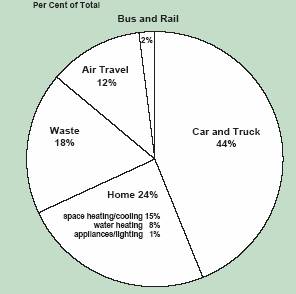
|
Source: BC Ministry of Environment |
| Since household GHG emissions constitute over 30 per cent of the provincial total, it is imperative that strategies be implemented to assist British Columbians adjust to a lower carbon footprint. Budget 2008 supports this goal by allocating a total of $98 million over 4 years to initiatives. Consistent with the 2008 Throne Speech, $60 million of this amount is to fund the new LiveSmartBC: Efficiency Incentive Program that will provide financial support to households for energy audits and building retrofits. Small businesses can receive energy assessments under the program as well. Some of the details of this new initiative are contained in Table 1.14. As part of this allocation to Individuals, Families, and Communities, Budget 2008 also will provide: · $20 million over four years to help switch remote communities, mainly First Nations, from diesel-generated power plants to sources of clean |
| |
| Table 1.14 LiveSmartBC: Efficiency Incentive Program |
| |
| | | Target | |
| Target Group | | 3-Year Amount | | Number | |
| Home owners | | $ | 38 million | | 30,000 | · Minimum 50% of household energy and carbon lifestyle audits paid by the program · Average retrofit payment of $1,000 per household · Will be in addition to federal incentives |
| | | | | (Retro-fits) |
| | | | | |
| | | | | |
| | | | | |
| | | | | |
| Social housing units | | $ | 18 million | | 9,000 | · In partnership with BC Housing |
| | | | | (Retro-fits) | |
| Small businesses | | $ | 4 million | | 3,000 | · Energy assessments for existing small commercial buildings with under $50,000/year in electricity |
| Total | | $ | 60 million | | 42,000 | |
Budget and Fiscal Plan – 2008/09 to 2010/11
29
A Budget for Climate Action
| electricity, and to improve the energy efficiency of their homes and businesses; · $15 million in 2007/08 to expand and refine the existing “SCRAP-it” program that provides financial and other incentives to get older, less efficient vehicles off the road; and · $3 million to fund an updated Energy Efficient Buildings Strategy, to encourage even greater participation by home-owners, businesses, and communities in taking advantage of conservation-oriented building technologies and practices. These initiatives will complement BC Hydro’s “smart metering” initiative, which will allow all of its customers to monitor power consumption as it is being utilized, allowing them to make conservation decisions immediately. The meters are to be installed by 2012 at a cost of up to $930 million. Provincial Transit Plan As is evident from Chart 1.1, the most significant component of household GHG emissions is from personal vehicles. On January 14, 2008, the government announced its Provincial Transit Plan, designed to reduce private vehicle usage. · The plan will fund four new rapid transit lines in the Lower Mainland, nine new Rapid Bus routes in the Lower Mainland, the Capital Region and Kelowna, and purchase up to 1,600 buses for use in many BC communities. · Overall, the plan is costed at $14 billion to 2020, with the intent that it be cost-shared among the province, the federal government, the South Coast British Columbia Transportation Authority (formerly TransLink), and local governments. · Over four years, the province’s contribution is anticipated to be $151 million of operating funding and $219 million in capital funding. The Provincial Transit Plan includes the existing commitment of $435 million to help fund the new Canada Line, which will connect downtown Vancouver with Richmond and the Vancouver International Airport. It is important to note that, while GHG reductions are an important benefit of improving mass transit, there are many other benefits to such investments. These include time savings for both transit riders and private vehicles by reducing road congestion, encouraging more efficient community planning, and providing seniors, young people, and others having limited access to automobiles with increased convenience in the course of their commuting requirements. Additional transportation initiatives A large proportion of emissions from the transportation sector are generated by heavy-duty commercial vehicles and port activities. Therefore, Budget 2008 provides funding for the following: · $30 million over three years for the BC Green Ports Initiative to implement emission reducing practices for short-haul commercial trucks servicing |
Budget and Fiscal Plan – 2008/09 to 2010/11
30
A Budget for Climate Action
| BC ports, and to fund port electrification to allow ships to turn off their engines while in port. · $3 million over three years for a Green Lights Transportation Program which will utilize new technologies to assess commercial vehicles for compliance with trucking regulations while in transit on highways, reducing the frequency of stoppages and idling. This funding will also provide plug-in infrastructure at key truck-stop locations to reduce idling times. As well, sales tax exemptions on after-market products that improve the aerodynamics and therefore the fuel efficiency of larger commercial vehicles are contained in Budget 2008. Bio-energy and alternative energy solutions To the extent that traditional fossil fuels can be replaced with cleaner energy choices, GHG emissions will be reduced. To encourage development of greener fuels in BC sooner than they would otherwise occur, the following initiatives are planned: · As announced on January 31, 2008, an immediate priority is for $25 million to establish a new Bioenergy Network, to encourage research and investments in such areas as wood-waste co-generation, bio-fuels from wood, agricultural, or waste biomass, and wood pellet production. The Network will also be responsible for directing research and initiating projects that promote the development and use of fuel from organic resources. · Also part of the announcement was a production incentive to encourage biodiesel production. If the appropriate capital investments are made, producers could be eligible for financial support, depending on the specifics of the facility. The actual cost to the fiscal plan is dependent on the size and nature of the investments made, but could reach $10 million over three years. · Additional 2007/08 funding of $5 million will support the expansion of solar thermal energy systems in BC. The funding is largely intended to increase the number of solar installations in BC, mainly for water heating purposes. · Also included in this category are planned 2008/09 expenditures of $17 million from the Innovative Clean Energy (ICE) Fund that was announced last spring. This fund will, among other functions, assist in bringing promising new clean energy technologies to market. Researching solutions to the climate challenge Further research is necessary to design the required actions to mitigate climate change and to better understand its implications, however government cannot do this alone. Therefore, as announced on January 25, 2008, an immediate priority for 2007/08 is to provide a $95 million contribution, of which $90 million is for an endowment fund, to assist two organizations undertake valuable research and generate solutions to key technical and policy questions posed by government. The organizations are as follows: |
Budget and Fiscal Plan – 2008/09 to 2010/11
31
A Budget for Climate Action
| · The Pacific Institute for Climate Solutions (PICS) – Led by the University of Victoria in cooperation with the University of BC, Simon Fraser University, and the University of Northern BC, this new collaborative will provide government with scientific research expertise on climate change issues, such as enhancing the understanding of low carbon technologies and industrial processes, investigating practical alternatives to current “carbon-intensive” consumer products, and researching opportunities for more environmentally-friendly commercial investments in BC. · The Pacific Climate Impacts Consortium (PCIC) – This organization has evolved from a concept in 2005 to a partnership among the University of Victoria, BC Hydro, Environment Canada, and the BC Ministry of Environment. Its mandate is to produce practical scientific information to help communities, natural resource managers and business adapt to climate change. In addition, given the economic importance of BC’s oil and gas industry, the capture and permanent underground storage of CO2 generated by petroleum production is likely to be an important mechanism to help meet BC’s emission reduction targets. To that end, Budget 2008 provides $3 million in 2007/08 to undertake a feasibility study on this technology at a natural gas plant in northern BC. Improving BC’s ability to adapt to climate change implications While acting to minimize the impacts of climate change, it is prudent to also accurately monitor and plan for those changes that will continue to occur for some time due to past emissions. In addition to the contributions to designing adaptation strategies that will be provided from organizations such as PCIC and PICS, Budget 2008 also provides for the following: · Working in partnership with federal agencies, $10 million over three years in operating funding and $1.5 million in capital funding, to upgrade the government’s hydrometric, fire, and meteorological networks to collect more reliable climate and related data. Data provided by these systems is critical in order to cope with extreme weather events and to adapt to long term changes in climate. · $1 million over three years will help assess strategies to improve the province’s ability to respond to events such as floods and droughts, the frequency of which is likely to increase. Key economic resources in the areas of fisheries, agriculture, and hydro-electricity face mounting risks from such occurrences. · An allocation of $30 million over three years is part of a 10-year, $100 million program for flood protection infrastructure and maintenance with a shift in emphasis from response/recovery to mitigation. Over 240 communities in BC have been identified as being at some risk of flooding. Projects will include structural flood protection works, gravel removal, and engineering/modeling work. Federal cost sharing is also being pursued. · An additional $6 million over three years will assist with eliminating the backlog in Independent Power Producer applications, resulting in additional green power supplies to augment the BC Hydro system. |
Budget and Fiscal Plan – 2008/09 to 2010/11
32
A Budget for Climate Action
| Policy Development and Public Outreach To ensure that ministries and other public sector organizations are coordinating their efforts to advance climate change initiatives, the Climate Action Secretariat was created in 2007 with an initial budget of $4 million for 2007/08. Budget 2008 increases the funding for its operations to $46 million over 3 years (along with a further $62 million in contingency funding for additional new initiatives) allocated as follows: · Operating budget – $12 million over 3 years for policy formulation and coordination, developing required legislation and regulations, ensuring the achievement of a carbon neutral public sector by 2010, development of a regional “cap and trade” system, and related functions. · Outreach and engagement – $12 million over 3 years for consultations with stakeholder groups, for work with other levels of government and other partners on climate action solutions, and to establish/fund the Citizen’s Conservation Council. The Council, to be established this year, will have a mandate for climate change education and outreach. A further $3 million over three years is provided outside of the Secretariat’s budget for a new “Food Miles” Initiative, to increase public awareness of the distance food products are transported to encourage the purchase of local agricultural products. · Technical analysis – $7 million over 3 years to develop models, impact assessments, and other analytical tools to assist in making key policy choices. Some of this funding will support the Climate Action Team, whose 22 members and a Special Advisor were announced on November 20, 2007. The Team will advise on interim emission reduction targets for 2012 and 2016, and provide recommendations to government on additional strategies to reduce emissions. · Communications and education – $15 million over 3 years to provide information to British Columbians about choices they can make in support of reducing greenhouse gas emissions. · Contingencies – The work of the Secretariat and the Climate Action Team is in its initial stages, and the Citizen’s Conservation Council has yet to be established. An allocation of $62 million over three years will also be maintained as a part of government’s contingencies vote to support further initiatives. Carbon neutral public sector Only through changing the collective behavior of all members of society, including government, can the climate challenge be met successfully. Simply put, government must lead by example. Therefore, the province has committed that its operations will be “carbon neutral” by 2010. Note that “carbon neutral” does not imply zero emissions, but rather zero net emissions. This means that for those emissions that can’t be reduced further, accountability is taken by purchasing offsets from projects that reduce or sequester emissions. Budget 2008 assists in this regard as follows: |
Budget and Fiscal Plan – 2008/09 to 2010/11
33
A Budget for Climate Action
| · Emissions by the public sector currently totals several hundred thousand tonnes of CO2-equivalent annually. Budget 2008 allocates $14 million in operating funding over 3 years, and $75 million in capital funding, to retrofit existing provincial public sector buildings. Retrofits will include measures such as higher efficiency lighting and more efficient boiler systems. This program complements the announcement in the 2008 Throne Speech that all new provincial public sector buildings will be constructed to a minimum of “LEED” (Leadership in Energy and Environmental Design) Gold or equivalent standards. · The Pacific Carbon Trust, a new Crown corporation, will receive $24 million over 4 years to invest in GHG-reducing projects in BC. The mandate of the Trust will be to purchase credible, low-cost offsets in BC to assist the government meet its carbon neutral target by 2010. Once up and running, the Trust will be able sell offsets to individuals and many businesses. · $15 million will be provided in 2007/08 to begin to develop advanced communication and collaboration tools, including desktop videoconferencing, to reduce public servant travel, in addition to $2 million to develop new low-carbon procurement procedures and a “Green BC Website” for ministries to better track their GHG emissions and evaluate new strategies for reductions. These initiatives will complement the Public Sector Energy Conservation Agreement, announced in 2007, which applies to some 6,500 public sector buildings. This $200 million joint government-BC Hydro initiative will decrease electricity consumption across the public sector building portfolio over the next 12 years. Managing BC’s Forests in a Changing Climate · $19 million in 2007/08 and a further $2 million for staffing over the next three years is allocated to accelerate forest growth and reduce losses due to forest health problems in order to sequester more CO2, develop new seed technologies that are more resilient to climate change, and reduce risks of wildfire to communities. · $10 million to assist BC’s pulp and paper industry develop new technologies to further reduce its GHG emissions from the processing of wood chips into pulp. |
| |
Total Climate Action Expenditures and the Federal Ecotrust Contribution |
| The above measures total almost $700 million in operating funding and $300 million in capital spending over four years beginning in 2007/08. As part of this operating funding, the government intends to introduce Supplementary Estimates to obtain the necessary legislative approvals to fund over $250 million of 2007/08 priority initiatives, such as the Provincial Transit Plan, the Bioenergy Network, the Pacific Institute for Climate Solutions and the Pacific Climate Impacts Consortium. The federal government provided BC with a $199.3 million “EcoTrust” contribution in 2007, to support provincial projects that will result in real reductions in greenhouse gas emissions and air pollutants. |
Budget and Fiscal Plan – 2008/09 to 2010/11
34
A Budget for Climate Action
| In summary, Budget 2008 provides the fiscal mechanisms to begin to address emissions in all the key sectors (see Chart 3 in the Climate Change Backgrounder topic box): the public transit, green ports, trucking, bio-energy, tailpipe emissions, and enhanced “SCRAP-it” initiatives will reduce emissions in the Transportation sector; the resources provided for “cap and trade,” energy plan carbon sequestration feasibility analysis and research will address the fossil fuels, industry, and electricity sectors; the new LiveSmartBC: Efficiency Incentive Program, electrification of remote communities, new Energy Efficient Building Strategy, solar, and public sector building retrofits will assist with emission reductions in the residential/commercial sector; and the new landfill emission standards will mitigate against higher GHGs in the Waste category. Finally, the carbon tax will address emissions in all sectors, due to the incentives it will create to utilize fossil fuels more efficiently. |
| |
Environmental, Economic and Health Implications |
| |
| · Greenhouse Gas Reductions – The regulatory, expenditure, and taxation policies being facilitated through Budget 2008, will be significant in helping British Columbia make the social and economic adjustments necessary to meet its GHG targets. The government has recently engaged MK Jaccard and Associates, a highly respected firm that has completed many other environment/energy/economy modeling exercises, to analyze the impacts of new and existing policy measures. At this time, given the large number of initiatives being undertaken and their complexity, the estimates of the impacts are not yet finalized. The Climate Action Team will be using this modeling to inform its recommendations, with significant work to be completed by Summer 2008. · Economic Implications – The economic impacts from the climate initiatives supported by Budget 2008 are anticipated to occur gradually over time. There will be some increased costs to businesses and consumers from the upcoming regulatory measures (e.g., “cap and trade” system for large emitters, new fuel standards, and the vehicle tailpipe standards), however many of the changes will be phased in so that any necessary adjustments can be made over several years. As for the new carbon tax, implementation in stages will have significantly lower economic impacts than if the tax were suddenly introduced in its entirety. This approach allows consumers and businesses to adjust their behaviour over time, and provides incentives for them to purchase lower carbon technologies when it is time to replace their capital stock (e.g. vehicles or production machinery). The macroeconomic costs of the carbon tax will be substantially reduced through the full and carefully planned recycling of carbon tax revenues. |
Budget and Fiscal Plan – 2008/09 to 2010/11
35
A Budget for Climate Action
| In order to continue to ensure that the economy remains competitive, the government has introduced a net reduction in overall taxes in this budget. Moreover, increasing the price of carbon, through the carbon tax, will also send more appropriate “price signals” to the market that make the development of alternative energy sources, such as wind power, more economically attractive. · Co-Benefits for Health – Many climate action policy initiatives will also have significant positive impacts for public health. The most obvious is due to improved air quality, since GHG emissions and air pollution often occur concurrently. Lowering emissions will also reduce incidences of respiratory diseases, often linked to premature mortality, and policies that reduce the reliance on automobiles will encourage more active lifestyles. |
| |
Section 1.5: Looking Ahead |
| |
| Continuing to Work with the Western Climate Initiative (WCI) and other Partners As noted previously, it is critical to work with other jurisdictions if BC is to be successful in reducing the effects of climate change. At this time, BC’s key partners are the eight other members (seven states and one other province) that comprise the WCI. For example, partnering on a regional emissions trading market through the WCI is a priority action for 2008. Through the WCI, the province is also collaborating with European Countries, US states, and New Zealand in the International Carbon Action Partnership to provide a global mechanism to share best practices and to consider development of compatible multi-country carbon trading markets. Pending Legislative and Regulatory Changes Introduction of some important legislation to further the climate action agenda is another priority for 2008. These regulatory changes will complement the measures facilitated by Budget 2008 and other actions now in the planning stage: · Limits on GHGs by large emitters (“cap and trade”) – The WCI has set a date of August 2008 to come to agreement on a workable system for carbon trading for large emitters. The government intends to introduce legislation in 2008 to enable adoption of this system. · Limits on GHGs from new vehicles sold in BC – The new tailpipe standards would be introduced over time, with standards to be fully phased in by 2016. Therefore legislation is planned for 2008. · Limits on GHGs from landfills – These new standards would set minimum requirements for the capture of methane gas from landfills. Legislation is planned for 2008. · Amend Utilities Commission Act – The Energy Plan, smart meters and rate structures to encourage energy efficiency and conservation will be supported by a new legislated direction for the BC Utilities Commission. |
Budget and Fiscal Plan – 2008/09 to 2010/11
36
A Budget for Climate Action
| · Renewable Fuel Standards (RFS) and Low Carbon Fuel Standards (LCFS) – Government will pass enabling legislation covering both these standards, likely in 2008. The RFS will require 5 percent renewables in fuel (gasoline and diesel) by 2010. The LCFS will require transportation fuel suppliers and importers to reduce the average global warming intensity of their products (grams of CO2-equivalent per unit of energy) by 10 per cent by 2020 . · Green Communities – Legislation is also being developed to assist local governments encourage more compact communities that reduce energy use, reduce the costs of servicing, and increase the opportunities to walk and cycle to work in order to reduce GHG emissions. Emission reduction targets, policies and actions will be required elements in all official community plans and regional growth strategies. Facilitating a new provincial climate action plan Like the 2007 Throne Speech, last year’s Energy Plan, and the Greenhouse Gas Reduction Targets Act, Budget 2008 is another step forward in developing a renewed climate action plan for BC. As noted earlier, Budget 2008 provides the fiscal resources and incentives, in the context of a revenue-neutral carbon tax, to support BC’s efforts to meet its GHG reduction targets. |
Budget and Fiscal Plan – 2008/09 to 2010/11
37
A Budget for Climate Action |
“Cap and Trade” System for Large Emitters
Working within the Western Climate Initiative
BC is participating with Manitoba and seven US states (Arizona, California, New Mexico, Oregon, Washington, Utah and Montana) in the Western Climate Initiative (WCI), to implement a market-based, multisector “cap and trade” system to reduce GHG emissions. Design of the system is underway and scheduled for completion by August 2008.
How a “Cap and-Trade” System Works
Under cap-and-trade, hard “caps” are placed on the quantity of GHGs that can be produced by major emitters covered by the system. The overall cap is reduced over time in line with emissions reduction targets. The total number of allowances within the system corresponds to the overall cap; for the WCI, each allowance will be a permit to emit one tonne of carbon dioxide equivalent
(CO2-equivalent). Each regulated entity must hold enough allowances to cover all of its regulated emissions in each compliance period. Initial allowances are issued either through free allocation or by auction, or some combination of both.
The main characteristics of a cap and trade system are as follows:
· A cap puts a ceiling on total emissions. The cap provides an environmental advantage over traditional regulatory methods for individual emitters, which do not prevent aggregate emissions from rising as new sources are created.
· Limiting the number of available emission allowances reinforces the cap. Scarcity of allowances ensures that a “price” is placed on pollution, and thus provides the incentive to reduce emissions.
· Covered entities may choose from many options to meet their emission reduction targets, adopting those which are the most cost-effective and best meet their needs. They may reduce their own emissions using new technologies or other means, buy unused allowances from other covered entities that have reduced their emissions, potentially purchase offset credits from outside the system, or use a combination of all of these.
· Covered entities can bank unused allowances for future use, which creates a tangible economic incentive to decrease emissions below allowable levels. Early emissions reductions also result in earlier environmental benefits.
Advantage of a Multi-Jurisdictional Cap and Trade System
The main advantage of BC participating in a WCI-wide cap-and-trade system rather than developing a system of its own is that the larger market provides more opportunities for low-cost emissions reduction solutions. WCI members now have a population of 63 million people, significantly more than the population of Canada, and is likely to grow. Participating in this larger market also helps ensure that BC businesses face the same policies as their competitors in other WCI jurisdictions.
GHG emissions trading is a growing phenomenon worldwide. Systems with varying degrees of sectoral coverage are underway or in the process of being developed in several regions and countries, including the North Eastern US States, New Zealand, Australia, Japan, Norway, Switzerland and the European Union. It is possible that eventually linkages could be made to other GHG emissions trading systems outside of the WCI region.
Budget and Fiscal Plan – 2008/09 to 2010/11 |
38
A Budget for Climate Action |
The US Acid Rain Program: A Successful Example of Cap-and-Trade
Using cap and trade to reduce other types of emissions has been successfully demonstrated in North America. The United States Environmental Protection Agency’s (EPA) Acid Rain Program is the most prominent example. The program sets a nationwide cap on sulphur dioxide (SO2) emissions from fossil fuel combustion electric-generating facilities under the US Clean Air Act.
The EPA outlines the same benefits of the program as noted above (1), and adds that emissions allowance trading leads to a reduction in overall compliance costs compared to meeting the same target emissions level through “command-and-control” regulatory means.
As shown in the chart, by 2006, (SO2) emissions in the US have been reduced by 7.9 million tons under the program compared to 1980 levels – over a 45 per cent reduction. The program also sets nitrogen oxide (NOX) emission limitations for coal-fired plants with some compliance flexibility, and has resulted in a 42 per cent reduction from 1990 levels.
(1) Source: US EPA. 2002. Clearing the Air: The Facts About Capping and Trading Emissions. Accessible at http://www.epa.gov/airmarkets/progsregs/arp/docs/clearingtheair.pdf.
Sulphur dioxide emissions under the US Acid Rain Program 1980-2006
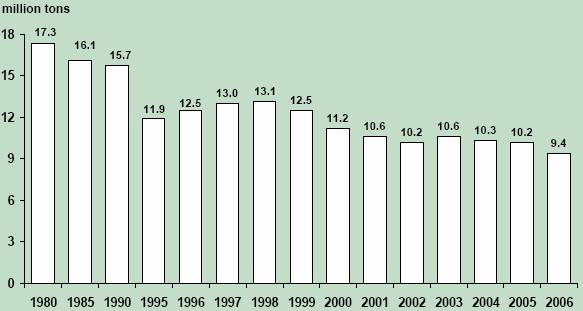
Source: United States Enviornmental Protection Agency
Budget and Fiscal Plan – 2008/09 to 2010/11 |
39
A Budget for Climate Action |
BC as a Climate Action Leader:
A Comparison with Other Jurisdictions
Since climate change became a major global issue, European countries have been the leaders in terms of advancing the agenda. However, along with California, BC is at the forefront in North America in terms of implementing progressive climate action policies. This is demonstrated in the table below, which is a summary of the records of various western, industrialized jurisdictions in terms of their key climate change policies. Note that change on this front is rapid and planning for climate change in most of these jurisdictions is in flux. However, at this time, the conclusions are:
· 7 of the 23 jurisdictions (the European Union is counted as a single jurisdiction) have legislated targets for absolute reductions of GHG emissions, some more aggressive than others;
· excluding the European Union (EU), 3 of 22 have some variation of a carbon tax – BC, Quebec, and the United Kingdom (UK) – however several countries in the EU also have some form of carbon tax;
· 8 of 23 either are now part of a GHG “cap & trade” system or have committed to join one, and all EU jurisdictions including the UK belong to the existing EU carbon trading system that was launched in 2005;
· 11 of 23 have either committed to adopt California’s proposed GHG tailpipe emissions standards or are proposing more stringent standards; and
· of those included in the table, only BC, the EU, and the United Kingdom have legislated targets for absolute emission reductions, some variation of a carbon tax, a commitment to “cap and trade” for large emitters, and intend to implement California tailpipe emission standards or better.
Significant Climate Action Policies in 23 Jurisdictions |
| | | | | | | | |
| | Legislated “Absolute” GHG | | | | GHG “Cap and | | |
| | Targets and Details of Policy | | | | Trade” System for | | Vehicle GHG Emission |
Jurisdiction | | or Other Targets | | Carbon Tax | | Large Emitters | | Standards |
| | | | | | | | |
| | Canadian Jurisdictions | | |
| | | | | | | | |
British Columbia | | Yes: 33% below 2007 level by 2020 & 80% by 2050 | | Yes: e.g., 2.41 cents/litre on gasoline in 2008; 7.24 cents in 2012 | | Yes: committed to join WCI system | | Yes: plan to adopt California tailpipe standards |
| | | | | | | | |
Government of Canada | | No; 20% below 2006 level by 2020 | | None | | Not currently | | To adopt at least C.A.F.E.(1) standards by 2011 |
| | | | | | | | |
Alberta | | No; 14% below 2005 level by 2050 | | None | | Not currently | | Interest in adopting California standards |
| | | | | | | | |
Saskatchewan | | No; reduce by 22 tonnes per person by 2020 vs. 2004 & 80% by 2050 | | None | | WCI Observer | | Interest in adopting California standards |
| | | | | | | | |
Manitoba | | Not at this time; reduce by 6% below 1990 level by 2012 | | None | | Yes: committed to join WCI system | | Yes: plan to adopt California standards by 2010 |
| | | | | | | | |
Ontario | | No; 15% below 1990 level by 2020 | | None | | Indicates it will join Cap & Trade | | No plan to adopt California standards |
| | | | | | | | |
Quebec | | No; 1.5%-6% below 1990 level by 2012 | | Yes: e.g., 0.8 cents/litre on gasoline | | WCI Observer; indicates it will join Cap & Trade | | Yes: plan to adopt California standards |
| | | | | | | | |
New Brunswick | | No; 10% below 1990 level by 2020 | | None | | Not currently | | Yes: plan to adopt California standards |
Budget and Fiscal Plan – 2008/09 to 2010/11 |
40
A Budget for Climate Action |
Significant Climate Action Policies in 20 Jurisdictions – Continued |
| | | | | | | | |
| | Legislated “Absolute” GHG | | | | | | |
| | Targets and Details of Policy or | | | | GHG Cap and Trade | | Vehicle GHG Emission |
Jurisdiction | | Other Targets | | Carbon Tax | | System for Industry | | Standards |
| | | | | | | | |
| | Canadian Jurisdictions – Continued | | |
| | | | | | | | |
Nova Scotia | | Yes: 10% below 1990 level by 2020 | | None | | Not currently | | Yes: plan to adopt California standards |
| | | | | | | | |
Prince Edward Island | | No; 10% below 1990 level by 2020 (region) | | None | | Not currently | | Interest in adopting California standards |
| | | | | | | | |
Newfoundland | | No; 10% below 1990 level by 2020 (region) | | None | | Not currently | | Interest in adopting California standards |
| | | | | | | | |
Yukon | | No | | None | | Not currently | | Interest in adopting California standards |
| | | | | | | | |
Northwest Territories | | No; public sector to be 10% below 2001 level by 2011 | | None | | Not currently | | Interest in adopting California standards |
| | | | | | | | |
Nunavut | | No | | None | | Not currently | | Interest in adopting California standards |
| | | | | | | | |
| | United States Jurisdictions | | |
| | | | | | | | |
U.S. Federal Government | | No | | None | | Not currently | | C.A.F.E Standards |
| | | | | | | | |
California | | Yes: 2000 level by 2010; 1990 level by 2020; 80% below 1990 level by 2050 | | None | | Yes: committed to join WCI system | | Yes: by 2016, new fleet average GHG emissions to be 30% below 2009 level(2) |
| | | | | | | | |
Washington | | Yes: 1990 level by 2020; 25% below 1990 by 2035; 50% below 1990 by 2050 | | None | | Yes: committed to join WCI system | | Yes: plan to adopt California standards |
| | | | | | | | |
Oregon | | Yes: Stabilize by 2010; 10% below 1990 level by 2020; 75% below 1990 by 2050 | | None | | Yes: committed to join WCI system | | Yes: plan to adopt California standards |
| | | | | | | | |
Alaska | | No targets, though some are expected | | None | | Observer at WCI | | No indication to adopt California standards |
| | | | | | | | |
Arizona | | No; 2000 level by 2020; 50% below 2000 level by 2040 | | None | | Yes: committed to join WCI system | | Yes: plan to adopt California standards |
| | | | | | | | |
| | Europe and Other Jurisdictions Outside of North America | | |
| | | | | | | | |
European Union(3)
(27 countries) | | Yes: 20% below 1990 level by 2020 and 50% by 2050 | | Yes: Several jurisdictions; amounts and coverage variable | | Yes: European Union Emission Trading Scheme | | Yes: proposed standards of most countries to be more stringent than California’s(4) |
| | | | | | | | |
United Kingdom | | Yes: 60% below 1990 level by 2050 and 26-32% by 2020 | | Yes: Climate Change Levy on some energy types | | Yes: member of the European Union Emission Trading Scheme | | Yes: conforms to EU standards |
| | | | | | | | |
Australia | | No; reduce by 60% below 2000 level by 2050 (signed Kyoto Accord in 2007) | | None | | To be introduced no later than 2012. | | None |
(1) “Corporate Average Fuel Economy Standards,” which are less stringent than California’s.
(2) California Tailpipe Standards: The fleet average GHG caps are scheduled to first apply to model year 2009. The caps become more stringent annually so that by 2016 the fleet average will be 30% below 2009 levels. (2009: 201.9g CO2e/km; 2012: 145.6g/km; 2016: 128.1g/km)
(3) Specific policies vary by member state.
(4) California Standards vs. EU Standards: By 2012, the EU will require average CO2e emissions to be 130g/km. California will require a 145.6g CO2e/km standard.
Budget and Fiscal Plan – 2008/09 to 2010/11 |
41
Part 2: THREE-YEAR FISCAL PLAN
Table 2.1 Three-Year Fiscal Plan – Operating Statement | | | | | | | | | |
| | | | | | | | | |
| | 2007/08 | | Budget | | | | | |
| | | | Updated | | Estimate | | Plan | | Plan | |
($ millions) | | Budget | | Forecast | | 2008/09 | | 2009/10 | | 2010/11 | |
| | | | | | | | | | | |
Taxpayer-supported programs and agencies: | | | | | | | | | | | |
Revenue | | 34,887 | | 36,525 | | 35,810 | | 37,238 | | 38,788 | |
Expense | | (36,240 | ) | (37,280 | ) | (37,690 | ) | (39,100 | ) | (40,700 | ) |
Taxpayer-supported balance | | (1,353 | ) | (755 | ) | (1,880 | ) | (1,862 | ) | (1,912 | ) |
Commercial Crown corporation income | | 2,503 | | 2,875 | | 2,680 | | 2,687 | | 2,737 | |
Surplus before forecast allowance | | 1,150 | | 2,120 | | 800 | | 825 | | 825 | |
Forecast allowance | | (750 | ) | (150 | ) | (750 | ) | (675 | ) | (675 | ) |
Surplus | | 400 | | 1,970 | | 50 | | 150 | | 150 | |
Introduction
Budget 2008 continues government’s legislated commitment to balanced budgets – the fifth consecutive balanced budget. In the current environment of economic uncertainty, Budget 2008 maintains government’s prudent approach to fiscal management to ensure the budget remains balanced while making major investments toward meeting its climate change goals; maintaining a competitive economic environment and strengthening health care and other government services.
As shown in Table 2.2, Budget 2008 provides for government’s plan to address climate change, for initiatives to promote economic growth, to strengthen and sustain government services while continuing to ensure a strong, vibrant and competitive economy.
In addition to the $3.1 billion available revenues identified in the Budget 2008 Consultation Paper, forecasted revenues have increased over the next three years by a further $891 million. Combined, these revenues and updates to the forecast allowance of $1.0 billion, result in a total available fiscal room that provides the basis for expanded service levels and lower taxes. Budget 2008 reflects tax reductions totaling $481 million over the next three years (in addition carbon taxes of $1.8 billion are being implemented and are fully offset by personal and corporate income tax reductions of $1.8 billion), and spending commitments totaling $4.6 billion.
Chart 2.1 Revenue and spending trends

Budget and Fiscal Plan – 2008/09 to 2010/11 |
43
Table 2.2 Three-Year Fiscal Plan Update – Changes from Budget 2007 |
|
($ millions) | | 2007/08 | | 2008/09 | | 2009/10 | | 2010/11 | |
Budget 2007 Fiscal Plan Surplus (February 20, 2007) | | 400 | | 150 | | 150 | | 150 | |
Budget 2008 Consultation Paper – available revenue | | 1,200 | | 600 | | 675 | | 1,775 | |
Updated fiscal plan before revenue changes and spending initiatives | | 1,600 | | 750 | | 825 | | 1,925 | |
Revenue changes: | | | | | | | | | |
Personal income tax: | | | | | | | | | |
Personal income tax – prior year adjustment | | 117 | | — | | — | | — | |
Personal income tax | | 207 | | 205 | | 212 | | 240 | |
Corporate income tax | | 449 | | 75 | | (154 | ) | 34 | |
Other tax sources | | 87 | | (7 | ) | (11 | ) | (16 | ) |
Forests | | (198 | ) | (420 | ) | (234 | ) | (175 | ) |
Natural gas royalties | | (160 | ) | (193 | ) | (72 | ) | 64 | |
Other energy, metals and minerals | | 29 | | 93 | | 161 | | 133 | |
Other health-care related fees | | 18 | | 33 | | 57 | | 83 | |
Investment earnings | | 56 | | (50 | ) | (44 | ) | (10 | ) |
Health and social transfers | | (111 | ) | 7 | | 5 | | (21 | ) |
Other taxpayer-supported revenue | | 282 | | 319 | | 293 | | 274 | |
Commercial Crown corporation operating results | | 118 | | (2 | ) | 28 | | (16 | ) |
Total revenue changes before tax measures | | 894 | | 60 | | 241 | | 590 | |
Plus : Carbon tax | | — | | 338 | | 631 | | 880 | |
Less : Tax reductions for recycled carbon tax | | — | | (338 | ) | (631 | ) | (880 | ) |
Budget 2008 tax measures | | (24 | ) | (150 | ) | (166 | ) | (165 | ) |
Total revenue changes after tax measures | | 870 | | (90 | ) | 75 | | 425 | |
Forecast allowance updates | | 350 | | 250 | | 375 | | 375 | |
Less : expense increases (decreases): | | | | | | | | | |
Consolidated revenue fund (CRF) spending initiatives: | | | | | | | | | |
Climate Action Initiatives (Table 1.13) | | 252 | | 139 | | 133 | | 166 | |
Climate Action Dividend (includes $10 million for administrative costs) | | 450 | | — | | — | | — | |
New Investments in the Economy and Communities (Table 2.5) | | 150 | | 60 | | 48 | | 88 | |
K-12 Education | | — | | 38 | | 31 | | 75 | |
Enhancing Health Care (Table 2.9) | | 100 | | 464 | | 817 | | 1,647 | |
Strengthening Social Services (Table 2.10) | | 36 | | 125 | | 127 | | 150 | |
Justice and Public Safety (Table 2.12) | | 16 | | 44 | | 48 | | 57 | |
Other allocations/changes | | 192 | | 14 | | (144 | ) | 186 | |
Sub total | | 1,196 | | 884 | | 1,060 | | 2,369 | |
MOPD debt servicing changes | | (130 | ) | (52 | ) | (5 | ) | 57 | |
Contingency allocations | | (140 | ) | (73 | ) | (45 | ) | (19 | ) |
Net increase in CRF spending | | 926 | | 759 | | 1,010 | | 2,407 | |
Change in expenses recovered from external entities | | 136 | | 30 | | 22 | | 30 | |
Net spending changes of service delivery agencies | | (212 | ) | 71 | | 93 | | 138 | |
Total expense increases (decreases) | | 850 | | 860 | | 1,125 | | 2,575 | |
Budget 2008 Updated Fiscal Plan Surplus | | 1,970 | | 50 | | 150 | | 150 | |
The fiscal plan is based on the Ministry of Finance’s economic forecast that projects real economic growth of 2.4 per cent for 2008, 2.8 per cent in 2009 and 2.9 per cent in 2010. Consistent with its prudent forecasting practices, the Ministry of Finance outlook is lower than the Economic Forecast Council average. The economic outlook is lower than expected at the time of the 2007/08 first Quarterly Report, particularly in 2008. This reflects deteriorating conditions in the US economy, its housing sector and related effects on BC’s forest sector. Full details of the economic forecast are found in Part 4: British Columbia Economic Review and Outlook.
Budget and Fiscal Plan – 2008/09 to 2010/11 |
44
Overall revenues are forecast to increase to $41.5 billion by 2010/11, an average annual increase of 1.8 per cent over the next three years. Excluding the impacts of one time revenues in 2007/08 and the impact of tax reduction measures, total revenues would increase by an average of 3.0 per cent annually over the same period.
In 2007/08, strong revenues have enabled government to allocate $1.05 billion to priority initiatives, primarily for climate action. Government intends to introduce Supplementary Estimates to obtain the necessary legislative appropriations to fund these initiatives.
Compared to the 2007/08 updated forecast, overall spending is forecast to increase by an average of 3.0 per cent annually over the next three years to total $40.7 billion by 2009/10, reflecting increases in most ministry budgets, including significant investments in health care.
Budget 2008 continues government’s commitment to an infrastructure spending plan that is affordable. Infrastructure spending on transit, roads, schools, hospitals, post secondary facilities, electrical generation, transmission and distribution projects and other capital assets totals $5.8 billion in 2008/09, $5.5 billion in 2009/10 and $5.4 billion in 2010/11. The capital plan includes a 5 per cent contingency for taxpayer-supported projects as a prudent planning measure to cover risks from higher than expected cost inflation on projects and to provide for new priority projects that may be identified and approved during the year. More information on the three-year capital spending plan is found on page 72.
Taxpayer-supported debt is forecast to increase by an average of 3.9 per cent annually over the next three years to $30.0 billion by 2010/11, reflecting planned infrastructure spending in the health, education and transportation sectors, offset by expected operating surpluses. Total provincial debt, which includes commercial Crown debt and borrowing forecast allowances, is forecast to increase by an average of 6.7 per cent annually over the next three years to $42.5 billion by 2010/11.
Chart 2.2 Taxpayer-supported debt to GDP ratio trends down

Budget and Fiscal Plan – 2008/09 to 2010/11 |
45
Table 2.3 Revenue by Source | | | | | | | | | | | |
| | | | | | | | | | | |
| | 2007/08 | | Budget | | | | | |
| | | | Updated | | Estimate | | Plan | | Plan | |
($ millions) | | Budget | | Forecast | | 2008/09 | | 2009/10 | | 2010/11 | |
Taxation revenue | | | | | | | | | | | |
Personal income | | 6,389 | | 6,741 | | 6,700 | | 6,963 | | 7,302 | |
Corporate income | | 1,395 | | 2,221 | | 1,343 | | 1,125 | | 1,193 | |
Social service | | 4,890 | | 5,091 | | 5,284 | | 5,563 | | 5,857 | |
Fuel | | 919 | | 938 | | 957 | | 975 | | 996 | |
Carbon | | — | | — | | 338 | | 631 | | 880 | |
Tobacco | | 705 | | 705 | | 705 | | 705 | | 705 | |
Property | | 1,863 | | 1,788 | | 1,861 | | 1,943 | | 2,040 | |
Property transfer | | 904 | | 1,075 | | 1,020 | | 1,020 | | 970 | |
Corporation capital | | 110 | | 95 | | 69 | | 36 | | — | |
Other | | 496 | | 515 | | 532 | | 549 | | 568 | |
| | 17,671 | | 19,169 | | 18,809 | | 19,510 | | 20,511 | |
Natural resource revenue | | | | | | | | | | | |
Natural gas royalties | | 1,699 | | 1,170 | | 1,165 | | 1,252 | | 1,357 | |
Columbia River Treaty | | 285 | | 230 | | 245 | | 305 | | 310 | |
Other energy and minerals | | 902 | | 956 | | 966 | | 1,018 | | 962 | |
Forests | | 1,395 | | 1,098 | | 952 | | 1,048 | | 1,131 | |
Water and other resources | | 347 | | 340 | | 395 | | 406 | | 402 | |
| | 4,628 | | 3,794 | | 3,723 | | 4,029 | | 4,162 | |
Other revenue | | | | | | | | | | | |
Medical Services Plan premiums | | 1,497 | | 1,550 | | 1,571 | | 1,592 | | 1,612 | |
Post secondary education fees | | 964 | | 957 | | 989 | | 1,015 | | 1,040 | |
Other health-care related fees | | 219 | | 243 | | 252 | | 276 | | 302 | |
Motor vehicle licences and permits | | 435 | | 436 | | 445 | | 454 | | 463 | |
Other fees and licences | | 756 | | 760 | | 819 | | 786 | | 779 | |
Investment earnings | | 914 | | 954 | | 884 | | 942 | | 1,015 | |
Sales of goods and services | | 706 | | 668 | | 688 | | 737 | | 751 | |
Miscellaneous | | 1,554 | | 1,928 | | 1,821 | | 1,856 | | 1,883 | |
| | 7,045 | | 7,496 | | 7,469 | | 7,658 | | 7,845 | |
Contributions from the federal government | | | | | | | | | | | |
Health and social transfers | | 4,644 | | 4,759 | | 4,794 | | 5,001 | | 5,260 | |
Other cost-shared agreements | | 899 | | 1,307 | | 1,015 | | 1,040 | | 1,010 | |
| | 5,543 | | 6,066 | | 5,809 | | 6,041 | | 6,270 | |
Taxpayer-supported programs and agencies | | 34,887 | | 36,525 | | 35,810 | | 37,238 | | 38,788 | |
| | | | | | | | | | | |
Commercial Crown corporation net income | | | | | | | | | | | |
BC Hydro | | 365 | | 370 | | 358 | | 402 | | 444 | |
Liquor Distribution Branch | | 810 | | 845 | | 854 | | 863 | | 875 | |
BC Lotteries (net of payments to federal government) | | 1,024 | | 1,026 | | 1,101 | | 1,151 | | 1,201 | |
BCRC (1) | | 60 | | 28 | | 75 | | 20 | | (1 | ) |
ICBC (2) | | 225 | | 594 | | 272 | | 231 | | 195 | |
Other | | 19 | | 12 | | 20 | | 20 | | 23 | |
| | 2,503 | | 2,875 | | 2,680 | | 2,687 | | 2,737 | |
Total revenue | | 37,390 | | 39,400 | | 38,490 | | 39,925 | | 41,525 | |
(1) The 2007/08 amounts represent BCRC’s projected earnings during government’s fiscal year. On BCRC’s fiscal year basis (December), the outlook for 2007 is: (budget) – $79 million; (forecast) – $28 million. For 2008/09 to 2010/11, the fiscal year and calendar year projections are assumed to be the same.
(2) The 2007/08 amounts represent ICBC’s projected earnings during government’s fiscal year. On ICBC’s fiscal year basis (December), the outlook for 2007 is: (budget) – $225 million; (forecast) – $642 million. For 2008/09 to 2010/11, the fiscal year and calendar year projections are assumed to be the same.
Budget and Fiscal Plan – 2008/09 to 2010/11 |
46
Three-Year Fiscal Plan
Table 2.4 Expense by Ministry, Program and Agency (1)
| | 2007/08 | | Budget | | | | | |
| | | | Updated | | Estimate | | Plan | | Plan | |
($ millions) | | Budget | | Forecast | | 2008/09 | | 2009/10 | | 2010/11 | |
Advanced Education | | 2,165 | | 2,165 | | 2,252 | | 2,359 | | 2,377 | |
Education | | 5,494 | | 5,494 | | 5,675 | | 5,778 | | 5,822 | |
Health | | 12,960 | | 12,960 | | 13,765 | | 14,583 | | 15,438 | |
Contingencies – Health Innovation Fund | | 100 | | 100 | | — | | — | | — | |
Sub-total | | 20,719 | | 20,719 | | 21,692 | | 22,720 | | 23,637 | |
Office of the Premier | | 14 | | 14 | | 14 | | 14 | | 14 | |
Aboriginal Relations and Reconciliation | | 56 | | 56 | | 62 | | 51 | | 51 | |
Agriculture and Lands | | 271 | | 253 | | 289 | | 257 | | 260 | |
Attorney General | | 527 | | 527 | | 555 | | 564 | | 565 | |
Children and Family Development | | 1,858 | | 1,858 | | 1,987 | | 2,043 | | 2,064 | |
Community Services | | 271 | | 271 | | 304 | | 307 | | 339 | |
Economic Development | | 266 | | 266 | | 226 | | 266 | | 168 | |
Employment and Income Assistance | | 1,494 | | 1,494 | | 1,527 | | 1,566 | | 1,571 | |
Energy, Mines and Petroleum Resources | | 80 | | 51 | | 91 | | 78 | | 78 | |
Environment | | 223 | | 223 | | 272 | | 281 | | 282 | |
Finance | | 95 | | 95 | | 97 | | 99 | | 99 | |
Forests and Range | | 1,089 | | 1,191 | | 1,211 | | 1,119 | | 1,128 | |
Labour and Citizens’ Services | | 98 | | 98 | | 104 | | 99 | | 99 | |
Public Safety and Solicitor General | | 629 | | 710 | | 647 | | 658 | | 660 | |
Small Business and Revenue | | 60 | | 60 | | 65 | | 67 | | 68 | |
Tourism, Sport and the Arts | | 129 | | 129 | | 375 | | 98 | | 96 | |
Transportation | | 882 | | 882 | | 970 | | 988 | | 1,021 | |
Total ministries and Office of the Premier | | 28,761 | | 28,897 | | 30,488 | | 31,275 | | 32,200 | |
Legislation | | 58 | | 101 | | 64 | | 66 | | 67 | |
Officers of the Legislature | | 34 | | 34 | | 53 | | 43 | | 43 | |
BC Family Bonus | | 17 | | 17 | | 14 | | 13 | | 12 | |
Management of public funds and debt | | 558 | | 405 | | 402 | | 390 | | 374 | |
Contingencies – new programs | | 317 | | 317 | | 375 | | 390 | | 400 | |
Contingencies – compensation | | 20 | | 20 | | — | | — | | 400 | |
Other appropriations | | 10 | | 10 | | 11 | | 11 | | 11 | |
Subtotal | | 29,775 | | 29,801 | | 31,407 | | 32,188 | | 33,507 | |
Supplementary Estimates | | — | | 1,045 | | — | | — | | — | |
Total consolidated revenue fund expense | | 29,775 | | 30,846 | | 31,407 | | 32,188 | | 33,507 | |
Expenses recovered from external entities | | 1,827 | | 2,077 | | 1,885 | | 1,955 | | 2,004 | |
Grants to service delivery agencies and other internal transfers: | | | | | | | | | | | |
School districts | | (4,743 | ) | (4,782 | ) | (4,909 | ) | (5,012 | ) | (5,069 | ) |
Universities | | (1,204 | ) | (1,347 | ) | (1,274 | ) | (1,341 | ) | (1,350 | ) |
Colleges, university colleges, and institutes | | (808 | ) | (859 | ) | (873 | ) | (892 | ) | (891 | ) |
Health authorities and hospital societies | | (8,605 | ) | (8,831 | ) | (9,264 | ) | (9,784 | ) | (10,326 | ) |
Children and family development agencies | | (684 | ) | (689 | ) | (724 | ) | (758 | ) | (764 | ) |
Other service delivery agencies | | (776 | ) | (867 | ) | (1,083 | ) | (754 | ) | (792 | ) |
| | (16,820 | ) | (17,375 | ) | (18,127 | ) | (18,541 | ) | (19,192 | ) |
Service delivery agency expense: | | | | | | | | | | | |
School districts | | 5,149 | | 5,183 | | 5,319 | | 5,425 | | 5,491 | |
Universities | | 2,794 | | 2,831 | | 2,965 | | 3,113 | | 3,213 | |
Colleges, university colleges, and institutes | | 1,353 | | 1,392 | | 1,436 | | 1,478 | | 1,497 | |
Health authorities and hospital societies (2) | | 9,345 | | 9,506 | | 9,883 | | 10,413 | | 10,981 | |
Children and family development agencies | | 687 | | 692 | | 725 | | 759 | | 765 | |
Other service delivery agencies | | 2,130 | | 2,128 | | 2,197 | | 2,310 | | 2,434 | |
| | 21,458 | | 21,732 | | 22,525 | | 23,498 | | 24,381 | |
Net spending of service delivery agencies | | 4,638 | | 4,357 | | 4,398 | | 4,957 | | 5,189 | |
Total taxpayer-supported expense | | 36,240 | | 37,280 | | 37,690 | | 39,100 | | 40,700 | |
(1) The 2007/08 budget estimate and updated forecast have been restated to reflect government’s current organization and accounting policies.
(2) Excludes inter-entity transactions between health authorities and hospital societies.
Budget and Fiscal Plan – 2008/09 to 2010/11
47
Three-Year Fiscal Plan
To ensure the debt remains affordable for future generations of British Columbians, the government remains committed to a declining trend in the taxpayer-supported debt to GDP ratio. Consistent with this commitment the taxpayer-supported debt to GDP ratio is expected to fall from 14.1 per cent in 2007/08 to 13.7 per cent by 2010/11. Additional information on the debt outlook is found starting on page 78.
The main risks to the government fiscal plan include economic fluctuations such as US economic growth rates, exchange rate movements or changes in natural gas, lumber or other commodity markets, as well as service demand pressures on the expenditure side. These and other risks are more fully described starting on page 81.
The fiscal plan includes forecast allowances of $750 million in 2008/09, and $675 million in 2009/10 and 2010/11 to help ensure government meets its surplus targets. In addition, the budget includes contingencies of $375 million in 2008/09, $390 million in 2009/10 and $400 million in 2010/11 representing roughly 1 per cent of total spending. The budget includes a further $400 million contingency in 2010/11 for the next round of wage and benefit contract negotiations.
The three-year fiscal plan conforms to the standards set by the accounting profession for senior governments in Canada referred to as generally accepted accounting principles or “GAAP”.
Consolidated Revenue Fund Spending
Consolidated Revenue Fund (CRF) spending, compared to Budget 2007, is forecast to increase from $29.8 billion in 2007/08 to $33.5 billion by 2010/11 – a 12.5 per cent increase. Budget 2008 represents a 5.5 per cent increase over Budget 2007, and increases of 2.5 and 4.1 per cent over the following two fiscal plans.
Budget 2008 supports the development and implementation of government’s Climate Action commitments, and is focused on actions that will help ensure new legislated greenhouse gas reduction targets are met. Funding for Climate Action and BC Energy Plan initiatives, along with other Budget 2008 commitments, supports investments in new technologies, environmentally sustainable natural resource and economic development, and continued infrastructure support for BC communities. Budget 2008 also sustains and enhances social services for British Columbians, provides additional skills development and training opportunities, and confirms government’s commitment to health care and education.
Climate Action
Budget 2008 commits almost $1 billion dollars over four years in operating and capital expenditure initiatives to support a comprehensive multi-sector approach to reducing BC’s greenhouse gas emissions. Climate Action initiatives funded in Budget 2008 will help set BC on the path to achieving a 33 per cent reduction in Provincial greenhouse gas emissions by 2020, a commitment that is now confirmed in the Greenhouse Gas Reduction Targets Act. Climate Action initiatives in the fiscal plan are described in full in Part 1, with the spending initiatives set out in Table 1.13.
Budget and Fiscal Plan – 2008/09 to 2010/11
48
Three-Year Fiscal Plan
New Investments in the Economy and Communities
Initiatives that stimulate economic growth and facilitate community enrichment continue to be critical components of the province’s fiscal plan. In addition to the Climate Action initiatives described in Part 1, Budget 2008 invests $346 million over four years towards short and long term initiatives that support environmentally responsible resource development, engagement with Aboriginal peoples regarding land and resource activities, post-secondary training and research opportunities, and community development through expanded arts and culture.
Table 2.5 New Investments in the Economy and Communities (in addition to Climate Action)
($ millions) | | 2007/08 | | 2008/09 | | 2009/10 | | 2010/11 | | Total | |
Economic Development | | | | | | | | | | | |
– | Asia Pacific trade and culture | | — | | 10 | | 10 | | 20 | | 40 | |
– | Expanding geoscience data in mountain pine beetle regions | | 12 | | — | | — | | — | | 12 | |
– | Crown-First Nations engagement on land and resource issues | | — | | 10 | | 10 | | 10 | | 30 | |
– | Environmental assessment and resource permitting demand | | — | | 7 | | 7 | | 7 | | 21 | |
– | Supporting new parks and protected areas | | — | | 2 | | 2 | | 2 | | 6 | |
| Sub-total | | 12 | | 29 | | 29 | | 39 | | 109 | |
Education, Research and a Skilled Workforce | | | | | | | | | | | |
– | Research and education through GenomeBC and Science World | | 60 | | — | | — | | — | | 60 | |
– | Expanding the Provincial Nominee Program | | — | | 1 | | 2 | | 4 | | 7 | |
– | Enhancing Immigrant Skills Connect/International Qualifications | | — | | 5 | | — | | — | | 5 | |
| Sub-total | | 60 | | 6 | | 2 | | 4 | | 72 | |
Developing Community Infrastructure | | | | | | | | | | | |
– | Build Canada Fund | | — | | — | | — | | 30 | | 30 | |
– | CRD Waste Water treatment project | | — | | 3 | | 3 | | 3 | | 9 | |
– | Road restoration in rural municipalities | | — | | 10 | | — | | — | | 10 | |
– | Maintaining inland and coastal ferries service standards | | — | | 3 | | 4 | | 4 | | 11 | |
| Sub-total | | — | | 16 | | 7 | | 37 | | 60 | |
Expanding Community Arts and Culture | | | | | | | | | | | |
– | $150 million permanent endowment for the BC150 Cultural Fund | | — | | 8 | | 8 | | 8 | | 24 | |
– | Vancouver East Cultural Centre revitalization | | 9 | | — | | — | | — | | 9 | |
– | Exploring opportunities for future exhibition centres | | — | | 1 | | 2 | | — | | 3 | |
– | Other arts and culture initiatives | | 69 | | — | | — | | — | | 69 | |
| Sub-total | | 78 | | 9 | | 10 | | 8 | | 105 | |
| Total | | 150 | | 60 | | 48 | | 88 | | 346 | |
| | | | | | | | | | | | | |
Economic Development
Government is committed to initiatives that encourage economic development, investment from foreign markets and new resource exploration. However, with the province’s strong commitment to Climate Action, investments in British Columbia must also be environmentally responsible and sustainable. The province’s Budget 2008 Climate Action initiatives will help to ensure future economic activities in British Columbia minimize greenhouse gas emissions. Budget 2008 also includes $109 million over four years to encourage economic development that meets government’s social, economic and environmental objectives.
Budget and Fiscal Plan– 2008/09 to 2010/11
49
Three-Year Fiscal Plan
· In support of the Asia-Pacific Initiative, the fiscal plan includes $40 million from 2008/09 to 2010/11 to promote Asia Pacific trade and culture. This includes coordination of provincial business services related to trade and investment with Asia Pacific nations and strengthening economic and cultural links between BC and Asian countries through the expansion of targeted trade, investment and cultural programs including trade missions, business networks, and marketing.
· Geoscience BC will receive $12 million in 2007/08, $6 million to further develop geoscience data that will support mineral exploration in the Mountain Pine Beetle infested areas of the province, and $6 million for oil and gas exploration in frontier areas of the province.
· Budget 2008 includes $10 million annually in new funding starting in 2008/09 for enhancing government’s engagements with First Nations when Crown land and resource decisions affect asserted Aboriginal territories.
· This allocation includes $1 million per year for the Province’s Environmental Assessment Office to assist with the costs of First Nations consultation obligations on major project assessments.
· $9 million per year will be available to natural resource ministries for an innovative cross government approach to effective engagements with First Nations who are affected by government decisions on access to Crown land and resources. This new strategy will ensure the Crown’s obligation to consult is fully and appropriately met, while providing opportunities to partner with First Nations in many large and small economic development projects.
· With these initiatives, Budget 2008 maintains the provincial commitment to funding for initiatives targeting reconciliation of aboriginal rights and title, as well as building strong and respectful relationships between government and aboriginal organizations.
· Budget 2008 includes $7 million annually in new funding starting in 2008/09 to address increased applications for access to natural resources, which require review by a number of provincial agencies.
· $2 million per year to enable the Environmental Assessment Office to keep pace with the increasing number of major projects throughout the province requiring environmental assessments. Environmental assessments are comprehensive project reviews that include public and First Nations consultation to ensure major projects meet the goals of environmental, economic and social sustainability. This funding builds on the $2 million base lift in Budget 2007 to ensure timely completion of assessments.
· Budget 2008 provides $5 million annually starting in 2008/09 for additional staff resources to reduce environmental permitting and licensing backlogs and to improve enforcement of environmental regulations.
$2 million of this annual allocation will focus on addressing significant independent power producer permit application backlogs that must move through a multi-ministry permitting process. Applications have risen dramatically in light of BC Hydro’s electricity self-sufficiency objectives and associated calls for green electricity production from independent producers.
Budget and Fiscal Plan – 2008/09 to 2010/11
50
Three-Year Fiscal Plan
· Budget 2008 provides $2 million annually to staff and manage 125 new protected areas covering nearly 1.4 million hectares in the Central Coast/North Coast, Morice, and Sea to Sky land and resource management plans.
· Budget 2008 also introduces a new special account called the Park Enhancement Fund, profiling BC Parks and inviting financial contributions by businesses, non-profit organizations, or individuals who wish to support BC Parks. All contributions to the Fund, as well as all revenues earned from the sales of parks promotional and educational merchandise and services, will be directed to enhanced parks projects or management initiatives that meet recreational and conservation objectives.
These investments build upon the $15 million provided in Budget 2007 for parks upgrades, in part to fund an expansion of recreation opportunities in selected parks, and to update water systems, campground trails, and day use amenities in the most well-used BC parks.
Education, Research and a Skilled Workforce
Budget 2008 reconfirms government’s commitment to increase access to post-secondary education and training to ensure that British Columbia continues to build a skilled and knowledgeable workforce that is well positioned to meet current and future labour market challenges. The province faces skilled labour shortages in a variety of sectors – healthcare, early childhood education, applied sciences, engineering and trades – all of which play key roles in ensuring a healthy, educated and financially secure population and a sustainable provincial economy.
Post-Secondary Education and Research
Budget 2008 supports $493 million, over three years, in post-secondary funding above the 2007 base budget level. By 2010/11, provincial funding for the Ministry of Advanced Education will have risen by $549 million since 2004/05, a 30 per cent increase.
Chart 2.3 Advanced Education budget increases 30% since 2004/05

Budget and Fiscal Plan – 2008/09 to 2010/11
51
Three-Year Fiscal Plan
Provincial funding has significantly increased access to post-secondary institutions throughout the province, increasing enrollment opportunities so that students with a B average in high school now have ready access to BC universities. Although access has improved, the overall number of students in the post-secondary system has increased less than previously forecast. This provides an opportunity for the province to work with post-secondary institutions to reassess current funding against program demands. Therefore, Budget 2008 takes a renewed focus on available resources inside the post-secondary system and redirects funds previously approved for seat growth to areas of high labour market demand.
This approach allows the redirection of $18 million over three years to ensure the province maintains its commitment to producing more trained doctors to meet the demands of a growing and aging population. An additional $3 million will be made available for increased nurse education and health care bursaries.
In 2007/08, government will contribute $60 million in new funding for research and innovation initiatives:
· $50 million to Genome BC, for research that focuses on the challenges of a changing world, including climate change. This contribution is expected to attract an additional $150 million in external funding toward these research activities.
· $10 million to Science World for structural upgrades to its landmark building and to develop an outdoor science park.
· In addition to these allocations shown in Table 2.5, the province is also investing $95 million in 2007/08 for Climate Action research at post-secondary institutions. Further details are available in Part 1: A Budget for Climate Action.
In the coming year, government will be reviewing the Campus 2020 report which provides government with 52 recommendations on how to build on the strengths of BC’s existing post-secondary education system and transform it for the future.
Investment in current and future learners is also supported by the Budget 2007 Children’s Education Credit which provides $1,000 per newborn toward the cost of future tuition and educational expenses.
Initiatives to Attract a Skilled Workforce
Government’s role in facilitating economic growth includes attracting a skilled and knowledgeable workforce through programs that remove employment impediments and welcome international workers into British Columbia’s economy. Budget 2008 provides $12 million over four years for the following initiatives:
· Increased funding of the Provincial Nominee Program (PNP) with an additional $7 million over three years. The PNP, which attracts high demand workers and business entrepreneurs from abroad, will be significantly expanded from 2008/09 to 2010/11. The target number of PNP approvals will total 15,000 for high demand and 720 for business immigrants,
Budget and Fiscal Plan – 2008/09 to 2010/11
52
Three-Year Fiscal Plan
representing increases of 150 per cent and 50 per cent respectively over previous targets.
· $5 million in 2008/09 to extend the Skills Connect for Immigrants (SCI) and International Qualifications (IQ) programs and leverage additional federal dollars for these two programs. The SCI program provides career planning services, job shadowing and mentoring opportunities to underemployed/unemployed skilled immigrants to help them find employment in sectors facing critical skills shortages, such as construction and tourism.
· The IQ program supports projects that remove systemic barriers preventing skilled immigrants from obtaining employment in an area related to their training and experience. Initiatives include work-based language training and strategies to improve credential assessment.
This funding builds on Budget 2007’s $33 million investment in the Industry Training Authority to create an additional 7,000 apprenticeship spaces through public and private training institutions by the end of 2009/10. In addition, Budget 2006 provided $39 million for an additional 3,700 apprentice training spaces, and to establish three Industry Training Organizations.
Developing Community Infrastructure
Budget 2008 provides an additional $60 million into projects that maintain community infrastructure across the province.
· $30 million in 2010/11 for the Build Canada Fund, a federal/provincial/local government infrastructure program which will allow communities in British Columbia to address drinking water, sewage treatment and other infrastructure issues.
Combined with existing investments of $157 million, the province will invest $187 million in municipal infrastructure over the next three years. This will leverage an additional $115 million in federal contributions, as well as municipal funding for a variety of projects throughout the province.
· $9 million over the fiscal plan to enter into a three-way cost sharing agreement for planning and procurement of wastewater treatment facilities in the provincial Capital Regional District.
· $10 million in one-time grants in 2008/09 to help municipalities rehabilitate roads damaged by increased logging truck traffic due to the increased harvesting of trees infested by mountain pine beetle.
· $8 million over three years for coastal ferries to meet continued funding requirements resulting from the purchase of new vessels for the northern ferry routes and address inflationary pressures. This additional funding maintains current service levels on unregulated ferry routes and continues to support social program subsidies for seniors, students, and people with disabilities.
· $3 million over three years for inland ferries to address expected inflationary pressures in provincial inland ferry contracts, ensuring that existing service levels continue for communities served by inland ferries.
Budget and Fiscal Plan – 2008/09 to 2010/11
53
Three-Year Fiscal Plan
Expanding Community Arts and Culture
Budget 2008 provides $105 million over four years on British Columbia arts and culture initiatives. The BC150 Cultural Fund, a $150 million permanent endowment is being established in 2007/08. This investment is forecast to generate $8 million annually to support new arts and cultural activities across the province. Spending priorities will be identified by the BC Arts Council. This represents a 50 per cent increase over current provincial funding to the BC Arts Council.
Additional Budget 2008 arts and culture spending includes:
· $9 million in 2007/08 toward the revitalization and restoration of the Vancouver East Cultural Centre, and establishment of an endowment fund to assist with the ongoing operation of the expanded centre.
· $3 million over the next two years for the planning of an Aboriginal art gallery and a World Women’s History Museum to celebrate the important arts, culture and societal contributions made by British Columbia’s women and Aboriginal peoples.
· $69 million in additional 2007/08 funding has been allocated to support other arts and culture projects. Announcements on finalized spending priorities will occur before the end of the fiscal year.
These investments will enhance the lives of British Columbians, providing new experiences through expanded arts and cultural activities in their communities.
Vancouver Convention Centre Expansion Project (VCCEP)
The Vancouver Convention Centre Expansion Project (VCCEP) represents a significant investment in tourism for the province. The total project budget of $883 million includes the expansion and upgrade of the Vancouver Convention and Exhibition Centre, and interconnection of the existing and new facilities. The project is scheduled to be substantially complete by March 15, 2009.
Table 2.6 Vancouver Convention Centre Expansion Project Funding
| | Prior | | | | | | | | | | | |
($ millions) | | years | | 2007/08 | | 2008/09 | | 2009/10 | | 2010/11 | | Total | |
Funding Sources | | | | | | | | | | | | | |
Provincial contribution | | 273 | | — | | 268 | | — | | — | | 541 | |
Contribution funded on behalf of Tourism Vancouver | | 58 | | 25 | | 7 | | — | | — | | 90 | |
Total funding by province (Ministry of Tourism, Sport and the Arts) | | 331 | | 25 | | 275 | | — | | — | | 631 | |
Funding from revenue generation | | | | | | | | | | | | 30 | |
Federal government funding | | | | | | | | | | | | 222 | |
Total funding | | | | | | | | | | | | 883 | |
Budget and Fiscal Plan – 2008/09 to 2010/11
54
Three-Year Fiscal Plan
2010 Olympic and Paralympic Winter Games (2010 Olympics)
The province has committed $600 million towards funding of the 2010 Olympic and Paralympic Winter Games. This includes a provincial contribution towards components that are jointly funded with the federal government including venues, security, a venue operating trust, live sites, and the Paralympic Games. It also includes a provincial commitment to medical costs, First Nations, sports and municipal legacies, and a contingency allocation earmarked for addressing unbudgeted costs.
Budget 2008 includes $254 million for expenditures within the $600 million envelope. Coupled with planned expenditures to the end of 2007/08, provincial expenditures to the end of 2010/11 are expected to be $600 million. Budget 2008 also includes an allocation of $20 million within the Contingencies Vote in 2008/09 and $49 million in 2009/10 for managing unforeseen pressures. This leaves $10 million remaining in the contingency allocation for 2010/11 that would be available should any post-Games costs emerge.
Table 2.7 2010 Olympics Funding
| | Prior | | | | | | | | | | Provincial | |
($ millions) | | years | | 2007/08 | | 2008/09 | | 2009/10 | | 2010/11 | | Envelope | |
Venues and Live Sites | | 179 | | 59 | | 56 | | 16 | | — | | 310 | |
Venues operating endowment | | 55 | | — | | — | | — | | — | | 55 | |
Medical | | — | | 1 | | 4 | | 8 | | — | | 13 | |
Security | | 6 | | 10 | | 10 | | 61 | | — | | 87 | |
Paralympic Games | | — | | — | | — | | 20 | | — | | 20 | |
First Nations and municipal legacies | | 32 | | 4 | | — | | — | | — | | 36 | |
Olympics contingency allocations (1) | | — | | — | | 20 | | 49 | | 10 | | 79 | |
Total contribution to provincial commitment | | 272 | | 74 | | 90 | | 154 | | 10 | | 600 | |
(1) Notionally allocated within the Contingencies vote.
Provincial Transportation Investments
Budget 2008 updates and builds on the government’s three-year transportation investment plan. The province remains committed to securing federal cost sharing on all eligible projects and programs, and leveraging additional investments through partnerships with private partners.
Between 2008/09 and 2010/11 the updated transportation plan provides:
· $2.3 billion of provincial investment in transportation infrastructure; and
· $0.7 billion of investment leveraged through federal cost-sharing and partnerships with private partners, local governments and other agencies.
The three-year transportation plan includes $438 million in provincial funding for the Gateway program. The Gateway program has three key projects, the North Fraser Perimeter Road, South Fraser Perimeter Road and the Port Mann/Highway 1 project. Under their Pacific Gateway Strategy, the federal government has committed $90 million to the North Fraser
Budget and Fiscal Plan – 2008/09 to 2010/11
55
Three-Year Fiscal Plan
Table 2.8 Provincial Transportation Investments
| | 2007/08 | | | | | | | | 3-Year | |
($ millions) | | Update | | 2008/09 | | 2009/10 | | 2010/11 | | Total | |
Transportation Investment Plan | | | | | | | | | | | |
– | Gateway program | | 174 | | 233 | | 90 | | 115 | | 438 | |
– | Rehabilitation | | 166 | | 146 | | 146 | | 146 | | 438 | |
– | Interior and rural side roads | | 78 | | 55 | | 50 | | 50 | | 155 | |
– | Oil and gas road rehabilitation | | 38 | | 42 | | — | | — | | 42 | |
– | Mountain pine beetle strategy | | 30 | | 30 | | 30 | | 30 | | 90 | |
– | Highway 1 – Kicking Horse Canyon | | 22 | | 8 | | 15 | | 16 | | 39 | |
– | Sea-to-Sky highway | | 219 | | 110 | | 43 | | — | | 153 | |
– | William R Bennett Bridge | | 61 | | 26 | | 1 | | — | | 27 | |
– | Border crossing infrastructure | | 54 | | 23 | | — | | — | | 23 | |
– | Okanagan Valley corridor | | 22 | | 32 | | 35 | | 24 | | 91 | |
– | Cariboo connector program | | 15 | | 31 | | 33 | | 25 | | 89 | |
– | Other highway corridors and programs | | 119 | | 79 | | 102 | | 68 | | 249 | |
– | Airports and ports | | 12 | | 11 | | 8 | | 8 | | 27 | |
– | Cycling infrastructure | | 3 | | 7 | | 7 | | 7 | | 21 | |
Provincial Transit Plan | | | | | | | | | | | |
– | Canada Line Rapid Transit Project | | 118 | | — | | 20 | | 20 | | 40 | |
– | Rail rapid transit projects | | — | | 2 | | 29 | | 111 | | 142 | |
– | Rapid bus projects | | 46 | | 23 | | 16 | | 16 | | 55 | |
– | Buses and other transit priorities | | 29 | | 31 | | 89 | | 30 | | 150 | |
| Total provincial investment (1) | | 1,206 | | 889 | | 714 | | 666 | | 2,269 | |
Investments funded through contributions from other partners | | | | | | | | | | | |
– | Canada Line (contributions from the federal government; South Coast British Columbia Transportation Authority; Vancouver Airport Authority; and private sector partner) | | 521 | | 202 | | 131 | | — | | 333 | |
– | Border crossing infrastructure (federal contribution) | | 19 | | 6 | | — | | — | | 6 | |
– | Other federal contributions to projects | | 100 | | 96 | | 114 | | 116 | | 326 | |
| Total investments funded through contributions from other partners | | 640 | | 304 | | 245 | | 116 | | 665 | |
(1) Total provincial investment includes operating and capital spending.
Perimeter Road, and $365 million towards South Fraser Perimeter Road costs. The Port Mann/Highway 1 project will be procured through a public-private partnership, financed in part through user tolls.
The updated plan also includes a significant commitment to the provincial transit plan, including $151 million in new operating funding and $219 million in new capital funding over four years. Further information is provided in Table 1.9.
K-12 Education
Budget 2008 provides $144 million over three years in increased funding for K-12 education. This is in addition to the $648 million allocated in previous budgets, for a total funding increase of $792 million over three years.
Over the fiscal plan, the K-12 education budget increases by an average of 2 per cent per year while the number of students is projected to decline by 1 per cent per year, resulting in an increase in per pupil funding.
Budget and Fiscal Plan – 2008/09 to 2010/11
56
Three-Year Fiscal Plan
Chart 2.4 Student enrolment and per pupil funding (public schools)
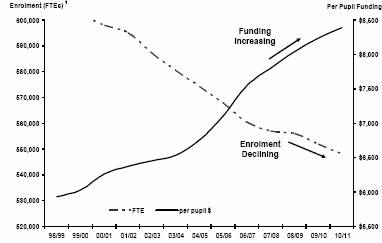
(1) The FTE formula has been updated to more appropriately reflect distributed learning students.
Budget 2008 includes funding to continue the Strong Start program for early learning. Up to 84 Strong Start centres are currently open and operating, and $38 million over three years will support a significant expansion with up to 400 Strong Start Centres projected to open by 2010.
In 2007/08, 41,000 public school students enrolled in distributed learning. Of these, 23,000 were students in grades 10-12 that enrolled in both classroom-based and distributed learning courses. Boards of Education will be allocated $37 million to fund distributed learning enrolment in the 2007/08 school year. By 2008/09, the number of public school students enrolled in distributed learning is projected to grow by 10 per cent to a total of 44,900 students. Independent school enrolment is forecast to increase at 2 per cent annually, and $17 million over three years in new funding has been allocated to meet statutory funding commitments to independent schools.
Enhancing Health Care
Budget 2008 continues government’s commitment to health care and provides $2.9 billion over three years in increased funding beginning in 2008/09. This is in addition to $2.0 billion allocated in previous budgets, for a total funding increase of $4.9 billion. The budget increases include funding for negotiated settlements through 2009/10. In 2010/11, Ministry of Health funding growth is maintained at the same 5.9 per cent growth as in 2009/10 to accommodate potential wage increases.
New funding for the Ministry of Health accounts for 68 per cent of the additional Consolidated Revenue Fund budget increases allocated in Budget 2008 over the next three years.
Budget 2008 provides additional funding of $2.0 billion to health authorities over the next 3 years, representing an average annual increase of 6 per cent. The financial forecast for health authorities has been developed by the Ministry of Health on an aggregate basis. Individual Health Authority budget allocations and Service Plans will be developed over the coming months and will be reflected in the updated fiscal plan in the first Quarterly Report.
Budget and Fiscal Plan – 2008/09 to 2010/11
57
Three-Year Fiscal Plan
Chart 2.5 Ministry of Health budget increases
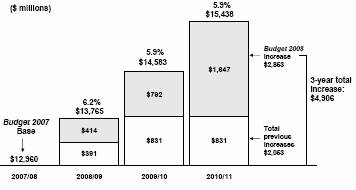
Funding for the Ministry of Health programs, including areas such as PharmaCare, Medical Services Programs and Emergency Health Services (including BC Ambulance Services) increases by $555 million over the next three years.
In total, funding to health authorities and ministry programs will rise to $15.4 billion by 2010/11. This funding will go towards maintaining core health services and government priorities, including new long-term care beds and community mental health services, and specific initiatives such as increased cataract procedures, improved access to services in Surrey, the opening of the Abbotsford Regional Hospital and Cancer Centre, and the introduction of the Human Papillomavirus (HPV) Vaccine immunization program to help protect women and girls from cervical cancer.
Based on feedback obtained during the Conversation on Health, government is implementing a broad package of changes impacting many areas of the system, including a range of legislative and regulatory initiatives, to improve health care for the long term with new emphasis on healthy lifestyles, prevention and accountability as highlighted in the Speech from the Throne. A Transformation Fund of $300 million over three years has been established in the ministry’s budget, that will be used to drive change in the health care system.
Budget 2008 also establishes a new Innovation and Integration Fund to assist health authorities in implementing best practices and in integrating and coordinating the delivery of health services, within a province wide patient centered funding model. The Contingencies (All Ministries) and New Programs vote includes an allocation of $50 million for the new funding in 2008/09 and $25 million in 2009/10.
Priority 2007/08 initiatives of $100 million will be focused on a range of important medical research initiatives in areas including cancer, neurological disease and intestinal and liver disorders in children as well as core promotional activities within the ActNow program in the Ministry of Tourism, Sport and the Arts.
Budget and Fiscal Plan – 2008/09 to 2010/11
58
Three-Year Fiscal Plan
Table 2.9 Enhancing Health Care
($ millions) | | 2007/08 | | 2008/09 | | 2009/10 | | 2010/11 | | Total | |
Operating | | | | | | | | | | | |
Services delivered by health authorities (including mental health) | | — | | 297 | | 588 | | 1,113 | | 1,998 | |
Ministry of Health programs | | — | | 17 | | 104 | | 434 | | 555 | |
Transformation Fund | | — | | 100 | | 100 | | 100 | | 300 | |
Neuroscience Research – UBC brain research centre | | 25 | | — | | — | | — | | 25 | |
Mental Illness – Coast Mental Health Foundation | | 1 | | — | | — | | — | | 1 | |
Paediatric oncology research | | 2 | | — | | — | | — | | 2 | |
Centre for Hip/Health and Musculoskeletal research | | 10 | | — | | — | | — | | 10 | |
Cancer research – Terry Fox Foundation | | 30 | | — | | — | | — | | 30 | |
Children with intestinal and liver disorders – CHILD Foundation | | 12 | | — | | — | | — | | 12 | |
Cancer research and care – Li Ka Shing Foundation | | 15 | | — | | — | | — | | 15 | |
Public health initiatives including heart health | | 5 | | — | | — | | — | | 5 | |
Subtotal operating | | 100 | | 414 | | 792 | | 1,647 | | 2,953 | |
Innovation and Integration Fund (to be funded from contingencies) | | — | | 50 | | 25 | | — | | 75 | |
Total operating | | 100 | | 464 | | 817 | | 1,647 | | 3,028 | |
Major Capital projects | | | | | | | | | | | |
Victoria Royal Jubilee Hospital inpatient facility | | 6 | | 83 | | 83 | | 10 | | 182 | |
Kelowna General Hospital Ambulatory Care Centre and EmergencyDepartment & Vernon Jubilee Hospital Diagnostic and Treatment Building | | 11 | | 37 | | 63 | | 71 | | 182 | |
Fort St. John replacement hospital | | — | | 8 | | 107 | | 64 | | 179 | |
Total capital | | 17 | | 128 | | 253 | | 145 | | 543 | |
In addition, government is supporting new health capital projects in Victoria, Kelowna, Vernon and Fort St. John with $543 million over 4 years beginning in 2007/08 for major health facilities expansions in those areas. As part of the Northern Cancer Control Strategy, government has committed to a new cancer centre in Prince George. Preliminary funding for the project is provided in the health capital plan. This allocation will be refined based on final project approval in the coming months. Government also intends to upgrade and expand BC Children’s Hospital facilities. Funding will be allocated from capital contingencies as the project scope and budget are defined.
Health spending by function includes all health care related spending by the Ministry of Health and other ministries, including Children and Family Development and Employment and Income Assistance, as well as other service delivery agencies such as Canadian Blood Services. Health spending by function, on a summary basis, increases to $14.8 billion in 2008/09, up from $9.4 billion in 2000/01, a 57 per cent increase.
Strengthening Social Services
Budget 2008 commits $438 million over four years on programs and services to enhance quality of life for British Columbians.
Included in the $438 million is $104 million of additional funding to reduce homelessness (see Table 2.11).
Budget 2008 builds on the successes of Budget 2007 with an additional $104 million over 4 years to implement new and expanded measures to help break the cycle of homelessness, including:
Budget and Fiscal Plan – 2008/09 to 2010/11
59
Three-Year Fiscal Plan
Table 2.10 Strengthening Social Services
($ millions) | | 2007/08 | | 2008/09 | | 2009/10 | | 2010/11 | | Total | |
Initiatives to reduce homelessness (see Table 2.11 for details) | | 3 | | 39 | | 31 | | 31 | | 104 | |
Improved call wait times for residential tenancy services | | — | | 2 | | 3 | | 3 | | 8 | |
Increasing childcare spaces and subsidies (federal funding) | | 33 | | 33 | | 34 | | 35 | | 135 | |
Supporting children and youth at risk and with special needs | | — | | 14 | | 14 | | 27 | | 55 | |
Strengthening Aboriginal child and family services | | — | | 5 | | 6 | | 6 | | 17 | |
Supporting persons with developmental disabilities | | — | | 8 | | 14 | | 20 | | 42 | |
Supplements for persons on income assistance | | — | | 10 | | 10 | | 11 | | 31 | |
Introducing a 211 service | | — | | 4 | | 1 | | 1 | | 6 | |
Action plan for positive aging | | — | | 5 | | 8 | | 10 | | 23 | |
Enhancing services to victims of crime and trauma | | — | | 5 | | 6 | | 6 | | 17 | |
Total | | 36 | | 125 | | 127 | | 150 | | 438 | |
· An additional $78 million over 4 years to allow emergency shelters to stay open 24 hours a day/seven days a week to provide on-going support to link people to existing community services, including more permanent types of housing. This is in addition to $27 million provided in Budget 2007 to convert 300 cold wet weather beds to year round shelter beds.
· An additional $2 million over 4 years is also provided for a new Aboriginal outreach component. More than 2,000 people on the street in about 40 communities across the province have found stable housing as a result of the $3 million outreach pilot project provided in Budget 2006. An additional $11 million is provided in Budget 2008 to make the pilot outreach project permanent as well as to expand homeless outreach services in 27 communities.
· A pilot program providing 315 rent supplements to assist homeless people find rental accommodation in the private market will be made permanent and an additional 750 additional rent supplements will be made available at a cost of $3 million over 4 years.
· To set the stage for faster delivery of additional, affordable and supportive housing, the province will provide one-time funding of $10 million in 2008/09 for pre-development costs, such as architectural, geotechnical and environmental plans and studies, to ensure city-owned sites will be ready to start construction within a year.
Table 2.11 Reducing Homelessness
($ millions) | | 2007/08 | | 2008/09 | | 2009/10 | | 2010/11 | | Total | |
Keeping emergency shelters open 24/7 | | 3 | | 25 | | 25 | | 25 | | 78 | |
Expanding homeless outreach services | | — | | 3 | | 5 | | 5 | | 13 | |
Additional homeless rent supplements | | — | | 1 | | 1 | | 1 | | 3 | |
Funding pre-development costs to fast-track construction of new supportive housing units | | — | | 10 | | — | | — | | 10 | |
Total | | 3 | | 39 | | 31 | | 31 | | 104 | |
Budget 2008 provides $8 million over 3 years for the Residential Tenancy Office to hire additional information and dispute resolution officers to improve client services and reduce call wait times and waits for dispute resolution hearings across the province.
Budget and Fiscal Plan – 2008/09 to 2010/11
60
Three-Year Fiscal Plan
In 2006/07, the federal government eliminated the Early Learning and Child Care Agreement which represented a loss of approximately $455 million in federal funding for BC between 2007/08 and 2009/10. In March 2007, the federal government agreed to provide funding to the provinces and territories to support the creation of child care spaces. Budget 2008 provides $135 million over four years for the creation of 2,000 additional child care spaces. This funding also provides for child care subsidy and operating funding to support the additional spaces.
Budget 2008 continues government’s commitment to enhancing the quality of life for children and their families. In Budget 2006, government invested $421 million between 2005/06 and 2008/09 on programs and services for children. In Budget 2007, $140 million was invested between 2006/07 and 2009/10 in programs and services to children and youth at risk or with special needs. Budget 2008 builds on this investment by providing $55 million over three years. This funding will support service providers in permanency planning for children-in-care and family supports and includes $20 million for new or continued access to services for children and youth with special needs.
Government is committed to ensuring culturally appropriate services for Aboriginal children at risk and their families. Budget 2008 provides a further $17 million over three years to support the delivery of services for Aboriginal children in care and building capacity within the Aboriginal community for child and family services.
Budget 2008 provides $42 million in programs and services to adults with developmental disabilities and their families. This funding will:
· assist service agencies in providing new or continued access to community living services including respite care, residential placements and life skills training;
· implement more manageable caseloads for staff that work with families and individuals; and
· provide an increased level of quality assurance in managing and monitoring services to adults, children and their families.
Budget 2008 includes an additional $31 million over 3 years to provide for increasing costs of and demand for supplementary benefits for persons and families on income assistance, including residential facilities, medical supplies and equipment and dental services provided under the Healthy Kids Program.
Budget 2008 provides $6 million to establish a provincial 211 service. This service will offer one-stop access to a wide range of community and social services and will provide families and individuals with referrals to basic human needs resources, such as income assistance, housing, and shelter support as well as connections to child care, literacy, and employment services.
Budget 2008 provides $23 million over three years to support the Positive Aging BC Action Plan. This plan is intended to provide a framework for action over the coming decade to support building systems of support for seniors.
Budget and Fiscal Plan – 2008/09 to 2010/11
61
Three-Year Fiscal Plan
Budget 2008 provides $17 million over three years for victims service programs to address caseload issues and introduce the Help Starts Here strategy, which addresses critical demand pressures in existing services for victims of crime and trauma and provides new service delivery approaches to address the unique needs of Aboriginal peoples, women, children, and at-risk populations. This funding will:
· support service transformation following best practice models to increase program effectiveness;
· increase services such as outreach programs for victims and support of victims of violent crime during court cases; and
· develop and implement strategies to address human trafficking into and within BC.
Justice and Public Safety
Budget 2008 invests $329 million over four years including $165 million to improve safety and maintain critical services in the justice sector and $164 million to increase physical capacity in BC correctional centres.
Table 2.12 Justice and Public Safety
($ millions) | | 2007/08 | | 2008/09 | | 2009/10 | | 2010/11 | | Total | |
Operating | | | | | | | | | | | |
Vancouver Community Court Pilot | | — | | 4 | | 4 | | 5 | | 13 | |
Maintaining courthouses | | — | | 6 | | 7 | | 7 | | 20 | |
Meeting justice sector compensation obligations | | 2 | | 12 | | 13 | | 20 | | 47 | |
Improving safety in BC correctional centres | | 14 | | 15 | | 17 | | 17 | | 63 | |
Increasing community safety through sharing traffic fine revenue | | — | | 5 | | 5 | | 6 | | 16 | |
Implementation of Ombudsman’s recommendations on gaming | | — | | 2 | | 2 | | 2 | | 6 | |
Total operating | | 16 | | 44 | | 48 | | 57 | | 165 | |
Capital | | | | | | | | | | | |
Increasing capacity in BC correctional centres | | 7 | | 22 | | 79 | | 56 | | 164 | |
ICBC | | | | | | | | | | | |
Improvements to BC driver licences | | — | | 6 | | 7 | | 7 | | 20 | |
With the Downtown Vancouver Community Court scheduled to begin operations in 2008, Budget 2008 provides $13 million to fund this innovative pilot project for a three year period. The project will coordinate justice, health and social services as part of an integrated solution to address the underlying causes of crime in downtown Vancouver.
Budget 2008 provides $20 million over three years to maintain courthouses, develop key information technology systems to support ministry operations, and provide administrative support to the Superior Courts Judiciary.
Budget 2008 provides $47 million over four years to fund compensation increases recommended by two independent judicial compensation commissions for judges, masters and judicial justices of the peace and to fund compensation increases contained in the 2007 Crown Counsel Association Agreement for Crown counsel, legal counsel and officers.
Budget and Fiscal Plan – 2008/09 to 2010/11
62
Three-Year Fiscal Plan
An additional $63 million is provided for enhanced safety initiatives within correctional centres and new transitional accommodation options for Aboriginal offenders. This funding will provide for:
· over 120 additional staff in provincial correctional centres to reduce isolation, increase training, increase supervisory interaction with living unit correctional officers and increase staffing for off-site inmate escorts; and
· contracted accommodation and specialized resources, including staffing, meals, facilities and programs, to facilitate reintegration of Aboriginal offenders into their communities.
Budget 2008 also provides an additional $16 million for Traffic Fine Revenue Sharing, reflecting the government’s commitment to help local communities improve policing and public safety, and the Peace River Fair Share Agreement.
In response to the provincial Ombudsman’s recommendations on lottery retailers, Budget 2008 invests $6 million to implement all 27 of the recommendations for regulation and oversight of the BC Lottery Corporation’s activities to enhance registration, equipment and ticket certifications, audit and compliance functions and investigations.
In addition, Budget 2008 includes $20 million for service improvements and security enhancements to BC driver licences including improved processes, card security and facial recognition biometrics. These changes will be funded by the Insurance Corporation of BC to support both the implementation of the Canadian Driver Licensing Agreement, a cross-Canada agreement to enable the exchange of licencing and driver record information between provinces, and the enhanced driver licence pilot to test the drivers licence as an alternative to the passport for over land travel between BC and Washington.
Expenses Recovered from External Entities
Expenses recovered from external entities are expected to increase by $136 million in 2007/08 compared to the projection in the Budget 2008 Consultation Paper, primarily due to federal funding received for the Conservation Investments and Incentives Initiative Fund, additional healthcare cost recoveries from insurance and out-of-province claims.
For 2008/09 to 2010/11, annual recovery projections are $30 million, $22 million and $30 million higher, respectively, than the forecast incorporated into the Budget 2008 Consultation Paper, reflecting higher projected healthcare cost recoveries and additional federal funds for childcare and immigration programs. These increases will be partially offset by lower recovery of interest costs due to lower interest rate projections and reduced sinking fund earnings.
Service Delivery Agency Expenses
Service delivery agency net spending (i.e. expenses in excess of government transfers) is forecast to decrease by $212 million in 2007/08 and then increase by $71 million in 2008/09, $93 million in 2009/10 and $138 million in 2010/11 compared to the Budget 2008 Consultation Paper.
Budget and Fiscal Plan – 2008/09 to 2010/11
63
Three-Year Fiscal Plan
Projected net spending by school districts is up $24 million, $14 million and $42 million in 2007/08 to 2009/10 respectively. The increase in spending in 2007/08 relates to higher forecasted salary costs due to updated staffing level information and the increases in 2008/09 and 2009/10 are due to increased operating cost forecasts. In Budget 2008, the net spending of school districts is expected to be consistent with prior years.
Projected net spending by universities and colleges is down $96 million in 2007/08 due to additional post-secondary funding grants relating to climate change initiatives and additional funding for medical research projects. The additional grants are funded through Supplementary Estimates. Projected net spending by universities and colleges is down $16 million and $10 million in 2008/09 and 2009/10 respectively due to updated forecasts for research spending.
In Budget 2008, the net spending of universities and colleges is expected to increase by $111 million between 2009/10 and 2010/11 mainly due to spending increases for faculty, research programs and operating costs partially funded through increases in own-source revenues.
Projected net spending by health authorities and hospital societies is down $32 million in 2007/08, relatively unchanged for 2008/09 and 2009/10, and then up $37 million in 2010/11 compared to the Budget 2008 Consultation Paper. The decrease in 2007/08 reflects additional grants received to fund health priority initiatives such as 5,000 beds, reduced wait times, health human resource strategies, and health innovation initiatives.
The 2007/08 forecast update reflects updated projections from health authorities and hospital societies. The combined health authority/hospital society projected deficit for 2007/08 is $39 million – down $16 million from the $55 million deficit forecast in the Budget 2008 Consultation Paper (down $80 million from the $119 million deficit forecast in Budget 2007), due primarily to revenue growth from one-time sources. The projections for 2008/09 to 2010/11 have assumed a balanced budget.
Revenue
Government revenue includes the combined revenues of the CRF, taxpayer-supported Crown agencies, the SUCH sector, and the net income of commercial Crown corporations. In Budget 2008, government is introducing a carbon tax based on GHG emissions from fossil fuel combustion effective July 1, 2008, and is committed to recycle all amounts collected back to British Columbians through cuts to personal income, corporate income and other tax sources. Other tax measures implemented in Budget 2008 totaling $505 million over the fiscal plan are in addition to almost $2.5 billion announced in Budget 2007. For more details on tax initiatives, see Part 3: Tax Measures.
Budget 2008 Plan
Following growth of 7.0 per cent in 2006/07, revenue is forecast to total $39.4 billion in 2007/08, up 2.3 per cent. The 2007/08 revised forecast incorporates the effects of 5.6 per cent nominal GDP growth on taxation revenue (up 6.4 per cent); and higher ICBC net income resulting from the disposition of Surrey Central City Mall and lower claims costs. These
Budget and Fiscal Plan – 2008/09 to 2010/11
64
Three-Year Fiscal Plan
Table 2.13 Budget 2008 Tax Measures – 2007/08 to 2010/11 |
($ millions) | | 2007/08 | | 2008/09 | | 2009/10 | | 2010/11 | | Total | |
Carbon tax | | — | | 338 | | 631 | | 880 | | 1,849 | |
Recycled carbon tax | | | | | | | | | | | |
– Personal income tax | | — | | (217 | ) | (415 | ) | (547 | ) | (1,179 | ) |
– Corporate income tax | | — | | (121 | ) | (216 | ) | (333 | ) | (670 | ) |
Total recycling | | — | | (338 | ) | (631 | ) | (880 | ) | (1,849 | ) |
Other Tax Measures | | | | | | | | | | | |
Personal income | | (21 | ) | 6 | | 40 | | 40 | | 65 | |
Corporate income | | — | | (49 | ) | (49 | ) | (20 | ) | (118 | ) |
Social service | | — | | (26 | ) | (26 | ) | (18 | ) | (70 | ) |
Fuel | | — | | (3 | ) | (3 | ) | (3 | ) | (9 | ) |
Property | | (3 | ) | (12 | ) | (24 | ) | (24 | ) | (63 | ) |
Property transfer | | — | | (30 | ) | (30 | ) | (30 | ) | (90 | ) |
Corporation capital | | — | | (36 | ) | (74 | ) | (110 | ) | (220 | ) |
Total tax measures | | (24 | ) | (150 | ) | (166 | ) | (165 | ) | (505 | ) |
improvements are partially offset by the impacts of tax cuts introduced in Budget 2007; lower forests revenue resulting from the effects of a rising Canadian dollar and a weak US housing sector; and declining federal transfers.
In 2008/09, revenue is forecast to decline 2.3 per cent or $910 million, due to the effects on taxation and forests revenue from a slowing US economy; tax measures introduced in Budget 2007 and Budget 2008; and a further decline in federal transfers mainly related to one-time funding received in 2007/08.
Over the next two years as economic growth strengthens due in part to an improving US economic outlook, revenue is expected to average 3.9 per cent annual growth, rising $1.4 billion and $1.6 billion in 2009/10 and 2010/11, respectively.
Key assumptions and sensitivities relating to revenue are provided in Appendix Table A10. The major revenue components are:
Chart 2.6 Revenue forecast
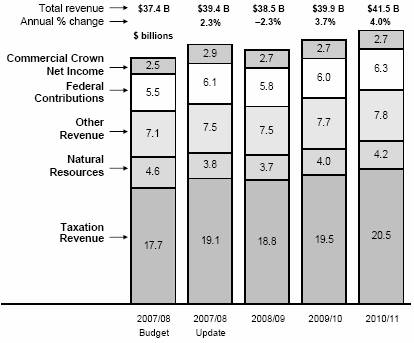
Budget and Fiscal Plan – 2008/09 to 2010/11
65
Three-Year Fiscal Plan
Table 2.14 Personal income tax revenue
($ millions) | | 2007/08 | | 2008/09 | | 2009/10 | | 2010/11 | |
Budget 2008 revenue | | 6,741 | | 6,700 | | 6,963 | | 7,302 | |
Budget 2008 measures: | | | | | | | | | |
– Recycling to individuals | | — | | 217 | | 415 | | 547 | |
– Other measures | | 21 | | (6 | ) | (40 | ) | (40 | ) |
Budget 2007 measures | | 321 | | 547 | | 575 | | 612 | |
Training tax credit | | 15 | | 15 | | 15 | | 15 | |
Federal government measure (income splitting) | | 40 | | 40 | | 40 | | 40 | |
Prior-year adjustment | | (42 | ) | — | | — | | — | |
Other one-time adjustments | | (15 | ) | — | | — | | — | |
Base personal income tax revenue | | 7,081 | | 7,513 | | 7,968 | | 8,476 | |
Annual growth | | 8.4 | % | 6.1 | % | 6.1 | % | 6.4 | % |
Personal income growth (calendar year) | | 5.3 | % | 4.4 | % | 4.2 | % | 4.5 | % |
Labour income growth
(calendar year) | | 6.0 | % | 4.7 | % | 4.7 | % | 4.8 | % |
· Personal income tax – down 0.6 per cent in 2008/09, and rising 3.9 per cent and 4.9 per cent over the next two years.
Over the four years, revenue includes the effects of $3.2 billion of tax reductions provided to BC residents in the 2007 and 2008 budgets – including an estimated $1,179 million of recycled carbon tax. Adding back the tax measures, base revenue is forecast to average 6.2 per cent annual growth over the next three years, consistent with Budget 2008 projections of personal and labor incomes.
· Corporate income tax – down $878 million in 2008/09 due to tax cuts implemented in Budget 2008 and abnormally high 2007/08 revenue mainly reflecting underpayments from the federal government in 2006. Revenue declines a further $218 million in 2009/10 due to overpayments from federal government in 2008 and additional tax reductions introduced in Budget 2008 associated with recycling carbon tax revenue.
In Budget 2008, the government has implemented corporate income tax reductions totaling $788 million including $670 million of recycled carbon tax cuts.
Table 2.15 Corporate income tax revenue
($ millions) | | 2007/08 | | 2008/09 | | 2009/10 | | 2010/11 | |
Advance instalments from the federal government: | | | | | | | | | |
– Payment share | | 10.2 | % | 10.0 | % | 9.6 | % | 9.4 | % |
Advances before measures | | 1,499 | | 1,550 | | 1,539 | | 1,596 | |
Budget 2008 measures: | | | | | | | | | |
– Recycling to corporations | | — | | (121 | ) | (216 | ) | (333 | ) |
– Other measures | | — | | (49 | ) | (49 | ) | (20 | ) |
International Financial Activity Act refunds | | (15 | ) | (25 | ) | (25 | ) | (25 | ) |
Prior-year adjustment | | 737 | | (12 | ) | (124 | ) | (25 | ) |
Corporate income tax revenue | | 2,221 | | 1,343 | | 1,125 | | 1,193 | |
Budget and Fiscal Plan – 2008/09 to 2010/11
66
Three-Year Fiscal Plan
· Social service tax – after incorporating measures introduced in Budget 2008, annual growth is forecast to average 4.8 per cent over the next three years, in line with expected consumer and business spending. For full details on tax initiatives, see Part 3: Tax Measures.
Table 2.16 Social service tax revenue
($ millions) | | 2007/08 | | 2008/09 | | 2009/10 | | 2010/11 | |
Budget 2008 revenue | | 5,091 | | 5,284 | | 5,563 | | 5,857 | |
Budget 2008 measures | | — | | 26 | | 26 | | 18 | |
Base revenue | | 5,091 | | 5,310 | | 5,589 | | 5,875 | |
Annual growth | | 8.0 | % | 4.3 | % | 5.3 | % | 5.1 | % |
| | | | | | | | | |
Annual per cent change (calendar year) | | | | | | | | | |
Personal consumption | | 6.2 | % | 5.0 | % | 5.2 | % | 5.2 | % |
Investment | | 9.3 | % | 5.4 | % | 6.9 | % | 6.6 | % |
Nominal GDP | | 5.6 | % | 4.2 | % | 5.3 | % | 5.0 | % |
· Property tax – including a new measure for major industrial property, revenue is expected to average 4.5 per cent growth annually over the three years, in line with expected inflation and new construction activity.
· Property transfer tax – including tax measures introduced in Budget 2008 targeted to first time homebuyers and moderation expected in the housing market (consistent with the outlook for BC housing starts), revenue declines an average of 3.4 per cent annually over the fiscal plan.
Chart 2.7 Property transfer tax
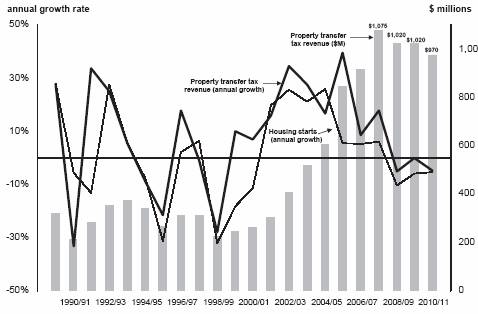
· Corporation capital tax – phased out over three years to help stimulate growth and competitiveness in the financial services sector by reducing tax rates by one-third in 2008/09, an additional one-third in 2009/10 and the final third effective April 1, 2010.
· Natural gas royalties – relatively flat growth in 2008/09 and 7.9 per cent average annual growth over the next two years reflects the impacts of expected changes in price, exchange rate and production volumes over the 2007/08 to 2010/11 period. The government continues to provide royalty programs and credits to encourage industry infrastructure investment that will generate oil and gas exploration and development. Robust sales of Crown land leases in 2007/08 indicate industry’s strong interest in
Budget and Fiscal Plan – 2008/09 to 2010/11
67
Three-Year Fiscal Plan
exploration and development in BC which could lead to higher future production. See Appendix Table A.11 for more details regarding natural gas price forecasts.
Chart 2.8 Natural gas

· Other – revenue from other energy, metals and minerals increases $25 million and $112 million in the first two years of the plan due to the effects of improving mine profitability and increasing coal and electricity prices. Revenue declines 3.9 per cent or $51 million in 2010/11 mainly due to falling coal and metal prices.
Chart 2.9 Revenue from energy metals and minerals

· Forests – From 2004/05 to 2007/08, stumpage revenue from Crown land harvests has declined 45 per cent due to the effects of a slowing US housing market, falling lumber prices, the mountain pine beetle infestation and a rising Canadian dollar.
The prevailing weak lumber prices and US housing market are expected to continue throughout 2008 resulting in a further stumpage revenue decline in 2008/09. As prices and markets recover beginning in 2009, stumpage
Budget and Fiscal Plan – 2008/09 to 2010/11
68
Three-Year Fiscal Plan
Chart 2.10 Crown harvest volume and lumber prices
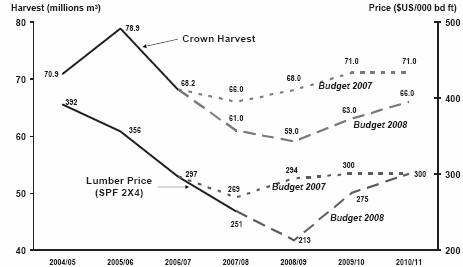
Sources
Ministry of Forests and Range: Crown harvest volumes by fiscal year
Madison’s Canadian Lumber Reporter: Western spruce, pine fir (SPF) 2x4 lumber prices by calender year.
revenue increases to $919 million by 2010/11, although still below levels recorded in the past three years.
Border tax revenue increases in 2007/08 due to the full-year impact of the Softwood Lumber Agreement 2006, effective October 2006 and declines in 2008/09 reflecting reduced lumber exports to the US in response to weak markets. The export border tax is assumed to be 15 per cent in 2007/08 and 2008/09 reflecting low lumber prices. Over the last two years of the fiscal plan, border tax revenue is expected to decline as the export tax rate falls to 5 per cent by 2010/11, consistent with the assumed recovery of lumber prices to US$300.
Chart 2.11 Forests revenue
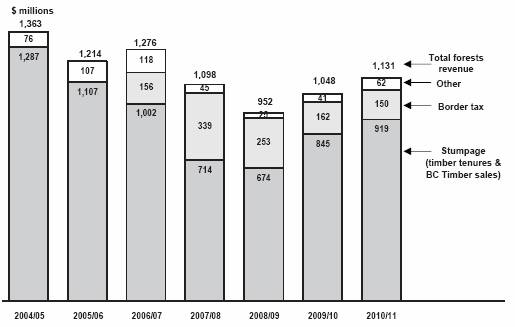
· Health and social transfers – growth is relatively flat in 2008/09 as the effects of increasing national bases and a higher BC population share are offset by declining deferred federal contributions (mainly 2004 Wait Time Trust) and the effect of $70 million prior-year adjustments recorded
Budget and Fiscal Plan – 2008/09 to 2010/11
69
Three-Year Fiscal Plan
in 2007/08. Over the next two years, revenue is expected to average 4.7 per cent annual growth, in line with federal commitments of annual increases for health and social programs of 6 per cent and 3 per cent, respectively.
Table 2.17 Health and social transfers
($ millions) | | 2007/08 | | 2008/09 | | 2009/10 | | 2010/11 | |
Canada Health Transfer (CHT) | | 3,057 | | 3,243 | | 3,444 | | 3,667 | |
Wait times | | — | | — | | 34 | | 34 | |
Health deferral | | 288 | | 144 | | 67 | | 52 | |
Canada Social Transfer (CST) | | 1,311 | | 1,407 | | 1,456 | | 1,507 | |
2007/08 Child care spaces funding (one time) | | 33 | | — | | — | | — | |
Prior-year adjustments | | 70 | | — | | — | | — | |
Total health and social transfers | | 4,759 | | 4,794 | | 5,001 | | 5,260 | |
Annual change | | 286 | | 35 | | 207 | | 259 | |
· Other federal contributions – the one-time ecoTrust ($199 million), the contribution to the Conservation Investments and Incentives Initiative fund ($30 million) and deferred revenue associated with mountain pine beetle ($33 million) recorded in 2007/08 contribute to the $292 million revenue decline in 2008/09. Over the last two years of the fiscal plan, other federal contributions are expected to be relatively flat.
Chart 2.12 Federal contributions

Commercial Crown Corporation Income
· British Columbia Hydro and Power Authority – BC Hydro’s net income projections for the Budget 2008 fiscal plan reflect increases in financing and operating costs resulting from additional borrowings needed to meet capital asset improvement programs and operating and maintenance requirements. These requirements are driven by the ageing infrastructure and the need for increased expenditures to address reliability issues, capacity constraints caused by demand load growth, and escalating construction costs.
· Energy costs are also expected to increase due largely to a greater proportion of energy requirements being met by energy purchases from new
Budget and Fiscal Plan – 2008/09 to 2010/11
70
Three-Year Fiscal Plan
sources of supply which cost more than energy from Heritage resources, and to an increase in the water rental rates paid on hydro generation.
While BC Hydro has incorporated rate increases into its projections, these rate increases are subject to review by the BC Utilities Commission through the revenue requirements application process. BC Hydro will be filing its Revenue Requirement Application for F2009 and F2010 in February 2008. Actual rate increases may vary and will be determined by the review process. Future rate assumptions for BC Hydro are disclosed in Appendix Table A10.
· British Columbia Liquor Distribution Branch (LDB) – LDB’s projections for the Budget 2008 fiscal plan reflects an increasing sales trend for spirits, imported wine and draught beer, and lower beverage container handling costs resulting from the devolution of the recycling program to the industry.
· British Columbia Lottery Corporation – BCLC’s projections for the Budget 2008 fiscal plan show continued strength in revenue from casinos and community gaming centres, partially offset by slower growth in lottery revenue, resulting in a projected increase in provincial income from $1,026 million in 2007/08 to $1,201 million in 2010/11.
A significant portion of provincial income from gaming is redistributed to charities and local governments. In Budget 2008, total distributions of gaming income are projected to increase from $253 million in 2007/08 to $281 million in 2010/11.
· British Columbia Railway Company – In its Budget 2008 outlook, BCRC anticipates the sales of residual properties will be completed by the end of 2009. BCRC will continue to operate the Port Subdivision (Robert’s Bank) as well as invest in the DeltaPort Berth 3 expansion project in support of government’s ports and gateway strategies.
· Insurance Corporation of British Columbia – ICBC’s premium revenue outlook for the Budget 2008 fiscal plan includes the full year impact of the 3.3 per cent rate increase on Basic insurance and a 3.8 per cent rate decrease on Optional insurance that came in effect on May 1, 2007, as well as strong vehicle growth. Projected claims costs reflect moderating claims trends and a slight increase in the discount rate used in calculating current value of outstanding claims. These improvements are partially offset by lower expected investment returns and higher projected operating costs, primarily resulting from road safety, climate action and other business initiatives.
Full-Time Equivalents (FTEs)
Taxpayer-supported FTEs, including ministries/special offices (CRF) and service delivery agencies, are projected at 36,095 in 2008/09. This represents an increase of 1,564 FTEs from 2007/08 and is 1,529 FTEs higher than the projection in Budget 2007. The increase reflects government’s priority to build internal capacity in a number of areas, including children at risk and healthcare as well as reflecting transit expansion.
By 2010/11, FTEs are projected to increase a further 449 to total 36,544 FTEs. Table 2.18 provides details of changes from Budget 2007. FTEs of the SUCH sector are not included in these forecasts.
Budget and Fiscal Plan – 2008/09 to 2010/11
71
Three-Year Fiscal Plan
Table 2.18 Full-Time Equivalents (FTEs) – Changes from Budget 2007
FTEs | | 2008/09 | | 2009/10 | | 2010/11 | |
Ministries and special offices (CRF): | | | | | | | |
Budget 2007 | | 30,581 | | 31,830 | | 31,830 | |
Changes: | | | | | | | |
Attorney General (courts services/enforcement) | | 92 | | — | | — | |
Children and Family Development (governance/children with special needs) | | 261 | | — | | — | |
Health (pharmacare/health line services/stewardship) | | 382 | | 133 | | 278 | |
Labour and Citizen’s Services (alternative service delivery/policy and research) | | 119 | | — | | — | |
Public Safety and Solicitor General (corrections/policing and community safety) | | 171 | | — | | — | |
Other ministry changes | | 224 | | 71 | | 71 | |
| | 1,249 | | 204 | | 349 | |
Budget 2008 Updated Fiscal Plan | | 31,830 | | 32,034 | | 32,179 | |
| | | | | | | |
Service delivery agencies (1): | | | | | | | |
Budget 2007 | | 3,985 | | 3,990 | | 3,990 | |
Changes: | | | | | | | |
BC Housing Management Commission – SRO housing management requirements | | 76 | | 85 | | 85 | |
BC Transit - impact of transit expansion | | 144 | | 194 | | 226 | |
Children and family development agencies – program increases | | 27 | | 27 | | 28 | |
Other changes (net) | | 33 | | 29 | | 36 | |
| | 280 | | 335 | | 375 | |
Budget 2008 Updated Fiscal Plan | | 4,265 | | 4,325 | | 4,365 | |
| | | | | | | |
Summary: | | | | | | | |
Ministries and special offices (CRF) | | 31,830 | | 32,034 | | 32,179 | |
Service delivery agencies | | 4,265 | | 4,325 | | 4,365 | |
Budget 2008 Updated Fiscal Plan | | 36,095 | | 36,359 | | 36,544 | |
(1) Service delivery agency FTE amounts do not include SUCH sector staff employment. | |
Ministries/special offices (CRF)
The 2008/09 FTEs projection for ministries and special offices is 31,830 – a net increase of 1,249 FTEs from Budget 2007. The increase primarily reflects government’s priority to build internal capacity in a number of areas, including additional resources for children at risk or with special needs, additional court enforcement, healthcare, and corrections requirements.
Service delivery agencies
The 2008/09 service delivery agencies FTE projection is 4,265 – an increase of 280 FTEs from Budget 2007. The increase is primarily due to the requirements for expanded transit service that is part of the provincial government’s climate action plan. Other increases include additional staff to manage the single room occupancy accommodations purchased by government in support of low income housing, and program increases for children and family development agencies (see Table 2.18). By 2010/11, service delivery agency FTEs are projected to increase to 4,365, mainly reflecting further transit expansion.
Capital Spending (1)
In addition to funding municipal and regional infrastructure delivered by local governments, the province also invests directly in capital infrastructure
(1) Capital investments are not included in the government’s annual surplus or deficit. In accordance with generally accepted accounting principles (GAAP), annual amortization expenses that recognize the estimated wear and tear of capital assets during the fiscal year are included in the government’s annual expenses instead of recording the full capital costs as they occur.
Budget and Fiscal Plan – 2008/09 to 2010/11
72
Three-Year Fiscal Plan
Table 2.19 Capital Spending
| | 2007/08 | | Budget | | | | | |
| | Budget | | Updated | | Estimate | | Plan | | Plan | |
($ millions) | | | Forecast | | 2008/09 | | 2009/10 | | 2010/11 | |
Taxpayer-supported | | | | | | | | | | | |
Education | | | | | | | | | | | |
Schools (K–12) | | 365 | | 426 | | 441 | | 441 | | 438 | |
Post-secondary | | 857 | | 870 | | 706 | | 578 | | 451 | |
Health | | 819 | | 973 | | 924 | | 946 | | 881 | |
BC Transportation Financing Authority | | 922 | | 1,063 | | 884 | | 639 | | 665 | |
BC Transit | | 44 | | 49 | | 74 | | 175 | | 110 | |
Vancouver Convention Centre expansion project | | 206 | | 261 | | 288 | | 37 | | — | |
Government operating (ministries) | | 325 | | 325 | | 286 | | 336 | | 317 | |
Other (1) | | 31 | | 77 | | 56 | | 43 | | 39 | |
Capital spending contingencies | | 295 | | 105 | | 200 | | 175 | | 150 | |
Total taxpayer-supported | | 3,864 | | 4,149 | | 3,859 | | 3,370 | | 3,051 | |
Self-supported | | | | | | | | | | | |
BC Hydro | | 995 | | 1,109 | | 1,663 | | 1,744 | | 1,921 | |
BC Transmission Corporation | | 68 | | 82 | | 21 | | 22 | | 10 | |
Columbia River power projects (2) | | 30 | | 28 | | 19 | | 154 | | 234 | |
BC Rail | | 66 | | 21 | | 30 | | 9 | | 12 | |
ICBC (3) | | 30 | | 24 | | 30 | | 45 | | 55 | |
BC Lotteries | | 85 | | 94 | | 124 | | 116 | | 117 | |
Liquor Distribution Branch | | 18 | | 18 | | 20 | | 19 | | 40 | |
Total self-supported commercial | | 1,292 | | 1,376 | | 1,907 | | 2,109 | | 2,389 | |
Total capital spending | | 5,156 | | 5,525 | | 5,766 | | 5,479 | | 5,440 | |
(1) Includes BC Housing Management Commission, Provincial Rental Housing Corporation and other service delivery agencies. |
|
(2) Joint ventures of the Columbia Power Corporation and Columbia Basin Trust. |
|
(3) Includes ICBC Properties Ltd. |
to provide services to the public and facilitate economic development. Provincial capital infrastructure investments are made through school districts, health authorities, post-secondary institutions, Crown agencies and ministries.
The rising infrastructure demands of a growing economy coupled with inflationary pressures on existing capital projects requires government to be diligent in ensuring that capital and debt are affordable over the long term. To achieve this, government is committed to maintain a downward trend in the taxpayer-supported debt to GDP ratio, using a three-year moving average. This ratio is a key measure often used by financial analysts and investors to assess a province’s ability to repay debt.
Additional information on the provincial capital plan and debt management is provided in the topic box on page 88.
Taxpayer-supported capital spending
Taxpayer-supported capital spending includes capital infrastructure for school districts, health authorities, post-secondary institutions, taxpayer-supported Crown agencies, and ministries.
Taxpayer-supported capital spending is projected at $3.9 billion in 2008/09, declining to $3.1 billion by 2010/11. Significant elements of this projected spending include the following:
· Continued management of the $1.5 billion program to seismically upgrade at-risk schools, as well as the ongoing rehabilitation of schools throughout the province. The province is providing $915 million in capital funding
Budget and Fiscal Plan – 2008/09 to 2010/11
73
Three-Year Fiscal Plan
from 2008/09 to 2010/11 to replace, renovate or expand K–12 facilities. Projects funded include Mission Hills Elementary in Kelowna, Duchess Park Secondary in Prince George, and Clayton Centre Area Elementary in Surrey.
· Budget 2008 includes $600 million in capital funding to post-secondary institutions throughout the province. Projects funded include the Arts and Science Building at UBC Okanagan, the UVIC Science building, the renovation and redevelopment of existing space at the Abbotsford campus of UCFV, upgraded trades training facilities at the College of New Caledonia, and places to support Aboriginal learners on campuses at post secondary institutions throughout the province.
· Post-secondary capital spending also includes a significant level of investment funded through other sources, including foundations, donations, cash balances, federal funding and revenues generated from services. Examples of projects financed wholly or partially through such sources include Marine Drive student housing at UBC, the Arts and Social Sciences Complex at SFU, and various parking structures and student residences planned at various campuses throughout the province.
· The Ministry of Health will also provide almost $1.2 billion in capital grants to health authorities for new major construction and upgrading of health facilities, equipment, and information systems over the next three years. Including funding from own sources, such as Regional Hospital Districts and Foundations, this will support a total capital spending plan for the health sector of approximately $2.7 billion over the next three years.
Examples of major capital projects include:
· Construction of a new ambulatory care facility in Surrey, the Surrey Outpatient Facility.
· Royal Jubilee Hospital inpatient facility in Victoria.
· Fort St John Hospital replacement.
· Kelowna General Hospital Ambulatory Care Centre and Emergency Department.
· Vernon Jubilee Hospital Diagnostic and Treatment Building.
· A new cancer centre in Prince George as part of the Northern Cancer Control Strategy.
· Residential care and Assisted Living projects to support seniors and people with disabilities throughout the province.
· New academic space in teaching hospitals throughout BC, including Prince George Regional Hospital, and planning is underway at Kelowna General Hospital to support medical school expansion.
· Abbotsford Regional Hospital and Cancer Centre P3 Project.
· Investments in new and replacement medical and diagnostic equipment such as MRI and CT scanners.
· Information management and technology projects including, for example, diagnostic imaging systems and clinical information systems.
· Province-wide eHealth initiatives.
Budget and Fiscal Plan – 2008/09 to 2010/11
74
Three-Year Fiscal Plan
Government also intends to upgrade and expand BC Children’s Hospital facilities. Funding will be allocated from capital contingencies as the project scope and budget are defined.
· Ongoing commitment to the provincial transportation investments (see page 56 for more information) which will provide $2.9 billion of public and private sector investment over the next three years. Under the plan, provincial capital spending for 2008/09 to 2010/11 is directed towards initiatives such as the new Pitt River Bridge component of the Gateway Project, Sea-to-Sky Highway improvements, the William R. Bennett Bridge, the Cariboo connector program, funding to support road rehabilitation benefiting the oil and gas sector and additional road rehabilitation to manage the impacts of intense harvesting required under the Mountain Pine Beetle Strategy.
· Commitments to the Provincial Transit Plan, building on exiting investments in transit vehicles and projects throughout the province. See page 56 for more information on the Provincial Transit Plan.
· The Vancouver Convention Centre Expansion Project (VCCEP). Capital spending for VCCEP on Table 2.19 is based on the total capital cost of the VCCEP, reflecting the funding provided by all partners; the province, the federal government, and Tourism Vancouver. Table 2.6 provides the timing and amount of provincial funding grants provided to the VCCEP. These grants are eliminated in the summary financial statements, so that only the total capital expenditures of the VCCEP are reported in the government financial statements.
· The capital plan also includes $164 million to increase physical capacity in BC correctional centres.
Capital Contingencies
Recognizing that rising construction costs remain a concern, the province has included a capital contingency in its three-year capital plan as a prudent planning measure. This contingency is in addition to the contingencies included in individual project budgets.
In addition to covering risks from higher than expected cost inflation on projects, the capital contingency will be used to fund emerging government priorities such as the upgrade and expansion of BC Children’s Hospital, the revitalization of Robson Square, eHealth projects and energy conservation upgrades to existing facilities.
Should the capital contingency not be used in any year, taxpayer-supported debt would be lower.
Financing Capital Projects
Provincial capital infrastructure spending is financed through a combination of sources:
· cash balances;
· partnerships with the private sector (public-private partnerships);
Budget and Fiscal Plan – 2008/09 to 2010/11
75
Three-Year Fiscal Plan
Chart 2.13 Capital financed through debt
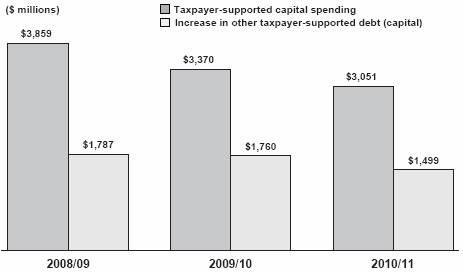
· cost-sharing with partners; and
· borrowing (debt financing).
Debt financing continues to represent a significant source of financing for provincial capital spending, so the level of capital spending has a significant impact on projected provincial debt.
Self-supported capital spending
Total capital spending includes capital infrastructure for self-supported commercial Crown corporations.
Self-supported capital spending is projected to increase from $1.9 billion in 2008/09 to $2.4 billion in 2010/11. The majority of this capital spending is for electrical generation, transmission and distribution projects carried out through BC Hydro to enhance reliability, public safety and growing demand. In addition to the projects shown on Table 2.20, other examples of electrical generation, transmission and distribution projects included in self-supported capital spending are the Mission-Matsqui Transmission Reinforcement Project, a new substation in Abbotsford, and upgrades to the GM Shrum generating station on the Peace River and the John Hart generating station on Vancouver Island.
Further details on provincial capital investments are shown in the service plans of ministries and Crown corporations.
Projects over $50 million
As required under the Budget Transparency and Accountability Act, major capital projects with multi-year budgets from provincial sources totaling $50 million or more are shown in Table 2.20. Annual allocations of the full budget for these projects are included as part of the provincial government’s capital investment spending shown in Table 2.19.
In addition to financing through provincial sources, major projects may be cost-shared with the federal government, municipalities and regional districts, and/or the private sector. Total capital spending for these major projects
Budget and Fiscal Plan – 2008/09 to 2010/11
76
Three-Year Fiscal Plan
Table 2.20 Capital Expenditure Projects Greater Than $50 million (1)
| | Projected | | Total Costs | | Projected | | Total | | Project Financing | |
| | Completion | | to | | Costs to | | Capital | | Internal/ | | Federal | | Other | |
($ millions) | | Date | | Dec. 31, 2007 | | Complete | | Costs | | Debt | | Government | | Contributions | |
Post secondary facilities | | | | | | | | | | | | | | | |
University of Victoria | | | | | | | | | | | | | | | |
– Science building | | Spring 2009 | | 18 | | 49 | | 67 | | 57 | | — | | 10 | |
University of British Columbia | | | | | | | | | | | | | | | |
– Marine Drive student housing | | Spring 2009 | | 87 | | 16 | | 103 | | 83 | | — | | 20 | |
Vancouver City College | | | | | | | | | | | | | | | |
– Broadway (King Edward) Campus expansion | | Winter 2008 | | 31 | | 25 | | 56 | | 53 | | — | | 3 | |
Total post-secondary facilities | | | | 136 | | 90 | | 226 | | 193 | | — | | 33 | |
Health facilities | | | | | | | | | | | | | | | |
Vancouver General Hospital redevelopment project | | Spring 2008 | | 155 | | 4 | | 159 | | 159 | | — | | — | |
Abbotsford Regional Hospital and Cancer Centre | | | | | | | | | | | | | | | |
– Government direct cost | | Summer 2008 | | 26 | | — | | 26 | | 26 | | — | | — | |
– P3 contract (2) | | Summer 2008 | | 367 | | 82 | | 449 | | 378 | | — | | 71 | |
Surrey Outpatient Facility (3) | | Spring 2010 | | 4 | | 194 | | 198 | | 198 | | — | | — | |
Victoria Royal Jubilee Hospital inpatient facility (3) | | Spring 2010 | | 4 | | 305 | | 309 | | 182 | | — | | 127 | |
Fort St. John Hospital replacement (3) | | Fall 2010 | | — | | 268 | | 268 | | 179 | | — | | 89 | |
Expansions to Kelowna General and Vernon Jubilee | | | | | | | | | | | | | | | |
Hospitals (3) | | Fall 2010 | | — | | 290 | | 290 | | 182 | | — | | 108 | |
Total health facilities | | | | 556 | | 1,143 | | 1,699 | | 1,304 | | — | | 395 | |
Transportation | | | | | | | | | | | | | | | |
Trans Canada Highway – 10 Mile (Park) Bridge | | | | | | | | | | | | | | | |
– Government direct cost | | Summer 2007 | | 61 | | 3 | | 64 | | 2 | | 62 | | — | |
– P3 contract (2) | | Summer 2007 | | 74 | | 5 | | 79 | | 79 | | — | | — | |
Pitt River Bridge | | Spring 2010 | | 72 | | 126 | | 198 | | 108 | | 90 | | — | |
Sea-to-Sky Highway | | | | | | | | | | | | | | | |
– Government direct cost | | Summer 2009 | | 158 | | 76 | | 234 | | 234 | | — | | — | |
– P3 contract (2) | | Summer 2009 | | 374 | | 187 | | 561 | | 561 | | — | | — | |
William R. Bennett Bridge (2) | | Summer 2008 | | 128 | | 57 | | 185 | | 185 | | — | | — | |
Total transportation | | | | 867 | | 454 | | 1,321 | | 1,169 | | 152 | | — | |
Power generation and transmission | | | | | | | | | | | | | | | |
BC Hydro | | | | | | | | | | | | | | | |
– Mica Dam – generator stator replacement | | Spring 2010 | | 51 | | 46 | | 97 | | 97 | | — | | — | |
– Peace Canyon Dam – generator stator replacement and rotor modification | | Fall 2009 | | 39 | | 47 | | 86 | | 86 | | — | | — | |
– Coquitlam Dam seismic upgrade | | Fall 2008 | | 56 | | 10 | | 66 | | 66 | | — | | — | |
– Aberfeldie redevelopment | | Fall 2008 | | 38 | | 57 | | 95 | | 95 | | — | | — | |
– GM Shrum G2–G4 stator replacement | | Summer 2010 | | 29 | | 46 | | 75 | | 75 | | — | | — | |
– Peace Canyon G1–G4 turbine overhaul | | Fall 2009 | | 20 | | 35 | | 55 | | 55 | | — | | — | |
– Revelstoke Unit 5 project (4) | | Fall 2011 | | 37 | | 313 | | 350 | | 350 | | — | | — | |
– Vancouver Island Transmission Reinforcement (5) | | Fall 2008 | | 83 | | 204 | | 287 | | 287 | | | | | |
– Mission and Matsqui Area Supply (6) | | Spring 2009 | | 30 | | 27 | | 57 | | 57 | | | | | |
BC Transmission Corporation | | | | | | | | | | | | | | | |
– System control centre modernization project | | Fall 2008 | | 110 | | 23 | | 133 | | 133 | | — | | — | |
Brilliant Expansion Power Corporation | | | | | | | | | | | | | | | |
– Brilliant Dam power expansion | | Summer 2007 | | 198 | | 7 | | 205 | | 205 | | — | | — | |
Total power generation and transmission | | | | 691 | | 815 | | 1,506 | | 1,506 | | — | | — | |
Other | | | | | | | | | | | | | | | |
Vancouver Convention Centre expansion project | | Summer 2009 | | 474 | | 409 | | 883 | | 541 | | 222 | | 120 | |
(1) | Only projects that have been approved by Treasury Board and/or Crown corporation boards are included in this table. Ministry service plans may include projects that still require final approval. Capital costs reflect current government accounting policy. |
| |
(2) | The following table shows the breakdown between capital and operating costs for each existing P3 contract as originally allocated and under new P3 accounting guidelines. See the Capital Financing and Debt Management topic box for further information. |
| | Total Original Allocation | | Total Current Allocation | |
| | Capital | | Operating | | Total | | Capital | | Operating | | Total | |
P3 Project | | Cost | | Expense | | Contract | | Cost | | Expense | | Contract | |
Abbotsford Regional Hospital and Cancer Centre | | 356 | | 1,326 | | 1,682 | | 449 | | 1,233 | | 1,682 | |
Trans Canada Highway – 10 Mile (Park) Bridge | | 66 | | 186 | | 252 | | 79 | | 173 | | 252 | |
Sea-to-Sky Highway | | 366 | | 1,247 | | 1,613 | | 561 | | 1,052 | | 1,613 | |
William R. Bennett Bridge | | 144 | | 442 | | 586 | | 185 | | 401 | | 586 | |
(3) | Figures shown for the Surrey, Victoria Royal Jubilee, Fort St. John, Kelowna General, and Vernon Jubilee hospital projects are based on preliminary Treasury Board approvals. These amounts will change after P3 contracts are finalized. |
| |
(4) | Total costs for Revelstoke Unit 5 range from $280 million to $350 million with forecast completion in 2010/11 or 2011/12, depending on final scope of the project. |
| |
(5) | Total costs for VITR have increased from $249 million to $287 million primarily as a result of cost escalation related to current market conditions in BC and in the utility industry, and due to higher legal and environmental expenses. |
| |
(6) | Total costs for the Mission Matsqui Area Supply project from $41 million to $57 million primarily as a result of changes in scope and cost escalation. |
Budget and Fiscal Plan – 2008/09 to 2010/11
77
Three-Year Fiscal Plan
is $5.3 billion, reflecting financing of $4.4 billion through internal sources or borrowing, $374 million from federal government contributions and $548 million from other sources including private donations. Major capital investments include:
· $226 million for post-secondary facilities including a new science building at the University of Victoria, student residences at UBC, and expansion of Vancouver City College’s Broadway (King Edward) Campus.
· $1.7 billion for health facilities including the Abbotsford Regional Hospital and Cancer Centre; the Surrey Outpatient Facility; expansions to the Victoria Royal Jubilee, Kelowna General and Vernon Jubilee hospitals, and replacement of the Fort St. John hospital.
· $1.3 billion for major transportation capital infrastructure. In addition, the Ministry of Transportation is investigating financial and project delivery options through P3s for improvements to Lower Mainland infrastructure. Provincial funding for the RAV project is not included in the province’s capital spending, but is included in the transportation investment plan.
· $1.2 billion for power generation and transmission capital projects by BC Hydro, BC Transmission Corporation and the Brilliant Expansion Power Corporation.
· $883 million for the Vancouver Convention Centre Expansion Project.
Provincial Debt
The provincial government along with its Crown corporations and agencies provide services and capital infrastructure to support the social and economic programs needed for maintaining and enhancing the quality of life in BC. Funding for these programs is mainly derived from revenue sources such as taxation and the sale of natural resources. Government also obtains financing from outside sources mainly through debt issuances that are to be repaid on future dates.
Borrowing for operations is required to finance deficits and to meet other working capital requirements such as loans and advances or changes in accounts receivable/payable. This type of debt (government direct operating debt) tends to rise during periods of deficits, but declines with surpluses. Government operating debt is forecast to decline by $1.8 billion over the next three years reflecting continuing surpluses.
Borrowing for capital projects finances the building of schools, hospitals, roads and other social and economic assets. As these investments provide essential services over several years, the government, like the private sector, borrows to fund these projects and amortizes the costs over the assets’ useful life.
In 2007/08, provincial debt is forecast to total $35.0 billion, $1.8 billion below budget. In 2008/09, provincial debt will increase $2.7 billion from the 2007/08 updated forecast to total $37.7 billion. The 2008/09 change reflects:
· a $949 million increase in taxpayer-supported debt reflecting a $1.8 billion increase in other taxpayer-supported debt mainly to finance net capital requirements, offset by a reduction in operating debt;
Budget and Fiscal Plan – 2008/09 to 2010/11
78
Three-Year Fiscal Plan
Table 2.21 Provincial Debt Summary (1), (2)
| | | | | | | | | | | |
| | 2007/08 | | Budget | | | |
| | Budget | | Updated | | Estimate | | Plan | | Plan | |
($ millions unless otherwise indicated) | | | Forecast | | 2008/09 | | 2009/10 | | 2010/11 | |
Taxpayer-supported debt | | | | | | | | | | | |
Provincial government direct operating debt | | 9,125 | | 8,246 | | 7,408 | | 6,880 | | 6,452 | |
Other taxpayer-supported debt (mainly capital) | | | | | | | | | | | |
Education (2) | | 8,399 | | 8,290 | | 8,755 | | 9,329 | | 9,782 | |
Health (2) | | 3,348 | | 3,380 | | 3,945 | | 4,479 | | 4,959 | |
Highways and public transit | | 6,202 | | 6,243 | | 6,916 | | 7,524 | | 8,048 | |
Other (3) | | 729 | | 633 | | 717 | | 761 | | 803 | |
Total other taxpayer-supported debt | | 18,678 | | 18,546 | | 20,333 | | 22,093 | | 23,592 | |
Total taxpayer-supported debt | | 27,803 | | 26,792 | | 27,741 | | 28,973 | | 30,044 | |
Self-supported commercial Crown corporations debt | | 8,284 | | 8,061 | | 9,250 | | 10,332 | | 11,754 | |
Total debt before forecast allowance | | 36,087 | | 34,853 | | 36,991 | | 39,305 | | 41,798 | |
Forecast allowance (4) | | 750 | | 150 | | 750 | | 675 | | 675 | |
Total provincial debt | | 36,837 | | 35,003 | | 37,741 | | 39,980 | | 42,473 | |
| | | | | | | | | | | |
Debt as a per cent of GDP | | | | | | | | | | | |
Provincial government direct operating | | 4.9 | % | 4.3 | % | 3.7 | % | 3.3 | % | 2.9 | % |
Taxpayer-supported | | 14.8 | % | 14.1 | % | 14.0 | % | 13.9 | % | 13.7 | % |
Total provincial | | 19.6 | % | 18.4 | % | 19.0 | % | 19.1 | % | 19.4 | % |
Taxpayer-supported debt per capita ($) | | 6,378 | | 6,117 | | 6,248 | | 6,441 | | 6,593 | |
Taxpayer-supported interest bite (cents per dollar of revenue) | | 4.7 | | 4.1 | | 4.5 | | 4.5 | | 4.6 | |
(1) | Debt is after deduction of sinking funds and unamortized discounts, and excludes accrued interest. Government direct and fiscal agency accrued interest is reported in the government’s accounts as an accounts payable. |
| |
(2) | Includes debt and guarantees incurred by the government on behalf of school districts, universities, colleges and health authorities/hospital societies (SUCH), and debt directly incurred by these entities. |
| |
(3) | Includes service delivery agencies, other fiscal agency loans, student assistance loan guarantees, loan guarantees to agricultural producers, guarantees issued under economic development and home mortgage assistance programs, and loan guarantee provisions. |
| |
(4) | Reflects the operating statement forecast allowance for each year (amounts are not cumulative). Since which agency would require this debt is unknown, the borrowing allowance is shown as a separate item over the plan. |
· a $1.2 billion increase in commercial Crown corporation debt, mainly to fund power generation and transmission capital projects by BC Hydro; and
· a $600 million increase in the forecast allowance to mirror the $750 million income statement forecast allowance.
Over the next two years, government direct operating debt is forecast to decrease $956 million reflecting continued surpluses, while other taxpayer-supported debt will increase $3.3 billion mainly to finance capital requirements.
Self-supported debt will increase $2.5 billion over 2009/10 and 2010/11, mainly to fund power generation and transmission projects which will refurbish aging infrastructure and expand capacity to support the province’s economic growth.
The debt forecast assumes a forecast allowance of $750 million in 2008/09, decreasing to $675 million in 2009/10 and 2010/11 to mirror the operating statement forecast allowance. Should the government not require this allowance, projected debt levels under the fiscal plan would be lower by the amount of the forecast allowance for each year.
Budget and Fiscal Plan – 2008/09 to 2010/11
79
Three-Year Fiscal Plan
In general, the change in debt will not equal the surplus:
· as debt is required to finance capital spending in excess of non-cash amortization costs included in the surplus; and
· due to other working capital sources/requirements that represent changes in balance sheet items (such as cash balances, loan receivables and other accounts receivables/payables), but do not form part of the surplus.
Table 2.22 Reconciliation of Summary Surpluses to Provincial Debt Changes
| | Updated | | Budget | | | | | |
| | Forecast | | Estimate | | Plan | | Plan | |
($ millions) | | 2007/08 | | 2008/09 | | 2009/10 | | 2010/11 | |
Operating statement surplus | | (1,970 | ) | (50 | ) | (150 | ) | (150 | ) |
Taxpayer-supported capital spending | | 4,149 | | 3,859 | | 3,370 | | 3,051 | |
Increase (reduction) in cash and temporary investments | | 1,102 | | (1,366 | ) | (480 | ) | (8 | ) |
Amortization (non-cash expense included in the surplus) | | (1,563 | ) | (1,781 | ) | (1,821 | ) | (1,910 | ) |
Net increase in commercial Crown corporations (mainly capital) | | 588 | | 1,189 | | 1,082 | | 1,422 | |
Other balance sheet and working capital changes | | (707 | ) | 887 | | 238 | | 88 | |
Total provincial debt increase (decrease) | | 1,599 | | 2,738 | | 2,239 | | 2,493 | |
Table 2.22 reconciles forecast surpluses with changes in debt. In the updated fiscal plan, debt rises despite expected surpluses mainly due to the impact of capital spending in excess of amortization, and higher commercial Crown corporation debt incurred for capital investments.
The ratio of taxpayer-supported debt, which excludes commercial Crown corporations and other self-supported debt, to GDP is a key measure often used by financial analysts and investors to assess a province’s ability to repay debt. The government is committed to maintaining a downward trend in this ratio, using a three-year moving average.
Table 2.23 Provincial Financing
| | Debt (1)
Outstanding
at March 31,
2007 | | | | Estimated
Debt (1)
Outstanding
at March 31, | | | | | | | | | |
| | | | | | | Estimated | |
| | | | | 2008/09 Transactions | | Debt (1) | |
| | | 2007/08
Debt
Change | | | New
Borrowing (2) | | Retirement
Provision (3) | | Net
Change | | Outstanding | |
| | | | | | | | at March 31, | |
($ millions) | | | | 2008 | | | | | 2009 | |
Taxpayer-supported debt | | | | | | | | | | | | | | | |
Provincial government direct operating | | 9,505 | | (1,259 | ) | 8,246 | | 1,271 | | (2,109 | ) | (838 | ) | 7,408 | |
Education (4) | | 7,633 | | 657 | | 8,290 | | 903 | | (438 | ) | 465 | | 8,755 | |
Health (4) | | 2,870 | | 510 | | 3,380 | | 832 | | (267 | ) | 565 | | 3,945 | |
Highways and public transit | | 5,378 | | 865 | | 6,243 | | 1,075 | | (402 | ) | 673 | | 6,916 | |
Other debt (5) | | 545 | | 88 | | 633 | | 104 | | (20 | ) | 84 | | 717 | |
Total taxpayer-supported debt | | 25,931 | | 861 | | 26,792 | | 4,185 | | (3,236 | ) | 949 | | 27,741 | |
Self-supported commercial Crown corporations debt | | 7,473 | | 588 | | 8,061 | | 837 | | 352 | | 1,189 | | 9,250 | |
|
Total self-supported debt | | 7,473 | | 588 | | 8,061 | | 837 | | 352 | | 1,189 | | 9,250 | |
Forecast allowance | | — | | 150 | | 150 | | 600 | | — | | 600 | | 750 | |
Total provincial debt | | 33,404 | | 1,599 | | 35,003 | | 5,622 | | (2,884 | ) | 2,738 | | 37,741 | |
| | | | | | | | | | | | | | | | | |
(1) | Debt is after deduction of sinking funds and unamortized discounts, and excludes accrued interest. Government direct and fiscal agency accrued interest is reported in the government’s accounts as an accounts payable. |
| |
(2) | New long-term borrowing plus net change in short-term debt. |
| |
(3) | Sinking fund contributions, sinking fund earnings and net maturities of long-term debt (after deduction of sinking fund balances for maturing issues). |
| |
(4) | Includes debt and guarantees incurred by the government on behalf of school districts, universities, colleges and health authorities/hospital societies (SUCH), and debt directly incurred by these entities. |
| |
(5) | Includes service delivery agencies, other fiscal agency loans, student assistance loans, loan guarantees to agricultural producers, guarantees issued under economic development and home mortgage assistance programs, and loan guarantee provisions. |
Budget and Fiscal Plan – 2008/09 to 2010/11
80
The taxpayer-supported debt to GDP ratio is forecast to decline from 14.0 per cent in 2008/09 to 13.9 per cent in 2009/10 and to 13.7 per cent in 2010/11, keeping debt affordable for future generations of British Columbians.
However, taxpayer-supported interest costs are expected to rise to 4.6 cents per dollar of revenue by 2010/11, due to higher interest rates and increased taxpayer-supported capital debt.
Table 2.23 summarizes the provincial financing plan for 2007/08.
New borrowing of $5.6 billion is anticipated, of which $2.9 billion will be used to replace maturing debt and $2.1 billion will be used for capital and other financing requirements. The remaining $0.6 billion reflects an increase in the debt forecast allowance.
Additional details on the debt outstanding for government, Crown corporations and service delivery agencies are provided in Appendix Tables A16 and A17.
Risks to the Fiscal Plan
The major risks to the fiscal plan stem mainly from changes in factors that government does not directly control. These include:
· Assumptions underlying revenue, commercial Crown corporation, and service delivery agency forecasts such as economic factors, commodity prices and weather conditions.
· The outcome of litigation, arbitrations, and negotiations with third parties.
· Potential changes to federal transfer allocations, cost-sharing agreements with the federal government and impacts on the provincial income tax bases arising from federal tax policy changes.
· Utilization rates for government services such as health care, children and family services, and employment assistance.
In addition, changes in accounting treatment or revised interpretations of generally accepted accounting principles (GAAP) could have material impacts on the bottom line.
Table 2.24 summarizes the approximate effect of changes in some of the key variables on the surplus. However, individual circumstances and inter-relationships between the variables may cause the actual variances to
Table 2.24 Key Fiscal Sensitivities
| | | | Annual Fiscal Impact | |
Variable | | Increases of: | | $ (millions) | |
Nominal GDP | | 1% | | $150 — $250 | |
Lumber prices (US$/thousand board feet) | | $50 | | $75 — $125 (1) | |
Natural gas prices (Cdn$/gigajoule) | | $1 | | $275 — $325 | |
US exchange rate (US cents/Cdn $) | | 1 cent | | -$25 to -$40 | |
Interest rates | | 1 percentage point | | -$90 | |
Debt | | $500 million | | -$23 | |
(1) Sensitivity relates to stumpage revenue only. Depending on market conditions, changes in stumpage revenues may be offset by changes in border tax revenues. |
Budget and Fiscal Plan – 2008/09 to 2010/11
81
be higher or lower than the estimates shown in the table. For example, an increase in the US/Cdn dollar exchange rate may be offset by higher commodity prices.
Forecast Allowance
In Budget 2008, the government continues its prudent approach of building forecast allowances into the bottom line to act as a cushion against possible deterioration in revenue or spending forecasts, and thus increase the certainty of meeting the surplus targets established in the fiscal plan.
Forecast allowances of $750 million in 2008/09, and $675 million in each of 2009/10 and 2010/11 are included the budget. The Budget Transparency and Accountability Act requires disclosure of such adjustments to the most likely fiscal result.
Corresponding borrowing forecast allowances have also been included in the provincial debt forecast for 2008/09 through 2010/11, increasing the total debt forecast compared to the most likely forecast.
Own Source Revenue
The main areas that may affect own source revenue forecasts are BC’s overall economic performance, the exchange rate and commodity prices.
Revenues are sensitive to economic performance. For example, taxation and other revenue sources are driven by economic factors such as personal income, retail sales, population growth and the exchange rate. The revenue forecast contained in the fiscal plan is based on the economic forecast detailed in Part 4: British Columbia Economic Review and Outlook.
Revenues in British Columbia are also volatile, largely due to the influence of the cyclical natural resource sector in the economy and the importance of natural resource revenues in the province’s revenue base. Spikes in commodity prices such as natural gas, or low lumber prices (as are currently being experienced) may have a positive or negative effect on natural resource revenues in the near term, until supply/demand imbalances level out.
Income tax revenues can be affected by timing lags in reporting current and prior years tax assessments by the Canada Revenue Agency.
Federal Government Contributions
Potential policy changes regarding federal transfer allocations and cost-sharing agreements could also affect the revenue forecast. However, due to insufficient information on specific proposals, it is speculative to estimate the fiscal impact with any degree of certainty. As a result, the fiscal plan includes only those commitments made to the Province by the federal government.
In particular, the federal government recently announced a $1 billion dollar Community Development Trust, of which BC’s estimated per capita share is $129 million; however, neither revenue nor associated spending plans have been reflected in Budget 2008. Revenue has not been included in the budget as the accounting treatment of these funds has not yet been finalized.
82
Three-Year Fiscal Plan
Spending plans will be prepared based on community needs and in line with the purposes of the trust. An update on the impacts of this trust will be reflected as part of the first Quarterly Report for 2008/09.
Budget 2008 does not include any federal funding or associated spending in respect of labour market agreements currently being negotiated with the federal government.
Details on major assumptions and sensitivities resulting from changes to those assumptions are outlined in Appendix Table A10.
Commercial Crown Corporations
Crown corporations and agencies have provided their own forecasts. These forecasts, as well as their statements of assumptions were used to prepare the fiscal plan. The boards of those corporations and agencies have also included these forecasts, along with further details on assumptions and risks, in the service plans being released with the budget.
The fiscal plan does not assume or make allowance for extraordinary adjustments other than those noted in the assumptions provided by the Crown corporations and agencies. Factors such as electricity prices, water inflows into the BC Hydro system, accident trends, interest/exchange rates, decisions of an independent regulator, or pending litigation could significantly change actual financial results over the forecast period. BC Hydro’s and ICBC’s results may be affected by the outcome of BC Utilities Commission decisions on current and future rate applications.
New decisions or directions by Crown corporation boards of directors may result in changes to costs and revenues due to restructuring, valuation allowances and asset write-downs, or gains and losses on disposals of businesses or assets.
SUCH Sector
Three-year aggregate financial plans for the SUCH sector have been developed by the Ministries of Health, Education and Advanced Education based on broad policy assumptions and the funding for SUCH sector organizations included in the respective ministry budgets. Since these are aggregate plans, they have not been signed off by the boards of the health authorities, universities and colleges or school districts.
Due to the on-going work stemming from the Conversation on Health, including new legislation and other policy changes, government has not communicated funding decisions to health authorities in advance of this years’ budget. Similarly, government is assessing progress against its plan to increase access to post secondary education, particularly given the significant challenges with labour and skills shortages. As a result, funding information was not provided to universities and colleges prior to budget.
Final financial plans, based on government funding to be communicated after budget, are still subject to formal approval of the respective boards. Final approved plans may, therefore, differ from the ministry developed forecasts included in the budget.
Budget and Fiscal Plan – 2008/09 to 2010/11
83
Three-Year Fiscal Plan
Spending
The spending forecast contained in the fiscal plan is based on ministry and taxpayer-supported Crown corporation and agency spending plans and strategies. Details on major assumptions and sensitivities resulting from changes to those assumptions are shown in Appendix Table A12 and in ministry service plans. The main spending issues follow.
Compensation
Many of the wage agreements reached in the last round of public sector negotiations expire by the end of 2009/10. In 2010/11, Ministry of Health funding growth is maintained at the same rate as for the previous year to accommodate wage increases in that sector, and an increased contingency vote allocation has been provided for other sectors.
Contingency Vote
Contingencies
A Contingency vote of $375 million is included in 2008/09, rising to $390 million in 2009/10 and $400 million in 2010/11. These contingencies represent roughly 1 per cent of overall government expense.
Table 2.25 Notional Allocations to Contingencies
($ millions) | | 2008/09 | | 2009/10 | | 2010/11 | |
Innovation and Integration Fund | | 50 | | 25 | | — | |
Climate Action | | 23 | | 20 | | 19 | |
2010 Olympics – preliminary allocation of contingency amount | | 20 | | 49 | | 10 | |
Subtotal notional allocations | | 93 | | 94 | | 29 | |
Unallocated contingencies | | 282 | | 296 | | 371 | |
Total contingencies before compensation | | 375 | | 390 | | 400 | |
2010/11 compensation contingencies | | — | | — | | 400 | |
Total contingencies | | 375 | | 390 | | 800 | |
The contingency amounts provide $75 million for the Innovation and Integration Fund. This fund will assist health authorities in implementing best practices and in integrating and coordinating the delivery of health services.
The work of the Climate Action Secretariat and the Climate Action Team is in its initial stages, and the Citizen’s Conservation Council has yet to be established. These groups, as well as other entities in government, could propose additional initiatives worth pursuing and therefore an allocation of $62 million over three years has been provided for within the contingencies vote.
The contingency amounts also include the remaining $79 million contingency that is earmarked to help address cost uncertainties in areas related to staging and hosting the 2010 Winter Olympic and Paralympic Games (2010 Winter Games), including security. Both the Province and Canada are continuing to review the various planning assumptions to be used in finalizing the security budget for the 2010 Winter Games. However, the level of security resources
Budget and Fiscal Plan – 2008/09 to 2010/11
84
Three-Year Fiscal Plan
ultimately committed will depend on various factors, including broader domestic and international conditions leading up to and during the 2010 Winter Games. As such, the security area will continue to represent a risk requiring close monitoring and attention.
The allocation to contingencies is a prudent budgeting measure that protects the three-year fiscal plan from:
• unforeseen and unbudgeted costs that may arise; and
• pressures for costs that are currently budgeted based on estimates whose final value are impacted by external events or prices.
Contingencies – Compensation
Budget 2008 includes $400 million in 2010/11 for the next round of wage and benefit contract negotiations.
Public Sector Program Delivery
The vast majority of government-funded services are delivered through third party delivery agencies that provide programs such as acute and continuing health care, K–12 education, post-secondary education, and community social services. All of these sectors face cost pressures in the form of program demand and non-wage inflation. The government also funds a number of demand-driven programs such as PharmaCare,
K–12 education, student financial assistance and income assistance. The budgets for these programs reflect the best estimates of demand and other factors such as price inflation. If demand is higher than estimated, this will result in a spending pressure to be managed.
Treaty Negotiations and the New Relationship
The provincial government is committed to building a new relationship with First Nations and Aboriginal people based on mutual respect, recognition, and reconciliation of Aboriginal rights and title. The vision for the New Relationship was established in 2005 and government continues to partner with Aboriginal leadership to develop new means and structures that promote co-operation and workable arrangements with a goal of closing the gap that exists between Aboriginals and other British Columbians.
Government remains committed to negotiating treaties which provide certainty regarding ownership and use of provincial Crown land and resources. In November 2007, legislation to establish the first two treaty Final Agreements under the BC Treaty Commission process, with the Maa-nulth and Tsawwassen First Nations, received Royal Assent in the British Columbia legislature. Both Final Agreements have been ratified by the respective First Nations and now require signing and legislative approval by the federal Parliament before taking effect. Implementation and settlement costs associated with the two Final Agreements have been accounted for in the fiscal plan. Government continues to negotiate treaties and their impact on the fiscal plan will depend on the outcome of negotiations.
Budget and Fiscal Plan – 2008/09 to 2010/11
85
Three-Year Fiscal Plan
Government is also considering new types of lasting agreements between the province and First Nations that provide land and resources to support the immediate social and economic needs of Aboriginal communities. The nature of these new agreements is evolving and will likely have associated costs that impact the fiscal plan.
The province is involved in litigation with First Nations relating to aboriginal rights. Settlement of these issues, either in or out of court, may result in additional costs to government.
Capital Risks
The capital spending forecasts assumed in the fiscal plan may be affected by a number of the various factors listed below:
· weather and geotechnical conditions causing project delays or unusual costs;
· changes in market conditions, including service demand, inflation and borrowing costs;
· the outcome of environmental impact studies;
· the accuracy of capital project forecasts;
· the successful negotiation of cost-sharing agreements with other jurisdictions;
· the application/interpretation of accounting treatments;
· the success of public-private sector partnership negotiations; and
· rising building material costs and upward pressure on wages stemming from shortages of skilled workers.
Unfunded Liabilities
The Public Service, Teachers, College and Municipal Pension Plans – the four major public service plans – are joint trusteeship plans. Actuarial evaluations are conducted on each plan every three years, and a report is received within one year of the evaluation. In the event that the actuarial evaluation indicates a plan deficit, the pension boards are required to address the shortfall by contribution adjustments or other means.
· The most recent actuarial valuation report for the Public Service Pension Plan as of March 31, 2005 indicated a $767 million liability. Contribution rate increases of 1.88 per cent for both members and employers were required effective April 1, 2006 to address the deficit.
· The most recent actuarial valuation report for the Teachers’ Pension Plan as of December 31, 2005 indicated a $904 million liability. Contribution rate increases of 1.61 per cent for both members and employers were required effective July 1, 2007.
· The most recent actuarial valuation report for the College Pension Plan as of August 31, 2006 indicated a $54 million liability. Contribution rate increases of 0.51 per cent for both members and employers were required effective September 1, 2007.
Budget and Fiscal Plan – 2008/09 to 2010/11
86
Three-Year Fiscal Plan
· The most recent actuarial valuation report for the Municipal Pension Plan as of December 31, 2006 indicated a surplus of $438 million.
· The next actual valuation report for the Public Service Pension Plan as of March 31, 2008 is expected to be received by March 31, 2009; the report for the Teachers’ Pension Plan as of December 31, 2008 is expected to be received by December 31, 2009; the report for the College Pension Plan as of August 31, 2009 is expected to be received by August 31, 2010; and the report for the Municipal Pension Plan as of December 31, 2009 is expected to be received by December 31, 2010.
Catastrophes and Disasters
The spending plans for the Ministries of Forests and Range and Public Safety and Solicitor General include amounts to fight forest fires and deal with other emergencies such as floods. These amounts are based on historical averages of actual spending and on conditions of normal to moderate severity. Extreme occurrences may affect expenses in these ministries and those of other ministries.
Pending Litigation
The spending plan for the Ministry of Attorney General contains provisions for payments under the Crown Proceeding Act based on estimates of expected claims and related costs of settlements likely to be incurred. Litigation developments may occur that are beyond the assumptions used in the plan (for example, higher-than-expected volumes, or size of claim amounts and timing of settlements). These developments may affect government revenues and/or expenditures in other ministries.
One-time Write-downs and Other Adjustments
Ministry budgets provide for anticipated levels of asset or loan write-downs where estimates can be reasonably predicted. The overall spending forecast does not make allowance for extraordinary items other than the amount provided in the contingency vote.
Budget and Fiscal Plan – 2008/09 to 2010/11
87
Three-Year Fiscal Plan
Capital Financing and Debt Management
Provincial capital plan
Provincial capital spending funds assets that are important to the province and its citizens, including schools, hospitals, medical equipment, university lecture halls, residences, government buildings, court houses, roads, bridges, dams and transmission lines.
Financing government’s capital plan

Capital is costly to build, operate and maintain. Furthermore, while surpluses help finance capital spending, borrowing is also required to fully finance the provincial capital spending program. Careful planning and budgeting is important so government can build new capital, and update existing capital, while leaving the province’s finances in good order for future generations.
In order to ensure value for British Columbians from capital spending and to promote efficiency in the allocation of capital funding, the government has promoted public-private partnerships and is reviewing how it manages capital grants to service delivery agencies, including the SUCH sector (schools, universities, colleges and health organizations). Development of these processes will result in improvements to how capital and capital funding are reported.
Prudent management
The relationship between capital spending and debt requires the province to establish an accountability measure that ensures the capital plan will meet the needs of the province, while at the same time keeping debt affordable for current and future citizens. The government is committed to maintaining a downward trend in the taxpayer-supported debt to GDP ratio, using a three-year moving average, which is a key measure used by financial analysts, investors, and bond rating agencies to assess whether a province can sustain its level of borrowing.
Taxpayer-supported debt to GDP ratio
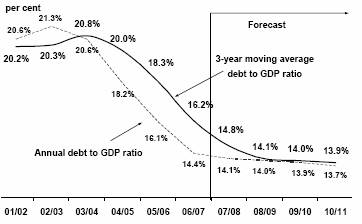
The key planning and accountability measure used by the provincial government for capital financing and debt management is debt allocations for each sector of taxpayer-supported debt: health, K–12, post-secondary, transportation and other. Capital plans are then prioritized within the available financing to ensure program requirements are met on a timely basis. Also, debt allocations encourage sectors to seek out the most efficient means of financing their capital requirements. Use of sector debt allocations will help ensure that overall government debt targets are met, while allowing for flexibility within sectors.
Table 1 Taxpayer-supported Debt – Sectoral Allocations
| | 2007/08 | | Budget | | | | | |
| | Updated | | Estimate | | Plan | | Plan | |
($ millions) | | Forecast | | 2008/09 | | 2009/10 | | 2010/11 | |
Taxpayer-supported debt | | | | | | | | | |
Government direct operating debt | | 8,246 | | 7,408 | | 6,880 | | 6,452 | |
Other agency debt (mainly capital) | | | | | | | | | |
Education (K-12) | | 4,959 | | 5,235 | | 5,513 | | 5,794 | |
Post-secondary | | 3,331 | | 3,520 | | 3,816 | | 3,988 | |
Health | | 3,380 | | 3,945 | | 4,479 | | 4,959 | |
Highways and public transit | | 6,243 | | 6,916 | | 7,524 | | 8,048 | |
Other | | 633 | | 717 | | 761 | | 803 | |
Total other agency debt | | 18,546 | | 20,333 | | 22,093 | | 23,592 | |
Total taxpayer-supported debt | | 26,792 | | 27,741 | | 28,973 | | 30,044 | |
Budget and Fiscal Plan – 2008/09 to 2010/11
88
Three-Year Fiscal Plan
Public Private Partnerships
Over the past 5 years, British Columbia has emerged as a leader in North America in the use of public-private partnerships (P3s) to deliver public-use infrastructure. P3s are a relatively new procurement method that transfers capital project risks from government to the private sector through fixed price agreements, guaranteed delivery dates, long-term warranties and guarantees of performance. Payments to the P3 concessionaire are subject to meeting performance standards, and usually include penalty provisions for non-performance.
Under a public-private partnership contract, a concessionaire constructs a specified capital asset, and operates and maintains it for a term specified by the contract. In return, the provincial government either pays the concessionaire an annual unitary service payment, or allows the concessionaire to charge a toll to users of the asset. The payments, or the tolls, cover both the cost of the capital asset plus the ongoing operating expenses over the term of the contract.
When government began entering into P3 contracts, there was little in the way of pre-existing guidelines specific to P3 accounting. While the total contract amount was known, it was based on a unitary payment for service based on performance that combined the provision of a capital asset with ongoing operation of the asset. For accounting and reporting purposes, it was unclear as to how much of the contract amount should be allocated to capital cost and how much toward operating expense.
Original reporting on the capital cost of these projects focussed on construction costs as the means of allocating the contract amount between capital cost and operating expense. The P3 accounting guidelines recently developed by the Office of the Comptroller General in accordance with generally accepted accounting principles, clarified that the costs allocated to capital for these projects must also include interest during construction and project management costs.
The application of P3 accounting guidelines has resulted in a restatement of the cost allocation between capital cost and operating expense for existing P3 contracts. Most projects have seen an increase in the allocation to capital cost, with a corresponding decrease to operating expense, as is shown in the table below.
Under P3 accounting, the capital cost is presented as an asset on the provincial government’s balance sheet that is offset by an equivalent liability, or debt, to pay for the capital cost. However, a feature of the unitary service payment is that it provides for the retirement of the liability/debt by the end of the contract. This feature reduces the build up of debt as new capital is constructed.
The application of P3 accounting guidelines does not affect the total contract amount or the amount of the annual service payment to the concessionaire. Nor does it impact the estimated benefits to the public of the P3 agreement in comparison to alternate or more traditional procurement methods.
Table 2 Impact of New P3 Accounting Guidelines on Allocation of Contract Costs
| | Total Original Allocation | | Total Current Allocation | |
| | Capital | | Operating | | Total | | Capital | | Operating | | Total | |
P3 Project | | Cost | | Expense | | Contract | | Cost | | Expense | | Contract | |
Abbotsford Regional Hospital and Cancer Centre | | 356 | | 1,326 | | 1,682 | | 449 | | 1,233 | | 1,682 | |
Trans Canada Highway – 10 Mile (Park) Bridge | | 66 | | 186 | | 252 | | 79 | | 173 | | 252 | |
Sea-to-Sky Highway | | 366 | | 1,247 | | 1,613 | | 561 | | 1,052 | | 1,613 | |
William R. Bennett Bridge | | 144 | | 442 | | 586 | | 185 | | 401 | | 586 | |
Budget and Fiscal Plan – 2008/09 to 2010/11
89
Three-Year Fiscal Plan
Capital Funding
Capital funding provided to service delivery agencies in the SUCH (schools, universities, colleges and health organizations) and transportation (BC Transit and RTP 2000 Ltd.) sectors is currently accounted for in the consolidated revenue fund (CRF) as prepaid capital advances (PCAs). PCAs were created as a means of reporting all the assets acquired with public money and, prior to the full consolidation of the SUCH entities in the Public Accounts, were disclosed as capital assets on the government’s balance sheet. Consolidation of the SUCH sector eliminated the presentation of PCAs in the Public Accounts; however, they remain as a CRF financing transaction in the annual Estimates.
In order to promote more transparent disclosure of all the funding provided to the SUCH and transportation sectors, and to improve efficiency in managing capital funding to service delivery agencies in these sectors, government is reviewing whether to record capital funding provided to SUCH and transportation service delivery agencies as “grants restricted for capital purposes” (restricted capital grants), rather than the current practice of recording these advances as PCAs. Under this option, capital funding would no longer be reported as a financing transaction, but as part of the grants to agencies.
The amortization of the PCA assets that was previously charged to the appropriations for the Ministries of Advanced Education, Education, Health, and Transportation (the ministries) would be eliminated as would all existing PCA balances in the CRF. As well, debt service costs would be centralized in the Management of Public Funds and Debt (MOPD) Vote, rather than being allocated to the ministries’ votes. Total debt servicing costs would remain the same and this classification is consistent with the presentation in the Public Accounts.
The proposed changes would clarify the total capital and operating funding provided to SUCH and transportation sector service delivery agencies by disclosing the total grants (operating and capital) in one place, the ministry vote. The change would improve cash and debt management processes by allowing debt to be managed on a consolidated basis; streamline operations; improve accountability; and facilitate simpler, more efficient debt service cost management. The ministries would no longer be required to track, allocate and budget for debt servicing costs that they have limited ability to control.
The change from issuing PCAs to issuing restricted capital grants impacts only the CRF. In the Public Accounts, PCAs are currently eliminated on consolidation of the SUCH agencies to avoid double counting of expense, and the new restricted capital grants would receive the same accounting treatment. While individual ministry appropriations may decrease, there would be no impact on total funding received by school districts, universities, colleges, health authorities, or transit programs, nor does it change how the agencies may use the funding they receive. As well, total expense would remain the same.
These proposed changes have not been reflected in the 2008/09 Estimates and the 2008/09-2010/11 Budget and Fiscal Plan as government is in the initial stages of discussing the changes with the SUCH and transportation sectors and developing conversion procedures.
An illustrative example of the impact of these changes on the funding for educational programs and the appropriation for the Ministry of Education in the 2008/09 Estimates is provided below. The changes would have a similar impact on the ministries of Advanced Education, Health, and Transportation.
The change in how capital funding is managed would have no impact on total debt, as the funding for either PCAs or restricted capital grants would come from the CRF. Regardless of how the appropriations are structured, the borrowing requirements are the same.
Budget and Fiscal Plan – 2008/09 to 2010/11
90
Three-Year Fiscal Plan
Table 3 CRF Impact of Change from PCAs to Restricted Capital Grants
| | Ministry of Education | | MOPD | | Total | |
| | 2008/09 | | Impact of | | Restated | | 2008/09 | | Impact of | | Restated | | 2008/09 | | Impact of | | Restated | |
($ millions) | | Budget | | Change | | Budget | | Budget | | Change | | Budget | | Budget | | Change | | Budget | |
Core Business | | | | | | | | | | | | | | | | | | | |
Educational programs – operating | | 5,009 | | — | | 5,009 | | — | | — | | — | | 5,009 | | — | | 5,009 | |
Educational programs – capital | | — | | 305 | | 305 | | — | | — | | — | | — | | 305 | | 305 | |
Debt servicing | | 375 | | (375 | ) | — | | 402 | | 375 | | 777 | | 777 | | — | | 777 | |
PCA amortization | | 196 | | (196 | ) | — | | — | | — | | — | | 196 | | (196 | ) | — | |
Public libraries | | 16 | | — | | 16 | | — | | — | | — | | 16 | | — | | 16 | |
Management services | | 21 | | — | | 21 | | — | | — | | — | | 21 | | — | | 21 | |
Executive and support services | | 58 | | — | | 58 | | — | | — | | — | | 58 | | — | | 58 | |
Total Vote | | 5,675 | | (266 | ) | 5,409 | | 402 | | 375 | | 777 | | 6,077 | | 109 | | 6,186 | |
Capital Financing | | | | | | | | | | | | | | | | | | | |
Educational programs – PCAs | | 305 | | (305 | ) | — | | — | | — | | — | | 305 | | (305 | ) | — | |
Total educational programs funding | | 5,314 | | — | | 5,314 | | — | | — | | — | | 5,314 | | — | | 5,314 | |
Continued monitoring and prudence
The capital planning and management regime will continue to evolve to ensure that government’s fiscal and operational objectives are met, including delivering provincial assets while keeping debt affordable.
At the same time, recognizing that rising construction costs are currently a concern, the province has included a capital contingency averaging 5 per cent of total taxpayer-supported capital spending in its three-year capital plan as a prudent planning measure.
This contingency is in addition to the contingencies included in individual project budgets.
The combination of constant improvement to capital procurement and funding management processes, the use of debt allocations as a key accountability measure and prioritization of capital projects within those allocations, and the provision for unusual circumstances through capital contingencies will ensure the robustness and affordability of the province’s capital plan.
Budget and Fiscal Plan – 2008/09 to 2010/11
91
Building on British Columbia’s Strengths
British Columbia is the home, workplace and community for over 4 million people. Over the span of its history, British Columbia has always welcomed people seeking to fulfill their dreams and prosper. The willingness of individuals to invest time and energy into building British Columbia has made the province the envy of many around the globe.
The government recognizes that keeping British Columbia an attractive place to live and invest is essential for the province’s continued growth and prosperity. Indeed, government policies have contributed to a remarkable improvement in British Columbia’s business investment activity over the last seven years. The positive investment climate has, in turn, contributed to a significant rebound in the provincial economy as sectors that languished in the 1990s, such as mining, have re-emerged.
This turnaround can be seen in the chart below. BC real (inflation adjusted) business capital investment rose at an average annual rate of 2.5 per cent between 1990 and 2000 before jumping to a 6.6 per cent average annual growth between 2000 and 2006. This bounce in investment activity translates into more jobs, better incomes and an increase in the overall standard of living for British Columbians. Real GDP per capita, a popular measure of average living standards, grew at a 1.9 per cent average annual rate in the six years to 2006, more than triple the 0.6 per cent average growth recorded in the 1990s.
The rekindling of the provincial economy and average living standards is evident in other economic figures. The pace of growth in British Columbia real GDP – the broadest measure of overall economic activity – has exceeded the national average every year since 2001. The number of people employed in British Columbia has risen by 345,000 since 2001; job growth in 2007 was the second strongest in Canada and the province’s annual unemployment rate dropped 0.6 percentage points to 4.2 per cent in 2007, its lowest annual rate in more than 30 years.
British Columbia has regained its reputation as a place to live, work and invest. The province now has a solid underpinning that will help it withstand the high degree of uncertainty and mounting economic upheaval seen in some international economies. But the government cannot take this improvement for granted and is now developing ways to create an even more resilient, flexible and diversified economy.
The government’s efforts are focused toward building on the province’s strengths, while also addressing areas of the economy where special attention is needed.
Bc’s rebound in business investment and average living standards

* Business fixed capital investment, including machinery and equipment and non-residential structures.
Source: Statistics Canada Provincial Economic Accounts, November 2007
Budget and Fiscal Plan – 2008/09 to 2010/11 |
92
The Government’s Strategy
Encouraging investment from overseas is a key to the future success of the provincial economy in an increasingly integrated, highly competitive, global economy. The government’s objective is to make the province a magnet for the domestic and international investments that create jobs and incomes for all British Columbians.
To accomplish this, the government will bolster British Columbia’s attractiveness as a place to invest. This will be done by enhancing the attributes that sway decisions about where firms locate and invest and where individuals choose to work and raise their families. The strategy focuses on six key attributes:
· Quality of life – Knowledge-based industries are increasingly attracted to locations with excellent recreational opportunities, cultural activities, health care and education systems;
· Environmental leadership – Many forward-looking firms are likely to choose to locate in jurisdictions that demonstrate a commitment to the environment;
· Tax and regulatory competitiveness – While not the only influence on investment decisions, a competitive tax and regulatory regime is a clear requirement for a healthy investment climate;
· Sound fiscal management – Investors are attracted to jurisdictions that have stable and sustainable fiscal practices and a government with a proven record of fiscal discipline;
· A skilled and adaptable workforce – The new fast-paced global economy requires successful businesses to be nimble and responsive to changing market conditions. This places a premium on employees that are technically skilled but also able to adapt to changing workplace demands; and
· Access to markets – The presence of an efficient and reliable transportation system as well as a network of connections to existing and emerging markets are critical to success in the global economy.
The government’s plan also recognizes the need to provide support for British Columbia’s traditional industries, particularly the forest sector, which is facing the challenges of a US housing market downturn, the high value of the Canadian dollar and the Mountain Pine Beetle infestation.
Quality of life
Many studies have shown that quality of life plays a major role in where businesses decide to locate and invest – particularly knowledge-based industries. British Columbia is renowned for the superior lifestyles enjoyed by its citizens, reflecting the province’s unparalleled natural beauty, first rate recreational facilities and abundant cultural activities. British Columbia boasts world class skiing, hiking and kayaking as well as a major professional hockey team. The province’s recreational opportunities will be enhanced by the hosting of the 2010 Olympic and Paralympic Winter Games and the legacy the games will leave to the province.
The high quality of life in British Columbia is recognized in the international community. This can be seen in the results of a recent survey of the livability of major cities around the world conducted by Mercer Human Resource Consulting. The survey considered 39 quality of living determinants including each jurisdiction’s political and social environment, health and sanitation, public services and education system. This survey ranked Vancouver third among major cities in overall quality of living in 2007, placing behind only Geneva and Zurich. Toronto was the next highest ranked Canadian city, placing 15th overall. Ottawa, Montreal and Calgary placed within the top thirty.
A major facet of British Columbia’s superior quality of life is the province’s universal health care system. British Columbians are able to access the system to help maintain and improve their health at all stages of life. According to the latest Statistics Canada provincial demographic figures,
Budget and Fiscal Plan – 2008/09 to 2010/11 |
93
British Columbians enjoy Canada’s highest life expectancy at birth, with residents expected, on average, to live to 81 years of age. Reliable high quality health care has long furnished the province with a significant competitive advantage, particularly compared to the United States.
As part of an ongoing commitment to strengthen the province’s health care system, the government engaged British Columbians in a Conversation on Health. The objective of this dialogue was to gather the views, concerns and insights of people that actually use the public health system. Input from the province-wide discussions is shaping future government policy directions, as outlined in the Throne Speech.
The government is committed to a broad range of initiatives that will transform many aspects of the province’s health care system. Budget 2008 creates a Transformation Fund within the Ministry of Health to facilitate the anticipated changes resulting from these initiatives, with a total of $300 million allocated over the three years of the fiscal plan. Budget 2008 increases health funding by $2.9 billion over the three years to 2010/11.
British Columbia also boasts a vibrant cultural life including a wide array of music venues, world class museums and a lively theatre scene. Budget 2008 includes funding totalling $105 million over four years in support of various arts and culture initiatives. The government is also establishing the BC150 Cultural Fund with a $150 million permanent endowment to support new arts and cultural activities.
Budget 2008 includes 2007/08 year-end priority initiatives of $78 million to support British Columbia arts and culture. This includes $9 million for the revitalization and restoration of the Vancouver East Cultural Centre.
Access to housing is another important factor in living standards. The strength of the provincial economy, combined with British Columbia’s desirability as a place to live, means that housing affordability is becoming an issue for some groups in the province. While there are recent signs that house price increases are moderating, Budget 2008 has introduced several measures to help improve affordability.
The Home Owner Grant phase-out threshold has been increased from $950,000 to $1,050,000, ensuring that more than 95 per cent of homeowners will continue to qualify for the full grant. First time home buyers will benefit from an increase in the price threshold from $375,000 to $425,000. This means first time home buyers can save up to $6,500 in property transfer tax.
The province’s overall quality of life also depends on helping those people who have fallen behind. The provincial government, working in partnership with local governments, has made a commitment to tackle the challenging issue of homelessness among the province’s most vulnerable citizens.
For example, the government recently announced increased funding of $41 million for the Province’s Housing Matters BC program which will support new and expanded measures to help break the cycle of homelessness.
Environmental Leadership
Increasingly, successful businesses are looking beyond just the bottom line and are considering their impacts on the environment. Concepts such as triple bottom line accounting – which take into consideration the business’s performance related to the environment, social issues and profits – are becoming increasingly commonplace.
British Columbia has long recognized the importance of using energy resources in an efficient and environmentally friendly manner. Two early plans are Energy for our Future: a Plan for BC, which was released in 2002, and Weather, Climate and the Future: BC’s Plan, released in 2004. Another example is last year’s $13.5 million air action plan that will result in
Budget and Fiscal Plan – 2008/09 to 2010/11 |
94
improved quality of community airsheds across the province.
The Province’s leadership in these areas will be a magnet for those progressive firms that embrace environmental responsibility as a core value. This is reinforced by the government’s legislated requirement for a one-third reduction in greenhouse gas (GHG) emissions by 2020.
British Columbia’s GHG reduction targets and policies will also create opportunities for research and development of new environmental technologies. The province is encouraging the investigation of alternative energy sources and other technologies to reduce the province’s carbon footprint. For example, the recent announcement by Westport Innovations Inc. of a new arrangement to supply its liquid natural gas (LNG) fuelling technology to Kenworth Trucks demonstrates the sort of economic opportunities created by sound environmental stewardship.
The province will also address climate change through its procurement practices that will focus on reducing the government’s ecological footprint. For example, the government is generating increased demand for innovative construction technologies by requiring that new government buildings meet the Leadership in Energy and Environmental Design (LEEDs) Gold standard or equivalent – an acknowledged green buildings rating.
Government’s commitment to become carbon neutral by 2010 includes the adoption of new technology, such as desktop video conferencing, to reduce greenhouse gases produced by travel. Public sector building retrofits will also improve the energy efficiency of government facilities.
Other initiatives include the new BC Energy Plan, announced in February 2007, which set ambitious goals for energy conservation and efficiency. In addition, the BC Bioenergy Strategy targets the province’s extensive natural biomass resources, such as wood residue, diseased timber and agricultural and municipal wastes, for use in the generation of clean and renewable sources of power.
The Innovative Clean Energy (ICE) Fund has been established and will produce new opportunities for research and development into alternative energy technologies and cleaner energy sources. Projects will begin receiving ICE funding in the Spring of 2008.
Another example of the government’s environmental leadership is its efforts to expand and improve the province’s network of protected areas. In recent years, the government has made land use decisions that add protected areas on the Central/North Coast and in other areas such as Haida Gwaii, bringing the total area protected up to 14 per cent of the province. Budget 2008 includes an additional $2 million annually to staff and manage many of the province’s new protected areas.
Tax and Regulatory Competitiveness
While taxes alone do not determine where firms will locate and invest, a competitive personal and corporate tax system is clearly a prerequisite to a strong investment climate. In addition, governments can provide certainty within the business environment by setting firm goals and articulating a policy road map showing how the goals will be achieved.
Since 2001, British Columbia has taken major strides to create a stable and competitive tax and regulatory system.
Budget 2008 builds on this record with additional cuts to personal and corporate income tax rates. These measures have been made possible by the government’s commitment to return the revenue generated from the carbon tax to British Columbians through direct tax reductions and from the commitment to constantly seek ways to become more competitive.
In 2008, as part of carbon tax revenue recycling, the general corporate income tax rate will be reduced to 11 per cent. The goal is to reach a general rate of 10 per cent
Budget and Fiscal Plan – 2008/09 to 2010/11 |
95
Major Tax Competitiveness Measures Since 2001
Personal Income Tax
2001 - Introduce a 25% reduction in provincial personal income tax
2005 - Introduce BC Tax reduction to eliminate or reduce tax for 730,000 taxpayers
2007 - Introduce a 10% tax cut on the first $100,000 in income
2008 - As part of revenue neutrality, a 5% reduction on the first $70,000 in income by 2009
Corporate Income Tax
2001 - Reduce general corporate income tax rate to 13.5% from 16.5%
2002 - Raise small business threshold to $300,000
2003 - Introduce new incentives for film and digital animation
- Introduce a new book publishing tax credit
2005 - Increase film tax credit rates
- Increase small business threshold to $400,000 from $300,000
2007 - Implement the BC training tax credit
2008 - As part of revenue neutrality, a reduction in the general and small business tax rate
- Increase in film tax credit rates
Provincial Sales Tax
2001 - Exemption of production machinery and equipment
2006 - Exempt services to maintain or modify software
Corporation Capital Tax
2001 - Phase out tax on general corporations
2008 - Phase out tax on financial corporations and replace with a minimum tax
International Financial Activity Act
2004 - Expand the list of qualifying activities and allow non-financial busineses to register
2005 - Provide refunds of corporate income tax related to the use of life science patents
2008 - Expand the list of eligible activities to include specified head office activities
Other Taxes
2004 - Reduce property taxes on major BC port facilities and compensate municipalities
2006 - Increase the small business venture tax credit budget
2008 - Lower major industry school property tax rate down to business class rate over two years
by 2011. This decrease, together with tax rate reductions announced by the federal government, will result in a combined federal and provincial rate of 25 per cent by 2012 – well below the average US rate of 35 per cent.
In addition, the small business income tax rate will be reduced from 4.5 per cent to 3.5 per cent, effective July 1, 2008 with a goal of further reductions to 2.5 per cent by 2011.
As a result of Budget 2008, British Columbia will have the lowest personal income taxes in the country on incomes up to $111,000. Keeping tax rates low for lower and middle income earners adds to the province’s allure as a place to work and live.
Changes to the International Financial Activity Act provide incentives for international firms to locate head office functions in the province. Changes include an amendment to allow non-security corporations to trade in money market investments and an amendment to allow management and control functions, such as human resource and strategic planning services, as eligible international financial activities.
Also, Budget 2008 phases out the capital tax on financial institutions. By 2010, the tax will be replaced with a financial institutions minimum tax, thereby creating new opportunities for investment and job growth in the credit union, trust and banking sectors. The financial sectors of the economy provide well paid, high skill jobs and a low “carbon foot-print.”
To secure the future of film production activity in the province and to ensure British Columbia retains its “Hollywood North” label, the province’s film tax credits are enhanced. In particular, the basic Film Incentive BC tax credit is increased from 30 per cent to 35 per cent while the basic Production Services Tax Credit is raised from 18 per cent to 25 percent.
British Columbia’s export-oriented sectors, such as forestry and mining, will benefit from a reduction in the provincial school tax rate on major industrial properties. This measure will result in a $12 million tax reduction in 2008 and a $24 million reduction in 2009 and future years.
An important government objective is a modern, efficient and effective regulatory system that promotes innovation and economic opportunity while protecting the public interest. As of December 31, 2007, the government exceeded its multi-year target of a zero net increase in regulatory requirements, with the number of regulatory requirements 1.3 per cent lower than the previous December. Since implementation of regulatory reforms in 2001, the government has reduced its regulatory burden by 42.6 per cent. Such continuous improvement reduces impediments to business success in British Columbia.
Budget and Fiscal Plan – 2008/09 to 2010/11 |
96
Regulatory Requirements and Results to December 31, 2007 | | | | | | | |
| | | | | | | |
| | | | Net Change | | Requirements | |
| | Requirements | | as of | | as of | |
| | as of | | Dec. 31, | | Dec. 31, | |
Ministry | | June 2004 | | 2007 | | 2007 | |
| | Number of Regulations | |
Aboriginal Relations and Reconciliation | | 61 | | — | | 61 | |
Advanced Education | | 1,271 | | 63 | | 1,334 | |
Agriculture and Lands | | 6,485 | | (212 | ) | 6,273 | |
Attorney General | | 14,637 | | (1,061 | ) | 13,576 | |
Children and Family Development | | 8,543 | | (209 | ) | 8,334 | |
Community Services | | 11,637 | | — | | 11,637 | |
Economic Development | | 1,244 | | (13 | ) | 1,231 | |
Education | | 21,095 | | (2,627 | ) | 18,468 | |
Employment and Income Assistance | | 1,322 | | (20 | ) | 1,302 | |
Energy, Mines and Petroleum Resources | | 11,448 | | (561 | ) | 10,887 | |
Environment | | 13,501 | | (1,039 | ) | 12,462 | |
Finance | | 25,611 | | (3,398 | ) | 22,213 | |
Forests and Range | | 28,598 | | (895 | ) | 27,703 | |
Health | | 7,744 | | (291 | ) | 7,453 | |
Labour and Citizens’ Services | | 29,789 | | (3,037 | ) | 26,752 | |
Premier’s Office - Intergovernmental Relations | | 9 | | — | | 9 | |
Public Safety and Solicitor General | | 21,560 | | (866 | ) | 20,694 | |
Small Business and Revenue | | 14,063 | | (753 | ) | 13,310 | |
Tourism, Sports and the Arts | | 7,042 | | (4,174 | ) | 2,868 | |
Transportation | | 13,754 | | (157 | ) | 13,597 | |
Total Government | | 239,414 | | (19,250 | ) | 220,164 | |
The government’s ongoing effort to improve British Columbia’s tax and regulatory competitiveness creates a business climate conducive to new investment and job creation. It also helps improve conditions in sectors that may be going through periods of difficulty, such as the province’s forestry sector.
Sound Fiscal Management
Successful businesses tend to prefer jurisdictions with sustainable fiscal management practices. Desirable locales exhibit relatively stable tax and regulatory regimes that allow business leaders to focus on the job at hand – orienting their operations toward meeting customer needs. This means that, if a government wants to attract and retain businesses and investment, it must establish a reputation for keeping its financial house in order.
Over the last several years, the British Columbia government has consistently demonstrated a commitment to prudent fiscal planning and sustainable budgetary practices. The province will record its fourth consecutive surplus budget in 2007/08 while the ratio of taxpayer-supported debt to GDP – a measure of the debt burden – has been reduced from previous high levels.
After peaking at 21.3 per cent in 2002/03, the province’s debt-to-GDP level is expected to fall to 14.1 per cent by the end of 2007/08.
The government’s careful attention to its fiscal bottom line and its ongoing success in bringing down the province’s debt burden has received favourable reviews from major credit rating agencies. Moody’s Investor Services has given British Columbia its coveted Aaa rating, the highest rating possible. Similarly, Standard and Poor’s gives the province its top AAA rating.
Looking forward, Budget 2008 maintains the government’s sound fiscal position with modest surpluses expected for each of the three years of the fiscal plan. These balanced budgets are underpinned by legislated fiscal rules that prohibit deficit budgets. Prudent financial planning practices, such as forecast allowances applied to the annual balance and conservative economic assumptions, will help ensure the Province achieves the projected budget surpluses.
A Skilled and Adaptable Workforce
North American businesses need an educated, well-trained workforce to succeed in today’s competitive world economy. For domestic enterprises to compete, governments must ensure businesses can rely on access to a pool of literate, engaged employees that have the educational foundation to adapt to the constantly changing nature of world markets.
The government is meeting the needs of businesses and individuals by working toward making British Columbia the best educated and most literate jurisdiction in North America. The province’s excellent primary and secondary education system consistently scores well in international standardized testing.
For example, recently released results of the Organization for Economic Co-operation and Development’s (OECD) tri-annual Programme for International Student Assessment (PISA) found that British Columbia 15-year-olds were in the top ranks worldwide, standing fourth in science, sixth in reading and thirteenth in math.
Budget and Fiscal Plan – 2008/09 to 2010/11 |
97
British Columbia’s PISA Rankings - 2006 |
| | | | |
Science | | Reading | | Math |
| | | | |
4th | | 6th | | 13th |
Note: assessments were conducted in 57 countries and 10 Canadian provinces.
Source: Programme for International Student Assessment (OECD)
for International Student Assessment (PISA) found that British Columbia 15-year-olds were in the top ranks worldwide, standing fourth in science, sixth in reading and thirteenth in math.
The Province is expanding access to post-secondary education institutions, boosting support for research and increasing opportunities for skills training. For example, the government is addressing priority education issues by creating 625 additional graduate spaces per year to complete the commitment to add 2,500 new graduate spaces. An additional 200 spaces will also be made available for aboriginal access and 300 spaces will be made available to respond to waitlist pressures for skilled trade foundation programs.
In addition to maintaining its previous commitment to produce more trained doctors, government is adding a further 900 health spaces to increase the number of nurses and allied health care professionals.
Increased Provincial support for skills training provided in earlier budgets is paying off. The Industry Training Authority (ITA) – the agency responsible for apprenticeships and industry training programs – expects a total of 43,900 participants in its training programs during 2007/08, which is up from 38,000 training participants in 2006/07. In addition, the ITA anticipates that it will award a total of 8,016 training credentials in 2007/08, an increase of 884, or 12 per cent, over the previous year’s total.
Access to markets
Successful businesses prefer to operate near the transportation hubs that give them access to suppliers and customers. Indeed, situating operations close to efficient and reliable transportation networks is a high priority for companies doing business in the global economy.
British Columbia is fortunate to be strategically situated at the junction between established North American markets and rapidly growing Asian economies. The province’s world-class transportation infrastructure provides the land, air and sea links essential for the movement of products to and from the immense Pacific Rim market.
Recognizing the benefits that are gained by tapping emerging overseas markets, the government is making the investments necessary to expand and improve the province’s transportation infrastructure. British Columbia’s reputation as North America’s gateway to the fast growing Pacific Rim economy will be greatly enhanced upon completion of current and planned transportation projects.
For example, the province, together with the federal government, other provinces and transportation stakeholders, is following through on the Pacific Gateway Strategy. This ambitious multi-year action plan is the backdrop for several current and anticipated road, highway, airport, rail and port improvement projects – undertakings that will upgrade vital links to overseas trading partners and bolster the competitiveness of the province’s transportation industry.
Another critical component of the government’s overall transportation plan is the Ports Strategy, which was adopted in 2005. The strategy seeks to boost exports, increase Asia-Pacific container traffic through British Columbia ports and enhance the province’s position as a world class cruise destination.
Budget and Fiscal Plan – 2008/09 to 2010/11 |
98
A major milestone in the Province’s Ports Strategy was achieved with the opening of the Prince Rupert Container Terminal in September 2007. The $170 million project was funded by the Province, the Government of Canada, the Prince Rupert Port Authority and private sector partners. The terminal has a designed shipping capacity of 500,000 twenty-foot equivalent units (TEUs), which will enable fast, efficient and reliable movement of products between North American and Asian markets. The terminal, given its location on the Pacific Ocean’s “Great Circle Route,” is one-to-two days closer to Asia than other west coast ports.
The government also recently announced a 10-year extension to its Ports Competitiveness Initiative, which was originally introduced in 2003. This program provides property tax relief to 20 of British Columbia’s major ports by capping municipal tax rates on eligible facilities and provides compensation to local governments for the resulting revenue loss. The extension increases the level of compensation and ties future payment increases to the rate of inflation. In addition, the initiative enables local governments to set up their own competitiveness agreements with port operators.
The Province’s investments in improving access to markets will pay dividends to British Columbians for years to come. The expansion and improvement in British Columbia’s transportation system will ensure that the province will remain a major player in the global economy and be ready to take advantage of emerging markets and future opportunities in the global economy.
Conclusion
Attracting businesses and investment to British Columbia remains a top priority for the Province. Having succeeded in rekindling investor interest in the province, the government is now building on the province’s renewed economic and social strengths. Measures introduced in Budget 2008 will ensure that British Columbia is an even more desirable place to live, work and do business.
Budget and Fiscal Plan – 2008/09 to 2010/11 |
99
Part 3: TAX MEASURES
Table 3.1 Summary of Tax Measures
| | | | Taxpayer Impacts | |
| | Effective Date | | 2008/09 | | 2009/10 | |
| | | | ($ millions) | |
Revenue Neutral Climate Action Initiatives | | | | | | | |
Carbon Tax | | | | | | | |
• Introduce a tax based on $10 per tonne of CO2e emissions effective July 1, 2008 and increasing by $5 per tonne each July from 2009 to 2012 | | July 1, 2008 | | 338 | | 631 | |
Income Tax Act | | | | | | | |
• Introduce a $100 per adult and $30 per child low income refundable climate action tax credit | | July 1, 2008 | | (104 | ) | (145 | ) |
• Reduce each of the bottom two personal income tax rates by 2 per cent for 2008 and by 5 per cent for 2009 | | January 1, 2008 | | (113 | ) | (230 | ) |
• Reduce general corporate income tax rate to 11 per cent from 12 per cent effective July 1, 2008 | | July 1, 2008 | | (75 | ) | (128 | ) |
• Reduce corporate income tax small business rate to 3.5 per cent from 4.5 per cent effective July 1, 2008 | | July 1, 2008 | | (46 | ) | (79 | ) |
Outstanding Revenue to be Returned to Taxpayers(1) | | | | 0 | | 49 | |
• Provide a one-time payment of $100 per person resident in BC on December 31, 2007(2) | | December 31, 2007 | | * | | * | |
Other Climate Action Initiatives | | | | | | | |
Small Business Venture Capital Act | | | | | | | |
• Increase equity tax credit budget by $5 million per year and set a tax credit budget of $7.5 million for clean technology | | 2008/09 | | (5 | ) | (5 | ) |
International Financial Activity Act | | | | | | | |
• Expand eligible intellectual property to include green-related patents | | March 1, 2008 | | * | | * | |
Social Service Tax Act | | | | | | | |
• Provide tax relief for conventional fuel efficient vehicles | | February 20, 2008 | | (11 | ) | (11 | ) |
• Exempt ENERGY STAR® qualified residential refrigerators, clothes washers and freezers(3) | | February 20, 2008 | | (5 | ) | (5 | ) |
• Exempt energy efficient residential gas-fired water heaters | | February 20, 2008 | | (3 | ) | (3 | ) |
• Exempt production machinery and equipment for local governments for power production and cogeneration | | February 20, 2008 | | * | | * | |
• Provide relief from passenger vehicle rental tax for rentals of 8 hours or less | | April 1, 2008 | | * | | * | |
• Expand the bicycle exemption to include electric power-assisted two and three wheel cycles and non-motorized adult tricycles | | February 20, 2008 | | * | | * | |
• Reduce tax payable on electric motorcycles | | February 20, 2008 | | * | | * | |
• Exempt insulation for hot water tanks, hot and cold water pipes and ductwork | | February 20, 2008 | | (2 | ) | (2 | ) |
• Reduce tax payable on hydrogen fuel cell buses | | February 20, 2008 | | * | | * | |
• Exempt biodiesel fuel or portion of biodiesel fuel for heating | | February 20, 2008 | | (1 | ) | (1 | ) |
• Exempt aerodynamic devices for commercial vehicles | | February 20, 2008 | | * | | * | |
• Impose tax on coal and coke except for residential use | | February 20, 2008 | | 3 | | 3 | |
Motor Fuel Tax Act | | | | | | | |
• Classify biodiesel and ethanol as alternative motor fuels for all purposes | | February 20, 2008 | | * | | * | |
* | | Denotes measures that have no material impact on the status quo revenue forecast for provincial revenues. |
(1) | | Additional tax reductions are planned for 2009/10 and future years, as shown in the required revenue neutral plan. This table only shows those legislated changes which are being introduced with Budget 2008 . |
(2) | | The cost of the one-time payment including administration costs is estimated at $450 million and is accounted for in 2007/08. |
(3) | | ENERGY STAR® mark is administered and promoted in Canada by Natural Resources Canada and is registered in Canada by the United States Environmental Protection Agency. |
Budget and Fiscal Plan – 2008/09 to 2010/11
100
Tax Measures
Table 3.1 Summary of Tax Measures – Continued
| | | | Taxpayer Impacts | |
| | Effective Date | | 2008/09 | | 2009/10 | |
| | | | ($ millions) | |
Other Revenue Measures | | | | | | | |
Income Tax Act | | | | | | | |
· Reduce dividend tax credit rates for ordinary dividends and for enhanced dividends | | January 1, 2009 | | 11 | | 45 | |
· Extend film tax credits for five more years from 2008 to 2013(4) | | various | | * | | * | |
· Increase the basic Film Incentive BC tax credit rate to 35 per cent from 30 per cent and the basic Production Services Tax Credit rate to 25 percent from 18 per cent for two years | | January 1, 2008 | | (44 | ) | (44 | ) |
· Enhance the regional film tax credit for productions in distant locations | | February 20, 2008 | | (3 | ) | (3 | ) |
· Change residency requirements for BC labour expenditures | | February 20, 2008 | | * | | * | |
Corporation Capital Tax Act | | | | | | | |
· Phase-out corporation capital tax and replace with a new financial institutions minimum tax | | April 1, 2008 | | (36 | ) | (74 | ) |
· Clarify tax treatment of non-equity shares | | January 1, 2001 | | * | | * | |
International Financial Activity Act | | | | | | | |
· Change definition of international financial business to include a substantial presence test | | February 20, 2008 | | (1 | ) | (1 | ) |
· Clarify hedging activities | | September 1, 2004 | | * | | * | |
· Allow trading in short term financial instruments for non-securities corporations | | February 20, 2008 | | (1 | ) | (1 | ) |
· Allow management and control activities | | February 20, 2008 | | * | | * | |
Social Service Tax Act | | | | | | | |
· Clarify tax application to nominal value tokens provided by registered charities in exchange for donations | | February 20, 2008 | | (1 | ) | (1 | ) |
· Expand exemption for catalysts and direct agents | | February 20, 2008 | | * | | * | |
· Clarify definition of charity funds for tax refund on eligible medical equipment purchased by charities | | February 21, 2007 | | * | | * | |
· Exempt diesel emission control devices | | February 20, 2008 | | (3 | ) | (3 | ) |
· Provide exemption for samples of prescription optical and dental appliances | | February 20, 2008 | | * | | * | |
· Clarify application of trade-in allowance to motor vehicles purchased out of province | | February 20, 2008 | | * | | * | |
· Clarify formula to calculate tax on dedicated telecommunication services | | February 20, 2008 | | * | | * | |
Motor Fuel Tax Act | | | | | | | |
· Clarify use of locomotive fuel in vehicles run on rails | | February 20, 2008 | | * | | * | |
· Expand definition of crew crummy | | February 20, 2008 | | * | | * | |
· Expand tax refund for persons with disabilities | | February 20, 2008 | | (3 | ) | (3 | ) |
Hotel Room Tax Act | | | | | | | |
· Increase tax dedicated to Tourism BC to 3 percentage points | | April 1, 2008 | | * | | * | |
Ports Property Tax Act | | | | | | | |
· Extend the ports competitiveness initiative for ten years(5) | | various | | * | | * | |
Property Transfer Tax Act | | | | | | | |
· Increase the First Time Home Buyers’ threshold to $425,000 from $375,000 | | February 20, 2008 | | (22 | ) | (22 | ) |
· Remove First Time Home Buyers’ 70% financing requirement | | February 20, 2008 | | (8 | ) | (8 | ) |
(4) The cost of the extension of the film tax credits is already included in the fiscal plan.
(5) The cost is an expenditure in Ministry of Community Services budget.
Budget and Fiscal Plan – 2008/09 to 2010/11
101
Tax Measures
Table 3.1 Summary of Tax Measures – Continued
| | | | Taxpayer Impacts | |
| | Effective Date | | 2008/09 | | 2009/10 | |
| | | | ($ millions) | |
Home Owner Grant Act | | | | | | | |
· Increase home-owner grant phase-out threshold | | 2008 tax year | | * | | * | |
· Allow grant for up to two years in certain cases of extended absence | | 2008 tax year | | * | | * | |
· Provide the additional grant to owners of new homes designed with modifications that cost at least $2,000 to accommodate a disability | | 2008 tax year | | * | | * | |
· Clarify various eligibility criteria | | 2008 tax year | | * | | * | |
School Tax Act | | | | | | | |
· Set residential school property tax rates | | 2008 tax year | | * | | * | |
· Set provincial non-residential school property tax rates | | 2008 tax year | | * | | * | |
· Reduce non-residential school tax rate for major industrial property | | 2008 tax year | | (12 | ) | (24 | ) |
Taxation (Rural Area) Act | | | | | | | |
· Exempt properties used by registered charities for eligible camps and temporarily grandparent others | | 2009 tax year | | * | | * | |
· Set provincial rural area property tax rates | | 2008 tax year | | * | | * | |
British Columbia Railway Act | | | | | | | |
· Provide authority for BC Rail to make an annual grant in lieu of school tax | | 2007 tax year | | * | | * | |
Provincial Sales Tax Review | | | | | | | |
Various Consumption Tax Statutes | | | | | | | |
· Change consumption tax statutes to reduce compliance burden for business and simplify specific exemptions | | various | | (3 | ) | (3 | ) |
Total | | | | (150 | ) | (166 | ) |
Motor Fuel Tax Act | | | | | | | |
· Increase the Victoria transit tax by 1 cent per litre on behalf of Victoria Regional Transit Commission | | April 1, 2008 | | 3 | | 3 | |
Tax Measures — Supplementary Information
For more details on tax changes see Ministry of Small Business and Revenue website at:
www.sbr.gov.bc.ca/budget/budget.htm
Revenue Neutral Climate Action Initiatives
Carbon Tax
The Government intends to introduce legislation that, if passed, will impose, effective July 1, 2008, a broadly based revenue neutral tax on the purchase or use in BC of fossil fuels such as gasoline, diesel fuel, natural gas, home heating fuel, propane and coal.
The initial rate of tax for each fuel will be based on $10 per tonne of carbon dioxide equivalent (CO2e) emissions released from the burning of the fuel. CO2e is a measure of the total greenhouse effect created from all greenhouse gases (GHGs) produced from the combustion of fossil fuels, with the non-CO2 GHG emissions adjusted to a CO2e basis. The tax rates will increase over the next four years based on CO2e emissions of:
• $15 per tonne on July 1, 2009;
• $20 per tonne on July 1, 2010;
• $25 per tonne on July 1, 2011; and
• $30 per tonne on July 1, 2012.
Budget and Fiscal Plan – 2008/09 to 2010/11
102
Tax Measures
As of July 1, 2008, the tax rates for major fuel types are:
• gasoline | | 2.41 cents per litre |
• diesel fuel | | 2.76 cents per litre |
• natural gas | | 49.88 cents per gigajoule |
• heating fuel oil | | 2.76 cents per litre |
• Canadian bituminous coal | | $20.79 per tonne |
• sub-bituminous coal | | $17.72 per tonne |
The carbon tax will be revenue neutral. The legislation will require that a plan be tabled in the legislature each year showing how all of the revenue raised from the carbon tax will be used to reduce other provincial taxes.
The following personal and corporate income tax reductions will return carbon tax revenue to taxpayers in 2008/09.
Income Tax Act
Low Income Climate Action Tax Credit Introduced
To help low-income individuals and families with the carbon taxes they pay and as part of the government’s commitment that the carbon tax be revenue neutral, a new ongoing low income climate action tax credit is introduced effective July 2008.
The maximum annual tax credit is calculated as $100 per adult plus $30 per child with single parent families receiving the adult amount for the first child in the family. The maximum annual credit is reduced by two per cent of net family income (recipient’s and spouse’s net incomes from the prior year) in excess of a threshold of $30,000 for single individuals and $35,000 for families. For example, for the period from July 2008 to June 2009, a single individual with net income of $30,000 or less will receive $100; a couple or a single parent with one child and $35,000 or less in family net income will receive $200; and a couple with two children and net family income of $35,000 or less will receive $260.
The reduction thresholds will be indexed to provincial inflation starting in 2009. The maximum tax credit amounts for 2009 will increase by 5 per cent each to $105 per adult and $31.50 per child.
The credit will be paid together with the federal Goods and Services Tax Credit payment which is made each January, April, July and October. As such, eligible recipients will receive one-quarter of the annual tax credit each calendar quarter. The first payments under this program will be made in October 2008 and will include the amount for July 2008.
Budget and Fiscal Plan – 2008/09 to 2010/11
103
Tax Measures
Personal Income Tax Rates Reduced
As part of the government’s commitment that the carbon tax be revenue neutral, the bottom two provincial personal income tax rates are reduced effective for the 2008, 2009 and subsequent tax years. The rate reductions will result in a tax cut for all taxpayers of about 2 per cent in 2008 and 5 per cent in 2009 on income in the first two tax brackets, up to about $70,000 in taxable income.
Table 3.2 shows the provincial personal income tax rates prior to the rate cuts and the rates for 2008, 2009 and subsequent tax years.
Table 3.2 British Columbia Personal Income Tax Brackets and Rates
| | | | Tax rates | |
| | | | | | After changes | |
Tax bracket | | Taxable income range* | | Prior to changes | | 2008 | | 2009 | |
1 | | $1 to $35,016 | | 5.35 | % | 5.24 | % | 5.06 | % |
2 | | $35,016.01 to $70,033 | | 8.15 | % | 7.98 | % | 7.70 | % |
3 | | $70,033.01 to $80,406 | | 10.50 | % | 10.50 | % | 10.50 | % |
4 | | $80,406.01 to $97,636 | | 12.29 | % | 12.29 | % | 12.29 | % |
5 | | Over $97,636 | | 14.70 | % | 14.70 | % | 14.70 | % |
* Brackets are indexed to provincial inflation.
Table 3.3 shows the impact of the tax rate changes to British Columbia personal income taxes payable by a single individual with wage income and claiming basic credits only.
Table 3.3 British Columbia Tax Cut – Impact on Taxpayers*
| | 2008 BC tax | | Reduction in tax | | Percentage change | |
Taxable Income | | before tax cuts | | 2008 | | 2009 | | when fully implemented | |
$20,000 | | $ | 233 | | $ | 11 | | $ | 28 | | 12 | % |
$30,000 | | $ | 1,015 | | $ | 20 | | $ | 55 | | 5 | % |
$40,000 | | $ | 1,654 | | $ | 34 | | $ | 90 | | 5 | % |
$50,000 | | $ | 2,455 | | $ | 51 | | $ | 134 | | 5 | % |
$60,000 | | $ | 3,270 | | $ | 68 | | $ | 179 | | 5 | % |
$70,000 | | $ | 4,085 | | $ | 85 | | $ | 224 | | 5 | % |
$80,000 | | $ | 5,134 | | $ | 85 | | $ | 224 | | 4 | % |
$100,000 | | $ | 7,642 | | $ | 85 | | $ | 224 | | 3 | % |
$120,000 | | $ | 10,582 | | $ | 85 | | $ | 224 | | 2 | % |
$150,000 | | $ | 14,992 | | $ | 85 | | $ | 224 | | 1 | % |
* Calculated for a single taxpayer with wage income and claiming basic credits.
The tax rate reductions build on the personal income tax cuts the government has introduced since 2001. These tax cuts include the 25 per cent tax cut in 2001, the BC Tax Reduction in 2005, the 10 per cent tax cut in 2007 and the reductions announced in this year’s budget. Table 3.4 shows the impact of these changes by comparing BC taxes payable using rates in effect prior to the changes in 2001 and after the rates are cut for 2009.
Budget and Fiscal Plan – 2008/09 to 2010/11
104
Tax Measures
Table 3.4 British Columbia Personal Income Taxes Payable Before 2001 and After 2009 Tax Cuts*
| | BC tax before | | BC tax after | | Reduction | | Percentage change | |
Taxable Income | | 2001 tax cuts | | after 2009 tax cuts | | in BC tax | | in BC tax | |
$15,000 | | $ | 419 | | $ | 0 | | $ | 419 | | -100 | % |
$20,000 | | $ | 810 | | $ | 205 | | $ | 605 | | -75 | % |
$30,000 | | $ | 1,594 | | $ | 960 | | $ | 634 | | -40 | % |
$40,000 | | $ | 2,553 | | $ | 1,564 | | $ | 989 | | -39 | % |
$50,000 | | $ | 3,721 | | $ | 2,321 | | $ | 1,400 | | -38 | % |
$60,000 | | $ | 4,911 | | $ | 3,091 | | $ | 1,820 | | -37 | % |
$70,000 | | $ | 6,101 | | $ | 3,861 | | $ | 2,240 | | -37 | % |
$80,000 | | $ | 7,769 | | $ | 4,910 | | $ | 2,859 | | -37 | % |
$100,000 | | $ | 11,525 | | $ | 7,418 | | $ | 4,107 | | -36 | % |
$120,000 | | $ | 15,465 | | $ | 10,358 | | $ | 5,107 | | -33 | % |
$150,000 | | $ | 21,375 | | $ | 14,768 | | $ | 6,607 | | -31 | % |
* Taxes are calculated for a single wage earner claiming basic credits and using 2008 credit amounts and tax bracket thresholds. Taxes before tax cuts are calculated using tax rates in place prior to the 25 per cent tax cut in 2001. Taxes after tax cuts are calculated using 2009 tax rates as announced in Budget 2008.
General Corporate Income Tax Rate Reduced
As part of the government’s commitment that the carbon tax be revenue neutral, the provincial general corporate income tax rate is reduced from 12 per cent to 11 per cent effective July 1, 2008. Since 2001, the rate has been reduced from 16.5 per cent to 11 per cent, a reduction of one-third.
Small Business Corporate Income Tax Rate Reduced
As part of the government’s commitment that the carbon tax be revenue neutral, the small business corporate income tax rate is reduced to 3.5 per cent from 4.5 per cent effective July 1, 2008, a reduction of 22 per cent. In recognition of the importance of small business to the economy, the small business tax rate threshold has also been doubled from $200,000 to $400,000 since 2001.
One-time Climate Action Dividend Payment
In addition to the tax cuts outlined above to make the carbon tax revenue neutral, the province will make an additional one-time climate action dividend payment of $100 to each British Columbian who was resident in the province on December 31, 2007. This additional payment, which is funded from the 2007/08 surplus, is intended to help British Columbians make changes to reduce their use of fossil fuels.
Individuals who have attained the age of 18 years, meet the residency requirement and are not incarcerated for a period of 90 days that includes January 1, 2008, and who have filed either a 2006 or 2007 personal income tax return for British Columbia, will receive the payment automatically. In addition to their $100 payment, parents will receive $100 for each child that is under 18 years of age at the end of 2007.
Budget and Fiscal Plan – 2008/09 to 2010/11
105
Tax Measures
Most British Columbians will receive their one-time payment in June 2008. Payments will continue to be made as eligible British Columbians file their income tax returns. To receive a payment, individuals must file an income tax return or notify the province of their eligibility no later than August 31, 2010.
Outreach programs will be established to ensure that all eligible British Columbians receive their payments.
Other Climate Action Initiatives
Small Business Venture Capital Act
Equity Capital Budget Increased for Clean Technology
Effective 2008/09, the tax credit budget for the equity capital program is increased by $5 million annually with $7.5 million of the total budget allocated to clean technology businesses. With this change, the total tax credit budget for the Equity Capital Program rises to $30 million annually.
International Financial Activity Act
Intellectual Property Expanded to Include Green-Related Patents
Effective March 1, 2008, the list of eligible life-science related patents is expanded to include patents with classifications under the International Patent Classification System related to power generation using forces of nature such as wind, solar and tidal.
Social Service Tax Act
Tax Relief Provided for Certain Conventional Fuel Efficient Vehicles
Effective February 20, 2008, a point-of-sale tax reduction is provided for the purchase or lease of new conventional fuel efficient vehicles that meet the fuel efficiency criteria set out in the federal government’s ecoAUTO rebate program.
The tax reduction program is generally based on the federal program with the following differences:
• hybrid vehicles and other alternative fuel vehicles eligible for existing partial provincial sales tax (PST) reductions to a maximum of $2,000 and $1,000 respectively will continue to receive that benefit;
• flexible fuel vehicles are treated the same as conventional gasoline or diesel powered vehicles; and
• unlike the federal program, there is no new levy imposed on fuel inefficient vehicles.
Budget and Fiscal Plan – 2008/09 to 2010/11
106
Tax Measures
Otherwise, all vehicles eligible for a federal rebate will receive a point-of-sale PST reduction equal to the amount of the federal rebate. Table 3.5 shows fuel efficiency ratings required to qualify for a tax reduction, the amount of the tax reduction and 2008 model year vehicles that qualify.
Table 3.5 Tax Reductions for Fuel Efficient Vehicles
Fuel Efficiency | | | | | |
Ratings(1) | | Tax Reductions | | Qualifying 2008 Vehicle Models(2) | |
Passenger Cars: | | | | | |
5.5 or less | | $ | 2,000 | | Smart For Two | |
5.6 to 6.0 | | $ | 1,500 | | — | |
6.1 to 6.5 | | $ | 1,000 | | Toyota Corolla, Toyota Yaris, Mini Cooper, Honda Civic, Honda Fit | |
| | | | | |
Light Trucks: | | | | | |
7.3 or less | | $ | 2,000 | | — | |
7.4 to 7.8 | | $ | 1,500 | | — | |
7.9 to 8.3 | | $ | 1,000 | | Jeep Compass, Jeep Patriot Chevrolet HHR, Nissan Rogue | |
(1) Fuel efficiency ratings are weighted averages of vehicle city fuel consumption (55%) and highway fuel consumption (45%) ratings as indicated by the federal government’s EnerGuide label for new motor vehicles. The ratings are expressed as litres per 100 kilometres.
(2) Some sub-models within a model group may not be eligible due to higher fuel consumption.
The tax reduction for conventional fuel efficient vehicles, hybrid electric vehicles and all other alternative fuel vehicles will expire on March 31, 2011.
Exemption Provided for “ENERGY STAR Qualified” Refrigerators, Clothes Washers and Freezers
Effective February 20, 2008, an exemption is provided for residential refrigerators, clothes washers and freezers that are listed as being “ENERGY STAR Qualified” by the Office of Energy Efficiency, Natural Resources Canada.
To be listed as “ENERGY STAR Qualified” products must meet or exceed technical specifications to ensure they are among the most energy efficient in the marketplace. This exemption will expire on March 31, 2010.
Although the production of hydro electricity does not itself produce greenhouse gas emissions, conservation of electricity is essential to achieving provincial Energy Plan objectives to reduce and, in the future, eliminate the importation of electricity produced from less environmentally friendly sources such as coal.
Exemption Provided for Energy Efficient Residential Gas-Fired Water Heaters
Effective February 20, 2008, gas-fired water heaters with an energy factor of 0.80 or greater are exempt from PST when purchased for residential use. The energy factor is a measure of efficiency and is determined according to
Budget and Fiscal Plan – 2008/09 to 2010/11
107
Tax Measures
Canadian Standards Association standardized testing methods. A list of eligible gas-fired water heaters is available at the Ministry of Small Business and Revenue website. This exemption will expire on December 31, 2009.
Exemption Provided for Production Machinery and Equipment Used by Local Governments for Power Production and Cogeneration Purposes
Effective February 20, 2008, local governments, including local government corporations, may qualify for exemption from PST on purchases or leases of production machinery and equipment used primarily to generate electricity or in a cogeneration plant to generate electricity and heat for sale or own use. Eligible machinery and equipment includes turbines, generators, cogenerating reciprocating engines, heat exchangers, boilers and associated equipment necessary for their operation.
Relief Provided from Passenger Vehicle Rental Tax for Short-Term Rentals
Due to uncertainty about the applicability of passenger vehicle rental tax (PVRT) to car-sharing organizations and automotive service facilities, the legislation clarifies that PVRT does not apply to leases entered into before April 1, 2008. As of February 20, 2008, PVRT should not be charged on leases made between a membership-based car-sharing organization and a member of the organization or on leases between an automotive service facility and a person receiving services to a motor vehicle from the facility (i.e. courtesy cars). If members of a car-sharing organization or persons who leased a courtesy car paid PVRT on these leases, the members or persons may apply for a refund of tax paid prior to February 20, 2008.
Effective April 1, 2008, the $1.50 per day PVRT will not apply to passenger vehicles leased for a period of 8 consecutive hours or less. While this tax relief will benefit members of car sharing companies and vehicle co-operatives who lease vehicles by the hour for short periods, it also applies to passenger vehicles leased from all lessors, including rental companies and automotive service facilities that provide courtesy vehicles for their customers.
Bicycle Exemption Expanded to Include Electric Power-Assisted Two and Three Wheeled Cycles and Non-Motorized Tricycles
Effective February 20, 2008, the exemption from PST for non-motorized two wheeled bicycles is expanded to include electric power-assisted two and three wheeled cycles. To be eligible, electric power-assisted cycles must be equipped with pedals or hand cranks for propelling the cycle by muscular power. The exemption for power-assisted cycles will expire on March 31, 2011. The exemption is also broadened to include adult-sized non-motorized three wheeled tricycles.
Tax Reduction for Electric Motorcycles
Effective February 20, 2008, two-wheeled vehicles that are manufactured to operate exclusively on electricity are eligible for the alternative fuel vehicle tax reduction. Electric motorcycles and other two-wheeled electric vehicles are eligible for a tax reduction of 50 per cent, to a maximum of $1,000,
Budget and Fiscal Plan – 2008/09 to 2010/11
108
Tax Measures
provided certain eligibility criteria are met. The tax reduction will expire on March 31, 2011.
Exemption Provided for Insulation for Hot Water Tanks, Pipes and Ductwork
Effective February 20, 2008, a new exemption from PST is provided for the purchase of insulation designed to prevent heat loss from hot water tanks, hot and cold water pipes, and ductwork (e.g., insulation jackets for hot water heaters, foam insulation sleeves for hot water pipes). The exemption does not apply to tapes and sealants.
Tax Reduction for Hydrogen Fuel Cell Buses
Effective February 20, 2008, hydrogen fuel cell passenger buses are eligible for a 50 per cent reduction in the amount of tax payable on the purchase or lease of the bus to a maximum of $10,000. This parallels the tax reduction available to other alternative fuel passenger buses. The tax reduction will expire on March 31, 2011.
Exemption Provided for Biodiesel Fuel Used for Heating
Effective February 20, 2008, an exemption from PST is provided for biodiesel fuel, including the portion of biodiesel fuel used in a furnace oil blend, when used for heating or other non-motive purposes.
Exemption Provided for Certain Aerodynamic Devices Purchased for Use on Commercial Motor Vehicles
Effective February 20, 2008, the following devices are exempt from PST when purchased for the purpose of increasing the aerodynamics of a commercial tractor trailer:
• tractor/trailer gap faring device;
• tractor roof faring;
• trailer side skirts; and
• aerodynamic bumper and tank skirts.
These devices can significantly improve the fuel efficiency of commercial tractor-trailers. Labour charges to install exempt devices are also exempt.
Tax Imposed on Coal and Coke Except for Residential Use
Effective February 20, 2008, the exemption from PST for coal and coke is repealed except when purchased for use in a residential dwelling unit. This amendment removes a historical tax preference for coal and coke compared to other sources of energy such as natural gas, fuel oil and electricity when purchased for commercial use.
Budget and Fiscal Plan – 2008/09 to 2010/11
109
Tax Measures
A one-year transitional refund is provided for purchases of coal or coke under fixed-price contracts entered into before February 20, 2008 where the contract cannot be adjusted to account for the tax.
Motor Fuel Tax Act
Alternative Motor Fuel (AMF) Classification for Biodiesel and Ethanol Expanded
Effective February 20, 2008, biodiesel and ethanol are classified as alternative motor fuels (AMFs) for all purposes. As such, biodiesel and ethanol used as coloured fuel, marine diesel, locomotive fuel, jet fuel or aviation fuel, including the portion used in a fuel blend, are exempt from tax. Previously biodiesel and ethanol were only exempt from tax when used in a motor vehicle on a highway.
Other Revenue Measures
Income Tax Act
Dividend Tax Credit Rates Reduced
Effective January 1, 2009, the provincial personal income tax dividend tax credit rates are reduced to reflect the one percentage point reduction in both the general and small business corporate income tax rates. The dividend tax credit rate applicable to enhanced dividends is reduced to 11 per cent from 12 per cent and the dividend tax credit applicable to ordinary dividends is reduced to 4.2 per cent from 5.1 per cent.
Film Tax Credits Extended for Five Years
As announced on October 19, 2007, the Production Services Tax Credit and Film Incentive BC tax credit are extended for five years to June and April 2013 respectively.
Basic Film Tax Credit Rates Increased for Two Years
As announced on January 25, 2008, the basic Film Incentive BC tax credit rate is increased to 35 per cent from 30 per cent and the basic Production Services Tax Credit rate is increased to 25 per cent from 18 per cent. These rates apply to qualifying BC labour expenditures incurred after December 31, 2007 and for new productions with principal photography beginning before January 1, 2010.
Regional Film Tax Credit Enhanced
Effective for productions with principal photography beginning after February 19, 2008, the regional film tax credit rates are increased for production activity in areas more distant from the Lower Mainland. Currently, the province provides additional credits for production activity in regions of the province outside a designated Vancouver area based on a labour-management agreed upon area called the Vancouver Zone. For purposes of the regional film tax credits, two regions will be defined that are outside the designated Vancouver area: the nearby region and the distant region.
Budget and Fiscal Plan – 2008/09 to 2010/11
110
Tax Measures
The nearby region will extend from the designated Vancouver area north up to and including Whistler, east to include Hope and will include the Capital Regional District. The distant region will be the area of the province beyond the nearby region.
The regional credit rates for the nearby region will be the same as the previous regional credit rates of 12.5 per cent for Film Incentive BC and 6 per cent for the Production Services Tax Credit. The regional credit rates for the distant region will be 18.5 per cent for the Film Incentive BC tax credit and 12 per cent for the Production Services Tax Credit.
Definition of BC-based Individual Changed
Currently, a BC-based individual is defined for the entire length of a production based on the residency status of the individual in the calendar year that precedes the year principal photography begins. Effective for productions with principal photography beginning after February 19, 2008, a BC-based individual is a person who is resident in the province on December 31 of the year preceding the year for which the tax credit is claimed. This change will help a production that spans more than one year in the tax credit calculation.
Corporation Capital Tax Act
Existing Corporation Capital Tax Phased out and Replaced with a Financial Institution Minimum Tax
The existing corporation capital tax is phased-out over three years by reducing the tax rates by one-third effective April 1, 2008, one-third effective April 1, 2009 and eliminated effective April 1, 2010. The following table shows current rates and the phase-out schedule over the next three years.
Table 3.6 Corporation Capital Tax Rates |
|
| | Tax rates | |
Tax Rate | | Current | | April 1, 2008 | | April 1, 2009 | | April 1, 2010 | |
Small financial institutions* | | 1 | % | 2/3 | % | 1/3 | % | 0 | % |
Large financial institutions | | 3 | % | 2 | % | 1 | % | 0 | % |
* Financial institutions with paid up capital under $1 billion or that have a head office in BC.
Effective April 1, 2010, a minimum tax will apply to financial institutions that have net paid up capital in excess of $1 billion. The tax will be calculated as one per cent of BC paid up capital and a deduction for BC corporate income taxes paid will be allowed. This will ensure that large financial institutions pay a minimum amount of tax each year.
Tax Treatment of Non-equity Shares Clarified
The Act is amended to clarify that only non-equity shares of credit unions are to be excluded from the tax base for purposes of corporation capital tax liabilities. This change is effective January 1, 2001.
Budget and Fiscal Plan – 2008/09 to 2010/11
111
Tax Measures
International Financial Activity Act
Definition of International Financial Business Amended
Effective February 20, 2008, the definition of international financial business is changed to include a substantial presence test. This change is made following consultations with taxpayers regarding the definition, which is critical to the program. The new definition of international financial business will include the following requirements:
· the corporation carries on an active business; or
· the corporation incurs a prescribed amount of expenditures for services rendered in BC in connection with international financial activities; and
· the corporation has shares of a prescribed level.
Allowable Hedging Activities Clarified
Effective September 1, 2004, the Act is amended to clarify the inclusion of hedging activities for taxpayers.
Short Term Financial Instruments Allowed
Effective February 20, 2008, the Act is amended to allow non-securities corporations to trade in money market investments. These are generally short-term investments and include treasury bills issued by a government, commercial paper and bankers’ acceptances.
Management and Control Activities Allowed
Effective February 20, 2008, the Act is amended to allow management and control functions as eligible international financial activity. Management and control functions will be prescribed and will include, for example, human resource and strategic planning services.
Social Service Tax Act
Application of Tax to Tokens Provided by Registered Charities In Exchange for Donations Clarified
Effective February 20, 2008, registered charities that provide tangible personal property of nominal value (tokens or gifts such as pins, ribbons, plastic bookmarks etc.) in exchange for donations are not required to collect PST from donors. In these circumstances, registered charities are required to pay PST on the purchase of the tokens or gifts. This tax application to goods of nominal value does not apply to goods sold by charity-run thrift stores which must continue to collect tax on their sales, to items of more than nominal value provided to donors, or to items sold by or on behalf of charities for a fixed price.
Budget and Fiscal Plan – 2008/09 to 2010/11
112
Tax Measures
Exemption Expanded for Catalysts and Direct Agents
Effective February 20, 2008, the PST exemption for catalysts and direct agents is expanded to include chemical substances that produce or modify a reaction that is essential for the processing or manufacture of a product for sale or lease. Reactions produced or modified by catalysts, direct agents and chemical substances may be physical or chemical in nature. The exemption no longer requires direct contact with the material being processed or manufactured. The exemption does not apply to substances:
· used to maintain, lubricate or prolong the life of machinery;
· added to a tailings or settling pond or to waste removed from the production process; or
· used for testing.
To qualify as processing, the processing must be a series of operations or a complex operation that results in a substantial change in the form or other physical or chemical characteristics of the tangible personal property.
This exemption also does not include changes in state effected only by temperature or pressure changes (e.g. from ice to water).
This change fully implements a 2007 PST Review recommendation by building on the results of a 2007 British Columbia Court of Appeal decision.
Charity Funds Eligible for the Registered Charities Medical Equipment Refund Clarified
Effective February 21, 2007, the definition of charity funds is clarified to include bingo affiliation grants for purposes of the medical equipment refund available to registered charities or eligible hospital auxiliaries. As a result, registered charities and eligible hospital auxiliaries may apply for refunds of PST paid on medical equipment purchased with the charity’s or auxiliary’s bingo affiliation grants.
Exemption Provided for Diesel Vehicle Emission Control Devices
Effective February 20, 2008, an exemption from PST is provided for emission control devices for diesel vehicles that are verified to reduce particulate emissions by at least 20 per cent if purchased before January 1, 2009. Emission control devices for diesel vehicles that are verified to reduce particulate emissions by at least 50 per cent are exempt if purchased before April 1, 2011. Labour charges to install exempt emission control devices are also exempt.
Exemption Introduced for Samples of Prescription Optical and Dental Appliances
Effective February 20, 2008, prescription dental and optical appliances provided for promotional purposes to a dentist, optometrist, optician, or physician are exempt from PST. This parallels the tax treatment provided to pharmaceutical samples.
Budget and Fiscal Plan – 2008/09 to 2010/11
113
Tax Measures
Trade-In Allowance for Out-of-Province Motor Vehicle Purchases Clarified
Effective February 20, 2008, the trade-in allowance is clarified to apply to purchases of motor vehicles from other Canadian jurisdictions for use in BC. The trade-in allowance allows purchasers to pay tax on the difference between the purchase price of the new vehicle and the value of the vehicle taken in trade. To qualify for the trade-in allowance on out of province purchases the trade-in vehicle must have been licensed in BC.
Formula to Calculate Tax Payable on Dedicated Telecommunications Services Clarified
Effective February 20, 2008, the application of PST to dedicated telecommunications services in BC is clarified by excluding distances to and from satellites to calculate the tax payable. With this clarification only the most direct land distance between originating and receiving transmitters is used to calculate the total distance.
Motor Fuel Tax Act
Locomotive Fuel Use in Vehicles Run on Rails Clarified
Effective February 20, 2008, the Act is amended to clarify that motor vehicles that also run on railway tracks are authorized to use locomotive fuel while traveling on the rails. Purchasers must self-assess and remit tax at the higher clear fuel tax rate for fuel used on highway.
Coloured Fuel Use in Crew Crummies Expanded
Effective February 20, 2008, crew crummies used by logging and mineral mining companies may use lower taxed coloured fuel when transporting contractors or agents as well as employees. This is consistent with longstanding administrative and industry practice.
Tax Refund Expanded for Persons with Disabilities
Effective February 20, 2008, the fuel tax refund for persons with disabilities is expanded to include persons with mental disabilities. To be eligible individuals must be certified by a medical practitioner as suffering from a permanent mental disability which precludes them from safely using public transit. Payments are made to guardians on behalf of eligible individuals.
Hotel Room Tax Act
Funding Increased for Tourism BC
Effective April 1, 2008, the proportion of the 8 per cent hotel room tax transferred to Tourism BC is increased to 3 percentage points from 1.65 percentage points.
Budget and Fiscal Plan – 2008/09 to 2010/11
114
Tax Measures
Ports Property Tax Act
Ports Competitiveness Initiative Extended for 10 years
The ports competitiveness initiative under which property tax relief is provided to port operators is extended for ten years. The initiative includes a municipal tax rate cap of $27.50 per $1,000 of assessed value on existing ports facilities, a 10-year cap on municipal tax rates for new investment in ports facilities of $22.50 per $1,000 of assessed value, and an increase in annual base compensation to municipalities. Starting in 2009 compensation will be adjusted annually for inflation.
Property Transfer Tax Act
Fair Market Value Threshold for Eligibility under the First Time Home Buyers’ Program Increased
Effective for registrations after February 19, 2008, the fair market value threshold for eligible residential property under the First Time Home Buyers’ Program is increased to $425,000 from $375,000.
A proportional exemption is provided for principal residences that have a fair market value up to $25,000 above the new threshold.
Financing Requirements under the First Time Home Buyers’ Program Removed
Effective February 20, 2008 first time buyers are no longer required to have registered financing to be eligible for the exemption.
For first time buyers who bought a home prior to February 20, 2008, and were eligible for the exemption because they had a mortgage of at least 70 per cent, the requirements regarding the amount by which the mortgage may be reduced during the first year of ownership remain in place until midnight February 19, 2008. After February 19, 2008, a mortgage may be paid down by any amount without losing entitlement to the exemption.
Home Owner Grant Act
Threshold for Home Owner Grant Phase-out Increased
As announced on January 11, 2008, effective for the 2008 tax year, the threshold for the phase-out of the home owner grant is increased to $1,050,000 of assessed value from $950,000. This change ensures that more than 95 per cent of homeowners remain eligible for the full grant.
For properties valued above the threshold of $1,050,000, the grant is reduced by $5 for every $1,000 of assessed value in excess of the threshold. The basic grant is eliminated for properties valued at $1,164,000 and above and for recipients of the additional grant, which is available to seniors, veterans and the disabled, it is eliminated for properties valued at $1,219,000 and above.
Budget and Fiscal Plan – 2008/09 to 2010/11
115
Tax Measures
Grant Provided During an Extended Absence
A person who ceases to occupy their residence because of damage or destruction from fire, flood or other natural disasters during reconstruction or repair may claim the grant or the low-income grant supplement for up to two taxation years if:
· the person occupied the residence as their principal residence before it was damaged or destroyed and intends to reoccupy it as their principal residence once it has been reconstructed or repaired;
· the residence is unoccupied and is not rented or for sale during the absence; and
· the person would have been eligible for a grant or a low-income grant supplement had the damaged or destroyed residence continued to be their principal residence during the absence.
A person who ceases to occupy their residence for any other reason, other than incarceration, may claim the grant for up to two taxation years if:
· the person occupied the residence as their principal residence before the absence and received a grant or low-income grant supplement on the residence in the year before the absence;
· the person intends to reoccupy the residence as their principal residence in the first taxation year after the last taxation year in which they claimed a home owner grant or low-income grant supplement as an absent owner;
· the residence is occupied by a spouse or relative of the owner or is vacant during the absence;
· the residence is not rented or for sale during the absence; and,
· the person would have been eligible for a home owner grant or low-income grant supplement had the residence continued to be their principal residence during the absence.
Disability Portion of Additional Grant for Home Owners Expanded
Effective for the 2008 tax year, home owners may qualify for the additional grant if they construct a new residence that has design specifications that have been modified to meet their disability needs or those of their spouse or relative and the modifications impose a cost that exceeds $2,000.
The Home Owner Grant Act is Clarified
The following clarifications are made to the Act:
· the definition of spouse is amended so that those who cohabit and live in a marriage-like relationship for a period of at least two years before they apply for a low-income grant supplement are considered spouses for purposes of the Act;
· the Act is amended to clarify that:
Budget and Fiscal Plan – 2008/09 to 2010/11
116
Tax Measures
· if an individual has received a home owner grant or a low-income grant supplement in respect of a residence for a taxation year, neither they nor their spouse may claim a home owner grant or a low-income grant supplement in respect of another residence for that year; and
· an individual may not claim a grant or a low-income grant supplement in respect of a residence for which their spouse has already claimed a grant or low-income grant supplement for a taxation year unless they claim a partial home owner grant or low-income grant supplement.
· a permanent resident is defined to have the same meaning as in the Immigration and Refugee Protection Act (Canada). The conditions for eligibility under the Act are amended to clarify that the applicant must be a Canadian citizen or permanent resident and that they must be ordinarily resident in British Columbia; and
· the conditions under which the spouse or relative of a deceased person may be eligible for the grant are amended to clarify that the deceased person must have been a Canadian citizen or permanent resident and must have occupied the residence as their principal residence at the time of death.
School Act
Provincial Residential School Property Tax Rates Policy Set
For the 2008 tax year, average residential school property taxes before application of the homeowner grant will be increased by the provincial inflation rate from the previous year. This rate setting policy has been in place since 2003.
Provincial Non-Residential School Property Tax Rates Policy Set
A single province-wide rate is set for each of the seven non-residential property classes.
In response to increases in assessed values, the rates for 2008, except for the rate for the major industry property class, will be set so that the change in total non-residential school tax revenue will be limited to inflation plus new construction. This adjustment to rates may differ by property class to reflect differences in relative changes in assessed values by class. The rates will be set when revised assessment roll data are available.
School Tax Rate for Major Industrial Property Reduced
Effective January 1, 2008, to reflect the competitive pressures facing British Columbia’s export oriented sectors, the provincial school tax rate on major industrial property will be reduced. Beginning in 2008, the rate will be reduced over two years to equal the business class rate.
This will provide a tax reduction of $12 million in 2008 and $24 million in 2009 and future years to British Columbia’s major industrial properties including pulpmills, sawmills, ports and mines.
Budget and Fiscal Plan – 2008/09 to 2010/11
117
Tax Measures
Taxation (Rural Area) Act
Exemption and Temporary Grandparenting Provided for Camp Properties that were Previously Exempt
In response to a Property Assessment Appeal Board decision, effective for the 2009 tax year, an exemption is provided for eligible camps that are owned, held in trust for, or occupied by a charity registered under the Income Tax Act (Canada).
Camps that were exempt prior to the decision but that do not qualify under the new exemption will be exempt for the 2008, 2009 and 2010 tax years. This will provide owners of those properties time to consult with government regarding eligibility criteria for the exemption or to seek registered charity status to qualify for the exemption.
Provincial Rural Area Property Tax Rates Policy Set
A single provincial rural residential tax rate applies province-wide. For the 2008 tax year, the average residential provincial rural area taxes will increase by the 2007 provincial inflation rate.
Non-residential provincial rural tax rates will be set so that the change in total non-residential rural tax revenue will be limited to inflation plus new construction.
British Columbia Railway Act
Authority Provided for BC Rail to pay Grants in Lieu of School Tax to the Province
Effective for the 2007 and subsequent tax years, in keeping with government policy, British Columbia Railway Company may make an annual grant to the Surveyor of Taxes, on behalf of the province, equivalent to the taxes that the company would have paid under the School Act if it were subject to taxation.
Victoria Regional Transit Commission Tax Increased by 1 Cent Per Litre
Effective April 1, 2008, at the request of the Victoria Regional Transit Commission, the tax collected by the province on its behalf to help fund the local share of transit services is increased by 1 cent per litre to 3.5 cents per litre.
Budget and Fiscal Plan – 2008/09 to 2010/11
118
Tax Measures
Provincial Sales Tax Review
A competitive and streamlined tax structure benefits British Columbians by making it easier to do business, encourages business growth and investment, and promotes British Columbia as the most small-business-friendly jurisdiction in Canada. In turn, the economic benefits of a streamlined tax structure support the province’s great goal to lead Canada in job creation.
To this end, the Ministry of Small Business and Revenue, with the support of the Ministry of Finance, completed a review of provincial sales tax (PST) policies and legislation. The review sought to develop options to simplify, streamline and enhance the fairness of the sales tax. Results from the first phase of the review were announced in Budget 2007.
Over 2007/08, the Ministry of Small Business and Revenue conducted further reviews, focusing on specific issues that arose during the 2007 consultation process. Changes in Budget 2008 that flow from the PST Review are described below. These changes streamline, simplify, and clarify the tax for business across British Columbia. Detailed information on these changes is available on the Ministry of Small Business and Revenue website.
PST Exemption Provided for Bona Fide Farmers
Effective February 20th, 2008, bona fide farmers and aquaculturists are exempt from PST on purchases of qualifying all terrain vehicles acquired and used solely for a farm or aquaculture purpose. To qualify, ATVs must have an engine displacement of 200 cc or greater and must be equipped at the time of sale with a carrying rack, platform or cargo box.
Government will continue to review the application of the PST to farm equipment on an ongoing basis with a focus on streamlining and simplification.
Coloured Fuel Use in Farm Vehicles
Effective February 20, 2008, under the Motor Fuel Tax Act, authorized coloured fuel use in farm vehicles is expanded to allow all vehicles licensed as farm vehicles under the Commercial Transport Act to use coloured fuel when traveling for farm purposes on a highway. This change will ensure all farms qualify for the benefit regardless of business structure. As the existing family farm truck emblem program is no longer required, it is eliminated.
Work Related Safety Equipment Exemption Modified
Effective February 20, 2008, work related safety equipment and apparel worn by or attached to a worker and purchased to meet the requirements of the Workers Compensation Act or the Mines Act is exempt from PST if it is:
· purchased by an employer for use by their employees in the course of their employment, or
· purchased by a person who is self-employed for own use in the course of self-employment, or
· purchased by a school board or similar authority for use in instructing students.
All workers continue to be exempt at the point-of-sale on the purchase of safety eyewear, footwear, head protection, hearing protection and gloves. In addition, the exemption for gloves is clarified and expanded to include any gloves with built in safety features, such as reinforced thumbs, cuffs or palms, that protect the wearer from physical injury. These changes support work safety and bring greater clarity and certainty to the exemption.
Budget and Fiscal Plan – 2008/09 to 2010/11
119
Tax Measures
Tax Application to Real Property Improvements Clarified and Simplified
Effective with contracts entered into on or after October 1, 2008, a contractor is responsible for paying the PST on any tangible personal property used in the completion of a contract to improve real property, unless the contract explicitly states that the customer is liable for the tax. Where a customer would be eligible for exemption on some or all of the materials if that customer purchased them directly (e.g. First Nations, Diplomatic Corps, Farmers), the contractor is eligible to claim the exemption on the purchase of the materials. The current application of tax depends upon whether a contract is for time and materials or for a lump sum amount, but there are no clear guidelines for determining the nature of the contract. The amendments remove tax uncertainty by providing clear guidelines on the application of tax to real property contracts, and allows businesses to determine the type of contract they wish to establish with their customer. The delayed implementation is to ensure that contractors have sufficient time to become fully familiar with the new application and to make any adjustments required to their business processes.
Special Registration Number Introduced
Effective April 1, 2008, eligible businesses may enter into an agreement with the Ministry of Small Business and Revenue to obtain a special registration number. Using the registration number replaces the need to complete a certificate of exemption for purchasing exempt production machinery and equipment and to apply for a refund of tax paid on items purchased in the province and subsequently shipped out of province for use. The special registration number will allow eligible businesses to purchase qualifying inventory exempt, and to self assess tax on any items subsequently used for a taxable purpose.
To be eligible to enter into an agreement, the business must purchase a minimum annual inventory of $250,000 and
· be eligible for exemption on the purchase or lease of production machinery and equipment, or
· be eligible for a refund of tax paid on items purchased in the province, retained in inventory, and subsequently removed from the province for use outside of the province.
Application of PST to Trusts and Amalgamations Clarified
Public information has been developed to provide clear guidelines on the application of PST to transactions involving trusts and the amalgamation of companies or organizations. As well, the application of PST to transfers of assets involving family and spousal trusts are clarified in the regulations. This provides greater clarity and tax certainty for business and individuals.
Application of PST to Partnerships Clarified
Public information has been developed to provide clear guidelines on the application of PST to transactions involving partnerships. This provides greater clarity and tax certainty for businesses and individuals.
Definition of Well Head Simplified
Effective February 20, 2008, the term “well head” for purposes of the production machinery and equipment exemption is replaced with the term well site. The well site is the area identified as such in applications for approval to drill submitted to the Oil and Gas Commission. This aligns the exemption with industry practice and clarifies eligibility for exemption.
Budget and Fiscal Plan – 2008/09 to 2010/11
120
Part 4: BRITISH COLUMBIA ECONOMIC REVIEW AND OUTLOOK
Summary
· The Ministry of Finance forecasts BC economic growth of 2.4 per cent in 2008 and 2.8 per cent in 2009 (see Chart 4.1).
· The forecast for BC in 2008 reflects the economic slowdown in the US, in particular the weakness in the US housing sector.
· The US housing market decline is having a pronounced negative impact on BC’s forest product exports.
· BC’s economy is now more diverse than in earlier decades, and the province’s domestic economy is less affected by weakness in the US than it was previously.
· In the medium-term, growth is expected to be slightly weaker than previously forecast due to a softer outlook for the US and Canadian economies, and associated weakness in BC’s trade sector.
The main risks to the economic outlook are:
· weaker than expected US economic growth driven by a deeper than expected housing market crash and financial sector crisis;
· a Canadian dollar significantly above the current forecast;
· slower than anticipated global demand resulting in reduced demand for BC’s exports;
· skilled labour shortages and inter-provincial migration pressures; and
· the response of BC’s forest industry to the Mountain Pine Beetle epidemic.
Chart 4.1 British Columbia’s economic outlook
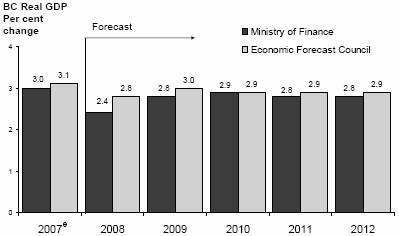
e: estimate; The EFC provided an average forecast for 2010 to 2012
(1) Reflects information available as of February 6, 2008 with the exception of Statistics Canada’s January Labour Force Survey results, released February 8, 2008. All annual and quarterly references are for the calendar year. Some numbers may not add due to rounding.
Budget and Fiscal Plan – 2008/09 to 2010/11
121
British Columbia Economic Review and Outlook
The Economic Forecast Council’s average estimate of BC’s economic growth is 3.1 per cent for 2007, 2.8 per cent for 2008 and 3.0 per cent for 2009. Over the medium - term (2010 to 2012), the Council’s average forecast calls for BC’s economic growth to be 2.9 per cent per year. Consistent with prudent forecast assumptions, the Ministry of Finance’s medium-term outlook is slightly lower than the Economic Forecast Council’s outlook, at 2.8 per cent per year on average (see Chart 4.1). A topic box at the end of Part 4 reports on the consultation between the Economic Forecast Council and the Ministry of Finance.
Recent Developments
BC’s economy showed considerable domestic strength in 2007, with solid growth in retail sales and housing. On the trade side, the value of merchandise exports declined due to the highly valued Canadian dollar and reduced demand for BC’s forest product exports caused by the US housing market slowdown. Lower natural gas and forest prices also put downward pressure on economic growth in the province.
The performance of key BC economic indicators in recent quarters is presented in Table 4.1.
Table 4.1 British Columbia Economic Indicators |
|
Data seasonally adjusted unless otherwise noted |
| | Third Quarter | | Fourth Quarter | | Year-to-Date | |
| | Jul. to Sep. 2007
change from
Apr. to Jun. 2007 | | Oct. to Dec. 2007
change from
Jul. to Sep. 2007 | | Jan. to Dec. 2007
change from
Jan. to Dec. 2006 | |
| | Per cent change | |
Employment | | +0.4 | | +1.0 | | +3.2 | ** |
Manufacturing shipments | | -2.5 | | -2.6 | * | -2.4 | * |
Exports | | -7.4 | | -2.9 | * | -5.1 | * |
Retail sales | | +0.5 | | +0.6 | * | +7.1 | * |
Housing starts | | +6.3 | | +7.3 | | +7.6 | ** |
Non-residential building permits | | -32.7 | | +12.7 | | +0.2 | ** |
Note: * data available to November only; **annual non-seasonally adjusted data | |
In 2007, employment in BC posted annual growth of 3.2 per cent, or 70,800 new jobs. The unemployment rate continued to reach lows not seen in over thirty years, falling to 3.9 per cent in March and ending the year at 4.2 per cent. The unemployment rate averaged 4.2 per cent for the year. Sectors that saw particularly strong gains in 2007 were: construction; transportation and warehousing; information, culture and recreation; as well as primary forestry, fishing, mining, oil and gas. BC’s economy added a further 12,300 jobs in January 2008, an increase of 0.5 per cent over December’s employment levels. The monthly unemployment rate fell to 4.1 per cent in January.
The housing sector continued to be a source of economic strength for BC in 2007, with housing starts for the year increasing by 7.6 per cent over 2006 levels and reaching 39,195 units. The growth in housing starts has been in multiple units, which increased 17.7 per cent through the year, while starts of single units declined 6.2 per cent from 2006 levels. Demand in the housing
Budget and Fiscal Plan – 2008/09 to 2010/11
122
British Columbia Economic Review and Outlook
sector continues to be supported by positive inter-provincial migration and solid income growth.
Retail sales in BC continued to post robust growth in the first eleven months of 2007, rising 7.1 per cent on a year-to-date basis to November. Growth in retail sales has been broad based, with categories such as home furnishings stores, home centres and hardware stores experiencing the most rapid growth. Sales in the retail sector have been driven by robust income growth, positive consumer confidence and additional demand for household goods from an active housing market.
The value of manufacturing shipments has fallen 2.4 per cent year-to-date to November 2007, largely due to a sizable decline in wood product shipments. Manufacturing shipments of fabricated metal, paper, primary metals and other minerals all saw gains in 2007. These gains were more than offset by a 19.1 per cent year- to-date decline in the value of wood product shipments, caused by weaker prices and the slowing US housing market.
The value of merchandise exports dropped 5.1 per cent through the first eleven months of 2007 due to declines in lumber, natural gas, coal and copper exports outweighing gains recorded in pulp, electricity, aluminum and zinc exports. The high value of the Canadian dollar coupled with slowing demand from the faltering US economy weighed heavily on BC’s export market through 2007. The US housing market crash has led to particular weakness in forest product exports.
The value of non-residential building permits rose 0.2 per cent in 2007. A rise in the value of commercial permits during the year offset declines in both industrial and institutional building permits.
The Outlook for the External Environment
United States
According to advance estimates, US economic growth decelerated in the fourth quarter of 2007, slowing to an annualized growth rate of just 0.6 per cent. This followed strong growth of 3.8 per cent in the second quarter and 4.9 per cent in the third quarter. US economic strength in the third quarter was somewhat misleading, as a surge in exports and a build-up of inventories masked negative indicators such as declines in investment and corporate profits. Slow economic growth in the fourth quarter was due to a number of factors, including weakness in personal consumption, a continued decline in residential investment, lower export growth and a decline in inventories.
The US labour market was relatively weak in 2007 as annual average non-farm employment increased by 1,540,000 persons (or 1.1 per cent). The unemployment rate remained at 4.6 per cent on average in 2007, matching the rate observed in 2006. On a monthly basis, however, the unemployment rate rose through the year, reaching 5.0 per cent by December 2007. US consumer price inflation was 2.9 per cent in 2007, while core inflation (which excludes food and energy) was 2.3 per cent. The US Federal Reserve expects inflation to moderate in coming quarters.
Budget and Fiscal Plan – 2008/09 to 2010/11
123
British Columbia Economic Review and Outlook
The US housing market has continued its rapid decline through 2007, with annual housing starts falling to 1,343,900 units – far below the 1,811,900 starts recorded in 2006. The pace of starts fell through the year, with annualized starts ending up at 1,006,000 units in December – the lowest monthly pace observed since May 1991.
The continued decline in housing was one of the largest drags on economic growth throughout the year. The US National Association of Home Builders’ (NAHB) housing market index, a measure of present and future housing market conditions, has shown considerable weakness in recent months, hitting a record low of 18 in December (see Chart 4.2). Given the continued low levels on this index, some analysts expect the worst is yet to come in the US housing market slowdown. With the continued degradation in housing, foreclosures and mortgage default risks have risen. With a sizable portion of subprime mortgages scheduled to reset in 2008, there is considerable risk to the US economy moving forward as well.
Chart 4.2 US housing market conditions very weak

Source: National Association of Home Builders
The total value of subprime mortgages in the US is currently estimated at around US$1.3 trillion.(2) In November 2007, the OECD estimated that losses caused by the US subprime and near-prime mortgage market could end up in the US$200 to US$300 billion range. The financial sector exposure to these losses lies mainly in holdings of mortgage-backed securities repackaged within collateralized debt obligations (CDOs), variously held by hedge funds, banks and bank-sponsored structured investment vehicles.
In addition, credit based on home-equity loans is now facing increasing risk as house prices fall. With growing concern over the extent of the contagion surrounding the subprime crisis, financial markets have been increasingly volatile, as investors reshuffle their portfolios in attempts to minimize their exposure to these risks.
In a bid to inject some much needed stimulus into the slowing US economy and financial markets, the Federal Reserve slashed its key Fed funds rate
(2) The Economist online – January 10, 2008.
Budget and Fiscal Plan – 2008/09 to 2010/11
124
British Columbia Economic Review and Outlook
by 75 basis points in an unscheduled announcement on January 22, 2008. In days leading up to this surprise announcement, stock markets world-wide lost considerable ground as fears mounted that a US recession may be on the horizon and that the subprime contagion in financial markets may be worse than investors had previously anticipated. The rate cut has raised some hope that positive feedback will be felt in the housing market. However, liquidity in the housing market has been severely restrained as financial institutions have tightened lending standards in response to the subprime crisis.
The Fed cut its key rate a further 50 basis points in a scheduled announcement on January 30, 2008. The Fed funds rate, now sitting at 3.00 per cent, is at its lowest since June 2005. The Fed cautioned that risks remain to the downside and that it plans on acting in a timely manner as needed to address those risks.
According to the January Consensus Economics survey of private sector economists, US real GDP is expected to grow by 2.0 per cent in 2008 and 2.7 per cent in 2009. The weak 2008 outlook for the US is due to growing speculation that the housing downturn and subprime crisis are likely to hamper economic growth more than previously expected. Along with the downgrade to overall economic growth for 2008, the probability of a US recession is increasing. In December, the Moody’s Economy.com probability of recession in the next six months increased to 56 per cent—its highest rating since 2001. Some analysts, such as David Rosenberg, Chief Economist with Merrill Lynch, believe the US economy has already drifted into recession.
Chart 4.3 Rising probability of recession in the US

Source: Moody’s Economy.com
In order to reflect the mounting risks surrounding the US economic outlook, the Ministry of Finance’s growth assumptions are somewhat lower than the January Consensus in anticipation that the Consensus will decline further in coming months. The Ministry of Finance is assuming that the US economy will grow by 1.7 per cent in 2008, compared to the 2.0 per cent January Consensus average. US growth is expected to recover to 2.4 per cent in the Ministry of Finance forecast for 2009, while the January Consensus predicts growth of 2.7 per cent. Over the medium-term, the Ministry of Finance assumes that the US economy will grow at a rate of about 2.7 per cent per year.
Budget and Fiscal Plan – 2008/09 to 2010/11
125
British Columbia Economic Review and Outlook
This medium-term outlook has been lowered since previous forecasts based on concern voiced by the Economic Forecast Council that potential growth (the rate at which the economy can grow without causing inflation to accelerate) in the US is lower than previously thought.
Chart 4.4 US consensus outlook for 2008 deteriorates
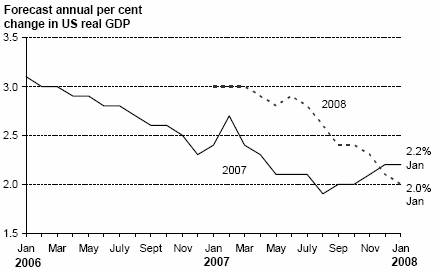
Source: Consensus Economics
The chart represents forecasts for US real GDP growth in 2007 and 2008 as polled on specific dates. For example, forecasters surveyed on January 14, 2008 had an average 2008 US growth forecast of 2.0 per cent, while on June 11th, 2007 they forecast 2008 US growth at 2.9 per cent.
Canada
The Canadian economy grew at an annualized pace of 3.5 per cent in the first quarter, 3.8 per cent in the second quarter, and then slowed to a still robust 2.9 per cent growth in the third quarter. The strength in the Canadian economy thus far in 2007 has been due to strong consumer spending and business investment outweighing weakness in the trade sector. Nationally, employment grew by 382,100 jobs (or 2.3 per cent) in 2007, while the unemployment rate averaged 6.0 per cent.
The appreciating Canadian dollar and weakened demand from the US contributed to slower (current value) merchandise exports growth of 2.5 per cent through the first eleven months of 2007. While exports of forestry products on the national level also fell substantially, they comprise a much smaller portion of total national exports than they do for BC. Growth observed in exports of agricultural, industrial, energy and consumer products more than offset declines in forestry and automotive products at the national level.
The value of manufacturing shipments edged up 1.0 per cent year-to-date to November 2007. Over the year, weakness in wood, chemical, plastics and computer manufacturing has been offset by strength in petroleum and coal products, minerals and metals.
Domestic demand continued to be a source of strength for the Canadian economy in 2007, with retail trade rising 5.7 per cent through the first eleven months of the year. Consumer confidence was slightly lower through 2007, falling 0.4 per cent compared to 2006 levels. Canadian housing starts stayed at relatively high levels through 2007, although a noticeable drop occurred in
Budget and Fiscal Plan – 2008/09 to 2010/11
126
British Columbia Economic Review and Outlook
December. On an annual basis, Canadian housing starts rose 0.4 per cent from 2006 levels. Healthy increases in Saskatchewan, Manitoba, Newfoundland and BC were largely offset by weakness in Ontario, with Alberta, PEI and Nova Scotia also registering declines.
The Consensus Economics average forecast for 2008 Canadian real GDP growth has deteriorated in recent months, averaging 2.1 per cent in the January survey. There is high variance among individual forecasters, with a high estimate of 2.8 per cent and a low of 1.5 per cent. The decline in expectations over the year is largely due to the softening US outlook and highly valued Canadian dollar, which forecasters believe will have a considerable impact on the Canadian economy. The January Consensus average indicates that Canadian economic growth is expected to recover to some degree in 2009, to 2.5 per cent. The Ministry of Finance’s economic forecast assumptions are more prudent, with Canadian real GDP growth expected to be 1.9 per cent in 2008, 2.2 per cent in 2009 and 2.5 per cent over the medium-term. The evolution of the Consensus survey average forecast for Canada can be seen in Chart 4.5.
Japan
Chart 4.5 Canada consensus outlook for 2008 downgraded
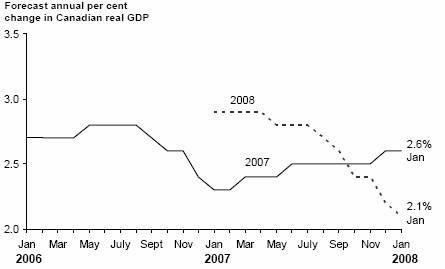
Source: Consensus Economics
The chart represents forecasts for Canadian real GDP growth in 2007 and 2008 as polled on specific dates. For example, forecasters surveyed on January 14, 2008 had an average 2008 Canadian growth forecast of 2.1 per cent, while on July 9th, 2007 they forecast 2008 Canadian growth at 2.8 per cent.
According to the January Consensus survey, the Japanese economy is expected to expand by 1.5 per cent in 2008. The survey noted weak exports and muted consumer spending as reasons for its meagre growth outlook. The January Consensus predicts that Japan’s real economic growth will reach 2.0 per cent in 2009. The Ministry of Finance is assuming lower growth of 1.2 per cent in 2008, 1.7 per cent in 2009 and 2.0 per cent over the medium-term.
These prudent assumptions reflect the continued uncertainty regarding the Japanese economic outlook.
Budget and Fiscal Plan – 2008/09 to 2010/11
127
British Columbia Economic Review and Outlook
Other Economies
According to the January Consensus, the European Monetary Union (EMU) economies are expected to expand by 1.8 per cent in 2008, slower than the growth exhibited by these regions over the past couple of years. In the January Consensus, expectations also call for slower growth in Europe going forward, with participants forecasting average growth of 2.0 per cent for 2009. The Ministry of Finance assumes slightly lower growth rates for Europe, of 1.6 per cent in 2008 and 1.7 per cent in 2009.
China continued its rapid pace of economic expansion in 2007, maintaining double digit growth of 11.3 per cent according to the January Blue Chip Economic Indicators, a monthly survey of about 50 leading business economists. The survey participants’ average forecast calls for continued rapid expansion in 2008 and 2009, with forecast growth of 10.2 and 9.4 per cent respectively. China’s growth in recent years has been fuelled in part by strength in exports, investment and manufacturing, which in turn has led to higher global demand and prices for commodities.
There is some concern, particularly with the global stock market volatility of late, that China’s economic expansion is not as well protected from a US slowdown as previously thought. The current view among economists is that while China and other Asian economies may be more buffered than they were through the 1990s, a US slowdown or recession would still have an impact on Asia. The increasing global integration of trade and investment fl ows, as well as the sheer size of the US economy, means most countries will likely feel some ill effects from a US slump.
Table 4.2 Ministry of Finance Economic Forecast: Key Assumptions
| | Forecast | |
| | 2007 | | 2008 | | 2009 | | 2010 | | 2011 | | 2012 | |
| | Per cent change unless otherwise noted | |
US real GDP | | 2.2 | | 1.7 | | 2.4 | | 2.7 | | 2.7 | | 2.7 | |
Canada real GDP | | 2.5 | (e) | 1.9 | | 2.2 | | 2.5 | | 2.5 | | 2.5 | |
Japan real GDP | | 1.8 | (e) | 1.2 | | 1.7 | | 2.0 | | 2.0 | | 2.0 | |
Europe real GDP | | 2.6 | (e) | 1.6 | | 1.7 | | 2.0 | | 2.0 | | 2.0 | |
US housing starts | | -25.8 | | -27.8 | | 13.4 | | 27.3 | | 14.3 | | 0.0 | |
Canada 3–month treasury bill rate | | 4.2 | | 3.9 | | 4.4 | | 4.9 | | 5.0 | | 5.0 | |
Canada 10–year government bonds | | 4.3 | | 4.2 | | 4.8 | | 5.4 | | 6.0 | | 6.0 | |
US cents/Canadian dollar | | 93.5 | | 99.9 | | 96.1 | | 93.8 | | 93.4 | | 93.3 | |
(e) Ministry of Finance estimate
Financial Markets
Interest Rates
After following a slight tightening trend through 2007, the US Federal Reserve Board cut its key overnight target rate by 75 basis points to 3.50 per cent on January 22, 2008, in response to mounting fears of a recession and associated rapid weakness observed in stock markets worldwide. The cut was not scheduled, but viewed as necessary to mitigate increasing downside risks to
Budget and Fiscal Plan – 2008/09 to 2010/11
128
British Columbia Economic Review and Outlook
growth in the economy and a deepening of the housing contraction. It marked the single biggest rate cut by the Fed since 1982.
The Fed cut its key rate a further 50 basis points in its scheduled announcement on January 30, 2008, in a further effort to aid the suffering US economy. The Fed funds rate, now sitting at 3.00 per cent, is at its lowest since June 2005. In their January 30, 2008 statement, the Fed stated that risks remain to the downside and that it plans on acting in a timely manner as needed to address those risks.
On January 22, 2008, the Bank of Canada (BoC) lowered its key interest rate (the target for the overnight rate) by 25 basis points to 4.00 per cent, as widely anticipated. The BoC noted that while the Canadian economy continues to operate above capacity right now, the US economy is suffering a more prolonged housing decline than previously expected. This will lead to downward pressure on Canadian export growth and lower inflation. The statement concluded that further stimulus will likely be necessary moving forward to keep aggregate supply and demand in balance, and to return the inflation rate to the BoC’s target over the medium-term.
Outlook
Based on the average of six private sector forecasts as of January 9, 2008, the Ministry of Finance interest rate outlook assumed that the US Federal Reserve would begin lowering interest rates at their January 30, 2008 meeting. With the unscheduled cut announced on January 22, 2008 however, the Fed’s target rate will be lower throughout the year compared to private sector forecasters’ views as of January 9, 2008. The private sector anticipated the Fed funds rate would average 3.8 per cent in 2008 and 4.1 per cent in 2009.
As of January 9, 2008, the private sector forecast assumed that the Bank of Canada would lower the overnight target rate by 25 basis points in their January 22, 2008 meeting (which did occur) then raise the rate by 25 basis points in December 2008. The Bank was then expected to raise it by a further 25 basis points in early 2009 and then hold it steady at 4.50 per cent for the rest of the year.
The average of private sector forecasters’ views on Canadian short-term interest rates (3 month treasury bills) as of January 9, 2008 (see Table 4.3) indicates that 90 day rates will average 3.9 per cent in 2008 and 4.4 per cent in 2009.
Table 4.3 | | Private Sector Canadian Three Month Treasury Bill |
| | Interest Rate Forecasts |
Average annual interest rate (per cent) | | 2008 | | 2009 | |
Global Insight | | 4.3 | | 4.9 | |
CIBC | | 3.8 | | 4.4 | |
Nesbitt Burns | | 3.8 | | 4.3 | |
Scotiabank | | 3.7 | | 4.2 | |
TD Economics | | 3.9 | | 4.0 | |
RBC Capital Markets | | 4.0 | | 4.5 | |
Average (as of January 9, 2008) | | 3.9 | | 4.4 | |
Budget 2008 Forecast | | 3.9 | | 4.4 | |
Budget and Fiscal Plan – 2008/09 to 2010/11
129
British Columbia Economic Review and Outlook
Ten-year Government of Canada bonds are forecast to average 4.2 per cent in 2008 and 4.8 per cent in 2009, indicating that the spreads between long-run and short-run rates are expected to remain positive.
Table 4.4 Private Sector Canadian 10-year Government Bond
Interest Rate Forecasts
Average annual interest rate (per cent) | | 2008 | | 2009 | |
Global Insight | | 4.4 | | 5.2 | |
CIBC | | 4.1 | | 4.7 | |
Nesbitt Burns | | 4.0 | | 4.7 | |
Scotiabank | | 4.0 | | 4.7 | |
TD Economics | | 4.2 | | 4.5 | |
RBC Capital Markets | | 4.3 | | 4.8 | |
Average (as of January 9, 2008) | | 4.2 | | 4.8 | |
Budget 2008 Forecast | | 4.2 | | 4.8 | |
Exchange Rate
The Canadian dollar continued its trend of appreciation against the US dollar in 2007, due in part to a general weakening of the US dollar and high prices for commodities such as oil and metals. The noon spot rate peaked at 109.1 US cents on November 7, 2007 then drifted back down to parity a couple of weeks later, and has remained within a few cents of parity ever since. For the year, the dollar averaged 93.5 US cents, appreciating 5.3 cents over the 88.2 cents average in 2006.
Chart 4.6 Private sector expects Canadian dollar to remain high in 2008
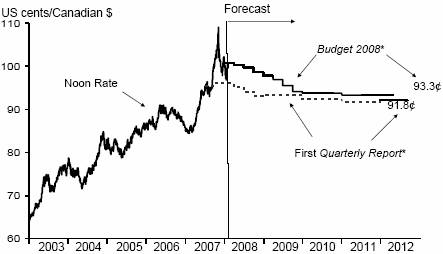
Sources: Bank of Canada and BC Ministry of Finance forecasts
*The average of 6 private sector forecasters: Global Insight, CIBC, BMO Capital Markets, RBC Financial Group, Scotiabank, and TD Bank. First Quarterly Report 2007 as of July 24th, 2007 and Budget 2008 as of January 9th, 2008.
Outlook
The Canadian dollar is expected to retain its strength in the near-term, due to high commodity prices and weakness in the US dollar. The loonie is expected to drift down slightly vis-à-vis the US dollar in the medium-term as the US dollar recovers from its current weakness.
Budget and Fiscal Plan – 2008/09 to 2010/11 |
130
British Columbia Economic Review and Outlook
Average private sector forecasts as of January 9, 2008 expect the Canadian dollar will average 99.9 US cents in 2008, falling to 96.1 US cents in 2009. The Ministry of Finance’s exchange rate outlook is based on these private sector averages (see Table 4.5). The Ministry of Finance assumes that the Canadian dollar will fall to 93.3 US cents by 2012.
Table 4.5 Private Sector Exchange Rate Forecasts
Average annual exchange rate (US cents/Can $ ) | | 2008 | | 2009 | |
Global Insight | | 100.0 | | 97.8 | |
CIBC | | 101.7 | | 97.6 | |
Nesbitt Burns | | 99.9 | | 93.7 | |
Scotiabank | | 102.1 | | 104.9 | |
TD Economics | | 97.9 | | 92.8 | |
RBC Capital Markets | | 97.7 | | 90.0 | |
Average (as of January 9, 2008) | | 99.9 | | 96.1 | |
Budget 2008 Forecast | | 99.9 | | 96.1 | |
The British Columbia Economic Outlook
BC’s economy continued its healthy expansion through 2007, as indicators of domestic demand such as housing starts and retail sales saw strong growth. Healthy income growth and a low unemployment rate contributed to solid increases in consumer spending. However, BC’s merchandise exports were hit by lower demand from the US and falling lumber and natural gas prices. The Ministry of Finance estimates that the BC economy posted growth of 3.0 per cent in 2007, slightly below last year’s February 2007 budget forecast of 3.1 per cent and matching the subsequent first Quarterly Report forecast of 3.0 per cent.
The Ministry of Finance forecasts BC’s economy to grow 2.4 per cent in 2008 and 2.8 per cent in 2009. Growth is expected to slow to some extent in 2008, largely due to weakness in the US economy. Domestic demand, while still the main driver of BC’s economic growth in 2008 and 2009, is expected to slow somewhat due to the US downturn. The province’s export market will likely continue to suffer with continued weakness in the US housing market.
Over the medium-term, the Ministry of Finance forecasts growth of 2.9 per cent in 2010, 2.8 per cent in 2011 and 2.8 per cent in 2012, averaging 2.8 per cent over the 2010 to 2012 period. This outlook is consistent with the Ministry of Finance’s prudent assumptions and is slightly lower than the Economic Forecast Council’s outlook (see Table 4.6 for a comparison of MoF and the EFC economic outlooks).
Table 4.6 British Columbia Economic Outlook
| | Forecast | |
| | 2007 | | 2008 | | 2009 | | 2010 | | 2011 | | 2012 | |
| | Per cent change in real GDP | |
Ministry of Finance economic forecast | | 3.0 | (e) | 2.4 | | 2.8 | | 2.9 | | 2.8 | | 2.8 | |
Economic Forecast Council (1) | | 3.1 | | 2.8 | | 3.0 | | 2.9 | | 2.9 | | 2.9 | |
(e) Ministry of Finance estimate.
(1) Average of the 12 members who provided forecasts (the Council provided a single average annual growth rate for the 2010 through 2012 period).
Budget and Fiscal Plan – 2008/09 to 2010/11 |
131
British Columbia Economic Review and Outlook
Table 4.7 summarizes the Ministry of Finance’s outlook for key economic indicators, while Tables 4.9.1 to 4.9.4 at the end of Part 4 provide additional detail on the economic forecast.
Table 4.7 Ministry of Finance Economic Forecast: Key Economic Indicators
| | Forecast | |
| | 2007 | | 2008 | | 2009 | | 2010 | | 2011 | | 2012 | |
| | Per cent change unless otherwise noted | |
British Columbia Economic Indicators | | | |
Real GDP | | 3.0 | (e) | 2.4 | | 2.8 | | 2.9 | | 2.8 | | 2.8 | |
Nominal GDP | | 5.6 | (e) | 4.2 | | 5.3 | | 5.0 | | 4.8 | | 4.8 | |
Employment | | 3.2 | | 1.7 | | 1.7 | | 1.9 | | 1.9 | | 1.9 | |
Unemployment rate (per cent) | | 4.2 | | 4.7 | | 4.8 | | 4.8 | | 4.8 | | 4.8 | |
Total net in-migration (thousands of persons) | | 51.6 | (1) | 48.9 | | 50.4 | | 51.4 | | 52.5 | | 51.4 | |
Personal income | | 5.3 | (e) | 4.4 | | 4.2 | | 4.5 | | 4.5 | | 4.6 | |
Corporate pre-tax profits | | 2.1 | (e) | 0.4 | | 5.8 | | 5.9 | | 3.4 | | 3.5 | |
Housing starts (thousands of units) | | 39.2 | | 34.6 | | 32.5 | | 30.8 | | 30.1 | | 29.3 | |
Retail sales | | 6.7 | (e) | 5.3 | | 5.2 | | 5.1 | | 4.9 | | 5.0 | |
(e) Ministry of Finance estimate.
(1) BC STATS estimate.
The Labour Market
Employment in British Columbia grew 3.2 per cent in 2007, following growth of 3.1 per cent in 2006 (see Chart 4.7). This translates to average total employment of 2,266,300 persons, an increase of 70,800 jobs. Full-time employment increased by 58,500 jobs, while part-time employment increased by 12,400 jobs.
Chart 4.7 BC employment continued to show strong gains through 2007
Thousands of jobs; seasonally adjusted
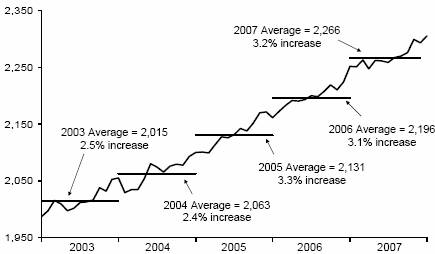
Source: Statistics Canada
Employment growth continued to outweigh growth in the labour force in 2007, resulting in British Columbia’s unemployment rate averaging 4.2 per cent during the year. The provincial unemployment rate struck levels that had not been observed in over 30 years, hitting a low of 3.9 per cent in March 2007.
Budget and Fiscal Plan – 2008/09 to 2010/11 |
132
British Columbia Economic Review and Outlook
BC’s economy added 12,300 additional jobs in January 2008, an increase of 0.5 per cent over December’s employment levels. The unemployment rate fell slightly to 4.1 per cent in January, as job gains outpaced the monthly expansion in the labour force.
Outlook
The Ministry of Finance outlook calls for employment in British Columbia to increase by 1.7 per cent in 2008, or approximately 37,600 jobs. Employment is forecast to grow by 1.7 per cent in 2009, then 1.9 per cent per year through the 2010 to 2012 period. Labour force growth in BC is expected to exceed employment growth in the near-term, resulting in the unemployment rate rising to 4.8 per cent for the 2009 to 2012 period.
Chart 4.8 BC unemployment rate forecast to rise from current lows
Unemployment rate; per cent

Sources: Statistics Canada and BC Ministry of Finance forecast
Domestic Demand
Consumer Spending and Housing
Retail sales saw robust growth through the first eleven months of 2007, rising 7.1 per cent compared to the same period the previous year. Sectors that saw solid year-to-date performance were: home centres and hardware stores, home furnishing stores, clothing stores and gasoline stations. High levels of housing activity in 2007 continued to support retailers that sell household goods.
Housing starts in BC totalled 39,195 units in 2007, a 7.6 per cent increase compared to 2006. Seasonally adjusted housing starts peaked in November, hitting an annualized 50,500 units, the fastest pace observed in the province since February 1990. Housing starts subsequently fell back down to an annualized pace of 33,900 units in December. The continued strength in housing starts in 2007 was supported by solid income growth and net migration. It should be noted that while most provinces showed further growth in housing in 2007, some provinces (most notably Ontario) experienced declines.
Leading indicators for non-residential investment remained high in 2007 with the total value of non-residential building permits rising 0.2 per cent
Budget and Fiscal Plan – 2008/09 to 2010/11 |
133
British Columbia Economic Review and Outlook
Chart 4.9 BC retail sales through November remained robust
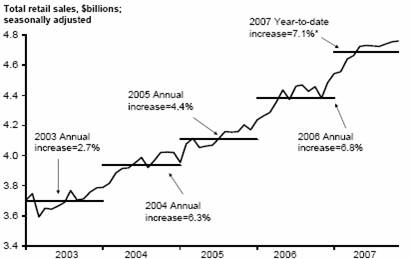
Source: Statistics Canada; * seasonally adjusted
compared to the high value observed in 2006. While the value of commercial permits rose during the year, it was offset by declines in both industrial and institutional building permits.
Outlook
The Ministry of Finance estimates that real (inflation-adjusted) consumer spending on goods and services grew by 4.4 per cent in 2007, and is forecasting growth of 3.4 per cent in 2008 (see Table 4.9.1 at the end of Part 4). A robust labour market, continued growth in personal income along with the federal GST cut effective January 1, 2008 are expected to support consumer demand for goods and services this year. Real consumer spending is forecast to grow around 3.0 per cent per year in the medium-term. Retail sales are estimated to have increased 6.7 per cent in 2007, and are forecast to grow 5.3 per cent in 2008, 5.2 per cent in 2009 and around 5.0 per cent per year through the 2010 to 2012 period.
Chart 4.10 BC housing starts forecast to ease from high levels
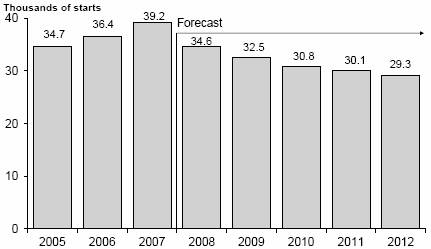
Sources: Canada Mortgage and Housing Corporation actuals and BC Ministry of Finance forecast
Budget and Fiscal Plan – 2008/09 to 2010/11 |
134
British Columbia Economic Review and Outlook
Housing starts in British Columbia are expected to ease from the high levels observed over the past couple of years, and are forecast to total approximately 34,600 units in 2008 and 32,500 units in 2009. Over the medium-term, BC housing starts are expected to level out, averaging around 30,000 units per year from 2010 to 2012.
Business and Government
Real business investment (including residential) is estimated to have increased by 5.4 per cent in 2007, after growing by 9.5 per cent in 2006. The main sources of strength behind business investment growth in 2007 are robust machinery and equipment investment and residential investment.
Real business machinery and equipment investment (adjusted for inflation) continued to benefit from the appreciation of the Canadian dollar in 2007. Following growth of 14.9 per cent in 2006, machinery and equipment investment is estimated to have grown 10.3 per cent in 2007.
Real business non-residential investment (adjusted for inflation) is estimated to have increased by 1.1 per cent in 2007, following a 9.2 per cent gain in 2006. This measure represents inflation-adjusted spending by businesses for construction of industrial, commercial and institutional buildings, highways, bridges, sewage systems and various other projects.
Real residential investment (adjusted for inflation), which includes new housing investment as well as renovations and improvements, is estimated to have grown 4.9 per cent in 2007, following growth of 6.6 per cent in 2006.
Continued strength in both residential and non-residential investment has raised concern that the construction industry may be facing rising labour costs due to a shortage of skilled workers.
The Vancouver non-residential building construction price index, a measure of costs facing the construction industry in Vancouver that includes both labour, building material costs and profits, rose 13.6 per cent through the first nine
Chart 4.11 Vancouver building construction price index accelerated in 2007

Source: Statistics Canada
Budget and Fiscal Plan – 2008/09 to 2010/11 |
135
British Columbia Economic Review and Outlook
months of 2007, compared to the same period in 2006. This follows annual growth of 10.3 per cent in 2006.
Real (inflation adjusted) local, provincial and federal government combined spending on goods and services in BC is estimated to have increased 6.4 per cent in 2007, following growth of 2.8 per cent in 2006.
Outlook
Total real (inflation adjusted) investment in British Columbia is forecast to grow by 3.6 per cent in 2008, slowing to 2.7 per cent in 2009. This growth reflects strength in non-residential investment, and investment in machinery and equipment. Over the medium-term, total investment in BC is expected to grow approximately 3.9 per cent per year on average. Growth in both non-residential investment and machinery and equipment investment are expected to continue as significant sources of growth over the medium-term.
On average, real non-residential investment is forecast to grow at 5.4 per cent from 2010 to 2012, while machinery and equipment investment is forecast to rise by an average 8.8 per cent per year. This growth will occur as firms continue to take advantage of the high Canadian dollar to import equipment from the US at a lower cost.
Combined real spending (adjusted for inflation) by the three levels of government (federal, provincial and municipal) on goods and services is expected to grow 2.2 per cent in 2008, rising to 2.5 per cent in 2009. Over the medium-term, real government spending from all three levels of government is forecast to grow 2.9 per cent on average per year.
External Trade and Commodity Markets
The value of BC’s merchandise exports declined throughout 2007, and year-to-date to November were down 5.1 per cent compared to the same period the previous year. The decline in the value of exports was chiefly due to an 8.8 per cent drop in year-to-date forestry exports. Further degradation in the US housing market, the highly valued Canadian dollar and weak lumber prices have taken a toll on BC’s forest industry. Weakness was also observed in exports of energy, agriculture and machinery and equipment.
Western spruce-pine-fir (SPF) prices averaged US$249 per thousand board feet in 2007, a 16.0 per cent decline from the US$296 average in 2006. The lumber price trended downwards through most of 2007 and into 2008. More recently, the western SPF price fell to US$185 on February 1, 2008, the lowest price registered since late 2002. However, the price of hemlock baby squares, a key price for the coastal forest industry, averaged US$609 in 2007, up 4.3 per cent compared to the 2006 average price of US$584. While the vast majority of SPF exported from BC is destined for the US, a sizable portion of BC’s hemlock exports is destined for Japan.
Natural gas prices averaged $5.40/GJ through 2007, down slightly from the $5.53/GJ observed in 2006. BC Plant inlet prices ranged from a high of $6.41/GJ in February to a low of $4.03/GJ in September. Since this low,
Budget and Fiscal Plan – 2008/09 to 2010/11 |
136
British Columbia Economic Review and Outlook
prices have regained some ground, with preliminary estimates of $5.55/GJ for December 2007.
Metallic mineral prices remained at historically high levels in 2007. Prices for both gold and silver rose by more than 15 per cent for the year, while copper increased a further 5.3 per cent to US$3.24/lb in 2007. Lead prices doubled to average US$1.17/lb for the year, while the prices of both zinc and aluminium showed little change relative to the high levels they both recorded in 2006. High mineral prices were largely driven by tight world supplies and robust global demand, particularly from China.
Outlook
Real exports of goods and services are forecast to increase 1.3 per cent in 2008. The high Canadian dollar and weak demand by the US housing market for BC forest products are among the reasons for the relatively soft performance. Real export growth is forecast to improve over the medium-term as the US and Canadian economies recover, resulting in growth of 3.8 per cent in 2009 and average growth of 3.4 per cent over the 2010 to 2012 period.
Due to continued weakness in the US housing market, Western SPF prices are expected to remain relatively weak through 2008, averaging US$213 per thousand board feet for the year, down from the $275 that was assumed in the first Quarterly Report. As the US housing market recovers, prices are expected to return to US$300 over the medium-term (see Chart 4.12).
Chart 4.12 Forestry prices expected to remain weak through 2008 before returning to trend
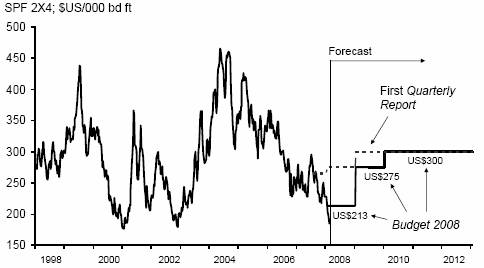
Sources: Madison’s Lumber Reporter; Ministry of Finance
Based on private sector forecasts, natural gas prices are expected to strengthen from 2007/08 levels over the forecast period. Between 2007/08 and 2011/2012, prices are expected to rise from $5.39/GJ to $6.39/GJ (see Chart 4.13).
Budget and Fiscal Plan – 2008/09 to 2010/11 |
137
British Columbia Economic Review and Outlook
Chart 4.13 Natural gas prices forecast to rise from current levels
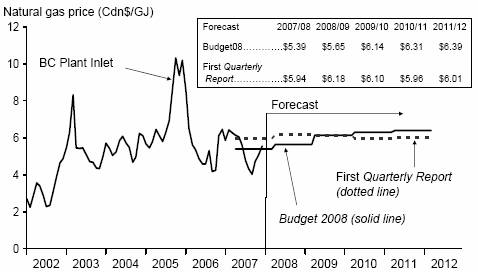
Sources: BC Ministry of Energy, Mines and Petroleum Resources; Ministry of Finance
The British Columbia goods and services export price deflator (the average price of BC goods and services exports) is forecast to fall 2.4 per cent in 2008, largely due to weakness in forestry prices and strength in the Canadian dollar. The Ministry of Finance forecasts that the price of BC’s exports will recover in 2009 as the Canadian dollar weakens and lumber prices recover. The average export price growth is expected to be 1.2 per cent over the 2010 to 2012 period, as commodity prices stabilize and the Canadian dollar levels out around 93.3 cents US by 2012.
Chart 4.14 Real exports growth to pick up in medium-term
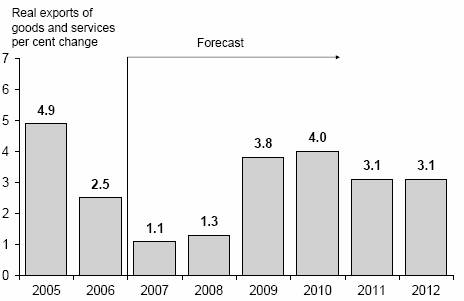
Sources: Statistics Canada and BC Ministry of Finance forecast
Budget and Fiscal Plan – 2008/09 to 2010/11 |
138
British Columbia Economic Review and Outlook
Inflation
Consumer price inflation (CPI) in British Columbia averaged 1.8 per cent in 2007, as higher consumer inflation in non-durables and services was offset by continued price deflation in durable and semi-durable goods. BC’s CPI inflation was below the Canadian average rate of inflation of 2.2 per cent in 2007. High gasoline, fuel oil and other fuel prices were partly responsible for the strength of non-durable inflation. Food prices rose 2.6 per cent during the year on average, while consumers saw the cost of clothing fall by 2.2 per cent. Excluding food and energy, two of the most volatile components, BC consumer prices rose 1.5 per cent in 2007.
Outlook
Consumer price inflation in BC is forecast to be 1.8 per cent in 2008, as a further reduction in the federal goods and services tax is expected to put downward pressure on some prices. Over the medium-term, CPI inflation is forecast to average 2.1 per cent. The Canadian rate of inflation is expected to average 1.8 per cent in 2008. Over the medium-term, national CPI inflation is expected to be 2.0 per cent, in line with the Bank of Canada’s inflation target.
Risks to the Economic Outlook
The balance of risks to the current economic forecast is to the downside. Primary downside risks in the short-term include:
· The US performs worse than expected, or enters into recession.
· The credit crisis in financial markets becomes worse than anticipated due to the onset of a US recession, or a worse than expected fallout from the subprime mortgage crisis.
· The Canadian dollar rises above its forecasted values, putting further strain on BC’s trade sector.
· Credit to small businesses in the US is restricted due to further tightening of lending standards in financial markets.
· Developing economies such as China and India are not as well buffered from a US slowdown as expected.
Medium-term risks to the economic forecast include:
· The possibility of a prolonged US slowdown.
· The Canadian dollar may rise higher (lower) than expected, leading to unanticipated weakness (strength) in BC’s trade sector.
· Skilled labour shortages lead to increased wage inflation or slower production.
· BC’s interprovincial migration weakens and its skilled labour shortages become worse.
· Commodity prices decline more sharply than forecast or become more volatile.
Budget and Fiscal Plan – 2008/09 to 2010/11 |
139
British Columbia Economic Review and Outlook
Table 4.8 British Columbia Economic Review
| | | | Budget 2007 | | Actual/ | |
| | Actual | | Forecast | | Estimate | |
| | 2006 | | 2007 | | 2007 | |
| | Per cent change unless otherwise noted | |
Real gross domestic product (per cent change) | | 3.3 | | 3.1 | | 3.0 | (1) |
Consumer expenditure | | 5.5 | | 3.2 | | 4.4 | (1) |
Capital investment | | 10.0 | | 3.8 | | 7.5 | (1) |
Government expenditure | | 4.3 | | 4.1 | | 6.4 | (1) |
Exports of goods and services | | 2.5 | | 2.7 | | 1.1 | (1) |
Imports of goods and services | | 8.1 | | 2.9 | | 5.1 | (1) |
Inventory investment (change in billions of constant 2002 dollars) | | 1.1 | | 0.7 | | 0.8 | (1) |
BC Economic Forecast Council – Real GDP growth | | n/a | | 3.4 | | 3.1 | |
Gross domestic product (current dollars; per cent change) | | 6.4 | | 5.0 | | 5.6 | (1) |
Population July 1 (per cent change) | | 1.4 | | 1.1 | | 1.4 | |
Total net in-migration (thousands of persons) | | 48.3 | | 39.8 | | 51.6 | (2) |
Interprovincial | | 10.2 | | 9.5 | | 13.0 | (2) |
International | | 38.1 | | 30.3 | | 38.6 | (2) |
Labour force (thousands of persons) | | 2,305 | | 2,349 | | 2,366 | |
(per cent change) | | 1.8 | | 1.9 | | 2.7 | |
Employment (thousands of persons) | | 2,196 | | 2,237 | | 2,266 | |
(per cent change) | | 3.1 | | 1.9 | | 3.2 | |
Unemployment rate (per cent) | | 4.8 | | 4.8 | | 4.2 | |
Retail sales (millions of current dollars) | | 52,627 | | 56,006 | | 56,152 | (1) |
(per cent change) | | 6.8 | | 5.4 | | 6.7 | |
Labour income(3) (millions of current dollars) | | 93,102 | | 95,836 | | 98,690 | (1) |
(per cent change) | | 8.5 | | 4.1 | | 6.0 | |
Corporate pre-tax profits (millions of current dollars) | | 21,322 | | 21,446 | | 21,764 | (1) |
(per cent change) | | 6.7 | | 5.2 | | 2.1 | |
Housing starts (units) | | 36,443 | | 33,590 | | 39,195 | |
(per cent change) | | 5.1 | | -7.8 | | 7.6 | |
Consumer Price Index (2002 = 100) | | 108.1 | | 110.3 | | 110.0 | |
(per cent change) | | 1.7 | | 2.0 | | 1.8 | |
Key Assumptions: | | | | | | | |
Economic growth (per cent change) | | | | | | | |
Canada | | 2.8 | | 2.0 | | 2.5 | (1) |
United States | | 2.9 | | 2.1 | | 2.2 | |
Japan | | 2.4 | | 1.7 | | 1.8 | (1) |
Europe | | 2.9 | | 1.8 | | 2.6 | (1) |
Housing starts (per cent change) | | | | | | | |
Canada | | 0.8 | | -14.2 | | 0.4 | |
United States | | -12.6 | | -23.0 | | -25.8 | |
Japan | | 4.4 | | -4.7 | | -17.8 | |
Industrial production (per cent change) | | | | | | | |
United States | | 4.0 | | 2.0 | | 1.9 | |
Japan | | 4.3 | | 2.0 | | 2.8 | |
Canadian consumer price index (per cent change) | | 2.0 | | 1.9 | | 2.2 | |
Canadian interest rates (per cent; annual average) | | | | | | | |
3-month treasury bills | | 4.0 | | 4.0 | | 4.2 | |
Government of Canada 10–year bonds | | 4.2 | | 4.1 | | 4.3 | |
United States interest rates (per cent; annual average) | | | | | | | |
3-month treasury bills | | 4.7 | | 4.7 | | 4.4 | |
Government 10–year bonds | | 4.8 | | 4.5 | | 4.6 | |
US cents/Canadian dollar (annual average) | | 88.2 | | 86.9 | | 93.5 | |
BC goods and services export price deflator (Cdn$; per cent change) | | 0.9 | | 2.1 | | -0.9 | (1) |
(1) Ministry of Finance estimate.
(2) BC Stats estimate.
(3) Wages, salaries and supplementary labour income.
Budget and Fiscal Plan – 2008/09 to 2010/11 |
140
British Columbia Economic Review and Outlook
Table 4.9.1 Gross Domestic Product: British Columbia
| | Forecast | |
| | 2006 | | 2007(e) | | 2008 | | 2009 | | 2010 | | 2011 | | 2012 | |
BRITISH COLUMBIA: | | | | | | | | | | | | | | | |
Gross Domestic Product at Market Prices: | | | | | | | | | | | | | | | |
– Real (2002 $ billion; chain-weighted) | | 158.3 | | 163.1 | | 167.0 | | 171.7 | | 176.6 | | 181.6 | | 186.7 | |
(% change) | | 3.3 | | 3.0 | | 2.4 | | 2.8 | | 2.9 | | 2.8 | | 2.8 | |
– Current dollar ($ billion) | | 180.3 | | 190.4 | | 198.3 | | 208.8 | | 219.3 | | 229.9 | | 241.0 | |
(% change) | | 6.4 | | 5.6 | | 4.2 | | 5.3 | | 5.0 | | 4.8 | | 4.8 | |
– GDP price deflator (2002 = 100) | | 113.9 | | 116.8 | | 118.8 | | 121.6 | | 124.2 | | 126.6 | | 129.1 | |
(% change) | | 3.0 | | 2.5 | | 1.7 | | 2.4 | | 2.1 | | 1.9 | | 1.9 | |
Real GDP per person | | | | | | | | | | | | | | | |
(2002 $; chain-weighted) | | 36,649 | | 37,232 | | 37,614 | | 38,167 | | 38,748 | | 39,333 | | 39,934 | |
(% change) | | 1.9 | | 1.6 | | 1.0 | | 1.5 | | 1.5 | | 1.5 | | 1.5 | |
Real GDP per employed person | | | | | | | | | | | | | | | |
(% change) | | 0.3 | | -0.2 | | 0.7 | | 1.1 | | 1.0 | | 0.9 | | 0.9 | |
Unit labour cost(1) (% change) | | 5.0 | | 2.9 | | 2.2 | | 1.8 | | 1.9 | | 1.9 | | 1.9 | |
| | | | | | | | | | | | | | | |
Components of British Columbia Real GDP at Market Prices ($2002 billions; chain-weighted) | | | |
Personal expenditure on | | | | | | | | | | | | | | | |
Goods and services | | 106.0 | | 110.7 | | 114.4 | | 118.1 | | 121.8 | | 125.3 | | 129.1 | |
(% change) | | 5.5 | | 4.4 | | 3.4 | | 3.2 | | 3.1 | | 2.9 | | 3.0 | |
– Goods | | 44.5 | | 47.2 | | 48.9 | | 50.6 | | 52.2 | | 53.8 | | 55.5 | |
(% change) | | 5.3 | | 6.0 | | 3.5 | | 3.5 | | 3.2 | | 2.9 | | 3.2 | |
– Services | | 61.4 | | 63.4 | | 65.5 | | 67.5 | | 69.6 | | 71.6 | | 73.7 | |
(% change) | | 5.6 | | 3.2 | | 3.3 | | 3.1 | | 3.1 | | 2.9 | | 2.9 | |
Government current expenditures on | | | | | | | | | | | | | | | |
Goods and services | | 30.3 | | 32.3 | | 33.0 | | 33.8 | | 34.6 | | 35.7 | | 36.9 | |
(% change) | | 4.3 | | 6.4 | | 2.2 | | 2.5 | | 2.4 | | 3.2 | | 3.2 | |
Investment in fixed capital | | 37.9 | | 40.8 | | 42.2 | | 43.4 | | 44.9 | | 46.7 | | 48.6 | |
(% change) | | 10.0 | | 7.5 | | 3.6 | | 2.7 | | 3.5 | | 4.2 | | 4.1 | |
Final domestic demand | | 174.0 | | 183.5 | | 189.5 | | 195.1 | | 201.1 | | 207.6 | | 214.4 | |
(% change) | | 6.2 | | 5.4 | | 3.2 | | 3.0 | | 3.1 | | 3.2 | | 3.3 | |
| | | | | | | | | | | | | | | |
Exports goods and services | | 72.2 | | 72.9 | | 73.9 | | 76.7 | | 79.8 | | 82.2 | | 84.8 | |
(% change) | | 2.5 | | 1.1 | | 1.3 | | 3.8 | | 4.0 | | 3.1 | | 3.1 | |
Imports goods and services | | 89.6 | | 94.1 | | 97.4 | | 100.8 | | 104.2 | | 107.9 | | 111.9 | |
(% change) | | 8.1 | | 5.1 | | 3.4 | | 3.5 | | 3.4 | | 3.6 | | 3.7 | |
Inventory change | | 1.1 | | 0.8 | | 0.9 | | 0.8 | | 0.5 | | 0.5 | | 0.6 | |
Statistical discrepancy | | -0.1 | | -0.1 | | -0.1 | | -0.1 | | -0.1 | | -0.1 | | -0.1 | |
Real GDP at market prices | | 158.3 | | 163.1 | | 167.0 | | 171.7 | | 176.6 | | 181.6 | | 186.7 | |
(% change) | | 3.3 | | 3.0 | | 2.4 | | 2.8 | | 2.9 | | 2.8 | | 2.8 | |
(1) Unit labour cost is the nominal cost of labour incurred to produce one unit of real output.
(e) 2007 figures are Ministry of Finance estimates.
Budget and Fiscal Plan – 2008/09 to 2010/11 |
141
British Columbia Economic Review and Outlook
Table 4.9.2 Components of Nominal Income and Expenditure
| | Forecast | |
| | 2006 | | 2007 | | 2008 | | 2009 | | 2010 | | 2011 | | 2012 | |
Labour income(1) ($ million) | | 93,102 | | 98,690 | (e) | 103,307 | | 108,155 | | 113,374 | | 118,792 | | 124,516 | |
(% change) | | 8.5 | | 6.0 | | 4.7 | | 4.7 | | 4.8 | | 4.8 | | 4.8 | |
Personal income ($ million) | | 141,098 | | 148,574 | (e) | 155,133 | | 161,704 | | 168,972 | | 176,583 | | 184,634 | |
(% change) | | 7.4 | | 5.3 | | 4.4 | | 4.2 | | 4.5 | | 4.5 | | 4.6 | |
Corporate profits before taxes ($ million) | | 21,322 | | 21,764 | (e) | 21,858 | | 23,117 | | 24,492 | | 25,312 | | 26,185 | |
(% change) | | 6.7 | | 2.1 | | 0.4 | | 5.8 | | 5.9 | | 3.4 | | 3.5 | |
Retail sales ($ million) | | 52,627 | | 56,152 | (e) | 59,112 | | 62,203 | | 65,389 | | 68,566 | | 72,005 | |
(% change) | | 6.8 | | 6.7 | | 5.3 | | 5.2 | | 5.1 | | 4.9 | | 5.0 | |
Housing starts | | 36,443 | | 39,195 | | 34,597 | | 32,524 | | 30,762 | | 30,100 | | 29,286 | |
(% change) | | 5.1 | | 7.6 | | -11.7 | | -6.0 | | -5.4 | | -2.2 | | -2.7 | |
Residential investment(2) ($ million) | | 17,191 | | 19,068 | (e) | 19,794 | | 20,575 | | 21,332 | | 22,182 | | 23,122 | |
(% change) | | 16.5 | | 10.9 | | 3.8 | | 3.9 | | 3.7 | | 4.0 | | 4.2 | |
BC consumer price index (2002 = 100) | | 108.1 | | 110.0 | | 111.9 | | 114.3 | | 116.7 | | 119.2 | | 121.7 | |
(% change) | | 1.7 | | 1.8 | | 1.8 | | 2.1 | | 2.1 | | 2.1 | | 2.1 | |
(1) Domestic basis; wages, salaries and supplementary labour income.
(2) Includes renovations and improvements.
(e) Ministry of Finance estimate.
Table 4.9.3 Labour Market Indicators
| | Forecast | |
| | 2006 | | 2007 | | 2008 | | 2009 | | 2010 | | 2011 | | 2012 | |
Population (on July 1) (000’s) | | 4,320 | | 4,380 | | 4,440 | | 4,498 | | 4,557 | | 4,617 | | 4,676 | |
(% change) | | 1.4 | | 1.4 | | 1.4 | | 1.3 | | 1.3 | | 1.3 | | 1.3 | |
Labour force population, 15+ Years (000’s) | | 3,511 | | 3,571 | | 3,632 | | 3,691 | | 3,751 | | 3,809 | | 3,865 | |
(% change) | | 1.8 | | 1.7 | | 1.7 | | 1.6 | | 1.6 | | 1.6 | | 1.5 | |
Net in-migration (000’s) | | | | | | | | | | | | | | | |
– International(1),(3) | | 38.1 | | 38.6 | (e) | 35.7 | | 37.0 | | 37.9 | | 39.0 | | 37.9 | |
– Interprovincial(3) | | 10.2 | | 13.0 | (e) | 13.2 | | 13.4 | | 13.5 | | 13.5 | | 13.5 | |
– Total | | 48.3 | | 51.6 | (e) | 48.9 | | 50.4 | | 51.4 | | 52.5 | | 51.4 | |
Participation rate(2) (%) | | 65.7 | | 66.3 | | 66.5 | | 66.7 | | 66.9 | | 67.1 | | 67.3 | |
Labour force (000’s) | | 2,305 | | 2,366 | | 2,416 | | 2,462 | | 2,508 | | 2,556 | | 2,603 | |
(% change) | | 1.8 | | 2.7 | | 2.1 | | 1.9 | | 1.9 | | 1.9 | | 1.8 | |
Employment (000’s) | | 2,196 | | 2,266 | | 2,304 | | 2,344 | | 2,388 | | 2,433 | | 2,479 | |
(% change) | | 3.1 | | 3.2 | | 1.7 | | 1.7 | | 1.9 | | 1.9 | | 1.9 | |
– Goods sector employment (000’s)(3) | | 455 | | 485 | | 496 | | 507 | | 520 | | 533 | | 546 | |
(% change) | | 2.9 | | 6.6 | | 2.3 | | 2.2 | | 2.4 | | 2.6 | | 2.4 | |
– Service sector employment (000’s)(3) | | 1,740 | | 1,781 | | 1,808 | | 1,837 | | 1,868 | | 1,900 | | 1,933 | |
(% change) | | 3.1 | | 2.3 | | 1.5 | | 1.6 | | 1.7 | | 1.7 | | 1.8 | |
Unemployment rate (%) | | 4.8 | | 4.2 | | 4.7 | | 4.8 | | 4.8 | | 4.8 | | 4.8 | |
(1) International migration includes net non-permanent residents and returning emigrants less net temporary residents abroad.
(2) Percentage of the population 15 years of age and over in the labour force.
(3) Components may not sum to total due to rounding.
(e) BC Stats estimate.
Budget and Fiscal Plan – 2008/09 to 2010/11 |
142
British Columbia Economic Review and Outlook
Table 4.9.4 Major Economic Assumptions
| | Forecast | |
| | 2006 | | 2007 | | 2008 | | 2009 | | 2010 | | 2011 | | 2012 | |
GDP (billions) | | | | | | | | | | | | | | | |
Canada real (2002 $; chain-weighted) | | 1,282 | | 1,314 | (e) | 1,339 | | 1,369 | | 1,403 | | 1,438 | | 1,474 | |
(% change) | | 2.8 | | 2.5 | | 1.9 | | 2.2 | | 2.5 | | 2.5 | | 2.5 | |
US real (2000 US$; chain-weighted) | | 11,319 | | 11,567 | | 11,766 | | 12,051 | | 12,380 | | 12,717 | | 13,066 | |
(% change) | | 2.9 | | 2.2 | | 1.7 | | 2.4 | | 2.7 | | 2.7 | | 2.7 | |
Japan real (2000 Yen; chain-weighted) | | 550,318 | | 560,458 | (e) | 567,334 | | 576,754 | | 588,556 | | 600,052 | | 611,903 | |
(% change) | | 2.4 | | 1.8 | | 1.2 | | 1.7 | | 2.0 | | 2.0 | | 2.0 | |
Europe real(1) (% change) | | 2.9 | | 2.6 | (e) | 1.6 | | 1.7 | | 2.0 | | 2.0 | | 2.0 | |
| | | | | | | | | | | | | | | |
Industrial production index | | | | | | | | | | | | | | | |
US (2002 = 100) | | 111.2 | | 113.4 | | 114.5 | | 116.8 | | 119.8 | | 123.0 | | 126.4 | |
(% change) | | 4.0 | | 1.9 | | 1.0 | | 2.1 | | 2.5 | | 2.7 | | 2.7 | |
Japan (2000 = 100) | | 106.3 | | 109.2 | | 111.1 | | 113.6 | | 115.9 | | 118.2 | | 120.6 | |
(% change) | | 4.3 | | 2.8 | | 1.7 | | 2.3 | | 2.0 | | 2.0 | | 2.0 | |
Europe(1) (2000 = 100) | | 107.9 | | 111.6 | (e) | 113.5 | | 115.5 | | 117.8 | | 120.2 | | 122.6 | |
(% change) | | 4.0 | | 3.4 | | 1.7 | | 1.8 | | 2.0 | | 2.0 | | 2.0 | |
| | | | | | | | | | | | | | | |
Housing starts(2) (000’s) | | | | | | | | | | | | | | | |
Canada | | 227 | | 228 | | 195 | | 185 | | 185 | | 185 | | 185 | |
(% change) | | 0.8 | | 0.4 | | -14.6 | | -5.1 | | 0.0 | | 0.0 | | 0.0 | |
US | | 1,812 | | 1,344 | | 970 | | 1,100 | | 1,400 | | 1,600 | | 1,600 | |
(% change) | | -12.6 | | -25.8 | | -27.8 | | 13.4 | | 27.3 | | 14.3 | | 0.0 | |
Japan | | 1,290 | | 1,061 | | 1,140 | | 1,150 | | 1,170 | | 1,170 | | 1,170 | |
(% change) | | 4.4 | | -17.8 | | 7.5 | | 0.9 | | 1.7 | | 0.0 | | 0.0 | |
| | | | | | | | | | | | | | | |
Consumer price index | | | | | | | | | | | | | | | |
Canada (2002 = 100) | | 109.1 | | 111.5 | | 113.5 | | 115.8 | | 118.1 | | 120.5 | | 122.9 | |
(% change) | | 2.0 | | 2.2 | | 1.8 | | 2.0 | | 2.0 | | 2.0 | | 2.0 | |
| | | | | | | | | | | | | | | |
Canadian interest rates (%) | | | | | | | | | | | | | | | |
3-Month treasury bills | | 4.0 | | 4.2 | | 3.9 | | 4.4 | | 4.9 | | 5.0 | | 5.0 | |
10-year government bonds | | 4.2 | | 4.3 | | 4.2 | | 4.8 | | 5.4 | | 6.0 | | 6.0 | |
| | | | | | | | | | | | | | | |
United States interest rates (%) | | | | | | | | | | | | | | | |
3-Month treasury bills | | 4.7 | | 4.4 | | 3.2 | | 4.1 | | 4.8 | | 5.0 | | 5.0 | |
10-year government bonds | | 4.8 | | 4.6 | | 4.1 | | 4.8 | | 5.5 | | 6.0 | | 6.0 | |
| | | | | | | | | | | | | | | |
Exchange rate (US cents / Canadian $) | | 88.2 | | 93.5 | | 99.9 | | 96.1 | | 93.8 | | 93.4 | | 93.3 | |
| | | | | | | | | | | | | | | |
British Columbia goods and services Export price deflator (% change) | | 0.9 | | -0.9 | (e) | -2.4 | | 4.6 | | 2.2 | | 0.8 | | 0.5 | |
(1) Euro zone (12) is Austria, Belgium, Finland, France, Germany, Greece, Ireland, Italy, Luxembourg, Netherlands, Portugal and Spain.
(2) British Columbia housing starts appear in Table 4.9.2.
(e) Ministry of Finance estimate.
Budget and Fiscal Plan – 2008/09 to 2010/11 |
143
British Columbia Economic Review and Outlook
The Economic Forecast Council, 2008
Introduction
The Budget Transparency and Accountability Act requires the Minister of Finance to consult the Economic Forecast Council (the Council) each year on the outlook for British Columbia’s economy. The consultation process takes place in advance of each year’s budget and the resulting forecasts are published in February along with the provincial budget.
The meeting between the Minister and Council members occurred on December 7, 2007, where the discussion centred around the Council’s estimates for 2007 and its economic outlook for 2008 and beyond. Participants each provided information for the individual years 2007, 2008 and 2009 as well as an average forecast for the years 2010 to 2012. Six members also subsequently updated their forecasts in early January.
Council members presented their opinions on BC’s near—term economic outlook and on factors that may affect the province’s medium—term outlook. Among various topics discussed were the US economic slowdown, the international credit crisis, commodity prices, the appreciating Canadian dollar, as well as the construction, forestry and tourism sectors. This was followed by discussions on climate change and possible means to further attract investment in the province.
Forecast details from the Council surveys are summarized in the table at the end of this topic box.
Chart 1 – Economic Forecast Council Outlook for the BC Economy
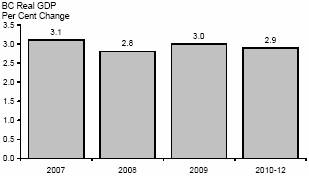
Note: BC real GDP per cent change represents the average of the Economic Forecast Council’s forecasts
Overview
Council members’ forecasts for economic growth in British Columbia in 2007 averaged 3.1 per cent, while their estimates for future growth averaged 2.8 per cent for 2008, 3.0 per cent for 2009 and 2.9 per cent on average over the 2010 to 2012 period. Council members expected slightly weaker growth over the next few years relative to what they had anticipated a year ago. The US housing market crash, and associated economic slowdown, as well as the high value of the Canadian dollar were the main reasons for their downward revisions. Despite the softer outlook, economic growth in BC is expected to outperform the national average through 2012.
Participants expected domestic demand to continue as the main source of growth for BC in the near–to–medium–term, with trade being the main soft spot for the province due to both weaker external demand (particularly from the US) as well as the high valued Canadian dollar. Council members expect a strong domestic economy to be supported by robust consumer spending, continued strength in construction and demand for BC’s natural resources. The Council noted that while trade with the US will likely suffer, BC is well positioned (both geographically and economically) to take further advantage of trading with Asia.
The Council encouraged the provincial government to maintain its healthy fiscal situation and to focus policies on attracting and retaining skilled labour and enhancing productivity.
The primary risk to the forecast noted by Council members is a harsher than expected US slowdown, as the turmoil in the US housing market could hinder US economic growth more than expected. Medium–to–long term forecast risks include the availability of labour with expected demographic trends, the impact of the Mountain Pine Beetle infestation, the rising cost of construction projects, and the risk of a prolonged US slowdown.
Budget and Fiscal Plan – 2008/09 to 2010/11 |
144
British Columbia Economic Review and Outlook
International Outlook
The Council’s estimates for US growth averaged 2.2 per cent for 2007, while its forecasts for US growth averaged 2.1 per cent for 2008, 2.6 per cent for 2009, and 2.8 per cent for the 2010 to 2012 period.
Most Council members felt that the overall US economy would expand at a slower pace in 2008, chiefly driven by the weakness in the US housing sector. While the Council felt the US would likely avoid recession in the near—term, some members warned that it was still a possibility. Most Council members also noted that US potential economic growth may be lower than previously thought. The majority of the council lowered their medium-term outlook on US real economic growth, relative to the previous Council survey prior to Budget 2007.
Outside of North America, Council members anticipated that global growth would remain relatively robust, especially in Asia and other developing countries. Most participants expected continued strong economic growth and high demand in China and India, while some also noted growing demand developing in other parts of the world such as Brazil, Mexico and parts of Europe.
The Canadian Economy
The Council was in agreement that Canada will also experience slower growth over the coming years, mainly brought on by weakness in the US economy. Most members felt that Canada would outperform the US economy in 2008, due in part to weakness in Ontario being somewhat offset by relative strength in the Western provinces. The Council acknowledged that a slowing manufacturing sector and high Canadian dollar will continue to hamper growth in Eastern Canada. Several Council members pointed out that the Canadian dollar, expected to remain high throughout the forecast period, could continue to hurt net exports and hinder tourism from the US.
Council members agreed that Western Canada would be one of the main drivers of national economic growth over the next few years. Participants noted concern over a general labour
British Columbia Economic Forecast Council: Summary of Forecasts
| | | | | | | | | | Average | |
Participant | | Organization | | 2007 | | 2008 | | 2009 | | 2010-2012 | |
| | | | Per cent change in real GDP | |
Doug Porter | | Bank of Montreal(1) | | 3.1 | | 3.0 | | 3.0 | | 2.9 | |
Jock Finlayson | | BC Business Council(1) | | 3.1 | | 2.8 | | 3.1 | | 2.8 | |
Avery Shenfeld | | CIBC | | 3.3 | | 3.3 | | 3.5 | | 3.3 | |
Marie-Christine Bernard | | Conference Board | | 2.9 | | 3.0 | | 3.1 | | 2.5 | |
Helmut Pastrick | | Credit Union Central of BC(1) | | 3.1 | | 3.0 | | 2.9 | | 4.0 | |
Dale Orr | | Global Insight(1) | | 3.1 | | 2.9 | | 3.0 | | 2.8 | |
Carl Sonnen | | Informetrica | | 3.4 | | 2.5 | | 2.8 | | 2.5 | |
Paul Ferley | | RBC Financial Group(1) | | 3.0 | | 2.5 | | 3.0 | | 3.2 | |
Warren Jestin | | Scotiabank(1) | | 3.0 | | 3.0 | | 3.2 | | 2.9 | |
Ernie Stokes | | Stokes Economic Consulting | | 2.9 | | 2.4 | | 2.5 | | 2.2 | |
Derek Burleton | | TD Bank | | 3.2 | | 2.8 | | 3.0 | | 2.7 | |
David Baxter | | Urban Futures Institute | | 2.9 | | 2.8 | | 2.8 | | 2.7 | |
Average | | | | 3.1 | | 2.8 | | 3.0 | | 2.9 | |
Standard Deviation | | | | 0.2 | | 0.3 | | 0.2 | | 0.5 | |
(1) Updated subsequent to the December 7, 2007 meeting
Budget and Fiscal Plan – 2008/09 to 2010/11 |
145
British Columbia Economic Review and Outlook
and skills shortage in the Canadian economy, and that interprovincial migration to Alberta could continue to deplete the already shrinking labour supply in other provinces.
Estimates for Canadian growth averaged 2.6 per cent for 2007, slowing to 2.3 per cent for 2008 before rising back to 2.6 per cent for 2009. The Council’s forecast then held steady at 2.6 per cent average for the 2010 through 2012 period.
The risks to Canadian economic growth in 2008 and 2009 included weakness in the US economy, a high Canadian dollar and worsening labour and skills shortages.
Financial Markets
At the time of the meeting in December, most Council members expected the Federal Reserve to lower its intended Federal Funds rate slightly from its present rate of 4.25 per cent, to an annual average of 3.93 per cent for 2008.(1) However, due to the increased financial and economic turmoil observed in January, the Federal Reserve employed a series of drastic rate cuts in late-January, leading to the current Fed funds rate of 3.00 per cent. Given the recent movements by the Fed, and mounting fears of a recession in the US, it is now unlikely that the Fed funds rate will average 3.93 per cent in 2008.
Council projections for the intended federal funds rate averaged 4.20 per cent for 2009 then rose to an average of 4.67 per cent over the 2010 to 2012 period.
There was a mixed view among Council members on whether the Bank of Canada would need a higher or lower overnight target rate in 2008 than the 4.25 per cent that was in effect at the time of the December meeting. On average, the Council expects the Bank’s overnight target rate to average 4.16 per cent
(1) The intended federal funds rate is the interest rate at which depository institutions lend balances at the Federal Reserve to other depository institutions overnight.
in 2008. The interest rate spread between the US and Canada was expected to narrow slightly on average over the medium–term. Council’s forecasts for the Bank of Canada’s overnight target rate averaged 4.42 per cent in 2009 and then averaged 4.56 per cent over the 2010 to 2012 period.
Chart 2 – Economic Forecast Council Outlook for the Exchange Rate
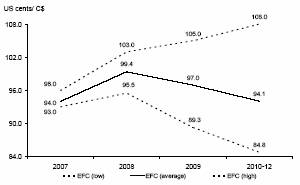
Exchange rate forecasts averaged 99.4 cents US for 2008, a rise from the 93.1 cents US observed in 2007. Council’s predictions for 2008 ranged from a low of 95.5 cents up to a high of 103.0 cents. Average exchange rate forecasts for 2009 were 97.0 cents US with nine of the twelve participants expecting the Canadian dollar to average below parity that year. On average, the Council expected the Canadian dollar to lose some value vis–à–vis the US dollar by the medium–term, and average 94.1 cents US for the 2010–12 period. However, Council members continued to have quite divergent views on the value of the Canadian dollar over the medium–term, with forecasts ranging from 84.8 cents to 108.0 cents over the 2010 to 2012 period.
Chart 3 – Economic Forecast Council Outlook for BC and Canada

Note: Real GDP per cent change for BC and Canada represent the average of the Economic Forecast Council’s forecasts
Budget and Fiscal Plan – 2008/09 to 2010/11 |
146
British Columbia Economic Review and Outlook
Council members were fairly consistent in their concerns over the possible impacts of a higher Canadian dollar. Several participants noted that the high dollar is already hurting net exports and tourism in BC and Canada, and will likely hinder economic growth if it continues to remain high.
British Columbia Forecast
Council forecasts for BC’s economic growth averaged 2.8 per cent in 2008, 3.0 per cent in 2009 and 2.9 per cent during the 2010 to 2012 period. Council members anticipated a softer outlook for BC than was forecast previously, largely due to weakness in the US economy. The Council agreed that while BC’s outlook is lower than before, the province is still expected to outperform the national average over the forecast period. Participants expected domestic demand to continue as the main source of growth for BC in the near–to–medium–term. Key economic drivers include robust consumer spending, strong construction activity and continued demand for BC’s resources, particularly from rapidly expanding Asian economies.
Chart 4 – Economic Growth Forecast 2008
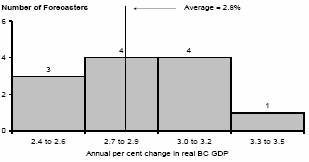
As shown in Chart 4, most Council members’ forecasts for BC growth in 2008 were distributed between 2.4 and 3.2 per cent, with one estimate
Chart 5 – Economic Growth Forecast 2009
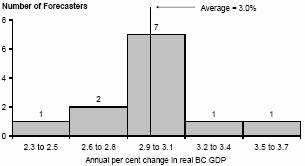
exceeding 3.2 per cent. For 2009, the majority of forecasts fell within the 2.9 to 3.1 per cent range, with a few falling outside of this range (see Chart 5).
Half of the Council forecasts for economic growth in the 2010 to 2012 period were within the 2.6 to 2.9 per cent range. A few participants predicted growth below this range, and a few predict growth above (see Chart 6). The range of forecasts was the broadest in this period, with a low of 2.2 per cent and a high of 4.0 per cent.
Chart 6 – Economic Growth Forecast 2010-12
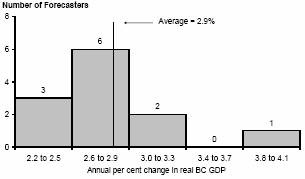
External Issues
The Council discussed at length the softening US economic outlook, with particular focus on the severe weakness in the US housing market. As the US is still BC’s major trading partner, a prolonged downturn in the US economy would have a significant negative impact on the province’s economic growth. However, some Council members noted that BC’s diversified export market, primarily BC’s growing trade with Asia, would help to shield the BC economy while other provinces, particularly Ontario, would be harder hit.
In addition, members noted that BC is well positioned to benefit from rising demand for overseas goods in several Asian countries, especially China and India. Several Council members emphasized trade opportunities brought on by the rapid growth of Asian economies and the current high demand for commodities. Some participants noted that sustained demand from Asia, as well as other parts of the world, will
Budget and Fiscal Plan – 2008/09 to 2010/11 |
147
British Columbia Economic Review and Outlook
cause commodity prices and energy prices to remain elevated in the medium–term.
Sector– specific Issues
The Council’s discussion on BC’s domestic economy focused on consumer spending, the labour market, construction and the forestry sector.
Most Council members cited continued strength in the domestic economy as the key driver of BC’s economic growth over the coming years. While the high dollar and slowing US economy are hindering BC’s external trade, BC’s domestic economy is expected to remain strong, keeping our economic growth ahead of the national average.
Most Council members noted that consumer spending in BC is expected to remain robust over the forecast period. While housing starts are expected to come down from the high level observed in 2007, they are expected to remain at relatively healthy levels in the medium term.
On average, the Council estimated total net migration to BC was 44,670 people in 2007, with forecasts averaging 45,900 people for 2008. Members provided a broad range of forecasts for total net migration in 2008, varying from a low of 38,400 people to a high of 55,000 people. Some participants voiced concern over the availability of working–aged migrants over the coming years due to the oncoming wave of retiring baby boomers, coupled with already tight labour market conditions in most parts of Canada. The Council anticipates total net migration to average 46,890 people in 2009, falling to an average 45,520 people per year through the 2010 to 2012 period.
The issue of a potential labour shortage in BC was one of the Council’s medium–term issues, with some members suggesting that migration levels may not be sufficient to replace all the retiring workers over the coming years. This could place significant strain on BC’s labour market, which is already exhibiting a very low unemployment rate. These shortages may push up labour costs and inflation and could strain economic growth. Alberta’s ability to attract workers, as well as increased ease of labour mobility due to the Trade, Investment and Labour Mobility Agreement (TILMA), were cited as possible contributors to labour shortages in British Columbia. Some Council members commented that policies to increase the inflow of working migrants, through programs such as the Provincial Nominee Program, could aid in combating potential labour shortages.
Many Council members were concerned about the impact of the softening US housing market on BC’s forest industry, as US demand for forest imports could continue to decline. Participants also discussed the Mountain Pine Beetle infestation and its negative effect on BC’s lumber industry, noting that the epidemic has spread more rapidly than anticipated and that the infestation has accelerated lumber processing rates in the near–term. With reduced demand and the high value of the Canadian dollar, Council members suggested the forest sector may be hard hit over the coming years.
Commenting on BC’s tourism industry, some Council members suggested that tourism would likely suffer with the continued high value of the Canadian dollar compared to its US counterpart. While tourism from the US is expected to be weak, some Council members noted that tourism from international sources may increase over the coming years.
Many participants mentioned BC’s lagging labour productivity relative to other provinces and to Canada. Members noted that continued weak productivity growth could create major constraints on the provincial economy in the medium–to–long–term. They agreed that the government must continue its focus on increasing productivity and skills training in the future.
Budget and Fiscal Plan – 2008/09 to 2010/11 |
148
British Columbia Economic Review and Outlook
Climate Change
The Council was asked to comment on the issue of climate change, in terms of BC’s recent policy announcements, as well as climate change policy options and how they may impact the economy.
Council members felt that BC had set ambitious targets for climate change, with the targeted 33 per cent reduction in emissions by 2020. It was also suggested that this target may be particularly challenging for BC to attain, since the province is already one of the lowest emitters per capita.
Most Council members said that a carbon tax would be their recommended method of introducing incentives for emission reductions. The Council members felt that a broad based carbon tax that affects choices at the consumer and household level, as well as all types of businesses is preferable to a system that only targets some emitters. Some members of the Council stressed that if carbon taxes were to be implemented, it should be done in a revenue–neutral fashion, meaning that carbon tax revenues collected by the government should be returned to consumers and business, and not be retained by government. One member added that carbon tax revenues could be used to fund alternative energy.
Some members commented that a cap and trade system may not be appropriate for BC, as they felt this type of system was preferred when there is “low hanging fruit”, meaning quick and easy ways for industries to reduce emissions. It was suggested BC industries had few quick and easy options available, and therefore a cap and trade system may work to the province’s disadvantage.
Council members also voiced some concerns and risks associated with undertaking climate change initiatives. The Council was unanimous in their view that there would be economic costs associated with meeting the announced targets. There was concern that climate change policies could have a more pronounced negative impact on BC’s interior, where many of the natural resource industries operate. Some members mentioned the conflict that could arise in BC from trying to take advantage of high demand for its natural resources and further develop the oil and gas industry, while at the same time trying to reduce greenhouse gas emissions.
The Council also commented on BC’s choice to implement climate change policies ahead of many other provinces, states, and federal governments. If other jurisdictions implement more business-friendly climate change policies in the near-future, or do not implement climate change policies at all, then BC could be at risk on a competitive front.
While members agreed that emissions reductions would cause economic disruption, some members pointed out that it would provide an opportunity for expansion in the environmental industry, and that it is a problem that all governments will have to address in the near future.
BC Business
The Council was asked to share their views and strategies on attracting investment to BC, including head offices or regional offices. Council members voiced a fairly unanimous opinion that trying to entice head offices to locate in BC would not be the best strategy. Rather, the Council suggested that government should continue to ensure that it creates a level playing field for all types of business in the province. Some Council members suggested lowering the top marginal income tax rate, or the marginal effective tax rate, would serve to benefit the business climate in BC. Overall, Council members stressed the importance of small business and that undertaking policies to encourage investment from existing business would be the most beneficial course of action to the province on this front.
Budget and Fiscal Plan – 2008/09 to 2010/11 |
149
British Columbia Economic Review and Outlook
Forecast Survey – Participants’ Opinions
All figures are based | | 2007 | | 2008 | | 2009 | | 2010 to 2012 | |
on annual averages | | Range | | Average(1) | | Range | | Average(1) | | Range | | Average(1) | | Range | | Average(2) | |
| | | | | | | | | | | | | | | | | |
United States | | | | | | | | | | | | | | | | | |
| | | | | | | | | | | | | | | | | |
Real GDP (% change) | | 1.9 – 2.7 | | 2.2 (12 | )(3) | 1.6 – 2.7 | | 2.1 (12 | ) | 1.7 – 3.5 | | 2.6 (12 | ) | 2.1 – 3.4 | | 2.8 (12 | ) |
Intended Federal Funds rate (%) | | 4.25 – 5.10 | | 4.91 (11 | ) | 3.37 – 4.80 | | 3.93 (11 | ) | 3.50 – 5.20 | | 4.20 (11 | ) | 3.75 – 5.30 | | 4.67 (11 | ) |
Housing starts (million units) | | 1.35 – 1.42 | | 1.37 (11 | ) | 0.90 – 1.60 | | 1.14 (11 | ) | 1.00 – 1.70 | | 1.28 (11 | ) | 1.35 – 1.80 | | 1.52 (11 | ) |
| | | | | | | | | | | | | | | | | |
Canada | | | | | | | | | | | | | | | | | |
| | | | | | | | | | | | | | | | | |
Real GDP (% change) | | 2.4 – 2.6 | | 2.6 (12 | ) | 1.9 – 2.8 | | 2.3 (12 | ) | 2.2 – 3.1 | | 2.6 (12 | ) | 2.4 – 2.8 | | 2.6 (12 | ) |
Bank of Canada Overnight Target rate (%) | | 4.26 – 4.40 | | 4.35 (11 | ) | 3.62 – 4.60 | | 4.16 (11 | ) | 4.00 – 4.94 | | 4.42 (11 | ) | 4.25 – 5.00 | | 4.56 (11 | ) |
Exchange rate (US cents/C$) | | 93.0 – 96.0 | | 94.0 (12 | ) | 95.5 – 103.0 | | 99.4 (12 | ) | 89.3 – 105.0 | | 97.0 (12 | ) | 84.8 – 108.0 | | 94.1 (12 | ) |
Consumer price index (% chg) | | 2.1 – 2.4 | | 2.2 (12 | ) | 1.4 – 2.2 | | 1.9 (12 | ) | 1.6 – 2.3 | | 2.0 (12 | ) | 1.9 – 2.4 | | 2.1 (12 | ) |
| | | | | | | | | | | | | | | | | |
British Columbia | | | | | | | | | | | | | | | | | |
| | | | | | | | | | | | | | | | | |
Real GDP (% change) | | 2.9 – 3.4 | | 3.1 (12 | ) | 2.4 – 3.3 | | 2.8 (12 | ) | 2.5 – 3.5 | | 3.0 (12 | ) | 2.2 – 4.0 | | 2.9 (12 | ) |
Nominal GDP (% change) | | 5.5 – 7.5 | | 6.3 (11 | ) | 4.5 – 6.5 | | 5.3 (11 | ) | 4.2 – 6.7 | | 5.3 (11 | ) | 3.8 – 6.7 | | 4.9 (11 | ) |
GDP Deflator (% change) | | 2.2 – 4.3 | | 3.2 (11 | ) | 1.8 – 3.4 | | 2.5 (11 | ) | 1.2 – 3.7 | | 2.3 (11 | ) | 1.4 – 3.3 | | 2.1 (11 | ) |
Personal Income (% change) | | 5.2 – 7.6 | | 6.4 (11 | ) | 3.9 – 7.2 | | 5.3 (11 | ) | 4.0 – 7.5 | | 5.4 (11 | ) | 4.2 – 6.5 | | 5.2 (11 | ) |
Net Migration (thousand persons) | | 39.7 – 52.0 | | 44.7 (12 | ) | 38.4 – 55.0 | | 45.9 (12 | ) | 39.9 – 58.0 | | 46.9 (12 | ) | 36.0 – 62.0 | | 45.5 (12 | ) |
Employment (% change) | | 2.6 – 3.2 | | 3.1 (12 | ) | 1.4 – 2.6 | | 1.9 (12 | ) | 1.0 – 2.6 | | 1.8 (12 | ) | 0.7 – 2.5 | | 1.6 (12 | ) |
Unemployment rate (%) | | 4.1 – 4.7 | | 4.3 (12 | ) | 4.0 – 4.7 | | 4.3 (12 | ) | 4.0 – 4.8 | | 4.3 (12 | ) | 3.8 – 5.0 | | 4.4 (12 | ) |
Corporate pre-tax profits (% change) | | 3.0 – 9.1 | | 5.1 (8 | ) | -3.0 – 6.6 | | 2.2 (8 | ) | 3.0 – 10.1 | | 7.2 (8 | ) | 2.6 – 6.7 | | 4.9 (7 | ) |
Housing starts (thousand units) | | 36.9 – 38.6 | | 37.7 (12 | ) | 31.1 – 37.0 | | 34.7 (12 | ) | 27.5 – 35.8 | | 32.4 (12 | ) | 23.0 – 35.5 | | 30.6 (12 | ) |
Retail sales (% change) | | 5.9 – 8.3 | | 6.9 (12 | ) | 2.0 – 7.0 | | 5.6 (12 | ) | 2.7 – 7.8 | | 5.4 (12 | ) | 3.2 – 8.5 | | 5.3 (12 | ) |
Consumer price index (% chg) | | 1.8 – 2.1 | | 1.9 (12 | ) | 1.4 – 2.2 | | 1.9 (12 | ) | 1.7 – 2.3 | | 2.1 (12 | ) | 1.9 – 3.9 | | 2.2 (12 | ) |
(1) Based on responses from participants providing forecasts.
(2) Participants provided an average forecast for 2010 to 2012.
(3) Number of respondents shown in parenthesis.
Budget and Fiscal Plan – 2008/09 to 2010/11
150
Part 5: 2007/08 UPDATED FINANCIAL FORECAST
(THIRD QUARTERLY REPORT)
Table 5.1 Budget 2007 and Quarterly Updates – Operating Statement
| | | | First | | Second | | Third | |
| | February 20 | | Quarterly | | Quarterly | | Quarterly | |
($ millions) | | Budget | | Report | | Report | | Report | |
Taxpayer-supported programs and agencies: | | | | | | | | | |
Revenue | | 34,887 | | 35,773 | | 36,350 | | 36,525 | |
Expense | | (36,240 | ) | (36,430 | ) | (36,540 | ) | (37,280 | ) |
Taxpayer-supported balance | | (1,353 | ) | (657 | ) | (190 | ) | (755 | ) |
Commercial Crown corporation income | | 2,503 | | 2,757 | | 2,815 | | 2,875 | |
Surplus before forecast allowance | | 1,150 | | 2,100 | | 2,625 | | 2,120 | |
Forecast allowance | | (750 | ) | (500 | ) | (500 | ) | (150 | ) |
Surplus | | 400 | | 1,600 | | 2,125 | | 1,970 | |
2007/08 Fiscal Year in Review
The surplus for 2007/08 is projected at $1.97 billion, $1.57 billion higher than the Budget 2007 budget.
Government revenue is forecast to be $2.0 billion higher than the projection in Budget 2007, reflecting higher than anticipated taxation revenue ($1.5 billion), federal transfers ($451 million) and commercial Crown corporation net income ($372 million), and other revenue increases totaling $451 million, partially offset by an $834 million reduction in natural resource revenue.
The net increase in revenue enabled government to allocate $1.05 billion to priority initiatives, primarily for climate action.
The 2007/08 forecast allowance has been reduced by $600 million to $150 million since the start of the year. The reduced forecast allowance reflects the forecast risk over the remaining three months of the fiscal year. Further details on the changes from Budget 2007 are provided in Table 5.7.
Chart 5.1 Progress of 2007/08 financial forecasts
Budget and Fiscal Plan – 2008/09 to 2010/11
151
2007/08 Updated Financial Forecast (Third Quarterly Report)
Changes since the Second Quarterly Report
The surplus forecast for 2007/08 has been reduced by $155 million from the second Quarterly Report forecast, primarily due to allocations for priority initiatives, partially offset by additional revenue and a reduction in the forecast allowance.
Chart 5.2 2007/08 surplus down $155 million since
the second Quarterly Report
Since the second Quarterly Report in November:
• The forecast for total revenue, including income from commercial Crown corporations, increased $235 million.
• Taxpayer-supported revenue is up $175 million, led by higher personal income tax revenue, additional investment income and an increase in other revenue, partially offset by a reduction in forest revenue and a decline in projected federal transfers.
• Income from commercial Crown corporations increased by $60 million, primarily due to the positive impact of lower claims cost projections and the sale of assets on ICBC’s financial results.
• Total spending increased $740 million from the previous forecast, primarily due to increased spending on one-time programs partially funded by the federal government.
• Government allocated $1,045 million of the surplus to priority initiatives such as climate action (including a Climate Action Dividend to individual British Columbians to help them achieve their climate action goals), arts and culture, health and children, and research and education.
• The additional spending on priority initiatives, additional flood and disaster relief costs and spending on one-time federally funded programs was partially offset by lower interest costs and other savings.
• Some of the priority initiative funding will flow to universities, health authorities and other organizations within the broader government entity in the form of endowments and funds, resulting in a $299 million reduction in the self-funded expenses of these organizations.
Budget and Fiscal Plan – 2008/09 to 2010/11
152
2007/08 Updated Financial Forecast (Third Quarterly Report)
• The forecast allowance was reduced by $350 million in recognition of the lower risk to achieving the projected surplus remaining until the accounts for the full year are completed.
Table 5.2 prpovides more details on developments since the second Quarterly Report.
Table 5.2 Operating Statement Update Since the Second Quarterly Report
| | | | Updated | |
($ millions) | | Changes | | Forecast | |
Budget 2007 Fiscal Plan (February 20, 2007) | | | | 400 | |
Revenue increases up to the second Quarterly Report | | 1,775 | | | |
Expense decreases up to the second Quarterly Report | | (300 | ) | | |
Forecast allowance decrease | | 250 | | | |
Net change | | | | 1,725 | |
2007/08 surplus – second Quarterly Report | | | | 2,125 | |
Third Quarterly Report forecast updates: | | | | | |
Revenue increases (decreases): | | | | | |
Personal income tax – stronger 2006 tax assessments and improved 2007 outlook | | 105 | | | |
Corporate income tax – improved prior year tax assessments | | 28 | | | |
Property transfer tax – continued strong housing market | | 25 | | | |
Sales of Crown land drilling rights – strong annual sales due to high average bid price/hectare | | 36 | | | |
Metal and minerals revenue – mainly lower mine production | | (30 | ) | | |
Forests – depressed US market conditions | | (110 | ) | | |
Investment earnings – primarily gain from sinking fund liquidations | | 68 | | | |
Federal government transfers – mainly deferral of federal government trusts related to health care | | (107 | ) | | |
All other taxpayer supported changes | | 160 | | | |
Commercial Crown corporation net income: | | | | | |
ICBC – mainly lower claims cost projections and gain from sale of Cambie Claims Centre | | 57 | | | |
Other Crown corporation changes | | 3 | | | |
Total revenue changes | | | | 235 | |
Less expense increases (decreases): | | | | | |
Priority initiatives | | 1,045 | | | |
Additional flood costs and disaster relief, partially offset by ministry savings | | 8 | | | |
Interest costs – reduced debt levels and the impact of liquidating sinking funds | | (89 | ) | | |
Increased recoverable expenses – mainly federally-funded programs and debt servicing costs | | 75 | | | |
Service delivery agencies net spending changes – funding for priority projects | | (299 | ) | | |
Total expense changes | | | | 740 | |
Subtotal | | | | (505 | ) |
Forecast allowance decrease | | | | 350 | |
Net change since the second Quarterly Report | | | | (155 | ) |
2007/08 surplus – third Quarterly Report | | | | 1,970 | |
2007/08 Priority Initiatives
Government intends to introduce Supplementary Estimates to obtain the necessary legislative appropriations to fund the following priority initiatives.
Climate Action
2007/08 priority initiatives for Climate Action total $702 million, with specific investments in the following areas:
• Climate Action Dividend ($450 million) – Budget 2008 will provide for a $100 Climate Action Dividend payment to each British Columbia resident to help people achieve their climate action goals ($440 million), and fund administrative costs associated with making the payments ($10 million).
Budget and Fiscal Plan – 2008/09 to 2010/11
153
2007/08 Updated Financial Forecast (Third Quarterly Report)
Table 5.3 2007/08 Priority Initiatives
| | Supplementary | |
($ millions) | | Estimates | |
Climate Action | | | |
Climate Action Dividend | | 450 | |
PICS /PCIC Climate Research | | 95 | |
Provincial Transit Plan | | 52 | |
Bioenergy Network | | 25 | |
SCRAP-it Program | | 15 | |
 Other Climate Action initiatives Other Climate Action initiatives
| | 65 | |
| | | |
Arts and Culture | | | |
BC150 Cultural Fund endowment | | 150 | |
Vancouver East Cultural Centre | | 9 | |
Other Arts and Culture initiatives | | 69 | |
| | | |
Health and Children | | | |
Advancements in health research | | 37 | |
Public health initiatives including heart health | | 5 | |
Coast Mental Health | | 1 | |
| | | |
Research and Education | | | |
Genome BC – climate action research | | 50 | |
Geoscience BC – resource data collection | | 12 | |
Science World – renewal and expansion | | 10 | |
| | | |
Total priority initiatives | | 1,045 | |
As British Columbian’s increase their awareness of the effects of greenhouse gas emissions, it is anticipated that they will begin making personal commitments to reduce their individual impacts on the world’s climate through different consumption choices. These choices may carry additional costs; but, while increasingly accepted as necessary costs, it will take time for individuals to manage them within their personal finances. As well, the government recognizes that the initial impact of new provincial Climate Action initiatives aimed at reducing our collective carbon footprint will impact individuals and businesses in the immediate term. The Climate Action Dividend is intended to assist in the transition.
• Pacific Institute for Climate Solutions (PICS) and Pacific Climate Impacts Consortium (PCIC) ($95 million) – PICS is a new multi-university collaboration that will provide government with scientific research expertise on climate change issues, enhancing our knowledge of low carbon technologies and investigating practical alternatives to “carbon-intensive” consumer products.
PCIC will produce reliable research to foster a better understanding of the future impacts of climate change on BC’s water and other natural resources, weather events, and the economy.
• Provincial Transit Plan ($52 million) – A grant will be provided to the South Coast British Columbia Transportation Authority for Rapid Bus development and other assets.
• Bioenergy Network ($25 million) – The funding will be used to establish a network responsible for encouraging research and initiating projects that promote the development and use of fuel from organic resources, including
Budget and Fiscal Plan – 2008/09 to 2010/11
154
2007/08 Updated Financial Forecast (Third Quarterly Report)
research and investments in wood-waste co-generation, bio-fuels from wood, agricultural, or waste biomass, and wood pellet production.
• SCRAP-it Program ($15 million) – Funding for expansion of the program that provides financial and other incentives to remove older, less efficient vehicles from BC roads.
• Other Climate Action initiatives totaling $65 million include:
• Forest health and growth ($19 million) – Initiatives that maximize forest sequestration of CO 2, including strategies that improve adaptability to climate change and reduce wildfire risks.
• Reduction of public servant travel ($15 million) – Allocated to the development of advanced communication and collaboration tools, including desktop videoconferencing, to reduce public servant travel.
• Pulp and paper industry emissions ($10 million) – Funding to assist British Columbia’s pulp and paper industry to develop new technologies to further reduce GHG emissions during the processing of wood chips into pulp.
• Pacific Carbon Trust ($9 million) – Start-up funding for a Crown corporation mandated to invest in GHG-reducing projects in British Columbia and to assist the government in meeting its carbon neutral target by 2010 by purchasing low-cost credible carbon offsets in BC.
• Solar energy ($5 million) – Funding to support the expansion and uptake of solar thermal energy systems in British Columbia.
• Clean energy ($4 million) – Support for remote First Nations and other communities currently reliant on diesel generated power plants to switch to sources of clean electricity and improve the energy efficiency of their homes and businesses.
• Carbon capture ($3 million) – Funding to research technology options for the capture and permanent underground storage of CO 2 from oil and gas production.
Arts and Culture
• BC150 Cultural Fund ($150 million) – This will be a permanent endowment generating investment income that will fund a wide range of arts and cultural activities in communities throughout the province, as identified by the BC Arts Council.
• Vancouver East Cultural Centre ($9 million) – Support for the revitalization and restoration of the Vancouver East Cultural Centre, and establishment of an endowment fund to assist with the ongoing operation of the expanded centre.
• Other arts and culture initiatives ($69 million) – Further initiatives will be announced before fiscal year end.
Health and Children
• Brain research ($25 million) – Funding provided to the Brain Research Centre at UBC for the development of prevention and rehabilitation strategies.
Budget and Fiscal Plan – 2008/09 to 2010/11
155
2007/08 Updated Financial Forecast (Third Quarterly Report)
• Centre for Hip Health ($10 million) – Funding to complete facility construction and support multidisciplinary programming on hip health and musculoskeletal research.
• Childhood Cancer Treatment ($2 million) – Funding for research in the area of Paediatric Oncology that focuses on developing new strategies for treating childhood cancer.
• Public Health ($5 million) – Support for public health initiatives, including $4.5 million to Legacies Now to fund health and wellness initiatives, and $0.5 million to the Healthy Heart Society to conduct heart screening and provide heart education sessions throughout the province.
• Coast Mental Health Foundation ($1 million) – An endowment fund for the Courage to Come Back Awards recognizing British Columbians who have overcome illness, injury or adversity to contribute to their communities.
Research and Education
• Genome BC ($50 million) – Support to the organization’s 2010-2015 strategic plan for research that focuses on addressing the challenges of a changing world, including climate change. This provincial contribution is expected to attract an additional $150 million in external funding toward these research activities.
• Geoscience BC ($12 million) – Funding for further development of geoscience data that will support mineral and oil & gas exploration.
• Science World ($10 million) – Support for a major upgrade and renewal of its facilities, including development of an outdoor science park. Science World attracts over 500,000 visitors annually, and reaches over 180,000 children, educators and parents through its outreach programs.
2007/08 Notional Contingencies Allocations
In addition to the priority initiatives, spending commitments and pressures totaling $140 million have been notionally allocated to the Contingencies vote, as is shown in Table 5.4.
Table 5.4 2007/08 Notional Allocations to Contingencies
| | ($ millions) | |
Negotiated Bill 29 compensation for BC healthcare workers | | 87 | |
Correctional institution caseload and safety issues | | 13 | |
Capitalization of forest service roads | | 11 | |
Flood Hazard Mitigation Program – new funding for flood prevention strategies | | 10 | |
Additional major trial costs | | 8 | |
Norman B. Keevil Institute of Mining Engineering at UBC | | 5 | |
Victims services – statutory benefits and victim support | | 4 | |
Enhanced driver’s licence pilot program | | 2 | |
Subtotal notional allocations | | 140 | |
Remaining contingencies | | 220 | |
Total contingencies | | 360 | |
Budget and Fiscal Plan – 2008/09 to 2010/11
156
2007/08 Updated Financial Forecast (Third Quarterly Report)
Musqueam
As noted in the second Quarterly Report, in November 2007 the government announced a negotiated reconciliation agreement with the Musqueam people to bring a resolution to three court cases. The agreement includes a cash payment of $20.3 million and land transfers in the Lower Mainland involving the University of BC golf course lands, Bridgepoint Casino lands and certain lands within the Pacific Spirit Regional Park.
The overall value and provincial cost of the agreement is dependant on several factors involving land transfers and valuations. The government expects to finalize the agreement in March 2008. If the agreement is ratified by the Musqueam, the government plans to seek the necessary approvals from the Legislative Assembly to implement the Final Agreement.
The final costs of implementing the reconciliation agreement are expected to be accommodated within the revised fiscal plan forecast for 2007/08.
Capital Spending and Provincial Debt
Updated capital spending of $5.5 billion is little changed from the second Quarterly Report forecast and $369 million higher than the Budget 2007 amount.
The main changes since the second Quarterly Report are shown in Table 5.6, and further details on capital spending are shown in Table 5.13.
Table 5.5 Budget 2007 and Quarterly Updates – Capital Spending and Provincial Debt
| | | | First | | Second | | Third | |
| | February 20 | | Quarterly | | Quarterly | | Quarterly | |
($ millions) | | Budget | | Report | | Report | | Report | |
Capital spending | | | | | | | | | |
Taxpayer-supported | | 3,864 | | 4,257 | | 4,206 | | 4,149 | |
Self-supported | | 1,292 | | 1,341 | | 1,327 | | 1,376 | |
Total capital spending | | 5,156 | | 5,598 | | 5,533 | | 5,525 | |
| | | | | | | | | |
Provincial Debt | | | | | | | | | |
Taxpayer-supported | | 27,803 | | 26,231 | | 26,367 | | 26,792 | |
Self-supported | | 8,284 | | 8,029 | | 8,041 | | 8,061 | |
Forecast allowance | | 750 | | 500 | | 500 | | 150 | |
Total provincial debt | | 36,837 | | 34,760 | | 34,908 | | 35,003 | |
| | | | | | | | | |
Taxpayer-supported debt as a per cent of GDP | | 14.8 | % | 13.8 | % | 13.9 | % | 14.1 | % |
Total provincial debt as a per cent of GDP | | 19.6 | % | 18.3 | % | 18.4 | % | 18.4 | % |
Budget and Fiscal Plan – 2008/09 to 2010/11
157
2007/08 Updated Financial Forecast (Third Quarterly Report)
Provincial debt is forecast to total $35.0 billion at year-end – up $95 million from the second Quarterly Report forecast, but $1.8 billion below the Budget 2007 amount. Taxpayer-supported debt is expected to total $26.8 billion – up $425 million from the second Quarterly Report forecast, but $1.0 billion below budget.
Significant changes in debt since the second Quarterly Report are shown in Table 5.6, and further details on the provincial debt forecast are shown in Table 5.14.
The total debt forecast represents 18.4 per cent of provincial GDP, while taxpayer-supported debt is forecast at 14.1 per cent of GDP. The debt to GDP ratios forecast in the Budget 2007 for total and taxpayer-supported debt were 19.6 per cent and 14.8 per cent respectively. The improvements in the debt to GDP ratios reflect lower than expected debt balances and stronger than forecast GDP.
Table 5.6 Capital Spending and Provincial Debt Update Since the Second Quarterly Report
| | | | Updated | |
($ millions) | | Change | | Forecast | |
Budget 2007 capital spending (February 20, 2007) | | | | 5,156 | |
Taxpayer-supported changes up to the second Quarterly Report | | 342 | | | |
Self-supported changes up to the second Quarterly Report | | 35 | | 377 | |
2007/08 updated capital spending – second Quarterly Report | | | | 5,533 | |
Taxpayer-supported changes: | | | | | |
K–12 schools – computer, furniture and equipment and vehicle purchases financed from cash balances | | 35 | | | |
Post-secondary education facilities – spending deferred on UBC and UBCO projects due to labour/material shortages | | (96 | ) | | |
Other | | 4 | | (57 | ) |
Self-supported changes: | | | | | |
BC Hydro – higher than expected spending on electricity transmission projects | | 46 | | | |
Other | | 3 | | 49 | |
Total third Quarterly Report changes | | | | (8 | ) |
2007/08 updated capital spending – third Quarterly Report | | | | 5,525 | |
| | | | | |
Budget 2007 total provincial debt (February 20, 2007) | | | | 36,837 | |
Taxpayer-supported debt changes up to the second Quarterly Report | | (1,436 | ) | | |
Self-supported debt changes up to the second Quarterly Report | | (243 | ) | | |
Forecast allowance decrease | | (250 | ) | (1,929 | ) |
2007/08 updated total provincial debt – second Quarterly Report | | | | 34,908 | |
Taxpayer-supported debt changes: | | | | | |
Government operating – mainly lower operating surplus | | 348 | | | |
Health facilities – mainly interest during construction being included on capital projects | | 94 | | | |
Other | | (17 | ) | 425 | |
Self-supported debt changes: | | | | | |
BC Hydro – mainly higher capital spending | | | | 20 | |
Debt forecast allowance adjustment to mirror operating statement change | | | | (350 | ) |
Total third Quarterly Report changes | | | | 95 | |
2007/08 updated total provincial debt – third Quarterly Report | | | | 35,003 | |
Budget and Fiscal Plan – 2008/09 to 2010/11
158
2007/08 Updated Financial Forecast (Third Quarterly Report)
Table 5.7 2007/08 Operating Statement
| | Year-to-Date to December 31 | | Full Year | |
| | 2007/08 | | Actual | | 2007/08 | | Actual | |
($ millions) | | Budget | | Actual | | Variance | | 2006/07 | | Budget | | Forecast | | Variance | | 2006/07 | |
Taxpayer-supported programs and agencies: | | | | | | | | | | | | | | | | | |
Revenue | | 25,665 | | 26,663 | | 998 | | 25,983 | | 34,887 | | 36,525 | | 1,638 | | 35,819 | |
Expense | | (25,930 | ) | (25,608 | ) | 322 | | (24,126 | ) | (36,240 | ) | (37,280 | ) | (1,040 | ) | (34,184 | ) |
Negotiating Framework incentive payments | | — | | — | | — | | (244 | ) | — | | — | | — | | (264 | ) |
Taxpayer-supported balance | | (265 | ) | 1,055 | | 1,320 | | 1,613 | | (1,353 | ) | (755 | ) | 598 | | 1,371 | |
Commercial Crown corporation income | | 1,965 | | 2,418 | | 453 | | 2,127 | | 2,503 | | 2,875 | | 372 | | 2,685 | |
Surplus before forecast allowance | | 1,700 | | 3,473 | | 1,773 | | 3,740 | | 1,150 | | 2,120 | | 970 | | 4,056 | |
Forecast allowance | | — | | — | | — | | — | | (750 | ) | (150 | ) | 600 | | — | |
Surplus | | 1,700 | | 3,473 | | 1,773 | | 3,740 | | 400 | | 1,970 | | 1,570 | | 4,056 | |
Budget and Fiscal Plan – 2008/09 to 2010/11
159
2007/08 Updated Financial Forecast(Third Quarterly Report)
Table 5.8 2007/08 Forecast Update – Changes from Budget 2007
| | | | Updated | |
($ millions) | | Changes | | Forecast | |
Budget 2007 Surplus (February 20, 2007) | | | | 400 | |
Revenue increases (decreases): | | | | | |
Personal income tax: | | | | | |
– Prior-year adjustment – stronger 2006 tax assessments | | 42 | | | |
– Base – improved economic growth and continuation of robust earnings from higher income taxpayers in 2007 | | 310 | | | |
Corporate income tax – improved 2006 corporate profits and tax assessments including higher impact of duty deposit refunds on forest sector firms’ income | | 826 | | | |
Social service tax – stronger 2007 economic and sales growth | | 201 | | | |
Fuel tax – higher year-to-date results mainly in diesel and natural gas volume sales | | 19 | | | |
Property tax – lower than expected property tax base | | (75 | ) | | |
Property transfer tax – strong year-to-date results and improved market outlook | | 171 | | | |
Insurance premium tax – higher 2006/07 results and improved growth in 2007/08 | | 14 | | | |
Natural gas royalties – lower natural gas prices and production volumes | | (529 | ) | | |
Forest revenue – lower lumber prices, stumpage rates and harvest volumes | | (297 | ) | | |
Medical Services Plan revenue – higher 2006/07 results and a change in accounting treatment | | 53 | | | |
Investment earnings – mainly higher investment balances | | 40 | | | |
Federal transfers: | | | | | |
Canada Health Transfer – mainly prior years | | 48 | | | |
Canada Social Transfer – mainly one-time child care spaces funding and prior years | | 67 | | | |
One-time eco-Trust | | 199 | | | |
Other transfers – multiculturalism and immigration, Millennium Scholarship Fund and direct post-secondary research grant funding and a contribution to CIII fund | | 209 | | | |
All other taxpayer-supported changes | | 340 | | | |
Commercial Crown corporation net income: | | | | | |
LDB – primarily improved sales and lower container handling costs | | 35 | | | |
BCRC – deferral of asset dispostions to future years | | (32 | ) | | |
ICBC – higher premium revenue and investment income, lower costs, and gain on sale of assets | | 369 | | | |
Other Crown corporation changes (net) | | — | | | |
Total revenue changes | | | | 2,010 | |
Less: expense increases (decreases): | | | | | |
Priority initiatives | | 1,045 | | | |
Forest fire costs | | 61 | | | |
Agriculture and Lands – primarily fewer Crown land grants | | (18 | ) | | |
Energy, Mines and Petroleum Resources – reflects a reduction in VIGAS agreement costs | | (29 | ) | | |
Forests and Range – mainly increase in BC Timber Sales costs | | 41 | | | |
Public Safety and Solicitor General – flood costs and disaster assistance | | 81 | | | |
Changes to MLA compensation and pensions | | 43 | | | |
Interest costs – mainly reduced operating debt levels | | (153 | ) | | |
CRF expense changes | | 1,071 | | | |
Increased ministry expenditures recoverable mainly from the federal government | | 250 | | | |
Service delivery agencies: | | | | | |
Funding for priority projects | | (299 | ) | | |
Other service delivery agencies net spending changes | | 18 | | | |
Total expense changes | | | | 1,040 | |
Subtotal | | | | 970 | |
Forecast allowance decrease | | | | 600 | |
Net change | | | | 1,570 | |
2007/08 surplus – third Quarterly Report | | | | 1,970 | |
Budget and Fiscal Plan – 2008/09 to 2010/11
160
2007/08 Updated Financial Forecast(Third Quarterly Report)
Table 5.9 2007/08 Revenue by Source
| | Year-to-Date to December 31 | | Full Year | |
| | 2007/08 | | Actual | | 2007/08 | | Actual | |
($ millions) | | Budget | | Actual | | Variance | | 2006/07 | | Budget | | Forecast | | Variance | | 2006/07 | |
Taxation | | | | | | | | | | | | | | | | | |
Personal income | | 4,770 | | 4,998 | | 228 | | 4,965 | | 6,389 | | 6,741 | | 352 | | 6,905 | |
Corporate income | | 952 | | 1,055 | | 103 | | 952 | | 1,395 | | 2,221 | | 826 | | 1,538 | |
Social service | | 3,740 | | 3,862 | | 122 | | 3,648 | | 4,890 | | 5,091 | | 201 | | 4,714 | |
Fuel | | 698 | | 713 | | 15 | | 684 | | 919 | | 938 | | 19 | | 901 | |
Tobacco | | 548 | | 549 | | 1 | | 597 | | 705 | | 705 | | — | | 726 | |
Property | | 1,385 | | 1,313 | | (72 | ) | 1,288 | | 1,863 | | 1,788 | | (75 | ) | 1,732 | |
Property transfer | | 707 | | 859 | | 152 | | 734 | | 904 | | 1,075 | | 171 | | 914 | |
Other | | 452 | | 472 | | 20 | | 463 | | 606 | | 610 | | 4 | | 588 | |
| | 13,252 | | 13,821 | | 569 | | 13,331 | | 17,671 | | 19,169 | | 1,498 | | 18,018 | |
Natural resources | | | | | | | | | | | | | | | | | |
Natural gas royalties | | 1,221 | | 811 | | (410 | ) | 907 | | 1,699 | | 1,170 | | (529 | ) | 1,207 | |
Columbia River Treaty | | 214 | | 175 | | (39 | ) | 178 | | 285 | | 230 | | (55 | ) | 223 | |
Other energy, metals and minerals | | 675 | | 746 | | 71 | | 721 | | 902 | | 956 | | 54 | | 935 | |
Forests | | 866 | | 810 | | (56 | ) | 736 | | 1,395 | | 1,098 | | (297 | ) | 1,276 | |
Water and other resources | | 247 | | 238 | | (9 | ) | 266 | | 347 | | 340 | | (7 | ) | 341 | |
| | 3,223 | | 2,780 | | (443 | ) | 2,808 | | 4,628 | | 3,794 | | (834 | ) | 3,982 | |
Other revenue | | | | | | | | | | | | | | | | | |
Medical Services Plan premiums | | 1,101 | | 1,165 | | 64 | | 1,133 | | 1,497 | | 1,550 | | 53 | | 1,524 | |
Post-secondary education fees | | 721 | | 684 | | (37 | ) | 656 | | 964 | | 957 | | (7 | ) | 928 | |
Other health-care related fees | | 166 | | 186 | | 20 | | 161 | | 219 | | 243 | | 24 | | 216 | |
Motor vehicle licences and permits | | 328 | | 337 | | 9 | | 321 | | 435 | | 436 | | 1 | | 424 | |
Other fees and licences | | 488 | | 530 | | 42 | | 503 | | 756 | | 760 | | 4 | | 699 | |
Investment earnings | | 564 | | 764 | | 200 | | 710 | | 914 | | 954 | | 40 | | 1,032 | |
Sales of goods and services | | 523 | | 483 | | (40 | ) | 509 | | 706 | | 668 | | (38 | ) | 693 | |
Miscellaneous | | 1,169 | | 1,387 | | 218 | | 1,173 | | 1,554 | | 1,928 | | 374 | | 1,917 | |
| | 5,060 | | 5,536 | | 476 | | 5,166 | | 7,045 | | 7,496 | | 451 | | 7,433 | |
Contributions from the federal government | | | | | | | | | | | | | | | | | |
Health and social transfers | | 3,478 | | 3,668 | | 190 | | 3,302 | | 4,644 | | 4,759 | | 115 | | 4,473 | |
Equalization | | — | | — | | — | | 345 | | — | | — | | — | | 459 | |
Other federal contributions | | 652 | | 858 | | 206 | | 1,031 | | 899 | | 1,307 | | 408 | | 1,454 | |
| | 4,130 | | 4,526 | | 396 | | 4,678 | | 5,543 | | 6,066 | | 523 | | 6,386 | |
Taxpayer-supported programs and agencies | | 25,665 | | 26,663 | | 998 | | 25,983 | | 34,887 | | 36,525 | | 1,638 | | 35,819 | |
Commercial Crown corporation net income | | | | | | | | | | | | | | | | | |
BC Hydro | | 298 | | 350 | | 52 | | 380 | | 365 | | 370 | | 5 | | 407 | |
Liquor Distribution Branch | | 650 | | 690 | | 40 | | 677 | | 810 | | 845 | | 35 | | 840 | |
BC Lotteries (net of payments to the federal government) | | 749 | | 812 | | 63 | | 762 | | 1,024 | | 1,026 | | 2 | | 1,011 | |
BCRC (1) | | 77 | | 19 | | (58 | ) | 20 | | 60 | | 28 | | (32 | ) | 29 | |
ICBC (2) | | 174 | | 531 | | 357 | | 265 | | 225 | | 594 | | 369 | | 381 | |
Other | | 17 | | 16 | | (1 | ) | 23 | | 19 | | 12 | | (7 | ) | 17 | |
| | 1,965 | | 2,418 | | 453 | | 2,127 | | 2,503 | | 2,875 | | 372 | | 2,685 | |
Total revenue | | 27,630 | | 29,081 | | 1,451 | | 28,110 | | 37,390 | | 39,400 | | 2,010 | | 38,504 | |
(1) The year to date figures reflect BCRC’s budget and results for the April to December period. The full year forecast represents BCRC’s earnings during government’s fiscal year. On BCRC’s fiscal year basis (December), the outlook is – 2007 (budget): $79 million; 2007 (forecast): $28 million.
(2) The year to date figures reflect ICBC’s budget and results for the April to December period. The full-year forecast represents ICBC’s earnings during government’s fiscal year. On ICBC’s fiscal year basis (December), the outlook is – 2007 (budget): $225 million; 2007 (forecast): $642 million.
Budget and Fiscal Plan – 2008/09 to 2010/11
161
2007/08 Updated Financial Forecast(Third Quarterly Report)
Table 5.10 2007/08 Expense by Ministry, Program and Agency
| | Year-to-Date to December 31 | | Full Year | |
| | 2007/08 | | Actual | | 2007/08 | | Actual | |
($ millions) | | Budget | | Actual | | Variance | | 2006/07 | | Budget | | Forecast | | Variance | | 2006/07 | |
Advanced Education | | 1,633 | | 1,619 | | (14 | ) | 1,499 | | 2,151 | | 2,151 | | — | | 2,027 | |
Education | | 4,099 | | 4,075 | | (24 | ) | 3,866 | | 5,494 | | 5,494 | | — | | 5,312 | |
Health | | 9,537 | | 9,598 | | 61 | | 8,821 | | 12,967 | | 12,967 | | — | | 12,124 | |
Contingencies – Health Innovation Fund | | 75 | | 47 | | (28 | ) | — | | 100 | | 100 | | — | | — | |
Subtotal | | 15,344 | | 15,339 | | (5 | ) | 14,186 | | 20,712 | | 20,712 | | — | | 19,463 | |
Office of the Premier | | 11 | | 10 | | (1 | ) | 9 | | 14 | | 14 | | — | | 12 | |
Aboriginal Relations and Reconciliation | | 37 | | 32 | | (5 | ) | 25 | | 55 | | 55 | | — | | 43 | |
Agriculture and Lands | | 121 | | 122 | | 1 | | 105 | | 270 | | 252 | | (18 | ) | 238 | |
Attorney General | | 390 | | 389 | | (1 | ) | 363 | | 520 | | 520 | | — | | 485 | |
Children and Family Development | | 1,399 | | 1,373 | | (26 | ) | 1,292 | | 1,867 | | 1,867 | | — | | 1,852 | |
Community Services | | 211 | | 181 | | (30 | ) | 182 | | 274 | | 274 | | — | | 267 | |
Economic Development | | 167 | | 138 | | (29 | ) | 161 | | 266 | | 266 | | — | | 282 | |
Employment and Income Assistance | | 1,100 | | 1,051 | | (49 | ) | 967 | | 1,480 | | 1,480 | | — | | 1,358 | |
Energy, Mines and Petroleum Resources | | 58 | | 32 | | (26 | ) | 61 | | 77 | | 48 | | (29 | ) | 75 | |
Environment | | 162 | | 143 | | (19 | ) | 137 | | 223 | | 223 | | — | | 193 | |
Finance | | 71 | | 64 | | (7 | ) | 58 | | 91 | | 91 | | — | | 75 | |
Forests and Range | | 765 | | 863 | | 98 | | 756 | | 1,078 | | 1,180 | | 102 | | 1,000 | |
Labour and Citizens’ Services | | 72 | | 51 | | (21 | ) | 42 | | 97 | | 97 | | — | | 210 | |
Public Safety and Solicitor General | | 445 | | 491 | | 46 | | 418 | | 603 | | 684 | | 81 | | 594 | |
Small Business and Revenue | | 44 | | 47 | | 3 | | 53 | | 60 | | 60 | | — | | 45 | |
Tourism, Sport and the Arts | | 94 | | 90 | | (4 | ) | 134 | | 130 | | 130 | | — | | 214 | |
Transportation | | 658 | | 667 | | 9 | | 629 | | 882 | | 882 | | — | | 842 | |
Total ministries and Office of the Premier | | 21,149 | | 21,083 | | (66 | ) | 19,578 | | 28,699 | | 28,835 | | 136 | | 27,248 | |
Legislation | | 44 | | 40 | | (4 | ) | 35 | | 58 | | 101 | | 43 | | 49 | |
Officers of the Legislature | | 26 | | 21 | | (5 | ) | 17 | | 34 | | 34 | | — | | 24 | |
BC Family Bonus | | 13 | | 12 | | (1 | ) | 18 | | 17 | | 17 | | — | | 23 | |
Management of public funds and debt | | 418 | | 295 | | (123 | ) | 431 | | 558 | | 405 | | (153 | ) | 544 | |
Contingencies – new programs | | — | | — | | — | | 53 | | 360 | | 360 | | — | | 53 | |
Contingencies – Negotiating Framework | | 4 | | 4 | | — | | — | | 39 | | 39 | | — | | — | |
Other appropriations | | (5 | ) | (15 | ) | (10 | ) | (15 | ) | 10 | | 10 | | — | | 4 | |
Subtotal | | 21,649 | | 21,440 | | (209 | ) | 20,117 | | 29,775 | | 29,801 | | 26 | | 27,945 | |
Supplementary Estimates | | — | | — | | — | | — | | — | | 1,045 | | 1,045 | | — | |
Negotiating Framework incentive payments | | — | | — | | — | | 245 | | — | | — | | — | | 264 | |
Total consolidated revenue fund expense | | 21,649 | | 21,440 | | (209 | ) | 20,362 | | 29,775 | | 30,846 | | 1,071 | | 28,209 | |
Expenses recovered from external entities | | 1,371 | | 1,495 | | 124 | | 1,451 | | 1,827 | | 2,077 | | 250 | | 2,117 | |
Grants to service delivery agencies and other internal transfers: | | | | | | | | | | | | | | | | | |
School districts | | (3,583 | ) | (3,598 | ) | (15 | ) | (3,684 | ) | (4,743 | ) | (4,782 | ) | (39 | ) | (4,677 | ) |
Universities | | (895 | ) | (897 | ) | (2 | ) | (857 | ) | (1,204 | ) | (1,347 | ) | (143 | ) | (1,109 | ) |
Colleges, university colleges, and institutes | | (598 | ) | (653 | ) | (55 | ) | (636 | ) | (808 | ) | (859 | ) | (51 | ) | (842 | ) |
Health authorities and hospital societies | | (6,425 | ) | (6,641 | ) | (216 | ) | (6,205 | ) | (8,605 | ) | (8,831 | ) | (226 | ) | (8,132 | ) |
Children and family development agencies | | (513 | ) | (508 | ) | 5 | | (463 | ) | (684 | ) | (689 | ) | (5 | ) | (629 | ) |
Other service delivery agencies | | (583 | ) | (602 | ) | (19 | ) | (531 | ) | (776 | ) | (867 | ) | (91 | ) | (913 | ) |
| | (12,597 | ) | (12,899 | ) | (302 | ) | (12,376 | ) | (16,820 | ) | (17,375 | ) | (555 | ) | (16,302 | ) |
Service delivery agency expense: | | | | | | | | | | | | | | | | | |
School districts | | 3,615 | | 3,635 | | 20 | | 3,816 | | 5,149 | | 5,183 | | 34 | | 5,041 | |
Universities | | 1,938 | | 1,953 | | 15 | | 1,855 | | 2,794 | | 2,831 | | 37 | | 2,593 | |
Colleges, university colleges, and institutes | | 971 | | 998 | | 27 | | 953 | | 1,353 | | 1,392 | | 39 | | 1,310 | |
Health authorities and hospital societies | | 7,000 | | 7,007 | | 7 | | 6,638 | | 9,345 | | 9,506 | | 161 | | 8,892 | |
Children and family development agencies | | 515 | | 512 | | (3 | ) | 461 | | 687 | | 692 | | 5 | | 631 | |
Other service delivery agencies | | 1,468 | | 1,467 | | (1 | ) | 1,210 | | 2,130 | | 2,128 | | (2 | ) | 1,957 | |
| | 15,507 | | 15,572 | | 65 | | 14,933 | | 21,458 | | 21,732 | | 274 | | 20,424 | |
Net spending of service delivery agencies | | 2,910 | | 2,673 | | (237 | ) | 2,557 | | 4,638 | | 4,357 | | (281 | ) | 4,122 | |
Total taxpayer-supported expense | | 25,930 | | 25,608 | | (322 | ) | 24,370 | | 36,240 | | 37,280 | | 1,040 | | 34,448 | |
Budget and Fiscal Plan – 2008/09 to 2010/11
162
2007/08 Updated Financial Forecast(Third Quarterly Report)
Table 5.11 2007/08 Expense By Function
| | Year-to-Date to December 31 | | Full Year | |
| | 2007/08 | | Actual | | 2007/08 | | Actual | |
($ millions) | | Budget | | Actual | | Variance | | 2006/07 | | Budget | | Forecast | | Variance | | 2006/07 | |
Health: | | | | | | | | | | | | | | | | | |
Medical Services Plan | | 2,368 | | 2,326 | | (42 | ) | 2,102 | | 3,154 | | 3,220 | | 66 | | 2,969 | |
Pharmacare | | 776 | | 764 | | (12 | ) | 733 | | 1,023 | | 1,020 | | (3 | ) | 914 | |
Regional services | | 6,565 | | 6,553 | | (12 | ) | 6,094 | | 9,048 | | 8,984 | | (64 | ) | 8,500 | |
Other healthcare expenses | | 583 | | 572 | | (11 | ) | 531 | | 890 | | 907 | | 17 | | 867 | |
Health Innovation Fund | | 75 | | 47 | | (28 | ) | — | | 100 | | 100 | | — | | — | |
| | 10,367 | | 10,262 | | (105 | ) | 9,460 | | 14,215 | | 14,231 | | 16 | | 13,250 | |
Education: | | | | | | | | | | | | | | | | | |
Elementary and secondary | | 3,855 | | 3,840 | | (15 | ) | 3,748 | | 5,545 | | 5,541 | | (4 | ) | 5,272 | |
Post-secondary | | 3,060 | | 3,055 | | (5 | ) | 3,139 | | 4,123 | | 4,090 | | (33 | ) | 4,088 | |
Other education expenses | | 127 | | 114 | | (13 | ) | 128 | | 169 | | 169 | | — | | 159 | |
| | 7,042 | | 7,009 | | (33 | ) | 7,015 | | 9,837 | | 9,800 | | (37 | ) | 9,519 | |
Social services: | | | | | | | | | | | | | | | | | |
Social assistance | | 1,418 | | 1,374 | | (44 | ) | 1,227 | | 1,912 | | 1,912 | | — | | 1,713 | |
Childcare services | | 806 | | 782 | | (24 | ) | 732 | | 1,106 | | 1,155 | | 49 | | 1,085 | |
Other social services expenses | | 71 | | 68 | | (3 | ) | 72 | | 88 | | 96 | | 8 | | 94 | |
| | 2,295 | | 2,224 | | (71 | ) | 2,031 | | 3,106 | | 3,163 | | 57 | | 2,892 | |
Protection of persons and property | | 1,020 | | 1,069 | | 49 | | 929 | | 1,418 | | 1,532 | | 114 | | 1,329 | |
Transportation | | 983 | | 973 | | (10 | ) | 857 | | 1,351 | | 1,365 | | 14 | | 1,251 | |
Natural resources and economic development | | 1,085 | | 1,131 | | 46 | | 1,052 | | 1,566 | | 1,998 | | 432 | | 1,663 | |
Other | | 903 | | 838 | | (65 | ) | 703 | | 1,335 | | 1,397 | | 62 | | 1,278 | |
Contingencies – new programs | | — | | — | | — | | 53 | | 360 | | 360 | | — | | — | |
– Negotiating Framework | | 4 | | 4 | | — | | — | | 39 | | 39 | | — | | — | |
General government | | 473 | | 451 | | (22 | ) | 346 | | 668 | | 1,170 | | 502 | | 768 | |
Interest | | 1,758 | | 1,647 | | (111 | ) | 1,680 | | 2,345 | | 2,225 | | (120 | ) | 2,234 | |
Subtotal | | 25,930 | | 25,608 | | (322 | ) | 24,126 | | 36,240 | | 37,280 | | 1,040 | | 34,184 | |
Negotiating framework incentive payments | | — | | — | | — | | 244 | | — | | — | | — | | 264 | |
Total expense | | 25,930 | | 25,608 | | (322 | ) | 24,370 | | 36,240 | | 37,280 | | 1,040 | | 34,448 | |
Budget and Fiscal Plan – 2008/09 to 2010/11
163
2007/08 Updated Financial Forecast(Third Quarterly Report)
Table 5.12 2007/08 Service Delivery Agency Operating Results (1)
| | Year-to-Date to December 31 | | Full Year | |
| | 2007/08 | | Actual | | 2007/08 | | Actual | |
($ millions) | | Budget | | Actual | | Variance | | 2006/07 | | Budget | | Forecast | | Variance | | 2006/07 | |
| | | | | | | | | | | | | | | | | |
School districts | | | | | | | | | | | | | | | | | |
| | | | | | | | | | | | | | | | | |
Revenue | | 3,653 | | 3,965 | | 312 | | 3,804 | | 5,200 | | 5,294 | | 94 | | 5,178 | |
Expense | | (3,615 | ) | (3,635 | ) | (20 | ) | (3,569 | ) | (5,149 | ) | (5,183 | ) | (34 | ) | (5,041 | ) |
| | 38 | | 330 | | 292 | | 235 | | 51 | | 111 | | 60 | | 137 | |
Accounting adjustments | | 14 | | 22 | | 8 | | 34 | | 18 | | 13 | | (5 | ) | 61 | |
Net impact | | 52 | | 352 | | 300 | | 269 | | 69 | | 124 | | 55 | | 198 | |
| | | | | | | | | | | | | | | | | |
Universities | | | | | | | | | | | | | | | | | |
| | | | | | | | | | | | | | | | | |
Revenue | | 1,953 | | 1,991 | | 38 | | 1,896 | | 2,813 | | 2,908 | | 95 | | 2,751 | |
Expense | | (1,938 | ) | (1,953 | ) | (15 | ) | (1,852 | ) | (2,794 | ) | (2,831 | ) | (37 | ) | (2,593 | ) |
| | 15 | | 38 | | 23 | | 44 | | 19 | | 77 | | 58 | | 158 | |
Accounting adjustments | | 39 | | 29 | | (10 | ) | 22 | | 52 | | 206 | | 154 | | 95 | |
Net impact | | 54 | | 67 | | 13 | | 66 | | 71 | | 283 | | 212 | | 253 | |
| | | | | | | | | | | | | | | | | |
Colleges, university colleges, and institutes | | | | | | | | | | | | | | | | | |
| | | | | | | | | | | | | | | | | |
Revenue | | 963 | | 1,076 | | 113 | | 1,024 | | 1,343 | | 1,417 | | 74 | | 1,378 | |
Expense | | (971 | ) | (998 | ) | (27 | ) | (940 | ) | (1,353 | ) | (1,392 | ) | (39 | ) | (1,310 | ) |
| | (8 | ) | 78 | | 86 | | 84 | | (10 | ) | 25 | | 35 | | 68 | |
Accounting adjustments | | 12 | | (5 | ) | (17 | ) | 12 | | 15 | | 9 | | (6 | ) | 22 | |
Net impact | | 4 | | 73 | | 69 | | 96 | | 5 | | 34 | | 29 | | 90 | |
| | | | | | | | | | | | | | | | | |
Health authorities and hospital societies | | | | | | | | | | | | | | | | | |
| | | | | | | | | | | | | | | | | |
Revenue | | 6,911 | | 7,050 | | 139 | | 6,622 | | 9,226 | | 9,467 | | 241 | | 8,857 | |
Expense | | (7,000 | ) | (7,007 | ) | (7 | ) | (6,638 | ) | (9,345 | ) | (9,506 | ) | (161 | ) | (8,892 | ) |
| | (89 | ) | 43 | | 132 | | (16 | ) | (119 | ) | (39 | ) | 80 | | (35 | ) |
Accounting adjustments | | (15 | ) | 83 | | 98 | | 19 | | (22 | ) | 47 | | 69 | | (88 | ) |
Net impact | | (104 | ) | 126 | | 230 | | 3 | | (141 | ) | 8 | | 149 | | (123 | ) |
| | | | | | | | | | | | | | | | | |
Children and family development agencies | | | | | | | | | | | | | | | | | |
| | | | | | | | | | | | | | | | | |
Revenue | | 515 | | 512 | | (3 | ) | 466 | | 687 | | 692 | | 5 | | 631 | |
Expense | | (515 | ) | (512 | ) | 3 | | (461 | ) | (687 | ) | (692 | ) | (5 | ) | (631 | ) |
| | — | | — | | — | | 5 | | — | | — | | — | | — | |
Accounting adjustments | | — | | 1 | | 1 | | 3 | | (1 | ) | (1 | ) | — | | 1 | |
Net impact | | — | | 1 | | 1 | | 8 | | (1 | ) | (1 | ) | — | | 1 | |
| | | | | | | | | | | | | | | | | |
BC Transportation Financing Authority | | | �� | | | | | | | | | | | | | | |
| | | | | | | | | | | | | | | | | |
Revenue | | 457 | | 501 | | 44 | | 468 | | 609 | | 622 | | 13 | | 618 | |
Expense | | (540 | ) | (503 | ) | 37 | | (423 | ) | (720 | ) | (703 | ) | 17 | | (585 | ) |
| | (83 | ) | (2 | ) | 81 | | 45 | | (111 | ) | (81 | ) | 30 | | 33 | |
Accounting adjustments | | (109 | ) | (116 | ) | (7 | ) | (132 | ) | (145 | ) | (145 | ) | — | | (155 | ) |
Net impact | | (192 | ) | (118 | ) | 74 | | (87 | ) | (256 | ) | (226 | ) | 30 | | (122 | ) |
Budget and Fiscal Plan – 2008/09 to 2010/11
164
2007/08 Updated Financial Forecast(Third Quarterly Report)
Table 5.12 2007/08 Service Delivery Agency Operating Results (1) – Continued
| | Year-to-Date to December 31 | | Full Year | |
| | 2007/08 | | Actual | | 2007/08 | | Actual | |
($ millions) | | Budget | | Actual | | Variance | | 2006/07 | | Budget | | Forecast | | Variance | | 2006/07 | |
| | | | | | | | | | | | | | | | | |
British Columbia Housing Management Commission | | | | | | | | | | | | | |
| | | | | | | | | | | | | | | | | |
Revenue | | 379 | | 308 | | (71 | ) | 230 | | 505 | | 506 | | 1 | | 497 | |
Expense | | (379 | ) | (308 | ) | 71 | | (226 | ) | (505 | ) | (506 | ) | (1 | ) | (497 | ) |
| | — | | — | | — | | 4 | | — | | — | | — | | — | |
Accounting adjustments | | (3 | ) | 78 | | 81 | | 20 | | (4 | ) | (5 | ) | (1 | ) | (15 | ) |
Net impact | | (3 | ) | 78 | | 81 | | 24 | | (4 | ) | (5 | ) | (1 | ) | (15 | ) |
| | | | | | | | | | | | | | | | | |
British Columbia Transit | | | | | | | | | | | | | | | | | |
| | | | | | | | | | | | | | | | | |
Revenue | | 140 | | 122 | | (18 | ) | 100 | | 187 | | 185 | | (2 | ) | 165 | |
Expense | | (140 | ) | (123 | ) | 17 | | (100 | ) | (187 | ) | (185 | ) | 2 | | (167 | ) |
| | — | | (1 | ) | (1 | ) | — | | — | | — | | — | | (2 | ) |
Accounting adjustments | | (4 | ) | — | | 4 | | 8 | | (6 | ) | (1 | ) | 5 | | — | |
Net impact | | (4 | ) | (1 | ) | 3 | | 8 | | (6 | ) | (1 | ) | 5 | | (2 | ) |
| | | | | | | | | | | | | | | | | |
Tourism British Columbia | | | | | | | | | | | | | | | | | |
| | | | | | | | | | | | | | | | | |
Revenue | | 44 | | 47 | | 3 | | 49 | | 58 | | 61 | | 3 | | 60 | |
Expense | | (44 | ) | (30 | ) | 14 | | (31 | ) | (58 | ) | (61 | ) | (3 | ) | (59 | ) |
| | — | | 17 | | 17 | | 18 | | — | | — | | — | | 1 | |
Accounting adjustments | | — | | (1 | ) | (1 | ) | 6 | | — | | — | | — | | 7 | |
Net impact | | — | | 16 | | 16 | | 24 | | — | | — | | — | | 8 | |
| | | | | | | | | | | | | | | | | |
Vancouver Convention Centre Expansion Project Ltd. | | | | | | | | | | | | | |
Revenue | | — | | — | | — | | — | | — | | — | | — | | — | |
Expense | | — | | — | | — | | — | | — | | — | | — | | — | |
| | — | | — | | — | | — | | — | | — | | — | | — | |
Accounting adjustments | | 24 | | 29 | | 5 | | — | | 36 | | 32 | | (4 | ) | 107 | |
Net impact | | 24 | | 29 | | 5 | | — | | 36 | | 32 | | (4 | ) | 107 | |
| | | | | | | | | | | | | | | | | |
Other service delivery agencies | | | | | | | | | | | | | | | | | |
| | | | | | | | | | | | | | | | | |
Revenue | | 336 | | 583 | | 247 | | 468 | | 671 | | 720 | | 49 | | 722 | |
Expense | | (330 | ) | (503 | ) | (173 | ) | (430 | ) | (660 | ) | (670 | ) | (10 | ) | (649 | ) |
| | 6 | | 80 | | 74 | | 38 | | 11 | | 50 | | 39 | | 73 | |
Accounting adjustments | | 4 | | (4 | ) | (8 | ) | 83 | | 8 | | 118 | | 110 | | 48 | |
Net impact | | 10 | | 76 | | 66 | | 121 | | 19 | | 168 | | 149 | | 121 | |
| | | | | | | | | | | | | | | | | |
Total net impact | | (159 | ) | 699 | | 858 | | 532 | | (208 | ) | 416 | | 624 | | 516 | |
| | | | | | | | | | | | | | | | | |
Total service delivery agency operating results: | | | | | | | | | | | | | |
| | | | | | | | | | | | | | | | | |
Revenue | | 15,351 | | 16,155 | | 804 | | 15,127 | | 21,299 | | 21,872 | | 573 | | 20,857 | |
Accounting adjustments | | (50 | ) | 114 | | 164 | | 67 | | (66 | ) | 266 | | 332 | | 73 | |
| | 15,301 | | 16,269 | | 968 | | 15,194 | | 21,233 | | 22,138 | | 905 | | 20,930 | |
Expense | | (15,472 | ) | (15,572 | ) | (100 | ) | (14,670 | ) | (21,458 | ) | (21,729 | ) | (271 | ) | (20,424 | ) |
Accounting adjustments | | 12 | | 2 | | (10 | ) | 8 | | 17 | | 7 | | (10 | ) | 10 | |
| | (15,460 | ) | (15,570 | ) | (110 | ) | (14,662 | ) | (21,441 | ) | (21,722 | ) | (281 | ) | (20,414 | ) |
| | | | | | | | | | | | | | | | | |
Total net impact | | (159 | ) | 699 | | 858 | | 532 | | (208 | ) | 416 | | 624 | | 516 | |
(1) Revenue and expense are shown as reported in the entity financial statements and service plans, before consolidation and accounting adjustments.
Budget and Fiscal Plan – 2008/09 to 2010/11
165
2007/08 Updated Financial Forecast(Third Quarterly Report)
Table 5.13 2007/08 Capital Spending
| | Year-to-Date to December 31 | | Full Year | |
| | 2007/08 | | Actual | | 2007/08 | | Actual | |
($ millions) | | Budget | | Actual | | Variance | | 2006/07 | | Budget | | Forecast | | Variance | | 2006/07 | |
Taxpayer-supported | | | | | | | | | | | | | | | | | |
Education | | | | | | | | | | | | | | | | | |
Schools (K–12) | | 275 | | 285 | | 10 | | 253 | | 365 | | 426 | | 61 | | 322 | |
Post-secondary | | 432 | | 530 | | 98 | | 566 | | 857 | | 870 | | 13 | | 874 | |
Health | | 458 | | 395 | | (63 | ) | 502 | | 819 | | 973 | | 154 | | 777 | |
BC Transportation Financing Authority | | 692 | | 658 | | (34 | ) | 610 | | 922 | | 1,063 | | 141 | | 821 | |
Vancouver Convention Centre expansion project | | 130 | | 183 | | 53 | | 77 | | 206 | | 261 | | 55 | | 108 | |
Government operating (ministries) | | 136 | | 121 | | (15 | ) | 125 | | 325 | | 325 | | — | | 309 | |
Other (1) | | 38 | | 94 | | 56 | | 57 | | 75 | | 126 | | 51 | | 172 | |
Capital spending contingencies | | — | | — | | — | | — | | 295 | | 105 | | (190 | ) | — | |
Total taxpayer-supported | | 2,161 | | 2,266 | | 105 | | 2,190 | | 3,864 | | 4,149 | | 285 | | 3,383 | |
| | | | | | | | | | | | | | | | | |
Self-supported | | | | | | | | | | | | | | | | | |
BC Hydro | | 764 | | 785 | | 21 | | 556 | | 995 | | 1,109 | | 114 | | 807 | |
BC Transmission Corporation | | 60 | | 58 | | (2 | ) | 30 | | 68 | | 82 | | 14 | | 50 | |
Columbia River power projects (2) | | 22 | | 12 | | (10 | ) | 18 | | 30 | | 28 | | (2 | ) | 19 | |
BC Rail | | 50 | | 19 | | (31 | ) | 16 | | 66 | | 21 | | (45 | ) | 19 | |
ICBC (3) | | 29 | | 20 | | (9 | ) | 20 | | 30 | | 24 | | (6 | ) | 22 | |
BC Lotteries | | 64 | | 46 | | (18 | ) | 29 | | 85 | | 94 | | 9 | | 44 | |
Liquor Distribution Branch | | 12 | | 7 | | (5 | ) | 9 | | 18 | | 18 | | — | | 22 | |
| | | | | | | | | | | | | | | | | |
Total self-supported | | 1,001 | | 947 | | (54 | ) | 678 | | 1,292 | | 1,376 | | 84 | | 983 | |
| | | | | | | | | | | | | | | | | |
Total capital spending | | 3,162 | | 3,213 | | 51 | | 2,868 | | 5,156 | | 5,525 | | 369 | | 4,366 | |
(1) Includes BC Housing Management Commission, Provincial Rental Housing Corporation, Rapid Transit Project 2000, BC Transit and other service delivery agencies.
(2) Joint ventures of the Columbia Power Corporation and Columbia Basin Trust.
(3) Includes ICBC Properties Ltd.
Budget and Fiscal Plan – 2008/09 to 2010/11
166
2007/08 Updated Financial Forecast(Third Quarterly Report)
Table 5.14 2007/08 Provincial Debt (1)
| | Balance | | Balance at December 31, 2007 | | Forecast at March 31, 2008 | |
| | March 31, | | Net | | Debt Outstanding | | | | Net | | Debt Outstanding | | | |
($ millions) | | 2007 | | Change (2) | | Actual | | Budget | | Variance | | Change(2) | | Forecast | | Budget | | Variance | |
Taxpayer-supported debt | | | | | | | | | | | | | | | | | | | |
Provincial government operating | | 9,505 | | (1,379 | ) | 8,126 | | 9,464 | | (1,338 | ) | (1,259 | ) | 8,246 | | 9,125 | | (879 | ) |
Other taxpayer-supported debt (mainly capital) | | | | | | | | | | | | | | | | | | | |
Education (3) | | | | | | | | | | | | | | | | | | | |
Schools | | 4,724 | | 138 | | 4,862 | | 4,847 | | 15 | | 235 | | 4,959 | | 4,961 | | (2 | ) |
Post-secondary institutions | | 2,909 | | 254 | | 3,163 | | 3,203 | | (40 | ) | 422 | | 3,331 | | 3,438 | | (107 | ) |
| | 7,633 | | 392 | | 8,025 | | 8,050 | | (25 | ) | 657 | | 8,290 | | 8,399 | | (109 | ) |
Health (3) | | 2,870 | | 187 | | 3,057 | | 3,107 | | (50 | ) | 510 | | 3,380 | | 3,348 | | 32 | |
Highways and public transit | | | | | | | | | | | | | | | | | | | |
BC Transportation Financing Authority | | 3,237 | | 507 | | 3,744 | | 3,710 | | 34 | | 851 | | 4,088 | | 4,058 | | 30 | |
Public transit | | 892 | | 21 | | 913 | | 908 | | 5 | | 21 | | 913 | | 916 | | (3 | ) |
SkyTrain extension | | 1,153 | | — | | 1,153 | | 1,150 | | 3 | | — | | 1,153 | | 1,150 | | 3 | |
BC Transit | | 96 | | (4 | ) | 92 | | 81 | | 11 | | (7 | ) | 89 | | 78 | | 11 | |
| | 5,378 | | 524 | | 5,902 | | 5,849 | | 53 | | 865 | | 6,243 | | 6,202 | | 41 | |
Other | | | | | | | | | | | | | | | | | | | |
Social housing (4) | | 216 | | 1 | | 217 | | 290 | | (73 | ) | (3 | ) | 213 | | 272 | | (59 | ) |
Homeowner Protection Office | | 110 | | 11 | | 121 | | 136 | | (15 | ) | 23 | | 133 | | 148 | | (15 | ) |
Other (5) | | 219 | | 72 | | 291 | | 259 | | 32 | | 68 | | 287 | | 309 | | (22 | ) |
| | 545 | | 84 | | 629 | | 685 | | (56 | ) | 88 | | 633 | | 729 | | (96 | ) |
Total other taxpayer-supported | | 16,426 | | 1,187 | | 17,613 | | 17,691 | | (78 | ) | 2,120 | | 18,546 | | 18,678 | | (132 | ) |
Total taxpayer-supported debt | | 25,931 | | (192 | ) | 25,739 | | 27,155 | | (1,416 | ) | 861 | | 26,792 | | 27,803 | | (1,011 | ) |
Self-supported debt | | | | | | | | | | | | | | | | | | | |
Commercial Crown corporations | | | | | | | | | | | | | | | | | | | |
BC Hydro | | 7,144 | | 501 | | 7,645 | | 7,344 | | 301 | | 543 | | 7,687 | | 7,806 | | (119 | ) |
BC Transmission Corporation | | 37 | | 48 | | 85 | | 71 | | 14 | | 58 | | 95 | | 95 | | — | |
Columbia River power projects (6) | | 236 | | (12 | ) | 224 | | 315 | | (91 | ) | (12 | ) | 224 | | 381 | | (157 | ) |
Liquor Distribution Branch | | 3 | | (1 | ) | 2 | | 3 | | (1 | ) | (1 | ) | 2 | | 2 | | — | |
Post-secondary institutions(1) subsidiaries | | 53 | | — | | 53 | | — | | 53 | | — | | 53 | | — | | 53 | |
| | 7,473 | | 536 | | 8,009 | | 7,733 | | 276 | | 588 | | 8,061 | | 8,284 | | (223 | ) |
Warehouse borrowing program | | — | | 55 | | 55 | | — | | 55 | | — | | — | | — | | — | |
Total self-supported debt | | 7,473 | | 591 | | 8,064 | | 7,733 | | 331 | | 588 | | 8,061 | | 8,284 | | (223 | ) |
Forecast allowance | | — | | — | | — | | — | | — | | 150 | | 150 | | 750 | | (600 | ) |
Total provincial debt | | 33,404 | | 399 | | 33,803 | | 34,888 | | (1,085 | ) | 1,599 | | 35,003 | | 36,837 | | (1,834 | ) |
(1) Debt is after deduction of sinking funds and unamortized discounts, and excludes accrued interest. Government direct and fiscal agency accrued interest is reported in the government’s accounts as an accounts payable.
(2) Gross new long-term borrowing plus net change in short-term debt outstanding, less sinking fund contributions, sinking fund earnings and net maturities of long-term debt (after deduction of sinking fund balances for maturing issues).
(3) Includes debt and guarantees incurred by the government on behalf of school districts, universities, colleges and health authorities/hospital societies (SUCH), and debt directly incurred by these entities.
(4) Includes the BC Housing Management Commission and the Provincial Rental Housing Corporation.
(5) Includes debt of other taxpayer-supported Crown corporations and agencies and fiscal agency loans to local governments. Also includes student loan guarantees, loan guarantees to agricultural producers, guarantees under economic development and home mortgage assistance programs, and loan guarantee provisions.
(6) Joint ventures of the Columbia Power Corporation and Columbia Basin Trust.
Budget and Fiscal Plan – 2008/09 to 2010/11
167
2007/08 Updated Financial Forecast(Third Quarterly Report)
Table 5.15 2007/08 Statement of Financial Position
| | Actual | | Year-to-Date | | Forecast | |
| | March 31, | | December 31, | | March 31, | |
($ millions) | | 2007 | | 2007 | | 2008 | |
Financial assets | | | | | | | |
Cash and temporary investments | | 3,367 | | 4,132 | | 4,469 | |
Other financial assets | | 7,854 | | 8,393 | | 7,798 | |
Sinking funds | | 3,798 | | 3,691 | | 2,698 | |
Investments in commercial Crown corporations: | | | | | | | |
Retained earnings | | 4,396 | | 5,232 | | 5,105 | |
Recoverable capital loans | | 7,170 | | 7,729 | | 7,780 | |
| | 11,566 | | 12,961 | | 12,885 | |
| | 26,585 | | 29,177 | | 27,850 | |
Liabilities | | | | | | | |
Accounts payable and accrued liabilities | | 7,094 | | 6,347 | | 8,473 | |
Deferred revenue | | 5,986 | | 6,740 | | 5,971 | |
Debt: | | | | | | | |
Taxpayer-supported debt | | 25,931 | | 25,739 | | 26,792 | |
Self-supported debt | | 7,473 | | 8,064 | | 8,061 | |
Forecast allowance | | — | | — | | 150 | |
Total provincial debt | | 33,404 | | 33,803 | | 35,003 | |
Add: debt offset by sinking funds | | 3,798 | | 3,691 | | 2,698 | |
Less : guarantees and non-guaranteed debt | | (407 | ) | (395 | ) | (395 | ) |
Financial statement debt | | 36,795 | | 37,099 | | 37,306 | |
| | 49,875 | | 50,186 | | 51,750 | |
Net liabilities | | (23,290 | ) | (21,009 | ) | (23,900 | ) |
Capital and other non-financial assets | | | | | | | |
Tangible capital assets | | 26,683 | | 27,761 | | 29,269 | |
Other non-financial assets | | 943 | | 977 | | 937 | |
| | 27,626 | | 28,738 | | 30,206 | |
Accumulated surplus (deficit) | | 4,336 | | 7,729 | | 6,306 | |
Changes in Financial Position
| | Year-to-Date | | Forecast | |
| | December 31, | | March 31, | |
($ millions) | | 2007 | | 2008 | |
(Increase) decrease in accumulated surplus | | (3,393 | ) | (1,970 | ) |
Change in comprehensive income and other equity adjustments | | (80 | ) | — | |
Surplus for the period | | (3,473 | ) | (1,970 | ) |
Capital and other non-financial asset changes: | | | | | |
Increase in taxpayer-supported capital investments | | 2,266 | | 4,149 | |
Less: amortization and other accounting changes | | (1,188 | ) | (1,563 | ) |
Change in net capital assets | | 1,078 | | 2,586 | |
Increase (decrease) in other non-financial assets | | 34 | | (6 | ) |
| | 1,112 | | 2,580 | |
Increase (decrease) in net liabilities | | (2,361 | ) | 610 | |
Investment and working capital changes: | | | | | |
Increase (reduction) in cash and temporary investments | | 765 | | 1,102 | |
Increase in total investment in commercial Crown corporations: | | | | | |
Increase (decrease) in retained earnings | | 836 | | 709 | |
Less: Change in comprehensive income | | 80 | | — | |
Self-supported capital investments | | 947 | | 1,376 | |
Less: loan repayments and other accounting changes | | (308 | ) | (766 | ) |
| | 1,475 | | 1,319 | |
Other working capital changes | | 425 | | (2,520 | ) |
| | 2,665 | | (99 | ) |
Increase (decrease) in financial statement debt | | 304 | | 511 | |
(Increase) decrease in sinking fund debt | | 107 | | 1,100 | |
Increase (decrease) in guarantees and non-guaranteed debt | | (12 | ) | (12 | ) |
Increase (decrease) in total provincial debt | | 399 | | 1,599 | |
Budget and Fiscal Plan – 2008/09 to 2010/11
168
APPENDICES
Tables: | | |
Tax Expenditures | | 170 |
| | A1.1 Social and Income Transfer Programs – Tax Expenditure | | 172 |
| | A1.2 Economic Development and Business Assistance Programs – Tax Expenditure | | 174 |
| | A1.3 Environmental Protection Programs – Tax Expenditure | | 174 |
A2 | | Interprovincial Comparisons of Tax Rates – 2008 | | 175 |
A3 | | Comparison of Provincial and Federal Taxes by Province – 2008 | | 176 |
A4 | | Interprovincial Comparisons of Provincial Personal Income Taxes Payable – 2008 | | 178 |
A5 | | Summary of Revenue Measures from July 30, 2001 to February19, 2008 | | 179 |
A6 | | Operating Statement – 2004/05 to 2010/11 | | 183 |
A7 | | Revenue by Source – 2004/05 to 2010/11 | | 184 |
A8 | | Expense by Function – 2004/05 to 2010/11 | | 185 |
A9 | | Service Delivery Agency Operating Results – 2004/05 to 2010/11 | | 186 |
A10 | | Material Assumptions – Revenue | | 188 |
A11 | | Natural Gas Price Forecasts: 2008/09 – 2010/11 | | 193 |
A12 | | Material Assumptions – Expense | | 194 |
A13 | | Full-Time Equivalents (FTEs) – 2004/05 to 2010/11 | | 197 |
A14 | | Capital Spending – 2004/05 to 2010/11 | | 197 |
A15 | | Statement of Financial Position – 2004/05 to 2010/11 | | 198 |
A15a | | Changes in Financial Position – 2004/05 to 2010/11 | | 199 |
A16 | | Provincial Debt Summary – 2004/05 to 2010/11 | | 200 |
A17 | | Key Provincial Debt Indicators – 2004/05 to 2010/11 | | 201 |
| | | | | |
Budget and Fiscal Plan – 2008/09 to 2010/11
169
Appendices
A1: Tax Expenditures | |
| |
| Introduction |
| |
| A tax expenditure is the reduction in revenues from delivering government programs or benefits through the tax system rather than through voted budget appropriations. Tax expenditures are usually made by offering special tax rates, exemptions, or tax credits. Governments introduce tax expenditures primarily to achieve social policy objectives such as transfers to lower income families or to promote economic development and job creation. |
| |
| Reporting tax expenditures improves government accountability by providing a more complete picture of government activities. The tax expenditure appendix outlines major tax expenditures for the 2007/08 fiscal year. It does not include tax expenditures introduced or expanded in Budget 2008. These are described in Part 3: Tax Measures. |
| |
| The Role of Tax Expenditure Programs |
| |
| Using the tax system to deliver programs can reduce administration costs and compliance costs for recipients. In certain situations, the tax system allows intended beneficiaries to be readily identified from information that is already collected. In these cases setting up a separate expenditure program would result in costly overlap and duplication of effort. An example is the provincial sales tax credit, which is delivered through the income tax system. If this were a direct provincial expenditure program, a provincial agency or office would have to be established to duplicate much of the work already done by the Canada Revenue Agency. In addition, it would require individuals to undertake a separate, time-consuming application process in order to qualify for the benefit. |
| |
| There are, however, several potential drawbacks to tax expenditure programs. First, their overall cost often receives less public scrutiny than is the case for spending programs because annual budget appropriations by the legislature are not typically required. Second, tax expenditure programs do not always effectively target those who are intended to benefit from them. Some expenditure programs that are intended to provide tax relief for low income earners may, in reality, confer the greatest benefit on high income earners who pay the most taxes. Sales tax exemptions, for example, often provide a greater absolute benefit to those with higher incomes because they have more to spend on consumer products. Finally, costs are often more difficult to control under a tax expenditure program because the benefits tend to be more open ended and enforcement is often more difficult than for spending programs. |
| |
| Tax Expenditure Reporting |
| |
| Not all tax reductions, credits and exemptions are classed as tax expenditures. Three criteria were used to choose those features of the tax system that should be reported as tax expenditures. |
Budget and Fiscal Plan — 2008/09 to 2010/11
170
Appendices
| | First, the emphasis is on tax reductions, exemptions and refunds that are close equivalents to spending programs. By implication, the list does not include tax measures designed to meet broad tax policy objectives such as improving fairness in the tax system, or measures designed to simplify the administration of the tax. The list also does not include items that are generally excluded from a particular tax base. For example, most services are excluded from provincial sales taxes, which are primarily designed to apply to purchases of goods. |
| | |
| | Second, revenues raised under provincial government authority that are turned over to agencies outside of government are not reported as tax expenditures in this appendix. This includes, for example, the hotel room tax revenues transferred to Tourism BC. |
| | |
| | Third, smaller items of less than $2 million are not included. Where practical, smaller items have been presented together as an aggregate figure. |
| | |
| | British Columbia Tax Expenditure Programs |
| | |
| | The following tables report 2007/08 tax expenditure estimates. |
| | |
| | For presentation purposes, British Columbia tax expenditures have been broken into three broad categories. |
| | |
| · | Social and Income Transfer Programs (Table A1.1): These include tax expenditures that are offered as part of government’s mix of health, education, housing, income transfer and family related programs. Examples include the BC Family Bonus, the home owner grant, the sales tax exemption for children’s clothing and the income tax credit for medical expenses. |
| | |
| · | Economic Development and Business Assistance Programs (Table A1.2): This category includes tax preferences for small businesses and measures to encourage new private sector investment. |
| | |
| · | Environmental Protection Programs (Table A1.3): There are relatively few tax expenditures in this category because environmental protection is now generally based on the principle of “polluter pay”, such as the lead-acid battery levy. However, environmental tax expenditures include, for example, a sales tax exemption for bicycles and a fuel tax exemption for certain alternative fuels. |
| | |
| | Each category has its own table of tax expenditure estimates. Within each table, the list of tax expenditures delivered through the income tax system has been separated into two sub-categories. |
| | |
| · | Provincial Measures: This includes all major tax expenditures that are under provincial policy control. |
| | |
| · | Federal Measures: British Columbia shares the cost of some federal income tax expenditure programs because, under the tax collection agreement between British Columbia and the federal government, the province has agreed to maintain a consistent income tax base with the federal government in the interest of reducing administrative and compliance costs. |
Budget and Fiscal Plan — 2008/09 to 2010/11
171
Appendices
| | The cost of individual tax expenditures cannot be added together to reach a total tax expenditure figure for two reasons: |
| | |
| · | in some cases the programs interact with one another so that eliminating one program could increase or decrease the cost of another; and |
| | |
| · | eliminating certain tax expenditure programs could change the choices taxpayers make, which in turn would affect the cost estimates. |
| | |
| | The estimates for each tax expenditure are based on a static analysis of the costs and do not take into account any behavioural changes which could change the cost over time. In addition, all estimates are recalculated each year using current data sources and using refinements to the methods of estimation which can result in significant changes to the value of a given tax expenditure from prior years’ reports. |
Table A1.1 Social and Income Transfer Programs — Tax Expenditure
| | 2007/08 | |
| | Estimated Cost | |
| | ($ millions) | |
Provincial Sales Tax (1) | | | |
Exemptions for the following items: | | | |
· Food (basic groceries, snack foods, candies, soft drinks and restaurant meals) | | 914 | |
· Residential fuels (electricity, natural gas, fuel oil, etc.) | | 192 | |
· Prescription and non-prescription drugs, vitamins and certain other health care products and appliances | | 166 | |
· Children’s clothing and footwear | | 32 | |
· Clothing patterns, fabrics and notions | | 4 | |
· Specified school supplies | | 54 | |
· Books, magazines and newspapers | | 64 | |
· Basic telephone and cable service | | 80 | |
· “1-800” and equivalent telephone services | | 8 | |
· Specified safety equipment | | 11 | |
· Labour to repair major household appliances, clothing and footwear | | 8 | |
· Miscellaneous consumer exemptions (e.g. used clothing under $100) | | 4 | |
· Livestock for human consumption and feed, seed and fertilizer | | 43 | |
| | | |
Personal Income Tax | | | |
Provincial Measures | | | |
BC Family Bonus (2) | | 17 | |
Sales tax credit | | 56 | |
Political contributions tax credit | | 3 | |
Provincial Non-Refundable Credits: (3) | | | |
· Charitable donations tax credit | | 155 | |
· Tax credits for tuition and education | | 45 | |
· Tax credits for disabilities and medical expenses | | 55 | |
· Pension income tax credit | | 22 | |
· Credit for persons older than 65 years | | 62 | |
· Married and equivalent-to-married credits | | 92 | |
· Tax credit for Canada Pension Plan contributions | | 127 | |
· Tax credit for Employment Insurance premiums paid | | 48 | |
Budget and Fiscal Plan — 2008/09 to 2010/11
172
Appendices
Table A1.1 Social and Income Transfer Programs — Tax Expenditure — Continued
| | 2007/08 | |
| | Estimated Cost | |
| | ($ millions) | |
Federal Measures (4) | | | |
· Deduction and inclusion of alimony and child support payments | | 5 | |
· Child care expense deduction | | 28 | |
· Exemption from capital gains up to $500,000 for small businesses and family farms | | 32 | |
· Deduction for residents of northern and isolated areas | | 8 | |
· Non-taxation of employer-paid insurance premiums for group private health and welfare plans | | 142 | |
· Registered Retirement Savings Plans:(5) | | | |
· exemption for | – contributions | 401 | | | |
| – investment earnings | 329 | | | |
· taxation of | – withdrawals | (278 | ) | | |
| Total | | | 452 | |
·Registered Pension Plans: (5) | | | | |
| | | | | |
| – contributions | 520 | | | |
· exemption for | – investment earnings | 553 | | | |
· taxation of | – withdrawals | (431 | ) | | |
| Total | | | 600 | |
Corporation Income Tax (6) | | | |
Charitable donations deduction | | 18 | |
| | | |
School and Rural Area Property Tax (7) | | | |
Home Owner Grant | | 663 | |
Exemption for places of worship | | 9 | |
| | | |
Property Transfer Tax | | | |
Exemption for first-time home buyers | | 73 | |
Exemptions for the following: | | | |
· Property transfers between related individuals | | 70 | |
· Property transfers to municipalities, regional districts, hospital districts, library boards, school boards, water districts and educational institutions | | 12 | |
· Property transfers to charities registered under the Income Tax Act (Canada) | | 4 | |
(1) | | Estimates of the cost of sales tax measures are based on most current information available. |
| | |
(2) | | The $17 million represents the tax expenditure portion of the program’s cost. The tax expenditure portion represents family bonus payments that effectively reduce the recipient’s personal income tax. The remaining cost of the program, including recoveries and administration costs, of $17 million for 2007/08, is presented in the BC Family Bonus Vote because it represents payments to families which exceed their provincial income tax liabilities.In 2007/08, the total program cost was $34 million. |
| | |
(3) | | Provincial non-refundable credits are generally based on estimates of credit claims by British Columbia residents. |
| | |
(4) | | The estimates show provincial revenue losses only. They are based on estimates of projected federal losses contained in Government of Canada: Tax Expenditures and Evaluations, 2006. British Columbia personal income tax expenditures for the federal measures are based on the amounts claimed by British Columbia residents for the measure and the relevant provincial tax rates for the period. (Prior to 1997 federal tax expenditure reports did not include projections; previous estimates of provincial revenue losses were based on historical federal estimates.) Certain tax expenditure items have been excluded where no data were available or the amounts were immaterial. |
| | |
(5) | | Registered retirement savings plans and registered pension plans are treated in the same way as in the federal tax expenditure report. The tax expenditure associated with these schemes is presented as the amount of tax that would otherwise be paid in the year of deferral, were the deferral not available. However, this type of estimate overstates the true costs of these preferences because taxes are eventually paid, including tax on investment earnings. An estimate that does not overstate these costs would, however, be difficult to develop and would require some largely speculative assumptions. |
| | |
(6) | | The deduction offered for corporate charitable donations is a federal measure, but the estimate shows only the provincial revenue loss. This is calculated from the federal revenue loss by applying British Columbia’s share of corporate taxable income and the relevant tax rates to the federal estimate. |
| | |
(7) | | The property tax estimate is for the 2007 calendar year, and includes only school and rural area property taxes levied by the province. The Home Owner Grant cost is shown for the 2007/08 fiscal year. |
Budget and Fiscal Plan — 2008/09 to 2010/11
173
Appendices
Table A1.2 Economic Development and Business Assistance Programs – Tax Expenditure
| | 2007/08 | |
| | Estimated Cost | |
| | ($ millions) | |
Fuel Tax | | | |
Tax exemption for international flights carrying cargo | | 2 | |
Tax exemption for family farm trucks (on road) | | 3 | |
Tax exemption for compressor fuel used to transmit natural gas from wellhead to processing plant | | 14 | |
| | | |
Personal Income Tax | | | |
Training tax credit | | 15 | |
Venture capital tax credit | | 20 | |
Employee venture capital tax credit | | 4 | |
BC mining flow-through tax credit | | 14 | |
| | | |
Corporation Income Tax | | | |
Provincial Measures | | | |
Training tax credit | | 15 | |
Film and video tax credit | | 40 | |
Production services tax credit | | 110 | |
International financial activities tax refund (1) | | 15 | |
Scientific Research and Experimental Development Tax Credit | | 150 | |
Mining Exploration Tax Credit | | 6 | |
| | | |
School and Rural Area Property Taxation (2) | | | |
Assessment exemption of $10,000 for industrial and business properties | | 9 | |
Overnight tourist accommodation assessment relief (3) | | 3 | |
Exemption for property used for pollution abatement (4) | | 6 | |
(1) | | Includes employee income tax refunds. |
(2) | | Estimates are for the 2007 calendar year and include only school and rural area property taxes levied by the province. |
(3) | | There is no reduction in the expenditure cost in 2007/08 compared to 2006/07. The $10 million cost reported in 2006/07 was overstated. |
(4) | | The property tax exemption for most land and improvements used in pollution abatement equipment was removed for 1997, but existing properties which were exempt in 1996 remain exempt under grandparenting provisions. |
Table A1.3 Environmental Protection Programs — Tax Expenditure
| | 2007/08 | |
| | Estimated Cost | |
| | ($ millions) | |
Provincial Sales Tax | | | |
Exemptions for the following items: | | | |
· Bicycles | | 8 | |
· Specified energy conservation equipment (1) | | 13 | |
· Hybrid electric passenger vehicles | | 5 | |
Fuel Tax | | | |
Tax exemption for alternative fuels | | 17 | |
(1) | | Includes only thermal insulation material, polystyrene forming blocks used in construction industry and similar material that prevents heat loss from a building. |
Budget and Fiscal Plan – 2008/09 to 2010/11
174
Appendices
Table A2 Interprovincial Comparisons of Tax Rates – 2008
(Rates known as of February 6, 2008) (1)
| | | | | | | | | | | | | | | | | | Prince | | | |
| | British | | | | Saskat- | | | | | | | | New | | Nova | | Edward | | New- | |
Tax | | Columbia(2) | | Alberta | | chewan | | Manitoba | | Ontario | | Quebec | | Brunswick | | Scotia | | Island | | foundland | |
Corporation income tax | | | | | | | | | | | | | | | | | | | | | |
(per cent of taxable income) (3) | | | | | | | | | | | | | | | | | | | | | |
General Rate | | 12 | | 10 | | 13 | | 14 | | 14 | | 11.4 | | 13 | | 16 | | 16 | | 14 | |
Manufacturing Rate | | 12 | | 10 | | 10 | | 14 | | 12 | | 11.4 | | 13 | | 16 | | 16 | | 5 | |
Small Business Rate | | 4.5 | | 3 | | 4.5 | | 2 | | 5.5 | | 8.0 | | 5 | | 5 | | 4.3 | | 5 | |
Small Business Threshold ($000s) | | 400 | | 460 | | 450 | | 400 | | 500 | | 400 | | 500 | | 400 | | 400 | | 400 | |
Corporation Capital Tax (4) | | | | | | | | | | | | | | | | | | | | | |
Non-financial | | Nil | | Nil | | .15 | | .3/.5 | | .225 | | .36 | | .25 | | .25 | | Nil | | Nil | |
Financial | | 1.0/3.0 | | Nil | | .7/3.25 | | 3.0 | | .54/.675 | | .72 | | 3.0 | | 4.0 | | 5.0 | | 4.0 | |
Health Care Premiums (5) | | | | | | | | | | | | | | | | | | | | | |
Individual/family | | 54/108 | | 44/88 | | Nil | | Nil | | Nil | | Nil | | Nil | | Nil | | Nil | | Nil | |
Payroll tax (6) (per cent) | | Nil | | Nil | | Nil | | 2.15 | | 1.95 | | 4.26 | | Nil | | Nil | | Nil | | 2.0 | |
Insurance premium tax | | | | | | | | | | | | | | | | | | | | | |
(per cent) (7) | | 2-4.4 | | 2-3 | | 3-4 | | 2-3 | | 2-3.5 | | 2-3 | | 2-3 | | 3-4 | | 3.5 | | 4 | |
Fuel tax (cents per litre) (8) | | | | | | | | | | | | | | | | | | | | | |
Gasoline | | 14.5 | | 9.0 | | 15.0 | | 11.5 | | 14.7 | | 22.5 | | 18.0 | | 23.0 | | 15.8 | | 24.5 | |
Diesel | | 15.0 | | 9.0 | | 15.0 | | 11.5 | | 14.3 | | 23.5 | | 24.5 | | 23.0 | | 20.0 | | 24.5 | |
Sales tax (per cent) (9) | | | | | | | | | | | | | | | | | | | | | |
General rate | | 7 | | Nil | | 5 | | 7 | | 8 | | 7.5 | | 8 | | 8 | | 10 | | 8 | |
Liquor (10) | | 10 | | Nil | | 10 | | 7 | | 10, 12 | | 7.5 | | 8 | | 8 | | 37.5 | | 8 | |
Meals | | Nil | | Nil | | Nil | | 7 | | 8 | | 7.5 | | 8 | | 8 | | 10 | | 8 | |
Accommodation | | 8 | | 4 | | 5 | | 7 | | 5 | | 7.5 | | 8 | | 8 | | 10 | | 8 | |
Tobacco tax (dollars per carton of 200 cigarettes) (11) | | 35.80 | | 37.00 | | 40.20 | | 39.90 | | 25.95 | | 20.60 | | 28.20 | | 38.50 | | 34.90 | | 41.65 | |
(1) | | Rates shown are those known as of February 6, 2008 and that are in effect for 2008. |
| | |
(2) | | British Columbia rates are those announced in the February 19, 2008 Budget. |
| | |
(3) | | The British Columbia corporate income tax rate is reduced to 11 per cent and the small business rate to 3.5 per cent effective July 1, 2008; Alberta’s small business threshold is increased to $500,000 effective January 1, 2009; Saskatchewan’s general rate is reduced to 12 per cent and the small business threshold is increased to $500,000 effective July 1, 2008; Manitoba’s general corporate income tax rate is reduced to 13 per cent effective July 1, 2008; Quebec’s general rate is increased to 11.9 per cent effective January 1, 2009; and Prince Edward Island’s small business rate is reduced by 1.1 percentage points each April in 2008, 2009 and 2010. |
| | |
(4) | | Ontario’s general corporation capital tax no longer applies to corporations primarily engaged in manufacturing and processing and those in the resource sectors. Provinces eliminating their general corporation capital taxes are Saskatchewan, effective July 1, 2008, although the tax will continue to apply to Crown corporations, and Ontario, effective July 1, 2010. Provinces eliminating their capital tax on financial institutions include British Columbia, effective April 1, 2010 and Ontario, effective July 1, 2010. |
| | |
(5) | | British Columbia has a two-person rate of $96. British Columbia and Alberta offer premium assistance in the form of lower rates or an exemption from premiums for lower income individuals and families. Ontario and Quebec levy health care contributions as additions to provincial personal income taxes payable. |
| | |
(6) | | Provinces with payroll taxes provide payroll tax relief for small businesses. |
| | |
(7) | | The lower rate applies to premiums for life, sickness and accident insurance; the higher rate applies to premiums for property insurance including automobile insurance. In Ontario, Quebec and Newfoundland specific sales taxes also apply to insurance premiums, except those related to individual life and health. |
| | |
(8) | | Tax rate is for regular fuel used on highways. The British Columbia rate includes 6.75 cents per litre dedicated to the BC Transportation Financing Authority. The rates do not include regional taxes. The tax rates for Quebec, New Brunswick, Nova Scotia and Newfoundland include provincial sales tax based on current pump prices. |
| | |
(9) | | The rates shown are statutory rates. Quebec and PEI impose tax on the purchase price including GST. |
| | |
(10) | | In Ontario, sellers of liquor at licensed establishments are generally required to charge sales tax at the rate of 10 per cent; however, a rate of 12 per cent applies to liquor purchased at beer manufacturers’ outlets, Brewers Retail stores, government liquor stores and wine stores. |
| | |
(11) | | Includes estimated provincial sales tax where applicable. |
Budget and Fiscal Plan — 2008/09 to 2010/11
175
Appendices
Table A3 Comparison of Provincial and Federal Taxes by Province – 2008
| | | | | | | | | | | | | | | | | | Prince | | | |
| | British | | | | Saskat- | | | | | | | | New | | Nova | | Edward | | New- | |
Tax | | Columbia | | Alberta | | chewan | | Manitoba | | Ontario | | Quebec | | Brunswick | | Scotia | | Island | | foundland | |
| | $ | |
Two Income Family of Four - $90,000 | | | | | | | | | | | | | | | | | | | | | |
1. Provincial Income Tax | | 3,629 | | 4,652 | | 6,231 | | 6,896 | | 4,957 | | 7,064 | | 7,053 | | 7,001 | | 6,903 | | 6,750 | |
Net Child Benefits | | 0 | | 27 | | 0 | | — | | 0 | | (1,551 | ) | 0 | | 0 | | — | | 0 | |
2. Property Tax - Gross | | 2,970 | | 2,537 | | 3,075 | | 4,064 | | 4,466 | | 4,398 | | 4,364 | | 2,306 | | 2,813 | | 2,516 | |
- Net | | 2,400 | | 2,537 | | 3,075 | | 3,539 | | 4,466 | | 4,398 | | 4,364 | | 2,306 | | 2,813 | | 2,516 | |
3. Sales Tax | | 1,237 | | 15 | | 930 | | 1,341 | | 1,705 | | 2,206 | | 1,891 | | 1,893 | | 1,942 | | 1,904 | |
4. Fuel Tax | | 218 | | 135 | | 225 | | 173 | | 221 | | 338 | | 270 | | 345 | | 237 | | 368 | |
5. Net Carbon Tax | | (34 | ) | — | | — | | — | | — | | — | | — | | — | | — | | — | |
6. Provincial Direct Taxes | | 7,450 | | 7,366 | | 10,461 | | 11,949 | | 11,349 | | 12,455 | | 13,578 | | 11,545 | | 11,895 | | 11,538 | |
7. Health Care Premiums/Payroll Tax | | 1,296 | | 1,056 | | — | | 1,935 | | 1,755 | | 3,834 | | — | | — | | — | | 1,800 | |
8. Total Provincial Tax | | 8,746 | | 8,422 | | 10,461 | | 13,884 | | 13,104 | | 16,289 | | 13,578 | | 11,545 | | 11,895 | | 13,338 | |
9. Federal Income Tax | | 8,612 | | 8,612 | | 8,612 | | 8,612 | | 8,612 | | 8,612 | | 8,612 | | 8,612 | | 8,612 | | 8,612 | |
10. Net Federal GST | | 1,273 | | 1,329 | | 1,251 | | 1,213 | | 1,257 | | 1,349 | | 1,182 | | 1,183 | | 1,276 | | 1,190 | |
11. Total Tax | | 18,631 | | 18,363 | | 20,324 | | 23,709 | | 22,973 | | 26,250 | | 23,372 | | 21,340 | | 21,783 | | 23,140 | |
| | | | | | | | | | | | | | | | | | | | | |
Two Income Family of Four - $60,000 | | | | | | | | | | | | | | | | | | | | | |
1. Provincial Income Tax | | 1,652 | | 2,112 | | 3,295 | | 3,697 | | 2,253 | | 3,029 | | 3,671 | | 3,671 | | 3,797 | | 3,663 | |
Net Child Benefits | | 0 | | 27 | | 0 | | — | | 0 | | (2,651 | ) | 0 | | 0 | | — | | 0 | |
2. Property Tax - Gross | | 2,162 | | 1,812 | | 2,713 | | 2,529 | | 3,104 | | 2,984 | | 2,165 | | 2,152 | | 2,237 | | 1,540 | |
- Net | | 1,592 | | 1,812 | | 2,713 | | 2,004 | | 3,104 | | 2,984 | | 2,165 | | 2,152 | | 2,237 | | 1,540 | |
3. Sales Tax | | 970 | | 12 | | 743 | | 1,074 | | 1,365 | | 1,892 | | 1,522 | | 1,522 | | 1,551 | | 1,522 | |
4. Fuel Tax | | 218 | | 135 | | 225 | | 173 | | 221 | | 338 | | 270 | | 345 | | 237 | | 368 | |
5. Net Carbon Tax | | (3 | ) | — | | — | | — | | — | | — | | — | | — | | — | | — | |
6. Provincial Direct Taxes | | 4,429 | | 4,098 | | 6,976 | | 6,948 | | 6,943 | | 5,592 | | 7,628 | | 7,690 | | 7,822 | | 7,093 | |
7. Health Care Premiums/Payroll Tax | | 1,296 | | 1,056 | | — | | 1,290 | | 1,170 | | 2,556 | | — | | — | | — | | 1,200 | |
8. Total Provincial Tax | | 5,725 | | 5,154 | | 6,976 | | 8,238 | | 8,113 | | 8,148 | | 7,628 | | 7,690 | | 7,822 | | 8,293 | |
9. Federal Income Tax | | 4,219 | | 4,219 | | 4,219 | | 4,219 | | 4,219 | | 4,219 | | 4,219 | | 4,219 | | 4,219 | | 4,219 | |
10. Net Federal GST | | 998 | | 1,091 | | 999 | | 971 | | 1,006 | | 1,157 | | 951 | | 951 | | 1,019 | | 951 | |
11. Total Tax | | 10,942 | | 10,464 | | 12,194 | | 13,428 | | 13,338 | | 13,524 | | 12,798 | | 12,860 | | 13,060 | | 13,463 | |
| | | | | | | | | | | | | | | | | | | | | |
Two Income Family of Four - $30,000 | | | | | | | | | | | | | | | | | | | | | |
1. Provincial Income Tax | | 0 | | 0 | | 552 | | 531 | | 437 | | (1,035 | ) | 0 | | 809 | | 863 | | 1,163 | |
Net Child Benefits | | 0 | | (1,033 | ) | 0 | | — | | (287 | ) | (3,136 | ) | 0 | | 0 | | — | | 0 | |
2. Property Tax - Gross | | 2,162 | | 1,812 | | 2,713 | | 2,529 | | 3,104 | | 2,984 | | 2,165 | | 2,152 | | 2,237 | | 1,540 | |
- Net | | 1,592 | | 1,812 | | 2,713 | | 2,004 | | 3,104 | | 2,984 | | 2,165 | | 2,152 | | 2,237 | | 1,540 | |
3. Sales Tax | | 716 | | 10 | | 322 | | 794 | | 983 | | 1,524 | | 1,148 | | 1,112 | | 1,135 | | 1,096 | |
4. Fuel Tax | | 145 | | 90 | | 150 | | 115 | | 147 | | 225 | | 180 | | 230 | | 158 | | 245 | |
5. Net Carbon Tax | | (103 | ) | — | | — | | — | | — | | — | | — | | — | | — | | — | |
6. Provincial Direct Taxes | | 2,453 | | 879 | | 3,737 | | 3,444 | | 4,384 | | 562 | | 3,493 | | 4,303 | | 4,393 | | 4,044 | |
7. Health Care Premiums/Payroll Tax | | 0 | | 263 | | — | | 645 | | 585 | | 1,278 | | — | | — | | — | | 600 | |
8. Total Provincial Tax | | 2,453 | | 1,142 | | 3,737 | | 4,089 | | 4,969 | | 1,840 | | 3,493 | | 4,303 | | 4,393 | | 4,644 | |
9. Federal Income Tax | | 635 | | 635 | | 635 | | 635 | | 635 | | 635 | | 635 | | 635 | | 635 | | 635 | |
10. Net Federal GST | | 0 | | 134 | | (2 | ) | (20 | ) | (14 | ) | 194 | | (21 | ) | (43 | ) | 8 | | (53 | ) |
11. Total Tax | | 3,088 | | 1,911 | | 4,370 | | 4,704 | | 5,590 | | 2,669 | | 4,107 | | 4,895 | | 5,036 | | 5,226 | |
| | | | | | | | | | | | | | | | | | | | | |
Unattached Individual - $25,000 | | | | | | | | | | | | | | | | | | | | | |
1. Provincial Income Tax | | 527 | | 599 | | 1,453 | | 1,014 | | 977 | | 264 | | 1,316 | | 1,268 | | 1,416 | | 1,269 | |
2. Property Tax | | — | | — | | — | | — | | — | | — | | — | | — | | — | | — | |
3. Sales Tax | | 404 | | 5 | | 319 | | 480 | | 585 | | 800 | | 687 | | 689 | | 732 | | 689 | |
4. Fuel Tax | | 145 | | 90 | | 150 | | 115 | | 147 | | 225 | | 180 | | 230 | | 158 | | 245 | |
5. Net Carbon Tax | | (37 | ) | — | | — | | — | | — | | — | | — | | — | | — | | — | |
6. Provincial Direct Taxes | | 1,039 | | 694 | | 1,922 | | 1,609 | | 1,709 | | 1,289 | | 2,183 | | 2,187 | | 2,306 | | 2,203 | |
7. Health Care Premiums/Payroll Tax | | 259 | | 528 | | — | | 538 | | 488 | | 1,065 | | — | | — | | — | | 500 | |
8. Total Provincial Tax | | 1,298 | | 1,222 | | 1,922 | | 2,147 | | 2,197 | | 2,354 | | 2,183 | | 2,187 | | 2,306 | | 2,703 | |
9. Federal Income Tax | | 1,730 | | 1,730 | | 1,730 | | 1,730 | | 1,730 | | 1,730 | | 1,730 | | 1,730 | | 1,730 | | 1,730 | |
10. Net Federal GST | | 90 | | 99 | | 77 | | 80 | | 78 | | 126 | | 60 | | 62 | | 90 | | 62 | |
11. Total Tax | | 3,118 | | 3,051 | | 3,729 | | 3,957 | | 4,005 | | 4,210 | | 3,973 | | 3,979 | | 4,126 | | 4,495 | |
Budget and Fiscal Plan — 2008/09 to 2010/11
176
Appendices
Table A3 Comparison of Provincial and Federal Taxes by Province – 2008 – Continued
| | | | | | | | | | | | | | | | | | Prince | | | |
| | British | | | | Saskat- | | | | | | | | New- | | Nova | | Edward | | New- | |
Tax | | Columbia | | Alberta | | chewan | | Manitoba | | Ontario | | Quebec | | Brunswick | | Scotia | | Island | | foundland | |
| | $ | |
Unattached Individual - $80,000 | | | | | | | | | | | | | | | | | | | | | |
1. Provincial Income Tax | | 4,473 | | 5,478 | | 7,511 | | 8,013 | | 5,879 | | 8,918 | | 8,466 | | 8,523 | | 8,148 | | 8,090 | |
2. Property Tax - Gross | | 1,479 | | 1,450 | | 2,170 | | 2,628 | | 2,914 | | 3,786 | | 1,913 | | 2,229 | | 2,062 | | 2,114 | |
- Net | | 909 | | 1,450 | | 2,170 | | 2,103 | | 2,914 | | 3,786 | | 1,913 | | 2,229 | | 2,062 | | 2,114 | |
3. Sales Tax | | 1,031 | | 12 | | 644 | | 1,149 | | 1,482 | | 1,776 | | 1,657 | | 1,654 | | 1,795 | | 1,675 | |
4. Fuel Tax | | 218 | | 135 | | 225 | | 173 | | 221 | | 338 | | 270 | | 345 | | 237 | | 368 | |
5. Net Carbon Tax | | (44 | ) | — | | — | | — | | — | | — | | — | | — | | — | | — | |
6. Provincial Direct Taxes | | 6,587 | | 7,075 | | 10,550 | | 11,438 | | 10,496 | | 14,818 | | 12,306 | | 12,751 | | 12,242 | | 12,247 | |
7. Health Care Premiums/Payroll Tax | | 648 | | 528 | | — | | 1,720 | | 1,560 | | 3,408 | | — | | — | | — | | 1,600 | |
8. Total Provincial Tax | | 7,235 | | 7,603 | | 10,550 | | 13,158 | | 12,056 | | 18,226 | | 12,306 | | 12,751 | | 12,242 | | 13,847 | |
9. Federal Income Tax | | 11,555 | | 11,555 | | 11,555 | | 11,555 | | 11,555 | | 11,555 | | 11,555 | | 11,555 | | 11,555 | | 11,555 | |
10. Net Federal GST | | 1,171 | | 1,192 | | 1,107 | | 1,074 | | 1,131 | | 1,099 | | 1,036 | | 1,034 | | 1,124 | | 1,047 | |
11. Total Tax | | 19,961 | | 20,350 | | 23,212 | | 25,787 | | 24,742 | | 30,880 | | 24,897 | | 25,340 | | 24,921 | | 26,449 | |
Senior Couple with Equal Pension Incomes - $30,000 | | | | | | | | | | | | | | | | | | | | | |
1. Provincial Income Tax | | 0 | | 0 | | 0 | | (300 | ) | (888 | ) | (870 | ) | 0 | | 426 | | 378 | | 495 | |
2. Property Tax - Gross | | 2,162 | | 1,812 | | 2,713 | | 2,529 | | 3,104 | | 2,984 | | 2,165 | | 2,152 | | 2,237 | | 1,540 | |
- Net | | 1,317 | | 1,812 | | 2,713 | | 2,004 | | 3,104 | | 2,984 | | 2,165 | | 2,152 | | 2,237 | | 1,540 | |
3. Sales Tax | | 730 | | 9 | | 571 | | 821 | | 993 | | 1,338 | | 1,197 | | 1,271 | | 1,245 | | 1,259 | |
4. Fuel Tax | | 145 | | 90 | | 150 | | 115 | | 147 | | 225 | | 180 | | 230 | | 158 | | 245 | |
5. Net Carbon Tax | | (73 | ) | — | | — | | — | | — | | — | | — | | — | | — | | — | |
6. Provincial Direct Taxes | | 2,119 | | 1,911 | | 3,434 | | 2,640 | | 3,356 | | 3,677 | | 3,542 | | 4,079 | | 4,018 | | 3,539 | |
7. Health Care Premiums/Payroll Tax | | 230 | | 0 | | — | | — | | — | | — | | — | | — | | — | | — | |
8. Total Provincial Tax | | 2,349 | | 1,911 | | 3,434 | | 2,640 | | 3,356 | | 3,677 | | 3,542 | | 4,079 | | 4,018 | | 3,539 | |
9. Federal Income Tax | | 0 | | 0 | | 0 | | 0 | | 0 | | 0 | | 0 | | 0 | | 0 | | 0 | |
10. Net Federal GST | | 339 | | 343 | | 338 | | 316 | | 301 | | 346 | | 264 | | 311 | | 356 | | 303 | |
11. Total Tax | | 2,688 | | 2,254 | | 3,772 | | 2,956 | | 3,657 | | 4,023 | | 3,806 | | 4,390 | | 4,374 | | 3,842 | |
Personal Income Tax
· Income tax is based on basic personal credits, applicable provincial credits, and typical major deductions at each income level. Quebec residents pay federal income tax less an abatement of 16.5 per cent of basic federal tax. This abatement has been used to reduce Quebec provincial tax rather than federal tax, for comparative purposes. The two income family of four with $60,000 annual income is assumed to have one spouse earning $40,000 and the other $20,000, the family with $90,000 income is assumed to have one spouse earning $50,000 and the other $40,000, the family with $30,000 is assumed to have each spouse earning $15,000 and each senior is assumed to receive $15,000. All representative families are assumed to have employment income except the senior couple. Contributions to the Quebec Health Services Fund are included in Quebec personal income tax. British Columbia personal income tax has been calculated using the 2008 tax rates in effect prior to the implementation of the rate cuts in the government’s plan to recycle carbon tax revenues.
Net Child Benefits
· Net child benefits are provincial measures affecting payments to families with children. Provincial child benefit measures are available in British Columbia (BC Family Bonus), Alberta (Family Employment Credit), Saskatchewan (Child Benefit), Ontario (Child Care Supplement for Working Families), Quebec (Child Assistance Payments), New Brunswick (Child Tax Benefit), Nova Scotia (Child Benefit) and Newfoundland (Child Benefit). In addition, the Alberta government has chosen to vary the amount of the basic federal child tax benefit that its residents receive (shown as a net amount).
Property Tax
· It is assumed that the individual at $25,000 rents accommodation; the family at $30,000 and at $55,000 and the senior couple own bungalows; the family at $90,000 owns a two-story executive style home; and the single at $80,000 owns a luxury condominium, in a major city for each province. Net local and provincial property taxes are estimate as taxes owing after credits provided through the property tax system are subtracted.
Sales, Fuel and Carbon Tax Estimates
· Includes sales tax on meals, liquor and accommodation. Estimates are based on expenditure patterns from the Survey of Household Spending. In estimating individual and family taxable consumption, disposable income is reduced by 20 per cent to reflect housing (mortgage and property taxes or rent) costs. The senior couple is assumed to own their home and have no mortgage costs. For each province, disposable income is further reduced by estimated federal income taxes, estimated provincial income taxes and health care premiums if applicable. In addition, the single individual with $80,000 annual income and the family with $90,000 annual income are assumed to have savings equal to 5 per cent of their disposable income. For each family, disposable income is distributed among expenditures using the consumption pattern of a typical family with the relevant characteristics as estimated by the family expenditure survey. The provincial retail sales tax and the federal goods and services tax (GST) components of these expenditures are then calculated. GST estimates have been reduced by the GST credit, where applicable.
· Fuel tax is based on annual consumption: 1,000 litres of unleaded fuel for the single at $25,000, the family at $30,000 and the senior couple; others are assumed to consume 1,500 litres.
· Carbon tax applies in British Columbia to household consumption of gasoline, diesel, natural gas and home heating fuel. Estimated carbon tax liabilities are based on natural gas and home heating fuel consumption amounts from the Survey of Household Spending and the assumed fuel tax consumption noted above. Net carbon tax is estimated carbon tax liabilities less the value of the personal income tax cuts and the low income Climate Action credit (where applicable) as reported in the Government’s plan to recycle carbon tax revenues.
Health Care Premiums/Payroll Tax
· Health care premiums are levied in British Columbia and Alberta only. Approximately 50 per cent of British Columbia premiums are paid by employers on behalf of their employees with the remainder paid by individuals, either by employees or by residents who are not employed. Payroll taxes, in the four provinces that levy them, are paid by the employer. The cost to employers of payroll taxes and health care premiums paid on behalf of employees is generally reflected in reduced wages.
Effective Tax Rates
· British Columbia taxes have been calculated using rates in effect for 2008. Taxes for other provinces were calculated using rates that were announced prior to February 6, 2008, and that come into effect during 2008.
Budget and Fiscal Plan – 2008/09 to 2010/11
177
Appendices
Table A4 Interprovincial Comparisons of Provincial Personal Income Taxes Payable (1) – 2008 |
| (Rates known as of February 6, 2008) |
| | | | | | | | | | | | | | | | | | Prince | | | |
| | British | | | | Saskat- | | | | | | | | New | | Nova | | Edward | | New- | |
Taxable income (2) | | Columbia | | Alberta | | chewan | | Manitoba | | Ontario | | Quebec(3) | | Brunswick | | Scotia | | Island | | foundland | |
Annual provincial taxes payable(4) ($) | |
$10,000 | | 0 | | 0 | | 62 | | 33 | | 0 | | (3 | ) | 0 | | 0 | | 0 | | 169 | |
$20,000 | | 222 | | 268 | | 1,088 | | 1,149 | | 614 | | 115 | | 798 | | 236 | | 1,091 | | 981 | |
$30,000 | | 995 | | 1,201 | | 2,115 | | 2,195 | | 1,479 | | 1,388 | | 2,001 | | 1,582 | | 2,005 | | 1,792 | |
$40,000 | | 1,620 | | 2,134 | | 3,158 | | 3,387 | | 2,317 | | 2,530 | | 3,222 | | 3,258 | | 3,240 | | 3,103 | |
$50,000 | | 2,404 | | 3,108 | | 4,430 | | 4,633 | | 3,366 | | 4,027 | | 4,744 | | 4,730 | | 4,595 | | 4,461 | |
$60,000 | | 3,202 | | 4,108 | | 5,730 | | 5,908 | | 4,281 | | 5,516 | | 6,292 | | 6,239 | | 5,975 | | 5,841 | |
$70,000 | | 4,000 | | 5,108 | | 7,030 | | 7,369 | | 5,283 | | 7,067 | | 7,844 | | 7,906 | | 7,530 | | 7,479 | |
$80,000 | | 5,050 | | 6,108 | | 8,330 | | 9,109 | | 6,875 | | 8,662 | | 9,524 | | 9,573 | | 9,200 | | 9,129 | |
$100,000 | | 7,557 | | 8,108 | | 10,930 | | 12,589 | | 10,357 | | 12,513 | | 12,884 | | 13,262 | | 12,544 | | 12,429 | |
$125,000 | | 11,232 | | 10,608 | | 14,443 | | 16,939 | | 14,709 | | 17,610 | | 17,206 | | 18,074 | | 17,136 | | 16,554 | |
$150,000 | | 14,907 | | 13,108 | | 18,193 | | 21,289 | | 19,062 | | 22,581 | | 21,666 | | 22,887 | | 21,729 | | 20,679 | |
| | | | | | | | | | | | | | | | | | | | | |
Provincial personal income taxes as a per cent of taxable income (%) | |
$10,000 | | 0.0 | | 0.0 | | 0.6 | | 0.3 | | 0.0 | | (0.0 | ) | 0.0 | | 0.0 | | 0.0 | | 1.7 | |
$20,000 | | 1.1 | | 1.3 | | 5.4 | | 5.7 | | 3.1 | | 0.6 | | 4.0 | | 1.2 | | 5.5 | | 4.9 | |
$30,000 | | 3.3 | | 4.0 | | 7.1 | | 7.3 | | 4.9 | | 4.6 | | 6.7 | | 5.3 | | 6.7 | | 6.0 | |
$40,000 | | 4.1 | | 5.3 | | 7.9 | | 8.5 | | 5.8 | | 6.3 | | 8.1 | | 8.1 | | 8.1 | | 7.8 | |
$50,000 | | 4.8 | | 6.2 | | 8.9 | | 9.3 | | 6.7 | | 8.1 | | 9.5 | | 9.5 | | 9.2 | | 8.9 | |
$60,000 | | 5.3 | | 6.8 | | 9.6 | | 9.8 | | 7.1 | | 9.2 | | 10.5 | | 10.4 | | 10.0 | | 9.7 | |
$70,000 | | 5.7 | | 7.3 | | 10.0 | | 10.5 | | 7.5 | | 10.1 | | 11.2 | | 11.3 | | 10.8 | | 10.7 | |
$80,000 | | 6.3 | | 7.6 | | 10.4 | | 11.4 | | 8.6 | | 10.8 | | 11.9 | | 12.0 | | 11.5 | | 11.4 | |
$100,000 | | 7.6 | | 8.1 | | 10.9 | | 12.6 | | 10.4 | | 12.5 | | 12.9 | | 13.3 | | 12.5 | | 12.4 | |
$125,000 | | 9.0 | | 8.5 | | 11.6 | | 13.6 | | 11.8 | | 14.1 | | 13.8 | | 14.5 | | 13.7 | | 13.2 | |
$150,000 | | 9.9 | | 8.7 | | 12.1 | | 14.2 | | 12.7 | | 15.1 | | 14.4 | | 15.3 | | 14.5 | | 13.8 | |
(1) Calculated for a single individual with wage income and claiming credits for Canada Pension Plan and Quebec Pension Plan contributions, Employment Insurance premiums, Quebec Parental Insurance Plan premiums and the basic personal amount.
(2) Taxable income, total income less allowable deductions, is defined by federal legislation in all provinces except Quebec. In the table it is assumed that federally defined taxable income is equal to Quebec taxable income.
(3) Quebec residents pay federal tax less an abatement of 16.5 per cent of federal tax. In the table, the Quebec abatement has been used to reduce Quebec provincial personal income tax for comparative purposes.
(4) Includes provincial low income reductions (all provinces except Saskatchewan and Newfoundland), surtaxes payable in Ontario, Nova Scotia and Prince Edward Island and contributions to the Health Services Fund in Quebec. Excludes credits for sales and property taxes.
Budget and Fiscal Plan – 2008/09 to 2010/11
178
Table A5 Summary of Revenue Measures from July 30, 2001 to February 19, 2008 (1) | |
July 30, 2001 Economic and Fiscal Update | | Effective Date | |
Income Tax | | | |
· 25 per cent personal income tax cut | | January 1, 2001 | |
· Dividend tax credit rates reduced | | January 1, 2001 | |
· General corporate income tax rate reduced to 13.5 per cent from 16.5 per cent | | January 1, 2002 | |
· Manufacturing and processing tax credit repealed | | July 31, 2001 | |
Corporation Capital Tax | | | |
· Tax phased-out for general corporations | | September 1, 2001 | |
Social Service Tax | | | |
· Tax exemption for production machinery equipment | | July 31, 2001 | |
· Vehicle surtax threshold for passenger vehicles increased | | July 31, 2001 | |
Motor Fuel Tax | | | |
· Tax exemption provided for marine bunker fuel | | August 1, 2001 | |
· Domestic jet fuel and aviation fuel tax rates reduced to 2 cents/litre | | August 1, 2001 | |
Budget 2002 | | | |
Income Tax | | | |
· Increase sales tax credit | | January 1, 2002 | |
· Adjust BC Family Bonus | | July 1, 2002 | |
· Raise small business threshold to $300,000 | | April 1, 2002 | |
Medical Services Plan Premiums | | | |
· Increase premiums and enhance premium assistance | | May 1, 2002 | |
Social Service Tax | | | |
· Increase provincial sales tax rate to 7.5 per cent from 7 per cent | | February 20, 2002 | |
· Expand machinery and equipment tax exemption to include repair parts | | February 20, 2002 | |
Tobacco Tax | | | |
· Increase tobacco tax rate to $30 from $22 per carton | | February 20, 2002 | |
School and Rural Area Property Taxes | | | |
· Increase average gross residential rural and school property taxes by 2 per cent | | January 1, 2002 | |
Miscellaneous measures | | | |
· Disability credits; sales tax exemptions for farmers and refunds to Parent Advisory Councils | | various | |
Budget 2003 | | | |
Income Tax | | | |
· Increase budget for labour sponsored venture capital tax credits | | April 1, 2003 | |
· Introduce an equity tax credit for new media | | April 1, 2003 | |
· Provide an enhanced regional incentive for film credits | | April 1, 2003 | |
· Introduce a Digital Animation or Visual Effects tax credit | | April 1, 2003 | |
· Extend the BC Mining Flow-Through Share Tax Credit | | January 1, 2004 | |
· Extend the Mining Exploration Tax Credit for three years | | August 1, 2003 | |
· Introduce a book publishing tax credit | | October 1, 2002 | |
Corporation Capital Tax | | | |
· Increase the capital tax exemption threshold for small financial institutions to $10 million from $5 million | | April 1, 2003 | |
Motor Fuel Tax | | | |
· Provide exemption for marine gas oil used in gas turbine powered commercial vessels | | February 19, 2003 | |
BC Transportation Financing Authority Revenue | | | |
· Increase the clear fuel tax rate levied on behalf of BC Transportation Financing Authority by 3.5 cents/litre | | March 1, 2003 | |
Tobacco Tax | | | |
· Increase the tobacco tax rate to $32 from $30 per carton and to 16 cents from 15 cents per gram of fine-cut tobacco | | February 19, 2003 | |
School and Rural Area Property Taxes | | | |
· Increase average gross residential rural and school property taxes by inflation | | January 1, 2003 | |
Insurance Premium Tax | | | |
· Increase tax on property insurance to 4.4 per cent from 4 per cent to offset forest fire suppression costs | | January 1, 2004 | |
· Clarify the definition of taxable insurers | | February 19, 2003 | |
Property Transfer Tax | | | |
· Enhance fairness and effectiveness of First Time Home Buyers’ exemption | | February 19, 2003 | |
Budget and Fiscal Plan – 2008/09 to 2010/11 |
179
Appendices
Table A5 Summary of Revenue Measures from July 30, 2001 to February 19, 2008 (1) – Continued
Budget 2004 | | Effective Date | |
Income Tax | | | |
| · | Reduce BC Family Bonus and BC Earned Income amounts | | July 1, 2004 | |
| · | Extend Scientific Research and Experimental Development Tax Credit | | September 1, 2004 | |
International Financial Business Tax Refund | | | |
| · | Allow non-financial institutions to register, expand the list of qualifying activities and eliminate the employee tax refund | | September 1, 2004 | |
Tobacco Tax | | | |
| · | Increase tobacco tax rate to $35.80 from $32.00 per carton and to 17.9 cents per gram for fine-cut tobacco | | December 20, 2003 | |
Home Owner Grant Act | | | |
| · | Increase the threshold for the home owner grant phase-out to $585,000 from $525,000 | | January 1, 2004 | |
Ports Property Tax Act | | | |
| · | Reduce property taxes on major BC port facilities and provide compensation to municipalities | | January 1, 2004 | |
Budget 2005 — February 15, 2005 | | | |
Income Tax | | | |
| · | Introduce the BC Tax Reduction, a non-refundable personal income tax credit | | January 1, 2005 | |
| · | Extend the Mining Exploration Tax Credit to 2016 | | August 1, 2006 | |
| · | Increase the Film Incentive BC and Production Services tax credit rates | | January 1, 2005 | |
| · | Increase corporate income tax small business threshold to $400,000 from $300,000 | | January 1, 2005 | |
Social Service Tax | | | |
| · | Reduce provincial sales tax rate to 7 per cent from 7.5 per cent | | October 21, 2004 | |
| · | Increase incentives for purchases of hybrid passenger vehicles on a time-limited basis | | February 16, 2005 | |
| · | Provide time-limited exemption for ENERGY STAR residential heating equipment | | February 16, 2005 | |
| · | Increase vehicle surtax threshold for passenger vehicles to $49,000 from $47,000 | | February 16, 2005 | |
Property Transfer Tax | | | |
| · | Increase thresholds for First Time Home Buyers’ program | | February 16, 2005 | |
Medicare Protection Act | | | |
| · | Enhance Medical Services Plan premium assistance | | July 1, 2005 | |
Home Owner Grant Act | | | |
| · | Increase threshold for Home Owner Grant phase-out and reduce reduction rate | | 2005 tax year | |
School Act | | | |
| · | Exempt specified improvements of eligible hydroelectric projects | | 2005 tax year | |
September Update (September 14, 2005) | | | |
Income Tax | | | |
| · | Reduce the general corporate income tax rate to 12 per cent from 13.5 per cent | | July 1, 2005 | |
International Financial Activity Act | | | |
| · | Provide tax refunds for the exploitation of life science related patents | | January 1, 2006 | |
Budget 2006 | | | |
Income Tax | | | |
| · | Introduce an enhanced dividend tax credit to parallel new federal credit | | January 1, 2006 | |
| · | Extend the BC Mining Flow-through Share Tax Credit to December 31, 2008 | | January 1, 2006 | |
| · | Extend the enhanced tax credit rates for the Film Incentive BC and Production | | | |
| | Services tax credits to 2008 | | April 1, 2006 | |
Social Service Tax | | | |
| · | Exempt services to maintain or modify software | | February 22, 2006 | |
| · | Clarify and expand eligibility for machinery and equipment exemption | | February 22, 2006 | |
| · | Increase vehicle surtax threshold for passenger vehicles to $55,000 from $49,000 | | February 22, 2006 | |
| · | Provide authority to repeal tire levy when industry stewardship program introduced | | January 1, 2007 | |
Motor Fuel Tax | | | |
| · | Expand eligible coloured fuel uses | | February 22, 2006 | |
Home Owner Grant Act | | | |
| · | Increase the basic Home Owner Grant to $570 from $470 and the grant for seniors, veterans and the disabled to $845 from $745 | | 2006 tax year | |
| · | Increase the threshold for the Home Owner Grant phase out | | 2006 tax year | |
Small Business Venture Capital Act | | | |
| · | Increase the tax credit budget to $25 million from $20 million | | April 1, 2006 | |
| | | | | | |
Budget and Fiscal Plan – 2008/09 to 2010/11
180
Appendices
Table A5 Summary of Revenue Measures from July 30, 2001 to February 19, 2008 (1) – Continued
Budget 2007 | | Effective Date | |
Income Tax | | | |
| · | Introduce a 10 per cent tax cut up to $100,000 in income | | January 1, 2007 | |
| · | Introduce an adoption expense tax credit | | January 1, 2007 | |
| · | Enhance the Mining Exploration Tax Credit for exploration activity in Mountain Pine Beetle affected areas | | February 21, 2007 | |
| · | Extend the Book Publishing Tax Credit for five more years to 2012 | | April 1, 2007 | |
| · | Extend the Scientific Research and Experimental Tax Credit for five more years to 2014 | | September 1, 2009 | |
| · | Implement the BC Training Tax Credit program | | January 1, 2007 | |
Mineral Tax Act | | | |
| · | Extend the new mine allowance to 2016 | | February 21, 2007 | |
Social Service Tax Act | | | |
| · | Restructure the exemption for multi-glazed windows/doors to apply only to ENERGY STAR windows, doors (including side panels and skylights) | | February 21, 2007 | |
| · | Extend the expiry date for ENERGY STAR furnaces, boilers and heat pumps to various dates | | February 21, 2007 | |
| · | Extend the tax relief for hybrid passenger vehicles to 2011 | | February 21, 2007 | |
| · | Provide a tax refund on eligible medical equipment purchased by charities | | February 21, 2007 | |
Motor Fuel Tax Act | | | |
| · | Classify all biodiesel fuel as alternative motor fuel | | February 21, 2007 | |
Property Transfer Tax Act | | | |
| · | Set the First Time Home Buyers’ exemption threshold at $375,000 province-wide | | February 21, 2007 | |
Home Owner Grant Act | | | |
| · | Increase the threshold for the Home Owner Grant phase-out | | 2007 tax year | |
| · | Extend Home Owner Grant eligibility to certain low-income homeowners with homes assessed above the phase-out threshold | | 2007 tax year | |
Land Tax Deferment Act | | | |
| · | Extend eligibility to homeowners age 55 and over from 60 and over | | 2007 tax year | |
Police Act | | | |
| · | New property tax to help fund police services in rural areas and communities under 5,000 population | | 2007 tax year | |
Provincial Sales Tax Review | | | |
Various Consumption Tax Statutes | | | |
| · | Changes to consumption tax statutes to reduce compliance burden for businesses and simplify specific exemptions | | various | |
Budget 2008 | | | |
Revenue Neutral Climate Action Measures | | | |
Carbon Tax | | | |
| · | Government to introduce a broadly based revenue neutral carbon tax on the purchase or use of fossil fuels subject to approval by the Legislature | | July 1, 2008 | |
Income Tax Act - Revenue Neutral Tax Reductions | | | |
| · | Introduce a Low Income Climate Action Tax Credit | | July 1, 2008 | |
| · | Reduce first two personal income tax bracket rates by 2 per cent for 2008 and by 5 per cent for 2009 and subsequent years | | January 1, 2008 | |
| · | Reduce general corporate income tax rate to 11 per cent from from 12 per cent | | July 1, 2008 | |
| · | Reduce corporate income tax small business rate to 3.5 per cent from 4.5 per cent | | July 1, 2008 | |
Income Tax Act - One-time Payment | | | |
| · | Provide a one-time Climate Action Dividend Payment of $100 to each person resident in BC on December 31, 2007 | | December 31, 2007 | |
Other Climate Action Initiatives | | | |
Small Business Venture Capital Act | | | |
| · | Increase equity tax credit budget by $5 million per year and set a tax credit budget of $7.5 million for clean technology | | 2008/09 | |
International Financial Activity Act | | | |
| · | Expand eligible intellectual property to include green-related patents | | March 1, 2008 | |
Social Service Tax Act | | | |
| · | Provide time-limited point-of-sale tax reduction for conventional fuel efficient vehicles | | February 20, 2008 | |
| · | Exempt ENERGY STAR qualified residential refrigerators, clothes washers and freezers to March 31, 2010 | | February 20, 2008 | |
| · | Exempt energy efficient residential gas-fired water heaters to December 31, 2009 | | February 20, 2008 | |
Budget and Fiscal Plan – 2008/09 to 2010/11
181
Appendices
Table A5 Summary of Revenue Measures from July 30, 2001 to February 19, 2008 (1) – Continued
Budget 2008 - (Continued) | | Effective Date | |
Social Service Tax Act | | | |
| · | Exempt production machinery and equipment for local governments for power production and cogeneration | | February 20, 2008 | |
| · | Expand the exemption for bicycles to include electric power-assisted two and three wheel cycles and non-motorized adult-sized tricycles | | February 20, 2008 | |
| · | Reduce tax payable on electric motorcycles | | February 20, 2008 | |
| · | Reduce tax payable on hydrogen fuel cell buses | | February 20, 2008 | |
| · | Exempt biodiesel fuel or portion of biodiesel for heating | | February 20, 2008 | |
| · | Impose tax on coal and coke except for residential use | | February 20, 2008 | |
Other Revenue Measures | | | |
Income Tax Act | | | |
| · | Reduce dividend tax credit rates for ordinary and enhanced dividends | | January 1, 2009 | |
| · | Extend film tax credits for five more years to 2013 from 2008 | | various | |
| · | Increase basic Film Incentive BC Tax Credit rate to 35 per cent from 30 per cent and basic Production Services Tax Credit rate to 25 per cent from 18 per cent for two years | | January 1, 2008 | |
| · | Enhance regional film tax credit for productions in distant locations | | February 20, 2008 | |
Corporation Capital Tax Act | | | |
| · | Phase-out corporation capital tax and replace it with a new financial institutions minimum tax | | April 1, 2008 | |
Ports Property Tax Act | | | |
| · | Extend ports competitiveness initiative for ten years | | various | |
Property Transfer Tax Act | | | |
| · | Increase First Time Home Buyers’ threshold to $425,000 from $375,000 | | February 20, 2008 | |
| · | Remove First Time Home Buyers’ 70 percent financing requirement | | February 20, 2008 | |
Home Owner Grant Act | | | |
| · | Increase in the Home-Owner Grant phase-out threshold | | 2008 tax year | |
School Act | | | |
| · | Reduce the non-residential school tax rate for major industrial property | | 2008 tax year | |
Provincial Sales Tax Review | | | |
Various Consumption Tax Statutes | | | |
| · | Changes to consumption tax statutes to reduce compliance burden for businesses and simplify specific exemptions | | various | |
(1) | Measures with no material revenue impact are excluded. For details of these measures see the revenue measures section of each budget publication. | |
Budget and Fiscal Plan – 2008/09 to 2010/11
182
Appendices
Table A6 Operating Statement – 2004/05 to 2010/11
($ millions) | | Actual
2004/05 | | Actual
2005/06 | | Actual
2006/07 | | Updated
Forecast
2007/08 | | Budget
Estimate
2008/09 | | Plan
2009/10 | | Plan
2010/11 | |
Taxpayer-supported programs and agencies: | | | | | | | | | | | | | | | |
Revenue | | 30,806 | | 33,753 | | 35,819 | | 36,525 | | 35,810 | | 37,238 | | 38,788 | |
Expense | | (30,665 | ) | (32,173 | ) | (34,184 | ) | (37,280 | ) | (37,690 | ) | (39,100 | ) | (40,700 | ) |
Negotiating Framework incentive payments | | — | | (710 | ) | (264 | ) | — | | — | | — | | — | |
Taxpayer-supported balance | | 141 | | 870 | | 1,371 | | (755 | ) | (1,880 | ) | (1,862 | ) | (1,912 | ) |
Commercial Crown corporation income | | 2,562 | | 2,220 | | 2,685 | | 2,875 | | 2,680 | | 2,687 | | 2,737 | |
Surplus/(deficit) before forecast allowance | | 2,703 | | 3,090 | | 4,056 | | 2,120 | | 800 | | 825 | | 825 | |
Forecast allowance | | — | | — | | — | | (150 | ) | (750 | ) | (675 | ) | (675 | ) |
Surplus/(deficit) | | 2,703 | | 3,090 | | 4,056 | | 1,970 | | 50 | | 150 | | 150 | |
Budget and Fiscal Plan – 2008/09 to 2010/11
183
Appendices
Table A7 Revenue by Source – 2004/05 to 2010/11
($ millions) | | Actual
2004/05 | | Actual
2005/06 | | Actual
2006/07 | | Updated
Forecast
2007/08 | | Budget
Estimate
2008/09 | | Plan
2009/10 | | Plan
2010/11 | |
Taxation revenue | | | | | | | | | | | | | | | |
Personal income | | 5,050 | | 5,838 | | 6,905 | | 6,741 | | 6,700 | | 6,963 | | 7,302 | |
Corporate income | | 1,255 | | 1,426 | | 1,538 | | 2,221 | | 1,343 | | 1,125 | | 1,193 | |
Social service | | 4,156 | | 4,367 | | 4,714 | | 5,091 | | 5,284 | | 5,563 | | 5,857 | |
Fuel | | 904 | | 911 | | 901 | | 938 | | 957 | | 975 | | 996 | |
Carbon | | — | | — | | — | | — | | 338 | | 631 | | 880 | |
Tobacco | | 699 | | 701 | | 726 | | 705 | | 705 | | 705 | | 705 | |
Property | | 1,661 | | 1,717 | | 1,732 | | 1,788 | | 1,861 | | 1,943 | | 2,040 | |
Property transfer | | 604 | | 843 | | 914 | | 1,075 | | 1,020 | | 1,020 | | 970 | |
Corporation capital | | 160 | | 161 | | 104 | | 95 | | 69 | | 36 | | — | |
Other (1) | | 428 | | 465 | | 484 | | 515 | | 532 | | 549 | | 568 | |
| | 14,917 | | 16,429 | | 18,018 | | 19,169 | | 18,809 | | 19,510 | | 20,511 | |
| | | | | | | | | | | | | | | |
Natural resource revenue | | | | | | | | | | | | | | | |
Natural gas royalties | | 1,439 | | 1,921 | | 1,207 | | 1,170 | | 1,165 | | 1,252 | | 1,357 | |
Columbia River Treaty | | 258 | | 319 | | 223 | | 230 | | 245 | | 305 | | 310 | |
Other energy and minerals | | 612 | | 797 | | 935 | | 956 | | 966 | | 1,018 | | 962 | |
Forests | | 1,363 | | 1,214 | | 1,276 | | 1,098 | | 952 | | 1,048 | | 1,131 | |
Other resources | | 301 | | 316 | | 341 | | 340 | | 395 | | 406 | | 402 | |
| | 3,973 | | 4,567 | | 3,982 | | 3,794 | | 3,723 | | 4,029 | | 4,162 | |
| | | | | | | | | | | | | | | |
Other revenue | | | | | | | | | | | | | | | |
Medical Services Plan premiums | | 1,465 | | 1,482 | | 1,524 | | 1,550 | | 1,571 | | 1,592 | | 1,612 | |
Post secondary education fees | | 836 | | 892 | | 928 | | 957 | | 989 | | 1,015 | | 1,040 | |
Other health-care related fees | | 189 | | 204 | | 216 | | 243 | | 252 | | 276 | | 302 | |
Motor vehicle licences and permits | | 381 | | 403 | | 424 | | 436 | | 445 | | 454 | | 463 | |
Other fees and licences | | 750 | | 685 | | 699 | | 760 | | 819 | | 786 | | 779 | |
Investment earnings | | 833 | | 949 | | 1,032 | | 954 | | 884 | | 942 | | 1,015 | |
Sales of goods and services | | 741 | | 719 | | 693 | | 668 | | 688 | | 737 | | 751 | |
Miscellaneous (2) | | 1,499 | | 1,598 | | 1,917 | | 1,928 | | 1,821 | | 1,856 | | 1,883 | |
| | 6,694 | | 6,932 | | 7,433 | | 7,496 | | 7,469 | | 7,658 | | 7,845 | |
| | | | | | | | | | | | | | | |
Contributions from the federal government | | | | | | | | | | | | | | | |
Health and social transfers | | 3,421 | | 4,220 | | 4,473 | | 4,759 | | 4,794 | | 5,001 | | 5,260 | |
Equalization | | 979 | | 590 | | 459 | | — | | — | | — | | — | |
Other cost shared agreements (3) | | 822 | | 1,015 | | 1,454 | | 1,307 | | 1,015 | | 1,040 | | 1,010 | |
| | 5,222 | | 5,825 | | 6,386 | | 6,066 | | 5,809 | | 6,041 | | 6,270 | |
Taxpayer-supported programs and agencies | | 30,806 | | 33,753 | | 35,819 | | 36,525 | | 35,810 | | 37,238 | | 38,788 | |
| | | | | | | | | | | | | | | |
Commercial Crown corporation net income | | | | | | | | | | | | | | | |
BC Hydro | | 402 | | 266 | | 407 | | 370 | | 358 | | 402 | | 444 | |
Liquor Distribution Branch | | 779 | | 800 | | 840 | | 845 | | 854 | | 863 | | 875 | |
BC Lotteries (net of payments to the federal government) | | 811 | | 914 | | 1,011 | | 1,026 | | 1,101 | | 1,151 | | 1,201 | |
BCRC (4) | | 182 | | 32 | | 29 | | 28 | | 75 | | 20 | | (1 | ) |
ICBC (4) | | 383 | | 191 | | 381 | | 594 | | 272 | | 231 | | 195 | |
Other | | 5 | | 17 | | 17 | | 12 | | 20 | | 20 | | 23 | |
| | 2,562 | | 2,220 | | 2,685 | | 2,875 | | 2,680 | | 2,687 | | 2,737 | |
Total revenue | | 33,368 | | 35,973 | | 38,504 | | 39,400 | | 38,490 | | 39,925 | | 41,525 | |
(1) | Includes revenue from insurance premium and hotel room taxes. |
(2) | Includes asset dispositions, reimbursements for health care and other services provided to external agencies, and other recoveries. |
(3) | Includes contributions for health, education, housing and social service programs, for transportation projects, and for coastal ferry services. |
(4) | Amounts represent earnings during government’s fiscal year. |
Budget and Fiscal Plan – 2008/09 to 2010/11
184
Appendices
Table A8 Expense by Function – 2004/05 to 2010/11
($ millions) | | Actual
2004/05 | | Actual
2005/06 | | Actual
2006/07 | | Updated
Forecast
2007/08 | | Budget
Estimate
2008/09 | | Plan
2009/10 | | Plan
2010/11 | |
Function: | | | | | | | | | | | | | | | |
Health: | | | | | | | | | | | | | | | |
Medical Services Plan | | 2,546 | | 2,696 | | 2,969 | | 3,220 | | 3,375 | | 3,584 | | 3,697 | |
Pharmacare | | 793 | | 868 | | 914 | | 1,020 | | 1,018 | | 1,057 | | 1,108 | |
Regional services | | 7,565 | | 8,112 | | 8,500 | | 8,984 | | 9,581 | | 10,124 | | 10,806 | |
Other healthcare expenses | | 625 | | 754 | | 867 | | 907 | | 861 | | 901 | | 932 | |
Health Innovation Fund | | — | | — | | — | | 100 | | — | | — | | — | |
| | 11,529 | | 12,430 | | 13,250 | | 14,231 | | 14,835 | | 15,666 | | 16,543 | |
| | | | | | | | | | | | | | | |
Education: | | | | | | | | | | | | | | | |
Elementary and secondary | | 4,757 | | 4,829 | | 5,272 | | 5,541 | | 5,711 | | 5,807 | | 5,849 | |
Post-secondary | | 3,549 | | 3,926 | | 4,088 | | 4,104 | | 4,329 | | 4,533 | | 4,615 | |
Other education expenses | | 206 | | 182 | | 159 | | 169 | | 173 | | 178 | | 179 | |
| | 8,512 | | 8,937 | | 9,519 | | 9,814 | | 10,213 | | 10,518 | | 10,643 | |
| | | | | | | | | | | | | | | |
Social services: | | | | | | | | | | | | | | | |
Social assistance | | 1,671 | | 1,637 | | 1,713 | | 1,912 | | 1,967 | | 2,034 | | 2,042 | |
Childcare services | | 809 | | 985 | | 1,085 | | 1,156 | | 1,204 | | 1,216 | | 1,229 | |
Other social services expenses | | 118 | | 102 | | 94 | | 96 | | 91 | | 90 | | 88 | |
| | 2,598 | | 2,724 | | 2,892 | | 3,164 | | 3,262 | | 3,340 | | 3,359 | |
Protection of persons and property | | 1,206 | | 1,381 | | 1,329 | | 1,566 | | 1,566 | | 1,573 | | 1,580 | |
Transportation | | 1,308 | | 1,196 | | 1,251 | | 1,365 | | 1,334 | | 1,400 | | 1,449 | |
Natural resources and economic development | | 1,686 | | 1,591 | | 1,663 | | 2,011 | | 1,753 | | 1,726 | | 1,744 | |
Other | | 1,027 | | 1,089 | | 1,278 | | 1,397 | | 1,413 | | 1,409 | | 1,350 | |
Contingencies | – new programs (1) | | — | | — | | — | | 317 | | 375 | | 390 | | 400 | |
| – Negotiating Framework | | — | | — | | — | | 20 | | — | | — | | 400 | |
General government | | 505 | | 644 | | 768 | | 1,170 | | 681 | | 687 | | 680 | |
Interest | | 2,294 | | 2,181 | | 2,234 | | 2,225 | | 2,258 | | 2,391 | | 2,552 | |
Subtotal | | 30,665 | | 32,173 | | 34,184 | | 37,280 | | 37,690 | | 39,100 | | 40,700 | |
Negotiating framework incentive payments | | — | | 710 | | 264 | | — | | — | | — | | — | |
Total expense | | 30,665 | | 32,883 | | 34,448 | | 37,280 | | 37,690 | | 39,100 | | 40,700 | |
(1) | The Contingencies vote is allocated to functions according to actual results for 2004/05 to 2006/07 and forecast results for 2007/08. |
Budget and Fiscal Plan – 2008/09 to 2010/11
185
Appendices
Table A9 Service Delivery Agency Operating Results (1) – 2004/05 to 2010/11
($ millions) | | Actual
2004/05 | | Actual
2005/06 | | Actual
2006/07 | | Updated
Forecast
2007/08 | | Budget
Estimate
2008/09 | | Plan
2009/10 | | Plan
2010/11 | |
| | | | | | | | | | | | | | | |
School districts | | | | | | | | | | | | | | | |
| | | | | | | | | | | | | | | |
Revenue | | 4,666 | | 4,812 | | 5,178 | | 5,294 | | 5,408 | | 5,507 | | 5,564 | |
Expense | | (4,533 | ) | (4,612 | ) | (5,041 | ) | (5,183 | ) | (5,319 | ) | (5,425 | ) | (5,491 | ) |
| | 133 | | 200 | | 137 | | 111 | | 89 | | 82 | | 73 | |
Accounting adjustments | | 44 | | 24 | | 61 | | 13 | | 19 | | 25 | | 22 | |
Net impact | | 177 | | 224 | | 198 | | 124 | | 108 | | 107 | | 95 | |
| | | | | | | | | | | | | | | |
Universities | | | | | | | | | | | | | | | |
| | | | | | | | | | | | | | | |
Revenue | | 2,158 | | 2,614 | | 2,751 | | 2,908 | | 3,070 | | 3,194 | | 3,263 | |
Expense | | (2,073 | ) | (2,429 | ) | (2,593 | ) | (2,831 | ) | (2,965 | ) | (3,113 | ) | (3,213 | ) |
| | 85 | | 185 | | 158 | | 77 | | 105 | | 81 | | 50 | |
Accounting adjustments | | 38 | | 93 | | 95 | | 206 | | 55 | | 61 | | 68 | |
Net impact | | 123 | | 278 | | 253 | | 283 | | 160 | | 142 | | 118 | |
| | | | | | | | | | | | | | | |
Colleges, university colleges, and institutes | | | | | | | | | | | | | | | |
| | | | | | | | | | | | | | | |
Revenue | | 1,400 | | 1,288 | | 1,378 | | 1,417 | | 1,422 | | 1,462 | | 1,467 | |
Expense | | (1,345 | ) | (1,249 | ) | (1,310 | ) | (1,392 | ) | (1,436 | ) | (1,478 | ) | (1,497 | ) |
| | 55 | | 39 | | 68 | | 25 | | (14 | ) | (16 | ) | (30 | ) |
Accounting adjustments | | 13 | | 40 | | 22 | | 9 | | 5 | | (1 | ) | 2 | |
Net impact | | 68 | | 79 | | 90 | | 34 | | (9 | ) | (17 | ) | (28 | ) |
| | | | | | | | | | | | | | | |
Health authorities and hospital societies | | | | | | | | | | | | | | | |
| | | | | | | | | | | | | | | |
Revenue | | 7,861 | | 8,245 | | 8,857 | | 9,467 | | 9,883 | | 10,413 | | 10,981 | |
Expense | | (7,794 | ) | (8,243 | ) | (8,892 | ) | (9,506 | ) | (9,883 | ) | (10,413 | ) | (10,981 | ) |
| | 67 | | 2 | | (35 | ) | (39 | ) | — | | — | | — | |
Accounting adjustments | | (40 | ) | 16 | | (88 | ) | 47 | | 27 | | 46 | | 46 | |
Net impact | | 27 | | 18 | | (123 | ) | 8 | | 27 | | 46 | | 46 | |
| | | | | | | | | | | | | | | |
Children and family development agencies (2) | | | | | | | | | | | | | | | |
| | | | | | | | | | | | | | | |
Revenue | | 1 | | 439 | | 631 | | 692 | | 725 | | 759 | | 766 | |
Expense | | (1 | ) | (439 | ) | (631 | ) | (692 | ) | (725 | ) | (759 | ) | (766 | ) |
| | — | | — | | — | | — | | — | | — | | — | |
Accounting adjustments | | — | | 4 | | 1 | | (1 | ) | 1 | | 1 | | 1 | |
Net impact | | — | | 4 | | 1 | | (1 | ) | 1 | | 1 | | 1 | |
| | | | | | | | | | | | | | | |
BC Transportation Financing Authority | | | | | | | | | | | | | | | |
| | | | | | | | | | | | | | | |
Revenue | | 1,405 | | 657 | | 618 | | 622 | | 630 | | 629 | | 656 | |
Expense | | (600 | ) | (604 | ) | (585 | ) | (703 | ) | (646 | ) | (727 | ) | (812 | ) |
| | 805 | | 53 | | 33 | | (81 | ) | (16 | ) | (98 | ) | (156 | ) |
Accounting adjustments | | (172 | ) | (168 | ) | (155 | ) | (145 | ) | (137 | ) | (130 | ) | (124 | ) |
Net impact | | 633 | | (115 | ) | (122 | ) | (226 | ) | (153 | ) | (228 | ) | (280 | ) |
| | | | | | | | | | | | | | | |
British Columbia Buildings Corporation | | | | | | | | | | | | | | | |
| | | | | | | | | | | | | | | |
Revenue | | 436 | | 452 | | — | | — | | — | | — | | — | |
Expense | | (385 | ) | (398 | ) | — | | — | | — | | — | | — | |
| | 51 | | 54 | | — | | — | | — | | — | | — | |
Accounting adjustments | | (1 | ) | (7 | ) | (12 | ) | — | | — | | — | | — | |
Net impact | | 50 | | 47 | | (12 | ) | — | | — | | — | | — | |
Budget and Fiscal Plan – 2008/09 to 2010/11
186
Appendices
Table A9 Service Delivery Agency Operating Results (1) – 2004/05 to 2010/11 – Continued |
|
| | | | | | | | Updated | | Budget | | | | | |
| | Actual | | Actual | | Actual | | Forecast | | Estimate | | Plan | | Plan | |
($millions) | | 2004/05 | | 2005/06 | | 2006/07 | | 2007/08 | | 2008/09 | | 2009/10 | | 2010/11 | |
| | | | | | | | | | | | | | | |
British Columbia Housing Management Commission | | | | | | | | | | | | | | | |
| | | | | | | | | | | | | | | |
Revenue | | 284 | | 343 | | 497 | | 506 | | 564 | | 501 | | 500 | |
Expense | | (284 | ) | (343 | ) | (497 | ) | (506 | ) | (564 | ) | (501 | ) | (500 | ) |
| | — | | — | | — | | — | | — | | — | | — | |
Accounting adjustments | | 4 | | 5 | | (15 | ) | (5 | ) | — | | — | | — | |
Net impact | | 4 | | 5 | | (15 | ) | (5 | ) | — | | — | | — | |
| | | | | | | | | | | | | | | |
British Columbia Transit | | | | | | | | | | | | | | | |
| | | | | | | | | | | | | | | |
Revenue | | 146 | | 155 | | 165 | | 185 | | 230 | | 256 | | 286 | |
Expense | | (146 | ) | (155 | ) | (167 | ) | (185 | ) | (230 | ) | (256 | ) | (286 | ) |
| | — | | — | | (2 | ) | — | | — | | — | | — | |
Accounting adjustments | | (3 | ) | 6 | | — | | (1 | ) | (1 | ) | (1 | ) | (1 | ) |
Net impact | | (3 | ) | 6 | | (2 | ) | (1 | ) | (1 | ) | (1 | ) | (1 | ) |
| | | | | | | | | | | | | | | |
Tourism British Columbia | | | | | | | | | | | | | | | |
| | | | | | | | | | | | | | | |
Revenue | | 45 | | 58 | | 60 | | 61 | | 69 | | 71 | | 74 | |
Expense | | (45 | ) | (57 | ) | (59 | ) | (61 | ) | (69 | ) | (71 | ) | (74 | ) |
| | — | | 1 | | 1 | | — | | — | | — | | — | |
Accounting adjustments | | 5 | | (1 | ) | 7 | | — | | — | | — | | — | |
Net impact | | 5 | | — | | 8 | | — | | — | | — | | — | |
| | | | | | | | | | | | | | | |
Vancouver Convention Centre Expansion Project Ltd. | | | | | | | | | | | | | | | |
| | | | | | | | | | | | | | | |
Revenue | | — | | — | | — | | — | | — | | 23 | | 23 | |
Expense | | — | | — | | — | | — | | — | | (22 | ) | (22 | ) |
| | — | | — | | — | | — | | — | | 1 | | 1 | |
Accounting adjustments | | — | | — | | 107 | | 32 | | 277 | | (16 | ) | (16 | ) |
Net impact | | — | | — | | 107 | | 32 | | 277 | | (15 | ) | (15 | ) |
| | | | | | | | | | | | | | | |
Other service delivery agencies | | | | | | | | | | | | | | | |
| | | | | | | | | | | | | | | |
Revenue | | 706 | | 683 | | 722 | | 720 | | 702 | | 734 | | 742 | |
Expense | | (661 | ) | (603 | ) | (649 | ) | (670 | ) | (688 | ) | (730 | ) | (739 | ) |
| | 45 | | 80 | | 73 | | 50 | | 14 | | 4 | | 25 | |
Accounting adjustments | | 45 | | 99 | | 60 | | 118 | | (4 | ) | (2 | ) | (15 | ) |
Net impact | | 90 | | 179 | | 133 | | 168 | | 10 | | 2 | | 10 | |
| | | | | | | | | | | | | | | |
Total net impact | | 1,174 | | 725 | | 516 | | 416 | | 420 | | 37 | | (54 | ) |
| | | | | | | | | | | | | | | |
Total service delivery agency operating results: | | | | | | | | | | | | | | | |
| | | | | | | | | | | | | | | |
Revenue | | 19,108 | | 19,746 | | 20,857 | | 21,872 | | 22,703 | | 23,549 | | 24,322 | |
Accounting adjustments | | (55 | ) | 105 | | 73 | | 266 | | 241 | | (16 | ) | 6 | |
| | 19,053 | | 19,851 | | 20,930 | | 22,138 | | 22,944 | | 23,533 | | 24,328 | |
Expense | | (17,867 | ) | (19,132 | ) | (20,424 | ) | (21,729 | ) | (22,525 | ) | (23,495 | ) | (24,381 | ) |
Accounting adjustments | | (12 | ) | 6 | | 10 | | 7 | | 1 | | (1 | ) | (1 | ) |
| | (17,879 | ) | (19,126 | ) | (20,414 | ) | (21,722 | ) | (22,524 | ) | (23,496 | ) | (24,382 | ) |
Total net impact | | 1,174 | | 725 | | 516 | | 416 | | 420 | | 37 | | (54 | ) |
(1) | Revenue and expense are shown as reported in the entity financial statements and service plans, before consolidation and accounting adjustments. |
(2) | Includes Community Living BC and interim aboriginal authorities. |
Budget and Fiscal Plan – 2008/09 to 2010/11
187
Appendices
Table A10 Material Assumptions – Revenue |
| | | | Updated | | Budget | | | | | | | |
Revenue Source and Assumptions | | Budget | | Forecast | | Estimate | | Plan | | Plan | | | |
($ millions unless otherwise specified) | | 2007/08 | | 2008/09 | | 2009/10 | | 2010/11 | | Sensitivities 2008/09 | |
Personal income tax | | $ | 6,389 | | $ | 6,741 | | $ | 6,700 | | $ | 6,963 | | $ | 7,302 | | | |
Current calendar year assumptions | | | | | | | | | | | | | |
Personal income growth | | 4.2 | % | 5.3 | % | 4.4 | % | 4.2 | % | 4.5 | % | +/- 1% change in 2008 BC | |
Labour income growth | | 4.1 | % | 6.0 | % | 4.7 | % | 4.7 | % | 4.8 | % | personal income growth | |
Tax base growth | | 4.0 | % | 8.0 | % | 5.4 | % | 5.1 | % | 5.5 | % | equals +/- $50 to$100 | |
Average tax yield | | 5.69 | % | 5.70 | % | 5.45 | % | 5.42 | % | 5.34 | % | million | |
Current-year tax | | $ | 6,276 | | $ | 6,609 | | $ | 6,662 | | $ | 6,957 | | $ | 7,239 | | +/- 1% change in 2007 BC | |
BC Tax Reduction | | $ | -111 | | $ | -114 | | $ | -116 | | $ | -118 | | $ | -121 | | personal or taxable income | |
Refundable sales tax credit | | $ | -60 | | $ | -56 | | $ | -56 | | $ | -56 | | $ | -56 | | growth equals +/- $50 to | |
Other tax credits and refunds | | $ | -87 | | $ | -98 | | $ | -99 | | $ | -96 | | $ | -88 | | $100 million one-time | |
Policy neutral elasticity * | | 1.3 | | 1.8 | | 1.4 | | 1.4 | | 1.4 | | effect (prior-year | |
Fiscal year assumptions | | | | | | | | | | | | adjustment) and could | |
Prior-year adjustment | | $ | 0 | | $ | 42 | | | | | | | | result in an additional +/- | |
Family Bonus offset | | $ | -17 | | $ | -17 | | $ | -14 | | $ | -13 | | $ | -12 | | $50 to $100 million base | |
| | | | | | | | | | | | | | | | | change in 2008/09 | |
Previous calendar year assumptions | | 2006 Assumptions | | | | | | | | | |
Personal income growth | | 6.5 | % | 7.4 | % | | | | | | | | |
Labour income growth | | 7.8 | % | 8.5 | % | | | | | | | | |
Tax base growth | | 8.0 | % | 9.4 | % | | | | | | | | |
Average 2006 tax yield | | 5.89 | % | 5.90 | % | | | | | | | | |
2006 tax | | $ | 6,240 | | $ | 6,330 | | | | | | | | | |
2005 and previous years tax | | $ | 325 | | $ | 293 | | | | | | | | | |
BC Tax Reduction | | $ | -109 | | $ | -112 | | | | | | | | | |
Refundable sales tax credit | | $ | -60 | | $ | -55 | | | | | | | | | |
Other tax credits and refunds | | $ | -75 | | $ | -84 | | | | | | | | | |
Policy neutral elasticity * | | 1.8 | | 1.8 | | | | | | | | | |
* Ratio of annual per cent change in current-year revenue to annual per cent change in personal income | |
Corporate income tax | | $ | 1,395 | | $ | 2,221 | | $ | 1,343 | | $ | 1,125 | | $ | 1,193 | | | |
Components of revenue | | | | | | | | | | | | | |
Advance instalments (fiscal year) | | $ | 1,267 | | $ | 1,499 | | $ | 1,382 | | $ | 1,276 | | $ | 1,245 | | | |
International Financial Activity Act refunds | | $ | -25 | | $ | -15 | | $ | -27 | | $ | -27 | | $ | -27 | | | |
Prior-year adjustment | | $ | 153 | | $ | 737 | | $ | -12 | | $ | -124 | | $ | -25 | | | |
Current year assumptions | | | | | | | | | | | | | |
National tax base ($billions) | | $ | 168.2 | | $ | 195.8 | | $ | 205.3 | | $ | 214.8 | | $ | 228.3 | | +/- 1% change in the 2008 | |
BC instalment share of national tax base | | 10.2 | % | 10.2 | % | 10.1 | % | 9.6 | % | 9.4 | % | national tax base equals +/- $15 to $20 million in | |
Effective tax rates (general/small business) | | 12.0 / 4.5 | | 12.0 / 4.5 | | 11.5 / 4.0 | | 11.0 / 3.5 | | 10.5 / 3.0 | | 2008/09 | |
BC tax base growth | | -1.8 | % | -12.6 | % | 0.5 | % | 6.0 | % | 6.0 | % | | |
BC corporate profits growth | | 5.2 | % | 2.1 | % | 0.4 | % | 5.8 | % | 5.9 | % | +/- 1% change in the 2007 | |
BC Tax credits | | | | | | | | | | | | BC tax base equals +/- $15 | |
Film, Television and Production Services | | $ | -130 | | $ | -150 | | $ | -204 | | $ | -214 | | $ | -194 | | to $20 million in 2008/09 | |
Scientific Research and Experimental Development | | $ | -125 | | $ | -150 | | $ | -135 | | $ | -145 | | $ | -155 | | | |
Other | | $ | -38 | | $ | -45 | | $ | -44 | | $ | -44 | | $ | -44 | | | |
Previous calendar year assumptions | | 2006 Assumptions | | | | | | | | | |
National tax base growth | | 5.4 | % | 22.2 | % | | | | | | | | |
BC instalment share of national tax base | | 11.0 | % | 11.6 | % | | | | | | | | |
National corporate profits growth | | 5.3 | % | 5.0 | % | | | | | | | | |
BC tax base growth | | 14.0 | % | 39.6 | % | | | | | | | | |
BC corporate profits growth | | 1.9 | % | 6.7 | % | | | | | | | | |
Gross 2006 tax | | $ | 1,671 | | $ | 2,136 | | | | | | | | | |
2005 and previous years tax | | $ | 0 | | $ | 180 | | | | | | | | | |
BC Tax credits | | | | | | | | | | | | | |
Film, Television and Production Services | | $ | -120 | | $ | -136 | | | | | | | | | |
Scientific Research and Experimental Development | | $ | -115 | | $ | -115 | | | | | | | | | |
Other | | $ | -14 | | $ | -49 | | | | | | | | | |
Revenue is recorded on a cash basis. Due to lags in the federal collection and instalment systems, changes to the BC corporate profits and tax base forecasts affect revenue in the succeeding year. For example, 2007/08 instalments from the federal government are based on BC’s share of the national tax base for the 2005 tax year (assessed as of December 31, 2006) and a forecast of the 2007 national tax base. The 2008/09 payments are based on the average of BC’s share of the 2004 and 2005 national tax bases as the 2006 share is unusually high reflecting partial refunds of duty deposits paid by forest sector firms over the May 2002 to October 2006 period. Cash adjustments for any under/over payments from the federal government in respect of 2008 will be received/paid on March 31, 2009.
Budget and Fiscal Plan – 2008/09 to 2010/11
188
Appendices
Table A10 Material Assumptions – Revenue – Continued |
| | | | Updated | | Budget | | | | | | | |
Revenue Source and Assumptions | | Budget | | Forecast | | Estimate | | Plan | | Plan | | | |
($ millions unless otherwise specified) | | 2007/08 | | 2008/09 | | 2009/10 | | 2010/11 | | Sensitivities 2008/09 | |
Carbon tax | | $ | 0 | | $ | 0 | | $ | 338 | | $ | 631 | | $ | 880 | | | |
Tax rates (July 1) | | | | | | | | | | | | | |
Carbon dioxide equivalent emissions ($/tonne) | | $ | 0 | | $ | 0 | | $ | 10 | | $ | 15 | | $ | 20 | | | |
Gasoline (cents/litre) | | 0¢ | | 0¢ | | 2.41¢ | | 3.62¢ | | 4.82¢ | | | |
Diesel & heating fuel oil (cents/litre) | | 0¢ | | 0¢ | | 2.76¢ | | 4.14¢ | | 5.52¢ | | | |
Natural gas (cents/gigajoule) | | 0¢ | | 0¢ | | 49.88¢ | | 74.82¢ | | 99.76¢ | | | |
Social service tax | | $ | 4,890 | | $ | 5,091 | | $ | 5,284 | | $ | 5,563 | | $ | 5,857 | | | |
Calendar Year | | | | | | | | | | | | | |
Consumer expenditure | | 5.2 | % | 6.2 | % | 5.0 | % | 5.2 | % | 5.2 | % | +/- 1% change in 2008 | |
| | | | | | | | | | | | growth equals up to +/- $25 million | |
Business investment | | 8.4 | % | 9.3 | % | 5.4 | % | 6.9 | % | 6.6 | % | +/- 1% change in 2008 | |
| | | | | | | | | | | | growth equals up to +/- $10 million | |
Other expenditure | | 4.6 | % | 2.7 | % | -0.7 | % | 6.7 | % | 5.4 | % | +/- 1% change in 2008 | |
| | | | | | | | | | | | growth equals up to +/- $10 million | |
Social service tax base growth (fiscalyear) | | 5.4 | % | 8.0 | % | 4.4 | % | 5.4 | % | 5.2 | % | | |
| | | | | | | | | | | | | |
Components of revenue | | | | | | | | | | | | | |
Consolidated Revenue Fund | | $ | 4,821 | | $ | 5,021 | | $ | 5,212 | | $ | 5,487 | | $ | 5,781 | | | |
BC Transportation Financing Authority | | $ | 12 | | $ | 12 | | $ | 14 | | $ | 14 | | $ | 14 | | | |
Recovery to vote (MSBR) | | $ | 57 | | $ | 58 | | $ | 58 | | $ | 62 | | $ | 62 | | | |
Fuel tax | | $ | 919 | | $ | 938 | | $ | 957 | | $ | 975 | | $ | 996 | | | |
Calendar Year | | | | | | | | | | | | | |
Real GDP | | 3.1 | % | 3.0 | % | 2.4 | % | 2.8 | % | 2.9 | % | +/- 1% change in | |
Gasoline and diesel volume | | 2.0 | % | 2.0 | % | 2.0 | % | 2.0 | % | 2.0 | % | gasoline and diesel | |
| | | | | | | | | | | | volume growth equals up to +/- $10 million | |
Components of revenue | | | | | | | | | | | | | |
Consolidated Revenue Fund | | $ | 492 | | $ | 500 | | $ | 506 | | $ | 516 | | $ | 528 | | | |
BC Transit | | $ | 8 | | $ | 8 | | $ | 12 | | $ | 12 | | $ | 12 | | | |
BC Transportation Financing Authority | | $ | 419 | | $ | 430 | | $ | 439 | | $ | 447 | | $ | 456 | | | |
Property tax | | $ | 1,863 | | $ | 1,788 | | $ | 1,861 | | $ | 1,943 | | $ | 2,040 | | | |
Calendar Year | | | | | | | | | | | | | |
BC Consumer Price Index | | 2.0 | % | 1.8 | % | 1.8 | % | 2.1 | % | 2.1 | % | +/- 1% change in new | |
Housing starts | | 33,590 | | 39,195 | | 34,597 | | 32,524 | | 30,762 | | construction and | |
Home owner grants (fiscal year) | | $ | -667 | | $ | -663 | | $ | -683 | | $ | -704 | | $ | -725 | | inflation equals up to | |
| | | | | | | | | | | | +/- $5 million in residential property taxation revenue | |
Components of revenue | | | | | | | | | | | | | |
Residential (net of home owner grants) | | $ | 659 | | $ | 602 | | $ | 635 | | $ | 671 | | $ | 706 | | | |
Non-residential | | $ | 992 | | $ | 981 | | $ | 1,012 | | $ | 1,041 | | $ | 1,083 | | +/- 1% change in non- | |
Rural area | | $ | 86 | | $ | 88 | | $ | 91 | | $ | 95 | | $ | 99 | | residential assessed | |
Police | | $ | 25 | | $ | 19 | | $ | 19 | | $ | 19 | | $ | 19 | | values equals up to | |
BC Assessment Authority | | $ | 66 | | $ | 65 | | $ | 69 | | $ | 73 | | $ | 76 | | +/- $5 million | |
BC Transit | | $ | 37 | | $ | 36 | | $ | 37 | | $ | 46 | | $ | 59 | | | |
Commissions | | $ | (2 | ) | $ | (3 | ) | $ | (2 | ) | $ | (2 | ) | $ | (2 | ) | | |
Budget and Fiscal Plan – 2008/09 to 2010/11
189
Appendices
Table A10 Material Assumptions – Revenue – Continued |
| | | | Updated | | Budget | | | | | | | |
Revenue Source and Assumptions | | Budget | | Forecast | | Estimate | | Plan | | Plan | | | |
($ millions unless otherwise specified) | | 2007/08 | | 2008/09 | | 2009/10 | | 2010/11 | | Sensitivities 2008/09 | |
Other taxes | | $ | 2,215 | | $ | 2,390 | | $ | 2,326 | | $ | 2,310 | | $ | 2,243 | | | |
Calendar Year | | | | | | | | | | | | | |
Population | | 1.1 | % | 1.4 | % | 1.4 | % | 1.3 | % | 1.3 | % | | |
BC Consumer Price Index | | 2.0 | % | 1.8 | % | 1.8 | % | 2.1 | % | 2.1 | % | | |
Housing starts | | -7.8 | % | 7.6 | % | -11.7 | % | -6.0 | % | -5.4 | % | | |
Nominal GDP | | 5.0 | % | 5.6 | % | 4.2 | % | 5.3 | % | 5.0 | % | | |
Real GDP | | 3.1 | % | 3.0 | % | 2.4 | % | 2.8 | % | 2.9 | % | | |
| | | | | | | | | | | | | |
Components of revenue | | | | | | | | | | | | | |
Property transfer | | $ | 904 | | $ | 1,075 | | $ | 1,020 | | $ | 1,020 | | $ | 970 | | | |
Tobacco | | $ | 705 | | $ | 705 | | $ | 705 | | $ | 705 | | $ | 705 | | | |
Corporation capital | | $ | 110 | | $ | 95 | | $ | 69 | | $ | 36 | | $ | 0 | | | |
Insurance premium | | $ | 348 | | $ | 362 | | $ | 372 | | $ | 381 | | $ | 391 | | | |
Hotel room | | | | | | | | | | | | | |
Consolidated Revenue Fund | | $ | 116 | | $ | 120 | | $ | 97 | | $ | 102 | | $ | 107 | | | |
Tourism British Columbia | | $ | 32 | | $ | 33 | | $ | 63 | | $ | 66 | | $ | 70 | | | |
Petroleum, natural gas, minerals and Columbia River Treaty export electricity sales | | $ | 2,886 | | $ | 2,356 | | $ | 2,376 | | $ | 2,575 | | $ | 2,629 | | | |
Natural gas price | | | | | | | | | | | | +/- $1.00 change in | |
($Cdn/gigajoule at plant inlet) | | $ | 6.50 | | $ | 5.39 | | $ | 5.65 | | $ | 6.14 | | $ | 6.31 | | the natural gas price | |
Natural gas volumes (petajoules) | | 1,116 | | 1,068 | | 1,069 | | 1,072 | | 1,073 | | equals +/- $275 to | |
Annual per cent change | | 1.9 | % | -1.2 | % | 0.1 | % | 0.3 | % | 0.1 | % | $325 million | |
Oil price ($US/bbl at Cushing, Ok) | | $ | 62.41 | | $ | 78.40 | | $ | 84.02 | | $ | 85.38 | | $ | 82.81 | | +/- 1% change in natural gas volumes equals +/- $10 to $20 million | |
| | | | | | | | | | | | | | | | | | |
Auctioned land base (000 hectares) | | 411 | | 556 | | 642 | | 623 | | 603 | | +/- 1 cent change in | |
Average bid price/hectare ($) | | $ | 1,000 | | $ | 1,798 | | $ | 710 | | $ | 614 | | $ | 614 | | exchange rate equals | |
Metallurgical coal price | | | | | | | | | | | | +/- $15 to $25 milion | |
($US/tonne,fob west coast) | | $ | 90 | | $ | 92 | | $ | 105 | | $ | 110 | | $ | 95 | | on natural gas royalties | |
Copper price ($US/lb) | | $ | 2.55 | | $ | 3.31 | | $ | 3.19 | | $ | 2.63 | | $ | 2.44 | | | |
| | | | | | | | | | | | | | | | | | |
Columbia River Treaty sales | | | | | | | | | | | | | |
Annual quantity set by treaty (million mega-watt hours) | | 4.1 | | 4.1 | | 4.0 | | 4.5 | | 4.6 | | +/- 10% change in the average Mid- | |
Mid-Columbia electricity price | | $ | 65 | | $ | 59 | | $ | 65 | | $ | 68 | | $ | 68 | | Columbia electricity | |
($US/mega-watt hour) | | | | | | | | | | | | price equals +/- $25 to | |
| | | | | | | | | | | | $30 million | |
| | | | | | | | | | | | | |
Components of revenue | | | | | | | | | | | | | |
Natural gas royalties | | $ | 1,699 | | $ | 1,170 | | $ | 1,165 | | $ | 1,252 | | $ | 1,357 | | | |
Bonus bids, permits and fees | | $ | 500 | | $ | 579 | | $ | 582 | | $ | 591 | | $ | 602 | | | |
Petroleum royalties | | $ | 112 | | $ | 113 | | $ | 113 | | $ | 113 | | $ | 106 | | | |
Columbia River Treaty electricity sales | | $ | 285 | | $ | 230 | | $ | 245 | | $ | 305 | | $ | 310 | | | |
Coal | | $ | 98 | | $ | 79 | | $ | 112 | | $ | 153 | | $ | 109 | | | |
Minerals, metals and other | | $ | 161 | | $ | 158 | | $ | 130 | | $ | 132 | | $ | 115 | | | |
Oil and Gas Commission fees and levies | | $ | 31 | | $ | 27 | | $ | 29 | | $ | 29 | | $ | 30 | | | |
| | | | | | | | | | | | | | | | | | |
Royalty Programs and Infrastructure credits | | | | | | | | | | | | | |
Summer drilling | | $ | -40 | | $ | -46 | | $ | -48 | | $ | -49 | | $ | -51 | | | |
Deep drilling | | $ | -56 | | $ | -60 | | $ | -63 | | $ | -66 | | $ | -68 | | | |
Marginal, Low Production and Ultramarginal | | $ | -113 | | $ | -128 | | $ | -138 | | $ | -148 | | $ | -156 | | | |
Road and Pipeline infrastructure | | $ | -54 | | $ | -44 | | $ | -78 | | $ | -95 | | $ | -30 | | | |
Total credits | | $ | -263 | | $ | -278 | | $ | -327 | | $ | -358 | | $ | -305 | | | |
| | | | | | | | | | | | | | | | | | |
Implicit natural gas royalty rate | | 23.4 | % | 20.3 | % | 19.3 | % | 19.0 | % | 20.0 | % | | |
Royalty program (marginal, low production and ultra marginal drilling) adjustments reflect reduced royalty rates
Budget and Fiscal Plan – 2008/09 to 2010/11
190
Appendices
Table A10 Material Assumptions – Revenue – Continued |
| | | | Updated | | Budget | | | | | | | |
Revenue Source and Assumptions | | Budget | | Forecast | | Estimate | | Plan | | Plan | | | |
($ millions unless otherwise specified) | | 2007/08 | | 2008/09 | | 2009/10 | | 2010/11 | | Sensitivities 2008/09 | |
Forests | | $ | 1,395 | | $ | 1,098 | | $ | 952 | | $ | 1,048 | | $ | 1,131 | | | |
Prices (calendar year average) | | | | | | | | | | | | +/- US$50 change in SPF price equals +/- $75 to $125 million +/- US$100 change in hemlock price equals +/- $15 to $30 million +/- US$50 change in price equals +/-$5 to $10 million +/- Cdn$10 change in average log price equals +/-$55 to $85 million +/- 1 cent change in exchange rate equals +/- $10 to $15 million on stumpagerevenue | |
SPF 2x4 ($US/1000 bd ft) | | $ | 269 | | $ | 249 | | $ | 213 | | $ | 275 | | $ | 300 | |
Random Lengths Composite | | | | | | | | | | | |
($US/thousand board feet) | | $ | 304 | | $ | 283 | | $ | 248 | | $ | 310 | | $ | 335 | |
Hemlock price ($US/1000 bd ft) | | $ | 600 | | $ | 609 | | $ | 600 | | $ | 600 | | $ | 600 | |
Pulp ($US/tonne) | | $ | 713 | | $ | 794 | | $ | 844 | | $ | 825 | | $ | 825 | |
Coastal log ($Cdn/cubic metre)
(Vancouver Log Market, fiscal year) | | $ | 86 | | $ | 104 | | $ | 96 | | $ | 99 | | $ | 105 | |
| | | | | | | | | | | |
Fiscal Year Trade Assumptions | | | | | | | | | | | |
Export tax rate (effective rate) | | 12.7 | % | 15.0 | % | 15.0 | % | 6.3 | % | 5.0 | % |
SPF 2x4 ($US/1000 bd ft) | | $ | 275 | | $ | 236 | | $ | 225 | | $ | 288 | | $ | 300 | |
Random Lengths Composite price | | | | | | | | | | | |
($US/thousand board feet) | | $ | 310 | | $ | 270 | | $ | 260 | | $ | 323 | | $ | 335 | | | |
Lumber shipments and consumption (billion board feet) | | | | | | | | | | | | | |
U.S. lumber consumption | | 55.0 | | 51.0 | | 40.6 | | 44.9 | | 49.2 | | | |
BC surge trigger volumes | | 11.7 | | 10.8 | | 8.6 | | 9.5 | | 10.4 | | | |
BC lumber exports to U.S | | 9.8 | | 10.1 | | 8.0 | | 9.5 | | 10.4 | | | |
| | | | | | | | | | | | | |
Crown harvest volumes (million cubic metres) | | | | | | | | | | | | +/- 10% change in Interior harvest volumes equals +/- $50 to $75 million +/- 10 change in Coastal harvest volumes equals +/- $10 to $15 million | |
Interior | | 52.0 | | 49.5 | | 49.0 | | 52.0 | | 54.5 | |
Coast | | 14.0 | | 11.5 | | 10.0 | | 11.0 | | 11.5 | |
Total | | 66.0 | | 61.0 | | 59.0 | | 63.0 | | 66.0 | |
BC Timber Sales (included in above) | | 14.3 | | 12.0 | | 11.5 | | 12.0 | | 12.5 | |
| | | | | | | | | | | | | |
Components of revenue | | | | | | | | | | | | The above sensitivities relate to stumpage revenue only. Depending on market conditions, changes in stumpage revenues may be offset by changes in border tax revenues. | |
Tenures | | $ | 659 | | $ | 449 | | $ | 434 | | $ | 598 | | $ | 663 | | |
BC Timber Sales | | $ | 318 | | $ | 265 | | $ | 240 | | $ | 248 | | $ | 256 | | |
Softwood Lumber Agreement 2006 | | | | | | | | | | | | |
border tax | | $ | 376 | | $ | 339 | | $ | 253 | | $ | 162 | | $ | 150 | | |
Logging tax | | $ | 20 | | $ | 25 | | $ | 5 | | $ | 20 | | $ | 40 | | |
Other | | $ | 22 | | $ | 20 | | $ | 20 | | $ | 20 | | $ | 22 | | |
Water and other resources | | $ | 347 | | $ | 340 | | $ | 395 | | $ | 406 | | $ | 402 | | | |
Components of revenue | | | | | | | | | | | | | |
Water rental and licences | | $ | 304 | | $ | 310 | | $ | 327 | | $ | 340 | | $ | 337 | | | |
BC Hydro remission (Water Use Plans) | | $ | 24 | | $ | 12 | | $ | 50 | | $ | 48 | | $ | 47 | | | |
Angling & hunting permits and licences | | $ | 19 | | $ | 18 | | $ | 18 | | $ | 18 | | $ | 18 | | | |
Forecast includes BC Hydro rate increases effective January 2008 only.
Budget and Fiscal Plan – 2008/09 to 2010/11
191
Appendices
Table A10 Material Assumptions – Revenue – Continued |
| | | | Updated | | Budget | | | | | | | |
Revenue Source and Assumptions | | Budget | | Forecast | | Estimate | | Plan | | Plan | | | |
($ millions unless otherwise specified) | | 2007/08 | | 2008/09 | | 2009/10 | | 2010/11 | | Sensitivities 2008/09 | |
Health and social transfers | | $ | 4,644 | | $ | 4,759 | | $ | 4,794 | | $ | 5,001 | | $ | 5,260 | | | |
National Cash Transfers | | | | | | | | | | | | | |
Canada Health Transfer (CHT) excluding Trusts, September 2004 First Ministers’ Meeting (FMM) and prior-year adjustments | | $ | 13,750 | | $ | 13,750 | | $ | 14,100 | | $ | 14,400 | | $ | 14,650 | | +/- 0.1 change in BC’s population share equals +/- $45 to $50 million | |
FMM | | $ | 7,598 | | $ | 7,598 | | $ | 8,529 | | $ | 9,587 | | $ | 10,776 | | | |
Canada Social Transfer (CST) | | $ | 8,450 | | $ | 9,487 | | $ | 10,537 | | $ | 10,853 | | $ | 11,178 | | | |
BC share of national population (June 1) | | 13.24 | % | 13.28 | % | 13.35 | % | 13.42 | % | 13.48 | % | | |
BC health and social transfers revenue | | | | | | | | | | | | | |
CHT | | $ | 2,045 | | $ | 2,048 | | $ | 2,104 | | $ | 2,158 | | $ | 2,214 | | | |
FMM | | $ | 1,006 | | $ | 1,009 | | $ | 1,139 | | $ | 1,286 | | $ | 1,453 | | | |
Wait Times | | $ | 0 | | $ | 0 | | $ | 0 | | $ | 34 | | $ | 34 | | | |
FMM Deferral (Base and Wait Times) | | $ | 267 | | $ | 268 | | $ | 79 | | $ | 0 | | $ | 0 | | | |
2003 Medical Equipment ($200 million) | | $ | 19 | | $ | 16 | | $ | 16 | | $ | 16 | | $ | 15 | | | |
FMM Capital Equipment Funding | | $ | 4 | | $ | 4 | | $ | 7 | | $ | 7 | | $ | 7 | | | |
Human Papillomavirus Immunization Trust | | $ | 0 | | $ | 0 | | $ | 14 | | $ | 13 | | $ | 13 | | | |
Patient Wait Times Guarantee Trust | | $ | 0 | | $ | 0 | | $ | 28 | | $ | 31 | | $ | 17 | | | |
CST | | $ | 1,303 | | $ | 1,311 | | $ | 1,407 | | $ | 1,456 | | $ | 1,507 | | | |
Child care spaces funding (one time) | | $ | 0 | | $ | 33 | | $ | 0 | | $ | 0 | | $ | 0 | | | |
Prior-year adjustments | | $ | 0 | | $ | 70 | | $ | 0 | | $ | 0 | | $ | 0 | | | |
Other federal contributions | | $ | 899 | | $ | 1,307 | | $ | 1,015 | | $ | 1,040 | | $ | 1,010 | | | |
Components of revenue | | | | | | | | | | | | | |
Consolidated revenue fund | | $ | 142 | | $ | 166 | | $ | 154 | | $ | 172 | | $ | 162 | | | |
ecoTrust | | $ | 0 | | $ | 199 | | $ | 0 | | $ | 0 | | $ | 0 | | | |
Recovery to vote (All ministries) | | $ | 228 | | $ | 388 | | $ | 298 | | $ | 289 | | $ | 259 | | | |
Crown corporations | | $ | 143 | | $ | 149 | | $ | 153 | | $ | 161 | | $ | 162 | | | |
Other service delivery agencies | | $ | 386 | | $ | 405 | | $ | 410 | | $ | 418 | | $ | 427 | | | |
Service delivery agency direct revenue | | $ | 4,430 | | $ | 4,773 | | $ | 4,818 | | $ | 4,994 | | $ | 5,135 | | | |
School districts | | $ | 475 | | $ | 525 | | $ | 518 | | $ | 520 | | $ | 517 | | | |
Universities | | $ | 1,661 | | $ | 1,767 | | $ | 1,851 | | $ | 1,914 | | $ | 1,981 | | | |
Colleges, university colleges | | | | | | | | | | | | | |
and institutes | | $ | 550 | | $ | 567 | | $ | 554 | | $ | 569 | | $ | 578 | | | |
Health authorities and hospital societies | | $ | 599 | | $ | 683 | | $ | 646 | | $ | 675 | | $ | 701 | | | |
Children and family development agencies | | $ | 2 | | $ | 2 | | $ | 2 | | $ | 2 | | $ | 2 | | | |
BC Transportation Financing Authority | | $ | 463 | | $ | 477 | | $ | 490 | | $ | 500 | | $ | 511 | | | |
Other service delivery agencies | | $ | 680 | | $ | 752 | | $ | 757 | | $ | 814 | | $ | 845 | | | |
Commercial Crown corporation net income | | $ | 2,503 | | $ | 2,875 | | $ | 2,680 | | $ | 2,687 | | $ | 2,737 | | | |
BC Hydro | | $ | 365 | | $ | 370 | | $ | 358 | | $ | 402 | | $ | 444 | | | |
reservoir water inflows | | 100 | % | 109 | % | 100 | % | 100 | % | 100 | % | +/-1% in hydro generation = +/-$30 million | |
mean gas price | | 7.44 | | 6.48 | | 7.55 | | 7.84 | | 7.79 | | +/-10% = -/+$20 million | |
(Sumas, $US/MMbtu - BC Hydro forecast based on NYMEX forward selling prices) | | | | | |
electricity prices
(Mid-C, $US/MWh) | | 60.00 | | 52.10 | | 59.72 | | 62.18 | | 62.04 | | +/-$1 MWh in electricity trade margins = +/-$40 million | |
assumed rate increases: | | | | | | | | | | | | | |
- base rate | | 0.10 | % | 0.10 | % | 6.56 | % | 8.21 | % | 6.52 | % | | |
- rate rider | | 2.00 | % | 2.00 | % | 0.50 | % | 0.50 | % | 0.50 | % | | |
(Assumed rate increases reflect the notional annual increases that would be required for BC Hydro to earn its allowed return on equity as mandated by the BCUC. These increases are included for planning purposes only. Actual rate increases in these years will be determined by future applications to the BCUC.) | |
ICBC | | $ | 225 | | $ | 594 | | $ | 272 | | $ | 231 | | $ | 195 | | | |
vehicle growth | | +2.5 | % | +3.3 | % | +2.6 | % | +2.5 | % | +2.0 | % | +/-1% = +/-$36 million | |
claims cost trend | | +6.3 | % | +4.1 | % | +4.6 | % | +4.5 | % | +4.7 | % | +/-1% = -/+$28 million | |
investment return | | 5.5 | % | 7.5 | % | 4.8 | % | 5.3 | % | 5.6 | % | +/-1% return = +/-$85 to $91 million | |
loss ratio | | 88.9 | % | 83.7 | % | 87.0 | % | 89.0 | % | 90.9 | % | | |
Budget and Fiscal Plan – 2008/09 to 2010/11
192
Appendices
Table A11 Natural Gas Price Forecasts: 2008/09 — 2010/11 |
| | Adjusted to fiscal years and | |
Private sector forecasts (calendar year) | | $C/gigajoule at plant inlet | |
| | 2008 | | 2009 | | 2010 | | 2008/09 | | 2009/10 | | 2010/11 | |
GLJ Henry Hub US$/MMBtu (Jan 08) | | 7.50 | | 8.25 | | 8.25 | | 5.79 | | 6.40 | | 6.53 | |
Sproule Henry Hub US$/MMBtu (Dec 07) | | 7.56 | | 8.27 | | 8.74 | | 5.60 | | 6.55 | | 7.03 | |
McDaniel Henry Hub US$/MMBtu (Jan 08) | | 7.75 | | 8.40 | | 8.40 | | 5.77 | | 6.55 | | 6.68 | |
AJM Henry Hub US$/Mcf (Dec 07) | | 7.80 | | 8.40 | | 8.60 | | 5.53 | | 6.31 | | 6.62 | |
GLJ Alberta AECO-C Spot CDN$/MMBtu (Jan 08) | | 6.75 | | 7.55 | | 7.60 | | 6.12 | | 6.47 | | 6.50 | |
Sproule Alberta AECO-C Spot CDN$/MMBtu (Dec 07) | | 6.51 | | 7.22 | | 7.69 | | 5.66 | | 6.27 | | 6.59 | |
McDaniel AECO-C Spot C$/GJ (Jan 08) | | 6.45 | | 7.00 | | 7.00 | | 5.90 | | 6.30 | | 6.30 | |
AJM AECO-C Spot C$/Mcf (Dec 07) | | 6.90 | | 7.75 | | 8.10 | | 5.83 | | 6.47 | | 6.81 | |
GLJ Sumas Spot US$/MMBtu (Jan 08) | | 6.90 | | 7.70 | | 7.70 | | 5.89 | | 6.53 | | 6.65 | |
Sproule Sumas Spot CDN$/MMBtu (Dec 07) | | 6.51 | | 7.22 | | 7.69 | | 5.22 | | 5.83 | | 6.15 | |
GLJ BC Spot Plant Gate CDN$/MMBtu (Jan 08) | | 6.35 | | 7.15 | | 7.20 | | 5.79 | | 6.15 | | 6.18 | |
Sproule BC Plant Inlet CDN$/MMBtu (Dec 07) | | 5.46 | | 6.17 | | 6.64 | | 5.37 | | 5.97 | | 6.30 | |
McDaniel BC Spot Plant Gate C$MMBtu (Jan 08) | | 6.60 | | 7.20 | | 7.20 | | 5.77 | | 6.18 | | 6.18 | |
AJM BC Spot Plant Gate C$/Mcf (Dec 07) | | 6.60 | | 7.45 | | 7.80 | | 5.61 | | 6.26 | | 6.59 | |
GLJ Midwest Chicago US$/MMBtu (Jan 08) | | 7.40 | | 8.20 | | 8.25 | | 5.92 | | 6.58 | | 6.77 | |
Sproule Alliance Plant Gate CDN$/MMBtu (Dec 07) | | 6.21 | | 6.95 | | 7.44 | | 5.38 | | 6.02 | | 6.36 | |
EIA US$/MMBtu Henry Hub (Dec 07) | | 7.55 | | | | | | | | | | | |
TD Economics Henry Hub FuturesUS$/MMBtu (Nov 07) | | 7.79 | | 7.88 | | | | 6.08 | | | | | |
Scotiabank Group Henry Hub US$/MMBtu (Dec 07) | | 6.95 | | | | | | | | | | | |
BMO Alberta Empress US$/MMBtu (Dec 07) | | 6.15 | | 7.55 | | | | 5.41 | | | | | |
Exports Development Canada Henry Hub US$/MMBtu (Fall 07) | | 7.50 | | | | | | | | | | | |
Tristone Capital Henry Hub US$/MMBtu (Dec 07) | | 7.50 | | 7.50 | | | | 5.35 | | | | | |
Petro-Canada AECO-C Spot CDN$/Mcf (Oct 07) | | 7.50 | | | | | | | | | | | |
NYMEX Forward Market converted to Plant Inlet CDN$/GJ (Jan 08) | | | | | | | | 6.13 | | 6.61 | | 6.65 | |
Average all minus high/low | | | | | | | | 5.68 | | 6.32 | | 6.50 | |
Average one forecast per consultant minus high/low | | | | | | | | 5.63 | | 6.14 | | 6.31 | |
Natural gas royalty price forecast | | | | | | | | 5.65 | | 6.14 | | 6.31 | |
GLJ: Gilbert Laustsen Jung Petroleum Consultants Ltd | | | | | |
AJM: Ashton Jenkins Mann Petroleum Consultants | | | | | |
US EIA: US Energy Information Administration | | | | | |
McDaniel: McDaniel & Associates Consultants Ltd | | | | | |
AECO: Alberta Energy Company | | | | | |
Budget and Fiscal Plan – 2008/09 to 2010/11
193
Appendices
Table A12 Material Assumptions – Expense |
| | | | Updated | | Budget | | | | | | | |
Ministry Programs and Assumptions | | Budget (1) | | Forecast | | Estimate | | Plan | | Plan | | | |
($ millions unless otherwise specified) | | 2007/08 | | 2008/09 | | 2009/10 | | 2010/11 | | Sensitivities 2008/09 | |
Advanced Education | | 2,165 | | 2,165 | | 2,252 | | 2,359 | | 2,377 | | The number of student spaces may the vary depending on the financial and other policies of post secondary institutions. | |
| | | | | | | | | | | |
Student spaces in public institutions (2) | | | | | | | | | | | |
(# of FTEs) | | 190,442 | | 186,700 | | 200,642 | | 206,668 | | 207,325 | |
| | | | | | | | | | | |
Attorney General | | 527 | | 527 | | 555 | | 564 | | 565 | | The number of recommended criminal cases brought forward by the various police departments, resulting in charges being laid by the Crown, the number of civil litigation cases, the number of traffic fines disputed and the number of family cases. | |
| | | | | | | | | | | |
New cases filed/processed | | 295,000 | | 295,000 | | 295,000 | | 295,000 | | 295,000 | |
(# for all courts) | | | | | | | | | | | |
| | | | | | | | | | | |
| | | | | | | | | | | |
| | | | | | | | | | | |
| | | | | | | | | | | |
| | | | | | | | | | | |
Crown Proceeding Act (CPA) | | 28 | | 14 | | 25 | | 25 | | 25 | | The number and size of litigation brought against the province, as well as the effectiveness of mitigation strategies and legal defence. | |
| | | | | | | | | | | |
| | | | | | | | | | | |
| | | | | | | | | | | |
Children and Family Development | | 1,858 | | 1,858 | | 1,987 | | 2,043 | | 2,064 | | A 1% increase in the cost per case or a 1% increase in the average caseload will affect expenditures by approximately $2.7 million. | |
| | | | | | | | | | | |
Average children-in-care caseload (#) | | 9,150 | | 9,200 | | 9,100 | | 9,000 | | 9,000 | |
| | | | | | | | | | | |
Average annual residential cost per child in care ($) | | 28,700 | | 29,000 | | 29,200 | | 29,800 | | 29,800 | | |
Adult Community Living (3): | | | | | | | | | | | | | |
Residential Services: | | | | | | | | | | | | The adult community living caseload is sensitive to the pressures of an aging population. A 1% increase in the adult caseload will increase expenditures by approximately $2.6 million. | |
Average caseload (#) | | 5,249 | | 5,255 | | 5,469 | | 5,692 | | 5,806 | |
Average cost per client ($) | | 66,100 | | 67,100 | | 68,200 | | 69,200 | | 68,500 | |
Day Programs: | | | | | | | | | | | |
Average caseload (#) | | 10,496 | | 10,634 | | 11,113 | | 11,599 | | 11,840 | |
Average cost per client ($) | | 18,100 | | 18,900 | | 19,200 | | 19,400 | | 19,200 | |
| | | | | | | | | | | |
Education | | 5,494 | | 5,494 | | 5,675 | | 5,778 | | 5,822 | | | |
Student Enrolment (4) (# of FTEs) | | 549,304 | | 556,889 | | 555,833 | | 551,727 | | 547,973 | | | |
Employment and Income Assistance | | 1,494 | | 1,494 | | 1,527 | | 1,566 | | 1,571 | | | |
Temporary Assistance annual average caseload (#) | | 41,870 | | 42,560 | | 41,840 | | 41,530 | | 41,390 | | The expected to work caseload is sensitive to fluctuations in economic and employment trends in the service sector. A 1% change in the Temporary Assistance annual average caseload or average cost per case will affect expenditures by approximately $3 million annually. | |
| | | | | | | | | | | |
| | | | | | | | | | | |
| | | | | | | | | | | |
| | | | | | | | | | | |
| | | | | | | | | | | |
| | | | | | | | | | | |
| | | | | | | | | | | |
| | | | | | | | | | | |
(1) The 2007/08 budget estimate and updated forecast have been restated to reflect government’s current organization and accounting policies.
(2) Beginning in 2008/09 the student space forecasts include apprentice training FTEs delivered by the Industry Training Authority.
(3) The 2007/08 assumptions for Adult Community Living have been restated to reflect a change in the reporting system for residential versus non-residential services.
(4) The FTE formula has been updated in 2007/08 to more appropriately reflect distributed learning students.
Budget and Fiscal Plan – 2008/09 to 2010/11
194
Appendices
Table A12 Material Assumptions – Expense – Continued
Ministry Programs and Assumptions | | Budget (1) | | Updated
Forecast | | Budget
Estimate | | Plan | | Plan | | | |
($ millions unless otherwise specified) | | 2007/08 | | | | 2008/09 | | 2009/10 | | 2010/11 | | Sensitivities 2008/09 | |
Employment and Income Assistance – continued Disability Assistance
annual average caseload (#) | | 64,000 | | 64,260 | | 67,190 | | 69,830 | | 72,470 | | The caseload for persons with disabilities is sensitive to the aging of the population and longer life expectancy for individuals with disabilities and significant health issues. A 1% change in the Disability Assistance annual average caseload or average cost per case will affect expenditures by approximately $7 million annually. | |
Total annual average caseload (#) | | 105,870 | | 106,820 | | 109,030 | | 111,360 | | 113,860 | | The average cost per case is sensitive to the composition of the caseload, and reported income. A 1% change in the annual caseload or average cost per case will affect expenditures by approximately $10 million annually. | |
Forests and Range | | 1,089 | | 1,191 | | 1,211 | | 1,119 | | 1,128 | | | |
Direct Fire Fighting | | 56 | | 117 | | 56 | | 56 | | 56 | | Over the past 10 years, fire fighting costs have ranged from a low of $19 million in 1997 to a high of $372 million in 2003. | |
BC Timber Sales | | 184 | | 229 | | 219 | | 186 | | 194 | | Targets can be impacted by changes to actual inventory costs incurred. There is a lag of approximately 2 years between when inventory costs are incurred and when they are expensed. Volume harvested can also impact targets. For example, if volume harvested is less than projected in any year then capitalized expenses will also be reduced in that year. | |
Health | | 12,960 | | 12,960 | | 13,765 | | 14,583 | | 15,438 | | | |
Pharmacare | | 1,018 | | 1,018 | | 1,055 | | 1,105 | | 1,098 | | A 1% change in utilization or drug prices affects costs by approximately $10 million. | |
Demand/cost growth
(per cent change) | | 7.3 | % | 7.3 | % | 3.7 | % | 3.7 | % | 3.7 | % | | |
Medical Services Plan (MSP) | | 3,053 | | 3,053 | | 3,190 | | 3,395 | | 3,504 | | A 1% increase in volume of services provided by fee-for- service physicians affects costs by approximately $20 million. | |
Regional Health Sector Funding | | 8,051 | | 8,051 | | 8,623 | | 9,127 | | 9,773 | | | |
(1) The 2007/08 budget estimate and updated forecast have been restated to reflect government’s current organization and accounting policies. | 
|
Budget and Fiscal Plan – 2008/09 to 2010/11 |
195
Table A12 Material Assumptions – Expense – Continued
Ministry Programs and Assumptions | | Budget (1) | | Updated
Forecast | | Budget
Estimate | | Plan | | Plan | | | |
($ millions unless otherwise specified) | | 2007/08 | | 2008/09 | | 2009/10 | | 2010/11 | | Sensitivities 2008/09 | |
Public Safety and Solicitor General | | 629 | | 710 | | 647 | | 658 | | 660 | | The volume and severity of criminal activity, the number of inmate beds occupied and the number of investigations and audits based on the volume of gaming activity. | |
Emergency Program Act (EPA) | | 16 | | 89 | | 16 | | 16 | | 16 | | The number and severity of natural disasters. | |
| | | | | | Funding remains constant on a year-to-year basis. | | |
Management of Public Funds and Debt | | 558 | | 405 | | 402 | | 390 | | 374 | | Full year impact on MoPD on interest costs of a 1% change in interest rates equals $26 million; $100 million increase in debt level equals $4 million. | |
Interest rates for new provincial borrowing: | | | | | | | | | | | | |
Short-term | | 4.24 | % | 4.32 | % | 4.30 | % | 4.78 | % | 5.25 | % | |
Long-term | | 4.84 | % | 4.96 | % | 5.04 | % | 5.59 | % | 6.33 | % | |
CDN/US exchange rate (cents) | | 87.1 | | 102.7 | | 100.1 | | 105.2 | | 106.7 | | |
Service delivery agency net spending | | 4,638 | | 4,357 | | 4,398 | | 4,957 | | 5,189 | | | |
School districts | | 406 | | 401 | | 410 | | 413 | | 422 | | | |
Universities | | 1,590 | | 1,484 | | 1,691 | | 1,772 | | 1,863 | | | |
Colleges, university colleges and institutes | | 545 | | 533 | | 563 | | 586 | | 606 | | | |
Health authorities and hospital societies | | 740 | | 675 | | 619 | | 629 | | 655 | | | |
Children and family development agencies | | 3 | | 3 | | 1 | | 1 | | 1 | | | |
BC Transportation Financing Authority | | 720 | | 703 | | 646 | | 727 | | 812 | | | |
Other service delivery agencies | | 634 | | 558 | | 468 | | 829 | | 830 | | | |
(1) The 2007/08 budget estimate and updated forecast have been restated to reflect government’s current organization and accounting policies.
Budget and Fiscal Plan – 2008/09 to 2010/11 |
196
Table A13 Full-Time Equivalents (FTEs)(1) – 2004/05 to 2010/11
| | | | | | | | Updated | | Budget | | | | | |
| | Actual | | Actual | | Actual | | Forecast | | Estimate | | Plan | | Plan | |
| | 2004/05 | | 2005/06 | | 2006/07 | | 2007/08 | | 2008/09 | | 2009/10 | | 2010/11 | |
Ministries and special offices (CRF) | | 27,252 | | 27,129 | | 28,647 | | 30,416 | | 31,830 | | 32,034 | | 32,179 | |
Service delivery agencies (2) | | 3,822 | | 3,992 | | 3,917 | | 4,115 | | 4,265 | | 4,325 | | 4,365 | |
Total FTEs | | 31,074 | | 31,121 | | 32,564 | | 34,531 | | 36,095 | | 36,359 | | 36,544 | |
(1) Full-time equivalents (FTEs) are a measure of staff employment. FTEs are calculated by dividing the total hours of employment paid for in a given period by the number of hours an individual, full-time person would normally work in that period. This does not equate to the physical number of employees. For example, two half-time employees would equal one FTE, or alternatively, three FTEs may represent two full-time employees who have worked sufficient overtime hours to equal an additional FTE.
(2) Service delivery agency FTE amounts do not include SUCH sector staff employment.
Table A14 Capital Spending – 2004/05 to 2010/11
| | | | | | | | Updated | | Budget | | | | | |
| | Actual | | Actual | | Actual | | Forecast | | Estimate | | Plan | | Plan | |
($ millions) | | 2004/05 | | 2005/06 | | 2006/07 | | 2007/08 | | 2008/09 | | 2009/10 | | 2010/11 | |
Taxpayer-supported | | | | | | | | | | | | | | | |
Education | | | | | | | | | | | | | | | |
Schools (K–12) | | 239 | | 286 | | 322 | | 426 | | 441 | | 441 | | 438 | |
Post-secondary | | 696 | | 790 | | 874 | | 870 | | 706 | | 578 | | 451 | |
Health | | 599 | | 858 | | 777 | | 973 | | 924 | | 946 | | 881 | |
BC Transportation Financing Authority | | 513 | | 713 | | 821 | | 1,063 | | 884 | | 639 | | 665 | |
BC Transit | | 8 | | 24 | | 13 | | 49 | | 74 | | 175 | | 110 | |
Vancouver Convention Centre expansion project | | 51 | | 85 | | 108 | | 261 | | 288 | | 37 | | — | |
Government operating (ministries) | | 175 | | 268 | | 309 | | 325 | | 286 | | 336 | | 317 | |
Other (1) | | 73 | | 87 | | 159 | | 77 | | 56 | | 43 | | 39 | |
Capital spending contingencies | | — | | — | | — | | 105 | | 200 | | 175 | | 150 | |
Total taxpayer-supported | | 2,354 | | 3,111 | | 3,383 | | 4,149 | | 3,859 | | 3,370 | | 3,051 | |
| | | | | | | | | | | | | | | |
Self-supported | | | | | | | | | | | | | | | |
BC Hydro | | 528 | | 610 | | 807 | | 1,109 | | 1,663 | | 1,744 | | 1,921 | |
BC Transmission Corporation | | — | | 21 | | 50 | | 82 | | 21 | | 22 | | 10 | |
Columbia River power projects (2) | | 84 | | 30 | | 19 | | 28 | | 19 | | 154 | | 234 | |
BC Rail | | 30 | | 15 | | 19 | | 21 | | 30 | | 9 | | 12 | |
ICBC (3) | | 31 | | 27 | | 22 | | 24 | | 30 | | 45 | | 55 | |
BC Lotteries | | 93 | | 83 | | 44 | | 94 | | 124 | | 116 | | 117 | |
Liquor Distribution Branch | | 10 | | 19 | | 22 | | 18 | | 20 | | 19 | | 40 | |
| | | | | | | | | | | | | | | |
Total self-supported commercial | | 776 | | 805 | | 983 | | 1,376 | | 1,907 | | 2,109 | | 2,389 | |
| | | | | | | | | | | | | | | |
Total capital spending | | 3,130 | | 3,916 | | 4,366 | | 5,525 | | 5,766 | | 5,479 | | 5,440 | |
(1) Includes BC Housing Management Commission, Provincial Rental Housing Corporation, Rapid Transit Project 2000, and other service delivery agencies.
(2) Joint ventures of the Columbia Power Corporation and Columbia Basin Trust.
(3) Includes ICBC Properties Ltd.
Budget and Fiscal Plan – 2008/09 to 2010/11 |
197
Table A15 Statement of Financial Position – 2004/05 to 2010/11 (1)
| | | | | | | | Updated | | Budget | | | | | |
| | Actual | | Actual | | Actual | | Forecast | | Estimate | | Plan | | Plan | |
($ millions) | | 2004/05 | | 2005/06 | | 2006/07 | | 2007/08 | | 2008/09 | | 2009/10 | | 2010/11 | |
Financial assets | | | | | | | | | | | | | | | |
Cash and temporary investments | | 3,583 | | 3,869 | | 3,367 | | 4,469 | | 3,103 | | 2,623 | | 2,615 | |
Other financial assets | | 6,619 | | 6,968 | | 7,854 | | 7,798 | | 7,790 | | 8,532 | | 8,404 | |
Sinking funds | | 4,516 | | 4,059 | | 3,798 | | 2,698 | | 2,152 | | 2,024 | | 1,765 | |
Investments in commercial Crown corporations Retained earnings | | 3,168 | | 3,448 | | 4,396 | | 5,105 | | 5,775 | | 6,260 | | 6,746 | |
Recoverable capital loans | | 6,901 | | 6,916 | | 7,170 | | 7,780 | | 8,954 | | 9,897 | | 11,342 | |
| | 10,069 | | 10,364 | | 11,566 | | 12,885 | | 14,729 | | 16,157 | | 18,088 | |
| | 24,787 | | 25,260 | | 26,585 | | 27,850 | | 27,774 | | 29,336 | | 30,872 | |
Liabilities | | | | | | | | | | | | | | | |
Accounts payable & accrued liabilities (2) | | 6,787 | | 7,288 | | 7,094 | | 8,473 | | 8,179 | | 9,062 | | 9,203 | |
Deferred revenue | | 5,181 | | 5,695 | | 5,986 | | 5,971 | | 6,114 | | 6,238 | | 6,378 | |
Debt: | | | | | | | | | | | | | | | |
Taxpayer-supported debt | | 28,675 | | 27,226 | | 25,931 | | 26,792 | | 27,741 | | 28,973 | | 30,044 | |
Self-supported debt | | 7,195 | | 7,200 | | 7,473 | | 8,061 | | 9,250 | | 10,332 | | 11,754 | |
Forecast allowance | | — | | — | | — | | 150 | | 750 | | 675 | | 675 | |
Total provincial debt | | 35,870 | | 34,426 | | 33,404 | | 35,003 | | 37,741 | | 39,980 | | 42,473 | |
Add: debt offset by sinking funds | | 4,516 | | 4,059 | | 3,798 | | 2,698 | | 2,152 | | 2,024 | | 1,765 | |
Less :guarantees and non-guaranteed debt | | (447 | ) | (397 | ) | (407 | ) | (395 | ) | (421 | ) | (577 | ) | (569 | ) |
Financial statement debt | | 39,939 | | 38,088 | | 36,795 | | 37,306 | | 39,472 | | 41,427 | | 43,669 | |
| | 51,907 | | 51,071 | | 49,875 | | 51,750 | | 53,765 | | 56,727 | | 59,250 | |
Net liabilities | | (27,120 | ) | (25,811 | ) | (23,290 | ) | (23,900 | ) | (25,991 | ) | (27,391 | ) | (28,378 | ) |
Capital and other assets | | | | | | | | | | | | | | | |
Tangible capital assets | | 23,250 | | 24,797 | | 26,683 | | 29,269 | | 31,347 | | 32,896 | | 34,037 | |
Other assets | | 613 | | 847 | | 943 | | 937 | | 934 | | 935 | | 931 | |
| | 23,863 | | 25,644 | | 27,626 | | 30,206 | | 32,281 | | 33,831 | | 34,968 | |
Accumulated surplus (deficit) | | (3,257 | ) | (167 | ) | 4,336 | | 6,306 | | 6,290 | | 6,440 | | 6,590 | |
(1) Comparative figures have been restated to reflect government’s accounting policies in effect at March 31, 2007.
(2) Accrued liabilities include accumulated forecast allowances of $150 million in 2008/09, $900 million in 2009/10, and $1,575 million in 2010/11.
Budget and Fiscal Plan – 2008/09 to 2010/11 |
198
Table A15a Changes in Financial Position – 2004/05 to 2010/11
| | | | | | | | Updated | | Budget | | | | | |
| | Actual | | Actual | | Actual | | Forecast | | Estimate | | Plan | | Plan | |
($ millions) | | 2004/05 | | 2005/06 | | 2006/07 | | 2007/08 | | 2008/09 | | 2009/10 | | 2010/11 | |
Change in accumulated (surplus) deficit | | (2,703 | ) | (3,090 | ) | (4,503 | ) | (1,970 | ) | 16 | | (150 | ) | (150 | ) |
Comprehensive income and other equity adjustments | | — | | — | | 447 | | — | | (66 | ) | — | | — | |
(Surplus) deficit for the year: | | (2,703 | ) | (3,090 | ) | (4,056 | ) | (1,970 | ) | (50 | ) | (150 | ) | (150 | ) |
| | | | | | | | | | | | | | | |
Capital and other asset changes: | | | | | | | | | | | | | | | |
Taxpayer-supported capital investments | | 2,354 | | 3,111 | | 3,383 | | 4,149 | | 3,859 | | 3,370 | | 3,051 | |
Less: amortization and other accounting changes | | (1,421 | ) | (1,564 | ) | (1,497 | ) | (1,563 | ) | (1,781 | ) | (1,821 | ) | (1,910 | ) |
Increase in net capital assets | | 933 | | 1,547 | | 1,886 | | 2,586 | | 2,078 | | 1,549 | | 1,141 | |
Increase (decrease) in other assets | | 74 | | 234 | | 96 | | (6 | ) | (3 | ) | 1 | | (4 | ) |
| | 1,007 | | 1,781 | | 1,982 | | 2,580 | | 2,075 | | 1,550 | | 1,137 | |
Increase (decrease) in net liabilities | | (1,696 | ) | (1,309 | ) | (2,074 | ) | 610 | | 2,025 | | 1,400 | | 987 | |
| | | | | | | | | | | | | | | |
Investment and working capital changes: | | | | | | | | | | | | | | | |
Increase (reduction) in cash and temporary investments | | 893 | | 286 | | (502 | ) | 1,102 | | (1,366 | ) | (480 | ) | (8 | ) |
Investment in commercial Crown corporations: | | | | | | | | | | | | | | | |
Increase (decrease) in retained earnings | | 148 | | 280 | | 948 | | 709 | | 670 | | 485 | | 486 | |
Less: comprehensive income | | — | | — | | (447 | ) | — | | 66 | | — | | — | |
Self-supported capital investments | | 776 | | 805 | | 983 | | 1,376 | | 1,907 | | 2,109 | | 2,389 | |
Less: loan repayments and other accounting changes | | (1,387 | ) | (790 | ) | (1,176 | ) | (766 | ) | (667 | ) | (1,166 | ) | (944 | ) |
| | (463 | ) | 295 | | 755 | | 1,319 | | 1,910 | | 1,428 | | 1,931 | |
Other working capital changes | | (736 | ) | (1,123 | ) | 528 | | (2,520 | ) | (403 | ) | (393 | ) | (668 | ) |
| | (306 | ) | (542 | ) | 781 | | (99 | ) | 141 | | 555 | | 1,255 | |
Increase (decrease) in financial statement debt | | (2,002 | ) | (1,851 | ) | (1,293 | ) | 511 | | 2,166 | | 1,955 | | 2,242 | |
(Increase) decrease in sinking fund debt | | 103 | | 457 | | 261 | | 1,100 | | 546 | | 128 | | 259 | |
Increase (decrease) in guarantees and non-guaranteed debt | | 34 | | (50 | ) | 10 | | (12 | ) | 26 | | 156 | | (8 | ) |
Increase (decrease) in total provincial debt | | (1,865 | ) | (1,444 | ) | (1,022 | ) | 1,599 | | 2,738 | | 2,239 | | 2,493 | |
Budget and Fiscal Plan – 2008/09 to 2010/11 |
199
Appendices
Table A16 Provincial Debt Summary – 2004/05 to 2010/11 (1), (2)
| | | | | | | | Updated | | Budget | | | | | |
| | Actual | | Actual | | Actual | | Forecast | | Estimate | | Plan | | Plan | |
($ millions unless otherwise indicated) | | 2004/05 | | 2005/06 | | 2006/07 | | 2007/08 | | 2008/09 | | 2009/10 | | 2010/11 | |
Taxpayer-supported debt | | | | | | | | | | | | | | | |
Provincial government direct operating | | 14,510 | | 11,923 | | 9,505 | | 8,246 | | 7,408 | | 6,880 | | 6,452 | |
Other taxpayer-supported debt (mainly capital) | | | | | | | | | | | | | | | |
Education | | | | | | | | | | | | | | | |
Schools (2) | | 4,483 | | 4,588 | | 4,724 | | 4,959 | | 5,235 | | 5,513 | | 5,794 | |
Post-secondary institutions (2) | | 2,284 | | 2,650 | | 2,909 | | 3,331 | | 3,520 | | 3,816 | | 3,988 | |
| | 6,767 | | 7,238 | | 7,633 | | 8,290 | | 8,755 | | 9,329 | | 9,782 | |
Health (2) | | 2,143 | | 2,488 | | 2,870 | | 3,380 | | 3,945 | | 4,479 | | 4,959 | |
Highways and public transit | | | | | | | | | | | | | | | |
BC Transportation Financing Authority | | 2,474 | | 2,699 | | 3,237 | | 4,088 | | 4,722 | | 5,170 | | 5,641 | |
Public transit | | 906 | | 904 | | 892 | | 913 | | 950 | | 1,048 | | 1,067 | |
SkyTrain extension | | 1,135 | | 1,145 | | 1,153 | | 1,153 | | 1,153 | | 1,153 | | 1,153 | |
BC Transit | | 78 | | 80 | | 96 | | 89 | | 91 | | 153 | | 187 | |
| | 4,593 | | 4,828 | | 5,378 | | 6,243 | | 6,916 | | 7,524 | | 8,048 | |
Other | | | | | | | | | | | | | | | |
BC Buildings | | 241 | | 246 | | — | (3) | — | | — | | — | | — | |
Social housing (4) | | 133 | | 189 | | 216 | | 213 | | 211 | | 209 | | 202 | |
Homeowner Protection Office | | 130 | | 110 | | 110 | | 133 | | 173 | | 221 | | 273 | |
Other (5) | | 158 | | 204 | | 219 | | 287 | | 333 | | 331 | | 328 | |
| | 662 | | 749 | | 545 | | 633 | | 717 | | 761 | | 803 | |
Total other taxpayer-supported debt | | 14,165 | | 15,303 | | 16,426 | | 18,546 | | 20,333 | | 22,093 | | 23,592 | |
Total taxpayer-supported debt | | 28,675 | | 27,226 | | 25,931 | | 26,792 | | 27,741 | | 28,973 | | 30,044 | |
Self-supported debt | | | | | | | | | | | | | | | |
Commercial Crown corporations | | | | | | | | | | | | | | | |
BC Hydro | | 6,906 | | 6,892 | | 7,144 | | 7,687 | | 8,876 | | 9,821 | | 11,062 | |
BC Transmission Corporation | | — | | 37 | | 37 | | 95 | | 79 | | 77 | | 73 | |
Columbia River power projects (6) | | 257 | | 247 | | 236 | | 224 | | 241 | | 380 | | 565 | |
Liquor Distribution Branch | | 6 | | 5 | | 3 | | 2 | | 1 | | 1 | | 1 | |
Post-secondary institutions’ subsidiaries | | 26 | | 19 | | 53 | | 53 | | 53 | | 53 | | 53 | |
Total self-supported debt | | 7,195 | | 7,200 | | 7,473 | | 8,061 | | 9,250 | | 10,332 | | 11,754 | |
Total debt before forecast allowance | | 35,870 | | 34,426 | | 33,404 | | 34,853 | | 36,991 | | 39,305 | | 41,798 | |
Forecast allowance (7) | | — | | — | | — | | 150 | | 750 | | 675 | | 675 | |
Total provincial debt | | 35,870 | | 34,426 | | 33,404 | | 35,003 | | 37,741 | | 39,980 | | 42,473 | |
Debt as a per cent of GDP | | | | | | | | | | | | | | | |
Provincial government direct operating | | 9.2 | % | 7.0 | % | 5.3 | % | 4.3 | % | 3.7 | % | 3.3 | % | 2.9 | % |
Taxpayer-supported | | 18.2 | % | 16.1 | % | 14.4 | % | 14.1 | % | 14.0 | % | 13.9 | % | 13.7 | % |
Total provincial | | 22.8 | % | 20.3 | % | 18.5 | % | 18.4 | % | 19.0 | % | 19.1 | % | 19.4 | % |
(1) | Debt is after deduction of sinking funds and unamortized discounts, and excludes accrued interest. Government direct and fiscal agency accrued interest is reported in the government’s accounts as an accounts payable. |
(2) | Includes debt and guarantees incurred by the government on behalf of school districts, universities, colleges and health authorities/hospital societies (SUCH), and debt directly incurred by these entities. |
(3) | Debt of BC Buildings was transferred to the province as the corporation’s operations are now conducted through the Ministry of Labour and Citizens’ Services |
(4) | Includes the BC Housing Management Commission and the Provincial Rental Housing Corporation. |
(5) | Includes service delivery agencies, student loan guarantees, loan guarantees to agricultural producers, guarantees issued under economic development and home mortgage assistance programs and loan guarantee provisions. |
(6) | A joint venture of the Columbia Power Corporation and Columbia Basin Trust. |
(7) | Reflects the operating statement forecast allowance for each year (amounts are not cumulative). Since it is unknown as to which agency would require this debt, the borrowing allowance is shown as a separate item over the plan. |
Budget and Fiscal Plan – 2008/09 to 2010/11 |
200
Appendices
Table A17 Key Provincial Debt Indicators – 2004/05 to 2010/11 (1)
| | | | | | | | Updated | | Budget | | | | | |
| | Actual | | Actual | | Actual | | Forecast | | Estimate | | Plan | | Plan | |
| | 2004/05 | | 2005/06 | | 2006/07 | | 2007/08 | | 2008/09 | | 2009/10 | | 2010/11 | |
Debt to revenue (per cent) | | | | | | | | | | | | | | | |
Total provincial | | 85.2 | | 74.8 | | 69.1 | | 69.9 | | 75.1 | | 76.3 | | 77.7 | |
Taxpayer-supported | | 88.5 | | 77.7 | | 69.6 | | 70.5 | | 74.6 | | 74.7 | | 74.5 | |
Debt per capita ($) (2) | | | | | | | | | | | | | | | |
Total provincial | | 8,532 | | 8,081 | | 7,732 | | 7,992 | | 8,500 | | 8,888 | | 9,320 | |
Taxpayer-supported | | 6,821 | | 6,391 | | 6,003 | | 6,117 | | 6,248 | | 6,441 | | 6,593 | |
Debt to GDP (per cent) (3) | | | | | | | | | | | | | | | |
Total provincial | | 22.8 | | 20.3 | | 18.5 | | 18.4 | | 19.0 | | 19.1 | | 19.4 | |
Taxpayer-supported | | 18.2 | | 16.1 | | 14.4 | | 14.1 | | 14.0 | | 13.9 | | 13.7 | |
Interest bite (cents per dollar of revenue) (4) | | | | | | | | | | | | | | | |
Total provincial | | 4.7 | | 4.3 | | 4.2 | | 4.1 | | 4.5 | | 4.7 | | 4.8 | |
Taxpayer-supported | | 5.0 | | 4.4 | | 4.1 | | 4.1 | | 4.5 | | 4.5 | | 4.6 | |
Interest costs ($ millions) | | | | | | | | | | | | | | | |
Total provincial | | 1,986 | | 1,991 | | 2,033 | | 2,069 | | 2,250 | | 2,443 | | 2,615 | |
Taxpayer-supported | | 1,622 | | 1,525 | | 1,534 | | 1,542 | | 1,659 | | 1,747 | | 1,843 | |
Interest rate (per cent) (5) | | | | | | | | | | | | | | | |
Taxpayer-supported | | 5.6 | | 5.5 | | 5.8 | | 5.8 | | 6.1 | | 6.2 | | 6.2 | |
| | | | | | | | | | | | | | | |
Background Information: | | | | | | | | | | | | | | | |
Revenue ($ millions) | | | | | | | | | | | | | | | |
Total provincial (6) | | 42,077 | | 46,026 | | 48,333 | | 50,072 | | 50,259 | | 52,424 | | 54,633 | |
Taxpayer-supported (7) | | 32,392 | | 35,029 | | 37,280 | | 37,995 | | 37,205 | | 38,778 | | 40,313 | |
Debt ($ millions) | | | | | | | | | | | | | | | |
Total provincial | | 35,870 | | 34,426 | | 33,404 | | 35,003 | | 37,741 | | 39,980 | | 42,473 | |
Taxpayer-supported (8) | | 28,675 | | 27,226 | | 25,931 | | 26,792 | | 27,741 | | 28,973 | | 30,044 | |
Provincial GDP ($ millions) (9) | | 157,365 | | 169,404 | | 180,328 | | 190,391 | | 198,329 | | 208,778 | | 219,280 | |
Population (thousands at July 1) (10) | | 4,204 | | 4,260 | | 4,320 | | 4,380 | | 4,440 | | 4,498 | | 4,557 | |
(1) Includes fiscal data of school districts, post-secondary institutions and regional health authorities/societies (SUCH).
(2) The ratio of debt to population (e.g. 2008/09 debt divided by population at July 1, 2008).
(3) The ratio of debt outstanding at fiscal year end to provincial nominal gross domestic product (GDP) for the calendar year ending in the fiscal year (e.g. 2008/09 debt divided by 2008 GDP).
(4) The ratio of interest costs (less sinking fund interest) to revenue. Figures include capitalized interest expense in order to provide a more comparable measure to outstanding debt.
(5) Weighted average of all outstanding debt issues.
(6) Includes revenue of the consolidated revenue fund (excluding dividends from enterprises) plus revenue of all government organizations and enterprises.
(7) Excludes revenue of government enterprises, but includes dividends from enterprises paid to the consolidated revenue fund.
(8) Excludes debt of commercial Crown corporations and agencies and funds held under the province’s warehouse borrowing program.
(9) GDP for the calendar year ending in the fiscal year (e.g. GDP for 2008 is used for the fiscal year ended March 31, 2009).
(10) Population at July 1st within the fiscal year (e.g. population at July 1, 2008 is used for the fiscal year ended March 31, 2009).
Budget and Fiscal Plan – 2008/09 to 2010/11 |
201