Exhibit 99.8
Budget and Fiscal Plan
2009/10 – 2011/12
February 17, 2009

National Library of Canada Cataloguing in Publication Data
British Columbia.
Budget and fiscal plan. — 2002/03/2004/05-
Annual
Also available on the Internet.
Continues: British Columbia. Ministry of Finance and
Corporate Relations. Budget ... reports. ISSN 1207-5841
ISSN 1705-6071 = Budget and fiscal plan — British Columbia.
1. Budget — British Columbia — Periodicals. 2. British
Columbia — Appropriations and expenditures — Periodicals.
I. British Columbia. Ministry of Finance. II. Title.
HJ12.B742 352.48’09711’05 C2003-960048-3
TABLE OF CONTENTS |
|
Budget and Fiscal Plan 2009/10 – 2011/12 | February 17, 2009 |
Attestation by the Secretary to Treasury Board
Summary | 1 |
| |
Part 1: Three-Year Fiscal Plan | |
| |
Introduction | 7 |
Revenue | 13 |
Changes since the first Quarterly Report | 13 |
Budget 2009 Plan | 17 |
Consolidated Revenue Fund Spending | 22 |
Protecting Health Care and Education | 23 |
Sustaining Social Services | 26 |
Supporting Communities and the Environment | 27 |
2010 Olympic and Paralympic Winter Games | 29 |
Administrative and Other Savings | 30 |
Public Service Transformation Fund | 31 |
Service Delivery Agencies | 31 |
Further Efficiencies | 32 |
Full-Time Equivalents | 32 |
Capital Spending | 33 |
Projects over $50 million | 38 |
Provincial Debt | 40 |
Risks to the Fiscal Plan | 43 |
| |
Tables: | |
1.1 | Three-Year Fiscal Plan – Operating Statement | 7 |
1.2 | Three-Year Fiscal Plan Update – Changes from Budget 2008 | 8 |
1.3 | Revenue by Source | 10 |
1.4 | Expense by Ministry, Program and Agency | 11 |
1.5 | Major Factors Underlying Revenue | 17 |
1.6 | Personal Income Tax Revenue | 18 |
1.7 | Corporate Income Tax Revenue | 19 |
1.8 | Social Service Tax Revenue | 19 |
1.9 | Health and Social Transfers | 21 |
1.10 | Sustaining Social Services | 26 |
1.11 | Supporting Communities and the Environment | 28 |
1.12 | Olympics Funding | 29 |
1.13 | Managing Down Expenses | 30 |
1.14 | Administrative Spending – Change from 2008/09 | 31 |
1.15 | Full-Time Equivalents (FTEs) – Changes from Budget 2008 | 32 |
1.16 | Capital Spending | 34 |
1.17 | Provincial Transportation Investments | 35 |
1.18 | Capital Expenditure Projects Greater Than $50 million | 39 |
1.19 | Provincial Debt Summary | 40 |
1.20 | Reconciliation of Summary Results to Provincial Debt Changes | 42 |
1.21 | Provincial Financing | 43 |
1.22 | Key Fiscal Sensitivities | 44 |
1.23 | Notional Allocations to Contingencies | 46 |
Budget and Fiscal Plan – 2009/10 to 2011/12
Topic Boxes: | |
Presentation of Provincial Government Debt | 50 |
The Port Mann Bridge / Highway 1 Project | 52 |
British Columbia’s Strong Foundation | 53 |
| |
Part 2: Tax Measures | |
| |
Tax Measures — Supplementary Information | 64 |
October 22 and November 1, 2008 Measures | 64 |
Budget 2009 Measures | 66 |
| |
Tables: | |
2.1 | Summary of Tax Measures | 63 |
2.2 | British Columbia Personal Income Tax Cut – Impact on Taxpayers | 65 |
2.3 | Commission Rates | 65 |
| | |
Topic Box: | |
Revenue Neutral Carbon Tax | 72 |
| |
Part 3: British Columbia Economic Review and Outlook | |
| |
Summary | 75 |
Recent Developments | 76 |
The Outlook for the External Environment | 78 |
United States | 78 |
Canada | 81 |
Other Economies | 83 |
Financial Markets | 84 |
Interest Rates | 84 |
Exchange Rate | 86 |
The British Columbia Economic Outlook | 87 |
Labour Market | 88 |
Domestic Demand | 88 |
Business and Government | 90 |
External Trade and Commodity Markets | 91 |
Inflation | 92 |
Risks to the Economic Outlook | 93 |
| |
Tables: | |
3.1 | British Columbia Economic Indicators | 76 |
3.2 | Ministry of Finance Economic Forecast: Key Assumptions | 84 |
3.3 | Private Sector Canadian Three Month Treasury Bill Interest Rate Forecasts | 85 |
3.4 | Private Sector Canadian 10-year Government Bond Interest Rate Forecasts | 85 |
3.5 | Private Sector Exchange Rate Forecasts | 86 |
3.6 | British Columbia Economic Outlook | 87 |
3.7 | Ministry of Finance Economic Forecast: Key Economic Indicators | 87 |
3.8 | British Columbia Economic Review | 94 |
3.9.1 | Gross Domestic Product: British Columbia | 95 |
3.9.2 | Components of Nominal Income and Expenditure | 96 |
3.9.3 | Labour Market Indicators | 96 |
3.9.4 | Major Economic Assumptions | 97 |
| | |
Topic Box: | |
The Economic Forecast Council, 2009 | 98 |
Economic Downturns in BC since 1980 | 104 |
Budget and Fiscal Plan – 2009/10 to 2011/12
ii
Part 4: 2008/09 Revised Financial Forecast (Third Quarterly Report) | |
| |
2008/09 Fiscal Year in Review | 107 |
Changes since the Second Quarterly Report | 109 |
2008/09 Priority Spending | 109 |
2008/09 Notional Contingencies Allocations | 111 |
Capital Spending and Provincial Debt | 112 |
| |
Tables: | |
4.1 | Budget 2008 and Quarterly Updates | 107 |
4.2 | 2008/09 Forecast Update | 108 |
4.3 | 2008/09 Priority Initiatives (Operating) | 110 |
4.4 | 2008/09 Priority Initiatives (Capital) | 111 |
4.5 | 2008/09 Notional Allocations to Contingencies | 112 |
4.6 | 2008/09 Capital Spending Update | 112 |
4.7 | 2008/09 Provincial Debt Update | 113 |
4.8 | 2008/09 Operating Statement | 114 |
4.9 | 2008/09 Revenue by Source | 114 |
4.10 | 2008/09 Expense by Function | 115 |
4.11 | 2008/09 Expense by Ministry, Program and Agency | 116 |
4.12 | 2008/09 Capital Spending | 117 |
4.13 | 2008/09 Provincial Debt | 118 |
4.14 | 2008/09 Statement of Financial Position | 119 |
| | |
Appendices | 121 |
Budget and Fiscal Plan – 2009/10 to 2011/12
iii

| | February 17, 2009 |
As required by Section 7(d) of the Budget Transparency and Accountability Act (BTAA), and Section 4(a)(v) of the Carbon Tax Act, I am confirming that the Budget and Fiscal Plan contains the following elements:
· The fiscal and economic forecasts for 2009/10 and the next two years, which are detailed in Parts 1 and 3 of the Budget and Fiscal Plan.
· All material economic, demographic, taxation, accounting policy and other assumptions underlying the 2009/10 economic, revenue, expenditure, surplus and debt forecasts are also disclosed. In particular:
· The capital plan includes $2 billion for accelerated infrastructure projects, based on the assumption that the federal government will contribute $1 billion from federal infrastructure programs announced in the January 27 federal budget;
· The Port Mann Bridge has not been included in the fiscal plan as final agreement has not been reached with the Connect BC Development Group, and accounting treatment has not been finalized. The implications are discussed further in the topic box on the Port Mann Bridge found on page 52 of the Budget and Fiscal Plan;
· The Province is assumed to reach an agreement with the federal government over the funding of Olympic security part of which will require a one-time payment to the federal government before the end of 2008/09;
· Unlike recent years, there are no forecast allowances included in the fiscal plan and government will be managing risks to the fiscal plan through expenditure management and use of the contingency vote;
· Most of the wage agreements reached in the last round of public sector negotiations expire by the end of 2009/10. No funding is included in the fiscal plan for the next round; and
· Further savings of $250 million are to be identified and achieved by 2011/12.
· The report on the advice received from the Minister’s Economic Forecast Council, which was last updated on January 9, on the economic growth outlook for British Columbia, including the range of forecasts for 2009 and 2010.
· The major areas of risk to the plan known at this time are disclosed in the risks section in Part 1 starting at page 43 of the Budget and Fiscal Plan, and in the material assumptions tables in the Appendix.
· A carbon tax report for 2008/09 and a carbon tax plan for 2009/10 to 2011/12 and corresponding material assumptions. These can be are found in the Revenue Neutral Carbon Tax topic box at the end of Part 2: Tax Measures (page 72).
Three-year aggregate financial plans for health authorities, school districts, and universities and colleges have been compiled by the Ministries of Health Services, Education, and Advanced Education and Labour Market Development based on funding included in respective ministry budgets. Individual plans for health authorities and post-secondary institutions, including strategies for managing spending pressures, will be subsequently developed and reflected in the updated fiscal plan in the first Quarterly Report.
The accounting policies followed in the Budget and Fiscal Plan comply, in all material respects, with generally accepted accounting principles (GAAP) for senior governments.
I would like to thank staff in government ministries and agencies for their contribution to this document. During a time of significant uncertainty, I would like to especially recognize the commitment of staff in the Ministry of Finance, whose teamwork and skills were put to the test this year and whose passion was essential to the timely and professional completion of this budget.

Chris Trumpy
Deputy Minister and
Secretary to Treasury Board
Ministry of
Finance | | Office of the
Deputy Minister | | Mailing Address:
PO Box 9417 Stn Prov Govt
Victoria BC V8W 9V1
www.gov.bc.ca/fin | | Location Address:
Room 109
617 Government Street
Victoria BC |
Summary: BUDGET AND FISCAL PLAN — 2009/10 to 2011/12
| | 2008/09 | | Budget | | | | | |
($ millions) | | Budget | | Updated
Forecast | | Estimate
2009/10 | | Plan
2010/11 | | Plan
2011/12 | |
Revenue | | 38,490 | | 38,455 | | 38,812 | | 39,795 | | 41,182 | |
Expense | | (37,690 | ) | (38,405 | ) | (39,307 | ) | (40,040 | ) | (41,182 | ) |
Surplus (Deficit) before forecast allowance | | 800 | | 50 | | (495 | ) | (245 | ) | — | |
Forecast allowance | | (750 | ) | — | | — | | — | | — | |
Surplus (Deficit) | | 50 | | 50 | | (495 | ) | (245 | ) | — | |
Capital spending: | | | | | | | | | | | |
Taxpayer-supported capital spending | | 3,859 | | 4,133 | | 4,746 | | 4,650 | | 3,382 | |
Total capital spending | | 5,766 | | 5,951 | | 6,945 | | 7,155 | | 5,924 | |
Provincial Debt: | | | | | | | | | | | |
Government direct operating debt | | 7,408 | | 6,437 | | 6,847 | | 7,104 | | 7,074 | |
Taxpayer-supported debt | | 27,741 | | 27,692 | | 30,213 | | 32,392 | | 34,078 | |
Total debt | | 37,741 | | 37,487 | | 40,471 | | 44,203 | | 47,215 | |
Government direct operating debt-to-GDP ratio | | 3.7 | % | 3.2 | % | 3.5 | % | 3.4 | % | 3.3 | % |
Taxpayer-supported debt-to-GDP ratio | | 14.0 | % | 13.8 | % | 15.2 | % | 15.7 | % | 15.8 | % |
Total debt-to GDP ratio | | 19.0 | % | 18.7 | % | 20.4 | % | 21.4 | % | 21.8 | % |
Protecting Public Services
Budget 2009 projects deficits of $495 million in 2009/10 and $245 million in 2010/11, returning to a balanced budget by 2011/12.
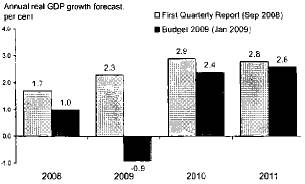
The fiscal plan is based on the Ministry of Finance economic forecast that projects real economic growth of minus 0.9 per cent for 2009, recovering to 2.4 per cent in 2010 and 2.6 per cent in 2011. The economic outlook is a significant reversal of expectations at the time of the 2008/09 first Quarterly Report, particularly in 2009.
Government’s economic forecast lowered from the first Quarterly Report
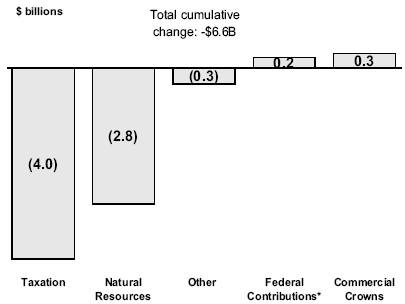
The economic downturn resulted in a reduction of $6.6 billion in revenue over the fiscal plan period since the September Budget Consultation Paper. This loss will be partially offset by $870 million in federal funding that comes with transfer of responsibilities under the Labour Market Development Agreement that provides training for British Columbians seeking employment, resulting in a net decrease in revenue of $5.8 billion.
3-Year cumulative change in revenue since the first Quarterly Report
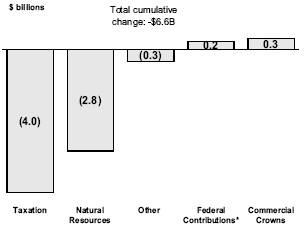
* Excludes $870 million in funding for the LMDA transfer
Overall, spending is projected to increase by $2.8 billion over the fiscal plan period. This includes spending associated with the Labour Market Development Agreement. Excluding the agreement, projected spending represents an average annual growth of 2.2 per cent. By achieving $1.9 billion of savings, government is able to maintain services during the economic downturn while providing additional spending in key areas.
Budget and Fiscal Plan – 2009/10 to 2011/12
Summary
Domestic Economy Contracts
BC’s economic forecast for 2009 reflects the sharp US and global economic slowdown, moderating domestic demand, as well as instability in global financial and commodity markets.
In the medium term, BC’s economy is expected to return closer to historical levels of growth, due primarily to an anticipated recovery of US demand (particularly in the housing sector) and a gradual rise in commodity prices.
BC’s economy to rebound in 2010
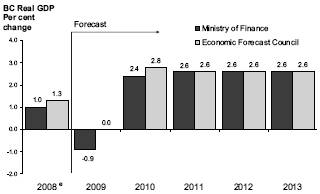
(e): estimate
Note: the EFC provided an average forecast for 2011 to 2013 on January 9, 2009
Indicators of economic performance through most of 2008 confirm that British Columbia’s economy slowed considerably in the latter half of the year. On the domestic side, monthly retail sales and housing starts declined significantly since July. The employment situation has also weakened in recent months, with the unemployment rate climbing by 1.6 per cent from July to January.
On the trade side, the value of manufacturing shipments fell steadily through most of 2008 due mainly to reduced demand for BC’s forest products from the troubled US economy. However, total exports from BC increased year-to-date to November 2008, driven by high energy prices pushing up the value of energy exports.
Infrastructure Program
Budget 2009 continues government’s commitment to an infrastructure spending plan that includes the acceleration of a number of new projects in order to keep British Columbians working and help stimulate the economy.
Infrastructure spending on transit, roads, schools, hospitals, post secondary facilities, electrical generation, transmission and distribution projects and other capital assets totals $20 billion over the three year period of the fiscal plan.
The capital plan includes $2 billion for accelerated infrastructure projects and assumes federal contributions of $1.0 billion, from infrastructure stimulus funds announced in the federal budget on January 27, 2009.
Construction investments of $10.6 billion are also included in the Province’s capital plan (i.e. excluding information technology projects, land purchases, and vehicle purchases).
An additional $1.4 billion in local infrastructure projects is being built in partnership with local governments and the federal government.
These investments are estimated to generate 88,000 direct construction jobs over the next three years.
Healthcare funding increases
* Before $120 million Supplementary Estimates
Protecting Healthcare and Education
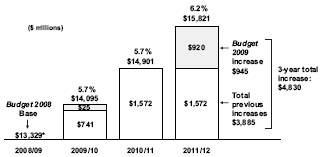
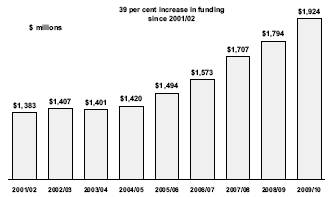
Budget 2009 confirms government’s commitment to health care and provides an additional $920 million for the Ministry of Health Services and health authorities in 2011/12, for an annual 6 per cent increase in funding for the third year of the fiscal plan. This funding is in addition to $3.9 billion over 3 years allocated previously in Budget 2008.
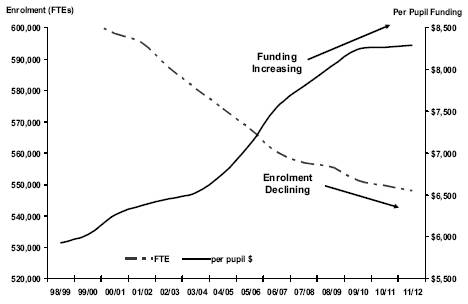
Budget 2009 maintains operating grant funding to school districts at previously announced funding levels. Despite enrolment declines over the next 3 years, the total budget for K-12 education continues to increase, resulting in higher levels of per pupil funding at the school district level.
Budget and Fiscal Plan – 2009/10 to 2011/12
2
Summary
Per pupil funding rises while student enrolment drops

Budget 2009 also increases access to post-secondary education and training throughout the province by providing $244 million over three years in new operating funding, including $228 million to post-secondary institutions and $16 million to support immigrant workers over three years.
Post-secondary funding increases
Sustaining Social Services
Budget 2009 ensures that programs and services that enhance the quality of life for British Columbians in need are protected, and provides $381 million over four years to:
· maintain previous funding commitments that implement new and expanded measures to help break the cycle of homelessness and support low income seniors and families;
· support priority programs and services for families and communities to care for and protect vulnerable children and youth;
· support programs and services to adults with developmental disabilities and their families, including continued access to community living services such as respite care, residential placements and life skills training; and
· provide additional support to individuals and families who experience difficulty in paying for their basic living necessities and will require income assistance.
Sustaining Social Services
($ millions) | | 4-year
Total (1) | |
Acquisition of social housing | | 30 | |
Children and Families | | | |
– Supporting families and children in care | | 47 | |
– Child care subsidies | | 25 | |
– Supporting children with special needs | | 38 | |
Subtotal | | 110 | |
Supporting adults with developmental disabilities | | 73 | |
Income assistance for individuals and families in need | | 110 | |
Policing and victim support | | 58 | |
Total | | 381 | |
(1) See page 26 for further information.
Supporting Communities and the Environment
Budget 2009 provides $479 million over four years, to support economic activity in communities throughout the province during the economic downturn, maintain BC as a leader in environmental protection and funds initiatives to support local government priorities and provide greater flexibility to address immediate needs including community safety.
Supporting Communities and the Environment
($ millions) | | 4-year
Total (1) | |
Supporting Communities | | | |
– Improving access for shale gas development | | 6 | |
– Improvements for rural resource roads | | 20 | |
– Community economic development | | 30 | |
– Towns for Tomorrow: cost shared community infrastructure | | 50 | |
– Local transportation projects to accelerate job creation | | 20 | |
– Bulkley-Nechako / Kitimal-Stikine Regional District grants | | 3 | |
– Internet connectivity for rural communities | | 5 | |
– Peace River Regional District infrastructure | | 9 | |
– Local government priorities, including community safety | | 151 | |
Subtotal | | 294 | |
Targeted Measures | | | |
– Michael Smith Foundation for health research | | 15 | |
– Provincial Transit Plan additional operating funding | | 59 | |
Subtotal | | 74 | |
Continued Environmental Leadership | | | |
– Carbon tax rebates for local government | | 15 | |
– Extending the ICE fund for green technology advancements | | 75 | |
– Planning for Capital Regional District water treatment facility | | 2 | |
– Trees for Tomorrow: planting trees in public places | | 11 | |
– BC portion of the Hydrogen Highway | | 8 | |
Subtotal | | 111 | |
Total | | 479 | |
(1) See page 28 for further information.
Budget and Fiscal Plan – 2009/10 to 2011/12
3
Summary
Tax Measures
On October 22, 2008, government announced economic stimulus measures including the accelerated personal income tax cuts and small business tax relief. The 3 per cent reduction in the rates for the two lowest income tax brackets, combined with the 2 per cent reduction in Budget 2008, provides a $211 million reduction in 2008 taxes for British Columbians to help stimulate the economy.
Government also introduced a temporary property tax deferment program for homeowners who are experiencing financial hardship due to current economic conditions.
Administrative Efficiencies
Government is managing down expenses in order to protect health care, education and social service programs. Significant savings in administrative and other discretionary spending will be achieved, and some government programs will be streamlined.
Budget 2009 reallocates $1.9 billion in administrative and other savings over 3 years to health care, education and social service programs as well as to support other priority programs that provide public services.
Administrative Spending – Change from 2008/09
| | 2008/09 | | 2009/10 | | $ | | % | |
($ millions) | | Estimates | | Estimates | | Change | | Change | |
Expense category: | | | | | | | | | |
– Boards, commissions and courts (fees and expenses) | | 11 | | 10 | | (1 | ) | -5 | % |
– Public servant travel | | 74 | | 58 | | (16 | ) | -22 | % |
– Professional services | | 769 | | 592 | | (177 | ) | -23 | % |
– Office and business expenses | | 116 | | 106 | | (10 | ) | -8 | % |
– Informational advertising and publications | | 30 | | 7 | | (23 | ) | -76 | % |
– Operating equipment and vehicles | | 135 | | 123 | | (12 | ) | -9 | % |
– Transfers — grants (discretionary) | | 826 | | 768 | | (58 | ) | -7 | % |
Total savings | | 1,961 | | 1,664 | | (297 | ) | -15 | % |
Government has also established a Transformation Fund within the Public Service Agency. The fund will be used to strategically invest in priority job streams and targeted recruitment, and to fund opportunities where the approach to work can be re-tooled to deliver quality services to citizens with fewer staff.
In addition, government will continue to review its operations to achieve a further $250 million in annual efficiencies by the end of 2011/12.
Return to Balanced Budgets by 2011/12
Government maintains its practice of strong fiscal management by requiring the budget to be balanced by the third year of the fiscal plan. In addition, the exemption to the balanced budget legislation requires government to use any future year end surpluses to eliminate direct operating debt, prohibiting Supplementary Estimates until the direct operating debt is eliminated.
BC will return to balanced budgets in 2011/12

Debt Remains Affordable
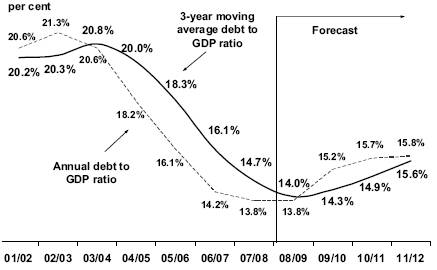
Significant progress has been made in reducing the taxpayer supported debt burden over the past five years. The taxpayer-supported debt to GDP ratio has declined from 21.3 per cent in 2002/03 to 13.8 per cent by 2008/09, a 35 per cent reduction. Due to significant infrastructure investments and weaker economic growth, the taxpayer-supported debt to GDP ratio is forecast to increase from 13.8 per cent in 2008/09 to 15.8 per cent in 2011/12. Debt remains affordable, despite the global economic downturn.
Taxpayer-supported debt burden remains low

Budget and Fiscal Plan – 2009/10 to 2011/12
4
Summary
Risks to the Fiscal Plan
The main risks to the government fiscal plan on the economic side include a protracted period of low economic growth in the US, reduced global demand for BC’s exports, continuing turmoil in global financial markets, and further weakening of domestic demand. Other risks include exchange rate movements or changes in natural gas, lumber or other commodity markets, as well as service demand pressures on the expenditure side.
No funding is included in the fiscal plan for the next round of public sector wage negotiations.
As the agreement has not been finalized, the fiscal implications of the Port Mann Bridge/ Highway 1 project, which will be funded from tolls, are not included in Budget 2009.
Other major risks to the fiscal plan stem from changes in factors that government does not directly control. These include:
· Assumptions underlying revenue and Crown corporation and agency forecasts such as economic factors, commodity prices and weather conditions.
· Utilization rates for government services such as health care, children and family services, and income assistance.
· The outcome of litigation, arbitrations, and negotiations with third parties.
· Potential changes to federal transfer allocations, cost-sharing agreements with the federal government and impacts on the provincial income tax bases arising from federal tax policy and budget changes. The impact of the recent federal income tax reductions on the economy was not anticipated when the economic forecast was finalized.
The fiscal plan includes contingencies of $385 million in 2009/10, $300 million in 2010/11 and $250 million in 2011/12 to help ensure the fiscal targets are met.
Conclusion
In summary, Budget 2009:
· provides a $2.0 billion accelerated infrastructure program to keep people at work in the construction sector over the next three years;
· protects public services and provides additional funding for health care, education and social services;
· reduces administrative and other costs and returns to balanced budgets by 2011/12; and
· keeps debt affordable.
Budget and Fiscal Plan – 2009/10 to 2011/12
5
Part 1: THREE-YEAR FISCAL PLAN
Table 1.1 Three-Year Fiscal Plan – Operating Statement
| | 2008/09 | | Budget | | | | | |
| | | | Updated | | Estimate | | Plan | | Plan | |
($ millions) | | Budget | | Forecast | | 2009/10 | | 2010/11 | | 2011/12 | |
Taxpayer-supported programs and agencies: | | | | | | | | | | | |
Revenue | | 38,490 | | 38,455 | | 38,812 | | 39,795 | | 41,182 | |
Expense | | (37,690 | ) | (38,405 | ) | (39,307 | ) | (40,040 | ) | (41,182 | ) |
Surplus (deficit) before forecast allowance | | 800 | | 50 | | (495 | ) | (245 | ) | — | |
Forecast allowance | | (750 | ) | — | | — | | — | | — | |
Surplus (deficit) | | 50 | | 50 | | (495 | ) | (245 | ) | — | |
Introduction
Budget 2009 reflects government’s response to the recent unprecedented drop in provincial revenues resulting from the global economic downturn. Despite economic stimulus measures and a comprehensive review of government operations to achieve administrative cost savings, revenue weakness has required the government to suspend its balanced budget legislation for a period of two years in order to protect vital health care, education and social services.
Budget 2009 projects deficits of $495 million in 2009/10 and $245 million in 2010/11. Nonetheless, government maintains its practice of strong fiscal management by requiring the budget to be balanced by the third year of the fiscal plan. In addition, the exemption to the balanced budget legislation requires government to use any future year end surpluses to eliminate direct operating debt, prohibiting Supplementary Estimates until the direct operating debt is eliminated.
The fiscal plan is based on the Ministry of Finance economic forecast that projects real economic growth of minus 0.9 per cent for 2009, recovering to 2.4 per cent in 2010 and 2.6 per cent in 2011. The Ministry of Finance’s outlook for 2009 is significantly lower than the outlook provided by the Economic Forecast Council. This greater-than-normal level of prudence recognizes the potential for further forecast downgrades by the private sector due to continuing economic and financial turmoil in global markets. The economic outlook is a significant reversal of expectations at the time of the 2008/09 first Quarterly Report, particularly in 2009. Full details of the economic forecast are found in Part 3: British Columbia Economic Review and Outlook.
The economic downturn resulted in a reduction of $6.6 billion in revenue over the fiscal plan period since the September Budget Consultation Paper. This loss was partially offset by $870 million in federal funding that comes with transfer of responsibilities under the Labour Market Development Agreement that provides training for British Columbians seeking employment, resulting in a net decrease in revenue of $5.8 billion as shown in Table 1.2.
Government is managing down expenses in order to protect health care, education and social service programs. Significant savings in administrative and other discretionary spending will be achieved, and some government programs will be streamlined. Budget 2009 reallocates $1.9 billion in administrative and other savings over 3 years to health care, education and social service programs as well as to support other priority programs that provide public services.
Budget and Fiscal Plan – 2009/10 to 2011/12
7
Three-Year Fiscal Plan
Table 1.2 Three-Year Fiscal Plan Update – Changes from Budget 2008
($ millions) | | 2008/09 | | 2009/10 | | 2010/11 | | 2011/12 | |
| | | | | | | | | |
Budget 2008 Fiscal Plan Surplus (February 19, 2008) | | 50 | | 150 | | 150 | | 150 | |
Budget 2009 Consultation Paper – available revenue | | 970 | | 1,015 | | 385 | | 1,500 | |
Updated fiscal plan before revenue changes and spending initiatives | | 1,020 | | 1,165 | | 535 | | 1,650 | |
Revenue changes: | | | | | | | | | |
Personal income tax: | | | | | | | | | |
Personal income tax – prior year adjustment | | (94 | ) | — | | — | | — | |
Personal income tax | | (285 | ) | (363 | ) | (325 | ) | (116 | ) |
Corporate income tax | | 311 | | (122 | ) | (244 | ) | (363 | ) |
Social service tax | | (234 | ) | (363 | ) | (421 | ) | (460 | ) |
Carbon tax | | (38 | ) | (85 | ) | (126 | ) | (175 | ) |
Property tax | | (24 | ) | (73 | ) | (122 | ) | (183 | ) |
Property transfer tax | | (165 | ) | (175 | ) | (100 | ) | (70 | ) |
Other tax sources | | 4 | | (20 | ) | (47 | ) | (43 | ) |
Forests | | (103 | ) | (226 | ) | (158 | ) | (269 | ) |
Natural gas royalties | | (356 | ) | (553 | ) | (346 | ) | (145 | ) |
Other energy, metals and minerals | | (214 | ) | (433 | ) | (363 | ) | (301 | ) |
Other fees and licenses | | (101 | ) | (13 | ) | (66 | ) | (73 | ) |
Investment earnings | | (76 | ) | (40 | ) | (25 | ) | 63 | |
Health and social transfers | | 49 | | 61 | | 6 | | (34 | ) |
Labour Market Development Agreement | | 48 | | 290 | | 290 | | 290 | |
Other federal transfers | | (24 | ) | 59 | | 67 | | 70 | |
Other taxpayer-supported revenue | | (55 | ) | (88 | ) | (112 | ) | (23 | ) |
Commercial Crown agencies operating results: | | | | | | | | | |
BC Hydro – mainly increase in allowed return on equity | | (4 | ) | 41 | | 37 | | 43 | |
Liquor Distribution Branch – mainly increased product sales | | 13 | | 33 | | 44 | | 58 | |
ICBC – mainly lower claims costs and operating efficiencies partially offset by lower premium and investment revenue | | 131 | | 13 | | 1 | | 38 | |
BC Railway Company – mainly delay in surplus property sales | | (25 | ) | (5 | ) | 21 | | (1 | ) |
Other commercial Crown agencies changes | | 4 | | 9 | | 4 | | (19 | ) |
Total revenue changes | | (1,238 | ) | (2,053 | ) | (1,985 | ) | (1,713 | ) |
Forecast allowance updates | | 750 | | 675 | | 675 | | 675 | |
Less : expense increases (decreases): | | | | | | | | | |
| | | | | | | | | |
Strategic priorities: | | | | | | | | | |
Healthcare (Chart 1.13) | | 120 | | 25 | | — | | 920 | |
Post-secondary education | | — | | 71 | | 86 | | 87 | |
Sustaining social services (Table 1.10) | | 30 | | 119 | | 127 | | 105 | |
Supporting communities and the environment (Table 1.11) | | 213 | | 104 | | 63 | | 99 | |
Public service transformation | | — | | 50 | | 25 | | — | |
Administrative and other savings | | — | | (589 | ) | (650 | ) | (631 | ) |
Labour Market Development Agreement | | 48 | | 290 | | 290 | | 290 | |
Adjust contingencies | | 125 | | (5 | ) | (100 | ) | (150 | ) |
Remove allocation for future wage increases | | — | | — | | (400 | ) | (400 | ) |
Debt servicing (including MOPD) | | (23 | ) | (64 | ) | (5 | ) | 160 | |
Additional expense recovered from external sources | | 22 | | 36 | | — | | 63 | |
Impact of transportation investment plan and infrastructure spending | | 22 | | 66 | | 109 | | 390 | |
Ministry year-end savings redirected to priorities | | (123 | ) | — | | — | | — | |
Other spending changes | | 48 | | 179 | | 50 | | (71 | ) |
Further efficiencies | | — | | — | | (125 | ) | (250 | ) |
Total expense increases (decreases) | | 482 | | 282 | | (530 | ) | 612 | |
Budget 2009 Updated Fiscal Plan Surplus (Deficit) | | 50 | | (495 | ) | (245 | ) | — | |
Budget and Fiscal Plan – 2009/10 to 2011/12
8
Three-Year Fiscal Plan
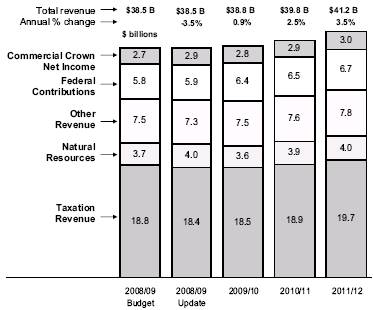
Chart 1.1 Revenue and spending trends

Overall, spending is projected to increase by $2.8 billion over the fiscal plan period. This includes spending associated with the Labour Market Development Agreement. Excluding the agreement, projected spending represents an average annual growth of 2.2 per cent, slightly higher than inflation. This will enable government to maintain services during the economic downturn while providing additional spending in key areas.
In 2008/09, ministry savings and a reduced forecast allowance have enabled government to allocate $622 million to priority initiatives, primarily to address the impact of the economic downturn. Government intends to introduce Supplementary Estimates to obtain the necessary legislative appropriations to fund these initiatives. (See Part 4: 2008/09 Revised Financial Forecast (third Quarterly Report) for further details).
Budget 2009 continues government’s commitment to an infrastructure spending plan that includes the acceleration of a number of new projects in order to keep British Columbians working and help stimulate the economy. Infrastructure spending on transit, roads, schools, hospitals, post secondary facilities, electrical generation, transmission and distribution projects and other capital assets totals $20 billion over the three year period of the fiscal plan. The capital plan includes $2 billion for accelerated infrastructure projects and assumes federal contributions of $1.0 billion from infrastructure stimulus funds announced in the federal budget on January 27, 2009. More information on the three-year capital spending plan is found on page 33.
Since peaking in 2003/04, government has made significant progress in reducing taxpayer-supported debt, including the operating debt. Taxpayer-supported debt has declined from $30.0 billion in 2003/04 to $27.7 billion by 2008/09. Operating debt has been reduced by 59 per cent from a peak of $15.7 billion in 2003/04 to $6.4 billion in 2008/09. These reductions allow government the flexibility to address the current economic challenges, while keeping debt affordable.
Budget and Fiscal Plan – 2009/10 to 2011/12
9
Three-Year Fiscal Plan
Table 1.3 Revenue by Source
| | 2008/09 | | Budget | | | | | |
($ millions) | | Budget | | Revised
Forecast | | Estimate
2009/10 | | Plan
2010/11 | | Plan
2011/12 | |
Taxation revenue | | | | | | | | | | | |
Personal income | | 6,700 | | 6,219 | | 6,562 | | 6,942 | | 7,366 | |
Corporate income | | 1,343 | | 2,037 | | 1,529 | | 1,072 | | 923 | |
Social service | | 5,284 | | 4,998 | | 5,087 | | 5,299 | | 5,533 | |
Fuel | | 957 | | 912 | | 914 | | 920 | | 928 | |
Carbon | | 338 | | 300 | | 546 | | 754 | | 968 | |
Tobacco | | 705 | | 713 | | 687 | | 687 | | 687 | |
Property | | 1,861 | | 1,840 | | 1,881 | | 1,936 | | 1,967 | |
Property transfer | | 1,020 | | 735 | | 685 | | 720 | | 750 | |
Other (1) | | 601 | | 610 | | 594 | | 553 | | 570 | |
| | 18,809 | | 18,364 | | 18,485 | | 18,883 | | 19,692 | |
Natural resource revenue | | | | | | | | | | | |
Natural gas royalties | | 1,165 | | 1,376 | | 1,014 | | 1,156 | | 1,281 | |
Forests | | 952 | | 587 | | 609 | | 707 | | 700 | |
Other resource (2) | | 1,606 | | 2,048 | | 2,007 | | 2,046 | | 2,030 | |
| | 3,723 | | 4,011 | | 3,630 | | 3,909 | | 4,011 | |
Other revenue | | | | | | | | | | | |
Medical Services Plan premiums | | 1,571 | | 1,577 | | 1,591 | | 1,613 | | 1,635 | |
Other fees (3) | | 2,505 | | 2,430 | | 2,518 | | 2,501 | | 2,519 | |
Investment earnings | | 884 | | 839 | | 918 | | 1,005 | | 1,095 | |
Miscellaneous (4) | | 2,509 | | 2,474 | | 2,475 | | 2,503 | | 2,562 | |
| | 7,469 | | 7,320 | | 7,502 | | 7,622 | | 7,811 | |
Contributions from the federal government | | | | | | | | | | | |
Health and social transfers | | 4,794 | | 4,693 | | 4,910 | | 5,110 | | 5,316 | |
Other federal contributions (5) | | 1,015 | | 1,223 | | 1,460 | | 1,408 | | 1,396 | |
| | 5,809 | | 5,916 | | 6,370 | | 6,518 | | 6,712 | |
Commercial Crown corporation net income | | | | | | | | | | | |
BC Hydro | | 358 | | 357 | | 452 | | 493 | | 542 | |
Liquor Distribution Branch | | 854 | | 867 | | 896 | | 918 | | 938 | |
BC Lotteries (net of payments to federal government) | | 1,101 | | 1,101 | | 1,154 | | 1,198 | | 1,228 | |
ICBC (6) | | 272 | | 459 | | 260 | | 192 | | 217 | |
Other | | 95 | | 60 | | 63 | | 62 | | 31 | |
| | 2,680 | | 2,844 | | 2,825 | | 2,863 | | 2,956 | |
Total revenue | | 38,490 | | 38,455 | | 38,812 | | 39,795 | | 41,182 | |
(1) Corporation capital, insurance premium and hotel room taxes.
(2) Columbia River Treaty, other energy and minerals, water rental and other resources.
(3) Post-secondary, healthcare-related, motor vehicle, and other fees.
(4) Includes asset dispositions, reimbursements for health care and other services provided to external agencies, and other recoveries.
(5) Includes contributions for health, education, community development, housing and social service programs, and transportation projects.
(6) The 2008/09 amounts represent ICBC’s projected earnings during government’s fiscal year. On ICBC’s fiscal year basis (December), the outlook for 2008 is: (budget) — $272 million; (forecast) — $498 million. For 2009/10 to 2011/12, the fiscal year and calendar year projections are assumed to be the same.
Budget and Fiscal Plan – 2009/10 to 2011/12
10
Three-year Fiscal Plan
Table 1.4 Expense by Ministry, Program and Agency
| | 2008/09 | | Budget | | | | | |
| | | | Revised | | Estimate | | Plan | | Plan | |
($ millions) | | Budget(1) | | Forecast | | 2009/10 | | 2010/11 | | 2011/12 | |
Office of the Premier | | 14 | | 14 | | 12 | | 12 | | 11 | |
Aboriginal Relations and Reconciliation | | 62 | | 62 | | 51 | | 47 | | 46 | |
Advanced Education and Labour Market Development | | 2,075 | | 2,056 | | 2,260 | | 2,262 | | 2,237 | |
Agriculture and Lands | | 289 | | 249 | | 298 | | 232 | | 230 | |
Attorney General | | 546 | | 546 | | 556 | | 549 | | 534 | |
Children and Family Development | | 1,389 | | 1,389 | | 1,403 | | 1,414 | | 1,414 | |
Community Development | | 238 | | 238 | | 197 | | 182 | | 234 | |
Education | | 5,117 | | 5,115 | | 5,179 | | 5,215 | | 5,231 | |
Energy, Mines and Petroleum Resources | | 73 | | 72 | | 73 | | 50 | | 55 | |
Environment | | 263 | | 251 | | 239 | | 237 | | 234 | |
Finance | | 234 | | 231 | | 153 | | 116 | | 104 | |
Forests and Range | | 806 | | 770 | | 768 | | 692 | | 696 | |
Health Services | | 13,329 | | 13,329 | | 14,095 | | 14,901 | | 15,821 | |
Healthy Living and Sport | | 72 | | 66 | | 71 | | 71 | | 72 | |
Housing and Social Development | | 2,602 | | 2,602 | | 2,641 | | 2,651 | | 2,617 | |
Labour and Citizens’ Services | | 102 | | 102 | | 78 | | 73 | | 64 | |
Public Safety and Solicitor General | | 624 | | 624 | | 647 | | 630 | | 625 | |
Small Business, Technology and Economic Development | | 67 | | 67 | | 85 | | 79 | | 79 | |
Tourism, Culture and the Arts | | 353 | | 349 | | 55 | | 51 | | 51 | |
Transportation and Infrastructure | | 771 | | 771 | | 766 | | 790 | | 844 | |
Total ministries and Office of the Premier | | 29,026 | | 28,903 | | 29,627 | | 30,254 | | 31,199 | |
Management of public funds and debt | | 1,262 | | 1,212 | | 1,200 | | 1,292 | | 1,330 | |
Contingencies | | 342 | | 342 | | 385 | | 300 | | 250 | |
Funding for capital expenditures | | 972 | | 899 | | 1,323 | | 1,347 | | 1,017 | |
Legislative and other appropriations | | 137 | | 137 | | 165 | | 127 | | 125 | |
Subtotal | | 31,739 | | 31,493 | | 32,700 | | 33,320 | | 33,921 | |
Priority spending initiatives | | — | | 622 | | — | | — | | — | |
Consolidated revenue fund total expense | | 31,739 | | 32,115 | | 32,700 | | 33,320 | | 33,921 | |
Expenses recovered from external entities | | 1,892 | | 2,193 | | 2,402 | | 2,385 | | 2,450 | |
Externally-funded service delivery agency expense: | | | | | | | | | | | |
School districts | | 301 | | 268 | | 273 | | 296 | | 329 | |
Post-secondary institutions | | 2,185 | | 2,174 | | 2,176 | | 2,378 | | 2,564 | |
Health authorities and hospital societies | | 427 | | 520 | | 686 | | 653 | | 727 | |
Other service delivery agencies | | 1,146 | | 1,135 | | 1,070 | | 1,133 | | 1,441 | |
| | 4,059 | | 4,097 | | 4,205 | | 4,460 | | 5,061 | |
Subtotal expense | | 37,690 | | 38,405 | | 39,307 | | 40,165 | | 41,432 | |
Further efficiencies | | — | | — | | — | | (125 | ) | (250 | ) |
Total expense | | 37,690 | | 38,405 | | 39,307 | | 40,040 | | 41,182 | |
(1) The 2008/09 budget estimate and revised forecast have been restated to reflect government’s current organization and accounting policies.
Budget and Fiscal Plan – 2009/10 to 2011/12
11
Three-year Fiscal Plan
Taxpayer-supported debt is forecast to increase to $34.1 billion by 2011/12, reflecting the significant infrastructure investments planned over the next three years that will benefit future generations of British Columbians, and the forecast deficits over the next two fiscal years. Total provincial debt, which includes commercial Crown agency debt, is forecast to increase over the next three years to $47.2 billion by 2011/12, primarily reflecting additional investment in improving and expanding British Columbia’s hydro generation assets.
Significant progress has been made in reducing the taxpayer supported debt burden over the past six years. The taxpayer-supported debt to GDP ratio has declined from 21.3 per cent in 2002/03 to 13.8 per cent by 2008/09, a 35 per cent reduction. Due to significant infrastructure investments and weaker economic growth, the taxpayer- supported debt to GDP ratio is forecast to increase from 13.8 per cent in 2008/09 to 15.8 per cent in 2011/12. Debt remains affordable, despite the global economic downturn. Additional information on the debt outlook is found starting on page 40.
Chart 1.2 Taxpayer-supported debt burden remains low
The main risks to the government fiscal plan include a protracted period of low economic growth in the US, reduced global demand for BC’s exports, continuing turmoil in global financial markets, and further weakening of domestic demand. Other risks include exchange rate movements or changes in natural gas, lumber or other commodity markets, as well as service demand pressures on the expenditure side. These and other risks are more fully described starting on page 43.
The fiscal plan includes contingencies of $385 million in 2009/10, $300 million in 2010/11 and $250 million in 2011/12 to help ensure the fiscal targets are met. In addition, government will continue to review its operations to achieve a further $250 million in annual efficiencies by the end of 2011/12. The budget provides no funding for annual wage increases in the next round of public sector bargaining.
The three-year fiscal plan conforms to the standards set by the accounting profession for senior governments in Canada referred to as generally accepted accounting principles or “GAAP”.
Budget and Fiscal Plan – 2009/10 to 2011/12
12
Three-year Fiscal Plan
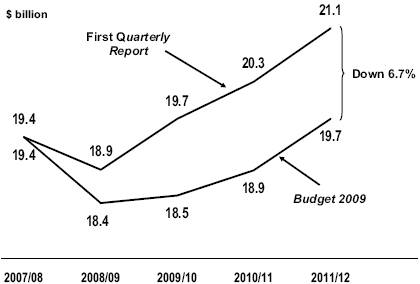
Revenue
Changes since the first Quarterly Report
Since the updated fiscal plan released September 12, 2008 in the 2009 Budget Consultation Paper, the revenue forecast has declined $1.2 billion, $2.1 billion, $2.0 billion and $1.7 billion in the four years 2008/09 to 2011/12, respectively. Changes to the 2008/09 revenue forecast are detailed in Part 4: 2008/09 Revised Financial Forecast (third Quarterly Report).
Chart 1.3 Three-year cumulative change in revenue since the first Quarterly Report
* Excludes $870 million in funding for the LMDA transfer
The economic downturn resulted in a reduction of $6.6 billion in revenue over the fiscal plan period since the September Budget Consultation Paper. This loss was partially offset by $870 million in federal funding in support of the Labour Market Development Agreement, resulting in a net decrease in revenue of $5.8 billion. The cumulative $5.8 billion revenue loss over the next three years reflects decreases
Chart 1.4 Nominal GDP changes
Budget and Fiscal Plan – 2009/10 to 2011/12
13
Three-year Fiscal Plan
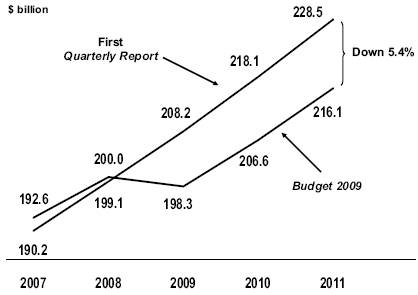
in taxation, natural resource and other revenue sources, partially offset by improvements in federal government transfers and commercial Crown corporation net income. The global economic slowdown combined with the financial market crisis and equity market disruptions have contributed to a significant decline in the BC economic outlook. The level of nominal Gross Domestic Product in 2011 is now projected to be 5.4 per cent lower than forecast in the first Quarterly Report. This loss in economic output, combined with the effects of accelerated tax cuts, results in a $4.0 billion cumulative reduction in taxation revenues over the three years. Weaker economic growth affects virtually all taxation revenue sources and in particular, the cumulative three-year loss from personal income, corporate income, social service, carbon and property transfer tax revenues totals $3.5 billion.
Chart 1.5 Taxation revenue changes
Plunging commodity prices and the fallout in the US housing sector are major contributors to the three-year total loss of $2.8 billion in natural resource revenues.
Chart 1.6 Change in natural gas prices

Budget and Fiscal Plan – 2009/10 to 2011/12
14
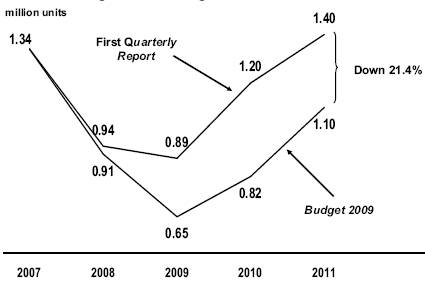
Three-year Fiscal Plan
Chart 1.7 Change in US housing starts
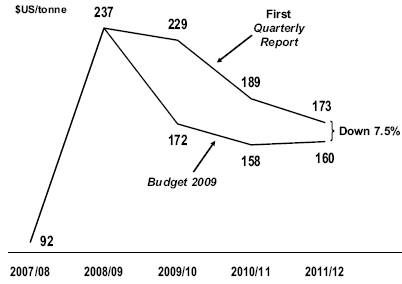
Lower natural gas prices, disruptions in capital markets and a reduced expectation of the average bonus bid per hectare result in a $1.5 billion reduction from natural gas royalties and revenue of sales of Crown land tenures over the three years ending 2011/12. Volatility in other commodity markets including lumber, pulp, coal, metals, oil and electricity contribute to a further $1.4 billion revenue decline.
Chart 1.8 Change in coal prices
Budget and Fiscal Plan – 2009/10 to 2011/12
15
Three-year Fiscal Plan
Chart 1.9 Change in natural resource revenue
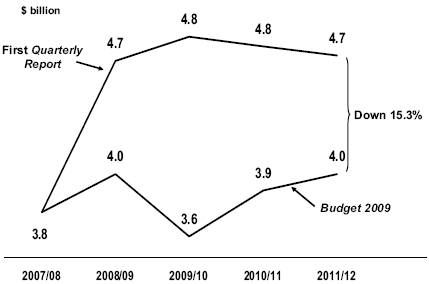
Excluding the $870 million in support of the Labour Market Development Agreement, the $0.2 billion improvement over the three years from federal government contributions mainly reflects increases in program recoveries from ministries and taxpayer supported Crown corporations. Since these transfers represent both higher revenues and expenses, there is no impact on government’s bottom line. These recoveries include $69 million for additional agricultural programs, $24 million in added support to the Ministry of Children and Family Development and $110 million directed to taxpayer supported Crown agencies.
The three-year $0.3 billion decline in other taxpayer-supported sources includes reduced revenue from the school, university, college and health authority (SUCH) sector and $183 million resulting from decommissioning the Coquihalla highway toll booths.
Higher net incomes from the commercial Crown corporations mainly reflect increased sales from the Liquor Distribution Branch, timing of BC Railway Company asset dispositions and an improved rate of return from BC Hydro.
Budget and Fiscal Plan – 2009/10 to 2011/12
16
Three-Year Fiscal Plan
Table 1.5 Major Factors Underlying Revenue
Calendar Year | | Budget 2009 | | First Quarterly Report | |
Per cent growth unless otherwise indicated | | 2008 | | 2009 | | 2010 | | 2011 | | 2008 | | 2009 | | 2010 | | 2011 | |
Real GDP | | 1.0 | | -0.9 | | 2.4 | | 2.6 | | 1.7 | | 2.3 | | 2.9 | | 2.8 | |
Nominal GDP | | 3.9 | | -0.9 | | 4.2 | | 4.6 | | 4.7 | | 4.6 | | 4.8 | | 4.8 | |
Personal income | | 5.1 | | 1.7 | | 3.5 | | 4.3 | | 5.5 | | 4.3 | | 4.5 | | 4.5 | |
Corporate profits | | -4.0 | | -24.7 | | 1.5 | | 3.2 | | -1.6 | | 1.7 | | 4.3 | | 4.5 | |
Consumer expenditures | | 3.7 | | 1.9 | | 4.8 | | 4.7 | | 4.8 | | 4.9 | | 5.1 | | 5.0 | |
Consumer expenditures on durable goods | | -5.1 | | 0.3 | | 2.3 | | 2.5 | | -1.0 | | 3.2 | | 2.7 | | 2.8 | |
Business investment | | 4.6 | | -0.5 | | 5.4 | | 4.8 | | 4.6 | | 3.4 | | 5.1 | | 5.6 | |
Retail sales | | 1.5 | | 1.3 | | 4.4 | | 4.4 | | 3.2 | | 4.7 | | 4.9 | | 4.9 | |
Employment | | 2.1 | | -0.5 | | 1.3 | | 1.5 | | 2.5 | | 1.7 | | 1.7 | | 1.6 | |
BC housing starts | | -12.4 | | -25.6 | | 4.9 | | 3.8 | | -5.4 | | -11.2 | | -4.3 | | -1.4 | |
| | | | | | | | | | | | | | | | | |
US housing starts | | -32.7 | | -28.0 | | 25.4 | | 35.0 | | -29.9 | | -5.3 | | 34.8 | | 16.7 | |
SPF 2x4 price ($US/thousand board feet) | | $ | 219 | | $ | 213 | | $ | 250 | | $ | 300 | | $ | 237 | | $ | 250 | | $ | 300 | | $ | 300 | |
Pulp ($US/tonne) | | $ | 851 | | $ | 606 | | $ | 650 | | $ | 700 | | $ | 882 | | $ | 850 | | $ | 825 | | $ | 800 | |
Exchange rate (US cents/Canadian dollar) | | 93.7 | | 79.3 | | 86.2 | | 89.4 | | 99.3 | | 98.2 | | 95.1 | | 94.4 | |
Fiscal Year | | 2008/09 | | 2009/10 | | 2010/11 | | 2011/12 | | 2008/09 | | 2009/10 | | 2010/11 | | 2011/12 | |
Natural gas price ($Cdn/GJ at plant inlet) | | $ | 6.57 | | $ | 5.87 | | $ | 6.21 | | $ | 6.61 | | $ | 7.58 | | $ | 7.27 | | $ | 6.86 | | $ | 6.67 | |
Bonus bids average bid price per hectare ($) | | $ | 3,659 | | $ | 794 | | $ | 954 | | $ | 1,226 | | $ | 4,299 | | $ | 1,010 | | $ | 1,082 | | $ | 1,173 | |
Electricity price ($US/mega-watt hour, Mid-C) | | $ | 61 | | $ | 61 | | $ | 67 | | $ | 67 | | $ | 81 | | $ | 76 | | $ | 74 | | $ | 75 | |
Metallurgical coal price ($US/tonne, fob west coast) | | $ | 237 | | $ | 172 | | $ | 158 | | $ | 160 | | $ | 237 | | $ | 229 | | $ | 189 | | $ | 173 | |
Copper price ($US/lb) | | $ | 2.65 | | $ | 1.73 | | $ | 2.44 | | $ | 2.38 | | $ | 3.56 | | $ | 3.23 | | $ | 2.93 | | $ | 2.58 | |
Crown harvest volumes (million cubic metres) | | 51.0 | | 52.0 | | 55.0 | | 60.0 | | 52.0 | | 54.0 | | 60.0 | | 63.0 | |
Budget 2009 Plan
Government revenue includes the combined revenues of the Consolidated Revenue Fund (CRF), taxpayer-supported Crown agencies, the SUCH sector, and the net income of commercial Crown corporations.
Following growth of 3.4 per cent in 2007/08, revenue is forecast to decline 3.5 per cent to total $38.5 billion in 2008/09. The 2008/09 revised forecast incorporates the impacts of slowing economic growth in 2008; and tax measures introduced in Budget 2007, Budget 2008, and Budget 2009 as well as accelerated tax cuts announced on October 22, 2008 designed to improve competitiveness and reduce costs for families and businesses. The 2008/09 revenue projection also includes the impacts of volatile commodity markets with increasing revenue from natural gas royalties, sales of Crown land tenures and coal production, partially offset by a 46 per cent decline in forest revenue.
In 2009/10, revenue growth of 0.9 per cent reflects a 7.7 per cent increase in federal government contributions and a 2.5 per cent increase in other taxpayer supported revenue sources, partially offset by the impacts of a 0.9 per cent decline in nominal GDP growth, falling natural gas prices and the full-year effect of reducing corporate income tax rates. More than half of the increasing federal government transfers represent additional funding in support of higher expenses under the Labour Market Development Agreement, agricultural programs and taxpayer supported Crown agencies.
Over the next two years as economic growth strengthens and commodity prices rise, due in part to an improving US economic outlook, revenue is expected to average 3.0 per cent annual growth.
Budget and Fiscal Plan – 2009/10 to 2011/12
17
Three-Year Fiscal Plan
Chart 1.10 Revenue forecast
Key assumptions and sensitivities relating to revenue are provided in Appendix Table A10. The major revenue components are:
· Personal income tax – up 5.5 per cent in 2009/10, and rising to 5.8 per cent and 6.1 per cent over the next two years.
Over the four years, revenue includes the effects of $2.6 billion of tax reductions provided to BC residents in the 2007 and 2008 budgets. Adding back the tax measures, base revenue is forecast to average 4.8 per cent annual growth over the next three years, consistent with Budget 2009 projections of personal and labour incomes. For full details on tax initiatives, see Part 2: Tax Measures.
Table 1.6 Personal Income Tax Revenue
($ millions) | | 2008/09 | | 2009/10 | | 2010/11 | | 2011/12 | |
Budget 2009 revenue | | 6,219 | | 6,562 | | 6,942 | | 7,366 | |
Budget 2009 measures – dividend tax credits | | — | | (8 | ) | (32 | ) | (32 | ) |
Budget 2008 measures | | | | | | | | | |
– carbon tax recycling | | 320 | | 365 | | 377 | | 404 | |
– Other measures | | (6 | ) | (41 | ) | (43 | ) | (46 | ) |
Budget 2007measures – tax cuts in 2008 | | 273 | | 282 | | 298 | | 316 | |
Federal government measures | | 11 | | 4 | | 11 | | 11 | |
Prior-year adjustment | | 151 | | — | | — | | — | |
Base personal income tax revenue | | 6,968 | | 7,164 | | 7,553 | | 8,019 | |
Annual growth | | 4.9 | % | 2.8 | % | 5.4 | % | 6.2 | % |
Personal income growth (calendar year) | | 5.1 | % | 1.7 | % | 3.5 | % | 4.3 | % |
Labour income growth (calendar year) | | 5.8 | % | 1.2 | % | 3.8 | % | 5.0 | % |
Elasticity (1) (calendar year basis, policy neutral) | | 1.0 | | 1.3 | | 1.4 | | 1.4 | |
(1) Percent growth in current year tax relative to per cent growth in personal income.
Budget and Fiscal Plan – 2009/10 to 2011/12
18
Three-Year Fiscal Plan
· Corporate income tax – declining $508 million or 25 per cent in 2009/10 reflecting a slowing economy; the full-year impact of tax cuts implemented in July and December 2008; and a lower settlement payment in respect of prior years. Revenue continues to decline over the next two years due to overpayments from the federal government in 2009 and 2010; and general rate reductions in 2010 and 2011 supporting the 2009/10 Revenue Neutral Carbon Tax Plan. For more details on carbon tax recycling, see the Revenue Neutral Carbon Tax topic box on page 72.
Table 1.7 Corporate Income Tax Revenue
($ millions) | | 2008/09 | | 2009/10 | | 2010/11 | | 2011/12 | |
Advance instalments from the federal government: | | | | | | | | | |
– Payment share | | 10.0 | % | 12.1 | % | 11.7 | % | 10.8 | % |
– Advances | | 1,386 | | 1,302 | | 1,257 | | 1,209 | |
International Financial Activity Act refunds | | (20 | ) | (20 | ) | (20 | ) | (20 | ) |
Prior-year adjustment | | 671 | | 247 | | (165 | ) | (266 | ) |
| | | | | | | | | |
Corporate income tax revenue | | 2,037 | | 1,529 | | 1,072 | | 923 | |
| | | | | | | | | |
Annual per cent growth | | -9.5 | % | -24.9 | % | -29.9 | % | -13.9 | % |
· Social Service tax — after incorporating measures introduced in Budget 2009, annual growth is forecast to average 3.4 per cent over the next three years, lower than recent history and consistent with the revised outlook of consumer and business spending and overall economic growth. For full details on tax initiatives, see Part 2: Tax Measures.
Table 1.8 Social Service Tax Revenue
($ millions) | | 2008/09 | | 2009/10 | | 2010/11 | | 2011/12 | |
Base revenue | | 4,998 | | 5,102 | | 5,317 | | 5,543 | |
Budget 2009 measures | | — | | (15 | ) | (18 | ) | (10 | ) |
Budget 2009 revenue | | 4,998 | | 5,087 | | 5,299 | | 5,533 | |
Annual growth | | -1.5 | % | 1.8 | % | 4.2 | % | 4.4 | % |
Annual per cent change (calendar year) | | | | | |
Personal consumption | | 3.7 | % | 1.9 | % | 4.8 | % | 4.7 | % |
Business investment | | 4.6 | % | -0.5 | % | 5.4 | % | 4.8 | % |
Nominal GDP | | 3.9 | % | -0.9 | % | 4.2 | % | 4.6 | % |
· Carbon tax – as announced in Budget 2008, the carbon tax rate per tonne of CO2-equivalent will increase by $5 each year to $25 per tonne in 2011/12. The forecast assumes that purchased volumes of natural gas will continue to grow by 2.0 per cent while consumption of gasoline is expected to be flat over the next three years. Revenue is expected to increase in line with these higher rates and assumed volume growth. By law, carbon tax revenue is fully returned to taxpayers through tax reductions. For more details on carbon tax recycling, see the Revenue Neutral Carbon Tax topic box on page 72.
· Property tax – revenue is expected to average 2.2 per cent annual growth over the fiscal plan and includes the effects of an Industrial Property Tax Credit for light and major industrial properties announced on October 22, 2008; and other tax measures including the northern and rural homeowner benefit announced in Budget 2009. These tax cuts are included in the 2009/10 Revenue Neutral Carbon Tax Plan. For full details on tax initiatives, see Part 2: Tax Measures.
Budget and Fiscal Plan – 2009/10 to 2011/12
19
Three-Year Fiscal Plan
Chart 1.11 Property transfer tax
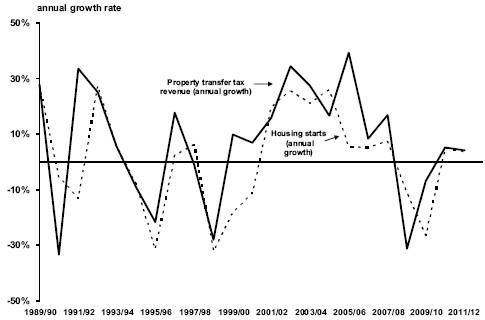
· Property transfer tax – consistent with the outlook for BC housing starts and expected moderation in the housing market, annual revenue growth is forecast to average 0.7 per cent over the next three years.
· Natural gas royalties – declines 26.3 per cent in 2009/10 due to lower natural gas prices and increasing production from wells qualifying for royalty programs and credits. Over the next two years, revenue is expected to increase as demand and average prices rise with an improving North American economy. The government continues to provide royalty programs and credits to foster industry investment in exploration and development. See Appendix Table A.11 for more details regarding natural gas price forecasts.
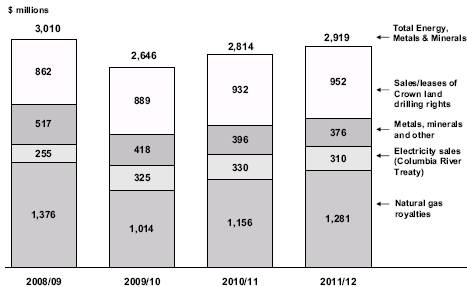
· Other energy, metals and minerals – average annual revenue growth from sales of Crown land tenures is forecast to be 3.4 per cent over the next three years as annual cash sales are recorded as revenue over eight years. Revenue from other
Chart 1.12 Revenue from energy metals and minerals
Budget and Fiscal Plan – 2009/10 to 2011/12
20
Three-Year Fiscal Plan
energy, metals and minerals falls in the next three years due to the effects of commodity prices, production volumes, the exchange rate and higher mining costs.
· Forests – in 2009/10, the impacts of the mountain pine beetle infestation, prevailing weak lumber prices and an anaemic US housing market are expected to continue to result in declining stumpage revenue. This is partially offset by increasing border tax revenues mainly resulting from a one-time $39 million refund to forest companies in 2008/09.
Over the next two years as prices and markets are expected to recover, stumpage revenue increases, partially offset by declining border tax revenues. Revenue is forecast to average 7.2 per cent annual growth, however by 2011/12, forests revenue is still expected to be significantly below recent historical levels.
· Health and social transfers – Over the next three years, revenue is expected to average 4.2 per cent annual growth reflecting national base growth, rising BC population share and incorporating partial protection from the federal government health transfer measures introduced in its recent budget on January 27, 2009.
Table 1.9 Health and Social Transfers
($ millions) | | 2008/09 | | 2009/10 | | 2010/11 | | 2011/12 | |
Canada Health Transfer (CHT) | | 3,168 | | 3,373 | | 3,536 | | 3,719 | |
Wait times | | — | | 33 | | 33 | | 33 | |
Health deferral | | 145 | | 68 | | 53 | | 23 | |
Canada Social Transfer (CST) | | 1,385 | | 1,436 | | 1,488 | | 1,541 | |
Prior-year adjustments | | (5 | ) | — | | — | | — | |
Total health and social transfers | | 4,693 | | 4,910 | | 5,110 | | 5,316 | |
Annual Change | | 79 | | 217 | | 200 | | 206 | |
| | 1.7 | % | 4.6 | % | 4.1 | % | 4.0 | % |
· Other federal contributions
· up $237 million or 19 per cent in 2009/10 mainly due to funding under the Labour Market Development Agreement for which the province administers programs and services previously provided by the federal government, aimed at helping Employment Insurance clients and the unemployed prepare for and obtain employment.
· declining $52 million in 2010/11 mainly reflecting the termination of funding for the Millennium Scholarship program in 2009/10.
Commercial Crown Corporation Net Income
· British Columbia Hydro and Power Authority – BC Hydro’s net income, based on meeting its allowed return on equity, is forecast at $452 million in 2009/10, $493 million in 2010/11 and $542 million in 2011/12 after regulatory account transfers. These transfers are used to mitigate the income risks of key assumptions such as water inflows, market prices and trade income.
The projections reflect increases in energy costs largely due to a greater proportion of requirements being met through imported energy and from new sources of supply generated by independent power producers. These sources result in higher energy costs than from power generated by Heritage resources which are operating at near maximum capacity. Maintenance requirements and additional borrowings for capital asset improvement programs are also increasing financing and amortization
Budget and Fiscal Plan – 2009/10 to 2011/12
21
Three-Year Fiscal Plan
expenses. These costs are driven by the need for major overhauls of ageing infrastructure and to address capacity constraints caused by demand load growth, reliability issues, and escalating construction costs.
While BC Hydro has incorporated rate increases into its projections, the rate increases are subject to approval by the BC Utilities Commission (BCUC) through the revenue requirements application process. In November 2008, BC Hydro filed its Final Argument for rate increases in 2008/09 and 2009/10. BCUC’s decision is expected in early 2009 (see Appendix Table A10 for rate assumptions).
· British Columbia Liquor Distribution Branch (LDB) – LDB’s net income is forecast at $896 million in 2009/10, $918 million in 2010/11 and $938 million in 2011/12. These projections reflect an increasing sales trend for spirits, wine and beer, and cost reductions resulting from operating efficiencies.
· British Columbia Lottery Corporation – BCLC’s net income (after payments to the federal government) is forecast at $1,154 million in 2009/10, $1,198 million in 2010/11 and $1,228 million in 2011/12. These projections reflect continued revenue growth mainly from casinos, community gaming centres and e-Gaming. Revenue from lotteries is also expected to increase, but at a more moderate pace.
A significant portion of provincial income from gaming is redistributed to charities and local governments. In Budget 2009, total distributions of gaming income are projected to increase from $263 million in 2008/09 to $280 million in 2011/12.
· British Columbia Railway Company – BCRC’s net income is forecast at $37 million in 2009, $32 million in 2010 and $0.2 million in 2011 reflecting the completion of surplus property sales at the end of 2010. BCRC will continue to operate the Port Subdivision (Robert’s Bank) as well as invest in the DeltaPort Berth 3 expansion project in support of government’s Pacific gateway and ports strategies.
· Insurance Corporation of British Columbia – ICBC’s net income is forecast at $260 million in 2009, $192 million in 2010 and $217 million in 2011. The projections reflect current assumptions for premiums including the full-year impact of a 3.0 per cent rate decrease on optional insurance, effective on July 1, 2008, and moderate growth in vehicles being insured. The projections also reflect lower investment income as a result of the decline in equity investment markets in 2008 and a return to historical claims trends.
Consolidated Revenue Fund Spending
Consolidated Revenue Fund (CRF) spending is forecast to increase from a revised forecast of $32.1 billion in 2008/09 to $33.9 billion by 2011/12 – a 5.6 per cent increase over the three year period.
Budget 2009 protects health care, education and social services on which BC families depend. To address the current economic challenges, Budget 2009 also provides support for communities and protection of the environment.
Government recognizes, and has acted on, the need to cut back in all areas of discretionary spending, just as British Columbia’s businesses and citizens are having to do in these difficult economic times. Budget 2009 achieves significant administrative savings while supporting direct services to the public in health care, education, social supports, and other priority services. A further review of programs throughout the public sector is planned over the next two years to achieve additional savings to again reach a balanced budget by 2011/12.
Budget and Fiscal Plan – 2009/10 to 2011/12
22
Three-Year Fiscal Plan
Protecting Health Care and Education
Health Care
Budget 2009 confirms government’s commitment to health care and provides an additional $920 million for the Ministry of Health Services and health authorities in 2011/12, for an annual 6 per cent increase in funding for the third year of the fiscal plan. This funding is in addition to $3.9 billion over 3 years allocated previously in Budget 2008.
Chart 1.13 Ministry of Health Services budget increases
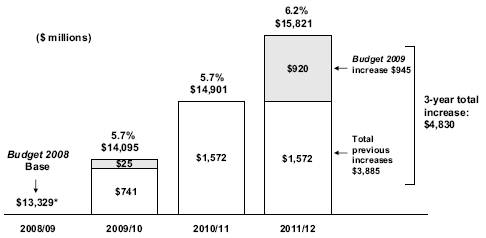
* Before $120 million Supplementary Estimates
Budget 2009 provides additional funding of $562 million to health authorities in 2011/12, an increase of 6 per cent from 2010/11. Funding for Ministry of Health Services programs including PharmaCare, Medical Services Plan, and Emergency Health Services, increases by $358 million in 2011/12.
Funding for the Ministry of Health Services and health authorities will support growth in beds, increased surgical procedures, improved access to services and new hospital facilities.
The Ministry’s budget includes $25 million in 2009/10 for the Lower Mainland Innovation and Integration Fund (LMIIF) to assist health authorities implement best practices and integrate and coordinate service delivery. This funding is in addition to the $50 million provided for the LMIIF in 2008/09.
To ensure that health services are protected in the current economic environment, the Ministry of Health Services and health authorities will be required to achieve efficiencies and administrative savings beginning in 2009/10. These savings will be re-directed to enhance health services.
· Collectively, health authorities will be required to achieve administrative savings of $25 million per year, approximately 2 per cent of the health authorities’ administration and support services costs. It is expected that a significant portion of these savings can be realized through innovation and lean-design approaches to health care delivery. Every dollar will be redirected to patient care.
Budget and Fiscal Plan – 2009/10 to 2011/12
23
Three-Year Fiscal Plan
· The Ministry will be required to achieve administrative savings of $48 million, of which $35 million will be redirected to health authorities to enhance patient care and the remaining $13 million will be allocated to establish a BC Family Residence Program for family members traveling to regional health centres.
Health spending by function includes all health care-related spending by the Ministry of Health Services and other ministries, including Healthy Living and Sport, Children and Family Development, and Housing and Social Development, as well as other service delivery agencies such as Canadian Blood Services. Health spending by function, on a summary basis, increases to $17.5 billion in 2011/12, up from $12.4 billion in 2005/06, a 41 per cent increase.
Post-Secondary Education
Budget 2009 is consistent with government’s commitment to increase access to post-secondary education and training throughout the province. At a time of global economic slowdown, government recognizes, more than ever, the importance of maintaining funding to this sector.
Budget 2009 provides $244 million in new operating funding, including $228 million to post-secondary institutions and $16 million to support immigrant workers, over three years. The post-secondary portion is comprised of:
· $165 million to further enhance general access to post-secondary educational opportunities in universities and colleges throughout BC.
· $40 million to expand health education programs to address health human resource shortages, including expanding the three-year Bachelor of Science in nursing, medical technology, and pharmacy.
· $23 million, starting in 2010/11, to fulfill the commitment to increase the number of doctors trained to address growing demands on the health care sector.
In recognition of the importance of BC’s industry training and apprenticeship system, government will maintain funding of $105 million per year to the Industry Training Authority for apprenticeship training spaces in public and private training institutions. By the end of 2009/10, government will have funded an additional 7,000 new apprenticeship spaces since 2007/08, allowing more apprentices to take their classroom training and complete their apprenticeships. Since 2001, funding for industry training has increased by 42 per cent and the number of apprentices and trainees in BC has more than doubled to an estimated 45,500 in 2008/09.
Collectively, public post-secondary institutions will be required to achieve administrative savings of $11 million per year. It is expected that these savings will be redirected to education and training within the institutions.
Post-secondary education spending by function, on a summary basis, increases to $4.8 billion in 2011/12, up from $3.9 billion in 2005/06, a 23 per cent increase.
Even during the current economic slowdown, skilled labour shortages remain a critical issue for BC employers. To remain competitive and address skills supply issues, BC must attract and retain a highly skilled workforce from other countries. Moreover, many immigrants face challenges in adapting their knowledge and integrating into the workforce.
Budget and Fiscal Plan – 2009/10 to 2011/12
24
Three-Year Fiscal Plan
Chart 1.14 Post-secondary funding

Budget 2009 includes new investments of $16 million over the next three years beginning in 2009/10 in the following initiatives that remove barriers to employment for BC’s immigrant workforce:
· To continue the Skills Connect for Immigrants and International Qualifications programs and leverage additional federal investments in these areas. Both programs address the barriers to full labour market participation that many immigrants face.
· Skills Connect provides immigrants with personal assessments and career planning to support skills upgrading, language enhancement and workplace experience opportunities in order to overcome barriers to employment.
· The International Qualifications program supports projects that remove systemic barriers that prevent skilled immigrants from finding employment in a career area related to their experience and training. Specific initiatives include strategies to improve recognition of foreign credentials and work-based language training.
On February 20, 2008 Canada and British Columbia signed a new Labour Market Development Agreement (LMDA). The LMDA provides BC with an investment of approximately $290 million annually for Employment Insurance (EI) Part II programs and services, which are designed to provide EI clients with appropriate training and support to help them prepare for, obtain and maintain employment. A separate new labour market agreement (LMA) totaling approximately $66 million per year for the next 5 years for non-EI eligible clients was also signed with the federal government at the same time. These two agreements enable the province to direct funding and programming to support BC’S short and long-term labour market challenges. The ministries of Advanced Education and Labour Market Development, Housing and Social Development and other ministries are working together to implement these agreements.
Stable Funding for K-12 Education
Budget 2009 maintains operating grant funding to school districts at previously announced funding levels. Over the next 3 years, while the total budget for K-12 education increases, enrolment is expected to decline, resulting in increasing levels of per pupil funding at the school district level.
Budget and Fiscal Plan – 2009/10 to 2011/12
25
Three-Year Fiscal Plan
Chart 1.15 Student enrolment and per pupil funding (public schools)
Collectively, school districts will be required to achieve administrative savings of $12 million per year. It is expected that these savings will be redirected to the classroom.
K–12 education spending by function, on a summary basis, increases to $5.8 billion in 2011/12, up from $4.8 billion in 2005/06, a 21 per cent increase.
Sustaining Social Services
Government is committed to ensuring that programs and services that enhance the quality of life for British Columbians in need are protected.
Table 1.10 Sustaining Social Services
($ millions) | | 2008/09 | | 2009/10 | | 2010/11 | | 2011/12 | | Total | |
Acquisition of social housing | | 30 | | — | | — | | — | | 30 | |
Children and Families | | | | | | | | | | | |
– Supporting families and children in care | | — | | 14 | | 13 | | 20 | | 47 | |
– Child care subsidies | | — | | 8 | | 8 | | 9 | | 25 | |
– Supporting children with special needs | | — | | 11 | | 13 | | 14 | | 38 | |
Subtotal | | — | | 33 | | 34 | | 43 | | 110 | |
Supporting adults with developmental disabilities | | — | | 19 | | 27 | | 27 | | 73 | |
Income assistance for individuals and families in need | | — | | 47 | | 47 | | 16 | | 110 | |
Policing and victim support | | — | | 20 | | 19 | | 19 | | 58 | |
Total | | 30 | | 119 | | 127 | | 105 | | 381 | |
Budget 2009 maintains previous funding commitments to implement new and expanded measures to help break the cycle of homelessness and support low income seniors and families. In 2008/09 the province intends to introduce supplementary estimates for $30 million to acquire and renovate rental properties including 4 single room occupancy (SRO) hotels in Vancouver and 4 hotels/motels throughout British Columbia. This new, year-end funding is part of a $36 million initiative to protect and
Budget and Fiscal Plan – 2009/10 to 2011/12
26
Three-Year Fiscal Plan
create housing involving 15 properties and utilizing $6 million in existing funding. In total, the provincial government has protected or created 45 properties since 2001 through multiple initiatives.
Budget 2009 continues to support families and communities to care for and protect vulnerable children and youth, and to support healthy child and family development, by providing $110 million over 3 years for priority programs and services, including:
· $47 million over 3 years to respond to the increasing acuity of needs and rising costs of supporting children in care and for preventative and family support services;
· $25 million over 3 years for the child care subsidy program. The program assists low and middle income families with the cost of child care; and
· $38 million over three years to support children and families with special needs.
Budget 2009 includes an additional $73 million over three years for programs and services to adults with developmental disabilities and their families. This funding will provide for continued access to community living services including respite care, residential placements and life skills training.
During this global economic downturn, more individuals and families will experience difficulty in paying for their basic living necessities and will require income assistance. Budget 2009 provides an additional $110 million over three years to support individuals and families in need of income assistance.
Budget 2009 provides $47 million over 3 years to fund RCMP salary, pension and operating cost increases and $11 million to fund increased costs related to providing financial assistance and benefits to victims and others who are impacted by violent crimes.
Supporting Communities and the Environment
Budget 2009 provides $479 million over four years to support economic activity in communities throughout the province during the economic downturn as well as to maintain BC as a leader in environmental protection.
Targeted new spending includes:
Supporting Communities
· In response to new types of petroleum resource development in North America, the province is investing $6 million over 3 years to support the strategic development of shale and tight gas resources in the northeast area of BC. This expenditure will assist in adding to BC’s natural gas potential.
· Government will increase spending on resource road maintenance (mainly Forest Service Roads) to address safety and access issues near many remote BC communities. $5 million has been allocated in 2008/09 with an additional $15 million allocated in 2009/10.
· $30 million is being allocated in 2009/10 to support community adjustment and job creation in rural BC.
Budget and Fiscal Plan – 2009/10 to 2011/12
27
Three-Year Fiscal Plan
Table 1.11 Supporting Communities and the Environment
($ millions) | | 2008/09 (1) | | 2009/10 | | 2010/11 | | 2011/12 | | Total | |
Supporting Communities | | | | | | | | | | | |
– Improving access for shale gas development | | — | | 2 | | 2 | | 2 | | 6 | |
– Improvements for rural resource roads | | 5 | | 15 | | — | | — | | 20 | |
– Community economic development | | — | | 30 | | — | | — | | 30 | |
– Towns for Tomorrow: cost shared community infrastructure | | 30 | | — | | 20 | | — | | 50 | |
– Local transportation projects to accelerate job creation | | 20 | | — | | — | | — | | 20 | |
– Bulkley-Nechako / Kitimat-Stikine Regional District grants | | — | | 1 | | 1 | | 1 | | 3 | |
– Internet connectivity for rural communities | | 2 | | 2 | | 1 | | — | | 5 | |
– Peace River Regional District infrastructure | | — | | 3 | | 3 | | 3 | | 9 | |
– Local government priorities, including community safety | | 151 | | — | | — | | — | | 151 | |
Subtotal | | 208 | | 53 | | 27 | | 6 | | 294 | |
Targeted Measures | | | | | | | | | | | |
– Michael Smith Foundation for health research | | — | | 15 | | — | | — | | 15 | |
– Provincial Transit Plan additional operating funding | | — | | — | | — | | 59 | | 59 | |
Subtotal | | — | | 15 | | — | | 59 | | 74 | |
Continued Environmental Leadership | | | | | | | | | | | |
– Carbon tax rebates for local government | | 3 | | 4 | | 4 | | 4 | | 15 | |
– Extending the ICE fund for green technology advancements | | — | | 25 | | 25 | | 25 | | 75 | |
– Planning for Capital Regional District water treatment facility | | — | | — | | 2 | | — | | 2 | |
– Trees for Tomorrow: planting trees in public places | | 2 | | 3 | | 3 | | 3 | | 11 | |
– BC portion of the Hydrogen Highway | | — | | 4 | | 2 | | 2 | | 8 | |
Subtotal | | 5 | | 36 | | 36 | | 34 | | 111 | |
Total | | 213 | | 104 | | 63 | | 99 | | 479 | |
(1) Supplementary Estimates will be introduced to obtain the necessary appropriations to fund all 2008/09 amounts, except base funding for rural resource road improvements.
· $50 million in additional investments for the Towns for Tomorrow grant program to local governments. Of this amount $30 million for cost-shared infrastructure projects is allocated in 2008/09 and a further $20 million in 2010/11, allowing communities in British Columbia to continue to maintain and improve community infrastructure.
· A further $20 million is provided in 2008/09 for local road maintenance and rehabilitation projects to ensure public safety and reliable access to communities, while providing near-term job creation in BC’s regions.
· Subject to agreement on a Memorandum of Understanding, annual grants of $1 million in total will be paid to the Bulkley-Nechako and Kitimat-Stikine Regional Districts for a period of 15 years, providing these communities with the same treatment as other communities which host and/or are impacted by generating facilities.
· $5 million over 3 years, beginning in 2008/09, for the Connecting Citizen’s Grant Program to encourage delivery of “last-mile” broadband internet connectivity and cell phone coverage for British Columbians living in rural and remote communities.
· $9 million over three years for grants to the Peace River Regional District and its member municipalities to address the infrastructure deficit in this region.
In collaboration with the Union of British Columbia Municipalities (UBCM) and its members, the government also plans to restructure current provincial/local funding arrangements to provide local governments with increased financial certainty in uncertain economic times. As part of this restructuring of local/provincial financial arrangements, an additional $151 million will be provided to local governments in 2008/09. This initiative will support local government priorities and will provide greater flexibility to address immediate needs, including community safety.
Budget and Fiscal Plan – 2009/10 to 2011/12
28
Three-Year Fiscal Plan
Targeted Measures
· $15 million in 2009/10 to support health research at the Michael Smith Foundation.
· Following on the Budget 2008 funding allocation for the Provincial Transit Plan, $59 million in operating funding is provided in 2011/12 for the fourth year of the twelve year Plan. This increased funding provides for fleet maintenance and operations, allowing for growth of transit service hours and ridership.
Continued Environmental Leadership
Budget 2009 builds on the over $1 billion in Climate Action initiatives funded in Budget 2008 to support some further measures to continue to protect BC’S environment. These include:
· UP to $15 million over 4 years to rebate the carbon tax paid by those local governments that commit to becoming carbon neutral by 2012.
· Government is extending the Innovative Clean Energy (ICE) Fund to provide $75 million over 3 years to advance investments in green technology.
· In excess of $2 million for project development costs and procurement activities related to wastewater treatment facilities in the Capital Regional District.
· $11 million over 4 years, for the Trees for Tomorrow program, to plant four million trees in schoolyards, hospital grounds, civic parks and other public spaces in British Columbia.
· $8 million over 3 years with a matching industry investment of more than $10 million to complete the BC portion of the Hydrogen Highway, a continuous network of hydrogen fuelling stations that will extend from British Columbia to California by 2010. This is in addition to $3 million in provincial funding and $36 million in federal and industry funding provided since 2004.
In addition, Budget 2009 provides $24 million over 3 years for Flood Protection initiatives which will be fully recovered from the federal government under the Build Canada agreement.
2010 Olympic and Paralympic Winter Games
The province has committed $600 million towards the costs of staging and hosting the 2010 Olympic and Paralympic Winter Games (2010 Games). This includes a provincial contribution towards components that are jointly funded with the federal government
Table 1.12 Olympics Funding
($ millions) | | Prior
years | | 2008/09 | | 2009/10 | | 2010/11 | | Provincial
Envelope | |
Venues and Live Sites | | 235 | | 56 | | 19 | | — | | 310 | |
Venues operating endowment | | 55 | | — | | — | | — | | 55 | |
Medical | | 1 | | 4 | | 8 | | — | | 13 | |
Security | | 13 | | 74 | | — | | — | | 87 | |
Paralympic Games | | — | | 20 | | — | | — | | 20 | |
First Nations and municipal legacies | | 36 | | — | | — | | — | | 36 | |
Olympics contingency allocations (1) | | — | | — | | 69 | | 10 | | 79 | |
Total contribution to provincial commitment | | 340 | | 154 | | 96 | | 10 | | 600 | |
(1) Notionally allocated within the Contingencies vote.
Budget and Fiscal Plan – 2009/10 to 2011/12
29
Three-Year Fiscal Plan
including venues, security, a venue operating trust, live sites, and the hosting of the Paralympic Games. It also includes a provincial funding commitment in relation to medical costs, First Nations, sports and municipal legacies, and a contingency allocation earmarked for addressing unbudgeted costs.
Budget 2009 includes $106 million over 2009/10-2010/11 for remaining expected spending within the $600 million funding commitment. Included in this funding is an allocation of $69 million within the contingencies vote in 2009/10 for managing unidentified pressures. This leaves $10 million available in the contingency allocation for 2010/11 should any post-2010 Games costs emerge.
Administrative and Other Savings
Government is managing down expenses in order to protect health care, education and social service programs. Significant savings in administrative and other discretionary spending will be achieved, and some government programs will be streamlined.
Budget 2009 reallocates $1.9 billion in administrative and other savings over 3 years to health care, education and social service programs noted above as well as to support other priority programs that provide public services.
Table 1.13 Managing Down Expenses
($ millions) | | 2009/10 | | 2010/11 | | 2011/12 | |
Budget 2008 – total ministries and Office of the Premier(1) | | 29,711 | | 30,590 | | 30,590 | |
| | | | | | | |
Budget 2009 measures: | | | | | | | |
– Health care | | 25 | | — | | 920 | |
– Post-secondary education | | 71 | | 86 | | 87 | |
– Sustaining social services | | 119 | | 127 | | 105 | |
– Supporting communities and the environment | | 104 | | 63 | | 99 | |
– Public service transformation fund | | 50 | | 25 | | | |
– Other changes | | 136 | (2) | 13 | | 29 | |
Subtotal | | 505 | | 314 | | 1,240 | |
Less : Administrative and other savings | | (589 | ) | (650 | ) | (631 | ) |
Budget 2009 – total ministries and Office of the Premier | | 29,627 | | 30,254 | | 31,199 | |
(1) Restated to reflect government’s current organization and accounting policies.
(2) Includes $65 million for increases to the Crown Land Special Acount.
The 2009/10 Estimates, in comparison to the 2008/09 Estimates, include administrative savings of $297 million in 2009/10. For example:
· Contracted professional services will be reduced by 23 per cent resulting in savings of $177 million;
· Public servant travel will be reduced by 22 per cent, resulting in savings of $16 million;
· Discretionary grants will be reduced by $59 million, or 7 per cent; and
· Informational advertising and publications will decrease by 76 per cent, saving $23 million.
Budget and Fiscal Plan – 2009/10 to 2011/12
30
Three-Year Fiscal Plan
Table 1.14 Administrative Spending – Change from 2008/09
($ millions) | | 2008/09
Estimates | | 2009/10
Estimates | | $
Change | | %
Change | |
Expense category: | | | | | | | | | |
– Boards, commissions and courts (fees and expenses) | | 11 | | 10 | | (1 | ) | -5 | % |
– Public servant travel | | 74 | | 58 | | (16 | ) | -22 | % |
– Professional services | | 769 | | 592 | | (177 | ) | -23 | % |
– Office and business expenses | | 116 | | 106 | | (10 | ) | -8 | % |
– Informational advertising and publications | | 30 | | 7 | | (23 | ) | -76 | % |
– Operating equipment and vehicles | | 135 | | 123 | | (12 | ) | -9 | % |
– Transfers – grants (discretionary) (1) | | 826 | | 768 | | (58 | ) | -7 | % |
Total savings | | 1,961 | | 1,664 | | (297 | ) | -15 | % |
(1) To provide a consistent comparison, 2008/09 and 2009/10 Estimates have been restated for local government services and transfers, the Crown Land Special Account and the transfer of funding from Contingencies to the Ministry of Health Services.
Public Service Transformation Fund
The BC Public Service is the province’s largest employer with approximately 30,000 ministry employees working in 280 communities around BC in more than 200 different professions. The vast and diverse scope of the public service means that public service employees do work that impacts virtually every aspect of the social and economic fabric of the province. The government believes it would be short-sighted to make staffing reductions now in job streams where government expects to have difficulty recruiting in a few years time.
As a result, a Public Service Transformation Fund of $50 million in 2009/10 and $25 million in 2010/11 has been established within the Public Service Agency. The purpose of this transformation fund is two-fold. The fund will be used:
· to strategically invest in priority job streams and targeted recruitment where an ongoing demand for the expertise is demonstrated; and
· for transformation opportunities where the approach to work can be re-tooled to deliver quality services to citizens with fewer staff.
The fund will also be used to cover workforce adjustment costs incurred as a result of ministry plans to meet their budget targets.
Service Delivery Agencies
Externally funded service delivery agency spending (expenses in excess of government transfers) is forecast to increase from a $3.0 billion revised forecast in 2008/09 to $3.6 billion in 2011/12 for the combined SUCH sector entities (Schools, Universities, Colleges and Health authorities). The increase reflects spending in the priority areas of health and education, and reflects an increase in the spending funded through own-source revenues.
In addition, other service delivery agency spending is forecast to increase from a $1.1 billion revised forecast in 2008/09 to $1.4 billion in 2011/12, primarily reflecting the impact of infrastructure spending, including investments under the transportation investment plan by the BC Transportation Financing Authority and BC Transit.
Budget and Fiscal Plan – 2009/10 to 2011/12
31
Three-Year Fiscal Plan
Further Efficiencies
In order to achieve a balanced budget by 2011/12, government will be seeking further efficiencies and savings of $125 million in 2010/11 and $250 million in 2011/12. Government will be reviewing programs delivered by ministries and service delivery agencies to ensure these programs are efficient and cost-effective, to minimize duplication and to ensure continued alignment with government priorities.
Full-Time Equivalents
Taxpayer-supported full-time equivalents (FTEs), including ministries/special offices (CRF) and service delivery agencies, are projected at 36,564 in 2009/10. This represents an increase of 469 FTEs from 2008/09 and is 205 FTEs higher than the projection in Budget 2008. However, by 2011/12 FTEs are projected to decline by 322 to total 36,232 FTEs reflecting government efficiency measures. Table 1.15 provides details of changes from Budget 2008. FTEs of the SUCH sector are not included in these forecasts.
Table 1.15 Full-Time Equivalents (FTEs) – Changes from Budget 2008
FTEs | | 2009/10 | | 2010/11 | | 2011/12 (1) | |
Ministries and special offices (CRF): | | | | | | | |
Budget 2008 | | 32,034 | | 32,179 | | 32,179 | |
Changes: | | | | | | | |
Transfer of federal programs (Agristability/Labour Market Development Agreement) | | 336 | | 336 | | 336 | |
Attorney General (courts security, recruitment lag and attrition) | | 58 | | (25 | ) | (168 | ) |
Children and Family Development (transfer from service delivery agency) | | 105 | | 105 | | 105 | |
Children and Family Development (vacancies, recruitment lag and attrition) | | (169 | ) | (169 | ) | (267 | ) |
Finance (recruitment lag, attrition and Olympic Games Secretariat wind-down) | | (65 | ) | (131 | ) | (206 | ) |
Forests and Range (recruitment lag and attrition) | | (105 | ) | (141 | ) | (188 | ) |
Health Services (Emergency and Health Services programs) | | 4 | | 4 | | 129 | |
Housing and Social Development (recruitment lag and attrition) | | (128 | ) | (128 | ) | (128 | ) |
Labour and Citizens’ Services (historical correction, recruitment lag and attrition) | | 61 | | 61 | | 61 | |
Other ministry changes (net) | | 83 | | 42 | | 19 | |
| | 180 | | (46 | ) | (307 | ) |
Budget 2009 Updated Fiscal Plan | | 32,214 | | 32,133 | | 31,872 | |
Service delivery agencies (2): | | | | | | | |
Budget 2008 | | 4,325 | | 4,365 | | 4,365 | |
Changes: | | | | | | | |
Oil and Gas Commission – activities increase | | 20 | | 23 | | 24 | |
BC Pavilion Corporation – Vancouver Convention Centre expansion and maintenance | | 27 | | 27 | | 25 | |
Pacific Carbon Trust – new entity | | 13 | | 16 | | 16 | |
Children and Family Development agencies – transfers to ministry/reorganization | | (53 | ) | (123 | ) | (123 | ) |
Other changes (net) | | 18 | | 7 | | 53 | |
| | 25 | | (50 | ) | (5 | ) |
Budget 2009 Updated Fiscal Plan | | 4,350 | | 4,315 | | 4,360 | |
Summary: | | | | | | | |
Ministries and special offices (CRF) | | 32,214 | | 32,133 | | 31,872 | |
Service delivery agencies | | 4,350 | | 4,315 | | 4,360 | |
Budget 2009 Updated Fiscal Plan | | 36,564 | | 36,448 | | 36,232 | |
Budget 2008 | | 36,359 | | 36,544 | | 36,544 | |
(1) 2011/12 reflects changes from the 2010/11 baseline.
(2) Service delivery agency FTE amounts do not include SUCH sector staff employment.
Budget and Fiscal Plan – 2009/10 to 2011/12
32
Three-Year Fiscal Plan
Ministries/special offices (CRF)
The 2009/10 FTEs projection for ministries and special offices is 32,214 – a net increase of 180 FTEs from Budget 2008. The increase primarily reflects devolution of the Labour Market Development and Agristability programs from the federal government, and revised FTE estimates to eliminate historical inconsistencies. The FTE total in 2011/12 will decline moderately from 2009/10 reflecting government efficiencies.
Service delivery agencies
The 2009/10 service delivery agencies FTE projection is 4,350 – an increase of 25 FTEs from Budget 2008. The increase is primarily due to increased activity by the Oil and Gas Commission, expansion and maintenance of services in the Vancouver Convention Centre, and staffing-up of the Pacific Carbon Trust. These increases are partially offset by staff transfers from children and family development agencies to Ministry of Children and Family Development and other reorganization changes within the children and family development agencies. By 2011/12, service delivery agency FTEs are projected to increase marginally to 4,360.
Capital Spending (1)
Capital spending on schools, hospitals, roads, bridges, hydro-electric projects and other infrastructure across the province over the next three years (2009/10 – 2011/12) is expected to total $20 billion. Provincial capital infrastructure investments are made through school districts, health authorities, post-secondary institutions, Crown agencies and ministries.
The total capital investment of $20 billion is comprised of $15.5 billion in capital investments funded wholly or in part by the province as well as capital investments by commercial Crown corporations and $2.0 billion of new capital investments cost-shared with the federal government to be accelerated over the next three years. The remaining $2.5 billion is comprised of $1.7 billion in capital investments in the K–12 and post-secondary education sectors that are wholly financed through contributions from other sources and $0.8 billion for capital contingencies.
The province is accelerating planned capital investments to stimulate the economy and keep people at work in the construction sector. Construction investments of $10.6 billion are also included in the Province’s capital plan (i.e. excludes information technology projects, land purchases, vehicle purchases).
An additional $1.4 billion in local infrastructure is being built in partnership with local government and the federal government.
These investments are estimated to generate 88,000 direct construction jobs over the next three years. Investments in construction projects generate approximately 6.4 direct jobs per million dollars (BC Stats, March 2008).
(1) Capital investments are not included in the government’s annual surplus or deficit. In accordance with generally accepted accounting principles (GAAP), annual amortization expenses that recognize the estimated wear and tear of capital assets during the fiscal year are included in the government’s annual expenses instead of recording the full capital costs as they occur.
Budget and Fiscal Plan – 2009/10 to 2011/12
33
Three-Year Fiscal Plan
Table 1.16 Capital Spending (1)
| | 2008/09 | | Budget | | | | | |
($ millions) | | Budget | | Revised
Forecast | | Estimate
2009/10 | | Plan
2010/11 | | Plan
2011/12 | |
Taxpayer-supported | | | | | | | | | | | |
Education | | | | | | | | | | | |
Schools (K–12) | | 441 | | 442 | | 458 | | 438 | | 414 | |
Post-secondary | | 706 | | 666 | | 619 | | 551 | | 487 | |
Health | | 924 | | 910 | | 886 | | 998 | | 619 | |
BC Transportation Financing Authority | | 884 | | 956 | | 1,000 | | 981 | | 762 | |
BC Transit | | 74 | | 74 | | 154 | | 110 | | 114 | |
Vancouver Convention Centre expansion project | | 288 | | 251 | | 37 | | 51 | | — | |
BC Place rejuvenation | | — | | 38 | | 125 | | 160 | | 42 | |
Government ministries | | 286 | | 436 | (2) | 279 | | 335 | | 248 | |
Other (3) | | 56 | | 125 | | 43 | | 36 | | 31 | |
Accelerated infrastructure projects | | — | | 55 | | 885 | | 720 | | 340 | |
Capital spending contingencies | | 200 | | 180 | | 260 | | 270 | | 325 | |
Total taxpayer-supported | | 3,859 | | 4,133 | | 4,746 | | 4,650 | | 3,382 | |
| | | | | | | | | | | |
Self-supported | | | | | | | | | | | |
BC Hydro | | 1,663 | | 1,596 | | 1,752 | | 1,920 | | 1,902 | |
BC Transmission Corporation | | 21 | | 18 | | 19 | | 12 | | 12 | |
Columbia River power projects (4) | | 19 | | 38 | | 166 | | 242 | | 258 | |
BC Railway Company | | 30 | | 10 | | 80 | | 95 | | 100 | |
ICBC | | 30 | | 25 | | 42 | | 100 | | 125 | |
BC Lotteries | | 124 | | 112 | | 120 | | 115 | | 115 | |
Liquor Distribution Branch | | 20 | | 19 | | 20 | | 21 | | 30 | |
Total self-supported commercial | | 1,907 | | 1,818 | | 2,199 | | 2,505 | | 2,542 | |
Total capital spending | | 5,766 | | 5,951 | | 6,945 | | 7,155 | | 5,924 | |
(1) As the agreement has not been finalized, the fiscal implications of the Port Mann Bridge/Highway 1 Project (which will be funded from tolls) are not included in Budget 2009 – see the topic box at the end of Part 1.
(2) Includes Supplementary Estimates of $80 million.
(3) Includes BC Housing Management Commission, Provincial Rental Housing Corporation and other service delivery agencies.
(4) Joint ventures of the Columbia Power Corporation and Columbia Basin Trust.
Taxpayer-supported capital spending
Taxpayer-supported capital spending includes capital infrastructure for school districts, health authorities, post-secondary institutions, taxpayer-supported Crown agencies, and ministries.
Taxpayer-supported capital spending is projected at $4.7 billion in 2009/10, declining to $3.4 billion by 2011/12. This is higher than the capital spending forecast in Budget 2008 of $3.4 billion in 2009/10 and $3.1 billion in 2010/11.
Significant elements of this projected spending include the following:
· Over the three years of the capital plan, $1.3 billion will be invested to replace, renovate or expand K–12 facilities. This includes continued investment in the program to seismically upgrade at-risk schools, as well as the ongoing rehabilitation of schools throughout the province.
· Budget 2009 includes $1.7 billion in capital spending by post-secondary institutions throughout the province. Projects funded include the Library Commons and First Nations House of Learning at Thompson Rivers University, the Health Sciences
Budget and Fiscal Plan – 2009/10 to 2011/12
34
Three-Year Fiscal Plan
Building at the University of BC’s Okanagan campus, and gathering places to support Aboriginal learners on campuses at post-secondary institutions throughout the province.
· Post-secondary capital spending also includes a significant level of investment funded through other sources, including foundations, donations, cash balances, federal funding and revenues generated from services.
· Capital spending in the Health sector will total $2.5 billion over the three years of the plan. These investments support new major construction and upgrading of health facilities, equipment, and information systems over the next three years, and include funding from the province as well as other sources, such as Regional Hospital Districts and Foundations.
· Capital investments in the Health sector include the new Fort St. John hospital, the Royal Jubilee Hospital inpatient facility, expansions to Kelowna General and Vernon Jubilee Hospitals, the Northern Cancer Centre in Prince George, and redevelopment of the Surrey Memorial Hospital.
Table 1.17 Provincial Transportation Investments (1)
| | 2008/09 | | | | | | | | 3-Year | |
($ millions) | | Update | | 2009/10 | | 2010/11 | | 2011/12 | | Total | |
Transportation Investment Plan | | | | | | | | | | | |
– Gateway program | | 180 | | 156 | | 115 | | 97 | | 368 | |
– Rehabilitation | | 161 | | 146 | | 146 | | 146 | | 438 | |
– Interior and rural side roads | | 68 | | 50 | | 50 | | 50 | | 150 | |
– Oil and gas rural road improvement program | | 44 | | 47 | | 47 | | — | | 94 | |
– Mountain pine beetle strategy | | 33 | | 30 | | 30 | | 30 | | 90 | |
– Highway 1 – Kicking Horse Canyon | | 8 | | 15 | | 16 | | 13 | | 44 | |
– Sea-to-Sky highway | | 167 | | 44 | | — | | — | | 44 | |
– William R Bennett Bridge | | 23 | | — | | — | | — | | — | |
– Border crossing infrastructure | | 34 | | — | | — | | — | | — | |
– Okanagan Valley corridor | | 61 | | 29 | | 27 | | 13 | | 69 | |
– Cariboo connector program | | 42 | | 45 | | 15 | | — | | 60 | |
– Other highway corridors and programs | | 80 | | 187 | | 118 | | 93 | | 398 | |
– Airports and ports | | 15 | | 8 | | 8 | | 8 | | 24 | |
– Cycling infrastructure | | 9 | | 5 | | 6 | | 6 | | 17 | |
Provincial Transit Plan | | | | | | | | | | | |
– Canada Line Rapid Transit Project | | 15 | | 20 | | 20 | | 20 | | 60 | |
– Evergreen Line | | 2 | | 25 | | 88 | | 82 | | 195 | |
– Rail rapid transit projects | | 11 | | 32 | | 11 | | 33 | | 76 | |
– Buses and other transit priorities | | 30 | | 94 | | 43 | | 49 | | 186 | |
Total provincial investment (2) | | 983 | | 933 | | 740 | | 640 | | 2,313 | |
Investments funded through contributions from other partners | | | | | | | | | | | |
– Canada Line (contributions from the federal government; South Coast British Columbia Transportation Authority; Vancouver Airport Authority; and private sector partner) | | 348 | | 145 | | — | | — | | 145 | |
– Evergreen Line (federal contribution and TransLink) | | 6 | | 50 | | 123 | | 83 | | 256 | |
– Federal contributions to other projects | | 96 | | 207 | | 220 | | 152 | | 579 | |
Total investments funded through contributions from other partners | | 450 | | 402 | | 343 | | 235 | | 980 | |
(1) As the agreement has not been finalized, the fiscal implications of the Port Mann Bridge/Highway 1 Project (which will be funded from tolls) are not included in Budget 2009 – see the topic box at the end of Part 1.
(2) Total provincial investment includes operating and capital spending.
Budget and Fiscal Plan – 2009/10 to 2011/12
35
Three-Year Fiscal Plan
· Budget 2009 Updates and builds on the government’s transportation investment Plan. The province remains committed to securing federal cost sharing on all eligible projects and programs, and leveraging additional investments through partnerships with private partners. The public and private sector together will provide $3.3 billion for transportation investments over the next three years.
· $2.3 billion of provincial investment in transportation infrastructure; and
· $1.0 billion of investment leveraged through federal cost-sharing and partnerships with private partners, local governments and other agencies.
Further information is provided in Table 1.17.
· Under the transportation investment plan, provincial capital spending for 2009/10 to 2011/12 is directed towards initiatives such as the Cariboo Connector Strategy, Kicking Horse Canyon and funding to support road rehabilitation benefiting the oil and gas sector.
· Budget 2009 continues to build on existing investments in transit vehicles and projects across the province through the Provincial Transit Plan, including rapid bus projects, buses and the Evergreen Line.
· As the agreement has not been finalized, the fiscal implications of the Port Mann Bridge/Highway 1 project, which will be funded by tolls, are not included in Budget 2009. Construction costs are estimated to total $2.46 billion and with financing charges the total could increase to over $3 billion (see the topic box at the end of Part 1).
· Capital spending for the Vancouver Convention Centre Expansion Project (VCCEP) is based on the total capital cost of the project, reflecting the funding provided by all partners; the Province, the federal government, and Tourism Vancouver. The expansion of the convention centre facility and connector between the new and existing facilities are scheduled for substantial completion on March 15, 2009. The upgrades to the existing facility will be completed by 2010/11.
· A total of approximately $365 million in major upgrades will be undertaken on BC place from 2008/09 to 2011/12. The upgrades include various deferred maintenance and interior refurbishment projects, as well as replacement of the current air-supported roof with a retractable fabric roof.
Accelerated capital investments
The province is committed to accelerating $1 billion in capital investments to stimulate the economy and keep people at work in the construction sector over the next three years. In January 2009, the federal government announced an infrastructure stimulus package as part of its 2009 budget. On a population basis, British Columbia’s share of this package is approximately $1 billion. The province has identified a total of $2 billion in new capital investments to maximize the cost sharing benefits of federal programs and will work with the federal government over the coming weeks to finalize program details.
In addition, the province has committed to accelerate $401 million in capital investments from within the capital plan since the end of October 2008. These capital investments were originally planned for future years and are now starting in 2008/09 and 2009/10.
Budget and Fiscal Plan – 2009/10 to 2011/12
36
Three-Year Fiscal Plan
· $277 million for a substantial number of highway improvement projects.
· $94 million will be invested in the maintenance and upgrades of rural resource roads to support the oil and gas sector.
· $30 million to purchase and renovate 8 properties to provide safe, affordable housing for the hard to house.
Capital Contingencies
Recognizing the risks associated with the current economic climate, the province has included a capital contingency in its three-year capital plan as a prudent planning measure. In addition to covering risks from higher than expected costs, the capital contingency will be used to fund emerging government priorities.
Should the capital contingency not be used, taxpayer-supported debt will be lower than currently forecast.
Financing Capital Projects
Provincial capital infrastructure spending is financed through a combination of sources:
· cash balances (e.g. school districts, post-secondary institutions, health authorities);
· partnerships with the private sector (public-private-partnerships);
· cost-sharing with partners (e.g. Government of Canada, Regional Hospital Districts); and
· borrowing (debt financing).
Since debt financing continues to represent a significant source of financing for provincial capital spending, the level of capital spending has a significant impact on projected provincial debt.
Chart 1.16 Financing government’s capital plan
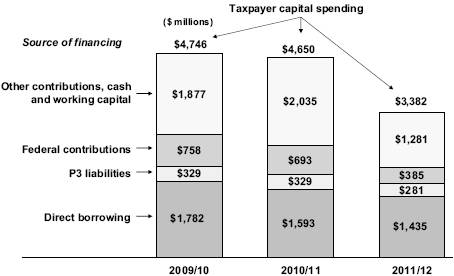
Self-supported capital spending
Total capital spending includes capital infrastructure for self-supported commercial Crown agencies.
Budget and Fiscal Plan – 2009/10 to 2011/12
37
Three-Year Fiscal Plan
Self-supported capital spending is projected to increase from $2.2 billion in 2009/10 to $2.5 billion in 2011/12. The majority of this capital spending is for electrical generation, transmission and distribution projects carried out through BC Hydro to meet growing customer demand and to enhance reliability. Large generating facilities built between the late 1960s and early 1980s provide about 90 per cent of the province’s electrical power. The major mechanical and electrical components (such as turbines and transformers) in these facilities are nearing the end of their design life and require major overhauls to maintain reliability. A significant portion of self-supported capital spending represents measures to address the issue of ageing infrastructure.
Table 1.18 provides information on major power generation and transmission projects. Further details on provincial capital investments are shown in the service plans of ministries and Crown agencies.
Projects over $50 million
As required under the Budget Transparency and Accountability Act, major capital projects with multi-year budgets from provincial sources totaling $50 million or more are shown in Table 1.18. Annual allocations of the full budget for these projects are included as part of the provincial government’s capital investment spending shown in Table 1.16.
In addition to financing through provincial sources, major projects may be cost-shared with the federal government, municipalities and regional districts, and/or the private sector. Total capital spending for these major projects is $8.5 billion, reflecting financing of $7.1 billion through internal sources or borrowing, $677 million from federal government contributions and $706 million from other sources including private donations. Major capital investments include:
· $226 million for post-secondary facilities including a science building at the University of Victoria, student residences at UBC, and expansion of Vancouver Community College’s Broadway (King Edward) Campus.
· $2.4 billion for health facilities including the Abbotsford Regional Hospital and Cancer Centre; the Surrey Outpatient Facility and Surrey Memorial Hospital critical care tower; expansions to the Victoria Royal Jubilee, Kelowna General and Vernon Jubilee hospitals; the Northern Cancer Centre initiative which encompasses construction of a new facility in Prince George and upgrades in other northern communities; and replacement of the Fort St. John hospital.
· $2.3 billion for major transportation capital infrastructure including improvements for the Pitt River Bridge, South Fraser perimeter road, and Sea-to-Sky Highway. Provincial funding for the Richmond-Air Port-Vancouver rapid transit line (Canada Line) is not included in the province’s capital spending, but is included in the transportation investment plan (see Table 1.17).
· As the agreement has not been finalized, the fiscal implications of the Port Mann Bridge/Highway 1 project, which will be funded by tolls, are not included in Budget 2009. Construction costs are estimated to total $2.46 billion and with financing charges the total could increase to over $3 billion (see the topic box at the end of Part 1).
· $2.3 billion for power generation and transmission capital projects by BC Hydro, BC Transmission Corporation and the Brilliant Expansion Power Corporation. These projects are driven by the need for major overhauls to ageing infrastructure, and to address reliability issues and increasing demand for power.
· $1.2 billion for the Vancouver Convention Centre Expansion and BC Place rejuvenation projects.
Budget and Fiscal Plan – 2009/10 to 2011/12
38
Three-Year Fiscal Plan
Table 1.18 Capital Expenditure Projects Greater Than $50 million (1)
Note: Information in bold type denotes changes from the second Quarterly Report.
| | Projected | | Total Costs | | Projected | | Total | | Project Financing | |
| | Completion | | to | | Costs to | | Capital | | Internal/ | | Federal | | Other | |
($ millions) | | Date | | Dec. 31, 2008 | | Complete | | Costs | | Debt | | Government | | Contributions | |
Post secondary facilities | | | | | | | | | | | | | | | |
University of Victoria | | | | | | | | | | | | | | | |
– Science building | | Spring 2009 | | 63 | | 4 | | 67 | | 57 | | — | | 10 | |
University of British Columbia | | | | | | | | | | | | | | | |
– Marine Drive student housing | | Spring 2009 | | 87 | | 16 | | 103 | | 103 | | — | | — | |
Vancouver Community College | | | | | | | | | | | | | | | |
– Broadway (King Edward) Campus expansion | | Winter 2008 | | 49 | | 7 | | 56 | | 45 | | — | | 11 | |
Total post-secondary facilities | | | | 199 | | 27 | | 226 | | 205 | | — | | 21 | |
Health facilities | | | | | | | | | | | | | | | |
Abbotsford Regional Hospital and Cancer Centre | | | | | | | | | | | | | | | |
– Government direct cost | | Summer 2008 | | 12 | | 14 | | 26 | | 26 | | — | | — | |
– P3 contract | | Summer 2008 | | 441 | | 8 | | 449 | | 378 | | — | | 71 | |
Surrey Outpatient Facility | | | | | | | | | | | | | | | |
– Government direct cost | | Spring 2011 | | 6 | | 61 | | 67 | | 67 | | — | | — | |
– P3 contract | | Spring 2011 | | 34 | | 138 | | 172 | | 172 | | — | | — | |
Victoria Royal Jubilee Hospital inpatient facility | | | | | | | | | | | | | | | |
– Government direct cost | | Winter 2011 | | 27 | | 121 | | 148 | | 21 | | — | | 127 | |
– P3 contract | | Winter 2011 | | 28 | | 173 | | 201 | | 201 | | — | | — | |
Fort St. John Hospital replacement (2) | | Winter 2011 | | 2 | | 299 | | 301 | | 203 | | — | | 98 | |
Expansions to Kelowna General and Vernon Jubilee Hospitals | | | | | | | | | | | | | | | |
– Government direct cost | | Fall 2012 | | 27 | | 248 | | 275 | | 26 | | — | | 249 | |
– P3 contract | | Fall 2012 | | 11 | | 147 | | 158 | | 158 | | — | | — | |
Northern Cancer Centre initiative (2) | | Winter 2012 | | — | | 100 | | 100 | | 100 | | — | | — | |
Surrey Memorial Hospital critical care tower (2) | | Winter 2014 | | — | | 517 | | 517 | | 497 | | — | | 20 | |
Total health facilities | | | | 588 | | 1,826 | | 2,414 | | 1,849 | | — | | 565 | |
Transportation | | | | | | | | | | | | | | | |
Pitt River Bridge | | Winter 2009 | | 159 | | 39 | | 198 | | 108 | | 90 | | — | |
Sea-to-Sky Highway | | | | | | | | | | | | | | | |
– Government direct cost | | Fall 2009 | | 196 | | 38 | | 234 | | 234 | | — | | — | |
– P3 contract | | Fall 2009 | | 491 | | 70 | | 561 | | 561 | | — | | — | |
William R. Bennett Bridge | | | | | | | | | | | | | | | |
– P3 contract | | Spring 2008 | (3) | 181 | | 4 | | 185 | | 185 | | — | | — | |
South Fraser Perimeter Road | | Winter 2012 | | 265 | | 863 | | 1,128 | | 763 | | 365 | | — | |
Total transportation | | | | 1,292 | | 1,014 | | 2,306 | | 1,851 | | 455 | | — | |
Power generation and transmission | | | | | | | | | | | | | | | |
BC Hydro | | | | | | | | | | | | | | | |
– Mica Dam – generator stator replacement | | Summer 2009 | | 71 | | 26 | | 97 | | 97 | | — | | — | |
– Peace Canyon Dam – generator stator | | | | | | | | | | | | | | | |
replacement and rotor modification | | Fall 2009 | | 55 | | 31 | | 86 | | 86 | | — | | — | |
– Coquitlam Dam seismic upgrade | | Fall 2008 | | 65 | | 1 | | 66 | | 66 | | — | | — | |
– Aberfeldie redevelopment | | Winter 2009 | | 83 | | 12 | | 95 | | 95 | | — | | — | |
– GM Shrum G1–G4 stator replacement | | Fall 2010 | | 47 | | 50 | | 97 | | 97 | | — | | — | |
– Peace Canyon G1–G4 turbine overhaul | | Fall 2009 | | 31 | | 24 | | 55 | | 55 | | — | | — | |
– Revelstoke Unit 5 generation (4) | | Fall 2011 | | 94 | | 256 | | 350 | | 350 | | — | | — | |
– Cheakamus spillway gate reliability upgrade | | Fall 2011 | | 13 | | 59 | | 72 | | 72 | | — | | — | |
– Vancouver Island transmission reinforcement (5) | | Fall 2008 | | 277 | | 21 | | 298 | | 298 | | — | | — | |
– Mission and Matsqui transmission and distribution (5) | | Winter 2009 | | 52 | | 4 | | 56 | | 56 | | — | | — | |
– Interior to Lower Mainland transmission line (5) | | Fall 2014 | | 24 | | 578 | | 602 | | 602 | | — | | — | |
– Central Vancouver Island transmission line (5) | | Fall 2010 | | 3 | | 91 | | 94 | | 94 | | — | | — | |
BC Transmission Corporation | | | | | | | | | | | | | | | |
– System control centre modernization | | Spring 2008 | (6) | 127 | | 2 | | 129 | | 129 | | — | | — | |
Brilliant Expansion Power Corporation | | | | | | | | | | | | | | | |
– Brilliant Dam power expansion | | Fall 2008 | | 228 | | 7 | | 235 | | 235 | | — | | — | |
Total power generation and transmission | | | | 1,170 | | 1,162 | | 2,332 | | 2,332 | | — | | — | |
Other | | | | | | | | | | | | | | | |
Vancouver Convention Centre expansion project | | Summer 2009 | | 734 | | 149 | | 883 | | 541 | | 222 | | 120 | |
BC Place rejuvenation | | Summer 2011 | | 13 | | 352 | | 365 | | 365 | | — | | — | |
Total other | | | | 747 | | 501 | | 1,248 | | 906 | | 222 | | 120 | |
(1) Only projects that have been approved by Treasury Board and/or Crown corporation boards are included in this table. Ministry service plans may include projects that still require final approval. Capital costs reflect current government accounting policy. As the agreement has not been finalized, the fiscal implications of the Port Mann Bridge/Highway 1 Project (which will be funded from tolls) are not included in Budget 2009 – see the topic box at the end of Part 1.
(2) Figures shown are based on preliminary Treasury Board approvals. These amounts will change after P3 contracts are finalized.
(3) The William R. Bennett Bridge was opened for traffic in May 2008. Decommissioning of the old bridge is forecast to be complete in March 2009.
(4) Total costs for Revelstoke Unit 5 range from $280 million to $350 million with forecast completion in 2010/11 or 2011/12, depending on the project’s final scope.
(5) Assets are owned by BC Hydro and managed by BC Transmission Corporation.
(6) The system control centre was substantially complete and put into service in March 2008.
Budget and Fiscal Plan – 2009/10 to 2011/12
39
Three-Year Fiscal Plan
Provincial Debt
The provincial government along with its Crown corporations and agencies provide services and capital infrastructure to support the social and economic programs needed for maintaining and enhancing the quality of life in BC. Funding for these programs is mainly derived from revenue sources such as taxation and the sale of natural resources. Government also obtains financing from outside sources mainly through debt issuances that are to be repaid on future dates.
Borrowing for operations is required to finance deficits and to meet other working capital requirements such as loans and advances or changes in accounts receivable/payable. This type of debt (government direct operating debt) tends to rise during periods of deficits, but declines with surpluses.
Since peaking in 2003/04, government has made significant progress in reducing taxpayer-supported debt, including the operating debt. Taxpayer-supported debt has declined from $30.0 billion in 2003/04 to $27.7 billion by 2008/09. Operating debt has been reduced by 59 per cent from a peak of $15.7 billion in 2003/04 to $6.4 billion in 2008/09. These reductions allow government the flexibility to address the current economic challenges, while keeping debt affordable.
Table 1.19 Provincial Debt Summary (1), (2)
| | 2008/09 | | Budget | | | | | |
($ millions unless otherwise indicated) | | Budget | | Revised
Forecast | | Estimate
2009/10 | | Plan
2010/11 | | Plan
2011/12 | |
Taxpayer-supported debt | | | | | | | | | | | |
Provincial government direct operating debt | | 7,408 | | 6,437 | | 6,847 | | 7,104 | | 7,074 | |
Other taxpayer-supported debt (mainly capital) | | | | | | | | | | | |
Education (2) | | 8,755 | | 8,692 | | 9,216 | | 9,624 | | 9,972 | |
Health (2) | | 3,945 | | 3,820 | | 4,332 | | 4,936 | | 5,431 | |
Highways and public transit | | 6,916 | | 6,814 | | 7,612 | | 8,232 | | 8,804 | |
Other (3) | | 717 | | 1,929 | | 2,206 | | 2,496 | | 2,797 | |
Total other taxpayer-supported debt | | 20,333 | | 21,255 | | 23,366 | | 25,288 | | 27,004 | |
Total taxpayer-supported debt | | 27,741 | | 27,692 | | 30,213 | | 32,392 | | 34,078 | |
Self-supported commercial Crown corporations debt | | 9,250 | | 9,395 | | 10,258 | | 11,811 | | 13,137 | |
Warehouse borrowing program | | — | | 400 | | — | | — | | — | |
Total debt before forecast allowance | | 36,991 | | 37,487 | | 40,471 | | 44,203 | | 47,215 | |
Forecast allowance | | 750 | | — | | — | | — | | — | |
Total provincial debt | | 37,741 | | 37,487 | | 40,471 | | 44,203 | | 47,215 | |
| | | | | | | | | | | |
Debt as a per cent of GDP | | | | | | | | | | | |
Provincial government direct operating | | 3.7 | % | 3.2 | % | 3.5 | % | 3.4 | % | 3.3 | % |
Taxpayer-supported | | 14.0 | % | 13.8 | % | 15.2 | % | 15.7 | % | 15.8 | % |
Total provincial | | 19.0 | % | 18.7 | % | 20.4 | % | 21.4 | % | 21.8 | % |
Taxpayer-supported debt per capita ($) | | 6,248 | | 6,320 | | 6,795 | | 7,186 | | 7,458 | |
Taxpayer-supported interest bite (cents per dollar of revenue) | | 4.5 | | 4.3 | | 4.3 | | 4.5 | | 4.6 | |
(1) Debt is after deduction of sinking funds and unamortized discounts, and excludes accrued interest. Government direct and fiscal agency accrued interest is reported in the government’s accounts as an accounts payable.
(2) Includes debt and guarantees incurred by the government on behalf of school districts, universities, colleges and health authorities/hospital societies (SUCH), and debt directly incurred by these entities.
(3) Includes service delivery agencies, other fiscal agency loans, student assistance loan guarantees, loan guarantees to agricultural producers, guarantees issued under economic development and home mortgage assistance programs, and loan guarantee provisions.
Budget and Fiscal Plan – 2009/10 to 2011/12
40
Three-Year Fiscal Plan
Chart 1.17 Operating debt down from peak in 2003/04
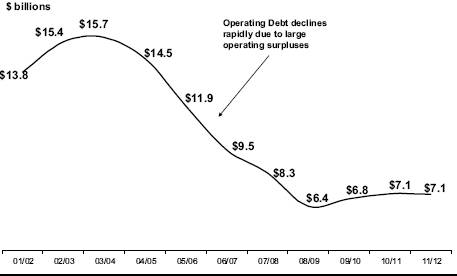
Chart 1.18 Taxpayer-supported debt burden remains low
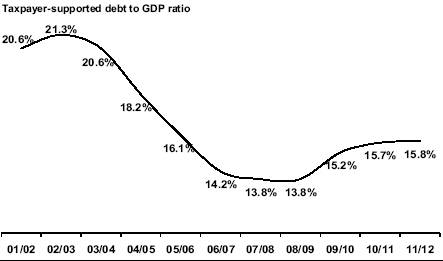
Government operating debt is forecast to increase by $637 million over the next three years mainly reflecting temporary deficits projected in 2009/10 and 2010/11.
Borrowing for capital projects finances the building of schools, hospitals, roads and other social and economic assets. As these investments provide essential services over several years, the government, like the private sector, borrows to fund these projects and amortizes the costs over the assets’ useful life.
In 2008/09, provincial debt is forecast to total $37.5 billion, $254 million below budget. In 2009/10, provincial debt is forecast to increase $3.0 billion from the 2008/09 updated forecast to total $40.5 billion. The 2009/10 change reflects:
· a $2.5 billion increase in taxpayer-supported debt reflecting the temporary operating deficit ($0.4 billion) and an increase in other taxpayer-supported debt mainly to finance net capital requirements ($2.1 billion);
· an $863 million increase in commercial Crown corporation debt, mainly to fund power generation and transmission capital projects by BC Hydro;
Budget and Fiscal Plan – 2009/10 to 2011/12
41
Three-Year Fiscal Plan
partially offset by
· a $400 million decrease in the warehouse borrowing program as pre-borrowed funds are used primarily to fund capital requirements.
Over the next two years, taxpayer-supported debt is forecast to increase by $3.9 billion reflecting the $3.6 billion required to finance government’s investments in infrastructure and the projected deficit in 2010/11.
Self-supported debt will increase $2.9 billion over 2010/11 and 2011/12, mainly to fund power generation and transmission projects which will refurbish ageing infrastructure and expand capacity to support the province’s economic growth.
In general, the change in debt will not equal the surplus/deficit:
· as debt is required to finance capital spending in excess of non-cash amortization costs included in the surplus; and
· due to other working capital sources/requirements that represent changes in balance sheet items (such as cash balances, loan receivables and other accounts receivables/payables), but do not form part of the surplus.
Table 1.20 reconciles forecast surplus/deficit with changes in debt. In the updated fiscal plan, debt rises due to the impact of capital spending in excess of amortization, and higher commercial Crown corporation debt incurred for capital investments as well as the projected deficits in 2009/10 and 2010/11.
Table 1.20 Reconciliation of Summary Results to Provincial Debt Changes
($ millions) | | Revised
Forecast
2008/09 | | Budget
Estimate
2009/10 | | Plan
2010/11 | | Plan
2011/12 | |
Operating statement (surplus) deficit | | (50 | ) | 495 | | 245 | | — | |
Taxpayer-supported capital spending | | 4,133 | | 4,746 | | 4,650 | | 3,382 | |
Increase (reduction) in cash and temporary investments | | 77 | | (1,659 | ) | (760 | ) | 5 | |
Amortization (non-cash expense included in the surplus) | | (2,086 | ) | (1,795 | ) | (2,099 | ) | (2,225 | ) |
Net increase in commercial Crown corporations (mainly capital) | | 1,747 | | 463 | | 1,553 | | 1,326 | |
Other balance sheet and working capital changes | | (961 | ) | 734 | | 143 | | 524 | |
Total provincial debt increase | | 2,860 | | 2,984 | | 3,732 | | 3,012 | |
The ratio of taxpayer-supported debt, which excludes commercial Crown corporations and other self-supported debt, to GDP is a key measure often used by financial analysts and investors to assess a province’s ability to repay debt.
Significant progress has been made in reducing the taxpayer supported debt burden over the past six years. The taxpayer-supported debt to GDP ratio has declined from 21.3 per cent in 2002/03 to 13.8 per cent by 2008/09, a 35 per cent reduction. The taxpayer-supported debt to GDP ratio is forecast to increase from 13.8 per cent in 2008/09 to 15.2 per cent in 2009/10 and to 15.8 per cent in 2011/12, due to both lower GDP and increased infrastructure spending. The debt remains low, despite the global economic downturn.
Taxpayer-supported interest costs continue to remain low, representing less than 5 cents per dollar of revenue in each year of the three year plan.
Budget and Fiscal Plan – 2009/10 to 2011/12
42
Three-Year Fiscal Plan
Table 1.21 Provincial Financing
| | | | | | Estimated | | | | | | | | Estimated | |
| | Debt (1) | | | | Debt (1) | | | | | | | | Debt (1) | |
| | Outstanding | | 2008/09 | | Outstanding | | 2009/10 Transactions | | Outstanding | |
| | at March 31, | | Debt | | at March 31, | | New | | Retirement | | Net | | at March 31, | |
($ millions) | | 2008 | | Change | | 2008 | | Borrowing (2) | | Provision (3) | | Change | | 2010 | |
Taxpayer-supported debt | | | | | | | | | | | | | | | |
Provincial government direct operating | | 8,264 | | (1,827 | ) | 6,437 | | 1,618 | | (1,208 | ) | 410 | | 6,847 | |
Education (4) | | 8,220 | | 472 | | 8,692 | | 908 | | (384 | ) | 524 | | 9,216 | |
Health (4) | | 3,345 | | 475 | | 3,820 | | 827 | | (315 | ) | 512 | | 4,332 | |
Highways and public transit | | 6,082 | | 732 | | 6,814 | | 1,052 | | (254 | ) | 798 | | 7,612 | |
Other debt (5) | | 668 | | 1,261 | | 1,929 | | 401 | | (124 | ) | 277 | | 2,206 | |
Total taxpayer-supported debt | | 26,579 | | 1,113 | | 27,692 | | 4,806 | | (2,285 | ) | 2,521 | | 30,213 | |
| | | | | | | | | | | | | | | |
Self-supported commercial Crown corporations debt | | 8,048 | | 1,347 | | 9,395 | | 1,530 | | (667 | ) | 863 | | 10,258 | |
| | | | | | | | | | | | | | | |
Warehouse borrowing program | | — | | 400 | | 400 | | — | | (400 | ) | (400 | ) | — | |
| | | | | | | | | | | | | | | |
Total self-supported debt | | 8,048 | | 1,747 | | 9,795 | | 1,530 | | (1,067 | ) | 463 | | 10,258 | |
Total provincial debt | | 34,627 | | 2,860 | | 37,487 | | 6,336 | | (3,352 | ) | 2,984 | | 40,471 | |
(1) Debt is after deduction of sinking funds and unamortized discounts, and excludes accrued interest. Government direct and fiscal agency accrued interest is reported in the government’s accounts as an accounts payable.
(2) New long-term borrowing plus net change in short-term debt.
(3) Sinking fund contributions, sinking fund earnings and net maturities of long-term debt (after deduction of sinking fund balances for maturing issues).
(4) Includes debt and guarantees incurred by the government on behalf of school districts, universities, colleges and health authorities/hospital societies (SUCH), and debt directly incurred by these entities.
(5) Includes service delivery agencies, other fiscal agency loans, student assistance loans, loan guarantees to agricultural producers, guarantees issued under economic development and home mortgage assistance programs, and loan guarantee provisions.
Table 1.21 summarizes the provincial financing plan for 2009/10. New borrowing of $6.3 billion is anticipated, of which $3.3 billion will be used to replace maturing debt and $3.0 billion will be used for capital and other financing requirements.
Additional details on the debt outstanding for government, Crown corporations and agencies are provided in Appendix Tables A16 and A17.
Risks to the Fiscal Plan
The major risks to the fiscal plan stem from changes in factors that government does not directly control. These include:
· Assumptions underlying revenue and Crown corporation and agency forecasts such as economic factors, commodity prices and weather conditions.
· The outcome of litigation, arbitrations, and negotiations with third parties.
· Potential changes to federal transfer allocations, cost-sharing agreements with the federal government and impacts on the provincial income tax bases arising from federal tax policy and budget changes.
· Utilization rates for government services such as health care, children and family services, and income assistance.
In addition, changes in accounting treatment or revised interpretations of generally accepted accounting principles (GAAP) could have material impacts on the bottom line.
Budget and Fiscal Plan – 2009/10 to 2011/12
43
Three-Year Fiscal Plan
Table 1.22 summarizes the approximate effect of changes in some of the key variables on the surplus. However, individual circumstances and inter-relationships between the variables may cause the actual variances to be higher or lower than the estimates shown in the table. For example, an increase in the US/Cdn dollar exchange rate may be offset by higher commodity prices.
Table 1.22 Key Fiscal Sensitivities
| | | | Annual Fiscal Impact | |
Variable | | Increases of: | | $ (millions) | |
Nominal GDP | | 1% | | $150 – $250 | |
Lumber prices (US$/thousand board feet) | | $50 | | $50 – $100 (1) | |
Natural gas prices (Cdn$/gigajoule) | | $1 | | $275 – $325 | |
US exchange rate (US cent/Cdn $) | | 1 cent | | -$25 to -$40 | |
Interest rates | | 1 percentage point | | -$80 | |
Debt | | $500 million | | -$18 | |
(1) Sensitivity relates to stumpage revenue only. Depending on market conditions, changes in stumpage revenues may be offset by changes in border tax revenues.
Own Source Revenue
The main areas that may affect own source revenue forecasts are BC’s overall economic performance, the relative health of its major trading partners, the exchange rate and commodity prices.
Revenues are sensitive to economic performance. For example, taxation and other revenue sources are driven by economic factors such as personal income, retail sales, population growth and the exchange rate. The revenue forecast contained in the fiscal plan is based on the economic forecast detailed in Part 3: British Columbia Economic Review and Outlook.
Revenues in British Columbia can also be volatile, largely due to the influence of the cyclical natural resource sector in the economy and the importance of natural resource revenues in the province’s revenue base. Changes in commodity prices such as natural gas, or lumber may have a significant effect on natural resource revenues.
Income tax revenues can be affected by timing lags in reporting current and prior years tax assessments by the Canada Revenue Agency.
Federal Government Contributions
Potential policy changes regarding federal transfer allocations, including federal health transfers and cost-sharing agreements, including sharing the 2010 Olympic security costs, could affect the revenue forecast.
In January 2009, the federal government announced an infrastructure stimulus package as part of its 2009 budget. On a population basis, British Columbia’s share of this package is approximately $1 billion. The province has identified a total of $2 billion in new capital investments to maximize the cost sharing benefits of federal programs and will work with the federal government over the coming weeks to finalize program details. Capital and debt forecasts and related interest and amortization could be impacted once negotiations on cost-sharing are finalized.
Details on major assumptions and sensitivities resulting from changes to those assumptions are outlined in Appendix Table A10.
Budget and Fiscal Plan – 2009/10 to 2011/12
44
Three-Year Fiscal Plan
Crown Corporations and Agencies
Crown corporations and agencies have provided their own forecasts. These forecasts, as well as their statements of assumptions were used to prepare the fiscal plan. The boards of those corporations and agencies have also included these forecasts, along with further details on assumptions and risks, in the service plans being released with the budget.
The fiscal plan does not assume or make allowance for extraordinary adjustments other than those noted in the assumptions provided by the Crown corporations and agencies. Factors such as electricity prices, water inflows into the BC Hydro system, accident trends, interest/exchange rates, decisions of an independent regulator, or pending litigation could significantly change actual financial results over the forecast period. BC Hydro’s and ICBC’s results may be affected by the outcome of BC Utilities Commission decisions on current and future rate applications.
New decisions or directions by Crown corporation or agency boards of directors may result in changes to costs and revenues due to restructuring, valuation allowances and asset write-downs, or gains and losses on disposals of businesses or assets.
SUCH Sector
Three-year aggregate financial plans for the SUCH sector have been developed by the Ministries of Health Services, Education and Advanced Education and Labour Market Development based on broad policy assumptions and the funding for SUCH sector organizations included in the respective ministry budgets. Allocations of funding to individual agencies is being developed by ministries and will be communicated in the coming weeks. Individual agency financial plans based on these funding decisions, may, therefore, differ from the ministry developed sector plans included in the budget.
Health authorities and hospital societies have identified annual spending pressures of approximately 3.5 per cent of the provincial funding provided to health organizations. The Ministry of Health Services will continue to work with the health authorities to manage these spending pressures.
Spending
The spending forecast contained in the fiscal plan is based on ministry and taxpayer-supported Crown corporation and agency spending plans and strategies. Details on major assumptions and sensitivities resulting from changes to those assumptions are shown in Appendix Table A12 and in ministry service plans. The main spending issues follow.
Compensation
The current public sector negotiating framework provides for a dividend to be made available to employees if the projected surplus at March 31, 2010 is greater than $150 million, to a maximum of $300 million. Given the forecasted deficit in 2009/10, provision for a dividend payment is not included in the fiscal plan. However, consistent with negotiated agreements, a dividend would be paid if the required surplus is achieved in the Public Accounts for 2009/10.
Budget and Fiscal Plan – 2009/10 to 2011/12
45
Three-Year Fiscal Plan
Many of the wage agreements reached in the last round of public sector negotiations expire by the end of 2009/10. In response to the global economic forecast and government’s fiscal position, the fiscal plan assumes no wage increases for 2010/11 and 2011/12. The Ministry of Health Services funding growth in 2010/11 and 2011/12 is maintained at approximately 6 per cent, as in previous years. This funding is expected to accommodate wage increases within the current negotiating framework and any labour market adjustments arising from the upcoming collective agreements. Health sector bargaining is expected to be consistent with the mandate for the rest of government.
Contingency Vote
A contingency vote of $385 million is included in 2009/10, decreasing to $300 million in 2010/11 and $250 million in 2011/12.
The allocation to contingencies is a prudent budgeting measure that protects the three-year fiscal plan from:
· unforeseen and unbudgeted costs that may arise; and
· pressures for costs that are currently budgeted based on estimates whose final values are impacted by external events or prices.
Table 1.23 Notional Allocations to Contingencies
($ millions) | | 2009/10 | | 2010/11 | | 2011/12 | |
2010 Olympics – preliminary allocation of contingency amount | | 69 | | 10 | | | |
Subtotal notional allocations | | 69 | | 10 | | — | |
Unallocated contingencies | | 316 | | 290 | | 250 | |
Total contingencies | | 385 | | 300 | | 250 | |
The contingency amounts provide $79 million for the remaining contingency that is earmarked to help address cost uncertainties in areas related to staffing and hosting the 2010 Winter Olympic and Paralympic Games (2010 Winter Games).
Budget 2008 provided $75 million for the Innovation and Integration Fund within the Contingency vote ($50 million in 2008/09 and $25 million in 2009/10). Budget 2009 provides the $25 million funding for the Innovation and Integration Fund in 2009/10 in the Ministry of Health Services budget.
Public Sector Program Delivery
The vast majority of government-funded services are delivered through third party delivery agencies that provide programs such as acute and continuing health care, K–12 education, post-secondary education, and community social services. All of these sectors face cost pressures in the form of program demand and non-wage inflation. The government also funds a number of demand-driven programs such as PharmaCare, K–12 education, student financial assistance and income assistance. The budgets for these programs reflect the best estimates of demand and other factors such as price inflation. If demand is higher than estimated, this will result in a spending pressure to be managed.
Budget and Fiscal Plan – 2009/10 to 2011/12
46
Three-Year Fiscal Plan
Budget 2009 protects and enhances funding for health, post secondary, and education, in part by setting targets for administrative efficiencies across government. As these efficiencies are implemented, government may reassess some efficiency targets to help ensure that program delivery is protected, particularly in areas vulnerable to rapidly changing economic circumstances
Treaty Negotiations and the New Relationship
The provincial government is committed to building a new relationship with First Nations and Aboriginal people based on mutual respect, recognition, and reconciliation of Aboriginal rights and title. The vision for the New Relationship was established in 2005 and government continues to partner with Aboriginal leadership to develop new means and structures that promote co-operation and workable arrangements with a goal of closing the gap that exists between Aboriginal and other British Columbians.
Treaties continue to be a primary objective for the province for achieving certainty over land and resource ownership. The Tsawwassen Final Agreement received full ratification by Canada in the federal Parliament on June 17, 2008, and the parties expect the treaty will take effect in April 2009. The five Maa-nulth First Nations and BC have ratified a treaty final agreement, which is awaiting ratification by Canada. On November 20, 2008, the Yale First Nation signed an understanding with BC on a final agreement. The First Nation and the federal government still need to resolve issues concerning salmon fisheries before a final agreement can be reached.
In November 2008, BC finalized the first Incremental Treaty Agreement (ITA) in the province with the Tla-o-qui-aht First Nation. The ITA will transfer Crown land and other benefits to the First Nation in increments tied to milestones in the treaty process, in exchange for accelerated treaty negotiations, commitments not to engage in litigation with the province, and other provisions. Government continues to negotiate treaties and incremental treaty agreements with First Nations, and the impact of these agreements on the fiscal plan will depend on the outcome of negotiations and ratification.
The province is involved in litigation with First Nations relating to aboriginal rights. Settlement of these issues, either in or out of court, may result in additional costs to government.
Capital Risks
The capital spending forecasts assumed in the fiscal plan may be affected by a number of the various factors listed below:
· meeting planned construction schedules;
· weather and geotechnical conditions causing project delays or unusual costs;
· changes in market conditions, including service demand, inflation and borrowing costs;
· the outcome of environmental impact studies;
· the accuracy of capital project forecasts;
Budget and Fiscal Plan – 2009/10 to 2011/12
47
Three-Year Fiscal Plan
· the successful negotiation/timing of cost-sharing agreements with the federal government;
· the application/interpretation of accounting treatments;
· the success of public-private sector partnership negotiations; and
· building material costs and wage rates for skilled workers.
Unfunded Liabilities
The Public Service, Teachers, College and Municipal Pension Plans — the four major public service plans — are joint trusteeship plans. Actuarial evaluations are conducted on each plan every three years, and a report is received within one year of the evaluation. In the event that the actuarial evaluation indicates a plan deficit, the pension boards are required to address the shortfall by contribution adjustments or other means.
· The most recent actuarial valuation report for the Public Service Pension Plan as of March 31, 2008 indicated a $487 million surplus. Contribution rate increases of 0.15 per cent for both members and employers were required effective April 1, 2009 to address a Pension Benefits Standards Act provision that imposes a minimum funding requirement, and are included in the fiscal plan.
· The most recent actuarial valuation report for the Teachers’ Pension Plan as of December 31, 2005 indicated a $904 million liability. Contribution rate increases of 1.61 per cent for both members and employers were required effective July 1, 2007, and are included in the fiscal plan.
· The most recent actuarial valuation report for the College Pension Plan as of August 31, 2006 indicated a $54 million liability. Contribution rate increases of 0.51 per cent for both members and employers were required effective September 1, 2007, and are included in the fiscal plan
· The most recent actuarial valuation report for the Municipal Pension Plan as of December 31, 2006 indicated a surplus of $438 million.
· The next actual valuation report for the Public Service Pension Plan as of March 31, 2011 is expected to be received by March 31, 2012; the report for the Teachers’ Pension Plan as of December 31, 2008 is expected to be received by December 31, 2009; the report for the College Pension Plan as of August 31, 2009 is expected to be received by August 31, 2010; and the report for the Municipal Pension Plan as of December 31, 2009 is expected to be received by December 31, 2010.
Catastrophes and Disasters
The spending plans for the Ministries of Forests and Range and Public Safety and Solicitor General include amounts to fight forest fires and deal with other emergencies such as floods. These amounts are based on historical averages of actual spending and on conditions of normal to moderate severity. Extreme occurrences may affect expenses in these ministries and those of other ministries.
Budget and Fiscal Plan – 2009/10 to 2011/12
48
Three-Year Fiscal Plan
Pending Litigation
The spending plan for the Ministry of Attorney General contains provisions for payments under the Crown Proceeding Act based on estimates of expected claims and related costs of settlements likely to be incurred. Litigation developments may occur that are beyond the assumptions used in the plan (for example, higher-than-expected volumes, or size of claim amounts and timing of settlements). These developments may affect government revenues and/or expenditures in other ministries.
One-time Write-downs and Other Adjustments
Ministry budgets provide for anticipated levels of asset or loan write-downs where estimates can be reasonably predicted. The overall spending forecast does not make allowance for extraordinary items other than the amount provided in the contingency vote.
Budget and Fiscal Plan – 2009/10 to 2011/12
49
Three-Year Fiscal Plan
Presentation of Provincial Government Debt
Why does it matter that taxpayer supported debt is increasing
After a downward trend over the past six years the ratio of taxpayer supported debt to GDP is set to increase in Budget 2009. This change is significant because provincial government debt represents an obligation passed on to future generations.
Government reports on both the level of total debt and the level of taxpayer-supported debt. Generally speaking taxpayer-supported debt is paid for out of government revenues while total debt includes debt paid from revenues generated from services provided by crown corporations or agencies. For many years taxpayer supported debt to GDP has been the measure most often referred to as an indicator of whether the level of provincial debt is affordable. However this measure of affordability does not provide information about the debt’s purpose. For example, government could borrow for current operations and neglect borrowing to support infrastructure. In both cases the obligation to pay would fall to future generations but it is generally accepted that borrowing for investments with long lives is more appropriate than borrowing to pay for day-to-day operations since investments provide benefits beyond one year. Over the next two years, as the government introduces deficit budgets, operating debt is expected to increase.
When GDP is growing faster than taxpayer-supported debt a decreasing portion of government revenue raised from economic activity is required to service debt obligations. When GDP growth is less than the rate of increase in borrowing a greater portion of future tax revenue is required to repay those debt obligations.
Sinking funds
Under the Budget Transparency and Accountability Act government prepares it’s budget and Public Accounts in accordance with generally accepted accounting principles which require the total amount of all obligations to be disclosed. Sinking funds, which are amounts set aside to retire both taxpayer-supported and self-supported debt, are presented separately. Since these amounts have already been set aside to repay future obligations when they become due, the net amount of debt obligations less sinking fund investments is the outstanding obligation that must be funded from future tax revenue or revenue raised through commercial activities.
Debt disclosure
The province currently reports information about provincial debt in a number of different documents. The budget documents provide information about the provinces debt forecast. Annual service plans and service plan reports provide accountability targets and report on results. The independently audited financial statements, detailed debt summary and debt statistics reports included in the annual Public Accounts provide an accounting of the province’s debt obligations at the end of each fiscal year.
How classification of self-supported debt may become inconsistent
Historically self-supported debt has been described as the amount of provincial borrowing that has been lent to commercial government business enterprises. This is unique to British Columbia as most jurisdictions in Canada report debt net of lending to commercial government business enterprises.
Budget and Fiscal Plan – 2009/10 to 2011/12
50
Three-Year Fiscal Plan
New types of business structures within other crown corporations could also fund the repayment of their debt through specifically dedicated revenues raised outside the government reporting entity. An example would be a student residence paid for from rent. Because these programs and projects may not be structured as government business enterprises, they would not be included under the current definition of self supported debt. This currently results in inconsistent treatment of debt even though the nature of the debt is the same.
Need for increased disclosure in notes
The types of debt obligations entered into by the province have also become more varied as the financial environment continues to change. Both taxpayer-supported and self-supported debt can include not only notes, bonds and debentures but also mortgages, demand loans, capital lease liabilities and obligations under Public Private Partnership contracts. It is important that debt information remains informative in the context of these changing structures.
Conclusion
To adapt and respond to the changing nature of business, government is reviewing how provincial debt is represented in all of its financial reports. Options include moving to gross debt reporting and refining the definition of taxpayer-supported debt to consistently segregate those debts supported from service revenue. In reviewing the presentation of debt in the financial reports of the province the first consideration is retaining compliance with the evolving principles of generally accepted accounting principles, and the expectations about the current and future materiality of the debt information being disclosed. The information requirements of the different user groups who rely on the financial information to support their decision making and the way other governments in Canada report their debt to ensure financial information remains comparable are also considerations.
Budget and Fiscal Plan – 2009/10 to 2011/12
51
Three-Year Fiscal Plan
The Port Mann Bridge / Highway 1 Project
The fiscal implications of the Port Mann/ Highway 1 Project, announced in January 2009, are not included in the Budget and Fiscal Plan. Based on continuing negotiation, appropriate presentation can only be determined when the agreement is finalized.
The project includes widening Highway 1, building a wider Port Mann Bridge, upgrading interchanges and improving access and safety on Highway 1 from the McGill interchange in Vancouver to 216th Street in Langley, a distance of approximately 37 kilometres. The pre-design concept includes congestion reduction measures such as high occupancy vehicle lanes, transit and commercial vehicle priority access to highway on-ramps, improvements to the cycling network, and the capability to accommodate future light rail transit.
Construction costs are estimated to total $2.46 billion. For presentation in financial statements, generally accepted accounting principles require the inclusion of interest charges and project management costs which could increase the total capital cost to over $3 billion.
To achieve an opening date of 2013, initial groundwork in preparation for construction was initiated in October and is ongoing. These expenditures, approximately $94 million to the end of 2008/09, are currently being managed by the province but will be fully recovered through the terms of the concession agreement. Total costs over the life of the concession will include operating and maintenance, rehabilitation, and interest.
Provincial financing is part of the ongoing negotiation. While the accounting treatment and financial statement presentation cannot be finalized until the structure of the deal is known on financial close, at an assumed total capital cost of $3 billion, the project debt would represent approximately 1.2 per cent of GDP by 2014/15.
All costs will be recovered by tolls. The announced toll is $3 each way for cars when the bridge opens in 2013. Final terms and conditions for project financing are anticipated to be settled in early March. The government retains control of the rate of the tolls as the concessionaire cannot change the toll rate without provincial approval.
Budget and Fiscal Plan – 2009/10 to 2011/12
52
Three-Year Fiscal Plan
British Columbia’s Strong Foundation
In 2002, facing a forecast $4.4 billion deficit, government undertook an ambitious strategy to revitalize the provincial economy. Since that time, the province has reduced its operating debt by 40 per cent, benefited from increases in investment in much of its resource sector, and experienced an average 2.6 per cent annual growth in real GDP per capita while the Canadian average was 1.8 per cent. Over the same period the unemployment rate has fallen, averaging 4.6 per cent in 2008.
A balanced budget was achieved in 2004 and maintained for four consecutive budget cycles. Operating debt has been reduced by $7.4 billion over the last five years and the province has the highest possible credit rating of AAA with Moody’s Investor Services and Standard & Poor’s.
Strong fiscal position restored
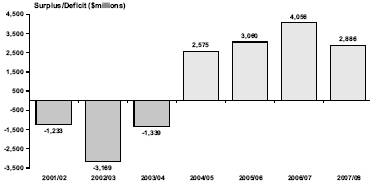
Source: Annual audited Public Accounts
Taxpayer-supported debt has decreased from 21.3 per cent of GDP in 2002 to below 14 per cent by the end of 2008/09.
Today the province is once again facing challenging times. The latest provincial economic forecast indicates the economy is expected to decline by 0.9 per cent in 2009 and in the last quarter of 2008, an estimated 13,700 jobs were lost. Since September 2008, forecasted provincial revenues have decreased by $6.6 billion over the next three years.
In 2002, government’s primary objectives were to build confidence in the economy and enable a stable, growing revenue base. Today those same objectives remain the priority for government. However, BC’s current base economic and fiscal position is stronger now than it was in 2002 and this will help to mitigate the impact of the global economic slowdown and ensure that British Columbia manages through these turbulent economic times.
Government’s investments over the last seven years to build a framework that is sustainable, flexible, and responsive have created a strong British Columbia. Initiatives such as the minimization of “red tape” and a competitive tax environment for business; reductions in personal income taxes; a focus on resource development in an environmentally sustainable manner; targeted spending on education to ensure a skilled and adaptable workforce; and a $31 billion capital infrastructure program supporting both urban and rural communities have all contributed to the productive and prosperous standard of living enjoyed by British Columbians today.
Tax and regulatory competitiveness
Since 2001, attracting business investment to British Columbia to create and maintain jobs has been a top priority for the province. The major tools to achieve this include a competitive tax system, streamlined regulations and a highly educated and trained workforce.
Significant changes have been made to the provincial tax system resulting in a very competitive tax regime in British Columbia that has supported the province’s strong economic performance over the last seven years.
Since 2001, and including Budget 2009, the government has introduced more than 120 tax cuts which have benefited British Columbian families, individuals, and businesses.
Personal income tax cuts put money back into people’s pockets to spend, or invest, or pay down debt. The tax changes have resulted in:
· personal income tax cuts of at least 37 per cent for most taxpayers with lower income taxpayers receiving tax cuts of 70 per cent or more;
Budget and Fiscal Plan – 2009/10 to 2011/12
53
Three-Year Fiscal Plan
· an additional 250,000 people coming off the tax rolls;
· the lowest provincial personal income taxes on up to $ 116,000 in earnings; and
· the second lowest top marginal tax rate of all of the provinces.
The government has also provided tax relief by extending, enhancing, expanding and introducing new tax credit programs over the past seven years. New programs include tax credits for new media, book publishing and apprenticeship training.
Personal income tax reductions since 2001
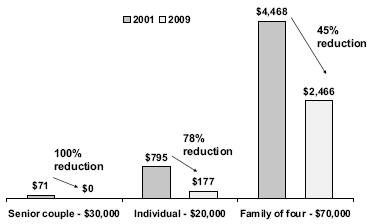
The reduction in the corporate income tax rate to 10 per cent, combined with the federal tax rate cuts that will take effect in 2012, means that British Columbia businesses will enjoy the lowest corporate income tax rate in the G7 by 2012.
Tax reductions that have specifically targeted business since 2001 include:
· reductions in the general corporate income tax rate from 16.5 per cent to 11 per cent with further reductions to 10.5 per cent on January 1, 2010 and to 10 per cent on January 1, 2011;
· reductions in the small business corporate income tax rate from 4.5 per cent to 2.5 per cent and an increase in the small business corporate income tax threshold to $400,000 from $200,000;
· elimination of the corporation capital tax;
· provincial sales tax exemptions for production machinery and equipment; and
Corporate tax reductions since 2001
(per cent of taxable income)

* Effective 2011
· significant reductions in school property taxes for light and major industrial properties.
Deregulation
The government continues to focus on ensuring a modern, efficient and effective regulatory system that promotes innovation and economic opportunity while protecting public health, safety, and the environment.
Since implementation of British Columbia’s groundbreaking regulatory reform initiative in 2001, the government has reduced its regulatory burden by more than 42 per cent.
Regulatory Requirements and Results to December 31, 2008
| | Requirement | | Net Change | | Requirement | |
| | as of June | | as of Dec-31- | | as of Dec-31- | |
Ministry (1) | | 2004 | | 2008 | | 2008 | |
| | Number of Regulations | |
Aboriginal Relations and Reconciliation | | 61 | | — | | 61 | |
Advanced Education and Labour Market Development | | 4,818 | | (672 | ) | 4,146 | |
Agriculture and Lands | | 6,438 | | (142 | ) | 6,296 | |
Attorney General | | 4,851 | | 47 | | 4,898 | |
Children and Family Development | | 8,597 | | (275 | ) | 8,322 | |
Community Development | | 8,916 | | (1,097 | ) | 7,819 | |
Education | | 17,607 | | (3,316 | ) | 14,291 | |
Energy, Mines and Petroleum Resources | | 11,448 | | (388 | ) | 11,060 | |
Environment | | 14,629 | | (923 | ) | 13,706 | |
Finance | | 47,346 | | (3,759 | ) | 43,587 | |
Forests and Range | | 8,954 | | (926 | ) | 8,028 | |
Health Services | | 4,789 | | (99 | ) | 4,690 | |
Healthy Living and Sports | | 2,955 | | (73 | ) | 2,882 | |
Housing and Social Development | | 11,548 | | (120 | ) | 11,428 | |
Labour and Citizens’ Services | | 29,703 | | (2,994 | ) | 26,709 | |
Premier’s Office - Intergovernmental Relations | | 9 | | — | | 9 | |
Public Safety and Solicitor General | | 10,887 | | (702 | ) | 10,185 | |
Small Business, Technology and Economic Competitiveness | | 14,420 | | (297 | ) | 14,123 | |
Tourism, Culture and the Arts | | 7,089 | | (4,174 | ) | 2,915 | |
Transportation and Infrastructure | | 13,769 | | (152 | ) | 13,617 | |
Total government | | 228,834 | | (20,062 | ) | 208,772 | |
(1) The distribution of the count across ministries was affected by the re-alignment of responsibilities completed in July 2008.
(2) The baseline regulatory count, June 2004, reflects corrections to the baseline count reported in Budget 2007.
Budget and Fiscal Plan – 2009/10 to 2011/12
54
Three-Year Fiscal Plan
Infrastructure
Since 2001, the province has invested $31 billion in capital projects in all sectors and across the province. This includes $22.8 billion in investments in the education, health and transportation sectors, government ministries and other service delivery agencies, and a further $8.2 billion in investments by commercial Crown corporations, primarily BC Hydro.
Infrastructure investments of $31 billion since 2001
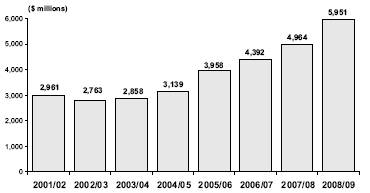
Source: 2008 British Columbia Financial and Economic Review – Capital Spending Forecasted 2008/09
Multi-year transportation investments in rail, road and port infrastructure have opened up the province to emerging global markets. The Prince Rupert Container Terminal, announced in 2007, established British Columbia as the closest container shipping port to Asian markets and shortened product movement times by one to two days. Improvements to the Trans-Canada Highway in the Kicking Horse Canyon are providing a safer and more efficient journey for all travelers, and a competitive corridor for the east-west movement of goods to ports and southern routes. The William R. Bennett Bridge, opened in May 2008, plays a pivotal role in growing the Okanagan’s signature tourism industry.
Critical capital investments in health and education have also been made in response to the changing demographics of both the population and workforce. The 300-bed Abbotsford Regional Hospital, opened in September 2008, is the first cancer centre in Western Canada to be integrated into a hospital from the ground up. In 2006, Simon Fraser University’s new campus in Surrey was opened, giving students in BC’s fastest-growing region access to a world-class university. SFU Surrey is expected to enroll the equivalent of 2,500 full-time students by 2010.
In 2002, government committed to increase the role of the private sector in the delivery of public infrastructure with the intention of minimizing costs and risks to taxpayers. By 2007, public-private partnerships (P3) became the base case for capital investment decisions over $20 million. Phase 2 of the Kicking Horse Pass project, the new floating bridge over Okanagan Lake, and the nearly completed Sea-to-Sky Highway improvements have, to date, all been delivered on budget and ahead of schedule through P3 arrangements with internationally supported consortiums. Two major elements of the Gateway Project, the South Fraser Perimeter Road and the Port Mann Bridge are also expected to be delivered through P3 arrangements.
Public-private partnerships have also been used to deliver health projects such as the Surrey Outpatient Facility, Abbotsford Regional Hospital and Cancer Centre, Fort St. John Hospital replacement, Victoria Royal Jubilee Hospital inpatient facility, and expansions to the Kelowna General and Vernon Jubilee Hospitals.
Key Sector Strategies
Forestry
British Columbia’s forest industry continues to be challenged by a slumping US housing market, low lumber prices and the devastating mountain pine beetle epidemic. Since 2002, the province has championed a number of policies and legislative changes to improve the market responsiveness and competitiveness of British Columbia’s forest sector.
Under the 2003 Forestry Revitalization Plan, new auction based Market Pricing Systems were introduced to more accurately respond to changes in the market. As well, through a province wide timber reallocation process, new forest sector opportunities have been provided to market loggers, First Nations and for new community forests and woodlots.
Budget and Fiscal Plan – 2009/10 to 2011/12
55
Three-Year Fiscal Plan
Forestry agreements have been provided to over 150 First Nations, and over 50 communities have benefited from new or expanded community forest agreements.
The performance-based criteria of the Forest and Range Practices Act encourages innovation while still maintaining high environmental standards.
Over the next years the government will continue its focus on revitalizing this key industry. Government will work to strengthen existing policies and develop strategies to increase the existing market for wood products as well as capture new wood markets such as China. British Columbia exported 308 million board feet of lumber to China in 2007 and exceeded that amount in the first nine months of 2008. As well, the province is looking to take advantage of emerging new sectors such as wood bioenergy.
Amendments to BC’s building code effective April 2009 will raise the limit on wood frame construction to six storeys. In addition, several 2010 Olympic venues and the Vancouver Convention and Exhibition Centre have used a significant amount of wood in their structures.
For displaced forestry workers, the Community Development Trust is supporting transition to new careers or bridge to retirement.
Oil and Gas
In 2008, oil and gas land right sales hit a record high of $2.7 billion demonstrating continued optimism about the future of BC’s oil and gas sector. Since 2001, provincial natural gas reserves as a share of Canadian reserves have increased from 15 per cent to 22 per cent, and BC’s share of capital investment has increased from 10 per cent to 15 per cent.
While current prices for oil and gas have fallen recently, strong investor confidence in BC’s resources and its fiscal and regulatory environment are expected to support the industry through this period of low prices.
Oil and gas
BC activity as a percentage of total Canadian activity
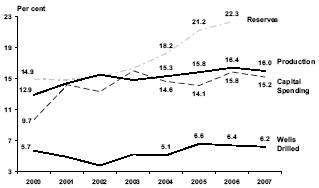
Source: CAPP
Policies supporting the development potential of the province’s abundant natural gas resources in a competitive global market have focused on resource access, regulatory streamlining, and a responsive royalty structure. The Infrastructure Royalty Credit Program encourages exploration and development in under-explored areas by providing infrastructure royalty credits to offset access road and pipeline costs.
The government continues to encourage active investment in the oil and gas sector through a flexible and timely royalty regime. As exploration has become more technically complex, royalty programs that encourage shale gas development, enhanced oil recovery, deep wells, and exploration in remote and under-explored areas have been introduced.
Mining
Since 2002, exploration expenditures have increased from a low of $29 million in 2001 to nearly $367 million in 2008 — the second highest total ever for exploration spending in the province. Over a similar time period,
Mineral exploration
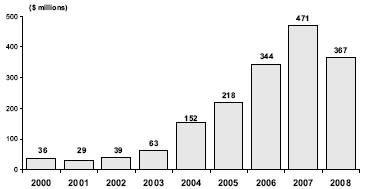
Source: Natural Resouces Canada – National Exploration Survey Forecasted 2008/09 (MEMPR)
Budget and Fiscal Plan – 2009/10 to 2011/12
56
Three-Year Fiscal Plan
BC’s share of Canadian mineral exploration investment in BC has increased to 15 per cent from approximately 7 per cent.
Government’s changes to the tax and regulatory systems, combined with appreciating commodity values, improved land use certainty, and proactive First Nations consultation, have been critical to the reemergence of the mining sector in BC.
Tax incentives include the BC Mining Flow-Through Share tax credit which, in combination with a similar federal tax credit, reduces the cost of a $1,000 investment to about $383. The Mining Exploration tax credit available for 20 per cent of eligible mineral exploration expenses was increased to 30 per cent in Mountain Pine Beetle affected areas in Budget 2007.
Land access remains a critical requirement for investor confidence. Policies implemented since 2001 have increased certainty for access to land and resource development for industry and investors. Several land use plans have been approved in recent years such as the Sea-to-Sky and Mid and North Coast plans and the Mining Resource Revenue Sharing program, a sector specific benefit, has been established under the New Relationship agreement with First Nations.
High-Tech and Research
Since 2001, BC has pursued its vision to establish the province as one of the top ten high-tech centres in the world. The strategy focused on improving both the personal and corporate income tax systems to create a competitive environment for the high-tech sector and building a knowledge-based economy through targeted investments in research and education.
Many of the personal and corporate income tax cuts implemented since 2001 have directly benefited the high-tech sector, an industry which attracts highly skilled workers and entrepreneurs.
Provincial investment in research and innovation has been considerable, with $1.7 billion invested since 2001.
These investments included:
· $350 million invested through the BC Knowledge Development Fund to enable key research institutions to undertake leading edge research and attract world renowned scientists.
· $244 million provided to the Michael Smith Foundation for Health Research for cancer research.
· $152 million invested in Genome BC to support its investments in and management of large-scale research projects in areas such as health, forestry, agriculture and the environment.
· $134 million invested in the UBC Life Sciences Centre, the UVIC Medical Sciences Building, and UNBC’s Dr Donald Rix Northern Health Sciences Centre, doubling the capacity available for first-year student doctors.
· $56 million for the Leading Edge Endowment Fund (LEEF) to conduct research on a variety of diverse issues from addiction and mental illness to early childhood development, marine ecosystems, and sport technology.
· $41 million for the World Centre for Digital Media Education. The Centre is training home-grown experts in digital media, a $2.3 billion industry in BC that employs 16,000 people.
Tourism
In 2002, the government committed to doubling tourism’s contribution to BC’s economy by 2015 and a corresponding effort was undertaken to streamline access to Crown land, encourage expansion of the cruise ship industry, and secure the 2010 Olympic and Paralympic Winter Games.
Budget and Fiscal Plan – 2009/10 to 2011/12
57
Three-Year Fiscal Plan
A number of initiatives since 2002 have strengthened this pledge including the BC Resort Strategy and Tourism Action Plan. To date the province has seen $1.044 billion in increased investments in resort expansion and development which, in turn, has contributed to the 35 per cent growth in tourism revenue since 2002.
Film and Television
British Columbia’s scenic beauty, expertise in digital animation and visual effects, and competitive tax credits has made the province an attractive location for film production. The film and television industry currently adds approximately $1 billion annually to the provincial economy and provides about 20,000 direct and 15,000 indirect jobs. Since 2001, the province has increased the basic film tax credit rate to 35 per cent from 20 per cent for domestic film productions and to 25 per cent from 11 per cent for foreign film productions.
Agriculture
Under the five-year provincial-federal Agricultural Policy Framework Agreement, which ran from 2003 to 2008, over $500 million was provided to British Columbia’s agri-food industry. Among the programs put into place were production insurance and farm income stabilization.
Capitalizing on the positive momentum generated by the original agreement, the province is preparing to enter into a new agreement with the federal government, the “Growing Forward Agreement on Agriculture, Agri-Food and Agri-Based Products”. Funding will support programs that focus on key results in the areas of competitiveness and innovation, environmental and food safety priorities, and proactive risk management.
Housing
British Columbia continues to be a desirable place to live and has attracted substantial investment in the housing sector over the past six years. This increased investment has, in some cases, resulted in financial challenges for British Columbians, whether for access to housing or managing sharp increases in existing housing costs.
Since 2001, the government has constructed 12,838 units of subsidized housing and 2,687 additional units are in a development stage. Rental assistance has been made available to elderly seniors and low-income families that earn less than $35,000. To further support seniors, the province has increased the total supply of supportive housing by more than threefold to 4,400 units today.
For existing homeowners, the government has provided tax relief for first time home buyers, making it easier for them to buy a home by increasing the exemption threshold and removing the 70 per cent financing eligibility requirement for the exemption from property transfer tax.
A number of additional changes also provide tax relief for homeowners including:
· increasing the home owner grant by $100;
· setting the home owner grant reduction threshold to ensure more than 95 per cent of homeowners receive the grant each year;
· extending the additional home owner grant to eligible low income homeowners with high valued homes;
· reducing the age to 55 from 60 for deferring property taxes; and
· providing a temporary two-year property tax deferment program for people facing financial hardship.
As part of its continued commitment to breaking the cycle of homelessness, the province has acquired 45 properties throughout BC and preserved 2,030 units of housing for low-income individuals and families. Budget 2008 provided $30 million annually to be directed primarily towards outreach teams and operating the Emergency Shelter Program as interim assistance until users can be connected with more permanent supportive housing.
Budget and Fiscal Plan – 2009/10 to 2011/12
58
Three-Year Fiscal Plan
Sustainable Environmental Policies
The government places a high priority on encouraging a thriving private sector economy that creates high-paying jobs while maintaining high environmental standards. A focus on results based regulation has created an environment that supports sustainable resource management.
Streamlined approval processes under the Environmental Assessment Act and Environmental Management Act have removed impediments to businesses and more appropriate penalties and incentives have been put in place to ensure improved compliance and accountability.
In recent years the Environmental Assessment Office has focused extensively on improving timeliness and providing certainty of process to all interested parties. The province and federal government have recently signed an agreement that commits to developing joint work plans to strengthen the delivery of cooperative environmental assessments in British Columbia.
Climate Action Plan
In 2008 government made a commitment to become carbon neutral by 2010 and to reduce BC’s greenhouse gas (GHG) emissions by one-third by 2020 and by 80 per cent by 2050. This commitment was entrenched in legislation and Budget 2008 committed over $1 billion towards these goals.
With the worldwide market for clean energy technologies valued at an estimated $1 trillion by 2030, the Climate Action Plan positions BC to support new innovation.
Investments under this Plan include a $95 million endowment to create the Pacific Institute for Climate Solutions which brings together universities, government and the private sector to facilitate cutting-edge solutions; a $25 million Innovative Clean Energy (ICE) Fund, designed to help make BC a leader in global alternative technologies; and a $25 million Bioenergy Network to encourage research and development in areas such as wood-waste cogeneration, biofuel production and wood pellet production.
The Pacific Carbon Trust, the crown agency mandated to assist the government in delivering on its GHG targets is on track to meet government’s carbon offset requirements. Negotiations are underway to secure the required 35,000 tonnes of offsets needed through an open, competitive tender call with private-sector suppliers.
Educational Excellence
In 2001, the government noted that a fundamental requirement for economic prosperity was a high quality, relevant education system that was sensitive to the changing requirements of both industry and students.
Quality education begins in the kindergarten to Grade 12 education system in British Columbia, a fact supported by BC students consistently scoring well on standardized international foundation skills tests. The province continues to increase per student funding as it has every year since 2001.
K-12 spending has increased 28% since 2001
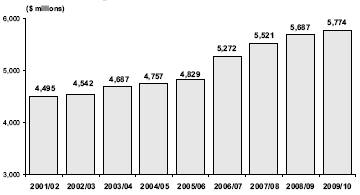
Source: 2008 British Columbia Financial and Economic Review – Expense by Function Forecasted 2008/09 & 2009/10
Investments in post-secondary education have increased and are focused on providing individuals with the education, training, and skills required to be productive and competitive in today as well as tomorrow’s economy.
Budget and Fiscal Plan – 2009/10 to 2011/12
59
Three-Year Fiscal Plan
Since 2001, government has supported:
· 36,700 new student spaces (including Industry Training Authority spaces);
· the creation of seven new public degree granting institutions at existing college campuses providing more choices, and better access, closer to home for students and their families;
· 248 new degrees offered to create greater choice and flexibility for students at a wider range of institutions; and
· increased seats in key areas such as nursing, physician training, physiotherapy, graduate programs and skilled trades to address workforce shortages.
Post secondary spending has increased 53% since 2001
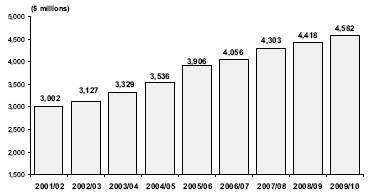
Source: 2008 British Columbia Financial and Economic Review – Expense by Function Forecasted 2008/09 & 2009/10
Lifestyle
British Columbia has long been recognized as one of the best places in the world to live, work, and invest. Studies indicate that quality of life influences people’s decisions about where to locate, whether it is to set up a new business, go to school, or immigrate from another province or country. Only Ontario has had a higher rate of new immigrants since 2001.
Quality of life includes health care considerations. The province remains committed to providing a high quality health care system in an era where the population is living much longer and expecting much more.
Moving Forward
In 2001, the government initiated a strategy to grow and build the province. Competitive tax policies, a proactive regulatory regime,
Health spending has increased 49% since 2001
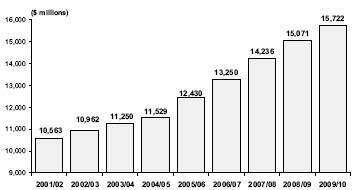
Source: 2008 British Columbia Financial and Economic Review – Expense by Function Forecasted 2008/09 & 2009/10
a highly educated, adaptive and well-skilled work force, and targeted sector strategies have provided a platform for economic growth and prosperity.
Notwithstanding the prudent fiscal management in place since 2001, the government will run an operating deficit in the next two years as it deals with the extraordinary economic circumstances it faces. In keeping with its record of fiscal discipline, the government will ensure protection of health and education funding.
The short term focus of Budget 2009 is twofold. Immediate additional investments in infrastructure projects across the province will provide employment opportunities and stability for families and businesses. Concurrently, the government will reduce its own expenses extensively, particularly in areas of administrative spending.
A number of measures that will result in employment opportunities, support families, and encourage economic growth in all regions of the province are underway.
· The capital plan includes $10.6 billion of capital spending over the next three years for construction projects including the South Fraser Perimeter Road pre-load, the Cariboo Connector, and various transit initiatives including the Evergreen Line as well as the new Fort St. John hospital and expansions to Kelowna General and Vernon Jubilee hospitals.
Budget and Fiscal Plan – 2009/10 to 2011/12
60
Three-Year Fiscal Plan
· Over the next three years, an additional $2 billion of approved capital infrastructure spending will be accelerated.
· Since the end of October 2008, the province has committed to accelerate $401 million in capital investments from within the capital plan. Projects include highway improvements; upgrades and maintenance of rural resource roads; and additional housing for the homeless.
Continued investments in infrastructure
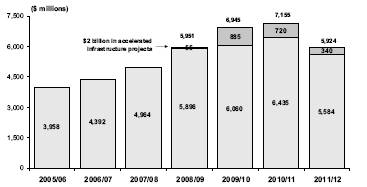
Source: 2008 British Columbia Financial and Economic Review – Capital Spending Forecasted 2008/09 to 2011/12
· Through a restructuring of current provincial/local funding arrangements, an additional $151 million in grants will be provided to local governments in 2008/09 providing immediate strategic investment opportunities for communities.
· The Industry Training Authority will provide an additional 2,000 apprenticeship training spaces in 2009/10 to accommodate the changing skill requirements of the provincial workforce.
The long term focus continues to be keeping British Columbia an attractive place to live and invest where multiple opportunities for growth and prosperity exist. Maintaining a competitive climate and encouraging the development of new markets will be critical factors. The province will continue taking advantage of key assets for success including:
· a strong economic and fiscal position;
· a diverse modern economy with abundant natural resources;
· a skilled, well educated, and adaptable workforce;
· a positive relationship with the Asia-Pacific economies, including BC’s strategic location on the West Coast; and
· being a destination of choice for tourists, investors, and newcomers searching for the superior lifestyle enjoyed by British Columbians today.
To position British Columbia for the future, the province will continue to seek out opportunities in the following areas:
· Green energy, including the use of biofuels and encouraging the development of alternative energy sources, will be a priority as the government makes every effort to achieve its goal of electricity self-sufficiency by 2016. The LiveSmart BC Energy Incentive Program, the Innovative Clean Energy Fund, and the Bioenergy Network support this direction.
· Capitalize on the enhanced provincial exposure to out-of-province visitors and the world at-large from the 2010 Olympic and Paralympic Winter Games to better position British Columbia to further market itself as a tourism destination and international sport event locale.
· Expand the province’s opportunities as an International Finance Centre through proactive policy, tax and investment regulations, including incentives to pursue the commercialization of intellectual property in the form of eligible patents such as those related to water treatment and fuel cell technology.
· Expand relationships with the province’s Asia-Pacific trade partners to maximize the economic benefits of the provincial investment in the Pacific Gateway Strategy which includes, amongst others, the Gateway Project (Pitt River Bridge, South Fraser Perimeter Road, Port Mann Bridge), the expansion of the Prince Rupert shipping terminal, and the Provincial Nominee Program.
Budget and Fiscal Plan – 2009/10 to 2011/12
61
Three-Year Fiscal Plan
Consistent with its strong record of fiscal management, government plans to balance the budget by 2011/12. This will be done by seeking further public sector efficiencies and administrative savings.
Core public services will be maintained, administrative spending will be kept to a minimum and ongoing monitoring and updating of the revenue and expenditure outlook will provide the ability to take corrective action as necessary.
Conclusion
The government is committed to following the same principles of strong fiscal management, protecting key government services, and building a strong competitive economy which have been the foundation of provincial financial performance since 2002. With a well-built framework for economic success in place, the government is confident that it can weather the economic downturn, achieve an operating surplus by 2011/12, and maintain BC’s ability to maximize its future opportunities for growth.
Budget and Fiscal Plan – 2009/10 to 2011/12
62
Part 2: TAX MEASURES
Table 2.1 Summary of Tax Measures
| | | | Taxpayer Impacts | |
| | Effective Date | | 2009/10 | | 2010/11 | |
| | | | ($ millions) | |
October 22 and November 1, 2008 Measures (1) | | | | | | | |
Income Tax Act | | | | | | | |
· Reduce personal income tax rates for the first two tax brackets by 3 per cent each effective January 1, 2008 (2) | | January 1, 2008 | | * | | * | |
· Reduce small business corporate income tax rate to 2.5 per cent from 3.5 per cent effective December 1, 2008 | | December 1, 2008 | | (83 | ) | (71 | ) |
Land Tax Deferment Act | | | | | | | |
· Introduce temporary financial hardship property tax deferment program | | 2009 tax year | | * | | * | |
Social Service Tax Act and Hotel Room Tax Act | | | | | | | |
· Increase commission paid to business for provincial sales tax and hotel room tax collection and remittance | | November 1, 2008 | | (25 | ) | (25 | ) |
School Act | | | | | | | |
· Provide an Industrial Property Tax Credit of 50 per cent of provincial school property tax payable by major industrial (class 4) and light industrial (class 5) properties | | 2009 tax year | | (50 | ) | (52 | ) |
Subtotal October 22 and November 1, 2008 Measures | | | | (158 | ) | (148 | ) |
| | | | | | | |
Budget 2009 Measures | | | | | | | |
Income Tax Act | | | | | | | |
· Reduce the dividend tax credit for ordinary dividends | | January 1, 2010 | | 8 | | 32 | |
· Exclude income from Registered Disability Savings Plans for the calculation of eligibility for BC Sales Tax Credit and Medical Services Plan premium assistance | | various | | * | | * | |
· Extend BC Mining Flow-through Share Tax Credit to December 31, 2009 | | January 1, 2009 | | * | | * | |
· Reduce general corporate income tax rate from 11 per cent to 10.5 per cent effective January 1, 2010 and to 10 per cent effective January 1, 2011 | | January 1, 2010 | | (6 | ) | (75 | ) |
· Remove expiry dates for film tax credits | | various | | * | | (21 | ) |
· Expand eligibility for Film Incentive BC tax credit | | January 1, 2009 | | * | | * | |
Corporation Capital Tax Act | | | | | | | |
· Clarify corporation capital tax base | | October 1, 2006 | | * | | * | |
International Financial Activity Act | | | | | | | |
· Relax 90 day amalgamation notification rule | | Royal Assent | | * | | * | |
· Expand the list of prescribed patents to include wastewater treatment and fuel cell technology | | April 1, 2009 | | * | | * | |
· Clarify meaning of non-resident person | | | | | | | |
· Initiate program review | | September 1, 2004 | | * | | * | |
Logging Tax Act | | February 17, 2009 | | * | | * | |
· Provide partial remission of logging tax to reflect lower small business corporate income tax rate | | January 1, 2009 | | * | | * | |
Social Service Tax Act | | | | | | | |
· Extend exemption for ENERGY STAR® qualified residential heating equipment to 2011 (3) | | February 18, 2009 | | (3 | ) | (3 | ) |
· Extend exemption for ENERGY STAR qualified windows, doors and skylights to 2011 | | February 18, 2009 | | (2 | ) | (2 | ) |
(1) | Measures announced as part of the October 22, 2008 economic plan and November 1, 2008 announcement. |
(2) | The cost of this measure is accounted for in fiscal 2008/09. |
(3) | ENERGY STAR® mark is administered and promoted in Canada by Natural Resources Canada and is registered in Canada by the United States Environmental Protection Agency. |
* | Denotes measures that have no material impact on the status quo revenue forecast for provincial revenues. |
Tax Measures
Table 2.1 Summary of Tax Measures – Continued
| | | | Taxpayer Impacts | |
| | Effective Date | | 2009/10 | | 2010/11 | |
| | | | ($ millions) | |
Social Service Tax Act – Continued | | | | | | | |
· Extend exemption for energy efficient residential gas-fired water heaters to 2011 | | February 18, 2009 | | * | | (3 | ) |
· Provide exemption for energy efficient commercial boilers to 2011 | | February 18, 2009 | | * | | * | |
· Provide exemption for devices which reduce idling by commercial vehicles to 2012 | | February 18, 2009 | | (1 | ) | (1 | ) |
· Expand exemption for aerodynamic devices for commercial vehicles | | February 18, 2009 | | * | | * | |
· Provide exemption for equipment to produce energy from ocean currents, tides and waves | | February 18, 2009 | | * | | * | |
· Clarify and expand exemption for production machinery and equipment | | various | | (9 | ) | (9 | ) |
· Provide additional exemptions for bona fide farmers | | February 18, 2009 | | * | | * | |
· Clarify and expand exemption for prescription drugs and vaccines | | February 18, 2009 | | * | | * | |
· Clarify the concept of “at another person’s expense” | | January 1, 2000 | | * | | * | |
Motor Fuel Tax Act | | | | | | | |
· Classify and exempt hydrogen as an alternative motor fuel when purchased for use in fuel cell vehicles | | February 18, 2009 | | * | | * | |
Tobacco Tax Act | | | | | | | |
· Increase tobacco tax rate from $35.80 to $37 per carton of 200 cigarettes | | February 18, 2009 | | 22 | | 22 | |
Home Owner Grant Act | | | | | | | |
· Maintain home owner grant phase-out threshold at 2008 level | | 2009 tax year | | * | | * | |
School Act | | | | | | | |
· Set provincial residential school property tax rates | | 2009 tax year | | * | | * | |
· Set provincial non-residential school property tax rates | | 2009 tax year | | * | | * | |
Taxation (Rural Area) Act | | | | | | | |
· Set provincial rural area property tax rates | | 2009 tax year | | * | | * | |
Subtotal Budget 2009 measures | | | | 9 | | (60 | ) |
Total | | | | (149 | ) | (208 | ) |
* Denotes measures that have no material impact on the status quo revenue forecast for provincial revenues. |
Tax Measures — Supplementary Information
For more details on tax changes see: www.sbr.gov.bc.ca/msbr/budget/budget.htm
October 22 and November 1, 2008 Measures
Income Tax Act
Personal Income Tax Rates Reduced
As announced on October 22, 2008, the 3 per cent reduction in the rates for the two lowest income tax brackets that was legislated to take effect January 1, 2009 is made retroactive to January 1, 2008. Combined with the 2 per cent reduction in Budget 2008, this provides a $211 million reduction in 2008 taxes for British Columbians to help stimulate the economy. Taxpayers will see the benefit of the 3 per cent reduction when they file their 2008 tax returns.
Budget and Fiscal Plan – 2009/10 to 2011/12
64
Tax Measures
Table 2.2 British Columbia Personal Income Tax Cut – Impact on Taxpayers (1)
| | | | Reduction in tax for 2008 | | | |
| | 2008 BC tax | | 2 per cent | | 3 per cent | | | | Percentage | |
Taxable Income | | before tax cuts | | tax cut (2) | | tax cut (3) | | Total reduction | | change in tax | |
$ | 20,000 | | $ | 233 | | $ | 11 | | $ | 17 | | $ | 28 | | 12 | % |
$ | 30,000 | | $ | 1,015 | | $ | 20 | | $ | 35 | | $ | 55 | | 5 | % |
$ | 40,000 | | $ | 1,654 | | $ | 34 | | $ | 56 | | $ | 90 | | 5 | % |
$ | 50,000 | | $ | 2,455 | | $ | 51 | | $ | 83 | | $ | 134 | | 5 | % |
$ | 60,000 | | $ | 3,270 | | $ | 68 | | $ | 111 | | $ | 179 | | 5 | % |
$ | 70,000 | | $ | 4,085 | | $ | 85 | | $ | 139 | | $ | 224 | | 5 | % |
$ | 80,000 | | $ | 5,134 | | $ | 85 | | $ | 139 | | $ | 224 | | 4 | % |
$ | 100,000 | | $ | 7,642 | | $ | 85 | | $ | 139 | | $ | 224 | | 3 | % |
$ | 120,000 | | $ | 10,582 | | $ | 85 | | $ | 139 | | $ | 224 | | 2 | % |
$ | 150,000 | | $ | 14,992 | | $ | 85 | | $ | 139 | | $ | 224 | | 1 | % |
| | | | | | | | | | | | | | | | | | |
(1) Calculated for a single taxpayer with wage income and claiming basic credits.
(2) Announced in Budget 2008.
(3) Announced on October 22, 2008.
Small Business Corporate Income Tax Rate Reduced
As announced on October 22, 2008, effective December 1, 2008, the small business corporate income tax rate is reduced from 3.5 per cent to 2.5 per cent. The small business corporate income tax rate had been reduced from 4.5 per cent to 3.5 per cent on July 1, 2008 and a further reduction to 2.5 per cent was planned by 2011. The accelerated tax rate reduction means a 44 per cent tax cut for small business in 2008.
Land Tax Deferment Act
Temporary Property Tax Deferment Program Introduced
As announced on November 1, 2008, effective for the 2009 and 2010 taxation years, a temporary property tax deferment program is introduced to allow homeowners who are experiencing financial hardship due to current economic conditions, and who have at least 15 per cent equity in their home, to defer their property taxes. Homeowners do not have to repay the taxes until their home is sold or transferred other than to a surviving spouse, but may repay the deferred taxes earlier if they choose.
Social Service Tax Act and Hotel Room Tax Act
Commission Rates Increased
As announced on October 22, 2008, effective for the November 2008 tax returns, the allowances paid to businesses for collecting and forwarding provincial sales tax and hotel room tax to the province is doubled. For amounts of tax collected above $333.33 per reporting period, the commission is now 6.6 per cent of the tax collected to a maximum of $198 per reporting period up from 3.3 per cent of tax collected to a maximum of $99 per reporting period.
Table 2.3 Commission Rates
Amount of tax collected for each reporting period | | Commission amount | |
$0 - $22 | | Equal to tax collected | |
$22.01 - $333.33 | | $22 | |
More than $333.33 | | 6.6% of tax collected to a maximum of $198 | |
Budget and Fiscal Plan – 2009/10 to 2011/12
65
Tax Measures
School Act
Industrial Property Tax Credit Introduced
As announced on October 22, 2008, effective for the 2009 and subsequent taxation years, an Industrial Property Tax Credit is introduced to reduce provincial school property tax on major industrial (class 4) and light industrial (class 5) properties by 50 per cent. The Industrial Property Tax Credit applies to British Columbia manufacturing, mining, forestry and other major and light industries.
Budget 2009 Measures
Income Tax Act
Dividend Tax Credit Rate Reduced
Effective January 1, 2010, the provincial personal income tax dividend tax credit rate applicable to ordinary dividends is reduced to 3.4 per cent from 4.2 per cent. This change maintains integration between the personal and corporate income taxes as a result of the December 1, 2008 reduction in the small business corporate income tax rate to 2.5 per cent from 3.5 per cent.
Income from Registered Disability Savings Plans (RDSP) Excluded from Benefit Calculation
Effective January 1, 2009, income from an RDSP is excluded from income for purposes of determining eligibility for the BC Sales Tax Credit. This income will also be excluded for purposes of Medical Services Plan premium assistance eligibility.
BC Mining Flow-Through Share Tax Credit Extended
As announced on December 5, 2008, the BC Mining Flow-Through Share Tax Credit is extended to the end of 2009.
General Corporate Income Tax Rate Reduced
As proposed in the 2008 Revenue Neutral Carbon Tax Plan, the general corporate income tax rate is reduced from 11 per cent to 10.5 per cent effective January 1, 2010 and to 10 per cent effective January 1, 2011.
Film Tax Credits Expiry Dates Removed
Expiry dates for the film tax credits are removed. The additional basic tax credit rates of 5 per cent for the Film Incentive BC and 7 per cent for the Production Services Tax Credit were legislated to expire in 2009. The basic, additional, regional, distant location, film training and digital animation and visual effects tax credits for the Film Incentive BC and Production Services Tax Credit were legislated to expire in 2013.
Film Incentive BC Eligibility Expanded
As announced on December 18, 2008, the requirement that a corporation be BC-controlled to be eligible for the Film Incentive BC tax credit is removed for productions with principal photography starting on or after January 1, 2009. This will allow Canadian-controlled eligible production corporations to qualify.
Budget and Fiscal Plan – 2009/10 to 2011/12
66
Tax Measures
Corporation Capital Tax Act
Corporation Capital Tax Base Clarified
Effective for taxation years ending on or after October 1, 2006, the capital tax base is amended to include accumulated other comprehensive income. This income is required to be shown as a separate item on a corporation’s balance sheet resulting from accounting changes made in 2006.
International Financial Activity Act
90 day Amalgamation Notification Rule Relaxed
The rule requiring the commissioner to be notified of an amalgamation between a registered and a non-registered corporation within 90 days of the amalgamation is amended to give the commissioner discretion to accept late notifications.
Intellectual Property Expanded
Effective April 1, 2009, the list of eligible patents is expanded to include patents relating to wastewater treatment and fuel cell technology.
Meaning of Non-resident Person Clarified
Effective September 1, 2004, the Act is amended to clarify that a non-resident person excludes a business carried on in Canada by that non-resident person.
Review Initiated
As required under the International Financial Activity Act, the government has initiated a review of the program. The review will examine program objectives and opportunities for improvement and streamlining.
Logging Tax Act
Logging Tax Remission
Effective for taxation years ending after December 2008, a partial remission of the logging tax is provided to corporations that cannot use the full amount of the logging tax credit under the Income Tax Act. The remission is provided to ensure that small business corporations with logging income can benefit from the reduction in the small business corporate income tax rate to 2.5 per cent from 3.5 per cent which is effective December 1, 2008.
Social Service Tax Act
Temporary Exemption for ENERGY STAR Residential Heating Equipment Extended
The exemption for ENERGY STAR qualified oil-fired forced-air furnaces, boilers, and air and ground-source heat pumps purchased or leased for residential use is extended to March 31, 2011.
Budget and Fiscal Plan – 2009/10 to 2011/12
67
Tax Measures
Temporary Exemption for ENERGY STAR Qualified Windows, Doors and Skylights Extended
The exemption for ENERGY STAR qualified windows, doors and skylights is extended to March 31, 2011.
Temporary Exemption for Energy Efficient Residential Gas-Fired Water Heaters Extended
The exemption for residential gas-fired water heaters with an energy factor of 0.80 or greater is extended to March 31, 2011.
Temporary Exemption for Energy Efficient Commercial Boilers Introduced
Effective February 18, 2009, commercial boilers fired by natural gas or propane with a boiler input rating of at least 200,000 BTU/h are exempt if they:
· have a combustion efficiency of at least 90 per cent as described and tested in accordance with the following standards:
· for boilers with a boiler input rating under 300,000 BTU/h
· CAN/CSA-P.2-07 “Testing Method for Measuring the Annual Fuel Utilization Efficiency of Residential gas-fired furnaces and boilers” of the Canadian Standards Association; or
· for boilers with a boiler input rating of 300,000 BTU/h or more:
· ANSI Z21.13-2004/CSA 4.9-2004 “Gas-Fired Low Pressure Steam and Hot Water Boilers” of the Canadian Standards Association or
· BTS-2000 Testing Standard, “Method to Determine Efficiency of Commercial Space Heating Boilers” of the Hydronics Institute Division of Air Conditioning, Heating and Refrigeration Institute.
This exemption expires March 31, 2011.
Temporary Exemption for Devices to Reduce Idling Introduced
Effective February 18, 2009, auxiliary power units, cabin heaters and engine heaters for trucks with a gross vehicle weight of at least 5000 kg are exempt until March 31, 2012. Use of these devices reduces fuel use and emissions as they reduce the need for trucks to idle.
Exemption for Aerodynamic Devices Expanded
Effective February 18, 2009, the exemption for certain aerodynamic devices that are designed to reduce wind resistance and improve the fuel efficiency of commercial tractor-trailers is expanded to include base flaps and boat tails. Labour charges to install these devices are also exempt.
Budget and Fiscal Plan – 2009/10 to 2011/12
68
Tax Measures
Exemption for Equipment to Produce Energy from Ocean Currents, Tides and Waves Introduced
Effective February 18, 2009, equipment specifically designed to produce mechanical or electrical energy from ocean currents, tides or waves is exempt. Generators, wiring, controllers, monitors, pumps, tubing, floats, water fences, aids to navigation as defined in the federal Canada Shipping Act, 2001, and devices that convert direct current into alternating current are also exempt when sold with and as part of the specifically designed equipment.
Exemption for Production Machinery and Equipment Clarified and Expanded
The exemption for production machinery and equipment is clarified and expanded:
· Effective February 18, 2009, the exemption is expanded to include, when used by manufacturers of tangible personal property other than electricity, transformers and converters, inverters, regulators, breakers and switches designed for use and used with transformers. This equipment is exempt if located within a qualifying manufacturing site, mine site, well site, natural gas processing plant or petroleum refinery and used exclusively to transmit or distribute electricity if more than 50 per cent of the electricity is used to power exempt machinery and equipment or as an integral component in a manufacturing process.
· Effective February 18, 2009, the exemption is clarified with respect to machinery and equipment used to transmit or distribute tangible personal property (including electricity and heat generated by local government bodies and local government corporations). This machinery and equipment is exempt if it is located within a qualifying manufacturing site, mine site, well site, natural gas processing plant or petroleum refinery and is used primarily to transmit or distribute qualifying tangible personal property, raw materials, partially finished goods or similar items within the site, processing plant or refinery.
· Effective February 18, 2009, the exemption is expanded to include materials used to repair, maintain, modify or assemble exempt machinery and equipment. Materials qualify for exemption if they are purchased by an eligible person and remain part of, or attached to, the machinery or equipment after the repair, maintenance, modification or assembly. Examples of materials that may qualify for exemption include sheet metal and electrical wiring.
· Effective July 31, 2001, the exemption is clarified to include machinery or equipment used to generate heat only if the generation of heat is one step in an activity to:
· fabricate or manufacture tangible personal property to create a new product that is substantially different from the material or property from which it was made,
· process tangible personal property by performing a series of operations or a complex operation that results in a substantial change in the form or other physical or chemical characteristics of the tangible personal property, or
· extract or process minerals, petroleum or natural gas.
Budget and Fiscal Plan – 2009/10 to 2011/12
69
Tax Measures
Exemption for Bona Fide Farmers Expanded
Effective February 18, 2009, bona fide farmers are exempt from PST on purchases of egg packing equipment and refrigeration equipment used for cooling or cold storage of farm products. To qualify for exemption, this equipment must be acquired and used solely for a farm purpose.
Exemption for Prescription Drugs and Vaccines Expanded and Clarified
Effective February 18, 2009, the following are exempt:
· drugs listed on Schedule I or Schedule IA and vaccines listed on Schedule II of the Drug Schedules Regulation under the Pharmacists, Pharmacy Operations and Drug Scheduling Act, and
· vaccines listed on Schedule A of the Veterinary Drug and Medicated Feed Regulation, under the Pharmacists, Pharmacy Operations and Drug Scheduling Act.
With this change, prescription drugs and vaccines for human and animal use no longer need to be sold on the prescription of an eligible medical practitioner to qualify for exemption. Therefore, medical service providers, medical clinics and public health units may purchase prescription drugs and vaccines for use in providing medical services (i.e. immunizations) exempt from tax. Medications not listed on those schedules or exempt under existing provisions for patent medicines or pain relievers continue to require a prescription to qualify for exemption.
Effective February 18, 2009, the definition of “prescription” is also updated to recognize that in addition to physicians, dentists and veterinarians, other practitioners such as midwives, nurse practitioners and pharmacists are authorized to prescribe certain medications.
Concept of “at another person’s expense” Clarified
Retroactive to January 1, 2000, the Act is amended to clarify the concept of “at another person’s expense”. These changes ensure that tax is payable on transactions where property, services or rights are acquired for use by one person at another person’s expense.
Motor Fuel Tax Act
Alternative Motor Fuel Classification for Hydrogen Fuel Provided
Effective February 18, 2009, hydrogen fuel is classified as a Category 1 alternative motor fuel and exempt from motor fuel tax provided that:
· the hydrogen is purchased for use in a fuel cell vehicle, and
· the hydrogen is not produced by electrolysis using coal-generated electricity, unless the carbon dioxide emitted as a result of the process is captured and stored or captured and sequestered.
Budget and Fiscal Plan – 2009/10 to 2011/12
70
Tax Measures
Tobacco Tax Act
Tobacco Tax Rates Increased
Effective February 18, 2009, the tax rate on cigarettes is increased to $37.00 from $35.80 per carton of 200 cigarettes, and the tax rate on fine-cut tobacco is increased to 18.5 cents per gram from 17.9 cents per gram. The new rates are consistent with the rates in Alberta.
Home Owner Grant Act
Threshold for Home Owner Grant Phase-out Maintained at 2008 Level
For the 2009 taxation year, the threshold for the phase-out of the home owner grant is maintained at the 2008 level of $1,050,000. Consistent with longstanding government policy, the home owner grant threshold is set so that more than 95 per cent of homeowners are eligible for the full grant. Given the assessment changes for 2009 announced on November 1, 2008, no adjustments to the threshold are required for 2009 to meet this policy objective.
For properties valued above the threshold of $1,050,000, the grant is reduced by $5 for every $1,000 of assessed value in excess of the threshold. The basic grant is eliminated for properties valued at $1,164,000 and above. The additional grant, available to seniors, veterans and the disabled, is eliminated for properties valued at $1,219,000 and above.
School Act
Provincial Residential School Property Tax Rates Set
For the 2009 taxation year, average residential school property taxes before application of the home owner grant will increase by the 2008 provincial inflation rate. This rate setting policy has been in place since 2003.
Provincial Non-Residential School Property Tax Rates Set
A single province-wide rate is set for each of the non-residential property classes. The rates for 2009, except the rate for the major industry property class, will be set so that non-residential school tax revenue will increase by inflation plus new construction. The rates will be set when revised assessment roll data are available.
Taxation (Rural Area) Act
Provincial Rural Area Property Tax Rates Set
A single rural area residential tax rate applies province-wide. For the 2009 taxation year, average residential rural area taxes will increase by the 2008 provincial inflation rate.
Non-residential rural area tax rates will be set so that total non-residential rural area tax revenue will increase by inflation plus new construction.
Budget and Fiscal Plan – 2009/10 to 2011/12
71
Tax Measures
Revenue Neutral Carbon Tax
Revenue Neutral Carbon Tax
As required under Part 2 of the Carbon Tax Act the following tables show the Revenue Neutral Carbon Tax Report for 2008/09 and the Revenue Neutral Carbon Tax Plan for 2009/10 to 2011/12.
Material Assumptions and Policy Decisions
In both the report and the plan the forecasts of carbon tax revenue and the cost of tax reductions to return revenues to taxpayers are consistent with, and have the same underlying material assumptions and policy decisions, as the forecasts prepared for Budget 2009. The only material assumption specific to the carbon tax report and plan is that the cost of the revenue reductions due to personal income tax rate cuts change with changes in personal income tax revenues for each year.
Revenue Neutral Carbon Tax Report
Revenue neutrality means that tax reductions must be provided that fully return the estimated revenue from the carbon tax to taxpayers in each fiscal year. Table 1, Revenue Neutral Carbon Tax Report 2008/09, reports the revised forecast of carbon tax revenues and the cost of the tax reductions for the 2008/09 fiscal year.
Carbon tax revenues for 2008/09 are now estimated to be $300 million, down from the original estimate in Budget 2008 of $338 million. Reduced revenue is due to a number of factors including lower than estimated motor fuel consumption.
The tax reductions shown in Table 1 are those that were listed in the Revenue Neutral Carbon Tax Plan 2008/09 to 2010/11 presented in Budget 2008 and that reduce revenues in 2008/09. The personal tax measures are the low income climate action tax credit and the two per cent reduction in the rates for the first two personal income tax brackets. The business tax measures are the one percentage point reductions in each of the general and small business corporate income tax rates effective July 1, 2008.
Based on the most recent available data there are very small changes in the estimated cost of each tax reduction but the total reduction remains unchanged from the total presented in Budget 2008. The estimated reduction in provincial revenues as a result of the designated revenue measures is now $220 million for the personal tax measures and $118 million for the business tax measures for a total reduction of $338 million.
Table 1 Revenue Neutral Carbon Tax Report 2008/09
| | Revised | |
| | Forecast | |
| | 2008/09 | |
| | $ millions | |
Carbon Tax Revenue | | 300 | |
| | | |
Reduction in provincial revenues due to designated measures (1) | | | |
Personal tax measures: | | | |
· Low income climate action tax credit effective July 1, 2008 | | (106 | ) |
· Reduction of 2 per cent in the first two personal income tax bracket rates effective January 1, 2008 | | (114 | ) |
Total personal tax measures | | (220 | ) |
Business tax measures: | | | |
· General corporate income tax rate cut from 12% to 11% effective July 1, 2008 | | (76 | ) |
· Small business corporate income tax rate cut from 4.5% to 3.5% effective July 1, 2008 | | (42 | ) |
Total business tax measures | | (118 | ) |
Total designated revenue measures | | (338 | ) |
(1) Designated measures are those included in the carbon tax plan presented in Budget 2008. | |
Budget and Fiscal Plan – 2009/10 to 2011/12
72
Tax Measures
Based on these revenue and tax reduction estimates, revenue neutrality has been met for 2008/09. In fact, the reduction in provincial revenue exceeds the $300 million in carbon tax revenue by $38 million. Next year’s carbon tax report will be based on actual carbon tax revenues for 2008/09 as reported in the 2008/09 Public Accounts.
Revenue Neutral Carbon Tax Plan
As required under the Carbon Tax Act Table 2 shows the Revenue Neutral Carbon Tax Plan for 2009/10 to 2011/12.
Table 2, the Revenue Neutral Carbon Tax Plan 2009/10 to 2011/12, shows carbon tax revenue and tax reduction cost estimates for the revenue measures designated as those that return the carbon tax revenues to taxpayers for 2009/10 to 2011/12.
The designated revenue measures include those presented in the first carbon tax plan in Budget 2008, measures introduced in October 2008 as part of the Economic Plan and measures included in Budget 2009. The October 2008 tax reduction measures include the acceleration to December 1, 2008 of the reduction in the small business corporate income tax rate to 2.5 per cent from 3.5 per cent, originally planned for 2011, and the Industrial Property Tax Credit for light and major industrial properties effective for the 2009 tax year. Measures announced in Budget 2009 are the following:
· increase the low income climate action tax credit by 10 per cent effective July 1, 2011;
· provide a Northern and Rural Homeowner benefit of up to $200 for homeowners in areas of the province outside the Capital Regional District, Greater Vancouver.
Table 2 Revenue Neutral Carbon Tax Plan 2009/10 to 2011/12
| | Forecast | |
| | 2009/10 | | 2010/11 | | 2011/12 | |
| | $ millions | |
Carbon Tax Revenue (1) | | 546 | | 754 | | 968 | |
| | | | | | | |
Reduction in provincial revenues due to designated revenue measures: | | | | | | | |
Personal tax measures: | | | | | | | |
· Introduce low income climate action tax credit of $100 per adult and $30 per child effective July 1, 2008 increasing by 5% effective July 1, 2009 | | (145 | ) | (146 | ) | (146 | ) |
· Increase low income climate action tax credit by 10% effective July 1, 2011 (2) | | — | | — | | (12 | ) |
· Reduction of 5% in the first two personal income tax rates | | (220 | ) | (231 | ) | (246 | ) |
· *Provide a Northern and Rural Homeowner benefit of up to $200 (3) | | — | | (21 | ) | (83 | ) |
Total personal tax measures | | (365 | ) | (398 | ) | (487 | ) |
Business tax measures: | | | | | | | |
· General corporate income tax rate cut from 12% to 11% effective July 1, 2008, to 10.5% effective January 1, 2010 and to 10% effective January 1, 2011 | | (150 | ) | (200 | ) | (270 | ) |
· Small business corporate income tax rate cut from 4.5% to 3.5% effective July 1, 2008 and to 2.5% effective December 1, 2008 | | (170 | ) | (142 | ) | (144 | ) |
· Introduce Industrial Property Tax Credit of 50% of school property taxes payable by light and major industrial properties effective for the 2009 tax year | | (50 | ) | (52 | ) | (54 | ) |
· *Increase the Industrial Property Tax Credit to 60% from 50% | | — | | (3 | ) | (11 | ) |
· *Reduce school property taxes by 50% for land classified as “farm” | | — | | (1 | ) | (2 | ) |
Total business tax measures | | (370 | ) | (398 | ) | (481 | ) |
Total designated revenue measures | | (735 | ) | (796 | ) | (968 | ) |
(1) The carbon tax applies to fossil fuels and combustibles at rates based on the CO2 equivalent emission of each particular fuel starting at $10 per tonne effective July 1, 2008 and increasing by $5 per tonne each July 1st through 2012.
(2) The 10% increase means the maximum annual low income climate action tax credit will increase to $115.50 per adult, from $105 per adult, plus $34.50 per child, from $31.50 per child, effective July 1, 2011.
(3) Eligible homeowners are those in areas outside the Capital, Greater Vancouver and Fraser Valley regional districts. Based on the current forecast of carbon tax revenues for 2011/12 the Northern and Rural Homeowner benefit is expected to be $200 per homeowner.
* Proposed measures effective for the 2011 tax year.
Budget and Fiscal Plan – 2009/10 to 2011/12
73
Tax Measures
Regional District and Fraser Valley Regional District for the 2011 tax year;
· increase the Industrial Property Tax Credit to 60 per cent from 50 per cent for the 2011 tax year; and
· reduce school property taxes for land classified as farm by 50 per cent for the 2011 tax year.
Carbon tax revenues for the 2009/10 through 2011/12 period are now forecast to be lower than estimated when Budget 2008 was prepared. The accuracy of the tax revenue estimates will improve as more information from tax remittances becomes available. As shown in Table 2, revenue from the carbon tax and the cost of the tax reductions are now estimated to be $546 million and $735 million respectively for 2009/2010. This means that the tax cuts are expected to exceed carbon tax revenues for 2009/10 by $189million. Carbon tax revenues in 2010/11 are now estimated at $754 million while the tax cuts are estimated at $796 million. This means that the tax cuts in 2010/11 are expected to exceed carbon tax revenues by $42 million.
Table 2 shows that carbon tax revenues are equal to the cost of the tax cuts in 2011/12.
Under the Carbon Tax Act, the portion of the cost of the following tax reductions from the October 2008 Economic Plan that reduce revenues in 2008/09 cannot be counted as carbon tax returned to taxpayers for purposes of the Revenue Neutral Carbon Tax Report for 2008/09. The cost of these tax reductions for 2009/10 and future years is included in the Revenue Neutral Carbon Tax Plan 2009/10 to 2011/12:
· acceleration of the three per cent cut in the first two personal income tax bracket rates from January 1, 2009 to January 1, 2008;
· acceleration of the small business corporate income tax rate cut to 2.5 per cent from 35 per cent effective December 1, 2008 rather than by 2011; and
· a new Industrial Property Tax Credit of 50 per cent of school property taxes payable for major and light industrial properties.
Although the portion of the cost of these tax cuts that reduce revenue in 2008/09 cannot be included in the calculation of revenue neutrality for purposes of the Revenue Neutra1 Carbon Tax Report 2008/09, the total tax reduction for taxpayers from these three measures is $156 million in 2008/09. As a result, if the value of these tax reductions which were introduced to return carbon tax revenue to taxpayers could be included in the report for 2008/09, the total tax reductions for taxpayers from the carbon tax in 2008/09 would be $494 million, or $194 million more than the carbon tax collected in that year.
Budget and Fiscal Plan – 2009/10 to 2011/12
74
Part 3: BRITISH COLUMBIA ECONOMIC REVIEW AND OUTLOOK(1)
Summary
· The Ministry of Finance Forecasts BC’s economy to contract by 0.9 per cent in 2009 and then to grow by 2.4 per cent in 2010 (see Chart 3.1).
· The forecast for BC in 2009 reflects the sharp US and global economic slowdown, moderating domestic demand, as well as instability in global financial and commodity markets.
· In the medium-term, BC’s economy is expected to return closer to historical levels of growth, due primarily to the anticipated recovery of US demand (particularly in the housing sector) and a gradual rise in commodity prices.
Chart 3.1 British Columbia’s economic outlook
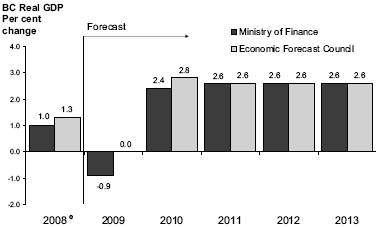
(e): estimate
Note: the EFC provided an average forecast for 2011 to 2013 on January 9, 2009
Risks to the economic outlook are weighted to the downside, and include:
· a more severe and prolonged US recession than assumed;
· slower than anticipated global demand resulting in reduced demand for BC’s exports;
· continued turmoil in global financial markets;
· further weakening of domestic demand; and
· further commodity price volatility.
However, there is also upside risk to the forecast resulting from the potential impact of Federal and Provincial fiscal stimulus measures.
The Economic Forecast Council’s average estimate of BC’s economic growth is 1.3 per cent for 2008, 0.0 per cent (or no growth) for 2009 and 2.8 per cent for 2010. Over the medium-term (2011 to 2013), the Council projects BC’s annual average economic growth at 2.6 per cent. The Council’s average forecast has been downgraded since the release of the first Quarterly Report in September 2008, when it projected BC’s real GDP to grow by 2.7 per cent in 2009 and 2.8 per cent each year for 2010 to 2012 (see Chart 3.2).
(1) Reflects information available as of February 6, 2009.
Budget and Fiscal Plan – 2009/10 to 2011/12
British Columbia Economic Review and Outlook
Chart 3.2 Economic Forecast Council lowers BC forecast from first Quarterly Report
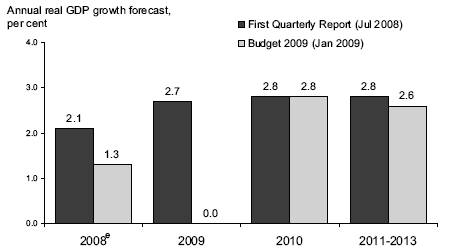
(e): estimate; The EFC provided an average forecast for 2011 to 2013 in the January 2009 survey.
NOTE: Forecast from July 2008 EFC for 2010 and 2011-2013 is the average growth for the years 2010-2012.
The Ministry of Finance’s outlook for 2009 is significantly lower than the outlook provided by the Economic Forecast Council. This greater-than-normal level of prudence recognizes the potential for further forecast downgrades by the private sector due to continuing economic and financial turmoil in global markets.
The Ministry’s medium-term outlook is slightly lower than the Council’s outlook for 2010, projecting 2.4 per cent real GDP growth compared to the Council’s 2.8 per cent. For 2011 to 2013, the Ministry’s forecast is equal to the Council’s medium-term outlook. A topic box at the end of Part 3 reports on the most recent consultation between the Economic Forecast Council and the Minister of Finance.
Recent Developments
Indicators of economic performance through most of 2008 confirm that British Columbia’s economy slowed considerably in the latter half of the year. On the domestic side, monthly retail sales declined in four of the five months from July to November. A dramatic decline in housing starts also occurred in the second half of the year, with starts plummeting nearly 36.0 per cent between July and December 2008. BC’s employment situation has also weakened in recent months, with the unemployment rate climbing from 4.5 per cent in July 2008 to 6.1 per cent in January 2009. On the trade side, the value of manufacturing shipments fell steadily through most of 2008 due mainly to reduced demand for BC’s forest products from the troubled US economy. However, total exports from BC increased year-to-date to
Table 3.1 British Columbia Economic Indicators
| | Third Quarter | | Fourth Quarter | | Year-to-Date | |
Data seasonally adjusted unless
otherwise noted | | Jul. to Sep. 2008
change from
Apr. to Jun. 2008 | | Oct. to Dec. 2008
change from
Jul. to Sep. 2008 | | Jan. to Dec. 2008
change from
Jan. to Dec. 2007 | |
| | Per cent change | |
Employment | | 0.0 | | -0.6 | | +2.1 | ** |
Manufacturing shipments | | -0.4 | | -0.9 | * | -6.3 | * |
Exports | | +3.2 | | +2.0 | * | +4.7 | * |
Retail sales | | -0.6 | | -3.1 | * | +1.4 | * |
Housing starts | | -4.7 | | -30.0 | | -12.4 | ** |
Non-residential building permits | | -34.2 | | +4.2 | | -7.1 | ** |
Note: * data available to November only;
** annual non-seasonally adjusted data
Budget and Fiscal Plan – 2009/10 to 2011/12
76
British Columbia Economic Review and Outlook
November 2008, driven by high energy prices in the middle of the year pushing up the value of energy exports.
The performance of key BC economic indicators in recent quarters is presented in Table 3.1.
In 2008, employment in BC posted annual growth of 2.1 per cent, an addition of 48,000 new jobs. Despite the slowing rate of job growth throughout the year, BC’s rate was third highest among provinces in 2008, behind Alberta’s 2.8 per cent increase and Saskatchewan’s 2.2 per cent gain. BC’s construction industry posted large employment gains in 2008, adding 23,900 jobs (a 12.2 per cent increase) over 2007. At the same time, employment in BC’s manufacturing industries fell by 17,700 jobs (or 8.6 per cent). Strong gains were also observed in the professional, scientific and technical sectors (up 4.6 per cent) and educational services (up 3.5 per cent). BC’s unemployment rate climbed gradually through the first half of 2008, beginning at 4.1 per cent in January and reaching 4.5 per cent in June. This pace accelerated after July, as the rate rose to reach 5.3 per cent in December. The unemployment rate averaged 4.6 per cent for the year compared to 4.2 per cent in 2007. The rate climbed even higher in January 2009, reaching 6.1 per cent - the highest unemployment rate recorded since April 2005.
Manufacturing shipments continued their descent year-to-date to November 2008, falling 6.3 per cent compared to the first 11 months of 2007. Declines were driven by a 15.4 per cent drop in the value of wood product shipments, but losses were widespread across many categories. Further slowing of wood product shipments are anticipated in the coming months, with weakening demand from the troubled US housing market resulting in lower wood prices and volumes of goods shipped.
Merchandise exports from BC, however, have grown by 4.7 per cent year-to-date to November 2008 compared to the same period in 2007. Overall growth in total exports has been buoyed by extremely strong gains in energy exports (up 54.6 per cent year-to-date to November 2008), which were driven by high energy prices (especially prices for coal and natural gas) through the middle months of the year. Strength in BC’s energy exports have helped to offset weakness in forestry exports, which have fallen by 18.0 per cent year-to-date to November. With continued weakness in US demand for forestry products and the recent downward trend in natural gas prices, it is likely that BC’s export market will weaken going forward in 2009.
BC’s retail sector, which helped to drive the province’s strong domestic economy in recent years, has slowed through the first 11 months of 2008. Year-to-date to November, retail sales increased 1.4 per cent compared to the same period in 2007. However, month-over-month retail sales in BC have declined in four of the last five months leading up to November, reflecting declining consumer confidence among British Columbians (see Chart 3.3). Falling confidence among consumers suggests that they will put off major retail purchases for the time being, and that BC’s retail sector is unlikely to resume the strong growth of recent years in 2009.
Moderating demand in BC’s domestic sector is also evident in housing start data. The housing sector – a source of economic strength for BC in recent years – saw significant softening in 2008, with the number of housing starts falling by 12.4 per cent over 2007 levels and reaching 34,321 units. This decline includes a rapid drop-off from 36,000 annualized units in July to 23,100 units in December. Further, November’s 21,300 housing starts is the lowest monthly rate observed since May 2003.
Budget and Fiscal Plan – 2009/10 to 2011/12
77
British Columbia Economic Review and Outlook
Chart 3.3 Consumer confidence at record lows in BC and Canada
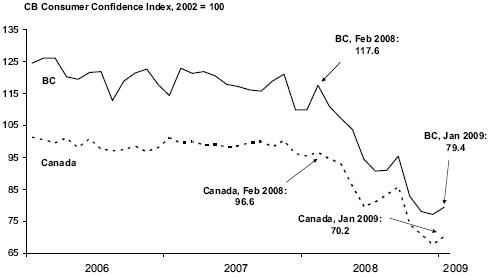
Source: Conference Board of Canada
The decline included losses in starts of both single and multiple units. Weakness in the non-residential sector is also apparent, as non-residential building permits fell by 7.1 per cent in 2008 compared to 2007, with declines across all major categories. Recently, large month-over-month declines were observed in November and December, as non-residential permits fell 35.8 per cent and 39.0 per cent, respectively.
The Outlook for the External Environment
United States
In the latter half of 2008, the US economy began to experience a period of dramatic economic instability. The fallout from the US housing market crisis – brought on by a period of intense speculation and reckless lending practices by American financial institutions – has left the US facing a severe and prolonged recession. Investors have lost trillions of dollars in equity markets, large and long-standing American financial institutions have collapsed, credit markets for individuals and businesses remain tight and millions of workers have lost their jobs. With the globalized nature of the US financial system, the economic shocks from this crisis have been felt throughout the world, resulting in financial, industrial and employment losses in many nations.
Since the onset of the most recent crisis period in early September 2008, the Dow Jones Industrial Average has shed over 3,000 points – nearly 30 per cent of its total value – and major US banks and financial institutions have lost hundreds of billions of dollars due to the financial upheaval. Most lending institutions have survived, but have subsequently reduced the availability of credit and increased the cost to borrowers of accessing credit by raising interest rates. Tighter credit markets have resulted in consumers encountering greater difficulty borrowing funds to buy big ticket items like houses and cars. Similarly, businesses that generally operate with borrowed money to pay workers and purchase supplies are having a tougher time meeting expenses.
In attempts to slow the financial downturn, US policymakers drastically lowered the intended federal funds rate (which now sits just above 0.0 per cent), issued income tax rebate cheques to all taxpayers as an incentive to increase consumer spending,
Budget and Fiscal Plan – 2009/10 to 2011/12
78
British Columbia Economic Review and Outlook
purchased troubled mortgage-backed assets from financial institutions and assumed partial ownership of some major banks. In addition, the incoming US administration has promised to provide almost a trillion dollars worth of fiscal stimulus to the economy through infrastructure spending and other initiatives. At this point, it is unclear what effect any of these policies have had or will have on the US economic outlook.
The US housing market continued its rapid decline through 2008, with annual housing starts falling to 902,400 units – 32.7 per cent below the 1,340,700 starts observed in 2007. Only 1974 posted a greater annual decline in housing starts, with a 34.8 per cent fall. The pace of starts dropped dramatically through the latter half of 2008, with annualized starts ending up at 550,000 units in December – the lowest monthly pace since 1959. With eroding demand for new homes due to job losses, rapidly weakening prices for new and existing homes, rising foreclosure rates, declining consumer confidence and tight credit markets, the bottom of this US housing slump may still be far off. This gloomy outlook is supported by the latest data from the National Association of Homebuilders Housing Market Index – an indicator of American homebuilder optimism – sitting at a record of low of 8 points in January.
Chart 3.4 US housing starts lowest on record in December 2008

Source: US Census Bureau
US citizens are faced with an increasingly bleak employment outlook, as job losses have been mounting since early 2008. The US economy shed about 3.6 million jobs since December 2007, with over two million jobs lost between September 2008 and January 2009, as businesses made deep cuts to costs in response to declining demand and tight credit conditions. On a monthly basis, the unemployment rate has climbed steadily since January 2008, and reached 7.6 per cent in January 2009 – the highest rate since 1992. As new data on the US economy continue to be released, most analysts anticipate further increases to unemployment in the coming months.
Confidence among American consumers was ravaged by the financial crisis through 2008, as the US Conference Board Index declined heavily during the year. The Index, which surveys consumers to measure their aggregate level of confidence in the US economy, fell to a historic low of 38.6 points in December 2008 after beginning the year at 87.3 points in January (1985=100). The index reached a new record low in January 2009, as it fell to 37.7 points. Behind this downturn in confidence are growing
Budget and Fiscal Plan – 2009/10 to 2011/12
79
British Columbia Economic Review and Outlook
Chart 3.5 US loses 3.6 million jobs since January 2008

Source: US Bureau of Labor Statistics
fears among consumers of job and income losses, falling house prices and reduced credit availability. Recent monthly declines in confidence arrived despite declining energy prices and deep discounting on consumer items by retailers.
Lack of confidence in the American economy among US citizens manifested itself in drastic monthly declines in retail sales through the latter months of 2008 (see Chart 3.6). After several years of healthy annual increases, the US retail sector saw an annual drop of 0.4 per cent in 2008 compared to 2007 – the first time since 1967 that the annual change in retail sales has fallen into negative territory.
Chart 3.6 US retail sector posts major declines in latter half of 2008
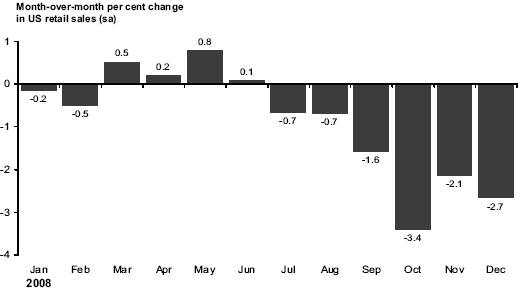
Source: US Census Bureau
US real GDP fell by 3.8 per cent on an annualized basis in the October to December quarter of 2008, following a 0.5 per cent decline in the previous quarter. GDP results from the most recent period represent the biggest quarterly contraction in the US economy since early 1982. Most private sector analysts expect the current economic
Budget and Fiscal Plan – 2009/10 to 2011/12
80
British Columbia Economic Review and Outlook
weakness to last through at least the first half of 2009, as the financial crisis continues to restrict the flow of credit through the US economy and leads consumers and businesses to further reduce spending.
Forecasts for the US economy in 2009 have deteriorated substantially from a year ago, when the January 2008 Consensus Economics survey of private sector economists forecast US real GDP to grow by 2.7 per cent. According to the January 2009 Consensus, the average forecast now sees US real GDP declining by 1.8 per cent in 2009 (see Chart 3.7). Reasons for the expected weakness include rising unemployment, falling industrial production, record-low consumer confidence and expectations of further weakness in the housing market. In December 2008, the US National Bureau of Economic Research declared that the US economy has been in recession since December 2007. However, the January Consensus expects the US economy to recover somewhat in 2010, projecting positive annual growth of 2.3 per cent in that year.
Chart 3.7 US Consensus outlook for 2009 deteriorates
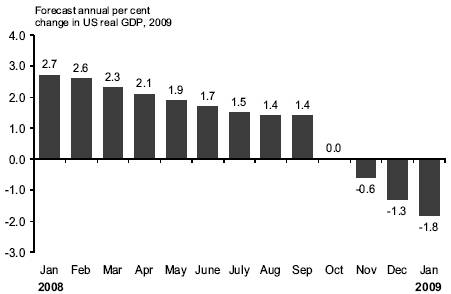
Source: Consensus Economics
The chart above represents forecasts for real GDP growth in 2009 as polled on specific dates. For example, forecasters surveyed on January 12, 2009 had an average 2009 US real GDP forecast of -1.8 per cent, while on January 14, 2008 they forecast 2009 US real GDP to grow 2.7 per cent.
In order to reflect the mounting risks surrounding the US economic outlook, the Ministry of Finance’s growth assumptions are lower than the January Consensus with the expectation that the Consensus outlook will decline further in coming months. The Ministry of Finance is assuming that the US economy will contract by 2.3 per cent in 2009, compared to the 1.8 per cent decline projected in the January Consensus. A recovery to 1.8 per cent real GDP growth is then expected by the Ministry in 2010, compared to the January Consensus prediction of 2.3 per cent. Over the medium-term, the Ministry of Finance assumes that the US economy will grow at a rate of 2.6 per cent per year.
Canada
Canada has also experienced a significant economic slowdown in recent months, though not as severely as the US economy. The Canadian housing market is in better shape than the American market – where reckless subprime lending practices and
Budget and Fiscal Plan – 2009/10 to 2011/12
81
British Columbia Economic Review and Outlook
widespread speculation over the last few years have led to the recent deflation of a huge housing bubble. Although Canada’s housing market has undergone some weakening through 2008, it has not seen the same drastic erosion in home values and rising foreclosure rates as in the US. Further, Canada’s banks and other financial institutions have much lower exposure to toxic sub prime debt than American financial institutions and, although Canadian firms have not escaped the effects of the credit crunch, their balance sheets are generally in better shape than their US counterparts.
The Canadian economy contracted at an annualized pace of 0.6 per cent in the January to March quarter of 2008, and then grew by 0.6 per cent in the April to June quarter and 1.3 per cent in the July to September quarter. However, gains in these last two quarters were mainly the result of high commodity prices driving capital expenditures and a contraction in imports due to slower domestic demand. Further, in the July to September quarter, Canada’s export sector continued its significant decline and the pace of consumer spending slowed considerably. With weakening demand from the US for Canadian products in recent months and consumer confidence currently residing at very low levels, many analysts expect Canadian real GDP to post a contraction in the final three months of 2008 and the first three months of 2009.
Similar to the outlook for the US, forecasts for the Canadian economy’s performance in 2009 declined considerably throughout the last year. The January 2009 Consensus Economics survey projected Canada’s real GDP to decline by 0.7 per cent this year, compared to the 2.5 per cent growth expected in the January 2008 survey. The Ministry of Finance assumes that the Canadian economy will post a 1.2 per cent contraction in 2009, followed by a recovery to 1.9 per cent growth in 2010 and 2.5 per cent growth over the medium-term.
Chart 3.8 Consensus outlook for Canada in 2009 also downgraded
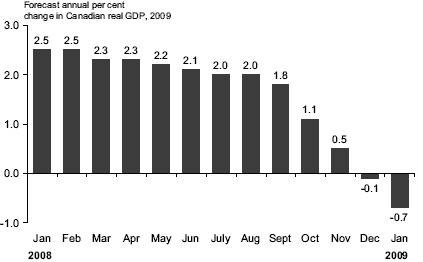
Source: Consensus Economics
The chart above represents forecasts for real GDP growth in 2009 as polled on specific dates. For example, forecasters surveyed on January 12, 2009 had an average 2009 Canadian real GDP forecast of -0.7 per cent, while on January 14, 2008 they forecast 2009 Canadian real GDP to grow by 2.5 per cent.
The Canadian housing market weakened in 2008, though not nearly as severely as the US housing market. Canadian housing starts fell 7.6 per cent last year compared to 2007, while residential building permits – a precursor to new residential building activity – declined by 10.2 per cent in 2008. Data from the October to December quarter suggest further weakness for the housing market, as housing starts fell 11.1 per cent from the previous quarter and residential permits dropped by 20.0 per cent.
Budget and Fiscal Plan – 2009/10 to 2011/12
82
British Columbia Economic Review and Outlook
Retail spending among Canadians increased by 4.2 per cent yea-to-date to November, although this figure has been boosted by high energy prices driving up gasoline sales through the middle months of the year. Recent declines in gasoline prices and waning demand for big ticket items due to low consumer confidence and tight credit conditions have left many private sector analysts expecting further weakening of Canadian retail sales moving into 2009.
Employment in Canada also made gains in 2008, as 259,400 jobs were added last year – a gain of 1.5 per cent from 2007. These employment gains were outpaced by the 1.7 per cent growth in the national labour force, leading to a slight rise in the national annual average unemployment rate to 6.1 per cent, from 6.0 per cent the previous year. The Canadian employment situation took a major monthly plunge in January 2009, as 129,000 jobs were lost across the country. At the same time, the national unemployment rate climbed to reach 7.2 per cent in January 2009, 0.6 percentage points higher than the rate in December 2008.
Despite having been weakened by eroding demand from the US, Canada’s trade sector also held its ground through the first 11 months of 2008. The value of Canadian merchandise exports experienced strong growth last year, rising 9.1 per cent year-to-date to November 2008 compared to the same period in 2007. Weakness in Canada’s wood and automotive exports in 2008 was offset by remarkable increases in energy exports, which were fuelled by surging energy prices through the middle months of the year. Excluding energy exports, the value of merchandise exports from Canada fell by 1.9 per cent yea-to-date to November.
Shipments of manufactured goods from Canada held fairly steady year-to-date to November, as the total value of these shipments rose 0.3 per cent compared to the first 11 months of 2007. The recent decline in the value of the Canadian dollar will likely offer some relief to Canadian manufacturers weary of a high dollar limiting American demand for their products. However, the rapidly deteriorating US economic outlook is likely to put further downward pressure on demand from the US for Canada’s manufactured goods.
Other Economies
The January 2009 Consensus survey forecast Euro zone real GDP to contract by 1.4 per cent in 2009 – a substantial reduction from the 2.0 per cent growth projected in the January 2008 survey. Consensus analysts expect the Euro zone to recover somewhat in 2010 by posting 0.8 per cent growth. The Ministry of Finance’s forecast assumes that Euro zone real GDP will contract by 1.9 per cent in 2009, followed by a modest recovery to 0.5 per cent growth in 2010, and an average of 2.0 per cent growth in the medium-term.
According to the January 2009 Consensus survey, the Japanese economy is expected to contract by 1.7 per cent in 2009. A steep decline in industrial production combined with falling earnings and rising unemployment has led Consensus analysts to downgrade their 2009 real GDP forecasts since January 2008, when they projected a 2.0 per cent increase on average. The January Consensus predicts that Japan’s economic growth will reach 1.1 per cent in 2010. The Ministry of Finance’s forecast assumes a greater contraction of 2.2 per cent in 2009, 0.6 per cent growth in 2010 and 1.7 per cent growth over the medium-term. These prudent assumptions reflect the continued uncertainty regarding the Japanese economic outlook.
Budget and Fiscal Plan – 2009/10 to 2011/12
83
British Columbia Economic Review and Outlook
Table 3.2 Ministry of Finance Economic Forecast: Key Assumptions
| | Forecast | |
| | 2008 | | 2009 | | 2010 | | 2011 | | 2012 | | 2013 | |
| | Per cent change unless otherwise noted | |
US real GDP | | 1.3 | | -2.3 | | 1.8 | | 2.6 | | 2.6 | | 2.6 | |
Canada real GDP | | 0.6 | (e) | -1.2 | | 1.9 | | 2.5 | | 2.5 | | 2.5 | |
Japan real GDP | | 0.3 | (e) | -2.2 | | 0.6 | | 1.6 | | 1.8 | | 1.8 | |
Europe real GDP | | 0.9 | (e) | -1.9 | | 0.5 | | 2.0 | | 2.0 | | 2.0 | |
US housing starts | | -32.7 | | -28.0 | | 25.4 | | 35.0 | | 18.2 | | 0.0 | |
Canada 3–month treasury bill rate (%) | | 2.4 | | 0.9 | | 1.7 | | 2.9 | | 3.9 | | 4.8 | |
Canada 10–year government bonds (%) | | 3.6 | | 2.9 | | 3.4 | | 4.0 | | 4.9 | | 5.8 | |
US cents/Canadian dollar | | 93.7 | | 79.3 | | 86.2 | | 89.4 | | 89.5 | | 88.6 | |
(e) Ministry of Finance estimate
Financial Markets
Interest Rates
Since January 2008, the Bank of Canada has gradually lowered the overnight target rate, its key interest rate, in efforts to stimulate Canadian economic growth in the wake of the global economic crisis. After beginning 2008 at 4.25 per cent, the overnight target rate has since fallen to 1.00 per cent – the lowest rate ever recorded. In its most recent announcement on January 20, 2009, the Bank cited the deteriorating global economic outlook and the erosion of global demand due to very low levels of business and consumer confidence as reasons for its latest rate cut. Many private sector analysts anticipate further easing of the overnight target rate by the Bank on March 3, 2009 – its next decision date for the key interest rate.
The US Federal Reserve Board has also gradually reduced its intended federal funds rate since early 2008, with its target for the rate now resting at 0.00 to 0.25 per cent – its lowest level ever. Following its December 16, 2008 meeting, the Fed noted that it “anticipates that weak economic conditions are likely to warrant exceptionally low levels of the federal funds rate for some time.” Private sector analysts suggest this statement indicates that rates will remain very low for the foreseeable future. The Fed hopes that a very low rate, combined with recent efforts to inject liquidity into the financial system, will lead to an economic recovery over time.
Chart 3.9 Private sector expects Canadian and US interest rates to remain low in 2009
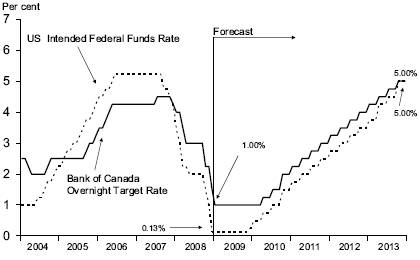
Sources: Bank of Canada, US Federal Reserve Bank; Ministry of Finance.
Budget and Fiscal Plan – 2009/10 to 2011/12
84
British Columbia Economic Review and Outlook
Outlook
Based on the average of five private sector forecasts as of January 7, 2009, the Ministry of Finance interest rate outlook assumes that the Bank of Canada will hold the overnight target rate steady at 1.00 per cent for the duration of 2009. These five forecasters expect the rate to rise to 1.25 per cent in the April to June quarter of 2010, and to reach 2.00 per cent by the end of that year.
As of January 7, 2009, the same five private sector forecasters project that the US Federal Reserve will keep the fed funds rate in the 0.00 per cent to 0.25 per cent range for the duration of 2009. They then expect the rate to rise gradually next year, ending 2010 at 1.50 per cent. As of January 7, on average, the private sector projects the US fed funds rate to average 0.14 per cent in 2009 and 0.94 per cent in 2010. The success of Federal monetary policy in aiding the US economic recovery is a significant risk to the US outlook.
The average of private sector forecasters’ views on Canadian short-term interest rates (3 month Treasury bills) as of January 7, 2009 (see Table 3.3) indicates that 90 day rates will average 0.9 per cent in 2009 and 1.7 per cent in 2010. This compares to the private sector averages in the first Quarterly Report of 3.2 per cent for 2009 and 4.1 per cent for 2010.
Table 3.3 Private Sector Canadian Three Month Treasury Bill Interest Rate Forecasts
Average annual interest rate (per cent) | | 2009 | | 2010 | |
Global Insight | | 0.7 | | 1.1 | |
Bank of Montreal | | 0.9 | | 2.2 | |
Scotiabank | | 0.5 | | 1.1 | |
TD Economics | | 1.4 | | 2.4 | |
RBC Capital Markets | | 0.9 | | 1.5 | |
Average (as of January 7, 2009) | | 0.9 | | 1.7 | |
Budget 2009 Forecast | | 0.9 | | 1.7 | |
Ten-year government of Canada bonds are forecast to average 2.9 per cent in 2009 and 3.4 per cent in 2010 (see Table 3.4). At the time of the first Quarterly Report, the private sector average was 4.1 per cent for 2009 and slightly higher for 2010 at 5.0 per cent.
Table 3.4 Private Sector Canadian 10-year Government Bond Interest Rate Forecasts
Average annual interest rate (per cent) | | 2009 | | 2010 | |
Global Insight | | 3.3 | | 4.0 | |
Bank of Montreal | | 2.7 | | 3.3 | |
Scotiabank | | 2.8 | | 3.3 | |
TD Economics | | 2.9 | | 3.4 | |
RBC Capital Markets | | 2.6 | | 3.2 | |
Average (as of January 7, 2009) | | 2.9 | | 3.4 | |
Budget 2009 Forecast | | 2.9 | | 3.4 | |
Budget and Fiscal Plan – 2009/10 to 2011/12
85
British Columbia Economic Review and Outlook
Exchange Rate
The Canadian dollar began 2008 trading around par with the US dollar, and maintained a fairly high value throughout most of the year, averaging 93.7 US cents on the year, up from 93.1 US cents in 2007. However, the value of the loonie experienced significant volatility in recent months, and fell as low as 77.1 US cents on December 5 before climbing to 81.7 US cents by December 31.
Chart 3.10 Private sector expects lower Canadian dollar in 2009
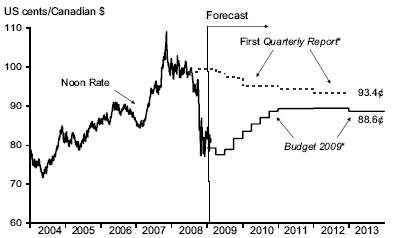
Sources: Bank of Canada and BC Ministry of Finance forecasts
*The average of 5 private sector forecasters: Global Insight, BMO Capital Markets, RBC Financial Group, Scotiabank and TD Bank. First Quarterly Report 2008 as of July 28th, 2008 (includes CIBC forecast) and Budget 2009 as of January 7th, 2009. CIBC was unable to provide a forecast for Budget 2009.
The drop in the dollar’s value in recent months can mainly be attributed to the recent plunge in commodity prices (on which much of the resource-rich Canadian economy is dependent) and the strengthening of the US dollar, as nervous investors flood to the perceived safety of US Treasury bills and bonds in the wake of the global financial crisis.
Outlook
Private sector expectations for the Canadian dollar and commodity prices have declined significantly since the first Quarterly Report, as uncertainty over the Canadian economy continues to grow. The loonie is expected to gradually increase vis-à-vis the US dollar through 2009 and 2010, and stabilize around 89.0 US cents in the medium-term.
An average of five private sector forecasts as of January 7, 2009 saw the Canadian dollar averaging 79.3 US cents in 2009, and rising to 86.2 US cents in 2010. The Ministry of Finance’s exchange rate outlook is based on these private sector averages (see Table 3.5).
Table 3.5 Private Sector Exchange Rate Forecasts
Average annual exchange rate (US cents/Can $) | | 2009 | | 2010 | |
Global Insight | | 80.6 | | 88.2 | |
Bank of Montreal | | 82.2 | | 87.1 | |
Scotiabank | | 76.3 | | 84.1 | |
TD Economics | | 79.6 | | 87.8 | |
RBC Capital Markets | | 78.0 | | 83.8 | |
Average (as of January 7, 2009) | | 79.3 | | 86.2 | |
Budget 2009 Forecast | | 79.3 | | 86.2 | |
Budget and Fiscal Plan – 2009/10 to 2011/12
86
British Columbia Economic Review and Outlook
The British Columbia Economic Outlook
Reflecting the deteriorating economic situation, the Ministry of Finance estimates that the BC economy posted growth of 1.0 per cent in 2008, well below last year’s February 2008 budget forecast of 2.4 per cent and the subsequent first Quarterly Report forecast of 1.7 per cent.
The Ministry of Finance forecasts BC’s economy to contract by 0.9 per cent in 2009 and then recover somewhat in 2010 to increase by 2.4 per cent. Economic activity is expected to slow considerably in 2009, largely due to weakness in the US economy limiting demand for BC products, as well as continued volatility in global financial and commodity markets. Domestic demand, the main driver of BC’s economic growth in recent years, is expected to slow considerably due to weakened consumer confidence and tighter credit conditions. The province’s export market – particularly the forestry sector – will likely continue to suffer with the sustained downturn in the US housing market.
Over the medium-term, the Ministry of Finance forecasts growth of 2.6 per cent in each of the years 2011, 2012 and 2013. This outlook is equal to the Economic Forecast Council’s medium-term projection (see Table 3.6 for a comparison of Ministry of Finance and EFC economic outlooks).
Table 3.6 British Columbia Economic Outlook
| | Forecast | |
| | 2008 | | 2009 | | 2010 | | 2011 | | 2012 | | 2013 | |
| | Per cent change in real GDP | |
Ministry of Finance economic forecast | | 1 .0 | (e) | -0.9 | | 2.4 | | 2.6 | | 2.6 | | 2.6 | |
Economic Forecast Council (1) | | 1.3 | | 0.0 | | 2.8 | | 2.6 | | 2.6 | | 2.6 | |
(e) Ministry of Finance estimate.
(1) Average of the 12 members who provided forecasts (the Council provided a single average annual growth rate for the 2011 through 2013 period).
Table 3.7 summarizes the Ministry of Finance’s outlook for key economic indicators, while Tables 3.9.1 to 3.9.4 at the end of Part 3 provide additional detail on the economic forecast.
Table 3.7 Ministry of Finance Economic Forecast: Key Economic Indicators
| | Forecast | |
| | 2008 | | 2009 | | 2010 | | 2011 | | 2012 | | 2013 | |
| | Per cent change unless otherwise noted | |
British Columbia Economic Indicators | | | | | | | | | | | | | |
Real GDP | | 1.0 | (e) | -0.9 | | 2.4 | | 2.6 | | 2.6 | | 2.6 | |
Nominal GDP | | 3.9 | (e) | -0.9 | | 4.2 | | 4.6 | | 4.8 | | 4.8 | |
Employment | | 2.1 | | -0.5 | | 1.3 | | 1.5 | | 1.6 | | 1.6 | |
Unemployment rate (per cent) | | 4.6 | | 6.2 | | 6.0 | | 5.7 | | 5.5 | | 5.5 | |
Total net in-migration (thousands of persons) | | 56.1 | (1) | 47.8 | | 48.7 | | 49.8 | | 49.6 | | 51.5 | |
Personal income | | 5.1 | (e) | 1.7 | | 3.5 | | 4.3 | | 4.5 | | 4.5 | |
Corporate pre-tax profits | | -4.0 | (e) | -24.7 | | 1.5 | | 3.2 | | 4.4 | | 4.4 | |
Housing starts (thousands of units) | | 34.3 | | 25.5 | | 26.8 | | 27.8 | | 28.4 | | 29.2 | |
Retail sales | | 1.5 | (e) | 1.3 | | 4.4 | | 4.4 | | 4.4 | | 4.4 | |
(e) Ministry of Finance estimate.
(1) BC Stats estimate.
Budget and Fiscal Plan – 2009/10 to 2011/12
87
British Columbia Economic Review and Outlook
Labour Market
Employment in British Columbia grew 2.1 per cent in 2008, following growth of 3.2 per cent in 2007. This translates to average total employment of 2,314,300 persons, an increase of 48,000 jobs. Full-time employment increased by 40,100 jobs over 2007, while part-time employment increased by 7,800 jobs.
Chart 3.11 BC Employment declines in recent months
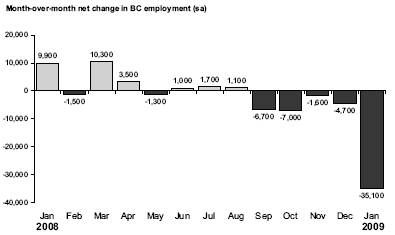
Source: Statistics Canada
Labour force growth outweighed employment growth in 2008, resulting in British Columbia’s unemployment rate averaging 4.6 per cent during the year, an increase of 0.4 percentage points from 2007.
January 2009 brought the most job losses BC has ever experienced in one month, as the number of jobs declined by 35,100 compared to December 2008. Much of the January decrease came from losses in the goods producing sector, namely in the manufacturing and construction industries. These record losses pushed BC’s monthly unemployment rate up to 6.1 per cent in January 2009, its highest rate since April 2005.
Outlook
The Ministry of Finance outlook calls for employment in British Columbia to decline by 0.5 per cent in 2009, or approximately 11,000 jobs. Employment is then forecast to grow by 1.3 per cent in 2010, then by about 1.6 per cent per year through the 2011 to 2013 period. Labour force growth in BC is expected to exceed employment growth in 2009, resulting in the unemployment rate rising to 6.2 per cent this year. The unemployment rate is then forecast to gradually fall after 2009, reaching 6.0 per cent in 2010 and about 5.6 per cent per year in the medium-term.
Domestic Demand
Consumer Spending and Housing
Retail sales increased by 1.4 per cent through the first 11 months of 2008 compared to the same period in 2007. However, retail sales in BC have fallen in four of the last five months leading up to November – a result of waning consumer confidence among shoppers in BC. Retail trade is certainly coming off the surge it experienced in recent years, after year-over-year sales grew 7.2 per cent in 2006 and 6.7 per cent in 2007. While steady gains have been made in sales by gasoline stations and home electronics and appliance stores, sizeable declines have occurred in sales of new and used automobiles.
Budget and Fiscal Plan – 2009/10 to 2011/12
88
British Columbia Economic Review and Outlook
Housing starts in BC declined significantly in 2008, averaging 34,321 units on the year — a decline of 12.4 per cent over 2007. Residential building permits, a precursor of new housing activity, fell 19.9 per cent in 2008, including a sizeable 50.7 per cent quarterly decline in the October to December quarter. This downward trend in residential permits suggests that weakness in housing starts will likely continue going forward in 2009.
Economic uncertainty and reduced confidence took hold of BC homebuyers during 2008, as seasonally adjusted MLS home sales plummeted from 7,837 units in January to 3,907 in December (see Chart 3.12). In November, home sales dipped to their lowest monthly level on record (dating back to 1988), reaching 3,632 units. Further, the average home price in BC fell from about $472,000 in January 2008 to about $406,000 in December — a reduction of 14.0 per cent. Homebuyers’ expectations of further price declines in the coming months, in combination with tighter credit conditions and growing fears of job losses, will likely result in further slowing of BC’s housing market in 2009.
Chart 3.12 BC home sales plummet in 2008
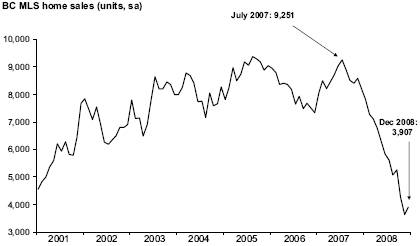
Source: Canadian Real Estate Association MLS
Suggestive of further declines in the non-residential building sector going forward, non-residential building permits, a leading indicator of non-residential investment, fell by 7.1 per cent in 2008. Declines in non-residential permits were observed across all major categories on the year.
Outlook
The Ministry of Finance estimates that real (inflation-adjusted) consumer spending on goods and services grew by 1.6 per cent in 2008, and is forecasting slower growth of just 0.9 per cent in 2009 (see Table 3.9.1 at the end of Part 3). Real consumer spending is forecast to improve in 2010, growing by 2.6 per cent, and to average 2.8 per cent growth per year in the medium-term. Retail sales are estimated to have increased by 1.5 per cent in 2008, and are forecast to grow by 1.3 per cent in 2009 and 4.4 per cent each year from 2010 to 2013. Weakened confidence among BC consumers combined with rising unemployment is expected to put downward pressure on personal consumption in the near-term.
Budget and Fiscal Plan – 2009/10 to 2011/12
89
British Columbia Economic Review and Outlook
As British Columbia’s housing boom draws to a close, housing starts are expected to ease from the high levels observed over the last few years. The Ministry of Finance forecasts housing starts to total approximately 25,500 units in 2009 and 26,800 units in 2010. Over the medium-term, BC housing starts are expected to level out, averaging around 28,500 units per year from 2011 to 2013.
Business and Government
Real business investment (including residential) is estimated to have increased by 1.9 per cent in 2008 — slightly greater than the 1.4 per cent observed in 2007. The main source of the 2008 increase in business investment was stronger investment in non-residential construction and in machinery and equipment that offset weaker investment in residential construction. BC is likely to see weaker non-residential investment moving into 2009, as non-residential building permits showed significant weakness in the final two months of 2008.
Real business machinery and equipment investment growth slowed in 2008. Following growth of 8.8 per cent in 2007, machinery and equipment investment is estimated to have grown 4.5 per cent in 2008.
Real business non-residential investment is estimated to have increased by 1.8 per cent in 2008, following a 6.4 per cent decline in 2007. This measure represents inflation-adjusted spending by businesses for construction of industrial, commercial and institutional buildings, highways, bridges, sewage systems and various other projects.
Real residential investment, which includes new housing investment as well as renovations and improvements, is estimated to have grown by just 0.5 per cent in 2008, following growth of 2.2 per cent in 2007.
The Vancouver non-residential building construction price index, a measure of costs facing the construction industry in Vancouver that includes both labour, building material costs and profits, rose 10.4 per cent through the first nine months of 2008, compared to the same period in 2007. This follows annual growth of 12.7 per cent in 2007. Central 1 Credit Union, a private sector group that frequently examines BC’s construction industry, points out that overall construction cost increases going into 2009 are moderating for both materials and labour. Lower prices for energy and wood products, as well as higher unemployment among construction workers, are aiding in this moderation. The BTY group, another private sector group that forecasts construction cost growth in several regions of Canada, projects that BC’s construction costs will increase by 3.0 per cent in 2009, 3.0 per cent in 2010 and 5.0 per cent in 2011. This represents a significant moderation of cost growth from recent years, due to lower expected energy costs, slower projected housing starts in the coming years and slower expected economic growth in general.
Real (inflation adjusted) local, provincial and federal government combined spending on goods and services in BC is estimated to have increased 3.2 per cent in 2008, following growth of 4.1 per cent in 2007.
Budget and Fiscal Plan – 2009/10 to 2011/12
90
British Columbia Economic Review and Outlook
Outlook
With a bleaker outlook for many businesses in 2009, total real business investment in BC is forecast to decline by 5.1 per cent on the year. This contraction reflects a slowdown of investment across all major categories. However, renewed growth in business investment is expected in 2010, as all categories are expected to post modest gains. Over the medium-term, total business investment in BC is projected to grow approximately 3.5 per cent per year on average, with all major sectors making steady annual gains. On average, real non-residential investment is forecast to grow by 3.3 per cent per year from 2011 to 2013, while investment in machinery and equipment is forecast to rise by an average of 3.5 per cent per year. Residential investment is projected to increase by 3.6 per cent per year on average in the medium-term.
Corporate pre-tax profits, which declined by 3.2 per cent in 2007, are estimated by the Ministry of Finance to have fallen by 4.0 per cent in 2008. Due to the weaker economic outlook and significant declines anticipated for commodity prices in 2009, the Ministry expects corporate profits to fall by 24.7 per cent on the year. A recovery to modest growth is anticipated in 2010, however, when corporate profits are forecast to rise by 1.5 per cent.
Combined real spending by the three levels of government (federal, provincial and municipal) on goods and services is expected to grow by 0.6 per cent in 2009, and rise again by 2.5 per cent in 2010. Over the medium-term, real spending from all three levels of government is forecast to grow by 2.3 per cent per year on average.
External Trade and Commodity Markets
The value of BC’s merchandise exports increased through 2008, rising 4.7 per cent year-to-date to November compared to the same period in 2007. Driving this healthy gain was a 54.6 per cent increase in energy exports, which helped to offset an 18.0 per cent drop in forestry exports. Further degradation in the US housing market that weakened demand for BC forest products (combined with falling lumber prices) took a toll on BC’s forest industry during 2008. Weakness was also observed in exports of automotive products and machinery and equipment.
Global commodity markets experienced substantial volatility in 2008, with the values of most commodities plunging in the latter months of the year. Lumber prices began the year at fairly low values, with western spruce-pine-fir (SPF) 2x4 prices averaging $204 US per thousand board feet in January 2008. Prices recovered somewhat throughout the year, with monthly values reaching as high as $276 US per thousand board feet in August. However, prices fell again in September as the turmoil in US financial markets took its toll on US demand for wood products. On the year, lumber prices averaged $219 US, down $30 US compared to 2007. Prices reached a recent low of $130 US per thousand board feet during the fourth week of January.
Natural gas prices also fluctuated significantly throughout 2008. After beginning the year at $5.86 C/GJ in January, natural gas reached a high of $9.33 C/GJ in June and then plunged to hit $5.46 C/GJ in September. Prices averaged $6.89 C/GJ in 2008, up from $5.41 C/GJ in 2007. Weaker demand due to the US economic downturn contributed to the fall in natural gas prices during the latter months of 2008.
Budget and Fiscal Plan – 2009/10 to 2011/12
91
British Columbia Economic Review and Outlook
Oil prices experienced remarkable volatility during 2008, as the West Texas Intermediate oil price began the year at $99.64 US/barrel and then rocketed up to $145.31 US/barrel on July 3, 2008. Prices have since fallen sharply, due primarily to declining demand brought on by the global financial crisis. The price of oil averaged $99.67 US/barrel in 2008, but ended the year at $44.60 US/barrel on December 31. With growing uncertainty over the direction of the global economy, oil prices are likely to remain volatile for some time.
Metal and mineral prices saw strong increases through most of 2008, but have generally been on a declining trend in recent months. For example, copper prices averaged $3.69 US per pound during the first six months of the year, but only $2.62 US per pound during the final six months, concluding the year at $1.40 US per pound in December. Similar trends can be observed in the prices of other commodities such as silver, aluminum, lead and zinc.
Outlook
Real exports of goods and services are forecast to decrease by 2.4 per cent in 2009. Declining demand from the US for BC products combined with continued volatility in commodity prices are the central reasons for the expected weakness this year. Real export growth is forecast to return in 2010, reaching 2.6 per cent on the year, with the expectation of a recovery in demand from the US and other areas. Over the medium-term, average annual growth of 3.2 per cent is anticipated for real exports.
Due to continued weakness in the US housing market, Western SPF prices are expected to remain weak through 2009, averaging $213 US per thousand board feet for the year, down from the $250 US that was assumed in the first Quarterly Report. As the US housing market gradually recovers, prices are forecast to average $250 US per thousand board feet in 2010 and then return to $300 US over the medium-term.
Based on private sector forecasts, natural gas prices are expected to strengthen from 2008/09 levels over the forecast period. Between 2008/09 and 2012/13, prices are forecast to rise from $6.57 C/GJ to $7.21 C/GJ.
The British Columbia goods and services export price deflator (the average price of BC goods and services exports) is forecast to grow by 2.5 per cent in 2009, largely due to the weakened Canadian dollar. The Ministry of Finance forecasts that the price of BC’s exports will decline by 0.8 per cent in 2010 as the value of the dollar recovers. The average annual export price growth is expected to be 2.4 per cent over the 2011 to 2013 period, as commodity prices stabilize and the Canadian dollar levels out around 88.6 US cents by 2013.
Inflation
Consumer price inflation (CPI) in British Columbia averaged 2.1 per cent in 2008, as higher consumer inflation in non-durables and services was offset by continued price deflation in durable and semi-durable goods. BC’s CPI inflation was below the Canadian average rate of inflation of 2.3 per cent in 2008. High gasoline, fuel oil and other fuel prices were partly responsible for the strength of non-durable inflation. Food prices rose 3.3 per cent during the year on average, while consumers saw the cost of automobiles fall by 6.9 per cent. Excluding food and energy, two of the most volatile components, BC consumer prices rose by 1.0 per cent in 2008.
Budget and Fiscal Plan – 2009/10 to 2011/12
92
British Columbia Economic Review and Outlook
Outlook
Consumer price inflation in BC is forecast to be 1.0 per cent in 2009, as slower consumer spending is expected to put downward pressure on some prices. CPI inflation is forecast at 2.2 per cent in 2010 and at 2.1 per cent per year on average in the medium-term. The Canadian rate of inflation is expected to average 0.8 per cent in 2009 and 2.0 per cent in 2010. Over the medium-term, national CPI inflation is expected to be 2.0 per cent, in line with the Bank of Canada’s inflation target.
Risks to the Economic Outlook
The balance of risks to the current economic forecast is weighted to the downside. The most significant risks to the BC outlook include:
· a more severe and prolonged US recession than assumed;
· slower than anticipated global demand resulting in reduced demand for BC’s exports;
· continued turmoil in global financial markets;
· further weakening of domestic demand; and
· further commodity price volatility.
However, there is also upside risk to the forecast resulting from the potential impact of Federal and Provincial fiscal stimulus measures.
Budget and Fiscal Plan – 2009/10 to 2011/12
93
British Columbia Economic Review and Outlook
Table 3.8 British Columbia Economic Review
| | Actual | | Budget 2008
Forecast | | Actual/
Estimate | |
| | 2007 | | 2008 | | 2008 | |
| | Per cent change unless otherwise noted | |
Real gross domestic product (per cent change) | | 3.0 | | 2.4 | | 1.0 | (1) |
Consumer expenditure | | 5.2 | | 3.4 | | 1.6 | (1) |
Capital investment | | 2.4 | | 3.6 | | 2.8 | (1) |
Government expenditure | | 4.1 | | 2.2 | | 3.2 | (1) |
Exports of goods and services | | -0.3 | | 1.3 | | -1.4 | (1) |
Imports of goods and services | | 3.9 | | 3.4 | | 0.0 | (1) |
Inventory investment (change in billions of constant 2002 dollars) | | 1.8 | | 0.9 | | 0.5 | (1) |
BC Economic Forecast Council — Real GDP growth | | n/a | | 2.8 | | 1.3 | |
Gross domestic product (current dollars; per cent change) | | 5.4 | | 4.2 | | 3.9 | (1) |
Population July 1 (per cent change) | | 1.6 | | 1.4 | | 1.7 | |
Total net in-migration (thousands of persons) | | 58.3 | | 48.9 | | 56.1 | (2) |
Interprovincial | | 15.5 | | 13.2 | | 6.0 | (2) |
International | | 42.8 | | 35.7 | | 50.1 | (2) |
Labour force (thousands of persons) | | 2,366 | | 2,416 | | 2,426 | |
(per cent change) | | 2.7 | | 2.1 | | 2.5 | |
Employment (thousands of persons) | | 2,266 | | 2,304 | | 2,314 | |
(per cent change) | | 3.2 | | 1.7 | | 2.1 | |
Unemployment rate (per cent) | | 4.2 | | 4.7 | | 4.6 | |
Retail sales (millions of current dollars) | | 56,365 | | 59,112 | | 57,193 | (1) |
(per cent change) | | 6.7 | | 5.3 | | 1.5 | |
Labour income(3) (millions of current dollars) | | 99,894 | | 103,307 | | 105,688 | (1) |
(per cent change) | | 6.3 | | 4.7 | | 5.8 | |
Corporate pre-tax profits (millions of current dollars) | | 21,385 | | 21,858 | | 20,521 | (1) |
(per cent change) | | -3.2 | | 0.4 | | -4.0 | |
Housing starts (units) | | 39,195 | | 34,597 | | 34,321 | |
(per cent change) | | 7.6 | | -11.7 | | -12.4 | |
Consumer Price Index (2002 = 100) | | 110.0 | | 111.9 | | 112.3 | |
(per cent change) | | 1.8 | | 1.8 | | 2.1 | |
Key Assumptions: | | | | | | | |
Economic growth (per cent change) | | | | | | | |
Canada | | 2.7 | | 1.9 | | 0.6 | (1) |
United States | | 2.0 | | 1.7 | | 1.2 | |
Japan | | 2.4 | | 1.2 | | 0.3 | (1) |
Europe | | 2.7 | | 1.6 | | 0.9 | (1) |
Housing starts (per cent change) | | | | | | | |
Canada | | -0.6 | | -14.6 | | -7.6 | |
United States | | -26.0 | | -27.8 | | -32.7 | |
Japan | | -17.8 | | 7.5 | | 3.1 | |
Industrial production (per cent change) | | | | | | | |
United States | | 1.7 | | 1.0 | | -1.7 | |
Japan | | 2.9 | | 1.7 | | -3.1 | |
Canadian consumer price index (per cent change) | | 2.2 | | 1.8 | | 2.3 | |
Canadian interest rates (per cent; annual average) | | | | | | | |
3-month treasury bills | | 4.2 | | 3.9 | | 2.4 | |
Government of Canada 10–year bonds | | 4.3 | | 4.2 | | 3.6 | |
United States interest rates (per cent; annual average) | | | | | | | |
3-month treasury bills | | 4.4 | | 3.2 | | 1.4 | |
Government 10–year bonds | | 4.6 | | 4.1 | | 3.7 | |
US cents/Canadian dollar (annual average) | | 93.1 | | 99.9 | | 93.7 | |
BC goods and services export price deflator (Cdn$; per cent change) | | 0.2 | | -2.4 | | 5.7 | (1) |
(1) Ministry of Finance estimate.
(2) BC Stats estimate.
(3) Wages, salaries and supplementary labour income.
Budget and Fiscal Plan – 2009/10 to 2011/12
94
British Columbia Economic Review and Outlook
Table 3.9.1 Gross Domestic Product: British Columbia
| | Forecast | |
| | 2007 | | 2008 (e) | | 2009 | | 2010 | | 2011 | | 2012 | | 2013 | |
BRITISH COLUMBIA: | | | | | | | | | | | | | | | |
Gross Domestic Product at Market Prices: | | | | | | | | | | | | | | | |
– Real (2002 $billion; chain-weighted) | | 164.6 | | 166.2 | | 164.6 | | 168.6 | | 173.0 | | 177.6 | | 182.3 | |
(% change) | | 3.0 | | 1.0 | | -0.9 | | 2.4 | | 2.6 | | 2.6 | | 2.6 | |
– Current dollar ($ billion) | | 192.6 | | 200.0 | | 198.3 | | 206.7 | | 216.1 | | 226.4 | | 237.4 | |
(% change) | | 5.4 | | 3.9 | | -0.9 | | 4.2 | | 4.6 | | 4.8 | | 4.8 | |
– GDP price deflator (2002 = 100) | | 117.0 | | 120.4 | | 120.4 | | 122.6 | | 124.9 | | 127.5 | | 130.2 | |
(% change) | | 2.3 | | 2.9 | | 0.1 | | 1.8 | | 1.9 | | 2.1 | | 2.1 | |
Real GDP per person | | | | | | | | | | | | | | | |
(2002 $; chain-weighted) | | 38,184 | | 37,925 | | 37,026 | | 37,400 | | 37,870 | | 38,352 | | 38,835 | |
(% change) | | 1.4 | | -0.7 | | -2.4 | | 1.0 | | 1.3 | | 1.3 | | 1.3 | |
Real GDP per employed person | | | | | | | | | | | | | | | |
(% change) | | -0.2 | | -1.1 | | -0.4 | | 1.1 | | 1.1 | | 1.1 | | 1.0 | |
Unit labour cost(1) (% change) | | 3.2 | | 4.8 | | 2.1 | | 1.4 | | 2.3 | | 2.2 | | 2.2 | |
| | | | | | | | | | | | | | | |
Components of British Columbia Real GDP at Market Prices ($2002 billions; chain-weighted) | |
Personal expenditure on | | | | | | | | | | | | | | | |
Goods and services | | 111.5 | | 113.3 | | 114.3 | | 117.3 | | 120.4 | | 123.8 | | 127.3 | |
(% change) | | 5.2 | | 1.6 | | 0.9 | | 2.6 | | 2.6 | | 2.8 | | 2.9 | |
– Goods | | 46.7 | | 47.0 | | 47.3 | | 48.5 | | 49.8 | | 51.1 | | 52.5 | |
(% change) | | 5.2 | | 0.6 | | 0.8 | | 2.4 | | 2.6 | | 2.7 | | 2.7 | |
– Services | | 64.8 | | 66.3 | | 66.9 | | 68.8 | | 70.6 | | 72.7 | | 74.8 | |
(% change) | | 5.3 | | 2.3 | | 1.0 | | 2.8 | | 2.6 | | 2.9 | | 3.0 | |
Government current expenditures on | | | | | | | | | | | | | | | |
Goods and services | | 30.9 | | 31.9 | | 32.1 | | 32.9 | | 33.6 | | 34.4 | | 35.3 | |
(% change) | | 4.1 | | 3.2 | | 0.6 | | 2.5 | | 2.1 | | 2.4 | | 2.5 | |
Investment in fixed capital | | 39.8 | | 40.9 | | 38.3 | | 39.1 | | 40.4 | | 41.6 | | 42.8 | |
(% change) | | 2.4 | | 2.8 | | -6.5 | | 2.3 | | 3.1 | | 3.1 | | 2.9 | |
Final domestic demand | | 182.3 | | 186.2 | | 184.5 | | 189.2 | | 194.2 | | 199.7 | | 205.3 | |
(% change) | | 4.4 | | 2.1 | | -0.9 | | 2.5 | | 2.6 | | 2.8 | | 2.8 | |
| | | | | | | | | | | | | | | |
Exports goods and services | | 72.6 | | 71.6 | | 69.9 | | 71.7 | | 74.1 | | 76.5 | | 78.9 | |
(% change) | | -0.3 | | -1.4 | | -2.4 | | 2.6 | | 3.3 | | 3.4 | | 3.0 | |
Imports goods and services | | 93.0 | | 93.0 | | 91.0 | | 93.6 | | 97.0 | | 100.3 | | 103.6 | |
(% change) | | 3.9 | | 0.0 | | -2.2 | | 2.9 | | 3.6 | | 3.4 | | 3.3 | |
Inventory change | | 1.8 | | 0.5 | | 0.2 | | 0.2 | | 0.7 | | 0.7 | | 0.6 | |
Statistical discrepancy | | 0.1 | | 0.1 | | 0.1 | | 0.1 | | 0.1 | | 0.1 | | 0.1 | |
Real GDP at market prices | | 164.6 | | 166.2 | | 164.6 | | 168.6 | | 173.0 | | 177.6 | | 182.3 | |
(% change) | | 3.0 | | 1.0 | | -0.9 | | 2.4 | | 2.6 | | 2.6 | | 2.6 | |
(1) Unit labour cost is the nominal cost of labour incurred to produce one unit of real output.
(e) Ministry of Finance estimate.
Budget and Fiscal Plan – 2009/10 to 2011/12
95
British Columbia Economic Review and Outlook
Table 3.9.2 Components of Nominal Income and Expenditure
| | Forecast | |
| | 2007 | | 2008 | | 2009 | | 2010 | | 2011 | | 2012 | | 2013 | |
Labour income(1) ($ million) | | 99,894 | | 105,688 | (e) | 106,938 | | 110,997 | | 116,600 | | 122,356 | | 128,347 | |
(% change) | | 6.3 | | 5.8 | | 1.2 | | 3.8 | | 5.0 | | 4.9 | | 4.9 | |
Personal income ($ million) | | 151,836 | | 159,568 | (e) | 162,215 | | 167,914 | | 175,104 | | 182,935 | | 191,133 | |
(% change) | | 6.8 | | 5.1 | | 1.7 | | 3.5 | | 4.3 | | 4.5 | | 4.5 | |
Corporate profits before taxes ($ million) | | 21,385 | | 20,521 | (e) | 15,460 | | 15,699 | | 16,204 | | 16,914 | | 17,662 | |
(% change) | | -3.2 | | -4.0 | | -24.7 | | 1.5 | | 3.2 | | 4.4 | | 4.4 | |
Retail sales ($ million) | | 56,365 | | 57,193 | (e) | 57,942 | | 60,466 | | 63,131 | | 65,934 | | 68,863 | |
(% change) | | 6.7 | | 1.5 | | 1.3 | | 4.4 | | 4.4 | | 4.4 | | 4.4 | |
Housing starts | | 39,195 | | 34,321 | | 25,541 | | 26,783 | | 27,800 | | 28,430 | | 29,248 | |
(% change) | | 7.6 | | -12.4 | | -25.6 | | 4.9 | | 3.8 | | 2.3 | | 2.9 | |
Residential investment(2) ($ million) | | 19,095 | | 19,542 | (e) | 18,244 | | 19,744 | | 21,198 | | 22,670 | | 24,153 | |
(% change) | | 10.7 | | 2.3 | | -6.6 | | 8.2 | | 7.4 | | 6.9 | | 6.5 | |
BC consumer price index (2001 = 100) | | 110.0 | | 112.3 | | 113.5 | | 116.0 | | 118.5 | | 120.9 | | 123.4 | |
(% change) | | 1.8 | | 2.1 | | 1.0 | | 2.2 | | 2.1 | | 2.1 | | 2.1 | |
(1) Domestic basis; wages, salaries and supplementary labour income.
(2) Includes renovations and improvements.
(e) Ministry of Finance estimate.
Table 3.9.3 Labour Market Indicators
| | Forecast | |
| | 2007 | | 2008 | | 2009 | | 2010 | | 2011 | | 2012 | | 2013 | |
Population (on July 1) (000’s) | | 4,310 | | 4,382 | | 4,447 | | 4,508 | | 4,569 | | 4,631 | | 4,694 | |
(% change) | | 1.6 | | 1.7 | | 1.5 | | 1.4 | | 1.4 | | 1.4 | | 1.4 | |
Labour force population, 15+ Years (000’s) | | 3,571 | | 3,642 | | 3,704 | | 3,763 | | 3,821 | | 3,876 | | 3,931 | |
(% change) | | 1.7 | | 2.0 | | 1.7 | | 1.6 | | 1.5 | | 1.5 | | 1.4 | |
Net in-migration (000’s) | | | | | | | | | | | | | | | |
– International(1),(3) | | 42.8 | | 50.1 | (e) | 38.3 | | 39.9 | | 41.0 | | 40.8 | | 41.6 | |
– Interprovincial(3) | | 15.5 | | 6.0 | (e) | 9.5 | | 8.8 | | 8.8 | | 8.8 | | 9.9 | |
– Total | | 58.3 | | 56.1 | (e) | 47.8 | | 48.7 | | 49.8 | | 49.6 | | 51.5 | |
Participation rate(2) (%) | | 66.3 | | 66.6 | | 66.2 | | 65.9 | | 65.7 | | 65.7 | | 65.7 | |
Labour force (000’s) | | 2,366 | | 2,426 | | 2,454 | | 2,481 | | 2,510 | | 2,545 | | 2,583 | |
(% change) | | 2.7 | | 2.5 | | 1.1 | | 1.1 | | 1.2 | | 1.4 | | 1.5 | |
Employment (000’s) | | 2,266 | | 2,314 | | 2,303 | | 2,333 | | 2,368 | | 2,405 | | 2,443 | |
(% change) | | 3.2 | | 2.1 | | -0.5 | | 1.3 | | 1.5 | | 1.6 | | 1.6 | |
Unemployment rate (%) | | 4.2 | | 4.6 | | 6.2 | | 6.0 | | 5.7 | | 5.5 | | 5.5 | |
(1) International migration includes net non-permanent residents and returning emigrants less net temporary residents abroad.
(2) Percentage of the population 15 years of age and over in the labour force.
(3) Components may not sum to total due to rounding.
(e) BC Stats estimate.
Budget and Fiscal Plan – 2009/10 to 2011/12
96
British Columbia Economic Review and Outlook
Table 3.9.4 Major Economic Assumptions
| | Forecast | |
| | 2007 | | 2008 | | 2009 | | 2010 | | 2011 | | 2012 | | 2013 | |
GDP (billions) | | | | | | | | | | | | | | | |
Canada real (2002 $; chain-weighted) | | 1,320 | | 1,328 | (e) | 1,312 | | 1,337 | | 1,370 | | 1,404 | | 1,439 | |
(% change) | | 2.7 | | 0.6 | | -1.2 | | 1.9 | | 2.5 | | 2.5 | | 2.5 | |
US real (1996 US$; chain-weighted) | | 11,524 | | 11,671 | | 11,405 | | 11,612 | | 11,908 | | 12,214 | | 12,535 | |
(% change) | | 2.0 | | 1.3 | | -2.3 | | 1.8 | | 2.6 | | 2.6 | | 2.6 | |
Japan real (2000 Yen; chain-weighted) | | 561,403 | | 562,940 | (e) | 550,680 | | 554,073 | | 562,689 | | 572,893 | | 583,119 | |
(% change) | | 2.4 | | 0.3 | | -2.2 | | 0.6 | | 1.6 | | 1.8 | | 1.8 | |
Europe real(1) (% change) | | 2.7 | | 0.9 | (e) | -1.9 | | 0.5 | | 2.0 | | 2.0 | | 2.0 | |
| | | | | | | | | | | | | | | |
Industrial production index | | | | | | | | | | | | | | | |
US (2002 = 100) | | 111.4 | | 109.5 | | 102.8 | | 104.2 | | 106.8 | | 109.6 | | 112.4 | |
(% change) | | 1.7 | | -1.7 | | -6.1 | | 1.4 | | 2.6 | | 2.6 | | 2.6 | |
Japan (2000 = 100) | | 107.3 | | 103.9 | | 90.6 | | 91.1 | | 92.5 | | 94.2 | | 95.9 | |
(% change) | | 2.9 | | -3.1 | | -12.8 | | 0.5 | | 1.6 | | 1.8 | | 1.8 | |
Europe(1) (2000 = 100) | | 111.7 | | 111.4 | (e) | 105.3 | | 105.7 | | 107.8 | | 109.9 | | 112.1 | |
(% change) | | 3.5 | | -0.3 | | -5.4 | | 0.3 | | 2.0 | | 2.0 | | 2.0 | |
| | | | | | | | | | | | | | | |
Housing starts(2) (000’s) | | | | | | | | | | | | | | | |
Canada | | 228 | | 211 | | 160 | | 160 | | 168 | | 176 | | 180 | |
(% change) | | 0.4 | | -7.6 | | -24.2 | | 0.0 | | 5.0 | | 4.8 | | 2.3 | |
US | | 1,341 | | 902 | | 650 | | 815 | | 1,100 | | 1,300 | | 1,300 | |
(% change) | | -26.0 | | -32.7 | | -28.0 | | 25.4 | | 35.0 | | 18.2 | | 0.0 | |
Japan | | 1,061 | | 1,093 | | 1,020 | | 1,020 | | 1,047 | | 1,065 | | 1,065 | |
(% change) | | -17.8 | | 3.1 | | -6.7 | | 0.0 | | 2.6 | | 1.7 | | 0.0 | |
| | | | | | | | | | | | | | | |
Consumer price index | | | | | | | | | | | | | | | |
Canada (2001 = 100) | | 111.5 | | 114.1 | | 115.0 | | 117.3 | | 119.7 | | 122.1 | | 124.5 | |
(% change) | | 2.2 | | 2.3 | | 0.8 | | 2.0 | | 2.0 | | 2.0 | | 2.0 | |
| | | | | | | | | | | | | | | |
Canadian interest rates (%) | | | | | | | | | | | | | | | |
3-Month treasury bills | | 4.2 | | 2.4 | | 0.9 | | 1.7 | | 2.9 | | 3.9 | | 4.8 | |
10-year government bonds | | 4.3 | | 3.6 | | 2.9 | | 3.4 | | 4.0 | | 4.9 | | 5.8 | |
| | | | | | | | | | | | | | | |
United States interest rates (%) | | | | | | | | | | | | | | | |
3-Month treasury bills | | 4.4 | | 1.4 | | 0.2 | | 1.1 | | 2.8 | | 3.9 | | 4.8 | |
10-year government bonds | | 4.7 | | 3.7 | | 2.4 | | 3.1 | | 3.8 | | 4.9 | | 5.8 | |
| | | | | | | | | | | | | | | |
Exchange rate (US cents / Canadian $) | | 93.1 | | 93.7 | | 79.3 | | 86.2 | | 89.4 | | 89.5 | | 88.6 | |
| | | | | | | | | | | | | | | |
British Columbia goods and services | | | | | | | | | | | | | | | |
Export price deflator (% change) | | 0.2 | | 5.7 | (e) | 2.5 | | -0.8 | | 1.8 | | 2.2 | | 3.1 | |
(1) | Euro zone (12) is Austria, Belgium, Finland, France, Germany, Greece, Ireland, Italy, Luxembourg, Netherlands, Portugal and Spain. |
(2) | British Columbia housing starts appear in Table 3.9.2. |
(e) | Ministry of Finance estimate. |
Budget and Fiscal Plan – 2009/10 to 2011/12
97
British Columbia Economic Review and Outlook
The Economic Forecast Council, 2009
Introduction
The Budget Transparency and Accountability Act requires the Minister of Finance to consult the Economic Forecast Council (the Council) each year on the outlook for British Columbia’s economy. The Council is comprised of leading economists from several of Canada’s major banks and private research institutions. The consultation process occurs each December and the resulting forecasts are published the following February along with the provincial budget.
The most recent meeting between the Minister and the Council was held on December 5, 2008, with the discussion focussing on Council members’ estimates for 2008 as well as their forecasts for 2009 and beyond. Participants each provided information for the individual years 2008, 2009 and 2010, as well as an average forecast for the years 2011 to 2013. Ten of the 12 Council members subsequently updated their forecasts in early January.
Council members presented their views on BC’s near—term economic outlook and on factors that could affect the province’s medium—term outlook. Among the various topics discussed were: the sharp US economic downturn, the international credit crisis, falling commodity prices, government deficit financing, the potential effectiveness of government stimulus packages, the impact of the 2010 Olympics, as well as the outlook for BC’s construction and forestry sectors.
Chart 1 — Economic Forecast Council Outlook for the BC Economy
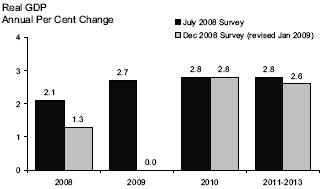
Source: Average of Economic Forecast Council forecasts
NOTE: Forecast from July 2008 EFC for 2010 and 2011-2013 is the average growth for the years 2010-2012.
Forecast details from the Council surveys are summarized in the table at the end of this topic box.
Overview
Since the first Quarterly Report, Council members have significantly downgraded their forecasts for near—term economic growth in British Columbia. The Council’s estimates for BC’s real GDP growth in 2008 average 1.3 per cent, down from the 2.1 per cent projected in the first Quarterly Report. Forecasts for BC’s economic growth in 2009 have also been lowered, as the Council now projects an average change of 0.0 per cent (or no growth) this year — a substantial drop from the 2.7 per cent presented in the first Quarterly Report. The rapidly deteriorating US economy, slowing domestic demand, lower commodity prices and continued instability in global financial markets are the main reasons for their downward revisions. However, Council members expect BC’s economy to rebound significantly in 2010, as their average forecast projects real GDP growth at 2.8 per cent in that year. In the medium—term, the Council anticipates an average annual increase of 2.6 per cent in real GDP for the 2011 to 2013 period. Despite the softer outlook in the near—term, economic growth in BC is expected to outperform the national average in 2009 and 2010.
Council members explained that BC will likely experience significantly lower economic growth in 2009 than it has in previous years due primarily to rapidly eroding demand from the troubled US economy. While participants agree that BC is in better shape than most other Canadian provinces to weather the ongoing economic storm, they caution that slowing domestic demand and weaker commodity prices will also contribute to BC’s expected economic weakness in 2009.
The Council encouraged the provincial government to increase its spending on infrastructure in the near-term in efforts to stimulate BC’s economy. Several Council
Budget and Fiscal Plan – 2009/10 to 2011/12
98
British Columbia Economic Review and Outlook
members also advised that running short-term fiscal deficits in times of economic weakness would also benefit economic growth in the province.
The primary risk to the forecast noted by Council members is continued weakness in the US economy affecting prices and hindering demand for products from BC and Canada, as well as continued volatility in financial and commodity markets. Medium-term forecast risks include a prolonged US economic downturn, the potential effects of government stimulus packages, the impact of demographic trends on government programs, the effect of BC’s carbon tax and declining construction activity.
US Outlook
On average, the Council estimates that the US economy grew 1.1 per cent in 2008, and forecasts US real GDP to decline by 1.5 per cent for 2009. However, Council members expect a recovery in 2010 and beyond, with an average forecast of 2.2 per cent growth in US real GDP for 2010, and 2.8 per cent growth for the 2011 to 2013 period.
Council members stressed the dismal outlook facing the US economy in 2009, and the monumental task lying before the US government to pull the country out of recession. Participants expressed concern about the rapidly deteriorating employment situation in the US that, combined with very tight credit conditions, could further depress consumer confidence and put greater downward pressure on consumer spending. However, some members felt that recent reductions in interest rates by the Federal Reserve and the planned fiscal stimulus by the US government will be effective at returning growth to the US economy. One Council member, on the other hand, cautioned that fiscal stimulus by the US government may not be effective if the economic downturn is far more severe than expected. Most participants agreed that the American economy will begin to improve in late 2009 or early 2010, with the loosening of credit conditions, improvement in consumer spending, a modest recovery in the housing market and a general rise in commodity prices.
Outside of North America, Council members anticipate that global growth in 2009 will
British Columbia Economic Forecast Council: Summary of Forecasts
Participant | | Organization | | 2008 | | 2009 | | 2010 | | Average
2011-2013 | |
| | | | Per cent change in real GDP | |
Doug Porter | | Bank of Montreal(1) | | 1.4 | | 0.0 | | 2.0 | | 2.5 | |
Jock Finlayson | | BC Business Council(1) | | 1.2 | | 0.0 | | 2.8 | | 2.6 | |
Helmut Pastrick | | Central 1 Credit Union (1) | | 1.3 | | -1.0 | | 2.0 | | 2.9 | |
Avery Shenfeld | | CIBC(1) | | 1.5 | | 0.7 | | 2.0 | | 2.8 | |
Marie-Christine Bernard | | Conference Board(1) | | 1.2 | | -0.2 | | 3.3 | | 3.1 | |
Dale Orr | | Global Insight(1) | | 1.5 | | -0.7 | | 3.0 | | 2.9 | |
Carl Sonnen | | Informetrica(1) | | 1.1 | | 0.8 | | 3.2 | | 2.0 | |
Paul Ferley | | RBC Financial Group(1) | | 0.8 | | 0.6 | | 3.5 | | 2.5 | |
Mary Webb | | Scotiabank(1) | | 1.5 | | -0.4 | | 2.6 | | 2.5 | |
Ernie Stokes | | Stokes Economic Consulting | | 1.6 | | 0.9 | | 3.8 | | 2.6 | |
Derek Burleton | | TD Bank(1) | | 1.4 | | -1.0 | | 3.6 | | 2.5 | |
David Baxter | | Urban Futures Institute | | 1.5 | | 0.2 | | 1.5 | | 2.8 | |
Average | | | | 1.3 | | 0.0 | | 2.8 | | 2.6 | |
Standard Deviation | | | | 0.2 | | 0.7 | | 0.8 | | 0.3 | |
(1)Updated subsequent to the December 5, 2008 meeting
Budget and Fiscal Plan – 2009/10 to 2011/12
99
British Columbia Economic Review and Outlook
slow from recent years, as all nations will likely experience effects of the worldwide economic downturn. Some participants noted that continued strong demand from China may provide some stability to commodity prices beyond 2009.
Canadian Outlook
As the US and Canadian economies are so closely linked, the Council expects economic weakness in Canada to persist as long as the US economy remains mired in recession. Several participants noted that shrinking US demand for Canadian products over the last few months has had a negative effect not only on Canada’s manufacturing sector but also on commodity prices — on which the resource-rich Canadian economy relies a great deal for its prosperity.
Estimates for Canadian growth average 0.6 per cent for 2008, followed by a 0.7 per cent decline, on average, projected for 2009. Council members expect the economic downturn to be less severe in Canada than in the US, but also point out that the Canadian economy will likely feel the strong negative effects of dramatically reduced demand from US consumers for Canadian products. Along the same lines, the Council expects a Canadian recovery in 2010 to coincide with a turnaround in the US economy, and forecasts Canadian real GDP growth of 2.3 per cent in that year. Council members then expect the Canadian economy to return to more historic levels of growth in the medium-term, as they forecast an average of 2.7 per cent for the 2011 through 2013 period.
Although the Canadian economy is likely to experience a decline in 2009, the Council was in agreement that Canada is in better shape to weather the current economic storm than many other countries, due to the resilience of the Canadian financial system and the federal government’s relatively healthy fiscal situation. Some Council members also pointed out that the recent decline in the value of the Canadian dollar will provide some relief to Canada’s exporters in the face of shrinking US demand — especially in central Canada, where the bulk of the nation’s manufacturers are located.
The risks to Canadian economic growth in 2009 and 2010 include a long and severe US economic downturn, continued weakness in commodity prices and further volatility in global financial markets.
Financial Markets
Following a year in which the US intended federal funds rate was gradually reduced to almost zero, the Council now expects the Federal Reserve to keep the rate at a very low level going forward.(1) In 2009, the Council members anticipate that the Fed Funds rate will average 0.25 per cent. Forecasts call for this rate to increase slightly in 2010, to 0.89 per cent on average, and to reach an average annual rate of 3.49 per cent for the 2011 to 2013 period. Several members emphasized the unprecedented nature of the current financial crisis, and expect the Fed to keep its key interest rate low in order to restore the flow of credit from American lenders to individuals and businesses.
Council members were generally in agreement on their forecasts for the Bank of Canada’s overnight target rate in 2009. Similar to the Fed Funds rate in the US, the Council expects the Bank to keep its key interest rate low this year, with forecasts averaging 1.01 per cent. The rate is expected to rise to 1.79 per cent in 2010 with the anticipated Canadian economic recovery, and continue its rise in subsequent years to average 3.71 for the 2011 to 2013 period.
Exchange rate forecasts average 83.3 US cents for 2009, a substantial drop from the 93.7 US cents observed in 2008, with predictions for the Canadian dollar ranging from a low of 78.0 US cents up to a high of 87.0 US cents. Average exchange rate forecasts
(1) The intended federal funds rate is the interest rate at which depository institutions lend balances at the Federal Reserve to other depository institutions overnight.
Budget and Fiscal Plan – 2009/10 to 2011/12
100
British Columbia Economic Review and Outlook
for 2010 were 88.0 US cents with a low of 85.0 US cents and a high of 91.0 US cents. The Council expects the Canadian dollar to gain value vis-à-vis the US dollar by the medium-term, and average 90.3 US cents for the 2011–13 period. As in past years, Council members offer divergent views on the value of the Canadian dollar over the medium-term, with forecasts for the 2011 to 2013 period ranging from as low as 80.0 US cents up to 96.0 US cents.
Chart 2 – Economic Forecast Council Outlook for the Exchange Rate
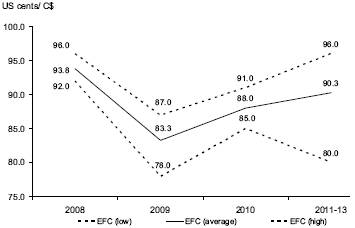
Several participants noted that the lower dollar will likely provide some relief to Canadian businesses who export to the US, after having dealt with a highly valued dollar hindering US demand for most of 2008.
British Columbia Forecast
Council estimates for BC’s economic growth average 1.3 per cent for 2008, and forecasts average 0.0 per cent (or no growth) for 2009, 2.8 per cent for 2010 and 2.6 per cent for the 2011 to 2013 period. Council members agreed on a much slower short-term outlook for BC than they forecast for the first Quarterly Report, largely due to the sharp downturn in the US economy combined with moderating domestic demand. In the first Quarterly Report, Council forecasts averaged 2.1 per cent for 2008, 2.7 per cent for 2009, and 2.8 per cent for the 2010 to 2012 period. The Council agreed that while BC’s outlook for 2009 is substantially lower than before, the province is still expected to outperform the national average in the near-term.
Chart 3 – Economic Forecast Council Outlook for BC and Canada
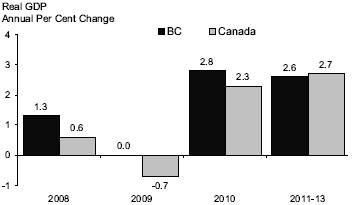
Note: Real GDP per cent change for BC and Canada represent the average of the Economic Forecast Council’s forecasts
Participants expect BC’s economy to experience significant weakness in 2009 compared to recent years, as the sharp economic downturn in the US hinders American demand for BC products. In particular, the Council noted that the dramatic decline of the US housing market has dampened demand for BC forest products and has also put downward pressure on lumber prices. Several members noted that these declines point to a bleak outlook for BC’s forestry sector in 2009, but some participants suggested that the situation could improve in 2010 as the American housing market begins to recover.
The Council also expects BC’s usually robust domestic economy to experience slower growth in 2009, citing declining consumer confidence and tight credit conditions as factors behind the this year’s projected domestic weakness. Retail sales are forecast to increase by just 1.6 per cent on average in 2009, but to return to a more robust level of growth in 2010 at 4.6 per cent. Housing starts are also expected to slow in 2009 from the torrid pace they exhibited during the construction boom of the last few years. On average, the Council anticipates that housing starts will average 26,110 in 2009 and 26,484 in 2010. However, Council members forecast an increase in housing starts in the medium-term, with starts averaging 29,565 each year during the 2011 to 2013 period.
Council members expect BC’s economy to improve significantly in 2010, with the anticipated recovery of US demand
Budget and Fiscal Plan – 2009/10 to 2011/12
101
British Columbia Economic Review and Outlook
(especially in the US housing sector) and the gradual rise of commodity prices. Also, members agreed that the 2010 Olympics will likely provide substantial economic stimulus to BC, and aid in the 2010 recovery.
Government Initiatives
Several participants recommended that the BC government increase capital spending in the near-term in order to provide stimulus to the provincial economy in the face of the current economic downturn. Two Council members further stressed the need for the provincial government to focus on small-scale, manageable infrastructure projects that can be completed in a relatively short time period. However, one other participant cautioned that BC does not necessarily have the excess capacity in its labour market to move large non-residential construction projects forward in an efficient timeframe.
Several Council members also emphasized the economic benefits of the provincial government running short-term fiscal deficits in order to provide stimulus during the global downturn. These members pointed to BC’s strong record of reducing its debt-to-GDP ratio to a low level, and that the province is in a healthy economic position to take on more debt in order to increase short-term spending.
The Council also discussed the potential impact of the carbon tax in the coming few years. They advised that BC should monitor carbon policy developments in other regions to ensure that BC companies remain on a competitive footing with neighbouring jurisdictions. One participant also pointed out that this tax may have compatibility issues with the incoming US administration, which favours a system of tradable emissions permits in its environmental policy. The Minister of Finance stated that British Columbia is working toward a tradable emissions system with several US states through the Western Climate Initiative and that the tax would be integrated with any cap and trade system.
Other Issues
Two Council members pointed out that expected declines in nominal GDP will significantly reduce the revenues that Canadian governments collect each year in order to fund programs.
Two members commented on the US recession’s likely impact on BC’s tourism industry. They suggested that BC will likely see far fewer tourists in 2009 due to rising unemployment and declining consumer confidence among American citizens.
Another two participants also cited concern over long-term health care spending in British Columbia due to expected demographic trends, suggesting that — similar to other provinces — rising health care costs could threaten the BC government’s strong fiscal position in the future.
In the medium-term, some Council members noted that the Mountain Pine Beetle infestation will exacerbate the current troubles in BC’s forestry sector — particularly in the province’s interior.
Budget and Fiscal Plan – 2009/10 to 2011/12
102
British Columbia Economic Review and Outlook
Forecast Survey — Participants’ Opinions
All figures are based | | 2008 | | 2009 | | 2010 | | 2011 to 2013 | |
on annual averages | | Range | | Average(1) | | Range | | Average(1) | | Range | | Average(1) | | Range | | Average(2) | |
| | | | | | | | | | | | | | | | | |
United States | | | | | | | | | | | | | | | | | |
| | | | | | | | | | | | | | | | | |
Real GDP (% change) | | 0.2 – 1.3 | | 1.1 (12 | )(3) | -2.5 – -0.2 | | -1.5 (12 | ) | 0.8 – 3.7 | | 2.2 (12 | ) | 2.2 – 3.6 | | 2.8 (12 | ) |
Intended Federal Funds rate (%) | | 1.53 – 2.13 | | 1.90 (11 | ) | 0.00 – 1.00 | | 0.25 (11 | ) | 0.00 – 1.50 | | 0.89 (11 | ) | 1.80 – 4.35 | | 3.49 (11 | ) |
Housing starts (million units) | | 0.90 – 0.95 | | 0.91 (11 | ) | 0.59 – 0.90 | | 0.70 (11 | ) | 0.70 – 1.28 | | 0.94 (11 | ) | 1.00 – 1.63 | | 1.32 (11 | ) |
| | | | | | | | | | | | | | | | | |
Canada | | | | | | | | | | | | | | | | | |
| | | | | | | | | | | | | | | | | |
Real GDP (% change) | | 0.1 – 0.9 | | 0.6 (12 | ) | -1.5 – 0.6 | | -0.7 (12 | ) | 1.0 – 3.6 | | 2.3 (12 | ) | 2.1 – 3.5 | | 2.7 (12 | ) |
Bank of Canada Overnight Target rate (%) | | 2.42 – 3.78 | | 3.01 (11 | ) | 0.50 – 1.80 | | 1.01 (11 | ) | 1.00 – 2.90 | | 1.79 (11 | ) | 2.80 – 4.60 | | 3.71 (11 | ) |
Exchange rate (US cents/C$) | | 92.0 – 96.0 | | 93.8 (12 | ) | 78.0 – 87.0 | | 83.3 (12 | ) | 85.0 – 91.0 | | 88.0 (12 | ) | 80.0 – 96.0 | | 90.3 (12 | ) |
Consumer price index (% chg) | | 2.3 – 2.8 | | 2.5 (12 | ) | 0.5 – 1.8 | | 1.0 (12 | ) | 1.5 – 3.2 | | 2.0 (12 | ) | 1.8 – 2.3 | | 2.0 (12 | ) |
| | | | | | | | | | | | | | | | | |
British Columbia | | | | | | | | | | | | | | | | | |
| | | | | | | | | | | | | | | | | |
Real GDP (% change) | | 0.8 – 1.6 | | 1.3 (12 | ) | -1.0 – 0.9 | | 0.0 (12 | ) | 1.5 – 3.8 | | 2.8 (12 | ) | 2.0 – 3.1 | | 2.6 (12 | ) |
Nominal GDP (% change) | | 2.3 – 5.7 | | 4.0 (11 | ) | -2.8 – 2.2 | | 0.3 (11 | ) | 1.9 – 6.5 | | 4.9 (11 | ) | 3.9 – 5.7 | | 4.9 (11 | ) |
GDP Deflator (% change) | | 1.5 – 4.1 | | 2.6 (11 | ) | -1.8 – 2.0 | | 0.3 (11 | ) | -0.1 – 2.9 | | 1.9 (11 | ) | 1.6 – 3.2 | | 2.3 (11 | ) |
Personal Income (% change) | | 3.8 – 6.8 | | 5.3 (8 | ) | -1.9 – 3.2 | | 2.0 (8 | ) | -0.4 – 7.5 | | 4.1 (8 | ) | 4.1 – 6.6 | | 5.1 (8 | ) |
Net Migration (thousand persons) | | 40.5 – 60.2 | | 51.0 (10 | ) | 33.0 – 59.8 | | 46.9 (10 | ) | 35.0 – 60.5 | | 47.9 (10 | ) | 38.0 – 60.9 | | 50.8 (9 | ) |
Employment (% change) | | 1.8 – 2.4 | | 2.2 (11 | ) | -1.8 – 1.2 | | -0.1 (11 | ) | -0.3 – 2.8 | | 1.4 (11 | ) | 1.0 – 2.5 | | 1.6 (11 | ) |
Unemployment rate (%) | | 4.3 – 4.9 | | 4.5 (12 | ) | 5.3 – 6.7 | | 5.8 (12 | ) | 4.7 – 7.5 | | 5.8 (12 | ) | 4.3 – 6.4 | | 5.1 (11 | ) |
Corporate pre-tax profits (% change) | | -20.0 – 7.3 | | -1.2 (8 | ) | -35.0 – -2.6 | | -11.4 (8 | ) | -3.3 – 20.0 | | 9.3 (8 | ) | -1.0 – 10.6 | | 6.2 (8 | ) |
Housing starts (thousand units) | | 33.8 – 36.9 | | 35.6 (12 | ) | 16.6 – 33.0 | | 26.1 (12 | ) | 17.4 – 32.3 | | 26.5 (12 | ) | 26.0 – 33.5 | | 29.6 (10 | ) |
Retail sales (% change) | | 1.3 – 7.1 | | 2.6 (12 | ) | -2.2 – 4.3 | | 1.6 (12 | ) | 0.7 – 6.8 | | 4.6 (12 | ) | 2.3 – 6.1 | | 4.3 (11 | ) |
Consumer price index (% chg) | | 2.1 – 2.6 | | 2.2 (12 | ) | 0.4 – 1.7 | | 1.1 (12 | ) | 1.3 – 3.2 | | 2.1 (12 | ) | 1.7 – 2.3 | | 2.0 (12 | ) |
(1) Based on responses from participants providing forecasts.
(2) Participants provided an average forecast for 2010 to 2012.
(3) Number of respondents shown in parenthesis.
Budget and Fiscal Plan – 2009/10 to 2011/12
103
British Columbia Economic Review and Outlook
Economic Downturns in BC Since 1980
Introduction
British Columbia is currently experiencing a period of significant economic weakness. Slowing domestic demand, plunging commodity prices, and the rapid erosion of global demand for BC products all threaten to push BC’s economy into recession for the first time in many years. As such, the Ministry of Finance forecasts BC’s economy to contract by 0.9 per cent in 2009.
The extent of the current downturn can be better understood when compared to other periods of economic weakness in BC throughout the past 30 years. This topic box compares BC’s projected economic performance in 2009 with previous downturns that occurred in 1982, 1991 and 2001.
Real GDP
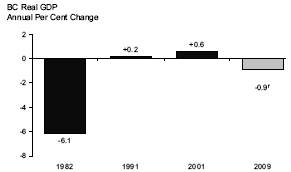
Source: BC Stats
(f) Budget 2009, Ministry of Finance Forecast
In terms of year-over-year changes in BC’s real GDP, 1982 saw a contraction of 6.1 per cent compared to the previous year. The decline in real GDP only lasted just one year, but weak growth of less than one per cent per year followed in 1983 and 1984. BC’s subsequent economic slowdowns in 1991 and 2001 avoided contractions in real GDP, but posted very slow growth of 0.2 per cent and 0.6 per cent, respectively. The current weakness in BC’s economy is expected to result in real GDP contracting by 0.9 per cent in 2009 — the first annual contraction since 1982, though not as drastic in scope. However, economic growth is projected to return in 2010, due in part to stimulus provided by the Olympic Games.
BC’s forest industry was hit especially hard during the 1982 recession, when real GDP from forestry and related industries declined 13.3 per cent compared to 1981. In the same year, real GDP from BC’s manufacturing industry dropped 16.6 per cent and construction GDP declined 7.3 per cent. The 2001 slowdown saw forestry GDP fall by 11.8 per cent, while manufacturing GDP slipped by 5.7 per cent and construction GDP actually rose by 3.9 per cent. Data on forestry and manufacturing GDP from 1991 is unavailable due to confidentiality issues, but GDP from the construction industry held steady in that year, rising just 0.1 per cent from 1990. Note that quarterly real GDP data for provinces does not exist, but that annual real GDP growth of less than 0.5 per cent is indicative of an economy in recession.
Employment
Total employment in British Columbia is forecast to decrease by 0.5 per cent in 2009. This projected decline is not as severe as the employment losses that occurred in 1982, when total employment fell by 5.0 per cent (or 66,200 jobs). Major job losses in 1982 occurred in the manufacturing (23,800 job losses), construction
Comparing economic downturns
| | 1982 | | 1991 | | 2001 | | 2009(f) | |
| | Per cent change unless otherwise noted | |
Real GDP | | -6.1 | | 0.2 | | 0.6 | | -0.9 | |
Employment | | -5.0 | | 1.1 | | -0.5 | | -0.5 | |
Unemployment rate (per cent) | | 12.1 | | 9.9 | | 7.7 | | 6.2 | |
Retail sales | | -1.7 | | -2.4 | | 5.9 | | 1.3 | |
Housing starts (units) | | 19,807 | | 31,875 | | 17,234 | | 25,541 | |
Real exports | | -5.4 | | 1.9 | | -1.8 | | -2.4 | |
(f) Ministry of Finance forecast.
Budget and Fiscal Plan – 2009/10 to 2011/12
104
(19,000 job losses) and forestry, fishing, mining, oil and gas sectors (16,300 job losses). In fact, employment in the forestry, fishing, mining, oil and gas sectors employed nearly 75,000 British Columbians in January of 1981, but this number fell to about 48,000 workers by December 1982.
Total employment in BC actually increased during the 1991 economic slowdown, although it grew by only 1.1 per cent that year (or an increase of 17,900 jobs). Significant losses in the construction (6,500 job losses) and manufacturing (6,100 job losses) sectors in 1991 were offset by a strong increase in the number of service sector jobs.
Employment growth fell into negative territory again in 2001, as total employment in BC declined by 0.5 per cent (or 9,700 job losses). Major losses in 2001 included a 12,000 job decline in the forestry, fishing, mining, oil and gas sectors as well as 7,500 jobs lost in the manufacturing industry.
Consumer Behaviour
For 2009, the Ministry of Finance forecasts retail sales in BC to grow by 1.3 per cent, marking a significant slowdown from recent years. The Ministry also projects substantial weakening in the housing sector, with housing starts forecast to reach 25,541 units — 25.6 per cent lower than 2008 levels. Helping to drive the expected weakness in 2009 is a low level of consumer confidence among British Columbians heading into the year. The Conference Board index of consumer confidence (2002 = 100) reached a quarterly rate of 77.1 in the final three months of 2008 — the lowest level observed since the 1982 recession.
Domestic demand shrank under the weight of economic weakness in 1982, with retail sales contracting by 1.7 per cent and housing starts falling by a remarkable 52.4 per cent to reach 19,807 units for the year. The consumer confidence index fell to average 85.1 for 1982, down from 91.0 in 1981. However, the quarterly rate of consumer confidence dropped a historic low of 74.4 in the April to June quarter of 1982.
Retail sales fell by an even greater rate in 1991, declining 2.4 per cent from the previous year, and housing starts dropped 13.2 per cent to reach 31,875 on the year. However, consumer confidence actually climbed in 1991, with an annual average of 102.4 — up from 98.3 in 1990.
The domestic sector saw healthy growth through 2001, as retail sales expanded by 5.9 per cent and housing starts grew by 19.5 per cent (although they averaged a very low 17,234 units for the year). The consumer confidence index rose slightly in 2001 to 100.4, an increase of 1.8 percentage points from 2000.
Exports
Due primarily to rapidly declining US demand for BC products, real exports of goods and services from BC are forecast to fall by 2.4 per cent in 2009. Greater weakness was observed in 1982, however, when real exports experienced an annual drop of 5.4 per cent. The 1991 slowdown actually saw an increase of 1.9 per cent in exports, while 2001 saw a decline of 1.8 per cent.
Conclusion
The current economic slowdown has its origins in the US housing market, where excessive lending practices and rampant speculation over the past few years created a major asset bubble that finally burst in 2007 as housing prices began to decline. British Columbia is certainly feeling the effects of the US downturn, as BC’s economic activity is being hindered by slowing US demand for BC products and falling consumer confidence among BC residents due to global economic uncertainty.
The downturn going into 2009 is unlike the 1982 recession, which was caused by the US Federal Reserve instituting a contractionary monetary policy in order to rein in high inflation. The present economic weakness in the global economy threatens to continue for several years, with risks to the Ministry of Finance’s current forecast weighted to the downside. A prolonged slowdown would be unlike the downturns observed in 1991 and 2001, which both saw quick returns to economic growth in subsequent years.
Budget and Fiscal Plan – 2009/10 to 2011/12
105
Part 4: 2008/09 REVISED FINANCIAL FORECAST
(THIRD QUARTERLY REPORT)
2008/09 Fiscal Year in Review
Table 4.1 Budget 2008 and Quarterly Updates
($ millions) | | February 19
Budget | | First
Quarterly
Report | | Second
Quarterly
Report | | Third
Quarterly
Report | |
Revenue | | 38,490 | | 39,693 | | 38,889 | | 38,455 | |
Expense | | (37,690 | ) | (37,923 | ) | (37,939 | ) | (38,405 | ) |
Surplus before forecast allowance | | 800 | | 1,770 | | 950 | | 50 | |
Forecast allowance | | (750 | ) | (750 | ) | (500 | ) | — | |
Surplus | | 50 | | 1,020 | | 450 | | 50 | |
The surplus for 2008/09 is projected at $50 million, unchanged from Budget 2008.
Government revenue is forecast to be $35 million lower than the projection in Budget 2008, reflecting lower than anticipated revenue from taxation sources ($445 million) and other miscellaneous sources including fees and investment earnings ($149 million), partially offset by improvements in natural resource revenues ($288 million), commercial Crown corporation net income ($164 million) and federal government contributions ($107 million).
The 2008/09 forecast allowance has been reduced by $750 million since the start of the year. The reduced forecast allowance allows government to allocate $622 million towards a number of priority initiatives including strategic investments to support communities, provide additional health care funding, and to acquire social housing. Further details on the changes from Budget 2008 are provided in Table 4.2.
Chart 4.1 Progress of 2008/09 financial forecasts
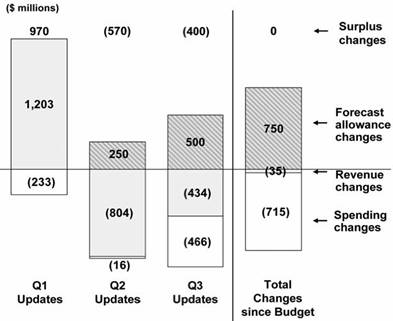
Budget and Fiscal Plan – 2009/10 to 2011/12
107
2008/09 Revised Financial Forecast (Third Quarterly Report)
Table 4.2 2008/09 Forecast Update
($ millions) | | Q1
Updates | | Q2
Updates | | Q3
Updates | | Total
Changes | |
2008/09 surplus — Budget 2008 Fiscal Plan (February 19, 2008) | | 50 | | | | | | 50 | |
2008/09 surplus — first Quarterly Report (September 12, 2008) | | | | 1,020 | | | | | |
2008/09 surplus — second Quarterly Report (November 24, 2008) | | | | | | 450 | | | |
Revenue increases (decreases): | | | | | | | | | |
Taxation revenue: | | | | | | | | | |
Personal income tax — advancing tax cuts previously planned in 2009 and weaker 2007 tax assessments | | (102 | ) | (310 | ) | (69 | ) | (481 | ) |
Corporate income tax — mainly stronger 2007 tax assessment data, partly offset by advancing small business tax cuts previously planned in 2010 and 2011 and lower federal government advances | | 383 | | 128 | | 183 | | 694 | |
Social service tax — lower personal and business sales growth | | (52 | ) | (110 | ) | (124 | ) | (286 | ) |
Property transfer tax — slower BC housing sales | | (120 | ) | (150 | ) | (15 | ) | (285 | ) |
Other taxes — slowing demand and year-to-date activity | | (29 | ) | (61 | ) | 3 | | (87 | ) |
Natural resource revenue: | | | | | | | | | |
Forest revenue — lower harvest volumes and average stumpage rates | | (262 | ) | (38 | ) | (65 | ) | (365 | ) |
Natural gas royalties — volatile natural gas prices | | 567 | | (144 | ) | (212 | ) | 211 | |
Bonus bids — mainly changes in average bid price/hectare | | 396 | | (50 | ) | (66 | ) | 280 | |
Other natural resources — mainly volatile electricity, oil, coal and metal prices | | 276 | | (81 | ) | (33 | ) | 162 | |
Other taxpayer-supported | | 67 | | (36 | ) | (180 | ) | (149 | ) |
Federal contributions: | | | | | | | | | |
Health and social transfers — changes in population share, effects of 2006 Census undercount, partly offset by higher 2008 share | | (150 | ) | 58 | | (9 | ) | (101 | ) |
Other transfers — mainly Community Development Trust, Labour Market Agreement and Police Officers Recruitment Fund | | 184 | | 18 | | 6 | | 208 | |
Commercial Crown corporation net income: | | | | | | | | | |
ICBC — lower claims costs, partially offset by lower investment income | | 56 | | (15 | ) | 146 | | 187 | |
Other Crown corporation changes — mainly timing of BCRC asset dispositions | | (11 | ) | (13 | ) | 1 | | (23 | ) |
Total revenue changes | | 1,203 | | (804 | ) | (434 | ) | (35 | ) |
Less: expense increases (decreases): | | | | | | | | | |
Priority Spending | | 120 | | — | | 502 | | 622 | |
BC Timber Sales — mainly reduced harvest volumes | | (60 | ) | — | | — | | (60 | ) |
Forests — higher forest fire-fighting costs | | — | | 24 | | — | | 24 | |
Other spending changes — mainly additional spending funded from federal trust allocations | | 248 | | 24 | | 5 | | 277 | |
Net ministry savings | | — | | — | | (49 | ) | (49 | ) |
Debt servicing costs — mainly lower debt levels | | (75 | ) | (32 | ) | 8 | | (99 | ) |
Total expense changes | | 233 | | 16 | | 466 | | 715 | |
Forecast allowance changes | | — | | (250 | ) | (500 | ) | (750 | ) |
Net change | | 970 | | (570 | ) | (400 | ) | — | |
2008/09 surplus — first Quarterly Report | | 1,020 | | | | | | | |
2008/09 surplus — second Quarterly Report | | | | 450 | | | | | |
2008/09 surplus — third Quarterly Report | | | | | | 50 | | 50 | |
Budget and Fiscal Plan – 2009/10 to 2011/12
108
2008/09 Revised Financial Forecast (Third Quarterly Report)
Changes since the Second Quarterly Report
The surplus forecast for 2008/09 has been reduced by $400 million from the second Quarterly Report forecast, primarily due to revenue declines and reduced forecast allowance, offset by funding of priority initiatives.
Since the second Quarterly Report in November:
· The forecast for total revenue, including income from commercial Crown corporations, decreased $434 million.
· Taxpayer-supported revenue is down $581 million, reflecting lower revenue from natural resources, social service tax and other taxpayer supported sources, partially offset by improvements in corporate income tax revenue.
· Income from commercial Crown corporations increased by $147 million, primarily due to the positive impact of lower claims cost projections on ICBC’s financial results.
· Total spending increased $466 million from the previous forecast, primarily due to increased spending on priority initiatives partially offset by ministry savings.
· The forecast allowance was reduced by $500 million.
2008/09 Priority Spending
The Provincial government intends to seek approval of the Legislature for Supplementary Estimates that authorize additional funding for the following priority spending initiatives for 2008/09.
Strategic Investment in Communities
As part of a wide range of initiatives the Province is taking to stimulate the economy, Budget 2009 provides a total of $208 million for strategic investments in communities before the end of 2008/09.
In collaboration with the Union of British Columbia Municipalities (UBCM) and its members, the government plans to restructure current provincial/local funding arrangements to provide local governments with increased financial certainty in uncertain economic times. As part of this restructuring arrangement, an additional $151 million will be provided to local governments in 2008/09. This initiative will support local government priorities and will provide greater flexibility to address immediate needs, including community safety.
Other planned investments in communities include:
· Towns for Tomorrow ($30 million) — This additional funding will provide $30 million for capital infrastructure projects with long term benefits (cost-shared with local governments). This is in addition to $7 million already provided for in existing base funding, for a total provincial investment of $37 million in 2008/09.
· Local transportation projects ($20 million) — These investments will provide for ignificant road maintenance and rehabilitation projects across the province.
Budget and Fiscal Plan – 2009/10 to 11/12
109
2008/09 Revised Financial Forecast (Third Quarterly Report)
Table 4.3 2008/09 Priority Initiatives (Operating)
($ millions) | | Supplementary
Estimates | |
Strategic Investment in Communities | | | |
Local government priorities, including community safety | | 151 | |
Towns for Tomorrow | | 30 | |
Local transportation projects | | 20 | |
Carbon tax rebates for local governments | | 3 | |
Trees for Tomorrow | | 2 | |
Internet connectivity for rural communities | | 2 | |
Health | | | |
Additional health authorities funding | | 120 | |
Housing | | | |
Acquisition of properties to protect social housing | | 30 | |
2010 Olympics | | | |
Olympic Games security | | 64 | |
Paralympics | | 20 | |
Arts, Culture, and Heritage | | | |
Arts, culture and heritage grants | | 15 | |
Liability Valuation Adjustment | | | |
Long-term disability plan | | 40 | |
Contingencies | | | |
Supplement to contingencies | | 125 | |
Total priority initiatives (operating) | | 622 | |
· Carbon tax rebates for local governments ($3 million) — This funding will be provided beginning in 2008/09 to local governments who committed to becoming carbon neutral by 2012.
· Trees for Tomorrow ($2 million) — This funding is part of the provincial government’s $13 million commitment to plant four million trees in schoolyards, hospital grounds, civic parks and other public spaces in British Columbia over the next five years.
· Internet connectivity for rural communities ($2 million) — This funding supports a grant program to encourage “last mile” delivery of broadband internet connectivity and cell phone coverage for homes and businesses in rural and remote communities.
Health
· Additional Health Authorities Funding ($120 million) — As previously announced, government will provide for an additional $120 million in 2008/09 for the public health care system to meet increased demands and pressures across the system, and to ensure that the province continues to build upon record levels of surgeries and diagnostic procedures.
Housing
· Acquisition of properties to create and protect social housing ($30 million) — Funding for the acquisition and renovation of 8 rental buildings including single room occupancy hotels to provide a range of housing options to help break the cycle of homelessness for people most in need.
Budget and Fiscal Plan – 2009/10 to 11/12
110
2008/09 Revised Financial Forecast (Third Quarterly Report)
Olympics
· Olympic Games Security ($64 million) — The Province is finalizing new funding arrangements with Canada in relation to providing security for the 2010 Olympic and Paralympic Winter Games (2010 Games). This contribution will facilitate the termination of the Province’s commitment under the existing arrangements and, together with other current year funding and amounts paid in previous years, will result in a total cumulative provincial contribution of $87.5 million towards the initial federal/provincial funding commitment of $175 million for 2010 Games security.
· Paralympic Games ($20 million) — The provincial and federal governments have each previously committed to provide a $20 million contribution to the Vancouver Organizing Committee (VANOC) in relation to the costs of staging and hosting the 2010 Paralympic Winter Games. VANOC is now ready to receive this contribution, thus fulfilling the Province’s commitment to this area.
Arts, Culture and Heritage
· Arts, Culture and Heritage Grants ($15 million) — Government will provide $15 million in strategic one-time grants to support arts and culture projects in the province and the conservation of the province’s historic places.
Liability Valuation Adjustment
· Long Term Disability Plan ($40 million) — Adjustments to reflect a new actuarial estimate of government’s liability for the public service’s long term disability plan and the recent fall in the market value of investment assets supporting the plan.
Contingencies
· Supplement to Contingencies ($125 million) — Funding will provide increased flexibility to accommodate the financial consequences of unanticipated events or pressures emerging from the current economic circumstances.
· Government also intends to introduce Supplementary Estimates to obtain the necessary legislative appropriations to supplement capital contingencies ($80 million) to fund additional priority capital spending initiatives for 2008/09.
Table 4.4 2008/09 Priority Initiatives (Capital)
($ millions) | | Supplementary
Estimates | |
Capital contingencies — to fund additional priority capital initiatives | | 80 | |
2008/09 Notional Contingencies Allocations
In addition to the priority initiatives, spending commitments and pressures totaling $142 million have been notionally allocated to the Contingencies vote, as shown in Table 4.5.
The remaining $233 million has been allocated to other pressures including the outcome of current negotiations, natural disasters, caseload pressures and other contingent items.
Budget and Fiscal Plan – 2009/10 to 11/12
111
2008/09 Revised Financial Forecast (Third Quarterly Report)
Table 4.5 2008/09 Notional Allocations to Contingencies
| | ($ millions) | |
Lower Mainland Innovation and Integration Fund (1) | | 33 | |
Olympic community engagement and leveraging | | 23 | |
BC Ferry Services fare reductions | | 20 | |
RCMP salaries and pensions | | 14 | |
Long term disability pressures | | 14 | |
Major trials | | 10 | |
Marketing for Vancouver Convention Centre | | 6 | |
First Nations connectivity | | 6 | |
Correctional officers and sheriffs’ wage adjustment | | 6 | |
BC-Canada Pavilion in Beijing | | 5 | |
In car (police) digital video cameras | | 2 | |
Contribution for earthquake relief in China | | 2 | |
Closed circuit cameras in high crime areas (pilot) | | 1 | |
Subtotal notional allocations | | 142 | |
Other allocations for the outcome of current negotiations, natural disasters, caseload pressures and other contingent items | | 233 | |
Total contingencies | | 375 | |
(1) $50 million contingency for LMIIF partially funded by Ministry of Health Services base budget.
Capital Spending and Provincial Debt
Updated capital spending of $5.9 billion is up $185 million from Budget 2008, reflecting higher capital spending by the BC Transportation Financing Authority and government ministries, but down $156 million from the second Quarterly Report forecast due to changes in the timing of capital expenditures. The main changes since the second Quarterly Report are shown in Table 4.6, and further details on capital spending are shown in Table 4.12.
Table 4.6 2008/09 Capital Spending Update
| | Q1 | | Q2 | | Q3 | | Total | |
($ millions) | | Updates | | Updates | | Updates | | Changes | |
Capital spending — Budget 2008 Fiscal Plan (February 19, 2008) | | 5,766 | | | | | | 5,766 | |
Capital spending — first Quarterly Report (September 12, 2008) | | | | 6,263 | | | | | |
Capital spending — second Quarterly Report (November 24, 2008) | | | | | | 6,107 | | | |
Taxpayer-supported changes: | | | | | | | | | |
Post-secondary education — mainly timing of capital spending | | 117 | | (74 | ) | (83 | ) | (40 | ) |
Health — mainly timing of capital spending | | 126 | | (32 | ) | (108 | ) | (14 | ) |
BCTFA— mainly timing of capital spending and accelerated capital investments within the capital plan | | 212 | | (7 | ) | (133 | ) | 72 | |
Government ministries — mainly Supplementary Estimates and use of capital contingencies | | | | | | 150 | | 150 | |
Accelerated infrastructure projects | | — | | | | 55 | | 55 | |
Other | | (6 | ) | 7 | | 50 | | 51 | |
Total taxpayer-supported | | 449 | | (106 | ) | (69 | ) | 274 | |
Self-supported changes: | | | | | | | | | |
BC Hydro — mainly reduced independent power producer projects and approval delays for the Central Vancouver Island transmission line | | — | | — | | (67 | ) | (67 | ) |
BC Railway Company — mainly timing of Port Subdivision land acquisition | | 32 | | (32 | ) | (20 | ) | (20 | ) |
Other | | 16 | | (18 | ) | — | | (2 | ) |
Total self-supported | | 48 | | (50 | ) | (87 | ) | (89 | ) |
Total changes | | 497 | | (156 | ) | (156 | ) | 185 | |
Capital spending — first Quarterly Report | | 6,263 | | | | | | | |
Capital spending — second Quarterly Report | | | | 6,107 | | | | | |
Capital spending — third Quarterly Report | | | | | | 5,951 | | 5,951 | |
Budget and Fiscal Plan – 2009/10 to 11/12
112
2008/09 Revised Financial Forecast (Third Quarterly Report)
Provincial debt is forecast to total $37.5 billion at year-end – up $1 billion from the second Quarterly Report forecast, but $254 million below the Budget 2008 amount. The increase from the second Quarterly Report reflects $1 billion of borrowings to support early commencement of the accelerated capital projects expected over the next few years. Significant changes in debt since the second Quarterly Report are shown in Table 4.7, and further details on the provincial debt forecast are shown in Table 4.13.
Table 4.7 2008/09 Provincial Debt Update
($ millions) | | Q1
Updates | | Q2
Updates | | Q3
Updates | | Total
Changes | |
Provincial debt – Budget 2008 Fiscal Plan (February 19, 2008) | | 37,741 | | | | | | 37,741 | |
Provincial debt – first Quarterly Report (September 12, 2008) | | | | 36,721 | | | | | |
Provincial debt – second Quarterly Report (November 24, 2008) | | | | | | 36,452 | | | |
Taxpayer–supported changes: | | | | | | | | | |
Government operating – mainly cash (bonus bids) and revenue improvements | | (1,071 | ) | — | | 100 | | (971 | ) |
Education facilities – mainly lower opening debt at March 31, 2008 and updated capital spending | | (54 | ) | 20 | | (29 | ) | (63 | ) |
Health facilities – mainly lower opening debt at March 31, 2008 and updated capital spending | | (86 | ) | 35 | | (74 | ) | (125 | ) |
Transportation – mainly lower opening debt at March 31, 2008 and updated capital spending | | 22 | | 32 | | (156 | ) | (102 | ) |
Other changes – updated capital spending and capital spending contingencies | | 46 | | (1 | ) | 167 | | 212 | |
Accelerated capital projects | | — | | — | | 1,000 | | 1,000 | |
Total taxpayer–supported | | (1,143 | ) | 86 | | 1,008 | | (49 | ) |
| | | | | | | | | |
Self–supported changes: | | | | | | | | | |
BC Hydro – mainly impact of cash flows from operations | | 101 | | (98 | ) | 126 | | 129 | |
BC Transmission – impact of improved cash flows | | — | | (6 | ) | — | | (6 | ) |
Columbia River power projects – impact of improved cash flows | | (34 | ) | — | | — | | (34 | ) |
Post–secondary institutions’ subsidiaries – higher debt balance at March 31, 2008 | | 56 | | (1 | ) | 1 | | 56 | |
Warehouse borrowing program | | — | | — | | 400 | | 400 | |
Total self–supported | | 123 | | (105 | ) | 527 | | 545 | |
Forecast allowance – reduction to match income statement | | — | | (250 | ) | (500 | ) | (750 | ) |
Total changes | | (1,020 | ) | (269 | ) | 1,035 | | (254 | ) |
Provincial debt – first Quarterly Report | | 36,721 | | | | | | | |
Provincial debt – second Quarterly Report | | | | 36,452 | | | | | |
Provincial debt – third Quarterly Report | | | | | | 37,487 | | 37,487 | |
Budget and Fiscal Plan – 2009/10 to 2011/12
113
2008/09 Revised Financial Forecast (Third Quarterly Report)
Table 4.8 2008/09 Operating Statement
| | Year-to-Date to December 31 | | Full Year | |
| | 2008/09 | | Actual | | 2008/09 | | Actual | |
($ millions) | | Budget | | Actual | | Variance | | 2007/08 | | Budget | | Forecast | | Variance | | 2007/08 | |
Revenue | | 28,506 | | 28,801 | | 295 | | 29,065 | | 38,490 | | 38,455 | | (35 | ) | 39,831 | |
Expense | | (27,424 | ) | (27,217 | ) | 207 | | (25,682 | ) | (37,690 | ) | (38,405 | ) | (715 | ) | (36,945 | ) |
Surplus before forecast allowance | | 1,082 | | 1,584 | | 502 | | 3,383 | | 800 | | 50 | | (750 | ) | 2,886 | |
Forecast allowance | | — | | — | | — | | — | | (750 | ) | — | | 750 | | — | |
Surplus | | 1,082 | | 1,584 | | 502 | | 3,383 | | 50 | | 50 | | — | | 2,886 | |
Accumulated surplus beginning of the year | | 5,793 | | 7,086 | | 1,293 | | 4,076 | | 5,793 | | 7,086 | | 1,293 | | 4,200 | |
Accumulated surplus before comprehensive income | | 6,875 | | 8,670 | | 1,795 | | 7,459 | | 5,843 | | 7,136 | | 1,293 | | 7,086 | |
Accumulated other comprehensive income from self-supported Crown agencies | | 447 | | 88 | | (359 | ) | 338 | | 447 | | 163 | | (284 | ) | 365 | |
Accumulated surplus end of period | | 7,322 | | 8,758 | | 1,436 | | 7,797 | | 6,290 | | 7,299 | | 1,009 | | 7,451 | |
Table 4.9 2008/09 Revenue by Source
| | Year-to-Date to December 31 | | Full Year | |
| | 2008/09 | | Actual | | 2008/09 | | Actual | |
($ millions) | | Budget | | Actual | | Variance | | 2007/08 | | Budget | | Forecast | | Variance | | 2007/08 | |
Taxation | | | | | | | | | | | | | | | | | |
Personal income | | 4,979 | | 4,674 | | (305 | ) | 4,998 | | 6,700 | | 6,219 | | (481 | ) | 6,956 | |
Corporate income | | 1,065 | | 1,059 | | (6 | ) | 1,055 | | 1,343 | | 2,037 | | 694 | | 2,250 | |
Social service | | 4,012 | | 3,824 | | (188 | ) | 3,862 | | 5,284 | | 4,998 | | (286 | ) | 5,072 | |
Fuel | | 721 | | 684 | | (37 | ) | 713 | | 957 | | 912 | | (45 | ) | 935 | |
Carbon | | 220 | | 192 | | (28 | ) | — | | 338 | | 300 | | (38 | ) | — | |
Tobacco | | 550 | | 520 | | (30 | ) | 549 | | 705 | | 713 | | 8 | | 692 | |
Property | | 1,384 | | 1,377 | | (7 | ) | 1,313 | | 1,861 | | 1,840 | | (21 | ) | 1,795 | |
Property transfer | | 818 | | 622 | | (196 | ) | 859 | | 1,020 | | 735 | | (285 | ) | 1,068 | |
Other (1) | | 476 | | 508 | | 32 | | 472 | | 601 | | 610 | | 9 | | 638 | |
| | 14,225 | | 13,460 | | (765 | ) | 13,821 | | 18,809 | | 18,364 | | (445 | ) | 19,406 | |
| | | | | | | | | | | | | | | | | |
Natural resources | | | | | | | | | | | | | | | | | |
Natural gas royalties | | 845 | | 1,212 | | 367 | | 811 | | 1,165 | | 1,376 | | 211 | | 1,132 | |
Forests | | 710 | | 494 | | (216 | ) | 810 | | 952 | | 587 | | (365 | ) | 1,087 | |
Other natural resource (2) | | 1,198 | | 1,654 | | 456 | | 1,159 | | 1,606 | | 2,048 | | 442 | | 1,559 | |
| | 2,753 | | 3,360 | | 607 | | 2,780 | | 3,723 | | 4,011 | | 288 | | 3,778 | |
Other revenue | | | | | | | | | | | | | | | | | |
Medical Services Plan premiums | | 1,179 | | 1,185 | | 6 | | 1,165 | | 1,571 | | 1,577 | | 6 | | 1,557 | |
Other fees (3) | | 1,808 | | 1,786 | | (22 | ) | 1,737 | | 2,505 | | 2,430 | | (75 | ) | 2,429 | |
Investment earnings | | 336 | | 593 | | 257 | | 764 | | 884 | | 839 | | (45 | ) | 1,139 | |
Miscellaneous (4) | | 1,845 | | 1,826 | | (19 | ) | 1,854 | | 2,509 | | 2,474 | | (35 | ) | 2,617 | |
| | 5,168 | | 5,390 | | 222 | | 5,520 | | 7,469 | | 7,320 | | (149 | ) | 7,742 | |
Contributions from the federal government | | | | | | | | | | | | | | | | | |
Health and social transfers | | 3,595 | | 3,518 | | (77 | ) | 3,686 | | 4,794 | | 4,693 | | (101 | ) | 4,614 | |
Other federal contributions (5) | | 707 | | 730 | | 23 | | 840 | | 1,015 | | 1,223 | | 208 | | 1,317 | |
| | 4,302 | | 4,248 | | (54 | ) | 4,526 | | 5,809 | | 5,916 | | 107 | | 5,931 | |
Commercial Crown corporation net income | | | | | | | | | | | | | | | | | |
BC Hydro | | 255 | | 369 | | 114 | | 351 | | 358 | | 357 | | (1 | ) | 370 | |
Liquor Distribution Branch | | 693 | | 713 | | 20 | | 690 | | 854 | | 867 | | 13 | | 858 | |
BC Lotteries (net of payments to the federal government) | | 819 | | 807 | | (12 | ) | 812 | | 1,101 | | 1,101 | | — | | 1,080 | |
ICBC (6) | | 220 | | 396 | | 176 | | 531 | | 272 | | 459 | | 187 | | 633 | |
Other | | 71 | | 58 | | (13 | ) | 34 | | 95 | | 60 | | (35 | ) | 33 | |
| | 2,058 | | 2,343 | | 285 | | 2,418 | | 2,680 | | 2,844 | | 164 | | 2,974 | |
Total revenue | | 28,506 | | 28,801 | | 295 | | 29,065 | | 38,490 | | 38,455 | | (35 | ) | 39,831 | |
(1) Corporation capital, insurance premium and hotel room taxes.
(2) Columbia River Treaty, Land sales/bonus bids, other energy and minerals, water rental and other resources.
(3) Post–secondary, healthcare–related, motor vehicle, and other fees.
(4) Includes asset dispositions, reimbursements for health care and other services provided to external agencies, and other recoveries.
(5) Includes contributions for health, education, community development, housing and social service programs, and transportation projects.
(6) The year to date figures reflect ICBC’s budget and results for the April to December period. The full–year forecast represents ICBC’s earnings during government’s fiscal year. On ICBC’s fiscal year basis (December), the outlook is – 2008 (budget): $272 million; 2008 (forecast): $498 million.
Budget and Fiscal Plan – 2009/10 to 2011/12
114
2008/09 Revised Financial Forecast (Third Quarterly Report)
Table 4.10 2008/09 Expense By Function (1)
| | Year-to-Date to December 31 | | Full Year | |
| | 2008/09 | | Actual | | 2008/09 | | Actual | |
($ millions) | | Budget | | Actual | | Variance | | 2007/08 | | Budget | | Forecast | | Variance | | 2007/08 | |
Health: | | | | | | | | | | | | | | | | | |
Medical Services Plan | | 2,418 | | 2,645 | | 227 | | 2,326 | | 3,375 | | 3,367 | | (8 | ) | 3,247 | |
Pharmacare | | 814 | | 806 | | (8 | ) | 764 | | 1,018 | | 1,018 | | — | | 955 | |
Regional services | | 6,982 | | 7,112 | | 130 | | 6,553 | | 9,630 | | 9,675 | | 45 | | 9,038 | |
Other healthcare expenses (2) | | 535 | | 642 | | 107 | | 619 | | 861 | | 1,011 | | 150 | | 996 | |
| | 10,749 | | 11,205 | | 456 | | 10,262 | | 14,884 | | 15,071 | | 187 | | 14,236 | |
| | | | | | | | | | | | | | | | | |
Education: | | | | | | | | | | | | | | | | | |
Elementary and secondary | | 3,972 | | 4,058 | | 86 | | 3,840 | | 5,711 | | 5,687 | | (24 | ) | 5,521 | |
Post–secondary | | 3,068 | | 3,211 | | 143 | | 3,055 | | 4,322 | | 4,418 | | 96 | | 4,303 | |
Other education expenses (3) | | 120 | | 47 | | (73 | ) | 114 | | 173 | | 133 | | (40 | ) | 165 | |
| | 7,160 | | 7,316 | | 156 | | 7,009 | | 10,206 | | 10,238 | | 32 | | 9,989 | |
Social services: | | | | | | | | | | | | | | | | | |
Social assistance (2),(3) | | 1,126 | | 1,116 | | (10 | ) | 1,374 | | 1,349 | | 1,343 | | (6 | ) | 1,297 | |
Childcare services (2) | | 1,025 | | 1,003 | | (22 | ) | 782 | | 1,142 | | 1,103 | | (39 | ) | 992 | |
Community living and other services | | 318 | | 257 | | (61 | ) | 68 | | 802 | | 901 | | 99 | | 757 | |
| | 2,469 | | 2,376 | | (93 | ) | 2,224 | | 3,293 | | 3,347 | | 54 | | 3,046 | |
Protection of persons and property | | 1,192 | | 1,128 | | (64 | ) | 1,067 | | 1,509 | | 1,519 | | 10 | | 1,579 | |
Transportation | | 1,011 | | 998 | | (13 | ) | 988 | | 1,348 | | 1,429 | | 81 | | 1,379 | |
Natural resources and economic development | | 1,324 | | 1,131 | | (193 | ) | 1,192 | | 1,766 | | 1,670 | | (96 | ) | 1,974 | |
Other | | 1,316 | | 994 | | (322 | ) | 842 | | 1,429 | | 1,821 | | 392 | | 1,398 | |
Contingencies | | — | | — | | — | | 4 | | 325 | | 467 | | 142 | | — | |
General government | | 509 | | 470 | | (39 | ) | 447 | | 672 | | 684 | | 12 | | 669 | |
Debt servicing costs | | 1,694 | | 1,599 | | (95 | ) | 1,647 | | 2,258 | | 2,159 | | (99 | ) | 2,231 | |
Subtotal | | 27,424 | | 27,217 | | (207 | ) | 25,682 | | 37,690 | | 38,405 | | 715 | | 36,501 | |
Climate Action Dividend | | — | | — | | — | | — | | — | | — | | — | | 440 | |
Negotiating Framework incentive payments | | — | | — | | — | | — | | — | | — | | — | | 4 | |
Total expense | | 27,424 | | 27,217 | | (207 | ) | 25,682 | | 37,690 | | 38,405 | | 715 | | 36,945 | |
(1) Amounts have been restated to reflect government’s accounting policies in effect at March 31, 2008.
(2) Payments for healthcare services by the Ministry of Housing and Social Development and the Ministry of Children and Family Development made on behalf of their clients are reported in the Health function.
(3) Payments for training costs by the Ministry of Housing and Social Development made on behalf of its clients are reported in the Education function.
Budget and Fiscal Plan – 2009/10 to 2011/12
115
2008/09 Revised Financial Forecast (Third Quarterly Report)
Table 4.11 2008/09 Expense by Ministry, Program and Agency
| | Year-to-Date to December 31 | | Full Year | |
| | 2008/09 | | Actual | | 2008/09 | | Actual | |
($ millions) | | Budget | | Actual | | Variance | | 2007/08 | | Budget | | Forecast | | Variance | | 2007/08 | |
Office of the Premier | | 10 | | 10 | | — | | 10 | | 14 | | 14 | | — | | 13 | |
Aboriginal Relations and Reconciliation | | 39 | | 36 | | (3 | ) | 30 | | 62 | | 62 | | — | | 87 | |
Advanced Education and Labour Market Development | | 1,652 | | 1,615 | | (37 | ) | 1,544 | | 2,206 | | 2,187 | | (19 | ) | 2,087 | |
Agriculture and Lands | | 133 | | 152 | | 19 | | 122 | | 289 | | 249 | | (40 | ) | 234 | |
Attorney General | | 414 | | 405 | | (9 | ) | 382 | | 546 | | 546 | | — | | 500 | |
Children and Family Development | | 989 | | 983 | | (6 | ) | 902 | | 1,326 | | 1,326 | | — | | 1,237 | |
Community Development | | 199 | | 176 | | (23 | ) | 155 | | 238 | | 238 | | — | | 241 | |
Education | | 3,930 | | 3,912 | | (18 | ) | 3,810 | | 5,313 | | 5,311 | | (2 | ) | 5,141 | |
Energy, Mines and Petroleum Resources | | 56 | | 41 | | (15 | ) | 32 | | 73 | | 72 | | (1 | ) | 67 | |
Environment | | 189 | | 168 | | (21 | ) | 142 | | 271 | | 259 | | (12 | ) | 228 | |
Finance | | 164 | | 153 | | (11 | ) | 160 | | 229 | | 226 | | (3 | ) | 229 | |
Forests and Range | | 593 | | 552 | | (41 | ) | 691 | | 806 | | 770 | | (36 | ) | 941 | |
Health Services | | 10,301 | | 10,312 | | 11 | | 9,500 | | 13,530 | | 13,530 | | — | | 12,783 | |
Healthy Living and Sport | | 49 | | 47 | | (2 | ) | 40 | | 72 | | 66 | | (6 | ) | 79 | |
Housing and Social Development | | 1,981 | | 1,974 | | (7 | ) | 1,823 | | 2,665 | | 2,665 | | — | | 2,507 | |
Labour and Citizens’ Services | | 82 | | 56 | | (26 | ) | 50 | | 102 | | 102 | | — | | 87 | |
Public Safety and Solicitor General | | 463 | | 479 | | 16 | | 478 | | 625 | | 625 | | — | | 695 | |
Small Business, Technology, and Economic Development | | 52 | | 35 | | (17 | ) | 39 | | 67 | | 67 | | — | | 71 | |
Tourism, Culture and the Arts | | 305 | | 335 | | 30 | | 54 | | 353 | | 349 | | (4 | ) | 74 | |
Transportation and Infrastructure | | 630 | | 612 | | (18 | ) | 564 | | 841 | | 841 | | — | | 761 | |
Total ministries and Office of the Premier | | 22,231 | | 22,053 | | (178 | ) | 20,528 | | 29,628 | | 29,505 | | (123 | ) | 28,062 | |
Management of public funds and debt | | 948 | | 902 | | (46 | ) | 908 | | 1,262 | | 1,212 | | (50 | ) | 1,142 | |
Contingencies | | — | | 4 | | 4 | | 4 | | 375 | | 375 | | — | | 91 | |
Legislative and other appropriations | | 91 | | 90 | | (1 | ) | 59 | | 142 | | 142 | | — | | 112 | |
Subtotal | | 23,270 | | 23,049 | | (221 | ) | 21,499 | | 31,407 | | 31,234 | | (173 | ) | 29,407 | |
Priority spending initiatives | | — | | — | | — | | — | | — | | 622 | | 622 | | 885 | |
Consolidated revenue fund total expense | | 23,270 | | 23,049 | | (221 | ) | 21,499 | | 31,407 | | 31,856 | | 449 | | 30,292 | |
Expenses recovered from external entities | | 1,414 | | 1,460 | | 46 | | 1,496 | | 1,885 | | 2,186 | | 301 | | 2,282 | |
Externally-funded service delivery agency expense: | | | | | | | | | | | | | | | | | |
School districts | | 40 | | 131 | | 91 | | 37 | | 410 | | 378 | | (32 | ) | 380 | |
Post-secondary institutions | | 1,660 | | 1,544 | | (116 | ) | 1,402 | | 2,254 | | 2,224 | | (30 | ) | 1,904 | |
Health authorities and hospital societies | | 295 | | 360 | | 65 | | 366 | | 619 | | 650 | | 31 | | 767 | |
Other service delivery agencies | | 745 | | 673 | | (72 | ) | 882 | | 1,115 | | 1,111 | | (4 | ) | 1,320 | |
| | 2,740 | | 2,708 | | (32 | ) | 2,687 | | 4,398 | | 4,363 | | (35 | ) | 4,371 | |
Total expense | | 27,424 | | 27,217 | | (207 | ) | 25,682 | | 37,690 | | 38,405 | | 715 | | 36,945 | |
Budget and Fiscal Plan – 2009/10 to 2011/12
116
2008/09 Revised Financial Forecast (Third Quarterly Report)
Table 4.12 2008/09 Capital Spending
| | Year-to-Date to December 31 | | Full Year | |
| | 2008/09 | | Actual | | 2008/09 | | Actual | |
($ millions) | | Budget | | Actual | | Variance | | 2007/08 | | Budget | | Forecast | | Variance | | 2007/08 | |
Taxpayer-supported | | | | | | | | | | | | | | | | | |
Education | | | | | | | | | | | | | | | | | |
Schools (K-12) | | 331 | | 307 | | (24 | ) | 285 | | 441 | | 442 | | 1 | | 380 | |
Post-secondary | | 530 | | 417 | | (113 | ) | 529 | | 706 | | 666 | | (40 | ) | 782 | |
Health | | 417 | | 372 | | (45 | ) | 343 | | 924 | | 910 | | (14 | ) | 881 | |
BC Transportation Financing Authority | | 663 | | 706 | | 43 | | 658 | | 884 | | 956 | | 72 | | 884 | |
Transportation Investment Corporation | | — | | — | | — | | — | | — | | — | | — | | — | |
BC Transit | | 56 | | 56 | | — | | 20 | | 74 | | 74 | | — | | 37 | |
Vancouver Convention Centre expansion project | | 225 | | 187 | | (38 | ) | 183 | | 288 | | 251 | | (37 | ) | 251 | |
BC Place rejuvenation | | — | | 13 | | 13 | | — | | — | | 38 | | 38 | | — | |
Government ministries | | 186 | | 183 | | (3 | ) | 158 | | 286 | | 436 | (1) | 150 | | 335 | |
Other (2) | | 43 | | 78 | | 35 | | 75 | | 56 | | 125 | | 69 | | 122 | |
Accelerated infrastructure projects | | — | | — | | — | | — | | — | | 55 | | 55 | | — | |
Capital spending contingencies | | — | | — | | — | | — | | 200 | | 180 | | (20 | ) | — | |
Total taxpayer-supported | | 2,451 | | 2,319 | | (132 | ) | 2,251 | | 3,859 | | 4,133 | | 274 | | 3,672 | |
| | | | | | | | | | | | | | | | | |
Self–supported | | | | | | | | | | | | | | | | | |
BC Hydro | | 1,260 | | 1,032 | | (228 | ) | 788 | | 1,663 | | 1,596 | | (67 | ) | 1,072 | |
BC Transmission Corporation | | 15 | | 12 | | (3 | ) | 58 | | 21 | | 18 | | (3 | ) | 70 | |
Columbia River power projects (3) | | 28 | | 26 | | (2 | ) | 12 | | 19 | | 38 | | 19 | | 29 | |
BC Rail | | 23 | | 9 | | (14 | ) | 19 | | 30 | | 10 | | (20 | ) | 20 | |
ICBC | | 27 | | 22 | | (5 | ) | 20 | | 30 | | 25 | | (5 | ) | 23 | |
BC Lotteries | | 93 | | 71 | | (22 | ) | 46 | | 124 | | 112 | | (12 | ) | 60 | |
Liquor Distribution Branch | | 16 | | 7 | | (9 | ) | 7 | | 20 | | 19 | | (1 | ) | 18 | |
Total self-supported | | 1,462 | | 1,179 | | (283 | ) | 950 | | 1,907 | | 1,818 | | (89 | ) | 1,292 | |
| | | | | | | | | | | | | | | | | |
Total capital spending | | 3,913 | | 3,498 | | (415 | ) | 3,201 | | 5,766 | | 5,951 | | 185 | | 4,964 | |
(1) Includes Supplementary Estimates of $80 million.
(2) Includes BC Housing Management Commission, Provincial Rental Housing Corporation, Rapid Transit Project 2000, BC Transit and other service delivery agencies.
(3) Joint ventures of the Columbia Power Corporation and Columbia Basin Trust.
Budget and Fiscal Plan – 2009/10 to 2011/12
117
2008/09 Revised Financial Forecast (Third Quarterly Report)
Table 4.13 2008/09 Provincial Debt (1)
| | Year-to-Date to December 31 | | Full Year | |
| | 2008/09 | | Actual | | 2008/09 | | Actual | |
($ millions) | | Budget | | Actual | | Variance | | 2007/08 | | Budget | | Forecast | | Variance | | 2007/08 | |
Taxpayer-supported debt | | | | | | | | | | | | | | | | | |
Provincial government operating | | 7,617 | | 5,261 | | (2,356 | ) | 8,126 | | 7,408 | | 6,437 | | (971 | ) | 8,264 | |
Other taxpayer-supported debt (mainly capital) | | | | | | | | | | | | | | | | | |
Education (2) | | | | | | | | | | | | | | | | | |
Schools | | 5,166 | | 5,084 | | (82 | ) | 4,862 | | 5,235 | | 5,195 | | (40 | ) | 4,906 | |
Post-secondary institutions | | 3,472 | | 3,407 | | (65 | ) | 3,163 | | 3,520 | | 3,497 | | (23 | ) | 3,314 | |
| | 8,638 | | 8,491 | | (147 | ) | 8,025 | | 8,755 | | 8,692 | | (63 | ) | 8,220 | |
Health (2) | | 3,804 | | 3,447 | | (357 | ) | 3,057 | | 3,945 | | 3,820 | | (125 | ) | 3,345 | |
Highways and public transit | | | | | | | | | | | | | | | | | |
BC Transportation Financing Authority | | 4,564 | | 4,322 | | (242 | ) | 3,744 | | 4,722 | | 4,638 | | (84 | ) | 3,948 | |
Public transit | | 940 | | 920 | | (20 | ) | 913 | | 950 | | 930 | | (20 | ) | 897 | |
SkyTrain extension | | 1,153 | | 1,153 | | — | | 1,153 | | 1,153 | | 1,153 | | — | | 1,153 | |
BC Transit | | 91 | | 95 | | 4 | | 92 | | 91 | | 93 | | 2 | | 84 | |
| | 6,748 | | 6,490 | | (258 | ) | 5,902 | | 6,916 | | 6,814 | | (102 | ) | 6,082 | |
Other | | | | | | | | | | | | | | | | | |
Social housing (3) | | 212 | | 307 | | 95 | | 217 | | 211 | | 309 | | 98 | | 218 | |
Homeowner Protection Office | | 163 | | 147 | | (16 | ) | 121 | | 173 | | 149 | | (24 | ) | 132 | |
Other (4) | | 321 | | 346 | | 25 | | 291 | | 333 | | 471 | | 138 | | 318 | |
Accelerated capital projects | | — | | — | | — | | — | | — | | 1,000 | | 1,000 | | — | |
| | 696 | | 800 | | 104 | | 629 | | 717 | | 1,929 | | 1,212 | | 668 | |
Total other taxpayer-supported | | 19,886 | | 19,228 | | (658 | ) | 17,613 | | 20,333 | | 21,255 | | 922 | | 18,315 | |
Total taxpayer-supported debt | | 27,503 | | 24,489 | | (3,014 | ) | 25,739 | | 27,741 | | 27,692 | | (49 | ) | 26,579 | |
Self-supported debt | | | | | | | | | | | | | | | | | |
Commercial Crown corporations | | | | | | | | | | | | | | | | | |
BC Hydro | | 8,351 | | 8,813 | | 462 | | 7,645 | | 8,876 | | 9,005 | | 129 | | 7,633 | |
BC Transmission Corporation | | 83 | | 74 | | (9 | ) | 85 | | 79 | | 73 | | (6 | ) | 86 | |
Columbia River power projects (5) | | 236 | | 208 | | (28 | ) | 224 | | 241 | | 207 | | (34 | ) | 219 | |
Liquor Distribution Branch | | 2 | | 2 | | — | | 2 | | 1 | | 1 | | — | | 2 | |
Post-secondary institutions’ subsidiaries | | 53 | | 109 | | 56 | | 53 | | 53 | | 109 | | 56 | | 108 | |
| | 8,725 | | 9,206 | | 481 | | 8,009 | | 9,250 | | 9,395 | | 145 | | 8,048 | |
Warehouse borrowing program | | — | | 1,051 | | 1,051 | | 55 | | — | | 400 | | 400 | | — | |
Total self-supported debt | | 8,725 | | 10,257 | | 1,532 | | 8,064 | | 9,250 | | 9,795 | | 545 | | 8,048 | |
Forecast allowance | | — | | — | | — | | — | | 750 | | — | | (750 | ) | — | |
Total provincial debt | | 36,228 | | 34,746 | | (1,482 | ) | 33,803 | | 37,741 | | 37,487 | | (254 | ) | 34,627 | |
(1) Debt is after deduction of sinking funds and unamortized discounts, and excludes accrued interest. Government direct and fiscal agency accrued interest is reported in the government’s accounts as an accounts payable.
(2) Includes debt and guarantees incurred by the government on behalf of school districts, universities, colleges and health authorities/hospital societies (SUCH), and debt directly incurred by these entities.
(3) Includes the BC Housing Management Commission and the Provincial Rental Housing Corporation.
(4) Includes debt of other taxpayer–supported Crown corporations and agencies and fiscal agency loans to local governments. Also includes student loan guarantees, loan guarantees to agricultural producers, guarantees under economic development and home mortgage assistance programs, and loan guarantee provisions.
(5) Joint ventures of the Columbia Power Corporation and Columbia Basin Trust.
Budget and Fiscal Plan – 2009/10 to 2011/12
118
2008/09 Revised Financial Forecast (Third Quarterly Report)
Table 4.14 2008/09 Statement of Financial Position
| | Actual
March 31, | | Year-to-Date
December 31, | | Forecast
March 31, | |
($ millions) | | 2008 | | 2008 | | 2009 | |
Financial assets | | | | | | | |
Cash and temporary investments | | 5,951 | | 5,252 | | 6,028 | |
Other financial assets | | 8,233 | | 8,684 | | 8,572 | |
Sinking funds | | 2,649 | | 2,139 | | 2,152 | |
Investments in commercial Crown corporations: | | | | | | | |
Retained earnings | | 5,090 | | 5,636 | | 5,718 | |
Recoverable capital loans | | 7,719 | | 8,889 | | 9,080 | |
| | 12,809 | | 14,525 | | 14,798 | |
| | 29,642 | | 30,600 | | 31,550 | |
Liabilities | | | | | | | |
Accounts payable and accrued liabilities | | 7,955 | | 7,097 | | 8,104 | |
Deferred revenue | | 7,136 | | 9,190 | | 8,757 | |
Debt: | | | | | | | |
Taxpayer-supported debt | | 26,579 | | 24,489 | | 27,692 | |
Self-supported debt | | 8,048 | | 10,257 | | 9,795 | |
Forecast allowance | | — | | — | | — | |
Total provincial debt | | 34,627 | | 34,746 | | 37,487 | |
Add:debt offset by sinking funds | | 2,649 | | 2,139 | | 2,152 | |
Less: guarantees and non-guaranteed debt | | (442 | ) | (425 | ) | (422 | ) |
Financial statement debt | | 36,834 | | 36,460 | | 39,217 | |
| | 51,925 | | 52,747 | | 56,078 | |
Net liabilities | | (22,283 | ) | (22,147 | ) | (24,528 | ) |
Capital and other non-financial assets | | | | | | | |
Tangible capital assets | | 28,933 | | 30,009 | | 30,980 | |
Other non-financial assets | | 801 | | 896 | | 847 | |
| | 29,734 | | 30,905 | | 31,827 | |
Accumulated surplus (deficit) | | 7,451 | | 8,758 | | 7,299 | |
Changes in Financial Position
| | Year-to-Date
December 31, | | Forecast
March 31, | |
($ millions) | | 2008 | | 2009 | |
| | | | | |
(Surplus) deficit for the year | | (1,584 | ) | (50 | ) |
Comprehensive income (increase) decrease | | 277 | | 202 | |
(Increase) decrease in accumulated surplus | | (1,307 | ) | 152 | |
Capital and other non-financial asset changes: | | | | | |
Increase in taxpayer-supported capital investments | | 2,319 | | 4,133 | |
Less: amortization and other accounting changes | | (1,243 | ) | (2,086 | ) |
Change in net capital assets | | 1,076 | | 2,047 | |
Increase (decrease) in other non-financial assets | | 95 | | 46 | |
| | 1,171 | | 2,093 | |
Increase (decrease) in net liabilities | | (136 | ) | 2,245 | |
Investment and working capital changes: | | | | | |
Increase (reduction) in cash and temporary investments | | (699 | ) | 77 | |
Increase in total investment in commercial Crown corporations: | | | | | |
Increase (decrease) in retained earnings | | 546 | | 628 | |
Self-supported capital investments | | 1,179 | | 1,818 | |
Less: loan repayments and other accounting changes | | (9 | ) | (457 | ) |
| | 1,716 | | 1,989 | |
Other working capital changes | | (1,255 | ) | (1,928 | ) |
| | (238 | ) | 138 | |
Increase (decrease) in financial statement debt | | (374 | ) | 2,383 | |
(Increase) decrease in sinking fund debt | | 510 | | 497 | |
Increase (decrease) in guarantees and non-guaranteed debt | | (17 | ) | (20 | ) |
Increase (decrease) in total provincial debt | | 119 | | 2,860 | |
Budget and Fiscal Plan – 2009/10 to 2011/12
119
APPENDICES
Tables: | | |
Tax Expenditures | 122 |
| A1.1 Social and Income Transfer Programs – Tax Expenditure | 124 |
| A1.2 Economic Development and Business Programs – Tax Expenditure | 126 |
| A1.3 Environmental Protection Programs – Tax Expenditure | 126 |
A2 | Interprovincial Comparisons of Tax Rates – 2009 | 127 |
A3 | Comparison of Provincial and Federal Taxes by Province – 2009 | 128 |
A4 | Interprovincial Comparisons of Provincial Personal Income Taxes Payable – 2009 | 130 |
A5 | Summary of Revenue Measures from July 30, 2001 to February 17, 2009 | 131 |
A6 | Operating Statement – 2005/06 to 2011/12 | 135 |
A7 | Revenue by Source – 2005/06 to 2011/12 | 136 |
A8 | Expense by Function – 2005/06 to 2011/12 | 137 |
A9 | Service Delivery Agency Operating Results – 2005/06 to 2011/12 | 138 |
A10 | Material Assumptions – Revenue | 140 |
A11 | Natural Gas Price Forecasts: 2009/10 to 2011/12 | 145 |
Al2 | Material Assumptions – Expense | 146 |
A13 | Full-Time Equivalents (FTEs) – 2005/06 to 2011/12 | 148 |
A14 | Capital Spending – 2005/06 to 2011/12 | 149 |
A15 | Statement of Financial Position – 2005/06 to 2011/12 | 150 |
A15a | Changes in Financial Position – 2005/06 to 2011/12 | 151 |
A16 | Provincial Debt Summary – 2005/06 to 2011/12 | 152 |
A17 | Key Provincial Debt Indicators – 2005/06 to 2011/12 | 153 |
| | | |
Budget and Fiscal Plan – 2009/10 to 2011/12
121
Appendices
A1: Tax Expenditures | |
| |
| Introduction |
| |
| A tax expenditure is the reduction in revenues from delivering government programs or benefits through the tax system rather than through voted budget appropriations. Tax expenditures are usually made by offering special tax rates, exemptions, or tax credits. Governments introduce tax expenditures primarily to achieve social policy objectives such as transfers to lower income families or to promote economic development and job creation. |
| |
| Reporting tax expenditures improves government accountability by providing a more complete picture of government activities. The tax expenditure appendix outlines major tax expenditures for the 2008/09 fiscal year. It does not include tax expenditures introduced or expanded in Budget 2009. These are described in Part 2: Tax Measures. |
| |
| The Role of Tax Expenditure Programs |
| |
| Using the tax system to deliver programs can reduce administration costs and compliance costs for recipients. In certain situations, the tax system allows intended beneficiaries to be readily identified from information that is already collected. In these cases setting up a separate expenditure program would result in costly overlap and duplication of effort. An example is the provincial sales tax credit, which is delivered through the income tax system. If this were a direct provincial expenditure program, a provincial agency or office would have to be established to duplicate much of the work already done by the Canada Revenue Agency. In addition, it would require individuals to undertake a separate, time-consuming application process in order to qualify for the benefit. |
| |
| There are, however, several potential drawbacks to tax expenditure programs. First, their overall cost often receives less public scrutiny than is the case for spending programs because annual budget appropriations by the legislature are not typically required. Second, tax expenditure programs do not always effectively target those who are intended to benefit from them. Some expenditure programs that are intended to provide tax relief for low income earners may, in reality, confer the greatest benefit on high income earners who pay the most taxes. Sales tax exemptions, for example, often provide a greater absolute benefit to those with higher incomes because they have more to spend on consumer products. Finally, costs are often more difficult to control under a tax expenditure program because the benefits tend to be more open ended and enforcement is often more difficult than for spending programs. |
| |
| Tax Expenditure Reporting |
| |
| Not all tax reductions, credits and exemptions are classed as tax expenditures. Three criteria were used to choose those features of the tax system that should be reported as tax expenditures. |
| |
| First, the emphasis is on tax reductions, exemptions and refunds that are close equivalents to spending programs. By implication, the list does not include tax measures designed to meet broad tax policy objectives such as improving fairness in the tax system, or measures designed to simplify the administration of the tax. The list also does not include items that are generally excluded from a particular tax base. For example, most services are excluded from provincial sales taxes, which are primarily designed to apply to purchases of goods. |
Budget and Fiscal Plan – 2009/10 to 2011/12
122
Appendices
| Second, revenues raised under provincial government authority that are turned over to agencies outside of government are not reported as tax expenditures in this appendix. This includes, for example, the hotel room tax revenues transferred to Tourism BC. |
| | |
| Third, smaller items of less than $2 million are generally not included. Where practical, smaller items have been presented together as an aggregate figure. |
| | |
| British Columbia Tax Expenditure Programs |
| | |
| The following tables report tax expenditure estimates. |
| | |
| For presentation purposes, British Columbia tax expenditures have been broken into three broad categories. |
| | |
| · | Social and Income Transfer Programs (Table A1.1): These include tax expenditures that are offered as part of government’s mix of health, education, housing, income transfer and family related programs. Examples include the BC Family Bonus, the home owner grant, the sales tax exemption for children’s clothing and the income tax credit for medical expenses. |
| | |
| · | Economic Development and Business Programs (Table A1.2): This category includes tax preferences for small businesses and measures to encourage new private sector investment. |
| | |
| · | Environmental Protection Programs (Table A1.3): There are relatively few tax expenditures in this category because environmental protection is now generally based on the principle of “polluter pay”, such as the lead-acid battery levy. However, environmental tax expenditures include, for example, a sales tax exemption for bicycles and a fuel tax exemption for certain alternative fuels. |
| | |
| Each category has its own table of tax expenditure estimates. Within each table, the list of tax expenditures delivered through the income tax system has been separated into two sub-categories. |
| | |
| · | Provincial Measures: This includes all major tax expenditures that are under provincial policy control. |
| | |
| · | Federal Measures: British Columbia shares the cost of some federal income tax expenditure programs because, under the tax collection agreement between British Columbia and the federal government, the province has agreed to maintain a consistent income tax base with the federal government in the interest of reducing administrative and compliance costs. |
| | |
| The cost of individual tax expenditures cannot be added together to reach a total tax expenditure figure for two reasons: |
| | |
| · | in some cases the programs interact with one another so that eliminating one program could increase or decrease the cost of another; and |
| | |
| · | eliminating certain tax expenditure programs could change the choices taxpayers make, which in turn would affect the cost estimates. |
| | |
| The estimates for each tax expenditure are based on a static analysis of the costs and do not take into account any behavioural changes which could change the cost over time. In addition, all estimates are recalculated each year using current data sources and using refinements to the methods of estimation which can result in significant changes to the value of a given tax expenditure from prior years’ reports. |
Budget and Fiscal Plan – 2009/10 to 2011/12
123
Appendices
Table A1.1 Social and Income Transfer Programs – Tax Expenditure
| | 2008/09 | |
| | Estimated Cost | |
| | ($ millions) | |
Provincial Sales Tax (1) | | | |
Exemptions for the following items: | | | |
· Food (basic groceries, snack foods, candies, soft drinks and restaurant meals) | | 991 | |
· Residential fuels (electricity, natural gas, fuel oil, etc.) | | 211 | |
· Prescription and non-prescription drugs, vitamins and certain other health care products and appliances | | 165 | |
· Children’s clothing and footwear | | 34 | |
· Clothing patterns, fabrics and notions | | 4 | |
· Specified school supplies | | 55 | |
· Books, magazines and newspapers | | 63 | |
· Basic telephone and cable service | | 82 | |
· “1-800” and equivalent telephone services | | 9 | |
· Specified safety equipment | | 11 | |
· Labour to repair major household appliances, clothing and footwear | | 8 | |
· Miscellaneous consumer exemptions (e.g. used clothing under $100) | | 4 | |
· Livestock for human consumption and feed, seed and fertilizer | | 47 | |
| | | |
Personal Income Tax | | | |
Provincial Measures | | | |
BC Family Bonus (2) | | 12 | |
BC Low Income Climate Action Tax Credit | | 106 | |
Sales Tax Credit | | 53 | |
Political contributions tax credit | | 1 | |
Provincial Non-Refundable Credits: (3) | | | |
· Charitable donations tax credit | | 174 | |
· Tax credits for tuition and education | | 44 | |
· Tax credits for disabilities and medical expenses | | 59 | |
· Pension income tax credit | | 22 | |
· Credit for persons older than 65 years | | 50 | |
· Married and equivalent-to-married credits | | 70 | |
· Tax credit for Canada Pension Plan contributions | | 122 | |
· Tax credit for Employment Insurance premiums paid | | 41 | |
Budget and Fiscal Plan – 2009/10 to 2011/12
124
Appendices
Table A1.1 Social and Income Transfer Programs – Tax Expenditure – Continued
| | 2008/09 | |
| | Estimated Cost | |
| | ($ millions) | |
Federal Measures (4) | | | |
· Deduction and inclusion of alimony and child support payments | | 5 | |
· Child care expense deduction | | 31 | |
· Exemption from capital gains up to $500,000 for small businesses and family farms | | 38 | |
· Deduction for residents of northern and isolated areas | | 6 | |
· Non-taxation of employer-paid insurance premiums for group private health and welfare plans | | 115 | |
· Tax Free Savings Accounts | | 1 | |
· Registered Retirement Savings Plans: (5) | | | |
· exemption for | – contributions | 354 | | | |
| – investment earnings | 346 | | | |
· taxation of | – withdrawals | (202 | ) | | |
| Total | | | 498 | |
· Registered Pension Plans: (5) | | | | |
· exemption for | – contributions | 380 | | | |
| – investment earnings | 624 | | | |
· taxation of | – withdrawals | (295 | ) | | |
| Total | | | 709 | |
| | | | | | | |
Corporation Income Tax (6) | | 20 | |
Charitable donations deduction | | | |
| | | |
School and Rural Area Property Tax (7) | | | |
Home Owner Grant | | 678 | |
Exemption for places of worship | | 9 | |
| | | |
Property Transfer Tax | | | |
Exemption for first-time home buyers | | 66 | |
Exemptions for the following: | | | |
· Property transfers between related individuals | | 68 | |
· Property transfers to municipalities, regional districts, hospital districts, library boards, school boards, water districts and educational institutions | | 12 | |
· Property transfers to charities registered under the Income Tax Act (Canada) | | 8 | |
(1) | | Estimates of the cost of sales tax measures are based on most current information available. |
| | |
(2) | | The $12 million represents the tax expenditure portion of the program’s cost. The tax expenditure portion represents family bonus payments that effectively reduce the recipient’s personal income tax. The remaining cost of the program, including recoveries and administration costs, of $12 million for 2008/09, is presented in the BC Family Bonus Vote because it represents payments to families which exceed their provincial income tax liabilities. In 2008/09, the total program cost was $24 million. |
| | |
(3) | | Provincial non-refundable credits are generally based on estimates of credit claims by British Columbia residents. |
| | |
(4) | | The estimates show provincial revenue losses only. They are based on estimates of projected federal losses contained in Government of Canada: Tax Expenditures and Evaluations, 2008. British Columbia personal income tax expenditures for the federal measures are based on the amounts claimed by British Columbia residents for the measure and the relevant provincial tax rates for the period. Certain tax expenditure items have been excluded where no data were available or the amounts were immaterial. |
| | |
(5) | | Registered retirement savings plans and registered pension plans are treated in the same way as in the federal tax expenditure report. The tax expenditure associated with these schemes is presented as the amount of tax that would otherwise be paid in the year of deferral, were the deferral not available. However, this type of estimate overstates the true costs of these preferences because taxes are eventually paid, including tax on investment earnings. An estimate that does not overstate these costs would, however, be difficult to develop and would require some largely speculative assumptions. |
| | |
(6) | | The deduction offered for corporate charitable donations is a federal measure, but the estimate shows only the provincial revenue loss. This is calculated from the federal revenue loss by applying British Columbia’s share of corporate taxable income and the relevant tax rates to the federal estimate. |
| | |
(7) | | The property tax estimate is for the 2008 calendar year, and includes only school and rural area property taxes levied by the province. The home owner grant cost is shown for the 2008/09 fiscal year. |
Budget and Fiscal Plan – 2009/10 to 2011/12
125
Appendices
Table A1.2 Economic Development and Business Programs – Tax Expenditure
| | 2008/09 | |
| | Estimated Cost | |
| | ($ millions) | |
Fuel Tax | | | |
Tax exemption for international flights carrying cargo | | 2 | |
Tax exemption for family farm trucks (on road) | | 5 | |
Tax exemption for compressor fuel used to transmit natural gas from wellhead to processing plant | | 14 | |
| | | |
Personal Income Tax | | | |
Training tax credit | | 15 | |
Venture capital tax credit | | 25 | |
Employee venture capital tax credit | | 2 | |
BC mining flow-through tax credit | | 16 | |
| | | |
Corporation Income Tax | | | |
Provincial Measures | | | |
Training tax credit | | 5 | |
Film and video tax credit | | 76 | |
Production services tax credit | | 116 | |
International financial activities tax refund (1) | | 20 | |
Scientific Research and Experimental Development Tax Credit | | 136 | |
Mining Exploration Tax Credit | | 10 | |
| | | |
School and Rural Area Property Taxation (2) | | | |
Assessment exemption of $10,000 for industrial and business properties | | 8 | |
Overnight tourist accommodation assessment relief | | 3 | |
Exemption for property used for pollution abatement (3) | | 6 | |
(1) | | Includes employee income tax refunds. |
| | |
(2) | | Estimates are for the 2008 calendar year and include only school and rural area property taxes levied by the province. |
| | |
(3) | | The property tax exemption for most land and improvements used in pollution abatement equipment was removed for 1997, but existing properties which were exempt in 1996 remain exempt under grand parenting provisions. |
Table A1.3 Environmental Protection Programs – Tax Expenditure
| | 2008/09 | |
| | Estimated Cost | |
| | ($ millions) | |
Provincial Sales Tax | | | |
Exemptions for the following items: | | | |
· Bicycles | | 8 | |
· Specified energy conservation equipment (1) | | 26 | |
· Hybrid electric and fuel efficient passenger vehicles | | 27 | |
Fuel Tax | | | |
Tax exemption for alternative fuels | | 17 | |
(1) | | Includes all energy conservation/energy efficient equipment: ENERGY STAR items, energy efficient water heaters, insulation material, polystyrene forming blocks used in construction industry and similar material that prevents heat loss from a building. |
Budget and Fiscal Plan – 2009/10 to 2011/12
126
Appendices
Table A2 Interprovincial Comparisons of Tax Rates – 2009
(Rates known as of February 6, 2009) (1)
Tax | | British
Columbia | | Alberta | | Saskat-
chewan | | Manitoba | | Ontario | | Quebec | | New
Brunswick | | Nova
Scotia | | Prince
Edward
Island | | New-
foundland | |
Corporation income tax (per cent of taxable income) (2) | | | | | | | | | | | | | | | | | | | | | |
General rate | | 11 | | 10 | | 12 | | 13 | | 14 | | 11.9 | | 13 | | 16 | | 16 | | 14 | |
Manufacturing rate | | 11 | | 10 | | 10 | | 13 | | 12 | | 11.9 | | 13 | | 16 | | 16 | | 5 | |
Small business rate | | 2.5 | | 3 | | 4.5 | | 1 | | 5.5 | | 8.0 | | 5 | | 5 | | 3.2 | | 5 | |
Small business threshold (3) ($000s) | | 400 | | 460 | | 500 | | 400 | | 500 | | 400 | | 500 | | 400 | | 400 | | 400 | |
Corporation capital tax (4) | | | | | | | | | | | | | | | | | | | | | |
Non-financial | | Nil | | Nil | | Nil | | .1/.3 | | .225 | | .24 | | Nil | | .25 | | Nil | | Nil | |
Financial | | .67/2.0 | | Nil | | .7/3.25 | | 3.0 | | .54/.675 | | .48 | | 3.0 | | 4.0 | | 5.0 | | 4.0 | |
Health care premiums (5) | | | | | | | | | | | | | | | | | | | | | |
Individual/family | | 54/108 | | Nil | | Nil | | Nil | | Nil | | Nil | | Nil | | Nil | | Nil | | Nil | |
Payroll tax (6) (per cent) | | Nil | | Nil | | Nil | | 2.15 | | 1.95 | | 4.26 | | Nil | | Nil | | Nil | | 2.0 | |
Insurance premium tax (per cent) (7) | | 2-4.4 | | 2-3 | | 3-4 | | 2-3 | | 2-3.5 | | 2-3 | | 2-3 | | 3-4 | | 3.5 | | 4 | |
Fuel tax (cents per litre) (8) | | | | | | | | | | | | | | | | | | | | | |
Gasoline | | 16.84 | | 9.0 | | 15.0 | | 11.5 | | 14.7 | | 20.4 | | 15.7 | | 20.6 | | 15.8 | | 22.4 | |
Diesel | | 17.69 | | 9.0 | | 15.0 | | 11.5 | | 14.3 | | 22.7 | | 23.6 | | 21.6 | | 20.2 | | 23.3 | |
Sales tax (per cent) (9) | | | | | | | | | | | | | | | | | | | | | |
General rate | | 7 | | Nil | | 5 | | 7 | | 8 | | 7.5 | | 8 | | 8 | | 10 | | 8 | |
Liquor (10) | | 10 | | Nil | | 10 | | 7 | | 10, 12 | | 7.5 | | 8 | | 8 | | 37.5 | | 8 | |
Meals | | Nil | | Nil | | Nil | | 7 | | 8 | | 7.5 | | 8 | | 8 | | 10 | | 8 | |
Accommodation | | 8 | | 4 | | 5 | | 7 | | 5 | | 7.5 | | 8 | | 8 | | 10 | | 8 | |
Tobacco tax (dollars per carton of 200 cigarettes) (11) | | 37.00 | | 37.00 | | 40.30 | | 40.00 | | 24.70 | | 20.60 | | 28.30 | | 36.60 | | 39.90 | | 41.80 | |
(1) | | Rates shown are those known as of February 6, 2009 and that are in effect for 2009. |
(2) | | British Columbia’s general corporate income tax rate is reduced to 10.5 per cent effective January 1, 2010 and 10 per cent effective January 1, 2011. Manitoba’s general corporate income tax rate is reduced to 12 per cent effective July 1, 2009. Prince Edward Island’s small business rate is reduced to 2.1 per cent effective April 1, 2009 and to 1 per cent effective April 1, 2010. |
(3) | | Effective March 31, 2009, Alberta’s small business threshold is increased to $500,000. |
(4) | | Ontario’s general corporation capital tax no longer applies to corporations primarily engaged in manufacturing and processing and those in the resource sectors. Provinces eliminating their general corporation capital taxes include Manitoba, effective December 31, 2010, Ontario, effective July 1, 2010, and Quebec, effective January 1, 2011. Provinces eliminating their capital tax on financial institutions include British Columbia, effective April 1, 2010 and Ontario, effective July 1, 2010. British Columbia’s rate for financial institutions is reduced to 0.33 per cent and 1 per cent effective April 1, 2009 and to nil effective April 1, 2010. |
(5) | | British Columbia has a two-person rate of $96 and offers premium assistance in the form of lower rates or an exemption from premiums for lower income individuals and families. Ontario and Quebec levy health care contributions as additions to provincial personal income taxes payable. |
(6) | | Provinces with payroll taxes provide payroll tax relief for small businesses. |
(7) | | The lower rate applies to premiums for life, sickness and accident insurance; the higher rate applies to premiums for property insurance including automobile insurance. In Ontario and Quebec specific sales taxes also apply to insurance premiums, except those related to individual life and health. |
(8) | | Tax rates are provincial rates for fuel used on highways. The British Columbia rate includes 6.75 cents per litre dedicated to the BC Transportation Financing Authority and the carbon tax rates of 2.34 cents per litre for gasoline and 2.69 cents per litre for diesel, increasing to 3.51 cents per litre for gasoline and 4.04 cents per litre for diesel effective July 1, 2009. The British Columbia rates do not include regional taxes that effectively increase the gasoline and diesel tax rates by 6 cents per litre in the South Coast British Columbia transportation service area and by 3.5 cents per litre in the Capital Regional District. The Quebec gasoline rate does not include the 1.5 cent per litre tax collected in the Metropolitan Montreal region. The tax rates for Quebec, New Brunswick, Nova Scotia and Newfoundland include provincial sales tax based on current pump prices. |
(9) | | The rates shown are statutory rates. Quebec and PEI impose tax on the purchase price including GST. |
(10) | | In Ontario, sellers of liquor at licensed establishments are generally required to charge sales tax at the rate of 10 per cent; however, a rate of 12 per cent applies to liquor purchased at beer manufacturers’ outlets, Brewers Retail stores, government liquor stores and wine stores. |
(11) | | The British Columbia rate is increased to $37.00 from $35.80 per carton of 200 cigarettes effective February 18, 2009. Tax rates for Saskatchewan, Manitoba, New Brunswick, Nova Scotia and Newfoundland include provincial sales tax. |
Budget and Fiscal Plan – 2009/10 to 2011/12
127
Appendices
Table A3 Comparison of Provincial and Federal Taxes by Province – 2009
| | | | | | | | | | | | | | | | | | Prince | | | |
| | British | | | | Saskat- | | | | | | | | New | | Nova | | Edward | | New- | |
Tax | | Columbia | | Alberta | | chewan | | Manitoba | | Ontario | | Quebec | | Brunswick | | Scotia | | Island | | foundland | |
| | ( $ ) | |
Two Income Family of Four - $90,000 | | | | | | | | | | | | | | | | | | | | | |
1. Provincial Income Tax | | 3,565 | | 4,520 | | 4,784 | | 6,811 | | 4,876 | | 7,917 | | 6,908 | | 6,949 | | 6,894 | | 5,987 | |
Net Child Benefits | | 0 | | 113 | | 0 | | — | | 0 | | (1,637 | ) | 0 | | 0 | | — | | 0 | |
2. Property Tax - Gross | | 3,092 | | 2,343 | | 4,226 | | 3,094 | | 4,461 | | 4,523 | | 4,080 | | 3,577 | | 2,813 | | 2,382 | |
- Net | | 2,522 | | 2,343 | | 4,226 | | 2,494 | | 4,461 | | 4,523 | | 4,080 | | 3,577 | | 2,813 | | 2,382 | |
3. Sales Tax | | 1,253 | | 15 | | 970 | | 1,359 | | 1,728 | | 2,045 | | 1,920 | | 1,919 | | 1,625 | | 1,959 | |
4. Fuel Tax | | 218 | | 135 | | 225 | | 173 | | 221 | | 306 | | 236 | | 309 | | 237 | | 336 | |
5. Net Carbon Tax | | (93 | ) | — | | — | | — | | — | | — | | — | | — | | — | | — | |
6. Provincial Direct Taxes | | 7,465 | | 7,126 | | 10,205 | | 10,837 | | 11,286 | | 13,154 | | 13,144 | | 12,754 | | 11,569 | | 10,664 | |
7. Health Care Premiums/Payroll Tax | | 1,296 | | 0 | | — | | 1,935 | | 1,755 | | 3,834 | | — | | — | | — | | 1,800 | |
8. Total Provincial Tax | | 8,761 | | 7,126 | | 10,205 | | 12,772 | | 13,041 | | 16,988 | | 13,144 | | 12,754 | | 11,569 | | 12,464 | |
9. Federal Income Tax | | 8,160 | | 8,160 | | 8,160 | | 8,160 | | 8,160 | | 8,160 | | 8,160 | | 8,160 | | 8,160 | | 8,160 | |
10. Net Federal GST | | 1,290 | | 1,379 | | 1,306 | | 1,230 | | 1,273 | | 1,252 | | 1,200 | | 1,199 | | 1,215 | | 1,225 | |
11. Total Tax | | 18,211 | | 16,665 | | 19,671 | | 22,162 | | 22,474 | | 26,400 | | 22,504 | | 22,113 | | 20,944 | | 21,849 | |
| | | | | | | | | | | | | | | | | | | | | |
Two Income Family of Four - $60,000 | | | | | | | | | | | | | | | | | | | | | |
1. Provincial Income Tax | | 1,594 | | 1,989 | | 1,878 | | 3,640 | | 2,131 | | 3,975 | | 3,464 | | 3,627 | | 3,797 | | 3,205 | |
Net Child Benefits | | 0 | | (283 | ) | 0 | | — | | 0 | | (2,737 | ) | 0 | | 0 | | — | | 0 | |
2. Property Tax - Gross | | 2,251 | | 1,901 | | 2,816 | | 2,501 | | 3,188 | | 3,109 | | 2,269 | | 2,245 | | 2,237 | | 1,640 | |
- Net | | 1,681 | | 1,901 | | 2,816 | | 1,901 | | 3,188 | | 3,109 | | 2,269 | | 2,245 | | 2,237 | | 1,640 | |
3. Sales Tax | | 983 | | 13 | | 782 | | 1,089 | | 1,385 | | 1,742 | | 1,549 | | 1,542 | | 1,298 | | 1,561 | |
4. Fuel Tax | | 218 | | 135 | | 225 | | 173 | | 221 | | 306 | | 236 | | 309 | | 237 | | 336 | |
5. Net Carbon Tax | | (13 | ) | — | | — | | — | | — | | — | | — | | — | | — | | — | |
6. Provincial Direct Taxes | | 4,463 | | 3,755 | | 5,701 | | 6,803 | | 6,925 | | 6,395 | | 7,518 | | 7,723 | | 7,569 | | 6,742 | |
7. Health Care Premiums/Payroll Tax | | 1,296 | | 0 | | — | | 1,290 | | 1,170 | | 2,556 | | — | | — | | — | | 1,200 | |
8. Total Provincial Tax | | 5,759 | | 3,755 | | 5,701 | | 8,093 | | 8,095 | | 8,951 | | 7,518 | | 7,723 | | 7,569 | | 7,942 | |
9. Federal Income Tax | | 3,980 | | 3,980 | | 3,980 | | 3,980 | | 3,980 | | 3,980 | | 3,980 | | 3,980 | | 3,980 | | 3,980 | |
10. Net Federal GST | | 1,012 | | 1,151 | | 1,052 | | 985 | | 1,021 | | 1,067 | | 968 | | 964 | | 970 | | 976 | |
11. Total Tax | | 10,751 | | 8,886 | | 10,733 | | 13,058 | | 13,096 | | 13,998 | | 12,466 | | 12,667 | | 12,519 | | 12,898 | |
| | | | | | | | | | | | | | | | | | | | | |
Two Income Family of Four - $30,000 | | | | | | | | | | | | | | | | | | | | | |
1. Provincial Income Tax | | 0 | | 0 | | 0 | | 503 | | 158 | | (735 | ) | 0 | | 765 | | 863 | | 997 | |
Net Child Benefits | | 0 | | (1,212 | ) | 0 | | — | | (287 | ) | (3,174 | ) | 0 | | 0 | | — | | 0 | |
2. Property Tax - Gross | | 2,251 | | 1,901 | | 2,816 | | 2,501 | | 3,188 | | 3,109 | | 2,269 | | 2,245 | | 2,237 | | 1,640 | |
- Net | | 1,681 | | 1,901 | | 2,816 | | 1,901 | | 3,188 | | 3,109 | | 2,269 | | 2,245 | | 2,237 | | 1,640 | |
3. Sales Tax | | 740 | | 10 | | 335 | | 822 | | 1,026 | | 1,447 | | 1,186 | | 1,152 | | 971 | | 1,141 | |
4. Fuel Tax | | 145 | | 90 | | 150 | | 115 | | 147 | | 204 | | 157 | | 206 | | 158 | | 224 | |
5. Net Carbon Tax | | (207 | ) | — | | — | | — | | — | | — | | — | | — | | — | | — | |
6. Provincial Direct Taxes | | 2,359 | | 789 | | 3,301 | | 3,341 | | 4,232 | | 851 | | 3,612 | | 4,368 | | 4,229 | | 4,002 | |
7. Health Care Premiums/Payroll Tax | | 0 | | 0 | | — | | 645 | | 585 | | 1,278 | | — | | — | | — | | 600 | |
8. Total Provincial Tax | | 2,359 | | 789 | | 3,301 | | 3,986 | | 4,817 | | 2,129 | | 3,612 | | 4,368 | | 4,229 | | 4,602 | |
9. Federal Income Tax | | 523 | | 523 | | 523 | | 523 | | 523 | | 523 | | 523 | | 523 | | 523 | | 523 | |
10. Net Federal GST | | 6 | | 154 | | 21 | | (13 | ) | 0 | | 130 | | (15 | ) | (36 | ) | (31 | ) | (43 | ) |
11. Total Tax | | 2,888 | | 1,466 | | 3,845 | | 4,496 | | 5,340 | | 2,782 | | 4,120 | | 4,855 | | 4,721 | | 5,082 | |
| | | | | | | | | | | | | | | | | | | | | |
Unattached Individual - $25,000 | | | | | | | | | | | | | | | | | | | | | |
1. Provincial Income Tax | | 498 | | 538 | | 977 | | 914 | | 965 | | 708 | | 1,253 | | 1,246 | | 1,416 | | 1,107 | |
2. Property Tax | | — | | — | | — | | — | | — | | — | | — | | — | | — | | — | |
3. Sales Tax | | 412 | | 5 | | 333 | | 487 | | 591 | | 730 | | 696 | | 696 | | 571 | | 703 | |
4. Fuel Tax | | 145 | | 90 | | 150 | | 115 | | 147 | | 204 | | 157 | | 206 | | 158 | | 224 | |
5. Net Carbon Tax | | (80 | ) | — | | — | | — | | — | | — | | — | | — | | — | | — | |
6. Provincial Direct Taxes | | 975 | | 633 | | 1,460 | | 1,516 | | 1,703 | | 1,642 | | 2,106 | | 2,148 | | 2,145 | | 2,034 | |
7. Health Care Premiums/Payroll Tax | | 130 | | 0 | | — | | 538 | | 488 | | 1,065 | | — | | — | | — | | 500 | |
8. Total Provincial Tax | | 1,105 | | 633 | | 1,460 | | 2,054 | | 2,191 | | 2,707 | | 2,106 | | 2,148 | | 2,145 | | 2,534 | |
9. Federal Income Tax | | 1,618 | | 1,618 | | 1,618 | | 1,618 | | 1,618 | | 1,618 | | 1,618 | | 1,618 | | 1,618 | | 1,618 | |
10. Net Federal GST | | 90 | | 112 | | 86 | | 77 | | 73 | | 74 | | 57 | | 57 | | 58 | | 61 | |
11. Total Tax | | 2,813 | | 2,363 | | 3,164 | | 3,749 | | 3,882 | | 4,399 | | 3,781 | | 3,823 | | 3,821 | | 4,213 | |
Budget and Fiscal Plan – 2009/10 to 2011/12
128
Appendices
Table A3 Comparison of Provincial and Federal Taxes by Province – 2009 – Continued
Tax | | British
Columbia | | Alberta | | Saskat-
chewan | | Manitoba | | Ontario | | Quebec | | New
Brunswick | | Nova
Scotia | | Prince
Edward
Island | | New-
foundland | |
| | ( $ ) | |
Unattached Individual - $80,000 | | | | | | | | | | | | | | | | | | | | | |
1. Provincial Income Tax | | 4,406 | | 5,407 | | 7,006 | | 7,917 | | 5,768 | | 9,203 | | 8,366 | | 8,493 | | 8,139 | | 7,344 | |
2. Property Tax - Gross | | 1,540 | | 1,882 | | 3,055 | | 3,676 | | 3,089 | | 4,127 | | 1,845 | | 2,948 | | 2,062 | | 1,683 | |
- Net | | 970 | | 1,882 | | 3,055 | | 3,076 | | 3,089 | | 4,127 | | 1,845 | | 2,948 | | 2,062 | | 1,683 | |
3. Sales Tax | | 1,039 | | 12 | | 655 | | 1,159 | | 1,495 | | 1,652 | | 1,673 | | 1,667 | | 1,398 | | 1,721 | |
4. Fuel Tax | | 218 | | 135 | | 225 | | 173 | | 221 | | 306 | | 236 | | 309 | | 237 | | 336 | |
5. Net Carbon Tax | | (140 | ) | — | | — | | — | | — | | -— | | — | | — | | — | | — | |
6. Provincial Direct Taxes | | 6,493 | | 7,436 | | 10,941 | | 12,325 | | 10,573 | | 15,288 | | 12,120 | | 13,417 | | 11,836 | | 11,084 | |
7. Health Care Premiums/Payroll Tax | | 648 | | 0 | | — | | 1,720 | | 1,560 | | 3,408 | | — | | — | | — | | 1,600 | |
8. Total Provincial Tax | | 7,141 | | 7,436 | | 10,941 | | 14,045 | | 12,133 | | 18,696 | | 12,120 | | 13,417 | | 11,836 | | 12,684 | |
9. Federal Income Tax | | 11,231 | | 11,231 | | 11,231 | | 11,231 | | 11,231 | | 11,231 | | 11,231 | | 11,231 | | 11,231 | | 11,231 | |
10. Net Federal GST | | 1,181 | | 1,218 | | 1,130 | | 1,084 | | 1,142 | | 1,024 | | 1,046 | | 1,042 | | 1,066 | | 1,076 | |
11. Total Tax | | 19,553 | | 19,885 | | 23,302 | | 26,360 | | 24,506 | | 30,951 | | 24,397 | | 25,690 | | 24,133 | | 24,991 | |
| | | | | | | | | | | | | | | | | | | | | |
Senior Couple with Equal Pension Incomes - $30,000 | | | | | | | | | | | | | | | | | | | | | |
1. Provincial Income Tax | | 0 | | 0 | | 0 | | (316 | ) | (897 | ) | (659 | ) | 0 | | 355 | | 378 | | 390 | |
2. Property Tax - Gross | | 2,251 | | 1,901 | | 2,816 | | 2,501 | | 3,188 | | 3,109 | | 2,269 | | 2,245 | | 2,237 | | 1,640 | |
- Net | | 1,406 | | 1,901 | | 2,816 | | 1,901 | | 3,188 | | 3,109 | | 2,269 | | 2,245 | | 2,237 | | 1,640 | |
3. Sales Tax | | 756 | | 9 | | 576 | | 871 | | 1,041 | | 1,299 | | 1,293 | | 1,278 | | 1,045 | | 1,304 | |
4. Fuel Tax | | 145 | | 90 | | 150 | | 115 | | 147 | | 204 | | 157 | | 206 | | 158 | | 224 | |
5. Net Carbon Tax | | (146 | ) | — | | — | | — | | — | | -— | | — | | — | | — | | — | |
6. Provincial Direct Taxes | | 2,161 | | 2,000 | | 3,542 | | 2,571 | | 3,479 | | 3,953 | | 3,719 | | 4,084 | | 3,818 | | 3,558 | |
7. Health Care Premiums/Payroll Tax | | 230 | | 0 | | — | | — | | — | | — | | — | | — | | — | | — | |
8. Total Provincial Tax | | 2,391 | | 2,000 | | 3,542 | | 2,571 | | 3,479 | | 3,953 | | 3,719 | | 4,084 | | 3,818 | | 3,558 | |
9. Federal Income Tax | | 0 | | 0 | | 0 | | 0 | | 0 | | 0 | | 0 | | 0 | | 0 | | 0 | |
10. Net Federal GST | | 356 | | 384 | | 334 | | 353 | | 327 | | 310 | | 312 | | 303 | | 313 | | 319 | |
11. Total Tax | | 2,747 | | 2,384 | | 3,876 | | 2,924 | | 3,806 | | 4,263 | | 4,031 | | 4,387 | | 4,131 | | 3,877 | |
Personal Income Tax
· Income tax is based on basic personal credits, applicable provincial credits, and typical major deductions at each income level. Quebec residents pay federal income tax less an abatement of 16.5 per cent of basic federal tax. This abatement has been used to reduce Quebec provincial tax rather than federal tax, for comparative purposes. The two income family of four with $60,000 annual income is assumed to have one spouse earning $40,000 and the other $20,000, the family with $90,000 income is assumed to have one spouse earning $50,000 and the other $40,000, the family with $30,000 is assumed to have each spouse earning $15,000 and each senior is assumed to receive $15,000. All representative families are assumed to have employment income except the senior couple. British Columbia personal income tax has been calculated using the 2008 tax rates in effect prior to the implementation of the rate cuts in the government’s plan to recycle carbon tax revenues. The benefit of the rate cuts is shown as a reduction in carbon taxes payable.
Net Child Benefits
· Net child benefits are provincial measures affecting payments to families with children. Provincial child benefit measures are available in British Columbia (BC Family Bonus), Alberta (Family Employment Credit), Saskatchewan (Child Benefit), Ontario (Child Care Supplement for Working Families), Quebec (Child Assistance Payments), New Brunswick (Child Tax Benefit), Nova Scotia (Child Benefit) and Newfoundland (Child Benefit). In addition, the Alberta government has chosen to vary the amount of the basic federal child tax benefit that its residents receive (shown as a net amount).
Property Tax
· It is assumed that the individual at $25,000 rents accommodation; the family at $30,000 and at $55,000 and the senior couple own bungalows; the family at $90,000 owns a two-story executive style home; and the single at $80,000 owns a luxury condominium, in a major city for each province. Net local and provincial property taxes are estimated as taxes owing after credits provided through the property tax system are subtracted.
Sales, Fuel and Carbon Tax Estimates
· Includes sales tax on meals, liquor and accommodation. Estimates are based on expenditure patterns from the Survey of Household Spending. In estimating individual and family taxable consumption, disposable income is reduced by 20 per cent to reflect housing (mortgage and property taxes or rent) costs. The senior couple is assumed to own their home and have no mortgage costs. For each province, disposable income is further reduced by estimated federal income taxes, estimated provincial income taxes and health care premiums if applicable. In addition, the single individual with $80,000 annual income and the family with $90,000 annual income are assumed to have savings equal to 5 per cent of their disposable income. For each family, disposable income is distributed among expenditures using the consumption pattern of a typical family with the relevant characteristics as estimated by the family expenditure survey. The provincial retail sales tax and the federal goods and services tax (GST) components of these expenditures are then calculated. GST estimates have been reduced by the GST credit, where applicable.
· Fuel tax is based on annual consumption: 1,000 litres of unleaded fuel for the single at $25,000, the family at $30,000 and the senior couple; others are assumed to consume 1,500 litres.
· Carbon tax applies in British Columbia to household consumption of gasoline, diesel, natural gas and home heating fuel. Estimated carbon tax liabilities are based on natural gas and home heating fuel consumption amounts from the Survey of Household Spending and the assumed fuel tax consumption noted above. Net carbon tax is estimated as carbon tax liabilities less the value of the personal income tax cuts and the BC Low income Climate Action Tax Credit (where applicable) as reported in the Government’s plan to recycle carbon tax revenues.
Health Care Premiums/Payroll Tax
· A health care premium is levied in British Columbia only. Approximately 50 per cent of British Columbia premiums are paid by employers on behalf of their employees with the remainder paid by individuals, either by employees or by residents who are not employed. Payroll taxes, in the four provinces that levy them, are paid by the employer. The cost to employers of payroll taxes and health care premiums paid on behalf of employees is generally reflected in reduced wages.
Effective Tax Rates
· British Columbia taxes have been calculated using rates in effect for 2009. Taxes for other provinces were calculated using rates that were announced prior to February 6, 2009, and that come into effect during 2009.
Budget and Fiscal Plan – 2009/10 to 2011/12
129
Appendices
Table A4 Interprovincial Comparisons of Provincial Personal Income Taxes Payable (1) – 2009
(Rates known as of February 6, 2009)
Taxable income (2) | | British
Columbia | | Alberta | | Saskat-
chewan | | Manitoba | | Ontario | | Quebec(3) | | New
Brunswick | | Nova
Scotia | | Prince
Edward
Island | | New-
foundland | |
| | Annual provincial taxes payable(4) ($) | |
$10,000 | | 0 | | 0 | | 0 | | 22 | | 0 | | 0 | | 0 | | 0 | | 0 | | 0 | |
$20,000 | | 177 | | 206 | | 613 | | 1,127 | | 602 | | 761 | | 734 | | 904 | | 1,091 | | 852 | |
$30,000 | | 951 | | 1,139 | | 1,639 | | 2,164 | | 1,467 | | 2,130 | | 1,980 | | 1,800 | | 2,005 | | 1,570 | |
$40,000 | | 1,536 | | 2,073 | | 2,666 | | 3,347 | | 2,279 | | 3,523 | | 3,154 | | 3,236 | | 3,240 | | 2,745 | |
$50,000 | | 2,289 | | 3,037 | | 3,925 | | 4,584 | | 3,323 | | 5,178 | | 4,667 | | 4,700 | | 4,586 | | 3,998 | |
$60,000 | | 3,059 | | 4,037 | | 5,225 | | 5,859 | | 4,238 | | 6,816 | | 6,215 | | 6,209 | | 5,966 | | 5,278 | |
$70,000 | | 3,829 | | 5,037 | | 6,525 | | 7,274 | | 5,212 | | 8,454 | | 7,763 | | 7,876 | | 7,521 | | 6,770 | |
$80,000 | | 4,838 | | 6,037 | | 7,825 | | 9,014 | | 6,693 | | 10,179 | | 9,424 | | 9,543 | | 9,191 | | 8,320 | |
$100,000 | | 7,270 | | 8,037 | | 10,425 | | 12,494 | | 10,175 | | 14,130 | | 12,784 | | 13,229 | | 12,534 | | 11,420 | |
$125,000 | | 10,945 | | 10,537 | | 13,882 | | 16,844 | | 14,527 | | 19,058 | | 17,086 | | 18,041 | | 17,126 | | 15,295 | |
$150,000 | | 14,620 | | 13,037 | | 17,632 | | 21,194 | | 18,880 | | 23,868 | | 21,574 | | 22,854 | | 21,719 | | 19,170 | |
| | | | | | | | | | | | | | | | | | | | | |
| | Provincial personal income taxes as a per cent of taxable income (%) | |
$10,000 | | 0.0 | | 0.0 | | 0.0 | | 0.2 | | 0.0 | | 0.0 | | 0.0 | | 0.0 | | 0.0 | | 0.0 | |
$20,000 | | 0.9 | | 1.0 | | 3.1 | | 5.6 | | 3.0 | | 3.8 | | 3.7 | | 4.5 | | 5.5 | | 4.3 | |
$30,000 | | 3.2 | | 3.8 | | 5.5 | | 7.2 | | 4.9 | | 7.1 | | 6.6 | | 6.0 | | 6.7 | | 5.2 | |
$40,000 | | 3.8 | | 5.2 | | 6.7 | | 8.4 | | 5.7 | | 8.8 | | 7.9 | | 8.1 | | 8.1 | | 6.9 | |
$50,000 | | 4.6 | | 6.1 | | 7.9 | | 9.2 | | 6.6 | | 10.4 | | 9.3 | | 9.4 | | 9.2 | | 8.0 | |
$60,000 | | 5.1 | | 6.7 | | 8.7 | | 9.8 | | 7.1 | | 11.4 | | 10.4 | | 10.3 | | 9.9 | | 8.8 | |
$70,000 | | 5.5 | | 7.2 | | 9.3 | | 10.4 | | 7.4 | | 12.1 | | 11.1 | | 11.3 | | 10.7 | | 9.7 | |
$80,000 | | 6.0 | | 7.5 | | 9.8 | | 11.3 | | 8.4 | | 12.7 | | 11.8 | | 11.9 | | 11.5 | | 10.4 | |
$100,000 | | 7.3 | | 8.0 | | 10.4 | | 12.5 | | 10.2 | | 14.1 | | 12.8 | | 13.2 | | 12.5 | | 11.4 | |
$125,000 | | 8.8 | | 8.4 | | 11.1 | | 13.5 | | 11.6 | | 15.2 | | 13.7 | | 14.4 | | 13.7 | | 12.2 | |
$150,000 | | 9.7 | | 8.7 | | 11.8 | | 14.1 | | 12.6 | | 15.9 | | 14.4 | | 15.2 | | 14.5 | | 12.8 | |
(1) | | Calculated for a single individual with wage income and claiming credits for Canada Pension Plan and Quebec Pension Plan contributions, Employment Insurance premiums, Quebec Parental Insurance Plan premiums, and the basic personal amount. |
(2) | | Taxable income, total income less allowable deductions, is defined by federal legislation in all provinces except Quebec. In the table it is assumed that federally defined taxable income is equal to Quebec taxable income. |
(3) | | Quebec residents pay federal tax less an abatement of 16.5 per cent of federal tax. In the table, the Quebec abatement has been used to reduce Quebec provincial personal income tax for comparative purposes. |
(4) | | Includes provincial low income reductions (all provinces except Alberta and Saskatchewan), surtaxes payable in Ontario, Nova Scotia and Prince Edward Island, and the Ontario Health Premium tax. Excludes credits for sales and property tax credits. |
Budget and Fiscal Plan – 2009/10 to 2011/12
130
Appendices
Table A5 Summary of Revenue Measures from July 30, 2001 to February 17, 2009 (1)
July 30, 2001 Economic and Fiscal Update | | Effective Date |
Income Tax | | |
· 25 per cent personal income tax cut | | January 1, 2001 |
· Dividend tax credit rates reduced | | January 1, 2001 |
· General corporate income tax rate reduced to 13.5 per cent from 16.5 per cent | | January 1, 2002 |
· Manufacturing and processing tax credit repealed | | July 31, 2001 |
Corporation Capital Tax | | |
· Tax phased-out for general corporations | | September 1, 2001 |
Social Service Tax | | |
· Tax exemption for production machinery equipment | | July 31, 2001 |
· Vehicle surtax threshold for passenger vehicles increased | | July 31, 2001 |
Motor Fuel Tax | | |
· Tax exemption provided for marine bunker fuel | | August 1, 2001 |
· Domestic jet fuel and aviation fuel tax rates reduced to 2 cents/litre | | August 1, 2001 |
| | |
Budget 2002 | | |
Income Tax | | |
· Increase sales tax credit | | January 1, 2002 |
· Adjust BC Family Bonus | | July 1, 2002 |
· Raise small business threshold to $300,000 | | April 1, 2002 |
Medical Services Plan Premiums | | |
· Increase premiums and enhance premium assistance | | May 1, 2002 |
Social Service Tax | | |
· Increase provincial sales tax rate to 7.5 per cent from 7 per cent | | February 20, 2002 |
· Expand machinery and equipment tax exemption to include repair parts | | February 20, 2002 |
Tobacco Tax | | |
· Increase tobacco tax rate to $30 from $22 per carton | | February 20, 2002 |
School and Rural Area Property Taxes | | |
· Increase average gross residential rural and school property taxes by 2 per cent | | January 1, 2002 |
Miscellaneous measures | | |
· Disability credits; sales tax exemptions for farmers and refunds to Parent Advisory Councils | | various |
| | |
Budget 2003 | | |
Income Tax | | |
· Increase budget for labour sponsored venture capital tax credits | | April 1, 2003 |
· Introduce an equity tax credit for new media | | April 1, 2003 |
· Provide an enhanced regional incentive for film credits | | April 1, 2003 |
· Introduce a Digital Animation or Visual Effects tax credit | | April 1, 2003 |
· Extend the BC Mining Flow-Through Share Tax Credit | | January 1, 2004 |
· Extend the Mining Exploration Tax Credit for three years | | August 1, 2003 |
· Introduce a book publishing tax credit | | October 1, 2002 |
Corporation Capital Tax | | |
· Increase the capital tax exemption threshold for small financial institutions to $10 million from $5 million | | April 1, 2003 |
Motor Fuel Tax | | |
· Provide exemption for marine gas oil used in gas turbine powered commercial vessels | | February 19, 2003 |
BC Transportation Financing Authority Revenue | | |
· Increase the clear fuel tax rate levied on behalf of BC Transportation Financing Authority by 3.5 cents/litre | | March 1, 2003 |
Tobacco Tax | | |
· Increase the tobacco tax rate to $32 from $30 per carton and to 16 cents from 15 cents per gram of fine-cut tobacco | | February 19, 2003 |
School and Rural Area Property Taxes | | |
· Increase average gross residential rural and school property taxes by inflation | | January 1, 2003 |
Insurance Premium Tax | | |
· Increase tax on property insurance to 4.4 per cent from 4 per cent to offset forest fire suppression costs | | January 1, 2004 |
· Clarify the definition of taxable insurers | | February 19, 2003 |
Property Transfer Tax | | |
· Enhance fairness and effectiveness of First Time Home Buyers’ exemption | | February 19, 2003 |
Budget and Fiscal Plan – 2009/10 to 2011/12
131
Appendices
Table A5 Summary of Revenue Measures from July 30, 2001 to February 17, 2009 (1) – Continued
Budget 2004 | | Effective Date |
Income Tax | | |
| · | Reduce BC Family Bonus and BC Earned Income amounts | | July 1, 2004 |
| · | Extend Scientific Research and Experimental Development Tax Credit | | September 1, 2004 |
International Financial Business Tax Refund | | |
| · | Allow non-financial institutions to register, expand the list of qualifying activities and eliminate the employee tax refund | | September 1, 2004 |
Tobacco Tax | | |
| · | Increase tobacco tax rate to $35.80 from $32.00 per carton and to 17.9 cents per gram for fine-cut tobacco | | December 20, 2003 |
Home Owner Grant Act | | |
| · | Increase the threshold for the home owner grant phase-out to $585,000 from $525,000 | | January 1, 2004 |
Ports Property Tax Act | | |
| · | Reduce property taxes on major BC port facilities and provide compensation to municipalities | | January 1, 2004 |
| | |
Budget 2005 – February 15, 2005 | | |
Income Tax | | |
| · | Introduce the BC Tax Reduction, a non-refundable personal income tax credit | | January 1, 2005 |
| · | Extend the Mining Exploration Tax Credit to 2016 | | August 1, 2006 |
| · | Increase the Film Incentive BC and Production Services tax credit rates | | January 1, 2005 |
| · | Increase corporate income tax small business threshold to $400,000 from $300,000 | | January 1, 2005 |
Social Service Tax | | |
| · | Reduce provincial sales tax rate to 7 per cent from 7.5 per cent | | October 21, 2004 |
| · | Increase incentives for purchases of hybrid passenger vehicles on a time-limited basis | | February 16, 2005 |
| · | Provide time-limited exemption for ENERGY STAR residential heating equipment | | February 16, 2005 |
| · | Increase vehicle surtax threshold for passenger vehicles to $49,000 from $47,000 | | February 16, 2005 |
Property Transfer Tax | | |
| · | Increase thresholds for First Time Home Buyers’ program | | February 16, 2005 |
Medicare Protection Act | | |
| · | Enhance Medical Services Plan premium assistance | | July 1, 2005 |
Home Owner Grant Act | | |
| · | Increase threshold for home owner grant phase-out and reduce reduction rate | | 2005 tax year |
School Act | | |
| · | Exempt specified improvements of eligible hydroelectric projects | | 2005 tax year |
| | |
September Update (September 14, 2005) | | |
Income Tax | | |
| · | Reduce the general corporate income tax rate to 12 per cent from 13.5 per cent | | July 1, 2005 |
International Financial Activity Act | | |
| · | Provide tax refunds for the exploitation of life science related patents | | January 1, 2006 |
| | |
Budget 2006 | | |
Income Tax | | |
| · | Introduce an enhanced dividend tax credit to parallel new federal credit | | January 1, 2006 |
| · | Extend the BC Mining Flow-through Share Tax Credit to December 31, 2008 | | January 1, 2006 |
| · | Extend the enhanced tax credit rates for the Film Incentive BC and Production Services tax credits to 2008 | | April 1, 2006 |
Social Service Tax | | |
| · | Exempt services to maintain or modify software | | February 22, 2006 |
| · | Clarify and expand eligibility for machinery and equipment exemption | | February 22, 2006 |
| · | Increase vehicle surtax threshold for passenger vehicles to $55,000 from $49,000 | | February 22, 2006 |
| · | Provide authority to repeal tire levy when industry stewardship program introduced | | January 1, 2007 |
Motor Fuel Tax | | |
| · | Expand eligible coloured fuel uses | | February 22, 2006 |
Home Owner Grant Act | | |
| · | Increase the basic home owner grant to $570 from $470 and the grant for seniors, veterans and the disabled to $845 from $745 | | 2006 tax year |
| · | Increase the threshold for the home owner grant phase out | | 2006 tax year |
Small Business Venture Capital Act | | |
| · | Increase the tax credit budget to $25 million from $20 million | | April 1, 2006 |
Budget and Fiscal Plan – 2009/10 to 2011/12
132
Appendices
Table A5 Summary of Revenue Measures from July 30, 2001 to February 17, 2009 (1) – Continued
Budget 2007 | | Effective Date |
Income Tax | | |
| · | Introduce a 10 per cent tax cut up to $100,000 in income | | January 1, 2007 |
| · | Introduce an adoption expense tax credit | | January 1, 2007 |
| · | Enhance the Mining Exploration Tax Credit for exploration activity in Mountain Pine Beetle affected areas | | February 21, 2007 |
| · | Extend the Book Publishing Tax Credit for five more years to 2012 | | April 1, 2007 |
| · | Extend the Scientific Research and Experimental Tax Credit for five more years to 2014 | | September 1, 2009 |
| · | Implement the BC Training Tax Credit program | | January 1, 2007 |
Mineral Tax Act | | |
| · | Extend the new mine allowance to 2016 | | February 21, 2007 |
Social Service Tax Act | | |
| · | Restructure the exemption for multi-glazed windows/doors to apply only to ENERGY STAR windows, doors (including side panels and skylights) | | February 21, 2007 |
| · | Extend the expiry date for ENERGY STAR furnaces, boilers and heat pumps to various dates | | February 21, 2007 |
| · | Extend the tax relief for hybrid passenger vehicles to 2011 | | February 21, 2007 |
| · | Provide a tax refund on eligible medical equipment purchased by charities | | February 21, 2007 |
Motor Fuel Tax Act | | |
| · | Classify all biodiesel fuel as alternative motor fuel | | February 21, 2007 |
Property Transfer Tax Act | | |
| · | Set the First Time Home Buyers’ exemption threshold at $375,000 province-wide | | February 21, 2007 |
Home Owner Grant Act | | |
| · | Increase the threshold for the home owner grant phase-out | | 2007 tax year |
| · | Extend home owner grant eligibility to certain low-income homeowners with homes assessed above the phase-out threshold | | 2007 tax year |
Land Tax Deferment Act | | |
| · | Extend eligibility to homeowners age 55 and over from 60 and over | | 2007 tax year |
Police Act | | |
| · | New property tax to help fund police services in rural areas and communities under 5,000 population | | 2007 tax year |
Provincial Sales Tax Review | | |
Various Consumption Tax Statutes | | |
| · | Changes to consumption tax statutes to reduce compliance burden for businesses and simplify specific exemptions | | various |
Budget 2008 | | |
Revenue Neutral Climate Action Measures | | |
Climate Action Act | | |
| · | Government to introduce a broadly based revenue neutral carbon tax on the purchase or use of fossil fuels subject to approval by the Legislature | | July 1, 2008 |
Income Tax Act - Revenue Neutral Tax Reductions | | |
| · | Introduce a Low Income Climate Action Tax Credit | | July 1, 2008 |
| · | Reduce first two personal income tax bracket rates by 2 per cent for 2008 and by 5 per cent for 2009 and subsequent years | | January 1, 2008 |
| · | Reduce general corporate income tax rate to 11 per cent from from 12 per cent | | July 1, 2008 |
| · | Reduce corporate income tax small business rate to 3.5 per cent from 4.5 per cent | | July 1, 2008 |
Income Tax Act - One-time Payment | | |
| · | Provide a one-time Climate Action Dividend Payment of $100 to each person resident in BC on December 31, 2007 | | December 31, 2007 |
Other Climate Action Initiatives | | |
Small Business Venture Capital Act | | |
| · | Increase equity tax credit budget by $5 million per year and set a tax credit budget of $7.5 million for clean technology | | April 1, 2008 |
International Financial Activity Act | | |
| · | Expand eligible intellectual property to include green-related patents | | March 1, 2008 |
Budget and Fiscal Plan – 2009/10 to 2011/12
133
Appendices
Table A5 Summary of Revenue Measures from July 30, 2001 to February 17, 2009 (1) – Continued
Budget 2008 - (Continued) | | Effective Date | |
Social Service Tax Act | | | |
| · | Provide time-limited point-of-sale tax reduction for conventional fuel efficient vehicles | | February 20, 2008 |
| · | Exempt ENERGY STAR qualified residential refrigerators, clothes washers and freezers to March 31, 2010 | | February 20, 2008 |
| · | Exempt energy efficient residential gas-fired water heaters to December 31, 2009 | | February 20, 2008 |
| · | Exempt production machinery and equipment for local governments for power production and cogeneration | | February 20, 2008 | |
| · | Expand the exemption for bicycles to include electric power-assisted two and three wheel cycles and non-motorized tricycles | | February 20, 2008 | |
| · | Exempt electric motorcycles to March 31, 2011 | | February 20, 2008 | |
| · | Reduce tax payable on hydrogen fuel cell buses | | February 20, 2008 | |
| · | Exempt biodiesel fuel or portion of biodiesel for heating | | February 20, 2008 | |
| · | Impose tax on coal and coke except for residential use | | February 20, 2008 | |
Other Revenue Measures | | | |
Income Tax Act | | | |
| · | Reduce dividend tax credit rates for ordinary and enhanced dividends | | January 1, 2009 | |
| · | Extend film tax credits for five more years to 2013 from 2008 | | various | |
| · | Increase basic Film Incentive BC Tax Credit rate to 35 per cent from 30 per cent and basic Production Services Tax Credit rate to 25 per cent from 18 per cent for two years | | January 1, 2008 | |
| · | Enhance regional film tax credit for productions in distant locations | | February 20, 2008 | |
Corporation Capital Tax Act | | | |
| · | Phase-out Corporation Capital Tax and replace it with a new financial institutions minimum tax | | April 1, 2008 | |
Ports Property Tax Act | | | |
| · | Extend ports competitiveness initiative for ten years | | various | |
Property Transfer Tax Act | | | |
| · | Increase First Time Home Buyers’ threshold to $425,000 from $375,000 | | February 20, 2008 | |
| · | Remove First Time Home Buyers’ 70 percent financing requirement | | February 20, 2008 | |
Home Owner Grant Act | | | |
| · | Increase in the home owner grant phase-out threshold | | 2008 tax year | |
School Act | | | |
| · | Reduce the non-residential school tax rate for major industrial property | | 2008 tax year | |
Provincial Sales Tax Review | | | |
Various Consumption Tax Statutes | | | |
| · | Changes to consumption tax statutes to reduce compliance burden for businesses and simplify specific exemptions | | various | |
| | |
October 22 and November 1, 2008 | | |
Income Tax Act | | |
| · | Reduce personal income tax rates for the first two tax brackets by 3 per cent | | January 1, 2008 |
| · | Reduce small business corporate income tax rate to 2.5 per cent from 3.5 per cent | | December 1, 2008 |
Land Tax Deferment Act | | |
| · | Introduce 2 year temporary financial hardship property tax deferment program | | 2009 tax year |
Social Service Tax Act and Hotel Room Tax Act | | |
| · | Double maximum commission paid to business for provincial sales tax and hotel room tax collection and remittance | | November 1, 2008 |
School Act | | |
| · | Provide an Industrial Property Tax Credit of 50 per cent of provincial school property tax on major industrial (class 4) and light industrial (class 5) properties | | 2009 tax year |
| | | | | | |
Budget and Fiscal Plan – 2009/10 to 2011/12
134
Appendices
Table A5 Summary of Revenue Measures from July 30, 2001 to February 17, 2009 (1) – Continued
Budget 2009 | | |
Income Tax Act | | |
| · | Reduce the dividend tax credit for ordinary dividends | | January 1, 2010 |
| · | Extend the BC Mining Flow-through Share Tax Credit to December 31, 2009 | | January 1, 2009 |
| · | Reduce general corporate income tax rate from 11 per cent to 10.5 per cent effective January 1, 2010 and to 10 per cent effective January 1, 2011 | | January 1, 2010 |
| · | Remove expiry dates for film tax credits | | various |
| · | Eligibility requirement for Film Incentive BC expanded | | January 1, 2009 |
International Financial Activity Act | | |
| · | Expand the list of prescribed patents to include wastewater treatment and fuel cell technology | | April 1, 2009 |
Social Service Tax Act | | |
| · | Extend exemption for ENERGY STAR qualified residential heating equipment to 2011 | | February 18, 2009 |
| · | Extend exemption for ENERGY STAR qualified windows, doors and skylights to 2011 | | February 18, 2009 |
| · | Extend exemption for energy efficient residential gas-fired water heaters to 2011 | | February 18, 2009 |
| · | Provide exemption for energy efficient commercial boilers to 2011 | | February 18, 2009 |
| · | Provide exemption for devices which reduce idling by commercial vehicles to 2012 | | February 18, 2009 |
| · | Expand exemption for aerodynamic devices for commercial vehicles | | February 18, 2009 |
| · | Provide exemption for equipment to produce energy from ocean currents, tides and waves | | February 18, 2009 |
| · | Expand exemption for production machinery and equipment | | February 18, 2009 |
Motor Fuel Tax Act | | |
| · | Classify and exempt hydrogen as an alternative motor fuel when purchased for use in fuel cell vehicles | | February 18, 2009 |
Tobacco Tax Act | | |
| · | Increase tobacco tax rate from $35.80 to $37 per carton of 200 cigarettes | | February 18, 2009 |
Home Owner Grant Act | | |
| · | Maintain home owner grant phase-out threshold at 2008 level | | 2009 tax year |
(1) | Measures with no material revenue impact are excluded. For details of these measures see the revenue measures section of each budget publication. | |
Table A6 Operating Statement – 2005/06 to 2011/12
($ millions) | | Actual
2005/06 | | Actual
2006/07 | | Actual
2007/08 | | Revised
Forecast
2008/09 | | Budget
Estimate
2009/10 | | Plan
2010/11 | | Plan
2011/12 | |
Revenue | | 35,974 | | 38,505 | | 39,831 | | 38,455 | | 38,812 | | 39,795 | | 41,182 | |
Expense | | (32,151 | ) | (34,162 | ) | (36,501 | ) | (38,405 | ) | (39,307 | ) | (40,040 | ) | (41,182 | ) |
Negotiating Framework incentive payments | | (710 | ) | (264 | ) | (4 | ) | — | | — | | — | | — | |
Climate Action Dividend | | — | | — | | (440 | ) | — | | — | | — | | — | |
Surplus/(deficit) | | 3,113 | | 4,079 | | 2,886 | | 50 | | (495 | ) | (245 | ) | — | |
Budget and Fiscal Plan – 2009/10 to 2011/12
135
Appendices
Table A7 Revenue by Source – 2005/06 to 2011/12
($ millions) | | Actual
2005/06 | | Actual
2006/07 | | Actual
2007/08 | | Revised
Forecast
2008/09 | | Budget
Estimate
2009/10 | | Plan
2010/11 | | Plan
2011/12 | |
Taxation revenue | | | | | | | | | | | | | | | |
Personal income | | 5,838 | | 6,905 | | 6,956 | | 6,219 | | 6,562 | | 6,942 | | 7,366 | |
Corporate income | | 1,426 | | 1,538 | | 2,250 | | 2,037 | | 1,529 | | 1,072 | | 923 | |
Social service | | 4,367 | | 4,714 | | 5,072 | | 4,998 | | 5,087 | | 5,299 | | 5,533 | |
Fuel | | 911 | | 901 | | 935 | | 912 | | 914 | | 920 | | 928 | |
Carbon | | — | | — | | — | | 300 | | 546 | | 754 | | 968 | |
Tobacco | | 701 | | 726 | | 692 | | 713 | | 687 | | 687 | | 687 | |
Property | | 1,717 | | 1,732 | | 1,795 | | 1,840 | | 1,881 | | 1,936 | | 1,967 | |
Property transfer | | 843 | | 914 | | 1,068 | | 735 | | 685 | | 720 | | 750 | |
Corporation capital | | 161 | | 104 | | 117 | | 80 | | 54 | | — | | — | |
Other (1) | | 465 | | 484 | | 521 | | 530 | | 540 | | 553 | | 570 | |
| | 16,429 | | 18,018 | | 19,406 | | 18,364 | | 18,485 | | 18,883 | | 19,692 | |
| | | | | | | | | | | | | | | |
Natural resource revenue | | | | | | | | | | | | | | | |
Natural gas royalties | | 1,921 | | 1,207 | | 1,132 | | 1,376 | | 1,014 | | 1,156 | | 1,281 | |
Bonus bids, permits and fees | | 405 | | 479 | | 607 | | 862 | | 889 | | 932 | | 952 | |
Forests | | 1,214 | | 1,276 | | 1,087 | | 587 | | 609 | | 707 | | 700 | |
Other natural resources | | 1,027 | | 1,020 | | 952 | | 1,186 | | 1,118 | | 1,114 | | 1,078 | |
| | 4,567 | | 3,982 | | 3,778 | | 4,011 | | 3,630 | | 3,909 | | 4,011 | |
| | | | | | | | | | | | | | | |
Other revenue | | | | | | | | | | | | | | | |
Medical Services Plan premiums | | 1,482 | | 1,524 | | 1,557 | | 1,577 | | 1,591 | | 1,613 | | 1,635 | |
Post secondary education fees | | 892 | | 928 | | 979 | | 997 | | 1,029 | | 1,055 | | 1,079 | |
Other fees and licences | | 1,313 | | 1,360 | | 1,450 | | 1,433 | | 1,489 | | 1,446 | | 1,440 | |
Investment earnings | | 949 | | 1,032 | | 1,139 | | 839 | | 918 | | 1,005 | | 1,095 | |
Miscellaneous (2) | | 2,296 | | 2,589 | | 2,617 | | 2,474 | | 2,475 | | 2,503 | | 2,562 | |
| | 6,932 | | 7,433 | | 7,742 | | 7,320 | | 7,502 | | 7,622 | | 7,811 | |
| | | | | | | | | | | | | | | |
Contributions from the federal government | | | | | | | | | | | | | | | |
Health and social transfers | | 4,220 | | 4,473 | | 4,614 | | 4,693 | | 4,910 | | 5,110 | | 5,316 | |
Equalization | | 590 | | 459 | | — | | — | | — | | — | | — | |
Other cost shared agreements (3) | | 1,015 | | 1,454 | | 1,317 | | 1,223 | | 1,460 | | 1,408 | | 1396 | |
| | 5,825 | | 6,386 | | 5,931 | | 5,916 | | 6,370 | | 6,518 | | 6,712 | |
| | | | | | | | | | | | | | | |
Commercial Crown corporation net income | | | | | | | | | | | | | | | |
BC Hydro | | 266 | | 407 | | 370 | | 357 | | 452 | | 493 | | 542 | |
Liquor Distribution Branch | | 800 | | 840 | | 858 | | 867 | | 896 | | 918 | | 938 | |
BCLC (net of payments to the federal government) | | 914 | | 1,011 | | 1,080 | | 1,101 | | 1,154 | | 1,198 | | 1,228 | |
ICBC (4) | | 191 | | 381 | | 633 | | 459 | | 260 | | 192 | | 217 | |
Other | | 50 | | 47 | | 33 | | 60 | | 63 | | 62 | | 31 | |
| | 2,221 | | 2,686 | | 2,974 | | 2,844 | | 2,825 | | 2,863 | | 2,956 | |
Total revenue | | 35,974 | | 38,505 | | 39,831 | | 38,455 | | 38,812 | | 39,795 | | 41,182 | |
(1) | Includes revenue from insurance premium and hotel room taxes. |
(2) | Includes asset dispositions, reimbursements for health care and other services provided to external agencies, and other recoveries. |
(3) | Includes contributions for health, education, housing and social service programs, for transportation projects, and for coastal ferry services. |
(4) | Amounts represent earnings during government’s fiscal year. |
Budget and Fiscal Plan – 2009/10 to 2011/12
136
Appendices
Table A8 Expense by Function – 2005/06 to 2011/12
($ millions) | | Actual
2005/06 | | Actual
2006/07 | | Actual
2007/08 | | Revised
Forecast
2008/09 (1) | | Budget
Estimate
2009/10 | | Plan
2010/11 | | Plan
2011/12 | |
Health | | | | | | | | | | | | | | | |
Medical Services Plan | | 2,696 | | 2,969 | | 3,247 | | 3,367 | | 3,576 | | 3,689 | | 3,810 | |
Pharmacare | | 868 | | 914 | | 955 | | 1,018 | | 1,062 | | 1,110 | | 1,157 | |
Regional services (1) | | 8,112 | | 8,500 | | 9,038 | | 9,675 | | 10,052 | | 10,729 | | 11,468 | |
Other healthcare expenses (2) | | 754 | | 867 | | 996 | | 1,011 | | 1,032 | | 1,046 | | 1,078 | |
| | 12,430 | | 13,250 | | 14,236 | | 15,071 | | 15,722 | | 16,574 | | 17,513 | |
Education | | | | | | | | | | | | | | | |
Elementary and secondary | | 4,829 | | 5,272 | | 5,521 | | 5,687 | | 5,774 | | 5,812 | | 5,836 | |
Post-secondary | | 3,906 | | 4,056 | | 4,303 | | 4,418 | | 4,582 | | 4,670 | | 4,762 | |
Other education expenses (3) | | 182 | | 159 | | 165 | | 133 | | 438 | | 438 | | 438 | |
| | 8,917 | | 9,487 | | 9,989 | | 10,238 | | 10,794 | | 10,920 | | 11,036 | |
Social services | | | | | | | | | | | | | | | |
Social assistance (2),(3) | | 1,151 | | 1,277 | | 1,297 | | 1,343 | | 1,391 | | 1,391 | | 1,356 | |
Child welfare (2) | | 892 | | 1,027 | | 992 | | 1,103 | | 1,094 | | 1,104 | | 1,101 | |
Community living and other services | | 681 | | 588 | | 757 | | 901 | | 925 | | 935 | | 936 | |
| | 2,724 | | 2,892 | | 3,046 | | 3,347 | | 3,410 | | 3,430 | | 3,393 | |
Protection of persons and property | | 1,379 | | 1,326 | | 1,579 | | 1,519 | | 1,544 | | 1,492 | | 1,460 | |
Transportation | | 1,196 | | 1,251 | | 1,379 | | 1,429 | | 1,402 | | 1,457 | | 1,569 | |
Natural resources & economic development | | 1,570 | | 1,641 | | 1,974 | | 1,670 | | 1,836 | | 1,637 | | 1,667 | |
Other | | 1,089 | | 1,278 | | 1,398 | | 1,821 | | 705 | | 616 | | 804 | |
Contingencies (4) | | — | | — | | — | | 467 | | 385 | | 300 | | 250 | |
Funding for capital expenditures | | — | | — | | — | | — | | 560 | | 620 | | 475 | |
General government | | 644 | | 768 | | 669 | | 684 | | 747 | | 710 | | 691 | |
Debt servicing costs | | 2,202 | | 2,269 | | 2,231 | | 2,159 | | 2,202 | | 2,409 | | 2,574 | |
Subtotal | | 32,151 | | 34,162 | | 36,501 | | 38,405 | | 39,307 | | 40,165 | | 41,432 | |
Negotiating Framework incentive payments | | 710 | | 264 | | 4 | | — | | — | | — | | — | |
Climate Action Dividend | | — | | — | | 440 | | — | | — | | — | | — | |
Subtotal expense | | 32,861 | | 34,426 | | 36,945 | | 38,405 | | 39,307 | | 40,165 | | 41,432 | |
Fiscal efficiencies | | — | | — | | — | | — | | — | | (125 | ) | (250 | ) |
Total expense | | 32,861 | | 34,426 | | 36,945 | | 38,405 | | 39,307 | | 40,040 | | 41,182 | |
(1) Includes Supplementary Estimates funding of $622 million.
(2) Payments for healthcare services by the Ministry of Housing and Social Development and the Ministry of Children and Family Development made on behalf of their clients are reported in the Health function.
(3) Payments for training costs by the Ministry of Housing and Social Development made on behalf of its clients are reported in the Education function.
(4) The Contingencies vote is allocated to functions according to actual results for 2004/05 to 2007/08 and revised forecast for 2008/09.
Budget and Fiscal Plan – 2009/10 to 2011/12
137
Appendices
Table A9 Service Delivery Agency Operating Results (1) – 2005/06 to 2011/12
($ millions) | | Actual
2005/06 | | Actual
2006/07 | | Actual
2007/08 | | Revised
Forecast
2008/09 | | Budget
Estimate
2009/10 | | Plan
2010/11 | | Plan
2011/12 | |
| | | | | | | | | | | | | | | |
School districts | | | | | | | | | | | | | | | |
| | | | | | | | | | | | | | | |
Revenue | | 4,812 | | 5,178 | | 5,243 | | 5,399 | | 5,488 | | 5,508 | | 5,514 | |
Expense | | (4,612 | ) | (5,041 | ) | (5,133 | ) | (5,308 | ) | (5,394 | ) | (5,437 | ) | (5,450 | ) |
| | 200 | | 137 | | 110 | | 91 | | 94 | | 71 | | 64 | |
Accounting adjustments | | 24 | | 61 | | 51 | | 132 | | 135 | | 131 | | 106 | |
Net impact | | 224 | | 198 | | 161 | | 223 | | 229 | | 202 | | 170 | |
| | | | | | | | | | | | | | | |
Post-secondary institutions | | | | | | | | | | | | | | | |
| | | | | | | | | | | | | | | |
Revenue | | 3,902 | | 4,129 | | 4,178 | | 4,161 | | 4,625 | | 4,731 | | 4,793 | |
Expense | | (3,678 | ) | (3,903 | ) | (4,133 | ) | (4,376 | ) | (4,548 | ) | (4,704 | ) | (4,798 | ) |
| | 224 | | 226 | | 45 | | (215 | ) | 77 | | 27 | | (5 | ) |
Accounting adjustments | | 133 | | 117 | | 329 | | 264 | | 106 | | 17 | | (75 | ) |
Net impact | | 357 | | 343 | | 374 | | 49 | | 183 | | 44 | | (80 | ) |
| | | | | | | | | | | | | | | |
Health authorities and hospital societies | | | | | | | | | | | | | | | |
| | | | | | | | | | | | | | | |
Revenue | | 8,245 | | 8,857 | | 9,467 | | 10,155 | | 10,454 | | 11,016 | | 11,667 | |
Expense | | (8,243 | ) | (8,892 | ) | (9,495 | ) | (10,194 | ) | (10,454 | ) | (11,016 | ) | (11,667 | ) |
| | 2 | | (35 | ) | (28 | ) | (39 | ) | — | | — | | — | |
Accounting adjustments | | 16 | | (88 | ) | (33 | ) | 187 | | (33 | ) | 8 | | (61 | ) |
Net impact | | 18 | | (123 | ) | (61 | ) | 148 | | (33 | ) | 8 | | (61 | ) |
| | | | | | | | | | | | | | | |
Community Living BC | | | | | | | | | | | | | | | |
| | | | | | | | | | | | | | | |
Revenue | | 439 | | 631 | | 687 | | 717 | | 722 | | 691 | | 691 | |
Expense | | (439 | ) | (631 | ) | (687 | ) | (717 | ) | (722 | ) | (691 | ) | (691 | ) |
| | — | | — | | — | | — | | — | | — | | — | |
Accounting adjustments | | 4 | | 1 | | — | | 1 | | — | | (1 | ) | (1 | ) |
Net impact | | 4 | | 1 | | — | | 1 | | — | | (1 | ) | (1 | ) |
| | | | | | | | | | | | | | | |
BC Transportation Financing Authority | | | | | | | | | | | | | | | |
| | | | | | | | | | | | | | | |
Revenue | | 657 | | 618 | | 651 | | 591 | | 602 | | 621 | | 669 | |
Expense | | (604 | ) | (585 | ) | (722 | ) | (733 | ) | (809 | ) | (790 | ) | (914 | ) |
| | 53 | | 33 | | (71 | ) | (142 | ) | (207 | ) | (169 | ) | (245 | ) |
Accounting adjustments | | (168 | ) | (155 | ) | (171 | ) | (137 | ) | (130 | ) | (124 | ) | (120 | ) |
Net impact | | (115 | ) | (122 | ) | (242 | ) | (279 | ) | (337 | ) | (293 | ) | (365 | ) |
| | | | | | | | | | | | | | | |
BC Pavilion Corporation | | | | | | | | | | | | | | | |
| | | | | | | | | | | | | | | |
Revenue | | 37 | | 39 | | 70 | | 51 | | 89 | | 83 | | 94 | |
Expense | | (37 | ) | (39 | ) | (41 | ) | (50 | ) | (97 | ) | (104 | ) | (111 | ) |
| | — | | — | | 29 | | 1 | | (8 | ) | (21 | ) | (17 | ) |
Accounting adjustments | | 97 | | 105 | | 26 | | 306 | | 2 | | 8 | | (6 | ) |
Net impact | | 97 | | 105 | | 55 | | 307 | | (6 | ) | (13 | ) | (23 | ) |
Budget and Fiscal Plan – 2009/10 to 2011/12
138
Appendices
Table A9 Service Delivery Agency Operating Results (1) – 2005/06 to 2011/12 – Continued
($ millions) | | Actual
2005/06 | | Actual
2006/07 | | Actual
2007/08 | | Updated
Forecast
2008/09 | | Budget
Estimate
2009/10 | | Plan
2009/11 | | Plan
2011/12 | |
| | | | | | | | | | | | | | | |
British Columbia Housing Management Commission | | | | | | | | | | | | | | | |
| | | | | | | | | | | | | | | |
Revenue | | 343 | | 497 | | 540 | | 608 | | 504 | | 499 | | 500 | |
Expense | | (343 | ) | (497 | ) | (540 | ) | (608 | ) | (504 | ) | (499 | ) | (500 | ) |
| | — | | — | | — | | — | | — | | — | | — | |
Accounting adjustments | | 5 | | (15 | ) | (4 | ) | — | | — | | — | | — | |
Net impact | | 5 | | (15 | ) | (4 | ) | — | | — | | — | | — | |
| | | | | | | | | | | | | | | |
British Columbia Transit | | | | | | | | | | | | | | | |
| | | | | | | | | | | | | | | |
Revenue | | 155 | | 165 | | 188 | | 231 | | 259 | | 293 | | 332 | |
Expense | | (155 | ) | (167 | ) | (187 | ) | (232 | ) | (259 | ) | (293 | ) | (332 | ) |
| | — | | (2 | ) | 1 | | (1 | ) | — | | — | | — | |
Accounting adjustments | | 6 | | — | | 2 | | (4 | ) | 52 | | (38 | ) | (37 | ) |
Net impact | | 6 | | (2 | ) | 3 | | (5 | ) | 52 | | (38 | ) | (37 | ) |
| | | | | | | | | | | | | | | |
Tourism British Columbia | | | | | | | | | | | | | | | |
| | | | | | | | | | | | | | | |
Revenue | | 58 | | 60 | | 61 | | 67 | | 66 | | 67 | | 69 | |
Expense | | (57 | ) | (59 | ) | (63 | ) | (67 | ) | (66 | ) | (67 | ) | (69 | ) |
| | 1 | | 1 | | (2 | ) | — | | — | | — | | — | |
Accounting adjustments | | (1 | ) | 7 | | (1 | ) | — | | — | | — | | — | |
Net impact | | — | | 8 | | (3 | ) | — | | — | | — | | — | |
| | | | | | | | | | | | | | | |
Other service delivery agencies | | | | | | | | | | | | | | | |
| | | | | | | | | | | | | | | |
Revenue | | 1,098 | | 683 | | 705 | | 878 | | 720 | | 800 | | 833 | |
Expense | | (964 | ) | (610 | ) | (662 | ) | (678 | ) | (716 | ) | (788 | ) | (818 | ) |
| | 134 | | 73 | | 43 | | 200 | | 4 | | 12 | | 10 | |
Accounting adjustments | | (5 | ) | 50 | | 48 | | (124 | ) | 517 | | 555 | | 404 | |
Net impact | | 129 | | 123 | | 91 | | 76 | | 521 | | 567 | | 414 | |
| | | | | | | | | | | | | | | |
Total net impact | | 725 | | 516 | | 374 | | 520 | | 609 | | 476 | | 17 | |
| | | | | | | | | | | | | | | |
Total service delivery agency operating results: | | | | | | | | | | | | | | | |
| | | | | | | | | | | | | | | |
Revenue | | 19,746 | | 20,857 | | 21,790 | | 22,858 | | 23,529 | | 24,309 | | 25,162 | |
Accounting adjustments | | 105 | | 73 | | 240 | | 632 | | 649 | | 556 | | 205 | |
| | 19,851 | | 20,930 | | 22,030 | | 23,490 | | 24,178 | | 24,865 | | 25,367 | |
Expense | | (19,132 | ) | (20,424 | ) | (21,663 | ) | (22,963 | ) | (23,569 | ) | (24,389 | ) | (25,350 | ) |
Accounting adjustments | | 6 | | 10 | | 7 | | (7 | ) | — | | — | | — | |
| | (19,126 | ) | (20,414 | ) | (21,656 | ) | (22,970 | ) | (23,569 | ) | (24,389 | ) | (25,350 | ) |
Total net impact | | 725 | | 516 | | 374 | | 520 | | 609 | | 476 | | 17 | |
(1) Revenue and expense are shown as reported in the entity financial statements and service plans, before consolidation and accounting adjustments.
Budget and Fiscal Plan – 2009/10 to 2011/12
139
Appendices
Table A10 Material Assumptions – Revenue
Revenue Source and Assumptions | | Budget | | Revised
Forecast | | Plan | | Plan | | Plan | | | |
($ millions unless otherwise specified) | | 2008/09 | | 2009/10 | | 2010/11 | | 2011/12 | | Sensitivities 2009/10 | |
Personal income tax | | $ | 6,700 | | $ | 6,219 | | $ | 6,562 | | $ | 6,942 | | $ | 7,366 | | | |
Current calendar year assumptions | | | | | | | | | | | | | |
Personal income growth | | 4.4 | % | 5.1 | % | 1.7 | % | 3.5 | % | 4.3 | % | +/- 1% change in 2009 BC personal income growth equals +/- $50 to $100 million | |
Labour income growth | | 4.7 | % | 5.8 | % | 1.2 | % | 3.8 | % | 5.0 | % | |
Tax base growth | | 5.4 | % | 4.5 | % | 1.3 | % | 4.1 | % | 5.3 | % | |
Average tax yield | | 5.45 | % | 5.28 | % | 5.35 | % | 5.41 | % | 5.45 | % | | |
Current-year tax | | $ | 6,662 | | $ | 6,401 | | $ | 6,580 | | $ | 6,926 | | $ | 7,341 | | +/- 1% change in 2008 BC personal or taxable income growth equals +/- $50 to $100 million one-time effect (prior-year adjustment) and could result in an additional +/- $50 to $100 million base change in 2009/10 | |
BC Tax Reduction | | $ | -116 | | $ | -130 | | $ | -131 | | $ | -134 | | $ | -137 | | |
Low income climate action tax credit | | $ | -90 | | $ | -70 | | $ | -145 | | $ | -146 | | $ | -138 | | |
Refundable sales tax credit | | $ | -56 | | $ | -53 | | $ | -53 | | $ | -53 | | $ | -53 | | |
Other tax credits and refunds | | $ | -99 | | $ | -110 | | $ | -106 | | $ | -98 | | $ | -93 | | |
Policy neutral elasticity * | | 1.4 | | 1.0 | | 1.3 | | 1.4 | | 1.4 | | |
Fiscal year assumptions | | | | | | | | | | | | |
Prior-year adjustment | | $ | 0 | | $ | -151 | | | | | | | | | |
Family Bonus offset | | $ | -14 | | $ | -12 | | $ | -9 | | $ | -6 | | $ | -4 | | | |
| | | | | | | | | | | | | | | | | | | | | | |
Previous calendar year assumptions | | 2007 Assumptions | | | | | | | | | |
Personal income growth | | 5.3 | % | 6.8 | % | | | | | | | | |
Labour income growth | | 6.0 | % | 6.3 | % | | | | | | | | |
Tax base growth | | 8.0 | % | 8.3 | % | | | | | | | | |
Average 2007 tax yield | | 5.70 | % | 5.64 | % | | | | | | | | |
2007 tax | | $ | 6,609 | | $ | 6,550 | | | | | | | | | |
2006 and previous years tax | | $ | 300 | | $ | 422 | | | | | | | | | |
BC Tax Reduction | | $ | -114 | | $ | -127 | | | | | | | | | |
Refundable sales tax credit | | $ | -56 | | $ | -53 | | | | | | | | | |
Other tax credits and refunds | | $ | -98 | | $ | -108 | | | | | | | | | |
Policy neutral elasticity * | | 1.8 | | 1.3 | | | | | | | | | |
* Ratio of annual per cent change in current-year revenue to annual per cent change in personal income | |
Corporate income tax | | $ | 1,343 | | $ | 2,037 | | $ | 1,529 | | $ | 1,072 | | $ | 923 | | | |
Components of revenue | | | | | | | | | | | | | |
Advance instalments (fiscal year) | | $ | 1,382 | | $ | 1,386 | | $ | 1,302 | | $ | 1,257 | | $ | 1,209 | | | |
International Financial Activity Act refunds | | $ | -27 | | $ | -20 | | $ | -20 | | $ | -20 | | $ | -20 | | | |
Prior-year adjustment | | $ | -12 | | $ | 671 | | $ | 247 | | $ | -165 | | $ | -266 | | | |
Current year assumptions | | | | | | | | | | | | | |
National tax base ($billions) | | $ | 205.3 | | $ | 199.9 | | $ | 177.2 | | $ | 186.4 | | $ | 203.8 | | +/- 1% change in the 2009 national tax base equals +/- $15 to $20 million in 2009/10 | |
BC instalment share of national tax base | | 10.0 | % | 10.0 | % | 12.1 | % | 11.7 | % | 10.8 | % | |
Effective tax rates (general/small business) | | 11.5 / 4.0 | | 11.5 / 3.92 | | 11.0 / 2.5 | | 10.5 / 2.5 | | 10.0 / 2.5 | | +/- 1% change in the 2008 BC tax base equals +/- $15 to $25 million in 2009/10 | |
BC tax base growth | | 0.5 | % | -5.0 | % | -18.2 | % | 1.6 | % | 3.6 | % | |
BC corporate profits growth | | 0.4 | % | -4.0 | % | -24.7 | % | 1.5 | % | 3.2 | % | | |
BC Tax credits | | | | | | | | | | | | | |
Film, Television and Production Services | | $ | -204 | | $ | -192 | | $ | -202 | | $ | -212 | | $ | -222 | | | |
Scientific Research and Experimental Development | | $ | -135 | | $ | -136 | | $ | -146 | | $ | -156 | | $ | -166 | | | |
Other | | $ | -44 | | $ | -21 | | $ | -15 | | $ | -20 | | $ | -24 | | | |
| | | | | | | | | | | | | | | | | | | | | | |
Previous calendar year assumptions | | 2007 Assumptions | |
National tax base growth | | 5.7 | % | 6.8 | % |
BC instalment share of national tax base | | 9.6 | % | 12.1 | % |
National corporate profits growth | | 5.0 | % | 3.3 | % |
BC tax base growth | | -12.6 | % | 11.3 | % |
BC corporate profits growth | | 2.1 | % | -3.2 | % |
Gross 2007 tax | | $ | 1,789 | | $ | 2,364 | |
2006 and previous years tax | | $ | 0 | | $ | 100 | |
BC Tax credits | | | | | |
Film, Television and Production Services | | $ | -146 | | $ | -144 | |
Scientific Research and Experimental Development | | $ | -125 | | $ | -126 | |
Other | | $ | -44 | | $ | -36 | |
Revenue is recorded on a cash basis. Due to lags in the federal collection and instalment systems, changes to the BC corporate profits and tax base forecasts affect revenue in the succeeding year. For example, 2009/10 instalments from the federal government are based on BC's share of the national tax base for the 2007 tax year (assessed as of December 31, 2008) and a forecast of the 2009 national tax base. Cash adjustments for any under/over payments from the federal government in respect of 2009 will be received/paid on March 31, 2010.
Budget and Fiscal Plan – 2009/10 to 2011/12
140
Appendices
Table A10 Material Assumptions – Revenue – Continued
Revenue Source and Assumptions | | Budget | | Revised
Forecast | | Plan | | Plan | | Plan | | | |
($ millions unless otherwise specified) | | 2008/09 | | 2009/10 | | 2010/11 | | 2011/12 | | Sensitivities 2009/10 | |
Social service tax | | $ | 5,284 | | $ | 4,998 | | $ | 5,087 | | $ | 5,299 | | $ | 5,533 | | | |
Calendar Year | | | | | | | | | | | | | |
Nominal durable consumer expenditure | | 3.0 | % | -5.1 | % | 0.3 | % | 2.3 | % | 2.5 | % | +/- 1% change in 2008 growth equals up to +/- $25 million
+/- 1% change in 2008 growth equals up to +/- $10 million
+/- 1% change in 2008 growth equals up to +/- $10 million | |
Nominal consumer expenditure | | 5.0 | % | 3.7 | % | 1.9 | % | 4.8 | % | 4.7 | % | |
Nominal business investment | | 5.4 | % | 4.6 | % | -0.5 | % | 5.4 | % | 4.8 | % | |
Other nominal taxable expenditure | | -0.7 | % | 5.1 | % | 0.0 | % | 2.4 | % | 4.6 | % | |
| | | | | | | | | | | | |
Components of revenue | | | | | | | | | | | | | |
Consolidated Revenue Fund. | | $ | 5,212 | | $ | 4,927 | | $ | 5,012 | | $ | 5,224 | | $ | 5,458 | | | |
BC Transportation Financing Authority | | $ | 14 | | $ | 14 | | $ | 14 | | $ | 14 | | $ | 14 | | | |
Recovery to vote | | $ | 58 | | $ | 57 | | $ | 61 | | $ | 61 | | $ | 61 | | | |
Fuel and carbon taxes | | $ | 1,295 | | $ | 1,212 | | $ | 1,460 | | $ | 1,674 | | $ | 1,896 | | | |
Calendar Year | | | | | | | | | | | | | |
Real GDP | | 2.4 | % | 1.0 | % | -0.9 | % | 2.4 | % | 2.6 | % | | |
Gasoline volumes. | | -2.7 | % | 0.0 | % | 0.0 | % | 0.0 | % | | | | |
Diesel volumes | | -5.7 | % | 2.0 | % | 2.0 | % | 2.0 | % | | | | |
Gasoline and diesel volumes | | 2.0 | % | | | | | | | | | | |
Natural gas volumes | | 2.0 | % | 2.0 | % | 2.0 | % | 2.0 | % | 2.0 | % | | |
Carbon tax rates (July 1) | | | | | | | | | | | | | |
Carbon dioxide equivalent emissions ($/tonne) | | $ | 10 | | $ | 10 | | $ | 15 | | $ | 20 | | $ | 25 | | | |
Gasoline (cents/litre) | | 2.41 | ¢ | 2.34 | ¢ | 3.51 | ¢ | 4.68 | ¢ | 5.85 | ¢ | | |
Diesel & heating fuel oil (cents/litre) | | 2.76 | ¢ | 2.69 | ¢ | 4.04 | ¢ | 5.38 | ¢ | 6.73 | ¢ | | |
Natural gas (cents/giga joule) | | 49.88 | ¢ | 49.66 | ¢ | 74.49 | ¢ | 99.32 | ¢ | 124.15 | ¢ | | |
Carbon tax revenue | | $ | 338 | | $ | 300 | | $ | 546 | | $ | 754 | | $ | 968 | | | |
Fuel tax revenue | | | | | | | | | | | | | |
Consolidated Revenue Fund | | $ | 506 | | $ | 476 | | $ | 476 | | $ | 479 | | $ | 485 | | | |
BC Transit | | $ | 12 | | $ | 12 | | $ | 12 | | $ | 12 | | $ | 12 | | | |
BC Transportation Financing Authority | | $ | 439 | | $ | 424 | | $ | 426 | | $ | 429 | | $ | 431 | | | |
| | $ | 957 | | $ | 912 | | $ | 914 | | $ | 920 | | $ | 928 | | | |
Property taxes | | $ | 1,861 | | $ | 1,840 | | $ | 1,881 | | $ | 1,936 | | $ | 1,967 | | | |
Calendar Year | | | | | | | | | | | | +/- 1% change in new construction and inflation equals up to +/- $5 million in residential property taxation revenue | |
BC Consumer Price Index | | 1.8 | % | 2.1 | % | 1.0 | % | 2.2 | % | 2.1 | % | |
Housing starts | | 34,597 | | 34,321 | | 25,541 | | 26,783 | | 27,800 | | |
Home owner grants (fiscal year) | | $ | -683 | | $ | -678 | | $ | -695 | | $ | -733 | | $ | -814 | | |
Components of revenue | | | | | | | | | | | | |
Residential (net of home owner grants) | | $ | 635 | | $ | 663 | | $ | 702 | | $ | 704 | | $ | 683 | |
+/- 1% change in non-residential assessed values equals up to +/- $5 million
| |
Non-residential | | $ | 1,012 | | $ | 971 | | $ | 962 | | $ | 998 | | $ | 1,030 | | |
Rural area | | $ | 91 | | $ | 78 | | $ | 78 | | $ | 81 | | $ | 85 | | |
Police | | $ | 19 | | $ | 20 | | $ | 20 | | $ | 20 | | $ | 20 | | |
BC Assessment Authority | | $ | 69 | | $ | 69 | | $ | 72 | | $ | 76 | | $ | 80 | | |
BC Transit | | $ | 37 | | $ | 42 | | $ | 49 | | $ | 59 | | $ | 71 | | | |
Commissions | | $ | (2 | ) | $ | (3 | ) | $ | (2 | ) | $ | (2 | ) | $ | (2 | ) | | |
Budget and Fiscal Plan – 2009/10 to 2011/12
141
Appendices
Table A10 Material Assumptions – Revenue – Continued
Revenue Source and Assumptions | | Budget | | Revised
Forecast | | Plan | | Plan | | Plan | | | |
($ millions unless otherwise specified) | | 2008/09 | | 2009/10 | | 2010/11 | | 2011/12 | | Sensitivities 2009/10 | |
Other taxes | | $ | 2,326 | | $ | 2,058 | | $ | 1,966 | | $ | 1,960 | | $ | 2,007 | | | |
Calendar Year | | | | | | | | | | | | | |
Population | | 1.4 | % | 1.7 | % | 1.5 | % | 1.4 | % | 1.4 | % | | |
BC Consumer Price Index | | 1.8 | % | 2.3 | % | 1.0 | % | 2.2 | % | 2.1 | % | | |
Housing starts | | -11.7 | % | -11.2 | % | -26.6 | % | 4.9 | % | 3.8 | % | | |
Nominal GDP | | 4.2 | % | 3.9 | % | -0.9 | % | 4.2 | % | 4.6 | % | | |
Real GDP | | 2.4 | % | 1.0 | % | -0.9 | % | 2.4 | % | 2.6 | % | | |
| | | | | | | | | | | | | |
Components of revenue | | | | | | | | | | | | | |
Property transfer | | $ | 1,020 | | $ | 735 | | $ | 685 | | $ | 720 | | $ | 750 | | | |
Tobacco | | $ | 705 | | $ | 713 | | $ | 687 | | $ | 687 | | $ | 687 | | | |
Corporation capital | | $ | 69 | | $ | 80 | | $ | 54 | | $ | 0 | | $ | 0 | | | |
Insurance premium | | $ | 372 | | $ | 383 | | $ | 393 | | $ | 403 | | $ | 413 | | | |
Hotel room | | | | | | | | | | | | | |
Consolidated Revenue Fund | | $ | 97 | | $ | 88 | | $ | 88 | | $ | 90 | | $ | 94 | | | |
Tourism British Columbia | | $ | 63 | | $ | 59 | | $ | 59 | | $ | 60 | | $ | 63 | | | |
Energy, sales of Crown land tenures, metals, minerals and other | | $ | 2,376 | | $ | 3,010 | | $ | 2,646 | | $ | 2,814 | | $ | 2,919 | | | |
Natural gas price | | | | | | | | | | | | +/- $1.00 change in the natural gas price equals +/- $275 to $325 million +/- 1% change in natural gas volumes equals +/- $10 to $20 million +/- 1 cent change in the exchange rate equals +/- $15 to $25 million on natural gas royalties | |
Plant inlet, $Cdn/gigajoule | | $ | 5.65 | | $ | 6.57 | | $ | 5.87 | | $ | 6.21 | | $ | 6.61 | | |
Sumas, $US/ MMBtu | | $ | 7.12 | | $ | 7.26 | | $ | 5.96 | | $ | 6.80 | | $ | 7.31 | | |
Natural gas volumes (petajoules) | | | | | | | | | | | | |
Base gas production | | 669 | | 689 | | 584 | | 524 | | 465 | | |
Incremental gas production | | 400 | | 400 | | 509 | | 572 | | 634 | | |
Total gas volume production | | 1,069 | | 1,089 | | 1,093 | | 1,096 | | 1,099 | | |
Annual per cent change | | 0.1 | % | 2.3 | % | 0.4 | % | 0.3 | % | 0.3 | % | |
Oil price ($US/bbl at Cushing, Ok) | | $ | 84.02 | | $ | 88.34 | | $ | 56.39 | | $ | 71.88 | | $ | 80.80 | | |
Auctioned land base (000 hectares) | | 642 | | 672 | | 666 | | 654 | | 642 | | | |
Average bid price/hectare ($) | | $ | 710 | | $ | 3,659 | | $ | 794 | | $ | 954 | | $ | 1,226 | | | |
Cash sales of Crown land tenures | | $ | 455 | | $ | 2,459 | | $ | 529 | | $ | 624 | | $ | 787 | | | |
Metallurgical coal price ($US/tonne, fob west coast) | | $ | 105 | | $ | 237 | | $ | 172 | | $ | 158 | | $ | 160 | | | |
Copper price ($US/lb) | | $ | 3.19 | | $ | 2.65 | | $ | 1.73 | | $ | 2.44 | | $ | 2.38 | | | |
Annual electricity volumes set by treaty (million mega-watt hours) | | 4.0 | | 4.0 | | 4.5 | | 4.6 | | 4.5 | | +/- 10% change in the | |
Mid-Columbia electricity price ($US/mega-watt hour) | | $ | 65 | | $ | 61 | | $ | 61 | | $ | 67 | | $ | 67 | | average Mid-Columbia electricity price equals +/- $25 to $30 million | |
| | | | | | | | | | | | | |
Exchange rate (US¢/ Cdn$, calendar year) | | 99.9 | | 93.7 | | 79.3 | | 86.2 | | 89.4 | | | |
| | | | | | | | | | | | | |
Components of revenue | | | | | | | | | | | | Based on a recommendation from the Auditor General to be consistent with generally accepted accounting principles, bonus bid revenue recognition reflects eight-year deferral of cash receipts from the sale of Crown land tenures | |
Natural gas royalties | | $ | 1,165 | | $ | 1,376 | | $ | 1,014 | | $ | 1,156 | | $ | 1,281 | | |
Bonus bids, fees and rentals | | $ | 582 | | $ | 862 | | $ | 889 | | $ | 932 | | $ | 952 | | |
Petroleum royalties | | $ | 113 | | $ | 117 | | $ | 74 | | $ | 82 | | $ | 85 | | |
Columbia River Treaty electricity sales | | $ | 245 | | $ | 255 | | $ | 325 | | $ | 330 | | $ | 310 | | |
Coal | | $ | 112 | | $ | 306 | | $ | 274 | | $ | 191 | | $ | 179 | | |
Minerals, metals and other | | $ | 130 | | $ | 68 | | $ | 37 | | $ | 88 | | $ | 76 | | |
Oil and Gas Commission fees and levies | | $ | 29 | | $ | 26 | | $ | 33 | | $ | 35 | | $ | 36 | | |
| | | | | | | | | | | | | |
Royalty programs and infrastructure credits | | | | | | | | | | | | | |
Summer drilling | | $ | -48 | | $ | -35 | | $ | -37 | | $ | -37 | | $ | -39 | | | |
Deep drilling | | $ | -63 | | $ | -105 | | $ | -134 | | $ | -150 | | $ | -166 | | | |
Marginal, low productivity and ultramarginal | | $ | -138 | | $ | -229 | | $ | -237 | | $ | -244 | | $ | -251 | | | |
Road and pipeline infrastructure | | $ | -78 | | $ | -90 | | $ | -131 | | $ | -74 | | $ | -51 | | | |
Total | | $ | -327 | | $ | -459 | | $ | -539 | | $ | -505 | | $ | -507 | | | |
Implicit natural gas royalty rate | | 19.3 | % | 18.7 | % | 15.8 | % | 16.9 | % | 17.6 | % | | |
| | | | | | | | | | | | | | | | | | | | |
Royalty program (marginal, low productivity and ultra marginal drilling) adjustments reflect reduced royalty rates
Budget and Fiscal Plan – 2009/10 to 2011/12
142
Appendices
Table A10 Material Assumptions – Revenue – Continued
Revenue Source and Assumptions | | Budget | | Revised
Forecast | | Plan | | Plan | | Plan | | | |
($ millions unless otherwise specified) | | 2008/09 | | 2009/10 | | 2010/11 | | 2011/12 | | Sensitivities 2009/10 | |
Forests | | $ | 952 | | $ | 587 | | $ | 609 | | $ | 707 | | $ | 700 | | | |
Prices (calendar year average) | | | | | | | | | | | | +/- US$50 change in SPF price equals +/- $50 to $100 million +/- US$100 change in hemlock price equals
+/- $10 to $20 million +/- US$50 change in pulp price equals +/-$5 to $10 million
+/- Cdn$10 change in average log price equals
+/-$40 to $60 million +/- 1 cent change in exchange rate equals
+/- $10 to $12 million on stumpage revenue | |
SPF 2x4 ($US/1000 bd ft) | | $ | 213 | | $ | 219 | | $ | 213 | | $ | 250 | | $ | 300 | | |
Random Lengths Composite | | | | | | | | | | | | |
($US/thousand board feet) | | $ | 248 | | $ | 252 | | $ | 248 | | $ | 285 | | $ | 335 | | |
Hemlock price ($US/1000 bd ft) | | $ | 600 | | $ | 723 | | $ | 700 | | $ | 650 | | $ | 600 | | |
Pulp ($US/tonne) | | $ | 844 | | $ | 851 | | $ | 606 | | $ | 650 | | $ | 700 | | |
Coastal log ($Cdn/cubic metre) (Vancouver Log Market, fiscal year) | | $ | 96 | | $ | 84 | | $ | 64 | | $ | 67 | | $ | 71 | | |
| | | | | | | | | | | | |
Fiscal Year Trade Assumptions | | | | | | | | | | | | |
Export tax rate (effective rate) | | 15.0 | % | 15.0 | % | 15.0 | % | 11.3 | % | 5.0 | % | |
SPF 2x4 ($US/1000 bd ft) Random Lengths Composite price | | $ | 225 | | $ | 219 | | $ | 219 | | $ | 269 | | $ | 300 | | | |
($US/thousand board feet) | | $ | 260 | | $ | 250 | | $ | 254 | | $ | 304 | | $ | 335 | | | |
Lumber shipments and consumption (billion board feet) | | | | | | | | | | | | | |
U.S. lumber consumption | | 40.6 | | 39.3 | | 34.0 | | 37.4 | | 43.3 | | | |
BC surge trigger volumes | | 8.6 | | 8.3 | | 7.2 | | 7.9 | | 9.2 | | | |
BC lumber exports to US | | 8.0 | | 6.6 | | 6.3 | | 7.9 | | 9.2 | | | |
| | | | | | | | | | | | | |
Crown harvest volumes (million cubic metres) | | | | | | | | | | | | +/- 10% change in Interior harvest volumes | |
Interior | | 49.0 | | 40.3 | | 42.4 | | 44.6 | | 48.4 | | equals +/- $20 to $30 | |
Coast | | 10.0 | | 10.7 | | 9.6 | | 10.4 | | 11.6 | | million +/- 10% change | |
Total | | 59.0 | | 51.0 | | 52.0 | | 55.0 | | 60.0 | | in Coastal harvest | |
BC Timber Sales (included in above) | | 11.5 | | 9.8 | | 10.0 | | 10.7 | | 10.9 | | volumes equals +/- $9 to $12 million | |
| | | | | | | | | | | | | |
Components of revenue | | | | | | | | | | | | The above sensitivities | |
Tenures | | $ | 434 | | $ | 270 | | $ | 210 | | $ | 257 | | $ | 331 | | relate to stumpage | |
BC Timber Sales | | $ | 240 | | $ | 135 | | $ | 137 | | $ | 167 | | $ | 188 | | revenue only. Depending | |
Border tax (SLA 2006) | | $ | 253 | | $ | 187 | | $ | 238 | | $ | 240 | | $ | 129 | | on market conditions, | |
Logging tax | | $ | 5 | | $ | -27 | | $ | 2 | | $ | 20 | | $ | 30 | | changes in stumpage | |
Other CRF revenue | | $ | 9 | | $ | 11 | | $ | 11 | | $ | 12 | | $ | 11 | | revenues may be offset | |
Recoveries to vote | | $ | 11 | | $ | 11 | | $ | 11 | | $ | 11 | | $ | 11 | | by changes in border tax | |
Other natural resources | | $ | 395 | | $ | 414 | | $ | 375 | | $ | 388 | | $ | 392 | | revenues. | |
Components of revenue | | $ | 327 | | $ | 346 | | $ | 310 | | $ | 323 | | $ | 327 | | | |
Water rental and licences | | | | | | | | | | | | | |
BC Hydro remission (Water Use Plans) | | $ | 50 | | $ | 50 | | $ | 47 | | $ | 47 | | $ | 47 | | | |
Angling & hunting permits and licences | | $ | 18 | | $ | 11 | | $ | 11 | | $ | 11 | | $ | 11 | | | |
Recoveries to vote | | $ | 0 | | $ | 7 | | $ | 7 | | $ | 7 | | $ | 7 | | | |
| | | | | | | | | | | | | |
Forecast for water rentals and licences includes BC Hydro rate increases approved by the BC Utilities Commission |
Other revenue | | $ | 7,469 | | $ | 7,320 | | $ | 7,502 | | $ | 7,622 | | $ | 7,811 | | | |
Components of revenue | | | | | | | | | | | | | |
Other fees and licences | | | | | | | | | | | | | |
Consolidated revenue fund | | $ | 2,460 | | $ | 2,377 | | $ | 2,446 | | $ | 2,426 | | $ | 2,427 | | | |
Recoveries to vote | | $ | 114 | | $ | 138 | | $ | 131 | | $ | 119 | | $ | 120 | | | |
Crown corporations and agencies | | $ | 113 | | $ | 107 | | $ | 108 | | $ | 117 | | $ | 130 | | | |
Other service delivery agencies | | $ | 1,389 | | $ | 1,385 | | $ | 1,424 | | $ | 1,452 | | $ | 1,477 | | | |
Investment earnings | | | | | | | | | | | | | |
Consolidated revenue fund | | $ | 58 | | $ | 64 | | $ | 58 | | $ | 68 | | $ | 75 | | | |
Recoveries to vote and gross ups | | $ | 614 | | $ | 666 | | $ | 658 | | $ | 727 | | $ | 804 | | | |
Crown corporations and agencies | | $ | 41 | | $ | 43 | | $ | 41 | | $ | 47 | | $ | 51 | | | |
Other service delivery agencies | | $ | 171 | | $ | 66 | | $ | 161 | | $ | 163 | | $ | 165 | | | |
Sales of goods and services | | $ | 688 | | $ | 706 | | $ | 740 | | $ | 754 | | $ | 784 | | | |
Miscellaneous | | | | | | | | | | | | | |
Consolidated revenue fund | | $ | 213 | | $ | 208 | | $ | 201 | | $ | 203 | | $ | 210 | | | |
Recoveries to vote | | $ | 418 | | $ | 431 | | $ | 415 | | $ | 417 | | $ | 418 | | | |
Crown corporations and agencies | | $ | 78 | | $ | 64 | | $ | 79 | | $ | 74 | | $ | 73 | | | |
Other service delivery agencies | | $ | 1,112 | | $ | 1,065 | | $ | 1,040 | | $ | 1,055 | | $ | 1,077 | | | |
| | | | | | | | | | | | | | | | | | | | |
Budget and Fiscal Plan – 2009/10 to 2011/12
143
Appendices
Table Al0 Material Assumptions – Revenue – Continued
Revenue Source and Assumptions | | Budget | | Revised
Forecast | | Plan | | Plan | | Plan | | | |
($ millions unless otherwise specified) | | 2008/09 | | 2009/10 | | 2010/11 | | 2011/12 | | Sensitivities 2009/10 | |
Health and social transfers | | $ | 4,794 | | $ | 4,693 | | $ | 4,910 | | $ | 5,110 | | $ | 5,316 | | | |
National Cash Transfers | | | | | | | | | | | | | |
Canada Health Transfer (CHT) | | $ | 22,629 | | $ | 22,629 | | $ | 23,987 | | $ | 25,426 | | $ | 26,952 | | | |
Wait Time | | — | | — | | $ | 250 | | $ | 250 | | $ | 250 | | +/- 0.1% change in | |
Canada Social Transfer (CST) | | $ | 10,537 | | $ | 10,537 | | $ | 10,853 | | $ | 11,178 | | $ | 11,514 | | BC’s population share | |
BC share of national population (June 1) | | 13.35 | % | 13.15 | % | 13.23 | % | 13.31 | % | 13.38 | % | equals +/- $45 to $50 million | |
BC health and social transfers revenue | | | | | | | | | | | | | |
CHT | | $ | 3,243 | | $ | 3,168 | | $ | 3,373 | | $ | 3,536 | | $ | 3,719 | | | |
Wait time | | — | | — | | $ | 33 | | $ | 33 | | $ | 33 | | | |
CST | | $ | 1,407 | | $ | 1,385 | | $ | 1,436 | | $ | 1,488 | | $ | 1,541 | | | |
Prior-year adjustments | | — | | $ | -5 | | | | — | | — | | | |
Health deferral | | | | | | | | | | | | | |
Wait times | | $ | 79 | | $ | 79 | | — | | — | | — | | | |
Diagnostic and Medical Equipment | | $ | 16 | | $ | 17 | | $ | 17 | | $ | 16 | | $ | 16 | | | |
Medical Equipment Trust | | $ | 7 | | $ | 7 | | $ | 7 | | $ | 7 | | $ | 7 | | | |
Human Papillomavirus Immunization Trust | | $ | 14 | | $ | 14 | | $ | 13 | | $ | 13 | | — | | | |
Patient Wait Times Guarantee Trust | | $ | 28 | | $ | 28 | | $ | 31 | | $ | 17 | | — | | | |
Other federal contributions | | $ | 1,015 | | $ | 1,223 | | $ | 1,460 | | $ | 1,408 | | $ | 1,396 | | | |
Components of revenue | | | | | | | | | | | | | |
Consolidated revenue fund | | $ | 154 | | $ | 165 | | $ | 156 | | $ | 149 | | $ | 133 | | | |
Millennium Scholarship Fund | | $ | 37 | | $ | 37 | | $ | 37 | | — | | — | | | |
Police Officer’s Recruitment Fund | | — | | $ | 10 | | $ | 25 | | $ | 15 | | $ | 3 | | | |
Community Development Trust | | — | | $ | 87 | | $ | 32 | | $ | 9 | | — | | | |
LabourMarketAgreement | | — | | $ | 66 | | $ | 66 | | $ | 66 | | $ | 66 | | | |
Labour Market Development Agreement | | — | | $ | 48 | | $ | 290 | | $ | 290 | | $ | 290 | | | |
Other recoveries to vote | | $ | 261 | | $ | 275 | | $ | 298 | | $ | 290 | | $ | 290 | | | |
Crown corporations and agencies | | $ | 153 | | $ | 159 | | $ | 173 | | $ | 200 | | $ | 220 | | | |
Other service delivery agencies | | $ | 410 | | $ | 376 | | $ | 383 | | $ | 389 | | $ | 394 | | | |
Service delivery agency direct revenue | | $ | 4,818 | | $ | 4,617 | | $ | 4,814 | | $ | 4,936 | | $ | 5,078 | | | |
School districts | | $ | 518 | | $ | 491 | | $ | 502 | | $ | 498 | | $ | 499 | | | |
Post-secondary institutions | | $ | 2,405 | | $ | 2,223 | | $ | 2,358 | | $ | 2,423 | | $ | 2,484 | | | |
Health authorities and hospital societies | | $ | 646 | | $ | 667 | | $ | 653 | | $ | 661 | | $ | 666 | | | |
BC Transportation Financing Authority | | $ | 490 | | $ | 454 | | $ | 469 | | $ | 479 | | $ | 491 | | | |
Other service delivery agencies | | $ | 759 | | $ | 782 | | $ | 832 | | $ | 875 | | $ | 938 | | | |
Commercial Crown corporation net income | | $ | 2,680 | | $ | 2,844 | | $ | 2,825 | | $ | 2,863 | | $ | 2,956 | | | |
BC Hydro | | $ | 358 | | $ | 357 | | $ | 452 | | $ | 493 | | $ | 542 | | | |
reservoir water inflows | | 100 | % | 97 | % | 100 | % | 100 | % | 100 | % | +/-1% in hydro | |
| | | | | | | | | | | | generation | |
mean gas price | | 7.55 | | 7.94 | | 7.64 | | 8.09 | | 8.19 | | = +/-$25 million | |
(Sumas, $US/MMbtu - BC Hydro forecast based on NYMEX forward selling prices) | | +/-10% = -/+$20 | |
electricity prices (Mid-C, $US/MWh) | | 59.72 | | 55.62 | | 55.71 | | 60.50 | | 60.99 | | million
+/-$1/MWh in electricity trade | |
assumed rate increases: | | | | | | | | | | | | |
- base rate | | 6.56 | % | 6.56 | % | 7.50 | % | 6.56 | % | 6.75 | % | margins = +/-$40 | |
- rate rider | | 0.50 | % | 0.50 | % | 0.00 | % | 2.00 | % | 1.00 | % | million | |
(Assumed rate increases reflect the notional annual increases that would be required for BC Hydro to earn its allowed return on equity as mandated by the BCUC. These increases are included for planning purposes only. Actual rate increases in these years will be determined by future applications to the BCUC.) | |
ICBC | | $ | 272 | | $ | 459 | | $ | 260 | | $ | 192 | | $ | 217 | | | |
vehicle growth | | +2.6 | % | +1.6 | % | +1.0 | % | +1.3 | % | +1.6 | % | +/-1% = +/-$37 million | |
claims cost trend | | +4.6 | % | -0.3 | % | +3.5 | % | +2.5 | % | +3.4 | % | +/-1% = -/+$27 million | |
investment return | | 4.8 | % | 2.8 | % | 3.5 | % | 3.5 | % | 4.2 | % | +/-1% return = +/-$99 | |
loss ratio | | 87.0 | % | 77.2 | % | 84.7 | % | 86.2 | % | 87.6 | % | to $103 million | |
Budget and Fiscal Plan – 2009/10 to 2011/12
144
Appendices
Table A11 Natural Gas Price Forecasts – 2009/10 to 2011/12 | |
| | | | | | | | Adjusted to fiscal years and | |
Private sector forecasts (calendar year) | | $C/gigajoule at plant inlet | |
| | 2009 | | 2010 | | 2011 | | 2009/10 | | 2010/11 | | 2011/12 | |
GLJ Henry Hub US$/MMBtu (Jan 1,09) | | 7.00 | | 7.50 | | 8.00 | | 7.05 | | 6.42 | | 6.88 | |
Sproule Henry Hub US$/MMBtu (Dec 31,08) | | 6.30 | | 7.32 | | 7.56 | | 5.90 | | 6.15 | | 6.46 | |
McDaniel Henry Hub US$/MMBtu (Jan 1, 09) | | 7.25 | | 7.75 | | 8.60 | | 6.85 | | 6.80 | | 7.51 | |
AJM Henry Hub US$/Mcf (Dec 31,08) | | 6.50 | | 7.65 | | 8.30 | | 5.90 | | 6.33 | | 7.02 | |
GLJ Alberta AECO-C Spot CDN$/MMBtu (Jan 1, 09) | | 7.58 | | 7.94 | | 8.34 | | 7.07 | | 6.99 | | 7.36 | |
Sproule Alberta AECO-C Spot CDN$/MMBtu (Dec 31,08) | | 6.82 | | 7.56 | | 7.84 | | 6.02 | | 6.59 | | 6.93 | |
McDaniel AECO-C Spot C$GJ (Jan 1, 09) | | 7.40 | | 8.00 | | 8.45 | | 6.53 | | 7.06 | | 7.46 | |
AJM AECO-C Spot C$/Mcf (Dec 31,08) | | 7.00 | | 8.05 | | 8.20 | | 6.03 | | 6.75 | | 7.06 | |
GLJ Sumas Spot US$/MMBtu (Jan 1, 09) | | 6.45 | | 6.95 | | 7.45 | | 7.06 | | 6.51 | | 6.98 | |
Sproule Sumas Spot CDN$/MMBtu (Dec 31, 08) | | 6.82 | | 7.56 | | 7.84 | | 5.52 | | 6.09 | | 6.43 | |
GLJ BC Spot Plant Gate CDN$/MMBtu (Jan 1, 09) | | 7.17 | | 7.54 | | 7.94 | | 6.64 | | 6.58 | | 6.94 | |
Sproule BC Plant Inlet CDN$/MMBtu (Dec 31, 08) | | 5.77 | | 6.51 | | 6.79 | | 5.67 | | 6.25 | | 6.58 | |
McDaniel BC Spot Plant Gate C$MMBtu (Jan 1, 09) | | 7.20 | | 7.80 | | 8.25 | | 6.31 | | 6.84 | | 7.23 | |
AJM BC Spot Plant Gate C$/Mcf (Dec 31, 08) | | 6.70 | | 7.75 | | 7.90 | | 5.72 | | 6.45 | | 6.75 | |
GLJ Midwest Chicago US$/MMBtu (Jan 1, 09) | | 7.00 | | 7.50 | | 8.10 | | 7.17 | | 6.57 | | 7.11 | |
Sproule Alliance Plant Gate CDN$/MMBtu (Dec 31, 08) | | 6.37 | | 7.26 | | 7.57 | | 5.63 | | 6.32 | | 6.68 | |
EIA US$/MMBtu Henry Hub (Jan 13, 09) | | 5.61 | | 6.44 | | | | 4.95 | | | | | |
TD Economics Henry Hub FuturesUS$/MMBtu (Dec 16, 08) | | 5.73 | | 6.63 | | | | 5.13 | | | | | |
Scotiabank Group Henry Hub US$/MMBtu (Dec 17, 08) | | 6.25 | | 7.00 | | | | 5.76 | | | | | |
BMO Alberta Empress US$/MMBtu (Dec 19, 08) | | 5.70 | | 7.35 | | | | 6.43 | | | | | |
RBC Financial Henry Hub US$/MMBtu (Dec 15, 08) | | 7.00 | | 7.50 | | | | 6.26 | | | | | |
Exports Development Canada Henry Hub US$/MMBtu (Jan 1, 09) | | 6.50 | | 7.00 | | | | 5.97 | | | | | |
Tristone Capital Henry Hub US$/MMBtu (Jan 5, 09) | | 7.00 | | | | | | | | | | | |
Petro-Canada AECO-C Spot CDN$/Mcf (Sep 29, 08) | | 7.75 | | 7.75 | | | | 6.44 | | | | | |
NYMEX Forward Market converted to Plant Inlet CDN$/GJ (Jan 7, 09) | | | | | | | | 6.04 | | 6.24 | | 6.16 | |
Average all minus high/low | | | | | | | | 6.19 | | 6.54 | | 6.96 | |
Average one forecast per consultant minus high/low | | | | | | | | 6.03 | | 6.53 | | 6.88 | |
Natural gas royalty price forecast | | | | | | | | 5.87 | | 6.21 | | 6.61 | |
GLJ: Gilbert Laustsen Jung Petroleum Consultants Ltd
AJM: Ashton Jenkins Mann Petroleum Consultants
US EIA: US Energy Information Administration
McDaniel: McDaniel & Associates Consultants Ltd
AECO: Alberta Energy Company
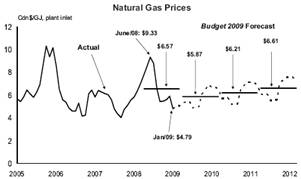
· | The Budget 2009 price forecast is based on the private sector average adjusted for more current year-to-date information in 2008/09. |
· | Average plant inlet prices rose 33 per cent from March to June 2008 and declined 49 per cent over the last seven months. |
· | Prices can be expected to remain volatile and influenced by economic demand, hurricane activity, winter weather and other energy prices. |
Budget and Fiscal Plan – 2009/10 to 2011/12
145
Appendices
Table Al2 Material Assumptions – Expense | |
| | | | Revised | | Budget | | | | | | | |
Ministry Programs and Assumptions | | Budget (1) | | Forecast | | Estimate | | Plan | | Plan | | | |
($ millions unless otherwise specified) | | 2008/09 | | 2009/10 | | 2010/11 | | 2011/12 | | Sensitivities 2009/10 | |
Advanced Education and Labour Market Development | | 2,075 | | 2,056 | | 2,260 | | 2,262 | | 2,237 | | The number of student spaces may vary depending on the financial and other policies of post secondary institutions. | |
| | | | | | | | | | | |
Student spaces in public institutions (2)
(# of FTEs) | | | | | | | | | | | |
| 199,627 | | 193,329 | | 205,396 | | 206,357 | | 206,626 | |
| | | | | | | | | | | |
Attorney General | | 546 | | 546 | | 556 | | 549 | | 534 | | The number of recommended criminal cases brought forward by the various police departments, resulting in charges being laid by the Crown, the number of civil litigation cases, the number of traffic fines disputed and the number of family cases. | |
| | | | | | | | | | | |
New cases filed/processed
(# for all courts) | | 295,000 | | 295,000 | | 295,000 | | 295,000 | | 295,000 | |
| | | | | | | | | | |
| | | | | | | | | | | |
| | | | | | | | | | | |
| | | | | | | | | | | |
| | | | | | | | | | | |
| | | | | | | | | | | |
Crown Proceeding Act (CPA) | | 25 | | 25 | | 25 | | 25 | | 25 | | The number and size of litigation brought against the province, as well as the effectiveness of mitigation strategies and legal defence. | |
| | | | | | | | | | | | |
| | | | | | | | | | | | |
| | | | | | | | | | | | |
Children and Family Development | | 1,389 | | 1,389 | | 1,403 | | 1,414 | | 1,414 | | A 1% increase in the cost per case or a 1% increase in the average caseload will affect expenditures by approximately $2.7 million. | |
| | | | | | | | | | | | |
Average children-in-care
caseload (#) | | 9,100 | | 9,100 | | 9,000 | | 9,000 | | 9,000 | | |
| | | | | | | | | | | | |
Average annual residential
cost per child in care ($) | | 29,200 | | 31,100 | | 31,400 | | 31,400 | | 31,400 | | |
| | | | | | | | | | | | |
Education | | 5,117 | | 5,115 | | 5,179 | | 5,215 | | 5,231 | | | |
Student Enrolment (# of FTEs) | | 555,833 | | 555,575 | | 551,169 | | 549,543 | | 547,929 | | | |
Forests and Range | | 806 | | 770 | | 768 | | 692 | | 696 | | | |
Direct Fire Fighting | | 56 | | 80 | | 62 | | 52 | | 52 | | Over the past 11 years, fire fighting costs have ranged from a low of $19 million in 1997 to a high of $372 million in 2003. | |
| | | | | | | | | | | | |
| | | | | | | | | | | | |
| | | | | | | | | | | | |
| | | | | | | | | | | | |
BC Timber Sales | | 219 | | 159 | | 175 | | 174 | | 180 | | Targets can be impacted by changes to actual inventory costs incurred. There is a lag of approximately 2 years between when inventory costs are incurred and when they are expensed. Volume harvested can also impact targets. For example, if volume harvested is less than projected in any year then capitalized expenses will also be reduced in that year. | |
(1) The 2008/09 budget estimate and updated forecast have been restated to reflect government’s current organization and accounting policies.
(2) Beginning in 2008/09 the student space forecasts include apprentice training FTEs delivered by the Industry Training Authority.
Budget and Fiscal Plan – 2009/10 to 2011/12
146
Appendices
Table Al2 Material Assumptions – Expense – Continued
| | | | Revised | | Budget | | | | | | | |
Ministry Programs and Assumptions | | Budget (1) | | Forecast | | Estimate | | Plan | | Plan | | | |
($ millions unless otherwise specified) | | 2008/09 | | 2009/10 | | 2010/11 | | 2011/12 | | Sensitivities 2009/10 | |
Health Services | | 13,329 | | 13,329 | | 14,095 | | 14,901 | | 15,821 | | | |
Additional health authority funding | | — | | 120 | | — | | — | | — | | | |
Pharmacare | | 1,016 | | 995 | | 1,105 | | 1,105 | | 1,157 | | A 1% change in utilization or drug prices affects costs by approximately $10 million. | |
Demand/cost growth
(per cent change) | | 3.7 | % | 3.7 | % | 3.7 | % | 3.7 | % | 3.7 | % | |
Medical Services Plan (MSP) | | 3,188 | | 3,222 | | 3,394 | | 3,503 | | 3,620 | | A 1% increase in volume of services provided by fee-for-service physicians affects costs by approximately $20 million. | |
Regional Health Sector funding | | 8,629 | | 8,735 | | 9,138 | | 9,759 | | 10,484 | | | |
Housing and Social Development | | 2,602 | | 2,602 | | 2,641 | | 2,651 | | 2,617 | | The expected to work caseload is sensitive to fluctuations in economic and employment trends in the service sector. A 1% change in the Temporary Assistance annual average caseload or average cost per case will affect expenditures by approximately $3.5 million annually. | |
Temporary Assistance
annual average caseload (#) | | 41,840 | | 42,185 | | 44,659 | | 44,173 | | 40,491 | | |
| | | | | | | | | | | | |
| | | | | | | | | | | | |
| | | | | | | | | | | | |
| | | | | | | | | | | | |
| | | | | | | | | | | | |
Disability Assistance
annual average caseload (#) | | 67,190 | | 67,917 | | 70,561 | | 71,009 | | 71,019 | | The caseload for persons with disabilities is sensitive to the aging of the population and longer life expectancy for individuals with disabilities and significant health issues. A 1% change in the Disability Assistance annual average caseload or average cost per case will affect expenditures by approximately $7 million annually. | |
Total annual average
caseload (#) | | 109,030 | | 110,102 | | 115,220 | | 115,182 | | 111,510 | | | |
| | | | | | | | | | | | The average cost per case is sensitive to the composition of the caseload, and reported income. | |
| | | | | | | | | | | | |
| | | | | | | | | | | | | |
Adult Community Living: | | | | | | | | | | | | The adult community living caseload is sensitive to the pressures of an aging population. A 1% increase in the adult caseload will increase expenditures by approximately $2.9 million. | |
Residential Services: | | | | | | | | | | | | |
Average caseload (#) | | 5,469 | | 5,233 | | 5,412 | | 5,646 | | 5,896 | | |
Average cost per client ($) | | 68,200 | | 67,900 | | 68,500 | | 66,300 | | 63,500 | | |
Day Programs: | | | | | | | | | | | | |
Average caseload (#) | | 11,113 | | 11,704 | | 12,429 | | 13,181 | | 13,925 | | |
Average cost per client ($) | | 19,200 | | 18,800 | | 19,800 | | 18,900 | | 17,900 | | |
(1) The 2008/09 budget estimate and updated forecast have been restated to reflect government’s current organization and accounting policies.
Budget and Fiscal Plan – 2009/10 to 2011/12
147
Appendices
Table Al2 Material Assumptions – Expense – Continued
| | | | Revised | | Budget | | | | | | | |
Ministry Programs and Assumptions | | Budget (1) | | Forecast | | Estimate | | Plan | | Plan | | | |
($ millions unless otherwise specified) | | 2008/09 | | 2009/10 | | 2010/11 | | 2011/12 | | Sensitivities 2009/10 | |
Public Safety and Solicitor General | | 624 | | 624 | | 647 | | 630 | | 625 | | The volume and severity of criminal activity and the number of inmate beds occupied. | |
Emergency Program Act (EPA) | | 16 | | 21 | | 16 | | 16 | | 16 | | | |
| | | | | | Funding remains constant on a year-to-year basis. | | The number and severity of natural disasters. | |
Management of Public Funds and Debt | | 1,262 | | 1,212 | | 1,200 | | 1,292 | | 1,330 | | Full year impact on MoPD on interest costs of a 1% change in interest rates equals $36 million; $100 million increase in debt level equals $4 million. | |
Interest rates for new provincial borrowing: | | | | | | | | | | | | |
Short-term | | 4.30 | % | 1.99 | % | 1.02 | % | 2.10 | % | 3.23 | % | |
Long-term | | 5.04 | % | 4.85 | % | 4.49 | % | 4.67 | % | 5.30 | % | |
CDN/US exchange rate (cents) | | 100.1 | | 112.1 | | 124.3 | | 114.1 | | 111.9 | | |
Service delivery agency net spending | | 4,059 | | 4,097 | | 4,205 | | 4,460 | | 5,061 | | | |
School districts | | 301 | | 268 | | 273 | | 296 | | 329 | | | |
Post-secondary institutions | | 2,185 | | 2,174 | | 2,176 | | 2,378 | | 2,564 | | | |
Health authorities and hospital societies | | 427 | | 520 | | 686 | | 653 | | 727 | | | |
BC Transportation Financing Authority | | 646 | | 733 | | 808 | | 791 | | 916 | | | |
Other service delivery agencies | | 500 | | 402 | | 262 | | 342 | | 525 | | | |
(1) The 2008/09 budget estimate and updated forecast have been restated to reflect government’s current organization and accounting policies.
Table A13 Full-Time Equivalents (FTEs)(1) – 2005/06 to 2011/12
| | | | | | | | Revised | | Budget | | | | | |
| | Actual | | Actual | | Actual | | Forecast | | Estimate | | Plan | | Plan | |
| | 2005/06 | | 2006/07 | | 2007/08 | | 2008/09 | | 2009/10 | | 2010/11 | | 2011/12 | |
Ministries and special offices (CRF) | | 27,129 | | 28,647 | | 30,224 | | 31,870 | | 32,214 | | 32,133 | | 31,872 | |
Service delivery agencies (2) | | 3,992 | | 3,917 | | 4,128 | | 4,335 | | 4,350 | | 4,315 | | 4,360 | |
Total FTEs | | 31,121 | | 32,564 | | 34,352 | | 36,205 | | 36,564 | | 36,448 | | 36,232 | |
(1) Full-time equivalents (FTEs) are a measure of staff employment. FTEs are calculated by dividing the total hours of employment paid for in a given period by the number of hours an individual, full-time person would normally work in that period. This does not equate to the physical number of employees. For example, two half-time employees would equal one FTE, or alternatively, three FTEs may represent two full-time employees who have worked sufficient overtime hours to equal an additional FTE.
(2) Service delivery agency FTE amounts do not include SUCH sector staff employment.
Budget and Fiscal Plan – 2009/10 to 2011/12
148
Table A14 Capital Spending – 2005/06 to 2011/12 (1)
($ millions) | | Actual
2005/06 | | Actual
2006/07 | | Actual
2007/08 | | Revised
Forecast
2008/09 | | Budget
Estimate
2009/10 | | Plan
2010/11 | | Plan
2011/12 | |
Taxpayer-supported | | | | | | | | | | | | | | | |
Education | | | | | | | | | | | | | | | |
Schools (K-12) | | 286 | | 322 | | 380 | | 442 | | 458 | | 438 | | 414 | |
Post-secondary | | 790 | | 874 | | 782 | | 666 | | 619 | | 551 | | 487 | |
Health | | 848 | | 760 | | 881 | | 910 | | 886 | | 998 | | 619 | |
BC Transportation Financing Authority | | 713 | | 821 | | 884 | | 956 | | 1,000 | | 981 | | 762 | |
BC Transit | | 24 | | 13 | | 37 | | 74 | | 154 | | 110 | | 114 | |
Vancouver Convention Centre expansion project | | 85 | | 105 | | 251 | | 251 | | 37 | | 51 | | — | |
BC Place rejuvenation | | — | | — | | — | | 38 | | 125 | | 160 | | 42 | |
Government ministries | | 320 | | 355 | | 335 | | 436 | (2) | 279 | | 335 | | 248 | |
Other (3) | | 87 | | 159 | | 122 | | 125 | | 43 | | 36 | | 31 | |
Accelerated infrastructure projects | | — | | — | | — | | 55 | | 885 | | 720 | | 340 | |
Capital spending contingencies | | — | | — | | — | | 180 | | 260 | | 270 | | 325 | |
Total taxpayer-supported | | 3,153 | | 3,409 | | 3,672 | | 4,133 | | 4,746 | | 4,650 | | 3,382 | |
| | | | | | | | | | | | | | | |
Self-supported | | | | | | | | | | | | | | | |
BC Hydro | | 610 | | 807 | | 1,072 | | 1,596 | | 1,752 | | 1,920 | | 1,902 | |
BC Transmission Corporation | | 21 | | 50 | | 70 | | 18 | | 19 | | 12 | | 12 | |
Columbia River power projects (4) | | 30 | | 19 | | 29 | | 38 | | 166 | | 242 | | 258 | |
BC Railway Company | | 15 | | 19 | | 20 | | 10 | | 80 | | 95 | | 100 | |
ICBC (5) | | 27 | | 22 | | 23 | | 25 | | 42 | | 100 | | 125 | |
BC Lotteries | | 83 | | 44 | | 60 | | 112 | | 120 | | 115 | | 115 | |
Liquor Distribution Branch | | 19 | | 22 | | 18 | | 19 | | 20 | | 21 | | 30 | |
Total self-supported commercial | | 805 | | 983 | | 1,292 | | 1,818 | | 2,199 | | 2,505 | | 2,542 | |
| | | | | | | | | | | | | | | |
Total capital spending | | 3,958 | | 4,392 | | 4,964 | | 5,951 | | 6,945 | | 7,155 | | 5,924 | |
(1) | | As the agreement has not been finalized, the fiscal implications of the Port Mann Bridge/Highway 1 Project (which will be funded from tolls) are not included in Budget 2009 – see the topic box at the end of Part 1. |
(2) | | Includes Supplementary Estimates of $80 million. |
(3) | | Includes BC Housing Management Commission, Provincial Rental Housing Corporation, Rapid Transit Project 2000, and other service delivery agencies. |
(4) | | Joint ventures of the Columbia Power Corporation and Columbia Basin Trust. |
(5) | | Includes ICBC Properties Ltd. |
Budget and Fiscal Plan – 2009/10 to 2011/12 |
149
Table A15 Statement of Financial Position – 2005/06 to 2011/12 (1)
($ millions) | | Actual
2005/06 | | Actual
2006/07 | | Actual
2007/08 | | Revised
Forecast
2008/09 | | Budget
Estimate
2009/10 | | Plan
2010/11 | | Plan
2011/12 | |
Financial assets | | | | | | | | | | | | | | | |
Cash and temporary investments | | 3,880 | | 3,450 | | 5,951 | | 6,028 | | 4,369 | | 3,609 | | 3,614 | |
Other financial assets | | 6,995 | | 7,914 | | 8,233 | | 8,572 | | 9,026 | | 9,289 | | 9,781 | |
Sinking funds | | 4,059 | | 3,798 | | 2,649 | | 2,152 | | 2,042 | | 1,800 | | 1,317 | |
Investments in commercial Crown corporations Retained earnings | | 3,476 | | 4,426 | | 5,090 | | 5,718 | | 6,186 | | 6,711 | | 7,169 | |
Recoverable capital loans | | 6,916 | | 7,170 | | 7,719 | | 9,080 | | 9,773 | | 11,106 | | 12,198 | |
| | 10,392 | | 11,596 | | 12,809 | | 14,798 | | 15,959 | | 17,817 | | 19,367 | |
| | 25,326 | | 26,758 | | 29,642 | | 31,550 | | 31,396 | | 32,515 | | 34,079 | |
Liabilities | | | | | | | | | | | | | | | |
Accounts payable & accrued liabilities (2) | | 7,288 | | 7,094 | | 7,955 | | 8,104 | | 8,246 | | 8,342 | | 8,284 | |
Deferred revenue | | 5,695 | | 5,989 | | 7,136 | | 8,757 | | 9,175 | | 9,711 | | 10,187 | |
Debt: | | | | | | | | | | | | | | | |
Taxpayer-supported debt | | 27,197 | | 25,960 | | 26,579 | | 27,692 | | 30,213 | | 32,392 | | 34,078 | |
Self-supported debt | | 7,200 | | 7,473 | | 8,048 | | 9,795 | | 10,258 | | 11,811 | | 13,137 | |
Total provincial debt | | 34,397 | | 33,433 | | 34,627 | | 37,487 | | 40,471 | | 44,203 | | 47,215 | |
Add: debt offset by sinking funds | | 4,059 | | 3,798 | | 2,649 | | 2,152 | | 2,042 | | 1,800 | | 1,317 | |
Less: guarantees and non-guaranteed debt | | (399 | ) | (410 | ) | (442 | ) | (422 | ) | (574 | ) | (782 | ) | (1,008 | ) |
Financial statement debt | | 38,057 | | 36,821 | | 36,834 | | 39,217 | | 41,939 | | 45,221 | | 47,524 | |
| | 51,040 | | 49,904 | | 51,925 | | 56,078 | | 59,360 | | 63,274 | | 65,995 | |
Net liabilities | | (25,714 | ) | (23,146 | ) | (22,283 | ) | (24,528 | ) | (27,964 | ) | (30,759 | ) | (31,916 | ) |
Capital and other assets | | | | | | | | | | | | | | | |
Tangible capital assets | | 25,074 | | 26,954 | | 28,933 | | 30,980 | | 33,931 | | 36,482 | | 37,639 | |
Other assets | | 761 | | 839 | | 801 | | 847 | | 837 | | 836 | | 836 | |
| | 25,835 | | 27,793 | | 29,734 | | 31,827 | | 34,768 | | 37,318 | | 38,475 | |
Accumulated surplus (deficit) | | 121 | | 4,647 | | 7,451 | | 7,299 | | 6,804 | | 6,559 | | 6,559 | |
(1) Comparative figures have been restated to reflect government’s accounting policies in effect at March 31, 2008.
Accrued liabilities include accumulated forecast allowances of $100 million.
Budget and Fiscal Plan – 2009/10 to 2011/12 |
150
Table A15a Changes in Financial Position – 2005/06 to 2011/12
($ millions) | | Actual
2005/06 | | Actual
2006/07 | | Actual
2007/08 | | Revised
Forecast
2008/09 | | Budget
Estimate
2009/10 | | Plan
2010/11 | | Plan
2011/12 | |
(Surplus) deficit for the year | | (3,113 | ) | (4,079 | ) | (2,886 | ) | (50 | ) | 495 | | 245 | | — | |
Comprehensive income and other equity adjustments | | — | | (447 | ) | 82 | | 202 | | — | | — | | — | |
Change in accumulated (surplus) deficit | | (3,113 | ) | (4,526 | ) | (2,804 | ) | 152 | | 495 | | 245 | | — | |
| | | | | | | | | | | | | | | |
Capital and other asset changes: | | | | | | | | | | | | | | | |
Taxpayer-supported capital investments | | 3,153 | | 3,409 | | 3,672 | | 4,133 | | 4,746 | | 4,650 | | 3,382 | |
Less: amortization and other accounting changes | | (1,594 | ) | (1,529 | ) | (1,693 | ) | (2,086 | ) | (1,795 | ) | (2,099 | ) | (2,225 | ) |
Increase in net capital assets | | 1,559 | | 1,880 | | 1,979 | | 2,047 | | 2,951 | | 2,551 | | 1,157 | |
Increase (decrease) in other assets | | 215 | | 78 | | (38 | ) | 46 | | (10 | ) | (1 | ) | — | |
| | 1,774 | | 1,958 | | 1,941 | | 2,093 | | 2,941 | | 2,550 | | 1,157 | |
Increase (decrease) in net liabilities | | (1,339 | ) | (2,568 | ) | (863 | ) | 2,245 | | 3,436 | | 2,795 | | 1,157 | |
| | | | | | | | | | | | | | | |
Investment and working capital changes: | | | | | | | | | | | | | | | |
Increase (reduction) in cash and temporary investments | | 291 | | (430 | ) | 2,501 | | 77 | | (1,659 | ) | (760 | ) | 5 | |
Investment in commercial Crown corporations: | | | | | | | | | | | | | | | |
Increase (decrease) in retained earnings | | 281 | | 950 | | 664 | | 628 | | 468 | | 525 | | 458 | |
Self-supported capital investments | | 805 | | 983 | | 1,292 | | 1,818 | | 2,199 | | 2,505 | | 2,542 | |
Less: loan repayments and other accounting changes | | (790 | ) | (729 | ) | (743 | ) | (457 | ) | (1,506 | ) | (1,172 | ) | (1,450 | ) |
| | 296 | | 1,204 | | 1,213 | | 1,989 | | 1,161 | | 1,858 | | 1,550 | |
Other working capital changes | | (1,103 | ) | 558 | | (2,838 | ) | (1,928 | ) | (216 | ) | (611 | ) | (409 | ) |
| | (516 | ) | 1,332 | | 876 | | 138 | | (714 | ) | 487 | | 1,146 | |
| | | | | | | | | | | | | | | |
Increase (decrease) in financial statement debt | | (1,855 | ) | (1,236 | ) | 13 | | 2,383 | | 2,722 | | 3,282 | | 2,303 | |
(Increase) decrease in sinking fund debt | | 456 | | 261 | | 1,149 | | 497 | | 110 | | 242 | | 483 | |
Increase (decrease) in guarantees and non-guaranteed debt | | (50 | ) | 11 | | 32 | | (20 | ) | 152 | | 208 | | 226 | |
Increase (decrease) in total provincial debt | | (1,449 | ) | (964 | ) | 1,194 | | 2,860 | | 2,984 | | 3,732 | | 3,012 | |
Budget and Fiscal Plan – 2009/10 to 2011/12 |
151
Table A16 Provincial Debt Summary – 2005/06 to 2011/12 (1),(2)
| | Actual | | Actual | | Actual | | Revised
Forecast | | Budget
Estimate | | Plan | | Plan | |
($ millions unless otherwise indicated) | | 2005/06 | | 2006/07 | | 2007/08 | | 2008/09 | | 2009/10 | | 2010/11 | | 2011/12 | |
Taxpayer-supported debt
Provincial government direct operating | | 11,923 | | 9,505 | | 8,264 | | 6,437 | | 6,847 | | 7,104 | | 7,074 | |
Other taxpayer-supported debt (mainly capital) | | | | | | | | | | | | | | | |
Education | | | | | | | | | | | | | | | |
Schools (2) | | 4,588 | | 4,724 | | 4,906 | | 5,195 | | 5,502 | | 5,793 | | 6,065 | |
Post-secondary institutions (2) | | 2,650 | | 2,909 | | 3,314 | | 3,497 | | 3,714 | | 3,831 | | 3,907 | |
| | 7,238 | | 7,633 | | 8,220 | | 8,692 | | 9,216 | | 9,624 | | 9,972 | |
Health(2) | | 2,459 | | 2,899 | | 3,345 | | 3,820 | | 4,332 | | 4,936 | | 5,431 | |
Highways and public transit | | | | | | | | | | | | | | | |
BC Transportation Financing Authority | | 2,699 | | 3,237 | | 3,948 | | 4,638 | | 5,377 | | 5,957 | | 6,485 | |
Public transit | | 904 | | 892 | | 897 | | 930 | | 928 | | 925 | | 922 | |
SkyTrain extension | | 1,145 | | 1,153 | | 1,153 | | 1,153 | | 1,153 | | 1,153 | | 1,153 | |
BC Transit | | 80 | | 96 | | 84 | | 93 | | 154 | | 197 | | 244 | |
| | 4,828 | | 5,378 | | 6,082 | | 6,814 | | 7,612 | | 8,232 | | 8,804 | |
| | | | | | | | | | | | | | | |
Other | | | | | | | | | | | | | | | |
BC Buildings | | 246 | | — | (3) | — | | — | | — | | — | | — | |
Social housing (4) | | 189 | | 216 | | 218 | | 309 | | 272 | | 225 | | 225 | |
Homeowner Protection Office | | 110 | | 110 | | 132 | | 149 | | 156 | | 172 | | 193 | |
Other (5) | | 204 | | 219 | | 318 | | 471 | | 778 | | 1,099 | | 1,379 | |
Accelerated capital projects | | — | | — | | — | | 1,000 | | 1,000 | | 1,000 | | 1,000 | |
| | 749 | | 545 | | 668 | | 1,929 | | 2,206 | | 2,496 | | 2,797 | |
Total other taxpayer-supported debt | | 15,274 | | 16,455 | | 18,315 | | 21,255 | | 23,366 | | 25,288 | | 27,004 | |
Total taxpayer-supported debt | | 27,197 | | 25,960 | | 26,579 | | 27,692 | | 30,213 | | 32,392 | | 34,078 | |
| | | | | | | | | | | | | | | |
Self-supported debt | | | | | | | | | | | | | | | |
Commercial Crown corporations | | | | | | | | | | | | | | | |
BC Hydro | | 6,892 | | 7,144 | | 7,633 | | 9,005 | | 9,698 | | 11,030 | | 12,122 | |
BC Transmission Corporation | | 37 | | 37 | | 86 | | 73 | | 73 | | 73 | | 73 | |
Columbia River power projects (6) | | 247 | | 236 | | 219 | | 207 | | 377 | | 598 | | 833 | |
Liquor Distribution Branch | | 5 | | 3 | | 2 | | 1 | | 1 | | 1 | | | |
Post-secondary institutions’ subsidiaries | | 19 | | 53 | | 108 | | 109 | | 109 | | 109 | | 109 | |
| | 7,200 | | 7,473 | | 8,048 | | 9,395 | | 10,258 | | 11,811 | | 13,137 | |
Warehouse borrowing program | | — | | — | | — | | 400 | | — | | — | | — | |
Total self-supported debt | | 7,200 | | 7,473 | | 8,048 | | 9,795 | | 10,258 | | 11,811 | | 13,137 | |
Total provincial debt | | 34,397 | | 33,433 | | 34,627 | | 37,487 | | 40,471 | | 44,203 | | 47,215 | |
| | | | | | | | | | | | | | | |
Debt as a per cent of GDP | | | | | | | | | | | | | | | |
Provincial government direct operating | | 7.0 | % | 5.2 | % | 4.3 | % | 3.2 | % | 3.5 | % | 3.4 | % | 3.3 | % |
Taxpayer-supported | | 16.1 | % | 14.2 | % | 13.8 | % | 13.8 | % | 15.2 | % | 15.7 | % | 15.8 | % |
Total provincial | | 20.3 | % | 18.3 | % | 18.0 | % | 18.7 | % | 20.4 | % | 21.4 | % | 21.8 | % |
(1) Debt is after deduction of sinking funds and unamortized discounts, and excludes accrued interest. Government direct and fiscal agency accrued interest is reported in the government’s accounts as an accounts payable.
(2) Includes debt and guarantees incurred by the government on behalf of school districts, universities, colleges and health authorities/hospital societies (SUCH), and debt directly incurred by these entities.
(3) Debt of BC Buildings was transferred to the province as the corporation’s operations are now conducted through the Ministry of Labour and Citizen’s Services.
(4) Includes the BC Housing Management Commission and the Provincial Rental Housing Corporation.
(5) Includes service delivery agencies, student loan guarantees, loan guarantees to agricultural producers, guarantees issued under economic development and home mortgage assistance programs and loan guarantee provisions.
(6) A joint venture of the Columbia Power Corporation and Columbia Basin Trust.
Budget and Fiscal Plan – 2009/10 to 2011/12 |
152
Table A17 Key Provincial Debt Indicators – 2005/06 to 2011/12 (1)
| | Actual
2005/06 | | Actual
2006/07 | | Actual
2007/08 | | Revised
Forecast
2008/09 | | Budget
Estimate
2009/10 | | Plan
2010/11 | | Plan
2011/12 | |
Debt to revenue (per cent) | | | | | | | | | | | | | | | |
Total provincial | | 74.6 | | 69.1 | | 68.3 | | 74.6 | | 79.1 | | 83.6 | | 86.4 | |
Taxpayer-supported | | 77.6 | | 69.6 | | 69.4 | | 74.8 | | 80.1 | | 83.9 | | 85.3 | |
Debt per capita ($) (2) | | | | | | | | | | | | | | | |
Total provincial | | 8,196 | | 7,878 | | 8,034 | | 8,556 | | 9,102 | | 9,806 | | 10,333 | |
Taxpayer-supported | | 6,480 | | 6,117 | | 6,166 | | 6,320 | | 6,795 | | 7,186 | | 7,458 | |
Debt to GDP (per cent) (3) | | | | | | | | | | | | | | | |
Total provincial | | 20.3 | | 18.3 | | 18.0 | | 18.7 | | 20.4 | | 21.4 | | 21.8 | |
Taxpayer-supported | | 16.1 | | 14.2 | | 13.8 | | 13.8 | | 15.2 | | 15.7 | | 15.8 | |
Interest bite (cents per dollar of revenue) (4) | | | | | | | | | | | | | | | |
Total provincial | | 4.4 | | 4.3 | | 4.0 | | 4.2 | | 4.2 | | 4.5 | | 4.7 | |
Taxpayer-supported | | 4.4 | | 4.2 | | 3.9 | | 4.3 | | 4.3 | | 4.5 | | 4.6 | |
Interest costs ($ millions) | | | | | | | | | | | | | | | |
Total provincial | | 2,012 | | 2,068 | | 2,005 | | 2,119 | | 2,173 | | 2,394 | | 2,583 | |
Taxpayer-supported | | 1,546 | | 1,569 | | 1,482 | | 1,579 | | 1,620 | | 1,753 | | 1,841 | |
Interest rate (per cent) (5) | | | | | | | | | | | | | | | |
Taxpayer-supported | | 5.5 | | 5.9 | | 5.6 | | 5.8 | | 5.6 | | 5.6 | | 5.5 | |
| | | | | | | | | | | | | | | |
Background Information: | | | | | | | | | | | | | | | |
Revenue ($ millions) | | | | | | | | | | | | | | | |
Total provincial (6) | | 46,096 | | 48,416 | | 50,678 | | 50,225 | | 51,180 | | 52,884 | | 54,657 | |
Taxpayer-supported (7) | | 35,029 | | 37,280 | | 38,287 | | 37,004 | | 37,736 | | 38,593 | | 39,970 | |
Debt ($ millions) | | | | | | | | | | | | | | | |
Total provincial | | 34,397 | | 33,433 | | 34,627 | | 37,487 | | 40,471 | | 44,203 | | 47,215 | |
Taxpayer-supported (8) | | 27,197 | | 25,960 | | 26,579 | | 27,692 | | 30,213 | | 32,392 | | 34,078 | |
Provincial GDP ($ millions) (9) | | 169,308 | | 182,743 | | 192,528 | | 199,984 | | 198,277 | | 206,628 | | 216,091 | |
Population (thousands at July 1) (10) | | 4,197 | | 4,244 | | 4,310 | | 4,382 | | 4,447 | | 4,508 | | 4,569 | |
(1) | | Includes fiscal data of school districts, post-secondary institutions and regional health authorities/societies (SUCH). |
(2) | | The ratio of debt to population (e.g. 2009/10 debt divided by population at July 1, 2009). |
(3) | | The ratio of debt outstanding at fiscal year end to provincial nominal gross domestic product (GDP) for the calendar year ending in the fiscal year (e.g. 2009/10 debt divided by 2009 GDP). |
(4) | | The ratio of interest costs (less sinking fund interest) to revenue. Figures include capitalized interest expense in order to provide a more comparable measure to outstanding debt. |
(5) | | Weighted average of all outstanding debt issues. |
(6) | | Includes revenue of the consolidated revenue fund (excluding dividends from enterprises) plus revenue of all government organizations and enterprises. |
(7) | | Excludes revenue of government enterprises, but includes dividends from enterprises paid to the consolidated revenue fund. |
(8) | | Excludes debt of commercial Crown corporations and agencies and funds held under the province’s warehouse borrowing program. |
(9) | | GDP for the calendar year ending in the fiscal year (e.g. GDP for 2009 is used for the fiscal year ended March 31, 2010). |
(10) | | Population at July 1st within the fiscal year (e.g. population at July 1, 2009 is used for the fiscal year ended March 31, 2010). |
Budget and Fiscal Plan – 2009/10 to 2011/12 |
153