Exhibit 99.11
Public Accounts
For the Fiscal Year Ended
March 31, 2009

National Library of Canada Cataloguing in Publication Data
British Columbia. Office of the Comptroller General.
Public accounts for the year ended...– 2000/2001–
Annual.
Report year ends Mar. 31.
Continues: British Columbia. Ministry of Finance.
Public accounts. ISSN 1187–8657.
ISSN 1499–1659 = Public accounts–British Columbia.
Office of the Comptroller General
1. British Columbia–Appropriations and expenditures–Periodicals. 2. Revenue–British Columbia–Periodicals.
3. Finance, Public–British Columbia–Periodicals. 1.British Columbia. Ministry of Finance. 2. Title.
HJ13.B74 352.4’09711’05 C2001–960204–9
July 9, 2009
Victoria, British Columbia
Lieutenant Governor of the Province of British Columbia
MAY IT PLEASE YOUR HONOUR:
The undersigned has the honour to present the Public Accounts of the Government of the Province of British Columbia for the fiscal year ended March 31, 2009.
COLIN HANSEN
Minister of Finance
Ministry of Finance
Victoria, British Columbia
Honourable Colin Hansen
Minister of Finance
I have the honour to submit herewith the Public Accounts of the Government of the Province of British Columbia for the fiscal year ended March 31, 2009.
Respectfully submitted,
CHERYL WENEZENKI–YOLLAND
Comptroller General
British Columbia’s Public Accounts
Leading the Way
British Columbia is committed to providing and ensuring strong public sector reporting. The Public Accounts are one of the more significant accountability documents of the provincial government. They demonstrate accountability to the citizens of British Columbia by providing audited financial statements and other information in a consistent, timely and understandable format. They allow the reader to see how government performed relative to its fiscal plan and provide a picture of the current financial state of the government in terms of its assets, liabilities and net debt.
The main focus of the Public Accounts is the Summary Financial Statements representing the consolidated financial results and financial position of the province. The Summary Financial Statements include the financial statements and the supporting notes and schedules. All parts of the statements must be considered when reading the financial statements and when considering their meaning. These statements provide a whole of government view of how the province and its various organizations performed against the fiscal plan. Consistent with its legislative requirement to follow generally accepted accounting principles (GAAP), the province follows Canadian Public Sector Accounting Standards and includes the financial balances and results of operations of all provincial government organizations including all school districts, universities, colleges, institutes and health organizations (the SUCH sector).
As a result of the province’s move to full compliance with GAAP, British Columbia continues to lead the country in terms of the organizations it includes in its reporting entity. This year, there have been no significant changes to the reporting entity. There is a complete listing of the reporting entity for government on pages 79 – 81.
The province’s financial statements must serve not only the technical requirements of Public Sector accounting, but must also ensure the information is understandable and useful to readers. In adopting changes to the Public Accounts, the accounting standards provide a number of considerations: how does the information aid understanding and assessments of government’s financial operations and promote accountability; does the benefit of providing the information exceed the cost of doing so; and is the information relevant and reliable and what trade–offs may be appropriate in guiding professional judgement. I must also remain mindful of the guidance provided by accounting standards, that no rule of general application of the standards can substitute the use of professional judgement in the determination of what constitutes fair presentation and/or good practices in a particular case. Professional judgement requires consideration of all of the implications and consultation with impacted government organizations, the broader professional community and other senior government jurisdictions. In addressing these issues the province is supported by the advice of the independent Accounting Policy Advisory Committee created under the Budget Transparency and Accountability Act in 2001.
Responsibility for the preparation of the government’s financial statements resides with my office. The applications of GAAP can be challenging and requires the use of professional judgement. This judgement is based on full analysis of the transactions and programs, application of Canadian guidance, and may involve broad consultation with other jurisdictions and professional accountants.
Each year the Auditor General expresses his opinion on the Summary Financial Statements based on his audit. This year, the Auditor General has expressed a qualified audit opinion and noted a few reservations in areas he believes the financial statements have departed from Canadian GAAP. These are difficult areas that depend on professional judgement; we will continue to have discussion with the Auditor General in regard to these reservations.
As a matter of due practice, accounting policies are reviewed each year to ensure they remain relevant and consistent with GAAP. As GAAP changes, the province must change its policies accordingly. While there have been no new standards or changes in GAAP this year, there has been one change to the province’s application of its accounting policies which is worth highlighting. The province’s policy regarding the recognition of highway land infrastructure has in the past included the land used for highways and will now be recognized as land and land improvements. The specifics of this change can be found in Note 1(e) of the Summary Financial Statements.
British Columbia continues to be a leader in budgeting and financial reporting based on the comparability of its Estimates and Public Accounts and the focus on “one bottom line”; that is, the Summary Financial Statements of the province. We will continue to change as accounting standards evolve and respond to the changing needs of the legislature and our financial statement readers. British Columbia’s open and transparent financial reporting has played a significant part in the decision by certain major credit rating agencies to maintain the high credit rating of the province.
Public sector reporting will need to continue to evolve and change. The way governments manage and deliver public services continues to adapt to changing needs and technology; information systems continue to advance and the globalization of economies is becoming a reality. The accounting and reporting standards need to acknowledge and evolve to recognize this new context and operational reality of public service. National and international public sector financial accounting standards also continue to change. Canadian GAAP is on the verge of a significant change with the announcement of convergence of private sector GAAP with international standards by 2011. The direction for Canadian public sector GAAP is currently under review by the Public Sector Accounting Board (PSAB). The results of this review and the confirmed direction may have significant implications for public sector financial reporting.
British Columbia remains committed to working with the broader accounting profession and other jurisdictions to ensure we maintain meaningful public reporting and strong public sector accounting standards. In this regard, the province participated in a joint working group, which was comprised of deputy ministers of finance from four other provincial jurisdictions, the federal government and members of PSAB. The purpose of the joint working group was to examine three areas of concern raised by the government community: the completeness of the current public sector accounting standards conceptual framework in guiding the establishment and development of public sector accounting standards and its recognition of the context of senior governments; governance practices of the PSAB; and a review of specific proposed accounting standards related to government transfers, financial instruments and the reporting entity. Each of the three topics resulted in the submission of a report and recommendations which are currently being considered by PSAB and the Accounting Standards Oversight Council.
I would like to thank the Select Standing Committee on Public Accounts of the Legislative Assembly, government ministries, Crown corporations, agencies, the SUCH sector and the Auditor General and his staff for their cooperation and support in preparing the 2008/09 Public Accounts. I would also like to acknowledge the dedication of staff of the Office of the Comptroller General—specifically, the Financial Reporting and Advisory Services Branch, who prepared the Public Accounts and supporting documents.
Comments or questions regarding the Public Accounts documents are encouraged and much appreciated. Please direct your comments or questions to me by mail at PO Box 9413 STN PROV GOVT, Victoria BC V8W 9V1; e–mail at: Cheryl. WenezenkiYolland@gov.bc.ca; by telephone at 250 387–6692, or by fax at 250 356–2001.
Further information on the government’s financial performance is also provided through the Consolidated Revenue Fund Extracts (available on the Internet – website http://www.fin.gov.bc.ca/ocg/htm). These extracts compare actual to planned spending of ministries on an appropriation basis, fulfilling ministries accountability back to the Legislative Assembly.
CHERYL WENEZENKI–YOLLAND
Comptroller General
PROVINCE OF BRITISH COLUMBIA
PUBLIC ACCOUNTS 2008/09
Contents
Overview (Unaudited) | |
Public Accounts Content | 9 |
Legislative Compliance and Accounting Policy Report | 10 |
Financial Statement Discussion and Analysis Report | 11 |
Highlights | 11 |
Economic Highlights | 12 |
Discussion and Analysis | 13 |
| |
Summary Financial Statements | |
Statement of Responsibility for the Summary Financial Statements of the Government of the Province of British Columbia | 31 |
Report of the Auditor General of British Columbia | 33 |
Consolidated Statement of Financial Position | 39 |
Consolidated Statement of Operations | 40 |
Consolidated Statement of Change in Net Liabilities | 41 |
Consolidated Statement of Cash Flow | 42 |
Notes to Consolidated Summary Financial Statements | 44 |
Reporting Entity | 79 |
Consolidated Statement of Financial Position by Sector | 82 |
Consolidated Statement of Operations by Sector | 86 |
Statement of Financial Position for Self–supported Crown Corporations and Agencies | 90 |
Summary of Results of Operations and Statement of Equity for Self–supported Crown Corporations and Agencies | 91 |
Consolidated Statement of Tangible Capital Assets | 92 |
Consolidated Statement of Guaranteed Debt | 93 |
| |
Supplementary Information (Unaudited) | |
Adjusted Net Income of Crown Corporations, Agencies and the SUCH Sector | 97 |
SUCH Statement of Financial Position | 100 |
SUCH Statement of Operations | 102 |
Consolidated Staff Utilization | 103 |
| |
Consolidated Revenue Fund Extracts (Unaudited) | |
Statement of Financial Position | 107 |
Statement of Operations | 109 |
Statement of Cash Flow | 110 |
Schedule of Net Revenue by Source | 112 |
Schedule of Comparison of Estimated Expenses to Actual Expenses | 114 |
Schedule of Financing Transaction Disbursements | 116 |
Schedule of Write–offs, Extinguishments and Remissions | 117 |
| |
Provincial Debt Summary | |
Overview of Provincial Debt (Unaudited) | 121 |
Provincial Debt (Unaudited) | 122 |
Change in Provincial Debt (Unaudited) | 123 |
Reconciliation of Summary Financial Statements’ Surplus to Change in Taxpayer–supported Debt and Total Debt (Unaudited) | 124 |
Reconciliation of Total Debt to Summary Financial Statements’ Debt (Unaudited) | 124 |
Change in Provincial Debt, Comparison to Budget (Unaudited) | 125 |
Interprovincial Comparison of Taxpayer–supported Debt as a Percentage of Gross Domestic Product (Unaudited) | 126 |
Interprovincial Comparison of Taxpayer–supported Debt Service Costs as a Percentage of Revenue (Unaudited) | 127 |
Report of the Auditor General of British Columbia on the Summary of Provincial Debt, Key Indicators of Provincial Debt, and Summary of Performance Measures | 129 |
Summary of Provincial Debt | 131 |
Key Indicators of Provincial Debt | 132 |
Summary of Performance Measures | 133 |
| |
Definitions (Unaudited) | 134 |
| |
Acronyms (Unaudited) | 137 |
PROVINCE OF BRITISH COLUMBIA
PUBLIC ACCOUNTS 2008/09
Public Accounts Content
Financial Statement Discussion and Analysis (Unaudited)—this section provides a written commentary on the Summary Financial Statements plus additional information on the financial performance of the provincial government.
Summary Financial Statements—these audited statements have been prepared to disclose the financial impact of the government’s activities. They aggregate the Consolidated Revenue Fund (CRF), the taxpayer–supported Crown corporations and agencies (government organizations), the self–supported Crown corporations and agencies (government enterprises) and the school districts, universities, colleges, institutes and health organizations (SUCH) sector.
Supplementary Information (Unaudited)—this section provides supplementary schedules containing detailed information on the results of those Crown corporations and agencies that are part of the government reporting entity and the impact of the SUCH sector on the province’s financial statements.
Consolidated Revenue Fund Extracts (Unaudited)—the CRF reflects the core operations of the province as represented by the operations of government ministries and legislative offices. Its statements are included in an abridged form. The CRF Extracts include a summary of the CRF Statement of Financial Position, the CRF operating result, the CRF Statement of Cash Flow, a schedule of net revenue by source, a schedule of expenses, a schedule of financing transactions, and a schedule of write–offs, extinguishments and remissions, as required by statute.
Provincial Debt Summary—this section presents unaudited schedules and unaudited statements that provide further details on provincial debt and reconcile the Summary Financial Statements debt to the province’s total debt. Also included are the audited Summary of Provincial Debt, Key Indicators of Provincial Debt and Summary of Performance Measures.
This publication is available on the Internet at: www.fin.gov.bc.ca
Additional Information Available (Unaudited)
The following information is available only on the Internet at: www.fin.gov.bc.ca
Consolidated Revenue Fund Supplementary Schedules—this section contains schedules that provide details of financial activities of the CRF, including details of expenses by ministerial appropriations, an analysis of statutory appropriations, Special Accounts and Special Fund balances and operating statements, and financing transactions.
Consolidated Revenue Fund Detailed Schedules of Payments—this section contains detailed schedules of salaries, wages, travel expenses, grants and other payments.
Financial Statements of Government Organizations and Enterprises—this section contains links to the audited financial statements of those Crown corporations, agencies and SUCH sector entities that are included in the government reporting entity.
Summaries of Financial Statements of Corporations and Agencies to which the Financial Information Act applies—this section contains summaries of the financial statements of corporations, associations, boards, commissions, societies and public bodies required to report under the Financial Information Act (R.S.B.C. 1996, chap. 140, sec. 2).
9
PROVINCE OF BRITISH COLUMBIA
PUBLIC ACCOUNTS 2008/09
Legislative Compliance and Accounting Policy Report
The focus of the province’s financial reporting is the Summary Financial Statements, which consolidate the operating and financial results of the province’s Crown corporations, agencies, school districts, universities, colleges, institutes and health organizations with the Consolidated Revenue Fund. These are general–purpose statements designed to meet, to the extent possible, the information needs of a variety of users.
The Public Accounts are prepared in accordance with the Financial Administration Act and the Budget Transparency and Accountability Act (BTAA).
The BTAA was amended in 2001 with the passing of Bill 5. Under section 20 of that Bill, the government has mandated that “all accounting policies and practices applicable to documents required to be made public under this Act for the government reporting entity must conform to generally accepted accounting principles.”
For senior governments, generally accepted accounting principles (GAAP) is generally considered to be the recommendations and guidelines of the Public Sector Accounting Board of the Canadian Institute of Chartered Accountants.
Section 4.1 of the BTAA established an Accounting Policy Advisory Committee (APAC) to advise Treasury Board on the implementation of GAAP for the government reporting entity (GRE). With the government’s transition to full GAAP for the 2004/05 year, the role of APAC changed to include the provision of advice on evolving developments in accounting standards by the accounting profession as well as emerging issues within government.
10
PROVINCE OF BRITISH COLUMBIA
PUBLIC ACCOUNTS 2008/09
Financial Statement Discussion and Analysis Report
Highlights
The highlights section provides a summary of the key events affecting the financial statements based on information taken from the Summary Financial Statements and Provincial Debt Summary included in the Public Accounts. The budget figures are from pages 3–7 of the Estimates—Fiscal Year Ending March 31, 2009.
· The province ended the year with a surplus of $78 million, compared to a budgeted surplus of $50 million. Taxation revenue decreased by $1,209 million compared to 2007/08 reflecting a broad based downturn across the economy. Self–supported Crown corporations earnings also decreased slightly by $69 million over the previous year. These declines were partially offset by increases in federal government transfers, fees and licences, and, natural resource revenues totalling $162 million. Program spending increased by $1,287 million in 2008/09 as the province spent more on health, education and social programs.
· In 2008/09, the province continued to invest in the capital infrastructure needed to deliver social programs and support the economy. The province’s net investment to build and upgrade schools, universities, colleges, hospitals, roads and bridges was $1,924 million in 2008/09, $1,953 million in 2007/08, $1,862 million in 2006/07 and $1,538 million in 2005/06. Capital investment is financed through a combination of debt, partnerships with the private sector, cost sharing with partners such as Federal and Municipal governments, and other sources including cash and temporary investments.
· Total provincial debt, the most commonly used measure of debt, increased by $3,377 million in 2008/09 to finance capital infrastructure and support working capital requirements for programs and initiatives. The change in total provincial debt over the last four years, from 2004/05 to 2008/09, has been a decrease of $2,168 million. For accounting purposes, financial statement debt increased by $2,862 million in 2008/09. A reconciliation of total provincial debt to financial statement debt is included on page 124 of the Public Accounts.
· In calendar year 2008, the provincial economy contracted by -0.3% as measured by real GDP. This is below the national average rate of growth of 0.5%. The province’s ratio of net liabilities to GDP remains in a comparatively low range when compared to historical norms. This means the province is able to increase spending on programs and services, and to invest in capital infrastructure in support of the economy.
· British Columbia continues to maintain a strong credit rating with all three major credit rating agencies. Dominion Bond Rating Service gave the province a rating of AA(high) while Standard & Poor’s and Moody’s Investors Services Inc. gave the province a rating of AAA and Aaa respectively, their highest possible ratings.
11
PROVINCE OF BRITISH COLUMBIA
PUBLIC ACCOUNTS 2008/09
Financial Statement Discussion and Analysis Report
Economic Highlights
British Columbia’s economy contracted modestly by -0.3% in the 2008 calendar year, the second worst among provinces and below the national average of a 0.5% expansion, according to preliminary data from Statistics Canada. Though mild, the recession marked the first annual decline in the province’s real GDP since 1982. Indicators of economic performance confirm that British Columbia’s economy slowed considerably in the latter half of the year.
Real Gross Domestic Product in Calendar Year 2008
The main contributor to the 0.3% contraction in BC’s real GDP in 2008 was a 6.8% decline in real exports of goods and services. Domestic demand, recently a strong driver of economic growth, also weakened considerably in 2008. Real consumer spending, which accounts for two–thirds of all provincial economic activity, increased by only 2.8% in 2008 compared to 5.2% growth in 2007 and 5.7% growth in 2006. The pace of total real business investment growth idled in 2008, increasing by only 1.1.%, marking the second straight year in which there has been little change in business investment. Residential investment decreased by 4.1%, following a 2.2% gain the previous year. This decrease was offset by the 8.5% jump in non–residential investment and a 2.8% gain in machinery and equipment investment in 2008.
Provincial Comparison

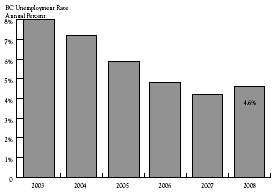
Unemployment Rate in Calendar Year 2008
After falling in consecutive years since 2002, British Columbia’s annual unemployment rate increased to 4.6% in 2008, a slight increase from a remarkably low 4.2% observed in 2007. Despite the increase, British Columbia’s unemployment rate was still lower than the national average of 6.1% in 2008.
2003 to 2008
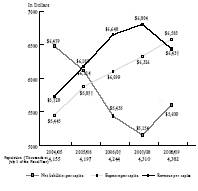
Per Capita Information
Per capita information describes the amount of revenue received, amounts expended, and net liabilities incurred per person in the province over the last five years. In 2008/09, the trend of increasing revenue per capita and decreasing expense per capita reversed. This change represents a risk to ongoing stability in the fiscal environment that government is committed to manage.
2004/05 to 2008/09
12
PROVINCE OF BRITISH COLUMBIA
PUBLIC ACCOUNTS 2008/09
Financial Statement Discussion and Analysis Report
Discussion and Analysis
The detailed analysis section provides an overview of significant trends relating to the statement of operations, statement of financial position and the provincial debt.
Summary Accounts Surplus (Deficit)
| | In Millions | | Variance | |
| | | | | | | | 2008/09 | | 2008/09 | |
| | 2008/09 | | 2008/09 | | 2007/08 | | Actual | | vs | |
| | Budget | | Actual | | Actual | | to Budget | | 2007/08 | |
| | $ | | $ | | $ | | $ | | $ | |
Taxpayer–supported Programs and Agencies | | | | | | | | | | | |
Revenue | | 35,810 | | 35,423 | | 36,826 | | (387 | ) | (1,403 | ) |
Expense | | (37,690 | ) | (38,250 | ) | (36,963 | ) | (560 | ) | (1,287 | ) |
Taxpayer–supported net earnings | | (1,880 | ) | (2,827 | ) | (137 | ) | (947 | ) | (2,690 | ) |
Self–supported Crown corporation net earnings | | 2,680 | | 2,905 | | 2,974 | | 225 | | (69 | ) |
Surplus (deficit) before unusual items | | 800 | | 78 | | 2,837 | | (722 | ) | (2,759 | ) |
Forecast allowance | | (750 | ) | | | | | 750 | | 0 | |
Surplus (deficit) for the year | | 50 | | 78 | | 2,837 | | 28 | | (2,759 | ) |
The province ended the year with a surplus of $78 million, $28 million higher than budget. The 2008/09 surplus of $78 million was $2,759 million lower than the surplus of $2,837 million in fiscal year 2007/08.
During the 2008/09 fiscal year the province continued to invest in capital projects. Investments in infrastructure, including the Sea–to–Sky highway, the Canada Line Rapid Transit Project, the Abbotsford Regional Hospital and Cancer Centre, the Royal Jubilee Patient Care Centre, various residential care and assisted living projects, new academic space in post–secondary institutions across BC, investments in social housing and various upgrades and improvements to K–12 schools and the province’s power generation and transmission facilities, ensure future service potential is available to support the delivery of government programs and services to the public. BC will continue to invest in the capital in the capital infrastructure necessary to support the economy in a time of broad based economic decline.
The significant surpluses of recent years have largely been due to higher than anticipated revenue. Decreases in revenue during 2008/09 indicate that higher than expected revenues cannot be counted on in future periods. Prudent financial management is required to ensure increases in operating expenses remain sustainable in the future.
13
PROVINCE OF BRITISH COLUMBIA
PUBLIC ACCOUNTS 2008/09
Financial Statement Discussion and Analysis Report
Components of Surplus (Deficit)
Revenue Analysis
Revenue analysis helps users understand the government’s finances in terms of its revenue sources and allows them to evaluate the revenue producing capacity of the government.
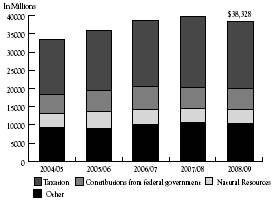
Revenue by Source
Revenue by source provides an outline of the primary sources of provincial revenue and how results change between those sources over time. Revenues are broken down into separate components of taxation, contributions from the federal government, natural resources and other sources, which include fees and licenses, contributions from self–supported Crown corporations, and investment income.
| | In Millions | |
| | 2004/05 | | 2005/06 | | 2006/07 | | 2007/08 | | 2008/09 | |
| | Actual | | Actual | | Actual | | Actual | | Actual | |
| | $ | | $ | | $ | | $ | | $ | |
| | | | | | | | | | | |
Taxation | | 14,917 | | 16,429 | | 18,017 | | 19,406 | | 18,197 | |
Contributions from federal government | | 5,222 | | 5,825 | | 6,386 | | 5,931 | | 5,989 | |
Fees and licences | | 3,660 | | 3,687 | | 3,812 | | 3,986 | | 4,020 | |
Natural resources | | 3,973 | | 4,567 | | 3,982 | | 3,778 | | 3,848 | |
Net earnings of self–supported Crown corporations | | 2,563 | | 2,221 | | 2,686 | | 2,974 | | 2,905 | |
Miscellaneous | | 2,195 | | 2,280 | | 2,563 | | 2,585 | | 2,565 | |
Investment income | | 833 | | 949 | | 1,032 | | 1,140 | | 804 | |
Total revenue | | 33,363 | | 35,958 | | 38,478 | | 39,800 | | 38,328 | |
Provincial revenues have decreased in 2008/09, after several years of steady increases. The decrease in provincial revenue was led by weaker tax revenue and investment income. Other sources of revenue have remained relatively stable year over year with minor increases in natural resource revenue, fees and licences, and federal transfers largely offset by decreases in the net earnings of self–supported Crown corporations and agencies and miscellaneous revenue.
2004/05 to 2008/09
In 2008/09, tax revenue decreased by $1,209 million (6%) over 2007/08 and increased by $3,280 million (22%) since 2004/05. The most significant decreases were in personal tax which decreased by $863 million, corporate tax which decreased by $212 million, and social services tax which decreased by $114 million. The decrease in tax revenue reflects slowing economic activity and the need for prudent planning and fiscal management.
Natural resource revenues increase marginally by $70 million (2%) from 2007/08 to 2008/09 due primarily to improvements in natural gas prices in the year. Improvements in natural gas prices were offset by continuing weakness in lumber prices caused by a weak US housing market. Forest revenues decreased by $531 million (49%) in 2008/09.
14
PROVINCE OF BRITISH COLUMBIA
PUBLIC ACCOUNTS 2008/09
Financial Statement Discussion and Analysis Report
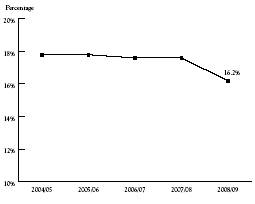
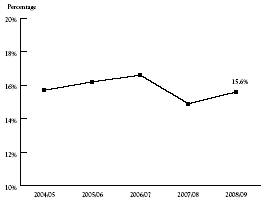
Own–source Revenue to GDP
The ratio of own–source revenue to GDP represents the amount of income government is taking from the whole provincial economy in the form of taxation, natural resource revenues, user fees and sales (own–source revenue is all revenue except for federal transfers).
Own–source revenue to GDP has decreased from a stable range around 18% over the past four years to 16.2% in 2008/09.
2004/05 to 2008/09
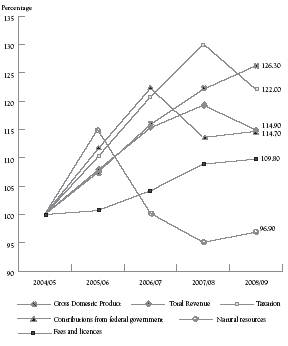
Percentage Change in Revenue
Trend analysis of revenue provides users with information about significant changes in revenue over time and between sources. This enables users to evaluate past performance and assess potential implications for the future.
The chart indicates a change in trend of total revenue after several years of steady increases. This trend is primarily due to a decrease in taxation revenue. The trend of natural resource revenue shows a small improvement after two years of successive declines.
2004/05 to 2008/09
15
PROVINCE OF BRITISH COLUMBIA
PUBLIC ACCOUNTS 2008/09
Financial Statement Discussion and Analysis Report
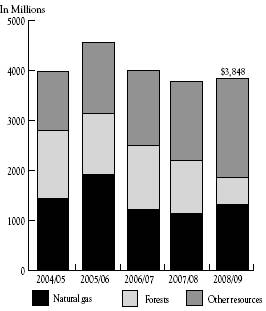
Natural Resource Revenue
The chart of natural resource revenues explains past trends of natural resource revenues in total and by major category. Natural resource revenues are among the most volatile revenue sources for the province because they are vulnerable to market fluctuations in commodity prices.
Natural gas royalty revenue improved by $182 million in 2008/09 after two years of successive declines. In 2007/08, the decline in natural gas royalty revenue began to moderate in the fourth quarter. Natural gas prices have continued to improve in 2008/09.
Forestry revenue decreased by $531 million in 2008/09 due to low lumber prices, and a weak housing market in the U.S. The proportion of natural resource revenue attributable to forestry has decreased significantly from 28% to 14% reflecting continuing weakness in the US housing market.
Other resource revenues have increased by $419 million in the year due to increased activity in the mining sector as commodity prices for metals increased.
2004/05 to 2008/09
Government–to–Government Transfers to Total Revenue
The ratio of government–to–government transfers to total revenue is an indicator of how dependent the province is on transfers from the federal government. An increasing trend shows more reliance and a decreasing trend shows less.
The decrease in 2007/08 was largely due to a decrease in federal transfers which represented an end to equalization payments. Federal transfers have increased slightly by $58 million in 2008/09 resulting in a slight increase to the trend.
2004/05 to 2008/09
16
PROVINCE OF BRITISH COLUMBIA
PUBLIC ACCOUNTS 2008/09
Financial Statement Discussion and Analysis Report
Expense Analysis
The following analysis helps users understand the impact of the government’s spending on the economy, the government’s allocation and use of resources, and the cost of government programs.
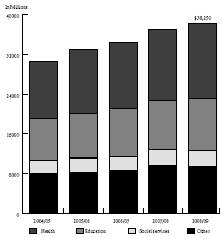
Expense by Function
Expense by function provides a summary of the major areas of government spending, and changes in spending over time. Functions, which indicate the purpose of expenditures, are defined by Statistics Canada’s Financial Management System of Government Statistics. The province uses the following functions: health, education, social services, interest, other, natural resources and economic development, protection of persons and property, transportation, and general government. The health, education and social services functions account for approximately 75% of the province’s total operating costs.
| | In Millions | |
| | 2004/05 | | 2005/06 | | 2006/07 | | 2007/08 | | 2008/09 | |
| | Actual | | Actual | | Actual | | Actual | | Actual | |
| | $ | | $ | | $ | | $ | | $ | |
| | | | | | | | | | | |
Health | | 11,529 | | 12,838 | | 13,253 | | 14,236 | | 15,121 | |
Education | | 8,499 | | 9,027 | | 9,742 | | 9,986 | | 10,477 | |
Social services | | 2,598 | | 2,798 | | 2,892 | | 3,045 | | 3,245 | |
Interest | | 2,306 | | 2,203 | | 2,274 | | 2,239 | | 2,144 | |
Natural resources and economic development | | 1,669 | | 1,610 | | 1,677 | | 1,961 | | 1,683 | |
Other | | 1,028 | | 1,094 | | 1,243 | | 1,398 | | 1,742 | |
Protection of persons and property | | 1,204 | | 1,414 | | 1,331 | | 1,579 | | 1,592 | |
Transportation | | 1,328 | | 1,222 | | 1,270 | | 1,398 | | 1,422 | |
General government | | 505 | | 739 | | 768 | | 1,121 | | 824 | |
Total expense | | 30,666 | | 32,945 | | 34,450 | | 36,963 | | 38,250 | |
Government spending has increased at a measured pace since 2004/05. Expenses increased by 3% in 2008/09 while revenues decreased by 4% in the same period, and GDP decreased by 0.3%.
In 2008/09, the province increased spending on health, education, and social programs, increasing spending on health by $885 million (6%), education by $491 million (5%) and social services by $200 million (7%). All other program spending in the province, including transportation and protection of persons and property increased by $381 million (9%), while savings were found in the general government and natural resource and economic development sectors of $575 million (19%), as well as interest savings of $95 million (4%).
2004/05 to 2008/09
17
PROVINCE OF BRITISH COLUMBIA
PUBLIC ACCOUNTS 2008/09
Financial Statement Discussion and Analysis Report
In 2008/09, provincial operating expenses were $38,250 million, a $1,287 million (3%) increase over 2007/08. Program spending has increased by $7,584 million (25%) since 2004/05 in line with government’s commitment to fund healthcare, education, and social programs despite the broad based economic downturn and resulting decline in revenues. Health expense increased by $885 million (6%), education expenses increased by $491 million (5%), and social program spending increased by $200 million (7%) over 2007/08. The province has also continued its February 2008 budget commitment to climate action initiatives.
Expense to GDP
The ratio of expense to GDP represents the amount of government spending in relation to the overall provincial economy.
Government spending as a percentage of GDP remained relatively stable in 2008/09, indicating that a slight decrease in GDP offset the increase in program spending.
2004/05 to 2008/09
18
PROVINCE OF BRITISH COLUMBIA
PUBLIC ACCOUNTS 2008/09
Financial Statement Discussion and Analysis Report
Changes in Actual Results from 2007/08 to 2008/09
| | In Millions | |
| | Revenue | | Expense | | Surplus | |
| | $ | | $ | | $ | |
| | | | | | | |
2007/08 Surplus | | 39,800 | | 36,963 | | 2,837 | |
Decrease in taxation revenue | | (1,209 | ) | | | (1,209 | ) |
Increase in federal contributions | | 58 | | | | 58 | |
Increase in natural resources revenue | | 70 | | | | 70 | |
Net decrease in other revenue | | (322 | ) | | | (322 | ) |
Decrease in self–supported Crown corporation net earnings | | (69 | ) | | | (69 | ) |
Increase in health expense | | | | 885 | | (885 | ) |
Increase in education expense | | | | 491 | | (491 | ) |
Decrease in general government expense | | | | (297 | ) | 297 | |
Decrease in natural resource expense | | | | (278 | ) | 278 | |
Increase in protection | | | | 13 | | (13 | ) |
Increase in other expenses | | | | 473 | | (473 | ) |
Subtotal of changes in actual results | | (1,472 | ) | 1,287 | | (2,759 | ) |
| | 38,328 | | 38,250 | | | |
2008/09 Surplus | | | | | | 78 | |
| | | | | | | |
2007/08 Accumulated Surplus | | | | | | 6,908 | |
Accumulated other comprehensive income from self–supported Crown corporations and agencies | | | | | | (67 | ) |
2008/09 Accumulated Surplus | | | | | | 6,919 | |
The net decrease in revenue of $1,472 million over 2007/08 and increased program spending of $1,287 million, resulted in a net decrease of $2,759 million in the surplus over the prior year. The surplus of $78 million in 2008/09, offset by the accumulated other comprehensive income from self–supported Crown corporations and agencies of $(67) million, resulted in an ending accumulated surplus of $6,919 million for 2008/09.
19
PROVINCE OF BRITISH COLUMBIA
PUBLIC ACCOUNTS 2008/09
Financial Statement Discussion and Analysis Report
Changes from 2008/09 Budget
| | In Millions | |
| | | | | | Forecast | | | |
| | Revenue | | Expense | | Allowance | | Surplus | |
| | $ | | $ | | $ | | $ | |
| | | | | | | | | |
Surplus per Budget February 2008 | | 38,490 | | 37,690 | | (750 | ) | 50 | |
Decrease in taxation revenue | | (612 | ) | | | | | (612 | ) |
Increased natural resource revenue | | 125 | | | | | | 125 | |
Increased self–supported Crown corporations earnings | | 225 | | | | | | 225 | |
Decreased investment earnings | | (80 | ) | | | | | (80 | ) |
Increased federal transfers | | 180 | | | | | | 180 | |
Interest savings | | | | (114 | ) | | | 114 | |
Increased education spending | | | | 264 | | | | (264 | ) |
Decreased natural resource spending | | | | (70 | ) | | | 70 | |
Increased other program spending | | | | 480 | | | | (480 | ) |
Unused forecast allowance | | | | | | 750 | | 750 | |
Subtotal of changes in actual results compared to budget | | (162 | ) | 560 | | 750 | | 28 | |
Actual Results | | 38,328 | | 38,250 | | 0 | | 78 | |
Revenue was $162 million (0%) lower than the budgeted amount of $38,490 million and expenses were $560 million (1%) higher than the budget of $37,690 million, which does not include supplementary estimates. The forecast allowance of $750 million was not used.
Net Liabilities and Accumulated Surplus (Deficit)
In accordance with Canadian generally accepted accounting principles, the government’s statement of financial position is presented on a net liabilities basis. Net liabilities represent net future cash outflows resulting from past transactions and events. An analysis of net liabilities and accumulated surplus helps users to assess the government’s overall financial position and the future revenue required to pay for past transactions and events.
| | In Millions | | Variance | |
| | | | | | | | 2008/09 | | 2008/09 | |
| | 2008/09 | | 2008/09 | | 2007/08 | | Actual | | vs | |
| | Budget | | Actual | | Actual | | to Budget | | 2007/08 | |
| | $ | | $ | | $ | | $ | | $ | |
| | | | | | | | | | | |
Financial assets | | 27,774 | | 31,733 | | 29,774 | | 3,959 | | 1,959 | |
Less: liabilities | | (53,765 | ) | (56,273 | ) | (51,986 | ) | 2,508 | | 4,287 | |
| | | | | | | | | | | |
Net Liabilities | | (25,991 | ) | (24,540 | ) | (22,212 | ) | (1,451 | ) | 2,328 | |
Less: non–financial assets | | 32,281 | | 31,459 | | 29,485 | | (822 | ) | 1,974 | |
Accumulated surplus (deficit) | | 6,290 | | 6,919 | | 7,273 | | (629 | ) | 354 | |
20
PROVINCE OF BRITISH COLUMBIA
PUBLIC ACCOUNTS 2008/09
Financial Statement Discussion and Analysis Report
The accumulated surplus (deficit) represents the sum of the current and prior years’ operating results. At March 31, 2009, the accumulated surplus was $6,919 million, $629 million higher than budget. The $354 million decrease in accumulated surplus compared to 2007/08 reflects the annual surplus of $78 million less the change in other comprehensive income of self–supported Crown corporations, which decreased by $432 million.
Financial assets were $3,959 million higher than budget and $1,959 million higher than 2007/08. Most of this increase was due to borrowing in advance of requirements through the Warehouse Borrowing Program which contained a balance of $2,081 million at the end of the fiscal year. Compared to 2007/08, cash, cash equivalent, temporary investments and warehouse investments increased by $1,313 million.
Liabilities were $2,508 million higher than budget, and $4,287 million higher than 2007/08. Compared to 2007/08, accounts payable and other liabilities decreased by $598 million, deferred revenue increased by $2,023 million, and self–supported debt increased by $3,033 million offset by a decrease in taxpayer–supported debt of $171 million.
Non–financial assets typically represent resources, such as tangible capital assets, that the government can use in the future to provide services. Non–financial assets increased by $1,974 million over 2007/08 due to the government’s increased capital investment in hospitals and health facilities, transportation infrastructure and post secondary institutions.
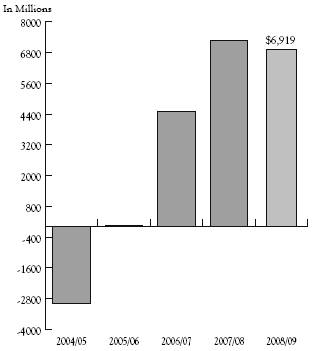
Accumulated Surplus (Deficit)
The accumulated surplus (deficit) represents current and all prior years operating results. The province had operating surpluses over the past five years which reduced the accumulated deficit in 2004/05 and virtually eliminated it by 2005/06. In 2007/08 the province had an accumulated surplus of $7,273 million which decreased to $6,919 million in 2008/09. Positive operating results have allowed for additional investment in capital infrastructure and increased spending on priority programs and services.
2004/05 to 2008/09
21
PROVINCE OF BRITISH COLUMBIA
PUBLIC ACCOUNTS 2008/09
Financial Statement Discussion and Analysis Report
Components of Net Liabilities
Financial Assets
Trend analysis of financial assets provides users with information regarding the amount of resources available to the government that can be converted to cash to meet obligations or fund operations.
| | In Millions | |
| | 2004/05 | | 2005/06 | | 2006/07 | | 2007/08 | | 2008/09 | |
| | Actual | | Actual | | Actual | | Actual | | Actual | |
| | $ | | $ | | $ | | $ | | $ | |
| | | | | | | | | | | |
Cash, cash equivalents, temporary investments and warehouse investments | | 3,632 | | 3,922 | | 3,494 | | 5,994 | | 7,307 | |
Accounts receivable | | 2,723 | | 2,698 | | 3,009 | | 2,919 | | 2,655 | |
Equity in self–supported Crown corporations and agencies | | 3,196 | | 3,476 | | 4,426 | | 5,090 | | 5,738 | |
Loans for purchases of assets recoverable from agencies | | 6,901 | | 6,916 | | 7,170 | | 7,719 | | 9,149 | |
Other financial assets | | 8,508 | | 8,446 | | 8,790 | | 8,052 | | 6,884 | |
Total financial assets | | 24,960 | | 25,458 | | 26,889 | | 29,774 | | 31,733 | |
In 2008/09, financial assets increased by $1,959 million over 2007/08 primarily due to an increase in warehouse borrowing in advance of requirements and loans for the purchase of assets recoverable from agencies. The treasury operation of government ensures that sufficient cash and liquid assets are on hand to cover current obligations, fulfill debt redemption requirements and fund priority capital investments. Warehouse borrowing increased by $2,081 million over 2007/08 offset by decreases in cash, cash equivalents and temporary investments of $768 million over 2007/08. Equity in self–supported Crown corporations increased by $648 million due to higher than expected income from self–supported Crown corporations and agencies. Recoverable capital loans increased by $1,430 million as the province provided funding to Crown agencies for capital projects. This was offset by a decrease of $515 million in sinking fund investments which were liquidated to fund redemptions. Other financial assets and accounts receivable decreased by $1,432 million.
Liabilities
Trend analysis of liabilities provides users with information to understand and assess the demands on financial assets and the revenue raising capacity of government.
| | In Millions | |
| | 2004/05 | | 2005/06 | | 2006/07 | | 2007/08 | | 2008/09 | |
| | Actual | | Actual | | Actual | | Actual | | Actual | |
| | $ | | $ | | $ | | $ | | $ | |
| | | | | | | | | | | |
Taxpayer–supported debt | | 32,023 | | 30,299 | | 28,924 | | 28,537 | | 28,366 | |
Self–supported debt | | 7,889 | | 7,758 | | 7,897 | | 8,297 | | 11,330 | |
Total financial statement debt | | 39,912 | | 38,057 | | 36,821 | | 36,834 | | 39,696 | |
Accounts payable and other liabilities | | 6,802 | | 7,365 | | 7,153 | | 8,007 | | 7,409 | |
Deferred revenue | | 5,165 | | 5,695 | | 5,980 | | 7,145 | | 9,168 | |
Total liabilities | | 51,879 | | 51,117 | | 49,954 | | 51,986 | | 56,273 | |
In 2008/09, liabilities increased by $4,287 million over 2007/08. Liabilities are obligations to third parties that must be settled at a future date by the transfer of financial assets. Financial statement debt increased by $2,862 million from 2007/08 and is $216 million lower than in 2004/05. Deferred revenue increased by $2,023 million in part due to an increase in Bonus Bids of $685 million for oil and gas tenures in areas of proven reserves. Accounts payable and other liabilities decreased by $598 million. Taxpayer–supported debt decreased in 2008/09 by $171 million, while self–supported debt increased by $3,033 million. Information relating to the government’s debt management can be found in more detail in the analysis of the total provincial debt on page 25.
22
PROVINCE OF BRITISH COLUMBIA
PUBLIC ACCOUNTS 2008/09
Financial Statement Discussion and Analysis Report
Non–financial Assets
Trend analysis of non–financial assets provides users with information to assess the management of a government’s infrastructure and long–term non–financial assets.
| | In Millions | |
| | 2004/05 | | 2005/06 | | 2006/07 | | 2007/08 | | 2008/09 | |
| | Actual | | Actual | | Actual | | Actual | | Actual | |
| | $ | | $ | | $ | | $ | | $ | |
| | | | | | | | | | | |
Tangible capital assets | | 23,402 | | 24,940 | | 26,802 | | 28,755 | | 30,679 | |
Other assets | | 547 | | 762 | | 781 | | 730 | | 780 | |
Total non–financial assets | | 23,949 | | 25,702 | | 27,583 | | 29,485 | | 31,459 | |
Management of non–financial assets has a direct impact on the level and quality of services a government is able to provide to its constituents. Non–financial assets typically represent resources that government can use in the future to provide services. At March 31, 2009, non–financial assets were $31,459 million which was $1,974 million higher than 2007/08 and $7,510 million higher than 2004/05. The majority of the province’s non–financial assets represent capital expenditures for tangible capital assets. The government has increased its investment in tangible capital assets by $1,924 million in 2008/09, $1,953 million in 2007/08, $1,862 million in 2006/07, $1,538 million in 2005/06 and $894 million in 2004/05 to ensure service potential is available to deliver programs and services in future periods. Capital expenditures are not included on the Consolidated Statement of Operations and have no effect on the current surplus. They reduce future surpluses in the form of amortization expense as the service potential of assets is used to deliver programs and services.
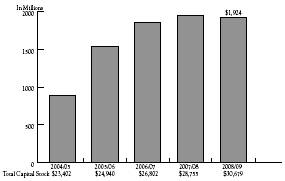
Change in Capital Stock
This measure shows the impact of net changes to the governments stock of physical capital. An increasing trend demonstrates investment in infrastructure to provide service potential in future periods. The net value of total assets is also provided to allow users to assess the significance of annual changes.
The net annual investment in capital increased by $1,924 million in 2008/09 and by $7,510 million since 2004/05. Total capital stock has also increased steadily over that period demonstrating that capital infrastructure is available to provide service in future periods
2004/05 to 2008/09
Net Liabilities and Accumulated Surplus (Deficit)
| | In Millions | |
| | 2004/05 | | 2005/06 | | 2006/07 | | 2007/08 | | 2008/09 | |
| | Actual | | Actual | | Actual | | Actual | | Actual | |
| | $ | | $ | | $ | | $ | | $ | |
| | | | | | | | | | | |
Financial assets | | 24,960 | | 25,458 | | 26,889 | | 29,774 | | 31,733 | |
Less: liabilities | | (51,879 | ) | (51,117 | ) | (49,954 | ) | (51,986 | ) | (56,273 | ) |
| | | | | | | | | | | |
Net liabilities | | (26,919 | ) | (25,659 | ) | (23,065 | ) | (22,212 | ) | (24,540 | ) |
Less: non–financial assets | | 23,949 | | 25,702 | | 27,583 | | 29,485 | | 31,459 | |
Accumulated surplus (deficit) | | (2,970 | ) | 43 | | 4,518 | | 7,273 | | 6,919 | |
23
PROVINCE OF BRITISH COLUMBIA
PUBLIC ACCOUNTS 2008/09
Financial Statement Discussion and Analysis Report
After several years of steady decline net liabilities have increased by $2,328 million in 2008/09 as liabilities have increased more than financial assets. The increase in liabilities includes an increase in deferred revenue of $2,023 million that represents payments collected in the year that will be recognized as revenue in future periods. Accumulated surplus has increased significantly from 2004/05 to 2008/09. Over that time the provinces financial position has increased by $9,889 million from an accumulated deficit of $2,970 million in 2004/05 to an accumulated surplus of $6,919 million in 2008/09.
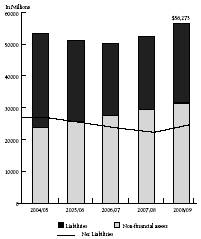
Non–financial Assets as a Portion of Liabilities
The chart provides an indication of what proportion of liabilities are used to fund capital infrastructure as opposed to funding working capital requirements including accounts payable and other operating liabilities, as well as revenue deferred to future periods.
2004/05 to 2008/09
Net Liabilities to GDP
The net liabilities to GDP ratio provides an indication of the province’s ability to maintain existing programs and meet existing creditor requirements without increasing the debt burden on the economy as a whole.
The government’s ratio of net liabilities to GDP has increased marginally after several years of steady decline. The increase in net liabilities to GDP indicates the province requires a greater proportion of GDP to fund program delivery and capital investment in support of the economy.
2004/05 to 2008/09
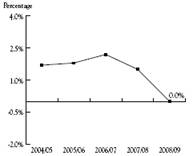
Surplus (Deficit) to GDP
The surplus (deficit) to GDP ratio is an indicator of sustainability that compares the province’s financial results to the overall results of the economy.
Results in the positive range of the chart indicate that government can maintain existing operations and reduce the debt burden or invest in infrastructure without a negative impact on the economy.
2004/05 to 2008/09
24
PROVINCE OF BRITISH COLUMBIA
PUBLIC ACCOUNTS 2008/09
Financial Statement Discussion and Analysis Report
Total Provincial Debt
Analysis of total provincial debt helps users to assess the extent of long–term liabilities and the government’s ability to meet future debt obligations.
| | In Millions | |
| | 2004/05 | | 2005/06 | | 2006/07 | | 2007/08 | | 2008/09 | |
| | Actual | | Actual | | Actual | | Actual | | Actual | |
| | $ | | $ | | $ | | $ | | $ | |
| | | | | | | | | | | |
Gross debt | | 39,912 | | 38,057 | | 36,821 | | 36,834 | | 39,696 | |
Less: sinking funds assets | | (4,515 | ) | (4,059 | ) | (3,798 | ) | (2,649 | ) | (2,134 | ) |
Third party guarantees and non–guaranteed debt | | 472 | | 459 | | 416 | | 452 | | 452 | |
Total provincial debt | | 35,869 | | 34,457 | | 33,439 | | 34,637 | | 38,014 | |
When reporting to rating agencies, the province adds to its financial statement debt, all debt guarantees and the debt directly incurred by self–supported Crown corporations reduced by sinking fund assets. This balance is referred to as the total provincial debt.
Total provincial debt is $1,682 million lower than the amounts reported in the province’s financial statements after deducting sinking funds held to pay down the debt and the inclusion of debt guarantees and non–guaranteed debt. Overall, total provincial debt increased by $3,377 million in 2008/09 because the government borrowed to fund capital projects and working capital requirements. The largest increases were the debt of the BC Transportation Financing Authority which rose by $638 million; education sector debt increased by $462 million; health sector debt increased by $412 million; the debt of other taxpayer–supported entities increased by $154 million; the debt of the British Columbia Hydro and Power Authority increased by $1,421 million; and other self–supported debt increased by $2,099 million. This was offset by a reduction of provincial government direct operating debt of $1,809 million compared to 2008/09.
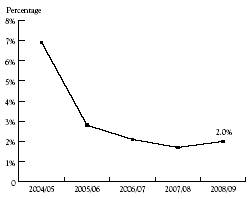
Taxpayer–supported debt to GDP
The ratio of taxpayer–supported debt to GDP is a key measure used by financial analysts and investors to assess a province’s ability to repay debt and is a key measure monitored by the bond rating agencies. The government is committed to maintaining a downward trend in the taxpayer–supported debt to GDP ratio. A declining ratio means that debt will not grow faster than the economy, so that future generations will not be left with a debt burden that they cannot afford.
2004/05 to 2008/09

25
PROVINCE OF BRITISH COLUMBIA
PUBLIC ACCOUNTS 2008/09
Financial Statement Discussion and Analysis Report
Strong Credit Rating
Reflecting the province’s strong fiscal performance, British Columbia has maintained a strong and stable credit rating with all three credit rating agencies. In 2008/09, Moody’s Investors Service Inc. gave the province an Aaa (stable) credit rating (2008: Aaa); Standard and Poor’s gave the province an AAA (stable) credit rating (2008: AAA), and Dominion Bond Rating Services gave the province an AA (high) credit rating (2008: AA (high)).
Credit Ratings June 2009
Rating Agency (1)
Jurisdiction | | Moody’s Investors
Service Inc. | | Standard and Poor’s | | Dominion Bond
Rating Service |
British Columbia | | Aaa | | AAA | | | AA (high) | |
Alberta | | Aaa | | AAA | | | AAA | |
Saskatchewan | | Aa1 | | AA+ | | | AA (low) | |
Manitoba | | Aa1 | | AA | | | A (high) | |
Ontario | | Aa1 | | AA | | | AA | |
Quebec | | Aa2 | | A+ | | | A (high) | |
New Brunswick | | Aa1 | | AA– | | | A (high) | |
Nova Scotia | | Aa2 | | A+ | | | A | |
Prince Edward Island | | Aa2 | | A | | | A (low) | |
Newfoundland | | Aa2 | | A | | | A | |
Canada | | Aaa | | AAA | | | AAA/AA (high) | |
(1)The rating agencies assign letter ratings to borrowers. The major categories, in descending order of credit quality, are: AAA/Aaa; AA/Aa; A; BBB/Baa; BB/Ba; and B. The “1”, “2”, “3”, “high”, “low”, “–”, and “+” modifiers show relative standing within the major categories. For example, AA+ exceeds AA.
A more comprehensive overview of provincial debt, including key debt indicators is located on pages 121–133.
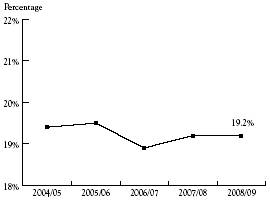
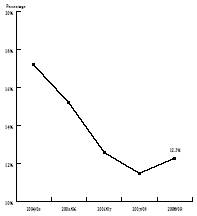
Public Debt Charges to Revenue (the Interest Bite)
The public debt charges to revenue indicator is often referred to as the “interest bite”. This provides users with the percentage of the province’s revenue used to pay interest on debt.
If a decreasing proportion of provincial revenue is used to pay interest on provincial debt, more money is left to provide government services. The interest bite has decreased over the last five years. In 2008/09, the province spent 4 cents of each revenue dollar on interest on the provincial debt.
2004/05 to 2008/09

26
PROVINCE OF BRITISH COLUMBIA
PUBLIC ACCOUNTS 2008/09
Financial Statement Discussion and Analysis Report
Non–Hedged Foreign Currency Debt to Total Provincial Debt
The ratio of non–hedged foreign currency debt to total provincial debt shows the degree of vulnerability of a government’s public debt position to swings in exchange rates.
Since 2004/05, the government has significantly reduced its foreign currency debt, thereby reducing the province’s vulnerability to changes in exchange rates.
2004/05 to 2008/09
Risks and Uncertainties
The government’s main exposure to risks and uncertainties arises from variables which the government does not directly control. These include:
· economic factors such as commodity prices, personal income, retail sales, population growth, and unexpected shocks such as terrorism, avian flu and forest fires
· outcomes from litigation, arbitration and negotiations with third parties
· changes in federal transfers
· utilization rates for government services such as health care, children and family services, or employment assistance
· exposure to interest rate fluctuations, foreign exchange rates and credit risk
· changes in Canadian generally accepted accounting principles
The following are the approximate effect of changes in some of the key variables on the surplus:
Key Fiscal Sensitivities
Variable | | Increase Of | | Annual Fiscal Impact
($ millions) | |
Nominal GDP | | 1% | | $150 to $250 | |
Lumber prices (US$/thousand board feet) | | $50 | | $50 to $100(1) | |
Natural gas prices (Cdn$/gigajoule) | | $1 | | $275 to $325 | |
US exchange rate (US cents/Cdn$) | | 1 cent | | $(25) to $(40) | |
Interest rate | | 1 percentage point | | $(80) | |
Debt | | $500 million | | $(18) | |
(1) Sensitivity relates to stumpage revenue only. Depending on market conditions, changes in stumpage revenues may be offset by changes in border tax revenues.
27
PROVINCE OF BRITISH COLUMBIA
PUBLIC ACCOUNTS 2008/09
Financial Statement Discussion and Analysis Report
Although the government is unable to directly control these variables, strategies have been implemented to mitigate these risks and uncertainties. The development of taxation, financial and corporate regulatory policy to reinforce British Columbia's position as an attractive place to invest and create jobs will help offset the increase in competition for investment as a result of globalization of economic and financial markets. As in previous years the government applied a forecast allowance in the budget to account for risks to revenue, expenditure, Crown corporations, and schools, universities, colleges and health organizations (SUCH) sector forecasts. The use of forecast allowances recognizes the uncertainties in predicting future economic developments.
Risk management in relation to debt is discussed in Note 19 on page 64 of the Notes to Consolidated Summary Financial Statements.
28
Summary Financial Statements
Province of British Columbia
For the Fiscal Year Ended
March 31, 2009

Statement of Responsibility
for the Summary Financial Statements
of the Government of the Province of British Columbia
Responsibility for the integrity and objectivity of the Summary Financial Statements for the Government of the Province of British Columbia rests with the government. The Comptroller General prepares these financial statements in accordance with generally accepted accounting principles for senior governments as recommended by the Public Sector Accounting Board of The Canadian Institute of Chartered Accountants. The fiscal year of the government is from April 1 to March 31 of the following year.
To fulfill its accounting and reporting responsibilities, the government maintains financial management and internal control systems. These systems give due consideration to costs, benefits and risks, and are designed to provide reasonable assurance that transactions are properly authorized by the Legislative Assembly, are executed in accordance with prescribed regulations and are properly recorded. This is done to maintain accountability of public money and safeguard the assets and properties of the Province of British Columbia under government administration. The Comptroller General of British Columbia maintains the accounts of British Columbia, a centralized record of the government’s financial transactions, and obtains additional information as required from ministries, Crown corporations, agencies, school districts, universities, colleges, institutes and health organizations to meet accounting and reporting requirements.
The Auditor General of British Columbia provides an independent opinion on the financial statements prepared by the government. The duties of the Auditor General in that respect are contained in section 11 of the Auditor General Act.
Annually, the financial statements are tabled in the legislature as part of the Public Accounts, and are referred to the Select Standing Committee on Public Accounts of the Legislative Assembly. The Select Standing Committee on Public Accounts reports to the Legislative Assembly with the results of its examination and any recommendations it may have with respect to the financial statements and accompanying audit opinions.
Approved on behalf of the Government of the Province of British Columbia:

COLIN HANSEN
Chair, Treasury Board

| | |
Report of the Auditor General
of British Columbia |
ON THE
SUMMARY FINANCIAL STATEMENTS
OF THE GOVERNMENT OF THE
PROVINCE OF BRITISH COLUMBIA
To the Legislative Assembly
of the Province of British Columbia:
I have audited the summary financial statements of the Government of the Province of British Columbia consisting of the consolidated statement of financial position as at March 31, 2009, and the consolidated statements of operations, change in net liabilities, and cash flow for the year then ended. These financial statements are the responsibility of the government. My responsibility is to express an opinion on these financial statements based on my audit.
I conducted my audit in accordance with Canadian generally accepted auditing standards. Those standards require that I plan and perform the audit to obtain reasonable assurance whether the financial statements are free of material misstatement. An audit includes examining, on a test basis, evidence supporting the amounts and disclosures in the financial statements. An audit also includes assessing the accounting principles used and significant estimates made by the government, as well as evaluating the overall financial statement presentation.
Reservations: Departures from Canadian Generally Accepted Accounting Principles
Failure to fully consolidate the Transportation Investment Corporation
Government has prematurely classified the Transportation Investment Corporation as a government business entity, now consolidated in these summary financial statements using the modified equity basis as described in note 1 (c). Under Canadian generally accepted accounting principles, to be classified as a government business entity, an organization must maintain its operations and meet its liabilities from revenues received from outside the government reporting entity. As of March 31, 2009, the Transportation Investment Corporation does not have this characteristic and, therefore, is not properly classified as a government business entity. Had this organization been properly classified, it would have been accounted for using the full consolidation method and certain financial statement line items would have changed by a material amount. Cash and cash equivalents would have increased by $51 million, equity in self-supported Crown corporations and agencies would have decreased by $142 million, tangible capital assets would have increased by $203 million and accounts payable and accrued liabilities would have increased by $98 million.
2
Page 2
REPORT OF THE AUDITOR GENERAL OF BRITISH COLUMBIA
ON THE SUMMARY FINANCIAL STATEMENTS
OF THE GOVERNMENT OF THE
PROVINCE OF BRITISH COLUMBIA
The supporting consolidated summary financial statements by sector and the supporting statements for self-supported Crown corporations and agencies would also be impacted by this inappropriate classification of the Transportation Investment Corporation and by the summary financial statement changes described above.
Had the Transportation Investment Corporation been appropriately classified as a taxpayer-supported Crown corporation, the presentation of contractual obligations in note 25 (d) in these summary financial statements would also differ. Contractual obligations for taxpayer-supported Crown corporations (transportation) would have increased, and contractual obligations for self–supported Crown corporations (transportation) would have decreased, by $2,327 million.
Failure to provide for deep-well credits
No provision has been made in the summary financial statements for deep-well credits cumulatively earned by oil and gas producers as at March 31, 2009 and March 31, 2008. In my opinion, a provision of $129 million should have been made for credits earned during the year ended March 31, 2009 and a provision of $59 million should have been made during the year ended March 31, 2008. In this respect the summary financial statements are not in accordance with Canadian generally accepted accounting principles.
Had a provision been made on a prospective basis beginning in 2008 (information is not available to determine the effect prior to 2008), accounts payable and accrued liabilities as at March 31, 2009 would have been greater by $129 million (2008: $59 million), natural resources and economic development expenses for the year then ended would have been greater by $129 million (2008: $59 million), and surplus for the year then ended would have been less by $129 million (2008: $59 million).
Inappropriate netting of oil and natural gas producer royalty credits
Government is inappropriately recording oil and gas royalty revenues net of credits provided to producers for exploration incentives. In my opinion, this basis of presentation is not in accordance with Canadian generally accepted accounting principles which require that financial statements record and disclose the gross amounts of revenues and expenses. Had oil and gas royalty revenues been recorded and disclosed on a gross basis, natural resources revenues would have been greater by $599 million (2008: $445 million), natural resources and economic development expenses would have been greater by $540 million (2008: $445 million), opening accumulated surplus would have been less by $59 million (2008: $0), and surplus for the year then ended would have been greater by $59 million (2008: $0).
3
Page 3
REPORT OF THE AUDITOR GENERAL OF BRITISH COLUMBIA
ON THE SUMMARY FINANCIAL STATEMENTS
OF THE GOVERNMENT OF THE
PROVINCE OF BRITISH COLUMBIA
Impact of reservations on surplus for the year
The cumulative effect of the reservations noted above would be to decrease the recorded surplus for the year by $70 million. Had the summary financial statements been prepared in accordance with Canadian generally accepted accounting principles the surplus for the year would have been $8 million.
Opinion
In my opinion, except for the effects of the matters described in the preceding section, these summary financial statements present fairly, in all material respects, the financial position of the Government of the Province of British Columbia as at March 31, 2009 and the results of its operations, change in net liabilities and cash flow for the year then ended, in accordance with Canadian generally accepted accounting principles.
| 
|
Victoria, British Columbia | John Doyle, MBA, CA |
June 30, 2009 | Auditor General |
PROVINCE OF BRITISH COLUMBIA
PUBLIC ACCOUNTS 2008/09
Summary Financial Statements
Consolidated Statement of Financial Position
as at March 31, 2009
| | | | In Millions | |
| | Note | | 2009 | | 2008 | |
| | | | $ | | $ | |
Financial Assets | | | | | | | |
Cash and cash equivalents | | | | 4,107 | | 4,979 | |
Temporary investments | | | | 1,119 | | 1,015 | |
Warehouse program investments | | | | 2,081 | | | |
Accounts receivable | | 3 | | 2,655 | | 2,919 | |
Inventories for resale | | 4 | | 57 | | 66 | |
Due from other governments | | 5 | | 473 | | 932 | |
Due from self–supported Crown corporations and agencies | | 6 | | 216 | | 509 | |
Equity in self–supported Crown corporations and agencies | | 7 | | 5,738 | | 5,090 | |
Loans, advances and mortgages receivable | | 8 | | 1,189 | | 1,063 | |
Other investments | | 9 | | 2,815 | | 2,833 | |
Sinking fund investments | | 10 | | 2,134 | | 2,649 | |
Loans for purchase of assets, recoverable from agencies | | 11 | | 9,149 | | 7,719 | |
| | | | 31,733 | | 29,774 | |
Liabilities | | | | | | | |
Accounts payable and accrued liabilities | | 12 | | 6,630 | | 6,893 | |
Due to other governments | | 13 | | 704 | | 1,000 | |
Due to Crown corporations, agencies and trust funds | | 14 | | 72 | | 112 | |
Deferred revenue | | 15 | | 9,168 | | 7,145 | |
Employee pension plans | | 16 | | 3 | | 2 | |
Taxpayer–supported debt | | 17 | | 28,366 | | 28,537 | |
Self–supported debt | | 18 | | 11,330 | | 8,297 | |
| | | | 56,273 | | 51,986 | |
Net assets (liabilities) | | 20 | | (24,540 | ) | (22,212 | ) |
| | | | | | | |
Non–financial Assets | | | | | | | |
Tangible capital assets | | 21 | | 30,679 | | 28,755 | |
Prepaid program costs | | 22 | | 457 | | 398 | |
Other assets | | 23 | | 323 | | 332 | |
| | | | 31,459 | | 29,485 | |
Accumulated surplus (deficit) | | 24 | | 6,919 | | 7,273 | |
| | | | | | | |
Measurement uncertainty | | 2 | | | | | |
Contingencies and contractual obligations | | 25 | | | | | |
Restricted assets | | 26 | | | | | |
Significant events | | 31 | | | | | |
The accompanying notes and supplementary statements are an integral part of these financial statements.
Prepared in accordance with Canadian generally accepted accounting principles.

CHERYL WENEZENKI—YOLLAND
Comptroller General
39
PROVINCE OF BRITISH COLUMBIA
PUBLIC ACCOUNTS 2008/09
Summary Financial Statements
Consolidated Statement of Operations
for the Fiscal Year Ended March 31, 2009
| | In Millions | |
| | 2009 | | 2008 | |
| | Estimates | | | | | |
| | (Note 32) | | Actual | | Actual | |
| | $ | | $ | | $ | |
Revenue | | | | | | | |
Taxation (Note 27) | | 18,809 | | 18,197 | | 19,406 | |
Contributions from the federal government | | 5,809 | | 5,989 | | 5,931 | |
Fees and licences | | 4,076 | | 4,020 | | 3,986 | |
Natural resources | | 3,723 | | 3,848 | | 3,778 | |
Net earnings of self–supported Crown corporations and agencies (Note 7) | | 2,680 | | 2,905 | | 2,974 | |
Miscellaneous | | 2,509 | | 2,565 | | 2,585 | |
Investment income | | 884 | | 804 | | 1,140 | |
| | 38,490 | | 38,328 | | 39,800 | |
Expense (Note 28) | | | | | | | |
Health | | 14,885 | | 15,121 | | 14,236 | |
Education | | 10,213 | | 10,477 | | 9,986 | |
Social services | | 3,262 | | 3,245 | | 3,045 | |
Interest | | 2,258 | | 2,144 | | 2,239 | |
Natural resources and economic development | | 1,753 | | 1,683 | | 1,961 | |
Other | | 1,738 | | 1,742 | | 1,398 | |
Protection of persons and property | | 1,566 | | 1,592 | | 1,579 | |
Transportation | | 1,334 | | 1,422 | | 1,398 | |
General government | | 681 | | 824 | | 1,121 | |
| | 37,690 | | 38,250 | | 36,963 | |
Surplus (deficit) for the year before unusual items | | 800 | | 78 | | 2,837 | |
Forecast allowance | | (750 | ) | | | | |
Surplus (deficit) for the year | | 50 | | 78 | | 2,837 | |
| | | | | | | |
Accumulated surplus (deficit)—beginning of year as restated (Note 24) | | | | 6,908 | | 4,071 | |
Accumulated surplus (deficit)—before other comprehensive income | | | | 6,986 | | 6,908 | |
Accumulated other comprehensive income from self—supported Crown corporations and agencies (see page 91)—end of year | | | | (67 | ) | 365 | |
Accumulated surplus (deficit)—end of year | | | | 6,919 | | 7,273 | |
The accompanying notes and supplementary statements are an integral part of these financial statements.
40
PROVINCE OF BRITISH COLUMBIA
PUBLIC ACCOUNTS 2008/09
Summary Financial Statements
Consolidated Statement of Change in Net Liabilities
for the Fiscal Year Ended March 31, 2009
| | In Millions | |
| | 2009 | | 2008 | |
| | Estimates | | Actual | | Actual | |
| | $ | | $ | | $ | |
Surplus (deficit) for the year | | 50 | | 78 | | 2,837 | |
Effect of change in tangible capital assets: | | | | | | | |
Acquisition of tangible capital assets | | (3,859 | ) | (3,778 | ) | (3,672 | ) |
Amortization of tangible capital assets | | 1,744 | | 1,765 | | 1,634 | |
Disposals and valuation adjustments | | 37 | | 89 | | 85 | |
| | (2,078 | ) | (1,924 | ) | (1,953 | ) |
Effect of change in: | | | | | | | |
Prepaid program costs | | 1 | | (59 | ) | 45 | |
Other assets | | 2 | | 9 | | 5 | |
| | 3 | | (50 | ) | 50 | |
Effect of self–supported Crown corporations and agencies other comprehensive income | | 66 | | (432 | ) | (82 | ) |
(Increase) decrease in net liabilities | | (1,959 | ) | (2,328 | ) | 852 | |
Net assets (liabilities)—beginning of year | | (24,032 | ) | (22,212 | ) | (23,064 | ) |
Net assets (liabilities)—end of year (Note 20) | | (25,991 | ) | (24,540 | ) | (22,212 | ) |
The accompanying notes and supplementary statements are an integral part of these financial statements.
41
PROVINCE OF BRITISH COLUMBIA
PUBLIC ACCOUNTS 2008/09
Summary Financial Statements
Consolidated Statement of Cash Flow
for the Fiscal Year Ended March 31, 2009
| | In Millions | |
| | 2009 | | 2008 | |
| | Receipts | | Disbursements | | Net | | Net | |
| | $ | | $ | | $ | | $ | |
Operating Transactions | | | | | | | | | |
Surplus (deficit) for the year(1) | | | | | | 78 | | 2,837 | |
Non–cash items included in surplus (deficit): | | | | | | | | | |
Amortization of tangible capital assets | | | | | | 1,765 | | 1,634 | |
Amortization of public debt deferred revenue and deferred charges | | | | | | 10 | | (25 | ) |
Concessionary loan adjustments (decreases) | | | | | | (2 | ) | | |
Valuation adjustments | | | | | | 172 | | 138 | |
Net earnings of self–supported Crown corporations and agencies | | | | | | (2,905 | ) | (2,974 | ) |
Temporary investments (increases) | | | | | | (104 | ) | (76 | ) |
Accounts receivable decreases (increases) | | | | | | 146 | | (24 | ) |
Due from other governments decreases (increases) | | | | | | 459 | | (51 | ) |
Due from self–supported Crown corporations and agencies decreases | | | | | | 293 | | 45 | |
Accounts payable (decreases) increases | | | | | | (263 | ) | 761 | |
Due to other governments (decreases) increases | | | | | | (296 | ) | 85 | |
Due to Crown corporations, agencies and trust funds (decreases) increases | | | | | | (40 | ) | 7 | |
Employee pension plans increases | | | | | | 1 | | | |
Items applicable to future operations increases | | | | | | 1,972 | | 1,221 | |
Contributions of self–supported Crown corporations and agencies | | | | | | 1,975 | | 2,228 | |
Cash derived from (used for) operations | | | | | | 3,261 | | 5,806 | |
| | | | | | | | | |
Capital Transactions | | | | | | | | | |
Tangible capital assets (acquisitions) | | 36 | | (3,778 | ) | (3,742 | ) | (3,588 | ) |
Cash derived from (used for) capital | | 36 | | (3,778 | ) | (3,742 | ) | (3,588 | ) |
| | | | | | | | | |
Investment Transactions | | | | | | | | | |
Investment in self–supported Crown corporations and agencies | | | | (100 | ) | (100 | ) | | |
Loans, advances and mortgages receivable (issues) | | 107 | | (252 | ) | (145 | ) | (94 | ) |
Other investments—net decreases (increases) | | | | (12 | ) | (12 | ) | (340 | ) |
Sinking fund investments—net decreases | | 605 | | (90 | ) | 515 | | 1,149 | |
Cash derived from (used for) investments | | 712 | | (454 | ) | 258 | | 715 | |
Sub–total cash (requirements) | | | | | | (223 | ) | 2,933 | |
42
PROVINCE OF BRITISH COLUMBIA
PUBLIC ACCOUNTS 2008/09
Summary Financial Statements
Consolidated Statement of Cash Flow—Continued
for the Fiscal Year Ended March 31, 2009
| | In Millions | |
| | 2009 | | 2008 | |
| | Receipts | | Disbursements | | Net | | Net | |
| | $ | | $ | | $ | | $ | |
Sub–total cash (requirements) carried forward from previous page | | | | | | (223 | ) | 2,933 | |
| | | | | | | | | |
Financing Transactions(2) | | | | | | | | | |
Public debt (decreases) increases | | 18,145 | | (15,276 | ) | 2,869 | | 76 | |
Derived from (used for) Warehouse Borrowing Program investment | | (3,291 | ) | 1,210 | | (2,081 | ) | | |
Derived from (used for) purchase of assets, recoverable from agencies | | (5,022 | ) | 3,585 | | (1,437 | ) | (584 | ) |
Cash derived from (used for) financing | | 9,832 | | (10,481 | ) | (649 | ) | (508 | ) |
Increase (decrease) in cash and cash equivalents | | | | | | (872 | ) | 2,425 | |
Cash and cash equivalents–beginning of year | | | | | | 4,979 | | 2,554 | |
Cash and cash equivalents–end of year | | | | | | 4,107 | | 4,979 | |
| | | | | | | | | |
Cash and cash equivalents are made up of: | | | | | | | | | |
Cash | | | | | | 1,403 | | 1,277 | |
Cash equivalents | | | | | | 2,704 | | 3,702 | |
| | | | | | 4,107 | | 4,979 | |
(1)Interest received during the year was $812 million (2008: $1,192 million). Interest paid during the year was $2,174 million (2008: $2,285 million). Interest received is made up of interest income from the statement of operations in the amount of $804 million (2008: $1,140 million) plus the change in accrued interest receivable in the amount of $8 million (2008: $52 million). Interest paid is made up of interest expense from the statement of operations in the amount of $2,144 million (2008: $2,239 million) plus the change in accrued interest payable in the amount of $30 million (2008: $46 million).
(2)Financing transaction receipts are from debt issues and disbursements are for debt repayments.
The accompanying notes and supplementary statements are an integral part of these financial statements.
43
PROVINCE OF BRITISH COLUMBIA
PUBLIC ACCOUNTS 2008/09
Notes to Consolidated Summary Financial Statements
for the Fiscal Year Ended March 31, 2009
1. Significant Accounting Policies
(a) BASIS OF ACCOUNTING
The government’s Summary Financial Statements are prepared in accordance with generally accepted accounting principles (GAAP) for senior governments as required by the Budget Transparency and Accountability Act (BTAA) and as recommended by the independent Public Sector Accounting Board of The Canadian Institute of Chartered Accountants.
(b) REPORTING ENTITY
These financial statements include the accounts of organizations that meet the criteria of control (by the province) as established under GAAP. The reporting entity also includes government partnerships.
A list of organizations included in these consolidated financial statements may be found on page 79 – 81. Trusts administered by government or government organizations are excluded from the reporting entity.
(c) PRINCIPLES OF CONSOLIDATION
Taxpayer–supported Crown corporations, agencies, and the school districts, universities, colleges, institutes, health organizations (SUCH) and the Consolidated Revenue Fund (CRF) are consolidated using the full consolidation method. The government’s interests in government partnerships are recorded on a proportional consolidation basis.
Self–supported Crown corporations, agencies, entities and government business partnerships are consolidated using the modified equity basis of consolidation.
The definitions of these consolidation methods can be found on page 134.
Adjustments are made for Crown corporations, agencies and entities whose fiscal year ends are different from the government’s fiscal year end of March 31. These Crown corporations, agencies and entities consist of the British Columbia Assessment Authority, the Insurance Corporation of British Columbia, the British Columbia Railway Company, and all school districts.
Statistics Canada’s Financial Management System for Government Statistics provides the guidance for establishing segment disclosure and function reporting. The Consolidated Statement of Financial Position by Sector and the Consolidated Statement of Operations by Sector are found on pages 82 – 89. These statements include the operations of the consolidated revenue fund, taxpayer–supported Crown corporations and agencies, and SUCH sector organizations. Each taxpayer–supported Crown corporation, agency and SUCH sector organization is assigned to a sector based on its major activity. Sectors are identified using functions. The nature of each function is described in greater detail under Note 1(d) Classification by Sector.
(d) SPECIFIC ACCOUNTING POLICIES
Classification by Sector
The province uses the following sectors: health, education, social services, natural resources and economic development, protection of persons and property, transportation, general government, debt servicing and other.
The health sector includes the provincial health care system. It includes providing medical, hospital and preventive care, and other health–related services such as laboratories and diagnostic facilities.
The education sector includes education services. It includes elementary, secondary, and post–secondary schools. It also includes other education services such as programs to upgrade the skills of individuals and to provide apprenticeship training.
The social services sector includes outlays that the province made to help disadvantaged individuals and families overcome obstacles and circumstances which threaten their well–being. It includes counselling and rehabilitation services, transfer payments to individuals who are unable to lead a normal life due to a physical or mental disability, and services and goods provided by the province to the elderly.
44
PROVINCE OF BRITISH COLUMBIA
PUBLIC ACCOUNTS 2008/09
Notes to Consolidated Summary Financial Statements
for the Fiscal Year Ended March 31, 2009—Continued
1. Significant Accounting Policies—Continued
The natural resources and economic development sector includes the promotion and development of industries as well as the development and conservation of the natural resources on which these industries depend. It includes regulating the various industrial activities that are carried on in the province, as well as research related to resource conservation.
The protection of persons and property sector includes the protection of persons and property from negligence, abuse and crime. It includes policing, operating and maintaining courts of law and correctional facilities. It also includes negotiations to resolve land, resources, governance and jurisdictional issues with First Nations.
The transportation sector includes the operation and maintenance of transportation systems. This includes highway infrastructure, other road systems and public transit.
The general government sector is composed of three sub–categories. These are general administration, executive and legislature, and other general government services. General administration includes central accounting, budgeting, tax administration and collection, and other centralized administrative services. Executive and legislature includes the political, law enactment and constitutional activities of the province.
The other sector consists of those activities which cannot be otherwise allocated.
Revenue
All revenue is recorded on an accrual basis except when the accruals cannot be determined with a reasonable degree of certainty or when their estimation is impracticable. The exception is corporate income tax, which is recorded on a cash basis.
Government transfers are recognized as revenues in the period during which the transfer is authorized and any eligibility criteria are met. Government transfers are deferred if they are restricted for specific programs such as health transfers.
Tax credits/offsets are accrued on the same basis as the associated tax revenues and reduce gross taxation revenue but are not considered valuation allowances.
Expense
The cost of all goods consumed and services received during the year is expensed. Interest expense includes debt servicing costs such as amortization of discounts and premiums, foreign exchange gains and losses, and issue costs.
Pension expense is calculated as the cost of pension benefits earned by employees during the year, interest on the pension benefits liability, net of pension plan assets, and amortization of the government’s share of any experience gains or losses, less contributions made by members. The estimated total cost of government’s share of plan amendments related to past service is expensed in the year the plan is amended.
Government transfers include grants, entitlements and transfers under agreements, as defined in the definitions on page 135. Government transfers are recognized as expenses in the period in which the events giving rise to the transfer occurred, as long as the transfer is authorized, eligibility criteria have been met and a reasonable estimate of the amount can be made. Transfers are deferred if the amount represents prepaid operating expenses.
Assets
Assets are recorded to the extent they represent cash and claims upon outside parties, items held for resale to outside parties, prepaid expenses, deferred charges or tangible capital assets acquired as a result of events and transactions prior to year end.
45
PROVINCE OF BRITISH COLUMBIA
PUBLIC ACCOUNTS 2008/09
Notes to Consolidated Summary Financial Statements
for the Fiscal Year Ended March 31, 2009—Continued
1. Significant Accounting Policies—Continued
Financial Assets
Cash and cash equivalents include cash on hand, demand deposits and short–term highly liquid investments that are readily convertible to known amounts of cash and that are subject to an insignificant risk of changes in value. These short–term investments generally have a maturity of three months or less and are held for the purpose of meeting short–term cash commitments rather than for investing.
Temporary investments and Warehouse Program Investments include short–term investments recorded at the lower of cost or market value. The fair values of short–term investments approximate their carrying values because of the short–term maturity of these instruments. Warehouse Program Investments are short–term investments related to specific borrowings in advance of requirements under the Warehouse Borrowing Program.
Inventories for resale include property that has been purchased, or for which development costs have been incurred, and that is held for ultimate resale or lease to outside parties. Inventories for resale are recorded at the lower of cost or net realizable value.
Equity in self–supported Crown corporations and agencies represents the province’s investment (including long–term advances) in those self–supported Crown corporations and agencies at cost, increases/decreases in the investees’ net assets, and other comprehensive income.
Loans for purchase of assets recoverable from agencies are recorded at maturity value, less unamortized premium or discount, deferred foreign exchange gains or losses and sinking fund balances. Premium/discount is amortized on a constant yield basis.
Loans and advances are recorded at cost less adjustment for any prolonged impairment in value. Mortgages receivable are recorded at the principal amount less valuation allowance, are secured by real estate and are repayable over periods ranging up to 30 years. Concessionary loans and mortgages are recorded at net present value at issue and related present value discounts are expensed. Valuation allowances are made when collectibility is considered doubtful. Interest is accrued on loans receivable only when collection is certain. Otherwise, it is recognized on the cash basis.
Other investments are recorded at the cost of acquisition (which may be adjusted by attributed income). Valuation adjustments are made when the value of investments is impaired.
Sinking fund investments are cash and marketable securities held specifically for the purpose of repaying outstanding debt at maturity.
Tangible Capital Assets
Tangible capital assets are recorded at historical cost, plus asset retirement obligations, less accumulated amortization. The recorded cost, less the residual value, is generally amortized over the estimated useful lives of the assets on a straight–line basis.
All significant tangible capital assets of government organizations and operations have been capitalized. Intangible assets and items inherited by right of the Crown, such as forest, water and mineral resources, are not recognized in these financial statements. Crown land is capitalized at a nominal value of one dollar.
The value of collections (artifacts, specimens and documents) has been excluded from the statement of financial position. When collections are purchased, these items are expensed.
Liabilities
All liabilities are recorded to the extent they represent claims payable to outside parties as a result of events and transactions prior to year end. This includes probable losses on loan guarantees issued by the province, contingent liabilities (when it is likely a liability exists and the amount of the liability can be reasonably determined on an individual or portfolio basis) and unfunded pension liabilities.
46
PRVINCE OF BRITISH COLUMBIA
PUBLIC ACCOUNTS 2008/09
Notes to Consolidated Summary Financial Statements
for the Fiscal Year Ended March 31, 2009—Continued
1. Significant Accounting Policies—Continued
Guaranteed debt includes guarantees by the minister of finance, made through specific agreements or legislation, to repay promissory notes, bank loans, lines of credit, mortgages and other securities. Loss provisions on guaranteed debt are recorded when it is likely that a loss will occur. The amount of the loss provision represents the best estimate of future payments less recoveries. The loss provision is recorded as a liability and an expense in the year determined and is adjusted as necessary to ensure it equals the expected payout of the guarantee.
Employee Pension Plans
The province accounts for employee pension plans by recognizing a liability and an expense in the reporting period in which the employee has provided service. The amount is calculated using the accrued benefit actuarial cost method. Where plans are in a net asset position and Joint Trusteeship Agreements restrict access to the assets, the province records the value of plan net assets as nil. Changes in net liabilities/assets, which arise as a result of actuarial gains and losses, are amortized on a straight–line basis over the average remaining service period of employees active at the date of the adjustments. Past service costs from plan amendments are recognized in full in the year of the amendment.
Unfunded pension liabilities of the Members of the Legislative Assembly Superannuation Account represent the terminal funding that would be required from the province for the difference between the present value of the obligations for future benefit entitlements and the amount of funds available in the account.
Public Debt
Public debt represents the direct debt obligations of the Province of British Columbia, including borrowings incurred for government operating purposes, the acquisition of capital assets, re–lending to authorized government bodies and borrowings in advance of future requirements under the Warehouse Borrowing Program. Public debt consists of short–term promissory notes, notes, bonds and debentures, bank loans, capital leases and mortgages payable. These obligations are recorded at principal less unamortized premium or discount and unrealized foreign exchange gains or losses.
Public debt is reported under two categories:
(i) Taxpayer–supported debt—includes direct debt used for government operating and capital purposes, the debt of those Crown corporations, agencies and SUCH sector entities who require an operating or debt servicing subsidy from the provincial government, and the debt of an entity that is fully consolidated within these financial statements.
(ii) Self–supported debt—includes the portion of debt of commercial Crown corporations, agencies and entities that has been borrowed through the government’s fiscal agency loan program. It does not include all debt of commercial Crown corporations and agencies as these entities are consolidated on the modified equity basis. Commercial Crown corporations and agencies fully fund their operations and debt from revenue generated through the sale of goods and/or services at commercial rates to buyers that are outside the government reporting entity. Self–supported debt includes debt of the Warehouse Borrowing Program.
Debt premium/discount is amortized on a constant yield basis. Unamortized premium/discount on bonds called and refinanced is amortized over the remaining life of the old debt or the life of the new debt, whichever is shorter.
47
PROVINCE OF BRITISH COLUMBIA
PUBLIC ACCOUNTS 2008/09
Notes to Consolidated Summary Financial Statements
for the Fiscal Year Ended March 31, 2009—Continued
1. Significant Accounting Policies—Continued
Foreign Currency Translation
Monetary assets and liabilities denominated in foreign currencies are translated to Canadian dollars at the exchange rate prevailing at year end. Foreign currency transactions are translated at the exchange rate prevailing at the date of the transaction unless hedged by forward contracts that specify the rate of exchange. Adjustments to revenue or expense transactions arising as a result of foreign currency translation are credited or charged to operations at the time the adjustments arise. Unrealized foreign currency gains and losses on long–term, fixed–term monetary assets and liabilities are reported as a component of sinking funds, public debt and loans for purchase of assets recoverable from agencies, and amortized over the remaining terms of the related items on a straight–line basis. Non–monetary assets and liabilities are translated at historical rates of exchange.
Derivative Financial Instruments
The province is a party to financial instruments with off–balance sheet risk due to fluctuations in foreign currency exchange rates, interest rate fluctuations and counterparty default on financial obligations. The province does not use derivative financial instruments for speculative purposes. Off–balance sheet position data is given in the form of nominal principal amounts outstanding. Amounts earned and expenses incurred under swaps are recognized and offset against the related interest expense. Gains and losses on terminated derivative contracts are deferred and amortized over the lesser of the remaining term of the contract or the term of the related debt.
Other Comprehensive Income
Public sector generally accepted accounting principles do not recognize other comprehensive income in relation to taxpayer–supported Crowns. Therefore, any transactions relating to other comprehensive income in the taxpayer–supported Crown corporation statements have been reversed. Any recognition of other comprehensive income for self–supported Crown corporations has been reflected in the equity in self–supported Crown corporations and agencies, and in the accumulated surplus (deficit).
Asset Retirement Obligations
The province recognizes asset retirement obligations where a reasonable estimate of the fair value of the obligation and the future settlement date of the retirement of the asset can be determined. The associated retirement costs are capitalized as part of the assets’ carrying value and amortized over the assets’ useful lives. Legal liabilities may exist for the removal and disposal of asbestos within buildings that will undergo major renovations or demolition. The fair value of the liability for asbestos removal or disposal will be recognized in the period in which it is incurred if a reasonable estimate of fair value can be made.
(e) CHANGES IN ACCOUNTING POLICY
Recognition of Highway Infrastructure
Highway Infrastructure has previously included the cost of land used for highways. The province has changed its policy to recognize land used for highways as Land and Land Improvements instead of Highway Infrastructure. The change has been implemented retroactively with a restatement of prior year figures.
The effects of changing between asset classes are to decrease Highway Infrastructure by $1,201 million (2008: $1,114 million) and increase Land and Land Improvements by $1,201 million (2008: $1,114 million). This change is reflected in Note 21, Tangible Capital Assets and the Consolidated Statement of Tangible Capital Assets.
2. Measurement Uncertainty
The preparation of financial statements requires the province to make estimates and assumptions that affect the amounts of assets, liabilities, revenues and expenses during the reporting period. Uncertainty in the determination of these amounts is known as measurement uncertainty.
48
PROVINCE OF BRITISH COLUMBIA
PUBLIC ACCOUNTS 2008/09
Notes to Consolidated Summary Financial Statements
for the Fiscal Year Ended March 31, 2009—Continued
2. Measurement Uncertainty—Continued
Some of the more significant estimates used in these financial statements affect the accrual of individual income tax revenues, Canada Health Transfer and Canada Social Transfer entitlements, obligations for pension obligations and other employee future benefits, accruals for environmental obligations, future payments related to contingent liabilities, and valuation allowances for loans, investment and advances. The range of this uncertainty is inestimable. Actual results could differ from estimates. For many common financial statement items, such as accounts payable and allowances for doubtful accounts, measurement uncertainty is inherent but inestimable.
Estimates are based on the best information available at the time of preparation of the financial statements and are reviewed annually to reflect new information as it becomes available. Measurement uncertainty exists in these financial statements as identified in the table below for items with a variability of over $10 million:
| | In Millions | |
| | Actual(1) | | | | | | | | | |
| | Amount | | Measurement | | Uncertainty | | Range | |
Program Area | | Recorded | | Minimum | | Maximum | | Minimum | | Maximum | |
| | $ | | $ | | $ | | $ | | $ | |
| | | | | | | | | | | |
Liabilities | | | | | | | | | | | |
| | | | | | | | | | | |
Accounts Payable and Accrued Liabilities | | | | | | | | | | | |
Litigation and Arbitration. | | 76 | | 66 | | 86 | | (10 | ) | 10 | |
| | | | | | | | | | | |
Variability exists in the outcomes of litigation and arbitration. |
| | | | | | | | | | | |
Crime Victim Assistance Program | | 170 | | 162 | | 179 | | (8 | ) | 9 | |
| | | | | | | | | | | |
Variability exists because actuarial estimates are used. |
| | | | | | | | | | | |
Silviculture Liability | | 66 | | 59 | | 72 | | (7 | ) | 6 | |
| | | | | | | | | | | |
Variability exists in the accruals as the recorded numbers are based on the province’s best estimate of expected results. |
| | | | | | | | | | | |
Revenues | | | | | | | | | | | |
| | | | | | | | | | | |
Taxation | | | | | | | | | | | |
Personal Income Tax | | 6,093 | | 5,793 | | 6,393 | | (300 | ) | 300 | |
| | | | | | | | | | | |
Contributions from the Federal Government | | | | | | | | | | | |
Health and Social Transfer payments(2) | | 4,601 | | 4,551 | | 4,651 | | (50 | ) | 50 | |
| | | | | | | | | | | |
Variability is based on the potential differences between the estimates for the economic factors used in calculating the accruals and actual economic results. |
| | | | | | | | | | | | | |
See note 25(b) with respect to the measurement uncertainty related to environmental remediation liabilities.
(1)Actual amount recorded for each program area may not represent the entire amount in financial statement line item.
(2)Health and Social Transfer payments are transfers from the federal government based on the provincial share of national population figures and estimates of tax point transfers.
49
PROVINCE OF BRITISH COLUMBIA
PUBLIC ACCOUNTS 2008/09
Notes to Consolidated Summary Financial Statements
for the Fiscal Year Ended March 31, 2009—Continued
3. Accounts Receivable
| | In Millions | |
| | 2009 | | 2008 | |
| | $ | | $ | |
| | | | | |
Accounts receivable | | 1,809 | | 2,082 | |
Taxes receivable | | 1,285 | | 1,294 | |
Accrued interest | | 208 | | 216 | |
| | 3,302 | | 3,592 | |
Provision for doubtful accounts | | (647 | ) | (673 | ) |
| | 2,655 | | 2,919 | |
4. Inventories for Resale
| | In Millions | |
| | 2009 | | 2008 | |
| | $ | | $ | |
| | | | | |
Properties | | 16 | | 17 | |
Other | | 41 | | 49 | |
| | 57 | | 66 | |
Inventories for resale are charged to expense when sold. During the year, total cost of sales was $196 million (2008: $191 million) including the effect of write–downs of $1 million (2008: nil) and the effect of reversals of write–downs of nil (2008: nil). Write–downs occurred due to obsolete materials no longer used and damaged goods.
5. Due from Other Governments
| | In Millions | |
| | 2009 | | 2008 | |
| | $ | | $ | |
| | | | | |
Government of Canada: | | | | | |
Current | | 346 | | 796 | |
Long–term | | 79 | | 92 | |
Provincial governments: | | | | | |
Current | | 19 | | 28 | |
Local governments:(1) | | 29 | | 16 | |
Current | | 473 | | 932 | |
(1)Local governments are municipal units established by the provincial government which include regional and metropolitan municipalities, cities, towns, townships, districts, rural municipalities and villages.
50
PROVINCE OF BRITISH COLUMBIA
PUBLIC ACCOUNTS 2008/09
Notes to Consolidated Summary Financial Statements
for the Fiscal Year Ended March 31, 2009—Continued
6. Due from Self–supported Crown Corporations and Agencies
| | In Millions | |
| | 2009 | | 2008 | |
| | $ | | $ | |
| | | | | |
British Columbia Hydro and Power Authority | | 12 | | 314 | |
British Columbia Lottery Corporation | | 202 | | 193 | |
Columbia Power Corporation | | 2 | | 2 | |
| | 216 | | 509 | |
See Statement of Financial Position for Self–supported Crown Corporations and Agencies on page 90 for details.
7. Equity in Self–supported Crown Corporations and Agencies
| | In Millions | |
| | 2009 | | 2008 | |
| | | | | | Other | | | | | |
| | | | Unremitted | | Comprehensive | | | | | |
| | Investments | | Earnings | | Income | | Total | | Total | |
| | $ | | $ | | $ | | $ | | $ | |
| | | | | | | | | | | |
British Columbia Hydro and Power Authority | | | | 2,231 | | (42 | ) | 2,189 | | 1,921 | |
British Columbia Railway Company | | 107 | | 144 | | | | 251 | | 215 | |
British Columbia Transmission Corporation | | 20 | | 31 | | | | 51 | | 44 | |
Columbia Power Corporation | | 276 | | 71 | | | | 347 | | 330 | |
Insurance Corporation of British Columbia | | | | 2,768 | | (25 | ) | 2,743 | | 2,565 | |
Provincial Capital Commission | | | | 15 | | | | 15 | | 15 | |
Transportation Investment Corporation | | 150 | | (8 | ) | | | 142 | | | |
| | 553 | | 5,252 | | (67 | ) | 5,738 | | 5,090 | |
Change in Equity in Self–supported Crown Corporations and Agencies | | | | | | | | | | | |
Balance—beginning of year | | 403 | | 4,322 | | 365 | | 5,090 | | 4,397 | |
Prior period adjustments | | | | | | | | | | 29 | |
Balance—beginning of year restated | | 403 | | 4,322 | | 365 | | 5,090 | | 4,426 | |
Increase (decrease) in investment | | 150 | | | | | | 150 | | | |
Increase (decrease) in other comprehensive income | | | | | | (432 | ) | (432 | ) | (82 | ) |
Net earnings of self–supported Crown corporations and agencies | | | | 2,905 | | | | 2,905 | | 2,974 | |
Contributions paid to the Consolidated Revenue Fund | | | | (1,719 | ) | | | (1,719 | ) | (1,972 | ) |
Adjustments to contributions paid | | | | (256 | ) | | | (256 | ) | (256 | ) |
Balance—end of year | | 553 | | 5,252 | | (67 | ) | 5,738 | | 5,090 | |
See Statement of Financial Position for Self–supported Crown Corporations and Agencies and Summary of Results of Operations and Statement of Equity for Self–supported Crown Corporations and Agencies on pages 90 – 91 for details.
51
PROVINCE OF BRITISH COLUMBIA
PUBLIC ACCOUNTS 2008/09
Notes to Consolidated Summary Financial Statements
for the Fiscal Year Ended March 31, 2009—Continued
8. Loans, Advances and Mortgages Receivable
| | In Millions | |
| | 2009 | | 2008 | |
| | $ | | $ | |
Loans and Advances | | | | | |
BC student loans | | 830 | | 799 | |
Land Tax Deferment loans | | 287 | | 234 | |
Construction loans to social housing projects | | 78 | | 82 | |
Industrial Development Fund commercial loans | | 33 | | 34 | |
Accountable advances | | 16 | | 19 | |
Miscellaneous | | 82 | | 72 | |
| | 1,326 | | 1,240 | |
Provision for doubtful accounts | | (272 | ) | (253 | ) |
| | 1,054 | | 987 | |
Mortgages Receivable | | | | | |
Reconstruction Program | | 80 | | 70 | |
Miscellaneous | | 55 | | 6 | |
| | 135 | | 76 | |
| | 1,189 | | 1,063 | |
52
PROVINCE OF BRITISH COLUMBIA
PUBLIC ACCOUNTS 2008/09
Notes to Consolidated Summary Financial Statements
for the Fiscal Year Ended March 31, 2009—Continued
8. Loans, Advances and Mortgages Receivable—Continued
The BC Student Loan Program provides loans to borrowers for higher education. Borrowers are required to repay these loans through a contracted service provider to the province with a floating interest rate of prime plus 2.5%. Amortization of the loans is usually set for 174 months, but borrowers can extend that amortization to a maximum of 234 months. Defaulted loans are due on demand with interest at a floating rate of prime plus 2.5%. The BC Student Loan Program also administers defaulted student loans issued by financial institutions under a guaranteed and risk sharing agreement with the province. Defaulted risk sharing loans arise due to bankruptcy or death of the borrower while attending school.
The Land Tax Deferment Program allows eligible owners to defer payment of all, or a portion of, annual property taxes due on principal residences. Eligible individuals are either 55 years of age or older, a surviving spouse, or a person with a disability. Simple interest is charged on the deferred taxes at a rate set by the minister of finance. This rate will not exceed 2% below the prime lending rate of the principal banker to the government. The deferred taxes, administration fees, plus outstanding interest must be repaid before the residence can be legally transferred to a new owner, other than directly to a surviving spouse.
Construction loans are provided by British Columbia Housing Management Commission (BCHMC), a taxpayer–supported Crown corporation and an approved lender under the National Housing Act. BCHMC provides construction loans for societies that are building approved projects under social housing programs. Interest is payable at the province’s weighted average borrowing rate for short–term funds, plus administration costs. Loans are repaid at substantial completion of each project from financing arranged with private lenders.
The Industrial Development Fund provided loans to assist the establishment of new industry, the introduction of new technology to existing industry, or the development of a region of British Columbia. These loans incur interest at rates ranging from 0% to 7.75%. The Industrial Development Fund was eliminated pursuant to the repeal of the Industrial Development Incentive Act under the Budget Measures Implementation Act, 2002. No loans were issued after March 31, 2002.
Accountable advances represent funds issued for program costs that have not yet been expended in accordance with the applicable agreements.
The Reconstruction Program provides financial assistance to homeowners to pay for repairs for homes with premature building envelope failure. The financial assistance is provided in the form of subsidized interest loans, no interest loans or deferred payment loans, and is secured by registered mortgages. This program is administered by the Homeowner Protection Office.
Miscellaneous mortgages receivable have terms ranging from less than one year to twenty years, with some loans being payable on demand, with interest rates from 3.95% to 9.48%.
53
PROVINCE OF BRITISH COLUMBIA
PUBLIC ACCOUNTS 2008/09
Notes to Consolidated Summary Financial Statements
for the Fiscal Year Ended March 31, 2009—Continued
9. Other Investments
| | In Millions | |
| | 2009 | | 2008 | |
| | $ | | $ | |
| | | | | |
Pooled investment portfolios | | 1,297 | | 934 | |
Equity investments | | 329 | | 388 | |
Commercial loans and investments | | 300 | | 334 | |
Municipal, corporate and other bonds | | 239 | | 486 | |
Provincial government bonds | | 199 | | 216 | |
Government of Canada bonds | | 162 | | 112 | |
British Columbia Ferry Services Inc | | 75 | | 75 | |
Miscellaneous | | 214 | | 293 | |
| | 2,815 | | 2,838 | |
Provision for doubtful accounts | | | | (5 | ) |
| | 2,815 | | 2,833 | |
Pooled investment portfolios consist mainly of units in various funds of the British Columbia Investment Management Corporation. These funds’ investments consist primarily of debt and equity holdings of privately held companies. Pooled investment portfolios have a market value of $1,160 million (2008: $946 million).
Equity investments have a market value of $312 million (2008: $435 million). They include investments in Canadian, U.S. and international equity markets. Also included in equity investments are investments by the University of British Columbia and University of Victoria in subsidiaries that are reported on the equity basis. The total investment reported for these entities is $6 million (2008: $8 million).
Commercial loans and investments are recorded at the lower of cost of acquisition adjusted by attributed income and market value. Commercial loans and investments include Columbia Basin Trust’s $298 million (2008: $301 million) investment in power development joint ventures.
Municipal, corporate and other bonds have a market value of $231 million (2008: $484 million) with yields ranging from 0% to 11%.
Provincial bonds of various provinces have a market value of $175 million (2008: $226 million), with yields ranging from 0.49% to 7.6%. Maturity dates range from May 19, 2009 to June 18, 2037.
Government of Canada bonds have a market value of $200 million (2008: $117 million), with yields ranging from 0.54% to 5.48%. Maturity dates range from September 15, 2009 to June 1, 2037.
As part of a secured debenture amendment and preferred share surrender agreement dated May 23, 2003, the province exchanged its interest in British Columbia Ferry Corporation for 75,477 preferred shares in British Columbia Ferry Services Inc. These non–voting preferred shares are valued at $1,000 per share and entitle the province to a fixed cumulative dividend at a rate of 8% of the issue price.
Miscellaneous investments consist of other pooled funds as well as various forms of income securities, notes and treasury bills. The market value of miscellaneous investments is $204 million (2008: $298 million).
54
PROVINCE OF BRITISH COLUMBIA
PUBLIC ACCOUNTS 2008/09
Notes to Consolidated Summary Financial Statements
for the Fiscal Year Ended March 31, 2009—Continued
10. Sinking Fund Investments
| | In Millions | |
| | 2009 | | 2008 | |
| | $ | | $ | |
| | | | | |
Taxpayer–supported sinking fund investments | | 2,019 | | 2,054 | |
Self–supported sinking fund investments | | 115 | | 595 | |
| | 2,134 | | 2,649 | |
| | In Millions | |
| | 2009 | | 2008 | |
| | $ | | $ | |
| | | | | |
Provincial government bonds | | 983 | | 862 | |
Pooled investment portfolios | | 802 | | 1,403 | |
Local government bonds | | 323 | | 349 | |
Cash | | 25 | | 28 | |
Government of Canada bonds | | 1 | | 7 | |
| | 2,134 | | 2,649 | |
Provincial bonds of various provinces have a market value of $1,063 million (2008: $963 million), with yields ranging from 0.11% to 5.79%. Maturity dates range from April 1, 2009 to February 15, 2045.
Pooled investment portfolios have a market value of $859 million (2008: $1,453 million). These pooled investment portfolios consist of units in the British Columbia Investment Management Corporation’s bond funds, which mainly consist of various governments’ bonds and short–term unitized funds that hold money market instruments.
Local government bonds have a market value of $328 million (2008: $355 million), with yields ranging from 2.53% to 11.33%. Maturity dates range from April 10, 2009 to November 30, 2023. Local government bonds mainly consist of debt issued by the BC Municipal Financing Authority.
Government of Canada bonds have a market value of $0.9 million (2008: $7 million), with yields ranging from 0.6% to 1.76%. Maturity dates range from June 1, 2009 to June 1, 2013.
11. Loans for Purchase of Assets, Recoverable from Agencies
| | In Millions | |
| | 2009 | | 2008 | |
| | $ | | $ | |
| | | | | |
British Columbia Hydro and Power Authority | | 9,044 | | 7,623 | |
British Columbia Transmission Corporation | | 70 | | 79 | |
Transportation Investment Corporation | | 20 | | | |
Improvement districts | | 15 | | 17 | |
| | 9,149 | | 7,719 | |
55
PROVINCE OF BRITISH COLUMBIA
PUBLIC ACCOUNTS 2008/09
Notes to Consolidated Summary Financial Statements
for the Fiscal Year Ended March 31, 2009—Continued
12. Accounts Payable and Accrued Liabilities
| | In Millions | |
| | 2009 | | 2008 | |
| | $ | | $ | |
| | | | | |
Accounts payable | | 2,474 | | 3,132 | |
Accrued employee leave entitlements (see table below) | | 1,908 | | 1,656 | |
Other accrued estimated liabilities(1) | | 1,689 | | 1,515 | |
Accrued interest on debt | | 559 | | 590 | |
| | 6,630 | | 6,893 | |
(1)Includes pending litigation, provision for guaranteed debt payout and other miscellaneous accrued claims.
| | In Millions | |
| | 2009 | | 2008 | |
| | $ | | $ | |
Accrued employee leave entitlements | | | | | |
Vacation, compensatory time off, sick bank | | 979 | | 771 | |
Retirement allowance | | 700 | | 577 | |
Long–term disability | | 159 | | 241 | |
Worker compensation benefits | | 70 | | 67 | |
| | 1,908 | | 1,656 | |
Across the reporting entity, there are a variety of employee benefit plans with different terms that provide for post–employment benefits, compensated absences and termination benefits. The province is responsible for adequately funding most of the plans. The cost of benefits are recognized in the periods the employee provides service. For benefits that do not vest or accumulate, a liability is recognized when an event that obligates the province to pay benefits occurs.
The province accrues a liability for vacation pay, compensatory time off and banked sick time. Part of the liability is based on actuarial valuations.
The province provides termination payments under various collective agreements. The amounts payable are based on years of service and annual salary.
Amounts recorded in the financial statements relating to long–term disability benefits represent the actual amount of benefits paid during the year plus the actuarial estimate for future payments, based on claims ongoing at year–end.
Amounts recorded for worker compensation benefits represent the actual premiums accruing to WorkSafeBC for the year.
56
PROVINCE OF BRITISH COLUMBIA
PUBLIC ACCOUNTS 2008/09
Notes to Consolidated Summary Financial Statements
for the Fiscal Year Ended March 31, 2009—Continued
13. Due to Other Governments
| | In Millions | |
| | 2009 | | 2008 | |
| | $ | | $ | |
| | | | | |
Government of Canada: | | | | | |
Current | | 192 | | 323 | |
Long–term | | 447 | | 520 | |
Provincial governments: | | | | | |
Current | | 33 | | 66 | |
Long–term | | 7 | | | |
Local governments:(1) | | | | | |
Current | | 25 | | 88 | |
Long–term | | | | 3 | |
| | 704 | | 1,000 | |
(1)Local governments are municipal units established by the provincial government that include regional and metropolitan municipalities, cities, towns, townships, districts, rural municipalities and villages.
14. Due to Crown Corporations, Agencies and Trust Funds
| | In Millions | |
| | 2009 | | 2008 | |
| | $ | | $ | |
| | | | | |
British Columbia Liquor Distribution Branch | | | | 35 | |
Trust funds | | 72 | | 77 | |
| | 72 | | 112 | |
15. Deferred Revenue
| | In Millions | |
| | 2009 | | 2008 | |
| | $ | | $ | |
| | | | | |
Petroleum, natural gas and minerals, leases and fees | | 4,039 | | 2,400 | |
Deferred contributions | | 2,793 | | 2,527 | |
Federal contributions | | 638 | | 660 | |
Federal and municipal highway project revenues | | 386 | | 297 | |
Unearned lease revenue | | 356 | | 345 | |
Motor vehicle licences and permits | | 239 | | 241 | |
Tuition | | 124 | | 120 | |
Derivative debt instruments | | 157 | | 147 | |
Water rentals and recording fees | | 90 | | 100 | |
Medical Services Plan premiums | | 83 | | 78 | |
Forest Stand Management Fund | | 9 | | 10 | |
Miscellaneous | | 254 | | 220 | |
| | 9,168 | | 7,145 | |
57
PROVINCE OF BRITISH COLUMBIA
PUBLIC ACCOUNTS 2008/09
Notes to Consolidated Summary Financial Statements
for the Fiscal Year Ended March 31, 2009—Continued
16. Employee Pension Plans
| | In Millions | |
| | 2009 | | 2008 | |
| | $ | | $ | |
| | | | | |
Members of the Legislative Assembly Superannuation Account | | 3 | | 2 | |
(a) Members of the Legislative Assembly Superannuation Account
The Legislative Assembly Superannuation Account (the “Account”) is administered by the British Columbia Pension Corporation (the “Pension Corporation”). As members of the Legislative Assembly retire, the present value of the amount required to provide a legislative member’s future pension benefit is transferred from the Account to the Public Service Pension Plan from which monthly pensions are paid. The province contributes to this plan and provides additional funding when the present value of the funding exceeds the accumulated assets in the Account available to fund those members’ benefit entitlements in the plan. This plan provides basic pension benefits based on length of service, highest five–year average earnings and plan members’ age at retirement. Benefits such as group health benefits and inflation protection for the basic pension are not guaranteed and are contingent upon available funding.
(b) Other Pension Plans
Other pension plans represent defined benefit plans outside of the College, Public Service, Municipal, and Teachers’ Pension plans which are funded by entities within the government reporting entity. They include the Retirement Plan for Non–Teaching Employees of the Board of School Trustees of School District No. 43 (Coquitlam), the University of Victoria’s pension plan for employees other than faculty and professional staff, and Simon Fraser University’s Academic Pension Plan and Administrative/Union Pension Plan. The accrued benefit obligation is $449 million (2008: $390 million), with estimated pension fund assets of $444 million (2008: $422 million), and an unamortized actuarial gain (loss) of $(10 million) (2008: $11 million). The accrued net asset is $5 million (2008: $21 million).
There are additional employee pension plans in Crown corporations and agencies consolidated on the modified equity basis. They include British Columbia Hydro and Power Authority, British Columbia Lottery Corporation, British Columbia Railway Company, British Columbia Transmission Corporation and the Insurance Corporation of British Columbia. Net assets or net liabilities of the pension funds are included in the investment balance of the particular Crown corporation or agency. Total accrued benefit obligations equal $3,064 million (2008: $3,696 million), with estimated pension fund assets of $2,949 million (2008: $3,732 million), and an unamortized actuarial gain (loss) of $(501) million (2008: $(285) million). The accrued net asset is $386 million (2008: $321 million).
(c) Joint Trusteed Plans
The province contributes to four defined benefit pension plans for substantially all of its employees. The four pension plans are the College Pension Plan, the Public Service Pension Plan, the Municipal Pension Plan, and the Teachers’ Pension Plan. The plans provide basic pensions based on length of service, highest five–year average earnings and plan members’ age at retirement. Benefits such as group health benefits and inflation protection for the basic pension are not guaranteed and are contingent upon available funding. No unfunded liability exists for the future indexing of pensions as the obligation is limited to the amount of available assets in separate inflation accounts.
58
PROVINCE OF BRITISH COLUMBIA
PUBLIC ACCOUNTS 2008/09
Notes to Consolidated Summary Financial Statements
for the Fiscal Year Ended March 31, 2009—Continued
16. Employee Pension Plans—Continued
The College, Public Service, Municipal and Teachers’ pension plans are joint trusteed plans. In joint trusteed plans, control of the plans and their assets is assumed by individual pension boards made up of government and plan member representatives. Provisions of these plans stipulate that the province has no formal claim to any pension plan surplus or asset. The boards are fully responsible for the management of the plans, including investment of the assets and administration of the plans. The Pension Corporation provides benefit administrative services as an agent of the boards of trustees. The British Columbia Investment Management Corporation provides investment management services as an agent of the independent pension boards.
In the event an unfunded liability is determined by an actuarial valuation (performed every three years), the pension boards are required to address it through contribution adjustments shared equally by plan members and employers. It is expected, therefore, that any unfunded liabilities in the future will be short–term in nature.
The reported net assets of the pension plans are under joint trust arrangements which limit the province’s possible conditional share to 50%. The province has no claim on accrued asset amounts. If the individual pension boards decide to reduce or suspend employer contributions for a period of time, the province may record an asset. Therefore, the recorded value of the net assets is nil until such time such a decision is made. Also, only 70% of the pension fund assets, accrued benefit obligation, and preliminary current year employer contributions are included for the Municipal Pension Plan, reflecting the province’s interest in the plan.
The accrued benefit obligations and pension assets shown for 2008/09 are based on extrapolations of the most recent actuarial valuations as shown below. Fund assets are based on market value at the date of actuarial valuation and extrapolated using actuarial growth assumptions as shown in the following table. The expected long–term inflation rates used in these assumptions are nil, since the future indexing of pensions is limited to the amount of available assets in the inflation adjustment account.
59
PROVINCE OF BRITISH COLUMBIA
PUBLIC ACCOUNTS 2008/09
Notes to Consolidated Summary Financial Statements
for the Fiscal Year Ended March 31, 2009—Continued
16. Employee Pension Plans—Continued
Key actuarial assumptions and dates:
| | Public | | | | | | | |
| | Service | | Municipal | | Teachers’ | | College | |
| | Pension | | Pension | | Pension | | Pension | |
| | Plan | | Plan | | Plan | | Plan | |
Date of actuarial valuation | | Mar 31/08 | | Dec 31/06 | | Dec 31/05 | | Aug 31/06 | |
Date of audited financial statements | | Mar 31/08 | | Dec 31/07 | | Dec 31/07 | | Aug 31/08 | |
Expected long–term rate of return | | 6.50 | % | 6.75 | % | 6.85 | % | 6.75 | % |
Assumed rate of salary escalation | | 3.75 | % | 4.00 | % | 4.10 | % | 4.00 | % |
The audited financial statements of each pension plan listed, except the Account, may be found in the annual reports at www.pensionsbc.ca outside these audited statements.
(d) Accrued net obligation (asset) table
The estimated financial position as at March 31, 2009, for the basic pension in each plan is as follows:
| | In Millions | |
| | Public | | | | | | | | | |
| | Service | | Municipal | | Teachers’ | | College | | | |
| | Pension | | Pension | | Pension | | Pension | | | |
| | Plan | | Plan | | Plan | | Plan | | Total | |
| | $ | | $ | | $ | | $ | | $ | |
| | | | | | | | | | | |
Accrued benefit obligation | | 12,731 | | 14,301 | | 13,829 | | 2,021 | | 42,882 | |
Pension fund assets | | 13,865 | | 14,578 | | 12,558 | | 2,071 | | 43,072 | |
| | (1,134 | ) | (277 | ) | 1,271 | | (50 | ) | (190 | ) |
Unamortized actuarial gain (loss) | | (923 | ) | (1,036 | ) | (1,287 | ) | (344 | ) | (3,590 | ) |
Accrued net obligation (asset) | | (2,057 | ) | (1,313 | ) | (16 | ) | (394 | ) | (3,780 | ) |
(e) The preliminary overall fund rates of return (loss) reported to the pension boards as at December 31, 2008 for each plan are: College Pension Plan (12.20)% (2008: 4.10%), Public Service Pension Plan (12.60)% (2008: 3.80%), Municipal Pension Plan (12.40)% (2008: 4.40%), and Teachers’ Pension Plan (12.80)% (2008: 4.00%).
(f) The province’s share includes contributions for all participants in the government reporting entity. Total contributions this year for each plan are: College Pension Plan $53 million (2008: $51 million), the Public Service Pension Plan $295 million (2008: $264 million), the Municipal Pension Plan $425 million (2008: $399 million), and the Teachers’ Pension Plan $328 million (2008: $317 million).
60
PROVINCE OF BRITISH COLUMBIA
PUBLIC ACCOUNTS 2008/09
Notes to Consolidated Summary Financial Statements
for the Fiscal Year Ended March 31, 2009—Continued
17. Taxpayer–supported Debt(1)
| | In Millions | |
| | | | | | | | | | | | 2009 | | 2008 | |
| | | | | | | | | | | | Canadian | | Canadian | |
| | Year of | | Canadian | | US | | Japanese | | Other | | Dollar | | Dollar | |
| | Maturity | | Dollar | | Dollar(2) | | Yen(2) | | Currencies(2) | | Total | | Total | |
| | | | $ | | $ | | $ | | $ | | $ | | $ | |
| | | | | | | | | | | | | | | |
Short–term promissory notes | | 2009 | | | | | | | | | | 0 | | 1,396 | |
| | 2010 | | 686 | | 1,957 | | | | | | 2,643 | | 0 | |
Notes, bonds and debentures(3) | | 2009 | | | | �� | | | | | | 0 | | 3,393 | |
| | 2010 | | 1,447 | | 308 | | 94 | | 573 | | 2,422 | | 2,407 | |
| | 2011 | | 1,958 | | | | 89 | | 614 | | 2,661 | | 2,683 | |
| | 2012 | | 2,550 | | | | | | | | 2,550 | | 2,550 | |
| | 2013 | | 687 | | | | | | | | 687 | | 683 | |
| | 2014 | | 1,668 | | 613 | | | | | | 2,281 | | 2,119 | |
| | 2015–2019 | | 2,030 | | | | | | | | 2,030 | | 1,631 | |
| | 2020–2024 | | 3,226 | | | | | | | | 3,226 | | 3,088 | |
| | 2025–2029 | | 2,650 | | | | | | | | 2,650 | | 2,546 | |
| | 2030–2034 | | 3,259 | | | | | | | | 3,259 | | 3,176 | |
| | 2035–2039 | | 3,106 | | | | | | | | 3,106 | | 2,322 | |
| | 2040–2044 | | 714 | | | | | | | | 714 | | 500 | |
| | 2045–2049 | | 283 | | | | | | | | 283 | | 141 | |
| | 2050–2054 | | 20 | | | | | | | | 20 | | 0 | |
Total debt issued at face value | | | | 24,284 | | 2,878 | | 183 | | 1,187 | | 28,532 | | 28,635 | |
| | | | | | | | | | | | | | | |
Unamortized discount | | (110 | ) | (126 | ) |
Unrealized foreign exchange gains (losses) | | (54 | ) | 30 | |
Amount held in the Consolidated Revenue Fund | | (2 | ) | (2 | ) |
Total taxpayer–supported debt | | 28,366 | | 28,537 | |
| | | | | |
The effective interest rates (weighted average) as at March 31 on the above debt are: | | | | | |
| | | | | |
2009 | | 5.57 | % | | |
2008 | | | | 5.95 | % |
Capital Lease Obligations
Notes, bonds and debentures include capital lease obligations of $246 million (2008: $277 million). Capital lease obligations consist of the present value of the minimum lease payment related to capital leased assets. Major leases include the capital leased assets for PHH Vehicle Management Services Inc. of $46 million (2008: $54 million). Additional leases include the capital leased assets of health organizations of $128 million (2008: $139 million), post–secondary institutions of $46 million (2008: $44 million) and other entities in the government reporting entity of $26 million (2008: $40 million).
(1)The balances and interest rates reflect the impact of the related derivative contracts, presented in Note 19 (Risk Management and Derivative Financial Instruments).
(2)A portion of the foreign currency denominated debt as at March 31, 2009 was hedged to Canadian dollars–US$1,852 million was fully hedged to CAD$2,420 million with the remaining US$300 million fully hedged to 36,075 million Japanese Yen (CAD$458 million); 17,000 million Japanese Yen was fully hedged to CAD$183 million; and 688 million Euro was fully hedged to CAD$1,187 million.
(3)Notes, bonds and debentures include $1,316 million (2008: $1,014 million) in public–private partnership obligations, $319 million (2008: $342 million) in mortgages, and $76 million (2008: $75 million) in demand loans.
61
PROVINCE OF BRITISH COLUMBIA
PUBLIC ACCOUNTS 2008/09
Notes to Consolidated Summary Financial Statements
for the Fiscal Year Ended March 31, 2009—Continued
17. Taxpayer–supported Debt—Continued
Notes, bonds and debentures
Redeemable by the province
Balances include debentures issued to the Canada Pension Plan totalling $3,514 million (2008: $3,450 million) at a weighted average interest rate of 6.99% (2008: 7.31%). These debentures mature at various dates from April 10, 2009 to August 11, 2038 with interest rates varying between 3.52% and 11.33%. These debentures are redeemable in whole or in part before maturity, on 30 days’ prior notice, at the option of the province. During the year, $244 million (2008: $288 million) Canada Pension Plan debentures were issued.
Aggregate payments to meet sinking fund instalments and retirement provisions
Aggregate payments for the next five fiscal years to meet sinking fund instalments and retirement provisions on notes, bonds and debentures are:
| | In Millions | |
| | Canadian | |
| | Dollar | |
| | $ | |
| | | |
2010 | | 2,246 | |
2011 | | 2,359 | |
2012 | | 2,016 | |
2013 | | 665 | |
2014 | | 2,163 | |
62
PROVINCE OF BRITISH COLUMBIA
PUBLIC ACCOUNTS 2008/09
Notes to Consolidated Summary Financial Statements
for the Fiscal Year Ended March 31, 2009—Continued
18. Self–supported Debt(1),(2)
| | In Millions | |
| | | | | | | | | | 2009 | | 2008 | |
| | | | | | | | | | Canadian | | Canadian | |
| | Year of | | Canadian | | US | | Other | | Dollar | | Dollar | |
| | Maturity | | Dollar | | Dollar(3) | | Currencies | | Total | | Total | |
| | | | $ | | $ | | $ | | $ | | $ | |
| | | | | | | | | | | | | |
Short–term promissory notes | | 2009 | | | | | | | | 0 | | 1,020 | |
| | 2010 | | 648 | | 1,066 | | | | 1,714 | | 0 | |
Notes, bonds and debentures | | 2009 | | | | | | | | 0 | | 124 | |
| | 2010 | | 574 | | 58 | | | | 632 | | 632 | |
| | 2011 | | 150 | | | | | | 150 | | 150 | |
| | 2012 | | 450 | | | | | | 450 | | 450 | |
| | 2013 | | 200 | | | | | | 200 | | 200 | |
| | 2014 | | 500 | | 290 | | | | 790 | | 790 | |
| | 2015–2019 | | 1,865 | | 204 | | 360 | | 2,429 | | 715 | |
| | 2020–2024 | | 1,701 | | | | | | 1,701 | | 1,701 | |
| | 2025–2029 | | | | 634 | | | | 634 | | 597 | |
| | 2030–2034 | | 1,500 | | | | | | 1,500 | | 1,300 | |
| | 2035–2039 | | | | 371 | | | | 371 | | 355 | |
| | 2040–2044 | | 342 | | | | | | 342 | | 0 | |
| | 2045–2049 | | 370 | | | | | | 370 | | 200 | |
Total debt issued at face value | | | | 8,300 | | 2,623 | | 360 | | 11,283 | | 8,234 | |
| | | | | | | | | | | | | |
Unamortized discount | | 29 | | (10 | ) |
Unrealized foreign exchange gain | | 18 | | 73 | |
Total self–supported debt | | 11,330 | | 8,297 | |
| | | | | |
The effective interest rates (weighted average) as at March 31 on the above debt are: | | | | | |
| | | | | |
2009 | | 5.03 | % | | |
2008 | | | | 6.16 | % |
(1)The balances and interest rates reflect the impact of the related derivative contracts, presented in Note 19 (Risk Management and Derivative Financial Instruments).
(2)Self-supported Debt includes Warehouse Borrowing Program debt with a book value of CAD$2,081 million (2008: nil).
(3)Foreign currency denominated debt as at March 31, 2009 includes US$2,107 million (CAD$2,623 million), of which US$1,879 million was fully hedged to CAD$2,336 million and US$228 million was unhedged (CAD$287 million).
Notes, bonds and debentures
Redeemable by the province
Balances include debentures issued to the Canada Pension Plan totalling $144 million (2008: $208 million) at a weighted average interest rate of 7.53% (2008: 9.02%). These debentures mature at various dates from May 10, 2009 to November 10, 2018 with interest rates varying between 4.75% and 10.17%. These debentures are redeemable in whole or in part before maturity, on 30 days’ prior notice, at the option of the province. During the year, $30 million (2008: $40 million) Canada Pension Plan debentures were issued.
63
PROVINCE OF BRITISH COLUMBIA
PUBLIC ACCOUNTS 2008/09
Notes to Consolidated Summary Financial Statements
for the Fiscal Year Ended March 31, 2009—Continued
18. Self–supported Debt—Continued
Aggregate payments to meet retirement provisions
Aggregate payments for the next five fiscal years to meet retirement provisions on notes, bonds and debentures are:
| | In Millions | |
| | Canadian | |
| | Dollar | |
| | $ | |
| | | |
2010 | | 630 | |
2011 | | 150 | |
2012 | | 450 | |
2013 | | 200 | |
2014 | | 790 | |
19. Risk Management and Derivative Financial Instruments
The province borrows funds in both domestic and foreign capital markets, and manages its existing debt portfolio to achieve the lowest debt costs within specified risk parameters. As a result, the province is exposed to risks associated with interest rate fluctuations, foreign exchange rate fluctuations and credit risk. In accordance with risk management policy guidelines set by the Risk Committee of the Ministry of Finance, the province uses a variety of derivative financial instruments to hedge exposure to interest and foreign exchange risks.
Derivatives used by the province include interest rate swaps, cross–currency swaps, forward foreign exchange contracts, forward rate agreements, advanced rate setting agreements and other agreements. A derivative instrument is a financial contract with a financial institution or counterparty that is applied to effect a hedge on interest rate or foreign exchange exposure contained in the underlying provincial debt instrument. A derivative derives value from the impact of market changes on the underlying hedged debt instrument.
The following tables present maturity schedules of the province’s derivatives by type, outstanding at March 31, 2009, based on the notional amounts of the contracts. The notional amounts of financial derivative instruments are the face amounts that are used to calculate interest payments made on those instruments. There is no exchange of the notional amounts in interest rate swaps. Cross–currency swaps can have an exchange of the notional amounts at the start of the contract, the end of the contract, or both.
Taxpayer–supported Portfolios
| | In Millions | |
| | | | | | | | Forward | | Other | | | |
| | | | Cross | | Interest | | Foreign | | Contracts | | | |
| | Year of | | Currency | | Rate | | Exchange | | and | | | |
| | Maturity | | Swaps | | Swaps | | Contracts | | Agreements | | Total | |
| | | | $ | | $ | | $ | | $ | | $ | |
| | | | | | | | | | | | | |
| | 2010 | | 974 | | 576 | | 1,957 | | 234 | | 3,741 | |
| | 2011 | | 793 | | | | | | | | 793 | |
| | 2012 | | | | 100 | | | | | | 100 | |
| | 2013 | | | | 240 | | | | | | 240 | |
| | 2014 | | 613 | | 615 | | | | | | 1,228 | |
| | 6–10 years | | | | 4 | | | | | | 4 | |
| | + 10 years | | 41 | | 870 | | | | | | 911 | |
Total | | | | 2,421 | | 2,405 | | 1,957 | | 234 | | 7,017 | |
64
PROVINCE OF BRITISH COLUMBIA
PUBLIC ACCOUNTS 2008/09
Notes to Consolidated Summary Financial Statements
for the Fiscal Year Ended March 31, 2009—Continued
19. Risk Management and Derivative Financial Instruments—Continued
Self–supported Portfolios
| | In Millions | |
| | | | | | | | Forward | | Advanced | | | |
| | | | Cross | | Interest | | Foreign | | Rate | | | |
| | Year of | | Currency | | Rate | | Exchange | | Setting | | | |
| | Maturity | | Swaps | | Swaps | | Contracts | | Agreements | | Total | |
| | | | $ | | $ | | $ | | $ | | $ | |
| | | | | | | | | | | | | |
| | 2010 | | | | 563 | | 1,123 | | 300 | | 1,986 | |
| | 2012 | | | | 350 | | | | | | 350 | |
| | 2014 | | 290 | | 930 | | | | | | 1,220 | |
| | 6–10 years | | 658 | | 50 | | 204 | | | | 912 | |
| | + 10 years | | | | | | 719 | | | | 719 | |
Total | | | | 948 | | 1,893 | | 2,046 | | 300 | | 5,187 | |
Interest rate risk
Interest rate risk is the risk that the province’s debt servicing costs will fluctuate due to changes in interest rates. The province uses derivative contracts (interest rate swaps) to manage interest rate risk by exchanging a series of interest payments, and assuming either a fixed or floating rate liability to a counterparty, based on the notional principal amount. Derivatives allow the province to alter the proportion of its debt held in fixed and floating rate form to take advantage of changes in interest rates.
The government’s current policy guidelines with respect to the provincial government direct debt portfolio, which totals $19,516 million (2008: $20,527 million), allow floating rate exposure up to 45.00% (2008: 45.00%) of this portion of the taxpayer–supported debt. At March 31, 2009, floating rate debt exposure was 24.94% (2008: 25.97%) of the government direct debt portfolio.
Under current policy guidelines for British Columbia Hydro and Power Authority (BC Hydro), the maximum floating rate exposure is 46.00% (2008: 46.00%) of their debt that totals $9,054 million (2008: $7,633 million). At March 31, 2009, floating rate debt exposure for BC Hydro was 32.50% (2008: 36.90%) of their debt.
Based on the taxpayer–supported and self–supported debt portfolios at March 31, 2009, a 1.00% change in interest rates would impact the annual debt servicing expense by $48 million (2008: $47 million) for the taxpayer–supported debt portfolio and $30 million (2008: $28 million) for the self–supported debt portfolio.
At March 31, 2009, swap agreements relating to investments held by taxpayer–supported portfolios included an interest rate swap totalling $84 million (2008: $44 million).
Foreign exchange risk
Foreign exchange risk is the risk that the province’s debt servicing costs and principal payments will fluctuate due to changes in foreign exchange rates. The province uses derivative contracts (cross–currency swaps) to hedge foreign exchange risk by converting foreign currency principal and interest cash flows into Canadian dollar cash flows.
The government’s current policy guidelines with respect to the provincial government direct debt portfolio, which totals $19,516 million (2008: $20,527 million), allow unhedged foreign debt exposure up to 10.00% (2008: 10.00%) of this portion of the taxpayer–supported debt. At March 31, 2009, unhedged foreign debt exposure in Japanese yen was 2.35% (2008: 1.81%) of the government direct debt portfolio.
65
PROVINCE OF BRITISH COLUMBIA
PUBLIC ACCOUNTS 2008/09
Notes to Consolidated Summary Financial Statements
for the Fiscal Year Ended March 31, 2009—Continued
19. Risk Management and Derivative Financial Instruments—Continued
Under current policy guidelines for BC Hydro, the maximum unhedged foreign debt exposure is 5.00% (2008: 5.00%) of its debt, which totals $9,054 million (2008: $7,633 million). At March 31, 2009, 1.80% (2008: 1.70%) of its debt was in the form of unhedged foreign debt in US dollars.
Based on the taxpayer–supported and self–supported debt portfolios at March 31, 2009, a one Japanese yen change versus the value of the Canadian dollar would impact the annual debt servicing costs for the taxpayer–supported debt portfolio by $1 million (2008: $1 million); and a one cent change in the Canadian dollar versus the US dollar would impact the annual debt servicing costs for the self–supported debt portfolio by $1 million (2008: $1 million).
At March 31, 2009, swap agreements relating to investments held by taxpayer–supported portfolios included cross–currency swaps totalling $41 million (2008: $64 million), foreign currency option agreements totalling nil (2008: $15 million), forward currency contracts and index–linked swaps totalling $233 million (2008: $230 million) and a forward foreign exchange agreement totalling $1 million (2008: nil).
Credit risk
Credit risk is the risk that the province will incur financial loss due to a counterparty defaulting on its financial obligation to the province. In accordance with the government’s policy guidelines, the province reduces its credit risk by dealing with only highly rated counterparties. The province only enters into derivative transactions with counterparties that have a rating from Standard & Poor’s and Moody’s Investors Service Inc. of at least AA–/Aa3 or A+/A1 in the case of Canadian Schedule A banks. The province also establishes limits on individual counterparty credit exposures and monitors these exposures on a regular basis.
20. Net Liabilities
The Consolidated Statement of Change in Net Liabilities (see page 41) shows the net impact of applying the expenditure basis of accounting. The net liabilities calculation uses the expenditure, rather than the expense basis of accounting. Under the expenditure basis of accounting, tangible capital assets, prepaid program costs and other assets are recorded as expenditures when calculating the current year surplus or deficit. Under the expense basis of accounting, these items are recorded on the Consolidated Statement of Financial Position as assets and amortized over an applicable period of time.
21. Tangible Capital Assets
| | In Millions | |
| | 2009 | | 2008 | |
| | $ | | $ | |
| | | | | |
Land and land improvements | | 3,764 | | 3,528 | |
Buildings (including tenant improvements) | | 14,417 | | 13,203 | |
Highway infrastructure | | 7,596 | | 7,169 | |
Transportation equipment | | 1,853 | | 1,858 | |
Computer hardware and software | | 1,178 | | 1,014 | |
Other | | 1,871 | | 1,983 | |
| | 30,679 | | 28,755 | |
See Consolidated Statement of Tangible Capital Assets on page 92.
66
PROVINCE OF BRITISH COLUMBIA
PUBLIC ACCOUNTS 2008/09
Notes to Consolidated Summary Financial Statements
for the Fiscal Year Ended March 31, 2009—Continued
21. Tangible Capital Assets—Continued
The estimated useful lives of the more common tangible capital assets are: buildings (3–50 years); highway infrastructure (15–40 years); transportation equipment (including ferries and related infrastructure) (3–25 years); computer hardware and software (1–10 years); major software systems (1–10 years); and other (including vehicles, specialized equipment, and furniture and equipment) (1–25 years). Land improvements are amortized over 30 years (recreation areas) or 40 years (dams and water management systems). Tenant improvements are amortized over five years or the length of the relevant lease term.
Included in tangible capital assets of British Columbia Transit (BCT) and of Rapid Transit Project 2000 Ltd (RTP) are capital assets under lease to South Coast British Columbia Transportation Authority (SCBCTA). These capital assets under lease consist of land, land improvements, stations, guideways and other assets related to the SkyTrain (including SkyTrain Extension) system and West Coast Express. These assets are made available to SCBCTA for their use pursuant to an Order in Council (OIC) and an operating lease and represent one of the province’s contributions toward public transportation in the Metro Vancouver service area. The operating lease arrangements with SCBCTA are for one dollar per year under an initial 15–year term to 2014, with an additional five–year renewal period upon the agreement of BCT and SCBCTA. The net book value of these assets is $779 million (2008: $811 million). A similar lease arrangement is under negotiation with SCBCTA for the RTP assets. The net book value of these assets is $894 million (2008: $921 million).
22. Prepaid Program Costs
| | In Millions | |
| | 2009 | | 2008 | |
| | $ | | $ | |
| | | | | |
Prepaid program costs | | 457 | | 398 | |
Includes deferred costs associated with the BC Timber Sales Program and other prepaid operating costs. Also includes inventories of supplies and other not–for–resale items held by taxpayer–supported Crown corporations and agencies which are charged to expense when consumed in the normal course of operations. At March 31, 2009 total inventories held for use or consumption was $264 million (2008: $231 million). During the year, total expense due to the consumption of inventories was $1,036 million (2008: $907 million) including the effect of write–downs of nil (2008: nil), and the effect of reversals of write–downs of nil (2008: nil).
23. Other Assets
| | In Millions | |
| | 2009 | | 2008 | |
| | $ | | $ | |
| | | | | |
Deferred debt instrument costs | | 296 | | 311 | |
Other deferred costs | | 27 | | 21 | |
| | 323 | | 332 | |
67
PROVINCE OF BRITISH COLUMBIA
PUBLIC ACCOUNTS 2008/09
Notes to Consolidated Summary Financial Statements
for the Fiscal Year Ended March 31, 2009—Continued
24. Accumulated Surplus (Deficit)
| | In Millions | |
| | 2009 | | 2008 | |
| | $ | | $ | |
| | | | | |
Accumulated surplus (deficit)—beginning of year as previously reported(1) | | 7,086 | | 4,200 | |
Adjustments to accumulated surplus (deficit)(2),(3) | | (178 | ) | (129 | ) |
Accumulated surplus (deficit)—beginning of year as restated | | 6,908 | | 4,071 | |
Surplus (deficit) for the year(4) | | 78 | | 2,837 | |
Accumulated surplus (deficit)—before other comprehensive income | | 6,986 | | 6,908 | |
| | | | | |
Accumulated other comprehensive income from self–supported Crown corporations and agencies (see page 91)—beginning of year | | 365 | | 447 | |
Other comprehensive income from self–supported Crown corporations and agencies (see page 91) | | (432 | ) | (82 | ) |
Accumulated other comprehensive income from self–supported Crown corporations and agencies (see page 91)—end of year | | (67 | ) | 365 | |
| | | | | |
Accumulated surplus (deficit)—end of year | | 6,919 | | 7,273 | |
(1)The opening accumulated surplus (deficit) figures for April 1, 2008 and April 1, 2007 are reported before accumulated other comprehensive income.
(2)During 2008/09, adjustments were made to the opening accumulated surplus for 2007/08 as follows:
BC Transit restatement for change in amortization policy from the sinking fund method to the straight-line method | | (65 | ) |
Record grants to Vancouver Convention Centre Expansion Project Ltd. from Tourism Vancouver as deferred revenue | | (58 | ) |
Record estimation error in 2005 Long Term Disability actuarial valuation | | (63 | ) |
Reduce capitalization rate of BC Timber Sales administration costs to 44%, which is the proportion related to timber development activities | | (40 | ) |
Recognition of mineral tax revenue on the accrual basis | | 87 | |
UBC restatement for capital asset amortization | | (37 | ) |
UBC restatement for Rick Hansen Trust | | 27 | |
UBC restatement for medical school expansion | | (14 | ) |
UBC restatement for direct grants | | 34 | |
Total | | (129 | ) |
(3)During 2008/09, adjustments were made to the opening accumulated surplus for 2008/09 for the following items:
BC Transit restatement for change in amortization policy from the sinking fund method to the straight-line method | | (82 | ) |
Record grants to Vancouver Convention Centre Expansion Project Ltd. from Tourism Vancouver as deferred revenue | | (82 | ) |
Record estimation error in 2005 Long Term Disability actuarial valuation | | (63 | ) |
Reduce capitalization rate of BC Timber Sales administration costs to 44%, which is the proportion related to timber development activities | | (32 | ) |
Record estimation error in 2007 Retiring Allowance actuarial valuation | | (8 | ) |
Recognition of mineral tax revenue on the accrual basis | | 87 | |
UBC restatement for capital asset amortization | | (40 | ) |
UBC restatement for Rick Hansen Trust | | 27 | |
UBC restatement for medical school expansion | | (19 | ) |
UBC restatement for direct grants | | 34 | |
Total | | (178 | ) |
(4)During 2008/09, adjustments were made to the reported surplus figure for the 2007/08 fiscal as follows:
BC Transit restatement for change in amortization policy from the sinking fund method to the straight-line method | | (17 | ) |
Record grants to Vancouver Convention Centre Expansion Project Ltd. from Tourism Vancouver as deferred revenue | | (24 | ) |
Reduce capitalization rate of BC Timber Sales administration costs to 44%, which is the proportion related to timber development activities | | 8 | |
Record estimation error in 2007 Retiring Allowance actuarial valuation | | (8 | ) |
UBC restatement for capital asset amortization | | (3 | ) |
UBC restatement for medical school expansion | | (5 | ) |
Total | | (49 | ) |
68
PROVINCE OF BRITISH COLUMBIA
PUBLIC ACCOUNTS 2008/09
Notes to Consolidated Summary Financial Statements
for the Fiscal Year Ended March 31, 2009—Continued
25. Contingencies and Contractual Obligations
(a) GUARANTEED DEBT
The authorized limit for loans guaranteed by the province as at March 31, 2009 was $410 million (2008: $423 million). These guarantees include amounts where indemnities have been made for explicit quantifiable loans. Guaranteed debt as at March 31, 2009, totalled $102 million (2008: $109 million). See Consolidated Statement of Guaranteed Debt on page 93 for details.
(b) CONTINGENT LIABILITIES
Litigation
The province is a defendant in legal actions and is involved in matters such as expropriation, contract and tax disputes. These matters may give rise to future liabilities.
The province has the following contingent liabilities where the estimated or known claim is, or exceeds $100,000, but the likelihood of payment is uncertain.
| | In Millions | |
| | 2009 | | 2008 | |
| | $ | | $ | |
| | | | | |
Contract disputes | | 114 | | 12 | |
Motor vehicle accidents | | 31 | | 34 | |
Damage to persons or property | | 27 | | 24 | |
Negligence and miscellaneous | | 4 | | 211 | |
Property access disputes | | | | 1 | |
| | 176 | | 282 | |
When it is determined it is likely a liability exists and the amount can be reasonably estimated, the amount is recorded as an accrued liability (see Note 12) and an expense. The accrued liability for pending litigation in process at March 31, 2009 was $36 million (2008: $37 million).
Guarantees and Indemnities
The province also has contingent liabilities in the form of indemnities, indirect guarantees and outstanding claims for amounts that are not explicit or reasonably estimable at this time.
Environmental Clean–up
The province is responsible for the environmental clean–up of numerous contaminated sites in the province. For those sites where the province has possession, a liability of $161 million (2008: $155 million) has been accrued based on preliminary environmental assessments. This liability is based on the minimum estimated clean–up costs for those sites where an estimate has been made and it has been determined the government is liable. Estimated clean–up costs, not already accrued for sites under evaluation, are approximately $17 million (2008: $47 million) as at March 31, 2009. In addition, the Ministry of Energy, Mines and Petroleum Resources has determined possible net liabilities of $540 million (2008: $391 million) for sites the province does not own. Many other sites remain to be evaluated; the future liability for all environmental clean–up costs is not currently determinable.
Aboriginal Land Claims
Treaty negotiations between the province, Canada and First Nations commenced in 1994. The province anticipates these negotiations will result in modern–day treaties defining the boundaries and nature of First Nations treaty settlement lands. As of March 31, 2009, there were 47 treaty tables in various stages of negotiation, representing two–thirds of the aboriginal people in British Columbia.
69
PROVINCE OF BRITISH COLUMBIA
PUBLIC ACCOUNTS 2008/09
Notes to Consolidated Summary Financial Statements
for the Fiscal Year Ended March 31, 2009—Continued
25. Contingencies and Contractual Obligations—Continued
When final treaty agreements are ratified by all parties, the provincial cost of treaties is recorded in the Public Accounts. Costs are accounted for based on the substance of the final agreement.
As the Final Agreement with the Tsawwassen First Nation was ratified by all parties in fiscal 2008/09, the associated costs were recognized as an expense in fiscal 2008/09. The Final Agreement came into effect on April 3, 2009.
As of March 31, 2009, the Final Agreement with the Maa–nulth First Nations has been ratified by the provincial government and 4 of the 5 respective First Nations. Ratification by the federal government is pending. Included in this Final Agreement and the treaty related agreement are commitments of land and benefits, including cash. The provincial commitments to the Maa–nulth First Nations are for 22,467 hectares of provincial Crown land, cash and benefits estimated at $31.6 million. (See Note 37 for events subsequent to March 31, 2009.)
On November 13, 2008, an Incremental Treaty Agreement was signed with the Tla–o–qui–aht First Nation that committed to the transfer of 63 hectares of provincial crown lands as milestones towards a Final Agreement are reached.
It is expected the capital transfer components in all Agreements in Principle (AiP) will be entirely provided by Canada. The current commitments of provincial Crown land for all Final Agreement tables are as follows:
· In–SHUCK–ch, 14,976 hectares
· Lheidli T’enneh, 3,416 hectares
· Maa–nulth, 22,467 hectares
· Sechelt, 933 hectares
· Sliammon, 6,346 hectares
· Yale, 1,595 hectares
· Yekooche, 5,960 hectares
Upon coming into effect, treaties will also trigger implementation costs and may result in compensation to third parties. Those costs are not determinable at this time.
Eighty per cent of funding for First Nations’ negotiation costs is in the form of loans from Canada and is repayable from treaty settlements. The province has committed to reimburse Canada 50% of any negotiation support loans that default along with 50% of the interest accrued. The amount of the loans from Canada to the First Nations at March 31, 2009 was $371 million (2008: $343 million). The amount of any provincial liability is not determinable at this time.
Some First Nations have chosen not to negotiate through the formal British Columbia Treaty Commission process. A number of First Nations have chosen to advance their claims through litigation. Claims include declarations with respect to aboriginal rights and title, commercial rights, challenges with respect to adequacy of consultation and accommodation, and damages for unjustified infringements. The amount of any provincial liability is not determinable at this time.
Crown Corporations, Agencies and the School Districts, Universities, Colleges, Institutes and Health Organizations (SUCH)Sector
(i) The Insurance Corporation of British Columbia (ICBC) settles most serious injury claims through the use of structured settlements which require ICBC to provide claimants with periodic payments, usually for a lifetime. ICBC has purchased annuities from approved life insurance companies to make these payments, and in the event a life insurance company fails in its obligation, ICBC becomes responsible for the annuity payments. To date, ICBC has not experienced any losses resulting from these arrangements, nor are any anticipated. The present value of these settlements at December 31, 2008, was approximately $1.01 billion (2007: $1.15 billion).
(ii) The BC Transportation Financing Authority has contingent liabilities of $115 million (2008: $100 million) remaining after deducting the estimated settlement expense currently accrued from gross claims and environmental issues outstanding for capital projects.
70
PROVINCE OF BRITISH COLUMBIA
PUBLIC ACCOUNTS 2008/09
Notes to Consolidated Summary Financial Statements
for the Fiscal Year Ended March 31, 2009—Continued
25. Contingencies and Contractual Obligations—Continued
(iii) Powerex, a wholly owned subsidiary of the British Columbia Hydro and Power Authority, has been named, along with other energy suppliers, as a defendant in a number of US lawsuits and regulatory proceedings regarding alleged market manipulation of energy prices in the California wholesale electricity markets during part of 2000 and 2001. A number of lawsuits have been dismissed on the basis that the proceedings should be at the U.S. Federal Energy Regulatory Commission. The ongoing cases are at various stages and none have been the subject of final judicial action. Management cannot predict the outcome of the various claims.
(iv) The BC Pavilion Corporation and predecessor property owners remain liable for environmental and reclamation obligations for known hazards that may exist at its facilities. Management is not aware of any existing environmental problems related to its facilities that may result in material liability to the BC Pavilion Corporation.
(v) The British Columbia Railway Corporation (BCRC) and BCR Properties Ltd. completed a transaction with Canadian National Railway Company (CN) on July 14, 2004. As a result of the transaction, the province and BCRC have provided commercial indemnities to CN with respect to the transaction and indemnities related to income tax attributes of BC Rail at closing. As at March 31, 2009, the maximum present value (calculated at 9%) of amounts payable under the tax indemnities related to income tax attributes (excluding any reimbursement of professional fees, tax arrears, interest on taxes payable, if any, on indemnity payments) is approximately $550 million (2008: $505 million). These indemnities remain in effect until 90 days after the last date on which a tax assessment or reassessment can be issued in respect of the income tax attributes. Management believes it is unlikely that the province or BCRC will ultimately be held liable for any amounts under the commercial and tax indemnities.
(c) COMMITMENTS
The government is involved in the following major commitments:
2010 Winter Olympics
On July 2, 2003, the International Olympic Committee (IOC) selected Vancouver to host the 2010 Olympic and Paralympic Winter Games (the Games). A comprehensive Multi–Party Agreement (MPA) among Canada, British Columbia, the City of Vancouver, the Resort Municipality of Whistler, the Canadian Olympic Committee, the Canadian Paralympic Committee, and the Vancouver 2010 Bid Corporation was signed November 14, 2002.
The MPA establishes the roles and relationships of all the parties, the contractual arrangements, financial contributions, legal responsibilities, and the sport legacies of the parties in relation to the Games. On September 30, 2003, the Vancouver Organizing Committee for the 2010 Olympic and Paralympic Winter Games (VANOC) was incorporated as the successor organization to the Vancouver 2010 Bid Corporation. The province has the power to appoint three of the 20 board members to VANOC. VANOC’s mandate is to plan, organize, finance, stage and host the Games. In addition, the province has provided a guarantee to the IOC of a potential financial shortfall of VANOC. The guarantee should not be relied on by parties other than the IOC.
The province made an initial commitment to contribute $600 million towards the Games. This commitment was allocated as follows:
· Venues and live sites $310 million
· Venues endowment legacy $55 million
· Medical and security costs $100 million
· Paralympic games $20 million
· First Nations sports and municipal legacies $36 million; and
· Olympic contingency allocations $79 million
71
PROVINCE OF BRITISH COLUMBIA
PUBLIC ACCOUNTS 2008/09
Notes to Consolidated Summary Financial Statements
for the Fiscal Year Ended March 31, 2009—Continued
25. Contingencies and Contractual Obligations—Continued
Under the MPA, Canada is responsible for providing Games security. In February 2009, the federal and provincial governments entered into new fiscal arrangements, whereby the province completed its security obligations under the original cost–sharing agreement by paying the federal government $63.7 million. This represented the balance of the province’s $87.5 million security funding commitment. Canada has agreed to assume complete responsibility of all operations and risks and provide the balance of the funding for Olympic Games security.
Under the new fiscal arrangements, the provincial government has agreed to increase its share of joint federal/provincial major infrastructure costs by up to $165 million over the next three years. As a result, the Olympic Games commitment has risen to $765 million.
The province spent $156 million in 2009 (2008: $67 million; previous years: $272 million) for a total to date of $495 million at March 31, 2009. Contractual obligations related to the Olympic games commitment are included in section (d) of this note.
Information about the Games may be found at the 2010 Olympic Games website: http://www.vancouver2010.com outside these audited statements, and at the BC Olympic and Paralympic Winter Games Secretariat http://www.2010bcsecretariat.ca/ outside these audited statements.
The province is also upgrading the Sea–to–Sky Highway to coincide with the Games. The province spent $184 million in 2009 (2008: $174 million). The project to date spending total is $726 million (2008: $542 million). The contractual obligations related to the Sea–to–Sky Highway are included in section (d) of this note.
Crown Corporations, Agencies and the SUCH Sector
The province has committed to the construction of the $885.3 million expansion to the Vancouver Convention Centre and other shared upgrades to adjacent facilities. The cost is to be shared by the province ($540.7 million), the government of Canada ($222.5 million), Tourism Vancouver ($90 million), Vancouver Convention Centre’s revenue generation program ($30 million), and a separate commitment with Western Economic Diversification Canada ($2.1 million). The contractual obligations related to the expansion of the Vancouver Convention Centre are included in section (d) of this note.
(d) CONTRACTUAL OBLIGATIONS
The government has entered into a number of multiple–year contracts for the delivery of services and the construction of assets. These contractual obligations will become liabilities in the future when the terms of the contracts are met. Disclosure relates to the unperformed portion of the contracts. Contractual obligations are future-oriented financial information about non-discounted future cash payments for operating and capital contracts, and do not indicate when the related expenses will be recognized in the financial statements.
72
PROVINCE OF BRITISH COLUMBIA
PUBLIC ACCOUNTS 2008/09
Notes to Consolidated Summary Financial Statements
for the Fiscal Year Ended March 31, 2009—Continued
25. Contingencies and Contractual Obligations—Continued
The following table presents the minimum amounts required to satisfy the contractual obligations, for contractual obligations that are greater than $50 million, by sector, by year. Details are available as unaudited supplementary information on the public website at http://www.fin.gov.bc.ca/pubs.htm.
| | In Millions | |
| | | | | | | | | | | | 2015 and | | | |
| | 2010 | | 2011 | | 2012 | | 2013 | | 2014 | | beyond | | Total | |
| | $ | | $ | | $ | | $ | | $ | | $ | | $ | |
Consolidated Revenue Fund and Taxpayer–supported Crown corporations and agencies | | | | | | | | | | | | | | | |
Health | | 1,503 | | 510 | | 334 | | 280 | | 266 | | 4,082 | | 6,975 | |
Education | | 150 | | 33 | | 14 | | 5 | | 2 | | | | 204 | |
Social services | | 252 | | 47 | | 23 | | | | | | | | 322 | |
Natural resources and economic development | | 71 | | 37 | | 29 | | 20 | | 15 | | 173 | | 345 | |
Other | | 78 | | 80 | | 73 | | 65 | | 45 | | 677 | | 1,018 | |
Protection of persons and property | | 285 | | 275 | | 267 | | 5 | | 5 | | 33 | | 870 | |
Transportation | | 1,369 | | 875 | | 844 | | 786 | | 626 | | 10,407 | | 14,907 | |
General government | | 340 | | 275 | | 218 | | 193 | | 158 | | 260 | | 1,444 | |
| | 4,048 | | 2,132 | | 1,802 | | 1,354 | | 1,117 | | 15,632 | | 26,085 | |
| | | | | | | | | | | | | | | |
Self–supported Crown corporations and agencies | | | | | | | | | | | | | | | |
Natural resources and economic development | | 1,900 | | 1,606 | | 1,557 | | 1,435 | | 1,257 | | 15,695 | | 23,450 | |
Transportation | | 449 | | 440 | | 422 | | 431 | | 529 | | 56 | | 2,327 | |
General government | | 134 | | 20 | | 17 | | 14 | | 11 | | 26 | | 222 | |
| | 2,483 | | 2,066 | | 1,996 | | 1,880 | | 1,797 | | 15,777 | | 25,999 | |
Total | | 6,531 | | 4,198 | | 3,798 | | 3,234 | | 2,914 | | 31,409 | | 52,084 | |
26. Restricted Assets
| | In Millions | |
| | 2009 | | 2008 | |
| | $ | | $ | |
| | | | | |
Endowment funds of universities and colleges | | 1,228 | | 1,264 | |
Donors have placed restrictions on their contributions to the endowment funds of universities and colleges. One restriction is that the original contribution should not be spent. Another potential restriction is that any investment income of the endowment fund that is required to offset the eroding effect of inflation or preserve the original value of the endowment should also not be spent.
73
PROVINCE OF BRITISH COLUMBIA
PUBLIC ACCOUNTS 2008/09
Notes to Consolidated Summary Financial Statements
for the Fiscal Year Ended March 31, 2009—Continued
27. Revenue
| | In Millions | |
| | 2009 | | 2008 | |
| | $ | | $ | |
Taxation revenue includes | | | | | |
Personal income | | 6,093 | | 6,956 | |
Corporate income | | 2,038 | | 2,250 | |
Social service | | 4,958 | | 5,072 | |
Property | | 1,848 | | 1,795 | |
Other | | 3,260 | | 3,333 | |
| | 18,197 | | 19,406 | |
See notes at the end of the Schedule of Net Revenue by Source on page 112 for additional information on taxation revenue.
28. Expense
| | In Millions | |
| | 2009 | | 2008 | |
| | $ | | $ | |
Total Expense by Group Account Classification | | | | | |
Salaries and benefits | | 15,526 | | 14,417 | |
Government transfers | | 8,774 | | 9,085 | |
Operating costs | | 9,424 | | 9,013 | |
Interest(1) | | 2,144 | | 2,239 | |
Amortization | | 1,765 | | 1,634 | |
Other | | 617 | | 575 | |
| | 38,250 | | 36,963 | |
(1)Includes foreign exchange gain amortization of $8 million (2008: $35 million).
29. Valuation Allowances
| | In Millions | |
| | 2009 | | 2008 | |
| | $ | | $ | |
| | | | | |
Accounts receivable | | 118 | | 114 | |
Loans, advances and mortgages receivable | | 21 | | 23 | |
Tangible capital assets | | 3 | | 1 | |
Investments | | 30 | | | |
| | 172 | | 138 | |
These amounts are included in “Other” of “Total Expense by Group Account Classification” in Note 28, and represent the write–down of assets and liabilities in the above Consolidated Statement of Financial Position categories.
74
PROVINCE OF BRITISH COLUMBIA
PUBLIC ACCOUNTS 2008/09
Notes to Consolidated Summary Financial Statements
for the Fiscal Year Ended March 31, 2009—Continued
30. Trusts Under Administration
| | In Millions | |
| | 2009 | | 2008 | |
| | $ | | $ | |
| | | | | |
Public Guardian and Trustee of British Columbia(1)
—administered by government officials | | 769 | | 753 | |
Supreme and provincial court (Suitors’ Funds)
—administered by the Courts | | 55 | | 43 | |
Credit Union Deposit Insurance Corporation of British Columbia(2)
—administered by various government officials and a non–government investment corporation | | 287 | | 261 | |
Other trust funds
—administered by various government officials | | 37 | | 23 | |
| | 1,148 | | 1,080 | |
(1)Public Guardian and Trustee of British Columbia information is draft and unaudited as at March 31, 2009.
(2)Credit Union Deposit Insurance Corporation of British Columbia financial statements are draft and unaudited as at March 31, 2009.
31. Significant Events
Asset–Backed Commercial Paper Write–downs
Three organizations in the government reporting entity have invested in asset–backed commercial paper (ABCP). ABCP is a form of short–term security secured by assets such as mortgages, credit cards and other receivables. The University of British Columbia, Insurance Corporation of British Columbia and the Fraser Health Authority invested a total of $189 million in ABCP during 2007/08. The value of these investments has been reduced due to their connection to US subprime mortgages. During the 2008/09 fiscal year these investments were written down by $38 million (2008: $48 million).
32. Comparison to Estimates
The Estimates numbers on the Statement of Operations are taken from the Estimated Statement of Operations on page 4 of the Estimates, Fiscal Year Ending March 31, 2009, presented to the Legislative Assembly February 19, 2008. The original Estimates do not include supplementary spending of $622 million. The supplementary spending was approved by the Legislature during the 2008/09 fiscal year.
33. Comparatives
Comparative figures have been restated to conform with the current year’s presentation. The effect of restatements on the previously reported operating result is disclosed in Note 24.
75
PROVINCE OF BRITISH COLUMBIA
PUBLIC ACCOUNTS 2008/09
Notes to Consolidated Summary Financial Statements
for the Fiscal Year Ended March 31, 2009—Continued
34. Asset Retirement Obligations(1)
| | In Millions | |
| | 2009 | | 2008 | |
| | $ | | $ | |
Consolidated Revenue Fund and Taxpayer–supported Crown corporations and agencies | | | | | |
Health | | 14 | | 11 | |
Education | | 11 | | 9 | |
Other | | 3 | | 3 | |
Natural resources and economic development | | 12 | | 6 | |
| | 40 | | 29 | |
| | | | | |
Self–supported Crown corporations and agencies | | | | | |
Natural resources and economic development | | 5 | | 8 | |
Transportation | | 30 | | 28 | |
| | 35 | | 36 | |
| | 75 | | 65 | |
(1)The province recognizes asset retirement obligations where a reasonable estimate of the fair value of the obligation and the future settlement date of the retirement of the asset can be determined. Additional asset retirement obligation costs exist which have not been recognized because they cannot be reasonably estimated at this time.
76
PROVINCE OF BRITISH COLUMBIA
PUBLIC ACCOUNTS 2008/09
Notes to Consolidated Summary Financial Statements
for the Fiscal Year Ended March 31, 2009—Continued
35. Government Partnerships
Canadian Blood Services owns and operates the national blood supply system for Canada, except for the province of Quebec. It is a government partnership amongst Canadian provinces and territories. The ministers of health for the provinces and territories, except Quebec, provide contributions to fund its operations. Its financial results are proportionately consolidated with those of the province based upon the province’s share of its total provincial contributions (14.67 %). The amounts included in these financial statements are as follows:
Consolidated Statement of Financial Position
| | In Millions | |
| | 2009 | | 2008 | |
| | $ | | $ | |
| | | | | |
Financial assets | | 69 | | 67 | |
Liabilities | | 105 | | 97 | |
Net liabilities | | (36 | ) | (30 | ) |
Non–financial assets | | 48 | | 41 | |
Accumulated surplus (deficit) | | 12 | | 11 | |
Consolidated Statement of Operations
| | In Millions | |
| | 2009 | | 2008 | |
| | $ | | $ | |
| | | | | |
Revenue | | 137 | | 131 | |
Expenses | | (136 | ) | (132 | ) |
Surplus (deficit) for the year | | 1 | | (1 | ) |
Accumulated surplus (deficit)—beginning of year | | 11 | | 12 | |
Accumulated surplus (deficit)—end of year | | 12 | | 11 | |
36. Regulatory Accounting
Included in the Summary Financial Statements are entities that are regulated by the independent British Columbia Utilities Commission (the Commission). The Commission is responsible for regulating utilities in British Columbia which includes establishing tariffs, approving the construction of new facilities planned by utilities, and their issuance of securities. As an independent provincial agency the operating results of the Commission are also included in the Summary Financial Statements.
Rate regulation can result in the deferral and amortization of costs and recoveries to allow for adjustment of future rates. In the absence of rate–regulation, these amounts would otherwise be included in the determination of net income in the year the amounts are incurred. BC Hydro and Power Authority had unamortized net regulatory assets at the end of March 31, 2009 of $1,016 million (2008: $572 million). Regulatory accounting resulted in an increase to net income for BC Hydro and Power Authority for the year ended March 31, 2009 of $438 million (2008: $142 million). Further details are available in BC Hydro and Power Authority’s financial statements.
77
PROVINCE OF BRITISH COLUMBIA
PUBLIC ACCOUNTS 2008/09
Notes to Consolidated Summary Financial Statements
for the Fiscal Year Ended March 31, 2009—Continued
37. Subsequent Events
BC Hydro and Power Authority
On June 17, 2009, BC Hydro and Power Authority announced plans to purchase a one–third ownership interest in Teck Resources Limited’s Waneta Dam and generating facility near Trail, B.C. The companies have agreed to non–binding terms of an agreement that will be subject to review by the British Columbia Utilities Commission to ensure the acquisition is in ratepayers’ interest. In addition, the agreement will be subject to appropriate consultations with First Nations. The purchase, which is valued at $825 million, will secure approximately 1,000 gigawatt hours of energy per year for BC Hydro. This energy is surplus to the needs of Teck’s Trail smelter operations and is currently sold on the open power market, mostly to the United States. The Waneta Dam is located on the Pend d’Oreille River near Trail, B.C. Its four generating units total 490 megawatts of capacity and produce an average of 2,800 gigawatt hours of energy per year.
Maa–nulth First Nations Final Agreement
Final Agreement was signed by the remaining parties on April 9, 2009, after the close of these financial statements. The required enabling legislation was passed by the Parliament of Canada on June 16, 2009, passed by the Senate and received Royal Assent on June 18, 2009. Ratification of the agreement occurred with the Royal Assent of the enabling federal legislation. The Final Agreement will result in a provincial expense estimated at $31.6 million which will be recognized in the Summary Financial Statements starting in the year ending March 31, 2010. (See Note 25 for additional details.)
78
PROVINCE OF BRITISH COLUMBIA
PUBLIC ACCOUNTS 2008/09
Summary Financial Statements
Reporting Entity
for the Fiscal Year Ended March 31, 2009
TAXPAYER–SUPPORTED CROWN CORPORATIONS AND AGENCIES
(GOVERNMENT ORGANIZATIONS)
RECORDED ON A CONSOLIDATED BASIS
Consolidated Revenue Fund(1)
Health Sector
Bella Coola General Hospital
Canadian Blood Services(2)
Fraser Health Authority
Interior Health Authority
Louis Brier Home and Hospital
Menno Hospital
Mount St. Mary Hospital
Nisga’a Valley Health Authority
Northern Health Authority
Providence Health Care
Provincial Health Services Authority
RW Large Memorial Hospital
St Joseph’s General Hospital
St Michael’s Centre
Vancouver Coastal Health Authority
Vancouver Island Health Authority
Wrinch Memorial Hospital
Education Sector
British Columbia Institute of Technology
Camosun College
Capilano University(3)
College of New Caledonia
College of the Rockies
Douglas College
Emily Carr University of Art & Design(3)
Industry Training Authority
Institute of Indigenous Government
Justice Institute of British Columbia
Knowledge Network Corporation(4)
Kwantlen Polytechnic University(3)
Langara College
Leading Edge Endowment Fund
Nicola Valley Institute of Technology
North Island College
Northern Lights College
Northwest Community College
Okanagan College
Okanagan University College
79
PROVINCE OF BRITISH COLUMBIA
PUBLIC ACCOUNTS 2008/09
Summary Financial Statements
Reporting Entity
for the Fiscal Year Ended March 31, 2009—Continued
TAXPAYER–SUPPORTED CROWN CORPORATIONS AND AGENCIES
(GOVERNMENT ORGANIZATIONS)
RECORDED ON A CONSOLIDATED BASIS
Education Sector—Continued
Private Career Training Institutions Agency
Royal Roads University
School Districts
Selkirk College
Simon Fraser University
Thompson Rivers University
The University of British Columbia
University of the Fraser Valley(3)
University of Northern British Columbia
University of Victoria
Vancouver Community College
Vancouver Island University(3)
Natural Resources and Economic Development Sector
BC Immigrant Investment Fund Ltd
B.C. Pavilion Corporation(5)
British Columbia Enterprise Corporation
British Columbia Innovation Council
Columbia Basin Trust
Creston Valley Wildlife Management Authority Trust Fund
Forestry Innovation Investment Ltd
Nechako–Kitamaat Development Fund Society
Oil and Gas Commission
Pacific Carbon Trust Inc
Partnerships British Columbia Inc
Tourism British Columbia
Transportation Sector
BC Transportation Financing Authority
British Columbia Transit
Rapid Transit Project 2000 Ltd
Protection of Persons and Property
British Columbia Securities Commission
Organized Crime Agency of British Columbia Society
Social Services Sector
Community Living British Columbia
Fraser Region Interim Aboriginal Authority(6)
Legal Services Society
Vancouver Island Aboriginal Transition Authority(6)
��
80
PROVINCE OF BRITISH COLUMBIA
PUBLIC ACCOUNTS 2008/09
Summary Financial Statements
Reporting Entity
for the Fiscal Year Ended March 31, 2009—Continued
TAXPAYER–SUPPORTED CROWN CORPORATIONS AND AGENCIES
(GOVERNMENT ORGANIZATIONS)
RECORDED ON A CONSOLIDATED BASIS
Other Sector
BC Games Society
British Columbia Arts Council
British Columbia Assessment Authority
British Columbia Housing Management Commission
First Peoples’ Heritage, Language and Culture Council
Homeowner Protection Office
Provincial Rental Housing Corporation
The Royal British Columbia Museum Corporation
SELF–SUPPORTED CROWN CORPORATIONS AND AGENCIES
(GOVERNMENT ENTERPRISES)
RECORDED ON A MODIFIED EQUITY BASIS
BCIF Management Ltd(7)
British Columbia Hydro and Power Authority(7)
British Columbia Liquor Distribution Branch(8)
British Columbia Lottery Corporation(8)
British Columbia Railway Company(9)
British Columbia Transmission Corporation(7)
Columbia Power Corporation(7)
Insurance Corporation of British Columbia(10)
Provincial Capital Commission(11)
Transportation Investment Corporation(9)
(1)The Consolidated Revenue Fund has been allocated to the appropriate sector on the Consolidated Statement of Financial Position by Sector (page 82) and Consolidated Statement of Operations by Sector (page 86).
(2)This organization reflects a government partnership amongst Canadian provinces and is proportionally consolidated based upon the province’s share (14.67%) of the total provincial contributions to the partnership.
(3)These organizations changed from Colleges to Universities in the current year.
(4)This organization was previously known as Open Learning Agency which was changed from a college to a taxpayer–supported Crown corporation in the current year.
(5)During this fiscal year Vancouver Convention Centre Expansion Project Ltd. was amalgamated with B.C. Pavilion Corporation.
(6)These organizations wound up operations during the fiscal year.
(7)These organizations were included in the Natural Resources and Economic Development Sector results.
(8)These organizations were included in the General Government Sector results.
(9)These organizations were included in the Transportation Sector results.
(10)This organization was included in the Protection of Persons and Property Sector results.
(11)This organization was included in the Other Sector results.
81
PROVINCE OF BRITISH COLUMBIA
PUBLIC ACCOUNTS 2008/09
Summary Financial Statements
Consolidated Statement of Financial Position by Sector
as at March 31, 2009
| | In Millions | |
| | | | | | | | | | | | | | | | | | Natural Resources and | |
| | | | | | | | | | | | | | | | | | Economic | |
| | Health | | Education | | Social Services | | Debt Servicing(1) | | Development | |
| | 2009 | | 2008 | | 2009 | | 2008 | | 2009 | | 2008 | | 2009 | | 2008 | | 2009 | | 2008 | |
| | $ | | $ | | $ | | $ | | $ | | $ | | $ | | $ | | $ | | $ | |
Financial Assets | | | | | | | | | | | | | | | | | | | | | |
Cash and cash equivalents | | 450 | | 419 | | 1,552 | | 1,767 | | 2 | | 6 | | 1,344 | | 2,090 | | 308 | | 251 | |
Temporary investments | | 294 | | 335 | | 444 | | 242 | | 6 | | 14 | | | | | | 264 | | 301 | |
Warehouse Borrowing Program investments | | | | | | | | | | | | | | 2,081 | | | | | | | |
Accounts receivable | | 412 | | 349 | | 231 | | 255 | | 65 | | 87 | | 248 | | 239 | | 317 | | 592 | |
Inventories for resale | | 1 | | 1 | | 29 | | 29 | | | | | | | | | | 7 | | 17 | |
Due from the Province of British Columbia | | 1 | | | | 5 | | 26 | | 1 | | 1 | | | | | | 9 | | 7 | |
Due from other governments | | 56 | | 60 | | 59 | | 62 | | 22 | | 14 | | | | | | 81 | | 115 | |
Due from self–supported Crown corporations and agencies | | | | | | | | | | | | | | | | | | 14 | | 316 | |
Equity in self–supported Crown corporations and agencies | | | | | | | | | | | | | | | | �� | | 2,587 | | 2,296 | |
Loans, advances and mortgages receivable | | 8 | | 1 | | 632 | | 620 | | | | | | | | | | 122 | | 121 | |
Other investments | | 150 | | 181 | | 2,132 | | 2,154 | | 12 | | 8 | | 9 | | 9 | | 385 | | 366 | |
Sinking fund investments | | | | | | 65 | | 61 | | | | | | 2,134 | | 2,649 | | | | | |
Loans for purchase of assets, recoverable from agencies | | | | | | | | | | | | | | 13,415 | | 11,406 | | | | | |
| | 1,372 | | 1,346 | | 5,149 | | 5,216 | | 108 | | 130 | | 19,231 | | 16,393 | | 4,094 | | 4,382 | |
82
PROVINCE OF BRITISH COLUMBIA
PUBLIC ACCOUNTS 2008/09
Summary Financial Statements
Consolidated Statement of Financial Position by Sector—Continued
as at March 31, 2009
| | In Millions | |
| | Other(2) | | Protection of Persons
and Property | | Transportation | | General Government (3) | | Adjustments(4) | | Total | |
| | 2009 | | 2008 | | 2009 | | 2008 | | 2009 | | 2008 | | 2009 | | 2008 | | 2009 | | 2008 | | 2009 | | 2008 | |
| | $ | | $ | | $ | | $ | | $ | | $ | | $ | | $ | | $ | | $ | | $ | | $ | |
Financial Assets | | | | | | | | | | | | | | | | | | | | | | | | | |
Cash and cash equivalents | | 455 | | 310 | | 20 | | 17 | | 149 | | 67 | | (173 | ) | 52 | | | | | | 4,107 | | 4,979 | |
Temporary investments | | 93 | | 104 | | 18 | | 19 | | | | | | | | | | | | | | 1,119 | | 1,015 | |
Warehouse Borrowing Program investments | | | | | | | | | | | | | | | | | | | | | | 2,081 | | 0 | |
Accounts receivable | | 35 | | 33 | | 76 | | 76 | | 36 | | 30 | | 1,313 | | 1,330 | | (78 | ) | (72 | ) | 2,655 | | 2,919 | |
Inventories for resale | | | | | | 9 | | 9 | | | | | | 11 | | 10 | | | | | | 57 | | 66 | |
Due from the Province of British Columbia | | | | | | | | | | 3 | | 35 | | | | | | (19 | ) | (69 | ) | 0 | | 0 | |
Due from other governments | | 13 | | 29 | | 44 | | 27 | | 51 | | 65 | | 147 | | 560 | | | | | | 473 | | 932 | |
Due from self–supported Crown corporations and agencies | | | | | | | | | | | | | | 202 | | 193 | | | | | | 216 | | 509 | |
Equity in self–supported Crown corporations and agencies | | 15 | | 15 | | 2,743 | | 2,565 | | 393 | | 214 | | | | | | | | | | 5,738 | | 5,090 | |
Loans, advances and mortgages receivable | | 225 | | 159 | | 1 | | 4 | | | | 1 | | 298 | | 244 | | (97 | ) | (87 | ) | 1,189 | | 1,063 | |
Other investments | | 52 | | 39 | | | | | | 75 | | 76 | | | | | | | | | | 2,815 | | 2,833 | |
Sinking fund investments | | | | | | | | | | 556 | | 471 | | | | | | (621 | ) | (532 | ) | 2,134 | | 2,649 | |
Loans for purchase of assets, recoverable from agencies | | | | | | | | | | | | | | | | | | (4,266 | ) | (3,687 | ) | 9,149 | | 7,719 | |
| | 888 | | 689 | | 2,911 | | 2,717 | | 1,263 | | 959 | | 1,798 | | 2,389 | | (5,081 | ) | (4,447 | ) | 31,733 | | 29,774 | |
83
PROVINCE OF BRITISH COLUMBIA
PUBLIC ACCOUNTS 2008/09
Summary Financial Statements
Consolidated Statement of Financial Position by Sector—Continued
as at March 31, 2009
| | In Millions | |
| | | | | | | | | | | | | | | | | | Natural Resources and | |
| | | | | | | | | | | | | | | | | | Economic | |
| | Health | | Education | | Social Services | | Debt Servicing(1) | | Development | |
| | 2009 | | 2008 | | 2009 | | 2008 | | 2009 | | 2008 | | 2009 | | 2008 | | 2009 | | 2008 | |
| | $ | | $ | | $ | | $ | | $ | | $ | | $ | | $ | | $ | | $ | |
Liabilities | | | | | | | | | | | | | | | | | | | | | |
Accounts payable and accrued liabilities | | 2,512 | | 2,205 | | 1,120 | | 1,096 | | 144 | | 140 | | 537 | | 578 | | 735 | | 902 | |
Due to other governments | | 57 | | 87 | | 20 | | 16 | | | | | | | | | | 2 | | 3 | |
Due to Crown corporations, agencies and trust funds | | 6 | | 6 | | 2 | | | | | | | | | | | | | | | |
Due to the Province of British Columbia | | | | | | | | | | 5 | | 1 | | | | | | | | 1 | |
Deferred revenue | | 1,654 | | 1,617 | | 1,695 | | 1,479 | | 17 | | 1 | | 157 | | 147 | | 4,510 | | 3,087 | |
Employee pension plans | | | | | | | | | | | | | | | | | | | | | |
Taxpayer–supported debt | | 696 | | 214 | | 925 | | 910 | | 10 | | 10 | | 25,734 | | 26,177 | | 370 | | 721 | |
Self–supported debt | | | | | | | | | | | | | | 11,330 | | 8,297 | | | | | |
| | 4,925 | | 4,129 | | 3,762 | | 3,501 | | 176 | | 152 | | 37,758 | | 35,199 | | 5,617 | | 4,714 | |
Net assets (liabilities) | | (3,553 | ) | (2,783 | ) | 1,387 | | 1,715 | | (68 | ) | (22 | ) | (18,527 | ) | (18,806 | ) | (1,523 | ) | (332 | ) |
Non–financial Assets | | | | | | | | | | | | | | | | | | | | | |
Tangible capital assets | | 5,226 | | 4,342 | | 11,336 | | 10,872 | | 61 | | 59 | | | | | | 1,980 | | 2,044 | |
Prepaid capital advances | | | | | | 23 | | 24 | | | | | | | | | | | | | |
Prepaid program costs | | 193 | | 174 | | 29 | | 33 | | 18 | | 2 | | | | | | 140 | | 117 | |
Other assets | | 1 | | 7 | | 20 | | 15 | | | | | | 287 | | 303 | | 2 | | 3 | |
| | 5,420 | | 4,523 | | 11,408 | | 10,944 | | 79 | | 61 | | 287 | | 303 | | 2,122 | | 2,164 | |
Accumulated surplus (deficit) | | 1,867 | | 1,740 | | 12,795 | | 12,659 | | 11 | | 39 | | (18,240 | ) | (18,503 | ) | 599 | | 1,832 | |
84
PROVINCE OF BRITISH COLUMBIA
PUBLIC ACCOUNTS 2008/09
Summary Financial Statements
Consolidated Statement of Financial Position by Sector—Continued
as at March 31, 2009
| | In Millions | |
| | Other(2) | | Protection of Persons
and Property | | Transportation | | General Government (3) | | Adjustments(4) | | Total | |
| | 2009 | | 2008 | | 2009 | | 2008 | | 2009 | | 2008 | | 2009 | | 2008 | | 2009 | | 2008 | | 2009 | | 2008 | |
| | $ | | $ | | $ | | $ | | $ | | $ | | $ | | $ | | $ | | $ | | $ | | $ | |
Liabilities | | | | | | | | | | | | | | | | | | | | | | | | | |
Accounts payable and accrued liabilities | | 264 | | 281 | | 294 | | 315 | | 255 | | 251 | | 859 | | 1,258 | | (90 | ) | (133 | ) | 6,630 | | 6,893 | |
Due to other governments | | 14 | | 78 | | 87 | | 73 | | | | 1 | | 524 | | 742 | | | | | | 704 | | 1,000 | |
Due to Crown corporations, agencies and trust funds | | 73 | | 77 | | | | | | | | | | | | 35 | | (9 | ) | (6 | ) | 72 | | 112 | |
Due to the Province of British Columbia | | | | 1 | | | | | | | | 2 | | | | | | (5 | ) | (5 | ) | 0 | | 0 | |
Deferred revenue | | 173 | | 108 | | 387 | | 323 | | 577 | | 390 | | 22 | | 24 | | (24 | ) | (31 | ) | 9,168 | | 7,145 | |
Employee pension plans | | | | | | | | | | | | | | 3 | | 2 | | | | | | 3 | | 2 | |
Taxpayer–supported debt | | 353 | | 271 | | 8 | | 9 | | 5,242 | | 4,522 | | 7 | | 22 | | (4,979 | ) | (4,319 | ) | 28,366 | | 28,537 | |
Self–supported debt | | | | | | | | | | | | | | | | | | | | | | 11,330 | | 8,297 | |
| | 877 | | 816 | | 776 | | 720 | | 6,074 | | 5,166 | | 1,415 | | 2,083 | | (5,107 | ) | (4,494 | ) | 56,273 | | 51,986 | |
Net assets (liabilities) | | 11 | | (127 | ) | 2,135 | | 1,997 | | (4,811 | ) | (4,207 | ) | 383 | | 306 | | 26 | | 47 | | (24,540 | ) | (22,212 | ) |
Non–financial Assets | | | | | | | | | | | | | | | | | | | | | | | | | |
Tangible capital assets | | 810 | | 711 | | 70 | | 67 | | 10,340 | | 9,860 | | 869 | | 816 | | (13 | ) | (16 | ) | 30,679 | | 28,755 | |
Prepaid capital advances | | | | | | | | | | | | | | | | | | (23 | ) | (24 | ) | 0 | | 0 | |
Prepaid program costs | | 19 | | 17 | | 1 | | 2 | | 3 | | 8 | | 54 | | 45 | | | | | | 457 | | 398 | |
Other assets | | 1 | | 1 | | | | | | 14 | | 24 | | | | | | (2 | ) | (21 | ) | 323 | | 332 | |
| | 830 | | 729 | | 71 | | 69 | | 10,357 | | 9,892 | | 923 | | 861 | | (38 | ) | (61 | ) | 31,459 | | 29,485 | |
Accumulated surplus (deficit) | | 841 | | 602 | | 2,206 | | 2,066 | | 5,546 | | 5,685 | | 1,306 | | 1,167 | | (12 | ) | (14 | ) | 6,919 | | 7,273 | |
(1)Debt servicing represents the financial impacts of activities related to management of the public debt.
(2)The other sector consists of those expenditures which cannot be otherwise allocated.
(3)Includes the legislature, tax collection and administration, Canadian Health and Social Transfers from the federal government, liquor and gaming profits, general administration and central agency services such as accounting, auditing, budgeting, insurance and risk management to all sectors.
(4)Represents sectoral adjustments to conform to government accounting policies and to eliminate transactions between sectors.
85
PROVINCE OF BRITISH COLUMBIA
PUBLIC ACCOUNTS 2008/09
Summary Financial Statements
Consolidated Statement of Operations by Sector
for the Fiscal Year Ended March 31, 2009
| | In Millions | |
| | | | | | | | | | | | | | | | | | Natural Resources and | |
| | | | | | | | | | | | | | | | | | Economic | |
| | Health | | Education | | Social Services | | Debt Servicing(1) | | Development | |
| | 2009 | | 2008 | | 2009 | | 2008 | | 2009 | | 2008 | | 2009 | | 2008 | | 2009 | | 2008 | |
| | $ | | $ | | $ | | $ | | $ | | $ | | $ | | $ | | $ | | $ | |
Revenue | | | | | | | | | | | | | | | | | | | | | |
Taxation | | | | | | | | | | | | | | | | | | 57 | | 32 | |
Contributions from the federal government | | 199 | | 334 | | 590 | | 551 | | 108 | | 92 | | | | | | 55 | | 299 | |
Fees and licences | | 1,891 | | 1,851 | | 1,191 | | 1,136 | | | | | | | | | | 121 | | 143 | |
Natural resources | | | | | | | | | | | | | | | | | | 3,848 | | 3,778 | |
Contributions from the provincial government/self–supported Crown corporations and agencies | | 42 | | 39 | | 179 | | 327 | | 11 | | 10 | | | | | | 418 | | 412 | |
Miscellaneous | | 786 | | 731 | | 1,176 | | 1,163 | | 14 | | 21 | | | | | | 125 | | 153 | |
Investment income | | 28 | | 32 | | 6 | | 172 | | 4 | | 5 | | 868 | | 1,020 | | 47 | | 58 | |
Total revenue | | 2,946 | | 2,987 | | 3,142 | | 3,349 | | 137 | | 128 | | 868 | | 1,020 | | 4,671 | | 4,875 | |
86
PROVINCE OF BRITISH COLUMBIA
PUBLIC ACCOUNTS 2008/09
Summary Financial Statements
Consolidated Statement of Operations by Sector—Continued
for the Fiscal Year Ended March 31, 2009
| | In Millions | |
| | Other(2) | | Protection of Persons
and Property | | Transportation | | General Government(3) | | Adjustments(4) | | Total | |
| | 2009 | | 2008 | | 2009 | | 2008 | | 2009 | | 2008 | | 2009 | | 2008 | | 2009 | | 2008 | | 2009 | | 2008 | |
| | $ | | $ | | $ | | $ | | $ | | $ | | $ | | $ | | $ | | $ | | $ | | $ | |
Revenue | | | | | | | | | | | | | | | | | | | | | | | | | |
Taxation | | 70 | | 66 | | | | | | 475 | | 484 | | 17,595 | | 18,824 | | | | | | 18,197 | | 19,406 | |
Contributions from the federal government | | 237 | | 182 | | 142 | | 129 | | 31 | | 26 | | 4,627 | | 4,318 | | | | | | 5,989 | | 5,931 | |
Fees and licences | | 16 | | 25 | | 692 | | 689 | | 91 | | 113 | | 18 | | 30 | | | | (1 | ) | 4,020 | | 3,986 | |
Natural resources | | | | | | | | | | | | | | | | | | | | | | 3,848 | | 3,778 | |
Contributions from the provincial government/
self–supported Crown corporations and agencies | | 19 | | 39 | | 513 | | 633 | | 38 | | 24 | | 1,973 | | 1,938 | | (288 | ) | (448 | ) | 2,905 | | 2,974 | |
Miscellaneous | | 81 | | 96 | | 154 | | 153 | | 29 | | 63 | | 278 | | 252 | | (78 | ) | (47 | ) | 2,565 | | 2,585 | |
Investment income | | 15 | | 18 | | 2 | | 9 | | 38 | | 34 | | 8 | | 10 | | (212 | ) | (218 | ) | 804 | | 1,140 | |
Total revenue | | 438 | | 426 | | 1,503 | | 1,613 | | 702 | | 744 | | 24,499 | | 25,372 | | (578 | ) | (714 | ) | 38,328 | | 39,800 | |
87
PROVINCE OF BRITISH COLUMBIA
PUBLIC ACCOUNTS 2008/09
Summary Financial Statements
Consolidated Statement of Operations by Sector—Continued
for the Fiscal Year Ended March 31, 2009
| | In Millions | |
| | | �� | | | | | | | | | | | | | | | Natural Resources and | |
| | | | | | | | | | | | | | | | | | Economic | |
| | Health | | Education | | Social Services | | Debt Servicing(1) | | Development | |
| | 2009 | | 2008 | | 2009 | | 2008 | | 2009 | | 2008 | | 2009 | | 2008 | | 2009 | | 2008 | |
| | $ | | $ | | $ | | $ | | $ | | $ | | $ | | $ | | $ | | $ | |
Expense | | | | | | | | | | | | | | | | | | | | | |
Salaries and benefits | | 5,988 | | 5,457 | | 7,119 | | 6,761 | | 407 | | 389 | | | | | | 559 | | 556 | |
Government transfers | | 3,997 | | 4,007 | | 758 | | 878 | | 1,949 | | 1,805 | | | | | | 220 | | 500 | |
Operating costs | | 4,689 | | 4,325 | | 1,796 | | 1,660 | | 888 | | 866 | | | | | | 710 | | 854 | |
Interest | | 36 | | 12 | | 56 | | 48 | | | | 1 | | 2,016 | | 2,163 | | 10 | | 10 | |
Amortization | | 497 | | 435 | | 602 | | 551 | | 15 | | 15 | | | | | | 76 | | 74 | |
Other | | 154 | | 254 | | 228 | | 164 | | 36 | | 10 | | | | | | 134 | | 123 | |
Operating expense | | 15,361 | | 14,490 | | 10,559 | | 10,062 | | 3,295 | | 3,086 | | 2,016 | | 2,163 | | 1,709 | | 2,117 | |
Surplus (deficit) for the Fiscal Year ended March 31 | | (12,415 | ) | (11,503 | ) | (7,417 | ) | (6,713 | ) | (3,158 | ) | (2,958 | ) | (1,148 | ) | (1,143 | ) | 2,962 | | 2,758 | |
88
PROVINCE OF BRITISH COLUMBIA
PUBLIC ACCOUNTS 2008/09
Summary Financial Statements
Consolidated Statement of Operations by Sector—Continued
for the Fiscal Year Ended March 31, 2009
| | In Millions | |
| | Other(2) | | Protection of Persons
and Property | | Transportation | | General Government(3) | | Adjustments(4) | | Total | |
| | |
| | 2009 | | 2008 | | 2009 | | 2008 | | 2009 | | 2008 | | 2009 | | 2008 | | 2009 | | 2008 | | 2009 | | 2008 | |
| | $ | | $ | | $ | | $ | | $ | | $ | | $ | | $ | | $ | | $ | | $ | | $ | |
Expense | | | | | | | | | | | | | | | | | | | | | | | | | |
Salaries and benefits | | 138 | | 124 | | 650 | | 598 | | 151 | | 139 | | 514 | | 393 | | | | | | 15,526 | | 14,417 | |
Government transfers | | 1,381 | | 1,058 | | 586 | | 603 | | 66 | | 128 | | 30 | | 485 | | (213 | ) | (379 | ) | 8,774 | | 9,085 | |
Operating costs | | 190 | | 184 | | 345 | | 361 | | 777 | | 714 | | 37 | | 52 | | (8 | ) | (3 | ) | 9,424 | | 9,013 | |
Interest | | 16 | | 15 | | | | 1 | | 222 | | 198 | | | | | | (212 | ) | (209 | ) | 2,144 | | 2,239 | |
Amortization | | 28 | | 24 | | 19 | | 20 | | 428 | | 417 | | 100 | | 98 | | | | | | 1,765 | | 1,634 | |
Other | | 13 | | 13 | | 22 | | 20 | | 4 | | 15 | | 169 | | 107 | | (143 | ) | (131 | ) | 617 | | 575 | |
Operating expense | | 1,766 | | 1,418 | | 1,622 | | 1,603 | | 1,648 | | 1,611 | | 850 | | 1,135 | | (576 | ) | (722 | ) | 38,250 | | 36,963 | |
Surplus (deficit) for the Fiscal Year ended March 31 | | (1,328 | ) | (992 | ) | (119 | ) | 10 | | (946 | ) | (867 | ) | 23,649 | | 24,237 | | (2 | ) | 8 | | 78 | | 2,837 | |
(1) Debt servicing represents the financial impacts of activities related to management of the public debt.
(2) The other sector consists of those expenditures which cannot be otherwise allocated.
(3) Includes the legislature, tax collection and administration, Canadian Health and Social Transfers from the federal government, liquor and gaming profits, general administration and central agency services such as accounting, auditing, budgeting, insurance and risk management to all sectors.
(4) Represents sectoral adjustments to conform to government accounting policies and to eliminate transactions between sectors.
89
PROVINCE OF BRITISH COLUMBIA
PUBLIC ACCOUNTS 2008/09
Summary Financial Statements
Statement of Financial Position
for Self–supported Crown Corporations and Agencies
as at March 31, 2009
| | In Millions | |
| | Other(1) | | Natural
Resources and
Economic
Development(2) | | Protection of
Persons and
Property(3) | | Transportation(4) | | General
Government(5) | | 2009
Total | | 2008
Total(6) | |
| | $ | | $ | | $ | | $ | | $ | | $ | | $ | |
Assets | | | | | | | | | | | | | | | |
Cash and temporary investments | | 2 | | 231 | | 10,003 | | 354 | | 63 | | 10,653 | | 10,204 | |
Accounts receivable | | | | 728 | | 1,110 | | 6 | | 96 | | 1,940 | | 1,730 | |
Inventories | | | | 178 | | | | 19 | | 97 | | 294 | | 187 | |
Long–term investments | | | | 48 | | 101 | | | | | | 149 | | 121 | |
Sinking fund investments | | | | 115 | | | | | | | | 115 | | 595 | |
Tangible capital assets | | 18 | | 12,641 | | 85 | | 497 | | 204 | | 13,445 | | 12,197 | |
Other assets | | | | 3,066 | | 199 | | 77 | | 36 | | 3,378 | | 2,392 | |
Total Assets | | 20 | | 17,007 | | 11,498 | | 953 | | 496 | | 29,974 | | 27,426 | |
| | | | | | | | | | | | | | | |
Liabilities | | | | | | | | | | | | | | | |
Accounts payable | | 1 | | 2,389 | | 7,077 | | 232 | | 293 | | 9,992 | | 9,176 | |
Deferred revenue | | 4 | | 2,399 | | 1,678 | | 308 | | | | 4,389 | | 4,318 | |
Due to Province of British Columbia | | | | 14 | | | | | | 202 | | 216 | | 509 | |
Debt due to Province of British Columbia | | | | 9,510 | | | | 20 | | | | 9,530 | | 8,215 | |
Other long–term debt | | | | 108 | | | | | | 1 | | 109 | | 118 | |
| | 5 | | 14,420 | | 8,755 | | 560 | | 496 | | 24,236 | | 22,336 | |
Equity | | | | | | | | | | | | | | | |
Investment by the Consolidated Revenue Fund | | | | 296 | | | | 257 | | | | 553 | | 403 | |
Other comprehensive income | | | | (42 | ) | (25 | ) | | | | | (67 | ) | 365 | |
Unremitted earnings—end of year | | 15 | | 2,333 | | 2,768 | | 136 | | | | 5,252 | | 4,322 | |
| | 15 | | 2,587 | | 2,743 | | 393 | | 0 | | 5,738 | | 5,090 | |
Total Liabilities and Equity | | 20 | | 17,007 | | 11,498 | | 953 | | 496 | | 29,974 | | 27,426 | |
(1) Provincial Capital Commission.
(2) British Columbia Hydro and Power Authority, British Columbia Transmission Corporation, Columbia Power Corporation and BCIF Management Ltd.
(3) Insurance Corporation of British Columbia.
(4) British Columbia Railway Company and Transportation Investment Corporation.
(5) British Columbia Liquor Distribution Branch and British Columbia Lottery Corporation.
(6) British Columbia Hydro and Power Authority made a revision to prior year accounting treatments. British Columbia Hydro and Power Authority has restated assets, liabilities, revenues, and expenses for 2007/08 related to its subsidiary Powerex identifying a balance sheet reclassification error relating to the presentation of its derivative commodity assets and liabilities. These changes have resulted in assets increasing by $837 million, liabilities increasing by $837 million, revenues decreasing by $645 million, and expenses decreasing by $645 million for 2007/08.
90
PROVINCE OF BRITISH COLUMBIA
PUBLIC ACCOUNTS 2008/09
Summary Financial Statements
Summary of Results of Operations and Statement
of Equity for Self–supported Crown Corporations and Agencies
for the Fiscal Year Ended March 31, 2009
| | In Millions | |
| | Other(1) | | Natural
Resources and
Economic
Development(2) | | Protection of
Persons and
Property(3) | | Transportation(4) | | General
Government(5) | | 2009
Total | | 2008
Total | |
| | $ | | $ | | $ | | $ | | $ | | $ | | $ | |
Revenue | | 4 | | 4,557 | | 3,977 | | 59 | | 5,371 | | 13,968 | | 13,969 | |
Expense | | 4 | | 4,165 | | 3,465 | | 31 | | 3,398 | | 11,063 | | 10,995 | |
Net earnings of self–supported Crown corporations and agencies | | 0 | | 392 | | 512 | | 28 | | 1,973 | | 2,905 | | 2,974 | |
Contributions paid to the Consolidated Revenue Fund | | | | (2 | ) | | | | | (1,717 | ) | (1,719 | ) | (1,972 | ) |
Adjustments to contributions(6) | | | | | | | | | | (256 | ) | (256 | ) | (256 | ) |
Increase (decrease) in unremitted earnings in self–supported Crown corporations and agencies | | 0 | | 390 | | 512 | | 28 | | 0 | | 930 | | 746 | |
Unremitted earnings—beginning of year | | 15 | | 1,943 | | 2,256 | | 108 | | | | 4,322 | | 3,547 | |
Adjustments to unremitted earnings | | | | | | | | | | | | 0 | | 29 | |
Unremitted earnings—end of year | | 15 | | 2,333 | | 2,768 | | 136 | | 0 | | 5,252 | | 4,322 | |
Accumulated other comprehensive income—beginning of year | | | | 56 | | 309 | | | | | | 365 | | 447 | |
Other comprehensive income | | | | (98 | ) | (334 | ) | | | | | (432 | ) | (82 | ) |
Accumulated other comprehensive income—end of year | | 0 | | (42 | ) | (25 | ) | 0 | | 0 | | (67 | ) | 365 | |
Investment by the Consolidated Revenue Fund | | | | 296 | | | | 257 | | | | 553 | | 403 | |
Equity in self–supported Crown corporations and agencies for the year | | 15 | | 2,587 | | 2,743 | | 393 | | 0 | | 5,738 | | 5,090 | |
(1) Provincial Capital Commission.
(2) British Columbia Hydro and Power Authority, British Columbia Transmission Corporation, Columbia Power Corporation, and BCIF Management Ltd.
(3) Insurance Corporation of British Columbia.
(4) British Columbia Railway Company and Transportation Investment Corporation.
(5) British Columbia Liquor Distribution Branch and British Columbia Lottery Corporation.
(6) The adjustments are for British Columbia Lottery Corporation transfers to charities and local governments, which is shown as a recovery by the Consolidated Revenue Fund.
91
PROVINCE OF BRITISH COLUMBIA
PUBLIC ACCOUNTS 2008/09
Summary Financial Statements
Consolidated Statement of Tangible Capital Assets(1)
for the Fiscal Year Ended March 31, 2009
| | In Millions | |
| | Land and Land
Improvements | | Building | | Highway
Infrastructure | | Transportation
Equipment | | Computer
Hardware/
Software | | Other(3) | | 2009
Total | | 2008
Total | |
| | $ | | $ | | $ | | $ | | $ | | $ | | $ | | $ | |
Historical Cost(2) | | | | | | | | | | | | | | | | | |
Opening Cost | | 3,699 | | 20,184 | | 12,875 | | 2,684 | | 2,371 | | 5,497 | | 47,310 | | 44,134 | |
Additions | | 244 | | 1,665 | | 863 | | 78 | | 440 | | 488 | | 3,778 | | 3,672 | |
Disposals and valuation adjustments | | 3 | | 191 | | (60 | ) | (32 | ) | (34 | ) | (508 | ) | (440 | ) | (496 | ) |
| | 3,946 | | 22,040 | | 13,678 | | 2,730 | | 2,777 | | 5,477 | | 50,648 | | 47,310 | |
| | | | | | | | | | | | | | | | | |
Accumulated Amortization | | | | | | | | | | | | | | | | | |
Opening balance | | (171 | ) | (6,981 | ) | (5,706 | ) | (826 | ) | (1,357 | ) | (3,514 | ) | (18,555 | ) | (17,332 | ) |
Amortization expense | | (13 | ) | (565 | ) | (377 | ) | (83 | ) | (295 | ) | (432 | ) | (1,765 | ) | (1,634 | ) |
Effect of disposals and valuation adjustments | | 2 | | (77 | ) | 1 | | 32 | | 53 | | 340 | | 351 | | 411 | |
| | (182 | ) | (7,623 | ) | (6,082 | ) | (877 | ) | (1,599 | ) | (3,606 | ) | (19,969 | ) | (18,555 | ) |
| | | | | | | | | | | | | | | | | |
Net book value for the year ended March 31, 2009 | | 3,764 | | 14,417 | | 7,596 | | 1,853 | | 1,178 | | 1,871 | | 30,679 | | | |
| | | | | | | | | | | | | | | | | |
Net book value for the year ended March 31, 2008 | | 3,528 | | 13,203 | | 7,169 | | 1,858 | | 1,014 | | 1,983 | | | | 28,755 | |
(1) This statement includes assets that are held on capital leases at March 31, 2009 at a gross value of $432 million less accumulated amortization of $(161) million for a net book value totalling $271 million (2008: gross value of $361 million less accumulated amortization of $(92) million for a net book value of $269 million) comprised of: heavy equipment gross $11 million less accumulated amortization $(12) million for a net book value of $(1) million (2008: gross $28 million less accumulated amortization $(28) million for a net book value of $0 million); vehicles gross $90 million less accumulated amortization $(41) million for a net book value of $49 million (2008: gross $90 million less accumulated amortization $(35) million for a net book value of $55 million); computer hardware/software gross $142 million less accumulated amortization $(75) million for a net book value of $67 million (2008: gross $76 million less accumulated amortization $(20) million for a net book value of $56 million); buildings gross $155 million less accumulated amortization $(11) million for a net book value of $144 million (2008: gross $158 million less accumulated amortization $(8) million for a net book value $150 million); ferries gross $6 million less accumulated amortization $(1) million for a net book value of $5 million (2008: gross $6 million less accumulated amortization $0 million for a net book value of $6 million) and other assets gross $28 million less accumulated amortization $(21) million for a net book value of $7 million (2008: gross $3 million less accumulated amortization $(1) million for a net book value of $2 million).
(2) Historical cost includes work–in–progress at March 31, 2009 totalling $3,158 million (2008: $3,273 million) comprised of: buildings $1,671 million (2008: $1,988 million); land improvements $24 million (2008: $30 million); highway infrastructure $1,006 million (2008: $1,037 million); transportation equipment $26 million (2008: $14 million); computer hardware/software $410 million (2008: $202 million); and specialized equipment $21 million (2008: $2 million). Work–in–progress is not amortized. Work in progress includes capitalized interest expense at March 31, 2009 totalling $39 million (2008: $50 million).
(3) “Other” at net book value includes office furniture and equipment $850 million (2008: $530 million), vehicles $88 million (2008: $84 million), machinery $707 million (2008: $1,172 million) and miscellaneous $226 million (2008: $197 million).
92
PROVINCE OF BRITISH COLUMBIA
PUBLIC ACCOUNTS 2008/09
Summary Financial Statements
Consolidated Statement of Guaranteed Debt
as at March 31, 2009
Guaranteed debt represents the debt of organizations that has been explicitly guaranteed or indemnified by the government under the authority of a statute as to net principal or redemption provisions. These organizations may include municipalities and other governments, private enterprises and individuals, minority interests of provincial Crown corporations and agencies, and SUCH(1) sector entities.
| | In Millions | |
| | 2009 | | 2008 | |
| | Maximum | | | | Maximum | | | |
| | Guarantee | | Net | | Guarantee | | Net | |
| | Authorized | | Outstanding | | Authorized | | Outstanding | |
| | $ | | $ | | $ | | $ | |
Taxpayer–supported Guaranteed Debt | | | | | | | | | |
Government services: | | | | | | | | | |
Homeowner Protection Act loan guarantees(2) | | 375 | | 82 | | 375 | | 82 | |
Subtotal, government services | | 375 | | 82 | | 375 | | 82 | |
Health and education: | | | | | | | | | |
Financial Administration Act student aid loans | | 5 | | 5 | | 7 | | 7 | |
SUCH sector loan guarantees(1) | | 1 | | 1 | | 4 | | 2 | |
Subtotal, health and education | | 6 | | 6 | | 11 | | 9 | |
| | | | | | | | | |
Economic development: | | | | | | | | | |
Columbia Basin Trust joint venture co–venturer debt(3) | | 6 | | 6 | | 6 | | 6 | |
Financial Administration Act: | | | | | | | | | |
Feeder Association’s Loan Guarantee Program | | 10 | | 2 | | 10 | | 3 | |
Miscellaneous guarantees less than $1 million | | 1 | | 1 | | 1 | | 1 | |
Home Mortgage Assistance Program Act mortgages | | 2 | | 2 | | 10 | | 5 | |
Subtotal, economic development | | 19 | | 11 | | 27 | | 15 | |
Total taxpayer–supported guaranteed debt | | 400 | | 99 | | 413 | | 106 | |
| | | | | | | | | |
Self–supported Guaranteed Debt | | | | | | | | | |
Total self supported guaranteed debt(4) | | 10 | | 10 | | 10 | | 10 | |
| | | | | | | | | |
Grand total, all guaranteed debt | | 410 | | 109 | | 423 | | 116 | |
Provision for probable payout | | | | (7 | ) | | | (7 | ) |
Net total, all guaranteed debt | | 410 | | 102 | | 423 | | 109 | |
(1) School districts, universities, colleges and health authorities/hospital societies.
(2) Homeowner Protection Act loan guarantees include indemnities provided to Canadian Mortgage and Housing Corporation (CMHC) for any claims made to homeowners for repairs to homes with premature building envelope failure. Net guarantee for 2008 includes a $4 million restatement.
(3) Figures for prior year restated to include $6 million Columbia Basin Trust guarantee.
(4) The government has unconditionally guaranteed the payment of principal and interest for $10 million (2008: $10 million) of debentures issued to the Canada Pension Plan Investment Fund that matures on August 9, 2024 with a coupon rate of 5.54%.
93
Supplementary Information
(Unaudited)
The following unaudited supplementary information is intended to provide additional information to financial statement readers and includes:
a) the impacts of the Crown corporations and the school districts, universities, colleges, institutes and health organizations (SUCH) sector on the province’s annual surplus (deficit);
b) the Consolidated Staff Utilization;
c) details of the Consolidated Revenue Fund; and
d) the Provincial Debt Summary.
The purpose of this information is to report organizational impacts on the Summary Financial Statements, to reflect management accountability including appropriation control and to provide greater detail on the provincial debt.
The accounting policies applied for this unaudited information are different in some cases from the generally accepted accounting principles followed for the audited Summary Financial Statements. For example, in order to reflect different management accountabilities, the Consolidated Revenue Fund records prepaid capital advances, nets recoveries against expenses, nets sinking funds against debt and nets sinking fund earnings against interest expense. The Provincial Debt Summary figures include guaranteed debt in the calculation of total debt and calculate debt, interest costs and revenue as if the modified equity enterprises were consolidated on a line–by–line basis.

PROVINCE OF BRITISH COLUMBIA
PUBLIC ACCOUNTS 2008/09
Adjusted Net Income of Crown Corporations, Agencies and the SUCH Sector(1)
for the Fiscal Year Ended March 31, 2009
(Unaudited)
| | In Millions | |
| | | | | | | | | | Contributions | | | |
| | | | | | | | | | Paid To | | | |
| | | | | | | | | | Consolidated | | | |
| | | | | | | | | | Revenue | | Adjusted | |
| | Revenue | | Expense | | Net Income | | Adjustments | | Fund | | Net Income | |
| | $ | | $ | | $ | | $ | | $ | | $ | |
Taxpayer–supported (Government Organizations) | | | | | | | | | | | | | |
BC Immigrant Investment Fund Ltd | | 30 | | (5 | ) | 25 | | (20 | ) | | | 5 | |
B.C. Pavilion Corporation | | 45 | | (44 | ) | 1 | | 290 | | | | 291 | |
BC Games Society | | 2 | | (2 | ) | | | | | | | | |
BC Transportation Financing Authority | | 745 | | (660 | ) | 85 | | (285 | ) | | | (200 | ) |
British Columbia Arts Council | | | | | | | | | | | | | |
British Columbia Assessment Authority(2) | | 76 | | (75 | ) | 1 | | | | | | 1 | |
British Columbia Enterprise Corporation | | | | | | | | | | | | | |
British Columbia Housing Management Commission | | 627 | | (627 | ) | | | 14 | | | | 14 | |
British Columbia Innovation Council | | 17 | | (22 | ) | (5 | ) | (2 | ) | | | (7 | ) |
British Columbia Securities Commission | | 32 | | (30 | ) | 2 | | | | | | 2 | |
British Columbia Transit | | 229 | | (232 | ) | (3 | ) | 10 | | | | 7 | |
Canadian Blood Services | | 137 | | (136 | ) | 1 | | | | | | 1 | |
Columbia Basin Trust | | 41 | | (33 | ) | 8 | | 3 | | | | 11 | |
Community Living British Columbia | | 724 | | (723 | ) | 1 | | 1 | | | | 2 | |
Creston Valley Wildlife Management Authority Trust Fund | | 1 | | (1 | ) | | | | | | | | |
First Peoples’ Heritage, Language and Culture Council | | 4 | | (4 | ) | | | | | | | | |
Forestry Innovation Investment Ltd | | 26 | | (26 | ) | | | (2 | ) | | | (2 | ) |
Fraser Region Interim Aboriginal Authority | | 2 | | (1 | ) | 1 | | (1 | ) | (1 | ) | (1 | ) |
Homeowner Protection Office | | 20 | | (24 | ) | (4 | ) | | | | | (4 | ) |
Industry Training Authority | | 104 | | (103 | ) | 1 | | | | | | 1 | |
Knowledge Network Corp | | 12 | | (12 | ) | | | 5 | | | | 5 | |
Leading Edge Endowment Fund Society | | 10 | | (10 | ) | | | (9 | ) | | | (9 | ) |
97
PROVINCE OF BRITISH COLUMBIA
PUBLIC ACCOUNTS 2008/09
Adjusted Net Income of Crown Corporations, Agencies and the SUCH Sector(1)
for the Fiscal Year Ended March 31, 2009—Continued
(Unaudited)
| | In Millions | |
| | | | | | | | | | Contributions | | | |
| | | | | | | | | | Paid To | | | |
| | | | | | | | | | Consolidated | | | |
| | | | | | | | | | Revenue | | Adjusted | |
| | Revenue | | Expense | | Net Income | | Adjustments | | Fund | | Net Income | |
| | $ | | $ | | $ | | $ | | $ | | $ | |
Taxpayer–supported (Government Organizations)—Continued | | | | | | | | | | | | | |
Legal Services Society | | 78 | | (82 | ) | (4 | ) | | | | | (4 | ) |
Nechako–Kitamaat Development Fund Society | | | | (1 | ) | (1 | ) | | | | | (1 | ) |
Oil and Gas Commission | | 30 | | (34 | ) | (4 | ) | | | | | (4 | ) |
Organized Crime Agency of British Columbia Society | | 7 | | (8 | ) | (1 | ) | | | | | (1 | ) |
Pacific Carbon Trust | | 5 | | (1 | ) | 4 | | 1 | | | | 5 | |
Partnerships British Columbia Inc | | 17 | | (15 | ) | 2 | | | | | | 2 | |
Private Career Training Institutions Agency | | 3 | | (2 | ) | 1 | | 1 | | | | 2 | |
Provincial Rental Housing Corporation | | 30 | | (24 | ) | 6 | | 35 | | | | 41 | |
Rapid Transit Project 2000 Ltd | | 28 | | (28 | ) | | | | | | | | |
The Royal British Columbia Museum Corporation | | 21 | | (21 | ) | | | (2 | ) | | | (2 | ) |
Tourism British Columbia | | 65 | | (65 | ) | | | 1 | | | | 1 | |
Vancouver Island Aboriginal Transition Authority | | 2 | | (2 | ) | | | | | | | | |
Taxpayer–supported Crown corporations and agencies | | 3,170 | | (3,053 | ) | 117 | | 40 | | (1 | ) | 156 | |
| | | | | | | | | | | | | |
SUCH Sector | | | | | | | | | | | | | |
School Districts | | 5,385 | | (5,352 | ) | 33 | | 68 | | | | 101 | |
Universities | | 3,102 | | (3,392 | ) | (290 | ) | 167 | | | | (123 | ) |
Colleges and Institutes | | 1,043 | | (1,043 | ) | | | (7 | ) | | | (7 | ) |
Health Authorities | | 10,060 | | (10,070 | ) | (10 | ) | (141 | ) | | | (151 | ) |
Hospital Societies | | 826 | | (836 | ) | (10 | ) | 15 | | | | 5 | |
SUCH sector | | 20,416 | | (20,693 | ) | (277 | ) | 102 | | 0 | | (175 | ) |
Net impact of taxpayer–supported Crown corporations, agencies and SUCH sector | | 23,586 | | (23,746 | ) | (160 | ) | 142 | | (1 | ) | (19 | ) |
98
PROVINCE OF BRITISH COLUMBIA
PUBLIC ACCOUNTS 2008/09
Adjusted Net Income of Crown Corporations, Agencies and the SUCH Sector(1)
for the Fiscal Year Ended March 31, 2009—Continued
(Unaudited)
| | In Millions | |
| | | | | | | | | | Contributions | | | |
| | | | | | | | | | Paid To | | | |
| | | | | | | | | | Consolidated | | | |
| | | | | | | | | | Revenue | | Adjusted | |
| | Revenue | | Expense | | Net Income | | Adjustments | | Fund | | Net Income | |
| | $ | | $ | | $ | | $ | | $ | | $ | |
Self–supported (Government Enterprises) | | | | | | | | | | | | | |
BCIF Management Ltd | | | | | | | | | | | | | |
British Columbia Hydro and Power Authority | | 4,269 | | (3,903 | ) | 366 | | | | | | 366 | |
British Columbia Liquor Distribution Branch | | 2,803 | | (1,912 | ) | 891 | | | | (891 | ) | | |
British Columbia Lottery Corporation | | 2,568 | | (1,477 | ) | 1,091 | | (9 | ) | (1,082 | ) | | |
British Columbia Railway Company(2) | | 59 | | (23 | ) | 36 | | | | | | 36 | |
British Columbia Transmission Corporation | | 238 | | (231 | ) | 7 | | | | | | 7 | |
Columbia Power Corporation | | 50 | | (31 | ) | 19 | | | | (2 | ) | 17 | |
Insurance Corporation of British Columbia(2) | | 3,977 | | (3,465 | ) | 512 | | | | | | 512 | |
Transportation Investment Corporation | | | | (8 | ) | (8 | ) | | | | | (8 | ) |
Provincial Capital Commission | | 4 | | (3 | ) | 1 | | (1 | ) | | | | |
Net impact of self–supported Crown corporations and agencies | | 13,968 | | (11,053 | ) | 2,915 | | (10 | ) | (1,975 | ) | 930 | |
(1) This schedule does not include elimination entries between entities.
(2) The revenues and expenses reported for the British Columbia Assessment Authority, British Columbia Railway Company and Insurance Corporation of British Columbia include a stub period reversal of January–March 2008 and an inclusion of the stub period of January–March 2009.
99
PROVINCE OF BRITISH COLUMBIA
PUBLIC ACCOUNTS 2008/09
SUCH (1) Statement of Financial Position
as at March 31, 2009
(Unaudited)
| | In Millions | |
| | Health | | | | | | | | | | | |
| | Authorities & | | | | | | | | | | | |
| | Hospital | | | | Colleges and | | School | | 2009 | | 2008 | |
| | Societies(2) | | Universities | | Institutes | | Districts | | Total | | Total | |
| | $ | | $ | | $ | | $ | | $ | | $ | |
Financial Assets | | | | | | | | | | | | | |
Cash and cash equivalents | | 425 | | 442 | | 305 | | 876 | | 2,048 | | 2,187 | |
Temporary investments | | 297 | | 258 | | 37 | | 128 | | 720 | | 459 | |
Accounts receivable | | 155 | | 106 | | 43 | | 60 | | 364 | | 358 | |
Inventories for resale | | | | 20 | | 11 | | 2 | | 33 | | 30 | |
Due from Crown corporations, agencies and trust funds | | 205 | | 12 | | 3 | | 4 | | 224 | | 219 | |
Due from other governments | | 35 | | 20 | | 3 | | | | 58 | | 67 | |
Loans, advances and mortgages receivable | | 8 | | 33 | | 2 | | | | 43 | | 35 | |
Other investments | | 107 | | 1,788 | | 108 | | 70 | | 2,073 | | 2,318 | |
Sinking fund investments | | | | 60 | | 7 | | | | 67 | | 67 | |
Financial assets before accounting adjustments | | 1,232 | | 2,739 | | 519 | | 1,140 | | 5,630 | | 5,740 | |
Policy accounting adjustments | | 17 | | 163 | | (178 | ) | 22 | | 24 | | (15 | ) |
Financial assets | | 1,249 | | 2,902 | | 341 | | 1,162 | | 5,654 | | 5,725 | |
100
PROVINCE OF BRITISH COLUMBIA
PUBLIC ACCOUNTS 2008/09
SUCH (1) Statement of Financial Position
as at March 31, 2009—Continued
(Unaudited)
| | In Millions | |
| | Health | | | | | | | | | | | |
| | Authorities & | | | | | | | | | | | |
| | Hospital | | | | Colleges and | | School | | 2009 | | 2008 | |
| | Societies(2) | | Universities | | Institutes | | Districts | | Total | | Total | |
| | $ | | $ | | $ | | $ | | $ | | $ | |
Liabilities | | | | | | | | | | | | | |
| | | | | | | | | | | | | |
Accounts payable and accrued liabilities | | 1,583 | | 415 | | 191 | | 483 | | 2,672 | | 2,485 | |
Due to other governments | | 23 | | 6 | | 9 | | | | 38 | | 30 | |
Due to Crown corporations, agencies and trust funds | | 31 | | 3 | | 1 | | 1 | | 36 | | 14 | |
Deferred revenue | | 4,627 | | 3,418 | | 1,162 | | 4,528 | | 13,735 | | 12,818 | |
Taxpayer–supported debt | | 681 | | 776 | | 153 | | 34 | | 1,644 | | 1,129 | |
Liabilities before accounting adjustments | | 6,945 | | 4,618 | | 1,516 | | 5,046 | | 18,125 | | 16,476 | |
Policy accounting adjustments | | (802 | ) | (655 | ) | (671 | ) | (223 | ) | (2,351 | ) | (2,100 | ) |
Liabilities | | 6,143 | | 3,963 | | 845 | | 4,823 | | 15,774 | | 14,376 | |
Net liabilities | | (4,894 | ) | (1,061 | ) | (504 | ) | (3,661 | ) | (10,120 | ) | (8,651 | ) |
Non–financial Assets | | | | | | | | | | | | | |
Tangible capital assets | | 5,206 | | 4,361 | | 1,614 | | 5,860 | | 17,041 | | 15,304 | |
Prepaid program costs | | 167 | | 20 | | 6 | | 5 | | 198 | | 182 | |
Other assets | | 47 | | 13 | | | | 6 | | 66 | | 16 | |
Non–financial assets before accounting adjustments | | 5,420 | | 4,394 | | 1,620 | | 5,871 | | 17,305 | | 15,502 | |
Policy accounting adjustments | | (266 | ) | 11 | | (540 | ) | | | (795 | ) | (282 | ) |
Non–financial assets | | 5,154 | | 4,405 | | 1,080 | | 5,871 | | 16,510 | | 15,220 | |
Accumulated surplus (deficit) | | 260 | | 3,344 | | 576 | | 2,210 | | 6,390 | | 6,569 | |
(1) School districts, universities, colleges, institutes, and health organizations.
(2) These numbers include inter–entity eliminations between Health Authorities and Hospital Societies.
101
PROVINCE OF BRITISH COLUMBIA
PUBLIC ACCOUNTS 2008/09
SUCH (1) Statement of Operations
for the Fiscal Year Ended March 31, 2009
(Unaudited)
| | In Millions | |
| | Health | | | | | | | | | | | |
| | Authorities & | | | | | | | | | | | |
| | Hospital | | | | Colleges and | | School | | 2009 | | 2008 | |
| | Societies(2) | | Universities | | Institutes | | Districts | | Total | | Total | |
| | $ | | $ | | $ | | $ | | $ | | $ | |
Revenue | | | | | | | | | | | | | |
Contributions from the federal government | | 17 | | 308 | | 4 | | 3 | | 332 | | 273 | |
Fees and licences | | 257 | | 799 | | 240 | | 146 | | 1,442 | | 1,376 | |
Contributions from the provincial government/ Crown corporations and agencies | | 9,565 | | 1,542 | | 687 | | 4,873 | | 16,667 | | 15,619 | |
Miscellaneous | | 410 | | 645 | | 109 | | 334 | | 1,498 | | 1,557 | |
Investment income | | 23 | | (192 | ) | 3 | | 29 | | (137 | ) | 85 | |
Total revenue | | 10,272 | | 3,102 | | 1,043 | | 5,385 | | 19,802 | | 18,910 | |
Expense | | | | | | | | | | | | | |
Salaries and benefits | | 5,385 | | 2,076 | | 694 | | 4,261 | | 12,416 | | 11,755 | |
Government transfers | | | | 211 | | 30 | | | | 241 | | 200 | |
Operating costs | | 4,305 | | 597 | | 209 | | 873 | | 5,984 | | 5,518 | |
Interest | | 36 | | 47 | | 7 | | 2 | | 92 | | 60 | |
Amortization | | 484 | | 305 | | 70 | | 212 | | 1,071 | | 959 | |
Other | | 82 | | 156 | | 33 | | 4 | | 275 | | 291 | |
Total operating expense | | 10,292 | | 3,392 | | 1,043 | | 5,352 | | 20,079 | | 18,783 | |
Surplus (deficit) for the year before accounting adjustments | | (20 | ) | (290 | ) | 0 | | 33 | | (277 | ) | 127 | |
Policy accounting adjustments | | (126 | ) | 167 | | (7 | ) | 68 | | 102 | | 339 | |
Surplus (deficit) for the year | | (146 | ) | (123 | ) | (7 | ) | 101 | | (175 | ) | 466 | |
(1) School districts, universities, colleges, institutes, and health organizations.
(2) These numbers include inter–entity eliminations between Health Authorities and Hospital Societies.
102
PROVINCE OF BRITISH COLUMBIA
PUBLIC ACCOUNTS 2008/09
Summary Financial Statements
Consolidated Staff Utilization
for the Fiscal Year Ended March 31, 2009(1)
(Unaudited)
| | | | | | | | Variance | |
| | | | | | | | 2008/09 | | 2008/09 | |
| | 2008/09 | | 2008/09 | | 2007/08 | | Actual | | vs | |
| | Budget(2) | | Actual | | Actual | | To Budget | | 2007/08 | |
Consolidated Revenue Fund(3) | | 31,830 | | 31,874 | | 30,224 | | 44 | | 1,650 | |
Taxpayer–supported Crown corporations and agencies(4) | | 4,265 | | 4,403 | | 4,128 | | 138 | | 275 | |
Total staff utilization | | 36,095 | | 36,277 | | 34,352 | | 182 | | 1,925 | |
The table above provides a summary of full–time equivalent (FTE) employment.
(1) Staff utilization is the full–time equivalent of the number of persons employed in the fiscal year whose salaries are paid by taxpayer–supported entities within the Summary Financial Statements.
(2) The budget figures do not include any provisions for the SUCH entities or for the self–supported Crown corporations and agencies.
(3) See the unaudited Consolidated Revenue Fund schedules at www.fin.gov.bc.ca/pubs.htm for details outside these financial statements.
(4) See Financial Statements of Government Organizations and Enterprises at www.fin.gov.bc.ca/pubs.htm for details outside these financial statements.
103
Consolidated Revenue Fund
Extracts
(Unaudited)

PROVINCE OF BRITISH COLUMBIA
PUBLIC ACCOUNTS 2008/09
Consolidated Revenue Fund
Statement of Financial Position
as at March 31, 2009
(Unaudited)
| | In Millions | |
| | 2009 | | 2008 | |
| | $ | | $ | |
Financial Assets | | | | | |
Cash and cash equivalents | | 1,619 | | 2,448 | |
Warehouse program investments | | 2,081 | | | |
Accounts receivable | | 2,433 | | 2,712 | |
Inventories for resale | | 28 | | 37 | |
Due from other governments | | 374 | | 820 | |
Due from Crown corporations and agencies | | 226 | | 509 | |
Investments in Crown corporations and agencies | | 954 | | 854 | |
Loans, advances and mortgages receivable | | 944 | | 887 | |
Other investments | | 284 | | 236 | |
Loans for purchase of assets, recoverable from agencies | | 13,416 | | 11,406 | |
| | 22,359 | | 19,909 | |
Liabilities | | | | | |
Accounts payable and accrued liabilities | | 3,388 | | 4,128 | |
Due to other governments | | 667 | | 971 | |
Due to Crown corporations, agencies and trust funds | | 283 | | 153 | |
Deferred revenue | | 5,338 | | 3,813 | |
Employee pension plans | | 3 | | 2 | |
Taxpayer-supported debt | | 23,798 | | 24,230 | |
Self-supported debt | | 11,215 | | 7,702 | |
| | 44,692 | | 40,999 | |
Net assets (liabilities) | | (22,333 | ) | (21,090 | ) |
| | | | | |
Non-financial Assets | | | | | |
Tangible capital assets | | 2,357 | | 2,167 | |
Prepaid capital advances | | 10,240 | | 10,047 | |
Prepaid program costs | | 211 | | 168 | |
Other assets | | 287 | | 303 | |
| | 13,095 | | 12,685 | |
Accumulated operating result | | (9,238 | ) | (8,405 | ) |
107
PROVINCE OF BRITISH COLUMBIA
PUBLIC ACCOUNTS 2008/09
Consolidated Revenue Fund
Statement of Operations
for the Fiscal Year Ended March 31, 2009
(Unaudited)
| | In Millions | |
| | 2009 | | 2008 | |
| | Estimated (1) | | Actual | | Actual | |
| | $ | | $ | | $ | |
Revenue | | | | | | | |
Taxation | | 18,100 | | 17,511 | | 18,758 | |
Contributions from the federal government | | 4,948 | | 4,931 | | 4,950 | |
Natural resource | | 3,672 | | 3,802 | | 3,736 | |
Other revenue | | 2,651 | | 2,569 | | 2,632 | |
Contributions from the Crown corporations | | 1,746 | | 1,719 | | 1,972 | |
| | 31,117 | | 30,532 | | 32,048 | |
Expense | | | | | | | |
Health | | 13,917 | | 14,039 | | 13,303 | |
Education | | 7,470 | | 7,470 | | 7,309 | |
Social services | | 3,190 | | 3,169 | | 2,975 | |
Interest(2) | | 1,330 | | 1,192 | | 1,177 | |
Natural resources and economic development | | 1,804 | | 1,689 | | 1,837 | |
Other | | 1,151 | | 1,142 | | 803 | |
Protection of persons and property | | 1,327 | | 1,388 | | 1,390 | |
Transportation | | 794 | | 848 | | 716 | |
General government | | 424 | | 429 | | 781 | |
| | 31,407 | | 31,366 | | 30,291 | |
Operating result for the year before unusual items | | (290 | ) | (834 | ) | 1,757 | |
Liquidation dividends | | | | 1 | | 3 | |
Operating result for the year | | (290 | ) | (833 | ) | 1,760 | |
| | | | | | | |
Accumulated operating result —beginning of year as restated | | | | (8,405 | ) | (10,165 | ) |
Accumulated operating result —end of year | | | | (9,238 | ) | (8,405 | ) |
(1)The estimated amount consists of the Main Estimates presented to the Legislative Assembly on February 19, 2008. It does not include other authorizations granted in subsequent Supplementary Estimates or under statutory authority of $628 million (2008: $1,082 million).
(2)Interest expense does not include the following: interest of $706.9 million (2008: $709.3 million) on cost of borrowing for relending to government bodies; interest of $26.7 million (2008: $4.8 million) on cost of unallocated borrowing under the Warehouse Borrowing Program; interest of $91 million (2008: $260 million) funded by sinking fund earnings; and, interest of $0.9 million (2008: $0.9 million) on cost of financial agreements entered into on behalf of government bodies. These amounts are not included because the interest expense and recovery are offsetting.
109
PROVINCE OF BRITISH COLUMBIA
PUBLIC ACCOUNTS 2008/09
Consolidated Revenue Fund
Statement of Cash Flow
for the Fiscal Year Ended March 31, 2009
(Unaudited)
| | In Millions | |
| | 2009 | | 2008 | |
| | Receipts | | Disbursements | | Net | | Net | |
| | $ | | $ | | $ | | $ | |
Operating Transactions | | | | | | | | | |
Operating result for the year | | | | | | (833 | ) | 1,760 | |
Non–cash items included in operating result: | | | | | | | | | |
Amortization of tangible capital assets | | | | | | 232 | | 227 | |
Amortization of prepaid capital assets | | | | | | 637 | | 577 | |
Amortization of public debt deferred revenue and deferred charges | | | | | | 10 | | (14 | ) |
Concessionary loan adjustments (decreases) | | | | | | (2 | ) | | |
Valuation adjustments | | | | | | 35 | | 50 | |
Accounts receivable decreases | | | | | | 267 | | 92 | |
Due from other governments decreases (increases) | | | | | | 446 | | (45 | ) |
Due from self–supported Crown corporations and agencies decreases | | | | | | 283 | | 45 | |
Accounts payable (decreases) increases | | | | | | (740 | ) | 375 | |
Due to other governments (decreases) increases | | | | | | (304 | ) | 98 | |
Due to Crown corporations, agencies and trust funds increases | | | | | | 130 | | 7 | |
Employee pension plans increases | | | | | | 1 | | | |
Items applicable to future operations increases | | | | | | 1,502 | | 744 | |
Cash derived from (used for) operations | | | | | | 1,664 | | 3,916 | |
| | | | | | | | | |
Capital Transactions | | | | | | | | | |
Tangible capital assets (acquisitions) | | 9 | | (431 | ) | (422 | ) | (313 | ) |
Prepaid capital advances (increases) | | | | (832 | ) | (832 | ) | (965 | ) |
Cash derived from (used for) capital | | 9 | | (1,263 | ) | (1,254 | ) | (1,278 | ) |
| | | | | | | | | |
Investment Transactions | | | | | | | | | |
Investment in self–supported Crown corporations and agencies | | | | (100 | ) | (100 | ) | | |
Loans, advances and mortgages receivable (issues) | | 105 | | (181 | ) | (76 | ) | (74 | ) |
Other investments—net decreases (increases) | | 24 | | (72 | ) | (48 | ) | (26 | ) |
Cash derived from (used for) investments | | 129 | | (353 | ) | (224 | ) | (100 | ) |
Sub–total cash (requirements) | | | | | | 186 | | 2,538 | |
110
PROVINCE OF BRITISH COLUMBIA
PUBLIC ACCOUNTS 2008/09
Consolidated Revenue Fund
Statement of Cash Flow
for the Fiscal Year Ended March 31, 2009—Continued
(Unaudited)
| | In Millions | |
| | 2009 | | 2008 | |
| | Receipts | | Disbursements | | Net | | Net | |
| | $ | | $ | | $ | | $ | |
| | | | | | | | | |
Sub–total cash (requirements) carried forward from previous page | | | | | | 186 | | 2,538 | |
| | | | | | | | | |
Financing Transactions(1) | | | | | | | | | |
Public debt increases | | 18,355 | | (15,266 | ) | 3,089 | | 743 | |
(Used for) derived from Warehouse Borrowing Program investment | | (3,291 | ) | 1,210 | | (2,081 | ) | | |
(Used for) derived from purchase of assets, recoverable from agencies | | (7,672 | ) | 5,649 | | (2,023 | ) | (1,184 | ) |
Cash derived from (used for) financing | | 7,392 | | (8,407 | ) | (1,015 | ) | (441 | ) |
Increase (decrease) in cash and cash equivalents | | | | | | (829 | ) | 2,097 | |
Cash and cash equivalents—beginning of year | | | | | | 2,448 | | 351 | |
Cash and cash equivalents—end of year | | | | | | 1,619 | | 2,448 | |
| | | | | | | | | |
Cash and cash equivalents are made up of: | | | | | | | | | |
Cash | | | | | | (280 | ) | (364 | ) |
Cash equivalents | | | | | | 1,899 | | 2,812 | |
| | | | | | 1,619 | | 2,448 | |
(1)Financing transaction receipts are from debt issues and disbursements are for debt repayments.
111
PROVINCE OF BRITISH COLUMBIA
PUBLIC ACCOUNTS 2008/09
Consolidated Revenue Fund
Schedule of Net Revenue by Source
for the Fiscal Year Ended March 31, 2009
(Unaudited)
| | In Millions | |
| | 2009 | | 2008 | |
| | Estimated | | Actual | | Actual | |
| | $ | | $ | | $ | |
Taxation Revenue(1) | | | | | | | |
Personal income | | 6,703 | | 6,097 | | 6,959 | |
Corporate income | | 1,347 | | 2,042 | | 2,252 | |
Social service | | 5,238 | | 4,921 | | 5,029 | |
Carbon | | 338 | | 306 | | | |
Property | | 1,757 | | 1,737 | | 1,693 | |
Fuel | | 506 | | 473 | | 500 | |
Other | | 2,264 | | 2,008 | | 2,368 | |
Commissions on collection of public funds | | (36 | ) | (47 | ) | (35 | ) |
Valuation adjustments | | (17 | ) | (26 | ) | (8 | ) |
Total taxation revenue | | 18,100 | | 17,511 | | 18,758 | |
Contributions from the Federal Government | | | | | | | |
Canada health and social transfers | | 4,794 | | 4,743 | | 4,581 | |
Other contributions | | 154 | | 188 | | 369 | |
Total contributions from the federal government | | 4,948 | | 4,931 | | 4,950 | |
Natural Resource Revenue(2) | | | | | | | |
Petroleum, natural gas and minerals | | 2,102 | | 2,620 | | 2,079 | |
Forests | | 941 | | 546 | | 1,076 | |
Water and other | | 641 | | 644 | | 587 | |
Commissions on collection of public funds | | (1 | ) | (1 | ) | (1 | ) |
Valuation adjustments | | (11 | ) | (7 | ) | (5 | ) |
Total natural resource revenue | | 3,672 | | 3,802 | | 3,736 | |
Other Revenue | | | | | | | |
Medical Services Plan premiums | | 1,513 | | 1,526 | | 1,499 | |
Motor vehicle licences and permits | | 448 | | 450 | | 445 | |
Other fees and licences | | 504 | | 374 | | 446 | |
Investment earnings | | 58 | | 86 | | 95 | |
Miscellaneous | | 210 | | 207 | | 229 | |
Asset dispositions | | 4 | | 4 | | 10 | |
Commissions on collection of public funds | | (7 | ) | (6 | ) | (7 | ) |
Valuation adjustments | | (79 | ) | (72 | ) | (85 | ) |
Total other revenue | | 2,651 | | 2,569 | | 2,632 | |
112
PROVINCE OF BRITISH COLUMBIA
PUBLIC ACCOUNTS 2008/09
Consolidated Revenue Fund
Schedule of Net Revenue by Source
for the Fiscal Year Ended March 31, 2009—Continued
(Unaudited)
| | In Millions | |
| | 2009 | | 2008 | |
| | Estimated | | Actual | | Actual | |
| | $ | | $ | | $ | |
Contributions from the Crown Corporations | | | | | | | |
| | | | | | | |
Self–supported Crown corporations | | | | | | | |
British Columbia Hydro and Power Authority | | 53 | | | | 288 | |
British Columbia Liquor Distribution Branch | | 854 | | 891 | | 857 | |
British Columbia Lottery Corporation | | 837 | | 826 | | 825 | |
Other | | 2 | | 2 | | 2 | |
Total contributions from the Crown corporations | | 1,746 | | 1,719 | | 1,972 | |
Net Consolidated Revenue Fund Revenue | | 31,117 | | 30,532 | | 32,048 | |
| | | | | | | |
Liquidation Dividends | | | | 1 | | 3 | |
| | | | | | | |
Revenue Collected for and Transferred to Crown Corporations, Agencies and Other Entities(3) | | | | | | | |
Energy, Mines and Petroleum Resources | | | | | | | |
Oil and Gas Commission Act | | (29 | ) | (32 | ) | (32 | ) |
Environment | | | | | | | |
Habitat Conservation Trust | | (6 | ) | (6 | ) | | |
Finance | | | | | | | |
British Columbia Transit Act (Motor Fuel Tax) | | (11 | ) | (11 | ) | (9 | ) |
British Columbia Transportation Authority (Motor Fuel Tax) | | (453 | ) | (421 | ) | (439 | ) |
Cowichan Tribes | | (2 | ) | (2 | ) | | |
Municipalities or Eligible Entities | | (30 | ) | (28 | ) | (27 | ) |
Resort Area | | (8 | ) | (10 | ) | (9 | ) |
Rural Area | | (275 | ) | (251 | ) | (249 | ) |
South Coast British Columbia Transportation Authority Act (Motor Fuel and Social Services Taxes) | | (296 | ) | (278 | ) | (282 | ) |
Tobacco Tax Amendment Act | | | | | | (2 | ) |
Tourism British Columbia (Hotel Room Tax Act) | | (63 | ) | (57 | ) | (33 | ) |
Total | | (1,173 | ) | (1,096 | ) | (1,082 | ) |
(1)Personal income tax and corporate income tax revenues are recorded after adjustment for tax credits. Deductions allowable in the calculation of personal income tax revenue were $146.6 million (2008: $144.0 million) and corporate income tax were $368.0 million (2008: $345.0 million). The types of tax credits adjusting personal income tax and corporation income tax revenues are for foreign taxes, logging taxes, sales taxes, venture capital, training, film and production services, scientific and experimental development tax and mining flow–through share.
Personal income tax revenue was also reduced by $130.4 million (2008: $114.3 million) for the BC Tax Reduction and by $106.3 million for the low income climate action tax credit (effective July 2008).
Personal income tax revenue was further reduced by $12.6 million (2008: $15.9 million), representing that portion of the Family Bonus program payments that effectively reduce recipients’ tax liability.
Additional personal income tax and corporate income tax refunds are issued under the International Financial Activity Act. Personal income tax refunds were $0.03 million (2008: $0.03 million) and corporate income tax refunds were $20.2 million (2008: $13.3 million).
Property tax revenue was recorded net of home owner grants of $674 million (2008: $651 million).
(2)Oil and gas royalty revenues are reported after adjustments for various royalty deduction programs such as producer cost of service allowances, deep well, summer drilling, marginal, ultra marginal, low production, new pool discovery and road construction. Deductions allowable in the calculation of royalties revenue were $610.8 million (2008: $454.9 million).
(3)The revenue collected for and transferred to Crown corporations, agencies and other entities has not been included in the Consolidated Revenue Fund.
113
PROVINCE OF BRITISH COLUMBIA
PUBLIC ACCOUNTS 2008/09
Consolidated Revenue Fund
Schedule of Comparison of Estimated Expenses to Actual Expenses
for the Fiscal Year Ended March 31, 2009
(Unaudited)
| | In Thousands | |
| | | | Other | | | | | |
| | Estimated | | Authorizations | | Total | | Actual | |
| | $ | | $ | | $ | | $ | |
Special Offices, Ministries and Other Appropriations | | | | | | | | | |
Legislation | | 64,058 | | 10,818 | | 74,876 | | 74,876 | |
Officers of the Legislature | | 52,905 | | 30 | | 52,935 | | 50,944 | |
Office of the Premier | | 14,102 | | | | 14,102 | | 13,524 | |
Aboriginal Relations and Reconciliation | | 62,127 | | 2,388 | | 64,515 | | 64,421 | |
Advanced Education and Labour Market Development | | 2,251,994 | | 21,791 | | 2,273,785 | | 2,225,110 | |
Agriculture and Lands | | 289,352 | | (57,384 | ) | 231,968 | | 225,609 | |
Attorney General | | 554,994 | | 14,282 | | 569,276 | | 547,853 | |
Children and Family Development | | 1,987,004 | | (660,877 | ) | 1,326,127 | | 1,320,950 | |
Community Development | | 303,646 | | 120,111 | | 423,757 | | 418,930 | |
Education | | 5,675,357 | | (343,113 | ) | 5,332,244 | | 5,301,551 | |
Energy, Mines and Petroleum Resources | | 90,594 | | (12,866 | ) | 77,728 | | 54,227 | |
Environment | | 272,486 | | (2,801 | ) | 269,685 | | 248,789 | |
Finance | | 97,287 | | 247,498 | | 344,785 | | 342,672 | |
Forests and Range | | 1,210,841 | | (378,826 | ) | 832,015 | | 779,408 | |
Health Services | | 13,764,737 | | (112,771 | ) | 13,651,966 | | 13,592,092 | |
Healthy Living and Sport | | | | 75,020 | | 75,020 | | 69,621 | |
Housing and Social Development | | 1,527,012 | | 1,190,572 | | 2,717,584 | | 2,715,468 | |
Labour and Citizens’ Services | | 103,657 | | 559 | | 104,216 | | 102,952 | |
Public Safety and Solicitor General | | 647,061 | | 27,460 | | 674,521 | | 673,311 | |
Small Business and Revenue | | 65,139 | | (65,139 | ) | | | | |
Small Business, Technology and Economic Development | | 225,718 | | (143,317 | ) | 82,401 | | 66,417 | |
Tourism, Culture and the Arts | | 374,770 | | 2,157 | | 376,927 | | 372,475 | |
Transportation and Infrastructure | | 970,553 | | (91,382 | ) | 879,171 | | 877,416 | |
Management of Public Funds and Debt | | 401,700 | | 860,013 | | 1,261,713 | | 1,191,692 | |
Contingencies (All Ministries) and New Programs(1) | | 375,000 | | (70,127 | ) | 304,873 | | 31,720 | |
BC Family Bonus | | 14,000 | | | | 14,000 | | 12,708 | |
Commissions on Collection of Public Funds | | 1 | | | | 1 | | | |
Allowances for Doubtful Revenue Accounts | | 1 | | | | 1 | | | |
Environmental Appeal Board and Forest Appeals Commission | | 2,096 | | | | 2,096 | | 1,373 | |
Forest Practices Board | | 3,808 | | | | 3,808 | | 3,806 | |
Pacific Carbon Trust | | 5,000 | | | | 5,000 | | 5,000 | |
Insurance and Risk Management Special Account | | | | (5,848 | ) | (5,848 | ) | (19,150 | ) |
Total expense | | 31,407,000 | | 628,248 | | 32,035,248 | | 31,365,765 | |
114
PROVINCE OF BRITISH COLUMBIA
PUBLIC ACCOUNTS 2008/09
Consolidated Revenue Fund
Schedule of Comparison of Estimated Expenses to Actual Expenses
for the Fiscal Year Ended March 31, 2009—Continued
(Unaudited)
| | In Thousands | |
| | | | Other | | | | | |
| | Estimated | | Authorizations | | Total | | Actual | |
| | $ | | $ | | $ | | $ | |
Summary of Appropriations | | | | | | | | | |
| | | | | | | | | |
Voted expense | | 30,844,124 | | 671,755 | | 31,515,879 | | 30,933,459 | |
Statutory | | | | | | | | | |
Various Acts | | | | 347,635 | | 347,635 | | 347,635 | |
Special Accounts | | 584,172 | | 26,680 | | 610,852 | | 520,039 | |
Inter–account transfers | | (21,296 | ) | (417,822 | ) | (439,118 | ) | (435,368 | ) |
Total expense by appropriation 2008/09 | | 31,407,000 | | 628,248 | | 32,035,248 | | 31,365,765 | |
| | | | | | | | | |
Total expense by appropriation 2007/08 | | 29,775,000 | | 1,082,375 | | 30,857,375 | | 30,291,487 | |
(1)Some of the budget for contingencies has been reallocated to ministries with approved access.
115
PROVINCE OF BRITISH COLUMBIA
PUBLIC ACCOUNTS 2008/09
Consolidated Revenue Fund
Schedule of Financing Transaction Disbursements
for the Fiscal Year Ended March 31, 2009
(Unaudited)
| | In Thousands | |
| | | | Other | | | | | |
| | Estimated | | Authorizations | | Total | | Actual | |
| | $ | | $ | | $ | | $ | |
Special Offices, Ministries and Other Appropriations | | | | | | | | | |
Legislation | | 27,530 | | | | 27,530 | | 1,160 | |
Officers of the Legislature | | 739 | | | | 739 | | 475 | |
Office of the Premier | | 95 | | | | 95 | | 7 | |
Aboriginal Relations and Reconciliation | | 4,493 | | | | 4,493 | | 2,154 | |
Advanced Education and Labour Market Development | | 451,840 | | (248,426 | ) | 203,414 | | 174,444 | |
Agriculture and Lands | | 16,951 | | | | 16,951 | | 8,421 | |
Attorney General | | 10,347 | | 2,655 | | 13,002 | | 12,456 | |
Children and Family Development | | 13,853 | | (6,000 | ) | 7,853 | | 6,306 | |
Community Development | | 3,549 | | (1,603 | ) | 1,946 | | 1,090 | |
Education | | 310,645 | | | | 310,645 | | 292,986 | |
Energy, Mines and Petroleum Resources | | 30,435 | | 18,215 | | 48,650 | | 48,650 | |
Environment | | 24,417 | | 26,562 | | 50,979 | | 50,764 | |
Finance | | 6,122 | | 1,467,208 | | 1,473,330 | | 1,319,943 | |
Forests and Range | | 45,073 | | 102,715 | | 147,788 | | 142,988 | |
Health Services | | 444,414 | | 60,610 | | 505,024 | | 409,543 | |
Healthy Living and Sport | | | | 280 | | 280 | | 276 | |
Housing and Social Development | | 22,725 | | (14,388 | ) | 8,337 | | 8,045 | |
Labour and Citizens’ Services | | 99,851 | | 51,140 | | 150,991 | | 150,991 | |
Public Safety and Solicitor General | | 5,515 | | (510 | ) | 5,005 | | 5,004 | |
Small Business and Revenue | | 1,214,503 | | (1,214,503 | ) | | | | |
Small Business, Technology and Economic Development | | 396 | | 849 | | 1,245 | | 1,245 | |
Tourism, Culture and the Arts | | 2,284 | | (114 | ) | 2,170 | | 1,749 | |
Transportation and Infrastructure | | 47,888 | | 100,000 | | 147,888 | | 147,333 | |
Contingencies (All Ministries) and New Programs | | 100,460 | | (62,655 | ) | 37,805 | | | |
Environmental Appeal Board and Forest Appeals Commission | | 15 | | | | 15 | | 4 | |
Forest Practices Board | | 125 | | | | 125 | | 125 | |
Insurance and Risk Management Special Account | | 370 | | | | 370 | | 157 | |
Total financing transaction disbursements | | 2,884,635 | | 282,035 | | 3,166,670 | | 2,786,316 | |
| | | | | | | | | |
Summary of Appropriations | | | | | | | | | |
Loans, investments and other requirements | | 353,287 | | 154,086 | | 507,373 | | 426,710 | |
Prepaid capital advances | | 971,848 | | | | 971,848 | | 832,320 | |
Revenue collected for, and transferred to, other entities | | 1,173,500 | | 4,661 | | 1,178,161 | | 1,095,665 | |
Capital expenditures | | | | | | | | | |
Land and land improvements | | 18,074 | | | | 18,074 | | 43,590 | |
Buildings and tenant improvements | | 90,514 | | | | 90,514 | | 74,082 | |
Specialized equipment | | 12,398 | | | | 12,398 | | 18,803 | |
Office furniture and equipment | | 7,866 | | | | 7,866 | | 6,909 | |
Vehicles | | 15,561 | | | | 15,561 | | 18,574 | |
Information systems | | 241,587 | | 80,000 | | 321,587 | | 199,670 | |
Highway infrastructure | | | | 43,288 | | 43,288 | | 69,993 | |
Total financing transactions by appropriation | | 2,884,635 | | 282,035 | | 3,166,670 | | 2,786,316 | |
116
PROVINCE OF BRITISH COLUMBIA
PUBLIC ACCOUNTS 2008/09
Consolidated Revenue Fund
Schedule of Write–offs, Extinguishments and Remissions
for the Fiscal Year Ended March 31, 2009
(Unaudited)
| | In Millions | |
| | Assets, | | | | | |
| | Debts and | | Debts and | | | |
| | Obligations | | Obligations | | Remissions | |
| | Written Off | | Extinguished | | Made | |
| | $ | | $ | | $ | |
Ministry | | | | | | | |
Advanced Education and Labour Market Development | | 1 | | 45 | | | |
Attorney General | | 2 | | | | | |
Finance | | 15 | | 1 | | 5 | |
Forests and Range | | 2 | | | | 1 | |
Health Services | | 11 | | | | | |
Housing and Social Development | | 36 | | | | | |
Public Safety and Solicitor General | | 6 | | | | | |
Small Business, Technology and Economic Development | | 2 | | | | | |
Total 2008/09 | | 75 | | 46 | | 6 | |
| | | | | | | |
Total 2007/08 | | 86 | | 56 | | 12 | |
This statement includes amounts authorized by sections 17, 18 and 19 of the Financial Administration Act. Amounts authorized for write–off, forgiveness or remission by other statutes are not shown separately in these financial statements.
This schedule is produced as required under Section 9(2)(d)(ii), (iii) and (iv) of the Budget Transparency and Accountability Act.
117
Provincial Debt
Summary

PROVINCE OF BRITISH COLUMBIA
PUBLIC ACCOUNTS 2008/09
Overview of Provincial Debt
(Unaudited)
The provincial government, its Crown corporations, agencies and government organizations incur debt to finance operations and capital projects. Borrowing for operations was required to finance deficits prior to the province balancing its budget in 2004/05 as required by the Balanced Budget and Ministerial Accountability Act and to meet other working capital requirements such as loans and advances or changes in accounts receivable/payable. Debt for government direct operating purposes has declined with surpluses achieved in 2004/05 through 2008/09. Borrowing for capital projects finances the building of schools, hospitals, roads, public transit and other social and economic assets. As these investments provide essential services over several years, the government, like the private sector, borrows to fund these projects and amortizes the cost over the asset’s useful life.
Provincial debt is reported using two basic classifications: (1) taxpayer–supported debt; and (2) self–supported debt.
Taxpayer– supported Debt—includes government direct debt, which is incurred for government operating and capital purposes, the debt of Crown corporations and agencies, school districts, universities, colleges, institutes and health authorities that require operating or debt service subsidies from the provincial government, and are fully consolidated in the Summary Financial Statements. The BC Transportation Financing Authority is an example of a taxpayer–supported Crown corporation.
Self–supported Debt—includes the debt of commercial Crown corporations and agencies as well as the Warehouse Borrowing Program. Commercial Crown corporations and agencies generate sufficient revenues to cover interest costs and repay principal and may pay dividends to the province. The British Columbia Hydro and Power Authority is an example of a commercial Crown corporation. The Warehouse Borrowing Program is used to take advantage of borrowing opportunities in advance of requirements. Eventually, this debt is allocated to the province or Crown corporations and agencies. In the interim, the funds are invested at market rates.
The following provincial debt summary provides additional detailed information and related key indicators and benchmarks to allow a more informed assessment of the debt totals. A reconciliation is also provided to explain the differences between the Summary of Provincial Debt and the Summary Financial Statements.
The total provincial debt as at March 31, 2009 was $38,014 million, which consists of $37,562 million (net of $2,134 million sinking fund investments) in the Summary Financial Statements, together with $343 million in additional debt of self–supported Crown corporations and agencies, and $109 million in additional guaranteed debt.
121
PROVINCE OF BRITISH COLUMBIA
PUBLIC ACCOUNTS 2008/09
Provincial Debt
as at March 31, 2009
(Unaudited)
The accumulated provincial debt of $38,014 million has been incurred for various purposes as shown in Chart 1 below. Over the years, the proceeds from borrowing have contributed to economic development in the province and have provided resources to deliver health, education and social programs, and transportation infrastructure.
At March 31, 2009, taxpayer–supported debt totalled $26,446 million—including debt incurred for government operating purposes ($6,455 million), educational facilities ($8,682 million), health facilities ($3,757 million), transportation infrastructure ($6,765 million), and other debt ($787 million). Other debt is comprised mainly of debt relating to social housing, service delivery agencies and various loan guarantee programs.
At March 31, 2009, self–supported debt totalled $11,568 million—including debt of commercial Crown corporations and agencies ($9,487 million), and the Warehouse Borrowing Program ($2,081 million). Commercial debt includes the debt incurred by British Columbia Hydro and Power Authority, debt relating to Columbia River power projects, and debt of commercial subsidiaries of certain post–secondary institutions.
Chart 1 – Provincial debt as at March 31, 2009
In Millions/Percent of Total

(1)Operating debt includes a portion of highway infrastructure debt incurred prior to 1994/95, ferry infrastructure debt transferred in 1999/00 and amounts required to finance operating deficits prior to the province balancing its budget in 2004/05.
122
PROVINCE OF BRITISH COLUMBIA
PUBLIC ACCOUNTS 2008/09
Change in Provincial Debt(1)
(Unaudited)
Provincial debt increased by $3,377 million in 2008/09 when compared to the prior year. This includes a decrease in taxpayer–supported debt of $143 million and an increase in self–supported debt of $3,520 million (see Chart 2 below).
Taxpayer–supported Debt—The decrease of $143 million was due to increases in new capital financing requirements in the transportation sector ($683 million), the education sector ($462 million), the health sector ($412 million), and other taxpayer–supported entities ($109 million). The increases were offset by a decrease of $1,809 million in government operating debt as a result of surplus funding from the Consolidated Revenue Fund, due mainly to revenue improvements and reduced working capital requirements.
Self–supported Debt—The increase of $3,520 million consisted of a $1,421 million increase in British Columbia Hydro and Power Authority debt, advanced borrowing in the Warehouse Borrowing Program of $2,081 million, $20 million increase for the Transportation Investment Corporation, and an increase of $19 million reported for subsidiaries of post–secondary institutions. The increases were offset by decreases in debt reported by the British Columbia Transmission Corporation ($9 million), the Columbia River power projects ($11 million), and the British Columbia Liquor Distribution Branch ($1 million).
Chart 2 – Change in provincial debt for the year ended March 31, 2009
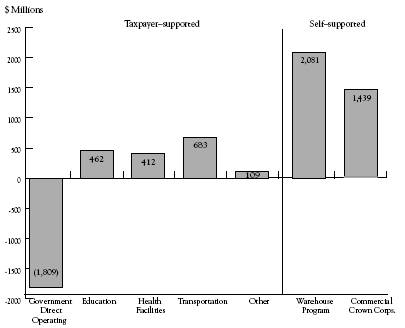
(1)Includes gross new borrowings plus changes in sinking fund balances, less debt maturities.
123
PROVINCE OF BRITISH COLUMBIA
PUBLIC ACCOUNTS 2008/09
Reconciliation of Summary Financial Statements’ Surplus
to Change in Taxpayer–supported Debt and Total Debt
for the Fiscal Year Ended March 31, 2009
(Unaudited)
| | In Millions | |
| | 2009 | | 2008(1) | |
| | $ | | $ | |
(Surplus) for the year | | (78 | ) | (2,837 | ) |
| | | | | |
Taxpayer–supported debt decreased by: | | | | | |
Non–cash expenses included in (surplus) | | (1,959 | ) | (1,813 | ) |
Accounts receivable, accounts payable and other working capital net changes | | (959 | ) | 457 | |
| | (2,918 | ) | (1,356 | ) |
Taxpayer–supported debt increased by: | | | | | |
Self–supported Crown corporation and agency earnings in excess of contributions to the Consolidated Revenue Fund | | 937 | | 785 | |
Tangible capital asset net acquisitions | | 3,742 | | 3,588 | |
Net increases in loans, advances and investments | | (1,826 | ) | 441 | |
| | 2,853 | | 4,814 | |
Net increase (decrease) in taxpayer–supported debt | | (143 | ) | 621 | |
Taxpayer–supported debt—beginning of year | | 26,589 | | 25,968 | |
Taxpayer–supported debt—end of year | | 26,446 | | 26,589 | |
Self–supported debt | | 11,568 | | 8,048 | |
Total debt(2) | | 38,014 | | 34,637 | |
Reconciliation of Total Debt to Summary Financial Statements’ Debt
as at March 31, 2009
(Unaudited)
| | In Millions | |
| | 2009 | | 2008(1) | |
| | $ | | $ | |
Total debt | | 38,014 | | 34,637 | |
| | | | | |
Debt included as part of equity in self–supported Crown corporations and agencies | | (343 | ) | (336 | ) |
Contingent liabilities for debt of individuals and organizations that have been guaranteed by the province | | (109 | ) | (116 | ) |
Sinking fund investments | | 2,134 | | 2,649 | |
Summary Financial Statements’ debt | | 39,696 | | 36,834 | |
| | | | | |
Comprised of: | | | | | |
Taxpayer–supported debt | | 28,366 | | 28,537 | |
Self–supported debt | | 11,330 | | 8,297 | |
Summary Financial Statements’ debt | | 39,696 | | 36,834 | |
(1)Comparative figures for the previous year have been restated.
(2)See Summary of Provincial Debt, page 131.
124
PROVINCE OF BRITISH COLUMBIA
PUBLIC ACCOUNTS 2008/09
Change in Provincial Debt,
Comparison to Budget
(Unaudited)
Provincial debt increased by $3,377 million, compared to a budgeted increase of $2,738 million (per the Budget and Fiscal Plan presented in February 2008), for an increase in debt of $639 million over budget, which included a $750 million forecast allowance. Chart 3 below shows the difference between the actual change in provincial debt and the budgeted change by major category.
Taxpayer–supported debt decreased by $143 million, compared to a budgeted increase of $949 million. The $1,092 million improvement over budget is due to reduced government operating debt ($971 million lower than forecast) primarily due to higher than forecast revenues and reduced working capital requirements; lower than forecast capital spending on education ($3 million less than forecast), health ($153 million less than forecast); offset by higher than forecast debt in transportation infrastructure ($10 million), and other taxpayer–supported Crown corporations and agencies ($25 million).
Self–supported debt increased by $3,520 million, compared to a budgeted increase of $1,189 million, for an increase in debt of $2,331 million over budget. The larger than forecast increase in self–supported debt is a result of advanced borrowing in the Warehouse Borrowing Program ($2,081 million), higher than forecast debt for British Columbia Hydro and Power Authority ($232 million), British Columbia Transmission Corporation ($7 million), subsidiaries of post–secondary institutions ($19 million) and the Transportation Investment Corporation ($20 million). These increases were offset by lower than forecast debt for Columbia River power project ($28 million).
Chart 3 – Change in provincial debt(1) (actual vs budget) for the year ended March 31, 2009
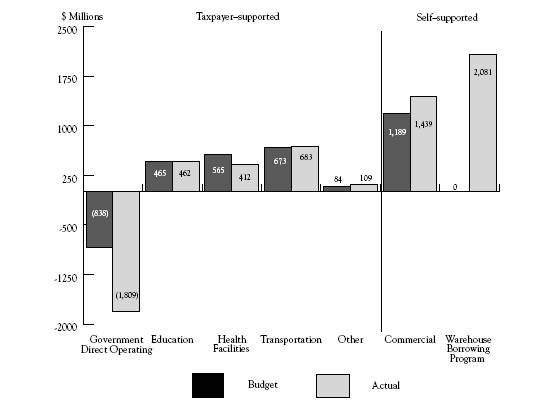
(1)The change in forecast allowance is not included in this chart.
125
PROVINCE OF BRITISH COLUMBIA
PUBLIC ACCOUNTS 2008/09
Interprovincial Comparison of Taxpayer–supported Debt
as a Percentage of Gross Domestic Product
(Unaudited)
Chart 4 below shows the ratio of each province’s taxpayer–supported debt as a percentage of their gross domestic product (GDP). The ratio of a province’s taxpayer–supported debt relative to its GDP highlights the ability of a province to service its debt load. This ratio is often used by investors and credit rating agencies when assessing a province’s investment quality. According to the Moody’s Investors Service Inc. (Moody’s), British Columbia’s taxpayer–supported debt ratio is one of the lowest in Canada and this translates into a strong credit rating and relatively low debt servicing costs.
Chart 4 – Interprovincial comparison of taxpayer–supported debt as a percentage of GDP
Percent of GDP(1), at March 31, 2009
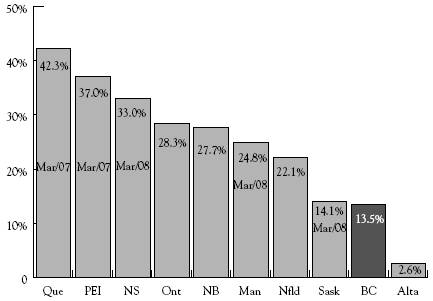
Source: Moody’s Investors Service Inc., based on June 2009 estimates.
(1) Current figures for the province of Quebec, Prince Edward Island, Nova Scotia, Manitoba, and Saskatchewan are not available, most recent figures from prior years have been used for the comparison.
126
PROVINCE OF BRITISH COLUMBIA
PUBLIC ACCOUNTS 2008/09
Interprovincial Comparison of Taxpayer–supported Debt
Service Costs as a Percentage of Revenue
(Unaudited)
Chart 5 shows the ratio (interest bite) of each province’s taxpayer–supported debt servicing costs as a percentage of revenue. The interest bite indicates how much of each dollar of provincial revenue is used to pay for taxpayer–supported debt service costs. According to Moody’s, British Columbia has the second lowest taxpayer–supported debt service costs as a percentage of revenue of all provinces.
Chart 5 – Interprovincial comparison of taxpayer–supported debt service costs as a percentage of revenue
Percent of revenue(1), at March 31, 2009
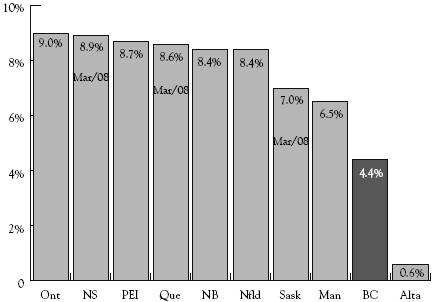
Source: Moody’s Investors Service Inc., based on June 2009 estimates.
(1) Current figures for the province of Nova Scotia, Quebec and Saskatchewan are not available, most recent figures from prior years have been used for this comparison.
Moody’s definition of taxpayer–supported debt is modestly different from the definition used by the Ministry of Finance. The financial community has not agreed upon a definition for taxpayer–supported debt. The definition used by Moody’s is the closest to that employed by the ministry but, even then, there are small differences. The value of presenting Moody’s debt indicators is that it provides an interprovincial comparison from a third party source, which is helpful for readers to understand the province’s relative performance and ranking.
More comprehensive information on the debt of the province and its Crown corporations and agencies is provided on the Debt Management Branch website. This detailed information can assist readers in assessing the province’s debt position. The website is available on the Internet at: www.fin.gov.bc.ca/PT/dmb/index.shtml.
127

Report of the Auditor General
of British Columbia
ON THE
SUMMARY OF PROVINCIAL DEBT,
KEY INDICATORS OF PROVINCIAL DEBT, AND
SUMMARY OF PERFORMANCE MEASURES
To the Legislative Assembly
of the Province of British Columbia:
Introduction
I have audited the debt-related statements of the Government of the Province of British Columbia consisting of the summary of provincial debt as at March 31 (2005 to 2009), the key indicators of provincial debt for the fiscal years ended March 31 (2005 to 2009), and the summary of performance measures for the fiscal year ended March 31, 2009. Through these statements, the government reports on its debt management by presenting five years of information on provincial debt and debt indicators, and compares its actual results of performance measures to its target measures for the fiscal year ended March 31, 2009. The preparation of the debt-related information and the setting of performance targets are the responsibility of the government. My responsibility is to express an opinion on this debt-related information based on my audit.
The debt-related statements are prepared using financial information that supports the government’s summary financial statements, which are prepared in accordance with Canadian generally accepted accounting principles. However, in the debt-related statements there are some differences in the methods of compilation and presentation compared to generally accepted accounting principles. In the debt-related statements, debt is calculated net of sinking fund assets, includes debt directly incurred by modified equity enterprises and other commercial subsidiaries of taxpayer-supported entities, and includes debt incurred by others outside the government reporting entity where there is a provincial government guarantee as to the payment of principal and interest. Also, total provincial revenue and interest costs include the gross revenue and interest costs of modified equity enterprises, and total provincial interest costs are net of sinking fund earnings.
2
Page 2
REPORT OF THE AUDITOR GENERAL OF BRITISH COLUMBIA
ON THE SUMMARY OF PROVINCIAL DEBT,
KEY INDICATORS OF PROVINCIAL DEBT, AND
SUMMARY OF PERFORMANCE MEASURES
Scope
I conducted my audit in accordance with Canadian generally accepted auditing standards. Those standards require that I plan and perform the audit to obtain reasonable assurance whether the debt-related statements are free of material misstatement. My audit included examining, on a test basis, evidence supporting the amounts and disclosures in the debt-related statements. My audit also included evaluating the overall presentation of the debt-related statements.
Opinion
In my opinion, these statements present fairly, in all material respects, the summary of provincial debt as at March 31, 2005 through 2009, the key indicators of provincial debt for the five fiscal years then ended, and the summary of performance measures for the year ended March 31, 2009, in accordance with the basis of accounting referred to in the introduction.

Victoria, British Columbia | John Doyle, MBA, CA |
June 30, 2009 | Auditor General |
PROVINCE OF BRITISH COLUMBIA
PUBLIC ACCOUNTS 2008/09
Summary of Provincial Debt(1)
as at March 31
| | In Millions | |
| | 2009 | | 2008 | | 2007 | | 2006 | | 2005 | |
| | $ | | $ | | $ | | $ | | $ | |
Taxpayer–supported Debt | | | | | | | | | | | |
Provincial government direct operating(2),(3) | | 6,455 | | 8,264 | | 9,505 | | 11,923 | | 14,510 | |
Education(4) | | | | | | | | | | | |
Schools | | 5,189 | | 4,906 | | 4,724 | | 4,588 | | 4,483 | |
Post–secondary institutions(5) | | 3,493 | | 3,314 | | 2,909 | | 2,663 | | 2,296 | |
| | 8,682 | | 8,220 | | 7,633 | | 7,251 | | 6,779 | |
Health facilities(4),(6) | | 3,757 | | 3,345 | | 2,899 | | 2,491 | | 2,119 | |
Highways, ferries and public transit | | | | | | | | | | | |
BC Transportation Financing Authority | | 4,586 | | 3,948 | | 3,237 | | 2,699 | | 2,474 | |
British Columbia Transit | | 94 | | 84 | | 96 | | 80 | | 78 | |
Public transit(4) | | 931 | | 897 | | 892 | | 904 | | 906 | |
Sky Train extension(4) | | 1,154 | | 1,153 | | 1,153 | | 1,145 | | 1,135 | |
| | 6,765 | | 6,082 | | 5,378 | | 4,828 | | 4,593 | |
Other | | | | | | | | | | | |
British Columbia Buildings Corporation(3) | | | | | | | | 246 | | 241 | |
Social housing(7) | | 286 | | 218 | | 216 | | 189 | | 133 | |
Homeowner Protection Office(8) | | 150 | | 136 | | 110 | | 110 | | 130 | |
Other(9),(10) | | 351 | | 324 | | 227 | | 213 | | 163 | |
| | 787 | | 678 | | 553 | | 758 | | 667 | |
Total taxpayer–supported debt | | 26,446 | | 26,589 | | 25,968 | | 27,251 | | 28,668 | |
Self–supported Debt | | | | | | | | | | | |
Commercial Crown corporations and agencies British Columbia Hydro and Power Authority | | 9,054 | | 7,633 | | 7,144 | | 6,892 | | 6,906 | |
British Columbia Transmission Corporation (11) | | 70 | | 79 | | 30 | | 30 | | | |
Columbia River power projects(12) | | 208 | | 219 | | 236 | | 247 | | 257 | |
British Columbia Liquor Distribution Branch | | 1 | | 2 | | 3 | | 5 | | 6 | |
Post–secondary institutions’ subsidiaries(5) | | 134 | | 115 | | 58 | | 32 | | 32 | |
Transportation Investment Corporation | | 20 | | | | | | | | | |
| | 9,487 | | 8,048 | | 7,471 | | 7,206 | | 7,201 | |
Warehouse Borrowing Program(13) | | 2,081 | | | | | | | | | |
Total self–supported debt | | 11,568 | | 8,048 | | 7,471 | | 7,206 | | 7,201 | |
Total provincial debt | | 38,014 | | 34,637 | | 33,439 | | 34,457 | | 35,869 | |
(1)Debt is after deductions of sinking funds, unamortized discounts and unrealized foreign exchange gains/(losses), and excludes accrued interest. Government direct and fiscal agency debt accrued interest is reported in the government’s accounts as an accounts payable.
(2)Effective July 19, 2004, the provincial government assumed responsibility for the fiscal agency loans of the British Columbia Rail Company ($463 million).
(3)Effective April 1, 2006, the provincial government assumed responsibility for the fiscal agency loans of the British Columbia Buildings Corporation ($246 million).
(4)Represents provincial direct debt incurred for capital financing of education and health facilities and public transit infrastructure.
(5)During fiscal 2006/07, the University of Victoria and the University of British Columbia changed their accounting policy for recording the activities of their controlled for–profit entities from full consolidation to the equity method. The long term debt of these commercial entities was reclassified as self–supported debt from taxpayer–supported debt. Restatements related to this debt reclassification include: an increase to taxpayer–supported post–secondary institutions’ debt of $12 million for fiscal 2004/05, and $13 million for fiscal 2005/06; and, an increase to self–supported post–secondary institutions’ subsidiaries debt of $4 million for fiscal 2004/05 and $6 million for fiscal 2005/06. Self–supported post–secondary institutions’ subsidiaries debt was also restated to include Simon Fraser University Community Trust debt of $2 million for fiscal 2004/05, $7 million for fiscal 2005/06, $5 million for fiscal 2006/07, and $7 million for fiscal 2007/08.
(6)Restated figures for public–private partnership obligations increased by $32 million in 2005/06.
(7)Includes the debt of the British Columbia Housing Management Commission and the Provincial Rental Housing Corporation.
(8)Figure for fiscal 2007/08 restated to reflect an additional $4 million of debt guarantees.
(9)Includes the debt of other taxpayer–supported Crown corporations and agencies and fiscal agency loans to local governments. Also includes student loan guarantees, loan guarantees to agricultural producers, guarantees under economic development and home mortgage assistance programs, and Columbia Basin Trust joint venture debt guarantees.
(10)Figures for prior years restated to include Columbia Basin Trust debt guarantees of $5 million for fiscal 2004/05, $9 million for fiscal 2005/06, $8 million for fiscal 2006/07, and $6 million for fiscal 2007/08.
(11)Figures for prior years restated to remove capital lease obligations to BC Hydro of $7 million for fiscal years 2005/06, 2006/07 and 2007/08.
(12)Debt related to joint ventures of the Columbia Power Corporation and the Columbia Basin Trust.
(13)The program borrows money in advance of requirements. Funds are invested until required. Debt is allocated to the provincial government or its Crown corporations and agencies.
131
PROVINCE OF BRITISH COLUMBIA
PUBLIC ACCOUNTS 2008/09
Key Indicators of Provincial Debt(1)
for the Fiscal Years Ended March 31
| | 2009 | | 2008 | | 2007 | | 2006 | | 2005 | |
| | Budget | | | | | | | | | | | |
| | Estimate | | Actual | | Actual | | Actual | | Actual | | Actual | |
Debt to Revenue (percent) | | | | | | | | | | | | | |
Total provincial | | 75.1 | | 77.9 | | 69.3 | | 69.1 | | 74.8 | | 85.1 | |
Taxpayer–supported | | 74.6 | | 71.9 | | 69.5 | | 69.7 | | 77.8 | | 88.5 | |
| | | | | | | | | | | | | |
Debt per Capita ($)(2) | | | | | | | | | | | | | |
Total provincial | | 8,500 | | 8,676 | | 8,036 | | 7,880 | | 8,210 | | 8,632 | |
Taxpayer–supported | | 6,248 | | 6,036 | | 6,169 | | 6,119 | | 6,493 | | 6,899 | |
| | | | | | | | | | | | | |
Debt to GDP (percent)(3) | | | | | | | | | | | | | |
Total provincial | | 19.0 | | 19.1 | | 18.0 | | 18.3 | | 20.4 | | 22.7 | |
Taxpayer–supported | | 14.0 | | 13.3 | | 13.8 | | 14.2 | | 16.1 | | 18.2 | |
| | | | | | | | | | | | | |
Interest Bite (cents per dollar of revenue)(4) | | | | | | | | | | | | | |
Total provincial | | 4.5 | | 4.4 | | 4.0 | | 4.3 | | 4.4 | | 4.7 | |
Taxpayer–supported | | 4.5 | | 4.2 | | 3.9 | | 4.2 | | 4.4 | | 5.1 | |
| | | | | | | | | | | | | |
Interest Costs ($ millions) | | | | | | | | | | | | | |
Total provincial | | 2,250 | | 2,123 | | 2,012 | | 2,074 | | 2,012 | | 2,000 | |
Taxpayer–supported | | 1,659 | | 1,555 | | 1,490 | | 1,575 | | 1,547 | | 1,636 | |
| | | | | | | | | | | | | |
Interest Rate (percent)(5) | | | | | | | | | | | | | |
Taxpayer–supported | | 6.1 | | 5.9 | | 5.7 | | 5.9 | | 5.5 | | 5.6 | |
| | | | | | | | | | | | | |
Background Information: | | | | | | | | | | | | | |
Revenue ($ millions) | | | | | | | | | | | | | |
Total provincial(6) | | 50,259 | | 48,790 | | 50,002 | | 48,389 | | 46,080 | | 42,136 | |
Taxpayer–supported(7) | | 37,205 | | 36,770 | | 38,256 | | 37,253 | | 35,013 | | 32,386 | |
132
PROVINCE OF BRITISH COLUMBIA
PUBLIC ACCOUNTS 2008/09
Key Indicators of Provincial Debt(1)
for the Fiscal Years Ended March 31—Continued
| | 2009 | | 2008 | | 2007 | | 2006 | | 2005 | |
| | Budget | | | | | | | | | | | |
| | Estimate | | Actual | | Actual | | Actual | | Actual | | Actual | |
| | | | | | | | | | | | | |
Total Debt ($ millions) | | | | | | | | | | | | | |
Total provincial | | 37,741 | | 38,014 | | 34,637 | | 33,439 | | 34,457 | | 35,869 | |
Taxpayer–supported(8) | | 27,741 | | 26,446 | | 26,589 | | 25,968 | | 27,251 | | 28,668 | |
| | | | | | | | | | | | | |
Provincial GDP ($ millions)(9) | | 198,329 | | 199,214 | | 192,528 | | 182,743 | | 169,308 | | 157,675 | |
| | | | | | | | | | | | | |
Population (thousands at July 1) (10) | | 4,440 | | 4,382 | | 4,310 | | 4,244 | | 4,197 | | 4,155 | |
(1)Figures for prior years and the 2008/09 budget have been restated to conform with the presentation used for 2009 and to include the effects of changes in underlying data and statistics.
(2)The ratio of debt to population (e.g., debt at March 31, 2009 divided by population at July 1, 2008).
(3)The ratio of debt outstanding at fiscal year end to provincial nominal gross domestic product (GDP) for the calendar year ending in the fiscal year (e.g., debt at March 31, 2009 divided by 2008 GDP).
(4)The ratio of interest costs (less sinking fund interest) to revenue. Figures include capitalized interest expense in order to provide a more comparable measure to outstanding debt.
(5)Weighted average of all outstanding debt issues.
(6)Includes revenue of the Consolidated Revenue Fund (excluding dividends from enterprises) plus revenue of all government organizations and enterprises.
(7)Excludes revenue of government enterprises, but includes dividends from enterprises paid to the Consolidated Revenue Fund.
(8)Excludes debt of commercial Crown corporations and agencies and funds held under the province’s Warehouse Borrowing Program.
(9)GDP for the calendar year ending in the fiscal year (e.g., GDP for 2008 is used for the fiscal year ending March 31, 2009).
(10)Population at July 1st within the fiscal year (e.g., population at July 1, 2008 is used for the fiscal year ending March 31, 2009).
Summary of Performance Measures(1)
for the Fiscal Year Ended March 31, 2009
| | 2009 | | 2009 | | 2008 | |
| | Target | | Actual | | Actual | |
Provincial credit rating(2) | | Aaa | | Aaa | | Aaa | |
Taxpayer–supported debt to GDP ratio(2) | | Declining trend | | 13.5 | % | 13.3 | % |
Taxpayer–supported debt service costs as a percentage of revenue(2) | | 2nd lowest | | 2nd lowest | | 2nd lowest | |
(1)Performance measures as presented in the Ministry of Finance Service Plan in Budget 2008.
(2)As per Moody’s Investors Service Inc., ratios are based on March 2009 estimates. The debt to gross domestic product (GDP) and debt service costs as a percentage of revenue performance measures represent inter–provincial comparisons.
133
PROVINCE OF BRITISH COLUMBIA
PUBLIC ACCOUNTS 2008/09
Definitions
(Unaudited)
Consolidated Revenue Fund—includes the taxpayer–supported activities of the General Fund and special funds of the government through which the government delivers central government programs. It does not include the activities of government operated through Crown corporations and agencies or the school districts, universities, colleges, institutes and health organizations (SUCH) sector.
Consolidation—the methods used to combine the results of Crown corporations and agencies and the SUCH sector entities with the Consolidated Revenue Fund. The two methods used are:
(i) Full or Proportional Consolidation—the accounts of the Crown corporation, agency or SUCH sector entity are adjusted to a basis consistent with the accounting policies of the government. The operating result and financial position of the Crown and SUCH entities are combined with those of the Consolidated Revenue Fund on a “line–by–line” basis. Inter–entity accounts and transactions are eliminated upon consolidation. Proportional consolidation differs from full consolidation in that only the government’s portion of operating and financial results of a joint venture is combined with those of the Consolidated Revenue Fund on a “line–by–line” basis.
(ii) Modified Equity Consolidation—the original investment of the government in the Crown corporation, agency or SUCH sector entity is initially recorded at cost and adjusted annually to include the net earnings/losses and other net equity changes of the entity. There is no adjustment to conform to government accounting policies. Since the government ensures the ongoing activities of self–supported Crown corporations and agencies, full account is taken of losses in these entities, even when cumulative losses exceed the original investment. Accounts and transactions between self–supported entities are not eliminated; however, profit elements included in such transactions, including certain increases in contributed surplus, are eliminated.
Debt has a variety of meanings:
(i) Gross debt—the par value of the debt, unamortized discount and premiums, and unrealized foreign exchange gains or losses.
(ii) Net debt—gross debt less sinking fund investments.
(iii) Provincial debt—net debt plus guaranteed debt and debt directly incurred by modified equity entities.
Deficit—the meaning is dependent upon the statement to which it applies:
(i) Consolidated Statement of Financial Position: Accumulated Deficit—the amount by which the total liabilities of the government exceeds its total assets.
(ii) Consolidated Statement of Operations: Annual Deficit—the amount by which the total annual expenses for the operating year exceed total annual revenues (see “Surplus” definition).
Entitlement—a government transfer that must be made if the recipient meets specified eligibility criteria. Entitlements are non-discretionary in the sense that both eligibility criteria and the amount of the payment are prescribed in a statute or regulation.
Financial assets—assets on hand at the end of the accounting period, including cash and assets that are readily convertible into cash and are not intended for consumption in the normal course of activities. These assets could be liquidated to discharge existing liabilities or finance future operations. Financial assets could include sinking fund investments held to pay debt at maturity.
Government business enterprise—a government organization that has all the following characteristics:
(i) is a separate legal entity with the power to contract in its own name and that can sue or be sued;
(ii) has been delegated the financial and operational authority to carry on a business;
(iii) sells goods and/or services to individuals and organizations outside the government reporting entity as its principal activity; and
(iv) can, in the normal course of its operation, maintain its operations and meet its liabilities from revenue received from sources outside the government reporting entity.
134
PROVINCE OF BRITISH COLUMBIA
PUBLIC ACCOUNTS 2008/09
Definitions—Continued
(Unaudited)
Government partnership—a contractual arrangement between the government and a party or parties outside the government reporting entity that has all the following characteristics:
(i) the partners cooperate toward achieving significant, clearly defined common goals;
(ii) the partners make a financial investment in the government partnership;
(iii) the partners share control of decisions related to the financial and operating policies of the government partnership on an ongoing basis; and
(iv) the partners share, on an equitable basis, significant risks and benefits associated with the operation.
Government transfers—transfer of money from government to an individual, organization or another government from which the government making the transfer does not:
(i) receive any goods or services directly in return;
(ii) expect to be repaid in the future; nor
(iii) expect a financial return.
Grants—a government transfer made at the sole discretion of the government. The government has the discretion to decide whether or not to make the grant, any conditions to be complied with, the amount of the grant and the recipient of the grant.
Net liabilities—the amount by which the total liabilities of the government exceed its total financial assets. The separate calculation of this number on the Consolidated Statement of Financial Position is unique to financial statements for Canadian senior governments. This calculation excludes non–financial assets such as buildings and prepaid expenses.
Other comprehensive income (OCI)—is made up of certain unrealized gains and losses of self–supported Crown corporations that are not reported in their statement of operations, but are reported in their statement of financial position. These unrealized gains and losses will be recognized in the statement of operations when they become realized gains and losses. OCI has arisen because of the adoption of a new comprehensive income accounting standard, issued by the Canadian Institute of Chartered Accounts, for Crown corporations and agencies that have fiscal years commencing after October 1, 2006.
Provincial government direct debt—combines the government direct operating debt and the debt incurred to finance education, health facilities and public transit. This combined portfolio represents the debt for which the government has direct responsibility for the associated debt service costs.
Self–supported Crown corporations and agencies—all Crown corporations and agencies that are accountable for the administration of their financial affairs and resources either to a minister of the government or directly to the legislature and are owned or controlled by the government. In addition, they must also carry on a business that sells goods and/or services to persons outside the government reporting entity as their principal activity and maintain operations and meet liabilities from revenue received outside the government reporting entity in the normal course of operations. This also includes the government’s interest in government business enterprises.
Sinking funds—a pool of cash and investments earmarked to provide resources for the redemption of debt.
Summary accounts—the financial position and operating result of the government reporting entity including the Consolidated Revenue Fund, Crown corporations, agencies and SUCH sector entities; the amounts represented by the Summary Financial Statements of the government.
Surplus—meaning is dependent upon the statement to which it applies:
(i) Consolidated Statement of Financial Position: the accumulated surplus is the amount by which the total assets of the government exceeds its total liabilities.
(ii) Consolidated Statement of Operations: the annual surplus is the amount by which the total annual revenues for the operating year exceed total annual expenses (see “Deficit” definition).
Taxpayer–supported Crown corporations and agencies and SUCH sector entities—all Crown corporations and agencies and entities outside the Consolidated Revenue Fund that meet the criteria of control (by the province) as established by generally accepted accounting principles. In addition, they must not meet the criteria for being self–supported. This also includes the government’s interest in government partnerships that are not government business enterprises.
135
PROVINCE OF BRITISH COLUMBIA
PUBLIC ACCOUNTS 2008/09
Definitions—Continued
(Unaudited)
Transfers under agreements (including shared cost)—a government transfer that is a reimbursement of eligible expenditures pursuant to an agreement between the government and the recipient. The recipient usually spends the money first; however, the government has some input into how the money is spent.
136
PROVINCE OF BRITISH COLUMBIA
PUBLIC ACCOUNTS 2008/09
Acronyms
(Unaudited)
ABCP | | Asset–backed commercial paper |
APAC | | Accounting Policy Advisory Committee |
AiP | | Agreements in Principle |
BC Hydro | | British Columbia Hydro and Power Authority |
BCHMC | | British Columbia Housing Management Commission |
BCRC | | British Columbia Railway Corporation |
BCRP | | BCR Properties Ltd. |
BCT | | British Columbia Transit |
BCTS | | British Columbia Timber Sales |
BTAA | | Budget Transparency and Accountability Act |
CBA | | Community Bargaining Association |
CHST | | Canada Health and Social Transfer |
CICA | | Canadian Institute of Chartered Accountants |
CMHC | | Canada Mortgage and Housing Corporation |
CN | | Canadian National Railway Company |
CRF | | Consolidated Revenue Fund |
FAA | | Financial Administration Act |
FBA | | Facilities Bargaining Association |
FERC | | U.S. Federal Energy Regulatory Commission |
FRAS | | Financial Reporting and Advisory Services |
FTE | | Full–time equivalent |
GAAP | | Generally accepted accounting principles (for senior governments as recommended by the Public Sector Accounting Board of the Canadian Institute of Chartered Accountants) |
GDP | | Gross domestic product |
GRE | | Government reporting entity |
GVTA | | Greater Vancouver Transportation Authority |
Health Accord | | February 2003 First Ministers’ Accord on Health Care Renewal |
HSPBA | | Health Science Professionals Bargaining Association |
ICBC | | Insurance Corporation of British Columbia |
IOC | | International Olympic Committee |
MLA | | Members of the Legislative Assembly |
Moody’s | | Moody’s Investors Service |
MPA | | Multi–Party Agreement |
137
PROVINCE OF BRITISH COLUMBIA
PUBLIC ACCOUNTS 2008/09
Acronyms—Continued
(Unaudited)
NBA | | Nurses’ Bargaining Association |
OAG | | Office of the Auditor General |
OCG | | Office of the Comptroller General |
OCI | | Other comprehensive income |
OIC | | Order in Council |
P3 | | Public private partnership |
Pension Corporation | | British Columbia Pension Corporation |
PHSA | | Provincial Health Services Authority |
PSAB | | Public Sector Accounting Board |
RCMP | | Royal Canadian Mounted Police |
RTP | | Rapid Transit Project 2000 Ltd. |
SCBCTA | | South Coast British Columbia Transportation Authority |
SUCH | | School districts, universities, colleges, institutes and health organizations |
TCA | | Tangible capital assets |
the Games | | 2010 Olympic and Paralympic Winter Games |
UBC | | University of British Columbia |
VANOC | | Vancouver Organizing Committee for the 2010 Olympic and Paralympic Winter Games |
138