Exhibit 99.9
Budget and Fiscal Plan
2010/11 — 2012/13
March 2, 2010

National Library of Canada Cataloguing in Publication Data
British Columbia.
Budget and fiscal plan. — 2002/03/2004/05-
Annual
Also available on the Internet.
Continues: British Columbia. Ministry of Finance and
Corporate Relations. Budget ... reports. ISSN 1207-5841
ISSN 1705-6071 = Budget and fiscal plan — British Columbia.
1. Budget — British Columbia — Periodicals. 2. British
Columbia — Appropriations and expenditures — Periodicals.
I. British Columbia. Ministry of Finance. II. Title.
HJ12.B742 352.48’09711’05 C2003-960048-3
TABLE OF CONTENTS | | |
| | |
Budget and Fiscal Plan 2010/11 – 2012/13 | | March 2, 2010 |
Attestation by the Secretary to Treasury Board
Summary | | 1 |
Part 1: Three-Year Fiscal Plan | | |
Introduction | | 7 |
Revenue | | 14 |
| Changes since September Update 2009 | | 14 |
| Budget 2010 Plan | | 15 |
| Budget 2010 Plan — Major Revenue Sources | | 17 |
Consolidated Revenue Fund Spending | | 23 |
| Increased Health Care Spending | | 24 |
| Supporting Communities, Families and Youth | | 26 |
| Justice and Public Safety | | 27 |
| Increased Education Funding | | 27 |
| Infrastructure and Climate Action Investments | | 30 |
| Refocusing Financial Resources | | 31 |
| 2010 Olympic and Paralympic Winter Games | | 31 |
| HST Impacts on CRF Spending | | 32 |
| Management of the BC Public Service | | 32 |
Service Delivery Agency Spending | | 33 |
Recovered Expense Changes | | 34 |
Capital Spending | | 35 |
| Projects over $50 million | | 41 |
Provincial Debt | | 44 |
Risks to the Fiscal Plan | | 48 |
Tables: | | |
| 1.1 | Three-Year Fiscal Plan — Operating Statement | | 7 |
| 1.2 | Three-Year Fiscal Plan Update — Changes from September Update 2009 | | 9 |
| 1.3 | Revenue by Source | | 12 |
| 1.4 | Expense by Ministry, Program and Agency | | 13 |
| 1.5 | Major Factors Underlying Revenue | | 17 |
| 1.6 | Personal Income Tax Revenue | | 17 |
| 1.7 | Corporate Income Tax Revenue | | 18 |
| 1.8 | Sales Taxes Revenue | | 18 |
| 1.9 | Federal Government Contributions | | 21 |
| 1.10 | Revenue Sources Allocated to Health Care | | 26 |
| 1.11 | Supporting Communities, Families and Youth | | 26 |
| 1.12 | Justice and Public Safety | | 27 |
| 1.13 | Maintaining Educational Opportunities | | 27 |
Budget and Fiscal Plan – 2010/11 to 2012/13
Table of Contents
| 1.14 | Community Infrastructure and Clean Energy Initiatives | 30 |
| 1.15 | Refocusing Financial Resources | 31 |
| 1.16 | Olympics Funding | 32 |
| 1.17 | Spending Funded by Third Party Recoveries — Changes from September Update 2009 | 35 |
| 1.18 | Capital Spending | 36 |
| 1.19 | Accelerated Capital Spending | 37 |
| 1.20 | Provincial Transportation Investments | 39 |
| 1.21 | Capital Expenditure Projects Greater Than $50 million | 42 |
| 1.22 | Provincial Debt Summary | 44 |
| 1.23 | Reconciliation of Summary Results to Provincial Debt Changes | 46 |
| 1.24 | Provincial Financing | 47 |
| 1.25 | Key Fiscal Sensitivities | 48 |
| 1.26 | Notional Allocations to Contingencies | 51 |
Topic Boxes: | |
| Five Year Fiscal Plan Update | 54 |
| Expenditure Management Update | 59 |
| A Renewed Emphasis on the Arts and Sports: New Opportunities for Participation | 64 |
| Priorities for British Columbia’s Next Generation | 67 |
| Building on the Olympic Legacy | 70 |
Part 2: Tax Measures | |
Tax Measures — Supplementary Information | 81 |
Tables: | | |
| 2.1 Summary of Tax Measures | 79 |
Topic Box: | |
| Harmonized Sales Tax | 92 |
| Property Tax Deferment Program for Families with Children | 103 |
| Revenue Neutral Carbon Tax | 105 |
Part 3: British Columbia Economic Review and Outlook | |
Summary | 107 |
British Columbia Economic Activity and Outlook | 108 |
| The Labour Market | 109 |
| Domestic Demand | 109 |
| Business and Government | 111 |
| External Trade and Commodity Markets | 112 |
| Inflation | 113 |
Risks to the Economic Outlook | 114 |
External Outlook | 114 |
| United States | 114 |
| Canada | 116 |
Financial Markets | 118 |
| Interest Rates | 118 |
| Exchange Rate | 119 |
Budget and Fiscal Plan – 2010/11 to 2012/13
ii
Table of Contents
Tables: | | |
3.1 | British Columbia Economic Indicators | 108 |
3.2 | Ministry of Finance Economic Forecast: Key Economic Indicators | 108 |
3.3 | US real GDP forecast: Consensus vs Ministry of Finance | 116 |
3.4 | Canadian real GDP forecast: Consensus vs Ministry of Finance | 117 |
3.5 | Private Sector Canadian Three Month Treasury Bill Interest Rate Forecasts | 119 |
3.6 | Private Sector Canadian 10-year Government Bond Interest Rate Forecasts | 119 |
3.7 | Private Sector Exchange Rate Forecasts | 120 |
3.8.1 | Gross Domestic Product: British Columbia | 121 |
3.8.2 | Components of Nominal Income and Expenditure | 122 |
3.8.3 | Labour Market Indicators | 122 |
3.8.4 | Major Economic Assumptions | 123 |
Topic Boxes: | | |
The Economic Forecast Council, 2010 | 124 |
Part 4: 2009/10 Revised Financial Forecast (Third Quarterly Report) | |
2009/10 Fiscal Year in Review | 129 |
Changes Since the Second Quarterly Report | 131 |
Revenue | 131 |
Expense | 131 |
Contingencies | 132 |
Capital Spending | 132 |
Provincial Debt | 133 |
Risks to the 2009/10 Outlook | 134 |
Tables: | | |
4.1 | September Update 2009 and Quarterly Report Updates | 129 |
4.2 | 2009/10 Forecast Update | 130 |
4.3 | 2009/10 Notional Allocations to Contingencies | 132 |
4.4 | 2009/10 Capital Spending Update | 133 |
4.5 | 2009/10 Provincial Debt Update | 134 |
4.6 | 2009/10 Operating Statement | 135 |
4.7 | 2009/10 Revenue by Source | 136 |
4.8 | 2009/10 Expense by Function | 137 |
4.9 | 2009/10 Expense by Ministry, Program and Agency | 138 |
4.10 | 2009/10 Capital Spending | 139 |
4.11 | 2009/10 Provincial Debt | 140 |
4.12 | 2009/10 Statement of Financial Position | 141 |
Appendices | | 143 |
Budget and Fiscal Plan – 2010/11 to 2012/13
iii

March 2, 2010
As required by Section 7(d) of the Budget Transparency and Accountability Act (BTAA), and Section 4a(v) of the Carbon Tax Act, I am confirming that Budget 2010 contains the following elements:
· The fiscal and economic forecasts for 2010/11 and the next two years, which are detailed in Parts 1 and 3 of this document.
· The advice received from the Economic Forecast Council last December, and updated this January, on the economic growth outlook for British Columbia, including the range of forecasts for 2010 and 2011, which is found on page 124.
· All material economic, demographic, taxation, accounting policy and other assumptions underlying the 2010/11 economic, revenue, expense, surplus, capital spending and debt forecasts are also disclosed. Key assumptions and the related risks include:
· The government economic forecast reflects the emerging global economic recovery, stabilizing commodity and financial markets, and improved domestic demand in British Columbia. However, the Ministry’s economic projection is prudent relative to that of the Economic Forecast Council in recognition of the substantial downside risks still facing the global economy.
· In order to meet its budget targets, the government will need to restrain spending growth over the next three years, below the recent historical rate of growth. This is expected to require tight hiring restrictions and tight expenditure controls. A $450 million contingency vote is established in each year of the fiscal plan to help manage unexpected or unmanaged spending pressures.
· A significant increase in capital expenditure has been funded in 2009/10 and in this fiscal plan. A capital contingency totalling $700 million over the next three years has been included to help manage pressures arising from potential cost overruns, delays, or new capital requirements.
· Increased forecast allowances are included in each year of the fiscal plan to help achieve the deficit and debt targets in the face of unexpected revenue declines. Particular attention will need to be paid to the prices for commodities like natural gas, copper and coal, or unplanned expenditures outside the contingencies vote such as those arising from an extreme fire season.
· Consistent with the September Update 2009, the FTE forecast for ministries has been developed as a single aggregate. This recognizes government’s continued intention to tightly manage FTEs corporately in order to minimize involuntary layoffs.
· Most of the current wage agreements expire by the end of 2009/10. No funding is included in this fiscal plan for the new bargaining round consistent with the “net zero” mandate.
Ministry of | Office of the | Mailing Address: | Location Address: |
Finance | Deputy Minister | PO Box 9417 Stn Prov Govt | Room 109 |
| | Victoria BC V8W 9V1 | 617 Government Street |
| | www.gov.bc.ca/fin | Victoria BC |
· Three-year financial forecasts for post secondary institutions and health authorities have been compiled by the Ministry of Advanced Education and Labour Market Development and the Ministry of Health Services respectively, based on preliminary plans developed and submitted by the entities in this sector. The three year forecasts for school districts have been compiled as an aggregate by the Ministry of Education based on the funding assumptions included in this budget. The plans for all three sectors will be updated in the First Quarterly Report to reflect the development of final plans by the respective boards during the coming months.
· Government has announced that it intends to introduce legislation that will enable qualifying universities to operate outside the government reporting entity. However for purposes of Budget 2010, all the universities are assumed to remain within the government reporting entity for the next three fiscal years.
· The three-year fiscal plan conforms to the standards and guidelines that comprise generally accepted accounting principles (GAAP) for senior governments. However, the Canadian accounting profession is in the process of adopting International Financial Reporting Standards (IFRS) within GAAP. In some aspects, IFRS is a significant departure from current Canadian accounting practice, and its adoption will introduce significant volatility into government’s operating statement and could materially affect the fiscal plan. For example, IFRS does not accurately reflect provincial legislation and the regulatory policy frameworks governing a number of government’s commercial Crown corporations. While government remains committed to having its financial reporting conform to GAAP, this issue may result in government adopting alternate accounting standards from other accredited standard setting organizations.
· The major areas of risk to the plan known at this time are disclosed in the risks section in Part 1 starting at page 48 of Budget 2010, and in the material assumptions tables in the Appendix.
· Carbon tax reports for 2008/09 and 2009/10, and a carbon tax plan for 2010/11 to 2012/13 with corresponding material assumptions. These can be found in the Revenue Neutral Carbon Tax topic box at the end of Part 2: Tax Measures (page 105).
· A table that details the specific revenue sources fully allocated to health care for 2010/11 to 2012/13 is included on page 26.
I would like to thank staff in government ministries, and in particular the highly professional and dedicated staff in the Ministry of Finance, as well as staff in Crown corporations and agencies for their work in preparing these multi-year economic and financial plans.
| 
|
| Graham Whitmarsh |
| Deputy Minister and |
| Secretary to Treasury Board |
Summary: BUDGET AND FISCAL PLAN — 2010/11 to 2012/13
| | 2009/10 | | Budget | | | | | |
| | September | | Updated | | Estimate | | Plan | | Plan | |
($ millions) | | Update | | Forecast | | 2010/11 | | 2011/12 | | 2012/13 | |
Revenue | | 37,608 | | 37,050 | | 39,190 | | 40,957 | | 42,800 | |
Expense | | (40,133 | ) | (39,700 | ) | (40,605 | ) | (41,602 | ) | (42,545 | ) |
Surplus (deficit) before forecast allowance | | (2,525 | ) | (2,650 | ) | (1,415 | ) | (645 | ) | 255 | |
Forecast allowance | | (250 | ) | (125 | ) | (300 | ) | (300 | ) | (400 | ) |
Deficit | | (2,775 | ) | (2,775 | ) | (1,715 | ) | (945 | ) | (145 | ) |
Capital spending: | | | | | | | | | | | |
Taxpayer-supported capital spending | | 4,729 | | 4,013 | | 5,414 | | 3,609 | | 3,073 | |
Total capital spending | | 7,434 | | 7,270 | | 8,159 | | 6,528 | | 6,058 | |
Provincial debt: | | | | | | | | | | | |
Government direct operating debt | | 7,487 | | 6,182 | | 7,511 | | 8,209 | | 7,838 | |
Taxpayer-supported debt | | 30,593 | | 29,093 | | 33,748 | | 36,720 | | 38,329 | |
Total debt | | 42,332 | | 41,318 | | 47,757 | | 52,363 | | 55,862 | |
Government direct operating debt-to-GDP ratio | | 4.0 | % | 3.3 | % | 3.8 | % | 4.0 | % | 3.6 | % |
Taxpayer-supported debt-to-GDP ratio | | 16.2 | % | 15.5 | % | 17.2 | % | 17.9 | % | 17.8 | % |
Total debt-to GDP ratio | | 22.4 | % | 22.0 | % | 24.3 | % | 25.5 | % | 25.9 | % |
Building on the Momentum of the 2010 Olympic Winter Games
Budget 2010 builds on the momentum provided by the 2010 Olympic and Paralympic Winter Games and the return to positive economic growth as the world recovers from the recession in 2008 and 2009.
Government has been able to fund $1.36 billion in program priorities over the fiscal plan period. Savings and efficiencies identified in 2009/10 enabled government to reallocate $500 million in HST transition funding from 2009/10 to 2010/11 and 2011/12. This reallocation was on top of a net revenue increase of $225 million. As well, many of the new initiatives were funded by refocusing $320 million primarily from the natural resource ministry budgets and $267 million in reduced interest costs to priority services and programs.
Budget 2010 provides priority program funding in the following areas:
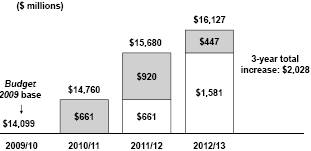
· a $447 million funding increase for health care in 2012/13, for a total budget increase of over $2 billion since 2009/10;
· $108 million focused on communities, families and youth, including $60 million in new funding for a 2010 Sports and Arts Legacy, and an additional $22 million for full day kindergarten;
· $69 million for justice and policing operations;
· an additional $156 million over three years for education, including $150 million for schools in addition to the allocation for full-day kindergarten;
· $58 million in additional provincial funding for infrastructure projects in communities, to be matched by other levels of government;
· $35 million in additional funding for LiveSmartBC programs; and
· $100 million to support new clean energy initiatives, including cleaner transportation choices, the production of bio-fuels, and new forms of electricity generation, that will lower greenhouse gas emissions.
As well, an additional $270 million has been allocated to Contingencies funding to provide government more flexibility to address future issues.
BC Economy Returning to Growth
The upgraded BC forecast for 2010 reflects the emerging economic recovery in the US and throughout the world, stabilizing global commodity and financial markets, and improved domestic demand in BC. The 2011 projection reflects a further recovery of US demand and commodity prices.
The fiscal plan is based on the Ministry of Finance economic forecast that projects the economy to grow by 2.2 per cent in 2010 and by 2.3 per cent
Budget and Fiscal Plan – 2010/11 to 2012/13
Summary
BC consumers in recovery
in 2011, returning to more normal growth of 2.8 per cent in the medium term.
Economic outlook recognizes risks ahead
The Ministry’s outlook for BC is 0.7 percentage points lower for 2010 and 0.8 percentage points lower for 2011 than the outlook provided by the Economic Forecast Council (EFC).
US outlook for 2010 improves in recent months

The ministry is projecting its estimate of the most likely economic scenario, and its forecast acknowledges significant downside risks relative to that of the EFC. The risks include:
· a “double—dip” return to recession in the US (characterized by tighter lending causing weaker investment, slower consumer spending and a delayed job market recovery) if fiscal and monetary stimulus are removed prematurely;
· slower than anticipated global demand resulting in weaker demand for BC’s exports;
· further appreciation of the Canadian dollar; and
· further weakening of the US dollar resulting in significant disruptions to global financial and commodity markets.
If one or more of these risks materialize in a significant way, in particular the “double-dip” scenario, it may create pressures that cannot be accommodated in the fiscal plan.
HST Implementation Impact Mitigated
As previously announced, effective July 1, 2010, the province intends to eliminate the 7 per cent provincial sales tax and implement the BC HST at 7 per cent for a total federal and provincial HST of 12 per cent — the lowest rate among the harmonized provinces in Canada.
This move to a modern value-added tax will reduce tax on new investment by over 40 per cent, create jobs and reduce compliance costs for business and administration costs for government; and harmonization will remove embedded tax from the price of goods and services purchased by British Columbians and our foreign customers by removing almost $2 billion in sales tax from business inputs.
Government is committed to ensuring the impact of HST on households is mitigated. Like the GST, consumers will not pay HST on basic groceries, prescription drugs and exempt services such as health and dental services, financial services, long-term residential rental accommodation, child-care services and educational services.
There will be point-of-sale rebates for the provincial portion of HST on motor fuels, books, children-sized clothing and footwear, children’s car seats and car booster seats, children’s diapers and feminine hygiene products; and government will provide a credit for the provincial portion of HST payable on residential energy similar to the existing PST exemption.
Budget and Fiscal Plan – 2010/11 to 2012/13
2
Summary
As well, the basic personal income tax credit was increased by $1,627 above the 2009 amount on January 1, 2010; and government will provide a new BC HST Credit to further reduce the impact on lower income families and individuals.
With the HST rebates, provincial residential energy credit and significant personal income tax cuts, the impact on taxpayers is significantly reduced.
Government will also provide an enhanced new housing rebate to ensure that purchasers of new homes up to $525,000 on average will pay no more provincial tax due to harmonization than is currently embedded as PST in the price of a new home.
Also, partial rebates are also provided for qualifying schools, universities, public colleges and health organizations to ensure that, on average, these institutions pay no more tax when HST is implemented than they currently pay in PST.
Additional Tax Competitiveness
Budget 2010 introduces enhancements to the International Financial Activity Program that will make BC much more attractive as an international financial centre. In addition, the program is broadened to include BC international businesses involved in emerging and potentially very high-growth areas such as carbon trading, clean technology and digital media distribution and publishing.
As announced on February 3, 2010, the province is introducing the BC Interactive Digital Media tax credit that will support the continued growth and development of the province’s vibrant video game sector; and additional film tax credit changes will support the continued success of our film sector.
Tax Deferral Support for Families
Budget 2010 implements a new property tax deferral program for families with children under 18 years of age. Eligible homeowners raising children will have the option of deferring their provincial and local property taxes in recognition of the high cost of raising a family.
Increased Health Care Spending
Protecting health care is a top priority for Budget 2010. By 2012/13, the Ministry of Health Services’ budget will increase by over $2.0 billion from the 2009/10 level. This represents the largest share of funding increases of all ministries.
Ministry of Health Services budget increases
Funding increases for the Ministry of Health Services are focused on sustaining front-line service delivery:
· $1.3 billion for the Regional Health Sector to fund acute care services, community and home-based services, assisted living and residential care services, mental health and addictions services, health promotion, disease prevention and other health services;
· $514 million for the Medical Services Plan to fund increased volumes of physician and laboratory services, and recruitment and retention of specialists and family physicians, particularly in rural and remote communities;
· $145 million for PharmaCare for coverage of new drugs and volume and price increases for prescription drugs; and
· $52 million for ground and air ambulance services, training of emergency personnel, and a tele-health platform — HealthLinkBC — providing self-care and other health services.
In addition, $80 million in 2010/11 and $180 million in 2011/12 included in the Ministry of Health Services’ budget has been allocated to innovation, pay for performance, and integration and standardization of health care operations and service delivery.
To further protect health care, measures will be introduced that ensure eligible organizations are not impacted by implementation of the HST.
Budget and Fiscal Plan – 2010/11 to 2012/13
3
Summary
Government is committed to allocating to health spending all revenue received from five key revenue sources. In 2010/11 these revenues fund 61 per cent of health spending, rising to 70 per cent by 2012/13.
Revenue Sources Allocated to Health Care
($ millions) | | 2010/11 | | 2011/12 | | 2012/13 | |
Harmonized Sales Tax | | 3,784 | | 5,376 | | 5,728 | |
Medical Services Plan Premiums | | 1,741 | | 1,886 | | 2,020 | |
Tobacco Tax | | 686 | | 686 | | 686 | |
Health Special Account | | 148 | | 148 | | 159 | |
Major Federal Government Transfers | | 3,683 | | 3,759 | | 3,995 | |
Total Health-related Revenue | | 10,042 | | 11,855 | | 12,588 | |
Total Health Spending by Function | | 16,474 | | 17,426 | | 17,893 | |
Health Spending in Excess of Revenue | | 6,432 | | 5,571 | | 5,305 | |
Supporting Communities, Families and Youth
Budget 2010 provides an additional $108 million over three years to reflect government’s commitment to support families through investments in education, services that assist families with children, and youth sport development and excellence; and by building our community level creative economies.
Supporting Communities, Families and Youth
($ millions) | | 2010/11 | | 2011/12 | | 2012/13 | | Total | |
Implement full-day kindergarten | | — | | — | | 22 | | 22 | |
Supports for child care | | 8 | | 9 | | 9 | | 26 | |
2010 Sports and Arts Legacy | | 20 | | 20 | | 20 | | 60 | |
Total | | 28 | | 29 | | 51 | | 108 | |
The funding increases include:
· an additional $22 million to fully fund the implementation of voluntary, full day kindergarten for five-year olds, in every school by September 2011 (total funding at $129 million annually by 2012/13);
· an additional $26 million in funding to support child care programs that assist low and moderate income families with the cost of child care; and
· $60 million over the next three fiscal years to provide a 2010 Sports and Arts Legacy for youth sports and community arts activities.
Budget 2010 continues to provide $160 million in 2012/13 in support of those in need of income assistance during the economic downturn, which is an extension of the annual increases provided in September Update 2009.
Justice and Public Safety
Budget 2010 provides an additional $69 million over the next three years in support of the justice system and to enhance public safety.
Of this amount, $30 million is allocated to maintaining court services, which is in addition to the $33 million provided in September Update 2009 in support of major prosecutions, and $39 million is funding for additional RCMP policing costs.
Justice and Public Safety
($ millions) | | 2010/11 | | 2011/12 | | 2012/13 | | Total | |
Maintaining the court system | | 10 | | 10 | | 10 | | 30 | |
Supporting increased RCMP policing costs | | 12 | | 13 | | 14 | | 39 | |
Total | | 22 | | 23 | | 24 | | 69 | |
Increased Education Funding
An additional $150 million is being targeted towards schools over three years to ensure that the cost of full day kindergarten and the teacher’s wage increase under the collective agreement that expires in June 2011 are fully funded.
Maintaining Educational Opportunities
($ millions) | | 2010/11 | | 2011/12 | | 2012/13 | | Total | |
Increased funding for schools | | 50 | | 50 | | 50 | | 150 | |
Medical program expansion | | — | | — | | 6 | | 6 | |
Total | | 50 | | 50 | | 56 | | 156 | |
As well, the measures that ensure the sector is not impacted by implementation of the HST will relieve a potential $32 million operating pressure identified by the school districts.
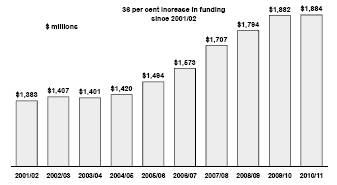
Budget 2010 maintains funding to post-secondary institutions at $1.88 billion, which includes the $55 million annual lift that was added in Budget 2009 and apportioned to the universities, colleges, and institutes.
Post-secondary funding increases
Budget and Fiscal Plan – 2010/11 to 2012/13
4
Summary
Increased Municipal Infrastructure Funding
The province has provided significant infrastructure funding to communities over the last year and continues to do so in Budget 2010.
Additional provincial operating funding of $58 million in 2010/11 has been made available to finance further federal-provincial-municipal cost-shared community infrastructure projects. This funding brings the total provincial commitment for the communities component of the Building Canada Fund and Infrastructure Stimulus Fund to $290 million.
Community Infrastructure and Clean Energy Initiatives
($ millions) | | 2010/11 | | 2011/12 | | 2012/13 | | Total | |
Municipal infrastructure investments | | 58 | | — | | — | | 58 | |
Additional funding for LiveSmartBC | | 5 | | 15 | | 15 | | 35 | |
Climate action and clean energy development | | 20 | | 40 | | 40 | | 100 | |
Total | | 83 | | 55 | | 55 | | 193 | |
Climate Action and Clean Energy Initiatives
A key government initiative in support of a sustainable clean environment has been the LiveSmartBC program, which has the added benefit of stimulating job creation in communities. Building on the current $60 million commitment already funded, an additional $35 million over three years is being provided for LiveSmartBC programs.
As well, the government continues to encourage investments in a more energy-efficient economy through a new Climate Action and Clean Energy allocation of $100 million in support of:
· partnerships in infrastructure for cleaner transportation choices;
· the production of bio-fuels from wood waste, including ethanol and wood pellets; and
· new forms of electricity generation, including wind, solar, geothermal, tidal, wave, and run-of-river applications.
This new funding will complement the anticipated Clean Energy Act to be introduced into legislation in the near future.
Accelerated Infrastructure Plan Continues
Budget 2010 continues government’s commitment to its accelerated infrastructure spending plan in order to keep British Columbians working and help stimulate the economy.
Since October 2008, $5.3 billion has been committed to accelerated infrastructure investments across British Columbia, an increase of $1.9 billion from $3.4 billion at September Update 2009.
Accelerated Capital Spending
| | Total Cost of | |
($ millions) | | Projects | |
Sector: | | | |
Transportation | | 1,710 | |
Communities | | 1,171 | |
Post-secondary | | 741 | |
Housing | | 629 | |
Energy transmission | | 400 | |
K—12 schools | | 368 | |
Health | | 85 | |
Justice and other | | 235 | |
Total | | 5,339 | |
New projects include investments in housing renovations, communities, the Northwest Transmission Line, highway rehabilitation, upgrades to the Royal BC Museum, air tanker bases in Castlegar and Williams Lake, the Klemtu Ferry Terminal, and the McKenzie Connector.
Capital spending on schools, hospitals, roads, bridges, hydro-electric projects and other infrastructure across the province over the next three years (2010/11 — 2012/13) is expected to total $20.7 billion, and assumes federal contributions of $1.5 billion, including accelerated infrastructure funds.
Maintaining the Plan to Balance the Budget
While the plan still projects deficits of $1.7 billion in 2010/11, $945 million in 2011/12, and $145 million in 2012/13, Budget 2010 reaffirms government’s commitment to return to balanced budgets by 2013/14 that was outlined in September Update 2009.
Over the next three years, government has limited spending growth to an average 2.34 per cent annually in order to enable revenue, which saw a 7.3 per cent decline from 2007/08 to 2009/10, to catch up to spending.
Budget and Fiscal Plan – 2010/11 to 2012/13
5
Summary
Return to balanced budgets by 2013/14
Debt Remains Affordable
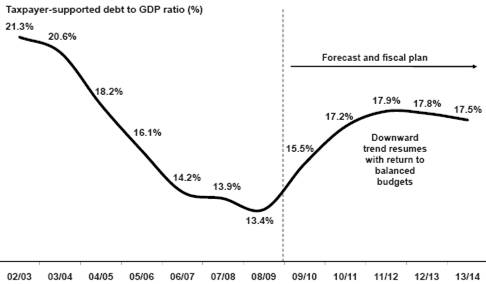
Taxpayer-supported debt is forecast to increase to $38.3 billion by 2012/13, mainly due to the significant infrastructure investments planned over the next three years. As a result, the taxpayer-supported debt to GDP ratio will climb to 17.9 per cent in 2011/12 before returning to a downward trend and falling to 17.8 per cent in 2012/13.
Total provincial debt is forecast to increase over the next three years to $55.9 billion by 2012/13, primarily reflecting additional investment in improving and expanding British Columbia’s hydro generation assets and the construction of the Port Mann Bridge.
Despite the debt increases in the fiscal plan, the projected taxpayer-supported debt to GDP ratio is still significantly below the 2002/03 mark. The significant reduction in debt between 2002/03 and 2008/09 has enabled government to absorb the impact of the economic slowdown without returning to earlier high levels of debt relative to the economy.
As is evidenced by the decline in 2012/13, the return to balanced budgets and the debt elimination measures put in place by government
Taxpayer-supported debt remains affordable

will help ensure that the debt to GDP ratio will return to the affordability levels the Province enjoyed prior to the economic slowdown.
Risks to the Fiscal Plan
The main risks to the government fiscal plan include slower than expected economic growth in our trading partners resulting in lower demand for BC’s exports, further weakening of the US dollar resulting in significant disruptions to global financial and commodity markets, and further appreciation of the Canadian dollar.
Other risks include higher than expected interest rates, as well as service demand pressures on the expenditure side. In addition, the budget provides no funding for wage increases in the public sector.
The fiscal plan includes contingencies of $450 million in each year of the fiscal plan period to help manage pressures and fund priority initiatives. As well, government has included a forecast allowance of $300 million in each of 2010/11 and 2011/12, and $400 million in 2012/13 as an added measure of prudence.
Conclusion
In summary, Budget 2010:
· builds on the momentum provided by the 2010 Olympic and Paralympic Winter Games and the return to positive economic growth;
· provides priority program funding in the key areas of health, education, families and youth, communities, climate action, and justice and safety;
· refocuses financial resources and savings towards government priorities;
· reflects government’s commitment to mitigating, and in some cases eliminating, the impact of the HST on households and non-profit organizations;
· reaffirms government’s commitment to return to balanced budgets by 2013/14;
· continues government’s accelerated infrastructure program to create jobs over the next three years; and
· ensures that the debt to GDP ratio will return to the affordability levels enjoyed prior to the economic slowdown by returning to balanced budgets and eliminating operating debt.
Budget and Fiscal Plan – 2010/11 to 2012/13
6
Part 1: THREE-YEAR FISCAL PLAN
Table 1.1 Three-Year Fiscal Plan — Operating Statement
| | 2009/10 | | Budget | | | | | |
| | September | | Updated | | Estimate | | Plan | | Plan | |
($ millions) | | Update | | Forecast | | 2010/11 | | 2011/12 | | 2012/13 | |
Taxpayer-supported programs and agencies: | | | | | | | | | | | |
Revenue | | 37,608 | | 37,050 | | 39,190 | | 40,957 | | 42,800 | |
Expense | | (40,133 | ) | (39,700 | ) | (40,605 | ) | (41,602 | ) | (42,545 | ) |
Surplus (deficit) before forecast allowance | | (2,525 | ) | (2,650 | ) | (1,415 | ) | (645 | ) | 255 | |
Forecast allowance | | (250 | ) | (125 | ) | (300 | ) | (300 | ) | (400 | ) |
Deficit | | (2,775 | ) | (2,775 | ) | (1,715 | ) | (945 | ) | (145 | ) |
Introduction
Budget 2010 builds on the momentum provided by the 2010 Olympic and Paralympic Winter Games and the return to positive economic growth as the world recovers from the recession in 2008 and 2009. In this budget, government maintains its commitment to protect the core services of health care, education and social services that British Columbians depend upon, and focuses on the needs of British Columbia’s families over the next decade by continuing to build a higher value-added economy; advancing our education plan (including full-day kindergarten); supporting healthy, active and creative communities; developing a modern transportation network; and promoting a clean energy environment.
Government has been able to fund an additional $1.36 billion in program priorities over the fiscal plan period (2010/11 to 2012/13). Savings and efficiencies identified in 2009/10 enabled government to update its agreement with the federal government, reducing the amount of HST transition funding required in 2009/10 by $500 million and increasing funding in 2010/11 and 2011/12. This reallocation was on top of a net revenue increase of $225 million over the fiscal plan period. As well, many of the new initiatives were funded by refocusing $320 million primarily from the natural resource ministry budgets and $267 million in reduced interest costs to the services and programs required in the decades ahead (see Table 1.2).
Budget 2010 provides priority program funding in the following areas:
· a $447 million funding increase for health care in 2012/13, for a total budget increase of over $2 billion since 2009/10;
· $108 million focused on families and youth, including $60 million in new funding for a 2010 Sports and Arts Legacy, and an additional $22 million for full-day kindergarten;
· $69 million for justice and policing operations;
· an additional $156 million over three years for education, including $150 million for schools in addition to the allocation for full-day kindergarten;
· $58 million in additional provincial funding for infrastructure projects in communities, to be matched by other levels of government;
· $35 million in additional funding for LiveSmartBC programs; and
Budget and Fiscal Plan – 2010/11 to 2012/13
Three-Year Fiscal Plan
· $100 million to support new clean energy initiatives, including cleaner transportation choices, the production of bio-fuels, and new forms of electricity generation, that will lower greenhouse gas emissions.
As well, an additional $270 million has been allocated to Contingencies funding to provide government more flexibility to address future issues.
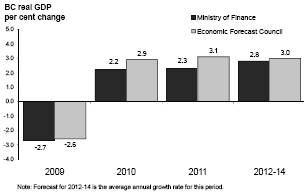
The fiscal plan is based on the Ministry of Finance economic forecast that projects the economy to grow by 2.2 per cent in 2010 and by 2.3 per cent in 2011, returning to more normal growth of 2.8 per cent in the medium term. The projection reflects a gradual recovery of US demand and commodity prices. The Ministry’s outlook for BC in 2010 is 0.7 percentage points lower than the outlook provided by the Economic Forecast Council. Full details of the economic forecast are found in Part 3: British Columbia Economic Review and Outlook.
The ministry is projecting its estimate of the most likely economic scenario, and its forecast acknowledges significant downside risks relative to that of the Economic Forecast Council. The risks include:
· a “double—dip” return to recession in the US (characterized by tighter lending causing weaker investment, slower consumer spending and a delayed job market recovery) if fiscal and monetary stimulus are removed prematurely;
· slower than anticipated global demand resulting in weaker demand for BC’s exports;
· further appreciation of the Canadian dollar; and
· further weakening of the US dollar resulting in significant disruptions to global financial and commodity markets.
If one or more of these risks materialize in a significant way, in particular the “double-dip” scenario, it may create pressures that cannot be accommodated in the fiscal plan.
As previously announced, effective July 1, 2010, the province intends to eliminate the 7 per cent provincial sales tax and implement the BC HST at 7 per cent for a total federal and provincial HST of 12 per cent — the lowest rate among the harmonized provinces in Canada.
This move to a modern value-added tax, which has already been done in more than 130 countries around the world, will vastly improve BC’s global competitiveness, reduce tax on new investment by over 40 per cent, enhance productivity and economic growth, create jobs and reduce compliance costs for business and administration costs for government. Harmonization will remove embedded tax from the price of goods and services purchased by British Columbians and our foreign customers by removing almost $2 billion in sales tax from business inputs.
Government is committed to ensuring the impact of HST on households is mitigated. Like the GST, consumers will not pay HST on basic groceries, prescription drugs and exempt services such as health and dental services, financial services, long-term residential rental accommodation, child-care services and educational services.
There will be point-of-sale rebates for the provincial portion of HST on motor fuels, books, children-sized clothing and footwear, children’s car seats and car booster seats, children’s diapers and feminine hygiene products; and government will provide a credit
Budget and Fiscal Plan – 2010/11-to 2012/13
8
Three-Year Fiscal Plan
Table 1.2 Three-Year Fiscal Plan Update — Changes from September Update 2009
($ millions) | | 2009/10 | | 2010/11 | | 2011/12 | | 2012/13 | |
September Update 2009 — Five Year Fiscal Plan | | (2,775 | ) | (1,725 | ) | (945 | ) | (140 | ) |
Projected spending lift in 2012/13 | | — | | — | | — | | 1,043 | |
Five Year Fiscal Plan before revenue changes and spending initiatives | | (2,775 | ) | (1,725 | ) | (945 | ) | 903 | |
Revenue changes: | | | | | | | | | |
Personal income tax | | (165 | ) | (66 | ) | (81 | ) | (78 | ) |
Corporate income tax | | (78 | ) | (252 | ) | 64 | | 179 | |
Social service tax | | (90 | ) | (24 | ) | (41 | ) | (61 | ) |
Carbon tax | | (15 | ) | (21 | ) | (27 | ) | (29 | ) |
Additional HST rebates for housing and SUCH | | — | | (227 | ) | (308 | ) | (313 | ) |
Tax on private sales of vehicles | | — | | 50 | | 70 | | 70 | |
Other tax sources | | 154 | | 127 | | 88 | | 45 | |
Forests | | (42 | ) | (59 | ) | (122 | ) | (129 | ) |
Natural gas royalties | | (58 | ) | (190 | ) | (193 | ) | (357 | ) |
Coal, metals and minerals | | 113 | | 179 | | 172 | | 150 | |
Other energy and natural resources | | 115 | | 103 | | 136 | | 109 | |
Fees, licenses, investment earnings and miscellaneous sources | | (32 | ) | 114 | | 147 | | 477 | |
Health and social transfers | | 9 | | (15 | ) | (33 | ) | (49 | ) |
Federal government transition payments for implementation of HST | | (500 | ) | 395 | | 105 | | — | |
Other federal government transfers | | 75 | | 311 | | 10 | | 1 | |
Commercial Crown agencies operating results: | | | | | | | | | |
BC Hydro — mainly increase in allowed return on equity offset by lower net electricity trade income | | (97 | ) | 97 | | 110 | | 107 | |
ICBC — mainly lower claims costs, partially offset by lower premiums earned, lower investment income and costs related to the renewal of critical business systems | | 113 | | 54 | | 36 | | 6 | |
Other commercial Crown agencies changes | | (60 | ) | (56 | ) | (28 | ) | (28 | ) |
Total revenue changes (1) | | (558 | ) | 520 | | 105 | | 100 | |
Forecast allowance updates | | 125 | | (50 | ) | (50 | ) | (150 | ) |
Less : expense increases (decreases): | | | | | | | | | |
Consolidated Revenue Fund changes: | | | | | | | | | |
Health funding increase | | — | | — | | — | | 447 | |
Maintaining educational opportunities (Table 1.13) | | — | | 50 | | 50 | | 56 | |
Supporting communities, families and youth (Table 1.11) | | — | | 28 | | 29 | | 51 | |
Community infrastructure and clean energy development (Table 1.14) | | — | | 83 | | 55 | | 55 | |
Justice and public safety (Table 1.12) | | — | | 22 | | 23 | | 24 | |
Refocusing financial resources (Table 1.15) | | — | | (70 | ) | (125 | ) | (125 | ) |
Contingencies and New Programs Vote allocations | | (44 | ) | 90 | | 90 | | 90 | |
Management of public debt (net) | | (3 | ) | (102 | ) | (109 | ) | (56 | ) |
Other spending changes | | (178 | ) | 40 | | 34 | | 47 | |
Adjustment of prior year accruals | | (74 | ) | — | | — | | — | |
Spending funded by third party recoveries (Table 1.17) | | (62 | ) | 343 | | 81 | | 289 | |
Increase in operating transfers to service delivery agencies | | (139 | ) | (161 | ) | (138 | ) | (341 | ) |
Changes in spending profile of service delivery agencies: | | | | | | | | | |
School districts | | 69 | | 105 | | 172 | | 190 | |
Post secondary institutions | | (5 | ) | 31 | | 22 | | 78 | |
Health authorities and hospital societies | | 43 | | (34 | ) | (70 | ) | 183 | |
Other service delivery agencies | | (40 | ) | 35 | | (59 | ) | 10 | |
Total expense increases (decreases) (1) | | (433 | ) | 460 | | 55 | | 998 | |
Budget 2010 updated fiscal plan deficit | | (2,775 | ) | (1,715 | ) | (945 | ) | (145 | ) |
(1) Revenue and expense changes are shown net of the impact of a review of residential energy credits that determined a more appropriate accounting treatment is to net them directly from revenue. In the September Update 2009, the HST attributable to these credits was included in revenue and the credits shown as an expense. The credits were estimated at $175 million in 2010/11 and $220 million in each of 2011/12 and 2012/13.
Budget and Fiscal Plan – 2010/11-to 2012/13
9
Three-Year Fiscal Plan
for the provincial portion of HST payable on residential energy similar to the existing PST exemption.
As well, the basic personal income tax credit was increased by $1,627 above the 2009 amount on January 1, 2010; and government will provide a new BC HST Credit to further reduce the impact on lower income families and individuals.
With the HST rebates, provincial residential energy credit and significant personal income tax cuts, the impact on taxpayers is significantly reduced. Government will also provide an enhanced new housing rebate, as announced on November 19, 2009, to ensure that purchasers of new homes up to $525,000 (an increase from $400,000) on average will pay no more provincial tax due to harmonization than is currently embedded as PST in the price of a new home.
As announced on January 14, 2010, partial rebates are also provided for qualifying schools, universities, public colleges and hospital authorities to ensure that, on average, these institutions pay no more tax when HST is implemented than they currently pay in PST.
Budget 2010 introduces enhancements to the International Financial Activity Program that will make BC much more attractive as an international financial centre. In addition, the program is broadened to include BC international businesses involved in emerging and potentially very high-growth areas such as carbon trading, clean technology and digital media distribution and publishing.
As announced on February 3, 2010, the province is introducing a new tax credit for digital media and enhancements to provincial film tax credits that recognize and reflect the convergence of these sectors. The BC Interactive Digital Media tax credit will support the continued growth and development of the province’s vibrant video game sector while the film tax credit changes will support the continued success of our film sector.
Budget 2010 implements a new property tax deferral program for families with children under 18 years of age. Eligible homeowners raising children will have the option of
Chart 1.1 Return to balanced budgets by 2013/14

Budget and Fiscal Plan – 2010/11-to 2012/13
10
Three-Year Fiscal Plan
deferring their provincial and local property taxes in recognition of the high cost of raising a family.
While the Budget 2010 fiscal plan projects deficits of $1.7 billion in 2010/11, $945 million in 2011/12, and $145 million in 2012/13, consistent with the five year plan in September Update 2009, Budget 2010 reaffirms government’s commitment to return to balanced budgets by 2013/14 that was outlined in September Update 2009.
The global economic downturn has reduced government revenue in 2009/10 by 7.3 per cent ($2.9 billion including forecast allowance), compared to its peak in 2007/08. During this time, spending rose 7.6 per cent ($2.8 billion) — with health care costs accounting for more than half of this increase. Over the next three years, government has limited spending growth to an average 2.35 per cent annually in order to enable the revenue growth emerging from the recovery to catch up. Additional information and an update on government’s plan to balance the budget can be found in the Five Year Fiscal Plan Update topic box on page 54.
Budget 2010 continues government’s commitment to an infrastructure spending plan that includes the acceleration of a number of new projects in order to keep British Columbians working and help stimulate the economy. Infrastructure spending on transit, roads, schools, hospitals, post secondary facilities, electrical generation, transmission and distribution projects and other capital assets totals $20.7 billion over the fiscal plan period.
The capital plan is partially funded by federal contributions of $1.5 billion, including infrastructure stimulus funds announced in the federal budget on January 27, 2009. More information on the three-year capital spending plan is found on page 35.
Taxpayer-supported debt is forecast to increase to $38.3 billion by 2012/13, reflecting the significant infrastructure investments planned over the next three years that will benefit future generations of British Columbians, and including the forecast deficits over the next three fiscal years. As a result, the taxpayer-supported debt to GDP ratio will climb to 17.9 per cent in 2011/12 before returning to a downward trend and falling to 17.8 per cent in 2012/13.
Total provincial debt, which includes commercial Crown corporation debt, is forecast to increase over the next three years to $55.9 billion by 2012/13, reflecting both the increase in taxpayer-supported debt and the additional investment in improving and expanding British Columbia’s hydro generation assets and the construction of the Port Mann Bridge. Additional information on the debt outlook is found starting on page 44.
Debt remains affordable. In the period 2002/03 to 2008/09, significant progress was made in reducing the taxpayer supported debt burden. The taxpayer-supported debt to GDP ratio has declined from 21.3 per cent in 2002/03 to 13.4 per cent in 2008/09; a 37 per cent reduction. Despite the debt increases in the fiscal plan, the projected taxpayer-supported debt to GDP ratio is still significantly below the 2002/03 mark.
The significant reduction in debt prior to 2008/09 has enabled government to absorb the impact of the economic slowdown without returning to earlier high levels of debt relative to the economy (see Chart 1.2). As evidenced by the decline beginning in 2012/13, the return to balanced budgets and the debt elimination measures put in place by government have kept debt within affordable levels.
Budget and Fiscal Plan – 2010/11 to 2012/13
11
Three-Year Fiscal Plan
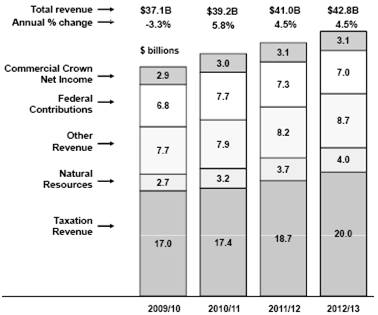
Table 1.3 Revenue by Source
| | 2009/10 | | Budget | | | | | |
| | September | | Updated | | Estimate | | Plan | | Plan | |
($ millions) | | Update | | Forecast | | 2010/11 | | 2011/12 | | 2012/13 | |
Taxation revenue | | | | | | | | | | | |
Personal income | | 5,681 | | 5,516 | | 5,861 | | 6,124 | | 6,545 | |
Corporate income | | 1,409 | | 1,331 | | 847 | | 1,102 | | 1,343 | |
Harmonized sales | | — | | — | | 3,784 | | 5,376 | | 5,728 | |
Other sales (1) | | 4,847 | | 4,757 | | 1,399 | | 201 | | 173 | |
Fuel | | 873 | | 883 | | 877 | | 875 | | 875 | |
Carbon | | 557 | | 542 | | 727 | | 928 | | 1,137 | |
Tobacco | | 686 | | 677 | | 686 | | 686 | | 686 | |
Property | | 1,891 | | 1,885 | | 1,906 | | 1,908 | | 1,998 | |
Property transfer | | 685 | | 855 | | 900 | | 1,045 | | 1,130 | |
Other (2) | | 588 | | 577 | | 435 | | 413 | | 424 | |
| | 17,217 | | 17,023 | | 17,422 | | 18,658 | | 20,039 | |
Natural resource revenue | | | | | | | | | | | |
Natural gas royalties | | 522 | | 464 | | 698 | | 1,002 | | 1,249 | |
Forests | | 387 | | 345 | | 491 | | 597 | | 603 | |
Other resource (3) | | 1,668 | | 1,896 | | 2,019 | | 2,084 | | 2,102 | |
| | 2,577 | | 2,705 | | 3,208 | | 3,683 | | 3,954 | |
Other revenue | | | | | | | | | | | |
Medical Services Plan premiums | | 1,628 | | 1,628 | | 1,741 | | 1,886 | | 2,020 | |
Other fees (4) | | 2,548 | | 2,462 | | 2,615 | | 2,584 | | 2,617 | |
Investment earnings | | 897 | | 924 | | 921 | | 1,015 | | 1,268 | |
Miscellaneous (5) | | 2,599 | | 2,626 | | 2,597 | | 2,766 | | 2,827 | |
| | 7,672 | | 7,640 | | 7,874 | | 8,251 | | 8,732 | |
Contributions from the federal government | | | | | | | | | | | |
Health and social transfers | | 4,873 | | 4,882 | | 5,165 | | 5,292 | | 5,580 | |
Harmonized sales tax transition payments | | 750 | | 250 | | 769 | | 580 | | — | |
Other federal contributions (6) | | 1,627 | | 1,702 | | 1,751 | | 1,411 | | 1,399 | |
| | 7,250 | | 6,834 | | 7,685 | | 7,283 | | 6,979 | |
Commercial Crown corporation net income | | | | | | | | | | | |
BC Hydro | | 452 | | 355 | | 609 | | 660 | | 640 | |
Liquor Distribution Branch | | 896 | | 872 | | 974 | | 1,014 | | 1,039 | |
BC Lotteries (net of payments to federal government) | | 1,121 | | 1,082 | | 1,106 | | 1,153 | | 1,195 | |
ICBC (7) | | 407 | | 520 | | 303 | | 245 | | 212 | |
Transportation Investment Corporation (Port Mann) | | (22 | ) | (10 | ) | (19 | ) | (19 | ) | (20 | ) |
Other | | 38 | | 29 | | 28 | | 29 | | 30 | |
| | 2,892 | | 2,848 | | 3,001 | | 3,082 | | 3,096 | |
Total revenue | | 37,608 | | 37,050 | | 39,190 | | 40,957 | | 42,800 | |
(1) Includes social service tax and, after June 30, 2010, continuation of the tax on private sales of vehicles now at 12%. More details are available in Table A9.
(2) Corporation capital, insurance premium and hotel room taxes.
(3) Columbia River Treaty, other energy and minerals, water rental and other resources.
(4) Post-secondary, healthcare-related, motor vehicle, and other fees.
(5) Includes asset dispositions, reimbursements for healthcare and other services provided to external agencies, and other recoveries.
(6) Includes contributions for health, education, community development, housing and social service programs, and transportation projects.
(7) The amounts represent ICBC’s projected earnings during government’s fiscal year. On ICBC’s fiscal year basis (December), the outlook for 2009 is: (budget) — $460 million, (outlook) — $563 million. For 2010 to 2012, the fiscal year and calendar year projections are assumed to be the same.
Budget and Fiscal Plan – 2010/11 to 2012/13
12
Three-Year Fiscal Plan
Table 1.4 Expense by Ministry, Program and Agency
| | 2009/10 (1) | | Budget | | | | | |
| | September | | Updated | | Estimate | | Plan | | Plan | |
($ millions) | | Update | | Forecast | | 2010/11 | | 2011/12 | | 2012/13 | |
Office of the Premier | | 10 | | 10 | | 10 | | 9 | | 9 | |
Aboriginal Relations and Reconciliation | | 67 | | 67 | | 40 | | 38 | | 37 | |
Advanced Education and Labour Market Development | | 2,117 | | 2,102 | | 2,114 | | 2,115 | | 2,121 | |
Agriculture and Lands | | 86 | | 95 | | 82 | | 80 | | 80 | |
Attorney General | | 465 | | 465 | | 468 | | 458 | | 458 | |
Children and Family Development | | 1,324 | | 1,318 | | 1,334 | | 1,334 | | 1,334 | |
Citizens’ Services | | 659 | | 638 | | 613 | | 598 | | 598 | |
Community and Rural Development | | 179 | | 178 | | 309 | | 220 | | 220 | |
Education | | 5,030 | | 5,025 | | 5,165 | | 5,243 | | 5,265 | |
Energy, Mines and Petroleum Resources | | 63 | | 60 | | 54 | | 50 | | 52 | |
Environment | | 171 | | 165 | | 167 | | 162 | | 162 | |
Finance | | 81 | | 79 | | 68 | | 64 | | 64 | |
Forests and Range | | 1,040 | | 1,019 | | 641 | | 595 | | 606 | |
Health Services | | 14,099 | | 14,010 | | 14,760 | | 15,680 | | 16,127 | |
Healthy Living and Sport | | 86 | | 86 | | 54 | | 51 | | 51 | |
Housing and Social Development | | 2,679 | | 2,679 | | 2,730 | | 2,694 | | 2,694 | |
Labour | | 18 | | 17 | | 16 | | 16 | | 16 | |
Public Safety and Solicitor General | | 597 | | 597 | | 602 | | 602 | | 603 | |
Small Business, Technology and Economic Development | | 63 | | 50 | | 62 | | 54 | | 54 | |
Tourism, Culture and the Arts | | 104 | | 103 | | 115 | | 96 | | 96 | |
Transportation and Infrastructure | | 734 | | 731 | | 753 | | 808 | | 808 | |
Total ministries and Office of the Premier | | 29,672 | | 29,494 | | 30,157 | | 30,967 | | 31,455 | |
Management of public funds and debt | | 1,186 | | 1,183 | | 1,301 | | 1,379 | | 1,432 | |
Contingencies | | 500 | | 456 | | 450 | | 450 | | 450 | |
Funding for capital expenditures | | 1,213 | | 968 | | 1,751 | | 1,162 | | 789 | |
Legislative and other appropriations | | 164 | | 164 | | 123 | | 122 | | 124 | |
Subtotal | | 32,735 | | 32,265 | | 33,782 | | 34,080 | | 34,250 | |
Prior year liability adjustments | | — | | (74 | ) | — | | — | | — | |
Consolidated revenue fund expense | | 32,735 | | 32,191 | | 33,782 | | 34,080 | | 34,250 | |
Expenses recovered from external entities | | 2,721 | | 2,659 | | 2,741 | | 2,604 | | 2,813 | |
Funding provided to service delivery agencies | | (19,315 | ) | (19,209 | ) | (20,704 | ) | (20,505 | ) | (20,337 | ) |
Ministry and special office direct program spending | | 16,141 | | 15,641 | | 15,819 | | 16,179 | | 16,726 | |
Service delivery agency expense: | | | | | | | | | | | |
School districts | | 5,324 | | 5,393 | | 5,440 | | 5,509 | | 5,527 | |
Post-secondary institutions | | 4,644 | | 4,639 | | 4,727 | | 4,789 | | 4,845 | |
Health authorities and hospital societies | | 10,696 | | 10,739 | | 11,141 | | 11,742 | | 11,995 | |
Other service delivery agencies | | 3,328 | | 3,288 | | 3,478 | | 3,383 | | 3,452 | |
Total service delivery agency expense | | 23,992 | | 24,059 | | 24,786 | | 25,423 | | 25,819 | |
Total expense | | 40,133 | | 39,700 | | 40,605 | | 41,602 | | 42,545 | |
(1) The 2009/10 budget estimate and revised forecast have been restated to reflect government’s current organization and accounting policies.
Budget and Fiscal Plan – 2010/11 to 2012/13
13
Three-Year Fiscal Plan
Chart 1.2 Taxpayer-supported debt burden remains affordable
The fiscal plan includes contingencies of $450 million in each year of the fiscal plan period to help manage unexpected pressures and fund priority initiatives. As well, government has included a forecast allowance of $300 million in each of 2010/11 and 2011/12, and $400 million in 2012/13 as an added measure of prudence against revenue and other spending pressures.
The three-year fiscal plan conforms to the standards and guidelines that comprise generally accepted accounting principles (GAAP) for senior governments. However, the Canadian accounting profession is in the process of adopting International Financial Reporting Standards (IFRS) with GAAP. In some aspects, IFRS is a significant departure from current Canadian accounting practice, and its adoption will introduce significant volatility into government’s operating statement and could materially affect the fiscal plan. For example, IFRS does not accurately reflect provincial legislation and the regulatory policy frameworks governing a number of government’s commercial Crown corporations. While government remains committed to having its financial reporting conform to GAAP, this issue may result in government adopting alternate accounting standards from other accredited standard setting organizations.
Revenue
Changes since September Update 2009
Since September Update 2009, revenue has increased $225 million cumulatively over the three years from 2010/11 to 2012/13, net of the change in the treatment of residential energy use credits and excluding the impact of re-profiling the federal HST transition contribution by reallocating $500 million from 2009/10 to 2010/11 and 2011/12. This reflects $1.2 billion in improvements from net income of Crown corporations, federal transfers and other revenue, partially offset by $1.0 billion lower taxation and natural resource revenue.
Budget and Fiscal Plan – 2010/11 to 2012/13
14
Three-Year Fiscal Plan
The $835 million loss in taxation revenue reflects a reduced 2008 personal income tax base; lower corporate income tax instalments from the federal government, partly offset by an improved outlook for BC corporate profits; $848 million lower harmonized sales tax (HST) due to additional rebates for new housing and the SUCH sector; and weaker than expected social service tax collections in 2009/10.
These losses are partly offset by $180 million stronger property transfer tax revenue reflecting a much improved housing market and the continuation of the tax on private sales of vehicles, now at 12 per cent. Since September, natural resource revenues decreased $201 million as the effects of lower forecasts of natural gas prices and Crown harvest forest volumes were partially offset by a higher outlook of coal, copper, electricity and bonus bid prices.
The 3-year $298 million improvement from commercial Crown net income mainly reflects an increase to the allowed return on equity for BC Hydro and lower claims cost projections for ICBC, partially offset by the operating losses projected by Transportation Investment Corporation during the construction phase of the new Port Mann Bridge. Higher other revenue and federal contributions excluding the HST transition payments total $963 million, mainly due to increased recoveries and federal stimulus funding that have offsetting expenses and ultimately no impact on government’s bottom line.
Chart 1.3 Revenue changes since September Update 2009 (1)

(1) Net of the change in the treatment of residential energy use rebates
Budget 2010 Plan
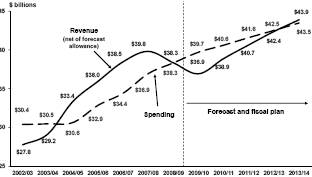
Following two years of declining growth in 2008/09 and 2009/10, total revenue is expected to average 4.9 per cent annual growth over the next three years. This reflects the relatively low base level in 2009/10, strengthening economic conditions, rising natural gas and lumber prices and improving forest harvest volumes expected over the next three years.
Over the three years of the Budget 2010 fiscal plan, taxation revenue is expected to average 5.6 per cent annual growth, consistent with the Ministry of Finance economic forecast including nominal GDP, personal income, corporate profits, consumer
Budget and Fiscal Plan – 2010/11 to 2012/13
15
Three-Year Fiscal Plan
Chart 1.4 Revenue trends

expenditures, housing starts and residential investment. Growth in natural resource revenue is forecast to average 13.5 per cent over the next three years reflecting increases in commodity prices and markets, in particular for natural gas, lumber, electricity and coal. Revenue growth from fees, investment earnings and other miscellaneous sources is expected to average 4.6 per cent annually based on planned Medical Service Plan premium rate increases; enhanced premium assistance; and forecasts provided by taxpayer supported Crown and SUCH sector agencies.
Federal government contributions are only expected to average 0.7 per cent annual growth as the scheduled end of stimulus and other one-time transfers, and federal government measures affecting the Canada Health Transfer partially offset normal growth in the Canada Health Transfer and Canada Social Transfer programs.
Commercial Crown net income is expected to average 2.8 per cent annual growth over three years reflecting improvements from BC Hydro, LDB and BCLC, partly offset by declining net income in ICBC. More detail on Crown corporation net income is provided in this chapter.
Chart 1.5 Revenue forecast
Budget and Fiscal Plan – 2010/11 to 2012/13
16
Three-Year Fiscal Plan
Table 1.5 Major Factors Underlying Revenue
Calendar Year | | September 1, 2009 | | March 2, 2010 | |
Per cent growth unless otherwise indicated | | 2009 | | 2010 | | 2011 | | 2012 | | 2009 | | 2010 | | 2011 | | 2012 | |
Real GDP | | -2.9 | | 1.9 | | 2.7 | | 2.7 | | -2.7 | | 2.2 | | 2.3 | | 2.7 | |
Nominal GDP | | -5.0 | | 3.5 | | 5.0 | | 5.1 | | -5.0 | | 4.5 | | 4.7 | | 5.0 | |
Personal income | | -1.0 | | 2.1 | | 3.8 | | 4.5 | | -1.5 | | 2.7 | | 3.5 | | 4.6 | |
Corporate profits | | -36.4 | | 7.3 | | 5.4 | | 8.2 | | -35.8 | | 12.7 | | 9.8 | | 7.6 | |
Consumer expenditures | | -2.0 | | 4.2 | | 4.5 | | 4.9 | | -2.1 | | 4.3 | | 4.5 | | 4.9 | |
Consumer expenditures on durable goods | | -12.3 | | -1.9 | | 1.1 | | 1.8 | | -8.0 | | 1.2 | | 1.6 | | 2.5 | |
Business investment | | -7.5 | | 5.5 | | 5.0 | | 6.3 | | -8.3 | | 5.4 | | 4.0 | | 5.6 | |
Residential investment | | -24.2 | | 15.5 | | 10.8 | | 8.5 | | -20.8 | | 17.9 | | 8.7 | | 6.4 | |
Retail sales | | -6.1 | | 3.4 | | 4.3 | | 4.5 | | -5.1 | | 3.9 | | 4.1 | | 4.6 | |
Employment | | -2.8 | | 0.5 | | 1.6 | | 1.7 | | -2.4 | | 0.9 | | 1.4 | | 1.8 | |
BC Housing starts | | -60.7 | | 28.5 | | 23.4 | | 17.9 | | -53.2 | | 27.4 | | 15.0 | | 9.4 | |
US Housing starts | | -42.2 | | 28.8 | | 47.0 | | 20.3 | | -38.7 | | 15.9 | | 25.0 | | 16.0 | |
SPF 2x4 price ($US/thousand board feet) | | $ | 176 | | $ | 200 | | $ | 238 | | $ | 288 | | $ | 181 | | $ | 225 | | $ | 238 | | $ | 288 | |
Pulp ($US/tonne) | | $ | 609 | | $ | 650 | | $ | 694 | | $ | 700 | | $ | 658 | | $ | 763 | | $ | 713 | | $ | 700 | |
Exchange rate (US cents/Canadian dollar) | | 86.2 | | 92.9 | | 92.6 | | 91.4 | | 87.6 | | 97.4 | | 98.6 | | 98.9 | |
Fiscal Year | | 2009/10 | | 2010/11 | | 2011/12 | | 2012/13 | | 2009/10 | | 2010/11 | | 2011/12 | | 2011/12 | |
Natural gas price ($Cdn/GJ at plant inlet) | | $ | 3.51 | | $ | 5.09 | | $ | 5.78 | | $ | 6.24 | | $ | 3.06 | | $ | 4.29 | | $ | 5.09 | | $ | 5.38 | |
Bonus bids average bid price per hectare ($) | | $ | 871 | | $ | 903 | | $ | 1,194 | | $ | 1,091 | | $ | 2,208 | | $ | 1,200 | | $ | 1,160 | | $ | 1,038 | |
Electricity price ($US/mega-watt hour, Mid-C) | | $ | 34 | | $ | 48 | | $ | 55 | | $ | 57 | | $ | 39 | | $ | 53 | | $ | 54 | | $ | 56 | |
Metallurgical coal price ($US/tonne, fob west coast) | | $ | 130 | | $ | 123 | | $ | 126 | | $ | 127 | | $ | 138 | | $ | 167 | | $ | 172 | | $ | 172 | |
Copper price ($US/lb) | | $ | 1.91 | | $ | 2.13 | | $ | 2.31 | | $ | 2.19 | | $ | 2.76 | | $ | 3.19 | | $ | 2.94 | | $ | 2.38 | |
Crown harvest volumes (million cubic metres) | | 44.0 | | 48.0 | | 53.0 | | 55.0 | | 41.0 | | 45.0 | | 47.0 | | 50.0 | |
Budget 2010 Plan — Major Revenue Sources
Key assumptions and sensitivities relating to revenue are provided in Appendix Table A9. The major revenue components are:
· Personal income tax — Over the three years, revenue incorporates almost $1.2 billion of personal income tax reductions provided to BC residents to help mitigate the impacts of the introduction of HST on July 1, 2010.
Table 1.6 Personal Income Tax Revenue
($ millions) | | 2010/11 | | 2011/12 | | 2012/13 | |
Budget 2010 revenue | | 5,861 | | 6,124 | | 6,545 | |
Previously announced measures: | | | | | | | |
– Basic personal amount tax credit increased to $11,000 | | 174 | | 183 | | 193 | |
– Elimination of sales tax & introduction of BC HST tax credit | | 157 | | 227 | | 227 | |
– Federal government | | 9 | | 9 | | 10 | |
– Dividend tax credits | | (79 | ) | (83 | ) | (88 | ) |
– Other measures | | 3 | | (2 | ) | (9 | ) |
Base personal income tax revenue | | 6,125 | | 6,458 | | 6,878 | |
Annual growth | | 4.3 | % | 5.4 | % | 6.5 | % |
Personal income growth (calendar year) | | 2.7 | % | 3.5 | % | 4.6 | % |
Labour income growth (calendar year) | | 2.8 | % | 4.5 | % | 4.9 | % |
Elasticity (1) (calendar year basis, policy neutral) | | 1.4 | | 1.4 | | 1.4 | |
(1) Per cent growth in current year tax relative to per cent growth in personal income.
Budget and Fiscal Plan – 2010/11 to 2012/13
17
Three-Year Fiscal Plan
These measures include a 17 per cent increase to the basic personal amount tax credit and a new BC HST Credit targeted to lower income families and individuals. Adjusting for the tax measures and the prior-year adjustment in 2009/10, base revenue is forecast to average 5.4 per cent annual growth over the three year plan, consistent with Budget 2010 projections of personal and labour incomes.
· Corporate income tax — declining $484 million or 36 per cent in 2010/11 as a lower payment share based on 2008 tax assessments results in lower instalment payments and BC repays a higher prior-year adjustment to the federal government. Revenue increases over the next two years reflecting changes in instalments and over/underpayments from the federal government in 2010 and 2011. The revenue forecast incorporates the tax rate reductions supporting the 2010/11 Revenue Neutral Carbon Tax Plan — namely the general rate reduction to 10.0 per cent over two years and the elimination of the small business tax rate, effective April 1, 2012. For more details on carbon tax recycling, see the Revenue Neutral Carbon Tax topic box on page 105.
Table 1.7 Corporate Income Tax Revenue
($ millions) | | 2010/11 | | 2011/12 | | 2012/13 | |
Advance instalments from the federal government: | | | | | | | |
– Payment share | | 11.8 | % | 10.4 | % | 11.5 | % |
– Advances | | 1,157 | | 1,149 | | 1,258 | |
International Financial Activity Act refunds | | (10 | ) | (10 | ) | (10 | ) |
Prior-year adjustment | | (300 | ) | (37 | ) | 95 | |
Corporate income tax revenue | | 847 | | 1,102 | | 1,343 | |
Annual per cent growth | | -36.4 | % | 30.1 | % | 21.9 | % |
· Harmonized sales tax (HST) — The introduction of the HST effective July 1, 2010 is part of government's overall strategy to enhance business competitiveness, encourage investment, improve productivity and reduce administrative costs and burden. Revenue growth is based on the Ministry of Finance Budget 2010 economic forecast of consumer expenditures and residential investment. These two bases together are expected to comprise about 84 per cent of the total BC portion of the HST base.
Revenue projections are net of $4.7 billion of rebates provided over the next three years at the point-of-sale mainly on motive fuel purchases and new housing, and directly to municipalities, charities, non-profit organizations and the SUCH sector.
Table 1.8 Sales Taxes Revenue
($ millions) | | 2010/11 | | 2011/12 | | 2012/13 | |
Harmonized Sales Tax (BC’s portion of HST) | | | | | | | |
Gross | | 4,914 | | 6,915 | | 7,311 | |
Temporary restrictions of input tax credits | | 118 | | 162 | | 168 | |
Rebates | | (1,248 | ) | (1,701 | ) | (1,751 | ) |
BC’s portion of HST | | 3,784 | | 5,376 | | 5,728 | |
Social service tax | | 1,274 | | 30 | | — | |
Tax on private sales of vehicles | | 125 | | 171 | | 173 | |
Annual per cent change (calendar year) | | 2010 | | 2011 | | 2012 | |
Consumer expenditure | | 4.3 | % | 4.5 | % | 4.9 | % |
Residential investment | | 17.9 | % | 8.7 | % | 6.4 | % |
Retail sales | | 3.9 | % | 4.1 | % | 4.6 | % |
Nominal GDP | | 4.5 | % | 4.7 | % | 5.0 | % |
Budget and Fiscal Plan – 2010/11 to 2012/13
18
Three-Year Fiscal Plan
The projections also are net of credits on residential energy purchases. In total, these rebates and credits account for about 25 per cent of the total gross HST. Revenue also includes the temporary restriction of input tax credits of large businesses as announced in September Update 2009; however projections do not incorporate the personal income tax reductions from increasing the basic personal amount tax credit to $11,000 and the introduction of the BC HST Credit. For more details on HST revenue, see the HST topic box on page 92 and Appendix Table A9.
· Other sales tax — Social service tax revenue is based on a forecast of collections in the April to June period, 2010 and audit recoveries in respect of prior years. After June 30, 2010, government will continue the tax on private sales of vehicles, but at a 12 per cent rate, which is expected to generate $173 million by 2012/13.
· Carbon tax — as announced in Budget 2008, the carbon tax rate per tonne of CO2-equivalent will increase by $5 each year to $25 per tonne in 2011/12. The forecast assumes that purchased volumes of natural gas will grow by 2.0 per cent while consumption of gasoline is expected to be decline by 1.0 per cent over the three year plan. Revenue is expected to increase in line with these higher rates and assumed volume growth. Carbon tax revenue is fully returned to taxpayers through tax reductions. For more details on carbon tax recycling, see the Revenue Neutral Carbon Tax topic box on page 105.
· Property tax — revenue is expected to average 2.0 per cent annual growth over the fiscal plan and includes the effects of an Industrial Property Tax Credit for light and major industrial properties announced on October 22, 2008 and other tax measures including the northern and rural homeowner benefit announced in February 2009. These tax cuts are included in the 2010/11—2012/13 Revenue Neutral Carbon Tax Plan. For full details on tax initiatives, see Part 2: Tax Measures.
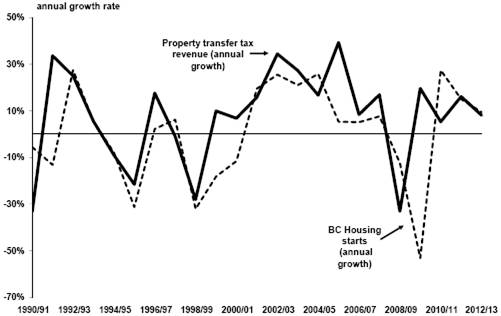
· Property transfer tax — revenue is forecast to increase 5.3 per cent in 2010/11, much slower than growth in BC housing starts in 2010 reflecting recent strength in resale housing activity that is expected to level off as pent-up demand abates and interest rates rise. Over the next two years, annual revenue growth is forecast to average 12.1 per cent — in line with the average growth in BC housing starts.
Chart 1.6 Property transfer tax
Budget and Fiscal Plan – 2010/11 to 2012/13
19
Three-Year Fiscal Plan
· Natural gas royalties — over the next three years, revenue increases on average by 39 per cent per year due to rising natural gas prices and production volumes, partially offset by increasing production from wells qualifying for royalty programs and credits. Although prices are forecast to average 21 per cent annual growth over the next three years, they are expected to remain below recent historical levels until 2012/13. Growth in production volumes is due in part to the effects of the royalty programs including the oil and gas stimulus package announced August 6, 2009 and expected increase in demand and prices with an improving North American economy. The government continues to provide royalty programs and credits to foster industry investment in exploration and development. See Appendix Table A10 for more details regarding natural gas price forecasts.
Chart 1.7 Revenue from energy, metals and minerals
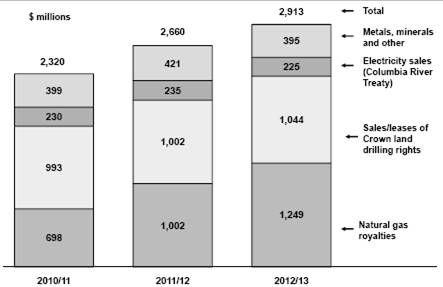
· Other energy, metals and minerals — average annual revenue growth from sales of Crown land tenures is forecast to be 3.5 per cent over the three years as annual cash sales are recorded as revenue over eight years which tends to moderate volatility. Revenue from other energy, metals and minerals increases $64 million (11.3 per cent) in 2010/11 mainly due to the improvement in the outlook of electricity prices. Revenue increases $27 million (4.3 per cent) and falls $36 million (5.5 per cent) over the next two years due to the effects of commodity prices, production volumes, exchange rates and mining costs.
· Forests — revenue is forecast to increase $146 million or 42 per cent and $106 million (22 per cent) in 2010/11 and 2011/12, respectively, as lumber prices and US housing markets including lumber exports are expected to recover. Despite this strong annual growth, revenue is projected to be well below recent historical levels of over a billion dollars. In 2012/13, revenue is relatively flat as increasing stumpage revenue is offset by declining border tax revenue collected under the Softwood Lumber Agreement (SLA). SLA border tax revenue is expected to decrease as the rate applied to US exports falls to 5 per cent from 15 per cent, consistent with the assumed recovery of lumber prices to US$300 per thousand feet.
· Fees, investment earnings and other miscellaneous sources — averaging 4.6 per cent annual growth over the three year fiscal plan period reflecting planned increases to Medical Service Plan premium rates to match rising health care expenditures, partially offset by
Budget and Fiscal Plan – 2010/11 to 2012/13
20
Three-Year Fiscal Plan
enhanced premium assistance; increasing ministry recoveries and earnings from fiscal agency loans; and forecasts provided by the SUCH sector and taxpayer supported Crown corporations. Ministry recoveries and earnings from fiscal agency loans are forecast to grow 10.6 per cent over the next three years with offsetting expenses resulting in no impact on the bottom line.
· Health and social transfers — Over the three years, revenue is expected to average 4.6 per cent annual growth reflecting national base growth, a rising BC population share and incorporating federal government health transfer measures announced in its budget on January 27, 2009, scheduled to take effect in 2011/12.
Table 1.9 Federal Government Contributions
($ millions) | | 2009/10 | | 2010/11 | | 2011/12 | | 2012/13 | |
Canada Health Transfer (CHT) | | 3,354 | | 3,597 | | 3,703 | | 3,939 | |
Wait times | | 33 | | 33 | | 33 | | 33 | |
Health deferral | | 68 | | 53 | | 23 | | 23 | |
Canada Social Transfer (CST) | | 1,433 | | 1,482 | | 1,533 | | 1,585 | |
Prior-year adjustments | | (6 | ) | — | | — | | — | |
Total health and social transfers | | 4,882 | | 5,165 | | 5,292 | | 5,580 | |
| | 2.9 | % | 5.8 | % | 2.5 | % | 5.4 | % |
BC share of national population (June 1) | | 13.20 | % | 13.26 | % | 13.31 | % | 13.37 | % |
Harmonized sales tax transition payments | | 250 | | 769 | | 580 | | — | |
Other contributions | | 1,702 | | 1,751 | | 1,411 | | 1,399 | |
· HST transitional funding —in order to facilitate the participation of the Province in the harmonized sales tax system, Canada committed to provide $1.6 billion transitional funding over the three years 2009/10 to 2011/12.
· Other federal contributions — up 2.9 per cent or $49 million in 2010/11 as increased funding for BC Housing Management Commission (with offsetting expenses) are partially offset by reduced transfers that were mainly one-time in 2009/10. Revenue declines $340 million or 19.4 per cent in 2011/12 primarily reflecting the scheduled end of stimulus funding for capital and housing projects with offsetting reduced expenses. Revenue is relatively flat in 2012/13 as transfers continue at a more normal level.
Commercial Crown Corporation Net Income
· British Columbia Hydro and Power Authority — BC Hydro’s net income, based on meeting its allowed return on equity (ROE), is forecast at $609 million in 2010/11, $660 million in 2011/12 and $640 million in 2012/13.
The annual increase is primarily the result of a decision by the BC Utilities Commission to increase the allowed ROE of BC Hydro’s industry comparator, Terasen Gas Inc. BC Hydro’s allowed ROE is usually set at the same pre-tax rate as its industry comparator.
Revenue projections for the fiscal plan period (2010/11 to 2012/13) show a decline of 7 per cent compared to the September Update 2009 outlook, mainly due to a combination of lower domestic sales volume, reduced trade activity and lower market forward energy prices. This decline is partially offset by lower energy purchase volumes due to lower domestic demand and lower energy purchase prices.
Budget and Fiscal Plan – 2010/11 to 2012/13
21
Three-Year Fiscal Plan
The forecast purchase of a one-third undivided interest in the Waneta Dam owned by Teck Metals Limited, as well as BC Hydro’s capital plan, has resulted in an 8.9 per cent increase in amortization expense and financing charges over the fiscal plan period.
Potential rate increases are subject to approval by the BC Utilities Commission through the revenue requirements application process (see Appendix Table A9 for rate assumptions).
· British Columbia Liquor Distribution Branch (LDB) — LDB’s net income is forecast at $974 million in 2010/11, $1,013 million in 2011/12 and $1,039 million in 2012/13, unchanged from September Update 2009. These projections reflect modest growth in the sale of beer, wine and spirits, and efficiencies to mitigate upward pressure on operating costs.
· British Columbia Lottery Corporation — BCLC’s net income (after payments to the federal government) is forecast at $1,106 million in 2010/11, $1,153 million in 2011/12 and $1,195 million in 2012/13. These projections are down $33 million, $6 million and $10 million respectively from September Update 2009, reflecting less discretionary spending by consumers on casino gaming.
Despite these unfavourable variances from the previous budget, moderate growth is projected for year-over-year net income as a result of the introduction of new lottery games, Keno enhancements, and internet-based games; further investment in casinos; and a reduction in discretionary spending.
Approximately 20 per cent of provincial income from gaming is redistributed to charities and local governments. In Budget 2010, total distributions of gaming income are projected at $229 million in 2010/11, $233 million in 2011/12 and $237 million in 2012/13. As well, $147 million of lottery revenue is allocated to the Health Special Account in support of health services.
· Insurance Corporation of British Columbia — ICBC’s net income is forecast at $303 million in 2010, $245 million in 2011 and $212 million in 2012. These amounts are up $54 million, $36 million and $6 million respectively from September Update 2009. Net income projections reflect current premium rates, moderate growth in the number of insured vehicles and longer term claims trends.
The improved outlook for 2010 reflects higher investment income and lower claims costs, partially offset by higher operating expenses as a result of costs related to the renewal of critical business systems. While the claims and operating cost trends continue into 2011 and 2012, there is a decrease in investment income as a result of government’s decision to have ICBC remit its excess optional capital to the consolidated revenue fund.
ICBC’s financial performance since the current regulatory framework was put into place in 2002/03 has resulted in the corporation being well capitalized in both its Basic and Optional insurance lines of business as measured according to the guideline set by the federal government’s regulator of insurance companies. Basic insurance capitalization is the purview of the BC Utilities Commission, which set rates for compulsory vehicle insurance. However, in proposed changes to ICBC’s legislation, government will reinforce the application of the federal guideline to ICBC’s Optional insurance capitalization to ensure ICBC operates in a manner similar to private insurance companies in a competitive marketplace. Income from this line of business
Budget and Fiscal Plan – 2010/11 to 2012/13
22
Three-Year Fiscal Plan
that is not required to maintain sufficient capital to meet the federal guideline will be remitted to the CRF in support of core government services.
· Transportation Investment Corporation (TI Corp) — TI Corp is projecting losses during construction of the new Port Mann Bridge and the adjacent highway. On completion of the project in 2013/14, TI Corp will begin charging tolls, and net income will be realized when annual toll revenue increases to a level that fully funds expenses, including operating and maintenance costs, amortization, and debt service charges. Over the 40 year project plan, TI Corp projects being able to retire all of the debt incurred during the construction phase.
Consolidated Revenue Fund Spending
Consolidated Revenue Fund (CRF) spending is projected to increase from a $32.7 billion budget in 2009/10 to $34.2 billion by 2012/13, an increase of $1.5 billion by the third year of the fiscal plan.
Despite the loss of revenue caused by the global economic downturn, government continues to support as a priority the key services British Columbians depend on, including health care, education and social services. Government is also managing spending tightly in order to bring spending in line with revenue by 2013/14, and continues to make strategic investments in key areas. These include investments to support communities, families and youth into the 21st century, encourage clean energy options, continue important community infrastructure investments, and protect health care for BC citizens in innovative ways.
In support of these priority areas, Budget 2010 provides additional operating funding in the following areas compared to September Update 2009:
· a funding increase for health care of $447 million in 2012/13, for a total budget increase of over $2 billion since 2009/10;
· $108 million focused on communities, families and youth, including $60 million in new funding for a 2010 Sports and Arts Legacy, and an additional $22 million for full-day kindergarten for five-year olds;
· $69 million for justice and policing operations;
· an additional $156 million over three years for education, including $150 million for schools in addition to the allocation for full-day kindergarten;
· $35 million in additional funding for LiveSmartBC programs;
· $58 million in additional provincial funding infrastructure spending in communities, to be matched by other levels of government; and
· $100 million in new clean energy development funding, to support new jobs and investments in communities, while at the same time lowering greenhouse gas emissions.
As the province enters a new decade, it must ensure its financial resources are focused on those areas that reflect tomorrow’s needs. Government is therefore rationalizing budgets in five resource ministries and the resulting savings have been redirected to priorities that will assist families, support our youth in achieving their full potential, fuel our community arts economies, and encourage a cleaner environmental future for all British Columbians.
Budget and Fiscal Plan – 2010/11 to 2012/13
23
Three-Year Fiscal Plan
Government has also achieved significant savings by centralizing administrative budgets for building and information technology management into the Ministry of Citizen’s Services.
In aggregate over the three year fiscal plan, Budget 2010 reflects a $1.36 billion increase in ministry spending in priority areas compared to September Update 2009, facilitated in part by $320 million in ministry savings and $267 million in reduced debt servicing costs.
Increased Health Care Spending
Protecting Health Care
Protecting health care is a top priority for Budget 2010. With a further budget increase of $447 million in 2012/13, the Ministry of Health Services’ budget will increase by over $2 billion, or 14 per cent, from the 2009/10 level. This represents the largest share of funding increases of all ministries in Budget 2010.
Chart 1.8 Ministry of Health Services budget increases
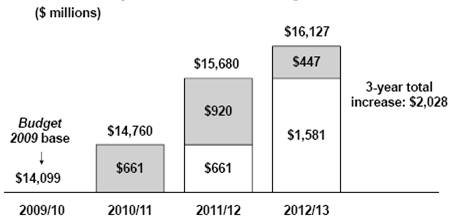
Funding increases for the Ministry of Health Services are focused on sustaining front-line service delivery:
· $1.3 billion for the Regional Health Sector for services delivered by health authorities and other service delivery partners, including acute care services, community and home-based services, assisted living and residential care services, mental health and addictions services, health promotion, disease prevention and other public health services;
· $514 million for the Medical Services Plan to fund increased volumes of physician and laboratory services, and recruitment and retention of specialists and family physicians, particularly in rural and remote communities;
· $145 million for PharmaCare for coverage of new drugs and volume and price increases for prescription drugs; and
· $52 million for ground and air ambulance services, training of emergency personnel, and a tele-health platform — HealthLinkBC — providing self-care and other health services.
Budget and Fiscal Plan – 2010/11 to 2012/13
24
Three-Year Fiscal Plan
In addition, $80 million in 2010/11 and $180 million in 2011/12 included in the Ministry of Health Service’s budget has been allocated toward innovation, pay for performance, and integration and standardization of health care operations and service delivery.
Over three years, funding for health authorities increases by $1.3 billion. All health authorities have provided balanced budget plans to the Ministry of Health Services for each year of the fiscal plan period.
Innovation that reduces the growth rate of health care costs, while raising productivity and improving health outcomes, is one of the best options for keeping the health care system sustainable. Government continues to promote healthy living as a key means of reducing health care demands in the future.
Health education and research institutions play an important role in health innovation, and an additional $15 million from the Ministry of Health Services budget in 2009/10 is being provided to the Michael Smith Foundation for important biomedical, clinical, health services and population health research. In total, government has invested over $250 million in the Michael Smith Foundation since 2001/02.
To further protect health care, the government has ensured that health authorities and other organizations that are eligible for the federal GST rebate will also qualify for a rebate on provincial HST paid. Eligible hospital societies, facility operators and external suppliers will continue to qualify for rebates on the 5 per cent federal portion of the HST (which replaces the GST) and will also be eligible for rebates applicable to the 7 per cent provincial portion of the HST. This measure is meant to ensure that, on average, these organizations will pay no additional tax due to harmonization.
Revenue Sources Allocated to Health Care
Health spending by function includes all health care related spending by the Ministry of Health Services and other ministries, including Healthy Living and Sport, Children and Family Development, and Housing and Social Development.
On a consolidated basis, health spending by function increases to $17.9 billion
(42.1 per cent of all government spending) by 2012/13, up from $10.6 billion
(34.8 per cent of all government spending) in 2001/02.
Government is committed to allocating to health spending all revenue received from five key revenue sources — harmonized sales tax; medical services plan premiums; tobacco taxes; lottery revenues dedicated to the Health Special Account; and health transfer payments from the federal government. In 2010/11, health spending is estimated to exceed the combined total revenue from these sources by $6.4 billion (see Table 1.10) In 2010/11, 61 per cent of health spending is funded by these revenue sources, rising to 70 per cent by 2012/13.
If government health spending continues to grow at the current pace, it will increasingly crowd out spending in other areas. Therefore, the government will introduce legislation to require the Minister of Finance to report annually to the Legislature on planned health
Budget and Fiscal Plan – 2010/11 to 2012/13
25
Three-Year Fiscal Plan
Table 1.10 Revenue Sources Allocated to Health Care
($ millions) | | 2010/11 | | 2011/12 | | 2012/13 | |
Harmonized Sales Tax | | 3,784 | | 5,376 | | 5,728 | |
Medical Services Plan Premiums | | 1,741 | | 1,886 | | 2,020 | |
Tobacco Tax | | 686 | | 686 | | 686 | |
Health Special Account | | 148 | | 148 | | 159 | |
Major Federal Government Transfers | | 3,683 | | 3,759 | | 3,995 | |
Total Health-related Revenue | | 10,042 | | 11,855 | | 12,588 | |
Total Health Spending by Function | | 16,474 | | 17,426 | | 17,893 | |
Health Spending in Excess of Revenue | | 6,432 | | 5,571 | | 5,305 | |
spending in relation to these health-related revenue sources. The purpose of these reports will be to demonstrate to British Columbians the significance of the HST and other key revenue sources to sustaining health spending.
Supporting Communities, Families and Youth
Budget 2010 provides an additional $108 million over three years to reflect government’s commitment to support families through investments in education, services that assist families with children, youth sport development and excellence; and by building our community level creative economies.
Table 1.11 Supporting Communities, Families and Youth
($ millions) | | 2010/11 | | 2011/12 | | 2012/13 | | Total | |
Implement full-day kindergarten | | — | | — | | 22 | | 22 | |
Supports for child care | | 8 | | 9 | | 9 | | 26 | |
2010 Sports and Arts Legacy | | 20 | | 20 | | 20 | | 60 | |
Total | | 28 | | 29 | | 51 | | 108 | |
In recognition of the importance of early childhood development Budget 2010 provides an additional $22 million to fully fund the implementation of voluntary, full-time kindergarten for five-year olds, in every school by September 2011 at $129 million annually by 2012/13.
An additional $26 million in funding is provided in Budget 2010 to support child care programs that assist low and moderate income families with the cost of child care. The budget also continues to support priority programs and services for families and communities to care for and protect vulnerable children and youth, and to support healthy child and family development. Assistance and safeguards for vulnerable children will also be maintained through a new Extended Family Program which will modernize and improve upon the Child in Home of a Relative Program.
Budget 2010 also provides another $60 million over the next three fiscal years to provide a 2010 Sports and Arts Legacy for youth sports and community arts activities. These funds are earmarked as part of the Contingencies and New Programs Vote to provide flexibility of access. These programs are still under development and the eligibility details will be finalized in the coming weeks.
Budget and Fiscal Plan – 2010/11 to 2012/13
26
Three-Year Fiscal Plan
The allocation is divided equally between sports and arts initiatives. Building on the momentum of the 2010 Olympic and Paralympic Winter Games, $30 million will facilitate increased participation in sports and sports excellence, with an emphasis on youth and improved athlete and coach development. The remaining $30 million will enhance existing provincial investments in the arts, promoting music, theatre, dance and other artistic pursuits in BC communities to further fund community arts activities.
Budget 2010 continues to provide $160 million in 2012/13 in support of those in need of income assistance during the economic downturn, which is an extension of the $160 million annual increase provided in 2010/11 and 2011/12 in September Update 2009.
Justice and Public Safety
Budget 2010 provides an additional $69 million over the next three years in support of the justice system and to enhance public safety.
Table 1.12 Justice and Public Safety
($ millions) | | 2010/11 | | 2011/12 | | 2012/13 | | Total | |
Maintaining the court system | | 10 | | 10 | | 10 | | 30 | |
Supporting increased RCMP policing costs | | 12 | | 13 | | 14 | | 39 | |
Total | | 22 | | 23 | | 24 | | 69 | |
This amount includes $30 million over three years to maintain the court system, which is in addition to the $33 million provided in September Update 2009 to support major prosecutions.
The remainder is comprised of $39 million over three years to fund additional RCMP policing costs related to the RCMP national back-up policy which requires a two member minimum response in specific situations, as well as RCMP and support staff salary and operating cost increases.
Increased Education Funding
Table 1.13 Maintaining Educational Opportunities
($ millions) | | 2010/11 | | 2011/12 | | 2012/13 | | Total | |
Increased funding for schools | | 50 | | 50 | | 50 | | 150 | |
Medical program expansion | | — | | — | | 6 | | 6 | |
Total | | 50 | | 50 | | 56 | | 156 | |
K-12 Education
The February 2010 Throne Speech outlined the importance of supporting families with children, and emphasized the importance of educational improvements in meeting that objective. Budget 2010 includes a number of measures that will increase resources and opportunities in the K—12 system, consistent with government’s past actions to enhance education and literacy.
Budget and Fiscal Plan – 2010/11 to 2012/13
27
Three-Year Fiscal Plan
Compared to September Update 2009, a targeted allocation of an additional $150 million to schools over three years is being added to the Ministry of Education budget. This confirms that the cost of full day kindergarten and the teacher’s wage increase under the collective agreement that expires in June 2011 are both fully funded. This is also consistent with the balanced budget financial forecasts for the school districts prepared by the Ministry of Education (see Appendix Table A8).
In total, and including previously budgeted items, operating funding for schools increases by $112 million, from $4.55 billion in 2009/10 to $4.66 billion in 2010/11 on a school year basis. On an individual level, this raises per pupil funding from almost $8,200 in 2009/10 to an estimated $8,301 for 2010/11, despite the increase in enrolment due to the introduction of full-day kindergarten for five-year olds (see Chart 1.9).
Chart 1.9 Student enrolment and per pupil funding (public schools)
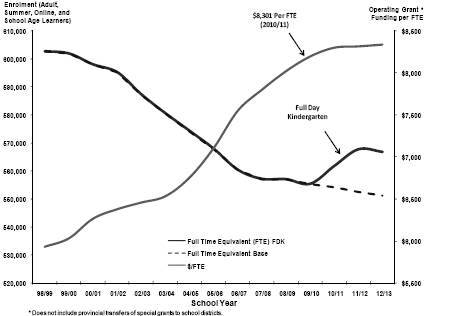
Additional relief has also been provided by making the sector eligible for rebates for the incremental costs that will be incurred by the K—12 sector upon the introduction of the HST. Eligible schools, school boards and school authorities will continue to qualify for rebates on the 5 per cent federal portion of the HST (which replaces the GST) and will also be eligible for rebates applicable to the 7 per cent provincial portion of the HST. At a minimum, this will relieve a potential $32 million operating pressure that was identified by the school districts.
Budget 2010 also announces that $110 million in annual facilities grants for maintenance of schools will be provided to school districts between now and March 31, 2011.
Post-Secondary Education
Budget 2010 maintains funding to post-secondary institutions (PSI) at $1.88 billion in 2010/11, which includes the $55 million annual lift that was added in Budget 2009 and apportioned to the universities, colleges, and institutes. (see Chart 1.10) Complementing the emphasis on improving K—12 education, government will be moving forward with additional initiatives to enhance learning at the post-secondary level.
Budget and Fiscal Plan – 2010/11 to 2012/13
28
Three-Year Fiscal Plan
Chart 1.10 Post-secondary funding
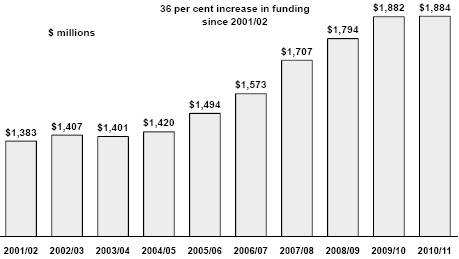
For example, government has previously committed to increasing the number of new medical spaces at various locations throughout the province, including at UNBC in Prince George and at UBC Okanagan in Kelowna. In order to fund this expansion, the PSI budget also contains an increase of $11.0 million in 2010/11, rising to $12.4 million in 2011/12 and $18.2 million in 2012/13. These budget increases were included in September Update 2009, except for an additional lift of $5.8 million, now provided in 2012/13.
Further investments in post-secondary education throughout the province are also planned. For example, government has committed to relocating the Emily Carr University of Art+Design to the Great Northern Way campus in the Lower Mainland, and a Wood Innovation and Design Centre will be established in Prince George.
As is the case with school districts, the introduction of the HST will create incremental costs for PSIs. Therefore, rebates will also be available for eligible universities and public colleges to ensure that, on average, they will pay no additional tax due to harmonization. Eligible institutions will continue to qualify for rebates on the 5 per cent federal portion of the HST (which replaces the GST) and will also be eligible for the applicable rebates of the 7 per cent provincial portion of the HST.
The February Throne Speech also anticipates the work that government will be undertaking towards allowing universities to operate outside the government reporting entity (GRE). Currently, even though the larger universities receive less than 50 per cent of their revenues from the provincial government, the financial statements of all publicly-funded PSIs (as is the case with the health authorities, school districts, and Crown corporations) are consolidated into the GRE for purposes of financial reporting under Generally Accepted Accounting Principles (GAAP). Since these entities are considered to be under government control in terms of key areas such as the ability to make board appointments, levels of debt, approval of capital expenditures, and land transactions, they are considered to be within the GRE according to GAAP.
The legislation that government intends to develop will reflect the principles whereby universities would be free from government control while recognizing that accountability for public funds will continue to be a key area of interest.
Budget and Fiscal Plan – 2010/11 to 2012/13
29
Three-Year Fiscal Plan
Infrastructure and Climate Action Investments
Table 1.14 Community Infrastructure and Clean Energy Initiatives
($ millions) | | 2010/11 | | 2011/12 | | 2012/13 | | Total | |
Municipal infrastructure investments | | 58 | | — | | — | | 58 | |
Additional funding for LiveSmartBC | | 5 | | 15 | | 15 | | 35 | |
Climate action and clean energy development | | 20 | | 40 | | 40 | | 100 | |
Total | | 83 | | 55 | | 55 | | 193 | |
Municipal Infrastructure
Communities remain a vital partner in the province’s challenging goal to return to a more prosperous economy in the near future. The province has provided significant infrastructure funding to communities over the last year and continues to do so in Budget 2010.
As part of the province’s accelerated infrastructure plan, additional provincial operating funding of $58 million in 2010/11 has been made available to finance further federal-provincial-municipal cost-shared community infrastructure projects. This funding brings the total provincial commitment for the communities component of the Building Canada Fund and Infrastructure Stimulus Fund community infrastructure programs to $290 million.
Climate Action and Clean Energy Development
A sustainable clean environment remains a key element in the province’s fiscal plan. A key government initiative in support of this goal has been the LiveSmartBC program, which has the added benefit of stimulating job creation in communities. Therefore, building on the current $60 million commitment already funded, an additional $35 million over three years is being provided for LiveSmartBC programs, which provide financial support to households for energy audits and energy efficiency building retrofits.
In addition, government continues to encourage investments in a more energy-efficient economy through the establishment of a new Climate Action and Clean Energy allocation in the Contingencies and New Programs Vote, providing $100 million over three years. This allocation will support investments in the following areas:
· partnerships in infrastructure to support cleaner transportation choices;
· support for the production of bio-fuels from wood waste, including ethanol and wood pellets; and
· further encouragement for new forms of electricity generation, including wind, solar, geothermal, tidal, wave, and run-of-river applications.
This new funding will complement the anticipated Clean Energy Act to be introduced into legislation in the near future.
Budget and Fiscal Plan – 2010/11 to 2012/13
30
Three-Year Fiscal Plan
Refocusing Financial Resources
As the province enters the start of a new decade, it must ensure its financial resources are focused on those areas that reflect tomorrow’s needs. The government continues to rationalize certain sector specific activities and redirect funding to priority areas.
In particular, as the forest sector continues to dramatically transform itself to target new areas of economic viability, the province too must look to manage land and natural resources in a more efficient and effective manner.
The identification of common delivery mechanisms among ministries, reductions in non-priority areas, and the rationalization of other activities in several resource ministries will achieve savings of $70 million in 2010/11 and $125 million in each of the two outer years of the fiscal plan. This includes savings to be realized from the centralization of ministry shared services (i.e. the central coordination and funding of government office space and information technology infrastructure and support). See the Expenditure Management Update topic box for further information.
Table 1.15 Refocusing Financial Resources
($ millions) | | 2010/11 | | 2011/12 | | 2012/13 | | Total | |
Forests and Integrated Land Management Bureau | | 38 | | 80 | | 80 | | 198 | |
Agriculture and Lands | | 5 | | 7 | | 7 | | 19 | |
Community and Rural Development | | 4 | | 6 | | 6 | | 16 | |
Energy Mines and Petroleum Resources | | 3 | | 5 | | 5 | | 13 | |
Transportation and Infrastructure | | 5 | | 5 | | 5 | | 15 | |
Efficiencies from shared services centralization | | 15 | | 22 | | 22 | | 59 | |
Total | | 70 | | 125 | | 125 | | 320 | |
2010 Olympic and Paralympic Winter Games
Government’s total financial commitment towards the costs of staging the 2010 Olympic and Paralympic Winter Games (2010 Games) is $765 million. This includes a direct financial commitment of $600 million as well as an indirect commitment of $165 million stemming from an agreement with Canada on 2010 Games security and provincial transportation infrastructure financing.
The direct financial commitment consists of provincial contributions towards components that are jointly funded with the federal government, including venues, security, a venue operating trust, live sites and the hosting of the Paralympic Games. It also includes a provincial funding commitment in relation to medical costs, First Nations, sports and municipal legacies.
In recognition of Canada’s higher costs for providing 2010 Games security, the Province has agreed to finance $165 million of the federal share of major infrastructure costs from 2009/10 to 2011/12. The Province considers this infrastructure financing arrangement as an additional indirect commitment to the 2010 Games.
Budget and Fiscal Plan – 2010/11 to 2012/13
31
Three-Year Fiscal Plan
The $765 million contains a total of $79 million within the contingencies vote for managing 2010 Games financial risks ($69 million in 2009/10 and $10 million in 2010/11).
Table 1.16 Olympics Funding
| | Prior | | | | | | | | | | Provincial | |
($ millions) | | years | | 2009/10 | | 2010/11 | | 2011/12 | | 2012/13 | | Commitment | |
Venues and Live Sites | | 292 | | 18 | | — | | — | | — | | 310 | |
Venues operating endowment | | 55 | | — | | — | | — | | — | | 55 | |
Medical | | 5 | | 8 | | — | | — | | — | | 13 | |
Security — Initial provincial commitment | | 87 | | — | | — | | — | | — | | 87 | |
Paralympic Games | | 20 | | — | | — | | — | | — | | 20 | |
First Nations and municipal legacies | | 36 | | — | | — | | — | | — | | 36 | |
Olympics contingency allocation (1) | | — | | 69 | | 10 | | — | | — | | 79 | |
Total direct provincial commitment | | 495 | | 95 | | 10 | | — | | — | | 600 | |
Indirect provincial commitment to increase provincial share of federal/provincial infrastructure costs | | — | | 41 | | 87 | | 37 | | — | | 165 | |
Total direct and indirect commitment | | 495 | | 136 | | 97 | | 37 | | — | | 765 | |
(1) Notionally allocated within the Contingencies vote.
HST Impacts on CRF Spending
After the HST is implemented, ministries will be required to pay the HST on taxable purchases, but these incremental costs will be fully rebated.
The Sustainable Environment Fund (SEF) and the Innovative Clean Energy (ICE) Fund are currently funded by specific PST levies that will be eliminated with the introduction of the HST, as will the Resort Municipality Tax Transfer Program. As a result, the following measures have been taken:
· Sustainable Environment Fund (SEF) — funding is being allocated to the Ministry of Environment to offset the loss of the $5 levy on lead-acid batteries and the end of the PST on diapers.
· Innovative Clean Energy (ICE) Fund — no incremental funding will be added in Budget 2010, as there is an accumulated balance in the fund that is sufficient to support anticipated expenditures for several years. Spending is expected to be maintained at $15 million annually, and is complemented by the new Climate Action and Clean Energy funding reserved in the Contingencies and New Programs Vote.
· Resort Municipality Tax Transfer Program — notional access to contingencies of $7.5 million is provided in 2010/11 for the portion of the tax that will not be collected in that year (i.e. after June 30, 2010). Funding for this program (now providing marketing funding to 13 resort municipalities) will continue in future years.
Management of the BC Public Service
Since 2002, the BC public service (ministries and special offices) as measured in full-time equivalents (FTEs) has averaged approximately 30,000 FTEs annually. Within the overall consolidated revenue fund, staffing costs (salaries and benefits) represent approximately 7 per cent of the consolidated revenue fund’s gross expenditures.
Budget and Fiscal Plan – 2010/11 to 2012/13
32
Three-Year Fiscal Plan
Consistent with September Update 2009, public service FTEs are presented in Budget 2010 on an aggregate basis, as shown in Appendix Table A12.
Between 2009/10 and 2012/13, public service FTEs are projected to decrease, as shown in Chart 1.11. Voluntary exits, including retirements, are expected to continue at consistent rates across the fiscal plan, resulting in attrition-based reductions in the public service.
Chart 1.11 Managing FTEs
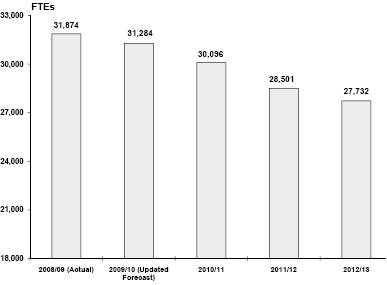
Despite expected natural attrition, some involuntary staff reductions will likely be necessary in 2010/11 and 2011/12 to ensure government manages within annual budget targets and achieves a balanced budget by 2013/14. As such, the forecasted decline in FTEs also reflects the budgetary requirement for government to prioritize key government services and programs and achieve savings and improved effectiveness in their delivery.
Staffing impacts will not be distributed equally across ministries as the focus will be on preserving frontline services. In order to ensure affordable and effective delivery of government services, impacted staff will be reallocated across ministries wherever possible. Government’s current policy of limiting external hires facilitates this reallocation and provides further opportunities for reducing involuntary exits.
To protect jobs and preserve services essential to British Columbians, Budget 2010 does not include funding for wage increases as collective agreements are renewed, consistent with the net-zero cost mandate for the collective bargaining cycle already underway.
Service Delivery Agency Spending
Service delivery agency spending is forecast to increase from $24.0 billion in 2009/10 to $25.8 billion by 2012/13, reflecting a total increase of $1.8 billion over the three-year period. Compared to September Update 2009, the current projections are up $67 million in 2009/10, $137 million in 2010/11, $65 million in 2011/12 and $461 million in 2012/13.
Budget and Fiscal Plan – 2010/11 to 2012/13
33
Three-Year Fiscal Plan
Projected spending by school districts is forecast to increase from $5.4 billion in 2009/10 to $5.5 billion by 2012/13, reflecting a total increase of $134 million over the three-year period. Compared to September Update 2009, the current projections are up $69 million, $105 million, $172 million and $190 million in 2009/10 to 2012/13. These increases in spending are mainly due to higher forecasted staffing and operating costs. School districts will receive additional grants in each of 2010/11, 2011/12, and 2012/13 to ensure full funding for wages, the full-day kindergarten program, and other pressures.
Projected spending by post-secondary institutions is forecast to increase from $4.6 billion in 2009/10 to $4.8 billion by 2012/13, reflecting a total increase of $206 million over the three-year period. Compared to September Update 2009, the current projections are little changed for 2009/10 and are up $31 million, $22 million and $78 million in 2010/11 to 2012/13. These increases mainly reflect additional faculty for education and research programs.
Projected spending by health authorities and hospital societies is forecast to increase from $10.7 billion in 2009/10 to $12.0 billion by 2012/13, reflecting a total increase of $1.3 billion over the three-year period. Compared to September Update 2009, the current projections are up $43 million for 2009/10, down $34 million and $70 million in 2010/11 and 2011/12, and then up $183 million in 2012/13. The 2009/10 increase is primarily due to increased physician and laboratory expenditures. The spending decreases in 2010/11 and 2011/12 reflect revised projections from health authorities for staffing and operating costs. In 2012/13, the health authorities will receive additional funding which is reflected in the increased spending projections.
Projected spending by other service delivery agencies (i.e. taxpayer-supported Crown corporations such as BC Transit, British Columbia Housing Management Commission) is forecast to increase from $3.3 billion in 2009/10 to $3.5 billion in 2012/13, reflecting a total increase of $164 million over the three-year period. Compared to September Update 2009, other service delivery agency spending is forecast to decrease by $40 million in 2009/10, reflecting the reduced spending by BC Transportation Financing Authority and BC Transit. Spending is then expected to increase by $35 million in 2010/11 primarily due to additional spending on accelerated social housing programs, decrease by $59 million in 2011/12 mainly due to reductions in spending by BC Transit, Industry Training Authority and housing programs, and increase by $10 million in 2012/13 primarily due to additional spending by BC Transportation Financing Authority.
Recovered Expense Changes
Spending funded by recoveries from third parties is projected to increase by $713 million over the fiscal plan period (2010/11 to 2012/13) compared to September Update 2009. The changes include:
· higher interest cost recoveries for fiscal agency loans ($236 million);
· additional federal funding for grant programs, primarily in 2010/11 for local governments ($152 million);
· recovery of costs for services provided to TransLink for the Evergreen Rapid Transit Line project ($306 million); and
· minor increases to other recoveries ($57 million);
Budget and Fiscal Plan – 2010/11 to 2012/13
34
Three-Year Fiscal Plan
partially offset by
· a reduction in the projected volume of free Crown grants ($38 million).
Table 1.17 Spending Funded by Third Party Recoveries
— Changes from September Update 2009
($ millions) | | 2010/11 | | 2011/12 | | 2012/13 | |
Fiscal agency loan and other interest cost recoveries | | 23 | | (24 | ) | 237 | |
Free Crown grants and nominal rent tenures | | 41 | | (38 | ) | (41 | ) |
Additional federal funding (mainly local government grants) | | 178 | | (9 | ) | (17 | ) |
Services provided to TransLink for the Evergreen Line | | 37 | | 134 | | 135 | |
Other recoveries | | 64 | | 18 | | (25 | ) |
Total changes | | 343 | | 81 | | 289 | |
In September Update 2009, the credit program for BC’s portion of the HST on residential energy was disclosed as an expense to be recovered from HST revenue. Since then, the presentation for this program has been further evaluated and it has been determined that a more appropriate accounting treatment is to net the credits directly from revenue. In September Update 2009, the HST attributable to these credits was included in revenue and the credits shown as an expense. The credits were estimated at $175 million in 2010/11 and $220 million in each of 2011/12 and 2012/13.
Capital Spending (1)
Capital spending on schools, hospitals, roads, bridges, hydro-electric projects and other infrastructure across the province over the next three years (2010/11 — 2012/13) is expected to total $20.7 billion. Provincial capital infrastructure investments are made through school districts, health authorities, post-secondary institutions, Crown agencies and ministries.
The total capital investment of $20.7 billion is comprised of $12.1 billion in taxpayer-supported capital investments and $8.6 billion in capital investments by commercial Crown corporations.
The elevated capital spending forecast for 2010/11 reflects accelerated capital investments to stimulate the economy and keep people at work in the construction sector.
Since October 2008, $5.3 billion has been committed to accelerated infrastructure investments across British Columbia, an increase of $1.9 billion from $3.4 billion at September Update 2009. New projects include investments in housing renovations, communities, the Northwest Transmission Line, highway rehabilitation, upgrades to the Royal BC Museum, air tanker bases in Castlegar and Williams Lake, the Klemtu Ferry Terminal, and the McKenzie Connector. For additional information on the accelerated capital program, refer to the Building on the Olympic Legacy topic box on page 70.
(1) Capital investments are not included in the government’s annual surplus or deficit. In accordance with generally accepted accounting principles (GAAP), annual amortization expenses that recognize the estimated wear and tear of capital assets during the fiscal year are included in the government’s annual expenses instead of recording the full capital costs as they occur.
Budget and Fiscal Plan – 2010/11 to 2012/13
35
Three-Year Fiscal Plan
Taxpayer-supported capital spending
Taxpayer-supported capital spending includes capital infrastructure for school districts, health authorities, post-secondary institutions, taxpayer-supported Crown agencies, and ministries.
Table 1.18 Capital Spending
| | 2009/10 | | Budget | | | | | |
| | September | | Updated | | Estimate | | Plan | | Plan | |
($ millions) | | Update | | Forecast | | 2010/11 | | 2011/12 | | 2012/13 | |
Taxpayer-supported | | | | | | | | | | | |
Education | | | | | | | | | | | |
Schools (K—12) | | 508 | | 516 | | 481 | | 368 | | 283 | |
Post-secondary | | 697 | | 676 | | 743 | | 485 | | 413 | |
Health | | 1,025 | | 980 | | 1,161 | | 880 | | 589 | |
BC Transportation Financing Authority | | 1,230 | | 995 | | 1,483 | | 1,076 | | 1,142 | |
BC Transit | | 167 | | 172 | | 89 | | 163 | | 208 | |
Vancouver Convention Centre expansion project | | 39 | | 43 | | 8 | | — | | — | |
BC Place rejuvenation | | 148 | | 88 | | 390 | | 41 | | — | |
Government ministries | | 398 | | 349 | | 355 | | 277 | | 194 | |
Other (1) | | 217 | | 169 | | 404 | | 119 | | 44 | |
Capital spending contingencies | | 300 | | 25 | | 300 | (2) | 200 | | 200 | |
Total taxpayer-supported | | 4,729 | | 4,013 | | 5,414 | | 3,609 | | 3,073 | |
| | | | | | | | | | | |
Self-supported | | | | | | | | | | | |
BC Hydro | | 1,695 | | 2,545 | | 1,770 | | 2,129 | | 2,192 | |
BC Transmission Corporation | | 22 | | 19 | | 14 | | 15 | | 15 | |
Columbia River power projects (3) | | 166 | | 16 | | 12 | | 6 | | 4 | |
Transportation Investment Corporation (Port Mann) | | 594 | | 511 | | 735 | | 540 | | 540 | |
BC Railway Company (4) | | 69 | | 14 | | — | | — | | — | |
ICBC | | 38 | | 19 | | 83 | | 77 | | 79 | |
BC Lotteries | | 100 | | 112 | | 107 | | 120 | | 120 | |
Liquor Distribution Branch | | 21 | | 21 | | 24 | | 32 | | 35 | |
Total self-supported commercial | | 2,705 | | 3,257 | | 2,745 | | 2,919 | | 2,985 | |
Total capital spending | | 7,434 | | 7,270 | | 8,159 | | 6,528 | | 6,058 | |
(1) Includes BC Housing Management Commission, Provincial Rental Housing Corporation and other service delivery agencies.
(2) Includes $70 million for ministry capital contingencies.
(3) Joint ventures of the Columbia Power Corporation and Columbia Basin Trust.
(4) Responsibility for the BC Railway Company is transferred to the BC Transportation Financing Authority effective April 1, 2010.
Taxpayer-supported capital spending is projected at $5.4 billion in 2010/11, declining to $3.6 billion in 2011/12 and $3.1 billion in 2012/13, reflecting completion of the accelerated capital projects.
Significant elements of this projected spending include the following:
· Over the three years of the capital plan, $1.1 billion will be invested to replace, renovate or expand K—12 facilities. This includes continued investment in the program to seismically upgrade or replace schools. Among these are Brantford Elementary (Burnaby), Burnaby Central Secondary, Carson Graham Secondary (North Vancouver), Laura Secord Elementary (Vancouver), Chilliwack Secondary, and Centennial Secondary (Coquitlam). In addition, the plan includes various new or expansion projects such as Alberni District Secondary (Port Alberni), Coldstream Elementary (Vernon), Revelstoke Elementary and Secondary, Duchess Park Secondary
Budget and Fiscal Plan – 2010/11 to 2012/13
36
Three-Year Fiscal Plan
Table 1.19 Accelerated Capital Spending
| | Total Cost of | |
($ millions) | | Projects | |
Sector: | | | |
Transportation | | 1,710 | |
Communities | | 1,171 | |
Post-secondary | | 741 | |
Housing | | 629 | |
Energy transmission | | 400 | |
K—12 schools | | 368 | |
Health | | 85 | |
Justice and other | | 235 | |
Total | | 5,339 | |
(Prince George), Heritage Mountain Middle School (Coquitlam), Acadia Road Primary and Intermediate (Vancouver), University Hill Secondary (Vancouver), Ecole Mer et Montagne Elementary (Campbell River), and Grief Point Elementary (Powell River). The province is also investing in various building envelope remediation projects.
Voluntary, full-day kindergarten for five year olds will be fully implemented by September 2011. The need for space and options to meet demand are being explored. Capital funding to implement full-day kindergarten is being held in capital spending contingencies until capital funding requirements are determined.
· Budget 2010 includes $1.6 billion in capital spending by post-secondary institutions throughout the province over the three years of the plan. Projects include the replacement of the Trades Building at the College of New Caledonia; the School for the Contemporary Arts and Schrum Science Centre renewal at SFU; the Health Sciences Complex, Arts and Science Building, renewal of Biological Sciences building, Earth System Sciences building, the Engineering and Management building, and the Pharmaceutical Sciences building at UBC; building renewals at BCIT; the Learning and Innovation Centre at Royal Roads University; the Waste Forest Wood conversion to bio fuel technology project at UNBC; building envelope renewal at Vancouver Community College; new library building at Thompson Rivers University; the building renewals at UVIC; building expansion at the College of the Rockies; Centre for Green Building Technologies at Okanagan College; Cowichan campus replacement at Vancouver Island University; new Skills Development and Trades training facility at North Island College; renewal/replacement of Northwest Community College campus; and a new Film Centre at Capilano University.
Post-secondary capital spending also includes a significant level of investment funded through other sources, including foundations, donations, cash balances, federal funding and revenues generated from services.
· Capital spending in the health sector will total $2.6 billion over the three years of the plan. These investments support new major construction and upgrading of health facilities, medical and diagnostic equipment, and information management technology systems, and include funding from the province as well as other sources, such as regional hospital districts and foundations.
Budget and Fiscal Plan – 2010/11 to 2012/13
37
Three-Year Fiscal Plan
Capital investments in the health sector include the new Fort St. John Hospital and residential care facility, the Royal Jubilee Hospital Patient Care Centre in Victoria, expansions to Kelowna General and Vernon Jubilee Hospitals, the Northern Cancer Centre in Prince George, the Surrey Outpatient Care and Surgical Centre, the Surrey Memorial Hospital Critical Care Tower, the Interior Heart and Surgical Centre at Kelowna General Hospital, St. Mary’s Hospital redevelopment in Sechelt, Kootenay Lake Hospital redevelopment in Nelson, the Provincial Radiation Therapy Program, and the emergency department expansion and Renal Dialysis Centre at Nanaimo Regional General Hospital.
· Budget 2010 builds on the government’s transportation investment plan. The province has secured significant federal cost sharing on projects and has leveraged additional investments through partnerships with private partners. The public and private sector together will provide $4.0 billion for transportation investments over the next three years.
· $2.7 billion of provincial investment in transportation infrastructure; and
· $1.3 billion of investment leveraged through federal cost sharing and partnerships with private partners, local governments and other agencies.
Further information is provided in Table 1.20.
· Under the transportation investment plan, provincial capital spending for 2010/11 to 2012/13 includes initiatives such as the Cariboo Connector Strategy, Kicking Horse Canyon (Phase 3), road rehabilitation projects throughout the Province, South Fraser Perimeter Road, Highway 1 improvements between Kamloops and Golden, and Highway 97 improvements including Winfield to Oyama, Westside interchange, and Bennett Creek to Link Creek.
· Budget 2010 builds on existing investments under the Provincial Transit Plan including bus fleet expansion throughout the Province and rapid bus projects along Highways 1, 7, and 99 in the lower mainland and Highway 97 in Kelowna. Design and planning work continues with the Evergreen Rapid Transit Line. Other projects include Faregates/Smartcards for improved security and replacement/expansion of the Capilano River Bridge with related transit improvements.
· Capital spending for the Vancouver Convention Centre Expansion Project (VCCEP) is based on the total capital cost of the project, reflecting the funding provided by all partners; the Province, the federal government, and Tourism Vancouver. The expansion of the convention centre facility and connector between the new and existing facilities was substantially completed in March 2009. The upgrades to the existing facility will be completed in 2010.
· A total of $563 million in major upgrades are planned for BC Place from 2008/09 to 2011/12. BC Place rejuvenation includes $458 million to install a retractable roof and $105 million to refurbish the facilities.
Capital Contingencies
The province has included a capital contingency in its three-year capital plan as a prudent h planning measure. In addition to covering risks from higher than expected costs, the capital contingency will be used to fund emerging government priorities. This includes the remaining funding for an accelerated project pending final approval and capital funding for full implementation of voluntary full-day kindergarten by September 2011 pending determination of requirements.
Budget and Fiscal Plan – 2010/11 to 2012/13
38
Three-Year Fiscal Plan
Table 1.20 Provincial Transportation Investments
| | 2009/10 | | | | | | | | | |
| | Updated | | | | | | | | 3-Year | |
($ millions) | | Forecast | | 2010/11 | | 2011/12 | | 2012/13 | | Total | |
Transportation Investment Plan | | | | | | | | | | | |
– Rehabilitation | | 158 | | 203 | | 146 | | 146 | | 495 | |
– Interior and rural side roads | | 61 | | 50 | | 50 | | 50 | | 150 | |
– Oil and gas rural road improvement program | | 46 | | 51 | | — | | — | | 51 | |
– Mountain pine beetle strategy | | 32 | | 30 | | 30 | | 30 | | 90 | |
– Highway 1 – Kicking Horse Canyon | | 49 | | 46 | | 7 | | — | | 53 | |
– Highway 1 – Kamloops to Golden | | 24 | | 88 | | 46 | | 45 | | 179 | |
– Sea-to-Sky highway corridor program | | 64 | | — | | — | | — | | — | |
– Gateway program | | 134 | | 128 | | 113 | | 100 | | 341 | |
– Okanagan Valley corridor | | 66 | | 87 | | 39 | | 7 | | 133 | |
– Cariboo connector program | | 46 | | 53 | | 10 | | 20 | | 83 | |
– Other highway corridors and programs | | 98 | | 124 | | 91 | | 80 | | 295 | |
– Cycling infrastructure | | 5 | | 3 | | 3 | | 3 | | 9 | |
Total transportation investment plan | | 783 | | 863 | | 535 | | 481 | | 1,879 | |
Provincial Transit Plan | | | | | | | | | | | |
– Canada Line Rapid Transit Project | | 20 | | 20 | | 20 | | 20 | | 60 | |
– Evergreen Line | | 16 | | 33 | | 133 | | 136 | | 302 | |
– Rapid transit projects | | 36 | | 52 | | 34 | | 158 | | 244 | |
– Buses and other transit priorities | | 91 | | 68 | | 63 | | 85 | | 216 | |
Total transportation investment plan | | 163 | | 173 | | 250 | | 399 | | 822 | |
Total provincial investment (1) | | 946 | | 1,036 | | 785 | | 880 | | 2,701 | |
| | | | | | | | | | | |
Investments funded through contributions from other partners | | | | | | | | | | | |
– Canada Line (contributions from the federal government; South Coast British Columbia Transportation Authority; Vancouver Airport Authority; and private sector partner) | | 176 | | — | | — | | — | | — | |
– Evergreen Line (federal contribution and TransLink) | | 31 | | 66 | | 239 | | 263 | | 568 | |
– Federal contributions to other projects | | 191 | | 394 | | 170 | | 170 | | 734 | |
Total investments funded through contributions from other partners | | 398 | | 460 | | 409 | | 433 | | 1,302 | |
Total investment in transportation infrastructure | | 1,344 | | 1,496 | | 1,194 | | 1,313 | | 4,003 | |
(1) Total provincial investment includes operating and capital spending.
Should the capital contingency not be used, taxpayer-supported debt will be lower than currently forecast.
Financing Capital Projects
Provincial capital infrastructure spending is financed through a combination of sources:
· cash balances (e.g. school districts, post-secondary institutions, health authorities);
· partnerships with the private sector (public-private-partnerships);
· cost-sharing with partners (e.g. government of Canada, regional hospital districts); and
· borrowing (debt financing).
Since debt financing continues to represent a significant source of financing for provincial capital spending, the level of capital spending has a significant impact on projected provincial debt.
Budget and Fiscal Plan – 2010/11 to 2012/13
39
Three-Year Fiscal Plan
Chart 1.12 Financing government’s capital plan
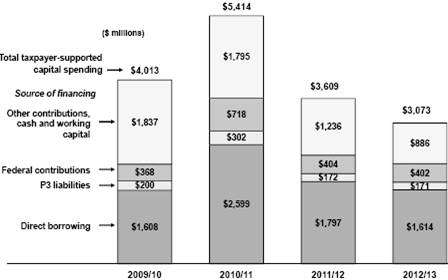
Self-supported capital spending
Total capital spending includes capital infrastructure for self-supported commercial Crown agencies.
Self-supported capital spending is projected at $2.7 billion in 2010/11, $2.9 billion in 2011/12 and $3.0 billion in 2012/13. Over the three year period:
· $6.1 billion (70 per cent) of total self-supported capital spending, will be used for electrical generation, transmission and distribution projects carried out through BC Hydro to meet growing customer demand and to enhance reliability. Large generating facilities built between the late 1960s and early 1980s provide about 90 per cent of the province’s electrical power. The major mechanical and electrical components (such as turbines and transformers) in these facilities are nearing the end of their design life and require major overhauls to maintain reliability. A significant portion of self-supported capital spending represents measures to address the issue of ageing infrastructure.
· $1.8 billion will be used for the Port Mann Bridge replacement and Highway 1 improvement project.
· $347 million will be used for BC Lotteries projects including the modernization of business systems and acquisition of gaming equipment to support lottery, eGaming, casino and community gaming activities.
· $239 million will be used for ICBC projects including reinvestment in critical business systems.
Table 1.21 provides information on major power generation and transmission projects. Further details on provincial capital investments are shown in the service plans of ministries and Crown agencies.
Budget and Fiscal Plan – 2010/11 to 2012/13
40
Three-Year Fiscal Plan
Projects over $50 million
As required under the Budget Transparency and Accountability Act, major capital projects with multi-year budgets from provincial sources totaling $50 million or more are shown in Table 1.21. Annual allocations of the full budget for these projects are included as part of the provincial government’s capital investment spending shown in Table 1.18.
In addition to financing through provincial sources, major projects may be cost-shared with the federal government, municipalities and regional districts, and/or the private sector. Total capital spending for these major projects is $13.8 billion, reflecting financing of $11.9 billion through internal sources or borrowing, $0.8 billion from federal government contributions and $1.1 billion from other sources including private donations. Major capital investments include:
· $302 million for school replacement projects including Chilliwack Secondary, Alberni District Secondary, Centennial Secondary, Revelstoke Elementary and Secondary, and Burnaby Central Secondary.
· $133 million for the Pharmaceutical Sciences and Centre for Drug Research and Development at UBC.
· $2.3 billion for health facilities including the Surrey Outpatient Facility and Surrey Memorial Hospital Critical Care Tower; the Royal Jubilee Hospital Patient Care Centre in Victoria; the Interior Heart and Surgical Centre in Kelowna; expansions to Kelowna General and Vernon Jubilee Hospitals; the Northern Cancer Centre initiative which encompasses construction of a new facility in Prince George and upgrades in other northern communities; and replacement of the Fort St. John Hospital.
· $5.8 billion for major transportation capital infrastructure including improvements for the Pitt River Bridge, South Fraser perimeter road, Sea-to-Sky Highway, Sierra Yoyo Desan Road Upgrade, and the Port Mann Bridge/Highway 1 project.
· $2.0 billion for completion of the Vancouver Convention Centre expansion project, BC Place rejuvenation, the integrated case management system, the Lower Mainland Pre-Trial Centre and the e—Health initiative.
· $3.2 billion for power generation and transmission capital projects by BC Hydro and BC Transmission Corporation. Three new projects were approved since the second Quarterly Report — Ruskin Dam safety and powerhouse upgrade, Dawson Creek area reinforcement, and Seymour Arm series capacitor installation. These projects are driven by the need for major overhauls to ageing infrastructure, and to address reliability issues and increasing demand for power.
Budget and Fiscal Plan – 2010/11 to 2012/13
41
Three-Year Fiscal Plan
Table 1.21 Capital Expenditure Projects Greater Than $50 million (1)
Note: Information in bold type denotes changes from the 2009/10 second Quarterly Report.
| | Projected | | Total Costs | | Projected | | Total | | Project Financing | |
($ millions) | | Completion
Date | | to
Dec. 31, 2009 | | Costs to
Complete | | Capital
Costs | | Internal/
Debt | | Federal
Government | | Other
Contributions | |
Taxpayer-supported | | | | | | | | | | | | | | | |
K–12 Schools | | | | | | | | | | | | | | | |
Revelstoke Elementary and Secondary | | Fall 2011 | | 2 | | 58 | | 60 | | 58 | | — | | 2 | |
Chilliwack Secondary | | Fall 2012 | | 1 | | 57 | | 58 | | 58 | | — | | — | |
Burnaby Central Secondary | | Spring 2012 | | 7 | | 57 | | 64 | | 64 | | — | | — | |
Centennial Secondary | | Fall 2014 | | — | | 62 | | 62 | | 62 | | — | | — | |
Alberni District Secondary | | Fall 2011 | | 2 | | 56 | | 58 | | 55 | | — | | 3 | |
Total K–12 schools | | | | 12 | | 290 | | 302 | | 297 | | — | | 5 | |
Post secondary facilities | | | | | | | | | | | | | | | |
University of British Columbia | | | | | | | | | | | | | | | |
– Pharmaceutical Sciences and Centre for Drug Research & Development | | Fall 2013 | | 3 | | 130 | | 133 | | 86 | | 3 | | 44 | |
Health facilities | | | | | | | | | | | | | | | |
Surrey Outpatient Facility | | | | | | | | | | | | | | | |
– Government direct cost | | Spring 2011 | | 9 | | 56 | | 65 | | 65 | | — | | — | |
– P3 contract | | Spring 2011 | | 108 | | 64 | | 172 | | 172 | | — | | — | |
Victoria Royal Jubilee Hospital – Patient Care Centre | | | | | | | | | | | | | | | |
– Government direct cost | | Spring 2013 | | 81 | | 69 | | 150 | | 23 | | — | | 127 | |
– P3 contract | | Winter 2011 | | 108 | | 91 | | 199 | | 199 | | — | | — | |
Fort St. John Hospital and Residential Care | | | | | | | | | | | | | | | |
– Government direct cost | | Spring 2012 | | 50 | | 215 | | 265 | | 169 | | — | | 96 | |
– P3 contract | | Spring 2012 | | — | | 33 | | 33 | | 33 | | — | | | |
Expansions to Kelowna General and Vernon Jubilee Hospitals | | | | | | | | | | | | | | | |
– Government direct cost | | Fall 2012 | | 106 | | 169 | | 275 | | 26 | | — | | 249 | |
– P3 contract | | Fall 2012 | | 41 | | 117 | | 158 | | 158 | | — | | — | |
Northern Cancer Centre initiative (2) | | | | | | | | | | | | | | | |
– Government direct cost | | Winter 2012 | | 4 | | 87 | | 91 | | 88 | | — | | 3 | |
– P3 contract | | Winter 2012 | | — | | 15 | | 15 | | 15 | | — | | — | |
Surrey Emergency/Critical Care Tower (3) | | Summer 2013 | | 7 | | 518 | | 525 | | 505 | | — | | 20 | |
Interior Heart and Surgical Centre (4) | | Spring 2017 | | — | | 393 | | 393 | | 302 | | — | | 91 | |
Total health facilities | | | | 514 | | 1,827 | | 2,341 | | 1,755 | | — | | 586 | |
Transportation | | | | | | | | | | | | | | | |
Pitt River Bridge | | Fall 2009 | (5) | 192 | | 15 | | 207 | | 110 | | 90 | | 7 | |
Sea-to-Sky Highway | | | | | | | | | | | | | | | |
– Government direct cost | | Fall 2009 | (6) | 224 | | 12 | | 236 | | 234 | | — | | 2 | |
– P3 contract | | Fall 2009 | | 561 | | — | | 561 | | 561 | | — | | — | |
William R. Bennett Bridge | | | | | | | | | | | | | | | |
– P3 contract | | Fall 2008 | (5) | 185 | | 3 | | 188 | | 188 | | — | | — | |
South Fraser Perimeter Road | | Winter 2012 | | 444 | | 684 | | 1,128 | | 763 | | 365 | | — | |
Sierra Yoyo-Desan Road upgrade | | Fall 2011 | | 31 | | 156 | | 187 | | 187 | | — | | — | |
Total transportation | | | | 1,637 | | 870 | | 2,507 | | 2,043 | | 455 | | 9 | |
Other | | | | | | | | | | | | | | | |
Vancouver Convention Centre expansion project | | Summer 2009 | (6) | 824 | | 17 | | 841 | | 499 | | 222 | | 120 | |
BC Place rejuvenation (7) | | Summer 2011 | | 92 | | 471 | | 563 | | 563 | | — | | — | |
Integrated case management system | | Fall 2014 | | 38 | | 144 | | 182 | | 182 | | — | | — | |
Lower Mainland Pre-Trial Centre | | TBD | (8) | 2 | | 128 | | 130 | | 130 | | — | | — | |
e-Health initiative (9) | | Spring 2013 | | 171 | | 92 | | 263 | | 139 | | — | | 124 | |
Total other | | | | 1,127 | | 852 | | 1,979 | | 1,513 | | 222 | | 244 | |
Total taxpayer-supported | | | | 3,293 | | 3,969 | | 7,262 | | 5,694 | | 680 | | 888 | |
Budget and Fiscal Plan – 2010/11 to 2012/13
42
Three-Year Fiscal Plan
Table 1.21 Capital Expenditure Projects Greater Than $50 million (1) (continued)
Note: Information in bold type denotes changes from the 2009/10 second Quarterly Report.
| | Projected | | Total Costs | | Projected | | Total | | Project Financing | |
($ millions) | | Completion
Date | | to
Dec. 31, 2009 | | Costs to
Complete | | Capital
Costs | | Internal/
Debt | | Federal
Government | | Other
Contributions | |
Self-supported | | | | | | | | | | | | | | | |
Transportation | | | | | | | | | | | | | | | |
Port Mann Bridge / Highway 1 | | Winter 2013 | | 619 | | 2,700 | | 3,319 | | 3,168 | | — | | 151 | |
Power generation and transmission | | | | | | | | | | | | | | | |
BC Hydro | | | | | | | | | | | | | | | |
– Mica Dam – generator stator replacement | | Fall 2009 | (6) | 85 | | 4 | | 89 | | 89 | | — | | — | |
– Peace Canyon Dam – generator stator replacement and rotor modification | | Fall 2009 | (6) | 73 | | 1 | | 74 | | 74 | | — | | — | |
– Aberfeldie redevelopment | | Spring 2009 | (6) | 93 | | 2 | | 95 | | 95 | | — | | — | |
– GM Shrum G1–G4 stator replacement | | Fall 2010 | | 67 | | 30 | | 97 | | 97 | | — | | — | |
– Peace Canyon G1–G4 turbine overhaul | | Fall 2009 | (6) | 42 | | 3 | | 45 | | 45 | | — | | — | |
– Revelstoke Unit 5 generation (10) | | Fall 2010 | | 185 | | 165 | | 350 | | 350 | | — | | — | |
– Cheakamus spillway gate reliability upgrade | | Fall 2011 | | 33 | | 40 | | 73 | | 73 | | — | | — | |
– Mica Dam gas insulated switchgear replacement (10) | | Summer 2013 | | 17 | | 183 | | 200 | | 200 | | — | | — | |
– Fort Nelson generating station upgrade (10) | | Fall 2011 | | 21 | | 144 | | 165 | | 165 | | — | | — | |
– Ruskin Dam safety and powerhouse upgrade (11) | | TBD | | 30 | | TBD | | TBD | | TBD | | — | | — | |
– Vancouver Island transmission reinforcement (12) | | Winter 2008 | (6) | 303 | | 3 | | 306 | | 306 | | — | | — | |
– Interior to Lower Mainland transmission line (12) | | Fall 2014 | | 36 | | 563 | | 599 | | 599 | | — | | — | |
– Central Vancouver Island transmission line (12) | | Fall 2010 | | 16 | | 75 | | 91 | | 91 | | — | | — | |
– Vancouver City Central transmission (12) | | Spring 2012 | | 9 | | 192 | | 201 | | 201 | | — | | — | |
– Columbia Valley transmission (12) | | Fall 2012 | | 3 | | 142 | | 145 | | 145 | | — | | — | |
– Southern Interior series compensation (12) | | Fall 2014 | | 1 | | 60 | | 61 | | 61 | | — | | — | |
– Dawson Creek area reinforcement (12) | | Fall 2013 | | — | | 132 | | 132 | | 132 | | — | | — | |
– Seymour Arm series capacitor (12) | | Fall 2013 | | — | | 58 | | 58 | | 58 | | — | | — | |
– Northwest transmission line (12) | | Winter 2012 | | — | | 404 | | 404 | | 274 | | 130 | | — | |
Total power generation and transmission | | | | 1,014 | | 2,201 | | 3,185 | | 3,055 | | 130 | | — | |
Total self-supported | | | | 1,633 | | 4,901 | | 6,504 | | 6,223 | | 130 | | 151 | |
Total $50 million projects | | | | 4,926 | | 8,870 | | 13,766 | | 11,917 | | 810 | | 1,039 | |
(1) | Only projects that have been approved by Treasury Board and/or Crown corporation boards are included in this table. Ministry service plans may include projects that still require final approval. Capital costs reflect current government accounting policy. |
(2) | Figures shown do not include an approved project reserve of $5 million. |
(3) | Figures shown are based on preliminary Treasury Board approvals and do not include approved project reserve of $32 million. These amounts will change after P3 contracts are finalized. |
(4) | Figures shown are based on preliminary Treasury Board approvals and do not include an approved project reserve of $55 million. These amounts will change after P3 contracts are finalized. |
(5) | The Pitt River and William R. Bennett bridges are open for traffic. Decommissioning of the old bridges is forecast to be complete in Summer 2010. |
(6) | Assets have been put into service and only trailing costs remain. |
(7) | BC Place rejuvenation includes $458 million to install a retractable roof and $105 million to refurbish the facilities. |
(8) | Project completion date is to be determined pending Treasury Board approval of the business case based on the site location. |
(9) | The e-Health initiative is comprised of 7 distinct projects. Figures shown reflect the total costs of the 7 Ministry of Health Services’ provincially co-ordinated e-Health projects and are subject to change pending final approval. |
(10) | Total costs and completion dates for these projects vary depending on the final scope. Information presented represents the highest cost estimates and latest completion dates. The completion date for Revelstoke Unit 5 is Fall 2010 or Fall 2011 depending on the ability to accelerate the project schedule. |
(11) | Definition phase of the Ruskin Dam safety and powerhouse upgrade project was approved for $52 million. The total project cost and completion date are being developed. |
(12) | Assets are owned by BC Hydro and managed by BC Transmission Corporation. |
Budget and Fiscal Plan – 2010/11 to 2012/13
43
Three-Year Fiscal Plan
Provincial Debt
Government obtains financing from outside sources mainly through debt issuances that are to be repaid on future dates.
During the period 2004/05 to 2008/09, surpluses allowed the provincial government to adjust its borrowing strategy to reduce a significant portion of its debt. For example, taxpayer-supported debt, including direct operating debt, declined by 12 per cent from $30.0 billion in 2003/04 to $26.4 billion in 2008/09.
These low levels of debt provided government with the flexibility needed to address the current economic challenges.
Table 1.22 Provincial Debt Summary (1)
| | 2009/10 | | Budget | | | | | |
| | September | | Updated | | Estimate | | Plan | | Plan | |
($ millions unless otherwise indicated) | | Update | | Forecast | | 2010/11 | | 2011/12 | | 2012/13 | |
Taxpayer-supported debt | | | | | | | | | | | |
Provincial government operating | | 4,791 | | 3,486 | | 4,815 | | 5,513 | | 5,142 | |
Provincial government general capital (2) | | 2,696 | | 2,696 | | 2,696 | | 2,696 | | 2,696 | |
Provincial government direct operating | | 7,487 | | 6,182 | | 7,511 | | 8,209 | | 7,838 | |
Other taxpayer-supported debt (mainly capital) | | | | | | | | | | | |
Education | | 9,879 | | 9,678 | | 10,305 | | 10,736 | | 11,020 | |
Health (3) | | 4,316 | | 4,352 | | 5,074 | | 5,656 | | 6,101 | |
Highways and public transit (4) | | 7,688 | | 7,585 | | 8,473 | | 9,216 | | 10,070 | |
Other | | 1,223 | | 1,296 | | 2,385 | | 2,903 | | 3,300 | |
Total other taxpayer-supported debt | | 23,106 | | 22,911 | | 26,237 | | 28,511 | | 30,491 | |
Total taxpayer-supported debt | | 30,593 | | 29,093 | | 33,748 | | 36,720 | | 38,329 | |
Self-supported commercial Crown corporations debt | | 11,489 | | 12,100 | | 13,709 | | 15,343 | | 17,133 | |
Total debt before forecast allowance | | 42,082 | | 41,193 | | 47,457 | | 52,063 | | 55,462 | |
Forecast allowance (5) | | 250 | | 125 | | 300 | | 300 | | 400 | |
Total provincial debt | | 42,332 | | 41,318 | | 47,757 | | 52,363 | | 55,862 | |
Debt as a per cent of GDP | | | | | | | | | | | |
Provincial government direct operating | | 4.0 | % | 3.3 | % | 3.8 | % | 4.0 | % | 3.6 | % |
Taxpayer-supported | | 16.2 | % | 15.5 | % | 17.2 | % | 17.9 | % | 17.8 | % |
Total provincial | | 22.4 | % | 22.0 | % | 24.3 | % | 25.5 | % | 25.9 | % |
Taxpayer-supported debt per capita ($) | | 6,876 | | 6,530 | | 7,459 | | 7,999 | | 8,233 | |
Taxpayer-supported interest bite (cents per dollar of revenue) | | 4.4 | | 4.4 | | 4.6 | | 4.8 | | 5.1 | |
(1) | Debt is after deduction of sinking funds and unamortized discounts, and excludes accrued interest. Government direct and fiscal agency accrued interest is reported in the government’s accounts as an accounts payable. |
(2) | Separate disclosures of borrowings for ministries’ capital spending are applied prospectively beginning in fiscal 2009/10. |
(3) | Health facilities’ debt includes public-private partnership obligations of $179 million for fiscal 2006/07; $410 million for fiscal year 2007/08; $540 million for fiscal year 2008/09; $688 million for fiscal 2009/10, $990 million for fiscal 2010/11, $1,162 million for fiscal 2011/12, and $1,333 million for fiscal 2012/13. |
(4) | BC Transportation Financing Authority’s debt includes public-private partnership obligations of $353 million for fiscal 2006/07; $604 million for fiscal year 2007/08; $776 million for fiscal year 2008/09; $797 million for fiscal 2009/10, $780 million for fiscal 2010/11, $763 million for fiscal 2011/12, and $744 million for fiscal 2012/13. |
(5) | Reflects the operating statement forecast allowance for each year (amounts are not cumulative). Since it is unknown as to which agency would require this debt, the forecast allowance is shown as a separate item over the plan. |
Budget and Fiscal Plan – 2010/11 to 2012/13
44
Three-Year Fiscal Plan
Due to lower economic growth in recent years and its impact on revenue projections, operating deficits are projected from 2009/10 to 2012/13. Government has responded to these challenging economic times by continuing to support health, education and social programs and by introducing initiatives to support economic growth (e.g. HST, accelerated infrastructure, announced tax reductions). Government’s operating debt is forecast to increase by $1.7 billion over the next three years primarily reflecting projected deficits, offset by cash available; from dividends and investments for example.
Taxpayer-supported debt is forecast to increase to $38.3 billion by 2012/13, reflecting the significant infrastructure investments planned over the next three years and projected deficits.
In 2009/10, provincial debt is forecast to total $41.3 billion, $1 billion below budget. Operating debt was contained, despite a significant deficit, by directing available cash from bonus bid sales and the liquidation of unallocated sinking funds to reduce operating borrowing requirements.
Chart 1.13 Operating debt increases to support priority programs
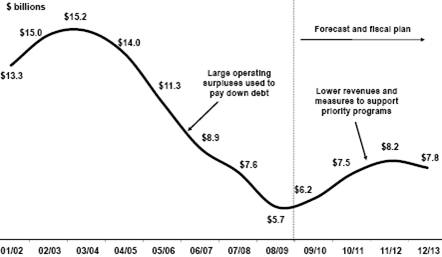
Chart 1.14 Taxpayer-supported debt burden remains affordable
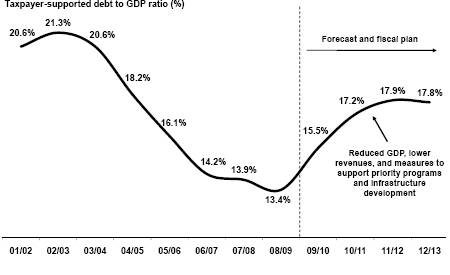
Budget and Fiscal Plan – 2010/11 to 2012/13
45
Three-Year Fiscal Plan
In 2010/11, provincial debt is forecast to increase $6.4 billion from the 2009/10 updated forecast to a total of $47.8 billion. The 2010/11 change reflects:
· a $4.6 billion increase in total taxpayer-supported debt reflecting the debt-financed operating deficit ($1.7 billion) and an increase in other taxpayer-supported debt mainly to finance net capital requirements ($2.9 billion);
· a $1.6 billion increase in commercial Crown corporation debt, mainly to fund investment in improving and expanding hydro generation assets by BC Hydro ($855 million) and construction of the Port Mann Bridge ($750 million); and
· a $175 million increase in the forecast allowance to mirror the income statement forecast allowance.
Total provincial debt, which includes commercial Crown self-supported debt, is forecast to increase to $55.9 billion by 2012/13.
The change in debt will not equal the surplus/deficit due to:
· non-cash amortization costs included in the surplus/deficit; and
· other working capital sources/requirements that represent changes in balance sheet items (such as cash balances, loan receivables and other accounts receivables/payables) and changes in cash balances such as dividends and bonus bid receipts.
Table 1.23 reconciles forecast surplus/deficit with changes in debt. In the updated fiscal plan, debt rises due to the impact of capital spending in excess of amortization; higher commercial Crown corporation debt incurred for capital investments; as well as the projected deficits from 2010/11 to 2012/13.
Table 1.23 Reconciliation of Summary Results to Provincial Debt Changes
| | Updated | | Budget | | | | | |
| | Forecast | | Estimate | | Plan | | Plan | |
($ millions) | | 2009/10 | | 2010/11 | | 2011/12 | | 2012/13 | |
Operating statement deficit | | 2,775 | | 1,715 | | 945 | | 145 | |
Taxpayer-supported capital spending | | 4,013 | | 5,414 | | 3,609 | | 3,073 | |
Increase (reduction) in cash and temporary investments | | (2,353 | ) | (284 | ) | 195 | | 112 | |
Amortization (non-cash expense included in the surplus) | | (1,920 | ) | (1,961 | ) | (2,106 | ) | (2,215 | ) |
Net increase in commercial Crown corporations (mainly capital) | | 3,518 | | 1,517 | | 2,008 | | 2,187 | |
Increase (decrease) in warehouse borrowing | | (2,081 | ) | — | | — | | — | |
Other balance sheet and working capital changes | | (648 | ) | 38 | | (45 | ) | 197 | |
Total provincial debt increase | | 3,304 | | 6,439 | | 4,606 | | 3,499 | |
The ratio of taxpayer-supported debt, which excludes commercial Crown corporations’ debt, to GDP is a key measure often used by financial analysts and investors to assess a province’s ability to repay debt.
In the period 2002/03 to 2008/09, significant progress was made in reducing the taxpayer supported debt burden. The taxpayer-supported debt to GDP ratio has declined from 21.3 per cent in 2002/03 to 13.4 per cent in 2008/09; a 37 per cent reduction. Due to the committed infrastructure spending, anticipated deficits and lower GDP projections, the taxpayer-supported debt to GDP ratio is forecast to increase from 15.5 per cent in 2009/10 to 17.2 per cent in 2010/11, and then to 17.9 per cent in 2011/12 before returning to a downward trend by falling to 17.8 per cent in 2012/13.
Budget and Fiscal Plan – 2010/11 to 2012/13
46
Three-Year Fiscal Plan
The progress made in improving the affordability in debt is enabling government to absorb the impact of the economic slowdown without returning to historic high levels of debt relative to the economy. Taxpayer-supported interest costs continue to remain low, representing less than 5.2 cents per dollar of revenue in each year of the three year plan.
As evidenced by the decline in taxpayer-supported debt to GDP ratios beginning in 2012/13, the return to balanced budgets and the debt elimination measures put in place by government have kept debt within affordable levels. As discussed in the Five Year Fiscal Plan Update topic box on page 54, is forecast to further decline to 17.5 percent in 2013/14.
Table 1.24 summarizes the provincial financing plan for 2010/11. New borrowing of $9.4 billion is anticipated, of which $3.0 billion will be used to replace maturing debt and $6.4 billion will be used for capital and other financing requirements.
Additional details on the debt outstanding for government, Crown corporations and agencies are provided in Appendix Tables A15 and A16.
In February 2009, government tabled the Finance Statutes (Deficit Authorization and Debt Elimination) Amendment Act, 2009. The act enables government to operate at a deficit for a fixed period of time in order to protect critical core services as it recovers from the economic downturn. Acknowledging that these deficits will result in operating debt, government prohibited supplementary estimates until operating debt was eliminated. This is consistent with government’s policy of paying down operating debt before other types of debt.
Table 1.24 Provincial Financing
| | Debt (1)
Outstanding | | 2009/10 | | Debt (1)
Outstanding | | 2010/11 Transactions | | Estimated
Debt (1)
Outstanding | |
($ millions) | | at March 31,
2009 | | Debt
Change | | at March 31,
2010 | | New
Borrowing (2) | | Retirement
Provision (3) | | Net
Change | | at March 31,
2011 | |
Taxpayer-supported debt | | | | | | | | | | | | | | | |
Provincial government direct operating | | 5,744 | | 438 | | 6,182 | | 2,781 | | (1,452 | ) | 1,329 | | 7,511 | |
Education | | 9,148 | | 530 | | 9,678 | | 1,132 | | (505 | ) | 627 | | 10,305 | |
Health | | 3,936 | | 416 | | 4,352 | | 925 | | (203 | ) | 722 | | 5,074 | |
Highways and public transit | | 6,831 | | 754 | | 7,585 | | 1,334 | | (446 | ) | 888 | | 8,473 | |
Other debt (4) | | 787 | | 509 | | 1,296 | | 1,296 | | (207 | ) | 1,089 | | 2,385 | |
Total taxpayer-supported debt | | 26,446 | | 2,647 | | 29,093 | | 7,468 | | (2,813 | ) | 4,655 | | 33,748 | |
Self-supported commercial Crown corporations debt | | 9,487 | | 2,613 | | 12,100 | | 1,769 | | (160 | ) | 1,609 | | 13,709 | |
Warehouse borrowing program | | 2,081 | | (2,081 | ) | — | | — | | — | | — | | — | |
Total self-supported debt | | 11,568 | | 532 | | 12,100 | | 1,769 | | (160 | ) | 1,609 | | 13,709 | |
Forecast allowance | | — | | 125 | | 125 | | 175 | | — | | 175 | | 300 | |
Total provincial debt | | 38,014 | | 3,304 | | 41,318 | | 9,412 | | (2,973 | ) | 6,439 | | 47,757 | |
(1) | Debt is after deduction of sinking funds and unamortized discounts, and excludes accrued interest. Government direct and fiscal agency accrued interest is reported in the government’s accounts as an accounts payable. |
(2) | New long-term borrowing plus net change in short-term debt. |
(3) | Sinking fund contributions, sinking fund earnings and net maturities of long-term debt (after deduction of sinking fund balances for maturing issues). |
(4) | Includes provincial government general capital, service delivery agencies, other fiscal agency loans, student assistance loans, loan guarantees to agricultural producers, guarantees issued under economic development and home mortgage assistance programs, and loan guarantee provisions. |
Budget and Fiscal Plan – 2010/11 to 2012/13
47
Three-Year Fiscal Plan
During 2009/10, further sinking funds were liquidated to benefit from current market conditions, and, consistent with policy, the proceeds were applied to operating debt. The provincial debt summary tables have been restated to reflect this policy.
Historically, government direct operating debt has included debt needed to finance ministry capital expenditures in addition to borrowing for operating deficits and working capital needs. Beginning in 2009/10, debt incurred to acquire ministry capital will be reported separately from direct operating debt providing disclosure consistent with the purpose of the debt.
Risks to the Fiscal Plan
The major risks to the fiscal plan stem from changes in factors that government does not directly control. These include:
· Assumptions underlying revenue and Crown corporation and agency forecasts such as economic factors, commodity prices and weather conditions.
· The outcome of litigation, arbitrations, and negotiations with third parties.
· Potential changes to federal transfer allocations, cost-sharing agreements with the federal government and impacts on the provincial income tax bases arising from federal tax policy and budget changes.
· Utilization rates for government services such as health care, children and family services, and income assistance.
In addition, changes in accounting treatment or revised interpretations of generally accepted accounting principles (GAAP) could have material impacts on the bottom line.
Table 1.25 summarizes the approximate effect of changes in some of the key variables on the surplus. However, individual circumstances and inter-relationships between the variables may cause the actual variances to be higher or lower than the estimates shown in the table. For example, an increase in the US/Cdn dollar exchange rate may be offset by higher commodity prices.
Table 1.25 Key Fiscal Sensitivities
| | | | Annual Fiscal Impact | |
Variable | | Increases of: | | ($ millions) | |
Nominal GDP | | 1% | | $150 – $250 | |
Lumber prices (US$/thousand board feet) | | $50 | | $35 – $70 (1) | |
Natural gas prices (Cdn$/gigajoule) | | $1 | | $255 – $305 | |
US exchange rate (US cent/Cdn $) | | 1 cent | | -$25 to -$40 | |
Interest rates | | 1 percentage point | | -$94 | |
Debt | | $500 million | | -$23 | |
(1) | Sensitivity relates to stumpage revenue only. Depending on market conditions, changes in stumpage revenues may be offset by changes in border tax revenues. |
Own Source Revenue
The main areas that may affect own source revenue forecasts are BC’s overall economic performance, the relative health of its major trading partners, the exchange rate and commodity prices.
Budget and Fiscal Plan – 2010/11 to 2012/13
48
Three-Year Fiscal Plan
Revenues are sensitive to economic performance. For example, taxation and other revenue sources are driven by economic factors such as personal income, retail sales, population growth and the exchange rate. The revenue forecast contained in the fiscal plan is based on the economic forecast detailed in Part 3: British Columbia Economic Review and Outlook. As well, it incorporates commodity price forecasts developed by the Ministry of Forests and Range and the Ministry of Energy, Mines and Petroleum Resources based on private sector information.
Income tax revenue forecasts are based on projections of personal and corporate income. The forecasts are updated from reports on tax assessments provided by the Canada Revenue Agency. As a result, revenue estimates can be affected by timing lags in the reporting of current and prior year tax assessments by the Canada Revenue Agency.
Revenues in British Columbia can also be volatile, largely due to the influence of the cyclical natural resource sector in the economy and the importance of natural resource revenues in the province’s revenue base. Changes in commodity prices such as natural gas, or lumber may have a significant effect on natural resource revenues.
Details on major assumptions and sensitivities resulting from changes to those assumptions are outlined in Appendix Table A9.
Federal Government Contributions
Potential policy changes regarding federal transfer allocations, including federal health transfers and cost-sharing agreements could affect the revenue forecast.
In January 2009, the federal government announced an infrastructure stimulus package as part of its 2009 budget. Negotiations with the federal government have now concluded and British Columbia has successfully leveraged $1.4 billion in infrastructure funding from the federal government. Federal funding for projects with cost-sharing agreements signed under the federal Infrastructure Stimulus Fund, Knowledge Infrastructure Fund, Building Canada Community Component Top-up and Community Adjustment Fund programs are conditional on substantial project completion by March 31, 2011. A total of $787 million in federal funding is committed to BC projects under these federal stimulus programs.
Crown Corporations and Agencies
Crown corporations and agencies have provided their own forecasts. These forecasts, as well as their statements of assumptions were used to prepare the fiscal plan. The boards of those corporations and agencies have also included these forecasts, along with further details on assumptions and risks, in the service plans being released with the budget.
The fiscal plan does not assume or make allowance for extraordinary adjustments other than those noted in the assumptions provided by the Crown corporations and agencies. Factors such as energy prices, water inflows into the BC Hydro system, accident trends, interest/exchange rates, decisions of an independent regulator, or pending litigation could significantly change actual financial results over the forecast period. BC Hydro’s and ICBC’s results may be affected by the outcome of BC Utilities Commission decisions on current and future rate applications.
Budget and Fiscal Plan – 2010/11 to 2012/13
49
Three-Year Fiscal Plan
New decisions or directions by Crown corporation or agency boards of directors may result in changes to costs and revenues due to restructuring, valuation allowances and asset write-downs, or gains and losses on disposals of businesses or assets.
SUCH Sector
SUCH sector forecasts have been provided by management of the various organizations based on policy assumptions provided by the Ministries of Health Services and Advanced Education and Labour Market Development.
Health authorities have submitted balanced financial plans for 2010/11 to 2012/13. These plans have been signed off by the board chairs of the respective health authorities. The Ministry of Health Services will continue to work with the health authorities to manage any emerging revenue and spending risks and spending pressures.
Forecasts for the universities, colleges, and institutions have been signed off by chairs of the board or audit committee and lead financial officers.
Forecasts for the combined school districts have been compiled by the Ministry of Education based on the requirements of the School Act, the current year plans developed by the school districts, and ministry policy assumptions respecting future funding allocations. Variances from these assumptions could impact the fiscal plan.
Spending
The spending forecast contained in the fiscal plan is based on ministry and taxpayer-supported Crown corporation and agency spending plans and strategies. Cost pressures such as higher fuel prices or the introduction of the HST may impact these spending projections; however, ministries will be fully refunded for HST costs. Details on major assumptions and sensitivities resulting from changes to those assumptions are shown in Appendix Table A11 and in ministry service plans. The main spending issues are outlined below.
The spending plans for the Ministries of Forests and Range and Public Safety and Solicitor General include base amounts to fight wildfires and deal with other emergencies such as floods. Unanticipated occurrences may affect expenses in these ministries.
Compensation
The current public sector negotiating framework provides for a dividend to be made available to employees if the projected surplus at March 31, 2010 is greater than $150 million, to a maximum of $300 million. Given the forecasted deficit in 2009/10, provision for a dividend payment is not included in the fiscal plan. However, consistent with negotiated agreements, a dividend would be paid if the required surplus is achieved in the Public Accounts for 2009/10.
In response to the global economic forecast and government’s fiscal position, Budget 2010 does not include funding for wage increases as collective agreements are renewed, consistent with the net-zero cost mandate for the collective bargaining cycle already underway.
Budget and Fiscal Plan – 2010/11 to 2012/13
50
Three-Year Fiscal Plan
Contingency Vote
A contingency vote of $450 million is included in 2010/11, and is maintained at $450 million in both 2011/12 and 2012/13.
The allocation to contingencies is a prudent budgeting measure that protects the three year fiscal plan from:
· unforeseen and unbudgeted costs that may arise; and
· pressures for costs that are currently budgeted based on estimates whose final values are impacted by external events or prices.
Table 1.26 Notional Allocations to Contingencies
($ millions) | | 2010/11 | | 2011/12 | | 2012/13 | |
2010 Sports and Arts Legacy | | 20 | | 20 | | 20 | |
Climate action and clean energy initiatives | | 20 | | 40 | | 40 | |
2010 Olympics — contingency allocation | | 10 | | — | | — | |
Subtotal notional allocations | | 50 | | 60 | | 60 | |
Reserved for unforeseen pressures related to natural disasters, caseload pressures, changes in assumed accounting treatment, possible workforce adjustment costs and other contingent items | | 400 | | 390 | | 390 | |
Total contingencies | | 450 | | 450 | | 450 | |
Budget 2010 includes three year funding totaling $160 million for two new specific allocations — the 2010 Sports and Arts Legacy and Climate Action and Clean Energy initiatives — that will be managed from the Contingencies vote. More information on these new commitments is provided in the CRF spending section of Part 1 and in the Arts and Sports topic box on page 64. The contingency amounts also include $10 million in 2010/11 for the remaining contingency that is earmarked to help address cost uncertainties in areas related to staffing and hosting the 2010 Winter Olympic and Paralympic Games (2010 Winter Games).
Public Sector Program Delivery
The vast majority of government-funded services are delivered through third party delivery agencies that provide programs such as acute and continuing health care, K—12 education, post-secondary education, and community social services. All of these sectors face cost pressures in the form of program demand and non-wage inflation. The government also funds a number of demand-driven programs such as PharmaCare, K—12 education, student financial assistance and income assistance. The budgets for these programs reflect reasonable estimates of demand and other factors such as price inflation. If demand is higher than estimated, this will result in a spending pressure to be managed.
Treaty Negotiations and the New Relationship
The provincial government is committed to building collaborative relationships with First Nations and Aboriginal people based on mutual respect, recognition, and reconciliation of Aboriginal rights and title.
Budget and Fiscal Plan – 2010/11 to 2012/13
51
Three-Year Fiscal Plan
Treaties continue to be a primary objective for the province for reconciling Aboriginal rights and title and providing increased certainty regarding ownership and use of provincial Crown land and resources. The treaty with the Maa-nulth First Nation has been ratified by the province, the federal government and the five Maa-nulth First Nations. The parties have agreed to an effective date of April 1, 2011. Implementation and settlement costs associated with the treaty Final Agreement have been accounted for in the fiscal plan.
A treaty Final Agreement was initialed by the Yale First Nation, the province and the federal government on February 5, 2010. The proposed Final Agreement must now be ratified by the members of the Yale First Nation before being ratified by the provincial and federal governments and taking effect. BC is also in final agreement negotiations with the In-SHUCK-ch, Sliammon and Yekooche First Nations and continues to negotiate treaties and incremental treaty agreements with a number of other First Nations. Outcomes of these negotiations and of the Yale First Nation Final Agreement ratification process could affect both the economic outlook and the fiscal plan.
Government is also committed to negotiating new revenue-sharing agreements and reconciliation agreements with First Nations to streamline consultation on natural resource decisions, provide increased certainty for investors, and provide new economic opportunities to communities. The number of possible new commitments, including the timing of their impacts, is uncertain, and government will need to accommodate associated fiscal plan impacts as individual negotiations progress. In December 2009, reconciliation protocols were reached with the Haida First Nation and with a number of Coastal First Nations, and an Amended Economic Benefits Agreement was reached with three Treaty 8 First Nations, with ongoing negotiations to achieve a Final Agreement. Costs associated with these agreements have been accounted for in the fiscal plan.
The province is involved in litigation with First Nations relating to aboriginal rights. Settlement of these issues, either in or out of court, may result in additional costs to government.
Capital Risks
The capital spending forecasts assumed in the fiscal plan may be affected by bids and proposals resulting in project costs that are higher than the initial approved budgets, particularly for large complex projects such as the BC Place roof replacement. For such projects, government will review the budget and scope risks, and the strategies to mitigate these risks. Any subsequent approved budget increases may be funded from capital contingencies.
Other risks impacting capital spending forecasts include:
· meeting planned construction schedules;
· weather and geotechnical conditions causing project delays or unusual costs;
· changes in market conditions, including service demand, inflation and borrowing costs;
Budget and Fiscal Plan – 2010/11 to 2012/13
52
Three-Year Fiscal Plan
· the outcome of environmental impact studies;
· the accuracy of capital project forecasts;
· the successful negotiation/timing of cost-sharing agreements with the federal government;
· the application/interpretation of accounting treatments;
· the success of public-private sector partnership negotiations; and
· building material costs and wage rates for skilled workers.
Pending Litigation
The spending plan for the Ministry of Attorney General contains provisions for payments under the Crown Proceeding Act based on estimates of expected claims and related costs of settlements likely to be incurred. Litigation developments may occur that are beyond the assumptions used in the plan (for example, higher-than-expected volumes, or size of claim amounts and timing of settlements). These developments may affect government revenues and/or expenditures in other ministries.
One-time Write-downs and Other Adjustments
Ministry budgets provide for anticipated levels of asset or loan write-downs where estimates can be reasonably predicted. The overall spending forecast does not make allowance for extraordinary items other than the amount provided in the contingency vote.
Resolution of Accounting Policy Issues
The three-year fiscal plan conforms to the standards and guidelines that comprise generally accepted accounting principles (GAAP) for senior governments. However, the Canadian accounting profession is in the process of adopting International Financial Reporting Standards (IFRS) with GAAP. In some aspects, IFRS is a significant departure from current Canadian accounting practice, and its adoption will introduce significant volatility into government’s operating statement and could materially affect the fiscal plan. For example, IFRS does not accurately reflect provincial legislation and the regulatory policy frameworks governing a number of government’s commercial Crown corporations. While government remains committed to having its financial reporting conform to GAAP, this issue may result in government adopting alternate accounting standards from other accredited standard setting organizations.
In the February 2010 Throne Speech, government committed to introducing legislation that will enable universities to remove themselves from the government reporting entity. This initiative may have a significant impact on government’s financial statements. The degree of impact will be determined as government finalizes the policy for removal and identifies the universities that will qualify for removal under the policy.
Budget and Fiscal Plan – 2010/11 to 2012/13
53
Three-Year Fiscal Plan
Five Year Fiscal Plan Update
Update on the plan to balance the budget by 2013/14
The government’s fiscal strategy, as set out in the Balanced Budget and Ministerial Accountability Act is to balance the budget. Due to the unprecedented economic effects of the provincial crisis, government amended the Act in 2009 to permit temporary deficits for the fiscal years 2009/10 through to 2012/13. This amendment provides government the flexibility needed to ensure that health, education, and social services are protected until the economy returns to strong growth.
Government set out a five year plan (2009/10 to 2013/14) in September Update 2009 to achieve a balanced budget and this topic box provides a progress report on that plan. Budget 2010 reaffirms government’s commitment to return to a balanced budget by 2013/14. The forecast deficits, and ultimate surplus position in 2013/14, is little changed from the September Update 2009.
Principles
The principles underlying the plan to return to balance are as follows:
· maintain a competitive economy;
· protect critical health, education and social services;
· the budget must be balanced by 2013/14;
· government intends to return to a declining debt to GDP ratio once the budget is balanced;
· government is committed to paying down operating debt as a first priority in its debt management strategy; and
· the fiscal plan should be based on prudent assumptions.
Underlying Economic and Revenue Assumptions
Five year fiscal projections require a forecast of economic conditions in order to project the revenue that is likely to be available to government. The five year economic forecast included in Part 3: British Columbia Economic Review and Outlook provides the necessary assumptions for the five year fiscal plan.
The five year fiscal projections (2009/10 to 2013/14) also require a forecast of the aggregate profit/loss position of Commercial Crown corporations and the projected revenues and expenses of taxpayer-supported crown corporations, health authorities/health societies, universities, colleges, and school districts (SUCH sector), as well as operating expenses of government ministries.
The revenue and expense forecasts depend on the projected performance of the economy and assumptions about fiscal policy. Outcomes will depend on the actual performance of the economy, the performance of revenue forecasts and adherence to spending plans. These decisions will evolve during each budget process and will be based on updated revenue and expense forecasts.
The main fiscal assumptions are as follows:
· The five year plan incorporates the impact of tax measures as of Budget 2010, but no further new tax measures are assumed.
· Tax revenues are assumed to grow consistently with the economic forecast underlying Budget 2010.
· Federal health and social transfers are assumed to grow in accordance with planned base increases announced by the federal government.
· Crown corporation net income, which is included in revenue, is based on five year forecasts submitted by the corporations.
· Forecasts for taxpayer-supported Crown corporations’ revenues and expenses are based on five year forecasts submitted by the corporations.
· Forecasts for the SUCH sector assume net income remains at 2012/13 levels. Equivalent, incremental revenue and expense increases are assumed for 2013/14 consistent with historical increases.
Revenue and Expense Projections
The five year fiscal plan is shown in Table 1.
Budget and Fiscal Plan – 2010/11 to 2012/13
54
Three-Year Fiscal Plan
Table 1 Five Year Fiscal Plan
($ millions) | | 2008/09 | | 2009/10 | | 2010/11 | | 2011/12 | | 2012/13 | | 2013/14 | |
Revenue | | 38,328 | | 37,050 | | 39,190 | | 40,957 | | 42,800 | | 44,280 | |
% change | | | | -3.3 | % | 5.8 | % | 4.5 | % | 4.5 | % | 3.5 | % |
Total Expense | | 38,250 | | 39,700 | | 40,605 | | 41,602 | | 42,545 | | 43,470 | |
% change | | | | 3.8 | % | 2.3 | % | 2.5 | % | 2.3 | % | 2.2 | % |
Surplus (Deficit) before forecast allowance | | 78 | | (2,650 | ) | (1,415 | ) | (645 | ) | 255 | | 810 | |
Forecast Allowance | | — | | (125 | ) | (300 | ) | (300 | ) | (400 | ) | (400 | ) |
Surplus (Deficit) | | 78 | | (2,775 | ) | (1,715 | ) | (945 | ) | (145 | ) | 410 | |
Taxpayer-supported capital expenditures | | 3,778 | | 4,013 | | 5,414 | | 3,609 | | 3,073 | | 3,053 | |
Total capital expenditures | | 5,540 | | 7,270 | | 8,159 | | 6,528 | | 6,058 | | 5,914 | |
Direct operating debt | | 5,744 | | 6,182 | | 7,511 | | 8,209 | | 7,838 | | 6,976 | |
Total Taxpayer-supported debt | | 26,446 | | 29,093 | | 33,748 | | 36,720 | | 38,329 | | 39,618 | |
Total debt | | 38,014 | | 41,318 | | 47,757 | | 52,363 | | 55,862 | | 58,667 | |
Taxpayer-supported debt/GDP (%) | | 13.4 | % | 15.5 | % | 17.2 | % | 17.9 | % | 17.8 | % | 17.5 | % |
Revenue over the five year period (2009/10 to 2013/14) is little changed compared to September Update 2009. The total five-year cumulative change is a $35 million increase in revenue, net of the policy change in accounting for residential energy use credits. The change in revenue results from declines in taxation revenue (personal income tax, corporate income tax, and HST rebates) and natural gas and forestry revenues, offset by increases in bonus bid and metals and minerals revenues and significant changes in recoveries.
Expenses over the five year period are projected to be lower than the September Update 2009. The total five-year cumulative change is a $155 million decrease in expenses. The change in expense results from maintaining continuing tight controls on spending in the out-years and significant reduction in debt services costs due to lower interest rates and controlling the amount of debt. This provides the ability to increase the forecast allowance to $300 million in each of 2010/11 and 2011/12, moving to $400 million in each of 2012/13 and 2013/14 in order to provide additional prudence in the fiscal plan.
The Ministry of Finance’s outlook for nominal GDP growth is discussed in Part 3, and averages 4.9 per cent for the period 2011 to 2013, reflecting forecasts of domestic demand as well as net exports for British Columbia.
The primary sources of revenue are taxation and natural resource revenues. Personal and corporate income tax revenues are forecast based on personal income and pre-tax corporate profit projections disclosed in Table 2.
Table 2 Material Assumptions
Annual percent change unless | | | | | | | | | | | |
otherwise indicated | | 2009 | | 2010 | | 2011 | | 2012 | | 2013 | |
Real GDP | | -2.7 | | 2.2 | | 2.3 | | 2.7 | | 2.8 | |
Nominal GDP | | -5.0 | | 4.5 | | 4.7 | | 5.0 | | 4.9 | |
Personal income growth | | -1.5 | | 2.7 | | 3.5 | | 4.6 | | 4.6 | |
Pre-tax corporate profit growth | | -35.8 | | 12.7 | | 9.8 | | 7.6 | | 7.5 | |
Natural gas (fiscal year): | | | | | | | | | | | |
Price ($Cdn/gJ; plant inlet) | | $ | 3.06 | | $ | 4.29 | | $ | 5.09 | | $ | 5.38 | | $ | 5.78 | |
% change in volumes | | 1.4 | % | 7.9 | % | 23.2 | % | 14.4 | % | 7.0 | % |
Lumber prices SPF ($US/000 mbf) | | $ | 182 | | $ | 225 | | $ | 238 | | $ | 288 | | $ | 300 | |
Effective interest costs | | 3.17 | % | 3.61 | % | 4.44 | % | 5.01 | % | 5.98 | % |
Budget and Fiscal Plan – 2010/11 to 2012/13
55
Three-Year Fiscal Plan
Natural gas royalty forecasts incorporate the private sector price outlook included in Table 2.
Overall revenue, including net income of the commercial Crown corporations, is expected to average 2.9 per cent growth over the five year period. This rate of growth is supported by rising commodity prices and improving economic growth while reflecting small growth in the service delivery agencies and Crown corporations.
The deficit/surplus position in each year is little changed from the Five Year Plan in September Update 2009 and reflects the small changes in revenue and expenses described above. The forecasted fiscal position for 2009/10, 2010/11, 2011/12 and 2012/13 is virtually identical to that projected in September, including the increased forecast allowance in each year. There has been a slight reduction in the surplus position in 2013/14 reflecting the increase in the forecast allowance from $250 million to $400 million.
Expenditure Plan
The plan assumes expense growth will average 2.6 per cent over the five year period. This level of growth is consistent with average expenditure growth for 2012/13 and reflects prudent planning for achieving a balanced budget.
Sound fiscal management will be required to bring spending in line with expected revenues to achieve a balanced budget by 2013/14.
Specific expense allocation decisions for 2013/14 have not been made at this time. Given service demands in health care and education, there may be little funding available for other financial commitments. However, as economic growth picks up, caseload pressures in ministries such as Housing and Social Development and Advanced Education and Labour Market Development can be expected to ease.
Protecting the Fiscal Plan
The 2010/11 fiscal year incorporates a forecast allowance of $300 million which is continued in the following year, increasing to $400 million in 2012/13 and the year after (see Table 1 Five Year Fiscal Plan). This forecast allowance helps protect against the uncertainties in predicting future economic developments which can be caused by variability in, for example, economic growth, energy prices, and tax revenues, as well as unexpected expenditures such as natural disaster costs.
The fiscal plan also includes contingencies of $450 million in each year of the period 2010/11 to 2013/14 to help ensure the ministry spending targets are met.
Capital
Significant capital expenditures were made in 2009/10 and will continue to be made in 2010/11 as part of the economic stimulus initiatives undertaken by government to respond to the economic downturn. Taxpayer-supported capital expenditures are projected
Chart 1 –Return to balanced budgets by 2013/14
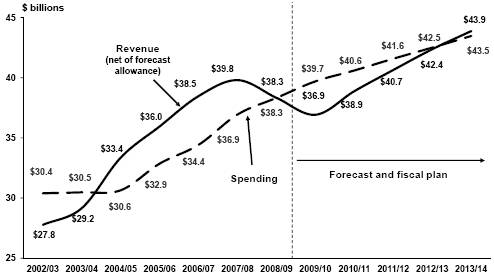
Budget and Fiscal Plan – 2010/11 to 2012/13
56
Three-Year Fiscal Plan
Chart 2 – Infrastructure investments

to be $4,013 million in 2009/10 rising to $5,414 million in 2010/11. Capital spending slows in 2011/12 to $3,609 million returning to levels of spending consistent with historical capital investment. The changes in taxpayer-supported capital spending compared to the September Update 2009 projection reflects both changes in timing of capital expenditures from 2009/10 to future years and the timing of capital investments for significant transportation projects.
Self-supported capital spending is projected to continue to increase primarily reflecting construction of the Port Mann Bridge and additional investment in improving and expanding BC Hydro hydroelectric power generation assets.
Total capital expenditures have been maintained at a level consistent with projections made in September.
Debt
Debt affordability is a government priority to ensure future generations are not encumbered by a debt burden built up by historical deficits. Government is implementing a fiscal management strategy that will result in the return to a balanced budget and a legislated requirement to eliminate operating debt.
The ratio of taxpayer-supported debt-to-GDP, which excludes commercial Crown corporations and other self-supported debt, is a key measure often used by rating agencies and investors to assess a province’s ability to repay debt. The return to a declining taxpayer-supported debt-to-GDP ratio is a key indicator of government’s commitment to implement fiscal policies to achieve a strong and vibrant economy and a financially sustainable fiscal plan.
During the period 2004/05 to 2008/09, a strong economy and consequent fiscal strategy allowed the provincial government to adjust its borrowing strategy to reduce a significant portion of its debt. The taxpayer-supported debt-to-GDP ratio has also declined. The low level of the debt-to-GDP ratio in 2008/09 provided government with the flexibility needed to manage through these challenging economic times and protect key services.
Due to the committed infrastructure spending, anticipated deficits and lower GDP projections, the taxpayer-supported debt-to-GDP ratio is forecast to increase from 15.5 per cent in 2009/10, to 17.2 per cent in 2010/11, and to 17.9 per cent in 2011/12. As the deficit is reduced, operating debt falls and the taxpayer-supported debt-to-GDP ratio is forecast to start to decline in 2012/13 to 17.8 per cent and is forecast to further decline to 17.5 per cent in 2013/14. As evidenced by the decline beginning in 2012/13, the return to balanced budgets and the debt elimination measures put in place by government have kept debt within affordable levels.
Budget and Fiscal Plan – 2010/11 to 2012/13
57
Three-Year Fiscal Plan
Chart 3 –Taxpayer debt burden remains affordable
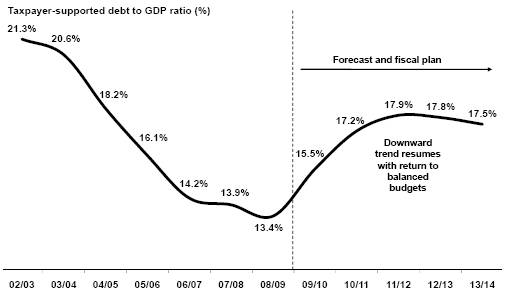
Debt, while rising, is projected to be lower compared to September Update 2009. Provincial debt is now forecast to total $41.3 billion in 2009/10, $1 billion below budget.
The increase in the direct operating debt highlights the importance of eliminating the deficit as quickly as possible, to avoid burdening future generations of British Columbians with high debt and debt service costs. Operating debt was contained despite a significant deficit, by directing all additional cash resources available from bonus bid sales and the liquidation of sinking funds to reduce operating borrowing requirements. Government is committed to paying down operating debt first.
Conclusion
While based on prudent economic assumptions and private sector commodity price forecasts, there remains uncertainty with respect to a medium-term forecast of this nature. Should revenue be lower than that projected, government would need to re-evaluate the spending and tax measure assumptions of the five year plan in order to achieve a balanced budget. However, should revenue outperform the forecast, government will have the option of achieving a balanced budget earlier, enhancing services, or further reducing taxes for British Columbians.
Chart 4 – Operating debt down from peak in 2003/04
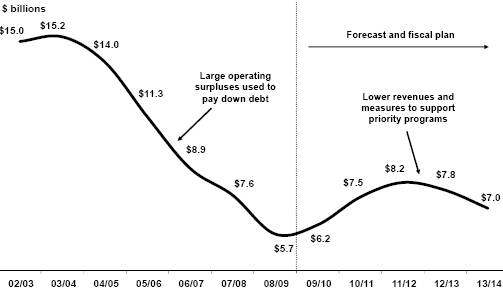
Budget and Fiscal Plan – 2010/11 to 2012/13
58
Three-Year Fiscal Plan
Expenditure Management Update
The budget challenges facing British Columbia are not unique. In Canada alone, a review of four other of the more populous provinces and the federal government shows that there has generally been a deterioration in fiscal position as of late 2009/10 compared to what they reported earlier in that fiscal year.
Table 1 Fiscal Deterioration in Canada and Provinces in 2009/10
Jurisdiction | | Budget
Balance:
Early 2009 | | Budget
Balance:
Latest Update | | Change in
Budget
Balance | |
| | | | $ millions | | | |
British Columbia | | (495 | ) | (2,775 | ) | (2,280 | ) |
Alberta | | (4,714 | ) | (3,624 | ) | 1,090 | |
Saskatchewan | | 415 | | (140 | ) | (555 | ) |
Ontario | | (14,100 | ) | (24,716 | ) | (10,616 | ) |
Quebec | | (3,526 | ) | (4,413 | ) | (887 | ) |
Canada | | (33,700 | ) | (55,900 | ) | (22,200 | ) |
All amounts exclude any transfers from stabilization funds (e.g. Saskatchewan’s Growth and Financial Security Fund) that would otherwise have a positive effect on budget balances.
The chart shows BC’s recent and anticipated growth in revenues and expenditures — the vertical distance between the two lines represents the operating surplus or deficit in any particular year. Given anticipated revenue growth, expenditures cannot grow at recent historic rates (the dotted line), but rather must grow at the rate projected by the solid line in order to reach a balanced budget by 2013/14. Hence, rigorous expenditure controls have been implemented since the onset of the world economic downturn in 2008; these controls are continuing to evolve and be refined in order to ensure that budget targets are met.
Revenue and expenditure trends: the need for expenditure controls

In the September Update 2009, a five year plan was outlined to return to a balanced budget by 2013/14. An updated plan is included in Budget 2010. This plan incorporated a number of assumptions regarding growth in both revenues and expenditures. While government’s view is that the assumptions underlying its revenue projections are sound and prudent, there are a number of factors outside of government’s control that can alter revenue estimates, such as demand for our exports, commodity prices, exchange rates, interest rates, and so on. On the expenditure side, while there are also some areas that are subject to unanticipated volatility (e.g. forest fires and other natural disasters), government has a much greater ability to control spending, as opposed to influencing revenue growth. These risks underscore the need for expenditure controls.
Recap of Expenditure Controls introduced for 2009/10
· Administrative and other savings — The February 2009 budget incorporated significant reductions to ministry expenditures for travel, informational advertising, professional services contracts, general office expenses, and discretionary grants. Compared to the Budget 2008 three-year fiscal plan, cumulative 3 year savings in the February 2009 budget in these areas totaled $1.9 billion.
· Realignment of expenditure categories — In spring 2009, ministries were directed to realign their budget allocations across lines of business to more accurately reflect operational realities for key areas (or “STOBs”)(1) such as salaries, operating costs (i.e. travel, corporate services, contracts, etc.), and grants/transfers to outside agencies. As a result of this process, it was determined that there was room to make further administrative expenditure reductions. Concurrently, a review of 2009/10 discretionary grants to non-government organizations was undertaken. Together,
(1) STOB means Standard Object of Expenditure — STOBs are categories of spending such as salaries, benefits, travel, office supplies, professional contracts, grants or contributions, etc across which ministry budgets are allocated and appear in the Supplement to the Estimates document.
Budget and Fiscal Plan – 2010/11 to 2012/13
59
Three-Year Fiscal Plan
these two exercises resulted in savings of an additional $1.5 billion over three years, as reported in the September Update 2009. Much of government’s success in achieving savings in 2009/10 was due to rigorous STOB controls and a similar approach will continue next year, including tight hiring restrictions.
· Year-end savings initiative — Similar to the process undertaken in 2008/09, in January 2010 ministries were asked to find year-end savings in their 2009/10 budgets, assuming year-end discretionary spending would be held to a minimum. A total of $178 million was identified as savings. These savings helped to facilitate a re-profiling of $500 million of the federal HST transitional funding from 2009/10 to 2010/11 and 2011/12 to help fund government priorities in these years.
Additional Expenditure Measures introduced for Budget 2010
Refocusing Priorities in Resource Ministries
· After a review of all ministry budgets, it has been determined that several resource management ministries will provide savings that are being reallocated to protect health, improve educational and other programming for families and youth, and to help manage pressures in the “caseload ministries” (Attorney General, Public Safety and Solicitor General, Children and Family Development, and Housing and Social Development). Re-allocation of these resource ministry budgets also help to keep government on track to balance the budget by 2013/14.
· As part of this re-focusing effort, five ministries will experience budget reductions totaling $55 million in 2010/11 and $103 million annually in the out-years. Those ministries are: Agriculture and Lands; Community and Rural Development; Energy, Mines, and Petroleum Resources; Forests and Range; and Transportation and Infrastructure.
· These ministries will be finding efficiencies and administrative savings, better coordinating front line services, and focusing their budgets on areas that provide maximum returns from a public service perspective. They are currently working on plans for achieving these savings.
Fall 2009 Grant Review
· Part of the $1.5 billion in three-year savings achieved in the September Update 2009 resulted from a review and subsequent reduction of grants and transfers to organizations outside government. This exercise resulted in additional savings of $296 million in 2009/10 compared to the February 2009 budget. These savings were found mainly in discretionary grants (with no contractual requirements) and payments to organizations under agreements. Even with these reductions, government still issued $10.7 billion in grants and transfers under agreements in fiscal year 2009/10.
· A further review of discretionary grants was conducted in preparation for Budget 2010, with the intent of ensuring that funding was focused on government priority areas. Discretionary grants were divided into seven categories (Education, Health, Social Supports, Environment/Climate Action, Economy, First Nations, and Other) so that government could be sure that appropriate allocations were in place. The resulting grants and transfers total for 2010/11 is $11.5 billion.
Shared Services Savings
· The fiscal plan includes net savings to government of $59 million over three years, due to a re-organization of the administration of leasing and other space/overhead management of government buildings and information technology services. These have been achieved through simplification of the internal administration and billing processes, increased standardization of services and space allocations across government, and a realignment of client services support. This work has been undertaken by Shared
Budget and Fiscal Plan – 2010/11 to 2012/13
60
Three-Year Fiscal Plan
Services BC (SSBC) within the Ministry of Citizen’s Services.
· This centralization is the key reason why the ministry’s budget appears to have increased from 2009/10 to 2010/11 if compared to the September Update 2009 document. However on a restated basis (i.e. assuming that the 2009/10 ministry composition is the same as the new organization), the ministry’s budget is actually declining in 2010/11.
· When the shared services model was created several years ago, it was based on a fully cost-recovered model, some efficiencies were achieved. However, ministries held the budget allocation and were charged by shared services for consumption.
· After an internal review of shared services cost pressures in 2009, it was determined that the accountability model could be further improved. Under the current model, it is challenging to control ministry consumption. Therefore, as of 2010/11, shared services funding in ministries is being transferred into SSBC. By having the overall budget reside within a single agency, ministry consumption of services can be better coordinated and a more pro-active risk management regime instituted.
The 2010 Compensation “Net-Zero” Bargaining Mandate
· About 55 per cent ($22 billion) of BC public sector expenditures by ministries, crown agencies, social service agencies, and the SUCH sector (school districts, universities, colleges, and health employers) consists of wages and benefits. In ministries alone, this amount is approaching $3 billion annually, with the remaining $19 billion, along with associated FTEs, accounted for by the broader government sector as shown in the table. This total compensation amount implies that a 1 per cent increase would add $220 million annually to BC public sector costs.
Table 2 Public Sector Compensaton and FTEs
| | Wages/ | | Wages/ | | | | | |
| | Benefits | | Benefits | | FTEs | | FTEs | |
Sector | | ($ Billions) | | (% of Total) | | (#) | | (% of Total) | |
Health | | 10.3 | | 47 | | 101,605 | | 39 | |
Education (K-12) | | 4.1 | | 19 | | 60,206 | | 23 | |
Post-secondary | | 2.7 | | 12 | | 34,965 | | 13 | |
Public service | | 2.8 | | 13 | | 36,104 | | 14 | |
Crown agencies | | 1.6 | | 7 | | 19,181 | | 7 | |
Community social services | | 0.5 | | 2 | | 9,627 | | 4 | |
Total | | 22.0 | | 100 | | 261,688 | | 100 | |
Data represents unionized non-unionized and management/excluded employees.
Source: Public Sector Employers Council Secretariat (November 30, 2009).
· Most collective agreements in the provincial public sector expire between March 31 and December 31, 2010. This will result in the negotiation of over 180 collective agreements covering more than 200,000 employees. Negotiations between employer bargaining agents and unions are already underway or will begin soon.
· Given the current fiscal situation, the government has been clear that there is no incremental funding available for compensation increases in this round of bargaining. Government’s position is that settlements must have no new cost to government (i.e. be “net-zero”). In other words, if a change to an agreement has a financial cost, it must be offset with another change within that same agreement that provides savings of an equivalent amount.
· For example, employers and unions can negotiate a wage increase provided they make other changes to the collective agreement that match the increase with equivalent savings that can be quantified and clearly demonstrated. Such compensation trade-offs must meet the following criteria:
· they may not impede service delivery objectives;
· they must be demonstrable and achievable; and
· any ongoing compensation increase must be funded by equivalent ongoing savings. Therefore no new funding will be provided consistent with the net-zero mandate.
· Negotiations under this environment will be a challenge for all parties. Nonetheless, progress has been made at a number of key bargaining tables and tentative agreements have been reached.
Budget and Fiscal Plan – 2010/11 to 2012/13
61
Three-Year Fiscal Plan
Results of Crown Corporation Review: Tourism BC, BC Rail, and the Homeowner Protection Office
The August 2009 Throne Speech announced that there would be a review of Crown corporations to increase effectiveness and reduce administrative overhead. Budget 2010 includes a restructuring of three Crown agencies.
Tourism BC:
· It was announced in August 2009 that Tourism BC is being amalgamated into the Ministry of Tourism, Culture and the Arts, effective April 1, 2010. Tourism BC, created in 1997, has been the key tourism marketing agency for the province.
· The ministry will now have direct responsibility for tourism marketing programs, and funding currently provided by the Hotel Room Tax (which ends on July 1, 2010 with the introduction of the HST) will now be provided annually through a budget appropriation.
· It is anticipated that bringing Tourism BC into government will enable better co- ordination of all the Province’s marketing initiatives and reduce administrative costs. These functions will be further reviewed as part of the development of Budget 2011.
BC Rail:
· As announced in the February Throne Speech, the British Columbia Railway Company (BCRC) will be brought into government, becoming a subsidiary of the British Columbia Transportation Financing Authority (BCTFA) under the responsibility of the Ministry of Transportation and Infrastructure.
· This restructuring will allow for all transportation-related assets to be controlled under the BCTFA, and will integrate management and funding under the supervision of the ministry. However, BCRC will continue as a legal entity, with is current legislative authority, existing agreements, and assets largely intact, including 2300 kilometres of rail line and additional land holdings.
· This integration of operations, including movement of key staff into the ministry, is to be implemented in 2010.
· This new arrangement, in addition to being more efficient, will enable the Province to more strategically manage BCRC’s rail assets within the context of the Pacific Gateway Strategy, which supports the movement of goods through the Roberts Bank and North Shore areas of the lower mainland and connecting to the remainder of the province. Going forward, BCRC’s financial plans will be reviewed by Treasury Board as it reviews those of the BCTFA and the ministry.
Homeowner Protection Office:
· The Homeowner Protection Office (HPO), under the responsibility of the Ministry of Housing and Social Development (HSD), will be wound up effective April 1, 2010.
· The HPO was established in October 1998 and was originally envisioned as a 10-year program. HPO has administered both the Reconstruction Program and Provincial Sales Tax (PST) Relief Grant, which have helped eligible owners of water-damaged homes through loan subsidy programs and providing PST refunds on reconstruction work.
· On July 31, 2009, the Province announced that it would no longer be accepting applications for new loans under the Reconstruction Program. In addition, the PST Relief Grant Program will end on June 30, 2010, in conjunction with the introduction of the HST.
· Key functions currently administered by HPO will continue as follows:
· the residential builder licensing, home warranty, reconstruction levy collection, and research and education responsibilities will be transferred to BC Housing under HSD; and
Budget and Fiscal Plan – 2010/11 to 2012/13
62
Three-Year Fiscal Plan
· administration of the reconstruction loan and interest subsidy programs will be transferred to the Ministry of Finance, with continued funding to be provided from the reconstruction levy collected by BC Housing.
Overall, these changes are expected to reduce corporate overhead and result in administrative efficiencies.
Expenditure Management in Remaining Crown Agencies and the SUCH Sector
School Districts, Universities, Colleges, and Health Authorities (the SUCH sector), as well as taxpayer-supported crown agencies, all receive funding from ministry budgets. Built into the current fiscal plan are substantial funding increases that have been received by SUCH members, both in recent years and in Budget 2010. However, these organizations will still have to manage to their fiscal targets. Ministers with SUCH sector and taxpayer-supported Crown responsibilities are accountable for managing them within these targets.
For example, in 2009/10, the Minister of Health Services has confirmed that health authorities are to manage within their September Update 2009 allocations, in spite of earlier forecasts of budget pressures by the health authorities.
The Ministries of Education and Advanced Education and Labour Market Development are also accountable to ensure that school districts and post-secondary institutions operate within their budgets. In the coming months, these ministries will be discussing expenditure targets with these entities to work towards a more transparent and simplified expenditure management process for these two SUCH sectors.
In addition, changes are proposed to the legislation governing the post-secondary sector in order to clarify some important accounting terminology contained in the relevant acts. For example, those acts do not provide a clear definition of “revenues” and “expenditures” at present, which has created challenges for government financial management and reporting processes and the fiscal plan. The intent is to provide amendments that increase clarity for the institutions and improve consistency in management and reporting from government’s perspective.
The projected net incomes of taxpayer-supported Crown agencies also affect government’s bottom line. Most ministers have responsibilities for at least one Crown agency, and hence have the responsibility for ensuring that these service delivery agencies work within their approved net income targets that are built into government’s fiscal plan.
Budget and Fiscal Plan – 2010/11 to 2012/13
63
Three-Year Fiscal Plan
A Renewed Emphasis on the Arts and Sports:
New Opportunities for Participation
The Significance of Arts, Culture, and Sports in BC
The province recognizes arts, culture and sports as core values in our society. A 2006 study on the state of the arts in BC concluded that, compared with other jurisdictions in Canada, BC rated “high” or “above average” in growth in the number of working artists, the number of people who donate to or volunteer in arts and culture, and the number of citizens who visit art galleries. British Columbians also recognize sports, not only as recreation and entertainment, but also as a way to build civic pride.
Children tend to experience the most significant benefits from becoming involved in the arts and sports. According to Statistics Canada, children who participate in organized activities outside of school, such as sports or the arts, tend to have higher self-esteem, interact better with friends and perform better in school. There are also considerable economic benefits to be derived from arts and sports-related activities in communities.
BC’s Commitment to Arts and Culture
Government support to the arts is administered through the Ministry of Tourism, Culture and the Arts (MTCA) and the BC Arts Council (BCAC). Since 2001, the BCAC has awarded over $134 million in funding. BCAC grants are awarded to drama associations, dance societies and opera companies, choral groups, conservatories and symphonies, writing schools, arts organizations and individual artists throughout the province.
In 2010/11, the MTCA’s budget to support arts and culture will total $24.6 million. The Ministry of Housing and Social Development (MHSD), through the community gaming grants program, intends to provide a further $11.5 million to arts and culture organizations. Including new 2010 Sports and Arts Legacy funding, discussed below, the total provincial contribution will be $46.1 million.
Table 1 BC Arts and Culture Funding 2010/11
| | ($ millions) | |
Arts and Culture Program | | 3.0 | |
BC Arts Council Grants | | 7.9 | |
BC Arts and Culture Endowment Fund | | 1.5 | |
Royal BC Museum Operating Grant | | 12.2 | |
MTCA Arts and Culture Budget | | 24.6 | |
MHSD Gaming Grants | | 11.5 | |
Total BC Arts and Culture Funding (net of contingency allocation) | | 36.1 | |
2010 Sport and Arts Legacy (Arts portion) | | 10.0 | |
Total BC Arts and Culture Funding | | 46.1 | |
While there have been fiscal challenges since 2008/09, arts and culture funding has been relatively robust in recent years, especially considering the added injections of “one-time” funding from supplementary estimates during years when government had more discretionary funds available. For example, in 2007/08, $68 million in Supplementary Estimates funded the BC 150 Cultural Fund (part of the BC Arts and Culture Endowment Fund), as well as for organizations such as the Vancouver Art Gallery and the Vancouver East Cultural Centre. The following year, supplementary estimates of $7 million funded additional BC Arts Council grants.
Table 2 Arts and Culture Funding Profile
Year | | MTCA
Budget | | MHSD
Gaming
Grants | | Supplementary
Estimates and
Contingencies | | Total | |
| | | | ($ millions) | | | | | |
2006/07 | | 37.3 | | 18.8 | | — | | 56.1 | |
2007/08 | | 33.4 | | 17.5 | | 68.0 | | 118.9 | |
2008/09 | | 37.8 | | 18.2 | | 7.0 | | 63.0 | |
2009/10 | | 18.4 | | 23.6 | | — | | 42.0 | |
2010/11 | | 24.6 | | 11.5 | | 10.0 | | 46.1 | |
As the vision of arts and culture expands with the growing emergence of electronic technologies, jurisdictions around the world are further recognizing the economic benefits of the arts. As part of the creative economy, industries such as film, television, digital media, publishing, music, architecture and design contributed approximately $3 to $4 billion in economic activity in BC in 2008. In fact today, BC is the third largest film and television production centre in North America after Los Angeles and New York.
Budget and Fiscal Plan – 2010/11 to 2012/13
64
Three-Year Fiscal Plan
Greater Vancouver is one of the top interactive media (e.g. videogames) centres in the world. To support BC’s competitive position, government has introduced a new tax credit incentive package for digital media that recognizes the convergence that is taking place within the film, television, video game and animation sectors (see information in Part 2: Tax Measures). Additionally, government intends to establish a new campus for the Emily Carr University of Art and Design at the Great Northern Way Campus in the lower mainland to support the growth and development of new talent, creative industries, and marketable ideas.
Government’s Support for Sports in BC
British Columbia has a longstanding tradition of sports excellence and is committed to encouraging broad participation in sports and physical activity, and supporting elite athletes in their pursuit of excellence. Government support to sports is administered through the Ministry of Healthy Living and Sports (MHLS).
In 2010/11, the MHLS’ budget to support sports, recreation and ActNow BC activities will total $14.8 million. MHSD, through the community gaming grants program, intends to provide a further $22.9 million to sports organizations. Including new 2010 Sports and Arts Legacy funding, discussed below, the total provincial contribution will be $47.7 million.
Table 3 BC Sport Funding 2010/11
| | ($ millions) | |
Sport and ActNow BC Program | | 12.0 | |
Sport Hosting | | 2.8 | |
MHLS Sport and ActNow BC Budget | | 14.8 | |
MHSD Gaming Grants | | 22.9 | |
Total BC Sport Funding (net of contingency allocation) | | 37.7 | |
2010 Sport and Arts Legacy (Sport portion) | | 10.0 | |
Total BC Sport Funding | | 47.7 | |
Government’s investment in sports and recreation is already paying off. British Columbia is Canada’s most physically active province. According to the 2009 Canadian Community Health Survey, 59 per cent of British Columbians undertake enough physical activity to derive health benefits compared with the national average of 51 per cent. Along with its obvious health benefits, sports has tangible economic benefits. For example, those involved in sporting events as spectators or participants, including those who travel to provincial sports tournaments, contributed about $265 million of BC’s tourism revenues in 2007.
The 2010 Sports and Arts Legacy
As athletes around the world trained for the 2010 Olympic and Paralympic Winter Games, the Vancouver 2010 Cultural Olympiad hosted a series of arts and cultural events that grew in scope and scale from 2008 through 2010 — the first time an Olympic Winter Games has hosted a Cultural Olympiad beginning as early as two years before the Games. Working in close partnership with local artists, Canadian and international arts and popular culture were showcased, featuring music, dance, theatre, visual arts, film, outdoor spectaculars and digital media experiences.
To build on the momentum created by the 2010 Games and the Cultural Olympiad, Budget 2010 provides $60 million over the next three years as a legacy for sports and the arts in British Columbia. Funding will be made available through the annual Contingencies and New Programs Vote. Eligibility criteria will include a focus on maximizing the long-term benefits of participation in arts and youth sports activities.
Of the $60 million, half will be provided to facilitate increased participation in youth sports and improved athlete and coach development. Amongst other options, the following are being considered under this initiative:
· enhanced after-school programs and funding for coach development;
· an expanded KidSports program to reduce the financial barriers faced by families whose children wish to participate in organized sports;
Budget and Fiscal Plan – 2010/11 to 2012/13
65
Three-Year Fiscal Plan
· establishing a “Sports on the Move” program to help school teams, particularly those in remote areas, with travel costs; and
· creating new regional sports academies that expand the role of BC’s regional centres focused on the province’s next generation of elite athletes.
The remaining three-year $30 million allocation will focus on enhancing opportunities among all British Columbians in the arts, such as visual art, music, theatre, dance and digital media. Themes will include:
· regional events that reflect the diversity of communities and include multi-disciplinary arts presentations and performances by artists and performers in various communities, and with a possibility of showcasing in larger centres;
· developing community cultural initiatives by supporting ideas for local employment with the potential for internships, mentorships, and collaboration to enhance local cultural development; and
· developing new arts or cultural product idea “incubators” (digital media, for example) to generate economic benefits. By integrating creative ideas in education and business, for example, and with the appropriate nurturing, ideas could become commercialized within a specified time frame.
Taken as a whole, this legacy funding represents a renewed government commitment to arts, culture, and sports. Further details on these new initiatives are expected to be available in the coming weeks.
Budget and Fiscal Plan – 2010/11 to 2012/13
66
Three-Year Fiscal Plan
Priorities for British Columbia’s Next Generation
Similar to the demographic situation in many other provinces and countries, the composition of British Columbia’s population is changing. The average BC family is getting smaller, couples are having fewer children and the overall population is aging. This evolving demographic trend means that British Columbia, as a society, must examine its priorities in the coming years. These priorities include: educating and training the next generation of the labour force; attracting new immigrants to ensure continued population and labour force growth; boosting productivity; and controlling the growing cost of health care. Chart 1 demonstrates how the baby boom cohort (ages 45 to 63 as of 2008) are approaching retirement age and leaving a much smaller proportion of BC’s population of working age.
Chart 1 – BC’s aging demographic profile

BC’s Changing Families
British Columbians are choosing to have fewer children than they did a generation ago, and are producing their children at later stages in their lives. Some factors behind this trend include an increasing number of women in the labour force, students spending a longer number of years in the education system before entering the workforce, and the rising cost of housing for families.
The fertility rate for BC’s population (the number of children per woman of child-bearing age) has declined significantly over the last several decades. This rate has been falling steadily since 1972 (the first year of available data), when it was 3.5 children per woman. As of 2008, the rate dropped to just 1.4 children, and is projected to reach 1.2 children by 2030. This trend is concerning for British Columbians, since the fertility rate (in modern industrialized countries) must be at least 2.1 children per woman in order for a population to maintain its size and not go into decline (assuming no immigration).
Chart 2 – BC’s fertility rate projected to continue to fall
At the same time that BC families are having fewer children, British Columbians are living longer. In 1972, the life expectancy at birth for BC citizens was 70.1 years for males and 77.0 years for females. With advances in medical research and technology throughout the last few decades, as well as greater awareness of the importance of healthy living, life expectancy at birth increased significantly by 2008 to 79.3 years for males and 83.5 years for females.
Educating Young British Columbians
While the offspring of current British Columbians are expected to be fewer in number, it is essential to ensure that these young citizens have the education and skills to compete in the evolving economy over the next 20 years. Budget 2010 includes a number of measures that will increase resources and opportunities in the K-12 system, consistent with governments’ past actions to enhance education and literacy. Chart 3 outlines
Budget and Fiscal Plan – 2010/11 to 2012/13
67
Three-Year Fiscal Plan
Chart 3 – Education spending to increase over the next three years

increases to BC’s total education funding over the last ten years and through the next three years of the Fiscal Plan.
In recognition of the importance of early childhood development, Budget 2010 provides an additional $22 million to fully fund the implementation of voluntary, full-time kindergarten for five-year-olds in every school by September 2011. On an individual level, per pupil funding increases from almost $8,200 in 2009/10 to around $8,300 for 2010/11.
Budget 2010 maintains funding to post-secondary institutions at $1.9 billion, which includes the $55 million annual lift that was added in Budget 2009 and apportioned to universities, colleges, and institutes. Complementing the emphasis on improving K-12 education, government will be moving forward with additional initiatives to enhance learning at the post-secondary level.
In addition to supporting K-12 and post-secondary education, government must also engage in long-term labour force planning, which includes the education and training of new and existing workers in needed employment areas. Planning entails detailed analysis of growing industries in the provincial economy, promoting immigration from other jurisdictions and facilitating rapid entry to employment, as well as channelling resources to encourage young workers to enter emerging industries (e.g. film, environmental sector).
Attracting New Immigrants
Chart 4 – Immigrants attracted to BC

Despite having a fertility rate below the replacement level, BC’s population growth continues to be boosted by immigrants from other provinces and countries. Due to strong economic growth and a favourable employment situation over the last ten years (about 46,000 jobs were created on average each year from 1999 to 2008), BC enjoyed very healthy positive net migration during this period compared to other Canadian provinces. In fact, BC has averaged over 39,000 net migrants to the province each year from 1999 to 2008 — one of the highest levels among Canadian provinces. Since existing British Columbians are not expected to produce enough children themselves to keep the population growing into the future, strong immigration — and integrating new immigrants into the workforce — is crucial to maintaining growth in the population and in the economy.
Chart 5 – Immigration expected to fuel population growth
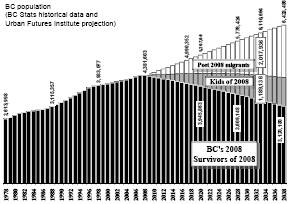
Budget and Fiscal Plan – 2010/11 to 2012/13
68
Three-Year Fiscal Plan
Since an aging population is a situation being faced by many other jurisdictions, BC will be in competition with other provinces and countries for prospective immigrants, and it is therefore important to promote BC’s status as an attractive destination for these new workers. This means highlighting BC’s mild climate, clean environment, beautiful scenery and healthy lifestyle, as well as its low provincial income tax rate relative to other jurisdictions.
Improving Labour Productivity
In addition to attracting new immigrants to increase the size of its labour force, BC must also aim to improve its labour productivity — or output per worker. BC’s record of labour productivity (measured in real GDP per hour worked) has historically lagged that of Canada — although this lag is partly due to BC’s industrial mix. Productivity can be enhanced in several ways, including better leverage of technology through business investment, improving education and training of the labour force in targeted job areas, and enhancing tax competitiveness.
Growing Health Care Costs
The increase in BC’s elderly dependency ratio (the relative size of the elderly population to the working age population) also presents a major challenge to the government’s fiscal situation, as it does for many jurisdictions around the world. The rise in this ratio, which is expected to climb from 22 per cent in 2008 to 39 per cent by 2030 (see Chart 6), will place significant pressure on provincial health care costs. Health care expenditures — a great deal of which are spent on elderly citizens — currently comprise over 40 per cent of total provincial government spending and have grown by over six per cent annually over the last ten years. In order to prevent health care from crowding out government spending in many other crucial areas, it is imperative that government control increasing health care costs moving forward.
Chart 6 – BC’s elderly dependency ratio expected to grow

Challenges ahead
BC’s population faces major demographic changes in the coming years as members of the baby boom generation retire, underscoring the importance of maintaining a growing and increasingly productive workforce. The province must attract new immigrants to boost the size of its labour force and work to enhance its productivity by investing in the education and training of young British Columbians.
Budget and Fiscal Plan – 2010/11 to 2012/13
69
Three-Year Fiscal Plan
Building on the Olympic Legacy
The provincial government is acting now to ensure British Columbia is in a strong position to take advantage of the emerging opportunities that await in the new decade and beyond. The government’s economic plan reinforces the BC economy’s solid foundation for future growth.
While recovery from the current world-wide recession is expected to be protracted, BC is fortunate that the timing of the Olympics provides additional stimulus just as the economic recovery is taking hold.
This provides the basis for a return to stronger growth and renewed prosperity as the economy builds upon its underlying strength.
Past success in improving the province’s competitiveness and productivity can be seen in the pattern of growth in real gross domestic product (GDP) per capita since 1990. This is often used as a broad brush indicator of overall productivity and is also commonly used as a measure of average living standards.
Recession interrupts rise in living standards
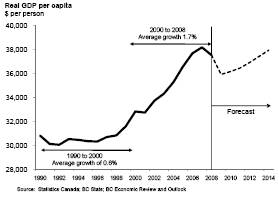
The chart above shows BC real GDP per capita grew at an average annual rate of 1.7 per cent from 2000 to 2008, almost triple the 0.6 per cent pace set during the 1990s.
The chart suggests that policy choices made early in the 2000s worked: average living standards grew at a relatively steady pace between 2001 and 2007 after modest overall growth in the previous decade.
However, the chart also shows the rebound in growth was interrupted in 2008, resulting from the international economic upheaval that swept across international borders.
To get the economy back on track toward rising productivity and living standards, Budget 2010 builds on the successful policies of the last decade. The budget also contains initiatives that take full advantage of emerging opportunities.
The government’s strategy includes:
· building on the momentum provided by the Olympic Games;
· continuing to enhance BC’s tax competitiveness to spur investment and job growth;
· continuing the government’s solid financial management plan;
· reducing the province’s regulatory burden by cutting red tape;
· improving links to domestic and world markets by lowering barriers to trade and increasing labour mobility;
· investing in key infrastructure projects;
· adopting innovative approaches to providing priority public services; and
· following through on the government’s commitment to clean energy development.
This strategy bolsters the underlying strength of the provincial economy, putting BC back on a growth track into the new decade.
Capitalizing on Olympic Opportunities
The 2010 Olympic and Paralympic Winter Games (2010 Games) have provided an opportunity to show the world the vigor and limitless potential of British Columbia. While the 2010 Games have already provided short term benefits for the province, more significant gains are expected in the future. By showcasing the province to the world, the government can attract foreign investments and boost tourism for years to come.
Preparation and launch activities for the 2010 Games have generated a wide range of economic and social benefits. A report from PricewaterhouseCoopers concluded that during
Budget and Fiscal Plan – 2010/11 to 2012/13
70
Three-Year Fiscal Plan
the pre-Games period, running from 2003 to 2008, games preparation activities generated between $684 million and $884 million in real GDP to British Columbia, while also creating as many as 3,400 businesses and producing up to 20,780 jobs in the province(1).
These economic benefits were primarily driven by venue construction and the operating activities of the Vancouver Olympic Organizing Committee (VANOC). These expenditures helped increase procurement opportunities for BC businesses to supply goods and services to the 2010 Games.
In terms of social benefits generated in the pre-Games period, the BC Sport Participation program attracted 100,000 new participants in 100 communities across BC. In addition, the Four Host First Nations have identified approximately $54 million in venue construction contracts awarded to self-identified Aboriginal businesses between 2003 and 2008.
The government will capitalize on the 2010 Games momentum and increased global awareness of BC by pursuing a cross-government strategy to increase tourism, investment, trade, and job creation.
This strategy will leverage investments made in key programs, such as the 2010 Commerce Centre, Business Hosting, BC Showcase, and video/multi-media resources to promote tourism, trade, and foreign investment throughout British Columbia.
The 2010 Games have provided an important catalyst for the federal, provincial and local governments to create or upgrade numerous venue facilities that will also provide lasting benefits for communities well past the 2010 Games themselves.
The federal and provincial governments have also provided a $110 million endowment to support the operation of certain sport venues in the post-Games period. The Four Host First Nations will also experience enhanced social and economic opportunities in the post-Games era through a number of land, sport and other legacies. As well, a significant number of housing units at the Whistler and Vancouver Athlete’s Villages are planned to be dedicated to affordable housing in BC following the 2010 Games — a key priority for provincial and local governments.
To maintain the momentum created by the 2010 Games, Budget 2010 includes funding over three years for a legacy for sports and the arts in BC. This program will focus on generating long-term benefits from participation in arts and youth sports related activities.
Boosting Tax Competitiveness
One of the most important contributions a government can make to economic growth is to create an environment that encourages businesses to invest and create jobs. Increasing business investment is critical for boosting productivity, the key driver of long-term growth in jobs, incomes and overall living standards.
The government remains committed to enhancing British Columbia’s investment climate with its ongoing efforts to improve the province’s tax competitiveness.
Significant reductions to personal and corporate income taxes since 2001 have added to the underlying strength of the BC economy.
As a result of income tax cuts since 2001, individuals earning up to $118,000 in BC pay the lowest provincial personal income taxes in Canada. For the majority of taxpayers, provincial income taxes have been reduced by at least 37 per cent since 2001 and an additional 325,000 people no longer pay any British Columbia income tax.
In 2008, the small business corporate income tax rate was reduced from 4.5 per cent to 2.5 per cent. The government remains committed to reducing the tax rate to zero by April 1, 2012. In addition, the small business corporate income tax threshold increased to $500,000 from $400,000, effective January 1, 2010.
Continuing its ongoing effort to boost tax competitiveness, the provincial government intends to eliminate the Provincial Sales Tax (PST), which embeds layers of the PST in the final selling prices of goods and services, and replace it with a modern value added tax. This value added tax will be
(1) Source: “The Games effect. Report 3: Impact of the 2010 Olympic and Paralympic Winter games on British Columbia and Canada: 2003-2008”, September 2009, prepared by PricewaterhouseCoopers. (Note: this analysis does not include infrastructure development whose timing was brought forward in preparation for the Games).
Budget and Fiscal Plan – 2010/11 to 2012/13
71
Three-Year Fiscal Plan
harmonized with the federal Goods and Service Tax (GST) and implemented on July 1, 2010 at a combined federal/provincial tax rate of 12 per cent, the lowest in Canada.
Harmonization will reduce tax on new investment by over 40 per cent (see chart below). By eliminating an inefficient tax that dampens investment, businesses will be better able to seek innovative solutions for customers, develop new technologies and take advantage of new market opportunities.
Marginal tax rates will fall with HST

British Columbia will reap the rewards resulting from moving to the HST. For example, businesses will be encouraged to invest in capacity expansion and productivity improvements which, in turn, will create jobs and boost incomes for workers.
Also, businesses will no longer have to comply with two vastly different sales taxes, which will save them about $150 million annually in compliance costs. The provincial government will see reduced administration costs of as much as $30 million per year.
Value added taxes, like the HST, have been put in place in over 130 countries worldwide. With the planned adoption of an HST by Ontario, only three provinces will have outmoded sales taxes (Alberta has no sales tax).
Budget 2010 includes other tax competitive measures, which are outlined in Part 2: Tax Measures. For example, development of new international financial activity is encouraged through amendments to the International Financial Activity Act. These measures will position Vancouver as a premier centre for commerce and support international jobs and expansion in the growing clean technology, green economy and digital media sectors.
In addition, to ensure the future competitiveness of the province’s film and digital media sector, Budget 2010 includes a new tax credit package that will help shape the media sector of the future.
Continuing Solid Fiscal Management
The government continues its sound budgeting strategy initiated in 2001, which strives to:
· encourage a competitive economy
· protect core services, and
· bring the budget to balance and keep debt affordable.
The international credit rating agencies recognize and affirm the government’s good record in fiscal management. Moody’s Investor Services has confirmed the province’s Aaa rating, the highest allowed by the agency, while Standard and Poor’s awards British Columbia its top AAA rating.
These high ratings benefit taxpayers by keeping the government’s borrowing costs relatively low. This allows the government to allocate more scarce public resources toward essential public services rather than debt service costs.
Moody’s Investors Services noted in November 2009 that “the province’s track record of managing fiscal pressures and the significant debt reduction achieved in recent years has put British Columbia in a strong position to face current fiscal challenges.”(2)
Looking to BC’s fiscal prospects, Moody’s stated that the province “... possesses sufficient fiscal and balance sheet flexibility to withstand the current economic downturn and reverse negative fiscal trends over the medium term.”(3)
(2) Moody’s Investor Services, Global Credit Research, November 4, 2009.
(3) Ibid.
Budget and Fiscal Plan – 2010/11 to 2012/13
72
Three-Year Fiscal Plan
BC’s financial management: a track record of managing fiscal pressures
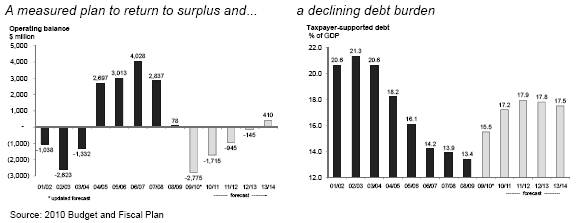
The Budget 2010 fiscal plan continues the strategy that has characterized past budgets.
While the global economic downturn in 2008 and 2009 has forced the government to accept temporary deficits, the government has a plan to return to surplus by 2013/14.
While this plan has the debt burden rising as a result of temporary operating deficits, accelerated capital spending, and the loss in GDP from the recession, it is expected to return to a downward trend after 2011/12.
Reducing the Regulatory Burden
The government is continuing to cut job-choking red tape by developing a streamlined, flexible and responsive regulatory system. These efforts lower the costs associated with unproductive regulations while continuing to protect public health, safety and the environment.
Adopting the HST ties into the overall effort to reduce red tape. A single, simpler, sales tax will significantly lower taxpayers, paper work and compliance costs.
To monitor the province's regulatory system, the Ministry of Small Business, Technology and Economic Development has set up Straightforward BC to track regulations and provide quarterly progress reports.
Since 2001, the province has recorded a 42 per cent reduction in regulatory requirements, meaning 152,000 unnecessary regulations have been eliminated. In 2004, the government committed to a zero net increase in regulatory requirements.
As shown in the table, this target has been exceeded in 2009 with the number of regulatory requirements 9.3 per cent below the 2004 base line count.
Regulatory Requirements and Results to December 31, 2009
| | Requirement | | Net Change | | Requirement | |
| | as of June | | as of Dec.31 | | as of Dec.31 | |
Ministry | | 2004 | | 2009 | | 2009 | |
| | Number of Regulations | |
Aboriginal Relations and Reconciliation | | 61 | | — | | 61 | |
Advanced Education and Labour Market Development | | 2,033 | | 35 | | 2,068 | |
Agriculture and Lands | | 6,772 | | (480 | ) | 6,292 | |
Attorney General | | 4,895 | | 78 | | 4,973 | |
Children and Family Development | | 8,597 | | (275 | ) | 8,322 | |
Citizens’ Services | | 3,450 | | (740 | ) | 2,710 | |
Community and Rural Development | | 11,567 | | (1,739 | ) | 9,828 | |
Education | | 17,607 | | (3,683 | ) | 13,924 | |
Energy, Mines and Petroleum Resources | | 11,448 | | (386 | ) | 11,062 | |
Environment | | 14,629 | | (687 | ) | 13,942 | |
Finance | | 57,836 | | (3,159 | ) | 54,677 | |
Forests and Range | | 9,032 | | (928 | ) | 8,104 | |
Health Services | | 4,427 | | (210 | ) | 4,217 | |
Healthy Living and Sports | | 2,983 | | (664 | ) | 2,319 | |
Housing and Social Development | | 11,548 | | (127 | ) | 11,421 | |
Labour | | 29,049 | | (3,289 | ) | 25,760 | |
Premier’s Office — Intergovernmental Relations | | 9 | | — | | 9 | |
Public Safety and Solicitor General | | 10,887 | | (623 | ) | 10,264 | |
Small Business, Technology and Economic Development | | 1,146 | | (107 | ) | 1,039 | |
Tourism, Culture and the Arts | | 7,089 | | (4,174 | ) | 2,915 | |
Transportation and Infrastructure | | 13,769 | | (147 | ) | 13,622 | |
Total government | | 228,834 | | (21,305 | ) | 207,529 | |
The province's success in restructuring its regulatory climate has been recognized by the Canadian Federation of Independent Business, which ranked BC first in a cross-Canada survey of leaders in regulatory reform.
Budget and Fiscal Plan – 2010/11 to 2012/13
73
Three-Year Fiscal Plan
Improving BC's Access to Markets
To continue to prosper, British Columbia must maintain and enhance its links to markets in the rest of Canada and internationally. As a relatively small, commodity-based and export-oriented economy, British Columbia relies on ongoing access to markets across Canada and throughout the world.
The government has focused efforts toward reinforcing access to markets through strategies to promote the efficient movement of people and goods as well as seeking opportunities to reinforce links to our neighbours and key trading partners.
British Columbia is moving to capitalize on its strategic location at the gateway between North American markets and Asian economies. Working with other governments and industry stakeholders, the province is following through on the Pacific Gateway Strategy to develop an integrated, secure, reliable transportation network. The strategy has resulted in significant investments in roadways, airports, seaports, railways and border crossings.
These forward-looking, strategic investments are needed to ensure the province can accommodate expected growth in trade to Asian markets. For example, the value of BC trade with the Asia-Pacific region is expected to increase by as much as $76 billion over the next decade, generating up to 255,000 jobs.
Upward trend in BC exports to China

Exports to China have been on an upward trend in recent years, rising from $582 million in 1999 to more than $2.6 billion in 2009. The chart above shows BC origin exports to the People’s Republic of China as a share of the province’s total exports. The major jump in 2009 is a reflection of an increase in exports to China as well as weaker demand in the province’s more traditional markets. By continuing to diversify the markets for our exports, BC will be able to dampen the impact of any downturn in any one region of the world economy.
The government is also seeking to spur business travel and tourism by encouraging the federal government to remove restrictions on foreign air carriers serving the province’s airports. Doing away with these restrictions through Open Skies agreements increases tourism activity, generates higher revenues and more employment growth in BC.
The tourism industry also recently received a welcome boost with the Chinese government's decision to give Canada its Approved Destination Status. This designation makes it easier for Chinese tourists to get visas for visits to Canada. As a result, British Columbia could see tourism from China increase by one-quarter over the next several years.
The government is also improving ties with BC’s neighbours by lowering trade barriers and increasing labour mobility. The far reaching Trade, Investment and Labour Mobility Agreement (TILMA) between BC and Alberta enables goods, services, certified workers and investments to move freely across the two province's shared border. The increased freedom of movement and competition created by this agreement improves opportunities for businesses and workers in both provinces.
Similarly, the government is moving toward completing a renewed Western Economic Partnership agreement between British Columbia, Alberta and Saskatchewan, which would create the largest free trade and investment market in Canada.
Investing in BC’s Infrastructure
Public infrastructure investments are critical to sustaining growth in productivity, expanding well-paying job opportunities and enhancing BC’s high quality of life.
For example, investments in transportation networks, such as roads, highways, transit, railways and ports, help ease congestion for commuters travelling to jobs and ensure BC products are able to efficiently move to world markets.
Capital spending that expands and enhances hospitals and other health facilities ensures our health care system is able to meet the current and future demands of a growing and aging population.
Budget and Fiscal Plan – 2010/11 to 2012/13
74
Three-Year Fiscal Plan
Investing in our education system, such as funding seismic upgrades for schools and increases to the capacity of the province’s post-secondary education institutions, ensures BC students continue to receive a world-class education.
The underlying strength in the province’s fiscal situation, reflected in a relatively low debt-to-GDP ratio and healthy credit rating, has allowed the province to respond to the current economic slowdown by bringing forward capital investments which, in turn, are helping sustain jobs and incomes.
Responding to early signs of the economic slowdown, the province announced in October 2008 a strategy to stimulate the economy through accelerated infrastructure investments. Additional funding has been highlighted in subsequent budgets and fiscal updates.
In order to maximize the benefits of government’s investments, each potential accelerated infrastructure project was assessed on its readiness to proceed quickly, its demonstrated high job impact and whether it would have a positive impact on local communities. In addition, projects meeting eligibility criteria for cost sharing under federal economic stimulus programs and with other partners were given special consideration.
Since October 2008, $5.3 billion in cost-shared funding has been committed to accelerated infrastructure investments across the province. The province leveraged funding from partners including the federal government, local governments and third parties.
Partners in infrastructure investments

The chart above shows the breakdown of accelerated funding by source. Overall, every dollar committed by the province is matched by investments by our partners.
These investments are distributed regionally, maintaining direct construction jobs throughout BC and providing stability for workers and communities during the economic downturn.
Infrastructure investments benefit all regions
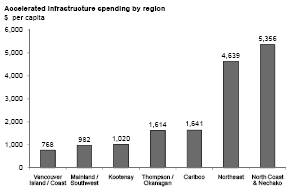
The chart above shows the per capita infrastructure stimulus spending by region.
Major projects by economic development region include:
· | Cariboo — replacement of Stone Creek Bridge, new skilled trades building at the College of New Caledonia, and a waste water treatment project in McBride. |
| |
· | Kootenay — Kootenay Lake Hospital expansion, replacement of Loop Bridge near Sparwood, and upgrades to the community library in Kimberley. |
| |
· | Mainland/Southwest — Riverstones (Squamish) will provide 84 units of affordable rental housing for seniors and people with disabilities, and the replacement of the Old Capilano bridge. |
| |
· | North Coast and Nechako — Northwest Transmission Line, upgrades to the McKenzie- Fort St James connector resource road, and the expansion of Northwest Community College. |
| |
· | Northeast — Fort Nelson recreation complex, new fire hall in Pouce Coupe, and building upgrades at Northern Lights College to accommodate expanded nursing programs. |
| |
· | Thompson/Okanagan — Willowbridge (Kelowna) will provide 40 units of short-term housing with support services for people who are homeless or at risk of homelessness, and a new library building at Thompson Rivers University. |
Budget and Fiscal Plan – 2010/11 to 2012/13
75
Three-Year Fiscal Plan
· | Vancouver Island — replacement of the Vancouver Island University’s Cowichan campus, improving access to the Victoria International Airport, and construction of 44 self-contained supportive housing units on Humboldt Street in Victoria for people who are homeless or at risk of homelessness. |
Broadly-based accelerated investments
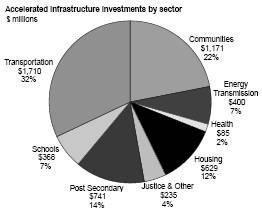
The chart above depicts the investments by sector. These investments contribute to government's key priorities in areas of post-secondary, housing, BC’s communities, transportation, schools and justice sectors.
Continuing Support for Priority Services
Governments must make the best possible use of taxpayer dollars, both by directing resources toward priority public services and ensuring each dollar is spent efficiently and effectively. This approach to budgeting is all the more important as the government experiences weaker revenues due to the world economic downturn.
Government must manage its spending priorities within the affordability constraints of taxpayers. To do otherwise would put the government’s fiscal environment at risk and hinder the flexibility that may be needed in the future.
While maintaining funding for key public services, government will direct scarce tax dollars toward priority spending areas. In addition, the government will redouble efforts to find innovative approaches to achieving priority policy objectives.
Health care, as one of the most highly valued services provided by the government, remains a top priority for public funds.
Health care has been the fastest growing component of government expenses, rising from $10,488 million in 2001/02 to $15,050 million in 2008/09, a 43 per cent increase. Since 2001/02, health care has taken 60 per cent of all growth in spending, rising from 35 per cent to 40 per cent of total government outlays.
Government has made health research and innovation a priority by establishing dedicated funds for innovation, integration, and pay for performance. For example, since 2001/02 government has invested over $250 million in the Michael Smith Foundation, including $15 million in 2009/10, for biomedical, clinical, health services and population health research.
Government also continues to meet the growing need for state-of-the-art health facilities. Major projects include: the Surrey Memorial Hospital Emergency Department and Critical Care Tower; Surrey Outpatient Facility; new Fort St. John Hospital; the Northern Cancer Centre in Prince George, the Interior Health Heart and Surgical Centre at Kelowna General Hospital, expansions to Kelowna General and Vernon Jubilee Hospitals and the Victoria Royal Jubilee Hospital Patient Care Centre.
The BC government’s ongoing efforts to contain growth in health care costs have not diminished the health of British Columbians. Recent comparative figures published by the BC Progress Board(4), an independent panel that reviews inter-provincial indicators of economic and social wellbeing, suggest that British Columbians are amongst the most healthy citizens in Canada. For example, the province consistently scores well in key measures of health outcomes, including regularly attaining the top score for life expectancy.
Government is also adopting innovative approaches to education. While British Columbia’s education system regularly scores well in international standardized testing, government continues to search for even better outcomes for the province's students.
Recognizing that early childhood learning is the basis for life-long success and well-being, Budget 2010 provides funding to support the implementation of
________________________________
(4) Progress Board benchmark reporting available at:
http://www.bcprogressboard.com
Budget and Fiscal Plan – 2010/11 to 2012/13
76
Three-Year Fiscal Plan
voluntary, full-time kindergarten for BC’s five year olds, beginning in September 2010. Budget 2010 provides an additional $22 million to fully fund this program so that complete implementation is achieved by September 2011.
The budget also continues funding for other learning and literacy programs such as StrongStart BC Centres and development of neighbourhood learning centres.
Also, recognizing the challenges of raising a family, especially for parents at the earlier stages of a career, families will be able to take advantage of the new Property Tax Deferment Program for Families with Children, which applies to homeowners who are financially responsible for a child under 18 years of age.
This program will allow eligible homeowners to defer all or part of the unpaid portion of their property taxes until they sell their home, transfer ownership of their home or their home becomes part of an estate.
Budget 2010 maintains support for post-secondary education. The government continues to meet the funding commitment from Budget 2009 of a $165 million increase in funding over three years to enhance general access to post-secondary educational opportunities.
The government is working toward providing additional medical spaces at the University of British Columbia (Okanagan), on top of earlier expansions at both the main campus of the University of British Columbia and the University of Victoria as well as at the University of Northern British Columbia.
The government is developing proposals for relocating the Emily Carr University of Art+Design to the Great Northern Way Campus in Vancouver and the creation of a centre for wood innovation and design that will be situated in Prince George.
Moving Toward Clean Energy
Recognizing that a clean environment and clean energy are the foundations for a modern economy, government continues to develop initiatives that move the province toward greenhouse gas reduction targets as envisioned in the BC Climate Action Plan.
The government continues work toward reducing British Columbia's greenhouse gas emissions by 33 per cent below 2007 levels by 2020 through a number of activities including:
· | achieving a carbon neutral government by 2010 by investing $75 million over 3 years in public sector energy efficiency retrofits under the Public Sector Energy Conservation Agreement with BC Hydro and by purchasing offsets through the Pacific Carbon Trust. A $25 million installment for this initiative remains for 2010/11. |
| |
· | rewarding green choices by putting a price on each tonne of greenhouse gases emitted through the carbon tax; |
| |
· | working towards development of a market-based cap and trade system through the Western Climate Initiative; and |
| |
· | engaging major emitters and other key stakeholders in 11 Climate Action Working Groups. |
BC also works with other provinces and states through participation in the International Carbon Action Partnership and the Climate Registry.
Budget 2010 includes funding for new clean energy initiatives, such as the LiveSmart BC Efficiency Incentive Program and investments that will support clean energy development initiatives. (Details on these initiatives are provided earlier in Part 1: Three-Year Fiscal Plan.)
This funding will complement the Clean Energy Act that is expected to be introduced later this year. This legislation will help reduce greenhouse gas emissions by encouraging investments in the clean energy sector.
Government’s new clean energy strategy will enhance the work supported by the Innovated Clean Energy (ICE) Fund. The ICE Fund encourages the development of new sources of clean energy and technologies, with $47 million committed since its creation in 2007.
Conclusion
The government's economic strategy reinforces the underlying strength of the BC economy by building on past successes and introducing new initiatives. The strategy will help the province meet future challenges and take advantage of emerging opportunities.
Budget and Fiscal Plan – 2010/11 to 2012/13
77
Part 2: TAX MEASURES
Table 2.1 Summary of Tax Measures
| | | | | | Taxpayer Impacts | |
| | | | Effective Date | | 2010/11 | | 2011/12 | |
| | | | ($ millions) | |
Income Tax Act | | | | | | | |
· | | Introduce refundable BC HST Credit of $230 per person targeted to low and modest income individuals and families | | July 1, 2010 | | (210 | ) | (280 | ) |
· | | BC Sales Tax Credit integrated with BC HST Credit | | January 1, 2010 | | 53 | | 53 | |
· | | Increase the basic Production Services Tax Credit rate to 33 per cent from 25 per cent | | March 1, 2010 | | (25 | ) | (25 | ) |
· | | Increase the labour cap for Film Incentive BC to 60 per cent from 48 per cent of total production spending | | March 1, 2010 | | (3 | ) | (3 | ) |
· | | Increase the Digital Animation or Visual Effects tax credit to 17.5 per cent from 15 per cent | | March 1, 2010 | | (4 | ) | (4 | ) |
· | | Introduce BC Interactive Digital Media Tax Credit of 17.5 per cent of qualifying BC labour expenditures | | September 1, 2010 | | * | | (2 | ) |
· | | Extend the BC Mining Flow-Through Share Tax Credit to the end of 2013 | | January 1, 2011 | | * | | * | |
Corporation Capital Tax Act | | | | | | | |
· | | Repeal the financial institutions minimum tax | | April 1, 2010 | | * | | * | |
International Financial Activity Act | | | | | | | |
· | | Broaden program to include international businesses in clean technology, carbon trading and digital media publishing and distribution | | Various | | * | | * | |
· | | Expand and clarify eligible activities to include operating an investment fund | | September 1, 2010 | | * | | * | |
· | | Clarify qualifying patent activities | | March 3, 2010 | | * | | * | |
· | | Introduce a minimum income requirement for specialists and change five year phase-out of refunds | | March 3, 2010 | | * | | * | |
· | | Replace management services as a qualifying activity with a new category of executive specialist | | March 3, 2010 | | * | | * | |
· | | Allow specialists for more international financial activities | | Various | | * | | * | |
· | | Remove effect of election under section 110.5 of the federal Income Tax Act | | March 3, 2010 | | * | | * | |
· | | Repeal prescribed business provision | | March 3, 2010 | | * | | * | |
· | | Restrict lending activities to arm’s length parties | | March 3, 2010 | | * | | * | |
Medicare Protection Act | | | | | | | |
· | | Increase MSP premiums | | January 1, 2011 | | 27 | | 108 | |
Carbon Tax Act | | | | | | | |
· | | Clarify definition of natural gas to include processed acid gas | | March 3, 2010 | | * | | * | |
· | | Introduce penalty for vendors who sell fuel without collector appointment | | March 3, 2010 | | * | | * | |
· | | Move propane into security scheme similar to most other fuels | | July 1, 2010 | | * | | * | |
· | | Increase tax rate on kerosene to match the rate for jet fuel | | July 1, 2010 | | * | | * | |
Motor Fuel Tax Act | | | | | | | |
· | | Exempt propane used in motor vehicles | | July 1, 2010 | | (3 | ) | (4 | ) |
· | | Introduce penalty for vendors who sell fuel without collector appointment | | March 3, 2010 | | * | | * | |
Social Service Tax Act — Transition to HST (1) | | | | | | | |
· | | Eliminate PST and levies and provide transitional provisions | | Various | | — | | — | |
· | | Provide transitional PST refund on construction materials used for residential improvements and repairs | | July 1, 2010 | | * | | * | |
· | | Provide transitional PST refund for eligible business purchases | | July 1, 2010 | | * | | * | |
Hotel Room Tax Act — Transition to HST (1) | | | | | | | |
· | | Eliminate the provincial portion of the tax and provide transitional provisions | | Various | | — | | — | |
Budget and Fiscal Plan – 2010/11 to 2012/13
Tax Measures
Table 2.1 Summary of Tax Measures — Continued
| | | | | | Taxpayer Impacts | |
| | | | Effective Date | | 2010/11 | | 2011/12 | |
| | | | ($ millions) | |
Consumption Tax Rebate and Transition Act — Transition to HST (1) | | | | | | | |
· | | Introduce provincial credit for provincial component of HST payable on residential energy | | July 1, 2010 | | (175 | ) | (220 | ) |
· | | Introduce point of sale rebates for provincial component of HST payable on motor fuels and other items | | July 1, 2010 | | * | | * | |
· | | Continue provincial tax on private sales of vehicles, boats and aircraft but at 12 per cent | | July 1, 2010 | | 125 | | 171 | |
Tobacco Tax Act | | | | | | | |
· | | Clarify how tax on cigars is calculated and increase the maximum tax payable from $5 to $6 per cigar | | March 3, 2010 | | 10 | | 10 | |
· | | Introduce authority to impose an annual fee payable by tobacco retailers as a condition of selling tobacco products | | March 3, 2010 | | * | | * | |
South Coast British Columbia Transportation Authority Act | | | | | | | |
· | | Move existing TransLink parking tax provisions from the Social Service Tax Act to the South Coast British Columbia Transportation Authority Act | | July 1, 2010 | | * | | * | |
Tourist Accommodation (Assessment Relief) Act | | | | | | | |
· | | Clarify statutes to which the assessment reduction applies | | 2010 tax year | | * | | * | |
Property Transfer Tax Act | | | | | | | |
· | | Clarify application of tax to transfers to correct conveyancing errors | | March 3, 2010 | | * | | * | |
· | | Re-instate exemption for transfers required to amend a strata plan | | March 3, 2010 | | * | | * | |
Home Owner Grant Act | | | | | | | |
· | | Maintain home owner grant phase-out threshold at 2009 level | | 2010 tax year | | * | | * | |
· | | Introduce northern and rural benefit of $200 for homeowners | | 2011 tax year | | (20 | ) | (83 | ) |
School Act | | | | | | | |
· | | Introduce school property tax credit of 50 per cent for land classified as “farm” | | 2011 tax year | | (1 | ) | (2 | ) |
· | | Increase school property tax credit to 60 per cent from 50 per cent for industrial properties | | 2011 tax year | | (3 | ) | (11 | ) |
· | | Set provincial residential school property tax rates | | 2010 tax year | | * | | * | |
· | | Set provincial non-residential school property tax rates | | 2010 tax year | | * | | * | |
Taxation (Rural Area) Act | | | | | | | |
· | | Set provincial rural area property tax rates | | 2010 tax year | | * | | * | |
Ports Property Tax Act / Assessment Act | | | | | | | |
· | | Clarify designation process for ports | | 2010 tax year | | * | | * | |
Land Tax Deferment Act | | | | | | | |
· | | Introduce tax deferment program for families with children | | 2010 tax year | | * | | * | |
Subtotal | | | | (229 | ) | (292 | ) |
Transition to HST (2) | | | | | | | |
· | | Increase basic personal amount tax credit to $11,000 | | January 1, 2010 | | (174 | ) | (183 | ) |
· | | Elimination of provincial sales and hotel room taxes (3) | | July 1, 2010 | | (3,688 | ) | (5,133 | ) |
· | | HST net of rebates | | July 1, 2010 | | 3,959 | | 5,596 | |
Subtotal (3) | | | | 97 | | 280 | |
Total | | | | (132 | ) | (12 | ) |
(1) See HST topic box for information on the transition to the HST.
(2) These estimates are presented to show the HST-related measures that impact taxpayers starting in 2010 that are not shown elsewhere in the table (i.e. it does not include the residential energy credit, the elimination of the motor fuel tax on propane and the tax on private sales of vehicles, boats and aircraft). The net impact on taxpayers of only the HST-related measures is presented in Table 3 in the HST topic box. As shown in Table 3, the net impact of only the HST-related measures is a reduction of $113 million in 2010/11 and zero in 2011/12.
(3) Includes adjustments for liquor markups and on-going funding for tourism initiatives.
* Denotes measures that have no material impact on taxpayers.
Budget and Fiscal Plan – 2010/11 to 2012/13
80
Tax Measures
Tax Measures — Supplementary Information
For more details on tax changes see:
www.sbr.gov.bc.ca/msbr/budget/budget.html
For more information on HST related changes see:
www.sbr.gov.bc.ca/business/Consumer_Taxes/Harmonized_sales_Tax/HST.html
Income Tax Act
BC HST Credit Introduced
To help low and modest income individuals and families with the harmonized sales tax (HST), a new ongoing BC HST credit is introduced effective July 2010.
The maximum annual tax credit is $230 per family member. The maximum annual credit is reduced by four per cent of family net income (recipient's and spouse's net incomes from the prior year) in excess of $20,000 for single individuals and $25,000 for families. For example, for the period from July 2010 to June 2011, a single individual with net income of $20,000 or less will receive $230; a couple or a single parent with one child and $25,000 or less in family net income will receive $460.
The credit will be paid together with the federal Goods and Services Tax Credit payment and the BC Low Income Climate Action Tax Credit payment which are made each January, April, July and October. The first payments under this program will be made in July 2010.
BC Sales Tax Credit Integrated with BC HST Credit
Consequential to the elimination of the provincial sales tax, the BC Sales Tax Credit is integrated with the new BC HST Credit effective for the 2010 tax year.
Production Services Tax Credit Increased
As announced on February 3, 2010, the basic Production Services Tax Credit rate is increased to 33 per cent from 25 per cent effective for productions with principal photography beginning after February 2010.
Film Incentive BC Cap Increased
The Film Incentive BC tax credit rate of 35 per cent applies to qualifying BC labour expenditures up to a cap of 48 per cent of total production costs. As announced on February 3, 2010, this cap is increased to 60 per cent for productions with principal photography beginning after February 2010. The increase in the cap to 60 per cent matches the federal Canadian Film or Video Production tax credit cap.
Digital Animation or Visual Effects Tax Credit Increased
As announced on February 3, 2010, the Digital Animation or Visual Effects tax credit, which is in addition to both the Film Incentive BC and Production Services tax credits, is increased to 17.5 per cent from 15 per cent for productions with principal photography beginning after February 2010.
Budget and Fiscal Plan – 2010/11 to 2012/13
81
Tax Measures
BC Interactive Digital Media Tax Credit Introduced
As announced on February 3, 2010, a new BC Interactive Digital Media tax credit is introduced for qualifying projects beginning after August 2010. The tax credit rate will be 17.5 per cent of qualifying BC labour employed in the development of qualifying interactive digital media. Interactive digital media means an interactive product made for use by an individual, the primary purpose of which is to educate, inform or entertain, and must include at least two of the following forms: text, sound and images. A certification process will be provided to assist in the tax credit application process. Projects must be completed to qualify for the tax credit.
BC Mining Flow-Through Share Tax Credit Extended
As announced on January 21, 2010, the BC Mining Flow-Through Share Tax Credit is extended for three additional years to the end of 2013.
Corporation Capital Tax Act
Financial Institutions Minimum Tax Repealed
Amendments to the Corporation Capital Tax Act to introduce a financial institutions minimum tax effective April 1, 2010, are repealed. The tax was intended to be a minimum capital tax for large financial institutions. However, the federal minimum capital tax, which applies to large financial institutions, effectively provides a provincial minimum corporate income tax because the province shares the federal corporate income tax base. As such, an additional provincial minimum tax on capital is not necessary.
International Financial Activity Act
The International Financial Activity Program provides tax refunds for BC corporate income tax paid on qualifying international financial activities. The program has been in place since 1988 to help grow BC as an international financial centre. The government has made significant enhancements in recent years by expanding the types of qualifying financial activities. It is the government's intention to further expand the program to help BC companies expand exports of certain technologies and expertise. The following provides a description of these expansions and other changes designed to streamline the program.
International Financial Business Expanded
The Act is amended to provide for new types of international businesses. The government intends to allow the following new types of international businesses to qualify under the program:
· digital media publishing and distribution;
· certification and trading of carbon credits; and
· clean technology.
Details of the businesses and technologies that qualify, qualifying international transactions and any required certification process will be provided in the coming months.
Budget and Fiscal Plan – 2010/11 to 2012/13
82
Tax Measures
Investment Fund Management Activities Added
Effective September 1, 2010, qualifying international financial activities under the Act are amended to include prescribed management and administrative services of prescribed investment funds.
Qualifying Patent Activities Clarified
The Act is amended to clarify that international financial business income includes all income related to the licensing of a qualifying patent.
Refunds for IFA Specialists Changed
Under the International Financial Activity Program, a refund of personal income tax is available for program participants to attract non—resident specialists. Registered specialists that work at least 70 per cent of their time on qualifying international financial activities are eligible for a refund of up to 75 per cent of BC personal income taxes paid for up to five years after moving to Canada. Effective March 3, 2010, an eligible specialist must be paid wages of at least $100,000 annually to qualify and the rate of the refund during the five years is changed to 100 per cent in their first two years of eligibility, 75 per cent in the third year, 50 per cent in the fourth year and 25 per cent in the fifth year.
Executive Specialist Introduced
A new category of specialist, an Executive Specialist, is introduced to replace the existing international financial activity related to management services, which is repealed. Executive Specialist includes the key decision maker(s) of a program participant. An Executive Specialist must have annual wages of at least $250,000, their wages must be included in the calculation of the program participant’s international financial business income, there is no requirement for a certain per cent of time to be spent working on international financial activities and the maximum number of Executive Specialists in any related group of program participants is limited. The non—resident requirement and the rates of refunds for the five years applicable to international financial activity specialists apply to Executive Specialists.
IFA Specialists for Administrative Support and Back-Up Office Services Introduced
Currently under the Act, individuals cannot be registered as specialists in administrative support and back-up office services. The Act is amended to allow for specialists for these international financial activities with similar requirements and limitations applicable to an Executive Specialist, but with a minimum annual wage requirement of $100,000.
Section 110.5 Election Effect Removed
Effective for taxation years ending after March 3, 2010, the Act is amended to remove the effect of an election under section 110.5 of the federal Income Tax Act. This removes an anomaly that allowed for tax refunds in years where the program participant had no other income or a loss.
Budget and Fiscal Plan – 2010/11 to 2012/13
83
Tax Measures
Prescribed Business Provision Repealed
The resident exception for deposit and loan transactions with a prescribed business is repealed effective March 3, 2010. This eliminates a provision that is inoperable in practice.
Lending Activities Restricted
Effective March 3, 2010, qualifying lending activities are restricted to arm’s length parties.
Medicare Protection Act
Medical Services Plan Premiums Increased
Effective January 1, 2011, Medical Services Plan premiums are increased.
Maximum monthly premium rates will increase by $3.50 per month to $60.50 for single persons, by $7.00 per month to $115.00 for two person families and by $7.00 per month to $121.00 for families of three or more persons.
For premium assistance recipients, the increase in premiums will range from 0 per cent to 80 per cent of the increased amount. However, with the premium assistance enhancements made in January 2010, premiums payable by premium assistance recipients will remain lower than they were in 2009.
Carbon Tax Act
Definition of Natural Gas Clarified
Effective March 3, 2010, the definition of “natural gas” is clarified to include acid gas and waste gas even when they have been removed from the natural gas.
Vendor Penalty Introduced
Effective March 3, 2010, a penalty is introduced for vendors who sell fuel in British Columbia without being appointed a collector as required under the Act. The maximum penalty is twice the amount of security the vendor would have been required to pay had the vendor been appointed a collector. The penalty is consistent with other penalties in consumption tax statutes.
Propane Moved into Security Scheme
Effective July 1, 2010, propane is included in the security scheme that applies to most fuels including gasoline and light fuel oil. The security scheme minimizes the cost of administration for government and compliance costs for those collecting the tax on government’s behalf.
Budget and Fiscal Plan – 2010/11 to 2012/13
84
Tax Measures
Kerosene Tax Rate Increased
Effective July 1, 2010, the carbon tax rate for kerosene fuel is increased to 5.22 cents per litre from 5.08 cents per litre to equal the jet fuel carbon tax rate. The change removes a costly compliance burden.
Motor Fuel Tax Act
Motor Propane Exempted
As announced in the September Update 2009, effective July 1, 2010, propane used in motor vehicles is exempt from motor fuel tax. An exemption is provided because propane used in motor vehicles is not eligible for the BC point-of-sale rebate of the provincial component of the HST for motor fuels.
Vendor Penalty Introduced
Effective March 3, 2010, a penalty is introduced for vendors who sell fuel in British Columbia without being appointed a collector as required under the Act. The maximum penalty is twice the amount of security the vendor would have been required to pay had the vendor been appointed a collector. The penalty is consistent with other penalties in the consumption tax statutes.
Social Service Tax Act — Transition to HST
Provincial Sales Tax and Levies Eliminated, TransLink Parking Tax Transferred and Transitional Provisions Provided
The 7 per cent provincial sales tax (PST) is eliminated to coincide with the implementation of the HST. Transitional provisions are provided to avoid the imposition of PST on payments for goods and services to which the HST applies.
The multijurisdictional vehicle tax is eliminated for multijurisdictional vehicles that have a vehicle license year that begins on or after July 1, 2010.
Effective July 1, 2010, the following taxes and levies are eliminated:
· $1.50 per day passenger vehicle rental tax;
· $5 per battery levy; and
· 0.4 per cent Innovative Clean Energy (ICE) Fund Levy.
Effective July 1, 2010, legislation related to the imposition of the TransLink parking tax, currently administered by the Province on behalf of TransLink, is transferred to the South Coast British Columbia Transportation Authority Act and administration of the tax is transferred to TransLink.
Transitional PST Refund Provided
As part of the transition to the HST, effective July 1, 2010, a refund of provincial sales tax is provided to contractors for PST paid on construction materials purchased by the contractor, held in inventory at the end of the day on June 30, 2010 and used by the contractor on or after July 1, 2010 to repair or improve residential real property under a contract to which the HST applies. Improvement of residential real property does not
Budget and Fiscal Plan – 2010/11 to 2012/13
85
Tax Measures
include construction of residential housing for which a PST Transitional New Housing Rebate is available.
A refund is not available in respect of tax paid on construction materials if the PST is recoverable by the contractor or any other party.
To obtain a refund, applications must be received by government on or before December 31, 2010.
Transitional PST Refund for Eligible Business Purchases Provided
As part of the transition to the HST, effective July 1, 2010, a refund of provincial sales tax is provided for PST paid on goods and services paid for after October 14, 2009, and before May 1, 2010, that are delivered or performed on or after July 1, 2010 and are for use exclusively in the course of commercial activities as defined for purposes of the Excise Tax Act (Canada). Under the “General Transitional Rules for British Columbia HST” (HST notice #1), these transactions are not subject to the HST even though the goods and services are delivered or performed on or after July 1, 2010 and, therefore, purchasers are not eligible for input tax credits.
The refund of PST is provided to ensure that tax is not payable by businesses that would have been eligible for input tax credits under HST had the timing of payment for these goods and services been on or after May 1, 2010.
In addition, as part of the transition to the HST, effective July 1, 2010, a refund of provincial sales tax is provided for PST paid on goods and services that are paid for after October 14, 2009 and before May 1, 2010 by certain businesses and selected listed financial institutions which, under the “General Transitional Rules for British Columbia HST” (HST notice #1), are required to self-assess HST on those purchases under Part IX of the Excise Tax Act (Canada).
The refund of PST is provided to prevent double taxation on goods and services that would otherwise be subject to both PST and HST.
To obtain a refund, applications must be received by government on or before December 31, 2010.
Hotel Room Tax Act — Transition to HST
Provincial Hotel Room Tax Eliminated and Transitional Provisions Provided
The 8 per cent provincial hotel room tax is eliminated to coincide with the implementation of the HST which applies to short-term rental accommodation. Transitional provisions are provided to ensure that provincial hotel room tax is not imposed on payments for such accommodation on which the HST will apply.
After consultations with tourism sector stakeholders, the province has decided to continue the additional hotel room tax (AHRT) program beyond June 30, 2011 for eligible local governments, regional districts, destination marketing organizations and other eligible entities to raise revenue for tourism marketing. Input from the consultations is being carefully considered in the design of the future structure of the program.
Budget and Fiscal Plan – 2010/11 to 2012/13
86
Tax Measures
Consumption Tax Rebate and Transition Act — Transition to HST
The Consumption Tax Rebate and Transition Act is introduced as part of the package of amendments that eliminates the PST and the provincial hotel room tax and supports the transition to the HST. The Act establishes the provincially administered credit for the provincial component of HST payable on residential energy, provides authority for the point-of-sale rebates of the provincial component of the HST on motor fuels and other items and continues the tax on the private sale of vehicles, boats and aircraft, all of which are described in more detail below. The Act also establishes a requirement for the Minister of Finance to report annually to the Legislature to show the difference between provincial expenditures on health care and revenues from the provincial component of HST, MSP premiums, tobacco tax, lottery revenues dedicated to the Health Special Account and health transfers from the federal government (see Table 1.10 in Part 1: Three-year Fiscal Plan).
Residential Energy Credit Introduced
As announced on September 1, 2009, effective July 1, 2010, a provincially administered credit is provided for energy, including electricity, natural gas, heating fuel, heat, steam, kerosene, propane, firewood and pellets purchased for residential use. The credit is equal to the provincial component of the HST paid or payable on residential energy excluding service and administration charges. For most residential consumers the credit is provided directly by energy suppliers on their utility bills similar to the current PST exemption. Residential consumers who purchase energy for both residential and non—residential use (e.g. split use) that is not separately metered or energy that is not delivered by the supplier to the residence will not receive the credit on their utility bills but may apply to the provincial government for the credit.
BC HST Point-of-Sale Rebates Introduced
Under the Comprehensive Integrated Tax Coordination Agreement with the Government of Canada, British Columbia is able to provide a limited number of provincial point-of-sale rebates for items representing up to five per cent of the GST base in BC. The point-of-sale rebates apply only to the seven per cent provincial component of the HST and are administered by the Canada Revenue Agency.
The point-of-sale rebates in BC are:
· motor fuels;
· books;
· children-sized clothing and footwear;
· children’s car seats and car booster seats;
· children’s diapers; and
· feminine hygiene products.
The point-of-sale rebate for motor fuels includes gasoline, gasoline-ethanol blends, diesel and biodiesel when used in motor vehicles, locomotive fuel used in trains, marine diesel used in boats and aviation fuel and jet fuel used in aircraft.
Budget and Fiscal Plan – 2010/11 to 2012/13
87
Tax Measures
Tax on Private Sales of Vehicles, Boats and Aircraft Continued
Effective July 1, 2010, the tax on the private sale of vehicles, boats and aircraft in British Columbia is continued, but at a rate of 12 per cent. The private sale of vehicles, boats and aircraft is currently subject to the 7 per cent PST but is not subject to GST/HST. The application of the 12 per cent tax provides comparable treatment between the private sale of vehicles, boats and aircraft and the sale of these same goods by HST registered businesses. It is also consistent with all other HST provinces as they also tax the private sale of vehicles, boats and aircraft at their HST rate of 13 per cent or higher.
Exemptions and refunds for individuals are generally continued including inheritances and settler’s effects. The partial exemption for vehicles modified for wheelchairs or with auxiliary driving controls for persons with disabilities is converted to a complete exemption.
Tobacco Tax Act
Tax on Cigars Clarified and Maximum Tax Rate Increased
Effective March 3, 2010, the calculation of the 77 per cent tax on cigars is clarified as follows:
· the tax applies to the retail cigar price if the retail dealer who sells the cigar also manufactured the cigar in Canada or imported the cigar into Canada; or
· in all other cases, the tax applies to the wholesale price plus a markup equal to 30 per cent of the wholesale price.
The maximum tax payable per cigar is increased to $6 per cigar from $5 per cigar.
Authority to Impose a Retail Tobacco Fee Introduced
The Tobacco Tax Act is amended to provide authority to impose an annual fee payable by tobacco retailers as a condition for selling tobacco products in the province. The fee amount, commencement date and reporting requirements will be provided later this year.
South Coast British Columbia Transportation Authority Act
TransLink Parking Tax
Effective July 1, 2010, legislation related to the imposition of the TransLink parking tax, currently administered by the Province on behalf of TransLink, is transferred from the Social Service Tax Act to the South Coast British Columbia Transportation Authority Act. Administration of the tax is also transferred to TransLink.
Tourist Accommodation (Assessment Relief) Act
Statutes to which the Assessment Reduction Applies Clarified
The Tourist Accommodation (Assessment Relief) Act (TAARA) provides assessment relief to business class Short—term Overnight Commercial Accommodation Properties (STOCAP). The assessed value of STOCAPs is reduced for the purpose of taxation under a number of “designated Acts”.
Budget and Fiscal Plan – 2010/11 to 2012/13
88
Tax Measures
For 2010 and subsequent taxation years the definition of “designated Act” is amended to include the Police Act, the School Act, the South Coast British Columbia Transportation Authority Act and the University Endowment Land Act, consistent with longstanding administrative practice.
Property Transfer Tax Act
Application of Tax to Transfers to Correct Conveyancing Errors Clarified
Effective March 3, 2010, the Act is amended to clarify that, consistent with longstanding administrative practice, no property transfer tax is payable on transfers to correct a conveyancing error. The requirement that an administrator’s certificate be obtained prior to registration of the transfers to correct the error is eliminated.
Exemption Re—instated for Transfers Required to Amend a Strata Plan
Effective March 3, 2010, an exemption is re—instated for transfers required to amend a strata plan. Transfers required to amend a strata plan under the former Condominium Act qualified for the exemption for subdivisions but with the replacement of that Act with the Strata Property Act such transfers no longer qualify. The new exemption is similar to the exemptions provided for transfers for subdivisions. Transfers resulting from amendments to strata plans are fully exempt where owners do not receive an increased interest as a result of the amendment. Where an owner receives an increased interest, property transfer tax is payable on the fair market value of the increased interest.
Home Owner Grant Act
Threshold for Home Owner Grant Phase-out Maintained at 2009 Level
For the 2010 taxation year, the threshold for the phase—out of the home owner grant is maintained at the 2009 level of $1,050,000. Consistent with longstanding government policy, the home owner grant threshold is set so that more than 95 per cent of homeowners are eligible for the full grant. Given projected assessments for 2010, no adjustments to the threshold are necessary for 2010 to meet this policy objective.
For properties valued above the threshold of $1,050,000, the grant is reduced by $5 for every $1,000 of assessed value in excess of the threshold.
Northern and Rural Area Home Owner Benefit Introduced
As announced in Budget 2009, effective for the 2011 taxation year, a northern and rural home owner benefit is introduced. The benefit is provided as an increase to the home owner grant and all eligibility requirements for the home owner grant apply.
The northern and rural benefit amount for owners of homes valued at or below the home owner grant phase—out threshold is $200. The amount that represents the combined northern and rural benefit and the home owner grant is phased—out at a rate of $5 per $1,000 of assessed value above the home owner grant phase—out threshold. The northern and rural benefit applies in those areas of the province outside the Greater Vancouver Regional District, the Fraser Valley Regional District and the Capital Regional District.
Budget and Fiscal Plan – 2010/11 to 2012/13
89
Tax Measures
School Act
Property Tax Credit for Farm Land Introduced
As announced in Budget 2009, effective for the 2011 and subsequent taxation years, the Provincial Farm Land Property Tax Credit is introduced to reduce provincial school property tax on farm land (class 9) by 50 per cent.
Industrial Property Tax Credit Increased
As announced in Budget 2009, effective for the 2011 and subsequent taxation years, the Industrial Property Tax Credit which reduces provincial school property tax on major industrial (class 4) and light industrial (class 5) properties is increased to 60 per cent from 50 per cent. The Industrial Property Tax Credit applies to British Columbia manufacturing, mining, forestry and other major and light industries.
Provincial Residential School Property Tax Rates Set
The longstanding rate setting policy is that average residential school property taxes before application of the home owner grant will increase by the previous year’s provincial inflation rate. This rate setting policy has been in place since 2003.
For the 2010 taxation year, average residential school property taxes before application of the home owner grant will be the same as in 2009 because the provincial inflation rate for 2009 is zero per cent. The rates will be set when revised assessment roll data are available.
Provincial Non-Residential School Property Tax Rates Set
A single province—wide rate is set for each of the non-residential property classes. Consistent with longstanding policy, the rates for 2010, except the rate for the major industry property class, will be set so that non-residential school tax revenue will increase by inflation plus new construction. The rates will be set when revised assessment roll data are available.
The major industry property tax class rate will be set to be the same as the business class rate, consistent with the policy announced in Budget 2008.
Taxation (Rural Area) Act
Provincial Rural Area Property Tax Rates Set
A single rural area residential tax rate applies province-wide. The longstanding rate setting policy that average residential rural property taxes increase by the previous year’s provincial inflation rate will continue. For the 2010 taxation year, average residential rural area taxes will be the same as in 2009 because the 2009 provincial inflation rate is zero per cent.
Consistent with longstanding policy, non—residential rural area tax rates will be set so that total non—residential rural area tax revenue will increase by inflation plus new construction. The rates will be set when revised assessment roll data are available.
Budget and Fiscal Plan – 2010/11 to 2012/13
90
Tax Measures
Ports Property Tax Act/Assessment Act
Designation of Port Land Clarified
Port lands are designated separately under two Acts. Port lands that are subject to municipal property tax rate caps are designated under the Ports Property Tax Act, while port lands that are to be assessed using the special port land valuation rules are designated under the Assessment Act. Under current policy, the same port lands are designated for both purposes. The process of designation is clarified to ensure that the designations are consistent with this policy.
The Assessment Act is amended to allow the value of port land in the year of designation to be prescribed. In a year where there is no new designation, the value of port land is the previous year’s value, adjusted by the previous year’s inflation.
Amendments to the Assessment Act and the Ports Property Tax Act allow the designation of any port land under those Acts to be made until December 31 of the year preceding the taxation year for which the designations are to take effect. Two exceptions are:
· designations made before December 31, 2010 that are effective for the 2010 taxation year; and
· port land in a municipality that is Crown land and either becomes occupied by the port or ceases to be occupied by the port. In this case, the designation applies to the portion of the year the land is occupied by the port.
Land Tax Deferment Act
Deferment Program for Families with Children Introduced
The property tax deferment program allows home owners to defer property taxes until their home is sold, transferred to a new owner or becomes part of an estate. As announced in the February 9, 2010 Throne Speech, eligibility for the program is expanded to include families with children under age 18. This expansion of the program applies for the 2010 and subsequent taxation years.
To be eligible, a home owner must financially support at least one child under age 18, meet the basic eligibility criteria for the program, and have at least 15 per cent equity in their home. Simple interest is charged on deferred taxes at the prime rate.
Applications for the expanded program will be available before property tax notices are sent out in May. They will be available from municipalities, Government Agents/Service BC offices and from the Ministry of Finance website by following the links at:
www.sbr.gov.bc.ca/individuals/Property_Taxes/Property_Tax_Deferment/ptd.htm
For further information see Property Tax Deferment for Families with Children topic box.
Budget and Fiscal Plan – 2010/11 to 2012/13
91
Tax Measures
Harmonized Sales Tax
The government of British Columbia announced on July 23, 2009 that it would implement a Harmonized Sales Tax (HST) on July 1, 2010.
The Province and the federal government signed a harmonization agreement, the Comprehensive Integrated Tax Coordination Agreement (CITCA), in November 2009.
The full text of the CITCA is available online at: http://www.gov.bc.ca/hst/Documents/bc_citca_nov09.pdf
Benefits of a Harmonized Sales Tax
The introduction of the harmonized sales tax is an essential step to make BC businesses more competitive, encourage new investment, improve productivity, and reduce administrative costs for BC taxpayers and businesses. Most importantly, harmonization will generate economic growth and, over time, create jobs and generate more revenue to sustain and improve crucial public services.
Increased Investment and Productivity
Economic experts have argued that BC could significantly improve productivity levels and lower taxes on new investment by eliminating the Provincial Sales Tax (PST) and replacing it with a value-added tax (VAT), such as the HST, which is designed to remove sales tax from business inputs (i.e. the equipment, materials, energy and other goods and services businesses purchase and use to produce the goods and services they sell to their customers).
Businesses in BC currently pay PST on their purchases, or business inputs, the cost of which is built into the price of their goods and services. The embedded PST makes goods and services more expensive, both for BC consumers and in export markets, and reduces our competitiveness. As such, the PST on business inputs represents a serious drag on productivity, investment, competitiveness, and job creation.
It is estimated that harmonization will remove over $2 billion in costs for BC businesses, including an estimated $1.9 billion of sales tax removed from business inputs. In addition, by removing a large impediment to new investment, the HST will create an incentive for businesses to increase investment in their BC operations, leading to improved productivity, increased employment and higher wages.
Removal of Embedded Tax
Under the PST, taxes are paid at every step in the creation of a product. Businesses pay PST on their business inputs and this tax becomes part of, or is “embedded” in, the price of the products and services sold by the business. Consumers pay PST and GST on the final purchase price, including the embedded PST.
Chart 1 Harmonization removes hidden PST
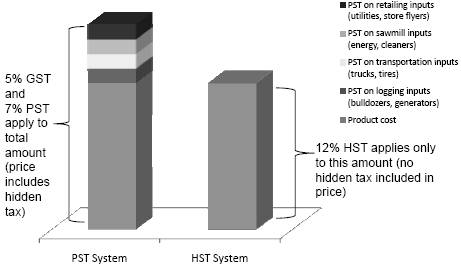
Budget and Fiscal Plan – 2010/11 to 2012/13
92
Tax Measures
Under the HST, businesses pay HST on their business inputs and have to collect HST from their customers. However, most businesses can deduct the HST they pay on their business inputs from the total amount they collect and send to government. This deduction is called an input tax credit or ITC. As a result, most businesses do not end up paying any HST so there is no HST embedded (or passed on to consumers) in the selling price of their products and services.
Chart 1 on the previous page shows how PST is hidden in the price of a very simple made-in-BC product, a 2x4 piece of lumber.
Competitiveness
According to the Organization for Economic Co-operation and Development (OECD), the VAT is now the most widespread general tax on consumption in the world. It is also generally regarded as the most efficient form of taxation.
The United States remains the only OECD country without a VAT. Five other Canadian provinces have either implemented (Quebec, Nova Scotia, New Brunswick and Newfoundland and Labrador), or are planning to implement (Ontario), a VAT. In the European Union standard VAT rates range from a low of 15 per cent in the United Kingdom to a high of 25 per cent in Sweden and Denmark, with most rates in the 18 per cent to 22 per cent range. The combined federal—provincial rate in other Canadian HST provinces is 13 per cent, compared to the proposed rate of 12 per cent for British Columbia.
British Columbia has to sell its goods and services to the rest of the world to prosper and grow. To do so successfully we must compete with companies from the more than 130 countries and five Canadian provinces which have a value—added tax. Unless BC moves to an HST, all of these jurisdictions will have a competitive advantage over BC. Moving to a value—added tax such as the HST is necessary to keep BC competitive in a global economy.
Simplification and Administrative Savings
The HST also results in reduced compliance costs for business. Instead of the duplication that exists with two taxes, the GST and the PST, the HST has one substantially harmonized tax base and one set of administrative rules. In addition, the provincial and federal governments pay HST at the time of purchase just like any other public service body, business or consumer (the Province maintains its constitutional immunity from federal taxes but pays HST up front and claims a 100 per cent rebate to simplify administration for business). This means that businesses are no longer required to have different rules for government, or to administer a special exemption system for government, as they did under the GST.
The HST is expected to result in administrative savings of about $150 million annually for BC businesses. In addition, the federal government will administer the HST at no cost to the province, resulting in administrative savings of about $30 million annually when fully phased-in.
Job Creation
Major industries such as forestry, mining, oil and gas, and transportation provide thousands of jobs for rural and remote communities. BC’s resource and manufacturing sectors will benefit significantly from the HST as their business inputs and exports will no longer be taxed. These businesses will be encouraged to invest in capacity expansion and productivity improvements which, in turn, will create jobs and boost income for workers.
The HST is good for business and ultimately for the people who work in those businesses because it means that BC will be an attractive place for investments to create long-term stable employment. In the long run, the HST will lead to increased economic growth and prosperity. This is in the best interest of British Columbians and is the right policy for the future of the province.
Harmonization Basics
· BC’s 7 per cent PST and 8 per cent Hotel Room Tax are eliminated.
· After July 1, 2010, there is no PST or GST in BC — only the HST.
· A 7 per cent BC rate is added to the 5 per cent federal Goods and Services Tax (GST). This combined 12 per cent tax is renamed the HST.
· HST applies to the same goods and services that were taxable under the GST.
Budget and Fiscal Plan – 2010/11 to 2012/13
93
Tax Measures
· If there was no GST on a product or service, there is no HST.
· If there was 5 per cent GST on a good or service, there is 12 per cent HST unless the item is eligible for a provincial point-of-sale rebate or provincial credit.
· There is only 5 per cent HST (the federal part) on point-of-sale rebate items; there is no provincial HST. The point-of-sale rebate items are motor fuels, books, children-sized clothing and footwear, children’s car seats and car booster seats, children’s diapers and feminine hygiene products.
· BC is providing a provincial credit for residential energy. The credit is equal to the provincial portion of the HST so it is like there is no provincial HST on residential energy, only 5 per cent federal HST.
· BC is also providing a new housing rebate, a BC HST Credit for low and modest income British Columbians, and rebates for municipalities, school authorities, universities, public colleges, hospital authorities, registered charities and qualifying non-profit organizations.
· The HST is imposed under federal legislation, the Excise Tax Act (Canada), and is administered by the Canada Revenue Agency (CRA).
· The CRA is currently conducting seminars across the province to help BC businesses prepare for the transition to the HST. Information about the seminars can be found on-line at: http://www.cra–arc.gc.ca/vnts/hrmnztn/bc/menu–eng.html
HST Base — How the HST Applies
Goods and services can be taxable, exempt or zero-rated.
Taxable Goods and Services
Most goods and services are taxable. HST of 12 per cent applies to all taxable goods and services (e.g. cars, clothing, furniture, haircuts), except the items eligible for a provincial point-of-sale rebate. Only the 5 per cent federal portion of the HST applies to these items. (Due to the provincial credit, consumers will also effectively pay only 5 per cent federal HST on residential energy.)
Businesses selling taxable goods and services, including point-of-sale rebate items, can claim input tax credits to recover the HST they pay.
Exempt or Zero-Rated Goods and Services
Many goods and services, including many that are currently exempt or not subject to PST, are either exempt from HST or are zero-rated. Consumers do not pay HST on exempt or zero-rated items. Exempt means that no HST applies and zero-rated means that a tax of 0 per cent applies.
Examples of goods and services on which consumers do not pay HST include:
· Exempt goods and services: most health and dental services; most financial services; long-term residential rental accommodation; child-care services; most educational services; most food or beverages sold in an elementary or secondary school cafeteria to students and most meal plans provided in a university or public college; music lessons; bridge, road and ferry tolls; most goods and services provided by charities; and certain services provided by non-profit organizations, governments and other public service bodies such as municipal transit services and standard residential services such as water distribution.
· Zero-rated goods and services: basic groceries; prescription drugs and drug-dispensing fees; medical devices such as hearing aids and artificial teeth; many transportation services where the origin or destination is outside Canada; and exports.
The difference for businesses is that businesses selling zero-rated goods and services can claim input tax credits while those selling exempt goods and services cannot.
HST Rate
The HST rate in BC is 12 per cent, which is made up of a 7 per cent provincial portion and a 5 per cent federal portion. BC’s HST rate is the lowest of all HST provinces.
The rate in all other provinces with an HST — Ontario (to be implemented effective July 1, 2010), New Brunswick, Newfoundland and Labrador, and
Budget and Fiscal Plan – 2010/11 to 2012/13
94
Tax Measures
Nova Scotia — is 13 per cent. Quebec has a similar value-added tax that is administered provincially and applied on top of the GST for an effective tax rate of 12.875 per cent (13.925 per cent effective January 1, 2011).
Point-of-Sale Rebates
Under the harmonization agreement with the federal government (the CITCA), BC is able to provide a limited number of provincial point-of-sale rebates for items representing up to 5 per cent of the GST base in British Columbia. Point-of-sale rebates are also subject to other conditions such as feasibility of administration and the ability to accurately estimate the value of the items for revenue allocation purposes using mutually agreed upon definitions, data sources and methodologies.
The point-of-sale rebates only apply to the provincial portion of the HST and are administered by the Canada Revenue Agency.
A point-of-sale rebate of HST is similar to a PST exemption in that it is an instant rebate of tax — the purchaser does not pay the 7 per cent provincial portion of the HST on the item at the time of purchase. The purchaser only pays the 5 per cent federal portion of the HST.
BC is providing point-of-sale rebates for the provincial portion of the HST on:
· motor fuels;
· books;
· children-sized clothing and footwear;
· children’s car seats and car booster seats;
· children’s diapers; and
· feminine hygiene products.
The point-of-sale rebate for motor fuels includes gasoline, gasoline-ethanol blends, diesel and biodiesel when used in motor vehicles, locomotive fuel used in trains, marine diesel used in boats, and aviation fuel and jet fuel used in aircraft. Propane, natural gas and hydrogen are not eligible for the point-of-sale rebate. However, fuels eligible for the point-of-sale rebate are generally subject to motor fuel taxes while propane, natural gas, and hydrogen are not.
Most businesses are able to recover any HST they pay on motor fuels through input tax credits, so this rebate primarily benefits British Columbia families and individuals. Gasoline and diesel continue to be subject to motor fuel taxes, which raise revenue for highway development and maintenance, and to British Columbia’s carbon tax which is specifically designed to send a consistent long term price signal to consumers so that they will make the choices required to reduce their fossil fuel use and emissions.
The point-of-sale rebates provided have used the room BC has available for such rebates under the CITCA with the federal government.
Additional information about the provincial point-of-sale rebates is available at: http://www.sbr.gov.bc.ca/documents_library/shared_documents/HST/ HST–POS–Notice_Nov–12.pdf and at: http://www.cra–arc.gc.ca/tx/pstr/rbts/psr/menu–eng.html
Rebates for Municipalities, Universities, Public Colleges, School Authorities, Hospital Authorities, Charities and Qualifying Non-Profit Organizations
BC is providing partial rebates of the provincial portion of the HST for eligible public service bodies to ensure that, on average, these entities pay no additional tax due to harmonization. The rebates are designed to mitigate the impact of the HST while providing certainty for eligible entities.
Public service bodies include municipalities and other eligible local government entities, eligible school authorities, universities, public colleges, and hospital authorities, and eligible registered charities and qualifying non—profit organizations.
The rebate rates were set to ensure that, on average, eligible entities do not pay any more in provincial HST than they paid in PST. The rates reflect that the HST applies to a broader range of goods and services than the PST and also that these entities paid PST on most goods and certain services.
Budget and Fiscal Plan – 2010/11 to 2012/13
95
Tax Measures
Municipalities
BC is providing a rebate of 75 per cent of the provincial portion of the HST for municipalities and other eligible local government entities. Eligible entities are those that currently qualify for the federal GST (or federal HST) rebate for municipalities. All entities that are eligible for the federal rebate are also eligible for the provincial HST rebate.
Municipalities and other eligible local government entities may claim a 100 per cent rebate of the 5 per cent federal portion of the HST (which replaces the GST in BC) paid and a 75 per cent rebate of the 7 per cent provincial portion of the HST paid.
School Authorities
BC is providing a rebate of 87 per cent of the provincial portion of the HST for eligible school authorities. Eligible schools, school boards and school authorities are those that currently qualify for the federal GST (or federal HST) rebate for school authorities. All entities that are eligible for the federal rebate are also eligible for the provincial HST rebate.
Eligible school authorities can claim a 68 per cent rebate of the 5 per cent federal portion of the HST (which replaces the GST in BC) paid and an 87 per cent rebate of the 7 per cent provincial portion of the HST paid.
Universities and Public Colleges
BC is providing a rebate of 75 per cent of the provincial portion of the HST for eligible universities and public colleges. Eligible universities and public colleges are those that currently qualify for the federal GST (or federal HST) rebate for universities and public colleges. All entities that are eligible for the federal rebate are also eligible for the provincial HST rebate.
Eligible universities and public colleges can claim a 67 per cent rebate of the 5 per cent federal portion of the HST (which replaces the GST in BC) paid and a 75 per cent rebate of the 7 per cent provincial portion of the HST paid.
Hospital Authorities
BC is providing a rebate of 58 per cent of the provincial portion of the HST for eligible hospital authorities. Eligible entities are health authorities and other organizations that currently qualify for the federal GST (or federal HST) rebate for hospital authorities. All entities that are eligible for the federal rebate are also eligible for the provincial HST rebate. Facility operators and external suppliers that currently qualify for the federal GST (or federal HST) rebate for these entities will also be eligible for a provincial HST rebate for their eligible activities.
Eligible hospital authorities, facility operators and external suppliers can claim an 83 per cent rebate of the 5 per cent federal portion of the HST (which replaces the GST in BC) paid and a 58 per cent rebate of the 7 per cent provincial portion of the HST paid.
Registered Charities and Qualifying Non-Profit Organizations
BC is providing a rebate of 57 per cent of the provincial portion of the HST for eligible registered charities and qualifying non-profit organizations. Eligible charities and non-profit organizations are those that qualify for the federal GST (or federal HST) rebate for registered charities and qualifying non-profit organizations. All entities that are eligible for the federal rebate are also eligible for the provincial HST rebate.
Eligible registered charities and qualifying non-profit organizations can claim a 50 per cent rebate of the 5 per cent federal portion of the HST (which replaces the GST in BC) paid and a 57 per cent rebate of the 7 per cent provincial portion of the HST paid.
Determining the Rebate Rates
The same methodology was used to set the rebate rate for each sector: municipalities, school authorities, universities and public colleges, hospital authorities, and registered charities and qualifying non—profit organizations.
Budget and Fiscal Plan – 2010/11 to 2012/13
96
Tax Measures
The additional tax that would have been paid by the entities in each sector without a rebate was estimated by subtracting the total amount of PST paid from the estimated total amount of provincial HST that would have been paid without a rebate (BC HST minus BC PST = additional tax due to harmonization). The estimated additional tax was then divided by the estimated total provincial HST that would have been paid without a rebate to determine the appropriate rebate percentage.
The percentage rebate for municipalities was set based on Statistics Canada data and Canada Revenue Agency GST rebate data. The percentage rebates for all other sectors were set based data provided by Statistics Canada.
To illustrate, if a sector paid a total of $1 million in PST and would have paid a total of $2 million in provincial HST without a rebate, the additional tax due to harmonization before the rebate is $1 million. To determine the rebate rate, the additional tax is divided by the total estimated provincial HST before any rebate ($1,000,000 / $2,000,000 = 50%). Therefore, the rebate rate for this sector is 50 per cent of provincial HST paid. This rebate rate returns $1 million to the sector, ensuring that, on average, no additional tax is paid due to harmonization.
The rebate rate for each sector was set to ensure that — on average — eligible entities in that sector pay no additional tax due to harmonization.
The rebates do not ensure that every entity pays exactly the same amount of tax as it did prior to harmonization. The impact on any particular entity, or any particular subgroup of entities within a sector, depends on the specific mix of goods and services purchased by the entity or group.
The rebate rates differ among sectors because the rates are affected by the particular expenditure patterns of a sector. Different sectors buy different mixes of goods and services and therefore pay different amounts of tax, both under the PST and under the HST. The rebate rate is based on the change in tax burden, or the estimated additional tax that would have been paid by a sector without a rebate (relative to the total provincial HST that would have been paid without a rebate).
Administration
The provincial rebates are administered by the Canada Revenue Agency together with the federal rebate, in a manner consistent with the administration of the federal GST (or federal HST) rebate.
New Housing Rebate
The HST only applies to “new” residential housing; used (i.e. resale) residential housing is not subject to HST.
BC is providing a rebate for new housing purchased as a primary residence to ensure that, on average, purchasers of new homes up to $525,000 do not pay any additional tax due to harmonization. That is, they pay no more in provincial HST than was embedded as PST in the price of a new home.
The rebate is 71.43 per cent of the provincial portion of the HST, up to a maximum rebate of $26,250. Purchasers of eligible new homes above $525,000 are eligible for a rebate of $26,250 (i.e. a rebate on the first $525,000 of value).
The HST only applies to new housing, so the rebate is only available for new housing. The rebate is available whether the new housing is to be owner occupied or rented.
Eligible New Housing
The BC new housing rebate is available for all types of housing currently eligible for the federal GST (or federal HST) new housing rebate and is subject to the same eligibility conditions. Qualifying housing generally includes newly constructed and substantially renovated homes used as a primary place of residence by an individual (or qualifying relation of the individual).
New Rental Housing Rebate
To support affordable rental housing in the province, BC is also providing a new rental housing rebate of 71.43 per cent of the provincial portion of the HST, up to a maximum rebate of $26,250 per unit. This rebate ensures that new rental housing up to $525,000 is not subject to any more tax, on average, than was embedded as PST in the price of new rental housing.
Budget and Fiscal Plan – 2010/11 to 2012/13
97
Tax Measures
The new rental housing rebate is provided to landlords who construct or substantially renovate their own rental housing and, as a result, are required to self—assess and pay HST under the self-supply rules. The rebate is also provided to landlords who purchase newly constructed or substantially renovated rental housing in BC and pay HST on the purchase.
The new rental housing rebate is available for all types of new or substantially renovated rental housing currently eligible for the federal GST (or federal HST) rebate for new residential rental properties, and is subject to the same eligibility conditions.
Rebate Rate Calculation
New housing was not directly subject to PST (i.e. the purchaser of a new home did not pay PST on the purchase price). However, builders had to pay PST on most construction materials (e.g. wood, cement, plaster, nails, etc.) used to build a home. The PST was part of the cost of building the home and included (embedded) in the total selling price of the home. It is estimated that the embedded PST in new homes in British Columbia was — on average — equal to about 2 per cent of the price.
Unlike with the PST, under the HST there is no sales tax embedded in the price of new homes because builders, like most other businesses, recover the HST they pay on their materials through input tax credits. Without a rebate, the provincial tax on new homes would have effectively increased from about 2 per cent on average (embedded PST) to 7 per cent (provincial portion of the HST).
The rebate rate was set to ensure purchasers of eligible new homes up to the $525,000 threshold pay no more provincial HST on average than under the PST.
Rebate rate: (7% BC HST minus 2% embedded BC PST) / 7% BC HST
Rebate rate = 5/7 = 71.43% of provincial portion of HST paid, to a maximum of $26,250.
Table 1 Total Sales Tax Payable on New Homes
Price of New
Home | | Current
Embedded
PST of 2% | | After Harmonization | | | |
| | | | HST (7% BC portion) | | $ | 17,500 | |
| | | | BC new housing rebate | | (12,500 | ) |
$ | 250,000 | | $ | 5,000 | | Net provincial HST | | $ | 5,000 | |
| | | | Previous 2% embedded PST | | (5,000 | ) |
| | | | Net impact on home buyer | | $ | 0 | |
| | | | HST (7% BC portion) | | $ | 28,000 | |
| | | | BC new housing rebate | | (20,000 | ) |
$ | 400,000 | | $ | 8,000 | | Net provincial HST | | $ | 8,000 | |
| | | | Previous 2% embedded PST | | (8,000 | ) |
| | | | Net impact on home buyer | | $ | 0 | |
| | | | HST (7% BC portion) | | $ | 36,750 | |
| | | | BC new housing rebate | | 26,250 | |
$ | 525,000 | | $ | 10,500 | | Net provincial HST | | $ | 10,500 | |
| | | | Previous 2% embedded PST | | (10,500 | ) |
| | | | Net impact on home buyer | | $ | 0 | |
| | | | HST (7% BC portion) | | $ | 56,000 | |
| | | | BC new housing rebate | | (26,250 | ) |
$ | 800,000 | | $ | 16,000 | | Net provincial HST | | $ | 29,750 | |
| | | | Previous 2% embedded PST | | (16,000 | ) |
| | | | Net impact on home buyer | | $ | 13,750 | |
Administration
The new housing rebates are administered by the Canada Revenue Agency.
Transitional Housing Rules
Transitional rules regarding the application of the HST to new housing were released on November 18, 2009.
Additional information about the new housing rebate and the transitional rules for residential real property can be found at: http://www.sbr.gov.bc.ca/documents_library/shared_documents/HST/new–housing–rebates.pdf and at: http://www.cra–arc.gc.ca/E/pub/gi/notice246/README.html
General Transitional Rules
The transitional rules provide technical details about collecting and paying the HST in the period around July 1, 2010.
Information about the transitional rules can be found at: http://www.sbr.gov.bc.ca/business/Consumer_Taxes/Harmonized_Sales_Tax/HST_Transitional_Rules.html and at: http://www.cra-arc.gc.ca/tx/pstr/trnstnl/prsnl/menu-eng.html
Budget and Fiscal Plan – 2010/11 to 2012/13
98
Tax Measures
CRA is currently conducting seminars across the province to help BC businesses prepare for the transition to the HST.
Information about the seminars can be found on-line at: http://www.cra—arc.gc.ca/vnts/hrmnztn/bc/ menu—eng.html
Residential Energy Credit
A provincially administered credit is provided for energy — i.e. electricity, natural gas, heating fuel, heat, steam, propane, kerosene, firewood and pellets — purchased for residential use. The credit is equal to the provincial portion of the HST paid or payable on the energy (excluding service and administration charges).
The credit ensures that harmonization does not increase the cost of residential energy for British Columbians. For most residential consumers the credit is provided directly on their utility bills by energy suppliers (similar to a PST exemption). Energy suppliers in these circumstances are reimbursed by the province.
Residential use will generally include personal use or consumption at a residence by the owner, tenant or other occupant of the residence. Residential use is not limited to energy used for heating a residence; it also includes energy for lighting, cooking and similar residential uses. Residential use generally will not include a business, commercial or industrial use, or a use on which a person may claim an input tax credit or a public service body rebate. Residences generally include single family dwellings, apartment buildings, residential condominium complexes, residential care facilities and portions of multi—use buildings used for single family dwellings.
Residential consumers who purchase energy for both residential and non—residential use (e.g. split use) that is not separately metered, or energy not delivered by the supplier directly to the residence, do not receive the credit on their utility bills but may apply to the BC government for the credit.
Temporary Input Tax Credit Restriction
Similar to the restrictions on input tax credits (ITCs) in Quebec and those proposed by Ontario, there is a temporary restriction on the ability of large businesses and financial institutions in BC to claim input tax credits for purchases of certain goods and services. The restriction only applies to the provincial portion of the HST.
ITCs will be restricted for up to the first five years and then phased in over the following three years unless the fiscal situation permits an earlier phase-in.
Large Businesses Subject to the Restriction
Large businesses subject to the restriction generally include those making taxable supplies, including zero—rated supplies, in excess of $10 million annually. Financial institutions subject to the restriction generally include banks, trust companies, credit unions, insurers, segregated funds of insurers, investment plans, and persons related to one of these institutions.
The restriction does not apply to public service bodies as defined under the federal Excise Tax Act. Public service bodies include municipalities, universities, public colleges, school authorities, hospital authorities, charities and qualifying non—profit organizations. In addition, the restriction does not apply to items acquired for use in farming activities by a person whose chief source of income is farming as defined in the federal Income Tax Act.
Items Subject to the Restriction
The restriction generally applies to the following goods and services acquired or brought into British Columbia for use by a large business, including a financial institution: road vehicles weighing less than 3,000 kilograms that must be registered for use on public highways, including certain vehicle parts and services; specified energy; specified telecommunications services; and meals and entertainment that are currently subject to an ITC repayment requirement under the federal Excise Tax Act.
Specified energy generally includes energy other than energy used directly in the production of tangible personal property (e.g. goods) for sale, directly in the production of equipment used in the production of tangible personal property for sale, or directly in eligible scientific research and experimental development activities.
Budget and Fiscal Plan – 2010/11 to 2012/13
99
Tax Measures
Specified telecommunications services include services such as local and long—distance telephone, cable and pay television, satellite television, facsimile and electronic mail, video, audio and computer link—ups and data transmission. Specified telecommunications services generally do not include internet access and toll—free numbers.
The restriction generally does not apply to items acquired by a large business for the sole purpose of being resupplied by that business, or for the sole purpose of becoming a component part of tangible personal property that is to be supplied by that business (e.g. auto-dealer vehicle inventory, electricity or natural gas purchased for re—distribution by a utility, or meals acquired for re-supply by an airline).
Simplification Measures
To help simplify compliance with the restricted ITC requirements, businesses producing tangible personal property for sale are generally able to elect to use a proxy to determine the portion of energy not subject to the restriction (i.e. the portion of energy used directly in the production of tangible personal property). Businesses are also generally allowed to make an election to use an estimation, installment and reconciliation approach to accounting for restricted ITCs.
Administration
The Canada Revenue Agency will administer the temporary ITC restriction.
Additional information about the temporary ITC restriction can be found at: http://www.sbr.gov.bc.ca/ documents_library/shared_documents/HST/Input_Tax_Credit_Req.pdf
BC HST Credit
The design of the HST, with tax relief for residential rent and basic groceries, helps to reduce the impact on low income individuals and families, as do the provincial point-of-sale rebates, the provincial rebates for new housing and new rental housing, and the provincial residential energy credit.
To further reduce the impact on low and modest income individuals and families, BC is providing a new BC HST Credit along with the quarterly GST credit payments. The annual amount of the credit is $230 per family member for individuals with incomes up to $20,000 and families with incomes up to $25,000. The credit is phased out by 4 per cent of income above the thresholds. About 1.1 million British Columbians benefit from the credit.
Other HST Related Income Tax Relief
Increase to Basic Personal Amount
Effective January 1, 2010, the basic personal amount tax credit is increased to $11,000 from the 2009 amount of $9,373, an increase of $1,627. In addition, the spouse and equivalent to spouse credits are increased by $1,627 above the 2009 amounts. This measure reduces provincial personal income taxes payable by up to about $80 for all single taxpayers and by up to $160 for taxpayers claiming a spouse or equivalent to spouse.
Table 2 provides examples of the impact of harmonization and associated income tax relief measures for various family types.
Table 2 Impact of Harmonization on Individuals and Families Before Removal of Embedded PST(1)
| | Single
individual
with
$25,000
income | | Single
individual
with
$80,000
income | | Family of
four with
$30,000
income | | Family of
four with
$60,000
income | | Family of
four with
$90,000
income | | Senior
couple
with
$30,000
income | |
Sales tax changes (2) | | | | | | | | | | | | | |
· Direct Provincial Sales Tax | | (413 | ) | (1,046 | ) | (740 | ) | (986 | ) | (1,258 | ) | (756 | ) |
· Direct Harmonized Sales Tax | | 575 | | 1,440 | | 967 | | 1,253 | | 1,596 | | 1,017 | |
Change in direct sales taxes payable | | 162 | | 394 | | 227 | | 267 | | 338 | | 261 | |
Personal tax measures related to harmonization | | | | | | | | | | | | | |
· BC HST Credit | | (84 | ) | — | | (762 | ) | — | | — | | (260 | ) |
· Increase to basic personal and spousal credits | | (80 | ) | (80 | ) | — | | (160 | ) | (160 | ) | — | |
Personal income tax impacts | | (164 | ) | (80 | ) | (762 | ) | (160 | ) | (160 | ) | (260 | ) |
Net change in tax | | (2 | ) | 314 | | (535 | ) | 107 | | 178 | | 1 | |
(1) Based on typical consumption patterns from the Survey of Household Spending. Does not include the savings to consumers from business no longer passing on the embedded provincial sales tax to consumers through increased prices.
(2) See Appendix Table A3 for a detailed explanation of how sales tax estimates are calculated.
Budget and Fiscal Plan – 2010/11 to 2012/13
100
Tax Measures
Fiscal Impact
The Province is implementing a number of measures designed to mitigate the impact of the HST on BC families and individuals, including:
· the point-of-sale rebates (for motor fuels, books and other items) and the residential energy credit for consumers;
· the partial HST rebates for public service bodies (i.e. municipalities, universities, public colleges, school authorities, hospital authorities, charities and non—profits);
· the new housing rebate; and
· the BC HST Credit for low and modest income British Columbians and the increase to the basic personal amount.
After taking into account these policy initiatives, and the temporary input tax credit restriction and other adjustment measures, harmonization is expected to be roughly fiscally neutral to government. This does not include the $1.6 billion in transitional funding that the federal government will provide to British Columbia.
The HST removes a substantial amount of tax from business inputs which enhances business competitiveness, investment, productivity and ultimately, the prosperity of all British Columbians.
In future years, harmonization is expected to result in increased revenues to support essential services such as health care because the HST is a more stable and robust revenue source than the PST and contributes to enhanced economic growth.
Related Tax Measures and Other Programs
Hotel Room Taxes and Funding for Tourism Marketing and Resort Municipalities
With the elimination of the provincial hotel room tax and implementation of the HST, the provincial tax rate on hotel accommodations in BC decreases by one percentage point.
The British Columbia Resort Municipality Initiative currently provides eligible resort municipalities with a portion of the revenue from the provincial 8 per cent hotel room tax. Although the hotel room tax is eliminated with the introduction of the HST, the provincial government funding for resort municipalities will continue.
As announced in the September Update 2009, the Province has extended the 2 per cent additional hotel room tax levied on behalf of local governments, regional districts, destination
Table 3 Estimated Fiscal Impact of Harmonization
| | 2010/11 | | 2011/12 | |
| | Millions | |
| | | | | |
BC HST revenues (1) | | | | | |
BC HST revenue before rebates | | $ | 4,914 | | $ | 6,915 | |
Point of sale rebates (books, motor fuels, children’s items, etc.) | | $ | (248 | ) | $ | (331 | ) |
Rebates for municipalities, charities, non-profits | | $ | (220 | ) | $ | (307 | ) |
Rebates for schools, universities, colleges, hospitals | | $ | (167 | ) | $ | (228 | ) |
New housing rebate | | $ | (438 | ) | $ | (615 | ) |
Residential energy credit | | $ | (175 | ) | $ | (220 | ) |
Temporary input tax credit restriction for large businesses (2) | | $ | 118 | | $ | 162 | |
Net BC HST revenues (1) | | $ | 3,784 | | $ | 5,376 | |
HST-related personal income tax reductions | | | | | |
BC HST Credit (3) | | $ | (157 | ) | $ | (227 | ) |
Increase basic personal amount to $11,000 | | $ | (174 | ) | $ | (183 | ) |
BC HST revenues after personal tax reductions | | $ | 3,453 | | $ | 4,966 | |
Net revenue reduction due to elimination of provincial sales tax (4) | | $ | (3,566 | ) | $ | (4,966 | ) |
Net fiscal impact of harmonization | | $ | (113 | ) | $ | 0 | |
(1) As the HST is implemented effective July 1, 2010, 2010/11 HST revenues, rebates, credits and restrictions are 3/4 year only.
(2) Temporary denial of full ITCs for up to 5 years only and then phased in over 3 years.
(3) The BC sales tax credit is integrated with the BC HST Credit.
(4) Includes elimination of the provincial sales tax, hotel room tax, ICE levy, battery levy, passenger vehicle rental tax, vehicle surtax, and motor fuel tax on propane effective July 1, 2010. Also includes adjustments to liquor markups, ongoing funding for tourism initiatives, and continuation of tax on private sales of vehicles.
Budget and Fiscal Plan – 2010/11 to 2012/13
101
Tax Measures
marketing organizations and other eligible entities to raise revenue for local tourism marketing until June 30, 2011. This extension was provided to allow for time to consult with stakeholders. During these consultations with the tourism industry, destination marketing organizations and local governments, the Province received critical input regarding the importance of the additional hotel room tax program as well as opportunities for improvements to the program. This input is being carefully considered in the design of the future structure of the additional hotel room tax program which will continue beyond June 30, 2011.
Elimination of Certain Taxes and Levies
Due to the implementation of the HST and the elimination of the provincial sales tax, the following levies and taxes are eliminated effective July 1, 2010:
· The Innovative Clean Energy (ICE) levy (imposed on residential and commercial energy purchases under the PST). Revenues from the levy collected prior to its elimination will remain in the ICE fund and expenditures will continue, utilizing the current balance in the account.
· The $5 battery levy. Government will continue to fund the programs to offset the revenue loss and will review the Sustainable Environment Fund (SEF) budget annually.
· The Passenger Vehicle Rental Tax of $1.50 per day. This revenue was previously dedicated to the BC Transportation Financing Authority.
· The surtax on motor vehicles over $55,000.
· The multijurisdictional vehicle tax (eliminated for multijurisdictional vehicles that have a vehicle license year that begins on or after July 1, 2010).
Motor Fuel Tax Exemption for Propane
Propane is exempted from motor fuel tax effective July 1, 2010 because it is not eligible for the provincial point-of-sale rebate for motor fuels.
Vancouver Parking Sales Tax
Effective July 1, 2010, legislation related to the imposition of the TransLink parking tax, currently administered by the Province on behalf of TransLink, is transferred to the South Coast British Columbia Transportation Authority Act and administration of the tax is transferred to TransLink.
Tax on Private Sales of Vehicles, Boats and Aircraft
The tax on private sales of vehicles, boats and aircraft in British Columbia is continued, at a rate of 12 per cent effective July 1, 2010. These sales were subject to PST but are not subject to HST. The 12 per cent provincial tax rate ensures similar tax treatment between private sales and sales by HST registered businesses. It is also consistent with the other HST provinces, all of which tax private sales of vehicles, boats and aircraft at a rate of at least 13 per cent (the HST rate in those provinces).
Liquor Mark—ups
The reduction in the provincial tax rate on liquor, from the PST rate of 10 per cent to the provincial HST rate of 7 per cent, would reduce liquor prices and result in a loss of revenue to the province if mark—ups are not adjusted. Therefore, liquor mark—ups are adjusted with the implementation of the HST to generally keep shelf prices constant. Restaurants and other licensed establishments benefit from 7 per cent HST being applied on their mark-ups rather than 10 per cent PST.
Implementation of the HST
Implementation of the HST on July 1, 2010 is subject to the approval of the Legislature of British Columbia and the Parliament of Canada.
Further Information
Additional information about the HST can be found at: http://www.gov.bc.ca/hst/ and at: http://www.cra—arc.gc.ca/gncy/hrmnztn/bc/menu—eng.html
Budget and Fiscal Plan – 2010/11 to 2012/13
102
Tax Measures
Property Tax Deferment Program for Families with Children
Strengthening families is at the centre of the government’s economic and social agenda. Beginning in 2010, homeowners who financially support a child under age 18 will be able to defer property taxes on their principal residence. This expansion of the property tax deferment program allows government to assist families with children, particularly during those years when household costs are typically highest.
As with the property tax deferment program for seniors and the financial hardship property tax deferment program, eligible homeowners will be able defer all or part of the unpaid portion of their property taxes until they sell their home, transfer ownership of their home or their home becomes part of an estate.
Interest will be charged on the deferred taxes at the prime rate of interest. The rate will be set twice a year. Interest charged will be simple interest.
Eligibility Criteria
Homeowners with at least 15 per cent equity in their home, based on assessed values as determined by BC Assessment, who declare that they financially support a child under age 18, and who meet all other program eligibility requirements, may apply.
A cap on the amount of accumulated tax and interest that can be deferred may be considered in the future.
A homeowner may be considered to financially support a child in the following situations:
· the child lives with the homeowner;
· the child lives elsewhere but the homeowner pays support for that child under a court order or written separation agreement;
· the child lives with the homeowner at least part of the time under a shared custody arrangement;
· the child lives in a long term care facility and the homeowner pays care costs for the child;
· the child lives on their own or with a friend or relative and is financially supported by the homeowner;
· the child attends and is in residence at a school (e.g. boarding school, university) and the homeowner is responsible for the fees and/or living costs in respect of attending the school.
The homeowner does not need to have legal guardianship of the child to be eligible.
To be eligible for the program, homeowners must meet the basic eligibility requirements of the current property tax deferral programs. They must:
· be the registered owner of the home;
· be a Canadian citizen or permanent resident under the Immigration Act (Canada);
· have lived in British Columbia for at least one year immediately prior to applying;
· apply on the home in which they live; and
· ave a current fire insurance policy on their home.
How to Apply
Applications for the Property Tax Deferment Program for Families with Children will be available before property tax notices are mailed out in May 2010. The program will require one initial application followed by an application for renewal in each subsequent year of deferral.
Application forms will be available on the Ministry of Finance website at the following link: www.sbr.gov.bc.ca/individuals/Property_Taxes/Property_Tax_Deferment/ptd.htm, and from municipalities and Government Agents/Service BC offices.
Budget and Fiscal Plan – 2010/11 to 2012/13
103
Tax Measures
Proof that the homeowner financially supports a child is not required at the time of application but must be supplied upon request. Examples of proof include the child’s Birth Certificate together with a Notice of Canada Child Tax Benefit eligibility; a copy of a financial support agreement; or evidence of payment (cancelled cheques) in respect of institutional care or schooling for a child under 18.
Examples
The following table provides selected examples of the costs of deferring annual property taxes on representative houses over a ten year period. The examples assume that property taxes will remain the same for ten years and that the interest rate remains at 2.25 per cent (the current prime interest rate). Note that rising property taxes and/or higher interest rates would increase the cost of deferral.
Municipality | | Value of a
Representative
House | | Estimated
Property Taxes | | Deferred Taxes
After 10 years | | Interest After
10 years | | Total Deferred
Taxes and
Interest | |
| | (2009 data)* | | (2009 data)** | | | | | | | |
Vancouver | | $ | 944,900 | | $ | 3,950 | | $ | 39,500 | | $ | 4,888 | | $ | 44,388 | |
Nanaimo | | $ | 323,600 | | $ | 2,666 | | $ | 26,660 | | $ | 3,330 | | $ | 29,967 | |
Abbotsford | | $ | 386,300 | | $ | 2,778 | | $ | 27,780 | | $ | 3,438 | | $ | 31,218 | |
Quesnel | | $ | 144,600 | | $ | 1,573 | | $ | 15,730 | | $ | 1,946 | | $ | 17,672 | |
Sparwood | | $ | 181,500 | | $ | 1,245 | | $ | 12,450 | | $ | 1,540 | | $ | 13,987 | |
Golden | | $ | 236,900 | | $ | 1,813 | | $ | 18,130 | | $ | 2,243 | | $ | 20,370 | |
*Data on representative house values estimated property taxes are taken from the Ministry of Community and Rural Development website on Local Government Statistics: http://www.cd.gov.bc.ca/lgd/infra/statistics_index.htm
** Estimated property taxes include all variable rate taxes including municipal, school, regional district and hospital district taxes.
Budget and Fiscal Plan – 2010/11 to 2012/13
104
Tax Measures
Revenue Neutral Carbon Tax
As required under Part 2 of the Carbon Tax Act the following tables show the revenue neutral carbon tax reports for 2008/09 and 2009/10 and the Revenue Neutral Carbon Tax Plan for 2010/11 to 2012/13.
Material Assumptions and Policy Decisions
In the reports and the Plan the estimates and forecasts of carbon tax revenue and the cost of tax reductions to return revenues to taxpayers are consistent with, and have the same material assumptions and policy decisions underlying them, as the revenue estimates and forecasts prepared for Budget 2010. The only material assumption specific to the carbon tax report and plan is that the cost of the revenue reductions due to personal income tax rate cuts increase with increases in personal income tax revenues for each year.
Revenue Neutral Carbon Tax Reports
Revenue neutrality means that tax reductions must be provided that fully return the estimated revenue from the carbon tax to taxpayers in each fiscal year. Table 1, Revenue Neutral Carbon Tax Report 2008/09, reports the carbon tax revenues and the cost of the tax reductions for the 2008/09 fiscal year. This report is the same as was presented in September Update 2009.
Table 1 Revenue Neutral Carbon Tax Report 2008/09 (1)
| | 2008/09 | |
| | $ millions | |
| | | |
Carbon tax revenue | | 306 | |
| | | |
Reduction in provincial revenues due to designated measures (2) | | | |
Personal tax measures: | | | |
· Low income climate action tax credit effective July 1, 2008 | | (106 | ) |
· Reduction of 2 per cent in the first two personal income tax bracket rates effective January 1, 2008 | | (107 | ) |
Total personal tax measures | | (213 | ) |
Business tax measures: | | | |
· General corporate income tax rate cut from 12% to 11% effective July 1, 2008 | | (65 | ) |
· Small business corporate income tax rate cut from 4.5% to 3.5% effective July 1, 2008 | | (35 | ) |
Total business tax measures | | (100 | ) |
Total designated revenue measures | | (313 | ) |
(1) Based on 2008/09 Public Accounts.
(2) Designated measures are those included in the carbon tax plan presented in Budget 2008.
Table 2, Revenue Neutral Carbon Tax Report 2009/10, reports the carbon tax revenues and the cost of the tax reductions for the 2009/10 fiscal year.
Table 2 Revenue Neutral Carbon Tax Report 2009/10
| | Revised
Forecast
2009/10 | |
| | $ millions | |
| | | |
Carbon tax revenue | | 542 | |
| | | |
Reduction in provincial revenues due to designated measures (1) | | | |
Personal tax measures: | | | |
· Low income climate action tax credit | | (153 | ) |
· Reduction of 5% in the first two personal income tax rates | | (206 | ) |
Total personal tax measures | | (359 | ) |
Business tax measures: | | | |
· General corporate income tax rate cut from 12% to 11% effective July 1, 2008, to 10.5% effective January 1, 2010 and to 10% effective January 1, 2011 | | (152 | ) |
· Small business corporate income tax rate reduced from 4.5% to 3.5% effective July 1, 2008 and to 2.5% effective December 1, 2008 | | (202 | ) |
· Industrial property tax credit of 50% | | (54 | ) |
Total business tax measures | | (408 | ) |
Total designated revenue measures | | (767 | ) |
(1) Designated measures are those included in the carbon tax plan presented in September Update 2009 that reduce revenue in 2009/10.
Carbon tax revenues for 2009/10 are now estimated to be $542 million, down slightly from the estimate in September Update 2009 of $557 million.
The tax reductions shown in Table 2 are those that were listed in the revenue neutral carbon tax plan presented in September Update 2009 and that reduce revenues in 2009/10. The personal income tax measures are the low income climate action tax credit and the five per cent reductions for the first two tax brackets rates. The business tax measures are the reductions in each of the general and small business corporate income tax rates and the industrial property tax credit.
The estimated reduction in provincial revenues for 2009/10 as a result of the designated revenue measures is now $359 million for the personal tax measures and $408 million for the business tax for a total reduction of $767 million. Based on these revenue and tax reduction estimates, revenue neutrality has been met for 2009/10. In fact, the reduction in provincial revenue exceeds the $542 million in carbon tax revenue by $225 million. Next year’s carbon tax report will be based on actual carbon tax revenues for 2009/10 as reported in the 2009/10 Public Accounts.
Budget and Fiscal Plan – 2010/11 to 2012/13
105
Tax Measures
Revenue Neutral Carbon Tax Plan
Table 3, the Revenue Neutral Carbon Tax Plan 2010/11 to 2012/13, shows carbon tax revenue and tax reduction cost estimates for the revenue measures designated as those that return the carbon tax revenues to taxpayers for 2010/11 to 2012/13.
The tax reduction measures in the Revenue Neutral Carbon Tax Plan 2010/11 to 2012/13 include the designated measures presented in the plan in September Update 2009. Carbon tax revenues are now forecast to be slightly lower than estimated when the September Update 2009 was prepared.
As shown in Table 3, revenue from the carbon tax and the cost of the tax reductions are now estimated to be $727 million and $796 million respectively for 2010/11. This means that the tax cuts are expected to exceed carbon tax revenues for 2010/11 by $69 million. Carbon tax revenues in 2011/12 are now estimated at $928 million while the tax cuts are estimated at $995 million. This means that the tax cuts in 2011/12 are expected to exceed carbon tax revenues by $67 million. Carbon tax revenues in 2012/13 are estimated at $1,137 million while the tax cuts are estimated at $1,260 million. This means that the tax cuts in 2012/13 are expected to exceed carbon tax revenues by $123 million.
Table 3 Revenue Neutral Carbon Tax Plan 2010/11 to 2012/13
| | Forecast | |
| | 2010/11 | | 2011/12 | | 2012/13 | |
| | | | $ millions | | | |
| | | | | | | |
Carbon tax revenue (1) | | 727 | | 928 | | 1,137 | |
| | �� | | | | | |
Designated revenue measures: | | | | | | | |
Personal tax measures: | | | | | | | |
· Low income climate action tax credit increasing to $115.50 per adult, from $105 per adult, plus $34.50 per child, from $31.50 per child, effective July 1, 2011 | | (153 | ) | (165 | ) | (168 | ) |
· Reduction of 5% in the first two personal income tax rates | | (211 | ) | (223 | ) | (238 | ) |
· Provide a Northern and Rural Homeowner benefit of $200 (2) | | (20 | ) | (83 | ) | (85 | ) |
Total personal tax measures | | (384 | ) | (471 | ) | (491 | ) |
| | | | | | | |
Business tax measures: | | | | | | | |
· General corporate income tax rate cut from 12% to 11% effective July 1, 2008, to 10.5% effective January 1, 2010 and to 10% effective January 1, 2011 | | (192 | ) | (268 | ) | (338 | ) |
· Small business corporate income tax rate reduced from 4.5% to 3.5% effective July 1, 2008, to 2.5% effective December 1, 2008 and to zero by April 1, 2012 | | (161 | ) | (186 | ) | (358 | ) |
· Industrial Property Tax Credit of 50% of school property taxes payable by light and major industrial properties starting in 2009 taxation year rising to 60% in 2011 | | (58 | ) | (68 | ) | (71 | ) |
· School property taxes by 50% for land classified as “farm” starting in 2011 | | (1 | ) | (2 | ) | (2 | ) |
Total business tax measures | | (412 | ) | (524 | ) | (769 | ) |
Total designated revenue measures | | (796 | ) | (995 | ) | (1,260 | ) |
(1) The carbon tax applies to fossil fuels and combustibles at rates based on the CO2 equivalent emission of each particular fuel starting at $10 per tonne effective July 1, 2008 and increasing by $5 per tonne each July 1st through 2012.
(2) Eligible homeowners are those in areas outside the Capital, Greater Vancouver and Fraser Valley regional districts.
Budget and Fiscal Plan – 2010/11 to 2012/13
106
Part 3: BRITISH COLUMBIA ECONOMIC REVIEW AND OUTLOOK(1)
Summary
· The Ministry of Finance forecasts BC’s economy to grow by 2.2 per cent in 2010 and by 2.3 per cent in 2011, following an estimated contraction of 2.7 per cent in 2009.
· BC’s economy is expected to grow by about 2.8 per cent per year in the medium-term, closer to historical levels. This is mainly due to the anticipated recovery of US demand (particularly in the US housing market) and a steady rise in commodity prices.
· The Economic Forecast Council estimates that BC’s economy will expand by 2.9 per cent in 2010 and by 3.1 per cent in 2011. Over the medium-term (2012 to 2014), the Council expects BC’s annual average economic growth to be 3.0 per cent.
Chart 3.1 British Columbia’s economic outlook


The Ministry’s outlook for BC’s real GDP growth in 2010 is 0.7 percentage points lower than the outlook provided by the Council. This level of prudence is included in recognition of the downside risks to the forecast, due to the potential for greater economic weakness in the US than assumed. Council members agreed that the 2010 Games would have a positive impact on BC’s economy this year.
While the private sector assumes a more traditional recovery on average, there is significant likelihood of much slower growth characterized by weak investment, lower consumer spending and a delayed job market recovery. As a result, the Ministry’s outlook for 2011 is lower than the Council’s as well, with the Ministry projecting 2.3 per cent real GDP growth compared to the Council’s 3.1 per cent. These 0.8 percentage points of prudence are greater than the 0.4 points included in the September Update 2009 forecast, as the risk of a stall in North American economic activity has shifted to the latter part of 2010 and into 2011.
The upgraded BC forecast reflects the nascent economic recovery in the US and throughout the world, stabilizing global commodity and financial markets, and improved domestic demand in BC. The forecast is the Ministry’s view of the most likely economic
(1) Reflects information available as of February 19, 2010
Budget and Fiscal Plan – 2010/11 to 2012/13
British Columbia Economic Review and Outlook
scenario. This forecast is more prudent than the Council’s in recognition of the following substantial downside risks, which include:
· a “double-dip” return to recession in the US (characterized by widespread deleveraging causing weaker investment, slower consumer spending and a delayed job market recovery) if fiscal and monetary stimulus are removed prematurely;
· slower than anticipated global demand resulting in weaker demand for BC’s exports;
· further appreciation of the Canadian dollar; and
· further weakening of the US dollar resulting in significant disruptions to global financial and commodity markets.
British Columbia Economic Activity and Outlook
The performance of key BC economic indicators in recent quarters is presented in Table 3.1.
Table 3.1 British Columbia Economic Indicators
| | Third Quarter | | Fourth Quarter | | Annual* | |
| | Jul. to Sep. 2009 | | Oct. to Dec. 2009 | | Jan. to Dec. 2009 | |
Data seasonally adjusted unless | | change from | | change from | | change from | |
otherwise noted | | Apr. to Jun. 2009 | | Jul. to Sep. 2009 | | Jan. to Dec. 2008 | |
| | | | Per cent change | | | |
Employment | | 0.3 | | 0.3 | | -2.4 | |
Manufacturing shipments | | 1.8 | | 1.0 | | -17.8 | |
Exports | | 2.1 | | 0.7 | | -24.3 | |
Retail sales | | 2.1 | | 3.1 | | -5.1 | |
Housing starts | | 32.7 | | 28.0 | | -53.2 | |
Non-residential building permits | | 47.1 | | -34.3 | | -14.7 | |
*annual non-seasonally adjusted data
Indicators of economic performance through the latter months of 2009 confirm that BC’s economy is stabilizing after a period of very weak activity that began in late 2008. Most major indicators, such as employment, retail sales and housing starts, have remained stable or made positive gains in recent months.
Table 3.2 summarizes the Ministry’s outlook for BC’s key economic indicators, while Tables 3.8.1 to 3.8.4 at the end of Part 3 provide additional detail on the economic forecast.
Table 3.2 Ministry of Finance Economic Forecast: Key Economic Indicators
| | | | Forecast | |
| | 2009 | | 2010 | | 2011 | | 2012 | | 2013 | | 2014 | |
| | | | Per cent change unless otherwise noted | | | |
British Columbia Economic Indicators | | | | | | | | | | | | | |
Real GDP | | -2.7 | (e) | 2.2 | | 2.3 | | 2.7 | | 2.8 | | 2.8 | |
Nominal GDP | | -5.0 | (e) | 4.5 | | 4.7 | | 5.0 | | 4.9 | | 4.8 | |
Employment | | -2.4 | | 0.9 | | 1.4 | | 1.8 | | 1.8 | | 1.8 | |
Unemployment rate (per cent) | | 7.6 | | 7.9 | | 7.7 | | 7.3 | | 7.1 | | 7.0 | |
Total net in-migration (thousands of persons) | | 57.7 | (1) | 53.9 | | 53.6 | | 52.2 | | 52.8 | | 54.0 | |
Personal income | | 5.2 | (e) | -1.0 | | 2.1 | | 3.8 | | 4.5 | | 4.5 | |
Corporate pre-tax profits | | -35.8 | (e) | 12.7 | | 9.8 | | 7.6 | | 7.5 | | 7.3 | |
Housing starts (thousands of units) | | 16.1 | | 20.5 | | 23.6 | | 25.8 | | 27.2 | | 27.8 | |
Retail sales | | -5.1 | | 3.9 | | 4.1 | | 4.6 | | 4.7 | | 4.7 | |
(e) Ministry of Finance estimate.
(1) BC STATS estimate.
Budget and Fiscal Plan – 2010/11 to 2012/13
108
British Columbia Economic Review and Outlook
The Labour Market
Employment in BC fell by 2.4 per cent in 2009, an annual loss of 54,900 jobs. BC’s rate of employment losses in 2009 is tied with Ontario for second greatest among provinces, behind only Newfoundland’s 2.5 per cent decline. The annual average unemployment rate grew to 7.6 per cent in 2009 from the 4.6 observed in 2008, due to the expansion of BC’s labour force in the face of declining employment. Major annual employment losses in BC through 2009 were observed in construction, manufacturing and primary forestry. However, the employment situation has stabilized in the most recent two quarters, with 6,500 jobs created in the July to September quarter and 6,900 new jobs in the October to December quarter.
Chart 3.2 BC employment levelling out
BC’s employment situation began 2010 on a positive note, with a net gain of 12,000 jobs in January. At the same time, the provincial unemployment rate ticked down 0.2 percentage points to 8.1 per cent from the previous month.
Outlook
The Ministry forecasts employment in BC to increase by 0.9 per cent in 2010, or approximately 21,000 jobs. Employment growth is projected to continue in 2011, with an expected increase of 1.4 per cent, or 32,000 jobs. In the medium-term, employment is forecast to rise by 1.8 per cent each year from 2012 to 2014. BC’s labour force is expected to increase by 1.3 per cent in 2010, resulting in the unemployment rate rising to average 7.9 per cent on the year. The unemployment rate is forecast to fall after 2010, reaching 7.7 per cent in 2011 and then averaging about 7.1 per cent per year over the medium-term.
Domestic Demand
Consumer Spending and Housing
Retail sales in BC have also recovered somewhat in recent months, following a period of heavy losses between September 2008 and March 2009. Retail sales increased in seven of the nine months between April and December of 2009, as confidence among consumers and businesses has gradually improved. Overall in 2009, retail sales fell by 5.1 per cent compared to 2008, with major losses in new and used vehicles, gas stations, home furnishing stores, home centres and hardware stores.
Budget and Fiscal Plan – 2010/11 to 2012/13
109
British Columbia Economic Review and Outlook
Chart 3.3 BC retail sales in recovery

Housing starts in BC have stabilized in recent months since plummeting through late 2008 and early 2009. For 2009, housing starts averaged 16,100 units, a drop of 53.2 per cent from the previous year, with major declines observed in starts of both single and multiple units. Although modest gains have been observed in recent months (starts increased in five of the seven months between July 2009 and January 2010), housing starts remain at very low levels compared to recent years. Residential building permits, a precursor of new housing activity, fell 34.9 per cent in 2009 (although they have recently recovered to levels observed prior to the recession).
Chart 3.4 BC housing starts still at low levels
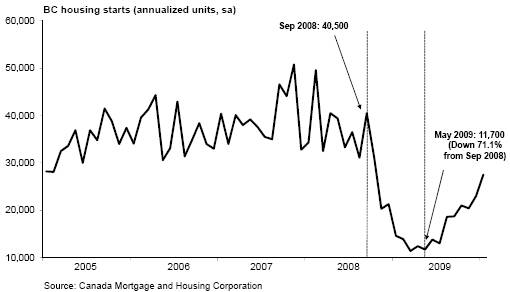
One positive development for BC’s domestic economy has been the remarkable rally in sales of existing homes since reaching a multi-decade low in early 2009. Despite beginning the year at low levels, seasonally adjusted MLS home sales were up 23.4 per cent in 2009, with strong month-over-month increases in sales for most of the year. In January 2010, home sales reached 8,759 units - more than double the number of units sold in January 2009. The average home price in BC also grew in 2009, reaching $465,700 on the year. This compares to about $454,600 in 2008 - an increase of
Budget and Fiscal Plan – 2010/11 to 2012/13
110
British Columbia Economic Review and Outlook
2.4 per cent. Private sector analysts suggest that the resurgence of BC home sales in 2009 is primarily due to rock-bottom mortgage rates luring buyers back to the market after many were frightened away by the economic uncertainty that took hold in late 2008.
Chart 3.5 BC existing home sales on the rise
Outlook
The Ministry forecasts real consumption of goods and services to increase by 2.4 h per cent in 2010, following a contraction of 2.1 per cent in 2009. Real consumer spending is projected to improve again in 2011, growing by 2.4 per cent, and then average 2.9 per cent growth annually in the medium-term.
Following last year’s sharp decline in retail sales, a gain of 3.9 per cent is forecast for 2010. Retail sales are forecast to subsequently grow by 4.1 per cent in 2011 and by about 4.7 per cent each year from 2012 to 2014.
While BC’s housing sector is expected to gradually recover from the crash it experienced in late 2008 and early 2009, housing starts are expected to remain much lower than the high levels observed during the housing boom of recent years. The Ministry forecasts housing starts to total approximately 20,500 units in 2010 — an increase of 4,400 units from the 16,100 starts observed in 2009. Starts are projected to reach 23,600 units in 2011 and to average about 26,900 units per year from 2012 to 2014.
Business and Government
Real business investment (including residential) is estimated to have fallen by 9.7 per cent in 2009, with declines observed in all major categories, including residential construction, non-residential construction, and machinery and equipment.
Total real dollar expenditures by federal, provincial and municipal governments are estimated to have grown by 6.4 per cent in 2009. This marks a significant jump from the 3.4 per cent growth observed in government spending in 2008.
Outlook
Real business investment (including residential) is forecast to rise by 6.6 per cent in 2010, as BC businesses recover from the economic decline that occurred in 2009.
Budget and Fiscal Plan – 2010/11 to 2012/13
111
British Columbia Economic Review and Outlook
Healthy investment gains in residential construction and in machinery and equipment are expected this year, complemented by a small increase in non-residential construction investment. Growth in total business investment of 3.5 per cent is anticipated in 2011, and of about 4.4 per cent annually in the medium-term.
Due to the improved economic outlook and higher expected commodity prices through 2010, the Ministry projects corporate pre-tax profits to rise by 12.7 per cent on the year. This follows a sizeable decline of an estimated 35.8 per cent in 2009. Growth in corporate profits is expected to be 9.8 per cent in 2011 and 7.5 per cent per year in the medium-term. Despite the notable recovery in growth rate terms, the level of corporate profits is not expected to return to 2008 levels until after the five-year forecast horizon.
Combined real spending by the three levels of government (federal, provincial and municipal) on goods and services is expected to decline by 1.0 per cent in 2010. Government spending is then projected to grow by 2.4 per cent in 2011 and to average 1.4 per cent per year in the medium-term.
External Trade and Commodity Markets
The value of BC’s merchandise exports fell 24.3 per cent in 2009 compared to 2008. This decline was partially fuelled by a 25.7 per cent drop in forestry exports, as continued weakness in the US housing market through the year (combined with low lumber prices) hampered demand for BC forest products. Significant declines were also observed in exports of energy products (due to the fall from last year’s surge in energy prices), industrial and consumer products, as well as automotive products and machinery and equipment.
Chart 3.6 BC exports stabilizing...commodity prices still low
Global commodity markets have experienced substantial volatility since mid-2008, with values of most commodities plunging in the latter months of 2008 and into 2009. Lumber prices began 2009 at very low values, with Western spruce-pine-fir (SPF) 2x4 prices averaging $151 US/000 board feet in January 2009. Prices recovered somewhat through the year, with monthly values reaching $221 US/000 board feet in December. However, lumber prices averaged just $182 US/000 board feet overall in 2009, which is 16.9 per cent lower than the $219 US averaged in 2008. In January 2010, monthly prices jumped to reach $230 US/000 board feet.
Budget and Fiscal Plan – 2010/11 to 2012/13
112
British Columbia Economic Review and Outlook
The price of natural gas has also fallen significantly since the highs it experienced in mid-2008. After beginning 2009 at $5.07 C/GJ in January, natural gas plunged every month to reach $1.94 C/GJ in September. Prices averaged $3.01 C/GJ for the year, much lower than the $6.90 C/GJ observed in 2008. However, natural gas prices have come back somewhat in recent months, climbing to $4.18 C/GJ in December 2009 and reaching $4.34 C/GJ in January 2010.
Following a remarkable decline in late 2008, oil prices recovered somewhat during 2009. The West Texas Intermediate daily oil price reached a low of $34.03 US/barrel in February 2009, but gradually climbed to hit a high of $81.03 US/barrel in October. The price of oil averaged $61.95 US/barrel through 2009, a 37.8 per cent fall from the $99.67 US/barrel observed in 2008.
Metal and mineral prices have also seen some recovery in their values since the low levels observed at the beginning of 2009. However, prices for most minerals in 2009 were far lower than they were in 2008, including molybdenum (down 61.3 per cent), aluminum (down 35.0 per cent), copper (down 25.3 per cent), lead (down 16.8 per cent) and zinc (down 11.0 per cent). The price of gold, however, increased in 2009, up 11.6 per cent over 2008.
Outlook
Real exports of goods and services are forecast to grow by 2.2 per cent in 2010, following an estimated loss of 6.5 per cent in 2009. Positive real export growth is forecast to continue in 2011, reaching 2.1 per cent on the year. In the medium-term, average annual growth of about 3.5 per cent is anticipated for real exports.
Due to continued weakness in the US housing market, Western SPF lumber prices are projected to remain fairly low through 2010, averaging $225 US/000 board feet for the year. As the US housing market is expected to gradually recover over the next few years, prices are forecast to average $238 US/000 board feet in 2011 and $296 US for the 2012 to 2014 period.
Based on private sector forecasts, natural gas prices are projected to strengthen over the forecast period. Between fiscal years 2009/10 and 2013/14, prices are expected to rise from $3.06 C/GJ to $5.78 C/GJ.
Inflation
Consumer price inflation in BC remained unchanged in 2009, as small increases in the inflation of semi-durables and services were offset by price deflation in durable and non-durable goods. Falling automobile prices pulled down inflation of durable goods while lower fuel prices provided downward pressure on non-durables. On the services side, rising prices for restaurants, health care and education provided upward inflationary pressure. In January 2010, BC’s consumer price index advanced by 0.7 per cent compared to January 2009.
Outlook
Consumer price inflation in BC is forecast to be 1.8 per cent in 2010, as improved consumer spending this year is expected to put upward pressure on some prices. CPI inflation is forecast at 2.0 per cent in 2011 and 2.1 per cent per year on average in the medium-term. The Canadian rate of inflation is assumed to be 2.2 per cent in 2010
Budget and Fiscal Plan – 2010/11 to 2012/13
113
British Columbia Economic Review and Outlook
and 2.0 per cent in 2011. Over the medium-term, national CPI inflation is expected to be 2.0 per cent, in line with the Bank of Canada’s inflation target.
The harmonized sales tax, which will become effective on July 1, 2010, is expected to cause a slight increase in the inflation rate in the second half of 2010 and the first half of 2011.
Risks to the Economic Outlook
The forecast is the Ministry’s view of the most likely economic scenario. This forecast is more prudent than the Council’s in recognition of the following substantial downside risks, which include:
· a “double-dip” return to recession in the US (characterized by widespread deleveraging causing weaker investment, slower consumer spending and a delayed job market recovery) if fiscal and monetary stimulus are removed prematurely;
· slower than anticipated global demand resulting in weaker demand for BC’s exports;
· further appreciation of the Canadian dollar; and
· further weakening of the US dollar resulting in significant disruptions to global financial and commodity markets.
External Outlook
United States
The US economy contracted by 2.4 per cent in 2009 compared to 2008, representing the largest annual decline in US real GDP in over 60 years. For the year, increases of 1.9 per cent in government spending and investment and 28.4 per cent in net exports were offset by declines in personal consumption (0.6 per cent) and private investment (23.5 per cent).
Following four consecutive quarter-over-quarter declines, US real GDP increased by 2.2 per cent (on an annualized basis) in the July to September quarter and then by 5.7 per cent in the October to December quarter of 2009. Of this 5.7 per cent growth in the most recent quarter, consumption contributed 1.4 per cent, private investment made up 0.4 per cent and exports comprised 0.5 per cent, while government spending and investment remained unchanged. However, the increase in real GDP during the October to December quarter was buoyed significantly by inventories, which contributed 3.4 per cent to the 5.7 per cent overall growth in the quarter.
Most private sector analysts attribute the recent end of the US recession to massive government stimulus spending, combined with slowly improving global demand and a low valued US dollar raising net exports. Private sector analysts anticipate a slow recovery of the US economy over the coming quarters, as the boost from fiscal stimulus fades, the hangover from the “cash for clunkers” program weighs on auto sales, and consumers and businesses remain tentative. Further, consumer spending is being discouraged by the continued weakening of the labour market (8.4 million jobs have been lost over the last two years and the unemployment rate was 9.7 per cent in January 2010), soft income growth and tight credit conditions. Chart 3.7 places growth in the first quarter of the current recovery (the July to September quarter of 2009) in context with the first quarters of previous economic recoveries.
Budget and Fiscal Plan – 2010/11 to 2012/13
114
British Columbia Economic Review and Outlook
Chart 3.7 First quarter recovery from recession in context

The risk of the US economy returning to recession in 2010 is now diminishing somewhat, primarily due to the efforts of the US federal government. The US Federal Reserve (the Fed), in order to encourage borrowing and lending in troubled credit markets, has held the US federal funds rate in the 0.00 to 0.25 per cent range since December 2008. Most private sector economists expect the Fed to keep this rate very low for the duration of 2010. Further, the US Congress is planning to spend $399 billion of the $787 billion stimulus earmarked through the American Recovery and Reinvestment Act (ARRA) in the 2010 fiscal year.
However, the risk of a stalled US recovery in late 2010 or early 2011 is now rising for several reasons. First, as the Fed tightens its monetary policy through 2011 (as most private sector economists predict), interest rates will rise, placing downward pressure on consumer spending and residential investment. The cost of borrowing money will increase and expected reductions in quantitative easing will make loans more difficult to obtain. Second, there will be far fewer federal stimulus dollars spent in 2011, with only $134 billion of ARRA money being injected into the US economy in that year. Third, US consumers (the main drivers of the US economy for many years) have lost considerable wealth and a great deal of confidence. It remains uncertain whether US consumers will be able to fill the void left in the economy as federal stimulus dollars are withdrawn in 2011. Finally, it is also uncertain whether investment by American businesses will help to fill the same gap in the economy left by the removal of government stimulus next year. As of January 2010, US businesses were utilizing only 72.6 per cent of their production capacity, making it questionable as to whether these firms will make any substantial investments to significantly expand their output capacity through 2010 and 2011.
Forecasts for the US economy in 2010 have improved significantly from September Update 2009, when the July 2009 Consensus Economics survey forecast US real GDP to grow by 2.1 per cent in 2010. According to the January 2010 Consensus, US real GDP is projected to increase by 2.9 per cent in 2010. Reasons for the improved outlook include the recent stabilization of several economic indicators (e.g. housing starts, retail sales), as well as gains in industrial production over the last several months. Consensus economists note concern, however, over continuing monthly declines in US employment.
Budget and Fiscal Plan – 2010/11 to 2012/13
115
British Columbia Economic Review and Outlook
The January 2010 Consensus expects the US economy to expand further in 2011, projecting annual growth of 3.1 per cent in that year.
Chart 3.8 US Consensus outlook for 2010 improves in recent months
While the private sector assumes a more traditional recovery on average, there is significant likelihood of much slower growth characterized by weak investment, lower consumer spending and a delayed job market recovery. In order to reflect the ongoing risks surrounding the US economic outlook in 2010, the Ministry’s growth assumptions are lower than the January 2010 Consensus. The Ministry assumes that the US economy will expand by 2.2 per cent in 2010, compared to the 2.9 per cent increase projected in the January Consensus. The Ministry then expects 2.3 per cent US real GDP growth in 2011 and 2.7 per cent annually over the medium-term.
Table 3.3 US real GDP forecast: Consensus vs Ministry of Finance
| | 2010 | | 2011 | |
| | Per cent change in real GDP | |
Ministry of Finance | | 2.2 | | 2.3 | |
Consensus Economics (January 2010) | | 2.9 | | 3.1 | |
Canada
Canada’s recession also ended in the July to September quarter of 2009, with real GDP expanding by 0.4 per cent (on an annualized basis) following three consecutive quarters of decline. The recent boost in economic growth was due to solid gains in consumer and government expenditures, as well as increased business investment. Healthy quarter-over-quarter increases in these categories helped to offset a sizeable decline in net exports.
Similar to the US, Canada’s domestic economy has seen recent signs of stabilization in several major indicators. Although national housing starts fell by 29.4 per cent in 2009, monthly increases have been observed in four of the seven months between July 2009 and January 2010. Further, Canadian retail sales — despite falling by 3.0 per cent in 2009 — have seen monthly increases in four of the six months between July and December.
Budget and Fiscal Plan – 2010/11 to 2012/13
116
British Columbia Economic Review and Outlook
The Canadian labour market has also shown improvement over the last few months, despite losing 276,900 jobs (a drop of 1.6 per cent) in 2009 compared to 2008. Following several months of sizeable declines in late 2008 and early 2009, four of the seven months between July 2009 and January 2010 saw healthy employment gains. Sectors that incurred major losses early in 2009 - like construction and professional services - have been strong contributors to the stabilization that has occurred in the latter half of the year. The national unemployment rate averaged 8.3 per cent in 2009, and registered a monthly rate of 8.3 per cent in January 2010.
Through 2009, Canada’s trade sector was weakened by an appreciating Canadian dollar and eroding demand from the US and other world economies. The value of Canadian merchandise exports fell by 26.8 per cent in 2009 compared to 2008, but has seen monthly gains in three of the six months between July and December. Shipments of manufactured goods also decreased in 2009, as the total value of these shipments fell by 17.4 per cent compared to last year. As with Canada’s exports, manufacturing shipments have also seen some small improvement in recent months. The continued appreciation of the Canadian dollar, if sustained, will likely provide downward pressure on Canada’s trade with the US going forward.
Chart 3.9 Consensus outlook for Canada in 2010 also upgraded
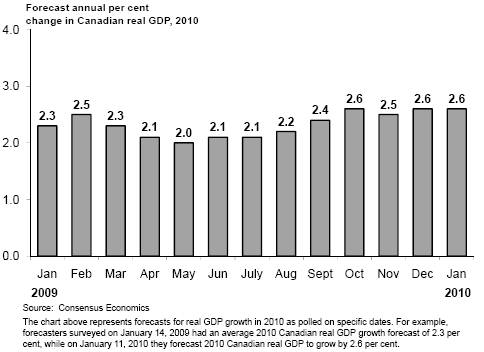
Similar to the outlook for the US, private sector forecasts for the Canadian economy’s performance in 2010 have improved since July 2009. The January 2010 Consensus projects Canada’s real GDP to grow by 2.6 per cent this year, compared to the 2.1 per cent expected in the July 2009 survey. The Ministry assumes that the Canadian economy will experience a 2.0 per cent expansion in 2010, followed by a 2.4 per cent increase in 2011 and 2.6 per cent growth per year over the medium-term.
Table 3.4 Canadian real GDP forecast: Consensus vs Ministry of Finance
| | 2010 | | 2011 | |
| | Per cent change in real GDP | |
Ministry of Finance | | 2.0 | | 2.4 | |
Consensus Economics (January 2010) | | 2.6 | | 3.2 | |
Budget and Fiscal Plan – 2010/11 to 2012/13
117
British Columbia Economic Review and Outlook
Financial Markets
Interest Rates
The Bank of Canada has held the overnight target rate, its key interest rate, at 0.25 per cent since April 2009. In its most recent announcement on January 19, 2010, the Bank reiterated its commitment to holding the rate at 0.25 per cent through the second quarter of 2010, provided the Bank’s inflation outlook does not change.
The Fed has held its intended federal funds rate in the 0.00 to 0.25 per cent range since December 2008. Following its January 27, 2010 meeting, the Fed confirmed that it will keep the fed funds rate “exceptionally low for an extended period.” However, the Fed also noted that it will be withdrawing some of the extraordinary support it has provided to the financial system in the coming months.
Chart 3.10 Private sector expects Canadian and US interest rates to remain very low in 2010

Outlook
Based on the average of six private sector forecasts as of January 6, 2010, the Ministry’s interest rate outlook assumes that the Bank of Canada will hold the overnight target rate steady at 0.25 per cent for the first two quarters of 2010. These six forecasters expect the rate to rise to 0.50 per cent in the July to September quarter, and to reach 0.75 per cent by the end of the year. The forecasters project the overnight target rate to average 0.4 per cent in 2010 and 2.0 per cent in 2011.
As of January 6, 2010, the same six forecasters project that the US Federal Reserve will keep the fed funds rate in the 0.00 per cent to 0.25 per cent range for the first three quarters of 2010. They then expect the rate to reach 0.50 per cent in the final quarter. On average, the six forecasters project the fed funds rate will be 0.3 per cent in 2010 and 1.9 per cent in 2011.
Budget and Fiscal Plan – 2010/11 to 2012/13
118
British Columbia Economic Review and Outlook
The average of private sector forecasters’ views on Canadian short—term interest rates (Three month Treasury bills) as of January 6, 2010 indicates that Three month rates will average 0.5 per cent in 2010 and 2.2 per cent in 2011.
Table 3.5 Private Sector Canadian Three Month Treasury Bill
Interest Rate Forecasts
Average annual interest rate (per cent) | | 2010 | | 2011 | |
Global Insight | | 0.3 | | 1.6 | |
CIBC | | 0.3 | | 1.8 | |
Bank of Montreal | | 0.6 | | 2.5 | |
Scotiabank | | 0.7 | | 2.2 | |
TD Economics | | 0.5 | | 2.2 | |
RBC Capital Markets | | 0.6 | | 2.8 | |
Average (as of January 6, 2010) | | 0.5 | | 2.2 | |
The same private sector forecasters project ten-year Government of Canada bonds to average 3.7 per cent in 2010 and 4.2 per cent in 2011.
Table 3.6 Private Sector Canadian 10-year Government Bond
Interest Rate Forecasts
Average annual interest rate (per cent) | | 2010 | | 2011 | |
Global Insight | | 3.6 | | 4.1 | |
CIBC | | 3.6 | | 4.1 | |
Bank of Montreal | | 3.6 | | 4.2 | |
Scotiabank | | 3.9 | | 4.6 | |
TD Economics | | 3.8 | | 4.4 | |
RBC Capital Markets | | 3.5 | | 4.0 | |
Average (as of January 6, 2010) | | 3.7 | | 4.2 | |
Exchange Rate
After beginning 2009 at 82.6 US cents, the value of the loonie appreciated through 2009, reaching 95.5 US cents on December 31, 2009. As of February 19, 2010 the Canadian dollar was trading at 96.0 US cents.
The rise in the dollar’s value in recent months can be attributed to the stabilization of commodity prices (on which much of the resource-rich Canadian economy is dependent), rising equity markets and, primarily, a weak US dollar. Private sector analysts note that while Canadian consumers are benefiting from increased purchasing power, manufacturers already suffering from a weak export environment will face further difficulty selling goods due to the high Canadian dollar.
Outlook
Private sector projections for the Canadian dollar have increased since September Update 2009, when forecasters projected the loonie to trade at 92.9 US cents in 2010 and 92.6 US cents in 2011. The loonie is now expected to increase gradually vis-à-vis the US dollar through 2010 and 2011, and to stabilize around 98.0 US cents in the medium-term.
Budget and Fiscal Plan – 2010/11 to 2012/13
119
British Columbia Economic Review and Outlook
Chart 3.11 Private sector expects Canadian dollar to remain high in 2010
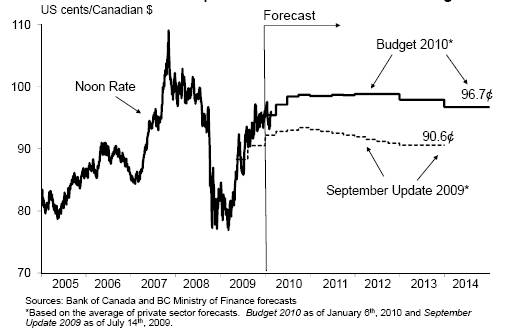
An average of six private sector forecasts as of January 6, 2010 sees the Canadian dollar averaging 97.4 US cents in 2010, and rising to 98.6 US cents in 2011. The Ministry’s exchange rate outlook is based on these private sector averages.
Table 3.7 Private Sector Exchange Rate Forecasts
Average annual exchange rate (US cents/Can $) | | 2010 | | 2011 | |
Global Insight | | 89.6 | | 91.2 | |
CIBC | | 94.7 | | 99.8 | |
Bank of Montreal | | 98.6 | | 101.4 | |
Scotiabank | | 99.7 | | 104.2 | |
TD Economics | | 102.3 | | 97.3 | |
RBC Capital Markets | | 99.3 | | 97.7 | |
Average (as of January 6, 2010) | | 97.4 | | 98.6 | |
Budget and Fiscal Plan – 2010/11 to 2012/13
120
British Columbia Economic Review and Outlook
Table 3.8.1 Gross Domestic Product: British Columbia
| | | | | | Forecast | |
| | 2008 | | 2009 (e) | | 2010 | | 2011 | | 2012 | | 2013 | | 2014 | |
BRITISH COLUMBIA: | | | | | | | | | | | | | | | |
Gross Domestic Product at Market Prices: | | | | | | | | | | | | | | | |
— Real (2002 $ billion; chain-weighted) | | 164.5 | | 160.0 | | 163.6 | | 167.3 | | 171.8 | | 176.7 | | 181.5 | |
(% change) | | 0.0 | | -2.7 | | 2.2 | | 2.3 | | 2.7 | | 2.8 | | 2.8 | |
— Current dollar ($ billion) | | 197.9 | | 188.0 | | 196.3 | | 205.7 | | 215.9 | | 226.6 | | 237.4 | |
(% change) | | 3.3 | | -5.0 | | 4.5 | | 4.7 | | 5.0 | | 4.9 | | 4.8 | |
— GDP price deflator (2002 = 100) | | 120.3 | | 117.5 | | 120.0 | | 122.9 | | 125.7 | | 128.3 | | 130.8 | |
(% change) | | 3.3 | | -2.4 | | 2.2 | | 2.4 | | 2.2 | | 2.1 | | 2.0 | |
Real GDP per person | | | | | | | | | | | | | | | |
(2002 $; chain-weighted) | | 37,529 | | 35,916 | | 36,161 | | 36,451 | | 36,910 | | 37,426 | | 37,938 | |
(% change) | | -1.7 | | -4.3 | | 0.7 | | 0.8 | | 1.3 | | 1.4 | | 1.4 | |
Real GDP per employed person | | | | | | | | | | | | | | | |
(% change) | | -2.1 | | -0.4 | | 1.3 | | 0.9 | | 0.9 | | 1.0 | | 1.0 | |
Unit labour cost(1) (% change) | | 5.3 | | 0.8 | | 0.5 | | 2.2 | | 2.1 | | 2.1 | | 2.2 | |
| | | | | | | | | | | | | | | |
Components of British Columbia Real GDP at Market Prices ($2002 billions; chain-weighted) | | | | | | | | | | | | | | | |
Personal expenditure on Goods and services | | 114.3 | | 111.9 | | 114.6 | | 117.4 | | 120.7 | | 124.2 | | 127.8 | |
(% change) | | 2.4 | | -2.1 | | 2.4 | | 2.4 | | 2.8 | | 2.9 | | 2.9 | |
— Goods | | 47.2 | | 45.1 | | 46.2 | | 47.4 | | 48.8 | | 50.3 | | 51.8 | |
(% change) | | 1.0 | | -4.5 | | 2.6 | | 2.5 | | 3.0 | | 3.0 | | 2.9 | |
— Services | | 67.1 | | 66.7 | | 68.3 | | 69.9 | | 71.8 | | 73.8 | | 75.9 | |
(% change) | | 3.6 | | -0.6 | | 2.3 | | 2.4 | | 2.7 | | 2.8 | | 2.8 | |
Government current expenditures on Goods and services | | 31.5 | | 33.5 | | 33.1 | | 33.9 | | 34.4 | | 34.9 | | 35.4 | |
(% change) | | 3.4 | | 6.4 | | -1.0 | | 2.4 | | 1.3 | | 1.5 | | 1.5 | |
Investment in fixed capital | | 40.2 | | 37.6 | | 39.7 | | 40.1 | | 41.4 | | 42.5 | | 44.1 | |
(% change) | | 1.0 | | -6.6 | | 5.6 | | 1.2 | | 3.1 | | 2.8 | | 3.7 | |
Final domestic demand | | 186.3 | | 183.0 | | 187.6 | | 191.7 | | 196.7 | | 201.8 | | 207.5 | |
(% change) | | 2.7 | | -1.7 | | 2.5 | | 2.2 | | 2.6 | | 2.6 | | 2.8 | |
Exports goods and services | | 70.2 | | 65.6 | | 67.0 | | 68.5 | | 70.9 | | 73.4 | | 75.9 | |
(% change) | | -5.1 | | -6.5 | | 2.2 | | 2.1 | | 3.5 | | 3.6 | | 3.4 | |
Imports goods and services | | 93.3 | | 89.3 | | 91.8 | | 94.6 | | 97.4 | | 100.5 | | 103.6 | |
(% change) | | -0.4 | | -4.3 | | 2.8 | | 3.0 | | 3.0 | | 3.2 | | 3.1 | |
Inventory change | | 0.5 | | -0.3 | | -0.2 | | 0.8 | | 0.7 | | 0.9 | | 0.8 | |
Statistical discrepancy | | -0.1 | | -0.1 | | -0.1 | | -0.1 | | -0.1 | | -0.1 | | -0.1 | |
Real GDP at market prices | | 164.5 | | 160.0 | | 163.6 | | 167.3 | | 171.8 | | 176.7 | | 181.5 | |
(% change) | | 0.0 | | -2.7 | | 2.2 | | 2.3 | | 2.7 | | 2.8 | | 2.8 | |
(1) Unit labour cost is the nominal cost of labour incurred to produce one unit of real output.
(e) Ministry of Finance estimate.
Budget and Fiscal Plan – 2010/11 to 2012/13
121
British Columbia Economic Review and Outlook
Table 3.8.2 Components of Nominal Income and Expenditure
| | | | | | Forecast | |
| | 2008 | | 2009 | | 2010 | | 2011 | | 2012 | | 2013 | | 2014 | |
Labour income(1) ($ million) | | 103,811 | | 101,735 | (e) | 104,534 | | 109,268 | | 114,619 | | 120,273 | | 126,317 | |
(% change) | | 5.3 | | -2.0 | | 2.8 | | 4.5 | | 4.9 | | 4.9 | | 5.0 | |
Personal income ($ million) | | 158,504 | | 156,080 | (e) | 160,268 | | 165,919 | | 173,500 | | 181,415 | | 189,773 | |
(% change) | | 5.1 | | -1.5 | | 2.7 | | 3.5 | | 4.6 | | 4.6 | | 4.6 | |
Corporate profits before taxes ($ million) | | 22,050 | | 14,164 | (e) | 15,967 | | 17,539 | | 18,865 | | 20,276 | | 21,760 | |
(% change) | | 3.6 | | -35.8 | | 12.7 | | 9.8 | | 7.6 | | 7.5 | | 7.3 | |
Retail sales ($ million) | | 56,562 | | 53,666 | | 55,745 | | 58,046 | | 60,693 | | 63,519 | | 66,474 | |
(% change) | | 0.3 | | -5.1 | | 3.9 | | 4.1 | | 4.6 | | 4.7 | | 4.7 | |
Housing starts | | 34,321 | | 16,077 | | 20,480 | | 23,553 | | 25,766 | | 27,165 | | 27,760 | |
(% change) | | -12.4 | | -53.2 | | 27.4 | | 15.0 | | 9.4 | | 5.4 | | 2.2 | |
Residential investment(2) ($ million) | | 19,198 | | 15,214 | (e) | 17,930 | | 19,485 | | 20,734 | | 22,012 | | 23,303 | |
(% change) | | 1.5 | | -20.8 | | 17.9 | | 8.7 | | 6.4 | | 6.2 | | 5.9 | |
BC consumer price index (2002 = 100) | | 112.3 | | 112.3 | | 114.3 | | 116.7 | | 119.0 | | 121.5 | | 124.0 | |
(% change) | | 2.1 | | 0.0 | | 1.8 | | 2.0 | | 2.0 | | 2.1 | | 2.1 | |
(1) Domestic basis; wages, salaries and supplementary labour income.
(2) Includes renovations and improvements.
(e) Ministry of Finance estimate.
Table 3.8.3 Labour Market Indicators
| | | | | | Forecast | |
| | 2008 | | 2009 | | 2010 | | 2011 | | 2012 | | 2013 | | 2014 | |
Population (on July 1) (000’s) | | 4,384 | | 4,455 | | 4,524 | | 4,590 | | 4,656 | | 4,720 | | 4,785 | |
(% change) | | 1.7 | | 1.6 | | 1.5 | | 1.5 | | 1.4 | | 1.4 | | 1.4 | |
Labour force population, 15+ Years (000’s) | | 3,642 | | 3,707 | | 3,772 | | 3,833 | | 3,892 | | 3,949 | | 4,005 | |
(% change) | | 2.0 | | 1.8 | | 1.8 | | 1.6 | | 1.5 | | 1.5 | | 1.4 | |
Net in-migration (000’s) | | | | | | | | | | | | | | | |
— International(1),(3) | | 54.9 | | 49.7 | (e) | 45.4 | | 44.6 | | 42.2 | | 42.8 | | 43.4 | |
— Interprovincial(3) | | 8.4 | | 8.0 | (e) | 8.5 | | 9.0 | | 10.0 | | 10.0 | | 10.6 | |
— Total | | 63.3 | | 57.7 | (e) | 53.9 | | 53.6 | | 52.2 | | 52.8 | | 54.0 | |
Participation rate(2) (%) | | 66.6 | | 66.0 | | 65.7 | | 65.4 | | 65.3 | | 65.3 | | 65.5 | |
Labour force (000’s) | | 2,426 | | 2,445 | | 2,478 | | 2,506 | | 2,541 | | 2,580 | | 2,623 | |
(% change) | | 2.5 | | 0.8 | | 1.3 | | 1.2 | | 1.4 | | 1.5 | | 1.7 | |
Employment (000’s) | | 2,314 | | 2,259 | | 2,280 | | 2,312 | | 2,353 | | 2,396 | | 2,439 | |
(% change) | | 2.1 | | -2.4 | | 0.9 | | 1.4 | | 1.8 | | 1.8 | | 1.8 | |
Unemployment rate (%) | | 4.6 | | 7.6 | | 7.9 | | 7.7 | | 7.3 | | 7.1 | | 7.0 | |
(1) International migration includes net non-permanent residents and returning emigrants less net temporary residents abroad.
(2) Percentage of the population 15 years of age and over in the labour force.
(3) Components may not sum to total due to rounding.
(e) BC Stats estimate.
Budget and Fiscal Plan – 2010/11 to 2012/13
122
British Columbia Economic Review and Outlook
Table 3.8.4 Major Economic Assumptions
| | | | | | Forecast | |
| | 2008 | | 2009 | | 2010 | | 2011 | | 2012 | | 2013 | | 2014 | |
GDP (billions) | | | | | | | | | | | | | | | |
Canada real (2002 $; chain-weighted) | | 1,321 | | 1,287 | (e) | 1,312 | | 1,344 | | 1,379 | | 1,415 | | 1,451 | |
(% change) | | 0.4 | | -2.6 | | 2.0 | | 2.4 | | 2.6 | | 2.6 | | 2.6 | |
US real (1996 US$; chain-weighted) | | 13,312 | | 12,989 | | 13,271 | | 13,583 | | 13,945 | | 14,326 | | 14,713 | |
(% change) | | 0.4 | | -2.4 | | 2.2 | | 2.3 | | 2.7 | | 2.7 | | 2.7 | |
Japan real (2000 Yen; chain-weighted) | | 554,398 | | 526,331 | | 532,279 | | 537,488 | | 546,984 | | 556,480 | | 565,888 | |
(% change) | | -1.2 | | -5.1 | | 1.1 | | 1.0 | | 1.8 | | 1.7 | | 1.7 | |
Europe real(1) (% change) | | 0.5 | | -4.1 | | 0.6 | | 1.0 | | 2.0 | | 2.0 | | 2.0 | |
Industrial production index | | | | | | | | | | | | | | | |
US (2002 = 100) | | 108.8 | | 98.2 | | 100.5 | | 102.9 | | 105.6 | | 108.5 | | 111.4 | |
(% change) | | -2.2 | | -9.7 | | 2.4 | | 2.3 | | 2.7 | | 2.7 | | 2.7 | |
Japan (2000 = 100) | | 103.8 | | 81.3 | | 87.8 | | 88.7 | | 90.3 | | 91.8 | | 93.4 | |
(% change) | | -3.2 | | -21.7 | | 8.0 | | 1.0 | | 1.8 | | 1.7 | | 1.7 | |
Europe(1) (2000 = 100) | | 106.3 | | 90.4 | | 91.6 | | 92.5 | | 94.3 | | 96.2 | | 98.1 | |
(% change) | | -1.7 | | -15.0 | | 1.3 | | 1.0 | | 2.0 | | 2.0 | | 2.0 | |
Housing starts(2) (000’s) | | | | | | | | | | | | | | | |
Canada | | 211 | | 149 | | 159 | | 163 | | 172 | | 180 | | 180 | |
(% change) | | -7.6 | | -29.4 | | 6.7 | | 2.7 | | 5.1 | | 4.9 | | 0.0 | |
US | | 900 | | 552 | | 640 | | 800 | | 928 | | 1,057 | | 1,185 | |
(% change) | | -32.9 | | -38.7 | | 15.9 | | 25.0 | | 16.0 | | 13.9 | | 12.1 | |
Japan | | 1,093 | | 788 | | 750 | | 826 | | 909 | | 1,000 | | 1,065 | |
(% change) | | 3.1 | | -27.9 | | -4.9 | | 10.1 | | 10.1 | | 10.1 | | 6.5 | |
Consumer price index | | | | | | | | | | | | | | | |
Canada (2002 = 100) | | 114.1 | | 114.4 | | 116.9 | | 119.3 | | 121.6 | | 124.1 | | 126.6 | |
(% change) | | 2.3 | | 0.3 | | 2.2 | | 2.0 | | 2.0 | | 2.0 | | 2.0 | |
Canadian interest rates (%) | | | | | | | | | | | | | | | |
3-Month treasury bills | | 2.4 | | 0.3 | | 0.5 | | 2.2 | | 3.4 | | 4.4 | | 5.0 | |
10-year government bonds | | 3.6 | | 3.3 | | 3.7 | | 4.2 | | 4.6 | | 5.4 | | 6.0 | |
United States interest rates (%) | | | | | | | | | | | | | | | |
3-Month treasury bills | | 1.4 | | 0.2 | | 0.4 | | 2.1 | | 3.4 | | 4.4 | | 5.0 | |
10-year government bonds | | 3.7 | | 3.3 | | 3.8 | | 4.4 | | 4.7 | | 5.4 | | 6.0 | |
Exchange rate (US cents / Canadian $) | | 93.7 | | 87.6 | | 97.4 | | 98.6 | | 98.8 | | 97.9 | | 96.7 | |
British Columbia goods and services Export price deflator (% change) | | 6.7 | | -7.4 | (e) | -1.0 | | 1.7 | | 2.8 | | 2.7 | | 2.3 | |
(1) Euro zone (12) is Austria, Belgium, Finland, France, Germany, Greece, Ireland, Italy, Luxembourg, Netherlands, Portugal and Spain.
(2) British Columbia housing starts appear in Table 3.8.2.
(e) Ministry of Finance estimate.
Budget and Fiscal Plan – 2010/11 to 2012/13
123
British Columbia Economic Review and Outlook
The Economic Forecast Council, 2010
Introduction
In accordance with the Budget Transparency and Accountability Act, the Minister of Finance, in preparing each year’s provincial budget, consults the Economic Forecast Council (the Council) on the outlook for British Columbia’s economy. The Council is comprised of 14 leading economists from several of Canada’s major banks and private research institutions.
The most recent meeting occurred on December 4, 2009, with Council members presenting their estimates for economic performance in 2009, as well as their forecasts for 2010 and beyond. The central issues discussed by the Council included the weakened US economy, stimulus spending by multiple governments, the appreciating Canadian dollar, sales tax harmonization in BC and the impact of the 2010 Games.
Subsequent to December’s meeting, participants were permitted to submit revised forecasts up to January 15, 2010 (11 of the 14 Council members chose to revise this year). Forecast details from the Council surveys are summarized in the table at the end of this topic box.
British Columbia Forecast
Since September Update 2009, Council members have upgraded their average outlook for BC’s real GDP growth for 2010. At the same time, members held their average forecast constant for BC’s economy in 2011, and slightly lowered their medium-term outlook.
Council members now expect BC’s economy to contract by 2.6 per cent in 2009, a further decrease from the 2.3 per cent decline projected in September Update 2009. The Council anticipates a return to growth in 2010, with BC’s economy expected to expand by 2.9 per cent, a stronger rate than the 2.5 per cent forecast in September. Members now see BC growing by 3.1 per cent in 2011 and by 3.0 per cent annually in the 2012 to 2014 period. This is a slight change from the 3.1 per cent annual growth forecast for the 2011 to 2013 period in September Update 2009.
Chart 1 — Economic Forecast Council Outlook for the BC Economy
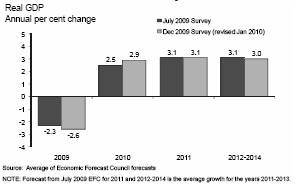
Council members, on average, expect economic growth in BC to outperform the national average in 2010. In 2011, they see BC’s real GDP growth being slightly lower than Canada’s, and slightly above the national average annual rate of growth in the 2012 to 2014 period.
Chart 2 — Economic Forecast Council Outlook for BC and Canada
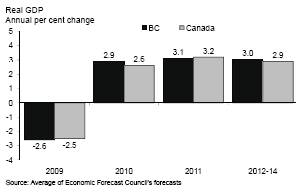
Council members generally agreed that, relative to most other provinces, BC is well-positioned to weather these turbulent economic times. Participants cited recent signs of economic stabilization in BC, most notably in the province’s real estate market. Also acknowledged by several members was BC’s solid fiscal position (i.e. lower deficit and debt levels) relative to some other provinces, which
Budget and Fiscal Plan – 2010/11 to 2012/13
124
British Columbia Economic Review and Outlook
provides BC with more flexibility to address its current budget shortfall.
However, Council members warned that substantial risks to the BC outlook continue to stem from abroad, especially from the US economy. Participants voiced concerns over slower US demand for BC products placing significant downward pressure on economic growth in the near-term. Several participants also raised concerns over the negative impact of the appreciating Canadian dollar on BC’s exporters. In particular, members noted that BC’s forest industry will continue to face considerable challenges until the US housing market recovers. Participants also cited further volatility in financial and commodity markets, as well as the sustainability of BC’s recent real estate rebound, as further risks to the BC outlook.
Some Council members reinforced the importance of governments ensuring that an economic recovery has taken hold before removing stimulus spending. Participants also encouraged the government to focus on reducing its deficit as the economy recovers though the medium-term.
The Council was in agreement on the positive impact that the 2010 Games will have on BC’s economy this year, noting the potential increases in tourism, retail trade and employment brought on by the Games. Participants also offered diverging views on the potential for a post-Olympic slowdown in 2011, with some acknowledging the risk of slower economic growth with the absence of the 2010 Games, and others arguing that a slowdown is unlikely.
Participants were also very supportive of the BC government’s recent decision to harmonize federal and provincial sales taxes, effective in July 2010. Several members pointed out that the new Harmonized Sales Tax (HST) will help reduce costs to businesses and boost future business investment. However, one participant noted that the introduction of HST will have a slightly positive impact on provincial inflation. One other member pointed out that harmonization is not being introduced at an optimal time (i.e. during the current economic downturn), but that the HST is unlikely to alter consumption patterns in a meaningful way.
Two Council members mentioned BC’s lagging labour productivity relative to other provinces and to Canada, noting that continued weak productivity growth could constrain long-term economic growth.
British Columbia Economic Forecast Council:
Summary of BC real GDP Forecasts, annual per cent change
| | | | | | | | | | Average | |
Participant | | Organization | | 2009 | | 2010 | | 2011 | | 2012-2014 | |
Doug Porter | | Bank of Montreal(1) | | -2.2 | | 3.1 | | 4.2 | | 3.5 | |
Jock Finlayson | | BC Business Council(1) | | -3.0 | | 2.8 | | 3.1 | | 2.7 | |
Warren Lovely | | CIBC(1) | | -2.2 | | 2.8 | | 3.4 | | 3.1 | |
Marie-Christine Bernard | | Conference Board(1) | | -2.4 | | 4.1 | | 3.2 | | 2.6 | |
Helmut Pastrick | | Central(1) Credit Union(1) | | -3.1 | | 2.5 | | 2.6 | | 3.8 | |
Dale Orr | | Dale Orr Economic Insight(1) | | -2.3 | | 3.0 | | 3.5 | | 3.1 | |
Arlene Kish | | Global Insight | | -2.0 | | 2.7 | | 3.5 | | 3.2 | |
Carl Sonnen | | Informetrica(1) | | -3.3 | | 3.2 | | 3.5 | | 3.2 | |
Carlos Leitao | | Laurentian Bank Securities(1) | | -2.9 | | 2.2 | | 2.7 | | 2.9 | |
Paul Ferley | | RBC Financial Group(1) | | -2.6 | | 3.3 | | 3.4 | | 3.0 | |
Mary Webb | | Scotiabank(1) | | -2.5 | | 3.0 | | 2.9 | | 2.6 | |
Ernie Stokes | | Stokes Economic Consulting | | -2.5 | | 3.1 | | 2.2 | | 3.1 | |
Derek Burleton | | TD(1) | | -2.7 | | 3.0 | | 2.8 | | 2.9 | |
David Baxter | | Urban Futures Institute | | -2.3 | | 2.5 | | 2.7 | | 2.9 | |
Average | | | | -2.6 | | 2.9 | | 3.1 | | 3.0 | |
Standard Deviation | | | | 0.4 | | 0.4 | | 0.5 | | 0.3 | |
(1) Updated subsequent to the December 4, 2009 meeting.
Budget and Fiscal Plan – 2010/11 to 2012/13
125
British Columbia Economic Review and Outlook
Two participants also urged the provincial government to control future increases in health care expenditures, as rising health spending occupies a growing share of public expenditures in many Canadian provinces.
The United States Economy
On average, the Council estimates that the US economy contracted by 2.5 per cent in 2009, a small improvement from the 2.7 per cent decrease projected in September Update 2009. Estimates for a US recovery in 2010 have risen, averaging 2.7 per cent growth for that year-an increase from the September forecast of 2.0 per cent. The Council’s average outlook for 2011 and the 2012 to 2014 period was held fairly steady, with members now anticipating growth of 3.2 per cent in 2011 and 3.1 per cent for the 2012 to 2014 period. These new forecasts are a slight downgrade from the September Update 2009 forecast of 3.3 per cent growth for the 2011 to 2013 period.
The discussion centred mostly on the US economic downturn that began in late 2008 with the collapse of the Lehman Brothers firm, and the potential for economic recovery in the coming years. Council members suggested that the nascent US recovery is extremely fragile, and that the premature removal of US government stimulus spending could result in a “double-dip” return to recession. Participants noted that considerable downside risk remains to the US economic outlook, especially with the US housing market residing at extremely low levels of activity and the potential negative impact of looming home foreclosures. One member also observed that US consumer activity will likely remain at low levels until the US employment situation improves.
The Canadian Economy
The Council estimates that the Canadian economy contracted by 2.5 per cent in 2009, a small decline from the 2.3 per cent drop projected in September Update 2009. Council members raised their average outlook for 2010 to 2.6 per cent growth from the 2.2 per cent expansion forecast in September. The average outlook for 2011 improved slightly from 3.1 per cent growth to 3.2 per cent, while the medium-term forecast was slightly downgraded from 3.1 per cent growth to 2.9 per cent.
In discussing the Canadian government’s recent stimulus spending, participants again raised concerns over the timing for future withdrawal of these stimulus measures. Members generally agreed that the federal government should ensure that the stable recovery of the Canadian economy has begun before removing the stimulus. One Council member also highlighted Canada’s favourable fiscal position relative to the US, and praised the coordinated fiscal response from all levels of government to the recent economic crisis.
Canadian Dollar
Council members continued to have divergent views on the value of the Canadian dollar in 2010, with forecasts ranging from 89.0 US cents to 101.0 US cents. For 2011, projections ranged from 91.0 US cents to 104.2 US cents, and from 90.0 US cents to 105.0 US cents over the 2012 to 2014 period.
Chart 3 — Economic Forecast Council Outlook for the Exchange Rate
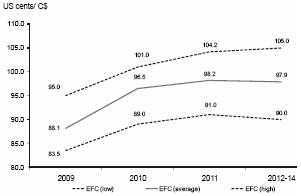
As noted above, most participants raised concerns over the potential negative impacts of a rising Canadian dollar, suggesting that the continued appreciation of the dollar could slow the economic recovery in BC and Canada. One member also urged Canadian businesses to broaden their export base beyond the US.
Budget and Fiscal Plan – 2010/11 to 2012/13
126
British Columbia Economic Review and Outlook
Forecast Survey — Participants’ Opinions
All figures are based | | 2009 | | 2010 | | 2011 | | 2012 to 2014 | |
on annual averages | | Range | | Average(1) | | Range | | Average(1) | | Range | | Average(1) | | Range | | Average(2) | |
British Columbia | | | | | | | | | | | | | | | | | |
Real GDP (% change) | | -3.3 – -2.0 | | -2.6 (14) | (3) | 2.2 – 4.1 | | 2.9 (14) | | 2.2 – 4.2 | | 3.1 (14) | | 2.6 – 3.8 | | 3.0 (14) | |
Nominal GDP (% change) | | -6.4 – -3.5 | | -4.8 (13) | | 4.0 – 7.4 | | 5.0 (13) | | 4.5 – 6.9 | | 5.5 (13) | | 4.7 – 6.8 | | 5.3 (13) | |
GDP Deflator (% change) | | -4.1 – -0.5 | | -2.2 (13) | | 1.3 – 3.2 | | 2.0 (13) | | 1.5 – 3.5 | | 2.2 (13) | | 1.6 – 3.0 | | 2.3 (13) | |
Personal Income (% change) | | -5.6 – 1.2 | | -1.5 (12) | | 1.7 – 5.1 | | 3.6 (12) | | 3.1 – 6.0 | | 4.4 (12) | | 3.0 – 5.6 | | 4.7 (12) | |
Net Migration (thousand persons) | | 40.4 – 62.2 | | 51.2 (12) | | 38.0 – 62.9 | | 50.5 (12) | | 36.0 – 65.0 | | 52.7 (12) | | 45.0 – 71.0 | | 55.2 (12) | |
Employment (% change) | | -2.5 – -2.3 | | -2.4 (14) | | 0.4 – 2.1 | | 1.4 (14) | | 1.1 – 2.3 | | 1.8 (14) | | 1.2 – 2.9 | | 1.9 (14) | |
Unemployment rate (%) | | 7.5 – 7.6 | | 7.6 (14) | | 7.1 – 8.1 | | 7.6 (14) | | 6.4 – 7.8 | | 7.2 (14) | | 5.3 – 7.3 | | 6.4 (14) | |
Corporate pre-tax profits (% change) | | -42.0 – -23.7 | | -33.7 (11) | | 6.0 – 24.1 | | 15.4 (11) | | 5.0 – 26.4 | | 14.0 (11) | | 3.8 – 15.8 | | 9.2 (10) | |
Housing starts (thousand units) | | 13.1 – 17.0 | | 15.4 (14) | | 19.0 – 25.8 | | 22.2 (14) | | 20.0 – 31.2 | | 25.5 (14) | | 20.0 – 35.3 | | 27.4 (14) | |
Retail sales (% change) | | -7.9 – -5.2 | | -6.3 (13) | | 3.0 – 6.5 | | 5.0 (13) | | 3.1 – 6.5 | | 4.9 (13) | | 2.0 – 6.9 | | 4.9 (13) | |
Consumer price index (% chg) | | -0.1 – 0.3 | | 0.1 (14) | | 1.1 – 2.5 | | 1.8 (14) | | 1.4 – 2.6 | | 2.0 (14) | | 1.8 – 2.2 | | 2.1 (14) | |
| | | | | | | | | | | | | | | | | |
United States | | | | | | | | | | | | | | | | | |
Real GDP (% change) | | -2.7 – -2.4 | | -2.5 (14) | | 2.0 – 3.3 | | 2.7 (14) | | 2.4 – 4.0 | | 3.2 (14) | | 2.4 – 3.5 | | 3.1 (14) | |
Intended Federal Funds rate (%) | | 0.10 – 0.25 | | 0.17 (13) | | 0.13 – 1.50 | | 0.41 (13) | | 0.43 – 3.77 | | 1.93 (13) | | 1.25 – 5.00 | | 3.56 (13) | |
Housing starts (million units) | | 0.53 – 0.60 | | 0.56 (13) | | 0.61 – 0.89 | | 0.75 (13) | | 0.75 – 1.40 | | 1.05 (13) | | 0.98 – 1.65 | | 1.38 (13) | |
| | | | | | | | | | | | | | | | | |
Canada | | | | | | | | | | | | | | | | | |
Real GDP (% change) | | -2.6 – -2.4 | | -2.5 (14) | | 2.2 – 2.8 | | 2.6 (14) | | 2.6 – 3.9 | | 3.2 (14) | | 2.5 – 3.4 | | 2.9 (14) | |
Bank of Canada Overnight Target rate (%) | | 0.25 – 0.65 | | 0.41 (13) | | 0.25 – 1.50 | | 0.65 (13) | | 0.85 – 4.04 | | 2.18 (13) | | 1.50 – 5.00 | | 3.69 (13) | |
Exchange rate (US cents/C$) | | 83.5 – 95.0 | | 88.1 (14) | | 89.0 – 1.01 | | 96.5 (14) | | 91.0 – 104.2 | | 98.2 (14) | | 90.0 – 105.0 | | 97.9 (13) | |
Consumer price index (% chg) | | 0.2 – 0.6 | | 0.3 (14) | | 1.1 – 2.1 | | 1.6 (14) | | 1.6 – 2.9 | | 2.0 (14) | | 1.9 – 2.2 | | 2.0 (14) | |
(1) Based on responses from participants providing forecasts.
(2) Participants provided an average forecast for 2012 to 2014.
(3) Number of respondents shown in parenthesis.
Budget and Fiscal Plan – 2010/11 to 2012/13
127
Part 4: 2009/10 REVISED FINANCIAL FORECAST
(THIRD QUARTERLY REPORT)
2009/10 Fiscal Year in Review
The deficit for 2009/10 is projected at $2.8 billion, unchanged from September Update 2009. However, ministry savings have enabled government to reduce the amount of HST transition funding required in 2009/10 by $500 million and shift it to 2010/11 and 2011/12.
Table 4.1 September Update 2009 and Quarterly Report Updates
| | September | | Second | | Third | |
| | Update | | Quarterly | | Quarterly | |
($ millions) | | 2009 | | Report | | Report | |
Revenue | | 37,608 | | 37,376 | | 37,050 | |
Expense | | (40,133 | ) | (40,026 | ) | (39,700 | ) |
Deficit before forecast allowance | | (2,525 | ) | (2,650 | ) | (2,650 | ) |
Forecast allowance | | (250 | ) | (125 | ) | (125 | ) |
Deficit | | (2,775 | ) | (2,775 | ) | (2,775 | ) |
Excluding the impact of reallocating the HST transition payments, government revenue is forecast to be $58 million lower than the projection in September Update 2009. The forecast includes lower than anticipated revenue from taxation sources ($194 million), commercial Crown corporation net income ($44 million), and other miscellaneous sources including fees and investment earnings ($32 million), partially offset by improvements in natural resource revenues ($128 million) and additional other federal government contributions ($84 million).
Government spending is forecast to be $433 million lower than the September Update 2009, reflecting projected savings in the consolidated revenue fund (CRF) ($658 million), partially offset by additional spending funded by third parties ($52 million) and higher externally-funded spending by the SUCH sector and service delivery agencies ($173 million).
Chart 4.1 Progress of 2009/10 financial forecast
($ millions)

Budget and Fiscal Plan – 2010/11 to 2012/13
2009/10 Revised Financial Forecast (Third Quarterly Report)
The forecast allowance was reduced to $125 million to reflect the risk to the 2009/10 results during the remainder of the fiscal year. Further details on the changes from September Update 2009 are provided in Table 4.2.
Table 4.2 2009/10 Forecast Update
| | Q2 | | Q3 | | Total | |
($ millions) | | Updates | | Updates | | Changes | |
2009/10 deficit — September Update (September 1, 2009) | | (2,775 | ) | | | (2,775 | ) |
2009/10 deficit — second Quarterly Report (November 27, 2009) | | | | (2,775 | ) | | |
Revenue changes: | | | | | | | |
Personal income tax – prior-year adjustment | | (121 | ) | 49 | | (72 | ) |
Personal income tax – base | | (84 | ) | (9 | ) | (93 | ) |
Corporate income tax – prior-year adjustment | | (75 | ) | (1 | ) | (76 | ) |
Corporate income tax – instalments and IFAA | | 34 | | (36 | ) | (2 | ) |
Social service tax | | (80 | ) | (10 | ) | (90 | ) |
Property transfer tax | | 95 | | 75 | | 170 | |
Forests | | (73 | ) | 31 | | (42 | ) |
Natural gas royalties | | (113 | ) | 55 | | (58 | ) |
Sales and leases of Crown land tenures | | 73 | | — | | 73 | |
Coal (mining tax) | | 46 | | 25 | | 71 | |
Metals and minerals | | 34 | | 8 | | 42 | |
Other energy sources | | 18 | | 3 | | 21 | |
HST transition payment | | — | | (500 | ) | (500 | ) |
Other federal government contributions | | 43 | | 41 | | 84 | |
All other taxpayer supported sources | | (4 | ) | (38 | ) | (42 | ) |
Commercial Crown agencies operating results: | | | | | | — | |
BC Hydro – mainly reduced electricity trade income and accounting adjustments | | (60 | ) | (37 | ) | (97 | ) |
ICBC – mainly higher investment income and lower claims costs | | 31 | | 82 | | 113 | |
BC Lotteries – mainly impact of lower discretionary consumer spending | | — | | (39 | ) | (39 | ) |
Liquor Distribution Branch – mainly consumer shift to lower lower priced products | | — | | (24 | ) | (24 | ) |
Other commercial Crown agencies changes | | 4 | | (1 | ) | 3 | |
Total revenue changes | | (232 | ) | (326 | ) | (558 | ) |
Forecast allowance updates | | 125 | | — | | 125 | |
Less : expense increases (decreases): | | | | | | | |
CRF changes: | | | | | | | |
Lower estimates for Free Crown Grants | | (10 | ) | (104 | ) | (114 | ) |
Ministry operating savings, mainly Health, Forests and Citizens’ Services | | — | | (178 | ) | (178 | ) |
Reprofiling capital grants to future years | | — | | (245 | ) | (245 | ) |
Lower MOPD interest costs – mainly due to reduced direct operating debt levels | | (3 | ) | — | | (3 | ) |
Other spending changes | | — | | 8 | | 8 | |
Self-insurance claim and other liability adjustments | | (15 | ) | (59 | ) | (74 | ) |
Changes in self-funded spending by SUCH sector and service delivery agencies: | | | | | | | |
School districts | | 4 | | (18 | ) | (14 | ) |
Post secondary institutions – mainly due to revised operating cost estimates | | (15 | ) | 39 | | 24 | |
Health authorities and hospital societies – primarily budget management measures | | (41 | ) | 30 | | (11 | ) |
Service delivery agencies | | (27 | ) | 201 | | 174 | |
Total expense changes | | (107 | ) | (326 | ) | (433 | ) |
Net change | | — | | — | | — | |
2009/10 deficit – second Quarterly Report | | (2,775 | ) | | | | |
2009/10 deficit – third Quarterly Report | | | | (2,775 | ) | (2,775 | ) |
Budget and Fiscal Plan – 2010/11 to 2012/13
130
2009/10 Revised Financial Forecast (Third Quarterly Report)
Changes since the Second Quarterly Report
Revenue
Excluding the reallocation of $500 million in HST transition payments, revenue in 2009/10 is projected to be $174 million higher than the forecast in the second Quarterly Report.
The increase includes improvements to personal income tax revenue, mainly from revised 2008 tax assessment reports; further increases in property transfer tax revenue from a stronger-than-expected domestic housing market; a partial reversal of declines in forests and natural gas royalty revenue, reflecting higher harvest volumes and lumber exports to the US and lower take-up of royalty programs and credits; further improvement in mining tax revenue; and higher federal transfers to post secondary institutions and health authorities.
These improvements are partially offset by a further reduction in corporate income tax revenue, mainly due to lower instalments paid by the federal government; and an overall decline in commercial Crown corporation net income projections, reflecting an accounting adjustment to BC Hydro’s expected results, less discretionary spending by consumers on gaming (BCLC), and a shift in consumer spending to lower priced liquor products (LDB), partially offset by the positive impact of lower claims costs and higher investment income on ICBC’s outlook.
Expense
Total expense is forecast to be $326 million less than the second Quarterly Report, primarily due to an additional reduction in estimates for free Crown grants ($104 million), ministry operating savings ($178 million), the re-profiling of capital transfers to service delivery agencies to coincide with capital project spending ($245 million), and adjustments to liability balances related to prior years ($59 million). These savings were partially offset by an increase in the self funded spending of the SUCH sector and service delivery agencies ($252 million).
The ministry operating savings enable the re-profiling of federal HST transition funding across the fiscal plan. Of this, $89 million in savings is expected in the Ministry of Health Services due to lower than anticipated costs related to H1N1, Medical Services Plan and Pharmacare demand.
Lower estimates for free Crown grants in the Ministry of Agriculture and Lands significantly reduce spending, but do not impact the bottom line as the reduction is offset by an equal reduction in revenue from the revaluation of Crown land to fair market value.
The increase in liability adjustments includes the reversal of an over-accrual of Medical Services Plan costs from a prior year, and the downward adjustment of an accrued provincial liability as a result of a Copyright Board of Canada decision. The projected increase in self funded spending by service delivery agencies reflects the impact of project timing changes to the capital transfers, as total spending by these agencies is only projected to increase by $52 million.
Budget and Fiscal Plan – 2010/11 to 2012/13
131
2009/10 Revised Financial Forecast (Third Quarterly Report)
Contingencies
Spending commitments and pressures totaling $125 million have been notionally allocated to the Contingencies vote, as shown in Table 4.3. It is anticipated that the full $500 million 2009/10 contingency allocation will not be required therefore a revised forecast of $456 million is presented. The remaining $331 million of unallocated contingency room is reserved for unforeseen costs arising from litigation, the outcomes of negotiations underway, potential changes in assumed accounting treatment, natural disasters, and other contingent items.
Table 4.3 2009/10 Notional Allocations to Contingencies
| | ($ millions) | |
2010 Olympics – contingency allocation | | 69 | |
Gaming grants | | 29 | |
Haida and coastal First Nations Reconciliation Agreements | | 16 | |
Operational pressures in policing | | 4 | |
Public Inquiry Act pressures (statutory) | | 3 | |
Crown Proceeding Act settlement pressures (statutory) | | 3 | |
Contribution for earthquake relief in Haiti | | 1 | |
Subtotal notional allocations | | 125 | |
Reserved for pressures related to litigation, caseload pressures, natural disasters, changes in assumed accounting treatment, write-downs, and other contingent items | | 331 | |
Revised contingencies forecast | | 456 | |
Capital spending
Total capital spending is forecast to be $7.3 billion in 2009/10, $700 million lower than the projection in the second Quarterly Report (see Table 4.4).
Excluding capital spending contingencies, taxpayer-supported capital spending is down $337 million, reflecting changes in the timing of capital spending for projects (mainly in the transportation sector). The $348 million reduction in capital spending contingencies reflects changes in the expected timing of new projects.
Projected commercial Crown corporation capital spending is up $15 million since the second Quarterly Report, as changes in the timing of spending for the Port Mann Bridge/Highway 1 project and Port Subdivision land acquisition is partially offset by additional spending by BC Hydro on its capital plan.
Budget and Fiscal Plan – 2010/11 to 2012/13
132
2009/10 Revised Financial Forecast (Third Quarterly Report)
Table 4.4 2009/10 Capital Spending Update
| | Q2 | | Q3 | | Total | |
($ millions) | | Updates | | Updates | | Changes | |
Capital spending – September Update (September 1, 2009) | | 7,434 | | | | 7,434 | |
Capital spending – second Quarterly Report (November 27, 2009) | | | | 7,970 | | | |
Taxpayer-supported changes: | | | | | | | |
K–12 schools – mainly timing of school district financed capital spending | | (6 | ) | 14 | | 8 | |
Post-secondary education – timing of capital spending | | 19 | | (40 | ) | (21 | ) |
Health – timing of capital spending | | (2 | ) | (43 | ) | (45 | ) |
BCTFA – timing of capital spending | | (22 | ) | (213 | ) | (235 | ) |
BC Place rejuvenation project – timing of capital spending | | (49 | ) | (11 | ) | (60 | ) |
Other – timing of capital spending on housing and corrections projects | | (44 | ) | (44 | ) | (88 | ) |
Capital spending contingencies | | 73 | | (348 | ) | (275 | ) |
Total taxpayer-supported | | (31 | ) | (685 | ) | (716 | ) |
Self-supported changes: | | | | | | | |
BC Hydro – mainly purchase of one-third ownership in Teck Resources Limited’s Waneta Dam and generating facility | | 720 | | 130 | | 850 | |
Columbia River power projects – mainly postponement of the Waneta expansion hydroelectric project | | (140 | ) | (10 | ) | (150 | ) |
Transportation Investment Corporation – timing of capital spending for the Port Mann Bridge/Highway 1 project | | 25 | | (108 | ) | (83 | ) |
BC Railway Company – mainly timing of Port Subdivision land acquisition | | (22 | ) | (33 | ) | (55 | ) |
Other | | (16 | ) | 6 | | (10 | ) |
Total self-supported | | 567 | | (15 | ) | 552 | |
Total changes | | 536 | | (700 | ) | (164 | ) |
Capital spending – second Quarterly Report | | 7,970 | | | | | |
Capital spending – third Quarterly Report | | | | 7,270 | | 7,270 | |
Provincial debt
Total provincial debt is projected to be $1.1 billion lower at March 31, 2010 compared to the projections in the second Quarterly Report, primarily due to reduction in government operating debt and reduced borrowing for capital transfers (see Table 4.5). These reductions were partially offset by increases in education and health debt balances, primarily due to the allocation of sinking fund proceeds to operating debt.
Self-supported debt is up $34 million from the second Quarterly Report, mainly due to additional borrowing by BC Hydro for its capital plan, partially offset by lower requirements of the Transportation Investment Corporation due to the timing of the Port Mann Bridge project capital spending.
The key taxpayer-supported debt-to-GDP ratio is projected to be 16.1 per cent by the end of 2009/10, unchanged from the second Quarterly Report.
Budget and Fiscal Plan – 2010/11 to 2012/13
133
2009/10 Revised Financial Forecast (Third Quarterly Report)
Table 4.5 2009/10 Provincial Debt Update
| | Q2 | | Q3 | | Total | |
($ millions) | | Updates | | Updates | | Changes | |
Provincial debt – September Update (September 1, 2009) | | 42,332 | | | | 42,332 | |
Provincial debt – second Quarterly Report (November 27, 2009) | | | | 42,389 | | | |
Taxpayer-supported changes: | | | | | | | |
Government operating – mainly increased cash (bonus bids, sinking fund | | | | | | | |
liquidation proceeds, and reduced spending) | | (418 | ) | (1,301 | ) | (1,719 | ) |
Education facilities – mainly updated capital spending and sinking funds | | 1 | | 290 | | 291 | |
Health facilities – mainly updated capital spending and sinking funds | | (10 | ) | 247 | | 237 | |
Transportation – mainly updated capital spending | | 13 | | (46 | ) | (33 | ) |
Other changes | | 19 | | (295 | ) | (276 | ) |
Total taxpayer-supported | | (395 | ) | (1,105 | ) | (1,500 | ) |
Self-supported changes: | | | | | | | |
BC Hydro – mainly due to purchase of one-third interest in Waneta Dam | | 726 | | 143 | | 869 | |
BC Transmission – impact of working capital changes | | 5 | | — | | 5 | |
Columbia River power projects – mainly Waneta expansion project postponement | | (175 | ) | (13 | ) | (188 | ) |
BC Lotteries – mainly updated capital spending and cash flows | | — | | 22 | | 22 | |
Transportation Investment Corporation – impact of timing of capital spending | | 21 | | (118 | ) | (97 | ) |
Total self-supported | | 577 | | 34 | | 611 | |
Forecast allowance reduction | | (125 | ) | — | | (125 | ) |
Total changes | | 57 | | (1,071 | ) | (1,014 | ) |
Provincial debt – second Quarterly Report | | 42,389 | | | | | |
Provincial debt – third Quarterly Report | | | | 41,318 | | 41,318 | |
Risks to the 2009/10 outlook
The major risks to the 2009/10 forecast stem from changes to the main tax bases (personal and corporate income, sales and property transfer) that are dependent on economic activity in BC and its trading partners, commodity prices (especially natural gas, lumber and electricity) and exchange rate fluctuations.
The spending forecast contained in the fiscal plan is based on ministry and service delivery agency spending plans and strategies. Changes to planning assumptions, such as utilization or demand rates for government services in the health care, education, or community social services sectors, represent the main spending risks.
As well, government is tracking a number of spending commitments and pressures resulting from the 2010 Olympic and Paralympic Winter Games, additional gaming grants, Haida and coastal First Nations reconciliation agreements, and justice system and policing costs.
These risks, as well as further government spending initiatives and the potential impact of accounting policy changes, are covered by the $500 million Contingencies Vote and the $125 million forecast allowance.
Budget and Fiscal Plan – 2010/11 to 2012/13
134
2009/10 Revised Financial Forecast (Third Quarterly Report)
Table 4.6 2009/10 Operating Statement
| | Year-to-Date to December 31 | | Full Year | |
| | 2009/10 | | Actual | | 2009/10 | | Actual | |
($ millions) | | Budget | | Actual | | Variance | | 2008/09 | | Budget | | Forecast | | Variance | | 2008/09 | |
Revenue | | 27,445 | | 27,356 | | (89 | ) | 28,789 | | 37,608 | | 37,050 | | (558 | ) | 38,328 | |
Expense | | (28,997 | ) | (28,707 | ) | 290 | | (27,220 | ) | (40,133 | ) | (39,700 | ) | 433 | | (38,268 | ) |
Negotiating Framework incentive payments | | — | | — | | — | | — | | — | | — | | — | | (2 | ) |
Climate Action Dividend | | — | | — | | — | | — | | — | | — | | — | | 20 | |
Surplus (deficit) before forecast allowance | | (1,552 | ) | (1,351 | ) | 201 | | 1,569 | | (2,525 | ) | (2,650 | ) | (125 | ) | 78 | |
Forecast allowance | | — | | — | | — | | — | | (250 | ) | (125 | ) | 125 | | — | |
Surplus (deficit) | | (1,552 | ) | (1,351 | ) | 201 | | 1,569 | | (2,775 | ) | (2,775 | ) | — | | 78 | |
Accumulated surplus beginning of the year | | 6,986 | | 6,986 | | — | | 6,908 | | 6,986 | | 6,986 | | — | | 6,908 | |
Accumulated surplus before comprehensive income | | 5,434 | | 5,635 | | 201 | | 8,477 | | 4,211 | | 4,211 | | — | | 6,986 | |
Accumulated other comprehensive income from self-supported Crown agencies | | (67 | ) | 396 | | 463 | | 88 | | (67 | ) | (67 | ) | — | | (67 | ) |
Accumulated surplus end of period | | 5,367 | | 6,031 | | 664 | | 8,565 | | 4,144 | | 4,144 | | — | | 6,919 | |
Budget and Fiscal Plan – 2010/11 to 2012/13
135
2009/10 Revised Financial Forecast (Third Quarterly Report)
Table 4.7 2009/10 Revenue by Source
| | Year-to-Date to December 31 | | Full Year | |
| | 2009/10 | | Actual | | 2009/10 | | Actual | |
($ millions) | | Budget | | Actual | | Variance | | 2008/09 | | Budget | | Forecast | | Variance | | 2008/09 | |
Taxation | | | | | | | | | | | | | | | | | |
Personal income | | 4,264 | | 4,146 | | (118 | ) | 4,674 | | 5,681 | | 5,516 | | (165 | ) | 6,093 | |
Corporate income | | 876 | | 896 | | 20 | | 1,059 | | 1,409 | | 1,331 | | (78 | ) | 2,038 | |
Social service | | 3,733 | | 3,653 | | (80 | ) | 3,824 | | 4,847 | | 4,757 | | (90 | ) | 4,958 | |
Fuel | | 659 | | 666 | | 7 | | 684 | | 873 | | 883 | | 10 | | 891 | |
Carbon | | 388 | | 376 | | (12 | ) | 192 | | 557 | | 542 | | (15 | ) | 306 | |
Tobacco | | 535 | | 523 | | (12 | ) | 520 | | 686 | | 677 | | (9 | ) | 708 | |
Property | | 1,414 | | 1,412 | | (2 | ) | 1,377 | | 1,891 | | 1,885 | | (6 | ) | 1,848 | |
Property transfer | | 561 | | 692 | | 131 | | 622 | | 685 | | 855 | | 170 | | 715 | |
Other (1) | | 467 | | 468 | | 1 | | 508 | | 588 | | 577 | | (11 | ) | 640 | |
| | 12,897 | | 12,832 | | (65 | ) | 13,460 | | 17,217 | | 17,023 | | (194 | ) | 18,197 | |
Natural resources | | | | | | | | | | | | | | | | | |
Natural gas royalties | | 364 | | 282 | | (82 | ) | 1,212 | | 522 | | 464 | | (58 | ) | 1,314 | |
Forests | | 280 | | 239 | | (41 | ) | 494 | | 387 | | 345 | | (42 | ) | 558 | |
Other natural resource (2) | | 1,260 | | 1,424 | | 164 | | 1,654 | | 1,668 | | 1,896 | | 228 | | 1,976 | |
| | 1,904 | | 1,945 | | 41 | | 3,360 | | 2,577 | | 2,705 | | 128 | | 3,848 | |
Other revenue | | | | | | | | | | | | | | | | | |
Medical Services Plan premiums | | 1,207 | | 1,240 | | 33 | | 1,185 | | 1,628 | | 1,628 | | — | | 1,595 | |
Other fees (3) | | 1,815 | | 1,779 | | (36 | ) | 1,783 | | 2,548 | | 2,462 | | (86 | ) | 2,425 | |
Investment earnings | | 669 | | 702 | | 33 | | 594 | | 897 | | 924 | | 27 | | 804 | |
Miscellaneous (4) | | 1,947 | | 1,840 | | (107 | ) | 1,818 | | 2,599 | | 2,626 | | 27 | | 2,565 | |
| | 5,638 | | 5,561 | | (77 | ) | 5,380 | | 7,672 | | 7,640 | | (32 | ) | 7,389 | |
Contributions from the federal government | | | | | | | | | | | | | | | | | |
Health and social transfers | | 3,655 | | 3,661 | | 6 | | 3,518 | | 4,873 | | 4,882 | | 9 | | 4,743 | |
Harmonized sales tax transition payments | | — | | — | | — | | — | | 750 | | 250 | | (500 | ) | — | |
Other federal contributions (5) | | 1,146 | | 1,090 | | (56 | ) | 728 | | 1,627 | | 1,702 | | 75 | | 1,246 | |
| | 4,801 | | 4,751 | | (50 | ) | 4,246 | | 7,250 | | 6,834 | | (416 | ) | 5,989 | |
Commercial Crown corporation net income | | | | | | | | | | | | | | | | | |
BC Hydro | | 345 | | 292 | (6) | (53 | ) | 369 | | 452 | | 355 | | (97 | ) | 366 | |
Liquor Distribution Branch | | 698 | | 695 | | (3 | ) | 713 | | 896 | | 872 | | (24 | ) | 891 | |
BC Lotteries (net of payments to the federal government) | | 843 | | 798 | | (45 | ) | 807 | | 1,121 | | 1,082 | | (39 | ) | 1,082 | |
ICBC (7) | | 307 | | 446 | | 139 | | 396 | | 407 | | 520 | | 113 | | 512 | |
Transportation Investment Corporation (Port Mann) | | (16 | ) | (1 | ) | 15 | | — | | (22 | ) | (10 | ) | 12 | | (8 | ) |
Other | | 28 | | 26 | | (2 | ) | 58 | | 38 | | 29 | | (9 | ) | 62 | |
| | 2,205 | | 2,256 | | 51 | | 2,343 | | 2,892 | | 2,848 | | (44 | ) | 2,905 | |
Total revenue | | 27,445 | | 27,345 | | (100 | ) | 28,789 | | 37,608 | | 37,050 | | (558 | ) | 38,328 | |
(1) Corporation capital, insurance premium and hotel room taxes.
(2) Columbia River Treaty, other energy and minerals, water rental and other resources.
(3) Post-secondary, healthcare-related, motor vehicle, and other fees.
(4) Includes asset dispositions, reimbursements for health care and other services provided to external agencies, and other recoveries.
(5) Includes contributions for health, education, community development, housing and social service programs, and transportation projects.
(6) BC Hydro’s net income is reported net of accounting adjustments for the valuation of debt it acquired from the Warehouse Program this year and a change in the treatment of intangible assets. In its financial statements, BC Hydro makes these adjustments directly to equity, and is reporting third quarter net income of $302 million and a full year forecast of $388 million.
(7) The 2009/10 forecast represents ICBC’s projected earnings during government’s fiscal year. On ICBC’s fiscal year basis (December), the outlook for 2009 is $563 million.
Budget and Fiscal Plan – 2010/11 to 2012/13
136
2009/10 Revised Financial Forecast (Third Quarterly Report)
Table 4.8 2009/10 Expense By Function
| | Year-to-Date to December 31 | | Full Year | |
| | 2009/10 | | Actual | | 2009/10 | | Actual | |
($ millions) | | Budget | | Actual | | Variance | | 2008/09 | | Budget | | Forecast | | Variance | | 2008/09 | |
Health: | | | | | | | | | | | | | | | | | |
Medical Services Plan | | 2,695 | | 2,662 | | (33 | ) | 2,645 | | 3,593 | | 3,548 | | (45 | ) | 3,406 | |
Pharmacare | | 818 | | 823 | | 5 | | 806 | | 1,062 | | 1,079 | | 17 | | 1,010 | |
Regional services | | 7,667 | | 7,626 | | (41 | ) | 7,052 | | 10,301 | | 10,211 | | (90 | ) | 9,794 | |
Other healthcare expenses (1) | | 740 | | 737 | | (3 | ) | 642 | | 955 | | 948 | | (7 | ) | 911 | |
| | 11,920 | | 11,848 | | (72 | ) | 11,145 | | 15,911 | | 15,786 | | (125 | ) | 15,121 | |
Education: | | | | | | | | | | | | | | | | | |
Elementary and secondary | | 4,080 | | 4,063 | | (17 | ) | 4,058 | | 5,743 | | 5,692 | | (51 | ) | 5,740 | |
Post-secondary | | 3,446 | | 3,450 | | 4 | | 3,211 | | 4,742 | | 4,625 | | (117 | ) | 4,565 | |
Other education expenses (2) | | 325 | | 285 | | (40 | ) | 120 | | 409 | | 424 | | 15 | | 172 | |
| | 7,851 | | 7,798 | | (53 | ) | 7,389 | | 10,894 | | 10,741 | | (153 | ) | 10,477 | |
Social services: | | | | | | | | | | | | | | | | | |
Social assistance (1),(2) | | 1,178 | | 1,140 | | (38 | ) | 1,116 | | 1,500 | | 1,507 | | 7 | | 1,379 | |
Childcare services (1) | | 855 | | 846 | | (9 | ) | 1,003 | | 1,209 | | 1,210 | | 1 | | 1,144 | |
Community living and other services | | 508 | | 494 | | (14 | ) | 239 | | 771 | | 774 | | 3 | | 722 | |
| | 2,541 | | 2,480 | | (61 | ) | 2,358 | | 3,480 | | 3,491 | | 11 | | 3,245 | |
Protection of persons and property | | 1,102 | | 1,106 | | 4 | | 1,125 | | 1,534 | | 1,613 | | 79 | | 1,592 | |
Transportation | | 1,039 | | 1,015 | | (24 | ) | 998 | | 1,480 | | 1,467 | | (13 | ) | 1,422 | |
Natural resources and economic development | | 1,475 | | 1,465 | | (10 | ) | 1,172 | | 2,118 | | 2,017 | | (101 | ) | 1,683 | |
Other | | 824 | | 790 | | (34 | ) | 963 | | 1,238 | | 1,237 | | (1 | ) | 1,742 | |
Contingencies | | — | | — | | — | | — | | 500 | | 456 | | (44 | ) | — | |
General government | | 584 | | 574 | | (10 | ) | 470 | | 752 | | 684 | | (68 | ) | 842 | |
Debt servicing costs | | 1,661 | | 1,631 | | (30 | ) | 1,600 | | 2,226 | | 2,208 | | (18 | ) | 2,144 | |
Subtotal | | 28,997 | | 28,707 | | (290 | ) | 27,220 | | 40,133 | | 39,700 | | (433 | ) | 38,268 | |
Climate Action Dividend | | — | | — | | — | | — | | — | | — | | — | | (20 | ) |
Negotiating Framework incentive payments | | — | | — | | — | | — | | — | | — | | — | | 2 | |
Total expense | | 28,997 | | 28,707 | | (290 | ) | 27,220 | | 40,133 | | 39,700 | | (433 | ) | 38,250 | |
(1) Payments for healthcare services by the Ministry of Housing and Social Development and the Ministry of Children and Family Development made on behalf of their clients are reported in the Health function.
(2) Payments for training costs by the Ministry of Housing and Social Development made on behalf of its clients are reported in the Education function.
Budget and Fiscal Plan – 2010/11 to 2012/13
137
2009/10 Revised Financial Forecast (Third Quarterly Report)
Table 4.9 2009/10 Expense by Ministry, Program and Agency
| | Year-to-Date to December 31 | | Full Year | |
| | 2009/10 | | Actual | | 2009/10 | | Actual | |
($ millions) | | Budget | | Actual | | Variance | | 2008/09 | | Budget | | Forecast | | Variance | | 2008/09 | |
Office of the Premier | | 8 | | 9 | | 1 | | 10 | | 11 | | 11 | | — | | 13 | |
Aboriginal Relations and Reconciliation | | 48 | | 31 | | (17 | ) | 36 | | 69 | | 69 | | — | | 62 | |
Advanced Education and Labour Market Development | | 1,609 | | 1,618 | | 9 | | 1,536 | | 2,131 | | 2,116 | | (15 | ) | 2,025 | |
Agriculture and Lands | | 56 | | 68 | | 12 | | 102 | | 222 | | 117 | | (105 | ) | 150 | |
Attorney General | | 419 | | 413 | | (6 | ) | 399 | | 548 | | 548 | | — | | 512 | |
Children and Family Development | | 1,041 | | 1,032 | | (9 | ) | 1,030 | | 1,394 | | 1,388 | | (6 | ) | 1,376 | |
Citizens’ Services | | 129 | | 69 | | (60 | ) | 62 | | 164 | | 143 | | (21 | ) | 162 | |
Community and Rural Development | | 163 | | 161 | | (2 | ) | 176 | | 184 | | 183 | | (1 | ) | 233 | |
Education | | 3,782 | | 3,703 | | (79 | ) | 3,764 | | 5,042 | | 5,037 | | (5 | ) | 5,102 | |
Energy, Mines and Petroleum Resources | | 46 | | 43 | | (3 | ) | 41 | | 70 | | 67 | | (3 | ) | 49 | |
Environment | | 143 | | 131 | | (12 | ) | 168 | | 193 | | 187 | | (6 | ) | 225 | |
Finance | | 67 | | 47 | | (20 | ) | 76 | | 90 | | 88 | | (2 | ) | 92 | |
Forests and Range | | 875 | | 879 | | 4 | | 612 | | 1,101 | | 1,080 | | (21 | ) | 841 | |
Health Services | | 10,659 | | 10,583 | | (76 | ) | 10,129 | | 14,155 | | 14,066 | | (89 | ) | 13,277 | |
Healthy Living and Sport | | 65 | | 62 | | (3 | ) | 86 | | 87 | | 87 | | — | | 148 | |
Housing and Social Development | | 2,047 | | 2,010 | | (37 | ) | 1,903 | | 2,725 | | 2,725 | | — | | 2,581 | |
Labour | | 16 | | 14 | | (2 | ) | 16 | | 22 | | 21 | | (1 | ) | 22 | |
Public Safety and Solicitor General | | 489 | | 493 | | 4 | | 498 | | 661 | | 661 | | — | | 657 | |
Small Business, Technology and Economic Development | | 52 | | 33 | | (19 | ) | 35 | | 69 | | 56 | | (13 | ) | 52 | |
Tourism, Culture and the Arts | | 80 | | 86 | | 6 | | 335 | | 106 | | 105 | | (1 | ) | 348 | |
Transportation and Infrastructure | | 562 | | 557 | | (5 | ) | 560 | | 756 | | 753 | | (3 | ) | 768 | |
Total ministries and Office of the Premier | | 22,356 | | 22,042 | | (314 | ) | 21,574 | | 29,800 | | 29,508 | | (292 | ) | 28,695 | |
Management of public funds and debt | | 872 | | 845 | | (27 | ) | 902 | | 1,186 | | 1,183 | | (3 | ) | 1,192 | |
Contingencies | | — | | — | | — | | 4 | | 500 | | 456 | | (44 | ) | 177 | |
Funding for capital expenditures | | 655 | | 517 | | (138 | ) | 428 | | 1,213 | | 968 | | (245 | ) | 832 | |
Legislative and other appropriations | | 131 | | 112 | | (19 | ) | 101 | | 164 | | 164 | | — | | 144 | |
Subtotal | | 24,014 | | 23,516 | | (498 | ) | 23,009 | | 32,863 | | 32,279 | | (584 | ) | 31,040 | |
Prior year liability adjustments | | — | | (38 | ) | (38 | ) | — | | — | | (74 | ) | (74 | ) | — | |
Priority spending initiatives | | — | | — | | — | | — | | — | | — | | — | | 497 | |
Consolidated revenue fund total expense | | 24,014 | | 23,478 | | (536 | ) | 23,009 | | 32,863 | | 32,205 | | (658 | ) | 31,537 | |
Expenses recovered from external entities | | 1,942 | | 1,982 | | 40 | | 1,460 | | 2,593 | | 2,645 | | 52 | | 2,244 | |
Externally-funded service delivery agency expense: | | | | | | | | | | | | | | | | | |
School districts | | 99 | | 160 | | 61 | | 97 | | 325 | | 311 | | (14 | ) | 319 | |
Post-secondary institutions | | 1,518 | | 1,591 | | 73 | | 1,541 | | 2,250 | | 2,274 | | 24 | | 2,284 | |
Health authorities and hospital societies | | 561 | | 568 | | 7 | | 418 | | 749 | | 738 | | (11 | ) | 776 | |
Other service delivery agencies | | 863 | | 928 | | 65 | | 695 | | 1,353 | | 1,527 | | 174 | | 1,090 | |
| | 3,041 | | 3,247 | | 206 | | 2,751 | | 4,677 | | 4,850 | | 173 | | 4,469 | |
Total expense | | 28,997 | | 28,707 | | (290 | ) | 27,220 | | 40,133 | | 39,700 | | (433 | ) | 38,250 | |
Budget and Fiscal Plan – 2010/11 to 2012/13
138
2009/10 Revised Financial Forecast (Third Quarterly Report)
Table 4.10 2009/10 Capital Spending
| | Year-to-Date to December 31 | | Full Year | |
| | 2009/10 | | Actual | | 2009/10 | | Actual | |
($ millions) | | Budget | | Actual | | Variance | | 2008/09 | | Budget | | Forecast | | Variance | | 2008/09 | |
Taxpayer-supported | | | | | | | | | | | | | | | | | |
Education | | | | | | | | | | | | | | | | | |
Schools (K–12) | | 381 | | 344 | | (37 | ) | 307 | | 508 | | 516 | | 8 | | 413 | |
Post-secondary | | 523 | | 404 | | (119 | ) | 418 | | 697 | | 676 | | (21 | ) | 658 | |
Health | | 769 | | 485 | | (284 | ) | 372 | | 1,025 | | 980 | | (45 | ) | 892 | |
BC Transportation Financing Authority | | 923 | | 749 | | (174 | ) | 706 | | 1,230 | | 995 | | (235 | ) | 881 | |
BC Transit | | 125 | | 88 | | (37 | ) | 56 | | 167 | | 172 | | 5 | | 77 | |
Vancouver Convention Centre expansion project | | 39 | | 39 | | — | | 187 | | 39 | | 43 | | 4 | | 242 | |
BC Place rejuvenation | | 148 | | 47 | | (101 | ) | 13 | | 148 | | 88 | | (60 | ) | 45 | |
Government operating (ministries) | | 294 | | 182 | | (112 | ) | 237 | | 398 | | 349 | | (49 | ) | 430 | |
Other (1) | | 163 | | 107 | | (56 | ) | 77 | | 217 | | 169 | | (48 | ) | 140 | |
Capital spending contingencies | | — | | — | | — | | — | | 300 | | 25 | | (275 | ) | — | |
Total taxpayer-supported | | 3,365 | | 2,445 | | (920 | ) | 2,373 | | 4,729 | | 4,013 | | (716 | ) | 3,778 | |
Self-supported | | | | | | | | | | | | | | | | | |
BC Hydro | | 1,234 | | 1,144 | | (90 | ) | 1,030 | | 1,695 | | 2,545 | | 850 | | 1,400 | |
BC Transmission Corporation | | 13 | | 9 | | (4 | ) | 12 | | 22 | | 19 | | (3 | ) | 19 | |
Columbia River power projects (2) | | 24 | | 12 | | (12 | ) | 26 | | 166 | | 16 | | (150 | ) | 32 | |
Transportation Investment Corporation (Port Mann) | | 427 | | 454 | | 27 | | — | | 594 | | 511 | | (83 | ) | 165 | |
BC Rail | | 47 | | 7 | | (40 | ) | 9 | | 69 | | 14 | | (55 | ) | 10 | |
ICBC | | 34 | | 18 | | (16 | ) | 21 | | 38 | | 19 | | (19 | ) | 22 | |
BC Lotteries | | 96 | | 69 | | (27 | ) | 71 | | 100 | | 112 | | 12 | | 97 | |
Liquor Distribution Branch | | 16 | | 12 | | (4 | ) | 7 | | 21 | | 21 | | — | | 17 | |
Total self-supported | | 1,891 | | 1,725 | | (166 | ) | 1,176 | | 2,705 | | 3,257 | | 552 | | 1,762 | |
Total capital spending | | 5,256 | | 4,170 | | (1,086 | ) | 3,549 | | 7,434 | | 7,270 | | (164 | ) | 5,540 | |
(1) Includes BC Housing Management Commission, Provincial Rental Housing Corporation, Rapid Transit Project 2000, BC Transit and other service delivery agencies.
(2) Joint ventures of the Columbia Power Corporation and Columbia Basin Trust.
Budget and Fiscal Plan – 2010/11 to 2012/13
139
2009/10 Revised Financial Forecast (Third Quarterly Report)
Table 4.11 2009/10 Provincial Debt (1)
| | Year -to-Date to December 31 | | Full Year | |
| | 2009/10 | | Actual | | 2009/10 | | Actual | |
($ millions) | | Budget | | Actual | | Variance | | 2008/09 | | Budget | | Forecast | | Variance | | 2008/09 | |
Taxpayer-supported debt Provincial government operating | | 7,240 | | 7,258 | | 18 | | 5,261 | | 8,250 | | 6,531 | | (1,719 | ) | 6,455 | |
Other taxpayer-supported debt (mainly capital) | | | | | | | | | | | | | | | | | |
Education (2) | | | | | | | | | | | | | | | | | |
Schools | | 5,656 | | 5,452 | | (204 | ) | 5,084 | | 5,571 | | 5,840 | | 269 | | 5,189 | |
Post-secondary institutions | | 3,798 | | 3,733 | | (65 | ) | 3,407 | | 3,816 | | 3,838 | | 22 | | 3,493 | |
| | 9,454 | | 9,185 | | (269 | ) | 8,491 | | 9,387 | | 9,678 | | 291 | | 8,682 | |
Health (2),(3) | | 4,127 | | 3,991 | | (136 | ) | 3,447 | | 4,115 | | 4,352 | | 237 | | 3,757 | |
Highways and public transit | | | | | | | | | | | | | | | | | |
BC Transportation Financing Authority (4) | | 5,041 | | 4,970 | | (71 | ) | 4,322 | | 5,325 | | 5,276 | | (49 | ) | 4,586 | |
Public transit | | 991 | | 991 | | — | | 920 | | 988 | | 997 | | 9 | | 931 | |
SkyTrain extension | | 1,154 | | 1,154 | | — | | 1,153 | | 1,154 | | 1,154 | | — | | 1,154 | |
BC Transit | | 139 | | 113 | | (26 | ) | 95 | | 151 | | 158 | | 7 | | 94 | |
| | 7,325 | | 7,228 | | (97 | ) | 6,490 | | 7,618 | | 7,585 | | (33 | ) | 6,765 | |
Other | | | | | | | | | | | | | | | | | |
Social housing (5) | | 382 | | 293 | | (89 | ) | 307 | | 431 | | 348 | | (83 | ) | 286 | |
Homeowner Protection Office | | 150 | | 156 | | 6 | | 147 | | 146 | | 151 | | 5 | | 150 | |
BC Pavilion Corporation | | 50 | | 30 | | (20 | ) | — | | 75 | | 55 | | (20 | ) | — | |
BC Immigrant Investment Fund | | 287 | | 283 | | (4 | ) | 287 | | 297 | | 295 | | (2 | ) | 287 | |
Other (6) | | 208 | | 67 | | (141 | ) | 59 | | 274 | | 98 | | (176 | ) | 64 | |
| | 1,077 | | 829 | | (248 | ) | 800 | | 1,223 | | 947 | | (276 | ) | 787 | |
Total other taxpayer-supported | | 21,983 | | 21,233 | | (750 | ) | 19,228 | | 22,343 | | 22,562 | | 219 | | 19,991 | |
Total taxpayer-supported debt | | 29,223 | | 28,491 | | (732 | ) | 24,489 | | 30,593 | | 29,093 | | (1,500 | ) | 26,446 | |
Self-supported debt | | | | | | | | | | | | | | | | | |
Commercial Crown corporations | | | | | | | | | | | | | | | | | |
BC Hydro | | 9,843 | | 9,932 | | 89 | | 8,813 | | 10,106 | | 10,975 | | 869 | | 9,054 | |
BC Transmission Corporation | | 76 | | 81 | | 5 | | 74 | | 70 | | 75 | | 5 | | 70 | |
Columbia River power projects (7) | | 325 | | 196 | | (129 | ) | 208 | | 383 | | 195 | | (188 | ) | 208 | |
BC Lotteries | | 55 | | 65 | | 10 | | — | | 83 | | 105 | | 22 | | — | |
Transportation Investment Corporation (Port Mann) | | 551 | | 576 | | 25 | | — | | 712 | | 615 | | (97 | ) | 20 | |
Liquor Distribution Branch | | 1 | | 1 | | — | | 2 | | 1 | | 1 | | — | | 1 | |
Post-secondary institutions’ subsidiaries | | 134 | | 134 | | — | | 109 | | 134 | | 134 | | — | | 134 | |
| | 10,985 | | 10,985 | | — | | 9,206 | | 11,489 | | 12,100 | | 611 | | 9,487 | |
Warehouse borrowing program | | 1,019 | | 723 | | (296 | ) | 1,051 | | — | | — | | — | | 2,081 | |
Total self-supported debt | | 12,004 | | 11,708 | | (296 | ) | 10,257 | | 11,489 | | 12,100 | | 611 | | 11,568 | |
Forecast allowance | | — | | — | | — | | — | | 250 | | 125 | | (125 | ) | — | |
Total provincial debt | | 41,227 | | 40,199 | | (1,028 | ) | 34,746 | | 42,332 | | 41,318 | | (1,014 | ) | 38,014 | |
(1) Debt is after deduction of sinking funds and unamortized discounts, and excludes accrued interest. Government direct and fiscal agency accrued interest is reported in the government’s accounts as an accounts payable.
(2) Includes debt and guarantees incurred by the government on behalf of school districts, universities, colleges and health authorities/hospital societies (SUCH), and debt directly incurred by these entities.
(3) Health facilities’ debt includes public-private partnership obligations of $466 million for the nine months ended December 31, 2009 and $688 million for fiscal 2009/10.
(4) BC Transportation Financing Authority’s debt includes public-private partnership obligations of $802 million for the nine months ended December 31, 2009 and $797 million for fiscal 2009/10.
(5) Includes the BC Housing Management Commission and the Provincial Rental Housing Corporation.
(6) Includes service delivery agencies, student loan guarantees, loan guarantees to agricultural producers, guarantees issued under economic development and home mortgage assistance programs and loan guarantee provisions.
(7) Joint ventures of the Columbia Power Corporation and Columbia Basin Trust.
Budget and Fiscal Plan – 2010/11 to 2012/13
140
2009/10 Revised Financial Forecast (Third Quarterly Report)
Table 4.12 2009/10 Statement of Financial Position
| | Actual | | Year-to-Date | | Forecast | |
| | March 31, | | December 31, | | March 31, | |
($ millions) | | 2009 | | 2009 | | 2010 | |
Financial assets | | | | | | | |
Cash and temporary investments | | 5,226 | | 3,397 | | 2,873 | |
Other financial assets | | 7,405 | | 7,789 | | 7,830 | |
Sinking funds | | 2,134 | | 1,309 | | 1,339 | |
Investments in commercial Crown corporations: | | | | | | | |
Retained earnings | | 5,738 | | 6,975 | | 6,630 | |
Recoverable capital loans | | 9,149 | | 10,659 | | 11,775 | |
| | 14,887 | | 17,634 | | 18,405 | |
Warehouse borrowing program assets | | 2,081 | | 723 | | — | |
| | 31,733 | | 30,852 | | 30,447 | |
Liabilities | | | | | | | |
Accounts payable and accrued liabilities | | 7,409 | | 6,583 | | 8,020 | |
Deferred revenue | | 9,168 | | 9,812 | | 9,695 | |
Debt: | | | | | | | |
Taxpayer-supported debt | | 26,446 | | 28,491 | | 29,093 | |
Self-supported debt | | 11,568 | | 11,708 | | 12,100 | |
Forecast allowance | | — | | — | | 125 | |
Total provincial debt | | 38,014 | | 40,199 | | 41,318 | |
Add: debt offset by sinking funds | | 2,134 | | 1,309 | | 1,339 | |
Less : guarantees and non-guaranteed debt | | (452 | ) | (433 | ) | (421 | ) |
Financial statement debt | | 39,696 | | 41,075 | | 42,236 | |
| | 56,273 | | 57,470 | | 59,951 | |
Net liabilities | | (24,540 | ) | (26,618 | ) | (29,504 | ) |
Capital and other non-financial assets | | | | | | | |
Tangible capital assets | | 30,679 | | 31,393 | | 32,772 | |
Other non-financial assets | | 780 | | 835 | | 876 | |
| | 31,459 | | 32,228 | | 33,648 | |
Accumulated surplus (deficit) | | 6,919 | | 5,610 | | 4,144 | |
Changes in Financial Position
| | Year-to-Date | | Forecast | |
| | December 31, | | March 31, | |
($ millions) | | 2009 | | 2010 | |
| | | | | |
(Surplus) deficit for the period | | 1,772 | | 2,775 | |
Comprehensive income (increase) decrease | | (463 | ) | — | |
(Increase) decrease in accumulated surplus | | 1,309 | | 2,775 | |
Capital and other non-financial asset changes: | | | | | |
Increase in taxpayer-supported capital investments | | 2,445 | | 4,013 | |
Less: amortization and other accounting changes | | (1,731 | ) | (1,920 | ) |
Change in net capital assets | | 714 | | 2,093 | |
Increase (decrease) in other non-financial assets | | 55 | | 96 | |
| | 769 | | 2,189 | |
Increase (decrease) in net liabilities | | 2,078 | | 4,964 | |
Investment and working capital changes: | | | | | |
Increase (reduction) in cash and temporary investments | | (1,829 | ) | (2,353 | ) |
Increase in total investment in commercial Crown corporations: | | | | | |
Increase (decrease) in retained earnings | | 1,237 | | 892 | |
Self-supported capital investments | | 1,725 | | 3,257 | |
Less: loan repayments and other accounting changes | | (215 | ) | (631 | ) |
| | 2,747 | | 3,518 | |
Other working capital changes | | (1,617 | ) | (3,589 | ) |
| | (699 | ) | (2,424 | ) |
Increase (decrease) in financial statement debt | | 1,379 | | 2,540 | |
(Increase) decrease in sinking fund debt | | 825 | | 795 | |
Increase (decrease) in guarantees and non-guaranteed debt | | (19 | ) | (31 | ) |
Increase (decrease) in total provincial debt | | 2,185 | | 3,304 | |
Budget and Fiscal Plan – 2010/11 to 2012/13
141
APPENDICES
Tables: | | |
Tax Expenditures | 144 |
A1.1 | Social and Income Transfer Programs — Tax Expenditure | 146 |
A1.2 | Economic Development and Business Programs — Tax Expenditure | 148 |
A1.3 | Environmental Protection Programs — Tax Expenditure | 148 |
A2 | Interprovincial Comparisons of Tax Rates — 2010 | 149 |
A3 | Comparison of Provincial and Federal Taxes by Province — 2010 | 150 |
A4 | Interprovincial Comparisons of Provincial Personal Income Taxes Payable — 2010 | 152 |
A5 | Operating Statement — 2006/07 to 2012/13 | 153 |
A6 | Revenue by Source — 2006/07 to 2012/13 | 154 |
A7 | Expense by Function — 2006/07 to 2012/13 | 155 |
A8 | Service Delivery Agency Operating Results — 2006/07 to 2012/13 | 156 |
A9 | Material Assumptions — Revenue | 158 |
A10 | Natural Gas Price Forecasts: 2010/11 to 2012/13 | 163 |
A11 | Material Assumptions — Expense | 164 |
A12 | Full-Time Equivalents (FTEs) 2006/07 to 2012/13 | 166 |
A13 | Capital Spending — 2006/07 to 2012/13 | 167 |
A14 | Statement of Financial Position — 2006/07 to 2012/13 | 168 |
A14a | Changes in Financial Position — 2006/07 to 2012/13 | 169 |
A15 | Provincial Debt Summary — 2006/07 to 2012/13 | 170 |
A16 | Key Provincial Debt Indicators — 2006/07 to 2012/13 | 171 |
| | | |
Budget and Fiscal Plan – 2010/11 to 2012/13
Appendices
A1: Tax Expenditures
Introduction
A tax expenditure is the reduction in revenues from delivering government programs or benefits through the tax system rather than through voted budget appropriations. Tax expenditures are usually made by offering special tax rates, exemptions, or tax credits. Governments introduce tax expenditures primarily to achieve social policy objectives such as transfers to lower income families or to promote economic development and job creation.
Reporting tax expenditures improves government accountability by providing a more complete picture of government activities. The tax expenditure appendix does not include tax expenditures introduced or expanded in Budget 2010. These are described in Part 2: Tax Measures.
The Role of Tax Expenditure Programs
Using the tax system to deliver programs can reduce administration costs and compliance costs for recipients. In certain situations, the tax system allows intended beneficiaries to be readily identified from information that is already collected. In these cases setting up a separate expenditure program would result in costly overlap and duplication of effort. An example is the low income climate action tax credit, which is delivered through the income tax system. If this were a direct provincial expenditure program, a provincial agency or office would have to be established to duplicate much of the work already done by the Canada Revenue Agency. In addition, it would require individuals to undertake a separate, time-consuming application process in order to qualify for the benefit.
There are, however, several potential drawbacks to tax expenditure programs. First, their overall cost often receives less public scrutiny than is the case for spending programs because annual budget appropriations by the legislature are not typically required. Second, tax expenditure programs do not always effectively target those who are intended to benefit from them. Some expenditure programs that are intended to provide tax relief for low income earners may, in reality, confer the greatest benefit on high income earners who pay the most taxes. Finally, costs are often more difficult to control under a tax expenditure program because the benefits tend to be more open-ended and enforcement is often more difficult than for spending programs.
Tax Expenditure Reporting
Not all tax reductions, credits and exemptions are classed as tax expenditures.
The emphasis is on tax reductions, exemptions and refunds that are close equivalents to spending programs. By implication, the list does not include tax measures designed to meet broad tax policy objectives such as improving fairness in the tax system, or measures designed to simplify the administration of the tax. The list also does not include anything that is not intended to be part of a tax base.
The tax expenditures that cost less than $2 million are generally not included. Where practical, smaller items have been presented together as an aggregate figure.
Budget and Fiscal Plan – 2010/11 to 2012/13
144
Appendices
British Columbia Tax Expenditure Programs
The following tables report tax expenditure estimates.
For presentation purposes, British Columbia tax expenditures have been broken into three broad categories.
· Social and Income Transfer Programs (Table A1.1): These include tax expenditures that are offered as part of government’s mix of health, education, housing, income transfer and family related programs. Examples include the BC Family Bonus, the home owner grant, and the income tax credit for medical expenses.
· Economic Development and Business Programs (Table A1.2): This category includes tax preferences for small businesses and measures to encourage new private sector investment.
· Environmental Protection Programs (Table A1.3): There are relatively few tax expenditures in this category because environmental protection is now generally based on the principle of “polluter pay”. However, environmental tax expenditures include, for example, fuel tax exemptions for certain alternative fuels.
Each category has its own table of tax expenditure estimates. Within each table, the list of tax expenditures delivered through the income tax system has been separated into two sub-categories.
· Provincial Measures: This includes all major tax expenditures that are under provincial policy control.
· Federal Measures: British Columbia shares the cost of some federal income tax expenditure programs because, under the tax collection agreement between British Columbia and the federal government, the province has agreed to maintain a consistent income tax base with the federal government in the interest of reducing administrative and compliance costs.
The cost of individual tax expenditures cannot be added together to reach a total tax expenditure figure for two reasons:
· in some cases the programs interact with one another so that eliminating one program could increase or decrease the cost of another; and
· eliminating certain tax expenditure programs could change the choices taxpayers make, which in turn would affect the cost estimates.
The estimates for each tax expenditure are based on a static analysis of the costs and do not take into account any behavioral changes which could change the cost over time. In addition, all estimates are recalculated each year using current data sources and using refinements to the methods of estimation which can result in significant changes to the value of a given tax expenditure from prior years’ reports.
Provincial Sales Tax
On July 23, 2009, the government of British Columbia announced that it intends to harmonize the Provincial Sales Tax (PST) with the federal Goods and Services Tax (GST) effective July 1, 2010. The Harmonized Sales Tax (HST) will combine a seven per cent BC rate with the five per cent federal GST for a combined HST rate of 12 per cent. The PST and the Hotel Room Tax will be eliminated. The tax on private sales of vehicles will be continued, but at a 12 per cent rate effective July 1, 2010.
Budget and Fiscal Plan – 2010/11 to 2012/13
145
Appendices
The provincial portion of the HST will generally apply to those goods and services currently subject to GST, with certain exceptions. To provide targeted relief while maintaining the single administration of sales taxes under the proposed HST, British Columbia has proposed point-of-sale rebates for the provincial portion of the tax for the following items:
· motor fuels;
· books;
· children-sized clothing and footwear;
· children’s car seats and car booster seats;
· children’s diapers; and
· feminine hygiene products.
This treatment would also preserve retailers’ ability to claim input tax credits on these items.
The Budget 2011 report will provide estimates for British Columbia HST tax expenditures. Federal GST tax expenditures can be found at:
http://www.fin.gc.ca/taxexp–depfisc/2009/taxexp09–eng.asp
Table A1.1 Social and Income Transfer Programs — Tax Expenditure
| | | | 2009/10 | |
| | | | Estimated Cost | |
| | | | ($ millions) | |
Personal Income Tax | | | | | |
Provincial Measures | | | | | |
BC Family Bonus (1) | | | | 9 | |
BC Low Income Climate Action Tax Credit | | | | 153 | |
Sales Tax Credit | | | | 41 | |
Political contributions tax credit | | | | 1 | |
Provincial Non-Refundable Credits: (2) | | | | | |
· Charitable donations tax credit | | | | 169 | |
· Tax credits for tuition and education | | | | 40 | |
· Tax credits for disabilities and medical expenses | | | | 55 | |
· Pension income tax credit | | | | 22 | |
· Credit for persons older than 65 years | | | | 52 | |
· Married and equivalent-to-married credits | | | | 68 | |
· Tax credit for Canada Pension Plan contributions | | | | 119 | |
· Tax credit for Employment Insurance premiums paid | | | | 40 | |
| | | | | |
Federal Measures (3) | | | | | |
· Deduction and inclusion of alimony and child support payments | | | | 5 | |
· Child care expense deduction | | | | 31 | |
· Exemption from capital gains up to $750,000 for small businesses and family farms | | | | 38 | |
· Deduction for residents of northern and isolated areas | | | | 6 | |
· Non-taxation of employer-paid insurance premiums for group private health and welfare plans | | | | 115 | |
· Tax Free Savings Accounts | | | | 3 | |
· Registered Retirement Savings Plans: (4) | | | | | |
· exemption for | — contributions | | 306 | | | |
| — investment earnings | | 175 | | | |
· taxation of | — withdrawals | | (180 | ) | | |
Total | | | | | 301 | |
· Registered Pension Plans: (4) | | | | | |
· exemption for | — contributions | | 382 | | | |
| — investment earnings | | 302 | | | |
· taxation of | — withdrawals | | (284 | ) | | |
| Total | | | | 400 | |
Budget and Fiscal Plan – 2010/11 to 2012/13
146
Appendices
Table A1.1 Social and Income Transfer Programs — Tax Expenditure — Continued
| | 2009/10 | |
| | Estimated Cost | |
| | ($ millions) | |
Corporation Income Tax (5) | | | |
Charitable donations deduction | | 27 | |
| | | |
School and Rural Area Property Tax (6) | | | |
Home Owner Grant | | 686 | |
Exemption for places of worship | | 9 | |
| | | |
Property Transfer Tax | | | |
Exemption for first-time home buyers | | 89 | |
Exemptions for the following: | | | |
· Property transfers between related individuals | | 67 | |
· Property transfers to municipalities, regional districts, hospital districts, library boards, school boards, water districts and educational institutions | | 12 | |
· Property transfers to charities registered under the Income Tax Act (Canada) | | 4 | |
(1) The $9 million represents the tax expenditure portion of the program’s cost. The tax expenditure portion represents family bonus payments that effectively reduce the recipient’s personal income tax. The remaining cost of the program, including recoveries and administration costs, of $9 million for 2009/10, is presented in the BC Family Bonus Vote because it represents payments to families which exceed their provincial income tax liabilities. In 2009/10, the total program cost was $18 million.
(2) Provincial non-refundable credits are generally based on estimates of credit claims by British Columbia residents.
(3) The estimates show provincial revenue losses only. They are based on estimates of projected federal losses contained in Government of Canada: Tax Expenditures and Evaluations, 2009 . British Columbia personal income tax expenditures for the federal measures are based on the amounts claimed by British Columbia residents for the measure and the relevant provincial tax rates for the period. Certain tax expenditure items have been excluded where no data were available or the amounts were immaterial.
(4) Registered retirement savings plans and registered pension plans are treated in the same way as in the federal tax expenditure report. The tax expenditure associated with these schemes is presented as the amount of tax that would otherwise be paid in the year of deferral, were the deferral not available. However, this type of estimate overstates the true costs of these preferences because taxes are eventually paid, including tax on investment earnings. An estimate that does not overstate these costs would, however, be difficult to develop and would require some largely speculative assumptions.
(5) The deduction offered for corporate charitable donations is a federal measure, but the estimate shows only the provincial revenue loss. This is calculated from the federal revenue loss by applying British Columbia’s share of corporate taxable income and the relevant tax rates to the federal estimate.
(6) The property tax estimate is for the 2009 calendar year, and includes only school and rural area property taxes levied by the province. The home owner grant cost is shown for the 2009/10 fiscal year.
Budget and Fiscal Plan – 2010/11 to 2012/13
147
Appendices
Table A1.2 Economic Development and Business Programs — Tax Expenditure
| | 2009/10 | |
| | Estimated Cost | |
| | ($ millions) | |
Fuel Tax | | | |
Tax exemption for international flights carrying cargo | | 2 | |
Tax exemption for family farm trucks (on road) | | 5 | |
Tax exemption for compressor fuel used to transmit natural gas from wellhead to processing plant | | 15 | |
| | | |
Personal Income Tax | | | |
Training tax credit | | 24 | |
Venture capital tax credit | | 25 | |
Employee venture capital tax credit | | 2 | |
BC mining flow-through tax credit | | 7 | |
| | | |
Corporation Income Tax | | | |
Provincial Measures | | | |
Training tax credit | | 10 | |
Film and video tax credit | | 43 | |
Production services tax credit | | 105 | |
International financial activities tax refund (1) | | 5 | |
Scientific Research and Experimental Development Tax Credit | | 133 | |
Mining Exploration Tax Credit | | 4 | |
| | | |
School and Rural Area Property Taxation (2) | | | |
Assessment exemption of $10,000 for industrial and business properties | | 8 | |
Overnight tourist accommodation assessment relief | | 3 | |
Exemption for property used for pollution abatement (3) | | 6 | |
(1) Includes employee income tax refunds.
(2) Estimates are for the 2009 calendar year and include only school and rural area property taxes levied by the province.
(3) The property tax exemption for most land and improvements used in pollution abatement equipment was removed in 1997, but existing properties which were exempt in 1996 remain exempt under grandparenting provisions.
Table A1.3 Environmental Protection Programs — Tax Expenditure
| | 2009/10
Estimated Cost | |
| | ($ millions) | |
Fuel Tax | | | |
Tax exemption for alternative fuels | | 15 | |
Budget and Fiscal Plan – 2010/11 to 2012/13
148
Appendices
Table A2 Interprovincial Comparisons of Tax Rates – 2010
(Rates known as of February 15, 2010) (1)
| | | | | | | | | | | | | | | | | | Prince | | | |
| | British | | | | Saskat- | | | | | | | | New | | Nova | | Edward | | New- | |
Tax | | Columbia | | Alberta | | chewan | | Manitoba | | Ontario | | Quebec | | Brunswick | | Scotia | | Island | | foundland | |
Corporation income tax (2)
(per cent of taxable income) | | | | | | | | | | | | | | | | | | | | | |
General rate | | 10.5 | | 10 | | 12 | | 12 | | 14 | | 11.9 | | 12 | | 16 | | 16 | | 14 | |
Manufacturing rate | | 10.5 | | 10 | | 10 | | 12 | | 12 | | 11.9 | | 12 | | 16 | | 16 | | 5 | |
Small business rate | | 2.5 | | 3 | | 4.5 | | 0 | | 5.5 | | 8.0 | | 5 | | 5 | | 1 | | 5 | |
Small business threshold ($000s) | | 500 | | 500 | | 500 | | 400 | | 500 | | 500 | | 500 | | 400 | | 500 | | 500 | |
Corporation capital tax (3) | | | | | | | | | | | | | | | | | | | | | |
Non-financial | | Nil | | Nil | | Nil | | .1/.3 | | .225 | | .24 | | Nil | | .15 | | Nil | | Nil | |
Financial | | .33/1.0 | | Nil | | .7/3.25 | | 3.0 | | .54/.675 | | .72 | | 3.0 | | 4.0 | | 5.0 | | 4.0 | |
Health care premiums (4) | | | | | | | | | | | | | | | | | | | | | |
Individual/family | | 57/114 | | Nil | | Nil | | Nil | | Nil | | Nil | | Nil | | Nil | | Nil | | Nil | |
Payroll tax (per cent) (5) | | Nil | | Nil | | Nil | | 2.15 | | 1.95 | | 4.26 | | Nil | | Nil | | Nil | | 2.0 | |
Insurance premium tax (per cent) (6) | | 2-4.4 | | 2-3 | | 3-4 | | 2-3 | | 2-3.5 | | 2-3 | | 2-3 | | 3-4 | | 3.5 | | 4 | |
Fuel tax (cents per litre) (7) | | | | | | | | | | | | | | | | | | | | | |
Gasoline | | 17.83 | | 9.0 | | 15.0 | | 11.5 | | 14.7 | | 22.2 | | 17.8 | | 22.9 | | 15.8 | | 24.3 | |
Diesel | | 18.84 | | 9.0 | | 15.0 | | 11.5 | | 14.3 | | 23.3 | | 24.4 | | 22.7 | | 20.2 | | 24.2 | |
Sales tax (per cent) (8) | | | | | | | | | | | | | | | | | | | | | |
General rate | | 7 | | Nil | | 5 | | 7 | | 8 | | 7.5 | | 8 | | 8 | | 10 | | 8 | |
Tobacco tax (dollars per carton of 200 cigarettes) (9) | | 37.00 | | 40.00 | | 40.30 | | 42.20 | | 24.70 | | 20.60 | | 28.30 | | 49.40 | | 44.90 | | 41.80 | |
(1) Rates shown are those known as of February 15, 2010 and that are in effect for 2010.
(2) Provinces planning reductions in general corporate income tax rates include British Columbia, to 10 per cent effective January 1, 2011, Ontario, to 12 per cent effective July 1, 2010, to 11.5 per cent effective July 1, 2011, to 11 per cent effective July 1, 2012 and to 10 per cent effective July 1, 2013; and New Brunswick, to 11 per cent effective July 1, 2010, to 10 per cent effective July 1, 2011 and to 8 per cent effective July 1, 2012. The Ontario manufacturing rate is reduced to 10 per cent effective July 1, 2010.
Provinces planning changes to their small business rates include British Columbia, to zero by April 1, 2012, Ontario, to 4.5 per cent effective July 1, 2010, Nova Scotia, to 4 per cent effective January 1, 2011, to 3 per cent effective January 1, 2012 and to 2.5 per cent effective January 1, 2013. The British Columbia small business threshold increases to $500,000 effective January 1, 2010.
(3) Provinces planning to eliminate their general corporation capital taxes include Manitoba effective January 1, 2011, Ontario effective July 1, 2010, Quebec effective January 1, 2011 and Nova Scotia by 2012. Provinces planning elimination of their capital taxes on financial institutions include British Columbia, effective April 1, 2010 and Ontario, effective July 1, 2010.
(4) British Columbia has a two-person rate of $108; rates will increase effective January 1, 2011. British Columbia provides premium assistance in the form of lower rates or an exemption from premiums for lower income individuals and families. Ontario and Quebec levy health care contributions as additions to provincial personal income taxes payable.
(5) Provinces with payroll taxes provide payroll tax relief for small businesses.
(6) The lower rate applies to premiums for life, sickness and accident insurance; the higher rate applies to premiums for property insurance including automobile insurance. In Ontario, Quebec and Newfoundland specific sales taxes also apply to insurance premiums, except those related to individual life and health.
(7) Tax rate is for regular fuel used on highways and includes all provincial taxes payable by consumers at the pump. The British Columbia rate includes 6.75 cents per litre dedicated to the BC Transportation Financing Authority and the carbon tax rates of 3.33 cents per litre for gasoline and 3.84 cents per litre for diesel. The British Columbia rates do not include regional taxes that effectively increase the gasoline and diesel tax rates by 9 cents per litre in the South Coast British Columbia transportation service area and by 3.5 cents per litre in the Capital Regional District. The tax rates for Quebec, New Brunswick, Nova Scotia and Newfoundland include provincial sales tax based on current pump prices. The PEI rate consists of an ad valorem tax rate capped at 8.7 cents per litre and a volume-based motor fuel tax rate set at 7.1 cents per litre for gasoline and 11.5 cents per litre for diesel fuel.
(8) The rates shown are statutory rates. Quebec and PEI impose tax on the purchase price including GST. British Columbia and Ontario propose to harmonize their sales taxes with the federal GST effective July 1, 2010 at 7 per cent and 8 per cent respectively for total HST rates of 12 per cent and 13 per cent. Alberta imposes a 4 per cent tax on short-term rental accommodation. The Quebec tax rate increases to 8.5 per cent effective January 1, 2011.
(9) Includes estimated provincial sales tax where applicable.
Budget and Fiscal Plan – 2010/11 to 2012/13
149
Appendices
Table A3 Comparison of Provincial and Federal Taxes by Province — 2010
| | | | | | | | | | | | | | | | | | Prince | | | |
| | British | | | | Saskat- | | | | | | | | New | | Nova | | Edward | | New- | |
Tax | | Columbia | | Alberta | | chewan | | Manitoba | | Ontario | | Quebec | | Brunswick | | Scotia | | Island | | foundland | |
| | ( $ ) | |
Two Income Family of Four - $90,000 | | | | | | | | | | | | | | | | | | | | | |
1. | Provincial Income Tax | | 3,195 | | 4,504 | | 4,749 | | 6,804 | | 4,340 | | 7,901 | | 6,046 | | 6,899 | | 6,889 | | 5,952 | |
| Net Child Benefits | | 0 | | 142 | | 0 | | — | | 0 | | -1,735 | | 0 | | 0 | | — | | 0 | |
2. | Property Tax - Gross | | 3,239 | | 2,484 | | 4,327 | | 3,096 | | 4,631 | | 4,582 | | 4,320 | | 3,709 | | 3,303 | | 2,390 | |
| - Net | | 2,669 | | 2,484 | | 4,327 | | 2,496 | | 4,631 | | 4,582 | | 4,320 | | 3,709 | | 3,303 | | 2,390 | |
3. | Sales Tax | | 1,596 | | 12 | | 972 | | 1,360 | | 1,977 | | 2,051 | | 1,936 | | 1,900 | | 1,626 | | 1,940 | |
4. | Fuel Tax | | 218 | | 135 | | 225 | | 173 | | 341 | | 333 | | 267 | | 344 | | 237 | | 365 | |
5. | Net Carbon Tax | | 139 | | — | | — | | — | | — | | — | | — | | — | | — | | — | |
6. | Provincial Direct Taxes | | 7,817 | | 7,277 | | 10,273 | | 10,833 | | 11,289 | | 13,132 | | 12,569 | | 12,852 | | 12,055 | | 10,647 | |
7. | Health Care Premiums/Payroll Tax | | 1,368 | | 0 | | — | | 1,935 | | 1,755 | | 3,834 | | — | | — | | — | | 1,800 | |
8. | Total Provincial Tax | | 9,185 | | 7,277 | | 10,273 | | 12,768 | | 13,044 | | 16,966 | | 12,569 | | 12,852 | | 12,055 | | 12,447 | |
9. | Federal Income Tax | | 8,110 | | 8,110 | | 8,110 | | 8,110 | | 8,110 | | 8,110 | | 8,110 | | 8,110 | | 8,110 | | 8,110 | |
10. | Net Federal GST | | 1,283 | | 1,379 | | 1,307 | | 1,230 | | 1,271 | | 1,255 | | 1,224 | | 1,202 | | 1,215 | | 1,227 | |
11. | Total Tax | | 18,578 | | 16,766 | | 19,690 | | 22,108 | | 22,425 | | 26,331 | | 21,903 | | 22,164 | | 21,380 | | 21,784 | |
| | | | | | | | | | | | | | | | | | | | | | |
Two Income Family of Four - $60,000 | | | | | | | | | | | | | | | | | | | | | |
1. | Provincial Income Tax | | 1,320 | | 1,979 | | 1,854 | | 3,640 | | 1,511 | | 3,960 | | 3,346 | | 3,583 | | 3,797 | | 3,185 | |
| Net Child Benefits | | 0 | | -262 | | 0 | | — | | 0 | | -2,835 | | 0 | | 0 | | — | | 0 | |
2. | Property Tax - Gross | | 2,358 | | 2,016 | | 2,883 | | 2,503 | | 3,309 | | 3,150 | | 2,402 | | 2,327 | | 2,627 | | 1,645 | |
| - Net | | 1,788 | | 2,016 | | 2,883 | | 1,903 | | 3,309 | | 3,150 | | 2,402 | | 2,327 | | 2,627 | | 1,645 | |
3. | Sales Tax | | 1,253 | | 10 | | 699 | | 1,090 | | 1,596 | | 1,750 | | 1,540 | | 1,529 | | 1,300 | | 1,547 | |
4. | Fuel Tax | | 218 | | 135 | | 225 | | 173 | | 341 | | 333 | | 267 | | 344 | | 237 | | 365 | |
5. | Net Carbon Tax | | 121 | | — | | — | | — | | — | | — | | — | | — | | — | | — | |
6. | Provincial Direct Taxes | | 4,700 | | 3,878 | | 5,661 | | 6,806 | | 6,757 | | 6,358 | | 7,555 | | 7,783 | | 7,961 | | 6,742 | |
7. | Health Care Premiums/Payroll Tax | | 1,368 | | 0 | | — | | 1,290 | | 1,170 | | 2,556 | | — | | — | | — | | 1,200 | |
8. | Total Provincial Tax | | 6,068 | | 3,878 | | 5,661 | | 8,096 | | 7,927 | | 8,914 | | 7,555 | | 7,783 | | 7,961 | | 7,942 | |
9. | Federal Income Tax | | 3,956 | | 3,956 | | 3,956 | | 3,956 | | 3,956 | | 3,956 | | 3,956 | | 3,956 | | 3,956 | | 3,956 | |
10. | Net Federal GST | | 1,007 | | 1,152 | | 1,057 | | 986 | | 1,026 | | 1,071 | | 974 | | 967 | | 972 | | 978 | |
11. | Total Tax | | 11,031 | | 8,986 | | 10,674 | | 13,038 | | 12,909 | | 13,941 | | 12,485 | | 12,706 | | 12,889 | | 12,876 | |
| | | | | | | | | | | | | | | | | | | | | | |
Two Income Family of Four - $30,000 | | | | | | | | | | | | | | | | | | | | | |
1. | Provincial Income Tax | | 0 | | 0 | | 0 | | 503 | | -126 | | -401 | | 356 | | 721 | | 863 | | 988 | |
| Net Child Benefits | | 0 | | -1,187 | | 0 | | — | | -1,483 | | -3,264 | | 0 | | 0 | | — | | 0 | |
2. | Property Tax - Gross | | 2,358 | | 2,016 | | 2,883 | | 2,503 | | 3,309 | | 3,150 | | 2,402 | | 2,327 | | 2,627 | | 1,645 | |
| - Net | | 1,788 | | 2,016 | | 2,883 | | 1,903 | | 3,309 | | 3,150 | | 2,402 | | 2,327 | | 2,627 | | 1,645 | |
3. | Sales Tax | | 205 | | 8 | | -37 | | 824 | | 385 | | 1,100 | | 1,161 | | 1,145 | | 974 | | 1,133 | |
4. | Fuel Tax | | 145 | | 90 | | 150 | | 115 | | 227 | | 222 | | 178 | | 229 | | 158 | | 243 | |
5. | Net Carbon Tax | | -192 | | — | | — | | — | | — | | — | | — | | — | | — | | — | |
6. | Provincial Direct Taxes | | 1,946 | | 927 | | 2,996 | | 3,345 | | 2,312 | | 807 | | 4,097 | | 4,422 | | 4,622 | | 4,009 | |
7. | Health Care Premiums/Payroll Tax | | 0 | | 0 | | — | | 645 | | 585 | | 1,278 | | — | | — | | — | | 600 | |
8. | Total Provincial Tax | | 1,946 | | 927 | | 2,996 | | 3,990 | | 2,897 | | 2,085 | | 4,097 | | 4,422 | | 4,622 | | 4,609 | |
9. | Federal Income Tax | | 513 | | 513 | | 513 | | 513 | | 513 | | 513 | | 513 | | 513 | | 513 | | 513 | |
10. | Net Federal GST | | 15 | | 149 | | 29 | | -16 | | 52 | | 129 | | -28 | | -38 | | -34 | | -45 | |
11. | Total Tax | | 2,474 | | 1,589 | | 3,538 | | 4,487 | | 3,462 | | 2,727 | | 4,582 | | 4,897 | | 5,101 | | 5,077 | |
| | | | | | | | | | | | | | | | | | | | | | |
Unattached Individual - $25,000 | | | | | | | | | | | | | | | | | | | | | |
1. | Provincial Income Tax | | 376 | | 533 | | 969 | | 914 | | 609 | | 998 | | 968 | | 1,224 | | 1,416 | | 1,103 | |
2. | Property Tax | | — | | — | | — | | — | | — | | — | | — | | — | | — | | — | |
3. | Sales Tax | | 491 | | 4 | | 113 | | 487 | | 597 | | 424 | | 697 | | 685 | | 572 | | 691 | |
4. | Fuel Tax | | 145 | | 90 | | 150 | | 115 | | 227 | | 222 | | 178 | | 229 | | 158 | | 243 | |
5. | Net Carbon Tax | | -21 | | — | | — | | — | | — | | — | | — | | — | | — | | — | |
6. | Provincial Direct Taxes | | 991 | | 627 | | 1,232 | | 1,516 | | 1,433 | | 1,644 | | 1,843 | | 2,138 | | 2,146 | | 2,037 | |
7. | Health Care Premiums/Payroll Tax | | 137 | | 0 | | — | | 538 | | 488 | | 1,065 | | — | | — | | — | | 500 | |
8. | Total Provincial Tax | | 1,128 | | 627 | | 1,232 | | 2,054 | | 1,921 | | 2,709 | | 1,843 | | 2,138 | | 2,146 | | 2,537 | |
9. | Federal Income Tax | | 1,608 | | 1,608 | | 1,608 | | 1,608 | | 1,608 | | 1,608 | | 1,608 | | 1,608 | | 1,608 | | 1,608 | |
10. | Net Federal GST | | 86 | | 110 | | 87 | | 75 | | 78 | | 72 | | 63 | | 56 | | 55 | | 59 | |
11. | Total Tax | | 2,822 | | 2,345 | | 2,927 | | 3,737 | | 3,607 | | 4,389 | | 3,514 | | 3,802 | | 3,809 | | 4,204 | |
Budget and Fiscal Plan – 2010/11 to 2012/13
150
Appendices
Table A3 Comparison of Provincial and Federal Taxes by Province — 2010 — Continued
| | | | | | | | | | | | | | | | | | Prince | | | |
| | British | | | | Saskat- | | | | | | | | New | | Nova | | Edward | | New- | |
Tax | | Columbia | | Alberta | | chewan | | Manitoba | | Ontario | | Quebec | | Brunswick | | Scotia | | Island | | foundland | |
| | ( $ ) | |
Unattached Individual - $80,000 | | | | | | | | | | | | | | | | | | | | | |
1. | Provincial Income Tax | | 4,080 | | 5,396 | | 6,985 | | 7,911 | | 5,497 | | 9,194 | | 6,967 | | 8,466 | | 8,133 | | 7,312 | |
7 | Property Tax - Gross | | 1,613 | | 1,995 | | 3,128 | | 3,679 | | 3,207 | | 4,181 | | 1,953 | | 3,057 | | 2,421 | | 1,688 | |
| - Net | | 1,043 | | 1,995 | | 3,128 | | 3,079 | | 3,207 | | 4,181 | | 1,953 | | 3,057 | | 2,421 | | 1,688 | |
3. | Sales Tax | | 1,440 | | 10 | | 809 | | 1,159 | | 1,755 | | 1,652 | | 1,707 | | 1,637 | | 1,397 | | 1,691 | |
4. | Fuel Tax | | 218 | | 135 | | 225 | | 173 | | 341 | | 333 | | 267 | | 344 | | 237 | | 365 | |
5. | Net Carbon Tax | | 121 | | — | | — | | — | | — | | — | | — | | — | | — | | — | |
6. | Provincial Direct Taxes | | 6,902 | | 7,536 | | 11,147 | | 12,322 | | 10,800 | | 15,360 | | 10,894 | | 13,504 | | 12,188 | | 11,056 | |
7. | Health Care Premiums/Payroll Tax | | 684 | | 0 | | — | | 1,720 | | 1,560 | | 3,408 | | — | | — | | — | | 1,600 | |
8. | Total Provincial Tax | | 7,586 | | 7,536 | | 11,147 | | 14,042 | | 12,360 | | 18,768 | | 10,894 | | 13,504 | | 12,188 | | 12,656 | |
9. | Federal Income Tax | | 11,195 | | 11,195 | | 11,195 | | 11,195 | | 11,195 | | 11,195 | | 11,195 | | 11,195 | | 11,195 | | 11,195 | |
10. | Net Federal GST | | 1,171 | | 1,218 | | 1,130 | | 1,084 | | 1,132 | | 1,023 | | 1,088 | | 1,043 | | 1,065 | | 1,078 | |
11. | Total Tax | | 19,952 | | 19,949 | | 23,472 | | 26,321 | | 24,687 | | 30,986 | | 23,177 | | 25,742 | | 24,448 | | 24,929 | |
| | | | | | | | | | | | | | | | | | | | | | |
Senior Couple with Equal Pension Incomes - $30,000 | | | | | | | | | | | | | | | | | | | | | |
1. | Provincial Income Tax | | 0 | | 0 | | 0 | | -316 | | -1,344 | | -318 | | 0 | | 283 | | 378 | | 383 | |
2. | Property Tax - Gross | | 2,358 | | 2,016 | | 2,883 | | 2,503 | | 3,309 | | 3,150 | | 2,402 | | 2,327 | | 2,627 | | 1,645 | |
| - Net | | 1,513 | | 2,016 | | 2,883 | | 1,903 | | 3,309 | | 3,150 | | 2,402 | | 2,327 | | 2,627 | | 1,645 | |
3. | Sales Tax | | 757 | | 7 | | 151 | | 871 | | 962 | | 941 | | 1,266 | | 1,257 | | 1,031 | | 1,283 | |
4. | Fuel Tax | | 145 | | 90 | | 150 | | 115 | | 227 | | 222 | | 178 | | 229 | | 158 | | 243 | |
5. | Net Carbon Tax | | -129 | | — | | — | | — | | — | | — | | — | | — | | — | | — | |
6. | Provincial Direct Taxes | | 2,286 | | 2,113 | | 3,184 | | 2,573 | | 3,154 | | 3,995 | | 3,846 | | 4,096 | | 4,194 | | 3,554 | |
7. | Health Care Premiums/Payroll Tax | | 0 | | 0 | | — | | — | | — | | — | | — | | — | | — | | — | |
8. | Total Provincial Tax | | 2,286 | | 2,113 | | 3,184 | | 2,573 | | 3,154 | | 3,995 | | 3,846 | | 4,096 | | 4,194 | | 3,554 | |
9. | Federal Income Tax | | 0 | | 0 | | 0 | | 0 | | 0 | | 0 | | 0 | | 0 | | 0 | | 0 | |
10. | Net Federal GST | | 353 | | 376 | | 336 | | 349 | | 328 | | 305 | | 305 | | 300 | | 298 | | 316 | |
11. | Total Tax | | 2,639 | | 2,489 | | 3,520 | | 2,922 | | 3,482 | | 4,300 | | 4,151 | | 4,396 | | 4,492 | | 3,870 | |
Personal Income Tax
· Income tax is based on basic personal credits, applicable credits and typical major deductions at each income level. Quebec residents pay federal income tax less an abatement of 16.5 per cent of basic federal tax. This abatement has been used to reduce Quebec provincial tax rather than federal tax, for comparative purposes. The two income family of four with $60,000 annual income is assumed to have one spouse earning $40,000 and the other $20,000, the family with $90,000 income is assumed to have one spouse earning $50,000 and the other $40,000, the family with $30,000 is assumed to have each spouse earning $15,000 and each senior is assumed to receive $15,000. All representative families are assumed to have employment income except the senior couple.
Net Child Benefits
· Net child benefits are provincial measures affecting payments to families with children. Provincial child benefit measures are available in British Columbia (BC Family Bonus), Alberta (Family Employment Credit), Saskatchewan (Child Benefit), Ontario (Child Benefit), Quebec (Child Assistance Payments), New Brunswick (Child Tax Benefit), Nova Scotia (Child Benefit) and Newfoundland (Child Benefit). In addition, the Alberta government has chosen to vary the amount of the basic federal child tax benefit that its residents receive (shown as a net amo
Property Tax
· It is assumed that the individual at $25,000 rents accommodation; the family at $30,000 and at $60,000 and the senior couple own bungalows; the family at $90,000 owns a two-story executive style home; and the single at $80,000 owns a luxury condominium, in a major city for each province. Net local and provincial property taxes are estimated as taxes owing after credits provided through the property tax system are subtracted.
Sales, Fuel and Carbon Tax Estimates
· Includes sales tax on meals, liquor and accommodation. Estimates are based on expenditure patterns from the Survey of Household Spending. In estimating individual and family taxable consumption, disposable income is reduced by 20 per cent to reflect housing (mortgage and property taxes or rent) costs. The senior couple is assumed to own their home and have no mortgage costs. For each province, disposable income is further reduced by estimated federal income taxes, estimated provincial income taxes and health care premiums if applicable. In addition, the single individual with $80,000 annual income and the family with $90,000 annual income are assumed to have savings equal to 5 per cent of their disposable income. For each family, disposable income is distributed among expenditures using the consumption pattern of a typical family with the relevant characteristics as estimated by the family expenditure survey and the relevant sales tax component is extracted. Sales tax includes provincial retail sales taxes in Saskatchewan, Manitoba and Prince Edward Island, Quebec’s value added tax, the provincial component of the HST in BC, Ontario, New Brunswick, Nova Scotia and Newfoundland, Alberta’s Tourism Levy and the federal GST. Sales tax estimates have been redcues by sales tax credits where applicable where applicable. The HST is effective July 1, 2010 in BC and Ontario; however, the sales tax estimates for these provinces assume the HST is in place for the full year and therefore do not contain retail sales tax estimates. Estimates for Ontario do not include the Ontario Sales Tax Transition Benefit which totals $200 for single persons with net income of $80,000 or less and $667 for families with net income of $160,000 or less in 2010.
· Fuel tax is based on annual consumption: 1,000 litres of unleaded fuel for the single at $25,000, the family at $30,000 and the senior couple; others are assumed to consume 1,500 litres.
· Carbon tax applies in British Columbia to household consumption of gasoline, diesel, natural gas and home heating fuel. Estimated carbon tax liabilities are based on natural gas and home heating fuel consumption amounts from the Survey of Household Spending and the assumed fuel tax consumption noted above. Net carbon tax is estimated as carbon tax liabilities less the BC Low income Climate Action Tax Credit where applicable. In previous years, the five per cent personal income tax cut in the first two tax bracket rates was shown as a reduction in carbon ta
Health Care Premiums/Payroll Tax
· A health care premium is levied in British Columbia only. Approximately 50 per cent of British Columbia premiums are paid by employers on behalf of their employees with the remainder paid by individuals, either by employees or by residents who are not employed. Payroll taxes, in the four provinces that levy them, are paid by the employer. Employer-paid payroll taxes and health care premiums are generally reflected in reduced wages.
Effective Tax Rates
· British Columbia taxes have been calculated using rates in effect for 2010. Taxes for other provinces were calculated using rates that were announced prior to February 18, 2010, and that come into effect during 2010.
Budget and Fiscal Plan – 2010/11 to 2012/13
151
Appendices
Table A4 Interprovincial Comparisons of Provincial Personal Income Taxes Payable (1) — 2010
(Rates known as of February 18, 2010)
| | | | | | | | | | | | | | | | | | Prince | | | |
| | British | | | | Saskat- | | | | | | | | New | | Nova | | Edward | | New- | |
Taxable income (2) | | Columbia | | Alberta | | chewan | | Manitoba | | Ontario | | Quebec(3) | | Brunswick | | Scotia | | Island | | foundland | |
| | Annual provincial taxes payable(4) ($) | |
$ | 10,000 | | 0 | | 0 | | 0 | | 22 | | 0 | | 0 | | 0 | | 0 | | 0 | | 129 | |
$ | 20,000 | | 91 | | 201 | | 604 | | 1,127 | | 500 | | 502 | | 550 | | 882 | | 1,091 | | 847 | |
$ | 30,000 | | 869 | | 1,134 | | 1,630 | | 2,164 | | 1,271 | | 1,869 | | 1,718 | | 1,778 | | 2,005 | | 1,566 | |
$ | 40,000 | | 1,450 | | 2,068 | | 2,657 | | 3,347 | | 2,011 | | 3,498 | | 2,786 | | 3,214 | | 3,240 | | 2,729 | |
$ | 50,000 | | 2,199 | | 3,026 | | 3,904 | | 4,578 | | 3,055 | | 5,152 | | 3,998 | | 4,673 | | 4,580 | | 3,978 | |
$ | 60,000 | | 2,969 | | 4,026 | | 5,204 | | 5,853 | | 3,970 | | 6,783 | | 5,248 | | 6,182 | | 5,960 | | 5,258 | |
$ | 70,000 | | 3,739 | | 5,026 | | 6,504 | | 7,267 | | 4,941 | | 8,418 | | 6,498 | | 7,849 | | 7,515 | | 6,739 | |
$ | 80,000 | | 4,741 | | 6,026 | | 7,804 | | 9,007 | | 6,397 | | 10,128 | | 7,805 | | 9,516 | | 9,185 | | 8,289 | |
$ | 100,000 | | 7,158 | | 8,026 | | 10,404 | | 12,487 | | 9,879 | | 14,083 | | 10,465 | | 13,199 | | 12,527 | | 11,389 | |
$ | 125,000 | | 10,833 | | 10,526 | | 13,849 | | 16,837 | | 14,231 | | 19,011 | | 13,856 | | 18,011 | | 17,120 | | 15,264 | |
$ | 150,000 | | 14,508 | | 13,026 | | 17,599 | | 21,187 | | 18,583 | | 23,825 | | 17,431 | | 22,824 | | 21,712 | | 19,139 | |
| | Provincial personal income taxes as a per cent of taxable income (%) | |
$ | 10,000 | | 0.0 | | 0.0 | | 0.0 | | 0.2 | | 0.0 | | 0.0 | | 0.0 | | 0.0 | | 0.0 | | 1.3 | |
$ | 20,000 | | 0.5 | | 1.0 | | 3.0 | | 5.6 | | 2.5 | | 2.5 | | 2.8 | | 4.4 | | 5.5 | | 4.2 | |
$ | 30,000 | | 2.9 | | 3.8 | | 5.4 | | 7.2 | | 4.2 | | 6.2 | | 5.7 | | 5.9 | | 6.7 | | 5.2 | |
$ | 40,000 | | 3.6 | | 5.2 | | 6.6 | | 8.4 | | 5.0 | | 8.7 | | 7.0 | | 8.0 | | 8.1 | | 6.8 | |
$ | 50,000 | | 4.4 | | 6.1 | | 7.8 | | 9.2 | | 6.1 | | 10.3 | | 8.0 | | 9.3 | | 9.2 | | 8.0 | |
$ | 60,000 | | 4.9 | | 6.7 | | 8.7 | | 9.8 | | 6.6 | | 11.3 | | 8.7 | | 10.3 | | 9.9 | | 8.8 | |
$ | 70,000 | | 5.3 | | 7.2 | | 9.3 | | 10.4 | | 7.1 | | 12.0 | | 9.3 | | 11.2 | | 10.7 | | 9.6 | |
$ | 80,000 | | 5.9 | | 7.5 | | 9.8 | | 11.3 | | 8.0 | | 12.7 | | 9.8 | | 11.9 | | 11.5 | | 10.4 | |
$ | 100,000 | | 7.2 | | 8.0 | | 10.4 | | 12.5 | | 9.9 | | 14.1 | | 10.5 | | 13.2 | | 12.5 | | 11.4 | |
$ | 125,000 | | 8.7 | | 8.4 | | 11.1 | | 13.5 | | 11.4 | | 15.2 | | 11.1 | | 14.4 | | 13.7 | | 12.2 | |
$ | 150,000 | | 9.7 | | 8.7 | | 11.7 | | 14.1 | | 12.4 | | 15.9 | | 11.6 | | 15.2 | | 14.5 | | 12.8 | |
(1) Calculated for a single individual with wage income and claiming credits for Canada Pension Plan and Quebec Pension Plan contributions, Employment Insurance premiums, Quebec Parental Insurance Plan premiums, and the basic personal amount.
(2) Taxable income, total income less allowable deductions, is defined by federal legislation in all provinces except Quebec. In the table it is assumed that federally defined taxable income is equal to Quebec taxable income.
(3) Quebec residents pay federal tax less an abatement of 16.5 per cent of federal tax. In the table, the Quebec abatement has been used to reduce Quebec provincial personal income tax for comparative purposes.
(4) Includes provincial low income reductions (all provinces except Alberta and Saskatchewan), surtaxes payable in Ontario, Nova Scotia and Prince Edward Island, and the Ontario Health Premium tax. Excludes credits for sales and property tax credits.
Budget and Fiscal Plan – 2010/11 to 2012/13
152
Appendices
Table A5 Operating Statement — 2006/07 to 2012/13
| | | | | | | | Updated | | Budget | | | | | |
| | Actual | | Actual | | Actual | | Forecast | | Estimate | | Plan | | Plan | |
($ millions) | | 2006/07 | | 2007/08 | | 2008/09 | | 2009/10 | | 2010/11 | | 2011/12 | | 2012/13 | |
Revenue | | 38,478 | | 39,800 | | 38,328 | | 37,050 | | 39,190 | | 40,957 | | 42,800 | |
Expense | | (34,186 | ) | (36,519 | ) | (38,268 | ) | (39,700 | ) | (40,605 | ) | (41,602 | ) | (42,545 | ) |
Negotiating Framework incentive payments | | (264 | ) | (4 | ) | (2 | ) | — | | — | | — | | — | |
Climate Action Dividend | | — | | (440 | ) | 20 | | — | | — | | — | | — | |
Surplus (deficit) before forecast allowance | | 4,028 | | 2,837 | | 78 | | (2,650 | ) | (1,415 | ) | (645 | ) | 255 | |
Forecast allowance | | — | | — | | — | | (125 | ) | (300 | ) | (300 | ) | (400 | ) |
Surplus (deficit) | | 4,028 | | 2,837 | | 78 | | (2,775 | ) | (1,715 | ) | (945 | ) | (145 | ) |
Budget and Fiscal Plan – 2010/11 to 2012/13
153
Appendices
Table A6 Revenue by Source — 2006/07 to 2012/13
| | | | | | | | Updated | | Budget | | | | | |
| | Actual | | Actual | | Actual | | Forecast | | Estimate | | Plan | | Plan | |
($ millions) | | 2006/07 | | 2007/08 | | 2008/09 | | 2009/10 | | 2010/11 | | 2011/12 | | 2012/13 | |
Taxation revenue | | | | | | | | | | | | | | | |
Personal income | | 6,905 | | 6,956 | | 6,093 | | 5,516 | | 5,861 | | 6,124 | | 6,545 | |
Corporate income | | 1,538 | | 2,250 | | 2,038 | | 1,331 | | 847 | | 1,102 | | 1,343 | |
Harmonized sales | | — | | — | | — | | — | | 3,784 | | 5,376 | | 5,728 | |
Other sales (1) | | 4,714 | | 5,072 | | 4,958 | | 4,757 | | 1,399 | | 201 | | 173 | |
Fuel | | 901 | | 935 | | 891 | | 883 | | 877 | | 875 | | 875 | |
Carbon | | — | | — | | 306 | | 542 | | 727 | | 928 | | 1,137 | |
Tobacco | | 726 | | 692 | | 708 | | 677 | | 686 | | 686 | | 686 | |
Property | | 1,732 | | 1,795 | | 1,848 | | 1,885 | | 1,906 | | 1,908 | | 1,998 | |
Property transfer | | 914 | | 1,068 | | 715 | | 855 | | 900 | | 1,045 | | 1,130 | |
Corporation capital | | 91 | | 117 | | 108 | | 56 | | — | | — | | — | |
Other (2) | | 496 | | 521 | | 532 | | 521 | | 435 | | 413 | | 424 | |
| | 18,017 | | 19,406 | | 18,197 | | 17,023 | | 17,422 | | 18,658 | | 20,039 | |
Natural resource revenue | | | | | | | | | | | | | | | |
Natural gas royalties | | 1,207 | | 1,132 | | 1,314 | | 464 | | 698 | | 1,002 | | 1,249 | |
Bonus bids, permits and fees | | 479 | | 606 | | 855 | | 941 | | 993 | | 1,002 | | 1,044 | |
Forests | | 1,276 | | 1,087 | | 558 | | 345 | | 491 | | 597 | | 603 | |
Other natural resources | | 1,020 | | 953 | | 1,121 | | 955 | | 1,026 | | 1,082 | | 1,058 | |
| | 3,982 | | 3,778 | | 3,848 | | 2,705 | | 3,208 | | 3,683 | | 3,954 | |
Other revenue | | | | | | | | | | | | | | | |
Medical Services Plan premiums | | 1,524 | | 1,557 | | 1,595 | | 1,628 | | 1,741 | | 1,886 | | 2,020 | |
Post secondary education fees | | 928 | | 979 | | 1,039 | | 1,103 | | 1,135 | | 1,159 | | 1,185 | |
Other fees and licences | | 1,360 | | 1,450 | | 1,386 | | 1,359 | | 1,480 | | 1,425 | | 1,432 | |
Investment earnings | | 1,032 | | 1,140 | | 804 | | 924 | | 921 | | 1,015 | | 1,268 | |
Miscellaneous (3) | | 2,563 | | 2,585 | | 2,565 | | 2,626 | | 2,597 | | 2,766 | | 2,827 | |
| | 7,407 | | 7,711 | | 7,389 | | 7,640 | | 7,874 | | 8,251 | | 8,732 | |
Contributions from the federal government | | | | | | | | | | | | | | | |
Health and social transfers | | 4,473 | | 4,614 | | 4,743 | | 4,882 | | 5,165 | | 5,292 | | 5,580 | |
Harmonized sales tax transition payments | | — | | — | | — | | 250 | | 769 | | 580 | | — | |
Equalization | | 459 | | — | | — | | — | | — | | — | | — | |
Other cost shared agreements (4) | | 1,454 | | 1,317 | | 1,246 | | 1,702 | | 1,751 | | 1,411 | | 1,399 | |
| | 6,386 | | 5,931 | | 5,989 | | 6,834 | | 7,685 | | 7,283 | | 6,979 | |
Commercial Crown corporation net income | | | | | | | | | | | | | | | |
BC Hydro | | 407 | | 370 | | 366 | | 355 | | 609 | | 660 | | 640 | |
Liquor Distribution Branch | | 840 | | 858 | | 891 | | 872 | | 974 | | 1,013 | | 1,039 | |
BCLC (net of payments to the federal government) | | 1,011 | | 1,080 | | 1,082 | | 1,082 | | 1,106 | | 1,153 | | 1,195 | |
ICBC (5) | | 381 | | 633 | | 512 | | 520 | | 303 | | 245 | | 212 | |
Transportation Investment Corporation (Port Mann) | | — | | — | | (8 | ) | (10 | ) | (19 | ) | (19 | ) | (20 | ) |
Other | | 47 | | 33 | | 62 | | 29 | | 28 | | 30 | | 30 | |
| | 2,686 | | 2,974 | | 2,905 | | 2,848 | | 3,001 | | 3,082 | | 3,096 | |
Total revenue | | 38,478 | | 39,800 | | 38,328 | | 37,050 | | 39,190 | | 40,957 | | 42,800 | |
(1) Includes social service tax and, after June 30, 2010, continuation of the tax on private sales of vehicles now at 12%. More details are available in Table A9.
(2) Includes revenue from insurance premium and hotel room taxes.
(3) Includes asset dispositions, reimbursements for health care and other services provided to external agencies, and other recoveries.
(4) Includes contributions for health, education, housing and social service programs, for transportation projects, and for coastal ferry services.
(5) Amounts represent earnings during government’s fiscal year.
Budget and Fiscal Plan – 2010/11 to 2012/13
154
Appendices
Table A7 Expense by Function — 2006/07 to 2012/13
| | | | | | | | Updated | | Budget | | | | | |
| | Actual | | Actual | | Actual | | Forecast | | Estimate | | Plan | | Plan | |
($ millions) | | 2006/07 | | 2007/08 | | 2008/09 | | 2009/10 | | 2010/11 | | 2011/12 | | 2012/13 | |
Health | | | | | | | | | | | | | | | |
Medical Services Plan | | 2,969 | | 3,247 | | 3,406 | | 3,548 | | 3,801 | | 4,013 | | 4,112 | |
Pharmacare | | 914 | | 955 | | 1,010 | | 1,079 | | 1,095 | | 1,145 | | 1,201 | |
Regional services | | 8,436 | | 8,971 | | 9,723 | | 10,142 | | 10,627 | | 11,282 | | 11,570 | |
Other healthcare expenses (1) | | 867 | | 996 | | 911 | | 948 | | 951 | | 986 | | 1,010 | |
| | 13,186 | | 14,169 | | 15,050 | | 15,717 | | 16,474 | | 17,426 | | 17,893 | |
Education | | | | | | | | | | | | | | | |
Elementary and secondary | | 5,272 | | 5,521 | | 5,740 | | 5,692 | | 5,809 | | 5,895 | | 5,915 | |
Post-secondary | | 4,056 | | 4,300 | | 4,565 | | 4,523 | | 4,556 | | 4,601 | | 4,645 | |
Other education expenses (2) | | 152 | | 158 | | 165 | | 519 | | 455 | | 453 | | 451 | |
| | 9,480 | | 9,979 | | 10,470 | | 10,734 | | 10,820 | | 10,949 | | 11,011 | |
Social services | | | | | | | | | | | | | | | |
Social assistance (1),(2) | | 1,243 | | 1,259 | | 1,339 | | 1,468 | | 1,511 | | 1,476 | | 1,476 | |
Child welfare (1) | | 997 | | 960 | | 1,110 | | 1,177 | | 1,171 | | 1,171 | | 1,171 | |
Community living and other services | | 567 | | 736 | | 701 | | 754 | | 772 | | 772 | | 771 | |
| | 2,807 | | 2,955 | | 3,150 | | 3,399 | | 3,454 | | 3,419 | | 3,418 | |
Protection of persons and property | | 1,159 | | 1,403 | | 1,406 | | 1,433 | | 1,426 | | 1,365 | | 1,364 | |
Transportation | | 1,252 | | 1,379 | | 1,402 | | 1,448 | | 1,515 | | 1,670 | | 1,739 | |
Natural resources & economic development | | 1,581 | | 1,861 | | 1,578 | | 1,916 | | 1,314 | | 1,389 | | 1,416 | |
Other | | 1,234 | | 1,389 | | 1,732 | | 1,227 | | 1,395 | | 1,203 | | 1,219 | |
Contingencies (3) | | — | | — | | — | | 456 | | 450 | | 450 | | 450 | |
General government | | 1,213 | | 1,145 | | 1,336 | | 1,162 | | 1,376 | | 1,110 | | 1,085 | |
Debt servicing costs | | 2,274 | | 2,239 | | 2,144 | | 2,208 | | 2,381 | | 2,621 | | 2,950 | |
Subtotal | | 34,186 | | 36,519 | | 38,268 | | 39,700 | | 40,605 | | 41,602 | | 42,545 | |
Negotiating Framework incentive payments | | 264 | | 4 | | 2 | | — | | — | | — | | — | |
Climate Action Dividend | | — | | 440 | | (20 | ) | — | | — | | — | | — | |
Total expense | | 34,450 | | 36,963 | | 38,250 | | 39,700 | | 40,605 | | 41,602 | | 42,545 | |
(1) Includes payments for healthcare services by the Ministry of Housing and Social Development and the Ministry of Children and Family Development made on behalf of their clients are reported in the Health function.
(2) Payments for training costs by the Ministry of Housing and Social Development made on behalf of its clients are reported in the Education function. Beginning in 2009/10, includes the expenses of the Labout Market Development Agreement made with the federal government.
(3) The Contingencies vote is allocated to functions according to actual results for 2006/07 to 2008/09.
Budget and Fiscal Plan – 2010/11 to 2012/13
155
Appendices
Table A8 Service Delivery Agency Operating Results (1) — 2006/07 to 2012/13
| | | | | | | | Updated | | Budget | | | | | |
| | Actual | | Actual | | Actual | | Forecast | | Estimate | | Plan | | Plan | |
($millions) | | 2006/07 | | 2007/08 | | 2008/09 | | 2009/10 | | 2010/11 | | 2011/12 | | 2012/13 | |
| | | | | | | | | | | | | | | |
School districts | | | | | | | | | | | | | | | |
| | | | | | | | | | | | | | | |
Revenue | | 5,178 | | 5,243 | | 5,385 | | 5,410 | | 5,440 | | 5,509 | | 5,527 | |
Expense | | (5,041 | ) | (5,133 | ) | (5,352 | ) | (5,393 | ) | (5,440 | ) | (5,509 | ) | (5,527 | ) |
| | 137 | | 110 | | 33 | | 17 | | — | | — | | — | |
Accounting adjustments | | 39 | | 88 | | 158 | | 169 | | 191 | | 162 | | 79 | |
Net impact | | 176 | | 198 | | 191 | | 186 | | 191 | | 162 | | 79 | |
| | | | | | | | | | | | | | | |
Post-secondary institutions | | | | | | | | | | | | | | | |
| | | | | | | | | | | | | | | |
Revenue | | 4,129 | | 4,178 | | 4,145 | | 4,829 | | 4,808 | | 4,868 | | 4,925 | |
Expense | | (3,903 | ) | (4,133 | ) | (4,435 | ) | (4,639 | ) | (4,727 | ) | (4,789 | ) | (4,845 | ) |
| | 226 | | 45 | | (290 | ) | 190 | | 81 | | 79 | | 80 | |
Accounting adjustments | | 270 | | 493 | | 202 | | (46 | ) | 92 | | (79 | ) | (135 | ) |
Net impact | | 496 | | 538 | | (88 | ) | 144 | | 173 | | — | | (55 | ) |
| | | | | | | | | | | | | | | |
Health authorities and hospital societies | | | | | | | | | | | | | | | |
| | | | | | | | | | | | | | | |
Revenue | | 8,857 | | 9,467 | | 10,272 | | 10,739 | | 11,141 | | 11,742 | | 11,995 | |
Expense | | (8,892 | ) | (9,495 | ) | (10,292 | ) | (10,739 | ) | (11,141 | ) | (11,742 | ) | (11,995 | ) |
| | (35 | ) | (28 | ) | (20 | ) | — | | — | | — | | — | |
Accounting adjustments | | 64 | | 181 | | (36 | ) | 5 | | 144 | | 137 | | (9 | ) |
Net impact | | 29 | | 153 | | (56 | ) | 5 | | 144 | | 137 | | (9 | ) |
| | | | | | | | | | | | | | | |
Community Living BC | | | | | | | | | | | | | | | |
| | | | | | | | | | | | | | | |
Revenue | | 631 | | 687 | | 724 | | 727 | | 691 | | 691 | | 692 | |
Expense | | (631 | ) | (687 | ) | (723 | ) | (723 | ) | (691 | ) | (691 | ) | (692 | ) |
| | — | | — | | 1 | | 4 | | — | | — | | — | |
Accounting adjustments | | 1 | | — | | 1 | | 2 | | (1 | ) | (1 | ) | (2 | ) |
Net impact | | 1 | | — | | 2 | | 6 | | (1 | ) | (1 | ) | (2 | ) |
| | | | | | | | | | | | | | | |
BC Transportation Financing Authority | | | | | | | | | | | | | | | |
| | | | | | | | | | | | | | | |
Revenue | | 618 | | 651 | | 745 | | 591 | | 609 | | 654 | | 658 | |
Expense | | (585 | ) | (722 | ) | (660 | ) | (811 | ) | (802 | ) | (930 | ) | (1,013 | ) |
| | 33 | | (71 | ) | 85 | | (220 | ) | (193 | ) | (276 | ) | (355 | ) |
Accounting adjustments | | (155 | ) | (171 | ) | (285 | ) | (130 | ) | (123 | ) | (117 | ) | (114 | ) |
Net impact | | (122 | ) | (242 | ) | (200 | ) | (350 | ) | (316 | ) | (393 | ) | (469 | ) |
| | | | | | | | | | | | | | | |
BC Pavilion Corporation | | | | | | | | | | | | | | | |
| | | | | | | | | | | | | | | |
Revenue | | 39 | | 70 | | 45 | | 95 | | 88 | | 103 | | 108 | |
Expense | | (39 | ) | (41 | ) | (44 | ) | (101 | ) | (115 | ) | (126 | ) | (118 | ) |
| | — | | 29 | | 1 | | (6 | ) | (27 | ) | (23 | ) | (10 | ) |
Accounting adjustments | | 105 | | 26 | | 290 | | 6 | | 242 | | (6 | ) | (21 | ) |
Net impact | | 105 | | 55 | | 291 | | — | | 215 | | (29 | ) | (31 | ) |
Budget and Fiscal Plan – 2010/11 to 2012/13
156
Appendices
Table A8 Service Delivery Agency Operating Results (1) — 2006/07 to 2012/13 — Continued
| | | | | | | | Updated | | Budget | | | | | |
| | Actual | | Actual | | Actual | | Forecast | | Estimate | | Plan | | Plan | |
($millions) | | 2006/07 | | 2007/08 | | 2008/09 | | 2009/10 | | 2010/11 | | 2011/12 | | 2012/13 | |
| | | | | | | | | | | | | | | |
British Columbia Housing Management Commission | | | | | | | | | | | | | | | |
| | | | | | | | | | | | | | | |
Revenue | | 497 | | 540 | | 627 | | 624 | | 885 | | 623 | | 550 | |
Expense | | (497 | ) | (540 | ) | (627 | ) | (624 | ) | (885 | ) | (623 | ) | (550 | ) |
| | — | | — | | — | | — | | — | | — | | — | |
Accounting adjustments | | (15 | ) | (4 | ) | 14 | | 4 | | (7 | ) | 3 | | — | |
Net impact | | (15 | ) | (4 | ) | 14 | | 4 | | (7 | ) | 3 | | — | |
| | | | | | | | | | | | | | | |
British Columbia Transit | | | | | | | | | | | | | | | |
| | | | | | | | | | | | | | | |
Revenue | | 165 | | 188 | | 229 | | 253 | | 293 | | 309 | | 344 | |
Expense | | (167 | ) | (187 | ) | (232 | ) | (252 | ) | (293 | ) | (309 | ) | (344 | ) |
| | (2 | ) | 1 | | (3 | ) | 1 | | — | | — | | — | |
Accounting adjustments | | (9 | ) | 2 | | (6 | ) | 47 | | (24 | ) | 4 | | (6 | ) |
Net impact | | (11 | ) | 3 | | (9 | ) | 48 | | (24 | ) | 4 | | (6 | ) |
| | | | | | | | | | | | | | | |
Tourism British Columbia | | | | | | | | | | | | | | | |
| | | | | | | | | | | | | | | |
Revenue | | 60 | | 61 | | 65 | | 104 | | — | | — | | — | |
Expense | | (59 | ) | (63 | ) | (65 | ) | (104 | ) | — | | — | | — | |
| | 1 | | (2 | ) | — | | — | | — | | — | | — | |
Accounting adjustments | | 7 | | (1 | ) | 1 | | (5 | ) | — | | — | | — | |
Net impact | | 8 | | (3 | ) | 1 | | (5 | ) | — | | — | | — | |
| | | | | | | | | | | | | | | |
Other service delivery agencies | | | | | | | | | | | | | | | |
| | | | | | | | | | | | | | | |
Revenue | | 683 | | 705 | | 735 | | 685 | | 710 | | 721 | | 756 | |
Expense | | (610 | ) | (662 | ) | (702 | ) | (673 | ) | (692 | ) | (704 | ) | (735 | ) |
| | 73 | | 43 | | 33 | | 12 | | 18 | | 17 | | 21 | |
Accounting adjustments | | 22 | | 20 | | (20 | ) | 86 | | 553 | | 233 | | 154 | |
Net impact | | 95 | | 63 | | 13 | | 98 | | 571 | | 250 | | 175 | |
| | | | | | | | | | | | | | | |
Total net impact | | 762 | | 761 | | 159 | | 136 | | 946 | | 133 | | (318 | ) |
| | | | | | | | | | | | | | | |
Total service delivery agency operating results: | | | | | | | | | | | | | | | |
| | | | | | | | | | | | | | | |
Revenue | | 20,857 | | 21,790 | | 22,972 | | 24,057 | | 24,665 | | 25,220 | | 25,555 | |
Accounting adjustments | | 323 | | 624 | | 312 | | 138 | | 1,067 | | 336 | | (54 | ) |
| | 21,180 | | 22,414 | | 23,284 | | 24,195 | | 25,732 | | 25,556 | | 25,501 | |
Expense | | (20,424 | ) | (21,663 | ) | (23,132 | ) | (24,059 | ) | (24,786 | ) | (25,423 | ) | (25,819 | ) |
Accounting adjustments | | 6 | | 10 | | 7 | | — | | — | | — | | — | |
| | (20,418 | ) | (21,653 | ) | (23,125 | ) | (24,059 | ) | (24,786 | ) | (25,423 | ) | (25,819 | ) |
Total net impact | | 762 | | 761 | | 159 | | 136 | | 946 | | 133 | | (318 | ) |
(1) Revenue and expense are shown as reported in the entity financial statements and service plans, before consolidation and accounting adjustments.
Budget and Fiscal Plan – 2010/11 to 2012/13
157
Appendices
Table A9 Material Assumptions — Revenue
| | September | | Updated | | Budget | | | | | | | |
Revenue Source and Assumptions | | Update | | Forecast | | Estimate | | Plan | | Plan | | | |
($ millions unless otherwise specified) | | 2009/10 | | 2010/11 | | 2011/12 | | 2012/13 | | Sensitivities 2010/11 | |
Personal income tax | | $5,681 | | $5,516 | | $5,861 | | $6,124 | | $6,545 | | | |
Current calendar year assumptions | | | | | | | | | | | | | |
Personal income growth | | -1.0% | | -1.5% | | 2.7% | | 3.5% | | 4.6% | | +/- 1% change in 2010 BC | |
Labour income growth | | -2.0% | | -2.0% | | 2.8% | | 4.5% | | 4.9% | | personal income growth | |
Tax base growth | | -1.7% | | -2.3% | | 2.9% | | 4.2% | | 5.6% | | equals +/- $50 to $100 million | |
Average tax yield | | 5.21% | | 5.12% | | 5.05% | | 5.09% | | 5.12% | | | |
Current-year tax | | $6,067 | | $5,955 | | $6,041 | | $6,339 | | $6,745 | | +/- 1% change in 2009 BC | |
BC Tax Reduction | | -$131 | | -$127 | | -$129 | | -$132 | | -$135 | | personal or taxable income | |
Low income climate action tax credit | | -$150 | | -$153 | | -$153 | | -$161 | | -$168 | | growth equals +/- $50 to $100 | |
Sales tax/BC HST credit | | -$53 | | -$53 | | -$146 | | -$283 | | -$280 | | million one-time effect | |
Other tax credits and refunds | | -$116 | | -$106 | | -$100 | | -$98 | | -$93 | | (prior-year adjustment) | |
Policy neutral elasticity * | | 1.0 | | 1.0 | | 1.4 | | 1.4 | | 1.4 | | and could result in an | |
Fiscal year assumptions | | | | | | | | | | | | additional base change in 2010/11 | |
Prior-year adjustment | | -$296 | | -$368 | | | | | | | | | |
Family Bonus offset | | -$9 | | -$9 | | -$7 | | -$5 | | -$4 | | | |
| | 2008 Assumptions | | | | | | | | | |
2008 Tax-year | | | | | | | | | | | | | |
Personal income growth | | 5.2% | | 5.1% | | | | | | | | | |
Tax base growth | | 1.9% | | 2.4% | | | | | | | | | |
Average 2008 tax yield | | 5.14% | | 5.05% | | | | | | | | | |
2008 tax | | $6,090 | | $6,003 | | | | | | | | | |
BC Tax Reduction | | -$130 | | -$127 | | | | | | | | | |
Low income climate action tax credit | | -$70 | | -$70 | | | | | | | | | |
Sales tax credit | | -$53 | | -$53 | | | | | | | | | |
Other tax credits and refunds | | -$120 | | -$83 | | | | | | | | | |
Policy neutral elasticity * | | 0.1 | | -0.2 | | | | | | | | | |
* Ratio of annual per cent change in current-year revenue to annual per cent change in personal income (calendar year).
Corporate income tax | | $1,409 | | $1,331 | | $847 | | $1,102 | | $1,343 | | | |
Components of revenue (fiscal year) | | | | | | | | | | | | | |
Advance instalments | | $1,399 | | $1,383 | | $1,157 | | $1,149 | | $1,258 | | | |
International Financial Activity Act refunds | | -$20 | | -$5 | | -$10 | | -$10 | | -$10 | | | |
Prior-year adjustment | | $30 | | -$47 | | -$300 | | -$37 | | $95 | | | |
Current calendar year assumptions | | | | | | | | | | | | | |
National tax base ($ billions) | | $162.3 | | $159.4 | | $169.7 | | $194.2 | | $214.9 | | +/- 1% change in the 2010 | |
BC instalment share of national tax base | | 12.1% | | 12.1% | | 11.8% | | 10.4% | | 11.5% | | national tax base equals | |
Effective tax rates (general/small business) | | 11.0 / 2.5 | | 11.0 / 2.5 | | 10.5 / 2.5 | | 10.0 / 2.5 | | 10.0 / 0.6 | | +/- $15 to $25 million | |
BC tax base growth (post federal measures) | | -26.1% | | -26.2% | | 12.8% | | 10.6% | | 5.8% | | | |
BC corporate profits growth | | -36.4% | | -35.8% | | 12.7% | | 9.8% | | 7.6% | | +/- 1% change in the 2009 | |
BC Tax credits | | | | | | | | | | | | BC tax base equals +/- $20 | |
Film, Television and Production Services | | -$196 | | -$153 | | -$163 | | -$173 | | -$183 | | to $30 million in 2010/11 | |
Scientific Research and Experimental Development | | -$146 | | -$126 | | -$140 | | -$150 | | -$155 | | | |
Interactive Digital Media | | $0 | | $0 | | $0 | | -$2 | | -$10 | | | |
Other | | -$21 | | -$21 | | -$26 | | -$38 | | -$38 | | | |
| | 2008 Assumptions | | | | | | | | | |
2008 Tax-year | | | | | | | | | | | | | |
BC tax base growth | | 1.0% | | -5.4% | | | | | | | | | |
BC corporate profits growth | | 2.2% | | 3.6% | | | | | | | | | |
Gross 2008 tax | | $2,213 | | $2,114 | | | | | | | | | |
Prior-year adjustments | | $30 | | -$47 | | | | | | | | | |
Prior years losses/gains (included in above) | | -$400 | | -$442 | | | | | | | | | |
BC Tax credits | | | | | | | | | | | | | |
Film, Television and Production Services | | -$186 | | -$131 | | | | | | | | | |
Scientific Research and Experimental Development | | -$136 | | -$124 | | | | | | | | | |
Other | | -$49 | | -$55 | | | | | | | | | |
Revenue is recorded on a cash basis. Due to lags in the federal collection and instalment systems, changes to the BC corporate profits and tax base forecasts affect revenue in the succeeding year. The 2010/11 instalments from the federal government reflect 9 months of payments related to the 2010 tax year (Apr/10-Dec/10) and 3 months of payments related to the 2011 tax year (Jan/11-Mar/11). Instalments for the 2010 (2011) tax year are based on BC’s share of the national tax base for the 2008 (2009) tax year and a forecast of the 2010 (2011) national tax base. BC’s share of the 2008 national tax base was 11.8%, based on tax assessments as of December 31, 2009. Cash adjustments for any under/over payments from the federal government in respect of 2009 will be received/paid on March 31, 2011.
Budget and Fiscal Plan – 2010/11 to 2012/13
158
Appendices
Table A9 Material Assumptions — Revenue — Continued
Revenue Source and Assumptions | | September
Update | | Updated
Forecast | | Budget Estimate | | Plan | | Plan | | | |
($ millions unless otherwise specified) | | 2009/10 | | 2010/11 | | 2011/12 | | 2012/13 | | Sensitivities 2010/11 | |
Harmonized sales tax | | | | | | $ | 3,784 | | $ | 5,376 | | $ | 5,728 | | | |
Calendar Year | | | | | | | | | | | | +/- 1% change in consumer | |
Nominal consumer expenditure | | -2.0 | % | -2.1 | % | 4.3 | % | 4.5 | % | 4.9 | % | expenditure growth equals up to | |
Nominal residential investment | | -24.2 | % | -20.8 | % | 17.9 | % | 8.7 | % | 6.4 | % | +/- $35 million | |
Above two bases represent about 84% of the total base | | | | | | | | | | | | | |
HST Rebates (% rebate of the provincial portion of the HST paid) | | | | | | | | | | | | +/- 1% change in residential | |
Municipalities | | | | | | 75 | % | 75 | % | 75 | % | construction growth equals up to | |
Charities and non-profit organizations | | | | | | 57 | % | 57 | % | 57 | % | +/- $10 million | |
New housing (up to $26,250) | | | | | | 71.43 | % | 71.43 | % | 71.43 | % | | |
School authorities | | | | | | 87 | % | 87 | % | 87 | % | | |
Universities and public colleges | | | | | | 75 | % | 75 | % | 75 | % | | |
Hospital authorities | | | | | | 58 | % | 58 | % | 58 | % | | |
Components of revenue | | | | | | | | | | | | +/- 1% change in the proportion | |
Gross | | | | | | $ | 4,914 | | $ | 6,915 | | $ | 7,311 | | of the consumer expenditure | |
Input tax credit denial (temporary) | | | | | | $ | 118 | | $ | 162 | | $ | 168 | | and residential construction bases | |
Rebates: | | | | | | | | | | | | equals up to -/+ $40 million | |
· Point of sale | | | | | | $ | (248 | ) | $ | (331 | ) | $ | (333 | ) | | |
· Residential energy use | | | | | | $ | (175 | ) | $ | (220 | ) | $ | (231 | ) | | |
· Municipalities, charities & non profit organizations | | | | | | $ | (220 | ) | $ | (307 | ) | $ | (322 | ) | | |
· SUCH sector | | | | | | $ | (167 | ) | $ | (228 | ) | $ | (231 | ) | | |
· New housing | | | | | | $ | (438 | ) | $ | (615 | ) | $ | (634 | ) | | |
Other sales taxes | | $ | 4,847 | | $ | 4,757 | | $ | 1,399 | | $ | 201 | | $ | 173 | | | |
Components of social service tax revenue | | | | | | | | | | | | | |
Consolidated Revenue Fund (net of commissions) | | $ | 4,772 | | $ | 4,682 | | $ | 1,210 | | $ | 0 | | $ | 0 | | | |
BC Transportation Financing Authority | | $ | 14 | | $ | 14 | | $ | 3 | | $ | 0 | | $ | 0 | | | |
Recoveries | | $ | 61 | | $ | 61 | | $ | 61 | | $ | 30 | | $ | 0 | | | |
Continued tax on private sales of vehicles (12% rate) | | $ | 0 | | $ | 0 | | $ | 125 | | $ | 171 | | $ | 173 | | | |
Fuel and carbon taxes | | $ | 1,430 | | $ | 1,425 | | $ | 1,604 | | $ | 1,803 | | $ | 2,012 | | | |
Calendar Year | | | | | | | | | | | | | |
Real GDP | | -2.9 | % | -2.7 | % | 2.2 | % | 2.3 | % | 2.7 | % | | |
Gasoline volumes | | -1.0 | % | -1.0 | % | -1.0 | % | -1.0 | % | -1.0 | % | | |
Diesel volumes | | -10.4 | % | -10.4 | % | 1.0 | % | 1.0 | % | 1.0 | % | | |
Natural gas volumes | | 2.0 | % | 2.0 | % | 2.0 | % | 2.0 | % | 2.0 | % | | |
Carbon tax rates (July 1) | | | | | | | | | | | | | |
Carbon dioxide equivalent emissions ($/tonne) | | $ | 15 | | $ | 15 | | $ | 20 | | $ | 25 | | $ | 30 | | | |
Natural gas (cents/gigajoule) | | 74.49 | ¢ | 74.49 | ¢ | 99.32 | ¢ | 124.15 | ¢ | 148.98 | ¢ | | |
Gasoline (cents/litre) | | 3.51 | ¢ | 3.51 | ¢ | 4.45 | ¢ | 5.56 | ¢ | 6.67 | ¢ | | |
Light fuel oil (cents/litre) | | 4.04 | ¢ | 4.04 | ¢ | 5.11 | ¢ | 6.39 | ¢ | 7.67 | ¢ | | |
Carbon tax revenue | | $ | 557 | | $ | 542 | | $ | 727 | | $ | 928 | | $ | 1,137 | | | |
Carbon tax rates changed effective January 1, 2010 (gasoline: 3.33¢; light fuel: 3.84¢) | | | | | | | | | | | | | |
Components of fuel tax revenue | | | | | | | | | | | | | |
Consolidated Revenue Fund | | $ | 456 | | $ | 456 | | $ | 452 | | $ | 453 | | $ | 455 | | | |
BC Transit | | $ | 11 | | $ | 11 | | $ | 11 | | $ | 11 | | $ | 11 | | | |
BC Transportation Financing Authority | | $ | 406 | | $ | 416 | | $ | 414 | | $ | 411 | | $ | 409 | | | |
| | $ | 873 | | $ | 883 | | $ | 877 | | $ | 875 | | $ | 875 | | | |
Property taxes | | $ | 1,891 | | $ | 1,885 | | $ | 1,906 | | $ | 1,908 | | $ | 1,998 | | | |
Calendar Year | | | | | | | | | | | | | |
BC Consumer Price Index | | 0.6 | % | 0.0 | % | 1.8 | % | 2.0 | % | 2.0 | % | +/- 1% change in new | |
Housing starts | | 13,491 | | 15,625 | | 20,480 | | 23,553 | | 25,766 | | construction and inflation | |
Home owner grants (fiscal year) | | $ | -685 | | $ | -685 | | $ | -723 | | $ | -803 | | $ | -823 | | equals up to +/- $5 million | |
| | | | | | | | | | | | in residential property | |
Components of revenue | | | | | | | | | | | | taxation revenue | |
Residential (net of home owner grants) | | $ | 687 | | $ | 685 | | $ | 669 | | $ | 635 | | $ | 666 | | | |
Non-residential | | $ | 975 | | $ | 974 | | $ | 987 | | $ | 1,010 | | $ | 1,044 | | +/- 1% change in new | |
Rural area | | $ | 82 | | $ | 81 | | $ | 83 | | $ | 85 | | $ | 86 | | construction and inflation | |
Police | | $ | 23 | | $ | 23 | | $ | 23 | | $ | 23 | | $ | 23 | | equals up to +/- $5 million | |
BC Assessment Authority | | $ | 73 | | $ | 73 | | $ | 76 | | $ | 78 | | $ | 81 | | in non-residential property | |
BC Transit | | $ | 53 | | $ | 52 | | $ | 70 | | $ | 79 | | $ | 100 | | taxation revenue | |
Commissions | | $ | (2 | ) | $ | (3 | ) | $ | (2 | ) | $ | (2 | ) | $ | (2 | ) | | |
| | | | | | | | | | | | | | | | | | | | | | | |
Budget and Fiscal Plan – 2010/11 to 2012/13
159
Appendices
Table A9 Material Assumptions — Revenue — Continued
Revenue Source and Assumptions | | September
Update | | Updated Forecast | | Budget Estimate | | Plan | | Plan | | | |
($ millions unless otherwise specified) | | 2009/10 | | 2010/11 | | 2011/12 | | 2012/13 | | Sensitivities 2010/11 | |
Other taxes | | $1,959 | | $2,109 | | $2,021 | | $2,144 | | $2,240 | | | |
Calendar Year | | | | | | | | | | | | | |
Population | | 1.5 | % | 1.6 | % | 1.5 | % | 1.5 | % | 1.4 | % | | |
BC Consumer Price Index | | 0.6 | % | 0.0 | % | 1.8 | % | 2.0 | % | 2.0 | % | | |
BC housing starts | | -60.7 | % | -53.2 | % | 27.4 | % | 15.0 | % | 9.4 | % | | |
Nominal GDP | | -5.0 | % | -2.7 | % | 2.2 | % | 2.3 | % | 2.7 | % | | |
Real GDP | | -2.9 | % | -5.0 | % | 4.5 | % | 4.7 | % | 5.0 | % | | |
| | | | | | | | | | | | | |
Components of revenue | | | | | | | | | | | | | |
Property transfer | | $ | 685 | | $ | 855 | | $ | 900 | | $ | 1,045 | | $ | 1,130 | | | |
Tobacco (net of commissions) | | $ | 686 | | $ | 677 | | $ | 686 | | $ | 686 | | $ | 686 | | | |
Corporation capital | | $ | 56 | | $ | 56 | | $ | 0 | | $ | 0 | | $ | 0 | | | |
Insurance premium | | $ | 393 | | $ | 393 | | $ | 403 | | $ | 413 | | $ | 424 | | | |
Hotel room (net of commissions) | | | | | | | | | | | | | |
Consolidated Revenue Fund | | $ | 85 | | $ | 78 | | $ | 32 | | $ | 0 | | $ | 0 | | | |
Tourism British Columbia | | $ | 54 | | $ | 50 | | $ | 0 | | $ | 0 | | $ | 0 | | | |
Energy, sales of Crown land tenures, metals, minerals and other | | $ | 1,821 | | $ | 1,970 | | $ | 2,320 | | $ | 2,660 | | $ | 2,913 | | | |
Natural gas price | | | | | | | | | | | | +/- $1.00 change in the | |
Plant inlet, $Cdn/gigajoule | | $ | 3.51 | | $ | 3.06 | | $ | 4.29 | | $ | 5.09 | | $ | 5.38 | | natural gas price equals | |
Sumas, $US/ MMBtu | | $ | 4.44 | | $ | 4.15 | | $ | 5.71 | | $ | 6.57 | | $ | 6.87 | | +/- $255 to $305 million | |
Natural gas volumes (petajoules) | | | | | | | | | | | | +/- 1% change in natural gas | |
Base gas production | | 602 | | 633 | | 517 | | 444 | | 371 | | volumes equals +/- $5 to $20 | |
Incremental gas production | | 521 | | 482 | | 686 | | 1,038 | | 1,325 | | million | |
Total gas volume production | | 1,123 | | 1,115 | | 1,203 | | 1,482 | | 1,696 | | +/- 1 cent change in the exchange | |
Annual per cent change | | 2.1 | % | 1.3 | % | 7.9 | % | 23.2 | % | 14.4 | % | rate equals +/- $15 to $25 | |
| | | | | | | | | | | | million on natural gas royalties | |
Oil price ($US/bbl at Cushing, Ok) | | $ | 64.13 | | $ | 70.20 | | $ | 80.02 | | $ | 84.11 | | $ | 87.43 | | | |
Auctioned land base (000 hectares) | | 465 | | 458 | | 582 | | 604 | | 591 | | | |
Average bid price/hectare ($) | | $ | 871 | | $ | 2,208 | | $ | 1,200 | | $ | 1,160 | | $ | 1,038 | | | |
Cash sales of Crown land tenures | | $ | 405 | | $ | 1,011 | | $ | 698 | | $ | 700 | | $ | 613 | | | |
Metallurgical coal price ($US/tonne, fob west coast) | | $ | 130 | | $ | 138 | | $ | 167 | | $ | 172 | | $ | 172 | | | |
Copper price ($US/lb) | | $ | 1.91 | | $ | 2.76 | | $ | 3.19 | | $ | 2.94 | | $ | 2.38 | | | |
Annual electricity volumes set by treaty | | 4.5 | | 4.5 | | 4.6 | | 4.5 | | 4.3 | | +/- 10% change in the average | |
(million mega-watt hours) | | | | | | | | | | | | Mid-Columbia electricity price | |
Mid-Columbia electricity price | | $ | 34 | | $ | 39 | | $ | 53 | | $ | 54 | | $ | 56 | | equals +/- $25 to $30 million | |
($US/mega-watt hour) | | | | | | | | | | | | | |
Exchange rate (US¢/ Cdn$, calendar year) | | 86.2 | | 87.6 | | 97.4 | | 98.6 | | 98.9 | | | |
| | | | | | | | | | | | Based on a recommendation from | |
Components of revenue | | | | | | | | | | | | the Auditor General to be | |
Natural gas royalties | | $ | 522 | | $ | 464 | | $ | 698 | | $ | 1,002 | | $ | 1,249 | | consistent with generally accepted | |
Bonus bids, fees and rentals | | $ | 868 | | $ | 941 | | $ | 993 | | $ | 1,002 | | $ | 1,044 | | accounting principles, bonus bid | |
Petroleum royalties | | $ | 67 | | $ | 71 | | $ | 68 | | $ | 66 | | $ | 63 | | revenue recognition reflects | |
Columbia River Treaty electricity sales | | $ | 150 | | $ | 170 | | $ | 230 | | $ | 235 | | $ | 225 | | eight-year deferral of cash | |
Coal | | $ | 158 | | $ | 229 | | $ | 226 | | $ | 232 | | $ | 226 | | receipts from the sale of Crown | |
Minerals, metals and other | | $ | 24 | | $ | 66 | | $ | 71 | | $ | 85 | | $ | 64 | | land tenures | |
Oil and Gas Commission fees and levies | | $ | 32 | | $ | 29 | | $ | 34 | | $ | 38 | | $ | 42 | | | |
| | | | | | | | | | | | | |
Royalty programs and infrastructure credits | | | | | | | | | | | | | |
Summer drilling | | $ | -43 | | $ | -37 | | $ | -37 | | $ | -35 | | $ | -32 | | | |
Deep drilling | | $ | -90 | | $ | -77 | | $ | -130 | | $ | -192 | | $ | -259 | | | |
Road and pipeline infrastructure | | $ | -98 | | $ | -54 | | $ | -115 | | $ | -134 | | $ | -72 | | | |
Total | | $ | -231 | | $ | -168 | | $ | -282 | | $ | -361 | | $ | -363 | | | |
Implicit average natural gas royalty rate | | 13.2 | % | 13.6 | % | 13.5 | % | 13.3 | % | 13.7 | % | | |
| | | | | | | | | | | | | | | | | | | | | | | |
Royalty program (marginal, low productivity and ultra marginal drilling) adjustments reflect reduced royalty rates.
Natural gas royalties incorporate royalty programs and Treasury Board approved infrastructure credits.
Budget and Fiscal Plan – 2010/11 to 2012/13
160
Appendices
Table A9 Material Assumptions — Revenue — Continued
| | September | | Updated | | Budget | | | | | | | |
Revenue Source and Assumptions | | Update | | Forecast | | Estimate | | Plan | | Plan | | | |
($ millions unless otherwise specified) | | 2009/10 | | 2010/11 | | 2011/12 | | 2012/13 | | Sensitivities 2010/11 | |
Forests | | $ | 387 | | $ | 345 | | $ | 491 | | $ | 597 | | $ | 603 | | | |
Prices (calendar year average) | | | | | | | | | | | | +/- US$50 change in SPF | |
SPF 2x4 ($US/1000 bd ft) | | $ | 176 | | $ | 181 | | $ | 225 | | $ | 238 | | $ | 288 | | price equals +/- $35 to | |
Random Lengths Composite ($US/thousand board feet) | | $ | 213 | | $ | 222 | | $ | 260 | | $ | 273 | | $ | 323 | | $ | 70 million
+/- US$100 change in hemlock | |
Hemlock price ($US/1000 bd ft) | | $ | 771 | | $ | 767 | | $ | 750 | | $ | 700 | | $ | 675 | | price equals +/- $10 to $20 | |
Pulp ($US/tonne) | | $ | 609 | | $ | 658 | | $ | 763 | | $ | 713 | | $ | 700 | | million | |
Coastal log ($Cdn/cubic metre) | | | | | | | | | | | | +/- US$50 change in pulp price | |
(Vancouver Log Market, fiscal year) | | $ | 66 | | $ | 72 | | $ | 66 | | $ | 70 | | $ | 74 | | equals +/-$5 to $10 million | |
| | | | | | | | | | | | +/- Cdn$10 change in average | |
Fiscal Year Trade Assumptions | | | | | | | | | | | | log price equals +/-$30 to | |
Export tax rate (effective rate) | | 15.0 | % | 15.0 | % | 15.0 | % | 13.8 | % | 6.3 | % | $ | 50 million | |
Lumber shipments and consumption (billion board feet) | | | | | | | | | | | | +/- 1 cent change in | |
U.S. lumber consumption | | 33.4 | | 33.4 | | 35.1 | | 38.2 | | 40.7 | | exchange rate equals | |
BC surge trigger volumes | | 7.1 | | 7.1 | | 7.4 | | 8.1 | | 8.6 | | +/- $8 to $10 million on | |
BC lumber exports to US | | 5.4 | | 5.3 | | 6.2 | | 7.1 | | 8.1 | | stumpage revenue | |
| | | | | | | | | | | | +/- 10% change in Interior | |
Crown harvest volumes (million cubic metres) | | | | | | | | | | | | harvest volumes equals | |
Interior | | 36.4 | | 33.5 | | 37.2 | | 37.8 | | 40.4 | | +/- $15 to $20 million | |
Coast | | 7.6 | | 7.5 | | 7.8 | | 9.2 | | 9.6 | | +/- 10% change in Coastal | |
Total | | 44.0 | | 41.0 | | 45.0 | | 47.0 | | 50.0 | | harvest volumes equals | |
BC Timber Sales (included in above) | | 9.4 | | 10.5 | | 10.9 | | 11.1 | | 11.8 | | +/- $6 to $12 million | |
| | | | | | | | | | | | | |
Components of revenue | | | | | | | | | | | | The above sensitivities relate | |
Tenures | | $ | 131 | | $ | 88 | | $ | 148 | | $ | 202 | | $ | 273 | | to stumpage revenue only. | |
BC Timber Sales | | $ | 104 | | $ | 101 | | $ | 137 | | $ | 153 | | $ | 172 | | Depending on market | |
Federal border tax (SLA 2006) | | $ | 144 | | $ | 151 | | $ | 181 | | $ | 210 | | $ | 121 | | conditions, changes in | |
Logging tax | | $ | -14 | | $ | -16 | | $ | 4 | | $ | 10 | | $ | 15 | | stumpage revenues may be | |
Other CRF revenue | | $ | 11 | | $ | 10 | | $ | 10 | | $ | 11 | | $ | 11 | | offset by changes in border | |
Recoveries | | $ | 11 | | $ | 11 | | $ | 11 | | $ | 11 | | $ | 11 | | tax revenues. | |
Other natural resources | | $ | 369 | | $ | 390 | | $ | 397 | | $ | 426 | | $ | 438 | | | |
Components of revenue | | | | | | | | | | | | | |
Water rental and licences* | | $ | 311 | | $ | 339 | | $ | 332 | | $ | 359 | | $ | 371 | | | |
Recoveries | | $ | 40 | | $ | 32 | | $ | 46 | | $ | 48 | | $ | 48 | | | |
Angling and hunting permits and licences | | $ | 11 | | $ | 12 | | $ | 12 | | $ | 12 | | $ | 12 | | | |
Recoveries | | $ | 7 | | $ | 7 | | $ | 7 | | $ | 7 | | $ | 7 | | | |
|
* Incorporates only BC Hydro rate increases approved by the BC Utilities Commission | | | | | |
| | | | | |
Other revenue | | $ | 7,672 | | $ | 7,640 | | $ | 7,874 | | $ | 8,251 | | $ | 8,732 | | | |
Components of revenue | | | | | | | | | | | | | |
Fees and licences | | | | | | | | | | | | | |
Consolidated Revenue Fund | | $ | 2,467 | | $ | 2,347 | | $ | 2,495 | | $ | 2,647 | | $ | 2,776 | | | |
Recoveries | | $ | 127 | | $ | 139 | | $ | 212 | | $ | 134 | | $ | 132 | | | |
Crown corporations and agencies | | $ | 99 | | $ | 99 | | $ | 98 | | $ | 101 | | $ | 105 | | | |
Other service delivery agencies | | $ | 1,483 | | $ | 1,505 | | $ | 1,551 | | $ | 1,588 | | $ | 1,624 | | | |
Investment earnings | | | | | | | | | | | | | |
Consolidated Revenue Fund | | $ | 40 | | $ | 40 | | $ | 47 | | $ | 57 | | $ | 70 | | | |
Fiscal agency loans & sinking funds earnings | | $ | 726 | | $ | 735 | | $ | 726 | | $ | 800 | | $ | 1,035 | | | |
Crown corporations and agencies | | $ | 40 | | $ | 48 | | $ | 48 | | $ | 57 | | $ | 57 | | | |
Other service delivery agencies | | $ | 91 | | $ | 101 | | $ | 100 | | $ | 101 | | $ | 106 | | | |
Sales of goods and services | | $ | 724 | | $ | 712 | | $ | 701 | | $ | 737 | | $ | 764 | | | |
Miscellaneous | | | | | | | | | | | | | |
Consolidated Revenue Fund | | $ | 185 | | $ | 187 | | $ | 194 | | $ | 201 | | $ | 210 | | | |
Recoveries | | $ | 429 | | $ | 482 | | $ | 501 | | $ | 600 | | $ | 609 | | | |
Crown corporations and agencies | | $ | 101 | | $ | 101 | | $ | 75 | | $ | 74 | | $ | 83 | | | |
Other service delivery agencies | | $ | 1,160 | | $ | 1,144 | | $ | 1,126 | | $ | 1,154 | | $ | 1,161 | | | |
Budget and Fiscal Plan – 2010/11 to 2012/13
161
Appendices
Table A9 Material Assumptions — Revenue — Continued
| | September | | Updated | | Budget | | | | | | | |
Revenue Source and Assumptions | | Update | | Forecast | | Estimate | | Plan | | Plan | | | |
($ millions unless otherwise specified) | | 2009/10 | | 2010/11 | | 2011/12 | | 2012/13 | | Sensitivities 2010/11 | |
Health and social transfers | | $ | 4,873 | | $ | 4,882 | | $ | 5,165 | | $ | 5,292 | | $ | 5,580 | | | |
National Cash Transfers | | | | | | | | | | | | | |
Canada Health Transfer (CHT) | | $ | 23,987 | | $ | 23,987 | | $ | 25,426 | | $ | 26,952 | | $ | 28,569 | | | |
Wait Times Reduction Transfer (WTRT) | | $ | 250 | | $ | 250 | | $ | 250 | | $ | 250 | | $ | 250 | | +/- 0.1% change in BC’s | |
Canada Social Transfer (CST) | | $ | 10,853 | | $ | 10,853 | | $ | 11,178 | | $ | 11,514 | | $ | 11,859 | | population share equals | |
BC share of national population (June 1) | | 13.23 | % | 13.20 | % | 13.26 | % | 13.31 | % | 13.37 | % | +/- $45 to $50 million | |
BC health and social transfers revenue | | | | | | | | | | | | | |
CHT | | $ | 3,355 | | $ | 3,354 | | $ | 3,597 | | $ | 3,703 | | $ | 3,939 | | | |
WTRT | | $ | 33 | | $ | 33 | | $ | 33 | | $ | 33 | | $ | 33 | | | |
CST | | $ | 1,437 | | $ | 1,433 | | $ | 1,482 | | $ | 1,533 | | $ | 1,585 | | | |
Prior-year adjustments | | -$20 | | -$6 | | | | | | | | | |
Health deferral | | | | | | | | | | | | | |
Diagnostic and Medical Equipment | | $ | 17 | | $ | 17 | | $ | 16 | | $ | 16 | | $ | 16 | | | |
Medical Equipment Trust | | $ | 7 | | $ | 7 | | $ | 7 | | $ | 7 | | $ | 7 | | | |
Human Papillomavirus Immunization Trust | | $ | 13 | | $ | 13 | | $ | 13 | | — | | — | | | |
Patient Wait Times Guarantee Trust | | $ | 31 | | $ | 31 | | $ | 17 | | — | | — | | | |
Other federal contributions | | $ | 2,377 | | $ | 1,952 | | $ | 2,520 | | $ | 1,991 | | $ | 1,399 | | | |
Components of revenue | | | | | | | | | | | | | |
HST Transitional Funding | | $ | 750 | | $ | 250 | | $ | 769 | | $ | 580 | | — | | | |
Other Consolidated Revenue Fund | | $ | 198 | | $ | 199 | | $ | 176 | | $ | 139 | | $ | 136 | | | |
Millennium Scholarship Fund | | $ | 37 | | $ | 38 | | — | | — | | — | | | |
Police Officer’s Recruitment Fund | | $ | 16 | | $ | 21 | | $ | 21 | | $ | 2 | | — | | | |
Community Development Trust | | $ | 47 | | $ | 45 | | $ | 13 | | — | | — | | | |
Community Adjustment Fund Agreement | | — | | $ | 15 | | $ | 15 | | — | | — | | | |
Canada-BC Co-operation on Immigration | | $ | 45 | | $ | 104 | | $ | 104 | | $ | 74 | | $ | 74 | | | |
Labour Market Agreement | | $ | 66 | | $ | 66 | | $ | 66 | | $ | 66 | | $ | 66 | | | |
Labour Market Development Agreement | | $ | 336 | | $ | 336 | | $ | 296 | | $ | 294 | | $ | 292 | | | |
Other recoveries | | $ | 304 | | $ | 247 | | $ | 339 | | $ | 214 | | $ | 210 | | | |
Crown corporations and agencies | | $ | 175 | | $ | 202 | | $ | 308 | | $ | 201 | | $ | 192 | | | |
Other service delivery agencies | | $ | 403 | | $ | 429 | | $ | 413 | | $ | 421 | | $ | 429 | | | |
Service delivery agency direct revenue | | $ | 4,919 | | $ | 4,986 | | $ | 5,028 | | $ | 5,051 | | $ | 5,164 | | | |
School districts | | $ | 511 | | $ | 497 | | $ | 484 | | $ | 484 | | $ | 484 | | | |
Post-secondary institutions | | $ | 2,338 | | $ | 2,418 | | $ | 2,460 | | $ | 2,512 | | $ | 2,565 | | | |
Health authorities and hospital societies | | $ | 779 | | $ | 743 | | $ | 734 | | $ | 765 | | $ | 777 | | | |
BC Transportation Financing Authority | | $ | 451 | | $ | 461 | | $ | 471 | | $ | 479 | | $ | 486 | | | |
Other service delivery agencies | | $ | 840 | | $ | 867 | | $ | 879 | | $ | 811 | | $ | 852 | | | |
Commercial Crown corporation net income | | $ | 2,892 | | $ | 2,848 | | $ | 3,001 | | $ | 3,082 | | $ | 3,096 | | | |
BC Hydro | | $ | 452 | | $ | 355 | | $ | 609 | | $ | 660 | | $ | 640 | | | |
reservoir water inflows | | 93 | % | 87 | % | 100 | % | 100 | % | 100 | % | +/-1% in hydro generation | |
| | | | | | | | | | | | = +/-$10 million | |
mean gas price | | 4.20 | | 3.60 | | 5.44 | | 6.18 | | 6.44 | | +/-10% = -/+$10 million | |
(Sumas, $US/MMbtu — BC Hydro forecast based on NYMEX forward selling prices) | | | | | | | | | | | | | |
electricity prices | | 33.60 | | 31.63 | | 42.13 | | 47.73 | | 49.25 | | +/-$1/MWh in electricity trade | |
(Mid-C, $US/MWh) | | | | | | | | | | | | margins = +/-$15 million | |
assumed rate increases: | | | | | | | | | | | | | |
· base rate | | 8.74 | % | 8.74 | % | 6.11 | % | 11.92 | % | 6.31 | % | | |
· rate rider changes from prior year | | 0.50 | % | 0.50 | % | 3.00 | % | 1.00 | % | -1.50 | % | | |
| |
Assumed base rate increases for 2010/11 through 2012/13 reflect the notional annual increases that would be required for BC Hydro to earn its allowed return on equity as mandated by the BCUC. These increases are included for planning purposes only. Actual rate increases in these years will be determined by future applications to, and approval from, the BCUC. | |
| | | | | | | | | | | | | |
ICBC | | $ | 407 | | $ | 520 | | $ | 303 | | $ | 245 | | $ | 212 | | | |
vehicle growth | | +0.3 | % | +1.0 | % | +1.3 | % | +1.6 | % | +1.8 | % | +/-1% = +/-$37 to $38 million | |
current claims cost percentage change | | +2.8 | % | -0.5 | % | +3.7 | % | +2.9 | % | +3.0 | % | +/-1% = -/+$26 to $30 million | |
investment return | | 4.6 | % | 5.0 | % | 4.4 | % | 4.5 | % | 4.7 | % | +/ -1% return = +/-$101 | |
| | | | | | | | | | | | to $114 million | �� |
loss ratio | | 83.2 | % | 81.4 | % | 85.1 | % | 87.0 | % | 88.1 | % | | |
Budget and Fiscal Plan – 2010/11 to 2012/13
162
Appendices
Table A10 Natural Gas Price Forecasts — 2010/11 to 2012/13
Private sector forecasts (calendar year) | | Adjusted to fiscal years and
$C/gigajoule at plant inlet | |
| | 2010 | | 2011 | | 2012 | | 2010/11 | | 2011/12 | | 2012/13 | |
GLJ Henry Hub US$/MMBtu (Jan 1,10) | | 6.00 | | 7.00 | | 7.10 | | 4.44 | | 4.84 | | 4.93 | |
Sproule Henry Hub US$/MMBtu (Dec 31, 09) | | 5.70 | | 6.48 | | 6.70 | | 3.81 | | 4.38 | | 4.73 | |
McDaniel Henry Hub US$/MMBtu (Jan 1,10) | | 6.05 | | 6.90 | | 7.30 | | 4.16 | | 4.83 | | 5.22 | |
AJM Henry Hub US$/Mcf (Dec 31,09) | | 5.75 | | 6.65 | | 7.00 | | 3.68 | | 4.35 | | 4.66 | |
GLJ Alberta AECO-C Spot CDN$/MMBtu
(Jan 1,10) | | 5.96 | | 6.79 | | 6.89 | | 5.24 | | 5.56 | | 5.65 | |
Sproule Alberta AECO-C Spot CDN$/MMBtu
(Dec 31, 09) | | 5.36 | | 6.21 | | 6.44 | | 4.41 | | 5.05 | | 5.41 | |
McDaniel AECO-C Spot C$/MMBtu (Jan 1,10) | | 6.05 | | 6.75 | | 7.15 | | 5.02 | | 5.60 | | 5.96 | |
AJM AECO-C Spot C$/Mcf (Dec 31, 09) | | 5.80 | | 6.70 | | 7.05 | | 4.64 | | 5.32 | | 5.65 | |
GLJ Sumas Spot US$/MMBtu (Jan 1,10) | | 5.60 | | 6.45 | | 6.55 | | 4.69 | | 5.00 | | 5.09 | |
Sproule Sumas Spot CDN$/MMBtu (Dec 31, 09) | | 5.61 | | 6.46 | | 6.69 | | 4.32 | | 4.96 | | 5.33 | |
GLJ BC Spot Plant Gate CDN$/MMBtu (Jan 1,10) | | 5.56 | | 6.38 | | 6.49 | | 5.01 | | 5.35 | | 5.44 | |
Sproule BC Plant Inlet CDN$/MMBtu (Dec 31, 09) | | 4.44 | | 5.29 | | 5.52 | | 4.44 | | 5.08 | | 5.44 | |
McDaniel BC Spot Plant Gate C$MMBtu (Jan 1,10) | | 5.85 | | 6.55 | | 6.95 | | 5.00 | | 5.59 | | 5.94 | |
AJM BC Spot Plant Gate C$/Mcf (Dec 31, 09) | | 5.50 | | 6.40 | | 6.75 | | 4.53 | | 5.21 | | 5.55 | |
GLJ Midwest Chicago US$/MMBtu (Jan 1,10) | | 6.10 | | 7.10 | | 7.20 | | 4.69 | | 5.09 | | 5.18 | |
Sproule Alliance Plant Gate CDN$/MMBtu
(Dec 31, 09) | | 4.70 | | 5.55 | | 5.88 | | 3.78 | | 4.45 | | 4.91 | |
EIA Henry Hub US$/MMBtu (Jan 12, 10) | | 5.21 | | 5.94 | | n/a | | 3.37 | | n/a | | n/a | |
TD Economics Henry Hub FuturesUS$/MMBtu (Dec 15, 09) | | 4.78 | | 6.25 | | n/a | | 3.09 | | n/a | | n/a | |
Scotiabank Group Henry Hub US$/MMBtu
(Dec 1, 09) | | 5.50 | | 5.50 | | n/a | | 3.40 | | n/a | | n/a | |
BMO Alberta Empress US$/MMBtu (Dec 18, 09) | | 4.65 | | 5.40 | | n/a | | 3.43 | | n/a | | n/a | |
RBC Financial Henry Hub US$/Mcf (Sep 29, 09) | | 6.00 | | n/a | | n/a | | n/a | | n/a | | n/a | |
Exports Development Canada Henry Hub US$/MMBtu (Dec 15, 09) | | 4.50 | | n/a | | n/a | | n/a | | n/a | | n/a | |
Paddock Lindstrom Henry Hub US$/MMBtu
(Dec 31, 09) | | 6.00 | | 6.50 | | 7.00 | | 4.31 | | 5.65 | | 6.14 | |
Fekete AECO-C Spot CDN$/MMBtu (Jan 8, 10) | | 5.75 | | 6.25 | | 6.75 | | 4.68 | | 5.16 | | 5.63 | |
NYMEX Forward Market converted to Plant Inlet CDN$/GJ (Jan 12, 10) | | | | | | | | 3.95 | | 4.27 | | 4.38 | |
Average all minus high/low | | | | | | | | 4.29 | | 5.09 | | 5.38 | |
Average one forecast per consultant minus high/low | | | | | | | | 4.24 | | 5.28 | | 5.60 | |
Natural gas royalty price forecast | | | | | | | | 4.29 | | 5.09 | | 5.38 | |
GLJ: Gilbert Laustsen Jung Petroleum Consultants Ltd
AJM: Ashton Jenkins Mann Petroleum Consultants
US EIA: US Energy Information Administration
McDaniel: McDaniel & Associates Consultants Ltd
AECO: Alberta Energy Company
Natural Gas Prices
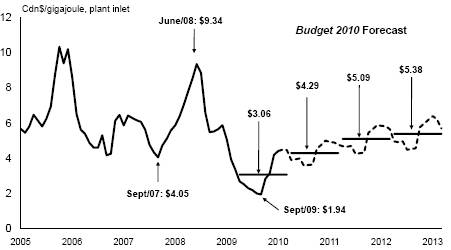
· Since peaking in June 2008, natural gas prices plummeted more than 79 per cent to $1.94 in September 2009 — a level not seen in over 10 years.
· Although average prices have risen recently to over $4.00, they can be expected to remain volatile, influenced by economic demand, inventory levels, weather, other energy prices, changes in drilling technologies and overseas supply of liquefied natural gas.
Budget and Fiscal Plan – 2010/11 to 2012/13
163
Appendices
Table A11 Material Assumptions — Expense
| | September | | Updated | | Budget | | | | | | | |
Ministry Programs and Assumptions | | Update (1) | | Forecast | | Estimate | | Plan | | Plan | | | |
($ millions unless otherwise specified) | | 2009/10 | | 2010/11 | | 2011/12 | | 2012/13 | | Sensitivities 2010/11 | |
Advanced Education and Labour Market Development | | 2,117 | | 2,102 | | 2,114 | | 2,115 | | 2,121 | | The number of student spaces may vary depending on the | |
Student spaces in public institutions
(# of FTEs) | | 204,457 | | 203,698 | | 205,278 | | 205,563 | | 205,754 | | financial and other policies of post secondary institutions. | |
Attorney General | | 465 | | 465 | | 468 | | 458 | | 458 | | The number of criminal | |
New cases filed/processed | | 295,000 | | 295,000 | | 295,000 | | 295,000 | | 295,000 | | cases proceeded on by the | |
(# for all courts) | | | | | | | | | | | | provincial and federal | |
| | | | | | | | | | | | Crown (including appeals to higher courts in BC), the number of civil and family litigation cases, the number of violation tickets disputed, and the number of municipal bylaw tickets disputed which would go to court for resolution. | |
Crown Proceeding Act (CPA) | | 25 | | 25 | | 25 | | 25 | | 25 | | The number and size of | |
| | | | | | | | | | | | litigation brought against the province, as well as the effectiveness of mitigation strategies and legal defence. | |
Children and Family Development | | 1,324 | | 1,318 | | 1,334 | | 1,334 | | 1,334 | | Caseload is expected to decline | |
Average children-in-care caseload (#) | | 8,800 | | 8,700 | | 8,500 | | 8,300 | | 8,300 | | over the next 2 years then flatten | |
Average annual residential cost per child in care ($) | | 31,400 | | 32,300 | | 33,800 | | 34,500 | | 35,200 | | out. This is due to large number of 15 to 17 year olds currently | |
| | | | | | | | | | | | in the system who will reach maturity. Number of aboriginal children in care may also decrease over time. A 1% increase in the cost per case or a 1% increase in the average caseload will affect expenditures by approximately $2.8 million. | |
Education | | 5,030 | | 5,025 | | 5,165 | | 5,243 | | 5,265 | | Enrolment figures are based on | |
Enrolment (# of FTEs) | | 554,627 | | 555,345 | | 561,734 | | 567,652 | | 566,711 | | BC Stats enrolment trends, to | |
School age (K—12) | | 526,785 | | 527,517 | | 524,879 | | 522,255 | | 520,949 | | which the Ministry has added | |
Expanded full-day kindergarten | | — | | — | | 7,543 | | 15,085 | | 15,450 | | forecasts for distributed learning, | |
Distributed Learning (online) | | 13,000 | | 12,516 | | 14,000 | | 15,000 | | 15,000 | | adult education, and summer | �� |
Summer | | 6,477 | | 7,093 | | 7,093 | | 7,093 | | 7,093 | | learning. | |
Adults | | 8,365 | | 8,219 | | 8,219 | | 8,219 | | 8,219 | | | |
Forests and Range | | 1,040 | | 1,019 | | 641 | | 595 | | 606 | | | |
Direct Fire Fighting | | 409 | | 403 | | 52 | | 52 | | 52 | | Over the past several years, fire | |
| | | | | | | | | | | | fighting costs have ranged from a low of $19 million in 1997 to an estimated $403 million in 2009. | |
BC Timber Sales | | 159 | | 164 | | 159 | | 158 | | 168 | | Targets can be impacted by | |
| | | | | | | | | | | | changes to actual inventory costs incurred. There is a lag of approximately 2 years between when inventory costs are incurred and when they are expensed. Volume harvested can also impact targets. For example, if volume harvested is less than projected in any year then capitalized expenses will also be reduced in that year. | |
(1) The 2009/10 budget estimates have been restated to reflect government’s current organization and accounting policies.
Budget and Fiscal Plan — 2010/11 to 2012/13
164
Appendices
Table A11 Material Assumptions — Expense — Continued
Ministry Programs and Assumptions | | September
Update (1) | | Updated
Forecast | | Budget
Estimate | | Plan | | Plan | | | |
($ millions unless otherwise specified) | | 2009/10 | | 2010/11 | | 2011/12 | | 2012/13 | | Sensitivities 2010/11 | |
Health Services | | 14,099 | | 14,010 | | 14,760 | | 15,680 | | 16,127 | | A 1% change in utilization or | |
Pharmacare | | 1,055 | | 1,026 | | 1,090 | | 1,145 | | 1,201 | | drug prices affects costs by | |
| | | | | | | | | | | | approximately $10 million. | |
Medical Services Plan (MSP) | | 3,408 | | 3,411 | | 3,616 | | 3,823 | | 3,922 | | A 1% increase in volume of services provided by fee-for-service physicians affects costs by approximately $25 million. | |
Regional Health Sector funding | | 9,185 | | 9,085 | | 9,581 | | 10,213 | | 10,489 | | | |
Housing and Social Development | | 2,679 | | 2,679 | | 2,730 | | 2,694 | | 2,694 | | The expected to work caseload is sensitive to fluctuations in | |
Temporary Assistance annual average caseload (#) | | 56,382 | | 56,382 | | 57,406 | | 49,981 | | 49,970 | | economic and employment trends in the service sector. A 1% change in the Temporary | |
| | | | | | | | | | | | Assistance annual average caseload or average cost per case will affect expenditures by approximately $4.5 million annually. | |
Disability Assistance annual average caseload (#) | | 72,344 | | 72,344 | | 76,190 | | 78,955 | | 78,955 | | The caseload for persons with disabilities is sensitive to the aging of the population and longer life expectancy for individuals with disabilities and significant health issues. A 1% change in the Disability Assistance annual average caseload or average cost per case will affect expenditures by approximately $7.5 million annually. | |
Total annual average caseload (#) | | 128,726 | | 128,726 | | 133,596 | | 128,936 | | 128,925 | | The average cost per case is sensitive to the composition of the caseload, and reported income. | |
Adult Community Living: | | | | | | | | | | | |
The adult community living caseload is sensitive to the pressures of an aging population. A 1% increase in the adult caseload will increase expenditures by approximately $2.4 million.
| |
Residential Services: | | | | | | | | | | | | |
Average caseload (#) | | 5,375 | | 5,356 | | 5,501 | | 5,681 | | 5,875 | | |
Average cost per client ($) | | 68,965 | | 69,385 | | 68,400 | | 66,233 | | 64,046 | | |
Day Programs: | | | | | | | | | | | | |
Average caseload (#) | | 12,358 | | 12,389 | | 13,201 | | 13,983 | | 14,666 | | |
Average cost per client ($) | | 19,941 | | 19,626 | | 19,074 | | 18,243 | | 17,394 | | |
Personal Supports Initiative | | | | | | | | | | | | |
Average caseload (#) | | n/a | | 6 | | 133 | | 220 | | 220 | | |
Average cost per client ($) | | n/a | | 47,500 | | 44,383 | | 41,832 | | 41,832 | | |
(1) The 2009/10 budget estimates have been restated to reflect government’s current organization and accounting policies.
Budget and Fiscal Plan – 2010/11 to 2012/13
165
Appendices
Table A11 Material Assumptions — Expense — Continued
Ministry Programs and Assumptions | | September
Update (1) | | Updated
Forecast | | Budget
Estimate | | Plan | | Plan | | | |
($ millions unless otherwise specified) | | 2009/10 | | 2010/11 | | 2011/12 | | 2012/13 | | Sensitivities 2010/11 | |
Public Safety and Solicitor General | | 597 | | 597 | | 602 | | 602 | | 603 | | The volume and severity of criminal activity, the number of inmate beds occupied and the number of offenders under community supervision. | |
Emergency Program Act (EPA) | | 21 | | 24 | | 15 | | 15 | | 15 | | The number and severity of natural disasters. | |
Management of Public Funds and Debt | | 1,186 | | 1,183 | | 1,301 | | 1,379 | | 1,432 | | Full year impact on MoPD on interest costs of a 1% change in interest rates equals $63.5 million; $100 million increase in debt level equals $4.6 million. | |
Interest rates for new provincial borrowing: | | | | | | | | | | | | |
Short-term | | 0.28% | | 0.25% | | 0.81% | | 2.59% | | 3.65% | | |
Long-term | | 4.35% | | 4.15% | | 4.55% | | 5.06% | | 5.64% | | |
CDN/US exchange rate (cents) | | 112.0 | | 109.0 | | 101.9 | | 104.4 | | 108.3 | | |
Service delivery agency net spending | | 4,677 | | 4,850 | | 4,082 | | 4,918 | | 5,482 | | | |
School districts | | 325 | | 311 | | 293 | | 322 | | 405 | | | |
Post-secondary institutions | | 2,250 | | 2,274 | | 2,287 | | 2,512 | | 2,620 | | | |
Health authorities and hospital societies | | 749 | | 738 | | 590 | | 628 | | 786 | | | |
BC Transportation Financing Authority | | 823 | | 811 | | 802 | | 930 | | 1,013 | | | |
Other service delivery agencies | | 530 | | 716 | | 110 | | 526 | | 658 | | | |
(1) The 2009/10 budget estimates have been restated to reflect government’s current organization and accounting policies.
Table A12 Full-Time Equivalents (FTEs) (1) — 2006/07 to 2012/13
| | Actual
2006/07 | | Actual
2007/08 | | Actual
2008/09 | | Updated
Forecast
2009/10 | | Budget
Estimate
2010/11 | | Plan
2011/12 | | Plan
2012/13 | |
Ministries and special offices (CRF) | | 28,647 | | 30,224 | | 31,874 | | 31,284 | | 30,096 | | 28,501 | | 27,732 | |
Service delivery agencies (2) | | 3,917 | | 4,128 | | 4,403 | | 4,436 | | 4,204 | | 4,249 | | 4,268 | |
Total FTEs | | 32,564 | | 34,352 | | 36,277 | | 35,720 | | 34,300 | | 32,750 | | 32,000 | |
(1) Full-time equivalents (FTEs) are a measure of staff employment. FTEs are calculated by dividing the total hours of employment paid for in a given period by the number of hours an individual, full-time person would normally work in that period. This does not equate to the physical number of employees. For example, two half-time employees would equal one FTE, or alternatively, three FTEs may represent two full-time employees who have worked sufficient overtime hours to equal an additional FTE.
(2) Service delivery agency FTE amounts do not include SUCH sector staff employment.
Budget and Fiscal Plan – 2010/11 to 2012/13
166
Appendices
Table A13 Capital Spending — 2006/07 to 2012/13
($ millions) | | Actual
2006/07 | | Actual
2007/08 | | Actual
2008/09 | | Updated
Forecast
2009/10 | | Budget
Estimate
2010/11 | | Plan
2011/12 | | Plan
2012/13 | |
Taxpayer-supported | | | | | | | | | | | | | | | |
Education | | | | | | | | | | | | | | | |
Schools (K—12) | | 322 | | 380 | | 413 | | 516 | | 481 | | 368 | | 283 | |
Post-secondary | | 874 | | 782 | | 658 | | 676 | | 743 | | 485 | | 413 | |
Health | | 760 | | 881 | | 892 | | 980 | | 1,161 | | 880 | | 589 | |
BC Transportation Financing Authority | | 821 | | 884 | | 881 | | 995 | | 1,483 | | 1,076 | | 1,142 | |
BC Transit | | 13 | | 37 | | 77 | | 172 | | 89 | | 163 | | 208 | |
Vancouver Convention Centre expansion project | | 105 | | 251 | | 242 | | 43 | | 8 | | — | | — | |
BC Place rejuvenation | | — | | — | | 45 | | 88 | | 390 | | 41 | | — | |
Government ministries | | 355 | | 335 | | 430 | | 349 | | 355 | | 277 | | 194 | |
Other (1) | | 159 | | 122 | | 140 | | 169 | | 404 | | 119 | | 44 | |
Capital spending contingencies | | — | | — | | — | | 25 | | 300 | (2) | 200 | | 200 | |
Total taxpayer-supported | | 3,409 | | 3,672 | | 3,778 | | 4,013 | | 5,414 | | 3,609 | | 3,073 | |
Self-supported | | | | | | | | | | | | | | | |
BC Hydro | | 807 | | 1,076 | | 1,400 | | 2,545 | | 1,770 | | 2,129 | | 2,192 | |
BC Transmission Corporation | | 50 | | 70 | | 19 | | 19 | | 14 | | 15 | | 15 | |
Columbia River power projects (3) | | 19 | | 29 | | 32 | | 16 | | 12 | | 6 | | 4 | |
Transportation Investment Corporation | | — | | — | | 165 | | 511 | | 735 | | 540 | | 540 | |
BC Railway Company (4) | | 19 | | 20 | | 10 | | 14 | | — | | — | | — | |
ICBC (5) | | 22 | | 23 | | 22 | | 19 | | 83 | | 77 | | 79 | |
BC Lotteries | | 44 | | 60 | | 97 | | 112 | | 107 | | 120 | | 120 | |
Liquor Distribution Branch | | 22 | | 18 | | 17 | | 21 | | 24 | | 32 | | 35 | |
Total self-supported commercial | | 983 | | 1,296 | | 1,762 | | 3,257 | | 2,745 | | 2,919 | | 2,985 | |
Total capital spending | | 4,392 | | 4,968 | | 5,540 | | 7,270 | | 8,159 | | 6,528 | | 6,058 | |
(1) Includes BC Housing Management Commission, Provincial Rental Housing Corporation, Rapid Transit Project 2000, and other service delivery agencies.
(2) Includes $70 million for minstry capital contingencies.
(3) Joint ventures of the Columbia Power Corporation and Columbia Basin Trust.
(4) Responsibility for the BC Railway Company is transferred to the BC Transportation Financing Authority effective April 1, 2010.
(5) Includes ICBC Properties Ltd.
Budget and Fiscal Plan – 2010/11 to 2012/13
167
Appendices
Table A14 Statement of Financial Position — 2006/07 to 2012/13 (1)
($ millions) | | Actual
2006/07 | | Actual
2007/08 | | Actual
2008/09 | | Updated
Forecast
2009/10 | | Budget
Estimate
2010/11 | | Plan
2011/12 | | Plan
2012/13 | |
Financial assets | | | | | | | | | | | | | | | |
Cash and temporary investments | | 3,492 | | 5,994 | | 5,226 | | 2,873 | | 2,589 | | 2,784 | | 2,896 | |
Other financial assets | | 8,003 | | 8,322 | | 7,405 | | 7,830 | | 8,777 | | 9,254 | | 9,683 | |
Sinking funds | | 3,798 | | 2,649 | | 2,134 | | 1,339 | | 1,325 | | 1,115 | | 1,251 | |
Investments in commercial Crown corporations | | | | | | | | | | | | | | | |
Retained earnings | | 4,426 | | 5,090 | | 5,738 | | 6,630 | | 6,524 | | 6,883 | | 7,264 | |
Recoverable capital loans | | 7,170 | | 7,719 | | 9,149 | | 11,775 | | 13,398 | | 15,047 | | 16,853 | |
| | 11,596 | | 12,809 | | 14,887 | | 18,405 | | 19,922 | | 21,930 | | 24,117 | |
Warehouse borrowing program assets | | — | | — | | 2,081 | | — | | — | | — | | — | |
| | 26,889 | | 29,774 | | 31,733 | | 30,447 | | 32,613 | | 35,083 | | 37,947 | |
Liabilities | | | | | | | | | | | | | | | |
Accounts payable & accrued liabilities (2) | | 7,152 | | 8,007 | | 7,409 | | 8,020 | | 8,583 | | 9,028 | | 9,372 | |
Deferred revenue | | 5,980 | | 7,145 | | 9,168 | | 9,695 | | 10,013 | | 10,053 | | 9,929 | |
Debt: | | | | | | | | | | | | | | | |
Taxpayer-supported debt | | 25,968 | | 26,589 | | 26,446 | | 29,093 | | 33,748 | | 36,720 | | 38,329 | |
Self-supported debt | | 7,471 | | 8,048 | | 11,568 | | 12,100 | | 13,709 | | 15,343 | | 17,133 | |
Forecast allowance | | — | | — | | — | | 125 | | 300 | | 300 | | 400 | |
Total provincial debt | | 33,439 | | 34,637 | | 38,014 | | 41,318 | | 47,757 | | 52,363 | | 55,862 | |
Add: debt offset by sinking funds | | 3,798 | | 2,649 | | 2,134 | | 1,339 | | 1,325 | | 1,115 | | 1,251 | |
Less : guarantees and non-guaranteed debt | | (416 | ) | (452 | ) | (452 | ) | (421 | ) | (381 | ) | (347 | ) | (321 | ) |
Financial statement debt | | 36,821 | | 36,834 | | 39,696 | | 42,236 | | 48,701 | | 53,131 | | 56,792 | |
| | 49,953 | | 51,986 | | 56,273 | | 59,951 | | 67,297 | | 72,212 | | 76,093 | |
Net liabilities | | (23,064 | ) | (22,212 | ) | (24,540 | ) | (29,504 | ) | (34,684 | ) | (37,129 | ) | (38,146 | ) |
Capital and other assets | | | | | | | | | | | | | | | |
Tangible capital assets | | 26,802 | | 28,755 | | 30,679 | | 32,772 | | 36,225 | | 37,728 | | 38,586 | |
Other assets | | 780 | | 730 | | 780 | | 876 | | 888 | | 885 | | 899 | |
| | 27,582 | | 29,485 | | 31,459 | | 33,648 | | 37,113 | | 38,613 | | 39,485 | |
Accumulated surplus (deficit) | | 4,518 | | 7,273 | | 6,919 | | 4,144 | | 2,429 | | 1,484 | | 1,339 | |
(1) Comparative figures have been restated to reflect government’s accounting policies in effect at March 31, 2009.
Accrued liabilities include accumulated forecast allowances of $250 million in 2010/11, $500 million in 2011/12 and $750 million in 2012/13.
Budget and Fiscal Plan – 2010/11 to 2012/13
168
Appendices
Table A14a Changes in Financial Position — 2006/07 to 2012/13
| | | | | | | | Updated | | Budget | | | | | |
| | Actual | | Actual | | Actual | | Forecast | | Estimate | | Plan | | Plan | |
($ millions) | | 2006/07 | | 2007/08 | | 2008/09 | | 2009/10 | | 2010/11 | | 2011/12 | | 2012/13 | |
(Surplus) deficit for the year | | (4,028 | ) | (2,837 | ) | (78 | ) | 2,775 | | 1,715 | | 945 | | 145 | |
Comprehensive income and other equity adjustments | | (447 | ) | 82 | | 432 | | — | | — | | — | | — | |
Change in accumulated (surplus) deficit | | (4,475 | ) | (2,755 | ) | 354 | | 2,775 | | 1,715 | | 945 | | 145 | |
Capital and other asset changes: | | | | | | | | | | | | | | | |
Taxpayer-supported capital investments | | 3,409 | | 3,672 | | 3,778 | | 4,013 | | 5,414 | | 3,609 | | 3,073 | |
Less : amortization and other accounting changes | | (1,549 | ) | (1,719 | ) | (1,854 | ) | (1,920 | ) | (1,961 | ) | (2,106 | ) | (2,215 | ) |
Increase in net capital assets | | 1,860 | | 1,953 | | 1,924 | | 2,093 | | 3,453 | | 1,503 | | 858 | |
Increase (decrease) in other assets | | 19 | | (50 | ) | 50 | | 96 | | 12 | | (3 | ) | 14 | |
| | 1,879 | | 1,903 | | 1,974 | | 2,189 | | 3,465 | | 1,500 | | 872 | |
Increase (decrease) in net liabilities | | (2,596 | ) | (852 | ) | 2,328 | | 4,964 | | 5,180 | | 2,445 | | 1,017 | |
Investment and working capital changes: | | | | | | | | | | | | | | | |
Increase (reduction) in cash and temporary investments | | (430 | ) | 2,502 | | (768 | ) | (2,353 | ) | (284 | ) | 195 | | 112 | |
Increase (decrease) in warehouse borrowing investments | | — | | — | | 2,081 | | (2,081 | ) | — | | — | | — | |
Investment in commercial Crown corporations: | | | | | | | | | | | | | | | |
Increase (decrease) in retained earnings | | 950 | | 664 | | 648 | | 892 | | (106 | ) | 359 | | 381 | |
Self-supported capital investments | | 983 | | 1,296 | | 1,762 | | 3,257 | | 2,745 | | 2,919 | | 2,985 | |
Less: loan repayments and other accounting changes | | (729 | ) | (747 | ) | (332 | ) | (631 | ) | (1,122 | ) | (1,270 | ) | (1,179 | ) |
| | 1,204 | | 1,213 | | 2,078 | | 3,518 | | 1,517 | | 2,008 | | 2,187 | |
Other working capital changes | | 586 | | (2,850 | ) | (2,857 | ) | (1,508 | ) | 52 | | (218 | ) | 345 | |
| | 1,360 | | 865 | | 534 | | (2,424 | ) | 1,285 | | 1,985 | | 2,644 | |
Increase (decrease) in financial statement debt | | (1,236 | ) | 13 | | 2,862 | | 2,540 | | 6,465 | | 4,430 | | 3,661 | |
(Increase) decrease in sinking fund debt | | 261 | | 1,149 | | 515 | | 795 | | 14 | | 210 | | (136 | ) |
Increase (decrease) in guarantees and non-guaranteed debt | | (43 | ) | 36 | | — | | (31 | ) | (40 | ) | (34 | ) | (26 | ) |
Increase (decrease) in total provincial debt | | (1,018 | ) | 1,198 | | 3,377 | | 3,304 | | 6,439 | | 4,606 | | 3,499 | |
Budget and Fiscal Plan – 2010/11 to 2012/13
169
Appendices
Table A15 Provincial Debt Summary — 2006/07 to 2012/13 (1)
| | | | | | | | Updated | | Budget | | | | | |
| | Actual | | Actual | | Actual | | Forecast | | Estimate | | Plan | | Plan | |
($ millions unless otherwise indicated) | | 2006/07 | | 2007/08 | | 2008/09 | | 2009/10 | | 2010/11 | | 2011/12 | | 2012/13 | |
Taxpayer-supported debt | | | | | | | | | | | | | | | |
Provincial government operating (2) | | 6,928 | | 5,330 | | 3,048 | | 3,486 | | 4,815 | | 5,513 | | 5,142 | |
Provincial government general capital (3) | | 1,961 | | 2,274 | | 2,696 | | 2,696 | | 2,696 | | 2,696 | | 2,696 | |
Provincial government direct operating | | 8,889 | | 7,604 | | 5,744 | | 6,182 | | 7,511 | | 8,209 | | 7,838 | |
Other taxpayer-supported debt (mainly capital) | | | | | | | | | | | | | | | |
Education | | | | | | | | | | | | | | | |
Schools (2) | | 5,013 | | 5,216 | | 5,522 | | 5,840 | | 6,194 | | 6,527 | | 6,777 | |
Post-secondary institutions (2) | | 3,024 | | 3,437 | | 3,626 | | 3,838 | | 4,111 | | 4,209 | | 4,243 | |
| | 8,037 | | 8,653 | | 9,148 | | 9,678 | | 10,305 | | 10,736 | | 11,020 | |
Health (2),(4) | | 3,053 | | 3,511 | | 3,936 | | 4,352 | | 5,074 | | 5,656 | | 6,101 | |
Highways and public transit | | | | | | | | | | | | | | | |
BC Transportation Financing Authority (5) | | 3,237 | | 3,948 | | 4,586 | | 5,276 | | 6,136 | | 6,807 | | 7,569 | |
Public transit (2) | | 950 | | 958 | | 997 | | 997 | | 997 | | 997 | | 997 | |
SkyTrain extension | | 1,153 | | 1,153 | | 1,154 | | 1,154 | | 1,154 | | 1,154 | | 1,154 | |
BC Transit | | 96 | | 84 | | 94 | | 158 | | 186 | | 258 | | 350 | |
| | 5,436 | | 6,143 | | 6,831 | | 7,585 | | 8,473 | | 9,216 | | 10,070 | |
Other | | | | | | | | | | | | | | | |
Social housing | | 216 | | 218 | | 286 | | 348 | | 530 | | 577 | | 568 | |
Homeowner Protection Office | | 110 | | 136 | | 150 | | 151 | | — | | — | | — | |
BC Pavilion Corporation | | — | | — | | — | | 55 | | 409 | | 433 | | 433 | |
BC Immigrant Investment Fund | | 167 | | 256 | | 287 | | 285 | | 297 | | 256 | | 276 | |
Provincial government general capital (3) | | — | | — | | — | | 349 | | 774 | | 1,079 | | 1,274 | |
Other | | 60 | | 68 | | 64 | | 108 | | 375 | | 558 | | 749 | |
| | 553 | | 678 | | 787 | | 1,296 | | 2,385 | | 2,903 | | 3,300 | |
Total other taxpayer-supported debt | | 17,079 | | 18,985 | | 20,702 | | 22,911 | | 26,237 | | 28,511 | | 30,491 | |
Total taxpayer-supported debt | | 25,968 | | 26,589 | | 26,446 | | 29,093 | | 33,748 | | 36,720 | | 38,329 | |
Self-supported debt | | | | | | | | | | | | | | | |
Commercial Crown corporations | | | | | | | | | | | | | | | |
BC Hydro | | 7,144 | | 7,633 | | 9,054 | | 10,975 | | 11,830 | | 12,902 | | 14,142 | |
BC Transmission Corporation | | 30 | | 79 | | 70 | | 75 | | 70 | | 70 | | 70 | |
Columbia River power projects | | 236 | | 219 | | 208 | | 195 | | 181 | | 166 | | 150 | |
BC Lotteries | | — | | — | | — | | 105 | | 128 | | 151 | | 163 | |
Transportation Investment Corporation (Port Mann) | | — | | — | | 20 | | 615 | | 1,365 | | 1,919 | | 2,473 | |
Liquor Distribution Branch | | 3 | | 2 | | 1 | | 1 | | 1 | | 1 | | 1 | |
Post-secondary institutions’ subsidiaries | | 58 | | 115 | | 134 | | 134 | | 134 | | 134 | | 134 | |
| | 7,471 | | 8,048 | | 9,487 | | 12,100 | | 13,709 | | 15,343 | | 17,133 | |
Warehouse borrowing program | | — | | — | | 2,081 | | — | | — | | — | | — | |
Total self-supported debt | | 7,471 | | 8,048 | | 11,568 | | 12,100 | | 13,709 | | 15,343 | | 17,133 | |
Total debt before forecast allowance | | 33,439 | | 34,637 | | 38,014 | | 41,193 | | 47,457 | | 52,063 | | 55,462 | |
Forecast allowance (4) | | — | | — | | — | | 125 | | 300 | | 300 | | 400 | |
Total provincial debt | | 33,439 | | 34,637 | | 38,014 | | 41,318 | | 47,757 | | 52,363 | | 55,862 | |
Debt as a per cent of GDP | | | | | | | | | | | | | | | |
Provincial government direct operating | | 4.9 | % | 4.0 | % | 2.9 | % | 3.3 | % | 3.8 | % | 4.0 | % | 3.6 | % |
Taxpayer-supported | | 14.2 | % | 13.9 | % | 13.4 | % | 15.5 | % | 17.2 | % | 17.9 | % | 17.8 | % |
Total provincial | | 18.3 | % | 18.1 | % | 19.2 | % | 22.0 | % | 24.3 | % | 25.5 | % | 25.9 | % |
(1) Debt is after deduction of sinking funds and unamortized discounts, and excludes accrued interest. Government direct and fiscal agency accrued interest is reported in the government’s accounts as an accounts payable.
(2) In 2009/10, sinking funds for government debt related to schools, post-secondary education, health care and public transit were liquidated and the proceeds ($763 million) used to offset direct operating borrowing requirements. Figures for prior years have been restated to reflect this decision.
(3) Separate disclosures of borrowings for ministries’ capital spending are applied prospectively beginning in fiscal 2009/10. Figures for prior years have been restated.
(4) Health facilities’ debt includes public-private partnership obligations of $179 million for fiscal 2006/07; $410 million for fiscal year 2007/08; $540 million for fiscal year 2008/09; $688 million for fiscal 2009/10, $990 million for fiscal 2010/11, $1,162 million for fiscal 2011/12, and $1,333 million for fiscal 2012/13.
(5) BC Transportation Financing Authority’s debt includes public-private partnership obligations of $353 million for fiscal 2006/07; $604 million for fiscal year 2007/08; $776 million for fiscal year 2008/09; $797 million for fiscal 2009/10, $780 million for fiscal 2010/11, $763 million for fiscal 2011/12, and $744 million for fiscal 2012/13.
(6) Reflects the operating statement forecast allowance for each year (amounts are not cumulative). Since it is unknown as to which agency would require this debt, the forecast allowance is shown as a separate item over the plan.
Budget and Fiscal Plan – 2010/11 to 2012/13
170
Appendices
Table A16 Key Provincial Debt Indicators — 2006/07 to 2012/13 (1)
| | | | | | | | Updated | | Budget | | | | | |
| | Actual | | Actual | | Actual | | Forecast | | Estimate | | Plan | | Plan | |
| | 2006/07 | | 2007/08 | | 2008/09 | | 2009/10 | | 2010/11 | | 2011/12 | | 2012/13 | |
Debt to revenue (per cent) | | | | | | | | | | | | | | | |
Total provincial | | 69.1 | | 69.3 | | 77.9 | | 86.9 | | 94.5 | | 98.7 | | 100.9 | |
Taxpayer-supported | | 69.7 | | 69.5 | | 71.9 | | 82.0 | | 87.8 | | 92.1 | | 92.3 | |
Debt per capita ($) (2) | | | | | | | | | | | | | | | |
Total provincial | | 7,880 | | 8,038 | | 8,671 | | 9,274 | | 10,556 | | 11,407 | | 11,999 | |
Taxpayer-supported | | 6,119 | | 6,170 | | 6,033 | | 6,530 | | 7,459 | | 7,999 | | 8,233 | |
Debt to GDP (per cent) (3) | | | | | | | | | | | | | | | |
Total provincial | | 18.3 | | 18.1 | | 19.2 | | 22.0 | | 24.3 | | 25.5 | | 25.9 | |
Taxpayer-supported | | 14.2 | | 13.9 | | 13.4 | | 15.5 | | 17.2 | | 17.9 | | 17.8 | |
Interest bite (cents per dollar of revenue) (4) | | | | | | | | | | | | | | | |
Total provincial | | 4.3 | | 4.0 | | 4.4 | | 4.5 | | 4.7 | | 4.9 | | 5.3 | |
Taxpayer-supported | | 4.2 | | 3.9 | | 4.2 | | 4.4 | | 4.6 | | 4.8 | | 5.1 | |
Interest costs ($ millions) | | | | | | | | | | | | | | | |
Total provincial | | 2,074 | | 2,012 | | 2,123 | | 2,122 | | 2,365 | | 2,584 | | 2,945 | |
Taxpayer-supported | | 1,575 | | 1,490 | | 1,555 | | 1,546 | | 1,775 | | 1,896 | | 2,121 | |
Interest rate (per cent) (5) | | | | | | | | | | | | | | | |
Taxpayer-supported | | 5.7 | | 5.7 | | 5.9 | | 5.6 | | 5.6 | | 5.4 | | 5.7 | |
Background Information: | | | | | | | | | | | | | | | |
Revenue ($ millions) | | | | | | | | | | | | | | | |
Total provincial (6) | | 48,389 | | 50,002 | | 48,790 | | 47,525 | | 50,552 | | 53,038 | | 55,352 | |
Taxpayer-supported (7) | | 37,253 | | 38,256 | | 36,770 | | 35,464 | | 38,420 | | 39,849 | | 41,536 | |
Debt ($ millions) | | | | | | | | | | | | | | | |
Total provincial | | 33,439 | | 34,637 | | 38,014 | | 41,318 | | 47,757 | | 52,363 | | 55,862 | |
Taxpayer-supported (8) | | 25,968 | | 26,589 | | 26,446 | | 29,093 | | 33,748 | | 36,720 | | 38,329 | |
Provincial GDP ($ millions) (9) | | 182,310 | | 191,598 | | 197,931 | | 187,963 | | 196,328 | | 205,654 | | 215,919 | |
Population (thousands at July 1) (10) | | 4,244 | | 4,309 | | 4,384 | | 4,455 | | 4,524 | | 4,590 | | 4,656 | |
(1) Includes fiscal data of school districts, post-secondary institutions and regional health authorities/societies (SUCH).
(2) The ratio of debt to population (e.g. 2010/11 debt divided by population at July 1, 2010).
(3) The ratio of debt outstanding at fiscal year end to provincial nominal gross domestic product (GDP) for the calendar year ending in the fiscal year (e.g. 2010/11 debt divided by 2010 GDP).
(4) The ratio of interest costs (less sinking fund interest) to revenue. Figures include capitalized interest expense in order to provide a more comparable measure to outstanding debt.
(5) Weighted average of all outstanding debt issues.
(6) Includes revenue of the consolidated revenue fund (excluding dividends from enterprises) plus revenue of all government organizations and enterprises.
(7) Excludes revenue of government enterprises, but includes dividends from enterprises paid to the consolidated revenue fund.
(8) Excludes debt of commercial Crown corporations and agencies and funds held under the province’s warehouse borrowing program.
(9) Nominal GDP for the calendar year ending in the fiscal year (e.g. GDP for 2010 is used for the fiscal year ended March 31, 2011).
(10) Population at July 1st within the fiscal year (e.g. population at July 1, 2010 is used for the fiscal year ended March 31, 2011).
Budget and Fiscal Plan – 2010/11 to 2012/13
171