Exhibit 99.14
2010
BRITISH COLUMBIA
FINANCIAL AND ECONOMIC REVIEW
70th EDITION
APRIL 2009 TO MARCH 2010

2010
British Columbia
Financial and Economic
Review
70th Edition
(July 2010)

| Ministry of
Finance |
Table of Contents
Chapter One — Economic Review | 1 |
2009 Overview | 3 |
British Columbia Economy | 4 |
Exports | 5 |
Population | 7 |
Labour and Income Developments | 8 |
Prices and Wages | 9 |
Consumer Expenditure and Housing | 9 |
Tourism | 10 |
External Environment | 10 |
United States Economy | 11 |
Canadian Economy | 11 |
International Economy | 12 |
Financial Markets | 13 |
Conclusion | 14 |
| |
Topic Box | |
Economic Downturn in 2009 | 15 |
| |
Charts | |
1.1 | Provincial economic growth | 3 |
1.2 | British Columbia real GDP by industry | 4 |
1.3 | Export shares by market | 6 |
1.4 | Lumber and natural gas prices | 7 |
1.5 | British Columbia population by age and sex, 2009 | 8 |
1.6 | Retail sales | 10 |
1.7 | Visitor entries to British Columbia | 11 |
1.8 | External economic growth | 12 |
1.9 | Canadian dollar | 13 |
Map 1.1 Net interprovincial and international migration in BC, 2009 | 7 |
| | |
Tables | | |
1.1 | British Columbia Population and Labour Market Statistics | 9 |
1.2 | Price and Earnings Indices | 9 |
| |
Appendix 1 — Economic Review | 17 |
| | |
Tables | | |
A1.1A | Aggregate and Labour Market Indicators | 18 |
A1.1B | Prices, Earnings and Financial Indicators | 19 |
A1.1C | Other Indicators | 20 |
A1.1D | Commodity Production Indicators | 21 |
A1.2 | British Columbia Real GDP at Market Prices, Expenditure Based | 22 |
A1.3 | British Columbia GDP at Basic Prices, by Industry | 23 |
A1.4 | British Columbia GDP, Income Based | 24 |
A1.5 | Employment by Industry in British Columbia | 25 |
A1.6 | Capital Investment by Industry | 26 |
A1.7 | British Columbia International Goods Exports by Major Market and Selected Commodities, 2009 | 27 |
A1.8 | British Columbia International Goods Exports by Market Area | 28 |
2010 Financial and Economic Review – July 2010
i
Table of Contents
A1.9 | Historical Commodity Prices (in U.S. Dollars) | 29 |
A1.10 | British Columbia Forest Sector Economic Activity Indicators | 30 |
A1.11 | Historical Value of Mineral, Petroleum and Natural Gas Shipments | 31 |
A1.12 | Petroleum and Natural Gas Activity Indicators | 31 |
A1.13 | Supply and Consumption of Electrical Energy in British Columbia | 32 |
A1.14 | Components of British Columbia Population Change | 33 |
| |
Chapter Two — Financial Review | 35 |
2009/10 Overview | 37 |
Revenue | 38 |
Expense | 44 |
Provincial Capital Spending | 45 |
Provincial Debt | 51 |
Taxpayer-supported Debt | 51 |
Self-supported Debt | 53 |
Debt Indicators | 54 |
Credit Rating | 55 |
Statement of Financial Position | 55 |
Unfunded Pension Liabilities | 57 |
| |
Topic Box | |
Review of the Province’s Financial Condition | 59 |
| |
Charts | |
2.1 | 2009/10 deficit – major changes from September Update 2009 | 37 |
2.2 | Revenue changes from September Update 2009 | 38 |
2.3 | Expense changes from September Update 2009 | 44 |
2.4 | Capital spending changes from September Update 2009 | 46 |
2.5 | Capital spending, 2009/10 | 50 |
2.6 | Financing taxpayer-supported capital spending | 50 |
2.7 | Debt changes from September Update 2009 | 51 |
2.8 | Provincial debt components | 52 |
2.9 | Taxpayer-supported debt to GDP ratio | 52 |
2.10 | 2009/10 changes in accumulated surplus | 56 |
| | |
Tables | | |
2.1 | Operating Statement | 37 |
2.2 | Consumption and Other Tax Revenues Change from September Update 2009 | 39 |
2.3 | Energy and Mineral Revenues Change from September Update 2009 | 39 |
2.4 | Forest Revenues Change from September Update 2009 | 40 |
2.5 | Other Revenue Change from September Update 2009 | 40 |
2.6 | Revenue by Source | 42 |
2.7 | Expense by Ministry, Program and Agency | 43 |
2.8 | Capital Spending | 47 |
2.9 | Capital Expenditure Projects Greater Than $50 Million | 48 |
2.10 | Provincial Debt Summary | 53 |
2.11 | Key Debt Indicators – 2005/06 to 2009/10 | 54 |
2.12 | Interprovincial Comparison of Credit Ratings, July 2010 | 55 |
2.13 | Net Liabilities and Accumulated Surplus | 56 |
2.14 | Pension Plan Balances | 57 |
2010 Financial and Economic Review – July 2010
ii
Table of Contents
Appendix 2 — Financial Review | 65 |
Government’s Financial Statements | 66 |
Government Reporting Entity | 66 |
Compliance with GAAP | 66 |
2009/10 Public Accounts Audit Reservations | 67 |
Supplementary Schedules | 68 |
| | |
Tables | | |
A2.1 | 2009/10 Forecasts – Year in Review | 68 |
A2.2 | Operating Statement – 2000/01 to 2009/10 | 69 |
A2.3 | Statement of Financial Position – 2000/01 to 2009/10 | 70 |
A2.4 | Changes in Financial Position – 2000/01 to 2009/10 | 71 |
A2.5 | Revenue by Source – 2000/01 to 2009/10 | 72 |
A2.6 | Revenue by Source Supplementary Information – 2000/01 to 2009/10 | 73 |
A2.7 | Expense by Function – 2000/01 to 2009/10 | 74 |
A2.8 | Expense by Function Supplementary Information – 2000/01 to 2009/10 | 75 |
A2.9 | Full-Time Equivalents (FTEs) – 2000/01 to 2009/10 | 76 |
A2.10 | Capital Spending – 2000/01 to 2009/10 | 77 |
A2.11 | Provincial Debt – 2000/01 to 2009/10 | 78 |
A2.12 | Provincial Debt Supplementary Information – 2000/01 to 2009/10 | 79 |
A2.13 | Historical Provincial Debt Summary | 80 |
A2.14 | Historical Operating Statement Surplus (Deficit) | 81 |
A2.15 | Historical Revenue by Source – Consolidated Revenue Fund | 82 |
A2.16 | Historical Revenue by Source – Consolidated Revenue Fund Supplementary Information | 83 |
A2.17 | Historical Expense by Function – Consolidated Revenue Fund | 84 |
A2.18 | Historical Expense by Function – Consolidated Revenue Fund Supplementary Information | 85 |
| |
Chapter Three — Commercial Crown Corporations Review | 87 |
Introduction | 89 |
BC Hydro and Power Authority | 89 |
BC Liquor Distribution Branch | 92 |
BC Lottery Corporation | 94 |
Insurance Corporation of BC | 96 |
BC Transmission Corporation | 98 |
Columbia Power Corporation | 100 |
Transportation Investment Corporation | 101 |
BC Railway Company | 102 |
Provincial Capital Commission | 103 |
| |
Charts | | |
3.1 | Electricity price competitiveness | 92 |
3.2 | Liquor sales by category | 93 |
3.3 | Interprovincial gaming comparisons | 96 |
3.4 | ICBC injury and material damages claims | 98 |
Map 3.1 500 kV transmission system and major generating stations | 90 |
2010 Financial and Economic Review – July 2010
iii
Table of Contents
Tables | | |
3.1 | British Columbia Hydro and Power Authority Five-Year Income Statement | 91 |
3.2 | Liquor Distribution Branch Five-Year Income Statement | 93 |
3.3 | British Columbia Lottery Corporation Five-Year Income Statement | 95 |
3.4 | Insurance Corporation of British Columbia Five-Year Income Statement | 97 |
3.5 | British Columbia Transmission Corporation Five-Year Income Statement | 99 |
3.6 | Columbia Power Corporation Five-Year Income Statement | 100 |
3.7 | Transportation Investment Corporation Five-Year Income Statement | 101 |
3.8 | British Columbia Railway Company Five-Year Income Statement | 102 |
3.9 | Provincial Capital Commission Five-Year Income Statement | 103 |
| | |
Chapter 4 — Supplementary Information | 105 |
General Description of the Province | 106 |
Geography | 106 |
Physiography | 106 |
Climate and Vegetation | 106 |
Population | 107 |
Constitutional Framework | 107 |
Provincial Government | 108 |
Legislature | 108 |
Executive | 108 |
Judiciary | 109 |
Provincial Government Jurisdiction | 109 |
The Annual Financial Cycle | 110 |
Summary of Tax Changes Announced in 2010 | 112 |
| |
Charts | | |
4.1 | Financial Planning and Reporting Cycle Overview | 110 |
| | |
Tables | | |
4.1 | Provincial Taxes (as of July 2010) | 114 |
4.2 | Interprovincial Comparisons of Tax Rates – 2010 | 119 |
2010 Financial and Economic Review – July 2010
iv
Chapter One
Economic Review (1)
(1) Reflects information available at July 6, 2010
2010 Financial and Economic Review – July 2010
Chapter 1 – Economic Review
2009 Overview
2009 marked an abnormal year by historical standards, as the outlook for the global economy deteriorated significantly early in the year. The financial crisis in the United States and Europe spread rapidly around the world, triggering a widespread and deep global recession. However, by mid-2009, most economies began to emerge from what some analysts are referring to as “the most severe economic crisis since the Great Depression”. For more details on the 2008-2009 recession, see the related topic box at the end of Chapter 1.
In contrast to prior years, Statistics Canada only provided real dollar industry-side GDP data in the preliminary release of their Provincial Economic Accounts in April 2010. As a result, the following analysis is based on GDP at basic prices as opposed to the usual market price definition.
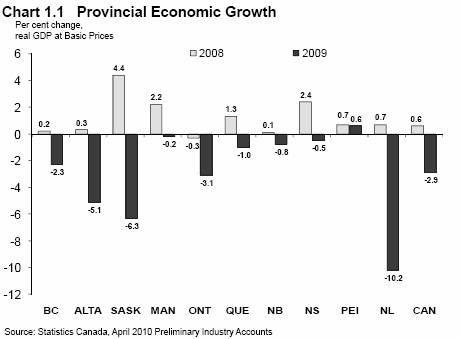
British Columbia’s economy contracted by 2.3 per cent in 2009, following growth of 0.2 per cent in 2008. The decline in 2009 marked the first contraction in the province’s real GDP since 1982. Despite starting the year facing significant economic challenges in the wake of the global economic recession, BC’s indicators of economic performance confirm that British Columbia’s economy began to stabilize during 2009 and into 2010.
The annual decline was largely attributable to a drop in the goods-producing industries, most notably manufacturing. Weakness in the US housing market (combined with low lumber prices) hampered demand for BC forest products, which resulted in large declines in the forestry industries. Further, job losses throughout the forestry sector contributed to a decrease in labour income and retail trade.
Demand for new housing in the province softened in 2009, as housing starts fluctuated around their lowest level since the early 2000s. Meanwhile, consumers remained cautious in 2009, cutting back significantly on their purchases of goods and services. Overall, retail sales fell by 4.4 per cent in 2009 compared to 2008, with major losses in new and used vehicles, gas stations, home furnishing stores, home centres, and hardware stores.
2010 Financial and Economic Review – July 2010
3
Chapter 1 – Economic Review
British Columbia Economy(2)
British Columbia’s real GDP shrank by 2.3 per cent in 2009, following a modest increase of 0.2 per cent growth in 2008, as the far-reaching impact of the global recession set in.
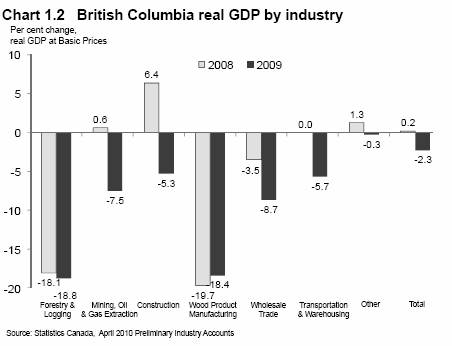
The downturn in 2009 reflects overall weakness in the goods-producing industries, which fell 9.2 per cent compared to the previous year. This decline more than offset a marginal 0.1 per cent increase experienced by the service-producing industries in 2009.
Overall manufacturing contracted by 14.5 per cent in 2009, as wood manufacturing shrank (by 18.8 per cent) for a third straight year, while the paper industry declined (by 16.0 per cent) for a fourth consecutive year in 2009. Further, wood product manufacturing fell 18.4 per cent compared to 2008.
The nominal value of BC’s manufacturing shipments decreased by 17.7 per cent in 2009, due primarily to weaker demand from the US as well as low commodity prices, particularly in the first half of the year. The value of shipments of wood products fell 31.5 per cent on the year, after sliding 15.9 per cent in 2008. The value of paper product shipments also decreased in 2009, dropping 17.9 per cent, following a 7.6 per cent decline in 2008. However, the slowdown in manufacturing during 2009 was not restricted to the resource-based industries. Annual declines in shipments were experienced across the board, with most manufacturing industries recording double-digit declines on the year.
A sharp drop in residential construction contributed to a 5.3 per cent decline in total construction, although this was partially mitigated by construction projects related to the 2010 Olympic and Paralympic Winter Games. Meanwhile, BC’s buoyant home resale market led to a 22.2 per cent increase in the output of real estate agents and brokers.
(2) Provincial and National real GDP estimates are based on Statistics Canada’s preliminary industry accounts, released in April 2010. Further information on British Columbia’s economic performance will be available in November 2010, when Statistics Canada releases revised GDP data for 2009 and previous years for the full income and expenditure accounts, including nominal data.
2010 Financial and Economic Review – July 2010
4
Chapter 1 – Economic Review
In 2009, the nominal value of non-residential building permits in BC dropped by 14.7 per cent to reach $3.1 billion. Declines in both commercial permits (33.0 per cent) and industrial permits (16.1 per cent) more than offset the boost from institutional and government permits, which increased by 49.1 per cent on the year.
As cited in the government’s Major Projects Inventory, investment figures for 2009 include spending on major capital projects across the province. Some of these projects are the:
· Revelstoke Elementary and Secondary School;
· Alberni District Secondary School;
· Fort St. John Hospital and Residential Care;
· Northern Cancer Centre initiative;
· Surrey Emergency/Critical Care Tower;
· Sierra Yoyo-Desan Road upgrade;
· South Fraser Perimeter Road; and
· Royal Jubilee Patient Care Centre.
Note that the number of projects includes projects under construction, as well as planned or proposed projects. Thus while the number of projects increased in 2009, actual non-residential investment activity was down as projects were deferred reflecting economic conditions.
Exports
By Destination:
Faced with the effects of the global recession, weaker coal and natural gas prices, as well as a strong Canadian dollar, the value of BC’s current dollar foreign merchandise exports fell by nearly $8 billion (or 24.0 per cent) in 2009 compared to the prior year. This decline was fuelled in part by a 25.7 per cent drop in forestry exports, as continued weakness in the US housing market throughout the year (combined with low lumber prices) hampered demand for BC forest products. Significant declines were also observed in the exports of energy products after the surge in energy prices in 2008.
Exports to the US, BC’s largest trading partner, slumped substantially in 2009, falling by 26.6 per cent on the year. This followed a decline of 7.7 per cent in 2008, reflecting the fallout of the US housing market collapse. (Exports to Japan slid 31.1 per cent in 2009, resulting from weaker coal, copper, and lumber exports.)
In contrast, the total value of BC exports to China continued to climb in 2009, rising 28.7 per cent over 2008. Most notably, the value of BC’s exports of coal to China soared, rising by 362.8 per cent in 2009, fuelled by China’s increased demand for coal. In addition, the value of softwood lumber exports to China jumped 78.0 per cent in 2009 compared to 2008. Appendix Tables A1.7 and A1.8 provide further detail on exports by major market and commodity.
2010 Financial and Economic Review – July 2010
5
Chapter 1 – Economic Review
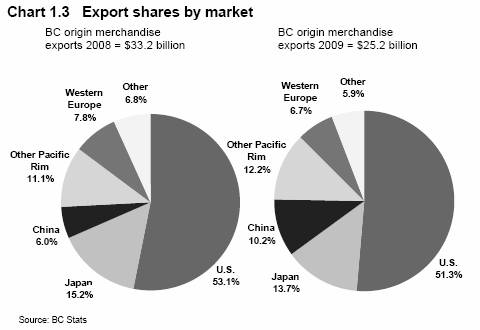
The US received a smaller proportion of BC’s total international exports in 2009 compared to 2008, reflecting a reduction in US demand and further diversification of provincial export markets. The US accounted for 51.3 per cent of the total in 2009, down from 53.1 per cent in the previous year. By comparison, the Pacific Rim (including Japan and China) took in 36.2 per cent of BC’s total exports to the world in 2009, up from 32.3 per cent in 2008.
By Commodity:
Current dollar energy product exports declined in 2009, down 29.3 per cent to $6.8 billion on the year, reflecting a fall from 2008’s surge in energy prices. On the whole, international demand for BC export commodities such as forest, energy and metal products crumbled in 2009 as the US and other economies fell into recession. The value of metallic mineral product exports fell 25.0 per cent to $2.5 billion, marking three consecutive years of decline. The value of wood product exports also dropped in 2009, falling 23.7 per cent to $4.1 billion, while the value of pulp and paper exports declined by 26.0 per cent to $3.5 billion.
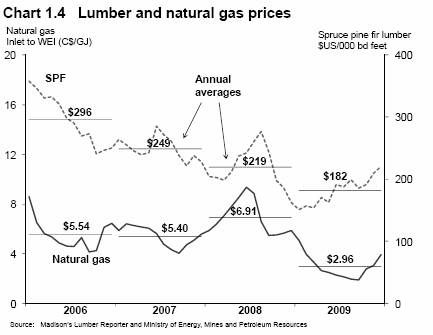
Prices for lumber products continued to retreat in 2009, down 16.9 per cent, following a decrease of 12.2 per cent in 2008. Meanwhile, the prices of pulp and newsprint declined sharply in 2009 compared to 2008, down 23.1 per cent and 17.7 per cent, respectively.
· Lumber prices averaged $182 US per thousand board feet in 2009, down from $219 US in 2008;
· Pulp prices fell in 2009, averaging $656 US per tonne, down from $853 US in the previous year; and
· Newsprint prices declined in 2009, averaging $565 US per tonne compared to $687 US per tonne in 2008.
2010 Financial and Economic Review – July 2010
6
Chapter 1 – Economic Review
Population
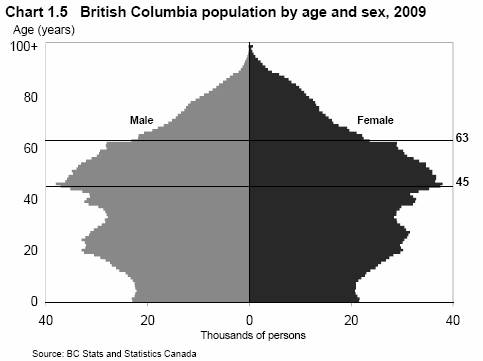
BC welcomed 58,571 net migrants into the province in 2009, including 51,072 from international sources and 7,499 from other Canadian provinces and territories. Historically, BC’s population has grown faster than the national average. From 1998 to 2002, BC’s population growth slowed due to a net outflow of people to other parts of Canada. However, this trend has changed course since 2003, returning to a net positive inflow of migrants from other provinces.

British Columbia’s population is aging, with the province’s baby boom generation, born between 1946 and 1964, currently between their mid 40s and mid 60s (see Chart 1.5) . As a result, there will be a substantial increase in the number of retired British Columbians over the next few years. Th e “bust” generation (born during a period of lower birth rates) is currently in their late-20s to mid-30s, while the “baby boom echo” generation is currently around 20 years old.
2010 Financial and Economic Review – July 2010
7
Chapter 1 – Economic Review
Labour and Income Developments
Employment in BC fell by 2.4 per cent, or 54,900 jobs, as employers scaled back their workforce in 2009. BC’s rate of employment losses in 2009 was tied with Ontario for second greatest among provinces, behind only Newfoundland and Labrador’s 2.5 per cent decline on the year. BC’s unemployment rate grew to average 7.6 per cent in 2009. Despite rising three full percentage points, BC’s unemployment rate remained below the national average of 8.3 per cent for the year. The majority of job losses were concentrated in the goods-producing sector — particularly in the construction, manufacturing, and primary forestry sectors. However, the overall employment situation in BC began to stabilize in the latter months of the year.
Employment in BC’s goods-producing sector shrank by 11.0 per cent in 2009, as the global recession took its toll. The construction industry experienced significant declines, shedding 25,500 jobs — an annual decrease of 11.5 per cent compared to 2008. The manufacturing industry also saw a substantial decline in employment, dropping 23,500 jobs in 2009, or 12.6 per cent on the year, with notable challenges experienced in the wood (-20.5 per cent) and paper (-17.8 per cent) product manufacturing sub-sectors. Employment in the primary forestry and logging industry also slid by 20.5 per cent in 2009, following a decrease of 28.3 per cent in 2008 (see Table A1.5 for more details).
Employment in BC’s service industries held steady in 2009, with an overall net increase of 100 jobs for the year. Despite the economic slowdown, gains in the health care and social assistance (+6.0 per cent) and retail (+5.0 per cent) sectors helped to off set a 10.0 per cent loss in the transportation and warehousing component in 2009.
For the year, British Columbia’s labour force increased 0.8 per cent in 2009, after expanding by 2.5 per cent in 2008.
2010 Financial and Economic Review – July 2010
8
Chapter 1 – Economic Review
Table 1.1 British Columbia Population and Labour Market Statistics
| | Units | | 2005 | | 2006 | | 2007 | | 2008 | | 2009 | |
Population (as of July 1) | | (thousands) | | 4,197 | | 4,244 | | 4,309 | | 4,384 | | 4,455 | |
| | (% change) | | 1.0 | | 1.1 | | 1.6 | | 1.7 | | 1.6 | |
Net Migration | | | | | | | | | | | | | |
International | | (persons) | | 43,610 | | 39,572 | | 42,043 | | 54,941 | | 51,072 | |
Interprovincial | | (persons) | | 7,212 | | 12,799 | | 16,776 | | 8,379 | | 7,499 | |
Labour Force | | (thousands) | | 2263 | | 2,305 | | 2,366 | | 2,426 | | 2,445 | |
| | (% change) | | 1.9 | | 1.8 | | 2.7 | | 2.5 | | 0.8 | |
Employment | | (thousands) | | 2,131 | | 2,196 | | 2,266 | | 2,314 | | 2,259 | |
| | (% change) | | 3.3 | | 3.1 | | 3.2 | | 2.1 | | -2.4 | |
Unemployment Rate | | (%) | | 5.9 | | 4.8 | | 4.2 | | 4.6 | | 7.6 | |
Source: Statistics Canada
Prices and Wages
BC’s Consumer Price Index (CPI) was unchanged in 2009, as small increases in the inflation of semi-durables and services were offset by price deflation in durable and non-durable goods. Falling automobile prices pulled down inflation of durable goods while lower fuel prices provided downward pressure on non-durables. On the services side, rising prices for restaurants, health care and education provided upward inflationary pressure.
Table 1.2 Price and Earnings Indices
| | Units | | 2005 | | 2006 | | 2007 | | 2008 | | 2009 | |
Consumer Price Index | | (2002=100) | | 106.3 | | 108.1 | | 110.0 | | 112.3 | | 112.3 | |
(British Columbia) | | (% change) | | 2.0 | | 1.7 | | 1.8 | | 2.1 | | 0.0 | |
Average weekly earnings | | ($) | | 704.5 | | 726.0 | | 747.8 | | 780.9 | | 800.5 | |
| | (% change) | | 2.6 | | 3.1 | | 3.0 | | 4.4 | | 2.5 | |
Labour income (1) | | ($ millions) | | 85,806 | | 93,963 | | 98,573 | | 103,811 | | na | |
| | (% change) | | 6.5 | | 9.5 | | 4.9 | | 5.3 | | na | |
Personal income (1) | | ($ millions) | | 131,408 | | 142,626 | | 150,794 | | 158,504 | | na | |
| | (% change) | | 5.7 | | 8.5 | | 5.7 | | 5.1 | | na | |
Corporate profits (pre-tax) (1) | | ($ millions) | | 19,631 | | 21,853 | | 21,279 | | 22,050 | | na | |
| | (% change) | | 17.1 | | 11.3 | | (2.6 | ) | 3.6 | | na | |
(1) As of November 2009 Provincial Economic Accounts
Source: Statistics Canada
The average weekly wage rate eased, up 2.5 per cent on the year, following a healthy 4.4 per cent annual gain in 2008.
Consumer Expenditure and Housing
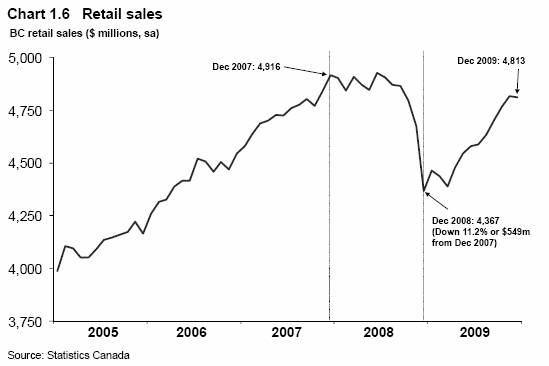
Job losses, a sudden drop in household wealth and generally weak economic conditions translated into reduced consumer spending in 2009. Total retail sales in the province dropped by 4.4 per cent on the year, with major losses in new and used vehicles, gas stations, home furnishing stores, home centres, and hardware stores. As was the case with most other indicators, the downturn was largely due to events which occurred early in the year. By April 2009, BC retail sales began to stabilize as confidence among consumers and businesses gradually improved.
2010 Financial and Economic Review – July 2010
9
Chapter 1 – Economic Review
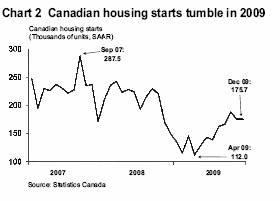
BC housing starts plummeted in late 2008 and into early 2009, falling 53.2 per cent on the year (with major declines observed in starts of both single and multiple units). BC registered just 16,077 housing starts for the year, compared to the 34,321 units in 2008. Despite stabilizing in the latter half of 2009, housing starts in the province remained at very low levels compared to recent years. Following sharp declines through 2008, the average house price in BC began the year at $418,173 before recovering lost ground from the prior year, to reach $494,620 by the end of 2009.
Meanwhile, the effects of a softened housing market spread to a lack-luster year for building permits. The value of residential building permits dropped 34.9 per cent in 2009, after falling by 19.9 per cent the previous year. Meanwhile, despite starting the year near a multi-decade low, existing home sales experienced a remarkable rally through 2009, up 23.4 per cent compared to 2008.
Tourism
The tourism sector also faced challenges in 2009, mainly due to the economic recession. The total number of visitors entering BC in 2009 fell 6.4 per cent to a 15-year low of 5.6 million. The number of US visitors entering BC in 2009 decreased by 4.0 per cent while downward pressure on discretionary spending and the global breakout of the H1N1 pandemic led to a 13.2 per cent drop in overseas visitors for the year. The recession interrupted the steady growth experienced by the accommodation industry since the earlier part of the decade, with overall room revenues sliding 11.9 per cent in 2009 compared to 2008.
External Environment
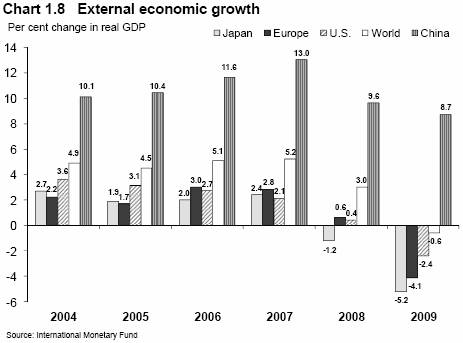
The pace of the 2008-2009 recession was rapid and closely synchronized around the globe, resulting in a 0.6 per cent contraction in world economic growth in 2009, compared to 2008 which saw growth of 3.0 per cent. The Japan and Euro area economies
2010 Financial and Economic Review – July 2010
10
Chapter 1 – Economic Review

experienced significant annual declines in 2009, down 5.2 per cent and 4.1 per cent respectively, compared to 2008. The pace of economic growth in China eased somewhat in 2009, increasing by 8.7 per cent on the year compared to economic growth of 9.6 per cent experienced in 2008.
United States Economy
The US economy contracted by 2.4 per cent in 2009 compared to 2008, representing the largest annual decline in US real GDP in over 60 years. Faced with a slumping economy and the effects of the subprime mortgage crisis, the US housing market continued its rapid decline through 2009, with annual housing starts plummeting to just 554,000 units — a significant 38.8 per cent drop on the year after falling 33.2 per cent in 2008. The US employment situation weakened further in 2009, incurring a net loss of 5.9 million jobs. Meanwhile, the annual unemployment rate increased to reach 9.3 per cent in 2009, its highest rate in 25 years.
The US current account deficit — the combined balances on trade in goods and services income, and net unilateral current transfers — narrowed in 2009, to $420 billion from the $706 billion reached in the previous year. The is marked the smallest current account deficit observed since 2001.
Canadian Economy
The Canadian economy contracted by 2.9 per cent in 2009, as every province with the exception of Prince Edward Island slipped into recession. While the recession was shorter and milder in Canada than in other G7 nations, Canada felt the impact of the global recession most directly through its international trade flows. Eroding demand from the US and other world economies, along with an appreciating Canadian dollar, weighed heavily on Canada’s trade sector through 2009.
2010 Financial and Economic Review – July 2010
11
Chapter 1 – Economic Review
The current account balance reversed to -$43.5 billion in 2009 compared to a surplus balance of $6.9 billion in 2008. The value of Canadian merchandise exports fell by 26.5 per cent through 2009, compared to last year’s increase of 8.4 per cent. Shipments of manufactured goods also decreased in 2009, as the total value of Canadian shipments fell by 17.4 per cent on the year.
Total employment in Canada decreased by 1.6 per cent (or 277,000 jobs) in 2009 as sectors such as construction and professional services incurred substantial losses in the early part of the year. Meanwhile, the national unemployment rate averaged 8.3 per cent in 2009, up from an average rate of 6.1 per cent observed in the previous year.
The number of Canadian housing starts fell substantially in 2009, down 29.4 per cent to 149,100 units following a decrease of 7.6 per cent in 2008. Residential building permits — a precursor to new residential building activity — shrank for a second consecutive year, down 15.1 per cent in 2009 after falling by 10.3 per cent in the prior year. Amidst gloomy economic conditions, cautious Canadian consumers cut back on purchases of goods and services resulting in a 2.9 per cent decline in national retail sales in 2009 compared to 2008.
International Economy
The International Monetary Fund estimates that global real GDP contracted by 0.6 per cent in 2009 following the 3.0 per cent gain observed in 2008. The Japanese economy contracted for a second consecutive year in 2009 with real GDP falling by 5.2 per cent after experiencing a decline of 1.2 per cent in 2008. The decrease was largely attributable to a decline in exports and waning domestic demand extending from the global economic crisis.
2010 Financial and Economic Review – July 2010
12
Chapter 1 – Economic Review
Meanwhile, Europe’s economy shrank by 4.1 per cent in 2009, after an increase of 0.6 per cent in 2008. All Euro area economies contracted in 2009, heavily affected by ongoing financial turmoil and the associated deep recession of the global economy. The economy for the Commonwealth of Independent States(3) contracted by 6.6 per cent in 2009, after experiencing growth of 5.5 per cent in the prior year.
In contrast, expanding Asian economies, especially those of China and India, continued to grow in 2009. China’s economy grew by 8.7 per cent in 2009, even after expanding by a robust 9.6 per cent in 2008. India’s economy also expanded further, reaching 5.7 per cent growth in 2009.
Financial Markets
The G-20 countries responded to the financial and economic crisis with aggressive policy actions, cutting monetary policy rates to historic lows in addition to other measures to ensure continued availability of credit. The Bank of Canada lowered its target for the overnight rate by 50 basis points in January 2009, and continued successive cuts to the rate through April. The overnight rate was brought down to 0.25 per cent, and was held at this effective lower bound for the remainder of the year.
Facing a sharp decline of economic activity in the latter half of 2008, the US Federal Reserve Board cut its intended federal funds rate to the range of 0.00 per cent to 0.25 per cent in December 2008 and held the rate at this unprecedented low throughout all of 2009.
After beginning 2009 at 82.6 US cents, the value of the loonie appreciated through 2009 to reach 95.5 US cents on December 31, 2009. The rise of the dollar’s value was attributed primarily to a weak US dollar, as well as the stabilization of commodity prices later in the year (on which much of the resource-rich Canadian economy is dependent), and rising equity markets.

(3) The Commonwealth of Independent States includes Armenia, Azerbaijan, Belarus, Georgia, Kazakhstan, Kyrgyz Republic, Moldova, Mongolia, Russia, Tajikistan, Turkmenistan, Ukraine and Uzbekistan.
2010 Financial and Economic Review – July 2010
13
Chapter 1 – Economic Review
Conclusion
British Columbia’s economy shrank by 2.3 per cent in 2009, as the province, together with most other regions of Canada and around the world, felt the effects of the global recession. The contraction in BC’s real GDP was largely attributable to a drop in the goods-producing industries, most notably manufacturing which fell 14.5 per cent on the year.
Waning demand for BC forest products took its toll on forestry related industries in 2009, with primary forestry and logging production falling 18.8 per cent and wood product manufacturing dropping 18.4 per cent on the year.
Further, a sharp drop in residential construction contributed to a 5.3 per cent decline in total construction in 2009, although this was mitigated in part by construction projects related to the 2010 Winter Olympic and Paralympic Games, which were successfully concluded in March 2010. Meanwhile, the buoyant home resale market led to a 22.2 per cent increase in the output of real estate agents and brokers on the year.
BC’s economy was in recession in late 2008 and into 2009, as it weathered significant economic challenges brought on by the global economic crisis. Despite the dismal global economic environment of 2009, most of BC’s major economic indicators confirm that British Columbia’s economy began to stabilize in the latter months of 2009.
2010 Financial and Economic Review – July 2010
14
Chapter 1 – Economic Review
Economic Downturn in 2009
In the latter half of 2008, the global economy began to experience a period of dramatic economic instability. The fallout from the US housing market crisis — brought on by a period of intense speculation and reckless lending practices by American financial institutions — left the US and much of the world mired in a severe recession through most of 2009. Investors lost billions of dollars in equity markets, large and long-standing financial institutions collapsed, credit markets froze, and millions of workers lost their jobs. In attempts to slow the onslaught of this financial downturn, policymakers in the US and other advanced countries drastically slashed interest rates, assumed partial ownership of some major corporations, and provided hundreds of billions of dollars in fiscal stimulus to the global economy through infrastructure spending and other initiatives.
Table 1 US and Canadian Economic Indicators 2009
(Annual per cent change from 2008) | | US | | Canada | |
| | | | | |
Employment | | -4.3 | | -1.6 | |
Real GDP* | | -2.4 | | -2.5 | |
Exports (goods and services) | | -9.6 | | -14.2 | |
Retail sales | | -6.3 | | -2.9 | |
Housing starts | | -38.8 | | -29.5 | |
* Real GDP, expenditure based, at market prices
United States
US real GDP fell by 2.4 per cent in 2009, driven down by major losses in business investment (-23.2 per cent) and personal consumption (-0.6 per cent). This was the first annual drop in real GDP since 1991 (-0.2 per cent), and the largest decrease since 1946 (-10.9 per cent).
The US housing market completely collapsed in 2009, with annual housing starts falling to 554,000 units — the lowest annual level on record. With eroding demand for new homes due to substantial job losses, rising foreclosure rates, and rapidly weakening prices for new and existing homes, the end of the US housing slump may still be several years off. US retail sales also saw significant declines in 2009, falling by a stunning 6.3 per cent from 2008, as consumers pulled back on expenditures in the wake of high debt levels, low consumer confidence and tight credit conditions.

Further, US citizens experienced an extremely bleak employment situation in 2009, with 4.7 million Americans losing their jobs during the year. In response to declining consumer demand and tighter credit for businesses, many firms made deep cuts to their expenses in order to lower costs. As job losses mounted throughout the year (which included a loss of 779,000 jobs in January alone), the monthly unemployment rate climbed steadily, beginning at 7.7 per cent in January and reaching 10.0 per cent by December.
Canada
The Canadian economy also slowed significantly in 2009, though not as severely as the US on some indicators. The Canadian housing market was in much better shape than the American market leading into 2009, and although it weakened in the early months of the year, Canada’s housing sector did not see the same drastic erosion in home values and rising foreclosure rates as in the US. Further, Canada’s banks and other financial institutions had much lower exposure to toxic subprime
2010 Financial and Economic Review – July 2010
15
Chapter 1 — Economic Review
debt than American financial institutions and, although Canadian firms did not escape the effects of the credit crunch, their balance sheets remained generally stronger than those of their US counterparts.
The Canadian economy contracted by 2.5 per cent in 2009, the largest annual drop since 1982. Losses in 2009 were partly driven by substantial declines in the export sector, as demand for Canadian exports from the US weakened substantially. Business investment also fell sharply during the year (-16.0 per cent), with Canadian firms slashing expenditures in the wake of falling domestic demand. Major quarter-over-quarter real GDP declines occurred in the first two quarters of the year, with a 7.0 per cent drop in the first quarter and a 2.8 per cent reduction in the second quarter (all quarterly figures annualized). However, Canada’s real GDP began to grow again in the latter half of the year, with a modest 0.9 per cent rise in the third quarter and a 4.9 per cent increase in the fourth quarter.
The Canadian housing market weakened significantly in 2009, though not nearly as severely as in the US. Canadian housing starts fell 29.4 per cent last year compared to 2008, while residential building permits — a precursor to new residential building activity — declined by 15.1 per cent in 2009. Retail spending among Canadians also fell in 2009, by 2.9 per cent, as consumer confidence among shoppers plummeted and credit conditions tightened.
Canada’s employment situation deteriorated somewhat in 2009, as 189,000 people lost their jobs between January and December. The majority of employment losses (252,900 jobs lost) occurred during the first six months of the year, while the latter half of 2009 saw a gain of 63,900 jobs. The Canadian unemployment rate rose in 2009, beginning at 7.3 per cent in January, climbing as high as 8.7 per cent in August, and ending the year at 8.4 per cent in December.
Conclusion
The economic weakness that occurred in 2009 had its origins in US secondary financial markets and the US housing market, where excessive lending practices and rampant speculation over the past few years created a major asset bubble that finally burst in late 2008. Economic activity in many advanced countries, including Canada, was hindered significantly in 2009, as job losses mounted, consumer confidence declined, credit conditions tightened (as financial institutions attempted to restore their balance sheets), and housing activity weakened. Although global activity improved somewhat in the latter months of 2009, substantial global economic uncertainty remains going forward.
2010 Financial and Economic Review – July 2010
16
Appendix 1
Economic Review
2010 Financial and Economic Review – July 2010
Appendix 1 – Economic Review
Table A1.1A Aggregate and Labour Market Indicators
| | Population (1)
(thousands) | | Nominal GDP*
($ millions) | | Real GDP*
(chained)
($2002 millions) | | Personal
income
($ millions) | | Capital
investment
($ millions) | | Business
incorporations
(number) | | Labour force
(thousands) | | Employment
(thousands) | | Unemployment
rate
(per cent) | |
1982 | | 2,877 | | 45,024 | | 79,324 | | 40,425 | | — | | — | | 1,427 | | 1,253 | | 12.1 | |
1983 | | 2,908 | | 47,477 | | 79,824 | | 41,634 | | — | | — | | 1,446 | | 1,245 | | 13.9 | |
1984 | | 2,947 | | 49,840 | | 80,440 | | 43,734 | | — | | — | | 1,465 | | 1,245 | | 15.0 | |
1985 | | 2,975 | | 53,540 | | 86,026 | | 46,588 | | — | | — | | 1,493 | | 1,280 | | 14.3 | |
1986 | | 3,004 | | 56,547 | | 86,187 | | 48,911 | | — | | — | | 1,526 | | 1,332 | | 12.7 | |
1987 | | 3,049 | | 62,515 | | 91,503 | | 52,903 | | — | | — | | 1,567 | | 1,378 | | 12.1 | |
1988 | | 3,115 | | 69,408 | | 96,824 | | 58,298 | | — | | — | | 1,599 | | 1,435 | | 10.3 | |
1989 | | 3,197 | | 75,582 | | 100,007 | | 65,009 | | — | | — | | 1,659 | | 1,508 | | 9.1 | |
1990 | | 3,292 | | 79,350 | | 101,408 | | 72,038 | | — | | — | | 1,703 | | 1,560 | | 8.4 | |
1991 | | 3,374 | | 81,849 | | 101,593 | | 75,336 | | 17,370 | | — | | 1,751 | | 1,578 | | 9.9 | |
1992 | | 3,469 | | 87,242 | | 104,216 | | 78,610 | | 17,979 | | — | | 1,800 | | 1,617 | | 10.1 | |
1993 | | 3,568 | | 94,077 | | 108,874 | | 81,914 | | 18,875 | | — | | 1,848 | | 1,668 | | 9.7 | |
1994 | | 3,676 | | 100,512 | | 111,945 | | 85,703 | | 21,353 | | — | | 1,918 | | 1,743 | | 9.1 | |
1995 | | 3,777 | | 105,670 | | 114,620 | | 90,056 | | 20,591 | | — | | 1,951 | | 1,786 | | 8.5 | |
1996 | | 3,874 | | 108,865 | | 117,442 | | 92,661 | | 19,408 | | 23,237 | | 1,988 | | 1,816 | | 8.7 | |
1997 | | 3,949 | | 114,383 | | 121,177 | | 95,925 | | 22,552 | | 22,958 | | 2,031 | | 1,861 | | 8.4 | |
1998 | | 3,983 | | 115,641 | | 122,766 | | 98,135 | | 20,819 | | 20,759 | | 2,038 | | 1,858 | | 8.8 | |
1999 | | 4,011 | | 120,921 | | 126,708 | | 101,465 | | 21,152 | | 21,009 | | 2,065 | | 1,894 | | 8.3 | |
2000 | | 4,039 | | 131,333 | | 132,578 | | 107,624 | | 21,799 | | 21,388 | | 2,080 | | 1,931 | | 7.1 | |
2001 | | 4,076 | | 133,514 | | 133,403 | | 110,369 | | 23,414 | | 19,474 | | 2,083 | | 1,922 | | 7.7 | |
2002 | | 4,098 | | 138,193 | | 138,193 | | 113,451 | | 23,732 | | 20,987 | | 2,148 | | 1,965 | | 8.5 | |
2003 | | 4,122 | | 145,642 | | 141,435 | | 117,126 | | 25,434 | | 22,531 | | 2,191 | | 2,015 | | 8.0 | |
2004 | | 4,155 | | 157,675 | | 146,541 | | 124,263 | | 29,665 | | 24,703 | | 2,222 | | 2,063 | | 7.2 | |
2005 | | 4,197 | | 169,664 | | 153,489 | | 131,408 | | 33,254 | | 30,937 | | 2,263 | | 2,131 | | 5.9 | |
2006 | | 4,244 | | 182,310 | | 159,916 | | 142,626 | | 39,912 | | 33,273 | | 2,305 | | 2,196 | | 4.8 | |
2007 | | 4,309 | | 191,598 | | 164,519 | | 150,794 | | 42,670 | | 34,036 | | 2,366 | | 2,266 | | 4.2 | |
2008 | | 4,384 | | 197,931 | | 164,520 | | 158,504 | | 46,936 | | 30,085 | | 2,426 | | 2,314 | | 4.6 | |
2009 | | 4,455 | | na | | na | | na | | 40,257 | | 26,431 | | 2,445 | | 2,259 | | 7.6 | |
| | Population (1)
(% change) | | Nominal GDP*
(% change) | | Real GDP*
(% change) | | Personal
income
(% change) | | Capital
investment
(% change) | | Business
incorporations
(% change) | | Labour force
(% change) | | Employment
(% change) | | Unemployment
rate
(change) | |
1983 | | 1.1 | | 5.4 | | 0.6 | | 3.0 | | — | | — | | 1.3 | | (0.7 | ) | 1.8 | |
1984 | | 1.4 | | 5.0 | | 0.8 | | 5.0 | | — | | — | | 1.3 | | 0.0 | | 1.1 | |
1985 | | 0.9 | | 7.4 | | 6.9 | | 6.5 | | — | | — | | 1.9 | | 2.8 | | (0.7 | ) |
1986 | | 1.0 | | 5.6 | | 0.2 | | 5.0 | | — | | — | | 2.2 | | 4.1 | | (1.6 | ) |
1987 | | 1.5 | | 10.6 | | 6.2 | | 8.2 | | — | | — | | 2.7 | | 3.4 | | (0.6 | ) |
1988 | | 2.2 | | 11.0 | | 5.8 | | 10.2 | | — | | — | | 2.0 | | 4.1 | | (1.8 | ) |
1989 | | 2.6 | | 8.9 | | 3.3 | | 11.5 | | — | | — | | 3.8 | | 5.1 | | (1.2 | ) |
1990 | | 3.0 | | 5.0 | | 1.4 | | 10.8 | | — | | — | | 2.6 | | 3.4 | | (0.7 | ) |
1991 | | 2.5 | | 3.1 | | 0.2 | | 4.6 | | — | | — | | 2.8 | | 1.1 | | 1.5 | |
1992 | | 2.8 | | 6.6 | | 2.6 | | 4.3 | | 3.5 | | — | | 2.8 | | 2.5 | | 0.2 | |
1993 | | 2.9 | | 7.8 | | 4.5 | | 4.2 | | 5.0 | | — | | 2.7 | | 3.1 | | (0.4 | ) |
1994 | | 3.0 | | 6.8 | | 2.8 | | 4.6 | | 13.1 | | — | | 3.8 | | 4.5 | | (0.6 | ) |
1995 | | 2.8 | | 5.1 | | 2.4 | | 5.1 | | (3.6 | ) | — | | 1.7 | | 2.4 | | (0.6 | ) |
1996 | | 2.6 | | 3.0 | | 2.5 | | 2.9 | | (5.7 | ) | — | | 1.9 | | 1.7 | | 0.2 | |
1997 | | 1.9 | | 5.1 | | 3.2 | | 3.5 | | 16.2 | | (1.2 | ) | 2.1 | | 2.4 | | (0.3 | ) |
1998 | | 0.9 | | 1.1 | | 1.3 | | 2.3 | | (7.7 | ) | (9.6 | ) | 0.4 | | (0.1 | ) | 0.4 | |
1999 | | 0.7 | | 4.6 | | 3.2 | | 3.4 | | 1.6 | | 1.2 | | 1.3 | | 1.9 | | (0.5 | ) |
2000 | | 0.7 | | 8.6 | | 4.6 | | 6.1 | | 3.1 | | 1.8 | | 0.7 | | 1.9 | | (1.2 | ) |
2001 | | 0.9 | | 1.7 | | 0.6 | | 2.6 | | 7.4 | | (8.9 | ) | 0.1 | | (0.5 | ) | 0.6 | |
2002 | | 0.5 | | 3.5 | | 3.6 | | 2.8 | | 1.4 | | 7.8 | | 3.1 | | 2.3 | | 0.8 | |
2003 | | 0.6 | | 5.4 | | 2.3 | | 3.2 | | 7.2 | | 7.4 | | 2.0 | | 2.5 | | (0.5 | ) |
2004 | | 0.8 | | 8.3 | | 3.6 | | 6.1 | | 16.6 | | 9.6 | | 1.4 | | 2.4 | | (0.8 | ) |
2005 | | 1.0 | | 7.6 | | 4.7 | | 5.7 | | 12.1 | | 25.2 | | 1.9 | | 3.3 | | (1.3 | ) |
2006 | | 1.1 | | 7.5 | | 4.2 | | 8.5 | | 20.0 | | 7.6 | | 1.8 | | 3.1 | | (1.1 | ) |
2007 | | 1.6 | | 5.1 | | 2.9 | | 5.7 | | 6.9 | | 2.3 | | 2.7 | | 3.2 | | (0.6 | ) |
2008 | | 1.7 | | 3.3 | | 0.0 | | 5.1 | | 10.0 | | (11.6 | ) | 2.5 | | 2.1 | | 0.4 | |
2009 | | 1.6 | | na | | na | | na | | (14.2 | ) | (12.1 | ) | 0.8 | | (2.4 | ) | 3.0 | |
(1) As at July 1. Data take into account adjustments made for net census undercount in 1996, 2001 and 2006, and non-permanent residents.
* GDP at Market Prices.
2010 Financial and Economic Review – July 2010
18
Appendix 1 – Economic Review
Table A1.1B Prices, Earnings and Financial Indicators
| | BC
CPI
(2002=100) | | Vancouver
CPI
(2002=100) | | Average
weekly
wage rate(1)
($) | | Labour
income
($ millions) | | Personal income
per capita
(dollars) | | Personal
Disposable
Income
per capita
(dollars) | | Prime
rate
(per cent) | | Can/US
exchange rate
(US cents) | | Conventional
(5 year)
mortgage rate
(per cent) | |
1982 | | 57.3 | | 56.6 | | — | | 26,497 | | 14,053 | | 11,468 | | 15.8 | | 81.1 | | 18.0 | |
1983 | | 60.4 | | 59.7 | | — | | 27,018 | | 14,320 | | 11,580 | | 11.2 | | 81.1 | | 13.2 | |
1984 | | 62.8 | | 62.1 | | — | | 27,811 | | 14,839 | | 12,134 | | 12.1 | | 77.2 | | 13.6 | |
1985 | | 64.8 | | 64.0 | | — | | 29,100 | | 15,659 | | 12,777 | | 10.6 | | 73.2 | | 12.1 | |
1986 | | 66.7 | | 66.2 | | — | | 30,339 | | 16,284 | | 13,135 | | 10.5 | | 72.0 | | 11.2 | |
1987 | | 68.7 | | 68.2 | | — | | 32,837 | | 17,353 | | 13,860 | | 9.5 | | 75.4 | | 11.2 | |
1988 | | 71.2 | | 70.6 | | — | | 36,110 | | 18,717 | | 14,846 | | 10.8 | | 81.3 | | 11.6 | |
1989 | | 74.4 | | 73.8 | | — | | 40,295 | | 20,336 | | 16,156 | | 13.3 | | 84.5 | | 12.1 | |
1990 | | 78.4 | | 77.8 | | — | | 44,216 | | 21,882 | | 17,003 | | 14.1 | | 85.7 | | 13.4 | |
1991 | | 82.6 | | 81.9 | | — | | 46,296 | | 22,330 | | 17,309 | | 9.9 | | 87.3 | | 11.1 | |
1992 | | 84.8 | | 84.3 | | — | | 48,924 | | 22,662 | | 17,454 | | 7.5 | | 82.7 | | 9.5 | |
1993 | | 87.8 | | 87.3 | | — | | 51,312 | | 22,959 | | 17,802 | | 5.9 | | 77.5 | | 8.8 | |
1994 | | 89.5 | | 89.1 | | — | | 53,972 | | 23,314 | | 17,968 | | 6.9 | | 73.2 | | 9.5 | |
1995 | | 91.6 | | 91.3 | | — | | 56,768 | | 23,841 | | 18,300 | | 8.6 | | 72.9 | | 9.2 | |
1996 | | 92.4 | | 92.1 | | — | | 58,517 | | 23,917 | | 18,221 | | 6.1 | | 73.3 | | 7.9 | |
1997 | | 93.1 | | 92.6 | | 612.63 | | 60,681 | | 24,294 | | 18,484 | | 5.0 | | 72.2 | | 7.1 | |
1998 | | 93.4 | | 93.0 | | 621.21 | | 61,965 | | 24,638 | | 18,676 | | 6.6 | | 67.4 | | 6.9 | |
1999 | | 94.4 | | 93.9 | | 628.82 | | 64,045 | | 25,294 | | 19,298 | | 6.4 | | 67.3 | | 7.6 | |
2000 | | 96.1 | | 96.0 | | 639.37 | | 68,369 | | 26,645 | | 20,276 | | 7.3 | | 67.3 | | 8.4 | |
2001 | | 97.7 | | 97.8 | | 648.19 | | 70,044 | | 27,076 | | 20,934 | | 5.8 | | 64.6 | | 7.4 | |
2002 | | 100.0 | | 100.0 | | 668.04 | | 72,900 | | 27,683 | | 21,618 | | 4.2 | | 63.7 | | 7.0 | |
2003 | | 102.2 | | 102.0 | | 683.68 | | 75,605 | | 28,412 | | 22,197 | | 4.7 | | 71.4 | | 6.4 | |
2004 | | 104.2 | | 104.0 | | 686.74 | | 80,599 | | 29,906 | | 23,321 | | 4.0 | | 76.8 | | 6.2 | |
2005 | | 106.3 | | 106.0 | | 704.49 | | 85,806 | | 31,312 | | 24,214 | | 4.4 | | 82.5 | | 6.0 | |
2006 | | 108.1 | | 108.0 | | 726.02 | | 93,963 | | 33,610 | | 26,086 | | 5.8 | | 88.2 | | 6.7 | |
2007 | | 110.0 | | 110.2 | | 747.84 | | 98,573 | | 34,991 | | 27,022 | | 6.1 | | 93.1 | | 7.1 | |
2008 | | 112.3 | | 112.8 | | 780.85 | | 103,811 | | 36,156 | | 28,368 | | 4.7 | | 93.7 | | 7.1 | |
2009 | | 112.3 | | 112.9 | | 800.50 | | na | | na | | na | | 2.4 | | 87.6 | | 5.6 | |
| | BC
CPI
(% change) | | Vancouver
CPI
(% change) | | Average
weekly
wage rate(1)
(% change) | | Labour
income
(% change) | | Personal income
per capita
(% change) | | Personal
Disposable
Income
per capita
(% change) | | Prime
rate
(change) | | Can/US
exchange rate
(change) | | Conventional
(5 year)
mortgage rate
(change) | |
1983 | | 5.4 | | 5.5 | | — | | 2.0 | | 1.9 | | 1.0 | | (4.6 | ) | 0.1 | | (4.8 | ) |
1984 | | 4.0 | | 4.0 | | — | | 2.9 | | 3.6 | | 4.8 | | 0.9 | | (3.9 | ) | 0.4 | |
1985 | | 3.2 | | 3.1 | | — | | 4.6 | | 5.5 | | 5.3 | | (1.5 | ) | (4.0 | ) | (1.5 | ) |
1986 | | 2.9 | | 3.4 | | — | | 4.3 | | 4.0 | | 2.8 | | (0.1 | ) | (1.3 | ) | (0.9 | ) |
1987 | | 3.0 | | 3.0 | | — | | 8.2 | | 6.6 | | 5.5 | | (1.0 | ) | 3.4 | | (0.0 | ) |
1988 | | 3.6 | | 3.5 | | — | | 10.0 | | 7.9 | | 7.1 | | 1.3 | | 5.8 | | 0.5 | |
1989 | | 4.5 | | 4.5 | | — | | 11.6 | | 8.6 | | 8.8 | | 2.5 | | 3.2 | | 0.4 | |
1990 | | 5.4 | | 5.4 | | — | | 9.7 | | 7.6 | | 5.2 | | 0.7 | | 1.2 | | 1.3 | |
1991 | | 5.4 | | 5.3 | | — | | 4.7 | | 2.0 | | 1.8 | | (4.1 | ) | 1.6 | | (2.2 | ) |
1992 | | 2.7 | | 2.9 | | — | | 5.7 | | 1.5 | | 0.8 | | (2.5 | ) | (4.5 | ) | (1.6 | ) |
1993 | | 3.5 | | 3.6 | | — | | 4.9 | | 1.3 | | 2.0 | | (1.5 | ) | (5.2 | ) | (0.7 | ) |
1994 | | 1.9 | | 2.1 | | — | | 5.2 | | 1.5 | | 0.9 | | 0.9 | | (4.3 | ) | 0.8 | |
1995 | | 2.3 | | 2.5 | | — | | 5.2 | | 2.3 | | 1.8 | | 1.8 | | (0.4 | ) | (0.4 | ) |
1996 | | 0.9 | | 0.9 | | — | | 3.1 | | 0.3 | | (0.4 | ) | (2.6 | ) | 0.5 | | (1.2 | ) |
1997 | | 0.8 | | 0.5 | | — | | 3.7 | | 1.6 | | 1.4 | | (1.1 | ) | (1.1 | ) | (0.9 | ) |
1998 | | 0.3 | | 0.4 | | 1.4 | | 2.1 | | 1.4 | | 1.0 | | 1.6 | | (4.8 | ) | (0.1 | ) |
1999 | | 1.1 | | 1.0 | | 1.2 | | 3.4 | | 2.7 | | 3.3 | | (0.2 | ) | (0.1 | ) | 0.6 | |
2000 | | 1.8 | | 2.2 | | 1.7 | | 6.8 | | 5.3 | | 5.1 | | 0.8 | | 0.0 | | 0.8 | |
2001 | | 1.7 | | 1.9 | | 1.4 | | 2.4 | | 1.6 | | 3.2 | | (1.5 | ) | (2.8 | ) | (0.9 | ) |
2002 | | 2.4 | | 2.2 | | 3.1 | | 4.1 | | 2.2 | | 3.3 | | (1.6 | ) | (0.9 | ) | (0.4 | ) |
2003 | | 2.2 | | 2.0 | | 2.3 | | 3.7 | | 2.6 | | 2.7 | | 0.5 | | 7.7 | | (0.6 | ) |
2004 | | 2.0 | | 2.0 | | 0.4 | | 6.6 | | 5.3 | | 5.1 | | (0.7 | ) | 5.5 | | (0.2 | ) |
2005 | | 2.0 | | 1.9 | | 2.6 | | 6.5 | | 4.7 | | 3.8 | | 0.4 | | 5.7 | | (0.2 | ) |
2006 | | 1.7 | | 1.9 | | 3.1 | | 9.5 | | 7.3 | | 7.7 | | 1.4 | | 5.6 | | 0.7 | |
2007 | | 1.8 | | 2.0 | | 3.0 | | 4.9 | | 4.1 | | 3.6 | | 0.3 | | 4.9 | | 0.4 | |
2008 | | 2.1 | | 2.4 | | 4.4 | | 5.3 | | 3.3 | | 5.0 | | (1.4 | ) | 0.6 | | (0.0 | ) |
2009 | | 0.0 | | 0.1 | | 2.5 | | na | | na | | na | | (2.3 | ) | (6.1 | ) | (1.4 | ) |
(1) Data prior to 1997 are not available.
Sources: Statistics Canada and BC Stats, Ministry of Finance, based on federal, provincial and industry data.
2010 Financial and Economic Review – July 2010
19
Appendix 1 – Economic Review
Table A1.1C Other Indicators
| | Manufacturing
shipments
($ millions) | | Retail sales(1)
($ millions) | | Housing
starts
(number) | | Non-residential
building permits
($ millions) | | Tourism
GDP
($ millions) | | High-tech
GDP
($ millions) | | BC product
exports
($ millions) | |
1982 | | — | | — | | 19,807 | | 1,026 | | — | | — | | 12,353 | |
1983 | | — | | — | | 22,607 | | 775 | | — | | — | | 13,244 | |
1984 | | — | | — | | 16,169 | | 827 | | — | | — | | 15,748 | |
1985 | | — | | — | | 17,969 | | 812 | | — | | — | | 13,591 | |
1986 | | — | | — | | 20,687 | | 912 | | — | | — | | 13,033 | |
1987 | | — | | — | | 28,944 | | 999 | | — | | — | | 15,883 | |
1988 | | — | | — | | 30,487 | | 1,647 | | — | | — | | 17,822 | |
1989 | | — | | — | | 38,894 | | 1,812 | | — | | — | | 18,307 | |
1990 | | — | | — | | 36,720 | | 1,833 | | — | | — | | 16,605 | |
1991 | | — | | 25,022 | | 31,875 | | 1,803 | | — | | — | | 15,253 | |
1992 | | 24,398 | | 26,194 | | 40,621 | | 2,082 | | — | | — | | 16,336 | |
1993 | | 26,583 | | 28,463 | | 42,807 | | 1,944 | | — | | — | | 19,033 | |
1994 | | 30,333 | | 31,770 | | 39,408 | | 1,772 | | — | | — | | 22,856 | |
1995 | | 34,207 | | 34,219 | | 27,057 | | 1,966 | | — | | — | | 26,873 | |
1996 | | 32,932 | | 34,775 | | 27,641 | | 1,957 | | — | | — | | 25,717 | |
1997 | | 33,496 | | 36,591 | | 29,351 | | 1,960 | | 4,482 | | 5,123 | | 26,699 | |
1998 | | 31,757 | | 35,762 | | 19,931 | | 2,022 | | 4,632 | | 5,454 | | 25,942 | |
1999 | | 36,679 | | 36,373 | | 16,309 | | 2,104 | | 4,807 | | 5,576 | | 29,044 | |
2000 | | 40,699 | | 38,435 | | 14,418 | | 2,089 | | 5,048 | | 6,280 | | 33,639 | |
2001 | | 38,303 | | 40,719 | | 17,234 | | 2,125 | | 5,191 | | 6,311 | | 31,680 | |
2002 | | 38,610 | | 43,265 | | 21,625 | | 1,771 | | 5,238 | | 6,730 | | 28,828 | |
2003 | | 39,772 | | 44,421 | | 26,174 | | 1,880 | | 5,233 | | 7,347 | | 28,264 | |
2004 | | 41,607 | | 47,219 | | 32,925 | | 2,070 | | 5,667 | | 7,805 | | 31,008 | |
2005 | | 42,883 | | 49,379 | | 34,667 | | 3,212 | | 6,182 | | 8,690 | | 34,167 | |
2006 | | 44,480 | | 53,133 | | 36,443 | | 3,921 | | 6,667 | | 9,445 | | 33,466 | |
2007 | | 42,526 | | 56,930 | | 39,195 | | 3,933 | | 7,081 | | 10,335 | | 31,512 | |
2008 | | 39,759 | | 57,783 | | 34,321 | | 3,678 | | 7,382 | | na | | 33,155 | |
2009 | | 32,720 | | 55,222 | | 16,077 | | 3,139 | | na | | na | | 25,191 | |
| | Manufacturing
shipments
(% change) | | Retail sales(1)
(% change) | | Housing
starts
(% change) | | Non-residential building permits
(% change) | | Tourism
GDP
(% change) | | High-tech
GDP
(% change) | | BC product
exports
(% change) | |
1983 | | — | | — | | 14.1 | | (24.5 | ) | — | | — | | 7.2 | |
1984 | | — | | — | | (28.5 | ) | 6.7 | | — | | — | | 18.9 | |
1985 | | — | | — | | 11.1 | | (1.7 | ) | — | | — | | (13.7 | ) |
1986 | | — | | — | | 15.1 | | 12.3 | | — | | — | | (4.1 | ) |
1987 | | — | | — | | 39.9 | | 9.6 | | — | | — | | 21.9 | |
1988 | | — | | — | | 5.3 | | 64.9 | | — | | — | | 12.2 | |
1989 | | — | | — | | 27.6 | | 10.0 | | — | | — | | 2.7 | |
1990 | | — | | — | | (5.6 | ) | 1.2 | | — | | — | | (9.3 | ) |
1991 | | — | | — | | (13.2 | ) | (1.6 | ) | — | | — | | (8.1 | ) |
1992 | | — | | 4.7 | | 27.4 | | 15.5 | | — | | — | | 7.1 | |
1993 | | 9.0 | | 8.7 | | 5.4 | | (6.7 | ) | — | | — | | 16.5 | |
1994 | | 14.1 | | 11.6 | | (7.9 | ) | (8.9 | ) | — | | — | | 20.1 | |
1995 | | 12.8 | | 7.7 | | (31.3 | ) | 11.0 | | — | | — | | 17.6 | |
1996 | | (3.7 | ) | 1.6 | | 2.2 | | (0.4 | ) | — | | — | | (4.3 | ) |
1997 | | 1.7 | | 5.2 | | 6.2 | | 0.1 | | — | | — | | 3.8 | |
1998 | | (5.2 | ) | (2.3 | ) | (32.1 | ) | 3.2 | | 3.3 | | 6.5 | | (2.8 | ) |
1999 | | 15.5 | | 1.7 | | (18.2 | ) | 4.0 | | 3.8 | | 2.2 | | 12.0 | |
2000 | | 11.0 | | 5.7 | | (11.6 | ) | (0.7 | ) | 5.0 | | 12.6 | | 15.8 | |
2001 | | (5.9 | ) | 5.9 | | 19.5 | | 1.7 | | 2.8 | | 0.5 | | (5.8 | ) |
2002 | | 0.8 | | 6.3 | | 25.5 | | (16.6 | ) | 0.9 | | 6.6 | | (9.0 | ) |
2003 | | 3.0 | | 2.7 | | 21.0 | | 6.1 | | (0.1 | ) | 9.2 | | (2.0 | ) |
2004 | | 4.6 | | 6.3 | | 25.8 | | 10.1 | | 8.3 | | 6.2 | | 9.7 | |
2005 | | 3.1 | | 4.6 | | 5.3 | | 55.2 | | 9.1 | | 11.3 | | 10.2 | |
2006 | | 3.7 | | 7.6 | | 5.1 | | 22.1 | | 7.8 | | 8.7 | | (2.1 | ) |
2007 | | (4.4 | ) | 7.1 | | 7.6 | | 0.3 | | 6.2 | | 9.4 | | (5.8 | ) |
2008 | | (6.5 | ) | 1.5 | | (12.4 | ) | (6.5 | ) | 4.3 | | na | | 5.2 | |
2009 | | (17.7 | ) | (4.4 | ) | (53.2 | ) | (14.7 | ) | na | | na | | (24.0 | ) |
(1) Retail sales data have been revised from 1991 to 2006 and are now classified under the North American Industry Classification System (NAICS 2002).
Sources: Statistics Canada and BC Stats, Ministry of Finance, based on federal, provincial and industry data.
2010 Financial and Economic Review – July 2010
20
Appendix 1 – Economic Review
Table A1.1D Commodity Production Indicators
| | Lumber
production
(thousand m3) | | Timber scale
billed
(thousand m3) | | Pulp
shipments
(000 tonnes) | | Newsprint, etc
production
(000 tonnes) | | Oil & natural
gas production
($ millions) | | Coal
production
(000 tonnes) | | Solid mineral
shipments
($ millions) | | Electric pwr
generated
(GWh) | | Farm cash
receipts
($ millions) | | Landed value of
seafood products
($ millions) | |
1982 | | 23,855 | | 56,232 | | 2,662 | | 1,862 | | — | | 11,769 | | — | | 48,238 | | 962 | | 241 | |
1983 | | 30,773 | | 71,443 | | 3,221 | | 2,120 | | — | | 11,717 | | — | | 47,213 | | 917 | | 210 | |
1984 | | 30,884 | | 74,557 | | 2,836 | | 2,082 | | — | | 20,771 | | — | | 52,369 | | 1,005 | | 243 | |
1985 | | 32,994 | | 76,869 | | 3,298 | | 2,481 | | — | | 22,993 | | 2,524 | | 59,126 | | 1,061 | | 378 | |
1986 | | 31,468 | | 77,503 | | 3,628 | | 2,629 | | — | | 20,361 | | 2,512 | | 50,759 | | 1,106 | | 405 | |
1987 | | 37,336 | | 90,592 | | 4,136 | | 2,762 | | — | | 21,990 | | 2,896 | | 63,066 | | 1,122 | | 455 | |
1988 | | 36,736 | | 86,808 | | 4,141 | | 2,845 | | — | | 24,942 | | 3,325 | | 60,943 | | 1,206 | | 573 | |
1989 | | 35,952 | | 86,793 | | 4,189 | | 2,834 | | — | | 24,800 | | 3,344 | | 57,655 | | 1,255 | | 513 | |
1990 | | 33,514 | | 78,045 | | 3,547 | | 2,992 | | — | | 24,557 | | 3,092 | | 60,662 | | 1,299 | | 559 | |
1991 | | 31,406 | | 73,449 | | 4,014 | | 2,667 | | 858 | | 24,965 | | 2,950 | | 62,981 | | 1,342 | | 492 | |
1992 | | 33,396 | | 73,937 | | 3,825 | | 2,708 | | 890 | | 17,173 | | 2,577 | | 64,058 | | 1,404 | | 533 | |
1993 | | 33,935 | | 79,232 | | 4,040 | | 3,110 | | 1,089 | | 20,633 | | 2,415 | | 58,774 | | 1,446 | | 605 | |
1994 | | 33,671 | | 75,639 | | 4,763 | | 2,983 | | 1,270 | | 22,583 | | 2,632 | | 61,015 | | 1,538 | | 728 | |
1995 | | 32,611 | | 76,471 | | 4,572 | | 2,833 | | 1,040 | | 24,350 | | 3,438 | | 58,006 | | 1,586 | | 604 | |
1996 | | 32,671 | | 75,213 | | 4,390 | | 2,801 | | 1,333 | | 25,422 | | 3,004 | | 71,765 | | 1,706 | | 590 | |
1997 | | 31,562 | | 68,628 | | 4,532 | | 2,649 | | 1,588 | | 27,876 | | 3,047 | | 66,961 | | 1,738 | | 604 | |
1998 | | 30,238 | | 64,967 | | 4,462 | | 2,567 | | 1,574 | | 24,868 | | 2,893 | | 67,710 | | 1,780 | | 547 | |
1999 | | 32,397 | | 75,998 | | 4,995 | | 3,016 | | 2,091 | | 24,845 | | 2,445 | | 68,045 | | 1,885 | | 613 | |
2000 | | 34,346 | | 76,988 | | 5,152 | | 3,126 | | 4,783 | | 25,682 | | 2,891 | | 68,241 | | 2,024 | | 667 | |
2001 | | 32,606 | | 72,008 | | 4,710 | | 2,879 | | 5,666 | | 27,006 | | 2,867 | | 57,332 | | 2,201 | | 647 | |
2002 | | 35,501 | | 73,386 | | 4,477 | | 2,900 | | 4,251 | | 24,397 | | 2,864 | | 64,945 | | 2,174 | | 664 | |
2003 | | 36,031 | | 61,925 | | 4,762 | | 2,919 | | 6,230 | | 23,073 | | 2,887 | | 63,051 | | 2,248 | | 645 | |
2004 | | 39,879 | | 92,361 | | 4,724 | | 2,976 | | 6,784 | | 27,313 | | 3,740 | | 60,496 | | 2,360 | | 635 | |
2005 | | 41,013 | | 83,134 | | 4,932 | | 2,953 | | 8,967 | | 26,718 | | 5,384 | | 67,811 | | 2,378 | | 706 | |
2006 | | 41,051 | | 81,526 | | 4,736 | | 3,019 | | 7,148 | | 23,161 | | 5,991 | | 62,021 | | 2,336 | | 788 | |
2007 | | 36,677 | | 75,557 | | 4,717 | | 2,763 | | 6,912 | | 25,941 | | 5,611 | | 72,217 | | 2,392 | | 723 | |
2008 | | 28,192 | | 62,081 | | 4,021 | | 2,514 | | 9,240 | | 26,163 | | 7,402 | | 65,856 | | 2,505 | | 710 | |
2009 | | 22,975 | | 47,316 | | 3,708 | | 2,021 | | 4,129 | | 21,193 | | 5,734 | | 62,206 | | na | | na | |
| | Lumber
production
(% change) | | Timber scale
billed
(% change) | | Pulp
shipments
(% change) | | Newsprint, etc
production
(% change) | | Oil & natural
gas production
(% change) | | Coal
production
(% change) | | Solid mineral
shipments
(% change) | | Electric pwr
generated
(% change) | | Farm cash
receipts
(% change) | | Value of
seafood products
(% change) | |
1983 | | 29.0 | | 27.1 | | 21.0 | | 13.9 | | — | | (0.4 | ) | — | | (2.1 | ) | (4.7 | ) | (12.9 | ) |
1984 | | 0.4 | | 4.4 | | (12.0 | ) | (1.8 | ) | — | | 77.3 | | — | | 10.9 | | 9.6 | | 15.7 | |
1985 | | 6.8 | | 3.1 | | 16.3 | | 19.2 | | — | | 10.7 | | — | | 12.9 | | 5.7 | | 55.6 | |
1986 | | (4.6 | ) | 0.8 | | 10.0 | | 6.0 | | — | | (11.4 | ) | (0.5 | ) | (14.2 | ) | 4.2 | | 7.1 | |
1987 | | 18.6 | | 16.9 | | 14.0 | | 5.1 | | — | | 8.0 | | 15.3 | | 24.2 | | 1.4 | | 12.3 | |
1988 | | (1.6 | ) | (4.2 | ) | 0.1 | | 3.0 | | — | | 13.4 | | 14.8 | | (3.4 | ) | 7.6 | | 25.9 | |
1989 | | (2.1 | ) | (0.0 | ) | 1.2 | | (0.4 | ) | — | | (0.6 | ) | 0.6 | | (5.4 | ) | 4.0 | | (10.5 | ) |
1990 | | (6.8 | ) | (10.1 | ) | (15.3 | ) | 5.5 | | — | | (1.0 | ) | (7.5 | ) | 5.2 | | 3.5 | | 9.0 | |
1991 | | (6.3 | ) | (5.9 | ) | 13.2 | | (10.8 | ) | — | | 1.7 | | (4.6 | ) | 3.8 | | 3.3 | | (12.0 | ) |
1992 | | 6.3 | | 0.7 | | (4.7 | ) | 1.5 | | 3.7 | | (31.2 | ) | (12.6 | ) | 1.7 | | 4.7 | | 8.3 | |
1993 | | 1.6 | | 7.2 | | 5.6 | | 14.8 | | 22.4 | | 20.1 | | (6.3 | ) | (8.2 | ) | 3.0 | | 13.5 | |
1994 | | (0.8 | ) | (4.5 | ) | 17.9 | | (4.1 | ) | 16.6 | | 9.5 | | 9.0 | | 3.8 | | 6.4 | | 20.3 | |
1995 | | (3.1 | ) | 1.1 | | (4.0 | ) | (5.0 | ) | (18.1 | ) | 7.8 | | 30.6 | | (4.9 | ) | 3.1 | | (17.0 | ) |
1996 | | 0.2 | | (1.6 | ) | (4.0 | ) | (1.1 | ) | 28.2 | | 4.4 | | (12.6 | ) | 23.7 | | 7.6 | | (2.3 | ) |
1997 | | (3.4 | ) | (8.8 | ) | 3.2 | | (5.4 | ) | 19.1 | | 9.7 | | 1.4 | | (6.7 | ) | 1.9 | | 2.4 | |
1998 | | (4.2 | ) | (5.3 | ) | (1.5 | ) | (3.1 | ) | (0.9 | ) | (10.8 | ) | (5.1 | ) | 1.1 | | 2.4 | | (9.4 | ) |
1999 | | 7.1 | | 17.0 | | 11.9 | | 17.5 | | 32.8 | | (0.1 | ) | (15.5 | ) | 0.5 | | 5.9 | | 12.1 | |
2000 | | 6.0 | | 1.3 | | 3.1 | | 3.6 | | 128.7 | | 3.4 | | 18.2 | | 0.3 | | 7.4 | | 8.8 | |
2001 | | (5.1 | ) | (6.5 | ) | (8.6 | ) | (7.9 | ) | 18.5 | | 5.2 | | (0.8 | ) | (16.0 | ) | 8.7 | | (3.0 | ) |
2002 | | 8.9 | | 1.9 | | (4.9 | ) | 0.7 | | (25.0 | ) | (9.7 | ) | (0.1 | ) | 13.3 | | (1.2 | ) | 2.6 | |
2003 | | 1.5 | | (15.6 | ) | 6.4 | | 0.7 | | 46.6 | | (5.4 | ) | 0.8 | | (2.9 | ) | 3.4 | | (2.9 | ) |
2004 | | 10.7 | | 49.2 | | (0.8 | ) | 2.0 | | 8.9 | | 18.4 | | 29.5 | | (4.1 | ) | 5.0 | | (1.6 | ) |
2005 | | 2.8 | | (10.0 | ) | 4.4 | | (0.8 | ) | 32.2 | | (2.2 | ) | 44.0 | | 12.1 | | 0.8 | | 11.2 | |
2006 | | 0.1 | | (1.9 | ) | (4.0 | ) | 2.2 | | (20.3 | ) | (13.3 | ) | 11.3 | | (8.5 | ) | (1.8 | ) | 11.6 | |
2007 | | (10.7 | ) | (7.3 | ) | (0.4 | ) | (8.5 | ) | (3.3 | ) | 12.0 | | (6.3 | ) | 16.4 | | 2.4 | | (8.2 | ) |
2008 | | (23.1 | ) | (17.8 | ) | (14.8 | ) | (9.0 | ) | 33.7 | | 0.9 | | 31.9 | | (8.8 | ) | 4.7 | | (1.8 | ) |
2009 | | (18.5 | ) | (23.8 | ) | (7.8 | ) | (19.6 | ) | (55.3 | ) | (19.0 | ) | (22.5 | ) | (5.5 | ) | na | | na | |
Sources: Statistics Canada and BC Stats, Ministry of Finance, based on federal, provincial and industry data.
2010 Financial and Economic Review – July 2010
21
Appendix 1 – Economic Review
Table A1.2 British Columbia Real GDP at Market Prices, Expenditure Based
| | Consumer
Expenditure | | Government
Expenditure | | Residential Investment | | Non-Residential
Investment | | Machinery and
Equipment
Investment | | Business
Investment | | Exports | | Imports | | Real GDP | |
| | (millions of 2002 $, chained) | |
1985 | | 50,790 | | 19,293 | | 4,567 | | 4,795 | | 2,942 | | 12,072 | | 34,493 | | 32,811 | | 86,026 | |
1986 | | 52,048 | | 19,491 | | 5,025 | | 3,758 | | 2,835 | | 11,406 | | 36,060 | | 34,148 | | 86,187 | |
1987 | | 54,882 | | 19,626 | | 5,967 | | 4,000 | | 3,422 | | 13,206 | | 38,879 | | 37,081 | | 91,503 | |
1988 | | 57,649 | | 20,887 | | 6,647 | | 4,846 | | 4,453 | | 15,844 | | 41,153 | | 40,168 | | 96,824 | |
1989 | | 61,216 | | 21,259 | | 7,651 | | 5,370 | | 5,295 | | 18,245 | | 40,426 | | 43,926 | | 100,007 | |
1990 | | 63,788 | | 22,152 | | 7,790 | | 5,325 | | 5,330 | | 18,379 | | 40,078 | | 45,889 | | 101,408 | |
1991 | | 63,972 | | 23,548 | | 7,368 | | 5,593 | | 5,254 | | 18,119 | | 40,825 | | 46,431 | | 101,593 | |
1992 | | 66,034 | | 24,415 | | 9,056 | | 4,388 | | 5,138 | | 18,674 | | 42,286 | | 48,547 | | 104,216 | |
1993 | | 68,115 | | 24,775 | | 9,289 | | 4,186 | | 5,150 | | 18,760 | | 44,034 | | 48,195 | | 108,874 | |
1994 | | 70,986 | | 24,868 | | 9,342 | | 5,388 | | 5,888 | | 20,605 | | 46,727 | | 55,624 | | 111,945 | |
1995 | | 72,960 | | 24,487 | | 8,224 | | 5,421 | | 5,972 | | 19,541 | | 49,407 | | 56,261 | | 114,620 | |
1996 | | 75,660 | | 25,144 | | 8,350 | | 4,859 | | 5,792 | | 18,981 | | 49,936 | | 55,930 | | 117,442 | |
1997 | | 78,443 | | 25,057 | | 8,783 | | 6,277 | | 6,781 | | 21,757 | | 51,917 | | 59,953 | | 121,177 | |
1998 | | 79,749 | | 25,743 | | 7,601 | | 5,099 | | 7,321 | | 20,013 | | 53,381 | | 59,318 | | 122,766 | |
1999 | | 81,984 | | 25,614 | | 7,016 | | 5,420 | | 7,652 | | 20,093 | | 58,065 | | 62,938 | | 126,708 | |
2000 | | 84,482 | | 26,672 | | 7,090 | | 5,423 | | 8,188 | | 20,713 | | 63,050 | | 67,745 | | 132,578 | |
2001 | | 86,296 | | 27,952 | | 7,752 | | 6,343 | | 8,284 | | 22,389 | | 61,927 | | 67,912 | | 133,403 | |
2002 | | 89,238 | | 28,260 | | 8,982 | | 5,890 | | 8,021 | | 22,893 | | 62,706 | | 68,144 | | 138,193 | |
2003 | | 92,250 | | 28,357 | | 9,969 | | 6,620 | | 8,133 | | 24,747 | | 63,918 | | 71,816 | | 141,435 | |
2004 | | 96,187 | | 28,346 | | 11,459 | | 7,222 | | 8,841 | | 27,587 | | 67,013 | | 77,380 | | 146,541 | |
2005 | | 100,180 | | 28,606 | | 12,184 | | 7,539 | | 10,577 | | 30,166 | | 70,162 | | 82,051 | | 153,489 | |
2006 | | 106,056 | | 29,376 | | 13,039 | | 8,846 | | 12,022 | | 33,671 | | 72,327 | | 88,444 | | 159,916 | |
2007 | | 111,648 | | 30,421 | | 13,275 | | 8,669 | | 12,707 | | 34,244 | | 73,949 | | 93,701 | | 164,519 | |
2008 | | 114,345 | | 31,450 | | 13,101 | | 9,293 | | 13,118 | | 35,025 | | 70,174 | | 93,312 | | 164,520 | |
2009 | | na | | na | | na | | na | | na | | na | | na | | na | | na | |
(annual percentage change) | |
1986 | | 2.5 | | 1.0 | | 10.0 | | (21.6 | ) | (3.6 | ) | (5.5 | ) | 4.5 | | 4.1 | | 0.2 | |
1987 | | 5.4 | | 0.7 | | 18.7 | | 6.4 | | 20.7 | | 15.8 | | 7.8 | | 8.6 | | 6.2 | |
1988 | | 5.0 | | 6.4 | | 11.4 | | 21.2 | | 30.1 | | 20.0 | | 5.8 | | 8.3 | | 5.8 | |
1989 | | 6.2 | | 1.8 | | 15.1 | | 10.8 | | 18.9 | | 15.2 | | (1.8 | ) | 9.4 | | 3.3 | |
1990 | | 4.2 | | 4.2 | | 1.8 | | (0.8 | ) | 0.7 | | 0.7 | | (0.9 | ) | 4.5 | | 1.4 | |
1991 | | 0.3 | | 6.3 | | (5.4 | ) | 5.0 | | (1.4 | ) | (1.4 | ) | 1.9 | | 1.2 | | 0.2 | |
1992 | | 3.2 | | 3.7 | | 22.9 | | (21.5 | ) | (2.2 | ) | 3.1 | | 3.6 | | 4.6 | | 2.6 | |
1993 | | 3.2 | | 1.5 | | 2.6 | | (4.6 | ) | 0.2 | | 0.5 | | 4.1 | | (0.7 | ) | 4.5 | |
1994 | | 4.2 | | 0.4 | | 0.6 | | 28.7 | | 14.3 | | 9.8 | | 6.1 | | 15.4 | | 2.8 | |
1995 | | 2.8 | | (1.5 | ) | (12.0 | ) | 0.6 | | 1.4 | | (5.2 | ) | 5.7 | | 1.1 | | 2.4 | |
1996 | | 3.7 | | 2.7 | | 1.5 | | (10.4 | ) | (3.0 | ) | (2.9 | ) | 1.1 | | (0.6 | ) | 2.5 | |
1997 | | 3.7 | | (0.3 | ) | 5.2 | | 29.2 | | 17.1 | | 14.6 | | 4.0 | | 7.2 | | 3.2 | |
1998 | | 1.7 | | 2.7 | | (13.5 | ) | (18.8 | ) | 8.0 | | (8.0 | ) | 2.8 | | (1.1 | ) | 1.3 | |
1999 | | 2.8 | | (0.5 | ) | (7.7 | ) | 6.3 | | 4.5 | | 0.4 | | 8.8 | | 6.1 | | 3.2 | |
2000 | | 3.0 | | 4.1 | | 1.1 | | 0.1 | | 7.0 | | 3.1 | | 8.6 | | 7.6 | | 4.6 | |
2001 | | 2.1 | | 4.8 | | 9.3 | | 17.0 | | 1.2 | | 8.1 | | (1.8 | ) | 0.2 | | 0.6 | |
2002 | | 3.4 | | 1.1 | | 15.9 | | (7.1 | ) | (3.2 | ) | 2.3 | | 1.3 | | 0.3 | | 3.6 | |
2003 | | 3.4 | | 0.3 | | 11.0 | | 12.4 | | 1.4 | | 8.1 | | 1.9 | | 5.4 | | 2.3 | |
2004 | | 4.3 | | (0.0 | ) | 14.9 | | 9.1 | | 8.7 | | 11.5 | | 4.8 | | 7.7 | | 3.6 | |
2005 | | 4.2 | | 0.9 | | 6.3 | | 4.4 | | 19.6 | | 9.3 | | 4.7 | | 6.0 | | 4.7 | |
2006 | | 5.9 | | 2.7 | | 7.0 | | 17.3 | | 13.7 | | 11.6 | | 3.1 | | 7.8 | | 4.2 | |
2007 | | 5.3 | | 3.6 | | 1.8 | | (2.0 | ) | 5.7 | | 1.7 | | 2.2 | | 5.9 | | 2.9 | |
2008 | | 2.4 | | 3.4 | | (1.3 | ) | 7.2 | | 3.2 | | 2.3 | | (5.1 | ) | (0.4 | ) | 0.0 | |
2009 | | na | | na | | na | | na | | na | | na | | na | | na | | na | |
Source: Statistics Canada
2010 Financial and Economic Review – July 2010
22
Appendix 1 – Economic Review
Table A1.3 British Columbia GDP at Basic Prices, by Industry
| | Crop and
Animal
Production | | Fishing,
Hunting and
Trapping | | Forestry
and
Logging | | Mining,
Oil and Gas
Extraction | | Manufacturing | | Construction | | Utilities | | Transportation
and
Warehousing | | Wholesale
and Retail
Trade | | Finance,
Insurance and
Real Estate | | Other
Services | | Public
Administration | | Real GDP
at Basic
Prices | |
| | (millions of 2002 $, chained) | |
1997 | | 954 | | 235 | | 2,935 | | 3,137 | | 11,507 | | 6,617 | | 2,914 | | 7,176 | | 11,380 | | 24,763 | | 33,274 | | 6,277 | | 111,554 | |
1998 | | 909 | | 153 | | 2,952 | | 3,324 | | 11,255 | | 6,101 | | 2,991 | | 7,273 | | 11,977 | | 25,076 | | 34,223 | | 6,339 | | 112,913 | |
1999 | | 979 | | 118 | | 2,789 | | 3,329 | | 12,840 | | 5,881 | | 3,040 | | 7,575 | | 12,158 | | 25,838 | | 34,762 | | 6,588 | | 116,307 | |
2000 | | 975 | | 135 | | 2,638 | | 3,344 | | 14,990 | | 5,795 | | 3,058 | | 8,122 | | 12,689 | | 26,284 | | 36,157 | | 6,790 | | 121,546 | |
2001 | | 1,141 | | 111 | | 2,647 | | 4,252 | | 13,667 | | 6,021 | | 2,389 | | 7,997 | | 13,055 | | 27,019 | | 37,079 | | 6,919 | | 122,848 | |
2002 | | 1,058 | | 134 | | 2,713 | | 4,383 | | 13,687 | | 6,328 | | 2,837 | | 8,072 | | 13,566 | | 28,078 | | 38,253 | | 7,128 | | 126,761 | |
2003 | | 1,053 | | 130 | | 2,761 | | 4,298 | | 13,884 | | 6,927 | | 2,844 | | 8,135 | | 14,114 | | 28,884 | | 39,272 | | 7,188 | | 130,026 | |
2004 | | 1,057 | | 150 | | 3,129 | | 4,270 | | 14,723 | | 7,675 | | 2,819 | | 8,447 | | 14,710 | | 30,503 | | 39,955 | | 7,202 | | 135,021 | |
2005 | | 1,061 | | 146 | | 3,102 | | 4,643 | | 15,435 | | 8,115 | | 3,236 | | 9,208 | | 15,436 | | 31,834 | | 41,266 | | 7,268 | | 141,339 | |
2006 | | 1,068 | | 163 | | 3,037 | | 4,619 | | 15,851 | | 9,069 | | 2,891 | | 9,530 | | 16,466 | | 33,230 | | 43,172 | | 7,474 | | 147,120 | |
2007 | | 1,125 | | 162 | | 2,778 | | 4,484 | | 15,841 | | 8,985 | | 3,125 | | 9,748 | | 17,658 | | 34,732 | | 44,592 | | 7,710 | | 151,162 | |
2008 | | 1,109 | | 140 | | 2,275 | | 4,511 | | 14,245 | | 9,559 | | 3,005 | | 9,749 | | 17,422 | | 35,269 | | 45,592 | | 7,950 | | 151,532 | |
2009 | | 1,062 | | 133 | | 1,848 | | 4,170 | | 12,183 | | 9,053 | | 2,861 | | 9,195 | | 16,526 | | 36,484 | | 45,663 | | 8,156 | | 148,101 | |
(annual percentage change) | |
1998 | | (4.8 | ) | (35.1 | ) | 0.6 | | 6.0 | | (2.2 | ) | (7.8 | ) | 2.6 | | 1.4 | | 5.2 | | 1.3 | | 2.9 | | 1.0 | | 1.2 | |
1999 | | 7.7 | | (23.0 | ) | (5.5 | ) | 0.2 | | 14.1 | | (3.6 | ) | 1.7 | | 4.1 | | 1.5 | | 3.0 | | 1.6 | | 3.9 | | 3.0 | |
2000 | | (0.4 | ) | 14.6 | | (5.4 | ) | 0.5 | | 16.7 | | (1.5 | ) | 0.6 | | 7.2 | | 4.4 | | 1.7 | | 4.0 | | 3.1 | | 4.5 | |
2001 | | 17.0 | | (17.5 | ) | 0.3 | | 27.1 | | (8.8 | ) | 3.9 | | (21.9 | ) | (1.5 | ) | 2.9 | | 2.8 | | 2.6 | | 1.9 | | 1.1 | |
2002 | | (7.3 | ) | 21.0 | | 2.5 | | 3.1 | | 0.1 | | 5.1 | | 18.7 | | 0.9 | | 3.9 | | 3.9 | | 3.2 | | 3.0 | | 3.2 | |
2003 | | (0.4 | ) | (3.0 | ) | 1.8 | | (1.9 | ) | 1.4 | | 9.5 | | 0.3 | | 0.8 | | 4.0 | | 2.9 | | 2.7 | | 0.8 | | 2.6 | |
2004 | | 0.4 | | 15.3 | | 13.3 | | (0.7 | ) | 6.0 | | 10.8 | | (0.9 | ) | 3.8 | | 4.2 | | 5.6 | | 1.7 | | 0.2 | | 3.8 | |
2005 | | 0.4 | | (2.5 | ) | (0.9 | ) | 8.7 | | 4.8 | | 5.7 | | 14.8 | | 9.0 | | 4.9 | | 4.4 | | 3.3 | | 0.9 | | 4.7 | |
2006 | | 0.7 | | 11.3 | | (2.1 | ) | (0.5 | ) | 2.7 | | 11.8 | | (10.7 | ) | 3.5 | | 6.7 | | 4.4 | | 4.6 | | 2.8 | | 4.1 | |
2007 | | 5.3 | | (0.5 | ) | (8.5 | ) | (2.9 | ) | (0.1 | ) | (0.9 | ) | 8.1 | | 2.3 | | 7.2 | | 4.5 | | 3.3 | | 3.2 | | 2.7 | |
2008 | | (1.4 | ) | (13.7 | ) | (18.1 | ) | 0.6 | | (10.1 | ) | 6.4 | | (3.9 | ) | 0.0 | | (1.3 | ) | 1.5 | | 2.2 | | 3.1 | | 0.2 | |
2009 | | (4.2 | ) | (5.1 | ) | (18.8 | ) | (7.5 | ) | (14.5 | ) | (5.3 | ) | (4.8 | ) | (5.7 | ) | (5.1 | ) | 3.4 | | 0.2 | | 2.6 | | (2.3 | ) |
Source: Statistics Canada
2010 Financial and Economic Review – July 2010
23
Appendix 1 – Economic Review
Table A1.4 British Columbia GDP, Income Based
| | Labour
Income | | Corporation
Profits before Taxes | | Interest and
Miscellaneous
Investment
Income | | Accrued Net
Income of
Farm
Operators | | Net Income of
Non-farm
unincorporated
Business | | Inventory
Valuation
Adjustment | | Net Domestic
Product at
Basic Prices | | Indirect
Taxes
less
Subsidies | | Capital Cons.
Allowances and
Misc. Valuation
Adjustments | | Statistical
Discrepency | | GDP
at Market
Prices | | GDP at
Basic
Prices | |
| | ($ millions) | |
1985 | | 29,100 | | 3,468 | | 4,939 | | 33 | | 3,433 | | (163 | ) | 43,360 | | 5,878 | | 6,917 | | (65 | ) | 53,540 | | 50,212 | |
1986 | | 30,339 | | 4,213 | | 4,893 | | 113 | | 3,745 | | (212 | ) | 45,603 | | 6,098 | | 7,337 | | 21 | | 56,547 | | 52,961 | |
1987 | | 32,837 | | 6,430 | | 5,085 | | 115 | | 3,954 | | (324 | ) | 50,679 | | 6,696 | | 7,517 | | 205 | | 62,515 | | 58,401 | |
1988 | | 36,110 | | 7,250 | | 5,820 | | 154 | | 4,283 | | (285 | ) | 56,076 | | 7,486 | | 8,044 | | 546 | | 69,408 | | 64,666 | |
1989 | | 40,295 | | 5,925 | | 7,183 | | 72 | | 4,580 | | (195 | ) | 60,769 | | 8,765 | | 8,748 | | 209 | | 75,582 | | 69,726 | |
1990 | | 44,216 | | 3,670 | | 7,887 | | 73 | | 4,796 | | 120 | | 63,803 | | 9,007 | | 9,590 | | (9 | ) | 79,350 | | 73,384 | |
1991 | | 46,296 | | 2,926 | | 7,650 | | 106 | | 5,067 | | (107 | ) | 64,888 | | 9,715 | | 10,016 | | 180 | | 81,849 | | 75,084 | |
1992 | | 48,924 | | 3,321 | | 7,586 | | 80 | | 5,563 | | (616 | ) | 68,325 | | 11,092 | | 10,601 | | 691 | | 87,242 | | 79,617 | |
1993 | | 51,312 | | 4,328 | | 8,035 | | 83 | | 6,034 | | (843 | ) | 72,905 | | 12,440 | | 11,258 | | 1,430 | | 94,077 | | 85,593 | |
1994 | | 53,972 | | 6,756 | | 8,649 | | 63 | | 6,665 | | (660 | ) | 79,662 | | 13,164 | | 12,043 | | (140 | ) | 100,512 | | 91,565 | |
1995 | | 56,768 | | 7,419 | | 8,808 | | 87 | | 6,758 | | (167 | ) | 83,942 | | 13,522 | | 12,882 | | (407 | ) | 105,670 | | 96,417 | |
1996 | | 58,517 | | 7,246 | | 8,731 | | 59 | | 7,173 | | (231 | ) | 85,950 | | 14,014 | | 13,494 | | (138 | ) | 108,865 | | 99,306 | |
1997 | | 60,681 | | 8,286 | | 8,444 | | 89 | | 7,780 | | 101 | | 90,040 | | 14,480 | | 14,526 | | (4 | ) | 114,383 | | 104,562 | |
1998 | | 61,965 | | 7,335 | | 8,355 | | 166 | | 8,285 | | (24 | ) | 90,860 | | 14,515 | | 15,050 | | (6 | ) | 115,641 | | 105,904 | |
1999 | | 64,045 | | 9,309 | | 8,365 | | 199 | | 8,723 | | (373 | ) | 95,125 | | 14,972 | | 15,659 | | 22 | | 120,921 | | 110,806 | |
2000 | | 68,369 | | 11,596 | | 10,184 | | 54 | | 9,078 | | (80 | ) | 104,232 | | 15,608 | | 16,526 | | (2 | ) | 131,333 | | 120,756 | |
2001 | | 70,044 | | 11,392 | | 8,834 | | 141 | | 9,637 | | 47 | | 105,163 | | 15,810 | | 17,539 | | 70 | | 133,514 | | 122,772 | |
2002 | | 72,900 | | 11,389 | | 8,828 | | 53 | | 10,591 | | (369 | ) | 108,406 | | 16,443 | | 18,341 | | 17 | | 138,193 | | 126,764 | |
2003 | | 75,605 | | 12,364 | | 9,151 | | 83 | | 11,312 | | 637 | | 114,303 | | 17,580 | | 18,956 | | (46 | ) | 145,642 | | 133,213 | |
2004 | | 80,599 | | 16,764 | | 9,708 | | 118 | | 12,256 | | (66 | ) | 124,831 | | 18,664 | | 19,720 | | (88 | ) | 157,675 | | 144,463 | |
2005 | | 85,805 | | 19,631 | | 10,418 | | 9 | | 13,061 | | 147 | | 134,821 | | 19,881 | | 20,773 | | (61 | ) | 169,664 | | 155,533 | |
2006 | | 93,963 | | 21,853 | | 10,295 | | (51 | ) | 13,683 | | (380 | ) | 145,383 | | 20,991 | | 21,894 | | 62 | | 182,310 | | 167,339 | |
2007 | | 98,573 | | 21,279 | | 11,499 | | (49 | ) | 14,461 | | 532 | | 152,598 | | 22,149 | | 23,195 | | (41 | ) | 191,598 | | 175,752 | |
2008 | | 103,811 | | 22,050 | | 11,837 | | (64 | ) | 15,082 | | (1,258 | ) | 157,966 | | 21,611 | | 24,734 | | 128 | | 197,931 | | 182,828 | |
2009 | | na | | na | | na | | na | | na | | na | | na | | na | | na | | na | | na | | na | |
(annual percentage change) | |
1985 | | 4.6 | | 13.3 | | 8.5 | | — | | 11.9 | | — | | 6.3 | | 3.6 | | 8.4 | | — | | 7.4 | | 7.5 | |
1986 | | 4.3 | | 21.5 | | (0.9 | ) | — | | 9.1 | | — | | 5.2 | | 3.7 | | 6.1 | | — | | 5.6 | | 5.5 | |
1987 | | 8.2 | | 52.6 | | 3.9 | | — | | 5.6 | | — | | 11.1 | | 9.8 | | 2.5 | | — | | 10.6 | | 10.3 | |
1988 | | 10.0 | | 12.8 | | 14.5 | | — | | 8.3 | | — | | 10.6 | | 11.8 | | 7.0 | | — | | 11.0 | | 10.7 | |
1989 | | 11.6 | | (18.3 | ) | 23.4 | | — | | 6.9 | | — | | 8.4 | | 17.1 | | 8.8 | | — | | 8.9 | | 7.8 | |
1990 | | 9.7 | | (38.1 | ) | 9.8 | | — | | 4.7 | | — | | 5.0 | | 2.8 | | 9.6 | | — | | 5.0 | | 5.2 | |
1991 | | 4.7 | | (20.3 | ) | (3.0 | ) | — | | 5.7 | | — | | 1.7 | | 7.9 | | 4.4 | | — | | 3.1 | | 2.3 | |
1992 | | 5.7 | | 13.5 | | (0.8 | ) | — | | 9.8 | | — | | 5.3 | | 14.2 | | 5.8 | | — | | 6.6 | | 6.0 | |
1993 | | 4.9 | | 30.3 | | 5.9 | | — | | 8.5 | | — | | 6.7 | | 12.2 | | 6.2 | | — | | 7.8 | | 7.5 | |
1994 | | 5.2 | | 56.1 | | 7.6 | | — | | 10.5 | | — | | 9.3 | | 5.8 | | 7.0 | | — | | 6.8 | | 7.0 | |
1995 | | 5.2 | | 9.8 | | 1.8 | | — | | 1.4 | | — | | 5.4 | | 2.7 | | 7.0 | | — | | 5.1 | | 5.3 | |
1996 | | 3.1 | | (2.3 | ) | (0.9 | ) | — | | 6.1 | | — | | 2.4 | | 3.6 | | 4.8 | | — | | 3.0 | | 3.0 | |
1997 | | 3.7 | | 14.4 | | (3.3 | ) | — | | 8.5 | | — | | 4.8 | | 3.3 | | 7.6 | | — | | 5.1 | | 5.3 | |
1998 | | 2.1 | | (11.5 | ) | (1.1 | ) | — | | 6.5 | | — | | 0.9 | | 0.2 | | 3.6 | | — | | 1.1 | | 1.3 | |
1999 | | 3.4 | | 26.9 | | 0.1 | | — | | 5.3 | | — | | 4.7 | | 3.1 | | 4.0 | | — | | 4.6 | | 4.6 | |
2000 | | 6.8 | | 24.6 | | 21.7 | | — | | 4.1 | | — | | 9.6 | | 4.2 | | 5.5 | | — | | 8.6 | | 9.0 | |
2001 | | 2.4 | | (1.8 | ) | (13.3 | ) | — | | 6.2 | | — | | 0.9 | | 1.3 | | 6.1 | | — | | 1.7 | | 1.7 | |
2002 | | 4.1 | | (0.0 | ) | (0.1 | ) | — | | 9.9 | | — | | 3.1 | | 4.0 | | 4.6 | | — | | 3.5 | | 3.3 | |
2003 | | 3.7 | | 8.6 | | 3.7 | | — | | 6.8 | | — | | 5.4 | | 6.9 | | 3.4 | | — | | 5.4 | | 5.1 | |
2004 | | 6.6 | | 35.6 | | 6.1 | | — | | 8.3 | | — | | 9.2 | | 6.2 | | 4.0 | | — | | 8.3 | | 8.4 | |
2005 | | 6.5 | | 17.1 | | 7.3 | | — | | 6.6 | | — | | 8.0 | | 6.5 | | 5.3 | | — | | 7.6 | | 7.7 | |
2006 | | 9.5 | | 11.3 | | (1.2 | ) | — | | 4.8 | | — | | 7.8 | | 5.6 | | 5.4 | | — | | 7.5 | | 7.6 | |
2007 | | 4.9 | | (2.6 | ) | 11.7 | | — | | 5.7 | | — | | 5.0 | | 5.5 | | 5.9 | | — | | 5.1 | | 5.0 | |
2008 | | 5.3 | | 3.6 | | 2.9 | | — | | 4.3 | | — | | 3.5 | | (2.4 | ) | 6.6 | | — | | 3.3 | | 4.0 | |
2009 | | na | | na | | na | | na | | na | | na | | na | | na | | na | | na | | na | | na | |
Source: Statistics Canada
2010 Financial and Economic Review – July 2010
24
Appendix 1 – Economic Review
Table A1.5 Employment by Industry in British Columbia
| | 1998 | | 1999 | | 2001 | | 2002 | | 2003 | | 2004 | | 2005 | | 2006 | | 2007 | | 2008 | | 2009 | |
| | | | | | | | | | | | (thousands) | | | | | | | |
Total – all industries | | 1,858 | | 1,894 | | 1,922 | | 1,965 | | 2,015 | | 2,063 | | 2,131 | | 2,196 | | 2,266 | | 2,314 | | 2,259 | |
| | | | | | | | | | | | | | | | | | | | | | | |
Primary industries | | 84 | | 77 | | 66 | | 67 | | 79 | | 72 | | 76 | | 79 | | 83 | | 79 | | 75 | |
Agriculture | | 33 | | 28 | | 26 | | 29 | | 33 | | 37 | | 39 | | 35 | | 36 | | 34 | | 34 | |
Forestry, logging & support activities | | 30 | | 30 | | 25 | | 25 | | 28 | | 22 | | 22 | | 22 | | 24 | | 17 | | 14 | |
Fishing, hunting and trapping | | 3 | | 4 | | 5 | | 3 | | 5 | | 3 | | 2 | | 3 | | 3 | | 2 | | 2 | |
Mining and oil & gas extraction | | 18 | | 15 | | 11 | | 9 | | 13 | | 11 | | 14 | | 19 | | 20 | | 26 | | 24 | |
| | | | | | | | | | | | | | | | | | | | | | | |
Manufacturing | | 196 | | 192 | | 195 | | 197 | | 207 | | 211 | | 198 | | 198 | | 205 | | 187 | | 164 | |
Food, beverages & tobacco | | 26 | | 22 | | 26 | | 27 | | 32 | | 31 | | 32 | | 24 | | 28 | | 31 | | 30 | |
Wood products | | 43 | | 42 | | 49 | | 44 | | 49 | | 47 | | 46 | | 45 | | 45 | | 34 | | 27 | |
Paper | | 23 | | 22 | | 15 | | 17 | | 14 | | 12 | | 12 | | 15 | | 15 | | 13 | | 11 | |
Printing & related support activities | | 8 | | 9 | | 9 | | 9 | | 8 | | 8 | | 8 | | 8 | | 6 | | 9 | | 8 | |
Primary metals | | 9 | | 10 | | 8 | | 6 | | 9 | | 7 | | 7 | | 7 | | 6 | | 5 | | 5 | |
Metal fabrication | | 10 | | 12 | | 14 | | 13 | | 14 | | 15 | | 18 | | 15 | | 16 | | 16 | | 13 | |
Transportation equipment | | 13 | | 13 | | 10 | | 13 | | 12 | | 12 | | 9 | | 10 | | 13 | | 10 | | 10 | |
Machinery manufacturing | | 9 | | 8 | | 7 | | 10 | | 9 | | 10 | | 10 | | 9 | | 9 | | 6 | | 6 | |
Other manufacturing | | 55 | | 53 | | 58 | | 58 | | 60 | | 71 | | 57 | | 64 | | 67 | | 62 | | 53 | |
| | | | | | | | | | | | | | | | | | | | | | | |
Construction | | 117 | | 114 | | 111 | | 118 | | 120 | | 144 | | 168 | | 179 | | 197 | | 221 | | 195 | |
General contractors | | 38 | | 42 | | 40 | | 42 | | 47 | | 51 | | 66 | | 66 | | 66 | | 85 | | 74 | |
Special trade contractors | | 79 | | 73 | | 71 | | 77 | | 73 | | 93 | | 102 | | 113 | | 131 | | 136 | | 122 | |
| | | | | | | | | | | | | | | | | | | | | | | |
Utilities | | 11 | | 11 | | 11 | | 11 | | 11 | | 9 | | 10 | | 9 | | 10 | | 14 | | 13 | |
| | | | | | | | | | | | | | | | | | | | | | | |
Transportation and warehousing | | 106 | | 116 | | 112 | | 113 | | 120 | | 117 | | 119 | | 120 | | 126 | | 128 | | 115 | |
Transportation | | 102 | | 112 | | 108 | | 108 | | 114 | | 112 | | 114 | | 113 | | 119 | | 122 | | 109 | |
Warehousing and storage | | 3 | | 4 | | 4 | | 5 | | 6 | | 5 | | 5 | | 7 | | 7 | | 6 | | 6 | |
| | | | | | | | | | | | | | | | | | | | | | | |
Trade | | 290 | | 305 | | 303 | | 325 | | 328 | | 316 | | 335 | | 354 | | 365 | | 355 | | 369 | |
Wholesale trade | | 61 | | 79 | | 67 | | 74 | | 76 | | 66 | | 80 | | 83 | | 82 | | 88 | | 89 | |
Retail trade | | 229 | | 226 | | 236 | | 251 | | 251 | | 250 | | 255 | | 271 | | 283 | | 267 | | 280 | |
| | | | | | | | | | | | | | | | | | | | | | | |
Finance, Insurance, Real Estate & Leasing | | 122 | | 121 | | 121 | | 123 | | 125 | | 129 | | 133 | | 138 | | 145 | | 147 | | 143 | |
Finance | | 52 | | 55 | | 56 | | 56 | | 60 | | 56 | | 60 | | 61 | | 69 | | 65 | | 61 | |
Insurance | | 24 | | 23 | | 25 | | 24 | | 20 | | 27 | | 26 | | 27 | | 29 | | 30 | | 29 | |
Real estate | | 38 | | 33 | | 28 | | 32 | | 34 | | 35 | | 35 | | 39 | | 37 | | 41 | | 43 | |
Leasing | | 8 | | 10 | | 12 | | 11 | | 11 | | 12 | | 13 | | 11 | | 10 | | 11 | | 11 | |
| | | | | | | | | | | | | | | | | | | | | | | |
Public administration | | 94 | | 93 | | 90 | | 88 | | 93 | | 97 | | 95 | | 91 | | 96 | | 103 | | 106 | |
Federal administration | | 29 | | 33 | | 30 | | 32 | | 37 | | 34 | | 33 | | 35 | | 36 | | 38 | | 39 | |
Provincial administration | | 29 | | 29 | | 33 | | 27 | | 28 | | 29 | | 30 | | 27 | | 26 | | 27 | | 27 | |
Local administration | | 35 | | 31 | | 27 | | 29 | | 29 | | 34 | | 32 | | 29 | | 34 | | 38 | | 40 | |
| | | | | | | | | | | | | | | | | | | | | | | |
Other service industries | | 839 | | 866 | | 913 | | 924 | | 933 | | 967 | | 997 | | 1,029 | | 1,039 | | 1,080 | | 1,079 | |
Education & related services | | 118 | | 127 | | 138 | | 139 | | 140 | | 136 | | 146 | | 156 | | 156 | | 162 | | 162 | |
Health & welfare services | | 197 | | 193 | | 197 | | 212 | | 213 | | 219 | | 217 | | 232 | | 240 | | 246 | | 260 | |
Professional, scientific & technical | | 123 | | 136 | | 139 | | 136 | | 139 | | 146 | | 164 | | 168 | | 166 | | 174 | | 169 | |
Information, culture & recreation | | 93 | | 91 | | 106 | | 106 | | 109 | | 115 | | 112 | | 113 | | 118 | | 118 | | 119 | |
Services to business management | | 67 | | 65 | | 71 | | 72 | | 80 | | 82 | | 90 | | 99 | | 99 | | 101 | | 94 | |
Accommodation & food services | | 147 | | 149 | | 164 | | 163 | | 159 | | 175 | | 176 | | 171 | | 173 | | 178 | | 172 | |
Miscellaneous services | | 93 | | 105 | | 98 | | 96 | | 93 | | 94 | | 91 | | 91 | | 88 | | 101 | | 102 | |
Source: Statistics Canada, Labour Force Survey (unpublished data). Totals may not add due to rounding.
2010 Financial and Economic Review – July 2010
25
Appendix 1 – Economic Review
Table A1.6 Capital Investment by Industry
| | Actual
2005 | | Actual
2006 | | Actual
2007 | | Actual
2008 | | Preliminary
Actual
2009 | | Intentions
2010 | | 2008
to
2009 | | 2009
to
2010 | |
| | | | | | ($ millions) | | | | | | (per cent) | |
Agriculture, forestry, fishing and hunting | | 414.6 | | 368.3 | | 418.9 | | 420.6 | | 360.2 | | 336.3 | | (14.4 | ) | (6.6 | ) |
Mining, quarrying and oil well industries | | 5,026.9 | | 6,411.9 | | 5,849.1 | | 6,775.0 | | 6,291.6 | | 7,627.3 | | (7.1 | ) | 21.2 | |
Manufacturing | | 1,656.7 | | 1,636.7 | | 1,502.2 | | 1,455.4 | | 1,153.6 | | 1,195.2 | | (20.7 | ) | 3.6 | |
Construction | | 391.9 | | 482.3 | | 777.4 | | 916.4 | | 924.2 | | 941.2 | | 0.9 | | 1.8 | |
Transport and warehousing | | 1,877.6 | | 2,882.2 | | 3,474.2 | | 3,487.2 | | 2,632.4 | | 2,151.1 | | (24.5 | ) | (18.3 | ) |
Utilities | | 1329.5 | | 1,551.7 | | 2,033.2 | | 2,570.6 | | 3,217.9 | | 3,135.1 | | 25.2 | | (2.6 | ) |
Wholesale | | 480.9 | | 465.3 | | 470.8 | | 527.6 | | 407.2 | | 342.3 | | (22.8 | ) | (15.9 | ) |
Retail trade | | 1,011.2 | | 1,124.3 | | 1,508.6 | | 1,617.4 | | 1,136.1 | | 1,235.9 | | (29.8 | ) | 8.8 | |
Finance and insurance | | 1,455.2 | | 1,589.2 | | 1,710.8 | | 1,401.9 | | 1,033.0 | | 1,093.9 | | (26.3 | ) | 5.9 | |
Real estate, rental and leasing | | 1,681.3 | | 2,036.7 | | 1,818.1 | | 2,430.0 | | 1,547.1 | | 1,866.7 | | (36.3 | ) | 20.7 | |
Information and cultural industries | | 828.2 | | 1,015.7 | | 824.6 | | 1,199.7 | | 1,320.6 | | 1,313.6 | | 10.1 | | (0.5 | ) |
Professional, scientific and technical | | 297.3 | | 296.4 | | 408.8 | | 402.7 | | 330.7 | | 321.5 | | (17.9 | ) | (2.8 | ) |
Management of companies and enterprises | | 32.9 | | 26.9 | | 19.2 | | 42.9 | | 14.4 | | 15.0 | | (66.4 | ) | 4.2 | |
Admin, waste and remediation services | | 113.2 | | 277.4 | | 237.3 | | 252.1 | | 191.9 | | 211.1 | | (23.9 | ) | 10.0 | |
Arts, entertainment and recreation | | 191.3 | | 248.3 | | 410.5 | | 498.2 | | 477.4 | | 327.4 | | (4.2 | ) | (31.4 | ) |
Accommodation and food services | | 543.0 | | 579.7 | | 712.4 | | 829.3 | | 653.8 | | 653.9 | | (21.2 | ) | 0.0 | |
Education services | | 1,020.7 | | 1,179.0 | | 1,384.7 | | 1,243.5 | | 1,224.0 | | 1,200.0 | | (1.6 | ) | (2.0 | ) |
Health services | | 993.9 | | 1,199.6 | | 1,044.0 | | 1,349.2 | | 1,083.4 | | 1,108.0 | | (19.7 | ) | 2.3 | |
Public administration | | 2,697.0 | | 3,086.2 | | 3,361.9 | | 3,678.8 | | 4,371.5 | | 4,687.5 | | 18.8 | | 7.2 | |
Other services | | 217.9 | | 155.6 | | 197.7 | | 246.3 | | 260.3 | | 248.3 | | 5.7 | | (4.6 | ) |
Housing | | 10,993.1 | | 13,298.9 | | 14,504.5 | | 15,591.1 | | 11,626.1 | | 12,194.8 | | (25.4 | ) | 4.9 | |
Total | | 33,254.2 | | 39,912.2 | | 42,669.6 | | 46,935.8 | | 40,257.2 | | 42,206.3 | | (14.2 | ) | 4.8 | |
Public | | 6,106.3 | | 7,130.2 | | 8,095.3 | | 10,034.6 | | 10,402.1 | | 10,898.5 | | 3.7 | | 4.8 | |
Private | | 27,147.9 | | 32,782.0 | | 34,574.2 | | 36,901.1 | | 29,855.1 | | 31,307.8 | | (19.1 | ) | 4.9 | |
Total | | 33,254.2 | | 39,912.2 | | 42,669.5 | | 46,935.7 | | 40,257.2 | | 42,206.3 | | (14.2 | ) | 4.8 | |
Machinery and equipment | | 10,215.4 | | 11,471.5 | | 12,365.9 | | 12,864.0 | | 10,474.1 | | 10,335.1 | | (18.6 | ) | (1.3 | ) |
Construction | | 23,038.8 | | 28,440.7 | | 30,303.7 | | 34,071.8 | | 29,783.1 | | 31,871.2 | | (12.6 | ) | 7.0 | |
Total | | 33,254.2 | | 39,912.2 | | 42,669.6 | | 46,935.8 | | 40,257.2 | | 42,206.3 | | (14.2 | ) | 4.8 | |
Note: Totals may not add due to rounding.
Totals may not add due to some data not being disclosed for confidentiality reasons.
Source: Statistics Canada.
2010 Financial and Economic Review – July 2010
26
Appendix 1 – Economic Review
Table A1.7 British Columbia International Goods Exports by Major Market and Selected Commodities, 2009
Commodity | | U. S. | | Japan | | European
Union (1) | | Other
Markets | | Total-
All Countries | |
| | | | | | ($ millions) | | | | | |
| | | | | | | | | | | |
Solid wood products | | 2,432 | | 753 | | 289 | | 653 | | 4,127 | |
Lumber (softwood) | | 1,543 | | 532 | | 152 | | 523 | | 2,749 | |
Cedar shakes and shingles | | 124 | | 0 | | 6 | | 4 | | 134 | |
Plywood (softwood) | | 103 | | 3 | | 5 | | 4 | | 115 | |
Other panel products | | 235 | | 35 | | 0 | | 17 | | 287 | |
Selected value-added wood products | | 313 | | 33 | | 6 | | 12 | | 364 | |
Logs | | 38 | | 121 | | 0 | | 89 | | 249 | |
Other | | 76 | | 29 | | 120 | | 3 | | 229 | |
| | | | | | | | | | | |
Pulp and paper products | | 1,585 | | 180 | | 241 | | 1,469 | | 3,476 | |
Pulp | | 539 | | 163 | | 193 | | 1,161 | | 2,056 | |
Newsprint | | 113 | | 4 | | 0 | | 90 | | 207 | |
Paper, paperboard — excluding newsprint | | 819 | | 11 | | 47 | | 180 | | 1,057 | |
Other | | 115 | | 2 | | 1 | | 37 | | 155 | |
| | | | | | | | | | | |
Agriculture and food other than fish | | 1,077 | | 175 | | 27 | | 283 | | 1,563 | |
Fruit and nuts | | 171 | | 8 | | 6 | | 22 | | 207 | |
Vegetables | | 201 | | 8 | | 1 | | 3 | | 213 | |
Other | | 705 | | 158 | | 20 | | 259 | | 1,142 | |
| | | | | | | | | | | |
Fish products | | 508 | | 143 | | 45 | | 173 | | 869 | |
Whole fish; fresh, chilled, frozen — excluding salmon | | 45 | | 25 | | 12 | | 57 | | 138 | |
Whole salmon; fresh, chilled, frozen | | 343 | | 14 | | 9 | | 12 | | 378 | |
Salmon; canned, smoked, etc. | | 2 | | 1 | | 20 | | 7 | | 29 | |
Other | | 118 | | 103 | | 4 | | 99 | | 325 | |
| | | | | | | | | | | |
Metallic mineral products | | 554 | | 689 | | 90 | | 1,158 | | 2,491 | |
Copper ores and concentrates | | 6 | | 430 | | 0 | | 637 | | 1,073 | |
Molybdenum ores and concentrates | | 42 | | 32 | | 86 | | 77 | | 237 | |
Unwrought aluminum | | 37 | | 208 | | 1 | | 247 | | 492 | |
Unwrought zinc | | 363 | | 4 | | 0 | | 82 | | 449 | |
Other | | 107 | | 15 | | 3 | | 115 | | 240 | |
| | | | | | | | | | | |
Fabricated metal products | | 658 | | 3 | | 12 | | 170 | | 843 | |
| | | | | | | | | | | |
Energy products | | 2,569 | | 1,411 | | 551 | | 2,302 | | 6,834 | |
Natural gas | | 1,866 | | 0 | | 0 | | 0 | | 1,866 | |
Coal | | 17 | | 1,411 | | 551 | | 2,137 | | 4,115 | |
Electricity | | 289 | | 0 | | 0 | | — | | 289 | |
Other | | 397 | | 1 | | 0 | | 166 | | 564 | |
| | | | | | | | | | | |
Machinery and equipment | | 1,775 | | 44 | | 310 | | 596 | | 2,726 | |
Motor vehicles and parts | | 153 | | 3 | | 9 | | 38 | | 202 | |
Electrical/electronic/communications | | 440 | | 10 | | 83 | | 108 | | 641 | |
Scientific/photographic/measuring equipment, etc. | | 202 | | 4 | | 70 | | 82 | | 358 | |
Other | | 981 | | 28 | | 148 | | 369 | | 1,525 | |
| | | | | | | | | | | |
Plastics and articles of plastic | | 289 | | 1 | | 8 | | 38 | | 336 | |
Chemicals and chemical products | | 467 | | 53 | | 43 | | 188 | | 752 | |
Apparel and accessories | | 61 | | 4 | | 8 | | 8 | | 81 | |
Textiles | | 20 | | 0 | | 2 | | 27 | | 49 | |
| | | | | | | | | | | |
All other commodities | | 916 | | 4 | | 47 | | 80 | | 1,047 | |
Total | | 12,912 | | 3,461 | | 1,674 | | 7,147 | | 25,194 | |
(1) As of January 1, 2009, Austria, Belgium, Bulgaria, Cyprus, Czech Republic, Denmark, Estonia, Finland, France, Germany, Greece, Hungary, Ireland, Italy, Latvia, Lithuania, Luxembourg, Malta, Netherlands, Poland, Portugal, Romania, Slovakia, Slovenia, Spain, Sweden, United Kingdom.
Source: BC Stats
2010 Financial and Economic Review – July 2010
27
Appendix 1 – Economic Review
Table A1.8 British Columbia International Goods Exports by Market Area
| | | | | | | | % Change | | Per cent of Total | |
| | 2007 | | 2008 | | 2009 | | 2008-2009 | | 2008 | | 2009 | |
| | | | ($ millions) | | | | | | (per cent) | | | |
United Kingdom | | 401 | | 405 | | 266 | | (34.4 | ) | 1.2 | | 1.1 | |
Germany | | 464 | | 516 | | 229 | | (55.7 | ) | 1.6 | | 0.9 | |
People’s Republic of China | | 1,723 | | 2,000 | | 2,574 | | 28.7 | | 6.0 | | 10.2 | |
Hong Kong | | 166 | | 236 | | 210 | | (11.0 | ) | 0.7 | | 0.8 | |
Taiwan | | 462 | | 598 | | 463 | | (22.6 | ) | 1.8 | | 1.8 | |
Japan | | 4,135 | | 5,026 | | 3,461 | | (31.1 | ) | 15.2 | | 13.7 | |
South Korea | | 1,308 | | 1,960 | | 1,662 | | (15.2 | ) | 5.9 | | 6.6 | |
India | | 234 | | 159 | | 77 | | (51.3 | ) | 0.5 | | 0.3 | |
Australia | | 224 | | 218 | | 179 | | (17.6 | ) | 0.7 | | 0.7 | |
Mexico | | 196 | | 343 | | 163 | | (52.5 | ) | 1.0 | | 0.6 | |
United States | | 19,065 | | 17,592 | | 12,912 | | (26.6 | ) | 53.1 | | 51.3 | |
Other | | 3,135 | | 4,103 | | 2,997 | | (27.0 | ) | 12.4 | | 11.9 | |
Total | | 31,512 | | 33,155 | | 25,194 | | (24.0 | ) | 100.0 | | 100.0 | |
Market Areas: | | | | | | | | | | | | | |
Western Europe (1) | | 2,295 | | 2,583 | | 1,686 | | (34.7 | ) | 7.8 | | 6.7 | |
Pacific Rim (2) | | 8,606 | | 10,702 | | 9,109 | | (14.9 | ) | 32.3 | | 36.2 | |
(1) Austria, Belgium, Denmark, Finland, France, Germany, Greece, Iceland, Ireland, Italy, Luxembourg, Netherlands, Norway, Portugal, Spain, Sweden, Switzerland and the United Kingdom.
(2) Australia, Brunei Darussalam, China, Fiji, Hong Kong, Indonesia, Japan, Laos, Macau, Malaysia, Mongolia, New Zealand, North Korea, Philippines, Singapore, South Korea, Taiwan, Thailand and Vietnam.
Source: BC Stats
2010 Financial and Economic Review – July 2010
28
Appendix 1 – Economic Review
Table A1.9 Historical Commodity Prices (in US Dollars)
| | 1999 | | 2000 | | 2001 | | 2002 | | 2003 | | 2004 | | 2005 | | 2006 | | 2007 | | 2008 | | 2009 | |
Metals | | | | | | | | | | | | | | | | | | | | | | | |
Copper (London; $/lb) | | 0.71 | | 0.82 | | 0.72 | | 0.71 | | 0.81 | | 1.30 | | 1.67 | | 3.07 | | 3.24 | | 3.15 | | 2.35 | |
Lead (London; $/lb) | | 0.23 | | 0.21 | | 0.22 | | 0.21 | | 0.23 | | 0.40 | | 0.44 | | 0.59 | | 1.17 | | 0.94 | | 0.78 | |
Zinc (London; $/lb) | | 0.53 | | 0.56 | | 0.44 | | 0.35 | | 0.39 | | 0.48 | | 0.63 | | 1.49 | | 1.47 | | 0.85 | | 0.75 | |
Gold (London; $/troy oz) | | 279 | | 280 | | 271 | | 310 | | 363 | | 409 | | 445 | | 604 | | 697 | | 872 | | 973 | |
Silver (London; $/troy oz) | | 5.25 | | 5.00 | | 4.39 | | 4.60 | | 4.88 | | 6.66 | | 7.32 | | 11.55 | | 13.38 | | 14.93 | | 14.68 | |
Molybdenum ($/lb) | | 2.65 | | 2.51 | | 2.31 | | 3.59 | | 5.21 | | 15.92 | | 31.05 | | 24.46 | | 30.22 | | 28.78 | | 11.13 | |
Aluminum (London; $/lb) | | 0.62 | | 0.69 | | 0.65 | | 0.61 | | 0.65 | | 0.78 | | 0.86 | | 1.17 | | 1.20 | | 1.16 | | 0.76 | |
Forest Products | | | | | | | | | | | | | | | | | | | | | | | |
Lumber (Madison’s Lumber Reporter; WSPF, $/1000 bd ft) | | 342 | | 256 | | 247 | | 235 | | 269 | | 392 | | 355 | | 296 | | 250 | | 219 | | 182 | |
Pulp (Northern Europe; $/tonne; transaction price) | | 523 | | 681 | | 543 | | 463 | | 522 | | 615 | | 611 | | 675 | | 793 | | 853 | | 656 | |
Newsprint (Pulp and Paper Week; $/tonne) | | 513 | | 564 | | 588 | | 468 | | 501 | | 550 | | 608 | | 667 | | 596 | | 687 | | 565 | |
Hemlock baby squares (Madison’s Lumber Reporter; 3 9/16”) | | 585 | | 566 | | 583 | | 593 | | 534 | | 613 | | 540 | | 584 | | 609 | | 727 | | 767 | |
Other | | | | | | | | | | | | | | | | | | | | | | | |
Oil (West Texas Intermediate; $/barrel) | | 19 | | 30 | | 26 | | 26 | | 31 | | 42 | | 57 | | 66 | | 72 | | 100 | | 62 | |
Natural Gas (Inlet to WEI; $/GJ) | | 2.02 | | 4.48 | | 5.09 | | 3.21 | | 5.39 | | 5.54 | | 7.26 | | 5.53 | | 5.41 | | 6.91 | | 2.96 | |
Coal (Japan-Australia JFY FOB US$/t) | | | | | | | | | | | | | | | | | | | | | | | |
Metallurgical | | 41.10 | | 32.95 | | 41.50 | | 46.20 | | 43.50 | | 56.00 | | 125.00 | | 107.00 | | 89.00 | | 289.00 | | 120.00 | |
Low Volatile PCl | | na | | 26.50 | | 34.50 | | 34.30 | | 32.85 | | 46.50 | | 102.00 | | 66.00 | | 67.50 | | 245.00 | | 90.00 | |
Thermal | | 29.95 | | 28.75 | | 34.50 | | 28.80 | | 26.75 | | 44.00 | | 53.00 | | 42.50 | | 55.65 | | 125.00 | | 70.00 | |
Sources: Ministry of Finance; Ministry of Energy, Mines and Petroleum Resources; Ministry of Forests and Range; US Federal Reserve Bank
2010 Financial and Economic Review – July 2010
29
Appendix 1 – Economic Review
Table A1.10 British Columbia Forest Sector Economic Activity Indicators
Indicator | | 2005 | | 2006 | | 2007 | | 2008 | | 2009 | | Change (1)
2008-2009 | |
Wood production | | (million cubic meters) | | | | | | | | | | (per cent) | |
Timber billed | | 83.1 | | 81.5 | | 75.6 | | 62.1 | | 47.3 | | (23.8 | ) |
Lumber | | 41.0 | | 41.1 | | 36.7 | | 28.2 | | 23.0 | | (18.5 | ) |
Plywood | | 1.9 | | 1.8 | | na | | na | | na | | na | |
Timber scaled by species | | (million cubic meters) | | | | | | | | | | | |
Lodgepole pine | | 37.6 | | 36.7 | | 32.0 | | 28.7 | | 24.8 | | (13.6 | ) |
Spruce | | 12.0 | | 11.8 | | 10.3 | | 8.5 | | 6.8 | | (19.9 | ) |
Hemlock | | 7.6 | | 7.3 | | 7.2 | | 5.6 | | 4.3 | | (23.0 | ) |
Douglas fir | | 11.0 | | 9.9 | | 8.7 | | 6.4 | | 5.4 | | (16.2 | ) |
Balsam | | 5.1 | | 4.9 | | 4.6 | | 3.6 | | 3.0 | | (17.1 | ) |
Cedar | | 5.9 | | 5.4 | | 5.7 | | 5.0 | | 2.7 | | (45.8 | ) |
All others | | 4.2 | | 4.3 | | 4.1 | | 3.2 | | 1.8 | | (45.5 | ) |
Total (2) | | 83.6 | | 80.4 | | 72.7 | | 61.1 | | 48.8 | | (20.2 | ) |
| | | | | | | | | | | | | |
| | (million cubic meters) | | | | | | | | | | | |
Harvest volumes | | 73.5 | | 71.3 | | 64.2 | | 55.0 | | 44.4 | | (19.3 | ) |
| | (million tonnes) | | | | | | | | | | | |
Pulp and paper shipments | | 7.9 | | 7.8 | | 7.2 | | 6.5 | | 5.7 | | (11.9 | ) |
Market pulp | | 4.9 | | 4.7 | | 4.7 | | 4.0 | | 3.7 | | (7.3 | ) |
Newsprint, paper and paperboard | | 3.0 | | 3.0 | | 2.8 | | 2.5 | | 2.0 | | (19.2 | ) |
| | | | | | | | | | | | | |
Industrial product price indices | | (1997=100) | | | | | | | | | | | |
Softwood lumber — British Columbia | | 74.7 | | 70.6 | | 65.9 | | 62.8 | | 63.6 | | 1.3 | |
Douglas fir plywood | | 94.6 | | 89.9 | | 90.2 | | 83.6 | | 77.5 | | (7.3 | ) |
Bleached sulphate pulp | | 97.0 | | 97.9 | | 103.9 | | 106.3 | | 97.8 | | (8.0 | ) |
Newsprint for export | | 94.2 | | 94.6 | | 83.1 | | 91.6 | | 95.3 | | 4.0 | |
(1) Percentage change based on unrounded numbers.
(2) Totals may not add due to rounding.
Sources: | Timber scaled (less waste, reject and Christmas tree products) — Ministry of Forests and Range Lumber and plywood production — Statistics Canada Pulp and paper production — Canadian Pulp and Paper Association Industrial product price indices — Statistics Canada |
2010 Financial and Economic Review – July 2010
30
Appendix 1 – Economic Review
Table A1.11 Historical Value of Mineral, Petroleum and Natural Gas Shipments
| | | | Industrial | | Construction | | | | | | Natural Gas | | Other oil | | | |
Year | | Metals | | Minerals (1) | | Aggregates (2) | | Coal | | Crude Oil (3) | | to Pipeline | | and Gas (4) | | Total | |
| | ($ millions) | | ($ millions) | | ($ millions) | | ($ millions) | | | | | | | | | |
| | | | | | | | | | | | | | | | | |
1991 | | 1,511 | | 290 | | 159 | | 990 | | 260 | | 562 | | 36 | | 3,808 | |
1992 | | 1,502 | | 212 | | 157 | | 706 | | 260 | | 592 | | 38 | | 3,467 | |
1993 | | 1,198 | | 229 | | 166 | | 822 | | 233 | | 814 | | 42 | | 3,504 | |
1994 | | 1,354 | | 237 | | 180 | | 861 | | 235 | | 991 | | 44 | | 3,902 | |
1995 | | 2,016 | | 249 | | 204 | | 968 | | 272 | | 710 | | 58 | | 4,478 | |
1996 | | 1,537 | | 251 | | 189 | | 1,027 | | 441 | | 817 | | 75 | | 4,337 | |
1997 | | 1,495 | | 249 | | 195 | | 1,107 | | 403 | | 1,087 | | 98 | | 4,635 | |
1998 | | 1,484 | | 245 | | 208 | | 956 | | 373 | | 1,154 | | 47 | | 4,467 | |
1999 | | 1,183 | | 249 | | 219 | | 797 | | 461 | | 1,577 | | 53 | | 4,539 | |
2000 | | 1,571 | | 284 | | 224 | | 812 | | 843 | | 3,826 | | 114 | | 7,674 | |
2001 | | 1,394 | | 296 | | 217 | | 959 | | 729 | | 4,834 | | 103 | | 8,532 | |
2002 | | 1,288 | | 310 | | 231 | | 1,035 | | 714 | | 3,458 | | 79 | | 7,114 | |
2003 | | 1,353 | | 336 | | 226 | | 972 | | 718 | | 5,396 | | 116 | | 9,117 | |
2004 | | 1,956 | | 355 | | 239 | | 1,191 | | 824 | | 5,827 | | 133 | | 10,523 | |
2005 | | 2,442 | | 364 | | 278 | | 2,300 | | 973 | | 7,821 | | 173 | | 14,351 | |
2006 | | 3,248 | | 363 | | 274 | | 2,105 | | 1,013 | | 5,956 | | 179 | | 13,139 | |
2007 | | 2,887 | | 424 | | 347 | | 1,949 | | 989 | | 5,723 | | 200 | | 12,519 | |
2008 | | 2,590 | | 696 | | 378 | | 3,738 | | 1,215 | | 7,501 | | 524 | | 16,642 | |
2009 | | 1,828 | | 283 | | 306 | | 3,317 | | 719 | | 3,294 | | 116 | | 9,863 | |
(1) Shipments of gypsum and silica to Canadian cement, lime and clay plants are not included in this table.
(2) Sand and gravel; stone.
(3) Includes pentanes and condensate.
(4) Liquified petroleum gases and sulphur.
Sources: Natural Resources Canada and Ministry of Energy, Mines and Petroluem Resources
Table A1.12 Petroleum and Natural Gas Activity Indicators
| | | | | | | | | | | | | | | | Change | |
Indicator | | Unit of Measure | | 2004 | | 2005 | | 2006 | | 2007 | | 2008 | | 2009 | | 2008-2009 | |
| | | | | | | | | | | | | | | | (per cent) | |
Natural gas production (wellhead) (1) | | (billion cubic m) | | 32.0 | | 32.8 | | 32.8 | | 32.6 | | 33.4 | | 33.0 | | (1.2 | ) |
Crude oil and condensate | | (million cubic m) | | 2.7 | | 2.5 | | 2.4 | | 2.2 | | 2.0 | | 1.8 | | (8.1 | ) |
Wells authorized | | (number) | | 1,698.0 | | 1,790.0 | | 1,730.0 | | 1,205.0 | | 1,412.0 | | 829.0 | | (41.3 | ) |
Wells drilled | | (number) | | 1,281.0 | | 1,429.0 | | 1,435.0 | | 906.0 | | 923.0 | | 616.0 | | (33.3 | ) |
Seismic crew-weeks | | (number) | | 1,420.9 | | 1,143.5 | | 773.3 | | 473.9 | | 333.3 | | 62.9 | | (81.1 | ) |
Provincial reserves | | | | | | | | | | | | | | | | | |
Marketable gas (remaining reserves) | | (billion cubic m) | | 317.0 | | 363.0 | | 380.1 | | 394.2 | | 496.6 | | n/a | | n/a | |
Oil (remaining reserves) | | (million cubic m) | | 22.0 | | 20.9 | | 18.2 | | 19.7 | | 18.5 | | n/a | | n/a | |
(1) Not including gas retrieved from storage. During 2009, 0.75 billion cubic metres were produced from storage wells.
Source: Ministry of Energy, Mines and Petroleum Resources
2010 Financial and Economic Review – July 2010
31
Appendix 1 – Economic Review
Table A1.13 Supply and Consumption of Electrical Energy in British Columbia
| | Supply | | Consumption | | | |
| | Net Generation | | Receipts | | | | Delivered | | | | | | | |
| | | | | | Total | | From Other | | | | To Other | | Total | | | | | |
| | | | | | Provincial | | Provinces | | Total | | Provinces | | Provincial | | Total | | | |
Year | | Hydro | | Thermal | | Generation | | and Imports | | Supply | | and Exports | | Consumption | | Demand | | Net Exports | |
| | | | | | | | (gigawatt-hours)(1) | | | | | | | | | | | |
1989 | | 51,082 | | 6,573 | | 57,655 | | 4,500 | | 62,155 | | 6,583 | | 55,572 | | 62,155 | | 2,083 | |
1990 | | 57,245 | | 3,417 | | 60,662 | | 3,233 | | 63,895 | | 6,689 | | 57,206 | | 63,895 | | 3,456 | |
1991 | | 60,149 | | 2,832 | | 62,981 | | 2,272 | | 65,253 | | 7,725 | | 57,528 | | 65,253 | | 5,454 | |
1992 | | 60,555 | | 3,503 | | 64,058 | | 2,685 | | 66,743 | | 9,473 | | 57,270 | | 66,743 | | 6,788 | |
1993 | | 53,057 | | 5,716 | | 58,774 | | 5,691 | | 64,465 | | 5,605 | | 58,860 | | 64,465 | | (86 | ) |
1994 | | 53,979 | | 7,036 | | 61,015 | | 7,836 | | 68,851 | | 9,541 | | 59,311 | | 68,851 | | 1,705 | |
1995 | | 49,814 | | 8,192 | | 58,006 | | 6,385 | | 64,391 | | 3,972 | | 60,419 | | 64,391 | | (2,413 | ) |
1996 | | 67,329 | | 4,436 | | 71,765 | | 3,289 | | 75,053 | | 10,390 | | 64,664 | | 75,053 | | 7,101 | |
1997 | | 61,772 | | 5,189 | | 66,961 | | 4,316 | | 71,278 | | 12,114 | | 59,163 | | 71,278 | | 7,798 | |
1998 | | 60,849 | | 6,861 | | 67,710 | | 5,056 | | 72,766 | | 10,619 | | 62,147 | | 72,766 | | 5,563 | |
1999 | | 61,588 | | 6,457 | | 68,045 | | 6,807 | | 74,852 | | 12,529 | | 62,323 | | 74,852 | | 5,722 | |
2000 | | 59,754 | | 8,487 | | 68,241 | | 6,039 | | 74,280 | | 10,698 | | 63,582 | | 74,280 | | 4,659 | |
2001 | | 48,338 | | 8,994 | | 57,332 | | 10,154 | | 67,486 | | 6,408 | | 61,079 | | 67,486 | | (3,747 | ) |
2002 | | 58,627 | | 6,318 | | 64,945 | | 5,769 | | 70,714 | | 8,078 | | 62,636 | | 70,714 | | 2,309 | |
2003 | | 56,689 | | 6,362 | | 63,051 | | 7,084 | | 70,135 | | 9,599 | | 60,535 | | 70,135 | | 2,515 | |
2004 | | 53,281 | | 7,214 | | 60,496 | | 8,261 | | 68,757 | | 6,791 | | 61,966 | | 68,757 | | (1,470 | ) |
2005 | | 60,605 | | 7,207 | | 67,811 | | 7,226 | | 75,037 | | 9,247 | | 65,790 | | 75,037 | | 2,021 | |
2006 | | 54,772 | | 7,249 | | 62,021 | | 12,695 | | 74,716 | | 6,155 | | 68,561 | | 74,716 | | (6,540 | ) |
2007 | | 64,738 | | 7,473 | | 72,212 | | 8,027 | | 80,239 | | 10,987 | | 69,252 | | 80,239 | | 2,960 | |
2008 | | 58,774 | | 7,082 | | 65,856 | | 12,027 | | 77,883 | | 9,844 | | 68,038 | | 77,883 | | (2,183 | ) |
2009 | | 55,872 | | 6,334 | | 62,206 | | 11,585 | | 73,790 | | 7,950 | | 65,841 | | 73,790 | | (3,635 | ) |
(1) Gigawatt-hour = one million kilowatt-hours
Source: Statistics Canada
2010 Financial and Economic Review – July 2010
32
Appendix 1 – Economic Review
Table A1.14 Components of British Columbia Population Change
| | Net Migration | | Natural Increase | | Total | | Total | |
| | Inter- | | Inter- | | | | | | | | | | Population | | Population | |
Year | | provincial | | national | | Total | | Births | | Deaths | | Total | | Increase (1) | | at July 1, 2010 | |
| | | | | | | | | | | | | | | | | |
1975 | | (2,864 | ) | 25,342 | | 22,478 | | 36,281 | | 19,151 | | 17,130 | | 39,608 | | 2,499,564 | |
1976 | | (464 | ) | 16,288 | | 15,824 | | 35,848 | | 18,788 | | 17,060 | | 32,884 | | 2,533,899 | |
1977 | | 12,452 | | 11,224 | | 23,676 | | 36,691 | | 18,596 | | 18,095 | | 41,771 | | 2,570,315 | |
1978 | | 20,106 | | 7,699 | | 27,805 | | 37,231 | | 19,058 | | 18,173 | | 45,978 | | 2,615,162 | |
1979 | | 32,541 | | 14,012 | | 46,553 | | 38,432 | | 19,204 | | 19,228 | | 65,781 | | 2,665,238 | |
1980 | | 38,773 | | 23,522 | | 62,295 | | 40,104 | | 19,371 | | 20,733 | | 83,028 | | 2,745,861 | |
1981 | | 23,270 | | 22,143 | | 45,413 | | 41,474 | | 19,857 | | 21,617 | | 67,030 | | 2,826,558 | |
1982 | | (1,129 | ) | 14,175 | | 13,046 | | 42,747 | | 20,707 | | 22,040 | | 35,086 | | 2,876,513 | |
1983 | | 3,000 | | 10,639 | | 13,639 | | 42,919 | | 19,827 | | 23,092 | | 36,731 | | 2,907,502 | |
1984 | | 3,867 | | 8,674 | | 12,541 | | 43,911 | | 20,686 | | 23,225 | | 35,766 | | 2,947,181 | |
1985 | | (3,430 | ) | 9,374 | | 5,944 | | 43,127 | | 21,302 | | 21,825 | | 27,769 | | 2,975,131 | |
1986 | | (772 | ) | 12,290 | | 11,518 | | 41,967 | | 21,213 | | 20,754 | | 32,272 | | 3,003,621 | |
1987 | | 16,588 | | 21,078 | | 37,666 | | 41,814 | | 21,814 | | 20,000 | | 57,666 | | 3,048,651 | |
1988 | | 25,829 | | 28,704 | | 54,533 | | 42,930 | | 22,546 | | 20,384 | | 74,917 | | 3,114,761 | |
1989 | | 35,711 | | 31,042 | | 66,753 | | 43,769 | | 22,997 | | 20,772 | | 87,525 | | 3,196,725 | |
1990 | | 40,088 | | 28,585 | | 68,673 | | 45,617 | | 23,577 | | 22,040 | | 90,713 | | 3,292,111 | |
1991 | | 34,600 | | 21,274 | | 55,874 | | 45,612 | | 23,977 | | 21,635 | | 77,509 | | 3,373,787 | |
1992 | | 39,578 | | 29,477 | | 69,055 | | 46,156 | | 24,615 | | 21,541 | | 90,596 | | 3,468,802 | |
1993 | | 37,595 | | 34,679 | | 72,274 | | 46,026 | | 25,764 | | 20,262 | | 92,536 | | 3,567,772 | |
1994 | | 34,449 | | 42,667 | | 77,116 | | 46,998 | | 25,939 | | 21,059 | | 98,175 | | 3,676,075 | |
1995 | | 23,414 | | 43,644 | | 67,058 | | 46,820 | | 26,375 | | 20,445 | | 87,503 | | 3,777,390 | |
1996 | | 17,798 | | 47,617 | | 65,415 | | 46,138 | | 27,538 | | 18,600 | | 84,015 | | 3,874,317 | |
1997 | | 1,980 | | 38,318 | | 40,298 | | 44,577 | | 27,412 | | 17,165 | | 57,463 | | 3,948,583 | |
1998 | | (17,521 | ) | 24,380 | | 6,859 | | 43,072 | | 27,978 | | 15,094 | | 21,953 | | 3,983,113 | |
1999 | | (12,413 | ) | 28,644 | | 16,231 | | 41,939 | | 28,017 | | 13,922 | | 30,153 | | 4,011,375 | |
2000 | | (14,783 | ) | 29,266 | | 14,483 | | 40,672 | | 27,461 | | 13,211 | | 27,694 | | 4,039,230 | |
2001 | | (7,028 | ) | 37,661 | | 30,633 | | 40,575 | | 28,362 | | 12,213 | | 42,846 | | 4,076,264 | |
2002 | | (4,445 | ) | 32,296 | | 27,851 | | 40,065 | | 28,884 | | 11,181 | | 39,032 | | 4,098,178 | |
2003 | | 3,025 | | 33,620 | | 36,645 | | 40,497 | | 29,320 | | 11,177 | | 47,822 | | 4,122,396 | |
2004 | | 7,785 | | 34,726 | | 42,511 | | 40,490 | | 29,924 | | 10,566 | | 37,709 | | 4,155,170 | |
2005 | | 7,212 | | 43,610 | | 50,822 | | 40,827 | | 30,235 | | 10,592 | | 37,447 | | 4,196,788 | |
2006 | | 12,799 | | 39,572 | | 52,371 | | 41,729 | | 30,688 | | 11,041 | | 43,487 | | 4,243,580 | |
2007 | | 16,776 | | 42,043 | | 58,819 | | 43,649 | | 31,123 | | 12,526 | | 47,899 | | 4,309,453 | |
2008 | | 8,379 | | 54,941 | | 63,320 | | 44,166 | | 31,902 | | 12,264 | | 40,281 | | 4,383,845 | |
2009 | | 7,499 | | 51,072 | | 58,571 | | 44,833 | | 31,195 | | 13,638 | | 38,694 | | 4,455,207 | |
(1) Components may not add to totals due to the revision of population statistics based on information collected during subsequent census years. The revisions are not distributed back to relevant components due to insufficient data.
Source: Statistics Canada.
2010 Financial and Economic Review – July 2010
33
| Chapter Two |
| |
| Financial Review (1) |
(1) Reflects 2009/10 Public Accounts released on July 8, 2010.
2010 Financial and Economic Review – July 2010
Chapter 2 – Financial Review
2009/10 Overview
Table 2.1 Operating Statement
| | September | | Actual | | Actual | |
($ millions) | | Update | | 2009/10 | | 2008/09 (1) | |
Revenue | | 37,608 | | 37,521 | | 38,302 | |
Expense | | (40,133 | ) | (39,300 | ) | (38,245 | ) |
Negotiating Framework incentive payments | | — | | — | | (2 | ) |
Climate Action Dividend | | — | | — | | 20 | |
Surplus (deficit) before forecast allowance | | (2,525 | ) | (1,779 | ) | 75 | |
Forecast allowance | | (250 | ) | — | | — | |
Surplus (deficit) | | (2,775 | ) | (1,779 | ) | 75 | |
(1) Comparative figures have been restated to reflect government accounting policies in effect at March 31, 2010.
The provincial government ended the 2009/10 fiscal year with a deficit of $1.8 billion; $996 million lower than the budgeted deficit of $2.8 billion (see Chart 2.1). The deficit followed five consecutive years of surpluses and reflected the impact of the global financial crisis on the economies of British Columbia and its trading partners in 2009.
The improvement from budget is primarily due to lower spending, as stronger revenue was offset by the reallocation of a portion of the federal HST transition payment to later years. Lower expenditures reflected government’s commitment to control spending and align it with priority services and programs.
The $87 million reduction in revenue reflected lower taxation revenue despite strong returns of property transfer tax, and deferral of a portion of the HST transition payment to later years in support of government’s commitment to provide health care and education while bringing the fiscal plan back into balance by 2013/14. These reductions were mostly offset by higher natural resources revenue (mainly from coal, metals and minerals), increased contributions from the federal government and higher commercial Crown corporation income.

2010 Financial and Economic Review –July 2010
37
Chapter 2 – Financial Review
The $833 million reduction in spending was primarily due to ministry operating savings and unused Contingencies funding, partially offset by additional spending funded by third party recoveries. Total spending also was positively impacted by the service delivery agencies’ use of operating transfers for future costs and a reduction in liabilities accrued in prior years for government’s obligations with respect to employee benefits, self-insurance, and various agreements.
As a result of the above, the $250 million forecast allowance was not needed, which also contributed to the overall improvement from budget.
Financial information in this publication, including this chapter and Appendix 2, is derived from the government’s 2010 Public Accounts.
Revenue
In 2009/10, revenue totaled $37.5 billion, $87 million lower than budget and down 2.0 per cent from 2008/09. In March 2010, the federal and provincial governments updated the Comprehensive Integrated Tax Coordination Agreement resulting in a $500 million reallocation of the Harmonized Sales Tax (HST) transition payments from 2009/10 to the next two years. Excluding the impact of re-profiling the HST transition contribution, revenue was $413 million higher than budget and down $1,031 million or 2.7 per cent annually. Compared to budget and excluding the HST transition payment, higher revenues from property transfer tax, mining taxes, miscellaneous sources, other federal contributions and commercial Crowns were partially offset by lower income and sales taxes and natural gas royalties.
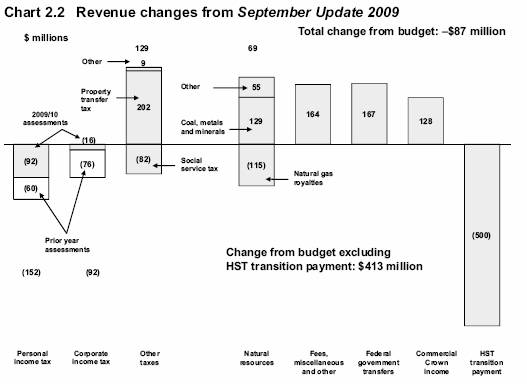
2010 Financial and Economic Review – July 2010
38
Chapter 2 – Financial Review
Major changes from the 2009/10 budget included:
· Personal income tax revenue was down $152 million reflecting the effects of lower 2009 personal income growth and weaker 2008 tax assessments due in part to slowing employment growth and volatile financial and equity markets during 2008.
· Corporate income tax revenue was down $92 million mainly due to lower tax assessments for 2008 and prior years and reduced instalment payments from federal government. The 2008 corporate income tax base fell 5.4 per cent annually compared to a 3.6 per cent increase in BC corporate profits, indicating the volatility associated with corporate income tax revenues.
· Revenue from social service tax was $82 million below budget and down 3.9 per cent from the previous year. The decline from budget was mainly due to lower-than-expected consumer expenditures and business investment. This marks the second consecutive annual decline in social service tax revenue mainly reflecting weak economic conditions and muted consumer and business confidence over the past two years.
Table 2.2 Consumption and Other Tax Revenues Change from September Update 2009
| | Revenue | | | | | | | |
| | changes | | | | September | | Q3 | |
| | ($ millions) | | Indicators (annual percent change) | | Update | | Forecast | |
Social service | | (82 | ) | Consumer expenditures | | -2.0 | % | -2.1 | % |
| | | | Business investment | | -7.5 | % | -8.3 | % |
Property transfer | | 202 | | Gradual return to trend revenue | | -4.2 | % | 19.6 | % |
| | | | BC housing starts | | -60.7 | % | -53.2 | % |
Other taxes | | 9 | | | | | | | |
· Property transfer tax revenue was $202 million higher than budget and up 24.1 per cent from the previous year reflecting the unexpected strength in the BC housing market during the year. The budget forecast assumed a moderate annual decline of 4.2 per cent after falling 33.1 per cent in 2008/09. In contrast, revenue rose significantly as the increase in the average price and transaction volumes in the residential market outweighed the decline in housing starts.
· Natural gas royalties were $115 million below budget as lower prices and production volumes were partly offset by savings from reduced utilization of credit and royalty program offsets. Natural gas prices were very volatile during the year ranging from $1.90 in September 2009 to $4.32 in January 2010 ($Cdn/gigajoule, plant inlet). Prices have not been at the $1.90 level in over a decade and the full-year average price of $2.87 was 18.2 per cent below budget reflecting weak market demand and high storage levels. The storage level at yearend was 10.8 per cent higher than the five year average.
Table 2.3 Energy and Mineral Revenues Change from September Update 2009
| | Revenue | | | | | | | |
| | changes | | | | September | | | |
| | ($ millions) | | Indicators | | Update | | Actual | |
Natural gas royalties | | (115 | ) | Natural gas price ($Cdn/GJ, plant inlet) | | $ | 3.51 | | $ | 2.89 | |
| | | | Production (annual change) | | 2.1 | % | 0.2 | % |
| | | | Bonus bid cash reciepts ($ million) | | $ | 405 | | $ | 896 | |
Crown land tenures | | (1 | ) | Bonus bid price per hectare ($) | | $ | 871 | | $ | 2,365 | |
| | | | Hectares disposed | | 465 | | 379 | |
Coal | | 84 | | Metallurgical coal price ($US/tonne) | | $ | 130 | | $ | 157 | |
Other metals and minerals | | 45 | | Copper price ($US/lb) | | $ | 1.91 | | $ | 2.77 | |
Columbia River Treaty electricity sales | | 18 | | Electricity price ($US/Mwh) | | $ | 34.00 | | $ | 38.00 | |
Petroleum royalties and other | | 10 | | Oil price ($US/bbl) | | $ | 64.13 | | $ | 65.60 | |
| | 41 | | | | | | | |
2010 Financial and Economic Review – July 2010
39
Chapter 2 – Financial Review
· Revenue from the sale of Crown land tenures and leases was slightly below budget as the impact of higher cash payments was offset by the change in revenue recognition from eight to nine-year deferral of cash receipts. The effect of this change reduced revenue by $61 million in 2009/10 and lowered revenue throughout the previous nine years. Cash receipts were $491 million higher than assumed as a higher average bonus bid price per hectare offset a lower volume of hectares disposed. At $2,365/hectare, the average bid price was 172 per cent higher than assumed at budget and marks the third consecutive year that bid prices exceeded $1,000 per hectare, indicating industry’s continued interest in exploring and developing BC resources.
· Other energy and mineral revenue including mining tax, petroleum royalties and receipts from electricity sales under the Columbia River Treaty was $157 million above budget mainly due to the impact of higher commodity prices.
· Forests revenue at $387 million was unchanged from budget. Stronger border tax collections and higher stumpage revenues under the BC Timber Sales program mainly reflecting increased volumes were offset by lower revenues from logging tax and major tenure stumpage primarily due to lower stumpage rates. Revenue declined 30.6 per cent from 2008/09 following a 51.3 per cent annual decline last year mainly due to the continued weakness in the US housing market resulting in low lumber prices and reduced Crown harvest volumes. Interior stumpage rates were also impacted by the effect of the mountain pine beetle infestation on log quality and grade.
Table 2.4 Forest Revenues Change from September Update 2009
| | Revenue | | | | | | | |
| | changes | | | | September | | | |
| | ($ millions) | | Indicators | | Update | | Actual | |
Stumpage from timber tenures | | (16 | ) | SPF 2x4 ($US/1000 bf, calendar year) | | $ | 176 | | $ | 181 | |
BC Timber Sales | | 10 | | Total stumpage rate ($/m3) | | $ | 4.80 | | $ | 4.45 | |
Softwood Lumber Agreement border tax | | 22 | | Harvest volumes (million m3) | | 44.0 | | 46.9 | |
Logging tax and other | | (16 | ) | US lumber exports (billion bf) | | 5.4 | | 5.2 | |
| | — | | | | | | | |
· Other taxpayer supported revenue including fees, licences, investment earning, sales of goods and services and other miscellaneous sources was $164 million above budget. Higher ministry vote recoveries in support of program spending, increased SUCH sector revenue from fees, investment earnings and miscellaneous sources were partially offset by reduced activity related to free Crown grants. Investment earnings under the fiscal agency loan program; and revenues from ministry vote recoveries and free Crown grants are fully offset by equivalent expenditures.
Table 2.5 Other Revenue Change from September Update 2009
| | Revenue | | | |
| | changes | | | |
| | ($ millions) | | | |
Free Crown Grants | | (122 | ) | offset by equivalent expense reduction | |
Ministry vote recoveries and fiscal agency loan program | | 125 | | offset by equivalent expense increase | |
SUCH sector | | 157 | | mainly post secondary institutions | |
Other | | 4 | | | |
Total other | | 164 | | | |
2010 Financial and Economic Review – July 2010
40
Chapter 2 – Financial Review
· Excluding the impact of re-profiling the HST transition payments, federal government contributions were up $167 million reflecting:
· a $50 million increase in direct funding to universities;
· a $43 million increase in vote recoveries mainly in support of labour market and immigration programs;
· a $31 million increase in contributions to health authorities and hospital societies;
· a $18 million increase for a variety of programs, mainly in support of Employment Insurance Skills;
· a $15 million transfer increase to taxpayer supported Crowns; and
· a $10 million increase in the Canada Health Transfer due to higher prior years’ entitlements.
· Commercial Crown corporation net income of $3.0 billion was $128 million higher than budget and $116 million higher than 2008/09. Major changes from budget include:
· BC Hydro net income was $5 million lower than plan after the inclusion of regulatory account transfers. However, operating income before regulatory account transfers was $327 million below plan, mainly reflecting lower net trade income and higher operating expenses due to a provision for future environmental compliance and remediation expenditures. The lower results were partially offset by reduced energy market purchases.
· Liquor Distribution Branch income was down $19 million mainly due to a consumer shift to purchasing lower priced products.
· BC Lottery Corporation income was down $51 million mainly reflecting lower net income from casino operations as consumers’ discretionary spending was influenced by personal finances and competition from the numerous 2010 Olympic and Paralympic Winter Games events.
· ICBC results were up $194 million mainly resulting from higher investment income, reflecting the recovery of global equity markets, and lower claims incurred costs, reflecting favourable driving conditions.
A detailed review of the above changes by quarter is available in Appendix Table A2.1. Further information on commercial Crown corporations is provided in Chapter 3.
2010 Financial and Economic Review – July 2010
41
Chapter 2 – Financial Review
Table 2.6 Revenue by Source
($ millions) | | September
Update | | Actual
2009/10 | | Actual
2008/09 | |
Taxation | | | | | | | |
Personal income | | 5,681 | | 5,529 | | 6,093 | |
Corporate income | | 1,409 | | 1,317 | | 2,038 | |
Social service | | 4,847 | | 4,765 | | 4,958 | |
Fuel | | 873 | | 884 | | 891 | |
Carbon | | 557 | | 542 | | 306 | |
Tobacco | | 686 | | 682 | | 708 | |
Property | | 1,891 | | 1,884 | | 1,848 | |
Property transfer | | 685 | | 887 | | 715 | |
Corporation capital | | 56 | | 95 | | 108 | |
Other taxes (1) | | 532 | | 517 | | 532 | |
| | 17,217 | | 17,102 | | 18,197 | |
Natural resource | | | | | | | |
Natural gas royalties | | 522 | | 406 | | 1,314 | |
Forests | | 387 | | 387 | | 557 | |
Other natural resource (2) | | 1,668 | | 1,853 | | 1,936 | |
| | 2,577 | | 2,646 | | 3,807 | |
Other revenue | | | | | | | |
Medical Services Plan premiums | | 1,628 | | 1,666 | | 1,595 | |
Other fees (3) | | 2,548 | | 2,453 | | 2,412 | |
Investment earnings | | 897 | | 963 | | 817 | |
Miscellaneous | | 2,599 | | 2,754 | | 2,585 | |
| | 7,672 | | 7,836 | | 7,409 | |
Contributions from the federal government | | | | | | | |
Health transfer | | 3,436 | | 3,450 | | 3,344 | |
Social transfer | | 1,437 | | 1,433 | | 1,399 | |
Harmonized sales tax transition payments | | 750 | | 250 | | — | |
Other federal contributions | | 1,627 | | 1,784 | | 1,242 | |
| | 7,250 | | 6,917 | | 5,985 | |
Commercial Crown corporation net income | | | | | | | |
BC Hydro | | 452 | | 447 | | 365 | |
Liquor Distribution Branch | | 896 | | 877 | | 891 | |
BC Lotteries (net of payments to the federal government) | | 1,121 | | 1,070 | | 1,082 | |
ICBC | | 407 | | 601 | | 512 | |
Transportation Investment Corporation (Port Mann) | | (22 | ) | (4 | ) | (8 | ) |
Other | | 38 | | 29 | | 62 | |
| | 2,892 | | 3,020 | | 2,904 | |
Total revenue | | 37,608 | | 37,521 | | 38,302 | |
(1) Insurance premium and hotel room taxes.
(2) Columbia River Treaty, other energy and minerals, water rental and other resources.
(3) Post-secondary, healthcare-related, motor vehicle, and other fees.
2010 Financial and Economic Review – July 2010
42
Chapter 2 – Financial Review
Table 2.7 Expense by Ministry, Program and Agency
| | 2009/10 | | | |
| | September
Update | | Contin-
gencies
Allocation (1) | | Restated
Budget | | Actual | | Actual
2008/09 (2) | |
Office of the Premier | | 11 | | — | | 11 | | 11 | | 13 | |
Aboriginal Relations and Reconciliation | | 69 | | 17 | | 86 | | 85 | | 62 | |
Advanced Education and Labour Market Development | | 2,131 | | — | | 2,131 | | 2,109 | | 2,025 | |
Agriculture and Lands | | 222 | | — | | 222 | | 108 | | 157 | |
Attorney General | | 548 | | — | | 548 | | 622 | | 519 | |
Children and Family Development | | 1,394 | | — | | 1,394 | | 1,376 | | 1,384 | |
Citizens’ Services | | 164 | | — | | 164 | | 14 | | 172 | |
Community and Rural Development | | 184 | | 25 | | 209 | | 208 | | 419 | |
Education | | 5,042 | | 44 | | 5,086 | | 5,070 | | 5,103 | |
Energy, Mines and Petroleum Resources | | 70 | | — | | 70 | | 47 | | 50 | |
Environment | | 193 | | — | | 193 | | 185 | | 249 | |
Finance | | 90 | | — | | 90 | | 69 | | 78 | |
Forests and Range | | 1,101 | | — | | 1,101 | | 1,075 | | 844 | |
Health Services | | 14,155 | | — | | 14,155 | | 13,924 | | 13,349 | |
Healthy Living and Sport | | 87 | | 84 | | 171 | | 171 | | 232 | |
Housing and Social Development | | 2,725 | | 18 | | 2,743 | | 2,735 | | 2,604 | |
Labour | | 22 | | — | | 22 | | 21 | | 22 | |
Public Safety and Solicitor General | | 661 | | 6 | | 667 | | 665 | | 661 | |
Small Business, Technology and Economic Development | | 69 | | — | | 69 | | 49 | | 51 | |
Tourism, Culture and the Arts | | 106 | | 1 | | 107 | | 107 | | 363 | |
Transportation and Infrastructure | | 756 | | — | | 756 | | 753 | | 791 | |
Total ministries and Office of the Premier | | 29,800 | | 195 | | 29,995 | | 29,404 | | 29,148 | |
Management of public funds and debt | | 1,186 | | — | | 1,186 | | 1,141 | | 1,209 | |
Contingencies | | 500 | | (195 | ) | 305 | | 165 | | 227 | |
Funding for capital expenditures | | 1,213 | | — | | 1,213 | | 866 | | 832 | |
Legislative and other appropriations | | 164 | | — | | 164 | | 148 | | 144 | |
Consolidated revenue fund expense | | 32,863 | | — | | 32,863 | | 31,724 | | 31,560 | |
Expenses recovered from external entities | | 2,593 | | — | | 2,593 | | 2,748 | | 2,241 | |
Funding provided to service delivery agencies | | (19,315 | ) | — | | (19,315 | ) | (19,240 | ) | (18,678 | ) |
Ministry and special office direct program spending | | 16,141 | | — | | 16,141 | | 15,232 | | 15,123 | |
Service delivery agency expense: | | | | | | | | | | | |
School districts | | 5,324 | | — | | 5,324 | | 5,379 | | 5,353 | |
Post-secondary institutions | | 4,644 | | — | | 4,644 | | 4,628 | | 4,435 | |
Health authorities and hospital societies | | 10,696 | | — | | 10,696 | | 10,761 | | 10,291 | |
Other service delivery agencies | | 3,328 | | — | | 3,328 | | 3,300 | | 3,025 | |
Total service delivery agency expense | | 23,992 | | — | | 23,992 | | 24,068 | | 23,104 | |
Total expense | | 40,133 | | — | | 40,133 | | 39,300 | | 38,227 | |
(1) Includes one-time funding for cost pressures.
(2) Prior year comparative figures have been restated to reflect government’s accounting policies as of March 31, 2010.
2010 Financial and Economic Review – July 2010
43
Chapter 2 – Financial Review
Expense
In 2009/10, government expenses totaled $39.3 billion, which was $833 million lower than budget but a 2.8 per cent increase over the previous year.

During the year, ministries were able to realize a total of $369 million in operating savings.
· Health expenditures were down $159 million, mainly due to regional savings and lower costs for Pharmacare and the H1N1 flu vaccination program.
· Costs for employee benefits and related programs were down $97 million.
· Expenses for direct fire and forest resource management programs were $38 million less than expected.
· Other areas of government were able to achieve $75 million in savings.
Liabilities accrued in prior years were adjusted downward by $228 million to reflect actuarial valuations and other updated information. These included reductions to employee benefits obligations ($83 million), MSP cost accruals ($73 million), the Vancouver Island gas pipeline agreement ($20 million), government’s self-insurance liability ($17 million) and a copyright liability ($17 million), and various other agreements ($18 million).
Other cost savings included $122 million in lower estimates for free Crown grants and $45 million in reduced debt servicing costs. As well, $140 million from the Contingencies vote was not needed.
During the year, government invoked standing statutory authority to cover $112 million in unforeseen costs, including $77 million for legal actions under the Crown Proceeding Act, $13 million for BC Timber Sales expenses, $9 million for current year self-insurance claims, $8 million for farm production insurance claims, and $5 million in other areas.
2010 Financial and Economic Review – July 2010
44
Chapter 2 – Financial Review
Program spending funded or co-funded by parties outside of government was $155 million higher than budget, mainly due to additional healthcare related receipts for room and board and medical services provided to out-of-province clients, as well as spending related to federal funding for labour market agreements, literacy programs, and policing and corrections services.
The impact of ministry spending on government’s total spending was reduced by $272 million due to service delivery agencies’ use of operating grants for minor capital spending, such as the acquisition of equipment, as well as their allocation of current year grants to fund future program spending. The costs funded by these grants will be expensed in subsequent years.
Service delivery agency spending was $76 million higher than budget.
· School districts spending increased by $55 million due to higher staffing and operating costs.
· Post secondary institution spending was $16 million under budget as a result of reduced operating costs ($61 million), partially offset by increased salaries and benefits ($45 million).
· Health authority and hospital society expenditures increased by $65 million due to higher physician and laboratory costs.
· Other service delivery agency spending was $28 million lower than budget.
A detailed review of the above changes by quarter is available in Appendix Table A2.1. Further information on 2009/10 spending by function is provided in Appendix Table A2.7.
Provincial Capital Spending
Capital spending in 2009/10 totaled $7.1 billion, $322 million below budget (see Chart 2.4). Spending on power generation and transmission projects accounted for 34 per cent of total capital investments, education facilities 16 per cent, health facilities 13 per cent, and highway/public transit projects for 26 per cent (see Chart 2.5 and Table 2.8).
Taxpayer-supported capital spending includes schools, hospitals, post-secondary facilities, social housing and transportation projects, plus minor capital spending by ministries and other minor taxpayer-supported agencies. In 2009/10, spending of $3.7 billion was $1 billion below budget mainly due to:
· Education facilities — down $51 million, reflecting project rescheduling and lower than expected spending by universities on their self-funded projects.
· Post-secondary institutions spent $25 million less than projected on various projects, including the UBC Pharmacy and Earth Sciences buildings and various other knowledge infrastructure projects, as well as self-funded university projects such as student residences.
· School districts spent $26 million less than expected on school replacements, capacity upgrades, seismic renovations and other projects, as well as lower direct spending by school districts on equipment and other minor capital.
2010 Financial and Economic Review – July 2010
45
Chapter 2 – Financial Review
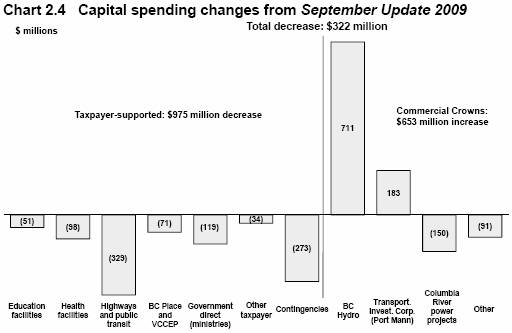
· Health facilities — down $98 million, reflecting construction scheduling changes to the Fort St John Hospital, Northern Cancer Centre, and Richmond Hospital projects; and lower than expected spending on various minor building, information management/technology and equipment projects.
· Transportation sector — down $329 million, mainly reflecting the construction scheduling changes to projects such as the Base Rehabilitation Program, Oil and Gas Rural Road Improvement Program, Highway 1 Brake Check to Yoho National Park, Highway 1 Golden Hill to West Portal, Highway 1 Donald Bridge and Overhead, Highway 1 Monte Creek to Pritchard, Highway 1 Clanwilliam Bridge, Highway 97 Bentley Road to Okanagan Lake Park, Highway 97 Wright Station Curves, Highway 97 148 mile to Likely Road, Highway 97 Simon Fraser Bridge to Sintich, Highway 5 Walterdale Passing Lane, Westcoast Express improvements, and 202nd Street Park and Ride.
· BC Place rejuvenation project — down $73 million, as additional project reviews delayed capital spending approvals.
· Government direct (ministries) — down $119 million due to lower than expected spending on government buildings and information management/technology projects including the Surrey Pre-Trial Services Centre expansion and the Integrated Case Management System, as well as lower spending on BC Timber Sales Roads.
· Other taxpayer-supported entities — down $34 million.
The changes from budget reflect the allocation of $27 million of capital funding contingencies for the Integrated Case Management System ($9 million) and the Sierra Yoyo Desan Road ($17 million). The remaining $273 million in capital contingencies was not utilized in 2009/10.
More than 72 per cent of self-supported commercial Crown corporation capital spending is for electricity generation, transmission and distribution projects undertaken by BC Hydro, BC Transmission and for Columbia River power projects. The remaining
2010 Financial and Economic Review – July 2010
46
Chapter 2 – Financial Review
Table 2.8 Capital Spending
($ millions) | | September
Update | | Contin-
gencies
Allocation | | Restated
Budget
2009/10 | | Actual
2009/10 | | Actual
2008/09 | |
Taxpayer-supported | | | | | | | | | | | |
Education | | | | | | | | | | | |
Schools (K—12) | | 508 | | — | | 508 | | 482 | | 413 | |
Post-secondary | | 697 | | — | | 697 | | 672 | | 658 | |
Health | | 1,025 | | — | | 1,025 | | 927 | | 892 | |
BC Transportation Financing Authority | | 1,230 | | — | | 1,230 | | 918 | | 881 | |
BC Transit | | 167 | | — | | 167 | | 150 | | 77 | |
Vancouver Convention Centre expansion project | | 39 | | — | | 39 | | 41 | | 242 | |
BC Place rejuvenation | | 148 | | — | | 148 | | 75 | | 45 | |
Government direct (ministries) | | 398 | | 27 | | 425 | | 306 | | 430 | |
Other (1) | | 217 | | — | | 217 | | 183 | | 140 | |
Capital spending contingencies | | 300 | | (27 | ) | 273 | | — | | — | |
Total taxpayer-supported | | 4,729 | | — | | 4,729 | | 3,754 | | 3,778 | |
| | | | | | | | | | | |
Self-supported commercial | | | | | | | | | | | |
BC Hydro | | 1,695 | | — | | 1,695 | | 2,406 | | 1,397 | |
BC Transmission Corporation | | 22 | | — | | 22 | | 12 | | 19 | |
Columbia River power projects (2) | | 166 | | — | | 166 | | 16 | | 32 | |
Transportation Investment Corporation
(Port Mann Bridge/Highway 1) | | 594 | | — | | 594 | | 777 | | 215 | |
BC Rail | | 69 | | — | | 69 | | 14 | | 10 | |
Insurance Corporation of British Columbia | | 38 | | — | | 38 | | 22 | | 22 | |
BC Lotteries | | 100 | | — | | 100 | | 92 | | 97 | |
Liquor Distribution Branch | | 21 | | — | | 21 | | 19 | | 17 | |
Total self-supported commercial | | 2,705 | | — | | 2,705 | | 3,358 | | 1,809 | |
Total capital spending | | 7,434 | | — | | 7,434 | | 7,112 | | 5,587 | |
(1) | | Includes BC Housing Management Commission, Provincial Rental Housing Corporation, BC Transit and other service delivery agencies. |
(2) | | Joint ventures of the Columbia Power Corporation and Columbia Basin Trust. |
28 per cent represents capital spending by the Transportation Investment Corporation (Port Mann Bridge/Highway 1) BC Rail, ICBC, BC Lotteries and the Liquor Distribution Branch. Overall spending for these agencies was $653 million above budget mainly due to:
· BC Hydro — $711 million above budget mainly reflecting the $850 million purchase of a one-third ownership interest in Teck Metals Ltd’s Waneta Dam and generating facility, partially offset by lower spending on capital projects;
· Columbia River power projects —$150 million below budget reflecting postponement of the plan to construct a new generating facility downstream of the Waneta Dam;
· Transportation Investment Corporation — $183 million above budget as construction activity for the Port Mann Bridge/Highway 1 redevelopment project is occurring faster than planned; and
· BC Rail — $55 million below budget mainly reflecting delays in Port Subdivision land acquisitions.
Significant capital projects (those with multi-year budgets totaling $50 million or more) are shown in Table A2.9. During 2009/10, $2.2 billion was invested in these larger enterprises that will provide long-term social and economic benefits for the province.
2010 Financial and Economic Review – July 2010
47
Chapter 2 – Financial Review
Table 2.9 Capital Expenditure Projects Greater Than $50 million (1)
| | Projected | | Total Costs | | Projected | | Total | | Project Financing | |
| | Completion | | to | | Costs to | | Capital | | Internal/ | | Federal | | Other | |
($ millions) | | Date | | Mar. 31, 2010 | | Complete | | Costs | | Debt | | Government | | Contributions | |
Taxpayer-supported | | | | | | | | | | | | | | | |
K—12 Schools | | | | | | | | | | | | | | | |
Revelstoke Elementary and Secondary | | Fall 2011 | | 4 | | 56 | | 60 | | 58 | | — | | 2 | |
Chilliwack Secondary | | Fall 2012 | | 1 | | 57 | | 58 | | 58 | | — | | — | |
Burnaby Central Secondary | | Spring 2012 | | 12 | | 52 | | 64 | | 64 | | — | | — | |
Centennial Secondary | | Fall 2014 | | — | | 62 | | 62 | | 62 | | — | | — | |
Alberni District Secondary | | Fall 2011 | | 4 | | 54 | | 58 | | 55 | | — | | 3 | |
Total K—12 schools | | | | 21 | | 281 | | 302 | | 297 | | — | | 5 | |
Post secondary facilities | | | | | | | | | | | | | | | |
University of British Columbia | | | | | | | | | | | | | | | |
– Pharmaceutical Sciences and Centre for Drug Research & Development | | Fall 2012 | | 9 | | 124 | | 133 | | 86 | | 3 | | 44 | |
Health facilities | | | | | | | | | | | | | | | |
Surrey Outpatient Facility | | | | | | | | | | | | | | | |
– Government direct cost | | Spring 2011 | | 14 | | 51 | | 65 | | 65 | | — | | — | |
– P3 contract | | Spring 2011 | | 121 | | 51 | | 172 | | 172 | | — | | — | |
Victoria Royal Jubilee Hospital – Patient Care Centre | | | | | | | | | | | | | | | |
– Government direct cost | | Spring 2013 | | 99 | | 51 | | 150 | | 23 | | — | | 127 | |
– P3 contract | | Winter 2011 | | 130 | | 69 | | 199 | | 199 | | — | | — | |
Fort St. John Hospital and Residential Care | | | | | | | | | | | | | | | |
– Government direct cost | | Spring 2012 | | 76 | | 189 | | 265 | | 169 | | — | | 96 | |
– P3 contract | | Spring 2012 | | — | | 33 | | 33 | | 33 | | — | | | |
Expansions to Kelowna General and | | | | | | | | | | | | | | | |
Vernon Jubilee Hospitals | | | | | | | | | | | | | | | |
– Government direct cost | | Fall 2012 | | 147 | | 128 | | 275 | | 26 | | — | | 249 | |
– P3 contract | | Fall 2012 | | 101 | | 57 | | 158 | | 158 | | — | | — | |
Northern Cancer Centre initiative (2) | | | | | | | | | | | | | | | |
– Government direct cost | | Winter 2012 | | 14 | | 77 | | 91 | | 88 | | — | | 3 | |
– P3 contract | | Winter 2012 | | 13 | | 2 | | 15 | | 15 | | — | | — | |
Surrey Emergency/Critical Care Tower (3) | | Summer 2013 | | 11 | | 514 | | 525 | | 505 | | — | | 20 | |
Interior Heart and Surgical Centre (4) | | Spring 2017 | | 3 | | 390 | | 393 | | 302 | | — | | 91 | |
Total health facilities | | | | 729 | | 1,612 | | 2,341 | | 1,755 | | — | | 586 | |
Transportation | | | | | | | | | | | | | | | |
Pitt River Bridge | | Fall 2009 | (5) | 199 | | 8 | | 207 | | 110 | | 90 | | 7 | |
Sea-to-Sky Highway | | | | | | | | | | | | | | | |
– Government direct cost | | Fall 2009 | (6) | 225 | | 11 | | 236 | | 234 | | — | | 2 | |
– P3 contract | | Fall 2009 | | 561 | | — | | 561 | | 561 | | — | | — | |
William R. Bennett Bridge | | | | | | | | | | | | | | | |
– P3 contract | | Fall 2008 | (5) | 188 | | — | | 188 | | 188 | | — | | — | |
South Fraser Perimeter Road | | Winter 2012 | | 493 | | 635 | | 1,128 | | 763 | | 365 | | — | |
Sierra Yoyo-Desan Road upgrade | | Fall 2012 | | 52 | | 135 | | 187 | | 187 | | — | | — | |
Total transportation | | | | 1,718 | | 789 | | 2,507 | | 2,043 | | 455 | | 9 | |
Other | | | | | | | | | | | | | | | |
Vancouver Convention Centre expansion project | | Summer 2009 | (6) | 826 | | 15 | | 841 | | 499 | | 222 | | 120 | |
BC Place rejuvenation (7) | | Summer 2011 | | 119 | | 444 | | 563 | | 563 | | — | | — | |
Integrated case management system | | Fall 2014 | | 43 | | 139 | | 182 | | 182 | | — | | — | |
Surrey Pretrial Service Centre expansion | | Fall 2013 | | 2 | | 128 | | 130 | | 130 | | — | | — | |
e-Health initiative (8) | | Spring 2013 | | 190 | | 72 | | 262 | | 138 | | 124 | | — | |
Total other | | | | 1,180 | | 798 | | 1,978 | | 1,512 | | 346 | | 120 | |
Total taxpayer-supported | | | | 3,657 | | 3,604 | | 7,261 | | 5,693 | | 804 | | 764 | |
2010 Financial and Economic Review – July 2010
48
Chapter 2 – Financial Review
Table 2.9 Capital Expenditure Projects Greater Than $50 million (1) (continued)
| | Projected | | Total Costs | | Projected | | Total | | Project Financing | |
| | Completion | | to | | Costs to | | Capital | | Internal/ | | Federal | | Other | |
($ millions) | | Date | | Mar. 31, 2010 | | Complete | | Costs | | Debt | | Government | | Contributions | |
Self-supported | | | | | | | | | | | | | | | |
Transportation | | | | | | | | | | | | | | | |
Port Mann Bridge / Highway 1 | | Winter 2013 | | 992 | | 2,327 | | 3,319 | | 3,319 | | — | | — | |
Power generation and transmission | | | | | | | | | | | | | | | |
BC Hydro | | | | | | | | | | | | | | | |
– Mica Dam — generator stator replacement | | Fall 2009 | (6) | 85 | | 4 | | 89 | | 89 | | — | | — | |
– Peace Canyon Dam — generator stator replacement and rotor modification | | Fall 2009 | (6) | 72 | | 2 | | 74 | | 74 | | — | | — | |
– Aberfeldie redevelopment | | Spring 2009 | (6) | 93 | | 2 | | 95 | | 95 | | — | | — | |
– GM Shrum G1—G4 stator replacement | | Fall 2010 | | 71 | | 11 | | 82 | | 82 | | — | | — | |
– Peace Canyon G1—G4 turbine overhaul | | Fall 2009 | (6) | 42 | | 3 | | 45 | | 45 | | — | | — | |
– Revelstoke Unit 5 generation (9) | | Fall 2010 | | 207 | | 73 | | 280 | | 280 | | — | | — | |
– Cheakamus spillway gate reliability upgrade | | Fall 2011 | | 36 | | 37 | | 73 | | 73 | | — | | — | |
– Mica Dam gas insulated switchgear replacement (9) | | Summer 2013 | | 27 | | 173 | | 200 | | 200 | | — | | — | |
– Fort Nelson generating station upgrade (9) | | Fall 2011 | | 29 | | 136 | | 165 | | 165 | | — | | — | |
– Ruskin Dam safety and powerhouse upgrade (10) | | TBD | | 34 | | TBD | | TBD | | TBD | | — | | — | |
– Vancouver Island transmission reinforcement (11) | | Winter 2008 | (6) | 303 | | 3 | | 306 | | 306 | | — | | — | |
– Interior to Lower Mainland transmission line (11) | | Fall 2014 | | 40 | | 559 | | 599 | | 599 | | — | | — | |
– Central Vancouver Island transmission line (11) | | Fall 2010 | | 26 | | 65 | | 91 | | 91 | | — | | — | |
– Vancouver City Central transmission (11) | | Spring 2012 | | 11 | | 190 | | 201 | | 201 | | — | | — | |
– Columbia Valley transmission (11) | | Fall 2012 | | 4 | | 141 | | 145 | | 145 | | — | | — | |
– Southern Interior series compensation (11) | | Fall 2014 | | 1 | | 60 | | 61 | | 61 | | — | | — | |
– Dawson Creek area reinforcement (11) | | Fall 2013 | | — | | 132 | | 132 | | 132 | | — | | — | |
– Seymour Arm series capacitor (11) | | Fall 2013 | | — | | 58 | | 58 | | 58 | | — | | — | |
– Northwest transmission line (11), (12) | | Winter 2012 | | — | | 404 | | 404 | | 274 | | 130 | | — | |
Total power generation and transmission | | | | 1,081 | | 2,053 | | 3,100 | | 2,970 | | 130 | | — | |
Total self-supported | | | | 2,073 | | 4,380 | | 6,419 | | 6,289 | | 130 | | — | |
Total $50 million projects | | | | 5,730 | | 7,984 | | 13,680 | | 11,982 | | 934 | | 764 | |
(1) | | Only projects that have been approved by Treasury Board and/or Crown corporation boards are included in this table. Ministry service plans may include projects that still require final approval. Capital costs reflect current government accounting policy. |
(2) | | Figures shown do not include an approved project reserve of $5 million. |
(3) | | Figures shown are based on preliminary Treasury Board approvals and do not include approved project reserve of $32 million. These amounts will change after P3 contracts are finalized. |
(4) | | Figures shown are based on preliminary Treasury Board approvals and do not include an approved project reserve of $55 million. These amounts will change after P3 contracts are finalized. |
(5) | | The Pitt River and William R. Bennett bridges are open for traffic. Decommissioning of the old bridges is forecast to be complete in Summer 2010. |
(6) | | Assets have been put into service and only trailing costs remain. |
(7) | | BC Place rejuvenation includes $458 million to install a retractable roof and $105 million to refurbish the facilities. |
(8) | | The e-Health initiative is comprised of 7 distinct projects. Figures shown reflect the total costs of the 7 Ministry of Health Services’ provincially co-ordinated e-Health projects. |
(9) | | Total costs and completion dates for these projects vary depending on the final scope. Information presented represents the highest cost estimates and latest completion dates. |
(10) | | Definition phase of the Ruskin Dam safety and powerhouse upgrade project was approved for $52 million. The total project cost and completion date are being developed. |
(11) | | Assets are owned by BC Hydro and managed by BC Transmission Corporation. In July 2010 these two corporations will be re-amalgamated. |
(12) | | In May 2010 AltaGas announced an electricity purchase agreement with BC Hydro for power from the Forrest Kerr project in northwest BC that will include a $180 million investment in the Northwest transmission line. |
2010 Financial and Economic Review – July 2010
49
Chapter 2 – Financial Review
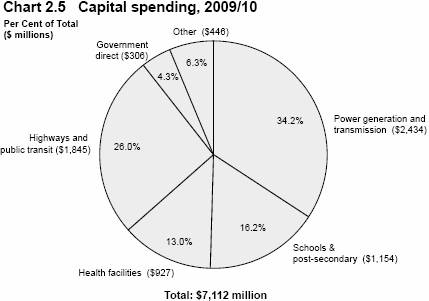
Provincial capital infrastructure spending is financed through a combination of sources:
· cash balances;
· partnerships with the private sector (public-private partnerships or P3s);
· cost-sharing with partners; and
· borrowing (debt financing).
Chart 2.6 shows that 45 per cent of 2009/10 taxpayer-supported capital spending was financed from direct borrowing, 29 per cent from cash balances and other working capital, 19 per cent from external capital contributions and 7 per cent from public-private partnerships.
Commercial Crown corporation capital spending of $3.4 billion was financed 71 per cent from direct borrowing ($2.4 billion), and 29 per cent from operating surpluses and cash balances ($981 million).
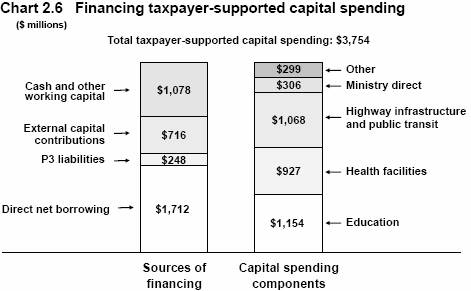
2010 Financial and Economic Review – July 2010
50
Chapter 2 – Financial Review
Provincial Debt
Provincial debt increased $3.9 billion to total $41.9 billion at March 31, 2010, or 22.3 per cent of provincial GDP (see Chart 2.7, Table 2.10 and Appendix Tables A2.11 and A2.12). Total debt was $447 million below budget reflecting improved government operating deficits, reduced requirements for capital spending, non-utilized forecast allowance, and partially offset by the increase in cash requirements for working capital and an increase in self-supported debt.
Total provincial debt was more than offset by investments in capital assets, which totaled $48.6 billion at March 31, 2010. Capital assets – such as schools, hospitals, roads, transportation, hydroelectric facilities, and other forms of provincial infrastructure – are crucial for the social and economic development of the province.
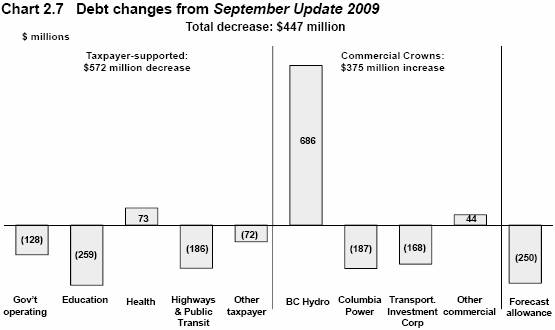
Taxpayer-supported Debt
Taxpayer-supported debt increased by $3.6 billion to total $30.0 billion at year-end. This was $572 million below budget, mainly reflecting:
· lower borrowing requirements for government’s consolidated revenue fund due to slightly improved operating results and offset by the cash requirements for working capital;
· reduced borrowing for education facilities due to lower than expected capital spending; and
· reduced borrowing for the BC Transportation Financing Authority mainly due to lower highway capital spending.
2010 Financial and Economic Review – July 2010
51
Chapter 2 – Financial Review

(1) Amount includes debt to finance deficits and borrowing allocated to provincial government general capital expenditures prior to fiscal 08/09 year-end
Th e taxpayer-supported debt to GDP ratio stood at 16.0 per cent, up 2.6 percentage points from 2008/09. This ratio is a measure often used by investors and credit rating agencies when analyzing a province’s ability to manage its debt load. British Columbia’s taxpayer-supported debt to gross domestic product ratio is one of the lowest in Canada, translating into a strong credit rating and lower debt service costs.

2010 Financial and Economic Review – July 2010
52
Chapter 2 – Financial Review
Table 2.10 Provincial Debt Summary (1)
| | September | | | | | |
| | Update | | Actual | | Actual | |
($ millions) | | 2009/10 | | 2009/10 | | 2008/09 | |
Taxpayer-supported debt | | | | | | | |
Provincial government direct operating (2) | | 7,487 | | 7,359 | | 5,744 | |
Other taxpayer-supported debt (mainly capital) | | | | | | | |
Education facilities (2), (3) | | 9,879 | | 9,620 | | 9,148 | |
Health facilities (2), (3) | | 4,316 | | 4,389 | | 3,936 | |
Highways and public transit (2) | | 7,688 | | 7,502 | | 6,831 | |
Other (4) | | 1,223 | | 1,151 | | 787 | |
Total other taxpayer-supported debt | | 23,106 | | 22,662 | | 20,702 | |
Total taxpayer-supported debt | | 30,593 | | 30,021 | | 26,446 | |
| | | | | | | |
Self-supported debt | | | | | | | |
Commercial Crown corporations and agencies | | 11,489 | | 11,864 | | 9,487 | |
Warehouse borrowing program | | — | | — | | 2,081 | |
Total self-supported debt | | 11,489 | | 11,864 | | 11,568 | |
Forecast allowance | | 250 | | — | | — | |
Total provincial debt | | 42,332 | | 41,885 | | 38,014 | |
(1) | | Debt is after deduction of sinking funds and unamortized discounts, and excludes accrued interest. Government direct and fiscal agency accrued interest is reported in the government’s accounts as an accounts payable. |
(2) | | In 2009/10, sinking funds for government debt related to schools, post-secondary education, health care and public transit were liquidated and the proceeds ($763 million) used to offset direct operating borrowing requirements. Figures for prior year have been restated to reflect this decision. |
(3) | | Includes debt and guarantees incurred by the government on behalf of school districts, universities, colleges and health authorities/hospital societies (SUCH), as well as debt directly incurred by these entities. |
(4) | | Includes debt of other taxpayer-supported Crown corporations and agencies and fiscal agency loans to local governments. Also includes student loan guarantees, loan guarantees to agricultural producers, guarantees under economic development and home mortgage assistance programs, and loan guarantee provisions. |
Self-supported Debt
Self-supported debt totaled $11.9 billion at March 31, 2010 (6.3 per cent of GDP). Debt at year-end was up $296 million from the previous year primarily due to increased spending on power generation and transmission infrastructure projects; the Port Mann Bridge/Highway 1 project being ahead of schedule; BC Lottery Corporation requirements for providing casino cash floats and the planned replacement of slot machines; and the utilization of advanced borrowing for the Warehouse Borrowing Program.
2010 Financial and Economic Review – July 2010
53
Chapter 2 – Financial Review
Debt Indicators
Table 2.11 provides a historical summary of financial indicators depicting the province’s debt position, recent borrowing trends and related interest cost burden.
Table 2.11 Key Debt Indicators – 2005/06 to 2009/10 (1)
| | | | | | | | | | Budget | | Actual | |
| | 2005/06 | | 2006/07 | | 2007/08 | | 2008/09 | | 2009/10 | | 2009/10 | |
Debt to revenue (per cent) | | | | | | | | | | | | | |
Total provincial | | 74.8 | | 69.1 | | 69.3 | | 78.0 | | 87.3 | | 87.8 | |
Taxpayer-supported | | 77.9 | | 69.8 | | 69.6 | | 72.0 | | 84.6 | | 83.8 | |
Debt per capita ($) (2) | | | | | | | | | | | | | |
Total provincial | | 8,210 | | 7,880 | | 8,038 | | 8,671 | | 9,515 | | 9,401 | |
Taxpayer-supported | | 6,493 | | 6,119 | | 6,170 | | 6,033 | | 6,876 | | 6,738 | |
Debt to GDP (per cent) (3) | | | | | | | | | | | | | |
Total provincial | | 20.3 | | 18.3 | | 18.1 | | 19.2 | | 22.4 | | 22.3 | |
Taxpayer-supported | | 16.1 | | 14.2 | | 13.9 | | 13.4 | | 16.2 | | 16.0 | |
Interest bite (cents per dollar of revenue) (4) | | | | | | | | | | | | | |
Total provincial | | 4.4 | | 4.3 | | 4.0 | | 4.4 | | 4.4 | | 4.4 | |
Taxpayer-supported | | 4.4 | | 4.2 | | 3.9 | | 4.3 | | 4.4 | | 4.2 | |
Interest costs ($ millions) | | | | | | | | | | | | | |
Total provincial | | 2,012 | | 2,074 | | 2,012 | | 2,141 | | 2,144 | | 2,098 | |
Taxpayer-supported | | 1,547 | | 1,575 | | 1,490 | | 1,573 | | 1,584 | | 1,504 | |
Interest rate (per cent) (5) | | | | | | | | | | | | | |
Taxpayer-supported | | 5.5 | | 5.9 | | 5.7 | | 5.9 | | 5.6 | | 5.3 | |
Background Information: | | | | | | | | | | | | | |
Revenue ($ millions) | | | | | | | | | | | | | |
Total provincial (6) | | 46,067 | | 48,360 | | 49,974 | | 48,765 | | 48,497 | | 47,721 | |
Taxpayer-supported (7) | | 34,998 | | 37,222 | | 38,226 | | 36,745 | | 36,161 | | 35,809 | |
Total debt ($ millions) | | | | | | | | | | | | | |
Total provincial | | 34,457 | | 33,439 | | 34,637 | | 38,014 | | 42,332 | | 41,885 | |
Taxpayer-supported (8) | | 27,251 | | 25,968 | | 26,589 | | 26,446 | | 30,593 | | 30,021 | |
Provincial GDP ($ millions) (9) | | 169,664 | | 182,310 | | 191,598 | | 197,931 | | 189,163 | | 187,963 | |
Population (thousands at July 1) (10) | | 4,197 | | 4,244 | | 4,309 | | 4,384 | | 4,449 | | 4,455 | |
(1) | | Figures for prior years and the 2009/10 budget have been restated to conform with the presentation used for 2010 and to include the effects of changes in underlying data and statistics. |
(2) | | The ratio of debt to population (e.g. debt at March 31, 2010 divided by population at July 1, 2009). |
(3) | | The ratio of debt outstanding at fiscal year end to provincial nominal gross domestic product (GDP) for the calendar year ending in the fiscal year (e.g. debt at March 31, 2009 divided by 2008 GDP). |
(4) | | The ratio of interest costs (less sinking fund interest) to revenue. Figures include capitalized interest expense in order to provide a more comparable measure to outstanding debt. |
(5) | | Weighted average of all outstanding debt issues. |
(6) | | Includes revenue of the consolidated revenue fund (excluding dividends from enterprises) plus revenue of all government organizations and enterprises. |
(7) | | Excludes revenue of government enterprises, but includes dividends from enterprises paid to the consolidated revenue fund. |
(8) | | Excludes debt of commercial Crown corporations and agencies and funds held under the province’s warehouse borrowing program. |
(9) | | Nominal GDP for the calendar year ending in the fiscal year (e.g. GDP for 2008 is used for the fiscal year ended March 31, 2009). As nominal GDP for the calendar year ending in 2009 is not available, the 2009 GDP projected in the March 2, 2010 budget has been used for the fiscal year ended March 31, 2010 for demonstration purposes. |
(10) | | Population at July 1st within the fiscal year (e.g. population at July 1, 2009 is used for the fiscal year ended March 31, 2010). |
2010 Financial and Economic Review – July 2010
54
Chapter 2 – Financial Review
Credit Rating
A credit rating is an evaluation of a borrower’s ability to pay interest and to repay principal. A credit rating affects the borrower’s debt servicing costs and the investor’s rate of return since an investor will demand a higher interest rate on a higher-risk, lower-rated security. Table 2.12 provides an interprovincial comparison of credit ratings.
BC’s fiscal outlook and its record for meeting annual budget targets has resulted in ratings of Aaa and AAA (the highest possible ratings) from Moodys and Standard & Poors respectively, while Dominion Bond Rating Service rates the province at AA (high).
Table 2.12 Interprovincial Comparison of Credit Ratings, July 2010
| | Rating Agency(1) | |
| | Moody’s Investors | | | | Dominion Bond | |
Province | | Service | | Standard & Poor’s | | Rating Service | |
British Columbia | | Aaa | | AAA | | AA (High) | |
Alberta | | Aaa | | AAA | | AAA | |
Saskatchewan | | Aa1 | | AA+ | | AA | |
Manitoba | | Aa1 | | AA | | A (High) | |
Ontario | | Aa1 | | AA- | | AA (Low) | |
Quebec | | Aa2 | | A+ | | A (High) | |
New Brunswick | | Aa2 | | AA- | | A (High) | |
Nova Scotia | | Aa2 | | A+ | | A | |
Prince Edward Island | | Aa2 | | A | | A (Low) | |
Newfoundland | | Aa2 | | A | | A | |
(1) | | The rating agencies assign letter ratings to borrowers. The major categories, in descending order of credit quality are: AAA/Aaa; AA/Aa; A; BBB/Baa; BB/Ba; and B. The “1”, “2”, “3”, “high”, “low”, “+”, and “-” modifiers show relative standing within the major categories. For example, AA+ exceeds AA and Aa2 exceeds Aa3. |
Statement of Financial Position
The provincial government’s statement of financial position (often referred to as the balance sheet) summarizes the consolidated assets and liabilities of central government, Crown corporations and agencies, and the SUCH sector. In accordance with generally accepted accounting principles, the government’s financial position is presented on a net liabilities basis(1) (see Table 2.13) .
Net liabilities represent the difference between government’s financial assets and its financial liabilities, and is the most comprehensive measure of government indebtedness and the future revenues required to pay for past transactions and events.
As a result of government operations and capital spending during 2009/10, the province’s financial assets remained the same and liabilities increased by $3.2 billion, resulting in an increase in net liabilities of $3.2 billion. This reflected a $1.9 billion increase in non-financial assets, mainly due to capital outlays, and a $1.3 billion decrease to the accumulated surplus.
(1) | | Other jurisdictions refer to this as the “net debt” basis. In British Columbia, the term “net liabilities” is used to avoid confusion with provincial borrowing in financial markets, which is referred to as “debt”. |
2010 Financial and Economic Review – July 2010
55
Chapter 2 – Financial Review
Table 2.13 Net Liabilities and Accumulated Surplus
| | 2009/10 | | | | | |
| | September | | | | Actual | | Annual | |
($ millions) | | Update | | Actual | | 2008/09 (1) | | Change (2) | |
Financial assets | | 30,262 | | 31,675 | | 31,678 | | (3 | ) |
Less : liabilities | | (60,445 | ) | (59,712 | ) | (56,541 | ) | (3,171 | ) |
Net assets (liabilities) | | (30,183 | ) | (28,037 | ) | (24,863 | ) | (3,174 | ) |
Non-financial assets | | 34,327 | | 33,309 | | 31,435 | | 1,874 | |
Accumulated surplus | | 4,144 | | 5,272 | | 6,572 | | (1,300 | ) |
(1) Comparative figures have been restated to reflect government accounting policies in effect at March 31, 2010.
(2) Change between 2009/10 actual and 2008/09 actual. Change in accumulated surplus includes other comprehensive income of $479 million in 2009/10, which is not included in the statement of operations.
The change in financial assets included:
· a $4.4 billion decrease in cash balances and warehouse program investments; partially offset by
· a $3.8 billion increase in commercial Crown corporation investments, reflecting an increase in retained earnings and capital investments, and a $0.6 billion increase in receivable and miscellaneous investments.
The change in liabilities included:
· a $3.0 billion increase in debt, resulting from capital spending and requirements for direct operating, partially offset by a $0.4 billion decrease in current liabilities; and
· a $0.6 billion increase in deferred revenue reflecting $456 million in contributions received from third parties (mainly federal government transfers for highway projects and post secondary infrastructure) and a $110 million increase in other deferred revenues (mainly bonus bid receipts).
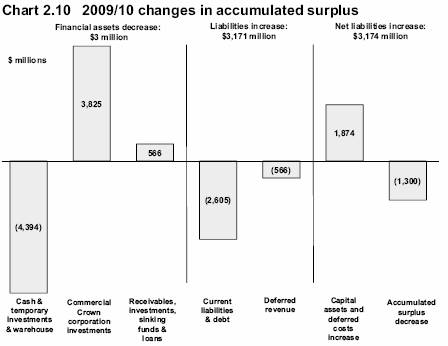
2010 Financial and Economic Review – July 2010
56
Chapter 2 – Financial Review
The change in non-financial assets included an increase of $1.7 billion (net of amortization) in tangible capital assets resulting from investments in healthcare and post-secondary facilities, and improvements to highway infrastructure, plus a $0.2 billion increase in deferred costs.
Further information on the statement of financial position and annual changes can be found in Appendix Tables A2.3 and 2.4. A topic box on the trends over the last ten years for key indicators of the province’s financial condition is included at the end of this chapter.
Unfunded Pension Liabilities
The province contributes to four defined benefit pension plans (Public Service, Municipal, Teachers’ and College) for many of its employees. These pension plans are managed under joint trusteeship arrangements with the plan members. Under joint trusteeship, the provincial government has no formal claim on plan surpluses or assets. As a result, government’s balance sheet only includes liabilities for the MLA pensions, which are not part of a joint trusteeship arrangement, and the government’s share of any unfunded pension liabilities incurred by the four pension plans under the joint trusteeship arrangements (e.g. $50 million under the Teachers’ Pension Plan in 2009/10).
In the event that a plan is determined to be in a deficit position, the pension boards, by agreement, are required to address the deficit through contribution adjustments or other measures. As a result, it is expected that any unfunded pension liability in the future would be short-term in nature. No unfunded liability exists for the future indexing of pensions, as the obligation is limited to the amount of available assets in separate inflation accounts.
The estimated financial positions of each plan (based on extrapolations of the most recent actuarial valuations) as at March 31, 2010 are shown in Table 2.14.
Table 2.14 Pension Plan Balances
| | Pension Plan | | Total | | | |
($ millions) | | Public Service | | Municipal (1) | | Teachers’ (2) | | College | | Other (3) | | 2009/10 | | 2008/09 | |
Accrued benefit obligation | | (13,504 | ) | (15,335 | ) | (15,076 | ) | (2,194 | ) | (451 | ) | (46,560 | ) | (43,331 | ) |
Pension fund assets | | 14,745 | | 15,788 | | 13,692 | | 2,253 | | 443 | | 46,921 | | 43,516 | |
Subtotal | | 1,241 | | 453 | | (1,384 | ) | 59 | | (8 | ) | 361 | | 185 | |
Unamortized actuarial (gain) loss | | 772 | | 894 | | 1,284 | | 297 | | 13 | | 3,260 | | 3,600 | |
Accrued net asset (obligation) | | 2,013 | | 1,347 | | (100 | ) | 356 | | 5 | | 3,621 | | 3,785 | |
(1) The balance shown for the Municipal Pension Plan (MPP) is based on an extrapolation of the December 31, 2006 actuarial valuation. The MPP recently underwent an actuarial valuation that was not completed in time for the Public Accounts. The assessment shows the plan to be in deficit, but the amount of the deficit has yet to be finalized. Government will be making the necessary adjustments to unfunded pension liability in its financial statements once the final amount is known.
(2) The government is responsible for 50 per cent of the unfunded pension liability incurred under the Teachers’ Pension Plan and has accrued this liability in its 2009/10 accounts. The liability will be settled in future periods through increased employer contributions.
(3) Represents other defined benefit plans, outside of the four main pension plans, which are funded by entities within the government reporting entity. Includes the Retirement Plan for Non-Teaching Employees of the Board of School Trustees of School District No. 43 (Coquitlam), the University of Victoria’s pension plan for employees other than faculty and professional staff, and Simon Fraser University’s Academic Pension Plan and Administrative/Union Pension Plan.
2010 Financial and Economic Review – July 2010
57
Chapter 2 – Financial Review
Actuarial valuations are performed on the pension plans normally every three years. The pension plans and the dates of their last actuarial valuation are:
· Public Service Pension Plan, March 31, 2008;
· Municipal Pension Plan, December 31, 2006(2);
· Teachers’ Pension Plan, December 31, 2008; and
· College Pension Plan, August 31, 2006.
Key actuarial assumptions, which are generally conservative, used in the valuations are:
· Public Service Pension Plan — long-term annual rate of return on fund assets (ARR) 6.50 per cent, long-term annual salary increase (ASI) 3.75 per cent;
· Municipal Pension Plan — ARR 6.75 per cent, ASI 4.00 per cent;
· Teachers’ Pension Plan — ARR 6.50 per cent, ASI 3.75 per cent;
and
· College Pension Plan — ARR 6.75 per cent, ASI 4.00 per cent.
The pension plans are administered by the BC Pension Corporation. The audited financial statements of each pension plan, along with full descriptions, benefit formulas, inflation assumptions and funding polices may be found on the corporation’s website at www.pensionsbc.ca.
(2) This is the date of the most recently published actuarial valuation. A more recent valuation of this plan was done in December 2009 as per the normal cycle; however the results of that valuation have not been finalized.
2010 Financial and Economic Review – July 2010
58
Chapter 2 – Financial Review
Review of the Province’s Financial Condition
Introduction
There are several indicators of government financial condition that are grouped into three broad categories:
· Sustainability — the degree to which government is able to maintain existing programs and meet existing creditor requirements without increasing the debt burden on the economy. The indicators in this group include the net liabilities to gross domestic product (GDP) ratio, non-financial assets to net liabilities, and net liabilities per capita.
· Flexibility — the degree to which a government has positioned itself to be able to respond to rising commitments by creating fiscal room and maintaining infrastructure. The indicators in this group are public debt charges as a percent of revenue, annual growth in capital assets, the own source revenue (i.e. excluding federal transfers) to GDP ratio, and the expenditure to GDP ratio.
· Vulnerability — the degree to which a government is dependent on sources of funding, or vulnerable to costs, outside its control or influence. The indicators in this group are federal government transfers as a per cent of revenue and unhedged foreign currency debt as a per cent of overall debt.
Sustainability
Net liabilities to GDP(1) is similar to the familiar debt to GDP ratio. Net liabilities is a more comprehensive indicator of overall indebtedness as it reflects the fact that government has financial liabilities not included in the debt figures, and also has financial assets available to offset its financial liabilities. An increasing ratio indicates government’s current level of operations and capital investment may not be sustainable in the long term.

Chart 1 shows that the net liabilities to GDP ratio was 14.9 per cent in 2009/10 — an increase of 2.3 per cent from the previous year, but 5.1 per cent lower than the peak of 20.0 per cent in 2002/03. The increase is primarily due to higher levels of taxpayer-supported debt, including an increase in direct operating debt.
Capital/non-financial assets relative to net liabilities indicates the proportion of government’s net liabilities that were used to acquire capital assets. Ratios less than one-to-one indicate that government indebtedness includes the financing of historical and ongoing operations as well as capital assets. Ratios greater than one indicate that government’s revenues have more than paid for all operating costs, resulting in an accumulated surplus that has financed a portion of its capital asset acquisitions.

(1) The CICA, and other jurisdictions, refer to this measure as net debt to GDP. In BC, the term “net debt” has been applied to borrowing from financial markets.
2010 Financial and Economic Review – July 2010
59
Chapter 2 – Financial Review
By 2007/08, all of government’s operations and 31 per cent of its capital assets were funded from revenue rather than debt, an improvement from the low in 2003/04 where all capital and 20 per cent of operating costs were debt financed (see Chart 2). However, the last two years have seen a gradual decline in this indicator to the point where revenue funded only 19 per cent of capital. This reflects the government’s stimulus measures that maintained capital spending in the face of declining revenue and an operating deficit in 2009/10.
Net liabilities per capita provides context to the amount of government’s net indebtedness by relating it to the number of people served by the programs for which the government incurred the debt. Constant increases to net liabilities per capita indicates that government is spending beyond the capacity of its population base to fund program costs through taxation or other forms of user pay revenue.

Beginning in 2004/05, when government turned the deficit corner, net liabilities per capita decreased significantly to a point where in 2007/08 they were 8.7 per cent lower than in 2000/01 (see Chart 3). The upturn in the last two years primarily reflects government’s accelerated capital plan and the decline in operating results, especially the deficit in 2009/10.
Overall, in the early years of this century, government indebtedness was high in relation to the size of the economy; government program spending resulted in an increasing debt burden as is demonstrated by the growth in net liabilities per capita.
Beginning in 2004/05, a combination of robust economic growth and a decrease in government net liabilities, primarily in the area of operating debt, resulted in a period of steadily improving sustainability. By 2006/07, government debt reached its lowest point in eight years; and by 2007/08, almost one-third of government’s capital assets had been financed from revenue rather than debt.
Over the last two years, the impact of the financial crisis has weakened fiscal sustainability, which reflects government’s use of debt to finance a higher portion of its capital spending as well as, in 2009/10, some of its operations. As a result, the debt burden on the population increased by 11 per cent in 2009/10. Nonetheless, the net liabilities to GDP ratio remains low relative to the beginning of the decade and capital assets still exceed net liabilities, indicating that there is no immediate pressure on the sustainability of government programs.
Flexibility
Taxpayer-supported debt charges as a per cent of revenue is an indicator of how much of a “bite” debt interest costs take out of provincial government revenue. Having to use a significant portion of revenue for interest payments limits government’s spending on program delivery.

2010 Financial and Economic Review – July 2010
60
Chapter 2 – Financial Review
As is seen in Chart 4 the proportion of revenue used to pay taxpayer-supported interest costs has remained fairly constant during the 2004/05 to 2009/10 period, reflecting a combination of increasing revenue and debt refinancing at lower interest rates. The current interest “bite” is 37 per cent less than what it was nine years ago in 2000/01.
The annual growth in capital assets is an indicator of whether the provincial government is maintaining its infrastructure, a large portion of which supports program delivery and economic growth (e.g. education and health care facilities, highways and bridges).
Sustained low growth in the face of increasing demand for services builds up a capital deficit, which must be addressed if government is to maintain service levels and provide a foundation for economic growth.

Chart 5 reflects the impact of government initiatives such as the transportation investment plan and increasing capacity in healthcare facilities and post secondary institutes. BC’s population has increased by an average of 1.1 per cent annually over the last nine years. Except for 2003/04, capital accumulation has exceeded population growth, reflecting newer assets and a greater capacity to provide services to British Columbians. The slight decline in the trend over the last three years reflects the broader asset base resulting from the capital program, as capital spending has remained relatively constant during this period.
Own source revenue to GDP is a measure of the provincial government’s taxation, fees and other revenue generating activities relative to the economy. A lower percentage indicates government’s capacity in a stable economic environment to raise additional revenue to fund programs and services.
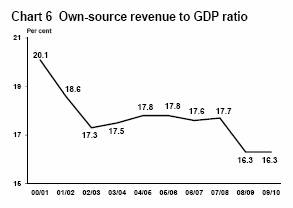
The own source revenue to GDP ratio was relatively constant between 2003/04 and 2007/08, with the impact of economic strength on government revenues during this period being partially offset by significant tax reductions (see Chart 6). The ratio’s drop in 2008/09 reflected the impact of the global economic downturn, as own source revenue declined 4.5 per cent year over year, mainly due to significant weakening in taxation revenue. While own source revenue declined a further 5.3 per cent in 2009/10, the ratio remained constant reflecting a 5.0 per cent decline in GDP.
The expenditure to GDP ratio is a measure of the size of government activity relative to the size of the economy. In 2001/02,
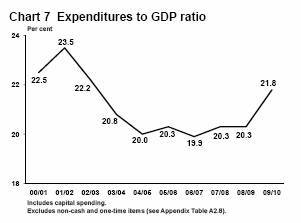
2010 Financial and Economic Review – July 2010
61
Chapter 2 – Financial Review
government expenditures as a proportion of the economy were relatively high. By 2006/07, the expenditure to GDP ratio had declined 3.6 per cent (see Chart 7), reflecting government measures to constrain spending outside of health and education programs, and to reduce interest costs. Only two-thirds of the increase in 2009/10 is due to higher government expenditure, with the remainder of the increase due to the decline in GDP.
Over the last decade, the reduction of debt charges as a percentage of revenue, the stability of own-source revenue in relation to the economy, and the lower expenditure to GDP ratio provided government with the flexibility to respond to the global economic downturn. This enabled government to implement a series of tax reductions and maintain spending, including last year’s stimulus measures, without increasing the debt burden on a declining revenue stream.
In the near term, government’s flexibility is limited by the reduction to own-source revenue caused by the global economic downturn and the increasing presence of government spending in the economy. However, as the economy recovers, these factors should improve.
Vulnerability
The provincial government receives transfers from the federal government in support of social programs. In recent years, transfers for health, childcare and infrastructure programs have increased.
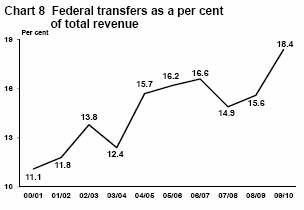
Federal transfers as a percentage of total government revenue increased in 2008/09 (see Chart 8), re-establishing the upward trend in this indicator despite the end of equalization payments to the province after 2006/07. The overall growth since 2000/01 reflects both pressure on the federal government from provinces to help fund healthcare, education, and transportation infrastructure, as well as the devolution of the delivery federal programs such as immigration and labour market development to the provinces.
While the end of equalization revenues has reduced the province’s exposure to a volatile revenue source, and federal commitments to health and social transfer programs are considered stable, the continued availability of federal funding may nevertheless have an increasing influence on provincial government spending initiatives — especially if the federal funding carries a requirement for the province to provide matching funds.
The provincial government’s debt includes debt borrowed in foreign currencies. In order to protect itself from the impact of foreign exchange rate fluctuations on interest costs for this debt, the government uses financial derivative instruments such as currency swaps and forward contracts as a “hedge” around these risks.

Not all foreign currency debt is protected in this manner. Some commercial Crown corporations with significant revenue derived from US sources, such as BC Hydro, have a
2010 Financial and Economic Review – July 2010
62
Chapter 2 – Financial Review
natural hedge for their $US denominated debt resulting from their operations. Chart 9 shows that the government’s exposure to foreign exchange rate fluctuations dropped significantly in 2002/03 and in 2005/06, and is now relatively low in relation to its position in 2000/01.
Summary
No single indicator, or subset of indicators, gives a complete financial picture of government; rather, they should be reviewed holistically. Between 2001/02 and 2007/08, the provincial government has improved its financial sustainability and its flexibility to react to future demands for its services. While this is in part due to strong economic growth in the middle of the decade, it also reflects the changes in spending policy and legislated financial management targets, set out in the Balanced Budget and Ministerial Accountability Act, and the introduction of three year fiscal plans.
The improvement has made possible significant increases in government spending, especially on healthcare and education, which have grown 47 and 44 per cent, respectively, since 2001/02(2), in part supported by increased federal health and social transfer payments.
Signs of strain in 2008/09 resulting from the global economic downturn is shown by a decline in the own source revenue to GDP ratio (reflecting a year over year decrease in revenue), and the increase in net indebtedness relative to the economy as the province’s expanded capital program continues. These trends continued into 2009/10 as the economy declined, clearly weakened by recession.
The correlation between own source revenue and nominal GDP shows the impact of external forces on government’s fiscal situation, as the impact of the global economic situation on personal finances, export markets and commodity prices affects taxation and natural resource revenues.
Despite the increase in net indebtedness relative to the economy and declining revenue, the government has been able to keep proportion of revenue used for interest costs low. Government has also maintained its capital spending program, which served as a stimulus measure during the economic downturn and provides for future economic growth.
While the economic downturn has impacted government’s fiscal situation, it still remains relatively sound. With net liabilities to GDP at 15 per cent and own source revenue and expenditures to GDP below 2001/02 levels, government has retained fiscal flexibility to meet future challenges.
(2) Further details on trends in provincial government revenue, expense, and financial position are provided in Appendix 2.
2010 Financial and Economic Review – July 2010
63
| Appendix 2 |
| |
| Financial Review |
2010 Financial and Economic Review — July 2010
Appendix 2 – Financial Review
Government’s Financial Statements
Government Reporting Entity
The provincial government conducts its activities through:
· ministries;
· service delivery agencies;
· the SUCH sector (school districts; universities; colleges, university colleges and institutes; and health authorities and hospital societies); and
· commercial Crown corporations.
The accounts relating to the ministries and other direct activities of government are contained in the Consolidated Revenue Fund (CRF), whose financial results are reported as a separate entity in the Public Accounts. The CRF comprises all money over which the legislature has direct power of appropriation. The operations of service delivery agencies, the SUCH sector entities and commercial Crown corporations are recorded in their own financial statements, which are subject to audit by the Auditor General or by private sector auditors.
The relationship between the Legislature and government’s service delivery agencies, including the SUCH sector, and commercial Crown corporations is guided by either legislation or governance agreements between the boards of directors and their responsible ministers. In general, government is moving towards adopting governance agreements as its primary guide for these relationships.
According to generally accepted accounting principles (GAAP) for senior governments as established by the Public Sector Accounting Board (PSAB) of the Canadian Institute of Chartered Accountants, the province’s financial reporting consolidates the financial results of all these entities into a single set of financial statements. The provincial government publishes its financial statements annually in the Public Accounts.
Compliance with GAAP
British Columbia’s Budget Transparency and Accountability Act (BTAA) requires all financial documents produced by the province under that legislation to fully comply with GAAP. Compliance with this requirement began with the February 2004 budget and was completed in the 2004/05 Public Accounts.
Under GAAP, the CRF must be converted from a net basis to provide gross revenues and expenses. Next, service delivery agencies are consolidated with the CRF on a line-by-line basis for both the income statement and balance sheet. Commercial Crown corporations(1) are disclosed on a modified equity basis — i.e. their net income is reported as revenue and their retained earnings as an investment.
Where the accounting policies of service delivery agencies differ from those used by the central government in preparing its own consolidated revenue fund financial statements, the service delivery agency financial statements are adjusted to conform to government’s accounting policies.
(1) Crown corporations are considered commercial if the majority of their operating revenue comes from non-government sources, and their operating revenue is sufficient to cover operating and debt service costs without the need for government grants or other forms of assistance. Otherwise they are included with the service delivery agencies.
2010 Financial and Economic Review – July 2010
66
Appendix 2 – Financial Review
The full text of government’s significant accounting policies can be found in Note 1 to the Consolidated Summary Financial Statements in the 2009/10 Public Accounts.
British Columbia is a leader in complying with GAAP and is recognized for the transparency of its budget and financial reports. However, recent pronouncements by PSAB, including its broad acceptance of International Financial Reporting Standards (IFRS) as GAAP for commercial Crown corporations, have given British Columbia’s government pause due to unresolved issues with IFRS – especially in the area of regulatory accounting.
As a result, the government of British Columbia recently passed legislation that authorizes Treasury Board to adopt different standards than those promoted by PSAB in order to ensure that British Columbia’s financial reporting reflects the policy framework within which the Crown corporations and agencies operate. Any alternate standard adopted by Treasury Board must come from other areas of Canadian GAAP, or from a widely-accepted accredited accounting standard setting body in another jurisdiction (e.g. the US Financial Accounting Standards Board).
2009/10 Public Accounts Audit Reservations
The Auditor General had two areas of reservation related to the resource sector: a recommendation to report oil and natural gas producer royalty credits on the gross basis as an increase to revenue and expense, and a recommendation to accrue deep well royalty credits as a liability before royalty revenues are accrued.
As well, the Auditor General disagreed with the treatment of the Transportation Investment Corporation as a commercial Crown corporation (government business enterprise), and recommended that it be fully consolidated into the financial statements instead of being reported on a modified equity basis.
These reservations would have added $444 million to revenue and $517 million to expense, primarily due to the impact of the royalty and deep well credits, with an overall net increase of $73 million to the 2009/10 deficit. Full consolidation of the Transportation Investment Corporation would have added $948 million to tangible capital assets and net liabilities with no impact on the bottom line. However, $544 million in debt would have been reclassified from self-supported to taxpayer-supported.
The Public Accounts are prepared on the basis of GAAP established by the Public Sector Accounting Board and are consistent with the treatment of other senior governments in Canada who have similar programs or transactions. These areas where professional judgment differs have been fully explored through consultation within government, with other jurisdictions, and with the broader accounting profession.
The government will continue to work with the professional accounting community and the Office of the Auditor General in conjunction to further explore the application of Canadian public sector accounting guidance in these areas. The full text of the Auditor General’s opinion and the comments of the Comptroller General of British Columbia can be found in the 2009/10 Public Accounts.
2010 Financial and Economic Review – July 2010
67
Appendix 2 – Financial Review
Supplementary Schedules
The following tables provide multi-year financial information on the government of British Columbia including operating results and financial position, as well as details on revenue, expense, debt and capital spending.
Table A2.1 2009/10 Forecasts — Year in Review
| | Q2 | | Q3 | | Q4 | | Total | |
($ millions) | | Updates | | Updates | | Updates | | Changes | |
2009/10 deficit – September Update 2009 (September 1, 2009) | | (2,775 | ) | | | | | (2,775 | ) |
2009/10 deficit – second Quarterly Report (November 27, 2009) | | | | (2,775 | ) | | | | |
2009/10 deficit – third Quarterly Report (March 2, 2010) | | | | | | (2,775 | ) | | |
Revenue increases (decreases): | | | | | | | | | |
Personal income tax – prior-year adjustment | | (121 | ) | 49 | | 12 | | (60 | ) |
Personal income tax – base | | (84 | ) | (9 | ) | 1 | | (92 | ) |
Corporate income tax – prior-year adjustment | | (75 | ) | (1 | ) | — | | (76 | ) |
Corporate income tax – mainly federal government instalments | | 34 | | (36 | ) | (14 | ) | (16 | ) |
Social service tax | | (80 | ) | (10 | ) | 8 | | (82 | ) |
Property transfer tax | | 95 | | 75 | | 32 | | 202 | |
Other taxes | | (11 | ) | (20 | ) | 40 | | 9 | |
Forests | | (73 | ) | 31 | | 42 | | — | |
Natural gas royalties | | (113 | ) | 55 | | (57 | ) | (115 | ) |
Sales and leases of Crown land tenures | | 73 | | — | | (74 | ) | (1 | ) |
Coal, metals and minerals | | 80 | | 33 | | 16 | | 129 | |
Other energy sources | | 18 | | 3 | | 7 | | 28 | |
Other natural resources | | 13 | | 8 | | 7 | | 28 | |
HST transition payment | | — | | (500 | ) | — | | (500 | ) |
Other federal government contributions | | 43 | | 41 | | 83 | | 167 | |
All other taxpayer supported sources | | (6 | ) | (26 | ) | 196 | | 164 | |
Commercial Crown agencies operating results: | | | | | | | | | |
BC Hydro – mainly changes in electricity trade income, lower energy costs and accounting adjustments | | (60 | ) | (37 | ) | 92 | | (5 | ) |
ICBC – mainly higher investment income and lower claims costs | | 31 | | 82 | | 81 | | 194 | |
BC Lotteries – mainly impact of lower discretionary consumer spending | | — | | (39 | ) | (12 | ) | (51 | ) |
Liquor Distribution Branch – mainly consumer shift to lower priced products | | — | | (24 | ) | 5 | | (19 | ) |
Other commercial Crown agencies changes | | 4 | | (1 | ) | 6 | | 9 | |
Total revenue changes | | (232 | ) | (326 | ) | 471 | | (87 | ) |
Less: expense increases (decreases): | | | | | | | | | |
Consolidated Revenue Fund changes:(1) | | | | | | | | | |
Ministry operating savings | | — | | (178 | ) | (191 | ) | (369 | ) |
Lower estimates for Free Crown Grants | | (10 | ) | (104 | ) | (8 | ) | (122 | ) |
Statutory spending – mainly Crown Proceeding Act settlements | | — | | — | | 112 | | 112 | |
Self-insurance claims, employee benefits and other liability adjustments | | (15 | ) | (59 | ) | (154 | ) | (228 | ) |
Unallocated Contingencies and New Programs vote | | — | | (44 | ) | (96 | ) | (140 | ) |
Lower MOPD interest costs – mainly due to reduced direct operating debt levels | | (3 | ) | — | | (42 | ) | (45 | ) |
Spending funded by third party recoveries | | — | | 52 | | 103 | | 155 | |
(Increase) decrease in operating transfers to service delivery agencies(1) | | (154 | ) | 15 | | (133 | ) | (272 | ) |
Changes in spending profile of service delivery agencies: | | | | | | | | | |
School districts – higher staffing and operating costs | | 103 | | (34 | ) | (14 | ) | 55 | |
Post secondary institutions – mainly lower operating costs | | (23 | ) | 18 | | (11 | ) | (16 | ) |
Health authorities/hospital societies – primarily physician and lab costs | | (17 | ) | 60 | | 22 | | 65 | |
Other service delivery agencies | | 12 | | (52 | ) | 12 | | (28 | ) |
Total expense changes | | (107 | ) | (326 | ) | (400 | ) | (833 | ) |
Forecast allowance changes | | (125 | ) | — | | (125 | ) | (250 | ) |
Net change | | — | | — | | 996 | | 996 | |
2009/10 deficit – second Quarterly Report | | (2,775 | ) | | | | | | |
2009/10 deficit – third Quarterly Report | | | | (2,775 | ) | | | | |
2009/10 deficit – Public Accounts | | | | | | (1,779 | ) | (1,779 | ) |
(1) Excludes impact of changes in capital funding provided to service delivery agencies (Vote 45).
2010 Financial and Economic Review – July 2010
68
Appendix 2 – Financial Review
Table A2.2 Operating Statement – 2000/01 to 2009/10
| | | | | | | | | | | | | | | | | | | | | | Average | |
| | Actual | | Actual | | Actual | | Actual | | Actual | | Actual | | Actual | | Actual | | Actual | | Actual | | annual | |
($ millions) | | 2000/01 | | 2001/02 | | 2002/03 | | 2003/04 | | 2004/05 | | 2005/06 | | 2006/07 | | 2007/08 | | 2008/09 | | 2009/10 | | change | |
| | | | | | | | | | | | | | | | | | | | | | (per cent) | |
Revenue | | 29,689 | | 28,169 | | 27,775 | | 29,155 | | 33,355 | | 35,946 | | 38,448 | | 39,772 | | 38,302 | | 37,521 | | 2.6 | |
Expense | | (28,439 | ) | (30,321 | ) | (30,227 | ) | (30,374 | ) | (30,666 | ) | (32,241 | ) | (34,198 | ) | (36,555 | ) | (38,245 | ) | (39,300 | ) | 3.7 | |
Surplus/(deficit) before unusual items | | 1,250 | | (2,152 | ) | (2,452 | ) | (1,219 | ) | 2,689 | | 3,705 | | 4,250 | | 3,217 | | 57 | | (1,779 | ) | | |
Joint trusteeship | | (52 | ) | 1,464 | | — | | — | | — | | — | | — | | — | | — | | — | | | |
Restructuring exit expenses | | — | | (347 | ) | (169 | ) | (123 | ) | — | | — | | — | | — | | — | | — | | | |
Negotiating Framework incentive payments | | — | | — | | — | | — | | — | | (710 | ) | (264 | ) | (4 | ) | (2 | ) | — | | | |
Climate Action Dividend | | — | | — | | — | | — | | — | | — | | — | | (440 | ) | 20 | | — | | | |
Surplus/(deficit) | | 1,198 | | (1,035 | ) | (2,621 | ) | (1,342 | ) | 2,689 | | 2,995 | | 3,986 | | 2,773 | | 75 | | (1,779 | ) | | |
| | | | | | | | | | | | | | | | | | | | | | | |
Per cent of GDP: (1) | | | | | | | | | | | | | | | | | | | | | | | |
Revenue | | 22.6 | | 21.1 | | 20.1 | | 20.0 | | 21.2 | | 21.2 | | 21.1 | | 20.8 | | 19.4 | | 20.0 | | -1.4 | |
Expense | | 21.7 | | 22.7 | | 21.9 | | 20.9 | | 19.4 | | 19.0 | | 18.8 | | 19.1 | | 19.3 | | 20.9 | | -0.4 | |
Growth rates: | | | | | | | | | | | | | | | | | | | | | | | |
Revenue | | 10.8 | | -5.1 | | -1.4 | | 5.0 | | 14.4 | | 7.8 | | 7.0 | | 3.4 | | -3.7 | | -2.0 | | 3.6 | |
Expense | | 6.0 | | 6.6 | | -0.3 | | 0.5 | | 1.0 | | 5.1 | | 6.1 | | 6.9 | | 4.6 | | 2.8 | | 3.9 | |
Per capita: (2) | | | | | | | | | | | | | | | | | | | | | | | |
Revenue | | 7,350.2 | | 6,910.5 | | 6,777.4 | | 7,072.3 | | 8,027.3 | | 8,565.1 | | 9,060.3 | | 9,229.0 | | 8,737.1 | | 8,421.8 | | 1.5 | |
Expense | | 7,040.7 | | 7,438.4 | | 7,375.7 | | 7,368.0 | | 7,380.2 | | 7,682.3 | | 8,058.8 | | 8,482.5 | | 8,724.1 | | 8,821.1 | | 2.5 | |
(1) Revenue and expense as a per cent of GDP is calculated using GDP for the calendar year ending in the fiscal year (e.g. 2009/10 amounts divided by GDP for the 2009 calendar year). As nominal GDP for the calendar year ending 2009 is not available, the 2009 GDP projected in February 2010 has been used for the fiscal year ended March 31, 2010 for demonstration purposes.
(2) Per capita revenue and expense is calculated using July 1 population (e.g. 2009/10 amounts divided by population on July 1, 2009).
2010 Financial and Economic Review – July 2010
69
Appendix 2 – Financial Review
Table A2.3 Statement of Financial Position – 2000/01 to 2009/10
| | | | | | | | | | | | | | | | | | | | | | Average | |
| | Actual | | Actual | | Actual | | Actual | | Actual | | Actual | | Actual | | Actual | | Actual | | Actual | | annual | |
($ millions) | | 2000/01 | | 2001/02 | | 2002/03 | | 2003/04 | | 2004/05 | | 2005/06 | | 2006/07 | | 2007/08 | | 2008/09 | | 2009/10 | | change | |
| | | | | | | | | | | | | | | | | | | | | | (per cent) | |
Financial assets: | | | | | | | | | | | | | | | | | | | | | | | |
Cash and temporary investments | | 1,977 | | 2,494 | | 2,659 | | 2,732 | | 3,631 | | 3,922 | | 3,492 | | 5,994 | | 5,226 | | 2,913 | | 4.4 | |
Other financial assets | | 5,835 | | 5,732 | | 5,420 | | 6,382 | | 6,716 | | 7,085 | | 8,003 | | 8,294 | | 7,360 | | 8,731 | | 4.6 | |
Sinking funds | | 6,000 | | 5,518 | | 5,074 | | 4,619 | | 4,516 | | 4,059 | | 3,798 | | 2,649 | | 2,134 | | 1,329 | | -15.4 | |
Investments in commercial Crown corporations: | | | | | | | | | | | | | | | | | | | | | | | |
Retained earnings | | 2,772 | | 2,435 | | 2,612 | | 3,030 | | 3,180 | | 3,463 | | 4,415 | | 5,081 | | 5,728 | | 7,231 | | 11.2 | |
Recoverable capital loans | | 7,111 | | 7,246 | | 7,231 | | 7,512 | | 6,901 | | 6,916 | | 7,170 | | 7,719 | | 9,149 | | 11,471 | | 5.5 | |
| | 9,883 | | 9,681 | | 9,843 | | 10,542 | | 10,081 | | 10,379 | | 11,585 | | 12,800 | | 14,877 | | 18,702 | | 7.3 | |
Warehouse borrowing program assets | | 1,312 | | 1,067 | | — | | — | | — | | — | | — | | — | | 2,081 | | — | | n/a | |
| | 25,007 | | 24,492 | | 22,996 | | 24,275 | | 24,944 | | 25,445 | | 26,878 | | 29,737 | | 31,678 | | 31,675 | | 2.7 | |
Liabilities: | | | | | | | | | | | | | | | | | | | | | | | |
Accounts payable & accrued liabilities | | 6,777 | | 5,717 | | 6,088 | | 7,092 | | 6,873 | | 7,441 | | 7,225 | | 8,075 | | 7,414 | | 6,994 | | 0.4 | |
Deferred revenue | | 2,180 | | 2,456 | | 3,105 | | 4,118 | | 5,311 | | 5,857 | | 6,174 | | 7,368 | | 9,431 | | 9,997 | | 18.4 | |
Debt: | | | | | | | | | | | | | | | | | | | | | | | |
| Taxpayer-supported debt | | 25,104 | | 27,514 | | 29,383 | | 30,014 | | 28,668 | | 27,251 | | 25,968 | | 26,589 | | 26,446 | | 30,021 | | 2.0 | |
| Self-supported debt | | 8,684 | | 8,568 | | 7,474 | | 7,761 | | 7,201 | | 7,206 | | 7,471 | | 8,048 | | 11,568 | | 11,864 | | 3.5 | |
Total provincial debt | | 33,788 | | 36,082 | | 36,857 | | 37,775 | | 35,869 | | 34,457 | | 33,439 | | 34,637 | | 38,014 | | 41,885 | | 2.4 | |
Add: | debt offset by sinking funds | | 6,000 | | 5,518 | | 5,074 | | 4,619 | | 4,515 | | 4,059 | | 3,798 | | 2,649 | | 2,134 | | 1,329 | | -15.4 | |
Less: | guarantees and non-guaranteed debt | | (602 | ) | (484 | ) | (437 | ) | (453 | ) | (472 | ) | (459 | ) | (416 | ) | (452 | ) | (452 | ) | (493 | ) | -2.2 | |
Financial statement debt | | 39,186 | | 41,116 | | 41,494 | | 41,941 | | 39,912 | | 38,057 | | 36,821 | | 36,834 | | 39,696 | | 42,721 | | 1.0 | |
| | 48,143 | | 49,289 | | 50,687 | | 53,151 | | 52,096 | | 51,355 | | 50,220 | | 52,277 | | 56,541 | | 59,712 | | 2.4 | |
Net liabilities | | (23,136 | ) | (24,797 | ) | (27,691 | ) | (28,876 | ) | (27,152 | ) | (25,910 | ) | (23,342 | ) | (22,540 | ) | (24,863 | ) | (28,037 | ) | 2.2 | |
Capital and other assets: | | | | | | | | | | | | | | | | | | | | | | | |
Tangible capital assets | | 21,759 | | 22,408 | | 22,689 | | 22,522 | | 23,416 | | 24,954 | | 26,800 | | 28,737 | | 30,655 | | 32,371 | | 4.5 | |
Other assets | | 496 | | 473 | | 465 | | 475 | | 546 | | 761 | | 780 | | 732 | | 780 | | 938 | | 7.3 | |
| | 22,255 | | 22,881 | | 23,154 | | 22,997 | | 23,962 | | 25,715 | | 27,580 | | 29,469 | | 31,435 | | 33,309 | | 4.6 | |
Accumulated surplus (deficit) | | (881 | ) | (1,916 | ) | (4,537 | ) | (5,879 | ) | (3,190 | ) | (195 | ) | 4,238 | | 6,929 | | 6,572 | | 5,272 | | n/a | |
Per cent of GDP: (1) | | | | | | | | | | | | | | | | | | | | | | | |
Net liabilities | | 17.6 | | 18.6 | | 20.0 | | 19.8 | | 17.2 | | 15.3 | | 12.8 | | 11.8 | | 12.6 | | 14.9 | | -1.8 | |
Capital and other assets | | 16.9 | | 17.1 | | 16.8 | | 15.8 | | 15.2 | | 15.2 | | 15.1 | | 15.4 | | 15.9 | | 17.7 | | 0.5 | |
Growth rates: | | | | | | | | | | | | | | | | | | | | | | | |
Net liabilities | | -0.2 | | 7.2 | | 11.7 | | 4.3 | | -6.0 | | -4.6 | | -9.9 | | -3.4 | | 10.3 | | 12.8 | | 2.2 | |
Capital and other assets | | 5.5 | | 2.8 | | 1.2 | | -0.7 | | 4.2 | | 7.3 | | 7.3 | | 6.8 | | 6.7 | | 6.0 | | 4.7 | |
Per capita: (2) | | | | | | | | | | | | | | | | | | | | | | | |
Net liabilities | | 5,728 | | 6,083 | | 6,757 | | 7,005 | | 6,535 | | 6,174 | | 5,501 | | 5,230 | | 5,672 | | 6,293 | | 1.1 | |
Capital and other assets | | 5,510 | | 5,613 | | 5,650 | | 5,579 | | 5,767 | | 6,127 | | 6,499 | | 6,838 | | 7,171 | | 7,476 | | 3.4 | |
(1) Net liabilities as a per cent of GDP is calculated using GDP for the calendar year ending in the fiscal year (e.g. 2009/10 amount divided by GDP for the 2009 calendar year). As nominal GDP for the calendar year ending 2009 is not available, the 2009 GDP projected in February 2010 has been used for the fiscal year ended March 31, 2010 for demonstration purposes.
(2) Per capita net liabilities is calculated using July 1 population (e.g. 2009/10 amount divided by population on July 1, 2009).
2010 Financial and Economic Review – July 2010
70
Appendix 2 – Financial Review
Table A2.4 Changes in Financial Position — 2000/01 to 2009/10
| | Actual | | Actual | | Actual | | Actual | | Actual | | Actual | | Actual | | Actual | | Actual | | Actual | | 10-Year | |
($ millions) | | 2000/01 | | 2001/02 | | 2002/03 | | 2003/04 | | 2004/05 | | 2005/06 | | 2006/07 | | 2007/08 | | 2008/09 | | 2009/10 | | Total | |
(Surplus) deficit for the year | | (1,198 | ) | 1,035 | | 2,621 | | 1,342 | | (2,689 | ) | (2,995 | ) | (3,986 | ) | (2,773 | ) | (75 | ) | 1,779 | | (6,939 | ) |
Comprehensive income (increase) decrease | | — | | — | | — | | — | | — | | — | | (447 | ) | 82 | | 432 | | (479 | ) | (412 | ) |
Change in accumulated (surplus) deficit | | (1,198 | ) | 1,035 | | 2,621 | | 1,342 | | (2,689 | ) | (2,995 | ) | (4,433 | ) | (2,691 | ) | 357 | | 1,300 | | (7,351 | ) |
Capital and other asset changes: | | | | | | | | | | | | | | | | | | | | | | | |
Taxpayer-supported capital investments | | 2,567 | | 2,095 | | 1,901 | | 2,074 | | 2,363 | | 3,153 | | 3,409 | | 3,672 | | 3,778 | | 3,710 | | 28,722 | |
Less: | amortization and other accounting changes | | (1,441 | ) | (1,446 | ) | (1,620 | ) | (2,241 | ) | (1,469 | ) | (1,615 | ) | (1,563 | ) | (1,735 | ) | (1,860 | ) | (1,994 | ) | (16,984 | ) |
Increase in net capital assets | | 1,126 | | 649 | | 281 | | (167 | ) | 894 | | 1,538 | | 1,846 | | 1,937 | | 1,918 | | 1,716 | | 11,738 | |
Increase (decrease) in other assets | | 34 | | (23 | ) | (8 | ) | 10 | | 71 | | 215 | | 19 | | (48 | ) | 48 | | 158 | | 476 | |
| | 1,160 | | 626 | | 273 | | (157 | ) | 965 | | 1,753 | | 1,865 | | 1,889 | | 1,966 | | 1,874 | | 12,214 | |
Increase (decrease) in net liabilities | | (38 | ) | 1,661 | | 2,894 | | 1,185 | | (1,724 | ) | (1,242 | ) | (2,568 | ) | (802 | ) | 2,323 | | 3,174 | | 4,863 | |
Investment and working capital changes: | | | | | | | | | | | | | | | | | | | | | | | |
Increase (reduction) in cash and temporary investments | | (739 | ) | 517 | | 165 | | 73 | | 899 | | 291 | | (430 | ) | 2,502 | | (768 | ) | (2,313 | ) | 197 | |
Increase (decrease) in warehouse borrowing investments | | (8 | ) | (245 | ) | (1,067 | ) | — | | — | | — | | — | | — | | 2,081 | | (2,081 | ) | (1,320 | ) |
Investment in commercial Crown corporations: | | | | | | | | | | | | | | | | | | | | | | | |
Increase (decrease) in retained earnings | | 62 | | (337 | ) | 177 | | 418 | | 150 | | 283 | | 952 | | 666 | | 647 | | 1,503 | | 4,521 | |
Self-supported capital investments | | 773 | | 891 | | 882 | | 783 | | 776 | | 805 | | 983 | | 1,296 | | 1,809 | | 3,358 | | 12,356 | |
Less: | loan repayments and other accounting changes | | (966 | ) | (756 | ) | (897 | ) | (502 | ) | (1,387 | ) | (790 | ) | (729 | ) | (747 | ) | (379 | ) | (1,036 | ) | (8,189 | ) |
| | (131 | ) | (202 | ) | 162 | | 699 | | (461 | ) | 298 | | 1,206 | | 1,215 | | 2,077 | | 3,825 | | 8,688 | |
Other working capital changes | | 410 | | 199 | | (1,776 | ) | (1,510 | ) | (743 | ) | (1,202 | ) | 556 | | (2,902 | ) | (2,851 | ) | 420 | | (9,399 | ) |
| | (468 | ) | 269 | | (2,516 | ) | (738 | ) | (305 | ) | (613 | ) | 1,332 | | 815 | | 539 | | (149 | ) | (1,834 | ) |
Increase (decrease) in financial statement debt | | (506 | ) | 1,930 | | 378 | | 447 | | (2,029 | ) | (1,855 | ) | (1,236 | ) | 13 | | 2,862 | | 3,025 | | 3,029 | |
(Increase) decrease in sinking fund debt | | 188 | | 482 | | 444 | | 455 | | 104 | | 456 | | 261 | | 1,149 | | 515 | | 805 | | 4,859 | |
Increase (decrease) in guarantees and non-guaranteed debt | | (332 | ) | (118 | ) | (47 | ) | 16 | | 19 | | (13 | ) | (43 | ) | 36 | | — | | 41 | | (441 | ) |
Increase (decrease) in total provincial debt | | (650 | ) | 2,294 | | 775 | | 918 | | (1,906 | ) | (1,412 | ) | (1,018 | ) | 1,198 | | 3,377 | | 3,871 | | 7,447 | |
Represented by increase (decrease) in: | | | | | | | | | | | | | | | | | | | | | | | |
| Taxpayer-supported debt | | (102 | ) | 2,410 | | 1,869 | | 631 | | (1,346 | ) | (1,417 | ) | (1,283 | ) | 621 | | (143 | ) | 3,575 | | 4,815 | |
| Self-supported debt | | (548 | ) | (116 | ) | (1,094 | ) | 287 | | (560 | ) | 5 | | 265 | | 577 | | 3,520 | | 296 | | 2,632 | |
| Total provincial debt | | (650 | ) | 2,294 | | 775 | | 918 | | (1,906 | ) | (1,412 | ) | (1,018 | ) | 1,198 | | 3,377 | | 3,871 | | 7,447 | |
2010 Financial and Economic Review – July 2010
71
Appendix 2 – Financial Review
Table A2.5 Revenue by Source — 2000/01 to 2009/10
| | | | | | | | | | | | | | | | | | | | | | Average | |
| | Actual | | Actual | | Actual | | Actual | | Actual | | Actual | | Actual | | Actual | | Actual | | Actual | | annual | |
($ millions) | | 2000/01 | | 2001/02 | | 2002/03 | | 2003/04 | | 2004/05 | | 2005/06 | | 2006/07 | | 2007/08 | | 2008/09 | | 2009/10 | | change | |
| | | | | | | | | | | | | | | | | | | | | | (per cent) | |
Taxation revenue: | | | | | | | | | | | | | | | | | | | | | | | |
Personal income | | 5,963 | | 5,366 | | 4,150 | | 4,877 | | 5,050 | | 5,838 | | 6,905 | | 6,956 | | 6,093 | | 5,529 | | -0.8 | |
Corporate income | | 1,054 | | 1,522 | | 612 | | 775 | | 1,255 | | 1,426 | | 1,538 | | 2,250 | | 2,038 | | 1,317 | | 2.5 | |
Social service | | 3,626 | | 3,552 | | 3,794 | | 4,024 | | 4,156 | | 4,367 | | 4,714 | | 5,072 | | 4,958 | | 4,765 | | 3.1 | |
Fuel | | 715 | | 659 | | 687 | | 875 | | 904 | | 911 | | 901 | | 935 | | 891 | | 884 | | 2.4 | |
Carbon | | — | | — | | — | | — | | — | | — | | — | | — | | 306 | | 542 | | n/a | |
Tobacco | | 460 | | 499 | | 606 | | 647 | | 699 | | 701 | | 726 | | 692 | | 708 | | 682 | | 4.5 | |
Property | | 1,452 | | 1,481 | | 1,541 | | 1,574 | | 1,661 | | 1,717 | | 1,732 | | 1,795 | | 1,848 | | 1,884 | | 2.9 | |
Property transfer | | 262 | | 303 | | 407 | | 518 | | 604 | | 843 | | 914 | | 1,068 | | 715 | | 887 | | 14.5 | |
Corporation capital | | 459 | | 395 | | 198 | | 124 | | 160 | | 162 | | 91 | | 117 | | 108 | | 95 | | -16.1 | |
Other | | 312 | | 333 | | 357 | | 416 | | 428 | | 464 | | 496 | | 521 | | 532 | | 517 | | 5.8 | |
| | 14,303 | | 14,110 | | 12,352 | | 13,830 | | 14,917 | | 16,429 | | 18,017 | | 19,406 | | 18,197 | | 17,102 | | 2.0 | |
Natural resource revenue: | | | | | | | | | | | | | | | | | | | | | | | |
Natural gas royalties | | 1,249 | | 836 | | 1,056 | | 1,230 | | 1,439 | | 1,921 | | 1,207 | | 1,132 | | 1,314 | | 406 | | -11.7 | |
Crown land tenures | | 219 | | 254 | | 267 | | 320 | | 342 | | 386 | | 441 | | 569 | | 814 | | 867 | | 16.5 | |
Columbia River Treaty | | 632 | | 360 | | 100 | | 230 | | 258 | | 319 | | 223 | | 246 | | 231 | | 168 | | -13.7 | |
Other energy and minerals | | 207 | | 173 | | 202 | | 199 | | 256 | | 392 | | 456 | | 367 | | 479 | | 421 | | 8.2 | |
Forests | | 1,341 | | 1,253 | | 1,323 | | 1,014 | | 1,363 | | 1,214 | | 1,276 | | 1,087 | | 557 | | 387 | | -12.9 | |
Other resources | | 308 | | 298 | | 270 | | 300 | | 301 | | 316 | | 341 | | 340 | | 412 | | 397 | | 2.9 | |
| | 3,956 | | 3,174 | | 3,218 | | 3,293 | | 3,959 | | 4,548 | | 3,944 | | 3,741 | | 3,807 | | 2,646 | | -4.4 | |
Other revenue: | | | | | | | | | | | | | | | | | | | | | | | |
Medical Services Plan premiums | | 894 | | 954 | | 1,355 | | 1,447 | | 1,465 | | 1,482 | | 1,524 | | 1,557 | | 1,595 | | 1,666 | | 7.2 | |
Post-secondary education fees | | 440 | | 452 | | 580 | | 781 | | 836 | | 892 | | 928 | | 979 | | 1,039 | | 1,126 | | 11.0 | |
Other health-care related fees | | 211 | | 221 | | 217 | | 231 | | 228 | | 225 | | 237 | | 248 | | 257 | | 267 | | 2.6 | |
Motor vehicle licences and permits | | 339 | | 342 | | 351 | | 363 | | 381 | | 403 | | 424 | | 442 | | 447 | | 447 | | 3.1 | |
BC Ferries tolls | | 292 | | 306 | | 315 | | — | | — | | — | | — | | — | | — | | — | | n/a | |
Other fees and licences | | 772 | | 762 | | 737 | | 710 | | 746 | | 679 | | 690 | | 749 | | 669 | | 613 | | -2.5 | |
Investment earnings | | 1,476 | | 1,279 | | 1,028 | | 955 | | 837 | | 955 | | 1,041 | | 1,150 | | 817 | | 963 | | -4.6 | |
Sales of goods and services | | 1,064 | | 1,006 | | 986 | | 714 | | 741 | | 719 | | 678 | | 637 | | 694 | | 733 | | -4.1 | |
Miscellaneous | | 1,022 | | 1,011 | | 979 | | 1,255 | | 1,458 | | 1,566 | | 1,890 | | 1,955 | | 1,891 | | 2,021 | | 7.9 | |
| | 6,510 | | 6,333 | | 6,548 | | 6,456 | | 6,692 | | 6,921 | | 7,412 | | 7,717 | | 7,409 | | 7,836 | | 2.1 | |
Contributions from the federal government: | | | | | | | | | | | | | | | | | | | | | | | |
Health and social transfers | | 2,619 | | 2,445 | | 2,606 | | 3,044 | | 3,421 | | 4,220 | | 4,473 | | 4,614 | | 4,743 | | 4,883 | | 7.2 | |
Harmonized sales tax transition payments | | — | | — | | — | | — | | — | | — | | — | | — | | — | | 250 | | n/a | |
Equalization | | — | | 158 | | 543 | | (330 | ) | 979 | | 590 | | 459 | | — | | — | | — | | n/a | |
Other cost shared agreements | | 677 | | 717 | | 674 | | 905 | | 822 | | 1,015 | | 1,455 | | 1,318 | | 1,242 | | 1,784 | | 11.4 | |
| | 3,296 | | 3,320 | | 3,823 | | 3,619 | | 5,222 | | 5,825 | | 6,387 | | 5,932 | | 5,985 | | 6,917 | | 8.6 | |
Commercial Crown corporation net income: | | | | | | | | | | | | | | | | | | | | | | | |
BC Hydro | | 446 | | 403 | | 418 | | 111 | | 402 | | 266 | | 407 | | 369 | | 365 | | 447 | | 0.0 | |
Liquor Distribution Branch | | 642 | | 637 | | 654 | | 727 | | 779 | | 800 | | 840 | | 857 | | 891 | | 877 | | 3.5 | |
BC Lotteries (net of payments to federal gov’t) | | 554 | | 598 | | 663 | | 719 | | 811 | | 914 | | 1,011 | | 1,080 | | 1,082 | | 1,070 | | 7.6 | |
BCRC | | (7 | ) | (166 | ) | 4 | | 41 | | 183 | | 33 | | 30 | | 13 | | 36 | | 2 | | n/a | |
ICBC | | (14 | ) | (242 | ) | 80 | | 352 | | 383 | | 191 | | 381 | | 633 | | 512 | | 601 | | n/a | |
Transportation Invest. Corp. (Port Mann) | | — | | — | | — | | — | | — | | — | | — | | — | | (8 | ) | (4 | ) | n/a | |
Other | | 3 | | 2 | | 15 | | 7 | | 7 | | 19 | | 19 | | 24 | | 26 | | 27 | | 27.7 | |
| | 1,624 | | 1,232 | | 1,834 | | 1,957 | | 2,565 | | 2,223 | | 2,688 | | 2,976 | | 2,904 | | 3,020 | | 7.1 | |
Total revenue | | 29,689 | | 28,169 | | 27,775 | | 29,155 | | 33,355 | | 35,946 | | 38,448 | | 39,772 | | 38,302 | | 37,521 | | 2.6 | |
2010 Financial and Economic Review – July 2010
72
Appendix 2 – Financial Review
Table A2.6 Revenue by Source Supplementary Information — 2000/01 to 2009/10
| | | | | | | | | | | | | | | | | | | | | | Average | |
| | Actual | | Actual | | Actual | | Actual | | Actual | | Actual | | Actual | | Actual | | Actual | | Actual | | annual | |
($ millions) | | 2000/01 | | 2001/02 | | 2002/03 | | 2003/04 | | 2004/05 | | 2005/06 | | 2006/07 | | 2007/08 | | 2008/09 | | 2009/10 | | change | |
| | | | | | | | | | | | | | | | | | | | | | (per cent) | |
Per cent of GDP: (1) | | | | | | | | | | | | | | | | | | | | | | | |
Taxation | | 10.9 | | 10.6 | | 8.9 | | 9.5 | | 9.5 | | 9.7 | | 9.9 | | 10.1 | | 9.2 | | 9.1 | | -2.0 | |
Natural resources | | 3.0 | | 2.4 | | 2.3 | | 2.3 | | 2.5 | | 2.7 | | 2.2 | | 2.0 | | 1.9 | | 1.4 | | -8.1 | |
Other | | 5.0 | | 4.7 | | 4.7 | | 4.4 | | 4.2 | | 4.1 | | 4.1 | | 4.0 | | 3.7 | | 4.2 | | -1.9 | |
Contributions from the federal government | | 2.5 | | 2.5 | | 2.8 | | 2.5 | | 3.3 | | 3.4 | | 3.5 | | 3.1 | | 3.0 | | 3.7 | | 4.3 | |
Commercial Crown corporation net income | | 1.2 | | 0.9 | | 1.3 | | 1.3 | | 1.6 | | 1.3 | | 1.5 | | 1.6 | | 1.5 | | 1.6 | | 3.0 | |
Total revenue | | 22.6 | | 21.1 | | 20.1 | | 20.0 | | 21.2 | | 21.2 | | 21.1 | | 20.8 | | 19.4 | | 20.0 | | -1.4 | |
Growth rates: | | | | | | | | | | | | | | | | | | | | | | | |
Taxation | | 4.0 | | -1.3 | | -12.5 | | 12.0 | | 7.9 | | 10.1 | | 9.7 | | 7.7 | | -6.2 | | -6.0 | | 2.5 | |
Natural resources | | 43.4 | | -19.8 | | 1.4 | | 2.3 | | 20.2 | | 14.9 | | -13.3 | | -5.1 | | 1.8 | | -30.5 | | 1.5 | |
Other | | 9.5 | | -2.7 | | 3.4 | | -1.4 | | 3.7 | | 3.4 | | 7.1 | | 4.1 | | -4.0 | | 5.8 | | 2.9 | |
Contributions from the federal government | | 3.6 | | 0.7 | | 15.2 | | -5.3 | | 44.3 | | 11.5 | | 9.6 | | -7.1 | | 0.9 | | 15.6 | | 8.9 | |
Commercial Crown corporation net income | | 39.0 | | -24.1 | | 48.9 | | 6.7 | | 31.1 | | -13.3 | | 20.9 | | 10.7 | | -2.4 | | 4.0 | | 12.1 | |
Total revenue | | 10.8 | | -5.1 | | -1.4 | | 5.0 | | 14.4 | | 7.8 | | 7.0 | | 3.4 | | -3.7 | | -2.0 | | 3.6 | |
Per capita: (2) | | | | | | | | | | | | | | | | | | | | | | | |
Taxation | | 3,541 | | 3,462 | | 3,014 | | 3,355 | | 3,590 | | 3,915 | | 4,246 | | 4,503 | | 4,151 | | 3,839 | | 0.9 | |
Natural resources | | 979 | | 779 | | 785 | | 799 | | 953 | | 1,084 | | 929 | | 868 | | 868 | | 594 | | -5.4 | |
Other | | 1,612 | | 1,554 | | 1,598 | | 1,566 | | 1,611 | | 1,649 | | 1,747 | | 1,791 | | 1,690 | | 1,759 | | 1.0 | |
Contributions from the federal government | | 816 | | 814 | | 933 | | 878 | | 1,257 | | 1,388 | | 1,505 | | 1,377 | | 1,365 | | 1,553 | | 7.4 | |
Commercial Crown corporation net income | | 402 | | 302 | | 448 | | 475 | | 617 | | 530 | | 633 | | 691 | | 662 | | 678 | | 6.0 | |
Total revenue | | 7,350 | | 6,910 | | 6,777 | | 7,072 | | 8,027 | | 8,565 | | 9,060 | | 9,229 | | 8,737 | | 8,422 | | 1.5 | |
| | | | | | | | | | | | | | | | | | | | | | | |
Real Per Capita Revenue (2009 $) (3) | | 8,589 | | 7,943 | | 7,611 | | 7,771 | | 8,651 | | 9,049 | | 9,412 | | 9,422 | | 8,737 | | 8,422 | | -0.2 | |
Growth rate (per cent) | | 8.0 | | -7.5 | | -4.2 | | 2.1 | | 11.3 | | 4.6 | | 4.0 | | 0.1 | | -7.3 | | -3.6 | | 0.8 | |
(1) Revenue as a per cent of GDP is calculated using GDP for the calendar year ending in the fiscal year (e.g. 2009/10 revenue divided by GDP for the 2009 calendar year). Totals may not add due to rounding.
(2) Per capita revenue is calculated using July 1 population (e.g. 2009/10 revenue divided by population on July 1, 2009). Totals may not add due to rounding.
(3) Revenue is converted to real (inflation-adjusted) terms using the consumer price index (CPI) for the corresponding calendar year (e.g. 2009 CPI for 2009/10 revenue).
2010 Financial and Economic Review – July 2010
73
Appendix 2 – Financial Review
Table A2.7 Expense by Function (1) — 2000/01 to 2009/10
| | | | | | | | | | | | | | | | | | | | | | Average | |
| | Actual | | Actual | | Actual | | Actual | | Actual | | Actual | | Actual | | Actual | | Actual | | Actual | | annual | |
($ millions) | | 2000/01 | | 2001/02 | | 2002/03 | | 2003/04 | | 2004/05 | | 2005/06 | | 2006/07 | | 2007/08 | | 2008/09 | | 2009/10 | | change | |
| | | | | | | | | | | | | | | | | | | | | | (per cent) | |
Function: | | | | | | | | | | | | | | | | | | | | | | | |
Health: | | | | | | | | | | | | | | | | | | | | | | | |
Medical Services Plan | | 2,118 | | 2,367 | | 2,461 | | 2,540 | | 2,546 | | 2,696 | | 2,969 | | 3,274 | | 3,424 | | 3,609 | | 6.1 | |
Pharmacare | | 657 | | 717 | | 728 | | 723 | | 793 | | 868 | | 914 | | 955 | | 1,010 | | 1,053 | | 5.4 | |
Regional services | | 6,174 | | 6,938 | | 7,202 | | 7,387 | | 7,565 | | 8,107 | | 8,496 | | 9,033 | | 9,750 | | 9,966 | | 5.5 | |
Other healthcare expenses | | 481 | | 541 | | 571 | | 600 | | 625 | | 756 | | 867 | | 996 | | 911 | | 887 | | 7.0 | |
| | 9,430 | | 10,563 | | 10,962 | | 11,250 | | 11,529 | | 12,427 | | 13,246 | | 14,258 | | 15,095 | | 15,515 | | 5.7 | |
Education: | | | | | | | | | | | | | | | | | | | | | | | |
Elementary and secondary | | 4,318 | | 4,495 | | 4,542 | | 4,687 | | 4,757 | | 4,829 | | 5,272 | | 5,521 | | 5,740 | | 5,778 | | 3.3 | |
Post-secondary | | 2,703 | | 3,002 | | 3,127 | | 3,329 | | 3,536 | | 3,914 | | 4,072 | | 4,314 | | 4,554 | | 4,740 | | 6.4 | |
Other education expenses | | 195 | | 205 | | 223 | | 210 | | 206 | | 182 | | 159 | | 165 | | 172 | | 542 | | 12.0 | |
| | 7,216 | | 7,702 | | 7,892 | | 8,226 | | 8,499 | | 8,925 | | 9,503 | | 10,000 | | 10,466 | | 11,060 | | 4.9 | |
Social services: | | | | | | | | | | | | | | | | | | | | | | | |
Social assistance | | 1,463 | | 1,419 | | 1,431 | | 1,190 | | 1,051 | | 1,151 | | 1,279 | | 1,297 | | 1,379 | | 1,489 | | 0.2 | |
Child welfare | | 1,038 | | 1,179 | | 982 | | 838 | | 819 | | 892 | | 1,027 | | 992 | | 1,144 | | 1,147 | | 1.1 | |
Community living and other services | | 713 | | 821 | | 673 | | 725 | | 728 | | 682 | | 586 | | 756 | | 723 | | 729 | | 0.2 | |
| | 3,214 | | 3,419 | | 3,086 | | 2,753 | | 2,598 | | 2,725 | | 2,892 | | 3,045 | | 3,246 | | 3,365 | | 0.5 | |
Protection of persons and property | | 1,173 | | 1,216 | | 1,248 | | 1,362 | | 1,204 | | 1,379 | | 1,326 | | 1,579 | | 1,588 | | 1,535 | | 3.0 | |
Transportation | | 1,470 | | 1,448 | | 1,606 | | 1,140 | | 1,328 | | 1,215 | | 1,270 | | 1,398 | | 1,422 | | 1,474 | | 0.0 | |
Natural resources & economic development | | 1,790 | | 1,847 | | 1,533 | | 1,630 | | 1,669 | | 1,571 | | 1,676 | | 1,961 | | 1,763 | | 1,986 | | 1.2 | |
Other | | 731 | | 814 | | 821 | | 1,075 | | 1,028 | | 1,089 | | 1,243 | | 1,398 | | 1,662 | | 1,443 | | 7.8 | |
General government | | 435 | | 564 | | 539 | | 490 | | 505 | | 707 | | 768 | | 677 | | 842 | | 753 | | 6.3 | |
Interest | | 2,980 | | 2,748 | | 2,540 | | 2,448 | | 2,306 | | 2,203 | | 2,274 | | 2,239 | | 2,161 | | 2,169 | | -3.5 | |
Total expense | | 28,439 | | 30,321 | | 30,227 | | 30,374 | | 30,666 | | 32,241 | | 34,198 | | 36,555 | | 38,245 | | 39,300 | | 3.7 | |
Per cent of total expense: | | | | | | | | | | | | | | | | | | | | | | | |
Health | | 33.2 | | 34.8 | | 36.3 | | 37.0 | | 37.6 | | 38.5 | | 38.7 | | 39.0 | | 39.5 | | 39.5 | | 2.0 | |
Education | | 25.4 | | 25.4 | | 26.1 | | 27.1 | | 27.7 | | 27.7 | | 27.8 | | 27.4 | | 27.4 | | 28.1 | | 1.2 | |
Social services and housing | | 11.3 | | 11.3 | | 10.2 | | 9.1 | | 8.5 | | 8.5 | | 8.5 | | 8.3 | | 8.5 | | 8.6 | | -3.0 | |
Protection of persons and property | | 4.1 | | 4.0 | | 4.1 | | 4.5 | | 3.9 | | 4.3 | | 3.9 | | 4.3 | | 4.2 | | 3.9 | | -0.6 | |
Transportation | | 5.2 | | 4.8 | | 5.3 | | 3.8 | | 4.3 | | 3.8 | | 3.7 | | 3.8 | | 3.7 | | 3.8 | | -3.5 | |
Natural resources & economic development | | 6.3 | | 6.1 | | 5.1 | | 5.4 | | 5.4 | | 4.9 | | 4.9 | | 5.4 | | 4.6 | | 5.1 | | -2.4 | |
Other | | 2.6 | | 2.7 | | 2.7 | | 3.5 | | 3.4 | | 3.4 | | 3.6 | | 3.8 | | 4.3 | | 3.7 | | 4.0 | |
General government | | 1.5 | | 1.9 | | 1.8 | | 1.6 | | 1.6 | | 2.2 | | 2.2 | | 1.9 | | 2.2 | | 1.9 | | 2.5 | |
Interest | | 10.5 | | 9.1 | | 8.4 | | 8.1 | | 7.5 | | 6.8 | | 6.6 | | 6.1 | | 5.7 | | 5.5 | | -6.9 | |
| | 100.0 | | 100.0 | | 100.0 | | 100.0 | | 100.0 | | 100.0 | | 100.0 | | 100.0 | | 100.0 | | 100.0 | | | |
(1) Excludes unusual items.
2010 Financial and Economic Review - July 2010
74
Appendix 2 – Financial Review
Table A2.8 Expense by Function (1) Supplementary Information — 2000/01 to 2009/10
| | | | | | | | | | | | | | | | | | | | | | Average | |
| | Actual | | Actual | | Actual | | Actual | | Actual | | Actual | | Actual | | Actual | | Actual | | Actual | | annual | |
($ millions) | | 2000/01 | | 2001/02 | | 2002/03 | | 2003/04 | | 2004/05 | | 2005/06 | | 2006/07 | | 2007/08 | | 2008/09 | | 2009/10 | | change | |
| | | | | | | | | | | | | | | | | | | | | | (per cent) | |
Per cent of GDP: (2) | | | | | | | | | | | | | | | | | | | | | | | |
Health | | 7.2 | | 7.9 | | 7.9 | | 7.7 | | 7.3 | | 7.3 | | 7.3 | | 7.4 | | 7.6 | | 8.3 | | 1.6 | |
Education | | 5.5 | | 5.8 | | 5.7 | | 5.6 | | 5.4 | | 5.3 | | 5.2 | | 5.2 | | 5.3 | | 5.9 | | 0.8 | |
Social services and housing | | 2.4 | | 2.6 | | 2.2 | | 1.9 | | 1.6 | | 1.6 | | 1.6 | | 1.6 | | 1.6 | | 1.8 | | -3.4 | |
Protection of persons and property | | 0.9 | | 0.9 | | 0.9 | | 0.9 | | 0.8 | | 0.8 | | 0.7 | | 0.8 | | 0.8 | | 0.8 | | -1.0 | |
Transportation | | 1.1 | | 1.1 | | 1.2 | | 0.8 | | 0.8 | | 0.7 | | 0.7 | | 0.7 | | 0.7 | | 0.8 | | -3.9 | |
Natural resources & economic development | | 1.4 | | 1.4 | | 1.1 | | 1.1 | | 1.1 | | 0.9 | | 0.9 | | 1.0 | | 0.9 | | 1.1 | | -2.8 | |
Other | | 0.6 | | 0.6 | | 0.6 | | 0.7 | | 0.7 | | 0.6 | | 0.7 | | 0.7 | | 0.8 | | 0.8 | | 3.6 | |
General government | | 0.3 | | 0.4 | | 0.4 | | 0.3 | | 0.3 | | 0.4 | | 0.4 | | 0.4 | | 0.4 | | 0.4 | | 2.2 | |
Interest | | 2.3 | | 2.1 | | 1.8 | | 1.7 | | 1.5 | | 1.3 | | 1.2 | | 1.2 | | 1.1 | | 1.2 | | -7.2 | |
Total expense | | 21.7 | | 22.7 | | 21.9 | | 20.9 | | 19.5 | | 19.0 | | 18.8 | | 19.1 | | 19.3 | | 20.9 | | -0.4 | |
Growth rates: | | | | | | | | | | | | | | | | | | | | | | | |
Health | | 7.5 | | 12.0 | | 3.8 | | 2.6 | | 2.5 | | 7.8 | | 6.6 | | 7.6 | | 5.9 | | 2.8 | | 5.9 | |
Education | | 8.3 | | 6.7 | | 2.5 | | 4.2 | | 3.3 | | 5.0 | | 6.5 | | 5.2 | | 4.7 | | 5.7 | | 5.2 | |
Social services and housing | | 4.5 | | 6.4 | | -9.7 | | -10.8 | | -5.6 | | 4.9 | | 6.1 | | 5.3 | | 6.6 | | 3.7 | | 1.1 | |
Protection of persons and property | | -1.3 | | 3.7 | | 2.6 | | 9.1 | | -11.6 | | 14.5 | | -3.8 | | 19.1 | | 0.6 | | -3.3 | | 3.0 | |
Transportation | | -8.6 | | -1.5 | | 10.9 | | -29.0 | | 16.5 | | -8.5 | | 4.5 | | 10.1 | | 1.7 | | 3.7 | | 0.0 | |
Natural resources & economic development | | 24.7 | | 3.2 | | -17.0 | | 6.3 | | 2.4 | | -5.9 | | 6.7 | | 17.0 | | -10.1 | | 12.6 | | 4.0 | |
Other | | 3.1 | | 11.4 | | 0.9 | | 30.9 | | -4.4 | | 5.9 | | 14.1 | | 12.5 | | 18.9 | | -13.2 | | 8.0 | |
General government | | 1.2 | | 29.7 | | -4.4 | | -9.1 | | 3.1 | | 40.0 | | 8.6 | | -11.8 | | 24.4 | | -10.6 | | 7.1 | |
Interest | | 1.5 | | -7.8 | | -7.6 | | -3.6 | | -5.8 | | -4.5 | | 3.2 | | -1.5 | | -3.5 | | 0.4 | | -2.9 | |
Total expense | | 6.0 | | 6.6 | | -0.3 | | 0.5 | | 1.0 | | 5.1 | | 6.1 | | 6.9 | | 4.6 | | 2.8 | | 3.9 | |
Per capita: (2) | | | | | | | | | | | | | | | | | | | | | | | |
Health | | 2,335 | | 2,591 | | 2,675 | | 2,729 | | 2,775 | | 2,961 | | 3,121 | | 3,309 | | 3,443 | | 3,482 | | 4.5 | |
Education | | 1,786 | | 1,889 | | 1,926 | | 1,995 | | 2,045 | | 2,127 | | 2,239 | | 2,320 | | 2,387 | | 2,482 | | 3.7 | |
Social services and housing | | 796 | | 839 | | 753 | | 668 | | 625 | | 649 | | 682 | | 707 | | 740 | | 755 | | -0.6 | |
Protection of persons and property | | 290 | | 298 | | 305 | | 330 | | 290 | | 329 | | 312 | | 366 | | 362 | | 345 | | 1.9 | |
Transportation | | 364 | | 355 | | 392 | | 277 | | 320 | | 290 | | 299 | | 324 | | 324 | | 331 | | -1.1 | |
Natural resources & economic development | | 443 | | 453 | | 374 | | 395 | | 402 | | 374 | | 395 | | 455 | | 402 | | 446 | | 0.1 | |
Other | | 181 | | 200 | | 200 | | 261 | | 247 | | 259 | | 293 | | 324 | | 379 | | 324 | | 6.7 | |
General government | | 108 | | 138 | | 132 | | 119 | | 122 | | 168 | | 181 | | 157 | | 192 | | 169 | | 5.1 | |
Interest | | 738 | | 674 | | 620 | | 594 | | 555 | | 525 | | 536 | | 520 | | 493 | | 487 | | -4.5 | |
Total expense | | 7,041 | | 7,437 | | 7,377 | | 7,368 | | 7,381 | | 7,682 | | 8,058 | | 8,482 | | 8,722 | | 8,821 | | 2.5 | |
Real Per Capita Expense (2009 $) (4) | | 8,228 | | 8,550 | | 8,283 | | 8,096 | | 7,954 | | 8,116 | | 8,372 | | 8,660 | | 8,724 | | 8,821 | | 0.8 | |
Growth rate (per cent) | | 3.4 | | 3.9 | | -3.1 | | -2.3 | | -1.8 | | 2.0 | | 3.2 | | 3.4 | | 0.7 | | 1.1 | | 1.1 | |
(1) Excludes unusual items. Prior years have been restated to be consistent with the 2009/10 Public Accounts presentation.
(2) Expense as a per cent of GDP is calculated using GDP for the calendar year ending in the fiscal year (e.g. 2009/10 expense divided by GDP for the 2009 calendar year). Totals may not add due to rounding.
(3) Per capita expense is calculated using July 1 population (e.g. 2009/10 expense divided by population on July 1, 2009). Totals may not add due to rounding.
(4) Expense is converted to real (inflation-adjusted) terms using the consumer price index (CPI) for the corresponding calendar year (e.g. 2009 CPI for 2009/10 expense).
2010 Financial and Economic Review – July 2010
75
Appendix 2 – Financial Review
Table A2.9 Full-Time Equivalents (FTEs) — 2000/01 to 2009/10
| | | | | | | | | | | | | | | | | | | | | | Average | |
| | Actual | | Actual | | Actual | | Actual | | Actual | | Actual | | Actual | | Actual | | Actual | | Actual | | annual | |
| | 2000/01 | | 2001/02 | | 2002/03 | | 2003/04 | | 2004/05 | | 2005/06 | | 2006/07 | | 2007/08 | | 2008/09 | | 2009/10 | | change | |
| | | | | | | | | | | | | | | | | | | | | | (per cent) | |
Taxpayer-supported programs and agencies: | | | | | | | | | | | | | | | | | | | | | | | |
Ministries and special offices (CRF) | | 33,579 | | 33,495 | | 29,751 | | 29,049 | | 27,252 | | 27,129 | | 28,647 | | 30,224 | | 31,874 | | 31,353 | | -0.8 | |
Service delivery agencies (1) | | 8,450 | | 8,447 | | 7,814 | | 4,570 | | 3,822 | | 3,992 | | 3,917 | | 4,128 | | 4,403 | | 4,508 | | -6.7 | |
Total FTEs | | 42,029 | | 41,942 | | 37,565 | | 33,619 | | 31,074 | | 31,121 | | 32,564 | | 34,352 | | 36,277 | | 35,861 | | -1.7 | |
Growth rates: | | | | | | | | | | | | | | | | | | | | | | | |
Ministries and special offices (CRF) | | 1.4 | | -0.3 | | -11.2 | | -2.4 | | -6.2 | | -0.5 | | 5.6 | | 5.5 | | 5.5 | | -1.6 | | -0.4 | |
Service delivery agencies | | -11.3 | | 0.0 | | -7.5 | | -41.5 | | -16.4 | | 4.4 | | -1.9 | | 5.4 | | 6.7 | | 2.4 | | -6.0 | |
Population per FTE: (2) | | | | | | | | | | | | | | | | | | | | | | | |
Total FTEs | | 96.1 | | 97.2 | | 109.1 | | 122.6 | | 133.7 | | 134.9 | | 130.3 | | 125.4 | | 120.8 | | 124.2 | | 2.9 | |
(1) Service delivery agency FTE amounts do not include SUCH sector staff employment.
(2) Population per FTE is calculated using July 1 population (e.g. population on July 1, 2009 divided by 2009/10 FTEs).
2010 Financial and Economic Review – July 2010
76
Appendix 2 — Financial Review
Table A2.10 Capital Spending — 2000/01 to 2009/10
| | | | | | | | | | | | | | | | | | | | | | Average | |
| | Actual | | Actual | | Actual | | Actual | | Actual | | Actual | | Actual | | Actual | | Actual | | Actual | | annual | |
($ millions) | | 2000/01 | | 2001/02 | | 2002/03 | | 2003/04 | | 2004/05 | | 2005/06 | | 2006/07 | | 2007/08 | | 2008/09 | | 2009/10 | | change | |
| | | | | | | | | | | | | | | | | | | | | | (per cent) | |
Taxpayer-supported: | | | | | | | | | | | | | | | | | | | | | | | |
Education | | | | | | | | | | | | | | | | | | | | | | | |
Schools (K—12) | | 595 | | 459 | | 383 | | 313 | | 239 | | 286 | | 322 | | 380 | | 413 | | 482 | | -2.3 | |
Post-secondary | | 254 | | 391 | | 412 | | 605 | | 696 | | 790 | | 874 | | 782 | | 658 | | 672 | | 11.4 | |
Health | | 459 | | 275 | | 422 | | 420 | | 568 | | 848 | | 760 | | 881 | | 892 | | 927 | | 8.1 | |
BC Transportation Financing Authority | | 485 | | 344 | | 275 | | 407 | | 513 | | 713 | | 821 | | 884 | | 881 | | 918 | | 7.3 | |
BC Transit | | 27 | | 19 | | 33 | | 7 | | 8 | | 24 | | 13 | | 37 | | 77 | | 150 | | 21.0 | |
Rapid Transit Project 2000 | | 300 | | 210 | | 35 | | 14 | | 15 | | 16 | | 15 | | — | | — | | — | | n/a | |
BC Ferries | | 55 | | 55 | | 58 | | — | | — | | — | | — | | — | | — | | — | | n/a | |
Vancouver Convention Centre expansion | | — | | — | | — | | 56 | | 51 | | 85 | | 105 | | 251 | | 242 | | 41 | | n/a | |
BC Place Rejuvenation | | — | | — | | — | | — | | — | | — | | — | | — | | 45 | | 75 | | n/a | |
Government direct (ministries) | | 208 | | 228 | | 208 | | 214 | | 215 | | 320 | | 355 | | 335 | | 430 | | 306 | | 4.4 | |
Other | | 184 | | 114 | | 75 | | 38 | | 58 | | 71 | | 144 | | 122 | | 140 | | 183 | | -0.1 | |
| | 2,567 | | 2,095 | | 1,901 | | 2,074 | | 2,363 | | 3,153 | | 3,409 | | 3,672 | | 3,778 | | 3,754 | | 4.3 | |
Self-supported: | | | | | | | | | | | | | | | | | | | | | | | |
BC Hydro | | 412 | | 531 | | 696 | | 574 | | 528 | | 610 | | 807 | | 1,076 | | 1,397 | | 2,406 | | 21.7 | |
BC Transmission Corporation | | — | | — | | — | | — | | — | | 21 | | 50 | | 70 | | 19 | | 12 | | n/a | |
Columbia River power projects | | 126 | | 118 | | 54 | | 100 | | 84 | | 30 | | 19 | | 29 | | 32 | | 16 | | -20.5 | |
Transportation Invest. Corp. (Port Mann) | | — | | ��� | | — | | — | | — | | — | | — | | — | | 215 | | 777 | | n/a | |
BC Railway Company | | 124 | | 78 | | 52 | | 33 | | 30 | | 15 | | 19 | | 20 | | 10 | | 14 | | -21.5 | |
ICBC | | 78 | | 107 | | 41 | | 26 | | 31 | | 27 | | 22 | | 23 | | 22 | | 22 | | -13.1 | |
BC Lotteries | | 13 | | 20 | | 30 | | 49 | | 93 | | 83 | | 44 | | 60 | | 97 | | 92 | | 24.3 | |
Liquor Distribution Branch | | 20 | | 37 | | 9 | | 1 | | 10 | | 19 | | 22 | | 18 | | 17 | | 19 | | -0.6 | |
| | 773 | | 891 | | 882 | | 783 | | 776 | | 805 | | 983 | | 1,296 | | 1,809 | | 3,358 | | 17.7 | |
Total capital spending | | 3,340 | | 2,986 | | 2,783 | | 2,857 | | 3,139 | | 3,958 | | 4,392 | | 4,968 | | 5,587 | | 7,112 | | 8.8 | |
| | | | | | | | | | | | | | | | | | | | | | | |
Per cent of GDP: (1) | | | | | | | | | | | | | | | | | | | | | | | |
Taxpayer-supported | | 2.0 | | 1.6 | | 1.4 | | 1.4 | | 1.5 | | 1.9 | | 1.9 | | 1.9 | | 1.9 | | 2.0 | | 0.2 | |
Self-supported | | 0.6 | | 0.7 | | 0.6 | | 0.5 | | 0.5 | | 0.5 | | 0.5 | | 0.7 | | 0.9 | | 1.8 | | 13.1 | |
Total | | 2.5 | | 2.2 | | 2.0 | | 2.0 | | 2.0 | | 2.3 | | 2.4 | | 2.6 | | 2.8 | | 3.8 | | 4.5 | |
Growth rates: | | | | | | | | | | | | | | | | | | | | | | | |
Taxpayer-supported | | 4.0 | | -18.4 | | -9.3 | | 9.1 | | 13.9 | | 33.4 | | 8.1 | | 7.7 | | 2.9 | | -0.6 | | 5.1 | |
Self-supported | | 8.3 | | 15.3 | | -1.0 | | -11.2 | | -0.9 | | 3.7 | | 22.1 | | 31.8 | | 39.6 | | 85.6 | | 19.3 | |
Total | | 5.0 | | -10.6 | | -6.8 | | 2.7 | | 9.9 | | 26.1 | | 11.0 | | 13.1 | | 12.5 | | 27.3 | | 9.0 | |
Per capita: (2) | | | | | | | | | | | | | | | | | | | | | | | |
Taxpayer-supported | | 636 | | 514 | | 464 | | 503 | | 569 | | 751 | | 803 | | 852 | | 862 | | 843 | | 3.2 | |
Self-supported | | 191 | | 219 | | 215 | | 190 | | 187 | | 192 | | 232 | | 301 | | 413 | | 754 | | 16.5 | |
Total | | 827 | | 733 | | 679 | | 693 | | 755 | | 943 | | 1,035 | | 1,153 | | 1,274 | | 1,596 | | 7.6 | |
| | | | | | | | | | | | | | | | | | | | | | | |
Real Per Capita Capital Spending (2009 $) (3) | | 966 | | 842 | | 763 | | 762 | | 814 | | 996 | | 1,075 | | 1,177 | | 1,274 | | 1,596 | | 5.7 | |
Growth rate (per cent) | | 2.4 | | -12.9 | | -9.4 | | -0.1 | | 6.9 | | 22.4 | | 7.9 | | 9.5 | | 8.3 | | 25.3 | | 6.0 | |
(1) Capital spending as a per cent of GDP is calculated using GDP for the calendar year ending in the fiscal year (e.g. 2009/10 amounts divided by GDP for the 2009 calendar year). Totals may not add due to rounding.
(2) Per capita capital spending is calculated using July 1 population (e.g. 2009/10 amounts divided by population on July 1, 2009). Totals may not add due to rounding.
(3) Capital spending is converted to real (inflation-adjusted) terms using the consumer price index (CPI) for the corresponding calendar year (e.g. 2009 CPI for 2009/10 capital spending).
2010 Financial and Economic Review — July 2010
77
Appendix 2 – Financial Review
Table A2.11 Provincial Debt — 2000/01 to 2009/10
| | Actual | | Actual | | Actual | | Actual | | Actual | | Actual | | Actual | | Actual | | Actual | | Actual | | Average
annual | |
($ millions) | | 2000/01 | | 2001/02 | | 2002/03 | | 2003/04 | | 2004/05 | | 2005/06 | | 2006/07 | | 2007/08 | | 2008/09 | | 2009/10 | | change | |
| | | | | | | | | | | | | | | | | | | | | | (per cent) | |
Taxpayer-supported debt: | | | | | | | | | | | | | | | | | | | | | | | |
Provincial government operating | | 11,260 | | 12,811 | | 14,315 | | 14,340 | | 12,894 | | 9,952 | | 6,928 | | 5,330 | | 3,048 | | 4,663 | | -9.3 | |
Provincial government general capital | | 318 | | 508 | | 642 | | 840 | | 1,075 | | 1,391 | | 1,961 | | 2,274 | | 2,696 | | 2,696 | | 26.8 | |
Provincial government direct operating | | 11,578 | | 13,319 | | 14,957 | | 15,180 | | 13,969 | | 11,343 | | 8,889 | | 7,604 | | 5,744 | | 7,359 | | -4.9 | |
Other taxpayer-supported debt (mainly capital): | | | | | | | | | | | | | | | | | �� | | | | | | |
Education facilities | | | | | | | | | | | | | | | | | | | | | | | |
Schools | | 4,111 | | 4,341 | | 4,562 | | 4,649 | | 4,737 | | 4,860 | | 5,013 | | 5,216 | | 5,522 | | 5,777 | | 3.9 | |
Post-secondary institutions | | 1,626 | | 1,785 | | 1,842 | | 2,190 | | 2,398 | | 2,772 | | 3,024 | | 3,437 | | 3,626 | | 3,843 | | 10.0 | |
| | 5,737 | | 6,126 | | 6,404 | | 6,839 | | 7,135 | | 7,632 | | 8,037 | | 8,653 | | 9,148 | | 9,620 | | 5.9 | |
Health facilities | | 2,028 | | 2,186 | | 2,265 | | 2,343 | | 2,253 | | 2,635 | | 3,053 | | 3,511 | | 3,936 | | 4,389 | | 9.0 | |
Highways, ferries and public transit | | | | | | | | | | | | | | | | | | | | | | | |
BC Transportation Financing Authority | | 2,197 | | 2,514 | | 2,661 | | 2,764 | | 2,474 | | 2,699 | | 3,237 | | 3,948 | | 4,586 | | 5,211 | | 10.1 | |
SkyTrain extension | | 836 | | 1,044 | | 1,105 | | 1,119 | | 1,135 | | 1,145 | | 1,153 | | 1,153 | | 1,154 | | 1,154 | | 3.6 | |
Public transit | | 991 | | 982 | | 979 | | 965 | | 957 | | 959 | | 950 | | 958 | | 997 | | 997 | | 0.1 | |
BC Transit | | 75 | | 79 | | 87 | | 83 | | 78 | | 80 | | 96 | | 84 | | 94 | | 140 | | 7.2 | |
Rapid Transit Project 2000 Ltd | | 114 | | 47 | | 3 | | — | | — | | — | | — | | — | | — | | — | | n/a | |
BC Ferries | | 21 | | 19 | | — | | — | | — | | — | | — | | — | | — | | — | | n/a | |
| | 4,234 | | 4,685 | | 4,835 | | 4,931 | | 4,644 | | 4,883 | | 5,436 | | 6,143 | | 6,831 | | 7,502 | | 6.6 | |
Other | | | | | | | | | | | | | | | | | | | | | | | |
Social Housing | | 265 | | 299 | | 161 | | 156 | | 133 | | 189 | | 216 | | 218 | | 286 | | 305 | | 1.6 | |
Provincial government general capital | | — | | — | | — | | — | | — | | — | | — | | — | | — | | 294 | | n/a | |
BC Immigration Investment Fund | | — | | 9 | | 18 | | 29 | | 88 | | 148 | | 167 | | 256 | | 287 | | 289 | | n/a | |
Homeowner Protection Office | | 71 | | 113 | | 123 | | 129 | | 130 | | 110 | | 110 | | 136 | | 150 | | 144 | | 8.2 | |
BC Pavilion Corporation | | — | | — | | — | | — | | — | | — | | — | | — | | — | | 49 | | n/a | |
BC Buildings | | 610 | | 596 | | 456 | | 317 | | 241 | | 246 | | — | | — | | — | | — | | n/a | |
552513 BC Ltd. (Skeena Cellulose) | | 337 | | — | | — | | — | | — | | — | | — | | — | | — | | — | | n/a | |
Other | | 244 | | 181 | | 164 | | 90 | | 75 | | 65 | | 60 | | 68 | | 64 | | 70 | | -13.0 | |
| | 1,527 | | 1,198 | | 922 | | 721 | | 667 | | 758 | | 553 | | 678 | | 787 | | 1,151 | | -3.1 | |
Total other taxpayer-supported debt | | 13,526 | | 14,195 | | 14,426 | | 14,834 | | 14,699 | | 15,908 | | 17,079 | | 18,985 | | 20,702 | | 22,662 | | 5.9 | |
Total taxpayer-supported debt | | 25,104 | | 27,514 | | 29,383 | | 30,014 | | 28,668 | | 27,251 | | 25,968 | | 26,589 | | 26,446 | | 30,021 | | 2.0 | |
| | | | | | | | | | | | | | | | | | | | | | | |
Self-supported debt: | | | | | | | | | | | | | | | | | | | | | | | |
Commercial Crown corporations and agencies | | | | | | | | | | | | | | | | | | | | | | | |
BC Hydro | | 6,649 | | 6,670 | | 6,784 | | 7,040 | | 6,906 | | 6,892 | | 7,144 | | 7,633 | | 9,054 | | 10,792 | | 5.5 | |
Transportation Invest. Corp. (Port Mann) | | — | | — | | — | | — | | — | | — | | — | | — | | 20 | | 544 | | n/a | |
Post-secondary institutions’ subsidiaries | | 5 | | 20 | | 22 | | 22 | | 32 | | 32 | | 58 | | 115 | | 134 | | 201 | | 50.7 | |
Columbia River power projects | | 113 | | 184 | | 165 | | 215 | | 257 | | 247 | | 236 | | 219 | | 208 | | 196 | | 6.3 | |
BC Transmission Corporation | | — | | — | | — | | — | | — | | 30 | | 30 | | 79 | | 70 | | 70 | | n/a | |
BC Lotteries | | — | | — | | — | | — | | — | | — | | — | | — | | — | | 60 | | n/a | |
Liquor Distribution Branch | | 2 | | 13 | | 9 | | 7 | | 6 | | 5 | | 3 | | 2 | | 1 | | 1 | | -7.4 | |
BC Rail . | | 603 | | 614 | | 494 | | 477 | | — | | — | | — | | — | | — | | — | | n/a | |
| | 7,372 | | 7,501 | | 7,474 | | 7,761 | | 7,201 | | 7,206 | | 7,471 | | 8,048 | | 9,487 | | 11,864 | | 5.4 | |
Warehouse borrowing program | | 1,312 | | 1,067 | | — | | — | | — | | — | | — | | — | | 2,081 | | — | | n/a | |
Total self-supported debt | | 8,684 | | 8,568 | | 7,474 | | 7,761 | | 7,201 | | 7,206 | | 7,471 | | 8,048 | | 11,568 | | 11,864 | | 3.5 | |
Total provincial debt | | 33,788 | | 36,082 | | 36,857 | | 37,775 | | 35,869 | | 34,457 | | 33,439 | | 34,637 | | 38,014 | | 41,885 | | 2.4 | |
2010 Financial and Economic Review – July 2010
78
Appendix 2 – Financial Review
Table A2.12 Provincial Debt Supplementary Information — 2000/01 to 2009/10
| | Actual | | Actual | | Actual | | Actual | | Actual | | Actual | | Actual | | Actual | | Actual | | Actual | | Average
annual | |
($ millions) | | 2000/01 | | 2001/02 | | 2002/03 | | 2003/04 | | 2004/05 | | 2005/06 | | 2006/07 | | 2007/08 | | 2008/09 | | 2009/10 | | change | |
| | | | | | | | | | | | | | | | | | | | | | (per cent) | |
Per cent of GDP: (1) | | | | | | | | | | | | | | | | | | | | | | | |
Taxpayer-supported debt: | | | | | | | | | | | | | | | | | | | | | | | |
Provincial government direct operating | | 8.8 | | 10.0 | | 10.8 | | 10.4 | | 8.9 | | 6.7 | | 4.9 | | 4.0 | | 2.9 | | 3.9 | | -8.6 | |
Education facilities | | 4.4 | | 4.6 | | 4.6 | | 4.7 | | 4.5 | | 4.5 | | 4.4 | | 4.5 | | 4.6 | | 5.1 | | 1.8 | |
Health facilities | | 1.5 | | 1.6 | | 1.6 | | 1.6 | | 1.4 | | 1.6 | | 1.7 | | 1.8 | | 2.0 | | 2.3 | | 4.7 | |
Highways, ferries and public transit | | 3.2 | | 3.5 | | 3.5 | | 3.4 | | 2.9 | | 2.9 | | 3.0 | | 3.2 | | 3.5 | | 4.0 | | 2.4 | |
Other | | 1.2 | | 0.9 | | 0.7 | | 0.5 | | 0.4 | | 0.4 | | 0.3 | | 0.4 | | 0.4 | | 0.6 | | -6.9 | |
Total taxpayer-supported debt | | 19.1 | | 20.6 | | 21.3 | | 20.6 | | 18.2 | | 16.1 | | 14.2 | | 13.9 | | 13.4 | | 16.0 | | -2.0 | |
Self-supported debt: | | | | | | | | | | | | | | | | | | | | | | | |
Commercial Crown corporations & agencies | | 5.6 | | 5.6 | | 5.4 | | 5.3 | | 4.6 | | 4.2 | | 4.1 | | 4.2 | | 4.8 | | 6.3 | | 1.3 | |
Warehouse borrowing program | | 1.0 | | 0.8 | | — | | — | | — | | — | | — | | — | | 1.1 | | — | | n/a | |
Total self-supported debt | | 6.6 | | 6.4 | | 5.4 | | 5.3 | | 4.6 | | 4.2 | | 4.1 | | 4.2 | | 5.8 | | 6.3 | | -0.5 | |
Total provincial debt | | 25.7 | | 27.0 | | 26.7 | | 25.9 | | 22.7 | | 20.3 | | 18.3 | | 18.1 | | 19.2 | | 22.3 | | -1.6 | |
Growth rates: | | | | | | | | | | | | | | | | | | | | | | | |
Taxpayer-supported debt: | | | | | | | | | | | | | | | | | | | | | | | |
Provincial government direct operating | | -12.9 | | 15.0 | | 12.3 | | 1.5 | | -8.0 | | -18.8 | | -21.6 | | -14.5 | | -24.5 | | 28.1 | | -4.3 | |
Education facilities | | 5.7 | | 6.8 | | 4.5 | | 6.8 | | 4.3 | | 7.0 | | 5.3 | | 7.7 | | 5.7 | | 5.2 | | 5.9 | |
Health facilities | | 20.8 | | 7.8 | | 3.6 | | 3.4 | | -3.8 | | 17.0 | | 15.9 | | 15.0 | | 12.1 | | 11.5 | | 10.3 | |
Highways, ferries and public transit | | 20.0 | | 10.7 | | 3.2 | | 2.0 | | -5.8 | | 5.1 | | 11.3 | | 13.0 | | 11.2 | | 9.8 | | 8.1 | |
Other | | 19.7 | | -21.5 | | -23.0 | | -21.8 | | -7.5 | | 13.6 | | -27.0 | | 22.6 | | 16.1 | | 46.3 | | 1.7 | |
Total taxpayer-supported debt | | -0.4 | | 9.6 | | 6.8 | | 2.1 | | -4.5 | | -4.9 | | -4.7 | | 2.4 | | -0.5 | | 13.5 | | 1.9 | |
Self-supported debt: | | | | | | | | | | | | | | | | | | | | | | | |
Commercial Crown corporations & agencies | | -6.8 | | 1.7 | | -0.4 | | 3.8 | | -7.2 | | 0.1 | | 3.7 | | 7.7 | | 17.9 | | 25.1 | | 4.6 | |
Warehouse borrowing program | | -0.6 | | -18.7 | | -100.0 | | — | | — | | — | | — | | — | | — | | -100.0 | | n/a | |
Total self-supported debt | | -5.9 | | -1.3 | | -12.8 | | 3.8 | | -7.2 | | 0.1 | | 3.7 | | 7.7 | | 43.7 | | 2.6 | | 3.4 | |
Total provincial debt | | -1.9 | | 6.8 | | 2.1 | | 2.5 | | -5.0 | | -3.9 | | -3.0 | | 3.6 | | 9.7 | | 10.2 | | 2.1 | |
Per capita: (2) | | | | | | | | | | | | | | | | | | | | | | | |
Taxpayer-supported debt: | | | | | | | | | | | | | | | | | | | | | | | |
Provincial government direct operating | | 2,866 | | 3,267 | | 3,650 | | 3,682 | | 3,362 | | 2,703 | | 2,095 | | 1,764 | | 1,310 | | 1,652 | | -5.9 | |
Education facilities | | 1,420 | | 1,503 | | 1,563 | | 1,659 | | 1,717 | | 1,819 | | 1,894 | | 2,008 | | 2,087 | | 2,159 | | 4.8 | |
Health facilities | | 502 | | 536 | | 553 | | 568 | | 542 | | 628 | | 719 | | 815 | | 898 | | 985 | | 7.8 | |
Highways, ferries and public transit | | 1,048 | | 1,149 | | 1,180 | | 1,196 | | 1,118 | | 1,164 | | 1,281 | | 1,425 | | 1,558 | | 1,684 | | 5.4 | |
Other | | 378 | | 294 | | 225 | | 175 | | 161 | | 181 | | 130 | | 157 | | 180 | | 258 | | -4.2 | |
Total taxpayer-supported debt | | 6,215 | | 6,750 | | 7,170 | | 7,281 | | 6,899 | | 6,493 | | 6,119 | | 6,170 | | 6,033 | | 6,738 | | 0.9 | |
Self-supported debt: | | | | | | | | | | | | | | | | | | | | | | | |
Commercial Crown corporations & agencies | | 1,825 | | 1,840 | | 1,824 | | 1,883 | | 1,733 | | 1,717 | | 1,761 | | 1,868 | | 2,164 | | 2,663 | | 4.3 | |
Warehouse borrowing program | | 325 | | 262 | | — | | — | | — | | — | | — | | — | | 475 | | — | | n/a | |
Total self-supported debt | | 2,150 | | 2,102 | | 1,824 | | 1,883 | | 1,733 | | 1,717 | | 1,761 | | 1,868 | | 2,639 | | 2,663 | | 2.4 | |
Total provincial debt | | 8,365 | | 8,852 | | 8,994 | | 9,163 | | 8,632 | | 8,210 | | 7,880 | | 8,037 | | 8,671 | | 9,401 | | 1.3 | |
Real Per Capita Provincial Debt (2009 $) (3) | | 9,775 | | 10,175 | | 10,100 | | 10,069 | | 9,303 | | 8,674 | | 8,186 | | 8,206 | | 8,671 | | 9,401 | | -0.4 | |
Growth rate (per cent) | | -4.3 | | 4.1 | | -0.7 | | -0.3 | | -7.6 | | -6.8 | | -5.6 | | 0.2 | | 5.7 | | 8.4 | | -0.7 | |
(1) Debt as a per cent of GDP is calculated using GDP for the calendar year ending in the fiscal year (e.g. 2009/10 debt divided by GDP for the 2009 calendar year). Totals may not add due to rounding.
(2) Per capita debt is calculated using July 1 population (e.g. 2009/10 debt divided by population on July 1, 2009). Totals may not add due to rounding.
(3) Debt is converted to real (inflation-adjusted) terms using the consumer price index (CPI) for the corresponding calendar year (e.g. 2009 CPI for 2009/10 debt).
2010 Financial and Economic Review – July 2010
79
Appendix 2 – Financial Review
Table A2.13 Historical Provincial Debt Summary (1)
| | Taxpayer-Supported Debt | | | | | | | | | |
Year | | Provincial
Government
Direct
Operating | | Education
Facilities
Capital
Financing | | Health
Facilities
Capital
Financing | | Highways,
Ferries and
Public Transit | | Other (2) | | Total
Taxpayer-
Supported
Debt | | Self
Supported
Debt (3) | | Total
Provincial
Debt | | Total Debt
as a Per
Cent of GDP | | Taxpayer-
Supported
Debt as a Per
Cent of GDP | |
| | | | | | | | | | (millions) | | | | | | | | (per cent) | |
1969/70 | | — | | 338 | | 42 | | 142 | | 100 | | 622 | | 1,661 | | 2,283 | | 24.7 | | 6.7 | |
1970/71 | | — | | 362 | | 64 | | 172 | | 99 | | 697 | | 1,808 | | 2,505 | | 25.6 | | 7.1 | |
1971/72 | | — | | 380 | | 85 | | 233 | | 95 | | 793 | | 1,948 | | 2,741 | | 24.9 | | 7.2 | |
1972/73 | | — | | 408 | | 105 | | 288 | | 87 | | 888 | | 2,062 | | 2,950 | | 23.8 | | 7.2 | |
1973/74 | | — | | 425 | | 117 | | 340 | | 145 | | 1,027 | | 2,228 | | 3,255 | | 21.1 | | 6.7 | |
1974/75 | | — | | 485 | | 133 | | 386 | | 149 | | 1,153 | | 2,650 | | 3,803 | | 21.3 | | 6.5 | |
1975/76 | | — | | 557 | | 178 | | 544 | | 145 | | 1,424 | | 3,144 | | 4,568 | | 23.1 | | 7.2 | |
1976/77 | | 261 | | 658 | | 236 | | 649 | | 188 | | 1,992 | | 3,787 | | 5,779 | | 24.4 | | 8.4 | |
1977/78 | | 261 | | 710 | | 291 | | 656 | | 215 | | 2,133 | | 4,464 | | 6,597 | | 24.9 | | 8.1 | |
1978/79 | | 261 | | 778 | | 334 | | 653 | | 91 | | 2,117 | | 4,838 | | 6,955 | | 23.3 | | 7.1 | |
1979/80 | | 235 | | 836 | | 401 | | 730 | | 195 | | 2,397 | | 5,704 | | 8,101 | | 23.3 | | 6.9 | |
1980/81 | | 209 | | 919 | | 461 | | 729 | | 270 | | 2,588 | | 5,956 | | 8,544 | | 21.6 | | 6.5 | |
1981/82 | | 183 | | 1,067 | | 561 | | 844 | | 291 | | 2,946 | | 7,227 | | 10,173 | | 22.7 | | 6.6 | |
1982/83 | | 883 | | 1,204 | | 660 | | 1,024 | | 894 | | 4,665 | | 7,692 | | 12,357 | | 27.4 | | 10.4 | |
1983/84 | | 1,596 | | 1,321 | | 712 | | 1,392 | | 1,174 | | 6,195 | | 8,440 | | 14,635 | | 30.8 | | 13.0 | |
1984/85 | | 2,476 | | 1,308 | | 717 | | 691 | | 1,276 | | 6,468 | | 9,082 | | 15,550 | | 31.2 | | 13.0 | |
1985/86 | | 3,197 | | 1,276 | | 680 | | 1,034 | | 1,376 | | 7,563 | | 8,990 | | 16,553 | | 30.9 | | 14.1 | |
1986/87 | | 4,802 | | 1,268 | | 681 | | 1,097 | | 812 | | 8,660 | | 8,485 | | 17,145 | | 30.3 | | 15.3 | |
1987/88 | | 5,017 | | 1,278 | | 716 | | 1,192 | | 660 | | 8,863 | | 8,149 | | 17,012 | | 27.2 | | 14.2 | |
1988/89 | | 4,919 | | 1,322 | | 763 | | 1,213 | | 842 | | 9,059 | | 7,396 | | 16,455 | | 23.7 | | 13.1 | |
1989/90 | | 4,209 | | 1,367 | | 837 | | 1,244 | | 1,262 | | 8,919 | | 7,340 | | 16,259 | | 21.5 | | 11.8 | |
1990/91 | | 4,726 | | 1,565 | | 959 | | 1,287 | | 1,281 | | 9,818 | | 7,444 | | 17,262 | | 21.8 | | 12.4 | |
1991/92 | | 6,611 | | 1,939 | | 1,040 | | 1,527 | | 1,431 | | 12,548 | | 7,493 | | 20,041 | | 24.5 | | 15.3 | |
1992/93 | | 8,969 | | 2,426 | | 1,141 | | 1,719 | | 1,641 | | 15,896 | | 7,526 | | 23,422 | | 26.8 | | 18.2 | |
1993/94 | | 10,257 | | 3,054 | | 1,181 | | 1,862 | | 1,627 | | 17,981 | | 7,946 | | 25,927 | | 27.6 | | 19.1 | |
1994/95 | | 10,181 | | 3,631 | | 1,318 | | 2,158 | | 1,749 | | 19,037 | | 8,013 | | 27,050 | | 26.9 | | 18.9 | |
1995/96 | | 10,237 | | 3,990 | | 1,399 | | 2,598 | | 1,695 | | 19,919 | | 8,847 | | 28,766 | | 27.2 | | 18.9 | |
1996/97 | | 11,030 | | 4,230 | | 1,431 | | 3,144 | | 1,440 | | 21,275 | | 8,096 | | 29,371 | | 27.0 | | 19.5 | |
1997/98 | | 11,488 | | 4,352 | | 1,417 | | 3,463 | | 1,431 | | 22,151 | | 8,204 | | 30,355 | | 26.5 | | 19.4 | |
Information from 1998/99 onwards has been restated to include the SUCH sector and re-allocation of sinking fund. (4) | |
1998/99 | | 11,707 | | 5,023 | | 1,494 | | 3,678 | | 1,330 | | 23,232 | | 8,910 | | 32,142 | | 27.8 | | 20.1 | |
1999/2000 | | 13,295 | | 5,429 | | 1,679 | | 3,527 | | 1,276 | | 25,206 | | 9,232 | | 34,438 | | 28.5 | | 20.8 | |
2000/01 | | 11,578 | | 5,737 | | 2,028 | | 4,234 | | 1,527 | | 25,104 | | 8,684 | | 33,788 | | 25.7 | | 19.1 | |
2001/02 | | 13,319 | | 6,126 | | 2,186 | | 4,685 | | 1,198 | | 27,514 | | 8,568 | | 36,082 | | 27.0 | | 20.6 | |
2002/03 | | 14,957 | | 6,404 | | 2,265 | | 4,835 | | 922 | | 29,383 | | 7,474 | | 36,857 | | 26.7 | | 21.3 | |
2003/04 | | 15,180 | | 6,839 | | 2,343 | | 4,931 | | 721 | | 30,014 | | 7,761 | | 37,775 | | 25.9 | | 20.6 | |
2004/05 | | 13,969 | | 7,135 | | 2,253 | | 4,644 | | 667 | | 28,668 | | 7,201 | | 35,869 | | 22.7 | | 18.2 | |
2005/06 | | 11,343 | | 7,632 | | 2,635 | | 4,883 | | 758 | | 27,251 | | 7,206 | | 34,457 | | 20.3 | | 16.1 | |
2006/07 | | 8,889 | | 8,037 | | 3,053 | | 5,436 | | 553 | | 25,968 | | 7,471 | | 33,439 | | 18.3 | | 14.2 | |
2007/08 | | 7,604 | | 8,653 | | 3,511 | | 6,143 | | 678 | | 26,589 | | 8,048 | | 34,637 | | 18.1 | | 13.9 | |
2008/09 | | 5,744 | | 9,148 | | 3,936 | | 6,831 | | 787 | | 26,446 | | 11,568 | | 38,014 | | 19.2 | | 13.4 | |
2009/10 | | 7,359 | | 9,620 | | 4,389 | | 7,502 | | 1,151 | | 30,021 | | 11,864 | | 41,885 | | 22.3 | | 16.0 | |
(1) Debt is after deduction of sinking funds, unamortized discounts and unrealized foreign exchange gains/(losses), and excludes accrued interest. Government direct and fiscal agency debt accrued interest is reported in the government’s accounts as an accounts payable. Figures for 1998/99 onwards have been restated to conform with the presentation used for 2006 and to reflect changes in underlying data.
(2) Includes BC Buildings, BC Housing Management Commission, Provincial Rental Housing Corporation, other taxpayer-supported Crown agencies, and loan guarantee provisions.
(3) Includes commercial Crown corporations and agencies and funds held under the province’s warehouse borrowing program.
(4) In 2009/10, sinking funds for government debt related to schools, post-secondary education, health care and public transit were liquidated and the proceeds ($763 million) used to offset direct operating borrowings requirements. Figures for prior years have been restated to reflect this decision.
2010 Financial and Economic Review – July 2010
80
Appendix 2 – Financial Review
Consolidated Revenue Fund Schedules
Chapter 2 and the previous Appendix 2 information provided summary financial information of the government of British Columbia according to generally accepted accounting principles. The presentation combined the financial results of all government entities (ministries, service delivery agencies, the SUCH sector and commercial Crown corporations) into one set of financial information.
The following tables provide financial information on the government’s consolidated revenue fund (i.e. money over which the legislature has direct power of appropriation).
Table A2.14 Historical Operating Statement Surplus (Deficit)
| | Consolidated Revenue Fund | | Crown
Corporations
and | | SUCH
Sector &
Regional | | Other | | Surplus | | Surplus
(Deficit)
as a Per Cent | |
($ millions) | | Revenue | | Expenditure | | Balance | | Agencies | | Authorities | | Adjustments | | (Deficit) (1) | | of GDP | |
1969/70 | | 1,248 | | 1,244 | | 4 | | — | | — | | — | | — | | 0.0 | |
1970/71 | | 1,373 | | 1,274 | | 99 | | — | | — | | — | | — | | 1.0 | |
1971/72 | | 1,558 | | 1,474 | | 84 | | — | | — | | — | | — | | 0.8 | |
1972/73 | | 1,772 | | 1,675 | | 97 | | | | — | | — | | — | | 0.8 | |
1973/74 | | 2,217 | | 2,071 | | 146 | | — | | — | | — | | — | | 0.9 | |
1974/75 | | 2,769 | | 2,779 | | (10 | ) | — | | — | | — | | — | | (0.1 | ) |
1975/76 | | 3,124 | | 3,534 | | (410 | ) | — | | — | | — | | — | | (2.1 | ) |
1976/77 | | 3,785 | | 3,691 | | 94 | | — | | — | | — | | — | | 0.4 | |
1977/78 | | 4,372 | | 4,168 | | 204 | | — | | — | | — | | — | | 0.8 | |
1978/79 | | 4,853 | | 4,582 | | 271 | | — | | — | | — | | — | | 0.9 | |
1979/80 (1) | | 5,860 | | 5,318 | | 542 | | (88 | ) | — | | — | | 454 | | 1.3 | |
1980/81 | | 5,982 | | 6,239 | | (257 | ) | 45 | | — | | — | | (212 | ) | (0.5 | ) |
1981/82 | | 7,139 | | 7,323 | | (184 | ) | 43 | | — | | — | | (141 | ) | (0.3 | ) |
1982/83 | | 7,678 | | 8,662 | | (984 | ) | (257 | ) | — | | — | | (1,241 | ) | (2.8 | ) |
1983/84 | | 8,335 | | 9,347 | | (1,012 | ) | 49 | | — | | — | | (963 | ) | (2.0 | ) |
1984/85 | | 8,807 | | 9,801 | | (994 | ) | 172 | | — | | — | | (822 | ) | (1.6 | ) |
1985/86 | | 9,160 | | 10,127 | | (967 | ) | 110 | | — | | — | | (857 | ) | (1.6 | ) |
1986/87 | | 9,463 | | 10,624 | | (1,161 | ) | 526 | | — | | — | | (635 | ) | (1.1 | ) |
1987/88 | | 11,007 | | 11,055 | | (48 | ) | 119 | | — | | — | | 71 | | 0.1 | |
1988/89 | | 12,570 | | 11,834 | | 736 | | 194 | | — | | — | | 930 | | 1.3 | |
1989/90 | | 13,656 | | 13,200 | | 456 | | 40 | | — | | — | | 496 | | 0.7 | |
1990/91 | | 14,236 | | 15,010 | | (774 | ) | 107 | | — | | — | | (667 | ) | (0.8 | ) |
1991/92 | | 14,570 | | 17,101 | | (2,531 | ) | 192 | | — | | — | | (2,339 | ) | (2.9 | ) |
1992/93 | | 16,172 | | 17,858 | | (1,686 | ) | 210 | | — | | — | | (1,476 | ) | (1.7 | ) |
1993/94 | | 17,923 | | 18,833 | | (910 | ) | 11 | | — | | — | | (899 | ) | (1.0 | ) |
1994/95 | | 19,506 | | 19,953 | | (447 | ) | 219 | | — | | — | | (228 | ) | (0.2 | ) |
1995/96 | | 19,698 | | 20,054 | | (356 | ) | 38 | | — | | — | | (318 | ) | (0.3 | ) |
1996/97 | | 20,126 | | 20,241 | | (115 | ) | (270 | ) | — | | — | | (385 | ) | (0.4 | ) |
1997/98 | | 20,216 | | 20,135 | | 81 | | (248 | ) | — | | — | | (167 | ) | (0.1 | ) |
1998/99 | | 20,312 | | 20,528 | | (216 | ) | (689 | ) | (56 | ) | — | | (961 | ) | (0.8 | ) |
1999/2000 | | 21,836 | | 22,161 | | (325 | ) | 345 | | (40 | ) | — | | (20 | ) | 0.0 | |
2000/01 | | 23,727 | | 22,444 | | 1,283 | | (171 | ) | 138 | | (52 | )(3) | 1,198 | | 0.9 | |
2001/02 | | 22,701 | | 24,669 | | (1,968 | )(2) | (711 | )(2) | 180 | | 1,464 | (3) | (1,035 | ) | (0.8 | ) |
2002/03 | | 21,995 | | 24,941 | | (2,946 | ) | (216 | ) | 541 | | — | | (2,621 | ) | (1.9 | ) |
2003/04 | | 23,175 | | 25,246 | | (2,071 | ) | 341 | | 382 | | — | | (1,348 | ) | (0.9 | ) |
2004/05 | | 27,295 | | 26,040 | | 1,255 | | 1,035 | | 399 | | — | | 2,689 | | 1.7 | |
2005/06 | | 29,460 | | 26,907 | | 2,553 | | 550 | | 602 | | (710 | )(4) | 2,995 | | 1.8 | |
2006/07 | | 31,206 | | 28,210 | | 2,996 | | 841 | | 413 | | (264 | )(4) | 3,986 | | 2.2 | |
2007/08 | | 31,982 | | 30,233 | | 1,749 | | 997 | | 471 | | (444 | )(4),(5) | 2,773 | | 1.4 | |
2008/09 | | 30,471 | | 31,578 | | (1,107 | ) | 1,021 | | 143 | | 18 | (4),(5) | 75 | | 0.0 | |
2009/10 | | 28,570 | | 31,723 | | (3,153 | ) | 860 | | 514 | | — | | (1,779 | ) | (0.9 | ) |
(1) The provincial government began publishing summary financial statements in 1979/80. Figures for prior years are unavailable. For 1969/70 to 1978/79, the CRF balance is used in place of the summary accounts surplus/(deficit).
(2) Does not include the $256 million transfer to the CRF for the wind-up of Forest Renewal BC and Fisheries Renewal BC.
(3) Impact of move to joint trusteeship for public service pension plans.
(4) Negotiating framework incentive payments.
(5) Climate Action Dividend.
2010 Financial and Economic Review – July 2010
81
Appendix 2 – Financial Review
Table A2.15 Historical Revenue by Source — Consolidated Revenue Fund (1)
| | | | | | | | | | | | | | | | | | Contributions from | | Contributions from | | | |
| | Taxation | | Natural Resources | | Fees and Licences | | Other Revenue | | Crown Corporations | | the Federal Government | | Total | |
| | | | % of Total | | | | % of Total | | | | % of Total | | | | % of Total | | | | % of Total | | | | % of Total | | | |
Year | | ($ millions) | | Revenue | | ($ millions) | | Revenue | | ($ millions) | | Revenue | | ($ millions) | | Revenue | | ($ millions) | | Revenue | | ($ millions) | | Revenue | | ($ millions) | |
1984/85 | | 5,015 | | 56.9 | | 721 | | 8.2 | | 617 | | 7.0 | | 185 | | 2.1 | | 444 | | 5.0 | | 1,825 | | 20.7 | | 8,807 | |
1985/86 | | 5,237 | | 57.2 | | 704 | | 7.7 | | 638 | | 7.0 | | 222 | | 2.4 | | 503 | | 5.5 | | 1,856 | | 20.3 | | 9,160 | |
1986/87 | | 5,354 | | 56.6 | | 658 | | 7.0 | | 685 | | 7.2 | | 133 | | 1.4 | | 609 | | 6.4 | | 2,024 | | 21.4 | | 9,463 | |
1987/88 | | 6,200 | | 56.3 | | 1,223 | | 11.1 | | 728 | | 6.6 | | 167 | | 1.5 | | 635 | | 5.8 | | 2,054 | | 18.7 | | 11,007 | |
1988/89 | | 6,973 | | 55.5 | | 1,272 | | 10.1 | | 984 | | 7.8 | | 556 | | 4.4 | | 636 | | 5.1 | | 2,149 | | 17.1 | | 12,570 | |
1989/90 | | 8,095 | | 59.3 | | 1,249 | | 9.1 | | 1,096 | | 8.0 | | 368 | | 2.7 | | 727 | | 5.3 | | 2,121 | | 15.5 | | 13,656 | |
1990/91 | | 8,702 | | 61.1 | | 1,171 | | 8.2 | | 1,109 | | 7.8 | | 324 | | 2.3 | | 834 | | 5.9 | | 2,096 | | 14.7 | | 14,236 | |
1991/92 | | 8,997 | | 61.8 | | 1,101 | | 7.6 | | 1,247 | | 8.6 | | 326 | | 2.2 | | 701 | | 4.8 | | 2,198 | | 15.1 | | 14,570 | |
1992/93 | | 9,897 | | 61.2 | | 1,264 | | 7.8 | | 1,317 | | 8.1 | | 263 | | 1.6 | | 1,016 | | 6.3 | | 2,415 | | 14.9 | | 16,172 | |
1993/94 | | 11,101 | | 61.9 | | 1,772 | | 9.9 | | 1,382 | | 7.7 | | 351 | | 2.0 | | 1,048 | | 5.8 | | 2,269 | | 12.7 | | 17,923 | |
1994/95 | | 11,937 | | 61.2 | | 2,244 | | 11.5 | | 1,464 | | 7.5 | | 371 | | 1.9 | | 1,028 | | 5.3 | | 2,462 | | 12.6 | | 19,506 | |
1995/96 | | 12,509 | | 63.5 | | 2,026 | | 10.3 | | 1,450 | | 7.4 | | 351 | | 1.8 | | 968 | | 4.9 | | 2,394 | | 12.2 | | 19,698 | |
1996/97 | | 13,094 | | 65.1 | | 2,186 | | 10.9 | | 1,481 | | 7.4 | | 262 | | 1.3 | | 1,148 | | 5.7 | | 1,955 | | 9.7 | | 20,126 | |
1997/98 | | 13,103 | | 64.8 | | 2,197 | | 10.9 | | 1,500 | | 7.4 | | 299 | | 1.5 | | 1,280 | | 6.3 | | 1,837 | | 9.1 | | 20,216 | |
1998/99 | | 13,133 | | 64.7 | | 1,889 | | 9.3 | | 1,480 | | 7.3 | | 351 | | 1.7 | | 1,362 | | 6.7 | | 2,097 | | 10.3 | | 20,312 | |
1999/2000 | | 13,363 | | 61.2 | | 2,442 | | 11.2 | | 1,538 | | 7.0 | | 352 | | 1.6 | | 1,454 | | 6.7 | | 2,687 | | 12.3 | | 21,836 | |
2000/01 | | 13,881 | | 58.5 | | 3,732 | | 15.7 | | 1,520 | | 6.4 | | 343 | | 1.4 | | 1,500 | | 6.3 | | 2,751 | | 11.6 | | 23,727 | |
2001/02 | | 13,652 | | 60.1 | | 3,001 | | 13.2 | | 1,543 | | 6.8 | | 333 | | 1.5 | | 1,437 | | 6.3 | | 2,735 | | 12.0 | | 22,701 | |
2002/03 | | 11,846 | | 53.9 | | 3,192 | | 14.5 | | 1,941 | | 8.8 | | 223 | | 1.0 | | 1,517 | | 6.9 | | 3,276 | | 14.9 | | 21,995 | |
2003/04 | | 13,241 | | 57.1 | | 3,257 | | 14.1 | | 2,026 | | 8.7 | | 293 | | 1.3 | | 1,371 | | 5.9 | | 2,987 | | 12.9 | | 23,175 | |
2004/05 | | 14,284 | | 52.3 | | 3,924 | | 14.4 | | 2,166 | | 7.9 | | 260 | | 1.0 | | 2,099 | | 7.7 | | 4,562 | | 16.7 | | 27,295 | |
2005/06 | | 15,812 | | 53.7 | | 4,508 | | 15.3 | | 2,137 | | 7.3 | | 251 | | 0.9 | | 1,732 | | 5.9 | | 5,020 | | 17.0 | | 29,460 | |
2006/07 | | 17,373 | | 55.7 | | 3,903 | | 12.5 | | 2,259 | | 7.2 | | 346 | | 1.1 | | 1,941 | | 6.2 | | 5,384 | | 17.3 | | 31,206 | |
2007/08 | | 18,758 | | 58.7 | | 3,699 | | 11.6 | | 2,284 | | 7.1 | | 319 | | 1.0 | | 1,972 | | 6.2 | | 4,950 | | 15.5 | | 31,982 | |
2008/09 | | 17,511 | | 57.5 | | 3,760 | | 12.3 | | 2,264 | | 7.4 | | 285 | | 0.9 | | 1,720 | | 5.6 | | 4,931 | | 16.2 | | 30,471 | |
2009/10 | | 16,417 | | 57.5 | | 2,560 | | 9.0 | | 2,286 | | 8.0 | | 187 | | 0.7 | | 1,771 | | 6.2 | | 5,349 | | 18.7 | | 28,570 | |
(1) Revenue has been restated to reflect the government’s accounting policy at March 31, 2010. Figures exclude dedicated revenue collected on behalf of, and transferred to, Crown corporations and agencies. These revenues are included as part of the operations of the Crown corporations and agencies. Figures are based on Public Accounts information. Figures also exclude liquidation dividends.
2010 Financial and Economic Review – July 2010
82
Appendix 2 – Financial Review
Table A2.16 Historical Revenue by Source — Consolidated Revenue Fund Supplementary Information (1)
| | | | | | | | | | | | | | | | | | Contributions from | | Contributions from | | | | | |
| | Taxation | | Natural Resources | | Fees and Licences | | Other Revenue | | Crown Corporations | | the Federal Government | | Total | |
| | % | | Per Capita | | % | | Per Capita | | % | | Per Capita | | % | | Per Capita | | % | | Per Capita | | % | | Per Capita | | % | | Per Capita | |
Year | | of GDP | | ($) (2) | | of GDP | | ($) (2) | | of GDP | | ($) (2) | | of GDP | | ($) (2) | | of GDP | | ($) (2) | | of GDP | | ($) (2) | | of GDP | | ($) (2) | |
1984/85 | | 10.1 | | 3,051.0 | | 1.4 | | 438.6 | | 1.2 | | 375.4 | | 0.4 | | 112.5 | | 0.9 | | 270.1 | | 3.7 | | 1,110.3 | | 17.7 | | 5,357.9 | |
1985/86 | | 9.8 | | 3,058.8 | | 1.3 | | 411.2 | | 1.2 | | 372.6 | | 0.4 | | 129.7 | | 0.9 | | 293.8 | | 3.5 | | 1,084.0 | | 17.1 | | 5,350.0 | |
1986/87 | | 9.5 | | 3,009.2 | | 1.2 | | 369.8 | | 1.2 | | 385.0 | | 0.2 | | 74.8 | | 1.1 | | 342.3 | | 3.6 | | 1,137.6 | | 16.7 | | 5,318.6 | |
1987/88 | | 9.9 | | 3,333.2 | | 2.0 | | 657.5 | | 1.2 | | 391.4 | | 0.3 | | 89.8 | | 1.0 | | 341.4 | | 3.3 | | 1,104.2 | | 17.6 | | 5,917.5 | |
1988/89 | | 10.0 | | 3,540.4 | | 1.8 | | 645.8 | | 1.4 | | 499.6 | | 0.8 | | 282.3 | | 0.9 | | 322.9 | | 3.1 | | 1,091.1 | | 18.1 | | 6,382.1 | |
1989/90 | | 10.7 | | 3,832.5 | | 1.7 | | 591.3 | | 1.5 | | 518.9 | | 0.5 | | 174.2 | | 1.0 | | 344.2 | | 2.8 | | 1,004.2 | | 18.1 | | 6,465.3 | |
1990/91 | | 11.0 | | 3,797.5 | | 1.5 | | 511.0 | | 1.4 | | 484.0 | | 0.4 | | 141.4 | | 1.1 | | 364.0 | | 2.6 | | 914.7 | | 17.9 | | 6,212.5 | |
1991/92 | | 11.0 | | 3,635.3 | | 1.3 | | 444.9 | | 1.5 | | 503.9 | | 0.4 | | 131.7 | | 0.9 | | 283.2 | | 2.7 | | 888.1 | | 17.8 | | 5,887.1 | |
1992/93 | | 11.3 | | 3,788.5 | | 1.4 | | 483.8 | | 1.5 | | 504.1 | | 0.3 | | 100.7 | | 1.2 | | 388.9 | | 2.8 | | 924.4 | | 18.5 | | 6,190.5 | |
1993/94 | | 11.8 | | 3,990.3 | | 1.9 | | 637.0 | | 1.5 | | 496.8 | | 0.4 | | 126.2 | | 1.1 | | 376.7 | | 2.4 | | 815.6 | | 19.1 | | 6,442.5 | |
1994/95 | | 11.9 | | 4,085.3 | | 2.2 | | 768.0 | | 1.5 | | 501.0 | | 0.4 | | 127.0 | | 1.0 | | 351.8 | | 2.4 | | 842.6 | | 19.4 | | 6,675.7 | |
1995/96 | | 11.8 | | 4,070.7 | | 1.9 | | 659.3 | | 1.4 | | 471.9 | | 0.3 | | 114.2 | | 0.9 | | 315.0 | | 2.3 | | 779.1 | | 18.6 | | 6,410.2 | |
1996/97 | | 12.0 | | 4,118.6 | | 2.0 | | 687.6 | | 1.4 | | 465.8 | | 0.2 | | 82.4 | | 1.1 | | 361.1 | | 1.8 | | 614.9 | | 18.5 | | 6,330.4 | |
1997/98 | | 11.5 | | 4,013.4 | | 1.9 | | 672.9 | | 1.3 | | 459.4 | | 0.3 | | 91.6 | | 1.1 | | 392.1 | | 1.6 | | 562.7 | | 17.7 | | 6,192.1 | |
1998/99 | | 11.4 | | 3,975.0 | | 1.6 | | 571.7 | | 1.3 | | 448.0 | | 0.3 | | 106.2 | | 1.2 | | 412.2 | | 1.8 | | 634.7 | | 17.6 | | 6,147.8 | |
1999/2000 | | 11.1 | | 3,973.5 | | 2.0 | | 726.1 | | 1.3 | | 457.3 | | 0.3 | | 104.7 | | 1.2 | | 432.3 | | 2.2 | | 799.0 | | 18.1 | | 6,493.0 | |
2000/01 | | 10.6 | | 4,026.6 | | 2.8 | | 1,082.6 | | 1.2 | | 440.9 | | 0.3 | | 99.5 | | 1.1 | | 435.1 | | 2.1 | | 798.0 | | 18.1 | | 6,882.8 | |
2001/02 | | 10.2 | | 3,859.9 | | 2.2 | | 848.5 | | 1.2 | | 436.3 | | 0.2 | | 94.2 | | 1.1 | | 406.3 | | 2.0 | | 773.3 | | 17.0 | | 6,418.3 | |
2002/03 | | 8.6 | | 3,254.7 | | 2.3 | | 877.0 | | 1.4 | | 533.3 | | 0.2 | | 61.3 | | 1.1 | | 416.8 | | 2.4 | | 900.1 | | 15.9 | | 6,043.2 | |
2003/04 | | 9.1 | | 3,538.8 | | 2.2 | | 870.5 | | 1.4 | | 541.5 | | 0.2 | | 78.3 | | 0.9 | | 366.4 | | 2.1 | | 798.3 | | 15.9 | | 6,193.8 | |
2004/05 | | 9.1 | | 3,714.7 | | 2.5 | | 1,020.5 | | 1.4 | | 563.3 | | 0.2 | | 67.6 | | 1.3 | | 545.9 | | 2.9 | | 1,186.4 | | 17.3 | | 7,098.4 | |
2005/06 | | 9.3 | | 3,990.9 | | 2.7 | | 1,137.8 | | 1.3 | | 539.4 | | 0.1 | | 63.4 | | 1.0 | | 437.2 | | 3.0 | | 1,267.0 | | 17.4 | | 7,435.7 | |
2006/07 | | 9.5 | | 4,264.4 | | 2.1 | | 958.0 | | 1.2 | | 554.5 | | 0.2 | | 84.9 | | 1.1 | | 476.4 | | 3.0 | | 1,321.5 | | 17.1 | | 7,659.8 | |
2007/08 | | 9.8 | | 4,455.6 | | 1.9 | | 878.6 | | 1.2 | | 542.5 | | 0.2 | | 75.8 | | 1.0 | | 468.4 | | 2.6 | | 1,175.8 | | 16.7 | | 7,596.7 | |
2008/09 | | 8.8 | | 3,994.5 | | 1.9 | | 857.7 | | 1.1 | | 516.4 | | 0.1 | | 65.0 | | 0.9 | | 392.4 | | 2.5 | | 1,124.8 | | 15.4 | | 6,950.8 | |
2009/10 | | 8.7 | | 3,684.9 | | 1.4 | | 574.6 | | 1.2 | | 513.1 | | 0.1 | | 42.0 | | 0.9 | | 397.5 | | 2.8 | | 1,200.6 | | 15.2 | | 6,412.7 | |
(1) Revenue has been restated to reflect the government’s accounting policy at March 31, 2010. Figures exclude dedicated revenue collected on behalf of, and transferred to, Crown corporations and agencies. These revenues are included as part of the operations of the Crown corporations and agencies. Figures are based on Public Accounts information. Figures also exclude liquidation dividends.
(2) Per capita revenue is converted to real (inflation adjusted) terms using the BC consumer price index (CPI) for the corresponding calendar year (e.g. 2009 CPI for 2009/10 revenue).
2010 Financial and Economic Review – July 2010
83
Appendix 2 – Financial Review
Table A2.17 Historical Expense by Function — Consolidated Revenue Fund (1)
| | Health | | Social Services | | Education | | Transportation | | Interest | | Other (2) | | Total | |
| | | | % of Total | | | | % of Total | | | | % of Total | | | | % of Total | | | | % of Total | | | | % of Total | | | |
Year | | ($ millions) | | Expense | | ($ millions) | | Expense | | ($ millions) | | Expense | | ($ millions) | | Expense | | ($ millions) | | Expense | | ($ millions) | | Expense | | ($ millions) | |
1984/85 | | 2,963 | | 30.2 | | 1,266 | | 12.9 | | 2,379 | | 24.3 | | 1,263 | | 12.9 | | 430 | | 4.4 | | 1,500 | | 15.3 | | 9,801 | |
1985/86 | | 3,084 | | 30.5 | | 1,298 | | 12.8 | | 2,328 | | 23.0 | | 1,157 | | 11.4 | | 476 | | 4.7 | | 1,784 | | 17.6 | | 10,127 | |
1986/87 | | 3,368 | | 31.7 | | 1,298 | | 12.2 | | 2,353 | | 22.1 | | 861 | | 8.1 | | 648 | | 6.1 | | 2,096 | | 19.7 | | 10,624 | |
1987/88 | | 3,603 | | 32.6 | | 1,349 | | 12.2 | | 2,501 | | 22.6 | | 886 | | 8.0 | | 810 | | 7.3 | | 1,906 | | 17.2 | | 11,055 | |
1988/89 | | 3,924 | | 33.2 | | 1,440 | | 12.2 | | 2,686 | | 22.7 | | 805 | | 6.8 | | 891 | | 7.5 | | 2,088 | | 17.6 | | 11,834 | |
1989/90 | | 4,405 | | 33.4 | | 1,496 | | 11.3 | | 2,962 | | 22.4 | | 1,160 | | 8.8 | | 859 | | 6.5 | | 2,318 | | 17.6 | | 13,200 | |
1990/91 | | 4,920 | | 32.8 | | 1,669 | | 11.1 | | 3,812 | | 25.4 | | 1,148 | | 7.6 | | 927 | | 6.2 | | 2,534 | | 16.9 | | 15,010 | |
1991/92 | | 5,503 | | 32.2 | | 1,994 | | 11.7 | | 4,171 | | 24.4 | | 1,223 | | 7.2 | | 1,093 | | 6.4 | | 3,117 | | 18.2 | | 17,101 | |
1992/93 | | 5,884 | | 32.9 | | 2,366 | | 13.2 | | 4,399 | | 24.6 | | 1,043 | | 5.8 | | 1,295 | | 7.3 | | 2,871 | | 16.1 | | 17,858 | |
1993/94 | | 6,164 | | 32.7 | | 2,704 | | 14.4 | | 4,550 | | 24.2 | | 989 | | 5.3 | | 1,436 | | 7.6 | | 2,990 | | 15.9 | | 18,833 | |
1994/95 | | 6,432 | | 32.2 | | 2,890 | | 14.5 | | 4,783 | | 24.0 | | 872 | | 4.4 | | 1,587 | | 8.0 | | 3,389 | | 17.0 | | 19,953 | |
1995/96 | | 6,614 | | 33.0 | | 3,033 | | 15.1 | | 4,951 | | 24.7 | | 817 | | 4.1 | | 1,627 | | 8.1 | | 3,012 | | 15.0 | | 20,054 | |
1996/97 | | 6,864 | | 33.9 | | 2,969 | | 14.7 | | 5,122 | | 25.3 | | 809 | | 4.0 | | 1,704 | | 8.4 | | 2,773 | | 13.7 | | 20,241 | |
1997/98 | | 7,050 | | 35.0 | | 3,048 | | 15.1 | | 5,125 | | 25.5 | | 735 | | 3.7 | | 1,684 | | 8.4 | | 2,493 | | 12.4 | | 20,135 | |
1998/99 | | 7,304 | | 35.6 | | 3,113 | | 15.2 | | 5,367 | | 26.1 | | 755 | | 3.7 | | 1,474 | | 7.2 | | 2,515 | | 12.3 | | 20,528 | |
1999/2000 | | 7,888 | | 35.6 | | 3,093 | | 14.0 | | 5,469 | | 24.7 | | 1,608 | | 7.3 | | 1,508 | | 6.8 | | 2,595 | | 11.7 | | 22,161 | |
2000/01 | | 8,597 | | 38.3 | | 3,212 | | 14.3 | | 5,840 | | 26.0 | | 521 | | 2.3 | | 1,608 | | 7.2 | | 2,666 | | 11.9 | | 22,444 | |
2001/02 | | 9,733 | | 39.5 | | 3,318 | | 13.5 | | 6,336 | | 25.7 | | 592 | | 2.4 | | 1,487 | | 6.0 | | 3,203 | | 13.0 | | 24,669 | |
2002/03 | | 10,258 | | 41.1 | | 3,018 | | 12.1 | | 6,370 | | 25.5 | | 612 | | 2.5 | | 1,442 | | 5.8 | | 3,241 | | 13.0 | | 24,941 | |
2003/04 | | 10,535 | | 41.7 | | 2,715 | | 10.8 | | 6,356 | | 25.2 | | 682 | | 2.7 | | 1,453 | | 5.8 | | 3,505 | | 13.9 | | 25,246 | |
2004/05 | | 10,685 | | 41.0 | | 2,570 | | 9.9 | | 6,447 | | 24.8 | | 1,574 | | 6.0 | | 1,414 | | 5.4 | | 3,350 | | 12.9 | | 26,040 | |
2005/06 | | 11,732 | | 42.5 | | 2,671 | | 9.7 | | 6,772 | | 24.5 | | 658 | | 2.4 | | 1,319 | | 4.8 | | 4,465 | | 16.2 | | 27,617 | |
2006/07 | | 12,483 | | 43.8 | | 2,862 | | 10.1 | | 7,142 | | 25.1 | | 654 | | 2.3 | | 1,318 | | 4.6 | | 4,015 | | 14.1 | | 28,474 | |
2007/08 | | 13,514 | | 44.1 | | 2,976 | | 9.7 | | 7,510 | | 24.5 | | 689 | | 2.2 | | 1,177 | | 3.8 | | 4,811 | | 15.7 | | 30,677 | |
2008/09 | | 14,129 | | 44.8 | | 3,170 | | 10.0 | | 7,585 | | 24.0 | | 819 | | 2.6 | | 1,209 | | 3.8 | | 4,648 | | 14.7 | | 31,560 | |
2009/10 | | 14,573 | | 45.9 | | 3,320 | | 10.5 | | 7,713 | | 24.3 | | 727 | | 2.3 | | 1,148 | | 3.6 | | 4,242 | | 13.4 | | 31,723 | |
(1) Expense has been restated to reflect the government’s accounting policy at March 31, 2010. Figures are based on Public Accounts information.
(2) Other includes: protection of persons and property, natural resources and economic development, general government and other expenses.
2010 Financial and Economic Review — July 2010
84
Appendix 2 – Financial Review
Table A2.18 Historical Expense by Function — Consolidated Revenue Fund Supplementary Information (1)
| | Health | | Social Services | | Education | | Transportation | | Interest | | Other (2) | | Total | |
| | % | | Per Capita | | % | | Per Capita | | % | | Per Capita | | % | | Per Capita | | % | | Per Capita | | % | | Per Capita | | % | | Per Capita | |
Year | | of GDP | | ($) (3) | | of GDP | | ($) (3) | | of GDP | | ($) (3) | | of GDP | | ($) (3) | | of GDP | | ($) (3) | | of GDP | | ($) (3) | | of GDP | | ($) (3) | |
1984/85 | | 5.9 | | 1,797.8 | | 2.5 | | 768.1 | | 4.8 | | 1,443.5 | | 2.5 | | 766.3 | | 0.9 | | 260.9 | | 3.0 | | 910.1 | | 19.7 | | 5,946.8 | |
1985/86 | | 5.8 | | 1,796.5 | | 2.4 | | 756.1 | | 4.3 | | 1,356.1 | | 2.2 | | 674.0 | | 0.9 | | 277.3 | | 3.3 | | 1,039.2 | | 18.9 | | 5,899.1 | |
1986/87 | | 6.0 | | 1,887.9 | | 2.3 | | 727.6 | | 4.2 | | 1,319.0 | | 1.5 | | 482.6 | | 1.1 | | 363.2 | | 3.7 | | 1,174.9 | | 18.8 | | 5,955.2 | |
1987/88 | | 5.8 | | 1,931.8 | | 2.2 | | 723.3 | | 4.0 | | 1,341.0 | | 1.4 | | 475.1 | | 1.3 | | 434.3 | | 3.0 | | 1,022.0 | | 17.7 | | 5,927.4 | |
1988/89 | | 5.7 | | 1,987.0 | | 2.1 | | 729.2 | | 3.9 | | 1,360.1 | | 1.2 | | 407.6 | | 1.3 | | 451.2 | | 3.0 | | 1,057.3 | | 17.0 | | 5,992.4 | |
1989/90 | | 5.8 | | 2,079.9 | | 2.0 | | 706.4 | | 3.9 | | 1,398.6 | | 1.5 | | 547.7 | | 1.1 | | 405.6 | | 3.1 | | 1,094.5 | | 17.5 | | 6,232.7 | |
1990/91 | | 6.2 | | 2,141.4 | | 2.1 | | 726.4 | | 4.8 | | 1,659.1 | | 1.4 | | 499.6 | | 1.2 | | 403.5 | | 3.2 | | 1,102.9 | | 18.9 | | 6,532.9 | |
1991/92 | | 6.7 | | 2,217.6 | | 2.4 | | 803.5 | | 5.1 | | 1,680.8 | | 1.5 | | 492.8 | | 1.3 | | 440.5 | | 3.8 | | 1,256.1 | | 20.9 | | 6,891.3 | |
1992/93 | | 6.7 | | 2,246.3 | | 2.7 | | 903.3 | | 5.0 | | 1,679.4 | | 1.2 | | 398.2 | | 1.5 | | 494.4 | | 3.3 | | 1,096.1 | | 20.5 | | 6,817.7 | |
1993/94 | | 6.6 | | 2,209.8 | | 2.9 | | 969.4 | | 4.8 | | 1,631.2 | | 1.1 | | 354.6 | | 1.5 | | 514.8 | | 3.2 | | 1,071.9 | | 20.0 | | 6,751.6 | |
1994/95 | | 6.4 | | 2,195.4 | | 2.9 | | 986.4 | | 4.8 | | 1,632.6 | | 0.9 | | 297.6 | | 1.6 | | 541.7 | | 3.4 | | 1,156.8 | | 19.9 | | 6,810.5 | |
1995/96 | | 6.3 | | 2,146.6 | | 2.9 | | 984.4 | | 4.7 | | 1,606.9 | | 0.8 | | 265.2 | | 1.5 | | 528.1 | | 2.9 | | 977.6 | | 19.0 | | 6,508.7 | |
1996/97 | | 6.3 | | 2,153.2 | | 2.7 | | 931.4 | | 4.7 | | 1,606.8 | | 0.7 | | 253.8 | | 1.6 | | 534.5 | | 2.5 | | 869.9 | | 18.6 | | 6,349.6 | |
1997/98 | | 6.2 | | 2,153.7 | | 2.7 | | 931.1 | | 4.5 | | 1,565.6 | | 0.6 | | 224.5 | | 1.5 | | 514.4 | | 2.2 | | 761.6 | | 17.6 | | 6,150.9 | |
1998/99 | | 6.3 | | 2,204.8 | | 2.7 | | 939.7 | | 4.6 | | 1,620.1 | | 0.7 | | 227.9 | | 1.3 | | 444.9 | | 2.2 | | 759.2 | | 17.8 | | 6,196.7 | |
1999/2000 | | 6.5 | | 2,339.3 | | 2.6 | | 917.3 | | 4.5 | | 1,621.9 | | 1.3 | | 476.9 | | 1.2 | | 447.2 | | 2.1 | | 769.6 | | 18.3 | | 6,572.1 | |
2000/01 | | 6.5 | | 2,487.2 | | 2.4 | | 929.3 | | 4.4 | | 1,689.6 | | 0.4 | | 150.7 | | 1.2 | | 465.2 | | 2.0 | | 771.3 | | 17.1 | | 6,493.2 | |
2001/02 | | 7.3 | | 2,744.5 | | 2.5 | | 935.6 | | 4.7 | | 1,786.6 | | 0.4 | | 166.9 | | 1.1 | | 419.3 | | 2.4 | | 903.2 | | 18.5 | | 6,956.2 | |
2002/03 | | 7.4 | | 2,810.9 | | 2.2 | | 827.0 | | 4.6 | | 1,745.5 | | 0.4 | | 167.7 | | 1.0 | | 395.1 | | 2.3 | | 888.1 | | 18.0 | | 6,834.4 | |
2003/04 | | 7.2 | | 2,808.1 | | 1.9 | | 723.7 | | 4.4 | | 1,694.2 | | 0.5 | | 181.8 | | 1.0 | | 387.3 | | 2.4 | | 934.3 | | 17.3 | | 6,729.3 | |
2004/05 | | 6.8 | | 2,771.4 | | 1.6 | | 666.6 | | 4.1 | | 1,672.2 | | 1.0 | | 408.2 | | 0.9 | | 366.7 | | 2.1 | | 868.9 | | 16.5 | | 6,754.0 | |
2005/06 | | 6.9 | | 2,953.3 | | 1.6 | | 672.4 | | 4.0 | | 1,704.7 | | 0.4 | | 165.6 | | 0.8 | | 332.0 | | 2.6 | | 1,124.0 | | 16.3 | | 6,951.9 | |
2006/07 | | 6.8 | | 3,055.9 | | 1.6 | | 700.6 | | 3.9 | | 1,748.4 | | 0.4 | | 160.1 | | 0.7 | | 322.7 | | 2.2 | | 982.9 | | 15.6 | | 6,970.6 | |
2007/08 | | 7.1 | | 3,201.4 | | 1.6 | | 705.0 | | 3.9 | | 1,779.1 | | 0.4 | | 163.2 | | 0.6 | | 278.8 | | 2.5 | | 1,139.7 | | 16.0 | | 7,267.3 | |
2008/09 | | 7.1 | | 3,223.0 | | 1.6 | | 723.1 | | 3.8 | | 1,730.2 | | 0.4 | | 186.8 | | 0.6 | | 275.8 | | 2.3 | | 1,060.3 | | 15.9 | | 7,199.2 | |
2009/10 | | 7.8 | | 3,271.0 | | 1.8 | | 745.2 | | 4.1 | | 1,731.2 | | 0.4 | | 163.2 | | 0.6 | | 257.7 | | 2.3 | | 952.1 | | 16.9 | | 7,120.4 | |
(1) Expense has been restated to reflect the government’s accounting policy at March 31, 2010. Figures are based on Public Accounts information.
(2) Other includes: protection of persons and property, natural resources and economic development, general government and other expenses.
(3) Per capita expense is converted to real (inflation adjusted) terms using the BC consumer price index (CPI) for the corresponding calendar year (e.g. 2009 CPI for 2009/10 expense).
2010 Financial and Economic Review – July 2010
85
| Chapter Three |
| |
| Commercial Crown |
| Corporations Review |
2010 Financial and Economic Review – July 2010
Chapter 3 – Commercial Crown Corporations Review
Introduction
Over the years, British Columbia’s governments have created or acquired a number of commercial Crown corporations as a means of combining public policy goals with private sector management practices. The Crown corporations vary greatly in terms of size and scope, from large companies such as the BC Hydro and Power Authority and the Insurance Corporation of British Columbia to the more limited scope of entities such as the Provincial Capital Commission.
The provincial government’s commercial Crown corporations report on their operations through the usual corporate publications such as audited financial statements and annual reports. However, under the Budget Transparency and Accountability Act, they are also required to table annually in the BC Legislature a three-year Service Plan outlining financial and non-financial performance targets, as well as an Annual Service Plan Report on the results achieved in relation to the previous year’s Service Plan. The Service Plan is based on the Shareholder’s Letter of Expectation, a document which serves as the basis of understanding between the government and each Crown agency on high-level performance expectations, public policy issues and strategic priorities.
In general, the Service Plans are tabled each February in conjunction with the provincial government’s Budget and Fiscal Plan. The Annual Service Plan Reports are tabled at the same time as, or shortly after, the release of the provincial government’s Public Accounts. The commercial Crown corporations also post the above reports on their websites.
BC Hydro and Power Authority
BC Hydro is one of North America’s leading providers of clean, renewable energy, and the largest electric utility in British Columbia, serving approximately 95 per cent of the province’s population and 1.8 million customers. While 89 per cent of the accounts represent residential clients, and the remaining 11 per cent are commercial or industrial operations, each of these three groups consume roughly one-third of the electricity supplied by BC Hydro.
The utility operates and maintains 75 dams at 41 sites mainly on the Peace and Columbia River Systems and on the Pacific Coast. About 90 per cent of BC Hydro’s 11.3 gigawatts generating capacity is produced by 80 generating units at 31 hydroelectric facilities, while the remaining 10 per cent comes from 9 units at 3 thermal generating plants. Power is delivered to customers through a network consisting of more than 75,000 kilometres of transmission and distribution lines, 890,000 utility poles and 270,000 transformers.
BC Hydro’s mandate is to provide a reliable, sustainable, low cost supply of electricity to the people of British Columbia. BC Hydro’s general powers and governance are established under the terms of the Hydro and Power Authority Act. The BC Hydro Public Power Legacy and Heritage Contract Act provides further direction with respect to BC Hydro’s assets. The act ensures public ownership of BC Hydro’s heritage resources, which includes BC Hydro’s transmission and distribution systems, and all of BC Hydro’s existing generation and storage assets. As well, BC Hydro is regulated by the British Columbia Utilities Commission (BCUC) under the terms of the Utilities Commission Act. The BCUC is responsible for ensuring that energy utilities under its jurisdiction charge fair, just and reasonable rates for energy, and provide safe, adequate and secure service to customers.
2010 Financial and Economic Review – July 2010
89
Chapter 3 – Commercial Crown Corporations Review
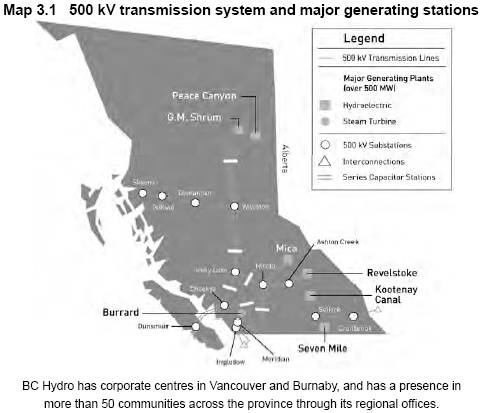
While BC Hydro owns the majority of the transmission and distribution systems that deliver electricity in the province, since 2003, the transmission systems have been managed by the BC Transmission Corporation (BCTC) at arm’s length from BC Hydro in order to ensure equal access to the transmission network for all power producers in the province. In July 2010 BCTC was re-amalgamated with BC Hydro in a manner that promotes operating efficiencies while continuing to provide equal access to the transmission network.
BC Hydro participates in the western North America energy trade market through the activities of its subsidiary Powerex Corp. BC Hydro uses the energy trade market to make the best financial use of its generation capacity by selling power when energy prices are high, and acquiring electricity for domestic demand or later re-sale when energy prices are low.
BC Hydro’s domestic energy costs are largely dependent on its hydroelectric storage and generation capability, which in turn is affected by water inflows into reservoirs. Low inflows impair hydro generation, resulting in higher energy costs from purchases to meet domestic demand. Energy prices also significantly affect energy costs as well as trade income. These factors have a significant impact on operating results and BC Hydro’s return on capital employed (ROCE).
Water supply into reservoirs was 87 per cent of average during 2009/10, the lowest recorded level in 15 years. The low water levels resulted in increased energy purchases and higher energy costs. Despite the below average water inflows for the year, prudent management of BC Hydro’s reservoirs has resulted in storage levels at 94 per cent of average at March 31, 2010. This will enable BC’s domestic power rates to remain among the lowest in North America.
2010 Financial and Economic Review – July 2010
90
Chapter 3 – Commercial Crown Corporations Review
Table 3.1 British Columbia Hydro and Power Authority
Five-Year Income Statement for the Years Ended March 31 (1)
($ millions, unless otherwise indicated) | | 2006 | | 2007 | | 2008 | | 2009 | | 2010 | |
Domestic energy revenue | | 2,727 | | 2,786 | | 2,944 | | 2,814 | | 3,090 | |
Domestic energy costs | | (1,135 | ) | (1,037 | ) | (948 | ) | (1,236 | ) | (1,150 | ) |
| | 1,592 | | 1,749 | | 1,996 | | 1,578 | | 1,940 | |
Trade margin | | 231 | | 326 | | 157 | | 298 | | 97 | |
Revenue net of energy costs | | 1,823 | | 2,075 | | 2,153 | | 1,876 | | 2,037 | |
Operations, maintenance and administration expenses | | (805 | ) | (716 | ) | (942 | ) | (915 | ) | (1,249 | ) |
Amortization and depreciation | | (411 | ) | (378 | ) | (368 | ) | (395 | ) | (445 | ) |
EBIT | | 607 | | 981 | | 843 | | 566 | | 343 | |
Interest and taxes | | (582 | ) | (602 | ) | (616 | ) | (639 | ) | (592 | ) |
Operating results | | 25 | | 379 | | 227 | | (73 | ) | (249 | ) |
Net transfer (to) from regulatory accounts | | 241 | | 28 | | 142 | | 438 | | 696 | |
Net income | | 266 | | 407 | | 369 | | 365 | | 447 | |
Financial data: | | | | | | | | | | | |
Shareholder’s dividend | | 223 | | 331 | | 288 | | — | | 47 | |
Capital expenditures | | 610 | | 807 | | 1,076 | | 1,397 | | 2,406 | |
Property, plant and equipment (including intangible assets) | | 10,023 | | 10,426 | | 11,154 | | 12,099 | | 14,104 | |
Debt (including current portion) | | 6,627 | | 6,916 | | 7,519 | | 9,135 | | 10,696 | |
Performance indicators: | | | | | | | | | | | |
Hydro generation (gigawatt hours) | | 46,850 | | 44,476 | | 52,140 | | 43,812 | | 43,207 | |
Domestic requirements (gigawatt hours) | | 52,440 | | 52,911 | | 53,300 | | 52,512 | | 50,233 | |
Winter Generation Availability Index (per cent) | | 96.8 | | 96.2 | | 94.9 | | 96.4 | | 97.6 | |
Customer Average Interruption Duration Index (hours) (2) | | 1.82 | | 2.16 | | 2.24 | | 2.47 | | 2.28 | |
ROCE (3) (per cent) | | 7.01 | | 11.31 | | 8.02 | | 4.45 | | 2.39 | |
(1) Prior years are restated to be consistent with the current presentation.
(2) Excludes unusual events.
(3) Excludes impact of regulatory accounts.
BC Hydro’s capital spending is driven as much by a requirement for sustaining existing capital (many of its key assets were constructed in the 1950’s, 1960’s and 1970’s) as it is for capital expansion to meet the demands of a growing economy. During 2009/10, capital spending of $2.4 billion was used for electrical generation, transmission and distribution projects throughout the province including major overhauls of turbines and transformers, and purchase of one-third ownership interest in Teck Metals Ltd’s Waneta Dam and generating facility. Appendix Table A3.11 provides more information on projects greater than $50 million.
BC has increasingly become a net importer of electricity as domestic demand has increased at a higher rate than generating capacity. Under the provincial government’s 2007 Energy Plan, increasing demand is to be met with conservation and demand management, upgrades to BC Hydro’s existing facilities, increased purchases from independent power producers, and, potentially, new larger-scale projects such as construction of the Site C dam and generating facility on the Peace River. In addition, the Clean Energy Act enacted in June 2010 provides a framework for electrical self-sufficiency and reduced greenhouse gas emissions powered by investments in clean, renewable energy across the province.
2010 Financial and Economic Review – July 2010
91
Chapter 3 – Commercial Crown Corporations Review

Each year BC Hydro establishes numerous financial and non-financial targets to evaluate its performance in a balanced framework. In fiscal 2010, BC Hydro met or exceeded 10 of 14 non-financial targets and 8 of 10 financial targets. The missed non-financial targets were largely attributable to system outages caused by windstorms in the Lower Mainland, Vancouver Island and the Southern Interior during November 2009 and January 2010. The missed financial targets were mainly due to a provision for future environmental compliance and remediation expenditures.
More information about BC Hydro’s financial results and performance measures are provided in the corporation’s annual report available at its website: www.bchydro.com.
BC Liquor Distribution Branch
LDB is responsible for the importation, distribution and retailing of beverage alcohol in British Columbia and the operation of government liquor stores and distribution centres in the province. LDB, under the authority of the Liquor Distribution Act, has the sole right to purchase beverage alcohol, both in and out of British Columbia, in accordance with the Importation of Intoxicating Liquors Act (Canada).
LDB has a workforce of approximately 3,500 full and part-time employees, and manages its retail and wholesale business through the operation of 197 government liquor stores throughout the province; two distribution centres located in Vancouver and Kamloops; and a head office facility in Vancouver.
LDB also enters into agreements that authorize manufacturers and agents to make direct sales on behalf of the LDB and appoints private retail outlets such as rural agency stores and duty free stores.
As of March 31, 2010, there were a total of 1,186 private liquor outlets in the province, a 17 per cent increase from 1,007 stores five years ago. The increase reflects a move to bring more private sector competition into the liquor marketplace. The expansion has been predominantly in the area of licensee retail stores (LRSs), whose numbers have been
2010 Financial and Economic Review – July 2010
92
Chapter 3 – Commercial Crown Corporations Review
Table 3.2 Liquor Distribution Branch
Five-Year Income Statement for the Years Ended March 31 (1)
($ millions) | | 2006 | | 2007 | | 2008 | | 2009 | | 2010 | |
Provincial liquor sales | | 2,318.6 | | 2,509.1 | | 2,679.5 | | 2,794.5 | | 2,854.1 | |
Less: commissions and discounts | | 124.9 | | 142.1 | | 180.0 | | 190.5 | | 198.3 | |
Net sales | | 2,193.7 | | 2,367.0 | | 2,499.5 | | 2,604.0 | | 2,655.8 | |
Cost of sales | | 1,170.8 | | 1,276.2 | | 1,396.4 | | 1,451.2 | | 1,515.3 | |
Gross margin | | 1,022.9 | | 1,090.8 | | 1,103.1 | | 1,152.8 | | 1,140.5 | |
Operating expenses | | (242.4 | ) | (256.3 | ) | (256.1 | ) | (270.0 | ) | (275.9 | ) |
Other income | | 20.0 | | 5.8 | | 10.2 | | 8.3 | | 12.7 | |
Net income | | 800.5 | | 840.3 | | 857.2 | | 891.1 | | 877.3 | |
Financial data: | | | | | | | | | | | |
Commissions as a per cent of total sales | | 5.39 | | 5.66 | | 6.72 | | 6.82 | | 6.95 | |
Gross margin percentage | | 44.12 | | 43.47 | | 41.17 | | 41.25 | | 39.96 | |
Performance indicators: | | | | | | | | | | | |
Operating costs per dollar of revenue (2) (cents) | | 10.45 | | 10.21 | | 9.56 | | 9.66 | | 9.67 | |
Sales per square foot (dollars) (3) | | 1,158 | | 1,167 | | 1,224 | | 1,269 | | 1,270 | |
Inventory turnover (times per year) | | 19 | | 19 | | 18 | | 17 | | 17 | |
(1) Prior years are restated to be consistent with the current presentation.
(2) Excludes the impact of restructuring accruals.
(3) Excludes stores that exclusively deal in wholesale transactions.
allowed to increase by over 13 per cent over the five year period (to 670 from 592) and in on-site manufacturer stores (wineries, breweries and distilleries with retail shops) which recorded a 72 per cent increase (to 232 from 135).
In 2009/10, beer (packaged and draught) accounted for 40.7 per cent of sales revenue followed by wine (29.0 per cent) and spirits (25.6 per cent). The percentage of beer, cider and cooler sales increased from last year, reversing a downward trend in the sale of these products (see Chart 3.2). The increase is attributable to a recession-related shift in consumer spending to lower cost products.
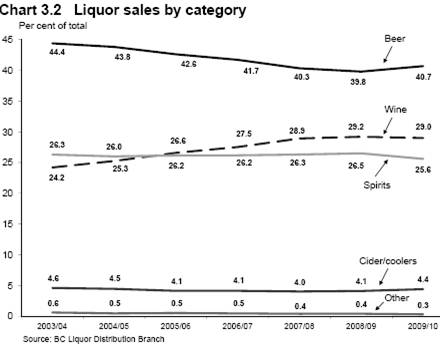
2010 Financial and Economic Review – July 2010
93
Chapter 3 – Commercial Crown Corporations Review
LDB has experienced a number of policy changes over the last five years that have affected its operating ratios. In addition to the increase in their numbers, LRSs are now permitted to sell spirits as well as beer and wine beverages, and their product discount has been increased to 16 per cent from 13 per cent five years ago. Other policy changes included moving from a percentage to a flat markup on beer products and the consolidation of a number of government liquor stores into larger “Signature” retail outlets.
From an operating perspective, the impacts on LDB from these policy changes has been an increase of commissions as a percentage of total sales (currently at 6.95 per cent), a 4.2 per cent decrease in gross margin percentage, and a 6.69 per cent reduction in market share for counter sales. However, LDB has introduced efficiencies in its distribution network by initiating direct shipments to LRSs from its warehouses instead of routing them through the local liquor stores. This change reduced its operating costs per dollar of revenue to 9.67 cents in 2009/10 from 10.45 cents in 2005/06. Revamping the retail outlets has also improved sales efficiencies to $1,270 per square foot from $1,158 over the same period.
More information about LDB’s financial results and performance measures are provided in the corporation’s annual report available at its website: www.bcldb.com.
BC Lottery Corporation
British Columbia’s gaming industry is operated and regulated under the authority and direction of the provincial government under the terms of the Criminal Code of Canada. Under the Gaming Control Act (2002), BCLC is designated as the agent of the Crown responsible for conducting, managing and operating all forms of lottery, casino and commercial bingo gaming in the province. BCLC also participates in the marketing of nationwide and regional lottery games in association with other Canadian provinces.
At its inception, BCLC operated within a limited, traditional lottery market. A number of policy changes in the late 1990s, including the introduction of slot machines in 1997/98 and full casino gaming in 1998/99, provided opportunity for growth of gaming in the province. In 2009/10, BCLC had gross gaming receipts of $2.5 billion, while its net income amounted to $1.1 billion. Net income was $50.6 million below budget and $11.6 million below the prior year reflecting less consumer disposable income during a challenging economic environment. Each year, a portion of BCLC’s net income is redistributed by the provincial government to charities and local governments. In 2009/10, this redistribution amounted to $226 million or 21 per cent of total net income.
BCLC has two corporate offices — Kamloops (finance, information technology and administration) and Richmond (sales and marketing) — and a workforce of over 800 FTEs. Retail operations and gaming is provided by a network of licensed and regulated service providers, including over 4,000 lottery retailers, 17 casinos, 15 community gaming centres, and 13 commercial bingo hall. It is estimated that the gaming industry in BC directly or indirectly employs 26,000 people.
2010 Financial and Economic Review – July 2010
94
Chapter 3 — Commercial Crown Corporations Review
Table 3.3 British Columbia Lottery Corporation
Five-Year Income Statement for the Years Ended March 31
($ millions) | | 2006 | | 2007 | | 2008 | | 2009 | | 2010 | |
Gaming revenue net of direct costs: | | | | | | | | | | | |
Lottery products | | 353.6 | | 368.5 | | 355.1 | | 356.9 | | 361.4 | |
Casinos | | 715.4 | | 800.0 | | 871.7 | | 867.7 | | 860.1 | |
Community gaming | | 45.9 | | 57.8 | | 89.0 | | 106.1 | | 111.5 | |
| | 1,114.9 | | 1,226.3 | | 1,315.8 | | 1,330.7 | | 1,333.0 | |
Administrative costs | | (103.2 | ) | (106.7 | ) | (118.8 | ) | (138.1 | ) | (149.2 | ) |
Amortization | | (52.8 | ) | (64.0 | ) | (64.9 | ) | (64.1 | ) | (68.9 | ) |
GST and other costs (net) | | (36.2 | ) | (36.8 | ) | (43.2 | ) | (37.8 | ) | (35.8 | ) |
Net income before payment to the federal gov’t | | 922.7 | | 1,018.8 | | 1,088.9 | | 1,090.7 | | 1,079.1 | |
Financial data: | | | | | | | | | | | |
Lottery product profit margin | | 28.2 | | 28.4 | | 27.0 | | 26.9 | | 28.4 | |
Casino profit margin | | 57.3 | | 57.8 | | 57.6 | | 56.5 | | 55.3 | |
Community gaming centre profit margin | | 13.4 | | 16.8 | | 24.3 | | 29.9 | | 31.5 | |
Gross gaming receipts | | 2,260.7 | | 2,425.2 | | 2,559.2 | | 2,550.2 | | 2,517.4 | |
Capital spending ($ millions) | | 82.9 | | 43.9 | | 60.5 | | 97.4 | | 92.5 | |
Performance indicators: | | | | | | | | | | | |
Administrative costs as a percent of total revenue | | 4.6 | | 4.4 | | 4.6 | | 5.4 | | 5.9 | |
Allocation of net income | | | | | | | | | | | |
Government of Canada | | 8.3 | | 8.4 | | 8.5 | | 8.7 | | 8.7 | |
Transfers to charities/local governments | | 210.8 | | 242.4 | | 255.6 | | 255.7 | | 225.9 | |
Contribution to provincial revenue | | 703.6 | | 768.0 | | 824.8 | | 826.3 | | 844.5 | |
Total allocation | | 922.7 | | 1,018.8 | | 1,088.9 | | 1,090.7 | | 1,079.1 | |
BCLC’s revenue comes from three sources — lotteries (including eGaming), casinos and community gaming. Casino operations account for 68 per cent of BCLC’s net income, lotteries 25 per cent and community gaming 7 per cent.
In May 2007 BC’s Ombudsman made 23 recommendations to improve player protection and ticket validation procedures for lottery winnings. BCLC accepted the recommendations and developed Player First, a comprehensive change in the way lotteries are administered in the province. BCLC has implemented 22 of the recommendations and is on track to complete all 23 by 2010/11.
BCLC also demonstrated its commitment to socially responsible gambling by pioneering GameSense in 2008/09. This program provides an easily accessible range of materials — including interactive kiosks in all BCLC casinos and community gaming centres and responsible gambling television ads — that help players make informed decisions about gaming products. BCLC has also attained level 4 certification in the World Lottery Association’s 4-level program that recognizes demonstrated commitment to responsible gambling.
2010 Financial and Economic Review — July 2010
95
Chapter 3 — Commercial Crown Corporations Review
Despite the increase in gaming activity in BC over the last decade, gaming activity on a per capita basis is still moderate compared to the rest of Canada. BC ranked 4th out of the 10 provinces in terms of gaming expenditures per capita at March 31, 2008 (the latest data available), and had the second fewest electronic gaming devices per 1,000 of adult population of all the provinces (see Chart 3.3).
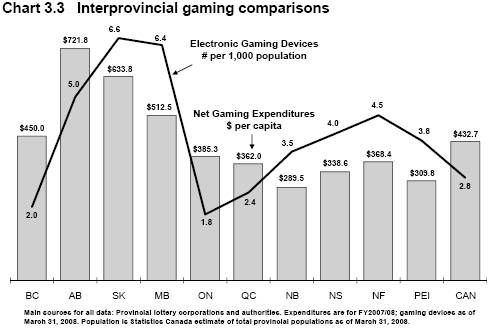
More information about BCLC’s financial results and performance measures are provided in the corporation’s annual report available at its website: www.bclc.com.
Insurance Corporation of BC
ICBC is one of BC’s largest corporations and one of Canada’s largest property and casualty insurers. ICBC earns approximately $3.6 billion in insurance premiums from over 3.2 million policies sold annually, and currently holds an $11.1 billion investment portfolio. ICBC offers automobile insurance products and services through a province-wide network of approximately 900 independent brokers, government agents and appointed agents. ICBC processes almost 1 million claims per year through its 24-hour telephone claims handling facility, province-wide network of 38 claim service locations and other claims handling facilities, and corporate website — www.icbc.com.
ICBC was established in 1973 under the Insurance Corporation Act to provide universal property and casualty liability (i.e. Basic) automobile insurance to BC motorists, which was made compulsory. At the time it was established, ICBC was designated the sole provider of all automobile insurance products in British Columbia, Basic and Optional. Soon afterwards, the legislation was amended to allow private insurance companies to compete in the sale of non-compulsory Optional automobile insurance products. As part of its mandate, ICBC also provides driver licensing services, vehicle licensing and registration services, and fines collection on behalf of the provincial government.
In 2003, the provincial government mandated a number of changes to ICBC’s operations in order to ensure fair competition among all insurance providers in the Optional insurance marketplace. The British Columbia Utilities Commission (BCUC) was directed to regulate ICBC’s Basic insurance rates, and ICBC was required to separately
2010 Financial and Economic Review — July 2010
96
Chapter 3 — Commercial Crown Corporations Review
Table 3.4 Insurance Corporation of British Columbia
Five-Year Income Statement for the Years Ended December 31
($ millions) | | 2005 | | 2006 | | 2007 | | 2008 | | 2009 | |
Revenue: | | | | | | | | | | | |
Net premiums | | 3,117.4 | | 3,256.9 | | 3,482.4 | | 3,631.2 | | 3,650.0 | |
Investment income | | 579.4 | | 512.3 | | 611.6 | | 280.4 | | 532.5 | |
Service fees | | 37.5 | | 47.1 | | 66.0 | | 69.2 | | 58.8 | |
| | 3,734.3 | | 3,816.3 | | 4,160.0 | | 3,980.8 | | 4,241.3 | |
Claims and expenses: | | | | | | | | | | | |
Claims incurred | | 2,444.5 | | 2,544.4 | | 2,646.4 | | 2,646.2 | | 2,648.2 | |
Prior years’ claims adjustments | | 80.7 | | 99.0 | | (33.8 | ) | (136.4 | ) | 2.4 | |
Net claims incurred | | 2,525.2 | | 2,643.4 | | 2,612.6 | | 2,509.8 | | 2,650.6 | |
Claims services and operations | | 423.8 | | 433.8 | | 450.8 | | 457.7 | | 488.7 | |
Insurance premium taxes and commissions | | 363.9 | | 379.7 | | 407.0 | | 429.0 | | 432.0 | |
Deferred premium acquisition cost adjustments (negative amounts are favourable) | | 114.6 | | (87.5 | ) | (26.5 | ) | (16.9 | ) | 2.8 | |
Non-insurance operating costs | | 108.9 | | 96.8 | | 92.9 | | 103.8 | | 104.3 | |
| | 3,536.4 | | 3,466.2 | | 3,536.8 | | 3,483.4 | | 3,678.4 | |
Income before unusual items | | 197.9 | | 350.1 | | 623.2 | | 497.4 | | 562.9 | |
Unusual items | | — | | — | | 19.1 | | — | | — | |
Net income | | 197.9 | | 350.1 | | 642.3 | | 497.4 | | 562.9 | |
Financial data: | | | | | | | | | | | |
Average premium ($) | | 1,038 | | 1,051 | | 1,094 | | 1,108 | | 1,100 | |
Claims incurred per thousand earned policies (2) | | 316 | | 314 | | 319 | | 302 | | 293 | |
Average cost per claim incurred ($) (3) | | 2,646 | | 2,687 | | 2,668 | | 2,745 | | 2,799 | |
Performance indicators: | | | | | | | | | | | |
Loss ratio | | 90.2 | | 90.4 | | 83.7 | | 77.6 | | 81.4 | |
Insurance expense ratio | | 16.0 | | 15.7 | | 16.0 | | 15.9 | | 16.4 | |
Return on investments (4) | | 6.4 | | 7.3 | | 6.0 | | 4.5 | | 5.1 | |
(1) Gain on sale of property and equipment.
(2) Represents the number of claims reported per thousand policies earned during the year
(3) Average claims incurred cost per claims reported.
(4) Four-year annualized return.
disclose information on its Basic insurance line of business to the BCUC for Basic insurance rate setting purposes and in order to ensure appropriate cost allocation between the Basic and Optional lines of business.
Government also set out minimum capitalization targets for both the Basic and Optional lines of business, based on the minimum capital test (MCT) for insurance companies in Canada as required by the federal Office of the Superintendent of Financial Institutions. Since the regulatory framework was put into place, ICBC’s financial performance has resulted in the corporation being well capitalized in both its Basic and Optional insurance lines of business. In 2010, government revised legislation to reflect current industry practice with respect to MCT, and determined that Optional capital in excess of the MCT (as determined by ICBC’s actuaries in accordance with federal regulatory guidance and validated by ICBC’s independent actuary, less any deductions approved by Treasury Board) will be transferred to government in support of core services beginning in 2010/11.
Since 2005, ICBC has maintained an average 4 per cent growth in premium revenue, primarily due to the increasing number of vehicles in the province, higher average optional insurance sales and changes to both Basic and Optional insurance rates. Investments remain a strong source of income with returns exceeding comparable market-based benchmarks.
2010 Financial and Economic Review — July 2010
97
Chapter 3 — Commercial Crown Corporations Review
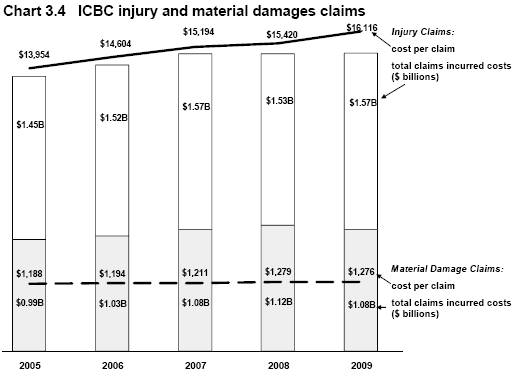
Rising injury claims costs are a concern throughout the automobile insurance industry. ICBC’s claims costs account for approximately three-quarters of ICBC’s total expenditures, and injury claims costs make up 60 per cent of that amount. Injury claims costs have increased by 8 per cent since 2005, reflecting a 15 per cent increase in the cost per claim, partially offset by a 6 per cent decrease in the number of claims. Comparatively, material damage claims costs have increased by 9 per cent since 2005, reflecting a 7 per cent increase in cost per claim and a 3 per cent increase in the number of claims.
Basic insurance rates were unchanged in 2009 and in 2008 compared to a 2007 increase of 3.3 per cent due to rising injury claims costs. ICBC continues to maintain its market share for Optional insurance products. Optional insurance rates have declined in each of the last three years — by 3.0 per cent in 2009, 3.0 per cent in 2008 and 3.8 per cent in 2007.
More information about ICBC’s financial results and performance measures are provided in the corporation’s annual report available at its website: www.icbc.com.
BC Transmission Corporation
BCTC was established in 2003 to manage the provincially owned transmission system by planning, building, operating and maintaining, the transmission system and managing interconnections with independent power producers. In July 2010 BCTC was re-amalgamated with BC Hydro in a manner that promotes operating efficiencies while continuing to provide safe, reliable and cost effective transmission service for a variety of system users through the Open Access Transmission Tariff .
2010 Financial and Economic Review — July 2010
98
Chapter 3 — Commercial Crown Corporations Review
Table 3.5 British Columbia Transmission Corporation
Five-Year Income Statement for the Years Ended March 31 (1)
($ millions) | | 2006 | | 2007 | | 2008 | | 2009 | | 2010 | |
Revenue | | 205.3 | | 189.8 | | 201.9 | | 237.8 | | 235.4 | |
Expenses: | | | | | | | | | | | |
Operations, maintenance and administration | | 157.2 | | 167.8 | | 186.1 | | 206.7 | | 211.9 | |
Amortization | | 19.7 | | 14.2 | | 14.4 | | 19.7 | | 17.5 | |
Finance charges and other costs | | 6.8 | | 6.5 | | 6.3 | | 9.2 | | 8.2 | |
| | 183.7 | | 188.5 | | 206.8 | | 235.6 | | 237.6 | |
Operating results | | 21.6 | | 1.3 | | (4.9 | ) | 2.2 | | (2.2 | ) |
Net transfer (to) from regulatory accounts | | (8.1 | ) | 1.8 | | 4.3 | | 4.8 | | 8.8 | |
Other income | | — | | — | | 3.8 | | 0.5 | | 0.4 | |
Net income | | 13.5 | | 3.1 | | 3.2 | | 7.5 | | 7.0 | |
Financial data: | | | | | | | | | | | |
Capital spending | | 20.8 | | 50.4 | | 70.1 | | 18.7 | | 12.1 | |
Debt (including capital leases) | | 37.2 | | 37.0 | | 85.9 | | 73.5 | | 73.4 | |
Performance indicators: | | | | | | | | | | | |
System Average Interruption Duration Index (hours) | | 2.07 | | 4.23 | | 2.43 | | 2.36 | | 3.00 | |
Operating costs as a percent of revenue | | 76.6 | | 88.4 | | 92.2 | | 86.9 | | 90.0 | |
(1) Prior years are restated to be consistent with the current presentation.
The heritage transmission system owned by BC Hydro is the second largest in the Pacific Northwest with over 18,500 kilometres of high-voltage power lines, underground and submarine cables; 22,000 steel towers; 100,000 wood poles; 300 substations; a state-of-the-art system control centre and backup facility; 115 microwave stations and microwave repeater sites; and seven grid connections to Alberta and Washington State.
BCTC’s mandate is to provide open and fair access to the provincially owned electric transmission system, facilitate private generation investment in BC and maintain access to the Western North American wholesale electricity market. BCTC’s powers and functions are set out in the Transmission Corporation Act (2003), and in agreements with BC Hydro that have been designated under that act.
BCTC is subject to regulation by the British Columbia Utilities Commission (BCUC), which reviews BCTC’s tariff structure and proposed transmission projects. BCTC has a number of transmission projects underway, including expansion of the transmission system in central Vancouver Island, a major 500 kilovolt reinforcement from the Southern Interior to the Lower Mainland and a new 287 kilovolt line in the northwest region of the province. Appendix Table A3.11 provides more information on projects greater than $50 million.
Capital spending on transmission assets is reflected in BC Hydro’s financial statements. BCTC’s own capital spending primarily reflects the System Control Modernization Project and business systems.
More information about BCTC’s financial results and performance measures are provided in the corporation’s annual report available at its website: www.bctc.com.
2010 Financial and Economic Review — July 2010
99
Chapter 3 — Commercial Crown Corporations Review
Columbia Power Corporation
CPC was incorporated in 1994 as a precursor to the Columbia Basin Initiative, a unique arrangement under which the provincial government directly shared a portion of the revenue from the sale of downstream power benefits from the Columbia River Treaty with the residents of the Columbia Basin in recognition of the significant economic, environmental and social costs resulting from the construction of the three dams required by the treaty.
Table 3.6 Columbia Power Corporation
Five-Year Income Statement for the Years Ended March 31
($ millions) | | 2006 | | 2007 | | 2008 | | 2009 | | 2010 | |
Revenue | | 31.7 | | 35.0 | | 41.8 | | 49.5 | | 51.6 | |
Expenses: | | | | | | | | | | | |
Water rentals | | 4.0 | | 4.2 | | 4.5 | | 4.6 | | 5.5 | |
Operations, maintenance and administration | | 3.1 | | 3.6 | | 5.4 | | 7.4 | | 7.3 | |
Amortization | | 6.3 | | 6.4 | | 7.9 | | 9.2 | | 9.6 | |
Other costs | | 1.9 | | 1.7 | | 3.7 | | 1.9 | | 1.9 | |
| | 15.3 | | 15.9 | | 21.5 | | 23.1 | | 24.3 | |
Operating results | | 16.4 | | 19.1 | | 20.3 | | 26.4 | | 27.3 | |
Finance charges | | (8.9 | ) | (8.5 | ) | (8.3 | ) | (8.0 | ) | (7.5 | ) |
Unusual items | | (4.4 | ) | 4.2 | | 3.9 | | (0.1 | ) | — | |
Net income | | 3.1 | | 14.8 | | 15.9 | | 18.3 | | 19.8 | |
Financial data: | | | | | | | | | | | |
Capital spending on power projects | | 17.3 | | 10.4 | | 15.2 | | 16.2 | | 6.9 | |
Debt (including current portion) | | 123.4 | | 118.0 | | 112.0 | | 106.4 | | 100.0 | |
Performance indicators: | | | | | | | | | | | |
Debt to Equity Ratio | | 29:71 | | 27:73 | | 25:75 | | 23:77 | | 21:79 | |
ROCE (per cent) | | 3.87 | | 4.44 | | 4.66 | | 5.93 | | 5.95 | |
The Columbia Basin Initiative was launched in 1995 with the Columbia Basin Trust Act, which created Columbia Basin Trust (CBT), and the 1995 Financial Agreement between the provincial government and CBT. Under the agreement, CPC and CBT each received $250 million over 10 years to provide equity for qualifying power project developments in the region. Returns from CBT’s 50 per cent share are used by CBT to provide benefits to the people of the region, in accordance with the Columbia Basin Trust Act.
CPC’s mandate is to efficiently develop and operate commercially viable, environmentally sound and safe power project investments through joint ventures with subsidiaries of CBT, and to manage the joint ventures. CPC finances the power projects using the government’s equity contributions, retained earnings and limited-recourse project debt, without government debt guarantees.
CPC is a small organization, with fewer than 50 full-time equivalent positions, located in Castlegar. The corporation focuses on asset management activities while engaging private sector firms to provide construction, plant operation and specialist consulting services. Through its joint ventures, CPC is one of the largest producers of electricity in British Columbia.
The purchase of the Brilliant Dam in 1996 was the first investment by the joint venture partners. In addition, three projects were designated as core to the initiative: Arrow Lakes Generating Station (completed); Brilliant Expansion (completed); and Waneta Expansion (postponed pending review of the project’s viability). Other generation, distribution and
2010 Financial and Economic Review — July 2010
100
Chapter 3 — Commercial Crown Corporations Review
transmission projects can be carried out by CPC and CBT, provided both parties agree and the projects meet the same commercial and other tests as the core projects.
CPC’s return on capital employed (ROCE) over the last five years has gradually increased reflecting completion of the Brilliant Expansion. Now that this project is in operation, further improvement in the provincial government’s overall return on its investment in the Columbia Basin projects is expected.
More information about CPC’s financial results and performance measures are provided in the corporation’s annual report available at its website: www.columbiapower.org.
Transportation Investment Corporation
The Transportation Investment Corporation was established in June 2008 under the Transportation Investment Act to implement the Port Mann Bridge/Highway 1 improvement project. TIC’s mandate includes the construction, operation and maintenance of 37 kilometres of improvements to the TransCanada Highway through Metro Vancouver, as well as development, implementation and management of tolling operations to pay for the project and help manage traffic growth over time.
The project was established as part of government’s overall Pacific Gateway Strategy to address the problem of growing regional congestion and to improve the movement of people, goods and transit. The Port Mann Bridge and Highway 1 is Metro Vancouver’s primary goods movement and commuting corridor, serving 130,000 to 160,000 vehicles daily through six municipalities, with key connections to the region’s remaining 14 communities.
The project consists of construction of a new 10-lane Port Mann Bridge over the Fraser River, widening the highway, upgrading interchanges and improving access and safety on Highway 1. The project includes congestion-reduction measures such as high occupancy vehicle lanes, transit and commercial vehicle priority measures and improvements to the cycling network. As well, the new bridge will be built to accommodate future light rail transit.
Table 3.7 Transportation Investment Corporation
Five-Year Income Statement for the Years Ended March 31
($ thousands) | | 2006 | | 2007 | | 2008 | | 2009 (1) | | 2010 | |
Revenue | | — | | — | | — | | 21 | | 219 | |
Expenses: | | | | | | | | | | | |
Operating and program costs | | — | | — | | — | | 7,779 | | 4,626 | |
Amortization | | — | | — | | — | | — | | 58 | |
| | — | | — | | — | | 7,779 | | 4,684 | |
Operating results | | — | | — | | — | | (7,758 | ) | (4,465 | ) |
Effective hedging loss | | — | | — | | — | | — | | (26,338 | ) |
Comprehensive results | | — | | — | | — | | (7,758 | ) | (30,803 | ) |
(1) Reflects the period June 25, 2008 to March 31, 2009.
Construction began in August 2008 and the new Port Mann Bridge will be operational by December 2012, at which time electronic tolling operations will begin. The project is expected to be substantially complete in December 2013
More information about the Port Mann Bridge/Highway 1 project is available at its website: www.pmh1project.com.
2010 Financial and Economic Review — July 2010
101
Chapter 3 — Commercial Crown Corporations Review
British Columbia Railway Company
The British Columbia Railway Company (BCRC) is governed by two principal pieces of legislation. The British Columbia Railway Act establishes the corporation’s structure, responsibilities and accountabilities. The British Columbia Railway Finance Act establishes the borrowing and investment framework for BCRC.
BCRC’s original mandate was to construct and operate a freight railway in British Columbia. Significant expansion of the corporation occurred in the 1990s, as it added to its rail network and acquired a telecommunications company, deep-sea bulk loading facilities in the Port of Vancouver, and barge operations in northern BC. BCRC also diversified into real estate development, and formed a joint venture management company. At its peak, BCRC was Canada’s fourth largest railway, operating 2,314 kilometres of mainline track and 638 kilometres of industrial and yard track.
Table 3.8 British Columbia Railway Company
Five-Year Income Statement for the Years Ended December 31
($ millions) | | 2005 | | 2006 | | 2007 | | 2008 | | 2009 | |
Revenue | | 24.4 | | 17.5 | | 18.2 | | 23.8 | | 20.2 | |
Expenses | | 35.3 | | 33.7 | | 35.4 | | 25.3 | | 37.7 | |
Operating income (loss) | | (10.9 | ) | (16.2 | ) | (17.2 | ) | (1.5 | ) | (17.5 | ) |
Non-operating income (expenses) (1) | | 9.1 | | 21.4 | | 17.0 | | 11.9 | | 3.0 | |
Income before special items | | (1.8 | ) | 5.2 | | (0.2 | ) | 10.4 | | (14.5 | ) |
Investment and asset impairment write-downs (2) | | (15.2 | ) | — | | — | | — | | — | |
BC Rail/CN transaction | | (5.6 | )(3) | — | | — | | — | | — | |
Gain on sale of assets (4) | | 9.9 | | 63.7 | | 19.8 | | 27.3 | | 15.7 | |
Net income (loss) | | (12.7 | ) | 68.9 | | 19.6 | | 37.7 | | 1.2 | |
(1) Includes gain (loss) from discontinued operations.
(2) Primarily relating to the investment in Vancouver Wharves Limited Partnership.
(3) Certain aspects of the BC Rail/CN transaction were finalized in 2005, resulting in a slight reduction to the gain recorded in 2004.
(4) Property sales, including sale of intermodal yard in 2006.
In 2002, the provincial government decided to wind down the operations of BCRC. The main initiative was the BC Rail Investment Partnership (BCRIP) agreement with CN, completed in July 2004. Under the agreement, BCRC’s rail operations (with the exception of its Port Subdivision subsidiary — the 24 mile railway line accessing the port terminals at Roberts Bank) were sold to CN. BCRC retained ownership of the railway right-of-way, rail bed, and track infrastructure.
BCRC has also divested itself of its North Vancouver ports operations, including the sale of Canadian Stevedoring Ltd to P&O Ports in 2003, and the recent divestiture of Vancouver Wharves (VW) through a 40 year nonrenewable Operating Lease Agreement with Kinder Morgan Canada Terminals ULC (KMCT). Under terms of the lease, KMCT will consolidate VW operations and assume the remediation obligations for VW lands. As well, BCRC is in the process of selling surplus real estate holdings not required to support its operations.
BCRC’s current mandate is to support and facilitate the British Columbia Ports Strategy and Pacific Gateway Strategy by providing consulting advice, acquiring and holding railway corridor and strategic port lands, and making related infrastructure investments
2010 Financial and Economic Review — July 2010
102
Chapter 3 — Commercial Crown Corporations Review
for the province. BCRC’s mandate includes the ongoing management of the agreements with CN and KMCT, other port related holdings and the Port Subdivision as part of the provincial government’s overall Pacific Gateway Strategy.
Effective April 1, 2010, the shares of BCRC were transferred to the BC Transportation Financing Authority. This consolidation will promote operational efficiencies while continuing to facilitate strategic priorities. BCRC will remain a separate entity and retain its legal and legislative authorities and agreements. The ongoing core functions and mandate of BCRC will continue.
More information about BCRC’s financial results and performance measures are provided in the corporation’s annual report available at its website: www.bcrco.com.
Provincial Capital Commission
PCC operates under the authority of the Capital Commission Act to protect and enhance the amenity value of the Capital Regional District (CRD) (formally known as the Capital Improvement District), which includes the City of Victoria, the municipalities of Esquimalt and Oak Bay, the Saanich Peninsula and the Western Communities. In 2003, PCC’s core mandate was revised to include the delivery of Outreach programs intended to connect British Columbians with their Capital, and foster awareness of and pride in the diverse cultures and rich history of the province.
Table 3.9 Provincial Capital Commission
Five-Year Income Statement for the Years Ended March 31
($ thousands) | | 2006 | | 2007 | | 2008 | | 2009 | | 2010 | |
Revenue | | 2,580 | | 3,089 | | 3,322 | | 3,543 | | 3,559 | |
Expenses: | | | | | | | | | | | |
Operating and program costs | | 2,159 | | 2,346 | | 2,777 | | 3,024 | | 3,058 | |
Amortization | | 284 | | 372 | | 401 | | 413 | | 450 | |
| | 2,443 | | 2,718 | | 3,178 | | 3,437 | | 3,508 | |
Operating results | | 137 | | 371 | | 144 | | 106 | | 51 | |
Property Plan dispositions (net of expenses) | | — | | — | | 645 | | 282 | | 53 | |
Grants from restricted reserves (1) | | (106 | ) | (35 | ) | (223 | ) | (604 | ) | — | |
Transition costs, other property activities | | (51 | ) | — | | — | | (175 | ) | — | |
Net income | | (20 | ) | 336 | | 566 | | (391 | ) | 104 | |
Financial data: | | | | | | | | | | | |
Capital spending, net of contributions | | 1,074 | | 228 | | 195 | | 371 | | 259 | |
Deferred contribution — Belleville Port Facility | | 1,163 | | 1,122 | | 1,078 | | 990 | | 903 | |
Restricted reserves | | 295 | | 95 | | 472 | | — | | — | |
Unrestricted reserves | | 414 | | 743 | | 850 | | 912 | | 992 | |
(1) Expenses in 2008 and 2009 were for BC 150 Celebrations; prior years were Greenways and Beautification grants.
PCC owns and manages a property inventory within the CRD that includes heritage buildings, Inner Harbour ferry terminal facilities, development sites currently used as temporary parking lots, parks and green space. As a self-supporting Crown agency, income from PCC’s property portfolio is used to fund property maintenance, and outreach programs and initiatives that create awareness of the Capital as a special place for British Columbians, that engages youth and that respects and showcases the province’s diverse cultures including Aboriginal peoples.
More information about PCC’s financial results and performance measures are provided in the commission’s annual report available at its website: www.bcpcc.com.
2010 Financial and Economic Review — July 2010
103
Chapter 4
Supplementary Information
· General Description of the Province
· Constitutional Framework
· Financial Cycle
· Provincial Taxes
2010 Financial and Economic Review — July 2010
Chapter 4 — Supplementary Information
General Description of the Province
British Columbia is located on Canada’s Pacific coast, and has a land and freshwater area of 95 million hectares. It is Canada’s third largest province and comprises 9.5 per cent of the country’s total land area.
Geography
The province is nearly four times the size of Great Britain, 2.5 times larger than Japan and larger than any American state except Alaska. BC’s 7,022-kilometre coastline supports a large shipping industry through ice-free, deep-water ports. The province has about 8.5 million hectares of grazing land, 1.8 million hectares of lakes and rivers, and 950,000 hectares of agricultural land that is capable of supporting a wide range of crops.
Physiography
BC is characterized by mountainous topography, but also has substantial areas of lowland and plateau country. The province has four basic regions, a northwesterly trending mountain system on the coast, a similar mountain system on the east, and an extensive area of plateau country between the two. The northeastern corner of the province is lowland, a segment of the continent’s Great Plains.
The western system of mountains averages about 300 kilometres in width and extends along the entire BC coast and the Alaska panhandle. The Coast Mountains contain some of the tallest peaks in the province. The western system includes the Insular Mountains that form the basis of Vancouver Island and Haida Gwaii (previously known as the Queen Charlotte Islands). These islands help to shelter the waters off the mainland coast of BC, which form an important transportation route for people and products.
The interior of the province is a plateau of rolling forest and grassland, 600 to 1,200 metres in average elevation. North of Prince George the interior becomes mountainous, but plateau terrain returns just south of the Yukon boundary in the area drained by the Liard River. The southern interior’s water system is dominated by the Fraser River, which has a drainage area covering about one-quarter of the province. The Rocky Mountains, in the eastern mountain system, rise abruptly on the southern BC—Alberta boundary and are cut by passes that provide dramatic overland transportation routes into the province. The Rocky Mountain Trench lies immediately to the west of the Rockies. This extensive valley, the longest in North America, is a geological fault zone separating different earth plates. It is the source of many of BC’s major rivers, including the Peace, Columbia and Fraser.
Climate and Vegetation
Coastal BC has abundant rainfall and mild temperatures associated with a maritime climate. The Pacific coast has an average annual rainfall of between 155 and 440 centimetres, while the more sheltered coasts of eastern Vancouver Island and the mainland along the Strait of Georgia average between 65 and 150 centimetres. Canada’s longest frost-free periods of over 180 days per year are enjoyed along the edges of the coastal zone and far inland along the Fraser River valley. Temperatures fall quickly up the steep slopes of the Coast Mountains. The predominant trees in this coastal region are the western hemlock, western red cedar and balsam (amabilis fir) in the wetter parts, and Douglas fir and grand fir in the drier areas.
2010 Financial and Economic Review — July 2010
106
Chapter 4 — Supplementary Information
BC’s interior region has a mainly continental type of climate, although not as severe as that of the Canadian prairies. Considerable variation in climate occurs, especially in winter, as mild Pacific storms bring relief from cold spells. The southern interior has the driest and warmest climate of the province. In the valleys, annual precipitation ranges from less than 30 centimetres to 50 centimetres, while daily temperatures can average over 20 degrees Celsius in July and just under freezing in January. The climate becomes more extreme further north and precipitation increases. The frost-free period in the north is short and variable. Lodgepole pine is the dominant tree of commercial value in the interior.
The northeast region of the province is an extension of the western prairie region of Alberta. It has a continental climate that is more extreme than that of the northern interior region. However, it does have long hot summers and a frost-free period long enough to grow grain, forage and other crops.
Population
BC is the third largest Canadian province in terms of population, which was estimated at 4.5 million persons or about 13.2 per cent of Canadians on July 1, 2009. BC’s population grew at an average annual compound rate of 1.0 per cent between 2000 and 2009, in line with the 1.0 per cent average annual growth rate of the Canadian population as a whole.
Vancouver, a principal Canadian shipping, manufacturing and services centre, has the largest urban population in BC with a population of 2,318,526 persons in 2009. Victoria, the province’s capital, is located on Vancouver Island and its regional district had a population of 367,572 persons in 2009.
Constitutional Framework
The structure of the British Columbia government is based on British parliamentary tradition and precedent. Prior to 1866, BC was composed of two British-controlled colonies — the Colony of Vancouver Island was established in 1849, and the Colony of British Columbia was established in 1858 on the mainland. In the Union Proclamation of 1866, the two colonies were joined to form the single united Crown Colony of British Columbia. On July 20, 1871, BC entered into Confederation with Canada. Although the Colony of Vancouver Island had a parliamentary form of government as far back as 1856, the first fully elected government was not instituted in BC until the autumn after Confederation with Canada. Responsible government was achieved in late 1872, when the Lieutenant Governor acquiesced to an executive council that was responsible to the legislative assembly.
Upon entering Confederation, BC came under the authority of the British North America Act, 1867 (BNA Act), a statute of the British parliament. Until 1982, the BNA Act defined the major national institutions and established the division of authority between the federal and provincial governments. In 1982, the BNA Act was renamed the Constitution Act, 1867 and its amendments were incorporated into the Constitution Act, 1982. The Constitution Act, 1982, which also includes the Canadian Charter of Rights and Freedoms, is companion legislation to the Canada Act, 1982. With the passage of the Canada Act, 1982, the British Parliament ended its legal right to legislate for Canada. Canada, as a federal state, divides legislative powers between the federal and provincial governments.
2010 Financial and Economic Review — July 2010
107
Chapter 4 — Supplementary Information
Provincial Government
BC’s government is modeled after the British system. Functionally there are three main branches: the legislature, the executive and the judiciary.
Legislature
Legislative powers in British Columbia are exercised by a single legislative chamber, which is elected for a term of four years. BC, the first province in Canada to legislate fixed election dates, requires an election on the second Tuesday in May every four years. An election may also be called if the government loses a vote of confidence in the legislative assembly.
The legislature consists of the Lieutenant Governor and 85 elected members of the legislative assembly. The legislative assembly represents the people of BC in the conduct of the province’s affairs. The assembly is required by law to meet at least once a year with a normal session lasting several months. However, special sessions can last just a few days or many months, depending on the nature of the government’s business.
The legislature operates on a fixed schedule — the second Tuesday in February each year is usually reserved for the Throne Speech and the third Tuesday in February each year is reserved for the Budget Speech. After an election, a new budget must be tabled within 90 days of the post-election appointment of the Executive Council.
Executive
The executive is composed of the Lieutenant Governor and the executive council. The Lieutenant Governor, the Queen’s representative in British Columbia, holds a largely ceremonial place in the modern provincial government. By constitutional custom, the Lieutenant Governor is appointed by the Governor General of Canada for a term usually lasting five years.
The Lieutenant Governor, on the advice of the premier, appoints members of the executive council and is guided by the executive council’s advice as long as it holds the confidence of the legislative assembly. Following a general election, the Lieutenant Governor calls upon the leader of the political party with the largest number of elected members to serve as premier and to form the provincial government.
The Lieutenant Governor, on recommendation of the premier, convenes, prorogues and dissolves the legislative assembly and gives Royal Assent to all measures and bills passed by the assembly before they become law.
The executive council, or cabinet, is headed by the premier and is composed of selected members of the ruling party. Ministers are the head of government ministries, and are usually members of cabinet.
Cabinet determines government policy and is held responsible by the legislative assembly for the operation of the provincial government. Deputy ministers are the chief operating officers of ministries and are appointed by cabinet. Deputy ministers are responsible for carrying out government policies and for managing the work of their ministries.
2010 Financial and Economic Review — July 2010
108
Chapter 4 — Supplementary Information
Judiciary
The judiciary performs functions that are central to the orderly operation of society. Judges hear and give judgment in criminal prosecutions and in actions arising from disputes between private citizens or between the government and private citizens. Judges apply both judge-made law, known as “common law,” and laws made by the Parliament of Canada and provincial legislatures. The judiciary is increasingly called on to determine whether laws passed by governments conform to the values expressed in the Canadian Charter of Rights and Freedoms.
BC’s judicial system is made up of the Provincial Court of British Columbia, the Supreme Court of British Columbia and the Court of Appeal of British Columbia. The Provincial Court includes Small Claims, Adult Criminal, Youth and Family divisions. The provincial government appoints Provincial Court judges, and the federal government appoints Court of Appeal and Supreme Court judges.
The federal judicial system includes the Tax Court of Canada, the Federal Court of Canada (Appeals division and Trial division) and the Supreme Court of Canada. The Federal Court of Canada hears cases in limited areas of exclusively federal jurisdiction, for example, reviewing decisions made by federal tribunals such as the Canada Labour Relations Board. The Supreme Court of Canada is the court of final resort and hears selected appeals from the Federal Court of Appeal and provincial Courts of Appeal.
Provincial Government Jurisdiction
Under Canada’s constitutional framework, BC has ownership and jurisdiction over natural resources and is responsible for education, health and social services, municipal institutions, property and civil rights, the administration of justice and other matters of purely provincial or local concern.
2010 Financial and Economic Review — July 2010
109
Chapter 4 — Supplementary Information
The Annual Financial Cycle (1)
British Columbia’s Budget Transparency and Accountability Act (BTAA) outlines the province’s reporting requirements during the financial cycle and imposes specific reporting deadlines or release dates for these publications. In particular, fixed dates for presentation of the Throne Speech and budget, as well as dates for quarterly and annual reports, are set by law.
Under the BTAA, the provincial government focuses its budgeting and reporting on a summary accounts basis. The BTAA requirements include reporting on the advice of the Economic Forecast Council; presentation of the annual Estimates, Budget and Fiscal Plan, Quarterly Reports, and Public Accounts in accordance with GAAP as set by a recognized standard setting organization and determined by Treasury Board (see page 66); publication of Quarterly Reports with revised forecasts; annual three-year service plans and service plan reports for each ministry and government organization; and an annual three-year government strategic plan and report.
Chart A5.1 summarizes the annual financial process of the province. This process consists of four main stages.
· Planning and Budget Preparation — Treasury Board reviews longer-term estimates of revenue, expense, capital and debt, and establishes a preliminary fiscal plan within the framework of the government’s overall strategic plan. Ministries, service
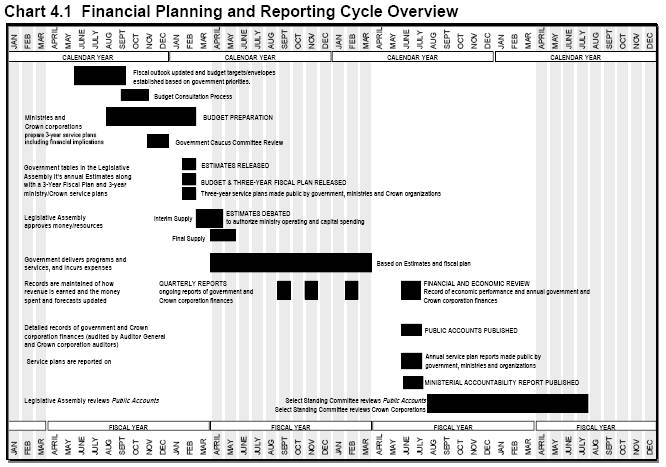
(1) Reflects the financial cycle for normal years.
2010 Financial and Economic Review — July 2010
110
Chapter 4 — Supplementary Information
delivery agencies and Crown corporations prepare three-year service plans, including performance measures and targets, and operating and capital budgets, for review by Treasury Board and/or government Caucus committees. Treasury Board makes decisions on budget allocations for ministries and agencies, and assesses commercial Crown corporation net income benchmarks, within the context of the fiscal plan. Included as inputs into this process are a consultation paper published by September 15th that invites public comment on issues for consideration as government develops its fiscal and service plans, and province-wide public hearings held by a committee of the legislature. A report outlining the results of the budget consultation process is made public by November 15th of each year.
· Implementation and Reporting — The government’s revenue, expense and capital plans for the next three fiscal years, as well as other information on the government’s finances, are presented to the Legislative Assembly by the Minister of Finance in a budget document called the Budget and Fiscal Plan. The financial plan for the next fiscal year is also included in the document called the Estimates, which describes the individual appropriations to be voted on by the Legislative Assembly. Government’s strategic plan, service plans and a report on major capital projects (those where government contribution exceeds $50 million) must also be tabled. Throughout the year, the authorized funding as specified in the Estimates and ministry service plans is spent on programs and services. Crown corporations follow approved service plans under the direction of their own Boards of Directors. Quarterly Reports, including full-year forecasts, are published by legislated dates, thereby providing regular updates to the public on the government’s finances.
· Evaluation — At the end of the fiscal year, the Public Accounts are prepared by the Comptroller General and examined by the Auditor General to ensure that the financial statements fairly present the government’s financial position. The Public Accounts are augmented by the British Columbia Financial and Economic Review, which provides an overview of annual and historical financial and economic results. In addition, annual service plan reports are made public that compare actual results with ministry and Crown corporation performance targets.
· Accountability — The Public Accounts are presented to the Legislative Assembly and are reviewed by two committees of the Legislative Assembly (the Select Standing Committee on the Public Accounts and the Select Standing Committee on Crown corporations). At the same time, the Ministerial Accountability Report is published detailing the individual and collective financial performance of cabinet ministers, and the performance and revenue results achieved by the Ministers of State and the Minister of Finance. The Minister of Finance also presents to the Legislative Assembly plans, reports and statements related to the revenue-neutrality objectives of the Carbon Tax Act. In addition, at the same time as, or shortly after, the Public Accounts are tabled, ministries and most Crown corporations release their service plan reports detailing results for the previous fiscal year. A report on the government’s strategic plan is also presented.
2010 Financial and Economic Review — July 2010
111
Chapter 4 — Supplementary Information
Summary of Tax Changes Announced in 2010
Income Tax Act
· The BC Sales Tax Credit is integrated into the new BC HST Credit which provides up to $230 per family member and is paid quarterly with the GST credit and Low Income Climate Action Tax Credit.
· Effective for productions with principal photography beginning after February 2010,
· the labour cap for Film Incentive BC is increased to 60 per cent from 48 per cent;
· the Digital Animation or Visual Effects tax credit rate is increased to 17.5 per cent from 15 per cent;
· the basic Production Services Tax Credit is increased to 33 per cent from 25 per cent.
· The new Interactive Digital Media tax credit is introduced to provide a credit of 17.5 per cent of eligible BC labour expenditures.
· The Mining Flow-Through Share Tax Credit is extended to the end of 2013.
Corporation Capital Tax Act
· The financial institutions minimum tax which was scheduled to be in effect April 1, 2010 is repealed.
International Financial Activity Act
· The Program is expanded to include international clean technology, carbon trading and digital media publishing and distribution businesses.
· The name of the Act was changed to the International Business Activity Act to better reflect the expansion of the program.
· The expanded program will allow for specialists in more areas.
· Qualifying international financial activities are clarified.
Social Service Tax Act
· The government of British Columbia announced on July 23, 2009 that it would implement a Harmonized Sales Tax (HST) on July 1, 2010. A 7 per cent BC rate is added to the 5 per cent federal Goods and Services Tax (GST) for a combined 12 per cent HST.
British Columbia’s 7 per cent Provincial Sales Tax (PST) and 8 per cent Hotel Room Tax (HRT) are eliminated.
The following taxes and levies are also eliminated:
· $1.50 per day passenger vehicle rental tax
· $5 per battery levy
· 0.4 per cent Innovative Clean Energy (ICE) Fund Levy
· annual multi-jurisdictional vehicle (MJV) tax in lieu of 7 per cent PST
· 10 per cent liquor tax (7 per cent under HST)
· 8 to 10 per cent surtax on vehicles over $55,000
The Province and the federal government signed a harmonization agreement, the Comprehensive Integrated Tax Coordination Agreement (CITCA), in November 2009. The HST is imposed under federal legislation, the Excise Tax Act, and is administered by the Canada Revenue Agency.
Consumption Tax Rebate and Transition Act
· Provincially administered point of sale rebates of the provincial portion of the HST are provided for residential energy, excluding administrative and service charges.
· Point of sale rebates, administered by the Canada Revenue Agency, are authorized for motor fuels, books, children-sized clothing and footwear, children’s car seats and car booster seats, children’s diapers and feminine hygiene products.
· 7 per cent provincial tax on the purchase of vehicles, boats and aircraft at private sale is increased to 12 per cent.
2010 Financial and Economic Review — July 2010
112
Chapter 4 — Supplementary Information
Summary of Tax Changes Announced in 2010 — Continued
Motor Fuel Tax Act
· Effective January 1, 2010, the motor fuel tax exemption for ethanol and renewable diesel fuel was eliminated and, as a result, they are taxed at the same rate as fuel with which they are blended, or if sold as 100 per cent pure ethanol or biodiesel, as gasoline and diesel fuel respectively.
· Effective July 1, 2010, propane used in motor vehicles is exempt from motor fuel tax.
Carbon Tax Act
· Propane is moved into the security scheme that applies to most fuels, effective July 1, 2010.
Medicare Protection Act
· Effective January 1, 2011, Medical Services Plan premiums are increased. Maximum monthly premium rates will increase by $3.50 per month to $60.50 for single persons, by $7 per month to $115 for two person families and by $7 per month to $121 for families of three or more persons.
Hotel Room Tax Act
· Effective July 1, 2010, the 8 per cent provincial hotel room tax is eliminated to coincide with the implementation of the harmonized sales tax which applies to short-term accommodation.
Tobacco Tax Act
· Effective March 3, 2010, the maximum tax payable per cigar was increased to $6 per cigar from $5 per cigar, and the calculation of the 77 per cent tax on cigars was clarified as follows:
· the tax applies to the retail cigar price if the retail dealer who sells the cigar also manufactured the cigar in Canada or imported the cigar into Canada; or
· in all other cases, the tax applies to the wholesale price plus a markup equal to 30 per cent of the wholesale price.
Home Owner Grant Act
· The Northern and Rural Benefit of up to $200 is introduced effective for the 2011 taxation year.
· The benefit is provided as an increase to the home owner grant and all eligibility requirements for the home owner grant apply.
· The Northern and Rural Benefit applies in all areas of the province outside the Greater Vancouver Regional District, the Fraser Valley Regional District, and the Capital Regional District.
Land Tax Deferment Act
· Eligibility for the Property Tax Deferment Program was extended to families with children under age 18 beginning in the 2010 taxation year.
· To be eligible, a home owner must financially support at least one child under age 18, meet the basic eligibility criteria for the program, and have at least 15 per cent equity in their home. Simple interest is charged on deferred taxes at the prime rate.
School Act
· Effective for the 2011 and subsequent taxation years, the Provincial Farm Land Property Tax Credit was introduced to reduce provincial school property tax on farm land (class 9) by 50 per cent.
· Effective for the 2011 and subsequent taxation years, the Industrial Property Tax Credit which reduces provincial school property tax on major industrial (class 4) and light industrial (class 5) properties was increased to 60 per cent from 50 per cent. The Industrial Property Tax Credit applies to British Columbia manufacturing, mining, forestry and other major and light industries.
South Coast British Columbia Transportation Authority Act
· Effective January 1, 2010, the motor fuel tax collected by the province on behalf of the South Coast British Columbia Transportation Authority was increased by 3 cents per litre to 15 cents per litre.
2010 Financial and Economic Review — July 2010
113
Chapter 4 – Supplementary Information
Table 4.1 Provincial Taxes (as of July 2010)
Type and | | | | | | |
Statute Reference | | Tax Base | | Tax Rate | | Characteristics and Exemptions |
| | | | | | |
Income — Income Tax Act | | Taxable Income (1) Corporate. | | 10.5% of taxable income
(small business rate: 2.5%). | | The Canada Revenue Agency administers BC’s personal and corporate taxes under an agreement between the province and the federal government. |
| | | | | | |
| | | | | | Corporate tax credits include the scientific research and experimental development tax credit, book publishing tax credit and the film tax credit. In addition, the political contributions tax credit, royalty tax credit, mining exploration tax credit, logging tax credit, training tax credits and venture capital tax credits are available to both individuals and corporations. |
| | | | | | |
| | (2) Personal. | | Tax rates of 5.06%, 7.7%, 10.5%, 12.29% and 14.7% corresponding to tax brackets of up to $35,859, $35,859 to $71,719, $71,719 to $82,342, $82,342 to $99,987 and over $99,987. | | BC provides a set of non-refundable credits similar to most federal non-refundable credits. BC Family Bonus and BC Earned Income Benefit are combined with the federal government’s Canada Child Tax Benefit in a single monthly payment to families. Tax credits include training tax credits, political contributions tax credit, BC Low Income Climate Action Tax Credit, BC HST Credit, the mining flow-through share tax credit and employee venture capital tax credits. |
| | | | | | |
Real Property Transfers — Property TransferTax Act | | Fair market value of property or interest in property transferred; for presold strata units purchased at arm's length, total consideration for the strata unit. | | 1% on the first $200,000 of value transferred and 2% on amounts in excess of $200,000. | | Exemptions include: transfers of principal residences, recreational residences and family farms to related individuals; transfers of property between spouses pursuant to written separation agreements or court orders; transfers of property to local governments, registered charities and educational institutions; transfers of property to veterans under the Veterans' Land Act (Canada); transfers of land to be protected, preserved, conserved or kept in a natural state; and transfers of leases less than 31 years in duration. A number of technical exemptions are also provided. Eligible first time home- buyers are exempt from tax on transfers of eligible properties. |
| | | | | | |
Retail Sales — Social Service Tax Act | | NA | | NA | | The provincial sales tax (PST) was eliminated with the implementation of the harmonized sales tax (HST). The HST is implemented effective July 1, 2010. |
| | | | | | |
Private Sales of vehicles, boats and aircraft – Consumption Tax Rebate and Transition Act | | Purchase of a vehicle, boat or aircraft at a private sale | | General rate is 12% | | Paid by purchasers either to ICBC when a vehicle is registered or licensed or directly to government. Exemptions and refunds are either to prevent double taxation where the harmonized sales tax would apply or to continue exemptions and refunds previously available under the Social Service Tax Act. |
| | | | | | |
Harmonized Sales Tax– Excise Tax Act (federal) | | Supply of most goods and services | | 7% provincial rate | | The Harmonized Sales Tax (HST) is imposed under the federal Excise Tax Act and is administered by the Canada Revenue Agency. The Comprehensive Integrated Tax Coordination Agreement (CITCA) sets out the terms of BC’s harmonization agreement with the federal government. |
| | | | | | |
| | | | | | The HST in British Columbia has a 7% provincial rate and a 5% federal rate for a combined rate of 12%. The HST applies to the supply of most goods and services in British Columbia. |
| | | | | | |
| | | | | | Certain goods and services are exempt from HST or zero-rated (0% tax). Examples of exempt and zero-rated supplies are most health, dental, education, and financial services, residential rent, basic groceries, prescription drugs, medical devices and exports. |
2010 Financial and Economic Review – July 2010
114
Chapter 4 – Supplementary Information
Table 4.1 Provincial Taxes (as of July 2010) — Continued
Type and | | | | | | |
Statute Reference | | Tax Base | | Tax Rate | | Characteristics and Exemptions |
| | | | | | |
Harmonized Sales Tax— Excise Tax Act (federal) (Continued) | | Supply of most goods and services | | 7% provincial rate | | There are also point-of-sale rebates of the provincial portion of the HST on motor fuels, books, children-sized clothing and footwear, children’s car seats and car booster seats, children’s diapers and feminine hygiene products. There is a provincial credit equal to the provincial portion of the HST on residential energy. |
| | | | | | |
| | | | | | There are also partial HST new housing and new rental housing rebates and partial HST rebates for public service bodies (municipalities, school authorities, hospital authorities, universities, public colleges, registered charities, qualifying non-profits). |
| | | | | | |
| | | | | | Businesses making taxable or zero-rated supplies are able to claim input tax credits to recover the HST they pay on their business inputs. Those making exempt supplies do not collect tax on their supplies but are not eligible for input tax credits. |
| | | | | | |
Accommodation — Hotel Room Tax Act | | Purchase price of accommodation in local areas eligible to collect the tax. | | Local governments may apply to have the province levy an additional tax of up to 2% on their behalf. | | The 8% provincial hotel room tax was eliminated with the implementation of the harmonized sales tax (HST). Under the HST accommodation is taxed at 7%. The HST was implemented effective July 1, 2010. |
| | | | | | |
| | | | | | The additional hotel room tax continues to be collected by the province on behalf of municipalities that have successfully applied to collect the tax. |
| | | | | | |
Tobacco — Tobacco Tax Act | | By cigarette, cigar retail price, and weight on other tobacco products. | | 18.5 cents per cigarette and tobacco stick; 77% of taxable price on cigars to a maximum tax of $6 per cigar; 18.5 cents per gram of loose tobacco | | The cigar tax rate applies to 1) the wholesale price plus a mark-up of 30% or 2) the retail price if the retail dealer who sells the cigar also manufactured the cigar in Canada or imported it into Canada. |
| | | | | | |
Carbon Dioxide Equivalent Emissions from combustion of fossil fuels – Carbon Tax Act | | Purchase, use or, in certain circumstances, transfer or importation of · Aviation Fuel · Gasoline · Heavy Fuel Oil · Jet Fuel · Kerosene · Light Fuel Oil · Methanol (not produced from biomass) · Naphtha · Butane · Coke Oven Gas · Ethane · Pentane Plus · Gas Liquids · Natural Gas · Propane · Refinery Gas · High Heat Value Coal · Low Heat Value Coal · Coke · Petroleum Coke · Also combustion of peat and tires (whole or shredded) when used to produce heat or energy (combustibles). | | Tax rates vary by type of fuel or combustible based on carbon dioxide equivalent emitted by each fuel or combustible. Tax rates effective July 1, 2010 based on $20 per tonne of carbon dioxide equivalent and increase by $5 annually to equal $30 per tonne of carbon dioxide equivalent on July 1, 2012. | | Tax is payable on fuels by purchasers at the time of retail purchase. Fuels, other than natural gas, are subject to a security scheme similar to the security scheme under the Motor Fuel Tax Act. Security is payable by collectors registered under the Act when fuel is sold in British Columbia for the first time after manufacture or importation. Tax on the purchase of natural gas is collected and remitted at the retail level. Tax on use, transfer and import is self-assessed. Tax on the burning of combustibles is self-assessed. Exemptions include fuels which are exported for use outside of British Columbia, fuel used for certain non-energy purposes, and fuel used for eligible inter-jurisdictional transportation because the resulting emissions are generally not considered as domestic emissions under the federal National Inventory Report. There are also minor exemptions similar to exemptions in other consumption tax Acts for administrative and technical reasons. |
2010 Financial and Economic Review – July 2010
115
Chapter 4 – Supplementary Information
Table 4.1 Provincial Taxes (as of July 2010) — Continued
Type and | | | | | | |
Statute Reference | | Tax Base | | Tax Rate | | Characteristics and Exemptions |
| | | | | | |
Motor Fuel — Motor Fuel Tax Act | | Purchase, use, or in certain circumstances, transfer or importation of | | | | Tax generally applies to all fuels purchased for use, or used in internal combustion engines. Tax is payable on fuels by purchasers at the time of retail purchase. Most fuels are subject to a security scheme similar to the security scheme under the Carbon Tax Act. Security is payable by collectors registered under the Act when fuel is sold in British Columbia for the first time after manufacture or importation. Qualifying persons with disabilities who own or lease a vehicle are entitled to refunds of provincial tax paid up to an annual maximum of $500. The additional tax collected in the South Coast BC Transportation Service Region, on behalf of TransLink, helps fund regional transportation costs. The additional tax collected in the Victoria Regional Transit Service Area, on behalf of BC Transit, helps fund the public transit system. |
| | | | | | |
| | Clear gasoline | | General rate: 14.5 cents per litre (includes 6.75 cents per litre collected on behalf of the BC Transportation Financing Authority). | | Ethanol blended with gasoline or pure is taxed as gasoline. |
| | | | | | |
| | | | South Coast BC Transportation Service Region: 23.5 cents per litre (includes 6.75 cents per litre collected on behalf of the BC Transportation Financing Authority and 15 cents per litre collected on behalf of TransLink). | | |
| | | | | | |
| | | | Victoria Regional Transit Service Area: 18 cents per litre (includes 6.75 cents per litre collected on behalf of the BC Transportation Financing Authority and 3.5 cents per litre collected on behalf of BC Transit). | | |
| | | | | | |
| | Motive fuel. | | General rate: 15 cents per litre (includes 6.75 cents per litre collected on behalf of the BC Transportation Financing Authority). | | Tax applies to diesel fuel, including renewable diesel fuels such as biodiesel, or a combination of fuels including diesel fuels, but does not include alternative motor fuels or coloured fuels. Refunds of 0.5 cents per litre are available for motive fuel used in private passenger vehicles. |
| | | | | | |
| | | | South Coast BC Transportation Service Region: 24 cents per litre (includes 6.75 cents per litre collected on behalf of the BC Transportation Financing Authority and 15 cents per litre collected on behalf of TransLink). | | |
| | | | | | |
| | | | Victoria Regional Transit Service Area: 18.5 cents per litre (includes 6.75 cents per litre collected on behalf of the BC Transportation Financing Authority and 3.5 cents per litre collected on behalf of BC Transit). | | |
2010 Financial and Economic Review – July 2010
116
Chapter 4 — Supplementary Information
Table 4.1 Provincial Taxes (as of July 2010) — Continued
Type and | | | | | | |
Statute Reference | | Tax Base | | Tax Rate | | Characteristics and Exemptions |
| | | | | | |
Motor Fuel — Motor Fuel Tax Act | | Alternative motor fuels. (Natural Gas, Propane, Hydrogen, Methanol (M85+)) | | Exempt. | | Natural gas and propane, when used as a motor fuel, are exempt from tax. Certain hydrogen is exempt from tax. Fuels comprised of at least 85% methanol are also exempt from tax. |
(Continued) | | | | | | |
| | Coloured fuel, marine diesel fuel. | | 3 cents per litre. | | Coloured fuel may be used in all vehicles not licensed to operate on a highway and in specific industrial vehicles. Bona fide farmers are exempt from paying the tax when fuel is used for farming purposes. Farm vehicles with A or G license plates are allowed to use tax-exempt coloured fuel for farming purposes on a highway. |
| | | | | | |
| | Locomotive fuel. | | 3 cents per litre. | | Tax applies to fuel specifically for use in locomotives. |
| | Jet and aviation fuel. | | 2 cents per litre. | | Jet fuel tax applies to fuel produced specifically for use in a turbine aircraft engine. |
| | | | | | Aviation fuel tax applies to fuel produced specifically for use in a non-turbine aircraft engine. |
| | Natural gas used in stationary engines. | | 7% of price if purchased. 1.1 cents per 810.32 litres if used but not purchased. | | Tax applies to natural gas used in stationary engines other than pipeline compressors. |
| | Natural gas used in pipeline compressors to transmit marketable gas. | | 1.9 cents per 810.32 litres. | | Tax applies to natural gas used in a stationary engine at a pipeline compressor station. |
| | | | | | |
| | Natural gas used in pipeline compressors to extract and transmit raw gas from wells to processing plants. | | Exempt | | |
| | | | | | |
| | Natural gas used in compressors to re-inject sour gas into depleted wells. | | Exempt. | | |
| | | | | | |
| | Marine bunker. | | Exempt | | Exemption applies to bunker fuel, or a combination of bunker and other fuels used as fuel in a ship. |
| | Marine gas oil. | | Exempt | | Exemption applies to marine gas oil when used in primary gas turbine engines to propel passenger and cargo vessels. |
| | | | | | |
Natural resources — Logging Tax Act | | Net income from logging in BC. | | 10% (fully recoverable against federal and provincial corporation and personal income tax). | | Net income from logging after deducting non-forestry income and a processing allowance. |
| | | | | | |
— Mineral Land Tax Act | | Assessed value of freehold mineral land and production areas. | | Undesignated mineral land — $1.25 to $4.94 per hectare. Designated production areas — $4.94 per hectare. | | Rates of tax set on sliding scale, dependent on size and designation of land. |
| | | | | | |
—Mineral Tax Act | | Cash flow from individual metal and coal mines (other than placer gold mines). | | 2% of net current proceeds (NCP). 13% of net revenue (NR). | | Tax calculated on a mine-by-mine basis. NCP tax paid on current operating cash flow until all current and capital costs, plus any investment allowance, are recovered. NR tax paid thereafter on cumulative cash flow. NCP tax creditable against NR tax. |
| | | | | | |
| | Volume of production of limestone, dolomite, marble, shale, clay, volcanic ash, diatomaceous earth, sandstone, quartzite and dimension stone. | | $0.15 per tonne removed from all quarries operated. | | An operator may deduct 25,000 tonnes from the total number of tonnes removed from all quarries operated by that operator. However the amount deducted from any one quarry by all operators of that quarry must not exceed 25,000 tonnes. |
| | | | | | |
| | Value of minerals sold by placer gold mines. | | 0.5% of value of minerals sold. | | |
| | | | | | |
Insurance — Insurance Premium Tax Act | | Direct premiums written. | | 4.4% for vehicle and property insurance; 2% for life, sickness, personal accident and loss of salary and wages insurance and 4 percent for other insurance. | | Exemptions — benefit societies; mutual corporations with 50% of income from farm or 100% from religious, educational or charitable institutions; marine, except pleasure craft; approved medical or hospitalization plans. |
2010 Financial and Economic Review – July 2010
117
Chapter 4 – Supplementary Information
Table 4.1 Provincial Taxes (as of July 2010) — Continued
Type and | | | | | | |
Statute Reference | | Tax Base | | Tax Rate | | Characteristics and Exemptions |
| | | | | | |
Real property — Taxation (Rural Area) Act | | Assessed value of land and improvements in rural areas (outside municipalities). Assessment determined under the Assessment Act. | | Rates are set annually as a percentage of assessed value. For residential properties the rates are set to increase average residential rural taxes by the rate of inflation. For 2010, the rates were set so that total non-residential rural tax revenues increase by inflation plus new construction. For 2010, the rates are 0.051% for farms; 0.041% for managed forest lands; 0.052% for residential; 0.096% for recreational property/non-profit organizations; 0.278% for light industry, business and other property not contained in any other class; 0.41% for utilities; 0.477% for major industry and 0.01% for supportive housing | | Some exemptions apply under various statutes. |
| | | | | | |
Residential school tax — School Act | | Assessed value of residential land and improvements. Assessment determined under the Assessment Act. | | Rates are set annually to increase average gross residential taxes by the rate of inflation. The rates vary by school district. For 2010 rates range from about 0.133% to 0.587%; weighted average 0.196%. | | Basic rates are calculated using a formula to moderate effects of varying average assessments on school district taxes. School districts may levy additional tax if authorized by local referendum. Amendments to the School Act in 2002 allow the Minister of Finance to apply different tax rates within a school district. Tofino is the only municipality with a rate that differs from the rest of the school district. |
| | | | | | |
Non-residential school tax — School Act | | Assessed value of non-residential land and improvements. Assessment determined under the Assessment Act. | | Rates are set annually. For 2010, except for the major industry property class, the rates are set so that total non-residential school tax revenues increase by inflation plus new construction. The major industry property class rate is set to be the same as the business property class rates. For 2010 the rates are 0.35% for recreational property/non-profit organizations; 0.18% for managed forest land; 0.68% for farms; 0.68% for light industry, major industry, business and other property not contained in any other class 1.44% for utilities and 0.01% for supportive housing. | | Some exemptions apply under various statutes. Effective for the 2009 and subsequent taxation years, an Industrial Property Tax Credit was introduced to reduce provincial school property tax on major industrial (class 4) and light industrial (class 5) properties. The rate is 50% and rises to 60% for 2011 and subsequent taxation years. The Industrial Property Tax Credit applies to British Columbia manufacturing, mining, forestry and other major and light industries. Effective in 2011, a 50% Provincial Farm Land Property Tax Credit will reduce the provincial school property tax on farm land (class 9). |
| | | | | | |
Police Tax — Police Act | | Assessed value of land and improvements in municipalities under 5,000 population and in rural areas. Assessment determined under the Assessment Act. | | Rates are set annually to raise up to 50% of the cost of rural and small community policing. Rates are set for each of the nine property classes in each municipality under 5,000 population, in each electoral area of the province and in the area of the province outside a regional district. | | Basic rates are calculated using a formula that moderates the effect of variations in assessed value in the province by adjusting for population. Adjustments are made to the rates to reflect the contribution taxpayers in the rural areas make to policing costs through the rural area property tax. Adjustments are also made to account for traffic fine revenue sharing and for payments in lieu of taxes from the federal government. |
2010 Financial and Economic Review – July 2010
118
Chapter 4 - Supplementary Information
Table 4.2 Interprovincial Comparisons of Tax Rates — 2010
(Rates known as of July 1, 2010) (1)
Tax | | British
Columbia | | Alberta | | Saskatchewan | | Manitoba | | Ontario | | Quebec | | New
Brunswick | | Nova
Scotia | | Prince
Edward
Island | | Newfoundland | |
Corporation income tax (2) (per cent of taxable income) | | | | | | | | | | | | | | | | | | | | | |
General rate | | 10.5 | | 10 | | 12 | | 12 | | 12 | | 11.9 | | 11 | | 16 | | 16 | | 14 | |
Manufacturing rate | | 10.5 | | 10 | | 10 | | 12 | | 10 | | 11.9 | | 11 | | 16 | | 16 | | 5 | |
Small business rate | | 2.5 | | 3 | | 4.5 | | 0 | | 4.5 | | 8.0 | | 5 | | 5 | | 1 | | 4 | |
Small business threshold ($000s) | | 500 | | 500 | | 500 | | 400 | | 500 | | 500 | | 500 | | 400 | | 500 | | 500 | |
Corporation capital tax (3) | | | | | | | | | | | | | | | | | | | | | |
Non-financial | | Nil | | Nil | | Nil | | .2 | | Nil | | .12 | | Nil | | .15 | | Nil | | Nil | |
Financial | | Nil | | Nil | | .7/3.25 | | 3.0 | | Nil | | .24 | | 3.0 | | 4.0 | | 5.0 | | 4.0 | |
Health care premiums (4) | | | | | | | | | | | | | | | | | | | | | |
Individual/family | | 57/114 | | Nil | | Nil | | Nil | | Nil | | Nil | | Nil | | Nil | | Nil | | Nil | |
Payroll tax (per cent) (5) | | Nil | | Nil | | Nil | | 2.15 | | 1.95 | | 4.26 | | Nil | | Nil | | Nil | | 2.0 | |
Insurance premium tax (per cent) (6) | | 2-4.4 | | 2-3 | | 3-4 | | 2-3 | | 2-3.5 | | 2-3 | | 2-3 | | 3-4 | | 3.5 | | 4 | |
Fuel tax (cents per litre) (7) | | | | | | | | | | | | | | | | | | | | | |
Gasoline | | 18.95 | | 9.0 | | 15.0 | | 11.5 | | 21.4 | | 22.1 | | 17.6 | | 22.6 | | 15.8 | | 24.2 | |
Diesel | | 20.11 | | 9.0 | | 15.0 | | 11.5 | | 21.1 | | 23.2 | | 24.1 | | 22.4 | | 20.0 | | 24.2 | |
Sales tax (per cent) (8) | | | | | | | | | | | | | | | | | | | | | |
General rate | | 7 | | Nil | | 5 | | 7 | | 8 | | 7.5 | | 8 | | 10 | | 10 | | 8 | |
Tobacco tax (dollars per carton of 200 cigarettes) (9) | | 42.70 | | 40.00 | | 46.30 | | 47.00 | | 30.20 | | 20.60 | | 28.90 | | 51.70 | | 44.90 | | 44.60 | |
(1) Rates shown are those known as of July 1, 2010 and that are in effect for 2010.
(2) Provinces planning reductions in general corporate income tax rates include British Columbia, to 10 per cent effective January 1, 2011, Ontario, to 11.5 per cent effective July 1, 2011, to 11 per cent effective July 1, 2012 and to 10 per cent effective July 1, 2013; and New Brunswick, to 10 per cent effective July 1, 2011 and to 8 per cent effective July 1, 2012.
Provinces planning changes to their small business rates include British Columbia, to zero by April 1, 2012, Nova Scotia, to 4 per cent effective January 1, 2011, to 3 per cent effective January 1, 2012 and to 2.5 per cent effective January 1, 2013.
(3) Provinces planning to eliminate their general corporation capital taxes include Manitoba effective January 1, 2011, Quebec effective January 1, 2011 and Nova Scotia by 2012.
(4) British Columbia has a two-person rate of $102; rates will increase effective January 1, 2011. British Columbia provides premium assistance in the form of lower rates or an exemption from premiums for lower income individuals and families. Ontario and Quebec levy health care contributions as additions to provincial personal income taxes payable.
(5) Provinces with payroll taxes provide payroll tax relief for small businesses.
(6) The lower rate applies to premiums for life, sickness and accident insurance; the higher rate applies to premiums for property insurance including automobile insurance. In Ontario, Quebec and Newfoundland specific sales taxes also apply to insurance premiums, except those related to individual life and health.
(7) Tax rate is for regular fuel used on highways and includes all provincial taxes payable by consumers at the pump. The British Columbia rate includes 6.75 cents per litre dedicated to the BC Transportation Financing Authority and the carbon tax rates of 4.45 cents per litre for gasoline and 5.11 cents per litre for diesel. The British Columbia rates do not include regional taxes that effectively increase the gasoline and diesel tax rates by 12 cents per litre in the South Coast British Columbia transportation service area and by 3.5 cents per litre in the Capital Regional District. The tax rates for Ontario, Quebec, New Brunswick, Nova Scotia and Newfoundland include provincial sales tax based on current pump prices. In BC, gasoline and diesel fuel are eligible for a point of sale rebate of the provincial portion of the HST. The PEI rate consists of an ad valorem tax rate capped at 8.7 cents per litre and a volume-based motor fuel tax rate set at 7.1 cents per litre for gasoline and 11.5 cents per litre for diesel fuel
(8) The rates shown are statutory rates. Quebec and PEI impose tax on the purchase price including GST. British Columbia and Ontario harmonized their sales taxes with the federal GST effective July 1, 2010 at 7 per cent and 8 per cent respectively for total HST rates of 12 per cent and 13 per cent. Alberta imposes a 4 per cent tax on short-term rental accommodation. The Quebec tax rate increases to 8.5 per cent effective January 1, 2011.
(9) Includes estimated provincial sales tax where applicable.
2010 Financial and Economic Review -July 2010
119
Visit our website at: www.gov.bc.ca/fin

| Ministry of
Finance |