Exhibit 99.11
BUDGET AND FISCAL PLAN
2011/12 — 2013/14
Presented to the Legislative Assembly on
May 3, 2011

Budget and Fiscal Plan
2011/12 — 2013/14
May 3, 2011

National Library of Canada Cataloguing in Publication Data
British Columbia.
Budget and fiscal plan. — 2002/03/2004/05-
Annual
Also available on the Internet.
Continues: British Columbia. Ministry of Finance and
Corporate Relations. Budget ... reports. ISSN 1207-5841
ISSN 1705-6071 = Budget and fiscal plan — British Columbia.
1. Budget — British Columbia — Periodicals. 2. British
Columbia — Appropriations and expenditures — Periodicals.
I. British Columbia. Ministry of Finance. II. Title.
HJ12.B742 352.48’09711’05 C2003-960048-3
TABLE OF CONTENTS
Budget and Fiscal Plan 2011/12 – 2013/14 | May 3, 2011 |
Attestation by the Secretary to Treasury Board
Summary | | 1 |
| | |
Part 1: Three-Year Fiscal Plan | | |
Introduction | | 5 |
Changes since Budget 2010 | | 8 |
Revenue | | 9 |
Major Revenue Sources | | 11 |
Expense | | 18 |
Consolidated Revenue Fund Spending | | 18 |
Management of the BC Public Service | | 22 |
Recovered Expenses | | 23 |
Operating Transfers | | 24 |
Service Delivery Agency Spending | | 24 |
Capital Spending | | 25 |
Taxpayer-supported Capital Spending | | 26 |
Self-supported Capital Spending | | 28 |
Projects over $50 million | | 29 |
Provincial Debt | | 32 |
Risks to the Fiscal Plan | | 35 |
Tables: | | |
1.1 | Three-Year Fiscal Plan – Operating Statement | | 5 |
1.2 | Fiscal Plan Update – Changes from Budget 2010 | | 8 |
1.3 | Major Factors Underlying Revenue | | 10 |
1.4 | Personal Income Tax Revenue | | 11 |
1.5 | Corporate Income Tax Revenue | | 11 |
1.6 | Sales Taxes Revenue | | 12 |
1.7 | Federal Government Contributions | | 14 |
1.8 | Revenue by Source | | 16 |
1.9 | Expense by Ministry, Program and Agency | | 17 |
1.10 | Health Per Capita Costs and Outcomes: Canadian Comparisons | | 20 |
1.11 | Health Funding Report and Plan | | 21 |
1.12 | Capital Spending | | 25 |
1.13 | Provincial Transportation Investments | | 27 |
1.14 | Capital Expenditure Projects Greater Than $50 million | | 30 |
1.15 | Provincial Debt Summary | | 32 |
1.16 | Provincial Borrowing Requirements | | 33 |
1.17 | Reconciliation of Summary Results to Provincial Debt Changes | | 34 |
1.18 | Key Fiscal Sensitivities | | 35 |
1.19 | Notional Allocations to Contingencies | | 38 |
Budget and Fiscal Plan – 2011/12 to 2013/14
Table of Contents
Part 2: Tax Measures | | |
Tax Measures – Supplementary Information | | 42 |
Tables: | | |
2.1 Summary of Tax Measures | | 41 |
Topic Box: | | |
Revenue Neutral Carbon Tax | | 45 |
| | |
Part 3: British Columbia Economic Review and Outlook | | |
Summary | | 47 |
British Columbia Economic Activity and Outlook | | 48 |
The Labour Market | | 49 |
Consumer Spending and Housing | | 49 |
Business and Government | | 51 |
External Trade and Commodity Markets | | 52 |
Inflation | | 53 |
Risks to the Economic Outlook | | 54 |
External Outlook | | 54 |
United States | | 54 |
Canada | | 56 |
Financial Markets | | 57 |
Interest Rates | | 57 |
Exchange Rate | | 58 |
Tables: | | |
3.1 | British Columbia Economic Indicators | | 48 |
3.2 | Ministry of Finance Economic Forecast: Key Economic Indicators | | 48 |
3.3 | US real GDP forecast: Consensus vs Ministry of Finance | | 56 |
3.4 | Canadian real GDP forecast: Consensus vs Ministry of Finance | | 57 |
3.5 | Private Sector Canadian Interest Rate Forecasts | | 58 |
3.6 | Private Sector Exchange Rate Forecasts | | 59 |
3.7.1 | Gross Domestic Product: British Columbia | | 60 |
3.7.2 | Components of Nominal Income and Expenditure | | 61 |
3.7.3 | Labour Market Indicators | | 61 |
3.7.4 | Major Economic Assumptions | | 62 |
Topic Box: | | |
The Economic Forecast Council, 2011 | | 63 |
| | |
Appendices | | 67 |
Budget and Fiscal Plan – 2011/12 to 2013/14
ii

May 3, 2011
Budget 2011, as tabled in the British Columbia Legislature on May 3, 2011, replaces the document tabled on February 15, 2011, with the exception of Part 4 - 2010/11 Revised Financial Forecast (Third Quarterly Report).
I have reviewed the economic and revenue forecasts since the tabling of Budget 2011 in February. In my opinion, there have not been material changes to the underlying assumptions that would require a change to the overall fiscal forecast presented in Budget 2011.
While the government has announced an intention to hold a referendum in relation to the provincial Harmonized Sales Tax (HST), the outcome of that referendum is unknown at this time. Consequently, Budget 2011 assumes a continuation of the current laws and agreements that prevail today. In particular, Budget 2011 as presented on May 3, 2011 assumes that the provincial HST will continue over the years covered by Budget 2011, and it does not accommodate any changes to revenue or costs that a change to the legal framework might cause.
As required by Section 7(d) of the Budget Transparency and Accountability Act (BTAA), and Section 4a(v) of the Carbon Tax Act, I confirm that Budget 2011 contains the following elements:
· Fiscal and economic forecasts for 2011/12 and the next two years — provided in Parts 1 and 3.
· Advice received from the Economic Forecast Council in December 2010 (updated January 2011), on the economic growth outlook for BC, including a range of forecasts for 2011 and 2012 (see Part 3, page 63).
· Material economic, demographic, fiscal, accounting policy and other assumptions and risks underlying the 2011/12 economic and fiscal forecasts, including:
· The Budget 2011 economic forecast reflects a slow but steady recovery for the BC economy, but recognizes ongoing challenges in the US economy and global financial market volatility. Accordingly, the economic projections assumed in Budget 2011 are more prudent than the average of the forecasts provided by the Economic Forecast Council. While recent events around the world (for example, Japan and the Middle East) have placed added pressure on the international economy, it is believed that there is still a significant amount of prudence in the provincial economic forecast at this time.
· Part 4 - 2010/11 Revised Financial Forecast (Third Quarterly Report) is not reproduced in the May 3, 2011 tabling of Budget 2011. Final results for 2010/11 will be available when the government releases its annual Public Accounts in the coming months.
· Forecast allowances of $350 million are included in each of fiscal years 2011/12 — 2013/14 to help achieve operating and debt level targets. These allowances are intended to help recognize uncertainty in revenue forecasts, commodity prices and the global economic recovery in general.
Ministry of | Office of the | Mailing Address: | Location Address: |
Finance | Deputy Minister | PO Box 9417 Stn Prov Govt | Room 109 |
| | Victoria BC V8W 9V1 | 617 Government Street |
| | www.gov.bc.ca/fin | Victoria BC |
· Given the current economic and revenue forecasts assumed in Budget 2011 and the legislative requirement to balance the provincial budget by 2013/14, the spending (expense) forecast in Budget 2011 assumes that annual spending growth will not exceed an average of 2.0 per cent over the three years of the fiscal plan. As this assumption is below actual historic spending growth levels, to achieve this will require continued financial discipline.
· Budget 2011 includes an allocation of $603 million to the Contingencies (All Ministries) and New Programs Vote in 2011/12, and $453 million in each of the following two fiscal years. These allocations were based on a review of ministry budgets, pressures and other government priorities.
· A capital funding contingency allocation, totalling $600 million over 2011/12 — 2013/14, is included in Budget 2011 to address costs associated with potential project scope changes, revised schedules or completion delays.
· Budget 2011 assumes the current public sector compensation negotiating mandate. This mandate requires two-year agreements with a net-zero cost to employers over the term of such agreements and applies to all public sector compensation contracts expiring between December 31, 2009 to December 31, 2011. No compensation mandate has been developed yet for contracts expiring after December 31, 2011.
· Budget 2011 assumes three-year financial projections for health authorities, K–12 education and post secondary institutions, as provided by the Ministries of Health, Education, and Advanced Education based on plans submitted by those entities in preparation of Budget 2011.
· Government and the BC Utilities Commission are reviewing a rate increase request of British Columbia Hydro and Power Authority. As the results of those reviews will be accommodated within Budget 2011, the overall fiscal forecast has remained unchanged.
· To the best of my knowledge, the three-year fiscal plan contained in Budget 2011 conforms to the standards and guidelines of generally accepted accounting principles (GAAP) for senior governments and with Public Sector Accounting Board (PSAB) guidelines. The adoption of International Financial Reporting Standards (IFRS) on January 1, 2011, by commercial Crown corporations is assumed in Budget 2011.
· Major areas of risk to the Budget 2011 fiscal plan are shown in Part 1 and the Appendix tables.
· Carbon tax reports for 2009/10 and 2010/11, and a carbon tax plan for 2011/12 to 2013/14 — see Revenue Neutral Carbon Tax topic box at the end of Part 2: Tax Measures (page 45).
· A health funding report for 2010/11 and a plan that includes a forecast for health spending and the specific revenue sources fully dedicated to these purposes for 2011/12 to 2013/14 (see page 21).
| 
|
| Peter Milburn Deputy Minister and Secretary to Treasury Board |
Summary: BUDGET AND FISCAL PLAN – 2011/12 to 2013/14
| | 2010/11 | | Budget | | | | | |
| | | | Updated | | Estimate | | Plan | | Plan | |
($ millions) | | Budget | | Forecast | | 2011/12 | | 2012/13 | | 2013/14 | |
Revenue | | 39,153 | | 39,893 | | 41,337 | | 42,446 | | 44,091 | |
Expense | | (40,568 | ) | (41,008 | ) | (41,912 | ) | (42,536 | ) | (43,566 | ) |
Surplus (deficit) before forecast allowance | | (1,415 | ) | (1,115 | ) | (575 | ) | (90 | ) | 525 | |
Forecast allowance | | (300 | ) | (150 | ) | (350 | ) | (350 | ) | (350 | ) |
Surplus (deficit) | | (1,715 | ) | (1,265 | ) | (925 | ) | (440 | ) | 175 | |
Capital spending: | | | | | | | | | | | |
Taxpayer-supported capital spending | | 5,388 | | 4,905 | | 4,105 | | 3,155 | | 3,098 | |
Self-supported capital spending | | 2,771 | | 2,688 | | 3,243 | | 3,011 | | 2,415 | |
| | 8,159 | | 7,593 | | 7,348 | | 6,166 | | 5,513 | |
Provincial debt: | | | | | | | | | | | |
Direct operating debt | | 7,511 | | 7,987 | | 8,763 | | 9,267 | | 8,599 | |
Taxpayer-supported debt | | 33,748 | | 33,388 | | 36,816 | | 39,162 | | 40,500 | |
Self-supported debt | | 13,709 | | 13,743 | | 16,271 | | 18,060 | | 19,505 | |
Total debt (including forecast allowance) | | 47,757 | | 47,281 | | 53,437 | | 57,572 | | 60,355 | |
Taxpayer-supported debt-to-GDP ratio | | 17.2 | % | 16.5 | % | 17.5 | % | 17.8 | % | 17.5 | % |
| | | | | | | | | | | |
| | 2010 | | 2011 | | 2012 | | 2013 | |
Economic Forecast: | | | | | | | | | | | |
Real GDP growth | | 2.2 | % | 3.1 | % | 2.0 | % | 2.6 | % | 2.7 | % |
Nominal GDP growth | | 4.5 | % | 5.6 | % | 4.1 | % | 4.9 | % | 4.8 | % |
Achieving Key Fiscal Plan Objectives
Budget 2011 reflects government’s ongoing commitment to its key fiscal plan objectives:
· protection of essential health care, education, and social services;
· a balanced budget by 2013/14; and
· returning to a downward trend in the taxpayer supported debt to GDP ratio to support maintaining a AAA credit rating.
As announced in November 2010, Budget 2011 is a status quo budget that confirms government’s commitment to maintaining the core services of health care, education and social services that British Columbians depend upon.
Maintaining Core Services
In support of these priorities, Budget 2011 provides operating funding increases in the following areas:
· a $604 million increase in the Ministry of Health in 2013/14 — when added to the increases provided in Budget 2010, this represents an almost $2.0 billion increase in health funding over the fiscal plan period;
· a $65 million increase in the Ministry of Social Development over three years for income assistance to individuals and families in need; and
· a $153 million increase to the Contingencies Vote in 2011/12 to address unforeseen issues and provide fiscal management flexibility for the next Executive Council.
As well, school district funding will reach $8,357 per student full time equivalent by 2011/12, an increase of over 33 per cent since 2000/01.
Balancing the Budget
Average annual revenue growth of 3.4 per cent is consistent with the Ministry of Finance economic forecast, and reflects strengthening economic conditions, rising commodity prices and improving forest harvest volumes expected over the next three years.
Bridging the deficit gap

Budget and Fiscal Plan – 2011/12 to 2013/14
Summary
Over the fiscal plan period, full realization of the efficiencies driven by government’s expenditure management strategies that were implemented over the last two years will result in an average annual expense growth rate of 2.0 per cent, enabling revenue growth to bridge the deficit gap by 2013/14.
This rate of growth in expense will still enable government to increase its spending by $2.6 billion over the fiscal plan period, in order to maintain its commitment to core services. The return to balanced budgets will enable government to focus on and address the future needs of British Columbia’s families.
BC’s Economy Improving, but still Vulnerable
While BC’s economy showed considerable improvement in 2010, growing by an estimated 3.1 per cent, the Ministry’s forecast of 2.0 per cent growth for 2011 reflects the likelihood of much slower global activity this year.
The Ministry of Finance forecasts BC’s economy to grow by 2.6 per cent in 2012, before returning to more historical levels in the medium term.
Ministry forecast more prudent than private sector
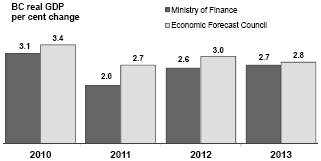
The Ministry’s outlook for BC’s real GDP growth is 0.7 percentage points lower in 2011 and 0.4 percentage points lower in 2012 than the outlook provided by the Economic Forecast Council.
Risks to the Ministry’s outlook are weighted to the downside, largely due to continued uncertainty surrounding global economic activity. The risks include:
· continued weakness in the US economy (characterized by weaker consumer spending, widespread deleveraging causing slower investment, a very slow job market recovery and further fiscal restraint — particularly at the state and local level);
· the sovereign debt crisis in some European countries threatening the stability of global financial markets;
· slower than anticipated global demand resulting in weaker demand for BC’s exports;
· greater than anticipated moderation in the Canadian housing market; and
· a sudden rise in the value of the Canadian dollar, resulting in further downward pressure on Canadian exports.
If one or more of these risks materialize in a significant way it may create pressures that cannot be accommodated in the fiscal plan.
Capital Spending Returns to Historical Levels
Infrastructure spending on hospitals, schools, post-secondary facilities, transit, roads, electrical generation, transmission and distribution projects, and other capital assets will total $19.0 billion over the fiscal plan period, and will be financed by $12.3 billion in borrowing, with the remainder funded by third parties such as the federal government and from internal cash flows.
Capital spending is projected to return to historical levels as the accelerated infrastructure program is wound down by the end of October 2011. Overall, total provincial debt is projected to increase to $60.4 billion by 2013/14.
Keeping Debt Affordable
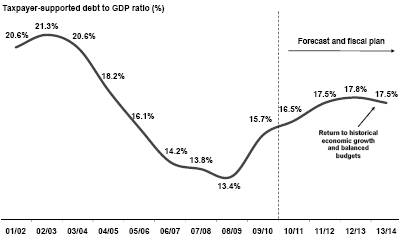
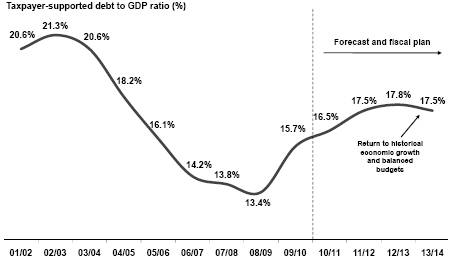
Due to the anticipated deficits, additional borrowing to support infrastructure spending, and lower GDP projections in the near term, the taxpayer-supported debt to GDP ratio will peak at 17.8 per cent in 2012/13.
Taxpayer-supported debt remains affordable
Budget and Fiscal Plan – 2011/12 to 2013/14
2
Summary
As government returns to balancing its budget, the accelerated infrastructure program winds down, and GDP growth and capital spending return to historical levels, this measure of affordability will return to a downward trend and fall to 17.5 per cent in 2013/14.
Risks to the Fiscal Plan
The main risks to the government’s fiscal plan include:
· risks to the BC economic outlook, largely due to the continued uncertainty surrounding global economic activity;
· assumptions underlying revenue and Crown corporation forecasts, such as economic factors, commodity prices and weather conditions; and
· utilization rates for government services, such as health care, children and family services, and income assistance.
Government has three main levels of prudence in its projections to mitigate the risks to the fiscal plan, including:
· the lower Ministry outlook for BC’s real GDP growth relative to the outlook provided by the Economic Forecast Council;
· Contingencies of $603 million in 2011/12, and $453 million in each of 2012/13 and 2013/14 to help manage unexpected pressures and fund priority initiatives; and
· a forecast allowance of $350 million in each year of the fiscal plan to guard against revenue volatility.
Conclusion
In summary, Budget 2011:
· maintains the core services of health care, education, and social services that British Columbians depend upon;
· augments priority program funding in the key areas of health and social services;
· delivers on government’s commitment to return to balanced budgets by 2013/14;
· continues government’s infrastructure program in support of government initiatives and to create jobs over the next three years;
· ensures the resumption of a downward trend in the debt to GDP ratio as the initial step in returning to the debt affordability levels enjoyed prior to the economic slowdown.
Budget and Fiscal Plan – 2011/12 to 2013/14
3
Part 1: THREE-YEAR FISCAL PLAN
Table 1.1 Three-Year Fiscal Plan — Operating Statement
| | 2010/11 | | Budget | | | | | |
| | | | Updated | | Estimate | | Plan | | Plan | |
($ millions) | | Budget | | Forecast | | 2011/12 | | 2012/13 | | 2013/14 | |
Revenue | | 39,153 | | 39,893 | | 41,337 | | 42,446 | | 44,091 | |
Expense | | (40,568 | ) | (41,008 | ) | (41,912 | ) | (42,536 | ) | (43,566 | ) |
Surplus (deficit) before forecast allowance | | (1,415 | ) | (1,115 | ) | (575 | ) | (90 | ) | 525 | |
Forecast allowance | | (300 | ) | (150 | ) | (350 | ) | (350 | ) | (350 | ) |
Surplus (deficit) | | (1,715 | ) | (1,265 | ) | (925 | ) | (440 | ) | 175 | |
Capital spending: | | | | | | | | | | | |
Taxpayer-supported capital spending | | 5,388 | | 4,905 | | 4,105 | | 3,155 | | 3,098 | |
Self-supported capital spending | | 2,771 | | 2,688 | | 3,243 | | 3,011 | | 2,415 | |
| | 8,159 | | 7,593 | | 7,348 | | 6,166 | | 5,513 | |
Provincial Debt: | | | | | | | | | | | |
Direct operating debt | | 7,511 | | 7,987 | | 8,763 | | 9,267 | | 8,599 | |
Taxpayer-supported debt | | 33,748 | | 33,388 | | 36,816 | | 39,162 | | 40,500 | |
Self-supported debt | | 13,709 | | 13,743 | | 16,271 | | 18,060 | | 19,505 | |
Total debt (including forecast allowance) | | 47,757 | | 47,281 | | 53,437 | | 57,572 | | 60,355 | |
Taxpayer-supported debt-to-GDP ratio | | 17.2 | % | 16.5 | % | 17.5 | % | 17.8 | % | 17.5 | % |
| | 2010 | | 2011 | | 2012 | | 2013 | |
Economic Forecast: | | | | | | | | | | | |
Real GDP growth | | 2.2 | % | 3.1 | % | 2.0 | % | 2.6 | % | 2.7 | % |
Nominal GDP growth | | 4.5 | % | 5.6 | % | 4.1 | % | 4.9 | % | 4.8 | % |
Introduction
Budget 2011 reflects government’s ongoing commitment to its key fiscal plan objectives:
· protection of essential health care, education, and social services;
· a balanced budget by 2013/14; and
· returning to a downward trend in the taxpayer-supported debt to GDP ratio to support maintaining a AAA credit rating.
As announced in November 2010, Budget 2011 is a status quo budget that confirms government’s commitment to maintaining the core services of health care, education, and social services that British Columbians depend upon.
In support of these priorities, Budget 2011 provides operating funding increases in the following areas:
· a $60 million increase in the Ministry of Health in 2013/14 — when added to the increases provided in Budget 2010, this represents an almost $2.0 billion increase in health funding over the fiscal plan period;
· a $65 million increase in the Ministry of Social Development over three years for income assistance to individuals and families in need; and
· a $153 million increase to the Contingencies Vote in 2011/12 to address unforeseen issues and provide fiscal management flexibility for the next Executive Council.
As well, school district funding will reach $8,357 per student full time equivalent by 2011/12, an increase of over 33 per cent since 2000/01.
Budget and Fiscal Plan – 2011/12 to 2013/14
Three-Year Fiscal Plan
The commitment to return to balanced budgets by 2013/14 was initially outlined in September Update 2009 and reaffirmed last year in Budget 2010. Following deficits of $925 million in 2011/12 and $440 million in 2012/13 the fiscal plan projects a surplus of $175 million in 2013/14. The return to balanced budgets will enable government to focus on and address the future needs of British Columbia’s families.
Chart 1.1 Bridging the deficit gap

Average annual revenue growth of 3.4 per cent is consistent with the Ministry of Finance economic forecast, and reflects strengthening economic conditions, rising commodity prices and improving forest harvest volumes expected over the next three years. The Ministry of Finance forecasts BC’s economy to grow by 2.0 per cent in 2011 and by 2.6 per cent in 2012, before returning to more historical levels in the medium term.
A cornerstone of government’s five year plan to balance the budget is management control of operating expenditures as identified in the expenditure management topic box in Budget 2010. Over the fiscal plan period, full realization of the efficiencies driven by the expenditure management strategy will result in an average annual growth rate of 2.0 per cent, enabling revenue growth to bridge the deficit gap by 2013/14.
Budget 2011 continues government’s commitment to an infrastructure spending plan that includes the completion of a number of projects that were part of the accelerated infrastructure plan to keep British Columbians working and help stimulate the economy during the global economic downturn.
Taxpayer-supported infrastructure spending on hospitals, schools, post-secondary facilities, transit, and roads will total $10.3 billion over the fiscal plan period, and will be financed by $6.5 billion in borrowing with the remainder funded by third parties such as the federal government, and from internal cash flows.
Self-supported infrastructure spending on electrical generation, transmission and distribution projects, the Port Mann Bridge and other capital assets will total $8.7 billion over the fiscal plan period, and will be financed by $5.8 billion in borrowing, with the remainder funded internally.
Budget and Fiscal Plan – 2011/12 to 2013/14
6
Three-Year Fiscal Plan
Capital spending is projected to return to historical levels as the accelerated infrastructure program winds down. More information on the three-year capital spending plan is found on page 25.
Government’s borrowing requirement for the next three years totals $21.4 billion, and includes $0.6 billion for operating needs and $8.5 billion to retire maturing debt in addition to the capital borrowing outlined above. Overall, total provincial debt is projected to increase to $60.4 billion by 2013/14. Additional information on the debt outlook is found starting on page 32.
Due to the anticipated deficits, additional borrowing to support infrastructure spending, and lower GDP projections in the near term, the taxpayer-supported debt to GDP ratio will peak at 17.8 per cent in 2012/13. As government returns to balancing its budget, the accelerated infrastructure program winds down, and GDP growth and capital spending return to historical levels, this measure of affordability will return to a downward trend and fall to 17.5 per cent in 2013/14.
Chart 1.2 Taxpayer-supported debt burden remains affordable
The major risks to the fiscal plan stem from changes in factors that government does not directly control. These include:
· Risks to the BC economic outlook, largely due to the continued uncertainty surrounding global economic activity.
· Assumptions underlying revenue and Crown corporation forecasts such as economic factors, commodity prices and weather conditions.
· Utilization rates for government services such as health care, children and family services, and income assistance.
Government incorporates three main levels of prudence in its projections to mitigate the risks to the fiscal plan:
· A lower Ministry outlook for BC’s real GDP growth relative to the outlook provided by the Economic Forecast Council (0.7 percentage points lower in 2011 and 0.4 percentage points lower in 2012).
Budget and Fiscal Plan – 2011/12 to 2013/14
7
Three-Year Fiscal Plan
· Government has included a forecast allowance of $350 million in each year of the fiscal plan to guard against revenue volatility.
· The fiscal plan includes contingencies of $60 3 million in 2011/12, and $45 3 million in each of 2012/13 and 2013/14 to help manage unexpected pressures and fund priority initiatives.
A complete discussion of the risks to the fiscal plan can be found beginning on page 35. Economic risks are discussed in the introduction to Part 3: Economic Review and Outlook.
Changes since Budget 2010
Since Budget 2010, changes in revenue and expense projections resulted in an improvement in the 2010/11 forecast and deterioration in the 2012/13 and 2013/14 projections, with 2011/12 relatively unchanged.
Table 1.2 Fiscal Plan Update — Changes from Budget 2010
($ millions) | | 2010/11 | | 2011/12 | | 2012/13 | | 2013/14 | |
Budget 2010 — Five Year Fiscal Plan | | (1,715 | ) | (945 | ) | (145 | ) | 410 | |
Revenue changes: | | | | | | | | | |
Taxation | | 744 | | 356 | | 349 | | 65 | |
Natural resources | | (454 | ) | (583 | ) | (685 | ) | (388 | ) |
Miscellaneous | | 321 | | 599 | | 56 | | 156 | |
Federal transfers | | 218 | | 297 | | 236 | | 260 | |
Commercial Crown corporation income | | (89 | ) | (155 | ) | (175 | ) | (147 | ) |
Total revenue changes | | 740 | | 514 | | (219 | ) | (54 | ) |
Forecast allowance updates | | 150 | | (50 | ) | 50 | | 50 | |
Projected spending lift in 2013/14 | | — | | — | | — | | 624 | |
Expense changes: | | | | | | | | | |
Forest firefighting and emergency costs | | 207 | | — | | — | | — | |
Contingencies | | — | | 153 | | 3 | | 3 | |
Health funding increase | | — | | — | | — | | 604 | |
Additional income assistance funding | | — | | 20 | | 30 | | 15 | |
Spending funded by third parties | | 259 | | 207 | | 21 | | 25 | |
Post secondary institutions | | 126 | | 154 | | 177 | | 219 | |
Other changes | | (152 | ) | (90 | ) | (105 | ) | (11 | ) |
Expense increases (decreases) | | 440 | | 444 | | 126 | | 855 | |
Net changes | | 450 | | 20 | | (295 | ) | (235 | ) |
Budget 2011 — Fiscal Plan | | (1,265 | ) | (925 | ) | (440 | ) | 175 | |
The change in revenue projections is due to:
· higher corporation income tax revenue and the impact of increases to the 2009 harmonized sales tax base, partially offset by lower personal income tax revenue and property transfer tax receipts;
· lower natural resource revenue, mainly due to the effects of lower natural gas and electricity prices, a reduced outlook for bonus bid prices per hectare, and weaker stumpage rates, partly offset by improvements in coal and metal prices and Crown forest harvest volumes;
· improvement in other revenue sources, reflecting higher Medical Services Plan premium collections and increased post-secondary fee revenue; and
Budget and Fiscal Plan – 2011/12 to 2013/14
8
Three-Year Fiscal Plan
· increased federal contributions for health and social transfers, infrastructure projects and programs delivered by ministries on its behalf; and
· lower commercial Crown corporation net income.
The increases to expense primarily reflect the additional income assistance funding, and spending increases in programs funded by third parties and by post-secondary institutions. As well, 2010/11 includes higher than expected forest firefighting and emergency program costs, 2011/12 includes a $15 3 million lift to the Contingencies Vote, and 2013/14 includes the health funding increase.
Further details on the changes to the five year fiscal plan from the 2010/11 first Quarterly Report can be found in Appendix Table A5.
Revenue
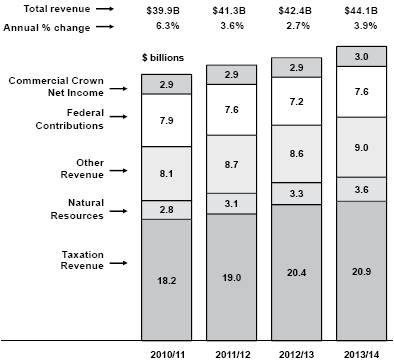
Chart 1.3 Revenue trends
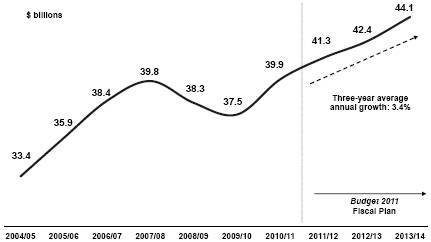
Total revenue is expected to average 3.4 per cent annual growth over the fiscal plan period (2011/12 to 2013/14). This reflects strengthening economic conditions, rising natural gas and electricity prices and improving forest harvest volumes expected over the next three years.
Over the three years of the Budget 2011 fiscal plan, taxation revenue is expected to average 4.9 per cent annual growth, consistent with the Ministry of Finance economic forecast including projections for growth in nominal GDP, personal income, corporate profits, consumer expenditures, housing starts and residential investment. Growth in natural resource revenue is forecast to average 9.4 per cent over the next three years reflecting the relatively low base in 2010/11 and increases in commodity prices and markets, in particular for natural gas, lumber, electricity and coal. Revenue growth from fees, investment earnings and other miscellaneous sources is expected to average 3.3 per cent annually based on projected Medical Services Plan premium rate increases and forecasts provided by taxpayer supported Crown and SUCH sector agencies.
Excluding HST transition payments, federal government transfers are expected to average 1.9 per cent annual growth over the next three years as the scheduled end of stimulus and other one-time transfers partially offset standard growth in the Canada Health Transfer and Canada Social Transfer programs.
Budget and Fiscal Plan – 2011/12 to 2013/14
9
Three-Year Fiscal Plan
Chart 1.4 Revenue forecast
Commercial Crown net income is expected to average 0.8 per cent annual growth over three years reflecting improvements from BC Hydro, LDB and BCLC, partly offset by declining net income from ICBC. More detail on Crown corporation net income is provided in this chapter.
Table 1.3 Major Factors Underlying Revenue
Calendar Year | | February 15, 2011 | | First Quarterly Report | |
Per cent growth unless otherwise indicated | | 2010 | | 2011 | | 2012 | | 2013 | | 2010 | | 2011 | | 2012 | | 2013 | |
Real GDP | | 3.1 | | 2.0 | | 2.6 | | 2.7 | | 3.1 | | 2.2 | | 2.8 | | 2.8 | |
Nominal GDP | | 5.6 | | 4.1 | | 4.9 | | 4.8 | | 5.0 | | 4.0 | | 5.1 | | 5.1 | |
Personal income | | 3.0 | | 3.5 | | 4.5 | | 4.4 | | 2.7 | | 3.6 | | 4.6 | | 4.6 | |
Corporate profits | | 19.4 | | 8.6 | | 6.5 | | 6.8 | | 19.6 | | 9.3 | | 7.8 | | 7.6 | |
Consumer expenditures | | 4.0 | | 4.6 | | 5.0 | | 4.9 | | 4.4 | | 4.6 | | 5.0 | | 5.1 | |
Consumer expenditures on durable goods | | 4.0 | | 2.3 | | 2.5 | | 2.2 | | 6.1 | | 2.2 | | 2.5 | | 2.5 | |
Business investment | | 7.0 | | 3.9 | | 5.8 | | 5.5 | | 2.6 | | 4.5 | | 5.0 | | 5.7 | |
Residential investment | | 21.7 | | 3.7 | | 6.7 | | 5.2 | | 14.6 | | 6.6 | | 4.9 | | 5.2 | |
Retail sales | | 4.3 | | 4.1 | | 4.5 | | 4.4 | | 5.2 | | 4.1 | | 4.5 | | 4.6 | |
Employment | | 1.7 | | 1.4 | | 1.8 | | 1.7 | | 1.9 | | 1.4 | | 1.8 | | 1.8 | |
BC Housing starts | | 64.7 | | -5.8 | | 6.4 | | 2.3 | | 46.8 | | 1.3 | | 4.8 | | 4.6 | |
US Housing starts | | 6.1 | | 3.8 | | 31.1 | | 12.5 | | 1.9 | | 15.1 | | 26.2 | | 11.0 | |
SPF 2x4 price ($US/thousand board feet) | | $ | 256 | | $ | 263 | | $ | 288 | | $ | 300 | | $ | 240 | | $ | 238 | | $ | 288 | | $ | 300 | |
Pulp ($US/tonne) | | $ | 932 | | $ | 888 | | $ | 738 | | $ | 700 | | $ | 920 | | $ | 865 | | $ | 738 | | $ | 700 | |
Exchange rate (US cents/Canadian dollar) | | 97.1 | | 99.7 | | 100.5 | | 97.6 | | 96.1 | | 98.9 | | 98.5 | | 97.9 | |
| | | | | | | | | | | | | | | | | |
Fiscal Year | | 2010/11 | | 2011/12 | | 2012/13 | | 2013/14 | | 2010/11 | | 2011/12 | | 2012/13 | | 2013/14 | |
Natural gas price ($Cdn/GJ at plant inlet) | | $ | 2.71 | | $ | 3.02 | | $ | 3.60 | | $ | 4.20 | | $ | 3.35 | | $ | 4.02 | | $ | 4.64 | | $ | 5.31 | |
Bonus bids average bid price per hectare ($) | | $ | 1,908 | | $ | 500 | | $ | 550 | | $ | 575 | | $ | 1,500 | | $ | 943 | | $ | 1,198 | | $ | 1,113 | |
Electricity price ($US/mega-watt hour, Mid-C) | | $ | 34 | | $ | 37 | | $ | 43 | | $ | 46 | | $ | 40 | | $ | 45 | | $ | 48 | | $ | 51 | |
Metallurgical coal price ($US/tonne, fob west coast) | | $ | 212 | | $ | 224 | | $ | 218 | | $ | 212 | | $ | 222 | | $ | 232 | | $ | 234 | | $ | 222 | |
Copper price ($US/lb) | | $ | 3.44 | | $ | 3.65 | | $ | 3.40 | | $ | 3.04 | | $ | 2.91 | | $ | 3.00 | | $ | 2.75 | | $ | 2.50 | |
Crown harvest volumes (million cubic metres) | | 57.5 | | 59.0 | | 60.0 | | 60.0 | | 50.0 | | 52.0 | | 55.0 | | 55.0 | |
Budget and Fiscal Plan – 2011/12 to 2013/14
10
Three-Year Fiscal Plan
Major Revenue Sources
Key assumptions and sensitivities relating to revenue are provided in Appendix Table A6. The major revenue components are:
· Personal income tax — over the next three years, the base revenue is forecast to average 5.9 per cent annual growth over the three year plan, consistent with Budget 2011 projections of personal and labour incomes. Actual revenue realized by government incorporates almost $1.3 billion of personal income tax reductions provided to BC residents to help mitigate the impacts of the introduction of HST.
Table 1.4 Personal Income Tax Revenue
($ millions) | | 2011/12 | | 2012/13 | | 2013/14 | |
Base personal income tax revenue | | 6,182 | | 6,579 | | 6,997 | |
Annual growth | | 4.9 | % | 6.4 | % | 6.4 | % |
Previously announced measures: | | | | | | | |
– Basic personal amount tax credit increased to $11,000 | | (183 | ) | (196 | ) | (209 | ) |
– Elimination of sales tax & introduction of BC HST tax credit | | (232 | ) | (232 | ) | (232 | ) |
– Federal government | | (8 | ) | (9 | ) | (9 | ) |
– Dividend tax credit | | 33 | | 36 | | 37 | |
– Other measures | | 4 | | 11 | | 12 | |
Budget 2011 revenue | | 5,796 | | 6,189 | | 6,596 | |
Personal income growth (calendar year) | | 3.5 | % | 4.5 | % | 4.4 | % |
Labour income growth (calendar year) | | 4.0 | % | 4.7 | % | 4.6 | % |
Elasticity(1) (calendar year basis, policy neutral) | | 1.2 | | 1.4 | | 1.4 | |
(1) Per cent growth in current year tax relative to per cent growth in personal income.
Adjusting for the tax measures and the prior-year adjustment in 2010/11, actual annual growth is up 8.3 per cent in 2011/12, and rising 6.8 per cent and 6.6 per cent over the next two years. The higher growth in 2011/12 is mainly due to the $230 million prior-year adjustment reducing 2010/11 revenue.
· Corporate income tax — declining $67 million in 2011/12 as the higher instalment payments resulting from the improvement in the federal outlook of the national tax base are offset by a lower prior-year adjustment payment forecast from the federal government. Revenue increases 19.2 per cent in 2012/13, but falls 22 per cent in the following year, reflecting changes in payment share, instalments and year-end settlement payments with the federal government with respect to 2011 and 2012. The revenue forecast incorporates the tax rate reductions supporting the Revenue Neutral Carbon Tax Plan — namely the general rate reduction to 10.0 per cent in 2011 and the planned reduction of the small business tax rate to zero per cent, effective April 1, 2012. For more details on carbon tax recycling, see the Revenue Neutral Carbon Tax topic box on page 45.
Table 1.5 Corporate Income Tax Revenue
($ millions) | | 2011/12 | | 2012/13 | | 2013/14 | |
Advance instalments from the federal government: | | | | | | | |
– Payment share | | 11.6 | % | 13.6 | % | 12.9 | % |
– Advances | | 1,498 | | 1,677 | | 1,638 | |
International Business Activity Act refunds | | (20 | ) | (20 | ) | (15 | ) |
Prior-year adjustment | | 93 | | 215 | | (162 | ) |
Corporate income tax revenue | | 1,571 | | 1,872 | | 1,461 | |
Annual per cent growth | | -4.1 | % | 19.2 | % | -22.0 | % |
Budget and Fiscal Plan – 2011/12 to 2013/14
11
Three-Year Fiscal Plan
· Sales taxes — the combined revenue from harmonized sales tax (HST), provincial sales tax (PST) and the tax on designated property is expected to average 5.8 per cent annual growth over the fiscal plan in line with nominal consumer expenditure and residential investment. In 2011/12, the forecast assumes $30 million in PST revenue representing expected audit collections in respect of prior years.
Table 1.6 Sales Taxes Revenue
($ millions) | | 2011/12 | | 2012/13 | | 2013/14 | |
Harmonized Sales Tax (BC’s portion of HST) | | | | | | | |
Gross | | 7,230 | | 7,646 | | 8,068 | |
Temporary restrictions of input tax credits | | 163 | | 171 | | 180 | |
Rebates | | (1,573 | ) | (1,653 | ) | (1,732 | ) |
BC’s portion of HST | | 5,820 | | 6,164 | | 6,516 | |
Social service tax | | 30 | | — | | — | |
Tax on designated property | | 86 | | 87 | | 88 | |
| | | | | | | |
Annual per cent change (calendar year) | | 2011 | | 2012 | | 2013 | |
Consumer expenditure | | 4.6 | % | 5.0 | % | 4.9 | % |
Residential investment | | 3.7 | % | 6.7 | % | 5.2 | % |
Government expenditures | | 1.0 | % | 2.2 | % | 2.8 | % |
Nominal GDP | | 4.1 | % | 4.9 | % | 4.8 | % |
Retail sales | | 4.1 | % | 4.5 | % | 4.4 | % |
· Carbon tax — as announced in Budget 2008, the carbon tax rate per tonne of CO2- equivalent will increase by $5 each year to $30 per tonne by July 1, 2012. The forecast assumes that purchased volumes of natural gas and consumption of gasoline will each grow by 1.0 per cent annually. Revenue is expected to increase in line with these higher rates and assumed volume growth. Carbon tax revenue is fully returned to taxpayers through tax reductions. For more details on carbon tax recycling, see the Revenue Neutral Carbon Tax topic box on page 45.
· Property tax — revenue is expected to grow by only 0.4 per cent in 2011/12 reflecting the effects of introducing the Industrial Property Tax Credit for light and major industrial properties and other tax measures including the Northern and Rural Homeowner Benefit announced in Budget 2010. Over the next two years, revenue is forecast to average 4.7 per cent growth, in line with expected inflation and new construction activity.
· Property transfer tax — consistent with the outlook for BC housing starts, the 2011/12 revenue is expected to decline 4.7 per cent from 2010/11. Over the next two years, annual revenue growth is forecast to average 4.0 per cent — in line with expected return to trend levels and the average growth in BC housing starts.
· Natural gas royalties — over the next three years, revenue increases on average by 33 per cent per year due to rising natural gas prices and production volumes, partially offset by increasing production from wells qualifying for royalty programs and credits. Although prices are forecast to average 16 per cent annual growth over the next three years, they are expected to remain below recent historical levels until 2013/14. Growth in production volumes is due in part to the effects of the royalty programs and expected increase in demand and prices with an improving North American economy. The government continues to provide royalty programs and credits to foster industry investment in exploration and development. See Appendix Table A7 for more details regarding natural gas price forecasts.
Budget and Fiscal Plan – 2011/12 to 2013/14
12
Three-Year Fiscal Plan
Chart 1.5 Revenue from energy, metals and minerals

· Other energy, metals and minerals — average annual revenue growth from sales of Crown land tenures is forecast to decline only 1.0 per cent over the three years as the lower outlook for average bid prices per hectare compared to 2010/11 is offset by the nine-year deferral of revenue recognition. Revenue from other energy, metals and minerals increases $128 million (20.0 per cent) in 2011/12 mainly due to the improvement in the outlook of coal and metal prices. Revenue increases $16 million (2.1 per cent) and $10 million (1.3 per cent) over the next two years mainly due to higher Columbia River Treaty electricity sales reflecting rising electricity prices.
· Forests — revenue is forecast to increase $104 million or 25 per cent in 2011/12 as lumber prices and US housing markets including lumber exports are expected to recover. Despite this strong annual growth, revenue is projected to be well below historical levels of over a billion dollars. Over the next two years revenue is expected to increase $8 million and $56 million respectively, as increasing stumpage revenue is offset by declining border tax revenue collected under the Softwood Lumber Agreement (SLA). SLA border tax revenue is expected to decrease as the rate applied to US exports falls to 5 per cent from 10 per cent, consistent with the assumed recovery of lumber prices to US$300 per thousand feet.
· Fees, investment earnings and other miscellaneous sources — averaging 3.3 per cent annual growth over the three year fiscal plan period reflecting projected increases to Medical Services Plan premium rates in support of rising health care expenditures; increasing ministry recoveries and earnings from fiscal agency loans; and forecasts provided by the SUCH sector and taxpayer supported Crown corporations. Ministry recoveries and earnings from fiscal agency loans are forecast to grow 15.6 per cent over the next three years with offsetting expenses resulting in no impact on the bottom line.
· Health and social transfers — Over the three years, revenue is expected to average 5.2 per cent annual growth reflecting national base growth and a rising BC population share.
Budget and Fiscal Plan – 2011/12 to 2013/14
13
Three-Year Fiscal Plan
Table 1.7 Federal Government Contributions
($ millions) | | 2011/12 | | 2012/13 | | 2013/14 | |
Canada Health Transfer (CHT) | | 3,806 | | 4,050 | | 4,312 | |
Wait Times Reduction Transfer | | 33 | | 34 | | 34 | |
Deferred health equipment grants | | 23 | | 23 | | 22 | |
Canada Social Transfer (CST) | | 1,536 | | 1,589 | | 1,643 | |
Total health and social transfers | | 5,398 | | 5,696 | | 6,011 | |
| | 4.5 | % | 5.5 | % | 5.5 | % |
BC share of national population (June 1) | | 13.34 | % | 13.40 | % | 13.45 | % |
Harmonized sales tax transition payments | | 580 | | — | | — | |
Other contributions | | 1,602 | | 1,519 | | 1,548 | |
· HST transitional funding — in order to facilitate the participation of the province in the harmonized sales tax system, Canada committed to provide $1.6 billion in transitional funding over the three years 2009/10 to 2011/12. The province has received the first two instalments totalling $1,019 million. The last instalment in 2011/12 will be $580 million.
· Other federal contributions — down 18.5 per cent or $364 million in 2011/12 primarily reflecting the scheduled end of stimulus funding for community development, police officer recruitment, the contribution associated with the elimination of the corporation capital tax and reduced funding for local government, labour market development, disaster financial assistance and strategic training and transition. In 2012/13, revenue is expected to decline by $83 million mainly due to reduced funding for BC Housing Management Commission (with offsetting expenses). Other federal contributions are expected to grow 1.9 per cent in 2013/14.
Commercial Crown Corporation Net Income
· British Columbia Hydro and Power Authority — BC Hydro’s net income is forecast to average approximately $600 million per year over the fiscal plan period. The stable forecast reflects BC Hydro’s allowed return on equity (ROE), which will decline from 14.38 per cent for 2011/12 to 12.75 per cent in each of the next two fiscal years. The impact of the ROE decline is offset by projected increases to BC Hydro’s equity.
Government recently introduced two changes that will mitigate rate increases to taxpayers:
· BC Hydro’s deemed equity for rate-setting purposes is now based on assets-in-service rather than debt plus equity in order to more closely mirror the more widely used method for regulated utilities.
· Water rental rates paid by hydro power producers have been indexed to CPI changes instead of BC Hydro’s general rate increase to be consistent with other operating expense assumptions.
Budget and Fiscal Plan – 2011/12 to 2013/14
14
Three-Year Fiscal Plan
· British Columbia Liquor Distribution Branch — LDB’s revenue projections have been reduced by 4.6 per cent compared to the Budget 2010 outlook for the fiscal plan period, reflecting a change in consumer purchasing patterns resulting from the recent economic downturn. While the change has reduced LDB’s revenue base, a modest annual growth of 2.4 per cent is projected.
· British Columbia Lottery Corporation — BCLC’s net income was also affected by the economic downturn, as consumers reduced their discretionary spending on lottery games and casino gambling. Revenues are down 4.7 per cent over the fiscal plan period compared to the projections in Budget 2010. However, BCLC is projecting moderate annual growth of 3.4 per cent as a result of continuing product development (primarily in PlayNow internet gaming), distribution enhancements, and facility improvements to casinos and gaming community centres.
The government projects it will distribute 20 per cent ($669 million) of its gaming income to charities and local governments over the next three years. As well, $441 million of the gaming income retained by government will be allocated to the Health Special Account in support of health services.
· Insurance Corporation of British Columbia — ICBC’s net income outlook is forecast at $290 million in 2011, declining to $235 million by 2013. The outlook reflects moderate growth in the number of insured vehicles and longer term claims trends. The decline in net income is primarily due to a decrease in investment income reflecting the remittance of ICBC’s excess optional capital to the consolidated revenue fund in support of core government services.
ICBC is undertaking a multi-year $400 million Transformation Program that is expected to promote a fairer, customer-based risk pricing model, resulting in better rates for safer drivers; simplified systems and processes to facilitate better support for customers and business partners with less paperwork; and more efficient business practices that will promote operating cost savings. The Transformation Program will be funded entirely from Optional insurance capital so as to not impact Basic insurance rates.
· Transportation Investment Corporation (TI Corp) — TI Corp manages the construction of the new Port Mann Bridge, which is scheduled to open ahead of schedule in December 2012. TI Corp’s projections in the fiscal plan reflect operating losses during the construction phase, changing to net income as tolls are introduced.
Budget and Fiscal Plan – 2011/12 to 2013/14
15
Three-Year Fiscal Plan
Table 1.8 Revenue by Source
| | 2010/11 | | Budget | | | | | |
| | | | Updated | | Estimate | | Plan | | Plan | |
($ millions) | | Budget | | Forecast | | 2011/12 | | 2012/13 | | 2013/14 | |
Taxation revenue | | | | | | | | | | | |
Personal income | | 5,861 | | 5,354 | | 5,796 | | 6,189 | | 6,596 | |
Corporate income | | 847 | | 1,638 | | 1,571 | | 1,872 | | 1,461 | |
Harmonized sales | | 3,784 | | 4,171 | | 5,820 | | 6,164 | | 6,516 | |
Other sales (1) | | 1,399 | | 1,399 | | 116 | | 87 | | 88 | |
Fuel | | 877 | | 946 | | 964 | | 969 | | 985 | |
Carbon | | 727 | | 740 | | 950 | | 1,166 | | 1,232 | |
Tobacco | | 686 | | 737 | | 676 | | 676 | | 676 | |
Property | | 1,906 | | 1,891 | | 1,898 | | 1,987 | | 2,080 | |
Property transfer | | 900 | | 850 | | 810 | | 854 | | 876 | |
Other (2) | | 435 | | 440 | | 413 | | 424 | | 434 | |
| | 17,422 | | 18,166 | | 19,014 | | 20,388 | | 20,944 | |
Natural resource revenue | | | | | | | | | | | |
Natural gas royalties | | 698 | | 365 | | 447 | | 597 | | 856 | |
Forests | | 491 | | 422 | | 526 | | 534 | | 590 | |
Other resource (3) | | 2,019 | | 1,967 | | 2,127 | | 2,138 | | 2,163 | |
| | 3,208 | | 2,754 | | 3,100 | | 3,269 | | 3,609 | |
Other revenue | | | | | | | | | | | |
Medical Services Plan premiums | | 1,741 | | 1,798 | | 1,945 | | 2,081 | | 2,193 | |
Other fees (4) | | 2,615 | | 2,749 | | 2,762 | | 2,734 | | 2,773 | |
Investment earnings (5) | | 910 | | 891 | | 1,037 | | 1,170 | | 1,334 | |
Miscellaneous (6) | | 2,560 | | 2,709 | | 2,958 | | 2,656 | | 2,682 | |
| | 7,826 | | 8,147 | | 8,702 | | 8,641 | | 8,982 | |
Contributions from the federal government | | | | | | | | | | | |
Health and social transfers | | 5,165 | | 5,168 | | 5,398 | | 5,696 | | 6,011 | |
Harmonized sales tax transition payments | | 769 | | 769 | | 580 | | — | | — | |
Other federal contributions (7) | | 1,751 | | 1,966 | | 1,602 | | 1,519 | | 1,548 | |
| | 7,685 | | 7,903 | | 7,580 | | 7,215 | | 7,559 | |
Commercial Crown corporation net income | | | | | | | | | | | |
BC Hydro | | 617 | | 571 | | 611 | | 584 | | 626 | |
Liquor Distribution Branch | | 974 | | 897 | | 925 | | 946 | | 967 | |
BC Lotteries (net of payments to federal government) | | 1,106 | | 1,071 | | 1,096 | | 1,137 | | 1,179 | |
ICBC (8) | | 303 | | 361 | | 290 | | 277 | | 235 | |
Transportation Investment Corporation (Port Mann) | | (19 | ) | (9 | ) | (15 | ) | (49 | ) | (48 | ) |
Other (5) | | 31 | | 32 | | 34 | | 38 | | 38 | |
| | 3,012 | | 2,923 | | 2,941 | | 2,933 | | 2,997 | |
Total revenue | | 39,153 | | 39,893 | | 41,337 | | 42,446 | | 44,091 | |
(1) Includes social service tax and, after June 30, 2010, continuation of the tax on private sales of vehicles now at 12%. More details are available in Table A6.
(2) Corporation capital, insurance premium and hotel room taxes.
(3) Columbia River Treaty, other energy and minerals, water rental and other resources.
(4) Post-secondary, healthcare-related, motor vehicle, and other fees.
(5) The 2010/11 budget was restated to reflect the continued accounting of the BC Railway Company as a commercial entity.
(6) Includes asset dispositions, reimbursements for healthcare and other services provided to external agencies, and other recoveries.
(7) Includes contributions for health, education, community development, housing and social service programs, and transportation projects.
(8) The amounts represent projected earnings on ICBC’s fiscal year basis (December).
Budget and Fiscal Plan – 2011/12 to 2013/14
16
Three Year Fiscal Plan
Table 1.9 Expense by Ministry, Program and Agency
| | 2010/11 (1) | | Budget | | | | | |
($ millions) | | Budget | | Updated
Forecast | | Estimate
2011/12 | | Plan
2012/13 | | Plan
2013/14 | |
Office of the Premier | | 10 | | 10 | | 9 | | 9 | | 9 | |
Aboriginal Relations and Reconciliation | | 81 | | 81 | | 80 | | 80 | | 81 | |
Advanced Education | | 1,978 | | 1,978 | | 1,980 | | 1,989 | | 1,989 | |
Agriculture | | 69 | | 69 | | 66 | | 66 | | 66 | |
Attorney General | | 458 | | 458 | | 443 | | 443 | | 443 | |
Children and Family Development | | 1,334 | | 1,334 | | 1,331 | | 1,331 | | 1,331 | |
Community, Sport and Cultural Development | | 340 | | 340 | | 254 | | 254 | | 254 | |
Education | | 5,164 | | 5,164 | | 5,242 | | 5,264 | | 5,264 | |
Energy and Mines | | 424 | | 424 | | 418 | | 420 | | 389 | |
Environment | | 136 | | 136 | | 130 | | 130 | | 130 | |
Finance | | 189 | | 274 | | 157 | | 154 | | 143 | |
Forests, Lands and Natural Resource Operations | | 633 | | 801 | | 590 | | 587 | | 582 | |
Health | | 14,796 | | 14,796 | | 15,714 | | 16,161 | | 16,765 | |
Jobs, Tourism and Innovation | | 269 | | 269 | | 237 | | 234 | | 234 | |
Labour, Citizens’ Services and Open Government | | 581 | | 581 | | 566 | | 566 | | 566 | |
Public Safety and Solicitor General | | 637 | | 676 | | 635 | | 635 | | 635 | |
Social Development | | 2,355 | | 2,355 | | 2,339 | | 2,349 | | 2,334 | |
Transportation and Infrastructure | | 753 | | 753 | | 807 | | 807 | | 807 | |
Total ministries and Office of the Premier | | 30,207 | | 30,499 | | 30,998 | | 31,479 | | 32,022 | |
Management of public funds and debt | | 1,301 | | 1,256 | | 1,349 | | 1,403 | | 1,502 | |
Contingencies | | 450 | | 450 | | 603 | | 453 | | 453 | |
Funding for capital expenditures | | 1,751 | | 1,284 | | 1,543 | | 887 | | 591 | |
Legislative and other appropriations | | 123 | | 123 | | 125 | | 125 | | 126 | |
Subtotal | | 33,832 | | 33,612 | | 34,618 | | 34,347 | | 34,694 | |
Prior year liability adjustments | | — | | (55 | ) | — | | — | | — | |
Consolidated revenue fund expense | | 33,832 | | 33,557 | | 34,618 | | 34,347 | | 34,694 | |
Expenses recovered from external entities | | 2,654 | | 2,913 | | 2,651 | | 2,682 | | 2,856 | |
Funding provided to service delivery agencies | | (20,704 | ) | (20,250 | ) | (21,369 | ) | (20,817 | ) | (21,024 | ) |
Ministry and special office direct program spending | | 15,782 | | 16,220 | | 15,900 | | 16,212 | | 16,526 | |
Service delivery agency expense: | | | | | | | | | | | |
School districts | | 5,440 | | 5,505 | | 5,513 | | 5,533 | | 5,535 | |
Universities | | 3,680 | | 3,785 | | 3,880 | | 3,954 | | 4,005 | |
Colleges and institutes | | 1,047 | | 1,068 | | 1,063 | | 1,068 | | 1,075 | |
Health authorities and hospital societies | | 11,141 | | 11,102 | | 11,989 | | 12,269 | | 12,709 | |
Other service delivery agencies | | 3,478 | | 3,328 | | 3,567 | | 3,500 | | 3,716 | |
Total service delivery agency expense | | 24,786 | | 24,788 | | 26,012 | | 26,324 | | 27,040 | |
Total expense | | 40,568 | | 41,008 | | 41,912 | | 42,536 | | 43,566 | |
(1) The 2010/11 budget estimate and revised forecast have been restated to reflect government’s current organization and accounting policies.
Budget and Fiscal Plan – 2011/12 to 2013/14
17
Three Year Fiscal Plan
Expense
Budget 2011 is a status quo budget that confirms government’s commitment to maintaining the core services of health care, education, and social services that British Columbians depend upon. Key to maintaining this commitment is effective management control of operating expenditures, including the targeting of resources to these core services as a first priority.
Chart 1.6 Expense trends
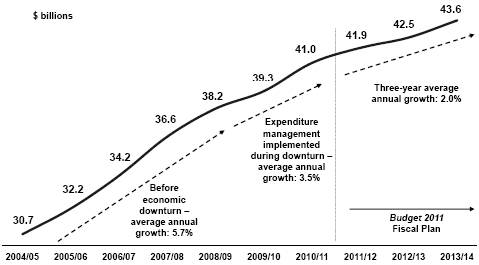
During the four years leading up to the economic downturn in the fall of 2008, government spending grew by an average annual rate of 5.7 per cent. As a result of the expenditure management measures that were initiated in Budget 2009 and expanded upon in the September Update 2009, the annual rate of growth decreased to an average of 3.5 per cent in the two fiscal years since 2008/09.
In Budget 2010, government continued the implementation of significant expenditure management strategies initiated in the previous year. A number of the measures announced in Budget 2010 had adjustments to ministry budgets in 2011/12. No additional expenditure management strategies or program reductions are implemented in Budget 2011. While there are some time-limited programs that conclude during the current three year fiscal plan, government may decide at a later date to continue these programs.
As a result of government’s expenditure management, the average annual growth in expense over the next three years is limited to 2.0 per cent, enabling revenue growth to bridge the deficit gap. This rate of expense growth will still enable government to increase its spending by $2.6 billion over the fiscal plan period, with total spending to reach $43.6 billion by 2013/14.
Consolidated Revenue Fund Spending
In support of government’s priority in maintaining core services, Budget 2011 provides operating funding increases in the following areas:
· a $604 million increase in the Ministry of Health in 2013/14 — when added to the increases provided in Budget 2010, this represents a $2.0 billion increase in health funding over the fiscal plan period; and
Budget and Fiscal Plan – 2011/12 to 2013/14
18
Three-Year Fiscal Plan
· a $65 million increase in the Ministry of Social Development over three years for income assistance to individuals and families in need.
As well, the Contingencies Vote will increase by $153 million in 2011/12 to address unforeseen issues and provide fiscal management flexibility for the next Executive Council.
Maintaining our Health Care System
Budget 2011 confirms government’s ongoing commitment to health care. By 2013/14, the Ministry of Health’s budget will increase by almost $2.0 billion, or over 13 per cent, compared to 2010/11.
Chart 1.7 Ministry of Health budget increases

Funding increases for the Ministry of Health are focused on sustaining front-line service delivery:
· $1.4 billion for the Regional Health Sector for services delivered by health authorities and other service delivery partners, including acute care services, community and home-based services, assisted living and residential care services, mental health and addictions services, health promotion, disease prevention and other public health services.
· $438 million for the Medical Services Plan to fund increased volumes of physician and laboratory services, and recruitment and retention of specialists and family physicians, particularly in rural and remote communities.
· $144 million for PharmaCare for coverage of new drugs and volume and price increases for prescription drugs.
It should also be noted that all health authorities have provided balanced budget plans to the Ministry of Health for each year of the fiscal plan period.
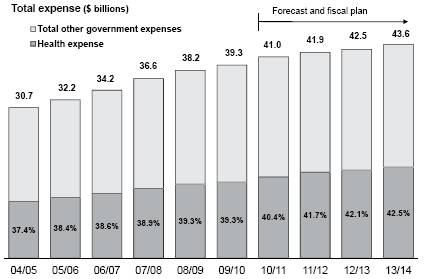
Total health spending (see Appendix Table A12) includes all health care related spending by the Ministry of Health, other ministries such as Children and Family Development and Social Development, and health authorities/hospital societies. As a proportion of total government expenses, health spending will soon approach 43 per cent, and therefore it is essential that costs be managed effectively and innovative cost controls continue to be sought.
Budget and Fiscal Plan – 2011/12 to 2013/14
19
Three-Year Fiscal Plan
Chart 1.8 Health spending as a percentage of total government expenses
Health Care Costs and Outcomes
While costs must be managed to keep the system sustainable, health outcomes are also a critical consideration. As indicated in Table 1.10, not only is BC comparatively efficient in providing health services, but the province also ranks highly in terms of results when compared to other Canadian jurisdictions.
Table 1.10 Health Per Capita Costs and Outcomes: Canadian Comparisons
Province | | Per Capita
Health Care
Costs ($) | | Life
Expectancy at
Birth (Years) | | Infant Mortality
per 1000 Live
Births | | Cancer Mortality Rate
per 100,000
Population | | Diseases of the Heart
Mortality Rate per
100,000 Population | |
Quebec | | 3,341 | | 80.7 | | 4.5 | | 181.6 | | 103.6 | |
British Columbia | | 3,544 | | 81.2 | | 4.0 | | 152.7 | | 102.3 | |
Ontario | | 3,548 | | 81.0 | | 5.2 | | 159.1 | | 109.8 | |
New Brunswick | | 3,789 | | 80.0 | | 4.3 | | 172.1 | | 115.5 | |
Nova Scotia | | 3,944 | | 79.7 | | 3.3 | | 186.4 | | 122.4 | |
Prince Edward Island | | 3,988 | | 80.2 | | 5.0 | | 160.9 | | 148.0 | |
Saskatchewan | | 4,077 | | 79.5 | | 5.8 | | 161.3 | | 126.1 | |
Manitoba | | 4,155 | | 79.3 | | 7.3 | | 172.5 | | 125.5 | |
Alberta | | 4,295 | | 80.5 | | 6.0 | | 155.1 | | 122.4 | |
Newfoundland | | 4,564 | | 78.3 | | 7.5 | | 195.4 | | 156.9 | |
Sources: Canadian Institute for Health Information, 2010 (cost data) and Ministry of Health (outcomes data).
While our per-capita costs are the second lowest in Canada as of 2010, key health outcomes are among the highest. Of the four health indicators shown, BC has the best outcomes in terms of high Life Expectancy and low rates of Cancer Mortality and Mortality Related to Diseases of the Heart compared to the other provinces; and second best outcome in terms of low Infant Mortality Rates.
Health Funding Report and Plan
As required under Part 14 of the Consumption Tax Rebate and Transition Act the following table shows the health funding report for 2010/11 and the health funding plan for 2011/12 to 2013/14.
Budget and Fiscal Plan – 2011/12 to 2013/14
20
Three-Year Fiscal Plan
Table 1.11 Health Funding Report and Plan
($ millions) | | 2010/11 | | 2011/12 | | 2012/13 | | 2013/14 | |
Harmonized sales tax | | 4,171 | | 5,820 | | 6,164 | | 6,516 | |
Medical Services Plan premiums | | 1,798 | | 1,945 | | 2,081 | | 2,193 | |
Tobacco tax | | 737 | | 676 | | 676 | | 676 | |
Health Special Account | | 147 | | 147 | | 147 | | 147 | |
Canada Health Transfer | | 3,597 | | 3,806 | | 4,050 | | 4,312 | |
Wait Times Reduction Transfer | | 33 | | 33 | | 34 | | 34 | |
Total revenue from above sources | | 10,483 | | 12,427 | | 13,152 | | 13,878 | |
Total government spending on health | | 16,557 | | 17,477 | | 17,914 | | 18,519 | |
Health spending in excess of revenue | | 6,074 | | 5,050 | | 4,762 | | 4,641 | |
For 2010/11, the government spending on health services by function (see Appendix Table A12) is projected to exceed forecasted revenues from the harmonized sales tax, Medical Services Plan premiums, tobacco tax, Health Special Account, Canada Health Transfer and Wait Times Reduction Transfer by $6,074 million. Next year’s health funding report for 2010/11 will be based on actual revenues for 2010/11 as reported in the 2010/11 Public Accounts.
For 2011/12 to 2013/14, total government spending on health services by function is projected to exceed forecasted revenues from the harmonized sales tax, Medical Services Plan premiums, tobacco tax, Health Special Account, Canada Health Transfer and Wait Times Reduction Transfer by a total of $14.5 billion over the three year fiscal plan.
Maintaining Education Funding
K–12 Education
Total operating funding for School Districts remains at $4.7 billion per year, however the average funding per student FTE is estimated to increase slightly to $8,357. This includes funding for full day kindergarten (FDK) for five year olds, and the teacher’s compensation increase that forms part of the current collective agreement.
Chart 1.9 Student enrolment and per pupil funding (public schools)

Budget and Fiscal Plan – 2011/12 to 2013/14
21
Three-Year Fiscal Plan
In 2010/11, more than 15,500 additional students were funded and enrolled in FDK in 52 public school districts, transitioning approximately 50 per cent of the estimated 30,200 kindergarten students to full day programs. During the second phase of FDK roll out in 2011/12, all 30,000-plus kindergarten students will be enrolled and funded in FDK.
Budget 2011 also includes annual facilities grant funding of $110 million in 2011/12 to provide for maintenance and repairs in schools.
Post-Secondary Education
Funding for post-secondary institutions (PSIs) in 2011/12 is $1.9 billion, continuing government’s commitment to funding higher education. As shown in Chart 1.10, since 2001/02, there have been significant increases in operational funding for this sector.
As part of government’s recent accelerated infrastructure program, $510 million has been spent from 2009/10 to 2012/13, of which $260 million was provincially funded. All PSIs have benefited from the Knowledge Infrastructure Program component of this funding, which contributed to 40 projects that resulted in renewed or additional buildings.
Chart 1.10 Post-secondary funding

Management of the BC Public Service
Since 2001/02, the core BC public service (ministries and special offices), as measured in full-time equivalents (FTEs), has been approximately 30,000 FTEs. Consistent with recent budget presentations, BC public service FTEs are presented in Budget 2011 on an aggregate basis, as shown in Appendix Table A14.
In 2010/11, oversight of the BC Ambulance Service transferred from the Ministry of Health to the Provincial Health Services Authority, which is part of the SUCH sector (schools, universities, colleges and health organizations). Under the Budget Transparency and Accountability Act, SUCH sector FTEs are not included in government reporting on staff levels, therefore projections starting in 2011/12 have been reduced by approximately 3,000 FTEs in accordance with this change in status.
Budget and Fiscal Plan – 2011/12 to 2013/14
22
Three-Year Fiscal Plan
Excluding the impact of the BC Ambulance Service transfer, the 2.7 per cent average annual reduction in FTEs in the fiscal plan is similar to government’s experience over the last two years, as shown in Chart 1.11.
The forecasted decline in FTEs reflects the continued budgetary requirement for government to prioritize key government services and programs and achieve savings and improved effectiveness in their delivery. While some involuntary staff reductions were implemented in 2009/10 and 2010/11 with a target of limiting overall staff impacts to 5 per cent of the workforce to the end of 2011/12, impacts to date have been only 2.5 per cent. With government’s improved fiscal outlook, no further involuntary reductions are anticipated over the new three year fiscal plan.
Chart 1.11 Managing FTEs

It is expected that the projected decrease for the next three years will be achieved through attrition — that is, through normal annual voluntary exits, including retirements, which are expected to continue at consistent rates across the fiscal plan. In addition, government also continues its policy of limited external hiring in order to manage within available salary budgets.
Recovered Expenses
Over the fiscal plan period (2011/12 to 2013/14), government projects it will incur $8.2 billion in program spending whose costs will be recovered from third parties. This includes a total of $2.1 billion spent on delivering programs on behalf of the federal government, such as the Labour Market Development and Labour Market Agreements, immigration initiatives, and local government services transfers.
In addition, an estimated $2.7 billion in interest costs will be recovered from the commercial Crown corporations through the fiscal agency loan program and from sinking fund investment returns. The remaining $3.4 billion in recoveries costs are incurred by a variety of programs, including hospital expansion recovered from regional health boards, industry-funded regulatory programs recovered through fees, and distribution of free Crown grants recovered through the revaluation of the land being distributed.
Budget and Fiscal Plan – 2011/12 to 2013/14
23
Three-Year Fiscal Plan
Operating Transfers
Transfers to service delivery agencies will total $63 billion over the fiscal plan period (2011/12 to 2013/14) in support of education, healthcare, social services, housing, and transportation programs delivered by the agencies on behalf of government. These service delivery agencies include the SUCH sector (schools, universities, colleges and health organizations), Community Living BC, BC Housing Management Commission, BC Transit, and the BC Transportation Financing Authority. Transfers to these organizations comprise over 60 per cent of ministry spending.
Service Delivery Agency Spending
Service delivery agency spending is projected to total $27.0 billion by 2013/14, reflecting an increase of $2.3 billion over the fiscal plan period.
School district spending is projected at $5.5 billion in 2013/14 — an increase of $30 million over the three-year period. This includes spending on full-day kindergarten and other pressures, partially offset by reduced spending in relation to federally funded programs. Other influences on school district spending are a diminishing demand to increase the total number of teachers due to stable enrolment projections, and government’s wage mandate (over 80 per cent of school district spending is on salaries).
Spending by universities is forecast to increase by $220 million over the three-year period, and will total $4.0 billion by 2013/14. The increase mainly reflects additional faculty and operating costs for education and research programs and amortization for capital assets resulting from provincial and federal government stimulus spending.
Projected spending by colleges and institutes will remain virtually unchanged at $1.1 billion, with only a minor increase of $7 million over the three-year period. This increase mainly relates to additional operating costs for facilities and education programs.
Spending by health authorities and hospital societies is projected to rise from $11.1 billion in 2010/11 to $12.7 billion by 2013/14 — an increase of $1.6 billion. This increase reflects the projected growth in demand for the health services delivered by these organizations on behalf of government. It also includes additional spending resulting from the integration of the BC Ambulance Service with the Provincial Health Services Authority.
Projected spending by other service delivery agencies is forecast to increase from $3.3 billion in 2010/11 to $3.7 billion in 2013/14, reflecting a total increase of $388 million over the three-year period. The increase is primarily due to additional spending on accelerated social housing programs by the BC Housing Management Commission and on transportation initiatives by the BC Transportation Financing Authority.
Budget and Fiscal Plan – 2011/12 to 2013/14
24
Three-Year Fiscal Plan
Capital Spending(1)
Capital spending on schools, hospitals, roads, bridges, hydro-electric projects and other infrastructure across the province over the next three years (2011/12 to 2013/14) is expected to total $19.0 billion. Provincial capital infrastructure investments are made through school districts, health authorities, post-secondary institutions, Crown agencies and ministries.
The total capital investment of $19.0 billion is comprised of $10.3 billion in taxpayer-supported capital investments and $8.7 billion in capital investments by commercial Crown corporations.
The capital spending forecast for 2011/12 reflects completion of approved projects, including accelerated capital investments to stimulate the economy and keep people at work in the construction sector, and investments by self-supported commercial Crown corporations in power projects and the Port Mann Bridge replacement project.
Table 1.12 Capital Spending
| | 2010/11 | | Budget | | | | | |
| | Budget | | Updated | | Estimate | | Plan | | Plan | |
($ millions) | | 2010 | | Forecast | | 2011/12 | | 2012/13 | | 2013/14 | |
Taxpayer-supported | | | | | | | | | | | |
Education | | | | | | | | | | | |
Schools (K-12) | | 481 | | 430 | | 520 | | 412 | | 308 | |
Post-secondary | | 743 | | 928 | | 599 | | 444 | | 286 | |
Health | | 1,161 | | 1,049 | | 859 | | 599 | | 451 | |
BC Transportation Financing Authority | | 1,457 | | 1,327 | | 986 | | 1,018 | | 1,343 | |
BC Transit | | 89 | | 61 | | 162 | | 207 | | 311 | |
Vancouver Convention Centre expansion project | | 8 | | 10 | | — | | — | | — | |
BC Place redevelopment | | 390 | | 298 | | 147 | | — | | — | |
Government ministries | | 355 | | 396 | | 332 | | 210 | | 148 | |
Other(1) | | 404 | | 277 | | 300 | | 65 | | 51 | |
Capital spending contingencies | | 300 | | 129 | | 200 | (2) | 200 | | 200 | |
Total taxpayer-supported | | 5,388 | | 4,905 | | 4,105 | | 3,155 | | 3,098 | |
| | | | | | | | | | | |
Self-supported | | | | | | | | | | | |
BC Hydro | | 1,784 | | 1,566 | | 2,195 | | 2,037 | | 2,020 | |
Columbia River power projects(3) | | 12 | | 63 | | 98 | | 120 | | 62 | |
Transportation Investment Corporation (Port Mann) | | 735 | | 871 | | 717 | | 586 | | 72 | |
BC Railway Company(4) | | 26 | | 14 | | 18 | | 27 | | 20 | |
ICBC | | 83 | | 44 | | 81 | | 84 | | 88 | |
BC Lotteries | | 107 | | 107 | | 109 | | 130 | | 125 | |
Liquor Distribution Branch | | 24 | | 23 | | 25 | | 27 | | 28 | |
Total self-supported commercial | | 2,771 | | 2,688 | | 3,243 | | 3,011 | | 2,415 | |
Total capital spending | | 8,159 | | 7,593 | | 7,348 | | 6,166 | | 5,513 | |
(1) Includes BC Housing Management Commission, Provincial Rental Housing Corporation, other service delivery agencies and project reserves held by the Ministry of Finance.
(2) Includes $50 million for ministry capital contingencies.
(3) Joint ventures of the Columbia Power Corporation and Columbia Basin Trust.
(4) The 2010/11 budget was restated to reflect the continued accounting of the BC Railway Company as a commercial entity.
(1) Capital investments are not included in the government’s annual surplus or deficit. In accordance with generally accepted accounting principles (GAAP), annual amortization expenses that recognize the estimated wear and tear of capital assets during the fiscal year are included in the government’s annual expenses instead of recording the full capital costs as they occur.
Budget and Fiscal Plan – 2011/12 to 2013/14
25
Three-Year Fiscal Plan
Since October 2008, $5.5 billion has been committed to accelerated infrastructure investments across the province. BC has successfully leveraged $1.4 billion in infrastructure funding from the federal government infrastructure stimulus plan announced in January 2009 in support of this program.
In December 2010, the federal government extended the deadline for substantial completion of projects under the Infrastructure Stimulus, Knowledge Infrastructure, and Build Canada Top-Up Funds from March 31, 2011 to October 31, 2011 upon application by the Province for specific project extensions. As a result, the timing of some accelerated expenditures has moved to fiscal 2011. Taxpayer-supported capital spending is projected to return to historical levels as the accelerated infrastructure program is wound down by the end of October 2011.
Taxpayer-supported capital spending
Taxpayer-supported capital spending includes capital infrastructure for school districts, health authorities, post-secondary institutions, taxpayer-supported Crown agencies, and ministries.
Taxpayer-supported capital spending is projected at $4.1 billion in 2011/12, declining to $3.1 billion in 2012/13 and 2013/14, reflecting completion of approved projects within the capital plan, including accelerated capital projects.
Significant elements of the projected spending include the following:
· Over the three years of the capital plan, $1.2 billion will be invested to replace, renovate or expand K-12 facilities. This includes continued investment in the program to seismically upgrade or replace schools and provide space for full day kindergarten for five year olds.
· Budget 2011 includes $1.3 billion in capital spending by post-secondary institutions throughout the province. Projects include building replacements and renewals, a number of which are accelerated though the Knowledge Infrastructure Program, and the TRIUMF Advanced Rare Isotope Laboratory.
Post-secondary capital spending also includes a significant level of investment funded through other sources, including foundations, donations, cash balances, federal funding and revenues generated from services.
· Capital spending in the health sector will total $1.9 billion over the next three years. These investments support new major construction and upgrading of health facilities, medical and diagnostic equipment, and information management technology systems, and include funding from the province as well as other sources, such as regional hospital districts and foundations. Investments include the Children’s and Women’s Hospital.
· Budget 2011 continues to invest in government’s transportation investment plan. The province has secured significant federal cost sharing on projects and has leveraged investments through partnerships with private partners. The public and private sector together will provide $5.3 billion for transportation investments over the next three years.
Budget and Fiscal Plan – 2011/12 to 2013/14
26
Three-Year Fiscal Plan
· $2.9 billion of provincial investment in transportation infrastructure;
· $1.0 billion of investment leveraged through federal cost sharing and partnerships with private partners, local governments and other agencies; and
· $1.4 billion of investment for the Port Mann Bridge/Highway 1 project.
Further information is provided in Table 1.13.
Table 1.13 Provincial Transportation Investments
| | 2010/11 | | | | | | | | | |
| | Updated | | | | | | | | 3-Year | |
($ millions) | | Forecast | | 2011/12 | | 2012/13 | | 2013/14 | | Total | |
Transportation Investment Plan | | | | | | | | | | | |
– Rehabilitation | | 223 | | 149 | | 146 | | 146 | | 441 | |
– Interior and rural side roads | | 55 | | 52 | | 50 | | 50 | | 152 | |
– Oil and gas rural road improvement program | | 36 | | 17 | | — | | — | | 17 | |
– Mountain pine beetle strategy | | 31 | | 30 | | 30 | | 30 | | 90 | |
– Highway 1 – Kicking Horse Canyon | | 33 | | 25 | | — | | — | | 25 | |
– Highway 1 – Kamloops to Golden | | 30 | | 74 | | 70 | | 19 | | 163 | |
– Gateway program | | 168 | | 178 | | 71 | | 72 | | 321 | |
– Okanagan Valley corridor | | 70 | | 40 | | 25 | | 18 | | 83 | |
– Cariboo connector program | | 40 | | 22 | | 33 | | 39 | | 94 | |
– Other highway corridors and programs | | 141 | | 100 | | 130 | | 127 | | 357 | |
– Cycling infrastructure | | 3 | | 3 | | 3 | | 3 | | 9 | |
Total transportation investment plan | | 830 | | 690 | | 558 | | 504 | | 1,752 | |
Provincial Transit Plan | | | | | | | | | | | |
– Canada Line rapid transit project | | 20 | | 20 | | 20 | | 20 | | 60 | |
– Evergreen Line rapid transit project | | 30 | | 51 | | 106 | | 147 | | 304 | |
– Other rapid transit projects | | 56 | | 33 | | 95 | | 319 | | 447 | |
– Buses and other transit priorities | | 57 | | 87 | | 113 | | 115 | | 315 | |
Total provincial transit plan | | 163 | | 191 | | 334 | | 601 | | 1,126 | |
Total provincial investment(1) | | 993 | | 881 | | 892 | | 1,105 | | 2,878 | |
| | | | | | | | | | | |
Investments funded through contributions from other partners | | | | | | | | | | | |
– Evergreen Line (federal contribution and TransLink) | | 59 | | 66 | | 200 | | 289 | | 555 | |
– Contributions to the Transportation Investment Plan | | 267 | | 153 | | 76 | | 54 | | 283 | |
– Contributions to the Provincial Transit Plan | | 42 | | 22 | | 22 | | 181 | | 225 | |
Total investments funded through contributions from other partners | | 368 | | 241 | | 298 | | 524 | | 1,063 | |
Total investment in transportation infrastructure | | 1,361 | | 1,122 | | 1,190 | | 1,629 | | 3,941 | |
Transportation Investment Corporation | | | | | | | | | | | |
– Port Mann Bridge/Highway 1 project | | 871 | | 717 | | 586 | | 72 | | 1,375 | |
Total investment in transportation infrastructure including the Port Mann Bridge/Highway 1 project | | 2,232 | | 1,839 | | 1,776 | | 1,701 | | 5,316 | |
(1) Total provincial investment includes operating and capital spending.
· Budget 2011 includes $147 million in 2011/12 to complete the redevelopment of BC Place, including installation of a retractable roof.
Budget and Fiscal Plan – 2011/12 to 2013/14
27
Three-Year Fiscal Plan
Capital Contingencies
The province has included $600 million in capital contingency in its three-year capital plan as a prudent planning measure. In addition to covering risks from higher than expected costs, the capital contingency will be used to fund emerging government priorities. This includes capital funding for annual facility grants in the Ministry of Education as required. Should the capital contingency not be used, taxpayer-supported debt will be lower than currently forecast.
Financing Capital Projects
Provincial capital infrastructure spending is financed through a combination of sources:
· cash balances (e.g. school districts, post-secondary institutions, health authorities);
· partnerships with the private sector (public-private-partnerships);
· cost-sharing with partners (e.g. the federal government, regional hospital districts); and
· borrowing (debt financing).
Since debt financing continues to represent a significant source of financing for provincial capital spending, the level of capital spending has a significant impact on projected provincial debt.
Chart 1.12 Financing government’s capital plan
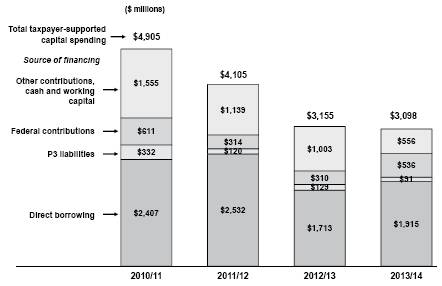
Self-supported capital spending
Total capital spending includes capital infrastructure for self-supported commercial Crown agencies.
Self-supported capital spending is projected at $3.2 billion in 2011/12, $3.0 billion in 2012/13 and $2.4 billion in 2013/14. Over the three year period:
· $6.5 billion (75 per cent) of total self-supported capital spending will be used for electrical generation, transmission and distribution projects to meet growing customer demand, to enhance reliability and to implement the smart metering and infrastructure program. Large generating facilities built between the late 1960s and
Budget and Fiscal Plan – 2011/12 to 2013/14
28
Three-Year Fiscal Plan
early 1980s provide about 90 per cent of the province’s electrical power. The major mechanical and electrical components (such as turbines and transformers) in these facilities are nearing the end of their design life and require major overhauls to maintain reliability. A significant portion of self-supported capital spending represents measures to address the issue of ageing infrastructure.
· $1.4 billion will be used for the Port Mann Bridge replacement and Highway 1 improvement project.
· $364 million will be used for BC Lotteries projects including the modernization of business systems and acquisition of gaming equipment to support lottery, PlayNow internet gaming, casino and community gaming activities.
· $253 million will be used for ICBC projects including reinvestment in critical business systems as part of its Transformation Program.
Table 1.14 provides information on major power generation and transmission projects. Further details on provincial capital investments are shown in the service plans of ministries and Crown agencies.
Projects over $50 million
As required under the Budget Transparency and Accountability Act, approved major capital projects with multi-year budgets from provincial sources totalling $50 million or more are shown in Table 1.14. Annual allocations of the full budget for these projects are included as part of the provincial government’s capital investment spending shown in Table 1.12.
In addition to financing through provincial sources, major projects may be cost-shared with the federal government, municipalities and regional districts, and/or the private sector. Total capital spending over the fiscal plan period for these major projects is $16.5 billion, reflecting provincial financing of $14.5 billion through internal sources or borrowing, $0.9 billion from federal government contributions and $1.1 billion from other sources including private donations. Major capital investments include:
· $446 million to provide space for full-day kindergarten and for school replacement projects including Chilliwack Secondary, Alberni District Secondary, Centennial Secondary, Revelstoke Elementary and Secondary, and Burnaby Central Secondary.
· $133 million for the Pharmaceutical Sciences and Centre for Drug Research and Development at UBC, of which the province is funding $86.4 million.
· $3.0 billion for health facilities including Children’s and Women’s Hospital, the Surrey Outpatient Facility and Surrey Memorial Hospital — Emergency Department/Critical Care Tower; the Royal Jubilee Hospital Patient Care Centre in Victoria; the Interior Heart and Surgical Centre in Kelowna; expansions to Kelowna General and Vernon Jubilee Hospitals; the Northern Cancer Centre initiative which encompasses construction of a new facility in Prince George and upgrades in other northern communities; and replacement of the Fort St. John Hospital.
· $5.8 billion for major transportation capital infrastructure including improvements for the Pitt River Bridge, South Fraser perimeter road, Sea-to-Sky Highway, Sierra Yoyo Desan Road Upgrade, and the Port Mann Bridge/Highway 1 project.
· $2.0 billion for completion of the Vancouver Convention Centre expansion project, BC Place redevelopment, the integrated case management system, the Surrey Pretrial Service Centre Expansion and the e-Health initiative.
Budget and Fiscal Plan – 2011/12 to 2013/14
29
Three-Year Fiscal Plan
Table 1.14 Capital Expenditure Projects Greater Than $50 million(1)
Note: Information in bold type denotes changes from the second Quarterly Report .
| | Projected | | Total Costs | | Projected | | Total | | Project Financing | |
| | Completion | | to | | Costs to | | Capital | | Internal/ | | Federal | | Other | |
($ millions) | | Date | | Dec. 31, 2010 | | Complete | | Costs | | Debt | | Government | | Contributions | |
Taxpayer-supported | | | | | | | | | | | | | | | |
K–12 Schools | | | | | | | | | | | | | | | |
Revelstoke Elementary and Secondary | | Fall 2011 | | 19 | | 41 | | 60 | | 58 | | — | | 2 | |
Chilliwack Secondary | | Fall 2012 | | 1 | | 57 | | 58 | | 58 | | — | | — | |
Burnaby Central Secondary | | Spring 2012 | | 28 | | 36 | | 64 | | 64 | | — | | — | |
Centennial Secondary | | Fall 2014 | | — | | 62 | | 62 | | 62 | | — | | — | |
Alberni District Secondary | | Fall 2012 | | 10 | | 48 | | 58 | | 54 | | — | | 4 | |
Full-day kindergarten | | Fall 2012 | | 9 | | 135 | | 144 | | 144 | | — | | — | |
Total K–12 schools | | | | 67 | | 379 | | 446 | | 440 | | — | | 6 | |
Post secondary facilities | | | | | | | | | | | | | | | |
University of British Columbia | | | | | | | | | | | | | | | |
– Pharmaceutical Sciences and Centre for Drug Research & Development | | Fall 2012 | | 13 | | 120 | | 133 | | 86 | | 3 | | 44 | |
Health facilities | | | | | | | | | | | | | | | |
Surrey Outpatient Care and Surgical Centre(2) | | | | | | | | | | | | | | | |
– Government direct cost | | Spring 2011 | | 32 | | 33 | | 65 | | 65 | | — | | — | |
– P3 contract | | Spring 2011 | | 161 | | 11 | | 172 | | 172 | | — | | — | |
Victoria Royal Jubilee Hospital – Patient Care Centre | | | | | | | | | | | | | | | |
– Government direct cost | | Spring 2013 | | 118 | | 32 | | 150 | | 23 | | — | | 127 | |
– P3 contract | | Spring 2011 | | 199 | | — | | 199 | | 199 | | — | | — | |
Fort St. John Hospital and Residential Care | | | | | | | | | | | | | | | |
– Government direct cost | | Spring 2012 | | 152 | | 113 | | 265 | | 169 | | — | | 96 | |
– P3 contract | | Spring 2012 | | — | | 33 | | 33 | | 33 | | — | | — | |
Expansions to Kelowna General and Vernon Jubilee Hospitals | | | | | | | | | | | | | | | |
– Government direct cost | | Fall 2012 | | 200 | | 75 | | 275 | | 26 | | — | | 249 | |
– P3 contract | | Fall 2012 | | 158 | | — | | 158 | | 158 | | — | | — | |
Northern Cancer Centre initiative(3) | | | | | | | | | | | | | | | |
– Government direct cost | | Fall 2012 | | 33 | | 58 | | 91 | | 88 | | — | | 3 | |
– P3 contract | | Fall 2012 | | 14 | | 1 | | 15 | | 15 | | — | | — | |
Surrey Emergency/Critical Care Tower(4) | | Summer 2014 | | 15 | | 471 | | 486 | | 466 | | — | | 20 | |
Interior Heart and Surgical Centre(5) | | Spring 2017 | | 13 | | 380 | | 393 | | 302 | | — | | 91 | |
Children’s and Women’s Hospital(6) | | Fall 2017 | | — | | 682 | | 682 | | 532 | | — | | 150 | |
Total health facilities | | | | 1,095 | | 1,889 | | 2,984 | | 2,248 | | — | | 736 | |
Transportation | | | | | | | | | | | | | | | |
Pitt River Bridge | | Fall 2009 | (7) | 204 | | 3 | | 207 | | 110 | | 90 | | 7 | |
Sea-to-Sky Highway | | | | | | | | | | | | | | | |
– Government direct cost | | Fall 2009 | (7) | 235 | | 1 | | 236 | | 234 | | — | | 2 | |
– P3 contract | | Fall 2009 | | 561 | | — | | 561 | | 561 | | — | | — | |
South Fraser Perimeter Road | | | | | | | | | | | | | | | |
– Government direct cost | | Summer 2014 | | 601 | | 461 | | 1,062 | | 697 | | 365 | | — | |
– P3 contract | | Summer 2014 | | 37 | | 165 | | 202 | | 202 | | — | | — | |
Sierra Yoyo-Desan Road upgrade | | Fall 2012 | | 68 | | 119 | | 187 | | 187 | | — | | — | |
Total transportation | | | | 1,706 | | 749 | | 2,455 | | 1,991 | | 455 | | 9 | |
Other | | | | | | | | | | | | | | | |
Vancouver Convention Centre expansion project | | Summer 2009( | 7) | 832 | | 4 | | 836 | | 494 | | 222 | | 120 | |
BC Place redevelopment(8) | | Fall 2011 | | 275 | | 288 | | 563 | | 563 | | — | | — | |
Integrated case management system | | Fall 2014 | | 59 | | 123 | | 182 | | 179 | | 3 | | — | |
Surrey Pretrial Service Centre expansion(9) | | Fall 2013 | | 4 | | 117 | | 121 | | 121 | | — | | — | |
e-Health initiative(10) | | Spring 2013 | | 196 | | 66 | | 262 | | 138 | | 124 | | — | |
Total other | | | | 1,366 | | 598 | | 1,964 | | 1,495 | | 349 | | 120 | |
Total taxpayer-supported | | | | 4,247 | | 3,735 | | 7,982 | | 6,260 | | 807 | | 915 | |
Budget and Fiscal Plan – 2011/12 to 2013/14
30
Three-Year Fiscal Plan
Table 1.14 Capital Expenditure Projects Greater Than $50 million (1) (continued)
Note: Information in bold type denotes changes from the second Quarterly Report.
| | Projected | | Total Costs | | Projected | | Total | | Project Financing | |
| | Completion | | to | | Costs to | | Capital | | Internal/ | | Federal | | Other | |
($ millions) | | Date | | Dec. 31, 2010 | | Complete | | Costs | | Debt | | Government | | Contributions | |
Self-supported | | | | | | | | | | | | | | | |
Transportation | | | | | | | | | | | | | | | |
Port Mann Bridge / Highway 1 | | Winter 2013 | | 1,616 | | 1,703 | | 3,319 | | 3,319 | | — | | — | |
Power generation and transmission | | | | | | | | | | | | | | | |
BC Hydro | | | | | | | | | | | | | | | |
– GM Shrum G1–G4 stator replacement | | Fall 2010 | (7) | 75 | | 1 | | 76 | | 76 | | — | | — | |
– Revelstoke Unit 5 generation | | Fall 2010 | (7) | 235 | | 15 | | 250 | | 250 | | — | | — | |
– Central Vancouver Island transmission line | | Fall 2010 | (7) | 58 | | 8 | | 66 | | 66 | | — | | — | |
– Ruskin Dam safety and powerhouse upgrade | | TBD | (11) | 47 | | 5 | | 52 | | 52 | | — | | — | |
– Cheakamus spillway gate reliability upgrade | | Fall 2011 | | 56 | | 8 | | 64 | | 64 | | — | | — | |
– Fort Nelson generating station upgrade (12) | | Fall 2011 | | 66 | | 73 | | 139 | | 139 | | — | | — | |
– Vancouver City Central transmission | | Fall 2012 | | 18 | | 168 | | 186 | | 186 | | — | | — | |
– Columbia Valley transmission | | Fall 2012 | | 12 | | 142 | | 154 | | 154 | | — | | — | |
– Northwest transmission line | | Winter 2013 | | 11 | | 384 | | 395 | | 85 | | 130 | | 180 | |
– Stave Falls spillway gate reliability upgrade (12) | | Winter 2013 | | 16 | | 49 | | 65 | | 65 | | — | | — | |
– Seymour Arm series capacitor | | Spring 2014 | | — | | 58 | | 58 | | 58 | | — | | — | |
– Smart metering and infrastructure program | | Summer 2013 | | 43 | | 887 | | 930 | | 930 | | — | | — | |
– Mica Dam gas insulated switchgear replacement (12) | | Summer 2013 | | 77 | | 103 | | 180 | | 180 | | — | | — | |
– Hugh Keenleyside spillway gate reliability upgrade(12) | | Fall 2013 | | 13 | | 88 | | 101 | | 101 | | — | | — | |
– Dawson Creek area reinforcement | | Fall 2013 | | 3 | | 129 | | 132 | | 132 | | — | | — | |
– Interior to Lower Mainland transmission line | | Fall 2014 | | 48 | | 552 | | 600 | | 600 | | — | | — | |
– Southern Interior series compensation | | Fall 2014 | | 1 | | 60 | | 61 | | 61 | | — | | — | |
– Mica units 5 and 6 project(12) | | Fall 2015 | | 39 | | 761 | | 800 | | 800 | | — | | — | |
– GM Shrum units 1 to 5 turbine upgrade(12) | | Fall 2016 | | 17 | | 295 | | 312 | | 312 | | — | | — | |
Columbia River power projects(13) – Waneta Dam power expansion | | May 2015 | | 45 | | 304 | | 349 | | 349 | | — | | — | |
Total power generation and transmission | | | | 880 | | 4,090 | | 4,970 | | 4,660 | | 130 | | 180 | |
Other | | | | | | | | | | | | | | | |
British Columbia Lottery Corporation | | | | | | | | | | | | | | | |
– Casino gaming management system | | Winter 2015 | | — | | 75 | | 75 | | 75 | | — | | — | |
Insurance Corporation of British Columbia | | | | | | | | | | | | | | | |
– Business transformation program | | Fall 2016 | | 13 | | 168 | | 181 | | 181 | | — | | — | |
Total other | | | | 13 | | 243 | | 256 | | 256 | | — | | — | |
Total self-supported | | | | 2,509 | | 6,036 | | 8,545 | | 8,235 | | 130 | | 180 | |
Total $50 million projects | | | | 6,756 | | 9,771 | | 16,527 | | 14,495 | | 937 | | 1,095 | |
(1) Only projects that receive provincial funding and have been approved by Treasury Board and/or Crown corporation boards are included in this table. Ministry service plans may include projects that still require final approval. Capital costs reflect current government accounting policy.
(2) Figures shown do not include an additional $2 million to establish an offsite access road to the facility.
(3) Figures shown do not include an approved project reserve of $5 million.
(4) Figures shown do not include an approved project reserve of $26 million. The Emergency Department is expected to be operational by summer 2013.
(5) Figures shown are based on preliminary Treasury Board approvals and do not include an approved project reserve of $55 million. These amounts will change after P3 contracts are finalized.
(6) Figures shown are based on preliminary Treasury Board approvals. These amounts will change after P3 contracts are finalized.
(7) Assets have been put into service and only trailing costs remain.
(8) BC Place redevelopment includes $458 million to install a retractable roof and $105 million to refurbish the facilities.
(9) Figures shown do not include an approved project reserve of $9 million.
(10) The e-Health initiative is comprised of 7 distinct projects. Figures shown reflect the total costs of the 7 Ministry of Health’s provincially co-ordinated e-Health projects. The federal government portion is an estimate based on a signed agreement with Canada Health Infoway and the actual amount may vary, depending on eligible project costs incurred.
(11) Definition phase of the Ruskin Dam safety and powerhouse upgrade project was approved for $52 million. The total project cost and completion date are being developed.
(12) Total costs and completion dates for these projects vary depending on the final scope. Information shown represents current assumptions. The BC Hydro service plan provides more detail on the range of costs for these projects.
(13) Joint ventures of the Columbia Power Corporation and Columbia Basin Trust. In October 2010, CPC/CBT reached an agreement for a partnership with Fortis Inc. to develop an electricity generating facility at the Waneta Dam south of Trail. Capital spending information reflects 49 per cent of the total project — CPC’s 32.5 per cent share combined with CBT’s 16.5 per cent share.
Budget and Fiscal Plan – 2011/12 to 2013/14
31
Three-Year Fiscal Plan
· $5.0 billion for power generation and transmission capital projects by BC Hydro and for Columbia River power projects including estimates for a 49 per cent share in the expansion of the Waneta Dam (a public-private partnership with Fortis Inc.).
· $181 million for the capital component of ICBC’s $400 million business transformation program that will completely overhaul its claims, insurance, customer, and business processes and technologies.
· $75 million for the replacement of BC Lotteries gaming management system that supports the generation of $1.6 billion in annual revenue from 34 casinos and community gaming centres operating more than 11,000 slot machines and 500 table games.
Provincial Debt
During the period 2004/05 to 2008/09, surpluses allowed the provincial government to adjust its borrowing strategy to reduce a significant portion of its debt. For example, taxpayer-supported debt declined by 12 per cent from $30.0 billion in 2003/04 to $26.4 billion in 2008/09. These low levels of debt provided government with the flexibility needed to address the economic downturn and current fiscal challenges.
Table 1.15 Provincial Debt Summary (1)
| | 2010/11 | | Budget | | | | | |
| | | | Updated | | Estimate | | Plan | | Plan | |
($ millions unless otherwise indicated) | | Budget | | Forecast | | 2011/12 | | 2012/13 | | 2013/14 | |
Taxpayer-supported debt | | | | | | | | | | | |
Provincial government operating | | 4,815 | | 5,291 | | 6,067 | | 6,571 | | 5,903 | |
Provincial government general capital (2) | | 2,696 | | 2,696 | | 2,696 | | 2,696 | | 2,696 | |
Provincial government direct operating | | 7,511 | | 7,987 | | 8,763 | | 9,267 | | 8,599 | |
Other taxpayer-supported debt (mainly capital) | | | | | | | | | | | |
Education | | 10,305 | | 10,131 | | 10,717 | | 11,117 | | 11,355 | |
Health (3) | | 5,074 | | 4,895 | | 5,411 | | 5,830 | | 6,109 | |
Highways and public transit (4) | | 8,473 | | 8,222 | | 8,883 | | 9,643 | | 10,727 | |
Other | | 2,385 | | 2,153 | | 3,042 | | 3,305 | | 3,710 | |
Total other taxpayer-supported debt | | 26,237 | | 25,401 | | 28,053 | | 29,895 | | 31,901 | |
Total taxpayer-supported debt | | 33,748 | | 33,388 | | 36,816 | | 39,162 | | 40,500 | |
Self-supported commercial Crown corporations debt | | 13,709 | | 13,743 | | 16,271 | | 18,060 | | 19,505 | |
Total debt before forecast allowance | | 47,457 | | 47,131 | | 53,087 | | 57,222 | | 60,005 | |
Forecast allowance (5) | | 300 | | 150 | | 350 | | 350 | | 350 | |
Total provincial debt | | 47,757 | | 47,281 | | 53,437 | | 57,572 | | 60,355 | |
Debt as a per cent of GDP | | | | | | | | | | | |
Provincial government direct operating | | 3.8 | % | 4.0 | % | 4.2 | % | 4.2 | % | 3.7 | % |
Taxpayer-supported | | 17.2 | % | 16.5 | % | 17.5 | % | 17.8 | % | 17.5 | % |
Total provincial | | 24.3 | % | 23.4 | % | 25.4 | % | 26.1 | % | 26.1 | % |
Taxpayer-supported debt per capita ($) | | 7,459 | | 7,369 | | 8,008 | | 8,397 | | 8,564 | |
Taxpayer-supported interest bite (cents per dollar of revenue) | | 4.6 | | 4.1 | | 4.5 | | 4.6 | | 4.9 | |
(1) Debt is after deduction of sinking funds and unamortized discounts, and excludes accrued interest. Government direct and fiscal agency accrued interest is reported in the government’s accounts as an accounts payable.
(2) Separate disclosures of borrowings for ministries’ capital spending are applied prospectively beginning in fiscal 2009/10.
(3) Health facilities’ debt includes public-private partnership obligations of $932 million for fiscal 2010/11, $995 million for fiscal 2011/12, $1,106 million for fiscal 2012/13, and $1,201 million for fiscal 2013/14.
(4) BC Transportation Financing Authority’s debt includes public-private partnership obligations of $852 million for fiscal 2010/11, $910 million for fiscal 2011/12, $928 million for fiscal 2012/13, and $925 million for fiscal 2013/14.
(5) Reflects the operating statement forecast allowance for each year (amounts are not cumulative). Since it is unknown as to which agency would require this debt, the forecast allowance is shown as a separate item over the plan.
Budget and Fiscal Plan – 2011/12 to 2013/14
32
Three-Year Fiscal Plan
In recent years, debt has increased due to government’s need to post annual deficits in order to protect core services and implement an accelerated infrastructure plan to keep British Columbians working and help stimulate the economy during the global economic downturn. As the infrastructure program winds down and government returns to a balanced budget, the rate of annual debt growth will decline from a peak of 13 per cent in 2011/12 to 4.8 per cent in 2013/14. By 2013/14, total provincial debt, which includes commercial Crown self-supported debt, will reach $60.4 billion.
Government borrowing projections include both the support of its operating and capital requirements and the retirement of existing debt that will mature during the fiscal plan period. Over the next three years, government will borrow $21.4 billion and retire $8.5 billion in maturing debt (see Table 1.16).
Table 1.16 Provincial Borrowing Requirements
| | Updated | | Budget | | | | | |
| | Forecast | | Estimate | | Plan | | Plan | |
($ millions) | | 2010/11 | | 2011/12 | | 2012/13 | | 2013/14 | |
Total provincial debt (1) at beginning of year | | 41,885 | | 47,281 | | 53,437 | | 57,572 | |
New borrowing (2) | | 7,940 | | 9,002 | | 5,504 | | 6,090 | |
Direct borrowing by Crown corporations and agencies | | 750 | | 255 | | 253 | | 251 | |
Retirement provision (3) | | (3,444 | ) | (3,301 | ) | (1,622 | ) | (3,558 | ) |
Change in forecast allowance | | 150 | | 200 | | — | | — | |
Net change in total debt | | 5,396 | | 6,156 | | 4,135 | | 2,783 | |
Total provincial debt (1) at year end | | 47,281 | | 53,437 | | 57,572 | | 60,355 | |
Annual growth in debt (per cent) | | 12.9 | | 13.0 | | 7.7 | | 4.8 | |
(1) Debt is after deduction of sinking funds and unamortized discounts, and excludes accrued interest which is reported in the financial statements as an accounts payable.
(2) New long-term borrowing plus net change in short-term debt.
(3) Sinking fund contributions, sinking fund earnings and net maturities of long-term debt (after deduction of sinking fund balances for maturing issues).
Taxpayer-supported debt is forecast to increase to $40.5 billion by 2013/14, up $7.1 billion from 2010/11, reflecting the significant infrastructure investments planned over the next three years. This includes a $2.4 billion increase due to capital spending on education and health facilities, a $2.5 billion increase in support of transportation projects, and a $1.6 billion increase for other initiatives. As well, direct operating debt is projected to increase by $0.6 billion.
The self-supported debt of commercial Crown corporations is forecast to increase to $19.5 billion by 2013/14, up $5.8 billion from 2010/11. The increase is primarily due to the additional investment in improving and expanding British Columbia’s hydro generation assets ($4.0 billion) and the construction of the Port Mann Bridge ($1.7 billion). Other self-supported debt is incurred to finance the Columbia River power projects and BC Lottery Corporation equipment and information systems.
Additional details on government’s outstanding debt are provided in Appendix Tables A18 to A20.
Budget and Fiscal Plan – 2011/12 to 2013/14
33
Three-Year Fiscal Plan
Debt affordability
In the period 2002/03 to 2008/09, significant progress was made in reducing the debt burden supported by taxpayers through a 37 per cent reduction in the taxpayer- supported debt to GDP ratio. The progress made in improving the affordability of debt enabled government to absorb the impact of the economic slowdown, which included the need for additional borrowing in support of the accelerated infrastructure program and other stimulus measures. As well, taxpayer-supported interest costs continue to remain low, averaging 4.7 cents per dollar of revenue over the fiscal plan period.
Chart 1.13 Taxpayer-supported debt burden remains affordable

Due to the committed infrastructure spending, anticipated deficits and lower GDP projections in the near term, the taxpayer-supported debt to GDP ratio will peak at 17.8 per cent in 2012/13. As government returns to balancing its budget, the accelerated infrastructure program winds down, and GDP growth returns to historical levels, this measure of affordability will return to a downward trend and fall to 17.5 per cent in 2013/14.
Relationship between debt and deficit
The change in debt will not equal the surplus/deficit due to:
· non-cash amortization costs included in the surplus/deficit; and
· other working capital sources/requirements that represent changes in balance sheet items (such as cash balances, loan receivables and other accounts receivables/payables) and changes in cash balances such as dividends and bonus bid receipts.
Table 1.17 Reconciliation of Summary Results to Provincial Debt Changes
| | Updated | | Budget | | | | | |
| | Forecast | | Estimate | | Plan | | Plan | |
($ millions) | | 2010/11 | | 2011/12 | | 2012/13 | | 2013/14 | |
Operating statement deficit (surplus) | | 1,265 | | 925 | | 440 | | (175 | ) |
Taxpayer-supported capital spending | | 4,905 | | 4,105 | | 3,155 | | 3,098 | |
Increase (reduction) in cash and temporary investments | | (173 | ) | (23 | ) | 115 | | 205 | |
Amortization (non-cash expense included in the surplus) | | (2,005 | ) | (2,089 | ) | (2,176 | ) | (2,182 | ) |
Net increase in commercial Crown corporations (mainly capital) | | 1,377 | | 3,038 | | 2,130 | | 1,655 | |
Other balance sheet and working capital changes | | 27 | | 200 | | 471 | | 182 | |
Total provincial debt increase | | 5,396 | | 6,156 | | 4,135 | | 2,783 | |
Budget and Fiscal Plan – 2011/12 to 2013/14
34
Three-Year Fiscal Plan
Table 1.17 reconciles forecast surplus/deficit with changes in debt. In the updated fiscal plan, debt rises due to the impact of capital spending in excess of amortization; higher commercial Crown corporation debt incurred for capital investments; as well as the projected deficits from 2011/12 to 2012/13.
Risks to the Fiscal Plan
The major risks to the fiscal plan stem from changes in factors that government does not directly control. These include:
· Assumptions underlying revenue and Crown corporation forecasts such as economic factors, commodity prices and weather conditions.
· The outcome of litigation, arbitrations, and negotiations with third parties.
· Potential changes to federal transfer allocations, cost-sharing agreements with the federal government and impacts on the provincial income tax bases arising from federal tax policy and budget changes.
· Utilization rates for government services such as health care, children and family services, and income assistance.
In addition, changes in accounting treatment or revised interpretations of generally accepted accounting principles (GAAP) could have material impacts on the bottom line.
Table 1.18 summarizes the approximate effect of changes in some of the key variables on the surplus. However, individual circumstances and inter-relationships between the variables may cause the actual variances to be higher or lower than the estimates shown in the table. For example, an increase in the US/Cdn dollar exchange rate may be offset by higher commodity prices.
Table 1.18 Key Fiscal Sensitivities
Variable | | Increases of: | | Annual Fiscal Impact
($ millions) | |
Nominal GDP | | 1% | | $150 – $250 | |
Lumber prices (US$/thousand board feet) | | $50 | | $25 – $50 (1) | |
Natural gas prices (Cdn$/gigajoule) | | $1 | | $315 – $365 | |
US exchange rate (US cent/Cdn $) | | 1 cent | | -$25 to -$40 | |
Interest rates | | 1 percentage point | | -$95 | |
Debt | | $500 million | | -$21 | |
(1) Sensitivity relates to stumpage revenue only. Depending on market conditions, changes in stumpage revenues may be offset by changes in border tax revenues.
Own Source Revenue
The main areas that may affect own source revenue forecasts are BC’s overall economic performance, the relative health of its major trading partners, the exchange rate and commodity prices.
Revenues are sensitive to economic performance. For example, taxation and other revenue sources are driven by economic factors such as personal income, retail sales, population growth and the exchange rate. The revenue forecast contained in the fiscal plan is based on the economic forecast detailed in Part 3: British Columbia Economic Review and Outlook. As well, it incorporates commodity price forecasts developed by the Ministry of Forests, Lands and Natural Resource Operations and the Ministry of Energy and Mines based on private sector information.
Budget and Fiscal Plan – 2011/12 to 2013/14
35
Three-Year Fiscal Plan
Income tax revenue forecasts are based on projections of personal and corporate income. The forecasts are updated from reports on tax assessments provided by the Canada Revenue Agency. As a result, revenue estimates can be affected by timing lags in the reporting of current and prior year tax assessments by the Canada Revenue Agency.
Revenues in British Columbia can also be volatile, largely due to the influence of the cyclical natural resource sector in the economy and the importance of natural resource revenues in the province’s revenue base. Changes in commodity prices such as natural gas or lumber may have a significant effect on natural resource revenues.
Details on major assumptions and sensitivities resulting from changes to those assumptions are outlined in Appendix Table A6.
Harmonized Sales Tax (HST)
With respect to the HST, Budget 2011 assumes a continuation of the current laws and agreements that prevail today. In the event that the referendum results in the HST being eliminated and replaced with the previous system of provincial social service tax (PST) and federal goods and services tax (GST), the fiscal plan will require a significant adjustment, including the repayment of the $1.6 billion in transitional funding that the province received from the federal government.
Softwood Lumber Agreement
On January 18, 2011, the United States requested arbitration with Canada under the Softwood Lumber Agreement of 2006 (SLA), claiming BC is breaching the SLA by subsidizing its forest industry through low stumpage rates. BC believes it has a strong case and it is expected the arbitration panel will validate that provincial timber pricing practices are in line with the SLA, as ensured by the province’s auction-based interior pricing system. The arbitration panel’s decision is likely at least two years away. In the interim, there is no change to BC’s market based stumpage system and the export tax on lumber shipments to the US will continue to be collected as determined under the SLA.
Federal Government Contributions
Potential policy changes regarding federal transfer allocations, including federal health transfers and cost-sharing agreements, could affect the revenue forecast.
Crown Corporations
Crown corporations have provided their own forecasts. These forecasts, as well as their statements of assumptions, were used to prepare the fiscal plan. The boards of those corporations and agencies have also included these forecasts, along with further details on assumptions and risks, in the service plans being released with the budget.
Factors such as energy prices, water inflows into the BC Hydro system, accident trends, interest/exchange rates, decisions of an independent regulator, or pending litigation could significantly change actual financial results over the forecast period. BC Hydro’s and ICBC’s results may be affected by the outcome of BC Utilities Commission decisions on current and future rate applications.
Budget and Fiscal Plan – 2011/12 to 2013/14
36
Three-Year Fiscal Plan
SUCH Sector
Health authorities have submitted balanced financial plans for 2011/12 to 2013/14 based on policy assumptions provided by the Ministry of Health. These plans have been signed off by the board chairs of the respective health authorities. The Ministry of Health will continue to work with the health authorities to manage any emerging revenue and spending risks and spending pressures.
Forecasts for the universities, colleges, and institutions have been signed off by chairs of the board or audit committee and lead financial officers.
Forecasts for the combined school districts have been compiled by the Ministry of Education based on the requirements of the School Act, the current year plans developed by the school districts, and ministry policy assumptions respecting future funding allocations. Variances from these assumptions could impact the fiscal plan.
Spending
Government funds a number of demand-driven programs, including those delivered through service delivery agencies, such as health care, K-12 and post-secondary education, income assistance, and community social services. The budgets for these programs reflect reasonable estimates of demand and other factors such as price inflation. If demand is higher than estimated, this will result in a spending pressure to be managed.
The spending plans for the Ministry of Forests, Lands and Natural Resource Operations and the Ministry of Public Safety and Solicitor General include base amounts to fight wildfires and deal with other emergencies such as floods. Unanticipated occurrences may affect expenses in these ministries.
Details on major assumptions and sensitivities resulting from changes to those assumptions are shown in Appendix Table A8 and in ministry service plans.
Public Sector Compensation Mandate
Budget 2011 assumes the current public sector compensation negotiating mandate. This mandate requires two year agreements with a net-zero cost to employers over the term of such agreements and applies to all public sector compensation contracts expiring between December 31, 2009 to December 31, 2011. No compensation mandate has been developed yet for contracts expiring after December 31, 2011.
Contingencies Vote
The allocation to contingencies is a prudent budgeting measure that protects the three-year fiscal plan from:
· unforeseen and unbudgeted costs that may arise; and
· pressures for costs that are currently budgeted based on estimates whose final values are impacted by external events or prices.
Budget and Fiscal Plan – 2011/12 to 2013/14
37
Three-Year Fiscal Plan
Table 1.19 Notional Allocations to Contingencies
($ millions) | | 2011/12 | | 2012/13 | | 2013/14 | |
Elections BC – 2011 Initiative Vote | | 31 | | — | | — | |
2010 Sports and Arts Legacy | | 20 | | 20 | | — | |
Climate action and clean energy initiatives | | 40 | | 40 | | — | |
Subtotal notional allocations | | 91 | | 60 | | — | |
Reserved for unforeseen pressures related to litigation, caseload, natural disasters, and other contingent items | | 512 | | 393 | | 453 | |
Total contingencies | | 603 | | 453 | | 453 | |
The Contingencies Vote has been increased to $60 million in 2011/12 to provide government with flexibility to address unforeseen issues and provide fiscal management flexibility for the next Executive Council. The vote returns to its more typical appropriation of $45 million in 2012/13 and 2013/14.
Budget 2011 includes some items for which notional Contingencies allocations have been provided due to the uncertainty surrounding the timing of when the expenditures will occur and the final amounts that will be required for these initiatives, including event-related funding for Elections BC primarily for the referendum on HST.
As well, Budget 2011 continues to include funding for two specific allocations that were established in Budget 2010 — the 2010 Sports and Arts Legacy and Climate Action and Clean Energy initiatives — that are being managed from the Contingencies Vote. The remaining funds, totalling $120 million over the next two fiscal years, will be allocated on the basis of spending proposals to be reviewed and approved for use based on government priorities.
Treaty Negotiations and the New Relationship
The Maa-nulth treaty Final Agreement will come into effect on April 1, 2011. As well, a treaty Final Agreement was initialled by the Yale First Nation, the province and the federal government on February 5, 2010, and must now be ratified by all three parties. BC also continues to negotiate treaties and incremental treaty agreements with a number of other First Nations. While implementation and settlement costs associated with the Maa-nulth treaty Final Agreement have been accounted for in the fiscal plan, the outcomes of other treaty negotiations and the Yale Final Agreement ratification process could affect both the economic outlook and the fiscal plan.
Government is also committed to negotiating new revenue-sharing agreements and reconciliation agreements with First Nations to streamline consultation on natural resource decisions, provide increased certainty for investors, and provide new economic opportunities to communities. Where agreements have been concluded, the costs associated with those agreements have been accounted for in the fiscal plan. The number of possible new commitments is uncertain, and government will need to accommodate associated fiscal plan impacts as individual negotiations progress.
The province is also involved in litigation with First Nations relating to aboriginal rights. Settlement of these issues, either in or out of court, may result in additional costs to government.
Budget and Fiscal Plan – 2011/12 to 2013/14
38
Three-Year Fiscal Plan
Capital Risks
The capital spending forecasts assumed in the fiscal plan may be affected by bids and proposals resulting in project costs that are higher than the initial approved budgets, particularly for large complex projects such as the BC Place roof replacement. For such projects, government will review the budget and scope risks, and the strategies to mitigate these risks. Any subsequent approved budget increases may be funded from capital contingencies.
Other risks impacting capital spending forecasts include:
· weather and geotechnical conditions, including the outcome of environmental impact studies, causing project delays or unusual costs;
· changes in market conditions, including service demand, the impact of inflation on building material costs, the availability of and wage rates for skilled workers, and borrowing costs;
· the accuracy of capital project forecasts, including planned construction schedules;
· the successful negotiation/timing of cost-sharing agreements with the federal government and other funding partners; and
· the success of public-private sector partnership negotiations.
Pending Litigation
The spending plan for the Ministry of Attorney General contains provisions for payments under the Crown Proceedings Act based on estimates of expected claims and related costs of settlements likely to be incurred. Litigation developments may occur that are beyond the assumptions used in the plan (for example, higher-than-expected volumes, or size of claim amounts and timing of settlements). These developments may affect government revenues and/or expenditures in other ministries.
One-time Write-downs and Other Adjustments
Ministry budgets provide for anticipated levels of asset or loan write-downs where estimates can be reasonably predicted. The overall spending forecast does not make allowance for extraordinary items other than the amount provided in the Contingencies Vote.
Resolution of Accounting Policy Issues
The three-year fiscal plan conforms to the standards and guidelines that comprise generally accepted accounting principles (GAAP) for senior governments. However, a number of exposure drafts on adjustments in those standards are being circulated by the Public Sector Accounting Board (PSAB) for comment from the accounting profession. This includes issues such as treatment of transfers, valuation of financial instruments and foreign currency translation. Decisions on these issues by the PSAB may impact government’s financial statements.
Budget and Fiscal Plan – 2011/12 to 2013/14
39
Part 2: TAX MEASURES
Table 2.1 Summary of Tax Measures
| | | | Taxpayer Impacts | |
| | Effective Date | | 2011/12 | | 2012/13 | |
| | | | ($ millions) | |
International Business Activity Act | | | | | | | |
· | Allow Schedule III Banks to register for the International Business Activity Program | | April 1, 2011 | | * | | * | |
Medicare Protection Act | | | | | | | |
· | Increase MSP premiums by about 6 per cent | | January 1, 2012 | | 30 | | 118 | |
Carbon Tax Act | | | | | | | |
· | Provide a credit for the carbon-neutral biomethane portion of blends of natural gas and biomethane sold under qualifying contracts | | February 16, 2011 | | * | | * | |
Home Owner Grant Act | | | | | | | |
· | Increase threshold for home owner grant phase-out | | 2011 tax year | | * | | * | |
· | Clarify adminstrative provisions for disentitled grants | | February 16, 2011 | | * | | * | |
School Act | | | | | | | |
· | Set provincial residential school property tax rates | | 2011 tax year | | * | | * | |
· | Set provincial non-residential school property tax rates | | 2011 tax year | | * | | * | |
· | Clarify exemption for land used for a farm purpose | | 2011 tax year | | * | | * | |
Taxation (Rural Area) Act | | | | | | | |
· | Set provincial rural area property tax rates | | 2011 tax year | | * | | * | |
· | Provide authority to correct errors | | 2011 tax year | | * | | * | |
University Act and Health Authorities Act | | | | | | | |
· | Clarify property tax exemption for property owned by a university or health authority | | 2011 tax year | | * | | * | |
Total | | | | 30 | | 118 | |
* Denotes measures that have no material impact on taxpayers.
Budget and Fiscal Plan – 2011/12 to 2013/14
Tax Measures
Tax Measures — Supplementary Information
For more details on tax changes see:
www.sbr.gov.bc.ca/msbr/budget/budget.html
International Business Activity Act
Expansion to Include Schedule III Banks
As announced on May 11, 2010, the Act is amended to allow Schedule III banks to qualify for the International Business Activity (IBA) Program with respect to their international financial business, effective April 1, 2011. Schedule III banks are branches of foreign banks operating in Canada.
The IBA Program provides tax refunds of BC corporate income tax paid by qualifying international businesses operating in BC. The Program has been in place since 1988 to help grow BC as an international financial centre.
Medicare Protection Act
Medical Services Plan Premiums Increased
In keeping with the policy announced in the September Update 2009, Medical Services Plan premiums are increased effective January 1, 2012 to help fund health care for British Columbians.
Maximum monthly premium rates will increase by about 6 per cent or $3.50 per month to $64 for single persons, by $7 per month to $116 for two person families and by $7 per month to $128 for families of three or more persons.
For premium assistance recipients, the increase in premiums will range from 0 per cent to 80 per cent of the increased amount. However, with the premium assistance enhancements made in January 2010, premiums payable by premium assistance recipients in 2012 will remain lower than they were in 2009.
Carbon Tax Act
Credit for Biomethane
Biomethane is a carbon neutral renewable fuel produced from biomass (e.g. agricultural and other organic wastes). Purchases of 100 per cent biomethane are exempt from carbon tax. The biomethane portion of a blend is exempt from carbon tax where the actual amount of biomethane in the blend is known.
Effective February 16, 2011, a credit is provided for blends of biomethane and natural gas sold under qualifying contracts by registered retail dealers of natural gas who inject biomethane into the system. Qualifying contracts must clearly stipulate the amount that purchasers are paying for a specified volume or percentage of biomethane. The credit is equal to the carbon tax payable on the specified volume or percentage of biomethane. Similar to the Residential Energy Credit, eligible purchasers will receive the biomethane credit on their natural gas bills.
Budget and Fiscal Plan – 2011/12 to 2013/14
42
Tax Measures
Home Owner Grant Act
Threshold for Home Owner Grant Phase-out Increased
As announced on January 3, 2011, the threshold for the phase-out of the home owner grant is increased from $1,050,000 to $1,150,000 for the 2011 taxation year. This change ensures that at least 95 per cent of homeowners are eligible for the grant, consistent with longstanding government policy.
For properties valued above the threshold of $1,150,000, the grant is reduced by $5 for every $1,000 of assessed value in excess of the threshold.
Administrative Provisions for Disentitled Grants Clarified
The Act is amended to clarify that a person who is not eligible for a home owner grant or a low-income grant supplement must repay the amount received, plus interest, by the due date on the notice of disentitlement.
The grant administrator may waive or cancel interest on a disentitled grant or low-income grant supplement in specified circumstances.
School Act
Provincial Residential School Property Tax Rates Set
The longstanding rate setting policy is that average residential school property taxes, before application of the home owner grant, will increase by the previous year’s provincial inflation rate. This rate setting policy has been in place since 2003 and will continue in 2011. The rates will be set when revised assessment roll data are available.
Provincial Non-Residential School Property Tax Rates Set
A single province-wide rate is set for each of the non-residential property classes. Consistent with longstanding policy, the rates for 2011, except the rate for the major industry property class, will be set so that non-residential school tax revenue will increase by inflation plus new construction. The rates will be set when revised assessment roll data are available.
The major industry property tax class rate will be set to be the same as the business class rate, consistent with the policy announced in Budget 2008.
Exemption for Land Used for a Farm Purpose Clarified
Qualifying land, excluding improvements, is exempt from taxation on 50 per cent of its value if it is used for a farm purpose. Amendments are made to clarify that managed forest land is not used for a farm purpose and, therefore, does not qualify for the exemption.
Budget and Fiscal Plan – 2011/12 to 2013/14
43
Tax Measures
Taxation (Rural Area) Act
Provincial Rural Area Property Tax Rates Set
A single rural area residential property tax rate applies province-wide. The longstanding rate setting policy that average residential rural property taxes increase by the previous year’s provincial inflation rate will continue for 2011.
Consistent with longstanding policy, non-residential rural area property tax rates will be set so that total non-residential rural area tax revenue will increase by inflation plus new construction. The rates will be set when revised assessment roll data are available.
Authority to Correct Errors Provided
The Act is amended to allow supplementary taxation notices to be issued to correct certain errors made during the preparation of the taxation roll. Notices correcting errors in the current year’s taxation roll may be sent in the current year or in the following year.
University Act and Health Authorities Act
Property Tax Exemption for University and Health Authority Property Clarified
Effective for the 2011 tax year, the Acts are amended to clarify that university property must be used by or on behalf of the university or an affiliated student society, and health authority property must be used by or on behalf of the regional health board, to qualify for an exemption under the University Act or the Health Authorities Act, respectively.
Specific exemptions continue to apply. For example, university property used by third parties for prescribed residential purposes and health authority property used by third parties that provide specified services in a hospital continue to be exempt.
The changes will bring the tax treatment of third parties occupying university or health authority property into closer alignment with occupiers of properties of tax exempt owners in other locations. Third parties operating independent businesses on their own behalf will be assessable and taxable. An exception is provided for any occupied properties that were exempt on the 2010 assessment roll. These exemptions will continue until a change in occupancy or December 31, 2015, whichever occurs earlier.
Budget and Fiscal Plan – 2011/12 to 2013/14
44
Tax Measures
Revenue Neutral Carbon Tax
As required under Part 2 of the Carbon Tax Act, the following tables show the Revenue Neutral Carbon Tax Report for 2009/10 and 2010/11 and the Revenue Neutral Carbon Tax Plan for 2011/12 to 2013/14.
Material Assumptions and Policy Decisions
In the Report and the Plan the estimates and forecasts of carbon tax revenue and the cost of tax reductions to return revenues to taxpayers are consistent with, and have the same material assumptions and policy decisions underlying them, as the revenue estimates and forecasts prepared for Budget 2011. The only material assumption specific to the Revenue Neutral Carbon Tax Report and Plan is that the cost of the revenue reductions, due to personal income tax rate cuts, increases with increases in personal income tax revenues for each year.
Revenue Neutral Carbon Tax Report
Revenue neutrality means that tax reductions must be provided that fully return the estimated revenue from the carbon tax to taxpayers in each fiscal year. Table 1, Revenue Neutral Carbon Tax Report for 2009/10 and 2010/11, reports the carbon tax revenues and the cost of the tax reductions for the 2009/10 and 2010/11 fiscal years. For the 2009/10 fiscal year, this report is based on the 2009/10 Public Accounts and updates the Report for 2009/10 presented with Budget 2010.
Carbon tax revenues for 2009/10 are $542 million, unchanged from the estimate provided in Budget 2010. The tax reductions for 2009/10 are those that were designated in the Revenue Neutral Carbon Tax Plan presented with the September Update 2009. The personal income tax measures are the low income climate action tax credit and the five per cent reductions in rates for the first two tax brackets. The business tax measures are the reductions in each of the general and small business corporate income tax rates and the industrial property tax credit.
The estimated reduction in provincial revenues for 2009/10, as a result of the designated revenue measures, is now $359 million for the personal tax measures and $370 million for the business tax measures for a total reduction of $729 million. Based on these revenue and tax reduction estimates, revenue neutrality has been met for 2009/10. In fact, the reduction in provincial revenue exceeds the $542 million in carbon tax revenue by $187 million.
Table 1 Revenue Neutral Carbon Tax Report 2009/10 and 2010/11
| | | | Revised | |
| | | | Forecast | |
| | 2009/10 (1) | | 2010/11 | |
| | $ millions | |
| | | | | |
Carbon tax revenue (2) | | 542 | | 740 | |
Reduction in provincial revenues due to designated measures (3) | | | | | |
Personal tax measures: | | | | | |
· Low income climate action tax credit | | (153 | ) | (168 | ) |
· Reduction of 5% in the first two personal income tax rates | | (206 | ) | (207 | ) |
· Northern and Rural Homeowner benefit of $200 (4) | | — | | (20 | ) |
Total personal tax measures | | (359 | ) | (395 | ) |
Business tax measures: | | | | | |
· General corporate income tax rate cut from 12% to 11% effective July 1, 2008, to 10.5% effective January 1, 2010 and to 10% effective January 1, 2011 | | (152 | ) | (267 | ) |
· Small business corporate income tax rate reduced from 4.5% to 3.5% effective July 1, 2008 and to 2.5% effective December 1, 2008 | | (164 | ) | (141 | ) |
· Industrial Property Tax Credit of 50% of school property taxes payable by light and major industrial properties starting in 2009 taxation year rising to 60% in 2011 | | (54 | ) | (58 | ) |
· School property taxes reduced by 50% for land classified as “farm” starting in 2011 | | — | | (1 | ) |
Total business tax measures | | (370 | ) | (467 | ) |
Total designated revenue measures | | (729 | ) | (862 | ) |
(1) Based on 2009/10 Public Accounts.
(2) The carbon tax applies to fossil fuels and combustibles at rates based on the CO 2 equivalent emission of each particular fuel starting at $10 per tonne effective July 1, 2008 and increasing by $5 per tonne each July 1 to $30 per tonne on July 1, 2012.
(3) Designated measures are measures designated to return carbon tax to taxpayers. Designated measures for 2009/10 are set out in the Carbon Tax Plan presented with the September Update 2009 and designated measures for 2010/11 are set out in the Carbon Tax Plan presented with Budget 2010.
(4) Eligible homeowners are those in areas outside the Capital, Greater Vancouver and Fraser Valley regional districts.
Budget and Fiscal Plan – 2011/12 to 2013/14
45
Tax Measures
Carbon tax revenues for 2010/11 are now estimated to be $740 million, up slightly from the estimate in Budget 2010 of $727 million.
The tax reductions shown for the 2010/11 fiscal year are those that were designated in the Revenue Neutral Carbon Tax Plan presented with Budget 2010. The personal income tax measures are the low income climate action tax credit, the five per cent reductions in rates for the first two tax brackets and the Northern and Rural Homeowner benefit. The business tax measures are the reductions in each of the general and small business corporate income tax rates, the industrial property tax credit and the 50 per cent reduction in school property tax for land classified as “farm”.
The estimated reduction in provincial revenues for 2010/11, as a result of the designated revenue measures, is now $395 million for the personal tax measures and $467 million for the business tax measures for a total reduction of $862 million. Based on these revenue and tax reduction estimates, revenue neutrality has been met for 2010/11. In fact, the reduction in provincial revenue exceeds the $740 million in carbon tax revenue by $122 million. Next year’s Revenue Neutral Carbon Tax Report for 2010/11 will be based on actual carbon tax revenues for 2010/11 as reported in the 2010/11 Public Accounts.
Revenue Neutral Carbon Tax Plan
Table 2, the Revenue Neutral Carbon Tax Plan 2011/12 to 2013/14, shows carbon tax revenue and tax reduction cost estimates for the revenue measures designated as those that return the carbon tax revenues to taxpayers for 2011/12 to 2013/14.
The tax reduction measures in the Revenue Neutral Carbon Tax Plan 2011/12 to 2013/14 are the designated measures in the Revenue Neutral Carbon Tax Plan 2010/11 to 2012/13 presented with Budget 2010. Carbon tax revenues are now forecast to be slightly higher than estimated when Budget 2010 was prepared. As shown in Table 2, revenue from the carbon tax and the cost of the tax reductions are now estimated to be $950 million and $1,141 million respectively for 2011/12. This means that the tax cuts are expected to exceed carbon tax revenues for 2011/12 by $191 million. Carbon tax revenues in 2012/13 are now estimated at $1,166 million while the tax cuts are estimated at $1,494 million. This means that the tax cuts in 2012/13 are expected to exceed carbon tax revenues by $328 million. Carbon tax revenues in 2013/14 are estimated at $1,232 million while the tax cuts are estimated at $1,474 million. This means that the tax cuts in 2013/14 are expected to exceed carbon tax revenues by $242 million.
Table 2 Revenue Neutral Carbon Tax Plan 2011/12 to 2013/14
| | Forecast | |
| | 2011/12 | | 2012/13 | | 2013/14 | |
| | $ millions | |
Carbon tax revenue (1) | | 950 | | 1,166 | | 1,232 | |
| | | | | | | |
Designated revenue measures: | | | | | | | |
Personal tax measures: | | | | | | | |
· Low income climate action tax credit increasing to $115.50 per adult, from $105 per adult, plus $34.50 per child, from $31.50 per child, effective July 1, 2011 | | (179 | ) | (182 | ) | (182 | ) |
· Reduction of 5% in the first two personal income tax rates | | (215 | ) | (226 | ) | (239 | ) |
· Northern and Rural Homeowner benefit of $200 (2) | | (83 | ) | (85 | ) | (87 | ) |
Total personal tax measures | | (477 | ) | (493 | ) | (508 | ) |
| | | | | | | |
Business tax measures: | | | | | | | |
· General corporate income tax rate cut from 12% to 11% effective July 1, 2008, to 10.5% effective January 1, 2010 and to 10% effective January 1, 2011 | | (385 | ) | (452 | ) | (390 | ) |
· Small business corporate income tax rate reduced from 4.5% to 3.5% effective July 1, 2008, to 2.5% effective December 1, 2008 and to zero by April 1, 2012 (3) | | (209 | ) | (476 | ) | (500 | ) |
· Industrial Property Tax Credit of 50% of school property taxes payable by light and major industrial properties starting in 2009 taxation year rising to 60% in 2011 | | (68 | ) | (71 | ) | (73 | ) |
· School property taxes reduced by 50% for land classified as “farm” starting in 2011 | | (2 | ) | (2 | ) | (3 | ) |
Total business tax measures | | (664 | ) | (1,001 | ) | (966 | ) |
Total designated revenue measures | | (1,141 | ) | (1,494 | ) | (1,474 | ) |
(1) The carbon tax applies to fossil fuels and combustibles at rates based on the CO 2 equivalent emission of each particular fuel starting at $10 per tonne effective July 1, 2008 and increasing by $5 per tonne each July 1 to $30 per tonne on July 1, 2012.
(2) Eligible homeowners are those in areas outside the Capital, Greater Vancouver and Fraser Valley regional districts.
(3) The planned small business corporate income tax rate reduction to zero by April 1, 2012 is a designated measure in 2012/13 and 2013/14.
Budget and Fiscal Plan – 2011/12 to 2013/14
46
Part 3: BRITISH COLUMBIA ECONOMIC REVIEW AND OUTLOOK (1)
Summary
· The Ministry of Finance forecasts BC’s economy to grow by 2.0 per cent in 2011 and by 2.6 per cent in 2012, following an estimated increase of 3.1 per cent in 2010.
· BC’s economy is expected to grow by about 2.8 per cent per year in the medium-term, closer to historical levels. This is mainly due to the anticipated recovery of US demand (particularly in the US housing market) and a steady rise in commodity prices.
· The Economic Forecast Council estimates that BC’s economy expanded by 3.4 per cent in 2010 and forecasts growth of 2.7 per cent in 2011 and 3.0 per cent in 2012. Over the medium-term (2013 to 2015), the Council expects BC’s annual average economic growth to be 2.8 per cent.
Chart 3.1 British Columbia’s economic outlook
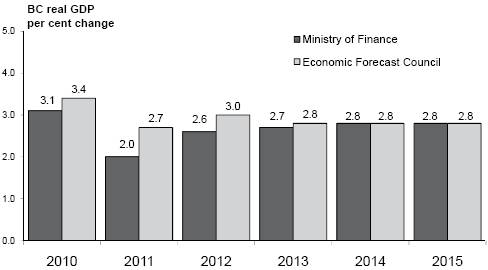
The Ministry’s outlook for BC’s real GDP growth in 2011 is 0.7 percentage points lower than the outlook provided by the Council. This level of prudence is included in recognition of the significant downside risks to the forecast, due to the potential for greater economic weakness than assumed in the US and around the world.
While the private sector assumes a steady recovery, there is significant likelihood of much slower growth characterized by lower consumer spending, weak investment and slow employment growth. As a result, the Ministry’s outlook for 2012 is also lower than the Council’s, with the Ministry projecting 2.6 per cent real GDP growth compared to the Council’s 3.0 per cent. In the medium-term, both the Ministry and the Council expect an expansion of about 2.7 to 2.8 per cent.
Risks to the BC economic outlook continue to be weighted to the downside, largely due to ongoing uncertainty surrounding global economic activity. The most significant risks to the current outlook include:
· continued weakness in the US economy (characterized by weaker consumer spending, widespread deleveraging causing slower investment, a very slow job market recovery and further fiscal restraint — particularly at the state and local level);
(1) Reflects information available as of February 4, 2011
Budget and Fiscal Plan – 2011/12 to 2013/14
British Columbia Economic Review and Outlook
· the sovereign debt crisis in some European countries threatening the stability of global financial markets;
· slower than anticipated global demand resulting in weaker demand for BC’s exports;
· greater than anticipated moderation in the Canadian housing market; and
· a sudden rise in the value of the Canadian dollar, resulting in further downward pressure on Canadian exports.
British Columbia Economic Activity and Outlook
The performance of key BC economic indicators in recent quarters is presented in Table 3.1.
Table 3.1 British Columbia Economic Indicators
| | Third Quarter | | Fourth Quarter | | Annual * | |
| | Jul. to Sep. 2010 | | Oct. to Dec. 2010 | | Jan. to Dec. 2010 | |
Data seasonally adjusted unless | | change from | | change from | | change from | |
otherwise noted | | Apr. to Jun. 2010 | | Jul. to Sep. 2010 | | Jan. to Dec. 2009 | |
| | Per cent change | |
Employment | | 0.6 | | 0.0 | | 1.7 | |
Manufacturing shipments(1) | | -0.4 | | 0.0 | | 8.1 | |
Exports (1) | | -3.8 | | 2.7 | | 13.7 | |
Retail sales (1) | | -0.2 | | 2.5 | | 5.5 | |
Housing starts | | -1.6 | | -3.5 | | 64.7 | |
Non-residential building permits(1) | | 30.3 | | 5.9 | | -4.6 | |
* annual non-seasonally adjusted data
(1) data to November
Indicators of economic performance through 2010 reveal that BC’s economy is recovering from the period of severe weakness it experienced in late 2008 and early 2009. Table 3.1 shows quarterly increases in several key sectors of the provincial economy during the October to December quarter of 2010 compared to the previous quarter. Further, the year-to-date performance among most indicators shows considerable improvement in economic activity compared to the same period in 2009. Table 3.2 summarizes the Ministry’s outlook for BC’s key economic indicators, while Tables 3.7.1 to 3.7.4 at the end of Part 3 provide additional detail on the economic forecast.
Table 3.2 Ministry of Finance Economic Forecast: Key Economic Indicators
| | | | Forecast | |
| | 2010 | | 2011 | | 2012 | | 2013 | | 2014 | | 2015 | |
| | Per cent change unless otherwise noted | |
British Columbia Economic Indicators | | | | | | | | | | | | | |
Real GDP | | 3.1 | (e) | 2.0 | | 2.6 | | 2.7 | | 2.8 | | 2.8 | |
Nominal GDP | | 5.6 | (e) | 4.1 | | 4.9 | | 4.8 | | 4.8 | | 4.8 | |
Employment | | 1.7 | | 1.4 | | 1.8 | | 1.7 | | 1.7 | | 1.7 | |
Unemployment rate (per cent) | | 7.6 | | 7.5 | | 7.2 | | 7.1 | | 7.1 | | 7.0 | |
Total net in-migration (thousands of persons) | | 54.0 | (1) | 54.3 | | 52.8 | | 53.9 | | 55.5 | | 54.9 | |
Personal income | | 3.0 | (e) | 3.5 | | 4.5 | | 4.4 | | 4.4 | | 4.4 | |
Corporate pre-tax profits | | 19.4 | (e) | 8.6 | | 6.5 | | 6.8 | | 7.7 | | 7.9 | |
Housing starts (thousands of units) | | 26.5 | | 24.9 | | 26.5 | | 27.1 | | 28.1 | | 28.5 | |
Retail sales | | 4.3 | (e) | 4.1 | | 4.5 | | 4.4 | | 4.4 | | 4.5 | |
(e) Ministry of Finance estimate
(1) BC Stats estimate
Relative to other Canadian provinces, BC’s economy performed well in 2010, with considerable improvement on several major indicators following the 2009 global downturn. An average of six private sector forecasters(2) estimate that BC’s real GDP
(2) A subset of the EFC that regularly forecasts economic performance in all provinces (BMO, RBC, CIBC, TD, Scotiabank, IHS Global Insight), as of February 4, 2011.
Budget and Fiscal Plan – 2011/12 to 2013/14
48
British Columbia Economic Review and Outlook
expanded by 3.4 per cent in 2010, placing BC second among provinces behind only Newfoundland. For 2011, however, the prospects are currently improving for growth in many other provinces, which will likely challenge the BC economy’s strong relative position.
The Labour Market
Employment in BC improved by 1.7 per cent in 2010 compared to the previous year — a gain of 38,600 jobs. Full-time employment rose by 1.1 per cent (or 19,600 jobs), while part-time employment increased by 3.9 per cent, or 19,000 jobs. Major job gains were observed in the services sector, most notably in professional, scientific and technical services (+10,300 jobs), health care and social assistance (+7,700 jobs) and educational services (+6,000 jobs).
BC employment declined by 9,100 jobs in January 2011, following a decline of 12,800 jobs in December 2010. At the same time, the provincial monthly unemployment rate rose to 8.2 per cent from 7.6 per cent in December.
Chart 3.2 BC employment recovery pauses
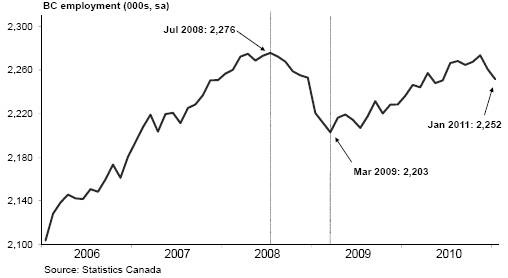
Outlook
The Ministry forecasts employment in BC to increase by 1.4 per cent in 2011, or approximately 32,000 jobs. Employment growth is projected to continue in 2012, with an expected increase of 1.8 per cent, or 41,000 jobs. In the medium-term, employment is expected to rise by 1.7 per cent each year from 2013 to 2015. BC’s unemployment rate is projected to fall slightly to 7.5 per cent in 2011 after averaging 7.6 per cent in 2010. The rate is forecast to fall again after 2011, reaching 7.2 per cent in 2012 and then averaging about 7.1 per cent per year over the medium-term.
Consumer Spending and Housing
Retail sales in BC also improved in 2010, after declining 4.4 per cent annually in 2009. Through the first 11 months of 2010, retail sales grew by 5.5 per cent compared to the same period in 2009, with major gains in sales at health and personal care stores, gas stations, as well as beer, wine and liquor stores.
Budget and Fiscal Plan – 2011/12 to 2013/14
49
British Columbia Economic Review and Outlook
Chart 3.3 Improving retail activity in BC

Following the sharp annual decline that occurred in 2009, housing starts in BC improved significantly in 2010, averaging 26,500 annualized units — an increase of 64.7 per cent over 2009. This annual rate of growth placed BC first among provinces in housing starts during 2010. Further, residential building permits (a leading indicator of new housing activity) jumped by 66.2 per cent year-to-date to November 2010 compared to the first 11 months of 2009.
Chart 3.4 BC housing starts closer to historical levels
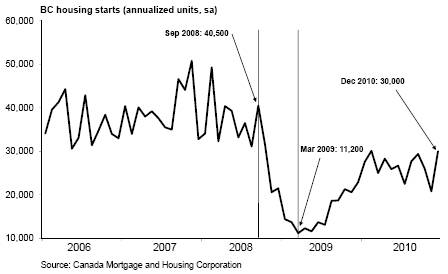
After a significant increase in home sales during 2009 (fueled by very low interest rates on mortgages) the BC housing market moderated somewhat during 2010. Unit sales averaged 6,220 last year, a 12.2 per cent decline from 2009. However, home prices in BC continued to grow in 2010, with the average price reaching about $505,000 (an increase of 8.5 per cent over 2009).
The value of total non-residential building permits dropped 4.6 per cent during the first 11 months of 2010 compared to the same period the previous year. Losses occurred in the institutional and government (-14.4 per cent) and industrial (-7.4 per cent) sectors, while a small gain was observed in commercial permits (+2.3 per cent).
Budget and Fiscal Plan – 2011/12 to 2013/14
50
British Columbia Economic Review and Outlook
Chart 3.5 BC existing home sales moderate after strong 2009

Outlook
The Ministry forecasts real consumption of goods and services to increase by 2.5 per cent in 2011, following an expected gain of 2.6 per cent in 2010. Improvement in real consumer spending is projected again in 2012, growing by 2.9 per cent, and then averaging 2.8 per cent growth annually in the medium-term.
Following last year’s 4.3 per cent estimated growth in BC retail sales, a gain of 4.1 per cent is forecast for 2011. Retail sales are forecast to subsequently grow by 4.5 per cent in 2012 and by about 4.4 per cent each year from 2013 to 2015.
While BC’s housing sector recovered somewhat in 2010 from the decline it experienced in late 2008 and early 2009, housing starts are expected to remain lower than the high levels observed during the boom of recent years. The Ministry forecasts housing starts to total approximately 24,900 units in 2011 - a decrease of 1,600 units from the 26,500 starts observed in 2010. Starts are projected to reach 26,500 units again in 2012 and to average about 27,900 units per year from 2013 to 2015.
Business and Government
Real business investment (including residential) is estimated to have grown by 10.1 per cent in 2010, with a strong increase in residential construction and small gains in non-residential construction and machinery and equipment.
Total real dollar expenditures by federal, provincial and municipal governments are estimated to have grown by 4.1 per cent in 2010. This follows growth of 2.7 per cent in government spending in 2009.
Outlook
Real business investment (including residential) is forecast to rise by 2.6 per cent in 2011, as BC businesses continue to recover from the economic weakness that occurred in late 2008 and early 2009. Steady investment gains in non-residential construction and in machinery and equipment are expected this year, complemented by a small increase in residential construction investment. Growth in total business investment of 4.9 per cent is anticipated in 2012, and of about 4.2 per cent annually in the medium-term.
Budget and Fiscal Plan – 2011/12 to 2013/14
51
British Columbia Economic Review and Outlook
Due to the forecast of continued recovery through 2011, the Ministry projects corporate pre-tax profits to rise by 8.6 per cent on the year. This follows a sizeable increase of an estimated 19.4 per cent in 2010. Growth in corporate profits is expected to be 6.5 per cent in 2012 and 7.5 per cent per year in the medium-term.
Combined real spending by the three levels of government (federal, provincial and municipal) on goods and services is expected to decline by 0.5 per cent in 2011 and then increase by 0.3 per cent in 2012. Government spending is then projected to grow by 0.8 per cent annually from 2013 to 2015.
External Trade and Commodity Markets
The value of BC’s merchandise exports increased 13.7 per cent through the first 11 months of 2010 compared to the same period in 2009. This healthy gain was partially fuelled by a 19.8 per cent climb in forestry exports, with stronger lumber prices and volumes compared to the previous year. Significant increases were also observed in exports of energy products (+16.9 per cent) and industrial and consumer products (+14.6 per cent).
Chart 3.6 BC exports up year-over-year
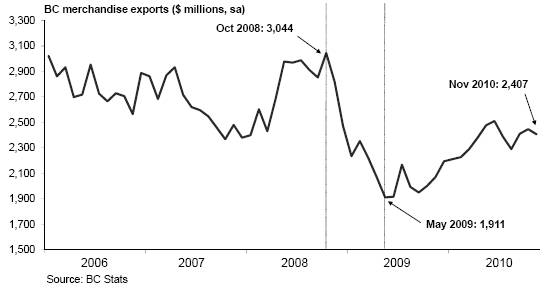
Lumber prices recovered somewhat in 2010, with monthly Western spruce-pine-fir (SPF) 2x4 prices beginning the year at $230 US/000 board feet in January and moving above $300 US/000 board feet in April (as a supply shortage led to a temporary jump in prices early in the year). Although prices subsequently fell as low as $205 US/000 board feet in June, they improved in the latter months of 2010, reaching $286 US/000 board feet in December. Lumber prices averaged $256 US/000 board feet in 2010, representing an annual increase of 40.4 per cent over 2009.
Despite some small fluctuations, the price of natural gas has remained at a low level during 2010 relative to recent years. The Plant Inlet price averaged $2.90 C/GJ during 2010, a slight decrease from the $3.00 C/GJ observed in 2009. The price of natural gas ended the year at $2.57 C/GJ in December 2010.
Oil prices recovered strongly through 2010, following a period of very low prices observed in late 2008 and early 2009. The West Texas Intermediate daily oil price averaged $79.48 US/barrel on the year, representing a hefty 28.3 per cent increase from
Budget and Fiscal Plan – 2011/12 to 2013/14
52
British Columbia Economic Review and Outlook
the $61.95 US/barrel recorded in 2009. In recent months, the depreciation of the US dollar has pushed oil prices up even further. Many analysts expect this price increase to continue as the US federal government moves forward with its second phase of quantitative easing, expected to further devalue the US greenback. Analysts also point out that recent political turmoil in Egypt (a choke point for international oil shipments and neighbor to major oil producers) could add volatility and upward pressure to oil prices in the near-term.
Metal and mineral prices have seen a robust recovery since the low levels observed in 2009. On average in 2010, prices for most minerals were much higher than they were during the previous year. Substantial annual price increases occurred in copper (+45.5 per cent), molybdenum (+41.6 per cent), silver (+37.3 per cent), zinc (+30.4 per cent), aluminum (+30.3 per cent), gold (+25.8 per cent) and lead (+24.5 per cent). The price of magnesium, however, fell 2.7 per cent during this period.
Outlook
Real exports of goods and services are forecast to rise by 2.1 per cent in 2011, following an estimated increase of 4.2 per cent in 2010. Stronger real export growth is forecast for 2012, reaching 3.3 per cent on the year. In the medium-term, average annual growth of about 3.6 per cent is anticipated for real exports.
Due to continued weakness in the US housing market, Western SPF lumber prices are projected to remain fairly low through 2011, averaging $263 US/000 board feet for the year. As the US housing market is expected to gradually recover over the next few years, prices are forecast to average $288 US/000 board feet in 2012 and $300 US/000 board feet for the 2013 to 2015 period.
Based on private sector forecasts, natural gas prices (after falling slightly in 2010/11) are expected to strengthen over the forecast period. Between fiscal years 2010/11 and 2015/16, prices are projected to rise from $2.71 C/GJ to $5.49 C/GJ.
Inflation
Consumer price inflation in BC rose by 1.3 per cent in 2010 compared to the previous year. Increases in the inflation of non-durables and services were offset by price deflation in durable and semi-durable goods. During the year, steadily rising fuel and electricity prices pushed up prices for non-durables. On the services side, rising prices for restaurants, health care and education provided upward inflationary pressure.
Outlook
Consumer price inflation in BC is forecast to be 2.0 per cent in 2011, as improved consumer spending this year is expected to put upward pressure on some prices. CPI inflation is forecast at 2.0 per cent in 2012 and 2.1 per cent per year on average in the medium-term. The Canadian rate of inflation is assumed to be 2.2 per cent in 2011 and 2.0 per cent in 2012 and over the medium-term, in line with the Bank of Canada’s inflation target.
The harmonized sales tax (HST), which took effect on July 1, 2010, is expected to cause a slight increase in the inflation rate during the second half of 2010 and the first half of 2011. In its January 2011 meeting, the Bank of Canada noted some evidence that HST-related tax refunds to Canadian businesses may have been passed through to consumers, dampening core inflation in line with expectations.
Budget and Fiscal Plan – 2011/12 to 2013/14
53
British Columbia Economic Review and Outlook
Risks to the Economic Outlook
Risks to the BC economic outlook continue to be weighted to the downside, largely due to ongoing uncertainty surrounding global economic activity. The most significant risks to the current outlook include:
· continued weakness in the US economy (characterized by weaker consumer spending, widespread deleveraging causing slower investment, a very slow job market recovery and further fiscal restraint — particularly at the state and local level);
· the sovereign debt crisis in some European countries threatening the stability of global financial markets;
· slower than anticipated global demand resulting in weaker demand for BC’s exports;
· greater than anticipated moderation in the Canadian housing market; and
· a sudden rise in the value of the Canadian dollar, resulting in further downward pressure on Canadian exports.
External Outlook
United States
Following four consecutive quarter-over-quarter declines ending in mid-2009, US real GDP has seen six consecutive quarters of growth as of the October to December quarter of 2010. After slowing through the first half of 2010, the pace of US real GDP growth accelerated in the two most recent quarters reported, expanding at annualized rates of 2.6 per cent in the July to September quarter and 3.2 per cent in the October to December quarter. Improvements in consumer spending, investment and net exports all worked to improve the pace of real GDP growth in the most recent quarter, offsetting a sizeable decline in inventories. However, private sector analysts note that the recent spike in consumer spending growth was mainly induced by price-cutting at retailers, and that real GDP growth will likely slow in the coming months as state and local governments pull back spending and business investment in inventories decelerates. Analysts also point out that the recent return to growth has been buoyed by an unprecedented amount of government fiscal and monetary stimulus, and that US economic output will likely slow down as stimulus is withdrawn over the coming years.
Chart 3.7 Pace of US real GDP growth improves in recent quarters
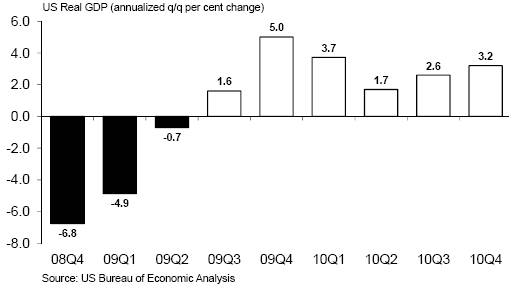
Budget and Fiscal Plan – 2011/12 to 2013/14
54
British Columbia Economic Review and Outlook
Despite the recent improvement in the US real GDP data, the US employment situation remains bleak, with 7.7 million American workers having lost their jobs since the January 2008 peak. During 2010, the US economy churned out about 75,800 new jobs per month on average. Although new jobs are now being created, the US Bureau of Labour Statistics reports that the labour market needs to create at least 100,000 jobs every month just to keep pace with expansion in the labour force. As such, the unemployment rate sits at a relatively high 9.0 per cent as of January 2011, and has remained well above 9.0 per cent since May 2009.
The struggling American housing market also continued to be a major source of weakness for the US economy last year, as housing starts averaged just 587,600 units in 2010. Although this represents a 6.1 per cent increase from 2009, housing starts remain at extremely low levels. Existing home sales are also suffering in the US, averaging just 4.9 million units through 2010 — a decline of 4.7 per cent from the previous year. Slow employment growth, negative home equity (where the amount owed on a mortgage is greater than the value of the home), mortgage processing irregularities and limited access to mortgage credit all placed downward pressure on sales in 2010.
According to the January 2011 Consensus, US real GDP is projected to increase by 3.2 per cent in 2011 (see Chart 3.8). The Consensus forecast was revised upward in recent months due to the small upward revision to US real GDP in the third quarter, the announcement of tax cut extensions for high income earners, as well as improvement in industrial production over the last several months. Consensus economists express concern, however, over the lackluster employment situation. The January 2011 Consensus expects the US economy to expand at a similar pace in 2012, projecting annual growth of 3.3 per cent in that year.
Chart 3.8 US Consensus outlook for 2011 improved in January
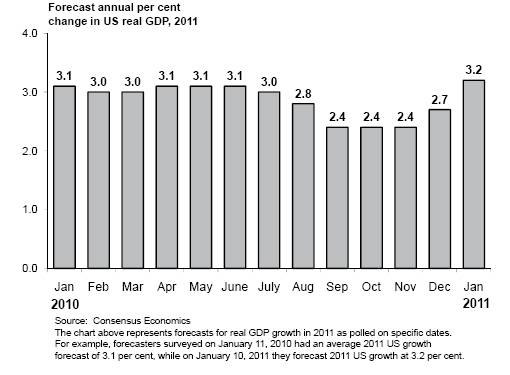
In recognition of the ongoing risks surrounding the US economic outlook in 2011, the Ministry’s growth assumptions are more prudent than the January 2011 Consensus. The Ministry assumes that the US economy will expand by 2.4 per cent in 2011,
Budget and Fiscal Plan – 2011/12 to 2013/14
55
British Columbia Economic Review and Outlook
compared to the 3.2 per cent increase projected in the January Consensus. The Ministry then expects 2.5 per cent US real GDP growth in 2012 and 2.6 per cent annually over the medium-term.
The performance of the US economy is crucial to BC’s export-based industries, as more than half the total value of BC’s exports are sold to buyers in the US. However, BC’s export market is less dependent on the US as a destination for its goods than some other provinces. For example, Ontario and Alberta each sell at least 80 per cent of their exported goods to US buyers.
Table 3.3 US real GDP forecast: Consensus vs Ministry of Finance
| | 2011 | | 2012 | |
| | Per cent change in real GDP | |
Ministry of Finance | | 2.4 | | 2.5 | |
Consensus Economics (January 2011) | | 3.2 | | 3.3 | |
Canada
After gaining momentum for three successive quarters (including a very strong 5.6 per cent increase in the January to March quarter), Canadian real GDP advanced by just 2.3 per cent (annualized) in the April to June quarter of 2010 and only 1.0 per cent in the July to September quarter. This slowdown in the most recent quarter was caused mainly by a large decline in exports, despite fairly strong growth in consumption and investment. Private sector analysts note that the large impact of falling exports on GDP growth highlights the dependence of the Canadian economy on growth picking up again in its main export markets, most importantly the US.
Like BC, Canada’s domestic economy has seen improvement in several major indicators in 2010 relative to the previous year. Canadian retail sales climbed by 5.1 per cent year- to-date to November 2010 compared to the same period the prior year. Further, housing
Chart 3.9 Consensus outlook for Canada upgraded as well
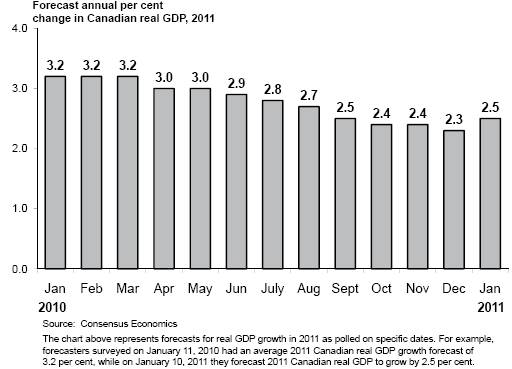
Budget and Fiscal Plan – 2011/12 to 2013/14
56
British Columbia Economic Review and Outlook
starts have averaged 189,900 in 2010, an increase of 27.4 per cent compared to 2009. National home sales fell slightly in 2010, however, with sales declining by 3.9 per cent compared to the previous year.
The Canadian labour market showed modest gains in 2010, following an annual loss of 274,300 jobs (or 1.6 per cent) in 2009 compared to 2008. Employment in Canada grew by 227,900 jobs (or 1.4 per cent) in 2010 compared to 2009, raising the total number of jobs close to 2008 levels. The national unemployment rate averaged 8.0 per cent in 2010, a slight decline from the 8.3 per cent observed the previous year. The monthly unemployment rate ticked up to 7.8 per cent in January 2011 from 7.6 per cent the previous month.
The value of Canadian merchandise exports improved by 10.9 per cent during the first 11 months of 2010, compared to the same period in 2009. The increase during 2010 follows a 26.5 per cent decline in 2009. Recent gains were driven by stronger exports of autos, energy, forest products and industrial goods. Shipments of manufactured goods also recovered in 2010, as the total value of these shipments climbed by 9.0 per cent year-to-date to November. Further appreciation of the Canadian dollar, if sustained, will continue to provide downward pressure on US demand for Canadian exports.
The January 2011 Consensus projects Canada’s real GDP to grow by 2.5 per cent this year and 2.7 per cent in 2012. The Ministry assumes that the Canadian economy will experience a 2.2 per cent expansion in 2011, followed by a 2.4 per cent increase in 2012 and 2.5 per cent growth per year over the medium-term.
Table 3.4 Canadian real GDP forecast: Consensus vs Ministry of Finance
| | 2011 | | 2012 | |
| | Per cent change in real GDP | |
Ministry of Finance | | 2.2 | | 2.4 | |
Consensus Economics (January 2011) | | 2.5 | | 2.7 | |
Financial Markets
Interest Rates
After holding the overnight target rate at 0.25 per cent for over a year, the Bank of Canada raised the rate to 0.50 per cent in June 2010, to 0.75 per cent in July, and finally to 1.00 per cent in September. With the pace of the global economic recovery still uncertain, the Bank has left the benchmark rate unchanged for several months. Many private sector analysts expect the Bank to hold its key interest rate at 1.00 per cent until later this year.
The US Federal Reserve has held its intended federal funds rate in the 0.00 to 0.25 per cent range since December 2008. Given little inflation pressure and the high US unemployment rate, private sector analysts view an increase in the federal funds rate as unlikely before early 2012.
Outlook
Based on the average of six private sector forecasts as of January 5, 2011, the Ministry’s interest rate outlook assumes that the Bank of Canada will hold the overnight target rate steady at 1.00 per cent until the second quarter of 2011. These six forecasters expect the rate to rise slowly during the year, reaching 1.75 per cent by the end of 2011.
Budget and Fiscal Plan – 2011/12 to 2013/14
57
British Columbia Economic Review and Outlook
The forecasters project the overnight target rate to average 1.3 per cent in 2011 and 2.6 per cent in 2012.
Chart 3.10 Private sector expects low interest rates in 2011
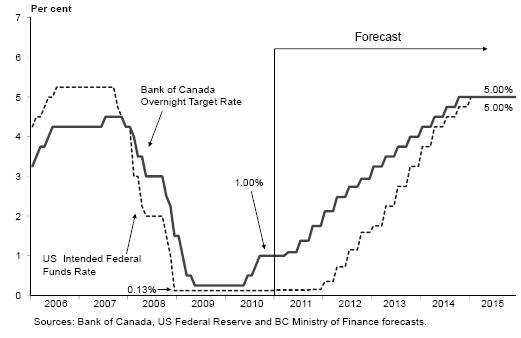
As of January 5, 2011, the same six forecasters project that the US Federal Reserve will keep the fed funds rate in the 0.00 per cent to 0.25 per cent range for the duration of 2011. They then expect the rate to rise through 2012, reaching 1.75 per cent in the final quarter. On average, the six forecasters project the fed funds rate will be 0.1 per cent in 2011 and 1.0 per cent in 2012.
The average of private sector forecasters’ views on Canadian short-term interest rates (Three month Treasury bills) as of January 5, 2011 indicates that Three month rates will average 1.3 per cent in 2011 and 2.6 per cent in 2012. The same private sector forecasters project ten-year Government of Canada bonds to average 3.3 per cent in 2011 and 3.9 per cent in 2012.
Table 3.5 Private Sector Canadian Interest Rate Forecasts
| | 3-month Treasury Bill | | 10-year Government Bond | |
Average annual interest rate (per cent) | | 2011 | | 2012 | | 2011 | | 2012 | |
Global Insight | | 1.3 | | 2.8 | | 3.0 | | 3.6 | |
CIBC | | 1.3 | | 1.9 | | 3.5 | | 3.8 | |
Bank of Montreal | | 1.4 | | 3.1 | | 3.3 | | 4.1 | |
Scotiabank | | 1.2 | | 2.2 | | 3.3 | | 3.6 | |
TD Economics | | 1.3 | | 2.5 | | 3.4 | | 4.2 | |
RBC Capital Markets | | 1.5 | | 3.0 | | 3.4 | | 4.0 | |
Average (as of January 5, 2011) | | 1.3 | | 2.6 | | 3.3 | | 3.9 | |
Exchange Rate
After beginning 2010 at 96.4 US cents, the value of the loonie has remained fairly high through the year, reaching parity in recent weeks. In 2010, the Canadian dollar averaged 97.1 US cents, and was trading slightly above parity as of February 4, 2011. The rise in
Budget and Fiscal Plan – 2011/12 to 2013/14
58
British Columbia Economic Review and Outlook
the dollar’s value through 2010 can primarily be attributed to the weakening US dollar, as well as strengthening commodity prices.
Chart 3.11 Private sector expects dollar near parity in 2011 and 2012
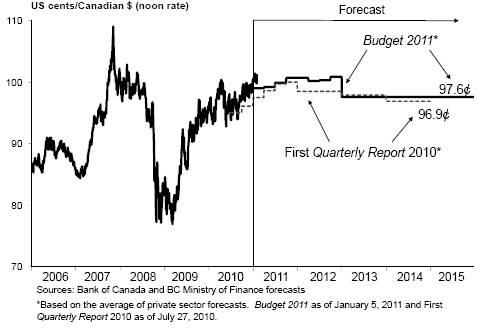
Private sector analysts note that while Canadian consumers are benefiting from increased purchasing power, manufacturers already suffering from weak export markets will face further difficulty selling goods priced in higher Canadian dollars, as the dollar is forecast to remain strong in 2011.
Outlook
Private sector economists now expect the loonie to remain close to parity vis-à-vis the US dollar through 2011 and 2012.
An average of six private sector forecasts as of January 5, 2011 sees the Canadian dollar averaging 99.7 US cents in 2011, and rising slightly to average 100.5 US cents in 2012. The Ministry’s exchange rate outlook is based on these private sector averages.
Table 3.6 Private Sector Exchange Rate Forecasts
Average annual exchange rate (US cents/Can $) | | 2011 | | 2012 | |
Global Insight | | 98.5 | | 95.9 | |
CIBC | | 96.9 | | 100.1 | |
Bank of Montreal | | 100.5 | | 101.2 | |
Scotiabank | | 101.3 | | 105.0 | |
TD Economics | | 99.5 | | 103.6 | |
RBC Capital Markets | | 101.5 | | 97.5 | |
Average (as of January 5, 2011) | | 99.7 | | 100.5 | |
Budget and Fiscal Plan – 2011/12 to 2013/14
59
British Columbia Economic Review and Outlook
Table 3.7.1 Gross Domestic Product: British Columbia
| | | | | | Forecast | |
| | 2009 | | 2010 (e) | | 2011 | | 2012 | | 2013 | | 2014 | | 2015 | |
BRITISH COLUMBIA: | | | | | | | | | | | | | | | |
Gross Domestic Product at Market Prices: | | | | | | | | | | | | | | | |
— Real (2002 $ billion; chain-weighted) | | 161.9 | | 166.9 | | 170.2 | | 174.5 | | 179.3 | | 184.3 | | 189.5 | |
(% change) | | -1.8 | | 3.1 | | 2.0 | | 2.6 | | 2.7 | | 2.8 | | 2.8 | |
— Current dollar ($ billion) | | 191.0 | | 201.8 | | 210.1 | | 220.3 | | 231.0 | | 242.2 | | 253.9 | |
(% change) | | -3.4 | | 5.6 | | 4.1 | | 4.9 | | 4.8 | | 4.8 | | 4.8 | |
— GDP price deflator (2002 = 100) | | 118.0 | | 120.9 | | 123.4 | | 126.2 | | 128.8 | | 131.3 | | 133.9 | |
(% change) | | -1.6 | | 2.5 | | 2.1 | | 2.2 | | 2.1 | | 2.0 | | 2.0 | |
Real GDP per person | | | | | | | | | | | | | | | |
(2002 $; chain-weighted) | | 36,287 | | 36,826 | | 37,013 | | 37,426 | | 37,909 | | 38,436 | | 38,974 | |
(% change) | | -3.5 | | 1.5 | | 0.5 | | 1.1 | | 1.3 | | 1.4 | | 1.4 | |
Real GDP per employed person | | | | | | | | | | | | | | | |
(% change) | | 0.3 | | 1.3 | | 0.6 | | 0.8 | | 1.0 | | 1.1 | | 1.1 | |
Unit labour cost(1) (% change) | | 0.1 | | 0.3 | | 2.0 | | 2.1 | | 1.9 | | 1.8 | | 1.8 | |
| | | | | | | | | | | | | | | |
Components of British Columbia Real GDP at Market Prices ($2002 billions; chain-weighted) | | | | | | | | | | | | | | | |
Personal expenditure on | | | | | | | | | | | | | | | |
Goods and services | | 114.7 | | 117.7 | | 120.7 | | 124.2 | | 127.7 | | 131.2 | | 134.9 | |
(% change) | | 0.3 | | 2.6 | | 2.5 | | 2.9 | | 2.8 | | 2.7 | | 2.8 | |
— Goods | | 46.1 | | 47.5 | | 48.6 | | 50.1 | | 51.5 | | 52.9 | | 54.4 | |
(% change) | | -2.5 | | 2.9 | | 2.5 | | 3.0 | | 2.8 | | 2.8 | | 2.8 | |
— Services | | 68.5 | | 70.2 | | 71.9 | | 74.0 | | 76.1 | | 78.2 | | 80.3 | |
(% change) | | 2.2 | | 2.4 | | 2.6 | | 2.9 | | 2.8 | | 2.7 | | 2.7 | |
Government current expenditures on | | | | | | | | | | | | | | | |
Goods and services | | 32.3 | | 33.7 | | 33.5 | | 33.6 | | 33.8 | | 34.1 | | 34.4 | |
(% change) | | 2.7 | | 4.1 | | -0.5 | | 0.3 | | 0.8 | | 0.8 | | 0.8 | |
Investment in fixed capital | | 36.3 | | 40.6 | | 40.4 | | 41.5 | | 43.1 | | 44.6 | | 46.1 | |
(% change) | | -10.7 | | 11.7 | | -0.4 | | 2.7 | | 3.9 | | 3.5 | | 3.4 | |
Final domestic demand | | 183.1 | | 191.9 | | 194.4 | | 199.1 | | 204.5 | | 209.7 | | 215.1 | |
(% change) | | -1.9 | | 4.8 | | 1.3 | | 2.4 | | 2.7 | | 2.6 | | 2.6 | |
Exports goods and services | | 65.2 | | 68.0 | | 69.4 | | 71.7 | | 74.2 | | 76.9 | | 79.7 | |
(% change) | | -9.1 | | 4.2 | | 2.1 | | 3.3 | | 3.5 | | 3.6 | | 3.6 | |
Imports goods and services | | 86.4 | | 93.2 | | 95.3 | | 98.0 | | 100.6 | | 103.7 | | 106.7 | |
(% change) | | -8.4 | | 7.9 | | 2.2 | | 2.9 | | 2.7 | | 3.0 | | 2.9 | |
Inventory change | | -1.0 | | -0.6 | | 0.8 | | 0.9 | | 0.3 | | 0.5 | | 0.5 | |
Statistical discrepancy | | 0.3 | | 0.3 | | 0.3 | | 0.3 | | 0.3 | | 0.3 | | 0.3 | |
Real GDP at market prices | | 161.9 | | 166.9 | | 170.2 | | 174.5 | | 179.3 | | 184.3 | | 189.5 | |
(% change) | | -1.8 | | 3.1 | | 2.0 | | 2.6 | | 2.7 | | 2.8 | | 2.8 | |
(1) Unit labour cost is the nominal cost of labour incurred to produce one unit of real output.
(e) Ministry of Finance estimate.
Budget and Fiscal Plan – 2011/12 to 2013/14
60
British Columbia Economic Review and Outlook
Table 3.7.2 Components of Nominal Income and Expenditure
| | | | | | Forecast | |
| | 2009 | | 2010 | | 2011 | | 2012 | | 2013 | | 2014 | | 2015 | |
Labour income (1) ($ million) | | 100,698 | | 104,171 | (e) | 108,366 | | 113,463 | | 118,726 | | 124,291 | | 130,054 | |
(% change) | | -1.7 | | 3.4 | | 4.0 | | 4.7 | | 4.6 | | 4.7 | | 4.6 | |
Personal income ($ million) | | 156,986 | | 161,630 | (e) | 167,326 | | 174,879 | | 182,562 | | 190,632 | | 199,005 | |
(% change) | | -0.1 | | 3.0 | | 3.5 | | 4.5 | | 4.4 | | 4.4 | | 4.4 | |
Corporate profits before taxes ($ million) | | 18,258 | | 21,807 | (e) | 23,672 | | 25,218 | | 26,935 | | 29,012 | | 31,303 | |
(% change) | | -21.3 | | 19.4 | | 8.6 | | 6.5 | | 6.8 | | 7.7 | | 7.9 | |
Retail sales ($ million) | | 55,222 | | 57,579 | (e) | 59,915 | | 62,620 | | 65,387 | | 68,282 | | 71,331 | |
(% change) | | -4.4 | | 4.3 | | 4.1 | | 4.5 | | 4.4 | | 4.4 | | 4.5 | |
Housing starts | | 16,077 | | 26,479 | | 24,946 | | 26,538 | | 27,144 | | 28,115 | | 28,500 | |
(% change) | | -53.2 | | 64.7 | | -5.8 | | 6.4 | | 2.3 | | 3.6 | | 1.4 | |
Residential investment(2) ($ million) | | 15,755 | | 19,177 | (e) | 19,890 | | 21,233 | | 22,327 | | 23,661 | | 24,923 | |
(% change) | | -15.5 | | 21.7 | | 3.7 | | 6.7 | | 5.2 | | 6.0 | | 5.3 | |
BC consumer price index (2001 = 100) | | 112.3 | | 113.8 | | 116.1 | | 118.5 | | 120.9 | | 123.4 | | 126.0 | |
(% change) | | 0.0 | | 1.3 | | 2.0 | | 2.0 | | 2.1 | | 2.1 | | 2.1 | |
(1) Domestic basis; wages, salaries and supplementary labour income.
(2) Includes renovations and improvements.
(e) Ministry of Finance estimate.
Table 3.7.3 Labour Market Indicators
| | | | | | Forecast | |
| | 2009 | | 2010 | | 2011 | | 2012 | | 2013 | | 2014 | | 2015 | |
Population (on July 1) (000’s) | | 4,460 | | 4,531 | | 4,598 | | 4,664 | | 4,729 | | 4,796 | | 4,863 | |
(% change) | | 1.7 | | 1.6 | | 1.5 | | 1.4 | | 1.4 | | 1.4 | | 1.4 | |
Labour force population, 15+ Years (000’s) | | 3,663 | | 3,729 | | 3,790 | | 3,849 | | 3,905 | | 3,962 | | 4,017 | |
(% change) | | 2.1 | | 1.8 | | 1.6 | | 1.5 | | 1.5 | | 1.4 | | 1.4 | |
Net in-migration (000’s) | | | | | | | | | | | | | | | |
— International (1),(3) | | 50.8 | | 48.5 | (e) | 46.3 | | 44.3 | | 43.4 | | 44.0 | | 43.4 | |
— Interprovincial (3) | | 10.4 | | 5.5 | (e) | 8.0 | | 8.5 | | 10.5 | | 11.5 | | 11.5 | |
— Total | | 61.1 | | 54.0 | (e) | 54.3 | | 52.8 | | 53.9 | | 55.5 | | 54.9 | |
Participation rate(2) (%) | | 65.6 | | 65.5 | | 65.3 | | 65.3 | | 65.3 | | 65.5 | | 65.6 | |
Labour force (000’s) | | 2,403 | | 2,443 | | 2,475 | | 2,511 | | 2,550 | | 2,593 | | 2,636 | |
(% change) | | 1.1 | | 1.7 | | 1.3 | | 1.5 | | 1.6 | | 1.7 | | 1.7 | |
Employment (000’s) | | 2,218 | | 2,257 | | 2,288 | | 2,328 | | 2,368 | | 2,408 | | 2,450 | |
(% change) | | -2.1 | | 1.7 | | 1.4 | | 1.8 | | 1.7 | | 1.7 | | 1.7 | |
| | | | | | | | | | | | | | | |
Unemployment rate (%) | | 7.7 | | 7.6 | | 7.5 | | 7.2 | | 7.1 | | 7.1 | | 7.0 | |
(1) International migration includes net non-permanent residents and returning emigrants less net temporary residents abroad.
(2) Percentage of the population 15 years of age and over in the labour force.
(3) Components may not sum to total due to rounding.
(e) BC Stats estimate.
Budget and Fiscal Plan – 2011/12 to 2013/14
61
British Columbia Economic Review and Outlook
Table 3.7.4 Major Economic Assumptions
| | | | | | Forecast | |
| | 2009 | | 2010 | | 2011 | | 2012 | | 2013 | | 2014 | | 2015 | |
GDP (billions) | | | | | | | | | | | | | | | |
Canada real (2002 $; chain-weighted) | | 1,286 | | 1,322 | (e) | 1,351 | | 1,383 | | 1,417 | | 1,454 | | 1,490 | |
(% change) | | -2.5 | | 2.9 | | 2.2 | | 2.4 | | 2.5 | | 2.5 | | 2.5 | |
US real (1996 US$; chain-weighted) | | 12,881 | | 13,249 | | 13,563 | | 13,908 | | 14,266 | | 14,642 | | 15,027 | |
(% change) | | -2.6 | | 2.9 | | 2.4 | | 2.5 | | 2.6 | | 2.6 | | 2.6 | |
Japan real (2000 Yen; chain-weighted) | | 519,708 | | 536,317 | (e) | 539,961 | | 548,281 | | 556,269 | | 564,496 | | 573,045 | |
(% change) | | -6.3 | | 3.2 | | 0.7 | | 1.5 | | 1.5 | | 1.5 | | 1.5 | |
Europe real(1) (% change) | | -4.2 | | 1.5 | (e) | 1.0 | | 1.6 | | 1.8 | | 1.8 | | 1.8 | |
| | | | | | | | | | | | | | | |
Industrial production index | | | | | | | �� | | | | | | | | |
US (2007 = 100) | | 87.7 | | 92.7 | | 95.8 | | 98.1 | | 100.7 | | 103.4 | | 106.1 | |
(% change) | | -9.3 | | 5.7 | | 3.3 | | 2.4 | | 2.6 | | 2.6 | | 2.6 | |
Japan (2005 = 100) | | 81.8 | | 94.5 | | 93.5 | | 94.9 | | 96.3 | | 97.8 | | 99.3 | |
(% change) | | -21.2 | | 15.5 | | -1.0 | | 1.5 | | 1.5 | | 1.5 | | 1.5 | |
Europe(1) (2005 = 100) | | 90.4 | | 96.2 | (e) | 97.7 | | 99.7 | | 101.7 | | 103.7 | | 105.8 | |
(% change) | | -14.9 | | 6.4 | | 1.6 | | 2.0 | | 2.0 | | 2.0 | | 2.0 | |
| | | | | | | | | | | | | | | |
Housing starts(2) (000’s) | | | | | | | | | | | | | | | |
Canada | | 149 | | 190 | | 165 | | 175 | | 180 | | 180 | | 180 | |
(% change) | | -29.4 | | 27.4 | | -13.1 | | 6.1 | | 2.9 | | 0.0 | | 0.0 | |
US | | 554 | | 588 | | 610 | | 800 | | 900 | | 1,000 | | 1,000 | |
(% change) | | -38.8 | | 6.1 | | 3.8 | | 31.1 | | 12.5 | | 11.1 | | 0.0 | |
Japan | | 788 | | 813 | | 810 | | 880 | | 1,000 | | 1,000 | | 1,000 | |
(% change) | | -27.9 | | 3.1 | | -0.4 | | 8.6 | | 13.6 | | 0.0 | | 0.0 | |
| | | | | | | | | | | | | | | |
Consumer price index | | | | | | | | | | | | | | | |
Canada (2002 = 100) | | 114.4 | | 116.5 | | 119.1 | | 121.4 | | 123.9 | | 126.4 | | 128.9 | |
(% change) | | 0.3 | | 1.8 | | 2.2 | | 2.0 | | 2.0 | | 2.0 | | 2.0 | |
| | | | | | | | | | | | | | | |
Canadian interest rates (%) | | | | | | | | | | | | | | | |
3-Month treasury bills | | 0.3 | | 0.6 | | 1.3 | | 2.6 | | 3.6 | | 4.6 | | 5.0 | |
10-year government bonds | | 3.3 | | 3.2 | | 3.3 | | 3.9 | | 4.6 | | 5.6 | | 6.0 | |
| | | | | | | | | | | | | | | |
United States interest rates (%) | | | | | | | | | | | | | | | |
3-Month treasury bills | | 0.2 | | 0.1 | | 0.3 | | 1.0 | | 2.8 | | 4.4 | | 5.0 | |
10-year government bonds | | 3.3 | | 3.2 | | 3.2 | | 3.9 | | 4.6 | | 5.6 | | 6.0 | |
| | | | | | | | | | | | | | | |
Exchange rate (US cents / Canadian $) | | 87.6 | | 97.1 | | 99.7 | | 100.5 | | 97.6 | | 97.6 | | 97.6 | |
| | | | | | | | | | | | | | | |
British Columbia goods and services Export price deflator (% change) | | -7.3 | | 3.1 | (e) | 0.7 | | 1.5 | | 3.2 | | 2.1 | | 2.4 | |
(1) Euro zone (12) is Austria, Belgium, Finland, France, Germany, Greece, Ireland, Italy, Luxembourg, Netherlands, Portugal and Spain.
(2) British Columbia housing starts appear in Table 3.7.2.
(e) Ministry of Finance estimate.
Budget and Fiscal Plan – 2011/12 to 2013/14
62
British Columbia Economic Review and Outlook
The Economic Forecast Council, 2011
Introduction
The Budget Transparency and Accountability Act requires the Minister of Finance, in preparing each year’s provincial budget, to consult the Economic Forecast Council (the Council) on the outlook for British Columbia’s economy. The 14-member Council consists of leading economists from several of Canada’s major banks and private research institutions.
The meeting between the Minister and Council occurred on December 10, 2010, where the discussion centred around the Council’s estimates for 2010, as well as its forecast for 2011 and beyond. The central issues examined included the slow US economic recovery, the appreciating Canadian dollar, the fiscal status of several provinces and countries, and sales tax harmonization in BC.
Subsequent to December’s meeting, participants were permitted to submit revised forecasts until January 14, 2011 (11 of the 14 Council members chose to revise). Forecast details from the Council surveys are summarized in the table at the end of this topic box.
British Columbia Forecast
Council members’ estimates for economic growth in BC in 2010 averaged 3.4 per cent, while their forecasts for future growth averaged 2.7 per cent in 2011, 3.0 per cent in 2012 and 2.8 per cent for the 2013 to 2015 period.
Chart 1 — Economic Forecast Council Outlook for the BC Economy
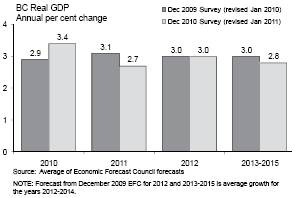
The Council raised its average outlook for BC’s economy in 2010 from a year ago, and lowered its projection for 2011 (for Budget 2010, Council members estimated growth of 2.9 per cent in 2010 and 3.1 per cent in 2011 - see Chart 1). Compared to its Budget 2010 forecast, the Council maintained a similar average outlook for BC in 2012 and slightly lowered their medium-term projection.
The majority of Council members expect economic growth in BC to outperform the national average for the entire 2010 to 2015 period (see Chart 2).
Chart 2 — Economic Forecast Council Outlook for BC and Canada

Members generally agreed that, relative to most other provinces, BC’s economy is in good shape going forward. Participants cited recent signs of recovery in BC, as well as its strong ties to emerging markets in Asia. Also acknowledged by several members was BC’s solid fiscal position (i.e. lower deficit and debt levels) relative to some other provinces, which provides the BC government with flexibility to achieve its balanced budget target in the medium-term.
Council members pointed out, however, that substantial risks to the BC outlook continue to stem from abroad, especially from the US economy. Participants voiced concerns over the slow pace of the US recovery causing downward pressure on American demand for BC exports. Instability in financial markets due to debt concerns in several large European nations was also listed by members as a risk to BC’s outlook. Several participants noted
Budget and Fiscal Plan – 2011/12 to 2013/14
63
British Columbia Economic Review and Outlook
concerns over the uncertainty associated with recent volatility in the Canadian dollar. Further, members noted that although BC’s forest industry is seeing growing demand from Asia for its products, the forest industry will continue to face considerable challenges until the US housing market recovers. Participants encouraged the government to maintain strong ties with Asian markets for BC forest products even after the US economy recovers.
Participants were very supportive of the BC government’s recent harmonization of federal and provincial sales taxes, which took effect in July 2010. Some members noted that the new Harmonized Sales Tax (HST) is a good long-term policy that will help reduce costs to businesses and boost future business investment. The Council supported HST as better tax policy than the PST/GST system it replaced. However, most participants expressed concern over the current uncertainty surrounding the fate of the HST. Members suggested that this uncertainty leading up to the September 2011 referendum on HST could delay some spending and investment decisions by both businesses and consumers. Two participants also highlighted the possible high financial cost of BC returning to the previous provincial sales tax system.
Some Council members also encouraged the government to continue to emphasize trade with emerging Asian markets, as well as maintain its competitive system of taxation relative to other provinces.
The Canadian Economy
The Council estimates, on average, that the Canadian economy grew by 2.9 per cent in 2010, and forecasts Canadian growth to be 2.6 per cent in 2011, 2.8 per cent in 2012 and 2.6 per cent during the 2013 to 2015 period.
Participants highlighted Canada’s strong fiscal and economic position relative to the US and many other Western countries. However, Council members also noted that expected austerity measures by the federal government — along with a gradual increase in interest rates — in the coming years will be a moderating influence on Canadian economic growth. Members also cited the volatile Canadian dollar, demographic challenges and rising levels of household debt as major risks to the Canadian outlook.
British Columbia Economic Forecast Council:
Summary of BC real GDP Forecasts, annual per cent change
| | | | | | | | | | Average | |
Participant | | Organization | | 2010 | | 2011 | | 2012 | | 2013-2015 | |
Doug Porter | | Bank of Montreal(1) | | 3.8 | | 3.3 | | 3.1 | | 2.9 | |
Ken Peacock | | BC Business Council(1) | | 3.2 | | 2.8 | | 2.9 | | 2.8 | |
Warren Lovely | | CIBC(1) | | 3.1 | | 2.7 | | 3.0 | | 3.2 | |
Marie-Christine Bernard | | Conference Board(1) | | 3.7 | | 2.0 | | 3.1 | | 2.8 | |
Helmut Pastrick | | Central 1 Credit Union(1) | | 3.6 | | 2.9 | | 3.1 | | 3.0 | |
Dale Orr | | Dale Orr Economic Insight | | 3.3 | | 3.1 | | 3.2 | | 3.0 | |
Arlene Kish | | IHS Global Insight(1) | | 3.4 | | 2.8 | | 3.1 | | 3.1 | |
Carl Sonnen | | Informetrica(1) | | 3.5 | | 2.7 | | 3.3 | | 2.8 | |
Carlos Leitao | | Laurentian Bank Securities(1) | | 3.5 | | 2.5 | | 2.6 | | 2.8 | |
Craig Wright | | RBC Financial Group(1) | | 3.1 | | 2.9 | | 3.2 | | 3.0 | |
Warren Jestin | | Scotiabank(1) | | 3.2 | | 2.5 | | 2.9 | | 2.4 | |
Ernie Stokes | | Stokes Economic Consulting | | 3.4 | | 2.8 | | 3.5 | | 2.0 | |
Pascal Gauthier | | TD(1) | | 3.5 | | 2.4 | | 2.3 | | 2.2 | |
David Baxter | | Urban Futures Institute | | 3.2 | | 2.8 | | 3.0 | | 2.7 | |
Average | | | | 3.4 | | 2.7 | | 3.0 | | 2.8 | |
Standard Deviation | | | | 0.2 | | 0.3 | | 0.3 | | 0.3 | |
(1) Updated subsequent to the December 10, 2010 meeting.
Budget and Fiscal Plan – 2011/12 to 2013/14
64
British Columbia Economic Review and Outlook
International Outlook
The Council’s estimates for US growth averaged 2.8 per cent for 2010, while its forecasts for US growth averaged 3.0 per cent in both 2011 and 2012, and 3.0 per cent for the 2013 to 2015 period.
The US discussion centred mostly on the long, protracted recovery currently underway within the US economy, and the risks associated with it. Council members suggested that the US recovery remains fragile, as credit availability is still strained, the housing market is extremely weak, and consumers and businesses continue to deleverage from massive amounts of debt. Although members generally pointed to a sluggish US recovery, they noted that the US is unlikely to experience a very long period of weakness similar to what occurred in the Japanese economy during the 1990s (Japan experienced many years of stagnant economic growth and deleveraging by businesses and consumers). Although the causes of the recent US and 1990s Japanese recessions are similar (the bursting of a massive asset bubble), Council members suggested that US fiscal and monetary policy has been more effective in fighting the economic downturn than Japanese policy in the 1990s, and that the demographic situation in the US is not as troubling as in Japan (i.e. Japan’s population is declining and is much older than the US population).
Participants also pointed to the recent extension of tax cuts for high income Americans, along with the second round of quantitative easing (where the government prints money to purchase US federal debt), as having a positive impact on US economic growth in the coming years. However, two Council members expressed concern over mounting US federal debt and the difficulty that the US government will have in paying this down in the coming years.
The debt troubles of several European countries were also discussed as a major risk to the global economic outlook, with members expressing concerns over the ability of these nations to overcome their financial problems, and of the potential negative impact that further difficulties will have on global financial markets.
Canadian Dollar
Chart 3 — Economic Forecast Council Outlook for the Exchange Rate
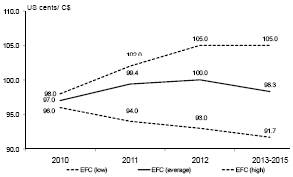
Council members continued to produce divergent views on the value of the Canadian dollar in 2011, with forecasts ranging from 94.0 US cents to 102.0 US cents. For 2012, projections ranged from 93.0 US cents to 105.0 US cents, and from 91.7 US cents to 105.0 US cents over the 2013 to 2015 period.
Some participants cited the rising value of the Canadian dollar (relative to the US dollar) as a downside risk to Canadian economic growth in the near-term. However, two members also noted that a high dollar is beneficial to long-term Canadian productivity, as a strong currency allows producers to purchase valuable machinery and equipment from foreign jurisdictions at lower prices.
Budget and Fiscal Plan – 2011/12 to 2013/14
65
British Columbia Economic Review and Outlook
Forecast Survey — Participants’ Opinions
All figures are based | | 2010 | | 2011 | | 2012 | | 2013 to 2015 | |
on annual averages | | Range | | Average(1) | | Range | | Average(1) | | Range | | Average(1) | | Range | | Average(2) | |
British Columbia | | | | | | | | | | | | | | | | | |
Real GDP (% change) | | 3.1 – 3.8 | | 3.4(14) | (3) | 2.0 – 3.3 | | 2.7(14) | | 2.3 – 3.5 | | 3.0(14) | | 2.0 – 3.2 | | 2.8(14) | |
Nominal GDP (% change) | | 5.3 – 7.0 | | 6.1(13) | | 4.6 – 5.8 | | 5.2(13) | | 4.1 – 6.3 | | 5.3(13) | | 4.0 – 6.0 | | 5.0(13) | |
GDP Deflator (% change) | | 1.7 – 3.4 | | 2.7(13) | | 1.8 – 3.6 | | 2.5(13) | | 1.8 – 3.0 | | 2.3(13) | | 1.9 – 3.0 | | 2.2(13) | |
Real business non-residential investment (% change) | | -6.7 – 9.7 | | 0.0(9) | | -3.0 – 15.0 | | 5.3(9) | | -4.2 – 17.4 | | 5.7(9) | | -3.6 – 7.3 | | 3.3(9) | |
Real business machinery and equipment investment (%change) | | -3.0 – 14.1 | | 6.5(8) | | -1.7 – 14.0 | | 8.2(8) | | -2.7 – 12.7 | | 6.4(8) | | -2.2 – 8.0 | | 4.6(8) | |
Personal Income (% change) | | 3.5 – 6.0 | | 4.5(12) | | 3.2 – 5.2 | | 4.3(12) | | 3.5 – 5.7 | | 4.8(12) | | 3.8 – 6.0 | | 4.6(12) | |
Net Migration (thousand persons) | | 46.0 – 57.4 | | 51.3(12) | | 42.0 – 60.0 | | 51.7(12) | | 38.0 – 60.0 | | 51.6(12) | | 37.0 – 65.0 | | 52.5(12) | |
Employment (% change) | | 1.7 – 2.1 | | 2.0(14) | | 1.3 – 2.3 | | 1.8(14) | | 1.5 – 2.8 | | 2.0(14) | | 0.9 – 2.3 | | 1.7(14) | |
Unemployment rate (%) | | 7.3 – 7.6 | | 7.5(14) | | 6.3 – 7.9 | | 7.1(14) | | 5.4 – 7.3 | | 6.7(14) | | 4.5 – 7.2 | | 6.1(14) | |
Corporate pre-tax profits (% change) | | 11.3 – 20.0 | | 15.5(10) | | 7.8 – 15.0 | | 10.6(10) | | 4.3 – 14.0 | | 8.4(10) | | 2.8 – 13.0 | | 7.6(10) | |
Housing starts (thousand units) | | 23.0 – 29.4 | | 26.5(14) | | 22.9 – 37.5 | | 25.6(14) | | 24.0 – 38.3 | | 27.8(14) | | 24.8 – 37.8 | | 29.1(14) | |
Retail sales (% change) | | 4.7 – 6.7 | | 5.4(14) | | 2.6 – 6.1 | | 4.2(14) | | 3.1 – 6.7 | | 4.7(14) | | 3.6 – 6.0 | | 4.7(14) | |
Consumer price index (% chg) | | 1.1 – 1.7 | | 1.4(14) | | 1.7 – 2.4 | | 2.1(14) | | 1.7 – 2.2 | | 1.9(14) | | 1.6 – 2.3 | | 2.0(14) | |
| | | | | | | | | | | | | | | | | |
United States | | | | | | | | | | | | | | | | | |
Real GDP (% change) | | 2.5 – 2.9 | | 2.8(14) | | 2.2 – 3.6 | | 3.0(14) | | 2.3 – 3.9 | | 3.0(14) | | 2.2 – 3.9 | | 3.0(14) | |
Intended Federal Funds rate (%) | | 0.10 – 0.25 | | 0.16(13) | | 0.10 – 0.37 | | 0.20(13) | | 0.25 – 2.30 | | 1.16(13) | | 1.96 – 4.31 | | 3.21(13) | |
Housing starts (million units) | | 0.58 – 0.60 | | 0.59(13) | | 0.61 – 0.84 | | 0.70(13) | | 0.70 – 1.09 | | 0.87(13) | | 0.78 – 1.60 | | 1.16(13) | |
| | | | | | | | | | | | | | | | | |
Canada | | | | | | | | | | | | | | | | | |
Real GDP (% change) | | 2.8 – 3.1 | | 2.9(14) | | 2.0 – 3.2 | | 2.6(14) | | 2.4 – 3.2 | | 2.8(14) | | 1.9 – 3.0 | | 2.6(14) | |
Bank of Canada overnight target rate (%) | | 0.57 – 0.70 | | 0.62(13) | | 1.10 – 1.60 | | 1.32(13) | | 2.00 – 3.57 | | 2.59(13) | | 2.00 – 4.42 | | 3.69(13) | |
Exchange rate (US cents/C$) | | 96.0 – 98.0 | | 97.0(14) | | 94.0 – 102.0 | | 99.4(14) | | 93.0 – 105.0 | | 100.0(14) | | 91.7 – 105.0 | | 98.3(14) | |
Housing starts (million units) | | 0.18 – 0.20 | | 0.19(14) | | 0.16 – 0.20 | | 0.18(14) | | 0.17 – 0.21 | | 0.18(14) | | 0.17 – 0.21 | | 0.19(14) | |
Consumer price index (% chg) | | 1.5 – 1.8 | | 1.7(14) | | 1.8 – 2.3 | | 2.1(14) | | 1.9 – 2.3 | | 2.1(14) | | 1.8 – 2.2 | | 2.0(14) | |
(1) Based on responses from participants providing forecasts.
(2) Participants provided an average forecast for 2013 to 2015.
(3) Number of respondents shown in parenthesis.
Budget and Fiscal Plan – 2011/12 to 2013/14
66
APPENDICES
A1 | Tax Expenditures | | 68 |
A1.1 | Social and Income Transfer Programs — Tax Expenditure | | 70 |
A1.2 | Economic Development and Business Programs — Tax Expenditure | | 72 |
A1.3 | Environmental Protection Programs — Tax Expenditure | | 72 |
A1.4 | Harmonized Sales Tax — Tax Expenditure | | 73 |
A2 | Interprovincial Comparisons of Tax Rates — 2011 | | 74 |
A3 | Comparison of Provincial and Federal Taxes by Province — 2011 | | 75 |
A4 | Interprovincial Comparisons of Provincial Personal Income Taxes Payable — 2011 | | 77 |
A5 | Fiscal Plan Update — Changes from Budget 2010 | | 78 |
A6 | Material Assumptions — Revenue | | 79 |
A7 | Natural Gas Price Forecasts: 2011/12 to 2013/14 | | 84 |
A8 | Material Assumptions — Expense | | 85 |
A9 | Operating Statement — 2004/05 to 2013/14 | | 87 |
A10 | Revenue by Source — 2004/05 to 2013/14 | | 88 |
A11 | Revenue by Source Supplementary Information — 2004/05 to 2013/14 | | 89 |
A12 | Expense by Function — 2004/05 to 2013/14 | | 90 |
A13 | Expense by Function Supplementary Information — 2004/05 to 2013/14 | | 91 |
A14 | Full—Time Equivalents (FTEs) 2004/05 to 2013/14 | | 92 |
A15 | Capital Spending — 2004/05 to 2013/14 | | 93 |
A16 | Statement of Financial Position — 2004/05 to 2013/14 | | 94 |
A17 | Changes in Financial Position — 2004/05 to 2013/14 | | 95 |
A18 | Provincial Debt — 2004/05 to 2013/14 | | 96 |
A19 | Provincial Debt Supplementary Information — 2004/05 to 2013/14 | | 97 |
A20 | Key Provincial Debt Indicators — 2004/05 to 2013/14 | | 98 |
Budget and Fiscal Plan – 2011/12 to 2013/14
Appendices
A1: Tax Expenditures
Introduction
A tax expenditure is the reduction in revenues from delivering government programs or benefits through the tax system rather than through voted budget appropriations. Tax expenditures are usually made by offering special tax rates, exemptions, or tax credits. Governments introduce tax expenditures primarily to achieve social policy objectives such as transfers to lower income families or to promote economic development and job creation.
Reporting tax expenditures improves government accountability by providing a more complete picture of government activities. The tax expenditure appendix does not include tax expenditures introduced or expanded in Budget 2011. These are described in Part 2: Tax Measures.
The Role of Tax Expenditure Programs
Using the tax system to deliver programs can reduce administration costs and compliance costs for recipients. In certain situations, the tax system allows intended beneficiaries to be readily identified from information that is already collected. In these cases setting up a separate expenditure program would result in costly overlap and duplication of effort. An example is the low income climate action tax credit, which is delivered through the income tax system. If this were a direct provincial expenditure program, a provincial agency or office would have to be established to duplicate much of the work already done by the Canada Revenue Agency. In addition, it would require individuals to undertake a separate, time-consuming application process in order to qualify for the benefit.
There are, however, several potential drawbacks to tax expenditure programs. First, their overall cost often receives less public scrutiny than is the case for spending programs because annual budget appropriations by the legislature are not typically required. Second, tax expenditure programs do not always effectively target those who are intended to benefit from them. Some expenditure programs that are intended to provide tax relief for low income earners may, in reality, confer the greatest benefit on high income earners who pay the most taxes. Finally, costs are often more difficult to control under a tax expenditure program because the benefits tend to be more open-ended and enforcement is often more difficult than for spending programs.
Tax Expenditure Reporting
Not all tax reductions, credits and exemptions are classed as tax expenditures.
The emphasis is on tax reductions, exemptions and refunds that are close equivalents to spending programs. By implication, the list does not include tax measures designed to meet broad tax policy objectives such as improving fairness in the tax system, or measures designed to simplify the administration of the tax. The list also does not include anything that is not intended to be part of a tax base.
Tax expenditures that cost less than $2 million are generally not included. Where practical, smaller items have been presented together as an aggregate figure.
Budget and Fiscal Plan – 2011/12 to 2013/14
68
Appendices
British Columbia Tax Expenditure Programs
The following tables report tax expenditure estimates.
For presentation purposes, British Columbia tax expenditures have been broken into three broad categories.
· Social and Income Transfer Programs (Table A1.1): These include tax expenditures that are offered as part of government’s mix of health, education, housing, income transfer and family related programs. Examples include the BC Family Bonus, the home owner grant, and the income tax credit for medical expenses.
· Economic Development and Business Programs (Table A1.2): This category includes measures to encourage new private sector investment and other business incentives.
· Environmental Protection Programs (Table A1.3): There are relatively few tax expenditures in this category because environmental protection is now generally based on the principle of “polluter pay”.
Each category has its own table of tax expenditure estimates. Within each table, the list of tax expenditures delivered through the income tax system has been separated into two sub-categories.
· Provincial Measures: This includes all major tax expenditures that are under provincial policy control.
· Federal Measures: British Columbia shares the cost of some federal income tax expenditure programs because, under the tax collection agreement between British Columbia and the federal government, the province has agreed to maintain a consistent income tax base with the federal government in the interest of reducing administrative and compliance costs.
The cost of individual tax expenditures cannot be added together to reach a total tax expenditure figure for two reasons:
· in some cases the programs interact with one another so that eliminating one program could increase or decrease the cost of another; and
· eliminating certain tax expenditure programs could change the choices taxpayers make, which in turn would affect the cost estimates.
The estimates for each tax expenditure are based on a static analysis of the costs and do not take into account any behavioral changes which could change the cost over time. In addition, all estimates are recalculated each year using current data sources and using refinements to the methods of estimation that can result in significant changes to the value of a given tax expenditure from prior years’ reports.
Harmonized Sales Tax
The Harmonized Sales Tax (HST) came into effect in British Columbia on July 1, 2010. The HST combines a seven per cent BC rate with the five per cent federal GST for a combined HST rate of 12 per cent. The Provincial Sales Tax (PST) and the Provincial Hotel Room Tax were eliminated with the introduction of the HST.
Budget and Fiscal Plan – 2011/12 to 2013/14
69
Appendices
The federal portion of the HST applies to the same goods and services that were taxable under the GST. The provincial portion of the HST applies to the same goods and services that were subject to GST, except items eligible for a provincial point-of-sale rebate or credit.
Exemptions, zero-rating and other measures that apply for purposes of the federal portion of the HST also apply for the provincial portion of the HST. BC is also providing a number of provincial rebates and credits.
BC is providing point-of-sale rebates for the provincial portion of the HST on motor fuels, books, child-sized clothing and footwear, children’s car seats and car booster seats, children’s diapers, and feminine hygiene products. Purchasers pay only the five per cent federal portion of the HST on point-of-sale rebate items.
There is also a provincial Residential Energy Credit. The credit is equal to the provincial portion of the HST payable on the purchase of residential energy (excluding service and administration charges).
Other rebates provided by the province include the BC New Housing Rebate, the BC HST Credit for low and modest income families and individuals, and the rebates for public service bodies, including municipalities and other eligible local government entities, universities and public colleges, school authorities, hospital authorities, registered charities and qualifying non-profit organizations.
HST tax expenditures are shown in Table A1.4.
Table A1.1 Social and Income Transfer Programs - Tax Expenditure
| | 2010/11 | |
| | Estimated Cost | |
| | ($ millions) | |
Personal Income Tax | | | |
Provincial Measures | | | |
BC Family Bonus (1) | | 7 | |
BC Low Income Climate Action Tax Credit | | 167 | |
BC HST Credit | | 214 | |
Political contributions tax credit | | 1 | |
Provincial Non-Refundable Credits: (2) | | | |
· Charitable donations tax credit | | 148 | |
· Tax credits for tuition and education | | 43 | |
· Tax credits for disabilities and medical expenses | | 62 | |
· Pension income tax credit | | 22 | |
· Credit for persons older than 65 years | | 56 | |
· Married and equivalent-to-married credits | | 74 | |
· Tax credit for Canada Pension Plan contributions | | 127 | |
· Tax credit for Employment Insurance premiums paid | | 41 | |
Budget and Fiscal Plan – 2011/12 to 2013/14
70
Appendices
Table A1.1 Social and Income Transfer Programs — Tax Expenditure — Continued
| | | | 2010/11 | |
| | | | Estimated Cost | |
| | | | ($ millions) | |
Personal Income Tax - Continued | | | | | |
Federal Measures (3) | | | | | |
· Deduction and inclusion of alimony and child support payments | | | | 4 | |
· Child care expense deduction | | | | 35 | |
· Exemption from capital gains up to $750,000 for small businesses and family farms | | | | 42 | |
· Deduction for residents of northern and isolated areas | | | | 8 | |
· Non-taxation of business-paid health and dental benefits | | | | 135 | |
· Tax Free Savings Accounts | | | | 10 | |
· Registered Retirement Savings Plans: (4) | | | | | |
· exemption for – contributions | | 331 | | | |
– investment earnings | | 228 | | | |
· taxation of – withdrawals | | (226 | ) | | |
Total | | | | 333 | |
· Registered Pension Plans: (4) | | | | | |
· exemption for – contributions | | 489 | | | |
– investment earnings | | 367 | | | |
· taxation of – withdrawals | | (327 | ) | | |
Total | | | | 529 | |
| | | | | |
Corporation Income Tax (5) | | | | | |
Charitable donations deduction | | | | 27 | |
| | | | | |
School and Rural Area Property Tax (6) | | | | | |
Homeowner Grant | | | | 716 | |
Northern and Rural Homeowner Benefit | | | | 20 | |
| | | | | |
Property Transfer Tax | | | | | |
Exemption for first-time home buyers | | | | 73 | |
Exemptions for the following: | | | | | |
· Property transfers between related individuals | | | | 72 | |
· Property transfers to municipalities, regional districts, hospital districts, library boards, school boards, water districts and educational institutions | | | | 7 | |
· Property transfers to charities registered under the Income Tax Act (Canada) | | | | 5 | |
(1) | The $7 million represents the tax expenditure portion of the program’s cost. The tax expenditure portion represents family bonus payments that effectively reduce the recipient’s personal income tax. The remaining cost of the program, including recoveries and administration costs, of $7 million for 2010/11, is presented in the BC Family Bonus Vote because it represents payments to families which exceed their provincial income tax liabilities. In 2010/11, the total program cost was $14 million. |
(2) | Provincial non-refundable credits are generally based on estimates of credit claims by British Columbia residents. |
(3) | The estimates show provincial revenue costs only. They are based on estimates of projected federal costs contained in Government of Canada: Tax Expenditures and Evaluations, 2010. British Columbia personal income tax expenditures for the federal measures are based on the amounts claimed by British Columbia residents for the measure and the relevant provincial tax rates for the period. Certain tax expenditure items have been excluded where no data were available or the amounts were immaterial. |
(4) | Registered retirement savings plans and registered pension plans are treated in the same way as in the federal tax expenditure report. The tax expenditure associated with these schemes is presented as the amount of tax that would otherwise be paid in the year of deferral, were the deferral not available. However, this type of estimate overstates the true costs of these preferences because taxes are eventually paid, including tax on investment earnings. An estimate that does not overstate these costs would, however, be difficult to develop and would require some largely speculative assumptions. |
(5) | The deduction offered for corporate charitable donations is a federal measure, but the estimate shows only the provincial revenue loss. This is calculated from the federal revenue loss by applying British Columbia’s share of corporate taxable income and the relevant tax rates to the federal estimate. |
(6) | The Home Owner Grant and Northern and Rural Home Owner Benefit costs are shown for the 2010/11 fiscal year. |
Budget and Fiscal Plan – 2011/12 to 2013/14
71
Appendices
Table A1.2 Economic Development and Business Programs — Tax Expenditure
| | 2010/11 | |
| | Estimated Cost | |
| | ($ millions) | |
Fuel Tax | | | |
Tax exemption for international flights carrying cargo | | 2 | |
Tax exemption for family farm trucks (on road) | | 5 | |
Tax exemption for compressor fuel used to transmit natural gas from wellhead to processing plant | | 15 | |
| | | |
Personal Income Tax | | | |
Training tax credit | | 20 | |
Venture capital tax credit | | 25 | |
Employee venture capital tax credit | | 2 | |
BC mining flow-through tax credit | | 7 | |
| | | |
Corporation Income Tax | | | |
Training tax credit | | 11 | |
Film and video tax credit | | 52 | |
Production services tax credit | | 147 | |
International business activities tax refund (1) | | 15 | |
Scientific Research and Experimental Development Tax Credit | | 160 | |
Mining Exploration Tax Credit | | 25 | |
Interactive Digital Media Tax Credit | | 14 | |
| | | |
School and Rural Area Property Tax (2) | | | |
Assessment exemption of $10,000 for industrial and business properties | | 8 | |
Overnight tourist accommodation assessment relief | | 3 | |
(1) | Includes employee income tax refunds. |
(2) | Estimates are for the 2010 calendar year and include only school and rural area property taxes levied by the province. |
Table A1.3 Environmental Protection Programs — Tax Expenditure
| | 2010/11 | |
| | Estimated Cost | |
| | ($ millions) | |
Fuel Tax | | | |
Tax exemption for alternative fuels | | 15 | |
Budget and Fiscal Plan – 2011/12 to 2013/14
72
Appendices
Table A1.4 Harmonized Sales Tax — Tax Expenditure
| | 2010/11 | |
| | Estimated Cost | |
| | ($ millions) | |
BC-specific Rebates and Credits (1) | | | |
BC Point-of-Sale Rebates | | | |
Motor fuels | | 193 | |
Books | | 32 | |
Child-sized clothing and footwear | | 26 | |
Children’s car seats/booster seats | | 1 | |
Feminine hygiene products and children’s diapers | | 6 | |
| | | |
BC Public Service Body Rebates | | | |
Municipalities and other eligible local government entities | | 181 | |
Universities and public colleges | | 50 | |
School authorities | | 53 | |
Hospital authorities | | 64 | |
Registered charities and qualifying non-profit organizations | | 43 | |
| | | |
Other BC Measures | | | |
BC New Housing Rebate (2) | | 342 | |
BC HST Credit | | 214 | |
Residential Energy Credit | | 143 | |
| | | |
Exemptions, Zero-rating and Other Measures Shared with the Federal Government (3) | | | |
Zero-rating of basic groceries | | 643 | |
Zero-rating of prescription drugs | | 100 | |
Zero-rating of medical devices | | 34 | |
Exemption for residential rent (long term) | | 153 | |
Exemption for health care services | | 108 | |
Exemption for child care and personal services | | 26 | |
Exemption for education services (tuition) | | 315 | |
Exemption for water and basic garbage collection services | | 46 | |
Exemption for municipal transit | | 33 | |
Exemption for ferry, road and bridge tolls | | 4 | |
Exemption and rebate for legal aid services | | 5 | |
Foreign Convention and Tour Incentive Program | | 4 | |
Small suppliers’ threshold | | 44 | |
Exemption for certain supplies made by charities and non-profit organizations | | 142 | |
(1) | Estimates are based on Statistics Canada data and/or administrative data. |
(2) | The new housing rebate cost does not include foregone HST revenue related to grandparented purchases of new housing. There is no provincial HST on grandparented new housing purchases. This foregone revenue is taken into account in gross HST revenue estimates. |
(3) | The estimates show provincial foregone revenue only. They are based on the federal GST tax expenditure estimates contained in Government of Canada: Tax Expenditures and Evaluations, 2010. British Columbia HST tax expenditures for the federal measures are based on the portion of the expenditure estimated to be attributable to British Columbia and adjusted for the provincial HST rate. Certain tax expenditure items have been excluded where no data are available. |
Budget and Fiscal Plan – 2011/12 to 2013/14
73
Appendices
Table A2 | Interprovincial Comparisons of Tax Rates — 2011 |
| (Rates known as of February 1, 2011) (1) |
| | | | | | | | | | | | | | | | | | Prince | | | |
| | British | | | | Saskat- | | | | | | | | New | | Nova | | Edward | | New- | |
Tax | | Columbia | | Alberta | | chewan | | Manitoba | | Ontario | | Quebec | | Brunswick | | Scotia | | Island | | foundland | |
Corporation income tax (2)
(per cent of taxable income) | | | | | | | | | | | | | | | | | | | | | |
General rate | | 10 | | 10 | | 12 | | 12 | | 12 | | 11.9 | | 11 | | 16 | | 16 | | 14 | |
Manufacturing rate | | 10 | | 10 | | 10 | | 12 | | 10 | | 11.9 | | 11 | | 16 | | 16 | | 5 | |
Small business rate | | 2.5 | | 3 | | 4.5 | | 0 | | 4.5 | | 8.0 | | 5 | | 4.5 | | 1 | | 4 | |
Small business threshold ($000s) | | 500 | | 500 | | 500 | | 400 | | 500 | | 500 | | 500 | | 400 | | 500 | | 500 | |
Corporation capital tax (3) | | | | | | | | | | | | | | | | | | | | | |
Non-financial | | Nil | | Nil | | Nil | | Nil | | Nil | | Nil | | Nil | | .10 | | Nil | | Nil | |
Financial | | Nil | | Nil | | .7/3.25 | | 3.0 | | Nil | | Nil | | 3.0 | | 4.0 | | 5.0 | | 4.0 | |
Health care premiums/month (4) | | | | | | | | | | | | | | | | | | | | | |
Individual/family | | 60.50/121 | | Nil | | Nil | | Nil | | Nil | | Nil | | Nil | | Nil | | Nil | | Nil | |
Payroll tax (per cent) (5) | | Nil | | Nil | | Nil | | 2.15 | | 1.95 | | 4.26 | | Nil | | Nil | | Nil | | 2.0 | |
Insurance premium tax (per cent) (6) | | 2-4.4 | | 2-3 | | 3-4 | | 2-3 | | 2-3.5 | | 2-3 | | 2-3 | | 3-4 | | 3.5 | | 4 | |
Fuel tax (cents per litre) (7) | | | | | | | | | | | | | | | | | | | | | |
Gasoline | | 18.95 | | 9.0 | | 15.0 | | 11.5 | | 22.8 | | 24.0 | | 18.5 | | 23.7 | | 15.8 | | 25.1 | |
Diesel | | 20.11 | | 9.0 | | 15.0 | | 11.5 | | 22.5 | | 25.2 | | 25.1 | | 23.6 | | 20.2 | | 25.2 | |
Sales tax (per cent) (8) | | | | | | | | | | | | | | | | | | | | | |
General rate | | 7 | | Nil | | 5 | | 7 | | 8 | | 8.5 | | 8 | | 10 | | 10 | | 8 | |
Tobacco tax (dollars per carton of 200 cigarettes) (9) | | 42.70 | | 40.00 | | 46.30 | | 47.00 | | 30.20 | | 21.20 | | 28.90 | | 51.70 | | 44.90 | | 44.60 | |
(1) | Rates shown are those known as of February 1, 2011 and that are in effect for 2011. |
(2) | Provinces planning reductions in general corporate income tax rates include Ontario, to 11.5 per cent effective July 1, 2011, to 11 per cent effective July 1, 2012 and to 10 per cent effective July 1, 2013; and New Brunswick, to 10 per cent effective July 1, 2011. British Columbia plans to reduce its small business tax rate to zero by April 1, 2012. |
(3) | Nova Scotia plans to reduce its large corporations tax on corporate capital to 0.05 per cent effective July 1, 2011 and to eliminate it effective July 1, 2012. |
(4) | British Columbia has a two-person rate of $109; rates will increase effective January 1, 2012. British Columbia provides premium assistance in the form of lower rates or an exemption from premiums for lower income individuals and families. Ontario and Quebec levy health care contributions as additions to provincial personal income taxes payable. |
(5) | Provinces with payroll taxes provide payroll tax relief for small businesses. |
(6) | The lower rate applies to premiums for life, sickness and accident insurance; the higher rate applies to premiums for property insurance including automobile insurance. In Ontario, Quebec and Newfoundland specific sales taxes also apply to insurance premiums, except those related to individual life and health. |
(7) | Tax rate is for regular fuel used on highways and includes all provincial taxes payable by consumers at the pump. The British Columbia rate includes 75 cents per litre dedicated to the BC Transportation Financing Authority and the carbon tax rates of 4.45 cents per litre for gasoline and 5.11 cents per litre for diesel. The British Columbia rates do not include regional taxes that effectively increase the gasoline and diesel tax rates by 9 cents per litre in the South Coast British Columbia transportation service region and by 3.5 cents per litre in the Capital Regional District. The tax rates for Ontario, Quebec, New Brunswick, Nova Scotia and Newfoundland include provincial sales tax based on average pump prices as of January 2011. In British Columbia, gasoline and diesel fuel are eligible for a point of sale rebate of the provincial portion of the HST. The PEI rate consists of an ad valorem tax rate capped at 8.7 cents per litre and a volume-based motor fuel tax rate set at 7.1 cents per litre for gasoline and 11.5 cents per litre for diesel fuel. |
(8) | The rates shown are statutory rates. Quebec and PEI impose tax on the purchase price including GST. British Columbia and Ontario harmonized their sales taxes with the federal GST effective July 1, 2010 at 7 per cent and 8 per cent, respectively, for total HST rates of 12 per cent and 13 per cent. Alberta imposes a 4 per cent tax on short-term rental accommodation. |
(9) | Includes estimated provincial sales tax in all provinces except Alberta, Quebec and Prince Edward Island. |
Budget and Fiscal Plan – 2011/12 to 2013/14
74
Appendices
Table A3 Comparison of Provincial and Federal Taxes by Province — 2011
| | | | | | | | | | | | | | | | | | Prince | | | |
| | British | | | | Saskat- | | | | | | | | New | | Nova | | Edward | | New- | |
Tax | | Columbia | | Alberta | | chewan | | Manitoba | | Ontario | | Quebec | | Brunswick | | Scotia | | Island | | foundland | |
| | ( $ ) | |
Two Income Family of Four - $90,000 | | | | | | | | | | | | | | | | | | | | | |
1. | Provincial Income Tax | | 3,166 | | 4,462 | | 4,668 | | 6,792 | | 4,263 | | 7,840 | | 5,815 | | 6,889 | | 6,877 | | 5,794 | |
| Net Child Benefits | | 0 | | 203 | | 0 | | — | | 0 | | -1,735 | | 0 | | 0 | | — | | 0 | |
2. | Property Tax - Gross | | 3,429 | | 2,634 | | 4,240 | | 3,144 | | 4,831 | | 4,679 | | 4,591 | | 3,864 | | 3,366 | | 2,455 | |
| - Net | | 2,859 | | 2,634 | | 4,240 | | 2,544 | | 4,831 | | 4,679 | | 4,591 | | 3,864 | | 3,366 | | 2,455 | |
3. | Sales Tax | | 1,596 | | 12 | | 974 | | 1,362 | | 1,982 | | 2,309 | | 1,948 | | 2,286 | | 1,629 | | 1,949 | |
4. | Fuel Tax | | 218 | | 135 | | 225 | | 173 | | 342 | | 360 | | 278 | | 356 | | 237 | | 377 | |
5. | Net Carbon Tax | | 136 | | — | | — | | — | | — | | — | | — | | — | | — | | — | |
6. | Provincial Direct Taxes | | 7,975 | | 7,446 | | 10,107 | | 10,871 | | 11,418 | | 13,453 | | 12,632 | | 13,395 | | 12,109 | | 10,575 | |
7. | Health Care Premiums/Payroll Tax | | 1,452 | | 0 | | — | | 1,935 | | 1,755 | | 3,834 | | — | | — | | — | | 1,800 | |
8. | Total Provincial Tax | | 9,427 | | 7,446 | | 10,107 | | 12,806 | | 13,173 | | 17,287 | | 12,632 | | 13,395 | | 12,109 | | 12,375 | |
9. | Federal Income Tax | | 7,996 | | 7,996 | | 7,996 | | 7,996 | | 7,996 | | 7,996 | | 7,996 | | 7,996 | | 7,996 | | 7,996 | |
10. | Net Federal GST | | 1,283 | | 1,380 | | 1,311 | | 1,232 | | 1,275 | | 1,247 | | 1,232 | | 1,186 | | 1,217 | | 1,233 | |
11. | Total Tax | | 18,706 | | 16,822 | | 19,414 | | 22,034 | | 22,444 | | 26,530 | | 21,860 | | 22,577 | | 21,322 | | 21,604 | |
| | | | | | | | | | | | | | | | | | | | | | |
Two Income Family of Four - $60,000 | | | | | | | | | | | | | | | | | | | | | |
1. | Provincial Income Tax | | 1,302 | | 1,945 | | 1,794 | | 3,637 | | 1,484 | | 3,912 | | 3,231 | | 3,580 | | 3,794 | | 3,112 | |
| Net Child Benefits | | 0 | | -201 | | 0 | | — | | 0 | | -2,835 | | 0 | | 0 | | — | | 0 | |
2. | Property Tax - Gross | | 2,496 | | 2,137 | | 2,825 | | 2,542 | | 3,465 | | 3,217 | | 2,553 | | 2,424 | | 2,677 | | 1,689 | |
| - Net | | 1,926 | | 2,137 | | 2,825 | | 1,942 | | 3,465 | | 3,217 | | 2,553 | | 2,424 | | 2,677 | | 1,689 | |
3. | Sales Tax | | 1,254 | | 10 | | 703 | | 1,093 | | 1,601 | | 1,972 | | 1,549 | | 1,842 | | 1,304 | | 1,554 | |
4. | Fuel Tax | | 218 | | 135 | | 225 | | 173 | | 342 | | 360 | | 278 | | 356 | | 237 | | 377 | |
5. | Net Carbon Tax | | 122 | | — | | — | | — | | — | | — | | — | | — | | — | | — | |
6. | Provincial Direct Taxes | | 4,822 | | 4,026 | | 5,547 | | 6,845 | | 6,892 | | 6,626 | | 7,611 | | 8,202 | | 8,012 | | 6,732 | |
7. | Health Care Premiums/Payroll Tax | | 1,452 | | 0 | | — | | 1,290 | | 1,170 | | 2,556 | | — | | — | | — | | 1,200 | |
8. | Total Provincial Tax | | 6,274 | | 4,026 | | 5,547 | | 8,135 | | 8,062 | | 9,182 | | 7,611 | | 8,202 | | 8,012 | | 7,932 | |
9. | Federal Income Tax | | 3,894 | | 3,894 | | 3,894 | | 3,894 | | 3,894 | | 3,894 | | 3,894 | | 3,894 | | 3,894 | | 3,894 | |
10. | Net Federal GST | | 1,008 | | 1,154 | | 1,061 | | 989 | | 1,029 | | 1,065 | | 980 | | 955 | | 974 | | 983 | |
11. | Total Tax | | 11,176 | | 9,074 | | 10,502 | | 13,018 | | 12,985 | | 14,141 | | 12,485 | | 13,051 | | 12,880 | | 12,809 | |
| | | | | | | | | | | | | | | | | | | | | | |
Two Income Family of Four - $30,000 | | | | | | | | | | | | | | | | | | | | | |
1. | Provincial Income Tax | | 0 | | 0 | | 0 | | 502 | | -151 | | -463 | | 300 | | 720 | | 861 | | 963 | |
| Net Child Benefits | | 0 | | -1,149 | | 0 | | — | | -1,483 | | -3,264 | | 0 | | 0 | | — | | 0 | |
2. | Property Tax - Gross | | 2,496 | | 2,137 | | 2,825 | | 2,542 | | 3,465 | | 3,217 | | 2,553 | | 2,424 | | 2,677 | | 1,689 | |
| - Net | | 1,926 | | 2,137 | | 2,825 | | 1,942 | | 3,465 | | 3,217 | | 2,553 | | 2,424 | | 2,677 | | 1,689 | |
3. | Sales Tax | | 213 | | 8 | | -32 | | 832 | | 396 | | 1,294 | | 1,174 | | 1,387 | | 983 | | 1,145 | |
4. | Fuel Tax | | 145 | | 90 | | 150 | | 115 | | 228 | | 240 | | 185 | | 237 | | 158 | | 251 | |
5. | Net Carbon Tax | | -197 | | — | | — | | — | | — | | — | | — | | — | | — | | — | |
6. | Provincial Direct Taxes | | 2,087 | | 1,086 | | 2,943 | | 3,391 | | 2,455 | | 1,024 | | 4,212 | | 4,768 | | 4,679 | | 4,048 | |
7. | Health Care Premiums/Payroll Tax | | 0 | | 0 | | — | | 645 | | 585 | | 1,278 | | — | | — | | — | | 600 | |
8. | Total Provincial Tax | | 2,087 | | 1,086 | | 2,943 | | 4,036 | | 3,040 | | 2,302 | | 4,212 | | 4,768 | | 4,679 | | 4,648 | |
9. | Federal Income Tax | | 488 | | 488 | | 488 | | 488 | | 488 | | 488 | | 488 | | 488 | | 488 | | 488 | |
10. | Net Federal GST | | 11 | | 145 | | 25 | | -20 | | 50 | | 119 | | -30 | | -52 | | -37 | | -48 | |
11. | Total Tax | | 2,586 | | 1,719 | | 3,456 | | 4,504 | | 3,578 | | 2,909 | | 4,670 | | 5,204 | | 5,130 | | 5,088 | |
| | | | | | | | | | | | | | | | | | | | | | |
Unattached Individual - $25,000 | | | | | | | | | | | | | | | | | | | | | |
1. | Provincial Income Tax | | 371 | | 516 | | 947 | | 913 | | 600 | | 999 | | 924 | | 1,223 | | 1,414 | | 1,090 | |
2. | Property Tax | | — | | — | | — | | — | | — | | — | | — | | — | | — | | — | |
3. | Sales Tax | | 491 | | 4 | | 114 | | 488 | | 598 | | 515 | | 700 | | 816 | | 573 | | 692 | |
4. | Fuel Tax | | 145 | | 90 | | 150 | | 115 | | 228 | | 240 | | 185 | | 237 | | 158 | | 251 | |
5. | Net Carbon Tax | | -21 | | — | | — | | — | | — | | — | | — | | — | | — | | — | |
6. | Provincial Direct Taxes | | 986 | | 610 | | 1,211 | | 1,516 | | 1,426 | | 1,754 | | 1,809 | | 2,276 | | 2,145 | | 2,033 | |
7. | Health Care Premiums/Payroll Tax | | 145 | | 0 | | — | | 538 | | 488 | | 1,065 | | — | | — | | — | | 500 | |
8. | Total Provincial Tax | | 1,131 | | 610 | | 1,211 | | 2,054 | | 1,914 | | 2,819 | | 1,809 | | 2,276 | | 2,145 | | 2,533 | |
9. | Federal Income Tax | | 1,582 | | 1,582 | | 1,582 | | 1,582 | | 1,582 | | 1,582 | | 1,582 | | 1,582 | | 1,582 | | 1,582 | |
10. | Net Federal GST | | 82 | | 106 | | 84 | | 70 | | 73 | | 64 | | 60 | | 45 | | 51 | | 55 | |
11. | Total Tax | | 2,795 | | 2,298 | | 2,877 | | 3,706 | | 3,569 | | 4,465 | | 3,451 | | 3,903 | | 3,778 | | 4,170 | |
Budget and Fiscal Plan – 2011/12 to 2013/14
75
Appendices
Table A3 Comparison of Provincial and Federal Taxes by Province — 2011 — Continued
| | | | | | | | | | | | | | | | | | Prince | | | |
| | British | | | | Saskat- | | | | | | | | New | | Nova | | Edward | | New- | |
Tax | | Columbia | | Alberta | | chewan | | Manitoba | | Ontario | | Quebec | | Brunswick | | Scotia | | Island | | foundland | |
| | ( $ ) | |
Unattached Individual - $80,000 | | | | | | | | | | | | | | | | | | | | | |
1. | Provincial Income Tax | | 4,047 | | 5,372 | | 6,943 | | 7,901 | | 5,434 | | 9,154 | | 6,715 | | 8,458 | | 8,124 | | 6,914 | |
2. | Property Tax - Gross | | 1,708 | | 2,115 | | 3,065 | | 3,754 | | 3,358 | | 4,270 | | 2,075 | | 3,184 | | 2,467 | | 1,734 | |
| - Net | | 1,138 | | 2,115 | | 3,065 | | 3,154 | | 3,358 | | 4,270 | | 2,075 | | 3,184 | | 2,467 | | 1,734 | |
3. | Sales Tax | | 1,439 | | 10 | | 810 | | 1,159 | | 1,757 | | 1,856 | | 1,718 | | 1,946 | | 1,397 | | 1,709 | |
4. | Fuel Tax | | 218 | | 135 | | 225 | | 173 | | 342 | | 360 | | 278 | | 356 | | 237 | | 377 | |
5. | Net Carbon Tax | | 136 | | — | | — | | — | | — | | — | | — | | — | | — | | — | |
6. | Provincial Direct Taxes | | 6,978 | | 7,632 | | 11,043 | | 12,387 | | 10,891 | | 15,640 | | 10,786 | | 13,944 | | 12,225 | | 10,734 | |
7. | Health Care Premiums/Payroll Tax | | 726 | | 0 | | — | | 1,720 | | 1,560 | | 3,408 | | — | | — | | — | | 1,600 | |
8. | Total Provincial Tax | | 7,704 | | 7,632 | | 11,043 | | 14,107 | | 12,451 | | 19,048 | | 10,786 | | 13,944 | | 12,225 | | 12,334 | |
9. | Federal Income Tax | | 11,116 | | 11,116 | | 11,116 | | 11,116 | | 11,116 | | 11,116 | | 11,116 | | 11,116 | | 11,116 | | 11,116 | |
10. | Net Federal GST | | 1,170 | | 1,218 | | 1,130 | | 1,083 | | 1,134 | | 1,015 | | 1,095 | | 1,028 | | 1,065 | | 1,089 | |
11. | Total Tax | | 19,990 | | 19,966 | | 23,289 | | 26,306 | | 24,701 | | 31,179 | | 22,997 | | 26,088 | | 24,406 | | 24,539 | |
| | | | | | | | | | | | | | | | | | | | | |
Senior Couple with Equal Pension Incomes - $30,000 | | | | | | | | | | | | | | | | | | | | | |
1. | Provincial Income Tax | | 0 | | 0 | | 0 | | -316 | | -1,415 | | -747 | | 0 | | 0 | | 147 | | 0 | |
2. | Property Tax - Gross | | 2,496 | | 2,137 | | 2,825 | | 2,542 | | 3,465 | | 3,217 | | 2,553 | | 2,424 | | 2,677 | | 1,689 | |
| - Net | | 1,651 | | 2,137 | | 2,825 | | 1,942 | | 3,465 | | 3,217 | | 2,553 | | 2,424 | | 2,677 | | 1,689 | |
3. | Sales Tax | | 752 | | 7 | | 152 | | 870 | | 959 | | 1,121 | | 1,260 | | 1,523 | | 1,038 | | 1,298 | |
4. | Fuel Tax | | 145 | | 90 | | 150 | | 115 | | 228 | | 240 | | 185 | | 237 | | 158 | | 251 | |
5. | Net Carbon Tax | | -131 | | — | | — | | — | | — | | — | | — | | — | | — | | — | |
6. | Provincial Direct Taxes | | 2,417 | | 2,234 | | 3,127 | | 2,611 | | 3,237 | | 3,831 | | 3,998 | | 4,184 | | 4,020 | | 3,238 | |
7. | Health Care Premiums/Payroll Tax | | 0 | | 0 | | — | | — | | — | | — | | — | | — | | — | | — | |
8. | Total Provincial Tax | | 2,417 | | 2,234 | | 3,127 | | 2,611 | | 3,237 | | 3,831 | | 3,998 | | 4,184 | | 4,020 | | 3,238 | |
9. | Federal Income Tax | | 0 | | 0 | | 0 | | 0 | | 0 | | 0 | | 0 | | 0 | | 0 | | 0 | |
10. | Net Federal GST | | 343 | | 367 | | 332 | | 342 | | 320 | | 303 | �� | 295 | | 287 | | 298 | | 320 | |
11. | Total Tax | | 2,760 | | 2,601 | | 3,459 | | 2,953 | | 3,557 | | 4,134 | | 4,293 | | 4,471 | | 4,318 | | 3,558 | |
Personal Income Tax
· Income tax is based on basic personal credits, applicable credits and typical major deductions at each income level. Quebec residents pay federal income tax less an abatement of 16.5 per cent of basic federal tax. This abatement has been used to reduce Quebec provincial tax rather than federal tax, for comparative purposes. The two income family of four with $60,000 annual income is assumed to have one spouse earning $40,000 and the other $20,000, the family with $90,000 income is assumed to have one spouse earning $50,000 and the other $40,000, the family with $30,000 is assumed to have each spouse earning $15,000 and each senior is assumed to receive $15,000. All representative families are assumed to have employment income except the senior couple.
Net Child Benefits
· Net child benefits are provincial measures affecting payments to families with children. Provincial child benefit measures are available in British Columbia (BC Family Bonus), Alberta (Family Employment Credit), Saskatchewan (Child Benefit), Ontario (Child Benefit), Quebec (Child Assistance Payments), New Brunswick (Child Tax Benefit), Nova Scotia (Child Benefit) and Newfoundland (Child Benefit). In addition, the Alberta government has chosen to vary the amount of the basic federal child tax benefit that its residents receive (shown as a net amount).
Property Tax
· It is assumed that the individual at $25,000 rents accommodation; the family at $30,000 and at $60,000 and the senior couple own bungalows; the family at $90,000 owns a two-story executive style home; and the single at $80,000 owns a luxury condominium, in a major city for each province. Net local and provincial property taxes are estimated as taxes owing after credits provided through the property tax system are subtracted.
Sales, Fuel and Carbon Tax Estimates
· Includes sales tax on meals, liquor and accommodation. Estimates are based on expenditure patterns from the Survey of Household Spending. In estimating individual and family taxable consumption, disposable income is reduced by 20 per cent to reflect housing (mortgage and property taxes or rent) costs. The senior couple is assumed to own their home and have no mortgage costs. For each province, disposable income is further reduced by estimated federal income taxes, estimated provincial income taxes and health care premiums if applicable. In addition, the single individual with $80,000 annual income and the family with $90,000 annual income are assumed to have savings equal to 5 per cent of their disposable income. For each family, disposable income is distributed among expenditures using the consumption pattern of a typical family with the relevant characteristics as estimated by the family expenditure survey and the relevant sales tax component is extracted. Sales tax includes provincial retail sales taxes in Saskatchewan, Manitoba and Prince Edward Island, Quebec’s value added tax, the provincial component of the HST in BC, Ontario, New Brunswick, Nova Scotia and Newfoundland, Alberta’s Tourism Levy and the federal GST. Sales tax estimates have been reduced by sales tax credits where applicable.
· Fuel tax is based on annual consumption: 1,000 litres of unleaded fuel for the single at $25,000, the family at $30,000 and the senior couple; others are assumed to consume 1,500 litres.
· Carbon tax applies in British Columbia to household consumption of gasoline, natural gas and home heating fuel. Estimated carbon tax liabilities are based on natural gas and home heating fuel consumption amounts from the Survey of Household Spending and the assumed fuel consumption noted above. Net carbon tax is estimated as carbon tax liabilities less the BC Low income Climate Action Tax Credit where applicable. In previous years, the five per cent personal income tax cut in the first two tax bracket rates was shown as a reduction in carbon tax.
Health Care Premiums/Payroll Tax
· A health care premium is levied in British Columbia only. Approximately 50 per cent of British Columbia premiums are paid by employers on behalf of their employees with the remainder paid by individuals, either by employees or by residents who are not employed. Payroll taxes, in the four provinces that levy them, are paid by the employer. Employer-paid payroll taxes and health care premiums are generally reflected in reduced wages.
Effective Tax Rates
· British Columbia taxes have been calculated using rates in effect for 2011. Taxes for other provinces were calculated using rates that were announced prior to February 1, 2011, and that come into effect during 2011.
Budget and Fiscal Plan – 2011/12 to 2013/14
76
Appendices
Table A4 | Interprovincial Comparisons of Provincial Personal Income Taxes Payable (1) — 2011 (Rates known as of February 1, 2011) |
| | | | | | | | | | | | | | | | | | Prince | | | |
| | British | | | | Saskat- | | | | | | | | New | | Nova | | Edward | | New- | |
Taxable income (2) | | Columbia | | Alberta | | chewan | | Manitoba | | Ontario | | Quebec(3) | | Brunswick | | Scotia | | Island | | foundland | |
| | Annual provincial taxes payable(4) ($) | |
$ | 10,000 | | 0 | | 0 | | 0 | | 22 | | 0 | | 0 | | 0 | | 0 | | 0 | | 116 | |
$ | 20,000 | | 86 | | 185 | | 582 | | 1,126 | | 491 | | 702 | | 513 | | 881 | | 1,090 | | 835 | |
$ | 30,000 | | 864 | | 1,118 | | 1,608 | | 2,162 | | 1,262 | | 2,059 | | 1,662 | | 1,777 | | 2,004 | | 1,553 | |
$ | 40,000 | | 1,437 | | 2,050 | | 2,634 | | 3,345 | | 1,974 | | 3,386 | | 2,682 | | 3,212 | | 3,238 | | 2,660 | |
$ | 50,000 | | 2,183 | | 3,002 | | 3,862 | | 4,568 | | 3,015 | | 5,044 | | 3,847 | | 4,665 | | 4,571 | | 3,872 | |
$ | 60,000 | | 2,953 | | 4,002 | | 5,162 | | 5,843 | | 3,930 | | 6,684 | | 5,057 | | 6,174 | | 5,951 | | 5,122 | |
$ | 70,000 | | 3,723 | | 5,002 | | 6,462 | | 7,257 | | 4,893 | | 8,328 | | 6,267 | | 7,841 | | 7,506 | | 6,422 | |
$ | 80,000 | | 4,708 | | 6,002 | | 7,762 | | 8,997 | | 6,292 | | 10,009 | | 7,494 | | 9,508 | | 9,176 | | 7,752 | |
$ | 100,000 | | 7,113 | | 8,002 | | 10,362 | | 12,477 | | 9,774 | | 13,981 | | 9,974 | | 13,190 | | 12,517 | | 10,412 | |
$ | 125,000 | | 10,769 | | 10,502 | | 13,774 | | 16,827 | | 14,126 | | 18,918 | | 13,087 | | 18,002 | | 17,110 | | 13,737 | |
$ | 150,000 | | 14,444 | | 13,002 | | 17,524 | | 21,177 | | 18,479 | | 23,751 | | 16,262 | | 22,815 | | 21,702 | | 17,062 | |
| | | | | | | | | | | | | | | | | | | | | |
| | Provincial personal income taxes as a per cent of taxable income (%) | |
$ | 10,000 | | 0.0 | | 0.0 | | 0.0 | | 0.2 | | 0.0 | | 0.0 | | 0.0 | | 0.0 | | 0.0 | | 1.2 | |
$ | 20,000 | | 0.4 | | 0.9 | | 2.9 | | 5.6 | | 2.5 | | 3.5 | | 2.6 | | 4.4 | | 5.5 | | 4.2 | |
$ | 30,000 | | 2.9 | | 3.7 | | 5.4 | | 7.2 | | 4.2 | | 6.9 | | 5.5 | | 5.9 | | 6.7 | | 5.2 | |
$ | 40,000 | | 3.6 | | 5.1 | | 6.6 | | 8.4 | | 4.9 | | 8.5 | | 6.7 | | 8.0 | | 8.1 | | 6.7 | |
$ | 50,000 | | 4.4 | | 6.0 | | 7.7 | | 9.1 | | 6.0 | | 10.1 | | 7.7 | | 9.3 | | 9.1 | | 7.7 | |
$ | 60,000 | | 4.9 | | 6.7 | | 8.6 | | 9.7 | | 6.6 | | 11.1 | | 8.4 | | 10.3 | | 9.9 | | 8.5 | |
$ | 70,000 | | 5.3 | | 7.1 | | 9.2 | | 10.4 | | 7.0 | | 11.9 | | 9.0 | | 11.2 | | 10.7 | | 9.2 | |
$ | 80,000 | | 5.9 | | 7.5 | | 9.7 | | 11.2 | | 7.9 | | 12.5 | | 9.4 | | 11.9 | | 11.5 | | 9.7 | |
$ | 100,000 | | 7.1 | | 8.0 | | 10.4 | | 12.5 | | 9.8 | | 14.0 | | 10.0 | | 13.2 | | 12.5 | | 10.4 | |
$ | 125,000 | | 8.6 | | 8.4 | | 11.0 | | 13.5 | | 11.3 | | 15.1 | | 10.5 | | 14.4 | | 13.7 | | 11.0 | |
$ | 150,000 | | 9.6 | | 8.7 | | 11.7 | | 14.1 | | 12.3 | | 15.8 | | 10.8 | | 15.2 | | 14.5 | | 11.4 | |
(1) Calculated for a single individual with wage income and claiming credits for Canada Pension Plan and Quebec Pension Plan contributions, Employment Insurance premiums, Quebec Parental Insurance Plan premiums, and the basic personal amount.
(2) Taxable income, total income less allowable deductions, is defined by federal legislation in all provinces except Quebec. In the table it is assumed that federally defined taxable income is equal to Quebec taxable income.
(3) Quebec residents pay federal tax less an abatement of 16.5 per cent of federal tax. In the table, the Quebec abatement has been used to reduce Quebec provincial personal income tax for comparative purposes.
(4) Includes provincial low income reductions (all provinces except Alberta and Saskatchewan), surtaxes payable in Ontario, Nova Scotia and Prince Edward Island, and the Ontario Health Premium tax. Excludes credits for sales and property tax credits.
Budget and Fiscal Plan – 2011/12 to 2013/14
77
Appendices
Table A5 Fiscal Plan Update — Changes from Budget 2010
($ millions) | | 2010/11 | | 2011/12 | | 2012/13 | | 2013/14 | |
Budget 2010 Five Year Fiscal Plan | | (1,715 | ) | (945 | ) | (145 | ) | 410 | |
First Quarterly Report — Five Year Fiscal Plan Update | | 335 | | 135 | | 15 | | 80 | |
Updated fiscal plan before revenue changes and spending initiatives | | (1,380 | ) | (810 | ) | (130 | ) | 490 | |
Revenue changes: | | | | | | | | | |
Personal income tax | | (387 | ) | (257 | ) | (280 | ) | (313 | ) |
Corporate income tax | | 117 | | (54 | ) | (204 | ) | (305 | ) |
Harmonized sales tax | | 352 | | 419 | | 419 | | 443 | |
Property transfer tax | | (50 | ) | (170 | ) | (173 | ) | (203 | ) |
Other tax sources | | 32 | | (30 | ) | (29 | ) | (14 | ) |
Natural gas royalties | | (167 | ) | (347 | ) | (478 | ) | (475 | ) |
Crown land tenures | | (9 | ) | (40 | ) | (85 | ) | (127 | ) |
Forests | | (40 | ) | (84 | ) | (107 | ) | (75 | ) |
Other natural resources | | (34 | ) | (30 | ) | (34 | ) | (14 | ) |
Fees, licenses, investment earnings and miscellaneous sources | | 140 | | 222 | | 142 | | 121 | |
Health and social transfers | | 41 | | 30 | | 29 | | 29 | |
Other federal government transfers | | (6 | ) | 123 | | 79 | | 100 | |
Commercial Crown agencies operating results: | | | | | | | | | |
BC Hydro — mainly impact on return on equity from the change to assets-in-service basis for rate setting purposes | | (33 | ) | (58 | ) | (71 | ) | (87 | ) |
LDB — reflects consumer spending trends | | (66 | ) | (60 | ) | (56 | ) | (47 | ) |
ICBC — mainly higher premiums earned and higher investment income | | 22 | | 52 | | 65 | | 57 | |
Other commercial Crown agencies changes | | 16 | | 25 | | (7 | ) | 58 | |
Total revenue changes | | (72 | ) | (259 | ) | (790 | ) | (852 | ) |
Reverse impact of allocating available revenue | | — | | 650 | | 700 | | 750 | |
Projected spending lift in 2013/14 | | — | | — | | — | | 624 | |
Forecast allowance updates | | 150 | | (50 | ) | 50 | | 50 | |
Less: expense increases (decreases): | | | | | | | | | |
Consolidated Revenue Fund changes: | | | | | | | | | |
Firefighting costs | | (52 | ) | — | | — | | — | |
Emergency program costs for floods and interface fires | | 39 | | — | | — | | — | |
Health funding increase | | — | | — | | — | | 604 | |
Additional income assistance for families in need | | — | | 20 | | 30 | | 15 | |
Benefits cost savings | | (25 | ) | (23 | ) | (23 | ) | (23 | ) |
Other spending changes | | — | | 11 | | 1 | | (44 | ) |
Contingencies Vote allocations | | — | | 153 | | 3 | | 3 | |
Management of public debt (net) | | (43 | ) | 9 | | 13 | | 70 | |
Adjustment of prior year accruals | | (55 | ) | — | | — | | — | |
Spending funded by third party recoveries | | 67 | | 180 | | 129 | | 156 | |
Increase in operating transfers to service delivery agencies | | 115 | | (433 | ) | (320 | ) | (777 | ) |
Changes in spending profile of service delivery agencies: | | | | | | | | | |
School districts | | 65 | | (2 | ) | (2 | ) | (2 | ) |
Universities | | 18 | | 53 | | 72 | | 73 | |
Colleges and institutes | | 10 | | 5 | | 5 | | 8 | |
Health authorities and hospital societies | | (62 | ) | 288 | | 315 | | 753 | |
Other service delivery agencies | | (114 | ) | 195 | | 47 | | 51 | |
Total expense increases (decreases) | | (37 | ) | 456 | | 270 | | 887 | |
Budget 2011 updated fiscal plan surplus (deficit) | | (1,265 | ) | (925 | ) | (440 | ) | 175 | |
Budget and Fiscal Plan – 2011/12 to 2013/14
78
Appendices
Table A6 Material Assumptions — Revenue (1)
| | Restated | | Updated | | Budget | | | | | | | |
Revenue Source and Assumptions | | Budget | | Forecast | | Estimate | | Plan | | Plan | | | |
($ millions unless otherwise specified) | | 2010/11 | | 2011/12 | | 2012/13 | | 2013/14 | | Sensitivities 2011/12 | |
Personal income tax | | $5,861 | | $5,354 | | $5,796 | | $6,189 | | $6,596 | | | |
Current calendar year assumptions | | | | | | | | | | | | | |
Personal income growth | | 2.7% | | 3.0% | | 3.5% | | 4.5% | | 4.4% | | +/- 1% change in 2011 BC | |
Labour income growth | | 2.8% | | 3.4% | | 4.0% | | 4.7% | | 4.6% | | personal income growth | |
Tax base growth | | 2.9% | | 2.1% | | 3.4% | | 5.5% | | 5.4% | | equals +/- $50 to $100 million | |
Average tax yield | | 5.05% | | 4.81% | | 4.85% | | 4.88% | | 4.92% | | | |
Current-year tax | | $6,041 | | $5,780 | | $6,024 | | $6,404 | | $6,798 | | +/- 1% change in 2010 BC | |
BC Tax Reduction | | -$129 | | -$139 | | -$141 | | -$144 | | -$147 | | personal or taxable income | |
Low income climate action tax credit | | -$153 | | -$164 | | -$175 | | -$182 | | -$182 | | growth equals +/- $50 to $100 | |
BC HST/sales tax credit | | -$146 | | -$149 | | -$288 | | -$285 | | -$285 | | million one-time effect | |
Other tax credits and refunds | | -$100 | | -$100 | | -$98 | | -$93 | | -$93 | | (prior-year adjustment) | |
Policy neutral elasticity * | | 1.4 | | 1.0 | | 1.2 | | 1.4 | | 1.4 | | and could result in an | |
Fiscal year assumptions | | | | | | | | | | | | additional +/-$50 to $75 | |
Prior-year adjustment | | | | -$230 | | | | | | | | million base change in | |
Family Bonus offset | | -$7 | | -$7 | | -$5 | | -$4 | | -$4 | | 2011/12 | |
| | 2009 Assumptions | | | | | | | | | |
2009 Tax-year | | | | | | | | | | | | | |
Personal income growth | | -1.5% | | -0.1% | | | | | | | | | |
Tax base growth | | -2.3% | | -1.0% | | | | | | | | | |
Average 2009 tax yield | | 5.12% | | 4.88% | | | | | | | | | |
2009 tax | | $5,955 | | $5,747 | | | | | | | | | |
BC Tax Reduction | | -$127 | | -$136 | | | | | | | | | |
Low income climate action tax credit | | -$153 | | -$153 | | | | | | | | | |
Sales tax credit | | -$53 | | -$56 | | | | | | | | | |
Other tax credits and refunds | | -$106 | | -$77 | | | | | | | | | |
* Ratio of annual per cent change in current-year revenue to annual per cent change in personal income (calendar year).
Corporate income tax | | $847 | | $1,638 | | $1,571 | | $1,872 | | $1,461 | | | |
Components of revenue (fiscal year) | | | | | | | | | | | | | |
Advance instalments | | $1,157 | | $1,380 | | $1,498 | | $1,677 | | $1,638 | | | |
International Business Activity Act refunds | | -$10 | | -$15 | | -$20 | | -$20 | | -$15 | | | |
Prior-year adjustment | | -$300 | | $273 | | $93 | | $215 | | -$162 | | | |
Current calendar year assumptions | | | | | | | | | | | | | |
National tax base ($ billions) | | $169.7 | | $186.5 | | $216.8 | | $234.3 | | $254.3 | | +/- 1% change in the 2011 | |
BC instalment share of national tax base | | 11.8% | | 11.8% | | 11.6% | | 13.6% | | 12.9% | | national tax base equals | |
Effective tax rates (general/small business) | | 10.5 / 2.5 | | 10.5 / 2.5 | | 10.0 / 2.5 | | 10.0 / 0.6 | | 10.0 / 0.0 | | +/- $10 to $20 million | |
BC tax base growth (post federal measures) | | 12.8% | | 15.3% | | 9.5% | | 5.2% | | 8.6% | | | |
BC corporate profits growth | | 12.7% | | 19.4% | | 8.6% | | 6.5% | | 6.8% | | +/- 1% change in the 2010 | |
BC Tax credits | | | | | | | | | | | | BC tax base equals +/- $20 | |
Film, Television and Production Services | | -$163 | | -$190 | | -$199 | | -$209 | | -$219 | | to $30 million in 2011/12 | |
Scientific Research and Experimental Development | | -$140 | | -$159 | | -$143 | | -$153 | | -$163 | | | |
Interactive Digital Media | | $0 | | -$5 | | -$35 | | -$35 | | -$35 | | | |
Other | | -$26 | | -$43 | | -$50 | | -$50 | | -$50 | | | |
| | 2009 Assumptions | | | | | | | | | |
2009 Tax-year | | | | | | | | | | | | | |
BC tax base growth | | -26.2% | | -5.2% | | | | | | | | | |
BC corporate profits growth | | -35.8% | | -21.3% | | | | | | | | | |
Gross 2009 tax | | $1,348 | | $1,800 | | | | | | | | | |
Prior-year adjustments | | -$300 | | $273 | | | | | | | | | |
BC Tax credits | | | | | | | | | | | | | |
Film, Television and Production Services | | -$143 | | -$177 | | | | | | | | | |
Scientific Research and Experimental Development | | -$130 | | -$134 | | | | | | | | | |
Other | | -$21 | | -$35 | | | | | | | | | |
Revenue is recorded on a cash basis. Due to lags in the federal collection and instalment systems, changes to the BC corporate profits and tax base forecasts affect revenue in the succeeding year. The 2011/12 instalments from the federal government reflect 9 months of payments related to the 2011 tax year (Apr/11-Dec/11) and 3 months of payments related to the 2012 tax year (Jan/12-Mar/12). Instalments for the 2011 (2012) tax year are based on BC’s share of the national tax base for the 2009 (2010) tax year and a forecast of the 2011 (2012) national tax base. BC’s share of the 2009 national tax base was 11.6%, based on tax assessments as of December 31, 2010. Cash adjustments for any under/over payments from the federal government in respect of 2010 will be received/paid on March 30, 2012.
Budget and Fiscal Plan – 2011/12 to 2013/14
79
Appendices
Table A6 Material Assumptions — Revenue (1) – Continued
| | Restated | | Updated | | Budget | | | | | | | |
Revenue Source and Assumptions | | Budget | | Forecast | | Estimate | | Plan | | Plan | | | |
($millions unless otherwise specified) | | 2010/11 | | 2011/12 | | 2012/13 | | 2013/14 | | Sensitivities 2011/12 | |
Harmonized sales tax | | $ | 3,784 | | $ | 4,171 | | $ | 5,820 | | $ | 6,164 | | $ | 6,516 | | | |
| | | | | | | | | | | | | |
Calendar Year | | | | | | | | | | | | +/- 1% change in consumer | |
Nominal consumer expenditure | | 4.3 | % | 4.0 | % | 4.6 | % | 5.0 | % | 4.9 | % | expenditure growth equals up to | |
Nominal residential investment | | 17.9 | % | 21.7 | % | 3.7 | % | 6.7 | % | 5.2 | % | +/- $35 million | |
Above two bases represent about 84% of the total base | | | | | | | | | | | | | |
HST Rebates (% rebate of the provincial portion of the HST paid) | | | | | | | | | | | | +/- 1% change in residential | |
Municipalities | | 75 | % | 75 | % | 75 | % | 75 | % | 75 | % | construction growth equals up to | |
Charities and non-profit organizations | | 57 | % | 57 | % | 57 | % | 57 | % | 57 | % | +/- $15 million | |
New housing (up to $26,250) | | 71.43 | % | 71.43 | % | 71.43 | % | 71.43 | % | 71.43 | % | | |
School authorities | | 87 | % | 87 | % | 87 | % | 87 | % | 87 | % | | |
Universities and public colleges | | 75 | % | 75 | % | 75 | % | 75 | % | 75 | % | | |
Hospital authorities | | 58 | % | 58 | % | 58 | % | 58 | % | 58 | % | | |
Components of revenue | | | | | | | | | | | | | |
Gross | | $ | 4,914 | | $ | 5,217 | | $ | 7,230 | | $ | 7,646 | | $ | 8,068 | | | |
Input tax credit denial (temporary) | | $ | 118 | | $ | 88 | | $ | 163 | | $ | 171 | | $ | 180 | | | |
Rebates: | | | | | | | | | | | | | |
· Point of sale | | $ | (248 | ) | $ | (258 | ) | $ | (359 | ) | $ | (376 | ) | $ | (395 | ) | | |
· Municipalities, charities & non profit organizations | | $ | (220 | ) | $ | (224 | ) | $ | (311 | ) | $ | (327 | ) | $ | (343 | ) | | |
· SUCH sector | | $ | (167 | ) | $ | (167 | ) | $ | (233 | ) | $ | (244 | ) | $ | (256 | ) | | |
· New housing | | $ | (438 | ) | $ | (342 | ) | $ | (475 | ) | $ | (506 | ) | $ | (533 | ) | | |
· Residential energy use | | $ | (175 | ) | $ | (143 | ) | $ | (195 | ) | $ | (200 | ) | $ | (205 | ) | | |
Other sales taxes | | $ | 1,399 | | $ | 1,399 | | $ | 116 | | $ | 87 | | $ | 88 | | | |
Components of social service tax revenue | | | | | | | | | | | | | |
Consolidated Revenue Fund | | $ | 1,271 | | $ | 1,332 | | $ | 30 | | $ | 0 | | $ | 0 | | | |
BC Transportation Financing Authority | | $ | 3 | | $ | 4 | | $ | 0 | | $ | 0 | | $ | 0 | | | |
Tax on designated property (12% rate) | | $ | 125 | | $ | 63 | | $ | 86 | | $ | 87 | | $ | 88 | | | |
Fuel and carbon taxes | | $ | 1,604 | | $ | 1,686 | | $ | 1,914 | | $ | 2,135 | | $ | 2,217 | | | |
Calendar Year | | | | | | | | | | | | | |
Real GDP | | 2.2 | % | 3.1 | % | 2.0 | % | 2.6 | % | 2.7 | % | | |
Gasoline volumes | | -1.0 | % | 0.2 | % | 1.0 | % | 1.0 | % | 1.0 | % | | |
Diesel volumes | | 1.0 | % | 14.5 | % | 3.0 | % | 2.0 | % | 2.0 | % | | |
Natural gas volumes | | 2.0 | % | 6.8 | % | 1.0 | % | 1.0 | % | 1.0 | % | | |
Carbon tax rates (July 1) | | | | | | | | | | | | | |
Carbon dioxide equivalent emissions ($/tonne) | | $ | 20 | | $ | 20 | | $ | 25 | | $ | 30 | | $ | 30 | | | |
Natural gas (cents/gigajoule) | | 99.32 | ¢ | 99.32 | ¢ | 124.15 | ¢ | 148.98 | ¢ | 148.98 | ¢ | | |
Gasoline (cents/litre) | | 4.45 | ¢ | 4.45 | ¢ | 5.56 | ¢ | 6.67 | ¢ | 6.67 | ¢ | | |
Light fuel oil (cents/litre) | | 5.11 | ¢ | 5.11 | ¢ | 6.39 | ¢ | 7.67 | ¢ | 7.67 | ¢ | | |
Carbon tax revenue | | $ | 727 | | $ | 740 | | $ | 950 | | $ | 1,166 | | $ | 1,232 | | | |
Carbon tax rates change on July 1 | | | | | | | | | | | | | |
Components of fuel tax revenue | | | | | | | | | | | | | |
Consolidated Revenue Fund | | $ | 452 | | $ | 495 | | $ | 506 | | $ | 504 | | $ | 514 | | | |
BC Transit | | $ | 11 | | $ | 11 | | $ | 11 | | $ | 12 | | $ | 12 | | | |
BC Transportation Financing Authority | | $ | 414 | | $ | 440 | | $ | 447 | | $ | 453 | | $ | 459 | | | |
| | $ | 877 | | $ | 946 | | $ | 964 | | $ | 969 | | $ | 985 | | | |
Property taxes | | $ | 1,906 | | $ | 1,891 | | $ | 1,898 | | $ | 1,987 | | $ | 2,080 | | | |
Calendar Year | | | | | | | | | | | | | |
BC Consumer Price Index | | 1.8 | % | 1.3 | % | 2.0 | % | 2.0 | % | 2.1 | % | +/- 1% change in new | |
Housing starts | | 20,480 | | 26,479 | | 24,946 | | 26,538 | | 27,144 | | construction and inflation | |
Home owner grants (fiscal year) | | $ | -723 | | $ | -736 | | $ | -816 | | $ | -836 | | $ | -857 | | equals up to +/- $5 million | |
| | | | | | | | | | | | in residential property | |
Components of revenue | | | | | | | | | | | | taxation revenue | |
Residential (net of home owner grants) | | $ | 669 | | $ | 668 | | $ | 635 | | $ | 668 | | $ | 703 | | | |
Non-residential | | $ | 987 | | $ | 988 | | $ | 1,007 | | $ | 1,040 | | $ | 1,076 | | +/- 1% change in new | |
Rural area | | $ | 83 | | $ | 82 | | $ | 84 | | $ | 86 | | $ | 88 | | construction and inflation | |
Police | | $ | 23 | | $ | 23 | | $ | 23 | | $ | 23 | | $ | 23 | | equals up to +/- $5 million | |
BC Assessment Authority | | $ | 76 | | $ | 76 | | $ | 77 | | $ | 79 | | $ | 82 | | in non-residential property | |
BC Transit | | $ | 70 | | $ | 56 | | $ | 74 | | $ | 93 | | $ | 110 | | taxation revenue | |
Commissions | | $ | (2 | ) | $ | (2 | ) | $ | (2 | ) | $ | (2 | ) | $ | (2 | ) | | |
Budget and Fiscal Plan – 2011/12 to 2013/14
80
Appendices
Table A6 Material Assumptions — Revenue (1) — Continued
| | Restated | | Updated | | Budget | | | | | | | |
Revenue Source and Assumptions | | Budget | | Forecast | | Estimate | | Plan | | Plan | | | |
($ millions unless otherwise specified) | | 2010/11 | | 2011/12 | | 2012/13 | | 2013/14 | | Sensitivities 2011/12 | |
Other taxes | | $ | 2,021 | | $ | 2,027 | | $ | 1,899 | | $ | 1,954 | | $ | 1,986 | | | |
Calendar Year | | | | | | | | | | | | | |
Population | | 1.5 | % | 1.6 | % | 1.5 | % | 1.4 | % | 1.4 | % | | |
BC Consumer Price Index | | 1.8 | % | 1.3 | % | 2.0 | % | 2.0 | % | 2.1 | % | | |
BC housing starts | | 27.4 | % | 64.7 | % | -5.8 | % | 6.4 | % | 2.3 | % | | |
Real GDP | | 2.2 | % | 3.1 | % | 2.0 | % | 2.6 | % | 2.7 | % | | |
Nominal GDP | | 4.5 | % | 5.6 | % | 4.1 | % | 4.9 | % | 4.8 | % | | |
| | | | | | | | | | | | | |
Components of revenue | | | | | | | | | | | | | |
Property transfer | | $ | 900 | | $ | 850 | | $ | 810 | | $ | 854 | | $ | 876 | | | |
Tobacco (net of commissions) | | $ | 686 | | $ | 737 | | $ | 676 | | $ | 676 | | $ | 676 | | | |
Corporation capital | | $ | 0 | | $ | 4 | | $ | 0 | | $ | 0 | | $ | 0 | | | |
Insurance premium | | $ | 403 | | $ | 403 | | $ | 413 | | $ | 424 | | $ | 434 | | | |
Hotel room (net of commissions) | | $ | 32 | | $ | 33 | | $ | 0 | | $ | 0 | | $ | 0 | | | |
Energy, sales of Crown land tenures, metals, minerals and other | | $ | 2,320 | | $ | 1,932 | | $ | 2,145 | | $ | 2,278 | | $ | 2,549 | | | |
Natural gas price | | | | | | | | | | | | +/- $1.00 change in the | |
Plant inlet, $Cdn/gigajoule | | $ | 4.29 | | $ | 2.71 | | $ | 3.02 | | $ | 3.60 | | $ | 4.20 | | natural gas price equals | |
Sumas, $US/MMBtu | | $ | 5.71 | | $ | 3.99 | | $ | 4.41 | | $ | 5.00 | | $ | 5.52 | | +/- $315 to $365 million | |
Natural gas volumes (petajoules) | | | | | | | | | | | | +/- 1% change in natural gas | |
Base gas production | | 517 | | 501 | | 417 | | 322 | | 268 | | volumes equals +/- $5 to $20 | |
Incremental gas production | | 686 | | 664 | | 1,059 | | 1,313 | | 1,515 | | million | |
Total gas volume production | | 1,203 | | 1,165 | | 1,476 | | 1,635 | | 1,783 | | +/- 1 cent change in the | |
Annual per cent change | | 7.9 | % | 7.0 | % | 26.7 | % | 10.8 | % | 9.1 | % | exchange rate equals | |
| | | | | | | | | | | | +/- $10 to $15 million on | |
Oil price ($US/bbl at Cushing, Ok) | | $ | 80.02 | | $ | 80.64 | | $ | 86.46 | | $ | 88.23 | | $ | 90.68 | | natural gas royalties | |
Auctioned land base (000 hectares) | | 582 | | 448 | | 612 | | 608 | | 508 | | | |
Average bid price/hectare ($) | | $ | 1,200 | | $ | 1,908 | | $ | 500 | | $ | 550 | | $ | 575 | | | |
Cash sales of Crown land tenures | | $ | 698 | | $ | 855 | | $ | 306 | | $ | 334 | | $ | 292 | | | |
Metallurgical coal price ($US/tonne, fob west coast) | | $ | 167 | | $ | 212 | | $ | 224 | | $ | 218 | | $ | 212 | | | |
Copper price ($US/lb) | | $ | 3.19 | | $ | 3.44 | | $ | 3.65 | | $ | 3.40 | | $ | 3.04 | | | |
| | | | | | | | | | | | | |
Annual electricity volumes set by treaty | | 4.6 | | 4.6 | | 4.5 | | 4.3 | | 4.3 | | +/- 10% change in the average | |
(million mega-watt hours) | | | | | | | | | | | | Mid-Columbia electricity price | |
Mid-Columbia electricity price | | $ | 53 | | $ | 34 | | $ | 37 | | $ | 43 | | $ | 46 | | equals +/- $10 to $20 million | |
($US/mega-watt hour) | | | | | | | | | | | | | |
| | | | | | | | | | | | | |
Exchange rate (US¢/ Cdn $, calendar year) | | 97.4 | | 97.1 | | 99.7 | | 100.5 | | 97.6 | | | |
Components of revenue | | | | | | | | | | | | Based on a recommendation | |
Natural gas royalties | | $ | 698 | | $ | 365 | | $ | 447 | | $ | 597 | | $ | 856 | | from the Auditor General to be | |
Bonus bids, fees and rentals | | $ | 993 | | $ | 926 | | $ | 929 | | $ | 896 | | $ | 898 | | consistent with generally | |
Petroleum royalties | | $ | 68 | | $ | 83 | | $ | 84 | | $ | 81 | | $ | 79 | | accepted accounting principles, | |
Columbia River Treaty electricity sales | | $ | 230 | | $ | 145 | | $ | 150 | | $ | 170 | | $ | 185 | | bonus bid revenue recognition | |
Coal | | $ | 226 | | $ | 293 | | $ | 387 | | $ | 370 | | $ | 372 | | reflects nine-year deferral of | |
Minerals, metals and other | | $ | 71 | | $ | 84 | | $ | 107 | | $ | 121 | | $ | 113 | | cash receipts from the sale of | |
Oil and Gas Commission fees and levies | | $ | 34 | | $ | 36 | | $ | 41 | | $ | 43 | | $ | 46 | | Crown land tenures | |
| | | | | | | | | | | | | |
Royalty programs and infrastructure credits | | | | | | | | | | | | | |
Summer drilling | | $ | -37 | | $ | -37 | | $ | -40 | | $ | -43 | | $ | -42 | | | |
Deep drilling | | $ | -130 | | $ | -85 | | $ | -130 | | $ | -215 | | $ | -299 | | | |
Road and pipeline infrastructure | | $ | -115 | | $ | -50 | | $ | -120 | | $ | -146 | | $ | -99 | | | |
Total | | $ | -282 | | $ | -172 | | $ | -290 | | $ | -404 | | $ | -440 | | | |
Implicit average natural gas royalty rate | | 13.5 | % | 11.5 | % | 10.0 | % | 10.1 | % | 11.4 | % | | |
Royalty program (marginal, low productivity and ultra marginal drilling) adjustments reflect reduced royalty rates. Natural gas royalties incorporate royalty programs and Treasury Board approved infrastructure credits.
Budget and Fiscal Plan – 2011/12 to 2013/14
81
Appendices
Table A6 Material Assumptions — Revenue (1) — Continued
| | Restated | | Updated | | Budget | | | | | | | |
Revenue Source and Assumptions | | Budget | | Forecast | | Estimate | | Plan | | Plan | | | |
($ millions unless otherwise specified) | | 2010/11 | | 2011/12 | | 2012/13 | | 2013/14 | | Sensitivities 2011/12 | |
Forests | | $ | 491 | | $ | 422 | | $ | 526 | | $ | 534 | | $ | 590 | | | |
Prices (calendar year average) | | | | | | | | | | | | +/- US$50 change in SPF | |
SPF 2x4 ($US/1000 bd ft) | | $ | 225 | | $ | 256 | | $ | 263 | | $ | 288 | | $ | 300 | | price equals +/- $25 to | |
Random Lengths Composite | | | | | | | | | | | | $50 million | |
($US/thousand board feet) | | $ | 260 | | $ | 283 | | $ | 298 | | $ | 323 | | $ | 335 | | +/- US$50 change in hemlock | |
Hemlock price ($US/1000 bd ft) | | $ | 750 | | $ | 777 | | $ | 713 | | $ | 675 | | $ | 675 | | price equals +/- $5 to $10 | |
Pulp ($US/tonne) | | $ | 763 | | $ | 932 | | $ | 888 | | $ | 738 | | $ | 700 | | million | |
Coastal log ($Cdn/cubic metre) | | | | | | | | | | | | +/- US$50 change in pulp price | |
(Vancouver Log Market, fiscal year) | | $ | 66 | | $ | 69 | | $ | 69 | | $ | 73 | | $ | 77 | | equals +/- $5 to $10 million | |
| | | | | | | | | | | | +/- Cdn $10 change in average | |
Fiscal Year Trade Assumptions | | | | | | | | | | | | log price equals+/-$10 to | |
Export tax rate (effective rate) | | 15.0 | % | 12.9 | % | 11.3 | % | 6.3 | % | 5.0 | % | $20 million | |
Lumber shipments and consumption (billion board feet) | | | | | | | | | | | | +/- 1 cent change in | |
U.S. lumber consumption | | 35.1 | | 33.3 | | 33.9 | | 37.7 | | 39.7 | | exchange rate equals | |
BC surge trigger volumes | | 7.4 | | 7.1 | | 7.2 | | 8.0 | | 8.4 | | +/- $5 to $10 million on | |
BC lumber exports to US | | 6.2 | | 5.3 | | 6.4 | | 7.5 | | 8.5 | | stumpage revenue | |
| | | | | | | | | | | | +/- 10% change in Interior | |
Crown harvest volumes (million cubic metres) | | | | | | | | | | | | harvest volumes equals | |
Interior | | 37.2 | | 46.0 | | 47.4 | | 47.9 | | 47.9 | | +/- $10 to $15 million | |
Coast | | 7.8 | | 11.5 | | 11.6 | | 12.1 | | 12.1 | | +/- 10% change in Coastal | |
Total | | 45.0 | | 57.5 | | 59.0 | | 60.0 | | 60.0 | | harvest volumes equals | |
BC Timber Sales (included in above) | | 10.9 | | 11.8 | | 11.8 | | 11.9 | | 12.0 | | +/- $3 to $10 million | |
| | | | | | | | | | | | | |
Components of revenue | | | | | | | | | | | | The above sensitivities relate | |
Tenures | | $ | 148 | | $ | 101 | | $ | 157 | | $ | 206 | | $ | 260 | | to stumpage revenue only. | |
BC Timber Sales | | $ | 137 | | $ | 144 | | $ | 158 | | $ | 169 | | $ | 170 | | Depending on market | |
Federal border tax (SLA 2006) | | $ | 181 | | $ | 141 | | $ | 174 | | $ | 120 | | $ | 116 | | conditions, changes in | |
Logging tax | | $ | 4 | | $ | 10 | | $ | 12 | | $ | 15 | | $ | 20 | | stumpage revenues may be | |
Other CRF revenue | | $ | 10 | | $ | 12 | | $ | 14 | | $ | 13 | | $ | 13 | | offset by changes in border | |
Recoveries | | $ | 11 | | $ | 14 | | $ | 11 | | $ | 11 | | $ | 11 | | tax revenues. | |
Other natural resources | | $ | 397 | | $ | 400 | | $ | 429 | | $ | 457 | | $ | 470 | | | |
Components of revenue | | | | | | | | | | | | | |
Water rental and licences* | | $ | 332 | | $ | 339 | | $ | 362 | | $ | 390 | | $ | 403 | | | |
Recoveries | | $ | 46 | | $ | 38 | | $ | 48 | | $ | 48 | | $ | 48 | | | |
Angling and hunting permits and licences | | $ | 12 | | $ | 12 | | $ | 12 | | $ | 12 | | $ | 12 | | | |
Recoveries | | $ | 7 | | $ | 11 | | $ | 7 | | $ | 7 | | $ | 7 | | | |
* BC Hydro rate increases are indexed to Consumer Price Index.
Other revenue | | $ | 7,826 | | $ | 8,147 | | $ | 8,702 | | $ | 8,641 | | $ | 8,982 | | | |
Components of revenue | | | | | | | | | | | | | |
Fees and licences | | | | | | | | | | | | | |
Consolidated Revenue Fund | | $ | 2,495 | | $ | 2,558 | | $ | 2,699 | | $ | 2,826 | | $ | 2,947 | | | |
Recoveries | | $ | 212 | | $ | 236 | | $ | 218 | | $ | 158 | | $ | 149 | | | |
Crown corporations and agencies | | $ | 98 | | $ | 102 | | $ | 106 | | $ | 110 | | $ | 111 | | | |
Other service delivery agencies | | $ | 1,551 | | $ | 1,651 | | $ | 1,684 | | $ | 1,721 | | $ | 1,759 | | | |
Investment earnings | | | | | | | | | | | | | |
Consolidated Revenue Fund | | $ | 47 | | $ | 70 | | $ | 78 | | $ | 87 | | $ | 94 | | | |
Fiscal agency loans & sinking funds earnings | | $ | 726 | | $ | 700 | | $ | 814 | | $ | 934 | | $ | 1,091 | | | |
Crown corporations and agencies | | $ | 37 | | $ | 39 | | $ | 36 | | $ | 38 | | $ | 40 | | | |
Other service delivery agencies | | $ | 100 | | $ | 82 | | $ | 109 | | $ | 111 | | $ | 109 | | | |
Sales of goods and services | | $ | 701 | | $ | 719 | | $ | 738 | | $ | 760 | | $ | 776 | | | |
Miscellaneous | | | | | | | | | | | | | |
Consolidated Revenue Fund | | $ | 194 | | $ | 183 | | $ | 188 | | $ | 195 | | $ | 200 | | | |
Recoveries | | $ | 464 | | $ | 546 | | $ | 510 | | $ | 484 | | $ | 475 | | | |
Crown corporations and agencies | | $ | 75 | | $ | 87 | | $ | 385 | | $ | 72 | | $ | 81 | | | |
Other service delivery agencies | | $ | 1,126 | | $ | 1,174 | | $ | 1,137 | | $ | 1,145 | | $ | 1,150 | | | |
Budget and Fiscal Plan – 2011/12 to 2013/14
82
Appendices
Table A6 Material Assumptions – Revenue (1) – Continued
| | Restated | | Updated | | Budget | | | | | | | |
Revenue Source and Assumptions | | Budget | | Forecast | | Estimate | | Plan | | Plan | | | |
($ millions unless otherwise specified) | | 2010/11 | | 2011/12 | | 2012/13 | | 2013/14 | | Sensitivities 2011/12 | |
Health and social transfers | | $ | 5,165 | | $ | 5,168 | | $ | 5,398 | | $ | 5,696 | | $ | 6,011 | | | |
National Cash Transfers | | | | | | | | | | | | | |
Canada Health Transfer (CHT) | | $ | 25,426 | | $ | 25,426 | | $ | 26,952 | | $ | 28,569 | | $ | 30,283 | | | |
Wait Times Reduction Transfer (WTRT) | | $ | 250 | | $ | 250 | | $ | 250 | | $ | 250 | | $ | 250 | | +/- 0.1% change in BC’s | |
Canada Social Transfer (CST) | | $ | 11,179 | | $ | 11,179 | | $ | 11,514 | | $ | 11,859 | | $ | 12,215 | | population share equals | |
BC share of national population (June 1) | | 13.26 | % | 13.28 | % | 13.34 | % | 13.40 | % | 13.45 | % | +/- $45 to $50 million | |
BC health and social transfers revenue | | | | | | | | | | | | | |
CHT | | $ | 3,597 | | $ | 3,600 | | $ | 3,806 | | $ | 4,051 | | $ | 4,312 | | | |
WTRT | | $ | 33 | | $ | 33 | | $ | 33 | | $ | 33 | | $ | 34 | | | |
CST | | $ | 1,482 | | $ | 1,485 | | $ | 1,536 | | $ | 1,589 | | $ | 1,643 | | | |
Prior-year adjustments | | | | -$1 | | | | | | | | | |
Health deferral | | | | | | | | | | | | | |
Diagnostic and Medical Equipment | | $ | 16 | | $ | 16 | | $ | 16 | | $ | 16 | | $ | 15 | | | |
Medical Equipment Trust | | $ | 7 | | $ | 7 | | $ | 7 | | $ | 7 | | $ | 7 | | | |
Human Papillomavirus Immunization Trust | | $ | 13 | | $ | 11 | | — | | — | | — | | | |
Patient Wait Times Guarantee Trust | | $ | 17 | | $ | 17 | | — | | — | | — | | | |
Other federal contributions | | $ | 2,520 | | $ | 2,735 | | $ | 2,182 | | $ | 1,519 | | $ | 1,548 | | | |
Components of revenue | | | | | | | | | | | | | |
HST Transitional Funding | | $ | 769 | | $ | 769 | | $ | 580 | | — | | — | | | |
Other Consolidated Revenue Fund | | $ | 176 | | $ | 261 | | $ | 192 | | $ | 165 | | $ | 152 | | | |
Labour Market Development Agreement | | $ | 296 | | $ | 346 | | $ | 296 | | $ | 297 | | $ | 297 | | | |
Local Government Services and Transfers | | $ | 172 | | $ | 173 | | $ | 50 | | $ | 50 | | $ | 50 | | | |
Canada-BC Co-operation on Immigration | | $ | 104 | | $ | 104 | | $ | 97 | | $ | 97 | | $ | 96 | | | |
Labour Market Agreement | | $ | 66 | | $ | 66 | | $ | 66 | | $ | 66 | | $ | 66 | | | |
Strategic Training and Transition Fund | | — | | $ | 30 | | — | | — | | — | | | |
Police Officer’s Recruitment Fund | | $ | 21 | | $ | 23 | | — | | — | | — | | | |
Community Development Trust | | $ | 13 | | $ | 19 | | $ | 5 | | — | | — | | | |
Community Adjustment Fund Agreement | | $ | 15 | | $ | 15 | | — | | — | | — | | | |
Other recoveries | | $ | 167 | | $ | 197 | | $ | 182 | | $ | 183 | | $ | 216 | | | |
Crown corporations and agencies | | $ | 308 | | $ | 254 | | $ | 236 | | $ | 176 | | $ | 183 | | | |
Other service delivery agencies | | $ | 413 | | $ | 478 | | $ | 478 | | $ | 485 | | $ | 488 | | | |
Service delivery agency direct revenue | | $ | 5,017 | | $ | 5,209 | | $ | 5,559 | | $ | 5,298 | | $ | 5,406 | | | |
School districts | | $ | 484 | | $ | 511 | | $ | 481 | | $ | 482 | | $ | 481 | | | |
Post-secondary institutions | | $ | 2,460 | | $ | 2,623 | | $ | 2,685 | | $ | 2,741 | | $ | 2,795 | | | |
Health authorities and hospital societies | | $ | 734 | | $ | 743 | | $ | 735 | | $ | 740 | | $ | 738 | | | |
BC Transportation Financing Authority | | $ | 460 | | $ | 497 | | $ | 493 | | $ | 505 | | $ | 522 | | | |
Other service delivery agencies | | $ | 879 | | $ | 835 | | $ | 1,165 | | $ | 830 | | $ | 870 | | | |
Commercial Crown corporation net income | | $ | 3,012 | | $ | 2,923 | | $ | 2,941 | | $ | 2,933 | | $ | 2,997 | | | |
BC Hydro | | $ | 617 | | $ | 571 | | $ | 611 | | $ | 584 | | $ | 626 | | | |
reservoir water inflows | | 100 | % | 83 | % | 100 | % | 100 | % | 100 | % | +/- 1% in hydro generation | |
| | | | | | | | | | | | = +/- $10million | |
mean gas price | | 5.44 | | 4.06 | | 4.61 | | 5.09 | | 5.36 | | +/- 10% = -/+ $5million | |
(Sumas, $US/MMbtu — BC Hydro forecast based on NYMEX forward selling prices) | | | | | | | | | | | | | |
electricity prices | | 42.13 | | 32.35 | | 35.77 | | 39.80 | | 42.51 | | +/- $1/MWh in electricity trade | |
(Mid-C, $US/MWh) | | | | | | | | | | | | margins = +/- $35million | |
assumed rate increases: | | | | | | | | | | | | | |
- base rate | | 6.11 | % | 4.67 | %* | 9.73 | % | 9.73 | % | 9.73 | % | | |
- rate rider changes from prior year | | 3.00 | % | 2.53 | % | -1.03 | % | 0.00 | % | 0.00 | % | | |
Assumed base rate increases for 2011/12 through 2013/14 reflect the notional annual increases that would be required for BC Hydro to earn its allowed return on equity as mandated by the BCUC. These increases are included for planning purposes only. Actual rate increases in these years will be determined by future applications to, and approval from, the BCUC. | |
| |
* Represents 6.11% approved rate increase and a 4.71% credit for the January 1 to March 31, 2011 period. | |
| | | | | | | | | | | | | |
ICBC | | $ | 303 | | $ | 361 | | $ | 290 | | $ | 277 | | $ | 235 | | | |
vehicle growth | | +1.3 | % | +1.7 | % | +1.8 | % | +2.0 | % | +2.0% | | +/- 1% = +/- $37 to $39 million | |
current claims cost percentage change | | +3.7 | % | +4.0 | % | +1.2 | % | +3.4 | % | +4.1% | | +/- 1% = -/+ $27 to $31million | |
investment return | | 4.4 | % | 4.5 | % | 4.6 | % | 4.6 | % | 4.7% | | +/- 1% return = +/-$111 | |
| | | | | | | | | | | | to $115 million | |
loss ratio | | 85.1 | % | 83.8 | % | 85.3 | % | 85.8 | % | 86.8 | % | | |
| | | | | | | | | | | | | | | | | | | |
(1) Revenue is based on information available as of January 24, 2011.
Budget and Fiscal Plan – 2011/12 to 2013/14
83
Appendices
Table A7 Natural Gas Price Forecasts — 2011/12 to 2013/14
| | | | | | | | Adjusted to fiscal years and | |
Private sector forecasts (calendar year) | | $C/gigajoule at plant inlet | |
| | 2011 | | 2012 | | 2013 | | 2011/12 | | 2012/13 | | 2013/14 | |
GLJ Henry Hub US$/MMBtu (Jan 1, 11) | | 4.50 | | 5.15 | | 5.75 | | 2.77 | | 3.22 | | 3.88 | |
Sproule Henry Hub US$/MMBtu (Dec 31, 10) | | 4.44 | | 5.01 | | 5.32 | | 2.52 | | 3.01 | | 3.74 | |
McDaniel Henry Hub US$/MMBtu (Jan 1, 11) | | 4.55 | | 5.30 | | 5.75 | | 2.67 | | 3.33 | | 3.90 | |
AJM Henry Hub US$/Mcf (Dec 31, 10) | | 4.50 | | 5.10 | | 5.70 | | 2.43 | | 3.00 | | 3.61 | |
GLJ Alberta AECO-C Spot CDN$/MMBtu (Jan 1, 11) | | 4.16 | | 4.74 | | 5.31 | | 3.47 | | 3.86 | | 4.37 | |
Sproule Alberta AECO-C Spot CDN $/MMBtu (Dec 31, 10) | | 4.04 | | 4.66 | | 4.99 | | 3.21 | | 3.72 | | 4.37 | |
McDaniel AECO-C Spot C$/MMBtu (Jan 1, 11) | | 4.25 | | 4.90 | | 5.40 | | 3.24 | | 3.42 | | 3.99 | |
AJM AECO-C Spot C $/Mcf (Dec 31, 10) | | 4.10 | | 4.60 | | 5.20 | | 3.09 | | 3.57 | | 4.05 | |
GLJ Sumas Spot US $/MMBtu (Jan 1, 11) | | 4.25 | | 4.85 | | 5.40 | | 3.20 | | 3.61 | | 4.23 | |
Sproule Sumas Spot CDN$/MMBtu (Dec 31, 10) | | 4.53 | | 5.15 | | 5.48 | | 3.31 | | 3.82 | | 4.47 | |
GLJ BC Spot Plant Gate CDN$/MMBtu (Jan 1, 11) | | 3.80 | | 4.39 | | 4.95 | | 3.24 | | 3.64 | | 4.14 | |
Sproule BC Plant Inlet CDN$/MMBtu (Dec 31, 10) | | 3.36 | | 3.98 | | 4.31 | | 3.35 | | 3.86 | | 4.51 | |
McDaniel BC Spot Plant Gate C$MMBtu (Jan 1, 11) | | 4.05 | | 4.70 | | 5.20 | | 3.34 | | 3.92 | | 4.39 | |
AJM BC Spot Plant Gate C$/Mcf (Dec 31, 10) | | 3.80 | | 4.30 | | 4.90 | | 2.93 | | 3.42 | | 3.89 | |
GLJ Midwest Chicago US$/MMBtu (Jan 1, 11) | | 4.60 | | 5.25 | | 5.85 | | 3.05 | | 3.50 | | 4.17 | |
Sproule Alliance Plant Gate CDN$/MMBtu (Dec 31, 10) | | 3.26 | | 3.98 | | 4.41 | | 2.50 | | 3.10 | | 3.83 | |
EIA Henry Hub US$/MMBtu (Dec 7, 2010) | | 4.33 | | n/a | | n/a | | n/a | | n/a | | n/a | |
TD Economics Henry Hub FuturesUS $/MMBtu (Dec 14, 10) | | 4.23 | | 5.00 | | n/a | | 2.36 | | n/a | | n/a | |
Scotiabank Group Henry Hub US$/MMBtu (Dec 7, 10) | | 4.40 | | 4.60 | | n/a | | 2.38 | | n/a | | n/a | |
BMO Alberta Empress US$/MMBtu (Nov, 10) | | 4.90 | | n/a | | n/a | | | | n/a | | n/a | |
RBC Financial Henry Hub US$/Mcf (Sep 14, 10) | | 5.00 | | 5.50 | | n/a | | 2.86 | | n/a | | n/a | |
Exports Development Canada Henry Hub US$/MMBtu (Dec 15, 10) | | 4.90 | | 5.50 | | n/a | | 2.96 | | n/a | | n/a | |
InSite Petroleum Consultants Ltd Henry Hub US$/MMBtu (Sep 30, 10) | | 4.65 | | 5.25 | | 6.00 | | 3.89 | | 4.53 | | 5.36 | |
Fekete AECO-C Spot CDN$/MMBtu (Oct 5, 10) | | 4.80 | | 5.55 | | 6.30 | | 3.96 | | 4.67 | | 5.33 | |
NYMEX Forward Market converted to Plant Inlet CDN$/GJ (Dec 9, 10) | | | | | | | | 2.61 | | 3.16 | | 3.51 | |
Average all minus high/low | | | | | | | | 3.02 | | 3.60 | | 4.20 | |
Average one forecast per consultant minus high/low | | | | | | | | 3.12 | | 3.87 | | 4.45 | |
Natural gas royalty price forecast | | | | | | | | 3.02 | | 3.60 | | 4.20 | |
GLJ: Gilbert Laustsen Jung Petroleum Consultants Ltd
AJM: Ashton Jenkins Mann Petroleum Consultants
US EIA: US Energy Information Administration
McDaniel: McDaniel & Associates Consultants Ltd
AECO: Alberta Energy Company
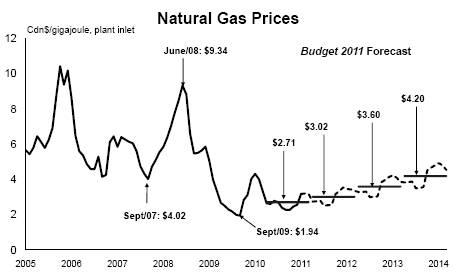
· High storage levels in 2010 have reduced the private sector natural gas price outlook.
· Average prices are expected to remain volatile as they are largely influenced by economic demand, inventory levels, weather, other energy prices, and changes in drilling technologies.
Budget and Fiscal Plan – 2011/12 to 2013/14
84
Appendices
Table A8 Material Assumptions — Expense
Ministry Programs and Assumptions | | Restated
Budget | | Updated
Forecast | | Budget
Estimate | | Plan | | Plan | | | |
($ millions unless otherwise specified) | | 2010/11 | | 2011/12 | | 2012/13 | | 2013/14 | | Sensitivities 2011/12 | |
Advanced Education | | 1,978 | | 1,978 | | 1,980 | | 1,989 | | 1,989 | | | |
Student spaces in public institutions
(# FTEs) | | 205,278 | | 205,015 | | 201,792 | | 201,983 | | 202,114 | | The number of student spaces may vary depending on the financial and other policies of post secondary institutions. | |
Attorney General | | 458 | | 458 | | 443 | | 443 | | 443 | | | |
New cases filed/processed
(# for all courts) | | 295,000 | | 295,000 | | 295,000 | | 295,000 | | 295,000 | | The number of criminal cases proceeded on by the provincial and federal Crown (including appeals to higher courts in BC), the number of civil and family litigation cases, the number of violation tickets disputed, and the number of municipal bylaw tickets disputed which would go to court for resolution. | |
|
Crown Proceedings Act (CPA) | | 25 | | 25 | | 25 | | 25 | | 25 | | The number and size of litigation brought against the province, as well as the effectiveness of mitigation strategies and legal defence. | |
Children and Family Development | | 1,334 | | 1,334 | | 1,331 | | 1,331 | | 1,331 | | | |
Average children-in-care
caseload (#) | | 8,500 | | 8,400 | | 8,300 | | 8,150 | | 8,150 | | Caseload is expected to decline due to large number of 15 to 17 year olds currently in the system who will reach maturity. A 1% increase in the cost per case or a 1% increase in the average caseload will affect expenditures by approximately $2.8 million. | |
Average annual residential cost per child in care ($) | | 33,800 | | 33,800 | | 34,500 | | 35,200 | | 35,900 | |
Education | | 5,164 | | 5,164 | | 5,242 | | 5,264 | | 5,264 | | | |
Enrolment (# of FTEs) | | 561,734 | | 556,331 | | 564,933 | | 565,298 | | 565,669 | | Enrolment figures are | |
School age (K–12) | | 524,879 | | 522,637 | | 521,022 | | 521,022 | | 521,022 | | based on BC Stats | |
Expanded full-day kindergarten | | 7,543 | | 7,772 | | 15,085 | | 15,450 | | 15,821 | | enrolment trends, to | |
Distributed Learning (online) | | 14,000 | | 12,096 | | 15,000 | | 15,000 | | 15,000 | | which the Ministry has | |
Summer | | 7,093 | | 5,890 | | 5,890 | | 5,890 | | 5,890 | | added forecasts for | |
Adults | | 8,219 | | 7,937 | | 7,937 | | 7,937 | | 7,937 | | distributed learning, | |
| | | | | | | | | | | | adult education, and | |
| | | | | | | | | | | | summer learning. | |
Forests, Lands and Natural Resource Operations | | 633 | | 801 | | 590 | | 587 | | 582 | | | |
BC Timber Sales | | 159 | | 163 | | 164 | | 161 | | 155 | | Targets can be impacted by changes to actual inventory costs incurred. There is a lag of approximately 2 years between when inventory costs are incurred and when they are expensed. Volume harvested can also impact targets. For example, if volume harvested is less than projected in any year then capitalized expenses will also be reduced in that year. | |
Direct Fire Fighting | | 63 | | 231 | | 63 | | 63 | | 63 | | Over the past several years, Direct fire fighting costs have ranged from a low of $19 million in 1997 to $382 million in 2009. | |
Health | | 14,796 | | 14,796 | | 15,714 | | 16,161 | | 16,765 | | | |
Pharmacare | | 1,101 | | 1,101 | | 1,140 | | 1,197 | | 1,245 | | A 1% change in utilization or drug prices affects costs by approximately $10 million. | |
Medical Services Plan (MSP) | | 3,595 | | 3,595 | | 3,802 | | 3,901 | | 4,033 | | A 1% increase in volume of services provided by fee-for-service physicians affects costs by approximately $25 million. | |
Regional Services | | 9,874 | | 9,874 | | 10,541 | | 10,828 | | 11,253 | | | |
Budget and Fiscal Plan – 2011/12 to 2013/14
85
Appendices
Table A8 Material Assumptions — Expense — Continued
| | Restated | | Updated | | Budget | | | | | | | |
Ministry Programs and Assumptions | | Budget | | Forecast | | Estimate | | Plan | | Plan | | | |
($ millions unless otherwise specified) | | 2010/11 | | 2011/12 | | 2012/13 | | 2013/14 | | Sensitivities 2011/12 | |
Public Safety and Solicitor General | | 637 | | 676 | | 635 | | 635 | | 635 | | | |
Policing, Victim Services and Corrections | | 529 | | 529 | | 527 | | 528 | | 528 | | The volume and severity of criminal activity, the number of inmate beds occupied and the number of offenders under community supervision. | |
Emergency Program Act (EPA) | | 15 | | 54 | | 15 | | 15 | | 15 | | The number and severity of natural disasters. | |
Social Development | | 2,355 | | 2,355 | | 2,339 | | 2,349 | | 2,334 | | | |
Temporary Assistance annual average caseload (#) | | 57,406 | | 57,700 | | 53,100 | | 50,400 | | 48,500 | | The expected to work caseload is sensitive to fluctuations in economic and employment trends in the service sector. A 1% change in the Temporary Assistance annual average caseload or average cost per case will affect expenditures by approximately $4.5 million annually. | |
Disability Assistance annual average caseload (#) | | 76,190 | | 75,500 | | 78,600 | | 81,600 | | 81,600 | | The caseload for persons with disabilities is sensitive to the aging of the population and longer life expectancy for individuals with disabilities and significant health issues. A 1% change in the Disability Assistance annual average caseload or average cost percase will affect expenditures by approximately $7.5 million annually. | |
Total annual average caseload (#) | | 133,596 | | 133,200 | | 131,700 | | 132,000 | | 130,100 | | The average cost per case is sensitive to the composition of the caseload, and reported income. | |
Adult Community Living: | | | | | | | | | | | | | |
Residential Services: | | | | | | | | | | | | | |
Average caseload (#) | | 5,501 | | 5,500 | | 5,600 | | 5,800 | | 6,000 | | The adult community living caseload is sensitive to the pressures of an aging population. A 1% increase in the adult caseload will increase expenditures by approximately $2.3 million. | |
Average cost per client ($) | | 68,400 | | 72,900 | | 71,500 | | 69,300 | | 67,000 | |
Day Programs: | | | | | | | | | | | |
Average caseload (#) | | 13,201 | | 13,100 | | 13,800 | | 14,400 | | 15,100 | |
Average cost per client ($) | | 19,074 | | 17,500 | | 16,600 | | 15,800 | | 15,100 | |
Personal Supports Initiative | | | | | | | | | | | | | |
Average caseload (#) | | 133 | | 100 | | 300 | | 500 | | 800 | | | |
Average cost per client ($) | | 44,383 | | 21,100 | | 20,400 | | 21,400 | | 19,100 | | | |
Management of Public Funds and Debt | | 1,301 | | 1,256 | | 1,349 | | 1,403 | | 1,502 | | | |
Interest rates for new provincial borrowing: | | | | | | | | | | | | Full year impact on MoPD on interest costs of a 1% change in interest rates equals $60.5 million; $100 million increase in debt level equals $4.2 million. | |
Short-term | | 0.81 | % | 0.82 | % | 1.66 | % | 2.92 | % | 3.95 | % |
Long-term | | 4.55 | % | 3.84 | % | 4.17 | % | 4.74 | % | 5.60 | % |
CDN/US exchange rate (cents) | | 101.9 | | 102.2 | | 99.9 | | 100.2 | | 102.5 | |
Service delivery agency net spending | | 4,082 | | 4,538 | | 4,643 | | 5,507 | | 6,016 | | | |
School districts | | 293 | | 373 | | 192 | | 301 | | 404 | | | |
Post-secondary institutions | | 2,287 | | 2,435 | | 2,649 | | 2,811 | | 2,909 | | | |
Health authorities and hospital societies | | 590 | | 633 | | 552 | | 701 | | 827 | | | |
BC Transportation Financing Authority | | 802 | | 798 | | 947 | | 1,042 | | 1,185 | | | |
Other service delivery agencies | | 110 | | 299 | | 303 | | 652 | | 691 | | | |
Budget and Fiscal Plan – 2011/12 to 2013/14
86
Appendices
Table A9 Operating Statement — 2004/05 to 2013/14
($ millions) | | Actual
2004/05 | | Actual
2005/06 | | Actual
2006/07 | | Actual
2007/08 | | Actual
2008/09 | | Actual
2009/10 | | Updated
Forecast
2010/11 | | Budget
Estimate
2011/12 | | Plan
2012/13 | | Plan
2013/14 | | Average
annual
change | |
| | | | | | | | | | | | | | | | | | | | | | (per cent) | |
Revenue | | 33,355 | | 35,946 | | 38,448 | | 39,772 | | 38,302 | | 37,521 | | 39,893 | | 41,337 | | 42,446 | | 44,091 | | 3.1 | |
Expense | | (30,666 | ) | (32,241 | ) | (34,198 | ) | (36,555 | ) | (38,245 | ) | (39,300 | ) | (41,008 | ) | (41,912 | ) | (42,536 | ) | (43,566 | ) | 4.0 | |
Surplus (deficit) before unusual items | | 2,689 | | 3,705 | | 4,250 | | 3,217 | | 57 | | (1,779 | ) | (1,115 | ) | (575 | ) | (90 | ) | 525 | | | |
Forecast allowance | | — | | — | | — | | — | | — | | — | | (150 | ) | (350 | ) | (350 | ) | (350 | ) | | |
Negotiating Framework incentive payments | | — | | (710 | ) | (264 | ) | (4 | ) | (2 | ) | — | | — | | — | | — | | — | | | |
Climate Action Dividend | | — | | — | | — | | (440 | ) | 20 | | — | | — | | — | | — | | — | | | |
Surplus (deficit) | | 2,689 | | 2,995 | | 3,986 | | 2,773 | | 75 | | (1,779 | ) | (1,265 | ) | (925 | ) | (440 | ) | 175 | | | |
| | | | | | | | | | | | | | | | | | | | | | | |
Per cent of Nominal GDP: (1) | | | | | | | | | | | | | | | | | | | | | | | |
Surplus (deficit) | | 1.7 | | 1.8 | | 2.2 | | 1.4 | | 0.0 | | -0.9 | | -0.6 | | -0.4 | | -0.2 | | 0.1 | | | |
Per cent of revenue: | | | | | | | | | | | | | | | | | | | | | | | |
Surplus (deficit) | | 8.1 | | 8.3 | | 10.4 | | 7.0 | | 0.2 | | -4.7 | | -3.2 | | -2.2 | | -1.0 | | 0.4 | | | |
Per capita: (2) | | | | | | | | | | | | | | | | | | | | | | | |
Surplus (deficit) | | 647 | | 714 | | 939 | | 643 | | 17 | | (399 | ) | (279 | ) | (201 | ) | (94 | ) | 37 | | | |
(1) Surplus (deficit) as a per cent of GDP is calculated using GDP for the calendar year ending in the fiscal year (e.g. 2011/12 amounts divided by GDP for the 2011 calendar year).
(2) Per capita revenue and expense is calculated using July 1 population (e.g. 2011/12 amounts divided by population on July 1, 2011).
Budget and Fiscal Plan – 2011/12 to 2013/14
87
Appendices
Table A10 Revenue by Source — 2004/05 to 2013/14
($ millions) | | Actual
2004/05 | | Actual
2005/06 | | Actual
2006/07 | | Actual
2007/08 | | Actual
2008/09 | | Actual
2009/10 | | Updated
Forecast
2010/11 | | Budget
Estimate
2011/12 | | Plan
2012/13 | | Plan
2013/14 | | Average
annual
change | |
| | | | | | | | | | | | | | | | | | | | | | (per cent) | |
Taxation revenue: | | | | | | | | | | | | | | | | | | | | | | | |
Personal income | | 5,050 | | 5,838 | | 6,905 | | 6,956 | | 6,093 | | 5,529 | | 5,354 | | 5,796 | | 6,189 | | 6,596 | | 3.0 | |
Corporate income | | 1,255 | | 1,426 | | 1,538 | | 2,250 | | 2,038 | | 1,317 | | 1,638 | | 1,571 | | 1,872 | | 1,461 | | 1.7 | |
Harmonized sales | | — | | — | | — | | — | | — | | — | | 4,171 | | 5,820 | | 6,164 | | 6,516 | | n/a | |
Other sales | | 4,156 | | 4,367 | | 4,714 | | 5,072 | | 4,958 | | 4,765 | | 1,399 | | 116 | | 87 | | 88 | | n/a | |
Fuel | | 904 | | 911 | | 901 | | 935 | | 891 | | 884 | | 946 | | 964 | | 969 | | 985 | | 1.0 | |
Carbon | | — | | — | | — | | — | | 306 | | 542 | | 740 | | 950 | | 1,166 | | 1,232 | | n/a | |
Tobacco | | 699 | | 701 | | 726 | | 692 | | 708 | | 682 | | 737 | | 676 | | 676 | | 676 | | -0.4 | |
Property | | 1,661 | | 1,717 | | 1,732 | | 1,795 | | 1,848 | | 1,884 | | 1,891 | | 1,898 | | 1,987 | | 2,080 | | 2.5 | |
Property transfer | | 604 | | 843 | | 914 | | 1,068 | | 715 | | 887 | | 850 | | 810 | | 854 | | 876 | | 4.2 | |
Corporation capital | | 160 | | 162 | | 91 | | 117 | | 108 | | 95 | | 4 | | — | | — | | — | | n/a | |
Other | | 428 | | 464 | | 496 | | 521 | | 532 | | 517 | | 436 | | 413 | | 424 | | 434 | | 0.2 | |
| | 14,917 | | 16,429 | | 18,017 | | 19,406 | | 18,197 | | 17,102 | | 18,166 | | 19,014 | | 20,388 | | 20,944 | | 3.8 | |
Natural resource revenue: | | | | | | | | | | | | | | | | | | | | | | | |
Natural gas royalties | | 1,439 | | 1,921 | | 1,207 | | 1,132 | | 1,314 | | 406 | | 365 | | 447 | | 597 | | 856 | | -5.6 | |
Crown land tenures | | 342 | | 386 | | 441 | | 569 | | 814 | | 867 | | 926 | | 929 | | 896 | | 898 | | 11.3 | |
Columbia River Treaty | | 258 | | 319 | | 223 | | 246 | | 231 | | 168 | | 145 | | 150 | | 170 | | 185 | | -3.6 | |
Other energy and minerals | | 256 | | 392 | | 456 | | 367 | | 479 | | 421 | | 496 | | 619 | | 615 | | 610 | | 10.1 | |
Forests | | 1,363 | | 1,214 | | 1,276 | | 1,087 | | 557 | | 387 | | 422 | | 526 | | 534 | | 590 | | -8.9 | |
Other resources | | 301 | | 316 | | 341 | | 340 | | 412 | | 397 | | 400 | | 429 | | 457 | | 470 | | 5.1 | |
| | 3,959 | | 4,548 | | 3,944 | | 3,741 | | 3,807 | | 2,646 | | 2,754 | | 3,100 | | 3,269 | | 3,609 | | -1.0 | |
Other revenue: | | | | | | | | | | | | | | | | | | | | | | | |
Medical Services Plan premiums | | 1,465 | | 1,482 | | 1,524 | | 1,557 | | 1,595 | | 1,666 | | 1,798 | | 1,945 | | 2,081 | | 2,193 | | 4.6 | |
Post-secondary education fees | | 836 | | 892 | | 928 | | 979 | | 1,039 | | 1,126 | | 1,212 | | 1,244 | | 1,279 | | 1,316 | | 5.2 | |
Other health-care related fees | | 228 | | 225 | | 237 | | 248 | | 257 | | 267 | | 299 | | 300 | | 303 | | 303 | | 3.2 | |
Motor vehicle licences and permits | | 381 | | 403 | | 424 | | 442 | | 447 | | 447 | | 469 | | 474 | | 479 | | 485 | | 2.7 | |
Other fees and licences | | 746 | | 679 | | 690 | | 749 | | 669 | | 613 | | 769 | | 744 | | 673 | | 669 | | -1.2 | |
Investment earnings | | 837 | | 955 | | 1,041 | | 1,150 | | 817 | | 963 | | 891 | | 1,037 | | 1,170 | | 1,334 | | 5.3 | |
Sales of goods and services | | 741 | | 719 | | 678 | | 637 | | 694 | | 733 | | 719 | | 738 | | 760 | | 776 | | 0.5 | |
Miscellaneous | | 1,458 | | 1,566 | | 1,890 | | 1,955 | | 1,891 | | 2,021 | | 1,990 | | 2,220 | | 1,896 | | 1,906 | | 3.0 | |
| | 6,692 | | 6,921 | | 7,412 | | 7,717 | | 7,409 | | 7,836 | | 8,147 | | 8,702 | | 8,641 | | 8,982 | | 3.3 | |
Contributions from the federal government: | | | | | | | | | | | | | | | | | | | | | | | |
Health and social transfers | | 3,421 | | 4,220 | | 4,473 | | 4,614 | | 4,743 | | 4,883 | | 5,168 | | 5,398 | | 5,696 | | 6,011 | | 6.5 | |
Harmonized sales tax transition payments | | — | | — | | — | | — | | — | | 250 | | 769 | | 580 | | — | | — | | n/a | |
Equalization | | 979 | | 590 | | 459 | | — | | — | | — | | | | | | | | | | n/a | |
Other cost shared agreements | | 822 | | 1,015 | | 1,455 | | 1,318 | | 1,242 | | 1,784 | | 1,966 | | 1,602 | | 1,519 | | 1,548 | | 7.3 | |
| | 5,222 | | 5,825 | | 6,387 | | 5,932 | | 5,985 | | 6,917 | | 7,903 | | 7,580 | | 7,215 | | 7,559 | | 4.2 | |
Commercial Crown corporation net income: | | | | | | | | | | | | | | | | | | | | | | | |
BC Hydro | | 402 | | 266 | | 407 | | 369 | | 365 | | 447 | | 571 | | 611 | | 584 | | 626 | | 5.0 | |
Liquor Distribution Branch | | 779 | | 800 | | 840 | | 857 | | 891 | | 877 | | 897 | | 925 | | 946 | | 967 | | 2.4 | |
BC Lotteries (net of payments to federal gov’t) | | 811 | | 914 | | 1,011 | | 1,080 | | 1,082 | | 1,070 | | 1,071 | | 1,096 | | 1,137 | | 1,179 | | 4.2 | |
ICBC | | 383 | | 191 | | 381 | | 633 | | 512 | | 601 | | 361 | | 290 | | 277 | | 235 | | -5.3 | |
BC Railway Company | | 183 | | 33 | | 30 | | 13 | | 36 | | 2 | | 12 | | 18 | | 20 | | 21 | | n/a | |
Transportation Invest. Corp. (Port Mann) | | — | | — | | — | | — | | (8 | ) | (4 | ) | (9 | ) | (15 | ) | (49 | ) | (48 | ) | n/a | |
Other | | 7 | | 19 | | 19 | | 24 | | 26 | | 27 | | 20 | | 16 | | 18 | | 17 | | 10.4 | |
| | 2,565 | | 2,223 | | 2,688 | | 2,976 | | 2,904 | | 3,020 | | 2,923 | | 2,941 | | 2,933 | | 2,997 | | 1.7 | |
Total revenue | | 33,355 | | 35,946 | | 38,448 | | 39,772 | | 38,302 | | 37,521 | | 39,893 | | 41,337 | | 42,446 | | 44,091 | | 3.1 | |
Budget and Fiscal Plan – 2011/12 to 2013/14
88
Appendices
Table A11 Revenue by Source Supplementary Information — 2004/05 to 2013/14
| | | | | | | | | | | | | | Updated | | Budget | | | | | | Average | |
| | Actual | | Actual | | Actual | | Actual | | Actual | | Actual | | Forecast | | Estimate | | Plan | | Plan | | annual | |
($ millions) | | 2004/05 | | 2005/06 | | 2006/07 | | 2007/08 | | 2008/09 | | 2009/10 | | 2010/11 | | 2011/12 | | 2012/13 | | 2013/14 | | change | |
| | | | | | | | | | | | | | | | | | | | | | (per cent) | |
Per cent of Nominal GDP: (1) | | | | | | | | | | | | | | | | | | | | | | | |
Taxation | | 9.5 | | 9.7 | | 9.9 | | 10.1 | | 9.2 | | 9.0 | | 9.0 | | 9.1 | | 9.3 | | 9.1 | | -0.5 | |
Natural resources | | 2.5 | | 2.7 | | 2.2 | | 1.9 | | 1.9 | | 1.4 | | 1.4 | | 1.5 | | 1.5 | | 1.6 | | -5.1 | |
Other | | 4.2 | | 4.1 | | 4.1 | | 4.0 | | 3.7 | | 4.1 | | 4.0 | | 4.1 | | 3.9 | | 3.9 | | -1.0 | |
Contributions from the federal government | | 3.3 | | 3.4 | | 3.5 | | 3.1 | | 3.0 | | 3.6 | | 3.9 | | 3.6 | | 3.3 | | 3.3 | | -0.1 | |
Commercial Crown corporation net income | | 1.6 | | 1.3 | | 1.5 | | 1.5 | | 1.5 | | 1.6 | | 1.4 | | 1.4 | | 1.3 | | 1.3 | | -2.5 | |
Total revenue | | 21.2 | | 21.2 | | 21.1 | | 20.7 | | 19.4 | | 19.6 | | 19.8 | | 19.7 | | 19.3 | | 19.1 | | -1.1 | |
Growth rates: | | | | | | | | | | | | | | | | | | | | | | | |
Taxation | | 7.9 | | 10.1 | | 9.7 | | 7.7 | | -6.2 | | -6.0 | | 6.2 | | 4.7 | | 7.2 | | 2.7 | | n/a | |
Natural resources | | 20.2 | | 14.9 | | -13.3 | | -5.1 | | 1.8 | | -30.5 | | 4.1 | | 12.6 | | 5.5 | | 10.4 | | n/a | |
Other | | 3.7 | | 3.4 | | 7.1 | | 4.1 | | -4.0 | | 5.8 | | 4.0 | | 6.8 | | -0.7 | | 3.9 | | n/a | |
Contributions from the federal government | | 44.3 | | 11.5 | | 9.6 | | -7.1 | | 0.9 | | 15.6 | | 14.3 | | -4.1 | | -4.8 | | 4.8 | | n/a | |
Commercial Crown corporation net income | | 31.1 | | -13.3 | | 20.9 | | 10.7 | | -2.4 | | 4.0 | | -3.2 | | 0.6 | | -0.3 | | 2.2 | | n/a | |
Total revenue | | 14.4 | | 7.8 | | 7.0 | | 3.4 | | -3.7 | | -2.0 | | 6.3 | | 3.6 | | 2.7 | | 3.9 | | n/a | |
Per capita: (2) | | | | | | | | | | | | | | | | | | | | | | | |
Taxation | | 3,590 | | 3,915 | | 4,246 | | 4,503 | | 4,151 | | 3,834 | | 4,009 | | 4,136 | | 4,372 | | 4,429 | | 2.4 | |
Natural resources | | 953 | | 1,084 | | 929 | | 868 | | 868 | | 593 | | 608 | | 674 | | 701 | | 763 | | -2.4 | |
Other | | 1,611 | | 1,649 | | 1,747 | | 1,791 | | 1,690 | | 1,757 | | 1,798 | | 1,893 | | 1,853 | | 1,899 | | 1.8 | |
Contributions from the federal government | | 1,257 | | 1,388 | | 1,505 | | 1,376 | | 1,365 | | 1,551 | | 1,744 | | 1,649 | | 1,547 | | 1,598 | | 2.7 | |
Commercial Crown corporation net income | | 617 | | 530 | | 633 | | 691 | | 662 | | 677 | | 645 | | 640 | | 629 | | 634 | | 0.3 | |
Total revenue | | 8,027 | | 8,565 | | 9,060 | | 9,229 | | 8,737 | | 8,412 | | 8,805 | | 8,991 | | 9,102 | | 9,323 | | 1.7 | |
| | | | | | | | | | | | | | | | | | | | | | | |
Real Per Capita Revenue (2013 $) (3) | | 9,329 | | 9,758 | | 10,150 | | 10,160 | | 9,422 | | 9,071 | | 9,353 | | 9,362 | | 9,286 | | 9,323 | | 0.0 | |
Growth rate (per cent) | | 11.3 | | 4.6 | | 4.0 | | 0.1 | | -7.3 | | -3.7 | | 3.1 | | 0.1 | | -0.8 | | 0.4 | | 1.2 | |
(1) Revenue as a per cent of GDP is calculated using GDP for the calendar year ending in the fiscal year (e.g. 2011/12 revenue divided by GDP for the 2011 calendar year). Totals may not add due to rounding.
(2) Per capita revenue is calculated using July 1 population (e.g. 2011/12 revenue divided by population on July 1, 2011). Totals may not add due to rounding.
(3) Revenue is converted to real (inflation-adjusted) terms using the consumer price index (CPI) for the corresponding calendar year (e.g. 2011 CPI for 2011/12 revenue).
Budget and Fiscal Plan – 2011/12 to 2013/14
89
Appendices
Table A12 Expense by Function (1) — 2004/05 to 2013/14
| | | | | | | | | | | | | | Updated | | Budget | | | | | | Average | |
| | Actual | | Actual | | Actual | | Actual | | Actual | | Actual | | Forecast | | Estimate | | Plan | | Plan | | annual | |
($ millions) | | 2004/05 | | 2005/06 | | 2006/07 | | 2007/08 | | 2008/09 | | 2009/10 | | 2010/11 | | 2011/12 | | 2012/13 | | 2013/14 | | change | |
| | | | | | | | | | | | | | | | | | | | | | (per cent) | |
Function: | | | | | | | | | | | | | | | | | | | | | | | |
Health: | | | | | | | | | | | | | | | | | | | | | | | |
Medical Services Plan | | 2,546 | | 2,696 | | 2,964 | | 3,263 | | 3,391 | | 3,536 | | 3,831 | | 4,026 | | 4,125 | | 4,257 | | 5.9 | |
Pharmacare | | 793 | | 868 | | 914 | | 955 | | 1,010 | | 1,053 | | 1,109 | | 1,140 | | 1,197 | | 1,245 | | 5.1 | |
Regional services | | 7,781 | | 8,346 | | 8,752 | | 9,319 | | 10,036 | | 10,273 | | 10,883 | | 11,593 | | 11,870 | | 12,297 | | 5.2 | |
Other healthcare expenses | | 361 | | 469 | | 565 | | 667 | | 601 | | 597 | | 734 | | 718 | | 722 | | 720 | | 8.0 | |
| | 11,481 | | 12,379 | | 13,195 | | 14,204 | | 15,038 | | 15,459 | | 16,557 | | 17,477 | | 17,914 | | 18,519 | | 5.5 | |
Education: | | | | | | | | | | | | | | | | | | | | | | | |
Elementary and secondary | | 4,757 | | 4,829 | | 5,272 | | 5,521 | | 5,740 | | 5,778 | | 5,892 | | 5,911 | | 5,912 | | 5,912 | | 2.4 | |
Post-secondary | | 3,536 | | 3,914 | | 4,072 | | 4,314 | | 4,554 | | 4,740 | | 4,772 | | 4,825 | | 4,922 | | 4,960 | | 3.8 | |
Other education expenses | | 195 | | 171 | | 147 | | 152 | | 158 | | 528 | | 515 | | 558 | | 551 | | 549 | | 12.2 | |
| | 8,488 | | 8,914 | | 9,491 | | 9,987 | | 10,452 | | 11,046 | | 11,179 | | 11,294 | | 11,385 | | 11,421 | | 3.4 | |
Social services: | | | | | | | | | | | | | | | | | | | | | | | |
Social assistance | | 1,027 | | 1,127 | | 1,254 | | 1,271 | | 1,352 | | 1,462 | | 1,500 | | 1,495 | | 1,506 | | 1,491 | | 4.2 | |
Childcare services | | 759 | | 832 | | 964 | | 925 | | 1,073 | | 1,077 | | 1,118 | | 1,112 | | 1,111 | | 1,111 | | 4.3 | |
Community living and other services | | 728 | | 682 | | 586 | | 756 | | 723 | | 729 | | 784 | | 770 | | 774 | | 779 | | 0.8 | |
| | 2,514 | | 2,641 | | 2,804 | | 2,952 | | 3,148 | | 3,268 | | 3,402 | | 3,377 | | 3,391 | | 3,381 | | 3.3 | |
Protection of persons and property | | 1,068 | | 1,245 | | 1,184 | | 1,429 | | 1,429 | | 1,380 | | 1,509 | | 1,322 | | 1,315 | | 1,316 | | 2.3 | |
Transportation | | 1,310 | | 1,197 | | 1,251 | | 1,378 | | 1,401 | | 1,453 | | 1,531 | | 1,617 | | 1,657 | | 1,755 | | 3.3 | |
Natural resources & economic development | | 1,579 | | 1,481 | | 1,581 | | 1,861 | | 1,658 | | 1,883 | | 1,588 | | 1,347 | | 1,317 | | 1,279 | | -2.3 | |
Other | | 1,006 | | 1,067 | | 1,220 | | 1,374 | | 1,637 | | 1,418 | | 1,420 | | 1,220 | | 1,218 | | 1,236 | | 2.3 | |
Contingencies | | — | | — | | — | | — | | — | | — | | 450 | | 603 | | 453 | | 453 | | n/a | |
General government | | 914 | | 1,114 | | 1,198 | | 1,131 | | 1,321 | | 1,224 | | 1,096 | | 1,102 | | 1,120 | | 1,111 | | 2.2 | |
Debt servicing | | 2,306 | | 2,203 | | 2,274 | | 2,239 | | 2,161 | | 2,169 | | 2,276 | | 2,553 | | 2,766 | | 3,095 | | 3.3 | |
Total expense | | 30,666 | | 32,241 | | 34,198 | | 36,555 | | 38,245 | | 39,300 | | 41,008 | | 41,912 | | 42,536 | | 43,566 | | 4.0 | |
| | | | | | | | | | | | | | | | | | | | | | | |
Per cent of total expense: | | | | | | | | | | | | | | | | | | | | | | | |
Health | | 37.4 | | 38.4 | | 38.6 | | 38.9 | | 39.3 | | 39.3 | | 40.4 | | 41.7 | | 42.1 | | 42.5 | | 1.4 | |
Education | | 27.7 | | 27.6 | | 27.8 | | 27.3 | | 27.3 | | 28.1 | | 27.3 | | 26.9 | | 26.8 | | 26.2 | | -0.6 | |
Social services and housing | | 8.2 | | 8.2 | | 8.2 | | 8.1 | | 8.2 | | 8.3 | | 8.3 | | 8.1 | | 8.0 | | 7.8 | | -0.6 | |
Protection of persons and property | | 3.5 | | 3.9 | | 3.5 | | 3.9 | | 3.7 | | 3.5 | | 3.7 | | 3.2 | | 3.1 | | 3.0 | | -1.6 | |
Transportation | | 4.3 | | 3.7 | | 3.7 | | 3.8 | | 3.7 | | 3.7 | | 3.7 | | 3.9 | | 3.9 | | 4.0 | | -0.6 | |
Natural resources & economic development | | 5.1 | | 4.6 | | 4.6 | | 5.1 | | 4.3 | | 4.8 | | 3.9 | | 3.2 | | 3.1 | | 2.9 | | -6.1 | |
Other | | 3.3 | | 3.3 | | 3.6 | | 3.8 | | 4.3 | | 3.6 | | 3.5 | | 2.9 | | 2.9 | | 2.8 | | -1.6 | |
Contingencies | | — | | — | | — | | — | | — | | — | | 1.1 | | 1.4 | | 1.1 | | 1.0 | | n/a | |
General government | | 3.0 | | 3.5 | | 3.5 | | 3.1 | | 3.5 | | 3.1 | | 2.7 | | 2.6 | | 2.6 | | 2.6 | | -1.7 | |
Debt servicing | | 7.5 | | 6.8 | | 6.6 | | 6.1 | | 5.7 | | 5.5 | | 5.6 | | 6.1 | | 6.5 | | 7.1 | | -0.6 | |
| | 100.0 | | 100.0 | | 100.0 | | 100.0 | | 100.0 | | 100.0 | | 100.0 | | 100.0 | | 100.0 | | 100.0 | | | |
(1) Excludes unusual items.
Budget and Fiscal Plan – 2011/12 to 2013/14
90
Appendices
Table A13 Expense by Function (1) Supplementary Information — 2004/05 to 2013/14
| | | | | | | | | | | | | | Updated | | Budget | | | | | | Average | |
| | Actual | | Actual | | Actual | | Actual | | Actual | | Actual | | Forecast | | Estimate | | Plan | | Plan | | annual | |
($ millions) | | 2004/05 | | 2005/06 | | 2006/07 | | 2007/08 | | 2008/09 | | 2009/10 | | 2010/11 | | 2011/12 | | 2012/13 | | 2013/14 | | change | |
| | | | | | | | | | | | | | | | | | | | | | (per cent) | |
Per cent of nominal GDP: (2) | | | | | | | | | | | | | | | | | | | | | | | |
Health | | 7.3 | | 7.3 | | 7.2 | | 7.4 | | 7.6 | | 8.1 | | 8.2 | | 8.3 | | 8.1 | | 8.0 | | 1.1 | |
Education | | 5.4 | | 5.3 | | 5.2 | | 5.2 | | 5.3 | | 5.8 | | 5.5 | | 5.4 | | 5.2 | | 4.9 | | -0.9 | |
Social services and housing | | 1.6 | | 1.6 | | 1.5 | | 1.5 | | 1.6 | | 1.7 | | 1.7 | | 1.6 | | 1.5 | | 1.5 | | -0.9 | |
Protection of persons and property | | 0.7 | | 0.7 | | 0.7 | | 0.7 | | 0.7 | | 0.7 | | 0.7 | | 0.6 | | 0.6 | | 0.6 | | -1.9 | |
Transportation | | 0.8 | | 0.7 | | 0.7 | | 0.7 | | 0.7 | | 0.8 | | 0.8 | | 0.8 | | 0.8 | | 0.8 | | -1.0 | |
Natural resources & economic development | | 1.0 | | 0.9 | | 0.9 | | 1.0 | | 0.8 | | 1.0 | | 0.8 | | 0.6 | | 0.6 | | 0.6 | | -6.4 | |
Other | | 0.6 | | 0.6 | | 0.7 | | 0.7 | | 0.8 | | 0.7 | | 0.7 | | 0.6 | | 0.6 | | 0.5 | | -1.9 | |
Contingencies | | — | | — | | — | | — | | — | | — | | 0.2 | | 0.3 | | 0.2 | | 0.2 | | n/a | |
General government | | 0.6 | | 0.7 | | 0.7 | | 0.6 | | 0.7 | | 0.6 | | 0.5 | | 0.5 | | 0.5 | | 0.5 | | -2.1 | |
Debt servicing | | 1.5 | | 1.3 | | 1.2 | | 1.2 | | 1.1 | | 1.1 | | 1.1 | | 1.2 | | 1.3 | | 1.3 | | -1.0 | |
Total expense | | 19.4 | | 19.0 | | 18.8 | | 19.0 | | 19.3 | | 20.6 | | 20.3 | | 20.0 | | 19.3 | | 18.9 | | -0.3 | |
Growth rates: | | | | | | | | | | | | | | | | | | | | | | | |
Health | | 2.1 | | 7.8 | | 6.6 | | 7.6 | | 5.9 | | 2.8 | | 7.1 | | 5.6 | | 2.5 | | 3.4 | | n/a | |
Education | | 3.2 | | 5.0 | | 6.5 | | 5.2 | | 4.7 | | 5.7 | | 1.2 | | 1.0 | | 0.8 | | 0.3 | | n/a | |
Social services and housing | | -8.7 | | 5.1 | | 6.2 | | 5.3 | | 6.6 | | 3.8 | | 4.1 | | -0.7 | | 0.4 | | -0.3 | | n/a | |
Protection of persons and property | | -21.6 | | 16.6 | | -4.9 | | 20.7 | | 0.0 | | -3.4 | | 9.3 | | -12.4 | | -0.5 | | 0.1 | | n/a | |
Transportation | | 14.9 | | -8.6 | | 4.5 | | 10.2 | | 1.7 | | 3.7 | | 5.4 | | 5.6 | | 2.5 | | 5.9 | | n/a | |
Natural resources & economic development | | -3.1 | | -6.2 | | 6.8 | | 17.7 | | -10.9 | | 13.6 | | -15.7 | | -15.2 | | -2.2 | | -2.9 | | n/a | |
Other | | -6.4 | | 6.1 | | 14.3 | | 12.6 | | 19.1 | | -13.4 | | 0.1 | | -14.1 | | -0.2 | | 1.5 | | n/a | |
General government | | 86.5 | | 21.9 | | 7.5 | | -5.6 | | 16.8 | | -7.3 | | -10.5 | | 0.5 | | 1.6 | | -0.8 | | n/a | |
Debt servicing | | -5.8 | | -4.5 | | 3.2 | | -1.5 | | -3.5 | | 0.4 | | 4.9 | | 12.2 | | 8.3 | | 11.9 | | n/a | |
Total expense | | 1.0 | | 5.1 | | 6.1 | | 6.9 | | 4.6 | | 2.8 | | 4.3 | | 2.2 | | 1.5 | | 2.4 | | n/a | |
Per capita: (3) | | | | | | | | | | | | | | | | | | | | | | | |
Health | | 2,763 | | 2,950 | | 3,109 | | 3,296 | | 3,430 | | 3,466 | | 3,654 | | 3,801 | | 3,841 | | 3,916 | | 4.0 | |
Education | | 2,043 | | 2,124 | | 2,237 | | 2,317 | | 2,384 | | 2,477 | | 2,467 | | 2,457 | | 2,441 | | 2,415 | | 1.9 | |
Social services and housing | | 605 | | 629 | | 661 | | 685 | | 718 | | 733 | | 751 | | 735 | | 727 | | 715 | | 1.9 | |
Protection of persons and property | | 257 | | 297 | | 279 | | 332 | | 326 | | 309 | | 333 | | 288 | | 282 | | 278 | | 0.9 | |
Transportation | | 315 | | 285 | | 295 | | 320 | | 320 | | 326 | | 338 | | 352 | | 355 | | 371 | | 1.8 | |
Natural resources & economic development | | 380 | | 353 | | 373 | | 432 | | 378 | | 422 | | 350 | | 293 | | 282 | | 270 | | -3.7 | |
Other | | 242 | | 254 | | 287 | | 319 | | 373 | | 318 | | 313 | | 265 | | 261 | | 261 | | 0.8 | |
Contingencies | | — | | — | | — | | — | | — | | — | | 99 | | 131 | | 97 | | 96 | | n/a | |
General government | | 220 | | 265 | | 282 | | 262 | | 301 | | 274 | | 242 | | 240 | | 240 | | 235 | | 0.7 | |
Debt servicing | | 555 | | 525 | | 536 | | 520 | | 493 | | 486 | | 502 | | 555 | | 593 | | 654 | | 1.8 | |
Total expense | | 7,380 | | 7,682 | | 8,059 | | 8,483 | | 8,723 | | 8,811 | | 9,049 | | 9,117 | | 9,119 | | 9,211 | | 2.5 | |
Real Per Capita Expense (2013 $) (4) | | 8,577 | | 8,752 | | 9,028 | | 9,338 | | 9,408 | | 9,502 | | 9,614 | | 9,492 | | 9,305 | | 9,212 | | 0.8 | |
Growth rate (per cent) | | -1.9 | | 2.0 | | 3.2 | | 3.4 | | 0.7 | | 1.0 | | 1.2 | | -1.3 | | -2.0 | | -1.0 | | 0.5 | |
(1) Excludes unusual items.
(2) Expense as a per cent of GDP is calculated using nominal GDP for the calendar year ending in the fiscal year (e.g. 2011/12 expense divided by nominal GDP for the 2011 calendar year). Totals may not add due to rounding.
(3) Per capita expense is calculated using July 1 population (e.g. 2011/12 expense divided by population on July 1, 2011). Totals may not add due to rounding.
(4) Expense is converted to real (inflation-adjusted) terms using the consumer price index (CPI) for the corresponding calendar year (e.g. 2011 CPI for 2011/12 expense).
Budget and Fiscal Plan – 2011/12 to 2013/14
91
Appendices
Table A14 Full-Time Equivalents (FTEs) — 2004/05 to 2013/14
| | | | | | | | | | | | | | Updated | | Budget | | | | | | Average | |
| | Actual | | Actual | | Actual | | Actual | | Actual | | Actual | | Forecast | | Estimate | | Plan | | Plan | | annual | |
| | 2004/05 | | 2005/06 | | 2006/07 | | 2007/08 | | 2008/09 | | 2009/10 | | 2010/11 | | 2011/12 (1) | | 2012/13 | | 2013/14 | | change | |
| | | | | | | | | | | | | | | | | | | | | | (per cent) | |
Taxpayer-supported programs and agencies: | | | | | | | | | | | | | | | | | | | | | | | |
Ministries and special offices (CRF) | | 27,252 | | 27,129 | | 28,647 | | 30,224 | | 31,874 | | 31,353 | | 30,146 | | 26,156 | | 25,660 | | 25,080 | | -0.9 | |
Service delivery agencies (2) | | 3,822 | | 3,992 | | 3,917 | | 4,128 | | 4,403 | | 4,508 | | 4,286 | | 4,441 | | 4,491 | | 4,530 | | 1.9 | |
Total FTEs | | 31,074 | | 31,121 | | 32,564 | | 34,352 | | 36,277 | | 35,861 | | 34,432 | | 30,597 | | 30,151 | | 29,610 | | -0.5 | |
Growth rates: | | | | | | | | | | | | | | | | | | | | | | | |
Ministries and special offices (CRF) | | -6.2 | | -0.5 | | 5.6 | | 5.5 | | 5.5 | | -1.6 | | -3.8 | | -13.2 | | -1.9 | | -2.3 | | -1.3 | |
Service delivery agencies | | -16.4 | | 4.4 | | -1.9 | | 5.4 | | 6.7 | | 2.4 | | -4.9 | | 3.6 | | 1.1 | | 0.9 | | 0.1 | |
Population per FTE: (3) | | 133.7 | | 134.9 | | 130.3 | | 125.5 | | 120.8 | | 124.4 | | 131.6 | | 150.3 | | 154.7 | | 159.7 | | 2.0 | |
(1) The ministry 2011/12 FTE total includes a reduction of about 3,000 FTEs reflecting the shift of BC Ambulance Service oversight from the Ministry of Health to the Provincial Health Services Authority.
(2) Service delivery agency FTE amounts do not include SUCH sector staff employment.
(3) Population per FTE is calculated using July 1 population (e.g. population on July 1, 2011 divided by 2011/12 FTEs).
Budget and Fiscal Plan – 2011/12 to 2013/14
92
Appendices
Table A15 Capital Spending — 2004/05 to 2013/14
($ millions) | | Actual
2004/05 | | Actual
2005/06 | | Actual
2006/07 | | Actual
2007/08 | | Actual
2008/09 | | Actual
2009/10 | | Updated
Forecast
2010/11 | | Budget
Estimate
2011/12 | | Plan
2012/13 | | Plan
2013/14 | | Average
annual
change | |
| | | | | | | | | | | | | | | | | | | | | | (per cent) | |
Taxpayer-supported: | | | | | | | | | | | | | | | | | | | | | | | |
Education | | | | | | | | | | | | | | | | | | | | | | | |
Schools (K—12) | | 239 | | 286 | | 322 | | 380 | | 413 | | 482 | | 430 | | 520 | | 412 | | 308 | | 2.9 | |
Post-secondary | | 696 | | 790 | | 874 | | 782 | | 658 | | 672 | | 928 | | 599 | | 444 | | 286 | | -9.4 | |
Health | | 568 | | 848 | | 760 | | 881 | | 892 | | 927 | | 1,049 | | 859 | | 599 | | 451 | | -2.5 | |
BC Transportation Financing Authority | | 513 | | 713 | | 821 | | 884 | | 881 | | 918 | | 1,327 | | 986 | | 1,018 | | 1,343 | | 11.3 | |
BC Transit | | 8 | | 24 | | 13 | | 37 | | 77 | | 150 | | 61 | | 162 | | 207 | | 311 | | 50.2 | |
Rapid Transit Project 2000 | | 15 | | 16 | | 15 | | — | | — | | — | | — | | — | | — | | — | | n/a | |
Vancouver Convention Centre expansion | | 51 | | 85 | | 105 | | 251 | | 242 | | 41 | | 10 | | — | | — | | — | | n/a | |
BC Place redevelopment | | — | | — | | — | | — | | 45 | | 75 | | 298 | | 147 | | — | | — | | n/a | |
Government direct (ministries) | | 215 | | 320 | | 355 | | 335 | | 430 | | 306 | | 396 | | 332 | | 210 | | 148 | | -4.1 | |
Capital contingencies | | — | | — | | — | | — | | — | | — | | 129 | | 200 | | 200 | | 200 | | | |
Other | | 58 | | 71 | | 144 | | 122 | | 140 | | 183 | | 277 | | 300 | | 65 | | 51 | | -1.4 | |
| | 2,363 | | 3,153 | | 3,409 | | 3,672 | | 3,778 | | 3,754 | | 4,905 | | 4,105 | | 3,155 | | 3,098 | | 3.1 | |
Self-supported: | | | | | | | | | | | | | | | | | | | | | | | |
BC Hydro | | 528 | | 610 | | 807 | | 1,076 | | 1,397 | | 2,406 | | 1,566 | | 2,195 | | 2,037 | | 2,020 | | 16.1 | |
BC Transmission Corporation | | — | | 21 | | 50 | | 70 | | 19 | | 12 | | — | | — | | — | | — | | n/a | |
Columbia River power projects | | 84 | | 30 | | 19 | | 29 | | 32 | | 16 | | 63 | | 98 | | 120 | | 62 | | -3.3 | |
Transportation Invest. Corp. (Port Mann) | | — | | — | | — | | — | | 215 | | 777 | | 871 | | 717 | | 586 | | 72 | | n/a | |
BC Railway Company | | 30 | | 15 | | 19 | | 20 | | 10 | | 14 | | 14 | | 18 | | 27 | | 20 | | -4.4 | |
ICBC | | 31 | | 27 | | 22 | | 23 | | 22 | | 22 | | 44 | | 81 | | 84 | | 88 | | 12.3 | |
BC Lotteries | | 93 | | 83 | | 44 | | 60 | | 97 | | 92 | | 107 | | 109 | | 130 | | 125 | | 3.3 | |
Liquor Distribution Branch | | 10 | | 19 | | 22 | | 18 | | 17 | | 19 | | 23 | | 25 | | 27 | | 28 | | 12.1 | |
| | 776 | | 805 | | 983 | | 1,296 | | 1,809 | | 3,358 | | 2,688 | | 3,243 | | 3,011 | | 2,415 | | 13.4 | |
Total capital spending | | 3,139 | | 3,958 | | 4,392 | | 4,968 | | 5,587 | | 7,112 | | 7,593 | | 7,348 | | 6,166 | | 5,513 | | 6.5 | |
| | | | | | | | | | | | | | | | | | | | | | | |
Per cent of Nominal GDP: (1) | | | | | | | | | | | | | | | | | | | | | | | |
Taxpayer-supported | | 1.5 | | 1.9 | | 1.9 | | 1.9 | | 1.9 | | 2.0 | | 2.4 | | 2.0 | | 1.4 | | 1.3 | | -1.2 | |
Self-supported | | 0.5 | | 0.5 | | 0.5 | | 0.7 | | 0.9 | | 1.8 | | 1.3 | | 1.5 | | 1.4 | | 1.0 | | 8.7 | |
Total | | 2.0 | | 2.3 | | 2.4 | | 2.6 | | 2.8 | | 3.7 | | 3.8 | | 3.5 | | 2.8 | | 2.4 | | 2.0 | |
Growth rates: | | | | | | | | | | | | | | | | | | | | | | | |
Taxpayer-supported | | 13.9 | | 33.4 | | 8.1 | | 7.7 | | 2.9 | | -0.6 | | 30.7 | | -16.3 | | -23.1 | | -1.8 | | 5.5 | |
Self-supported | | -0.9 | | 3.7 | | 22.1 | | 31.8 | | 39.6 | | 85.6 | | -20.0 | | 20.6 | | -7.2 | | -19.8 | | 15.6 | |
Total | | 9.9 | | 26.1 | | 11.0 | | 13.1 | | 12.5 | | 27.3 | | 6.8 | | -3.2 | | -16.1 | | -10.6 | | 7.7 | |
Per capita: (2) | | | | | | | | | | | | | | | | | | | | | | | |
Taxpayer-supported | | 569 | | 751 | | 803 | | 852 | | 862 | | 842 | | 1,083 | | 893 | | 677 | | 655 | | 1.6 | |
Self-supported | | 187 | | 192 | | 232 | | 301 | | 413 | | 753 | | 593 | | 705 | | 646 | | 511 | | 11.8 | |
Total | | 755 | | 943 | | 1,035 | | 1,153 | | 1,274 | | 1,595 | | 1,676 | | 1,598 | | 1,322 | | 1,166 | | 4.9 | |
| | | | | | | | | | | | | | | | | | | | | | | |
Real Per Capita Capital Spending (2013 $) (3) | | 878 | | 1,074 | | 1,159 | | 1,269 | | 1,374 | | 1,719 | | 1,780 | | 1,664 | | 1,349 | | 1,166 | | 3.2 | |
Growth rate (per cent) | | 6.7 | | 22.4 | | 7.9 | | 9.5 | | 8.3 | | 25.1 | | 3.5 | | -6.5 | | -18.9 | | -13.6 | | 4.4 | |
(1) Capital spending as a per cent of GDP is calculated using GDP for the calendar year ending in the fiscal year (e.g. 2011/12 amounts divided by GDP for the 2011 calendar year). Totals may not add due to rounding.
(2) Per capita capital spending is calculated using July 1 population (e.g. 2011/12 amounts divided by population on July 1, 2011). Totals may not add due to rounding.
(3) Capital spending is converted to real (inflation-adjusted) terms using the consumer price index (CPI) for the corresponding calendar year (e.g. 2009 CPI for 2009/10 capital spending).
Budget and Fiscal Plan – 2011/12 to 2013/14
93
Appendices
Table A16 Statement of Financial Position — 2004/05 to 2013/14
($ millions) | | Actual
2004/05 | | Actual
2005/06 | | Actual
2006/07 | | Actual
2007/08 | | Actual
2008/09 | | Actual
2009/10 | | Updated
Forecast
2010/11 | | Budget
Estimate
2011/12 | | Plan
2012/13 | | Plan
2013/14 | | Average
annual
change | |
| | | | | | | | | | | | | | | | | | | | | | (per cent) | |
Financial assets: | | | | | | | | | | | | | | | | | | | | | | | |
Cash and temporary investments | | 3,631 | | 3,922 | | 3,492 | | 5,994 | | 5,226 | | 2,913 | | 2,740 | | 2,717 | | 2,832 | | 3,037 | | -2.0 | |
Other financial assets | | 6,716 | | 7,085 | | 8,003 | | 8,294 | | 7,360 | | 8,731 | | 9,198 | | 9,085 | | 9,628 | | 10,105 | | 4.6 | |
Sinking funds | | 4,516 | | 4,059 | | 3,798 | | 2,649 | | 2,134 | | 1,329 | | 1,411 | | 1,293 | | 1,528 | | 1,629 | | -10.7 | |
Investments in commercial Crown corporations: | | | | | | | | | | | | | | | | | | | | | | | |
Retained earnings | | 3,180 | | 3,463 | | 4,415 | | 5,081 | | 5,728 | | 7,231 | | 6,924 | | 7,307 | | 7,514 | | 7,707 | | 10.3 | |
Recoverable capital loans | | 6,901 | | 6,916 | | 7,170 | | 7,719 | | 9,149 | | 11,471 | | 13,078 | | 15,597 | | 17,406 | | 18,857 | | 11.8 | |
| | 10,081 | | 10,379 | | 11,585 | | 12,800 | | 14,877 | | 18,702 | | 20,002 | | 22,904 | | 24,920 | | 26,564 | | 11.4 | |
Warehouse borrowing program assets | | — | | — | | — | | — | | 2,081 | | — | | — | | — | | — | | — | | n/a | |
| | 24,944 | | 25,445 | | 26,878 | | 29,737 | | 31,678 | | 31,675 | | 33,351 | | 35,999 | | 38,908 | | 41,335 | | 5.8 | |
Liabilities: | | | | | | | | | | | | | | | | | | | | | | | |
Accounts payable & accrued liabilities | | 6,873 | | 7,441 | | 7,225 | | 8,075 | | 7,414 | | 6,994 | | 7,099 | | 7,196 | | 7,571 | | 8,000 | | 1.7 | |
Deferred revenue | | 5,311 | | 5,857 | | 6,174 | | 7,368 | | 9,431 | | 9,997 | | 10,636 | | 10,218 | | 9,916 | | 9,789 | | 7.0 | |
Debt: | | | | | | | | | | | | | | | | | | | | | | | |
| Taxpayer-supported debt | | 28,668 | | 27,251 | | 25,968 | | 26,589 | | 26,446 | | 30,021 | | 33,388 | | 36,816 | | 39,162 | | 40,500 | | 3.9 | |
| Self-supported debt | | 7,201 | | 7,206 | | 7,471 | | 8,048 | | 11,568 | | 11,864 | | 13,743 | | 16,271 | | 18,060 | | 19,505 | | 11.7 | |
| Forecast allowance | | — | | — | | — | | — | | — | | — | | 150 | | 350 | | 350 | | 350 | | n/a | |
Total provincial debt | | 35,869 | | 34,457 | | 33,439 | | 34,637 | | 38,014 | | 41,885 | | 47,281 | | 53,437 | | 57,572 | | 60,355 | | 6.0 | |
Add: | debt offset by sinking funds | | 4,515 | | 4,059 | | 3,798 | | 2,649 | | 2,134 | | 1,329 | | 1,411 | | 1,293 | | 1,528 | | 1,629 | | -10.7 | |
Less: | guarantees and | | | | | | | | | | | | | | | | | | | | | | | |
| non-guaranteed debt | | (472 | ) | (459 | ) | (416 | ) | (452 | ) | (452 | ) | (493 | ) | (758 | ) | (752 | ) | (745 | ) | (739 | ) | 5.1 | |
Financial statement debt | | 39,912 | | 38,057 | | 36,821 | | 36,834 | | 39,696 | | 42,721 | | 47,934 | | 53,978 | | 58,355 | | 61,245 | | 4.9 | |
| | 52,096 | | 51,355 | | 50,220 | | 52,277 | | 56,541 | | 59,712 | | 65,669 | | 71,392 | | 75,842 | | 79,034 | | 4.7 | |
Net liabilities | | (27,152 | ) | (25,910 | ) | (23,342 | ) | (22,540 | ) | (24,863 | ) | (28,037 | ) | (32,318 | ) | (35,393 | ) | (36,934 | ) | (37,699 | ) | 3.7 | |
Capital and other assets: | | | | | | | | | | | | | | | | | | | | | | | |
Tangible capital assets | | 23,416 | | 24,954 | | 26,800 | | 28,737 | | 30,655 | | 32,371 | | 35,271 | | 37,287 | | 38,266 | | 39,182 | | 5.9 | |
Other assets | | 546 | | 761 | | 780 | | 732 | | 780 | | 938 | | 977 | | 975 | | 983 | | 996 | | 6.9 | |
| | 23,962 | | 25,715 | | 27,580 | | 29,469 | | 31,435 | | 33,309 | | 36,248 | | 38,262 | | 39,249 | | 40,178 | | 5.9 | |
Accumulated surplus (deficit) | | (3,190 | ) | (195 | ) | 4,238 | | 6,929 | | 6,572 | | 5,272 | | 3,930 | | 2,869 | | 2,315 | | 2,479 | | n/a | |
| | | | | | | | | | | | | | | | | | | | | | | |
Per cent of Nominal GDP: (1) | | | | | | | | | | | | | | | | | | | | | | | |
Net liabilities | | 17.2 | | 15.3 | | 12.8 | | 11.7 | | 12.6 | | 14.7 | | 16.0 | | 16.8 | | 16.8 | | 16.3 | | -0.6 | |
Capital and other assets | | 15.2 | | 15.2 | | 15.1 | | 15.3 | | 15.9 | | 17.4 | | 18.0 | | 18.2 | | 17.8 | | 17.4 | | 1.5 | |
Growth rates: | | | | | | | | | | | | | | | | | | | | | | | |
Net liabilities | | -6.0 | | -4.6 | | -9.9 | | -3.4 | | 10.3 | | 12.8 | | 15.3 | | 9.5 | | 4.4 | | 2.1 | | 3.0 | |
Capital and other assets | | 4.2 | | 7.3 | | 7.3 | | 6.8 | | 6.7 | | 6.0 | | 8.8 | | 5.6 | | 2.6 | | 2.4 | | 5.8 | |
Per capita: (2) | | | | | | | | | | | | | | | | | | | | | | | |
Net liabilities | | 6,535 | | 6,174 | | 5,501 | | 5,230 | | 5,671 | | 6,286 | | 7,133 | | 7,698 | | 7,920 | | 7,972 | | 2.2 | |
Capital and other assets | | 5,767 | | 6,127 | | 6,499 | | 6,838 | | 7,171 | | 7,468 | | 8,000 | | 8,322 | | 8,416 | | 8,496 | | 4.4 | |
(1) Net liabilities as a per cent of GDP is calculated using GDP for the calendar year ending in the fiscal year (e.g. 2011/12 amount divided by GDP for the 2011 calendar year).
(2) Per capita net liabilities is calculated using July 1 population (e.g. 2011/12 amount divided by population on July 1, 2011).
Budget and Fiscal Plan – 2011/12 to 2013/14
94
Appendices
Table A17 Changes in Financial Position — 2004/05 to 2013/14
($ millions) | | Actual
2004/05 | | Actual
2005/06 | | Actual
2006/07 | | Actual
2007/08 | | Actual
2008/09 | | Actual
2009/10 | | Updated
Forecast
2010/11 | | Budget
Estimate
2011/12 | | Plan
2012/13 | | Plan
2013/14 | | 10-Year
Total | |
(Surplus) deficit for the year | | (2,689 | ) | (2,995 | ) | (3,986 | ) | (2,773 | ) | (75 | ) | 1,779 | | 1,265 | | 925 | | 440 | | (175 | ) | (8,284 | ) |
Comprehensive income (increase) decrease | | — | | — | | (447 | ) | 82 | | 432 | | (479 | ) | 77 | | 136 | | 114 | | 11 | | (74 | ) |
Change in accumulated (surplus) deficit | | (2,689 | ) | (2,995 | ) | (4,433 | ) | (2,691 | ) | 357 | | 1,300 | | 1,342 | | 1,061 | | 554 | | (164 | ) | (8,358 | ) |
Capital and other asset changes: | | | | | | | | | | | | | | | | | | | | | | | |
Taxpayer-supported capital investments | | 2,363 | | 3,153 | | 3,409 | | 3,672 | | 3,778 | | 3,754 | | 4,905 | | 4,105 | | 3,155 | | 3,098 | | 35,392 | |
Less: amortization and other accounting changes | | (1,469 | ) | (1,615 | ) | (1,563 | ) | (1,735 | ) | (1,860 | ) | (2,038 | ) | (2,005 | ) | (2,089 | ) | (2,176 | ) | (2,182 | ) | (18,732 | ) |
Increase in net capital assets | | 894 | | 1,538 | | 1,846 | | 1,937 | | 1,918 | | 1,716 | | 2,900 | | 2,016 | | 979 | | 916 | | 16,660 | |
Increase (decrease) in other assets | | 71 | | 215 | | 19 | | (48 | ) | 48 | | 158 | | 39 | | (2 | ) | 8 | | 13 | | 521 | |
| | 965 | | 1,753 | | 1,865 | | 1,889 | | 1,966 | | 1,874 | | 2,939 | | 2,014 | | 987 | | 929 | | 17,181 | |
Increase (decrease) in net liabilities | | (1,724 | ) | (1,242 | ) | (2,568 | ) | (802 | ) | 2,323 | | 3,174 | | 4,281 | | 3,075 | | 1,541 | | 765 | | 8,823 | |
Investment and working capital changes: | | | | | | | | | | | | | | | | | | | | | | | |
Increase (reduction) in cash and temporary investments | | 899 | | 291 | | (430 | ) | 2,502 | | (768 | ) | (2,313 | ) | (173 | ) | (23 | ) | 115 | | 205 | | 305 | |
Increase (decrease) in warehouse borrowing investments | | — | | — | | — | | — | | 2,081 | | (2,081 | ) | — | | — | | — | | — | | — | |
Investment in commercial Crown corporations: | | | | | | | | | | | | | | | | | | | | | | | |
Increase (decrease) in retained earnings | | 150 | | 283 | | 952 | | 666 | | 647 | | 1,503 | | (307 | ) | 383 | | 207 | | 193 | | 4,677 | |
Self-supported capital investments | | 776 | | 805 | | 983 | | 1,296 | | 1,809 | | 3,358 | | 2,688 | | 3,243 | | 3,011 | | 2,415 | | 20,384 | |
Less: loan repayments and other accounting changes | | (1,387 | ) | (790 | ) | (729 | ) | (747 | ) | (379 | ) | (1,036 | ) | (1,081 | ) | (724 | ) | (1,202 | ) | (964 | ) | (9,039 | ) |
| | (461 | ) | 298 | | 1,206 | | 1,215 | | 2,077 | | 3,825 | | 1,300 | | 2,902 | | 2,016 | | 1,644 | | 16,022 | |
Other working capital changes | | (743 | ) | (1,202 | ) | 556 | | (2,902 | ) | (2,851 | ) | 420 | | (195 | ) | 90 | | 705 | | 276 | | (5,846 | ) |
| | (305 | ) | (613 | ) | 1,332 | | 815 | | 539 | | (149 | ) | 932 | | 2,969 | | 2,836 | | 2,125 | | 10,481 | |
Increase (decrease) in financial statement debt | | (2,029 | ) | (1,855 | ) | (1,236 | ) | 13 | | 2,862 | | 3,025 | | 5,213 | | 6,044 | | 4,377 | | 2,890 | | 19,304 | |
(Increase) decrease in sinking fund debt | | 104 | | 456 | | 261 | | 1,149 | | 515 | | 805 | | (82 | ) | 118 | | (235 | ) | (101 | ) | 2,990 | |
Increase (decrease) in guarantees and non-guaranteed debt | | 19 | | (13 | ) | (43 | ) | 36 | | — | | 41 | | 265 | | (6 | ) | (7 | ) | (6 | ) | 286 | |
Increase (decrease) in total provincial debt | | (1,906 | ) | (1,412 | ) | (1,018 | ) | 1,198 | | 3,377 | | 3,871 | | 5,396 | | 6,156 | | 4,135 | | 2,783 | | 22,580 | |
Represented by increase (decrease) in: | | | | | | | | | | | | | | | | | | | | | | | |
Taxpayer-supported debt | | (1,346 | ) | (1,417 | ) | (1,283 | ) | 621 | | (143 | ) | 3,575 | | 3,367 | | 3,428 | | 2,346 | | 1,338 | | 10,486 | |
Self-supported debt | | (560 | ) | 5 | | 265 | | 577 | | 3,520 | | 296 | | 1,879 | | 2,528 | | 1,789 | | 1,445 | | 11,744 | |
Forecast allowance | | — | | — | | — | | — | | — | | — | | 150 | | 200 | | — | | — | | 350 | |
Total provincial debt | | (1,906 | ) | (1,412 | ) | (1,018 | ) | 1,198 | | 3,377 | | 3,871 | | 5,396 | | 6,156 | | 4,135 | | 2,783 | | 22,580 | |
Budget and Fiscal Plan – 2011/12 to 2013/14
95
Appendices
Table A18 Provincial Debt — 2004/05 to 2013/14
($ millions) | | Actual
2004/05 | | Actual
2005/06 | | Actual
2006/07 | | Actual
2007/08 | | Actual
2008/09 | | Actual
2009/10 | | Updated
Forecast
2010/11 | | Budget
Estimate
2011/12 | | Plan
2012/13 | | Plan
2013/14 | | Average
annual
change | |
| | | | | | | | | | | | | | | | | | | | | | (per cent) | |
Taxpayer-supported debt: | | | | | | | | | | | | | | | | | | | | | | | |
Provincial government operating | | 12,894 | | 9,952 | | 6,928 | | 5,330 | | 3,048 | | 4,663 | | 5,291 | | 6,067 | | 6,571 | | 5,903 | | -8.3 | |
Provincial government general capital | | 1,075 | | 1,391 | | 1,961 | | 2,274 | | 2,696 | | 2,696 | | 2,696 | | 2,696 | | 2,696 | | 2,696 | | 10.8 | |
Provincial government direct operating | | 13,969 | | 11,343 | | 8,889 | | 7,604 | | 5,744 | | 7,359 | | 7,987 | | 8,763 | | 9,267 | | 8,599 | | -5.2 | |
Other taxpayer-supported debt (mainly capital): | | | | | | | | | | | | | | | | | | | | | �� | | |
Education facilities | | | | | | | | | | | | | | | | | | | | | | | |
Schools | | 4,737 | | 4,860 | | 5,013 | | 5,216 | | 5,522 | | 5,777 | | 6,039 | | 6,499 | | 6,850 | | 7,098 | | 4.6 | |
Post-secondary institutions | | 2,398 | | 2,772 | | 3,024 | | 3,437 | | 3,626 | | 3,843 | | 4,092 | | 4,218 | | 4,267 | | 4,257 | | 6.6 | |
| | 7,135 | | 7,632 | | 8,037 | | 8,653 | | 9,148 | | 9,620 | | 10,131 | | 10,717 | | 11,117 | | 11,355 | | 5.3 | |
Health facilities | | 2,253 | | 2,635 | | 3,053 | | 3,511 | | 3,936 | | 4,389 | | 4,895 | | 5,411 | | 5,830 | | 6,109 | | 11.7 | |
Highways, ferries and public transit | | | | | | | | | | | | | | | | | | | | | | | |
BC Transportation Financing Authority | | 2,474 | | 2,699 | | 3,237 | | 3,948 | | 4,586 | | 5,211 | | 5,900 | | 6,493 | | 7,178 | | 8,156 | | 14.2 | |
SkyTrain extension | | 1,135 | | 1,145 | | 1,153 | | 1,153 | | 1,154 | | 1,154 | | 1,153 | | 1,153 | | 1,154 | | 1,155 | | 0.2 | |
Public transit | | 957 | | 959 | | 950 | | 958 | | 997 | | 997 | | 997 | | 997 | | 997 | | 997 | | 0.5 | |
BC Transit | | 78 | | 80 | | 96 | | 84 | | 94 | | 140 | | 172 | | 240 | | 314 | | 419 | | 20.5 | |
| | 4,644 | | 4,883 | | 5,436 | | 6,143 | | 6,831 | | 7,502 | | 8,222 | | 8,883 | | 9,643 | | 10,727 | | 9.7 | |
Other | | | | | | | | | | | | | | | | | | | | | | | |
Social Housing | | 133 | | 189 | | 216 | | 218 | | 286 | | 305 | | 555 | | 716 | | 591 | | 581 | | 17.8 | |
Provincial government general capital | | — | | — | | — | | — | | — | | 294 | | 719 | | 1,087 | | 1,340 | | 1,524 | | n/a | |
BC Immigrant Investment Fund | | 88 | | 148 | | 167 | | 256 | | 287 | | 289 | | 347 | | 406 | | 393 | | 477 | | n/a | |
Homeowner Protection Office | | 130 | | 110 | | 110 | | 136 | | 150 | | 144 | | — | | — | | — | | — | | -100.0 | |
BC Pavilion Corporation | | — | | — | | — | | — | | — | | 49 | | 298 | | 445 | | 445 | | 443 | | n/a | |
BC Buildings | | 241 | | 246 | | — | | — | | — | | — | | — | | — | | — | | — | | n/a | |
Other | | 75 | | 65 | | 60 | | 68 | | 64 | | 70 | | 234 | | 388 | | 536 | | 685 | | 27.9 | |
| | 667 | | 758 | | 553 | | 678 | | 787 | | 1,151 | | 2,153 | | 3,042 | | 3,305 | | 3,710 | | 21.0 | |
Total other taxpayer-supported debt | | 14,699 | | 15,908 | | 17,079 | | 18,985 | | 20,702 | | 22,662 | | 25,401 | | 28,053 | | 29,895 | | 31,901 | | 9.0 | |
Total taxpayer-supported debt | | 28,668 | | 27,251 | | 25,968 | | 26,589 | | 26,446 | | 30,021 | | 33,388 | | 36,816 | | 39,162 | | 40,500 | | 3.9 | |
| | | | | | | | | | | | | | | | | | | | | | | |
Self-supported debt: | | | | | | | | | | | | | | | | | | | | | | | |
Commercial Crown corporations and agencies | | | | | | | | | | | | | | | | | | | | | | | |
BC Hydro | | 6,906 | | 6,892 | | 7,144 | | 7,633 | | 9,054 | | 10,792 | | 11,647 | | 13,537 | | 14,742 | | 15,632 | | 9.5 | |
Transportation Invest. Corp. (Port Mann) | | — | | — | | — | | — | | 20 | | 544 | | 1,360 | | 1,983 | | 2,561 | | 3,105 | | n/a | |
Post-secondary institutions’ subsidiaries | | 32 | | 32 | | 58 | | 115 | | 134 | | 201 | | 201 | | 201 | | 201 | | 201 | | 22.7 | |
Columbia River power projects | | 257 | | 247 | | 236 | | 219 | | 208 | | 196 | | 468 | | 463 | | 457 | | 451 | | 6.4 | |
BC Transmission Corporation | | — | | 30 | | 30 | | 79 | | 70 | | 70 | | — | | — | | — | | — | | n/a | |
BC Lotteries | | — | | — | | — | | — | | — | | 60 | | 66 | | 87 | | 99 | | 116 | | n/a | |
Liquor Distribution Branch | | 6 | | 5 | | 3 | | 2 | | 1 | | 1 | | 1 | | — | | — | | — | | -100.0 | |
| | 7,201 | | 7,206 | | 7,471 | | 8,048 | | 9,487 | | 11,864 | | 13,743 | | 16,271 | | 18,060 | | 19,505 | | 11.7 | |
Warehouse borrowing program | | — | | — | | — | | — | | 2,081 | | — | | — | | — | | — | | — | | n/a | |
Total self-supported debt | | 7,201 | | 7,206 | | 7,471 | | 8,048 | | 11,568 | | 11,864 | | 13,743 | | 16,271 | | 18,060 | | 19,505 | | 11.7 | |
Forecast allowance | | — | | — | | — | | — | | — | | — | | 150 | | 350 | | 350 | | 350 | | | |
Total provincial debt | | 35,869 | | 34,457 | | 33,439 | | 34,637 | | 38,014 | | 41,885 | | 47,281 | | 53,437 | | 57,572 | | 60,355 | | 6.0 | |
Budget and Fiscal Plan – 2011/12 to 2013/14
96
Appendices
Table A19 Provincial Debt Supplementary Information — 2004/05 to 2013/14
($ millions) | | Actual
2004/05 | | Actual
2005/06 | | Actual
2006/07 | | Actual
2007/08 | | Actual
2008/09 | | Actual
2009/10 | | Updated
Forecast
2010/11 | | Budget
Estimate
2011/12 | | Plan
2012/13 | | Plan
2013/14 | | Average
annual
change | |
| | | | | | | | | | | | | | | | | | | | | | (per cent) | |
Per cent of Nominal GDP: (1) | | | | | | | | | | | | | | | | | | | | | | | |
Taxpayer-supported debt: | | | | | | | | | | | | | | | | | | | | | | | |
Provincial government direct operating | | 8.9 | | 6.7 | | 4.9 | | 4.0 | | 2.9 | | 3.9 | | 4.0 | | 4.2 | | 4.2 | | 3.7 | | -9.2 | |
Education facilities | | 4.5 | | 4.5 | | 4.4 | | 4.5 | | 4.6 | | 5.0 | | 5.0 | | 5.1 | | 5.0 | | 4.9 | | 0.9 | |
Health facilities | | 1.4 | | 1.6 | | 1.7 | | 1.8 | | 2.0 | | 2.3 | | 2.4 | | 2.6 | | 2.6 | | 2.6 | | 7.1 | |
Highways, ferries and public transit | | 2.9 | | 2.9 | | 3.0 | | 3.2 | | 3.5 | | 3.9 | | 4.1 | | 4.2 | | 4.4 | | 4.6 | | 5.2 | |
Other | | 0.4 | | 0.4 | | 0.3 | | 0.4 | | 0.4 | | 0.6 | | 1.1 | | 1.4 | | 1.5 | | 1.6 | | 16.0 | |
Total taxpayer-supported debt | | 18.2 | | 16.1 | | 14.2 | | 13.8 | | 13.4 | | 15.7 | | 16.5 | | 17.5 | | 17.8 | | 17.5 | | -0.4 | |
Self-supported debt: | | | | | | | | | | | | | | | | | | | | | | | |
Commercial Crown corporations & agencies | | 4.6 | | 4.2 | | 4.1 | | 4.2 | | 4.8 | | 6.2 | | 6.8 | | 7.7 | | 8.2 | | 8.4 | | 7.1 | |
Warehouse borrowing program | | — | | — | | — | | — | | 1.1 | | — | | — | | — | | — | | — | | n/a | |
Total self-supported debt | | 4.6 | | 4.2 | | 4.1 | | 4.2 | | 5.9 | | 6.2 | | 6.8 | | 7.7 | | 8.2 | | 8.4 | | 7.1 | |
Total provincial debt | | 22.7 | | 20.3 | | 18.3 | | 18.0 | | 19.2 | | 21.9 | | 23.4 | | 25.4 | | 26.1 | | 26.1 | | 1.6 | |
Growth rates: | | | | | | | | | | | | | | | | | | | | | | | |
Taxpayer-supported debt: | | | | | | | | | | | | | | | | | | | | | | | |
Provincial government direct operating | | -8.0 | | -18.8 | | -21.6 | | -14.5 | | -24.5 | | 28.1 | | 8.5 | | 9.7 | | 5.8 | | -7.2 | | -4.2 | |
Education facilities | | 4.3 | | 7.0 | | 5.3 | | 7.7 | | 5.7 | | 5.2 | | 5.3 | | 5.8 | | 3.7 | | 2.1 | | 5.2 | |
Health facilities | | -3.8 | | 17.0 | | 15.9 | | 15.0 | | 12.1 | | 11.5 | | 11.5 | | 10.5 | | 7.7 | | 4.8 | | 10.2 | |
Highways, ferries and public transit | | -5.8 | | 5.1 | | 11.3 | | 13.0 | | 11.2 | | 9.8 | | 9.6 | | 8.0 | | 8.6 | | 11.2 | | 8.2 | |
Other | | -7.5 | | 13.6 | | -27.0 | | 22.6 | | 16.1 | | 46.3 | | 87.1 | | 41.3 | | 8.6 | | 12.3 | | 21.3 | |
Total taxpayer-supported debt | | -4.5 | | -4.9 | | -4.7 | | 2.4 | | -0.5 | | 13.5 | | 11.2 | | 10.3 | | 6.4 | | 3.4 | | 3.3 | |
Self-supported debt: | | | | | | | | | | | | | | | | | | | | | | | |
Commercial Crown corporations & agencies | | -7.2 | | 0.1 | | 3.7 | | 7.7 | | 17.9 | | 25.1 | | 15.8 | | 18.4 | | 11.0 | | 8.0 | | 10.0 | |
Warehouse borrowing program | | — | | — | | — | | — | | — | | -100.0 | | — | | — | | — | | — | | n/a | |
Total self-supported debt | | -7.2 | | 0.1 | | 3.7 | | 7.7 | | 43.7 | | 2.6 | | 15.8 | | 18.4 | | 11.0 | | 8.0 | | 10.4 | |
Total provincial debt | | -5.0 | | -3.9 | | -3.0 | | 3.6 | | 9.7 | | 10.2 | | 12.9 | | 13.0 | | 7.7 | | 4.8 | | 5.0 | |
Per capita: (2) | | | | | | | | | | | | | | | | | | | | | | | |
Taxpayer-supported debt: | | | | | | | | | | | | | | | | | | | | | | | |
Provincial government direct operating | | 3,362 | | 2,703 | | 2,095 | | 1,764 | | 1,310 | | 1,650 | | 1,763 | | 1,906 | | 1,987 | | 1,818 | | -6.6 | |
Education facilities | | 1,717 | | 1,819 | | 1,894 | | 2,008 | | 2,087 | | 2,157 | | 2,236 | | 2,331 | | 2,384 | | 2,401 | | 3.8 | |
Health facilities | | 542 | | 628 | | 719 | | 815 | | 898 | | 984 | | 1,080 | | 1,177 | | 1,250 | | 1,292 | | 10.1 | |
Highways, ferries and public transit | | 1,118 | | 1,164 | | 1,281 | | 1,425 | | 1,558 | | 1,682 | | 1,815 | | 1,932 | | 2,068 | | 2,268 | | 8.2 | |
Other | | 161 | | 181 | | 130 | | 157 | | 180 | | 258 | | 475 | | 662 | | 709 | | 784 | | 19.2 | |
Total taxpayer-supported debt | | 6,899 | | 6,493 | | 6,119 | | 6,170 | | 6,033 | | 6,731 | | 7,369 | | 8,008 | | 8,397 | | 8,564 | | 2.4 | |
Self-supported debt: | | | | | | | | | | | | | | | | | | | | | | | |
Commercial Crown corporations & agencies | | 1,733 | | 1,717 | | 1,761 | | 1,867 | | 2,164 | | 2,660 | | 3,033 | | 3,539 | | 3,873 | | 4,124 | | 10.1 | |
Warehouse borrowing program | | — | | — | | — | | — | | 475 | | — | | — | | — | | — | | — | | n/a | |
Total self-supported debt | | 1,733 | | 1,717 | | 1,761 | | 1,867 | | 2,639 | | 2,660 | | 3,033 | | 3,539 | | 3,873 | | 4,124 | | 10.1 | |
Total provincial debt | | 8,632 | | 8,210 | | 7,880 | | 8,037 | | 8,671 | | 9,391 | | 10,435 | | 11,623 | | 12,345 | | 12,762 | | 4.4 | |
Real Per Capita Provincial Debt (2013 $) (3) | | 10,032 | | 9,353 | | 8,828 | | 8,848 | | 9,351 | | 10,127 | | 11,085 | | 12,103 | | 12,595 | | 12,762 | | 2.7 | |
Growth rate (per cent) | | -7.6 | | -6.8 | | -5.6 | | 0.2 | | 5.7 | | 8.3 | | 9.5 | | 9.2 | | 4.1 | | 1.3 | | 1.8 | |
(1) Debt as a per cent of GDP is calculated using GDP for the calendar year ending in the fiscal year (e.g. 2011/12 debt divided by GDP for the 2011 calendar year). Totals may not add due to rounding.
(2) Per capita debt is calculated using July 1 population (e.g. 2011/12 debt divided by population on July 1, 2011). Totals may not add due to rounding.
(3) Debt is converted to real (inflation-adjusted) terms using the consumer price index (CPI) for the corresponding calendar year (e.g. 2011 CPI for 2011/12 debt).
Budget and Fiscal Plan – 2011/12 to 2013/14
97
Appendices
Table A20 Key Provincial Debt Indicators — 2004/05 to 2013/14 (1)
| | Actual
2004/05 | | Actual
2005/06 | | Actual
2006/07 | | Actual
2007/08 | | Actual
2008/09 | | Actual
2009/10 | | Updated
Forecast
2010/11 | | Budget
Estimate
2011/12 | | Plan
2012/13 | | Plan
2013/14 | | Average
annual
change | |
| | | | | | | | | | | | | | | | | | | | | | (per cent) | |
Debt to revenue (per cent) | | | | | | | | | | | | | | | | | | | | | | | |
Total provincial | | 85.1 | | 74.8 | | 69.1 | | 69.3 | | 78.0 | | 87.8 | | 93.1 | | 100.9 | | 105.2 | | 105.7 | | 2.4 | |
Taxpayer-supported | | 88.5 | | 77.9 | | 69.8 | | 69.6 | | 72.0 | | 83.8 | | 84.6 | | 92.0 | | 95.0 | | 94.6 | | 0.7 | |
Debt per capita ($) (2) | | | | | | | | | | | | | | | | | | | | | | | |
Total provincial | | 8,632 | | 8,210 | | 7,880 | | 8,037 | | 8,671 | | 9,391 | | 10,435 | | 11,623 | | 12,345 | | 12,762 | | 4.4 | |
Taxpayer-supported | | 6,899 | | 6,493 | | 6,119 | | 6,170 | | 6,033 | | 6,731 | | 7,369 | | 8,008 | | 8,397 | | 8,564 | | 2.4 | |
Debt to Nominal GDP (per cent) (3) | | | | | | | | | | | | | | | | | | | | | | | |
Total provincial | | 22.7 | | 20.3 | | 18.3 | | 18.0 | | 19.2 | | 21.9 | | 23.4 | | 25.4 | | 26.1 | | 26.1 | | 1.6 | |
Taxpayer-supported | | 18.2 | | 16.1 | | 14.2 | | 13.8 | | 13.4 | | 15.7 | | 16.5 | | 17.5 | | 17.8 | | 17.5 | | -0.4 | |
Interest bite (cents per dollar of revenue) (4) | | | | | | | | | | | | | | | | | | | | | | | |
Total provincial | | 4.7 | | 4.4 | | 4.3 | | 4.0 | | 4.4 | | 4.4 | | 4.2 | | 4.6 | | 4.8 | | 5.1 | | 0.8 | |
Taxpayer-supported | | 5.1 | | 4.4 | | 4.2 | | 3.9 | | 4.3 | | 4.2 | | 4.1 | | 4.5 | | 4.6 | | 4.9 | | -0.4 | |
Interest costs ($ millions) | | | | | | | | | | | | | | | | | | | | | | | |
Total provincial | | 2,000 | | 2,012 | | 2,074 | | 2,012 | | 2,141 | | 2,098 | | 2,148 | | 2,430 | | 2,633 | | 2,911 | | 4.3 | |
Taxpayer-supported | | 1,636 | | 1,547 | | 1,575 | | 1,490 | | 1,573 | | 1,504 | | 1,618 | | 1,799 | | 1,901 | | 2,087 | | 2.7 | |
Interest rate (per cent) (5) | | | | | | | | | | | | | | | | | | | | | | | |
Taxpayer-supported | | 5.6 | | 5.5 | | 5.9 | | 5.7 | | 5.9 | | 5.3 | | 5.1 | | 5.1 | | 5.0 | | 5.2 | | -0.7 | |
Background Information: | | | | | | | | | | | | | | | | | | | | | | | |
Revenue ($ millions) | | | | | | | | | | | | | | | | | | | | | | | |
Total provincial (6) | | 42,136 | | 46,067 | | 48,360 | | 49,974 | | 48,765 | | 47,721 | | 50,805 | | 52,965 | | 54,717 | | 57,108 | | 3.4 | |
Taxpayer-supported (7) | | 32,386 | | 34,998 | | 37,222 | | 38,226 | | 36,745 | | 35,809 | | 39,451 | | 40,007 | | 41,223 | | 42,828 | | 3.2 | |
Debt ($ millions) | | | | | | | | | | | | | | | | | | | | | | | |
Total provincial | | 35,869 | | 34,457 | | 33,439 | | 34,637 | | 38,014 | | 41,885 | | 47,281 | | 53,437 | | 57,572 | | 60,355 | | 6.0 | |
Taxpayer-supported (8) | | 28,668 | | 27,251 | | 25,968 | | 26,589 | | 26,446 | | 30,021 | | 33,388 | | 36,816 | | 39,162 | | 40,500 | | 3.9 | |
Provincial Nominal GDP ($ millions) (9) | | 157,675 | | 169,664 | | 182,251 | | 192,117 | | 197,728 | | 191,006 | | 201,792 | | 210,071 | | 220,311 | | 230,976 | | 4.3 | |
Population (thousands at July 1) (10) | | 4,155 | | 4,197 | | 4,244 | | 4,310 | | 4,384 | | 4,460 | | 4,531 | | 4,598 | | 4,664 | | 4,729 | | 1.4 | |
(1) Includes fiscal data of school districts, post-secondary institutions and regional health authorities/societies (SUCH).
(2) The ratio of debt to population (e.g. 2011/12 debt divided by population at July 1, 2011).
(3) The ratio of debt outstanding at fiscal year end to provincial nominal gross domestic product (GDP) for the calendar year ending in the fiscal year (e.g. 2011/12 debt divided by 2011 GDP).
(4) The ratio of interest costs (less sinking fund interest) to revenue. Figures include capitalized interest expense in order to provide a more comparable measure to outstanding debt.
(5) Weighted average of all outstanding debt issues.
(6) Includes revenue of the consolidated revenue fund (excluding dividends from enterprises) plus revenue of all government organizations and enterprises.
(7) Excludes revenue of government enterprises, but includes dividends from enterprises paid to the consolidated revenue fund.
(8) Excludes debt of commercial Crown corporations and agencies and funds held under the province’s warehouse borrowing program.
(9) Nominal GDP for the calendar year ending in the fiscal year (e.g. GDP for 2011 is used for the fiscal year ended March 31, 2012).
(10) Population at July 1st within the fiscal year (e.g. population at July 1, 2011 is used for the fiscal year ended March 31, 2012).
Budget and Fiscal Plan – 2011/12 to 2013/14
98
Visit our website at: www.bcbudget.ca