Exhibit 99.6

Second Quarterly Report
Economic Outlook,
2011/12 Financial Update
&
Six Month Results
April — September 2011

National Library of Canada Cataloguing in Publication Data
British Columbia.
Budget and fiscal plan. — 2002/03/2004/05-
Annual
Also available on the Internet.
Continues: British Columbia. Ministry of Finance and
Corporate Relations. Budget ... reports. ISSN 1207-5841
ISSN 1705-6071 = Budget and fiscal plan — British Columbia.
1. Budget — British Columbia — Periodicals. 2. British
Columbia — Appropriations and expenditures — Periodicals.
I. British Columbia. Ministry of Finance. II. Title.
HJ12.B742 352.48’09711’05 C2003-960048-3
TABLE OF CONTENTS | | |
| | |
2011/12 Second Quarterly Report | | November 28, 2011 |
Summary | 1 |
| |
Part One: Updated Financial Forecast | |
| |
Introduction | 3 |
| |
Revenue | 5 |
| |
Expense | 6 |
Consolidated Revenue Fund spending | 6 |
Operating transfers to service delivery agencies | 6 |
Spending recovered from third parties | 7 |
Service delivery agency spending | 7 |
Government employment (FTEs) | 7 |
| |
Provincial capital spending | 8 |
| |
Provincial debt | 9 |
| |
Risks to the 2011/12 outlook | 10 |
| |
Tables: | |
1.1 Budget 2011 and Quarterly Report Forecasts | 3 |
1.2 2011/12 Forecast Update | 4 |
1.3 2011/12 Capital Spending Update | 8 |
1.4 2011/12 Provincial Debt Update | 9 |
| |
Part Two: Economic Review and Outlook | |
| |
Summary | 11 |
| |
Comparison to private sector forecasts | 11 |
| |
British Columbia economic activity | 12 |
Labour market | 12 |
Consumer spending and housing | 13 |
External trade and commodity markets | 15 |
| |
British Columbia economic outlook | 16 |
Economic Forecast Council | 16 |
Second Quarterly Report 2011/12
Table of Contents
Risks to the outlook | 17 |
| |
External environment | 17 |
United States | 17 |
Canada | 20 |
Other economies | 22 |
Financial markets | 23 |
| |
Tables: | |
2.1 British Columbia Economic Indicators | 12 |
2.2 Private Sector Canadian Interest Rate Forecasts | 24 |
2.3 Private Sector Exchange Rate Forecasts | 25 |
| |
Topic Box: | |
Provincial Economic Accounts Update | 26 |
| |
Appendix | |
Financial results for the six months ended September 30, 2011 and 2011/12 full-year forecast | 27 |
Second Quarterly Report 2011/12
ii
SUMMARY | | |
| | |
2011/12 Second Quarterly Report | | November 28, 2011 |
Budget 2011 and Quarterly Report Forecasts
| | | | First | | Second | |
| | Budget | | Quarterly | | Quarterly | |
($ millions) | | 2011 | | Report | | Report | |
Revenue | | 41,337 | | 40,593 | | 40,870 | |
Expense | | (41,912 | ) | (43,021 | ) | (43,611 | ) |
Deficit before forecast allowance | | (575 | ) | (2,428 | ) | (2,741 | ) |
Forecast allowance | | (350 | ) | (350 | ) | (350 | ) |
Deficit | | (925 | ) | (2,778 | ) | (3,091 | ) |
| | | | | | | |
Capital spending: | | | | | | | |
Taxpayer-supported capital spending | | 4,105 | | 4,331 | | 4,161 | |
Self-supported capital spending | | 3,243 | | 3,348 | | 3,229 | |
| | 7,348 | | 7,679 | | 7,390 | |
Provincial Debt: | | | | | | | |
Government direct operating debt | | 8,763 | | 9,325 | | 9,165 | |
Taxpayer-supported debt | | 36,816 | | 36,872 | | 36,521 | |
Self-supported debt | | 16,271 | | 16,265 | | 16,241 | |
Total debt (including forecast allowance) | | 53,437 | | 53,487 | | 53,112 | |
| | | | | | | |
Taxpayer-supported debt-to-GDP ratio | | 17.5 | % | 17.5 | % | 17.2 | % |
| | 2011 | |
Economic Forecast: | | | | | | | |
Real GDP growth | | 2.0 | % | 2.0 | % | 2.0 | % |
Nominal GDP growth | | 4.1 | % | 4.2 | % | 4.2 | % |
Fiscal outlook deteriorates slightly
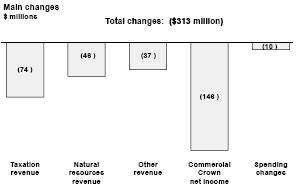
· The province’s projected deficit for 2011/12 has deteriorated by $313 million since the first Quarterly Report.
· The second Quarterly Report reflects a change in accounting treatment for the repayment of the final HST transition funding received on July 1, 2011. Instead of a reduction in revenue, the $580 million will also be shown as an expense, resulting in a $580 million increase to both revenue and expense with no impact on the deficit.
· Excluding this accounting change, the current forecast projects a $303 million decrease in revenue and a $10 million increase in spending.
· The revenue projections reflect lower taxation revenue (mainly corporate income tax), the impact of lower commodity prices on natural resource revenue, and reduced net income projections from commercial Crown corporations (mainly ICBC).
2011/12 changes from the first Quarterly Report
· Aside from the HST transition funding repayment, projected spending includes $30 million in additional statutory emergency program flood-related costs, partially offset by a net $20 million reduction in operating expenses.
· Government continues to face significant spending pressures which ministries and agencies will work to manage within existing budgets, with additional funding provided from the Contingencies vote as necessary.
· Government has maintained the forecast allowance at $350 million, reflecting the fiscal plan risks over the remainder of the fiscal year.
· At $7.4 billion, total capital spending is forecast to be $289 million lower than the first Quarterly Report forecast, reflecting construction schedule changes to health facility projects and the re-prioritization of BC Hydro capital spending in light of the June 2011 review.
· At $36.5 billion, the taxpayer-supported debt forecast is $351 million lower than the projection in the first Quarterly Report, as improved working capital management and reduced capital spending projections reduced borrowing requirements.
· The lower debt combined with the impact of Statistics Canada’s revisions to BC’s 2010 GDP reduced the taxpayer-supported debt to GDP ratio by 0.3 percentage points from the first Quarterly Report.
Economic growth slows
· Private sector forecasters have downgraded their average outlook for BC in both 2011 and 2012 since the first Quarterly Report was released on September 8, 2011 (see chart).
Private sector downgrades forecast for BC
Second Quarterly Report 2011/12
Summary
· This is due to several factors, including the continued sluggish recovery of the US and Canadian economies, the European debt crisis, a fluctuating Canadian dollar and the slowing performance of some of BC’s major economic indicators.
· Data for the current year indicate mixed results for BC’s economic growth, following a period of moderate increases experienced through most of 2010.
Risks to the 2011/12 Outlook
· Despite prudence in the current projections, a number of risks to the current year forecast continue to be monitored, including further decline in economic activity, volatile commodity prices and potential increased demand on social services.
· Downside risks to British Columbia’s economic outlook continue to be of significant concern and include a return to recession in the US economy, the ongoing sovereign debt crisis in Europe, and a corresponding slowdown in global demand for BC exports.
· Additional risks include a fluctuating Canadian dollar and continued volatility in global financial and commodity markets.
· The Minister of Finance met with members of the independent Economic Forecast Council in November 2011 to obtain their views on the economic outlook. The Council has downgraded its outlook for BC mainly due to external factors such as the weakening US and European outlook.
· The ministry will consider advice received from the Council when preparing its updated economic forecast to be presented in Budget 2012, along with a full report on the results of the annual Economic Forecast Council meeting (see the British Columbia Economic Outlook section on page 16 for further information on the Economic Forecast Council survey).
Second Quarterly Report 2011/12
2
PART ONE — UPDATED FINANCIAL FORECAST | | |
| | |
2011/12 Second Quarterly Report | | November 28, 2011 |
Introduction
The fiscal outlook for 2011/12 projects a deficit of $3.1 billion. The deficit forecast is $313 million higher than the first Quarterly Report and $2.2 billion higher than Budget 2011.
Table 1.1 Budget 2011 and Quarterly Report Forecasts
| | | | First | | Second | |
| | Budget | | Quarterly | | Quarterly | |
($ millions) | | 2011 | | Report | | Report | |
Revenue | | 41,337 | | 40,593 | | 40,870 | |
Expense | | (41,912 | ) | (43,021 | ) | (43,611 | ) |
Deficit before forecast allowance | | (575 | ) | (2,428 | ) | (2,741 | ) |
Forecast allowance | | (350 | ) | (350 | ) | (350 | ) |
Deficit | | (925 | ) | (2,778 | ) | (3,091 | ) |
Capital spending: | | | | | | | |
Taxpayer-supported capital spending | | 4,105 | | 4,331 | | 4,161 | |
Self-supported capital spending | | 3,243 | | 3,348 | | 3,229 | |
| | 7,348 | | 7,679 | | 7,390 | |
Provincial Debt: | | | | | | | |
Government direct operating debt | | 8,763 | | 9,325 | | 9,165 | |
Taxpayer-supported debt | | 36,816 | | 36,872 | | 36,521 | |
Self-supported debt | | 16,271 | | 16,265 | | 16,241 | |
Total debt (including forecast allowance) | | 53,437 | | 53,487 | | 53,112 | |
Taxpayer-supported debt-to-GDP ratio | | 17.5 | % | 17.5 | % | 17.2 | % |
| | | | | | | |
| | 2011 | |
Economic Forecast: | | | | | | | |
Real GDP growth | | 2.0 | % | 2.0 | % | 2.0 | % |
Nominal GDP growth | | 4.1 | % | 4.2 | % | 4.2 | % |
The second Quarterly Report reflects a change in accounting treatment for the repayment of the final HST transition funding received on July 1, 2011. In the 2011/12 first Quarterly Report forecast, the $580 million was shown as a reduction in revenue. It subsequently was determined that this portion of the repayment should also be shown as an expense, resulting in a $580 million increase to both revenue and expense with no impact on the deficit. The repayment of HST transition funding received in prior years will continue to be shown as an expense in 2011/12, as was the case in the first Quarterly Report.
Excluding this accounting change:
· Revenue is down $303 million reflecting lower revenue projections for corporate income taxes, fees and investment earnings, and commercial Crown corporation net income (see Table 1.2) .
· Spending is up $10 million reflecting higher projections for flood-related costs and the impact of reduced transfers to service delivery agencies, partially offset by lower debt servicing costs and service delivery agency spending.
· At $7.4 billion, total capital spending is $289 million lower mainly reflecting lower projections for health facilities and the re-prioritization of BC Hydro capital spending (see Table 1.3) .
Second Quarterly Report 2011/12
Updated Financial Forecast
Table 1.2 2011/12 Forecast Update
| | Q1 | | Q2 | | Total | |
($ millions) | | Update | | Update | | Changes | |
2011/12 deficit – Budget 2011 Fiscal Plan (May 3, 2011) | | (925 | ) | | | (925 | ) |
2011/12 deficit – first Quarterly Report (September 8, 2011) | | | | (2,778 | ) | | |
Revenue changes: | | | | | | | |
Personal income tax – mainly improved 2010 results | | 32 | | 23 | | 55 | |
Corporate income tax – reflects changes in federal government instalments | | 215 | | (111 | ) | 104 | |
Harmonized sales tax and other sales taxes – improved 2010 and year-to-date results | | 56 | | 10 | | 66 | |
Property transfer tax – higher year-to-date results | | 50 | | 50 | | 100 | |
Fuel and carbon taxes – weaker year-to-date results | | 20 | | (45 | ) | (25 | ) |
Other tax sources | | (7 | ) | (1 | ) | (8 | ) |
Natural gas royalties – mainly reduced price outlook and lower volumes | | (34 | ) | (32 | ) | (66 | ) |
Coal, metals and minerals – mainly higher mining costs, partially offset by coal price increases | | (85 | ) | 31 | | (54 | ) |
Forests – mainly lower stumpage rates and border tax collections, partially offset by improved volumes | | (32 | ) | (18 | ) | (50 | ) |
Columbia River Treaty electricity sales – mainly lower electricity prices | | (20 | ) | (10 | ) | (30 | ) |
Other natural resources | | 2 | | (17 | ) | (15 | ) |
Fees and licenses | | 55 | | (69 | ) | (14 | ) |
Investment earnings – mainly the effects of weaker equity and financial markets | | (22 | ) | (41 | ) | (63 | ) |
Miscellaneous revenue – delay in the completion date of the sale of Little Mountain property, partially offset by improved vote recoveries and SUCH sector revenue | | (198 | ) | 8 | | (190 | ) |
Health and social transfers – mainly lower population share | | (21 | ) | (6 | ) | (27 | ) |
Other federal government transfers | | 46 | | 71 | | 117 | |
Commercial Crown agencies operating results: | | | | | | | |
Liquor Distribution Branch – mainly reduced sales and consumer shift to purchasing products with lower margins | | (26 | ) | — | | (26 | ) |
BC Lotteries – mainly reduced revenue from casino operations | | (33 | ) | 5 | | (28 | ) |
ICBC – mainly higher bodily injury and accident benefit claims, and lower investment income | | (141 | ) | (149 | ) | (290 | ) |
Other commercial Crown agencies changes | | (21 | ) | (2 | ) | (23 | ) |
Revenue changes before HST transition repayment | | (164 | ) | (303 | ) | (467 | ) |
Liabilty for 2011 HST transition funding repayment – report as an expense | | (580 | ) | 580 | | — | |
Total revenue changes | | (744 | ) | 277 | | (467 | ) |
Less : expense increases (decreases): | | | | | | | |
Consolidated Revenue Fund changes: | | | | | | | |
Emergency program flood-related costs | | 17 | | 30 | | 47 | |
Management of public debt (net) – mainly lower debt balances | | (19 | ) | (34 | ) | (53 | ) |
Spending funded by third party recoveries | | 70 | | (25 | ) | 45 | |
(Increase) decrease in operating transfers to service delivery agencies | | (167 | ) | 45 | | (122 | ) |
Changes in spending profile of service delivery agencies: | | | | | | | |
School districts – higher repairs and maintenance costs | | 13 | | — | | 13 | |
Universities – spending related to federal research grants and higher student enrolment | | 48 | | 13 | | 61 | |
Colleges – spending related to higher student enrolment | | 21 | | 4 | | 25 | |
Health authorities and hospital societies – higher demand for healthcare services | | 138 | | 7 | | 145 | |
Other service delivery agencies | | (31 | ) | (30 | ) | (61 | ) |
Expense increases (decreases) before HST transition repayment | | 90 | | 10 | | 100 | |
Liability for reimbursement of HST transition funding, including the 2011 amount previously recorded as a reduction in revenue | | 1,019 | | 580 | | 1,599 | |
Total expense increases (decreases) | | 1,109 | | 590 | | 1,699 | |
Total changes | | (1,853 | ) | (313 | ) | (2,166 | ) |
2011/12 deficit – first Quarterly Report | | (2,778 | ) | | | | |
2011/12 deficit – second Quarterly Report | | | | (3,091 | ) | (3,091 | ) |
Second Quarterly Report 2011/12
4
Updated Financial Forecast
· At $36.5 billion, taxpayer-supported debt is $351 million lower mainly due to improved working capital management and reduced capital spending projections for health facilities (see Table 1.4). As a result, the projected taxpayer-supported debt to GDP ratio has fallen to 17.2 per cent.
Government has maintained the forecast allowance at $350 million, reflecting the fiscal plan risks over the remainder of the fiscal year. These risks include further changes to the economic outlook, volatile commodity prices, and unforeseen costs, such as those resulting from natural disasters.
Revenue
The 2011/12 revised revenue forecast incorporates year-to-date results for the first six months, updated personal and corporate income tax assessment information from the federal government for 2010 and prior years, and revised forecasts from ministries, the federal government, service delivery agencies and commercial Crown corporations.
Revenue in 2011/12 is projected to be $40.9 billion — $277 million higher than the first Quarterly Report and $467 million below the Budget 2011 forecast. However, if the effect of the change in accounting for the repayment of the $580 million HST transition funding that was received in 2011/12 is excluded, revenue is $303 million lower than the first Quarterly Report. Detailed revenue projections are disclosed in Table A2 and, and key assumptions and sensitivities relating to revenue are provided in Table A5.
Major changes from the first Quarterly Report include:
· Personal income tax revenue is up $23 million as a result of stronger 2010 tax assessment results partly offset by expected reduced contributions from higher income individuals in 2011.
· Corporate income tax revenue is down $111 million mainly due to lower instalments from the federal government reflecting weaker 2010 national tax base results.
· Property transfer tax revenue is up $50 million due to continuing strength in housing sales this year.
· Natural gas royalties are forecast to be down $32 million reflecting a 6.4 per cent decline in the average natural gas price since the first Quarterly Report due to weak demand and increased supply in the North American market.
· Coal, metals and mineral revenue is up $31 million mainly due to an improved coal price, partially offset by higher mining costs.
· Forests revenue is reduced by $18 million as the effects of a weak US housing market and the mountain pine beetle infestation continue to result in lower stumpage rates and US softwood lumber exports.
· Revenue from other natural resources is expected to be $27 million lower due to the effects of lower commodity prices.
· Revenue from fees and licenses is expected to be down $69 million due to lower MSP premiums reflecting increased premium assistance take up and reduced vote recoveries, partially offset by improved SUCH sector revenues.
· Investment earnings are forecast to be down $41 million reflecting lower cash balances and weak equity and financial markets.
Second Quarterly Report 2011/12
5
Updated Financial Forecast
· Other federal contributions are expected to increase $71 million due to a one-time contribution for disaster financial assistance related to floods and fires in 2010, higher vote recoveries and improved forecasts from taxpayer supported Crown corporations.
· In total, commercial Crown corporation net income projections decreased by $146 million since the first Quarterly Report primarily due to lower ICBC investment income reflecting ongoing deterioration in the investment market.
Expense
Spending is projected to total $43.6 billion in 2011/12 — a $590 million increase from the first Quarterly Report. The expense increase primarily relates to a change in accounting treatment for the repayment of the 2011/12 portion of the HST transition funding. Previously shown as a reduction in revenue, the $580 million is now reported as an expense.
Aside from the HST transition funding repayment, spending reflects additional statutory emergency program flood-related costs, partially offset by a net $20 million reduction in operating expenses.
Consolidated Revenue Fund spending
Emergency program flood-related costs have increased by $30 million since the first Quarterly Report and are projected to total $62 million for the year, which is $47 million higher than the Ministry of Public Safety and Solicitor General emergency program budget. The additional costs are paid under statutory authority.
Debt servicing cost projections are down $34 million since the first Quarterly Report, mainly due to lower projected debt levels.
Government continues to face significant spending pressures, such as:
· higher than anticipated income assistance caseloads and services to support the developmentally disabled;
· justice system commitments, including additional supports for the court system and police resources dedicated to combat gang violence and organized crime;
· new support for Community Recreation Infrastructure;
· higher than anticipated Crime Victim Assistance Program costs; and
· Teachers Pension Plan contribution rate adjustments based on recent actuarial valuations.
Ministries and agencies will work to manage these pressures within existing budgets, with additional funding provided from the Contingencies vote as necessary.
Operating transfers to service delivery agencies
Operating transfers to service delivery agencies are forecasted to be $45 million lower in 2011/12 compared to the first Quarterly Report. The reduction primarily relates to a downward adjustment to the increase in funding requirements that was projected in the first Quarterly Report.
Second Quarterly Report 2011/12
6
Updated Financial Forecast
Spending recovered from third parties
Spending funded by recoveries from third parties is projected to decrease by $25 million in 2011/12 compared to the first Quarterly Report. The changes reflect decreases in:
· environmental and agriculture spending, primarily reduced free crown grants (down $43 million); and
· transportation spending primarily related to road and air facilities (down $9 million);
partially offset by increases in:
· healthcare spending mainly associated with the medical service plan and related collections cost, PharmaCare and other health regional services (up $12 million);
· recoverable direct fire costs (up $14 million); and
· other recoverable costs (up $1 million).
The above spending changes are offset by an equal decrease in revenue, and as a result have no net impact on the current year forecast.
Service delivery agency spending
Service delivery agency spending is forecast to decrease by $6 million in 2011/12 compared to the first Quarterly Report.
· Post secondary institution spending is projected to increase by $17 million due to increased operating costs resulting from additional federal research funding and higher student enrolment.
· Health authority and hospital society spending is forecast to be up $7 million, reflecting a slight increase in staffing and operating costs. This spending increase is projected to be funded by additional provincial grants and own-source revenue.
· Other service delivery agency spending is projected to decrease by $30 million reflecting lower debt servicing costs due to lower interest rates and lower amortization expense due to changes in capital project spending and completion timelines.
Detailed expense projections are disclosed in Table A3. Key spending assumptions and sensitivities are provided in Table A6.
Government employment (FTEs)
At 30,597 FTEs, the projection of government employment for 2011/12 is unchanged from the first Quarterly Report. Further details on FTEs are provided in Table A7.
Second Quarterly Report 2011/12
7
Updated Financial Forecast
Provincial capital spending
Total capital spending is projected to be $7.4 billion in 2011/12, $289 million lower than the first Quarterly Report but $42 million higher than Budget 2011.
Table 1.3 2011/12 Capital Spending Update
| | Q1 | | Q2 | | Total | |
($ millions) | | Update | | Update | | Changes | |
2011/12 capital spending – Budget 2011 Fiscal Plan (May 3, 2011) | | 7,348 | | | | 7,348 | |
2011/12 capital spending – first Quarterly Report (September 8, 2011) | | | | 7,679 | | | |
Taxpayer-supported changes: | | | | | | | |
School districts – mainly increased maintenance program spending | | 48 | | 2 | | 50 | |
Post secondary institutions – mainly increased spending on self-funded projects | | 107 | | 7 | | 114 | |
Health – mainly for priority spending on various maintenance programs and project scheduling changes | | 98 | | (71 | ) | 27 | |
BCTFA – mainly timing of capital spending and additional investments in the Oil and Gas Rural Road Improvement Program | | 61 | | — | | 61 | |
Government ministries – mainly rescheduling of the Sierra-Yoyo-Desan road upgrade | | — | | (64 | ) | (64 | ) |
Other changes | | 30 | | (44 | ) | (14 | ) |
Capital contingencies – reflects allocation to BC Place redevelopment for carry-over of underspending from 2010/11 and others | | (118 | ) | — | | (118 | ) |
Total taxpayer-supported | | 226 | | (170 | ) | 56 | |
| | | | | | | |
Self-supported changes: | | | | | | | |
BC Hydro – reflects capital project re-prioritization | | (18 | ) | (95 | ) | (113 | ) |
Transportation Investment Corporation – Port Mann Bridge/Highway 1 | | 119 | | (21 | ) | 98 | |
Other | | 4 | | (3 | ) | 1 | |
Total self-supported | | 105 | | (119 | ) | (14 | ) |
Total changes | | 331 | | (289 | ) | 42 | |
2011/12 capital spending – first Quarterly Report | | 7,679 | | | | | |
2011/12 capital spending – second Quarterly Report | | | | 7,390 | | 7,390 | |
· Taxpayer-supported capital spending is projected to be $4.2 billion, $170 million lower than the first Quarterly Report forecast. This change is primarily due to the timing of capital spending for projects in health facilities, Sierra Yoyo-Desan Road upgrade, Surrey Pre-Trail Centre and BC Transit Long Term Capital Plan development (see Table 1.3).
· Self-supported capital spending is projected to be $3.2 billion, $119 million lower than the first Quarterly Report forecast. The change mainly reflects BC Hydro’s re-prioritization of capital spending in light of the June 2011 review.
Details on capital spending are shown in Table A8, and capital spending projects with provincial contributions greater than $50 million are presented in Table A9.
Second Quarterly Report 2011/12
8
Updated Financial Forecast
Provincial debt
The provincial debt is projected to total $53.1 billion at March 31, 2012 — $325 million lower than the projection for the first Quarterly Report (see Tables 1.4 and A10).
Table 1.4 2011/12 Provincial Debt Update
| | Q1 | | Q2 | | Total | |
($ millions) | | Update | | Update | | Changes | |
2011/12 provincial debt – Budget 2011 Fiscal Plan (May 3, 2011) | | 53,437 | | | | 53,437 | |
2011/12 provincial debt – first Quarterly Report (September 8, 2011) | | | | 53,487 | | | |
Taxpayer-supported changes: | | | | | | | |
2010/11 changes: | | | | | | | |
– Improved government operating deficits | | (806 | ) | — | | (806 | ) |
– Reduced borrowing requirements for capital spending | | (510 | ) | — | | (510 | ) |
– Changes in working capital and others | | (217 | ) | — | | (217 | ) |
Impact of lower debt balance at March 31, 2011 | | (1,533 | ) | — | | (1,533 | ) |
2011/12 forecast updates: | | | | | | | |
– Repayment of HST transition funding | | 1,599 | | — | | 1,599 | |
– CRF working capital requirements | | — | | (160 | ) | (160 | ) |
– Education facilities | | 66 | | 4 | | 70 | |
– Health facilities | | 3 | | (107 | ) | (104 | ) |
– Transportation infrastructure | | 9 | | (18 | ) | (9 | ) |
– Other changes | | (88 | ) | (70 | ) | (158 | ) |
Total taxpayer-supported | | 56 | | (351 | ) | (295 | ) |
Self-supported changes: | | | | | | | |
– BC Hydro | | (23 | ) | 6 | | (17 | ) |
– Transportation Investment Corporation | | 10 | | (25 | ) | (15 | ) |
– Other changes | | 7 | | (5 | ) | 2 | |
Total self-supported | | (6 | ) | (24 | ) | (30 | ) |
Total changes | | 50 | | (375 | ) | (325 | ) |
2011/12 provincial debt – first Quarterly Report | | 53,487 | | | | | |
2011/12 provincial debt – second Quarterly Report | | | | 53,112 | | 53,112 | |
· Taxpayer-supported debt is projected at $36.5 billion — a $351 million decrease since the first Quarterly Report projection, reflecting working capital improvements and reductions in capital financing requirements.
· The projected self-supported debt balance of $16.2 billion at March 31, 2012 is $24 million lower than the projection in the first Quarterly Report also reflecting reductions in capital financing requirements.
· The total provincial debt forecast includes a $350 million forecast allowance to mirror the operating statement forecast allowance.
The taxpayer-supported debt to GDP ratio is projected to be 17.2 per cent by the end of 2011/12, an improvement of 0.3 percentage points from the first Quarterly Report.
Second Quarterly Report 2011/12
9
Updated Financial Forecast
Risks to the 2011/12 outlook
There are a number of risks and pressures to the fiscal plan, including slower than expected economic growth in our trading partners resulting in lower demand for BC’s exports, continuing instability in financial markets brought about by the European sovereign debt crisis, and further weakening of the US dollar.
Revenues in British Columbia can be volatile, largely due to the influence of the cyclical nature of the natural resource sector in the economy. Changes in energy or commodity prices, such as natural gas and lumber, may have a significant effect on revenue and the fiscal forecast.
The spending forecast is based on ministry and service delivery agency spending plans and strategies. Changes to planning assumptions, such as utilization or demand rates for government services in the health care, education, or community social services sectors, represent the main spending risks.
These risks, as well as further government spending initiatives and the potential impact of accounting policy changes, are covered by the $603 million Contingencies vote and the $350 million forecast allowance.
Second Quarterly Report 2011/12
10
PART TWO — ECONOMIC REVIEW AND OUTLOOK (1) |
| | |
2011/12 Second Quarterly Report | | November 28, 2011 |
Summary
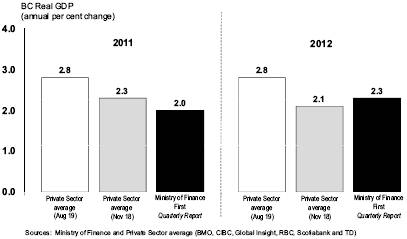
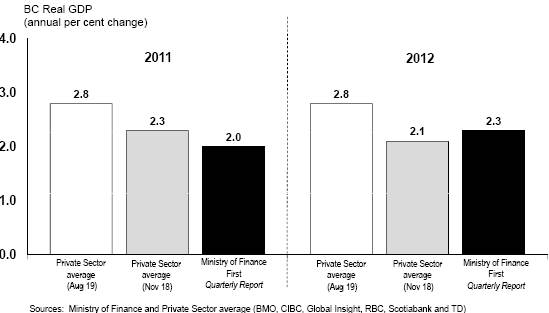
· Since the first Quarterly Report, the private sector has downgraded its outlook for the BC economy in 2011 and 2012. The private sector average(2) (based on a subset of the Economic Forecast Council) now pegs BC’s annual real GDP to grow by 2.3 per cent in 2011 and by 2.1 per cent in 2012. These recent forecasts are lower than the private sector average at the time of the first Quarterly Report, which projected 2.8 per cent growth for both 2011 and 2012.
· Data for the current year indicate mixed results for BC’s economic growth, following a period of moderate increases experienced through most of 2010.
· Downside risks to British Columbia’s economic outlook continue to be of significant concern and include a return to recession in the US economy, the ongoing sovereign debt crisis in Europe, and a corresponding slowdown in global demand for BC exports. Additional risks include a fluctuating Canadian dollar and continued volatility in global financial and commodity markets.
Comparison to Private Sector Forecasts
Private sector forecasters have downgraded their average outlook for BC in both 2011 and 2012 since the first Quarterly Report was released on September 8, 2011.
At the time of the first Quarterly Report, the private sector expected BC’s real GDP to increase by an average of 2.8 per cent in 2011 and 2012.
Chart 2.1 Private sector downgrades forecast for BC
(1) Reflects information available as of November 21, 2011.
(2) The six private sector institutions in Chart 2.1 are selected because they produce regular provincial forecasts and are sitting members of the Economic Forecast Council.
Second Quarterly Report 2011/12
Economic Review and Outlook
Private sector forecasters are now expecting BC’s economic growth in 2011 to be lower than previous projections. This is due to several factors, including the continued sluggish recovery of the US and Canadian economies, the European debt crisis, a fluctuating Canadian dollar and the slowing performance of some of BC’s major economic indicators. As of November 18, 2011, the same private sector forecasters projected a 2.3 per cent rise in BC’s real GDP in 2011 and a 2.1 per cent increase in 2012.
Compared to other provinces, private sector economists expect BC to tie Manitoba in experiencing the fourth largest expansion in real GDP in 2011, behind Newfoundland and Labrador, Alberta and Saskatchewan. In 2012, private sector projections place BC’s real GDP fourth among provinces, trailing Alberta, Saskatchewan and Manitoba.
British Columbia Economic Activity
Indicators of British Columbia’s economic performance so far in 2011 have been mixed. Table 2.1 shows quarterly declines in some key sectors of the provincial economy during the two most recent quarters of this year. However, the year-to-date performance among most indicators shows improvement in the province’s economic activity compared to the same period in 2010.
Table 2.1 British Columbia Economic Indicators
| | | | | | Year-to-Date | |
| | Apr. to Jun. 2011 | | Jul. to Sep. 2011 | | Jan. to Sep. 2011 | |
| | change from | | change from | | change from | |
All data seasonally adjusted | | Jan. to Mar. 2011 | | Apr. to Jun. 2011 | | Jan. to Sep. 2010 | |
| | Per cent change | |
Employment | | +0.6 | | +0.3 | | +0.8 | |
Manufacturing shipments | | -1.1 | | +2.0 | | +7.2 | |
Exports | | -0.3 | | +8.2 | | +16.0 | |
Retail sales(1) | | +1.7 | | -0.5 | | +1.5 | |
Housing starts | | +7.7 | | +7.1 | | -2.9 | |
Non-residential building permits | | +25.2 | | -11.6 | | +8.8 | |
(1) Data to August
Labour market
Employment in the province has been trending relatively flat since early 2010, with the exception of a notable jump in September 2011 that added 31,600 jobs on the month. This gain was somewhat offset as total employment shed 10,800 jobs the following month.
Year-to-date to October, BC employment edged up 0.8 per cent compared to the first ten months of 2010. This translates into 17,700 more jobs than the same period last year, primarily due to an increase in part-time employment (17,400 jobs), while full-time employment added 300 jobs on the year.
Major job gains to date have been observed in the service sector (+0.7 per cent), primarily due to growth in the accommodation and food services sector, which added around 19,000 jobs (+11.7 per cent) year-to-date to October. In addition, employment gains in professional, scientific and technical services (+3.7 per cent) and in the transportation and warehousing sector (+5.2 per cent) more than offset declines in the health care and social assistance (-2.2 per cent) and trade (-4.4 per cent) sectors compared to the same period of 2010.
Second Quarterly Report 2011/12
12
Economic Review and Outlook
Chart 2.2 BC employment recovering slowly
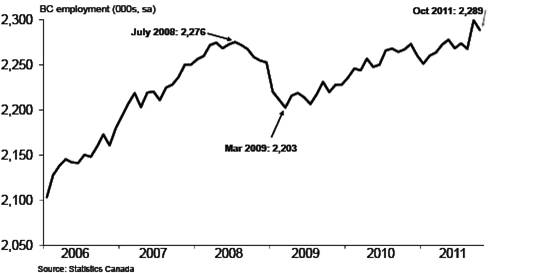
Meanwhile, employment in the goods producing sector grew by 1.0 per cent over the January to October period of 2011, largely attributable to an increase in construction related employment (+12,200 jobs) compared to the same period a year ago. This gain more than offset the declines recorded in other goods producing sectors, such as agriculture (-16.1 per cent), utilities (-6.4 per cent) and other primary goods sectors (-4.0 per cent).
British Columbia’s labour force expanded by 0.7 per cent year-to-date to October. At the same time, BC’s unemployment rate has averaged 7.6 per cent year-to-date, unchanged from the same period a year ago. While the absolute number of jobs in BC has surpassed the pre-recession peak of July 2008, the provincial unemployment rate remains higher than it was at that peak. For example, as of October 2011, BC’s monthly unemployment rate was 6.6 per cent — 1.9 percentage points higher than the 4.7 per cent recorded in July 2008. The provincial labour force has expanded faster than employment over the last two years, resulting in the higher unemployment rate.
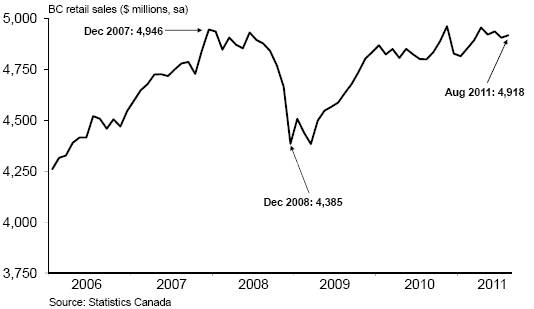
Consumer spending and housing
Retail sales advanced 1.5 per cent year-to-date to August 2011, primarily due to gains in the value of sales of new vehicles as well as increased sales at gas stations and at health and personal care stores. Despite increased sales activity on the year, consumer purchases in BC have stagnated in recent months. Further, BC recorded the slowest pace of growth in retail sales amongst provinces over the first eight months of 2011. Modest growth in employment, high debt loads and economic uncertainty have taken a toll on retail sales, which have barely regained levels observed prior to the onset of the 2008/09 recession. Solid consumer spending will be fundamental to a sustained economic recovery, going forward.
Housing starts have been volatile through 2011, with sizable swings in construction from one month to the next. Although quarterly increases have occurred in both the April to June and July to September quarters, BC housing starts have decreased on a year-to-date basis, down 0.9 per cent compared to the first ten months of 2010. Further, residential building permits (a precursor of new housing activity) fell by 12.4 per cent year-to-date to September.
Second Quarterly Report 2011/12
13
Economic Review and Outlook
Chart 2.3 BC consumer spending trending flat
MLS home sales in BC have retreated in recent quarters following the steady gains recorded through the latter months of 2010. However, MLS home sales improved by 4.5 per cent year-to-date to October, compared to the same period a year ago.
Chart 2.4 BC housing starts mixed in 2011

The value of total non-residential building permits rose 8.8 per cent during the first nine months of 2011 compared to the same period in 2010. Sizeable gains were observed in both the industrial (+41.8 per cent) and commercial (+24.3 per cent) categories, which more than offset a decline in the value of institutional and government permits (-25.4 per cent) on the year. More recently, the value of total non-residential building permits has fallen back, slipping 11.6 per cent in the July to September quarter of 2011, following growth of 25.2 per cent in the April to June quarter.
Second Quarterly Report 2011/12
14
Economic Review and Outlook
External trade and commodity markets
The value of BC’s merchandise exports increased 16.0 per cent year-to-date to September 2011 compared to the same period in 2010. The broad based gain in exports was led by a substantial increase in energy exports (+25.3 per cent), brought on by stronger coal prices. In addition, strong growth was experienced in exports of forestry products (+11.7 per cent) and industrial and consumer goods (+19.6 per cent).
Chart 2.5 BC exports recovery on track
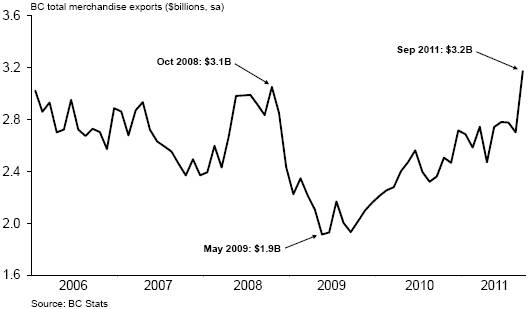
Exports from BC have been a bright spot this year, despite a sluggish US economy and an elevated currency, highlighting the province’s diversified trade portfolio. China’s progression into an economic power-house with increased demand for BC resource-based commodities has boosted the province’s recovery in exports. The share of BC’s exports to Pacific Rim countries year-to-date to September was 43.5 per cent — exceeding the proportion of goods shipped to the US (42.1 per cent) over the same period.
BC manufacturing shipments have grown by 7.2 per cent year-to-date to September, compared to the first nine months of 2010. Broad based gains on the year were led by notable increases in shipments of primary metals (+22.1 per cent), paper (+6.5 per cent) and wood products (+4.6 per cent).
Continued global economic uncertainty and financial market turbulence have weighed heavily on many commodity prices in recent months. Although recent price corrections have been mild compared to the overall plunge experienced in the second half of 2008, commodity markets are likely to remain volatile over the near-term given the fragile global economic backdrop.
Lumber prices fell sharply through the early part of 2011, dropping from $311 US/000 board feet in January to as low as $222 US/000 board feet in May, weighed down by a depressed US housing market. More recently, slight improvements have resulted in an average lumber price of $258 US/000 board feet year-to-date to October, representing an increase of 3.3 per cent over the first ten months of 2010.
Pulp prices started the year on a sharp upward trend, hitting a record high $1,016 US per tonne in the spring of 2011. Although prices have since retreated for three
Second Quarterly Report 2011/12
15
Economic Review and Outlook
consecutive months, pulp prices year-to-date to October averaged $979 US per tonne, which represents an increase of 5.8 per cent over the same period of 2010.
Oil prices are particularly sensitive to sentiment on the global economic outlook and geopolitics, with the West Texas Intermediate (WTI) daily oil price falling as low as $75.40 US per barrel on October 4, 2011, before rebounding to $93.96 US per barrel three weeks later following the announcement of a Euro zone sovereign debt plan and a pickup in US GDP growth in the third quarter of this year.
Year-to-date to October, the price of oil averaged $94.28 US per barrel, a 20.9 per cent increase compared to the same period a year ago. Note that since the beginning of the year, the WTI price has been running lower than crude oil that is priced off Brent (the main benchmark outside of North America) due to an excess supply of oil accumulating at Cushing, Oklahoma. Meanwhile, the price of natural gas has hovered around historically low levels since early-2010. Plant Inlet prices averaged just $2.55 C/GJ year-to-date to October — a notable drop from $3.00 C/GJ observed over the same period a year ago.
British Columbia Economic Outlook
In the first Quarterly Report, released September 8, 2011, the Ministry of Finance projected BC’s real GDP to grow by 2.0 per cent in 2011 and 2.3 per cent in 2012. At the time, the Ministry’s forecast was more prudent than the average of six private sector forecasters, in recognition of the downside risks facing BC’s economy. By comparison, the private sector expected BC’s economy to expand by an average of 2.8 per cent in both 2011 and 2012. Since then, the average private sector forecast has fallen to 2.3 per cent for 2011 and 2.1 per cent in 2012. These downgrades have absorbed almost all of the prudence included in the Ministry’s first Quarterly Report forecast.
The first Quarterly Report forecast was based in part on the Ministry’s assumption that the US economy would grow by 1.3 per cent in 2011 and by 1.7 per cent in 2012. The Ministry’s US forecast was lower than the August Consensus Economics survey that projected 1.8 per cent growth in 2011 and 2.4 per cent growth in 2012. Currently, the November Consensus forecasts US real GDP to improve by 1.8 per cent in 2011 and 2.1 per cent in 2012. In preparation for Budget 2012, evolving views on the US economy from numerous sources will be assessed to ensure that the Ministry’s economic forecast continues to include prudent economic assumptions.
In the first Quarterly Report, the Ministry assumed that the Canadian economy would expand by 2.4 per cent in 2011 and 2.3 per cent in 2012. These forecasts were lower than the August Consensus survey average, which called for a 2.7 per cent expansion in 2011 followed by 2.5 per cent growth in 2012. Currently, the November Consensus survey expects Canada’s real GDP to rise by 2.3 per cent in 2011 and 2.0 per cent in 2012. The impact of the struggling US economy, uncertainty surrounding the sovereign debt crisis in Europe, a moderating pace of domestic economic growth, as well as a fluctuating Canadian dollar will be incorporated into the Ministry’s Budget 2012 forecast.
Economic Forecast Council
In preparation for Budget 2012, the Minister of Finance met with members of the independent Economic Forecast Council in November 2011 to obtain their views on the economic outlook. The Council has downgraded its forecast for BC economic growth since the last survey, conducted in January 2011. The Council now estimates BC real
Second Quarterly Report 2011/12
16
Economic Review and Outlook
GDP growth of 2.2 per cent in 2011 and 2012, respectively, in contrast to its previous real GDP forecast of 2.7 per cent in 2011 and 3.0 per cent in 2012. This downward revision reflects increased risks to the economic outlook, mainly due to external factors such as the weakening US and European outlook. The Ministry will consider advice received from the Economic Forecast Council when preparing its updated economic forecast, which will be presented in Budget 2012 along with a full report on the results of the annual Economic Forecast Council meeting.
Risks to the Outlook
Risks to British Columbia’s economic outlook are largely weighted to the downside. The most significant risks to the current outlook include:
· a return to recession in the US economy (characterized by widespread deleveraging causing weaker investment, slower consumer spending, a very slow job market recovery, the depressed housing situation and further fiscal restraint at the federal, state and local levels);
· the sovereign debt crisis in Greece, Ireland and Portugal spreading to other European countries such as Italy and Spain, threatening the stability of global financial markets, including the possibility of another credit crunch;
· slower than anticipated Asian demand resulting in weaker demand for BC’s exports;
· exchange rate volatility; and
· further weakening of the US dollar resulting in significant disruptions to global financial and commodity markets.
External Environment
United States
The US economy is displaying the long-term symptoms consistent with a balance sheet recession, which was caused by the bursting of the housing bubble in 2007/08. While economic growth strengthened somewhat in the July to September quarter of 2011, underlying economic indicators show that the US economy is still not on a sustainable growth path. This situation will most likely continue for several years.
US real GDP expanded at an annualized rate of 2.5 per cent in the July to September quarter of 2011, following smaller gains in the first half of the year (0.4 per cent in the January to March quarter and 1.3 per cent in the April to June quarter of 2011). The July to September increase was mainly driven by positive contributions from consumer spending, nonresidential investment, exports and federal government spending that were partly offset by negative contributions from private inventory investment and state and local government spending. With the US fiscal situation under considerable strain it is unclear how sustainable the increase in federal government spending will be, as those gains were attributable to defense spending, which was offset by declines in non-defense spending.
Furthermore, high consumer spending going forward seems unlikely as the unusually high July to September quarter growth occurred amidst declining real disposable incomes and weak consumer confidence. Indeed, current consumer spending patterns cut unsustainably into savings, and in the July to September quarter of 2011 the savings rate declined to 4.1 per cent, a full percentage point lower than in the April to June quarter and the lowest rate since 2007.
Second Quarterly Report 2011/12
17
Economic Review and Outlook
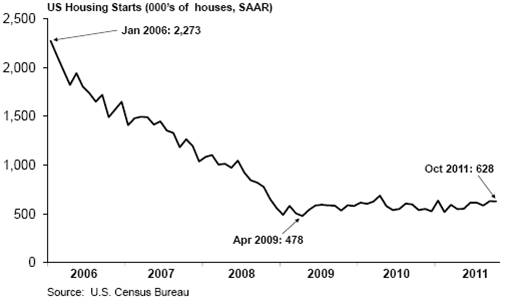
On the housing front, there is continued concern as homebuilding has come to a standstill, there is a glut of distressed homes on the market, house prices remain at record lows and many households have mortgages worth more than their property — all of which is eroding household wealth. Housing starts averaged just 592,200 units year-to-date to October 2011, a 0.3 per cent decrease from the same period a year ago.
Chart 2.6 US housing starts fluctuate around historical lows
Meanwhile, existing home sales in the US have declined in the last two quarters of 2011, and have averaged around 5.0 million annualized units year-to-date to October, a 1.0 per cent increase from the same period of 2010, which included a month when existing home sales hit an all-time record low in July 2010.
US home prices continue to decline with the Case-Shiller 20-city home price index sitting at 30.8 per cent below its June 2006 peak. Furthermore, almost one quarter of all US mortgages were underwater at the end of the second quarter of 2011 (where the
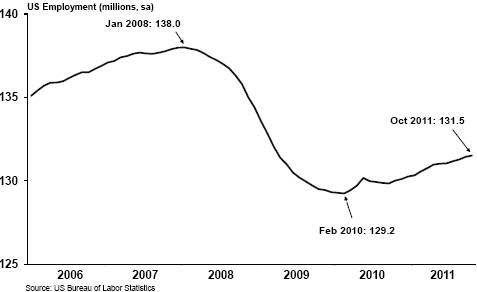
Chart 2.7 US employment remains weak
Second Quarterly Report 2011/12
18
Economic Review and Outlook
amount owed on a mortgage exceeds the value of the home). The weak US job situation and negative home equity will put downward pressure on the housing market for the duration of 2011 and into next year.
The US employment situation continues to stagnate. Employment remains 6.5 million below the January 2008 peak and about one million below the pre-2001 recession peak. The unemployment rate still sits at a relatively high 9.0 per cent as of October 2011, and has been at around this level now for 30 months. As of October 2011, there were 967 thousand discouraged workers in the US, which is higher than the levels observed during the 2008/09 recession. Discouraged workers are people who have stopped actively looking for work since they believe there are no job opportunities for them. The weak job market is another factor weighing on consumer confidence.
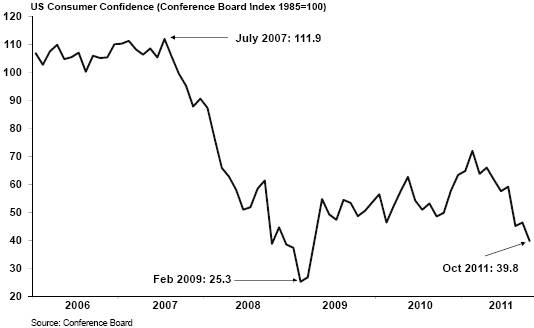
Uncertainty regarding the economic outlook and fiscal situation, coupled with declining home equity, has left consumer confidence near historical lows. The Conference Board consumer confidence index registered 39.8 in October 2011, its lowest level since early 2009, when the index fell below 40 in the midst of the recession. Business confidence also remains weak, with the National Federation of Independent Business small business optimism sentiment at 90.2 in October. The October index is well shy of its historical average of 98.4. As such, measures of business, homebuilder and consumer sentiment remain depressed and consistent with sluggish growth.
Chart 2.8 US consumer confidence remains depressed
Meanwhile, the US fiscal situation continues to deteriorate at the federal, state and local government levels as Washington remains gridlocked. In the July to September quarter of 2011, state and local government spending contracted 1.3 per cent, the eleventh decline in the last 15 quarters. While overall federal government spending increased 2.0 per cent in the July to September quarter of 2011, this was due to an increase in defense spending, which was offset by a decline in non-defense spending. While some states are collecting more in taxes than last year, tax collection is less than before the recession began, and not as much as they expected when budgets were prepared earlier this year.
Second Quarterly Report 2011/12
19
Economic Review and Outlook
Furthermore, this past summer’s debt ceiling impasse was only temporarily resolved by referring the issue of deficit reduction to a Joint Congressional Committee of Democrats and Republicans. This committee is expected to release its report by November 23, 2011; indications are that the committee is deadlocked and analysts fear another debt ceiling stand-off which may lead to further credit downgrades for the US federal government.
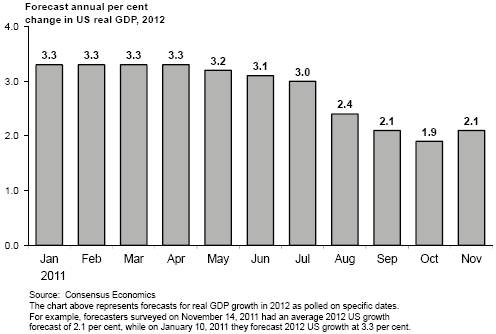
As a result, the private sector view of the US has plummeted since August 2011. The November 2011 Consensus survey forecasts US real GDP to grow by 1.8 per cent in 2011, following growth expectations of 2.5 per cent in the summer (June and July).
For 2012, the November Consensus expects US economic growth of 2.1 per cent, a large reduction from the 3.0 per cent forecast in July. Private sector forecasters have downgraded their expectations due to weak domestic economic indicators (such as the unsatisfactory job market, dire housing situation and high government debt levels), as well as foreign factors such as the European debt crisis which has shaken world financial markets.
Chart 2.9 Consensus forecasting weaker US outlook for 2012
Canada
Like BC, Canada has weathered the 2008/09 recession and financial crisis relatively well. Canada has a healthy banking system, job creation has recovered quickly and the fiscal situation has not been as dire as in other countries. However, with the effects of the last recession still lingering, and the global economic situation (particularly in Europe) deteriorating, Canadian consumers and businesses are less confident about prospects going forward.
Indeed, after an upbeat start to the year, Canada’s economy has weakened somewhat since July 2011, including a brief contraction of 0.4 per cent in the second quarter of this year. Amidst a significantly less favourable external environment, Canada’s recovery faces potential challenges through financial, confidence and trade channels.
Second Quarterly Report 2011/12
20
Economic Review and Outlook
Although Canadian growth rebounded in the third quarter of 2011 with the unwinding of temporary factors (such as supply chain disruptions attributable to Japan’s natural and nuclear disasters earlier this year), underlying economic momentum has slowed and is expected to remain modest through the middle of next year.
As the European situation unfolds, there could be massive repercussions for US and Asian economies due to their trade links with Europe. As a result, Canada is at risk of a significant slowing in exports due to its strong trade links with the US, Asian and European economies.
Against a deteriorating global economic outlook and faced with a slowing economy, the federal Department of Finance announced a revised deficit reduction schedule in its November Economic and Fiscal Projections update — delaying a federal fiscal surplus until 2015/16 or 2016/17, depending on the successful implementation of the deficit reduction action plan which aims to achieve at least four billion dollars in ongoing annual savings by 2014/15 and beyond.
Earlier this year, the Canadian labour market surpassed pre-recession highs, adding over 275,000 jobs (or 1.6 per cent) year-to-date to October 2011. However, Canadian job growth has paused in recent months, consistent with the deterioration in the economic situation. Further, October 2011 data revealed a notable drop in manufacturing employment, which led to Canada’s largest monthly decline in employment since February 2009. Meanwhile, the national unemployment rate averaged 7.5 per cent year-to-date to October, 0.6 percentage points lower than the same period of 2010.
National retail sales have advanced by 3.4 per cent year-to-date to August compared to the first eight months of 2010. Despite improving on the year, national retail sales have moderated in recent months, reflecting the weight of weaker employment conditions, fragile consumer confidence and high debt loads of Canadian consumers.
Canadian housing starts have fluctuated in recent months, to average 193,200 annualized units year-to-date to October, edging down 0.1 per cent compared to the same period of 2010. National home sales grew by 2.0 per cent year-to-date to October compared to the same period of 2010. Despite this modest increase, Canadian MLS home sales have been mixed on a month-to-month basis, with the level of national home sales trending flat in recent months. At the same time, the national home price average climbed to nearly $369,500 in March 2011 before easing back slightly in recent months. On the year, the average Canadian home price rose by 8.0 per cent compared to the first ten months of 2010.
Canada’s trade sector has improved on the year despite the effects of a strong dollar through the first half of 2011. The value of Canadian merchandise exports jumped 11.7 per cent year-to-date to September, led by significant gains in exports of energy and industrial goods compared to the first nine months of 2010. Shipments of manufactured goods also improved on the year, as the total value of Canadian shipments rose 7.5 per cent year-to-date to September. Despite recent positive trends in Canada’s trade sector to date, mounting headwinds such as weaker US demand, global economic uncertainty and an elevated Canadian dollar may impose downward pressure on trade going forward.
Second Quarterly Report 2011/12
21
Economic Review and Outlook
Chart 2.10 Consensus downgrades 2012 Canadian outlook in recent months
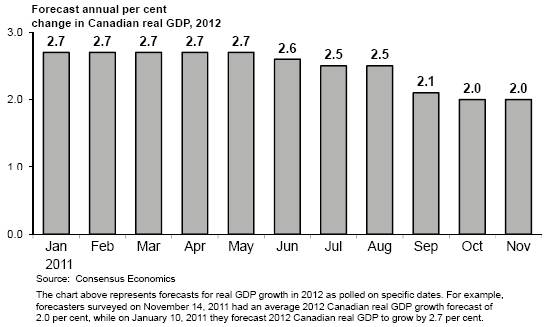
As with their outlook for the US, private sector forecasters have lowered their projections for the Canadian economy in 2011 and 2012, with the November Consensus expecting Canada’s real GDP to grow by 2.3 per cent this year and 2.0 per cent in 2012.
Other economies
The external economic setting is clouded with an unusually high degree of uncertainty. While the risk of a recession in the Euro zone is increasing, economic developments have taken a back seat to the political issues surrounding efforts to address severe fiscal challenges and the mounting sovereign debt crisis. While European leaders met in late October 2011, securing a last-minute agreement to address a host of European public debt issues, critics warn that the existing plan is short on details and may potentially prove inadequate in the next few months.
Fears over a contagion beyond Greece are growing as Italy and Spain bond yields continue to ratchet up toward dangerously high levels. Economic indicators continue to suggest slowing growth in the Euro zone, which has prompted some central banks (Bank of Canada and the European Central Bank) to concede the potential for a mild European recession going forward.
Further, yields on Italian two-year and 10-year bonds rose above seven per cent for the first time in early November 2011 — a level viewed as unsustainable by the markets — and the level at which Greece, Ireland and Portugal sought help.
Global stocks and the euro currency have since tumbled as Italian borrowing costs spiked, igniting fears among investors that Italy could be forced to seek a bailout from other European nations. The cost of an Italian bailout could overwhelm the euro zone’s finances and push the region into a period of severe economic decline. Meanwhile, growing concerns over the threat of a global credit crunch have prompted US administrators to examine how exposed US banks are to European debt.
Second Quarterly Report 2011/12
22
Economic Review and Outlook
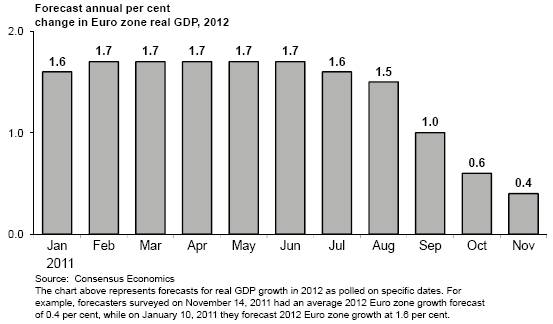
The Euro zone continues to edge towards recession, prompting private sector forecasters to lower their projections for both 2011 and 2012. As such, the November Consensus pegs Euro zone real GDP to grow by 1.6 per cent this year followed by a small increase of 0.4 per cent in 2012.
Chart 2.11 Consensus cuts 2012 expectations for faltering Euro zone
Financial markets
Interest rates
Upon meeting in October 2011, the Bank of Canada chose to hold its target for the overnight rate at 1.00 per cent — unchanged since September 2010 — acknowledging that the pace of the global economy has slowed markedly since July. Indeed, the Bank now expects the Euro area will experience a brief recession. The Bank’s recent weaker economic outlook implies greater and more persistent economic slack than they anticipated in the early half of 2011. As such, most private sector analysts believe the Bank will postpone tightening monetary policy until late-2012.
The Federal Open Market Committee (FOMC) met in November 2011 and elected to maintain its intended federal funds rate in the 0.00 to 0.25 per cent range at least through mid-2013. Supporting their decision, FOMC members cited that they continue to expect a moderate pace of economic growth over the coming quarters, a slow decline in the unemployment rate and the stabilization of inflation at levels at or below those consistent with the Fed’s dual mandate. In addition, the Committee announced its intention of continuing its program to extend the average maturity of its holdings of securities, dubbed “Operation Twist”. Given the FOMC’s announced intentions along with prevalent risks in global financial markets, private sector analysts anticipate that the federal funds rate will remain in the 0.00 to 0.25 per cent range for all of 2011 and 2012.
Second Quarterly Report 2011/12
23
Economic Review and Outlook
Chart 2.12 Private sector expects interest rates to stay lower for longer

In line with expectations of slower real GDP growth, analysts have lowered their interest rate projections over the medium-term. The average of private sector forecaster’s views on Canadian short-term interest rates (three-month Treasury bills) as of October 21, 2011 indicates that three-month rates are expected to average around 0.9 per cent in 2011 and 1.1 per cent in 2012.
The same private sector forecasters project ten-year Government of Canada bonds to average around 2.8 per cent for 2011 and around 2.6 per cent in 2012.
Table 2.2 Private Sector Canadian Interest Rate Forecasts
| | 3-month Treasury Bill | | 10-year Government Bond | |
Average annual interest rate (per cent) | | 2011 | | 2012 | | 2011 | | 2012 | |
Global Insight | | 0.9 | | 1.0 | | 2.8 | | 2.5 | |
CIBC | | 0.9 | | 1.2 | | 2.8 | | 2.6 | |
Bank of Montreal | | 0.9 | | 0.8 | | 2.8 | | 2.4 | |
Scotiabank | | 0.9 | | 1.2 | | 2.8 | | 2.5 | |
TD Economics | | 0.9 | | 0.9 | | 2.8 | | 2.8 | |
RBC Capital Markets | | 0.9 | | 1.2 | | 2.8 | | 2.7 | |
Average (as of October 21, 2011) | | 0.9 | | 1.1 | | 2.8 | | 2.6 | |
Exchange rate
The Canadian dollar spent the early half of this year trading above par, reaching as high as 105.8 US cents in July 2011, bolstered by robust commodity prices and a weaker US dollar. More recently however, the value of the loonie depreciated sharply — falling to as low as 94.3 US cents in early October of this year — battered by weaker commodity prices and cautious investors fleeing to the perceived safe haven of the US dollar.
Second Quarterly Report 2011/12
24
Economic Review and Outlook
Chart 2.13 Private sector lowers dollar expectations into 2012
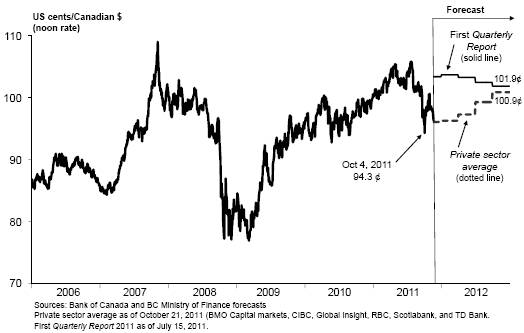
Given the escalating uncertainty in global economic and financial market conditions along with the prospect of potentially weaker commodity prices in the near-term, an average of six private sector analysts sees the Canadian dollar averaging 100.7 US cents for 2011 before falling back to average 98.5 US cents in 2012.
Table 2.3 Private Sector Exchange Rate Forecasts
Average annual exchange rate (US cents/Can $) | | 2011 | | 2012 | |
Global Insight | | 100.5 | | 96.3 | |
CIBC | | 101.2 | | 103.5 | |
Bank of Montreal | | 100.5 | | 95.0 | |
Scotiabank | | 100.8 | | 100.8 | |
TD Economics | | 100.6 | | 97.1 | |
RBC Capital Markets | | 100.6 | | 98.1 | |
Average (as of October 21, 2011) | | 100.7 | | 98.5 | |
Second Quarterly Report 2011/12
25
Provincial Economic Accounts Update
Provincial Economic Accounts
Statistics Canada released its estimates of provincial GDP for 2010 on November 8, 2011.
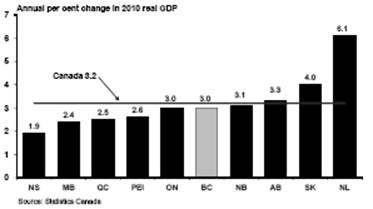
British Columbia’s real GDP increased by 3.0 per cent in 2010, following a 2.1 per cent contraction in the previous year. BC was tied with Ontario for the fifth strongest growth rate among provinces last year, behind Newfoundland and Labrador (6.1 per cent), Saskatchewan (4.0 per cent), Alberta (3.3 per cent) and New Brunswick (3.1 per cent). Overall, Canadian real GDP rose 3.2 per cent in 2010.
Chart 1 – Real GDP in Canadian provinces
The main contributor to BC’s 3.0 per cent increase in real GDP was a 3.8 per cent increase in consumer spending — the largest among provinces in 2010. All major components of investment posted gains in 2010 and trade with other countries advanced 9.8 per cent due to notable gains in the production and export of commodities such as lumber, wood pulp, natural gas and coal. At the same time, government spending (federal, provincial and local) on goods and services grew by 1.6 per cent (down from 3.3 per cent growth in 2009) and real imports rose by 9.9 per cent (following a 8.8 per cent decline in 2009).
Chart 2 – BC real GDP
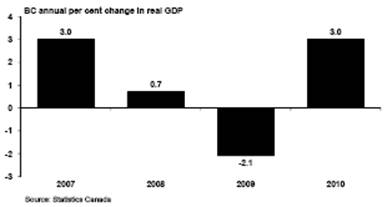
Real GDP
Chart 2 shows the annual changes in BC’s real GDP from 2007 to 2010. The most recent year saw British Columbia’s economy making up lost ground after registering its largest decline in real GDP since 1982, in the wake of the 2008/09 global financial crisis.
Nominal GDP
Changes in BC’s nominal GDP in 2007, 2008, 2009 and 2010 are presented in Chart 3. Last year’s economic recovery resulted in a nominal GDP increase of $11.3 billion (or 5.9 per cent) in 2010, following a 3.8 per cent decline in the previous year.
Chart 3 – BC nominal GDP
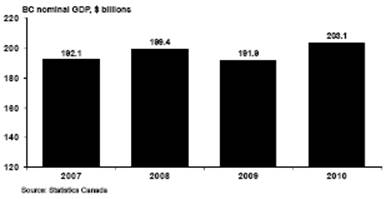
While historical revisions to nominal GDP can sometimes create noticeable changes to government’s debt to GDP ratio, the latest revisions had a small impact, changing the taxpayer-supported debt to GDP ratio for 2010/11 up to 15.7 per cent from 15.6 per cent in 2009/10.
Chart 4 – Corporate profits
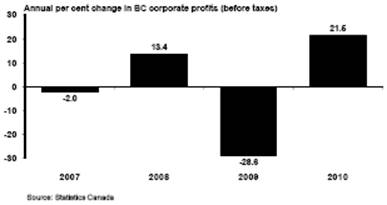
Further, BC’s corporate profits (before taxes) saw a substantial increase in 2010, climbing 21.5 per cent — its largest increase since 2004 — following a 28.6 per cent decline the previous year.
Second Quarterly Report 2011/12
APPENDIX: | FINANCIAL RESULTS |
| For the Six Months Ended September 30, 2011 and 2011/12 Full-Year Forecast |
2011/12 Second Quarterly Report | November 28, 2011 |
| Table A1 | Operating Statement |
| Table A2 | Revenue by Source |
| Table A3 | Expense by Ministry, Program and Agency |
| Table A4 | Expense by Function |
| Table A5 | Material Assumptions — Revenue |
| Table A6 | Material Assumptions — Expense |
| Table A7 | Full-Time Equivalents |
| Table A8 | Capital Spending |
| Table A9 | Capital Expenditure Projects Greater Than $50 Million |
| Table A10 | Provincial Debt |
| Table A11 | Statement of Financial Position |
Second Quarterly Report 2011/12
Appendix
Table A1 2011/12 Operating Statement
| | Year-to-Date to September 30 | | Full Year | |
| | 2011/12 | | Actual | | 2011/12 | | Actual | |
($ millions) | | Budget | | Actual | | Variance | | 2010/11 | | Budget | | Forecast | | Variance | | 2010/11 | |
Revenue | | 20,313 | | 20,140 | | (173 | ) | 19,549 | | 41,337 | | 40,870 | | (467 | ) | 39,926 | |
Expense | | (19,490 | ) | (20,963 | ) | (1,473 | ) | (19,086 | ) | (41,912 | ) | (43,611 | ) | (1,699 | ) | (40,235 | ) |
Surplus (deficit) before forecast allowance | | 823 | | (823 | ) | (1,646 | ) | 463 | | (575 | ) | (2,741 | ) | (2,166 | ) | (309 | ) |
Forecast allowance | | — | | — | | — | | — | | (350 | ) | (350 | ) | — | | — | |
Surplus (deficit) | | 823 | | (823 | ) | (1,646 | ) | 463 | | (925 | ) | (3,091 | ) | (2,166 | ) | (309 | ) |
Accumulated surplus beginning of the year | | 3,595 | | 4,302 | | 707 | | 4,596 | | 3,595 | | 4,396 | | 801 | | 4,705 | |
Accumulated surplus before comprehensive income | | 4,418 | | 3,479 | | (939 | ) | 5,059 | | 2,670 | | 1,305 | | (1,365 | ) | 4,396 | |
Accumulated other comprehensive income from self-supported Crown agencies | | 267 | | (81 | ) | (348 | ) | 252 | | 199 | | 123 | | (76 | ) | 436 | |
Accumulated surplus end of period | | 4,685 | | 3,398 | | (1,287 | ) | 5,311 | | 2,869 | | 1,428 | | (1,441 | ) | 4,832 | |
Second Quarterly Report 2011/12
28
Appendix
Table A2 2011/12 Revenue by Source
| | Year-to-Date to September 30 | | Full Year | |
| | 2011/12 | | Actual | | 2011/12 | | Actual | |
($ millions) | | Budget | | Actual | | Variance | | 2010/11 | | Budget | | Forecast | | Variance | | 2010/11 | |
Taxation | | | | | | | | | | | | | | | | | |
Personal income | | 2,850 | | 2,860 | | 10 | | 2,823 | | 5,796 | | 5,851 | | 55 | | 5,361 | |
Corporate income | | 743 | | 816 | | 73 | | 639 | | 1,571 | | 1,675 | | 104 | | 1,658 | |
Harmonized sales | | 2,877 | | 2,886 | | 9 | | 1,237 | | 5,820 | | 5,859 | | 39 | | 4,176 | |
Other sales (1) | | 58 | | 90 | | 32 | | 1,294 | | 116 | | 143 | | 27 | | 1,387 | |
Fuel | | 487 | | 475 | | (12 | ) | 477 | | 964 | | 929 | | (35 | ) | 940 | |
Carbon | | 412 | | 419 | | 7 | | 321 | | 950 | | 960 | | 10 | | 741 | |
Tobacco | | 350 | | 336 | | (14 | ) | 426 | | 676 | | 651 | | (25 | ) | 734 | |
Property | | 935 | | 939 | | 4 | | 950 | | 1,898 | | 1,920 | | 22 | | 1,918 | |
Property transfer | | 463 | | 562 | | 99 | | 501 | | 810 | | 910 | | 100 | | 855 | |
Other (2) | | 225 | | 204 | | (21 | ) | 256 | | 413 | | 408 | | (5 | ) | 427 | |
| | 9,400 | | 9,587 | | 187 | | 8,924 | | 19,014 | | 19,306 | | 292 | | 18,197 | |
Natural resources | | | | | | | | | | | | | | | | | |
Natural gas royalties | | 195 | | 196 | | 1 | | 168 | | 447 | | 381 | | (66 | ) | 313 | |
Forests | | 229 | | 196 | | (33 | ) | 163 | | 526 | | 476 | | (50 | ) | 436 | |
Other natural resource (3) | | 1,055 | | 996 | | (59 | ) | 955 | | 2,127 | | 2,028 | | (99 | ) | 1,978 | |
| | 1,479 | | 1,388 | | (91 | ) | 1,286 | | 3,100 | | 2,885 | | (215 | ) | 2,727 | |
Other revenue | | | | | | | | | | | | | | | | | |
Medical Services Plan premiums | | 973 | | 951 | | (22 | ) | 883 | | 1,945 | | 1,901 | | (44 | ) | 1,787 | |
Other fees (4) | | 1,168 | | 1,269 | | 101 | | 1,169 | | 2,762 | | 2,792 | | 30 | | 2,658 | |
Investment earnings | | 512 | | 585 | | 73 | | 370 | | 1,037 | | 974 | | (63 | ) | 859 | |
Miscellaneous (5) | | 1,521 | | 1,263 | | (258 | ) | 1,348 | | 2,958 | | 2,768 | | (190 | ) | 2,790 | |
| | 4,174 | | 4,068 | | (106 | ) | 3,770 | | 8,702 | | 8,435 | | (267 | ) | 8,094 | |
Contributions from the federal government | | | | | | | | | | | | | | | | | |
Health and social transfers | | 2,699 | | 2,699 | | — | | 2,575 | | 5,398 | | 5,371 | | (27 | ) | 5,176 | |
Harmonized sales tax transition payment | | 580 | | 580 | | — | | 769 | | 580 | | 580 | | — | | 769 | |
Other federal contributions (6) | | 657 | | 693 | | 36 | | 754 | | 1,602 | | 1,719 | | 117 | | 2,052 | |
| | 3,936 | | 3,972 | | 36 | | 4,098 | | 7,580 | | 7,670 | | 90 | | 7,997 | |
Commercial Crown corporation net income | | | | | | | | | | | | | | | | | |
BC Hydro | | 119 | | 155 | | 36 | | 212 | | 611 | | 595 | | (16 | ) | 591 | |
Liquor Distribution Branch | | 483 | | 475 | | (8 | ) | 461 | | 925 | | 899 | | (26 | ) | 890 | |
BC Lotteries (net of payments to the federal government) | | 551 | | 546 | | (5 | ) | 566 | | 1,096 | | 1,068 | | (28 | ) | 1,096 | |
ICBC | | 160 | | (57 | ) | (217 | ) | 213 | | 290 | | — | | (290 | ) | 323 | |
Transportation Investment Corporation (Port Mann) | | (7 | ) | (4 | ) | 3 | | (3 | ) | (15 | ) | (16 | ) | (1 | ) | (7 | ) |
Other | | 18 | | 10 | | (8 | ) | 22 | | 34 | | 28 | | (6 | ) | 18 | |
| | 1,324 | | 1,125 | | (199 | ) | 1,471 | | 2,941 | | 2,574 | | (367 | ) | 2,911 | |
Total revenue | | 20,313 | | 20,140 | | (173 | ) | 19,549 | | 41,337 | | 40,870 | | (467 | ) | 39,926 | |
(1) Includes social service tax and continuation of the tax on designated property.
(2) Corporation capital, insurance premium and hotel room taxes.
(3) Columbia River Treaty, other energy and minerals, water rental and other resources.
(4) Post-secondary, healthcare-related, motor vehicle, and other fees.
(5) Includes asset dispositions, reimbursements for health care and other services provided to external agencies, and other recoveries.
(6) Includes contributions for health, education, community development, housing and social service programs, and transportation projects.
Second Quarterly Report 2011/12
29
Appendix
Table A3 2011/12 Expense by Ministry, Program and Agency
| | Year-to-Date to September 30 | | Full Year | |
| | 2011/12 | | Actual | | 2011/12 | | Actual | |
($ millions) | | Budget | | Actual | | Variance | | 2010/11 (1) | | Budget (1) | | Forecast | | Variance | | 2010/11 (1) | |
Office of the Premier | | 5 | | 5 | | — | | 4 | | 9 | | 9 | | — | | 9 | |
Aboriginal Relations and Reconciliation | | 40 | | 40 | | — | | 42 | | 80 | | 80 | | — | | 95 | |
Advanced Education | | 958 | | 963 | | 5 | | 967 | | 1,980 | | 1,980 | | — | | 1,975 | |
Agriculture | | 37 | | 43 | | 6 | | 41 | | 66 | | 66 | | — | | 80 | |
Attorney General | | 221 | | 227 | | 6 | | 220 | | 443 | | 443 | | — | | 474 | |
Children and Family Development | | 635 | | 652 | | 17 | | 649 | | 1,331 | | 1,331 | | — | | 1,334 | |
Community, Sport and Cultural Development | | 179 | | 182 | | 3 | | 147 | | 254 | | 254 | | — | | 433 | |
Education | | 2,697 | | 2,694 | | (3 | ) | 2,608 | | 5,242 | | 5,242 | | — | | 5,197 | |
Energy and Mines | | 207 | | 194 | | (13 | ) | 194 | | 418 | | 418 | | — | | 439 | |
Environment | | 60 | | 60 | | — | | 61 | | 130 | | 130 | | — | | 132 | |
Finance | | 67 | | 42 | | (25 | ) | 149 | | 157 | | 157 | | — | | 160 | |
Forests, Lands and Natural Resource Operations | | 282 | | 289 | | 7 | | 474 | | 590 | | 590 | | — | | 810 | |
Health | | 7,741 | | 7,556 | | (185 | ) | 7,247 | | 15,714 | | 15,714 | | — | | 14,721 | |
Jobs, Tourism and Innovation | | 119 | | 93 | | (26 | ) | 115 | | 238 | | 238 | | — | | 299 | |
Labour, Citizens’ Services and Open Government | | 269 | | 266 | | (3 | ) | 295 | | 566 | | 566 | | — | | 585 | |
Public Safety and Solicitor General | | 317 | | 329 | | 12 | | 318 | | 635 | | 682 | | 47 | | 706 | |
Social Development | | 1,164 | | 1,206 | | 42 | | 1,163 | | 2,338 | | 2,338 | | — | | 2,369 | |
Transportation and Infrastructure | | 370 | | 371 | | 1 | | 373 | | 807 | | 807 | | — | | 752 | |
Total ministries and Office of the Premier | | 15,368 | | 15,212 | | (156 | ) | 15,067 | | 30,998 | | 31,045 | | 47 | | 30,570 | |
Management of public funds and debt | | 677 | | 632 | | (45 | ) | 639 | | 1,349 | | 1,296 | | (53 | ) | 1,243 | |
Contingencies | | — | | — | | — | | — | | 603 | | 603 | | — | | 1 | |
Funding for capital expenditures | | 414 | | 496 | | 82 | | 310 | | 1,543 | | 1,414 | | (129 | ) | 1,083 | |
Legislative and other appropriations | | 63 | | 64 | | 1 | | 55 | | 125 | | 125 | | — | | 120 | |
Subtotal | | 16,522 | | 16,404 | | (118 | ) | 16,071 | | 34,618 | | 34,483 | | (135 | ) | 33,017 | |
Liability for reimbursement of HST transition funding | | — | | 1,599 | | 1,599 | | — | | — | | 1,599 | | 1,599 | | — | |
Prior year liability adjustments | | — | | — | | — | | — | | — | | — | | — | | (167 | ) |
Consolidated revenue fund expense | | 16,522 | | 18,003 | | 1,481 | | 16,071 | | 34,618 | | 36,082 | | 1,464 | | 32,850 | |
Expenses recovered from external entities | | 1,183 | | 1,225 | | 42 | | 1,305 | | 2,651 | | 2,696 | | 45 | | 2,924 | |
Funding provided to service delivery agencies | | (10,425 | ) | (10,470 | ) | (45 | ) | (9,905 | ) | (21,369 | ) | (21,362 | ) | 7 | | (20,303 | ) |
Total direct program spending | | 7,280 | | 8,758 | | 1,478 | | 7,471 | | 15,900 | | 17,416 | | 1,516 | | 15,471 | |
Service delivery agency expense | | | | | | | | | | | | | | | | | |
School districts | | 2,403 | | 2,427 | | 24 | | 2,362 | | 5,513 | | 5,526 | | 13 | | 5,418 | |
Universities | | 1,853 | | 1,845 | | (8 | ) | 1,783 | | 3,880 | | 3,941 | | 61 | | 3,734 | |
Colleges and institutes | | 505 | | 516 | | 11 | | 505 | | 1,063 | | 1,088 | | 25 | | 1,064 | |
Health authorities and hospital societies | | 5,903 | | 5,810 | | (93 | ) | 5,508 | | 11,989 | | 12,134 | | 145 | | 11,187 | |
Other service delivery agencies | | 1,546 | | 1,607 | | 61 | | 1,457 | | 3,567 | | 3,506 | | (61 | ) | 3,361 | |
| | 12,210 | | 12,205 | | (5 | ) | 11,615 | | 26,012 | | 26,195 | | 183 | | 24,764 | |
Total expense | | 19,490 | | 20,963 | | 1,473 | | 19,086 | | 41,912 | | 43,611 | | 1,699 | | 40,235 | |
(1) Restated to reflect government’s current organization and/or accounting policies.
Second Quarterly Report 2011/12
30
Appendix
Table A4 2011/12 Expense By Function
| | Year-to-Date to September 30 | | Full Year | |
| | 2011/12 | | Actual | | 2011/12 | | Actual | |
($ millions) | | Budget | | Actual | | Variance | | 2010/11 (1) | | Budget | | Forecast | | Variance | | 2010/11 (1) | |
Health: | | | | | | | | | | | | | | | | | |
Medical Services Plan | | 1,976 | | 1,953 | | (23 | ) | 1,898 | | 4,026 | | 4,058 | | 32 | | 3,799 | |
Pharmacare | | 575 | | 561 | | (14 | ) | 550 | | 1,140 | | 1,152 | | 12 | | 1,129 | |
Regional services | | 5,632 | | 5,428 | | (204 | ) | 5,200 | | 11,593 | | 11,480 | | (113 | ) | 10,597 | |
Other healthcare expenses (2) | | 303 | | 301 | | (2 | ) | 313 | | 718 | | 707 | | (11 | ) | 625 | |
| | 8,486 | | 8,243 | | (243 | ) | 7,961 | | 17,477 | | 17,397 | | (80 | ) | 16,150 | |
Education: | | | | | | | | | | | | | | | | | |
School districts | | 2,510 | | 2,530 | | 20 | | 2,463 | | 5,911 | | 5,918 | | 7 | | 5,802 | |
Post-secondary institutions | | 2,295 | | 2,303 | | 8 | | 2,314 | | 4,825 | | 5,078 | | 253 | | 4,865 | |
Other education expenses (3) | | 255 | | 225 | | (30 | ) | 230 | | 558 | | 553 | | (5 | ) | 504 | |
| | 5,060 | | 5,058 | | (2 | ) | 5,007 | | 11,294 | | 11,549 | | 255 | | 11,171 | |
Social services: | | | | | | | | | | | | | | | | | |
Social assistance (2),(3) | | 848 | | 880 | | 32 | | 853 | | 1,495 | | 1,483 | | (12 | ) | 1,512 | |
Childcare services (2) | | 539 | | 548 | | 9 | | 537 | | 1,112 | | 1,115 | | 3 | | 1,118 | |
Community living and other services | | 261 | | 255 | | (6 | ) | 241 | | 770 | | 763 | | (7 | ) | 754 | |
| | 1,648 | | 1,683 | | 35 | | 1,631 | | 3,377 | | 3,361 | | (16 | ) | 3,384 | |
Protection of persons and property | | 643 | | 678 | | 35 | | 649 | | 1,322 | | 1,344 | | 22 | | 1,448 | |
Transportation | | 725 | | 720 | | (5 | ) | 736 | | 1,617 | | 1,602 | | (15 | ) | 1,577 | |
Natural resources and economic development | | 640 | | 666 | | 26 | | 850 | | 1,347 | | 1,407 | | 60 | | 1,997 | |
Other | | 547 | | 646 | | 99 | | 573 | | 1,220 | | 1,217 | | (3 | ) | 1,211 | |
Contingencies | | — | | — | | — | | — | | 603 | | 603 | | — | | — | |
General government | | 521 | | 2,095 | | 1,574 | | 541 | | 1,102 | | 2,684 | | 1,582 | | 1,044 | |
Debt servicing costs | | 1,220 | | 1,174 | | (46 | ) | 1,138 | | 2,553 | | 2,447 | | (106 | ) | 2,253 | |
Total expense | | 19,490 | | 20,963 | | 1,473 | | 19,086 | | 41,912 | | 43,611 | | 1,699 | | 40,235 | |
(1) Restated to reflect government’s current organization and accounting policies.
(2) Payments for healthcare services by the Ministry of Social Development and the Ministry of Children and Family Development made on behalf of their clients are reported in the Health function.
(3) Payments for training costs by the Ministry of Social Development made on behalf of its clients are reported in the Education function.
Second Quarterly Report 2011/12
31
Appendix
Table A5 2011/12 Material Assumptions — Revenue
Revenue Source and Assumptions | | | | 1st Quarter | | 2nd Quarter | | |
($ millions unless otherwise specified) | | Budget | | Forecast | | Forecast | | Sensitivities |
Personal income tax | | $ | 5,796 | | $ | 5,828 | | $ | 5,851 | | |
Current calendar year assumptions | | | | | | | | |
Personal income growth | | 3.5 | % | 3.8 | % | 3.8 | % | +/- 1% change in 2011 BC personal income growth equals +/- $50 to $100 million |
Labour income growth | | 4.0 | % | 4.0 | % | 4.0 | % |
Tax base growth | | 3.4 | % | 3.9 | % | 3.5 | % |
Average tax yield | | 4.85 | % | 4.85 | % | 4.85 | % | |
Current-year tax | | $ | 6,024 | | $ | 6,051 | | $ | 6,029 | | +/- 1% change in 2010 BC personal or taxable income growth equals +/- $50 to $100 million one-time effect (prior-year adjustment) and could result in an additional +/-$50 to $75 million base change in 2011/12 |
BC Tax Reduction | | $ | -141 | | $ | -141 | | $ | -111 | |
Low income climate action tax credit | | $ | -175 | | $ | -175 | | $ | -180 | |
BC HST/sales tax credit | | $ | -288 | | $ | -288 | | $ | -313 | |
Other tax credits and refunds | | $ | -98 | | $ | -98 | | $ | -98 | |
Policy neutral elasticity * | | 1.2 | | 1.2 | | 1.1 | |
Fiscal year assumptions | | | | | | | |
Prior-year adjustment | | | | $ | 7 | | $ | 48 | |
Family Bonus offset | | $ | -5 | | $ | -5 | | $ | -5 | | |
| | 2010 Assumptions | | | | |
2010 Tax-year | | | | | | | | |
Personal income growth | | 3.0 | % | 3.4 | % | 4.0 | % | |
Tax base growth | | 2.1 | % | 2.1 | % | 2.1 | % | |
Average 2010 tax yield | | 4.81 | % | 4.81 | % | 4.81 | % | |
2010 tax | | $ | 5,780 | | $ | 5,780 | | $ | 5,780 | | |
BC Tax Reduction | | $ | -139 | | $ | -138 | | $ | -108 | | |
Low income climate action tax credit | | $ | -164 | | $ | -164 | | $ | -164 | | |
BC HST/sales tax credit | | $ | -148 | | $ | -148 | | $ | -148 | | |
Other tax credits and refunds | | $ | -100 | | $ | -100 | | $ | -90 | | |
Policy neutral elasticity * | | 1.0 | | 0.9 | | 0.7 | | |
* Ratio of annual per cent change in current-year revenue to annual per cent change in personal income (calendar year).
Corporate income tax | | $ | 1,571 | | $ | 1,786 | | $ | 1,675 | | |
Components of revenue (fiscal year) | | | | | | | | |
Advance instalments | | $ | 1,498 | | $ | 1,657 | | $ | 1,520 | | |
International Business Activity Act refunds | | $ | -20 | | $ | -20 | | $ | -20 | | |
Prior-year adjustment | | $ | 93 | | $ | 149 | | $ | 175 | | |
Current calendar year assumptions | | | | | | | | |
National tax base ($ billions) | | $ | 216.8 | | $ | 242.0 | | $ | 228.7 | | +/- 1% change in the 2011 national tax base equals +/- $10 to $20 million |
BC instalment share of national tax base | | 11.6 | % | 11.6 | % | 11.6 | % |
Effective tax rates (general/small business) | | 10.0 / 2.5 | | 10.0 / 2.5 | | 10.0 / 2.5 | |
BC tax base growth (post federal measures) | | 9.5 | % | 10.2 | % | 10.3 | % | |
BC corporate profits growth | | 8.6 | % | 10.3 | % | 10.0 | % | +/- 1% change in the 2010 BC tax base equals +/- $20 to $30 million in 2011/12 |
BC Tax credits | | | | | | | |
Film, Television and Production Services | | $ | -199 | | $ | -199 | | $ | -208 | |
Scientific Research and Experimental Development | | $ | -143 | | $ | -143 | | $ | -139 | | |
Interactive Digital Media | | $ | -35 | | $ | -35 | | $ | -35 | | |
Other | | $ | -50 | | $ | -50 | | $ | -50 | | |
| | 2010 Assumptions | | | | |
2010 Tax-year | | | | | | | | |
BC tax base growth | | 15.3 | % | 12.8 | % | 9.3 | % | |
BC corporate profits growth | | 19.4 | % | 19.1 | % | 21.5 | % | |
Gross 2010 tax | | $ | 1,994 | | $ | 1,950 | | $ | 1,883 | | |
Prior-year adjustments | | $ | 93 | | $ | 149 | | $ | 175 | | |
Prior years losses/gains (included in above) | | $ | -200 | | $ | -100 | | $ | 0 | | |
BC Tax credits | | | | | | | | |
Film, Television and Production Services | | $ | -189 | | $ | -189 | | $ | -198 | | |
Scientific Research and Experimental Development | | $ | -144 | | $ | -144 | | $ | -140 | | |
Other | | $ | -50 | | $ | -50 | | $ | -52 | | |
Revenue is recorded on a cash basis. Due to lags in the federal collection and instalment systems, changes to the BC corporate profits and tax base forecasts affect revenue in the succeeding year. The 2011/12 instalments from the federal government reflect 9 months of payments related to the 2011 tax year (Apr/11-Dec/11) and 3 months of payments related to the 2012 tax year (Jan/12-Mar/12). Instalments for the 2011 (2012) tax year are based on BC’s share of the national tax base for the 2009 (2010) tax year and a forecast of the 2011 (2012) national tax base. BC’s share of the 2009 national tax base was 11.6%, based on tax assessments as of December 31, 2010. Cash adjustments for any under/over payments from the federal government in respect of 2010 will be received/paid on March 30, 2012.
Second Quarterly Report 2011/12
32
Appendix
Table A5 2011/12 Material Assumptions — Revenue (continued)
Revenue Source and Assumptions | | | | 1st Quarter | | 2nd Quarter | | |
($ millions unless otherwise specified) | | Budget | | Forecast | | Forecast | | Sensitivities |
Harmonized sales tax | | $ | 5,820 | | $ | 5,859 | | $ | 5,859 | | |
Calendar Year | | | | | | | | +/- 1% change in consumer expenditure growth equals up to |
Nominal consumption | | 4.6 | % | 3.7 | % | 3.7 | % |
Nominal government expenditures | | 1.0 | % | 4.0 | % | 4.0 | % | |
Nominal residential investment | | 3.7 | % | 3.1 | % | 3.1 | % | +/- $35 million |
Nominal GDP | | 4.1 | % | 4.2 | % | 4.2 | % | |
| | | | | | | | |
HST Rebates (% rebate of the provincial portion of the HST paid) | | | | | | | | +/- 1% change in residential construction growth equals up to +/- $15 million |
Municipalities | | 75 | % | 75 | % | 75 | % |
Charities and non-profit organizations | | 57 | % | 57 | % | 57 | % |
New housing (up to $26,250) | | 71.43 | % | 71.43 | % | 71.43 | % |
School authorities | | 87 | % | 87 | % | 87 | % |
Universities and public colleges | | 75 | % | 75 | % | 75 | % | |
Hospital authorities | | 58 | % | 58 | % | 58 | % | |
| | | | | | | | |
Components of revenue | | | | | | | | |
Gross | | $ | 7,230 | | $ | 7,306 | | $ | 7,306 | | |
Input tax credit denial (temporary) | | $ | 163 | | $ | 107 | | $ | 107 | | |
Rebates: | | | | | | | | |
- Point of sale | | $ | (359 | ) | $ | (358 | ) | $ | (358 | ) | |
- Municipalities, charities & non profit organizations | | $ | (311 | ) | $ | (305 | ) | $ | (305 | ) | |
- SUCH sector | | $ | (233 | ) | $ | (225 | ) | $ | (225 | ) | |
- New housing | | $ | (475 | ) | $ | (469 | ) | $ | (469 | ) | |
- Residential energy use | | $ | (195 | ) | $ | (197 | ) | $ | (197 | ) | |
Other sales taxes | | $ | 116 | | $ | 133 | | $ | 143 | | |
Components of social service tax revenue | | | | | | | | |
Social service | | $ | 30 | | $ | 40 | | $ | 45 | | |
Tax on designated property (12% rate) | | $ | 86 | | $ | 93 | | $ | 98 | | |
Fuel and carbon taxes | | $ | 1,914 | | $ | 1,934 | | $ | 1,889 | | |
Carbon tax | | $ | 950 | | $ | 970 | | $ | 960 | | |
Calendar Year | | | | | | | | |
Real GDP | | 2.0 | % | 2.0 | % | 2.0 | % | |
Gasoline volumes | | 1.0 | % | -7.3 | % | -4.0 | % | |
Diesel volumes | | 3.0 | % | -0.1 | % | 3.0 | % | |
Natural gas volumes | | 1.0 | % | 10.2 | % | 6.6 | % | |
| | | | | | | | |
Carbon tax rates (July 1) | | | | | | | | |
Carbon dioxide equivalent emissions ($/tonne) | | $ | 25 | | $ | 25 | | $ | 25 | | |
Natural gas (cents/gigajoule) | | 124.15 | ¢ | 124.15 | ¢ | 124.15 | ¢ | |
Gasoline (cents/litre) | | 5.56 | ¢ | 5.56 | ¢ | 5.56 | ¢ | |
Light fuel oil (cents/litre) | | 6.39 | ¢ | 6.39 | ¢ | 6.39 | ¢ | |
| | | | | | | | |
Fuel tax | | $ | 964 | | $ | 964 | | $ | 929 | | |
Carbon tax revenue | | $ | 950 | | $ | 970 | | $ | 960 | | |
Carbon tax rates change on July 1 | | | | | | | | |
| | | | | | | | |
Components of fuel tax revenue | | | | | | | | |
Consolidated Revenue Fund | | $ | 506 | | $ | 506 | | $ | 496 | | |
BC Transit | | $ | 11 | | $ | 11 | | $ | 11 | | |
BC Transportation Financing Authority | | $ | 447 | | $ | 447 | | $ | 422 | | |
| | $ | 964 | | $ | 964 | | $ | 929 | | |
Property taxes | | $ | 1,898 | | $ | 1,925 | | $ | 1,924 | | |
Calendar Year | | | | | | | | |
BC Consumer Price Index | | 2.0 | % | 2.4 | % | 2.4 | % | +/- 1% change in new construction and inflation equals up to +/- $5 million in residential property taxation revenue |
Housing starts | | 24,946 | | 25,000 | | 25,000 | |
Home owner grants (fiscal year) | | $ | -816 | | $ | -816 | | $ | -816 | |
| | | | | | | |
Components of revenue | | | | | | | |
Residential (net of home owner grants) | | $ | 635 | | $ | 675 | | $ | 667 | | |
Non-residential | | $ | 1,007 | | $ | 983 | | $ | 991 | | +/- 1% change in new construction and inflation equals up to +/- $5 million in non-residential property taxation revenue |
Rural area | | $ | 84 | | $ | 90 | | $ | 90 | |
Police | | $ | 23 | | $ | 28 | | $ | 28 | |
BC Assessment Authority | | $ | 77 | | $ | 77 | | $ | 77 | |
BC Transit | | $ | 74 | | $ | 74 | | $ | 74 | |
Commissions | | $ | (2 | ) | $ | (2 | ) | $ | (3 | ) | |
Second Quarterly Report 2011/12
33
Appendix
Table A5 2011/12 Material Assumptions — Revenue (continued)
Revenue Source and Assumptions | | | | 1st Quarter | | 2nd Quarter | | | |
($ millions unless otherwise specified) | | Budget | | Forecast | | Forecast | | Sensitivities | |
Other taxes | | $ | 1,899 | | $ | 1,915 | | $ | 1,975 | | | |
Calendar Year | | | | | | | | | |
Population | | 1.5 | % | 1.1 | % | 1.1 | % | | |
BC Consumer Price Index | | 2.0 | % | 2.4 | % | 2.4 | % | | |
BC housing starts | | -5.8 | % | -5.6 | % | -5.6 | % | | |
Real GDP | | 2.0 | % | 2.0 | % | 2.0 | % | | |
Nominal GDP | | 4.1 | % | 4.2 | % | 4.2 | % | | |
| | | | | | | | | |
Components of revenue | | | | | | | | | |
Property transfer | | $ | 810 | | $ | 860 | | $ | 910 | | | |
Tobacco (net of commissions) | | $ | 676 | | $ | 641 | | $ | 651 | | | |
Corporation capital | | $ | 0 | | $ | 1 | | $ | 1 | | | |
Insurance premium | | $ | 413 | | $ | 413 | | $ | 413 | | | |
Hotel room (net of commissions) | | $ | 0 | | $ | 0 | | $ | 0 | | | |
Energy, sales of Crown land tenures, metals, minerals and other | | $ | 2,145 | | $ | 2,017 | | $ | 1,987 | | | |
Natural gas price | | | | | | | | +/- $1.00 change in the natural gas price equals +/- $280 to $330 million | |
Plant inlet, $Cdn/gigajoule | | $ | 3.02 | | $ | 2.82 | | $ | 2.64 | | |
Sumas, $US/ MMBtu | | $ | 4.41 | | $ | 4.46 | | $ | 4.11 | | +/- 1% change in natural gas volumes equals +/- $5 to $10 million | |
Natural gas production volumes (petajoules) | | 1,476 | | 1,436 | | 1,418 | | |
Annual per cent change | | 26.7 | % | 17.5 | % | 16.0 | % | +/- 1 cent change in the exchange rate equals +/- $5 million on natural gas royalties | |
Oil price ($US/bbl at Cushing, Ok) | | $ | 86.46 | | $ | 99.14 | | $ | 92.68 | | |
Auctioned land base (000 hectares) | | 612 | | 310 | | 310 | | | |
Average bid price/hectare ($) | | $ | 500 | | $ | 700 | | $ | 700 | | | |
Cash sales of Crown land tenures | | $ | 306 | | $ | 217 | | $ | 217 | | | |
Metallurgical coal price ($US/tonne, fob west coast) | | $ | 224 | | $ | 239 | | $ | 258 | | | |
Copper price ($US/lb) | | $ | 3.65 | | $ | 4.01 | | $ | 3.76 | | | |
Annual electricity volumes set by treaty (million mega-watt hours) | | 4.5 | | 4.5 | | 4.5 | | +/- 10% change in the average Mid-Columbia electricity price equals +/- $10 to $20 million | |
Mid-Columbia electricity price ($US/mega-watt hour) | | $ | 37 | | $ | 34 | | $ | 31 | | |
Exchange rate (US¢/ Cdn$, calendar year) | | 99.7 | | 102.9 | | 100.7 | | | |
Components of revenue | | | | | | | | Based on a recommendation from the Auditor General to be consistent with generally accepted accounting principles, bonus bid revenue recognition reflects nine-year deferral of cash receipts from the sale of Crown land tenures | |
Natural gas royalties | | $ | 447 | | $ | 413 | | $ | 381 | | |
Bonus bids, fees and rentals | | $ | 929 | | $ | 915 | | $ | 915 | | |
Petroleum royalties | | $ | 84 | | $ | 109 | | $ | 90 | | |
Columbia River Treaty electricity sales | | $ | 150 | | $ | 130 | | $ | 120 | | |
Coal | | $ | 387 | | $ | 336 | | $ | 381 | | |
Minerals, metals and other | | $ | 107 | | $ | 73 | | $ | 59 | | |
Oil and Gas Commission fees and levies | | $ | 41 | | $ | 41 | | $ | 41 | | |
Royalty programs and infrastructure credits | | | | | | | | | |
Summer drilling | | $ | -40 | | $ | -14 | | $ | -25 | | | |
Deep drilling | | $ | -130 | | $ | - 204 | | $ | -186 | | | |
Road and pipeline infrastructure | | $ | -120 | | $ | -111 | | $ | -86 | | | |
Total | | $ | -290 | | $ | -329 | | $ | -297 | | | |
Implicit average natural gas royalty rate | | 10.0 | % | 10.2 | % | 10.1 | % | | |
Royalty program (marginal, low productivity and ultra marginal drilling) adjustments reflect reduced royalty rates.
Natural gas royalties incorporate royalty programs and Treasury Board approved infrastructure credits.
Second Quarterly Report 2011/12
34
Appendix
Table A5 2011/12 Material Assumptions — Revenue (continued)
Revenue Source and Assumptions | | | | 1st Quarter | | 2nd Quarter | | |
($ millions unless otherwise specified) | | Budget | | Forecast | | Forecast | | Sensitivities |
Forests | | $ | 526 | | $ | 494 | | $ | 476 | | |
Prices (calendar year average) | | | | | | | | +/- US$50 change in SPF |
SPF 2x4 ($US/1000 bd ft) | | $ | 263 | | $ | 262 | | $ | 257 | | price equals +/- $25 to |
Random Lengths Composite | | | | | | | | $ 50 million |
($US/thousand board feet) | | $ | 298 | | $ | 283 | | $ | 276 | | +/- US$50 change in hemlock |
Hemlock price ($US/1000 bd ft) | | $ | 713 | | $ | 771 | | $ | 789 | | price equals +/- $5 to $10 |
Pulp ($US/tonne) | | $ | 888 | | $ | 990 | | $ | 970 | | million |
Coastal log ($Cdn/cubic metre) | | | | | | | | +/- US$50 change in pulp price |
(Vancouver Log Market, fiscal year) | | $ | 69 | | $ | 71 | | $ | 72 | | equals +/-$5 to $10 million |
| | | | | | | | +/- Cdn$10 change in average |
Fiscal Year Trade Assumptions | | | | | | | | log price equals +/-$10 to |
Export tax rate (effective rate) | | 11.3 | % | 15.0 | % | 15.0 | % | $ 20 million |
Lumber shipments and consumption (billion board feet) | | | | | | | | +/- 1 cent change in exchange rate equals +/- $5 to $10 million on stumpage revenue +/- 10% change in Interior harvest volumes equals +/- $10 to $15 million +/- 10% change in Coastal harvest volumes equals +/- $3 to $10 million The above sensitivities relate to stumpage revenue only. Depending on market conditions, changes in stumpage revenues may be offset by changes in border tax revenues. |
U.S. lumber consumption | | 33.9 | | 32.9 | | 32.5 | |
BC surge trigger volumes | | 7.2 | | 7.0 | | 6.9 | |
BC lumber exports to US | | 6.4 | | 4.9 | | 4.5 | |
| | | | | | | |
Crown harvest volumes (million cubic metres) | | | | | | | |
Interior | | 47.4 | | 48.0 | | 48.5 | |
Coast | | 11.6 | | 12.0 | | 13.5 | |
Total | | 59.0 | | 60.0 | | 62.0 | |
BC Timber Sales (included in above) | | 11.8 | | 11.8 | | 11.3 | |
Components of revenue | | | | | | | |
Tenures | | $ | 157 | | $ | 135 | | $ | 129 | |
BC Timber Sales | | $ | 158 | | $ | 158 | | $ | 158 | |
Federal border tax (SLA 2006 ) | | $ | 174 | | $ | 159 | | $ | 143 | |
Logging tax | | $ | 12 | | $ | 12 | | $ | 12 | |
Other CRF revenue | | $ | 14 | | $ | 15 | | $ | 15 | |
Recoveries | | $ | 11 | | $ | 15 | | $ | 19 | |
Other natural resources | | $ | 429 | | $ | 420 | | $ | 422 | | |
Components of revenue | | | | | | | | |
Water rental and licences* | | $ | 362 | | $ | 360 | | $ | 360 | | |
Recoveries | | $ | 48 | | $ | 41 | | $ | 41 | | |
Angling and hunting permits and licences | | $ | 12 | | $ | 12 | | $ | 12 | | |
Recoveries | | $ | 7 | | $ | 7 | | $ | 9 | | |
| | | | | | | | | | | |
|
*BC Hydro rate increases are indexed to Consumer Price Index |
|
Other revenue | | $ | 8,702 | | $ | 8,537 | | $ | 8,435 | | |
Components of revenue | | | | | | | | |
Fees and licences | | | | | | | | |
Consolidated Revenue Fund | | $ | 2,699 | | $ | 2,702 | | $ | 2,661 | | |
Recoveries | | $ | 218 | | $ | 226 | | $ | 184 | | |
Crown corporations and agencies | | $ | 106 | | $ | 98 | | $ | 100 | | |
Other service delivery agencies | | $ | 1,684 | | $ | 1,736 | | $ | 1,748 | | |
Investment earnings | | | | | | | | |
Consolidated Revenue Fund | | $ | 78 | | $ | 63 | | $ | 63 | | |
Fiscal agency loans & sinking funds earnings | | $ | 814 | | $ | 805 | | $ | 788 | | |
Crown corporations and agencies | | $ | 36 | | $ | 34 | | $ | 30 | | |
Other service delivery agencies | | $ | 109 | | $ | 113 | | $ | 93 | | |
Sales of goods and services | | $ | 738 | | $ | 807 | | $ | 871 | | |
Miscellaneous | | | | | | | | |
Consolidated Revenue Fund | | $ | 188 | | $ | 185 | | $ | 189 | | |
Recoveries | | $ | 510 | | $ | 556 | | $ | 563 | | |
Crown corporations and agencies | | $ | 385 | | $ | 73 | | $ | 85 | | |
Other service delivery agencies | | $ | 1,137 | | $ | 1,139 | | $ | 1,060 | | |
Second Quarterly Report 2011/12
35
Appendix
Table A5 2011/12 Material Assumptions — Revenue (continued)
Revenue Source and Assumptions | | | | 1st Quarter | | 2nd Quarter | | |
($ millions unless otherwise specified) | | Budget | | Forecast | | Forecast | | Sensitivities |
Health and social transfers | | $ | 5,398 | | $ | 5,377 | | $ | 5,371 | | |
National Cash Transfers | | | | | | | | |
Canada Health Transfer (CHT) | | $ | 26,952 | | $ | 26,952 | | $ | 26,952 | | |
Wait Times Reduction Transfer (WTRT) | | $ | 250 | | $ | 250 | | $ | 250 | | +/- 0.1% change in BC’s |
Canada Social Transfer (CST) | | $ | 11,514 | | $ | 11,514 | | $ | 11,514 | | population share equals |
BC share of national population (June 1) | | 13.34 | % | 13.30 | % | 13.27 | % | +/- $45 to $50 million |
BC health and social transfers revenue | | | | | | | | |
CHT | | $ | 3,806 | | $ | 3,794 | | $ | 3,804 | | |
WTRT | | $ | 33 | | $ | 33 | | $ | 33 | | |
CST | | $ | 1,536 | | $ | 1,530 | | $ | 1,527 | | |
Prior-year adjustments | | — | | -$ 3 | | -$ 16 | | |
Health deferral | | | | | | | | |
Diagnostic and Medical Equipment | | $ | 16 | | $ | 16 | | $ | 16 | | |
Medical Equipment Trust | | $ | 7 | | $ | 7 | | $ | 7 | | |
Other federal contributions | | $ | 2,182 | | $ | 1,648 | | $ | 2,299 | | |
Components of revenue | | | | | | | | |
HST Transition Payment | | $ | 580 | | — | | $ | 580 | | |
Other Consolidated Revenue Fund | | $ | 192 | | $ | 192 | | $ | 231 | | |
Labour Market Development Agreement | | $ | 296 | | $ | 284 | | $ | 284 | | |
Local Government Services and Transfers | | $ | 50 | | $ | 64 | | $ | 64 | | |
Canada-BC Co-operation on Immigration | | $ | 97 | | $ | 97 | | $ | 97 | | |
Labour Market Agreement | | $ | 66 | | $ | 66 | | $ | 66 | | |
Community Development Trust | | $ | 5 | | — | | — | | |
Other recoveries | | $ | 182 | | $ | 195 | | $ | 207 | | |
Crown corporations and agencies | | $ | 236 | | $ | 238 | | $ | 259 | | |
Other service delivery agencies | | $ | 478 | | $ | 512 | | $ | 511 | | |
Service delivery agency direct revenue | | $ | 5,559 | | $ | 5,400 | | $ | 5,378 | | |
School districts | | $ | 481 | | $ | 481 | | $ | 481 | | |
Post-secondary institutions | | $ | 2,685 | | $ | 2,801 | | $ | 2,777 | | |
Health authorities and hospital societies | | $ | 735 | | $ | 793 | | $ | 802 | | |
BC Transportation Financing Authority | | $ | 493 | | $ | 489 | | $ | 474 | | |
Other service delivery agencies | | $ | 1,165 | | $ | 836 | | $ | 844 | | |
Commercial Crown corporation net income | | $ | 2,941 | | $ | 2,720 | | $ | 2,720 | | |
BC Hydro | | $ | 611 | | $ | 592 | | $ | 595 | | |
reservoir water inflows | | 100 | % | 100 | % | 100 | % | +/-1% in hydro generation = +/-$10 million +/-10% = -/+$5 million |
mean gas price | | 4.61 | | 4.30 | | 4.30 | |
(Sumas, $US/MMbtu — BC Hydro forecast based on NYMEX forward selling prices) | | | | | | | | |
electricity prices | | 35.77 | | 28.69 | | 28.69 | | +/-$1/MWh in electricity trade margins = +/-$30 million |
(Mid-C, $US/MWh) | | | | | | | |
assumed rate increases: | | | | | | | | |
- base rate | | 9.73 | % | 8.00 | % | 8.00 | % | |
- rate rider changes from prior year | | -1.03 | % | -1.03 | % | -1.03 | % | |
ICBC | | $ | 290 | | $ | 149 | | $ | 0 | | |
vehicle growth | | + 1.8 | % | + 0.6 | % | + 1.1 | % | +/-1% = +/-$37 million |
current claims cost percentage change | | + 1.2 | % | + 5.4 | % | + 5.4 | % | +/-1% = -/+$29 million |
investment return | | 4.6 | % | 4.5 | % | 3.6 | % | +/-1% return = +/-$115 million |
loss ratio | | 85.3 | % | 88.6 | % | 89.9 | % | |
Second Quarterly Report 2011/12
36
Appendix
Table A6 2011/12 Material Assumptions – Expense
Ministry Programs and Assumptions | | | | 1st Quarter | | 2nd Quarter | | | |
($ millions unless otherwise specified) | | Budget | | Forecast | | Forecast | | Sensitivities | |
| | | | | | | | | |
Advanced Education | | 1,980 | | 1,980 | | 1,980 | | | |
Student spaces in public institutions
(# FTEs) | | 201,792 | | 201,792 | | 201,792 | | The number of student spaces may vary depending on the financial and other policies of post secondary institutions. | |
| | | | | | | | | |
Attorney General | | 443 | | 443 | | 443 | | | |
New cases filed/processed
(# for all courts) | | 295,000 | | 295,000 | | 295,000 | | The number of criminal cases proceeded on by the provincial and federal Crown (including appeals to higher courts in BC), the number of civil and family litigation cases, the number of violation tickets disputed, and the number of municipal bylaw tickets disputed which would go to court for resolution. | |
| | | | | | | | | |
Crown Proceedings Act (CPA) | | 25 | | 25 | | 25 | | The number and size of litigation brought against the province, as well as the effectiveness of mitigation strategies and legal defence. | |
| | | | | | | | | |
Children and Family Development | | 1,331 | | 1,331 | | 1,331 | | | |
Average children-in-care
caseload (#) | | 8,300 | | 8,300 | | 8,300 | | Caseload is expected to decline due to large number of 15 to 17 year olds currently in the system who will reach maturity. A 1% increase in the cost per case or a 1% increase in the average caseload will affect expenditures by approximately $2.8 million. | |
Average annual residential
cost per child in care ($) | | 34,500 | | 34,500 | | 34,500 | | |
| | | | | | | | | |
Education | | 5,242 | | 5,242 | | 5,242 | | | |
Enrolment (# of FTEs) | | 564,933 | | 564,933 | | 564,933 | | Enrolment figures are based on BC Stats enrolment trends, to which the Ministry has added forecasts for distributed learning, adult education, and summer learning. | |
School age (K–12) | | 521,022 | | 521,022 | | 521,022 | |
Expanded full-day kindergarten | | 15,085 | | 15,085 | | 15,085 | | |
Distributed Learning (online) | | 15,000 | | 15,000 | | 15,000 | | |
Summer | | 5,890 | | 5,890 | | 5,890 | | | |
Adults | | 7,937 | | 7,937 | | 7,937 | | | |
| | | | | | | | | |
Forests, Lands and Natural Resource Operations | | 590 | | 590 | | 590 | | | |
BC Timber Sales | | 164 | | 164 | | 164 | | Targets can be impacted by changes to actual inventory costs incurred. There is a lag of approximately 2 years between when inventory costs are incurred and when they are expensed. Volume harvested can also impact targets. For example, if volume harvested is less than projected in any year then capitalized expenses will also be reduced in that year. | |
| | | | | | | | | |
Direct Fire Fighting | | 63 | | 63 | | 63 | | Over the past several years, Direct fire fighting costs have ranged from a low of $19 million in 1997 to $382 million in 2009. | |
| | | | | | | | | |
Health | | 15,714 | | 15,714 | | 15,714 | | | |
Pharmacare | | 1,140 | | 1,140 | | 1,134 | | A 1% change in utilization or drug prices affects costs by approximately $10 million. | |
| | | | | | | | | |
Medical Services Plan (MSP) | | 3,802 | | 3,802 | | 3,794 | | A 1% increase in volume of services provided by fee-for-service physicians affects costs by approximately $25 million. | |
| | | | | | | | | |
Regional Services | | 10,541 | | 10,541 | | 10,551 | | | |
Second Quarterly Report 2011/12
37
Appendix
Table A6 2011/12 Material Assumptions – Expense (continued)
Ministry Programs and Assumptions | | | | 1st Quarter | | 2nd Quarter | | | |
($ millions unless otherwise specified) | | Budget | | Forecast | | Forecast | | Sensitivities | |
| | | | | | | | | |
Public Safety and Solicitor General | | 635 | | 652 | | 682 | | | |
Policing, Victim Services and Corrections | | 527 | | 527 | | 527 | | The volume and severity of criminal activity, the number of inmate beds occupied and the number of offenders under community supervision. | |
| | | | | | | | | |
Emergency Program Act (EPA) | | 15 | | 32 | | 62 | | The number and severity of natural disasters. | |
| | | | | | | | | |
Social Development | | 2,338 | | 2,338 | | 2,338 | | | |
Temporary Assistance
annual average caseload (#) | | 53,100 | | 53,100 | | 53,100 | | The expected to work caseload is sensitive to fluctuations in economic and employment trends in the service sector. A 1% change in the Temporary Assistance annual average caseload or average cost per case will affect expenditures by approximately $4.5 million annually. | |
| | | | | | | | | |
Disability Assistance
annual average caseload (#) | | 78,600 | | 78,600 | | 78,600 | | The caseload for persons with disabilities is sensitive to the aging of the population and longer life expectancy for individuals with disabilities and significant health issues. A 1% change in the Disability Assistance annual average caseload or average cost per case will affect expenditures by approximately $7.5 million annually. | |
| | | | | | | | | |
Total annual average
caseload (#) | | 131,700 | | 131,700 | | 131,700 | | The average cost per case is sensitive to the composition of the caseload, and reported income. | |
Adult Community Living: | | | | | | | | | |
Residential Services: | | | | | | | | | |
Average caseload (#) | | 5,600 | | 5,600 | | 5,600 | | The adult community living caseload is sensitive to the pressures of an aging population. A 1% increase in the adult caseload will increase expenditures by approximately $2.3 million. | |
Average cost per client ($) | | 71,500 | | 71,500 | | 71,500 | |
Day Programs: | | | | | | | | |
Average caseload (#) | | 13,800 | | 13,800 | | 13,800 | | |
Average cost per client ($) | | 16,600 | | 16,600 | | 16,600 | | | |
Personal Supports Initiative | | | | | | | | | |
Average caseload (#) | | 300 | | 300 | | 300 | | | |
Average cost per client ($) | | 20,400 | | 20,400 | | 20,400 | | | |
| | | | | | | | | |
Management of Public Funds and Debt | | 1,349 | | 1,330 | | 1,296 | | | |
Interest rates for new provincial borrowing: | | | | | | | | Impact on MoPD on interest costs of a 1% change in interest rates equals $31.1 million; $100 million increase in debt level equals $0.8 million. | |
Short-term | | 1.66 | % | 1.25 | % | 0.97 | % | |
Long-term | | 4.17 | % | 4.06 | % | 3.46 | % |
CDN/US exchange rate (cents) | | 99.9 | | 96.7 | | 99.4 | | | |
| | | | | | | | | |
Service delivery agency net spending | | 4,643 | | 4,685 | | 4,833 | | | |
School districts | | 192 | | 123 | | 123 | | | |
Post-secondary institutions | | 2,649 | | 2,722 | | 2,733 | | | |
Health authorities and hospital societies | | 552 | | 550 | | 651 | | | |
BC Transportation Financing Authority | | 947 | | 900 | | 881 | | | |
Other service delivery agencies | | 303 | | 390 | | 445 | | | |
Second Quarterly Report 2011/12
38
Appendix
Table A7 2011/12 Full-Time Equivalents (FTEs) (1)
| | 2011/12 (2) | | Actual | |
FTEs | | Budget | | Forecast | | Variance | | 2010/11 | |
Ministries and special offices (consolidated revenue fund) | | 26,156 | | 26,156 | | — | | 30,221 | |
Service delivery agencies (3) | | 4,441 | | 4,441 | | — | | 4,423 | |
Total FTEs | | 30,597 | | 30,597 | | — | | 34,644 | |
(1) | Full-time equivalents (FTEs) are a measure of staff employment. FTEs are calculated by dividing the total hours of employment paid for in a given period by the number of hours an individual, full-time person would normally work in that period. This does not equate to the physical number of employees. For example, two half-time employees would equal one FTE, or alternatively, three FTEs may represent two full-time employees who have worked sufficient overtime hours to equal an additional FTE. |
| |
(2) | The ministry 2011/12 FTE total includes a reduction of about 3,000 FTEs reflecting the shift of BC Ambulance Service oversight from the Ministry of Health to the Provincial Health Services Authority. |
| |
(3) | Service delivery agency FTE amounts do not include SUCH sector staff employment. |
Table A8 2011/12 Capital Spending
| | Year-to-Date to September 30 | | Full Year | |
| | 2011/12 | | Actual | | 2011/12 | | Actual | |
($ millions) | | Budget | | Actual | | Variance | | 2010/11 | | Budget | | Forecast | | Variance | | 2010/11 | |
Taxpayer-supported | | | | | | | | | | | | | | | | | |
Education | | | | | | | | | | | | | | | | | |
School districts | | 260 | | 319 | | 59 | | 204 | | 520 | | 570 | | 50 | | 433 | |
Post-secondary institutions | | 300 | | 265 | | (35 | ) | 335 | | 599 | | 713 | | 114 | | 925 | |
Health | | 430 | | 272 | | (158 | ) | 364 | | 859 | | 886 | | 27 | | 916 | |
BC Transportation Financing Authority | | 592 | | 635 | | 43 | | 719 | | 986 | | 1,047 | | 61 | | 1,080 | |
BC Transit | | 81 | | 19 | | (62 | ) | 17 | | 162 | | 66 | | (96 | ) | 39 | |
Vancouver Convention Centre expansion project | | — | | 1 | | 1 | | 4 | | — | | 3 | | 3 | | 10 | |
BC Place redevelopment | | 147 | | 159 | | 12 | | 105 | | 147 | | 247 | | 100 | | 197 | |
Government operating (ministries) | | 169 | | 86 | | (83 | ) | 70 | | 332 | | 268 | | (64 | ) | 261 | |
Other (1) | | 134 | | 115 | | (19 | ) | 119 | | 300 | | 279 | | (21 | ) | 252 | |
Capital spending contingencies (2) | | — | | — | | — | | — | | 200 | | 82 | | (118 | ) | — | |
Total taxpayer-supported | | 2,113 | | 1,871 | | (242 | ) | 1,937 | | 4,105 | | 4,161 | | 56 | | 4,113 | |
Self-supported | | | | | | | | | | | | | | | | | |
BC Hydro | | 1,101 | | 884 | | (217 | ) | 736 | | 2,195 | | 2,082 | | (113 | ) | 1,519 | |
Columbia River power projects (3) | | 70 | | 61 | | (9 | ) | 8 | | 98 | | 89 | | (9 | ) | 67 | |
Transportation Investment Corporation (Port Mann) | | 359 | | 400 | | 41 | | 425 | | 717 | | 815 | | 98 | | 738 | |
BC Rail | | 9 | | 5 | | (4 | ) | — | | 18 | | 17 | | (1 | ) | 6 | |
ICBC | | 47 | | 47 | | — | | 7 | | 81 | | 96 | | 15 | | 48 | |
BC Lotteries | | 55 | | 38 | | (17 | ) | 34 | | 109 | | 105 | | (4 | ) | 81 | |
Liquor Distribution Branch | | 12 | | 6 | | (6 | ) | 4 | | 25 | | 25 | | — | | 18 | |
Total self-supported | | 1,653 | | 1,441 | | (212 | ) | 1,214 | | 3,243 | | 3,229 | | (14 | ) | 2,477 | |
Total capital spending | | 3,766 | | 3,312 | | (454 | ) | 3,151 | | 7,348 | | 7,390 | | 42 | | 6,590 | |
(1) | Includes BC Housing Management Commission, Provincial Rental Housing Corporation, other service delivery agencies and project reserves held by the Ministry of Finance. |
| |
(2) | Includes $50 million for ministry capital contingencies. |
| |
(3) | Joint ventures of the Columbia Power Corporation and Columbia Basin Trust. |
Second Quarterly Report 2011/12
39
Appendix
Table A9 Capital Expenditure Projects Greater Than $50 million (1)
Note: Information in bold type denotes changes from the 2011/12 first Quarterly Report.
| | Projected | | Total Costs | | Projected | | Total | | Project Financing | |
| | Completion | | to | | Costs to | | Capital | | Internal/ | | Federal | | Other | |
($ millions) | | Date | | Sept. 30, 2011 | | Complete | | Costs | | Debt | | Government | | Contributions | |
Taxpayer-supported | | | | | | | | | | | | | | | |
School districts | | | | | | | | | | | | | | | |
Revelstoke Elementary and Secondary | | Fall 2012 | | 41 | | 19 | | 60 | | 58 | | — | | 2 | |
Chilliwack Secondary | | Fall 2012 | | 4 | | 54 | | 58 | | 58 | | — | | — | |
Burnaby Central Secondary | | Spring 2012 | �� | 44 | | 20 | | 64 | | 64 | | — | | — | |
Centennial Secondary | | Fall 2014 | | — | | 62 | | 62 | | 62 | | — | | — | |
Alberni District Secondary | | Fall 2012 | | 22 | | 36 | | 58 | | 54 | | — | | 4 | |
Full-day kindergarten | | Fall 2012 | | 76 | | 68 | | 144 | | 144 | | — | | — | |
Total school districts | | | | 187 | | 259 | | 446 | | 440 | | — | | 6 | |
Post-secondary institutions | | | | | | | | | | | | | | | |
University of British Columbia | | | | | | | | | | | | | | | |
– Pharmaceutical Sciences and Centre for Drug Research & Development | | Fall 2012 | | 49 | | 84 | | 133 | | 86 | | 3 | | 44 | |
Health facilities | | | | | | | | | | | | | | | |
Jim Pattison Outpatient Care and Surgery Centre (2) | | | | | | | | | | | | | | | |
– Government direct cost | | Spring 2011 | | 54 | | 11 | | 65 | | 65 | | — | | — | |
– P3 contract | | Spring 2011 | | 172 | | — | | 172 | | 172 | | — | | — | |
Victoria Royal Jubilee Hospital – Patient Care Centre | | | | | | | | | | | | | | | |
– Government direct cost | | Spring 2013 | | 137 | | 13 | | 150 | | 23 | | — | | 127 | |
– P3 contract | | Spring 2011 | | 199 | | — | | 199 | | 199 | | — | | — | |
Fort St. John Hospital and Residential Care | | | | | | | | | | | | | | | |
– Government direct cost | | Spring 2012 | | 231 | | 34 | | 265 | | 169 | | — | | 96 | |
– P3 contract | | Spring 2012 | | — | | 33 | | 33 | | 33 | | — | | — | |
Expansions to Kelowna General and Vernon Jubilee Hospitals | | | | | | | | | | | | | | | |
– Government direct cost | | Spring 2012 | | 246 | | 29 | | 275 | | 26 | | — | | 249 | |
– P3 contract | | Spring 2012 | | 158 | | — | | 158 | | 158 | | — | | — | |
Northern Cancer Control Strategy (3) | | | | | | | | | | | | | | | |
– Government direct cost | | Fall 2012 | | 56 | | 35 | | 91 | | 87 | | — | | 4 | |
– P3 contract | | Fall 2012 | | 14 | | 1 | | 15 | | 15 | | — | | — | |
Lions Gate Hospital (Mental Health) Redevelopment (4) | | Fall 2013 | | — | | 58 | | 58 | | 34 | | — | | 24 | |
Surrey Emergency/Critical Care Tower (5) | | | | | | | | | | | | | | | |
– Government direct cost | | Summer 2014 | | 44 | | 263 | | 307 | | 287 | | — | | 20 | |
– P3 contract | | Summer 2014 | | 47 | | 132 | | 179 | | 179 | | — | | — | |
Interior Heart and Surgical Centre (6) | | Spring 2017 | | 77 | | 316 | | 393 | | 302 | | — | | 91 | |
Children’s and Women’s Hospital (7) | | Fall 2017 | | 8 | | 674 | | 682 | | 532 | | — | | 150 | |
Total health facilities | | | | 1,443 | | 1,599 | | 3,042 | | 2,281 | | — | | 761 | |
Transportation | | | | | | | | | | | | | | | |
South Fraser Perimeter Road | | | | | | | | | | | | | | | |
– Government direct cost | | Summer 2014 | | 727 | | 335 | | 1,062 | | 714 | | 348 | | — | |
– P3 contract | | Summer 2014 | | 88 | | 114 | | 202 | | 202 | | — | | — | |
Sierra Yoyo-Desan Road upgrade | | Fall 2012 | | 77 | | 110 | | 187 | | 187 | | — | | — | |
Total transportation | | | | 892 | | 559 | | 1,451 | | 1,103 | | 348 | | — | |
Other | | | | | | | | | | | | | | | |
Vancouver Convention Centre expansion project | | Summer 2009(8) | | 834 | | 2 | | 836 | | 494 | | 222 | | 120 | |
BC Place redevelopment (9) | | Fall 2011 | | 475 | | 88 | | 563 | | 563 | | — | | — | |
Integrated case management system | | Fall 2014 | | 88 | | 94 | | 182 | | 179 | | 3 | | — | |
Surrey Pretrial Service Centre expansion (10) | | Fall 2013 | | 11 | | 93 | | 104 | | 104 | | — | | — | |
e-Health initiative (11) | | Spring 2013 | | 234 | | 28 | | 262 | | 138 | | 124 | | — | |
Total other | | | | 1,642 | | 305 | | 1,947 | | 1,478 | | 349 | | 120 | |
Total taxpayer-supported | | | | 4,213 | | 2,806 | | 7,019 | | 5,388 | | 700 | | 931 | |
Second Quarterly Report 2011/12
40
Appendix
Table A9 Capital Expenditure Projects Greater Than $50 million (1) (continued )
Note: Information in bold type denotes changes from the 2011/12 first Quarterly Report .
| | Projected | | Total Costs | | Projected | | Total | | Project Financing | |
| | Completion | | to | | Costs to | | Capital | | Internal/ | | Federal | | Other | |
($ millions) | | Date | | Sept. 30, 2011 | | Complete | | Costs | | Debt | | Government | | Contributions | |
Self-supported | | | | | | | | | | | | | | | |
Transportation | | | | | | | | | | | | | | | |
Port Mann Bridge / Highway 1 | | Winter 2013 | | 2,131 | | 1,188 | | 3,319 | | 3,319 | | — | | — | |
Power generation and transmission | | | | | | | | | | | | | | | |
BC Hydro (12) | | | | | | | | | | | | | | | |
– GM Shrum G1–G4 stator replacement | | Fall 2010 | (8) | 75 | | 1 | | 76 | | 76 | | — | | — | |
– Revelstoke Unit 5 generation | | Fall 2010 | (8) | 242 | | 7 | | 249 | | 249 | | — | | — | |
– Central Vancouver Island transmission line | | Fall 2010 | (8) | 59 | | 1 | | 60 | | 60 | | — | | — | |
– Cheakamus spillway gate reliability upgrade | | Summer 2011 | (8) | 60 | | 3 | | 63 | | 63 | | — | | — | |
– Fort Nelson generating station upgrade (13) | | Fall 2011 | | 133 | | 16 | | 149 | | 149 | | — | | — | |
– Columbia Valley transmission | | Fall 2012 | | 42 | | 91 | | 133 | | 133 | | — | | — | |
– Stave Falls spillway gate reliability upgrade (13) | | Winter 2013 | | 26 | | 38 | | 64 | | 64 | | — | | — | |
– Mica gas insulated switchgear replacement (13) | | Winter 2013 | | 100 | | 88 | | 188 | | 188 | | — | | — | |
– Vancouver City Central transmission | | Spring 2013 | | 68 | | 109 | | 177 | | 177 | | — | | — | |
– Smart metering and infrastructure program | | Summer 2013 | | 142 | | 788 | | 930 | | 930 | | — | | — | |
– Dawson Creek area reinforcement (13) | | Fall 2013 | | 6 | | 244 | | 250 | | 250 | | — | | — | |
– Northwest transmission line | | Spring 2014 | | 45 | | 516 | | 561 | | 234 | | 130 | | 197 | |
– Seymour Arm series capacitor (13) | | Spring 2014 | | 1 | | 99 | | 100 | | 100 | | — | | — | |
– Hugh Keenleyside spillway gate reliability upgrade (13) | | Spring 2014 | | 20 | | 74 | | 94 | | 94 | | — | | — | |
– Interior to Lower Mainland transmission line | | Winter 2015 | | 62 | | 647 | | 709 | | 709 | | — | | — | |
– GM Shrum units 1 to 5 turbine upgrade (13) | | Spring 2015 | | 22 | | 266 | | 288 | | 288 | | — | | — | |
– Mica units 5 and 6 project (13) | | Fall 2015 | | 121 | | 618 | | 739 | | 739 | | — | | — | |
– Ruskin Dam safety and powerhouse upgrade (13) | | Winter 2018 | | 60 | | 720 | | 780 | | 780 | | — | | — | |
– Southern Interior series compensation (13) | | Fall 2018 | | 1 | | 81 | | 82 | | 82 | | — | | — | |
– John Hart replacement (13) | | TBD | | 52 | | 1,298 | | 1,350 | | 1,350 | | — | | — | |
Columbia River power projects (14) | | | | | | | | | | | | | | | |
– Waneta Dam power expansion | | May 2015 | | 99 | | 250 | | 349 | | 349 | | — | | — | |
Total power generation and transmission | | | | 1,436 | | 5,955 | | 7,391 | | 7,064 | | 130 | | 197 | |
Other | | | | | | | | | | | | | | | |
British Columbia Lottery Corporation | | | | | | | | | | | | | | | |
– Gaming management system | | Winter 2015 | | — | | 104 | | 104 | | 104 | | — | | — | |
Insurance Corporation of British Columbia | | | | | | | | | | | | | | | |
– Business transformation program | | Fall 2016 | | 39 | | 128 | | 167 | | 167 | | — | | — | |
Total other | | | | 39 | | 232 | | 271 | | 271 | | — | | — | |
Total self-supported | | | | 3,606 | | 7,375 | | 10,981 | | 10,654 | | 130 | | 197 | |
Total $50 million projects | | | | 7,819 | | 10,181 | | 18,000 | | 16,042 | | 830 | | 1,128 | |
(1) | Only projects that receive provincial funding and have been approved by Treasury Board and/or Crown corporation boards are included in this table. Ministry service plans may include projects that still require final approval. Capital costs reflect current government accounting policy. |
(2) | Figures shown do not include an additional $2 million to establish an offsite access road to the facility. |
(3) | Figures shown do not include an approved project reserve of $5 million. |
(4) | Figures shown do not include an approved project reserve of $4 million. |
(5) | Figures shown do not include an approved project reserve of $26 million. The Emergency Department is expected to be operational by summer 2013. |
(6) | Figures shown are based on preliminary Treasury Board approvals and do not include an approved project reserve of $55 million. These amounts will change after P3 contracts are finalized. |
(7) | Figures shown are based on preliminary Treasury Board approvals. These amounts will change after P3 contracts are finalized. |
(8) | Assets have been put into service and only trailing costs remain. |
(9) | BC Place redevelopment includes $458 million to upgrade the stadium and install a retractable roof, and $105 million to refurbish the facilities. |
(10) | Figures shown do not include an approved project reserve of $9 million. |
(11) | The e-Health initiative is comprised of 7 distinct projects. Figures shown reflect the total costs of the 7 Ministry of Health’s provincially co-ordinated e-Health projects. The federal government portion is an estimate based on a signed agreement with Canada Health Infoway and the actual amount may vary, depending on eligible project costs incurred. |
(12) | BC Hydro has restated the capital cost of a number of its projects to conform with the move to International Financial Reporting Standards. For further details, please see Appendix I of the F2012-F2014 Amended Revenue Requirements Application currently before the BC Utilities Commission. |
(13) | Total costs and completion dates for these projects vary depending on the final scope. Information shown represents current assumptions. |
(14) | Joint ventures of the Columbia Power Corporation and Columbia Basin Trust. In October 2010, CPC/CBT reached an agreement for a partnership with Fortis Inc to develop an electricity generating facility at the Waneta Dam south of Trail. Capital spending information reflects 49 per cent of the total project — CPC’s 32.5 per cent share combined with CBT’s 16.5 per cent share. |
Second Quarterly Report 2011/12
41
Appendix
Table A10 2011/12 Provincial Debt (1)
| | Year-to-Date to September 30 | | Full Year | |
| | 2011/12 | | Actual | | 2011/12 | | Actual | |
($ millions) | | Budget | | Actual | | Variance | | 2010/11 | | Budget | | Forecast | | Variance | | 2010/11 | |
Taxpayer-supported debt | | | | | | | | | | | | | | | | | |
Provincial government operating | | 5,679 | | 3,849 | | (1,830 | ) | 2,988 | | 6,067 | | 6,469 | | 402 | | 4,268 | |
Provincial government general capital | | 2,696 | | 2,696 | | — | | 2,696 | | 2,696 | | 2,696 | | — | | 2,696 | |
Provincial government operating | | 8,375 | | 6,545 | | (1,830 | ) | 5,684 | | 8,763 | | 9,165 | | 402 | | 6,964 | |
Other taxpayer-supported debt (mainly capital) | | | | | | | | | | | | | | | | | |
Education (2) | | | | | | | | | | | | | | | | | |
School districts | | 6,268 | | 5,981 | | (287 | ) | 5,602 | | 6,499 | | 6,552 | | 53 | | 6,016 | |
Post-secondary institutions | | 4,155 | | 4,050 | | (105 | ) | 3,824 | | 4,218 | | 4,212 | | (6 | ) | 4,092 | |
| | 10,423 | | 10,031 | | (392 | ) | 9,426 | | 10,717 | | 10,764 | | 47 | | 10,108 | |
Health (2),(3) | | 5,153 | | 4,916 | | (237 | ) | 4,407 | | 5,411 | | 5,307 | | (104 | ) | 4,895 | |
Highways and public transit | | | | | | | | | | | | | | | | | |
BC Transportation Financing Authority (4) | | 6,197 | | 5,921 | | (276 | ) | 5,311 | | 6,493 | | 6,391 | | (102 | ) | 5,785 | |
Public transit | | 997 | | 1,000 | | 3 | | 997 | | 997 | | 1,000 | | 3 | | 997 | |
SkyTrain extension | | 1,153 | | 1,175 | | 22 | | 1,154 | | 1,153 | | 1,175 | | 22 | | 1,155 | |
BC Transit | | 206 | | 193 | | (13 | ) | 155 | | 240 | | 181 | | (59 | ) | 158 | |
| | 8,553 | | 8,289 | | (264 | ) | 7,617 | | 8,883 | | 8,747 | | (136 | ) | 8,095 | |
Other | | | | | | | | | | | | | | | | | |
Social housing (5) | | 635 | | 596 | | (39 | ) | 420 | | 716 | | 675 | | (41 | ) | 511 | |
Provincial government general capital | | 903 | | 647 | | (256 | ) | 363 | | 1,087 | | 873 | | (214 | ) | 570 | |
BC Pavilion Corporation | | 371 | | 337 | | (34 | ) | 188 | | 445 | | 445 | | — | | 250 | |
BC Immigrant Investment Fund | | 376 | | 366 | | (10 | ) | 327 | | 406 | | 407 | | 1 | | 347 | |
Homeowner Protection Office | | — | | — | | — | | — | | — | | — | | — | | — | |
Other (6) | | 311 | | 95 | | (216 | ) | 119 | | 388 | | 138 | | (250 | ) | 115 | |
| | 2,596 | | 2,041 | | (555 | ) | 1,417 | | 3,042 | | 2,538 | | (504 | ) | 1,793 | |
Total other taxpayer-supported | | 26,725 | | 25,277 | | (1,448 | ) | 22,867 | | 28,053 | | 27,356 | | (697 | ) | 24,891 | |
Total taxpayer-supported debt | | 35,100 | | 31,822 | | (3,278 | ) | 28,551 | | 36,816 | | 36,521 | | (295 | ) | 31,855 | |
Self-supported debt | | | | | | | | | | | | | | | | | |
Commercial Crown corporations | | | | | | | | | | | | | | | | | |
BC Hydro | | 12,378 | | 12,636 | | 258 | | 11,537 | | 13,537 | | 13,520 | | (17 | ) | 11,710 | |
BC Transmission Corporation | | — | | — | | — | | — | | — | | — | | — | | — | |
Columbia River power projects (7) | | 465 | | 483 | | 18 | | 190 | | 463 | | 482 | | 19 | | 183 | |
BC Lotteries | | 77 | | 110 | | 33 | | 57 | | 87 | | 98 | | 11 | | 85 | |
Transportation Investment Corporation (Port Mann) | | 1,672 | | 1,631 | | (41 | ) | 1,022 | | 1,983 | | 1,968 | | (15 | ) | 1,148 | |
Liquor Distribution Branch | | — | | — | | — | | 1 | | — | | — | | — | | — | |
Post-secondary institutions’ subsidiaries | | 201 | | 173 | | (28 | ) | 201 | | 201 | | 173 | | (28 | ) | 173 | |
| | 14,793 | | 15,033 | | 240 | | 13,008 | | 16,271 | | 16,241 | | (30 | ) | 13,299 | |
Warehouse borrowing program | | — | | 1,522 | | 1,522 | | 1,555 | | — | | — | | — | | — | |
Total self-supported debt | | 14,793 | | 16,555 | | 1,762 | | 14,563 | | 16,271 | | 16,241 | | (30 | ) | 13,299 | |
Forecast allowance | | — | | — | | — | | — | | 350 | | 350 | | — | | — | |
Total provincial debt | | 49,893 | | 48,377 | | (1,516 | ) | 43,114 | | 53,437 | | 53,112 | | (325 | ) | 45,154 | |
(1) | Debt is after deduction of sinking funds and unamortized discounts, and excludes accrued interest. Government direct and fiscal agency accrued interest is reported in the government’s accounts as an accounts payable. |
(2) | Includes debt and guarantees incurred by the government on behalf of school districts, universities, colleges and health authorities/hospital societies (SUCH), and debt directly incurred by these entities. |
(3) | Health facilities’ debt includes public-private partnership obligations of $848 million for the six months ended September 30, 2010, $952 million for the six months ended September 30, 2011, $935 million for fiscal 2010/11 and $994 million forecast for fiscal 2011/12. |
(4) | BC Transportation Financing Authority debt includes public-private partnership obligations of $817 million for the six months ended September 30, 2010, $863 million for the six months ended September 30, 2011, $838 million for fiscal 2010/11 and $904 million forecast for fiscal 2011/12. |
(5) | Includes the BC Housing Management Commission and the Provincial Rental Housing Corporation. |
(6) | Includes service delivery agencies, student loan guarantees, loan guarantees to agricultural producers, guarantees issued under economic development and home mortgage assistance programs and loan guarantee provisions. |
(7) | Joint ventures of the Columbia Power Corporation and Columbia Basin Trust. |
Second Quarterly Report 2011/12
42
Appendix
Table A11 2011/12 Statement of Financial Position
| | Actual | | Year-to-Date | | Forecast | |
| | March 31, | | September 30, | | March 31, | |
($ millions) | | 2011 | | 2011 | | 2012 | |
Financial assets | | | | | | | |
Cash and temporary investments | | 3,096 | | 3,818 | | 2,398 | |
Other financial assets | | 9,603 | | 8,876 | | 9,429 | |
Sinking funds | | 1,410 | | 1,508 | | 1,299 | |
Investments in commercial Crown corporations: | | | | | | | |
Retained earnings | | 6,968 | | 6,397 | | 6,925 | |
Recoverable capital loans | | 12,947 | | 14,376 | | 15,586 | |
| | 19,915 | | 20,773 | | 22,511 | |
Warehouse borrowing program assets | | — | | 1,522 | | — | |
| | 34,024 | | 36,497 | | 35,637 | |
Liabilities | | | | | | | |
Accounts payable and accrued liabilities | | 7,664 | | 8,788 | | 7,651 | |
Deferred revenue | | 10,854 | | 11,587 | | 10,568 | |
Debt: | | | | | | | |
Taxpayer-supported debt | | 31,855 | | 31,822 | | 36,521 | |
Self-supported debt | | 13,299 | | 16,555 | | 16,241 | |
Forecast allowance | | — | | — | | 350 | |
Total provincial debt | | 45,154 | | 48,377 | | 53,112 | |
Add: debt offset by sinking funds | | 1,410 | | 1,508 | | 1,299 | |
Less : guarantees and non-guaranteed debt | | (421 | ) | (742 | ) | (715 | ) |
Financial statement debt | | 46,143 | | 49,143 | | 53,696 | |
| | 64,661 | | 69,518 | | 71,915 | |
Net liabilities | | (30,637 | ) | (33,021 | ) | (36,278 | ) |
Capital and other non-financial assets | | | | | | | |
Tangible capital assets | | 34,390 | | 35,229 | | 36,547 | |
Other non-financial assets | | 1,079 | | 1,190 | | 1,159 | |
| | 35,469 | | 36,419 | | 37,706 | |
Accumulated surplus (deficit) | | 4,832 | | 3,398 | | 1,428 | |
Changes in Financial Position
| | Year-to-Date | | Forecast | |
| | September 30, | | March 31, | |
($ millions) | | 2011 | | 2012 | |
(Surplus) deficit for the period | | 823 | | 3,091 | |
Comprehensive income and accounting adjustments (increase) decrease | | 611 | | 313 | |
(Increase) decrease in accumulated surplus | | 1,434 | | 3,404 | |
Capital and other non-financial asset changes: | | | | | |
Increase in taxpayer-supported capital investments | | 1,871 | | 4,161 | |
Less: amortization and other accounting changes | | (1,032 | ) | (2,004 | ) |
Change in net capital assets | | 839 | | 2,157 | |
Increase (decrease) in other non-financial assets | | 111 | | 80 | |
| | 950 | | 2,237 | |
Increase (decrease) in net liabilities | | 2,384 | | 5,641 | |
Investment and working capital changes: | | | | | |
Increase (reduction) in cash and temporary investments | | 722 | | (698 | ) |
Increase in total investment in commercial Crown corporations: | | | | | |
Increase (decrease) in retained earnings | | (571 | ) | (43 | ) |
Self-supported capital investments | | 1,441 | | 3,229 | |
Less: loan repayments and other accounting changes | | (12 | ) | (590 | ) |
| | 858 | | 2,596 | |
Other working capital changes | | (964 | ) | 14 | |
| | 616 | | 1,912 | |
Increase (decrease) in financial statement debt | | 3,000 | | 7,553 | |
(Increase) decrease in sinking fund debt | | (98 | ) | 111 | |
Increase (decrease) in guarantees and non-guaranteed debt | | 321 | | 294 | |
Increase (decrease) in total provincial debt | | 3,223 | | 7,958 | |
Second Quarterly Report 2011/12
43